optimization of catalytic glycerol steam reforming to light olefins using cu/zsm-5 catalyst
TRANSCRIPT

Energy Conversion and Management 86 (2014) 735–744
Contents lists available at ScienceDirect
Energy Conversion and Management
journal homepage: www.elsevier .com/ locate /enconman
Optimization of catalytic glycerol steam reforming to light olefins usingCu/ZSM-5 catalyst
http://dx.doi.org/10.1016/j.enconman.2014.06.0400196-8904/� 2014 Elsevier Ltd. All rights reserved.
⇑ Corresponding author. Tel.: +60 7 5535553; fax: +60 7 55881463.E-mail address: [email protected] (N.A.S. Amin).
Z.Y. Zakaria a, N.A.S. Amin a,⇑, J. Linnekoski b
a Chemical Reaction Engineering Group, Faculty of Chemical Engineering, Universiti Teknologi Malaysia, 81310 UTM Skudai, Malaysiab VTT, Process Chemistry, Biologinkuja 7, P.O. Box 1000, FI-02044 VTT, Finland
a r t i c l e i n f o a b s t r a c t
Article history:Received 3 October 2013Accepted 15 June 2014Available online 5 July 2014
Keywords:Glycerol to olefinCatalytic conversionProcess optimization
Response surface methodology (RSM) and multi-objective genetic algorithm was employed to optimizethe process parameters for catalytic conversion of glycerol, a byproduct from biodiesel production, tolight olefins using Cu/ZSM-5 catalyst. The effects of operating temperature, weight hourly space velocity(WHSV) and glycerol concentration on light olefins selectivity and yield were observed. Experimentalresults revealed the data adequately fitted into a second-order polynomial model. The linear temperatureand quadratic WHSV terms gave significant effect on both responses. Optimization of both the responsesindicated that temperature favouring high light olefin formation lied beyond the experimental designrange. The trend in the temperature profile concurred commensurately with the thermodynamicanalysis. Multi-objective genetic algorithm was performed to attain a single set of processing parametersthat could produce both the highest light olefin selectivity and yield. The turn-over-frequency (TOF) ofthe optimized responses demonstrated a slightly higher value than the one which was not optimized.Combination of RSM, multi-objective response and thermodynamic is useful to determine the processoptimal operating conditions for industrial applications.
� 2014 Elsevier Ltd. All rights reserved.
1. Introduction
Biodiesel is an alternative bioenergy produced from renewableresources such as palm, canola, soya bean and rape seed oil [1]. Itcan be produced via transesterification reaction of fatty acids andalcohols. Approximately 10 wt.% of glycerol, an alcohol with threehydroxyl groups is produced as a byproduct in this reaction [2–4].The crude glycerol obtained is 50% pure with huge potential as araw material to produce valuable products [5] including gas phase[6]. With more crude glycerol being generated from biodiesel pro-duction as a by-product, continuous efforts are inherently seekedto manage and convert glycerol to useful chemicals economicallywhich can indirectly minimize the cost of biodiesel production.
Glycerol can be converted to various precious products such asfuel additives [7], acrolein [5,8–10], propane [11] 1-hydroxyace-tone [12], formaldehyde [5], acetol [5], alkyl aromatics [13], andhydrogen [14,15]. In several reports involving glycerol dehydration[8,11,16–18], light olefins have been detected as side product of thereaction. Corma [8] obtained some light olefins while catalyticallytesting glycerol to acrolein with zeolite ZSM-5. In a separate study,Murata and co-workers found propylene when testing glycerol to
propane using ZSM-5 zeolite catalyst [11]. Recently, Zakaria [19]compared several metal-loaded ZSM-5 catalysts to convert glycerolto light olefin with Cu/ZSM-5 exhibited the best performance. It isworthy to note that dedicated research on glycerol conversion toolefin is relatively new and very much at its infancy stage.
The impact for light olefins research is huge since the chemicalshave such high commercial value and industrial importance.Literatures concerning glycerol transformation to light olefins arelimited. However, studies involving methanol and ethanol to lightolefins over zeolite catalysts [20–23] are abundant inferring thatglycerol, being in the same alcohol group as methanol and ethanol,has the potential to be converted to light olefins. In another devel-opment, the utilization of biomass such as rice husk, sawdust andsugarcane bagasse to produce light olefin has also progressivelygain attention [24].
Olefin is basically a petrochemical derivative conventionallyproduced by thermal cracking of natural gas and crude oil inrefineries worldwide. Ethylene is the simplest olefin with onlytwo carbon atoms. Major olefin products like ethylene, propylene,butadiene and C4 derivatives, better known as light olefins are usedto produce plastics, chemical intermediates, and industrialsolvents [25]. The exorbitant price of light olefin can be reduced[26] by utilizing glycerol, as a feed, and establishing acommercially and economically viable process. In addition, the

736 Z.Y. Zakaria et al. / Energy Conversion and Management 86 (2014) 735–744
overall process is environmentally friendly since the feed stock toproduce light olefin is from a renewable source.
The main objective of this paper is to determine the optimalprocess parameters for conversion of glycerol to light olefins usingresponse surface methodology (RSM). The RSM technique attemptsto optimize light olefin selectivity and yield individually at thecorresponding process parameters. A central composite rotatabledesign is used for design of experiment. The empirical mathemat-ical models for olefin selectivity and yield are also generated. Thestatistical analysis is also implemented to testify the adequacy ofthe models. Imperatively, multi-objective genetic algorithm isemployed to determine the maximum light olefin selectivity andyield simultaneously at the corresponding optimal independentvariables. The turn-over-frequency (TOF) of the catalyst at the opti-mized process is also evaluated. The RSM, multi-objective geneticalgorithm and TOF analysis for the conversion of glycerol to lightolefin have not been presented and discussed previously by otherresearchers. In order to provide better comprehension of theoptimum operating condition results, the discussion is correlatedwith thermodynamic analysis for ethylene, which represents lightolefins. Finally, a view on the available technologies and the cost ofcorresponding feedstock to produce light olefin is presented,providing insight on the economic cost conjecture.
2. Materials and method
2.1. Materials
The main reagents were HZSM-5 (SiO2/nAl2O3 = 30; Zeolyst,USA), and glycerol (87.5% purity; Merck, USA). Copper nitrate fromEmory Laboratory Reagents was used to impregnate HZSM-5.
2.2. Catalyst preparation
Cu/ZSM-5 catalyst was prepared according to the wet-impreg-nation method. Initially, the parent HZSM-5 zeolite was added into100 ml of distilled water before 30 wt% of copper nitrate salt wasadded into the solution, mixed and stirred at 60–70 �C temperaturefor an hour. The solution was then dried at 100 �C for 12 h andfinally calcined at 550 �C for 5 h. The calcined catalyst was thencrushed and sieved between 40 and 50 mesh to obtain uniform cat-alyst size for the catalytic cracking of glycerol with steam.
2.3. Catalyst characterization
Cu/ZSM-5 was characterized by XRD, FTIR, BET, TPD-ammoniaand TPR. It has comparatively larger surface area and higher aciditythan other metal ZSM-5 studied earlier [19]. Detail characteriza-tion methods as well as chemical and physical properties of Cu/ZSM-5 have been discussed elsewhere [19]. The characterizationresults reveal that the physico-chemical properties of Cu/ZSM-5is suitable for the catalytic conversion of glycerol to olefins, as sig-nificantly shown from the higher distribution of strong acid sites.
2.4. Catalytic performance test
Catalyst testing was performed in a fixed-bed quartz reactor,with outside diameter = 13 mm and length = 35 cm, positionedinside a vertical Carbolite tubular furnace. Prior to testing, the cat-alyst was activated in helium gas flow for 1 h at 500 �C. After thecatalyst has been reduced, glycerol solution was vaporized andfed at temperature between 300 and 310 �C. A set of thermocou-ples attached to a temperature data logger was fixed along the lineto monitor the temperature reading at various locations. Thepurpose was mainly to ensure that glycerol did not condense
before entering the reactor. The processing parameters were tem-peratures 511.8–688.2 �C, WHSV 25.6–184.4 h�1 and glycerol con-centration of 12.4–47.6% at atmospheric pressure. The gaseousproducts were then analyzed with an on-line HP 6890N GC-TCD/FID gas chromatography equipped with both thermal conductivedetector (TCD) and flame ionization detector (FID). The columnsused were HP plot/Q, HP-Mole sieve, GP-Gaspro and Hayasep-Qfor the main product analysis. The final amount of gaseous prod-ucts as well as liquid was recorded for the overall mass balance cal-culation to provide the amount of coke. The liquid was analyzed todetermine unreacted glycerol for glycerol conversion calculation. Adetail liquid analysis was not performed in this study since lightolefins production was the main focus. The schematic experimen-tal set-up is shown in Fig. 1. The glycerol conversion, selectivityand yield of products are each defined by Eqs. (1)–(3):
Glycerol conversion ð%Þ¼ Amount of glycerol converted ðmolÞTotal amount of glycerol in the feed ðmolÞ�100
ð1Þ
Olefin selectivity ð%Þ; S ¼ Amount of olefins ðmolÞAmount of all products ðmolÞ� 100 ð2Þ
Olefin yield ð%; YÞ ¼ Amount of olefins ðmolÞAmount of glycerol feed ðmolÞ � 100 ð3Þ
Only selectivity and yield of gaseous products, specifically lightolefins, are discussed in this study in view of their commercialimportance.
2.5. Experimental design
Investigating a five level three factor Central Composite Design(CCD) using Statistika version 7.0 required 16 experiments in thisstudy. Eight star points (a = ±1), six axial points (a = ±2) and tworeplicates at the center point (a = 0) were chosen as experimentalpoints. Central points were used to check the reproducibility andstability of results. The runs were conducted in randomized man-ner to guard against systematic bias. The performance of the pro-cess was evaluated by analyzing the (1) selectivity and (2) yieldas the responses. Each run was performed in duplicate.
For experimental design of the catalytic steam reforming ofglycerol; temperature, WHSV and glycerol concentration were cho-sen as the parameters that would most likely influence the perfor-mance of the system. The low, middle and high levels of all theindependent variables were based on prior screening of the litera-tures and designed for future economic pilot scale operation, aslisted in Table 1.
The substitution of the chosen parameters into the resultingmodel enabled the calculation of the predicted response as shownin Eq. (4),
g ¼ b0 þX3
i¼1
bixi þX3
i¼1
biix2i þ
X
i¼1
X3
j¼iþ1
biixixj þ e ð4Þ
where g is the response, b0 is constant coefficient, bi, bii, and bij arelinear, quadratic and second order interaction coefficient, respec-tively. xi and xj are independent variables where e is the error.The R-square was determined by Eq. (5),
R2 ¼ 1� SSResidual
SSmodel þ SSResidualð5Þ
where SS is the sum of square and degree of freedom, respectively.R-Square is the most important factor in examining the variability of
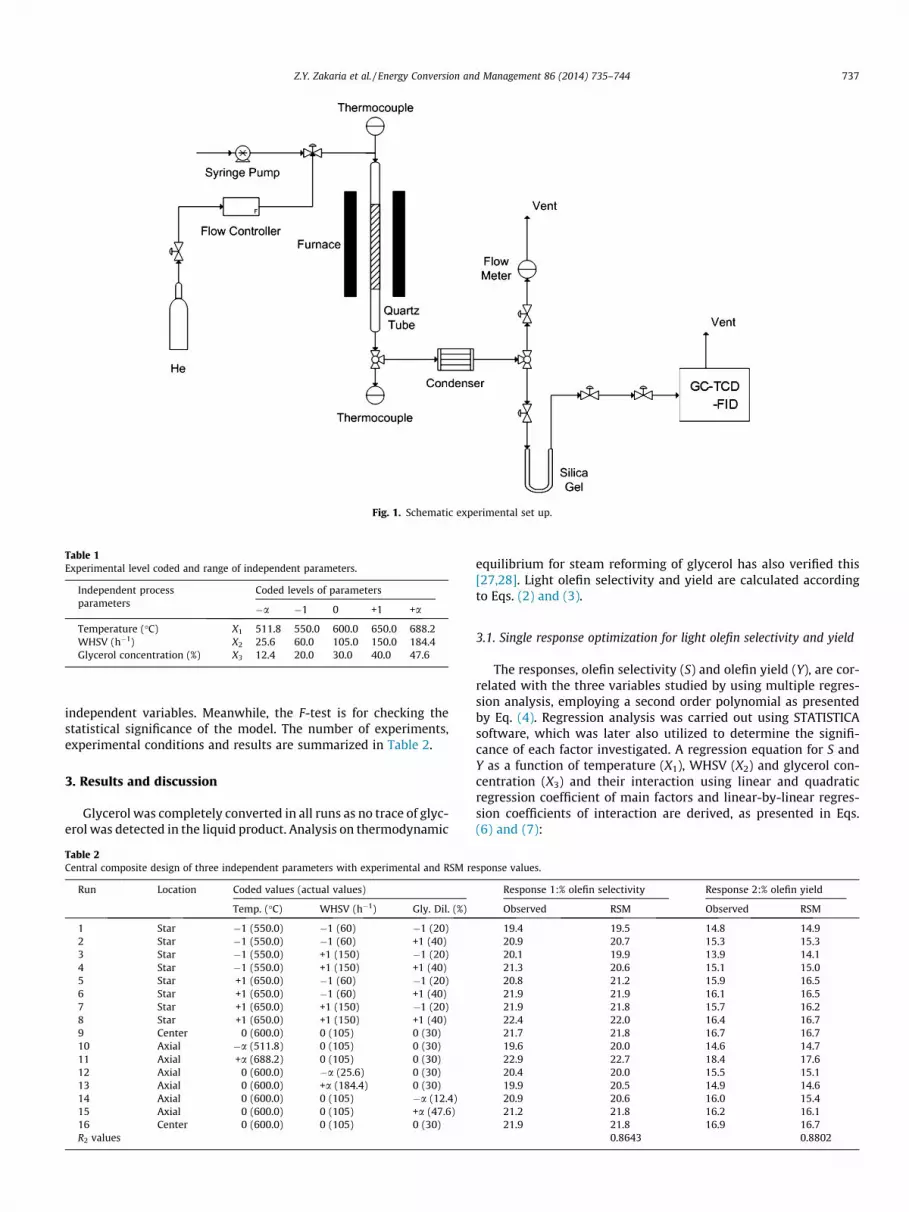
Fig. 1. Schematic experimental set up.
Table 1Experimental level coded and range of independent parameters.
Independent processparameters
Coded levels of parameters
�a �1 0 +1 +a
Temperature (�C) X1 511.8 550.0 600.0 650.0 688.2WHSV (h�1) X2 25.6 60.0 105.0 150.0 184.4Glycerol concentration (%) X3 12.4 20.0 30.0 40.0 47.6
Z.Y. Zakaria et al. / Energy Conversion and Management 86 (2014) 735–744 737
independent variables. Meanwhile, the F-test is for checking thestatistical significance of the model. The number of experiments,experimental conditions and results are summarized in Table 2.
3. Results and discussion
Glycerol was completely converted in all runs as no trace of glyc-erol was detected in the liquid product. Analysis on thermodynamic
Table 2Central composite design of three independent parameters with experimental and RSM re
Run Location Coded values (actual values)
Temp. (�C) WHSV (h�1) Gly. Dil. (%)
1 Star �1 (550.0) �1 (60) �1 (20)2 Star �1 (550.0) �1 (60) +1 (40)3 Star �1 (550.0) +1 (150) �1 (20)4 Star �1 (550.0) +1 (150) +1 (40)5 Star +1 (650.0) �1 (60) �1 (20)6 Star +1 (650.0) �1 (60) +1 (40)7 Star +1 (650.0) +1 (150) �1 (20)8 Star +1 (650.0) +1 (150) +1 (40)9 Center 0 (600.0) 0 (105) 0 (30)10 Axial �a (511.8) 0 (105) 0 (30)11 Axial +a (688.2) 0 (105) 0 (30)12 Axial 0 (600.0) �a (25.6) 0 (30)13 Axial 0 (600.0) +a (184.4) 0 (30)14 Axial 0 (600.0) 0 (105) �a (12.4)15 Axial 0 (600.0) 0 (105) +a (47.6)16 Center 0 (600.0) 0 (105) 0 (30)R2 values
equilibrium for steam reforming of glycerol has also verified this[27,28]. Light olefin selectivity and yield are calculated accordingto Eqs. (2) and (3).
3.1. Single response optimization for light olefin selectivity and yield
The responses, olefin selectivity (S) and olefin yield (Y), are cor-related with the three variables studied by using multiple regres-sion analysis, employing a second order polynomial as presentedby Eq. (4). Regression analysis was carried out using STATISTICAsoftware, which was later also utilized to determine the signifi-cance of each factor investigated. A regression equation for S andY as a function of temperature (X1), WHSV (X2) and glycerol con-centration (X3) and their interaction using linear and quadraticregression coefficient of main factors and linear-by-linear regres-sion coefficients of interaction are derived, as presented in Eqs.(6) and (7):
sponse values.
Response 1:% olefin selectivity Response 2:% olefin yield
Observed RSM Observed RSM
19.4 19.5 14.8 14.920.9 20.7 15.3 15.320.1 19.9 13.9 14.121.3 20.6 15.1 15.020.8 21.2 15.9 16.521.9 21.9 16.1 16.521.9 21.8 15.7 16.222.4 22.0 16.4 16.721.7 21.8 16.7 16.719.6 20.0 14.6 14.722.9 22.7 18.4 17.620.4 20.0 15.5 15.119.9 20.5 14.9 14.620.9 20.6 16.0 15.421.2 21.8 16.2 16.121.9 21.8 16.9 16.7
0.8643 0.8802

22.5
23.0
23.5(a) Sexp (Selectivity from experimental results) SP (Selectivity from predicted modeling results)
738 Z.Y. Zakaria et al. / Energy Conversion and Management 86 (2014) 735–744
S ¼ 0:0001X21 � 0:0002X2
2 � 0:0020X23 þ 0:0916X1
þ 0:0459X2 þ 3:387X3 þ 0:0001X1X2 þ 0:0003X1X3
þ 0:0003X2X3 � 18:50 ð6Þ
18.5 19.0 19.5 20.0 20.5 21.0 21.5 22.0 22.5 23.0 23.5
Observed Values
19.0
19.5
20.0
20.5
21.0
21.5
22.0
Pred
icte
d Va
lues
13.0 13.5 14.0 14.5 15.0 15.5 16.0 16.5 17.0 17.5 18.0 18.5 19.0
Observed Values
13.5
14.0
14.5
15.0
15.5
16.0
16.5
17.0
17.5
18.0
Pred
icte
d Va
lues
(b) Yexp (Yield from experimental results) YP (Yield from predicted modeling results)
Fig. 2. Observed versus predicted value for (a) C2H4 Selectivity and (b) C2H4 Yield.
Y ¼ 0:0001X21 � 0:0003X2
2 � 0:2942X23 þ 0:1023X1
þ 0:0157X2 þ 0:2942X3 þ 0:0001X1X2 � 0:0002X1X3
þ 0:0003X2X3 � 24:2426 ð7Þ
The coefficients with one factor represent the effect of the par-ticular factor, while the coefficients with two factors signify inter-action between the two terms. Coefficients with second orderterms denote the quadratic effect of the factor. The positive andnegative signs in front of each coded variables indicate paralleland adverse effect of the factors to the responses respectively.The models were selected based on the highest order of polynomi-als where the models were significant and not aliased.
The main effects model indicated that the quadratic term forglycerol concentration has the highest negative effect on light ole-fin selectivity as observed through beta regression coefficient,whereas, glycerol concentration linear term has highest positiveeffect on light olefin selectivity. On the other hand, the interactionbetween temperature and glycerol concentration as well as thequadratic term for WHSV and glycerol concentration showednegative effect toward light olefin yield. The linear temperatureterm has the highest positive contribution as observed from theregression term compared to others for light olefin yield. Generally,it is evident that all interaction terms showed positive effect forboth responses except for the interaction between temperatureand glycerol concentration for light olefin yield.
Having generated the regression model equation to representthe effect of each variable including their interactions with eachother on the S and Y values, analysis to evaluate the adequacy ofthe model was performed. The first criteria evaluated to determinethe model adequacy is by judging the appropriateness of the modelfrom the determination coefficient, the R-squared value, whichreveals the total variation of the observed values of activity aboutits mean [29].
The R2 for the regression model relating all three effects are0.86428 and 0.88024 for S and Y, respectively, which is consideredgood in describing the validity of the models generated. Accordingto the R2 for S, 86.4% of the sample variation could be attributed tothe variable and only 13.6% of the total variance could not beexplained by the models. Similarly for Y, 88.0% of the samplesare ascribed by the measured variable and 12.0% are not. Usingthe regression model generated, a predicted value for the responsein each run according to the experimental design was obtained, aslisted in Table 2.
Fig. 2 depicts the variation of the experimental data against thepredicted value for both S and Y. From Fig. 2(a), it could clearly beobserved that the linear red line plotted using points calculatedaccording to the regression model deviates very slightly from Sexp
where Sexp = Sp, and Sexp and Sp are selectivity from experimentaland predicted data, respectively, showing appropriateness of themodel generated. The predicted values calculated from the regres-sion model also in majority falls very near to the line plotted asexpected from the reasonably good value of R-squared. Fig. 2(b)shows similar scenario as depicted by Fig. 2(a). Generally, it canbe stated that Yexp = Yp, where Yexp and Yp are yields from experi-mental and predicted Y, respectively, showing appropriateness ofthe model generated.
The adequacy of the generated regression models were alsoevaluated using ANOVA method, which is very useful to determinesignificant effects of process variables to the response and to fit thesecond order polynomial models to the experimental data [29].
Table 3 lists the outcome of such analysis. In order to evaluatethe adequacy or accuracy of the model using ANOVA, the impor-tant value to be observed is the F-value, which is the ratio of meansquare due to regression to the mean square due to residual error.In general the F-value calculated from ANOVA should be greaterthan the tabulated value for the model to be considered appropri-ate. F-value calculated for the S model is 4.3, which exceeded thetabulated F-value for 95% confidence (F0.05,9,6) (4.1) while the cal-culated F-value for Y is 4.9, which also exceeded the tabulated Fvalue.
Once the validity and adequacy of the regression model hasbeen assessed, it is very useful to identify the variables that wouldaffect the process significantly. The factor with the lowest p-valueand the highest F-value is considered the most significant. FromFig. 3(a), it is evident that the linear temperature term, X1, hasthe most effect on S with p-value of 0.014918 at F-value 4.967.The next factor rated as significant is quadratic WHSV. The limitingvalue for p is 0.05, which is based on the confidence level fixed forthe ANOVA analysis carried out; hence all factors with p-valuelower than 5% are judged significant. Other factors not mentionedare all rated as insignificant to affect the value of S in the process.As for Y, the most significant factor is also the linear term of tem-perature, X1, with p-value = 0.010454 and F-value = 5.3294, fol-lowed by the quadratic term of WHSV, as shown in Fig. 3(b). Thep-values were obtained form the regression analysis tool in thesoftware. This information concluded that both temperature andWHSV significantly affected the selectivity and yield, respectively.

Table 3The results for ANOVA test for% olefin selectivity and% olefin yield.
Sources Sum of square Degree of freedom Mean square F value F tabulated
% Olefin selectivity Regression 13.3547 9 1.483856 4.245446 4.1Residual 2.09710 6 0.349517Total 15.45181 15
% Olefin yield Regression 14.7437 9 1.638185 4.90023 4.1Residual 2.00585 6 0.334308Total 16.74951 15
.2790455
-.569572
-.619065
-.807858
.8554028
-1.10749
2.168855
-2.66184
4.96786
p=.05
Standardized Effect Estimate (Absolute Value)
1Lby2L
2Lby3L
1Lby3L
Temp(Q)
(2)WHSV(L)
Gly Conc(Q)
(3)Gly Conc(L)
WHSV(Q)
(1)Temp(L)
-.465655
.6306072
.669377
-.923303
-1.0041
1.374774
-1.77685
-3.36033
5.32948
p=.05
Standardized Effect Estimate (Absolute Value)
1Lby3L
1Lby2L
2Lby3L
(2)WHSV(L)
Temp(Q)
(3)Gly Conc(L)
Gly Conc(Q)
WHSV(Q)
(1)Temp(L)
(a)
(b)
Fig. 3. Pareto Chart for (a) C2H4 selectivity and (b) C2H4 yield.
Temperature (ºC)
Temperature (ºC)
0
20
40
60
80
100
120
140
160
180
200
WH
SV (h
-1)
22
1819
20
21
10
15
20
25
30
35
40
45
50
Gly
cero
l Con
cent
ratio
n (%
)
22
1819
20
21
500 520 540 560 580 600 620 640 660 680 700
500 520 540 560 580 600 620 640 660 680 700
0 20 40 60 80 100 120 140 160 180 200
WHSV (h-1)
10
15
20
25
30
35
40
45
50
Gly
cero
l Con
cent
ratio
n (%
)
21
1819
20
(a)
(b)
(c)
Fig. 4. Contour plots manifesting interactions between factors affecting S (a) graphof temperature versus WHSV for S when glycerol concentration is 30% (b) graph oftemperature versus glycerol concentration for S when WHSV is 105 h�1 (c) graph ofglycerol concentration versus WHSV for S when temperature is 600 �C.
Z.Y. Zakaria et al. / Energy Conversion and Management 86 (2014) 735–744 739
3.2. Response surface contour plots
Contour plots of the response toward variation of two factors ata time could be obtained to see their effect and interaction on theresponse at the center point of the other variable. Figs. 4 and 5illustrates the contour plots for all possible combinations of twovariables. The effects of any two independent variables on theresponse could be observed by plotting a 3D surface plot of theresponse against the other independent variables, as the third var-iable kept at the center of their range.
The contour plots presented in Fig. 4(a) for value of S as a func-tion of temperature and WHSV with glycerol concentration kept at30%, indicates that the selectivity, S increases with temperature. S

Temperature (ºC)
Temperature (ºC)
0
20
40
60
80
100
120
140
160
180
200
WH
SV (h
-1)
17
1213
14
15
16
10
15
20
25
30
35
40
45
50
Gly
cero
l Con
cent
ratio
n (%
)
13
17
1615
14
500 520 540 560 580 600 620 640 660 680 700
500 520 540 560 580 600 620 640 660 680 700
0 20 40 60 80 100 120 140 160 180 200
WHSV (h-1)
10
15
20
25
30
35
40
45
50
Gly
cero
l Con
cent
ratio
n (%
)
16
1314
15
(a)
(b)
(c)
Fig. 5. Contour plots manifesting interactions between factors affecting Y (a) graphof temperature versus WHSV for Y when glycerol concentration is 30% (b) graph oftemperature versus glycerol concentration for Y when WHSV is 105 h�1 (c) graph ofglycerol concentration versus WHSV for Y when temperature is 600 �C.
740 Z.Y. Zakaria et al. / Energy Conversion and Management 86 (2014) 735–744
also increases with WHSV, but decreases after 120 h�1. The ellipti-cal contour obtained portrays a perfect interaction between theindependent variables [30]. It can be observed that the maximum
Table 4Predicted responses for olefin selectivity (S) and yield (Y).
% Olefin Selectivity
Temp. (�C) WHSV (h�1) Glycerol conc. (%) Optimum
Predicted 737.80 119.36 28.7 22.9
S with respect to temperature lies beyond the parameter decidedearlier in this study.
The surface temperature plot against glycerol concentrationpresented the interaction between both independent variablestoward S while maintaining WHSV at 105�1, in Fig. 4(b). It couldbe seen that S also increases and does not show sign of decreasingwhen temperature increases. This shows that the optimumtemperature is situated beyond 700 �C. On the other hand, theeffect of glycerol concentration toward S is identical to thatexplained earlier in Fig. 4(a). This demonstrated that the optimumglycerol concentration is between the 25% and 36% plateau.
The effects and interactions of glycerol concentration andWHSV were also investigated via a surface plot, presented inFig. 4(c). As WHSV was increased, S increases. However, as theWHSV increased beyond 130 h�1, S decreased. The plot reveals thatthe range of WHSV producing the highest possible S is between 70and 130 h�1 at glycerol concentration between 24% and 42%.
Evident from Fig. 5(a), temperature and WHSV gave almost sim-ilar effects on Y; in concurrence to what was revealed for S. Theeffects and interactions of temperature and glycerol concentrationon Y are illustrated in Fig. 5(b), while Fig. 5(c) depicts the effect andinteraction of WHSV and glycerol concentration on the yield, Y.Both resemble almost the same pattern. For Fig. 5(a) and (b), thetemperature exceeded the maximum range set for the design ofexperiment. It is probable the optimum temperature for both Sand Y lied beyond 700 �C. Hence, it can be deduced that in general,the process parameters interaction in this study followed the sametrend toward S and Y. It can be assumed that the formation of othergases, liquid, oxygenates and solid (coke), have negligible effect onS and Y for the light olefins.
3.3. Optimum operating conditions
The statistical software used is fully capable of generating aregression model to predict an appropriate value of the response,and also investigating the effect of each operating condition as wellas their interaction with each other. The ultimate goal however, isto achieve or obtain a specific value for each variable involved inthis investigation to finally determine the most efficient catalyticglycerol steam reforming process, provided by S and Y values.Table 4 tabulates the predicted results for S and Y. It can be seenthat the values for WHSV and glycerol concentration are withinthe experimental range. However, the temperature value is highand beyond the maximum range. This implies that the light olefinselectivity and yield require higher temperature, more than the ini-tial ceiling temperature value set in Table 1, which is 650 �C andeven more than the alpha or extreme temperature value, 688 �C.Thermodynamic analysis of glycerol steam reforming illustratedin Fig. 6 reveals that ethylene production reached a maximum peak[31]. Generally, without catalyst, ethylene formation peaksbetween 600 and 800 �C depending on the glycerol to water(GWR) ratio [31]. Although the thermodynamic analysis gave goodgeneral indication of the optimum temperature range, the GWR1:12 ratio employed in this study gave ethylene peak around600 �C, which is the center value of temperature for RSM. It ishowever unfair to equate both conditions since the thermody-namic analysis was conducted without catalyst. However, thethermodynamic analysis reveals that if we compare the average
% Olefin Yield
S Temp. (�C) WHSV (h�1) Glycerol conc. (%) Optimum Y
715.88 110.95 30.1 17.7

Mol
es o
f C2H
4 pro
duce
d (m
ol)
0
5x10⁻⁶
10x10-6
15x10-6
20x10-6
GWR 1:12 GWR 1:6 GWR 1:3 GWR 1:1 GWR 2:1
300 400 500 600 700 800 900 1000
Temperature (ºC)
Fig. 6. Thermodynamic equilibrium of light olefin produced from glycerol.
Z.Y. Zakaria et al. / Energy Conversion and Management 86 (2014) 735–744 741
of all GWR, the optimum temperature will be around 700 �C.Hence, the thermodynamic explanation supports the reason whythe optimum temperature for both S and Y lied beyond 688 �C.
A total of 13 possible chemical reactions that could take place inglycerol steam reforming process are represented in equations R1–R13. Glycerol steam reforming (R1) and decomposition of glycerol(R2) are spontaneous reactions leading to a complete glycerol con-version. Series of reactions (R3–R7) which include hydrogenationtook place before ethylene is formed via oxidative coupling ofmethane reactions (R8 and R9). Since the overall reaction is com-plex, ethylene, in this case, represents the total light olefin produc-tion. The inevitable coking process is represented by reactionsR10–R13 where carbon (solid) is formed.
R1 Glycerol steam reforming C3H8O3(g) + 3H2O(g) M 3CO2(g) + 7H2(g) DH298 = 122.89 kJ/molR2 Decomposition of glycerol C3H8O3(g) M 4H2(g) + 3CO(g) DH298 = 246.31 kJ/molR3 Water gas shift reaction CO(g) + H2O(g) M H2(g) + CO2(g) DH298 = �41.14 kJ/molR4 Methanation CO(g) + 3H2(g) M CH4(g) + H2O(g) DH298 = �206.11 kJ/molR5 Methanation CO2(g) + 4H2(g) M CH4(g) + 2H2O(g) DH298 = �164.94 kJ/molR6 CO2 reforming of methane CO2(g) + CH4(g) M 2H2(g) + 2CO(g) DH298 = 247.28 kJ/molR7 Oxidative coupling of methane 2CH4(g) + CO2(g) M C2H6(g) + CO(g) + H2O(g) DH298 = 106.00 kJ/molR8 Oxidative coupling of methane 2CH4(g) + 2CO2(g) M C2H4(g) + 2CO(g) + 2H2O(g) DH298 = 284.00 kJ/molR9 Dehydrogenation of ethane C2H6(g) M C2H4(g) + H2(g) DH298 = 136.33 kJ/molR10 Methane decomposition CH4(g) M 2H2(g) + C(s) DH298 = 74.52 kJ/molR11 Disproportionation 2CO(g) M CO2(g) + C(s) DH298 = �172.44 kJ/molR12 Hydrogenation of CO2 CO2(g) + 2H2(g) M 2H2O(g) + C(s) DH298 = �90.16 kJ/molR13 Hydrogenation of CO H2(g) + CO(g) M H2O(g) + C(s) DH298 = �131.3 kJ/mol
3.4. Multi-objective genetic algorithm optimization
The previous section utilizes design of experiment and only pro-vides operating condition for a single response. When there aremore than two responses, the optimum operating conditions willprovide two or more sets. In order to optimize a process havingtwo or more responses, a single set of operating parameter thatis capable to optimize two or more responses is required. For thispurpose, multi-objective genetic algorithm optimization usingMATLAB was carried out. The multi-objective optimization pro-vides a set of independent variables that maximizes two or moreresponses simultaneously, in this case to optimize S and Y concur-rently. Prior to the optimization part, the experimental data wasused for training of the network, where Levenberg–Marquardtalgorithm was applied [32]. The minimum and maximum boundary
was assigned to follow the initial processing parameters (asin Table 1) in the MATLAB optimization tool interface. After obtain-ing the best network, the genetic algorithm tool (gatool) availablein MATLAB was launched, and the solver option for multi-objectiveoptimization was selected (gamultiobj). At the end of the run,MATLAB produced several optimal conditions for optimumresponses of S and Y. This then lead to the Pareto-optimal solutionsfor simultaneous optimization corresponding to S and Y as illus-trated in Fig. 7. The choice of the final solution (optimal point)was based on the combination of S and Y producing the highestvalue. From there, a solution on the Pareto front that fulfilled thisrequirement was identified, as presented in Table 5.
As explained earlier, the result produced only a single opti-mized set of process parameters to optimize both S and Y. Asdesired, simulation results provided temperature, WHSV and glyc-erol concentration are within the range. The temperature valuesimulated is the maximum temperature, 650 �C, due to the maxi-mum or ceiling value set earlier which would not allow it to gobeyond the range. From the confirmatory experiments, an averagewas taken and compared with the simulated results. The percent-age differences between the simulated and experimental valuesare below 2%. It can be inferred that the multi-objective geneticalgorithm optimization successfully provide a single set of processparameter for optimum S and Y. Fig. 7 illustrates the Pareto frontobtained during the multi-objective genetic algorithm optimiza-tion to attain the best dependent and independent responses. Fromthis finding, it can be concluded that the optimum S (22.1%) and Y(17.8%) can be attained at 650 �C, 116.54 h�1 and 26.9% glycerolconcentration.
Table 6 compares non-optimized and optimized values for thedependant and independent responses. It can be observed thatthe optimized process parameters produced slighly better light
olefin selectivity and yield. This information is crucial for the opti-mization of glycerol steam reforming to light olefins and provideshow the process parameters should be set in order to optimize thereaction.
3.5. Turnover frequency
The turnover frequency (TOF) for the optimized Cu/ZSM-5 toattain light olefin components, namely ethylene, propylene andbutylene taken between 5 and 15 min was compared with thatof the non-optimized conducted earlier [19], as exemplified inFig. 8. The TOF in this case is defined as equal to the rate of olefinmolecule produced per second per surface area of the catalyst. Asexpected, the TOF of the optimized reaction is slightly higher thanthe non-optimized reaction. Although the difference seems to be

-23.2 -23 -22.8 -22.6 -22.4 -22.2 -22-17.9
-17.8
-17.7
-17.6
-17.5
-17.4
-17.3
-17.2
Objective 1
Obj
ectiv
e 2
Pareto front
Fig. 7. Pareto front using genetic algorithm multiple objective.
Table 6Comparison between non-optimized and optimized dependent and independentresponses using multi-objective genetic algorithm optimization.
Non-optimized Optimized
Temperature (�C) 600.00 650.00WHSV (h�1) 105.00 116.54Glycerol concentration (%) 30.00 26.91Selectivity (%) 20.2 22.1Yield (%) 16.3 17.8
C2H4 C3H6 C4H8TO
F (m
ol.m
-2.s
-1)
0
1
2
3
4
5
6
7
Non optimized Optimized
Fig. 8. Turnover frequency for the optimized function.
742 Z.Y. Zakaria et al. / Energy Conversion and Management 86 (2014) 735–744
small, such tiny improvement will significantly affect the overallproduction cost in a pilot or commercial scale process.
Since the chemical and physical properties of Cu/ZSM-5 weremore favorable for light olefins formation compared to other cata-lysts screened earlier [19], the optimized condition is however, notrelated to the catalytic properties. The temperature programdesorption ammonia (TPD-NH3) and temperature program reduc-tion (TPR) do not show any effect when temperature is increasedfrom 500 to 700 �C. This indicates that the combination effect ofthe process parameters (temperature, WHSV and glycerol concen-tration) gives optimum performance over the Cu/ZSM-5 catalyst.
The TOF for optimum and non-optimum conditions have almostsimilar distribution of ethylene, propylene and butylene, withethylene as the major component. The TOF for propylene for allcatalysts were below 1 mol m�2 s�1 while for butylene, it is almostnegligible. The TOF of CuZSM-5 for optimized condition increaseswhen temperature is increased to 650 �C. Operating the processat about 600 �C will also yield light olefin but not as optimum asat 650 �C. This can be related to the light olefins thermodynamicequilibrium profile. Consequently, it is expected that the TOF ofoptimized Cu/ZSM-5 will decrease when tested beyond 700 �C.
At optimum WHSV, a higher TOF compared to the non-optimized one was observed. This is true since more glycerolvapor was adsorped onto the catalyst surface and reacted via dehy-dration, dehydrogenation and deoxygenation to produce lightercompounds. However, since the surface and micropore area ofCu/ZSM-5 is limited, it could not accommodate more glycerolvapor (with 30% concentration) above 116.54 h�1. Performing theexperiment at WHSV = 105 h�1 has proven that the amount ofglycerol vapor is insufficient to fully utilize the surface and micro-pore area available for Cu/ZSM-5. Unfortunately, beyond116.54 h�1, the formation of light olefin decreased. This is mainlydue to the fact that the light olefins competes heavily with the for-mation toward hydrogen and CO. It is tough to explain the reasonwhy glycerol with concentration lower than the non-optimizedproduced more light olefins. Ideally, higher glycerol concentration,
Table 5Multi-objective genetic algorithm optimization using Matlab.
Temp. (�C)
(a) Predicted (multi-objective genetic algorithm optimization) 650.00(b) Observed (experimental)(c) Error
i.e. more carbon atoms, will tend to increase the production ofother carbon related compound such as CO and CO2. In actualeffect, as glycerol initially reacted, the earliest important reactionsthat may possibly take place are the glycerol steam reformingreaction (Eq. (8)) and decomposition of glycerol (Eq. (9)). Both reac-tions are highly reactive and take place spontaneously, withincreasing temperature [28]. Hence, it can be assumed that higherglycerol concentration may trigger the inclination toward reac-tions in Eqs. (8) and (9) to take place strongly. Perhaps subsequentreactions may not at all favor the formation of light olefins withsuch higher glycerol concentration. Thus, glycerol concentrationlower than 30% may be more desirable for the formation of lightolefins via methanation reaction route [31]. Hence, in this case,the optimum glycerol concentration should be around 26.9%. Anyvalue more or less than that will reduce the S and Y, as well asTOF. One plus point for this is that lower glycerol concentrationwill reduce the cost of the raw material for this process.
C3H8O3ðgÞ þ 3H2OðgÞ $ 3CO2ðgÞ þ 7H2ðgÞ DH298
¼ 122:89 kJ=mol ð8Þ
C3H8O3ðgÞ $ 4H2ðgÞ þ 3COðgÞ DH298 ¼ 246:31 kJ=mol ð9Þ
3.6. Economic overview
Olefins demand is speculated to rise in future [33]. Sinceolefin is such an important chemical, various technologies from
WHSV (h�1) Glycerol conc. (%) Optimum (S) Optimum (Y)
116.54 26.91 22.1 17.820.5 16.41.54 1.41

Table 7Comparison of feedstock cost and technologies to obtain olefin.
Technology Feedstock Feedstock cost, $ tonne�1 Process Refs.
Naphtha to olefins Non renewable, secondary product 600–860 [35] Cracking, dehydrogenation [34]Methanol to olefin (MTO) Non renewable, secondary product 310–420 [41] Dehydration, demethanizer, depropanizer,
deethanizer, CO2 removal[37,38]
Ethanol to olefin (ETO) Non renewable, secondary product 720–850 [40] Dehydration [39]Methane to olefins Non renewable, secondary product 395–397 G Joulec [43] Oxidative chlorination [42]Coal to olefin (CTO) Non renewable, primary product 65–300 [46] Coal to syngas to DME [45]Glycerol to olefin (GTO) Renewable, By product from biodiesel 500–520a Dehydration, dehydrogenation [18]
130–170b [47,48]
a Refined.b Crude.c Based on natural gas price in early September 2010 and measured in G Joule.
Z.Y. Zakaria et al. / Energy Conversion and Management 86 (2014) 735–744 743
numerous sources are currently being pursued to produce olefin.Traditionally, olefins are obtained from hydro-cracking of naphtha[34] which is quite expensive due to overpriced raw material costs[35]. There are also other chemical processes used to produce ole-fins such as elimination reactions, synthesis from carbonyl com-pounds, olefin metathesis and coupling reactions but all of themstill very much depend on petroleum as the main raw material[36]. Table 7 compares feedstock cost and technologies to obtainolefin.
The most widely used process for producing olefins is frommethane which proceeds via methanol-to-olefins or Fischer–Tropsch process [37] with synthesis gas as intermediate products.Both processes are capital and energy-intensive [38]. Another pro-cess is the ethanol to olefin technology which has already beencommercialized by Chematur Engineering Group from Sweden[39]. The process utilizes Syndol based catalysts to react with eth-anol to obtain light olefin. Less is known about the actual costing ofthis process. However, from Table 7, it is noticeable that ethanolprice [40] is double the price of methanol [41]. It can be deducedthat the utilization of ethanol as feedstock to produce olefin maynot be economically attractive. Furthermore, both methanol andethanol are valuable chemicals, and therefore using it as a feed-stock may not be favorable.
Lately, a new way to produce olefins from underutilized meth-ane via a process called oxidative chlorination was developedwhere methane reacted with hydrogen chloride over lanthanumtrichloride (LaCl3) catalyst [42]. Although it is a good process, thefact that methane from natural gas is not renewable underminedthe practicality. Nevertheless, the utilization of methane as olefinsis a promising option as the feedstock is cleaner and cheaper [43].
Coal-to-olefin (CTO) technology have recently emerged [44].CTO seems to be the answer to the world olefin supply in the nearfuture since the process is technologically sound [45] and coalprice is very cheap [46]. However, the main issue still lies in thefact that coal is non renewable. Hence, there is serious need toexplore ways of producing olefins from renewable sources.
The conversion of glycerol produced from biodiesel process toolefin maybe the answer for sustainable olefin supply. Despitethe slightly higher refined price [47,48], glycerol has the opportu-nity to breakthrough as the preferred feedstock due to the develop-ment of third generation biofuel that employs algae as a source forproducing biodiesel [49]. Lately, Exxon Mobil Corporation declaresthat they will be testing the commercial viability of algae biofuel asan alternative energy source [50]. The progress of biodieselproduction from algae is astounding and can possibly repeat thesuccessful trend of the first generation biofuel. The earlier secondgeneration biofuel as in Jatropha curcas [51], waste frying oil [52]and fatty acid distillate [53] has potential to be further developedand cannot be ignored. Both second and third generation biofueltriumphs will ensure continuous glycerol supply.
4. Conclusion
The optimization of catalytic glycerol steam reforming has beeninvestigated. RSM successfully determined the optimum values foreach single response. The optimum olefin selectivity, S of 22.9% isachieved at temperature = 737.8 �C, WHSV = 119.4 h�1 and glyc-erol concentration = 28.7%. The optimum response obtained for Yis 17.7% at temperature = 715.9 �C, WHSV = 111.0 h�1 and glycerolconcentration = 30.1%. Thermodynamic analysis supported the factthat the optimum temperature was established beyond the setrange since average optimum temperature formation of light olefinreached its peak at around 700 �C. Multi-objective responsegenetic algorithm predicted S = 22.1% and Y = 17.8% at thefollowing optimum conditions; temperature = 650 �C, WHSV =116.54 h�1 and glycerol concentration = 26.9% with 2% errorbetween the experimental and predicted values. TOF of the opti-mized process was higher than the non-optimized, indicating thatthe optimization effort successfully increase the productivity of theprocess. Brief economic study revealed that sustainable andcheaper light olefin production can be realized when glycerol isemployed as feedstock. It is indeed proven that combination ofRSM, multi-objective response and thermodynamic is useful forpractical applications to industrial production of glycerol steamreforming. The output of this study can also support the bioenergyindustry in managing and generating clean and sustainable energy.
Acknowledgements
The authors would like to acknowledge the following agenciesin Malaysia for the financial supports received for this work: Min-istry of Higher Education (MOHE) through the project number (Vot78401) under Fundamental Research Grant Scheme (FRGS), theMinistry of Science, Technology and Innovation (MOSTI) undereScience Fund 03-01-06-SF0963 and Universiti Teknologi Malaysia(UTM).
References
[1] Haas MJ. Improving the economics of biodiesel production through the use oflow value lipids as feedstocks: vegetable oil soapstock. Fuel Process Technol2005;86:1087–96.
[2] Karinen RS, Krause AOI. New biocomponents from glycerol. Appl Catal A: Gen2006;306:128–33.
[3] Chew TL, Bhatia S. Catalytic processes towards the production of biofuels in apalm oil and oil palm biomass-based biorefinery. Bioresour Technol2008;99:7911–22.
[4] Huber GW, Corma A. Synergies between bio-and oil refineries for theproduction of fuels from biomass. Angew Chem Int Ed 2007;46:7184–201.
[5] Pathak K, Reddy KM, Bakhshi NN, Dalai AK. Catalytic conversion of glycerol tovalue added liquid products. Appl Catal A 2010;372:224–38.
[6] Wolfson A, Dlugy C, Shotland Y. Glycerol as a green solvent for high productyields and selectivities. Environ Chem Lett 2007;5:67–71.

744 Z.Y. Zakaria et al. / Energy Conversion and Management 86 (2014) 735–744
[7] Serafim H, Fonseca IM, Ramos AM, Vital J, Castanheiro JE. Valorization ofglycerol into fuel additives over zeolites as catalysts. Chem Eng J2011;178:291–6.
[8] Corma A, Huber GW, Sauvanaud L, O’Connor P. Biomass to chemicals: catalyticconversion of glycerol/water mixtures into acrolein, reaction network. J Catal2008;257:163–71.
[9] de Oliveira AS, Vasconcelos SJS, de Sousa JR, de Sousa FF, Filho JM, Oliveira AC.Catalytic conversion of glycerol to acrolein over modified molecular sieves:activity and deactivation studies. Chem Eng J 2011;168:765–74.
[10] Katryniok B, Paul S, Capron M, Dumeignil F. Towards the sustainableproduction of acrolein by glycerol dehydration. ChemSusChem2009;2:719–30.
[11] Murata K, Takahara I, Inaba M. Propane formation by aqueous-phasereforming of glycerol over Pt/H-ZSM5 catalysts. React Kinet Catal Lett2008;93:59–66.
[12] Vasconcelos SJS, Lima CL, Filho JM, Oliveira AC, Barros EB, de Sousa FF, et al.Activity of nanocasted oxides for gas-phase dehydration of glycerol. Chem EngJ 2011;168:656–64.
[13] Hoang TQ, Zhu X, Danuthai T, Lobban LL, Resasco DE, Mallinson RG. Conversionof glycerol to alkyl-aromatics over zeolites. Energy Fuels 2010;24:3804–9.
[14] Adhikari S, Fernando SD, Haryanto A. Hydrogen production from glycerin bysteam reforming over nickel catalysts. Renew Energy 2008;33:1097–100.
[15] Adhikari S, Fernando SD, Haryanto A. Hydrogen production from glycerol: anupdate. Energy Convers Manage 2009;50:2600–4.
[16] Zhou C-H, Beltramini JN, Fan Y-X, Lu GQ. Chemoselective catalytic conversionof glycerol as a biorenewable source to valuable commodity chemicals. ChemSoc Rev 2008;37:527–49.
[17] Pagliaro M, Rossi M. The future of glycerol new usages of a versatile rawmaterial. UK: RSC Green Chemistry Book Series; 2008.
[18] Zakaria ZY, Amin NAS, Linnekoski J. A perspective on catalytic conversion ofglycerol to olefins. Biomass Bioenerg
[19] Zakaria ZY, Linnekoski J, Amin NAS. Catalyst screening for conversion ofglycerol to light olefins. Chem Eng J 2012;207–208:803–13.
[20] Patcas FC. The methanol-to-olefins conversion over zeolite-coated ceramicfoams. J Catal 2005;231:194–200.
[21] Park JW, Kim SJ, Seo M, Kim SY, Sugi Y, Seo G. Product selectivity and catalyticdeactivation of MOR zeolites with different acid site densities in methanol-to-olefin (MTO) reactions. Appl Catal A 2008;349:76–85.
[22] Takahara I, Saito M, Inaba M, Murata K. Dehydration of ethanol into ethyleneover solid acid catalysts. Catal Lett 2005;105:249–52.
[23] Inaba M, Murata K, Saito M, Takahara I. Ethanol conversion to aromatichydrocarbons over several zeolitecatalysts.ReactKinet Catal Lett 2006;88:135–41.
[24] Huang W, Gong F, Fan M, Zhai Q, Hong C, Li Q. Production of light olefins bycatalytic conversion of lignocellulosic biomass with HZSM-5 zeoliteimpregnated with 6 wt.% lanthanum. Bioresour Technol 2012;121:248–55.
[25] Li X, Shen B, Guo Q, Gao J. Effects of large pore zeolite additions in the catalyticpyrolysis catalyst on the light olefins production. Catal Today 2007;125:270–7.
[26] Masih M, Algahtani I, De Mello L. Price dynamics of crude oil and the regionalethylene markets. Energy Econo 2010;32:1435–44.
[27] Wang X, Li S, Wang H, Liu B, Ma X. Thermodynamic analysis of glycerin steamreforming. Energy Fuels 2008;22:4285–91.
[28] Kale GR, Kulkarni BD. Thermodynamic analysis of dry autothermal reformingof glycerol. Fuel Process Technol 2010;91:520–30.
[29] Cornell JA. How to apply response surface methodology. American Society forQuality Control Statistics Division., Winconsin: ASQS.; 1990.
[30] Erbay Z, Icier F. Optimization of hot air drying of olive leaves using responsesurface methodology. J Food Eng 2009;91:533–41.
[31] Zakaria ZY, Linnekoski J, Amin NAS. Thermodynamic analysis of glycerol toethylene. International Graduate Conference on Engineering, Science &Humanity 2013, Skudai, Malaysia: Universiti Teknologi Malaysia (UTM); 2013.
[32] Mohammad Fauzi AH, Saidina Amin NA. Optimization of oleic acidesterification catalyzed by ionic liquid for green biodiesel synthesis. EnergyConvers Manage 2013;76:818–27.
[33] Zakaria ZY, Amin NAS, Linnekoski J. A perspective on catalytic conversion ofglycerol to olefins. Biomass Bioenergy 2013;55:370–85.
[34] Yoshimura Y, Kijima N, Hayakawa T, Murataa K, Suzuki K, Mizukami F, et al.Catalytic cracking of naphtha to light olefins. Catal Surv Jpn 2000;4:157–67.
[35] Dillon T, London RY. Crude oil falls help to push spot naphtha lower. ICISChemical Business; 2010. p. 24.
[36] Ren T, Patel M, Blok K. Olefins from conventional and heavy feedstocks: energyuse in steam cracking and alternative processes. Energy 2006;31:425–51.
[37] UOP. UOP/HYDRO MTO process -– Methanol to olefins conversion. ProcessTechnology and Equipment; 2004.
[38] Soundararajan S, Dalai AK, Berruti F. Modeling of methanol to olefins (MTO)process in a circulating fluidized bed reactor. Fuel 2001;80:1187–97.
[39] Chematur EEG. Business area biomass chemicals – ethylene from ethanol.Chematur Engineering AB; 2010.
[40] ICIS. Ethanol prices and pricing information. In: R.B.I. Limited, (Ed.); 2011.[41] Methanex. Methanol price. Methanex Corporation ;2012.[42] Reisch M. Dow issues methane challenge – call for proposals targets direct
conversion of methane into feedstocks. Chem Eng News 2007;85:12.[43] Global K. Natural gas prices set for gains. The street; 2010. <http://
www.thestreet.com/story/10851133/1/natural-gas-prices-set-for-gains.html>[accessed 29.01.14.].
[44] Burridge E. Looming excess methanol could marginalize China production. ICISChemical Business; 2010. p. 17.
[45] Plotkin JS, Coleman HJ. PERP program – cole to olefins. Nexant Chem System;2007.
[46] Maher K. Chinese slowdown idles U.S. Coal Mines; 2012. Available from:<http://online.wsj.com/article/SB10000872396390443890304578010472748244256.html>. 2012 [accessed 29.01.14.]
[47] Seng S. Asia glycerine prices poised to rise on tight supply in Q1 ICIS news;2010.
[48] ICIS. ICIS Pricing – 2nd May 2012 – Glycerine (US Gulf); 2012.[49] Doan TTY, Sivaloganathan B, Obbard JP. Screening of marine microalgae for
biodiesel feedstock. Biomass Bioenergy 2011;35:2534–44.[50] Tan J, Seng LP. Exxon explores algae biofuels as alternative energy. Kuala
Lumpur: Reuters; 2010.[51] Kumar Tiwari A, Kumar A, Raheman H. Biodiesel production from jatropha oil
(Jatropha curcas) with high free fatty acids: An optimized process. BiomassBioenergy 2007;31:569–75.
[52] Zheng S, Kates M, Dubé MA, McLean DD. Acid-catalyzed production ofbiodiesel from waste frying oil. Biomass Bioenergy 2006;30:267–72.
[53] Chongkhong S, Tongurai C, Chetpattananondh P, Bunyakan C. Biodieselproduction by esterification of palm fatty acid distillate. Biomass Bioenergy2007;31:563–8.