redox-optimized ros balance and the relationship between mitochondrial respiration and ros
TRANSCRIPT
Biochimica et Biophysica Acta 1837 (2014) 287–295
Contents lists available at ScienceDirect
Biochimica et Biophysica Acta
j ourna l homepage: www.e lsev ie r .com/ locate /bbab io
Redox-Optimized ROS Balance and the relationship betweenmitochondrial respiration and ROS
Sonia Cortassa, Brian O'Rourke, Miguel A. Aon ⁎Division of Cardiology, Johns Hopkins University School of Medicine, Baltimore, MD, USA
Abbreviations: ΑRed, Amplex Red; ΔΨm, mitochondforward electron transport; G/M, glutamate/malateGSSG, oxidized form of GSH; H2O2, hydrogen peroximonochlorobimane; MU, mild uncoupling; OxPhos, oredox environment; R-ORB, Redox-Optimized ROS Bspecies; Trx, thioredoxin; VO2, respiratory rate⁎ Corresponding author at: Johns Hopkins Universit
Rutland Avenue, Ross Bldg. 1059, Baltimore, MD 21205410 502 5055.
E-mail address: [email protected] (M.A. Aon).
0005-2728/$ – see front matter © 2013 Elsevier B.V. All rhttp://dx.doi.org/10.1016/j.bbabio.2013.11.007
a b s t r a c t
a r t i c l e i n f oArticle history:Received 9 August 2013Received in revised form 7 November 2013Accepted 11 November 2013Available online 20 November 2013
Keywords:Redox environmentForward electron transportNADHGSHH2O2
Mild uncoupling
The Redox-Optimized ROS Balance [R-ORB] hypothesis postulates that the redox environment [RE] is the mainintermediary between mitochondrial respiration and reactive oxygen species [ROS]. According to R-ORB, ROSemission levels will attain a minimum vs. RE when respiratory rate (VO2) reaches a maximum following ADPstimulation, a tenet that we test herein in isolated heart mitochondria under forward electron transport [FET].ROS emission increased two-fold as a function of changes in the RE (~400 to ~900 mV·mM) in state 4 respirationelicited by increasing glutamate/malate (G/M). In G/Menergizedmitochondria, ROS emission decreases two-foldfor RE ~500 to ~300 mV·mM in state 3 respiration at increasing ADP. Stressedmitochondria released higher ROS,thatwas only weakly dependent on RE under state 3. As a function of VO2, the ROS dependence on REwas strongbetween ~550 and ~350 mV·mM, when VO2 is maximal, primarily due to changes in glutathione redox poten-tial. A similar dependence was observed with stressed mitochondria, but over a significantly more oxidized REand ~3-fold higher ROS emission overall, as compared with non-stressed controls. We conclude that undernon-stressful conditions mitochondrial ROS efflux decreases when the RE becomes less reduced within a rangeinwhichVO2 ismaximal. These results agreewith theR-ORBpostulate thatmitochondriaminimizeROS emissionas they maximize VO2 and ATP synthesis. This relationship is altered quantitatively, but not qualitatively, byoxidative stress although stressed mitochondria exhibit diminished energetic performance and increased ROSrelease.
© 2013 Elsevier B.V. All rights reserved.
1. Introduction
How mitochondria attain a reliable energy provision while keepingROS within physiological limits compatible with signaling is a relevantquestion linked with the relationship between respiration and ROS.The importance of this question cannot be overstated because of thecentral role that mitochondrial energetics/redox functions play in thepathogenesis of numerous human disorders [reviewed in [1,2]]. Alsounbeknownst to us is how the dependence of ROS emission on respira-tion is influenced by oxidative stress. This is also a fundamental questionbecause it is becoming increasingly clear that mitochondrial dysfunc-tion under oxidative stress underlies aging [3,4] and acute or chronicdisease conditions such as metabolic disorders (obesity, diabetes) [5],
rial membrane potential; FET,; GSH, reduced glutathione;de; LS, light scattering; MCB,xidative phosphorylation; RE,alance; ROS, reactive oxygen
y, Division of Cardiology, 720, USA. Tel.: 410 955 2759; fax:
ights reserved.
cancer [6,7], neurodegeneration [8], and cardiovascular disease [9–11].The role of mitochondrial functions pertains not only to pathology butalso to vital physiological activities, such as exercise and nutrition [12].
“Uncoupling to survive” [13], or its parental “mild uncoupling” [MU][14,15], and the recent Redox-Optimized ROS Balance [R-ORB] [16], arehypotheses attempting to explain at a mechanistic level the linkbetween mitochondrial respiration and ROS levels. A main differencebetweenMU and R-ORB is the proposed intermediary between respira-tion and ROS: mitochondrial membrane potential [ΔΨm] and redoxenvironment [RE], respectively.
The MU hypothesis postulates that in energized mitochondria, milduncoupling, i.e. slight drop in ΔΨm, decreases mitochondrial ROSproduction. Originally, it was proposed that MU was mediated byproteins that regulate the proton permeability of inner mitochondrialmembrane [15,17]. Evidence of mild-uncoupling has been obtained inisolated mitochondria under both forward [18] and reverse electrontransport modes of respiration [14]. In this hypothetical framework,ΔΨm would be the main mediator between the rate of respiration andROS. That a slight decrease in ΔΨm should also decrease ROS is amajor prediction of the MU hypothesis but this has been verified onlyin isolated mitochondria, not in intact cells [16]. Indeed, MU elicitedan increase rather than a decrease in ROS in living cardiomyocytesfrom guinea pig loaded with two ROS probes simultaneously. TheR-ORB hypothesis was introduced inpart to account for this discrepancy.
288 S. Cortassa et al. / Biochimica et Biophysica Acta 1837 (2014) 287–295
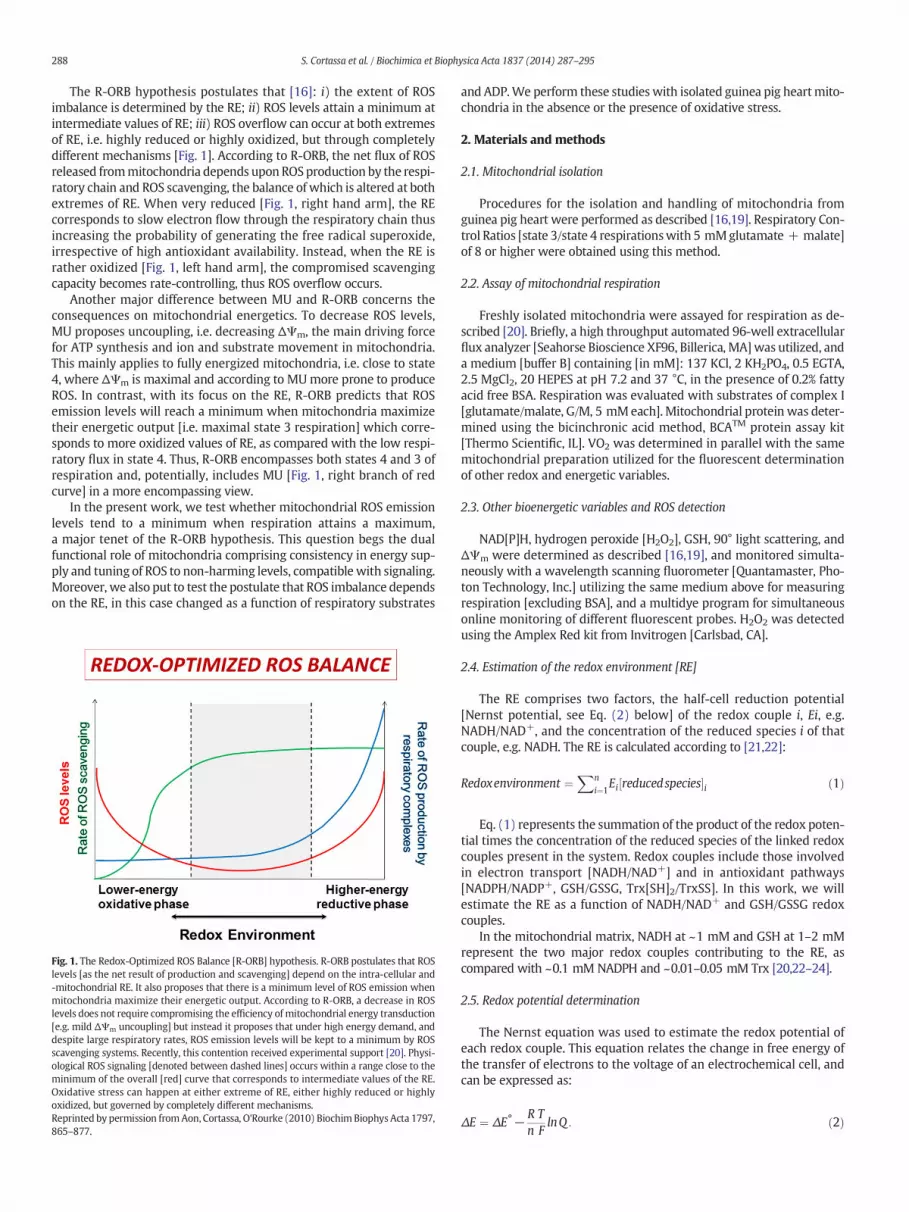
The R-ORB hypothesis postulates that [16]: i) the extent of ROSimbalance is determined by the RE; ii) ROS levels attain a minimum atintermediate values of RE; iii) ROS overflow can occur at both extremesof RE, i.e. highly reduced or highly oxidized, but through completelydifferent mechanisms [Fig. 1]. According to R-ORB, the net flux of ROSreleased frommitochondria depends uponROSproduction by the respi-ratory chain and ROS scavenging, the balance of which is altered at bothextremes of RE. When very reduced [Fig. 1, right hand arm], the REcorresponds to slow electron flow through the respiratory chain thusincreasing the probability of generating the free radical superoxide,irrespective of high antioxidant availability. Instead, when the RE israther oxidized [Fig. 1, left hand arm], the compromised scavengingcapacity becomes rate-controlling, thus ROS overflow occurs.
Another major difference between MU and R-ORB concerns theconsequences on mitochondrial energetics. To decrease ROS levels,MU proposes uncoupling, i.e. decreasing ΔΨm, the main driving forcefor ATP synthesis and ion and substrate movement in mitochondria.This mainly applies to fully energized mitochondria, i.e. close to state4, where ΔΨm is maximal and according to MUmore prone to produceROS. In contrast, with its focus on the RE, R-ORB predicts that ROSemission levels will reach a minimum when mitochondria maximizetheir energetic output [i.e. maximal state 3 respiration] which corre-sponds to more oxidized values of RE, as compared with the low respi-ratory flux in state 4. Thus, R-ORB encompasses both states 4 and 3 ofrespiration and, potentially, includes MU [Fig. 1, right branch of redcurve] in a more encompassing view.
In the present work, we test whether mitochondrial ROS emissionlevels tend to a minimum when respiration attains a maximum,a major tenet of the R-ORB hypothesis. This question begs the dualfunctional role of mitochondria comprising consistency in energy sup-ply and tuning of ROS to non-harming levels, compatible with signaling.Moreover, we also put to test the postulate that ROS imbalance dependson the RE, in this case changed as a function of respiratory substrates
Fig. 1. The Redox-Optimized ROS Balance [R-ORB] hypothesis. R-ORB postulates that ROSlevels [as the net result of production and scavenging] depend on the intra-cellular and-mitochondrial RE. It also proposes that there is a minimum level of ROS emission whenmitochondria maximize their energetic output. According to R-ORB, a decrease in ROSlevels does not require compromising the efficiency of mitochondrial energy transduction[e.g. mild ΔΨm uncoupling] but instead it proposes that under high energy demand, anddespite large respiratory rates, ROS emission levels will be kept to a minimum by ROSscavenging systems. Recently, this contention received experimental support [20]. Physi-ological ROS signaling [denoted between dashed lines] occurs within a range close to theminimum of the overall [red] curve that corresponds to intermediate values of the RE.Oxidative stress can happen at either extreme of RE, either highly reduced or highlyoxidized, but governed by completely different mechanisms.Reprinted by permission fromAon, Cortassa, O'Rourke (2010) BiochimBiophys Acta 1797,865–877.
and ADP.We perform these studies with isolated guinea pig heartmito-chondria in the absence or the presence of oxidative stress.
2. Materials and methods
2.1. Mitochondrial isolation
Procedures for the isolation and handling of mitochondria fromguinea pig heart were performed as described [16,19]. Respiratory Con-trol Ratios [state 3/state 4 respirationswith 5 mMglutamate + malate]of 8 or higher were obtained using this method.
2.2. Assay of mitochondrial respiration
Freshly isolated mitochondria were assayed for respiration as de-scribed [20]. Briefly, a high throughput automated 96-well extracellularflux analyzer [Seahorse Bioscience XF96, Billerica, MA] was utilized, anda medium [buffer B] containing [in mM]: 137 KCl, 2 KH2PO4, 0.5 EGTA,2.5 MgCl2, 20 HEPES at pH 7.2 and 37 °C, in the presence of 0.2% fattyacid free BSA. Respiration was evaluated with substrates of complex I[glutamate/malate, G/M, 5 mMeach]. Mitochondrial protein was deter-mined using the bicinchronic acid method, BCATM protein assay kit[Thermo Scientific, IL]. VO2 was determined in parallel with the samemitochondrial preparation utilized for the fluorescent determinationof other redox and energetic variables.
2.3. Other bioenergetic variables and ROS detection
NAD[P]H, hydrogen peroxide [H2O2], GSH, 90° light scattering, andΔΨm were determined as described [16,19], and monitored simulta-neously with a wavelength scanning fluorometer [Quantamaster, Pho-ton Technology, Inc.] utilizing the same medium above for measuringrespiration [excluding BSA], and a multidye program for simultaneousonline monitoring of different fluorescent probes. H2O2 was detectedusing the Amplex Red kit from Invitrogen [Carlsbad, CA].
2.4. Estimation of the redox environment [RE]
The RE comprises two factors, the half-cell reduction potential[Nernst potential, see Eq. (2) below] of the redox couple i, Ei, e.g.NADH/NAD+, and the concentration of the reduced species i of thatcouple, e.g. NADH. The RE is calculated according to [21,22]:
Redoxenvironment ¼Xn
i¼1Ei reducedspecies½ �i ð1Þ
Eq. (1) represents the summation of the product of the redox poten-tial times the concentration of the reduced species of the linked redoxcouples present in the system. Redox couples include those involvedin electron transport [NADH/NAD+] and in antioxidant pathways[NADPH/NADP+, GSH/GSSG, Trx[SH]2/TrxSS]. In this work, we willestimate the RE as a function of NADH/NAD+ and GSH/GSSG redoxcouples.
In the mitochondrial matrix, NADH at ~1 mM and GSH at 1–2 mMrepresent the two major redox couples contributing to the RE, ascompared with ~0.1 mM NADPH and ~0.01–0.05 mM Trx [20,22–24].
2.5. Redox potential determination
The Nernst equation was used to estimate the redox potential ofeach redox couple. This equation relates the change in free energy ofthe transfer of electrons to the voltage of an electrochemical cell, andcan be expressed as:
ΔE ¼ ΔE̊ − R Tn F
lnQ : ð2Þ
289S. Cortassa et al. / Biochimica et Biophysica Acta 1837 (2014) 287–295
ΔE° is the electromotive force under standard conditions that corre-sponds to the difference in standard reduction potentials of the twohalf-cells involved in the process; n is the number of electronsexchanged in the chemical process; F is the Faraday constant; R, theuniversal gas constant; T, temperature (Kelvin scale). Q stands for thequotient of the concentration of reduced over oxidized species fromthe redox couple. Standard redox potentials, ΔE° [see Eq. (2)], usedwere −320 mV for NADH/NAD+ and −240 mV for 2 GSH/GSSG [21].
To calculate the redox potential using Eq. (2) we need to determinethe redox status of the couple, i.e. the relative concentration of reducedand oxidized species.
2.6. NAD(P)H and GSH determination
NAD(P)H was monitored by exciting mitochondrial suspensions at340 nm and collecting the emission at 450 nm. The NAD(P)H signalwas calibrated with addition of 1 mM KCN [100%] and 6 μM FCCP[0% ± 5%–10%] at the end of the experiment [e.g. Fig. 2B]. Under certainexperimental conditions FCCP additionmay only account for 90% to 95%of NAD(P)H due to the existence of NADPH and bound-NADH; the lattermay vary between mitochondrial preparations within the specifiedrange and may imply longer time to achieve full oxidation.
GSHwas quantitated in supernatants frommitochondria undergoingstate 4 and 3 respirations after trichloroacetic acid precipitation as de-scribed elsewhere [24]. Briefly, after neutralizing to pH 7.4 the trichloro-acetic acid supernatants, we utilized non-enzymatic fluorescent labelingof thiols with the probe N-[4-[7-diethylamino-4-methylcoumarin-3-yl]phenyl]maleimide; picomole levels of GSH can be detected with this
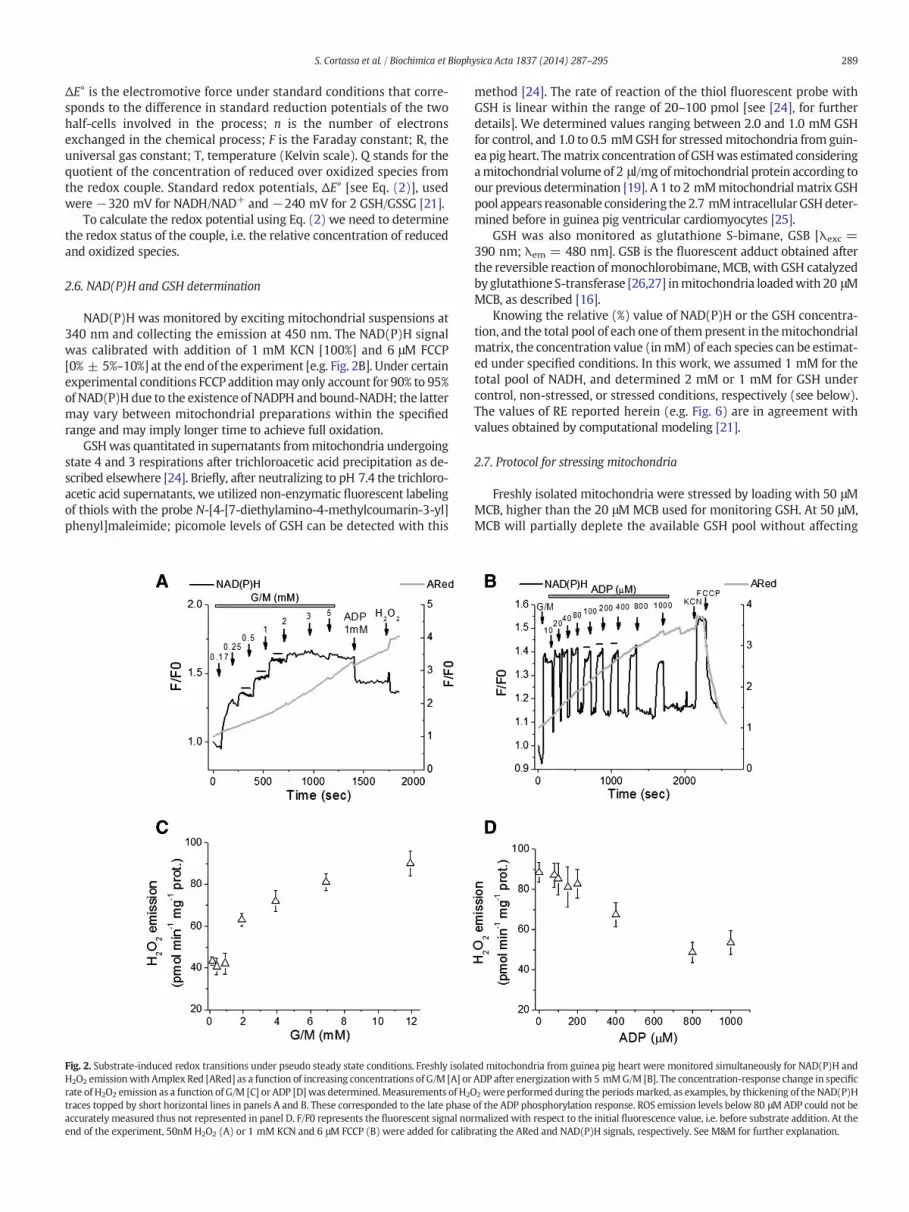
Fig. 2. Substrate-induced redox transitions under pseudo steady state conditions. Freshly isolatH2O2 emissionwith Amplex Red [ARed] as a function of increasing concentrations of G/M [A] orrate of H2O2 emission as a function of G/M [C] or ADP [D]was determined. Measurements of H2Otraces topped by short horizontal lines in panels A and B. These corresponded to the late phaseaccurately measured thus not represented in panel D. F/F0 represents the fluorescent signal noend of the experiment, 50nM H2O2 (A) or 1 mM KCN and 6 μM FCCP (B) were added for calib
method [24]. The rate of reaction of the thiol fluorescent probe withGSH is linear within the range of 20–100 pmol [see [24], for furtherdetails]. We determined values ranging between 2.0 and 1.0 mM GSHfor control, and 1.0 to 0.5 mMGSH for stressedmitochondria from guin-ea pig heart. Thematrix concentration of GSHwas estimated consideringamitochondrial volume of 2 μl/mg ofmitochondrial protein according toour previous determination [19]. A 1 to 2 mMmitochondrialmatrix GSHpool appears reasonable considering the 2.7 mM intracellular GSHdeter-mined before in guinea pig ventricular cardiomyocytes [25].
GSH was also monitored as glutathione S-bimane, GSB [λexc =390 nm; λem = 480 nm]. GSB is the fluorescent adduct obtained afterthe reversible reaction of monochlorobimane, MCB, with GSH catalyzedby glutathione S-transferase [26,27] inmitochondria loadedwith 20 μMMCB, as described [16].
Knowing the relative (%) value of NAD(P)H or the GSH concentra-tion, and the total pool of each one of thempresent in themitochondrialmatrix, the concentration value (inmM) of each species can be estimat-ed under specified conditions. In this work, we assumed 1 mM for thetotal pool of NADH, and determined 2 mM or 1 mM for GSH undercontrol, non-stressed, or stressed conditions, respectively (see below).The values of RE reported herein (e.g. Fig. 6) are in agreement withvalues obtained by computational modeling [21].
2.7. Protocol for stressing mitochondria
Freshly isolated mitochondria were stressed by loading with 50 μMMCB, higher than the 20 μM MCB used for monitoring GSH. At 50 μM,MCB will partially deplete the available GSH pool without affecting
ed mitochondria from guinea pig heart were monitored simultaneously for NAD(P)H andADP after energizationwith 5 mMG/M [B]. The concentration-response change in specific2 were performed during the periodsmarked, as examples, by thickening of the NAD(P)Hof the ADP phosphorylation response. ROS emission levels below 80 μMADP could not bermalized with respect to the initial fluorescence value, i.e. before substrate addition. At therating the ARed and NAD(P)H signals, respectively. See M&M for further explanation.
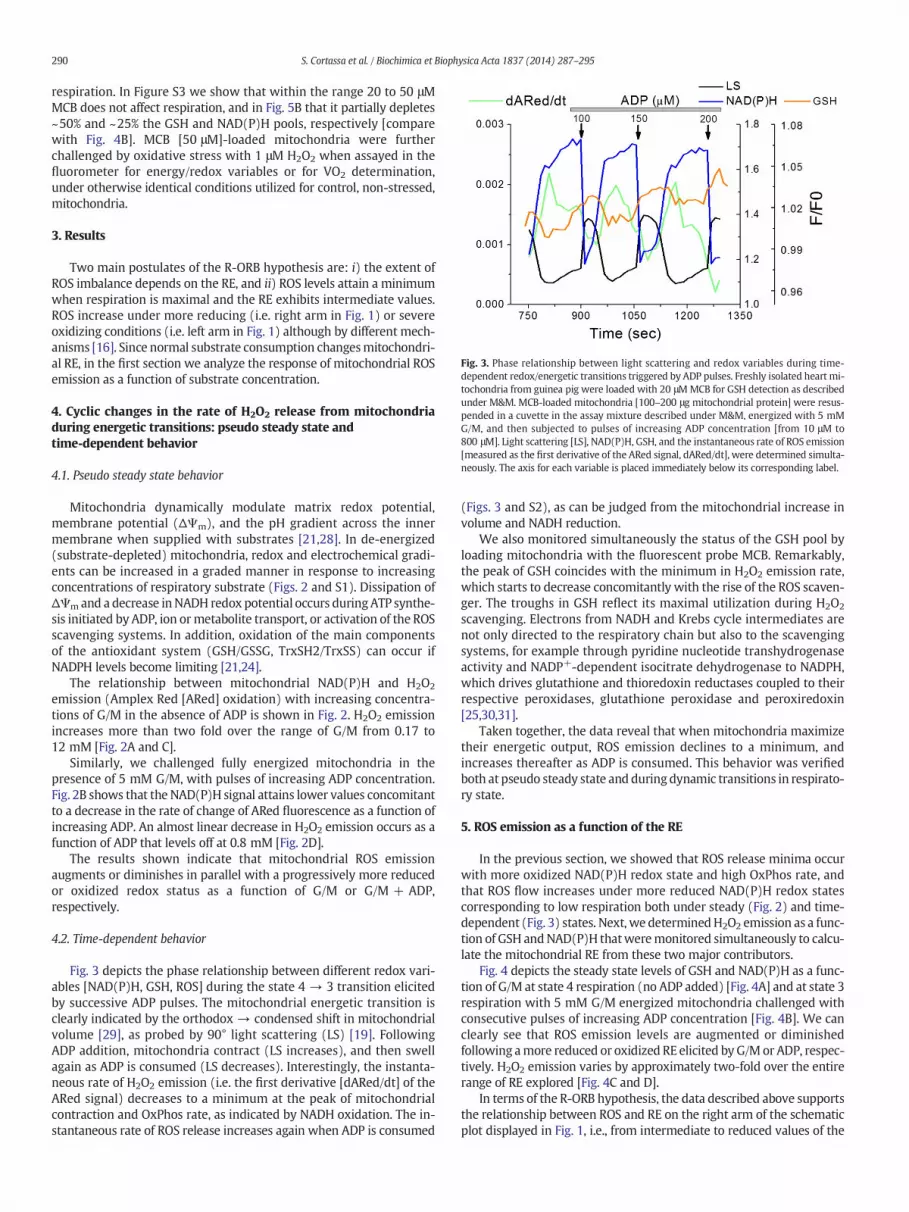
Fig. 3. Phase relationship between light scattering and redox variables during time-dependent redox/energetic transitions triggered by ADP pulses. Freshly isolated heart mi-tochondria from guinea pig were loaded with 20 μMMCB for GSH detection as describedunder M&M. MCB-loaded mitochondria [100–200 μg mitochondrial protein] were resus-pended in a cuvette in the assay mixture described under M&M, energized with 5 mMG/M, and then subjected to pulses of increasing ADP concentration [from 10 μM to800 μM]. Light scattering [LS], NAD(P)H, GSH, and the instantaneous rate of ROS emission[measured as the first derivative of the ARed signal, dARed/dt], were determined simulta-neously. The axis for each variable is placed immediately below its corresponding label.
290 S. Cortassa et al. / Biochimica et Biophysica Acta 1837 (2014) 287–295
respiration. In Figure S3 we show that within the range 20 to 50 μMMCB does not affect respiration, and in Fig. 5B that it partially depletes~50% and ~25% the GSH and NAD(P)H pools, respectively [comparewith Fig. 4B]. MCB [50 μM]-loaded mitochondria were furtherchallenged by oxidative stress with 1 μM H2O2 when assayed in thefluorometer for energy/redox variables or for VO2 determination,under otherwise identical conditions utilized for control, non-stressed,mitochondria.
3. Results
Two main postulates of the R-ORB hypothesis are: i) the extent ofROS imbalance depends on the RE, and ii) ROS levels attain a minimumwhen respiration is maximal and the RE exhibits intermediate values.ROS increase under more reducing (i.e. right arm in Fig. 1) or severeoxidizing conditions (i.e. left arm in Fig. 1) although by different mech-anisms [16]. Since normal substrate consumption changesmitochondri-al RE, in the first section we analyze the response of mitochondrial ROSemission as a function of substrate concentration.
4. Cyclic changes in the rate of H2O2 release from mitochondriaduring energetic transitions: pseudo steady state andtime-dependent behavior
4.1. Pseudo steady state behavior
Mitochondria dynamically modulate matrix redox potential,membrane potential (ΔΨm), and the pH gradient across the innermembrane when supplied with substrates [21,28]. In de-energized(substrate-depleted) mitochondria, redox and electrochemical gradi-ents can be increased in a graded manner in response to increasingconcentrations of respiratory substrate (Figs. 2 and S1). Dissipation ofΔΨm and a decrease inNADH redox potential occurs duringATP synthe-sis initiated by ADP, ion ormetabolite transport, or activation of the ROSscavenging systems. In addition, oxidation of the main componentsof the antioxidant system (GSH/GSSG, TrxSH2/TrxSS) can occur ifNADPH levels become limiting [21,24].
The relationship between mitochondrial NAD(P)H and H2O2
emission (Amplex Red [ARed] oxidation) with increasing concentra-tions of G/M in the absence of ADP is shown in Fig. 2. H2O2 emissionincreases more than two fold over the range of G/M from 0.17 to12 mM [Fig. 2A and C].
Similarly, we challenged fully energized mitochondria in thepresence of 5 mM G/M, with pulses of increasing ADP concentration.Fig. 2B shows that the NAD(P)H signal attains lower values concomitantto a decrease in the rate of change of ARed fluorescence as a function ofincreasing ADP. An almost linear decrease in H2O2 emission occurs as afunction of ADP that levels off at 0.8 mM [Fig. 2D].
The results shown indicate that mitochondrial ROS emissionaugments or diminishes in parallel with a progressively more reducedor oxidized redox status as a function of G/M or G/M + ADP,respectively.
4.2. Time-dependent behavior
Fig. 3 depicts the phase relationship between different redox vari-ables [NAD(P)H, GSH, ROS] during the state 4 → 3 transition elicitedby successive ADP pulses. The mitochondrial energetic transition isclearly indicated by the orthodox → condensed shift in mitochondrialvolume [29], as probed by 90° light scattering (LS) [19]. FollowingADP addition, mitochondria contract (LS increases), and then swellagain as ADP is consumed (LS decreases). Interestingly, the instanta-neous rate of H2O2 emission (i.e. the first derivative [dARed/dt] of theARed signal) decreases to a minimum at the peak of mitochondrialcontraction and OxPhos rate, as indicated by NADH oxidation. The in-stantaneous rate of ROS release increases again when ADP is consumed
(Figs. 3 and S2), as can be judged from the mitochondrial increase involume and NADH reduction.
We also monitored simultaneously the status of the GSH pool byloading mitochondria with the fluorescent probe MCB. Remarkably,the peak of GSH coincides with the minimum in H2O2 emission rate,which starts to decrease concomitantly with the rise of the ROS scaven-ger. The troughs in GSH reflect its maximal utilization during H2O2
scavenging. Electrons from NADH and Krebs cycle intermediates arenot only directed to the respiratory chain but also to the scavengingsystems, for example through pyridine nucleotide transhydrogenaseactivity and NADP+-dependent isocitrate dehydrogenase to NADPH,which drives glutathione and thioredoxin reductases coupled to theirrespective peroxidases, glutathione peroxidase and peroxiredoxin[25,30,31].
Taken together, the data reveal that when mitochondria maximizetheir energetic output, ROS emission declines to a minimum, andincreases thereafter as ADP is consumed. This behavior was verifiedboth at pseudo steady state and during dynamic transitions in respirato-ry state.
5. ROS emission as a function of the RE
In the previous section, we showed that ROS release minima occurwith more oxidized NAD(P)H redox state and high OxPhos rate, andthat ROS flow increases under more reduced NAD(P)H redox statescorresponding to low respiration both under steady (Fig. 2) and time-dependent (Fig. 3) states. Next, we determinedH2O2 emission as a func-tion of GSH andNAD(P)H thatweremonitored simultaneously to calcu-late the mitochondrial RE from these two major contributors.
Fig. 4 depicts the steady state levels of GSH and NAD(P)H as a func-tion of G/M at state 4 respiration (no ADP added) [Fig. 4A] and at state 3respiration with 5 mM G/M energized mitochondria challenged withconsecutive pulses of increasing ADP concentration [Fig. 4B]. We canclearly see that ROS emission levels are augmented or diminishedfollowing amore reduced or oxidized RE elicited by G/Mor ADP, respec-tively. H2O2 emission varies by approximately two-fold over the entirerange of RE explored [Fig. 4C and D].
In terms of the R-ORB hypothesis, the data described above supportsthe relationship between ROS and RE on the right arm of the schematicplot displayed in Fig. 1, i.e., from intermediate to reduced values of the
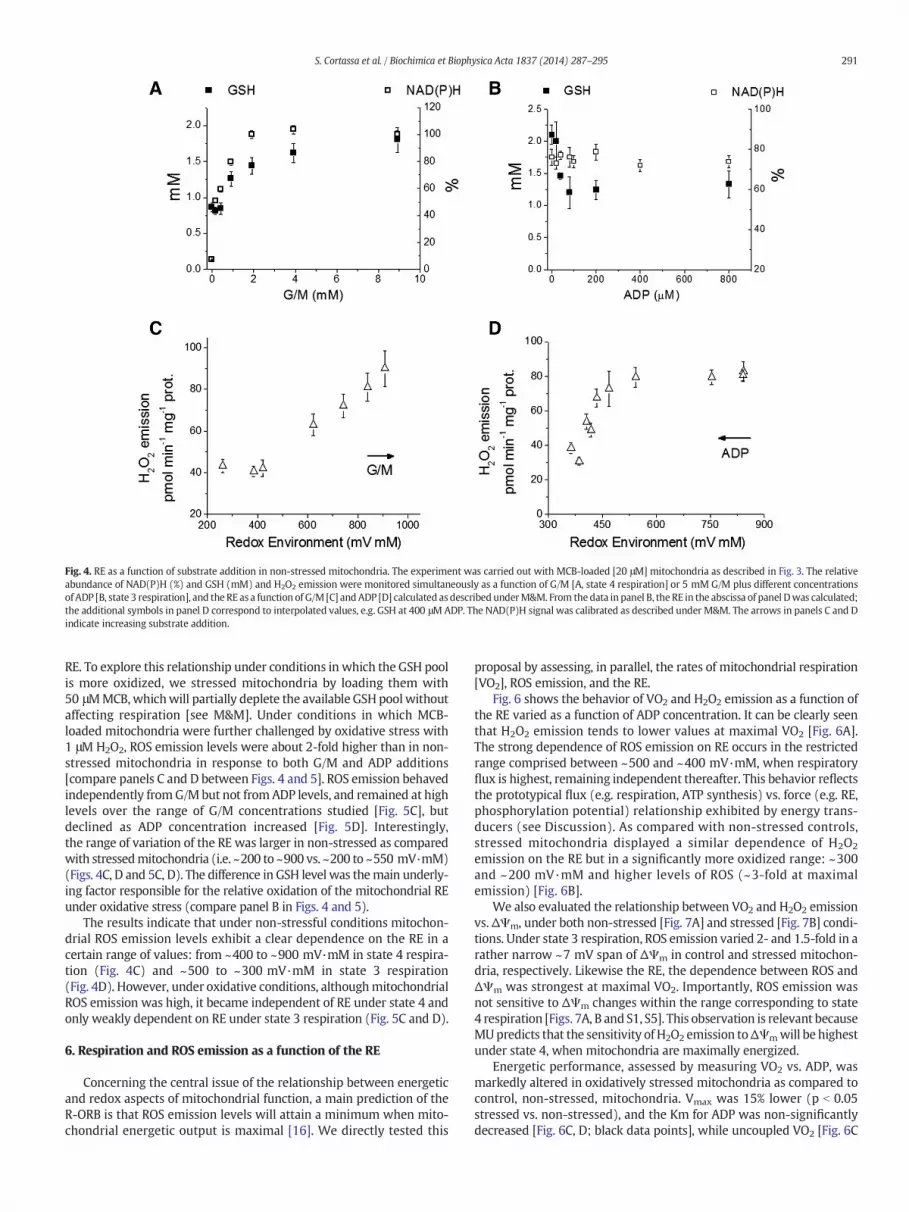
Fig. 4. RE as a function of substrate addition in non-stressed mitochondria. The experiment was carried out with MCB-loaded [20 μM] mitochondria as described in Fig. 3. The relativeabundance of NAD(P)H (%) and GSH (mM) and H2O2 emission were monitored simultaneously as a function of G/M [A, state 4 respiration] or 5 mM G/M plus different concentrationsof ADP [B, state 3 respiration], and the RE as a function of G/M [C] andADP [D] calculated as describedunderM&M. From thedata inpanel B, theRE in the abscissa of panel Dwas calculated;the additional symbols in panel D correspond to interpolated values, e.g. GSH at 400 μMADP. The NAD(P)H signal was calibrated as described under M&M. The arrows in panels C and Dindicate increasing substrate addition.
291S. Cortassa et al. / Biochimica et Biophysica Acta 1837 (2014) 287–295
RE. To explore this relationship under conditions in which the GSH poolis more oxidized, we stressed mitochondria by loading them with50 μMMCB,whichwill partially deplete the available GSH poolwithoutaffecting respiration [see M&M]. Under conditions in which MCB-loaded mitochondria were further challenged by oxidative stress with1 μM H2O2, ROS emission levels were about 2-fold higher than in non-stressed mitochondria in response to both G/M and ADP additions[compare panels C and D between Figs. 4 and 5]. ROS emission behavedindependently fromG/M but not from ADP levels, and remained at highlevels over the range of G/M concentrations studied [Fig. 5C], butdeclined as ADP concentration increased [Fig. 5D]. Interestingly,the range of variation of the RE was larger in non-stressed as comparedwith stressedmitochondria (i.e. ~200 to ~900 vs. ~200 to ~550 mV·mM)(Figs. 4C, D and 5C, D). The difference in GSH level was themain underly-ing factor responsible for the relative oxidation of the mitochondrial REunder oxidative stress (compare panel B in Figs. 4 and 5).
The results indicate that under non-stressful conditions mitochon-drial ROS emission levels exhibit a clear dependence on the RE in acertain range of values: from ~400 to ~900 mV·mM in state 4 respira-tion (Fig. 4C) and ~500 to ~300 mV·mM in state 3 respiration(Fig. 4D). However, under oxidative conditions, althoughmitochondrialROS emission was high, it became independent of RE under state 4 andonly weakly dependent on RE under state 3 respiration (Fig. 5C and D).
6. Respiration and ROS emission as a function of the RE
Concerning the central issue of the relationship between energeticand redox aspects of mitochondrial function, a main prediction of theR-ORB is that ROS emission levels will attain a minimum when mito-chondrial energetic output is maximal [16]. We directly tested this
proposal by assessing, in parallel, the rates of mitochondrial respiration[VO2], ROS emission, and the RE.
Fig. 6 shows the behavior of VO2 and H2O2 emission as a function ofthe RE varied as a function of ADP concentration. It can be clearly seenthat H2O2 emission tends to lower values at maximal VO2 [Fig. 6A].The strong dependence of ROS emission on RE occurs in the restrictedrange comprised between ~500 and ~400 mV·mM, when respiratoryflux is highest, remaining independent thereafter. This behavior reflectsthe prototypical flux (e.g. respiration, ATP synthesis) vs. force (e.g. RE,phosphorylation potential) relationship exhibited by energy trans-ducers (see Discussion). As compared with non-stressed controls,stressed mitochondria displayed a similar dependence of H2O2
emission on the RE but in a significantly more oxidized range: ~300and ~200 mV·mM and higher levels of ROS (~3-fold at maximalemission) [Fig. 6B].
We also evaluated the relationship between VO2 and H2O2 emissionvs. ΔΨm, under both non-stressed [Fig. 7A] and stressed [Fig. 7B] condi-tions. Under state 3 respiration, ROS emission varied 2- and 1.5-fold in arather narrow ~7 mV span of ΔΨm in control and stressed mitochon-dria, respectively. Likewise the RE, the dependence between ROS andΔΨm was strongest at maximal VO2. Importantly, ROS emission wasnot sensitive to ΔΨm changes within the range corresponding to state4 respiration [Figs. 7A, B and S1, S5]. This observation is relevant becauseMUpredicts that the sensitivity of H2O2 emission toΔΨmwill be highestunder state 4, when mitochondria are maximally energized.
Energetic performance, assessed by measuring VO2 vs. ADP, wasmarkedly altered in oxidatively stressed mitochondria as compared tocontrol, non-stressed, mitochondria. Vmax was 15% lower (p b 0.05stressed vs. non-stressed), and the Km for ADP was non-significantlydecreased [Fig. 6C, D; black data points], while uncoupled VO2 [Fig. 6C
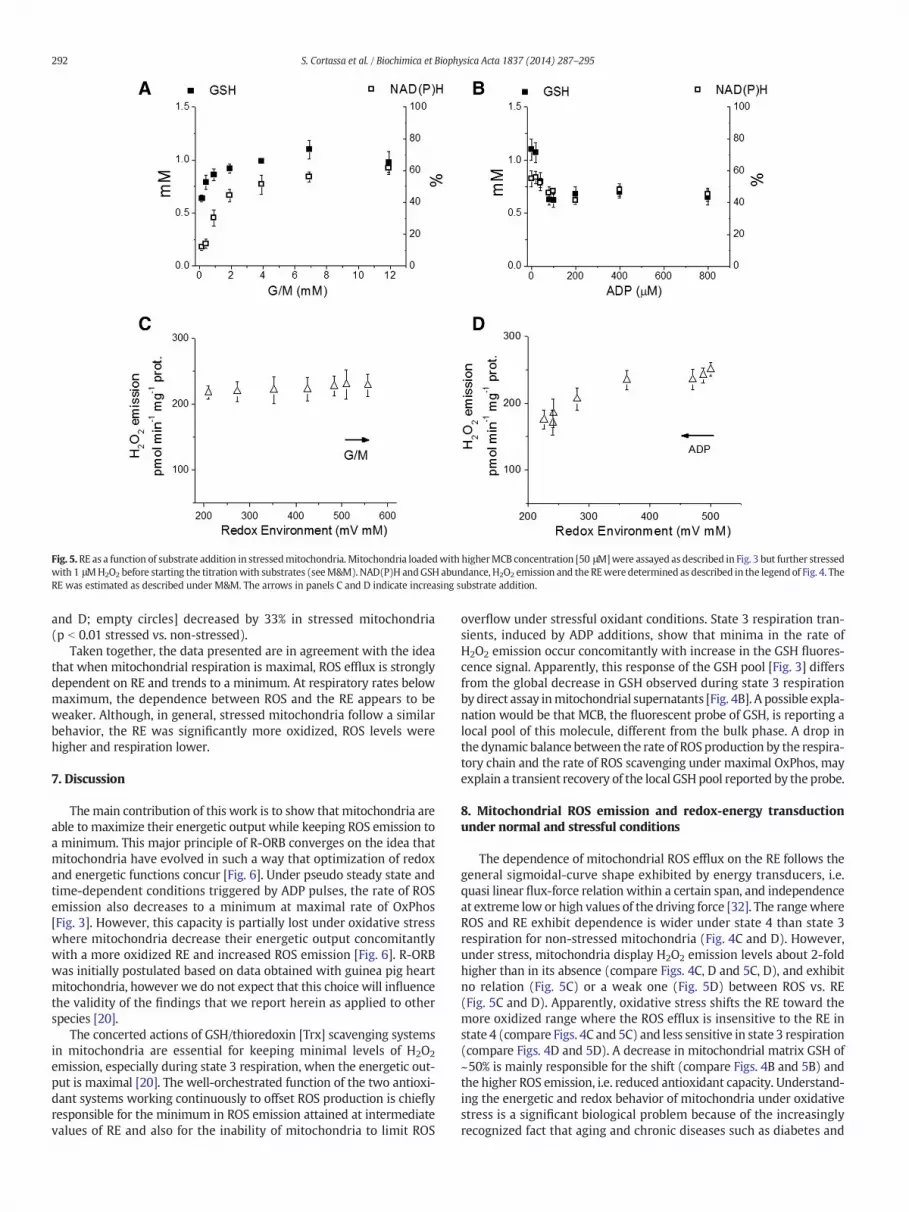
Fig. 5.RE as a function of substrate addition in stressedmitochondria. Mitochondria loadedwith higherMCB concentration [50 μM]were assayed as described in Fig. 3 but further stressedwith 1 μMH2O2 before starting the titrationwith substrates (seeM&M). NAD(P)H andGSH abundance, H2O2 emission and the REwere determined as described in the legend of Fig. 4. TheRE was estimated as described under M&M. The arrows in panels C and D indicate increasing substrate addition.
292 S. Cortassa et al. / Biochimica et Biophysica Acta 1837 (2014) 287–295
and D; empty circles] decreased by 33% in stressed mitochondria(p b 0.01 stressed vs. non-stressed).
Taken together, the data presented are in agreement with the ideathat when mitochondrial respiration is maximal, ROS efflux is stronglydependent on RE and trends to a minimum. At respiratory rates belowmaximum, the dependence between ROS and the RE appears to beweaker. Although, in general, stressed mitochondria follow a similarbehavior, the RE was significantly more oxidized, ROS levels werehigher and respiration lower.
7. Discussion
The main contribution of this work is to show that mitochondria areable to maximize their energetic output while keeping ROS emission toa minimum. This major principle of R-ORB converges on the idea thatmitochondria have evolved in such a way that optimization of redoxand energetic functions concur [Fig. 6]. Under pseudo steady state andtime-dependent conditions triggered by ADP pulses, the rate of ROSemission also decreases to a minimum at maximal rate of OxPhos[Fig. 3]. However, this capacity is partially lost under oxidative stresswhere mitochondria decrease their energetic output concomitantlywith a more oxidized RE and increased ROS emission [Fig. 6]. R-ORBwas initially postulated based on data obtained with guinea pig heartmitochondria, however we do not expect that this choice will influencethe validity of the findings that we report herein as applied to otherspecies [20].
The concerted actions of GSH/thioredoxin [Trx] scavenging systemsin mitochondria are essential for keeping minimal levels of H2O2
emission, especially during state 3 respiration, when the energetic out-put is maximal [20]. The well-orchestrated function of the two antioxi-dant systems working continuously to offset ROS production is chieflyresponsible for the minimum in ROS emission attained at intermediatevalues of RE and also for the inability of mitochondria to limit ROS
overflow under stressful oxidant conditions. State 3 respiration tran-sients, induced by ADP additions, show that minima in the rate ofH2O2 emission occur concomitantly with increase in the GSH fluores-cence signal. Apparently, this response of the GSH pool [Fig. 3] differsfrom the global decrease in GSH observed during state 3 respirationby direct assay inmitochondrial supernatants [Fig. 4B]. A possible expla-nation would be that MCB, the fluorescent probe of GSH, is reporting alocal pool of this molecule, different from the bulk phase. A drop inthe dynamic balance between the rate of ROSproduction by the respira-tory chain and the rate of ROS scavenging under maximal OxPhos, mayexplain a transient recovery of the local GSH pool reported by the probe.
8. Mitochondrial ROS emission and redox-energy transductionunder normal and stressful conditions
The dependence of mitochondrial ROS efflux on the RE follows thegeneral sigmoidal-curve shape exhibited by energy transducers, i.e.quasi linear flux-force relation within a certain span, and independenceat extreme low or high values of the driving force [32]. The rangewhereROS and RE exhibit dependence is wider under state 4 than state 3respiration for non-stressed mitochondria (Fig. 4C and D). However,under stress, mitochondria display H2O2 emission levels about 2-foldhigher than in its absence (compare Figs. 4C, D and 5C, D), and exhibitno relation (Fig. 5C) or a weak one (Fig. 5D) between ROS vs. RE(Fig. 5C and D). Apparently, oxidative stress shifts the RE toward themore oxidized range where the ROS efflux is insensitive to the RE instate 4 (compare Figs. 4C and 5C) and less sensitive in state 3 respiration(compare Figs. 4D and 5D). A decrease in mitochondrial matrix GSH of~50% is mainly responsible for the shift (compare Figs. 4B and 5B) andthe higher ROS emission, i.e. reduced antioxidant capacity. Understand-ing the energetic and redox behavior of mitochondria under oxidativestress is a significant biological problem because of the increasinglyrecognized fact that aging and chronic diseases such as diabetes and

Fig. 6.Mitochondrial respiration and H2O2 emission as a function of RE. Mitochondria loadedwith 20 μMMCB concentration [non-stressed: A, C] or 50 μMMCB plus 1 μMH2O2 addition[stressed: B, D]were assayed in parallel for redox variables [NAD(P)H, GSH, H2O2] by fluorometry [A, B] and respiration, VO2 [C, D] as a function of ADP concentration (from 10 to 800 μM)with high throughput Seahorse equipment as described [see M&M]. In panels C and D displayed are the state 3 [black squares] and uncoupled with 50 μM dinitrophenol [empty circles]VO2 values. The RE determined from GSH and NAD(P)H was calculated as described under M&M.
293S. Cortassa et al. / Biochimica et Biophysica Acta 1837 (2014) 287–295
obesity involve the progressive deterioration of the redox status of cellsand the organism [9,22,33].
Concerning energetics, the respiratory flux was lower under oxida-tive stress than in its absence (Fig. 6A and B) although ΔΨm was similar(Fig. S1A and C). The latter result suggests that the NADH-electron-donor capacity to respiration might have been diminished under stresslikely due to redirection of electrons to the antioxidant systems. Indeed,the relationship between respiration and ROS is altered by oxidativestress, resulting in decreased mitochondrial energetic performanceand higher levels of ROS emission (Figs. 6–8).
Present data suggest that under high energy demand, e.g. exercise, inthe absence of additional oxidative stress, mitochondria will function atrelativelymore reducedRE, i.e. from right arm to theminimumROS rath-er than on the left arm [Figs. 1 and 8]. However, a shift to more oxidizedREs will happen under pathological conditions thus displacing mito-chondrial function toward the left arm of the plot in Fig. 1 (see Fig. 8).This was indeed the case for heart mitochondria isolated from diabeticguinea pigs as shown by recent data from our laboratory (Tocchetti,Stanley, Sivakumaran, O'Rourke, Paolocci, Cortassa, Aon, submitted).Likewise, an effective shift to higher ROS release was observed previous-ly [16], when heart mitochondria were stressed under similar conditionsand were subjected to increasing levels of uncoupling (thick gray arrowpointing toward the dash-dot line in Fig. 8). In fact, the redox stressintroduced by FCCP in already stressed mitochondria [Fig. S3 A and B]was responsible for further RE oxidation and higher ROS emission [16].
9. Role of compartmentation and the release of ROSfrommitochondria
As redox/energetic functions of mitochondria are intermingled, soare the mitochondrial and cytoplasmic REs. A dynamic interaction
between themitochondrial RE and energetic functionmay underlie mi-tochondrial dysfunction in aging and disease. For instance, in burn inju-ry, mitochondrially targeted antioxidant treatmentwith the peptide SS-31 improvesmitochondrial redox status, restoring OxPhos coupling andATP synthesis rate in skeletal muscle [34].
As a dynamic metric, the RE is a function of the different redoxcouples accounting for both their redox potential and the concentrationof the reduced species [21,22]. The RE exhibits its own dynamics indifferent but interdependent cellular compartments, e.g. mitochondriaand cytoplasm,mediated by exchange of ROS and redox-related compo-nents such as GSH. Compartmentation plays a significant role in thecontrol of ROS levels, the RE, and dynamic behavior [21]. Furthermore,and since GSH/Trx scavenging systems appear to act concertedly andcontinuously to keep low rates of H2O2 emission from mitochondria[20], duplication of antioxidant defense systems in multiple compart-ments can be viewed as an efficient salvage mechanism to avoid or toreduce oxidative bursts [21].
The phenomenological concept of “mitohormesis” refers to the asso-ciation observedbetween increasedmitochondrialmetabolismandROSformationwith the induction of an adaptive response that culminates inincreased stress resistance, antioxidant defense and extended life span[35,36]. This concept is similar to what R-ORB proposes as levels ofROS compatible with physiological signaling, due tomoderate increasesaround the minimum toward more reduced or oxidized RE [see Fig. 1,gray area around the minimum]. Conceptually, mitohormesis pointsout that not all increase in ROS is negative, but it can be positive instead.However, mitohormesis does not specify under which conditions theadaptive response will happen, and how this is compatible with mito-chondria supplying energy reliably and consistently, while at the sametime keeping ROS levels within non detrimental boundaries compatiblewith physiological signaling.
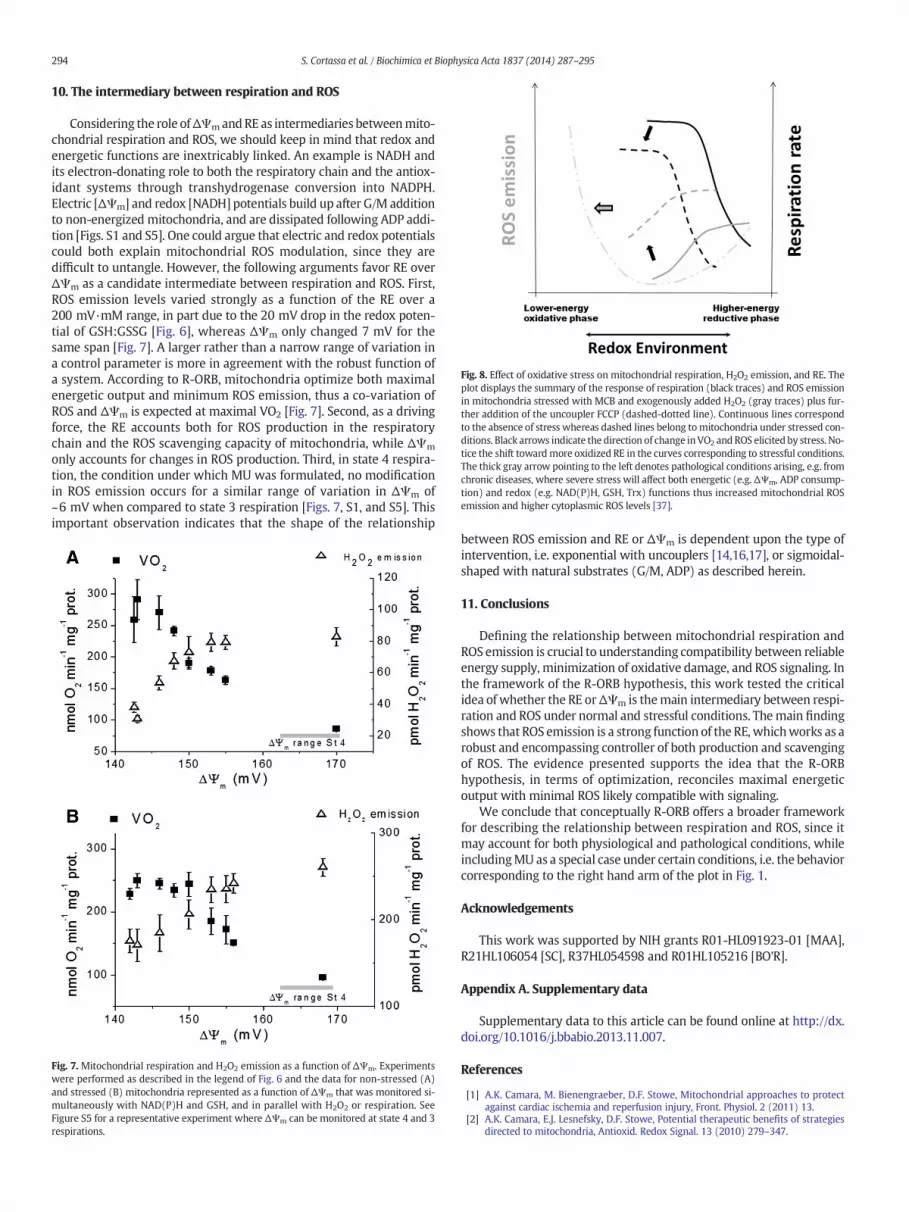
Fig. 8. Effect of oxidative stress on mitochondrial respiration, H2O2 emission, and RE. Theplot displays the summary of the response of respiration (black traces) and ROS emissionin mitochondria stressed with MCB and exogenously added H2O2 (gray traces) plus fur-ther addition of the uncoupler FCCP (dashed-dotted line). Continuous lines correspondto the absence of stress whereas dashed lines belong tomitochondria under stressed con-ditions. Black arrows indicate the direction of change inVO2 and ROS elicited by stress. No-tice the shift towardmore oxidized RE in the curves corresponding to stressful conditions.The thick gray arrow pointing to the left denotes pathological conditions arising, e.g. fromchronic diseases, where severe stress will affect both energetic (e.g. ΔΨm, ADP consump-tion) and redox (e.g. NAD(P)H, GSH, Trx) functions thus increased mitochondrial ROSemission and higher cytoplasmic ROS levels [37].
294 S. Cortassa et al. / Biochimica et Biophysica Acta 1837 (2014) 287–295
10. The intermediary between respiration and ROS
Considering the role ofΔΨmandRE as intermediaries betweenmito-chondrial respiration and ROS, we should keep in mind that redox andenergetic functions are inextricably linked. An example is NADH andits electron-donating role to both the respiratory chain and the antiox-idant systems through transhydrogenase conversion into NADPH.Electric [ΔΨm] and redox [NADH] potentials build up after G/M additionto non-energized mitochondria, and are dissipated following ADP addi-tion [Figs. S1 and S5]. One could argue that electric and redox potentialscould both explain mitochondrial ROS modulation, since they aredifficult to untangle. However, the following arguments favor RE overΔΨm as a candidate intermediate between respiration and ROS. First,ROS emission levels varied strongly as a function of the RE over a200 mV·mM range, in part due to the 20 mV drop in the redox poten-tial of GSH:GSSG [Fig. 6], whereas ΔΨm only changed 7 mV for thesame span [Fig. 7]. A larger rather than a narrow range of variation ina control parameter is more in agreement with the robust function ofa system. According to R-ORB, mitochondria optimize both maximalenergetic output and minimum ROS emission, thus a co-variation ofROS and ΔΨm is expected at maximal VO2 [Fig. 7]. Second, as a drivingforce, the RE accounts both for ROS production in the respiratorychain and the ROS scavenging capacity of mitochondria, while ΔΨm
only accounts for changes in ROS production. Third, in state 4 respira-tion, the condition under which MU was formulated, no modificationin ROS emission occurs for a similar range of variation in ΔΨm of~6 mV when compared to state 3 respiration [Figs. 7, S1, and S5]. Thisimportant observation indicates that the shape of the relationship
Fig. 7. Mitochondrial respiration and H2O2 emission as a function of ΔΨm. Experimentswere performed as described in the legend of Fig. 6 and the data for non-stressed (A)and stressed (B) mitochondria represented as a function of ΔΨm that was monitored si-multaneously with NAD(P)H and GSH, and in parallel with H2O2 or respiration. SeeFigure S5 for a representative experiment where ΔΨm can be monitored at state 4 and 3respirations.
between ROS emission and RE or ΔΨm is dependent upon the type ofintervention, i.e. exponential with uncouplers [14,16,17], or sigmoidal-shaped with natural substrates (G/M, ADP) as described herein.
11. Conclusions
Defining the relationship between mitochondrial respiration andROS emission is crucial to understanding compatibility between reliableenergy supply, minimization of oxidative damage, and ROS signaling. Inthe framework of the R-ORB hypothesis, this work tested the criticalidea of whether the RE orΔΨm is themain intermediary between respi-ration and ROS under normal and stressful conditions. Themain findingshows that ROS emission is a strong function of the RE,whichworks as arobust and encompassing controller of both production and scavengingof ROS. The evidence presented supports the idea that the R-ORBhypothesis, in terms of optimization, reconciles maximal energeticoutput with minimal ROS likely compatible with signaling.
We conclude that conceptually R-ORB offers a broader frameworkfor describing the relationship between respiration and ROS, since itmay account for both physiological and pathological conditions, whileincludingMU as a special case under certain conditions, i.e. the behaviorcorresponding to the right hand arm of the plot in Fig. 1.
Acknowledgements
This work was supported by NIH grants R01-HL091923-01 [MAA],R21HL106054 [SC], R37HL054598 and R01HL105216 [BO'R].
Appendix A. Supplementary data
Supplementary data to this article can be found online at http://dx.doi.org/10.1016/j.bbabio.2013.11.007.
References
[1] A.K. Camara, M. Bienengraeber, D.F. Stowe, Mitochondrial approaches to protectagainst cardiac ischemia and reperfusion injury, Front. Physiol. 2 (2011) 13.
[2] A.K. Camara, E.J. Lesnefsky, D.F. Stowe, Potential therapeutic benefits of strategiesdirected to mitochondria, Antioxid. Redox Signal. 13 (2010) 279–347.
295S. Cortassa et al. / Biochimica et Biophysica Acta 1837 (2014) 287–295
[3] I. Bratic, A. Trifunovic, Mitochondrial energy metabolism and ageing, Biochim.Biophys. Acta 1797 (2010) 961–967.
[4] M.M. Sedensky, P.G. Morgan, Mitochondrial respiration and reactive oxygen speciesin mitochondrial aging mutants, Exp. Gerontol. 41 (2006) 237–245.
[5] H. Bugger, E.D. Abel, Mitochondria in the diabetic heart, Cardiovasc. Res. 88 (2010)229–240.
[6] U.E. Martinez-Outschoorn, F. Sotgia, M.P. Lisanti, Power surge: supporting cells“fuel” cancer cell mitochondria, Cell Metab. 15 (2012) 4–5.
[7] D.C. Wallace, Mitochondria and cancer, Nat. Rev. Cancer 12 (2012) 685–698.[8] P. Helguera, J. Seiglie, J. Rodriguez, M. Hanna, G. Helguera, J. Busciglio, Adaptive
downregulation of mitochondrial function in down syndrome, Cell Metab. 17(2013) 132–140.
[9] F.G. Akar, M.A. Aon, G.F. Tomaselli, B. O'Rourke, The mitochondrial origin ofpostischemic arrhythmias, J. Clin. Invest. 115 (2005) 3527–3535.
[10] M.A. Aon, S. Cortassa, F.G. Akar, B. O'Rourke, Mitochondrial criticality: a new conceptat the turning point of life or death, Biochim. Biophys. Acta 1762 (2006) 232–240.
[11] B. O'Rourke, S. Cortassa, M.A. Aon, Mitochondrial ion channels: gatekeepers of lifeand death, Physiology (Bethesda) 20 (2005) 303–315.
[12] K.H. Fisher-Wellman, P.D. Neufer, Linking mitochondrial bioenergetics to insulinresistance via redox biology, Trends Endocrinol. Metab. 23 (2012) 142–153.
[13] M.D. Brand, Uncoupling to survive? The role of mitochondrial inefficiency in ageing,Exp. Gerontol. 35 (2000) 811–820.
[14] S.S. Korshunov, V.P. Skulachev, A.A. Starkov, High protonic potential actuates amechanism of production of reactive oxygen species in mitochondria, FEBS Lett.416 (1997) 15–18.
[15] V.P. Skulachev, Role of uncoupled and non-coupled oxidations inmaintenance of safelylow levels of oxygen and its one-electron reductants, Q. Rev. Biophys. 29 (1996)169–202.
[16] M.A. Aon, S. Cortassa, B. O'Rourke, Redox-optimized ROS balance: a unifyinghypothesis, Biochim. Biophys. Acta 1797 (2010) 865–877.
[17] A.A. Starkov, “Mild” uncoupling of mitochondria, Biosci. Rep. 17 (1997) 273–279.[18] A.A. Starkov, G. Fiskum, Regulation of brainmitochondrial H2O2 production bymem-
brane potential and NAD(P)H redox state, J. Neurochem. 86 (2003) 1101–1107.[19] M.A. Aon, S. Cortassa, A.C. Wei, M. Grunnet, B. O'Rourke, Energetic performance is
improved by specific activation of K+fluxes through K(Ca) channels in heart
mitochondria, Biochim. Biophys. Acta 1797 (2010) 71–80.[20] M.A. Aon, B.A. Stanley, V. Sivakumaran, J.M. Kembro, B. O'Rourke, N. Paolocci, S.
Cortassa, Glutathione/thioredoxin systemsmodulatemitochondrial H2O2 emission:an experimental-computational study, J Gen Physiol 139 (2012) 479–491.
[21] J.M. Kembro, M.A. Aon, R.L. Winslow, B. O'Rourke, S. Cortassa, Integrating mitochon-drial energetics, redox and ROS metabolic networks: a two-compartment model,Biophys. J. 104 (2013) 332–343.
[22] F.Q. Schafer, G.R. Buettner, Redox environment of the cell as viewed through theredox state of the glutathione disulfide/glutathione couple, Free Radic. Biol. Med.30 (2001) 1191–1212.
[23] A.G. Cox, C.C. Winterbourn, M.B. Hampton, Mitochondrial peroxiredoxin in-volvement in antioxidant defence and redox signalling, Biochem. J. 425 (2010)313–325.
[24] B.A. Stanley, V. Sivakumaran, S. Shi, I. McDonald, D. Lloyd, W.H. Watson, M.A.Aon, N. Paolocci, Thioredoxin reductase-2 is essential for keeping low levels ofH(2)O(2) emission from isolated heart mitochondria, J. Biol. Chem. 286(2011) 33669–33677.
[25] M.A. Aon, S. Cortassa, C. Maack, B. O'Rourke, Sequential opening of mitochondrialion channels as a function of glutathione redox thiol status, J. Biol. Chem. 282(2007) 21889–21900.
[26] S. Cortassa, M.A. Aon, R.L. Winslow, B. O'Rourke, A mitochondrial oscillatordependent on reactive oxygen species, Biophys. J. 87 (2004) 2060–2073.
[27] M.K. Slodzinski, M.A. Aon, B. O'Rourke, Glutathione oxidation as a trigger of mito-chondrial depolarization and oscillation in intact hearts, J. Mol. Cell. Cardiol. 45(2008) 650–660.
[28] A.C. Wei, M.A. Aon, B. O'Rourke, R.L. Winslow, S. Cortassa, Mitochondrial energetics,pH regulation, and ion dynamics: a computational-experimental approach, Biophys.J. 100 (2011) 2894–2903.
[29] C.R. Hackenbrock, Chemical and physical fixation of isolated mitochondria inlow-energy and high-energy states, Proc. Natl. Acad. Sci. U. S. A. 61 (1968)598–605.
[30] J.B. Hoek, J. Rydstrom, Physiological roles of nicotinamide nucleotide transhydrogenase,Biochem. J. 254 (1988) 1–10.
[31] L.A. Sazanov, J.B. Jackson, Proton-translocating transhydrogenase and NAD- andNADP-linked isocitrate dehydrogenases operate in a substrate cycle which contrib-utes to fine regulation of the tricarboxylic acid cycle activity in mitochondria, FEBSLett. 344 (1994) 109–116.
[32] H.V. Westerhoff, K. Van Dam, Thermodynamics and Control of BiologicalFree-Energy Transduction, Elsevier, Amsterdam, 1987.
[33] W. Droge, Free radicals in the physiological control of cell function, Physiol. Rev. 82(2002) 47–95.
[34] V. Righi, C. Constantinou, D. Mintzopoulos, N. Khan, S.P. Mupparaju, L.G. Rahme,H.M. Swartz, H.H. Szeto, R.G. Tompkins, A.A. Tzika, Mitochondria-targeted antioxi-dant promotes recovery of skeletal muscle mitochondrial function after burn trau-ma assessed by in vivo 31P nuclear magnetic resonance and electronparamagnetic resonance spectroscopy, FASEB J 27 (2013) 2521–2530.
[35] E.J. Calabrese, Hormesis and medicine, Br. J. Clin. Pharmacol. 66 (2008) 594–617.[36] M. Ristow, K. Zarse, How increased oxidative stress promotes longevity and meta-
bolic health: the concept of mitochondrial hormesis (mitohormesis), Exp. Gerontol.45 (2010) 410–418.
[37] C.G. Tocchetti, V. Caceres, B.A. Stanley, C. Xie, S. Shi, W.H. Watson, B. O'Rourke, R.C.Spadari-Bratfisch, S. Cortassa, F.G. Akar, N. Paolocci, M.A. Aon, GSH or palmitatepreserves mitochondrial energetic/redox balance, preventing mechanicaldysfunction in metabolically challenged myocytes/hearts from type 2 diabeticmice, Diabetes 61 (2012) 3094–3105.