interplay of ionizing radiation, oxygen, ros and age
TRANSCRIPT
Vom Fachbereich Chemie
der Technischen Universität Darmstadt
zur Erlangung des akademischen Grades eines
Doctor rerum naturalium (Dr. rer. nat.)
genehmigte
Dissertation
vorgelegt von
Tamara Džinić, Magistra
aus Tuzla, Bosnien und Herzegowina
Referent: Prof. Dr. Norbert A. Dencher
Korreferent: PD Dr. Tobias Meckel
Tag der Einreichung: 15. März 2017
Tag der mündlichen Prüfung: 15. Mai 2017
Darmstadt 2017
D17
Interplay of ionizing radiation, oxygen,
ROS and age-associated diseases
Interplay of ionizing radiation, oxygen, ROS
and age-associated diseases
Vom Fachbereich Chemie
der Technischen Universität Darmstadt
zur Erlangung des Grades eines
Doctor rerum naturalium (Dr. rer. nat.)
genehmigte Dissertation
von Tamara Džinić, Magistra
aus Tuzla, Bosnien und Herzegowina
Referenten: Prof. Dr. Norbert A. Dencher
PD Dr. Tobias Meckel
Tag der Einreichung: 15.03.2017
Tag der mündlichen Prüfung: 15.05.2017
Darmstadt 2017
D17

ii
Die vorliegende Arbeit wurde unter Leitung von Herrn Prof. Dr. Norbert A. Dencher in der Zeit
von Mai 2014 bis März 2017 im Fachbereich Chemie am Clemens-Schöpf-Institut für Organische
Chemie und Biochemie, Abteilung Physikalische Biochemie, der Technischen Universität
Darmstadt angefertigt. Diese Arbeit wurde von der DFG im Rahmen des Graduiertenkollegs
„Molekulare und zelluläre Reaktionen auf ionisierende Strahlung“ (GRK 1657) gefördert.
iii
Publications
Parts of the doctoral thesis are published:
Džinić T, Hartwig S, Lehr S, Dencher NA. (2016). Oxygen and differentiation status modulate the effect of X-ray irradiation on physiology and mitochondrial proteome of human neuroblastoma cells. Arch. Physiol. Biochem., 122: 257-265.
Manuscript submitted (March 2017):
Džinić T, Dencher NA. (2017). Oxygen concentration and oxidative stress modulate the influence of Alzheimer’s disease Aβ1-42 peptide on human neuroblastoma cells. (submitted to PNAS).
Manuscripts for submission in 2017:
Džinić T, Čavlović L, Dencher NA. (2017). Studying hypoxia in the cell culture: controlling oxygen concentration and incubation with the hypoxia mimetic CoCl2. Džinić T, Dencher NA. (2017). The requirement of physiological O2 concentration in cell cultivation. Džinić T, Decker V, Meckel T, Okhrimenko I, Dencher NA. (2017). Traffic and organelle targets of Alzheimer´s disease Aβ1-42 peptide in human neuroblastoma cells and in rat oligodendrocytes. Džinić T, Dencher NA. (2017). The effect of low/high dose fibrillized versus disaggregated Aβ1-
42 on cellular physiology.
Other publications:
Siegemund M, Seifert O, Zarani M, Džinić T, De Leo V, Göttsch D, Münkel S, Hutt M, Pfizenmaier K, Kontermann RE. (2016). An optimized antibody-single-chain TRAIL fusion protein for cancer therapy. MAbs, 8: 879-891. Antunovic M, Matic I, Nagy B, Caput Mihalic K, Skelin J, StambukJ, Josipovic P, Dzinic T, Pavicic I. (2017). FADD protein acts as a turning point for diverse death fates after UVB radiation of mouse embryonic fibroblasts. (submitted to BBA - Molecular Cell Research).
iv
Oral presentations at conferences and other events
GRK 1657 PhD-retreat, Annweiler am Trifels (2017), Germany Title: Interplay of ionizing radiation, oxygen, ROS and age-associated diseases International conference Dementia and Neuroscience, Los Angeles (2016), USA Title: Implication of oxidative stress in Alzheimer´s disease
GRK 1657 PhD-retreat, Hirschegg im Kleinwalsertal (2014/15), Austria Title: Interplay of ionizing radiation, oxygen, ROS and age-associated diseases International conference Mitochondria at the Crossroad, Strasbourg (2015), France Title: Interplay of ionizing radiation, oxygen, ROS and age-associated diseases GRK 1657 PhD-workshop, Darmstadt (2014/15), Germany Title: Interplay of ionizing radiation, oxygen, ROS and age-associated diseases
v
Poster presentations
68. Mosbacher Kolloquium “Cell Organelles-Origin, Dynamics, Communication”, Mosbach (2017), Germany Title: Interaction of Alzheimer´s disease Aβ1-42 peptide with human neuroblastoma cells and their
organelles
GRK 1657 PhD-networking event with GRK 1739, Höchst im Odenwald (2016), Germany Title: Interplay of ionizing radiation, oxygen, ROS and age-associated diseases
GRK 1657 PhD-retreat, Hirschegg im Kleinwalsertal (2015/16), Austria Title: Interplay of ionizing radiation, oxygen, ROS and age-associated diseases
GRK 1657 PhD-retreat, Annweiler im Trifels (2016), Germany Title: Interplay of ionizing radiation, oxygen, ROS and age-associated diseases PhD-workshop at the TU Darmstadt, Darmstadt (2015), Germany Title: Interplay of ionizing radiation, oxygen, ROS and age-associated diseases German Peptide Symposium, Darmstadt (2015), Germany Title: Interplay of ionizing radiation, oxygen, ROS and age-associated diseases
EACR Conference Radiation Biology and Cancer, Essen (2015), Germany Title: Interplay of ionizing radiation, oxygen, ROS and age-associated diseases
GRK 1657 PhD-networking event with GRK 1739, Bonn (2016), Germany Title: Interplay of ionizing radiation, oxygen, ROS and age-associated diseases
vi
Acknowledgement
• Thank you Prof. Dr. Norbert A. Dencher for giving me the opportunity to work on an interesting topic, for all discussions and motivation. I appreciate all your contributions of time and ideas to make my PhD experience productive and stimulating.
• Dr. Tobias Meckel for being my second reviewer and for interesting scientific conversations. • Prof. Dr. Gerhard Thiel, Prof. Dr. Boris Schmidt and Dr. Tobias Meckel for precious discussions
during the Thesis Committee meeting in the frame of the Graduate College (GRK 1657). • Prof. Dr. Markus Löbrich, speaker of the GRK 1657, for providing equipment for radiation
experiments. • AG Cardoso, particularly M.Sc. Anne Ludwig for maintaining the flow cytometer and solving all
technical issues during my sessions. • AG Laube, thank you for providing a cell culture incubator in difficult times when our incubator
was broken. • AG Thiel, particularly Sebastian Fuck, my GRK colleague, for providing the HyPer sensor and for
introducing the new method for ROS measurement to me. Also, I am thankful to M.Sc. Marina Kithil for the help with the confocal microscopy and for nice time during the flow cytometry sessions.
• AG Schmitz, for giving me the opportunity to use the plate reader. • Dr. Stefan Lehr, Dr. Sonja Hartwig and co-workers from the German Diabetes Center (Deutsches
Diabetes-Zentrum, DDZ) for MALDI MS/MS analyses and for contribution to the manuscript. • Dr. Julius Hellmann-Regen for useful advices on differentiation of SH-SY5Y cells. • Dr. Katarzyna Kuter, I will always remember the wonderful time in the lab and outside. Thank
you for inspiration! • M.Sc. Sarah Bothe for being a dedicated student during the practical course and Master thesis.
Thank you for your interest in science and for numerous questions you had for me. • German Research Foundation (Deutsche Forschungsgemeinschaft, DFG) for financial and
educational support in the frame of Graduate College 1657 “Molecular and cellular responses to ionizing radiation”.
• Dr. Victoria Decker, Dr. Manuela Kratochwil and Dr. Sven Marx thank you for introducing the laboratory to me, for showing me the methods, for nice times in the lab and during our group activities. Also, thank you for reminding me to have an ice-cream break on the balcony.
• Dr. Lidija Cavlovic for being a wonderful, loving person and for conversations in “that strange language” (Bosnian/Croatian).
• Master Students in AG Dencher: Victoria Petermann, Olga Akundin, Stefanie Ascher for nice time in the laboratory and in our social events.
• Ivan Okhrimenko from the Moscow Institute of Physics and Technology (Russia) for the exchange of knowledge and ideas during a short stay in the laboratory at the TU Darmstadt.
• Christine Schröpfer, the heart of the lab, for all your support as a technical assistant, secretary, for your advices and for being there when no one else was. Thank you for have a faith in my experiments.
• Sabine Reinhold for the support with the documentation and all nice small talks in the kitchen.

vii
• SciMento team of the TU Darmstadt (Laura Babel, Oxana Upir, Christine Groß and Meike Egert) for the exchange of experience, knowledge, information, and for fun times in our group meetings. With you I am always few steps forward and each “Zielsetzung” until the next meeting was a tremendous way to reach my aims.
• All colleagues from the GRK 1657 for sharing your knowledge and for nice times during the GRK events.
• My friends Patricia, Anita and Sandi, I am looking forward to our reunion anytime. • Elham Abdolahi, my dear friend, our friendship has started in the first PhD retreat of the GRK and
I hope it will never end. • Rajvinder Kaur, our friendship has started in the last PhD retreat of the GRK of my generation and
I am looking forward to all our future meetings. • My parents and my sister Tatjana for all their love and encouragement. Thank you for supporting
me in all my pursuits and for being my safe harbour for all these years. I am thankful to all other family members for the moral support.
• My dear Tobias thank you for your extraordinary love, support and patience and also for being my safe harbour. I am lucky to have you in my life.

viii
Per aspera ad astra. “If you're going to try, go all the way. Otherwise, don't even start. This could mean losing girlfriends, wives, relatives and maybe even your mind. It could mean not eating for three or four days. It could mean freezing on a park bench. It could mean jail. It could mean derision. It could mean mockery-isolation. Isolation is the gift. All the others are a test of your endurance, of how much you really want to do it. And, you'll do it, despite rejection and the worst odds. And it will be better than anything else you can imagine. If you're going to try, go all the way. There is no other feeling like that. You will be alone with the gods, and the nights will flame with fire. You will ride life straight to perfect laughter. It's the only good fight there is.” Charles Bukowski, Faktotum (1975)
ix
Table of Contents
Publications .................................................................................................................................................. iii
Oral presentations at conferences and other events ................................................................................. iv
Poster presentations ................................................................................................................................. v
Acknowledgement ....................................................................................................................................... vi
1. Summary .............................................................................................................................................. 1
1. Zusammenfassung ............................................................................................................................... 5
2. Introduction ......................................................................................................................................... 9
2.1. Cellular responses to ionizing radiation .................................................................................... 9
2.2. Oxygen concentration in the cell culture ................................................................................. 14
2.3. Implication of the Aβ peptide in Alzheimer´s disease ............................................................ 17
2.4. Motivation .................................................................................................................................. 20
3. Materials ............................................................................................................................................ 22
3.1. Equipment .................................................................................................................................. 22
3.2. Software...................................................................................................................................... 23
3.3. Chemicals ................................................................................................................................... 24
3.4. Gases ........................................................................................................................................... 26
3.5. Consumables .............................................................................................................................. 27
3.6. Cell culture ................................................................................................................................. 28
3.7. Kits/assays .................................................................................................................................. 28
3.8. Peptides ...................................................................................................................................... 28
3.9. Antibodies .................................................................................................................................. 28
3.10. Oligonucleotides .................................................................................................................... 29
3.11. Gel markers/standards.......................................................................................................... 29
4. Methods .............................................................................................................................................. 30
4.1. Cell culture ................................................................................................................................. 30
4.1.1. Cell culture maintenance and oxygen adjustment ............................................................... 30
4.1.2. Cell differentiation .................................................................................................................. 31
4.1.3. Amyloid β peptide treatment .................................................................................................. 32
4.1.4. X-ray irradiation ..................................................................................................................... 32
4.2. Cell culture experiments ........................................................................................................... 32
4.2.1. Measurement of intracellular oxygen concentration ............................................................... 32
4.2.2. Cell proliferation ..................................................................................................................... 33
4.2.3. Interaction of Aß1-42 peptide with SH-SY5Y cells ................................................................. 35
x
4.2.4. Neutral red uptake assay ........................................................................................................ 36
4.2.5. Determination of cell death .................................................................................................... 36
4.2.6. Cellular ATP concentration ................................................................................................... 37
4.2.7. Measurement of intracellular ROS level ............................................................................... 38
4.2.8. Glutathione level ...................................................................................................................... 40
4.2.9. Mitochondrial membrane potential ....................................................................................... 40
4.3. Protein analysis ............................................................................................................................... 41
4.3.1. Isolation of total cellular proteins .......................................................................................... 41
4.3.2. Isolation of mitochondria ........................................................................................................ 42
4.3.3. Bradford assay ......................................................................................................................... 42
4.3.4. Solubilisation of mitochondrial membranes ......................................................................... 44
4.3.5. Polyacrylamide gel electrophoresis ........................................................................................ 44
4.3.6. Protein staining in gels ............................................................................................................ 49
4.3.7. Western blot ............................................................................................................................. 50
4.4. DNA analysis ................................................................................................................................... 53
4.4.1. Total genomic DNA isolation and quantitation .................................................................... 53
4.4.2. PCR analysis ............................................................................................................................ 54
5. Results and discussion ....................................................................................................................... 56
5.1. Intracellular oxygen concentration ............................................................................................... 57
5.2. Cell proliferation ............................................................................................................................ 59
5.3. Intracellular localization of externally applied Aβ1-42 peptide .................................................... 63
5.4. Lysosomal integrity ........................................................................................................................ 71
5.5. Cell death ........................................................................................................................................ 73
5.6. Intracellular ATP concentration ................................................................................................... 78
5.7. ROS level ......................................................................................................................................... 80
5.8. Glutathione level ............................................................................................................................. 83
5.9. Mitochondrial membrane potential .............................................................................................. 85
5.10. Effects of X-ray radiation on cellular physiology and mitochondrial proteome .................... 86
5.11. Expression of cytoplasmic proteins........................................................................................... 100
5.12. Level of protein carbonylation .................................................................................................. 101
5.13. Mitochodrial DNA amount ........................................................................................................ 104
5.14. Mitochondrial DNA deletion ..................................................................................................... 106
6. General discussion ........................................................................................................................... 110
7. References ........................................................................................................................................ 115

xi
8. List of abbreviations ........................................................................................................................ 124
9. Curriculum vitae ............................................................................................................................. 127
Eidesstattliche Erklärungen ................................................................................................................... 130

Summary 1
1. Summary
The aim of this doctoral thesis was to investigate and to understand the implication of oxidative
stress, created by the interplay of ionizing (X-ray) radiation, oxygen and neurotoxic amyloid beta
(Aβ) peptide, in age-associated diseases, with the focus on Alzheimer´s disease (AD), the most
common dementia. Although AD has been known for more than hundred years, its mechanisms
are still intriguing and there is no cure at the moment.
High doses of ionizing radiation (IR) lead to learning and memory impairment which is
characteristic for AD as well. The cumulative doses of IR used in medical imaging procedures
such as computed tomography (CT) and dental X-rays present a potential danger, particularly to
children whose brains are not completely developed. Although single doses of radiation used for
diagnostic purposes or therapeutic treatment are relatively low, small changes on the molecular
and cellular level may accumulate upon repeated exposure and result in delayed long-term defects.
Thus, the most important objective of this thesis was to reveal if there is an interplay of radiation
and age-associated diseases through the effects of oxygen, reactive oxygen species (ROS) and Aβ
peptide implicated in AD.
Aβ peptide monomers and small oligomers (one of the players in AD) are proposed to be involved
in damage and death of neurons. Since IR causes oxidative stress and inflammation, occurring in
AD as well, there is a concern that radiation exposure may be linked with neurodegeneration.
2 Gy X-rays presents a commonly used fractionated dose in radiotherapy of a variety of tumors
and was used in this thesis as a single radiation dose alone or combined with the previous treatment
with externally applied Aβ1-42 peptide (the most toxic form) at two environmental oxygen
concentrations.
The data provided in the thesis emphasize the importance of using the appropriate model system
and conditions in the cell culture such as oxygen concentration that has to be considered in studies
of cellular responses to oxidative stress, IR and neurotoxic peptides.
Changes in cellular responses of non-differentiated human neuroblastoma (SH-SY5Y) cells and/or
cells pre-treated with retinoic acid (RA) for induction of differentiation, in order to obtain cells
that resemble neurons, were investigated in parallel under standard condition of oxygen (~21%)
used in cell culture incubators, but never found in tissues of human body, and 5% O2 which
resembles physiological oxygen concentration in human brain. For this purpose, home-made low
O2 incubators were setup using plastic containers able to retain a gas mixture containing 5% or 1%
O2, 5% CO2 and 90% or 94% N2.
Initially, two different low oxygen concentrations (1% and 5%) were tested in SH-SY5Y cells for
cell proliferation and ATP concentration as a measure of the bioenergetic status. 5% O2 was
demonstrated to be more suitable for cultivation of SH-SY5Y cell since the proliferation activity
and ATP concentration were higher than in cells at 1% O2.
Summary 2
The starting hypothesis was that cells exposed to non-physiological oxygen concentration and/or
in the presence of Aβ peptide react differently, more sensitive or less sensitive, due to the oxygen
effect (i.e. increased sensitivity due to the increased formation of harmful ROS and modulation of
signaling pathways or decreased sensitivity due to the previous adaptation to these processes).
A very important result was that the oxygen concentration in the cell culture and differentiation
status of SH-SY5Y cells are modulators of cellular responses to X-ray radiation and Aβ peptide as
shown employing cell and molecular biology as well as biochemistry methods and techniques.
Retinoic acid used for induction of differentiation leads to morphological changes of SH-SY5Y
cells (i.e. flattening of the cell body and formation of long outgrowths that resemble axons of
neurons) and increase in the sensitivity to radiation and/or to Aβ peptide depending on oxygen
concentration. Moreover, oxygen plays a role in differentiation and proliferation of SH-SY5Y cells
since the amount of neurofilament-M, a marker of differentiation, was dependent of oxygen
concentration and was higher in cells cultivated at 5% O2 which also showed increased cell number
in the proliferation assay as compared to 21% O2.
Intracellular oxygen concentration [O2] differs from the oxygen concentration applied to the cell
culture. Using an oxygen sensitive probe, intracellular [O2] for SH-SY5Y cells cultivated at 21%
O2 was about 10% and for cells cultivated at 5% O2 was 0.9% determined for the first time.
However, 5% O2 was not hypoxic for SH-SY5Y cells since no expression of hypoxia inducible
factor (HIF-1α) was detected.
Changes in the mitochondrial proteome isolated from SH-SY5Y cells were investigated using a
combination of blue-native/2D SDS-PAGE for protein separation, subsequent staining with the
fluorescent dye SYPRO Ruby and quantitation of protein spot intensities from gel images. The
protein amount of selected subunits of Oxidative Phosphorylation (OxPhos) complexes and other
non-OxPhos mitochondrial proteins (identified by MALDI-TOF/TOF mass spectrometry and
Western blot) did not change upon irradiation with the exception of the heat shock protein 70,
which amount was increased depending on oxygen concentration and differentiation status.
Monomers and small oligomers of Aβ peptide interacted with SH-SY5Y cells as detected by flow
cytometry. Compartments with low pH value (i.e. lysosomes and possibly late endosomes) were
the main target and the peptide interacted only to a minor extent with mitochondria and
endoplasmatic reticulum, respectively, as visualized by confocal scanning microscopy.
Although site and kinetics of interaction of Aβ peptide with SH-SY5Y cells cultivated at both 21%
and 5% O2 were similar, decreased lysosomal integrity after Aβ peptide treatment of SH-SY5Y
cells was observed solely at 21% O2.
Aβ peptide alone induced only a slight increase in ROS (up to 1.2 fold), a slight increase in
mitochondrial membrane potential, and no changes in ATP concentration and in glutathione (GSH)
level (used as an indicator of cell´s antioxidant capacity) regardless of oxygen concentration in the
cell culture.
Summary 3
Radiation alone led to a significant increase in ROS (~1.5 fold) and a slight increase in ATP
concentration (~1.2 fold) but solely in cells at 5% O2. A slight increase in mitochondrial membrane
potential was observed at both 21% and 5% O2. Radiation caused a slight increase in GSH level at
21% O2 and decrease at 5% O2 (up to 1.2 fold).
Increase in protein carbonylation (~2.5 fold) induced by oxidative stress measured in the Oxyblot
assay was specific for irradiated cells at 21% O2.
A very important target of oxidative stress is DNA, particularly mtDNA that is less studied than
nuclear DNA. MtDNA was assayed using primers specific for mtDNA in PCR methods for
changes in its amount and for the presence of 4977 bp deletion. Aß peptide or radiation alone
caused a change in mtDNA amount depending on O2 concentration: up to 1.3 fold decrease at 21%
O2 and up to 1.5 fold increase at 5% O2. The occurrence of the mtDNA deletion was specific for
irradiated cells at both 21% and 5% O2 but was more pronounced at 21% O2.
For the first time, the combined effect of Aβ peptide and IR on cellular parameters and survival
was studied. Radiation combined with Aβ peptide resulted in a statistically significant increase in
ROS level at both 21% (~1.2 fold) and 5% O2 (~1.4 fold); increase in ATP concentration (1.5 fold)
at 5% O2 solely; increase in GSH level at 21% O2 and decrease at 5% O2 (up to 1.2 fold) and no
change in the mitochondrial membrane potential.
The results of the cell death assay (measurement of apoptotic and necrotic cells by flow cytometry)
revealed that Aβ1-42 peptide or 2 Gy X-rays alone resulted in a significant increase in cell death of
SH-SY5Y cells at 5% O2 and only in a minor increase at 21% O2. Noteworthy, Aβ peptide restored
the cell death of irradiated cells to the control level or below, particularly at 5% O2. The
combination of Aβ peptide and irradiation did not lead to a significant increase in protein
carbonylation, mtDNA deletion and change in mtDNA amount. Therefore, the initial level of
oxidative stress determines the point at which cellular defense mechanisms occur and it is possible
that even neuroprotective mechanisms are triggered in such cases.
Furthermore, this study demonstrated that the incubation time together with concentration and
state of the peptide (disaggregated versus aggregated to fibrils) is a crucial factor in Aβ peptide
toxicity. High concentration (100 µM) of aggregated peptide (induced by storage at 37 °C
overnight) caused an early response (after 1 day) of SH-SY5Y cells which underwent cell death.
However, the effect of disaggregated Aß peptide (100 µM) after 3 days of incubation was more
pronounced than of aggregated peptide. Aβ peptide treatment decreased the percentage of
apoptotic and necrotic cells (2.5 fold) in irradiated cells after 1 day. However, after 3 days, a ~2.8
fold increase in cell death as compared to non-irradiated control cells was observed.
The observed traffic of Aβ peptide towards cellular organelles and the corresponding changes in
cell physiology that were dependent on the level of oxidative stress are of relevance for AD
pathology.
The results obtained require the use of more physiological 5% O2 rather than of the non-
physiological 21% O2 for cultivation of SH-SY5Y cells and studies of their response to stress,

Summary 4
which is crucial for outcome and reliability of experiments. Cells cultivated at 5% O2 have
displayed higher total cellular ATP concentration (~1.3 fold), lower ROS level (1.5 fold), lower
protein carbonlyation (2.5 fold), lower mtDNA deletion (2 fold) as compared to cells at 21% O2.
Zusammenfassung 5
1. Zusammenfassung
Ziel dieser Doktorarbeit war es den Einfluß von oxidativem Stress zu verstehen, der durch das
Zusammenspiel von ionisierender Strahlung, Sauerstoff und neurotoxischem Amyloid beta (Aβ)
Peptid der Alzheimer Demenz (AD) entstanden ist. Obwohl AD, die häufigste Form von Demenz,
seit mehr als hundert Jahren bekannt ist, sind seine Mechanismen noch nicht verstanden und es
gibt zur Zeit keine Heilung.
Hohe Dosen ionisierender Strahlung führen zu Lern- und Gedächtnisstörungen, die auch für AD
charakteristisch sind. Die kumulativen Dosen von ionisierender Strahlung, die in medizinischen
Bildgebungsverfahren wie Computertomographie und zahnärztlichen Untersuchungen verwendet
werden, stellen eine potentielle Gefahr dar, insbesondere für Kinder, deren Gehirn nicht
vollständig entwickelt ist. Obwohl einzelne Dosen von Strahlung, die für diagnostische Zwecke
oder Behandlung verwendet werden, relativ niedrig sind, können kleine Schäden auf molekularer
und zellulärer Ebene bei wiederholter Exposition akkumulieren und zu verzögerten
Langzeitdefekten führen.
So war das wichtigste Ziel dieser Arbeit zu zeigen, ob es Wechselwirkungen von Strahlung und
altersbedingten Erkrankungen durch die Effekte von Sauerstoff, reaktiver Sauerstoffspezies (ROS)
und Aβ Peptid gibt, die an AD beteiligt sind.
Aβ Peptid Monomere und kleine Oligomere (Akteure in AD) sollen an Schäden und Tod von
Neuronen beteiligt sein. Da ionisierende Strahlung oxidativen Stress und Entzündungen
verursacht, die auch in AD auftreten, besteht die Möglichkeit, dass Strahlenbelastung mit
Neurodegeneration verknüpft ist.
2 Gy Röntgenstrahlen ist eine häufig verwendete Dosis in der Strahlentherapie einer Vielzahl von
Tumoren und wurde in dieser Arbeit als Strahlendosis alleine oder in Kombination mit der
vorherigen Behandlung mit extern applizierten Aβ1-42 Peptid (die schädlichste Form) bei zwei
unterschiedlichen Sauerstoffkonzentrationen eingesetzt.
Die in der Arbeit erhaltenen Ergebnisse betonen die Bedeutung von geeigneten
Zellkulturbedingungen, insbesondere der Sauerstoffkonzentration, die in Studien der zellulären
Reaktionen auf oxidativen Stress, ionisierende Strahlung und neurotoxischem Peptid eingesetzt
werden müssen.
Änderungen der zellulären Reaktionen von nicht-differenzierten menschlichen Neuroblastom
(SH-SY5Y) Zellen und von mit Retinsäure (RA) zur Induktion der Differenzierung
vorbehandelten Zellen, die Neuronen ähneln, wurden unter drei Sauerstoffkonzentrationen parallel
untersucht. Bei ~21% Sauerstoff, was gewöhnlich in Zellkultur-Inkubatoren verwendet wird, aber
nie in Geweben des menschlichen Körpers vorkommt und bei 5% bzw. 1% O2, was der
physiologischen Sauerstoffkonzentration im menschlichen Gehirn ähnelt. Zu diesem Zweck
wurden O2-Inkubatoren aus Kunststoffbehältern angefertigt, in denen die Zellen in einem
Gasgemisch mit 5% oder 1% O2, 5% CO2 und 90% oder 94% N2 kultiviert werden konnten.
Zusammenfassung 6
Anfänglich wurden die Auswirkungen von zwei verschiedenen niedrigen
Sauerstoffkonzentrationen (1% und 5%) in SH-SY5Y Zellen auf die Zellproliferation und ATP-
Konzentration als Maß für den bioenergetischen Status getestet. 5% O2 war für die Kultivierung
der SH-SY5Y Zellen besser geeignet, da die Proliferationsaktivität und die ATP-Konzentration
höher waren als bei den Zellen mit 1% O2.
Die Ausgangshypothese war, dass Zellen, die einer nicht-physiologischen hohen
Sauerstoffkonzentration ausgesetzt sind, gegenüber Strahlung und/oder dem Vorhandensein von
Aβ Peptid aufgrund des Sauerstoffeffekts anders reagieren, empfindlicher oder unempfindlicher
sind (d.h. erhöhte Empfindlichkeit aufgrund der erhöhten Bildung von schädlichem ROS und
Modulation von Signalwegen oder aber unempfindlicher wegen vorheriger Adaptation dieser
Prozesse).
Ein sehr wichtiges Ergebnis war, dass die Sauerstoffkonzentration in der Zellkultur und der
Differenzierungsstatus von SH-SY5Y Zellen wichtige Modulatoren von zellulären Reaktionen auf
Röntgenstrahlung und Aβ Peptid sind. Dies ergab sich aus den zell- und molekularbiologischen
sowie aus den biochemischen Untersuchungen.
Die zur Induktion der Differenzierung verwendete Retinsäure führt zu morphologischen
Veränderungen von SH-SY5Y Zellen (d.h. Abflachung des Zellkörpers und Bildung von langen
Auswüchsen, die Axonen von Neuronen ähneln) und zu einer Erhöhung der Empfindlichkeit
gegenüber Strahlung und Aβ Peptid in Abhängigkeit von der Sauerstoffkonzentration. Darüber
hinaus spielt Sauerstoff eine Rolle bei der Differenzierung und Proliferation von SH-SY5Y Zellen,
da die Menge an Neurofilament-M, ein Marker der Differenzierung, von der
Sauerstoffkonzentration abhängig ist und bei 5% O2 kultivierten Zellen höher war. Der
Proliferationstest zeigte ebenfalls eine erhöhte Zellzahl im Vergleich zu den kultivierten Zellen
bei 21% O2.
Unter Verwendung einer sauerstoffempfindlichen optischen Sonde konnte nachgewiesen werden,
dass die intrazelluläre Sauerstoffkonzentration [O2] sich von der externen Sauerstoffkonzentration
unterscheidet. Die intrazelluläre [O2] von SH-SY5Y Zellen, die bei 21% O2 kultiviert wurden, war
10%, die bei 5% O2 kultivierten dagegen 0,9% O2. 5% externe Sauerstoffkonzentration ist für SH-
SY5Y Zellen nicht hypoxisch, da keine Expression von Hypoxie-induzierbarem Faktor (HIF-1α)
nachgewiesen wurde.
Zusammenfassung 7
Veränderungen des aus SH-SY5Y Zellen isolierten mitochondrialen Proteoms wurden unter
Verwendung einer Kombination von blau-nativer/2D-SDS-PAGE zur Proteintrennung,
anschließende Färbung mit dem Fluoreszenzfarbstoff SYPRO Ruby und Quantifizierung von
Proteinspotsintensitäten aus Gelbildern untersucht. Die Proteinmenge ausgewählter
Untereinheiten von Enzymkomplexen der oxidativen Phosphorylierung (OxPhos) und anderer
nicht-OxPhos-mitochondrialer Proteine (identifiziert durch MALDI-TOF/TOF-
Massenspektrometrie und Western Blot) änderte sich bei der Bestrahlung nicht. Nur die Menge
des Hitzeschockproteins 70 erhöhte sich in Abhängigkeit von der Sauerstoffkonzentration und dem
Differenzierungsstatus.
Monomere und kleine Oligomere des Aβ Peptids interagierten mit SH-SY5Y Zellen, wie durch
Durchflusszytometrie nachgewiesen wurde. Kompartimente mit niedrigem pH-Wert (d.h.
Lysosomen und möglicherweise späte Endosomen) waren der Hauptzielort (Target) des Peptids
während es nur in geringem Maße mit Mitochondrien und dem endoplasmatischen Retikulum in
Wechselwirkung tritt, wie durch konfokale Rastermikroskopie sichtbar gemacht wurde.
Obwohl der Ort und die Kinetik der Wechselwirkung von Aβ Peptid mit SH-SY5Y Zellen, die bei
21% oder bei 5% O2 kultiviert wurden, ähnlich war, wurde eine verminderte lysosomale Integrität
nach der Aβ Peptidbehandlung von SH-SY5Y Zellen allein bei 21% O2 beobachtet.
Aβ Peptid allein induzierte nur eine leichte Erhöhung von ROS (bis zu 1,2-fach), eine leichte
Zunahme des mitochondrialen Membranpotentials und keine Änderungen in der ATP
Konzentration und in der Menge von Glutathion (GSH) (ein Indikator für die
Antioxidationskapazität der Zelle), unabhängig von der Sauerstoffkonzentration in der Zellkultur.
Strahlung allein führte zu einem signifikanten Anstieg der ROS (~ 1,5-fach) und einer leichten
Erhöhung der ATP-Konzentration (~1,2-fach), aber nur in Zellen bei 5% O2. Eine leichte Zunahme
des mitochondrialen Membranpotentials wurde bei 21% und 5% O2 beobachtet. Strahlung
bewirkte eine leichten Anstieg der GSH-Menge bei 21% O2 und eine Abnahme bei 5% O2 (bis zu
1,2-fach).
Die Zunahme der Proteincarbonylierung (~ 2,5-fach) durch oxidativen Stress, gemessen im
Oxyblot-Assay, war für bestrahlte Zellen bei 21% O2 spezifisch.
Ein sehr sensitiver Wirkungsort des oxidativen Stresses ist DNA, insbesondere mtDNA, die aber
bis jetzt viel weniger untersucht wird als nukleare DNA. MtDNA wurde unter Verwendung von
für mtDNA spezifischen Primern in PCR-Verfahren auf Änderungen in seiner Menge und auf das
Vorhandensein von 4977 bp-Deletion untersucht. Aß Peptid oder Strahlung allein führen zu einer
Veränderung der mtDNA Menge in Abhängigkeit von der O2 Konzentration: bis zu 1,3-fache
Abnahme bei 21% O2 und bis zu 1,5-fachem Anstieg bei 5% O2. Das Auftreten der mtDNA-
Deletion war für bestrahlte Zellen sowohl bei 21% als auch bei 5% O2 spezifisch, war aber bei
21% O2 stärker ausgeprägt.
Zusammenfassung 8
Zum ersten Mal wurde die kombinierte Wirkung von Aβ Peptid und ionisierender Strahlung auf
zelluläre Parameter und Zellüberleben untersucht. Die mit Aβ Peptid kombinierte Strahlung führte
zu einem statistisch signifikanten Anstieg der ROS-Menge bei 21% (~1,2-fach) und 5% O2 (~1,4-
fach), Erhöhung der ATP-Konzentration (1,5-fach) nur bei 5% O2, Erhöhung der GSH-Menge bei
21% O2 und Abnahme bei 5% O2 (bis zu 1,2 fach) und zu keiner Veränderung des mitochondrialen
Membranpotentials.
Die Ergebnisse des Zelltod-Assays (Messung von apoptotischen und nekrotischen Zellen durch
Durchflusszytometrie) zeigten, dass Aβ1-42 Peptid oder 2 Gy-Röntgenstrahlen allein zu einer
signifikanten Zunahme des Zelltods von SH-SY5Y Zellen bei 5% O2 führte und nur in einer
geringfügigen Zunahme bei 21% O2. Bemerkenswerterweise verringerte Aβ Peptid den Zelltod
von bestrahlten Zellen auf das Kontrollniveau oder darunter, insbesondere bei 5% O2. Im
Gegensatz zu den individuellen Stressoren führte die Kombination von Aβ Peptid und Bestrahlung
nicht zu einer signifikanten Zunahme der Proteincarbonylierung, der mtDNA Deletion und der
Änderung der mtDNA Menge. Daher bestimmt der anfängliche Oxidationsstress den Punkt, an
dem zelluläre Abwehrmechanismen auftreten, und es ist möglich, dass in diesem Fall auch
neuroprotektive Mechanismen ausgelöst werden.
Darüber hinaus zeigte diese Studie, dass die Inkubationszeit zusammen mit der Konzentration und
dem Zustand des Peptids (disaggregiert versus aggregiert zu Fibrillen) ein entscheidender Faktor
für die Aβ Peptid-Toxizität ist. Eine hohe Konzentration (100 µM) des fibrillären Peptids
(induziert durch Lagerung bei 37 °C über Nacht) führte zum Zelltod von SH-SY5Y Zellen nach
einem Tag. Allerdings war die Wirkung des disaggregierten Aß Peptids (100 μM) nach 3 Tagen
Inkubation stärker ausgeprägt als bei fibrillärem Peptid. Aβ Peptid Behandlung verringerte den
Prozentsatz von apoptotischen und nekrotischen Zellen (2,5-fach) in bestrahlten Zellen nach 1 Tag.
Nach 3 Tagen wurde jedoch ein ~2,8-facher Anstieg von apoptotischen und nekrotischen Zellen
im Vergleich zu unbestrahlten Kontrollzellen beobachtet.
Der beobachtete Weg von Aβ Peptid zu zellulären Organellen und die induzierten Veränderungen
der Zellphysiologie, die vom Oxidationsstress abhängen, könnten für die AD Pathologie von
Bedeutung sein.
Die erhaltenen Ergebnisse fordern den Einsatz von mehr physiologischen 5% O2 anstatt der nicht-
physiologischen 21% O2 für die Kultivierung von SH-SY5Y Zellen, insbesondere bei Studien ihrer
Reaktion auf Stress. Dies ist die Zuverlässigkeit der experimentellen Aussagen entscheidend.
Zellen, die bei 5% O2 kultiviert wurden, zeigten eine höhere ATP Konzentration (~1,3-fach), eine
niedrigere ROS Menge (1,5-fach), eine geringere Proteincarbonylierung (2,5-fach) und weniger
mtDNA Deletion (2-fach) im Vergleich zu Zellen bei 21% O2.
Introduction 9
2. Introduction
The effect of radiation on cells is usually exerted through the formation of ROS in the radiolysis
of water and through their high potential to react with other molecules creating more ROS in the
cell. Although single doses of radiation used for diagnostic purposes or therapeutic treatment are
relatively low, small changes on the molecular and cellular level may accumulate upon repeated
exposure and result in delayed long-term defects.
Oxygen concentration in the cell culture is of crucial importance for the cellular response to
oxidative stress caused by ionizing radiation or by presence of toxic peptides. The differentiation
state is another important factor in cellular response to stress (Džinić et al., 2016). Differentiation
state of the cell determines the gene expression which then regulates the sensitivity and cellular
response to any treatment. The cell possesses different anti-oxidant mechanisms such as
glutathione (GSH) (Dani et al., 2010) and repair mechanisms which are activated depending on
the amount of oxidative stress.
Oxygen concentration and differentiation state are important in studies of disease mechanisms,
particularly of multifactorial diseases such as neurodegenerative AD (Alzheimer´s disease).
Although exact cause(s) of AD are still unknown, one of the players is Aβ peptide. However, the
implication of different aggregation states of the peptide (fibrillized or disaggregated to monomers
and oligomers) is largely debated. Monomers and small oligomers of Aβ peptide are recently
proposed to be involved in damage of neurons, instead of extracellular Aβ peptide plaques, since
they interact with and even intercalate in cellular membranes (Buchsteiner et al., 2010; Dante et
al., 2011) and the peptide is found inside neurons of AD patients (Gouras et al., 2000). Lysosomal
activity of sequestration and potential degradation of Aβ peptide is probably the first and most
important defense mechanism of cells against Aβ peptide toxicity (Zheng et al., 2012).
Although effects of irradiation and Aβ peptide share some similarities, such as induction of
inflammation linked with neurodegeneration, these two stressors probably affect different cellular
pathways and result in different cellular responses.
2.1. Cellular responses to ionizing radiation
Absorption of radiation by tissue is a function of the electronic excitability of its constituent
molecules. High energy radiation (α-, β-particles, neutrons, γ- and X-rays) sufficient for ejection
of electrons from their orbital or collision with other energetic particles (e.g. α-particles, high
energy electrons) results in molecular ionization leaving chemical entities with one or more
electrons unpaired (Riley, 1994). The absorbed dose of radiation (D) is the fundamental dose
quantity given by:
� = ��
��
Introduction 10
where Δε is the mean energy imparted to matter of mass Δm by ionizing radiation. The SI unit for
absorbed dose is joule per kilogram (J kg-1) and its name is gray (Gy) (ICRP, 2007).
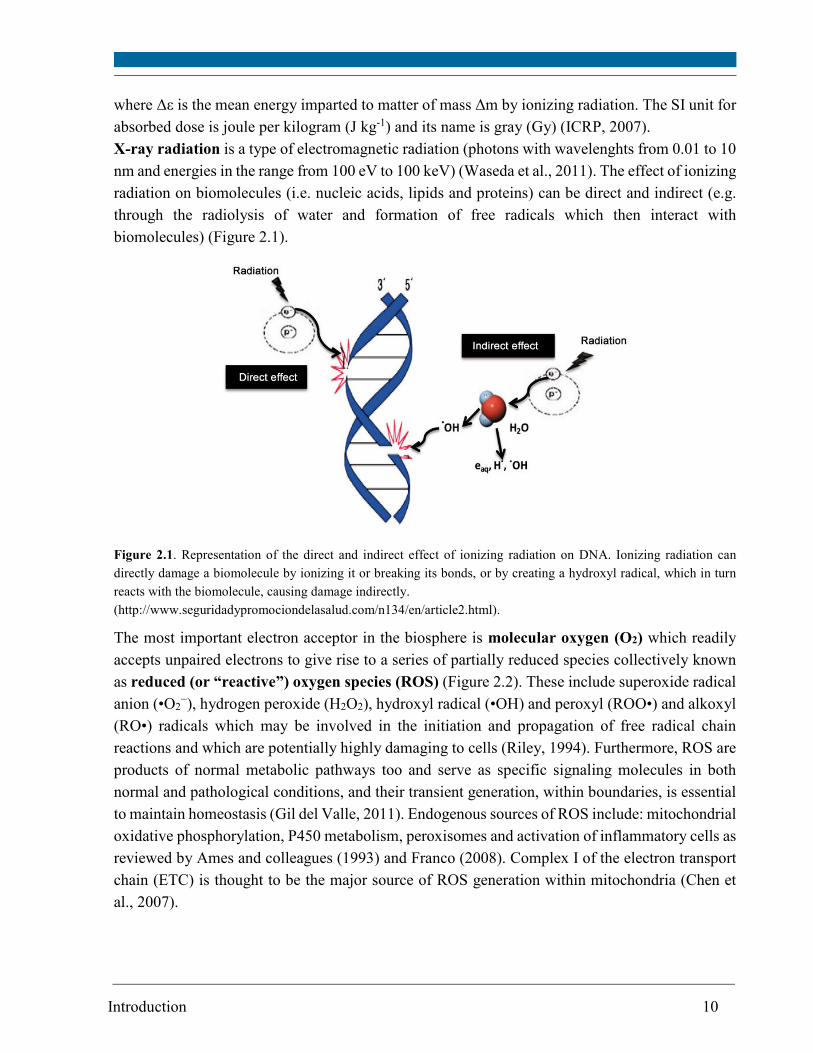
X-ray radiation is a type of electromagnetic radiation (photons with wavelenghts from 0.01 to 10
nm and energies in the range from 100 eV to 100 keV) (Waseda et al., 2011). The effect of ionizing
radiation on biomolecules (i.e. nucleic acids, lipids and proteins) can be direct and indirect (e.g.
through the radiolysis of water and formation of free radicals which then interact with
biomolecules) (Figure 2.1).
Figure 2.1. Representation of the direct and indirect effect of ionizing radiation on DNA. Ionizing radiation can
directly damage a biomolecule by ionizing it or breaking its bonds, or by creating a hydroxyl radical, which in turn
reacts with the biomolecule, causing damage indirectly.
(http://www.seguridadypromociondelasalud.com/n134/en/article2.html).
The most important electron acceptor in the biosphere is molecular oxygen (O2) which readily
accepts unpaired electrons to give rise to a series of partially reduced species collectively known
as reduced (or “reactive”) oxygen species (ROS) (Figure 2.2). These include superoxide radical
anion (•O2−), hydrogen peroxide (H2O2), hydroxyl radical (•OH) and peroxyl (ROO•) and alkoxyl
(RO•) radicals which may be involved in the initiation and propagation of free radical chain
reactions and which are potentially highly damaging to cells (Riley, 1994). Furthermore, ROS are
products of normal metabolic pathways too and serve as specific signaling molecules in both
normal and pathological conditions, and their transient generation, within boundaries, is essential
to maintain homeostasis (Gil del Valle, 2011). Endogenous sources of ROS include: mitochondrial
oxidative phosphorylation, P450 metabolism, peroxisomes and activation of inflammatory cells as
reviewed by Ames and colleagues (1993) and Franco (2008). Complex I of the electron transport
chain (ETC) is thought to be the major source of ROS generation within mitochondria (Chen et
al., 2007).
Introduction 11
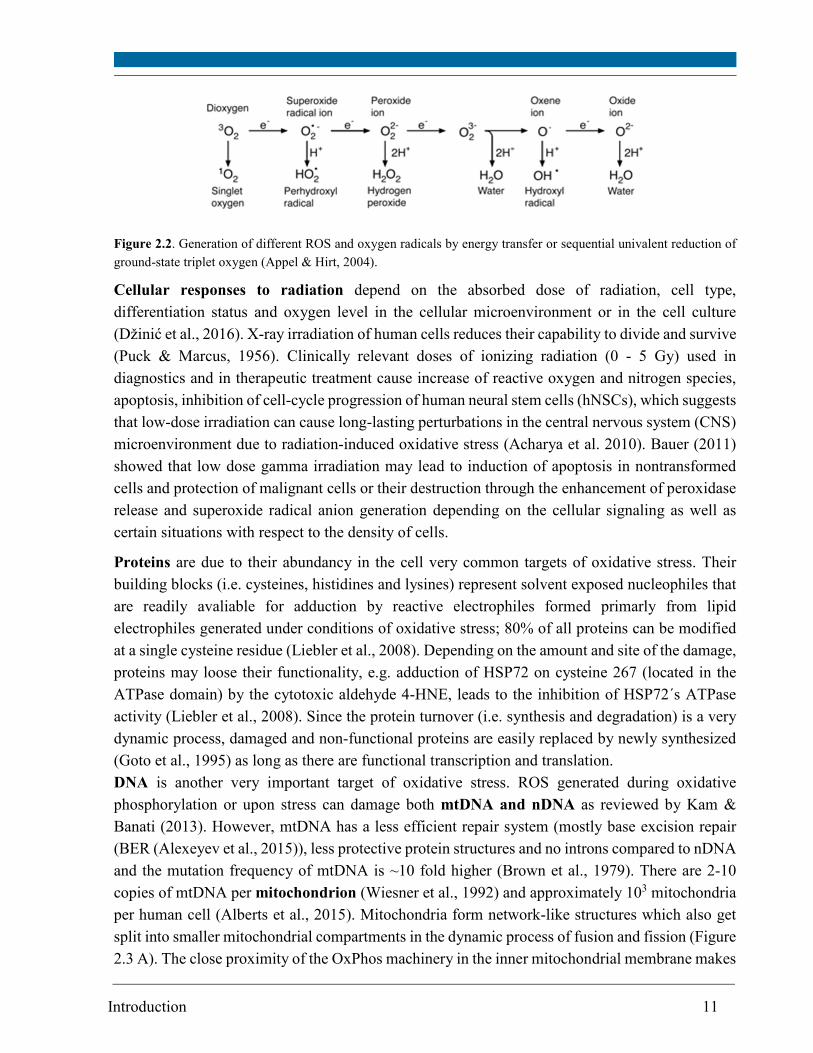
Figure 2.2. Generation of different ROS and oxygen radicals by energy transfer or sequential univalent reduction of
ground-state triplet oxygen (Appel & Hirt, 2004).
Cellular responses to radiation depend on the absorbed dose of radiation, cell type,
differentiation status and oxygen level in the cellular microenvironment or in the cell culture
(Džinić et al., 2016). X-ray irradiation of human cells reduces their capability to divide and survive
(Puck & Marcus, 1956). Clinically relevant doses of ionizing radiation (0 - 5 Gy) used in
diagnostics and in therapeutic treatment cause increase of reactive oxygen and nitrogen species,
apoptosis, inhibition of cell-cycle progression of human neural stem cells (hNSCs), which suggests
that low-dose irradiation can cause long-lasting perturbations in the central nervous system (CNS)
microenvironment due to radiation-induced oxidative stress (Acharya et al. 2010). Bauer (2011)
showed that low dose gamma irradiation may lead to induction of apoptosis in nontransformed
cells and protection of malignant cells or their destruction through the enhancement of peroxidase
release and superoxide radical anion generation depending on the cellular signaling as well as
certain situations with respect to the density of cells.
Proteins are due to their abundancy in the cell very common targets of oxidative stress. Their
building blocks (i.e. cysteines, histidines and lysines) represent solvent exposed nucleophiles that
are readily avaliable for adduction by reactive electrophiles formed primarly from lipid
electrophiles generated under conditions of oxidative stress; 80% of all proteins can be modified
at a single cysteine residue (Liebler et al., 2008). Depending on the amount and site of the damage,
proteins may loose their functionality, e.g. adduction of HSP72 on cysteine 267 (located in the
ATPase domain) by the cytotoxic aldehyde 4-HNE, leads to the inhibition of HSP72´s ATPase
activity (Liebler et al., 2008). Since the protein turnover (i.e. synthesis and degradation) is a very
dynamic process, damaged and non-functional proteins are easily replaced by newly synthesized
(Goto et al., 1995) as long as there are functional transcription and translation.
DNA is another very important target of oxidative stress. ROS generated during oxidative
phosphorylation or upon stress can damage both mtDNA and nDNA as reviewed by Kam &
Banati (2013). However, mtDNA has a less efficient repair system (mostly base excision repair
(BER (Alexeyev et al., 2015)), less protective protein structures and no introns compared to nDNA
and the mutation frequency of mtDNA is ~10 fold higher (Brown et al., 1979). There are 2-10
copies of mtDNA per mitochondrion (Wiesner et al., 1992) and approximately 103 mitochondria
per human cell (Alberts et al., 2015). Mitochondria form network-like structures which also get
split into smaller mitochondrial compartments in the dynamic process of fusion and fission (Figure
2.3 A). The close proximity of the OxPhos machinery in the inner mitochondrial membrane makes
Introduction 12
mtDNA vulnerable to damage by ROS in the „vicious cycle“ (Figure 2.3 B). ROS produced in the
ETC, and during oxidative stress as well, can react with mtDNA and result in mutations. Due to
these alterations in the functioning of OxPhos complexes more ROS is formed. Human mtDNA is
a circular double-stranded 16569 bp molecule encoding 13 polypeptides all being subunits of
OxPhos complexes, two rRNAs and 22 tRNAs (Anderson et al., 1981). Thus, damages in mtDNA,
which has no introns and is less protected by accompanying proteins than nDNA, are more likely
to cause functional changes such as respiratory chain dysfunction than those in nDNA.
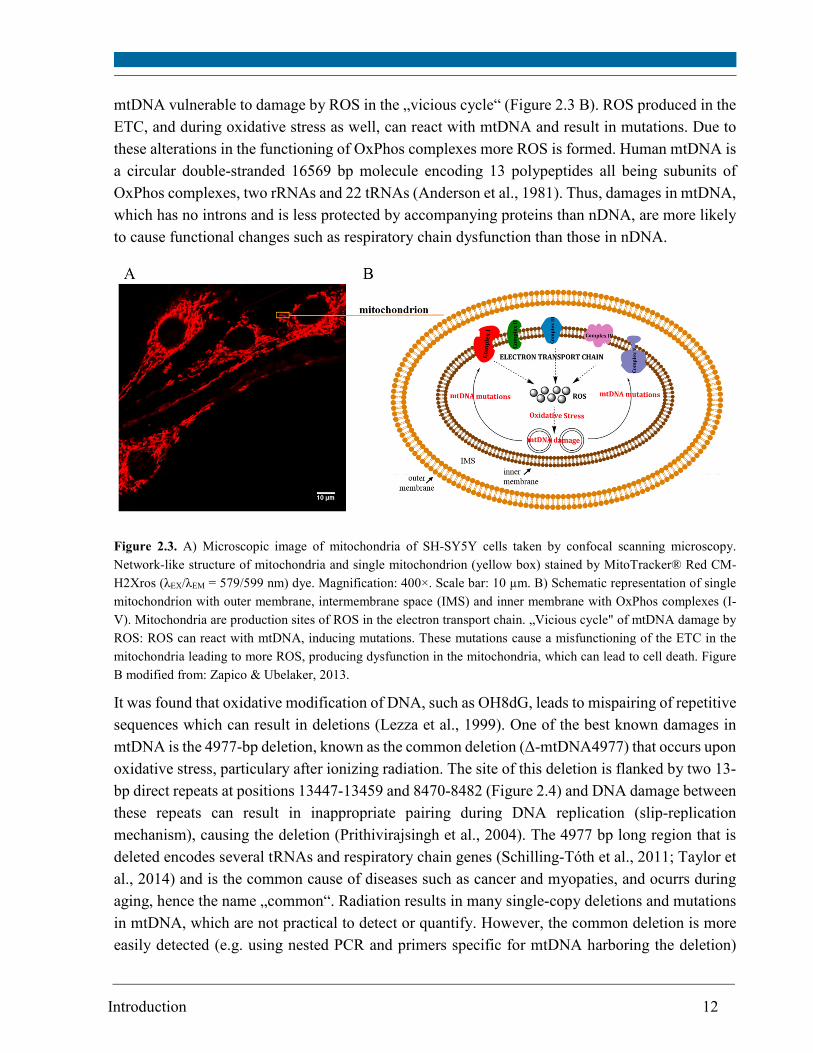
Figure 2.3. A) Microscopic image of mitochondria of SH-SY5Y cells taken by confocal scanning microscopy.
Network-like structure of mitochondria and single mitochondrion (yellow box) stained by MitoTracker® Red CM-
H2Xros (λEX/λEM = 579/599 nm) dye. Magnification: 400×. Scale bar: 10 µm. B) Schematic representation of single
mitochondrion with outer membrane, intermembrane space (IMS) and inner membrane with OxPhos complexes (I-
V). Mitochondria are production sites of ROS in the electron transport chain. „Vicious cycle" of mtDNA damage by
ROS: ROS can react with mtDNA, inducing mutations. These mutations cause a misfunctioning of the ETC in the
mitochondria leading to more ROS, producing dysfunction in the mitochondria, which can lead to cell death. Figure
B modified from: Zapico & Ubelaker, 2013.
It was found that oxidative modification of DNA, such as OH8dG, leads to mispairing of repetitive
sequences which can result in deletions (Lezza et al., 1999). One of the best known damages in
mtDNA is the 4977-bp deletion, known as the common deletion (Δ-mtDNA4977) that occurs upon
oxidative stress, particulary after ionizing radiation. The site of this deletion is flanked by two 13-
bp direct repeats at positions 13447-13459 and 8470-8482 (Figure 2.4) and DNA damage between
these repeats can result in inappropriate pairing during DNA replication (slip-replication
mechanism), causing the deletion (Prithivirajsingh et al., 2004). The 4977 bp long region that is
deleted encodes several tRNAs and respiratory chain genes (Schilling-Tóth et al., 2011; Taylor et
al., 2014) and is the common cause of diseases such as cancer and myopaties, and ocurrs during
aging, hence the name „common“. Radiation results in many single-copy deletions and mutations
in mtDNA, which are not practical to detect or quantify. However, the common deletion is more
easily detected (e.g. using nested PCR and primers specific for mtDNA harboring the deletion)
Introduction 13
because of its unique mechanism of formation, making it a very sensitive marker of mtDNA
damage (Prithivirajsingh et al., 2004; Chen et al., 2011).
Since mitochondria are organelles in the center of different cellular pathways including energy
conversion and metabolism, calcium homeostasis and apoptosis (Alberts et al., 2015), their
dysfunction is linked with many diseases including neurodegenerations such as Parkinson´s or
Alzheimer´ disease. More than 100 deletions found in mtDNA is associated with human diseases
(http://www.mitomap.org/).
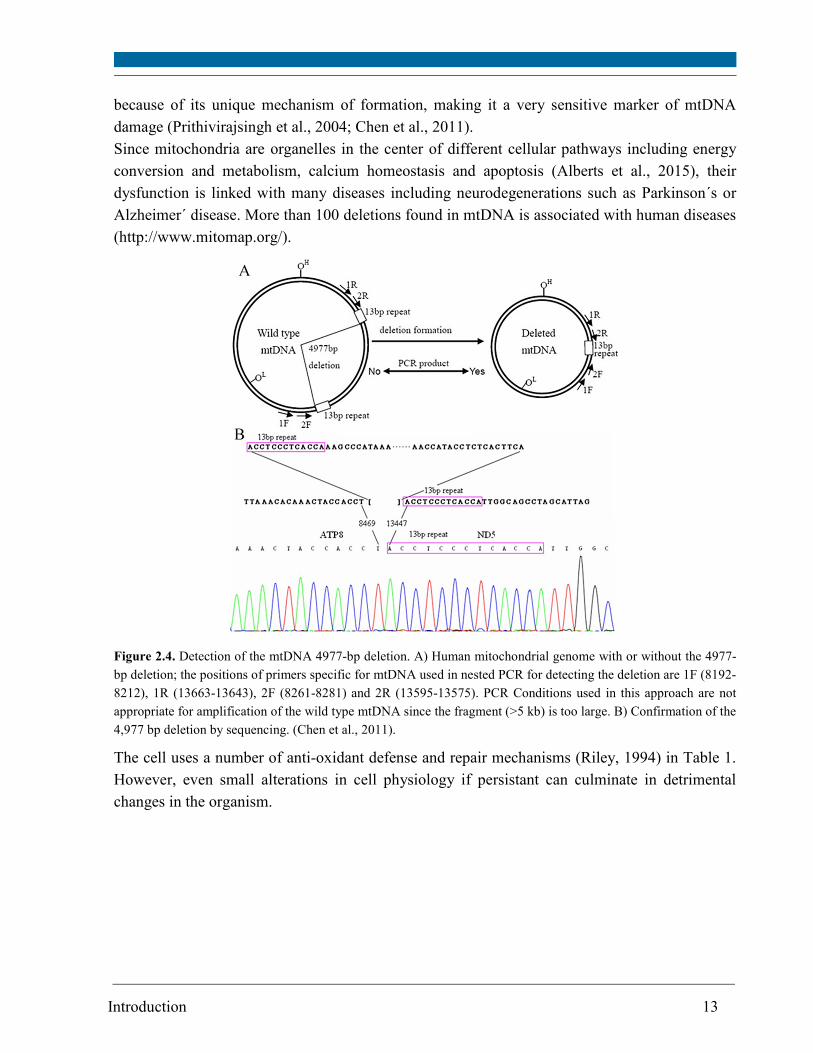
Figure 2.4. Detection of the mtDNA 4977-bp deletion. A) Human mitochondrial genome with or without the 4977-
bp deletion; the positions of primers specific for mtDNA used in nested PCR for detecting the deletion are 1F (8192-
8212), 1R (13663-13643), 2F (8261-8281) and 2R (13595-13575). PCR Conditions used in this approach are not
appropriate for amplification of the wild type mtDNA since the fragment (>5 kb) is too large. B) Confirmation of the
4,977 bp deletion by sequencing. (Chen et al., 2011).
The cell uses a number of anti-oxidant defense and repair mechanisms (Riley, 1994) in Table 1.
However, even small alterations in cell physiology if persistant can culminate in detrimental
changes in the organism.
Introduction 14
Table 1. Cellular antioxidant defense mechanisms (modified according to Riley (1994)). (1) Compartmentation of `sensitive' material (e.g. DNA) (2) Removal of ROS by antioxidant enzymes (SOD, catalase, GPX) (3) Sequestration of transition metals (e.g. in ferritin) (4) Radical scavengers such as cellular thiols (e.g. glutathione) and chain-breaking antioxidants (e.g. a-tocopherol, ascorbate) (5) Inhibition of vulnerable processes (e.g. DNA replication) (6) Monitoring and repair (e.g. excision repair of DNA lesions) (7) Initiation of apoptosis
Furthermore, lysosomal activity of sequestration and degradation of damaged cellular components
or harmful external stressors is another very important mechanism of cellular defense. For
example, damaged mitochondria or their parts are targeted for endo/lysosomal degradation
(Juhász, 2016) preventing further damage. Lysosomes, besides their digestive roles together with
autophagosomes or late endosomes, are responsible for the repair of the plasma membrane by
fusing locally with damaged sites. Lysosomes serve as a pool or storage of amino acids, phosphate,
ions and intermediate metabolites and they are capable of sensing nutrients through the activation
of kinases (e.g. mTORC1) and transcription factors, as reviewed by Lim and Zoncu (2016).
2.2. Oxygen concentration in the cell culture
O2 is a molecule essential for life of aerobic organisms and proper function of most of the cells
and tissues. Oxygen concentration in cells of the living organism or cells in the culture depends on
the balance between its delivery and consumption by cellular processes. Intracellular oxygen
concentration is usually much lower than in the atmosphere. Furthermore, varying concentrations
of oxygen are present in tissues depending on their metabolism and functions. For example, lungs
experience much higher oxygen concentration (~14.4% in the alveoli) than skin (1.1 ± 0.4% in
superficial region). Oxygen concentration in arteries and veins of lungs is ~10-13% and ~5%,
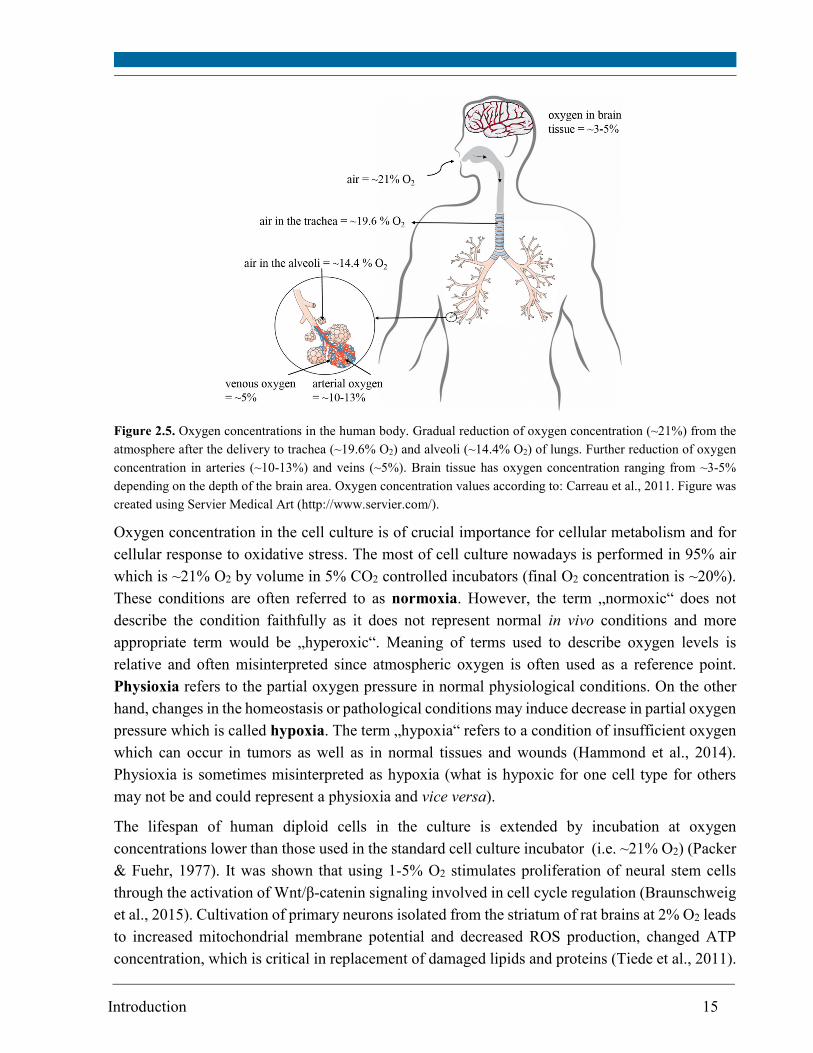
respectively, whereas brain tissues has ~3-5% O2 (Carreau et al., 2011) (Figure 2.5).
Introduction 15
Figure 2.5. Oxygen concentrations in the human body. Gradual reduction of oxygen concentration (~21%) from the
atmosphere after the delivery to trachea (~19.6% O2) and alveoli (~14.4% O2) of lungs. Further reduction of oxygen
concentration in arteries (~10-13%) and veins (~5%). Brain tissue has oxygen concentration ranging from ~3-5%
depending on the depth of the brain area. Oxygen concentration values according to: Carreau et al., 2011. Figure was
created using Servier Medical Art (http://www.servier.com/).
Oxygen concentration in the cell culture is of crucial importance for cellular metabolism and for
cellular response to oxidative stress. The most of cell culture nowadays is performed in 95% air
which is ~21% O2 by volume in 5% CO2 controlled incubators (final O2 concentration is ~20%).
These conditions are often referred to as normoxia. However, the term „normoxic“ does not
describe the condition faithfully as it does not represent normal in vivo conditions and more
appropriate term would be „hyperoxic“. Meaning of terms used to describe oxygen levels is
relative and often misinterpreted since atmospheric oxygen is often used as a reference point.
Physioxia refers to the partial oxygen pressure in normal physiological conditions. On the other
hand, changes in the homeostasis or pathological conditions may induce decrease in partial oxygen
pressure which is called hypoxia. The term „hypoxia“ refers to a condition of insufficient oxygen
which can occur in tumors as well as in normal tissues and wounds (Hammond et al., 2014).
Physioxia is sometimes misinterpreted as hypoxia (what is hypoxic for one cell type for others
may not be and could represent a physioxia and vice versa).
The lifespan of human diploid cells in the culture is extended by incubation at oxygen
concentrations lower than those used in the standard cell culture incubator (i.e. ~21% O2) (Packer
& Fuehr, 1977). It was shown that using 1-5% O2 stimulates proliferation of neural stem cells
through the activation of Wnt/β-catenin signaling involved in cell cycle regulation (Braunschweig
et al., 2015). Cultivation of primary neurons isolated from the striatum of rat brains at 2% O2 leads
to increased mitochondrial membrane potential and decreased ROS production, changed ATP
concentration, which is critical in replacement of damaged lipids and proteins (Tiede et al., 2011).
Introduction 16
Interestingly, mitochondrial morphology or dynamics of mitoreticulum is affected by oxygen
concentration, which leads to changes in cell bioenergetics (Willems et al., 2015). Plecitá-Hlavatá
and colleagues (2016) observed expansion of mitochondrial IMS and rounding of a sharp cristae
shape in hepatocellular carcinoma HepG2 cells adapted to 5% O2, which resulted in profound
changes in ATP production in glycolytic cells via disruption of ATP synthase dimers while
OXPHOS cells (cultivated in aglycemic medium with galactose and glutamine) showed only non-
significant changes in ATP production.
Furthermore, oxygen concentration affects gene expression. For example, transcription factor HIF-
1 (hypoxia inducible factor 1) is a heterodimer consisting of HIF-1α protein (and of HIF-1β
protein), which under conditions of high oxygen is rapidly degraded. HIF-1α has a half-life less
than 10 min under normoxic conditions since PHDs (prolyl hydroxylases) hydroxylate prolyl
residues of HIF-1-alpha making it a target for interaction with E3 ubiquitin-protein ligase complex.
This leads to poly-ubiquitinilation and finally proteosomal degradation by 26 S proteasome. HIF-
1 alpha is expressed in some cancer cell lines and in normal cell lines following stimulation or
stress at non-hypoxic oxygen levels (Chun et al., 2002). When stabilized HIF-1α binds to HRE
(Hypoxia Response Element) sequences in the DNA and then it is cabable to regulate (activation
or inhibition) of more than 100 target genes involved in regulation of a variety of cellular processes
(Horowitz and Simons, 2008).
Other cellular factors regulated by oxygen are microRNAs (miRNAs) (20-24 nucleotide non-
coding RNAs) (Kulshreshtha et al., 2007) and cell adhesion molecules. Low oxygen induces
switch from oxidative phosphorylation to anaerobic glycolysis, increased glucose uptake, and
expression of stress proteins related to cell survival or death. Cell proliferation rates under
conditions of low oxygen may increase as it was in the case of colon cancer HCT116 cells
cultivated at 5% O2 where HIF-1 alpha was upregulated and probably mediated by MAPK (Carrera
et al., 2014).
Performing in vitro studies under appropriate oxygen conditions or at “physiologically-relevant
oxygen concentrations” (Jež et al., 2015) is to be considered in tumor microenvironment studies
but also in cellular therapies, regeneration medicine and identification of relevant biomarkers for
diagnostic purposes. Furthermore, investigation of anti-oxidant properties of compounds under
inappropriately high concentration of oxygen may contribute to false negative results as cell are
exposed to high oxidative stress.
The differentiation state is another important factor in cellular response to stress. Differentiation
state of the cell determines the gene expression which then regulates the sensitivity and cellular
response to any treatment. All-trans retinoic acid (ATRA, tretinoin or vitamin A acid, RA), a
ligand for both the retinoic acid receptor (RAR) and the retinoid X receptor (RXR) (Balmer &
Blomhoff, 2002) is used alone or in combination with growth factors for differentiation of
multipotent or oligopotent cells into more specialized cell types (Biedler et al., 1973). Activated
RAR and RXR regulate the expression of genes involved in growth and differentiation of both
Introduction 17
normal and malignant cells (Chiu et al., 1995, Korecka et al., 2013). Embryonic stem cells are
primed to become neurons and human neuroblastoma (SH-SY5Y) cells resemble neurons after the
treatment with RA (Rhinn & Dollé, 2012; Fagerström, 1996). Additionally, the oxygen
concentration modulates the expression of neurofilament M, a marker of differentiation (Džinić et
al., 2016) and is known to be implicated in differentiation (Cheng et al., 2014) and metabolic
activity of neuronal cells (Zhu et al., 2012). Hematopoietic stem cells (HSC) important in clinical
studies and in fundamental research come from the bone where levels of oxygen are very low
(endosteal region next to the inside surface of the bone where blood vessels are small and the blood
flow rate is slow). HSCs in vitro must be maintained at 3% O2 since at higher oxygen
concentrations these cells rather undergo differentiation and below 3% O2 they do not proliferate
(Ivanovic et al., 2004).
2.3. Implication of the Aβ peptide in Alzheimer´s disease
Alzheimer´s disease (AD) is one of many age-associated diseases (e.g. cancer, cardiovascular
diseases, diabetes type 2) and the most common dementia in elderly (60-80% of all known
dementias) (Alzheimer’s Association, 2014). AD and related dementias affected about 47 million
people worldwide (Alzheimer’s Disease International, 2016). Despite the quantum leap in the
progress of science and medicine, the cause(s) of AD and mechanisms involved in its pathology
remain unresolved even more than 100 years after the disease was first described as a form of
progessive, neurodegenerative and behavioral disorder (Alzheimer, 1907). Some researchers point
out that AD is rather a systemic disorder than a brain-limited condition (Swerdlow et al., 2010;
Querfurth et al., 2010).
AD is considered one of protein misfolding diseases (Sipe et al., 2010; Stefani et al., 2012) but it
took until the mid to late 1980s to correlate Aβ peptide with AD symptoms (Masters et al., 1985;
Tanzi et al., 1988) as processing of amyloid precursor protein (APP) peptide is altered in AD.
Amyloid beta peptide is a metabolic product of the APP in cellular organelles (endoplasmatic
reticulum, Golgi apparatus, endosomes and possibly in mitochondria) and is secreted
predominantly as Aβ1-40 or Aβ1-42 peptide (Martin et al., 1995; Pagani & Eckert, 2011).
There is no direct correlation between the accumulation of Aβ peptide and cognitive decline
(Soldano & Hassan, 2014), suggesting that the Aβ peptide is not a sole player in AD. Premature
death of cholinergic neurons in the brain is caused by multiple genetic and environmental factors.
In the early-onset AD with a familial pattern of inheritance (which accounts for only about 1% of
all cases), autosomal dominant mutations in three nuclear genes: amyloid precursor protein (APP)
at chromosome 21, presenilin 1 (PS-1) at chromosome 14 and apolipoprotein (ApoE) at
chromosome 19 are involved in the pathogenesis. Risk factors for the late-onset and sporadic form
of AD beside age, which is the most important factor, are the prevalence of ApoE4 allele among
affected individuals and mutations in mitochondrial DNA (Scheffler, 1999, pg. 303).
APP is expressed at high levels in neurons and undergoes proteolytic processing by three different
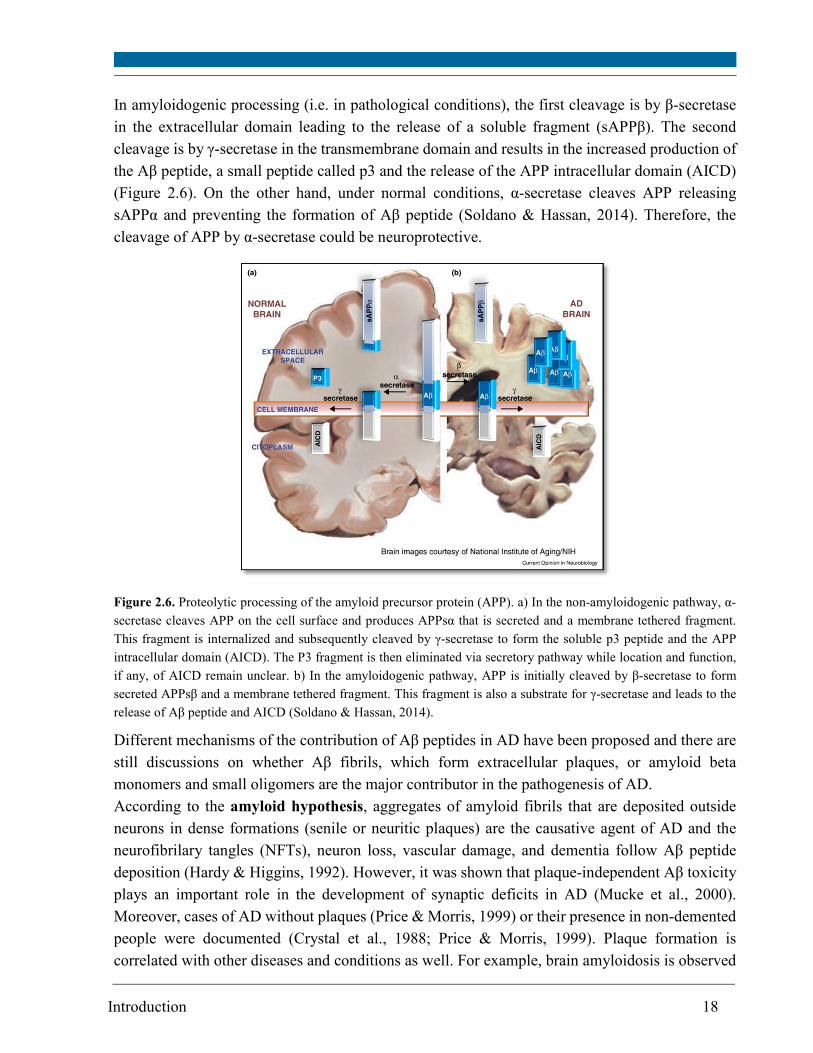
secretases: α-secretase, β-secretase, and γ-secretase (Soldano & Hassan, 2014) (Figure 2.6).
Introduction 18
In amyloidogenic processing (i.e. in pathological conditions), the first cleavage is by β-secretase
in the extracellular domain leading to the release of a soluble fragment (sAPPβ). The second
cleavage is by γ-secretase in the transmembrane domain and results in the increased production of
the Aβ peptide, a small peptide called p3 and the release of the APP intracellular domain (AICD)
(Figure 2.6). On the other hand, under normal conditions, α-secretase cleaves APP releasing
sAPPα and preventing the formation of Aβ peptide (Soldano & Hassan, 2014). Therefore, the
cleavage of APP by α-secretase could be neuroprotective.
Figure 2.6. Proteolytic processing of the amyloid precursor protein (APP). a) In the non-amyloidogenic pathway, α-
secretase cleaves APP on the cell surface and produces APPsα that is secreted and a membrane tethered fragment.
This fragment is internalized and subsequently cleaved by γ-secretase to form the soluble p3 peptide and the APP
intracellular domain (AICD). The P3 fragment is then eliminated via secretory pathway while location and function,
if any, of AICD remain unclear. b) In the amyloidogenic pathway, APP is initially cleaved by β-secretase to form
secreted APPsβ and a membrane tethered fragment. This fragment is also a substrate for γ-secretase and leads to the
release of Aβ peptide and AICD (Soldano & Hassan, 2014).
Different mechanisms of the contribution of Aβ peptides in AD have been proposed and there are
still discussions on whether Aβ fibrils, which form extracellular plaques, or amyloid beta
monomers and small oligomers are the major contributor in the pathogenesis of AD.
According to the amyloid hypothesis, aggregates of amyloid fibrils that are deposited outside
neurons in dense formations (senile or neuritic plaques) are the causative agent of AD and the
neurofibrilary tangles (NFTs), neuron loss, vascular damage, and dementia follow Aβ peptide
deposition (Hardy & Higgins, 1992). However, it was shown that plaque-independent Aβ toxicity
plays an important role in the development of synaptic deficits in AD (Mucke et al., 2000).
Moreover, cases of AD without plaques (Price & Morris, 1999) or their presence in non-demented
people were documented (Crystal et al., 1988; Price & Morris, 1999). Plaque formation is
correlated with other diseases and conditions as well. For example, brain amyloidosis is observed
Introduction 19
in people with Down syndrome since they have an extra chromosome 21 where the gene coding
APP, a protein from which β-amyloid peptides are derived, is located (Zigman et al., 2008).
Recent research put in focus smaller oligomers and/or monomers which have more potential to
cause damages in neuronal cells in comparison to relatively inert fibrils (Ono et al., 2009). Studies
showed that intracellular Aβ peptide in human neurons is implicated in Alzheimer´s disease before
formation of extracellular plaques (Gouras et al., 2000; Friedrich et al., 2010). Aβ peptide is highly
hydrophobic and has a great potential to interact with all cellular membranes and to cause structural
perturbation, membrane fusion, changes in lipid diffusion and dynamics (Dante et al., 2003;
Buchsteiner et al., 2010; Barrett et al., 2016). Lipid composition of cellular membranes is
important in pathogenesis of AD. For example, cholesterol that prevents Aβ peptide insertion
(Dante et al., 2006) can modulate lateral movements of proteins in the plasma membrane giving a
preference either for nonamyloidogenic α-secretase cleavage of APP or β-secretase cleavage of
APP in the plasma membrane (Bodovitz and Klein, 1996).
Both nonfibrillized and fibrillized microinjected Aβ1-42 or cDNA-expressing Aβ1-42 peptide are
capable of apoptosis induction via p53-Bax pathway in primary human neurons in vitro (Zhang et
al., 2002). Studies revealed that mitochondria are important targets of Aβ peptide (Selkoe, 1997).
Mitochondrial dysfunction is broadly discussed to be implicated in late-onset and sporadic forms
of Alzheimer´s disease. Aβ peptides are suggested to localize to mitochondrial membranes, to
block the transport of nuclear-encoded proteins to mitochondria, disrupt the ETC, increase ROS
production, cause mitochondrial damage and prevent neurons from functioning normally (Hansson
Petersen et al., 2008; Sirk et al., 2007). Aβ peptides directly initiate free radical/ROS formation,
cellular dysfunction, and subsequent neuronal death (Hensley et al., 1994). Aβ1-42 peptide can
induce reactive ROS production from cortical neurons through activation of NADPH oxidase
(Shelat et al., 2008). Aβ peptide-induced „inflammatory“ changes lead to metabolic and
cytoskeletal alterations, including changes in calcium homeostasis, and injury to mitochondrial
functions (Scheffler, 1999; pg. 303). Hansson Petersen and colleagues (2008) showed that Aβ
peptides are transported into mitochondria via the translocase of the outer mitochondrial
membrane (TOM) and localizes within the mitochondrial cristae. MtDNA deletions,
dysregulations of the fission and fusion events, mitochondrial autophagy have been linked to
neurodegeneration (Villeneuve et al., 2013). Oxidative stress as one of the factors in AD leading
to mtDNA mutations and deletions resulting in disturbance of ETC and leakage of ROS targeting
mtDNA (Yoneda et al., 1995). Moreover, mtDNA damage in senescent cells results in apoptosis
(Laberge et al., 2013) which can be induced by persistant single-stranded DNA breaks (Tann et
al., 2011). Mutations in mitochondrial genes as well as changes in the activity of four OxPhos
complexes (I-IV) are often related to AD. However, other studies did not prove respiratory chain
enzyme activities below the normal range in AD patients (Scheffler, 1999, pg. 303). According to
the mitochondrial cascade hypothesis, mitochondrial dysfunction is the primary event in sporadic
AD. Inheritance determines mitochondrial baseline function and durability which influences how
Introduction 20
mitochondria change with age and potentially governs AD histopathology (Swerdlow and Khan,
2009).
There is no direct link between exposure to ionizing radiation and Alzheimer´s disease. It is known
that high doses of IR to the head (e.g. 20-50 Gy) lead to severe learning and memory impairment
(Kempf et al., 2013) which are characteristic for AD as well. Both non-direct and direct effects of
ionizing radiation may play important roles in the pathology of AD as well as of other age-
associated diseases. For example, routine exposure of human head to dental X-rays can lead to
direct DNA damage or cause increase in ROS that can later damage cellular structures such as
telomeres of chromosomes. Cranial irradiation (3 Gy) used for the treatment of primary and
metastatic brain tumors (Bauman et al., 1994) can impact cognition through the damage and
depletion of neural progenitor stem cells found in hippocampus (Raber et al., 2004). Microglia,
cells with a supportive role in the brain, and neuronal progenitor cells that keep dividing are more
susceptible to radiation-induced damage such as telomere shortening leading to reduced cellular
lifespan. Neurons deprived of the support by microglia, maintenance and nourishment undergo
pathological changes resulting in cell death (Rodgers, 2011). Neurogenesis is a process which
enables generation of new neural and glia cell not only during the development of the brain but
also throughout life (Eriksson et al., 1998).
2.4. Motivation
Exposure to ionizing radiation (IR) regardless of the source and dose presents a potential danger
to human health. Even low doses of radiation used in diagnostics or therapeutic treatment cause
small changes on the molecular and cellular level (e.g. oxidation of biomolecules, mutations, cell
death) which may accumulate upon repeated exposure. Thus, there is need to sentisize the society
toward the risks of ionizing radiation. For example, patients are usually not given information
about the risks, benefits, and radiation dose for a CT scan. Moreover, a study showed that patients,
physicians, and radiologists are unable to provide accurate estimates of CT doses regardless of
their experience level (Lee et al., 2004).
On the other hand, IR is an important tool in medicine, industry, agriculture and research, and its
mechanisms of interaction with biological matter have to be elaborated.
In this thesis, in order to understand the molecular and cellular responses to IR, cells were
irradiated with 2 Gy X-rays that represents a commonly used fractionated dose in radiotherapy of
a variety of tumors (e.g. 50 Gy in 5 weeks, fractionated at 5 x 2 Gy/week) (Pedraza Muriel, 2007).
Age is an important factor in response to radiation. For example, children are more sensitive to
radiation exposure since their brains are not completely developed. Differentiation state of the cell
determines the sensitivity and cellular response to stress. Since it is difficult to study differences
in the effect of radiation therapy between young and old patients, this thesis is focused on the
interplay between IR and age-related diseases through the effects of oxygen in the cell culture and
Aβ peptide implicated in Alzheimer´s disease. The effects of externally applied disaggregated Aß1-
42 peptide, which exact mechanisms of toxicity are still not resolved, were investigated alone or
Introduction 21
combined with irradiation. Human neuroblastoma (SH-SY5Y) cells widely used to study
mechanisms of neurodegeneration (Schlachetzki et al., 2013) served as a biological system in this
thesis. Cellular responses of non-differentiated and/or SH-SY5Y cell pre-treated with retinoic acid
for induction of differentiation were studied in parallel under 21% and 5% O2, respectively. This
approach enables comparison of different factors (i.e. IR, oxygen concentration, differentiation
state and Aβ peptide) and their interplay.
Furthermore, most of studies on the molecular and cellular effects of ionizing radiation consider
changes solely in the nuclear DNA (nDNA). The number of studies investigating the effects of
ionizing radiation on mitochondria and mtDNA is far less than of those on the cell nucleus (Kam
& Banati, 2013). Since mitochondrial DNA is highly susceptible to oxidative stress, changes in
mitochondrial functioning can mediate oxidative damage of other cellular components including
nDNA (e.g. by radiation-induced mitochondrial superoxide radical ions) (Kam & Banati, 2013).
The reliability of in vitro studies comes ever more into question as cell cultivation is performed
under normoxic conditions meaning that cells are exposed to atmospheric air which is 21% oxygen
by volume. Moreover, cultivated cells derived from different sources response differently to
changes in oxygen tensions. For this reason, they should be cultivated under oxygen conditions
which are similar to those found in tissues. Cell state, physiology and destiny are much influenced
by oxygen.
The oxygen concentration in the cell culture can be regulated using „tri-gas“ incubators which
function relies, besides usage of a standard CO2 gas, on the application of nitrogen gas for
regulation of oxygen concentration taken up from the atmospheric air. Although such incubators
are available at the market, high cost required for providing a continuous source of nitrogen gas
makes most of cell culture laboratories to continue work using standard incubators with high non-
physiological oxygen concentrations. Ideally, performing cell culture in dedicated „hypoxia
stations“, which represent a closed system for cultivation and handling of cells at desired oxygen
concentration without exposure to atmospheric air, provides the most reliable results. Moreover,
broken oxygen conditions, i.e. exposure of cells cultivated at low oxygen concentrations to
atmospheric air for the purpose of subculturing or treatment, can change behavior of these cells
and decrease their yield (Mantel et al., 2015). However „hypoxia stations“ are due to their very
high costs not a favoured approach and most laboratories cannot afford such systems. On the other
hand, simple home-made incubators for cultivation of cells at desired oxygen concentration, by
using closed system and pre-mixed gas with a given oxygen concentration, were used in this thesis
and can be set up by an average cell culture laboratory (Wright & Shay, 2006). Altering oxygen
concentration is a useful tool in the modeling of metabolic disorders and neurodegeneration with
a variety of different mitochondrial conditions (Villeneuve et al., 2013). Therefore, appropriate
oxygen conditions were established and employed in this thesis in order to study not only the
effects of Aβ peptide or radiation on cells but also their interplay the first time.
Materials 22
3. Materials
3.1. Equipment
Name Manufacturer
Balance R 200 D Sartorius AG, Göttingen, Germany Balance U 4100 S Sartorius AG, Göttingen, Germany Cannula with Luer-Lock connector (1×200 mm)
neoLab Migge GmbH, Heidelberg, Germany
CCD camera system of Fujibox Fujifilm Holdings K.K., Tokyo, Japan Cell counting chamber Neubauer Marienfeld, Lauda-Königshofen, Germany Cell culture incubator CO2-Auto-Zero Type B 50 61 EC O2
Heraeus GmbH, Hanau, Germany
Centrifuge 5804 R Eppendorf, Hamburg, Germany Centrifuge Biofuge Primo R Heraeus GmbH, Hanau, Germany Centrifuge Micro V Fisher Scientific, Schwerte, Germany Confocal laser scanning microscope TCS SP5II
Leica Microsystems GmbH, Wetzlar, Germany
Electrophoresis power supply EPS301/ EPS601/EPS1001
Amersham pharmacia biotech Europe GmbH, Freiburg, Germany
Flow cytometer S3™ Cell Sorter Bio-Rad Laboratories, Hercules, CA, USA Gas bottle regulator HD 300-200-4-2 Airliquide, Kornwestheim, Germany Glas/teflon homogenizer Potter-Elvehjem tight-fit (2 ml)
B. Braun, Melsungen, Germany
Gradient mixer (ø 18 mm chamber) Mechanic workshop of Chemistry Department, TU Darmstadt
Handheld automated cell counter Scepter™ Merck Millipore, Billerica, MA, USA Horizontal mini gel system PerfectBlue™ PEQLAB Biotechnologie GmbH, Erlangen,
Germany Laminar flow bench Lamin Air HLB 2448 Heraeus GmbH, Hanau, Germany Light microscope Wilovert S Helmut Hund GmbH, Wetzlar, Germany Light microscope Zeiss Axio Observer.Z1 Carl-Zeiss Microscopy GmbH, Jena, Germany Liquid nitrogen tank Locator 6 Plus Thermo Scientific, Marietta, OH, USA Magnetic stirrer IKAMAG® RET IKA®-Werke GmbH, Staufen, Germany Mass spectrometer MALDI-TOF/TOF MS Ultraflex I
Bruker Daltonik GmbH, Bremen, Germany
Mixer for homogenization EUROSTAR digital IKA®-Werke GmbH, Staufen, Germany Peristaltic pump Minipuls 3 Gilson, Middleton, WI, USA pH-meter Blueline 14 pH/CG842 Schott AG, Mainz, Germany Pipette 100/300 µl 8-channel Eppendorf, Hamburg, Germany Pipette PIPETMAN Classic™ P2/10/20/100/200/1000
Gilson, Middleton, WI, USA
Pipettor accu-jet®-pro BRAND GmbH, Wertheim, Germany Plate reader Infinite M1000 Tecan Group Ltd., Männedorf, Switzerland Plate reader POLARstar Galaxy BMG Labtech GmbH, Ortenberg, Germany
Materials 23
Scanner ViewPix 900 biostep® GmbH, Jahnsdorf, Germany SE260 Mighty Small II Deluxe Mini Vertical Electrophoresis Unit
Hoefer, Holliston, MA, USA
Shaker for microtiterplates DSG Titertek 1 Flow Laboratories, Inglewood, CA, USA Shaker Roto-Shake-Genie® type SI-1101 Scientific Industries, Bohemia, NY, USA Shaker type 3016 Gesellschaft für Labortechnik (GFL),
Burgwedel, Germany Shaker with temperature regulation Vortemp UniEquip GmbH, Planegg, Germany Thermal cycler MyCycler™ Bio-Rad Laboratories, Hercules, CA Trans-Blot® SD Semi-Dry Transfer Cell Bio-Rad Laboratories, Hercules, CA, USA Ultrasonic bath Sonorex TK 52 H Bandelin electronic GmbH, Berlin, Germany UV-VIS-scanning spektrophotometer UV-2102 PC
SCHIMADZU, Kyoto, Japan
Vortex mixer Reax 2000 Heidolf Instruments GmbH, Schwabach, Germany
Water bath RC 20/KWU R mgw Lauda, Königshofen, Germany Water bath type 1004 Gesselschaft für Labortechnik (GFL),
Burgwedel, Germany Water purification system D4000 distinction water still
Bibby Scientific Limited, Staffordshire, UK
Water purification system Simplicity® Merck Millipore, Billerica, MA, USA X-ray machine Pxi Precision X-rays x-rad 320 Pxi Precision X-rays, North Brandford, CT,
USA X-ray tube Isovolt DS1 with wolfram anode Seifert, Fairview Village, PA, USA
3.2. Software
Name Manufacturer
Axio Vision 4.8.2. SP1 (for Axio Observer.Z)
Carl-Zeiss GmbH, Jena, Germany
BLAST (Basic Local Alignment Search Tool; for comparison of nucleotide or protein sequences)
National Center for Biotechnology Information, Bethesda MD, USA
Compass 1.3 (MS software) Bruker Daltonik GmbH, Bremen, Germany DELTA2D 4.3 (for analysis of gels) DECODON GmbH, Greifswald, Germany Epson Scan 3.81 DE (for ViewPix scanner)
biostep® GmbH, Jahnsdorf, Germany
FLUOstar-control 4.21-0 (for plate reader POLARstar Galaxy)
BMG Labtech GmbH, Ortenberg, Germany
i-control 1.9.17.0 (for plate reader Infinite M1000)
Tecan Group Ltd., Männedorf, Switzerland
Image J 1.48 (for analysis of images) Wayne Rasband, National Institutes of Health, USA Kaluza® 1.3 (for flow cytometry data analysis)
Beckman Coulter, Inc., Indianapolis, IN, USA
Materials 24
LAS-3000 2.1 (for imaging system LAS3000)
Fujifilm Holdings K.K., Tokyo, Japan
LAS AF 2.60 (for confocal microscope TCS SP5 II)
Leica Camera, Wetzlar, Germany
Mascot search engine (for peptide mass fingerprint)
Matrix Science Inc., Boston, MA, USA
ProSort™ 1.1 (for S3™ Cell Sorter) Bio-Rad Laboratories, Hercules, CA, USA ProteinScape 3.1 (for the analysis of proteomics data)
Bruker Daltonik GmbH, Bremen, Germany
GraphPad Prism 7.01 (for statistical analysis)
GraphPad Software, Inc., La Jolla, CA, USA
UniProt (universal protein resource) UniProt Consortium UV-2102/3102 PC 3.0 (for UV-VIS-scanning spectrophotometer)
SCHIMADZU, Kyoto, Japan
ZEN 2 (blue and black edition; for analysis of microscopy images)
Carl-Zeiss GmbH, Jena, Germany
3.3. Chemicals
Name Manufacturer
2-(4-(2-hydroxyethyl)-1-piperazineethanesulfonic acid (HEPES) >99%, tissue culture grade
Carl Roth GmbH, Karlsruhe, Germany
4´,6´-diamidino-2-phenylindole dihydrochloride (DAPI)
Molecular Probes Invitrogen, Eugene, OR, USA
4-Iodophenylboronic acid (4-IPBA) ≥95% Sigma-Aldrich Life Science, Saint Louis, MO, USA6-aminohexanoic acid >99% Carl Roth GmbH, Karlsruhe, Germany Acetic acid 100%, p.a. Carl Roth GmbH, Karlsruhe, Germany Ammonium persulfate (APS) Fluka, Buchs, Switzerland Antimycin A from Streptomyces species Sigma-Aldrich Life Science, Saint Louis, MO, USAAscorbic acid (Na-salt) ≥98% Sigma-Aldrich Life Science, Saint Louis, MO, USAβ-Mercaptoethanol, 99%, p.a. Carl Roth GmbH, Karlsruhe, Germany Bis-Tris ≥98% Sigma-Aldrich Life Science, Saint Louis, MO, USABovine serum albumin (BSA), fraction V Carl Roth GmbH, Karlsruhe, Germany Bromphenol blue Fluka Chemie GmbH, Buchs, Switzerland Calcium chloride ≥99.5%, p.a. Carl Roth GmbH, Karlsruhe, Germany Carbonyl cyanide 3-chlorophenyl-hydrazone (CCCP)
Sigma-Aldrich Life Science, Saint Louis, MO, USA
Carboxy-2,7-dichlorodihydrofluorescein diacetate (C-H2DCFDA)
Molecular Probes Invitrogen, Eugene, OR, USA
Dibasic potassium phosphate (K2HPO4) ≥99%, p.a.
Fluka Chemie GmbH, Buchs, Switzerland
Digitonin A1905 Applichem GmbH, Darmstadt, Germany
Materials 25
Dimethylsulfoxide (DMSO) ≥99.5%, for Molecular Biology
Carl Roth GmbH, Karlsruhe, Germany
Dithiothreitol (DTT), p.a. Carl Roth GmbH, Karlsruhe, Germany Disodium hydrogen phosphate (Na2HPO4
≥98%, p.a. Fluka Chemie GmbH, Buchs, Switzerland
ER-Tracker™ Red Molecular Probes Invitrogen, Eugene, OR, USA Ethanol, denatured Chemistry department, TU Darmstadt Ethylenediaminetetraacetic acid (EDTA) ≥99%, p.a.
Carl Roth GmbH, Karlsruhe, Germany
Ferric chloride hexahydrate (FeCl3 x 6 H2O) ≥98%, extra pure
Carl Roth GmbH, Karlsruhe, Germany
Formaldehyde 37%, p.a. Glacial acetic acid 99.5%, p.a. Fluka Chemie GmbH, Buchs, Switzerland Glucose oxidase from Aspergillus niger
G7141 Sigma-Aldrich Life Science, Saint Louis, MO, USA
Glycerol ≥99.5%, p.a. Carl Roth GmbH, Karlsruhe, Germany Glycin, ≥99%, p.a. Carl Roth GmbH, Karlsruhe, Germany Hydrochloric acid (HCl) 37%, p.a. Carl Roth GmbH, Karlsruhe, Germany Hydrogen peroxide, 30% (H2O2) Merck KGaA, Darmstadt, Germany IGEPAL-CA630 Sigma-Aldrich Life Science, Saint Louis, MO, USAImidazole >99.5%, p.a. Fluka Chemie GmbH, Buchs, Switzerland Immersion oil Sigma-Aldrich Life Science, Saint Louis, MO, USAIsopropanol, denatured Chemistry department, TU Darmstadt Luminol Fluka Chemie GmbH, Buchs, Switzerland LysoTracker® Red Molecular Probes, Invitrogen, Eugene, OR Magnesium chloride hexahydrate (MgCl2
x 6 H2O) >98%, Ph.Eur. Carl Roth GmbH, Karlsruhe, Germany
Methanol, denatured Chemistry department, TU Darmstadt MitoTracker® Red CM-H2XRos Molecular Probes, Invitrogen, Eugene, OR Neutral red dye Sigma-Aldrich Life Science, Saint Louis, MO, USANitrogen (l) Airliquide, Kornwestheim, Germany N-(Tri(hydroxymethyl)methyl)glycin (Tricin) ≥99%
Sigma-Aldrich Life Science, Saint Louis, MO, USA
N, N, N´, N´-tetramethylethylenediamine (TEMED) ~99%
Sigma-Aldrich Life Science, Saint Louis, MO, USA
NuPAGE® LDS Sample Buffer Life Technologies, Carlsbad, CA, USA NuPAGE® MES SDS Running Buffer Life Technologies, Carlsbad, CA, USA NuPAGE® Reducing Agent Life Technologies, Carlsbad, CA, USA NuPAGE® Transfer Buffer Life Technologies, Carlsbad, CA, USA PeqFECT DNA transfection reagent PEQLAB Biotechnologie GmbH, Erlangen,
Germany PeqGOLD universal agarose PEQLAB Biotechnologie GmbH, Erlangen,
Germany PicoGreen dye Molecular Probes, Eugene, OR, USA Ponceau S Sigma-Aldrich Life Science, Saint Louis, MO, USA
Materials 26
Potassium acetate >99%, p.a. Carl Roth GmbH, Karlsruhe, Germany Potassium dihydrogen phosphate (KH2PO4) ≥99%, p.a., ACS
Carl Roth GmbH, Karlsruhe, Germany
Pottasium hydroxide (KOH) ≥99.5%, p.a. Carl Roth GmbH, Karlsruhe, Germany Prolong Gold® antifade reagent Molecular Probes Invitrogen, Eugene, OR, USA Propidium iodide Molecular Probes Invitrogen, Eugene, OR, USA Protease inhibitor cocktail (PIC) for mammalian cell tissue
Sigma-Aldrich Life Science, Saint Louis, MO, USA
Retinoic acid ≥98%, HPLC grade Sigma-Aldrich Life Science, Saint Louis, MO, USARoti®-Block 10× Carl Roth GmbH, Karlsruhe, Germany Roti®-Blue 5× Carl Roth GmbH, Karlsruhe, Germany Roti®-Nanoquant 5× Carl Roth GmbH, Karlsruhe, Germany Rotiphorese® Gel A Carl Roth GmbH, Karlsruhe, Germany Rotiphorese® Gel B (2%) Carl Roth GmbH, Karlsruhe, Germany Rotiphorese® Gel A/B 40 (29:1) Carl Roth GmbH, Karlsruhe, Germany Serva blue G (Coomassie-Brilliant blue G250)
SERVA Electrophoresis GmbH, Heidelberg, Germany
Silver nitrate (AgNO3) ≥99.9%, p.a. Carl Roth GmbH, Karlsruhe, Germany Sodium carbonate (Na2CO3) ≥99.5%, p.a. Carl Roth GmbH, Karlsruhe, Germany Sodium chloride (NaCl) ≥99.5%, p.a. Carl Roth GmbH, Karlsruhe, Germany Sodium-deoxycholat (Na-deoxycholat) Calbiochem, San Diego, CA, USA Sodium dodecyl sulfate (SDS) ≥99.5%, ultra pure
Carl Roth GmbH, Karlsruhe, Germany
Sodium fluoride (NaF) ≥98%, technical Sigma-Aldrich Life Science, Saint Louis, MO, USASodium hydroxide (NaOH) ≥99%, p.a. Carl Roth GmbH, Karlsruhe, Germany Sodium thiosulfate pentahydrate >99.5%, p.a.
Merck KGaA, Darmstadt, Germany
Staurosporine >99% Cell Signaling Technology, Danvers, MA, USA Sucrose ≥99.5%, p.a. Carl Roth GmbH, Karlsruhe, Germany SYPRO® Ruby Protein Gel Stain 1× Life Technologies, Carlsbad, CA, USA Taq DNA Polymerase New England Biolabs, Ipswich, MA, USA Trifluoroacetic acid (TFA) ≥99.9%, for peptide synthesis
Carl Roth GmbH, Karlsruhe, Germany
Tris(hydroxymethyl)-aminomethan (Tris) >99.9%, p.a.
Carl Roth GmbH, Karlsruhe, Germany
Triton X-100 pure Carl Roth GmbH, Karlsruhe, Germany Trypan blue stain 0.4% Gibco by Life Technologies, Paisley, UK Tween® 20 Ph.Eur. Carl Roth GmbH, Karlsruhe, Germany
3.4. Gases Name Manufacturer
Carbon dioxide (CO2) Airliquide, Kornwestheim, Germany Gas mixture (1% O2, 5% CO2, 94% N2) Airliquide, Kornwestheim, Germany
Materials 27
Gas mixture (5% O2, 5% CO2, 90% N2) Airliquide, Kornwestheim, Germany Nitrogen Airliquide, Kornwestheim, Germany
3.5. Consumables
Name Manufacturer
6, 12, 24, 96 (clear, black and white, F-bottom)-well plates
Greiner bio-one GmbH, Frickenhausen, Germany
Cell culture flasks (T25,T75, T175) Greiner bio-one GmbH, Frickenhausen, Germany
Chamber slides RS Glass 2/4 well Nalge Nunc International, Naperville, IL, USAChamber slides CC2 Glass 2 well Nalge Nunc International, Naperville, IL, USACryovials with inner thread, 2 ml Carl Roth GmbH, Karlsruhe, Germany Dyalisis membrane, 12-16 kDa cut-off Carl Roth GmbH, Karlsruhe, Germany Eppendorf tubes (0.2, 0.5, 1 and 2 ml) Eppendorf, Hamburg, Germany Filters (0.22 µm) Sarstedt, Nümbrecht, Germany Flow cytometry vials (5 ml) Sarstedt, Nümbrecht, Germany Microscope slides Carl Roth GmbH, Karlsruhe, Germany Microscope slide coverslips Carl Roth GmbH, Karlsruhe, Germany Nitrocellulose membrane Roti®-NC Carl Roth GmbH, Karlsruhe, Germany NuPAGE® Novex® Bis-Tris Pre-Cast gels Life Technologies, Carlsbad, CA, USA Petri dishes (ø 35 mm; 10 cm2) Greiner bio-one GmbH, Frickenhausen,
Germany Pipette with tip, sterile (2, 5, 10, 25 ml) Greiner bio-one GmbH, Frickenhausen,
Germany Pipette tips Gilson® (200, 1000 µl) Greiner bio-one GmbH, Frickenhausen,
Germany Pipette tips Omnitip™ (10 µl) ULPLAST, Warsaw, Poland Rotilabo®-blotting paper, 1.5 mm thick Carl Roth GmbH, Karlsruhe, Germany Rotilabo®-stoppers (silicone rubber) Carl Roth GmbH, Karlsruhe, Germany Roti®-NC nitrocellulose membrane Carl Roth GmbH, Karlsruhe, Germany Rotisilon® B silicone grease Carl Roth GmbH, Karlsruhe, Germany Sensors (60 μm) for automated handheld cell counter Scepter™
Merck Millipore, Billerica, MA, USA
Tubes Cellstar® (15, 50 ml) Greiner bio-one GmbH, Frickenhausen, Germany
Tygon® tube E-1000 Carl Roth GmbH, Karlsruhe, Germany Plastic wide mouth jars (Nalgene® style) Sigma-Aldrich, Taufkirchen, Germany Sterile filters (0.22 and 0.45 µm) Merck Millipore, Billerica, MA, USA
Materials 28
3.6. Cell culture
Name Manufacturer 0.05% Trypsin- EDTA (1×) Gibco by Life Technologies, Paisley, UK Advanced DMEM (1×) Dulbecco's Modified Eagle Medium
Gibco by Life Technologies, Paisley, UK
DPBS (1×) Dulbecco's Phosphate Buffered Saline Gibco by Life Technologies, Paisley, UK Fetal Bovine Serum (FBS) Gold PAA Laboratories GmbH, Pasching,
Austria L-glutamine (L-Gln) Gibco by Life Technologies, Paisley, UK Penicillin/Streptomycin Gibco by Life Technologies, Paisley, UK
3.7. Kits/assays
Name Manufacturer
Annexin V-FITC Apoptosis Detection Kit Biotool, Houston, TX, USA Blood & Cell Culture DNA Mini Kit Qiagen, Hilden, Germany EarlyTox Gluthatione Assay Kit Molecular Devices, Sunnyvale, CA, USA Luminescent ATP Detection Assay Kit Abcam, Cambridge, UK MitoXpress® Intra Luxcel Biosciences, Cork, Ireland OxyBlot™ Protein Oxidation Detection Kit Merck Millipore, Billerica, MA, USA Taq 2× Master Mix for PCR New England Biolabs, Ipswich, MA, USA
3.8. Peptides
Name Manufacturer
Amyloid-β 1-42 peptide (Aβ1-42), human China Peptides, Shanghai, China
FITC labelled amyloid-β 1-42 peptide (FITC-Aβ1-42), human Bachem, Bubendorf, Switzerland
3.9. Antibodies
Name and dilution in PBS-T Manufacturer
Actin goat polyclonal antibody, 1:1000 Santa Cruz Biotechnology, Inc, Dallas, TX, USA
ATPB mouse monoclonal antibody, 1:1000 Abcam, Cambridge, UK Bcl-2 mouse monoclonal antibody, 1:1000 Santa Cruz Biotechnology, Inc, Dallas,
TX, USA Caspase-9 mouse monoclonal antibody, 1:1000 Santa Cruz Biotechnology, Inc, Dallas,
TX, USA OxPhos Complex V subunit alpha polyclonal antibody, 1:1000
Molecular Probes, Eugene, OR, USA
Materials 29
Donkey anti-goat IgG-HRP, 1:2000 Santa Cruz Biotechnology, Inc, Dallas, TX, USA
Donkey anti-mouse IgG-HRP, 1:2000 Santa Cruz Biotechnology, Inc, Dallas, TX, USA
Donkey anti-rabbit IgG HRP antibody, 1:2000 Santa Cruz Biotechnology, Inc, Dallas, TX, USA
Hsp 60 mouse monoclonal antibody, 1:1000 Santa Cruz Biotechnology, Inc, Dallas, TX, USA
Hsp 70 mouse monoclonal antibody, 1:100 Abcam, Cambridge, UK Hsp 90 mouse monoclonal antibody, 1:1000 Santa Cruz Biotechnology, Inc, Dallas,
TX, USA MTCO1 mouse monoclonal antibody, 1:1000 Abcam, Cambridge, UK NDUFS1 rabbit polyclonal antibody, 1:1000 Proteintech Group, Chicago, IL, USA OGG1/2 mouse monoclonal antibody, 1:500 Santa Cruz Biotechnology, Inc, Dallas,
TX, USA Rabbit Anti-DNP Antibody, 1:500 Merck Millipore, Billerica, MA, USA VDAC1 goat polyclonal antibody, 1:2000 Santa Cruz Biotechnology, Inc, Dallas,
TX, USA
3.10. Oligonucleotides
Name Manufacturer
5’-CTGAGCCTTTTACCACTCCAG-3’ biomers.net GmbH, Ulm, Germany 5’-GGTGATTGATACTCCTGATGCG-3’ biomers.net GmbH, Ulm, Germany 5’-AACCACAGTTTCATGCCCATC-3’ biomers.net GmbH, Ulm, Germany 5’-TGTTAGTAAGGGTGGGGAAGC-3’ biomers.net GmbH, Ulm, Germany 5’- ACCCTATTGCACCCCCTCTAC’-3 biomers.net GmbH, Ulm, Germany 5’-CTTGTCAGGGAGGTAGCGATG-3’ biomers.net GmbH, Ulm, Germany
3.11. Gel markers/standards
Name Manufacturer
Amersham™ HMW Calibration Kit for Native Electrophoresis (HMW)
GE Healthcare, Chalfont St Giles, UK
Amersham™ LMW Calibration Kit for SDS Electrophoresis (LMW)
GE Healthcare, Chalfont St Giles, UK
Lambda/HindIII DNA Digest New England Biolabs, Ipswich, MA, USA MagicMark™ XP Western Standard Life Technologies, Carlsbad, CA, USA PageRuler™ Plus Prestained Protein Ladder Thermo Fisher Scientific, Waltham, MA, USA
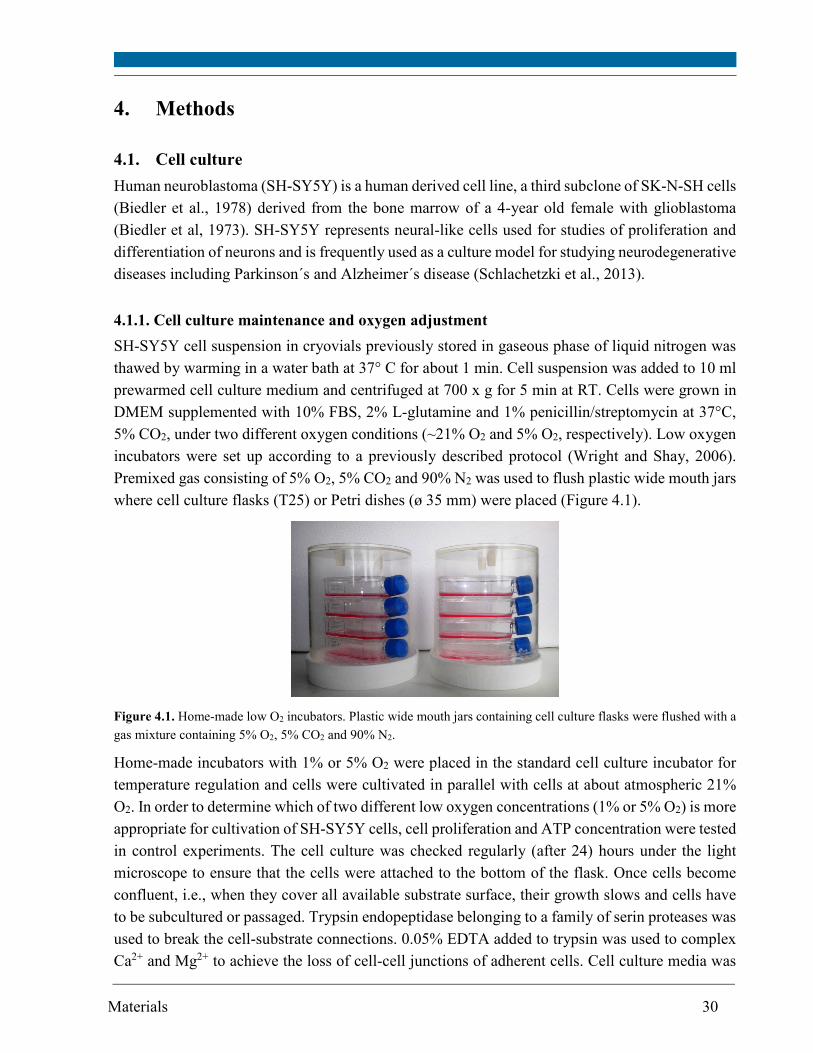
Materials 30
4. Methods
4.1. Cell culture
Human neuroblastoma (SH-SY5Y) is a human derived cell line, a third subclone of SK-N-SH cells
(Biedler et al., 1978) derived from the bone marrow of a 4-year old female with glioblastoma
(Biedler et al, 1973). SH-SY5Y represents neural-like cells used for studies of proliferation and
differentiation of neurons and is frequently used as a culture model for studying neurodegenerative
diseases including Parkinson´s and Alzheimer´s disease (Schlachetzki et al., 2013).
4.1.1. Cell culture maintenance and oxygen adjustment
SH-SY5Y cell suspension in cryovials previously stored in gaseous phase of liquid nitrogen was
thawed by warming in a water bath at 37° C for about 1 min. Cell suspension was added to 10 ml
prewarmed cell culture medium and centrifuged at 700 x g for 5 min at RT. Cells were grown in
DMEM supplemented with 10% FBS, 2% L-glutamine and 1% penicillin/streptomycin at 37°C,
5% CO2, under two different oxygen conditions (~21% O2 and 5% O2, respectively). Low oxygen
incubators were set up according to a previously described protocol (Wright and Shay, 2006).
Premixed gas consisting of 5% O2, 5% CO2 and 90% N2 was used to flush plastic wide mouth jars
where cell culture flasks (T25) or Petri dishes (ø 35 mm) were placed (Figure 4.1).
Figure 4.1. Home-made low O2 incubators. Plastic wide mouth jars containing cell culture flasks were flushed with a
gas mixture containing 5% O2, 5% CO2 and 90% N2.
Home-made incubators with 1% or 5% O2 were placed in the standard cell culture incubator for
temperature regulation and cells were cultivated in parallel with cells at about atmospheric 21%
O2. In order to determine which of two different low oxygen concentrations (1% or 5% O2) is more
appropriate for cultivation of SH-SY5Y cells, cell proliferation and ATP concentration were tested
in control experiments. The cell culture was checked regularly (after 24) hours under the light
microscope to ensure that the cells were attached to the bottom of the flask. Once cells become
confluent, i.e., when they cover all available substrate surface, their growth slows and cells have
to be subcultured or passaged. Trypsin endopeptidase belonging to a family of serin proteases was
used to break the cell-substrate connections. 0.05% EDTA added to trypsin was used to complex
Ca2+ and Mg2+ to achieve the loss of cell-cell junctions of adherent cells. Cell culture media was
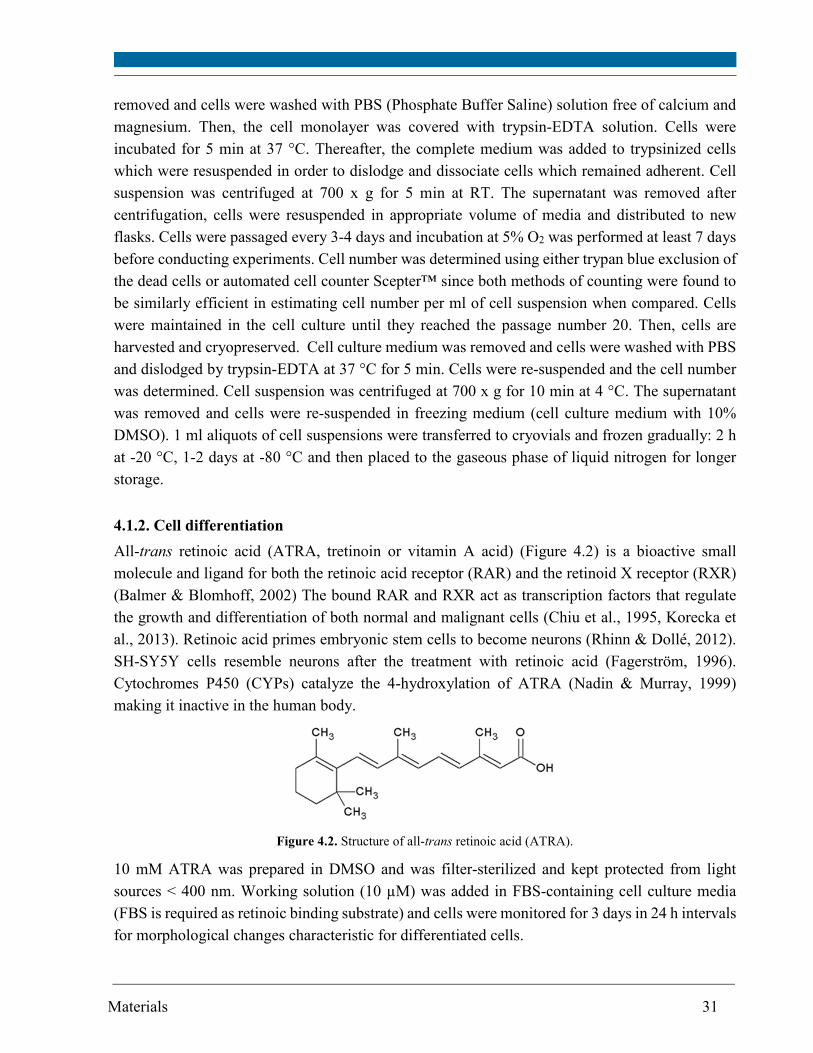
Materials 31
removed and cells were washed with PBS (Phosphate Buffer Saline) solution free of calcium and
magnesium. Then, the cell monolayer was covered with trypsin-EDTA solution. Cells were
incubated for 5 min at 37 °C. Thereafter, the complete medium was added to trypsinized cells
which were resuspended in order to dislodge and dissociate cells which remained adherent. Cell
suspension was centrifuged at 700 x g for 5 min at RT. The supernatant was removed after
centrifugation, cells were resuspended in appropriate volume of media and distributed to new
flasks. Cells were passaged every 3-4 days and incubation at 5% O2 was performed at least 7 days
before conducting experiments. Cell number was determined using either trypan blue exclusion of
the dead cells or automated cell counter Scepter™ since both methods of counting were found to
be similarly efficient in estimating cell number per ml of cell suspension when compared. Cells
were maintained in the cell culture until they reached the passage number 20. Then, cells are
harvested and cryopreserved. Cell culture medium was removed and cells were washed with PBS
and dislodged by trypsin-EDTA at 37 °C for 5 min. Cells were re-suspended and the cell number
was determined. Cell suspension was centrifuged at 700 x g for 10 min at 4 °C. The supernatant
was removed and cells were re-suspended in freezing medium (cell culture medium with 10%
DMSO). 1 ml aliquots of cell suspensions were transferred to cryovials and frozen gradually: 2 h
at -20 °C, 1-2 days at -80 °C and then placed to the gaseous phase of liquid nitrogen for longer
storage.
4.1.2. Cell differentiation
All-trans retinoic acid (ATRA, tretinoin or vitamin A acid) (Figure 4.2) is a bioactive small
molecule and ligand for both the retinoic acid receptor (RAR) and the retinoid X receptor (RXR)
(Balmer & Blomhoff, 2002) The bound RAR and RXR act as transcription factors that regulate
the growth and differentiation of both normal and malignant cells (Chiu et al., 1995, Korecka et
al., 2013). Retinoic acid primes embryonic stem cells to become neurons (Rhinn & Dollé, 2012).
SH-SY5Y cells resemble neurons after the treatment with retinoic acid (Fagerström, 1996).
Cytochromes P450 (CYPs) catalyze the 4-hydroxylation of ATRA (Nadin & Murray, 1999)
making it inactive in the human body.
Figure 4.2. Structure of all-trans retinoic acid (ATRA).
10 mM ATRA was prepared in DMSO and was filter-sterilized and kept protected from light
sources < 400 nm. Working solution (10 µM) was added in FBS-containing cell culture media
(FBS is required as retinoic binding substrate) and cells were monitored for 3 days in 24 h intervals
for morphological changes characteristic for differentiated cells.
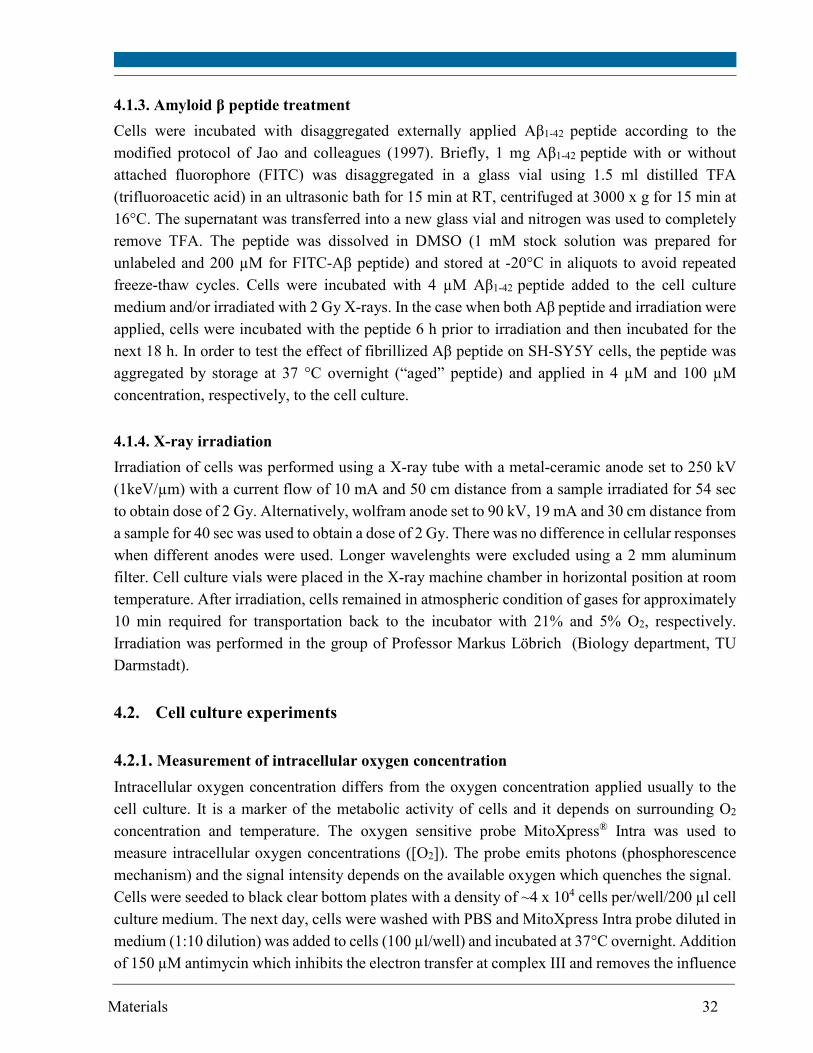
Materials 32
4.1.3. Amyloid β peptide treatment
Cells were incubated with disaggregated externally applied Aβ1-42 peptide according to the
modified protocol of Jao and colleagues (1997). Briefly, 1 mg Aβ1-42 peptide with or without
attached fluorophore (FITC) was disaggregated in a glass vial using 1.5 ml distilled TFA
(trifluoroacetic acid) in an ultrasonic bath for 15 min at RT, centrifuged at 3000 x g for 15 min at
16°C. The supernatant was transferred into a new glass vial and nitrogen was used to completely
remove TFA. The peptide was dissolved in DMSO (1 mM stock solution was prepared for
unlabeled and 200 µM for FITC-Aβ peptide) and stored at -20°C in aliquots to avoid repeated
freeze-thaw cycles. Cells were incubated with 4 µM Aβ1-42 peptide added to the cell culture
medium and/or irradiated with 2 Gy X-rays. In the case when both Aβ peptide and irradiation were
applied, cells were incubated with the peptide 6 h prior to irradiation and then incubated for the
next 18 h. In order to test the effect of fibrillized Aβ peptide on SH-SY5Y cells, the peptide was
aggregated by storage at 37 °C overnight (“aged” peptide) and applied in 4 µM and 100 µM
concentration, respectively, to the cell culture.
4.1.4. X-ray irradiation
Irradiation of cells was performed using a X-ray tube with a metal-ceramic anode set to 250 kV
(1keV/µm) with a current flow of 10 mA and 50 cm distance from a sample irradiated for 54 sec
to obtain dose of 2 Gy. Alternatively, wolfram anode set to 90 kV, 19 mA and 30 cm distance from
a sample for 40 sec was used to obtain a dose of 2 Gy. There was no difference in cellular responses
when different anodes were used. Longer wavelenghts were excluded using a 2 mm aluminum
filter. Cell culture vials were placed in the X-ray machine chamber in horizontal position at room
temperature. After irradiation, cells remained in atmospheric condition of gases for approximately
10 min required for transportation back to the incubator with 21% and 5% O2, respectively.
Irradiation was performed in the group of Professor Markus Löbrich (Biology department, TU
Darmstadt).
4.2. Cell culture experiments
4.2.1. Measurement of intracellular oxygen concentration
Intracellular oxygen concentration differs from the oxygen concentration applied usually to the
cell culture. It is a marker of the metabolic activity of cells and it depends on surrounding O2
concentration and temperature. The oxygen sensitive probe MitoXpress® Intra was used to
measure intracellular oxygen concentrations ([O2]). The probe emits photons (phosphorescence
mechanism) and the signal intensity depends on the available oxygen which quenches the signal.
Cells were seeded to black clear bottom plates with a density of ~4 x 10⁴ cells per/well/200 µl cell
culture medium. The next day, cells were washed with PBS and MitoXpress Intra probe diluted in
medium (1:10 dilution) was added to cells (100 µl/well) and incubated at 37°C overnight. Addition
of 150 µM antimycin which inhibits the electron transfer at complex III and removes the influence
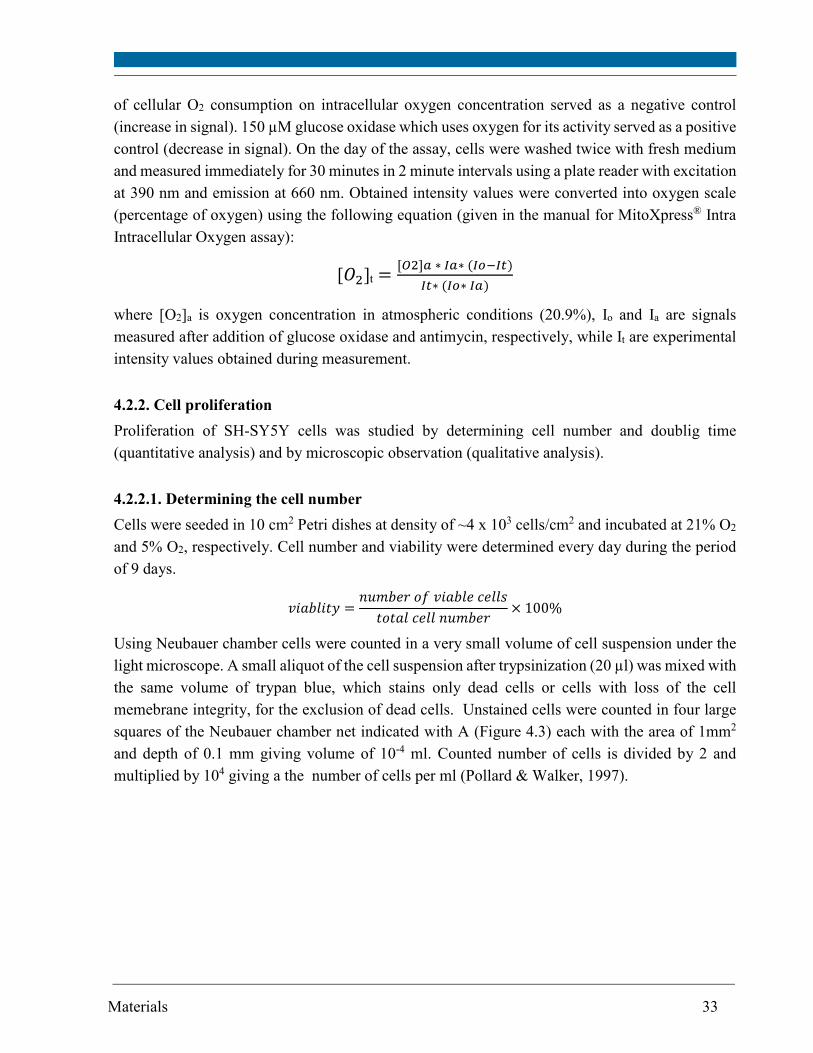
Materials 33
of cellular O2 consumption on intracellular oxygen concentration served as a negative control
(increase in signal). 150 µM glucose oxidase which uses oxygen for its activity served as a positive
control (decrease in signal). On the day of the assay, cells were washed twice with fresh medium
and measured immediately for 30 minutes in 2 minute intervals using a plate reader with excitation
at 390 nm and emission at 660 nm. Obtained intensity values were converted into oxygen scale
(percentage of oxygen) using the following equation (given in the manual for MitoXpress® Intra
Intracellular Oxygen assay):
[��]t =[�]� ∗ ��∗ (�����)
��∗ (��∗ ��)
where [O2]a is oxygen concentration in atmospheric conditions (20.9%), Io and Ia are signals
measured after addition of glucose oxidase and antimycin, respectively, while It are experimental
intensity values obtained during measurement.
4.2.2. Cell proliferation
Proliferation of SH-SY5Y cells was studied by determining cell number and doublig time
(quantitative analysis) and by microscopic observation (qualitative analysis).
4.2.2.1. Determining the cell number
Cells were seeded in 10 cm2 Petri dishes at density of ~4 x 10³ cells/cm2 and incubated at 21% O2
and 5% O2, respectively. Cell number and viability were determined every day during the period
of 9 days.
�������� =������ � ������ !���"
����� !��� ������× 100%
Using Neubauer chamber cells were counted in a very small volume of cell suspension under the
light microscope. A small aliquot of the cell suspension after trypsinization (20 µl) was mixed with
the same volume of trypan blue, which stains only dead cells or cells with loss of the cell
memebrane integrity, for the exclusion of dead cells. Unstained cells were counted in four large
squares of the Neubauer chamber net indicated with A (Figure 4.3) each with the area of 1mm2
and depth of 0.1 mm giving volume of 10-4 ml. Counted number of cells is divided by 2 and
multiplied by 104 giving a the number of cells per ml (Pollard & Walker, 1997).
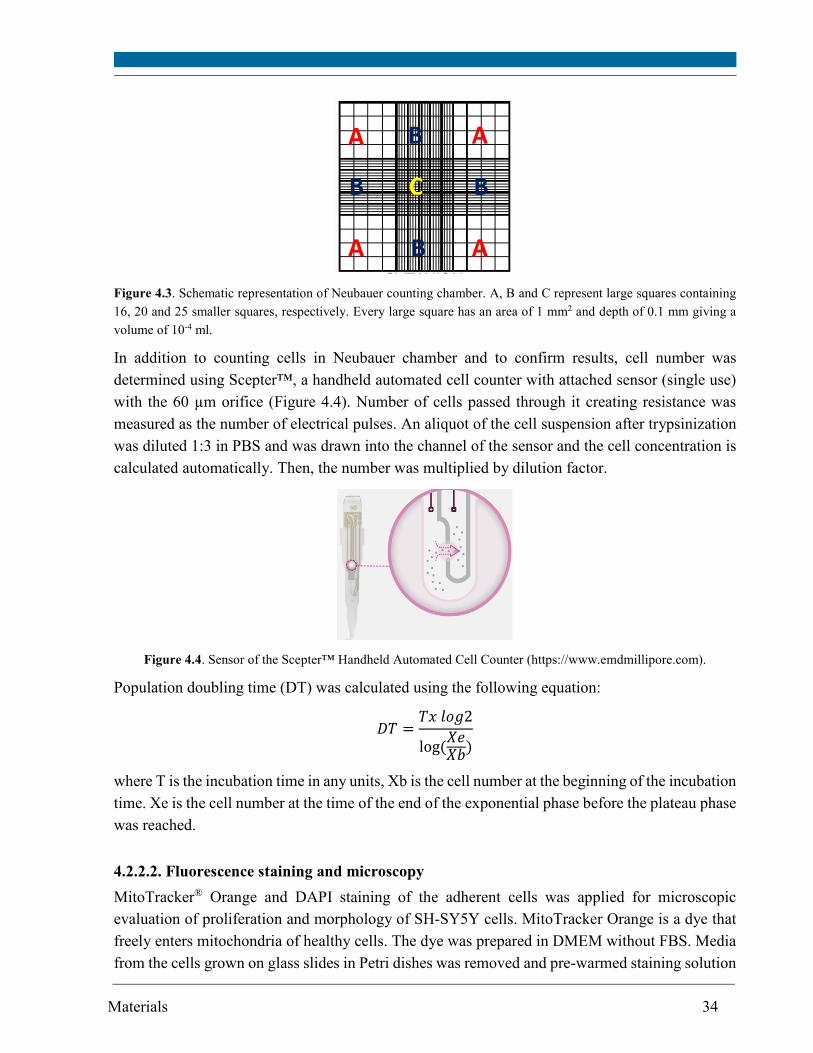
Materials 34
Figure 4.3. Schematic representation of Neubauer counting chamber. A, B and C represent large squares containing
16, 20 and 25 smaller squares, respectively. Every large square has an area of 1 mm2 and depth of 0.1 mm giving a
volume of 10-4 ml.
In addition to counting cells in Neubauer chamber and to confirm results, cell number was
determined using Scepter™, a handheld automated cell counter with attached sensor (single use)
with the 60 µm orifice (Figure 4.4). Number of cells passed through it creating resistance was
measured as the number of electrical pulses. An aliquot of the cell suspension after trypsinization
was diluted 1:3 in PBS and was drawn into the channel of the sensor and the cell concentration is
calculated automatically. Then, the number was multiplied by dilution factor.
Figure 4.4. Sensor of the Scepter™ Handheld Automated Cell Counter (https://www.emdmillipore.com).
Population doubling time (DT) was calculated using the following equation:
�' ='( ��)2
log (.�.�
)
where T is the incubation time in any units, Xb is the cell number at the beginning of the incubation
time. Xe is the cell number at the time of the end of the exponential phase before the plateau phase
was reached.
4.2.2.2. Fluorescence staining and microscopy
MitoTracker® Orange and DAPI staining of the adherent cells was applied for microscopic
evaluation of proliferation and morphology of SH-SY5Y cells. MitoTracker Orange is a dye that
freely enters mitochondria of healthy cells. The dye was prepared in DMEM without FBS. Media
from the cells grown on glass slides in Petri dishes was removed and pre-warmed staining solution
A A
A A
B
B B
B
C
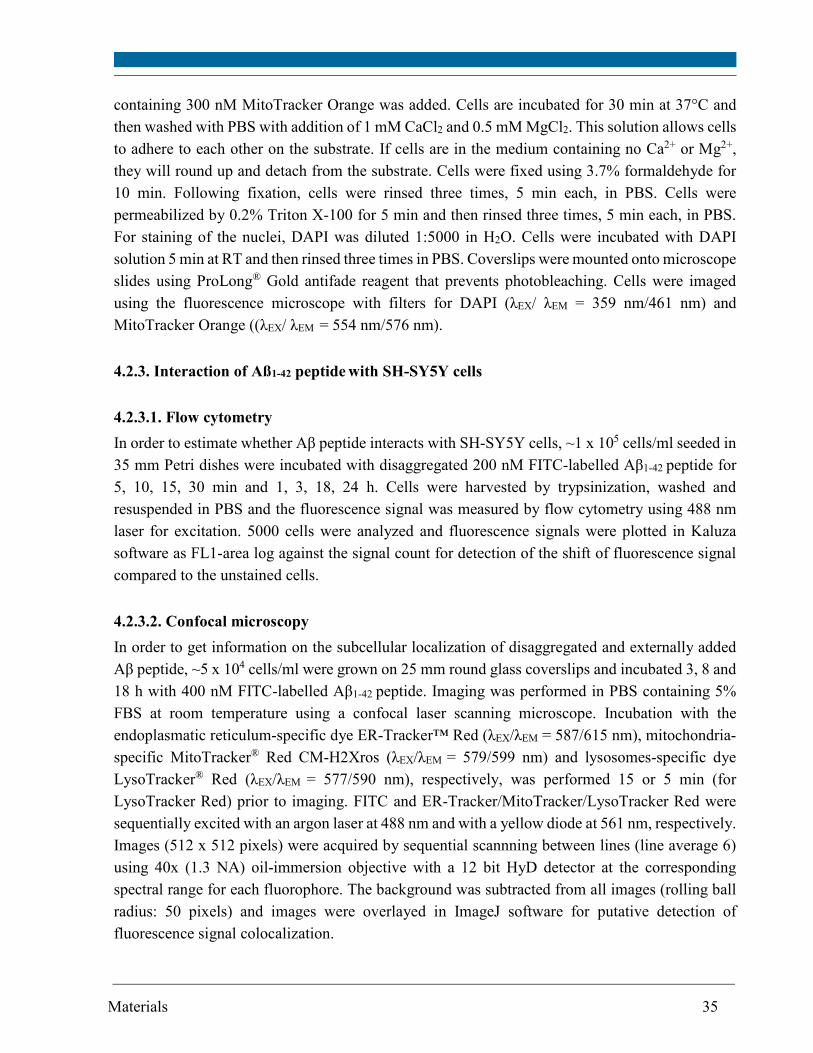
Materials 35
containing 300 nM MitoTracker Orange was added. Cells are incubated for 30 min at 37°C and
then washed with PBS with addition of 1 mM CaCl2 and 0.5 mM MgCl2. This solution allows cells
to adhere to each other on the substrate. If cells are in the medium containing no Ca2+ or Mg2+,
they will round up and detach from the substrate. Cells were fixed using 3.7% formaldehyde for
10 min. Following fixation, cells were rinsed three times, 5 min each, in PBS. Cells were
permeabilized by 0.2% Triton X-100 for 5 min and then rinsed three times, 5 min each, in PBS.
For staining of the nuclei, DAPI was diluted 1:5000 in H2O. Cells were incubated with DAPI
solution 5 min at RT and then rinsed three times in PBS. Coverslips were mounted onto microscope
slides using ProLong® Gold antifade reagent that prevents photobleaching. Cells were imaged
using the fluorescence microscope with filters for DAPI (λEX/ λEM = 359 nm/461 nm) and
MitoTracker Orange ((λEX/ λEM = 554 nm/576 nm).
4.2.3. Interaction of Aß1-42 peptide with SH-SY5Y cells
4.2.3.1. Flow cytometry
In order to estimate whether Aβ peptide interacts with SH-SY5Y cells, ~1 x 10⁵ cells/ml seeded in
35 mm Petri dishes were incubated with disaggregated 200 nM FITC-labelled Aβ1-42 peptide for
5, 10, 15, 30 min and 1, 3, 18, 24 h. Cells were harvested by trypsinization, washed and
resuspended in PBS and the fluorescence signal was measured by flow cytometry using 488 nm
laser for excitation. 5000 cells were analyzed and fluorescence signals were plotted in Kaluza
software as FL1-area log against the signal count for detection of the shift of fluorescence signal
compared to the unstained cells.
4.2.3.2. Confocal microscopy
In order to get information on the subcellular localization of disaggregated and externally added
Aβ peptide, ~5 x 10⁴ cells/ml were grown on 25 mm round glass coverslips and incubated 3, 8 and
18 h with 400 nM FITC-labelled Aβ1-42 peptide. Imaging was performed in PBS containing 5%
FBS at room temperature using a confocal laser scanning microscope. Incubation with the
endoplasmatic reticulum-specific dye ER-Tracker™ Red (λEX/λEM = 587/615 nm), mitochondria-
specific MitoTracker® Red CM-H2Xros (λEX/λEM = 579/599 nm) and lysosomes-specific dye
LysoTracker® Red (λEX/λEM = 577/590 nm), respectively, was performed 15 or 5 min (for
LysoTracker Red) prior to imaging. FITC and ER-Tracker/MitoTracker/LysoTracker Red were
sequentially excited with an argon laser at 488 nm and with a yellow diode at 561 nm, respectively.
Images (512 x 512 pixels) were acquired by sequential scannning between lines (line average 6)
using 40x (1.3 NA) oil-immersion objective with a 12 bit HyD detector at the corresponding
spectral range for each fluorophore. The background was subtracted from all images (rolling ball
radius: 50 pixels) and images were overlayed in ImageJ software for putative detection of
fluorescence signal colocalization.
Materials 36
4.2.4. Neutral red uptake assay
neutral red stock solution 4 mg/ml neutral red in PBS neutral red medium 40 µg/ml neutral red stock solution incell culture medium
Neutral red assay is one of the most used cytotoxictiy tests. It is based on the ability of viable cells
to uptake take up neutral red, a weakly cationic dye that penetrates cell membranes by nonionic
passive diffusion (Nemes et al., 1979). The dye is accumulated in lysosomes, where it becomes
charged due to the lysosomal proton gradient necessary to maintain low pH. Charged neutral red
is retained inside the lysosomes as it binds by electrostatic bonds to anionic groups of the lysosomal
matrix (Winckler, 1974). Thus, the assay can provide valuable information on endocytotic activity
of cells and lysosomal integrity. In order to get information on lysosomal integrity of SH-SY5Y
cells upon oxidative stress caused by amyloid beta peptide and ionizing radiation, non-
differentiated and cells treated with retinoic acid (~9 x 10⁴ cells/ml) were seeded into 96-well
plates in duplicates (n = 2). The next day, cells were treated with Aβ peptide and/or irradiated with
2 Gy X-rays and incubated for 24 hours. Neutral red working solution was prepared one day before
the assay and kept at 37°C in the cell culture incubator as previously described (Repetto et al.,
2008). On the day of the assay, cell culture medium was discarded and 100 µl neutral red medium
was added to all wells containing cells and incubated 2 h at 21% and 5% O2, respectively.
Following incubation, neutral red medium was removed and cells were washed with 150 µl PBS
per well. The dye was extracted from viable cells using acidified ethanol solution (100 µl/well) by
shaking plates rapidly on a plate shaker for 15 minutes. Absorbance of extracted neutral red was
measured at 540 nm using a plate reader.
4.2.5. Determination of cell death
4.2.5.1. Cell death detection by fluorescence microscopy
Apoptotic cells undergo rapid morphological alterations that indicate the progression of cell death.
These include changes in the cytoskeleton and plasma membrane, condensation of the cytoplasm
and nucleus and internucleosomal cleavage of DNA (Elmore, 2007). An early indicator of
apoptosis is the rapid translocation and accumulation of the membrane phospholipid
phosphatidylserine (PS) from the cytoplasm interface to the extracellular surface. This loss of
membrane asymmetry can be detected by utilizing the binding properties of Annexin V. Annexin
V is a calcium dependent phospholipid binding protein that preferentially binds to negatively
charged phospholipids including PS. Cells progressing through apoptosis can be monitored
according to their Annexin V and propidium iodide staining pattern. Early apoptotic cells will bind
neutral red destain solution 50% (v/v) ethanol 49% (v/v) Milli-Q-water 1% (v/v) glacial acetic acid
Materials 37
extracellular Annexin V but are not sensitive to intracellular staining with propidium iodide (PI).
As cells progress through apoptosis, the integrity of the plasma membrane is lost, allowing PI to
penetrate, which results in a strong yellow-red fluorescence signal.
Cells were cultivated on chamber slides at a density of ~0.5 x 10⁴ cells/ml/well of a 4-chamber
slide at 21% and 5% O2, respectively. Next day, cells were treated with Aβ1-42 peptide and/or
irradiated using 2 Gy X-rays. On the day of the assay, cells were rinsed with PBS and fixed using
3.7% formaldehyde for 10 min. Following fixation, cells were rinsed three times, 5 min each, in
PBS. 1× Assay buffer (500 µl/well) from Annexin V-FITC Apoptosis Detection Kit was added
and cells were incubated with 5 μl (1 μg) Annexin V-FITC and 10 μl of propidium iodide per 100
μl Assay Buffer for 15 minutes at room temperature in the dark. Cells were covered with coverslips
and visualized under the fluorescence microscope using a dual filter set for FITC (λEX/λEM = 495
nm/517 nm) and rhodamine (λEX/λEM = 551 nm/573 nm).
4.2.5.2. Cell death detection by flow cytometry
FCS buffer FBS in PBS (1:20)
Cells were grown in 10 cm2 Petri dishes (~1 x 10⁵ cells/ml) at 21% and 5% O2, respectively. Next
day, cells were treated with Aβ1-42 peptide and/or irradiated using 2 Gy X-rays. Treatment with 1
µM staurosporine (ihnibits protein C kinase and other kinases) for 24 h was used as a positive
control for apoptosis. On the day of the assay, cells were rinsed with PBS and harvested by
trypisinization. Cells were resuspended in 300 µl FCS buffer and pelleted by centrifugation (700
x g for 5 min at 4 °C). Incubation of cells at 60 °C for 15 min served as a positive control for
necrosis. Cells were resuspended in 200 μl 1× Assay Buffer and incubated with 0.5 μg (10 µl)
propidium iodide (PI) and 0.4 μg (2 μl) Annexin V FITC for 15 min at room temperature in the
dark. Positive control for apoptosis and necrosis were single (either Annexin V-FITC or PI) and
double stained (both Annexin V-FITC and PI). Following incubation, 1× Assay Buffer (200 µl)
was added to all samples and controls. Fluorescence emission was measured at 514 nm (FL1) for
Annexin V-FITC and 617 nm (FL2/3) for PI. 10000 cells was analyzed and data were compensated
in Kaluza software using single stained controls.
4.2.6. Cellular ATP concentration
The nucleotide ATP (adenosine-5'-triphosphate) generated mainly in mitochondria is a primary
energy source of living cells and its amount can be influenced by pathological processes. For
example, ATP supports synaptic vesicle recycling in axons and energy failure can contribute to
neurodegeneration (Pathak et al., 2015). Thus, changes of cellular ATP concentration can indicate
changes in cell viability and proliferation in response to cytotoxic compounds or other modifiers.
In order to assess cellular ATP concentration depending on irradiation, differentiation status,
treatment with Aβ1-42 peptide and oxygen concentration in the cell culture, Luminiscent ATP
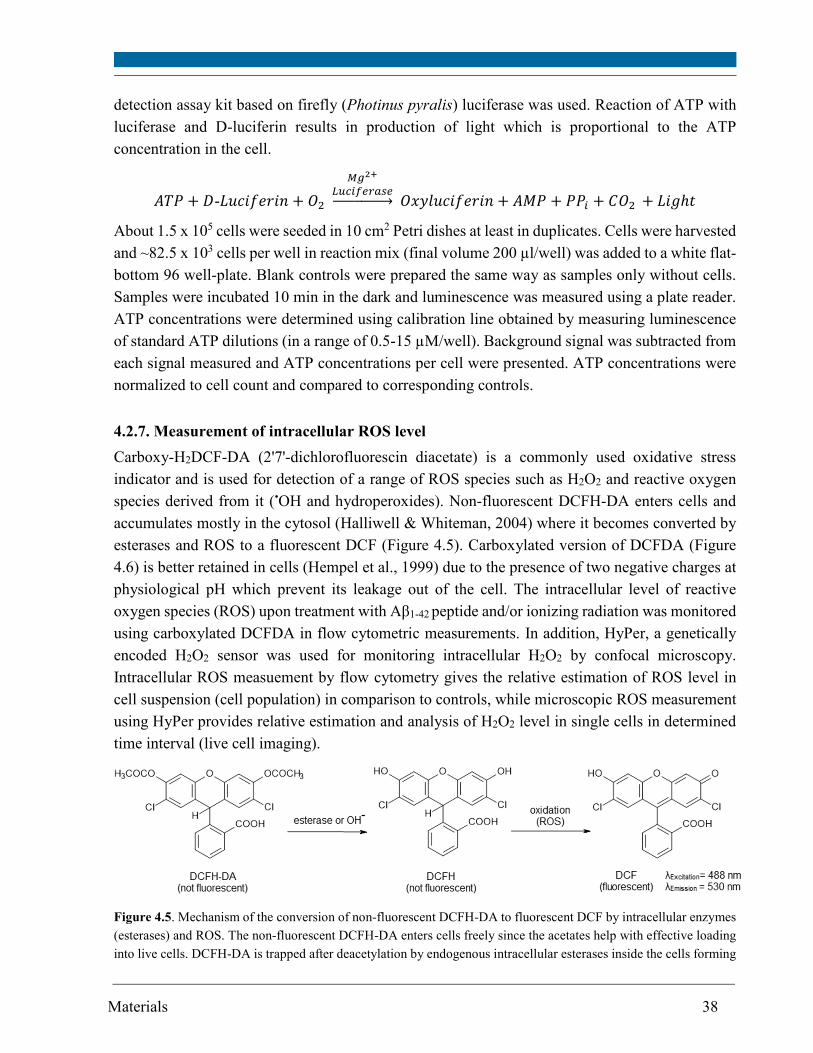
Materials 38
detection assay kit based on firefly (Photinus pyralis) luciferase was used. Reaction of ATP with
luciferase and D-luciferin results in production of light which is proportional to the ATP
concentration in the cell.
/'0 1 �-2�!� ���� 1 ��
3456
789:;<=�><?@@@@@@A �(���!� ���� 1 /B0 1 00: 1 C�� 1 2�)D�
About 1.5 x 10⁵ cells were seeded in 10 cm2 Petri dishes at least in duplicates. Cells were harvested
and ~82.5 x 10³ cells per well in reaction mix (final volume 200 µl/well) was added to a white flat-
bottom 96 well-plate. Blank controls were prepared the same way as samples only without cells.
Samples were incubated 10 min in the dark and luminescence was measured using a plate reader.
ATP concentrations were determined using calibration line obtained by measuring luminescence
of standard ATP dilutions (in a range of 0.5-15 µM/well). Background signal was subtracted from
each signal measured and ATP concentrations per cell were presented. ATP concentrations were
normalized to cell count and compared to corresponding controls.
4.2.7. Measurement of intracellular ROS level
Carboxy-H2DCF-DA (2'7'-dichlorofluorescin diacetate) is a commonly used oxidative stress
indicator and is used for detection of a range of ROS species such as H2O2 and reactive oxygen
species derived from it (•OH and hydroperoxides). Non-fluorescent DCFH-DA enters cells and
accumulates mostly in the cytosol (Halliwell & Whiteman, 2004) where it becomes converted by
esterases and ROS to a fluorescent DCF (Figure 4.5). Carboxylated version of DCFDA (Figure
4.6) is better retained in cells (Hempel et al., 1999) due to the presence of two negative charges at
physiological pH which prevent its leakage out of the cell. The intracellular level of reactive
oxygen species (ROS) upon treatment with Aβ1-42 peptide and/or ionizing radiation was monitored
using carboxylated DCFDA in flow cytometric measurements. In addition, HyPer, a genetically
encoded H2O2 sensor was used for monitoring intracellular H2O2 by confocal microscopy.
Intracellular ROS measuement by flow cytometry gives the relative estimation of ROS level in
cell suspension (cell population) in comparison to controls, while microscopic ROS measurement
using HyPer provides relative estimation and analysis of H2O2 level in single cells in determined
time interval (live cell imaging).
Figure 4.5. Mechanism of the conversion of non-fluorescent DCFH-DA to fluorescent DCF by intracellular enzymes
(esterases) and ROS. The non-fluorescent DCFH-DA enters cells freely since the acetates help with effective loading
into live cells. DCFH-DA is trapped after deacetylation by endogenous intracellular esterases inside the cells forming
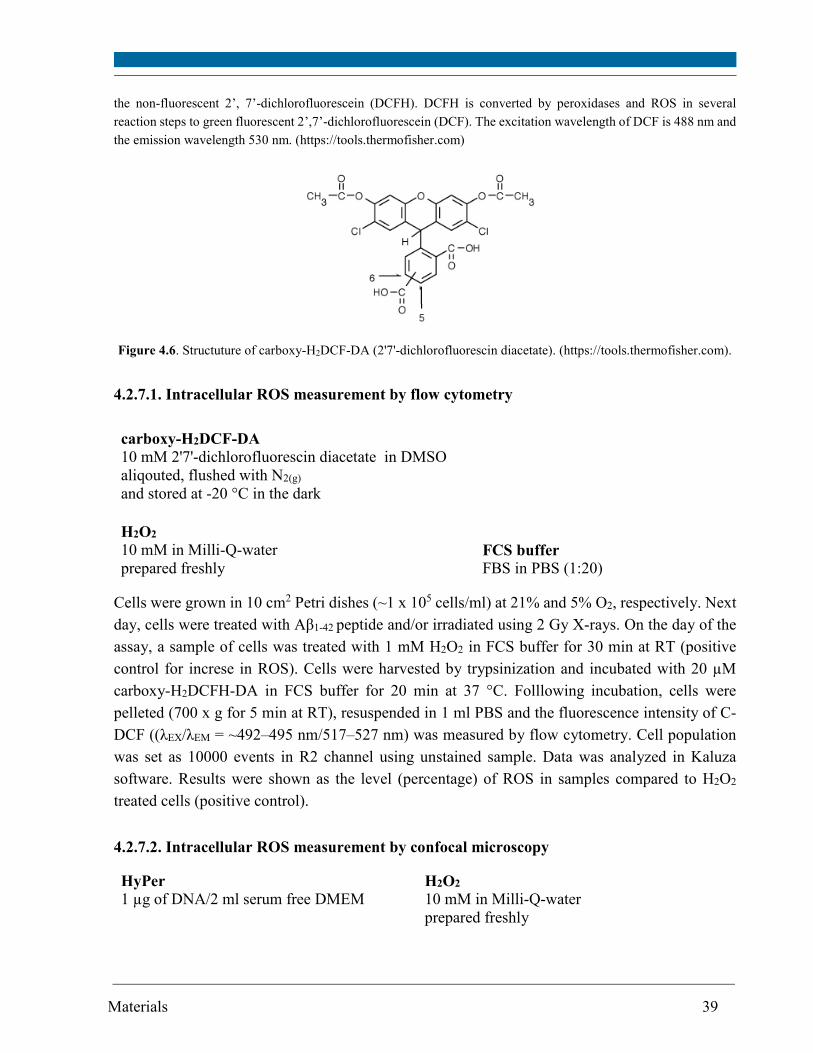
Materials 39
the non-fluorescent 2’, 7’-dichlorofluorescein (DCFH). DCFH is converted by peroxidases and ROS in several
reaction steps to green fluorescent 2’,7’-dichlorofluorescein (DCF). The excitation wavelength of DCF is 488 nm and
the emission wavelength 530 nm. (https://tools.thermofisher.com)
Figure 4.6. Structuture of carboxy-H2DCF-DA (2'7'-dichlorofluorescin diacetate). (https://tools.thermofisher.com).
4.2.7.1. Intracellular ROS measurement by flow cytometry
carboxy-H2DCF-DA 10 mM 2'7'-dichlorofluorescin diacetate in DMSO aliqouted, flushed with N2(g) and stored at -20 °C in the dark
H2O2
10 mM in Milli-Q-water FCS buffer prepared freshly FBS in PBS (1:20)
Cells were grown in 10 cm2 Petri dishes (~1 x 10⁵ cells/ml) at 21% and 5% O2, respectively. Next
day, cells were treated with Aβ1-42 peptide and/or irradiated using 2 Gy X-rays. On the day of the
assay, a sample of cells was treated with 1 mM H2O2 in FCS buffer for 30 min at RT (positive
control for increse in ROS). Cells were harvested by trypsinization and incubated with 20 µM
carboxy-H2DCFH-DA in FCS buffer for 20 min at 37 °C. Folllowing incubation, cells were
pelleted (700 x g for 5 min at RT), resuspended in 1 ml PBS and the fluorescence intensity of C-
DCF ((λEX/λEM = ~492–495 nm/517–527 nm) was measured by flow cytometry. Cell population
was set as 10000 events in R2 channel using unstained sample. Data was analyzed in Kaluza
software. Results were shown as the level (percentage) of ROS in samples compared to H2O2
treated cells (positive control).
4.2.7.2. Intracellular ROS measurement by confocal microscopy
HyPer H2O2
1 µg of DNA/2 ml serum free DMEM
10 mM in Milli-Q-water prepared freshly
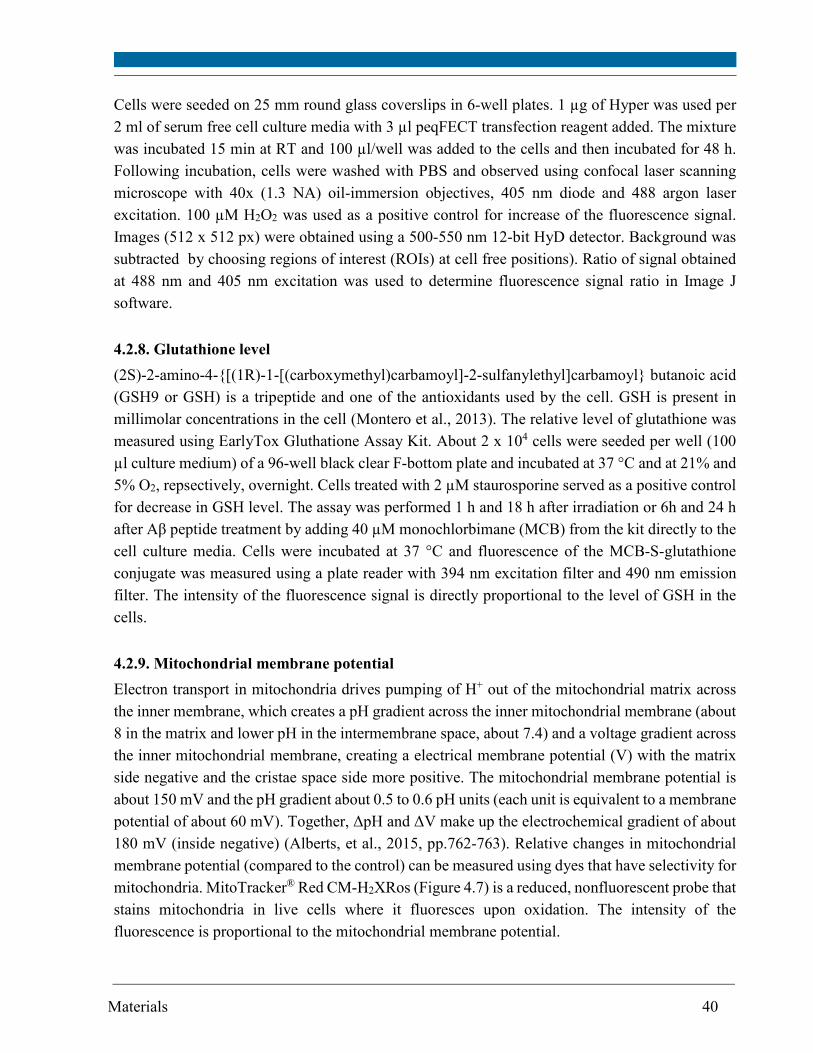
Materials 40
Cells were seeded on 25 mm round glass coverslips in 6-well plates. 1 µg of Hyper was used per
2 ml of serum free cell culture media with 3 µl peqFECT transfection reagent added. The mixture
was incubated 15 min at RT and 100 µl/well was added to the cells and then incubated for 48 h.
Following incubation, cells were washed with PBS and observed using confocal laser scanning
microscope with 40x (1.3 NA) oil-immersion objectives, 405 nm diode and 488 argon laser
excitation. 100 µM H2O2 was used as a positive control for increase of the fluorescence signal.
Images (512 x 512 px) were obtained using a 500-550 nm 12-bit HyD detector. Background was
subtracted by choosing regions of interest (ROIs) at cell free positions). Ratio of signal obtained
at 488 nm and 405 nm excitation was used to determine fluorescence signal ratio in Image J
software.
4.2.8. Glutathione level
(2S)-2-amino-4-{[(1R)-1-[(carboxymethyl)carbamoyl]-2-sulfanylethyl]carbamoyl} butanoic acid
(GSH9 or GSH) is a tripeptide and one of the antioxidants used by the cell. GSH is present in
millimolar concentrations in the cell (Montero et al., 2013). The relative level of glutathione was
measured using EarlyTox Gluthatione Assay Kit. About 2 x 10⁴ cells were seeded per well (100
µl culture medium) of a 96-well black clear F-bottom plate and incubated at 37 °C and at 21% and
5% O2, repsectively, overnight. Cells treated with 2 µM staurosporine served as a positive control
for decrease in GSH level. The assay was performed 1 h and 18 h after irradiation or 6h and 24 h
after Aβ peptide treatment by adding 40 µM monochlorbimane (MCB) from the kit directly to the
cell culture media. Cells were incubated at 37 °C and fluorescence of the MCB-S-glutathione
conjugate was measured using a plate reader with 394 nm excitation filter and 490 nm emission
filter. The intensity of the fluorescence signal is directly proportional to the level of GSH in the
cells.
4.2.9. Mitochondrial membrane potential
Electron transport in mitochondria drives pumping of H+ out of the mitochondrial matrix across
the inner membrane, which creates a pH gradient across the inner mitochondrial membrane (about
8 in the matrix and lower pH in the intermembrane space, about 7.4) and a voltage gradient across
the inner mitochondrial membrane, creating a electrical membrane potential (V) with the matrix
side negative and the cristae space side more positive. The mitochondrial membrane potential is
about 150 mV and the pH gradient about 0.5 to 0.6 pH units (each unit is equivalent to a membrane
potential of about 60 mV). Together, ΔpH and ΔV make up the electrochemical gradient of about
180 mV (inside negative) (Alberts, et al., 2015, pp.762-763). Relative changes in mitochondrial
membrane potential (compared to the control) can be measured using dyes that have selectivity for
mitochondria. MitoTracker® Red CM-H2XRos (Figure 4.7) is a reduced, nonfluorescent probe that
stains mitochondria in live cells where it fluoresces upon oxidation. The intensity of the
fluorescence is proportional to the mitochondrial membrane potential.
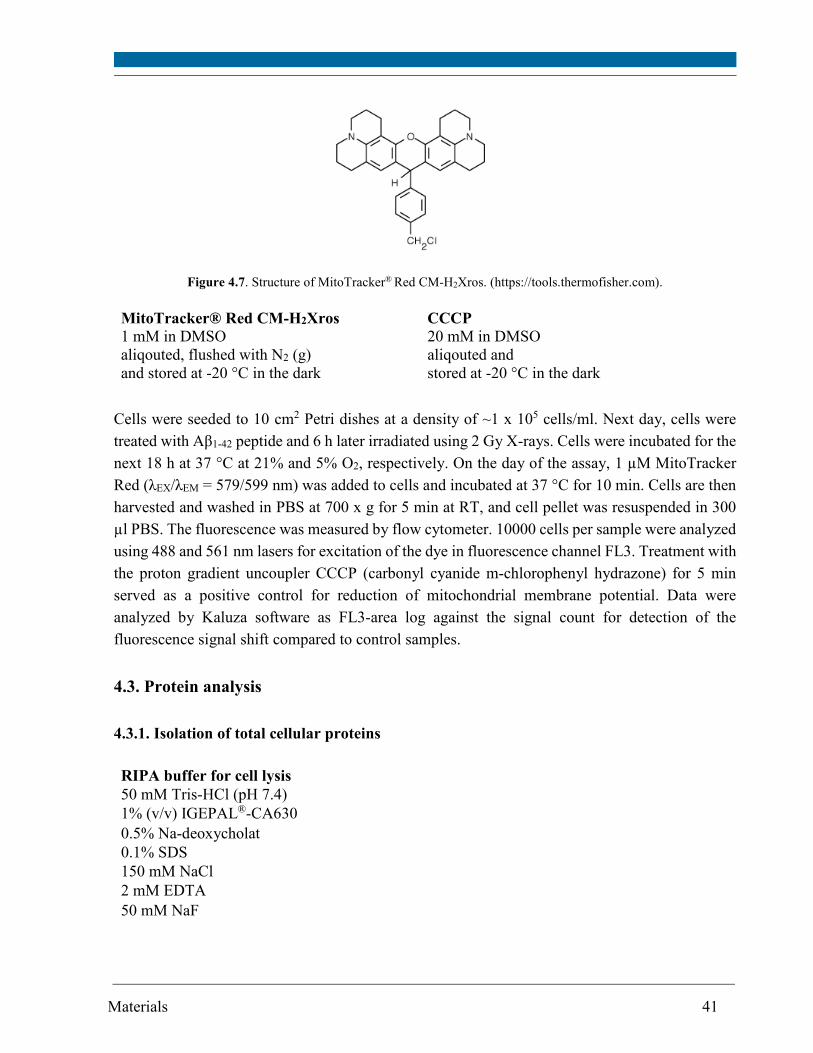
Materials 41
Figure 4.7. Structure of MitoTracker® Red CM-H2Xros. (https://tools.thermofisher.com).
MitoTracker® Red CM-H2Xros CCCP 1 mM in DMSO 20 mM in DMSO aliqouted, flushed with N2 (g) aliqouted and and stored at -20 °C in the dark stored at -20 °C in the dark
Cells were seeded to 10 cm2 Petri dishes at a density of ~1 x 10⁵ cells/ml. Next day, cells were
treated with Aβ1-42 peptide and 6 h later irradiated using 2 Gy X-rays. Cells were incubated for the
next 18 h at 37 °C at 21% and 5% O2, respectively. On the day of the assay, 1 µM MitoTracker
Red (λEX/λEM = 579/599 nm) was added to cells and incubated at 37 °C for 10 min. Cells are then
harvested and washed in PBS at 700 x g for 5 min at RT, and cell pellet was resuspended in 300
µl PBS. The fluorescence was measured by flow cytometer. 10000 cells per sample were analyzed
using 488 and 561 nm lasers for excitation of the dye in fluorescence channel FL3. Treatment with
the proton gradient uncoupler CCCP (carbonyl cyanide m-chlorophenyl hydrazone) for 5 min
served as a positive control for reduction of mitochondrial membrane potential. Data were
analyzed by Kaluza software as FL3-area log against the signal count for detection of the
fluorescence signal shift compared to control samples.
4.3. Protein analysis
4.3.1. Isolation of total cellular proteins
RIPA buffer for cell lysis
50 mM Tris-HCl (pH 7.4) 1% (v/v) IGEPAL®-CA630 0.5% Na-deoxycholat 0.1% SDS 150 mM NaCl 2 mM EDTA 50 mM NaF
Materials 42
In order to extract total cellular proteins, cells were lysed thoroughly using RIPA buffer. Medium
was discarded and cells were harvested and re-suspended in PBS, counted and centrifuged at 700
x g for 5 min at 4 °C. The supernatant was discarded and the cell pellet was re-suspended in ice-
cold RIPA buffer where ~2 x 10⁵ cells per 24 µl RIPA-buffer was used. Samples were incubated
on ice for 30 min and vortexed every 10 min for efficient release of the cellular content in the
suspension. Afterwards, suspension was centrifuged at 14000 x g for 15 min at 4 °C. The
supernatant containing the all proteins, both water soluble and solubilized membrane proteins, was
transferred into pre-cooled Eppendorf tubes and stored at -20 °C. Small aliquot of the cell lysate
was used for determination of the protein concentration by Bradford assay (Bradford, 1976).
4.3.2. Isolation of mitochondria
In order to extract „crude“ mitochondria for investigation of the mitochondrial proteome, cells
were harvested and mechanically homogenized in 1.8 ml buffer with addition of protease inhibitor
cocktail (PIC), preventing protein degradation, and using glas-teflon homogenizer (800 rpm, 15
strokes) on ice. 0.25 M sucrose preventing swelling of mitochondria was added to the
homogenized suspension and centrifuged at 1900 x g for 10 min at 4 °C. Supernatant was kept on
ice and pellet was resuspended in homogenisation buffer with 0.25 M sucrose and centrifuged at
1900 x g for 10 min at 4 °C three times to increase the yield of mitochondria. Supernatants from
three centrifugation steps were merged and centrifuged at 14000 x g for 10 min at 4 °C. The pellet
containing mitochondria (and partly other cellular compartments and components) was
resuspended in homogenisation buffer with PIC and sucrose. Aliquots of isolates were quickly
frozen in liquid nitrogen and then kept at -80 °C for longer storage. Small aliquots were used for
determination of total protein concentration using Bradford assay (Bradford, 1976).
4.3.3. Bradford assay
In order to determine protein concentration either of isolated „crude“ mitochondria (4.3.2) or total
cellular proteins from cell lysate (4.3.1), Bradford assay (Bradford, 1976) was employed. 1× Roti®-
Nanoquant was prepared from 5× stock and used for colorimetric assay. The reagent Coomassie-
Brilliant Blue G250 contained in Roti®-Nanoquant is red in its cathionic form (absorption
maxiumum at about 465 nm) and green in its neutral form (absorption maxiumum at about 650
nm). In the presence of proteins, the neutral form of Coomassie-Brilliant blue G250 in acidic
solution will be converted in the blue anionic form (Figure 4.8) with the decrease of absorption
below 465 nm and the appearance of an additional peak at 595 nm.
homogenisation buffer 10 mM HEPES (pH 7.4) 1.1 mM EDTA in Milli-Q-water, stored at -20 °C
sucrose
2 M sucrose in Milli-Q-water, stored at 4 °C
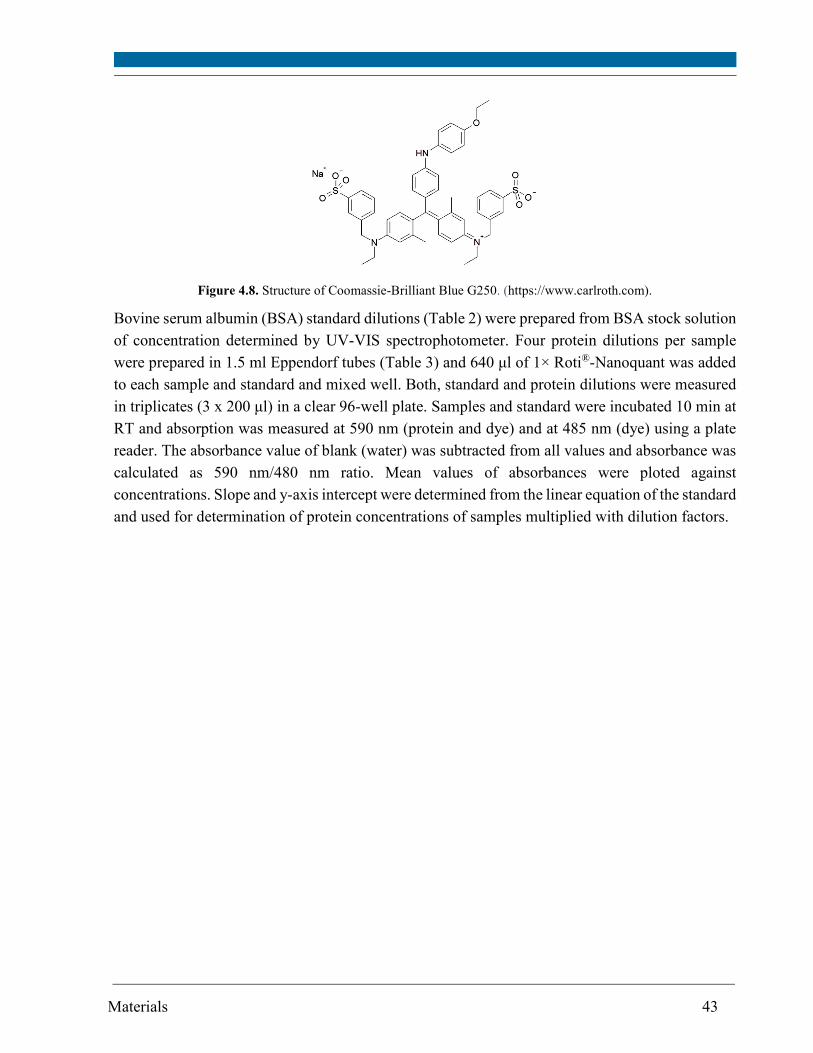
Materials 43
Figure 4.8. Structure of Coomassie-Brilliant Blue G250. (https://www.carlroth.com).
Bovine serum albumin (BSA) standard dilutions (Table 2) were prepared from BSA stock solution
of concentration determined by UV-VIS spectrophotometer. Four protein dilutions per sample
were prepared in 1.5 ml Eppendorf tubes (Table 3) and 640 μl of 1× Roti®-Nanoquant was added
to each sample and standard and mixed well. Both, standard and protein dilutions were measured
in triplicates (3 x 200 μl) in a clear 96-well plate. Samples and standard were incubated 10 min at
RT and absorption was measured at 590 nm (protein and dye) and at 485 nm (dye) using a plate
reader. The absorbance value of blank (water) was subtracted from all values and absorbance was
calculated as 590 nm/480 nm ratio. Mean values of absorbances were ploted against
concentrations. Slope and y-axis intercept were determined from the linear equation of the standard
and used for determination of protein concentrations of samples multiplied with dilution factors.
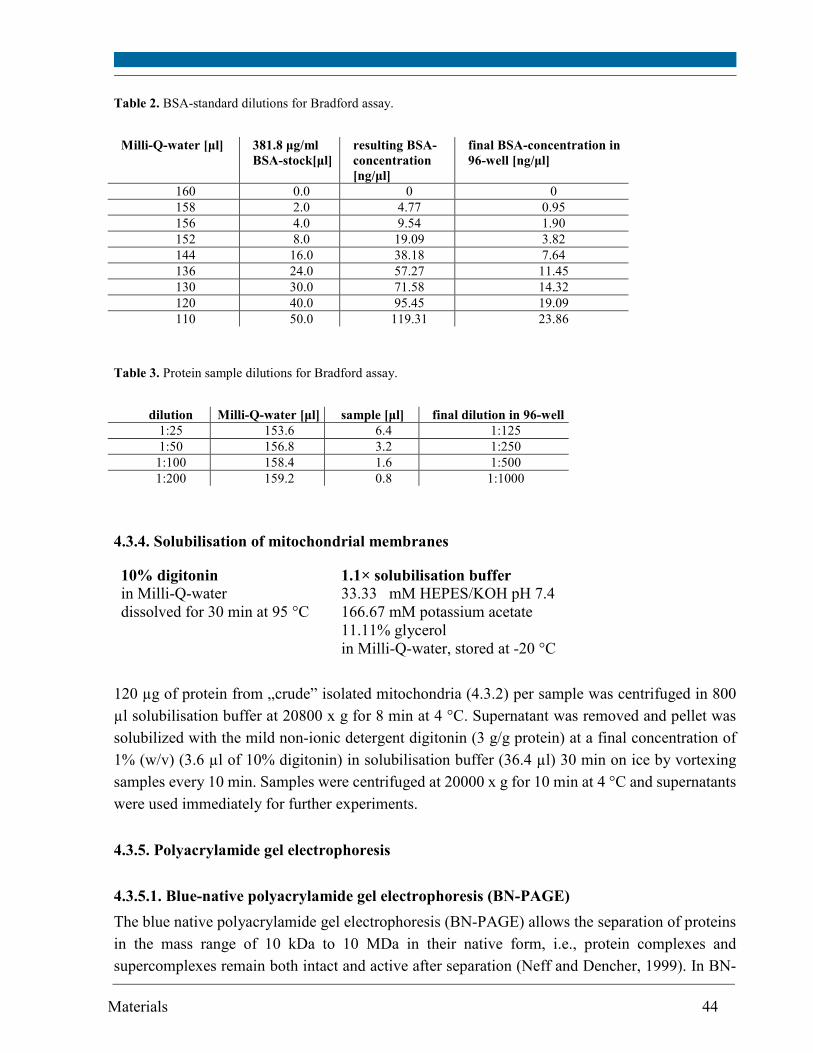
Materials 44
Table 2. BSA-standard dilutions for Bradford assay.
Milli-Q-water [μl] 381.8 μg/ml
BSA-stock[μl]
resulting BSA-
concentration
[ng/μl]
final BSA-concentration in
96-well [ng/μl]
160 0.0 0 0 158 2.0 4.77 0.95 156 4.0 9.54 1.90 152 8.0 19.09 3.82 144 16.0 38.18 7.64 136 24.0 57.27 11.45 130 30.0 71.58 14.32 120 40.0 95.45 19.09 110 50.0 119.31 23.86
Table 3. Protein sample dilutions for Bradford assay.
dilution Milli-Q-water [μl] sample [μl] final dilution in 96-well
1:25 153.6 6.4 1:125 1:50 156.8 3.2 1:250
1:100 158.4 1.6 1:500 1:200 159.2 0.8 1:1000
4.3.4. Solubilisation of mitochondrial membranes
10% digitonin 1.1× solubilisation buffer in Milli-Q-water 33.33 mM HEPES/KOH pH 7.4 dissolved for 30 min at 95 °C 166.67 mM potassium acetate 11.11% glycerol in Milli-Q-water, stored at -20 °C
120 µg of protein from „crude” isolated mitochondria (4.3.2) per sample was centrifuged in 800
µl solubilisation buffer at 20800 x g for 8 min at 4 °C. Supernatant was removed and pellet was
solubilized with the mild non-ionic detergent digitonin (3 g/g protein) at a final concentration of
1% (w/v) (3.6 µl of 10% digitonin) in solubilisation buffer (36.4 µl) 30 min on ice by vortexing
samples every 10 min. Samples were centrifuged at 20000 x g for 10 min at 4 °C and supernatants
were used immediately for further experiments.
4.3.5. Polyacrylamide gel electrophoresis
4.3.5.1. Blue-native polyacrylamide gel electrophoresis (BN-PAGE)
The blue native polyacrylamide gel electrophoresis (BN-PAGE) allows the separation of proteins
in the mass range of 10 kDa to 10 MDa in their native form, i.e., protein complexes and
supercomplexes remain both intact and active after separation (Neff and Dencher, 1999). In BN-
Materials 45
PAGE, the cathode buffer contains Coomassie Brilliant Blue G-250, a blue dye which binds to
proteins almost proportional to their size, masking their intrinsic charge by its own net negative
charge. Hence, separation of proteins occurs according to their molecular mass. Since interactions
between Coomassie Brilliant Blue G-250 and proteins exhibit minor effects on protein structure
or protein-protein interactions, secondary, tertiary and quaternary protein structures are preserved
and enzyme activity can be determined in in-gel activity assays (Shagger & von Jagow, 1991). The
separation of the proteins is carried out in a gradient polyacrylamide gel composed of a stacking
gel with large pores and a separating gel with pores gradually decreasing in their size.
light BN-PAGE gel buffer (3×) 6-aminohexanoic acid imidazole/HCl, pH 7.0
1.5 M 75 mM
in Milli-Q-H2O, stored at 4 °C
BN-PAGE sample buffer Bis-Tris/HCl pH 7.0 Serva Blue G-250 6-aminohexanoic acid
50 mM 5 % (w/v) 500 mM
in dest. H2O stored at RT under light exclusion
heavy BN-PAGE gel buffer (3×)
6-aminohexanoic acid imidazole/HCl pH 7.0 glycerin
1.5 M 75 mM 60 % (v/v)
in Milli-Q-H2O, stored at 4 °C
10 % (w/v) ammonium persulfate (APS)
in Milli-Q-H2O, stored up to 2 months at -20 °C, always used freshly thawed solution
BN-PAGE anode buffer imidazole/HCl, pH 7.0 25 mM in dest. H2O, stored at 4 °C
empty well solution (EMS) buffer mix 10 % digitonin
180 µl 20 µl
BN-PAGE cathode buffer tricine pH 7.0 imidazole Serva Blue G-250
50 mM 7.5 mM 0.02 % (w/v)
in dest. H2O, stored at RT, dye is resolved by stirring overnight, filtered
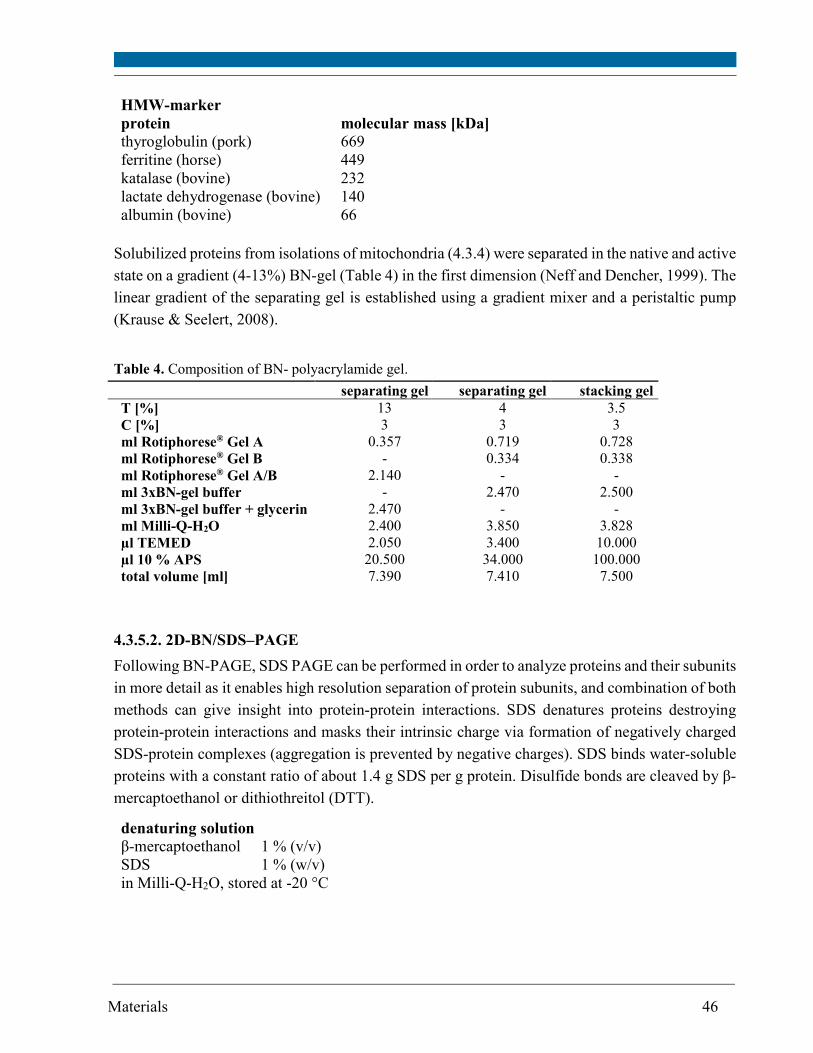
Materials 46
HMW-marker
protein molecular mass [kDa] thyroglobulin (pork) ferritine (horse) katalase (bovine) lactate dehydrogenase (bovine) albumin (bovine)
669 449 232 140 66
Solubilized proteins from isolations of mitochondria (4.3.4) were separated in the native and active
state on a gradient (4-13%) BN-gel (Table 4) in the first dimension (Neff and Dencher, 1999). The
linear gradient of the separating gel is established using a gradient mixer and a peristaltic pump
(Krause & Seelert, 2008).
Table 4. Composition of BN- polyacrylamide gel.
separating gel separating gel stacking gel
T [%]
C [%]
13 3
4 3
3.5 3
ml Rotiphorese® Gel A
ml Rotiphorese® Gel B
ml Rotiphorese® Gel A/B
ml 3xBN-gel buffer
ml 3xBN-gel buffer + glycerin
ml Milli-Q-H2O
0.357 -
2.140 -
2.470 2.400
0.719 0.334
- 2.470
- 3.850
0.728 0.338
- 2.500
- 3.828
µl TEMED
µl 10 % APS
2.050 20.500
3.400 34.000
10.000 100.000
total volume [ml] 7.390 7.410 7.500
4.3.5.2. 2D-BN/SDS–PAGE
Following BN-PAGE, SDS PAGE can be performed in order to analyze proteins and their subunits
in more detail as it enables high resolution separation of protein subunits, and combination of both
methods can give insight into protein-protein interactions. SDS denatures proteins destroying
protein-protein interactions and masks their intrinsic charge via formation of negatively charged
SDS-protein complexes (aggregation is prevented by negative charges). SDS binds water-soluble
proteins with a constant ratio of about 1.4 g SDS per g protein. Disulfide bonds are cleaved by β-
mercaptoethanol or dithiothreitol (DTT).
denaturing solution β-mercaptoethanol SDS
1 % (v/v) 1 % (w/v)
in Milli-Q-H2O, stored at -20 °C
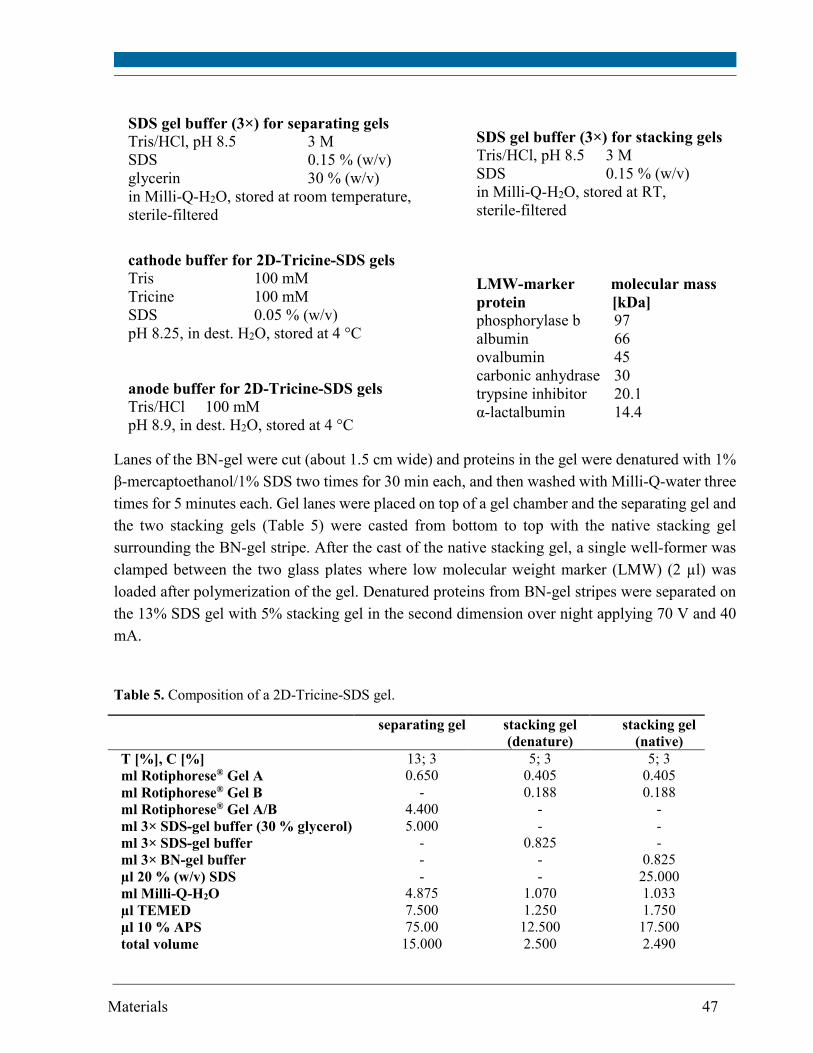
Materials 47
SDS gel buffer (3×) for separating gels Tris/HCl, pH 8.5 SDS glycerin
3 M 0.15 % (w/v) 30 % (w/v)
in Milli-Q-H2O, stored at room temperature, sterile-filtered
anode buffer for 2D-Tricine-SDS gels Tris/HCl 100 mM pH 8.9, in dest. H2O, stored at 4 °C
cathode buffer for 2D-Tricine-SDS gels Tris Tricine SDS
100 mM 100 mM 0.05 % (w/v)
pH 8.25, in dest. H2O, stored at 4 °C
SDS gel buffer (3×) for stacking gels Tris/HCl, pH 8.5 SDS
3 M 0.15 % (w/v)
in Milli-Q-H2O, stored at RT, sterile-filtered LMW-marker molecular mass
protein [kDa] phosphorylase b albumin ovalbumin carbonic anhydrase trypsine inhibitor α-lactalbumin
97 66 45 30 20.1 14.4
Lanes of the BN-gel were cut (about 1.5 cm wide) and proteins in the gel were denatured with 1%
β-mercaptoethanol/1% SDS two times for 30 min each, and then washed with Milli-Q-water three
times for 5 minutes each. Gel lanes were placed on top of a gel chamber and the separating gel and
the two stacking gels (Table 5) were casted from bottom to top with the native stacking gel
surrounding the BN-gel stripe. After the cast of the native stacking gel, a single well-former was
clamped between the two glass plates where low molecular weight marker (LMW) (2 µl) was
loaded after polymerization of the gel. Denatured proteins from BN-gel stripes were separated on
the 13% SDS gel with 5% stacking gel in the second dimension over night applying 70 V and 40
mA.
Table 5. Composition of a 2D-Tricine-SDS gel.
separating gel stacking gel
(denature)
stacking gel
(native)
T [%], C [%] 13; 3 5; 3 5; 3 ml Rotiphorese® Gel A
ml Rotiphorese® Gel B
ml Rotiphorese® Gel A/B
ml 3× SDS-gel buffer (30 % glycerol)
ml 3× SDS-gel buffer
ml 3× BN-gel buffer
µl 20 % (w/v) SDS
ml Milli-Q-H2O
0.650 -
4.400 5.000
- - -
4.875
0.405 0.188
- -
0.825 - -
1.070
0.405 0.188
- - -
0.825 25.000 1.033
µl TEMED
µl 10 % APS
7.500 75.00
1.250 12.500
1.750 17.500
total volume 15.000 2.500 2.490
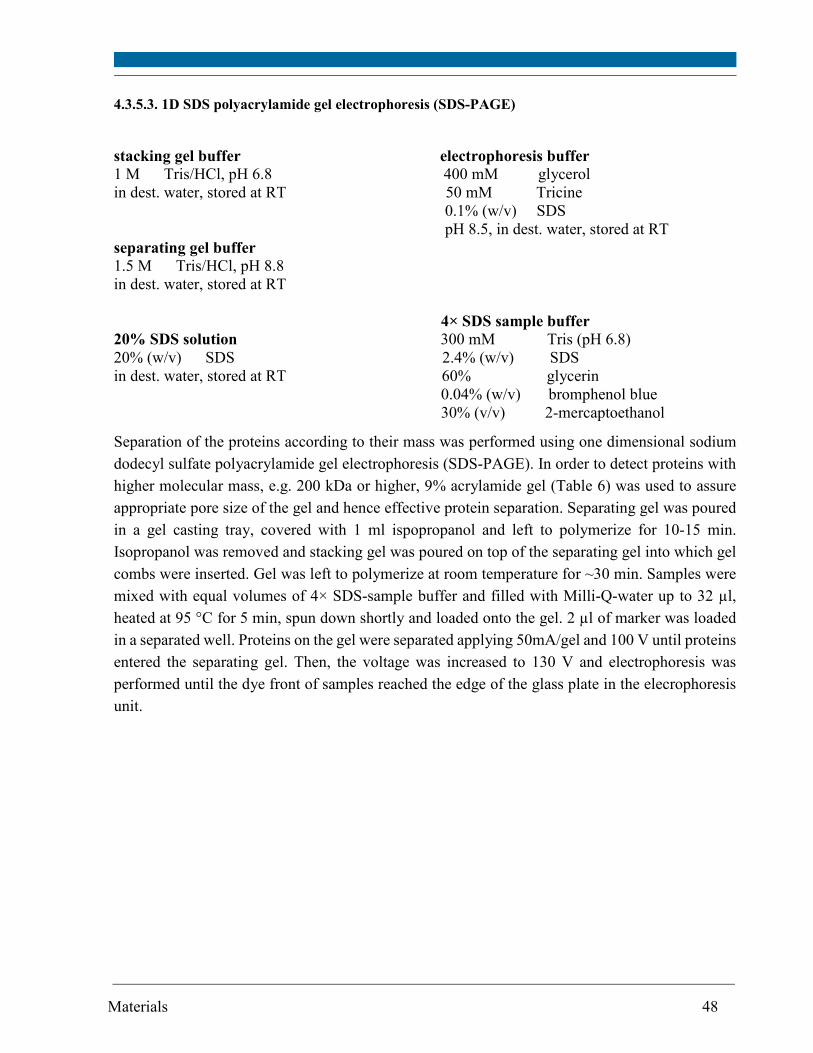
Materials 48
4.3.5.3. 1D SDS polyacrylamide gel electrophoresis (SDS-PAGE)
stacking gel buffer electrophoresis buffer 1 M Tris/HCl, pH 6.8 400 mM glycerol in dest. water, stored at RT 50 mM Tricine 0.1% (w/v) SDS pH 8.5, in dest. water, stored at RT separating gel buffer 1.5 M Tris/HCl, pH 8.8 in dest. water, stored at RT 4× SDS sample buffer 20% SDS solution 300 mM Tris (pH 6.8) 20% (w/v) SDS 2.4% (w/v) SDS in dest. water, stored at RT 60% glycerin 0.04% (w/v) bromphenol blue 30% (v/v) 2-mercaptoethanol
Separation of the proteins according to their mass was performed using one dimensional sodium
dodecyl sulfate polyacrylamide gel electrophoresis (SDS-PAGE). In order to detect proteins with
higher molecular mass, e.g. 200 kDa or higher, 9% acrylamide gel (Table 6) was used to assure
appropriate pore size of the gel and hence effective protein separation. Separating gel was poured
in a gel casting tray, covered with 1 ml ispopropanol and left to polymerize for 10-15 min.
Isopropanol was removed and stacking gel was poured on top of the separating gel into which gel
combs were inserted. Gel was left to polymerize at room temperature for ~30 min. Samples were
mixed with equal volumes of 4× SDS-sample buffer and filled with Milli-Q-water up to 32 µl,
heated at 95 °C for 5 min, spun down shortly and loaded onto the gel. 2 µl of marker was loaded
in a separated well. Proteins on the gel were separated applying 50mA/gel and 100 V until proteins
entered the separating gel. Then, the voltage was increased to 130 V and electrophoresis was
performed until the dye front of samples reached the edge of the glass plate in the elecrophoresis
unit.
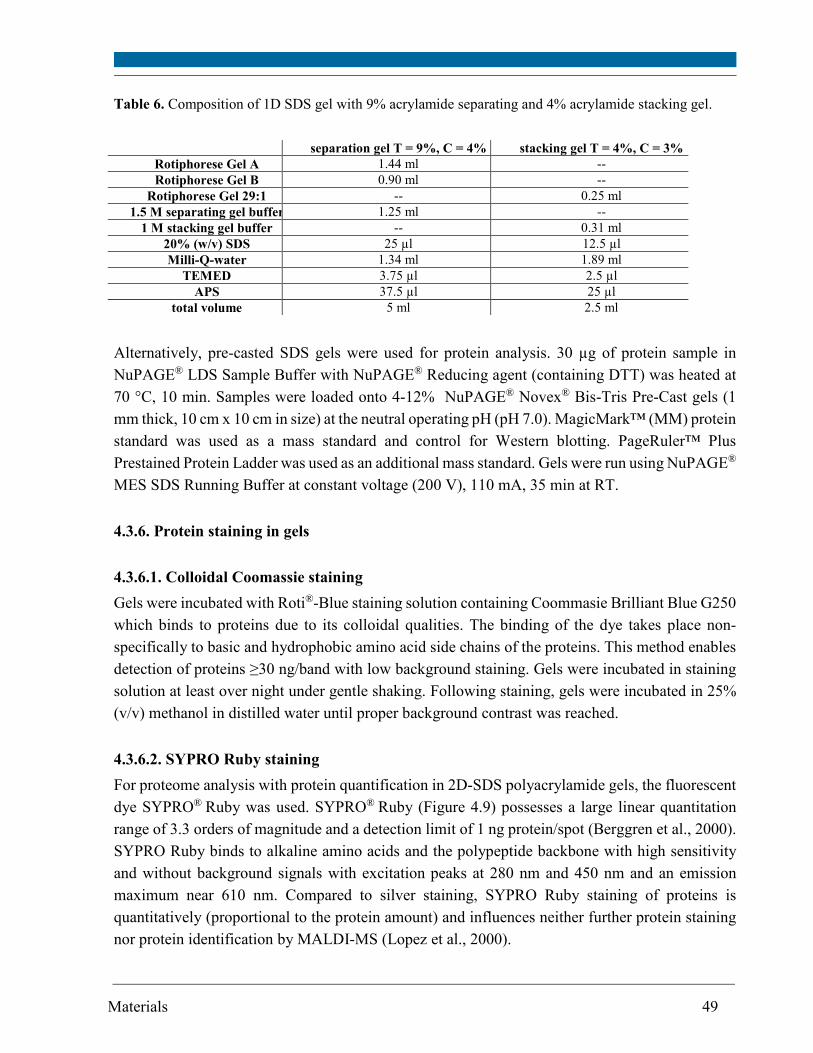
Materials 49
Table 6. Composition of 1D SDS gel with 9% acrylamide separating and 4% acrylamide stacking gel.
separation gel T = 9%, C = 4% stacking gel T = 4%, C = 3%
Rotiphorese Gel A 1.44 ml -- Rotiphorese Gel B 0.90 ml --
Rotiphorese Gel 29:1 -- 0.25 ml 1.5 M separating gel buffer 1.25 ml --
1 M stacking gel buffer -- 0.31 ml 20% (w/v) SDS 25 µl 12.5 µl Milli-Q-water 1.34 ml 1.89 ml
TEMED 3.75 µl 2.5 µl APS 37.5 µl 25 µl
total volume 5 ml 2.5 ml
Alternatively, pre-casted SDS gels were used for protein analysis. 30 µg of protein sample in
NuPAGE® LDS Sample Buffer with NuPAGE® Reducing agent (containing DTT) was heated at
70 °C, 10 min. Samples were loaded onto 4-12% NuPAGE® Novex® Bis-Tris Pre-Cast gels (1
mm thick, 10 cm x 10 cm in size) at the neutral operating pH (pH 7.0). MagicMark™ (MM) protein
standard was used as a mass standard and control for Western blotting. PageRuler™ Plus
Prestained Protein Ladder was used as an additional mass standard. Gels were run using NuPAGE®
MES SDS Running Buffer at constant voltage (200 V), 110 mA, 35 min at RT.
4.3.6. Protein staining in gels
4.3.6.1. Colloidal Coomassie staining
Gels were incubated with Roti®-Blue staining solution containing Coommasie Brilliant Blue G250
which binds to proteins due to its colloidal qualities. The binding of the dye takes place non-
specifically to basic and hydrophobic amino acid side chains of the proteins. This method enables
detection of proteins ≥30 ng/band with low background staining. Gels were incubated in staining
solution at least over night under gentle shaking. Following staining, gels were incubated in 25%
(v/v) methanol in distilled water until proper background contrast was reached.
4.3.6.2. SYPRO Ruby staining
For proteome analysis with protein quantification in 2D-SDS polyacrylamide gels, the fluorescent
dye SYPRO® Ruby was used. SYPRO® Ruby (Figure 4.9) possesses a large linear quantitation
range of 3.3 orders of magnitude and a detection limit of 1 ng protein/spot (Berggren et al., 2000).
SYPRO Ruby binds to alkaline amino acids and the polypeptide backbone with high sensitivity
and without background signals with excitation peaks at 280 nm and 450 nm and an emission
maximum near 610 nm. Compared to silver staining, SYPRO Ruby staining of proteins is
quantitatively (proportional to the protein amount) and influences neither further protein staining
nor protein identification by MALDI-MS (Lopez et al., 2000).
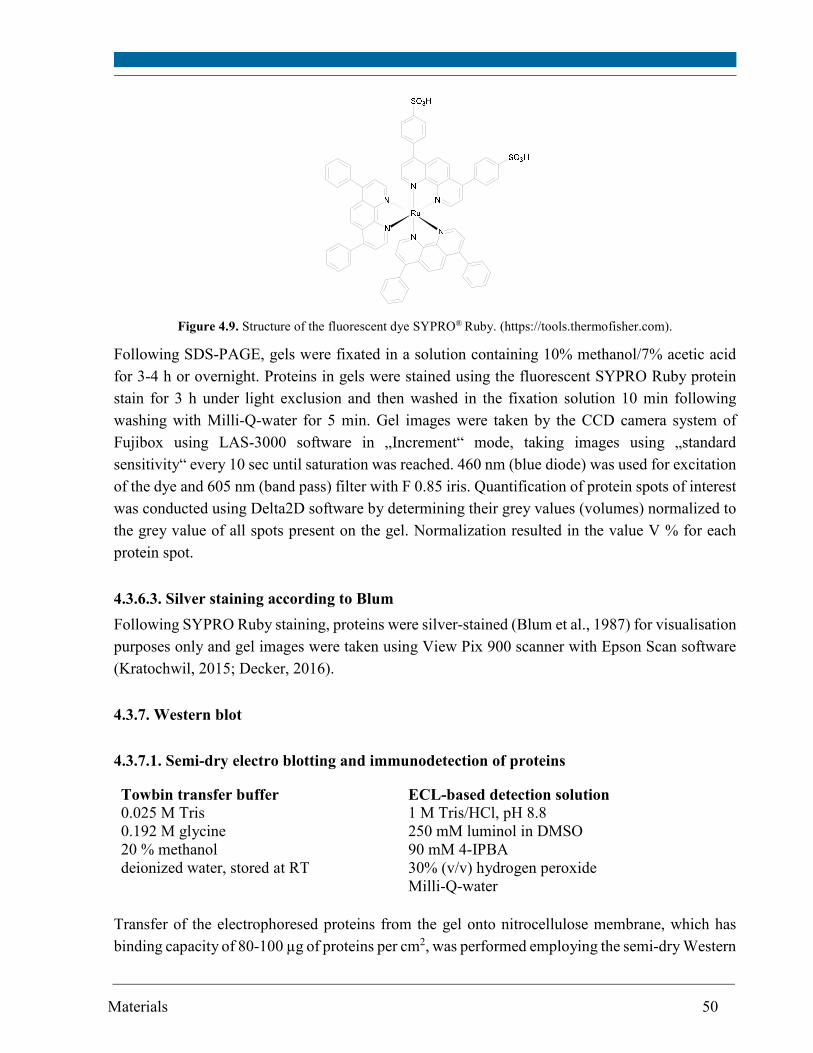
Materials 50
Figure 4.9. Structure of the fluorescent dye SYPRO® Ruby. (https://tools.thermofisher.com).
Following SDS-PAGE, gels were fixated in a solution containing 10% methanol/7% acetic acid
for 3-4 h or overnight. Proteins in gels were stained using the fluorescent SYPRO Ruby protein
stain for 3 h under light exclusion and then washed in the fixation solution 10 min following
washing with Milli-Q-water for 5 min. Gel images were taken by the CCD camera system of
Fujibox using LAS-3000 software in „Increment“ mode, taking images using „standard
sensitivity“ every 10 sec until saturation was reached. 460 nm (blue diode) was used for excitation
of the dye and 605 nm (band pass) filter with F 0.85 iris. Quantification of protein spots of interest
was conducted using Delta2D software by determining their grey values (volumes) normalized to
the grey value of all spots present on the gel. Normalization resulted in the value V % for each
protein spot.
4.3.6.3. Silver staining according to Blum
Following SYPRO Ruby staining, proteins were silver-stained (Blum et al., 1987) for visualisation
purposes only and gel images were taken using View Pix 900 scanner with Epson Scan software
(Kratochwil, 2015; Decker, 2016).
4.3.7. Western blot
4.3.7.1. Semi-dry electro blotting and immunodetection of proteins
Towbin transfer buffer ECL-based detection solution 0.025 M Tris 1 M Tris/HCl, pH 8.8 0.192 M glycine 250 mM luminol in DMSO 20 % methanol deionized water, stored at RT
90 mM 4-IPBA 30% (v/v) hydrogen peroxide Milli-Q-water
Transfer of the electrophoresed proteins from the gel onto nitrocellulose membrane, which has
binding capacity of 80-100 µg of proteins per cm2, was performed employing the semi-dry Western
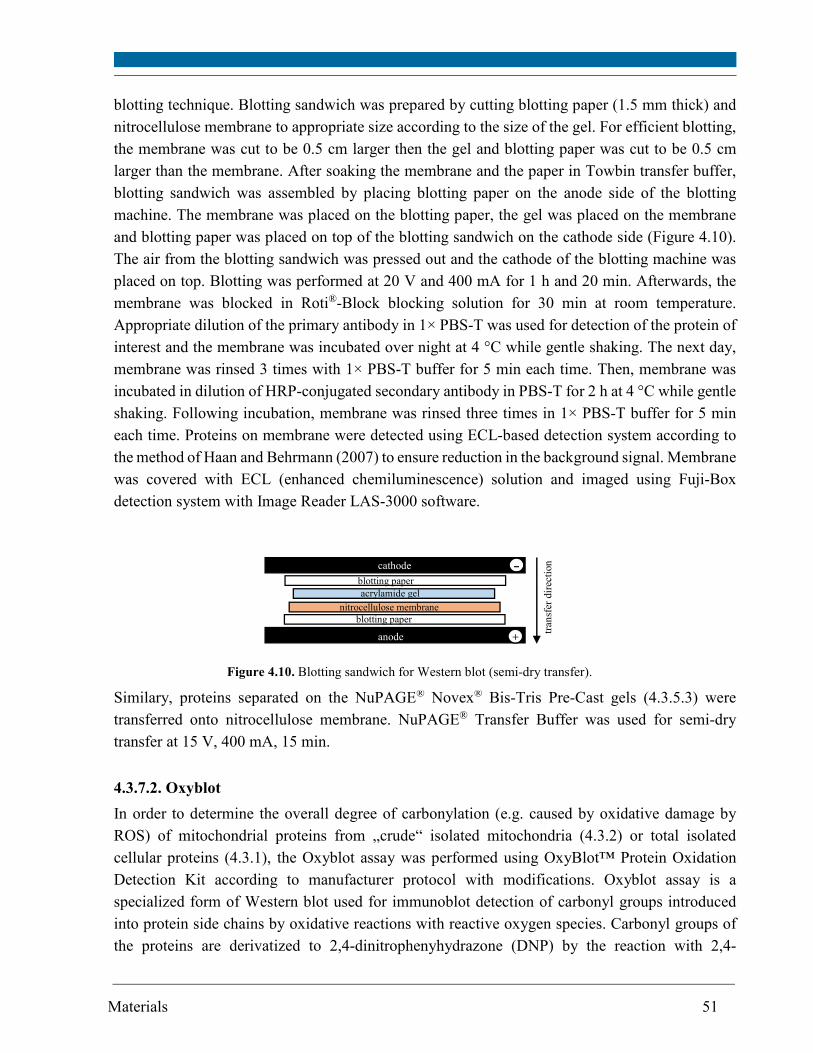
Materials 51
blotting technique. Blotting sandwich was prepared by cutting blotting paper (1.5 mm thick) and
nitrocellulose membrane to appropriate size according to the size of the gel. For efficient blotting,
the membrane was cut to be 0.5 cm larger then the gel and blotting paper was cut to be 0.5 cm
larger than the membrane. After soaking the membrane and the paper in Towbin transfer buffer,
blotting sandwich was assembled by placing blotting paper on the anode side of the blotting
machine. The membrane was placed on the blotting paper, the gel was placed on the membrane
and blotting paper was placed on top of the blotting sandwich on the cathode side (Figure 4.10).
The air from the blotting sandwich was pressed out and the cathode of the blotting machine was
placed on top. Blotting was performed at 20 V and 400 mA for 1 h and 20 min. Afterwards, the
membrane was blocked in Roti®-Block blocking solution for 30 min at room temperature.
Appropriate dilution of the primary antibody in 1× PBS-T was used for detection of the protein of
interest and the membrane was incubated over night at 4 °C while gentle shaking. The next day,
membrane was rinsed 3 times with 1× PBS-T buffer for 5 min each time. Then, membrane was
incubated in dilution of HRP-conjugated secondary antibody in PBS-T for 2 h at 4 °C while gentle
shaking. Following incubation, membrane was rinsed three times in 1× PBS-T buffer for 5 min
each time. Proteins on membrane were detected using ECL-based detection system according to
the method of Haan and Behrmann (2007) to ensure reduction in the background signal. Membrane
was covered with ECL (enhanced chemiluminescence) solution and imaged using Fuji-Box
detection system with Image Reader LAS-3000 software.
Similary, proteins separated on the NuPAGE® Novex® Bis-Tris Pre-Cast gels (4.3.5.3) were
transferred onto nitrocellulose membrane. NuPAGE® Transfer Buffer was used for semi-dry
transfer at 15 V, 400 mA, 15 min.
4.3.7.2. Oxyblot
In order to determine the overall degree of carbonylation (e.g. caused by oxidative damage by
ROS) of mitochondrial proteins from „crude“ isolated mitochondria (4.3.2) or total isolated
cellular proteins (4.3.1), the Oxyblot assay was performed using OxyBlot™ Protein Oxidation
Detection Kit according to manufacturer protocol with modifications. Oxyblot assay is a
specialized form of Western blot used for immunoblot detection of carbonyl groups introduced
into protein side chains by oxidative reactions with reactive oxygen species. Carbonyl groups of
the proteins are derivatized to 2,4-dinitrophenyhydrazone (DNP) by the reaction with 2,4-
cathode
blotting paper
blotting paper
nitrocellulose membrane
tran
sfer
dir
ecti
on
+ anode
acrylamide gel
Figure 4.10. Blotting sandwich for Western blot (semi-dry transfer).
Materials 52
dinitrophenylhydrazine (DNPH). An antibody directed against DNP was applied. New aliquots of
samples were used for each experiment since subsequent freezing and thawing can introduce
additional damage and lead to false positive results.
SDS solution 12% (w/v) SDS in Milli-Q-water, stored at RT
OxyBlot™ Protein Oxidation Detection Kit 1× 2,4-dinitrophenylhydrazine (DNPH) Solution 1× Derivatization-Control Solution Neutralization Solution rabbit anti-DNP antibody
buffer for positive control BSA (positive control) 25 mM HEPES 10 mg/ml BSA, incubated for 5h at 37 °C 25 mM ascorbic acid (Na-salt) in the buffer for positive control 100 μM FeCl3 x 6 H2O pH 7.2, in bidest. water, stored at RT
dialyzed overnight (12-16 kDa cut-off membrane), stored at 4 °C
Isolated mitochondria previously stored in solubilisation buffer containig sucrose and protease
inhibitor cocktail at -80 °C were thawed on ice and appropriate volumes containing about 15 µg
protein were centrifuged at 20800 x g for 8 min at 4 °C. Supernatant was carefully removed and
pellet containing mitochondria was resuspended (5 µl) ice-cold solubilisation buffer. In the case
when total cellular proteins from cell lysates were assessed, about 15 µg protein from cell lysates
was used. BSA (15 µg) was used as a positive control. Each sample is denatured by adding 12%
SDS to a final concentration of 6% SDS. Samples are derivatized by adding 10 µl of 1× DNPH
Solution except for the negative control for immuno-binding (BSA) to which 10 µl 1×
Derivatization-Control Solution was added instead of DNPH Solution. All samples were incubated
at room temperature for 15 min. Derivatization reaction was stopped by adding 7.5 µl
Neutralization Solution to all samples including controls. Samples were mixed with SDS sample
loading buffer and loaded in duplicates into 9% SDS gel of 0.75 mm thickness. Electrophoresis
was performed for 1.5 h at 50 mA/gel and 100 V until proteins entered the separating gel. Then,
the voltage was increased to 130 V.
Following electrophoresis, gels were blotted on nitrocellulose membrane which was then blocked
as described previously in this section. The membrane was incubated in primary rabbit anti-DNP
antibody from the assay kit (1:500 in PBS-T) over night at 4 °C while gentle shaking. The
membrane was rinsed three times with 1× PBS-T buffer for 5 min each time. Thereafter, the
membrane was incubated in secondary anti-rabbit IgG HRP-conjugated antibody (1:2000 in PBS-
dialysis buffer 50 mM HEPES 1mM EDTA in bidest. water, stored at RT
Materials 53
T) for 1 h at 4 °C and then washed three times with 1× PBS-T buffer for 5 min each time. Proteins
on the membrane were detected using ECL-detection system as described above. Quantification
of the oxidized proteins was performed with ImageJ software and data is expressed as a ratio of
oxyblot lane average intensity and control (BSA positive control) band intensity. Data is expressed
as a fold-change from control values.
4.4. DNA analysis
4.4.1. Total genomic DNA isolation and quantitation
Total genomic DNA was isolated using Blood & Cell Culture DNA Mini Kit that enables mild
purification of stable and high molecular weight DNA. Samples of cultured cells were harvested
and prepared according to the manufacturer protocol for DNA isolation from tissue samples since
protocol for cultured cells includes steps which remove mitochondrial DNA. Quantitation of
isolated genomic DNA and PCR products, respectively, was performed using PicoGreen dye that
binds to dsDNA. DNA samples (2 µl) and standard (Lambda/HindIII DNA Digest) were diluted
in Milli-Q-water and loaded onto a black 96-well plate in duplicates. Lambda/HindIII DNA Digest
was used for generating a standard curve (1.25-20 ng/µl DNA) (Table 7) for determining
concentrations of samples. PicoGreen (5µl of reagent per milliliter of Milli-Q-water) was added
into each well with DNA and incubated 10 min at room temperature in the dark. Quantitation of
isolated DNA was performed to estimate the initial amount of DNA for preparing 100 ng DNA in
each sample. Fluorescence of the dye was measured using a plate reader with the 485 nm excitation
filter and 535 nm emission filter. Fluorescence readings (of the duplicate samples) were averaged
and blank value (from no-DNA control) was subtracted.
Tris-EDTA (TE) buffer 20× 200 mM Tris 20 mM EDTA in Milli-Q-water, autoclaved stored at RT
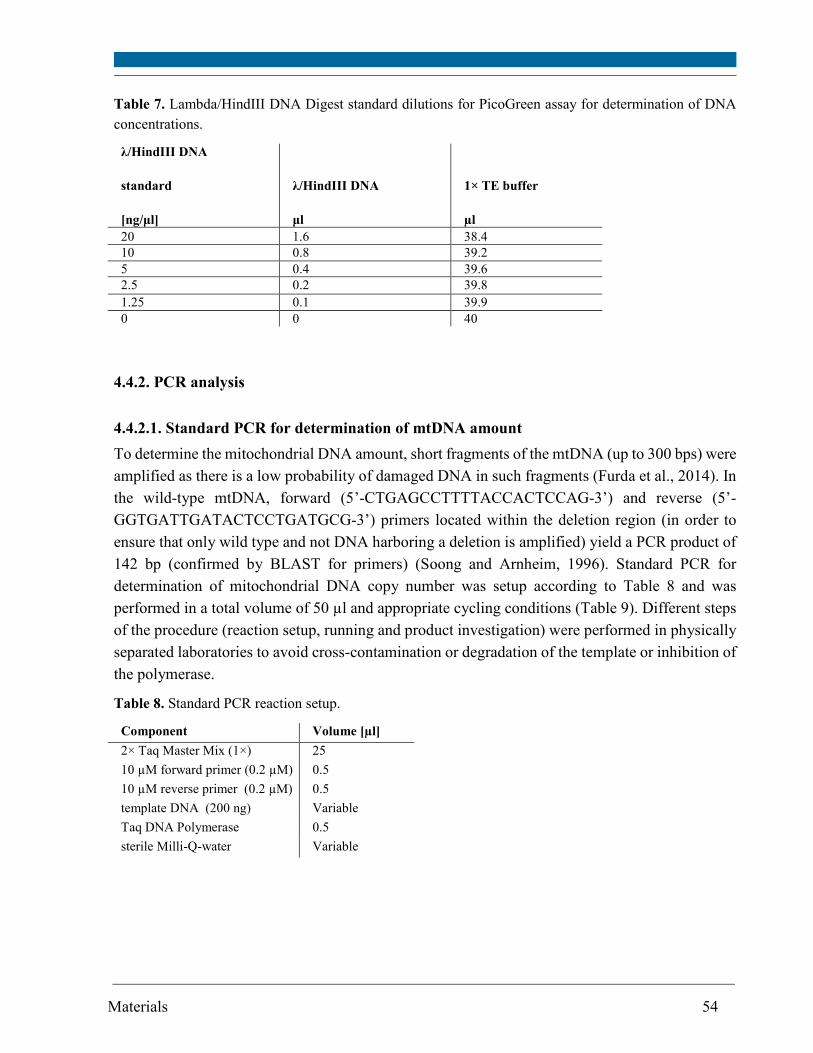
Materials 54
Table 7. Lambda/HindIII DNA Digest standard dilutions for PicoGreen assay for determination of DNA
concentrations.
λ/HindIII DNA
standard
[ng/μl]
λ/HindIII DNA
μl
1× TE buffer
µl
20 1.6 38.4 10 0.8 39.2 5 0.4 39.6 2.5 0.2 39.8 1.25 0.1 39.9 0 0 40
4.4.2. PCR analysis
4.4.2.1. Standard PCR for determination of mtDNA amount
To determine the mitochondrial DNA amount, short fragments of the mtDNA (up to 300 bps) were
amplified as there is a low probability of damaged DNA in such fragments (Furda et al., 2014). In
the wild-type mtDNA, forward (5’-CTGAGCCTTTTACCACTCCAG-3’) and reverse (5’-
GGTGATTGATACTCCTGATGCG-3’) primers located within the deletion region (in order to
ensure that only wild type and not DNA harboring a deletion is amplified) yield a PCR product of
142 bp (confirmed by BLAST for primers) (Soong and Arnheim, 1996). Standard PCR for
determination of mitochondrial DNA copy number was setup according to Table 8 and was
performed in a total volume of 50 µl and appropriate cycling conditions (Table 9). Different steps
of the procedure (reaction setup, running and product investigation) were performed in physically
separated laboratories to avoid cross-contamination or degradation of the template or inhibition of
the polymerase.
Table 8. Standard PCR reaction setup.
Component Volume [µl]
2× Taq Master Mix (1×) 25
10 µM forward primer (0.2 µM) 0.5
10 µM reverse primer (0.2 µM) 0.5
template DNA (200 ng) Variable
Taq DNA Polymerase 0.5
sterile Milli-Q-water Variable
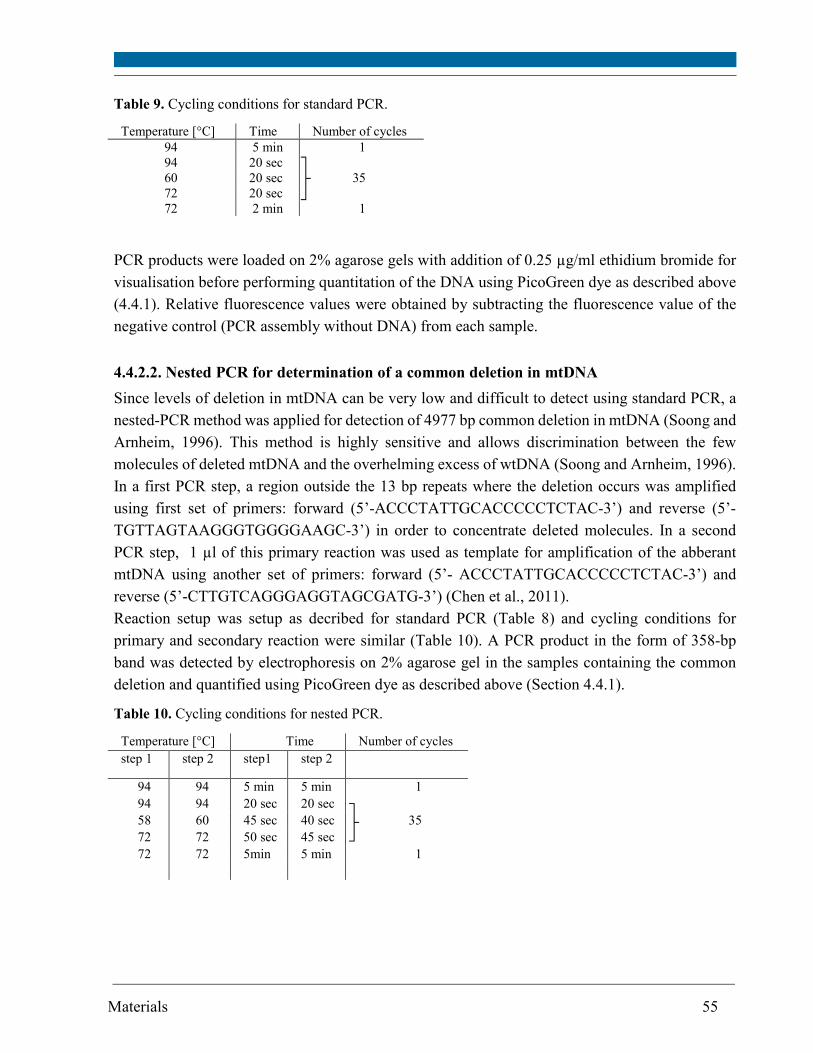
Materials 55
Table 9. Cycling conditions for standard PCR.
Temperature [°C] Time Number of cycles 94 5 min 1 94 20 sec 60 20 sec 35 72 20 sec 72 2 min 1
PCR products were loaded on 2% agarose gels with addition of 0.25 µg/ml ethidium bromide for
visualisation before performing quantitation of the DNA using PicoGreen dye as described above
(4.4.1). Relative fluorescence values were obtained by subtracting the fluorescence value of the
negative control (PCR assembly without DNA) from each sample.
4.4.2.2. Nested PCR for determination of a common deletion in mtDNA
Since levels of deletion in mtDNA can be very low and difficult to detect using standard PCR, a
nested-PCR method was applied for detection of 4977 bp common deletion in mtDNA (Soong and
Arnheim, 1996). This method is highly sensitive and allows discrimination between the few
molecules of deleted mtDNA and the overhelming excess of wtDNA (Soong and Arnheim, 1996).
In a first PCR step, a region outside the 13 bp repeats where the deletion occurs was amplified
using first set of primers: forward (5’-ACCCTATTGCACCCCCTCTAC-3’) and reverse (5’-
TGTTAGTAAGGGTGGGGAAGC-3’) in order to concentrate deleted molecules. In a second
PCR step, 1 µl of this primary reaction was used as template for amplification of the abberant
mtDNA using another set of primers: forward (5’- ACCCTATTGCACCCCCTCTAC-3’) and
reverse (5’-CTTGTCAGGGAGGTAGCGATG-3’) (Chen et al., 2011).
Reaction setup was setup as decribed for standard PCR (Table 8) and cycling conditions for
primary and secondary reaction were similar (Table 10). A PCR product in the form of 358-bp
band was detected by electrophoresis on 2% agarose gel in the samples containing the common
deletion and quantified using PicoGreen dye as described above (Section 4.4.1).
Table 10. Cycling conditions for nested PCR.
Temperature [°C] Time Number of cycles step 1 step 2 step1 step 2
94 94
94 94
5 min 20 sec
5 min 20 sec
1
58 60 45 sec 40 sec 35 72 72 50 sec 45 sec 72 72 5min 5 min 1
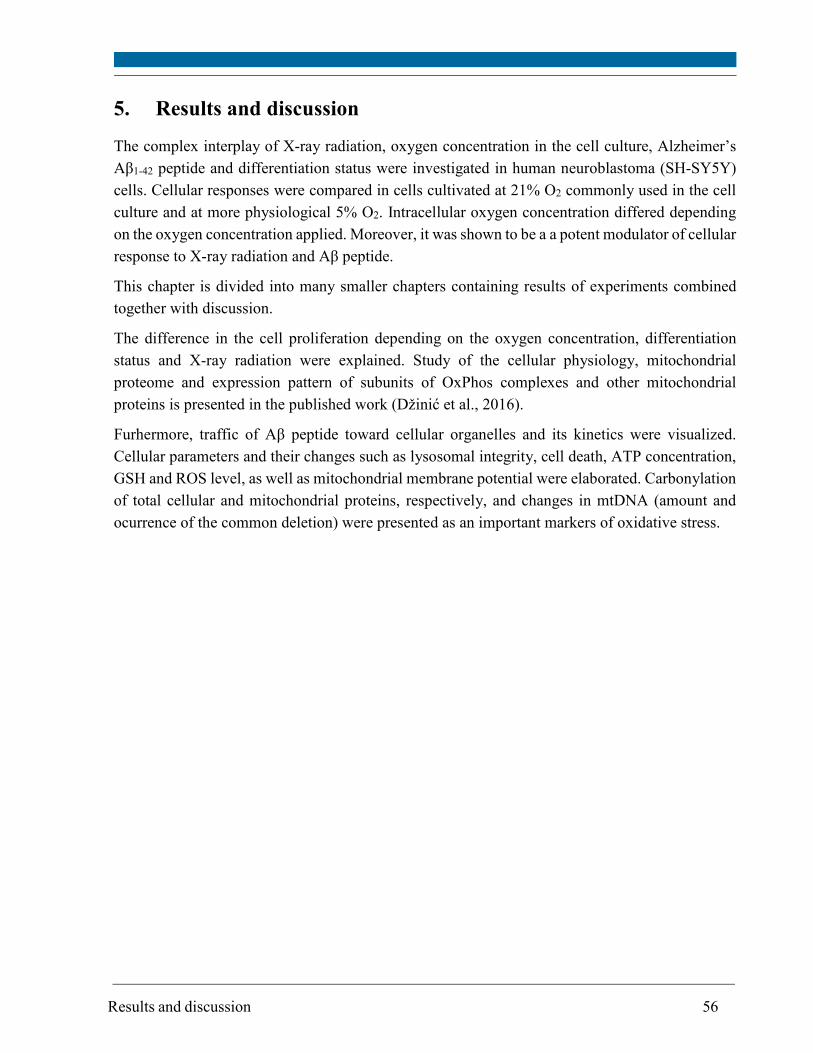
Results and discussion 56
5. Results and discussion
The complex interplay of X-ray radiation, oxygen concentration in the cell culture, Alzheimer’s
Aβ1-42 peptide and differentiation status were investigated in human neuroblastoma (SH-SY5Y)
cells. Cellular responses were compared in cells cultivated at 21% O2 commonly used in the cell
culture and at more physiological 5% O2. Intracellular oxygen concentration differed depending
on the oxygen concentration applied. Moreover, it was shown to be a a potent modulator of cellular
response to X-ray radiation and Aβ peptide.
This chapter is divided into many smaller chapters containing results of experiments combined
together with discussion.
The difference in the cell proliferation depending on the oxygen concentration, differentiation
status and X-ray radiation were explained. Study of the cellular physiology, mitochondrial
proteome and expression pattern of subunits of OxPhos complexes and other mitochondrial
proteins is presented in the published work (Džinić et al., 2016).
Furhermore, traffic of Aβ peptide toward cellular organelles and its kinetics were visualized.
Cellular parameters and their changes such as lysosomal integrity, cell death, ATP concentration,
GSH and ROS level, as well as mitochondrial membrane potential were elaborated. Carbonylation
of total cellular and mitochondrial proteins, respectively, and changes in mtDNA (amount and
ocurrence of the common deletion) were presented as an important markers of oxidative stress.
Results and discussion 57
5.1. Intracellular oxygen concentration
In order to determine the intracellular oxygen concentration in SH-SY5Y cells cultivated at two
different oxygen concentrations applied to the cell culture (21% and 5% O2, respectively) in
parallel, an oxygen sensitive probe loaded to cells overnight was used. The signal intensity
measured depends on the oxygen concentration present in cells since oxygen quenches the signal.
Cells were cultivated at least for 7 days before conducting measurements using fully confluent
cells. Values of the signal intensities were converted into oxygen scale (Chapter 4.2.1). SH-SY5Y
cells cultivated at 21% O2 (blue dots) had about 10.5% O2, whereas cells cultivated at 5% O2 (red
Parts of chapters 5.4, 5.6, 5.9, 5.10 and 5.11 are published:
Džinić T, Hartwig S, Lehr S, Dencher NA. (2016). Oxygen and differentiation status modulate
the effect of X-ray irradiation on physiology and mitochondrial proteome of human
neuroblastoma cells. Arch. Physiol. Biochem., 122: 257-265.
Data described in chapters 5.3, 5.5, 5.6, 5.7, 5.8, 5.12, 5.13 and 5.14 are part of a manuscript
submitted in March 2017:
Džinić T, Dencher NA. (2017). Oxygen concentration and oxidative stress modulate the
influence of Alzheimer’s disease Aβ1-42 peptide on human neuroblastoma cells.
Abstract
Reactive oxygen species (ROS) generated e.g. after exposure to ionizing radiation (IR), toxic
peptides as well as by mitochondrial metabolism and during aging contribute to damage of
cell’s structural and functional components and can lead to diseases. Monomers and small
oligomers of amyloid beta (Aβ) peptide, one of the players in Alzheimer’s disease (AD), and
their intriguing mechanisms of action are recently thought to be involved in damage of neurons,
instead of extracellular Aß plaques. We demonstrate that externally applied disaggregated Aβ1-
42 peptide interacts with SH-SY5Y cells, preferentially with acidic compartments (lysosomes).
Oxygen concentration in the cell culture (5% versus 21%) and oxidative stress caused by IR
modulate responses of differentiated SH-SY5Y cells to treatment with Aβ peptide. Cells did
not exhibit dramatic increase in ROS and change in glutathione (GSH) level upon 4 µM Aβ
peptide treatment, whereas exposure to 2 Gy X-rays increased ROS and changed GSH level
and ATP concentration. Occurrence of the 4977 bp deletion in mtDNA and significant protein
carbonlyation were specific effects of ionizing radiation and more pronounced at 21% O2.
Increase in cell death after Aβ peptide treatment or irradiation was unexpectedly restored to the
control level or below when both Aβ peptide and irradiation were combined, particularly at 5%
O2. Therefore, Aβ peptide at low concentration can trigger neuroprotective mechanisms in cells
exposed to ionizing radiation.
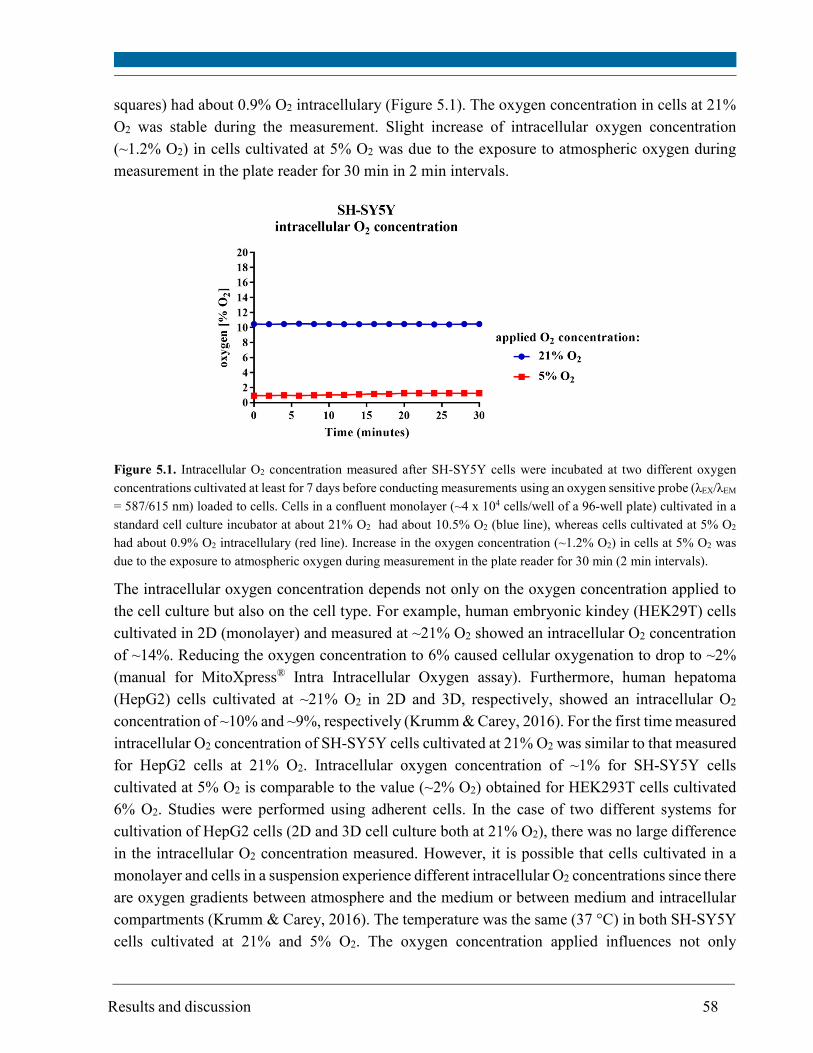
Results and discussion 58
squares) had about 0.9% O2 intracellulary (Figure 5.1). The oxygen concentration in cells at 21%
O2 was stable during the measurement. Slight increase of intracellular oxygen concentration
(~1.2% O2) in cells cultivated at 5% O2 was due to the exposure to atmospheric oxygen during
measurement in the plate reader for 30 min in 2 min intervals.
Figure 5.1. Intracellular O2 concentration measured after SH-SY5Y cells were incubated at two different oxygen
concentrations cultivated at least for 7 days before conducting measurements using an oxygen sensitive probe (λEX/λEM
= 587/615 nm) loaded to cells. Cells in a confluent monolayer (~4 x 10⁴ cells/well of a 96-well plate) cultivated in a
standard cell culture incubator at about 21% O2 had about 10.5% O2 (blue line), whereas cells cultivated at 5% O2
had about 0.9% O2 intracellulary (red line). Increase in the oxygen concentration (~1.2% O2) in cells at 5% O2 was
due to the exposure to atmospheric oxygen during measurement in the plate reader for 30 min (2 min intervals).
The intracellular oxygen concentration depends not only on the oxygen concentration applied to
the cell culture but also on the cell type. For example, human embryonic kindey (HEK29T) cells
cultivated in 2D (monolayer) and measured at ~21% O2 showed an intracellular O2 concentration
of ~14%. Reducing the oxygen concentration to 6% caused cellular oxygenation to drop to ~2%
(manual for MitoXpress® Intra Intracellular Oxygen assay). Furthermore, human hepatoma
(HepG2) cells cultivated at ~21% O2 in 2D and 3D, respectively, showed an intracellular O2
concentration of ~10% and ~9%, respectively (Krumm & Carey, 2016). For the first time measured
intracellular O2 concentration of SH-SY5Y cells cultivated at 21% O2 was similar to that measured
for HepG2 cells at 21% O2. Intracellular oxygen concentration of ~1% for SH-SY5Y cells
cultivated at 5% O2 is comparable to the value (~2% O2) obtained for HEK293T cells cultivated
6% O2. Studies were performed using adherent cells. In the case of two different systems for
cultivation of HepG2 cells (2D and 3D cell culture both at 21% O2), there was no large difference
in the intracellular O2 concentration measured. However, it is possible that cells cultivated in a
monolayer and cells in a suspension experience different intracellular O2 concentrations since there
are oxygen gradients between atmosphere and the medium or between medium and intracellular
compartments (Krumm & Carey, 2016). The temperature was the same (37 °C) in both SH-SY5Y
cells cultivated at 21% and 5% O2. The oxygen concentration applied influences not only
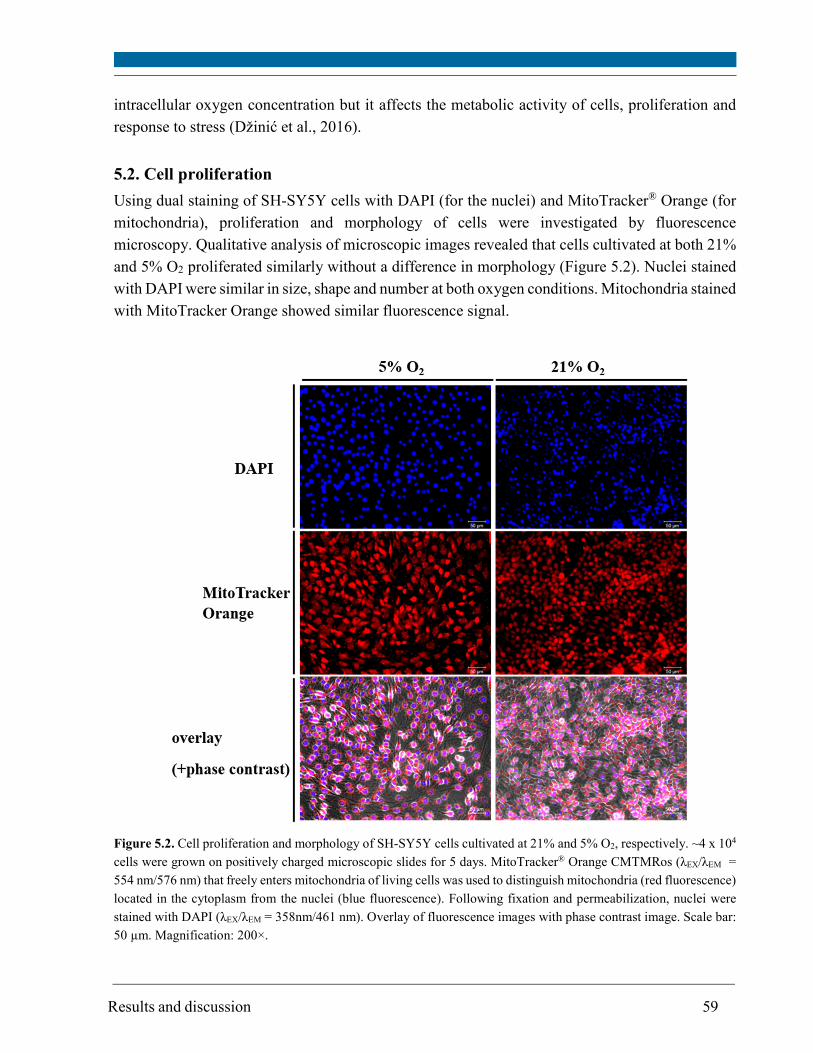
Results and discussion 59
intracellular oxygen concentration but it affects the metabolic activity of cells, proliferation and
response to stress (Džinić et al., 2016).
5.2. Cell proliferation
Using dual staining of SH-SY5Y cells with DAPI (for the nuclei) and MitoTracker® Orange (for
mitochondria), proliferation and morphology of cells were investigated by fluorescence
microscopy. Qualitative analysis of microscopic images revealed that cells cultivated at both 21%
and 5% O2 proliferated similarly without a difference in morphology (Figure 5.2). Nuclei stained
with DAPI were similar in size, shape and number at both oxygen conditions. Mitochondria stained
with MitoTracker Orange showed similar fluorescence signal.
Figure 5.2. Cell proliferation and morphology of SH-SY5Y cells cultivated at 21% and 5% O2, respectively. ~4 x 10⁴
cells were grown on positively charged microscopic slides for 5 days. MitoTracker® Orange CMTMRos (λEX/λEM =
554 nm/576 nm) that freely enters mitochondria of living cells was used to distinguish mitochondria (red fluorescence)
located in the cytoplasm from the nuclei (blue fluorescence). Following fixation and permeabilization, nuclei were
stained with DAPI (λEX/λEM = 358nm/461 nm). Overlay of fluorescence images with phase contrast image. Scale bar:
50 µm. Magnification: 200×.
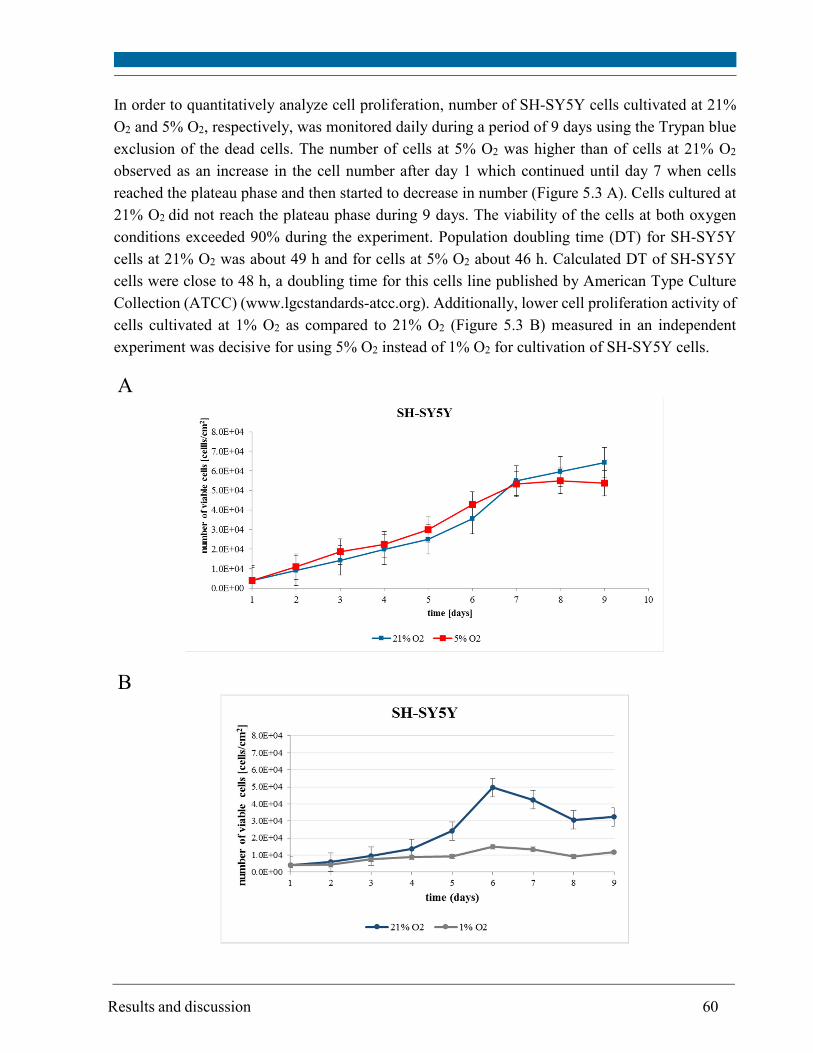
Results and discussion 60
In order to quantitatively analyze cell proliferation, number of SH-SY5Y cells cultivated at 21%
O2 and 5% O2, respectively, was monitored daily during a period of 9 days using the Trypan blue
exclusion of the dead cells. The number of cells at 5% O2 was higher than of cells at 21% O2
observed as an increase in the cell number after day 1 which continued until day 7 when cells
reached the plateau phase and then started to decrease in number (Figure 5.3 A). Cells cultured at
21% O2 did not reach the plateau phase during 9 days. The viability of the cells at both oxygen
conditions exceeded 90% during the experiment. Population doubling time (DT) for SH-SY5Y
cells at 21% O2 was about 49 h and for cells at 5% O2 about 46 h. Calculated DT of SH-SY5Y
cells were close to 48 h, a doubling time for this cells line published by American Type Culture
Collection (ATCC) (www.lgcstandards-atcc.org). Additionally, lower cell proliferation activity of
cells cultivated at 1% O2 as compared to 21% O2 (Figure 5.3 B) measured in an independent
experiment was decisive for using 5% O2 instead of 1% O2 for cultivation of SH-SY5Y cells.
A
B
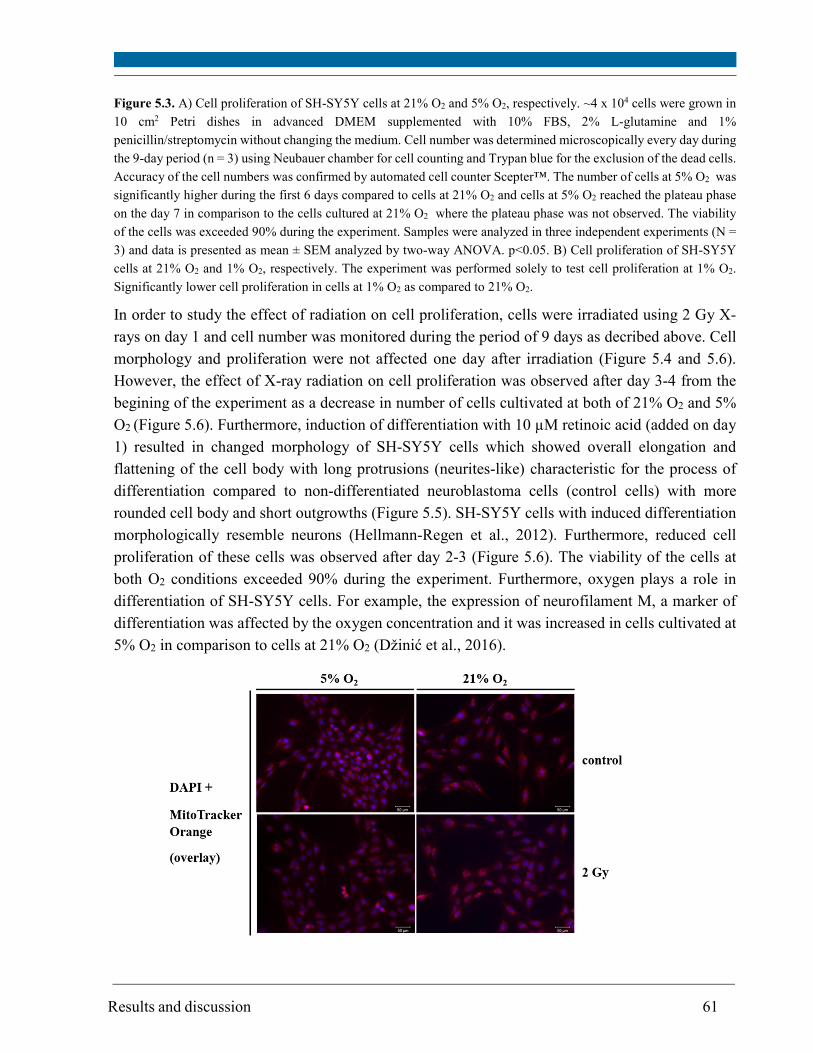
Results and discussion 61
Figure 5.3. A) Cell proliferation of SH-SY5Y cells at 21% O2 and 5% O2, respectively. ~4 x 10⁴ cells were grown in
10 cm2 Petri dishes in advanced DMEM supplemented with 10% FBS, 2% L-glutamine and 1%
penicillin/streptomycin without changing the medium. Cell number was determined microscopically every day during
the 9-day period (n = 3) using Neubauer chamber for cell counting and Trypan blue for the exclusion of the dead cells.
Accuracy of the cell numbers was confirmed by automated cell counter Scepter™. The number of cells at 5% O2 was
significantly higher during the first 6 days compared to cells at 21% O2 and cells at 5% O2 reached the plateau phase
on the day 7 in comparison to the cells cultured at 21% O2 where the plateau phase was not observed. The viability
of the cells was exceeded 90% during the experiment. Samples were analyzed in three independent experiments (N =
3) and data is presented as mean ± SEM analyzed by two-way ANOVA. p<0.05. B) Cell proliferation of SH-SY5Y
cells at 21% O2 and 1% O2, respectively. The experiment was performed solely to test cell proliferation at 1% O2.
Significantly lower cell proliferation in cells at 1% O2 as compared to 21% O2.
In order to study the effect of radiation on cell proliferation, cells were irradiated using 2 Gy X-
rays on day 1 and cell number was monitored during the period of 9 days as decribed above. Cell
morphology and proliferation were not affected one day after irradiation (Figure 5.4 and 5.6).
However, the effect of X-ray radiation on cell proliferation was observed after day 3-4 from the
begining of the experiment as a decrease in number of cells cultivated at both of 21% O2 and 5%
O2 (Figure 5.6). Furthermore, induction of differentiation with 10 µM retinoic acid (added on day
1) resulted in changed morphology of SH-SY5Y cells which showed overall elongation and
flattening of the cell body with long protrusions (neurites-like) characteristic for the process of
differentiation compared to non-differentiated neuroblastoma cells (control cells) with more
rounded cell body and short outgrowths (Figure 5.5). SH-SY5Y cells with induced differentiation
morphologically resemble neurons (Hellmann-Regen et al., 2012). Furthermore, reduced cell
proliferation of these cells was observed after day 2-3 (Figure 5.6). The viability of the cells at
both O2 conditions exceeded 90% during the experiment. Furthermore, oxygen plays a role in
differentiation of SH-SY5Y cells. For example, the expression of neurofilament M, a marker of
differentiation was affected by the oxygen concentration and it was increased in cells cultivated at
5% O2 in comparison to cells at 21% O2 (Džinić et al., 2016).
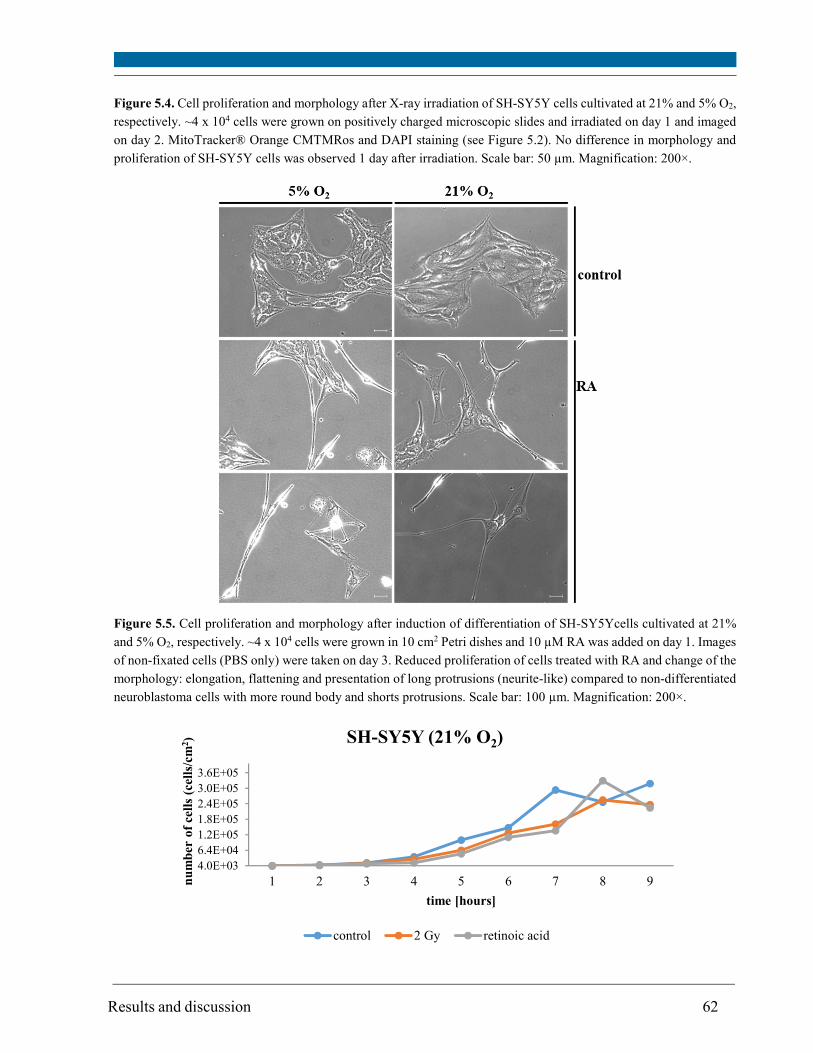
Results and discussion 62
Figure 5.4. Cell proliferation and morphology after X-ray irradiation of SH-SY5Y cells cultivated at 21% and 5% O2,
respectively. ~4 x 10⁴ cells were grown on positively charged microscopic slides and irradiated on day 1 and imaged
on day 2. MitoTracker® Orange CMTMRos and DAPI staining (see Figure 5.2). No difference in morphology and
proliferation of SH-SY5Y cells was observed 1 day after irradiation. Scale bar: 50 µm. Magnification: 200×.
Figure 5.5. Cell proliferation and morphology after induction of differentiation of SH-SY5Ycells cultivated at 21%
and 5% O2, respectively. ~4 x 10⁴ cells were grown in 10 cm2 Petri dishes and 10 µM RA was added on day 1. Images
of non-fixated cells (PBS only) were taken on day 3. Reduced proliferation of cells treated with RA and change of the
morphology: elongation, flattening and presentation of long protrusions (neurite-like) compared to non-differentiated
neuroblastoma cells with more round body and shorts protrusions. Scale bar: 100 µm. Magnification: 200×.
4.0E+036.4E+041.2E+051.8E+052.4E+053.0E+053.6E+05
1 2 3 4 5 6 7 8 9nu
mb
er o
f ce
lls
(cel
ls/c
m2)
time [hours]
SH-SY5Y (21% O2)
control 2 Gy retinoic acid
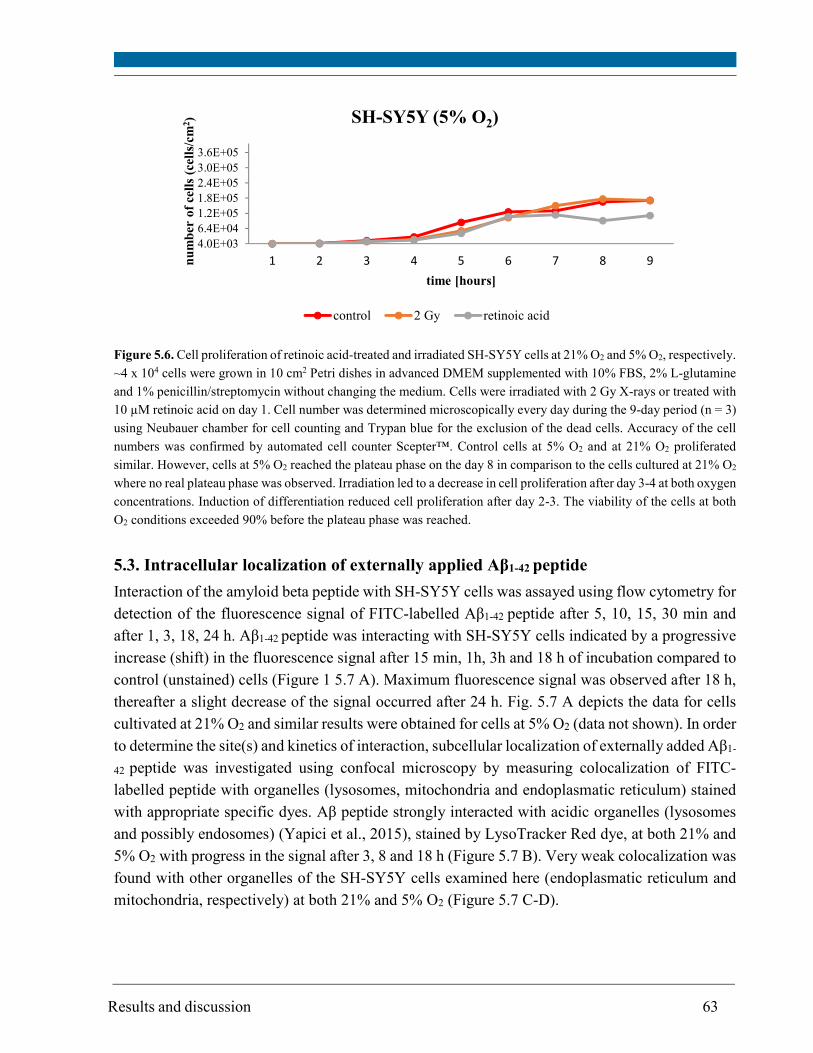
Results and discussion 63
Figure 5.6. Cell proliferation of retinoic acid-treated and irradiated SH-SY5Y cells at 21% O2 and 5% O2, respectively.
~4 x 10⁴ cells were grown in 10 cm2 Petri dishes in advanced DMEM supplemented with 10% FBS, 2% L-glutamine
and 1% penicillin/streptomycin without changing the medium. Cells were irradiated with 2 Gy X-rays or treated with
10 µM retinoic acid on day 1. Cell number was determined microscopically every day during the 9-day period (n = 3)
using Neubauer chamber for cell counting and Trypan blue for the exclusion of the dead cells. Accuracy of the cell
numbers was confirmed by automated cell counter Scepter™. Control cells at 5% O2 and at 21% O2 proliferated
similar. However, cells at 5% O2 reached the plateau phase on the day 8 in comparison to the cells cultured at 21% O2
where no real plateau phase was observed. Irradiation led to a decrease in cell proliferation after day 3-4 at both oxygen
concentrations. Induction of differentiation reduced cell proliferation after day 2-3. The viability of the cells at both
O2 conditions exceeded 90% before the plateau phase was reached.
5.3. Intracellular localization of externally applied Aβ1-42 peptide
Interaction of the amyloid beta peptide with SH-SY5Y cells was assayed using flow cytometry for
detection of the fluorescence signal of FITC-labelled Aβ1-42 peptide after 5, 10, 15, 30 min and
after 1, 3, 18, 24 h. Aβ1-42 peptide was interacting with SH-SY5Y cells indicated by a progressive
increase (shift) in the fluorescence signal after 15 min, 1h, 3h and 18 h of incubation compared to
control (unstained) cells (Figure 1 5.7 A). Maximum fluorescence signal was observed after 18 h,
thereafter a slight decrease of the signal occurred after 24 h. Fig. 5.7 A depicts the data for cells
cultivated at 21% O2 and similar results were obtained for cells at 5% O2 (data not shown). In order
to determine the site(s) and kinetics of interaction, subcellular localization of externally added Aβ1-
42 peptide was investigated using confocal microscopy by measuring colocalization of FITC-
labelled peptide with organelles (lysosomes, mitochondria and endoplasmatic reticulum) stained
with appropriate specific dyes. Aβ peptide strongly interacted with acidic organelles (lysosomes
and possibly endosomes) (Yapici et al., 2015), stained by LysoTracker Red dye, at both 21% and
5% O2 with progress in the signal after 3, 8 and 18 h (Figure 5.7 B). Very weak colocalization was
found with other organelles of the SH-SY5Y cells examined here (endoplasmatic reticulum and
mitochondria, respectively) at both 21% and 5% O2 (Figure 5.7 C-D).
4.0E+036.4E+041.2E+051.8E+052.4E+053.0E+053.6E+05
1 2 3 4 5 6 7 8 9nu
mb
er o
f ce
lls
(cel
ls/c
m2)
time [hours]
SH-SY5Y (5% O2)
control 2 Gy retinoic acid
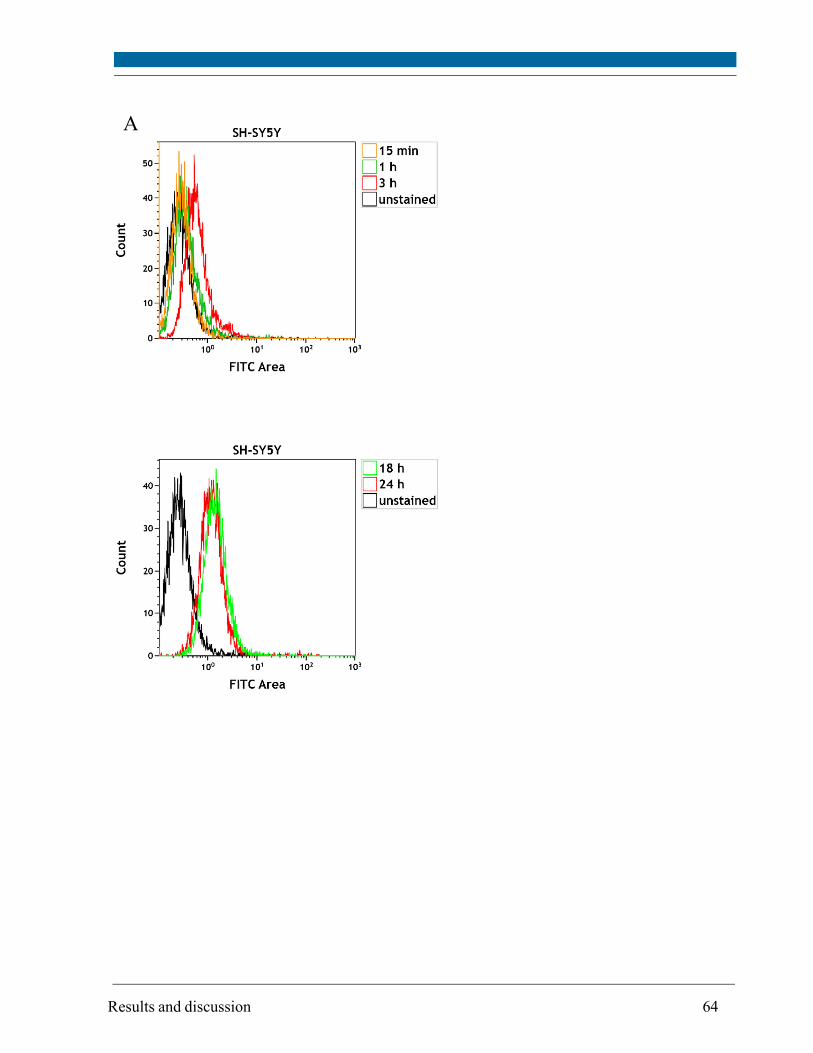
Results and discussion 64
A
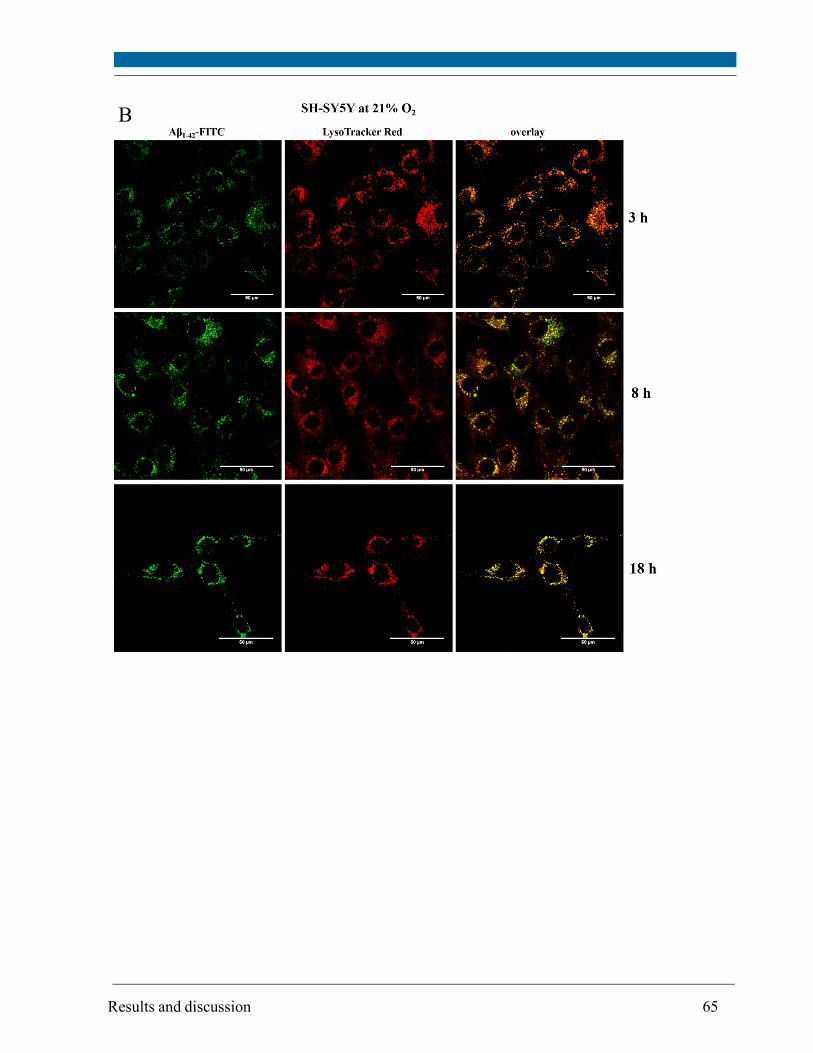
Results and discussion 65
B
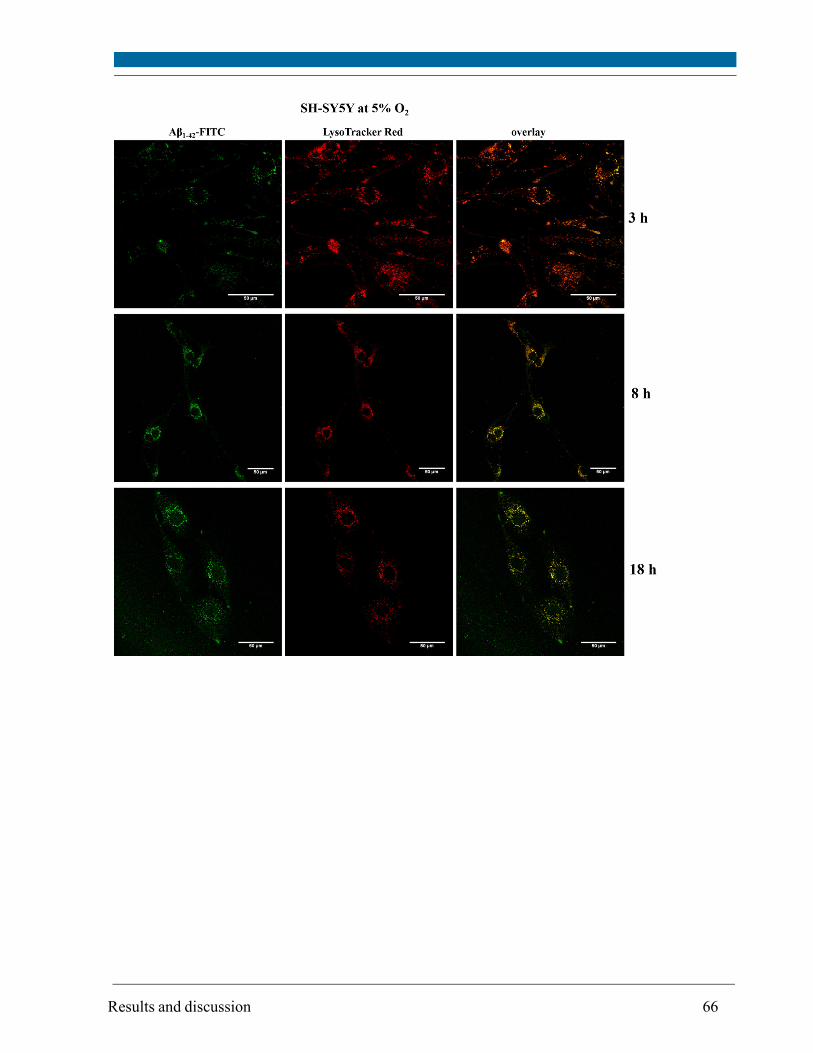
Results and discussion 66
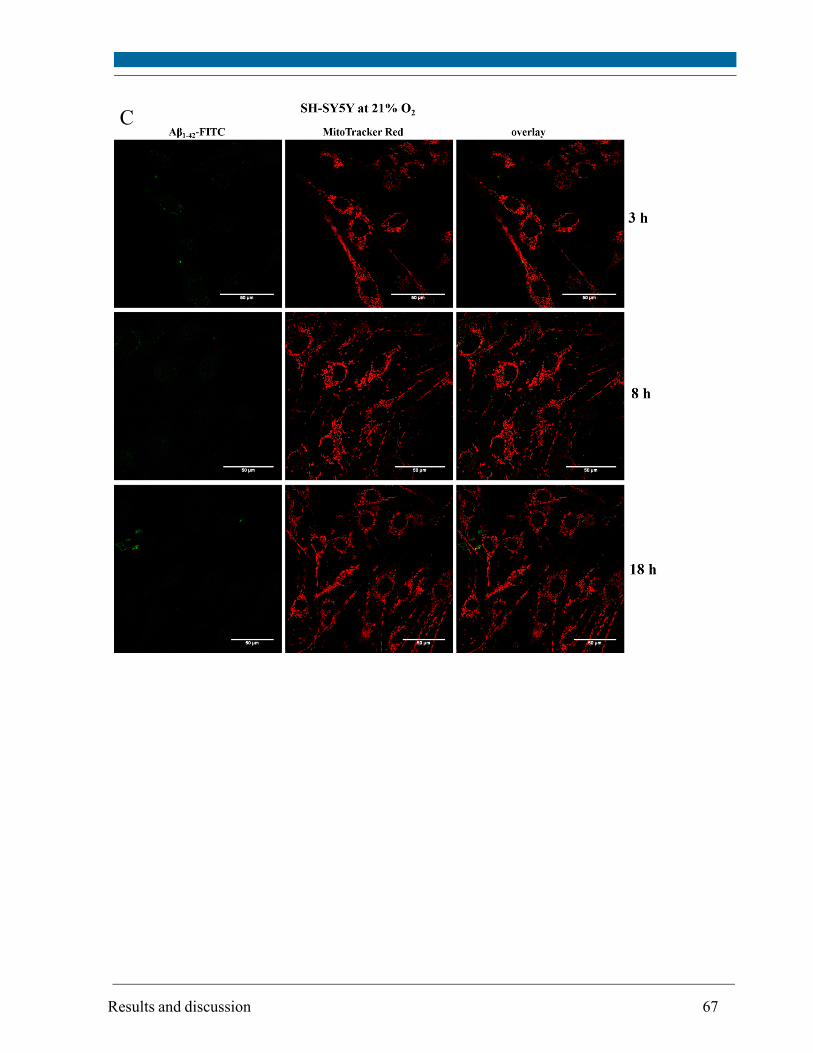
Results and discussion 67
C
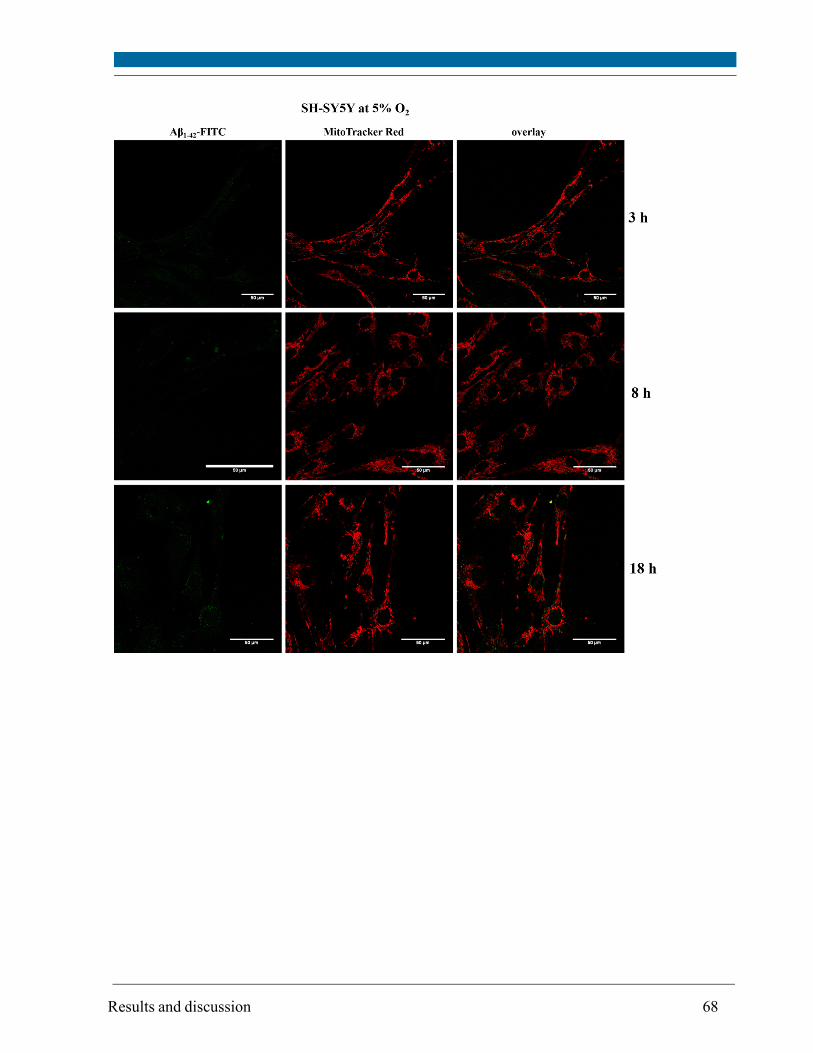
Results and discussion 68
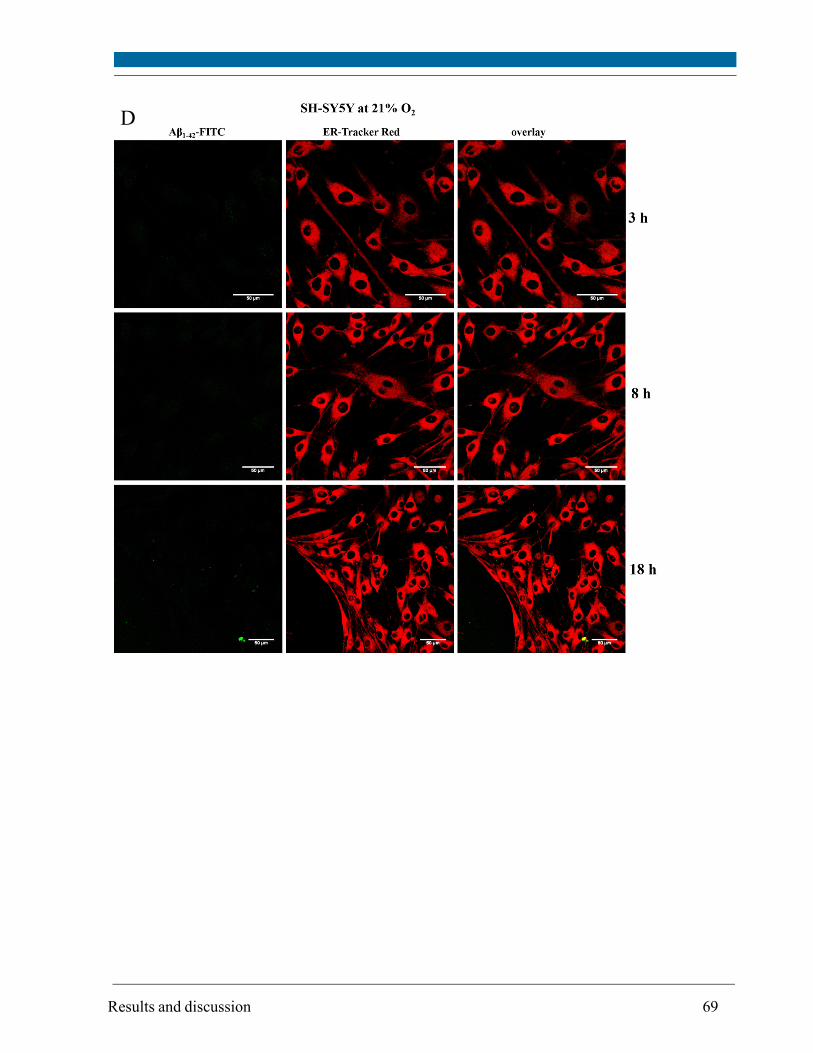
Results and discussion 69
D
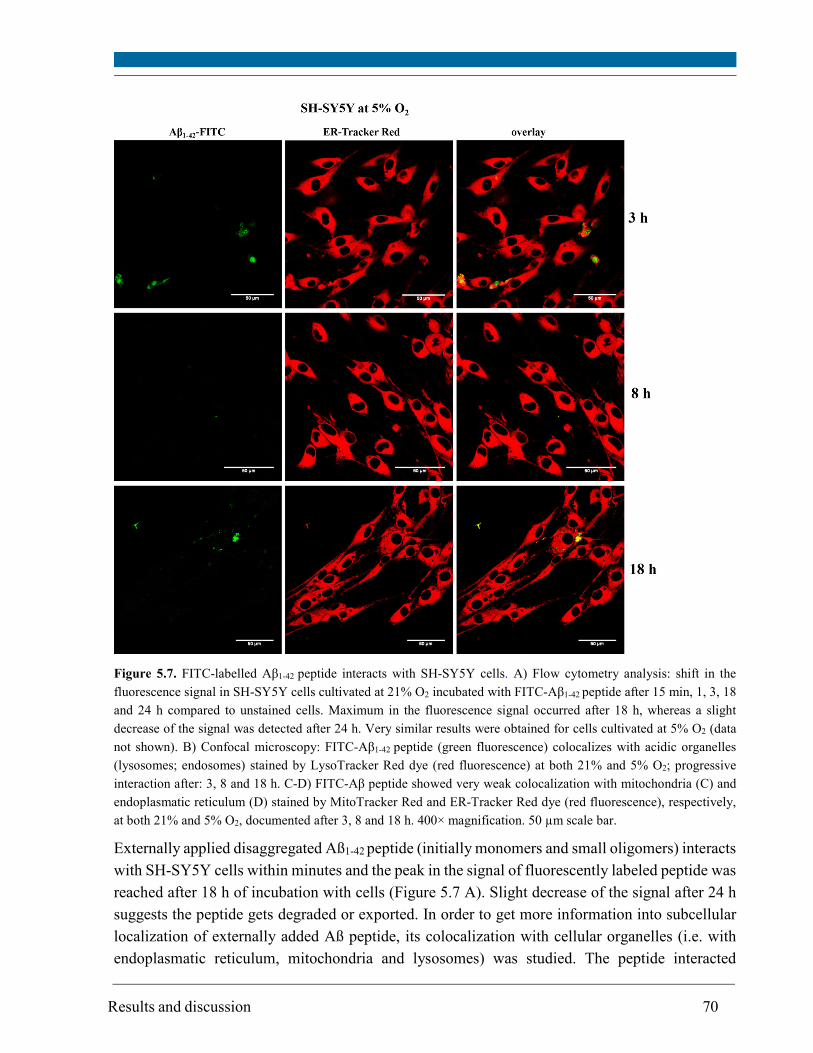
Results and discussion 70
Figure 5.7. FITC-labelled Aβ1-42 peptide interacts with SH-SY5Y cells. A) Flow cytometry analysis: shift in the
fluorescence signal in SH-SY5Y cells cultivated at 21% O2 incubated with FITC-Aβ1-42 peptide after 15 min, 1, 3, 18
and 24 h compared to unstained cells. Maximum in the fluorescence signal occurred after 18 h, whereas a slight
decrease of the signal was detected after 24 h. Very similar results were obtained for cells cultivated at 5% O2 (data
not shown). B) Confocal microscopy: FITC-Aβ1-42 peptide (green fluorescence) colocalizes with acidic organelles
(lysosomes; endosomes) stained by LysoTracker Red dye (red fluorescence) at both 21% and 5% O2; progressive
interaction after: 3, 8 and 18 h. C-D) FITC-Aβ peptide showed very weak colocalization with mitochondria (C) and
endoplasmatic reticulum (D) stained by MitoTracker Red and ER-Tracker Red dye (red fluorescence), respectively,
at both 21% and 5% O2, documented after 3, 8 and 18 h. 400× magnification. 50 µm scale bar.
Externally applied disaggregated Aß1-42 peptide (initially monomers and small oligomers) interacts
with SH-SY5Y cells within minutes and the peak in the signal of fluorescently labeled peptide was
reached after 18 h of incubation with cells (Figure 5.7 A). Slight decrease of the signal after 24 h
suggests the peptide gets degraded or exported. In order to get more information into subcellular
localization of externally added Aß peptide, its colocalization with cellular organelles (i.e. with
endoplasmatic reticulum, mitochondria and lysosomes) was studied. The peptide interacted
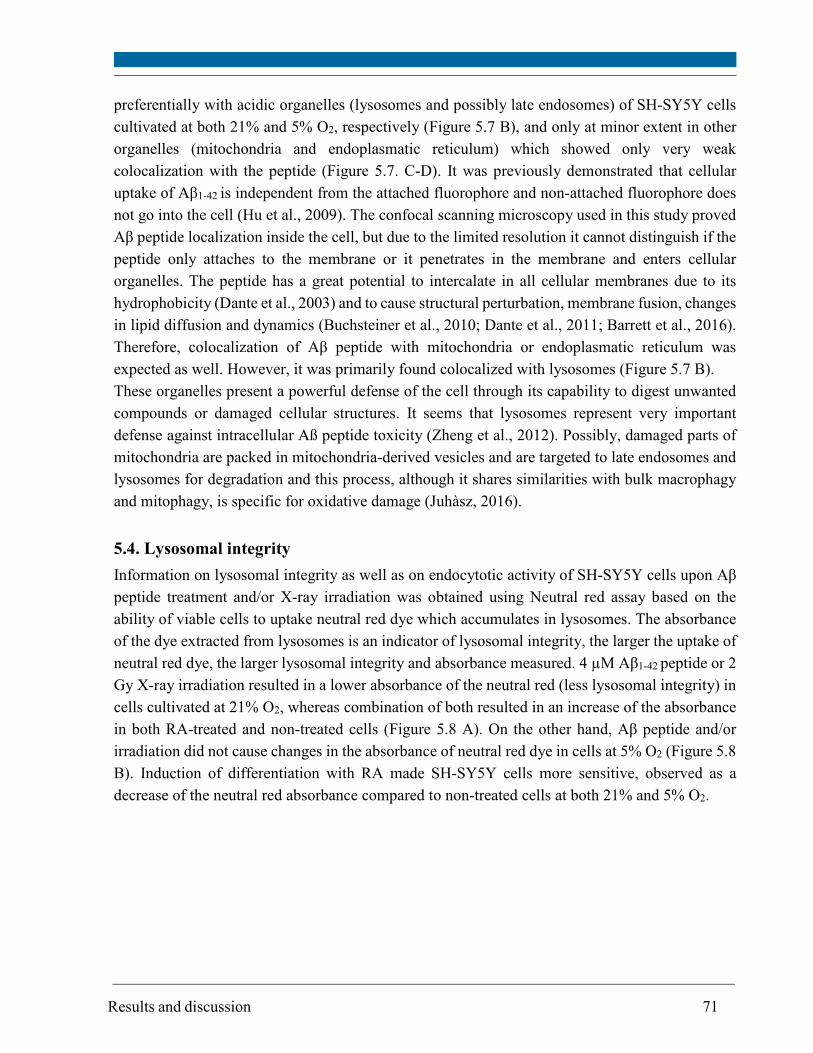
Results and discussion 71
preferentially with acidic organelles (lysosomes and possibly late endosomes) of SH-SY5Y cells
cultivated at both 21% and 5% O2, respectively (Figure 5.7 B), and only at minor extent in other
organelles (mitochondria and endoplasmatic reticulum) which showed only very weak
colocalization with the peptide (Figure 5.7. C-D). It was previously demonstrated that cellular
uptake of Aβ1-42 is independent from the attached fluorophore and non-attached fluorophore does
not go into the cell (Hu et al., 2009). The confocal scanning microscopy used in this study proved
Aβ peptide localization inside the cell, but due to the limited resolution it cannot distinguish if the
peptide only attaches to the membrane or it penetrates in the membrane and enters cellular
organelles. The peptide has a great potential to intercalate in all cellular membranes due to its
hydrophobicity (Dante et al., 2003) and to cause structural perturbation, membrane fusion, changes
in lipid diffusion and dynamics (Buchsteiner et al., 2010; Dante et al., 2011; Barrett et al., 2016).
Therefore, colocalization of Aβ peptide with mitochondria or endoplasmatic reticulum was
expected as well. However, it was primarily found colocalized with lysosomes (Figure 5.7 B).
These organelles present a powerful defense of the cell through its capability to digest unwanted
compounds or damaged cellular structures. It seems that lysosomes represent very important
defense against intracellular Aß peptide toxicity (Zheng et al., 2012). Possibly, damaged parts of
mitochondria are packed in mitochondria-derived vesicles and are targeted to late endosomes and
lysosomes for degradation and this process, although it shares similarities with bulk macrophagy
and mitophagy, is specific for oxidative damage (Juhàsz, 2016).
5.4. Lysosomal integrity
Information on lysosomal integrity as well as on endocytotic activity of SH-SY5Y cells upon Aβ
peptide treatment and/or X-ray irradiation was obtained using Neutral red assay based on the
ability of viable cells to uptake neutral red dye which accumulates in lysosomes. The absorbance
of the dye extracted from lysosomes is an indicator of lysosomal integrity, the larger the uptake of
neutral red dye, the larger lysosomal integrity and absorbance measured. 4 µM Aβ1-42 peptide or 2
Gy X-ray irradiation resulted in a lower absorbance of the neutral red (less lysosomal integrity) in
cells cultivated at 21% O2, whereas combination of both resulted in an increase of the absorbance
in both RA-treated and non-treated cells (Figure 5.8 A). On the other hand, Aβ peptide and/or
irradiation did not cause changes in the absorbance of neutral red dye in cells at 5% O2 (Figure 5.8
B). Induction of differentiation with RA made SH-SY5Y cells more sensitive, observed as a
decrease of the neutral red absorbance compared to non-treated cells at both 21% and 5% O2.
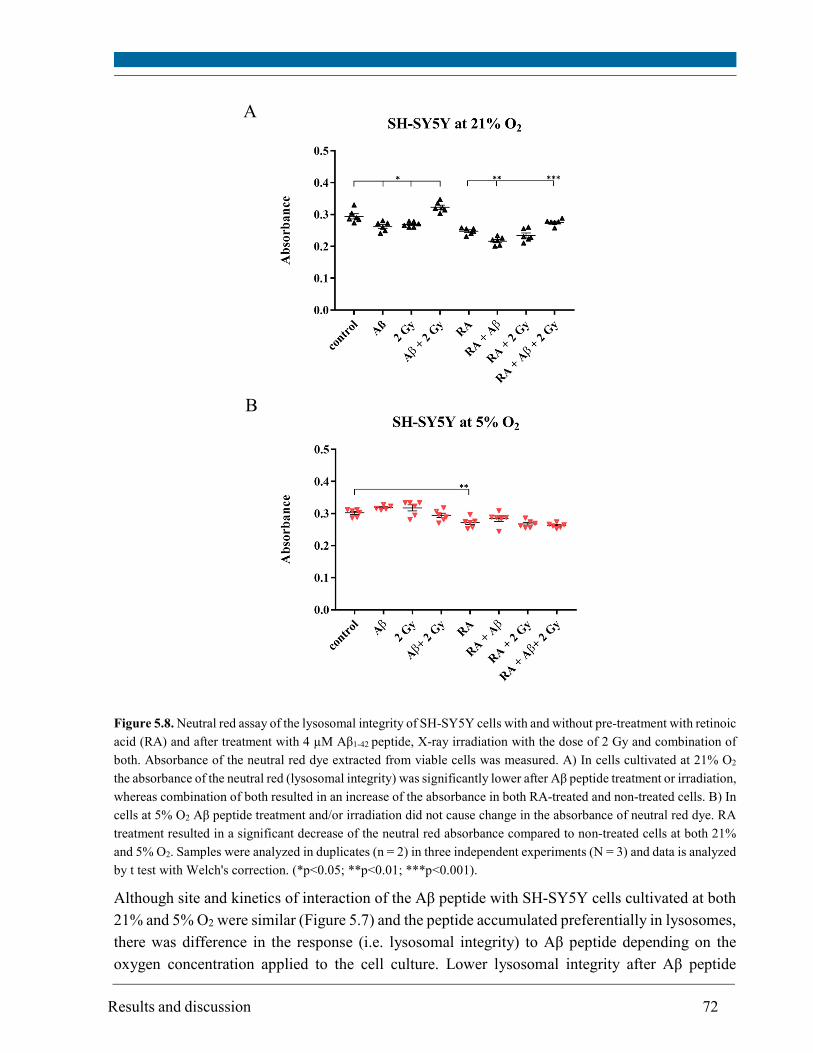
Results and discussion 72
Figure 5.8. Neutral red assay of the lysosomal integrity of SH-SY5Y cells with and without pre-treatment with retinoic
acid (RA) and after treatment with 4 µM Aβ1-42 peptide, X-ray irradiation with the dose of 2 Gy and combination of
both. Absorbance of the neutral red dye extracted from viable cells was measured. A) In cells cultivated at 21% O2
the absorbance of the neutral red (lysosomal integrity) was significantly lower after Aβ peptide treatment or irradiation,
whereas combination of both resulted in an increase of the absorbance in both RA-treated and non-treated cells. B) In
cells at 5% O2 Aβ peptide treatment and/or irradiation did not cause change in the absorbance of neutral red dye. RA
treatment resulted in a significant decrease of the neutral red absorbance compared to non-treated cells at both 21%
and 5% O2. Samples were analyzed in duplicates (n = 2) in three independent experiments (N = 3) and data is analyzed
by t test with Welch's correction. (*p<0.05; **p<0.01; ***p<0.001).
Although site and kinetics of interaction of the Aβ peptide with SH-SY5Y cells cultivated at both
21% and 5% O2 were similar (Figure 5.7) and the peptide accumulated preferentially in lysosomes,
there was difference in the response (i.e. lysosomal integrity) to Aβ peptide depending on the
oxygen concentration applied to the cell culture. Lower lysosomal integrity after Aβ peptide
A
B
Results and discussion 73
treatment or irradiation of SH-SY5Y cells cultivated at 21% O2 suggests that cultivation at non-
physiological oxygen concentration makes cells more susceptible to oxidative stress in comparison
to cells cultivated at 5% O2. Interestingly, combination of Aβ peptide and radiation resulted in an
increased lysosomal integrity, but solely in cells cultivated at 21% O2, in both retinoic-acid treated
and non-treated cells. This is in line with already published data which show that oxygen
concentration modulates cellular response to stress (Tiede et al., 2011; Džinić et al., 2016). General
decline of lysosomal integrity was observed in RA-treated cells compared to non-treated cells at
both 21% and 5% O2, which indicates that differentiation status of cells is another important factor
in response to stress.
5.5. Cell death
In order to determine the level of cell death (apoptosis and necrosis) after treatment of SH-SY5Y
cells with externally applied disaggregated Aβ1-42 peptide and/or X-ray irradiation, Annexin V-
FITC, for detection of apoptotic cells, together with propidium iodide (PI) staining, for detection
of late apoptotic and necrotic cells, was used. Qualitative analysis of the cell death was performed
using microscopy for visualization of the fluorescence signal (Figure 5.9). In this assay, non-
differentiated SH-SY5Y cells were analyzed.
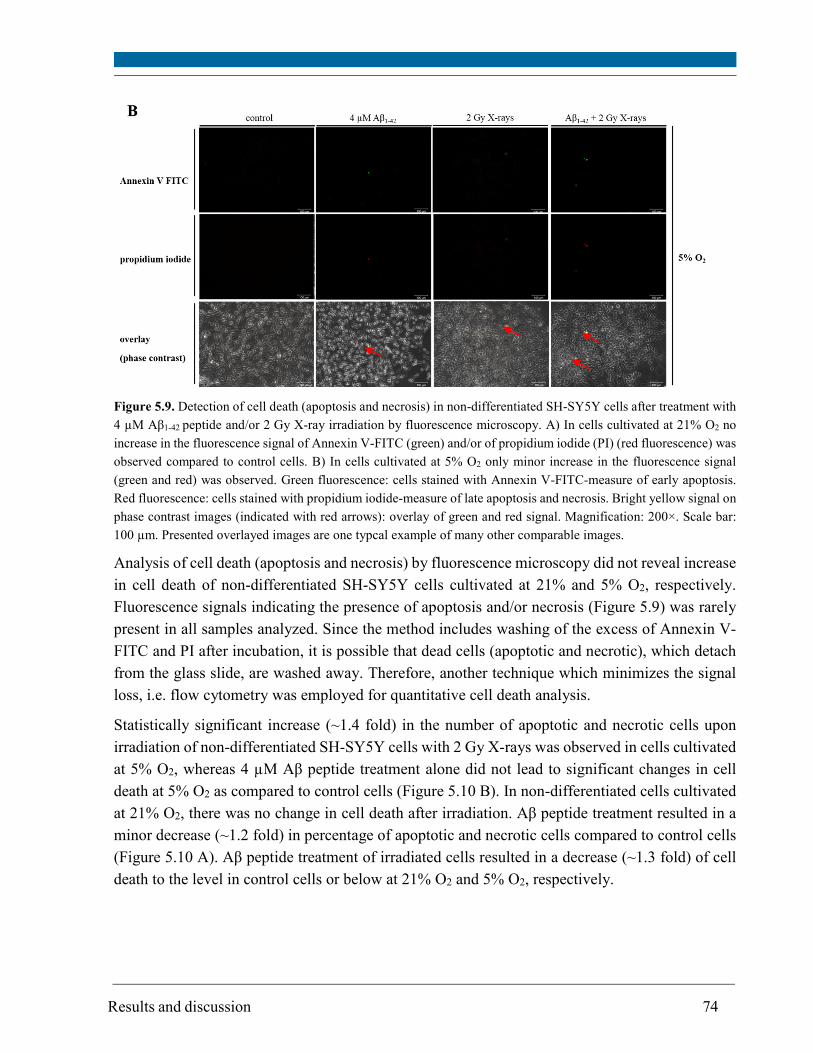
Results and discussion 74
Figure 5.9. Detection of cell death (apoptosis and necrosis) in non-differentiated SH-SY5Y cells after treatment with
4 µM Aβ1-42 peptide and/or 2 Gy X-ray irradiation by fluorescence microscopy. A) In cells cultivated at 21% O2 no
increase in the fluorescence signal of Annexin V-FITC (green) and/or of propidium iodide (PI) (red fluorescence) was
observed compared to control cells. B) In cells cultivated at 5% O2 only minor increase in the fluorescence signal
(green and red) was observed. Green fluorescence: cells stained with Annexin V-FITC-measure of early apoptosis.
Red fluorescence: cells stained with propidium iodide-measure of late apoptosis and necrosis. Bright yellow signal on
phase contrast images (indicated with red arrows): overlay of green and red signal. Magnification: 200×. Scale bar:
100 µm. Presented overlayed images are one typcal example of many other comparable images.
Analysis of cell death (apoptosis and necrosis) by fluorescence microscopy did not reveal increase
in cell death of non-differentiated SH-SY5Y cells cultivated at 21% and 5% O2, respectively.
Fluorescence signals indicating the presence of apoptosis and/or necrosis (Figure 5.9) was rarely
present in all samples analyzed. Since the method includes washing of the excess of Annexin V-
FITC and PI after incubation, it is possible that dead cells (apoptotic and necrotic), which detach
from the glass slide, are washed away. Therefore, another technique which minimizes the signal
loss, i.e. flow cytometry was employed for quantitative cell death analysis.
Statistically significant increase (~1.4 fold) in the number of apoptotic and necrotic cells upon
irradiation of non-differentiated SH-SY5Y cells with 2 Gy X-rays was observed in cells cultivated
at 5% O2, whereas 4 µM Aβ peptide treatment alone did not lead to significant changes in cell
death at 5% O2 as compared to control cells (Figure 5.10 B). In non-differentiated cells cultivated
at 21% O2, there was no change in cell death after irradiation. Aβ peptide treatment resulted in a
minor decrease (~1.2 fold) in percentage of apoptotic and necrotic cells compared to control cells
(Figure 5.10 A). Aβ peptide treatment of irradiated cells resulted in a decrease (~1.3 fold) of cell
death to the level in control cells or below at 21% O2 and 5% O2, respectively.
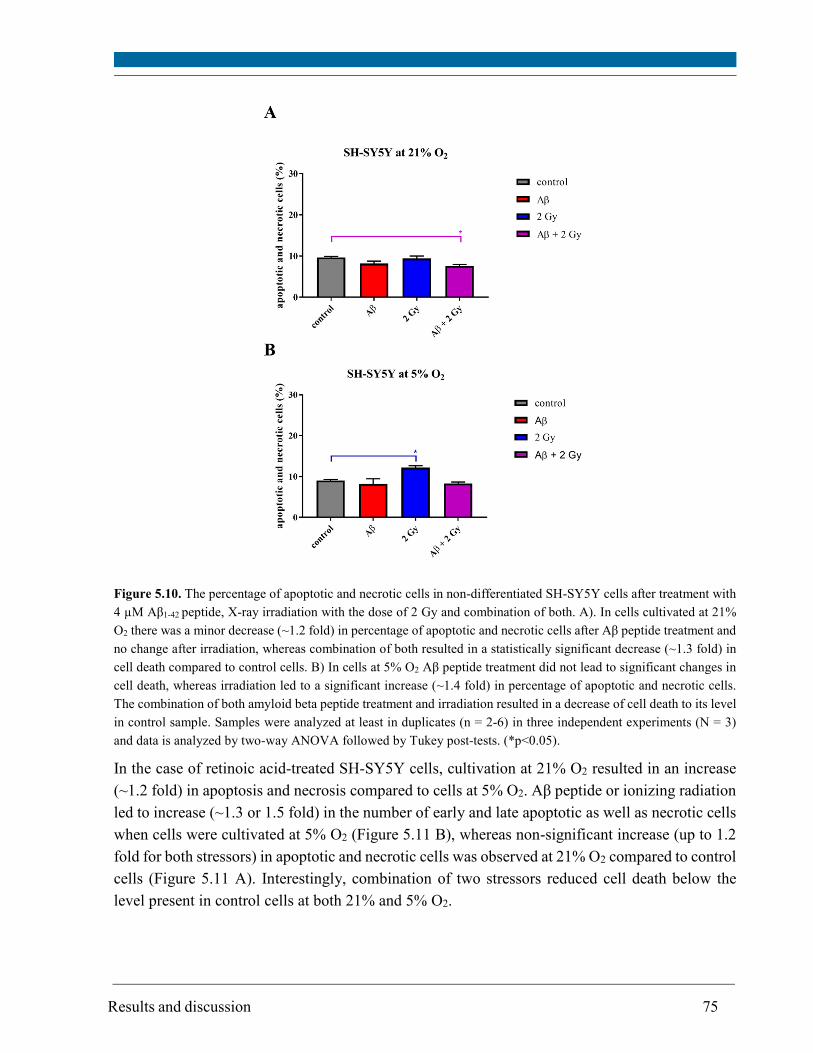
Results and discussion 75
Figure 5.10. The percentage of apoptotic and necrotic cells in non-differentiated SH-SY5Y cells after treatment with
4 µM Aβ1-42 peptide, X-ray irradiation with the dose of 2 Gy and combination of both. A). In cells cultivated at 21%
O2 there was a minor decrease (~1.2 fold) in percentage of apoptotic and necrotic cells after Aβ peptide treatment and
no change after irradiation, whereas combination of both resulted in a statistically significant decrease (~1.3 fold) in
cell death compared to control cells. B) In cells at 5% O2 Aβ peptide treatment did not lead to significant changes in
cell death, whereas irradiation led to a significant increase (~1.4 fold) in percentage of apoptotic and necrotic cells.
The combination of both amyloid beta peptide treatment and irradiation resulted in a decrease of cell death to its level
in control sample. Samples were analyzed at least in duplicates (n = 2-6) in three independent experiments (N = 3)
and data is analyzed by two-way ANOVA followed by Tukey post-tests. (*p<0.05).
In the case of retinoic acid-treated SH-SY5Y cells, cultivation at 21% O2 resulted in an increase
(~1.2 fold) in apoptosis and necrosis compared to cells at 5% O2. Aβ peptide or ionizing radiation
led to increase (~1.3 or 1.5 fold) in the number of early and late apoptotic as well as necrotic cells
when cells were cultivated at 5% O2 (Figure 5.11 B), whereas non-significant increase (up to 1.2
fold for both stressors) in apoptotic and necrotic cells was observed at 21% O2 compared to control
cells (Figure 5.11 A). Interestingly, combination of two stressors reduced cell death below the
level present in control cells at both 21% and 5% O2.
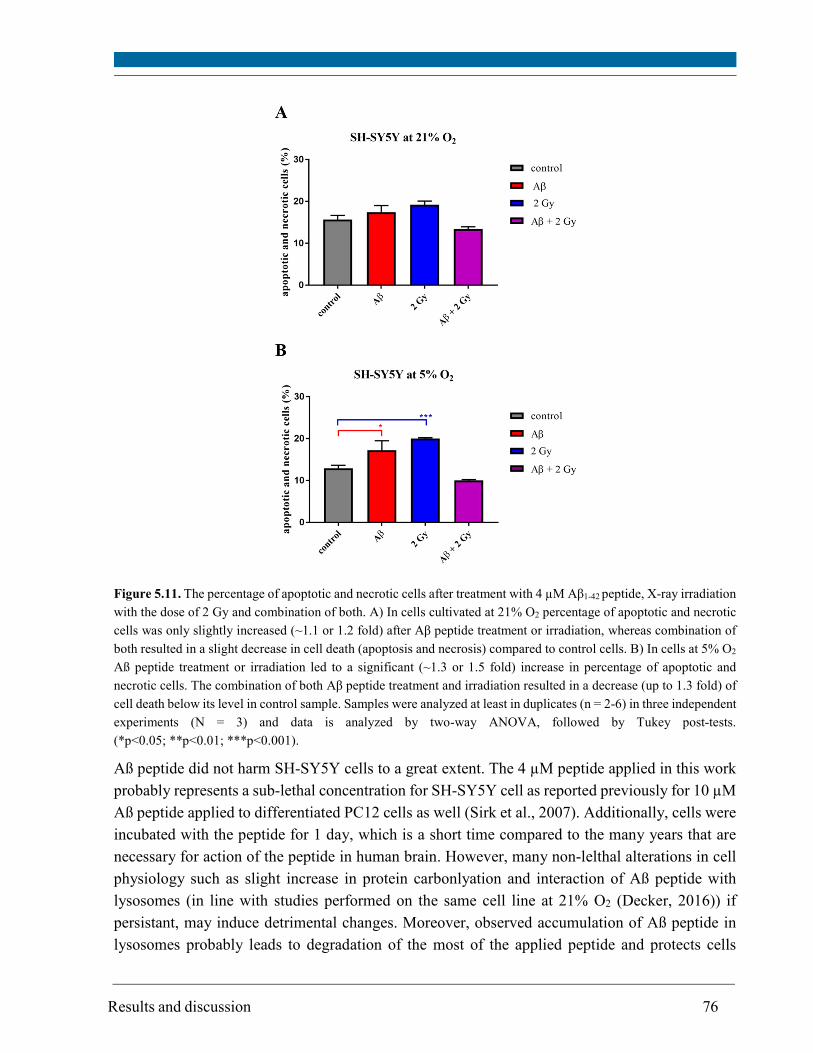
Results and discussion 76
Figure 5.11. The percentage of apoptotic and necrotic cells after treatment with 4 µM Aβ1-42 peptide, X-ray irradiation
with the dose of 2 Gy and combination of both. A) In cells cultivated at 21% O2 percentage of apoptotic and necrotic
cells was only slightly increased (~1.1 or 1.2 fold) after Aβ peptide treatment or irradiation, whereas combination of
both resulted in a slight decrease in cell death (apoptosis and necrosis) compared to control cells. B) In cells at 5% O2
Aß peptide treatment or irradiation led to a significant (~1.3 or 1.5 fold) increase in percentage of apoptotic and
necrotic cells. The combination of both Aβ peptide treatment and irradiation resulted in a decrease (up to 1.3 fold) of
cell death below its level in control sample. Samples were analyzed at least in duplicates (n = 2-6) in three independent
experiments (N = 3) and data is analyzed by two-way ANOVA, followed by Tukey post-tests.
(*p<0.05; **p<0.01; ***p<0.001).
Aß peptide did not harm SH-SY5Y cells to a great extent. The 4 µM peptide applied in this work
probably represents a sub-lethal concentration for SH-SY5Y cell as reported previously for 10 µM
Aß peptide applied to differentiated PC12 cells as well (Sirk et al., 2007). Additionally, cells were
incubated with the peptide for 1 day, which is a short time compared to the many years that are
necessary for action of the peptide in human brain. However, many non-lelthal alterations in cell
physiology such as slight increase in protein carbonlyation and interaction of Aß peptide with
lysosomes (in line with studies performed on the same cell line at 21% O2 (Decker, 2016)) if
persistant, may induce detrimental changes. Moreover, observed accumulation of Aß peptide in
lysosomes probably leads to degradation of the most of the applied peptide and protects cells
Results and discussion 77
against its harmful effects as long as lysosomal integrity and functions are preserved. Lysosomes,
besides their digestive roles, have numerous other functions for maintenance of cell integrity (Lim
and Zoncu, 2016). However, it is possible that continuous accumulation of the peptide harm the
integrity and normal function of lysosomes. In some cases the peptide even had protective
functions, which requires further investigation. Possibly, aromatic amino acid residues of Aß
peptide act as ROS scavengers (Stadtman, 1993). Furthermore, Aβ peptide toxicity is cell-specific
and depends on their metabolism; basal metabolism and its rate affects the level of endogenous
oxidants and other mutagens (Ames et al., 1993; Decker, 2016). For example, picomolar
concentrations of intracellular Aß1-42 (both non-fibrillized and fibrillized) induce cell death of
primary neurons through p53-Bax pathway (Zhang et al., 2002) but not of other neuronal and non-
neuronal cell types.
Very high concentration of the peptide (100 µM) did not harm SH-SY5Y cells after 1 day (Figure
5.12). However, incubation for 3 days was sufficient to cause a massive cell death (~5.3 fold
increase as compared to control). Additionally, 100 µM of aged (aggregated by storage at 37 °C
overnight) peptide led to a significant increase (up to 3.4 fold) in cell death after 1 and 3 days as
well (i.e. earlier response than disaggregated peptide but less cell death after 3 days). On the other
hand, the effect of 4 µM aged peptide was very similar to that of disaggregated peptide (data not
shown). Irradiation with 10 Gy X-rays increased the percentage of apoptotic and necrotic cells (1.6
and 1.7 fold) after 1 and 3 days, respectively. Interestingly and in accordance with data described
above, Aβ peptide treatment decreased the percentage of apoptotic and necrotic cells (2.5 fold) in
irradiated cells after 1 day. However, after 3 days, a ~2.8 fold increase in cell death as compared
to control cells was observed. Data in Figure 5.12 is presented for RA-treated cells cultivated at
5% O2 only. Incubation time together with concentration and aggregation state of the peptide
(disaggregated or aggregated to fibrils) is a crucial factor in Aβ peptide toxicity. Aged peptide
caused earlier response of SH-SY5Y cells which underwent cell death. However, the effect of
disaggregated Aß peptide after 3 days of incubation was more pronounced than of aged peptide.
Although not used in this work, the reverse peptide (Aβ42-1) tested on SH-SY5Y cells cultivated at
21% O2 behaved as a negative control and did not induce changes in cell death, ATP and ROS
level (Decker, 2016).
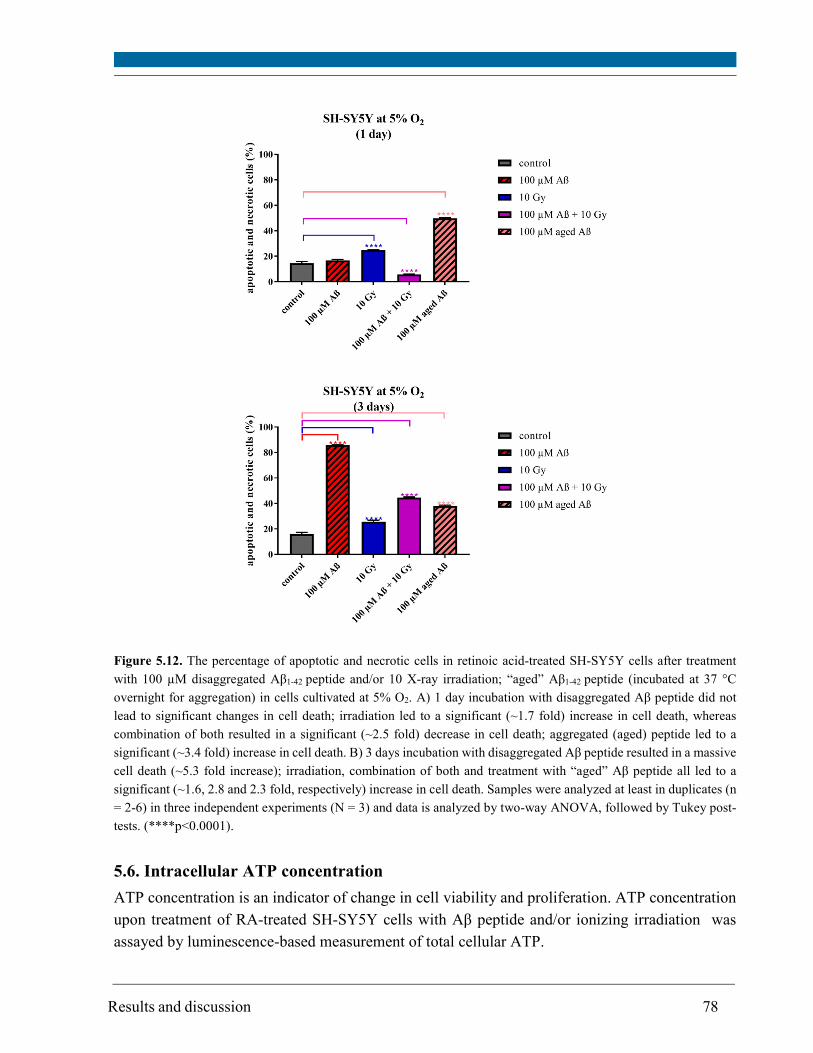
Results and discussion 78
Figure 5.12. The percentage of apoptotic and necrotic cells in retinoic acid-treated SH-SY5Y cells after treatment
with 100 µM disaggregated Aβ1-42 peptide and/or 10 X-ray irradiation; “aged” Aβ1-42 peptide (incubated at 37 °C
overnight for aggregation) in cells cultivated at 5% O2. A) 1 day incubation with disaggregated Aβ peptide did not
lead to significant changes in cell death; irradiation led to a significant (~1.7 fold) increase in cell death, whereas
combination of both resulted in a significant (~2.5 fold) decrease in cell death; aggregated (aged) peptide led to a
significant (~3.4 fold) increase in cell death. B) 3 days incubation with disaggregated Aβ peptide resulted in a massive
cell death (~5.3 fold increase); irradiation, combination of both and treatment with “aged” Aβ peptide all led to a
significant (~1.6, 2.8 and 2.3 fold, respectively) increase in cell death. Samples were analyzed at least in duplicates (n
= 2-6) in three independent experiments (N = 3) and data is analyzed by two-way ANOVA, followed by Tukey post-
tests. (****p<0.0001).
5.6. Intracellular ATP concentration
ATP concentration is an indicator of change in cell viability and proliferation. ATP concentration
upon treatment of RA-treated SH-SY5Y cells with Aβ peptide and/or ionizing irradiation was
assayed by luminescence-based measurement of total cellular ATP.
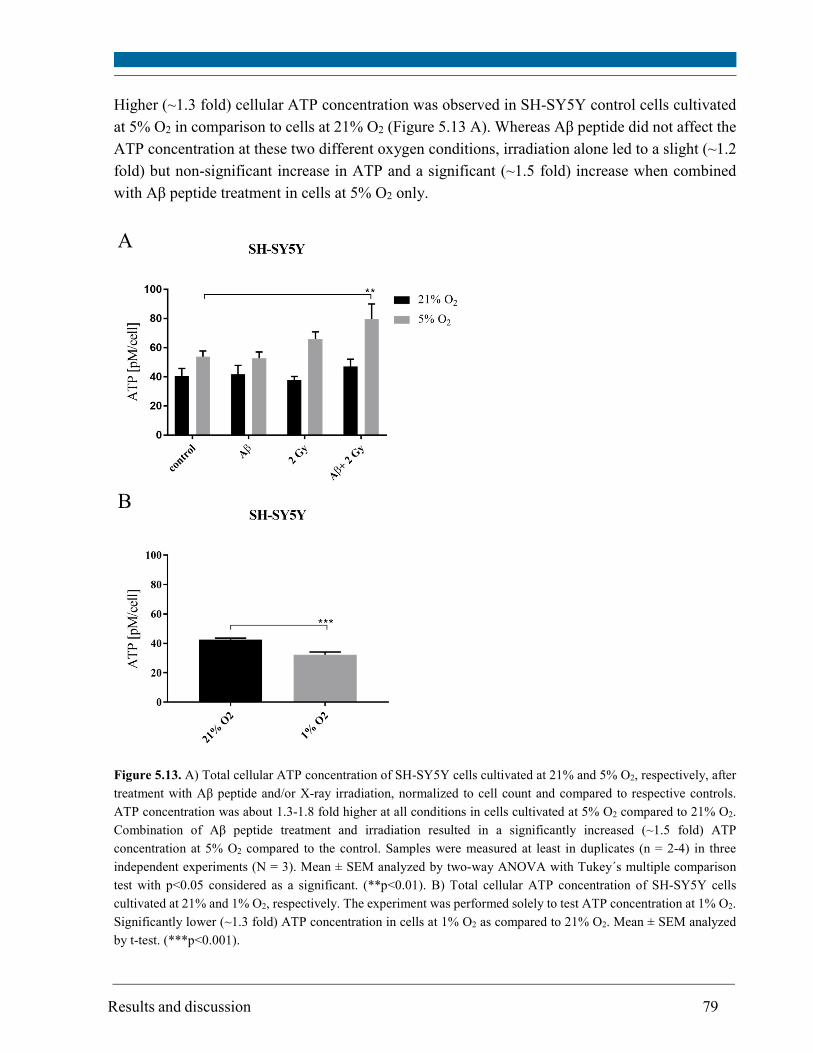
Results and discussion 79
Higher (~1.3 fold) cellular ATP concentration was observed in SH-SY5Y control cells cultivated
at 5% O2 in comparison to cells at 21% O2 (Figure 5.13 A). Whereas Aβ peptide did not affect the
ATP concentration at these two different oxygen conditions, irradiation alone led to a slight (~1.2
fold) but non-significant increase in ATP and a significant (~1.5 fold) increase when combined
with Aβ peptide treatment in cells at 5% O2 only.
Figure 5.13. A) Total cellular ATP concentration of SH-SY5Y cells cultivated at 21% and 5% O2, respectively, after
treatment with Aβ peptide and/or X-ray irradiation, normalized to cell count and compared to respective controls.
ATP concentration was about 1.3-1.8 fold higher at all conditions in cells cultivated at 5% O2 compared to 21% O2.
Combination of Aβ peptide treatment and irradiation resulted in a significantly increased (~1.5 fold) ATP
concentration at 5% O2 compared to the control. Samples were measured at least in duplicates (n = 2-4) in three
independent experiments (N = 3). Mean ± SEM analyzed by two-way ANOVA with Tukey´s multiple comparison
test with p<0.05 considered as a significant. (**p<0.01). B) Total cellular ATP concentration of SH-SY5Y cells
cultivated at 21% and 1% O2, respectively. The experiment was performed solely to test ATP concentration at 1% O2.
Significantly lower (~1.3 fold) ATP concentration in cells at 1% O2 as compared to 21% O2. Mean ± SEM analyzed
by t-test. (***p<0.001).
A
B
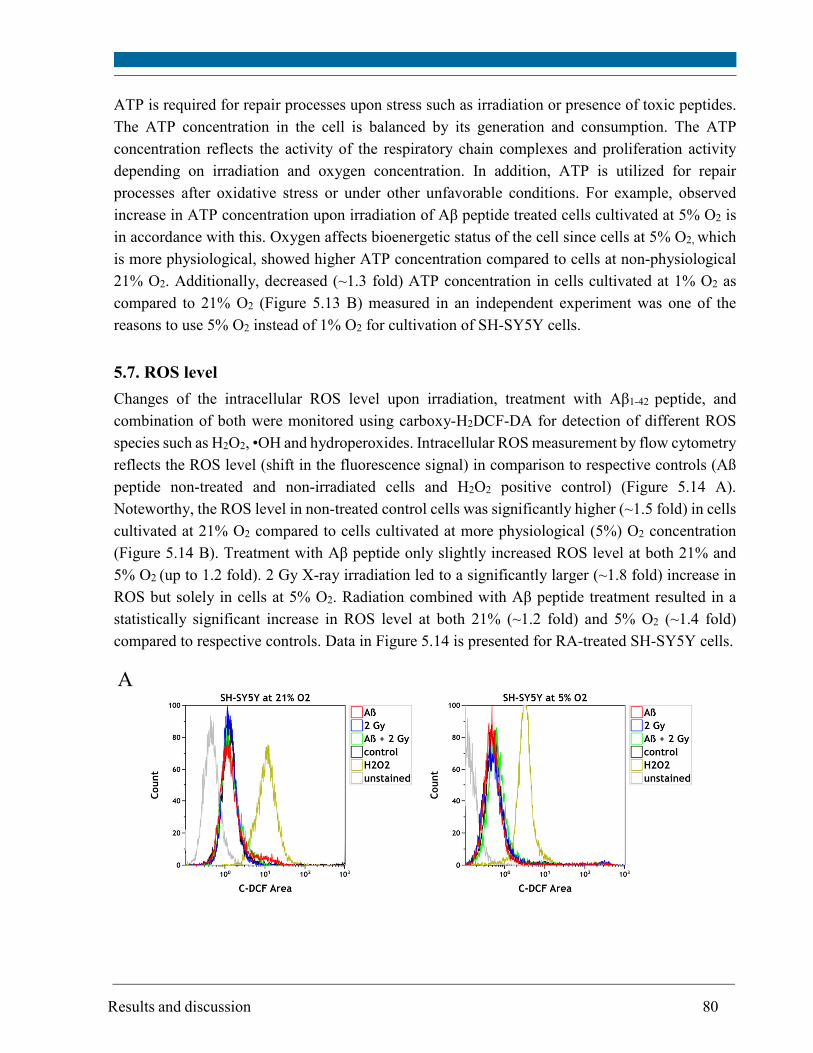
Results and discussion 80
ATP is required for repair processes upon stress such as irradiation or presence of toxic peptides.
The ATP concentration in the cell is balanced by its generation and consumption. The ATP
concentration reflects the activity of the respiratory chain complexes and proliferation activity
depending on irradiation and oxygen concentration. In addition, ATP is utilized for repair
processes after oxidative stress or under other unfavorable conditions. For example, observed
increase in ATP concentration upon irradiation of Aβ peptide treated cells cultivated at 5% O2 is
in accordance with this. Oxygen affects bioenergetic status of the cell since cells at 5% O2, which
is more physiological, showed higher ATP concentration compared to cells at non-physiological
21% O2. Additionally, decreased (~1.3 fold) ATP concentration in cells cultivated at 1% O2 as
compared to 21% O2 (Figure 5.13 B) measured in an independent experiment was one of the
reasons to use 5% O2 instead of 1% O2 for cultivation of SH-SY5Y cells.
5.7. ROS level
Changes of the intracellular ROS level upon irradiation, treatment with Aβ1-42 peptide, and
combination of both were monitored using carboxy-H2DCF-DA for detection of different ROS
species such as H2O2, •OH and hydroperoxides. Intracellular ROS measurement by flow cytometry
reflects the ROS level (shift in the fluorescence signal) in comparison to respective controls (Aß
peptide non-treated and non-irradiated cells and H2O2 positive control) (Figure 5.14 A).
Noteworthy, the ROS level in non-treated control cells was significantly higher (~1.5 fold) in cells
cultivated at 21% O2 compared to cells cultivated at more physiological (5%) O2 concentration
(Figure 5.14 B). Treatment with Aβ peptide only slightly increased ROS level at both 21% and
5% O2 (up to 1.2 fold). 2 Gy X-ray irradiation led to a significantly larger (~1.8 fold) increase in
ROS but solely in cells at 5% O2. Radiation combined with Aβ peptide treatment resulted in a
statistically significant increase in ROS level at both 21% (~1.2 fold) and 5% O2 (~1.4 fold)
compared to respective controls. Data in Figure 5.14 is presented for RA-treated SH-SY5Y cells.
A
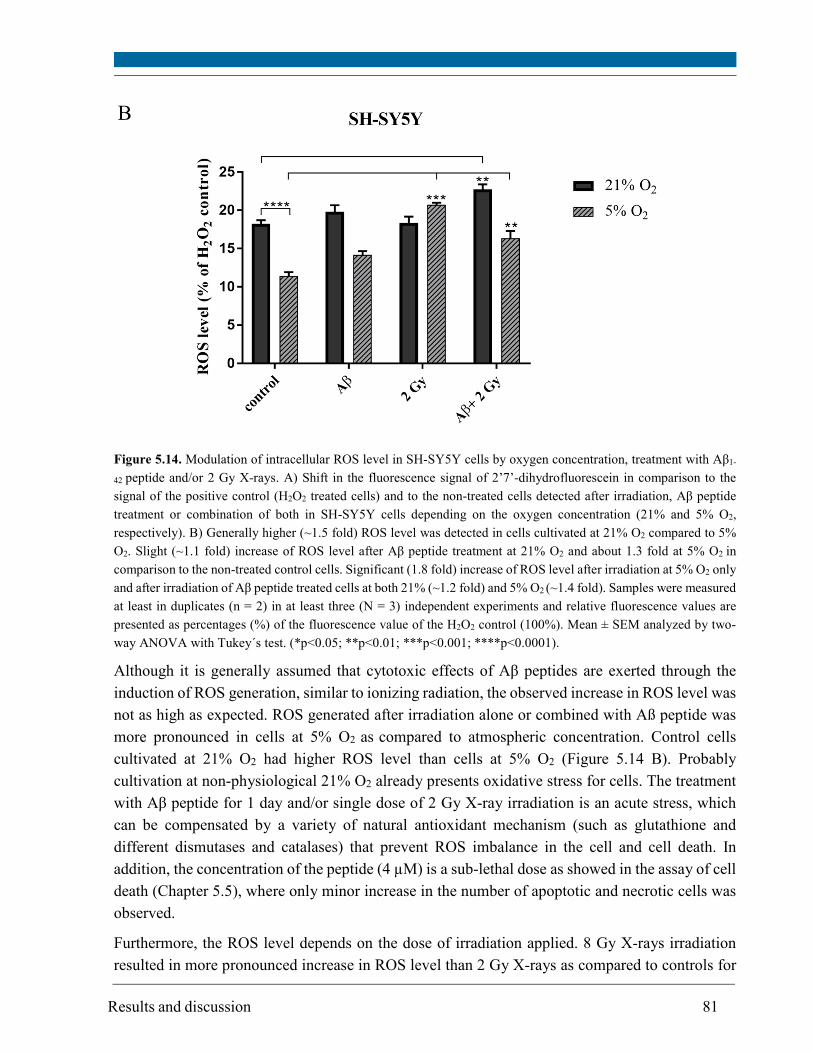
Results and discussion 81
Figure 5.14. Modulation of intracellular ROS level in SH-SY5Y cells by oxygen concentration, treatment with Aβ1-
42 peptide and/or 2 Gy X-rays. A) Shift in the fluorescence signal of 2’7’-dihydrofluorescein in comparison to the
signal of the positive control (H2O2 treated cells) and to the non-treated cells detected after irradiation, Aβ peptide
treatment or combination of both in SH-SY5Y cells depending on the oxygen concentration (21% and 5% O2,
respectively). B) Generally higher (~1.5 fold) ROS level was detected in cells cultivated at 21% O2 compared to 5%
O2. Slight (~1.1 fold) increase of ROS level after Aβ peptide treatment at 21% O2 and about 1.3 fold at 5% O2 in
comparison to the non-treated control cells. Significant (1.8 fold) increase of ROS level after irradiation at 5% O2 only
and after irradiation of Aβ peptide treated cells at both 21% (~1.2 fold) and 5% O2 (~1.4 fold). Samples were measured
at least in duplicates (n = 2) in at least three (N = 3) independent experiments and relative fluorescence values are
presented as percentages (%) of the fluorescence value of the H2O2 control (100%). Mean ± SEM analyzed by two-
way ANOVA with Tukey´s test. (*p<0.05; **p<0.01; ***p<0.001; ****p<0.0001).
Although it is generally assumed that cytotoxic effects of Aβ peptides are exerted through the
induction of ROS generation, similar to ionizing radiation, the observed increase in ROS level was
not as high as expected. ROS generated after irradiation alone or combined with Aß peptide was
more pronounced in cells at 5% O2 as compared to atmospheric concentration. Control cells
cultivated at 21% O2 had higher ROS level than cells at 5% O2 (Figure 5.14 B). Probably
cultivation at non-physiological 21% O2 already presents oxidative stress for cells. The treatment
with Aβ peptide for 1 day and/or single dose of 2 Gy X-ray irradiation is an acute stress, which
can be compensated by a variety of natural antioxidant mechanism (such as glutathione and
different dismutases and catalases) that prevent ROS imbalance in the cell and cell death. In
addition, the concentration of the peptide (4 µM) is a sub-lethal dose as showed in the assay of cell
death (Chapter 5.5), where only minor increase in the number of apoptotic and necrotic cells was
observed.
Furthermore, the ROS level depends on the dose of irradiation applied. 8 Gy X-rays irradiation
resulted in more pronounced increase in ROS level than 2 Gy X-rays as compared to controls for
B
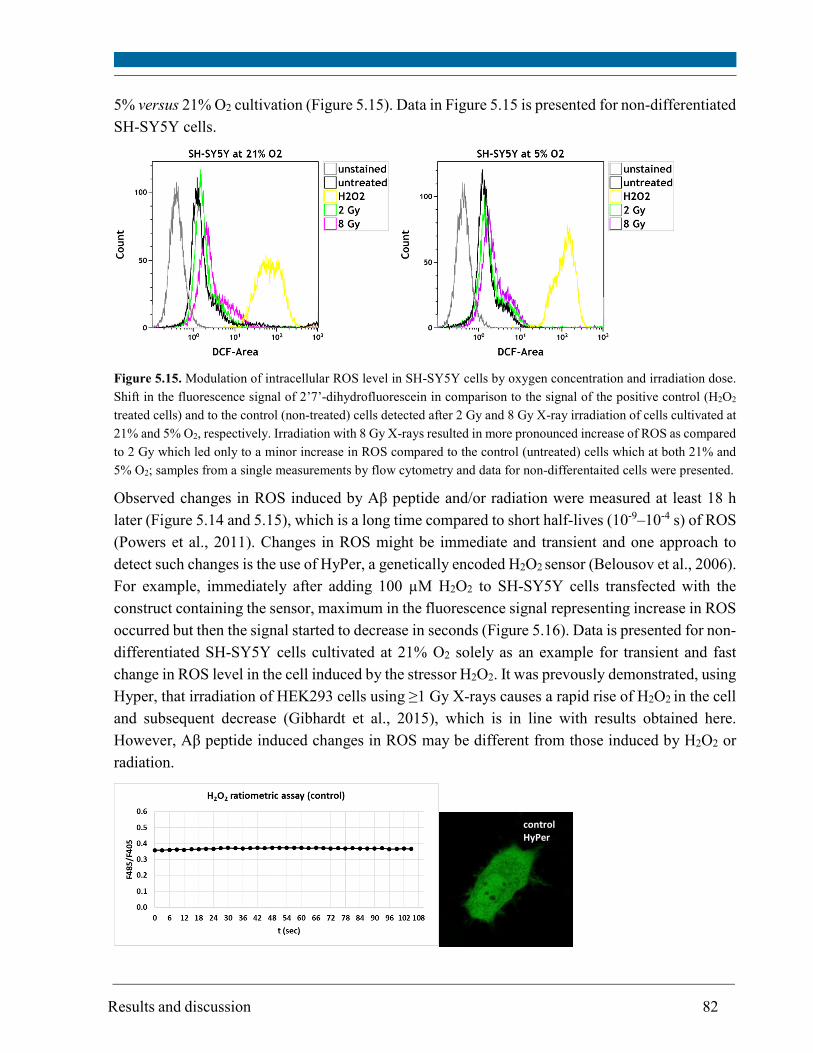
Results and discussion 82
5% versus 21% O2 cultivation (Figure 5.15). Data in Figure 5.15 is presented for non-differentiated
SH-SY5Y cells.
Figure 5.15. Modulation of intracellular ROS level in SH-SY5Y cells by oxygen concentration and irradiation dose.
Shift in the fluorescence signal of 2’7’-dihydrofluorescein in comparison to the signal of the positive control (H2O2
treated cells) and to the control (non-treated) cells detected after 2 Gy and 8 Gy X-ray irradiation of cells cultivated at
21% and 5% O2, respectively. Irradiation with 8 Gy X-rays resulted in more pronounced increase of ROS as compared
to 2 Gy which led only to a minor increase in ROS compared to the control (untreated) cells which at both 21% and
5% O2; samples from a single measurements by flow cytometry and data for non-differentaited cells were presented.
Observed changes in ROS induced by Aβ peptide and/or radiation were measured at least 18 h
later (Figure 5.14 and 5.15), which is a long time compared to short half-lives (10-9–10-4 s) of ROS
(Powers et al., 2011). Changes in ROS might be immediate and transient and one approach to
detect such changes is the use of HyPer, a genetically encoded H2O2 sensor (Belousov et al., 2006).
For example, immediately after adding 100 µM H2O2 to SH-SY5Y cells transfected with the
construct containing the sensor, maximum in the fluorescence signal representing increase in ROS
occurred but then the signal started to decrease in seconds (Figure 5.16). Data is presented for non-
differentiated SH-SY5Y cells cultivated at 21% O2 solely as an example for transient and fast
change in ROS level in the cell induced by the stressor H2O2. It was prevously demonstrated, using
Hyper, that irradiation of HEK293 cells using ≥1 Gy X-rays causes a rapid rise of H2O2 in the cell
and subsequent decrease (Gibhardt et al., 2015), which is in line with results obtained here.
However, Aβ peptide induced changes in ROS may be different from those induced by H2O2 or
radiation.
control HyPer
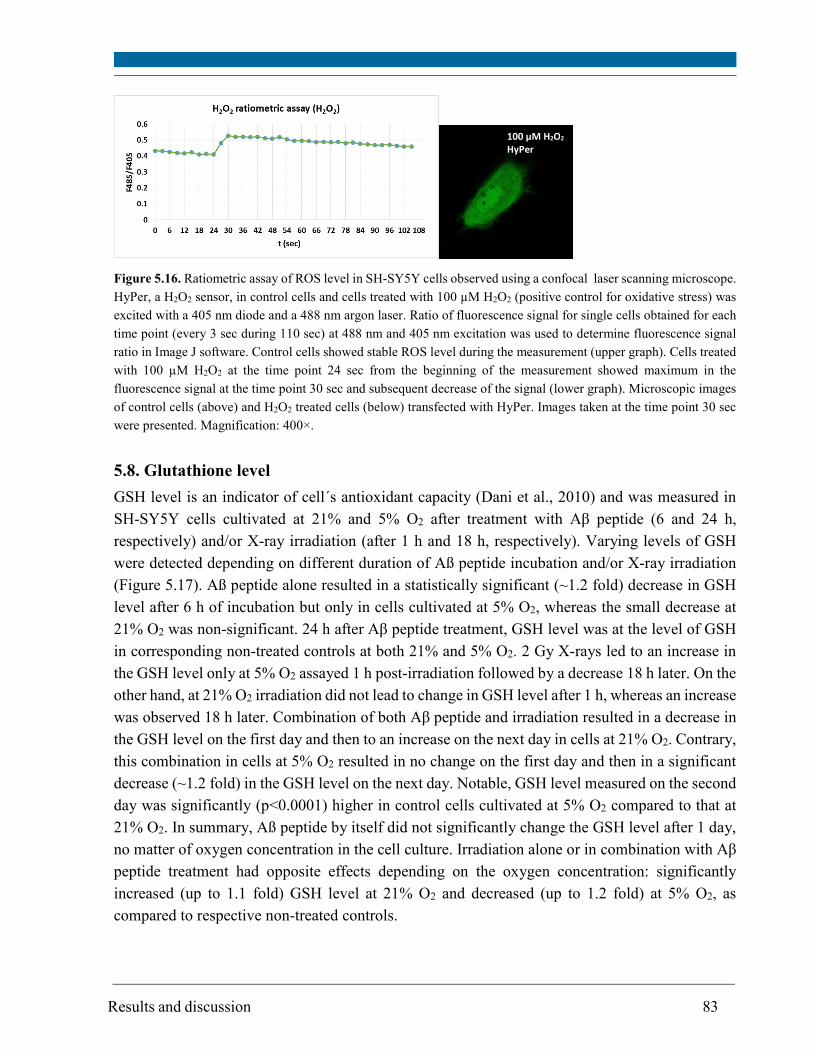
Results and discussion 83
Figure 5.16. Ratiometric assay of ROS level in SH-SY5Y cells observed using a confocal laser scanning microscope.
HyPer, a H2O2 sensor, in control cells and cells treated with 100 µM H2O2 (positive control for oxidative stress) was
excited with a 405 nm diode and a 488 nm argon laser. Ratio of fluorescence signal for single cells obtained for each
time point (every 3 sec during 110 sec) at 488 nm and 405 nm excitation was used to determine fluorescence signal
ratio in Image J software. Control cells showed stable ROS level during the measurement (upper graph). Cells treated
with 100 µM H2O2 at the time point 24 sec from the beginning of the measurement showed maximum in the
fluorescence signal at the time point 30 sec and subsequent decrease of the signal (lower graph). Microscopic images
of control cells (above) and H2O2 treated cells (below) transfected with HyPer. Images taken at the time point 30 sec
were presented. Magnification: 400×.
5.8. Glutathione level
GSH level is an indicator of cell´s antioxidant capacity (Dani et al., 2010) and was measured in
SH-SY5Y cells cultivated at 21% and 5% O2 after treatment with Aβ peptide (6 and 24 h,
respectively) and/or X-ray irradiation (after 1 h and 18 h, respectively). Varying levels of GSH
were detected depending on different duration of Aß peptide incubation and/or X-ray irradiation
(Figure 5.17). Aß peptide alone resulted in a statistically significant (~1.2 fold) decrease in GSH
level after 6 h of incubation but only in cells cultivated at 5% O2, whereas the small decrease at
21% O2 was non-significant. 24 h after Aβ peptide treatment, GSH level was at the level of GSH
in corresponding non-treated controls at both 21% and 5% O2. 2 Gy X-rays led to an increase in
the GSH level only at 5% O2 assayed 1 h post-irradiation followed by a decrease 18 h later. On the
other hand, at 21% O2 irradiation did not lead to change in GSH level after 1 h, whereas an increase
was observed 18 h later. Combination of both Aβ peptide and irradiation resulted in a decrease in
the GSH level on the first day and then to an increase on the next day in cells at 21% O2. Contrary,
this combination in cells at 5% O2 resulted in no change on the first day and then in a significant
decrease (~1.2 fold) in the GSH level on the next day. Notable, GSH level measured on the second
day was significantly (p<0.0001) higher in control cells cultivated at 5% O2 compared to that at
21% O2. In summary, Aß peptide by itself did not significantly change the GSH level after 1 day,
no matter of oxygen concentration in the cell culture. Irradiation alone or in combination with Aβ
peptide treatment had opposite effects depending on the oxygen concentration: significantly
increased (up to 1.1 fold) GSH level at 21% O2 and decreased (up to 1.2 fold) at 5% O2, as
compared to respective non-treated controls.
100 µM H2O2 HyPer
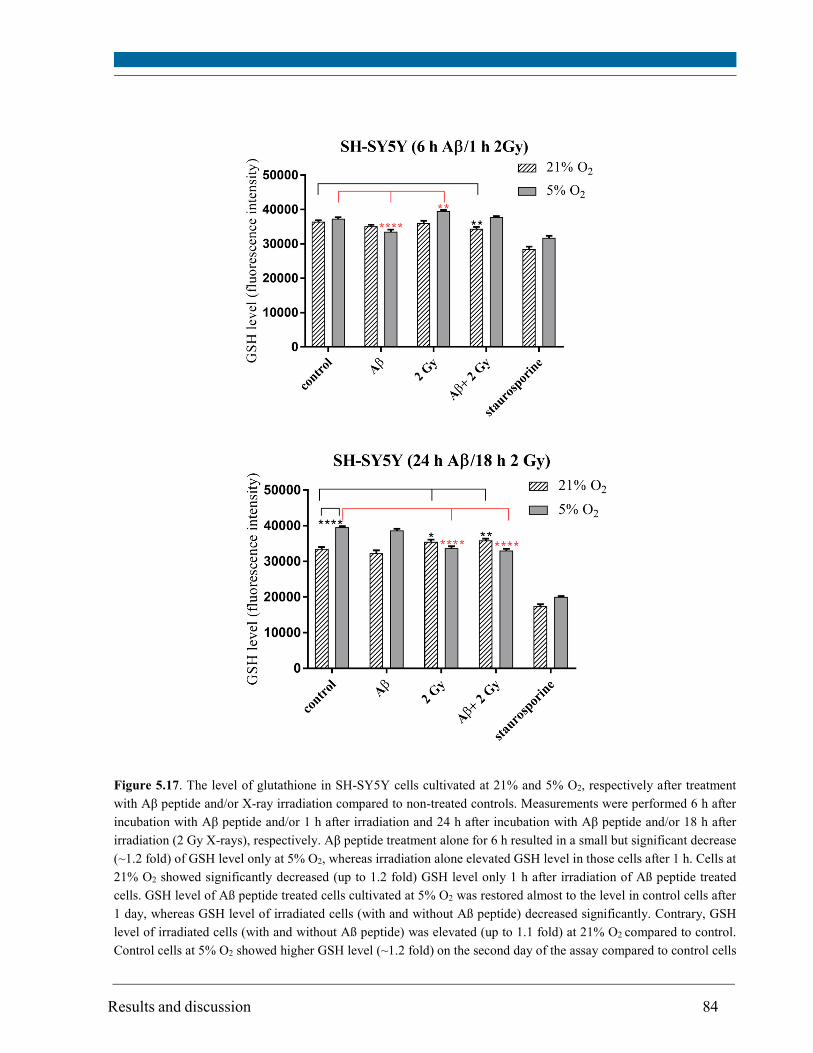
Results and discussion 84
Figure 5.17. The level of glutathione in SH-SY5Y cells cultivated at 21% and 5% O2, respectively after treatment
with Aβ peptide and/or X-ray irradiation compared to non-treated controls. Measurements were performed 6 h after
incubation with Aβ peptide and/or 1 h after irradiation and 24 h after incubation with Aβ peptide and/or 18 h after
irradiation (2 Gy X-rays), respectively. Aβ peptide treatment alone for 6 h resulted in a small but significant decrease
(~1.2 fold) of GSH level only at 5% O2, whereas irradiation alone elevated GSH level in those cells after 1 h. Cells at
21% O2 showed significantly decreased (up to 1.2 fold) GSH level only 1 h after irradiation of Aß peptide treated
cells. GSH level of Aß peptide treated cells cultivated at 5% O2 was restored almost to the level in control cells after
1 day, whereas GSH level of irradiated cells (with and without Aß peptide) decreased significantly. Contrary, GSH
level of irradiated cells (with and without Aß peptide) was elevated (up to 1.1 fold) at 21% O2 compared to control.
Control cells at 5% O2 showed higher GSH level (~1.2 fold) on the second day of the assay compared to control cells
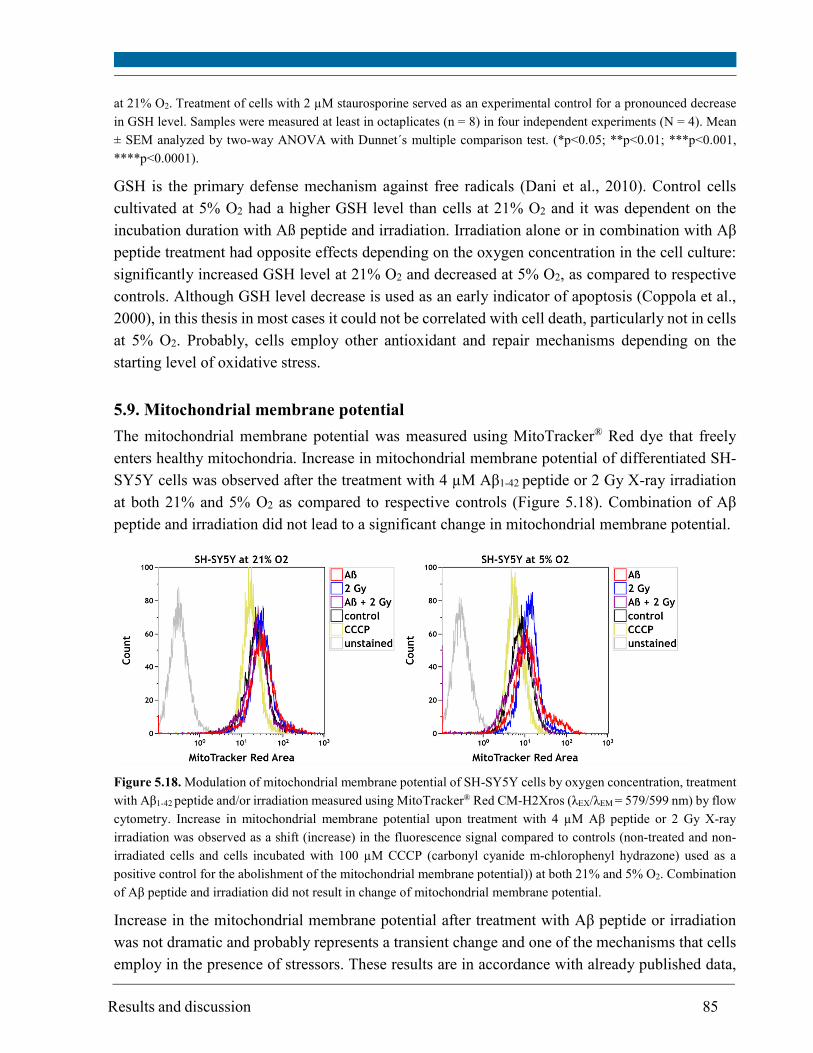
Results and discussion 85
at 21% O2. Treatment of cells with 2 µM staurosporine served as an experimental control for a pronounced decrease
in GSH level. Samples were measured at least in octaplicates (n = 8) in four independent experiments (N = 4). Mean
± SEM analyzed by two-way ANOVA with Dunnet´s multiple comparison test. (*p<0.05; **p<0.01; ***p<0.001,
****p<0.0001).
GSH is the primary defense mechanism against free radicals (Dani et al., 2010). Control cells
cultivated at 5% O2 had a higher GSH level than cells at 21% O2 and it was dependent on the
incubation duration with Aß peptide and irradiation. Irradiation alone or in combination with Aβ
peptide treatment had opposite effects depending on the oxygen concentration in the cell culture:
significantly increased GSH level at 21% O2 and decreased at 5% O2, as compared to respective
controls. Although GSH level decrease is used as an early indicator of apoptosis (Coppola et al.,
2000), in this thesis in most cases it could not be correlated with cell death, particularly not in cells
at 5% O2. Probably, cells employ other antioxidant and repair mechanisms depending on the
starting level of oxidative stress.
5.9. Mitochondrial membrane potential
The mitochondrial membrane potential was measured using MitoTracker® Red dye that freely
enters healthy mitochondria. Increase in mitochondrial membrane potential of differentiated SH-
SY5Y cells was observed after the treatment with 4 µM Aβ1-42 peptide or 2 Gy X-ray irradiation
at both 21% and 5% O2 as compared to respective controls (Figure 5.18). Combination of Aβ
peptide and irradiation did not lead to a significant change in mitochondrial membrane potential.
Figure 5.18. Modulation of mitochondrial membrane potential of SH-SY5Y cells by oxygen concentration, treatment
with Aβ1-42 peptide and/or irradiation measured using MitoTracker® Red CM-H2Xros (λEX/λEM = 579/599 nm) by flow
cytometry. Increase in mitochondrial membrane potential upon treatment with 4 µM Aβ peptide or 2 Gy X-ray
irradiation was observed as a shift (increase) in the fluorescence signal compared to controls (non-treated and non-
irradiated cells and cells incubated with 100 µM CCCP (carbonyl cyanide m-chlorophenyl hydrazone) used as a
positive control for the abolishment of the mitochondrial membrane potential)) at both 21% and 5% O2. Combination
of Aβ peptide and irradiation did not result in change of mitochondrial membrane potential.
Increase in the mitochondrial membrane potential after treatment with Aβ peptide or irradiation
was not dramatic and probably represents a transient change and one of the mechanisms that cells
employ in the presence of stressors. These results are in accordance with already published data,
Results and discussion 86
where increase in mitochondrial membrane potential of differentiated cells at both oxygen
concentrations upon 2 Gy X-ray irradiation was observed (Džinić et., 2016).
5.10. Effects of X-ray radiation on cellular physiology and mitochondrial proteome
The influence of X-ray radiation on human neuroblastoma (SH-SY5Y) cells, their physiology and
mitochondrial proteome was studied depending on the oxygen concentration in the cell culture and
differentiation status. Cells were in parallel cultivated at 21% and 5% O2 for comparison of cellular
responses to stress at high oxygen concentration used in standard cell culture incubators and at
concentration of 5% which resembles physiological oxygen concentration in human brain.
Retinoic acid was used for induction of differentiation to obtain cells that resemble neurons.
Specific cellular parameters such as mitochondrial membrane potential, ATP concentration and
cell viability were investigated.
Complex interplay of oxygen and differentiation status modulated the cellular response to
oxidative stress upon ionizing radiation as discussed in the published work:
Džinić T, Hartwig S, Lehr S, Dencher NA. (2016). Oxygen and differentiation status modulate the
effect of X-ray irradiation on physiology and mitochondrial proteome of human neuroblastoma
cells. Arch. Physiol. Biochem., 122: 257-265.
Published data are not separately discussed in the thesis.
Results and discussion 87
Results and discussion 88
Results and discussion 89
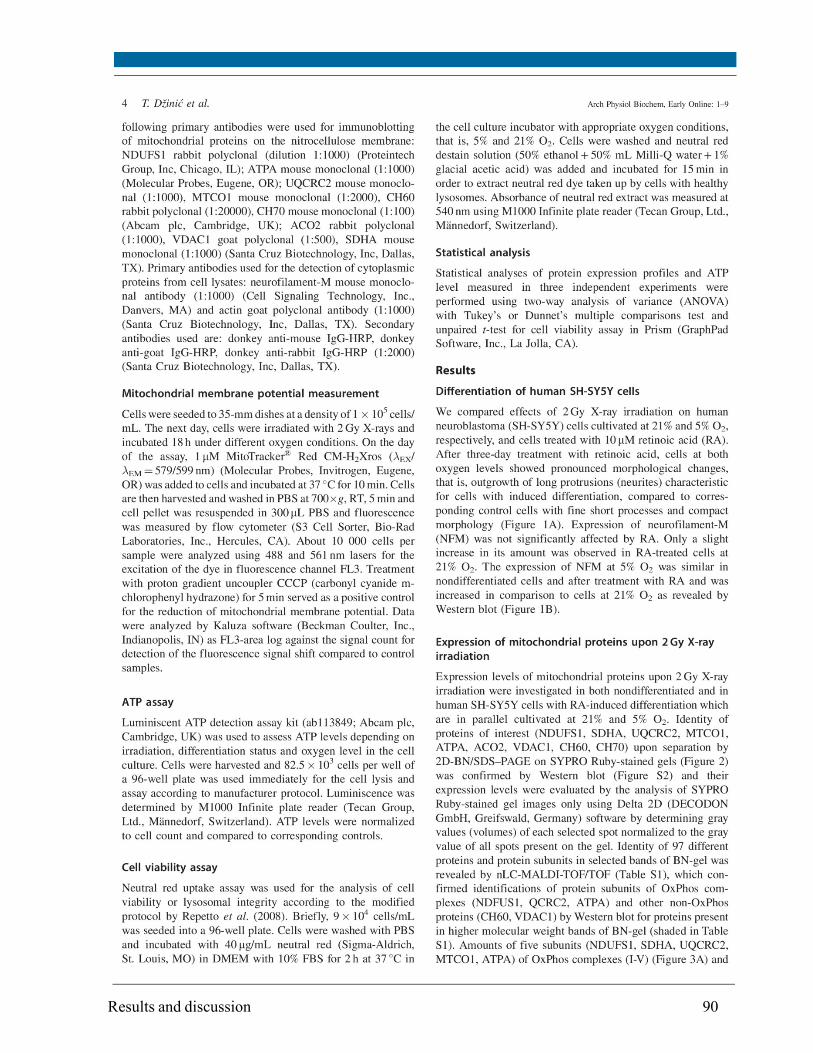
Results and discussion 90
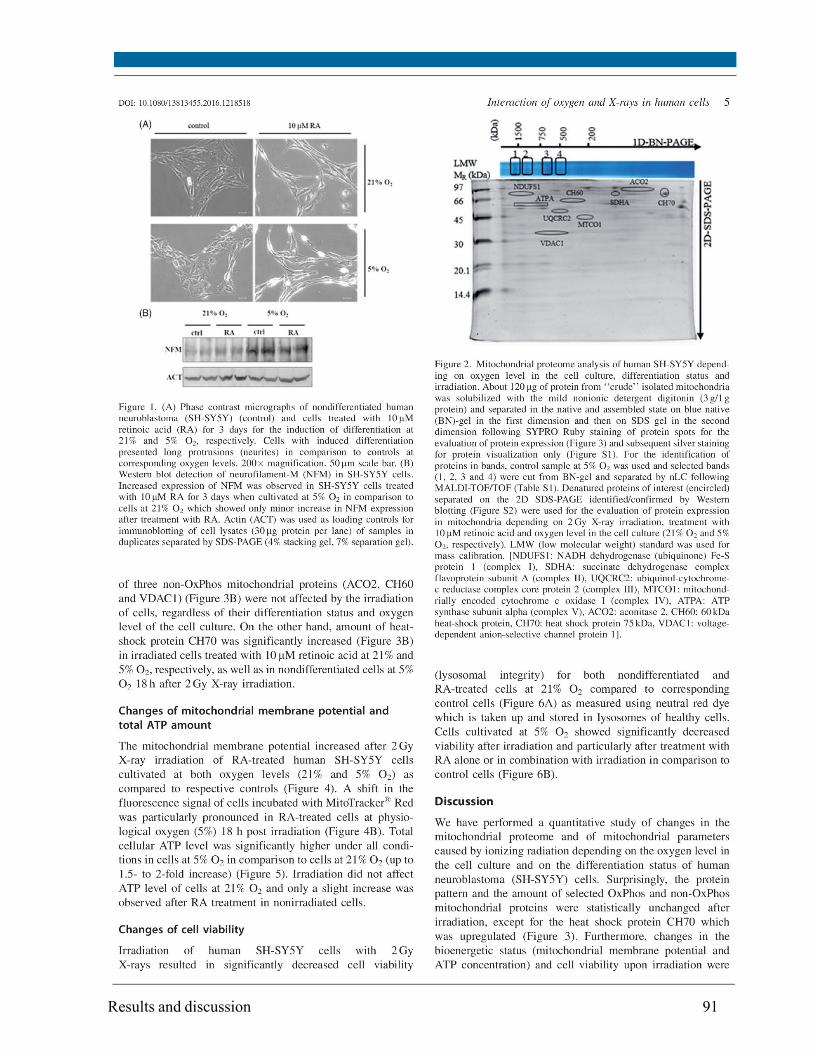
Results and discussion 91
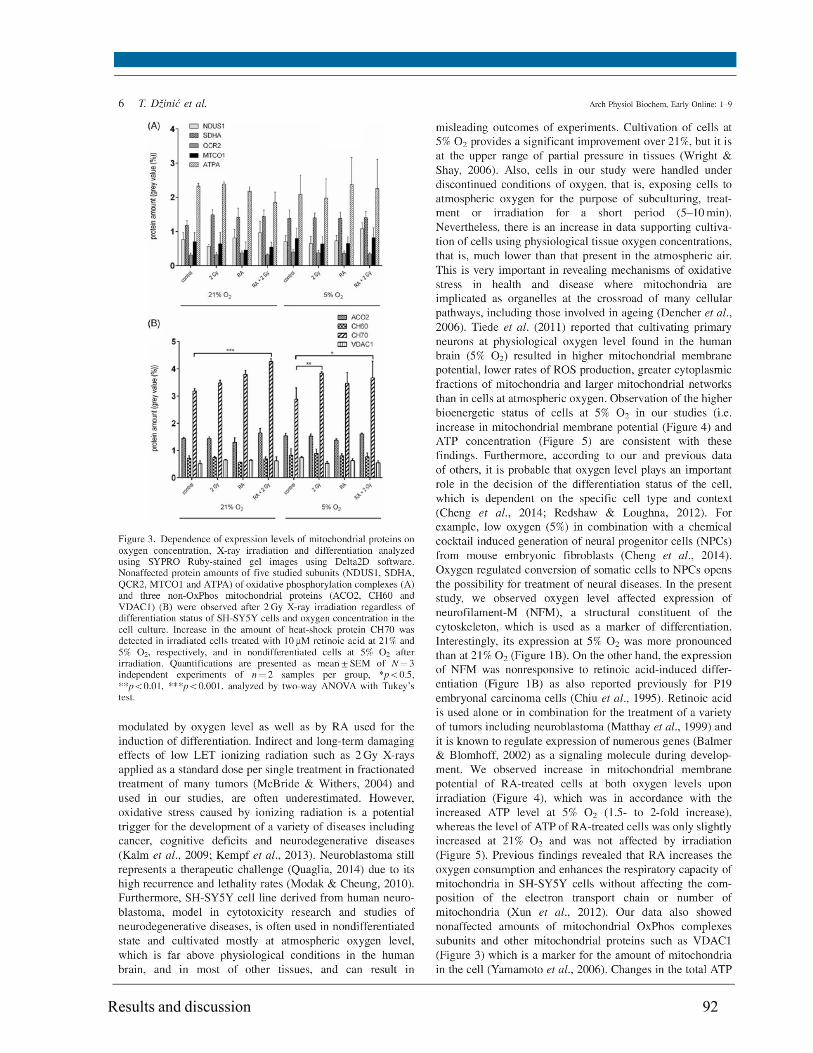
Results and discussion 92
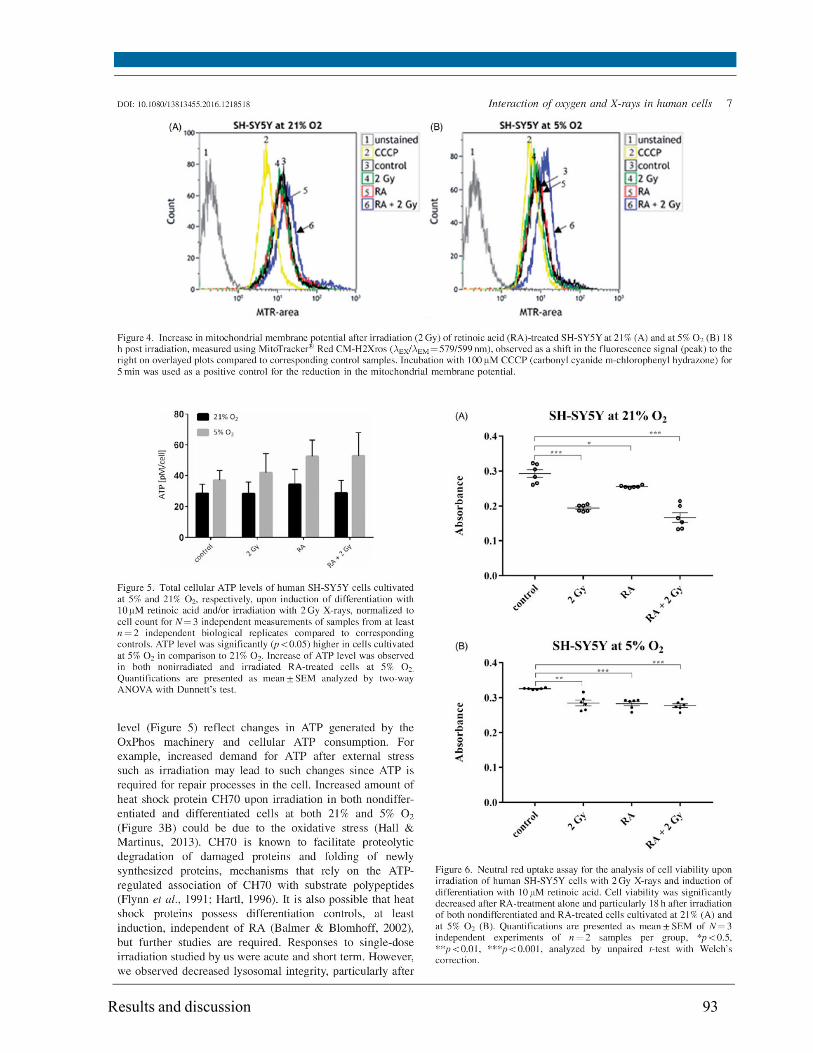
Results and discussion 93
Results and discussion 94
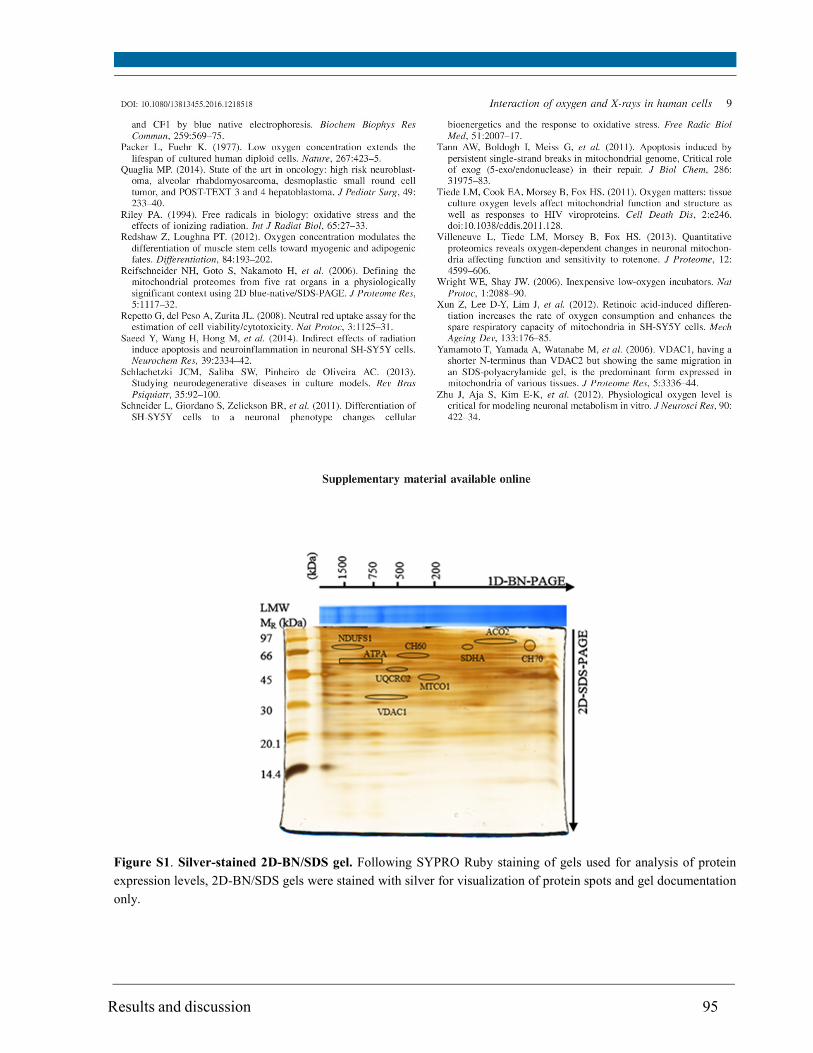
Results and discussion 95
Figure S1. Silver-stained 2D-BN/SDS gel. Following SYPRO Ruby staining of gels used for analysis of protein
expression levels, 2D-BN/SDS gels were stained with silver for visualization of protein spots and gel documentation
only.
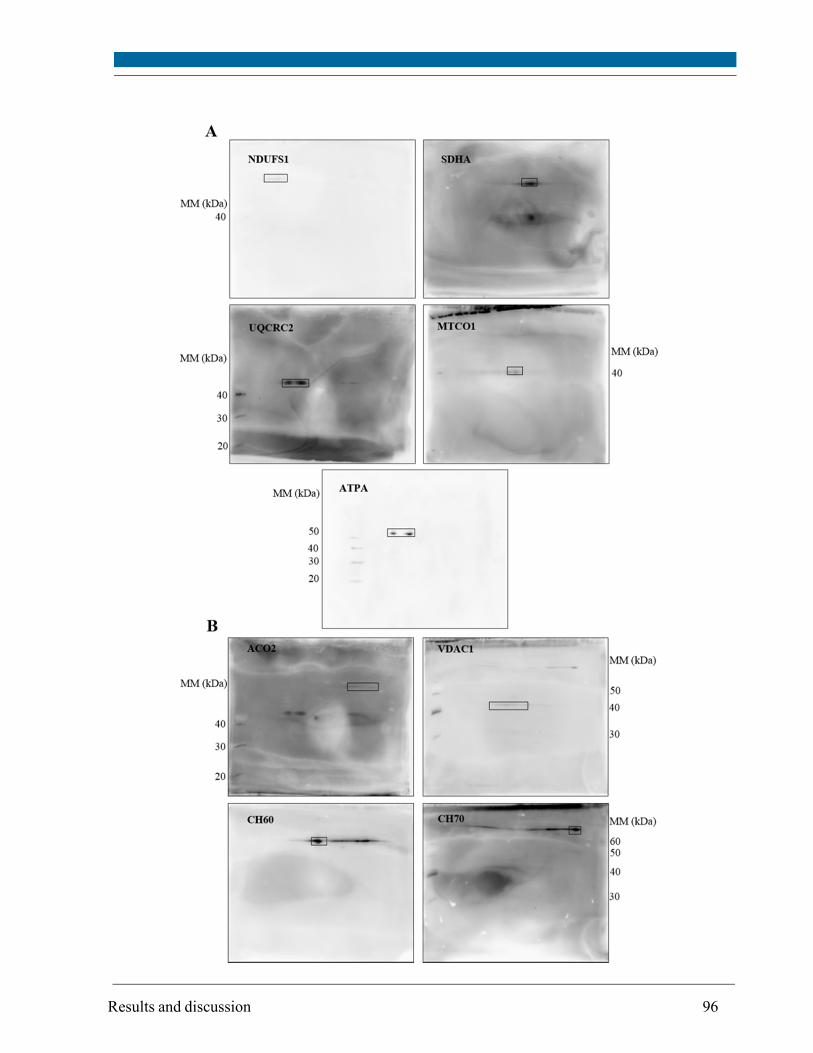
Results and discussion 96
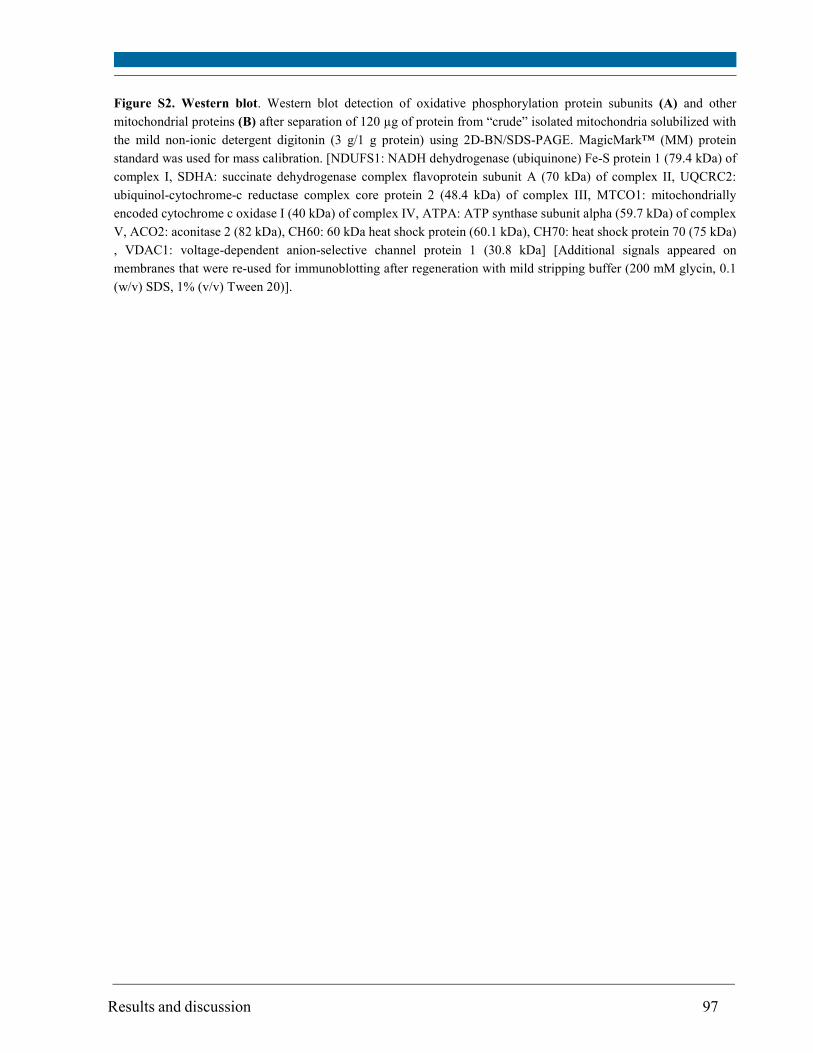
Results and discussion 97
Figure S2. Western blot. Western blot detection of oxidative phosphorylation protein subunits (A) and other
mitochondrial proteins (B) after separation of 120 µg of protein from “crude” isolated mitochondria solubilized with
the mild non-ionic detergent digitonin (3 g/1 g protein) using 2D-BN/SDS-PAGE. MagicMark™ (MM) protein
standard was used for mass calibration. [NDUFS1: NADH dehydrogenase (ubiquinone) Fe-S protein 1 (79.4 kDa) of
complex I, SDHA: succinate dehydrogenase complex flavoprotein subunit A (70 kDa) of complex II, UQCRC2:
ubiquinol-cytochrome-c reductase complex core protein 2 (48.4 kDa) of complex III, MTCO1: mitochondrially
encoded cytochrome c oxidase I (40 kDa) of complex IV, ATPA: ATP synthase subunit alpha (59.7 kDa) of complex
V, ACO2: aconitase 2 (82 kDa), CH60: 60 kDa heat shock protein (60.1 kDa), CH70: heat shock protein 70 (75 kDa)
, VDAC1: voltage-dependent anion-selective channel protein 1 (30.8 kDa] [Additional signals appeared on
membranes that were re-used for immunoblotting after regeneration with mild stripping buffer (200 mM glycin, 0.1
(w/v) SDS, 1% (v/v) Tween 20)].
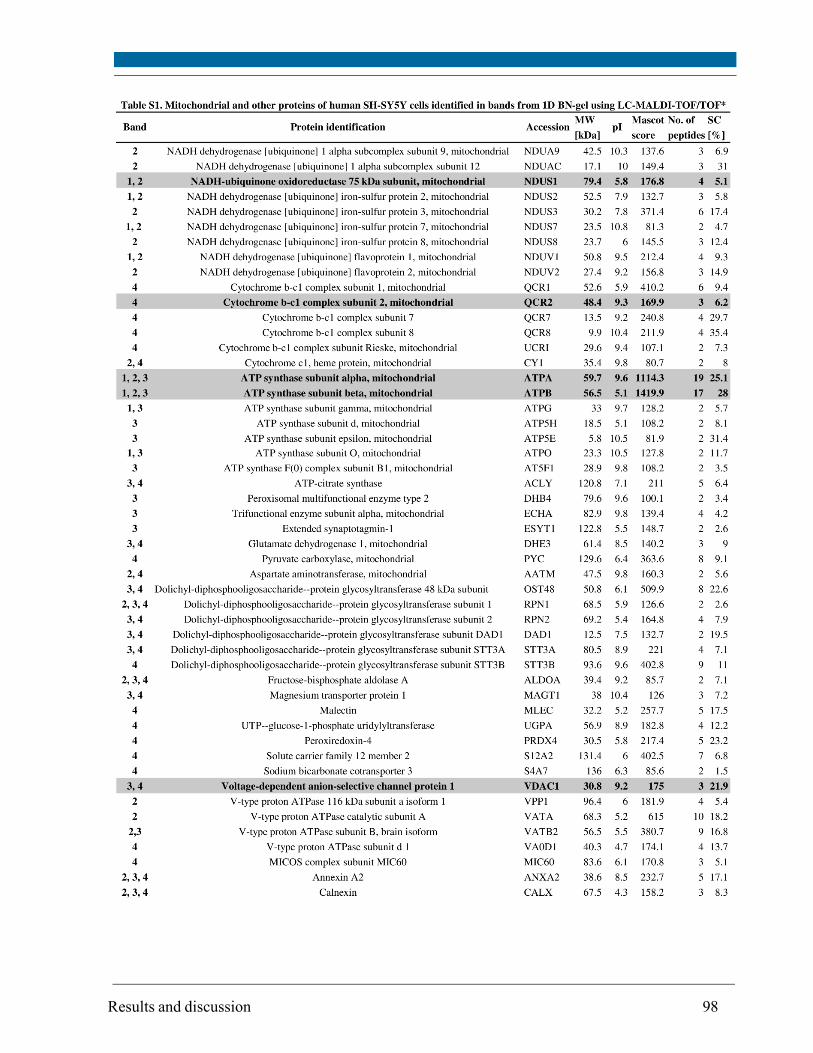
Results and discussion 98
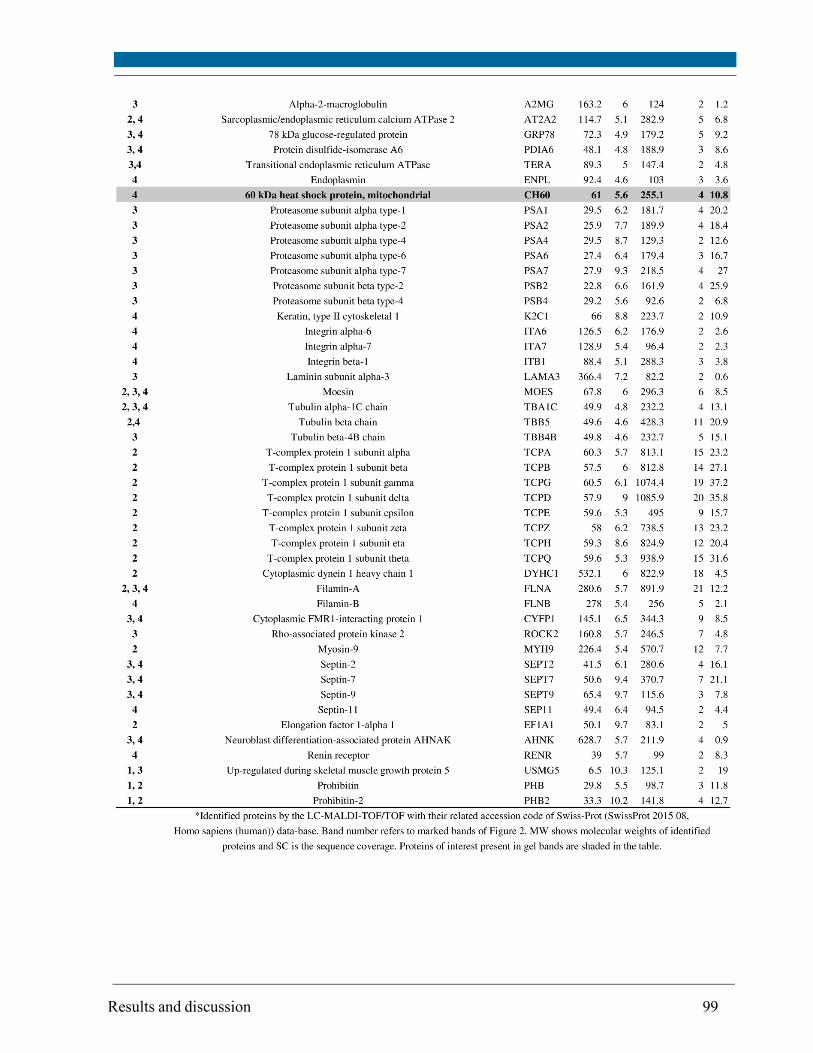
Results and discussion 99
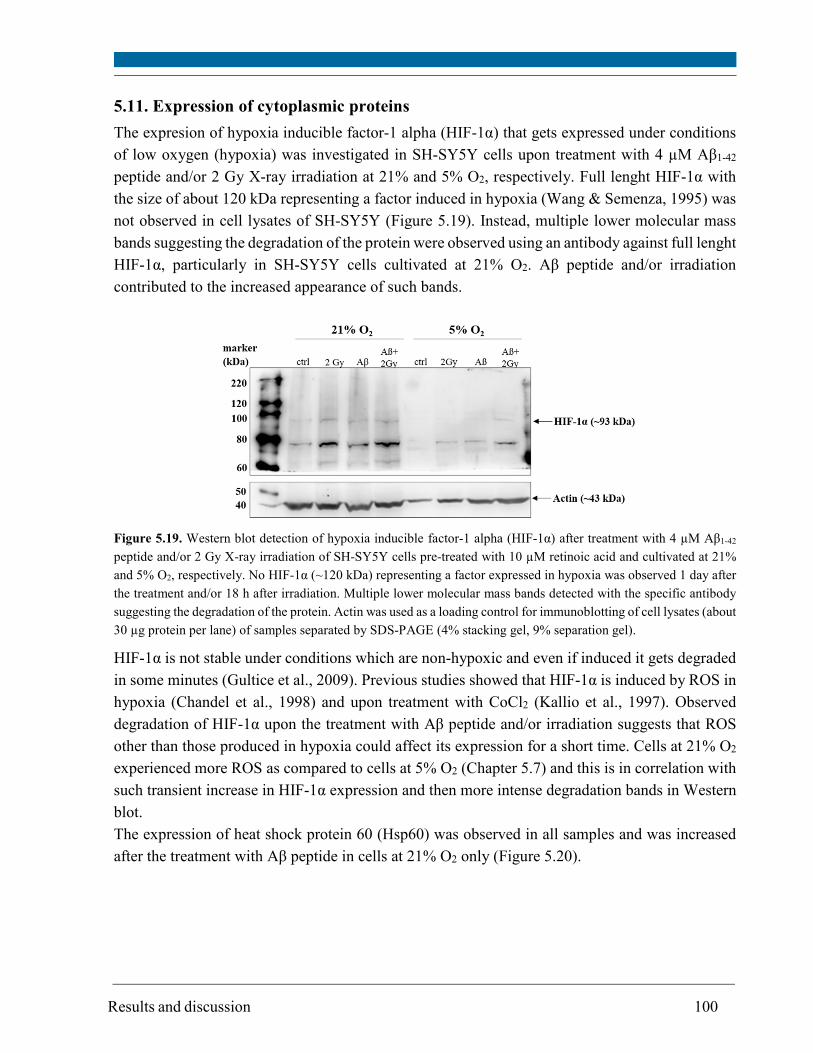
Results and discussion 100
5.11. Expression of cytoplasmic proteins
The expresion of hypoxia inducible factor-1 alpha (HIF-1α) that gets expressed under conditions
of low oxygen (hypoxia) was investigated in SH-SY5Y cells upon treatment with 4 µM Aβ1-42
peptide and/or 2 Gy X-ray irradiation at 21% and 5% O2, respectively. Full lenght HIF-1α with
the size of about 120 kDa representing a factor induced in hypoxia (Wang & Semenza, 1995) was
not observed in cell lysates of SH-SY5Y (Figure 5.19). Instead, multiple lower molecular mass
bands suggesting the degradation of the protein were observed using an antibody against full lenght
HIF-1α, particularly in SH-SY5Y cells cultivated at 21% O2. Aβ peptide and/or irradiation
contributed to the increased appearance of such bands.
Figure 5.19. Western blot detection of hypoxia inducible factor-1 alpha (HIF-1α) after treatment with 4 µM Aβ1-42
peptide and/or 2 Gy X-ray irradiation of SH-SY5Y cells pre-treated with 10 µM retinoic acid and cultivated at 21%
and 5% O2, respectively. No HIF-1α (~120 kDa) representing a factor expressed in hypoxia was observed 1 day after
the treatment and/or 18 h after irradiation. Multiple lower molecular mass bands detected with the specific antibody
suggesting the degradation of the protein. Actin was used as a loading control for immunoblotting of cell lysates (about
30 µg protein per lane) of samples separated by SDS-PAGE (4% stacking gel, 9% separation gel).
HIF-1α is not stable under conditions which are non-hypoxic and even if induced it gets degraded
in some minutes (Gultice et al., 2009). Previous studies showed that HIF-1α is induced by ROS in
hypoxia (Chandel et al., 1998) and upon treatment with CoCl2 (Kallio et al., 1997). Observed
degradation of HIF-1α upon the treatment with Aβ peptide and/or irradiation suggests that ROS
other than those produced in hypoxia could affect its expression for a short time. Cells at 21% O2
experienced more ROS as compared to cells at 5% O2 (Chapter 5.7) and this is in correlation with
such transient increase in HIF-1α expression and then more intense degradation bands in Western
blot.
The expression of heat shock protein 60 (Hsp60) was observed in all samples and was increased
after the treatment with Aβ peptide in cells at 21% O2 only (Figure 5.20).
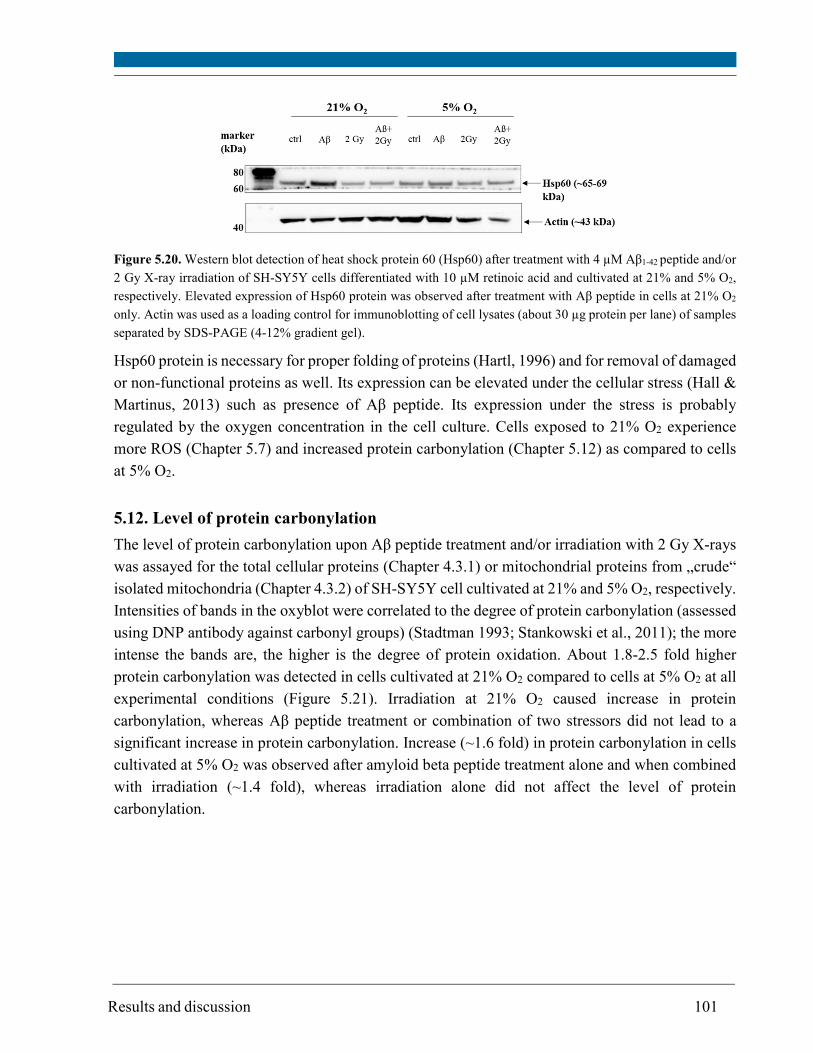
Results and discussion 101
Figure 5.20. Western blot detection of heat shock protein 60 (Hsp60) after treatment with 4 µM Aβ1-42 peptide and/or
2 Gy X-ray irradiation of SH-SY5Y cells differentiated with 10 µM retinoic acid and cultivated at 21% and 5% O2,
respectively. Elevated expression of Hsp60 protein was observed after treatment with Aβ peptide in cells at 21% O2
only. Actin was used as a loading control for immunoblotting of cell lysates (about 30 µg protein per lane) of samples
separated by SDS-PAGE (4-12% gradient gel).
Hsp60 protein is necessary for proper folding of proteins (Hartl, 1996) and for removal of damaged
or non-functional proteins as well. Its expression can be elevated under the cellular stress (Hall &
Martinus, 2013) such as presence of Aβ peptide. Its expression under the stress is probably
regulated by the oxygen concentration in the cell culture. Cells exposed to 21% O2 experience
more ROS (Chapter 5.7) and increased protein carbonylation (Chapter 5.12) as compared to cells
at 5% O2.
5.12. Level of protein carbonylation
The level of protein carbonylation upon Aβ peptide treatment and/or irradiation with 2 Gy X-rays
was assayed for the total cellular proteins (Chapter 4.3.1) or mitochondrial proteins from „crude“
isolated mitochondria (Chapter 4.3.2) of SH-SY5Y cell cultivated at 21% and 5% O2, respectively.
Intensities of bands in the oxyblot were correlated to the degree of protein carbonylation (assessed
using DNP antibody against carbonyl groups) (Stadtman 1993; Stankowski et al., 2011); the more
intense the bands are, the higher is the degree of protein oxidation. About 1.8-2.5 fold higher
protein carbonylation was detected in cells cultivated at 21% O2 compared to cells at 5% O2 at all
experimental conditions (Figure 5.21). Irradiation at 21% O2 caused increase in protein
carbonylation, whereas Aβ peptide treatment or combination of two stressors did not lead to a
significant increase in protein carbonylation. Increase (~1.6 fold) in protein carbonylation in cells
cultivated at 5% O2 was observed after amyloid beta peptide treatment alone and when combined
with irradiation (~1.4 fold), whereas irradiation alone did not affect the level of protein
carbonylation.
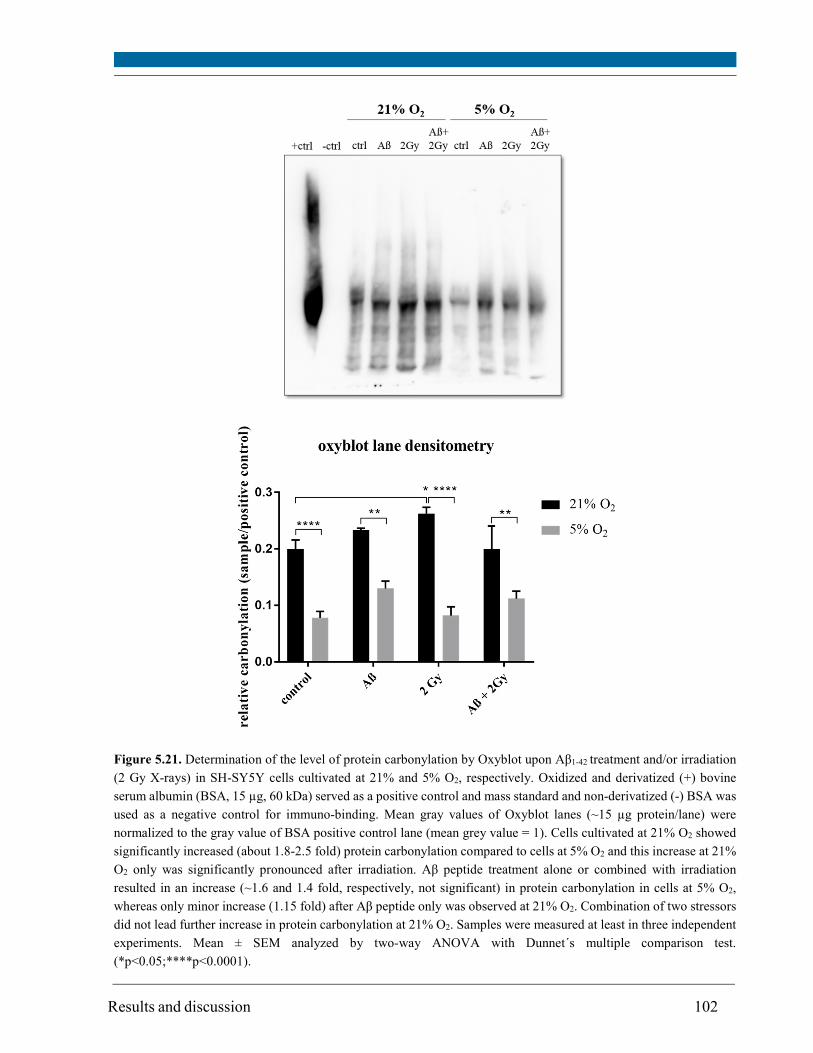
Results and discussion 102
Figure 5.21. Determination of the level of protein carbonylation by Oxyblot upon Aβ1-42 treatment and/or irradiation
(2 Gy X-rays) in SH-SY5Y cells cultivated at 21% and 5% O2, respectively. Oxidized and derivatized (+) bovine
serum albumin (BSA, 15 µg, 60 kDa) served as a positive control and mass standard and non-derivatized (-) BSA was
used as a negative control for immuno-binding. Mean gray values of Oxyblot lanes (~15 µg protein/lane) were
normalized to the gray value of BSA positive control lane (mean grey value = 1). Cells cultivated at 21% O2 showed
significantly increased (about 1.8-2.5 fold) protein carbonylation compared to cells at 5% O2 and this increase at 21%
O2 only was significantly pronounced after irradiation. Aβ peptide treatment alone or combined with irradiation
resulted in an increase (~1.6 and 1.4 fold, respectively, not significant) in protein carbonylation in cells at 5% O2,
whereas only minor increase (1.15 fold) after Aβ peptide only was observed at 21% O2. Combination of two stressors
did not lead further increase in protein carbonylation at 21% O2. Samples were measured at least in three independent
experiments. Mean ± SEM analyzed by two-way ANOVA with Dunnet´s multiple comparison test.
(*p<0.05;****p<0.0001).
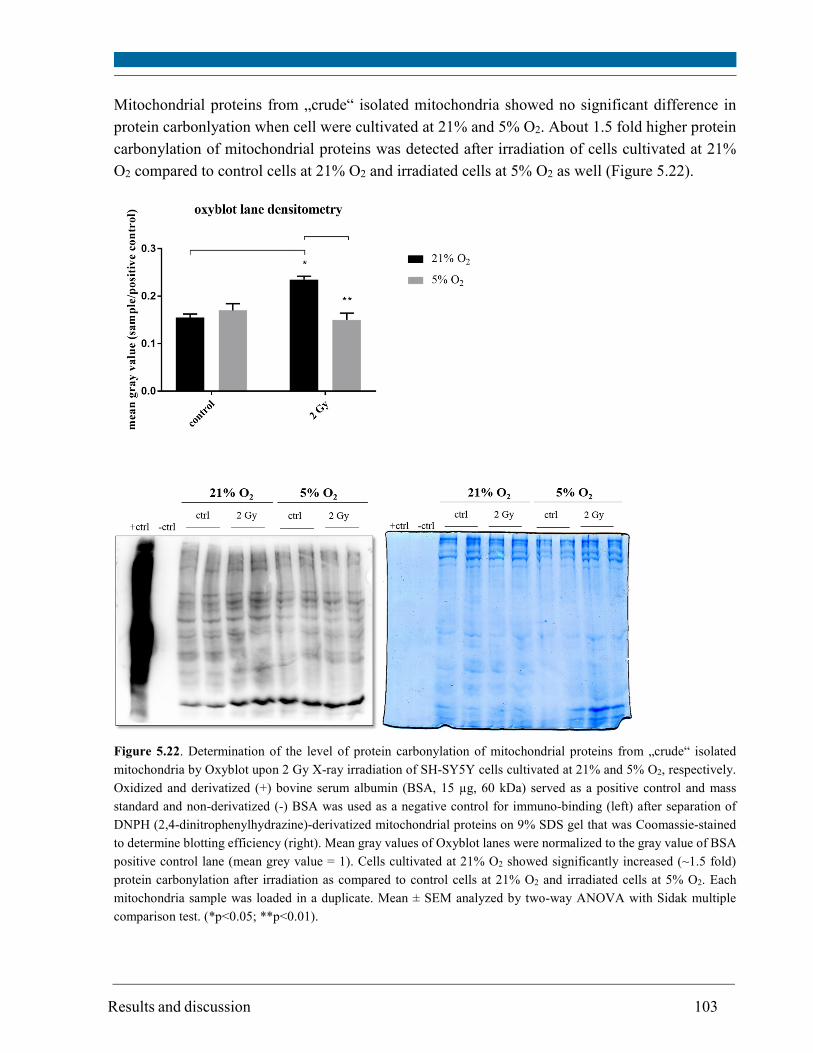
Results and discussion 103
Mitochondrial proteins from „crude“ isolated mitochondria showed no significant difference in
protein carbonlyation when cell were cultivated at 21% and 5% O2. About 1.5 fold higher protein
carbonylation of mitochondrial proteins was detected after irradiation of cells cultivated at 21%
O2 compared to control cells at 21% O2 and irradiated cells at 5% O2 as well (Figure 5.22).
Figure 5.22. Determination of the level of protein carbonylation of mitochondrial proteins from „crude“ isolated
mitochondria by Oxyblot upon 2 Gy X-ray irradiation of SH-SY5Y cells cultivated at 21% and 5% O2, respectively.
Oxidized and derivatized (+) bovine serum albumin (BSA, 15 µg, 60 kDa) served as a positive control and mass
standard and non-derivatized (-) BSA was used as a negative control for immuno-binding (left) after separation of
DNPH (2,4-dinitrophenylhydrazine)-derivatized mitochondrial proteins on 9% SDS gel that was Coomassie-stained
to determine blotting efficiency (right). Mean gray values of Oxyblot lanes were normalized to the gray value of BSA
positive control lane (mean grey value = 1). Cells cultivated at 21% O2 showed significantly increased (~1.5 fold)
protein carbonylation after irradiation as compared to control cells at 21% O2 and irradiated cells at 5% O2. Each
mitochondria sample was loaded in a duplicate. Mean ± SEM analyzed by two-way ANOVA with Sidak multiple
comparison test. (*p<0.05; **p<0.01).
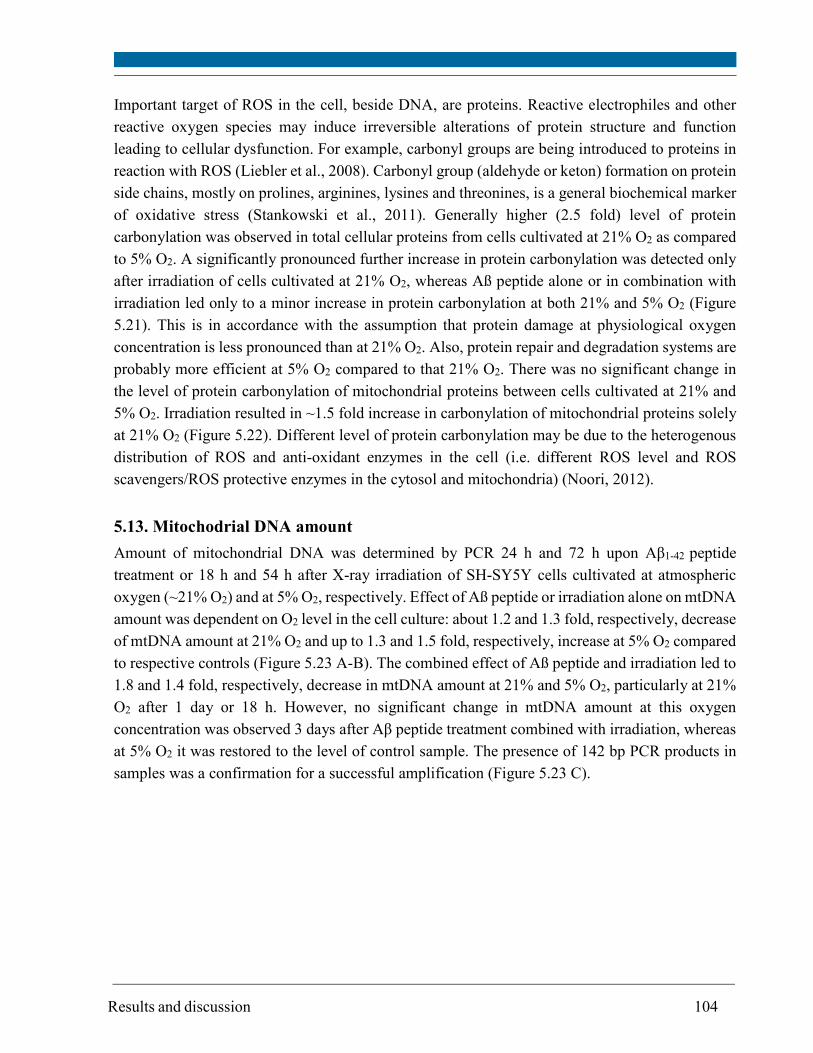
Results and discussion 104
Important target of ROS in the cell, beside DNA, are proteins. Reactive electrophiles and other
reactive oxygen species may induce irreversible alterations of protein structure and function
leading to cellular dysfunction. For example, carbonyl groups are being introduced to proteins in
reaction with ROS (Liebler et al., 2008). Carbonyl group (aldehyde or keton) formation on protein
side chains, mostly on prolines, arginines, lysines and threonines, is a general biochemical marker
of oxidative stress (Stankowski et al., 2011). Generally higher (2.5 fold) level of protein
carbonylation was observed in total cellular proteins from cells cultivated at 21% O2 as compared
to 5% O2. A significantly pronounced further increase in protein carbonylation was detected only
after irradiation of cells cultivated at 21% O2, whereas Aß peptide alone or in combination with
irradiation led only to a minor increase in protein carbonylation at both 21% and 5% O2 (Figure
5.21). This is in accordance with the assumption that protein damage at physiological oxygen
concentration is less pronounced than at 21% O2. Also, protein repair and degradation systems are
probably more efficient at 5% O2 compared to that 21% O2. There was no significant change in
the level of protein carbonylation of mitochondrial proteins between cells cultivated at 21% and
5% O2. Irradiation resulted in ~1.5 fold increase in carbonylation of mitochondrial proteins solely
at 21% O2 (Figure 5.22). Different level of protein carbonylation may be due to the heterogenous
distribution of ROS and anti-oxidant enzymes in the cell (i.e. different ROS level and ROS
scavengers/ROS protective enzymes in the cytosol and mitochondria) (Noori, 2012).
5.13. Mitochodrial DNA amount
Amount of mitochondrial DNA was determined by PCR 24 h and 72 h upon Aβ1-42 peptide
treatment or 18 h and 54 h after X-ray irradiation of SH-SY5Y cells cultivated at atmospheric
oxygen (~21% O2) and at 5% O2, respectively. Effect of Aß peptide or irradiation alone on mtDNA
amount was dependent on O2 level in the cell culture: about 1.2 and 1.3 fold, respectively, decrease
of mtDNA amount at 21% O2 and up to 1.3 and 1.5 fold, respectively, increase at 5% O2 compared
to respective controls (Figure 5.23 A-B). The combined effect of Aß peptide and irradiation led to
1.8 and 1.4 fold, respectively, decrease in mtDNA amount at 21% and 5% O2, particularly at 21%
O2 after 1 day or 18 h. However, no significant change in mtDNA amount at this oxygen
concentration was observed 3 days after Aβ peptide treatment combined with irradiation, whereas
at 5% O2 it was restored to the level of control sample. The presence of 142 bp PCR products in
samples was a confirmation for a successful amplification (Figure 5.23 C).
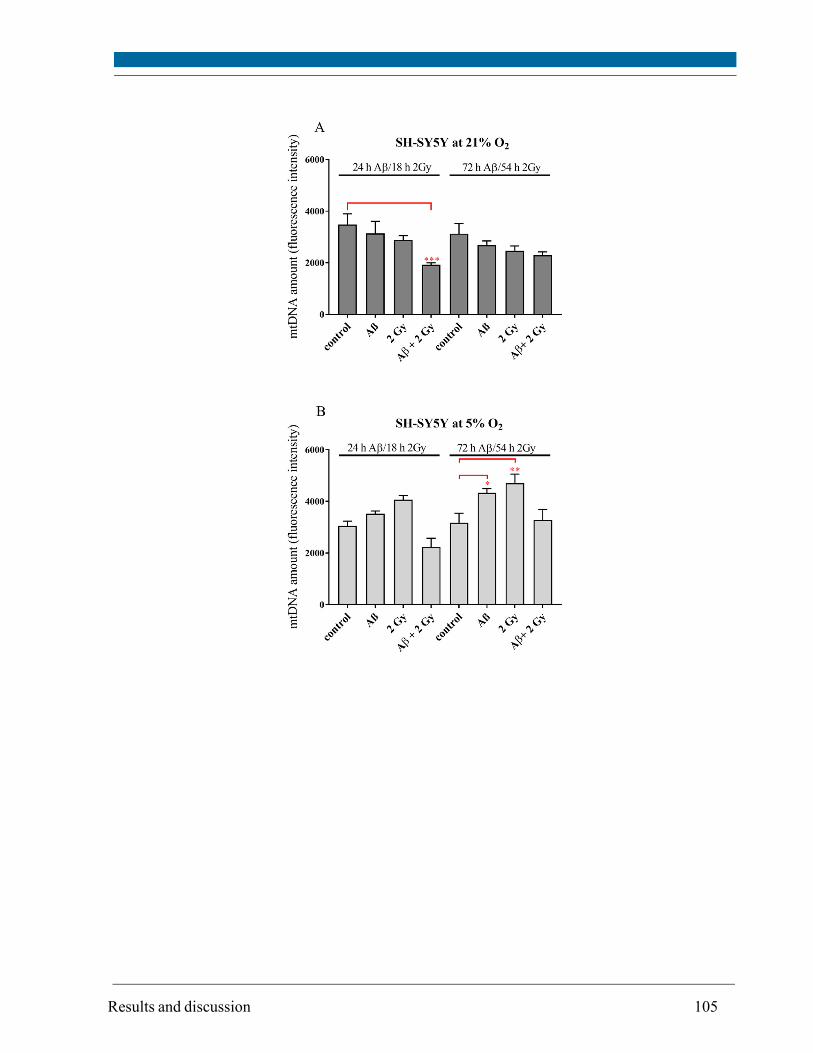
Results and discussion 105
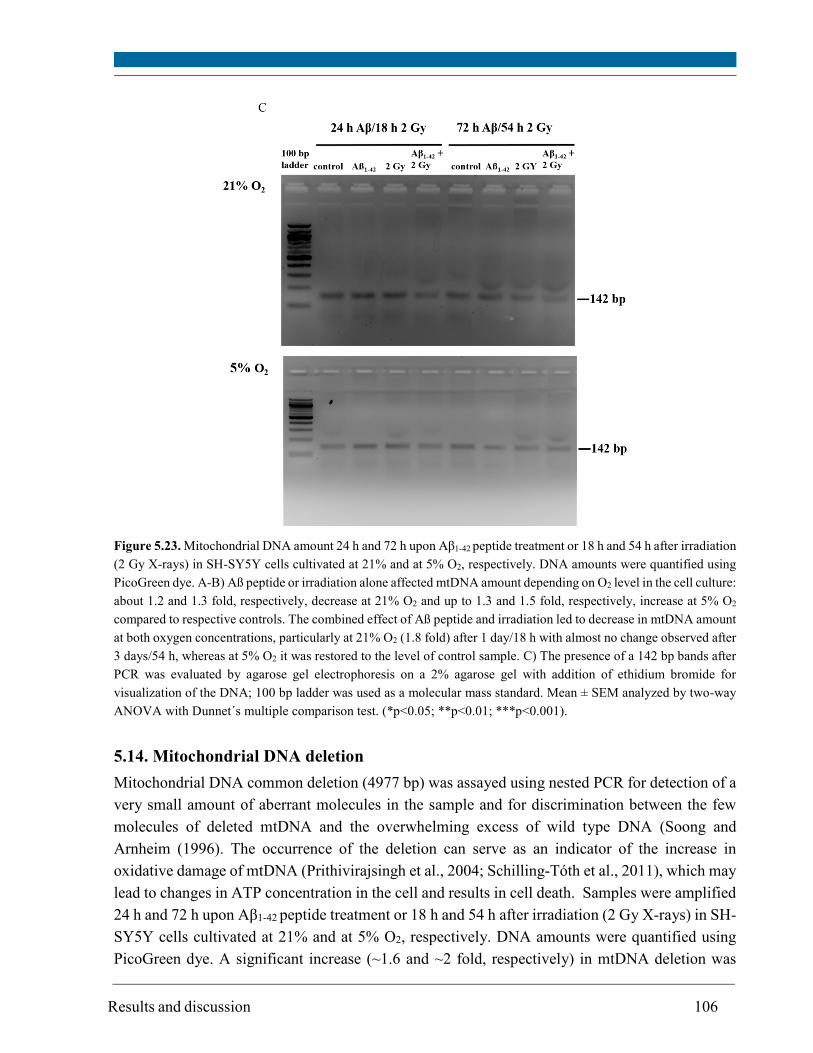
Results and discussion 106
Figure 5.23. Mitochondrial DNA amount 24 h and 72 h upon Aβ1-42 peptide treatment or 18 h and 54 h after irradiation
(2 Gy X-rays) in SH-SY5Y cells cultivated at 21% and at 5% O2, respectively. DNA amounts were quantified using
PicoGreen dye. A-B) Aß peptide or irradiation alone affected mtDNA amount depending on O2 level in the cell culture:
about 1.2 and 1.3 fold, respectively, decrease at 21% O2 and up to 1.3 and 1.5 fold, respectively, increase at 5% O2
compared to respective controls. The combined effect of Aß peptide and irradiation led to decrease in mtDNA amount
at both oxygen concentrations, particularly at 21% O2 (1.8 fold) after 1 day/18 h with almost no change observed after
3 days/54 h, whereas at 5% O2 it was restored to the level of control sample. C) The presence of a 142 bp bands after
PCR was evaluated by agarose gel electrophoresis on a 2% agarose gel with addition of ethidium bromide for
visualization of the DNA; 100 bp ladder was used as a molecular mass standard. Mean ± SEM analyzed by two-way
ANOVA with Dunnet´s multiple comparison test. (*p<0.05; **p<0.01; ***p<0.001).
5.14. Mitochondrial DNA deletion
Mitochondrial DNA common deletion (4977 bp) was assayed using nested PCR for detection of a
very small amount of aberrant molecules in the sample and for discrimination between the few
molecules of deleted mtDNA and the overwhelming excess of wild type DNA (Soong and
Arnheim (1996). The occurrence of the deletion can serve as an indicator of the increase in
oxidative damage of mtDNA (Prithivirajsingh et al., 2004; Schilling-Tóth et al., 2011), which may
lead to changes in ATP concentration in the cell and results in cell death. Samples were amplified
24 h and 72 h upon Aβ1-42 peptide treatment or 18 h and 54 h after irradiation (2 Gy X-rays) in SH-
SY5Y cells cultivated at 21% and at 5% O2, respectively. DNA amounts were quantified using
PicoGreen dye. A significant increase (~1.6 and ~2 fold, respectively) in mtDNA deletion was
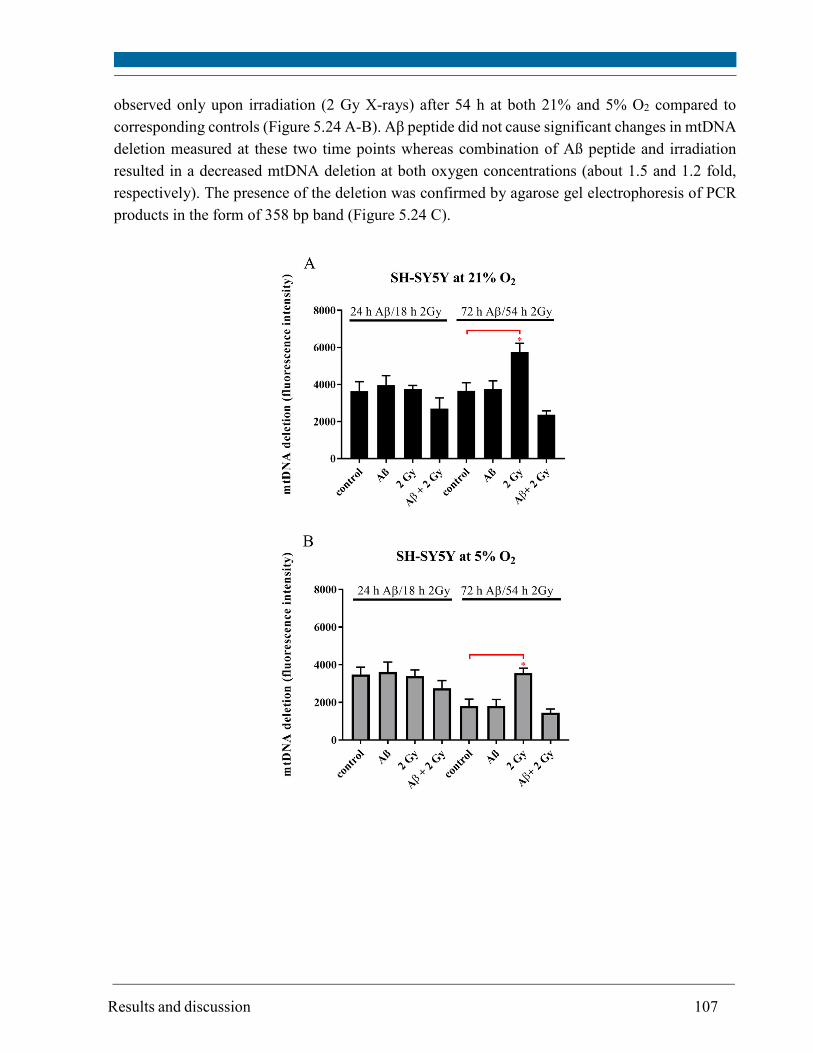
Results and discussion 107
observed only upon irradiation (2 Gy X-rays) after 54 h at both 21% and 5% O2 compared to
corresponding controls (Figure 5.24 A-B). Aβ peptide did not cause significant changes in mtDNA
deletion measured at these two time points whereas combination of Aß peptide and irradiation
resulted in a decreased mtDNA deletion at both oxygen concentrations (about 1.5 and 1.2 fold,
respectively). The presence of the deletion was confirmed by agarose gel electrophoresis of PCR
products in the form of 358 bp band (Figure 5.24 C).
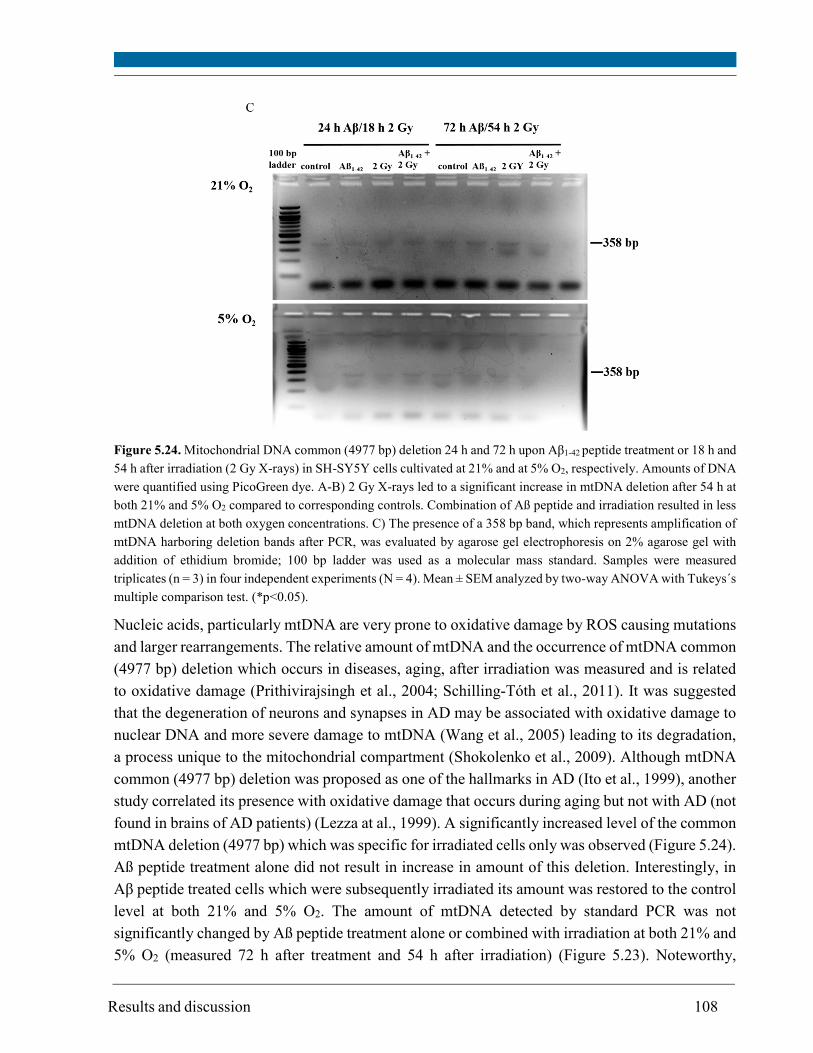
Results and discussion 108
Figure 5.24. Mitochondrial DNA common (4977 bp) deletion 24 h and 72 h upon Aβ1-42 peptide treatment or 18 h and
54 h after irradiation (2 Gy X-rays) in SH-SY5Y cells cultivated at 21% and at 5% O2, respectively. Amounts of DNA
were quantified using PicoGreen dye. A-B) 2 Gy X-rays led to a significant increase in mtDNA deletion after 54 h at
both 21% and 5% O2 compared to corresponding controls. Combination of Aß peptide and irradiation resulted in less
mtDNA deletion at both oxygen concentrations. C) The presence of a 358 bp band, which represents amplification of
mtDNA harboring deletion bands after PCR, was evaluated by agarose gel electrophoresis on 2% agarose gel with
addition of ethidium bromide; 100 bp ladder was used as a molecular mass standard. Samples were measured
triplicates (n = 3) in four independent experiments (N = 4). Mean ± SEM analyzed by two-way ANOVA with Tukeys´s
multiple comparison test. (*p<0.05).
Nucleic acids, particularly mtDNA are very prone to oxidative damage by ROS causing mutations
and larger rearrangements. The relative amount of mtDNA and the occurrence of mtDNA common
(4977 bp) deletion which occurs in diseases, aging, after irradiation was measured and is related
to oxidative damage (Prithivirajsingh et al., 2004; Schilling-Tóth et al., 2011). It was suggested
that the degeneration of neurons and synapses in AD may be associated with oxidative damage to
nuclear DNA and more severe damage to mtDNA (Wang et al., 2005) leading to its degradation,
a process unique to the mitochondrial compartment (Shokolenko et al., 2009). Although mtDNA
common (4977 bp) deletion was proposed as one of the hallmarks in AD (Ito et al., 1999), another
study correlated its presence with oxidative damage that occurs during aging but not with AD (not
found in brains of AD patients) (Lezza at al., 1999). A significantly increased level of the common
mtDNA deletion (4977 bp) which was specific for irradiated cells only was observed (Figure 5.24).
Aß peptide treatment alone did not result in increase in amount of this deletion. Interestingly, in
Aβ peptide treated cells which were subsequently irradiated its amount was restored to the control
level at both 21% and 5% O2. The amount of mtDNA detected by standard PCR was not
significantly changed by Aß peptide treatment alone or combined with irradiation at both 21% and
5% O2 (measured 72 h after treatment and 54 h after irradiation) (Figure 5.23). Noteworthy,
Results and discussion 109
irradiation of cells at 5% O2 resulted in a significant increase of mtDNA amount after 54 h (Figure
5.23). In general, cells at 5% O2 showed higher mtDNA amount after Aβ peptide treatment or after
irradiation than cells at 21% O2. Probably, increase in mtDNA amount is a compensatory
mechanism after stress and damage and it is dependent on the oxygen concentration in the cell
culture. Although effects of irradiation and Aβ peptide share some similarities, such as induction
of inflammation, these two stressors probably affect different cellular pathways and result in
different cellular responses. Mitochondrial DNA deletions could be responsible for triggering
compensatory mechanisms such as increase in mtDNA amount (observed in cells at 5% O2) and
improvement in mitochondrial respiration, which allows normal functioning of cells and may have
neuroprotective effect (Perier et al., 2013). Also, balanced mitochondrial fission and fusion
processes enable maintenance of their proper function and integrity including mtDNA quality
(Busch et al., 2014) and it was reported that mitochondria of cells cultivated at 5% O2 show larger
mitochondrial networks, greater cytoplasmic fractions of mitochondria (area occupied by the
mitochondria) and larger mitochondrial perimeters than those cultured at higher oxygen
concentrations (Tiede et al., 2011). It was shown previously that Aß peptide can induce oxidative-
mediated autophagic cell death in vitro after damage of mtDNA in AD (Wang et al. 2010). In
addition, hyperoxic conditions (e.g. 95% O2) induce rapid cell death with fragmentation of mtDNA
(Yoneda et al., 1995). Overexpression of mitochondrial transcription factor A (Tfam) is one of the
mechanisms to compensate mitochondrial dysfunction, protect mtDNA from oxidative stress and
to maintain mtDNA amount in SH-SY5Y cells treated with Aß peptide (Xu et al., 2009).
General discussion 110
6. General discussion
The complex interplay of ionizing radiation (IR), oxygen in the cell culture, differentiation status
of cells and Alzheimer´s disease (AD) Aβ1-42 peptide were presented and discussed in this thesis.
Oxygen concentration in the cell culture is of crucial importance for the cellular response to
oxidative stress, which was compared between cells cultivated at 21% O2 commonly used in the
cell culture and at more physiological 5% O2.
It was demonstrated that the intracellular oxygen concentration was about 2-5 fold lower than the
concentration applied to the cell culture. For human neuroblastoma (SH-SY5Y) cells cultivated at
21% O2 the measured intracellular oxygen concentration was ~10%, and for cells cultivated at 5%
O2 was ~1% (Figure 5.1). Although no previous measurements for SH-SY5Y cells were
performed, data obtained in this thesis are in line with published data for adheherent 2D culture of
HepG2 cells at 21% O2 (~10% O2 intracellularly) (Krumm & Carey, 2016), and for HEK293T cells
cultivated 6% O2 (~2% O2 intracellulary) (manual for MitoXpress® Intra Intracellular Oxygen
assay).
5% O2 was considered more physiological for SH-SY5Y cells as compared to 21% O2 and the
term „hypoxia“ (i.e. lack of oxygenation or O2 concentration lower than that measured in different
organs in a physiological condition) (Carreau et al., 2011) could not be attributed to this
concentration. Moreover, no hypoxia inducible factor (HIF-1α), which is usually expressed in
hypoxia, was detected in the studied system (Figure 5.19). Furthermore, proliferation activity of
cells cultivated at 5% O2 was higher than at 21% O2 (Figure 5.3), which was in accordance with
published data showing that lower O2 concentrations are beneficial for cell proliferation (Packer
and Fuehr, 1977; Brewer and Cotman, 1989; Parinello et al., 2003).
Oxygen affects bioenergetic status of the cell since cells at 5% O2, which is more physiological,
revealed higher ATP concentration (~1.3 fold) (Figure 5.13 A) and less mtDNA deletion (up to 2
fold) (Figure 5.24) compared to cells at non-physiological 21% O2. Furthermore, lower ROS level
(~1.5 fold) (Figure 5.14 B) and less protein carbonylation (~2.5 fold) in total cellular proteins
(Figure 5.21) were observed at 5% O2. This is in accordance with the assumption that the protein
damage at physiological oxygen concentration is less pronounced than at 21% O2. Also, protein
repair and degradation systems are probably more efficient at 5% O2 compared to that at 21% O2.
However, no significant change in the level of protein carbonylation of mitochondrial proteins
between cells cultivated at 21% and 5% O2 was observed (Figure 5.22). This may be due to the
heterogenous distribution of ROS and anti-oxidant enzymes in the cell (i.e. different ROS level
and ROS scavengers/ROS protective enzymes in the cytosol and mitochondria) (Noori, 2012).
The differentiation state is another important factor in cellular response to stress. Treatment of
cells with retinoic acid (RA) for 3 days used for induction of differentiation resulted in changed
morphology of SH-SY5Y cells (i.e. elongation of the cell body and presentation of long
outgrowths) (Figure 5.5). Furthermore, RA reduced cell proliferation at both of 21% O2 and 5%
General discussion 111
O2 (Figure 5.6). Differentiation state of the cell determines the gene expression which then
regulates the sensitivity and cellular response to any treatment. Noteworthy, SH-SY5Y cells in this
study, due to the limited time frame, were not terminally differentiated to homogenous human
neuronal cultures as described by Shipley and colleagues (2016) where the differentiation is based
on sequential removal of serum from media with introduction of extracellular matrix proteins and
neurotrophic factors. In this work, only RA was used to induce differentiation (Hellmann-Regen
et al., 2012) and this resulted in rather heterogenous population where most, but not all cells, were
at a similar differentiation state.
Additionally, oxygen concentration modulated the expression of neurofilament M, a marker of
differentiation (Džinić et al., 2016) and is known to be implicated in differentiation (Cheng et al.,
2014) and metabolic activity of neuronal cells (Zhu et al., 2012).
Oxygen concentration and differentiation state are important in studies of disease mechanisms,
particularly of multifactorial diseases e.g. neurodegenerative AD. Although exact cause(s) of AD
are still unknown, one of the players is Aβ peptide. However, the implication of different
aggregation states of the peptide (fibrillized or disaggregated to monomers and oligomers) is
largely debated. Monomers and small oligomers of Aβ peptide are recently proposed to be
involved in damage of neurons, instead of extracellular Aβ plaques, since they interact with
cellular membranes (Buchsteiner et al., 2010; Dante et al., 2011) and the peptide is found inside
neurons of AD patients (Gouras et al., 2000).
In this thesis, externally applied disaggregated Aß1-42 peptide was found to interact preferentially
with lysosomes of SH-SY5Y cells at both 21% and 5% O2 (Figure 5.7 B). Thus, the peptide
interacted only to a minor extent with mitochondria and endoplasmatic reticulum (Figure 5.8 C-
D). Flow cytometric analysis revealed increase in cell death after Aβ peptide treatment solely in
RA-treated cells, particularly at 5% O2 (~1.3 fold) (Figure 5.11). However, the effect of 4 µM Aβ
peptide on cell survival was not dramatic. Similar results were obtained for 10 µM Aß peptide
applied to differentiated PC12 cells as well (Sirk et al., 2007). In studies of Aβ peptide toxicity, it
is important to consider the concentration and aggregation state of the peptide and the cell type.
For example, picomolar concentrations of intracellular Aß1-42 peptide (both non-fibrillized and
fibrillized) induced cell death of primary neurons through p53-Bax pathway (Zhang et al., 2002)
but not of other neuronal and non-neuronal cell types.
In order to test the effect of high concentration of two different aggregation states of the peptide,
100 µM disaggregated and the same concentration of fibrillized Aβ peptide, respectively, was
applied to SH-SY5Y cells for 1 and 3 days, respectively. Interesting finding was that the aged
peptide caused earlier response of SH-SY5Y cells which underwent cell death (~3.4 fold increase
compared to control cells) (Figure 5.12). This may indicate that aggregated peptide is more
harmful and that the monomer/oligomer theory does not apply here. However, the effect of
disaggregated Aß peptide after 3 days of incubation was much more pronounced (~5.3 fold
increase in cell death as compared to control cells) than of fibrillized peptide (~2.3 fold increase
General discussion 112
in cell death as compared to control cells). Therefore, time of incubation, together with all other
factors mentioned above, is a crucial factor in Aβ peptide toxicity.
Aβ peptide did not dramatically affect mitochondrial-related parameters. There was only a slight
increase in ROS (up to 1.2 fold) (Figure 5.14), a slight increase in mitochondrial membrane
potential (Figure 5.18), and no changes in ATP concentration at both 21% and 5% O2 (Figure 5.13
A). Although mtDNA common (4977 bp) deletion was proposed as one of the hallmarks in AD
(Ito et al., 1999), another study correlated its presence with oxidative damage that occurs during
aging but not with AD (not found in brains of AD patients) (Lezza at al., 1999). Also, in this thesis,
no change in the mtDNA deletion could be detected in Aβ peptide treated cells (Figure 5.24).
Change in mtDNA amount after Aβ peptide treatment depended on O2 concentration: up to 1.3
fold decrease at 21% O2 and up to 1.5 fold increase at 5% O2 (Figure 5.23).
Aβ affected lysosomal integrity in oxygen dependent manner: decreased lysosomal integrity was
measured after Aβ peptide treatment in SH-SY5Y cells cultivated at 21% O2 (Figure 5.8).
Therefore, oxygen concentration was confirmed to be an important modulator of cellular response
to stress (Tiede et al., 2011; Džinić et al., 2016). Additionaly, RA-treated cells were more sensitive
than non-differentiated cells reflected in overall decline of lysosomal integrity in the former.
Many non-lethal alterations in cell physiology such as slight increase in protein carbonlyation
(Figure 5.21) and interaction of Aß peptide with lysosomes (in line with studies performed at 21%
O2 (Decker, 2016)) if persistant, may induce detrimental changes. Important to note, the reverse
peptide (Aβ42-1), which was not used in this work, tested previously on SH-SY5Y cells cultivated
at 21% O2 behaved as a negative control and did not induce changes in cell death, ATP
concentration and ROS level (Decker, 2016).
Lysosomal activity of sequestration and potential degradation of Aβ peptide is probably the first
and most important defense mechanism of SH-SY5Y cells against Aβ peptide toxicity, as
described by Zheng and colleagues (2012) as well. Other acidic compartments such as endosomes
may be involved in the mechanism against Aβ peptide toxicity as well. Beside the observed
interaction of Aβ peptide with lysosomes, which suggests their degradation, an increased
expression of heat shock protein 60 (Hsp60), necessary for proper folding of proteins (Hartl, 1996)
and for removal of damaged or non-functional proteins as well, was observed after the treatment
with Aβ peptide, but solely in cells at 21% O2 (Figure 5.20).
Ionizing X-ray radiation in general affected SH-SY5Y cells more than Aβ peptide. 2 Gy X-rays
caused a significant increase in ROS (~1.5 fold) (Figure 5.14), and a slight increase in ATP
concentration (~1.2 fold) (Figure 5.13 A) but solely in cells at 5% O2. A slight increase in
mitochondrial membrane potential observed upon irradiation at both 21% and 5% O2 (Figure 5.18)
was as similar as the effect of Aβ peptide. This is probably a transient change and one of the
mechanisms that cells employ in the presence of stressors (Džinić et al., 2016).
General discussion 113
Cell proliferation activity of irradiated cells was reduced after 3-4 days, observed as a decrease in
the number of cells cultivated at both of 21% O2 and 5% O2 (Figure 5.6). This suggests that the
effect of radiation on cells is not immediate but exerted through the formation of ROS in the
radiolysis of water and through their high potential to react with other molecules creating more
ROS in the cell. 2 Gy applied does not present a high dose (commonly used as a fractionated dose
in tumor treatment as well) of radiation compared to 8 Gy that resulted in more pronounced
increase in ROS level at both 21% and 5% O2 (Figure 5.15). Since half-lives (10-9–10-4 s) of ROS
are short (Powers et al., 2011), and changes in ROS were measured after at least 18 h, another
approach to measure immediate and transient changes in ROS, as suggested and tested in this
thesis, is the use of HyPer, a genetically encoded H2O2 sensor (Belousov et al., 2006).
The cell possesses its own anti-oxidant mechanisms such as glutathione (GSH) (Dani et al., 2010)
which is activated depending on the amount of oxidative stress. For example, radiation caused a
slight increase in GSH level at 21% O2 and decrease at 5% O2 (up to 1.2 fold) (Figure 5.17). The
level of GSH, although used as an indicator of cell viability or of apoptosis (Coppola et al., 2000),
studied here was varying and in most cases it could not be correlated with cell death; an increase
of cell death after irradiation was observed in non-differentiated cells solely at 5% O2 (~1.4 fold)
(Figure 5.10) but in RA-treated cells at both 21% (~1.2 fold) and 5% O2 (~1.5 fold) (Figure 5.11).
Since GSH is not the only anti-oxidant in the cell, it is probable that the cell employs other
antioxidant (e.g. dismutases and catalases) and repair mechanisms depending on the starting level
of oxidative stress. For example, the observed increase in ATP that is utilized for repair processes
under unfavorable conditions is one of the ways to cope with oxidative stress.
Increase in carbonyl groups in proteins induced by oxidative stress (Liebler et al., 2008) was
specific for both total isolated (Figure 5.21) and mitochondrial proteins (Figure 5.22) of irradiated
cells at 21% O2. Furthermore the occurrence of the mtDNA deletion after 3 days was specific for
irradiated cells at both 21% and 5% O2 and was more pronounced at 21% O2 (Figure 5.24). The
presence of the deletion after irradiation is in accordance with previously published data
(Prithivirajsingh et al., 2004; Schilling-Tóth et al., 2011). A significant increase of mtDNA amount
in irradiated cells at 5% O2 (Figure 5.23) is probably a compensatory mechanism after stress and
damage and may have neuroprotective effect (Perier et al., 2013) depending on oxygen
concentration in the cell culture. Damaged mtDNA, if not repaired, is usually degraded and this
process is unique to the mitochondrial compartment (Shokolenko et al., 2009).
Similar to Aβ peptide, X-ray radiation reduced the lysosomal integrity in both RA-treated and non-
treated cells solely at 21% O2 (Figure 5.8). Increase in Hsp60 detected after treatment with Aβ
peptide was not observed in irradiated cells (Figure 5.20). However, another heat shock protein
(Hsp70) was found to be increased upon irradiation of SH-SY5Y cells (Džinić et al., 2016).
Although effects of irradiation and Aβ peptide share some similarities, such as induction of
inflammation, these two stressors probably affect different cellular pathways and result in different
General discussion 114
cellular responses. For the first time studied combined effects of Aß peptide and X-ray radiation
revealed interesting cellular responses of SH-SY5Y cells.
Mitochondrial membrane potential (Figure 5.18), mtDNA amount (Figure 5.23), mitochondrial
deletion (Figure 5.24) and cell death (Figure 5.10 and 5.11) were restored to their levels in control
cells at both 21% and 5% O2 in irradiated cells which were previously treated with Aβ peptide. Furthermore, there was an increase in ATP concentration upon irradiation of Aβ treated cells
cultivated at 5% O2 (~1.5 fold). Lysosomal integrity, which was decreased in cells at 21% O2 upon
Aβ treatment or irradiation, was restored to its level in control cells when both stressors were
combined (Figure 5.8). Although the level of ROS was significantly increased at both 21% and
5% O2 (up to 1.4 fold) (Figure 5.14), only minor increase in protein carbonylation was detected at
both 21% and 5% O2 (Figure 5.21).
It seems that Aβ peptide in lower concentration (4µM) has a protective effect on irradiated SH-
SY5Y cells and the final cellular response is modulated by the starting level of oxidative stress
(i.e. oxygen concentration) and differentiation state. Possibly, aromatic amino acid residues of Aß
peptide act as selective ROS scavengers (Stadtman, 1993) but not for all ROS since there was a
slight increase in ROS after Aβ peptide treatment alone or combined with radiation measured in
this work. This demands further investigation of cellular responses to Aβ peptide.
References 115
7. References
Acharya MM, Lan ML, Kan VH, Patel NH, Giedzinski E, Tseng BP, Limoli CL. (2010). Consequences of ionizing radiation-induced damage in human neural stem cells. Free Radic. Biol. Med., 49: 1846-1855.
Alberts B, Johnson A, Lewis J, Morgan D, Raff M, Roberts K, Walter P. (2015). Molecular Biology of the cell. New York: Garland Science.
Alexeyev M, Shokolenko I, Wilson G, LeDoux S. (2015). The maintenance of mitochondrial DNA integrity-critical analysis and update. Cold. Spring Harb. Perspect. Biol., 5: a012641. doi: 10.1101/cshperspect.a012641.
Alzheimer A. (1907). Über eine eigenartige Erkrankung der Hirnrinde. Allgemeine Zeitschrift für
Psychiatrie und Psychisch-gerichtliche Medizin, 64: 146-148.
Ames B, Shigenaga MK, Hagen TM. (1993). Oxidants, antioxidants, and the degenerative diseases of aging. Proc. Natl. Acad. Sci. USA, 90: 7915-7922.
Anderson S, Bankier AT, Barrell BG, de Bruijn MH, Coulson AR, Drouin J, Eperon IC, Nierlich DP, Roe BA, Sanger F, Schreier PH, Smith AJ, Staden R, Young IG. (1981). Sequence and organization of the human mitochondrial genome. Nature, 290: 457-465.
Apel K, Hirt H. (2004). Reactive oxygen species: metabolism, oxidative stress, and signal transduction. Annu. Rev. Plant. Biol., 55: 373-399.
Balmer JE, Blomhoff R. (2002). Gene expression regulation by retinoic acid. Journal of Lipid Research, 43: 1773-1808.
Barrett MA, Trapp M, Lohstroh W, Seydel T, Ollivier J, Ballauff M, Dencher NA, Hauß T. (2016). Alzheimer's peptide amyloid-β, fragment 22–40, perturbs lipid dynamics. Soft Matter, 12: 1444-1451.
Bauer G. (2011). Low dose gamma irradiation enhances defined signaling components of intercellular reactive oxygen-mediated apoptosis induction. Journal of Physics Conference Series, 261: 012001.
Bauman GS, Gaspar LE, Fisher BJ, Halperin EC, Macdonald DR, Cairncross JG. (1994). A prospective study of short-course radiotherapy in poor prognosis glioblastoma multiforme. Int. J. Radiat. Oncol. Biol.
Phys., 29: 835-839.
Belousov VV, Fradkov AF, Lukyanov KA, Staroverov DB, Shakhbazov KS, Terskikh AV, Lukyanov S. (2006). Genetically encoded fluorescent indicator for intracellular hydrogen peroxide. Nature Methods, 3: 281-286.
Berggren K, Chernokalskaya E, Steinberg TH, Kemper C, Lopez MF, Diwu Z, Haugland RP, Patton WF. (2000). Background-free, high sensitivity staining of proteins in one- and two-dimensional sodium dodecyl sulfate-polyacrylamide gels using a luminescent ruthenium complex. Electrophoresis, 21: 2509-2521.
Biedler JL, Helson L, Spengler BA. (1973). Morphology and growth, tumorigenicity, and cytogenetics of human neuroblastoma cells in continuous culture. Cancer Res., 33: 2643-2652.
Biedler JL, Roffler-Tarlov S, Schachner M, Freedman LS. (1978). Multiple neurotransmitter synthesis by human neuroblastoma cell lines and clones. Cancer Res., 38: 3751-3757.
Blum H, Beier H, Gross H. (1987). Improved silver staining of plant proteins, RNA and DNA in polyacrylamide gels. Electrophoresis, 8: 93-99.
Bodovitz S, Klein WL. (1996). Cholesterol modulates alpha-secretase cleavage of amyloid presursor protein. J. Biol.Chem. 271: 4436-4440.
Bradford MM. (1976). Rapid and sensitive method for the quantitation of microgram quantities of protein utilizing the principle of protein-dye binding. Anal. Biochem., 72: 248–254.

References 116
Braunschweig L, Meyer AK, Wagenführ L, Storch A. (2015). Oxygen regulates proliferation of neural stem cells through Wnt/β-catenin signaling. Molecular and Cellular Neuroscience, 67: 84-92.
Brewer GJ, Cotman CW. (1989). Survival and growth of hippocampal neurons in defined medium at low density: advantages of a sandwich culture technique or low oxygen. Brain Res., 494: 65-74.
Brown WM, George M Jr, Wilson AC. (1979). Rapid evolution of animal mitochondrial DNA. Proc. Natl.
Acad. Sci. USA, 76: 1967-1971.
Buchsteiner A, Hauss T, Dante S, Dencher NA. (2010). Alzheimer's disease amyloid-beta peptide analogue alters the ps-dynamics of phospholipid membranes. Biochim. Biophys. Acta, 1798: 1969-1976.
Busch KB, Kowald A, Spelbrink JN. (2014). Quality matters: how does mitochondrial network dynamics and quality control impact on mtDNA integrity? Philos. Trans. R. Soc. Lond. B. Biol. Sci., 369: 20130442.
Carreau A, El Hafny-Rahbi B, Matejuk A, Grillon C, Kieda C. (2011). Why is the partial oxygen pressure of human tissues a crucial parameter? Small molecules and hypoxia. Journal of Cellular and Molecular
Medicine, 6: 1239-1253.
Carrera S, Senra J, Acosta MI, Althubiti M, Hammond EM, de Verdier PJ, Macip S. (2014). The role of the HIF-1a transcription factor in increased cell division at physiological oxygen tensions. PLOS ONE, 9: e97938.
Chandel NS, Maltepe E, Goldwasser E, Mathieu CE, Simon MC, Schumacker PT. (1998). Mitochondrial reactive oxygen species trigger hypoxia-induced transcription. Cell Biology, 95: 11715-11720.
Chen C-L, Zhang L, Yeh A, Chen C-A, Green-Church KB, Zweier JL, Chen Y-R. (2007). Site-specific S-glutathiolation of mitochondrial NADH ubiquinone reductase. Biochemistry, 46: 5754–5765.
Chen T, He J, Shen L, Fang H, Nie H, Jin T, Wie X, Xin Y, Jiang Y, Li H, Chen G, Lu J, Bai Y. (2011). The mitochondrial DNA 4,977-bp deletion and its implication in copy number alteration in colorectal cancer. BMC Medical Genetics, 12: 1-8.
Cheng L, Yang W, Hu W, Pei G, Qiu B, Zhao J, Yu Y, Guan W, Wang M. (2014). Generation of neural progenitor cells by chemical cocktails and hypoxia. Cell Research, 24: 665-679.
Chiu F-C, Feng L, Chan S-O, Padin C, Federoff HJ. (1995). Expression of neurofilament proteins during retinoic acid-induced differentiation of P19 embryonal carcinoma cells. Molecular Brain Research, 30: 77-86.
Chun Y-S, Kim M-S, Park J-W. (2002). Oxygen-dependent and -independent regulation of HIF-1 alpha. J.
Korean. Med. Sci., 17: 581-588.
Coppola S, Ghibelli L. (2010). GSH extrusion and the mitochondrial pathway of apoptotic signaling. Biochem. Soc. Trans., 28: 56-61.
Crystal H, Dickson D, Fuld P, Masur D, Scott R, Mehler M, Masdeu J, Kawas C, Aronson M, Wolfson L. (1988). Clinico-pathologic studies in dementia: nondemented subjects with pathologically confirmed Alzheimer's disease. Neurology, 38: 1682-1687.
Dani D, Shimokawa I, Komatsu T, Higami Y, Warnken U, Schokraie E, Schnölzer M, Krause F, Sugawa MD, Dencher NA. (2010). Modulation of oxidative phosphorylation machinery signifies a prime mode of anti-ageing mechanism of calorie restriction in male rat liver mitochondria. Biogerontology, 11: 321-334.
Dante S, Hauß T, Dencher NA. (2003). Insertion of externally administered amyloid beta peptide 25-35 and perturbation of lipid bilayers. Biochemistry, 42: 13667-13672.
Dante S, Hauss T, Dencher NA. (2006). Cholesterol inhibits the insertion of the Alzheimer's peptide Abeta(25-35) in lipid bilayers. Eur. Biophys. J., 35: 523-531.
References 117
Decker V. (2016). Beeinflussung von Zellphysiologie und mitochondrialer Funktion durch Alzheimer Demenz-assoziiertes Amyloides-β Peptid (Doctoral dissertation). Technische Universität Darmstadt, Darmstadt. http://tuprints.ulb.tu-darmstadt.de/5731/.
Džinić T, Hartwig S, Lehr S, Dencher NA. (2016). Oxygen and differentiation status modulate the effect of X-ray irradiation on physiology and mitochondrial proteome of human neuroblastoma cells. Arch.
Physiol. Biochem., 122: 257-265.
Elmore S. (2007). Apoptosis: A review of programmed cell death. Toxicol. Pathol., 35: 495–516.
Eriksson PS, Perfilieva E, Björk-Eriksson T, Alborn AM, Nordborg C, Peterson DA, Gage FH. (1998). Neurogenesis in the adult human hippocampus. Nat. Med., 4: 1313-1317.
Fagerström S, Påhlman S, Gestblom C, Nånberg E. (1996). Protein kinase C-epsilon is implicated in neurite outgrowth in differentiating human neuroblastoma cells. Cell Growth Differ., 7:775-785.
Franco R, Schoneveld O, Georgakilas AG, Panayiotidis MI. (2008). Oxidative stress, DNA methylation and carcinogenesis. Cancer Letters, 266: 6-11.
Friedrich RP, Tepper K, Rönicke R, Soom M, Westermann M, Reymann K, Kaether C, Fändrich M. (2010). Mechanism of amyloid plaque formation suggests an intracellular basis of Abeta pathogenicity. Proc. Natl.
Acad. Sci. USA, 107: 1942-1947.
Furda A, Santos JH, Meyer JN, Van Houten B. (2014). Quantitative PCR-based measurement of nuclear and mitochondrial DNA damage and repair in mammalian cells. Methods Mol. Biol., 1105: 419-437.
Gibhardt CS, Roth B, Schroeder I, Fuck S, Becker P, Jakob B, Fournier C, Moroni A, Thiel G. (2015). X-ray irradiation activates K+ channels via H2O2 signaling. Sci. Rep., 5: 13861. doi: 10.1038/srep13861.
Gil del Valle L. (2011). Oxidative stress in aging: Theoretical outcomes and clinical evidences in humans. Biomedicine & Aging Pathology, 1: 1–7.
Goto S, Hasegawa A, Nakamoto H, Nakamura A, Takahashi R, Kurochkin IV. (1995). Age-associated changes of oxidative modification and turnover of proteins. Oxidative Stress and Aging. Basel: Birkhäuser Basel, pp. 151-158.
Gouras GK, Tsai J, Naslund J, Vincent B, Edgar M, Checler P, Greenfield JP, Haroutunian V, Buxbaum JD, Xu H, Greengard P, Relkin NR. (2000). Intraneuronal Aβ42 accumulation in human brain. Am. J.
Pathol., 156: 15-20.
Gultice AD, Kulkarni-Datar K, Brown TL. (2009). Hypoxia-inducible factor 1alpha (HIF1A) mediates distinct steps of rat trophoblast differentiation in gradient oxygen. Biol. Reprod., 80: 184-193.
Haan C, Behrmann I. (2007). A cost effective non-commercial ECL-solution for Western blot detections yielding strong signals and low background. J. Immunological Methods, 318: 11-19.
Hall RD, Martinus L. (2013). Hyperglycaemia and oxidative stress upregulate HSP60; HSP70 expression in HeLa cells. SpringerPlus, 2:431. doi:10.1186/2193-1801-2-431.
Halliwell B, Whiteman M. (2004). Measuring reactive species and oxidative damage in vivo and in cell culture: how should you do it and what do the results mean? British Journal of Pharmacology, 142: 231-255.
Hammond EM, Asselin MC, Forster D, O' Connor JP, Senra JM, Williams KJ. (2014). The meaning, measurement and modification of hypoxia in the laboratory and the clinic. Clinical Oncology, 26: 277-288.
Hansson Petersen CA, Alikhani N, Behbahani H, Wiehager B, Pavlov PF, Alafuzoff I, Leinonen V, Ito A, Winblad B, Glaser E, Ankarcrona M. (2008). The amyloid β-peptide is imported into mitochondria via the TOM import machinery and localized to mitochondrial cristae. PNAS, 105: 13145-13150.
References 118
Hardy JA, Higgins GA. (1992). Alzheimer's disease: the amyloid cascade hypothesis. Science, 256: 184-185.
Hartl FU. (1996). Molecular chaperones in cellular protein folding. Nature, 381: 571–580.
Hellmann-Regen J, Gertz K, Uhlemann R, Colla M, Endres M, Kronenberg G. (2012). Retinoic acid as target for local pharmacokinetic interaction with modafinil in neural cells. Euro. Arch. Psychiatry. Clin.
Neurosci., 262:697–704.
Hempel SL, Buettner GR, O'Malley YQ, Wessels DA, Flaherty DM. (1999). Dihydrofluorescein diacetate is superior for detecting intracellular oxidants: comparison with 2',7'-dichlorodihydrofluorescein diacetate, 5 (and 6)-carboxy-2',7'-dichlorodihydrofluorescein diacetate, and dihydrorhodamine 123. Free Radic. Biol.
Med., 27: 146-59.
Hensley K, Carney JM, Mattson MP, Aksenova M, Harris M, Wu JF, Floyd RA, Butterfield DA. (1994). A model for beta-amyloid aggregation and neurotoxicity based on free radical generation by the peptide: relevance to the Alzheimer's disease. Proc. Natl. Acad. Sci. USA, 91: 3270-3274.
Horowitz A, Simons M. ( 2008). Branching morphogenesis. Circulation research, 103: 784-795.
Hu X, Crick SL, Bu G, Frieden C, Pappu RV, Lee J-M. (2009). Amyloid seeds formed by cellular uptake, concentration, and aggregation of the amyloid-beta peptide. PNAS, 106: 20324–20329.
ICRP, 2007. The 2007 Recommendations of the International Commission on Radiological Protection. ICRP Publication 103. Ann. ICRP, 37 (2-4).
Ivanovic Z, Hermitte F, Brunet de la Grange P, Dazey B, Belloc F, Lacombe F, Vezon G, Praloran V. (2004). Simultaneous maintenance of human cord blood SCID‐repopulating cells and expansion of committed progenitors at low O2 concentration (3%). Stem Cells, 22: 716-724.
Ito S, Ohta S, Nishimaki K, Kagawa Y, Soma R, Kuno SY, Komatsuzaki Y, Mizusawa H, Hayashi J. (1999). Functional integrity of mitochondrial genomes in human platelets and autopsied brain tissues from elderly patients with Alzheimer's disease. Proc. Natl. Acad. Sci. USA, 96: 2099-2103.
Jao S, Ma K, Talafous J, Orlando R, Zagorski MG. (1999). Trifluoroacetic acid pretreatment reproducibly disaggregates the amyloid β-peptide. Amyloid: Int. J. Exp. Clin. Invest., 4: 240-252.
Jež M, Rožman P, Ivanović Z, Bas T. (2015). Concise review: the role of oxygen in hematopoietic stem cell physiology. J. Cell Physiol., 230: 1999-2005.
Juhàsz G. (2016). A mitochondrial-derived vesicle HOPS to endolysosomes using Syntaxin-17. J.Cell Biol., 214: jcb.201603105.
Kallio PJ, Pongratz I, Gradin K, McGuire J, Poellinger L. (1997). Activation of hypoxia-inducible factor 1alpha: posttranscriptional regulation and conformational change by recruitment of the Arnt transcription factor. Proc. Natl. Acad. Sci. USA, 94: 5667-5672.
Kam W W-Y, Banati RB. (2013). Effects of ionizing radiation on mitochondria. Free Radical Biology and
Medicine, 65: 607–619.
Kempf SJ, Azimzadeh O, Atkinson MJ, Tapio S. (2013). Long-term effects of ionising radiation on the brain: cause for concern? Radiat. Environ. Biophys., 52: 5-16.
Korecka JA, van Kesteren RE, Blaas E, Spitzer SO, Kamstra JH, Smit AB, Swaab DF, Verhaagen J, Bossers K. (2013). Phenotypic characterization of retinoic acid differentiated SH-SY5Y cells by transcriptional profiling. PLOS ONE, 8: e63862.
Kratochwil M. (2015). Effects of ageing, calorie restriction and ageing-associated diseases on themitochondrial proteome (Doctoral dissertation). Technische Universität Darmstadt, Darmstadt. http://tuprints.ulb.tu-darmstadt.de/id/eprint/5217.
References 119
Krause F, Seelert H. (2008). Detection and analysis of protein-protein interactions of organellar and prokaryotic proteomes by blue native and colorless native gel electrophoresis. Curr. Protoc. Protein Sci.,
Chapter 14: Unit 14 11.
Krumm A, Carey C. (2016). Real-time monitoring of cellular metabolic activity: intracellular oxygen. Nature Methods., 13. 10.1038/nmeth.f.396.
Kulshreshtha R, Ferracin M, Wojcik SE, Garzon R, Alder H, Agosto-Perez FJ, Davuluri R, Liu CG, Croce CM, Negrini M, Calin GA, Ivan M. (2007). A microRNA signature of hypoxia. Mol. Cell. Biol., 27: 1859-1867.
Laberge R-M, Adler D, DeMaria M, Mechtouf N, Teachenor R, Cardin GB, Desprez P-Y, Campisi J, Rodier F. (2013). Mitochondrial DNA damage induces apoptosis in senescent cells. Cell Death Dis., 4: e727.
Lee CI, Haims AH, Monico EP, Brink JA, Forman HP. (2004). Diagnostic CT scans: assessment of patient, physician, and radiologist awareness of radiation dose and possible risks. Radiology, 231: 393–398.
Lezza AMS, Mecocci P, Cormio A, Beal MF, Cherubini A, Cantatore P, Senin U, Gadaleta MN. (1999). Mitochondrial DNA 4977 bp deletion and OH8dG levels correlate in the brain of aged subjects but not Alzheimer’s disease patients. FASEB J., 13: 1083–1088.
Liebler DC. (2008). Protein damage by reactive electrophiles: targets and consequences. Chem. Res.
Toxicol., 21: 117–128.
Lim C-Y, Zoncu R. (2016). The lysosome as a command-and-control center for cellular metabolism. J. Cell
Biol., 214: 653–664.
Lopez MF, Berggren K, Chernokalskaya E, Lazarev A, Robinson M, Patton WF. (2000). A comparison of silver stain and SYPRO Ruby Protein Gel Stain with respect to protein detection in two-dimensional gels and identification by peptide mass profiling. Electrophoresis, 21: 3673-3683.
Mantel CR, O'Leary HA, Chitteti BR, Huang X, Cooper S, Hangoc G, Brustovetsky N, Srour EF, Lee MR, Messina-Graham S, Haas DM, Falah N, Kapur R, Pelus LM, Bardeesy N, Fitamant J, Ivan M, Kim KS, Broxmeyer HE. (2015). Enhancing hematopoietic stem cell transplantation efficacy by mitigating oxygen shock. Cell, 161: 1553-1565.
Martin BL, Schraeder-Fischer G, Busciglio J, Duke M, Paganetti P, Yankne BA. (1995). Intracellular accumulation of β-amyloid in cells expressing the Swedish mutant amyloid precursor protein. J. Biol.
Chem., 270: 26727-26730.
Masters CL, Simms G, Weinman NA, Multhaup G, McDonald BL, Beyreuther K. (1985). Amyloid plaque core protein in Alzheimer disease and Down syndrome. PNAS, 82: 4245–4249.
Montero D, Tachibana C, Rahr Winther J, Appenzeller-Herzog C. (2013). Intracellular glutathione pools are heterogeneously concentrated. Redox Biol., 28: 508-513.
Mucke L, Masliah E, Yu GQ, Mallory M, Rockenstein EM, Tatsuno G, Hu K, Kholodenko D, Johnson-Wood K, McConlogue L. (2000). High-level neuronal expression of abeta 1-42 in wild-type human amyloid protein precursor transgenic mice: synaptotoxicity without plaque formation. J. Neurosci., 20: 4050-4058.
Nadin L, Murray M. (1999). Participation of CYP2C8 in retinoic acid 4-hydroxylation in human hepatic microsomes. Biochem Pharmacol., 58: 1201-1208.
Neff D, Dencher NA. (1999). Purification of multisubunit membrane protein complexes: Isolation of chloroplast FoF1-ATP-synthase, CFo and CF1 by blue native electrophoresis. Biochem. Biophys. Res.
Commun., 259: 569-575.
Nemes Z, Dietz R, Lüth JB, Gomba S, Hackenthal E. Gross F. (1979). The pharmacological relevance of vital staining with neutral red. Experientia, 35: 1475-1476.
References 120
Noori S. (2012). An overview of oxidative stress and antioxidant defensive system. Scientific Reports, 1: 413. doi:10.4172/scientificreports.413.
Ono K, Condron MM, Teplow DB. (2009). Structure-neurotoxicity relationships of amyloid beta-protein oligomers. PNAS, 106: 14745–14750.
Packer L, Fuehr K. (1977). Low oxygen concentration exends the lifespan of cultured human diploid cells. Nature, 267: 423-425.
Pagani L, Eckert A. (2011). Amyloid-beta interaction with mitochondria. International Journal of
Alzheimer’s Disease, 2011: 1-9.
Parrinello S, Samper E, Krtolica A, Goldstein J, Melov S, Campisi J. (2003). Oxygen sensitivity severely limits the replicative lifespan of murine fibroblasts. Nat. Cell Biol., 5: 741-747.
Pathak D, Shields LY, Mendelsohn BA, Haddad D, Lin W, Gerencser AA, Kim H, Brand MD, Edwards RH, Nakamura K. (2015). The role of mitochondrially derived ATP in synaptic vesicle recycling. J. Biol.
Chem., 290: 22325-22336.
Pedraza Muriel V. (2007). Hypofractionation in radiotherapy. Clin. Transl. Oncol., 9: 21-27.
Perier C, Bender A, García-Arumí E, Melià MJ, Bové J, Laub C, Klopstock T, Elstner M, Mounsey RB, Teismann P, Prolla T, Andreu AL, Vila M. (2013). Accumulation of mitochondrial DNA deletions within dopaminergic neurons triggers neuroprotective mechanisms. Brain, 136: 2369–2378.
Plecitá-Hlavatá L, Engstová H, Alán L, Špaček T, Dlasková A, Smolková K, Špačková J, Tauber J, Strádalová V, Malínský J, Lessard M, Bewersdorf J, Ježek P. (2016). Hypoxic HepG2 cell adaptation decreases ATP synthase dimers and ATP production in inflated cristae by mitofilin down-regulation concomitant to MICOS clustering. FASEB J., 30: 1941-1957.
Pollard JW, Walker JM. (1997). Basic cell culture protocols. Methods in Molecular Biology, 75. New Jersey: Humana Press.
Powers SK, Ji LL, Kavazis AN, Jackson MJ. (2011). Reactive oxygen species: impact on skeletal muscle. Compr. Physiol., 1: 941-969.
Price JL, Morris JC. (1999). Tangles and plaques in nondemented aging and "preclinical" Alzheimer's disease. Ann. Neurol., 45: 358-368.
Prithivirajsingh S, Story MD, Bergh SA, Geara FB, Ang KK, Ismail SM, Stevens CW, Buchholz TA, Brock WA. (2004). Accumulation of the common mitochondrial DNA deletion induced by ionizing radiation, FEBS Letters, 571: 227-232.
Puck TT, Marcus PI. (1956). Action of X-rays on mammalian cells. J. Exp. Med., 103: 653-666.
Querfurth HW, LaFerla FM. (2010). Alzheimer's disease. N. Engl. J. Med., 362: 329-344.
Raber J, Rola R, LeFevour A, Morhardt D, Curley J, Mizumatsu S, VandenBerg SR, Fike JR. (2004). Radiation-induced cognitive impairments are associated with changes in indicators of hippocampal neurogenesis. Radiat. Res., 162: 39-47.
Repetto G, del Pesso A, Zurita JL. (2008). Neutral red uptake assay for the estimation of cell viability/cytotoxicity. Nature Protocols, 3: 1125-1131.
Riley PA. (1994). Free radicals in Biology: oxidative stress and the effects of ionizing radiation. International Journal of Radiation Biology, 65: 27-33.
Rhinn M, Dollé P. (2012). Retinoic acid signalling during development. Development, 138: 843-858.
Rodgers CC. (2011). Dental X-ray exposure and Alzheimer´s disease: A hypothetical etiological association. Medical Hypotheses, 77: 29-34.
References 121
Scheffler IE. (1999). Mitochondrion. New York: Wiley-Liss Inc., pp.304-304.
Schilling-Tóth B, Sándor N, Kis E, Kadhim M, Sáfrány G, Hegyesi H. (2011). Analysis of the common deletions in the mitochondrial DNA is a sensitive biomarker detecting direct and non-targeted cellular effects of low dose ionizing radiation. Mutation Research, 716: 33-39.
Shipley MM, Mangold CA, Szpara ML. (2016). Differentiation of the SH-SY5Y human neuroblastoma cell line. J. Vis. Exp., 108: e53193, doi: 10.3791/53193.
Schlachetzki J CM, Saliba SW, de Oliveira ACP. (2013). Studying neurodegenerative diseases in culture models. Revista Brasileira de Psiquiatria, 35: 92-100.
Schagger H, von Jagow G. (1991). Blue native electrophoresis for isolation of membrane protein complexes in enzymatically active form. Anal. Biochem., 199: 223-231.
Shokolenko I, Venediktova N, Bochkareva A, Wilson GL & Alexeyev MF. (2009). Oxidative stress induces degradation of mitochondrial DNA. Nucleic Acids Research, 37: 2539–2548.
Selkoe DJ. (1991). The molecular pathology of Alzheimer’s disease. Neuron, 6: 487–498.
Shelat PB, Chalimoniuk M, Wang JH, Strosznajder JB, Lee JC, Sun AY, Simonyi A, Sun GY. (2008). Amyloid beta peptide and NMDA induce ROS from NADPH oxidase and AA release from cytosolic phospholipase A2 in cortical neurons. J. Neurochem., 106: 45-55.
Sipe JD, Benson MD, Buxbaum JN, Ikeda S, Merlini G, Saraiva MJ, Westermark P. (2010). Amyloid fibril protein nomenclature: recommendations from the nomenclature committee of the International Society of Amyloidosis. Amyloid, 17: 101–104.
Sirk D, Zhu Z, Wadia JS, Shulyakova N, Phan N, Fong J, Mills LR. (2007). Chronic exposure to sub-lethal beta-amyloid (Ab) inhibits the import of nuclear-encoded proteins to mitochondria in differentiated PC12 cells. Journal of Neurochemistry, 103: 1989–2003.
Soldano A, Hassan BA. (2014). Beyond pathology: APP, brain development and Alzheimer's disease. Curr.
Opin. Neurobiol., 27: 61-67.
Soong N-W, Arnheim N. (1996). Detection and quantification of mitochondrial DNA deletions. Methods
in Enzymology, 264: 421-431.
Stankowski JN, Codreanu SG, Liebler DC, McLaughlin BA. (2011). Analysis of protein targets by oxidative stress using the oxyblot and biotin-avidin-capture methodology. Neuromethods, 56: 365-381.
Stefani M. (2012). Structural features of cytotoxicity of amyloid oligomers: Implications in Alzheimer’s disease and other diseases with amyloid deposits. Prog. Neurobiol., 99: 226–245.
Swerdlow RH, Burns JM, Khan SM. (2010). The Alzheimer's disease mitochondrial cascade hypothesis. J.
Alzheimers Dis., 20: 265-279.
Swerdlow RH, Khan SM. (2009). The Alzheimer's disease mitochondrial cascade hypothesis: an update. Exp. Neurol., 218: 308-315.
Tann AW, Boldogh I, Meiss G, Qian W, Van Houten B, Mitra S, Szczesny B. (2011). Apoptosis induced by persistent single-strand breaks in mitochondrial genome: critical role of EXOG (5'-EXO/endonuclease) in their repair. J. Biol. Chem., 286: 31975-31983.
Tanzi RE, McClatchey AI, Lamperti ED, Villa-Komaroff L, Gusella JF, Neve RL. (1988). Protease inhibitor domain encoded by an amyloid protein precursor mRNA associated with Alzheimer’s disease. Nature, 331: 528–530.
Taylor SD, Ericson NG, Burton JN, Prolla TA, Silber JR, Shendure J, Bielas JH. (2014). Targeted enrichment and high-resolution digital profiling of mitochondrial DNA deletions in human brain. Aging
Cell, 13: 29-38.
References 122
Tiede LM, Cook EA, Morsey B, Fox HS. (2011). Oxygen matters: tissue culture oxygen levels affect mitochondrial function and structure as well as responses to HIV viroproteins. Cell Death and Disease, 2. 10.1038/cddis.2011.128.
Villeneuve L, Tiede LM, Morsey B, Fox HS. (2013). Quantitative proteomics reveals oxygen-dependent changes in neuronal mitochondria affecting function and sensitivity to rotenone. J. Proteome, 12: 4599–4606.
Wang GL, Semenza GL. (1995). Purification and characterization of hypoxia-inducible factor 1. J. Biol.
Chem., 270: 1230-1237.
Wang J, Xiong S, Xie C, Markesbery WR & Lovell MA. (2005). Increased oxidative damage in nuclear and mitochondrial DNA in Alzheimer’s disease. Journal of Neurochemistry, 93: 953–962.
Waseda Y, Matsubara E, Shinoda K. (2011). Fundamental properties of X-rays. X-Ray diffraction crystallography: Introduction, examples and solved problems. Berlin, Heidelberg: Springer Berlin Heidelberg, pp.1-20.
Wiesner RJ, Rüegg JC, Morano I. (1992). Counting target molecules by exponential polymerase chain reaction: copy number of mitochondrial DNA in rat tissues. Biochem. Biophys. Res. Commun., 183: 553-559.
Willems PH, Rossignol R, Dieteren CE, Murphy MP, Koopman WJ. (2015). Redox homeostasis and mitochondrial dynamics. Cell Metabolism, 22: 207-218.
Winckler J. (1974). Vital staining of lysosomes and other cell organelles of the rat with neutral red. Prog.
Histochem. Cytochem., 6: 1-91.
Wright WE., Shay JW. (2006). Inexpensive low-oxygen incubators. Nature Protocols, 4: 2088-2090.
Xu S, Zhong M, Zhang L, Wang Y, Zhou Z, Hao Y, Zhang W. Yang X, Wei A, Pei L, Yu Z. (2009). Overexpression of Tfam protects mitochondria against b-amyloid-induced oxidative damage in SH-SY5Y cells. FEBS Journal, 276: 3800-3809.
Yapici NB, Bi Y, Li P, Chen X, Yan X, Mandalapu SR, Faucett M, Jockusch S, Ju J, Gibson KM, Pavan WJ, Bi L. (2015). Highly stable and sensitive fluorescent probes (LysoProbes) for lysosomal labeling and tracking. Sci. Rep., 5: 8576. doi: 10.1038/srep08576.
Yoneda M, Katsumata K, Hayakawa M, Tanaka M, Ozawa T. (1995). Oxygen stress induces an apoptotic cell death associated with fragmentation of mitochondrial genome. Biochem. Biophys. Res. Commun., 209: 723-729.
Zapico SC, Douglas H. Ubelaker DH. (2013). mtDNA mutations and their role in aging, diseases and forensic sciences. Aging and Disease, 4: 364-380.
Zhang Y, McLaughlin R, Goodyer C, LeBlanc A. (2002). Selective cytotoxicity of intracellular amyloid β peptide1-42 through p53 and Bax in cultured primary human neurons. The Journal of Cell Biology, 156: 519-529.
Zheng L, Cedazo-Minguez A, Hallbeck M, Jerhammar F, Marcusson J, Terman A. (2012). Intracellular distribution of amyloid beta peptide and its relationship to the lysosomal system. Translational
Neurodegeneration, 1: 1-19.
Zhu J, Aja S, Kim E-K, Park MJ, Ramamurthy S, Jia J, Hu X, Geng P, Ronnett GV. (2012). Physiological oxygen level is critical for modeling neuronal metabolism in vitro. Journal of Neuroscience Research, 90: 422-434.
Zigman WB, Devenny DA, Krinsky-McHale SJ, Jenkins EC, Urv TK, Wegiel J, Schupf N, Silverman W. (2008). Alzheimer's disease in adults with Down syndrome. Int. Rev. Res. Ment. Retard., 36: 103-145.
References 123
Other sources:
Alzheimer’s Association, 2014. Alzheimer’s Disease Facts and Figures, Alzheimer’s & Dementia, Volume 10, Issue 2. http://www.alz.org/downloads/Facts_Figures_2014.pdf
Alzheimer’s Disease International. World Alzheimer Report 2016. https://www.alz.co.uk/research/world-report-2016
https://www.carlroth.com
https://www.emdmillipore.com
http://www.mitomap.org/
http://www.seguridadypromociondelasalud.com/n134/en/article2.html
http://www.servier.com/
https://tools.thermofisher.com
www.lgcstandards-atcc.org
List of abbreviations 124
8. List of abbreviations
1D one dimensional 2D two dimensional 3D three dimensional Aβ amyloid beta AD Alzheimer´s disease ADP adenosine diphosphate APS ammonium persulfate ATP adenosine triphosphate ATRA all-trans retinoic acid Bis-Tris 2-Bis(2-hydroxyethyl)amino-2-(hydroxymethyl)-1,3-propanediol BN blue native BSA bovine serum albumin CCCP carbonyl-cyanid-3-chlorophenylhydrazone CCD charge-coupled device ctrl control Da Dalton DCF dichlorfluorescein dest. distilled DMEM Dulbecco’s modified Eagle's medium DMSO dimethylsulfoxid DNA deoxyribonucleic acid DNP 2,4-dinitrophenylhydrazone DNPH 2,4-dinitrophenylhydrazine DPBS Dulbecco's phosphate-buffered saline DT doubling time DTT 1,4-dithiotreitol e- electron eV electronvolt EDTA ethylenediaminetetraacetic acid ER endoplasmatic reticulum EM emission EX excitation ECL enhanced chemiluminescence reaction ETC electron tranport chain FBS fetal bovine serum FITC fluoresceinisothiocyanat FL fluorescence channel FSC forward scatter g gravitational acceleration g gram Gy Gray H2O2 hydrogen peroxide HEK293T human embryonic kidney cells HEPES 2-(4-(2-hydroxyethyl)-1-piperazineethanesulfonic acid HEPG2 hepatoma cells HIF hypoxia inducible factor HMW high molecular weight HO2• hydroperoxylradical Hsp heat-shock protein
List of abbreviations 125
HRP horse radish peroxidase IgG immunoglobulin G IR ionizing radiation J Joule k kilo λ wavelength L-Gln L-Glutamin LMW low molecular weight LTR LysoTracker® Red μg Microgram μL Microliter μm micrometer M 1 mol/l, molar MALDI matrix-assisted laser desorption/ionisation MCB monochlorbimane mg milligram Milli-Q-water purified and deionized water to a high degree min minute ml milliliter mM millimolar mm millimeter MM MagicMark™ XP Western ProteinStandard MTR MitoTracker® Red MS mass spectrometry mtDNA mitochondrial deoxyribonucleic acid n number of replicates N number of independent experiments nDNA nuclear deoxyribonucleic acid NFM neurofilament M O2•‾ superoxide radical anion OH• hydroxyl radical 8-OHdG 8-hydroxy-2' -deoxyguanosine OxPhos oxidative phosphorylation p p-value p.a. pro analysi PAGE polyacrylamide gel electrophoresis PBS phosphate buffered saline Pi phosphat PI propidium iodide PIC protease inhibitor cocktail PS phosphatidylserine P/S penicillin-streptomycin RA retinoic acid ROS reactive oxygen species RT room temperature SDS sodium dodecylsulfate SEM standard error mean SH-SY5Y human neuroblastoma cells SSC side scatter t time TEMED N,N,N',N'-Tetramethylethylendiamin TFA trifluoroacetic acid
List of abbreviations 126
TOF time of flight TOM translocase of the outer mitochondrial membrane (v/v) volume per volume V voltage (w/v) weight per volume wt wild type % C total cross-linker concentration % T total acrylamide concentration °C degree Celsius
Curriculum vitae 127
9. Curriculum vitae
Tamara Džinić
Date of birth: 12/09/1988
Place of birth: Tuzla, Bosnia and Herzegovina
Citizenship: Croatian
Address: Siegfriedstraße 2, D-64646 Heppenheim
Phone: +49(0)15780345926
E-Mail: [email protected]
Skype: tamara_dzinic
Education and experience
05/2014 - Technische Universität Darmstadt
PhD student in the group Physical Biochemistry, Chemistry Department
Scholar of the DFG-funded graduate college (GRK 1657) “Molecular and
cellular responses to ionizing radiation”
Project: “Interplay of ionizing-radiation, oxygen, ROS and age-associated
diseases” supervised by Prof. Dr. Norbert A. Dencher
Occupations
Understanding of the implication of oxidative stress, created by the
interplay of ionizing (X-ray) radiation, oxygen and neurotoxic amyloid beta
(Aβ) peptide, in age-associated diseases, with the focus on Alzheimer´s
disease (AD)
Expertise in Cell and Molecular Biology, Biochemistry and Radiation
Biology
Utilizing cell culture techniques, methods of protein and DNA analysis and
microscopy
Teaching in practical courses
Supervising master thesis
Data presenting at international conferences
03/2017 68. Mosbacher Kolloquium “Cell Organelles-Origin, Dynamics,
Communication”, Mosbach, Germany (poster)
09/2016 Dementia and Neuroscience, Los Angeles, USA (talk)
09/2015 Mitochondria at the Crossroad, Strasbourg, France (talk)
03/2015 German Peptide Symposium, Darmstadt, Germany (poster)
02/2015 Radiation Biology and Cancer, Essen, Germany (poster)
Curriculum vitae 128
Publishing in peer reviewed journals
(DOI: 10.1080/13813455.2016.1218518)
Attending courses and workshops for professional development
09/2015 Protein Rainbow Workshop-Mass Spectrometry in Life Sciences, DDZ,
Düsseldorf, Germany
2016/2017 Organization of the PhD retreat, Annweiler am Trifels
04/2013 - 05/2014 University of Stuttgart
Research assistant at the Institute of Cell Biology and Immunology
Occupation: Design and development of novel recombinant protein
therapeutics
(DOI: 10.1080/19420862.2016.1172163)
09/2012 - 04/2013 Applying for visa, job interview, language course and moving to Germany
University of Zagreb, Faculty of Science
10/2010 - 09/2012 Master of Molecular Biology, grade average: 4.869/5.00, 122 ECTS
Thesis: “The effect of UV irradiation on Bcl-2 and Bax proteins in mouse
embryonic fibroblast culture”
10/2007 - 09/2010 Bachelor of Molecular Biology, grade average: 4.483/5.00, 180 ECTS
Thesis: “On the brink of the synthetic life forms era”
Publishing in Croatian magazine for popularization of science
(ISSN 0351-0662)
09/2003 - 06/2007 High school St.Francis, Tuzla
grade average: 5.00/5.00
Scholarships and awards
2017 Postdoctoral support grant by the DFG within the graduate college (GRK
1657)
2014 - 2017 PhD scholarship by the DFG in the frame of graduate college (GRK 1657)
2012 Scholarship by the University of Zagreb for excellent grades in studies
2010 - 2012 Award by the Municipality of Tuzla for outstanding achievements in
studies
2008 - 2011 Scholarship by the Croatian Ministry of Foreign and European Affairs
2007 Second place regional school competition in chemistry, Tuzla
Memberships
10/2015 - SciMento, networking group for women in science

Curriculum vitae 129
05/2014 - Gesellschaft für Biochemie und Molekularbiologie (GBM)
11/2010 - European Association for Cancer Research
Language skills
Croatian (native) English (full professional proficiency) German (fluent, C1 level)
Software competencies
GraphPad Prism ImageJ Kaluza CloneManager Delta2D MS Office
Hobbys and interests
volunteering (humanitarian organization for children without parents)
writing (personal narratives and essays)
creating handmade postcards
Darmstadt, 15.03.2017
________________________
Eidesstattliche Erklärungen 130
Eidesstattliche Erklärungen
Tamara Džinić Darmstadt, 15.03.2017
Siegfriedstraße 2
D-64646 Heppenheim
Erklärung
Ich erkläre hiermit, dass ich meine Dissertation selbstständig und nur mit den angegebenen
Hilfsmitteln angefertigt habe.
Tamara Džinić
Eidesstattliche Erklärungen 131
Tamara Džinić Darmstadt, 15.03.2017
Siegfriedstraße 2
D-64646 Heppenheim
Erklärung
Ich erkläre hiermit, noch keinen Promotionsversuch unternommen zu haben.
Tamara Džinić