rate-sensitive contractile responses of lymphatic vessels to circumferential stretch
TRANSCRIPT
J Physiol 587.1 (2009) pp 165–182 165
Rate-sensitive contractile responses of lymphatic vesselsto circumferential stretch
Michael J. Davis1, Ann M. Davis1, Megan M. Lane1, Christine W. Ku1 and Anatoliy A. Gashev2
1Department of Medical Pharmacology & Physiology and Dalton CVRC, University of Missouri School of Medicine, Columbia, MO, USA2Department of Systems Biology and Translational Medicine, Cardiovascular Research Institute, Division of Lymphatic Biology, Texas A & M Health
Science Center, Temple, TX, USA
Phasic contractile activity in rat portal vein is more sensitive to the rate of change in length
than to absolute length and this response is widely assumed to be a general characteristic
of myogenic behaviour for vascular smooth muscle. Previously, we found that rat lymphatic
vessels exhibit phasic contractile behaviour similar to that of portal vein. In the present study,
we hypothesized that lymphatic muscle would exhibit rate-sensitive contractile responses to
stretch. The hypothesis was tested on rat mesenteric lymphatics (90–220 µm, i.d.) using
servo-controlled wire- and pressure-myograph systems to enable ramp increases in force
or pressure at different rates. Under isometric conditions in wire-myograph preparations,
both the amplitude and the frequency of phasic activity were enhanced at more optimal
preloads, but superimposed upon this effect were bursts of contractions that occurred only
during fast preload ramps. In such cases, the ratio of contraction frequency during the ramp
to that at the subsequent plateau (at optimal preload) was > 1. Further, the frequency ratio
increased as a function of the preload ramp speed, consistent with a rate-sensitive mechanism.
In contrast, the amplitude ratio was < 1 and declined further with higher ramp speeds.
Downward preload ramps produced corresponding rate-sensitive inhibition of contraction
frequency but not amplitude. Similar findings were obtained in pressurized lymphatics in
response to pressure ramps and steps. Our results suggest that lymphatics are sensitive to the
rate of change in preload/pressure in a way that is different from portal vein, possibly because
the pacemaker for generating electrical activity is rate sensitive but lymphatic muscle is not. The
behaviour may be widely present in collecting lymphatic vessels and is probably an important
mechanism for rapid adaptation of the lymphatic pump to local vascular occlusion.
(Received 27 August 2008; accepted after revision 10 November 2008; first published online 10 November 2008)
Corresponding author M. J. Davis: Department of Medical Pharmacology and Physiology University of Missouri
School of Medicine 1 Hospital Dr., Rm. M451 Columbia, MO 65212, USA. Email: [email protected]
Phasic contractile activity of smooth muscle in rat portalvein is known to be more sensitive to the rate of change inlength than to the absolute length (Johansson & Mellander,1975). Under isometric conditions, the longitudinalmuscle layer of portal vein exhibited spontaneouscontractile activity that was superimposed on, andmodulated by, the level of passive force (preload). Whenpreload was elevated gradually from suboptimal tooptimal level, large amplitude (AMP), high frequency(FREQ) contraction bursts were evident in the forcerecordings (Johansson & Mellander, 1975). The mostprominent contraction bursts occurred just before andjust after passive force reached a plateau at a more optimalpreload. During the plateau, both AMP and FREQ
This paper has online supplemental material.
declined somewhat to values that were still higher thantheir respective values at the original (suboptimal) pre-load. Thus, the values of both AMP and FREQ were largerduring the force ramp than at the higher, plateau levelassociated with a more optimal preload. Portal vein alsoexhibited the opposite response to reduction in preload:during a declining force ramp, inhibition of both AMPand FREQ occurred, with the effect again most prominentat the end, or just after the end, of a downward forceramp. The rate-sensitive aspect of this behaviour becameparticularly apparent when the changes were analysed asa function of the rate of the preload ramp (mN s−1). Asthe speed of the ramp increased, the bursting responsesbecame more prominent. Positive force ramps up at a rateof 3% length s−1 produced maximum AMP and FREQresponses, whereas declining force ramps up at a rateof –3% length s−1 produced contractions with AMP and
C© 2009 The Authors. Journal compilation C© 2009 The Physiological Society DOI: 10.1113/jphysiol.2008.162438
166 M. J. Davis and others J Physiol 587.1
FREQ values that were disproportionately smaller thanthose at the final force (Johansson & Mellander, 1975;Sigurdsson et al. 1977).
The physiological impact of rate-sensitive changesin portal vein contractility remains unclear. Whatchanges in portal vein diameter and/or length wouldbe associated with the observed rate-sensitive changesin contraction AMP in response to vessel lengthening?Could the associated diameter/length changes alter portalvein resistance to a significant degree? Despite theseunanswered questions about relevance, the rate-sensitivebehaviour of portal vein to stretch has been inferredto be a general characteristic of all myogenically activeblood vessels (Grande et al. 1977; Sigurdsson et al. 1977;Grande & Mellander, 1978; Johnson, 1981; Bjornberget al. 1988). A presumed correlate to this behaviour wasnoted by Sparks (1964) in isometric human umbilicalartery, where secondary force development was observedafter initial stretch and stress-relaxation and that responsewas evident only after a 25% stretch, not after a 10%stretch. Conceptually, rate-sensitive myogenic behaviourof peripheral arteries/arterioles could be homeostaticallyadvantageous by allowing those vessels to respond torapid changes in local vascular pressure associated withpostural shifts or local occlusions. Evidence to supportthat possibility was deduced from whole-organ resistancechanges (Grande et al. 1977; Grande & Mellander,1978) and microvascular diameter changes (Borgstrom& Grande, 1979) in response to controlled rates of changein perfusion pressure; however, the interpretation ofthat data is highly controversial because of difficultiesin distinguishing pressure-dependent and -independenteffects in vivo (Davis & Sikes, 1989, 1990; Davis &Meininger, 1993; Davis & Hill, 1999).
Few, if any, arteries/arterioles exhibit the same typeof spontaneous contractions as portal vein; however,the behaviour is well documented in most collectinglymphatic vessels (McHale & Roddie, 1976; McHale &Meharg, 1992; Crowe et al. 1997; Gashev et al. 2002;Gashev et al. 2004). In the lymphatic circulation, phasicactivity serves as an essential pump mechanism to propellymph uphill against a hydrostatic pressure gradientfrom peripheral lymphatics through lymph nodes intothe thoracic duct (Szabo & Magyar, 1967; Hargens &Zweifach, 1976; Zweifach & Lipowsky, 1984). In the courseof a recent study of rat mesenteric lymphatic vessels(Zhang et al. 2007b), we observed that rapid preload orpressure steps were associated with contraction bursts, i.e.behaviour reminiscent of that in portal vein. Therefore,the objective of the present study was to systematicallytest if lymphatic vessels exhibit rate-sensitivecontractile responses to controlled changes incircumferential length.
Methods
Vessel isolation
Male Sprague–Dawley rats (170–260 g) were anaesthetizedwith Nembutal (60 mg kg−1, I.P.) and a loop of intestinefrom each animal was exteriorized through a midlineabdominal incision. All animal protocols were approvedby the University of Missouri Animal Care and UseCommittee and conformed to the Public Health ServicePolicy for the Humane Care and Use of LaboratoryAnimals (PHS Policy, 1996). Collecting lymphatic vessels(90–180 µm inner diameter, by 1–2 mm in length)were dissected away from their paired mesenteric smallarteries/veins in Mops-buffered, albumin-supplementedPSS (APSS) at room temperature. After clearingconnective tissue and fat, each vessel was transferred toa wire- or pressure-myograph chamber for respectiveisometric or isobaric studies. The animal was subsequentlykilled with Nembutal (120 mg kg−1, I.C.).
Solutions
APSS contained (in mM): 145.0 NaCl, 4.7 KCl, 2.0 CaCl2,1.2 MgSO4, 1.2 NaH2PO4, 0.02 EDTA, 5.0 glucose, 2.0sodium pyruvate, 3.0 Mops and 0.5 g per 100 ml purifiedbovine serum albumin (pH 7.4 at 37◦C). The compositionof Ca2+-free APSS was identical except that 3.0 mM EDTAwas substituted for CaCl2. All chemicals were from Sigma(St Louis, MO, USA) except albumin (U.S. Biochemicalsno. 10856).
Wire myograph methods
To study isometric contractions, each vessel wascannulated with two 40 µm stainless steel wires andmounted in a small vessel wire myograph (Danish MyoTechnology; Aarhus, Denmark). The rate of change inpassive force was controlled using an Inchworm piezoactuator (EXFO, Fishers, NY, USA). The direct forceoutput of the myograph was amplified and filtered(NPI Electronic; Tamm, Germany) before digitizationat 20 Hz with a PCI 6030e A–D interface (NationalInstruments, Austin, TX, USA) in a Pentium 4 computer.The Inchworm was controlled using GPIB and serialcommands (IW800 controller, EXFO Burleigh, Fishers).Images of the mounted vessel were acquired at 100×
magnification using a Leica DM IL inverted microscope,Sony X-55 CCD camera, and video acquisition card (PCI1409, National Instruments). Servo-control, acquisitionand analysis routines were written in LabView and IMAQVision (National Instruments). Igor (Wavemetrics, LakeOswego, OR, USA) was used for data display.
C© 2009 The Authors. Journal compilation C© 2009 The Physiological Society
J Physiol 587.1 Rate-sensitive lymphatic contractile responses 167
Pressure myograph methods
To study isobaric contractions, mesenteric lymphaticsegments (12 mm in length) were cannulated with glassmicropipettes on a Burg-style V-track system (Duling et al.1981) and pressurized on the stage of an inverted micro-scope. The vessel segments used for these protocols had atmost one valve to ensure adequate pressure control in theentire segment. Pressure was initially set to 3 cmH2O fora 30–60 min equilibration period. To control the rate ofchange in intraluminal pressure, the pipette connectionswere switched from the reservoirs to a servo-controlledpressure system (Davis et al. 2007). Servo-null style shakerpumps (Ling Dynamic Systems, Royston, UK) connectedto the pipettes were driven by a hardware-based servocontroller through unitary-gain power amplifiers (Cardio-vascular Research Institute, Texas A & M University). Thecontroller compared the output signal from low-pressuretransducers (CyQ model 104; Cybersense, Nicholsville,KY, USA) to reference voltages specified by a computerand adjusted the pump voltages accordingly. Diameterand pressure signals were recorded using a PCI 6030eA–D/D–A interface (National Instruments). Diameterchanges were continuously tracked by computer bydigitizing the image using a 1632 × 1234 pixel firewirecamera (Basler AG model A641FM, Ahrensburg,Germany) and processing it as previously described(Davis, 2005). All diameters reported in this studyrepresent internal diameters.
Isometric force ramp protocols
Each vessel was equilibrated for 30–60 min at 36–37◦C,with preload fixed at the optimal level (0.3 mN)until a stable contraction pattern developed. The forcetransducer was then re-zeroed and preload set to theminimum, passive (isometric) force at which spontaneouscontractions developed (0.02–0.05 mN), typically at arate of 2–5 contractions min−1. The servo-controlledwire-myograph permitted the generation of constantspeed, ramp increases in passive force to test whetherrate-sensitive changes in the AMP and/or FREQ ofspontaneous lymphatic contractions occurred. To test fora possible rate-sensitive reaction to stretch, the rampspeed was altered in increments between 0.3 and 7 ×
10−3 mN s−1, from a constant initial preload (F i) of∼0.02 mN to a more optimal preload (F o) of 0.3 mN(optimal preload was typically 0.3 mN). In force rampprotocols, internal diameter changed as needed topermit precise force control. The computer algorithmfor controlling the ramp detected the initiation ofeach spontaneous contraction and temporarily disabledthe servo control until that contraction was complete;otherwise the servo system would have interfered withthe amplitude and duration of the force transient (Davis
et al. 2007). Ramp speeds were selected empirically, withthe lowest speed producing minimal or no rate-sensitiveeffect, and the highest rate being sufficiently long to permitmultiple contractions (otherwise FREQ determinationscould not be made with confidence). Ultimately, five tosix different ramp speeds were selected and we attemptedto perform ramps of each speed on each vessel in apseudo-randomized order.
Isometric diameter ramp protocols
Responses to controlled, ramp changes in vessel diameterwere also tested using the wire myograph. This mode moreclosely simulated previous studies on portal vein wherethe rate of change in longitudinal length was controlled(Johansson & Mellander, 1975; Sigurdsson et al. 1977).Here, the associated change in force was slightly differentfrom a force ramp, due to stress relaxation and the elasticproperties of the vessel. As diameter changed at a constantrate, force rose slowly at first and then accelerated nearthe end of the ramp. The diameter ramp protocol alsopermitted us to test lymphatic responses to declining pre-load ramps, which was not possible with the force rampprotocol due to difficulties in designing an appropriatealgorithm (Davis et al. 2007). For diameter ramps, aninitial test on each vessel measured the optimal diameter(Do) associated with a stable passive force at F o (optimalpreload). Passive force was then set at the minimal force(F i) and corresponding diameter (D i) that producedregular contractions (0.02–0.05 mN). Internal diameter(the outer edge of the wires) was continuously measuredby tracking the inside edges of the wires and adjusting forconstant wire thickness. Once D i and Do were determined,diameter ramps at varying speeds were imposed on thevessel. Internal diameter was increased to Do using a rampwaveform, with force increasing as needed for precisediameter control. A range of ramp speeds was chosen toclosely match those used in the force ramp protocols. Insome cases (as noted in figures), a low dose of substance P(SP) was applied to increase basal contraction frequency.
Isobaric protocols
Rate-sensitive AMP and FREQ responses were also testedin pressurized mesenteric lymphatics. During the initialequilibration period, a stable contraction pattern typicallydeveloped at 36–37◦C. Pressure was then lowered from 3.0to 0.5 cmH2O until a new contraction pattern developed.
In the first protocol, pressure ramps from 0.5to 3 cmH2O at different rates were imposed whilecontinuously tracking internal diameter. The range ofpressures was selected because (1) 0.5 cmH2O is theminimum pressure at which spontaneous contractionspersist in most vessels (Gashev et al. 2001), (2) optimal
C© 2009 The Authors. Journal compilation C© 2009 The Physiological Society
168 M. J. Davis and others J Physiol 587.1
pumping occurs at 3–5 cmH2O (Gashev et al. 2004),and (3) during lymphatic systole intraluminal pressurein rat mesenteric lymphatics increases by 3–4 cmH2O onaverage (Benoit et al. 1989). After each ramp was complete,pressure was returned to 0.5 cmH2O until the basalcontraction pattern recovered. Pressure ramps lasting 30,15, 6, 3 or 1.5 min were imposed, with each ramp speedtested in each vessel, if possible. To account for differencesin baseline and peak FREQ that typically occurred fromvessel to vessel, the values of FREQ and AMP werenormalized according to the following equation:
Normalized FREQ =
(FREQ − FREQmin)/(FREQmax − FREQmin)
(1)
An analogous equation was used to calculate normalizedAMP. Using this procedure, FREQ and AMP for each vesselvaried between 0 and 1 for a given series of ramps andsteps. As an alternative analysis method, FREQ and AMPratios (ramp/plateau) were computed as described abovefor isometric protocols.
In the second protocol, rapid pressure steps wereused to test the pressure range over which rate-sensitiveresponses occurred. The vessel was equilibrated at a lowpressure (1 cmH2O) and then rapidly stepped to a higherpressure (3, 5, 7 or 9 cmH2O). Pressure steps were ∼90%complete within 200 ms without any overshoot or artifactsthat might otherwise trigger extra contractions. Positivepressure steps were always initiated when the vessel wasin diastole. After 1–2 min at the higher pressure (allowingfor at least 25 contraction cycles), pressure was rapidlyreturned to the baseline value, with the pressure dropalways being initiated in systole.
At the end of the isobaric protocols, the bath solutionwas replaced with Ca2+-free APSS at a pressure of5 cmH2O. After allowing ∼30 min for equilibration,pressure was lowered to 0.5 cmH2O for 1 min and thenset at 1 cmH2O for 1 min, after which a pressure ramp orpressure steps were imposed, to the same pressures usedpreviously in that experiment.
Data analysis
After completion of an experiment, custom analysisroutines were used to detect the amplitudes andfrequencies of the individual contractions prior to, duringand following the preload or pressure ramps/steps.AMP was taken as the difference between the peakforce/diameter of the spontaneous contraction and thepreload/pressure immediately prior to the contraction.Frequency was computed on a contraction-by-contractionbasis.
The data were analysed using JMP 5.1 (SAS, Cary,NC, USA). For tests on contraction parameters, one-way
ANOVAs were performed, with pressure or preloaddesignated as the independent variable. Tukey–Kramer orDunnett’s post hoc tests were used to test for significantwithin-group variation. Significance was defined asP < 0.05.
Results
Positive preload ramps
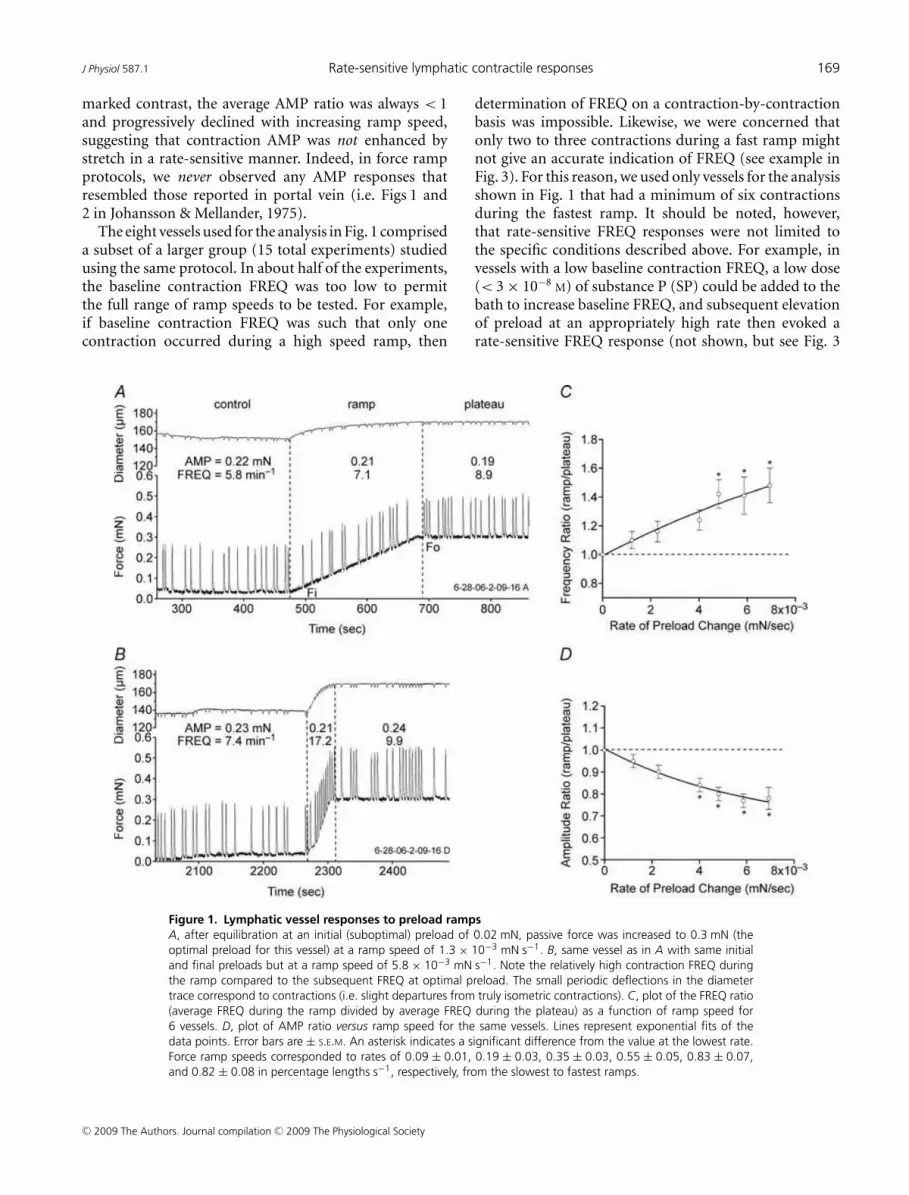
To test for rate-sensitive contractile responses to stretch,preload was increased from ∼0.03 to 0.3 mN at varyingrates. Figure 1 shows two examples of the lymphaticresponse to preload ramps using the wire myograph.With preload set to 0.02 mN, FREQ averaged 5.8 min−1
(measured over a 3 min control period; Fig. 1A). Att = 475 s, a preload ramp was initiated. During the ramp(using a low speed of 1.3 × 10⁻³ mN s−1), FREQ increasedto 7.1 min−1 and then to 8.9 min−1 after a plateau wasreached at 0.3 mN passive force (t ∼ 690 s). AMP wasvirtually unchanged during the control, ramp and plateauperiods. Figure 1B shows the response of the same vesselto a faster ramp (6.1 × 10⁻³ mN s−1) in which FREQ wasalmost double during the ramp compared to its valueduring the plateau at the more optimal preload. Notably,a comparable enhancement in AMP did not occur.
Substantial changes in baseline FREQ sometimesoccurred from vessel to vessel and even for a given vesselover the time period required to test the response to anentire set of preload ramps (∼1 h). To normalize for thesedifferences, the AMP and FREQ data for each vessel wereexpressed in terms of the ratio of the average value duringthe ramp to the average value during the plateau. Wepreviously documented that both AMP and FREQ increaseover the preload range 0.03–0.3 mN (Zhang et al. 2007b)so that, in the absence of a rate-sensitive mechanism,AMP and FREQ ratios (ramp/plateau) < 1 would bepredicted. For the recordings in Fig. 1, the FREQ ratio was0.80 for the slower ramp compared to 1.74 for the fasterramp; the AMP ratios were 1.14 and 0.88, respectively,for the two ramps. Thus, rate-sensitive enhancementin FREQ was characterized by a ratio > 1 (reflecting aburst of contractions during the faster ramp). The resultsfrom eight lymphatic vessels subjected to preload rampsat six different speeds are summarized in Fig. 1C andD, where the FREQ and AMP ratios, respectively, areplotted as a function of ramp speed. The dotted lines inthe two panels indicate boundaries (where ratios were> 1) for the appearance of rate-sensitive enhancementwith this protocol. Clearly, the FREQ ratio exceeded 1regardless of the ramp speed, and the ratio increasedwith increasing ramp speed to a value of ∼1.5 for thefastest ramp. A value > 1 for the FREQ ratio (1.1) at thelowest ramp speed suggests even that speed was associatedwith a slight, rate-sensitive enhancement of FREQ. In
C© 2009 The Authors. Journal compilation C© 2009 The Physiological Society
J Physiol 587.1 Rate-sensitive lymphatic contractile responses 169
marked contrast, the average AMP ratio was always < 1and progressively declined with increasing ramp speed,suggesting that contraction AMP was not enhanced bystretch in a rate-sensitive manner. Indeed, in force rampprotocols, we never observed any AMP responses thatresembled those reported in portal vein (i.e. Figs 1 and2 in Johansson & Mellander, 1975).
The eight vessels used for the analysis in Fig. 1 compriseda subset of a larger group (15 total experiments) studiedusing the same protocol. In about half of the experiments,the baseline contraction FREQ was too low to permitthe full range of ramp speeds to be tested. For example,if baseline contraction FREQ was such that only onecontraction occurred during a high speed ramp, then
Figure 1. Lymphatic vessel responses to preload ramps
A, after equilibration at an initial (suboptimal) preload of 0.02 mN, passive force was increased to 0.3 mN (the
optimal preload for this vessel) at a ramp speed of 1.3 × 10⁻³ mN s−1. B, same vessel as in A with same initial
and final preloads but at a ramp speed of 5.8 × 10⁻³ mN s−1. Note the relatively high contraction FREQ during
the ramp compared to the subsequent FREQ at optimal preload. The small periodic deflections in the diameter
trace correspond to contractions (i.e. slight departures from truly isometric contractions). C, plot of the FREQ ratio
(average FREQ during the ramp divided by average FREQ during the plateau) as a function of ramp speed for
6 vessels. D, plot of AMP ratio versus ramp speed for the same vessels. Lines represent exponential fits of the
data points. Error bars are ± S.E.M. An asterisk indicates a significant difference from the value at the lowest rate.
Force ramp speeds corresponded to rates of 0.09 ± 0.01, 0.19 ± 0.03, 0.35 ± 0.03, 0.55 ± 0.05, 0.83 ± 0.07,
and 0.82 ± 0.08 in percentage lengths s−1, respectively, from the slowest to fastest ramps.
determination of FREQ on a contraction-by-contractionbasis was impossible. Likewise, we were concerned thatonly two to three contractions during a fast ramp mightnot give an accurate indication of FREQ (see example inFig. 3). For this reason, we used only vessels for the analysisshown in Fig. 1 that had a minimum of six contractionsduring the fastest ramp. It should be noted, however,that rate-sensitive FREQ responses were not limited tothe specific conditions described above. For example, invessels with a low baseline contraction FREQ, a low dose(< 3 × 10⁻⁸
M) of substance P (SP) could be added to thebath to increase baseline FREQ, and subsequent elevationof preload at an appropriately high rate then evoked arate-sensitive FREQ response (not shown, but see Fig. 3
C© 2009 The Authors. Journal compilation C© 2009 The Physiological Society

170 M. J. Davis and others J Physiol 587.1
below). This effect occurred as long as baseline FREQ waswell below the maximum value of ∼50 min−1 (induced bya high dose of SP). However, the group data analysed inFig. 1C and D were collected from vessels in the absenceof SP stimulation.
Positive diameter ramps
To ensure that rate-sensitive contractile responses werenot unique to force-ramp protocols, we performed analternative ‘diameter ramp’ protocol in which vesseldiameter, rather than passive force, was servo-controlled(Fig. 2). This protocol more closely matched that usedpreviously on portal vein, where the rate of changein longitudinal length was controlled (Johansson &Mellander, 1975). To impose a diameter ramp, the on-linediameter tracking signal obtained from the video imagewas used in the software-based loop to control the rate
Figure 2. Lymphatic vessel responses to diameter ramps
A, initially, the diameters at 0.02 mN (D i) and 0.3 mN (Do) passive force were measured; subsequently, diameter
was ramped from D i to Do at a constant speed of ∼0.15% lengths s−1. B, same vessel as in A with same initial and
final preloads and diameters but with a ramp speed of ∼1.1% lengths s−1. Note the relatively high contraction
FREQ near and just after the end of the ramp. C, plot of the FREQ ratio as a function of ramp speed for 11 vessels.
D, plot of AMP ratio versus ramp speed for the same vessels. Lines represent exponential fits of the data points.
Error bars are ± S.E.M. An asterisk indicates a significant difference from the value at the lowest rate.
of diameter change (note the well-defined ramp shapeof the diameter traces in Fig. 2A and B). Because preloadunder these conditions needed to approach but not exceedits optimal value in the plateau phase of the protocol,it was first necessary to determine D i, the diameterassociated with a minimal preload that produced a regularcontraction pattern, and Do, the diameter associatedwith optimal preload (∼0.3 mN). Once D i and Do weredetermined for each vessel, a ramp was imposed such thatdiameter changed at a constant rate. Figure 2 shows tworepresentative examples of the lymphatic response to aslow (Fig. 2A) and a fast (Fig. 2B) diameter ramp. For theslow ramp, the AMP ratio (ramp/plateau) was 0.9 andthe FREQ ratio was 1.3. A pattern often observed withfast diameter ramps was the appearance of a contractionburst immediately at the end of the ramp (Fig. 2B) thatpersisted into the beginning of the plateau period (asimilar pattern was also evident in portal vein (Fig. 1
C© 2009 The Authors. Journal compilation C© 2009 The Physiological Society
J Physiol 587.1 Rate-sensitive lymphatic contractile responses 171
in Johansson & Mellander, 1975). Because this contra-ctile pattern was consistently observed, the data used foranalysis of the ramp period included the entire contractionburst. The end of the burst was defined as the time whendiastolic force returned to the plateau level (lasting 2–15 safter the end of the ramp). For the faster ramp shownin Fig. 2B, the AMP ratio (ramp/plateau) was 0.8 andthe FREQ ratio was 1.7. The viscoelastic properties ofthe wall were apparent in that relatively large increases indiameter typically occurred before there were substantialincreases in preload, after which preload increased rapidlynear the end of the diameter ramp (Fig. 2A). An analysisof the diameter ramp data from 11 vessels, with each vesselsubjected to four to six different ramp speeds, is shown inFig. 2C and D. The rate of the diameter change (dL/dt) isexpressed as percentage length ((Do – D i)/D i) × 100, perunit time. The diameter was altered at each of six standardrates for each vessel but since the vessels were of differentsizes, the actual rate, in percentage lengths s−1 variedslightly between vessels. Nevertheless, the average responsepatterns were very similar to those shown with forceramps, with the FREQ ratio increasing approximately2-fold at the highest ramp speed without a correspondingincrease in the AMP ratio (the average response was aslight but not significant decrease with increasing rampspeed). The maximum FREQ ratio increases were higherfor diameter ramps than for force ramps probably becausewe were able to increase diameter at faster rates than in thefirst protocol where force ramp speeds corresponded torates of 0.09 ± 0.01, 0.19 ± 0.03, 0.35 ± 0.03, 0.55 ± 0.05,0.83 ± 0.07 and 0.82 ± 0.08 in percentage lengths s−1 fromthe slowest to fastest ramps (Fig. 1C).
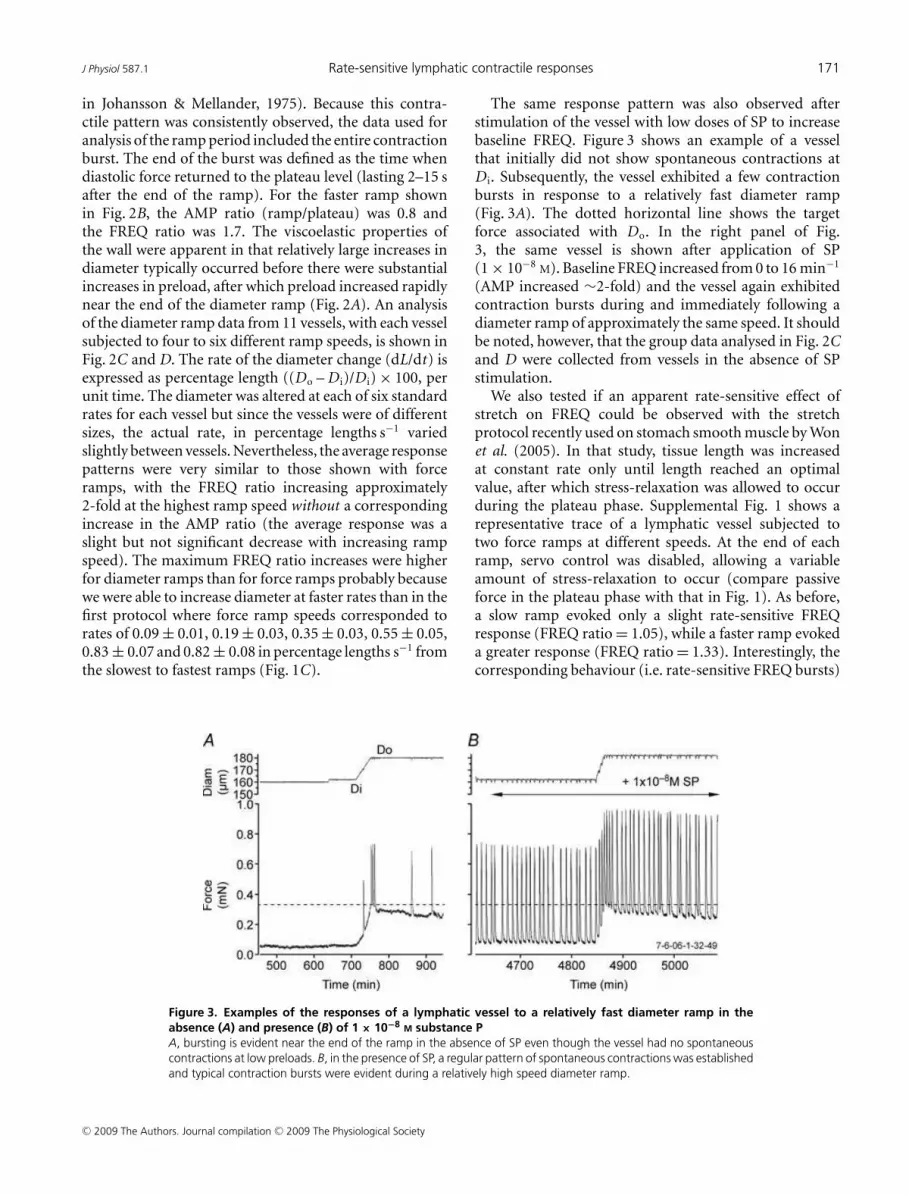
Figure 3. Examples of the responses of a lymphatic vessel to a relatively fast diameter ramp in the
absence (A) and presence (B) of 1 × 10⁻⁸ M substance P
A, bursting is evident near the end of the ramp in the absence of SP even though the vessel had no spontaneous
contractions at low preloads. B, in the presence of SP, a regular pattern of spontaneous contractions was established
and typical contraction bursts were evident during a relatively high speed diameter ramp.
The same response pattern was also observed afterstimulation of the vessel with low doses of SP to increasebaseline FREQ. Figure 3 shows an example of a vesselthat initially did not show spontaneous contractions atD i. Subsequently, the vessel exhibited a few contractionbursts in response to a relatively fast diameter ramp(Fig. 3A). The dotted horizontal line shows the targetforce associated with Do. In the right panel of Fig.3, the same vessel is shown after application of SP(1 × 10⁻⁸
M). Baseline FREQ increased from 0 to 16 min−1
(AMP increased ∼2-fold) and the vessel again exhibitedcontraction bursts during and immediately following adiameter ramp of approximately the same speed. It shouldbe noted, however, that the group data analysed in Fig. 2Cand D were collected from vessels in the absence of SPstimulation.
We also tested if an apparent rate-sensitive effect ofstretch on FREQ could be observed with the stretchprotocol recently used on stomach smooth muscle by Wonet al. (2005). In that study, tissue length was increasedat constant rate only until length reached an optimalvalue, after which stress-relaxation was allowed to occurduring the plateau phase. Supplemental Fig. 1 shows arepresentative trace of a lymphatic vessel subjected totwo force ramps at different speeds. At the end of eachramp, servo control was disabled, allowing a variableamount of stress-relaxation to occur (compare passiveforce in the plateau phase with that in Fig. 1). As before,a slow ramp evoked only a slight rate-sensitive FREQresponse (FREQ ratio = 1.05), while a faster ramp evokeda greater response (FREQ ratio = 1.33). Interestingly, thecorresponding behaviour (i.e. rate-sensitive FREQ bursts)
C© 2009 The Authors. Journal compilation C© 2009 The Physiological Society
172 M. J. Davis and others J Physiol 587.1
was not evident in visceral smooth muscle (see Figs 1, 3,4, 5 and 6 in Won et al. 2005).
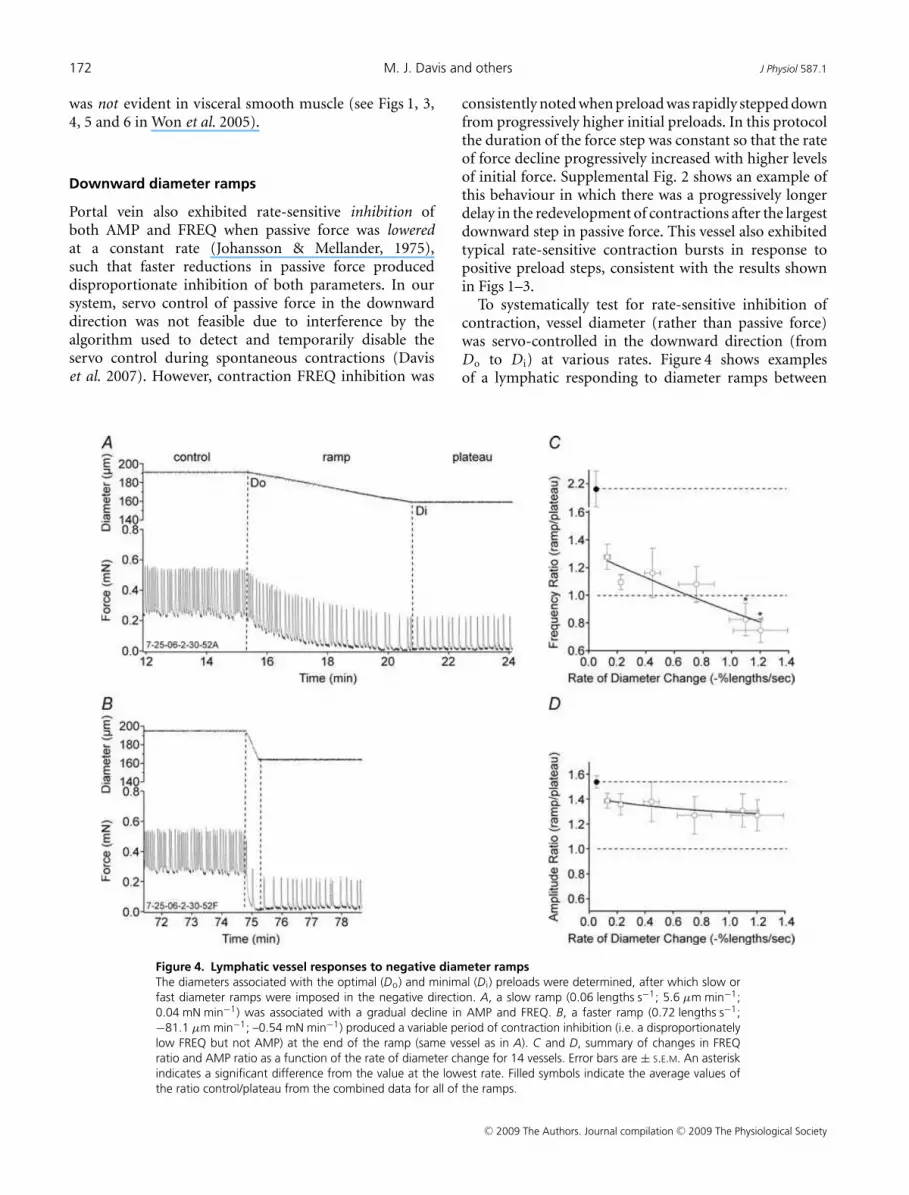
Downward diameter ramps
Portal vein also exhibited rate-sensitive inhibition ofboth AMP and FREQ when passive force was loweredat a constant rate (Johansson & Mellander, 1975),such that faster reductions in passive force produceddisproportionate inhibition of both parameters. In oursystem, servo control of passive force in the downwarddirection was not feasible due to interference by thealgorithm used to detect and temporarily disable theservo control during spontaneous contractions (Daviset al. 2007). However, contraction FREQ inhibition was
Figure 4. Lymphatic vessel responses to negative diameter ramps
The diameters associated with the optimal (Do) and minimal (D i) preloads were determined, after which slow or
fast diameter ramps were imposed in the negative direction. A, a slow ramp (0.06 lengths s−1; 5.6 µm min−1;
0.04 mN min−1) was associated with a gradual decline in AMP and FREQ. B, a faster ramp (0.72 lengths s−1;
−81.1 µm min−1; –0.54 mN min−1) produced a variable period of contraction inhibition (i.e. a disproportionately
low FREQ but not AMP) at the end of the ramp (same vessel as in A). C and D, summary of changes in FREQ
ratio and AMP ratio as a function of the rate of diameter change for 14 vessels. Error bars are ± S.E.M. An asterisk
indicates a significant difference from the value at the lowest rate. Filled symbols indicate the average values of
the ratio control/plateau from the combined data for all of the ramps.
consistently noted when preload was rapidly stepped downfrom progressively higher initial preloads. In this protocolthe duration of the force step was constant so that the rateof force decline progressively increased with higher levelsof initial force. Supplemental Fig. 2 shows an example ofthis behaviour in which there was a progressively longerdelay in the redevelopment of contractions after the largestdownward step in passive force. This vessel also exhibitedtypical rate-sensitive contraction bursts in response topositive preload steps, consistent with the results shownin Figs 1–3.
To systematically test for rate-sensitive inhibition ofcontraction, vessel diameter (rather than passive force)was servo-controlled in the downward direction (fromDo to D i) at various rates. Figure 4 shows examplesof a lymphatic responding to diameter ramps between
C© 2009 The Authors. Journal compilation C© 2009 The Physiological Society
J Physiol 587.1 Rate-sensitive lymphatic contractile responses 173
∼0.3 and ∼0.03 mN, where diameter was lowered attwo different rates. In Fig. 4A, a slow ramp produceda gradual reduction in both AMP and FREQ, withboth parameters declining gradually to stable but lowervalues at the minimal preload associated with D i. TheFREQ and AMP ratios for this record were 1.29 and1.28, respectively. However, as shown in Fig. 4B, a faster,declining diameter ramp was associated with an initiallow contraction frequency (i.e. contraction inhibition)at the target diameter (D i) that gradually increased withtime after the diameter had stabilized at the lower level.The FREQ and AMP ratios for this record were 1.13and 1.25, respectively. Figure 4C and D summarizes thedata for downward diameter ramps at six different ramp
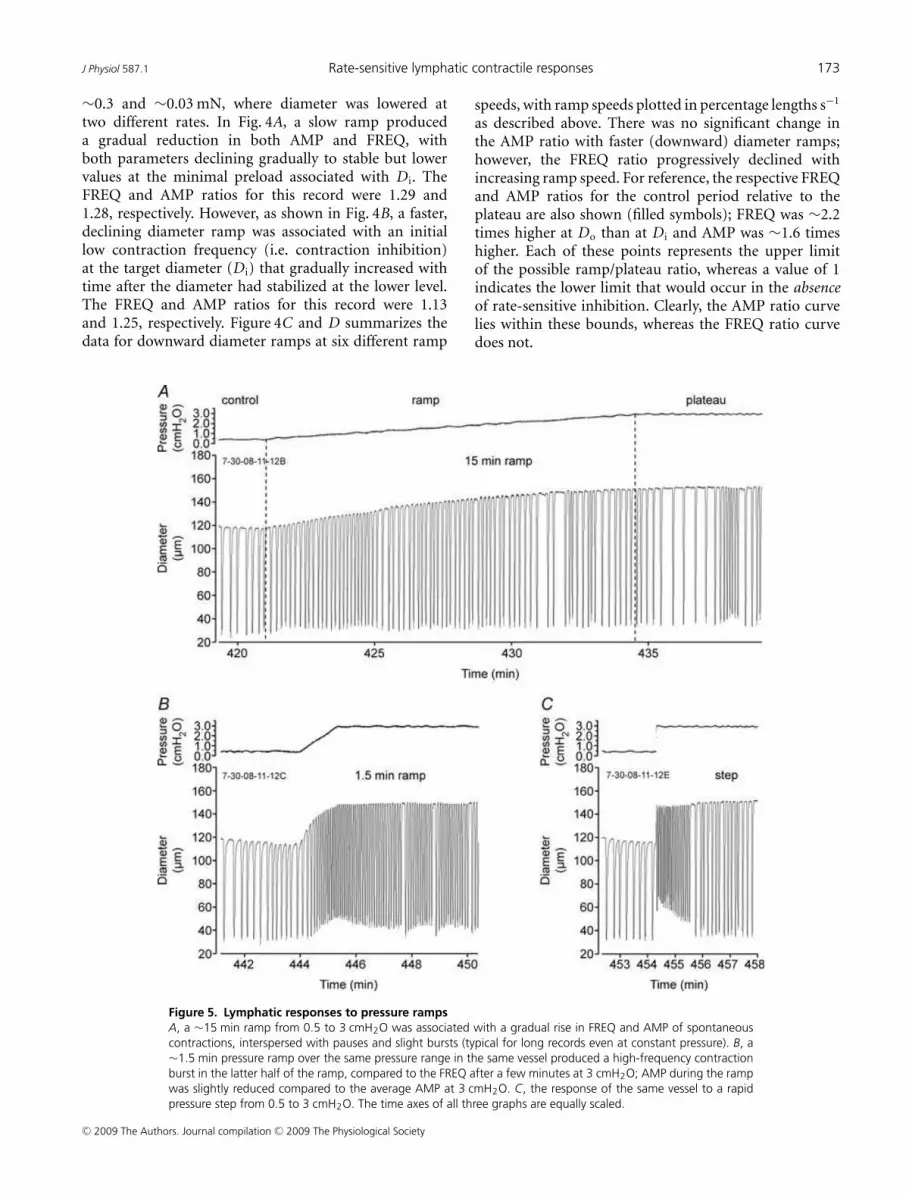
Figure 5. Lymphatic responses to pressure ramps
A, a ∼15 min ramp from 0.5 to 3 cmH2O was associated with a gradual rise in FREQ and AMP of spontaneous
contractions, interspersed with pauses and slight bursts (typical for long records even at constant pressure). B, a
∼1.5 min pressure ramp over the same pressure range in the same vessel produced a high-frequency contraction
burst in the latter half of the ramp, compared to the FREQ after a few minutes at 3 cmH2O; AMP during the ramp
was slightly reduced compared to the average AMP at 3 cmH2O. C, the response of the same vessel to a rapid
pressure step from 0.5 to 3 cmH2O. The time axes of all three graphs are equally scaled.
speeds, with ramp speeds plotted in percentage lengths s−1
as described above. There was no significant change inthe AMP ratio with faster (downward) diameter ramps;however, the FREQ ratio progressively declined withincreasing ramp speed. For reference, the respective FREQand AMP ratios for the control period relative to theplateau are also shown (filled symbols); FREQ was ∼2.2times higher at Do than at D i and AMP was ∼1.6 timeshigher. Each of these points represents the upper limitof the possible ramp/plateau ratio, whereas a value of 1indicates the lower limit that would occur in the absenceof rate-sensitive inhibition. Clearly, the AMP ratio curvelies within these bounds, whereas the FREQ ratio curvedoes not.
C© 2009 The Authors. Journal compilation C© 2009 The Physiological Society
174 M. J. Davis and others J Physiol 587.1
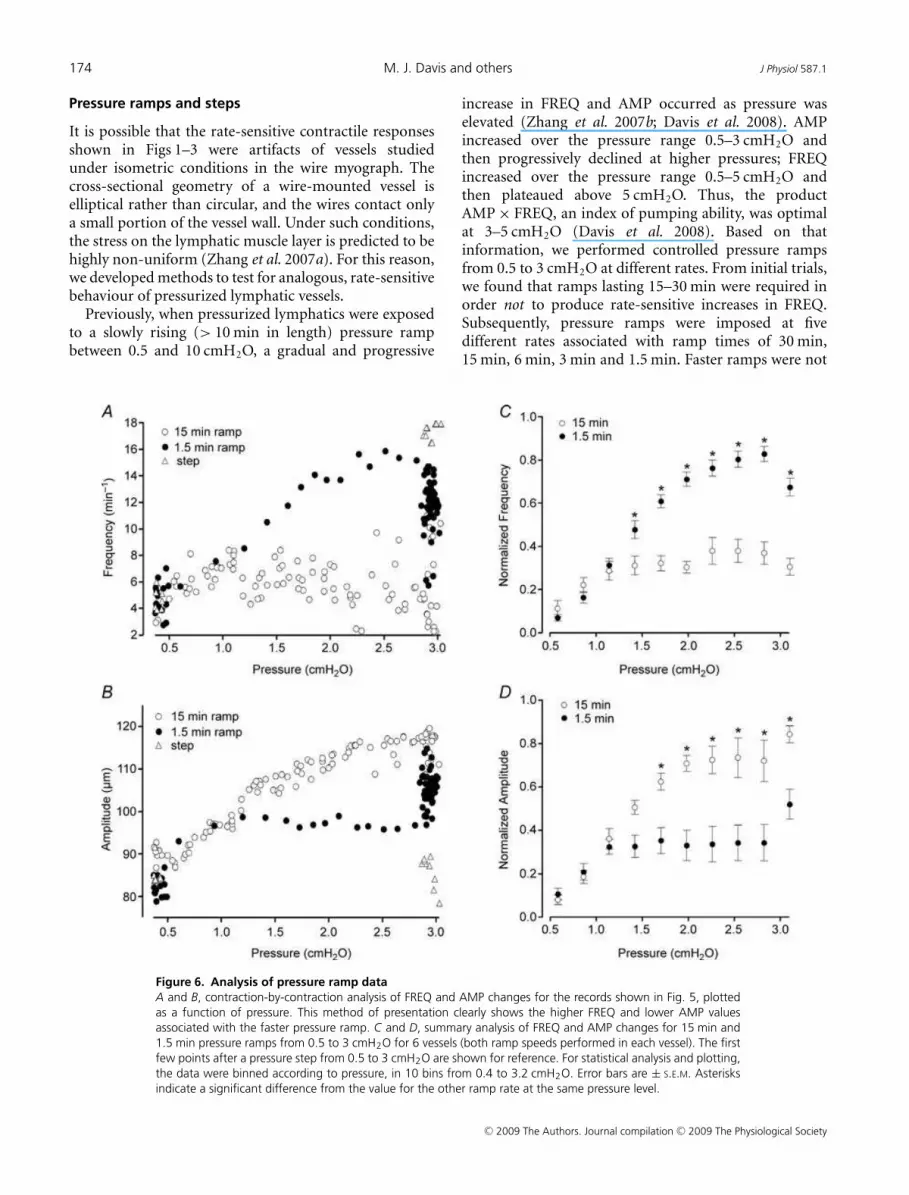
Pressure ramps and steps
It is possible that the rate-sensitive contractile responsesshown in Figs 1–3 were artifacts of vessels studiedunder isometric conditions in the wire myograph. Thecross-sectional geometry of a wire-mounted vessel iselliptical rather than circular, and the wires contact onlya small portion of the vessel wall. Under such conditions,the stress on the lymphatic muscle layer is predicted to behighly non-uniform (Zhang et al. 2007a). For this reason,we developed methods to test for analogous, rate-sensitivebehaviour of pressurized lymphatic vessels.
Previously, when pressurized lymphatics were exposedto a slowly rising (> 10 min in length) pressure rampbetween 0.5 and 10 cmH2O, a gradual and progressive
Figure 6. Analysis of pressure ramp data
A and B, contraction-by-contraction analysis of FREQ and AMP changes for the records shown in Fig. 5, plotted
as a function of pressure. This method of presentation clearly shows the higher FREQ and lower AMP values
associated with the faster pressure ramp. C and D, summary analysis of FREQ and AMP changes for 15 min and
1.5 min pressure ramps from 0.5 to 3 cmH2O for 6 vessels (both ramp speeds performed in each vessel). The first
few points after a pressure step from 0.5 to 3 cmH2O are shown for reference. For statistical analysis and plotting,
the data were binned according to pressure, in 10 bins from 0.4 to 3.2 cmH2O. Error bars are ± S.E.M. Asterisks
indicate a significant difference from the value for the other ramp rate at the same pressure level.
increase in FREQ and AMP occurred as pressure waselevated (Zhang et al. 2007b; Davis et al. 2008). AMPincreased over the pressure range 0.5–3 cmH2O andthen progressively declined at higher pressures; FREQincreased over the pressure range 0.5–5 cmH2O andthen plateaued above 5 cmH2O. Thus, the productAMP × FREQ, an index of pumping ability, was optimalat 3–5 cmH2O (Davis et al. 2008). Based on thatinformation, we performed controlled pressure rampsfrom 0.5 to 3 cmH2O at different rates. From initial trials,we found that ramps lasting 15–30 min were required inorder not to produce rate-sensitive increases in FREQ.Subsequently, pressure ramps were imposed at fivedifferent rates associated with ramp times of 30 min,15 min, 6 min, 3 min and 1.5 min. Faster ramps were not
C© 2009 The Authors. Journal compilation C© 2009 The Physiological Society
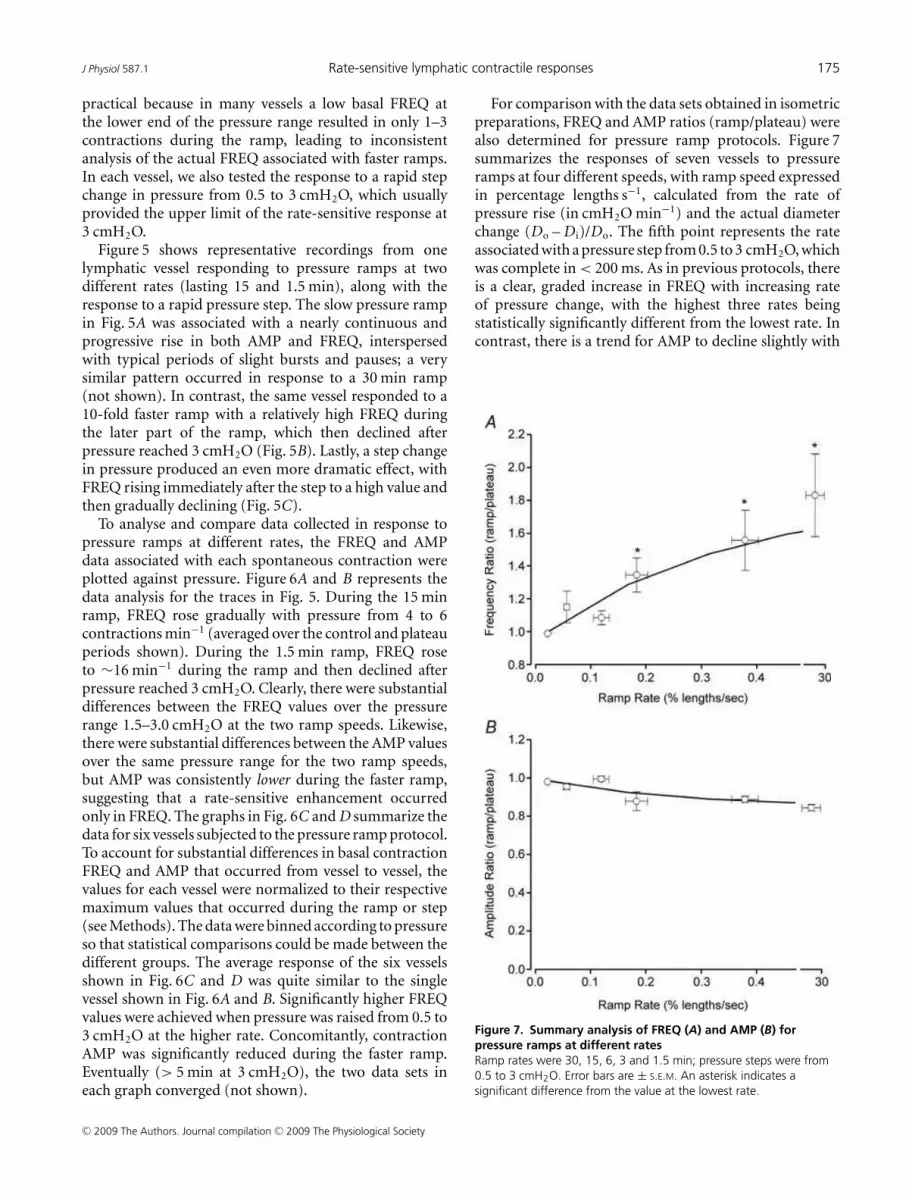
J Physiol 587.1 Rate-sensitive lymphatic contractile responses 175
practical because in many vessels a low basal FREQ atthe lower end of the pressure range resulted in only 1–3contractions during the ramp, leading to inconsistentanalysis of the actual FREQ associated with faster ramps.In each vessel, we also tested the response to a rapid stepchange in pressure from 0.5 to 3 cmH2O, which usuallyprovided the upper limit of the rate-sensitive response at3 cmH2O.
Figure 5 shows representative recordings from onelymphatic vessel responding to pressure ramps at twodifferent rates (lasting 15 and 1.5 min), along with theresponse to a rapid pressure step. The slow pressure rampin Fig. 5A was associated with a nearly continuous andprogressive rise in both AMP and FREQ, interspersedwith typical periods of slight bursts and pauses; a verysimilar pattern occurred in response to a 30 min ramp(not shown). In contrast, the same vessel responded to a10-fold faster ramp with a relatively high FREQ duringthe later part of the ramp, which then declined afterpressure reached 3 cmH2O (Fig. 5B). Lastly, a step changein pressure produced an even more dramatic effect, withFREQ rising immediately after the step to a high value andthen gradually declining (Fig. 5C).
To analyse and compare data collected in response topressure ramps at different rates, the FREQ and AMPdata associated with each spontaneous contraction wereplotted against pressure. Figure 6A and B represents thedata analysis for the traces in Fig. 5. During the 15 minramp, FREQ rose gradually with pressure from 4 to 6contractions min−1 (averaged over the control and plateauperiods shown). During the 1.5 min ramp, FREQ roseto ∼16 min−1 during the ramp and then declined afterpressure reached 3 cmH2O. Clearly, there were substantialdifferences between the FREQ values over the pressurerange 1.5–3.0 cmH2O at the two ramp speeds. Likewise,there were substantial differences between the AMP valuesover the same pressure range for the two ramp speeds,but AMP was consistently lower during the faster ramp,suggesting that a rate-sensitive enhancement occurredonly in FREQ. The graphs in Fig. 6C and D summarize thedata for six vessels subjected to the pressure ramp protocol.To account for substantial differences in basal contractionFREQ and AMP that occurred from vessel to vessel, thevalues for each vessel were normalized to their respectivemaximum values that occurred during the ramp or step(see Methods). The data were binned according to pressureso that statistical comparisons could be made between thedifferent groups. The average response of the six vesselsshown in Fig. 6C and D was quite similar to the singlevessel shown in Fig. 6A and B. Significantly higher FREQvalues were achieved when pressure was raised from 0.5 to3 cmH2O at the higher rate. Concomitantly, contractionAMP was significantly reduced during the faster ramp.Eventually (> 5 min at 3 cmH2O), the two data sets ineach graph converged (not shown).
For comparison with the data sets obtained in isometricpreparations, FREQ and AMP ratios (ramp/plateau) werealso determined for pressure ramp protocols. Figure 7summarizes the responses of seven vessels to pressureramps at four different speeds, with ramp speed expressedin percentage lengths s−1, calculated from the rate ofpressure rise (in cmH2O min−1) and the actual diameterchange (Do – D i)/Do. The fifth point represents the rateassociated with a pressure step from 0.5 to 3 cmH2O, whichwas complete in < 200 ms. As in previous protocols, thereis a clear, graded increase in FREQ with increasing rateof pressure change, with the highest three rates beingstatistically significantly different from the lowest rate. Incontrast, there is a trend for AMP to decline slightly with
Figure 7. Summary analysis of FREQ (A) and AMP (B) for
pressure ramps at different rates
Ramp rates were 30, 15, 6, 3 and 1.5 min; pressure steps were from
0.5 to 3 cmH2O. Error bars are ± S.E.M. An asterisk indicates a
significant difference from the value at the lowest rate.
C© 2009 The Authors. Journal compilation C© 2009 The Physiological Society
176 M. J. Davis and others J Physiol 587.1
ramp speed, but none of the AMP values are significantlydifferent from each other.
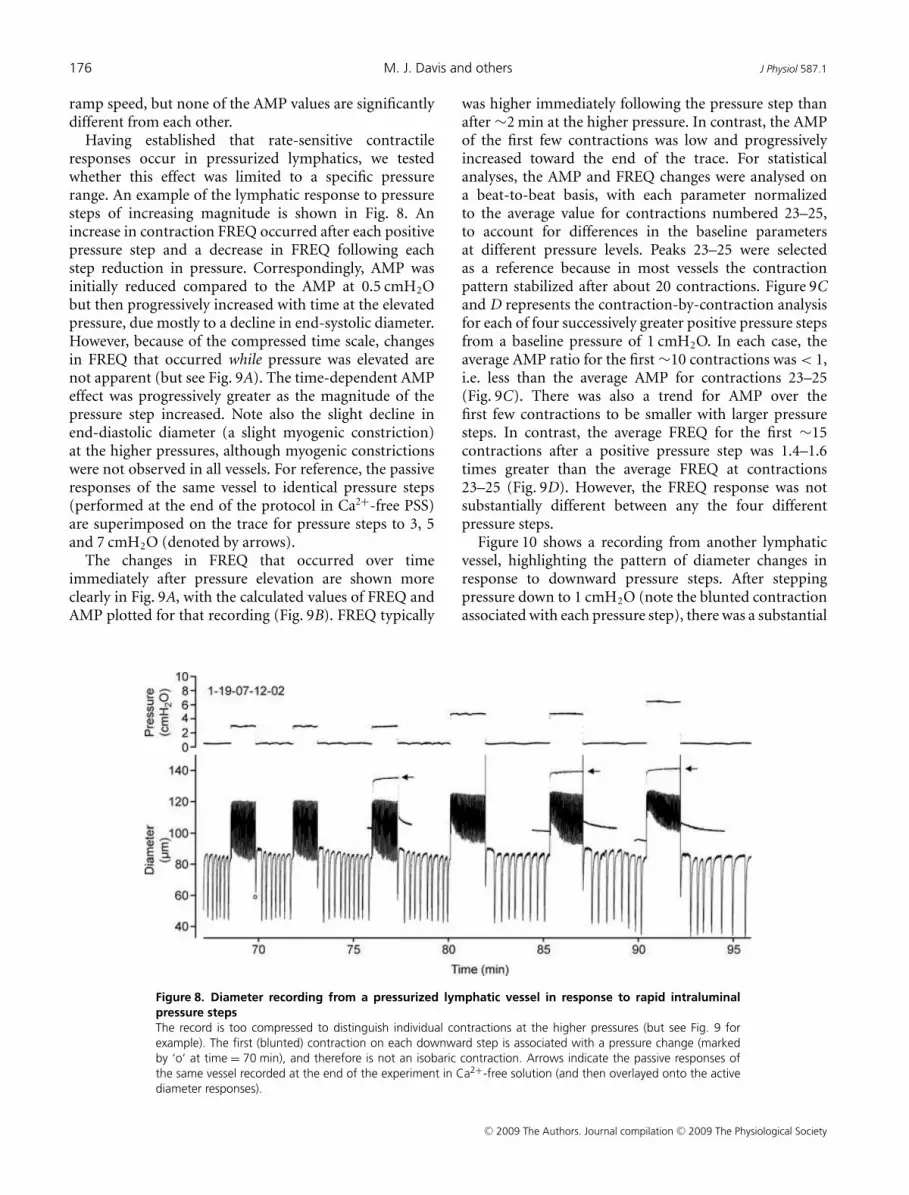
Having established that rate-sensitive contractileresponses occur in pressurized lymphatics, we testedwhether this effect was limited to a specific pressurerange. An example of the lymphatic response to pressuresteps of increasing magnitude is shown in Fig. 8. Anincrease in contraction FREQ occurred after each positivepressure step and a decrease in FREQ following eachstep reduction in pressure. Correspondingly, AMP wasinitially reduced compared to the AMP at 0.5 cmH2Obut then progressively increased with time at the elevatedpressure, due mostly to a decline in end-systolic diameter.However, because of the compressed time scale, changesin FREQ that occurred while pressure was elevated arenot apparent (but see Fig. 9A). The time-dependent AMPeffect was progressively greater as the magnitude of thepressure step increased. Note also the slight decline inend-diastolic diameter (a slight myogenic constriction)at the higher pressures, although myogenic constrictionswere not observed in all vessels. For reference, the passiveresponses of the same vessel to identical pressure steps(performed at the end of the protocol in Ca2+-free PSS)are superimposed on the trace for pressure steps to 3, 5and 7 cmH2O (denoted by arrows).
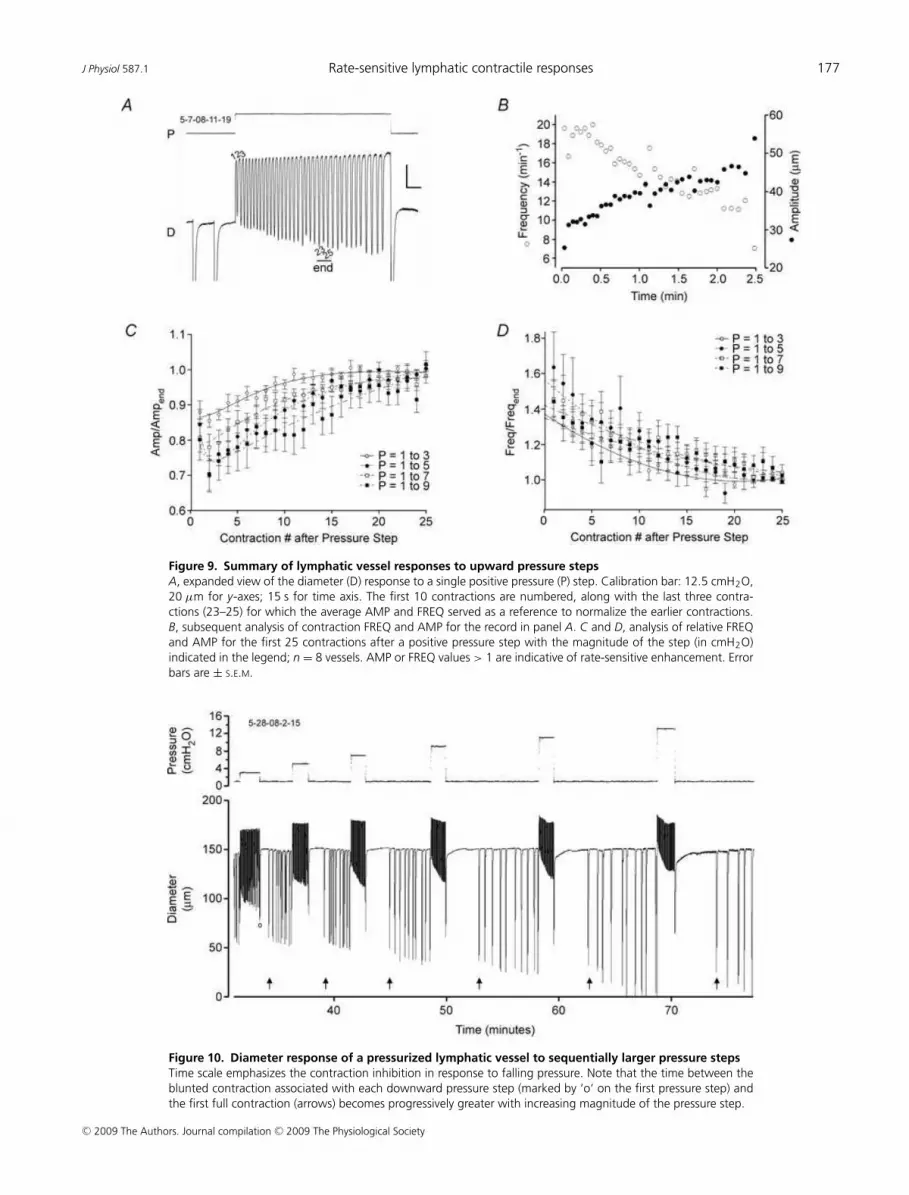
The changes in FREQ that occurred over timeimmediately after pressure elevation are shown moreclearly in Fig. 9A, with the calculated values of FREQ andAMP plotted for that recording (Fig. 9B). FREQ typically
Figure 8. Diameter recording from a pressurized lymphatic vessel in response to rapid intraluminal
pressure steps
The record is too compressed to distinguish individual contractions at the higher pressures (but see Fig. 9 for
example). The first (blunted) contraction on each downward step is associated with a pressure change (marked
by ‘o’ at time = 70 min), and therefore is not an isobaric contraction. Arrows indicate the passive responses of
the same vessel recorded at the end of the experiment in Ca2+-free solution (and then overlayed onto the active
diameter responses).
was higher immediately following the pressure step thanafter ∼2 min at the higher pressure. In contrast, the AMPof the first few contractions was low and progressivelyincreased toward the end of the trace. For statisticalanalyses, the AMP and FREQ changes were analysed ona beat-to-beat basis, with each parameter normalizedto the average value for contractions numbered 23–25,to account for differences in the baseline parametersat different pressure levels. Peaks 23–25 were selectedas a reference because in most vessels the contractionpattern stabilized after about 20 contractions. Figure 9Cand D represents the contraction-by-contraction analysisfor each of four successively greater positive pressure stepsfrom a baseline pressure of 1 cmH2O. In each case, theaverage AMP ratio for the first ∼10 contractions was < 1,i.e. less than the average AMP for contractions 23–25(Fig. 9C). There was also a trend for AMP over thefirst few contractions to be smaller with larger pressuresteps. In contrast, the average FREQ for the first ∼15contractions after a positive pressure step was 1.4–1.6times greater than the average FREQ at contractions23–25 (Fig. 9D). However, the FREQ response was notsubstantially different between any the four differentpressure steps.
Figure 10 shows a recording from another lymphaticvessel, highlighting the pattern of diameter changes inresponse to downward pressure steps. After steppingpressure down to 1 cmH2O (note the blunted contractionassociated with each pressure step), there was a substantial
C© 2009 The Authors. Journal compilation C© 2009 The Physiological Society
J Physiol 587.1 Rate-sensitive lymphatic contractile responses 177
Figure 9. Summary of lymphatic vessel responses to upward pressure steps
A, expanded view of the diameter (D) response to a single positive pressure (P) step. Calibration bar: 12.5 cmH2O,
20 µm for y-axes; 15 s for time axis. The first 10 contractions are numbered, along with the last three contra-
ctions (23–25) for which the average AMP and FREQ served as a reference to normalize the earlier contractions.
B, subsequent analysis of contraction FREQ and AMP for the record in panel A. C and D, analysis of relative FREQ
and AMP for the first 25 contractions after a positive pressure step with the magnitude of the step (in cmH2O)
indicated in the legend; n = 8 vessels. AMP or FREQ values > 1 are indicative of rate-sensitive enhancement. Error
bars are ± S.E.M.
Figure 10. Diameter response of a pressurized lymphatic vessel to sequentially larger pressure steps
Time scale emphasizes the contraction inhibition in response to falling pressure. Note that the time between the
blunted contraction associated with each downward pressure step (marked by ‘o’ on the first pressure step) and
the first full contraction (arrows) becomes progressively greater with increasing magnitude of the pressure step.
C© 2009 The Authors. Journal compilation C© 2009 The Physiological Society
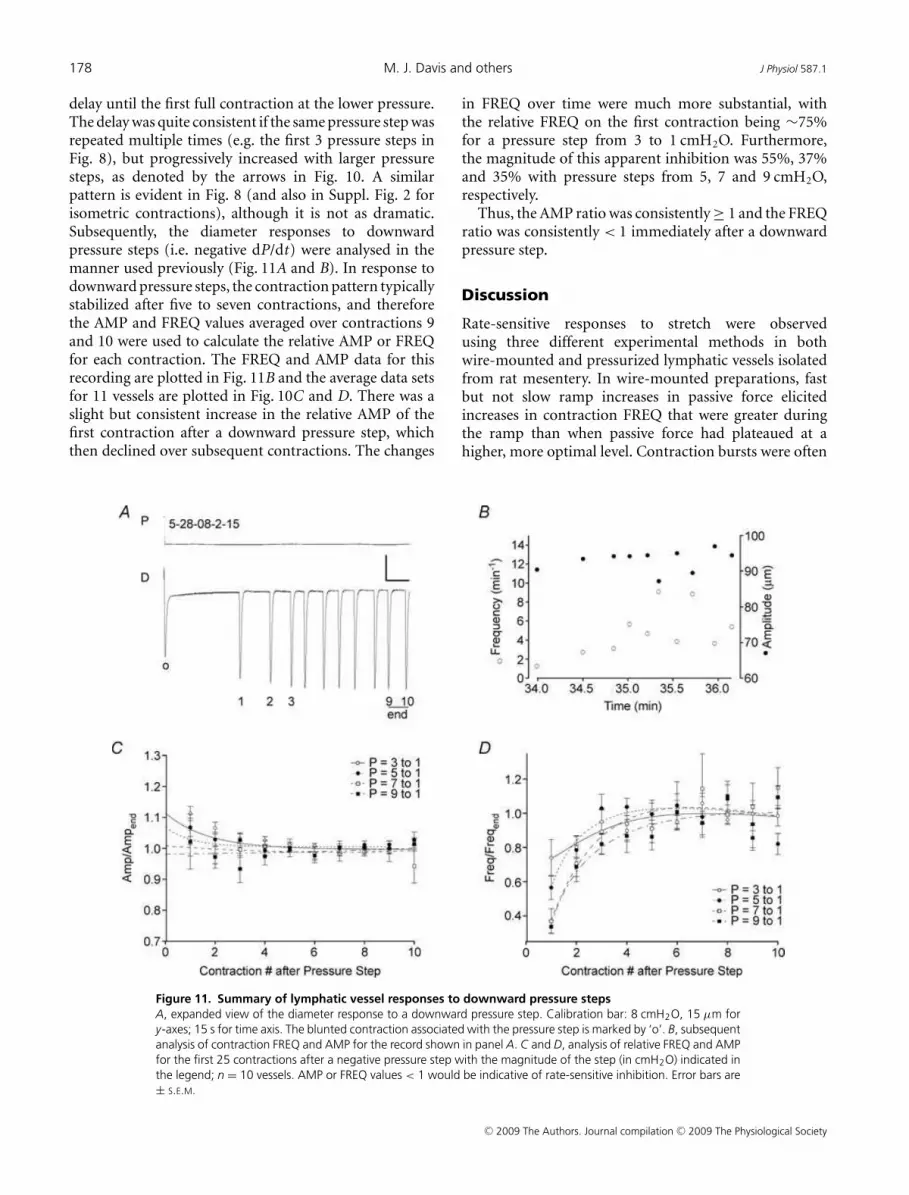
178 M. J. Davis and others J Physiol 587.1
delay until the first full contraction at the lower pressure.The delay was quite consistent if the same pressure step wasrepeated multiple times (e.g. the first 3 pressure steps inFig. 8), but progressively increased with larger pressuresteps, as denoted by the arrows in Fig. 10. A similarpattern is evident in Fig. 8 (and also in Suppl. Fig. 2 forisometric contractions), although it is not as dramatic.Subsequently, the diameter responses to downwardpressure steps (i.e. negative dP/dt) were analysed in themanner used previously (Fig. 11A and B). In response todownward pressure steps, the contraction pattern typicallystabilized after five to seven contractions, and thereforethe AMP and FREQ values averaged over contractions 9and 10 were used to calculate the relative AMP or FREQfor each contraction. The FREQ and AMP data for thisrecording are plotted in Fig. 11B and the average data setsfor 11 vessels are plotted in Fig. 10C and D. There was aslight but consistent increase in the relative AMP of thefirst contraction after a downward pressure step, whichthen declined over subsequent contractions. The changes
Figure 11. Summary of lymphatic vessel responses to downward pressure steps
A, expanded view of the diameter response to a downward pressure step. Calibration bar: 8 cmH2O, 15 µm for
y-axes; 15 s for time axis. The blunted contraction associated with the pressure step is marked by ‘o’. B, subsequent
analysis of contraction FREQ and AMP for the record shown in panel A. C and D, analysis of relative FREQ and AMP
for the first 25 contractions after a negative pressure step with the magnitude of the step (in cmH2O) indicated in
the legend; n = 10 vessels. AMP or FREQ values < 1 would be indicative of rate-sensitive inhibition. Error bars are
± S.E.M.
in FREQ over time were much more substantial, withthe relative FREQ on the first contraction being ∼75%for a pressure step from 3 to 1 cmH2O. Furthermore,the magnitude of this apparent inhibition was 55%, 37%and 35% with pressure steps from 5, 7 and 9 cmH2O,respectively.
Thus, the AMP ratio was consistently ≥ 1 and the FREQratio was consistently < 1 immediately after a downwardpressure step.
Discussion
Rate-sensitive responses to stretch were observedusing three different experimental methods in bothwire-mounted and pressurized lymphatic vessels isolatedfrom rat mesentery. In wire-mounted preparations, fastbut not slow ramp increases in passive force elicitedincreases in contraction FREQ that were greater duringthe ramp than when passive force had plateaued at ahigher, more optimal level. Contraction bursts were often
C© 2009 The Authors. Journal compilation C© 2009 The Physiological Society

J Physiol 587.1 Rate-sensitive lymphatic contractile responses 179
evident during the ramps. The FREQ responses becameprogressively greater when the vessels were subjected tohigher-speed force ramps. Similar behaviour was recordedin response to ramp increases in vessel diameter ratherthan passive force. In both protocols, contraction AMP didnot change in an analogous fashion, but merely showeda graded increase with preload. Furthermore, increasingthe ramp speed caused a slight decrease rather than anincrease in the AMP ratio. In pressurized lymphatics,slow pressure ramps from 0.5 to 3 cmH2O were associatedwith gradual increases in both FREQ and AMP, whereasfaster ramps over the same pressure range producedmuch larger increases in FREQ and decreases in AMP.FREQ bursts were often evident for the first 1–2 minafter rapid pressure elevation and contraction inhibitionoccurred after rapid pressure reduction. Rate-sensitiveFREQ changes occurred over a relatively wide range ofintraluminal pressures from normal physiological valuesto pressures associated with lymphoedema (Zaugg-Vestiet al. 1993; Gretener et al. 2000). The redundancy andconsistency of these findings suggests that rate-sensitiveFREQ responses of lymphatics to circumferentialstretch are robust and consistent between vessels andpreparations. Unlike previous findings in blood vessels,FREQ but not AMP exhibited rate–sensitive enhancementin response to stretch. It is likely that the behaviourdescribed in the present study is a general characteristicof lymphatics and may allow the lymphatic pumpto compensate for impaired flow during/after partialocclusion of the outflow tract.
Differences between portal vein and mesenteric
lymphatics
Like the longitudinal smooth muscle layer of ratportal vein (Johansson & Mellander, 1975), rate-sensitiveenhancement in FREQ was consistently demonstratedin lymphatic vessels in response to increases in length.The FREQ of spontaneous force transients in lymphaticvessels was higher during an increasing preload ramp thanafter the vessel reached optimal preload; furthermore,the FREQ ratio increased with the speed of the ramp(Fig. 1). The pattern of lymphatic FREQ responses underisometric conditions was strikingly similar to that of ratportal vein, but in contrast to portal vein, the AMPof lymphatic force transients was always lower during arising preload ramp compared to the stable AMP value atoptimal preload; furthermore, the lymphatic AMP ratiofell further as the rate of change in preload increased(Fig. 1). In most cases, the AMP values during the rampwere intermediate between those at the initial preloadand those at the optimal preload (particularly evident inFig. 2A), suggesting that AMP was determined simply by the
instantaneous preload value prior to each contraction. Thedramatic difference in the AMP response of lymphaticscompared to portal vein is evident from the raw recordingsin Johansson & Mellander (1975), which show a clearenhancement in AMP during/after positive length rampsas well as inhibition of AMP after negative ramps. Ourestimates of AMP and FREQ ratios from portal vein data(calculated from traces shown in Fig. 1 in Johansson &Mellander, 1975) indicate that both ratios were greaterthan 1 for positive length ramps (AMP ratio = 1.4, FREQratio = 3.5 for dL/dt = +3% lengths s−1). In contrast,for the lymphatic vessels shown in Fig. 2, comparablecalculations yielded an AMP ratio ∼0.9 and FREQ ratio∼1.5 when diameter was increased at +1.1% lengths s−1
(the peak FREQ response in Fig. 2C). This degree ofstretch of portal vein produced ∼2-fold increase in FREQ(Fig. 3 in Johansson & Mellander, 1975), which is very closeto what we observed in lymphatics. We were unable todetermine whether lymphatic vessels would have furtherincreased their FREQ at higher rates of stretch due to aninsufficient number of contractions during faster forceramps. However, occasional examples of the lymphaticresponse to force steps suggest that FREQ could potentiallyincrease up to 4-fold (e.g. Suppl. Fig. 2), closer to themaximum value observed in portal vein.
Rate-sensitive changes in contraction FREQ were alsorecorded in pressurized lymphatic vessels, indicatingthat the phenomenon was not limited to wire-mountedor isometric preparations. Transient, high-frequencycontraction bursts were consistently noted in responseto rapid pressure elevation (Figs 5C and 9A) and topressure ramps lasting 1.5–3.0 min (Fig. 6). Furthermore,the relationship between the FREQ ratio and the rampspeed (Fig. 7A) had a very similar appearance to thatrecorded in wire-mounted vessels (Figs 1C and 2C). Incontrast, there was not a substantial or significant changein the AMP ratio with increasing ramp speed (Fig. 7B).
Lymphatic vessels appeared to be more sensitive tostretch than portal vein. From Fig. 3 in Johansson &Mellander (1975) the threshold for a rate-sensitive FREQresponse was ∼ +0.6% lengths s−1 compared to isometriclymphatic vessels where the threshold was ∼ +0.2%lengths s−1; however, the lowest significant increase inlymphatic FREQ ratio occurred at a ramp rate of∼0.8% lengths s−1 (Fig. 2C). In pressurized lymphatics,the threshold for an increase in the FREQ ratio appearedto be even lower (∼0.05% lengths s−1), with the loweststatistically significant value occurring at a ramp rateof ∼ +0.2% lengths s−1 (Fig. 7A). These comparisonssuggest either that lymphatics are 2- to 3-fold moresensitive to stretch than portal vein or that pressurizedvessels may be more sensitive to stretch than wire-mountedvessels, possibly due to a more uniform force distributionin the former.
C© 2009 The Authors. Journal compilation C© 2009 The Physiological Society
180 M. J. Davis and others J Physiol 587.1
Mechanisms underlying rate-sensitive contractions
Our finding that rat lymphatics exhibit rate-sensitiveenhancement in FREQ but not AMP to stretch,unlike rat portal vein, is consistent with a previousassertion that lymphatic muscle is not typical vascularsmooth muscle but exhibits biochemical characteristicsof both vascular and striated muscle (Muthuchamy et al.2003). Although the mechanism underlying rate-sensitiveFREQ modulation is unknown, preliminary observationsrule out a few possibilities. First, rate-sensitive FREQenhancement does not require an intact endothelium,since the endothelial layer was disrupted in manyof our isometric protocols (e.g. Figs 1–4) in theprocess of sliding wires into the vessel lumen; also,in preliminary experiments (not shown), rate-sensitiveresponses continued in the presence of the cyclo-oxygenase inhibitor indomethacin (10 µM; n = 5) to blockthe possible action of endothelial-derived prostanoids.Second, the mechanism does not appear to involve therelease of SP or other tachykinins from nerve endings(Widdicombe, 2003) that are present on the outside ofthe vessels because rate-sensitive responses also persist inthe presence of neurokinin receptor blocker with spantide(1 µM; n = 2) or WIN57108 (10 µM; n = 5; not shown).Mediation of rate-sensitive FREQ responses by SP is alsounlikely given the fact that SP is known to modulate bothFREQ and AMP (Davis et al. 2008).
A possible explanation for a differential effect of stretchon lymphatic FREQ but not AMP is that an electricalpacemaker in the wall is rate-sensitive but lymphaticmuscle is not . This distinction points to a possibleneural mechanism, given the fact that rate-sensitivecharacteristics are well-documented in certain mechano-receptors (Widdicombe, 2003). Although the mechanismof pacemaker activity has not yet been definitively resolvedin either portal vein or lymphatic vessels, recent studieshave implicated interstitial cells of Cajal (ICC). ICC arepresent in many hollow organs (Pucovsky et al. 2007)but have been characterized best in the gastrointestinalsystem as networks of pacemaker cells connecting entericneurons to circular and longitudinal smooth muscle cells(Sanders & Ward, 2008); ICC are strongly implicated in thegeneration and propagation of gastrointestinal slow waves(Ordog et al. 1999) in addition to mediating inhibitoryand excitatory neurotransmission (Hirst et al. 2002). Intra-mural ICC in murine gastric muscle can function as stretchreceptors to regulate pacemaker activity, but do not appearto show bursting in response to ramp increases in passiveforce (Won et al. 2005).
A specialized population of ICC-like cells has beensuggested to be involved in the generation of pacemakeractivity and basal tone of blood vessels and lymphatics(McCloskey et al. 2002; Harhun et al. 2005), but thatremains a controversial issue (Pucovsky et al. 2007). Rat
mesenteric lymphatics have only 1–2 layers of musclecells, making it difficult to envision how a discrete ICClayer could be present, particularly between the endo-thelium and smooth muscle (McCloskey et al. 2002).However, the sparse, longitudinally orientated cells locatedin the outer medial layer (Crowe et al. 1997) couldpossibly function as ICC to generate pacemaker signals andtransduce stretch. Resolution of these issues will likelyrequire the application of electrophysiological methods tothe mechanical protocols described here.
Physiological significance
The behaviour of lymphatic vessels described here isnot specific to isolated mesenteric lymphatics becausewe have observed similar rate-sensitive stretch responsesin femoral lymphatics and thoracic duct of the rat(unpublished observations). Moreover, an analysis ofthe lymphatic literature yields anecdotal evidence forrate-sensitive stretch responses in other types/species oflymphatic vessels. Despite numerous published examplesof lymphatic diameter recordings at various steady-statelevels of intraluminal pressure (Mizuno et al. 1997; Zhanget al. 2007b), only a few continuous records of lymphaticvessel responses during changes in pressure/preloadappear in the literature. In one prominent example (Fig. 8in McHale & Roddie, 1976), an isolated bovine mesentericlymphatic did not exhibit obvious bursting after positivepressure steps but did show slight contraction inhibitionafter negative pressure steps. In a similar preparation,Ohhashi et al. showed a recording of the response of atwo-lymphagion segment to sinusoidal pressure (Fig. 7Bin Ohhashi et al. 1980) in which the downstream segmentmay have exhibited modest bursting on the rising phaseof the pressure wave. Orlov and Lobacheva published asingle recording from a goat mammary gland lymphaticin response to changes in pressure at two differentrates (4 or 0.5 mmH2O s−1), in which the vessel waspressurized from one end while axial tension was recordedat the other end. In response to pressure elevation, theotherwise quiescent vessel showed a large increase inpassive (axial) tension followed by the development ofcontractions in which both the FREQ and AMP werehigher when pressure was increased at the higher rate(Orlov et al. 1983). In this regard the vessel behaved morelike portal vein (Johansson & Mellander, 1975) than thelymphatics described in the present study, pointing tothe possibility that the circular and longitudinal musclelayers in lymphatics (and portal vein?) may responddifferently to rapid stretch, with the longitudinal layerexhibiting rate-sensitive changes in both AMP and FREQwith axial stretch but the circular layer showing changesonly in FREQ with circumferential stretch. In spite of thisevidence in isolated vessels, we were unable to find invivo evidence in the literature for rate-sensitive lymphatic
C© 2009 The Authors. Journal compilation C© 2009 The Physiological Society

J Physiol 587.1 Rate-sensitive lymphatic contractile responses 181
responses. Downstream microocclusion of rat mesentericlymphatics in vivo led consistently to elevated pressureand elevated contraction FREQ (Hargens & Zweifach,1977) but methodological limitations resulted in onlyvery slow and delayed intraluminal pressure changes; notsurprisingly, no rate-sensitive effects in FREQ or AMPwere apparent in the records. Collectively, these reportssuggest that the behaviour of the rat mesenteric lymphaticsdescribed here may be a general characteristic of collectinglymphatic vessels, if the experiments are performed underthe appropriate conditions.
A rate-sensitive change in FREQ to rapidcircumferential stretch is more likely to bephysiologically important in lymphatic vessels thanin portal vein. The longitudinal muscle layer of rat portalvein shows rate-sensitive AMP and FREQ responses whenthat vessel is stretched axially, but the impact of suchchanges on portal vein diameter or resistance to flow hasnot been established – nor are such changes likely to besubstantial. In lymphatics, however, rate-sensitive FREQresponses occur at intraluminal pressure levels associatedwith normal states of hydration (Hargens & Zweifach,1977; Benoit et al. 1989) as well as at elevated pressuresthat are characteristic of patients with lymphoedema(Zaugg-Vesti et al. 1993; Gretener et al. 2000). In ratmesenteric lymphatics, optimal pumping occurs at3–5 cmH2O (Gashev et al. 2004) and the AMP × FREQproduct, which is an index of pumping ability, would bedramatically altered by rate-sensitive changes in FREQimmediately after a pressure change, because FREQ istypically the more dominant of the two terms (Gashevet al. 2004; Zhang et al. 2007b; Davis et al. 2008). Arate-sensitive change in FREQ potentially would allow thelymphatic pump to compensate for impaired flow duringand/or after sudden, partial occlusions of the outflowtract. In addition, it might enhance mesenteric lymphaticpump function during an initial, postprandial period ofincreased lymph flow.
References
Benoit JN, Zawieja DC, Goodman AH & Granger HJ (1989).Characterization of intact mesenteric lymphatic pump andits responsiveness to acute edemagenic stress. Am J PhysiolHeart Circ Physiol 257, H2059–H2069.
Bjornberg J, Grande P-O, Maspers M & Mellander S (1988).Site of autoregulatory reactions in the vascular bed of catskeletal muscle as determined with a new technique forsegmental vascular resistance recordings. Acta Physiol Scand133, 199–210.
Borgstrom P & Grande PO (1979). Myogenic microvascularresponses to change of transmural pressure. A mathematicalapproach. Acta Physiol Scand 106, 411–423.
Crowe MJ, von der Weid PY, Brock JA & Van Helden DF(1997). Co-ordination of contractile activity in guinea-pigmesenteric lymphatics. J Physiol 500, 235–244.
Davis MJ (2005). An improved, computer-based method toautomatically track internal and external diameter of isolatedmicrovessels. Microcirculation 12, 361–372.
Davis MJ & Hill MA (1999). Signaling mechanisms underlyingthe vascular myogenic response. Physiol Rev 79,387–423.
Davis MJ, Lane MM, Davis AM, Durtschi D, Zawieja DC,Muthuchamy M & Gashev AA (2008). Modulation oflymphatic muscle contractility by the neuropeptidesubstance P. Am J Physiol Heart Circ Physiol 295,H587–H597.
Davis MJ, Lane MM, Scallan JP, Gashev AA & Zawieja DC(2007). An automated method to control preload bycompensation for stress relaxation in spontaneouslycontracting, isometeric rat mesenteric lymphatics.Microcirculation 14, 603–612.
Davis MJ & Meininger GA (1993). The myogenic response inmicrovascular networks. In Mechanotransduction by theVascular Wall, ed. Rubanyi G, pp. 37–60. Futura PublishingCo., Mt Kisco, NY, USA.
Davis MJ & Sikes PJ (1989). A rate-sensitive component to themyogenic response is absent from bat wing arterioles. Am JPhysiol Heart Circ Physiol 256, H32–H40.
Davis MJ & Sikes PJ (1990). Myogenic response of isolatedarterioles: test for a rate-sensitive mechanism. Am J PhysiolHeart Circ Physiol 259, H1890–H1900.
Duling BR, Gore RW, Dacey RG Jr & Damon DN (1981).Methods for isolation, cannulation, and in vitro study ofsingle microvessels. Am J Physiol Heart Circ Physiol 241,H108–H116.
Gashev AA, Davis MJ, Delp MD & Zawieja DC (2004).Regional variations of contractile activity in isolated ratlymphatics. Microcirculation 11, 477–492.
Gashev AA, Davis MJ & Zawieja DC (2002). Inhibition of theactive lymph pump by flow in rat mesenteric lymphatics andthoracic duct. J Physiol 450, 1023–1037.
Gashev AA, Orlov RS & Zawieja DC (2001). [Contractions ofthe lymphangion under low filling conditions and theabsence of stretching stimuli. The possibility of the suckingeffect]. (In Russian.) Ross Fiziol Zh Im I M Sechenova 87,97–109.
Grande P-O, Lundvall J & Mellander S (1977). Evidence for arate-sensitive regulatory mechanism in myogenicmicrovascular control. Acta Physiol Scand 99, 432– 447.
Grande P-O & Mellander S (1978). Characteristics of static anddynamic regulatory mechanisms in myogenic microvascularcontrol. Acta Physiol Scand 102, 231–245.
Gretener SB, Lauchli S, Leu AJ, Koppensteiner R & FranzeckUK (2000). Effect of venous and lymphatic congestion onlymph capillary pressure of the skin in healthy volunteersand patients with lymph edema. J Vasc Res 37, 61–67.
Hargens AR & Zweifach BW (1976). Transport between bloodand peripheral lymph in intestine. Microvasc Res 11,89–101.
Hargens AR & Zweifach BW (1977). Contractile stimuli incollecting lymph vessels. Am J Physiol Heart Circ Physiol 233,H57–H65.
Harhun MI, Pucovsky V, Povstyan OV, Gordienko DV &Bolton TB (2005). Interstitial cells in the vasculature. J CellMol Med 9, 232–243.
C© 2009 The Authors. Journal compilation C© 2009 The Physiological Society

182 M. J. Davis and others J Physiol 587.1
Hirst GD, Dickens EJ & Edwards FR (2002). Pacemaker shift inthe gastric antrum of guinea-pigs produced by excitatoryvagal stimulation involves intramuscular interstitial cells.J Physiol 541, 917–928.
Johansson B & Mellander S (1975). Static and dynamiccomponents in the vascular myogenic response to passivechanges in length as revealed by electrical and mechanicalrecordings from the rat portal vein. Circulation Res 36,76–83.
Johnson PC (1981). The myogenic response. In Handbook ofPhysiology, section 2, The Cardiovascular System, vol. II,Vascular Smooth Muscle, ed. Berne RM & Sperelakis N,pp. 409–422. American Physiological Society, Bethesda.
McCloskey KD, Hollywood MA, Thornbury KD, Ward SM &McHale NG (2002). Kit-like immunopositive cells in sheepmesenteric lymphatic vessels. Cell Tissue Res 310, 77–84.
McHale NG & Meharg MK (1992). Co-ordination of pumpingin isolated bovine lymphatic vessels. J Physiol 450, 503–512.
McHale NG & Roddie IC (1976). The effect of transmuralpressure on pumping activity in isolated bovine lymphaticvessels. J Physiol 261, 255–269.
Mizuno R, Dornyei G, Koller A & Kaley G (1997). Myogenicresponses of isolated lymphatics: modulation byendothelium. Microcirculation 4, 413–420.
Muthuchamy M, Gashev A, Boswell N, Dawson N & Zawieja D(2003). Molecular and functional analyses of the contractileapparatus in lymphatic muscle. FASEB J 17, 920–922.
Ohhashi T, Azuma T & Sakaguchi M (1980). Active and passivemechanical characteristics of bovine mesenteric lymphatics.Am J Physiol Heart Circ Physiol 239, H88–H95.
Ordog T, Ward SM & Sanders KM (1999). Interstitial cells ofcajal generate electrical slow waves in the murine stomach.J Physiol 518, 257–269.
Orlov RS, Borisov AV & Borisova RP (1983). Lymphatic Vessels:Structure and Mechanisms of Contractile Activity (InRussian). Nauka, Leningrad/St Petersburg.
Orlov RS & Lobacheva TA (1997). Intravascular pressure andspontaneous lymph node contractions. Biull Eksp Bio Med(In Russian) 83, 392–394.
Pucovsky V, Harhun MI, Povstyan OV, Gordienko DV, MossRF & Bolton TB (2007). Close relation of arterial ICC-likecells to the contractile phenotype of vascular smooth musclecell. J Cell Mol Med 11, 764–775.
Sanders KM & Ward SM (2008). Interstitial cells of Cajal: a newperspective on smooth muscle function. J Physiol 576,721–726.
Sigurdsson SB, Johansson B & Mellander S (1977). Rate-dependent myogenic response of vascular smooth muscleduring imposed changes in length and force. Acta PhysiolScand 99, 183–189.
Sparks HV Jr (1964). Effect of quick stretch on isolated vascularsmooth muscle. Circ Res 15 (Suppl. 1), I254–I260.
Szabo G & Magyar Z (1967). Pressure measurements in variousparts of the lymphatic system. Acta Med Acad Sci Hung 23,237–241.
Widdicombe J (2003). Functional morphology and physiologyof pulmonary rapidly adapting receptors (RARs). Anat Rec ADiscov Mol Cell Evol Biol 270, 2–10.
Won KJ, Sanders KM & Ward SM (2005). Interstitial cells ofCajal mediate mechanosensitive responses in the stomach.Proc Natl Acad Sci U S A 102, 14913–14918.
Zaugg-Vesti B, Dorffler-Melly J, Spiegel M, Wen S, FranzeckUK & Bollinger A (1993). Lymphatic capillary pressure inpatients with primary lymphedema. Microvasc Res 46,128–134.
Zhang R-Z, Gashev AA, Zawieja DC & Davis MJ (2007a).Length-tension relationships of small arteries, veins andlymphatics from the rat mesenteric microcirculation. Am JPhysiol Heart Circ Physiol 292, H1943–H1952.
Zhang R-Z, Gashev AA, Zawieja DC, Lane MM & Davis MJ(2007b). Length-dependence of lymphatic phasic contractileactivity under isometric and isobaric conditions.Microcirculation 14, 613–625.
Zweifach BW & Lipowsky HH (1984). Pressure-flow relationsin blood and lymph microcirculation. In Handbook ofPhysiology, section 2, The Cardiovascular System, vol IV,Microcirculation, ed. Renkin EM & Michel CC. pp. 251–307.American Physiological Society, Bethesda.
Acknowledgements
The authors would like to thank David Durtschi and Shan Yu Ho
for technical assistance. We are indebted to David C. Zawieja for
proof-reading the manuscript and contributing many helpful
suggestions and ideas. This work was supported by NIH grants
HL-075199 and HL-089784.
Supplemental material
Online supplemental material for this paper can be accessed at:
http://jp.physoc.org/cgi/content/full/jphysiol.2008.162438/DC1
C© 2009 The Authors. Journal compilation C© 2009 The Physiological Society