rapid prototyping technology ranking using an anp approach and its sensitivity analysis
TRANSCRIPT

[Kumar* et al., 5(9): September, 2016] ISSN: 2277-9655
IC™ Value: 3.00 Impact Factor: 4.116
http: // www.ijesrt.com © International Journal of Engineering Sciences & Research Technology
[93]
IJESRT INTERNATIONAL JOURNAL OF ENGINEERING SCIENCES & RESEARCH
TECHNOLOGY
RAPID PROTOTYPING TECHNOLOGY RANKING USING AN ANP APPROACH
AND ITS SENSITIVITY ANALYSIS Vineet Kumar*, Lalit Kumar, Abid Haleem
Research Scholar, Department of Mechanical Engineering, Jamia Millia Islamia, New Delhi, INDIA
Research Scholar, Department of Mechanical Engineering, Jamia Millia Islamia, New Delhi, INDIA
Professor, Department of Mechanical Engineering, Jamia Millia Islamia, New Delhi, INDIA
DOI: 10.5281/zenodo.61471
ABSTRACT There are many rapid prototyping machine available in the market and all of them have their own advantages and
limitations. When the time come to purchase a new machine it is a crucial decision to select best alternate available
in the market. Here in this paper analytical network process approach is applied to this problem. This approach help
in selecting best machine among the available options. A Frame work was developed in previous paper1 for Selection
of RP Technology based on some qualitative and quantitative attributes. In this paper Multi criteria based decision
making Analytical Network Process Approach (ANP) is used for ranking and its sensitivity analysis done for
robustness of framework.
KEYWORDS: Rapid prototyping; Analytical Network process; Machine Selection; Sensitivity Analysis.
INTRODUCTION The rapid prototyping technology is growing day by day. The use of fully automatic additive manufacturing system
provides many advantages to the industries in terms of time, money, profit, resources etc. The process of
manufacturing the product without human interaction or with limited human interaction with the help of computer
system. There are numerous machine available in the market which can do this task and the process of selecting best
machine2 from them is a laborious work as every machine have their own advantages and limitations. The selection
process is done with the help on analytical network process (ANP) approach3. For the use of ANP4 we have to select
the parameter on which we will categories the machine selection process and also the framework is needed to be made
which shows relationships between machine and selection criteria5 and interrelationship between different criteria.
The ANP approach6 and the framework7 was described in previous paper and here the ranking and sensitivity analysis
is being described. Table number 1 below shows the nomenclature8 of different attributes used in the ANP for ranking
different attributes and figure number 1 below shows the frame work used for the process which have already been
discussed in earlier paper1.
Table 1. Nomenclature of different attributes used
Nomenclature
CP Customer Perspectives IPPT Initial Pre Processing Time
FP Financial Perspectives BUT Build up Time
MC Market Competitiveness PPT Post Processing Time
EP Environmental Perspectives GE Gas Emission
TC Total cost NV Noise & Vibration
PQ Product Quality WD&R Waste disposal & Recycling
PCT Product Cycle time ALT1
FDM (Fused Deposition
Machine)

[Kumar* et al., 5(9): September, 2016] ISSN: 2277-9655
IC™ Value: 3.00 Impact Factor: 4.116
http: // www.ijesrt.com © International Journal of Engineering Sciences & Research Technology
[94]
PC Pollution Control ALT2 SLS (Selective Laser Sintering)
MC' Machine cost ALT3
3DP( Three Dimensional
Printing)
RM&PC' Raw material & production cost
EC Energy consumption
MS Material Strength
ACCU Accuracy
SF&CT Surface finish & Close tolerance
Figure 1: Decision Making Frame work
RANKING DIFFERENT TECHNOLOGIES As there are numerous technologies available in the market but as we have discussed in our earlier paper we have
selected three of them for our study i.e. fused deposition modeling, selective laser sintering and 3 dimensional printing.
Now for selecting different attributes and for a robust comparison between these three technologies we have prepared
a comparison between them which is shown below in table number 2.

[Kumar* et al., 5(9): September, 2016] ISSN: 2277-9655
IC™ Value: 3.00 Impact Factor: 4.116
http: // www.ijesrt.com © International Journal of Engineering Sciences & Research Technology
[95]
Table 2. Comparison between the Technologies8,9,10,11,12,13,14,15,16
Sr.
No. Components FDM SLS 3DP
1 Model Materials ABS, Wax, Teflon
Filament
Powder Gypsum powder,
conventional starch
2 Processing Speed Low Medium High
3 Maximum Part Size (mm) 610x508x610 381x330x457 508x609x406
4 Accuracy (mm) 0.1-0.3 mm 0.1 to 0.2 mm 0.2 to 0.3 mm
5 Fabrication Technique Fused deposition of
Molten polymer
Selective laser
tracing
of polymer
Adhesive/glue
Bonding of
powder by inkjet
6 Preprocessing Time 5-10 min. 2Hrs 10-20 min.
7 Post Processing Time 1 to 2 Hrs. 5 to 10 Hrs. 1 to 2 Hrs.
8 Energy Consumed Heat High Power
Laser Beam
Piezoelectric nozzle,
heat
9 Laser Used No Yes No
10 Solid Residues Materials chips,
removed supports
Materials chips Removed Supports,
materials chips
11 Gas Emission CO2, CO, SOx, PM,
NOx
CO2 NIL
12 Strength Axial compressive
strength is 42 MPa
Axial -20 MPa Axial -5 MPa
Diagonal- 8 MPa
Transverse-7 MPa
13 Speed (m/s) 175 m/s 125-250 m/s 860-1960 m/s
14 Variety High High Very low
15 Surface Finish (µm) 6.5-12 7.5-10 60-70
16 Office friendly OK Less OK
17 Employee skill & Training
required
High High High
18 Reliability High High Higher
19 Flexibility Moderate Less Highest
20 Product Quality
Improvement Potential
Medium Potential Medium
Potential
High Potential
21 Lead Time
Improvement Potential
Less Potential Medium
Potential
High Potential
22 Cost Improvement
Potential
Less Potential Medium
Potential
High Potential
23 Complex design Limitation to extrude
successively
Ease to form
complex design
Ease to form
complex design
24 Tensile Strength (Horizontal) Approx. 35 MPa Approx. 40 MPa 9 MPa
25 Tensile Strength (Vertical) Approx. 20 MPa Approx. 30 MPa 10 MPa

[Kumar* et al., 5(9): September, 2016] ISSN: 2277-9655
IC™ Value: 3.00 Impact Factor: 4.116
http: // www.ijesrt.com © International Journal of Engineering Sciences & Research Technology
[96]
26 Minimum layer
thickness (mm)
0.254 mm 0.1 mm 0.089 mm
Table number 3 below shows the relative importance among the Customer Perspective, Financial Perspective, Market
Competitiveness and Environmental Perspective. The e-vectors calculated to find out the overall weighted index.
Table 3. Comparison of determinants
CP FP MC EP e-vector CR=CI/RI<0.1
CP 1 3 0.2 3 0.189815
0.038993444 FP 0.333333333 1 0.166666667 2 0.0936564
MC 5 6 1 9 0.657545
EP 0.333333333 0.5 0.111111111 1 0.0589835
Table number 4 below shows super matrix M detailing the results of the relative measures for each of the attribute
enablers for the customer perspectives determinant. Since there are 12 pair-wise comparison matrices, one for each of
the interdependent enablers in Customer Perspective, there are 12 non-zero columns in the super matrix each of the
non-zero values in the column of super matrix is the relative importance or weight associated with interdependently
pair wise comparison matrices. In this model there are four super matrices, one such super matrix is shown in table 4.
Table 4. Super matrix for Cost before convergence
CP MC' RM
& PC' EC MS ACCU
SF
&
CT
IPPT BUT PPT GE NV WD
&R
MC' 0 0.125 0.166667 0 0 0 0 0 0 0 0 0
RM
&P
C'
0.75 0
0.833333
0 0 0 0 0 0 0 0 0
EC 0.25 0.875 0 0 0 0 0 0 0 0 0 0
MS 0 0 0 0 0.75 0.25 0 0 0 0 0 0
AC
CU 0 0 0
0.333333 0
0.75 0 0 0 0 0 0
SF
&C
T
0 0 0
0.666667 0.25
0 0 0 0 0 0 0
IPP
T 0 0 0 0 0 0 0
0.666667 0.2 0 0 0
BU
T 0 0 0 0 0 0
0.75 0
0.8 0 0 0
PPT 0 0 0 0 0 0 0.25 0.333333 0 0 0 0
GE 0 0 0 0 0 0 0 0 0 0 0.666667
0.2
5
NV 0 0 0 0 0 0 0 0 0 0.25
0 0.7
5
WD
&R 0 0 0 0 0 0 0 0 0
0.75 0.333333 0
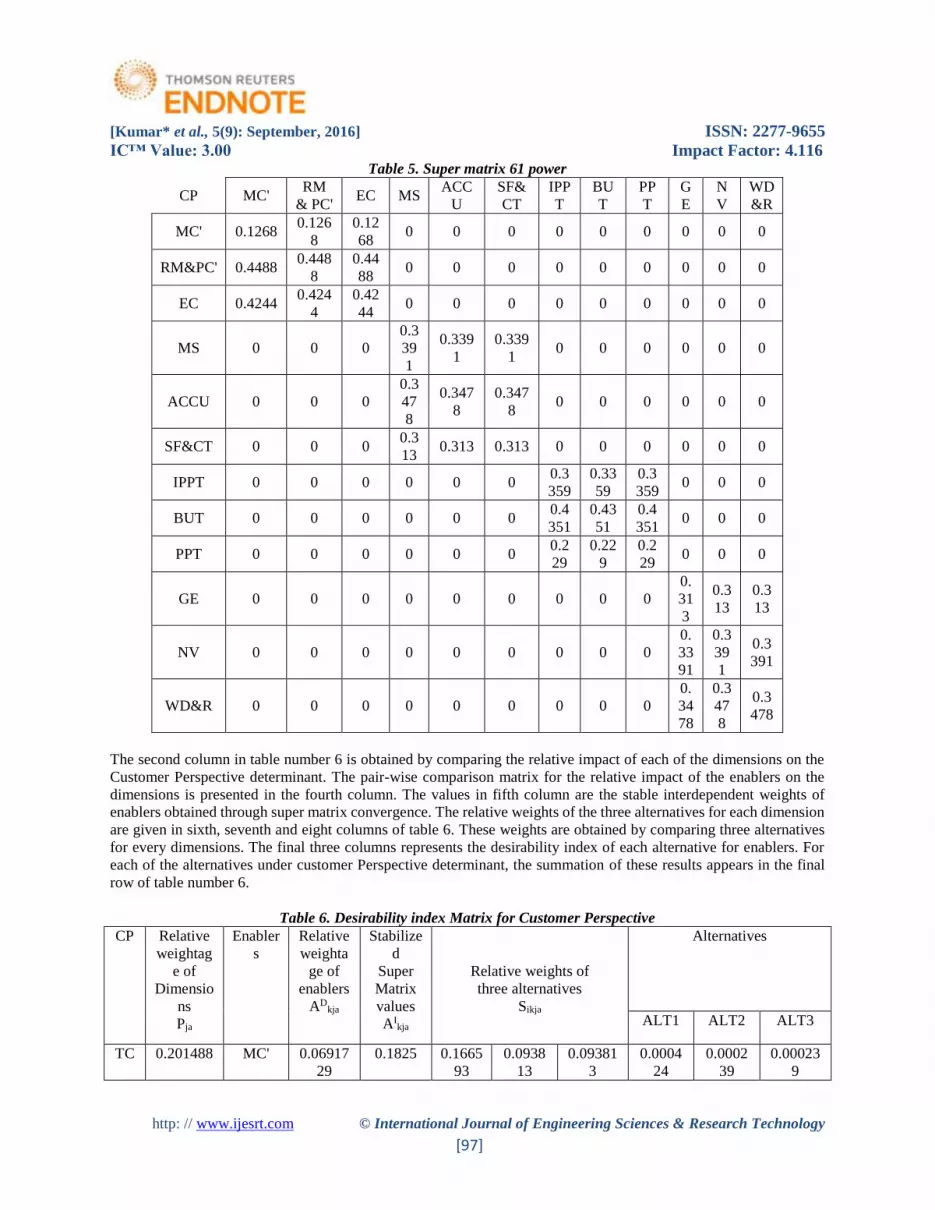
The super matrix is converged for getting a long term stable set of weights. For this power of super matrix is raised to
an arbitrarily large number. Convergence for customer Perspective is reached 61 power the table number 5 illustrates
the value after convergence.
[Kumar* et al., 5(9): September, 2016] ISSN: 2277-9655
IC™ Value: 3.00 Impact Factor: 4.116
http: // www.ijesrt.com © International Journal of Engineering Sciences & Research Technology
[97]
Table 5. Super matrix 61 power
CP MC' RM
& PC' EC MS
ACC
U
SF&
CT
IPP
T
BU
T
PP
T
G
E
N
V
WD
&R
MC' 0.1268 0.126
8
0.12
68 0 0 0 0 0 0 0 0 0
RM&PC' 0.4488 0.448
8
0.44
88 0 0 0 0 0 0 0 0 0
EC 0.4244 0.424
4
0.42
44 0 0 0 0 0 0 0 0 0
MS 0 0 0
0.3
39
1
0.339
1
0.339
1 0 0 0 0 0 0
ACCU 0 0 0
0.3
47
8
0.347
8
0.347
8 0 0 0 0 0 0
SF&CT 0 0 0 0.3
13 0.313 0.313 0 0 0 0 0 0
IPPT 0 0 0 0 0 0 0.3
359
0.33
59
0.3
359 0 0 0
BUT 0 0 0 0 0 0 0.4
351
0.43
51
0.4
351 0 0 0
PPT 0 0 0 0 0 0 0.2
29
0.22
9
0.2
29 0 0 0
GE 0 0 0 0 0 0 0 0 0
0.
31
3
0.3
13
0.3
13
NV 0 0 0 0 0 0 0 0 0
0.
33
91
0.3
39
1
0.3
391
WD&R 0 0 0 0 0 0 0 0 0
0.
34
78
0.3
47
8
0.3
478
The second column in table number 6 is obtained by comparing the relative impact of each of the dimensions on the
Customer Perspective determinant. The pair-wise comparison matrix for the relative impact of the enablers on the
dimensions is presented in the fourth column. The values in fifth column are the stable interdependent weights of
enablers obtained through super matrix convergence. The relative weights of the three alternatives for each dimension
are given in sixth, seventh and eight columns of table 6. These weights are obtained by comparing three alternatives
for every dimensions. The final three columns represents the desirability index of each alternative for enablers. For
each of the alternatives under customer Perspective determinant, the summation of these results appears in the final
row of table number 6.
Table 6. Desirability index Matrix for Customer Perspective
CP Relative
weightag
e of
Dimensio
ns
Pja
Enabler
s
Relative
weighta
ge of
enablers
ADkja
Stabilize
d
Super
Matrix
values
AIkja
Relative weights of
three alternatives
Sikja
Alternatives
ALT1 ALT2 ALT3
TC 0.201488 MC' 0.06917
29
0.1825 0.1665
93
0.0938
13
0.09381
3
0.0004
24
0.0002
39
0.00023
9

[Kumar* et al., 5(9): September, 2016] ISSN: 2277-9655
IC™ Value: 3.00 Impact Factor: 4.116
http: // www.ijesrt.com © International Journal of Engineering Sciences & Research Technology
[98]
0.201488 RM&P
C'
0.68708
6
0.3802 0.0809
61
0.1883
94
0.73064
5
0.0042
61
0.0099
16
0.03845
7
0.201488 EC 0.24374
1
0.4373 0.1665
93
0.0938
13
0.73959
4
0.0035
78
0.0020
15
0.01588
4
PQ 0.42862 MS 0.1958 0.3391 0.3089
96
0.5815
52
0.10945
2
0.0087
94
0.0165
5
0.00311
5
0.42862 ACCU 0.49338
6
0.3478 0.3108
14
0.4933
86
0.1958 0.0228
61
0.0362
89
0.01440
1
0.42862 SF&CT 0.31081
4
0.313 0.5590
65
0.3521
89
0.08874
6
0.0233
12
0.0146
86
0.00370
1
PC
T
0.328707 IPPT 0.12430
6
0.3359 0.2582
85
0.1047
29
0.63698
6
0.0035
45
0.0014
37
0.00874
3
0.328707 BUT 0.35856 0.4351 0.0809
61
0.1883
94
0.73064
5
0.0041
52
0.0096
61
0.03746
8
0.328707 PPT 0.51713
4
0.229 0.1829
55
0.0752
01
0.74184
5
0.0071
22
0.0029
27
0.02887
8
PC 0.041184
8
GE 0.57690
5
0.313 0.2922
19
0.0925
28
0.61525
3
0.0021
73
0.0006
88
0.00457
6
0.041184
8
NV 0.34199
8
0.3391 0.3108
14
0.4933
86
0.1958 0.0014
85
0.0023
57
0.00093
5
0.041184
8
WD&R 0.08109
68
0.3478 0.5396
15
0.1634
24
0.29696
1
0.0006
27
0.0001
9
0.00034
5
Desirability Index Dia 0.0823
32
0.0969
55
0.15674
1
The final results shown in table number 7 indicates rank that the three dimensional printing followed by selective laser
sintering and fused deposition modelling.
Table 7. Overall weighted Index for alternatives in Frameworks
CP FP MC EP OWI Normalized
Ca Vector
for
Determina
nts
0.189815 0.0936564 0.657545 0.0589835
ALT1 0.08233230
6
0.06154973
2
0.07374926
8
0.08141065
2
0.07468778
1 0.20977044
4
Rank 3
(FDM)
ALT2 0.09695458
2
0.07169412
5
0.08561726
5
0.12679383
8
0.08889399
6 0.24967046
7
Rank 2
(SLS)
ALT3 0.15674061
5
0.24565832
7
0.19965434
8
0.14279604
6
0.19246352
3 0.54055908
9
Rank 1
(3DP)
0.3560453 1
SENSITIVITY ANALYSIS Sensitivity analysis is an important concept for the effective use of any quantitative decision model. In the present
work sensitivity analysis is done to find out the changes in the OWI for Fused Deposition Modeling, Selective Laser
Sintering, three dimensional Printing with variation in the expert opinion towards Customer Perspective with respect
to Financial Perspective17, Market Competitiveness5, Environment Perspective15 and Financial Perspective18.
Overall objective of sensitivity analysis19,20 is to see the robustness of proposed framework due to variation in experts’
opinion in assigning the weights during comparison. Table number 7 weighted index (OWI) for proposed framework

[Kumar* et al., 5(9): September, 2016] ISSN: 2277-9655
IC™ Value: 3.00 Impact Factor: 4.116
http: // www.ijesrt.com © International Journal of Engineering Sciences & Research Technology
[99]
of three alternatives varies with changing priority of Customer Perspective, Financial Perspective, Market
Competitiveness and Environmental Perspective15.
In figure 2, X-axis represents the relative weight of Customer perspective as compare to Financial perspective weights
are in the scale of 1/9-9 (Saaty Scale21). Y-axis represents the normalized value of Selection of Rapid Prototyping
Technology weight-age index (OWI). These weights are obtained using ANP framework, which captures the
interdependence among Rapid Prototyping Technology Variables17. This frame work consists of 117 pair wise
comparison matrices. The purpose is to analyze the effect of variation in relative weight assigned to selection of Rapid
prototyping technology determinants on the priority level of alternative.
In present ANP framework, experts have assigned relative weight 0.189815 to Customer Perspective in compare with
Financial Perspective. With this relative weight, OWI for Three dimensional Printing is the highest followed by
Selective Laser Sintering and FDM. This priority level does not change if XCP/FP Changed from 0.111 to 9.
Figure 2. Variation in priority of Customer Perspective with respect to Finance Perspective
In figure 2 graph results showed that as we increase the weightage of financial perspective with respect to customer
perspective with constant market competitiveness and environmental Perspective the normalized over all weight age
of 3DP slightly decreases and the normalized overall weight age of SLS and FDM slightly increases .In this graph
the above trends represents that overall financial perspective (Machine cost, processing cost, material cost, processing
cost, energy consumption cost and other costs including Fixed and variables cost and product cost produced by
machines and overall revenue considered in it) weightage increases with respect to customer perspectives like (product
strength, surface finish22 & close tolerances23 etc.) Considered then SLS and FDP technology gives better results than
3DP with constant market competitiveness (Factors like lead time, processing and post processing time etc. and
product cost etc. ) and environmental perspective like ( gas emission ,noise& vibration and waste deposal & recycling
etc.)
0.111 0.125 0.143 0.167 0.200 0.250 0.333 0.500 1.000 2.000 3.000 4.000 5.000 6.000 7.000 8.000 9.000
FDM 0.1988 0.1994 0.1999 0.2006 0.2013 0.2022 0.2033 0.2047 0.2067 0.2086 0.2098 0.2106 0.2113 0.2119 0.2125 0.2129 0.2133
SLS 0.2363 0.237 0.2377 0.2386 0.2395 0.2406 0.242 0.2437 0.2462 0.2484 0.2497 0.2506 0.2514 0.2521 0.2526 0.2532 0.2536
3DP 0.5649 0.5637 0.5623 0.5608 0.5591 0.5571 0.5547 0.5517 0.5471 0.543 0.5406 0.5387 0.5373 0.536 0.5349 0.5339 0.533
00.020.040.060.08
0.10.120.140.160.18
0.20.220.240.260.28
0.30.320.340.360.38
0.40.420.440.460.48
0.50.520.540.560.58
0.60.620.640.660.68
0.70.720.740.760.78
0.8
Norm
ali
zed
Va
lue
Variation in priority of Customer Perspective with respect to Finance Perspective

[Kumar* et al., 5(9): September, 2016] ISSN: 2277-9655
IC™ Value: 3.00 Impact Factor: 4.116
http: // www.ijesrt.com © International Journal of Engineering Sciences & Research Technology
[100]
Figure 3. Variation in priority of Customer Perspective with respect to Market Competitiveness Perspective
The figure 3 graph represents that as the expert opinioned weightage increases for customer perspectives (Product
Mechanical strength compressive and tensile strength, surface finish & close tolerances etc. with respective to Market
competitiveness product with different technology with constant Financial perspective (Machine cost, processing
cost, material cost, processing cost, energy consumption cost and other costs including Fixed and variables cost and
product cost produced by machines and overall revenue considered in it) weightage and Environmental Perspective
like Gas Emission, Noise &Vibration and waste disposal & Recycling . The trends showed that 3DP weightage
decreases slightly, SLS and FDM Trends increases with increasing Customer Perspective weightage with market
competitiveness.
0.111 0.125 0.143 0.167 0.200 0.250 0.333 0.500 1.000 2.000 3.000 4.000 5.000 6.000 7.000 8.000 9.000
FDM 0.2085 0.2088 0.209 0.2094 0.2098 0.2103 0.211 0.2122 0.2147 0.2178 0.22 0.2216 0.223 0.224 0.225 0.2258 0.2265
SLS 0.2475 0.2479 0.2484 0.249 0.2497 0.2505 0.2517 0.2535 0.2568 0.2609 0.2635 0.2655 0.267 0.2683 0.2694 0.2703 0.2711
3DP 0.544 0.5433 0.5426 0.5417 0.5406 0.5392 0.5373 0.5344 0.5285 0.5213 0.5165 0.5129 0.51 0.5076 0.5057 0.504 0.5025
00.020.040.060.08
0.10.120.140.160.18
0.20.220.240.260.28
0.30.320.340.360.38
0.40.420.440.460.48
0.50.520.540.560.58
0.60.620.640.660.68
0.70.720.740.760.78
0.8
Norm
ali
zed
Va
lue
Variation in priority of Customer Perspective with respect to Market Competitiveness
Perspective

[Kumar* et al., 5(9): September, 2016] ISSN: 2277-9655
IC™ Value: 3.00 Impact Factor: 4.116
http: // www.ijesrt.com © International Journal of Engineering Sciences & Research Technology
[101]
Figure 4. Variation in priority of Customer Perspective with respect to Environmental Perspective
The figure 4 graphs represents that as we have same financial as well as market competitiveness and varies weightage
with respect to Environmental perspective form 1/9 to 9 according to T.L Saaty21. The results are in favor of 3DP due
to more gas emission for SLS like CO2, CO, SOX, PM, NOX and for FDM CO2 emission.
CONCLUSION In the previous paper1 a framework was developed by considering three rapid prototyping technologies. Then an
ANP methodology was adopted for decision making through ranking. In this paper the result of that study are
discussed. In the ANP methodology pair wise comparison matrices are developed for determinants, dimensions,
enablers, alternatives. This methodology integrates various determinants, dimensions, enablers and alternatives and
also gives their relationships and interdependencies along hierarchies by considering quantitative as well as qualitative
characteristics. This methodology gives finally normalized over all weight age indexes for FDM, SLS and 3DP are
0.209770444, 0.249670467 and 0.540559089 respectively. This results shows that NOWI (Normalized over all weight
age Index) for 3DP is higher than SLS and FDM Technology weight age. For its robustness a Sensitivity analysis is
also done by consider expert opinion variation form 1/9 to 9 weightage in T.L Saaty Scale21. This study demonstrates
potential benefits of using ANP Approach for selection of rapid prototyping technology by considering some limited
determinants, dimensions, enablers, and alternatives. In future this methodology can be implemented for other criteria
which are not considered in it for decision making.
0.111 0.125 0.143 0.167 0.200 0.250 0.333 0.500 1.000 2.000 3.000 4.000 5.000 6.000 7.000 8.000 9.000
FDM 0.2092 0.2091 0.209 0.2089 0.2089 0.2088 0.2087 0.2087 0.2132 0.2094 0.2098 0.2101 0.2105 0.2108 0.211 0.2113 0.2116
SLS 0.2614 0.2605 0.2596 0.2586 0.2574 0.2562 0.2547 0.253 0.2582 0.2499 0.2497 0.2497 0.2498 0.2499 0.2501 0.2503 0.2505
3DP 0.5294 0.5304 0.5314 0.5325 0.5337 0.5351 0.5366 0.5383 0.5286 0.5408 0.5406 0.5402 0.5397 0.5393 0.5388 0.5384 0.538
00.020.040.060.08
0.10.120.140.160.18
0.20.220.240.260.28
0.30.320.340.360.38
0.40.420.440.460.48
0.50.520.540.560.58
0.60.620.640.660.68
0.70.720.740.760.78
0.8
Norm
ali
zed
Va
lue
Variation in priority of Customer Perspective with respect to Environmental Perspective

[Kumar* et al., 5(9): September, 2016] ISSN: 2277-9655
IC™ Value: 3.00 Impact Factor: 4.116
http: // www.ijesrt.com © International Journal of Engineering Sciences & Research Technology
[102]
REFERENCES [1] Kumar V, Kumar L, Haleem A. Selection of Rapid Prototyping Technology Using an ANP Based Approach.
IOSR J Mech Civ Eng. 2016;13(4):71-78. doi:10.9790/1684-13040647178.
[2] Borille A, Gomes J, Meyer R, Grote K. Applying decision methods to select rapid prototyping technologies.
Rapid Prototyp J. 2010;16(1):50-62. doi:10.1108/13552541011011712.
[3] Bansal M, Kumar L. IMPLEMENTATION OF ANALYTIC NETWORK PROCESS APPROACH (ANP)
FOR GREEN MANUFACTURING. In: International Conference on Agile Manufacturing (ICAM 2012).
BHU Varanasi; 2012
[4] Saaty TL. Decision making with the analytic hierarchy process. Int J Serv Sci. 2008;1(1):83-98.
doi:10.1504/IJSSci.2008.01759.
[5] Brown BR, Stier KW. Selecting Rapid Prototyping Systems Selecting Rapid Prototyping Systems. J Ind
Technol. 2002;18(1):1-8. www.nait.org.
[6] Jharkharia S, Shankar R. Selection of logistics service provider: An analytic network process (ANP)
approach. Omega. 2007;35(3):274-289. doi:http://dx.doi.org/10.1016/j.omega.2005.06.005.
[7] Agarwal A, Shankar R, Tiwari MK. Modeling the metrics of lean, agile and leagile supply chain: An ANP-
based approach. Eur J Oper Res. 2006;173(1):211-225. doi:http://dx.doi.org/10.1016/j.ejor.2004.12.005.
[8] Cheah CM, Chua CK, Lee CW, Feng C, Totong K. Rapid prototyping and tooling techniques: a review of
applications for rapid investment casting. Int J Adv Manuf Technol. 2005;25(3):308-320.
doi:10.1007/s00170-003-1840-6.
[9] Chandramohan D, Marimuthu K. Rapid Prototyping / Rapid Tooling – A Overview and its Applications in
Orthopaedics. Int J Adv Eng Technol. 2011;2(4):435-448.
http://www.technicaljournalsonline.com/ijeat/VOL II/IJAET VOL II ISSUE IV OCTBER DECEMBER
2011.htm.
[10] Lee CS, Kim SG, Kim HJ, Ahn SH. Measurement of anisotropic compressive strength of rapid prototyping
parts. J Mater Process Technol. 2007;187–188:627-630.
doi:http://dx.doi.org/10.1016/j.jmatprotec.2006.11.095.
[11] Kumar V, Kumar L, Haleem A, Rajesh. Design and Development of Thermal Rapid Prototyping Machine
and Its Application. Int J Emerg Technol Eng Res. 2016;4(2):101-106. www.ijeter.everscience.org.
[12] Kumar L, Kumar V, Haleem A. Rapid Prototyping Technology for New Product Development. IJISET - Int
J Innov Sci Eng Technol. 2016;3(1):287-292. www.ijiset.com.
[13] Javaid M, Kumar L, Haleem A, Kumar V. Product Design and Development using Polyjet Rapid Prototyping
Technology. Control Theory Informatics. 2015;5(3):12-20. www.iiste.org.
[14] Lokesh K, Jain PK. Selection of Rapid Prototyping Technology. Adv Prod Eng Manag. 2010;5(2):75-84.
[15] Huang SH, Liu P, Mokasdar A, Hou L. Additive manufacturing and its societal impact: A literature review.
Int J Adv Manuf Technol. 2013;67(5-8):1191-1203. doi:10.1007/s00170-012-4558-5
[16] Gebhardt A. Product Development ? Product Formation ? Rapid Product Development. In: Rapid
Prototyping. Carl Hanser Verlag GmbH & Co. KG; 2003:1-27. doi:doi:10.3139/9783446402690.001.
[17] Venkata Rao R. Modeling and Optimization of Rapid Prototyping Processes. In: Advanced Modeling and
Optimization of Manufacturing Processes: International Research and Development. London: Springer
London; 2011:317-338. doi:10.1007/978-0-85729-015-1_5.
[18] Onuh SO, Yusuf YY. Rapid prototyping technology: applications and benefits for rapid product
development. J Intell Manuf. 1999;10(3):301-311. doi:10.1023/A:1008956126775.
[19] Morteza Z, Reza FM, Seddiq MM, Sharareh P, Jamal G. Selection of the optimal tourism site using the ANP
and fuzzy TOPSIS in the framework of Integrated Coastal Zone Management: A case of Qeshm Island.
Ocean Coast Manag. 2016;130:179-187. doi:http://dx.doi.org/10.1016/j.ocecoaman.2016.06.012.
[20] Chemweno P, Pintelon L, Van Horenbeek A, Muchiri P. Development of a risk assessment selection
methodology for asset maintenance decision making: An analytic network process (ANP) approach. Int J
Prod Econ. 2015;170, Part :663-676. doi:http://dx.doi.org/10.1016/j.ijpe.2015.03.017.
[21] Saaty TL. Decision making — the Analytic Hierarchy and Network Processes (AHP/ANP). J Syst Sci Syst
Eng. 2004;13(1):1-35. doi:10.1007/s11518-006-0151-5.
[22] Vijay P, Danaiah P, D. Rajesh K V. Critical Parameters Effecting the Rapid Prototyping Surface Finish. J
Mech Eng Autom. 2012;1(1):17-20. doi:10.5923/j.jmea.20110101.03.

[Kumar* et al., 5(9): September, 2016] ISSN: 2277-9655
IC™ Value: 3.00 Impact Factor: 4.116
http: // www.ijesrt.com © International Journal of Engineering Sciences & Research Technology
[103]
[23] Anitha R, Arunachalam S, Radhakrishnan P. Critical parameters influencing the quality of prototypes in
fused deposition modelling. J Mater Process Technol. 2001;118(1–3):385-388.
doi:http://dx.doi.org/10.1016/S0924-0136(01)00980-3.