quantification of total iodine in intact granular starches of different botanical origin exposed to...
TRANSCRIPT
Carbohydrate Research 346 (2011) 2482–2490
Contents lists available at SciVerse ScienceDirect
Carbohydrate Research
journal homepage: www.elsevier .com/locate /carres
Quantification of total iodine in intact granular starches of differentbotanical origin exposed to iodine vapor at various water activities
Bruce Manion, Mei Ye, Bruce E. Holbein, Koushik Seetharaman ⇑Department of Food Science, University of Guelph, Guelph, Ontario, Canada N1G 2W1
a r t i c l e i n f o
Article history:Received 18 May 2011Received in revised form 1 August 2011Accepted 16 August 2011Available online 27 August 2011
Keywords:StarchIodine vaporGranule sizeAmyloseAmylopectinPolyiodide complex
0008-6215/$ - see front matter � 2011 Elsevier Ltd. Adoi:10.1016/j.carres.2011.08.017
⇑ Corresponding author. Tel.: +1 519 824 4120x522E-mail addresses: [email protected] (B. Man
(M. Ye), [email protected] (B.E. Holbein),(K. Seetharaman).
a b s t r a c t
Iodine has been used as an effective tool for studying both the structure and composition of dispersedstarch and starch granules. In addition to being employed to assess relative amylose contents for starchsamples, it has been used to look at the molecular mobility of the glucose polymers within intact starchgranules based on exposure to iodine vapor equilibrated at different water activities. Starches of differentbotanical origin including corn, high amylose corn, waxy corn, potato, waxy potato, tapioca, wheat, rice,waxy rice, chick pea and mung bean were equilibrated to 0.33, 0.75, 0.97 water activities, exposed toiodine vapor and then absorbance spectra and LAB color were determined. In addition, a new iodinequantification method sensitive to <0.1% iodine (w/w) was employed to measure bound iodine withinintact granular starch. Amylose content, particle size distribution of granules, and the density of thestarch were also determined to explore whether high levels of long linear glucose chains and the surfacearea-to-volume ratio were important factors relating to the granular iodine binding. Results showed, inall cases, starches complexed more iodine as water content increased and waxy starches bound lessiodine than their normal starch counterparts. However, much more bound iodine could be measuredchemically with waxy starches than was expected based on colorimetric determination. Surface areaappeared to be a factor as smaller rice and waxy rice starch granules complexed more iodine, whilethe larger potato and waxy potato granules complexed less than would be expected based on measuredamylose contents. Corn, high amylose corn, and wheat, known to have starch granules with extensivesurface pores, bound higher levels of iodine suggesting pores and channels may be an important factorgiving iodine vapor greater access to bind within the granules. Exposing iodine vapor to moisture-equil-ibrated native starches is an effective tool to explore starch granule architecture.
� 2011 Elsevier Ltd. All rights reserved.
1. Introduction
All starches from diverse botanical origins are universally com-posed of two molecules, the linear amylose and the branched amy-lopectin, and these are organized into larger, more complex starchgranules ranging from under 1 to over 100 lm in diameter.Although both amylose and amylopectin are simple homopoly-mers comprised only of glucose units linked at a-(1?4) linkagesand a-(1?6) linkages for branch points, starches from differentbotanical origins are known to exhibit different physicochemicalproperties, including differences in swelling, pasting, and gelatini-zation temperatures as well as viscosities.1 These differences areoften attributed to the varying proportions of amylose and amylo-pectin, granule size, the distribution of small and long-branchchains within the amylopectin molecules, the amounts of phos-phate esters, as well as bound lipids and proteins affecting water
ll rights reserved.
04; fax: +1 519 824 6631.ion), [email protected]
binding and swelling. The overall macro organization of thesemolecules within the granules is often termed the starch granulearchitecture.2–5 Iodine has been used for over 75 years as a toolto help elucidate the structure and composition of starch granules,after it was discovered that amylose forms left-handed helices inwhich iodine binds within the hydrophobic interior6–8 formingunique and vivid blue-colored polyiodide complexes.9 Geneticvariants with virtually no amylose (waxy starches) would remaina fainter red-brown/violet color based on the binding of smallertriiodide molecules in shorter helical segments in the amorphoussegments of amylopectin. This later became the basis for the devel-opment of several spectrophotometric assays to determine amy-lose content in starch.10–14 In addition, microscopic analyses usedilute iodine solutions to stain the starch granules in solution toallow visualization.15 Langton and Hermannson16 observed areasof more concentrated amylose displayed by a denser blue colorcompared to regions with higher amylopectin displaying the char-acteristic red-brown color in heated starch granules. Iodine hasalso been used for determining amylose–lipid complexation duringthermal treatments based on the decrease or increase in iodine-binding capacity of the starches once the lipids were added or
B. Manion et al. / Carbohydrate Research 346 (2011) 2482–2490 2483
removed.17,18 Bailey and Whelan19 and John et al.,20 using glucosechains of controlled lengths, reported that the degree of polymer-ization affected the color of the glucose polymer solutions rangingfrom brown (DP 21–24), red (DP 25–29), red-violet (DP 30–38),blue-violet (DP 39–46) and blue (DP >47). Thus, the maximalwavelength absorbance for waxy starches remains around550 nm, while starches containing amylose exhibit wavelengthmaxima in the vicinity of 620 nm, the wavelength where spectro-photometric amylose determinations are performed.21 Saibene andSeetharaman22 reported that starches of different botanical origin,which were equilibrated at different water activities and exposedto iodine vapor, produced different spectrophotometric absorbancespectra, indicating different binding affinities for iodine in intactstarch granules from different botanical sources. As the moisturecontent of the starches increased, a higher overall intensity ofabsorbance was observed, indicating higher water absorptionwithin granules. This allowed greater molecular mobility for iodineto penetrate and form complexes within normal and waxy starchesalike. This suggests that differences exist in the granule architec-tures for the various starches of differing botanical origin regard-less of amylose content. However, information obtained from thespectrophotometric analysis is limited, and, in particular, it is notknown what actual quantities of iodine are complexed to thestarch granules exposed to iodine vapor. For spectrophotometricamylose content determinations, starch granules are firstchemically and/or thermally dispersed prior to iodine bindingand spectrophotometric analyses. With the starches exposed toiodine vapor, they are in their intact native granular form and bindiodine based on accessibility to the glucan polymers’ helices at thesurface and/or within the granule. Several factors could affect theaccessibility of the iodine vapor for the intact granule, withamylose content being just one such factor. As already mentioned,molecular mobility of the glucose polymers is important. Wateracts as a plasticizer that can hydrate the granule and help toseparate closely packed amylose and amylopectin molecules, caus-ing the granules to swell slightly and therefore allow more iodineto permeate the granule, in the water-soluble triiodide form.22 Anincrease in temperature aids in this process. Surface pores on theoutside of the granule and channels extending from these poresinto the granule providing additional internal surface area canallow greater accessibility for iodine and other molecules such asdigestive enzymes into the interior.23 Based on scanning electronmicroscopy studies, it has been determined surface pores existon several starches, including many cereal starches such as thoseof corn and wheat. On the other hand, it is believed that potatostarch does not have such surface pores.24 Correlations have beenfound between a-amylase digestibility of granules and presenceof surface pores, with corn being very digestible and potato beingone of the least digestible.25 Furthermore, total surface area canhave a large impact on the binding of iodine with starch granules,so granule morphology will be a factor. For example, smallergranules will have greater surface area per volume of starch thanlarger granules, and disc-shaped and polyhedral granules will havegreater surface area per volume of starch than spherical granules.Therefore, it was necessary to determine the quantity of iodine thatthe different types of starches bound from exposure to iodinevapor when equilibrated at different water activities, and to relatethis to the spectrophotometric absorbance, amylose content, andparticle size measurements. Our recently described direct iodinequantification method has been found to be sensitive and usefulfor granular starches,26 as modified from the method developedby D’Ulivo et al.27 This research describes the first direct iodinequantification technique employed for intact granular starchexposed to iodine vapor at different water activities. The resultsare discussed in relation to the more typically employed
semiquantitative and qualitative comparisons that have previouslyinferred structural aspects for starches, such as amylose content,average granule size, starch density and color analysis of granularstarches that have been exposed to iodine vapor.
2. Materials and methods
2.1. Materials
Melojel (Common Corn Starch; CS), Amioca (Waxy Corn Starch;WCS) and Hylon VII (High Amylose Corn; HAC), Perfectamyl D6(Potato Starch; PS), Eliane 100 (Waxy Potato Starch; WPS), TapiocaStarch (TS), starch samples were all obtained from National Starchand Chemical Company (Bridgewater, NJ, USA). Midsol 50 wheatstarch was obtained from MGP Ingredients (Atchison, KS, USA).Rice, waxy rice, chick pea, and mung bean starches were non-com-mercial samples generously donated by Dr. R. Hoover (MemorialUniversity, St. John’s, NFLD, Canada). Triethyloxonium tetrafluoro-borate was purchased from VWR Scientific Company (Mississauga,ON, Canada). Dichloromethane, 0.1 M iodine/potassium iodidesolution (I2:KI 1.3%:2.6%), sodium borohydride, sodium hydroxide,and trichloroacetic acid were purchased from Fisher Scientific Co.(Ottawa, ON, Canada). Iodine, potassium iodide crystals (99.99%purity), and 64% amylose test standard were purchased from Sig-ma–Aldrich Chemical Co., (Oakville, ON, Canada).
2.2. Exposure of starches to iodine vapor
Starches were equilibrated to three different water activitiesfor a minimum of 30 days in desiccators with saturated salt solu-tions (0.33 using MgCl2, 0.75 using NaCl, and 0.97 using K2SO4)and exposed to iodine vapor for 24 h as per the method ofSaibene and Seetharaman.21 Equilibrated starch moisture con-tents ranged from 7.8% for rice starch to 11.2% for potato starchat 0.33 Aw, 12% for rice starch to 17.5% for high amylose cornstarch at 0.75 Aw, and 18.8% for rice starch to 25.7% for potatostarch at 0.97 Aw. Since potato starch at 0.97 Aw bound generallylower amounts of iodine, it was not seen as a major factor. Thedifferent starches were exposed to 2 g of iodine within the sameiodine chamber, with separate iodine chambers at each of thethree different water activities, and starches at each water activ-ity were exposed to iodine vapor in triplicate on three separateoccasions.
2.3. K/S absorbance spectra and LAB color
A CM3500-d spectrophotometer (Konika Minolta Photo Imag-ing, Mahwah, NJ) was used to evaluate the LAB color and the K/Svalue of the starch samples exposed to iodine vapor. The K/S valueis defined as the ratio between the absorbance and the scatteringcoefficients, with an increase in K/S reflecting an increase in lightabsorbance and/or decrease in light scattering as based on the Kub-elka–Munk equation for diffuse reflectance:28
k=s ¼ ð1� RÞ2=2R ¼ Ac=s
where k and s are the absorption and scattering coefficients, respec-tively, R is the measured reflectance, A is the absorbance and c is theconcentration of the absorbing species. The K/S value of the starchsamples after exposure to iodine vapor was measured at wave-lengths ranging from 400 to 700 nm at 10-nm intervals using un-stained (white) starch as the target color.22 Instrumental colorreadings also included L⁄, a⁄ and b⁄ color values (designated LABcolor) with L⁄ an indication of lightness with larger values indicat-ing lighter color intensities, and a⁄ and b⁄ representing the color-opponent dimensions.

2484 B. Manion et al. / Carbohydrate Research 346 (2011) 2482–2490
2.4. Particle size distribution of granular starches
Particle size distribution of starch granules was performedusing integrated (or static) light scattering (ILS) with a Malvern2000SC instrument (Malvern Instruments Ltd, Malvern, UK) usinga refractive index of 1.333 for the aqueous continuous phase, arefractive index of 1.52329 for the starches is the dispersed phase,and a sample absorption of 0.001. Results are reported as D[3,2] orthe surface area-weighted mean diameter (or Sauter Mean Diame-ter) as calculated from all particle diameters detected (in lm),cubed, and summed, divided by all particle diameters detected(in lm), squared, and summed. This gives a better indication ofaverage surface area of all particles detected irrespective ofnumber of particles present.30 Particle size distribution for variousstarches was performed on native starches before and afterexposure to iodine (at 0.97 water activity), and analyses wereperformed in duplicate.
2.5. Determination of amylose content
Amylose content was determined based on the method ofChrastil13 with slight modifications. Modifications involved weigh-ing 10 mg of each commercial starch into 2 mL Eppendorf tubesand 1.9 mL of 0.5 M NaOH was pipetted into tubes. The Eppendorftubes were placed in an Eppendorf thermomixer set at 95 �C agitat-ing at 800 rpm for 30 min for solubilization of the granules intoamylose and amylopectin. A standard curve was prepared by mak-ing two stock solutions of 50 mg/10 mL of pure potato amylose andpotato amylopectin and pipetting various ratios into Eppendorftubes to make up 1.9 mL total. Absorbance was read at 620 nmon a UV–vis spectrophotometer (Cary 3C, Varian Instruments,Australia). A small correction factor of 0.98 was applied to correctfor a known 64% amylose standard. Amylose content determina-tion for all starches was performed in duplicate.
2.6. Apparent starch granule densities
The apparent densities of the selected starches were deter-mined by weighing �20 g of each starch into pre-weighed 100-mL volumetric flasks. Flasks were then half filled with MilliQ waterat 22 �C (density 0.99777 g/mL), covered with a pre-weighed para-film strip, and mixed by swirling for 30 s and allowed to sit for10 min for air bubbles to evolve and the volume to adjust. The vol-umetric flasks were then filled to volume and weighed. Starch den-sity was calculated using the equation:
Apparent Starch Density ðg=mLÞ¼ S=ð100� ðT � S� F � PÞ=0:99777Þ
where S is the starch weight, T is the total weight of the flask withstarch and water added to volume, F is the weight of the dry flask,and P is the weight of the parafilm. Densities were not determinedfor the rice, waxy rice, chick pea, and mung bean starches due toinsufficient amounts of samples. Analyses were performed induplicate.
2.7. Sample preparation for gas chromatographic analysis ofiodine as ethyl iodide
Sample preparation for the GC analysis involved weighing out40 mg of starches that were exposed to iodine vapor into 2 mLpolypropylene Eppendorf microcentrifuge tubes within one dayafter the 24 h iodine exposure was complete. Then, 400 lL of0.5 M NaBH4 in 0.1 M NaOH was pipetted into each microcentri-fuge tube, and tubes were capped and vortexed until all starchsamples had turned to their original white color (approximately
10–15 s). Microcentrifuge caps were removed in a fume hood for10 min to purge the hydrogen produced. Then, 400 lL of MilliQwater was pipetted in with the starch samples bringing the totalvolume to 800 lL, and the tubes were re-capped. After 24 h, thesamples were centrifuged for 10 min at 13,000 rpm. A 200-lL sub-sample of supernatant was pipetted into a separate 1.5-mL Eppen-dorf microcentrifuge tube being careful not to disrupt the starchpellet, and 150 lL of the derivatizing agent, 1 M triethyloxoniumtetrafluoroborate (TEOT) in CH2Cl2 containing 2 lL/mL of toluenewas added as the GC internal reference standard (IS), was addedto the subsample under a fume hood. The caps of the Eppendorftubes were kept off for 15–30 s while a vigorous reaction evolvedexcess gas, then sample tubes were capped and allowed to stand(without vortexing) for 4 h for the derivatization reaction to com-plete. Iodine standards were prepared similarly by adding varyingamounts of 0.1 M iodine:potassium iodide solution (1.3% I2:2.6% KI,making up a total of 3.3% molecular iodine) along with 40 mg ofunexposed native starch with sample preparation remaining thesame as for iodine–starch samples. After the 4-h derivatization,70 lL of the bottom CH2Cl2 phase was pipetted into a 200 lL glassmicro vial insert and placed in an 8-mm neck GC vial and cappedready for injection into the GC.
2.8. Gas chromatographic analysis of ethyl iodide
The analyses were performed using a Thermo Trace Ultra GC(Thermo Scientific, Italy) as per the same conditions used in Man-ion et al.,26 with the compounds detected using the flame ioniza-tion detector (FID). Quantification was performed by normalizingthe ethyl iodide peak area against the toluene IS peak area, andplotting this signal:response ratio against a standard curve. Stan-dard curves were also completed in triplicate as per Manionet al.,26 and the averaged linear regression equation was used forquantification. All starch samples equilibrated at three water activ-ities were exposed to iodine vapor three times and analyzed by GC.
2.9. Statistical analysis
Statistical analysis was performed using SPSS 16.0 with one-way ANOVA at an alpha level of 0.05 and Duncan’s multiple rangetest for multiple difference comparison.
3. Results and discussion
3.1. Iodine content in starch
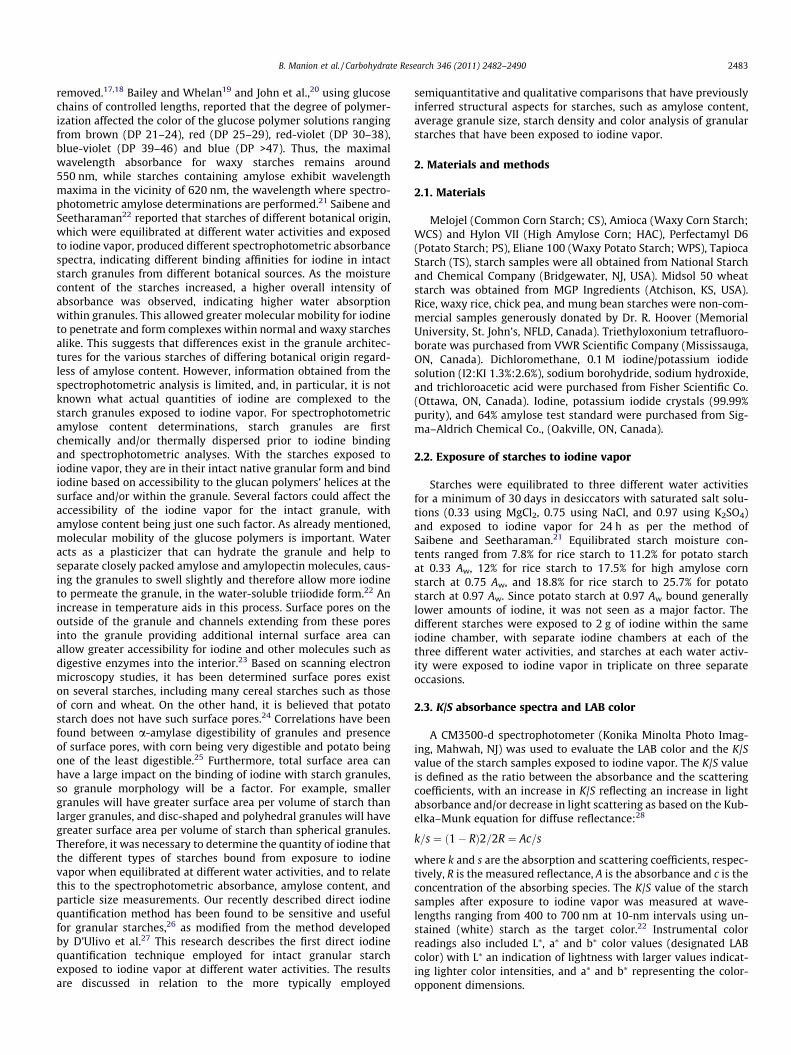
Figure 1 shows color illustrations of all 11 starches that wereexposed to iodine vapor at each water activity (0.33 Aw top, 0.75Aw middle, 0.97 Aw bottom). The inset box value for each iodine-ex-posed starch image reports the % iodine bound in intact starchgranules (w/w) as determined by the GC method. The emphasishere is to illustrate how amounts of actual iodine quantified showno clear relationship with the colors observed for the exposedstarches. For example, at 0.97 water activity, corn, high amylosecorn, potato, rice, chick pea and mung bean starch all show a sim-ilar intense dark blue, almost black, color that is indicative of thecolor formed from the amylose–iodine complex. However, the io-dine contents range from 1.28% for high amylose corn to 0.40%for mung bean starch. Alternately, in comparing potato, waxy po-tato, tapioca, waxy rice, chick pea, and mung bean starch—all with-in a narrower range of 0.30–0.43% iodine—the colors vary fromdark blue, to dark brown, to light blue, to faint pink, to dark blueand to dark blue, respectively.
As expected, a trend can be observed where, as the water activ-ity increases for each type of starch, both the intensity of color and
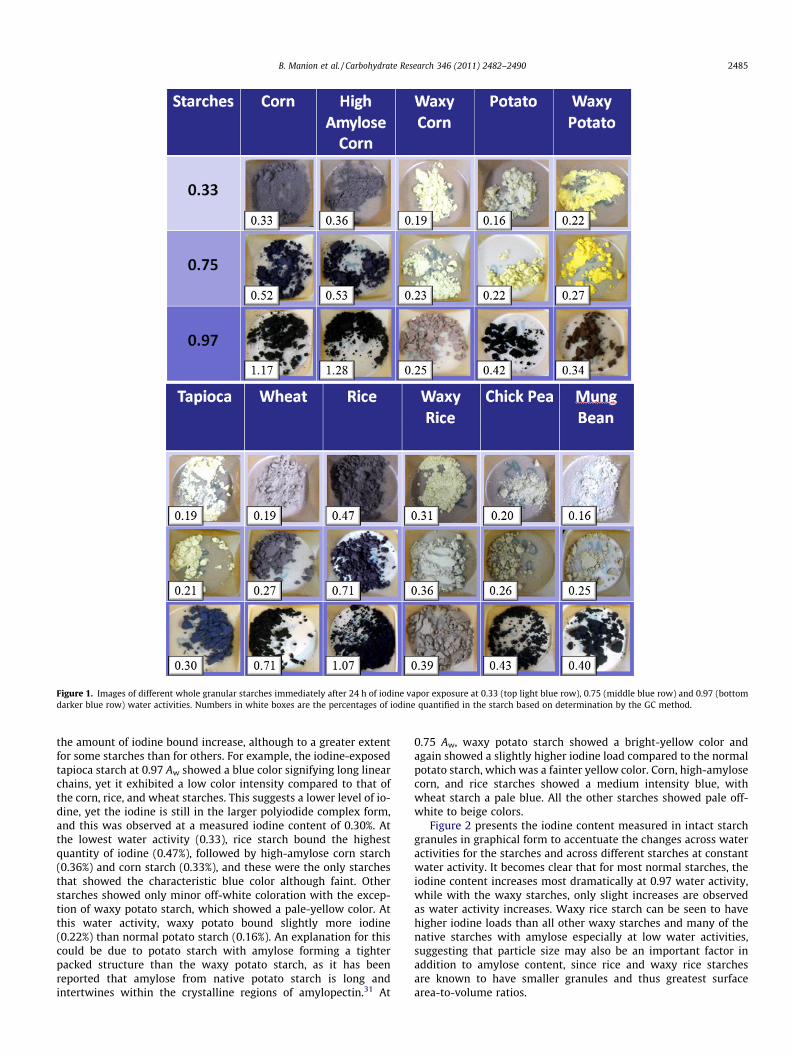
Figure 1. Images of different whole granular starches immediately after 24 h of iodine vapor exposure at 0.33 (top light blue row), 0.75 (middle blue row) and 0.97 (bottomdarker blue row) water activities. Numbers in white boxes are the percentages of iodine quantified in the starch based on determination by the GC method.
B. Manion et al. / Carbohydrate Research 346 (2011) 2482–2490 2485
the amount of iodine bound increase, although to a greater extentfor some starches than for others. For example, the iodine-exposedtapioca starch at 0.97 Aw showed a blue color signifying long linearchains, yet it exhibited a low color intensity compared to that ofthe corn, rice, and wheat starches. This suggests a lower level of io-dine, yet the iodine is still in the larger polyiodide complex form,and this was observed at a measured iodine content of 0.30%. Atthe lowest water activity (0.33), rice starch bound the highestquantity of iodine (0.47%), followed by high-amylose corn starch(0.36%) and corn starch (0.33%), and these were the only starchesthat showed the characteristic blue color although faint. Otherstarches showed only minor off-white coloration with the excep-tion of waxy potato starch, which showed a pale-yellow color. Atthis water activity, waxy potato bound slightly more iodine(0.22%) than normal potato starch (0.16%). An explanation for thiscould be due to potato starch with amylose forming a tighterpacked structure than the waxy potato starch, as it has beenreported that amylose from native potato starch is long andintertwines within the crystalline regions of amylopectin.31 At
0.75 Aw, waxy potato starch showed a bright-yellow color andagain showed a slightly higher iodine load compared to the normalpotato starch, which was a fainter yellow color. Corn, high-amylosecorn, and rice starches showed a medium intensity blue, withwheat starch a pale blue. All the other starches showed pale off-white to beige colors.
Figure 2 presents the iodine content measured in intact starchgranules in graphical form to accentuate the changes across wateractivities for the starches and across different starches at constantwater activity. It becomes clear that for most normal starches, theiodine content increases most dramatically at 0.97 water activity,while with the waxy starches, only slight increases are observedas water activity increases. Waxy rice starch can be seen to havehigher iodine loads than all other waxy starches and many of thenative starches with amylose especially at low water activities,suggesting that particle size may also be an important factor inaddition to amylose content, since rice and waxy rice starchesare known to have smaller granules and thus greatest surfacearea-to-volume ratios.
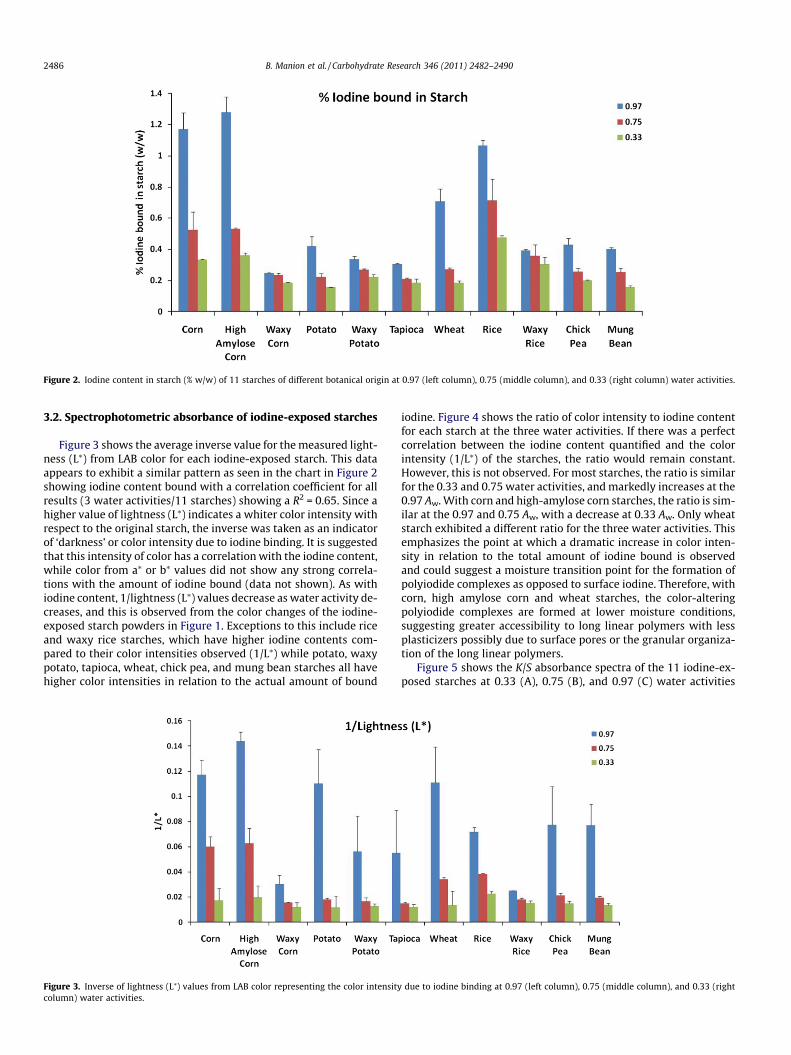
Figure 2. Iodine content in starch (% w/w) of 11 starches of different botanical origin at 0.97 (left column), 0.75 (middle column), and 0.33 (right column) water activities.
2486 B. Manion et al. / Carbohydrate Research 346 (2011) 2482–2490
3.2. Spectrophotometric absorbance of iodine-exposed starches
Figure 3 shows the average inverse value for the measured light-ness (L⁄) from LAB color for each iodine-exposed starch. This dataappears to exhibit a similar pattern as seen in the chart in Figure 2showing iodine content bound with a correlation coefficient for allresults (3 water activities/11 starches) showing a R2 = 0.65. Since ahigher value of lightness (L⁄) indicates a whiter color intensity withrespect to the original starch, the inverse was taken as an indicatorof ‘darkness’ or color intensity due to iodine binding. It is suggestedthat this intensity of color has a correlation with the iodine content,while color from a⁄ or b⁄ values did not show any strong correla-tions with the amount of iodine bound (data not shown). As withiodine content, 1/lightness (L⁄) values decrease as water activity de-creases, and this is observed from the color changes of the iodine-exposed starch powders in Figure 1. Exceptions to this include riceand waxy rice starches, which have higher iodine contents com-pared to their color intensities observed (1/L⁄) while potato, waxypotato, tapioca, wheat, chick pea, and mung bean starches all havehigher color intensities in relation to the actual amount of bound
Figure 3. Inverse of lightness (L⁄) values from LAB color representing the color intensitycolumn) water activities.
iodine. Figure 4 shows the ratio of color intensity to iodine contentfor each starch at the three water activities. If there was a perfectcorrelation between the iodine content quantified and the colorintensity (1/L⁄) of the starches, the ratio would remain constant.However, this is not observed. For most starches, the ratio is similarfor the 0.33 and 0.75 water activities, and markedly increases at the0.97 Aw. With corn and high-amylose corn starches, the ratio is sim-ilar at the 0.97 and 0.75 Aw, with a decrease at 0.33 Aw. Only wheatstarch exhibited a different ratio for the three water activities. Thisemphasizes the point at which a dramatic increase in color inten-sity in relation to the total amount of iodine bound is observedand could suggest a moisture transition point for the formation ofpolyiodide complexes as opposed to surface iodine. Therefore, withcorn, high amylose corn and wheat starches, the color-alteringpolyiodide complexes are formed at lower moisture conditions,suggesting greater accessibility to long linear polymers with lessplasticizers possibly due to surface pores or the granular organiza-tion of the long linear polymers.
Figure 5 shows the K/S absorbance spectra of the 11 iodine-ex-posed starches at 0.33 (A), 0.75 (B), and 0.97 (C) water activities
due to iodine binding at 0.97 (left column), 0.75 (middle column), and 0.33 (right

Figure 4. The ratio of 1/lightness (L⁄) to % iodine content for each starch at 0.97 (left column), 0.75 20 (middle column), and 0.33 (right column) water activities.
B. Manion et al. / Carbohydrate Research 346 (2011) 2482–2490 2487
from wavelengths 400 nm to 700 nm. At all water activities, the K/Sabsorbance maximum reaches approximately 550 nm. With color-imetric amylose determination tests, where the long linear glucanmolecules are dispersed in dilute solutions, the absorbance max-ima approaches 620 nm. It has been shown7,19,32 that glucan chainsof different lengths have different wavelength absorbance maximareflecting different colors of solution ranging from brown (DP 21–24), red (DP 25–29), red-violet (DP 30–38), blue-violet (DP 39–46)and blue (DP >47). This difference in wavelength maxima of550 nm for intact granular starch and that for dispersed starch at620 nm could suggest that long linear glucan chains may be con-stricted within the granular organization due to twisting and pos-sibly being intertwined (e.g., potato starch) with the crystallineregion of amylopectin such that the larger polyiodide complexescannot be formed to shift the maximum absorbance to higherwavelengths. Smaller ‘humps’ are seen at �600 nm at all threewater activities for corn, high amylose corn, wheat and ricestarches, and at 600 and 650 nm at 0.97 water activity for corn,high amylose corn, wheat, potato, chick pea, mung bean and ricestarches, possibly suggesting the absorbance regions for the gran-ule surface amylose where long linear chains can form unrestrictedhelices with large, rigid polyiodide complexes, which absorb atthese higher wavelengths. The humps observed at 450–500 nmin the spectrum could be a result of smaller helices, possibly in-ter-branch chains with potential length of 6–15 glucose units thatbind smaller iodine complexes as shown by Whelan and Bailey19 instudies of iodine binding of controlled-length dextrins.
3.3. Amylose content
With quantifying the iodine content in the granular starch, itwas important to determine the amylose content in the starchesbased on an established spectrophotometric assay, as this will re-flect the binding of iodine to form polyiodide complexes in the longlinear glucan chains when the granules have been fully dispersedin solution. Table 1 reports the amylose contents in terms of themeasured spectrophotometric absorbances at 620 nm in order toshow relative absorbances for the waxy starches, which translateto 0% amylose when applying the linear regression equation deter-mined from a pure amylose–amylopectin standard curve of vary-ing amounts (% Amylose = [Abs@620 nm � 0.06376]/0.00583R2 = 0.9972). Table 1 also indicates the % amylose content in thefollowing column as calculated by applying the equation with anadditional 0.98 correction factor for the amylose test standard. As
expected, the high-amylose corn starch had the highest apparentamylose content with 62.7% amylose, which is almost three timesthe apparent amylose in common corn starch at 21.6%. However, incomparing iodine quantities, the high-amylose corn granulesbound 1.28% iodine, which was only 1.1 times more iodine thanthe common corn at 1.17%, again reflecting a degree of limitedaccessibility of iodine to bind in the intact granule. As mentioned,the surface pores could play a role in accessibility to the amylosewithin the granules, as it has been reported that corn starch varie-ties have many pores and channels, which allow access for en-zymes into the granules aiding in rapid amylase digestion, whilepotato starch is reported to not have surface pores and is moreresistant to enzymatic digestion.22–24 Furthermore, the shape ofgranules will influence accessibility to iodine based on changesin surface area-to-volume ratios. Wheat, chick pea, and mung beanstarches all have high amylose content (>30%), yet only wheat hadrelatively high iodine content from iodine vapor exposure, and thiscould be due in part to the lenticular shape of the large A granulesof wheat starch greatly increasing their surface area-to-volume ra-tios.33 Beyond this, it is not fully understood what the relationshipwith determined amylose content and the iodine content bound inthe whole granules based on iodine vapor exposure. Where theamylose is preferentially located in the granule, whether concen-trated at the surface34 or in the interior,35 could influence theaccessibility of the iodine to form complexes. Also, surprisingwas the low amylose content of 8.6% for the rice starch, yet a rel-atively high iodine load of 1.07% for the granules. With rice havingsmaller granules, even if the amylose was concentrated in the inte-rior, it would still be located closer to the surface than with otherstarches and thus be more accessible. It is reported that the theo-retical maximum iodine binding for 100% amylose is approxi-mately 30% (w/w) of starch if fully accessible.36 With corn, highamylose corn and rice starches binding just over 1% iodine (w/w)in the starch granules from iodine-vapor at highest water activity,it is apparent that still only a small fraction of the total amylose(long linear chains) have formed complexes with iodine. This doesnot take into account the amount of iodine that complexes inshorter non-amylose helical segments found in the amorphous re-gions as evidenced by the slight increases in iodine binding ob-served for waxy starch granules as water activity increased. Nordoes it take into account, surface-bound iodine possibly looselybound implied by the similar iodine levels of waxy to native starchgranules at the lowest water activity. However, based on the dra-matic increase as water activity increases in iodine contents bound

Figure 5. The K/S absorbance spectra from 400 nm to 700 nm of the starches exposed to iodine vapor and equilibrated at 0.33 Aw (A), 0.75 Aw (B), and 0.97 Aw (C).
2488 B. Manion et al. / Carbohydrate Research 346 (2011) 2482–2490
in granules of starches with high measured amylose contents com-pared to their waxy counterparts, it does suggest that long linearchains are an important factor in the granular binding of iodinefrom iodine vapor.
3.4. Particle size measurements
Particle size results are presented in Table 1 for the average D[3,2]surface area weighted mean diameter for the 11 starches before andafter exposure to iodine vapor. In both cases, the starches used wereequilibrated at 0.97 Aw (native and iodine-exposed). The followingcolumn after the D[3,2] for native and iodine-exposed surface areaweighted mean diameters presents the ratio of iodine-exposedD[3,2] to native D[3,2]. In all cases except for with potato and waxypotato starches, which were the largest starch granules measured,the average granular diameter was larger after exposure to iodine
vapor, indicating an expansion in granule sizes. For reasons thatare not clear, a slight contraction in average particle size diameterwas observed with potato and waxy potato starches (0.95 and 0.93ratio, respectively). The largest increases in D[3,2] particle size werewith waxy rice starch followed by rice starch, which were the small-est starch granules measured, with a 3.39 and 2.51 times increase inaverage surface weighted mean diameter, respectively. Interest-ingly, the high-amylose corn starch had the next largest increasein average particle size diameter with a 2.04 times increase, whichis much larger than that of the common corn starch and waxy cornstarch ratios of 1.48 and 1.45, respectively.
The most important implication from this experiment seems tobe that surface area is indeed an important factor for the binding ofiodine in intact granules from iodine vapor. This is evidenced bythe higher-than-expected amounts of iodine bound in rice andwaxy rice starches compared to that of potato and waxy potato
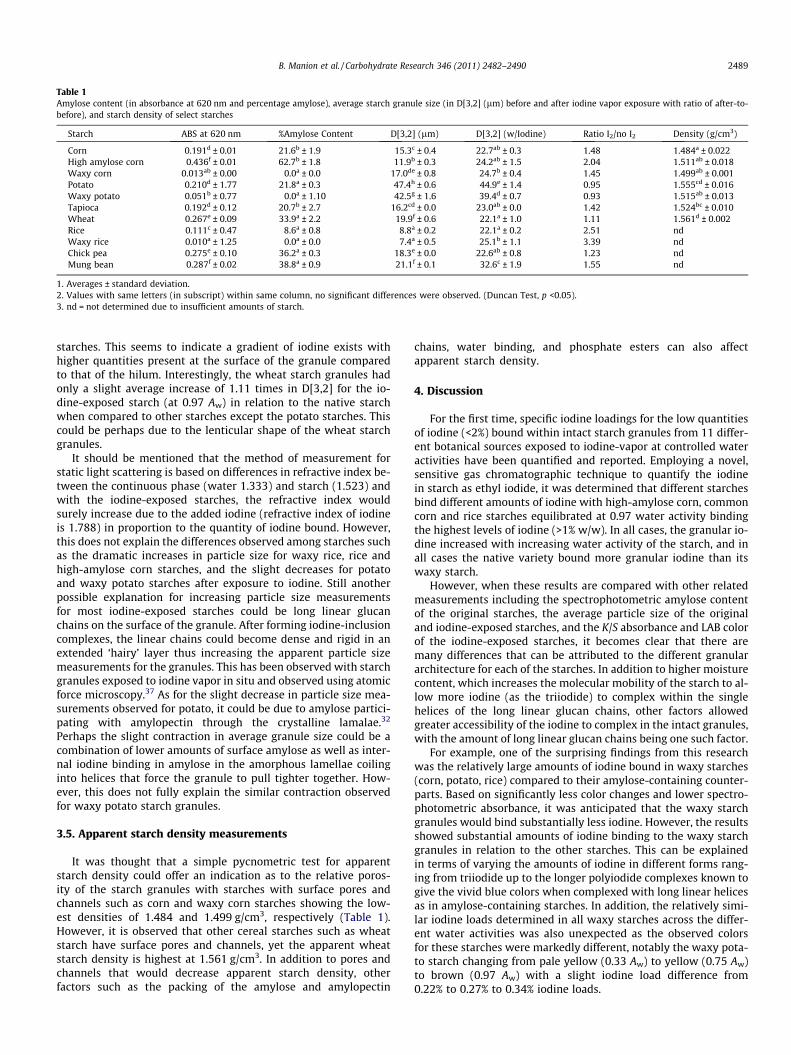
Table 1Amylose content (in absorbance at 620 nm and percentage amylose), average starch granule size (in D[3,2] (lm) before and after iodine vapor exposure with ratio of after-to-before), and starch density of select starches
Starch ABS at 620 nm %Amylose Content D[3,2] (lm) D[3,2] (w/Iodine) Ratio I2/no I2 Density (g/cm3)
Corn 0.191d ± 0.01 21.6b ± 1.9 15.3c ± 0.4 22.7ab ± 0.3 1.48 1.484a ± 0.022High amylose corn 0.436f ± 0.01 62.7b ± 1.8 11.9b ± 0.3 24.2ab ± 1.5 2.04 1.511ab ± 0.018Waxy corn 0.013ab ± 0.00 0.0a ± 0.0 17.0de ± 0.8 24.7b ± 0.4 1.45 1.499ab ± 0.001Potato 0.210d ± 1.77 21.8a ± 0.3 47.4h ± 0.6 44.9e ± 1.4 0.95 1.555cd ± 0.016Waxy potato 0.051b ± 0.77 0.0a ± 1.10 42.5g ± 1.6 39.4d ± 0.7 0.93 1.515ab ± 0.013Tapioca 0.192d ± 0.12 20.7b ± 2.7 16.2cd ± 0.0 23.0ab ± 0.0 1.42 1.524bc ± 0.010Wheat 0.267e ± 0.09 33.9a ± 2.2 19.9f ± 0.6 22.1a ± 1.0 1.11 1.561d ± 0.002Rice 0.111c ± 0.47 8.6a ± 0.8 8.8a ± 0.2 22.1a ± 0.2 2.51 ndWaxy rice 0.010a ± 1.25 0.0a ± 0.0 7.4a ± 0.5 25.1b ± 1.1 3.39 ndChick pea 0.275e ± 0.10 36.2a ± 0.3 18.3e ± 0.0 22.6ab ± 0.8 1.23 ndMung bean 0.287f ± 0.02 38.8a ± 0.9 21.1f ± 0.1 32.6c ± 1.9 1.55 nd
1. Averages ± standard deviation.2. Values with same letters (in subscript) within same column, no significant differences were observed. (Duncan Test, p <0.05).3. nd = not determined due to insufficient amounts of starch.
B. Manion et al. / Carbohydrate Research 346 (2011) 2482–2490 2489
starches. This seems to indicate a gradient of iodine exists withhigher quantities present at the surface of the granule comparedto that of the hilum. Interestingly, the wheat starch granules hadonly a slight average increase of 1.11 times in D[3,2] for the io-dine-exposed starch (at 0.97 Aw) in relation to the native starchwhen compared to other starches except the potato starches. Thiscould be perhaps due to the lenticular shape of the wheat starchgranules.
It should be mentioned that the method of measurement forstatic light scattering is based on differences in refractive index be-tween the continuous phase (water 1.333) and starch (1.523) andwith the iodine-exposed starches, the refractive index wouldsurely increase due to the added iodine (refractive index of iodineis 1.788) in proportion to the quantity of iodine bound. However,this does not explain the differences observed among starches suchas the dramatic increases in particle size for waxy rice, rice andhigh-amylose corn starches, and the slight decreases for potatoand waxy potato starches after exposure to iodine. Still anotherpossible explanation for increasing particle size measurementsfor most iodine-exposed starches could be long linear glucanchains on the surface of the granule. After forming iodine-inclusioncomplexes, the linear chains could become dense and rigid in anextended ‘hairy’ layer thus increasing the apparent particle sizemeasurements for the granules. This has been observed with starchgranules exposed to iodine vapor in situ and observed using atomicforce microscopy.37 As for the slight decrease in particle size mea-surements observed for potato, it could be due to amylose partici-pating with amylopectin through the crystalline lamalae.32
Perhaps the slight contraction in average granule size could be acombination of lower amounts of surface amylose as well as inter-nal iodine binding in amylose in the amorphous lamellae coilinginto helices that force the granule to pull tighter together. How-ever, this does not fully explain the similar contraction observedfor waxy potato starch granules.
3.5. Apparent starch density measurements
It was thought that a simple pycnometric test for apparentstarch density could offer an indication as to the relative poros-ity of the starch granules with starches with surface pores andchannels such as corn and waxy corn starches showing the low-est densities of 1.484 and 1.499 g/cm3, respectively (Table 1).However, it is observed that other cereal starches such as wheatstarch have surface pores and channels, yet the apparent wheatstarch density is highest at 1.561 g/cm3. In addition to pores andchannels that would decrease apparent starch density, otherfactors such as the packing of the amylose and amylopectin
chains, water binding, and phosphate esters can also affectapparent starch density.
4. Discussion
For the first time, specific iodine loadings for the low quantitiesof iodine (<2%) bound within intact starch granules from 11 differ-ent botanical sources exposed to iodine-vapor at controlled wateractivities have been quantified and reported. Employing a novel,sensitive gas chromatographic technique to quantify the iodinein starch as ethyl iodide, it was determined that different starchesbind different amounts of iodine with high-amylose corn, commoncorn and rice starches equilibrated at 0.97 water activity bindingthe highest levels of iodine (>1% w/w). In all cases, the granular io-dine increased with increasing water activity of the starch, and inall cases the native variety bound more granular iodine than itswaxy starch.
However, when these results are compared with other relatedmeasurements including the spectrophotometric amylose contentof the original starches, the average particle size of the originaland iodine-exposed starches, and the K/S absorbance and LAB colorof the iodine-exposed starches, it becomes clear that there aremany differences that can be attributed to the different granulararchitecture for each of the starches. In addition to higher moisturecontent, which increases the molecular mobility of the starch to al-low more iodine (as the triiodide) to complex within the singlehelices of the long linear glucan chains, other factors allowedgreater accessibility of the iodine to complex in the intact granules,with the amount of long linear glucan chains being one such factor.
For example, one of the surprising findings from this researchwas the relatively large amounts of iodine bound in waxy starches(corn, potato, rice) compared to their amylose-containing counter-parts. Based on significantly less color changes and lower spectro-photometric absorbance, it was anticipated that the waxy starchgranules would bind substantially less iodine. However, the resultsshowed substantial amounts of iodine binding to the waxy starchgranules in relation to the other starches. This can be explainedin terms of varying the amounts of iodine in different forms rang-ing from triiodide up to the longer polyiodide complexes known togive the vivid blue colors when complexed with long linear helicesas in amylose-containing starches. In addition, the relatively simi-lar iodine loads determined in all waxy starches across the differ-ent water activities was also unexpected as the observed colorsfor these starches were markedly different, notably the waxy pota-to starch changing from pale yellow (0.33 Aw) to yellow (0.75 Aw)to brown (0.97 Aw) with a slight iodine load difference from0.22% to 0.27% to 0.34% iodine loads.
2490 B. Manion et al. / Carbohydrate Research 346 (2011) 2482–2490
With the exception of corn, high-amylose corn, rice and waxyrice starches, which all showed higher iodine contents at 0.33 Aw,the other starches including waxy starch exhibited relatively sim-ilar iodine contents at low water activity implying a baseline va-lue for surface bound iodine. The slight increases in the waxystarch and the more dramatic increases in the starches with amy-lose as water activity increased reflect more interior iodine bind-ing within the granule as water increases the molecular mobilityand access to bind within the linear glucans. Also, a relationshipbetween the iodine bound and the color intensity as representedby the inverse of the lightness (L⁄) from LAB color measurementsappears to exist but with exceptions. Future research includesattempting to determine how much iodine is loosely bound onthe surface of the granule as opposed to tightly bound iodinewithin helical complexes through vacuum evaporation and selec-tive solvent extraction, and examining chemical, enzymatic, andphysical treatments that may alter the binding properties of io-dine with intact granular starches exposed to iodine vapor, andthus helping to elucidate the original and altered starch granulearchitecture.
5. Conclusions
This study shows the relationship between the types of starchesof different botanical origin and the amount of iodine their gran-ules bind after exposure to iodine vapor is complex and involvesmany factors including the amount of long linear glucan chains,and the accessibility of these glucan chains to bind iodine basedon moisture content increasing the chain molecular mobility, thesize of the granules affecting the surface area-to-volume ratio ofthe granules, pores and channels allowing easier access into thegranule, and finally how the glucan chains are organized withinthe granule and the degree of crystallinity as defined by denselypacked double-helices of glucan chains that are aligned in the crys-talline lamellae.
References
1. Thebaudin, J. Y.; Lefebvre, A. C.; Doublier, J. L. Lebens-Wiss. Tech. 1998, 31, 354–360.2. Manners, D. J. Carbohydr. Polym. 1989, 11, 87–112.3. Buleon, A.; Colonna, P.; Planchot, V.; Ball, S. Biol. Macromol. 1998, 23, 85–112.4. Tester, R. F.; Karkalas, J.; Xin, Q. J. Cereal Sci. 2004, 39, 151–165.5. Perez, S.; Bertoft, E. Starch 2010, 62, 389–420.6. Freudenberg, K.; Schaaf, E.; Dumpett, G.; Ploetz, T. Naturwissenschaften 1939,
27, 850–853.7. Rundle, R. E.; Baldwin, R. R. J. Am. Chem. Soc. 1943, 65, 554–558.8. Bates, F. L.; French, D.; Rundle, R. E. J. Am. Chem. Soc. 1943, 65, 142–148.9. Nolteneyer, M.; Saenger, W. Nature 1976, 259, 629–632.
10. Williams, P. C.; Kuzina, F. D.; Hlynka, I. Cereal Chem. 1970, 47, 411–421.11. Morrison, W. R.; Laignelet, B. J. Cereal Sci. 1983, 1, 9–20.12. Knutson, C. A. Cereal Chem. 1986, 63, 89–92.13. Chrastil, J. Carbohydr. Res. 1987, 159, 154–158.14. McGrance, S. J.; Cornell, H. J.; Rix, C. J. Starch/Staerke 1998, 50, 158–163.15. Evans, A.; McNish, N.; Thompson, D. B. Starch/Staerke 2003, 55, 250–257.16. Langton, M.; Hermannson, A. M. Food Microstruct. 1989, 8, 29–39.17. Krog, N. Starch/Staerke 1971, 23, 206–210.18. Kaur, K.; Singh, N. Food Chem. 2000, 71, 511–517.19. Bailey, J. M.; Whelan, W. J. J. Biol. Chem. 1961, 236, 969–973.20. John, M.; Schmidt, J.; Kneifel, H. Carbohydr. Res. 1983, 119, 254–257.21. Juliano, B. O.; Perez, C. M.; Blakeney, A. B.; Castillo, T.; Kongseree, N.; Laignelet,
B.; Lapis, E. T.; Murty, V. V. S.; Paule, C. M.; Webb, B. D. Starch/Staerke 1981, 33,157–162.
22. Saibene, D.; Seetharaman, K. Carbohydr. Polym. 2006, 64, 539–547.23. Fannon, J. E.; Hauber, R. J.; BeMiller, J. N. Cereal Chem. 1992, 69, 284–288.24. Huber, K. C.; BeMiller, J. N. Cereal Chem. 1997, 74, 537–541.25. Sajilata, M. G.; Singhal, R. S.; Kulkarni, P. R. Comp. Rev. Food Sci. Food Safety
2006, 5, 1–17.26. Manion, B. A.; Holbein, B. E.; Marcone, M. F.; Seetharaman, K. Carbohydr. Res.
2010, 345, 2698–2704.27. D’Ulivo, A.; Pagliano, E.; Onor, M.; Pitzalis, E.; Zamboni, R. Anal. Chem. 2009, 81,
6399–6406.28. Billmeyer, F. W.; Saltzman, M. Principles of Color Technology, 2nd ed.; Wiley:
New York, 1981. pp 133–172.29. Howarth, P. J. Phys Educ.: Sci. Instrum. 1975, 8, 1055–1057.30. http://www.silver-colloids.com/Tutorials/psintro.html (accessed 16 August
2011).31. Jane, J. L.; Craig, S. A. S.; Seib, P. A.; Hoseney, R. C. Starch/Staerke 1986, 38, 258–263.32. Banks, W.; Greenwood, C. T.; Khan, K. M. Carbohydr. Res. 1971, 17, 25–33.33. Evers, A. D. Starch/Staerke 1971, 5, 157–161.34. Srichuwong, S.; Jane, J. L. Food Sci. Biotechnol. 2007, 16, 663–674.35. BeMiller, J. N. Starch/Staerke 1997, 49, 127–131.36. Murdoch, K. A. Carbohydr. Res. 1992, 233, 161–174.37. Waduge, R. N.; Xiu, S.; Seetharaman, K. Carbohydr. Polym. 2010, 82, 786–794.