absorption spectrum of iodine vapour using constant ... - niser
TRANSCRIPT
Absorption spectrum of Iodine vapour using constant deviation spectrometer
Introduction:
Determining the absorption spectrum of iodine is a classic experiment in Physical Chemistry.
Study of this spectrum clearly shows the relationship between vibrational and electronic
energy levels by introducing the concept of a vibronic transition, demonstrating the
anharmonicity of vibrational energy levels, and providing the dissociative limit for the
vibronic transitions.
According to Schrödinger equation every bound system of particles can have only discrete
energy levels and any transition between two such levels results in absorption or emission of
a photon with energy equal to energy difference of the two levels. In this experiment, a white
light source with a continuous spectrum is used to excite the molecules of iodine
vapour.When the spectrum of light after passing through the iodine vapour is analysed by a
spectrometer, it is observed that specific wavelengths are absorbed. Each absorbed
wavelength will appear as a dark line in the spectrum corresponding to the difference of
different energy states of iodine molecule. The characteristics of the iodine molecule can be
determined from this spectrum.
Objective:
To study the absorption spectrum of iodine vapour with Constant Deviation
spectrometer and then to determine:
(a) the energy level diagram of iodine molecule
(b) the electronic energy gap and vibrational energies
(c) bond dissociation limit.
(d) force constant for the excited state
Apparatus Required: (1) Constant deviation spectrometer with the special prism
(Pellin-Broca), (2) a mercury lamp for calibration, (3) an incandescent bulb of 60 to
100 watts, (4) a long glass tube with plane windows to hold the iodine vapour.
Theory:
In atoms and molecules different electronic energy levels exist corresponding to particular
quantum states. The lowest energy level is called the ground state, all higher energy states are
called excited states. The potential energy experienced by the electrons in a molecule in any
"bound state" is described by the anharmonic Morse potential1:
𝑈(𝑟) = 𝐷 1 − 𝑒 ( ) (1)
where De is the depth of the potential well, re is the internuclear distance between the
atoms at the energy minimum (also called the bond length), a is the constant for a
particular molecule given as:
𝑎 = ν (ħD𝑒
) (2)
Here ν is the wavenumber corresponding to the harmonic vibrational frequency (in
cm-1) in the given electronic state and µ is the reduced mass of the system. Solving the
Schrodinger equation with Morse potential the vibrational energy states can be obtained
as follows:
𝐸(ν) = ν ν + − ν 𝑥 (ν + ) (3)
where ν is the vibrational quantum number (=0,1,2…) and 𝑥 (= ) is the
anharmonicity constant.
Vibronic transition in iodine:
Molecular iodine is purple in colour because it absorbs light in the visible (yellow) region of
the electromagnetic spectrum. The absorption involves the following transition
(X, 𝛎′′)→ (B, 𝛎′)
where X represents the ground state and B is the first excited electronic energy state. ν′′ (=0,
1, 2 etc) and ν′ (=0,1,2, etc) represent the vibrational quantum numbers in the ground and
excited electronic states, respectively.
Figure 1 shows a schematic energy level diagram of iodine with ground and first excited
electronic state along with the vibrational states. At room temperature most of the
molecules of iodine reside in ground state ν′′ =0. When a beam of light having
continuous spectrum is made to pass through the iodine vapour the first transition
corresponds to ν′′ =0 to ν′ = 0 which is labelled as 0←0 absorption line. The next peak
corresponds to the 1←0 transition, the third, 2←0 and so on. However, according to Franck-
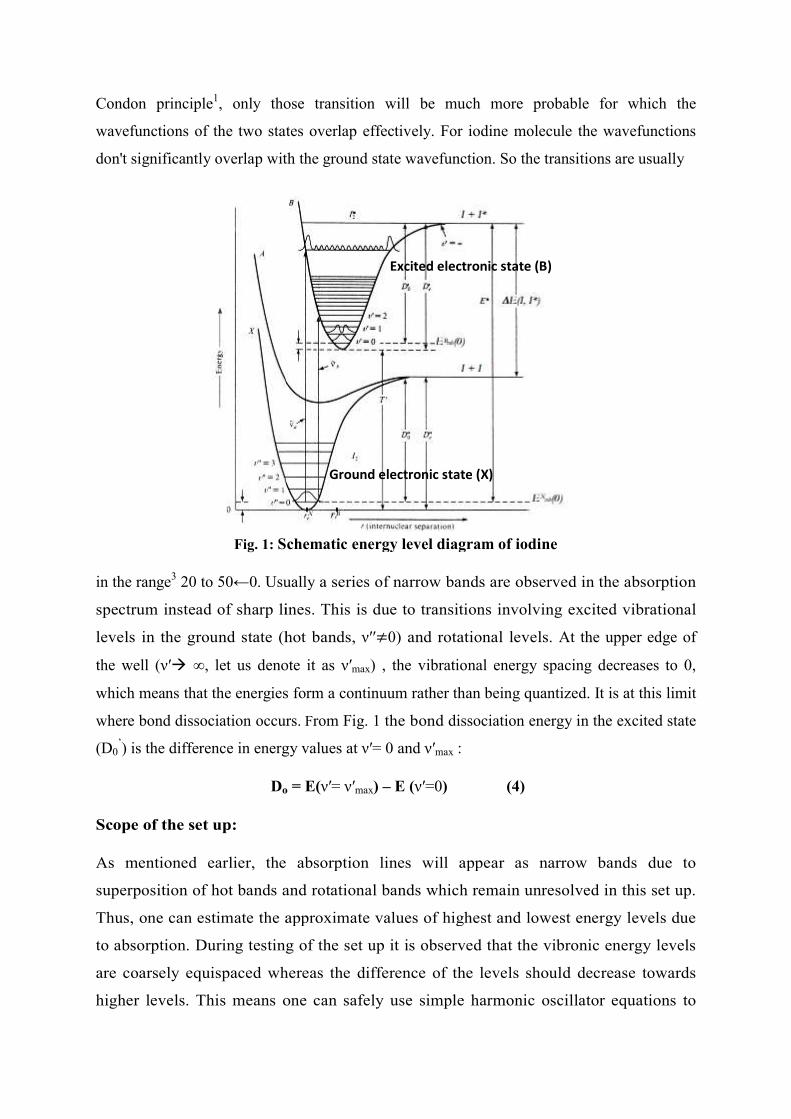
Condon principle1, only those
wavefunctions of the two stat
don't significantly overlap with the ground state wavefunction
Fig. 1: Schematic energy level diagram of iodin
in the range3 20 to 50←0. Usually
spectrum instead of sharp lines.
levels in the ground state (hot bands
the well (ν′ ∞, let us denote it as
which means that the energies form a continuum rather than being quantized. It
where bond dissociation occurs.
(D0’) is the difference in energy values at
Do
Scope of the set up:
As mentioned earlier, the absorption lines will appear as narrow bands due to
superposition of hot bands and rotational bands
Thus, one can estimate the approximate
to absorption. During testing of the s
are coarsely equispaced whereas the
higher levels. This means one can safely use simple harmonic oscillator equations to
those transition will be much more probable
tes overlap effectively. For iodine molecule
ly overlap with the ground state wavefunction. So the transitions
Schematic energy level diagram of iodine
sually a series of narrow bands are observed
spectrum instead of sharp lines. This is due to transitions involving excited vibrational
levels in the ground state (hot bands, ν′′≠0) and rotational levels. At the upper edge of
, let us denote it as ν′max) , the vibrational energy spacing decreases to 0,
which means that the energies form a continuum rather than being quantized. It
bond dissociation occurs. From Fig. 1 the bond dissociation energy
the difference in energy values at ν′= 0 and ν′max :
o = E(ν′= ν′max) – E (ν′=0) (4)
mentioned earlier, the absorption lines will appear as narrow bands due to
perposition of hot bands and rotational bands which remain unresolved in this set up
approximate values of highest and lowest
testing of the set up it is observed that the vibronic
whereas the difference of the levels should
means one can safely use simple harmonic oscillator equations to
Excited electronic state (B)
Ground electronic state (X)
probable for which the
the wavefunctions
the transitions are usually
observed in the absorption
involving excited vibrational
At the upper edge of
) , the vibrational energy spacing decreases to 0,
which means that the energies form a continuum rather than being quantized. It is at this limit
dissociation energy in the excited state
mentioned earlier, the absorption lines will appear as narrow bands due to
which remain unresolved in this set up.
of highest and lowest energy levels due
vibronic energy levels
the levels should decrease towards
means one can safely use simple harmonic oscillator equations to
calculate the energy values (put 𝑥 =0 in Eq. 3) and force constant etc. If ∆ν avg is the
average value of change in wave number of two consecutive states, then the force
constant, f, of iodine molecule in excited state is given as:
𝑓 = 4𝜋 𝜇(𝑐∆ν ) (5)
Useful conversions/calculations:
1. Convert the wavelengths of the absorption band into the wave number by
using: ν (𝑐𝑚 ) = 1/λ.
2. 1eV = 8068cm-1
3. E(eV)= hc/ λmax =hcν min
Procedure:
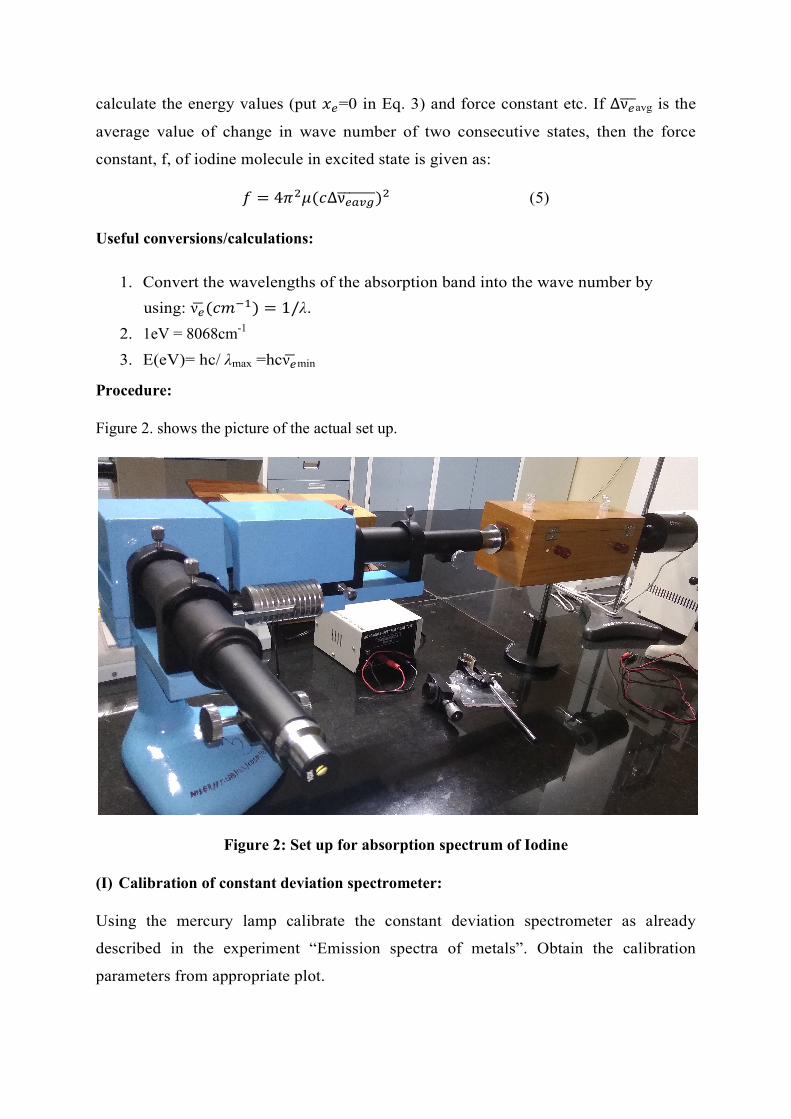
Figure 2. shows the picture of the actual set up.
Figure 2: Set up for absorption spectrum of Iodine
(I) Calibration of constant deviation spectrometer:
Using the mercury lamp calibrate the constant deviation spectrometer as already
described in the experiment “Emission spectra of metals”. Obtain the calibration
parameters from appropriate plot.
(II) Observation of Iodine spectrum
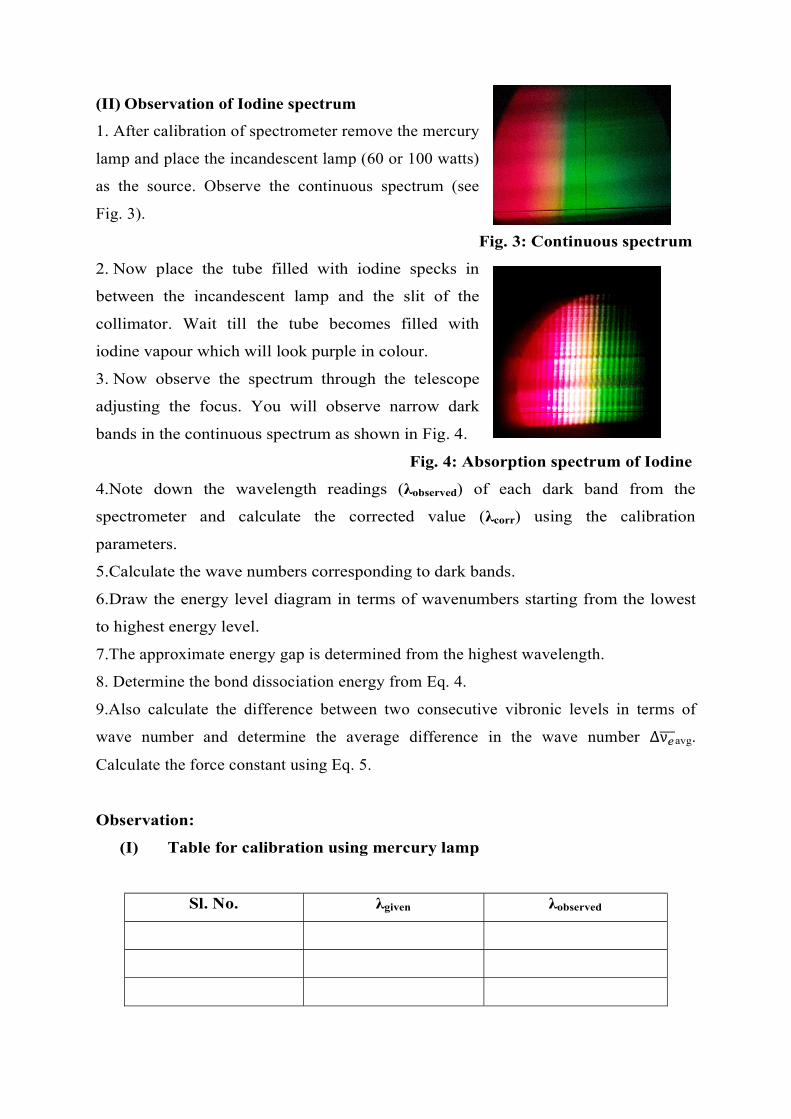
1. After calibration of spectrometer remove the mercury
lamp and place the incandescent lamp (60 or 100 watts)
as the source. Observe the continuous spectrum (see
Fig. 3).
Fig. 3: Continuous spectrum
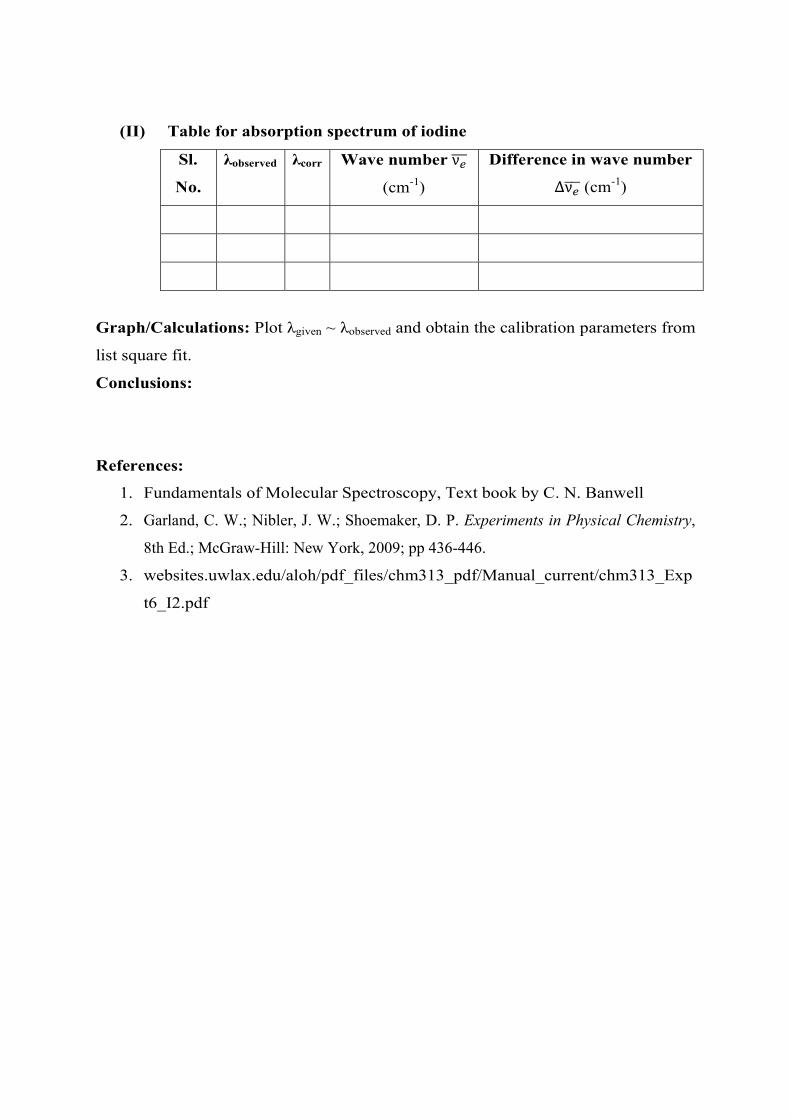
2. Now place the tube filled with iodine specks in
between the incandescent lamp and the slit of the
collimator. Wait till the tube becomes filled with
iodine vapour which will look purple in colour.
3. Now observe the spectrum through the telescope
adjusting the focus. You will observe narrow dark
bands in the continuous spectrum as shown in Fig. 4.
Fig. 4: Absorption spectrum of Iodine
4.Note down the wavelength readings (λobserved) of each dark band from the
spectrometer and calculate the corrected value (λcorr) using the calibration
parameters.
5.Calculate the wave numbers corresponding to dark bands.
6.Draw the energy level diagram in terms of wavenumbers starting from the lowest
to highest energy level.
7.The approximate energy gap is determined from the highest wavelength.
8. Determine the bond dissociation energy from Eq. 4.
9.Also calculate the difference between two consecutive vibronic levels in terms of
wave number and determine the average difference in the wave number ∆ν avg.
Calculate the force constant using Eq. 5.
Observation:
(I) Table for calibration using mercury lamp
Sl. No. λgiven λobserved
(II) Table for absorption spectrum of iodine
Sl.
No.
λobserved λcorr Wave number ν
(cm-1)
Difference in wave number
∆ν (cm-1)
Graph/Calculations: Plot λgiven ~ λobserved and obtain the calibration parameters from
list square fit.
Conclusions:
References:
1. Fundamentals of Molecular Spectroscopy, Text book by C. N. Banwell
2. Garland, C. W.; Nibler, J. W.; Shoemaker, D. P. Experiments in Physical Chemistry,
8th Ed.; McGraw-Hill: New York, 2009; pp 436-446.
3. websites.uwlax.edu/aloh/pdf_files/chm313_pdf/Manual_current/chm313_Exp
t6_I2.pdf