chemistry of +1 iodine in alkaline solution
TRANSCRIPT

Lawrence Berkeley National LaboratoryLawrence Berkeley National Laboratory
TitleCHEMISTRY OF +1 IODINE IN ALKALINE SOLUTION
Permalinkhttps://escholarship.org/uc/item/71312227
AuthorChia, Yuan-tsan.
Publication Date2008-06-23
eScholarship.org Powered by the California Digital LibraryUniversity of California

UCRL-8311
Chemistry Distribution
UNIVERSITY OF CALIFORNIA
Radiation LaboratoryBerkeley, California
Contract No. W-7405-enz-4G
CHEMISTRY OF +1 IODINE IN ALKALINE SOLUTION
Yuan-tsan Chi2-
(Thesis)
June 2, 1958
Printed for the U. S. Atomic Energy Commission

This report
sponsored work.mISSIon, nor any
was prepared as an account of Government
Neither the United States, nor the Comperson acting on behalf of the Commission:
A. Makes any warranty or representation, express
or implied, with respect to the accuracy, completeness, or usefulness of the information
contained in this report, or that the use ofany information, apparatus, method, or processdisclosed in this report may not infringe privately owned rights; or
B. Assumes any liabilities with respect to the use
of, or for damages resulting from the use of anyinformation, apparatus, method, or process dis
closed In this report.
As used in the above, "person acting on behalf of theCommission" includes any employee or contractor of the
Commission to the extent that such employee or contractorprepares, handles or distributes, or provides access to, anyinformation pursuant to his employment or contract with theCommission.

Abstract
. .
I.
II.
III.
IV •
-2-
CHEMISTRY OF +1 IODINE IN ALKALINE SOLUTION
Contents
Introduction
Apparatus and Equipment
Preparation and Analysis of Reagents •••••
+1 Iodine Species in Alkaline Solution - the Hypoiodite Ion.
(A) Preparation. • •
(B) Identification • • • •
(C) Absorption Spectra of 10-, C10-, I;, 10;, and I
(D) Discussion 0 • • • • • •
Page
4
5
6
10
12
12
15
17
29
The Injection Method • • • • • •
Results and Calculation of the Rate Constant for a
V. The Rate of Formation of 10
Solution • • • • •
(A) Introduction
(B)
(C)
from I and C10 in Alkaline
31
31
33
VI.
Typical Experiment • • • • • • • •
(D) Acid Dependence •••• • • • • •
(E) Rate Law ••••
(F) Discussion • • • •
Studies of the Equilibria Between 10 , I;, I , 120H-, and 12°=(A) Other Species •••••••••
1. The Presence of Triiodide Ion • • • • • • •
2. The Presence of 120H- ••••
3. Dependence of Effective Molar Absorptivity on
Hydroxide Concentration and Presence of 12°-
36
41
41
41
44
44
44
45
48

-3-
Contents
(continued)
(B) Calculation of the Equilibrium Constants from the
Discussion
1. Experimental Procedure
Spectrophotometric Results
EMF Measurements
58
67
76
76
78
80
82
- 1- - I Equilibrium3
Calculation of the Ionization Constant of HOI .
Discussion of the EMF Measurements
2. Measurement of 10
3·
4.
(C)
(D)
Acknowledgments •
Bibliography
85
86

-4-
CHEMISTRY OF +1 IODINE IN ALKALINE SOLUTION
Yuan-tsan Chia
Radiation Laboratory andDepartment of Chemistry and Chemical EngineeringUniversity of California, Berkeley, California
June 2, 1958
ABSTRACT
The iodine species formed either by adding hypochlorite to a basic
iodide solution or by adding triiodide to sodium hydroxide, was identified
as hypoiodite ion. The absorption spectrum of 10 was investigated in
the wavelength range from 450 ~ to 280 ~.
The kinetics of the reaction
I + C10 10 + Cl
was studied spectrophotometrically in alkaline solution. The forward
rate law was found to be
d(IO-)dt
k( 1- )(C10-)
(OH-)
o -1At 25 C and an ionic strength of 1.00 ~, k is 61 + 3 sec
It was found spectrophotometrically that for certain ratios of the
initial iodide to hydroxide concentrations, there was evidence of the
presence of 13, I 20H-, and 120 along with 10-. The equilibrium constants
between 10 and these three species were evaluated by a graphical method.
The formal potential of the cell:
1 M NaOH 1 ~ NaOH, KI, NaIO : Au
was found to be 1.297 V at 25°C. Th 'lOb' t t K (I-)(OH-)2/e equl l rlum cons an, 2 = 3
10 + 21 + 20H
calculated ,from emf measurements agreed well with that from spectro-
photometric measurements. The ionization constant of HOI was calculated
to be 2.3 x 10⁻¹¹ at 25°C.


-5-
I. INTRODUCTION
At first glance it might appear that an element known so long and
so intensively studied as iodine would re~uire no further discussion;
however, the a~ueous solution chemistry of this element in the +1
oxidation state has not been well defined. For example, no reliable
values of the ionization constant of HOI and the potential of the I - 10
suggested as one of the products
little evidence has so far been
couple in basic solution have been reported in the literature. In acid
+H2IO has been
. d' 1,2 t10 1ne, ye
solution the species
of the hydrolysis of
obtained for its existence. Because in a~ueous solution the o~gen
atom in the water molecule appears to be more negative than that in
hypoiodous acid, as judged from the ionization constants, it seems
~uestionable whether H2
IO+ does in fact exist in preference to H30+.
Therefore it is evident that further research will be necessary before
the +1 iodine chemistry can be considered well established.
Initially it was hoped that the species 10 and HOI of +1 iodine
could be prepared in alkaline solution and studied spectrophotometrically
to give the spectra and ionization constant of HOI. The spectrum of this
latter species could be used as a starting point for the spectrophoto
+metric investigation of H2IO .
The work reported here was carried on in alkaline solution and
consists of (a) the preparation and identification of 10-; (b) a kinetic
study of the formation of 10- from 1- and C10-; (c) spectrophotometric
studies of the e~uilibria between 10-, I;, I-, 120H-, and 12
0=; (d) emf
measurement of the I - 10 couple and (e) determination of the ionization
constant of HOI.

-6-
II. APPARATUS AND EQUIPMENT
All absorbances (optical densities) were measured on either a model
11, serial 4 Cary recording spectrophotometer or a Beckman model DU
spectrophotometer. The wavelength scale of the former was checked
against the emission spectra from hydrogen and mercury-discharge tubes
as well as the Fraunhofer lines in the spectrum of the sun. The wave-
length scale of the latter was checked against a mercury-discharge tube.
The solution samples were contained in quartz absorption cells while the
absorbances were being measured. The absorbance of a material was
obtained by running the spectrum versus air and then, using the same cell,
measuring the absorption due to the blank solution (in most ca~es water)
also versus air. Subtraction of the two absorption curves gave the
absorption due to the material in the solution. The scale of absorbance
on the Beckman Spectrophotometer could be read to 0.002, that of the Cary
to 0.005.
The emf measurements and the mixing process of all experiments were
carried out in a 250
C thermostated water bath, constant to + a.OloC.
The cell used in the emf measurements is shown in Fig. 1. It was
made of Pyrex glass with ground-glass joints. It was designed to measure
the potential of the 1 - 10 couple in the internal cell compartment
(A) with hydrogen electrodes (Bl
, B2
) as reference electrodes. The
hydroxide concentration in (A) was made the same as that in the external
cell compartment (C). Cell (A) was a glass container of about 50 ml
volume to level (D). The bottom part ,_' (E) of (A) was removable by
means of a ground-glass joint. The contact of the two half cells was
made through the thin film of liquid in the joint. Cell (A) had a
top with three openings (Gl
, G2
, G3
). Two of the openings were for the
-.....

M
-7-
MU-15403
Fi~. 1. The cell used in the emf measurements.

-8-
platinum and gold electrodes. The third one was for a funnel for trans
ferring solution, and was stoppered when not in use. The gold and platinum
electrodes were foils about 1 by 2 cm in area. They were cleaned by
dripping with freshly condensed CC14 vapor on the electrodes. The leads
from the two electrodes to the contact tubes were made long enough so
that the two electrodes and wires would be immersed below level (D) when
a 50-ml sample was put into (A). The leads from all electrodes (including
the two hydrogen electrodes) were sealed in solid glass and were connected
directly to the wire leads to the potentiometer, with no mercury being
used for making the contacts. In the case of the gold elec~rode, a gold
wire about 4 cm in length was used to connect the electrode to a platinum
wire, which was sealed into glass. The electrodes were stored in con
ductivity water when not in use. The volume of the solution put into
cell (C) was about 500 ml. The hydrogen inlet (Ql' Q2) and outlet (Rl ,
R2
) bubblers were about 30 ml in volume. About 20 ml of the same solution
as in (C) was put into both Ql and Q2' while about 10 ml was introduced
into Rl
and R2
• The level of the solution in Ql
was adjusted to equal
that of Q2
and that of Rl
to equal R2
•
The two hydrog~n electrodes were platinum foils of about 1 by 2 cm
in area. They were not prepared in an absolutely identical manner on
purpose. 3 The old platinum black was removed by dipping the electrodes
into aqua regia for a few minutes. The electrodes were platinized in a
2% platinic chloride solution containing 0.02% of lead acetate. 3 A
current density of 60 milliamp/cm2
was applied with gentle stirring and
a reversal of polarity every half minute. The total time used on
platinization was from 5 to 7 minutes. The electrodes were then
electrolyzed in a 0.2 ~ H2S0
4solution for half an hour with the same

-9-
procedure as used in platinization. Finally the electrodes were soaked in
conductivity water for about an hour before they were put into the cell.
The potential of the cell was measured with a Rubicon type-B, high
precision potentiometer with a dc spotlight galvanometer (sensitivity
0.01 ua/mm, period 4.0 sec, and critical-damping resistance 190 ohms)
for indication of the null point. The potentiometer was checked against
a Weston standard cell from time to time during an experiment~
A stopwatch that could be read to 1/5 sec was used for all the
experiments to record time. The time record was supplemented by the
use of the running speed of the spectrophotometer's chart paper, which
was found to be 5.00 ~ 0.02 sec per division.
The apparatus used in the "injection method" will be reported under
that subject.

-10-
III. PREPARATION AND ANALYSIS OF REAGENTS
Conductivity water, prepared by redistilling distilled water from
alkaline permanganate solution in a Barnstead still, was used for making
all solutions. All solid chemicals were reagent grade.
The hypochlorite solution was prepared by passing tank chlorine into
a standardized sodium hydroxide solution, until the pH of the solution
was about 12 (measured with a Beckman model-G pH meter). The concentration
or the hypochlorite solution was determined iodometrically by forming
triiodide from hypochlorite and iodide in a dilute sulfuric acid solution
and titrating the triiodide with standard sodium thiosulfate using starch
as the indicator. The concentration of iodide ion and hydrogen ion were
both adjusted to 0.1 ~ for the titration. The sodium thiosulfate solution
was standardized against potassium iodate. The concentration of hypochlo
rite solution was usually checked before each experiment. At most, a very
slow decrease in concentration was found.
The sodium hydroxide solution was prepared by diluting saturated
sodium hydroxide with cold, freshly boiled conductivity water. It was
standardized against a standard hydrochloric acid solution.
The iodide solution used in all experiments was freshly prepared by
dissolving a weighed amount of potassium iodide in the desired amount of
water. Potassium iodide was used in most of the experiments. When NaC104
was used to keep the ionic strength constant, sodium iodide was used.
The sodium perchlorate solution was prepared by treating analytical
grade sodium carbonate with a small excess of double-vacuum-distilled
perchloric acid. The solution was boiled to expel carbon dioxide, and
the acidity was adjusted to a pH of 5 or 6 with a pH meter by addition
of carbonate-free sodium hydroxide. The resulting NaC104 solution was

-11-
standardized by evaporating ali~uots to dryness in a platinum crucible
oand weighing as NaCI04 after drying at 150 C for 2 hr.
The sodium chloride solution used in adjusting the ionic strength
owas prepared by drying "Mallinckrodt" analytical reagent salt at 110 CJ
then dissolving a weighed amount of the salt i,n the desired amount of
water.
The triiodide solution was prepared by weighing solid iodine in a
concentrated potassium iodide solution, and diluting the triiodide
solution with desired amount of water. Ali~uot portions of the resulting
solution were titrated against standard sodium thiosulfate solution with
both concentrations of iodide and hydrogen ion adjusted to 0.1 M. The
concentration compared well with that calculated from the initial
weighing.
Very pure hydrogen, prepared by electrolysis of water and passed
over platinum sponge and hot nickel catalyst, as well as through a cold
trap, was used.
The alkaline pyrogallol solution used was made by dissolving 15 g
of pyrogallic acid in 100 ml of 50% KOH solution.

-12-
IV. +1 IODINE SPECIES IN 1 M OR SOLUTION - THE HYPOIODITE ION
(A) Preparation
It has been reported that hypoiodite ion can be prepared by mixing
triiodide ion with an alkaline solution. 4,5,6 Comparing the oxidation
potential of the Cl and CIO couple to that of I and 10-, one predicts
the formation of 10 by the reaction of I and CIO-. In this investigation
both methods were used to prepare 10-.
(1) Experimental Procedure
(a) The mixing process. A measured volume of the basic iodide
solution (no iodide was present in the case of 10- prepared by r; + OR-)
of known concentration and a standardized solution of hypochlorite
(or I;) were placed in separate glass-stoppered flasks and were brought
to 25.00 ~ O.OloC by immersion in a. thermostated water bath for over an
hour. The flasks were covered with aluminum foil to exclude light.
Added chloride ion or perchlorate ion was contained in the flask of
basic iodide solution for experiments in which the ionic strength was
kept constant. The reaction was started by adding the desired volume
of CIO- (or I;) through a calibrated pipet to the basic iodide (or OR
only) while the latter was being stirred vigorously by an electric
stirrer. The pipet used for some of the experiments had a delivery time
of less than 5 sec. The zero time was taken at the start of the addition
~
of CIO (or I;). Experiments were done with reversal of the order of
mixing (i.e. by adding 1- to CIO-), but no effects were observed.
(b) Spectrophotometric measurements. A pipet with a large opening
at the delivery end was used to transfer the reaction mixture from the
mixing flask to the absorption cell, which had been placed in the cell
compartment before the mixing process. The volume of the pipet was

-13-
slightly larger than the volume of the absorption cell used and the wide
open orifice just fitted the opening of the cello The time required from
the zero time to the first spectrophotometric measurement was usually
about 1 min.
To make the spectrophotometric measurements) the air blank was
checked first. The recording of the absorption spectrum of the sample
solution usually was started at 400 ~ and went down in wavelength to
where the absorbance exceeded 3.4) usually between 240 ~ and 280 ~.
The scanning was repeated at appropriate time intervals. For experiments
in which the disproportionation of hypoiodite ion was rapid) the
spectrophotometric scannings were carried on one right after another.
(2) The Absorbance-time Curves for a Typical Experim~nt
The values of the absorbance of the sample solution (i.e. the
difference between the observed absorbance and the absorbance of
conductivity water) at one wavelength was plotted against time) the
absorbance of the sample solution at zero time at that wavelength was
obtained by extrapolation; The absorbance-time (A-t) curves at 400.6 ~
and 360.5 ~ for a typical experiment are shown in Fig. 2.
(3) The Solid Iodine Method
Attempts were made to prepare 10 by the hydrolysis of solid iodine
in alkaline solution. A wide-mouth reaction flask which contained the
desired volume of standard sodium hydroxide solution was thermostated
in a 25.00 ~ O.Oloe water bath for over an hour, then a freshly weighed)
well-ground sample of solid iodine in a weighing bottle was held barely
above the solution level of the reaction flask. The weighing bottle
had a wide mouth and was very short 0 The reaction was started by opening
the stopper of the weighing bottle and quickly pouring the solid iodine

-14-
A
0.5
0.4
0.3
0.2
0.1
16012080
t (min)40o
OL-...I-_--J__....L..._-l.__..L-_--L__..L-_--I...._---l---J
MU-15404
11112 2.bsorbaIlce-tinl~
(::::xperiment I-J-6).curve for a ty~ica1 experiment
Curve 1 A = 400.6 ~ ;Curve 2 A = 360.5 r~.
-15-
into the reaction flask while the latter was being stirred. The stirrer
was temporarily stopped for a second or so to drop the empty weighing
bottle and stopper into the reaction flask. The zero time was recorded
as the time of adding the solid iodine. By experience, the time required
for the disappearance of 1 g of solid iodine in 500 ml of 1.00 M OR
was about 40 sec; therefore this was the time allowed in experiment
III-M-l before a sample was taken out for spectrophotometric measurement.
The initial concentration of iodine of that experiment was 0.01007 ~
and that of OR was 1.020 M. The extrapolated value of the absorbance
at zero time at 400.6 ~ from the A-t curve was found to be 0.200.
(B) Identification
In order to make sure that the iodine species prepared by the two
methods mentioned above (i.e. I; + OR- and I + CIO- + OR-) was in the
+1 oxidation state, a series of experiments was run keeping the initial
hydroxide concentration at 1.000 ~ and varying the concentrations of I
as well as CIO-. The results are listed in Table I. The headings are
self-explanatory except for E, which is defined as the effective molar
absorptivity (Extinction coefficient), or E = A /bL, where A represents0_0
the absorbance at zero time, L is the initial concentration of CIO
(or I;) in moles per liter, and b is the length in centimeters of the
cell used in that experiment. The uncertainty of the value of € depends
on the initial slope of the A-t curve and how soon the first point was
measured. The rates of disproportionation of 10 of all experiments of
Table I were not too fast to permit a fairly good extrapolation. The €
values at 400.6 ~, 360.5 ~ and 320.1 ~ are believed to be accurate
within 3%, and that for 289.9 ~ may be somewhat more uncertain. The
values of € in Table I at the four wavelengths were plotted against

-16-
Table I
The effective molar absorptivities at zero time of solutions
of iodide oxidized by hypochlorite*
No. ofExp'to
(CI0-) .In
(xl03 !i)
(1-)in
(CI0-).In
CellLength
(em)
-400.6 -360.5 -320.1 -289.9E E E E
10000 1.109
20500 1.387
4.000 20218
3.141 **40742
8.950 4.964
3.676 **50030
3.655 **5·030
1I-C-2 6.000
II-C-l 4.000
1-J-6 10.00
III-P-l 90017
1I1-A-3 1.803
II1-A-4 1.803
+1II-G-5 1.803
III-H-I 1.803
+III-G-3 1.810
+III-G-4 1.800
20000
20000
10000
0·3333
0·5000
10000
5
5
1
1
5
5
5
5
5
5
12.1 24.5 130.0 276
17.9 3105 116.6 260
3805 57.1 4706 134.3
38.8 5808 4902 141.0
3707 5704 47.4 129.5
3706 5800 48.0
38.3 56.0 46.8 13202
40.5 61.0 48.7 140.0
3802 5608 4609 13603
3800 59.0 51.9 14308
+The reported value is initial triiodide concentration.
**The reported value represents [(1-). + 3(13-), ]/(1
3-), .
In In In

-17-
~4~. The subscript "in" indicates initial concentration in moles per litero
All four plots show that the effective molar absorptivity varies linearly
with respect to (1-). /(C10-). from zero to the point where the ratio ofIn In
(C10-) to (1-) was 1; then when the ratio changed from 1 to 5, the values
of € remained constant within experimental error. The break at the point
where (1-). /(CIO-). = 1 gives evidence that the main species formed inIn In
both methods of preparation was in the +1 oxidation state. It will be
shown later that this species is 10 •
(c) Absorption Spectra of 10-, C10-, 1;, 10;, and I
(1) The Absorption Spectrum of 10
The molar absorptivity of 10 at wavelengths other than 400.6 ~
was calculated by using the A-t curve at 400.6 ~ and the following equation:
(1)
The superscript indicates the wavelength in millimicrons and the subscript
the time after mixing. The spectrophotometric results of Experiment I-J-6
were used for the calculation and are listed in Table II. The values of
the molar absorptivity of 10 at 360.5 illj.1.' 320.1 ~ and 28909 illj.1 calculated
from Eq. (1) agree with the corresponding extrapolated values from the
A-t curves at those wavelengths within experimental error. This gives
justification for the use of Eq. (1) to calculate the values of A foro
those wavelengths at which no A-t curves have been plotted. The
absorption spectrum of 10 from 450 illj.1 to 280 illj.1 is shown in Fig. 5).
(2) The Absorption Spectrum of CIO
The absorption spectrum of C10 was studied by measuring the
absorbances of standard CIO solutions with the Cary recording spectrophotometer

70
600
0 0
2 0
50
40 0
0
E30
20
10
0
3.0 4.0 5.0
(1-) in/ (C 10- )inMU-15405
Fig. 3. Plot of E vs (1-). 1/(C10) .•In In
Curve 1 A = 400.6 ~ ; Curve 2

E
350
300
250
200
150
100
50
-19-
MU-15406
Plo'c of E vs (1-). / (ClO-) ..J_D lD
Curve 1 A, = 320.1 TI1jJ.; Curve 2 2i39·9 TI1jJ..

-20-
Table II
The molar absorptivities of hypoiodite and hypochlorite ions
A CIO - cCI0-(~)
450·3 9·45
42504 20.0
400.6 38.5 0·510
393.0 4507 0·730
382.2 54.7 1.580
371.6 5906 3.86
360.5 5701 9080
350.8 53·9 22.8
340·5 49.6 52·9
330.2 4707 102.8
320.1 4706 178.0
310.0 5403 266
299·9 79·6 337
289·9 134.3 356
280.0 224 304
270.0 201
260.0 104·5
250.0 4400
240.0 17.41

-21-
100
80
60E
40
20
10
8.0
280 300 320 340 360 380 400 420 440
A(mJL)MU-15407
Fig. 5. The absorption spectrum of hypoiodite ion.

-22-
in the wavelength range from 400 ~ to 240 ~o The values of the molar
absorptivities are listed in Table II and the absorption spectrQm is shown
in Fig. 6.
The absorption spectrum of CIO was previously studied by Friedmanj7
however, in order to obtain more precise values of the molar absorptivities,
it was considered desirable to investigate it again. Over the wavelength
region from 340 ~ to 270 ~, the shape of the absorption curve from
Friedman's results agreed with that from this investigation, but the
molar absorptivities from the plot given by Friedman were about 10%
lower than those obtained in this work. Then from 260 ~ to 240 ~
Friedman's results of the molar absorptivities became higher than the
values reported here. The discrepancy at 240 ~ was about 50%.
(3) The Absorption Spectra of 10; and I
Awtrey and Connick studied the absorption spectra of 10; and I in
( 6 -) 8the wavelength range from 215 ~ to 270 ~ or 2 °~ in the case of I •
Because both I and 10; are the final products of the disproportionation
of 10-, it was thought worthwhile to study the absorption spectra of these
two ions in the wavelength range from 280 ~ to 400 ~, which is the
region where this investigation has been conducted. These spectra were
investigated by measuring the absorbances of the solutions of potassium
salts of known concentrations with the Beckman model DU spectrophotometer.
The solutions had been centrifuged before they were introduced into the
absorption cells. In the case of iodide, several solutions were prepared
from KI salts of different manufacturersj these were potassium iodide
solutions with or without trace amounts of S20;J KI in 1.000 ~ OH-,
and KI in 1.000 M KClo Due to the very small absorptions of iodide in
this wavelength range, and the possible contamination by trace amounts

-23-
100
50
E
10
5.0
1.0
0.5
320 360 400
>dmfdMU-15408
Fig. 6. The absorption spectrum of hypochlorite ion.

-24-
of I; in some of the above cases, attempts to get accurate values of
EI
- at the higher wavelengths were not successful. Therefore only upper
limits of EI
- are given in Table III from 290 ~ to 320 ~o From 330 ~
to 400 ~, the value of EI
- was found to be less than 0.006. Because of
the same difficulties of small absorbances, only upper limits of the
absorptivities of 10; are listed in Table III from 290 ~ to 340 ~.
(4) The Molar Absorptivity of I; and Its Linear Variation with (1-)
) 8The absorption spectrum of I; was studied by Awtrey and Connick
in I; solutions containing 0.049 ~ r- from 270 ~ to 590 ~o For
studies to be drscussed later, it was necessary to measure the absorption
spectrum of triiodide ion as a function of iodide concentration.
(a) Experimental procedureo Five aliQuots of standard triiodide
solution were diluted with conductivity water containing different
weighed amounts of potassium iodideo The concentration of I in the
final solutions ranged from 001 ~ to 1 Mo The dilute triiodide solution
was transferred to a gas-washing bottle and was maintained at 25000 +
O.Oloe in a water bath for about I hro During this period, carbon
dioxide gas was passed slowly into the air space over the solution in
the washing bottle to avoid air oxidation 0 Finally the washing bottle
was shaken, and a sample of the triiodide solution was introduced into
a l-cm ground-glass-stoppered Quartz cell for spectrophotometric measure-
mento The cell was filled as completely as possible to avoid air. The
absorption spectra from 400 ~ to 280 ~ of these triiodide solutions
were measured by the use of the Cary recording spectrophotometer. The
values of absorbances at 400.6 ~ and 36005 illM were checked with the
Beckman model DU spectrophotometer 0 A constant-temperature cell holder

-25-
Table III
The molar absorptivities of iodide and iodate ions
A. €I- x 103€IO- x 102
(~) 3
340.4 < 3
330·3 < 3
320·3 < 8 < 4
310·3 < 10 < 7
300.2 < 15 < 20
290.2 < 29 < 100
280.1 161 520

-26-
was used with the latter to keep the temperature of the cell compartment
oat 25 C. No deviation was ever found in the results of molar
absorptivities at 360.5 ~ and 400.6 ~ from the two different machines.
(b) Results. From the above experiments it was noticed that at
different iodide concentrations the absorption peaks of r; remained
at the same wavelengths, but the molar absorptivities (after correction
for the absorption due to r-) varied with the iodide concentration.
The values of cr - at 400.6 ~, 360·5 ~J 320.1 ~, and 289.9 ~ were3
plotted against r- concentration. A straight line was obtained within
the experimental accuracy at each of the four wavelengths. The plot at
360.5 ~ is shown in Fig. 7. As a conse~uence, the molar absorptivity
of r; can be expressed as
where cr- is the molar absorptivity of r; at zero iodide concentration30 (
and a is a constant. The values of cr - and a at the four wavelengths3
mentioned above are reported in Table I&.

-27-
Table IV
Parameters for the equation:
E - x 10-31
3o
400.6
360.5
320.1
289·9
5·99
24.6
14.0
40.0
1.93
4.1
2.1

-28-
2.9
2.8
2.7
orI
oXIII
2.6
2.5
o 0.2
MU-15409
Fig. 70 Plot of E of I; vs iodide concentrationo
A. = 36005 lllf-lo

-29-
(D) Discussion
As indicated in Table I as well as in Figs. 3 and 4, the effective
molar absorptivities obtained from preparing 10 by the hydrolysis of
I; in alkaline solution agreed very well with those obtained from
mixing CIO in base with iodide. However, when solid iodine was dissolved
into LOOO M OH as a thi.rd method of preparation) the absorbance at
zero time at 400.6 ~ from the extrapolation of the A-t curve was only
a little bit over half of the values from the two other methods. This
observation was reproducible and was also true at other wavelengths.
Nevertheless the shape of the absorption spectrum from the solid iodine
method was the same as those from the other two methods. It is inferred
that the absorbing species produced by the solid iodine method was also
10-) but the concentration of it at the so-called "zero time" was smaller
than in the other two cases. A possible explanation for this difference
was thought to be related to the dissolution process. During the
process of dissolving solid iodine in alkaline solution there would be
a considerable decrease in basicity at the surface of the iodine
because hydroxide ion is consumed. As the hydroxide concentration
decreases) the rate of disproportionation of 10 increases) so that
it is likely that appreciable disproportionation occurred during the
dissolution.
The absorption spectrum of 10 in the wavelength range below
280 ~ has not been carefully studied in the present investigation)
because difficulty was experienced in using a l-rnm absorption cell to
study spectrophotometrically an 10 solution that had the same initial
concentrations of OH-, CIO-, and I as those in Bxperiment I-J-6 of
Table I. The rate of ~he disproportionation of 10 shown from the A-t

-30-
curve when a i-rom cell is used was found to be about ten times faster
than that shown with a l-cm cell, while all the other conditions were
the same. Experimentally it was found that the effect of surface
catalysis on the disproportionation of 10 and the surface effect on
the mixing process were both negligible by comparing the behavior of
stirred and unstirred solutions. It was observed, however, that light
speeds up the disproportionation. The effect of ultraviolet light on
the rate of the disproportionation was inversely proportional to the
amount of material present. The thicker the cell, the more hypoiodite
present and the smaller the light effect. For this reason, the flask
of C10- (or I;) and the flask where the mixing process took place
were always covered with aluminum foil.
The absorption spectrum of I; was found to be a linear function
of the I concentration in the wavelength range from 400 ~ to 280 ~'
Whether this was due to the presence of another species or was simply
a "solvent" effect caused by changing iodide concentrations cannot be
stated at the moment. The solid circle in Fig. 7 was the value from
Awtrey and Connick8 and was found to be in good agreement with the
extrapolated value from this work.

-31-
v . THE RATE OF FORMATION OF 10 FROM I AND CIO IN ALKALINE SOLUTION
(A) Introduction
During the investigation of the absorption spectrum of hypoiodite ion
at initial iodide a;nd hypochlorite concentrations of both 2000 x 10-3 ~
or lower and 10000 M OH- J an unusual phenomenon was observedo As shown
in Fig. 2) ordinarily the absorbance that was due to 10 decreased with
timej however in this unusual case, a maximum absorbance at 40006 IIlj.J.
and 360.5 IIlj.J. was found about 6 min after the CIO was added 0 This
phenomenon was not observed at 320.1~. The absorption curves from
400 IIlj.J. to 280 IIlj.J. at times after the time of appearance of the maximum
matched well with the absorption spectrum of 10 obtained previouslyo
The appearance of the maximum absorbance was reproducible and was present
when the initial hydroxide concentration was changed to 00500 M. It
was also found that sodium hydroxide from different manufacturers gave
the same phenomenon. Table V summarizes the experimental results at
400.6 IIlj.J. and 360.5 IIlj.J. of those experiments that gave absorbances with
maxima. In order to minimize the effect of any impurities in the reagents
at these quite low CIO and very high OH- initial concentrations} a
hypoiodite solution was prepared under the same cond.itions as those in
Experiment II-B-l of Table VJ and let stand. at room temperature in the
darkness for 125 hrso At the end of this period) a sample of this
solution was tested spectrophotometrically to make sure that almost all
the hypoiodite ion had been disproportionatedo A desired. amount of CIO
solution was added to a measured volume of the aged solution. The
s~ectrophotometric data were obtained as usual and again the maximum
was observed (Experiment IV-A-2-c of Table V)o

-32-
Table V
Lower limits of E for experiments showing maxima
in the absorbance vs time plots
Exp1t (clo-L (I-) . (OH-). Cell 40006 360·5ln ln ln length(x 103 !i) (x 103 M)
- -Noo (!i) (em) E E
II-B-l 20000 20000 10000 .5 > 3604 > 5500
III-R-l L803 20000 10000 5 > 3800 > 57·4
III-A-l L803 10500 10000 5 > 3005 > 4602
II-W-l 2.000 20000 0·5000 5 > 35·9 > 5601
IV-A-2-c 20000 L856 009346 5 > 37·4 > 55· 7

-33-
The A-t curves at 400.6 ~ and 320.1 mu of Experiment IV-A-2-c
are given in Fig. 8. By comparing the molar absorptivities of 10
(Table II) at 400.6 ~ and at 320.1 ~ to those of CIO-, one notices
that at 400.6 ~ 10- absorbs much more strongly than CIO-, but at
320.1 ~ the molar absorptivity of CIO is greater than that of 10
Therefore, the simplest explanation of the maxima is that the rate of
formation of 10 from I and CIO is measurable under the conditions
used in all experiments of Table V. Accordingly it seemed desirable
to investigate further the rate of this reaction. In order to get
fast and adequate mixing, the injection method, which had been used
by Stern and DuBois9 as well as by BelowlO was chosen to study this
reaction.
(B) The Injection Method
(1) Apparatus
The absorption cell used for mixing and observation was the same
10as that used by Below. It was a (2.15 + O.Ol)-cm cylindrical cell
made of Pyrex with quartz windows. It had a neck about 2 cm in diameter
and 2.5 cm high to avoid splashing of liquid. The cell capacity (to
the lower end of the neck) was about 9 ml. The length of the cell was
checked by calibrating it against another 2-cm cell using a dilute
potassium chromate solution.
As was found by Below, too large a needle bore gave poor results
because the flow velocity is too small for adequate mixing.10
On the
other hand, too small a needle made it impossible to deliver the 2 ml
of solution in less than 1 sec without rupturing the syringe. As in
Below's work, a #16 hypodermic needle was used for all the experiments
in this investigation without any attempt to use other kinds of needles.

-34-
A
O'~
0.4
0.3
0.2
o 40 80
t (min)MU-15410
Fig. 8. The absorbance-time curve of Exneriment IV-A-2-C of Table V.Curve 1 ~ = 400.6 ~ Curve 2 ~ = 320.1 ~.

-35-
The syringe was carefully lubricated with Kel-F #90 grease before
each run. To prevent contamination of the reagent by grease in the
syringe, the latter was lubricated with as little grease as possible
only in the part higher than the 2.5-ml mark. However, it was found
that too thin a layer of grease caused the formation of bubbles during
the mixing and thus gave erroneous spectrophotometric results.
No reaction between the #16 stainless steel hypodermic needle and
the basic hypochlorite solution could be detected spectrophotometrically.
This was tested by immersing the stainless steel hypodermic needle in a
basic CIO- solution (0.500 ~ OH- and 0,010 ~ of CIO-) for over an hour.
The absorption spectrum of the CIO solution was examined before and
after the I-hr immersion. No difference in the shapes of the absorp
tion curve or the absorbances was found. Therefore the reaction
between CIO and the stainless steel hypodermic needle was negligible,
(2) Experimental Procedure
Eight ml of solution with the desired concentrations of OH and CIO
were pipetted into the 2.15-cm cell wh~ch had been previously air-dried.
The cell with its contents was placed in the cell compartment of the
Cary recording spectrophotometer. The wavelength scale was set at
400.6 ~, the room was darkened, the cover of the cell compartment was
removed, and the absorbance of the basic CIO solution was measured
for use as a blank for the later calculation. Basic iodide solution
with the desired concentration of iodide and the same hydro~ide con
centration as that of the solution in the cell was carefully introduced
into the hypodermic syringe through the needle. When it was certain
that there were no bubbles in the syringe, the volume of this basic
iodide solution was adjusted to the 2,O-ml mark. With the cell set

-36-
in the light path and with the Cary spectrophotometer's master switch
turned on (i.e. tee switches controlling the slit) pen) and chart were
all on)) the basic iodide solution in the syringe was injected into the
cell manually. The syringe was held in such a position that the needle
was just below the surface of the solution in the cell and barely out of
the light path. The measurement of absorbance was carried on as a
function of time usually over an hour.
The zero time was taken as the time at which the absorbance on the
spectrophotometer chart started to rise. The times of other points on
the absorption curve were calculated on the basis of the running speed
of the chart.
For experiments to investigate the hydroxide dependence of the rate)
NaCl was used to keep the ionic strength at 1.00 ~) with chloride solution
added to both the syringe and the cell solutions.
No effect of reversing the order of mixing was detected by injecting
basic C10 solution into a basic iodide solution in the cell.
(C) Results and Calculation of the Rate Constant for a Typical Experiment
The absorption curves shown on the Cary spectrophotometer chart
from the runs made by the injection method described above were very
smooth curves. They started from a point with an absorbance eQual to
that of the blank solution) gradually reached a certain value of
absorbance) and remained constant for a period of time before decreasing
again.
Figure 9 shows the plot of absorbance versus time for Experiment
Here k is defined as the rate constant of the formation ofIV-K-l-b.
10 from I and C10 The calculation of k for Experiment IV-k-l-b is
listed in Table VI. The first column records the time in seconds. The

-37-
0.160
0.120
0.080
A
0.040
t (sec)MU-15411
Fig. 9. The absorbance-time curve of Experiment IV-K-l-b.A. := 400.6 lTIjJ..

-38-
Table VI
Calculation of k for a typical experiment
(Experiment *IV-K-l-b of Table VII)
Time A (10-) (1-) = (OC1-) d(IO-)jdt k
(sec) (x 103 !'i) ( x 103 M) (x 104
) (-1 -1!'i sec )
2.0 0.026 0·314 1.686 1,752 61. 7
3·0 0.035 0.423 1·577 1.493 60.1
4.0 0.044 0·531 1.469 1.257 58.4
5·0 0.054 0.652 1·348 1.118 61.5
6.0 0.064 0.773 1.227 0·920 61.2
8.0 0.082 0·991 1.009 0.619 60.9
14.0 0.105 1.269 0·731 0.326 60.6

-39-
second column represents the observed absorbance with correction for the
blank. The third colQ~n gives the concentration of 10 in moles per liter
calculated from the absorbance by the use of
(10-) = Alb Ei~~·6
400.6where E
IO- is the molar absorptivity of 10- at 400.6 ~, and b is the
cell length. During the period of first 14 sec, which was the time
interval used in Table VI to calculate k, the rate of disproportionation
of 10 was negligible. The values oP the iodide concentrations in the
fourth column were obtained by subtracting the 10 concentrations from
the initial iodide concentration, and were assumed to be equal to that
of C10-. From the slope of the A-t curve in Fig. 9 at time t, the value
of d(IO-)/dt was calculated and reported as such in the fifth column.
The values of the rate constant k in the last column were defined as
k = 1
The uncertainty of the average value of k was estimated from all possible
experimental sources of error as well as from the uncertainty in measuring
the slope. The uncertainty of the recording of zero time and its effect
on the calculation of k should be pointed out. The time required for
complete mixing is unknown. Therefore the zero time, which was taken as
the time when the absorbance on the spectrophotometer chart started to rise,
might not be the true zero time if the mixing is not instantaneous.
Because it is very hard to tell what the true zero time is, the values
iof k of all experiments using the injection method were calculated by
measuring the slopes of the A-t curve at individual times in order to
minimize effects of the accuracy of zero time on k.
The values of k from other experiments with different initial con~
centrations of C10-, r- and OH- are listed in Table VII. All the headingsin the latter are self-explanatory.

-40-
Table VII
Rate data on CI0 - I reaction from injection method
Exp't. (CI0 -) . (I-)in (OH-) . (Cl-) . k k x(OH-).In In In In
(x 103 !i) (x 103 !i) (!i) (!i) (!i-l -1 ( -1No. sec ) sec )
IV-G-l-d 4.00 2.00 1.00 0.004 60.3 + 5 60·3 + 5
IV-J-l-c 2.00 4.00 1.00 0.002 62.7 ~ 5 62.7 ~ 5
IV-K-l-b 2.00 2.00 1.00 0.002 60.6 ::!:: 5 60.6::!:: 5
IV-K-2-a 2.00 2.00 0·500 0·502 116 + 10 58.0 + 5
IV-K-3-c 2.00 2.00 0.250 0·752 234 + 20 58.5 ::!:: 5

-41-
(D) Acid Dependence
As shown in the last column of Table VII, the values of k x (OH-)in
of all experiments using the injection method remained constant within
the experimental error. This indicates that the rate of the formation
of 10 from CIO and I in alkaline solution is inversely proportional
to the hydroxide concentration.
(E) Rate Law
As indicated in Table VII, in 1.00 M OH solution, when the ratios
of the initial concentration of CIO to that of I was changed from
experimental error.
, remained constant within the(I-)(CIO-)
Therefore the rate of formation of hypoiodite from
1 or 1 : 2, the Jrate' constant, which was calculated by
d(IO-) 1 ___= dt x
1 : 1 to 2
assuming k
hypochlorite and iodide in 1.00 ~ hydroxide solution is first-order
dependent on both hypochlorite and iodide concentrations. Moreover,
as described above, the rate was found to be inversely proportional to
the hydroxide concentration. As a consequence the rate law can be
expressed as
= k(I-)(CIO-) ,(OH-)
6 -1where k has the value 1 + 3 sec at an ionic strength of 1.00 M at
(F) Discussion
Many reactions between ions of like charge are catalyzed by ions of
opposite charge. Proton catalysis of reactions between anions, like the
one studied here, might be ascribed to this phenomenon. Two mechanisms
with the reaction between HOCl and I as the determining step were
considered to be possible for the formation of 10 from I and CIO-o

-42-
The first mechanism can be expressed as follmls:
CIO + H2O > HOC 1 + OH (rapid equilibrium) ,<
HOCI + Ik
HOI + Cl (rate determining),>
HOI + OH > 10 + H2
O ( fast)<
In this mechanism I attacks the OH of HOCI so that oxygen transfer occurs.
This mechanism is analogous to the mechanism suggested by Farkas, Lewin,
and Bloch for the formation of BrO - - 11from CIO and Br. The latter
12reaction was also discussed recently by Anbar and Taube.
The other mechanism, which includes the attack of I on Cl of HOCl,
might be
HOCI + I
---'><'----k---'>
HOCl + OH
ICI + OH
(rapid equilibrium),
(rate determining),
ICI + 20H ---><---' 10 + Cl + H2
0 (fast) .
The rate-determining step could be thought of as a nucleophilic displace
ment of hydroxyl ion by the 1-.13
In view of the composition of the activated complex (HOCII)- of
the reaction studied, the only reasonable place for the proton in the
activated complex is on oxygen. 12 According to either mechanism, the
+role of H is to labilize the oxygen-chlorine bond. It is hard to tell
which one of the two mechanisms would be more favorable. Anbar and
Taube pointed out from their results of the rate of exchange of oxygen
between BrO and water in alkaline solution that the rates of attack of
12Br in HOBr by Br and Cl are about equal. However the specific rate
(1.77 x 10⁵ M-l
min-l
at zero ionic strength) for Br reacting with
HOCI is almost 20 times that for Cl substituting on Cl in HOCl. ll ,12

-43-
Because of this relatively higher rate for Br reacting with HOC1, they
suggested that it is more likely that bromine attacks the oxygen of HOC1,
The specific rate (k) for I reacting with HOCl can be calculated from
our
and
investigation by finding
~20H20 < > H+
the difference between
+ OH
~OClHOCl <_. > H+ + C10 ( -8)~OCl = 3044 x 10 ,
CillK'
+ H20 <------> HOCl + OH
which is (Eq.(2)- Eq. (3)>, where K' = (HOC1)(OH-)/(C10-) = 2091 x 10-7•
From the rate law of the formation of 10 from I and C10-, one obtains
d(C10-) 61 (I-)(C10-)k(HOC1)(I-).= -
dt (OH-)
Therefore k = 61/K' 2.10 x 10⁸ M-l -1 6 10 -1 -1= sec = 1.2 x 10 M min 0 By
comparing the value of k with the corresponding result for Br from
Farkas, Lewin, and B10Ch,11 one concludes that I reacts with HOC1 about
7 x 10⁴ times faster than does Br- (i.e. almost 106 times faster than
does Cl-). If one accepts the above-mentioned suggestion made by Anbar
12and Taube, this much higher rate for I reacting with HOCl would
strongly indicate that iodine attacks the oxygen of HOC1.

==VI. STUDIES OF THE EQUILIBRIA BETWEEN IO-, I y I , 120H-, and 1
20
(A) Other Species
(1) The Presence of Triiodide Ion
In addition to the species later identified as 10-, it was evident
from the spectra that other species were sometimes present. During the
investigation of the rate of disproportionation of 10 -; it ,vas observed
spectrophotometrically that when the initial hydroxide concentration
was lower than 1 M and the iodide concentration was equal to or higher
than 0.1 ~, an appreciable amount of I; was presento The presence of I;
in some cases could be detected by just looking at the absorption curve
from the Cary spectrophotometer charto For example, under the condition
(Experiment II-H-5), the characteristic absorption peak of I; at 35300 ~
8was shown very clearly on the charto Therefore; it seemed worthwhile
to study the follmring equilibrium:
10 + 21 I; +- 20H-;-'
(4)
When hypoiodite ion was produced with an initial iodide concentration
of 1.0002 ~, hydroxide concentration of 0.0500 ~J and hypochlorite con
~4centration of 2.00 x 10 ~,the majority of the absorption was due to
1;0 However the ratio of the absorbances at zero time at 360.5 ~ and
400.6 ~ was found to be 3.63} which is smaller than the value calculated
- 8from the known molar absorptivities of 13
, Therefore the absorption
spectrum of pure I; was measured in a 1.000 M I solution, and it was
36005 / 400.6 6found that the value of Er - . EI~ was equal to 3. 2. As a consequence,_ 3 3
the 13
absorption spectrum was studied as a function of iodide concentration

as reported in Part IT J and molar absorptivitj,es were obtained as a function
of the I concentration 0
(2) The Presence of 120H-
The first attempt to study the e~uilibrium constant K2
of E~o (4)
was made under the assumption that +1 iodine and IS were the only two
iodine species present as the product of the reaction between I and CIO-o
However, when the dependences of the e~uilibrium between +1 iodine and I;
on the concentrations of OH as well as I were studied spectrophotometrically,
it was found that the data could not be fitted assuming the +1 iodine species
to be 10-0 Some preliminary results indicated that the ratio of I; to
+1 iodine might depend on the inverse first power of the hydroxide con-
centration and the s~uare of the iodide concentration, corresponding to
the e~uilibrium:
HOI + 21 I; + OH
On the basis of this assumption, the hydrolysis constant of iodine could
be calculated by adding algebraically Eqso (5), (6») and (2),
1- + OH HOI + 21 (5 )3
12 + I - I; (6)
H2
O + (2)"" H + OR
The summation is
HOI + I
The value for the hydrolysis constant thus obtained was about one hundred
> • 2 15 16 17 .times greater than those reported In the Ilterature j ' " thus rullng
out HOI as the principal +1 iodine species in 1 ~ hydroxideo Finally it
was concluded that the assumption of only two iodine species in addition
to I was erroneous.

-46-
As a second approach J spectrophotometric runs over a considerably
larger range of I and OH concentrations were done. The experimental
procedure and the method for getting the values of the effective molar
absorptivities at 400.6 ~, 360.5 ~, 320,1 ~ and 289.9 ~ were the
same as described in Part IV. The results are listed in Table VIII
with (1-) and (OH-) representing the concentrations of I and OHo 0
respectively after mixing. The values of Ewere plotted against the
values of (I-)o/(OH-)o on logarithmic paper. The solid circles
represent experiments with the initial hydroxide concentrations equal
to 0.1000 ~, and the open circles are experiments with concentrations
other than 0.1000 M. (For reasons which will be clear later, the
curves in the region where the value of (r-) /(OH-) varies from 0.01o 0
to 10 were drawn through the solid circles.) As shown in Fig. 10 and
Fig. 11, quite smooth curves were obtained. This indicates that the
effective molar absorptivity was some function of (r~) /(OH-) . Fromo 0
Eq. (4) the equilibrium ratio of (1;) to (ro-') is second-order
dependent on the function (r-)/(OH-). Quite naturally the existence
of another species that would give a first-order dependence on (I-)/(OH-)
was considered - this is 120H. The equilibrium between 10 and 1
20H
can be expressed as follows:
10 + I + OR (8)
where Kl
= (I20H-)(OR-)/(IO-)(I-).
It was readily shown that 10 and I; alone or 12
0R and r; alone
would not account for the spectral data. By the method which will be
explained later, it was found that the assumption of the presence of 10-,
13, and I 20R fitted the spectral data very well when the hydroxide con
centration was held constant. Deviations from the fit were found at
;,.. '

-47 ..
'Iiable VIII
Effective molar absorptivi ties
Exp't. (OH->rn (I-)in (CI0 -)in (CI0~) (1 -) /(OH -') 0_J-+00.6 -360c5_320Q1~89.9E E E fco '
No. (!i) (xl03 !i) (xl03 M) (!i)
III-A-3 10000 20500 1.803 6 -4 57·4 4704097 x 10 . .3707 129·5
III-P-l 10000 10000 9·017 9083 x 10~4
3808 .5808 4902 141.0
III-A-4 1.000 40000 1.803... '\
3706 5800 480020197x 10'
III-G-5 1.004 30141 *1.803 60744x 10~3 3803 5600 4608 132.2
III-H-l 1.000 8·950 1.803 70147x 10-3 4005 61.0 4807 14000
III-G-4 1.004 30655 *1.800 70252x 10-3 3800 5900 51.9 143.8
III-G-3 1.004 30676 *1.810 70293x 10'':3 3802 5608 4609 13603
II-R-2-a 001000 20000 10000,-2
3700 5509 46011.000x 10 13500
III-L-l 0.2040 30147 *10803 0.8000 30370x 10-2. 3703 5905 48.8 13803
II-X-l 0.1000 12000 20000 001000 40·5 6504 5600 16908IV-M-l 001000 12000 20000 009900 001000 3904 6409 5507 16701II-X-3 1.000 10200 20000 001000 3907 6907 5906 206
II-H-6 005000 10200 20000 002000 41.6 7502 6701 234
IV-R-2 1.000 34900 10000 003480 4700 103.8 9508 410
II-H-4 0.2000 10200 20000 003000 005000 i+S 03 11003 9600 334II-G-l 001000 52000 20000 0·5000 520'7 11506 10007 323
IV-P-l 0·5000 50002 0.2000 1.000 74·5 220 19005 70.5II-H-5 0.1000 10200 2.000 004000 10000 7302 204 16305 .550
IV-N-2 005000 1000.2 002000 'C~0000 14705 467 354 1292I1-H-7 0.0500 10200 20000 0.4500 20000 140 465 3~9 1112
11-J-1 001000 50002 002000 50000 515 1935 1265 3).53x103II-K-l 0.1000 50003 *0.2000 50027 540 1995 1330 3069::<:103II-Y-1 0.2000 1000.2 002000 50000 527 1847 1230 3 o 36xl0
II-U-l 001000 100002 002000 10.00 1375 5000X103 3007x 7.S3::<:
3103 103
II-L-2 O.O~OO 100002 002000 20000 2071x 9.S1x10 509~X 104:tSx.103 10 104
* 1- was used as the starting materi.a13

.~48-
higher hydroxide concentrations. Therefore the presence of a fourth
species, which was in equilibrium with hydroxide, was apparent.
(3) Dependence of Effective Molar Absorptivity on Hydroxide Concentration
and Presence of 12~-
Under the assumption of the presence of 10-', 13, and 12
0H , the
relation
A =A -+A-obs 10 13
should hold} ,,,here A represents absorbance. From Eq. (9) and the two
equilibrium constants Kl
and K2
of Eq. (8) and Eq. (4), Eq. (10) can be
easily derived:
E = (10 )
From Eq. (10), experiments in Table VIII having the same values of
(I-)O/(OH-)O should give equal values of E if 10-, 13, and 12
0H are
the three correct species. In other word~ at each of the four wavelengths
in Fig. 10 and 11, the values of the abscissas of the points with the same
ordinate values should agree within experimental error, if the above
assumption holds. As mentioned earlier, in the region of
from 0.01 to 10, the curves were drawn through the points for experiments
with 0.100 M initial hydroxide concentration. As ShOlVil in these two
figures, at 400.6 ~ very small deviations were found between the E values
of 0.100 M OH- and those of higher hydroxide concentrations. However at
289.9 ~ a pronounced deviation between experiments at different
hydroxide concentrations was observed in the region where the value of
(1-) /(OH-) ranged from 3.5 x 10⁻² to 2. As to the two intermediateo 0
wavelengths (i.e. 360.5 ~ and 320.1 ~), the effect of hydroxide

0.5 1.0
-49-
5.0 10
€ X 10-2
50
MU-15412
Fig. 10. Plot of (I-)O/(OH-)O vs E.Curve 1 \ = 400.6 ~ j Curve 2 360.5 ~.

-50-
100505.0 10
EX 10-2
1.00.5
0.1
'"ox
~If- 5.0!-:r:-8
MU-15413
Fig. 11. Plot of (r-)O/(OH-)O vs E.Curve 1 ~ = 320.1 ~; Curve 2 289·9 ~.

-51-
concentration on E was smaller than that at 28909 ~ but greater than
that at 400.6~. This result indicates that at least one of the three
species (i.e. 10-, 13, and I2
0H-) is tied up by hydroxide ion, and that
the new species absorbs strongly at 289.9~. The species that is tied
up by hydroxide could not be 10-, because the molar absorptivity
determined for 10 at very low ratios of (1-) /(OH-) is the same foro 0
0.1 M and 1 M OH solutions and is in agreement with the limiting value
of Figs. 10 and 11 at low (1-) /(OH-) • Similarly 13- was considered
o 0
not likely to be the. species that was tied up by OH because the deviation
of E caused by different hydroxide concentration between experiments
with the same (1-) /(OH-) was found to be negligible in the region ofo 0
high ratios of (1-) /(OH-) , where the majority of the absorption waso 0
due to I;. In Fig. 11, one notices that the region where the deviation
was observed was actually the region where 12
0H was supposed to be
present in appreciable concentration 0 This gives evidence that the
species that was tied up by OH- was I2
0H-.
From the above considerations, it was believed that the fourth
species that causes the difference in E of two experiments with the same
concentrations is 120-, orbut different initial OH
K3120H + OH <====::>
However, in order to eliminate the possibility that the fourth species
was some ion other than 120-, attempts were made to find the formula of
the fourth ion in a more general way. One may write the general
equation:
10 + xOH + yI new species
For the 289.9-~ curve from
Fig. 11, it may be seen that changing the initial 10 concentration has

-52-
little or no effect on the deviations of E from the curve for the 0.100 M
OH solutions, thus leading to the conclusion that the new species contains
one 10. This may be seen best in the values for Experiments IV-R-2 and
IV-P-l with E values at 289.9 ~ of 410 and 705, respectively. The
deviations from the curve do not differ by anywhere near the five-fold
change in 10 concentration. A ten-fold change in 10 concentration
between Experiment IV-R-2 and an experiment not reported because of the
uncertainty in the extrapolated absorbance leads to the same conclusion.
With four species contributing to the light absorption, Eq. (10)
E =
+ K1EI
OH- (I-)!(OH-) + K2
EI
- (I-)2/(OH-)2 + Q4E4(OH-)x(I-)y
2 3 ) (11)
1 + Kl(I-)/(OH-) + K2
(I-)2/(OH-)2 + Q4(OH-)x(I-)y
with E4
representing the molar absorptivity of the fourth species. In
order to determine the values of x and y, the values of Kl
, K2
, and
EI
OH- must be known first. As an approximation, it was assumed that2
when the hydroxide concentration was equal to or smaller than 0.100 ~'
=the presence of 12
0 would not be appreciable, i.e. the effect of 120-
on the light absorption was small enough to be negligible. Therefore
Eq. (10) could be used and was rearranged to
E - €IO- + EKl (I-)/(OH-)
(I-)/(OH-)(12)
In Eq. (12), Kl , K2
, and €I OH- are unknown. A graphical method was2
used to obtain the constants. If Kl
is known, the value of the left -
side of the equation is fixed by the experimental data, while the right
side is known except for €I OH- and K2
• Thus the equation reduces to the2
form Y = a + bX where a and b are constants and X is (€ - - E)(I-)/(OH-).1
3

-53-
The fit of the data to this equation was tested by a log-log plot of the
left side (Y) of EQ. (12) versus X. The fit was tested by superimposing
a master curve from the equation Y = 1 + X plotted on transparenta a
graph paper of the same scale. Horizontal and vertical movement of the
curves relative to each other was used until the best fit was obtained.
The positioning of the two scales relative to each other yields K1E r OH2
and K2
• Becuase the value of Kl
was not known, it was necessary to make
a series of plots of the experimental data with different assumed values
of Kl
to find the value of this parameter which best fitted the data.
Values of Kl
ranging from 0.4 to 0.04 were tried. rt was found that with
Kl
= 0.115 the best fit of the master curve was obtained. The E values
of four wavelengths, namely 400.6 ~, 360.5 ~, 320.1~, and 289.9 ~,
were used for the calculations. Because this kind of calculation and
plot with further refinements will appear later (Figs. 13 to 16), no
figure will be given here. The Er
- used in the calculation is the3
value at the iodide concentration of the experiment.
From EQ. (12), the ordinate limit of the curve is K1E r OH-.2
Because the best value of Kl
was found as 0.115, Er
OH- could thus be2
calculated. The abscissa on the master plot is K2
(Er - - E)[(r-)/(OH-)J/3
K1Er
OH- and that on the plot of data is (Er
- - E)(r-)/(OH-)j therefore,2 3
when the master plot and the plot of data were superimposed, the abscissa
value of the latter which corresponds to X = 1 on the former shoulda
satisfy the equation,
K2/K1Er20H- = l/abscissa value on the plot of data at Xo = 1. (13)
Since K1Er
OH- is the ordinate limit as mentioned above, therefore. 2
(ordinate limit on the plot of data)K
2= --'------------~'---------'------
(abscissa value on the plot of data at X 1)a
(14)

-54-
The average K2 value obtained from the curves at 400.6 ~, 360.5 ~,
and 320.1 ~ as well as 289.9 ~ was 4.5 x 10⁻³ •
By knowing the values of Kl , K2 , and Er OH-' one can go back to2
Eq. (11) and attempt to get the value of x and y. For any pair of
experiments of Table VIII that had the same (1-) /(OH-) but differento 0
initial iodide and hydroxide concentrations, one can designate the
experiment with higher (OH-) as No.1 and the one with lower hydroxide
as No.2. The results of both experiments then can be substituted
into Eq. (11) independently as follows:
E18
:-:, + Kl E1OH-(1-)
+ K2 E --(1-)2
+ Q4 E4(OH-)~ (1-);2 (OH-) 1
3 (OH-)2- 2 (16)E2 =
1 + Kl(1-)
+ K2(1-)2
+ Q4(OH-)~ (1-);(OH-) (OH-)2
where the newly added subscripts 1 and 2 refer to experiments 1 and 2
respectively. From Equations (15) and (16), we have

-55-
Eq. (17) can be rearranged as follows:
+ =

-56-
In Eq. (18) all quantities are known - at least approximately _
except Q4' E4, x, and y. From Eq. (18), if experimental values of the
two terms on the left side of the equation are plotted against the total
value within the braces on the right side, one should get a straight
line with slope equal to Q4 and intercept equal to Q4E4, provided the
correct values of x and y have been chosen. On the other hand, the
plot would not be a straight line if the wrong species were assumed.
In making this kind of plot, actually a method of successive approximation
has to be used because the value of Q4' which is included in one of the
terms on the left side of the equation, is initially not known. The
first approximation was carried out by neglecting the terms containing
Q4' Then the slope of that line was used for the value of Q4 in the
second approximation, the calculation was carried out as above until
two successive approximations gave the same values of Q4' Different
combinations of the values of x and y, each ranging from -2 to +2,
were tried with the data at 289.9 ~ of the eight pairs of experiments
in Table VIII. (The values 'of E2
in the two pairs containing experiments
II-H-6 and IV-R-2 were obtained from the curves in Fig. 11.) It was
concluded that there would/be no possible solutions of x and y with
y < -1 since this would correspond to a negative number of iodine
atoms in the new species. The results as shown in Table IX indicated
that only when x = 0, Y 1 could a straight line be drawn within the
experimental error. In the case where x = 1 and y = 1, it is possible
that the plot could be a straight line, however it would not fit the
points as well as when x = 0 and y = 1. All the other plots were not
straight lines. The straight line in the case of x = 0 and y = I, which
gave a value of Q4 = 0.11, will not be shown here since a similar line

-57-
Table IX
The formula of the fourth species
x*
-2
-1
-1
-1
-1
°°o
1
1
1
1
2
2
2
2
*y
2
-1
°1
2
-1
1
2
-1
o
1
2
-1
o
1
2
Formula of the fourth species
(i.e. besides 10-) I; and 120H-)
HOI
12
0H
I OH-23
H202 or °
Remarks about the
plot
thermodynamicallyimpossible
thermodynamicallyimpossible
curved
thermodynamicallyimpossible
straight line
curved
thermodynamicallyimpossible
curved with amaximum
possibly a straightline
curved
thermodynamicallyimpossible
curved
curved with amaximum
curved
* 10 + xOH + Y1-<~ > the fourth species

-58-
with corrections for ionic strength will be given later. As shown in
Table IX) when x ~ ° and y = 1) the fourth species is 12°-. In other
words) the equilibrium is as follows:
10K4
+ I ><---
As indicated in Table IX, neither with y = 0 nor y = 2 could a straight
line be drawn; this result agreed with the previous consideration that
neither 10 nor I; could be the species tied up by OH-.
(B) Calculation of the Equilibrium Constants from the
Spectrophotometric Results
With the presence of 120 established) it is of interest ~o go back
to Eq. (11) and recalculate the equilibrium constants (i.e. Kl
) K2
) and
Q4). In view of Eqs. (4) and (8), it was considered that the dependence
of the values of Kl
and K2
on the ionic strength would be small because
equal numbers of monovalent ions were present on both sides of the
chemical equations. Therefore activity-coefficient corrections were
ignored for Kl and K2 . The same is not true in the case of K4 (Eq. (19))
which is most likely to be greatly affected by the ionic strength. In
Eq. (20)) if a represents activity and I represents the activity
coefficient) we have
= (20).....
Thus K4 is the value of Q4 at zero ionic strength. In order to estimate
the value of II 0= and Iro-' a method of analogy has to be used. Suppose2
the activity coefficient of Na2S04 18 is used to substitute for Na2
12
0

-59-
and that of NaC104
18 is used for Na10 as well as Na10 Then we have
71 0=
K4 = Q4,~( 71 -2
710 -)~ = Q4 /, ,~
2 2 47+Na17+Na1O 7!,NaC10
4Q4 / [
-]~
'V
Q4,~ / ( )~= =,~
73
73
:!::.Na212O :!::.Na2S04
where ~ represents the ionic strength of the experiment and
The value of 7 changes from 2 to about 4,5 as the ionic strength increases~
from 0.15 to 1.5- With the knowledge of the presence of 120- and the
correction for ionic strength, one can rewrite E~, (18) as follows:
(El
- E2 ) [1 + Kl
(1-)+ K2
(1-)2 __ 2 + K4 1'1(1 )1 ]
(OH-) (OH )x
[1 +Kl(1-) K
2(1-)2
+(OH-)2(OH-)
[1 + K ~ + K(1-)2
+ K472(1-)2 ]K
2(I-)2
(€ - - € - )1 (OH-) 2 (OH-)2 (OH-)2 1
31
32 1+

-60-
As mentioned earlier in this report, E1
- was found to vary linearly3
with respect to (1-) in the wavelength range of our study according to
where Er - is the molar absorptivity of I; at zero iodide concentration3
and a is ~ constant. From EQ. (23), one obtains
=
----,-------------------=----------
+a(r-)1(1-)2 (72 - 71)
71(1-)1 - 72(1-)2----E- +
13o
a(1-)1(1-)2 (72 - 71)
71 (1-)1 - 72 (1-)2(24)

-61-
Substituting Eq. (24) into Eqo (22), one can rewrite the latter as
(1-)2 a(I-)1(1-)2('2 - 'i)K
2 (OH-)2 '1(1-)1 - '2(1-)2
1 + K ...:...(1_-.:-)_ + K (1-)21 (OH-) 2 (OH-)2
}
Let
K2
(1-)2 a(I-)1(1-)2(/2 - 11)
(OH-)2 11(1-)1 - 12(1-)2

(OH-)
-62-
Then we have
+
where EOO corresponds to the effective molar absorptivity at zero iodide
and zero hydroxide concentrations but at a relevant ratio of (r-) to
(OH-). The term "8" was always found to be negligibly small compared
with EOO
' When the quantity on the left side (R) of Eq. (25) was
computed with the experimental results of Table VIII at 289.9 ~ and
was plotted against the values of (EOO
- 8), a straight line was obtained.
The values of Kl
and K2 used here for the first approximation were those
from the previous calculation in this report (Le. Kl
= 0.12 and K2 =
-3)4.5 x 10 . The slope of the line is K4, and the intercept is K4Er 0= •2
By mhe use of the same method of successive approximations as used
before, a value for K4 of 0.045 was obtained from the straight line of
Fig. 12. This value is much smaller than that of Q4 from the previous
calculation in this report because of the activity-coefficient correction.
This result of K4 was confirmed when the data at 320.1 ~ were treated
in the same way as at 289.9~. For the other two wavelengths (i.e.
=400.6 ~ and 360.5 ~)J where the effect of 120 is smaller, 00045 was

-63-
6
4
2
4-t\l <> fI0
0 +-x0:::
-2
-4
-6
o 0.4 0.8 1.2 1.6 2.0 2.4
(Eoo + S) X 10-32.8 3.2 3.6 4.0
MU-15414
Fig. 12. Plot of R vs (EOO
+ S). A 289.9~.

-61+-
assumed as the slope of the line and was combined with the data of three
pairs of experiments of Table VIII (ioeo the three pairs containing
Experiments II-X-l, IV-M-l, and IV-R-2) to calculate the average values
400.6 360.5of E
10= and EI 0= 0 The uncertainties of the points shown in Fig. 12
2 2were calculated from the probable error of (E
l- E2 ). The upper and lower
limits of the values of El
and E2 were first estimated at 400.6 ~ on
the basis of the uncertainty in extrapolating the A-t curve:., to zero
time. The same percentage uncertainty was used at the other wavelengths.
Because the value of Q4
was greatly influenced by ionic strength and
estimated activity-coefficients had to be used for the calculation, the
value of K4
is not considered to be an accurate one. The correction
for ionic strength did show apparent improvement in giving a straight-
line fit to the experimental points (Fig. 12). From the magnitude of
K4
obtained in this investigation, one sees that under experimental
conditions where the initial hydroxide concentration is equal to or
lower than 0.100 M and the ionic strength is also small, the ratio
between the concentrations of I2
0H- and 120- is quite large, i.e. the
correction for 120- is small.
=Although the contribution of 120 to the effective molar absorptivity
of experiments with hydroxide concentration equal to or lower than 0.100 M
was small, it was desirable to correct the latter to zero hydroxide and
zero iodide concentrations (at a constant ratio of (1-) to (OH-), so as
to get more precise values of ~ and K2 • By assuming that in Eq. (25),
Experiment 1 is the one to be corrected and Experiment 2 is the one with
zero iodide and zero hydroxide concentrations (ioe. E2 = EOO )' one can
rearrange Eq. (25) as follows:

-65-
K2(I-)2
(E I 0= El ) +(OH-)2
(E - E - )
2K471(I-)1
13
131 0
E l EOO K2
(I-)2(26)
Kl(I-)[1 + + K471(I-)1]+
(OH-)2(OH-)- 1
K471(I-)1
This correction of € according to Eqo (26) is based upon the
assumption that the changing of the molar absorptivity of I; as a
linear function of the iodide concentration is due to a solvent effect
on the molar absorptivity, ioe. Eqo (23) was used in the correction.
Alternatively one could attribute the change in molar absorptivity to
the presence of a new species which is in equilibrium with I; and
contributes a different light absorption 0 It was found that this
-latter method of correction did not give the same value of EOO as that
of the previous method because there was no information on the magnitude
of either the molar absorptivity of that unknown species or the
equilibrium constant between it and triiodide, an exact correction
of € could not be made with this alternative methodo It is believed
that the difference of the two corrections probably is not large,
although it might be appreciable. Davies and Gwynne19 studied the
equilibrium between 12 , 1-, and I; by solvent partition at 250
C in a
range of iodide concentration from 0002 M to 1 M. No evidence of the
presence of a new species was reported 0 Although their assumption of
cancellation of the activity coefficients of I; and I may not be
strictly valid, yet it is considered that their results give good
reason for using the solvent-effect model to correct the E in this
investigation.

-66-
All values of E of Table VIII at the four wavelengths were corrected
to EOO
by the use of Eq. (26). The EOO
values of the experiments with
(OH-) ~ 0.100 ~ were used in Eqo (12) to calculate Y by letting E = EOO
.
When different values of Kl
were tried and the plots of YOO versus
(E1
- - EOO )(1-)/(OH-) were made for 400.6 ~, 360.5 ~, and 32001 ~3
as well as 28909 ~, the best value of Kl
, ioe. that which made the
experimental points at the four wavelengths fall upon the master curve
best, was found to be 0013. The data from which the plots were made
are tabulated in Tables X and XI. The upper and lower limits of the
value of EOO were obtained by the use of the corresponding limits of
El
in Eq. (26). The method of estimation of the uncertainty of El
was
the same as reported earlier. The data along with the superimposed
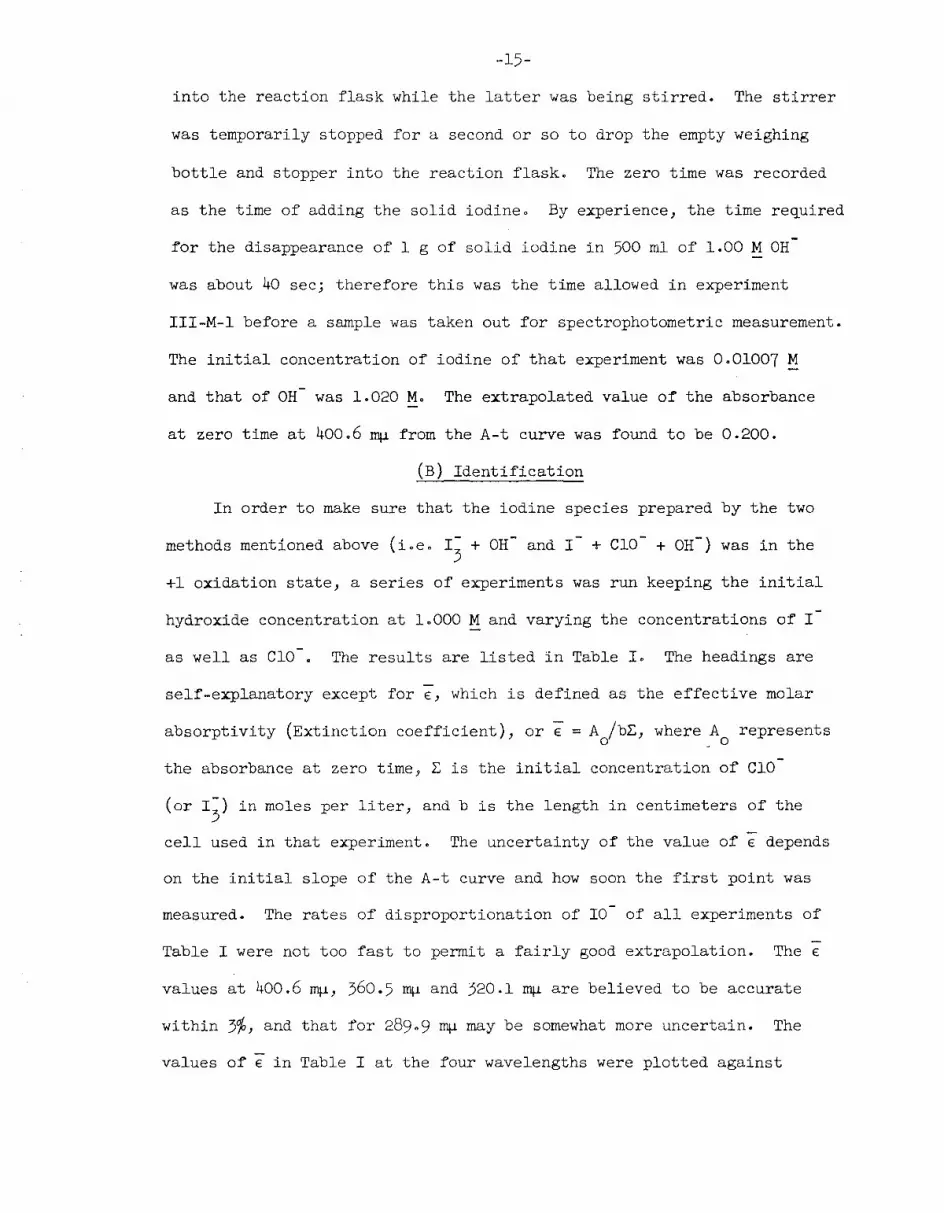
master curve are shown in Figs. 13 to 160 The values of the equilibrium
constants from the spectrophotometric results are as follows:
10- + I + H2OKl I
20H + OH [Kl
(I2
OH-)(OH-)0.13 ] ;~>
=: =:
(10-)(1-)
10 + 21 + H2OK
2 I; + 20H [K2
(r;) (OH-)2-3:> = = 5.1 x 10 ];
<:(10-)(1-)2
K4 = /aIO - 0.045]010 + I ~
12
0 [K4 aI 0= a - =2
I
The molar absorptivities of 12
0H and 120~ are given in Table XII. The
values of €1 OH- were calculated from the results of Experiment II-H-52
of Table VIII by the use of the known equilibrium constant and on the
assumption that the effect due to 120- was negligible at the hydroxide
concentration used, Leo 00100 M. These calculated results at 400.6 ~,
360.5 ~, 32001 ~J and 289.9 ~ were compared with those read from the

-67-
plots of Figs 13 to 16, They were found to be in agreement to within 5%
except at 360.5 ~, where the deviation was about 13%. The reported
values of E1 OH- and E1
0= in Table XII at the four wavelengths mentioned2 2
above were those from the plots, The absorption spectrum of 120H-, which
was present in equilibrium with 12°- in Experiment I1-H-5, is shown in
Fig, 17. The uncertainties shown were estimated by allowing ~ 0.005
error in the absorbance. The values contain any additional error arising
from errors in Kl
and K2
and neglect of 12°-.
(c) Discussion
The species 120H is believed to be analogous to I; with OH
substituted for the 1-. As to 12°-' presumably it is an ionization
product of 12
0H-. The electronic arrangement of I; has been discussed
by pauling,20 Kimball,21 and Pimentel,22 The latter explained the bonding
in trihalide ions by presenting a simple molecular orbital treatment and
suggested the possibility of predicting the stability of other molecular
species having electronic structures like those of the trihalide ions,
According to this kind of prediction, the hydroxide ion, which is iso-
electronic with 1-, should be able to combine with the 12 molecule to
form 12
0H ,
Near the close of this investigation, it was found that Kennedy23
had suggested 120H as an intermediate in the hydrolysis of iodine in
order to fit the rate law found for the reaction of n-propanol with
iodine in ca. 1 ~ HCI04• Alternative explanations are possible, Recently
12Anbar and Taube have proposed C120H as a possible intermediate in the
exchange reaction between Cl and HOC1. They suggested that the structure

-68-
Table X
The effective molar absorptivities
at zero iodide and zero hydroxide concentrations*
Exp't.
No.
-400,6EOO
y 400 .600
II-X-l
IV-M-l
II-G-l
II-H-5
II-H-7
II-J-l
**II-K-l
II-U-l
II-L-2
0.1000
0.1000
0·5000
1.000
2.000
5·000
5·027
10.00
20.00
4L540·53905
40.4390438,4
5509520650.4
76,572.669,4
169·6139·3118.0
487472456
508497476
122211421115
32.18xl°32.13xl0
300620.410·3
4L434.229·6
470843033907
88.068.95503
15408149·814406
161.0157·3150,5
282264257
398390
0,5950·5950·595
0,5950·595
2·972·972097
5·915·925092
11.6411·7011.74
27·527.627·7
27.627·727·8
47.7480548.8
76.377·2
660265.26402
121.61140410309
21120119L6
535423349
192718701811
196719301852
34 o 92xl034.63xl0
34.53xlO
38.88xl038.72xl0
90·980.870.6
82.872.662.5
143.6128.210508
18L31690915903
31023919202
632613594
642630604
114510771053
16311603
2.452.452.45
2.452.452.45
12.2112.2212022
24.324.324.4
48.048.348.4
113·1113.4113·7
114.0114.011405
196.319902200
314317
*Kl = 0.134j A = 400.6 ~ and 360.5 ~j
XOO = (E1- - EOO)[(I-)/(OH-)]j and YOO = [EOO - E10- + EOO Kl (I-)/(OH-)] 730
[(I-)/(OH-) J. ** I; was used as the starting materiaL

-69-
Table XI _. .-.._....._--
The effective molar absorptivities
at zero iodide and zero hydroxide concentrations*~---------~-'.
Exp't. (I-)/ (OH-) -320.1 y320 .1 x320 .1 -289·9 y289.9 x289 .9E OO 00 00 E OO 00 00,No. (x 10-3) (x 10-3) (x 10-))
0.378(,. -_..
56.8 95.6 1.394 169.8 3·90II-X-1 0.1000 5508 85.5 10394 16708 0·357 3·98
54.8 75·4 1.395 165.8 0·337 3.98
56.1 88.3 1.394 16406 0·325 3·98IV-M-1 0.1000 5502 7904 1.395 16206 0.305 3·98
5401 68.3 1.395 160.6 0.285 3·98
10508 129·8 6.95 332 0.440 19·83II-G-1 0·5000 99·5 11604 6.95 313 00399 19·84
95·1 107·0 6·95 299 0.369 19.85
168.8 143·4 13.83 555 0.495 39·4II-H-5 1.000 160.2 133·7 13.84 524 0.460 39·5
152·9 12504 13.85 501 0.434 39·5
411 237 2702 1348 0·787 77·3II-H-7 2.000 335 188.5 27·3 1100 0.630 77.8
285 15607 27.4 942 0·530 78.1
409 63.7 3 1.244 181.01252 3080X103II-J-1 5·000 1212 395 6309 3.70x10³ 1.209 181·51174 382 64.1 3·58x10 10170 182.1
1304 427 64.0 3.96x10⁵ 1.288 181.9**II-K-1 50027 1278 418 64.2 3.87x10³ 1.260 182.0
1230 402 64.4 3·73x10 1.215 183·03 718 109.1 3 2.15 3083.09x103 9.23x10³
II-U-l 10.00 2.91x10³ 677 110·9 8085x103 2.06 3122.85xl0 662 111·5 8.67xl0 2.02 313
3 I 45· 51x103 1013 169·9 1.616xl°4 2·97 477II-L-2 20.00 5. 41x10 994 171.8 1. 593xl0 2·92 481
K1 = 0.134; A = 320.1 ~ and 289.9 ~ ;
XOO = (E - - €Oo)[(I-)!(OH-)]; and YOO = [EOO - E IO - + EOOK1(I-)/(OH-)] ~130
[(I-)/(OH-)] • **1; was used as the starting material.
Io
0.05 0.1
-70-
0.5 1.0 5.0 10
Xoo X 10-350
MU-15415
Fig. 130 Plot of YOO VB XOO of Table Xo A = 400.6 ~o

-71-
N 10Io-5.0><
o
~
0.05 0.1 0.5 1.0 5.0 10
Xoo X 10-350 100 500
MU-15416
Fig. 14. Plot of YOO VB XOO of Table X. ~ = 360<5 ~.

50
-72-
10C\II
05.0
xo
~
0.05 0.1 0.5 1.0 50 100 500
MU-15417
Fig. 15. Plot of YOO vs XOO of Table XI. ~ = 320.1 ~.

-73-
50
NI
0 10
o
1.0
50050 1005.0 10
Xoo X 10-3
0.5 \.0
0.5'-- L...-............................~_ __'____L_"_...............~_~.._...J_.L...........~_.........__..lI__L.........~.u
0.1
MU-15418
F . lb~ Pl .'- .0 Y X .0 rll bl VI'lg•• _0\:'0.1 OOVS~000.L~Et e/,.

-74-
Table XII
=The molar absorptivities of 1
20H and 1
20
~oo.6
393·0382.2
371.6
360·5350.8
340·5330.2320.1
310.0
299·9289·9280.0
l.0
1.3
1.92.74.24.6
4·74.7
5·26.6
1122
43
0.60
3·3
3·5
26

-75-
60
40
20
10(\I 8.0I0
x 6.01&1
4.0
2.0
1.0
O.B
0.6
280 300 320 340 360
>.. (miL)380 400
MU-15419
Fig. 17. The absorption spectrum of I,')OH from bxperimentII-H-5 of Tpbl':~" VIII. C

-76-
of C12
0H is analogous to that of Br3) which is the same analogy as
that used in this investigation between I; and 120H-.
By knowing the values of Kl
and K4
) one can calculate the ionization
constant of 12
0H )
where KI
OH- = (I2
0=)(H+) I(I20H-)
2this value with the result of the
+
I -15= K4~ 0' Kl = 3·3 x 10 .
2ionization constant ofRO~
Comparing
( -112.3 x 10 ))
which will be reported later) one finds that there is a factor of 7000
between the two ionization constants) with 12
0H being a much weaker acid
than HOI. One would probably predict this because there is a negative
charge on 12
0H as well as one pair of electrons above that for an
octet structure) both of which factors would make the proton harder to
remove than from HOI.
(D) EMF Measurements
Attempts were made to determine the potential of the I - 10 couple
in 1 M OH solution by measuring the emf of the cell
Pt 1 M NaOH : 1 ~ NaOH) KI) NaIO : Au (or Pt)) (28a)
or) in other words) to measure the potential of the following reaction
(28b)
It was hoped that a more precise value of K2
(Eq. (4)) could be obtained)
and) by use of it with the spectrophotometric results) one could then
improve the accuracy of the value of Kl
•
(1) Experimental Procedure
A sodium hydroxide solution of the desired concentration was put into

-77-
cell C and the four bubblers (Ql' Q2' Rl
, and R2
), as described earlier.
Cell A and the hydrogen electrodes which had been platinized were also
placed in position. The cell was then put into the 25.00 ~ O.OloC water
bath and left there in order to establish temperature equilibrium as
well as to attain equilibrium at the hydrogen electrodes. Hydrogen
gas from two separate tanks was gently passed first through alkaline
pyrogallol solutions in 250-ml gas-washing bottles, then to the
inlet bubblers,' and finally through the tubes M and N to the hydrogen
electrodes. The two hydrogen electrodes were measured against one another.
It was assumed that equilibrium conditions were attained when the emf
reading of the two electrodes was found to be 0.02 mv or less. This
could be reached within an hour or two if the solution in cell Chad
been presaturated with the same hydrogen gas and the electrodes had
been properly platinized. The central part of cell C where cell A was
placed was covered with aluminum foil to exclude any light effect.
The process of mixing basic iodide and hypochlorite was carried
out with the same procedure as used in the spectrophotometric study.
The reaction mixture was quickly transferred to cell A through a long
stem funnel which was inserted into the cell through the third opening
(G3
). The emf readings of the cell were taken immediately after the
sample was introduced into A with gold and platinum electrodes
successively. The measurement was carried out as a function of time.
Frequently the electrode was lifted from the cell, and the solution in
A wap stmrred by using the electrode as a stirrer. The emf readings
were taken before and after stirring to see whether there was any
stirring effect. The balance of the hydrogen electrodes was checked
from time to time during an experimento

(2) Measurement of 10
-78-
- 1- - I Equilibrium3-~------"'---_":'--
As indicated above, both gold and platinum electrodes were used in
the measurement df emf of Eq. (28a). Only the results using a gold
electrode in the 10 compartment will be reported here however,
because the platinum electrode was found to be greatly affected by
stirring. This effect will be discussed later. Attempts were made
to correct for the liquid-junction potential by using Henderson's
equation. 24 The result was found to be negligibly small. The data
used in calculating the value of K2
of the equilibrium between 10-,
13, and 1- (Eq. (4)) are presented in Table XIII. The concentrations
listed in columns 2 to 4 were all in moles per liter. The fifth
column records the observed emf reading at zero time, which was obtained
by extrapolating to zero time the curve of emf versus time (emf-t).
A typical emf-t curve is indicated in Fig. 18. (Experiment V-C-l).
The solid circles indicate measurement after stirring. The sixth
column of Table XIII represents the standard potential of Eq. (28b)
and was obtained from the following equation:
o ( ( 0.05916E (total) =EO
cell) + 2 )log[ ] ,
where (1-). and (10-). were respectively the initial concentrationsIn In
of 1 and 10 in the experiment, and the activity-coefficient correction
to zero ionic strength has been assumed negligible. By knowing EO(total)
o ( 0and EB
(H2
- H20) of Eq. 30), one can then calculate the value of EB
(1- - 10-) (Eq. (31)) from
+ 20H = + 2e
20H + 1 10 +

-79-
Table XIII
EMF measurement of 10 - - 1- - I equilibrium*3
---_._----~~-
Exp't. (1-) . (ClO-). (Cl-). EO(cell) EO(total) E~(I--IO-) E~(IO--I;) K2In In In
No. (xl03~n (xl03!i) (Xl03!i) (volts) (volts) (volt) (volt ) (xl03)--~'----_.._.._. __ .
V-A-2 102.0 2.000 1.24680 1.29706 -0.46882 -0.0667 5·56
V-B-2 105.0 5·000 1.25895 1.29743 -0.46919 -0.0663 5.74
V-C-l 35·33 2.000 66.67 1.26105 1.29719 -0.46895 -0.0665 5.65
==========================.-----------------

-8o ...
Subtracting Eq. (31) from Eq. (30), one has
(28b)
Therefore, one obtains
The results for E~ (1- - 10-) are reported in column 7. The E~ (10- - I;)
values in column 8 were defined as the standard potential of Eq. (4),
which could easily be obtained by subtracting Eq. (31) from Eq. (33):
31 = I; + 2e
Subtracting, one finds
K2
< > I; + 20H (4)
Finally by the use of the relation E~(IO- - I;) = (0:.05916/2) log K2 ,
one obtains the values of K2 in column 90
(3) Calculation of the Ionization Constant of HOI
/ From the results for K2 listed in Table XIII, and the known equilibrium
constants of Eqs. (2), (6) and (7), one can calculate the ionization
constant of hypoiodous acid in the following way.K
10 + 21 + H 0 2 > 13- + 20H
2 <--
and
~20H 0 > ¥+ + OH2 < a
K7 - +12 + H 0 > HOI + I + H2 <
We have
[K2
= (13
-) (OH-)2/(IO-)(I-)2
= 5.65 x 10⁻³ ], (4)
[~~ = (H+)(OH-) = lO-l4], (2)~Ii20
[K6 = (1;)/(1-)(12 ) = 7.14 x 10² ],(6)18
[K7
(HOI)(H+)(I-)/(I2
)
= 5.40 x 10⁻¹³ ]

-81-
1.260
1.255
1.250
1.245
o 40 80
t (min)
MU-15420
Fig. 18. The emf-time curve of Experiment V-C-l. Measurementsmade immediately after stirring are denoted by .0

-82-
Performing the operation Eq. (6) - Eq. (4) + 2 x Eq. (2) - Eq. (7),
one finds
~OIHOI < >H+ + 10
Therefore the ionization constant
The accuracy of the ionization constant of HOI calculated above also
depends on the precision of the hydrolysis constant of iodine. The value
2used here was from Allen and Keefer. Values reported by some other
investigators deviate considerably.25,26
(4) Discussion of the EMF Measurement~
In comparison of the result for K2
(Eq. (4)) from emf measurement
with that from the spectrophotometric study, one notices that they are
nearly, although not exactly, the same. As mentioned earlier, the K2value from emf measurement was obtained by the use of a gold electrode
in the I - 10 compartment. The platinum electrode used in the
experiments of Table XIII gave lower values of K2 • For example the value
of Eo(cell) of Experiment V-A-2 from the platinum electrode was 5.00 mv
smaller than that from the gold electrode. This might be due to a
reaction catalyzed by platinum as for example the disproportionation of
the 10-. The solution in the vicinity of the electrodes could then have
a different composition than the bulk solution, and concentration
polarization would result. The emf reading would then be influenced by
stirring. There is also the possibility that the platinum electrode
has a different response from the gold electrode to intermediate species
formed from the disproportionation of 10-) thus leading to a different
emf. A new, pure) shiny platinum electrode did not improve the deviation
from the gold electrode. Therefore it .seemed unlikely that the trouble
was due to impurities in the electrode.

-83-
Attempts were made to find conditions such that 12
0H would be the
predominant species in order to get more evidence for its presence.
Spectrophotometrically one was not able to study the absorption of 12
0H
without getting interference from 13, which absorbs very strongly in the
wavelength region of this investigation. Similarly, difficulty was
experienced in the emf measurement of a reaction mixture with relatively
high 120H-. The following initial concentrations were used:
(OH-). = 0.1000 M_;In
From the known values of Kl
and K2
, it was calculated that the concentration
of 12
0H would be equal to that of 10-, and because of a low initial
concentration of 10-, its disproportionation should be quite slow even
with the comparatively high ratio of (I-)/(OH-). It was found that the
emf readings of both the platinum and gold electrodes were appreciably
affected by stirring. Contrary to the experiments of Table XIII, the
value of K2
using the platinum electrode was found to be closer to the
value of K2
reported in Table XIII than that from the gold electrode,
although even the former was only about one-third of the value of K2
reported in Table XIII. The cause of the deviation was probably not due
to impurities in the solution or accidental contamination of the electrodes
because, following disproportionation of the 10-, the addition of fresh
C10 to the decomposed solution to start a new run gave the same results
within experimental error. The most likely explanation is that the two
electrodes respond differently to the intermediate species from the

-84-
disproportionation of 10-, or that the electrodes are catalyzing the
disproportionation to some extent. It is to be hoped that further
emf studies will be carried on in the near future.

-85
ACKNOWLEDGMENTS
The author wishes to express her deep appreciation to Professor
Robert E. Cop~ic$, who suggested this study and who has given thoughtful
gUidance, advice, and inspiration throughout the course of this
investigationj to her fellow graduate students, particularly Dr.
Claude P. Coppel, for their help and encouragementj and to Mrs. Jane
Waite for her contribution to the progress of this project.
Thanks are also due to the Frank M. Hsu Scientific Fellowship
from the China Institute in America and James M. Goewey Fellowship
from the University of California, which made graduate study at the
University of California possible.
Gratitude is felt for the financial support through the University
of California Radiation Laboratory from the U. S. Atomic Energy
Commission.

-86-
BIBLIOGRAPHY
1. R. P. Bell and E. Gelles, J. Chern. Soc. (London) 1951, 2734.
2. T. L. Allen and R. M. Keefer, J. Am. Chern. Soc. 77, 2957 (1955).
3. Hubert T. S. Britton, Hydrogen Ions, Ed. IV, Vol I, (D. Van Nostrand,
Princeton, 1956).
4. E. L. C. Forster, J. Phys. Chern. 1, 640 (1903).
5. Anton Skrabal, Monatsh. Chern. 32, 167 (1911).
6. C. H. Li and C. F. White, J. Am. Chern. Soc. 65, 335 (1943).
7. Harold L. Friedman, J. Chern. Phys. 21, 319 (1953).
8. A. D. Awtrey and R. E. Connick, J. Am. Chern. Soc. 73, 1842 (1951).
9. K. G. Stern and D. DuBois, J. Biol. Chern. 116, 575 (1936).
10. John F. Below, Rapid Reactions: Kinetics of the Formation of the
Ferric Thiocyanate Complex (Thesis), UCRL-3011, June 1955.
11. Farkas, Lewin and Bloch, J. Am. Chern. Soc. 71, 1988 (1949).
12. M. Anbar and H. Taube, J. Am. Chern. Soc. 80, 1073 (1958).
lB. John O. Edwards, Chern. Revs 50, 455 (1952).
14. Robert E. Connick, J. Am. Chern. Soc. 69, 1509 (1947).
15. w. C. Bray and E. L. Connolly, J. Am. Chern. Soc. 33, 1485 (1911).
16. G. Horiguchi and H. Hagisawa, Bull. Inst. Phys. Chern. Research (Tokyo)
22, 661 (1943).
17. C. Herbo and J. Sigalla, Anal. Chim. Acta 17, No.2, 199 (1957).
18. Wendell M. Latimer, The Oxidation States of the Elements and Their
Potentials in Aqueous Solutions, Ed. II, (Prentice-Hall, New York, 1952).
19. M. Davies and E. Gwynne, J. Am. Chern. Soc. 74, 2748 (1952).
20. Linus Pauling, The Nature of the Chemical Bond, Ed. II, (Cornell
Univ. Press, Ithaca, N. Y., 1940).
21. George E. Kimball, J. Chern, Phys. Q, 188 (1940).
22. George C. Pimentel, J. Chern. Phys. 19, 446 (1951).

-87-
BIBLIOGRAPHY
(contd. )
23. Joseph W. Kennedy, The Hydrolysis of Iodine and a Reaction with
f/Propanol~.~ BNL-30, 1949.
24. Duncan A. MacInnes, The Principle of Electrochemistry, (Reinhol~
New York, 1939).
25· Adolf FUrth, Z. Electrochem. 28, 57 (1922).
26. Anton Skrabal, Ber. 75B, 1570 (1942).

1111111111111111111111111111111111111111111111111111111111111111111111

-87-
BIBLIOGRAPHY
(contd. )
23. Joseph W. Kennedy, The Hydrolysis of Iodine and a Reaction with
"Propanol~.~ BNL-30, 1949.
24. Duncan A. MacInnes, The Principle of Electrochemistry, (Reinhol~
New York, 1939).
25. Adolf FUrth, Z. Electrochem. 28, 57 (1922).
26. Anton Skrabal, Ber. 75B, 1570 (1942).
