pv (photovoltaics) performance evaluation and simulation-based energy yield prediction for tropical...
TRANSCRIPT
Elsevier Editorial System(tm) for Energy Manuscript Draft Manuscript Number: Title: PV performance evaluation and simulation-based energy yield prediction for tropical buildings Article Type: Full Length Article Keywords: Photovoltaic system; Building Integrated PhotoVoltaics; Tropics; PV performance model; Low-slope rooftop PV; PV external sunshade Corresponding Author: Mr. Esmail Mahmoudi Saber, Ph.D. Student Corresponding Author's Institution: National University of Singapore First Author: Esmail Mahmoudi Saber, Ph.D. Student Order of Authors: Esmail Mahmoudi Saber, Ph.D. Student; Siew Eang Lee, Ph.D.; Sumanth Manthapuri, M.Sc.; Wang Yi, Ph.D. Student; Chirag Deb, Ph.D. Student Abstract: Air pollution and climate change increased the importance of renewable energy resources like solar energy in the last decades. Rack-mounted PhotoVoltaics (PV) and Building Integrated PhotoVoltaics (BIPV) are the most common photovoltaic systems which convert incident solar radiation on façade or surrounding area to electricity. In this paper the performance of different solar cell types are evaluated for tropical weather of Singapore. As a case study, the on-site measured data of PV systems implemented in a zero energy building in Singapore, is analyzed. The impact of different solar cell generations, arrays environmental conditions (no shading, dappled shading, full shading), orientation (South, North, East or West facing) and inclination (between PV module and horizontal direction) are investigated on performance of modules. In the second stage of research, the whole PV systems in the case study are simulated in EnergyPlus energy simulation software with several PV performance models including Simple, Equivalent one-diode and Sandia. It has been concluded that orientation of low-slope rooftop PV has negligible impact on annual energy yield but in case of PV external sun shade, the east façade and panel slope of 30-40 ° are the most suitable location and inclination.

Dear Sir/Madam,
Editor of Energy Journal,
The manuscript which enclosed to this letter prepared based on a group research which has been done in
department of building at National University of Singapore. The whole photovoltaics systems installed in a zero
energy building in Singapore has been investigated as a case study. The PV performance models are used to
predict the energy production of on-site PV modules in tropical weather of Singapore. Please find the details of
report and results of research in the manuscript.
Regards,
Esmail M. Saber
Cover Letter

Dear Sir/Madam,
Editor of Energy Journal,
The core finding of this research paper could be summarized as follows,
Characteristics of PV systems in tropics are analyzed in depth
The ambiguity toward amorphous panel energy yield in tropics is discussed
Equivalent-one diode and Sandia models can fairly predict the energy yield
A general guideline provided to estimate the energy yield of PV systems in tropics
Regards,
Esmail M. Saber
Highlights (for review)
1 2 3 4 5 6 7 8 9 10 11 12 13 14 15 16 17 18 19 20 21 22 23 24 25 26 27 28 29 30 31 32 33 34 35 36 37 38 39 40 41 42 43 44 45 46 47 48 49
PV performance evaluation and simulation-based energy yield prediction for
tropical buildings
Esmail Saber * 12
Siew Eang Lee 1 Sumanth Manthapuri
1 Wang Yi
1 Chirag Deb
1
1 Department of Building, School of Design and Environment, National University of
Singapore, Singapore 2 Singapore-ETH Centre for Global Sustainability, Future Cities Project, Department
of Architecture, ETH Zurich, 8092 Zurich, Switzerland
* Corresponding author. Tel.: +6592279136
E-mail address: [email protected] (Esmail Saber).
Abstract
Air pollution and climate change increased the importance of
renewable energy resources like solar energy in the last decades. Rack-
mounted PhotoVoltaics (PV) and Building Integrated PhotoVoltaics (BIPV)
are the most common photovoltaic systems which convert incident solar
radiation on façade or surrounding area to electricity. In this paper the
performance of different solar cell types are evaluated for tropical weather
of Singapore. As a case study, the on-site measured data of PV systems
implemented in a zero energy building in Singapore, is analyzed. Different
types of PV systems (silicon wafer and thin film) have been installed on
rooftop, façade, car park shelter, railing and etc. The impact of different
solar cell generations, arrays environmental conditions (no shading, dappled
shading, full shading), orientation (South, North, East or West facing) and
inclination (between PV module and horizontal direction) are investigated
on performance of modules. In the second stage of research, the whole PV
systems in the case study are simulated in EnergyPlus energy simulation
software with several PV performance models including Simple, Equivalent
one-diode and Sandia. The predicted results by different models are
compared with measured data and the validated model is used to provide the
*ManuscriptClick here to download Manuscript: Saber et al. Energy Final.docxClick here to view linked References
1 2 3 4 5 6 7 8 9 10 11 12 13 14 15 16 17 18 19 20 21 22 23 24 25 26 27 28 29 30 31 32 33 34 35 36 37 38 39 40 41 42 43 44 45 46 47 48 49
simulation-based energy yield predictions for wide ranges of scenarios. It
has been concluded that orientation of low-slope rooftop PV has negligible
impact on annual energy yield but in case of PV external sun shade, the east
façade and panel slope of 30-40 ° are the most suitable location and
inclination.
Keywords – Photovoltaic system; Building Integrated PhotoVoltaics; Tropics;
PV performance model; Low-slope rooftop PV; PV external sunshade
1. Introduction
Emerging new technologies of on-site renewable energy
production system keeps alive the dream of zero energy buildings (ZEB).
ZEBs involve two strategies, minimizing the required energy by using
energy efficient technologies and adopting renewable energies to meet the
remaining energy needs [1]. In this context, Photovoltaics (PV) is one of the
most promising renewable energy technologies in achieving sustainable
building design [2,3]. Modern technologies of solar cells with lower cost
and higher efficiency increased the feasibility of BIPV in real residential
and commercial buildings. Based on Swanson’s law, the price of solar cells
decreases 20 % by each doubling the global manufacturing capacity. This
trend in price of solar cells will increase the applications of solar panels in
small sized residential and general buildings. The forecasts of solar systems
installation market have shown that the total capacity of BIPV will increase
to 2000 MW in 2015 compared to 250 MW in 2010 [4]. While
photovoltaics efficiency and manufacturing costs have not reached the point
to replace the conventional power generation facilities, a broad range of
suitable policies have been implemented to unlock the considerable
potential of solar energy [5].
1 2 3 4 5 6 7 8 9 10 11 12 13 14 15 16 17 18 19 20 21 22 23 24 25 26 27 28 29 30 31 32 33 34 35 36 37 38 39 40 41 42 43 44 45 46 47 48 49
Solar panels could be integrated into façade and roof of building in
design stage as Building Integrated PV (BIPV) or as a retrofit added to
Building after construction which called Building Applied PV (BAPV).
There are various geometrical considerations for installing PV systems. In
addition to the installation slope and azimuth angle, the real application of
the BIPV system should take into account the influence of shading caused
by the surroundings [6]. A BIPV system as a shading is useful not only for
the power generation, but also for shading to reduce cooling load. BIPV
compared to rack-mounted PV system is more aesthetically pleasant and
cost effective. There is saving potential of materials in the integration of PV
in building and also eliminating the PV module-mounting structure. On the
other hand rack mounted systems are easier to install and operate the
maintenance service. In the last years by decreasing the price of solar cells
in the market, the application of BIPV, BAPV and rack-mounted PV have
been growing in tropical cities as well as other climates. BIPV windows
have been proposed by many as an innovative and emerging glazing
technology in the buildings [7,8]. In a relevant study, Redweik et al. [9]
showed that although the annual irradiation on vertical facades is lower than
that of more favourable surfaces (roofs), due to their very large areas, the
solar potential of facades is relevant for the overall solar potential of a
building.
2. PV System for Tropical Buildings
Tropical regions on earth are mostly surrounding the equator and
their main characteristics are year-around high humidity and temperature
with significant amount of rainfall. The cloudy sky is the main characteristic
1 2 3 4 5 6 7 8 9 10 11 12 13 14 15 16 17 18 19 20 21 22 23 24 25 26 27 28 29 30 31 32 33 34 35 36 37 38 39 40 41 42 43 44 45 46 47 48 49
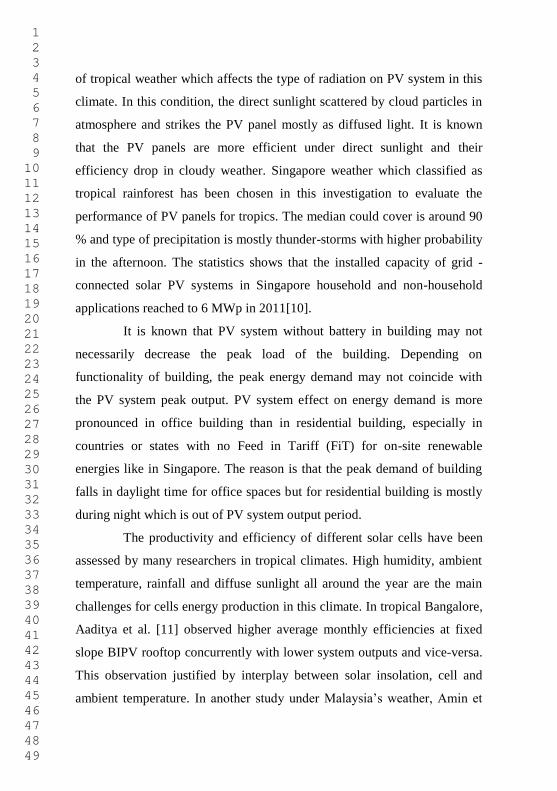
of tropical weather which affects the type of radiation on PV system in this
climate. In this condition, the direct sunlight scattered by cloud particles in
atmosphere and strikes the PV panel mostly as diffused light. It is known
that the PV panels are more efficient under direct sunlight and their
efficiency drop in cloudy weather. Singapore weather which classified as
tropical rainforest has been chosen in this investigation to evaluate the
performance of PV panels for tropics. The median could cover is around 90
% and type of precipitation is mostly thunder-storms with higher probability
in the afternoon. The statistics shows that the installed capacity of grid -
connected solar PV systems in Singapore household and non-household
applications reached to 6 MWp in 2011[10].
It is known that PV system without battery in building may not
necessarily decrease the peak load of the building. Depending on
functionality of building, the peak energy demand may not coincide with
the PV system peak output. PV system effect on energy demand is more
pronounced in office building than in residential building, especially in
countries or states with no Feed in Tariff (FiT) for on-site renewable
energies like in Singapore. The reason is that the peak demand of building
falls in daylight time for office spaces but for residential building is mostly
during night which is out of PV system output period.
The productivity and efficiency of different solar cells have been
assessed by many researchers in tropical climates. High humidity, ambient
temperature, rainfall and diffuse sunlight all around the year are the main
challenges for cells energy production in this climate. In tropical Bangalore,
Aaditya et al. [11] observed higher average monthly efficiencies at fixed
slope BIPV rooftop concurrently with lower system outputs and vice-versa.
This observation justified by interplay between solar insolation, cell and
ambient temperature. In another study under Malaysia’s weather, Amin et
1 2 3 4 5 6 7 8 9 10 11 12 13 14 15 16 17 18 19 20 21 22 23 24 25 26 27 28 29 30 31 32 33 34 35 36 37 38 39 40 41 42 43 44 45 46 47 48 49
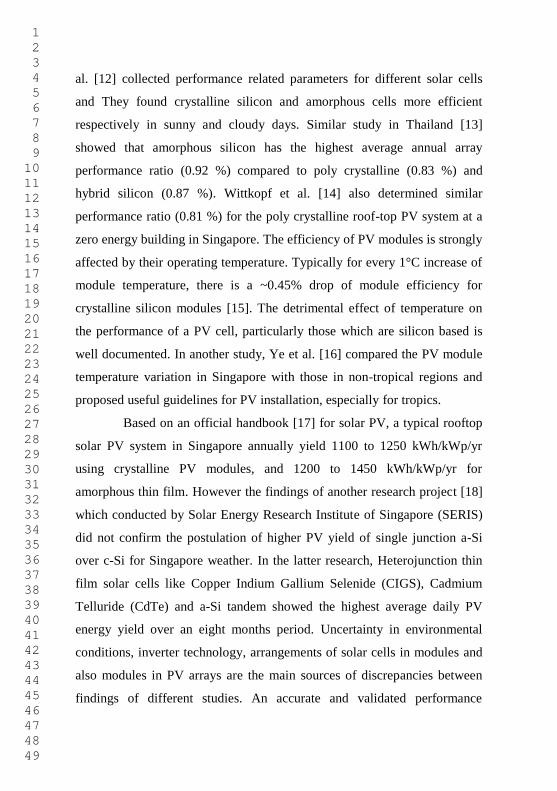
al. [12] collected performance related parameters for different solar cells
and They found crystalline silicon and amorphous cells more efficient
respectively in sunny and cloudy days. Similar study in Thailand [13]
showed that amorphous silicon has the highest average annual array
performance ratio (0.92 %) compared to poly crystalline (0.83 %) and
hybrid silicon (0.87 %). Wittkopf et al. [14] also determined similar
performance ratio (0.81 %) for the poly crystalline roof-top PV system at a
zero energy building in Singapore. The efficiency of PV modules is strongly
affected by their operating temperature. Typically for every 1°C increase of
module temperature, there is a ~0.45% drop of module efficiency for
crystalline silicon modules [15]. The detrimental effect of temperature on
the performance of a PV cell, particularly those which are silicon based is
well documented. In another study, Ye et al. [16] compared the PV module
temperature variation in Singapore with those in non-tropical regions and
proposed useful guidelines for PV installation, especially for tropics.
Based on an official handbook [17] for solar PV, a typical rooftop
solar PV system in Singapore annually yield 1100 to 1250 kWh/kWp/yr
using crystalline PV modules, and 1200 to 1450 kWh/kWp/yr for
amorphous thin film. However the findings of another research project [18]
which conducted by Solar Energy Research Institute of Singapore (SERIS)
did not confirm the postulation of higher PV yield of single junction a-Si
over c-Si for Singapore weather. In the latter research, Heterojunction thin
film solar cells like Copper Indium Gallium Selenide (CIGS), Cadmium
Telluride (CdTe) and a-Si tandem showed the highest average daily PV
energy yield over an eight months period. Uncertainty in environmental
conditions, inverter technology, arrangements of solar cells in modules and
also modules in PV arrays are the main sources of discrepancies between
findings of different studies. An accurate and validated performance
1 2 3 4 5 6 7 8 9 10 11 12 13 14 15 16 17 18 19 20 21 22 23 24 25 26 27 28 29 30 31 32 33 34 35 36 37 38 39 40 41 42 43 44 45 46 47 48 49
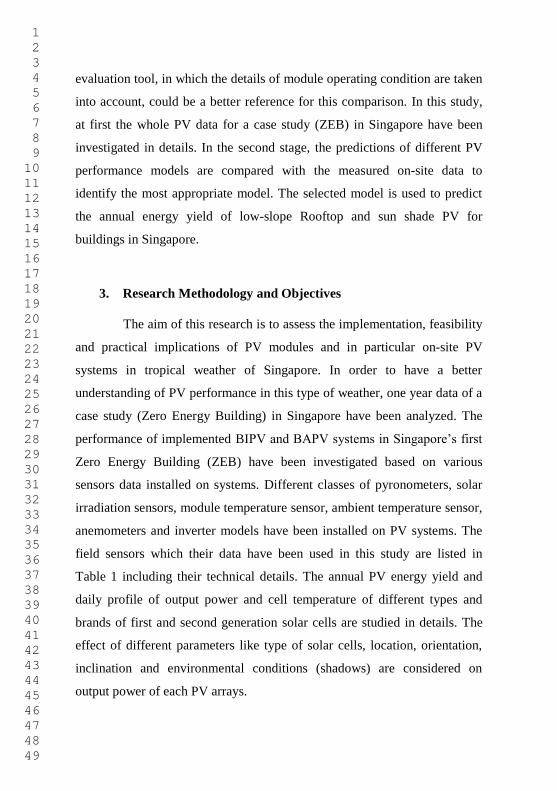
evaluation tool, in which the details of module operating condition are taken
into account, could be a better reference for this comparison. In this study,
at first the whole PV data for a case study (ZEB) in Singapore have been
investigated in details. In the second stage, the predictions of different PV
performance models are compared with the measured on-site data to
identify the most appropriate model. The selected model is used to predict
the annual energy yield of low-slope Rooftop and sun shade PV for
buildings in Singapore.
3. Research Methodology and Objectives
The aim of this research is to assess the implementation, feasibility
and practical implications of PV modules and in particular on-site PV
systems in tropical weather of Singapore. In order to have a better
understanding of PV performance in this type of weather, one year data of a
case study (Zero Energy Building) in Singapore have been analyzed. The
performance of implemented BIPV and BAPV systems in Singapore’s first
Zero Energy Building (ZEB) have been investigated based on various
sensors data installed on systems. Different classes of pyronometers, solar
irradiation sensors, module temperature sensor, ambient temperature sensor,
anemometers and inverter models have been installed on PV systems. The
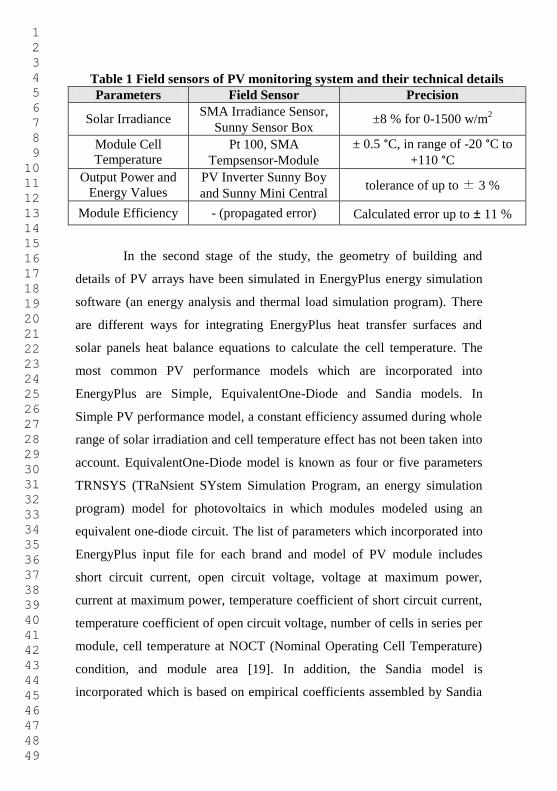
field sensors which their data have been used in this study are listed in
Table 1 including their technical details. The annual PV energy yield and
daily profile of output power and cell temperature of different types and
brands of first and second generation solar cells are studied in details. The
effect of different parameters like type of solar cells, location, orientation,
inclination and environmental conditions (shadows) are considered on
output power of each PV arrays.
1 2 3 4 5 6 7 8 9 10 11 12 13 14 15 16 17 18 19 20 21 22 23 24 25 26 27 28 29 30 31 32 33 34 35 36 37 38 39 40 41 42 43 44 45 46 47 48 49
Table 1 Field sensors of PV monitoring system and their technical details
Parameters Field Sensor Precision
Solar Irradiance SMA Irradiance Sensor,
Sunny Sensor Box ±8 % for 0-1500 w/m
2
Module Cell
Temperature
Pt 100, SMA
Tempsensor-Module
± 0.5 °C, in range of -20 °C to
+110 °C
Output Power and
Energy Values
PV Inverter Sunny Boy
and Sunny Mini Central tolerance of up to ± 3 %
Module Efficiency - (propagated error) Calculated error up to ± 11 %
In the second stage of the study, the geometry of building and
details of PV arrays have been simulated in EnergyPlus energy simulation
software (an energy analysis and thermal load simulation program). There
are different ways for integrating EnergyPlus heat transfer surfaces and
solar panels heat balance equations to calculate the cell temperature. The
most common PV performance models which are incorporated into
EnergyPlus are Simple, EquivalentOne-Diode and Sandia models. In
Simple PV performance model, a constant efficiency assumed during whole
range of solar irradiation and cell temperature effect has not been taken into
account. EquivalentOne-Diode model is known as four or five parameters
TRNSYS (TRaNsient SYstem Simulation Program, an energy simulation
program) model for photovoltaics in which modules modeled using an
equivalent one-diode circuit. The list of parameters which incorporated into
EnergyPlus input file for each brand and model of PV module includes
short circuit current, open circuit voltage, voltage at maximum power,
current at maximum power, temperature coefficient of short circuit current,
temperature coefficient of open circuit voltage, number of cells in series per
module, cell temperature at NOCT (Nominal Operating Cell Temperature)
condition, and module area [19]. In addition, the Sandia model is
incorporated which is based on empirical coefficients assembled by Sandia
1 2 3 4 5 6 7 8 9 10 11 12 13 14 15 16 17 18 19 20 21 22 23 24 25 26 27 28 29 30 31 32 33 34 35 36 37 38 39 40 41 42 43 44 45 46 47 48 49
National Laboratory for each specific type and brand of PV modules. The
many empirical coefficients for each PV module have been found in System
Advisor Model (SAM) database provided by National Renewable Energy
Laboratory (NREL).
It is known that the optimum angle of solar panels at each location
on the earth is close to the value of that location latitude or slightly lower
[20,21]. It is also the case for rooftop PV in tropical buildings which are
mostly located near to the equator and the panels are preferred to be
horizontal (0 ° as latitude of equator). However, the situation is a bit more
complicated for the optimum slope of external shading PV or PV glass
which are located on the façade. Getting a better understanding on the
impact of solar panel angle on annual energy yield of different types of
solar cells is one of the objectives of this study.
Empirical and non-empirical models have been used by many
researchers in the literature to predict the annual energy yield of solar panels
[22,23]. Several PV performance models like Equivalent one-diode and
Sandia models have been incorporated into EnergyPlus energy simulation
software to model PV arrays on different sites and the results are validated
with experimental data [24]. The required input parameters, location, and
inclination of each installed arrays in ZEB have been incorporated into
EnergyPlus as input file. The daily profile of output power, cell temperature
and also annual energy yield of modules have been predicted with different
PV performance models and compared to measured on-site data. With a
certified accurate PV performance model, the efforts have been taken to
provide guidelines of annual PV yield for different generation, location,
orientation and inclination of PV arrays in tropical weather of Singapore.
4. Performance Evaluation of a Case Study in Singapore
1 2 3 4 5 6 7 8 9 10 11 12 13 14 15 16 17 18 19 20 21 22 23 24 25 26 27 28 29 30 31 32 33 34 35 36 37 38 39 40 41 42 43 44 45 46 47 48 49
4.1 Overal Installed PV System in ZEB
The Zero Energy Building (ZEB) is retrofitted from an existing
building. Converted from a three-storey former workshop, ZEB houses
offices, classrooms and a resource centre. The ZEB is a zero energy
building because the building produces enough energy to run itself. The
building aims to produce enough energy to power the building, through a
combination of green building technology, clever building design that takes
advantages of natural ventilation and lighting, and the harnessing of solar
energy. To achieve the self-sufficient energy, the building is powered by a
broad spectrum of grid-tied and standalone solar panels installed at many
locations in the building. Surplus power generated by these solar panels
distributed to the rest of BCA Academy buildings. If insufficient power is
produced, then grid supply will provide for ZEB, so that user comfort and
function are never compromised.
Various brands of poly-crystalline silicon, mono-crystalline
silicon, heterojunction with intrinsic thin layer (HIT), amorphous thin film,
copper indium gallium (di) selenide (CIGS) PV modules have been installed
on rooftop, linkway, car park shelter, sunshade, railing and other locations
in the building. In overall, 1540 m2 of PV modules with peak system power
of 190 kWp have been implemented in the building to produce about 207
MWh electricity each year. Different types of sensors including 36 solar
irradiation sensors, one ambient temperature sensors, 9 Pyranometers, 6
Anemometers, 21 cell temperature sensors and 37 power meters on
Invertors are installed on PV systems. A software platform has been
developed to collect and monitor the real-time measured data and also
export them into text files.
The energy yield of different solar cells installed in ZEB varies
based on their location, orientation, inclination, and also environmental and
1 2 3 4 5 6 7 8 9 10 11 12 13 14 15 16 17 18 19 20 21 22 23 24 25 26 27 28 29 30 31 32 33 34 35 36 37 38 39 40 41 42 43 44 45 46 47 48 49
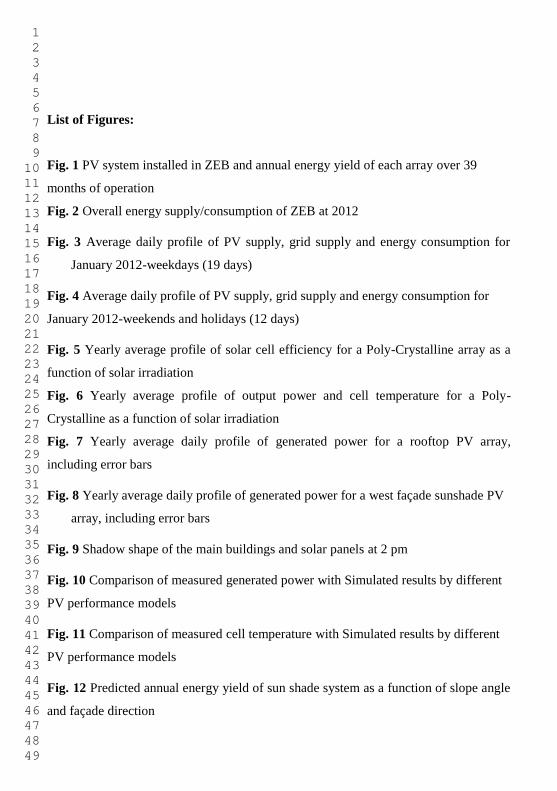
shading conditions. The fluctuations in annual energy yield of PV system in
ZEB over 39 months of installation from October 2009 to December 2012
are shown in Fig.1. The annual PV yield of arrays ranges between 600 to
1200 kWh/yr and the type of solar cells, shading condition and arrangement
of modules in an array are the key factors. The roof top arrays produced the
highest electricity per peak watt of installed PV modules because of their
exposure to sunlight in the whole day. Also in general, the east-oriented
arrays with lower inclination were the most productive PV modules during
39 months of operation. The reason of this fact could be higher probability
of rainfall in afternoon which affects the average daily radiation striking
west-oriented arrays. The other source of variation is different arrangement
of modules in northern rooftop arrays compared to southern ones which
degraded their produced annual energy.
Fig. 1 here
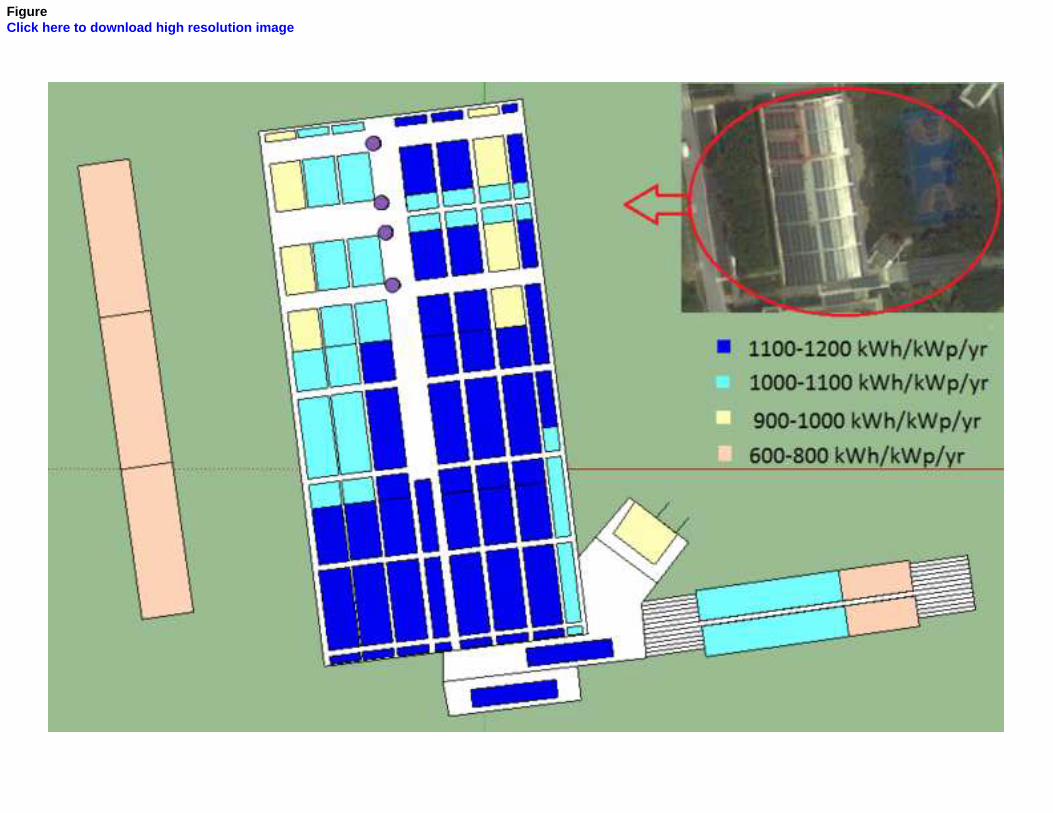
The details of energy consumption and production of building for
different months over the year are shown in Fig. 2. Evaluation of ZEB data
at 2012 shows that the BIPV energy production was 5 % more than building
energy consumption which confirms the claim of net zero energy building.
In total PV systems produced 201 MWh electricity in this year which is
slightly lower than expected energy yield for a typical year (207 MWh).
Fig. 2 here
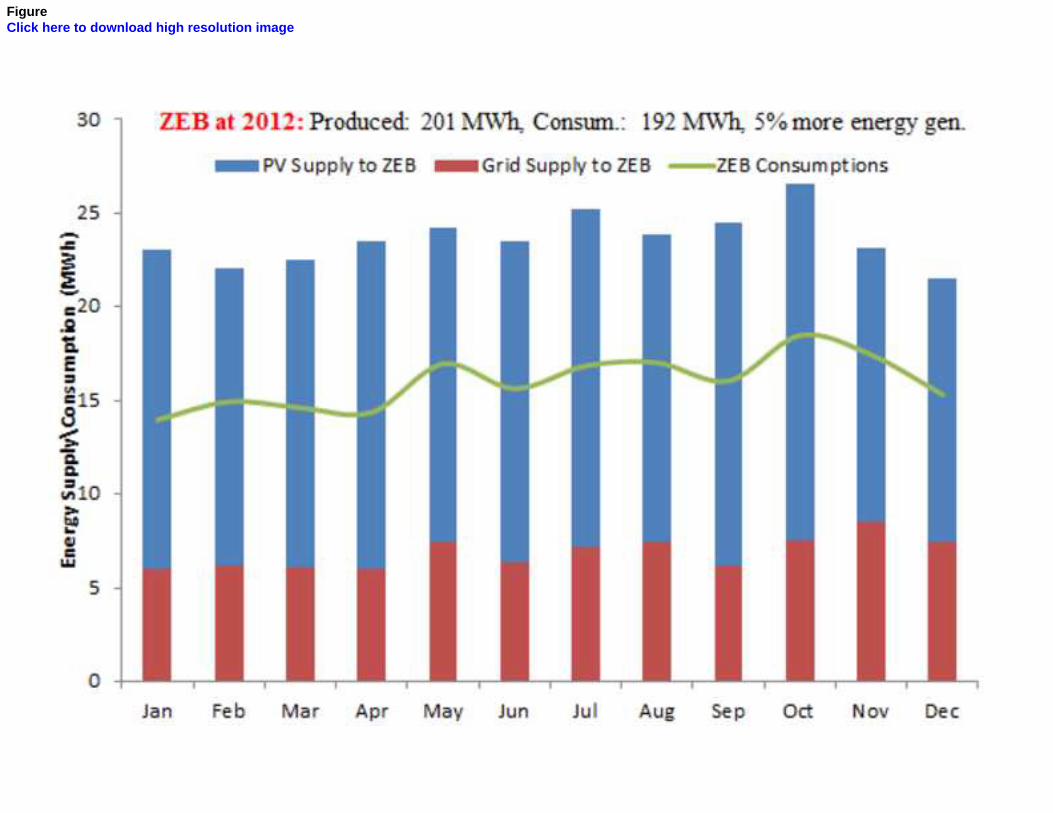
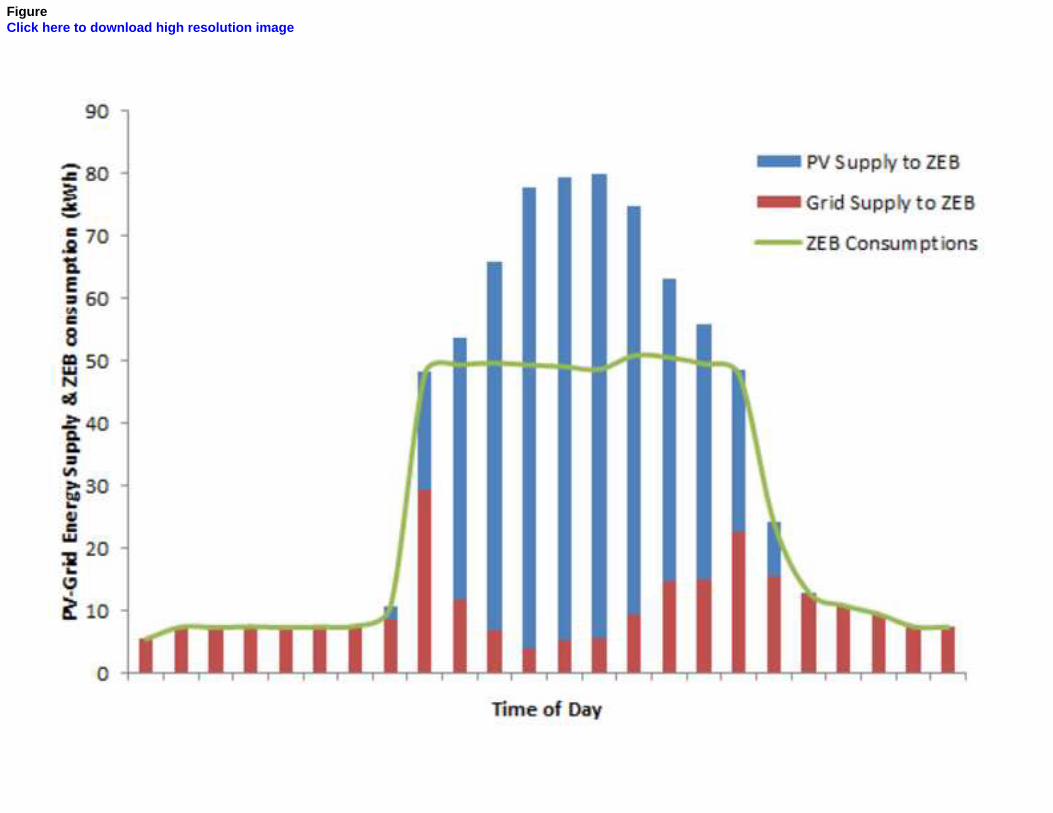
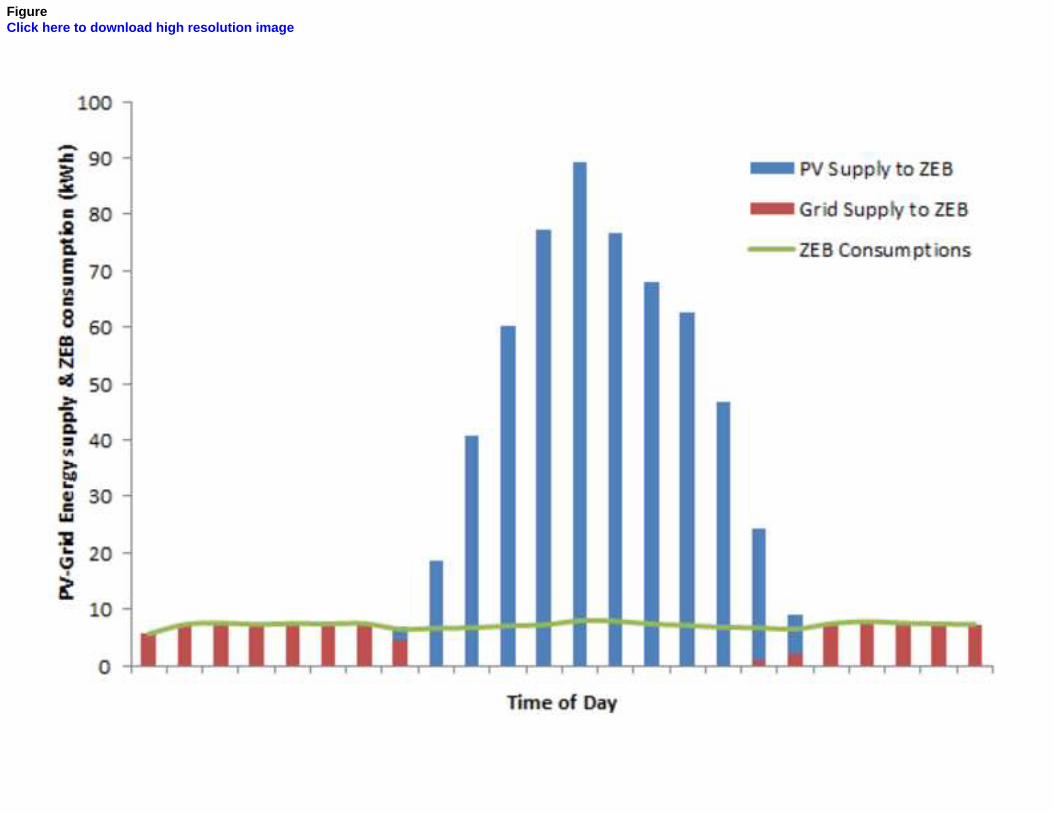
The average daily profile of PV supply, city grid supply and
energy consumption for weekdays and weekends over January 2012 are
shown in Fig. 3-4. The daily profile of PV supply and city power grid
supply to ZEB is different from weekdays to weekends and holidays.
During the week, the building is mostly occupied by employees and it has
1 2 3 4 5 6 7 8 9 10 11 12 13 14 15 16 17 18 19 20 21 22 23 24 25 26 27 28 29 30 31 32 33 34 35 36 37 38 39 40 41 42 43 44 45 46 47 48 49
uniform energy consumption during office hours. On the other hand in the
weekends, the building is mostly empty and energy demand is much lower
which means more energy saving of produced energy by PV systems.
Fig. 3& 4 here
4.2 Daily Profile of Efficiency, Output power and Cell
Temperature
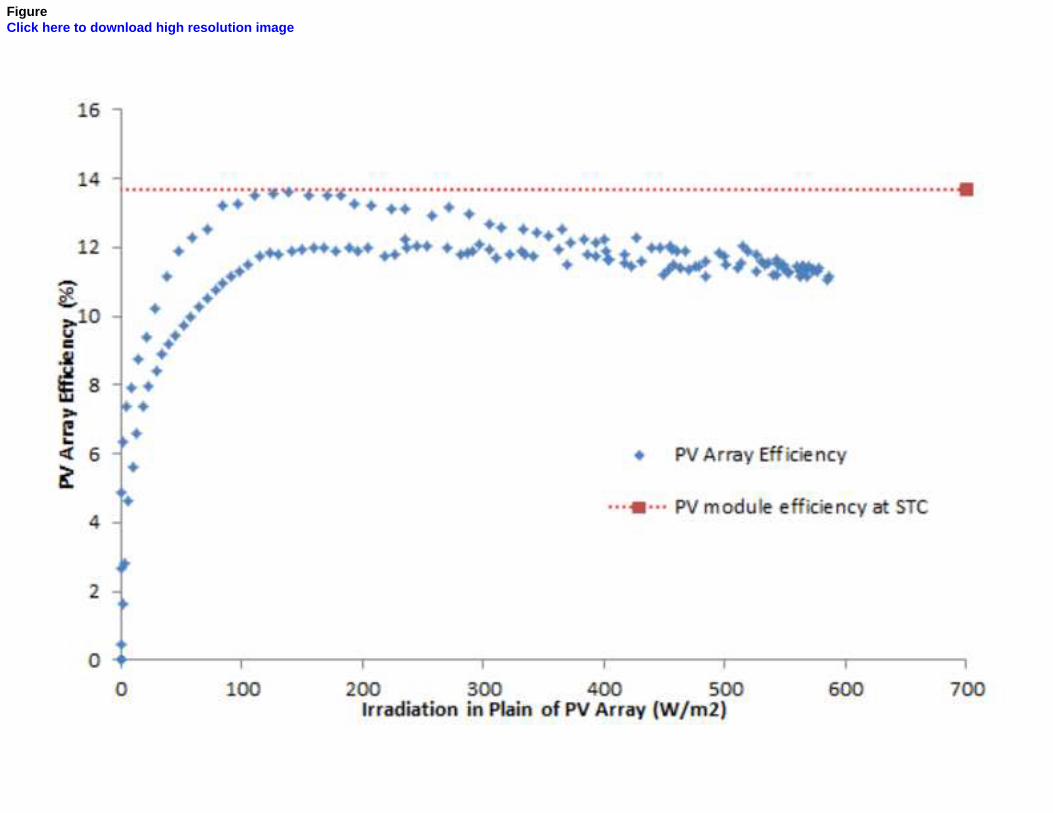
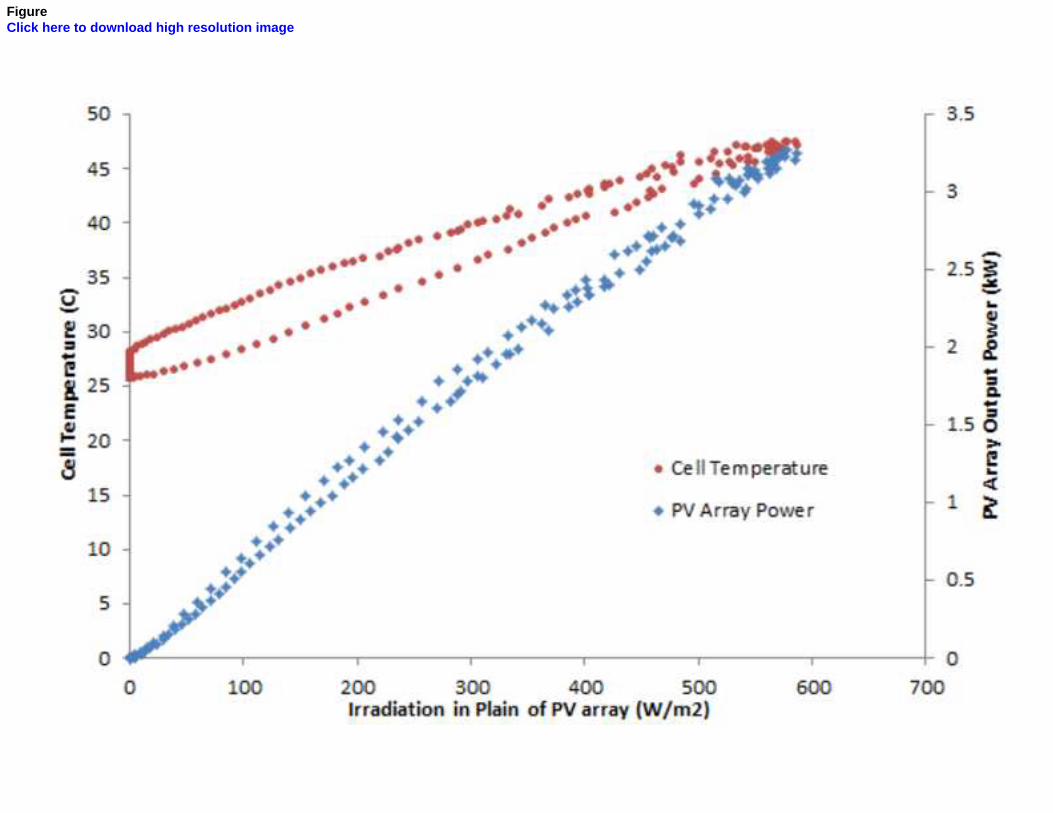
The measured output power, efficiency and cell temperature of
arrays in ZEB brought the chance of getting a better understanding of
module performance during the day. The yearly average daily profile of
output power and efficiency together with solar cell temperature variations
for a PolyCrystalline Silicon array are shown in Fig. 5-6. With the same
amount of radiation on solar panel, its efficiency varies from morning to
afternoon due to different cell temperature. This variation mainly depends
on the thermal mass of PV modules, day/night temperature range and also
other environmental conditions. The nominal power (peak power) of this
array is 6.84 kWp, however its actual output power does not exceed 3.5 kW
in a normal day. As expected, cell temperature is higher in afternoon which
causes a small decrease in produced energy of modules compared to
morning output energy. It is also observed that around 9 AM, the efficiency
of module is close to standard test condition (25 °C, 1.5 Air Mass, 1000
W/m2) efficiency which is 13.7 %. This value drops to 12 % during the
noon and also in afternoon due to higher cell temperature.
Fig. 5 & 6 here
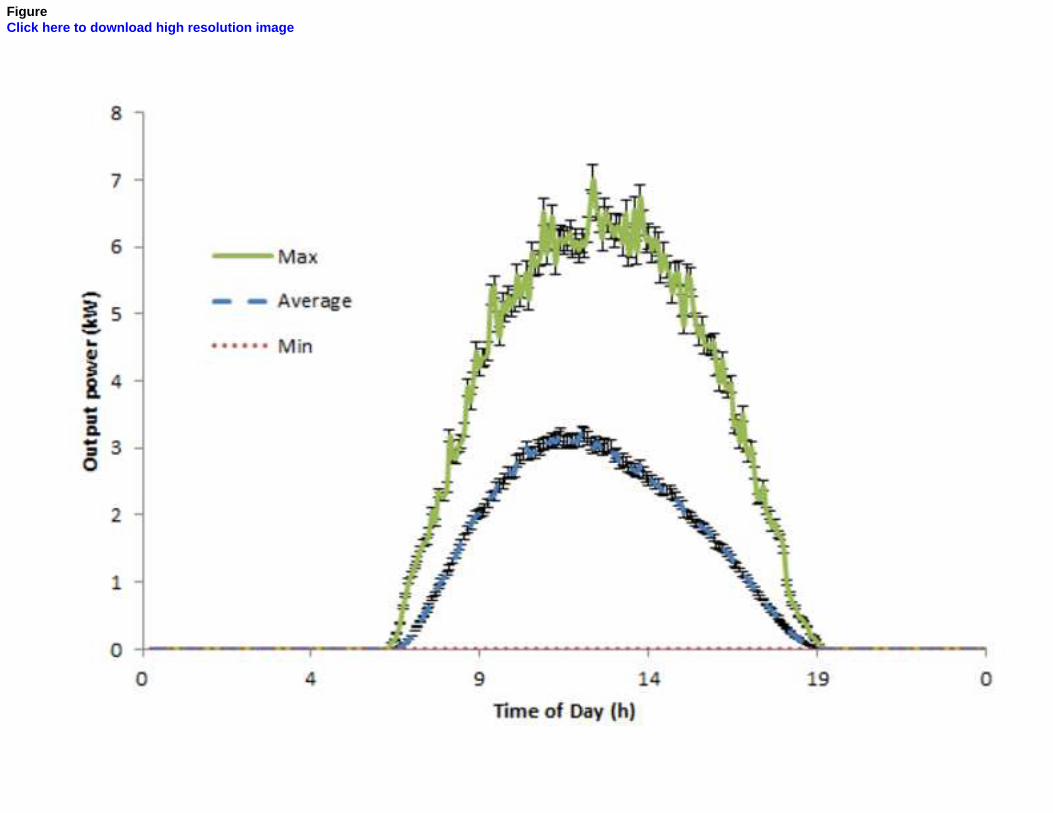
The other interesting graphs which have been generated based on
the measured data in this case study, are the yearly average daily profile of
1 2 3 4 5 6 7 8 9 10 11 12 13 14 15 16 17 18 19 20 21 22 23 24 25 26 27 28 29 30 31 32 33 34 35 36 37 38 39 40 41 42 43 44 45 46 47 48 49
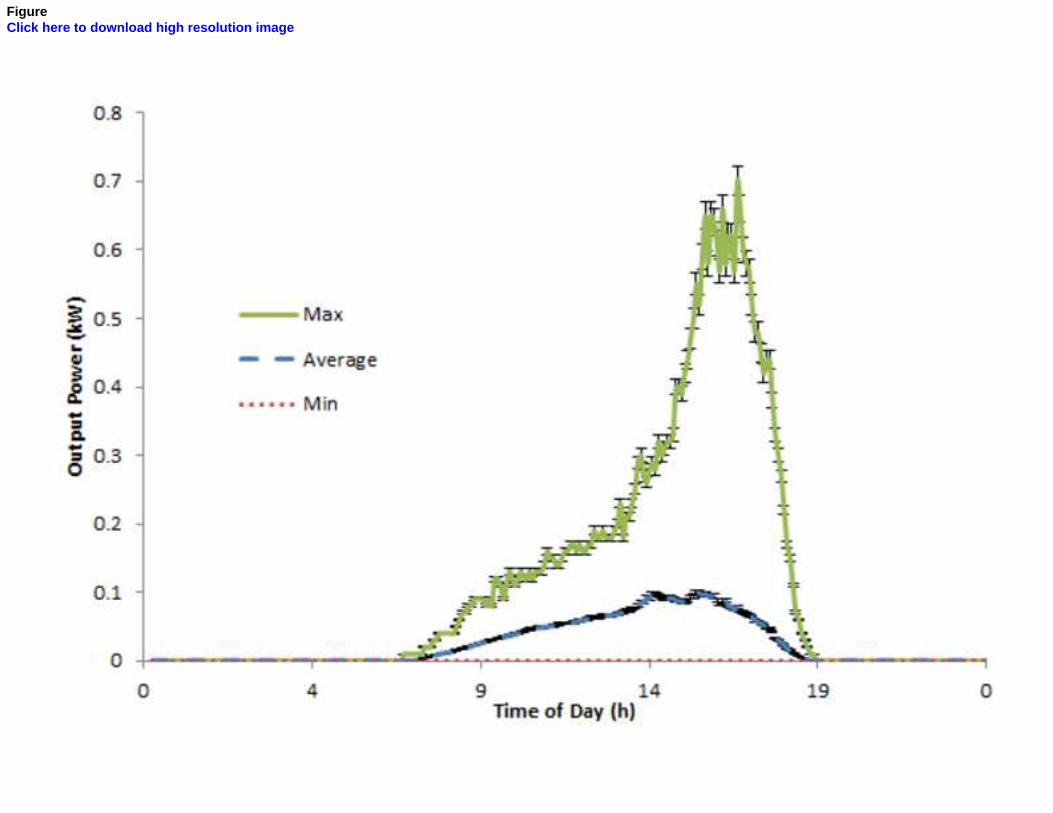
arrays actual power. The deviation of the on-site produced energy of PV
arrays from their nominal capacity depends on their façade direction,
inclination, orientation, shading and other environmental conditions. As a
sample, the maximum, minimum and average daily profiles of a roof top
PolyCrystalline and sunshade Amorphous PV arrays are shown in Fig. 7-8.
The maximum capacity of roof top array is around 7 kW which is close to
its nominal capacity. However, the maximum power of the Sunshade array
which is located on west façade is around 0.7 kW and is lower than its
nominal capacity (1.044 kWp). The peak capacity mostly happens around
noon for rooftop array but for sunshade array on west facade, the peak point
happens in the afternoon when it receives the highest solar irradiation.
Fig. 7 & 8 here
5. Validation of PV Performance Models
An accurate modeling tool for predicting the energy yield of solar
system could be useful in recognizing the optimum location, orientation and
inclination of on-site PV systems in buildings. It is also applicable in
recognizing the financial potential of solar panels by determining the Return
of Investment (ROI) for new buildings or retrofits. The whole PV systems
installed in ZEB have been simulated in EnergyPlus to consider the most
realistic shading conditions for panels. This prediction tool could be used to
have an estimation of annual PV yield and also to identify the optimum
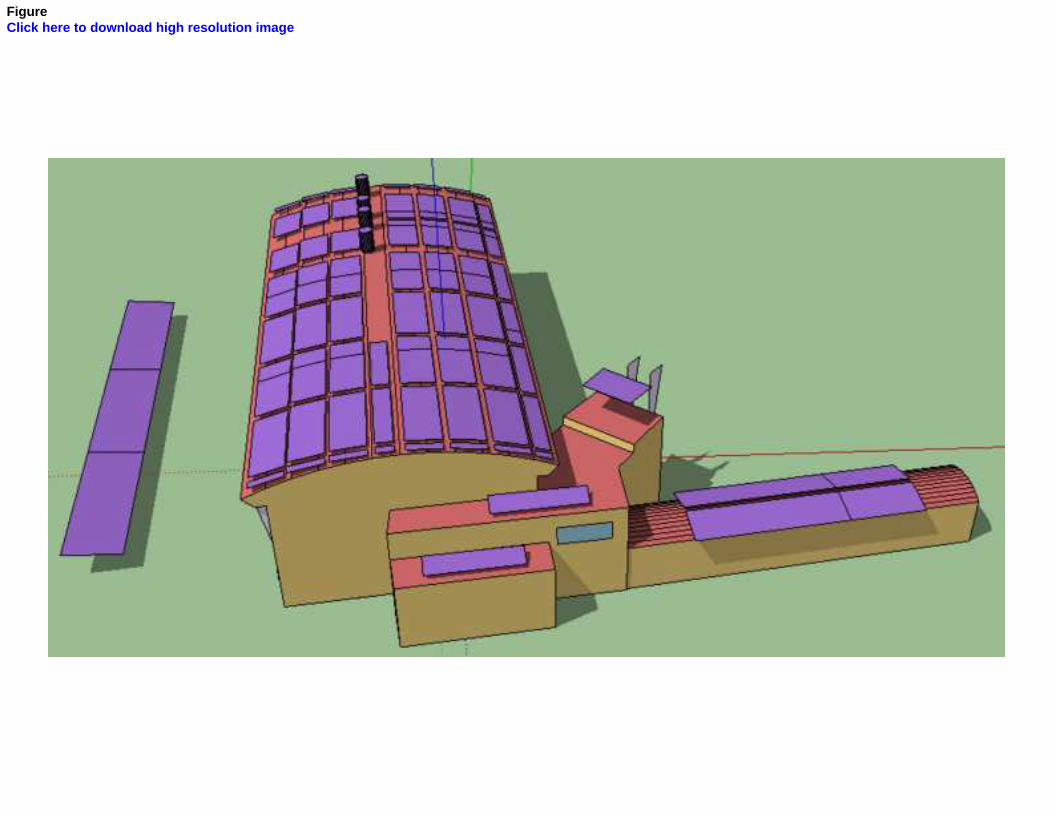
location, orientation and inclination of PV modules. The 3D model of the
zero energy building has been generated in 3D modeling program of
SketchUp. Geometrical dimensions of building and solar panels have been
modeled based on the available data in the building drawing, PV
manufacturer’s technical catalogues and also actual building on-site
1 2 3 4 5 6 7 8 9 10 11 12 13 14 15 16 17 18 19 20 21 22 23 24 25 26 27 28 29 30 31 32 33 34 35 36 37 38 39 40 41 42 43 44 45 46 47 48 49
measured data. The legacy OpenStudio Plug-in for SketchUp have been
used to create EnergyPlus input file based on defined boundary conditions,
thermal loads and other parameters. This modeling tool is capable of
predicting the shadow zones at different times and days in the year which is
the dominant factor for estimating the annual PV yield. The modeled
building and solar panels are shown in Fig. 9.
Fig. 9 here
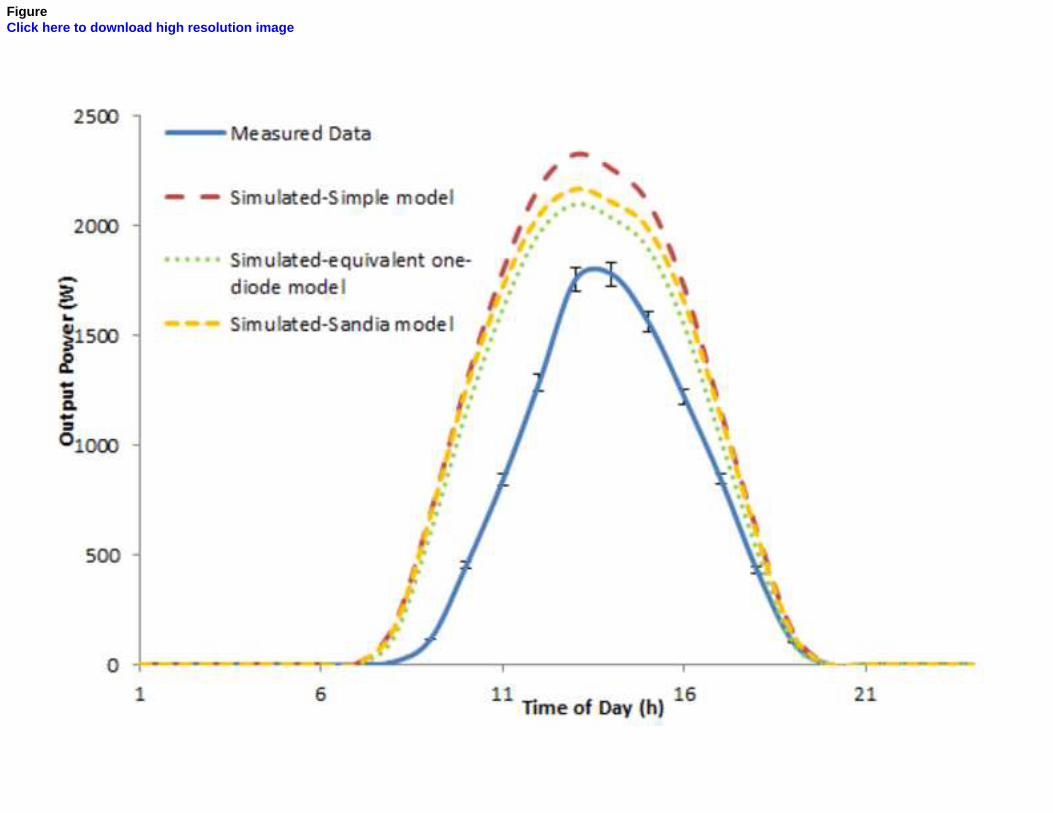
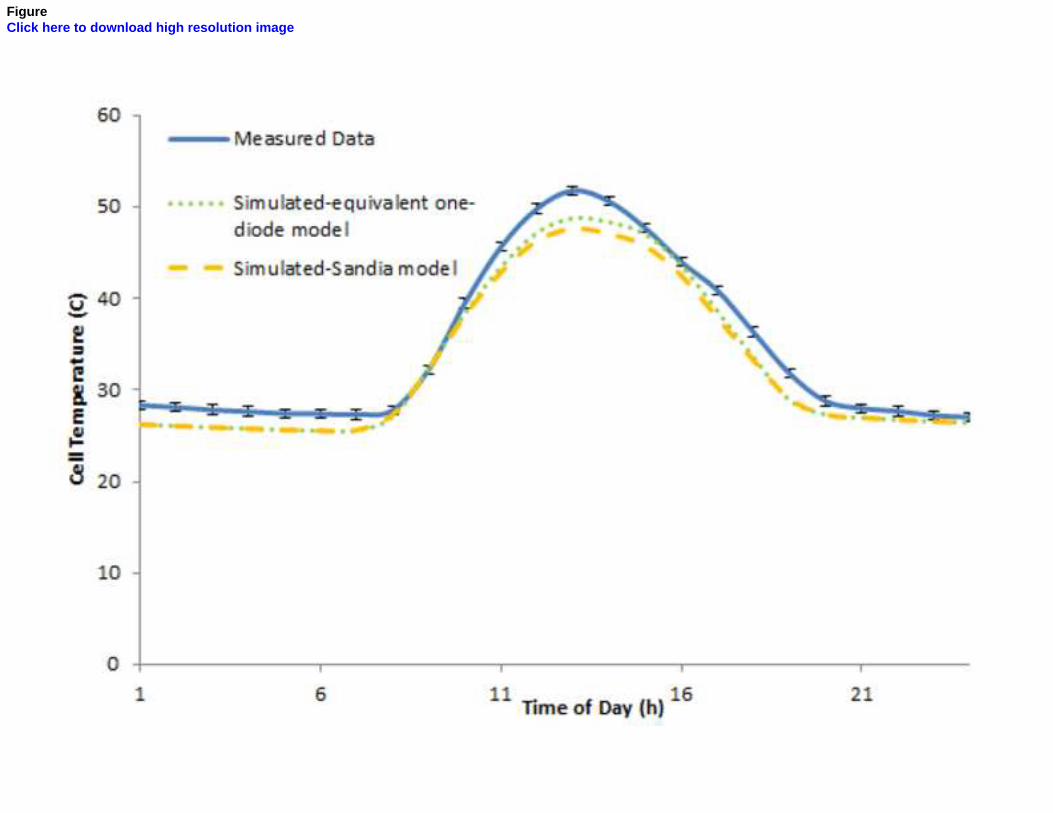
The results of simulations are compared with measured data in
terms of instantaneous DC output power of arrays and cell temperature for
different solar panels. The predictions of three PV performance models of
Simple, Equivalent one-diode and Sandia are compared with measured data
for a PolyCrystalline array in Fig. 10-11. It can be seen that one-diode and
Sandia model could capture more accurate results in contrast with Simple
model but there is still rooms for improvement. By implementing actual
weather data of a specific year instead of IWEC (International Weather for
Energy Calculation) weather data and also considering other sources of on-
site energy loss in PV systems more accurate results could be achieved.
Fig. 10 & 11 here
6. Simulation-based Energy Yield Prediction
Having a validated PV performance model brings the opportunity
of predicting the annual energy yield of PV systems at design stage of the
building construction process. With this mindset, low-slope rooftop and
sunshade solar panels have been simulated for tropical weather of
Singapore. Three types of Mono-Crystalline, Poly-Crystalline and
Amorphous solar cells have been modeled in EnergyPlus with Equivalent
one-diode performance model. For each cell type, three different popular
1 2 3 4 5 6 7 8 9 10 11 12 13 14 15 16 17 18 19 20 21 22 23 24 25 26 27 28 29 30 31 32 33 34 35 36 37 38 39 40 41 42 43 44 45 46 47 48 49
brands in the market have been chosen to cover the variations in energy
yield of different products. In overall 9 brands (A-I) have been picked up
for the simulations and the input parameters for one-diode are taken from
the technical catalogues of these products.
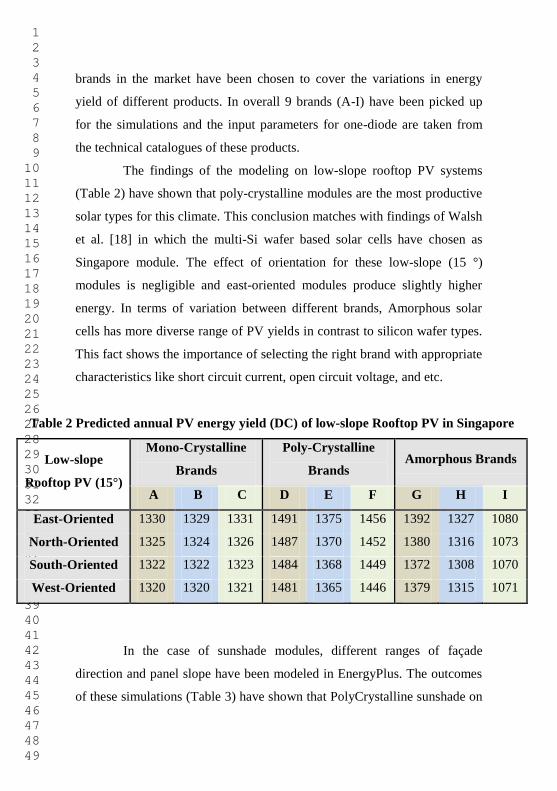
The findings of the modeling on low-slope rooftop PV systems
(Table 2) have shown that poly-crystalline modules are the most productive
solar types for this climate. This conclusion matches with findings of Walsh
et al. [18] in which the multi-Si wafer based solar cells have chosen as
Singapore module. The effect of orientation for these low-slope (15 °)
modules is negligible and east-oriented modules produce slightly higher
energy. In terms of variation between different brands, Amorphous solar
cells has more diverse range of PV yields in contrast to silicon wafer types.
This fact shows the importance of selecting the right brand with appropriate
characteristics like short circuit current, open circuit voltage, and etc.
Table 2 Predicted annual PV energy yield (DC) of low-slope Rooftop PV in Singapore
Low-slope
Rooftop PV (15°)
Mono-Crystalline
Brands
Poly-Crystalline
Brands Amorphous Brands
A B C D E F G H I
East-Oriented 1330 1329 1331 1491 1375 1456 1392 1327 1080
North-Oriented 1325 1324 1326 1487 1370 1452 1380 1316 1073
South-Oriented 1322 1322 1323 1484 1368 1449 1372 1308 1070
West-Oriented 1320 1320 1321 1481 1365 1446 1379 1315 1071
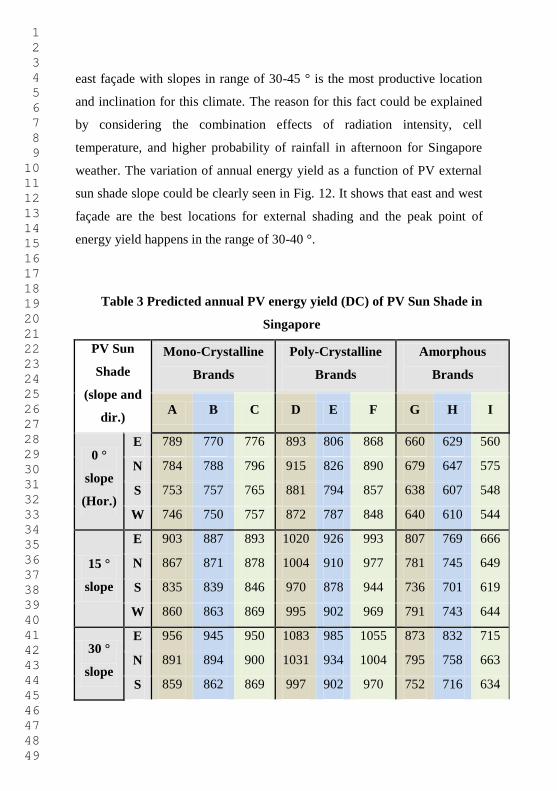
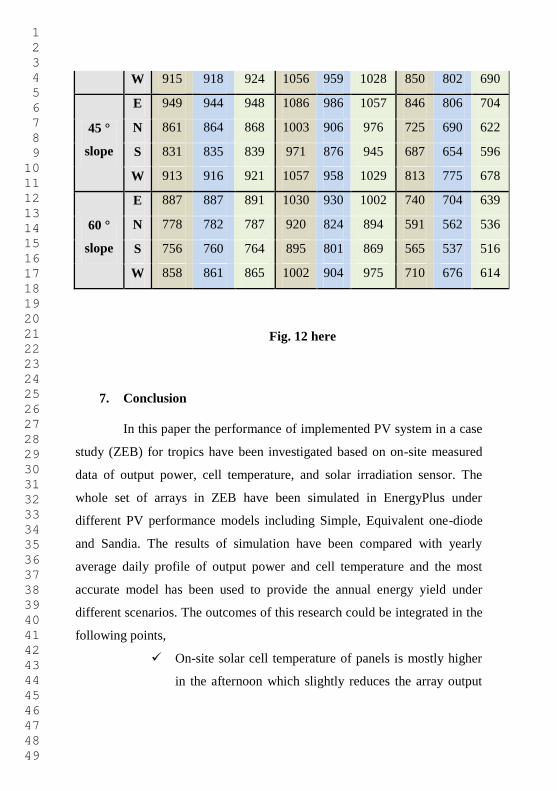
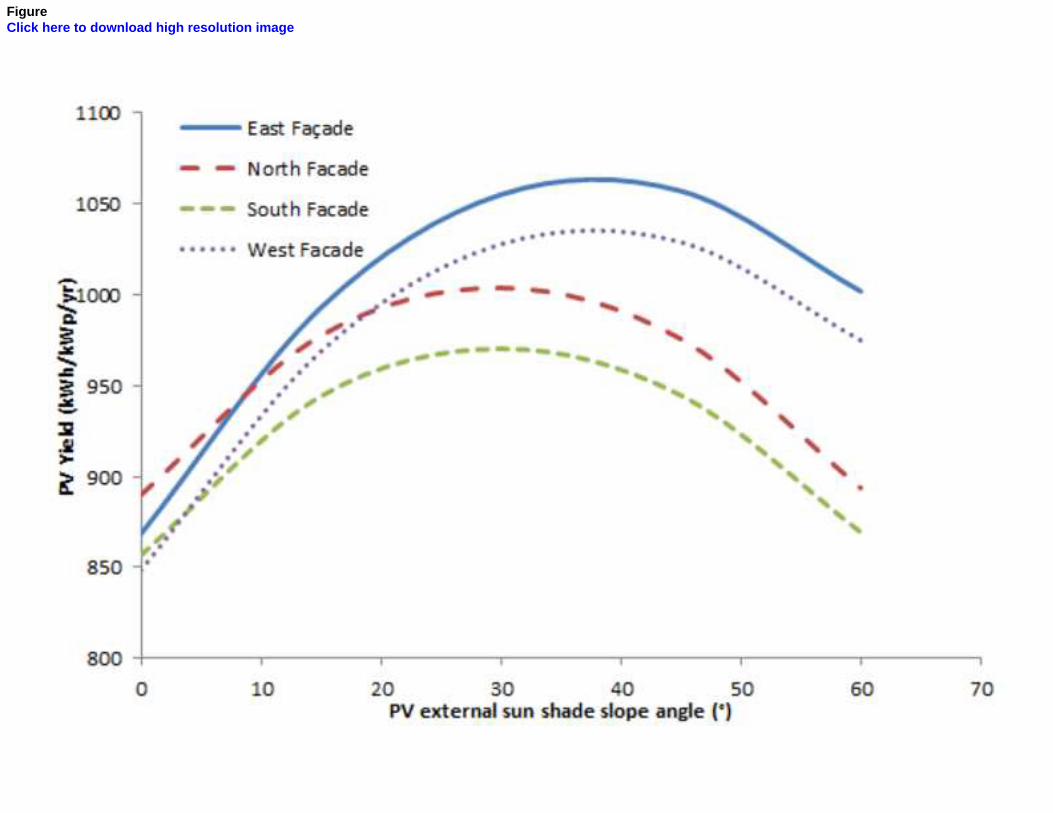
In the case of sunshade modules, different ranges of façade
direction and panel slope have been modeled in EnergyPlus. The outcomes
of these simulations (Table 3) have shown that PolyCrystalline sunshade on
1 2 3 4 5 6 7 8 9 10 11 12 13 14 15 16 17 18 19 20 21 22 23 24 25 26 27 28 29 30 31 32 33 34 35 36 37 38 39 40 41 42 43 44 45 46 47 48 49
east façade with slopes in range of 30-45 ° is the most productive location
and inclination for this climate. The reason for this fact could be explained
by considering the combination effects of radiation intensity, cell
temperature, and higher probability of rainfall in afternoon for Singapore
weather. The variation of annual energy yield as a function of PV external
sun shade slope could be clearly seen in Fig. 12. It shows that east and west
façade are the best locations for external shading and the peak point of
energy yield happens in the range of 30-40 °.
Table 3 Predicted annual PV energy yield (DC) of PV Sun Shade in
Singapore
PV Sun
Shade
(slope and
dir.)
Mono-Crystalline
Brands
Poly-Crystalline
Brands
Amorphous
Brands
A B C D E F G H I
0 °
slope
(Hor.)
E 789 770 776 893 806 868 660 629 560
N 784 788 796 915 826 890 679 647 575
S 753 757 765 881 794 857 638 607 548
W 746 750 757 872 787 848 640 610 544
15 °
slope
E 903 887 893 1020 926 993 807 769 666
N 867 871 878 1004 910 977 781 745 649
S 835 839 846 970 878 944 736 701 619
W 860 863 869 995 902 969 791 743 644
30 °
slope
E 956 945 950 1083 985 1055 873 832 715
N 891 894 900 1031 934 1004 795 758 663
S 859 862 869 997 902 970 752 716 634
1 2 3 4 5 6 7 8 9 10 11 12 13 14 15 16 17 18 19 20 21 22 23 24 25 26 27 28 29 30 31 32 33 34 35 36 37 38 39 40 41 42 43 44 45 46 47 48 49
W 915 918 924 1056 959 1028 850 802 690
45 °
slope
E 949 944 948 1086 986 1057 846 806 704
N 861 864 868 1003 906 976 725 690 622
S 831 835 839 971 876 945 687 654 596
W 913 916 921 1057 958 1029 813 775 678
60 °
slope
E 887 887 891 1030 930 1002 740 704 639
N 778 782 787 920 824 894 591 562 536
S 756 760 764 895 801 869 565 537 516
W 858 861 865 1002 904 975 710 676 614
Fig. 12 here
7. Conclusion
In this paper the performance of implemented PV system in a case
study (ZEB) for tropics have been investigated based on on-site measured
data of output power, cell temperature, and solar irradiation sensor. The
whole set of arrays in ZEB have been simulated in EnergyPlus under
different PV performance models including Simple, Equivalent one-diode
and Sandia. The results of simulation have been compared with yearly
average daily profile of output power and cell temperature and the most
accurate model has been used to provide the annual energy yield under
different scenarios. The outcomes of this research could be integrated in the
following points,
On-site solar cell temperature of panels is mostly higher
in the afternoon which slightly reduces the array output
1 2 3 4 5 6 7 8 9 10 11 12 13 14 15 16 17 18 19 20 21 22 23 24 25 26 27 28 29 30 31 32 33 34 35 36 37 38 39 40 41 42 43 44 45 46 47 48 49
power compared to the morning with the same amount of
irradiation in-plain.
The efficiency of modules is close to the standard test
condition (in technical catalogue of panel) in the morning
but when it passes through noon and afternoon, the
efficiency drops because of higher cell temperature.
For this climate, the maximum generated power of
rooftop arrays is close to their nominal capacity in some
days, however sunshade arrays maximum power never
reaches to their nominal capacity during the year.
Comparison of modeling results with measured data has
shown the Equivalent one-diode and Sandia model could
fairly predict the yearly average actual output power of
modules but there is still room for improvement by
implementing more realistic weather data and
considering other sources of energy loss in panels.
The simulation-based energy yield predictions of low-
slope rooftop PV have shown that available product of
PolyCrystalline in the market are better choice than
Monocrystalline and single junction amorphous silicon
and the effect of orientation in these modules is
negligible for this climate.
The simulation-based energy yield predictions of external
sun shade PV have shown that east façade with panel
slope angle of 30-40 ° is the most productive location
and inclination for this climate.
The outcomes of this research have shown the potential of building
energy simulation and PV performance prediction model at design stage of
1 2 3 4 5 6 7 8 9 10 11 12 13 14 15 16 17 18 19 20 21 22 23 24 25 26 27 28 29 30 31 32 33 34 35 36 37 38 39 40 41 42 43 44 45 46 47 48 49
building construction projects. Since the importance of life cycle cost is
increasing in the decision making process of building construction project, a
more accurate and realistic simulation tools could help designers to have
more reliable return of investment (ROI) for solar panels in buildings.
8. Acknowledgment
We would like to thank the help of Ms. Alice Swee Lee Goh and Mr.
Alvin Seoh, from zero energy building administration office in BCA
academy at Singapore for giving us the opportunity to access the required
information in their centre. The assistance and guidance of Mr. Valliappan
Selvam and Dr. Thomas Reindl from Solar Energy Research Institute of
Singapore (SERIS) is also appreciated. In addition, the effort of other
members of the original investigation group including Mr. Arnab Pradhan
and Mr. Lauri Johannes Mikkonen is sincerely valued.
9. References
[1] Li DHW, Yang L, Lam JC. Zero energy buildings and sustainable
development implications – A review. Energy 2013;54:1–10.
[2] Sharma R, Tiwari GN. Technical performance evaluation of stand-alone
photovoltaic array for outdoor field conditions of New Delhi. Appl Energy
2012;92:644–52.
[3] Tiwari GN, Mishra RK, Solanki SC. Photovoltaic modules and their
applications: A review on thermal modelling. Appl Energy 2011;88:2287–304.
[4] Solar&Energy Co., Ltd. BIPV Technology and Market Forecast
(2009~2015). 2011.
[5] Singh GK. Solar power generation by PV (photovoltaic) technology: A
review. Energy 2013;53:1–13.
[6] Yoon J-H, Song J, Lee S-J. Practical application of building integrated
photovoltaic (BIPV) system using transparent amorphous silicon thin-film PV module.
Sol Energy 2011;85:723–33.
[7] Norton B, Eames PC, Mallick TK, Huang MJ, McCormack SJ, Mondol JD,
et al. Enhancing the performance of building integrated photovoltaics. Sol Energy
2011;85:1629–64.
1 2 3 4 5 6 7 8 9 10 11 12 13 14 15 16 17 18 19 20 21 22 23 24 25 26 27 28 29 30 31 32 33 34 35 36 37 38 39 40 41 42 43 44 45 46 47 48 49
[8] Wong PW, Shimoda Y, Nonaka M, Inoue M, Mizuno M. Semi-transparent
PV: Thermal performance, power generation, daylight modelling and energy saving
potential in a residential application. Renew Energy 2008;33:1024–36.
[9] Redweik P, Catita C, Brito M. Solar energy potential on roofs and facades in
an urban landscape. Sol Energy 2013;97:332–41.
[10] Energy Market Authority. Energising Our Nation: Singapore Energy
Statistics 2012. 2012.
[11] Aaditya G, Pillai R, Mani M. An insight into real-time performance
assessment of a building integrated photovoltaic (BIPV) installation in Bangalore
(India). Energy Sustain Dev n.d.
[12] Amin N, Lung CW, Sopian K. A practical field study of various solar cells
on their performance in Malaysia. Renew Energy 2009;34:1939–46.
[13] Chimtavee A, Ketjoy N. PV Generator Performance Evaluation and Load
Analysis of the PV Microgrid System in Thailand. Procedia Eng 2012;32:384–91.
[14] Wittkopf S, Valliappan S, Liu L, Ang KS, Cheng SCJ. Analytical
performance monitoring of a 142.5kWp grid-connected rooftop BIPV system in
Singapore. Renew Energy 2012;47:9–20.
[15] Skoplaki E, Palyvos JA. On the temperature dependence of photovoltaic
module electrical performance: A review of efficiency/power correlations. Sol Energy
2009;83:614–24.
[16] Ye Z, Nobre A, Reindl T, Luther J, Reise C. On PV module temperatures in
tropical regions. Sol Energy 2013;88:80–7.
[17] EMA & BCA. Handbook for Solar Photovoltaic (PV) Systems 2010.
[18] Walsh TM, Xiong Z, Khoo YS, Tay AAO, Aberle AG. Singapore Modules -
Optimised PV Modules for the Tropics. Energy Procedia 2012;15:388–95.
[19] ENERGYPLUSTM
. Input Output Reference: The Encyclopedic Reference to
EnergyPlus Input and Output. 2010.
[20] Chang TP. Performance evaluation for solar collectors in Taiwan. Energy
2009;34:32–40.
[21] Yadav AK, Chandel SS. Tilt angle optimization to maximize incident solar
radiation: A review. Renew Sustain Energy Rev 2013;23:503–13.
[22] Almonacid F, Rus C, Pérez-Higueras P, Hontoria L. Calculation of the
energy provided by a PV generator. Comparative study: Conventional methods vs.
artificial neural networks. Energy 2011;36:375–84.
[23] Ayompe LM, Duffy A, McCormack SJ, Conlon M. Validated real-time
energy models for small-scale grid-connected PV-systems. Energy 2010;35:4086–91.
[24] Cameron CP, Boyson WE, Riley DM. Comparison of PV system
performance-model predictions with measured PV system performance. Photovolt.
Spec. Conf. 2008 PVSC08 33rd IEEE, 2008, p. 1–6.
1 2 3 4 5 6 7 8 9 10 11 12 13 14 15 16 17 18 19 20 21 22 23 24 25 26 27 28 29 30 31 32 33 34 35 36 37 38 39 40 41 42 43 44 45 46 47 48 49
List of Figures:
Fig. 1 PV system installed in ZEB and annual energy yield of each array over 39
months of operation
Fig. 2 Overall energy supply/consumption of ZEB at 2012
Fig. 3 Average daily profile of PV supply, grid supply and energy consumption for
January 2012-weekdays (19 days)
Fig. 4 Average daily profile of PV supply, grid supply and energy consumption for
January 2012-weekends and holidays (12 days)
Fig. 5 Yearly average profile of solar cell efficiency for a Poly-Crystalline array as a
function of solar irradiation
Fig. 6 Yearly average profile of output power and cell temperature for a Poly-
Crystalline as a function of solar irradiation
Fig. 7 Yearly average daily profile of generated power for a rooftop PV array,
including error bars
Fig. 8 Yearly average daily profile of generated power for a west façade sunshade PV
array, including error bars
Fig. 9 Shadow shape of the main buildings and solar panels at 2 pm
Fig. 10 Comparison of measured generated power with Simulated results by different
PV performance models
Fig. 11 Comparison of measured cell temperature with Simulated results by different
PV performance models
Fig. 12 Predicted annual energy yield of sun shade system as a function of slope angle
and façade direction

1 2 3 4 5 6 7 8 9 10 11 12 13 14 15 16 17 18 19 20 21 22 23 24 25 26 27 28 29 30 31 32 33 34 35 36 37 38 39 40 41 42 43 44 45 46 47 48 49
FigureClick here to download high resolution image
FigureClick here to download high resolution image
FigureClick here to download high resolution image
FigureClick here to download high resolution image
FigureClick here to download high resolution image
FigureClick here to download high resolution image
FigureClick here to download high resolution image
FigureClick here to download high resolution image
FigureClick here to download high resolution image
FigureClick here to download high resolution image
FigureClick here to download high resolution image
FigureClick here to download high resolution image