pv cool umh pedro quiles
TRANSCRIPT
Energy Analysis of an Inverter Air Conditioner Connected Directly to Photovoltaic Solar Panels
Aguilar, F.J.#1, Aledo, S.*2, Quiles, P.V.#3 #Dpto. de Ingeniería Mecánica y Energía, Universidad Miguel Hernández
Avda. de la Universidad SN, Edificio Quorum 5, 03202 Elche, Spain [email protected] [email protected]
*Prointer, SL C/ Nicolás de Bussí, 30, 03320, Elche, Spain
Abstract In air conditioning systems there is a close correlation between the insolation and cooling needs. The use of photovoltaic panels (PV) for air conditioning systems (AC) is an attractive application because of the close relationship between the daytime cooling load and the availability of solar radiation. This paper presents an experimental study onan "inverter" air conditioner with a nominal power of 3.52 kW. Three 235Wpphotovoltaic panels are connected directly to the inverter of the air conditioners compressor at 24 Vcc. It is a technically optimal solution that does not require the installation of batteries and inverters. The air conditioner and the photovoltaic installation have been fully monitored. The measurements taken allow us to evaluate the following data: Electrical power consumed by the machine from the network and electrical power consumed by the machine from the photovoltaic panels. These data are integrated to provide daily and monthly electrical power consumption and the solar contribution in %. Measurements were carried out with the machine operating for 12 hours: 8 to 20 h. The results show that it is possible to get solar contributions higher than 50% in the summer months. The utilization of the energy produced by the panels depends largely on the demand where its performance can be optimized for solar contributions higher than 60%. The averageEER evaluated by the relationship between useful thermal energy and the electricity consumed from the grid is close to 8.
Keywords - Energy Eficciency; Solar energy; photovoltaic panels component.
1. Introduction
The use of HVAC systems for air conditioning in buildings has become a very common practice in most climate zones in Europe. In certain areas, the energy consumption resulting from the use of air conditioning systems can reach half of total consumption of buildings [1].
The general concern for the shortage of energy resources, as well as the increasingly pronounced effects of climate change, requires us to develop technologies that are more environmentally friendly and that are guaranteed substitutes for the current use of fossil fuels.
In this regard, it has been observed that for certain applications, the thermal demand of the buildings has a direct relationship with the hours of solar radiation. This suggests the use of air conditioning systems that take advantage in one way or another of the solar radiation, and use it as the primary source of energy.
The most widespread technologies are those that use solar thermal energy for air conditioning, as described in Solar Thermal Refrigeration Solar Sorption Refrigeration and Solid Desiccant.There are several studies where these technologies are exposed and they are developed with Flat Plate Solar Collectors and Solar Vacuum Tubes as solar caption surface. In [2] the state of the art about solar refrigeration is exposed.
One of the other documented technologies focuses on the use of a hybrid photovoltaic and thermal system, where the heat dissipated by the PV panel is absorbed by a thermal fluid and used for HVAC purposes [3]. More technologies with hybrid systems PV-Thermal are presented in [4] and [5].
A final possibility is to use photovoltaic panels to produce the electricity that powers the compressor of an air conditioning unit.The work detailed in [6]describes, among other things, a water condenser cooling system that works by means of a cooling tower, using fan-coil units indoors and solar energy to drive the compressor. This report exposes thatthe use absorption and photovoltaic refrigeration systems, have the largest energy saving potential for buildings in subtropical cities.
In [7] a comparison is made between different cooling systems that use solar energy. In this case the comparison is made between PV panels with battery’s, regulators and inverter controllers versus a thermal system. This second technology presents three options, solid desiccant, adsorption cooling and absorption cooling. The lower catchment area required when using photovoltaic technology and the downward trend in the price of photovoltaic panels is of special importance, presently reaching as lower market prices as less than 1 €/Wp.
From the documents we have studied we can deduce that, for installations demanding large amounts of power, cooling by absorption may the most attractive option, due to the fact that the price of the equipment is softened with the rest of the components. On the other hand for smaller power plants, below about 100 kW, the reliability and simplicity offered in refrigeration using solar photovoltaic energy is of great interest.
In brief, one could understand that the use of solar photovoltaic panels to power air conditioners is an attractive application that can bring significant advantages over the use of conventional systems, such as its enormous
operational reliability, the correlation between hours of sunlight and energy demand or the potential energy and cost savings.
We have analyzed an air conditioning unit simultaneously connected to two power sources, a photovoltaic solar source and the conventional electrical grid. The removal of the faultiest components in the system for that type of energy production technology, such as the batteries and the inverter device, has provided an added benefit to those mentioned in the preceding paragraph.
This paper presents an experimental study focused on the analysis of the operation of a DC Inverter type air conditioner with a rated thermal power of 3.52 kW. The analysis is performed on the cooling system and includes the study of the months of July, August, September and October 2012. The analyzed performance profile focuses on typical office hours from 8 to 20 h.
The system is connected to the conventional electrical grid in parallel with 3 solar panels with a rated electrical power output of 235 Wp /panel.
2. Experimental Setup
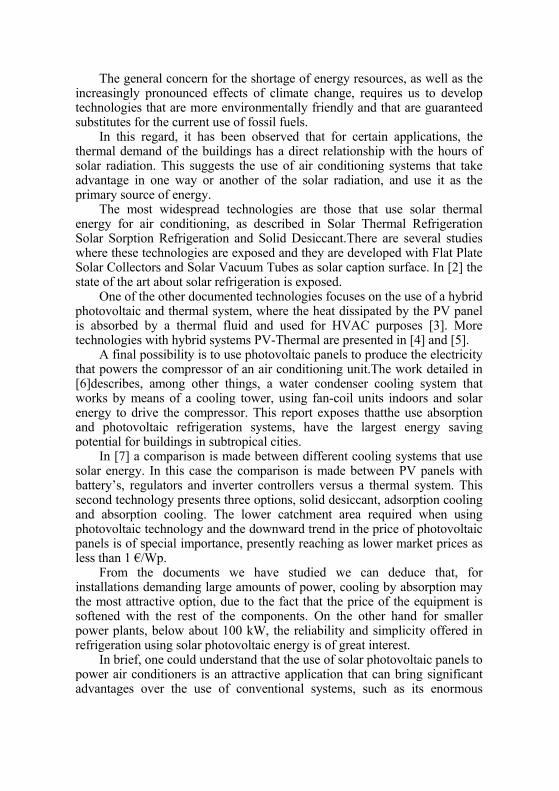
To perform the study a test installation was arranged represented in Fig. 1. The subsystem “A” consists of a DC Inverter type air conditioner with 3.5 kW rated thermal power. Said setup is connected simultaneously to one line of alternating current (230 V) from the conventional mains, as well as a line direct current (24 V) derived from solar panels.
Fig.1 Experimental Setup
The indoor unit is used for the air conditioning of premises belonging to an office building located in Alicante (Spain). The outdoor unit is located on the building’s roof.
The machine used is the model Suite Solar 3D, trademark KAYSUN. The Nominal Cooling Capacity of the machine is 3.52 kW, and its Power Input is 0.86 kW. The refrigerant used is R410A.
The photovoltaic solar energy production comes from the subsystem B, which consists of three photovoltaic solar panels connected in parallel with one another each with a 235 W peak power output. The panels are placed on the flat roof of the building, facing 150º south with an inclination of 30°.
Finally, data are taken from three photovoltaic solar panels (subsystem C of Fig. 1.) connected to the mains via conventional inverter equipment.
The subsystem C is used to measure the energy produced by the photovoltaic panels connected to the grid. This configuration allows one to measure the operating factor of the photovoltaic panels as well as the relationship between the energy delivered by the subsystem B and C and the energy delivered by said subsystem. The influence of the behavior of the air-conditioning unit over the energy production of photovoltaic panels makes the operating factor always less than 1.
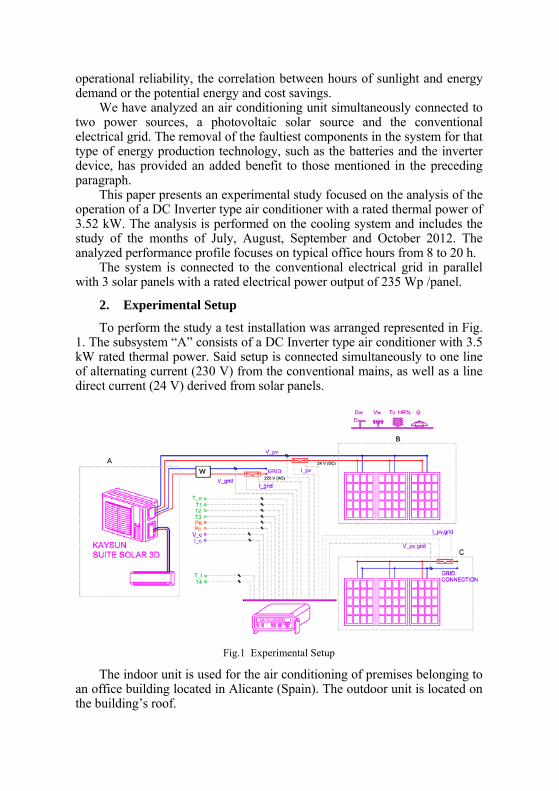
A series of sensors and measurement equipment along the entire installation have been used to record data. A HP Agilent 34970A datalogger has been used to save the data. Data readings are logged every 5 minutes. The parameters included in the data readings are detailed in Table 1.
Table 1. Parameters recorded in the trial
Description Symbology Units Compressor inlet temp. T1 ºC
Compressor discharge temp. T2 ºC Condenser outlet temp. T3 ºC Evaporator inlet temp. T4 ºC
Outside temp. TO ºC Local temp. TI ºC
Evaporating pressure PE bar Condensing pressure PC bar
Absorbed power network PGRID kW PV current equipment IPV A PV voltage equipment VPV V
PV current network IPV,GRID A PV voltage network VPV,GRID V
Solar irradiance G W/m2
Relative Humidity HR % Wind Speed Vw m/s
Wind direction Dw º The IPV and IPV,GRID are determined from a value of voltage drop
produced in a shunt resistance, calibrated to the passage of electric current,
as shown in Fig. 1.For the measurement of the electric power consumed by the compressor (PCOM) a network analyzer Chauvin Arnoux brand, model CA 8334 is used.
3. Experimental Study
The data of the analyzed parameters allows us to evaluate the electrical power consumed by the system from the conventional mains and the photovoltaic production. As a result we can determine the daily and monthly energy consumption of the system, including the photovoltaic solar contribution percentage.We can also use the measurements of the temperatures and pressures of the refrigerant circuit allow us to calculate the systems EER.
The experimental study includes results from July to October 2012. The following shows the methodology used and the results obtained.
3.1. Energy analysis of the trial
The aim of the study was to determine the potential energy savings of the air conditioning (AC) invest directly connected to a photovoltaic power source. Two benchmarks have been defined for this purpose: On one hand is the solar contribution percentage (CS), and on the other, is the determination of the production factor (F). The way we calculated these parameters is described below.
The power consumed by the air conditioner from solar power is calculated as
PVPVPV VIP W
The power consumed from the electrical grid is known from conventional PGRID thanks to a watt meter installed in the line.
The total power consumed by the air conditioning can be found from the sum of the two previous powers
GRIDPVTOT PPP W
The power produced by the solar PV connected to the grid (PPV,GRID) is calculated using the same product for PPV.
GRID,PVGRID,PVGRID,PV VIP W
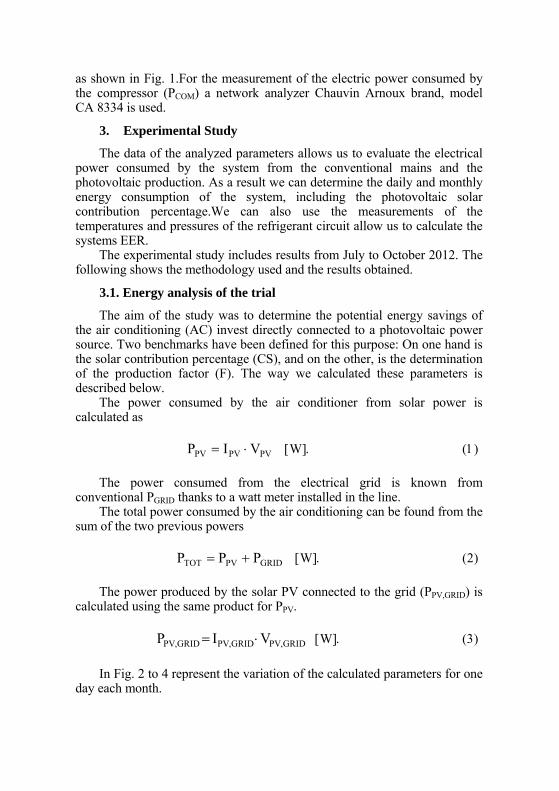
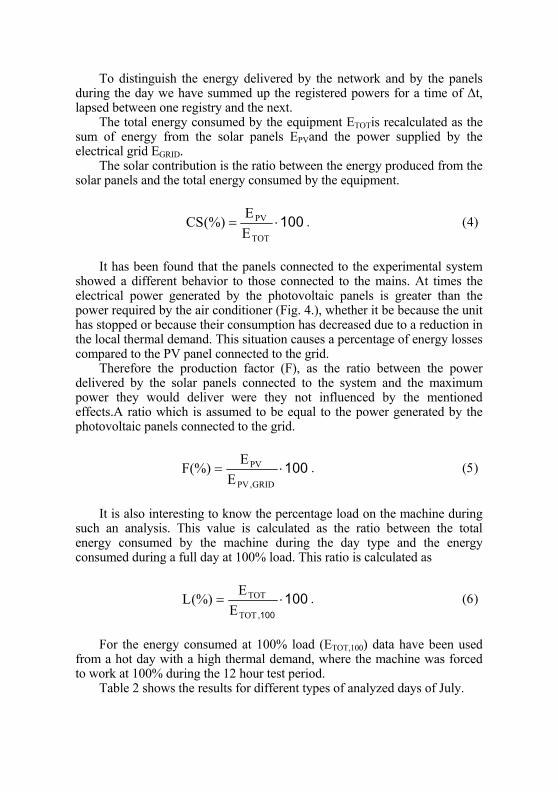
In Fig. 2 to 4 represent the variation of the calculated parameters for one day each month.
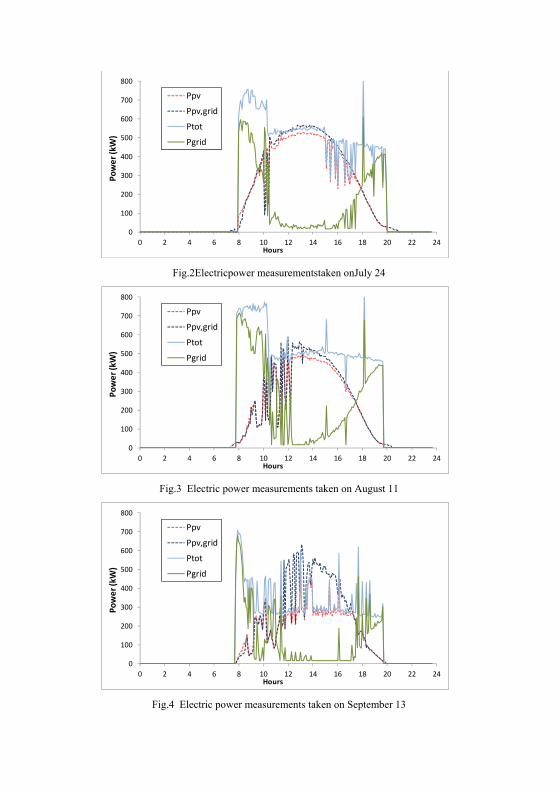
Fig.2Electricpower measurementstaken onJuly 24
Fig.3 Electric power measurements taken on August 11
Fig.4 Electric power measurements taken on September 13
0
100
200
300
400
500
600
700
800
0 2 4 6 8 10 12 14 16 18 20 22 24
Power (kW)
Hours
Ppv
Ppv,grid
Ptot
Pgrid
0
100
200
300
400
500
600
700
800
0 2 4 6 8 10 12 14 16 18 20 22 24
Power (kW)
Hours
Ppv
Ppv,grid
Ptot
Pgrid
0
100
200
300
400
500
600
700
800
0 2 4 6 8 10 12 14 16 18 20 22 24
Power (kW)
Hours
Ppv
Ppv,grid
Ptot
Pgrid
To distinguish the energy delivered by the network and by the panels during the day we have summed up the registered powers for a time of Δt, lapsed between one registry and the next.
The total energy consumed by the equipment ETOTis recalculated as the sum of energy from the solar panels EPVand the power supplied by the electrical grid EGRID.
The solar contribution is the ratio between the energy produced from the solar panels and the total energy consumed by the equipment.
100TOT
PV
E
E(%)CS
It has been found that the panels connected to the experimental system showed a different behavior to those connected to the mains. At times the electrical power generated by the photovoltaic panels is greater than the power required by the air conditioner (Fig. 4.), whether it be because the unit has stopped or because their consumption has decreased due to a reduction in the local thermal demand. This situation causes a percentage of energy losses compared to the PV panel connected to the grid.
Therefore the production factor (F), as the ratio between the power delivered by the solar panels connected to the system and the maximum power they would deliver were they not influenced by the mentioned effects.A ratio which is assumed to be equal to the power generated by the photovoltaic panels connected to the grid.
100GRID,PV
PV
E
E(%)F
It is also interesting to know the percentage load on the machine during such an analysis. This value is calculated as the ratio between the total energy consumed by the machine during the day type and the energy consumed during a full day at 100% load. This ratio is calculated as
100100
,TOT
TOT
E
E(%)L
For the energy consumed at 100% load (ETOT,100) data have been used from a hot day with a high thermal demand, where the machine was forced to work at 100% during the 12 hour test period.
Table 2 shows the results for different types of analyzed days of July.
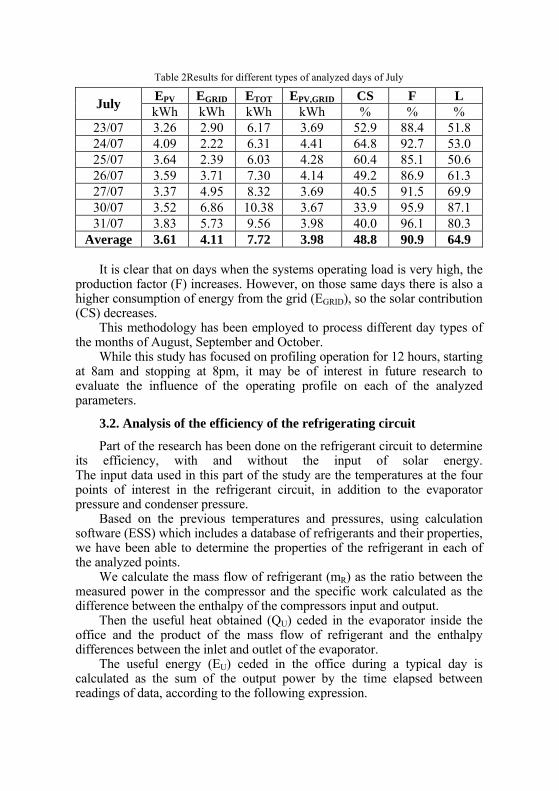
Table 2Results for different types of analyzed days of July
July EPV EGRID ETOT EPV,GRID CS F L kWh kWh kWh kWh % % %
23/07 3.26 2.90 6.17 3.69 52.9 88.4 51.8 24/07 4.09 2.22 6.31 4.41 64.8 92.7 53.0 25/07 3.64 2.39 6.03 4.28 60.4 85.1 50.6 26/07 3.59 3.71 7.30 4.14 49.2 86.9 61.3 27/07 3.37 4.95 8.32 3.69 40.5 91.5 69.9 30/07 3.52 6.86 10.38 3.67 33.9 95.9 87.1 31/07 3.83 5.73 9.56 3.98 40.0 96.1 80.3
Average 3.61 4.11 7.72 3.98 48.8 90.9 64.9 It is clear that on days when the systems operating load is very high, the
production factor (F) increases. However, on those same days there is also a higher consumption of energy from the grid (EGRID), so the solar contribution (CS) decreases.
This methodology has been employed to process different day types of the months of August, September and October.
While this study has focused on profiling operation for 12 hours, starting at 8am and stopping at 8pm, it may be of interest in future research to evaluate the influence of the operating profile on each of the analyzed parameters.
3.2. Analysis of the efficiency of the refrigerating circuit
Part of the research has been done on the refrigerant circuit to determine its efficiency, with and without the input of solar energy. The input data used in this part of the study are the temperatures at the four points of interest in the refrigerant circuit, in addition to the evaporator pressure and condenser pressure.
Based on the previous temperatures and pressures, using calculation software (ESS) which includes a database of refrigerants and their properties, we have been able to determine the properties of the refrigerant in each of the analyzed points.
We calculate the mass flow of refrigerant (mR) as the ratio between the measured power in the compressor and the specific work calculated as the difference between the enthalpy of the compressors input and output.
Then the useful heat obtained (QU) ceded in the evaporator inside the office and the product of the mass flow of refrigerant and the enthalpy differences between the inlet and outlet of the evaporator.
The useful energy (EU) ceded in the office during a typical day is calculated as the sum of the output power by the time elapsed between readings of data, according to the following expression.
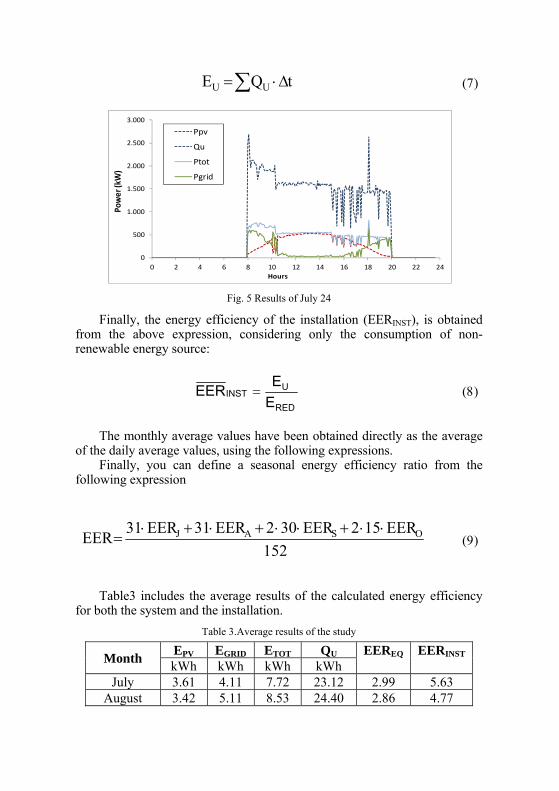
tQE UU
Fig. 5 Results of July 24
Finally, the energy efficiency of the installation (EERINST), is obtained from the above expression, considering only the consumption of non-renewable energy source:
RED
UINST
EEEER
The monthly average values have been obtained directly as the average of the daily average values, using the following expressions.
Finally, you can define a seasonal energy efficiency ratio from the following expression
152
EER152EER302EER31EER31EER OSAJ
Table3 includes the average results of the calculated energy efficiency
for both the system and the installation.
Table 3.Average results of the study
Month EPV EGRID ETOT QU EEREQ EERINST kWh kWh kWh kWh
July 3.61 4.11 7.72 23.12 2.99 5.63 August 3.42 5.11 8.53 24.40 2.86 4.77
0
500
1.000
1.500
2.000
2.500
3.000
0 2 4 6 8 10 12 14 16 18 20 22 24
Power (kW)
Hours
Ppv
Qu
Ptot
Pgrid
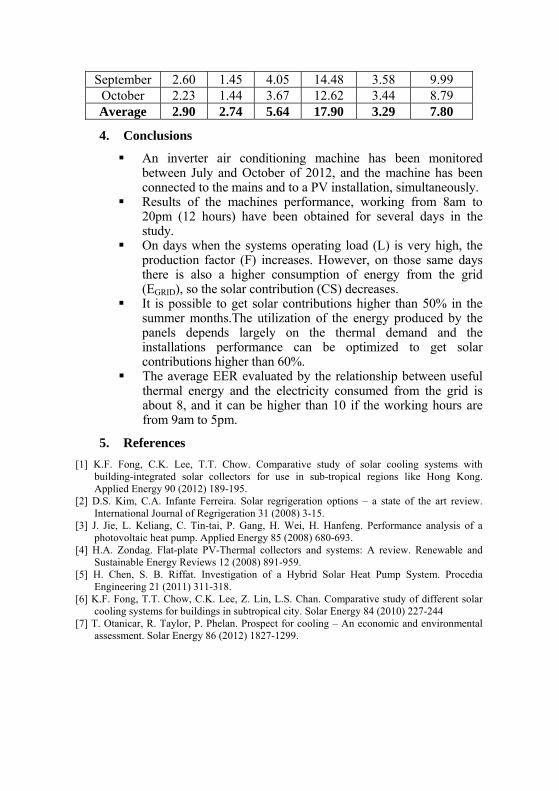
September 2.60 1.45 4.05 14.48 3.58 9.99 October 2.23 1.44 3.67 12.62 3.44 8.79 Average 2.90 2.74 5.64 17.90 3.29 7.80
4. Conclusions
An inverter air conditioning machine has been monitored between July and October of 2012, and the machine has been connected to the mains and to a PV installation, simultaneously.
Results of the machines performance, working from 8am to 20pm (12 hours) have been obtained for several days in the study.
On days when the systems operating load (L) is very high, the production factor (F) increases. However, on those same days there is also a higher consumption of energy from the grid (EGRID), so the solar contribution (CS) decreases.
It is possible to get solar contributions higher than 50% in the summer months.The utilization of the energy produced by the panels depends largely on the thermal demand and the installations performance can be optimized to get solar contributions higher than 60%.
The average EER evaluated by the relationship between useful thermal energy and the electricity consumed from the grid is about 8, and it can be higher than 10 if the working hours are from 9am to 5pm.
5. References
[1] K.F. Fong, C.K. Lee, T.T. Chow. Comparative study of solar cooling systems with building-integrated solar collectors for use in sub-tropical regions like Hong Kong. Applied Energy 90 (2012) 189-195.
[2] D.S. Kim, C.A. Infante Ferreira. Solar regrigeration options – a state of the art review. International Journal of Regrigeration 31 (2008) 3-15.
[3] J. Jie, L. Keliang, C. Tin-tai, P. Gang, H. Wei, H. Hanfeng. Performance analysis of a photovoltaic heat pump. Applied Energy 85 (2008) 680-693.
[4] H.A. Zondag. Flat-plate PV-Thermal collectors and systems: A review. Renewable and Sustainable Energy Reviews 12 (2008) 891-959.
[5] H. Chen, S. B. Riffat. Investigation of a Hybrid Solar Heat Pump System. Procedia Engineering 21 (2011) 311-318.
[6] K.F. Fong, T.T. Chow, C.K. Lee, Z. Lin, L.S. Chan. Comparative study of different solar cooling systems for buildings in subtropical city. Solar Energy 84 (2010) 227-244
[7] T. Otanicar, R. Taylor, P. Phelan. Prospect for cooling – An economic and environmental assessment. Solar Energy 86 (2012) 1827-1299.