cool data: quantity and quality
TRANSCRIPT

Acta Cryst. (1999). D55, 1641±1653 Garman � Cool data 1641
research papers
Acta Crystallographica Section D
BiologicalCrystallography
ISSN 0907-4449
Cool data: quantity AND quality
Elspeth Garman
Laboratory of Molecular Biophysics, Department
of Biochemistry, University of Oxford, Oxford
OX1 3QU, England
Correspondence e-mail: [email protected]
# 1999 International Union of Crystallography
Printed in Denmark ± all rights reserved
The use of cryo-techniques in macromolecular crystallography
has increased enormously over the last eight years and has
become a vital part of modern X-ray data-collection methods.
This paper presents some reasons for the rise in popularity of
cryo-techniques and a brief outline of the basic methods,
followed by a detailed discussion of factors to be considered
when trying to optimize both the quantity and quality of the
data collected. As more experimenters at synchrotrons
observe signi®cant radiation damage to crystals held near
100 K, the available options for further prolonging crystal
lifetime and extending the techniques become worth investi-
gating. Some possibilities and parameters to be considered are
presented, although these must remain speculative until more
experimental data are available.
Received 1 March 1999
Accepted 25 June 1999
1. Introduction
Cryocrystallography has come to the forefront as a pivotal
tool in structural biology over the last eight years, driven
largely by the great reduction in radiation damage to protein
crystals during X-ray diffraction experiments at cryo-
temperatures. At the last CCP4 Study Weekend on Data
Collection in 1993, Steve Gamblin (Gamblin & Rodgers, 1993)
summarized the cryo-techniques which have since been
developed further in a number of laboratories (reviewed in
Garman & Schneider, 1997; Rodgers, 1997). Six years ago,
cryo-data collections were the exception rather than the rule.
Today the situation is reversed; the techniques are currently
being used by the majority of protein crystallographers and
the advantages are now widely recognized.
In many ways, data collection with cryo-cooled crystals is
much easier than with room-temperature samples, and some
problems have disappeared altogether (e.g. crystal slippage).
However, some aspects which did not previously merit
consideration are now worth taking into account to ensure
consistently high-quality data. Much of the subsequent work
on the structure determination will be more straightforward if
the best possible data are collected in the ®rst place; if the
original data are untrustworthy, they cannot be improved later
on. In this paper, some measures for optimizing X-ray data
quality are presented.
2. Why cool?
The main motivation behind the development of cryo-tech-
niques was the observation (Low et al., 1966; Haas & Ross-
mann, 1970) that radiation damage to protein crystals is
greatly reduced at lower than room temperatures. In the early
1990s, radiation damage was becoming a limiting problem in

research papers
1642 Garman � Cool data Acta Cryst. (1999). D55, 1641±1653
the full utilization of newly available synchrotron sources.
Flash-cooling of crystals to near 100 K extends the crystal
lifetime, making it effectively in®nite on a home source and
signi®cantly prolonging it at the synchrotron.
Radiation damage is caused largely by `primary' interac-
tions between the molecules in the crystal and the beam. This
energy is dissipated in at least two ways: it produces heat
(thermal vibration of the molecules) and it provides the
necessary energy to break bonds between the atoms in the
molecules. The extent of this primary damage is dose-depen-
dent.
There are two predominant mechanisms for producing
reactive radicals: direct (e.g. damage to polypeptide) and
indirect (reactive H* or OH* produced by destruction of a
water molecule). Any thermal energy will allow the reactive
products to diffuse through the crystal causing further
destruction (`secondary' damage). This component of the
radiation damage is time- and temperature-dependent.
At cryo-temperatures (around 100 K), the reactive products
are immobilized in the crystal and do not cause extensive
secondary damage in areas of the crystal which are not
exposed to the beam. At room temperature, the reactive
products diffuse and spread through the crystal, and this time-
dependent secondary damage in addition to the primary dose-
dependent part often destroys the crystal. Thus, cooling the
samples for data collection signi®cantly reduces radiation
damage.
Because protein crystals can have a high water content,
cooling them to around 100 K requires particular techniques.
Work by Hope (1988) in extending small-molecule cryo-
techniques for use with protein crystals prompted a number of
researchers to undertake serious experimentation. Currently,
the simplest and most generally used technique is the loop-
mounting method of Teng, which has been developed further
since it was originally reported (Teng, 1990). The crystal is ®rst
soaked for anything between 1 s and a few days (but usually
around 3 min) in a so-called `cryo-solution' (mother liquor
plus an antifreeze agent; see x3). The crystal is then held by the
surface tension of the cryo-solution across a loop made of thin
(10±30 mm diameter) ®bre (e.g. rayon, nylon, mohair, glass). It
is immediately plunged into a cryogen such as gaseous
nitrogen or liquid nitrogen, propane or ethane at temperatures
around 100 K. The ®lm of cryo-solution becomes solid and
holds the crystal rigidly in the loop. The antifreeze in the cryo-
solution and the rapid rate of freezing enable the crystal to be
cooled to cryo-temperatures with no ordered ice formation;
instead, a vitreous glass is formed which does not disrupt the
crystal order or interfere with the diffraction.
A side bene®t of cryo-techniques is that the loop-mounting
method is a much gentler way of handling crystals than the
glass or quartz capillary tubes used for room-temperature data
collection. This factor enables very thin and/or small crystals
to be used for structure determination. Thin crystals can be
mounted in a large loop with the minimum of handling and it
is possible to loop-mount without any physical contact with
the crystal. For example, for the MIR structure determination
of bovine cyclin A (Brown et al., 1995), crystals of dimensions
100 � 300 � 5 mm were successfully mounted in large loops
for ®ve derivative and two native data collections at
synchrotron sources. Generally, small crystals suffer from
fewer mechanical problems than larger ones and can be very
successfully ¯ash-cooled.
Owing to the prolonged lifetime of crystals held at cryo-
temperatures, a whole data set can usually be collected from a
single crystal. Systematic errors can thus be minimized, and
this is very important for MAD experiments (Smith, 1991),
where accurate data at three, four or even ®ve incident X-ray
Figure 1X-ray diffraction patterns of water/glycerol(v/v) mixes. The image from60% water/40% glycerol shows that this solution is well cryoprotected,the scattering ring having similar shallow slopes on the high- and low-resolution sides (®gure modi®ed from Garman & Mitchell, 1996).

wavelengths are compared and the differences provide the
phase information.
Another compelling reason for ¯ash-cooling crystals is the
potential to test them and then store them for later use in-
house or at a synchrotron (Garman & Schneider, 1997;
Rodgers, 1997). They can be frozen while in peak condition or
stored if data collection has to be interrupted before
completion. Once exposed, crystals stored in liquid nitrogen
suffer minimum secondary radiation damage, unlike room-
temperature crystals in capillaries, which will usually degrade
with time once they have been subjected even brie¯y to an
X-ray beam.
3. Basic loop-mounting technique
The ®rst step in preparing to ¯ash-cool a protein crystal is to
®nd a suitable cryo-solution. This is usually the mother liquor
with an antifreeze agent added (e.g. glycerol, ethylene glycol,
MPD, light PEGs, sucrose) in suf®ciently high concentration
to prevent the formation of ordered ice and to promote
vitri®cation of the sample. The mother liquor should not be
diluted by the cryo-agent: the cryo-solution should be made up
so that water in the mother liquor is replaced by cryo-agent
(see x6.1). A test with the putative cryo-solution ¯ash-cooled
in the loop without the crystal will give the correct concen-
tration needed. A clear ®lm in the loop is a necessary but not
suf®cient criterion: a diffraction image should always be taken
to check for diffuse rings from ice crystallites. Fig. 1 shows
images from water/glycerol mixtures containing increasing
concentrations of glycerol. Satisfactory cryo-protection is
afforded by addition of 40% glycerol; the diffuse scattering
ring has a similar slope on the high- and low-resolution sides
(Garman & Mitchell, 1996). If a crystal and mother liquor are
transferred to the cryo-solution, the cryo-solution will be
diluted, and thus it is wise to increase the cryo-agent
concentration by 2±5% as a safety margin in order to take the
dilution into account.
Next, the crystal is introduced into the cryo-solution,
broadly in three alternative ways. For most crystals, the easiest
option, which is usually satisfactory, is to transfer the sample
from its growing drop straight into the ®nal concentration of
cryo-solution and leave it for between 30 s and 4 min. It must
be emphasized that this soak time is rather empirical; a longer
soak allows more time for equilibration but prolongs the time
during which the cryo-solution can degrade the crystal,
whereas a short soak does not achieve osmotic equilibration of
the crystal but minimizes the degradation time. Times between
0.5 s (crystal dragged through cryo-solution) and several days
have been used successfully, and there is a huge variation in
soaking times used in different laboratories practising cryo-
crystallography. Sequential soaks in increasing concentrations
can also be used; these lessen the osmotic shock to the crystal
(see x5.3 and x6.4).
Cryoprotectant agents can also be dialysed into the crystal,
and this method often succeeds where soaking has failed (e.g.
Nagata et al., 1996). However, the ideal case, which minimizes
the crystal handling, is where the crystals are grown in a
mother liquor which is already adequately cryoprotected. In
fact, some such crystal screens are now commercially avail-
able. An account of this approach is given in Garman (1999).
Most laboratories are now equipped to allow rapid
mounting of the crystal in the loop from the cryo-solution onto
the goniostat; a typical arrangement is shown in Fig. 2. The
volume of cryo-solvent around the crystal can be minimized by
lifting the loop out of the cryo-solvent so that its plane is
perpendicular to the surface of the drop. Further practical
details of the method can be found in Garman & Schneider
(1997) and Rodgers (1997).
4. Quantity
As already mentioned, the potential now exists to collect all
the required/desired data from a single crystal. In terms of
quantity of data, what is desirable?
Acta Cryst. (1999). D55, 1641±1653 Garman � Cool data 1643
research papers
Figure 2A typical experimental arrangement for a cryocrystallographic datacollection. A magnetic rubber disc is pierced with a stainless steel pin, thetop of which is rounded and the bottom of which ®ts into the hole in thegoniometer head. The magnet must be strong enough to make a rigidconnection, but weak enough to allow the experimenter ®ne control ofthe top hat, which is fabricated from a magnetic metal such as stainlesssteel or nickel. (Figure reproduced from Garman & Schneider, 1997.)

research papers
1644 Garman � Cool data Acta Cryst. (1999). D55, 1641±1653
4.1. Completeness
Whatever the purpose of the data collection, the data are
likely to be much more useful if they are complete; i.e. the
number of unique re¯ections collected in each resolution shell
is at least 95% of the theoretical maximum number. With the
recent advent of reliable data-collection strategy software
(Messerschmidt & P¯ugrath, 1987; Kabsch, 1988; Leslie, 1996;
Noble, 1996; Ravelli et al., 1997), this is now routinely possible.
The ®rst image is autoindexed to ®nd the unit cell and
possible space group, and the experimental parameters are
re®ned to obtain satisfactory agreement between the
predicted and actual spot positions. Some data-strategy soft-
ware programmes (e.g. the `strategy' option in MOSFLM;
Leslie, 1996) can be used at this stage, whereas others (e.g.
PREDICT; Noble, 1996) require prior integration of a single
image. This output is then used by the strategy software to
either calculate the completeness obtained for a total oscilla-
tion angle speci®ed by the experimenter, or to ®nd the oscil-
lation range necessary for a desired completeness and then to
advise on the optimum starting angle for the data collection.
An example of the output from such a calculation is shown in
Fig. 3 for a crystal in point group 321 for a 60� total oscillation
angle. It can be seen that the overall completeness is in anti-
phase with the redundancy (number of times the intensity of
each unique re¯ection is measured). If the anomolous signal is
required for phasing, the optimum starting angle is not
necessarily the same as for optimizing the overall complete-
ness.
Before starting a data collection, it is advisable to collect an
image 90� away from the ®rst test image to check for correct
centring and for anisotropic disorder (see Garman, 1993) in
the crystal.
For low-symmetry space groups, the crystal is sometimes in
an unfavourable orientation and it is hard to obtain complete
data owing to geometric constraints on the experiment,
especially when using only a single-axis goniostat. If a
removeable arc goniometer (see Garman & Schneider, 1997)
is used for crystal storage, the arm can be attached so that the
crystal can be conveniently moved around to access new parts
of reciprocal space. Care must be taken to avoid collisions
between the arc and the collimator during the data collection.
Another possible solution is to glue a piece of narrow-gauge
wire onto the loop-mounting pin (David, 1999) and then stick
the loop to this, as shown in Fig. 4. After the ®rst sweep of data
has been collected, the wire can be bent with plastic tweezers
or another non-heat-conducting material tool in order to place
the crystal in a new orientation with respect to the beam. Care
must be taken not to displace the crystal too far from the
centre of the cold gas stream during the wire bending; an
iterative procedure of bending and centring is usually neces-
sary.
4.2. Redundancy
A higher redundancy or `multiplicity', where each unique
re¯ection is measured multiple times, will result in more
accurate data even though R(I)sym might become larger, where
R(I)sym is
R�I�sym �P jI ÿ hIij=P jhIij;
and hIi is the mean intensity of a set of equivalent re¯ections.
In the extreme case, where most unique re¯ections are
measured only once, R(I)sym for the data set will be lower than
if each were measured four or ®ve times, but the latter data
would be more accurate and thus more reliable. Software now
available can again be used to give an indication of the
average redundancy which will be collected for a speci®ed
angular sweep. It is important to check this for low-symmetry
space groups, since in some unfortunate orientations the
redundancy is likely to be very low.
Figure 3The results of running PREDICT (Noble, 1996) for a crystal of pointgroup P321 to ®nd the overall completeness, anomalous completenessand redundancy for a 60� sweep starting at different ' angles.
Figure 4A cryo-loop design for crystals of a low-symmetry space group. A piece ofnarrow-gauge wire is inserted between the mounting pin and ®bre loop.The wire can then be bent to different positions (taking care that thecrystal remains in the cold nitrogen stream at all times) for access todifferent parts of reciprocal space.

4.3. Higher resolution
Cryo-cooled crystals in general diffract to higher resolution
than the same crystals at room temperature for two main
reasons. Radiation damage tends ®rst to be evident in the
higher range order (which gives the higher resolution
diffraction) and thermal vibrations are in general lower for
structures determined at 100 K, giving enhanced diffraction
intensity at higher resolution (see x7.3.2 for two examples). In
addition, sometimes the soak in the cryo-solution, especially
PEGs, causes dehydration which results in increased order
(e.gs. Schick & Jurnak, 1994; Esnouf et al., 1998).
It can be tempting to try and obtain the highest resolution
possible, but if the higher resolution data are collected, a
smaller oscillation angle per image will be required to avoid
overlapping re¯ections at higher resolutions. This implies
more images and thus more time will be needed for the data
collection. Additionally, the low-resolution re¯ections may be
overloaded (see x5.2) at the exposure times needed to give
adequate statistics for the faint high-resolution data and so
one or more low-resolution passes may be necessary, which
will take even more time. All this should be considered at the
stage of deciding on the data-collection parameters (Mitchell
et al., 1999).
4.4. Crystal storage
Since crystals can be stored for later re-use, more data can
be collected at a future date if necessary. The techniques for
storing crystals (Garman & Schneider, 1997; Rodgers, 1997;
Parkin & Hope, 1998) are still evolving and it is hoped they
will become more foolproof in the next few years; currently
the success rate is rather variable and the technique is not as
reliable as it might be. During the next few years, service
crystallography is likely to become a feature of synchrotron-
radiation sites, so it will be even more important for retrieval
of cryo-cooled crystals to be as reproducible as possible.
5. Quality
Cryo-cooling also provides the opportunity to optimize the
quality of the data which are collected, since the prolonged
crystal lifetime allows more time for the experiment. Para-
doxically, the ¯ash-cooling technique can also introduce
features which compromise the data quality, such as increased
mosaicity and ice diffraction. Experimental parameters can be
adjusted to improve data quality by considering the factors
discussed below.
5.1. Overloads
Overloaded re¯ections are those where some individual
pixels have so many counts that the detector response is no
longer linear, i.e. the number of counts in the pixel is not a
reliable measure of the number of X-rays arriving at that
position on the detector. These re¯ections should be rejected
by using the appropriate switch in the processing software,
since intense inaccurate low-resolution data can have a serious
detrimental effect on the resulting electron density. Data with
overloads rejected will be less complete at low resolution than
at high resolution (see Fig. 5), but low-resolution data are vital
for structure solution and also for obtaining interpretable
good-quality electron-density maps. It is thus very important
that reliable low-resolution data are collected by either
performing a second lower resolution and lower exposure time
(or dose) sweep or by reducing the exposure time per image of
the original sweep until there are no overloaded re¯ections.
The latter strategy may be incompatible with collecting
reasonable I/�(I) at high resolution (see x5.4). The experi-
menter should check locally for the number of counts per pixel
above which a particular detector is known to have a non-
linear response.
In the event that a signi®cant fraction of the low-resolution
re¯ections are overloaded and no low-resolution pass was
collected owing to instrumental or other problems, informa-
tion on the low-resolution re¯ections can be obtained by
®tting their tails to a model peak shape and extrapolating this
peak height to obtain a measure of the re¯ection intensity (e.g.
in MOSFLM, use the input line `pro®le ®tted'). Although this
method will have a larger error than a properly measured
experimental intensity, it is much better than having no
measure at all. An example of this situation is shown in Fig. 5.
Data processed with the overloads rejected gave R(I)sym of
6.6% and a completeness of 96.7% overall but only 32±72%
for the 15±5.5 AÊ data, and resulted in uninterpretable electron
density for the cell-cycle protein CDK2 with an inhibitor
bound. With ®tted pro®les for the overloaded re¯ections,
R(I)sym increased to 7.7%, the data were 99.7% complete
overall (838 more unique re¯ections) and the resulting elec-
tron density was interpretable and very clean. Note that in
SCALEPACK overloads can be included at the scaling stage
with the `include overloads' keywords.
Acta Cryst. (1999). D55, 1641±1653 Garman � Cool data 1645
research papers
Figure 5Completeness versus resolution for a crystal of CDK2 cell-cycle proteinsoaked in an inhibitor solution. Data were collected at BW7B, EMBL,Hamburg and serious detector problems prevented the collection of alow-resolution data set. The plot shows the effect of rejecting overloadedre¯ections and also of pro®le-®tting them. Data with the overloadsrejected were very incomplete at low resolution and electron-densitymaps calculated from them were uninterpretable. With pro®le-®ttedoverloads, the more complete data set resulted in good electron density.

research papers
1646 Garman � Cool data Acta Cryst. (1999). D55, 1641±1653
5.2. Overlaps
It is wise to minimize the number of overlapping re¯ections,
since they will be rejected by the integration software, thus
causing the data to have lower completeness. Since the reso-
lution limit is in general higher for ¯ash-cooled crystals, more
care must be taken to avoid collecting overlapped re¯ections.
For a two-dimensional data collection, the maximum oscilla-
tion angle per image, �'m, to minimize overlaps is
�'m �maximum resolution of data �AÊ �
maximum primitive cell �AÊ � �360
2�ÿmosaicity ���;
e.g. if collecting 1.8 AÊ data with a maximum primitive cell edge
of 200 AÊ , a �'m of 0.5� would be appropriate, assuming zero
mosaicity. The above formula shows that in order to minimize
the number of overlaps for a given �', the mosaicity also has
to be minimized (see below).
5.3. Mosaicity
A common observation is that the mosaic spread of cryo-
cooled crystals tends to be higher than that of the same crystal
at room temperature. Increased mosaicity adversely affects
the data quality since it increases the number of overlaps (see
x5.2), it decreases the signal-to-noise ratio of a re¯ection as the
re¯ection is spread over a larger volume of reciprocal space
and for two-dimensional data collection it decreases the ratio
of fully to partially recorded re¯ections (see Fig. 6). The
decrease in signal-to-noise ratio with increasing mosaicity
usually means that if the mosaicity is minimized, the diffrac-
tion limit is maximized (see Mitchell & Garman, 1994, where
this was shown for crystals of phosphorylase b).
Mosaic spread can be increased by any handling of the
crystals, which should thus be minimized. By investing some
time into exploring different cryo-conditions, cryo-solutions
and soaking methods, it should be possible to reproduce room-
temperature mosaicity in most cases. Rocking curves can most
easily be collected and investigated on an electronic area
detector (e.g. a CCD-based detector or a multiwire) where
three-dimensional data collection is time-ef®cient and thus
three-dimensional pro®les of re¯ections can be obtained to
give an accurate measure of the mosaicity.
Sequential soaking in increasing concentrations of cryo-
solution, rather than putting the crystal into the ®nal
concentration, can reduce the mosaicity. During a sequential
soak, both the handling of the crystal and the severity of the
osmotic shock to it of the 5 or 10% increases in the concen-
trations of cryo-agent can be lessened by the following simple
measure. The crystal and mother liquor are left in the same
microbridge or soaking well and 10% cryosolution is pipetted
onto them, the drop is agitated with the pipette end without
touching the crystal and then some of the liquid (say 10 ml) is
removed. 10 ml of the 10% solution is now added again, mixed,
10 ml removed, 10 ml of the 20% cryo-solution added, mixed
and so on until the desired concentration of cryo-solution is
reached. The resulting increase in cryo-solution concentration
is illustrated in Fig. 7. For crystals of the 42 kDa neur-
Figure 6The pro®le of a high and low mosaic spread re¯ection of equal totalintensity as a function of ' angle. For a low mosaic spread re¯ection, a 1�
oscillation image will encompass the whole re¯ection, which will thus be`fully recorded'. For a re¯ection with larger mosaic spread, the samere¯ection intensity is detected over three consecutive 1� images, and is`partially recorded' on the (n ÿ 1)th, nth and (n + 1)th images. To obtainthe full re¯ection intensity, these images must be scaled together afterintegration, resulting in higher errors (�s) on the measurements.
Figure 7Concentration of cryo-solution versus time for (a) a sequential 1 min soakin each of 10, 20, 30 and 40% solutions, transferring the crystal betweensolutions, and (b) leaving the crystal in the same place in a 10 ml drop ofmother liquor and pipetting 10 ml of 10% cryo-solution onto it, mixing,waiting 30 s, removing 10 ml, adding another 10 ml of 10%, mixing, waiting30 s, removing 10 ml, adding 10 ml of 20% and so on. In (b) the crystal issubjected to more gradual osmotic shock as the concentration of cryo-solution is increased.
aminidase from Salmonella typhimurium (STNA), for which
some time was spent experimenting with cryo-protocols to
optimize diffraction, this method resulted in routinely
obtaining resolutions better than 1.0 AÊ at the synchrotron,
whereas moving the crystal between microbridges during the
sequential soak gave resolutions worse than 1.0 AÊ and non-
sequential soaking gave resolutions of around 1.3 AÊ .
Several factors can affect the mosaic spread during the
actual cooling procedure. Swift transfer from the drop to the
cryogen is desirable, since the crystal surface can dehydrate
while travelling through the air. Placing the microscope as
close as possible to the cryogen, as well as practizing the
transfer on several `dry runs' beforehand, minimizes the
transfer time.
The rate of crystal cooling is another important factor: in
general, the faster the cooling the lower the resulting mosaic
spread. Since the rate of cooling is critically dependent on the
crystal surface-to-volume (S/V) ratio, those with larger S/V
tend to cool better than those with smaller S/V (cf. insects
having high S/V which do not survive in the winter). However,
a balance must be struck between the desirable increase in
diffracting power of high-volume crystals and the undesirable
increase in mosaicity observed when ¯ash-cooling them.
The choice of cryogen can also affect the rate of cooling and
hence the mosaic spread (see x6.2). Crystal annealing can be
used to reduce the mosaic spread (see x6.5).
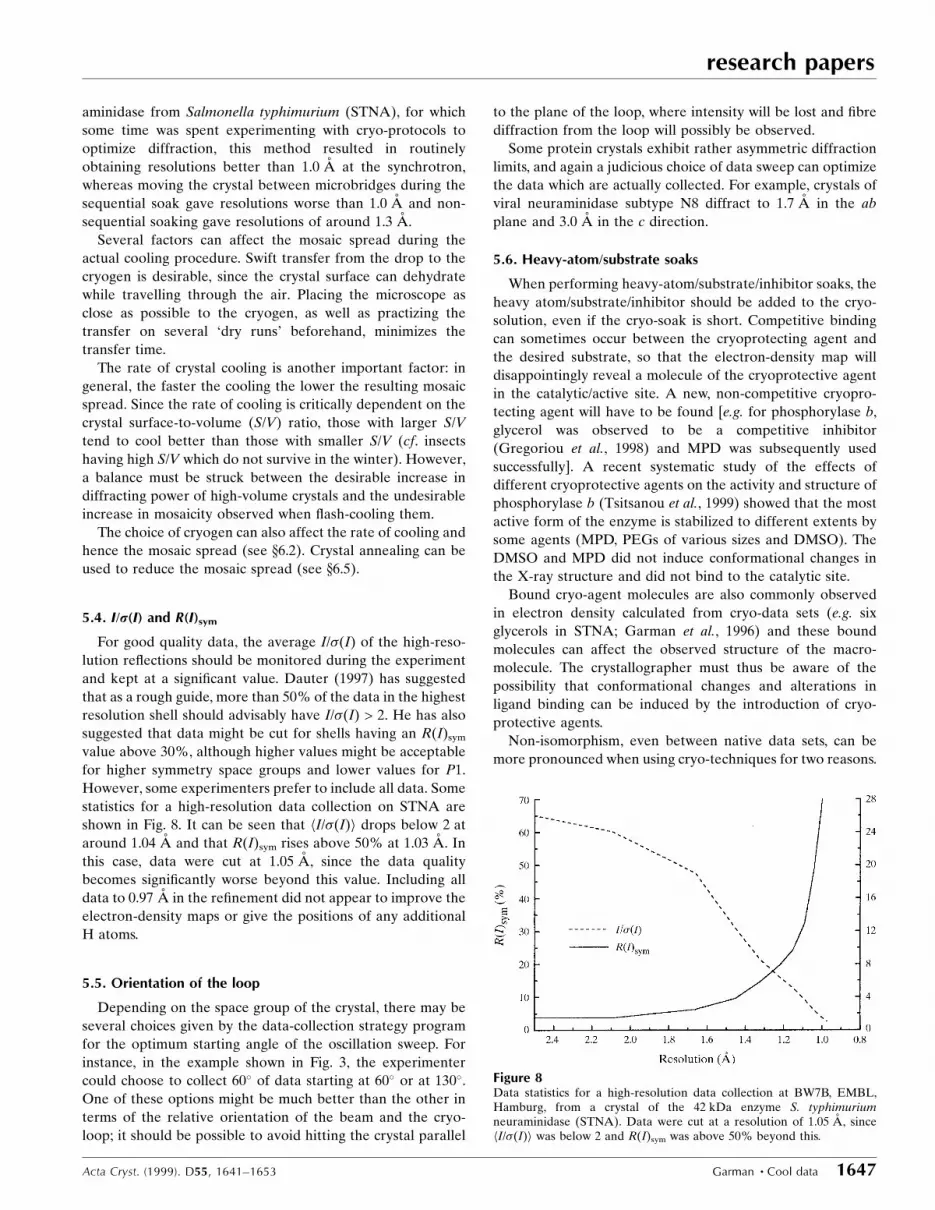
5.4. I/r(I) and R(I)sym
For good quality data, the average I/�(I) of the high-reso-
lution re¯ections should be monitored during the experiment
and kept at a signi®cant value. Dauter (1997) has suggested
that as a rough guide, more than 50% of the data in the highest
resolution shell should advisably have I/�(I) > 2. He has also
suggested that data might be cut for shells having an R(I)sym
value above 30%, although higher values might be acceptable
for higher symmetry space groups and lower values for P1.
However, some experimenters prefer to include all data. Some
statistics for a high-resolution data collection on STNA are
shown in Fig. 8. It can be seen that hI/�(I)i drops below 2 at
around 1.04 AÊ and that R(I)sym rises above 50% at 1.03 AÊ . In
this case, data were cut at 1.05 AÊ , since the data quality
becomes signi®cantly worse beyond this value. Including all
data to 0.97 AÊ in the re®nement did not appear to improve the
electron-density maps or give the positions of any additional
H atoms.
5.5. Orientation of the loop
Depending on the space group of the crystal, there may be
several choices given by the data-collection strategy program
for the optimum starting angle of the oscillation sweep. For
instance, in the example shown in Fig. 3, the experimenter
could choose to collect 60� of data starting at 60� or at 130�.One of these options might be much better than the other in
terms of the relative orientation of the beam and the cryo-
loop; it should be possible to avoid hitting the crystal parallel
to the plane of the loop, where intensity will be lost and ®bre
diffraction from the loop will possibly be observed.
Some protein crystals exhibit rather asymmetric diffraction
limits, and again a judicious choice of data sweep can optimize
the data which are actually collected. For example, crystals of
viral neuraminidase subtype N8 diffract to 1.7 AÊ in the ab
plane and 3.0 AÊ in the c direction.
5.6. Heavy-atom/substrate soaks
When performing heavy-atom/substrate/inhibitor soaks, the
heavy atom/substrate/inhibitor should be added to the cryo-
solution, even if the cryo-soak is short. Competitive binding
can sometimes occur between the cryoprotecting agent and
the desired substrate, so that the electron-density map will
disappointingly reveal a molecule of the cryoprotective agent
in the catalytic/active site. A new, non-competitive cryopro-
tecting agent will have to be found [e.g. for phosphorylase b,
glycerol was observed to be a competitive inhibitor
(Gregoriou et al., 1998) and MPD was subsequently used
successfully]. A recent systematic study of the effects of
different cryoprotective agents on the activity and structure of
phosphorylase b (Tsitsanou et al., 1999) showed that the most
active form of the enzyme is stabilized to different extents by
some agents (MPD, PEGs of various sizes and DMSO). The
DMSO and MPD did not induce conformational changes in
the X-ray structure and did not bind to the catalytic site.
Bound cryo-agent molecules are also commonly observed
in electron density calculated from cryo-data sets (e.g. six
glycerols in STNA; Garman et al., 1996) and these bound
molecules can affect the observed structure of the macro-
molecule. The crystallographer must thus be aware of the
possibility that conformational changes and alterations in
ligand binding can be induced by the introduction of cryo-
protective agents.
Non-isomorphism, even between native data sets, can be
more pronounced when using cryo-techniques for two reasons.
Acta Cryst. (1999). D55, 1641±1653 Garman � Cool data 1647
research papers
Figure 8Data statistics for a high-resolution data collection at BW7B, EMBL,Hamburg, from a crystal of the 42 kDa enzyme S. typhimuriumneuraminidase (STNA). Data were cut at a resolution of 1.05 AÊ , sincehI/�(I)i was below 2 and R(I)sym was above 50% beyond this.

research papers
1648 Garman � Cool data Acta Cryst. (1999). D55, 1641±1653
The ®rst is that some cryoprotecting agents can dehydrate
crystals and cause shrinkage. The second is that the cooling
procedure itself causes shrinkage owing to the decrease in
volume between water in the sample and the vitreous ice
(glass) formed on ¯ash-cooling. The degree of shrinkage
seems to depend on the solvent content of the crystal and the
exact cooling protocol used. Therefore, to increase the chance
of isomorphous data, identical procedures should be followed
[soak times, crystal size (if possible), cryo-solution concen-
trations, cryogen temperature]. If practicable, the same human
being should ¯ash-cool the crystals, since then idiosyncracies
of procedure will be the same.
Flash-cooling has enabled experimenters to start using
krypton and xenon routinely in the search for heavy-atom
derivatives (Soltis et al., 1997; Sauer et al., 1997). A crystal
suspended in its cryo-solution in a loop is bathed in gas at up
to 1.5 MPa pressure for about 10 min. The main prerequisite is
that the crystal should be stable in the cryo-solution for 10 min
at room temperature. Several laboratories have built devices
to facilitate the technique and two of these are available
commercially (from MSC and from Oxford Cryosystems).
5.7. Ice
In spite of efforts to avoid ice formation (see Garman &
Schneider, 1997, for detailed discussion), some ice may
gradually accumulate on the sample during the experiment.
This will be evident on the diffraction pattern, either as diffuse
rings, sharp rings or individual re¯ections (see Fig. 1). Ice can
be carefully removed with a small artist's brush or with an
acupuncture needle attached to a non-heat-conducting rod.
Alternatively, a little liquid nitrogen can be poured onto the
loop.
However, if there are ice features on the images, their effect
on the data quality can be minimized during data processing.
If the software allows, the ice diffraction is best masked out
before integration rather than at the scaling stage. For
instance, in MOSFLM, the input line `resolution exclude 3.87
3.93' would remove the 3.90 AÊ ice ring. In DENZO (Otwi-
nowski & Minor, 1997), the command `reject X' can be used,
where X is the proportion of background pixels which must
satisfy the constraints imposed by the software on the slope
and uniformity of the background. The default value of X is
0.75, and it can be increased sequentially in small steps (it is a
sensitive parameter) to 0.76, 0.77 etc. until no spots are
predicted on the ice rings, as these spots usually have a high
and irregular background and thus do not give accurate
intensity values. The same software commands can be used to
mask out re¯ections from salt crystals, which occasionally
form in high-salt cryo-solutions during the transfer of the loop
to the goniostat.
Monitoring the images as they are collected and removing
ice if it forms is the best way to minimize the problem. Other
foreign bodies can sometimes cause shadows on the diffrac-
tion image and can be dealt with if the quality of the images is
being continually checked. For instance, ¯ying insects can
become frozen onto the end of the cryonozzle if they alight
there.
5.8. Beamstops
The position of the beamstop can have a signi®cant effect
on the data quality. The beamstop should be aligned properly
to avoid asymmetric scattering, as this background will give
large values of R(I)sym at low resolution. Most beamstops can
be pulled away from the crystal position for easier ¯ash-
cooling access. The crystal-to-beamstop distance used for data
collection is a compromise between being short, to minimize
main beam background from air scatter but causing the loss of
low-resolution data, and being long, which gives the low-
resolution data but increases the background (see Fig. 9).
On home sources, the background can be signi®cantly
reduced by minimizing the collimator-to-beamstop distance,
e.g. a reduction of 60% was observed when the collimator-to-
crystal and the crystal-to-beamstop distances were reduced
from 11 to 4 mm and 27 to 7 mm, respectively. If the beamstop
shadow on the diffraction image seems too large, it is worth
checking the beamstop and collimator end for Plasticene and
¯uff. Alternatively, the beamstop might be bigger than
necessary, and a smaller one could be installed.
6. If nothing seems to work . . .
Occasionally the experimenter is faced with a problem protein
crystal, for which an appropriate cryo-solution cannot be
found, or having found a seemingly benign cryo-solution, the
diffraction is still not satisfactory. In these circumstances, there
are various aspects of the cryo-cooling procedure which can be
changed in a search for better results. However, it is always
worth having more than one attempt at ¯ash-cooling before
Figure 9Two extremes of beamstop position. (a) Beamstop near the crystal giveslow background from main beam scattering from air but obscures thelow-resolution diffraction data. (b) Beamstop further from the crystalgives higher background but allows more low-resolution data to berecorded. The beamstop position will be a compromise between these twoextremes

giving up on a particular set of conditions, as small differences
in procedure can often make the difference between success
and failure.
Before embarking on any of the experiments suggested
below, it is very useful to collect some data from a crystal
mounted in a quartz or glass capillary tube at room
temperature to give an idea of its intrinsic diffraction power
and mosaicity. If there is no diffraction beyond 6 AÊ or if the
crystals are highly mosaic, it is unlikely that cryo-cooling will
improve them. Having established, for instance, that the
crystals diffract to 3.0 AÊ on an in-house source at room
temperature, it is worth the effort of ®nding appropriate cryo-
conditions.
6.1. Cryo-solutions
If the cryo-solutions have unfortunately been made up by
adding cryo-agents to the original mother-liquor stock solu-
tion, it is worth making up a more concentrated stock solution
of mother liquor and adding cryoprotecting agents to this in
such proportions that the original mother-liquor component
concentrations remain the same, i.e. the cryoprotecting agent
replaces water in the mother liquor rather than diluting it. For
instance, if the mother liquor has concentration X, make up a
2X solution, and to make 100 ml of 5% cryo-solution, mix 50 ml
2X, 5 ml glycerol and 45 ml water.
As well as the more common cryoprotecting agents already
mentioned, others such as erythritol, xylitol, inositol, raf®nose,
trehalose, 2,3,R,R-butanediol, propylene glycol, 2-propanol
(concentrations up to 70% required), DMSO (dimethyl sulf-
oxide) and other alcohols have been used successfully. This list
is by no means exhaustive and mixtures of two different agents
have also been found helpful, as well as treatment with a cryo-
solution followed by immersion in oil such as Paratone-N
(Kwong & Liu, 1999) prior to ¯ash-cooling. Crystals have also
been found to tolerate ¯ash-freezing better after being gently
cross-linked with glutaraldehyde (Lusty, 1999).
If no benign cryo-solution can be found, another option is
to exchange the mother liquor in the crystals for another
solution in which the crystals are stable and which can be more
easily cryoprotected. This exchange may have to be performed
slowly and/or gradually. A convenient vapour-diffusion
method of ®nding an alternative solvent has been reported by
Wierenga et al. (1992). If the crystals do not react well to a
sudden change of solvent, a ¯ow cell can be used. For instance,
in the study of phosphoglucomutase, 2 M ammonium sulfate
and PEG 3350 was replaced over many hours in a ¯ow cell by
PEG 600 (Ray et al., 1997). A decrease in mosaic spread and
an improvement of the diffraction limit from 2.75 to 2.35 AÊ
was observed.
6.2. Cryogen choice
The most common cryogens in use are liquid nitrogen
[melting point (MP), 63 K; boiling point (BP), 78 K], propane
(MP, 86 K; BP, 231 K) and gaseous nitrogen. Measurements of
the cooling rates of various cryogens are notoriously dif®cult
to make, because of the heat carried into the system by the
measuring instrument. For samples comparable with a typical
protein crystal, there are two reported sets of measurements
(Teng & Moffat, 1998; Walker et al., 1998). Both concluded
that gaseous nitrogen is the slowest in cooling between 300
and 100 K, but were at variance on whether liquid propane or
liquid nitrogen was faster overall. The results depend critically
on the size of the sample and the cooling regimes (nucleate or
®lm boiling). Teng and Moffatt concluded that gaseous
nitrogen provides the fastest cooling rate between 300 and
250 K, propane is fastest between 250 and 150 K and liquid
nitrogen fastest between 150 and 80 K. Gaseous helium allows
fast (>500 K sÿ1) cooling over the larger temperature range of
300±15 K.
Generally, the simplest technique is to stream-freeze into
gaseous nitrogen. If stream-freezing has failed, both propane
and liquid nitrogen are worth a try. Note that there are safety
implications of using propane in the laboratory and some
problems may be experienced in shipping dry dewars with
crystals frozen in propane to synchrotrons. More experi-
menters are now also trying ethane as a cryogen, and freon 12
and methylcyclopentane have also been used.
6.3. Transfer/handling/soaking procedures
Some protein crystals are very sensitive to any handling,
and the way the cryoprotectant agent is introduced can also
have a great impact on the observed diffraction pattern. As a
general rule, handling should be minimized. It is worth
thinking about the way the crystals are treated from the
moment of opening up the tray in which they were grown to
the point they are ¯ash-cooled, and considering all the stages
where degradation of crystal order might occur. For manip-
ulation of crystals, acupuncture needles are extremely useful
and are also cheap. Loops can be used to move crystals gently
from the growing drop to the soaking well. In sequential soaks,
crystals are better not moved between soaking wells (see x5.3).
Another variable which can be explored is the temperature
of the cryo-solution soak. Some experimenters routinely leave
their crystals in cryo-solutions overnight at 277 K prior to
¯ash-cooling.
A critical step in the cryo-cooling procedure is the time
taken to transfer the crystal from the soaking drop to the
cryogen: this should be as swift as possible. If stream-freezing
straight onto the goniostat, it is advisable to block the stream
with a narrow piece of card until the crystal is safely positioned
in the pre-centered place and the transfer tweezers are well
out of the way. The card is then quickly removed. This
prevents inadvertent knocking of the crystal out of the stream
after it has been frozen.
6.4. Osmolarity matching
When they are soaked in cryo-solutions, crystals often suffer
from a large osmotic shock and are thus compressed, resulting
in cracks, mosaic spread increase and resolution degradation.
One approach to overcome this is to match the osmolarity
(Os lÿ1) or osmality (Os kgÿ1) of the mother liquor (or
stabilizing solution) and cryo-solution by modifying the
Acta Cryst. (1999). D55, 1641±1653 Garman � Cool data 1649
research papers

research papers
1650 Garman � Cool data Acta Cryst. (1999). D55, 1641±1653
concentration of the stabilizing solution. Osmalities are
tabulated for most of the commonly used solutions in Section
D of the Handbook of Chemistry and Physics (1988±1989; full
editions only). So, for example (David, 1999), for a protein
crystal grown in 2.0 M NaCl and 50 mM pH 7.8 Tris±HCl, the
osmality is 3.95 Os kgÿ1. The mother liquor requires the
addition of 20% glycerol for adequate cryo-protection; 20%
glycerol (�2.27 g mol lÿ1) has an osmality of 2.9 Os kgÿ1. The
difference in osmality between the glycerol and mother liquor
is 1.05 Os kgÿ1, so in order to match the osmalities, the new
stabilizing solution must have an osmality of 1.05 Os kgÿ1,
which is equivalent to 0.55 M NaCl. The crystal may thus be
stable in a 20% glycerol/0.55 M NaCl solution which has the
same osmality as 2.0 M NaCl, whereas it was damaged by a
20% glycerol/2 M NaCl solution. Lower salt concentration
solutions require a higher percentage of cryo-agent for cryo-
protection than higher molar salt solutions, so it may be that in
this example the glycerol concentration would have to be
increased a little to compensate for the removal of salt. The
new stabilizing buffer can be introduced through vapour
equilibration overnight (for example, using the method of
David & Burley, 1991) and the crystal then soaked in the new
cryo-solution prior to ¯ash-cooling.
6.5. Crystal annealing
Some researchers have had success in extending the
diffraction limits and decreasing the mosaicity of their crystals
by the technique of crystal annealing, where the frozen sample
is allowed to thaw to room temperature and is then ¯ash-
cooled again, sometimes being cycled in this way several times.
Two methods of cycling have been reported. In one (Yeh &
Hol, 1998), the crystal was rapidly thawed and re-frozen in situ
on the goniostat by blocking the gas stream for 1.5±2 s and
waiting 6 s before repeating the process twice more. In the
other (Harp et al., 1998, 1999), the frozen crystals were
removed from the goniostat and replaced into the cryo-solu-
tion for at least 3 min before being frozen again.
It is possible that the static disorder of the crystals is
reduced during the annealing procedure. Crystal annealing is
always worth trying, although as with many aspects of work
with protein crystals, it does not necessarily succeed in all
cases.
7. Future development of cryo-techniques
Can further advances in cryo-techniques help us overcome
radiation damage to macromolecular crystals in third-
generation synchrotron wiggler- and undulator-produced
beams?
Consideration of the energy loss of electrons in samples
being investigated by electron microscopy compared with the
energy loss of 8 keV X-rays has allowed a theoretical estimate
of the maximum X-radiation dose a protein crystal held at
80 K might be able to tolerate (Henderson, 1990). This dose,
of around 1.2 � 1017 keV mmÿ3 (2 � 107 Gray, 1.6 � 1016
photons mmÿ2), corresponds to approximately 5 years on a
rotating anode and 24 h on a second-generation synchrotron
wiggler beamline; signi®cantly less on a third-generation
undulator source. Gonzales & Nave (1994) tested this
prediction for lysozyme crystals held at 100 K and observed
radiation damage at a dose in good agreement with that
calculated by Henderson. A detailed discussion of the physical
factors which are thought to be pertinent to radiation damage
in protein crystals can be found in Nave (1995).
For a crystal held at around 100 K, the energy density per
unit volume at low photon ¯ux is probably not high enough to
induce signi®cant heating effects. In extremely bright beams,
the energy density per unit volume will produce enough
thermal energy to literally vapourize samples even at 100 K, as
has been observed in some third-generation synchrotron
beams. It follows that there is a threshold energy density
where damage arising from local heating becomes appreciable.
This threshold will vary mostly with crystal surface-to-volume
ratio and local cooling regimes. Although the primary damage
is largely unavoidable and inescapable, a small proportion
may not be, and there are several possible ways by which the
overall radiation damage caused by high-intensity beams
might be reduced.
7.1. Data-collection rate
As yet, there has been little systematic study of the rela-
tionship between beam heating of the sample and radiation
damage. Experiments which monitored the rate of radiation
damage in¯icted by a white beam on line 9.5 at SRS Daresbury
for different incident ¯uxes (Gonzales & Nave, 1994) seemed
to indicate that the sample degradation was not a consequence
of beam heating, but rather to primary damage, although this
result has not been con®rmed for more intense or for mono-
chromatic beams.
Sample heating will undoubtedly occur in very intense
beams, and there may be some advantage in collecting data at
less than the maximum possible rate (attenuated ¯ux and/or
pulsed beam and/or short exposures followed by beam-off
sample `resting' time), since beam heating averaged over time
should then be reduced and this should lessen the degradation
rate. Collecting the data at a higher rate will only reduce the
speed of radiation damage if the time component of the
damage is signi®cant. With CCD-based detectors, detector
read-out time is much reduced and is no longer so signi®cant a
factor. Data can be collected so quickly with the high available
¯uxes that secondary damage should be low. For instance, a
MAD experiment performed recently at the APS took only
23 min for four wavelengths (16 kDa protein, CCD-based
detector, 3 s per image with 2� oscillation, space group C2221,
unit-cell dimensions 62.7, 64.7 and 74.2 AÊ , resolution 2.25 AÊ ,
60 images per data set, 5 min 45 s per data set; Walsh et al.,
1999). For this experiment, the APS beam was attenuated by a
factor of ten with an aluminium ®lter and defocused from 200
� 200 mm to 600 � 600 mm. Thus, potentially the ¯ux could
have been at least 100 times higher (assuming a square beam-
intensity distribution). If the sample could have withstood this
¯ux, the exposure time per image could have been much
shorter and the experiment could have been completed in an
even shorter time. For very fast data collection, high-speed
and high-precision goniometer motors are required.
7.2. Change the incident X-ray wavelength
Experimentally, there is much anecdotal evidence that at
room temperature more data can usually be obtained from the
same protein crystal at lower X-ray wavelengths, where beam
absorption is decreased. Helliwell (1992) has performed
model calculations for room-temperature samples using X-ray
wavelengths down to 0.33 AÊ , which suggest that the amount of
data recorded per crystal will increase as the wavelength is
reduced.
Changing the wavelength in¯uences the primary radiation
damage, but the nature of the relationship is not yet known.
Radiation damage may increase with the amount of energy
absorbed per scattered photon or (possibly and) with the
number of quanta absorbed. Arndt (1984) has shown that
when transmission through the crystal is high, the energy
absorbed per scattered photon is almost independent of
wavelength, which implies that if energy absorption is the
more important factor for radiation damage, there will be only
a small advantage in collecting data at shorter wavelengths.
Experimentally, Gonzales & Nave (1994), using different
thickness absorbers in a white beam, concluded that there was
no reduction in radiation damage to a 100 K crystal at shorter
wavelengths, but these experiments need to be repeated with
monochromatic beams.
7.3. Go to lower cryogen temperatures
A commercially available open-¯ow cryostat now allows the
possibility of data collection at temperatures down to 28 K
(HeliX, Oxford Cryosystems, Long Hanborough, Oxon). To
consider whether the gain of going to lower cryogen
temperature outweighs the disadvantages (mainly cost), some
of the factors which might be relevant are outlined below.
7.3.1. Thermal conductivity, k, and speci®c heat, Cp, ofhelium compared with those of nitrogen. Both the thermal
conductivity and the speci®c heat of the cryogen affect, along
with many other parameters, the heat-exchange coef®cient.
The ¯ow regime of open-¯ow cryostats is laminar: any
turbulence around the crystal position will assist heat transfer.
The thermal conductivity, k, of helium at 30 K is
0.35 mW cmÿ1 Kÿ1, whereas for nitrogen at 100 K, k is
0.1 mW cmÿ1 Kÿ1. The speci®c heat of helium is also a little
higher than that of nitrogen (5.2 J g mÿ1 Kÿ1 for helium
compared with 1.25 J g mÿ1 Kÿ1 for nitrogen; mass ratio He:N
is 4:14) so more heat can be carried away by the same unit
mass (at 30 K the gas is denser, so care must be taken in
comparing ¯ow rates, velocities, masses and volumes of helium
and nitrogen at different temperatures). Helium at 30 K
should therefore be a more ef®cient cryogen than nitrogen gas
at 100 K, and this is borne out by experience in that cold-burns
are much more swiftly in¯icted by helium-gas streams than by
nitrogen-gas streams held at the same temperature.
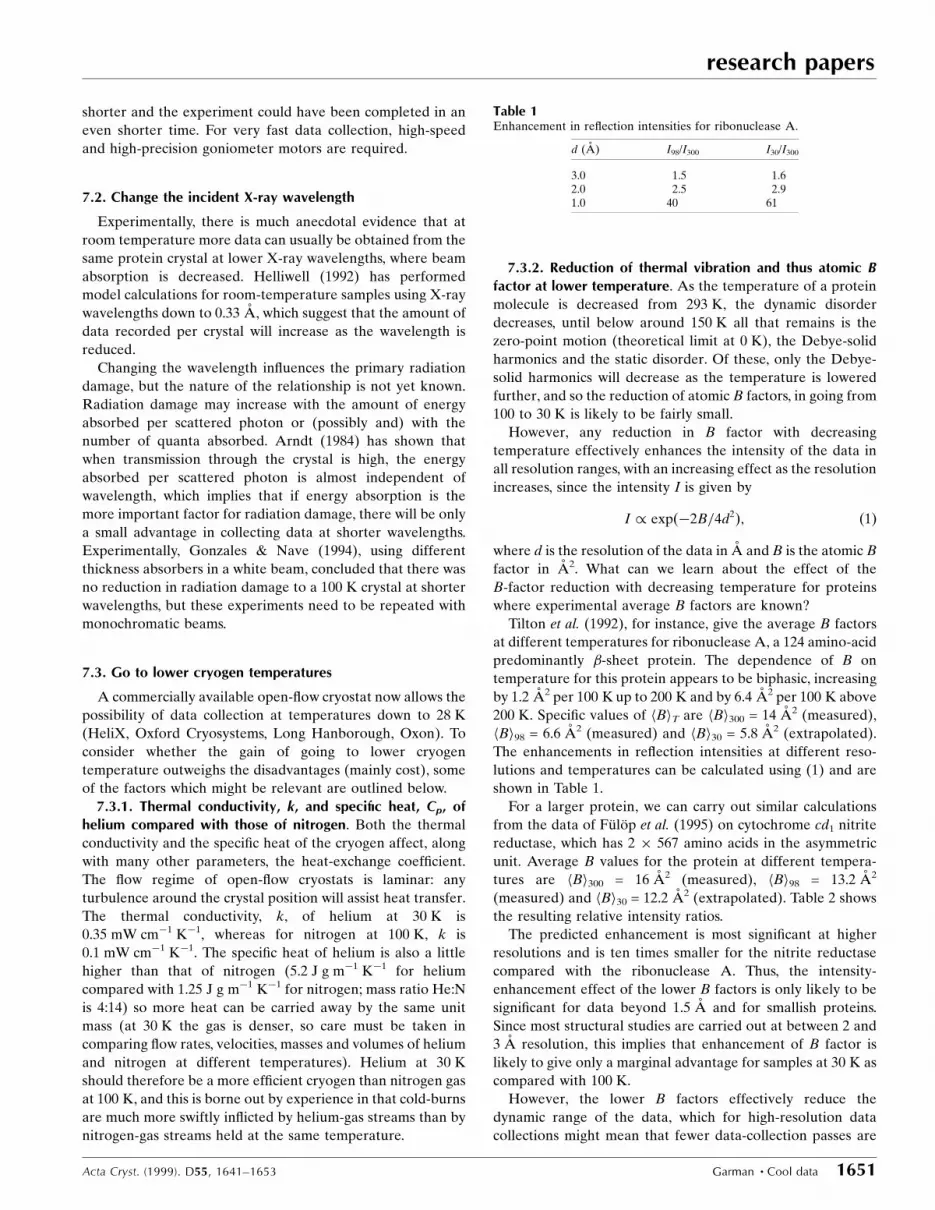
7.3.2. Reduction of thermal vibration and thus atomic Bfactor at lower temperature. As the temperature of a protein
molecule is decreased from 293 K, the dynamic disorder
decreases, until below around 150 K all that remains is the
zero-point motion (theoretical limit at 0 K), the Debye-solid
harmonics and the static disorder. Of these, only the Debye-
solid harmonics will decrease as the temperature is lowered
further, and so the reduction of atomic B factors, in going from
100 to 30 K is likely to be fairly small.
However, any reduction in B factor with decreasing
temperature effectively enhances the intensity of the data in
all resolution ranges, with an increasing effect as the resolution
increases, since the intensity I is given by
I / exp�ÿ2B=4d2�; �1�where d is the resolution of the data in AÊ and B is the atomic B
factor in AÊ 2. What can we learn about the effect of the
B-factor reduction with decreasing temperature for proteins
where experimental average B factors are known?
Tilton et al. (1992), for instance, give the average B factors
at different temperatures for ribonuclease A, a 124 amino-acid
predominantly �-sheet protein. The dependence of B on
temperature for this protein appears to be biphasic, increasing
by 1.2 AÊ 2 per 100 K up to 200 K and by 6.4 AÊ 2 per 100 K above
200 K. Speci®c values of hBiT are hBi300 = 14 AÊ 2 (measured),
hBi98 = 6.6 AÊ 2 (measured) and hBi30 = 5.8 AÊ 2 (extrapolated).
The enhancements in re¯ection intensities at different reso-
lutions and temperatures can be calculated using (1) and are
shown in Table 1.
For a larger protein, we can carry out similar calculations
from the data of FuÈ loÈ p et al. (1995) on cytochrome cd1 nitrite
reductase, which has 2 � 567 amino acids in the asymmetric
unit. Average B values for the protein at different tempera-
tures are hBi300 = 16 AÊ 2 (measured), hBi98 = 13.2 AÊ 2
(measured) and hBi30 = 12.2 AÊ 2 (extrapolated). Table 2 shows
the resulting relative intensity ratios.
The predicted enhancement is most signi®cant at higher
resolutions and is ten times smaller for the nitrite reductase
compared with the ribonuclease A. Thus, the intensity-
enhancement effect of the lower B factors is only likely to be
signi®cant for data beyond 1.5 AÊ and for smallish proteins.
Since most structural studies are carried out at between 2 and
3 AÊ resolution, this implies that enhancement of B factor is
likely to give only a marginal advantage for samples at 30 K as
compared with 100 K.
However, the lower B factors effectively reduce the
dynamic range of the data, which for high-resolution data
collections might mean that fewer data-collection passes are
Acta Cryst. (1999). D55, 1641±1653 Garman � Cool data 1651
research papers
Table 1Enhancement in re¯ection intensities for ribonuclease A.
d (AÊ ) I98/I300 I30/I300
3.0 1.5 1.62.0 2.5 2.91.0 40 61

research papers
1652 Garman � Cool data Acta Cryst. (1999). D55, 1641±1653
necessary, thus enabling the experiment to be completed in a
shorter time.
7.3.3. Temperature-dependence of the thermal conduc-tivity, k, of crystals. The temperature-dependence of k has not
been measured for protein crystals in vitreous ice, but the
thermal conductivity may become very low at low tempera-
tures. For glasses, and also for clathrate hydrates (maximum
6 AÊ diameter molecules trapped in a matrix of ice) where
measurements are available down to 100 K (Ross &
Andersson, 1982; Andersson & Ross, 1983), k/ T. For perfect
crystalline solids, k / 1/T. Protein crystals are likely to mimic
the clathrates rather than perfect crystals and will thus have
k / T. The rate of heat conduction with time is
�dQ=dT� � kA�dT=dx�;where Q is the heat in J, t is the time in s, A is the cross-
sectional area in m2, T is the temperature and x is the distance
across the temperature gradient in m. Thus, if k becomes very
small, the heat-transfer rate (dQ/dt) from the centre of the
sample to the cryogen also decreases.
7.3.4. Temperature-dependence of speci®c heat capacity,Cp, of crystals. This parameter is similarly not yet measured
for protein crystals, but there is reason to think it may also
become very low at low temperatures. Measurements for
vitreous glass and various different vitri®ed salt solutions all
show a decrease in Cp with decreasing temperature (Angell &
Tucker, 1980). The heat, H, required to raise the temperature
of a mass m by �T is
H � mCp�T:
Thus, at lower temperature less energy is needed to heat the
crystal and the thermal conductivity may also be lower, so it
will be harder to conduct the heat away by cooling. Although
counter-intuitive, the effect of this will be that the centre of the
crystal will heat up faster and be harder to cool when held at
30 K compared with 100 K. However, it will still be advanta-
geous to hold the crystal at 30 K, as the time taken to heat the
centre up to 100 K will be gained. The equilibrium heat-
transfer state for a crystal at 30 K should allow a higher inci-
dent energy ¯ux for the same level of beam heating.
7.3.5. Temperature-dependence of primary radiationdamage. The temperature-dependence of primary radiation
damage will depend on the (as yet unknown) temperature
dependence of the density of colour centres, crystal defects,
shrinkage and crystal contact changes owing to cell shrinkage
with decreasing temperature. This list is not exhaustive and,
because the mechanism of radiation damage itself is poorly
understood, there may be additional factors which will affect
the balance of advantage/disadvantage in going to lower
cryogen temperature.
7.3.6. Cooling regime. For the actual ¯ash-cooling proce-
dure, there is advantage in cooling the sample down to lower
temperatures. Newton's Law of Cooling states that dT/dt is
proportional to �T. �T between room temperature and
100 K gaseous nitrogen is approximately 193 K (�T1) and is
263 K (�T2) for helium cooling running at 30 K. Thus
�T2/�T1 = 1.4. Teng & Moffat (1998) reported that at 20 K
and a helium ¯ow rate of 40 l minÿ1, a cooling rate of
>500 K sÿ1 was achieved in the temperature range 300±150 K
and a rate of <100 K sÿ1 was achieved in the temperature
range 120±20 K. The lower helium temperature and the heat-
transfer properties of helium must thus surely be an advantage
in providing a more ef®cient cooling regime. Although this
does not directly impact the rate of radiation damage during
data collection, it does decrease the amount of cryoprotectant
agent required to obtain a vitreous glass. The relationship
between the rate of radiation damage for different cryo-
solution concentrations has not yet been investigated and is
therefore another uncertainty when considering damage
avoidance.
8. Conclusions
From the above discussion, it can be seen that there are too
many simultaneous variables to make a prediction of whether
using helium as a cryogen will be effective in reducing radia-
tion damage in¯icted by very hot beams. The answer will
depend on the balance of advantages and disadvantages
outlined above.
Since heat removal from the sample is proportional to its
surface area and heat deposition by the beam is proportional
to the sample volume, the surface-to-volume ratio of the
crystal may well be the most important single parameter in
tipping the balance of advantage/disadvantage of reducing the
temperature to 30 K. Therefore, larger S/V crystals can be
used with more brilliant beams to improve the heat-transfer
properties. Smaller crystals overall can be used productively
since the ¯ux is so large, but there will always be a lower limit
to the crystal size owing to primary radiation damage
(Gonzales & Nave, 1994). It is vital for us to acquire a better
understanding of the interplay between the various experi-
mental parameters and, in particular, the radiation-damage
process itself before any conclusions can be drawn. Systematic
experiments, balancing cost with likely gain, are required over
the next few years to enable us to optimize the use of the
X-ray beams now available to the macromolecular crystal-
lography community.
I would like to thank all the various people with whom I
have discussed data collection, cryo-techniques and radiation
damage at courses and meetings, as well as my past and
present colleagues at the LMB, Oxford. I am especially
grateful for input from Thomas Schneider, Martin Noble,
Table 2Enhancement in re¯ection intensities for cytochrome cd1 nitrilereductase.
d (AÊ ) I100/I300 I30/I300
3.0 1.2 1.242.0 1.4 1.61.0 4.1 6.8

Peter David, John Cosier, Peter Kuhn, Susan Lea and Colin
Nave. I thank Stephen Lee for assistance with the ®gures. This
work is supported by the UK Medical Research Council.
References
Andersson, P. & Ross, R. (1983). J. Phys. C Solid State Phys. 16,1423±1432.
Angell, C. A. & Tucker, J. C. (1980). J. Phys. Chem. 84, 268±272.Arndt, U. (1984). J. Appl. Cryst. 17, 118±119.Brown, N., Noble, M. E. M., Endicott, J. A., Garman, E. F.,
Wakatsuki, S., Mitchell, E., Rasmussen, B., Hunt, T. & Johnson,L. N. (1995). Structure, 3, 1235±1247.
Dauter, Z. (1997). Methods Enzymol. 276, 326±344.David, P. R. (1999). In Practical Protein Crystallography, edited by D.
McRee, 2nd ed. New York: Academic Press.David, P. R. & Burley, S. K. (1991). J. Appl. Cryst. 24, 1073±1074.Esnouf, R. M., Ren, J., Garman, E. F., Somers, D. O'N., Ross, C. K.,
Jones, E. Y., Stammers, D. K. & Stuart, D. I. (1998). Acta Cryst.D54, 938±953.
FuÈ loÈ p, V., Moir, J. W. B., Ferguson, S. J. & Hadju, J. (1995). Cell, 81,369±377.
Gamblin, S. J. & Rodgers, D. W. (1993). Proceedings of the CCP4Study Weekend. Data Collection and Processing, edited by L.Sawyer, N. Isaacs & S. Bailey, pp. 28±32. Warrington: DaresburyLaboratory.
Garman, E. F. (1993). Proceedings of the CCP4 Study Weekend. DataCollection and Processing, edited by L. Sawyer, N. Isaacs & S.Bailey, pp. 123±131. Warrington: Daresbury Laboratory.
Garman, E. F. (1999). Protein Crystallization: Techniques, Strategies,and Tips. A Laboratory Manual, edited by T. Bergfors, ch. 17. LaJolla, California: International University Line.
Garman, E. F. & Mitchell, E. P. (1996). J. Appl. Cryst. 29, 584±587.Garman, E. F. & Schneider, T. R. (1997). J. Appl. Cryst. 30, 211±237.Garman, E. F., Wouters, J., Vimr, E., Laver, G. & Sheldrick, G. M.
(1996). Acta Cryst. A52, C8.Gonzales, A. & Nave, C. (1994). Acta Cryst. D50, 874±877.Gregoriou, M., Noble, M. E. M., Watson, K. A., Garman, E. F., Krulle,
T. M., de la Fuente, C., Fleet, G. W. J., Oikonomakos, N. K. &Johnson, L. N. (1998). Protein Sci. 7, 915±927.
Haas, D. J. & Rossmann, M. G. (1970). Acta Cryst. B26, 998±1004.Handbook of Chemistry and Physics (1988±1989). 69th ed., edited by
R. C. Weast, Table D-232. Boca Raton, Florida: CRC Press.Harp, J. M., Leif Hanson, B., Timm, D. E. & Bunick, G. J. (1999). Acta
Cryst. D55, 1129±1334.Harp, J. M., Timm, D. E. & Bunick, G. J. (1998). Acta Cryst. D54,
622±628.
Helliwell, J. R. (1992). Macromolecular Crystallography withSynchrotron Radiation. Cambridge University Press.
Henderson, R. (1990). Proc. R. Soc. Lond. B, 241, 6±8.Hope, H. (1988). Acta Cryst. B44, 22±26.Kabsch, W. (1988). J. Appl. Cryst. 21, 916±924.Kwong, P. D. & Liu, Y. (1999). J. Appl. Cryst. 32, 102±105.Leslie. A. G. W. (1996). CCP4 Newslett. Protein Crystallogr. 32, 7±8.Low, B. W., Chen, C. C. H., Berger, J. E., Singman, L. & Pletcher, J. F.
(1966). Proc. Natl Acad. Sci. USA, 56, 1746±1750.Lusty, C. J. (1999). J. Appl. Cryst. 32, 106±112.Messerschmidt, A. & P¯ugrath, J. W. (1987). J. Appl. Cryst. 20,
306±315.Mitchell, E. P. & Garman, E. F. (1994). J. Appl. Cryst. 27, 1070±1074.Mitchell, E. P., Kuhn, P. & Garman, E. F. (1999). Structure, 7,
R111±R121.Nagata, C., Moriyama, H., Tanaka, N., Nakasako, M., Yamamoto, M.,
Ueki, T. & Oshima, T. (1996). Acta Cryst. D52, 623±630.Nave, C. (1995). Radiat. Phys. Chem. 45, 483±490.Noble, M. E. M. (1996). PREDICT Package, http://biop.ox.ac.uk/
www/distrib/predict.html.Otwinowski, Z. & Minor, W. (1997). Methods Enzymol. 276, 307±326.Parkin, S. & Hope, H. (1998). J. Appl. Cryst. 31, 945±953.Ravelli, R. G. B., Sweet, R. M., Skinner, J. M., Duisenberg, A. J. M. &
Kroon, J. (1997). J. Appl. Cryst. 30, 551±554.Ray, W. R. Jr, Baranidharan, S. & Liu, Y. (1997). Acta Cryst. D53,
385±391.Rodgers, D. (1997). Methods Enzymol. 276, 183±203.Ross, R. & Andersson, P. (1982). Can. J. Phys. 60, 881±892.Sauer, O., Schmidt, A. & Kratky, C. (1997). J. Appl. Cryst. 30,
476±486.Schick, B. & Jurnak, F. (1994). Acta Cryst. D50, 563±568.Smith, J. L. (1991). Curr. Opin. Struct. Biol. 1, 1002±10011.Soltis, S. M., Stowell, M. H. B., Wiener, M. C., Philips, G. N. & Rees,
D. C. (1997). J. Appl. Cryst. 30, 190±194.Teng, T.-Y. (1990). J. Appl. Cryst. 23, 387±391.Teng, T.-Y. & Moffat, K. (1998). J. Appl. Cryst. 31, 252±257.Tilton, R. F. Jr, Dewan, J. & Petsko, G. A. (1992). Biochemistry, 31,
2469±2481.Tsitsanou, K. E., Oikonomakos, N. G., Zogrphos, S. E., Skamnaki,
V. T., Gregoriou, M., Watson, K. A., Johnson, L. N. & Fleet, G. W. J.(1999). Protein Sci. 8, 741±749.
Walker, L. J., Moreno, P. O. & Hope, H. (1998). J. Appl. Cryst. 31,954±956.
Walsh, M. A., Dementieva, I., Evans, G., Sanishvili, R. & Joachimiak,A. (1999). Acta Cryst. D55, 1168±1173.
Wierenga, R. K. Zeelan, J. P. & Noble, M. E. M. (1992). J. Cryst.Growth. 122, 231±234.
Yeh, J. I. & Hol, W. G. J. (1998). Acta Cryst. D54, 479±480.
Acta Cryst. (1999). D55, 1641±1653 Garman � Cool data 1653
research papers