achievements and challenges of solar electricity from photovoltaics
TRANSCRIPT

1Achievements and Challengesof Solar Electricity fromPhotovoltaics
Steven Hegedus1 and Antonio Luque2
1Institute of Energy Conversion, University of Delaware, USA2Instituto de Energıa Solar, Universidad Politecnica de Madrid, Spain
1.1 THE BIG PICTURE
Congratulations! You are reading a book about a technology that has changed the way we thinkabout energy. Photovoltaics (or PV) is an empowering technology that has shown that it cangenerate electricity for the human race for a wide range of applications, scales, climates, andgeographic locations. Photovoltaics can bring electricity to a rural homemaker who lives 100kilometers and 100 years away from the nearest electric grid connection in her country, thusallowing her family to have clean, electric lights instead of kerosene lamps, to listen to a radio,and to run a sewing machine for additional income. It can pump clean water from undergroundaquifers for drinking or watering crops or cattle. Or, photovoltaics can provide electricity to remotetransmitter stations in the mountains, allowing better communication without building a road todeliver diesel fuel for its generator. It can allow a suburban or urban homeowner to produce someor all of their annual electricity, selling any excess solar electricity back into the grid. It can helpa major electric utility in Los Angeles, Tokyo, or Madrid to meet its peak load on hot summerafternoons when air conditioners are working full time. Finally, photovoltaics has been poweringsatellites orbiting the Earth for 30 years or vehicles roving over the surface of Mars.
Every day the human race is more aware of the need for sustainable management of itsPlanet Earth. It upholds almost seven billion human beings of which one billion have adopted a
Handbook of Photovoltaic Science and Engineering, Second EditionEdited by Antonio Luque and Steven Hegedus© 2011 John Wiley & Sons, Ltd
COPYRIG
HTED M
ATERIAL

2 ACHIEVEMENTS AND CHALLENGES OF SOLAR ELECTRICITY FROM PV
high-consumption lifestyle which is not sustainable. “High consumption” used to refer materialsthat could become scarce, but it increasingly refers to energy. Here the term energy, refers to“useful energy” (or exergy), that once used is degraded, typically to waste heat, and will be nolonger be useful.
Here we are concerned with electrical energy which is a secondary form of energy. Fossilfuel (coal, petroleum and natural gas) combustion and nuclear fission are the primary processeswhich create heat to turn water into steam which rotate giant turbines which generate electricity.When the C–H bonds in fossil fuels are burned in the presence of air for heat, they produceCO2, and H2O. The latter waste is not a problem because there is already so much water in theseas and in the atmosphere. But CO2 is a different story. Analysis of the air bubbles embeddedin Antarctic ice layers provides information on the CO2 concentration of the atmosphere in thelast 150 000 years. This content shows an unprecedented growth in the last 300 years, coincidingwith the beginning of the industrialization. This fact is linked by most scientists to global climatechange, including global warming, sea level rise, more violent storms, and changes in rainfall. Thiswill disrupt agriculture, disease control, and other human activities. Thus, a substantial fraction ofour energy must be generated without any C emissions within the next 10–20 years, or else theEarth will become a dangerous experiment. Besides, fossil fuels cannot last forever. Supplies ofpetroleum and natural gas will both peak and then decrease within decades if not years, and coalwithin few centuries. We must develop large-scale alternatives to burning fossil fuels very soon.
Another primary energy source for electrical generation is radioactivity in the form ofuranium, which when conveniently transformed, fuels nuclear plants through nuclear fission. Con-cerning the uranium, most of it consists of the 238 isotope, which is not “fissile” (not a nuclearfuel) and only about 0.7% is the 235 isotope, which is fissile. With the present technology, nuclearfuel will peak within decades. However, uranium 238 can be converted to an artificial fissile fuelby proper bombardment with neutrons. With this technology, not fully commercial today, it wouldbe possible to have nuclear power (with unproven cost effectiveness) maybe for a millennium.Nuclear fusion, which is a totally different nuclear technology, could be practically inexhaustible,but its practical feasibility is very far from being proven.
While nuclear plants emit no CO2, they are still inherently dangerous. Nuclear engineersand regulators take many precautions to ensure safe operation, and (excepting very few cases) thepower plants function without catastrophic problems. But the storage of highly radioactive wastes,which must remain controlled for centuries, remains an unsolved issue worldwide, along with thepossibility of diversion of nuclear fuel to making a bomb.
So the situation at the beginning of the 21st century is that the previous century’s methods ofgenerating our most useful form of energy, electricity, are recognized as unsustainable, due to eitherincreasing CO2 poisoning of the atmosphere or the increasing stockpile of radioactive waste withno safe storage. What about using existing energy more efficiently? This will be crucial for slowingand perhaps even reversing the increased CO2 levels. Doing more with less energy or just doing less(considered unpopular with growth-oriented economic advocates) are certainly necessary to reduceour demand for energy. But a growing world population with a growing appetite for energy is dif-ficult to reconcile with using less energy. Besides, there is a large group whose voices are often notheard in this discussion – namely, the one out of three human beings who lack any electricity at all.
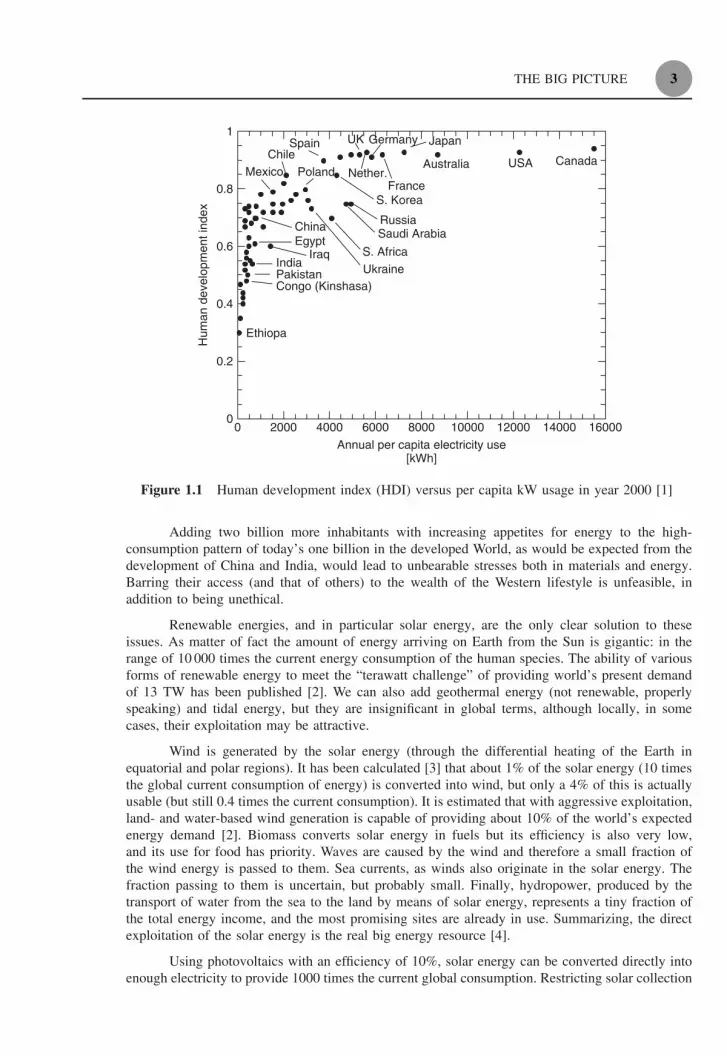
In fact, access to and consumption of electricity is closely correlated with quality oflife, up to a point. Figure 1.1 shows the human development Index (HDI) for over 60 countries,which includes over 90% of the Earth’s population, versus the annual per capita electricity use(adapted from [1]). The HDI is compiled by the UN and calculated on the basis of life expectancy,educational achievement, and per capita gross domestic product. To improve the quality of lifein many countries, as measured by their HDI, will require increasing their electricity consumptionby factors of 10 or more, from a few hundred to a few thousand kilowatt-hours (kW h) per year.
THE BIG PICTURE 3
0
0.2
0.4
0.6
0.8
1
0 2000 4000 6000 8000 10000 12000 14000 16000
Annual per capita electricity use[kWh]
CanadaUSAAustralia
Japan
France
GermanyUKSpain
S. Korea
ChileMexico
RussiaSaudi Arabia
S. Africa
Ethiopa
Congo (Kinshasa)PakistanIndia
Iraq
China
Poland
Egypt
Nether.
Ukraine
Hum
an d
evel
opm
ent i
ndex
Figure 1.1 Human development index (HDI) versus per capita kW usage in year 2000 [1]
Adding two billion more inhabitants with increasing appetites for energy to the high-consumption pattern of today’s one billion in the developed World, as would be expected from thedevelopment of China and India, would lead to unbearable stresses both in materials and energy.Barring their access (and that of others) to the wealth of the Western lifestyle is unfeasible, inaddition to being unethical.
Renewable energies, and in particular solar energy, are the only clear solution to theseissues. As matter of fact the amount of energy arriving on Earth from the Sun is gigantic: in therange of 10 000 times the current energy consumption of the human species. The ability of variousforms of renewable energy to meet the “terawatt challenge” of providing world’s present demandof 13 TW has been published [2]. We can also add geothermal energy (not renewable, properlyspeaking) and tidal energy, but they are insignificant in global terms, although locally, in somecases, their exploitation may be attractive.
Wind is generated by the solar energy (through the differential heating of the Earth inequatorial and polar regions). It has been calculated [3] that about 1% of the solar energy (10 timesthe global current consumption of energy) is converted into wind, but only a 4% of this is actuallyusable (but still 0.4 times the current consumption). It is estimated that with aggressive exploitation,land- and water-based wind generation is capable of providing about 10% of the world’s expectedenergy demand [2]. Biomass converts solar energy in fuels but its efficiency is also very low,and its use for food has priority. Waves are caused by the wind and therefore a small fraction ofthe wind energy is passed to them. Sea currents, as winds also originate in the solar energy. Thefraction passing to them is uncertain, but probably small. Finally, hydropower, produced by thetransport of water from the sea to the land by means of solar energy, represents a tiny fraction ofthe total energy income, and the most promising sites are already in use. Summarizing, the directexploitation of the solar energy is the real big energy resource [4].
Using photovoltaics with an efficiency of 10%, solar energy can be converted directly intoenough electricity to provide 1000 times the current global consumption. Restricting solar collection

4 ACHIEVEMENTS AND CHALLENGES OF SOLAR ELECTRICITY FROM PV
to the earth’s solid surface (one quarter of the total surface area), we still have a potential of 250times the current consumption. This means that using 0.4% of the land area could produce all theenergy (electricity plus heat plus transportation) currently demanded. This fraction of land is muchsmaller than the one we use for agriculture.
Achieving the required strong penetration of solar energy is not trivial. In the rest of thischapter we shall present a description of the status PV and broadly outline some of the challengesfor it to become a TW scale energy source. But let us advance arguments that are seldom spoken:(a) PV is technologically more mature than advanced nuclear fission or nuclear fusion technology,the two non-renewable CO2-free energies permitting substantial increments of the global energyproduction; (b) even well-developed wind energy cannot match the amount of energy directlyavailable from the sun; (c) biomass energy can expect further scientific development, but willprobably not reach efficiency levels that will make of it a global alternative to solve the issuespresented; (d) concentrating solar thermal power (CSP) could produce electricity in concurrencewith PV. We think that PV has a bigger innovation potential and has also modularity properties(it operates at small or large scale) and lacks the geographic limitations of CSP which makes it aclear winner in this competition.
1.2 WHAT IS PHOTOVOLTAICS?
PV is the technology that generates direct current (DC) electrical power measured in watts (W)or kilowatts (kW) from semiconductors when they are illuminated by photons. As long as light isshining on the solar cell (the name for the individual PV element), it generates electrical power.When the light stops, the electricity stops. Solar cells never need recharging like a battery. Somehave been in continuous outdoor operation on Earth or in space for over 30 years.
Table 1.1 lists some of the advantages and disadvantages of PV. Note, that they includeboth technical and nontechnical issues
Table 1.1 Advantages and disadvantages of photovoltaics
Advantages of photovoltaics
• Fuel source is vast, widely accessible and essentially infinite• No emissions, combustion or radioactive waste (does not contribute perceptibly to global
climate change or air/water pollution)• Low operating costs (no fuel)• No moving parts (no wear); theoretically everlasting• Ambient temperature operation (no high-temperature corrosion or safety issues)• High reliability of solar modules (manufacturers’ guarantees over 30 years)• Rather predictable annual output• Modular (small or large increments)• Can be integrated into new or existing building structures• Can be very rapidly installed at nearly any point-of-use
Disadvantages of photovoltaics
• Fuel source is diffuse (sunlight is a relatively low-density energy)• High initial (installed) costs• Unpredictable hourly or daily output• Lack of economical efficient energy storage

WHAT IS PHOTOVOLTAICS? 5
What is the physical basis of PV operation? Solar cells are typically made of semiconductormaterials, which have weakly bonded electrons occupying a band of energy called the valence band.When energy exceeding a certain threshold, called the bandgap energy, is applied to a valenceelectron, the bonds are broken and the electron is somewhat “free” to move around in a newenergy band called the conduction band where it can “conduct” electricity through the material1.Thus, the free electrons in the conduction band are separated from the valence band by the bandgap(measured in units of electron volts or eV). This energy needed to free the electron can be suppliedby photons, which are particles of light.
Figure 1.2 shows the idealized relation between energy (vertical axis) and the spatial bound-aries (horizontal axis). When the solar cell is exposed to sunlight of sufficient energy, the incidentsolar photons are absorbed by the atoms, breaking the bonds of valence electrons and pumpingthem up to higher energy in the conduction band. There, a specially made selective contact collectsconduction-band electrons and drives these freed electrons to the external circuit. The electrons losetheir energy by doing work in the external circuit such as pumping water, spinning a fan, poweringa sewing machine motor, a light bulb, or a computer. They are restored to the solar cell by thereturn loop of the circuit via a second selective contact, which returns them to the valence bandwith the same energy that they started with. The movement of these electrons in the external circuitand contacts is called the electric current . The potential at which the electrons are delivered to theexternal world is less than the threshold energy that excited the electrons; that is, the bandgap. It isindependent of the energy of the photon that created it (provided its energy is above the threshold).Thus, in a material with a 1 eV bandgap, electrons excited by a 2 eV (red) photon or by a 3 eV(blue) photon will both still have a potential voltage of slightly less than 1 V (i.e. both of the
Band gap
Free (mobile)electrons
Conduction band (CB)(excited states)
High (free) energyelectrons
Valence band (VB)(ground states)
Photon e–
Contact to CB(negative)
Contact to VB(positive)
External load (electric power)
Figure 1.2 Schematic of a solar cell. Electrons are pumped by photons from the valence bandto the conduction band. There they are extracted by a contact selective to the conduction band(an n-doped semiconductor) at a higher (free) energy and delivered to the outside world via wires,where they do some useful work, then are returned to the valence band at a lower (free) energy bya contact selective to the valence band (a p-type semiconductor)
1 The bandgap energy or energy gap is a fundamental and unique parameter for each semiconductor material. Tobe a good absorber of solar energy on earth, a semiconductor should have a bandgap between about 1 and 2 eV.See figure 4.3.
6 ACHIEVEMENTS AND CHALLENGES OF SOLAR ELECTRICITY FROM PV
electrons are delivered with an energy of about 1 eV). The electrical power produced is the productof the current times the voltage; that is, power is the number of free electrons times their electriccharge times their voltage. Brighter sunlight causes more electrons to be freed resulting in morepower generated.
Sunlight is a spectrum of photons distributed over a range of energy. Photons whose energyis greater than the bandgap energy (the threshold energy) can excite electrons from the valenceto conduction band where they can exit the device and generate electrical power. Photons withenergy less than the energy gap fail to excite free electrons. Instead, that energy travels throughthe solar cell and is absorbed at the rear as heat. Solar cells in direct sunlight can be somewhatwarmer (20–30 ◦C) than the ambient air temperature. Thus, PV cells can produce electricity withoutoperating at high temperature and without moving parts. These are the salient characteristics of PVthat explain safe, simple and reliable operation.
At the heart of almost any solar cell is the pn junction. Modeling and understanding is verymuch simplified by using the pn junction concept. This pn junction results from the “doping” thatproduces conduction-band or valence-band selective contacts with one becoming the n-side (lots ofnegative charge), the other the p-side (lots of positive charge). The role of the pn junction and of theselective contacts will be explained in detail in Chapters 3 and 4. Here, pn junctions are mentionedbecause this term is often present when talking of solar cells, and is used occasionally in this chapter.
For practical applications, a certain number of solar cells are interconnected and encapsulatedinto units called PV modules, which is the product usually sold to the customer. They produce DCcurrent that is typically transformed into the more useful AC current by an electronic device calledan inverter . The inverter, the rechargeable batteries (when storage is needed), the mechanicalstructure to mount and aim the modules (when aiming is necessary or desired), and any otherelements necessary to build a PV system are called the balance of the system (BOS). These BOSelements are presented in Chapters 19–21.
Most of the solar modules today in the market today are made of crystalline silicon(c-Si) solar cells (Chapters 5–7). About 10% are made of the so-called thin film solar cells(TFSC), comprising in reality a variety of technologies: amorphous silicon (a-Si, Chapter 12),copper indium gallium diselenide (CIGS, Cu(InGa)S2, Chapter 13), cadmium telluride (CdTe,Chapter 14), and others (Chapter 11). Many think that thin film cells are more promising inreducing costs. There is also an incipient market of concentrator photovoltaics (CPV) whereexpensive and efficient multijunction (MJ) solar cells receive a high intensity of sunlight focusedby concentrators made of lenses or mirrors (Chapters 8 and 10). The motivation of all thesetechnologies is the same: to decrease the module costs compared with the dominant Si technology.Other options are under research and development, including organic solar cells (Chapters 15 and16) and the new (or third) generation solar cells (Chapter 4).
1.2.1 Rating of PV Modules and Generators
A fuel-fired power generator is rated in watts (or kW or MW). This means that they are designedto operate producing this level of power continuously, as long as they have fuel, and will be ableto dissipate the heat produced during its operation. If they are forced to operate at more than therated power, they will use more fuel, suffer more wear and have a shorter lifetime. Some can beoperated at lower power output, although with loss of efficiency, but many cannot be controlled atless-than-rated power.
PV modules, instead, are rated in watts of peak power (Wp). This is the power the modulewould deliver to a perfectly matched load when the module is illuminated with 1 kW/m2 of

WHAT IS PHOTOVOLTAICS? 7
insolation (incident solar radiation) power of a certain standard spectrum (corresponding to brightsunlight) while the cell temperature is fixed at 25 ◦C. An array of modules is rated by summingup the watts peak of all the modules.
These “standard test conditions” or STC are universally applied to rate peak power output ofa solar cell in a laboratory or a module out in the field, but rarely occur in real outdoor applications(see Chapter 18 for a complete discussion of testing conditions and Chapter 22 for real outdoorconditions). Generally, the irradiance (insolation power) is smaller and the temperature higher. Bothfactors reduce the power that can be delivered by the module to the matched load. In some casesthe load is not so well matched (or the modules among themselves) reducing further the power.Thus while the output power is well defined under these STC, output power under real conditionsvaries considerably. While a 10 kW diesel generator produces 10 kW so long as it has diesel fuel,a 10 kW PV array will produce from perhaps 0–11 kW, depending on sunlight and temperature.
To enable useful predictions, the energy (not power) in kW h produced by the solar radiationfalling in a generator in one year (or one month or one average day) is obtained by multiplying therated power in kWp times the number of “effective hours” of irradiance falling on the generator inone year (one month, one average day) times the performance ratio (PR), which accounts for lossesabove mentioned in real operation plus those in the wiring, the inverter (whose efficiency may be0.90–0.97), etc. Time for maintenance is also included here. The PR in well-designed installationsvaries from 0.7 to 0.8 as discussed in Chapter 19, but may be even lower in warmer climatesbecause the efficiency of the cell is reduced with the temperature.
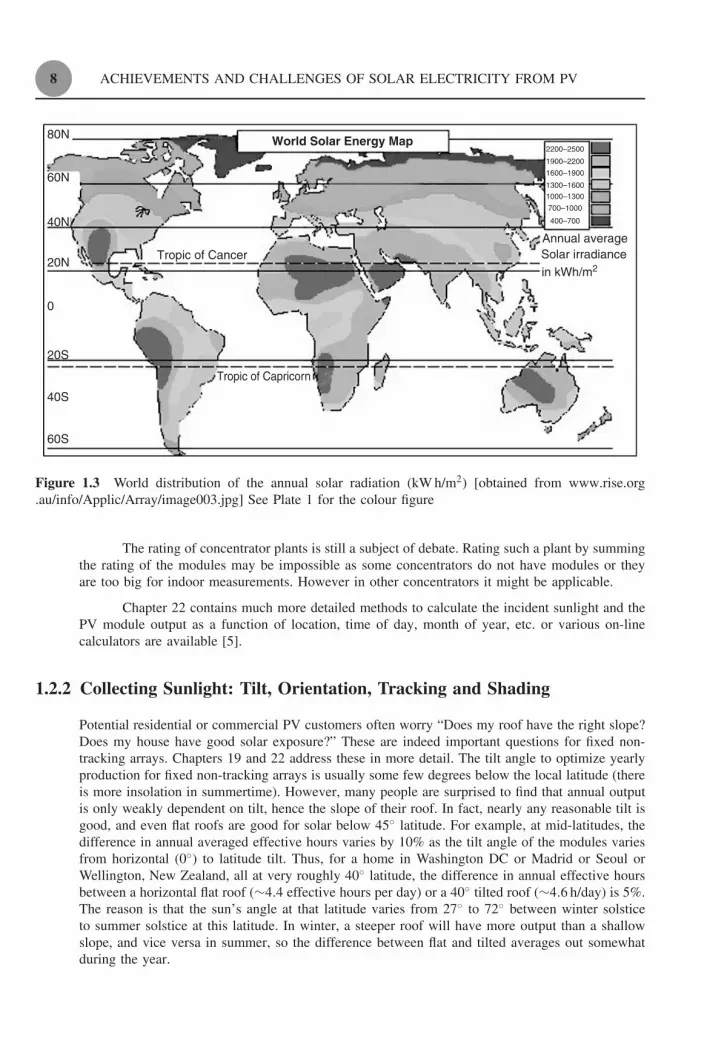
What are the “effective” sun hours? Since the rating irradiance is 1 kW/m2, the number of“effective” hours at the rating power is the number of kWh/m2 falling on a plane with the sameorientation of the PV generator. Thus, a typical mid-latitude location might receive a daily averageof 4 kWh/m2 of sunlight integrated over a period of 24 hours (including night time) on a horizontalsurface, due to an incident power that ranged from 0 to 1 kW/m2. This is equivalent to a constantincident solar power of 1 sun = 1 kW/m2 for a period of only 4 hours, hence 4 ‘effective sun hours’.Locations such as Phoenix (United States), Madrid (Spain), Seoul (South Korea) or Hamburg (Ger-many) have respectively, 2373, 1679, 1387 and 1059 kW h/m2 per year (or equivalently the samenumber of effective hours) for optimally oriented surfaces (facing south and tilted about 10◦ belowthe latitude). In these locations a PV plant of 1000 kW optimally oriented, with PR = 0.75 willproduce 1 779 375; 1 2259 250, 1 040 250 and 793 857 kW h in one year. Table 1.2 shows, for fourwidely varying cities, the average daily input in solar irradiance, equivalent hours of full sunlight(at 1 kW/m2), and average annual yield in kW h from each kW of installed PV, assuming a systemperformance ratio PR = 1. Once multiplied by the actual PR, this average yield is independentof the efficiency or area of the modules, thus demonstrating the simplicity of this method. Theserepresent close to the entire range of sunlight conditions found where most people live. A worldmap with the effective hours on horizontal surface (kW h/m2·year) is presented in Figure 1.3.
Table 1.2 Daily irradiance (kW/m2), equivalent daily “sun hours” of1 sun = 1 kW/m2, and annual energy production per kW of installed PV(assuming PR = 1), all for optimum latitude tilt
City Phoenix Madrid Seoul Hamburg
Daily kW h/m2 6.5 4.6 3.8 2.9Daily “sun hours” 6.5 4.6 3.8 2.9Annual kW h/kW 2372 1679 1387 1058
8 ACHIEVEMENTS AND CHALLENGES OF SOLAR ELECTRICITY FROM PV
80N
60N
40N
20N
0
20S
40S
Tropic of Capricorn
Solar irradianceAnnual average
2200–2500
1900–2200
1600–1900
1300–1600
1000–1300
700–1000
400–700
Tropic of Cancerin kWh/m2
World Solar Energy Map
60S
Figure 1.3 World distribution of the annual solar radiation (kW h/m2) [obtained from www.rise.org.au/info/Applic/Array/image003.jpg] See Plate 1 for the colour figure
The rating of concentrator plants is still a subject of debate. Rating such a plant by summingthe rating of the modules may be impossible as some concentrators do not have modules or theyare too big for indoor measurements. However in other concentrators it might be applicable.
Chapter 22 contains much more detailed methods to calculate the incident sunlight and thePV module output as a function of location, time of day, month of year, etc. or various on-linecalculators are available [5].
1.2.2 Collecting Sunlight: Tilt, Orientation, Tracking and Shading
Potential residential or commercial PV customers often worry “Does my roof have the right slope?Does my house have good solar exposure?” These are indeed important questions for fixed non-tracking arrays. Chapters 19 and 22 address these in more detail. The tilt angle to optimize yearlyproduction for fixed non-tracking arrays is usually some few degrees below the local latitude (thereis more insolation in summertime). However, many people are surprised to find that annual outputis only weakly dependent on tilt, hence the slope of their roof. In fact, nearly any reasonable tilt isgood, and even flat roofs are good for solar below 45◦ latitude. For example, at mid-latitudes, thedifference in annual averaged effective hours varies by 10% as the tilt angle of the modules variesfrom horizontal (0◦) to latitude tilt. Thus, for a home in Washington DC or Madrid or Seoul orWellington, New Zealand, all at very roughly 40◦ latitude, the difference in annual effective hoursbetween a horizontal flat roof (∼4.4 effective hours per day) or a 40◦ tilted roof (∼4.6 h/day) is 5%.The reason is that the sun’s angle at that latitude varies from 27◦ to 72◦ between winter solsticeto summer solstice at this latitude. In winter, a steeper roof will have more output than a shallowslope, and vice versa in summer, so the difference between flat and tilted averages out somewhatduring the year.

WHAT IS PHOTOVOLTAICS? 9
What about orientation? For solar installations in the northern hemisphere, the optimumorientation for fixed non-tracking arrays is true south. But again, it is not very sensitive to minordeviations. An array oriented to the southeast will get more sunlight in the morning and less inthe afternoon. Thus, for an array installed at 40 ◦N latitude with 40◦ tilt and oriented from 45◦east or west of true south, the annual output will be only 6% less compared to the optimum truesouth orientation.
Or, you can install modules on movable supports that “track” the sun. They can track fromE to W (oriented in long N–S linear arrays) called single-axis trackers. They can also be installedon special mounts that track the sun in both its daily E–W motion across the sky and its dailyand seasonal variation in vertical height, called two-axis trackers. Single- and double-axis trackinggenerally increase the sunlight collected by 15–20% and 25–40%, respectively. They typically areonly employed in large, utility-scale ground-mounted arrays. Of course, costs are higher than forfixed-mount arrays.
So, are there any limits to the location for the installation of an array such as on a roof orin a farmer’s field? Yes! The array must not have much shadowing on it, at least not during thepeak production hours from 9 am to 3 pm (solar time). The first obvious reason is that the shadedparts produce negligible energy because although PVs can operate with diffuse light, the amountof energy in this diffuse light is rather small. But there are other effects that are more insidious.Even a slight shadow, such as due to a thin pole or leafy tree, on a corner or edge of a modulecould dramatically reduce the output from the shadowed module and also from the entire array.This is because the modules are connected in series; restricting the flow of current in one cell willrestrict the output of all other cells in that module and thus in all modules connected in it in series.But the use of bypass diodes in series strings reduces these losses to very acceptable values. Thistopic is further analyzed in Chapters 7 and 21. The shadow issue may present a significant limitin cities or towns with lots of trees or tall buildings. A proper preinstallation design will includea shading analysis. Some governments are considering “guaranteed solar access” laws to preventa newly constructed building or neighbor’s trees from shading another roof’s array, but the legalproblem is not trivial.
1.2.3 PV Module and System Costs and Forecasts
Although the important figure of merit for cost is $/kW h, typically $/WP is used. Policy makers andconsumers alike often ask “How much do PV modules cost?” Prices for the same module can differfrom country to country. There are challenges of discussing a unique module price even withina single country such as Germany with a very mature and well-regulated PV market, educatedconsumers and high-volume installers. For example, using average module selling price data inGermany during 2009 [6], the factory gate price for c-Si modules was 2.34 ¤/W. Due to the excessinventory caused by the failure of the Spanish market in 2009 (a fact that will be explained later),the “market” price for c-Si modules was 16% lower. Market prices for less-efficient thin film a-Siand CdTe modules were about another 10% lower, approaching 1.50 ¤/W. Market prices for c-Simodules made in Asia were 19% below the average. This is consistent with a more detailed studyshowing 25% higher costs due to labor for a hypothetical 347 MW c-Si PV module factory in the USor Germany compared with China [7]. This range of module pricing in the most advanced PV marketin the world indicates the difficulty of answering the question “how much does a module cost”.
But what about the cost for complete systems? This is what really determines the priceof solar electricity. We turn to a report analyzing installed costs of 52 000 PV systems (566 MW)installed in the US, mostly in California, from 1998 to 2008 [8]. The average price, before applyingany incentives or state refunds, decreased from $US 10.8/W to $US 7.5/W, a 3.6% annual decrease.

10 ACHIEVEMENTS AND CHALLENGES OF SOLAR ELECTRICITY FROM PV
1
10
100 101 102 103 104
100
y = 28*x^(–0.28) R = 0.99
1985
20012009
1998 2005
Progress ratio = 0.821977
cumulative module production (MW)
mod
ule
pric
e (U
S$/
W)
Figure 1.4 Experience curve for photovoltaics from 1976 until 2009. Straight line is fit indicatingan experience factor of 1 − 2−0.28 = 0.18 or equivalently a progress ratio 2−0.28 = 0.82
As expected, prices decreased as the system size increased (2008 prices): $US 9.2/W for small(2 kW) residential systems versus $US 6.5/W for large (500–750 kW) commercial-scale system.Excluding any taxes, installed prices of residential systems in 2008 was $US 6.1/W in Germany,$US 6.9/W in Japan compared with $US 7.9/W in the US. But prices decreased significantly in2009 as this was being written.
Therefore, any discussion of module or system prices is complicated by numerous factors,including location, size of the system, discounts or incentives, and the PV technology. Furthermore,it is strongly time dependent. Nevertheless, analysts worldwide commonly assume some price inorder to analyze trends and market influences, as in Chapter 2. A common method predict thecost evolution is the so-called learning curve that states the “price” (whatever definition of this isadopted) of the modules is reduced by a factor 2n every time the cumulated production is doubled.Figure 1.4 shows a learning curve for PV modules based on their past prices. It suggests that to reach$US 1/W at the present rate will require an order of magnitude increase in cumulative production.
1.3 PHOTOVOLTAICS TODAY
1.3.1 But First, Some PV History
The history of photovoltaics goes back to the nineteenth century. The first functional, intentionallymade PV device was by Fritts [9] in 1883. He melted Se into a thin sheet on a metal substrateand pressed an Ag-leaf film as the top contact. It was nearly 30 cm2 in area. He noted, “the cur-rent, if not wanted immediately, can be either stored where produced, in storage batteries, . . . ortransmitted a distance and there used.” This man foresaw today’s PV technology and applicationsover a hundred years ago. The modern era of photovoltaics started in 1954 when researchers atBell Labs in the US accidentally discovered that pn junction diodes generated a voltage whenthe room lights were on. Within a year, they had produced a 6% efficient Si pn junction solarcell [10]. In the same year, the group at Wright Patterson Air Force Base in the US publishedresults of a thin film heterojunction solar cell based on Cu2S/CdS also having 6% efficiency [11].A year later, a 6% GaAs pn junction solar cell was reported by RCA Lab in the US [12]. By1960, several key papers by Prince [13], Loferski [14], Rappaport and Wysocki [15], Shockley (a

PHOTOVOLTAICS TODAY 11
Nobel laureate) and Queisser [16], developed the fundamentals of pn junction solar cell operation,including the theoretical relation between bandgap, incident spectrum, temperature, thermodynam-ics, and efficiency. Thin films of CdTe were also producing cells with 6% efficiency [17]. By thistime, the US space program was utilizing Si PV cells for powering satellites. Since space was stillthe primary application for photovoltaics, studies of radiation effects and more radiation-tolerantdevices were made using Li-doped Si [18]. Similar achievements took place in the former USSRwhose Sputnik II satellite in 1957, was already powered with silicon cells. In 1970, a group atthe Ioffe Institute led by Alferov (a Nobel laureate), developed a heteroface GaAlAs/GaAs solarcell [19] which solved one of the main problems that affected GaAs devices and pointed the wayto new device structures. GaAs cells were of interest due to their high efficiency and their resis-tance to the ionizing radiation in outer space. A significant improvement in performance occurringin 1973 was the “violet cell”, having an improved short wavelength response leading to a 30%relative increase in efficiency over state-of-the-art Si cells [20]. GaAs heterostructure cells werealso developed at IBM in the US having 13% efficiency [21]. Finally, in October 1973, the firstworld oil embargo was instituted by the Persian Gulf oil producers. This sent shock waves throughthe industrialized world. Several governments began programs to encourage solar energy, usheringin the modern age of photovoltaics and giving a new sense of urgency to research of photovoltaicsfor terrestrial applications.
An excellent history of the PV early times can be found in a book by John Perlin [22] or,more briefly, in Chapter 1 of the first edition of this book.
In the 1980s, the industry began to mature, as emphasis on manufacturing and costs grew.Manufacturing facilities for producing PV modules from Si wafer pn junction solar cells were builtin the US, Japan, and Europe. New technologies began to move out of government, universityand industrial laboratories, and into precommercialization or “pilot” line production. Companiesattempting to scale up thin film PV technologies such as a-Si and CuInSe2, which had achieved>10% efficiency for small area (∼1 cm2) devices made with carefully controlled laboratory-scaleequipment, found that this was far more complicated than merely scaling the size of the equipment.Unfortunately, by the 1980s most large US semiconductor and oil companies gave up their R&D orpilot-scale efforts in the absence of large infusions of private or government support. One commonresult was the purchase of American companies and their technologies by foreign companies,displacing the center of the PV industrial activity from the US to Japan and Europe and later toChina, currently the world’s largest solar cell producer.
1.3.2 The PV Picture Today
In the last decade (1998–2008) the market of PV modules has multiplied by more than 20. Theexplosive growth transformed PV from a dream for environmentally conscious citizens to a realitythat attracts investors eager to exploit this new Eldorado.
Who is making all the PV modules? Figure 1.5 shows where these modules have beenproduced. The US led the world in production during most of the 1990s (not shown) when Europeand Japan had relatively static manufacturing growth. Then in 1998, progressive and supportivegovernment policies in Germany and in Japan resulted in substantial increases in their production.These policies were driven partly by a strong commitment to CO2 reduction, as prescribed by theKyoto Protocol, and partly to develop PV as an export.
But the big story in PV production since the first edition was published is the rapid riseof Chinese production since 2006. In 2003, none of the top ten manufacturers were from Asia. In2008, three are from China and one from Taiwan. In 2009, China is expected to appear as the topmanufacturing location.

12 ACHIEVEMENTS AND CHALLENGES OF SOLAR ELECTRICITY FROM PV
10
100
1000
1996 1998 2000 2002 2004 2006 2008
TotalJapanEuropeUSROW
MW
of P
V s
olar
mod
ules
pro
duce
d
Year
Figure 1.5 Production of PV modules by country or region (ROW = rest of world, mostly Chinaand Taiwan, Europe is mainly Germany and Spain)
101 100
Japan
% produced
% installed
Germany
Spain
ROE
US
S. Korea
China
ROW
16
19
3
5
7
2
33
17
4
27
45
9
6
5
1
3
% PV produced or installed in 2008
Figure 1.6 Percentage of PV cells/modules produced [23] and installed [24] in 2008 by countryor region. Note the logarithmic scale. ROE = rest of Europe, ROW = rest of world (mostly Taiwanand India.). Total installed = 5500 MW; total produced = 7900
Where are the modules being installed? Figure 1.6 shows the geopolitical breakdown for2008 including the top four producers – China, Germany, Japan, and the US – and the top fourinstallers – Spain, Germany, US, and South Korea. Note that Spain installed 15 times more PVthan they produced and China produced 30 times more than they installed. The US was nearlybalanced in terms of imports and exports (6–7%). In 2008, Spain became the top destination forPV modules for the first time, overtaking Germany. Most of these modules were installed in largecentralized plants >10 MW such as the one presented Figure 1.10. But the brief two years ofSpanish leadership in PV installation, created by favorable feed-in tariff (FIT) legislation, ended in2009 due to restrictive modifications of the law.
The difference between production and installation for 2008 has been variously quoted as1500–2500 MW. This may represent a double counting of production caused by including both thecells produced in one factory and delivered to a second one for making into modules, and alsocounting the modules made in the second factory. Some believe that this discrepancy can be caused

PHOTOVOLTAICS TODAY 13
by a surplus in inventory of unsold modules, but this is doubtful because the module prices werehigh throughout 2008 and the market experienced a shortage. Prices only decreased significantlyin 2009, when the Spanish markets collapsed.
1.3.3 The Crucial Role of National Policies
The real origins of today’s surging PV growth started in the mid 1990s when residential scalegrid-connected applications in Europe and Japan began to grow rapidly, primarily owing to stronggovernment support. Until then, the primary destination for a PV module was in an off-grid appli-cation, whether a rural home in developing country, a water pump for cattle or people, a vacationcabin in the mountains, or a radio transmission antenna. The relative change in dominance of thethree main PV applications – off-grid, grid-connected residential and commercial, and large utilityscale – is shown in Table 1.3. There are two types of incentive programs responsible for the suc-cess of grid-connected residential or commercial applications. One approach, pioneered in Japanand later copied by many US states, provides home or business owners a rebate from the govern-ment or their electric utility agency for 10–50% of the PV system cost. Then, their electric billis determined by the utility using “net metering” where the customer pays only the net differencebetween what they used and what they generated. Thus, they get a reduction in the initial priceof the system, and their PV electricity is valued at the same rate as their utility electricity. Thisinitiated the new market of grid-connected residential and commercial buildings, PV’s first big burstin growth, beginning around 1995. Interestingly, government support of photovoltaics in Japan hasbeen decreasing while the market for PV homes has continued to show a good growth rate. Thesecond approach, pioneered by Germany, paid the home or business owners for the electricity theyfeed into the public electric grid at a rate that is several times greater than the rate that they buyelectricity from the grid. Additionally, German banks provided generous loans for purchasing theinstallation. But there is no government rebate to reduce initial cost. This has resulted in solararrays being installed on German houses, barns, commercial roofs, government buildings, schools,dairy farms, abandoned airports, and parking garages – in short, any place they can face the sunand still be connected to the grid. This concept, called either a feed-in tariff (FIT) or productiontax credit (PTC), has been implemented in Spain, the Netherlands, South Korea, Canada, recentlyin Japan and soon will be in a few municipalities or states in the US. The German FIT initiatedthe second great wave in grid-connected PV growth in the mid 2000s. Chapter 2 discusses theseand other funding policies to promote PV, including solar renewable energy certificates (SRECs)and mandated renewable energy portfolios (REPs). And the Spanish FIT resulted in the explosivegrowth of utility scale PV projects in 2007–2008. While many people, especially PV engineersand scientists, might think otherwise, the rapid growth of grid-connected PV, hence all PV, is duemore to innovations in policy than to advances in technology.
Table 1.3 Approximate percentages (±20% relative) of different types ofapplication installed
Year Off-grid (%) Grid-connected Grid-connected Total installedresidential or utility scale (%) each year
commercial (%) (MW)
1996 95 5 <1 892000 60 40 1 2882004 30 68 2 9552008 10 35 55 5600

14 ACHIEVEMENTS AND CHALLENGES OF SOLAR ELECTRICITY FROM PV
Table 1.3 shows very approximate percentages (±20% relative) of each type of applicationinstalled in that year. Off-grid includes single module rural homes, cabins, water pumping, dieselhybrids, and remote communication transmitters. Grid-connected residential and commercial istypically roof-mounted arrays <200 KW in 1996 and 2000, but maybe <1000 kW in 2004 and 2008.Anything larger defined as utility scale. Data and definitions vary from a variety of sources [25].
The importance of the Spanish market in 2007–2008 (3.4 GWp in total) and its sudden col-lapse deserves some reflection. The subject is very well explained in Chapter 2, but we want to addhere some additional thoughts. The FIT, issued by a Royal Decree, guaranteed a generous price (ofabout 43–46 ¤cents/kW h in 2008) over 25 years for the electricity privately produced and sold tothe grid by a PV installation, finished and registered in that year. Three Royal Decrees were neces-sary to permit the market to expand. The first Royal Decree limited FIT payments to generators ofless than 5 kW. Some entrepreneurs circumvented this limitation by gathering many small investorsand making bigger plants, called solar farms, where each investor owed 5 kW. A second RoyalDecree in 2004 lifted the power limitation per owner to 100 kW. The reaction of entrepreneurs wasto register dozens of 100 kW installations to effectively create MW plants. Clearly there was higherprofitability in larger installations. Finally in 2008 any restriction on size was removed, triggeringa frantic activity to build big plants in Spain, so that by the end of 2008 they had built 40 of the50 biggest plants in the world [26], totaling 2.6 GW in only one year, including the world’s biggestPV installation at Olmedilla de Alarcon of 60 MW. No other energy technology can expand soquickly. A 1 GW nuclear plant with about five times more capacity factor (equivalent to 5 GW PVplants) would require at least 10 years to be built, so utility scale PV can be built five times faster.
The trend to build big plants has continued and by early 2010 there were 15 plants withpower above 25 MW: 8 in Spain, 5 in Germany, 1 in Portugal and 1 in the US [26]. There are1000 plants in the world of 1.3 MW or bigger totaling a power of 4.5 GW out of the total 14.7 GWinstalled. Thus, the Spanish FIT was responsible for the third wave of steep growth, namely thatof utility scale projects after 2006.
Unfortunately, the unexpected success of this program resulted in overwhelming the fundswhich had been allocated, requiring a significant reduction in scale. The collapse of this market in2009 reportedly resulted in the firing of 25 000 of the 75 000 people working in PV in Spain. Itwas caused by the unexpectedly strong and fast growth of the market and downturn in the worldeconomy, neither of which was foreseen by the Government. The present regulation plans for amarket of only 500 MW in 2009, divided between installations smaller than 20 KW (26.7 MW) andlarger than 20 kW (241.3 MW) and the rest in ground installations. The offer for ground installationshas largely exhausted the quota by several times (the excess being on a waiting list) while the quotais still open for roof-mounted plants. To date, the FIT regulations have been the most successfulpolicy to expand PV. They explain why Europe (where the climatic conditions are not the best)leads the world in PV installation, with over 70% of the world’s total cumulative installed PVpower. Some countries are reluctant to adopt a FIT program, sometimes because they consider it anunacceptable intrusion into the market laws.Yet the FIT allows the competition between various PVtechnologies (Si wafer, thin films, concentrators), installation strategies (roof-top, ground mount,BIPV) and companies. A well-designed FIT must decrease with time (the time when the installationis commissioned, not the time years later when the kW h are sold) in a predictable way to forcethe industry to reduce their costs and hence their selling price.
1.3.4 Grid Parity: The Ultimate Goal for PV
The ultimate goal for PV is to reach grid parity without subsidies. The relevant parameter toevaluate the long-term cost of any energy source cost is the levelized cost of energy (LCOE).Calculation of LCOE ($/kW h) for PV is complicated; it includes the output of the system overits lifetime (efficiency, solar irradiance and temperature at that location, tilt angle, system losses,
PHOTOVOLTAICS TODAY 15
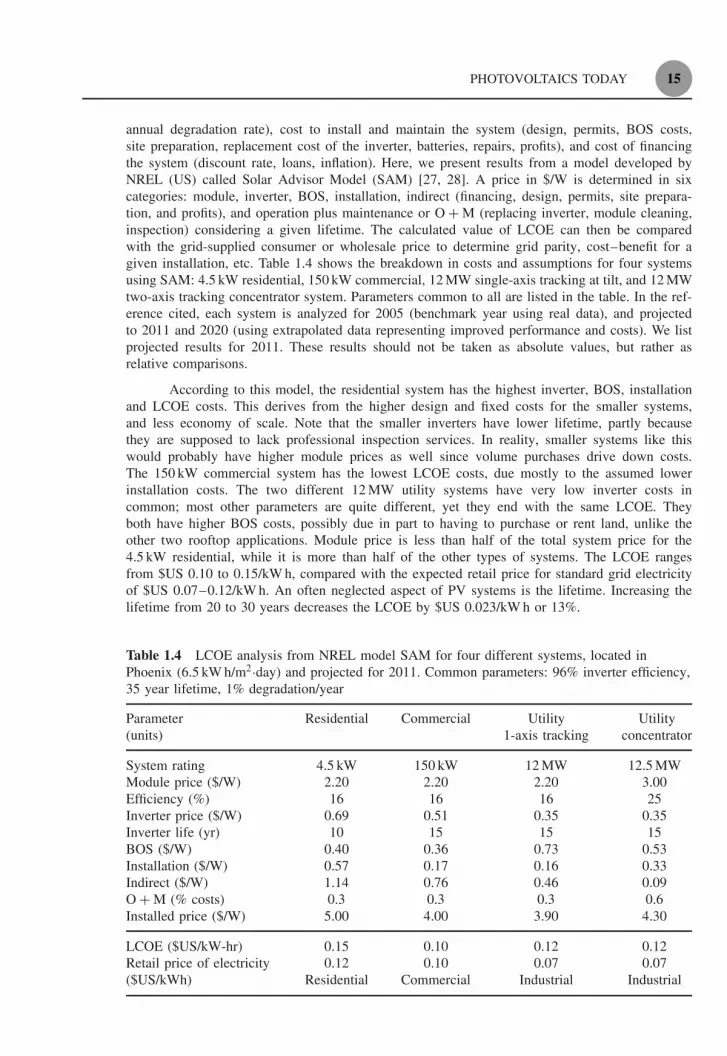
annual degradation rate), cost to install and maintain the system (design, permits, BOS costs,site preparation, replacement cost of the inverter, batteries, repairs, profits), and cost of financingthe system (discount rate, loans, inflation). Here, we present results from a model developed byNREL (US) called Solar Advisor Model (SAM) [27, 28]. A price in $/W is determined in sixcategories: module, inverter, BOS, installation, indirect (financing, design, permits, site prepara-tion, and profits), and operation plus maintenance or O + M (replacing inverter, module cleaning,inspection) considering a given lifetime. The calculated value of LCOE can then be comparedwith the grid-supplied consumer or wholesale price to determine grid parity, cost–benefit for agiven installation, etc. Table 1.4 shows the breakdown in costs and assumptions for four systemsusing SAM: 4.5 kW residential, 150 kW commercial, 12 MW single-axis tracking at tilt, and 12 MWtwo-axis tracking concentrator system. Parameters common to all are listed in the table. In the ref-erence cited, each system is analyzed for 2005 (benchmark year using real data), and projectedto 2011 and 2020 (using extrapolated data representing improved performance and costs). We listprojected results for 2011. These results should not be taken as absolute values, but rather asrelative comparisons.
According to this model, the residential system has the highest inverter, BOS, installationand LCOE costs. This derives from the higher design and fixed costs for the smaller systems,and less economy of scale. Note that the smaller inverters have lower lifetime, partly becausethey are supposed to lack professional inspection services. In reality, smaller systems like thiswould probably have higher module prices as well since volume purchases drive down costs.The 150 kW commercial system has the lowest LCOE costs, due mostly to the assumed lowerinstallation costs. The two different 12 MW utility systems have very low inverter costs incommon; most other parameters are quite different, yet they end with the same LCOE. Theyboth have higher BOS costs, possibly due in part to having to purchase or rent land, unlike theother two rooftop applications. Module price is less than half of the total system price for the4.5 kW residential, while it is more than half of the other types of systems. The LCOE rangesfrom $US 0.10 to 0.15/kW h, compared with the expected retail price for standard grid electricityof $US 0.07–0.12/kW h. An often neglected aspect of PV systems is the lifetime. Increasing thelifetime from 20 to 30 years decreases the LCOE by $US 0.023/kW h or 13%.
Table 1.4 LCOE analysis from NREL model SAM for four different systems, located inPhoenix (6.5 kW h/m2·day) and projected for 2011. Common parameters: 96% inverter efficiency,35 year lifetime, 1% degradation/year
Parameter Residential Commercial Utility Utility(units) 1-axis tracking concentrator
System rating 4.5 kW 150 kW 12 MW 12.5 MWModule price ($/W) 2.20 2.20 2.20 3.00Efficiency (%) 16 16 16 25Inverter price ($/W) 0.69 0.51 0.35 0.35Inverter life (yr) 10 15 15 15BOS ($/W) 0.40 0.36 0.73 0.53Installation ($/W) 0.57 0.17 0.16 0.33Indirect ($/W) 1.14 0.76 0.46 0.09O + M (% costs) 0.3 0.3 0.3 0.6Installed price ($/W) 5.00 4.00 3.90 4.30
LCOE ($US/kW-hr) 0.15 0.10 0.12 0.12Retail price of electricity 0.12 0.10 0.07 0.07($US/kWh) Residential Commercial Industrial Industrial

16 ACHIEVEMENTS AND CHALLENGES OF SOLAR ELECTRICITY FROM PV
Compared with the retail electric rates for the US shown at the bottom, the LCOE costof a PV system in a very sunny location is very close to grid parity, in particular for the so-called commercial applications (roofs of factories or supermarkets). This is why in the US there isincreasing interest in this type of system. Of course, such predictive calculations are only as validas their assumptions, which do seem reasonable.
There is considerable uncertainty in future electric rates due to possible environmentallydriven costs (carbon tax) and the need for substantial reinvestment in new transmission and grid con-trol systems (which will probably be paid for by customers through higher rates). Thus, predictingthe price of either PV or conventional electricity is problematic.
Figure 1.7 shows the dependence of the LCOE on available sunshine (irradiance in annualkW h/m2) for module prices of $US 1 or 2/W. The system was assumed to be a 2.5 kW residentialarray with a 30 year mortgage at 6% and 30 year lifetime with 1% annual degradation. The otherfixed costs were taken from Table 1.4, and amounted to $US 2.80/W. The module price of $US 2/Wis close to today’s selling price, and $US 1/W represents what many believe is achievable withreasonable advances in today’s technologies in the near future. The symbols indicate the averageresidential electricity rate for various cities indexed by their annual irradiance. Already in 2009,PV electricity prices matched a few markets in the US and Europe that have relatively high-priceelectricity and/or high solar irradiation such as Italy, Hawaii, New York and California (San Diego,not shown), when determined as the LCOE. Similar analysis has been published using differentassumptions (system cost of $EU 3/W) but showing similar trends and conclusions [7]. In reality,the cost of conventional electricity is presently less than the PV LCOE for most cities but the gap isnarrowing. The LCOE cost would be less for a larger system as in Table 1.4 due to lower installationcosts. This graph shows that grid parity is a complex relation between geographic location, price ofelectricity, and price of PV system (related to size of PV array). Note that increasing the incidentsunlight, hence module output energy, by a factor of two reduces the LCOE by the exact sameamount, thus having significantly greater impact than decreasing the price by a factor of 2.
In order to reduce the LCOE, it is acknowledged that efficiency must increase and cost mustdecrease. But what is their relative contribution? Where should we put our efforts? Figure 1.8(a)presents the dependence of LCOE on module efficiency for module costs of $US 1 and 2/W (again)for a 2.5 kW system in two US locations, sunny hot Phoenix or temperate coastal Philadelphia,
5
10
15
20
25
30
35
40
45
1200800 1600 2000 2400
LCOE PV=$1/WLCOE PV=$2/WPHOENIX, USROME, ITMEXICO CITYHAWAII, USMADRID, ESBERLIN, DENEW YORK, USTOKYO, JP
PV
LC
OE
or
resi
dent
ial r
etai
l pric
e(U
S c
ents
/kW
hr)
incident solar kWhr/m2
LONDON, UKLOS ANGELES, US
Figure 1.7 LCOE and cost of residential electricity versus average annual incident irradiance.LCOE calculated using SAM model parameters explained in the text assuming a 2.5 kW array with$US 1 or 2/W module cost

THE GREAT CHALLENGE 17
5
10
15
20
25
6 8 10 12 14 16 18 20
$1/Watt$2/Watt$1/Watt$2/Watt
LCO
E (
US
cen
ts/k
W-h
r)
Efficiency (%)
PHNX
PHIL
0.2
0.4
0.6
0.8
1
1.2
1.4
1.6
6 8 10 12 14 16 18 20
BOS (w/o inverter)InstallationIndirect
Cos
ts (
US
$/W
)
Efficiency (%)
inverter=$0.69/W
(a) (b)
Figure 1.8 (a) Calculated impact of efficiency and module cost on LCOE for Phoenix (sunny,2370 kW h/m2/yr, solid lines) and Philadelphia (temperate, 1680 kW h/m2/yr, dashed lines) for2.5 kW systems at latitude tilt. (b) Fixed costs as function of efficiency. Indirect for $US 2/Wmodule. A 30 year lifetime is assumed in all cases. Other assumptions are described in the text orcaption for Figure 1.7
calculated using SAM with the same parameters as in Figure 1.7. (Philadelphia has comparablesolar irradiance to Shanghai, Melbourne, New York or Madrid.)
As efficiency increases, the module area and hence area-related costs decrease. In this study,the number of 1 m2 modules decreased from 41 to 12 as efficiency increased from 6 to 20%. Thearea-related costs were: BOS = $64/m2, installation $91/m2 and indirect $180/m2 as derived fromTable 1.4 for the 2011 residential case. The 2.5 kW inverter cost $1725 ($0.69/W). For a factorof 2 decrease in module cost, the LCOE decreases by 12% (at 6% module efficiency) to 22% (at20% module efficiency), independent of location. For a factor of 2 increase in efficiency (from 10to 20%), the LCOE decreases by ∼20%, independent of location. For a factor of two decrease inmodule cost (at 16% efficiency), the LCOE decreases by ∼25%, independent of location. Thusboth price and efficiency have comparable impact on LCOE. This weak correlation between eithermodule cost and efficiency with LCOE might surprise some readers, but this just indicates theimportance of area-related and fixed costs. The indirect costs are much greater than either theBOS or installation. This could be alleviated with lower interest rates for PV projects, and shortermortgages. Figure 1.8(b) shows how the area related costs decrease with efficiency. Decreases inboth LCOE and area related costs are steeper at low efficiency, becoming less sensitive at higherefficiency, suggesting the relatively greater impact of increasing the efficiency of low-efficiencythin film modules (rather than lowering their price) compared with high-efficiency Si modules.Together, these figures indicate the importance of efficiency and module cost as a driver to lowerLCOE, but also the impact of reducing fixed or area-related costs as well, which are often neglectedby research and development funding agencies. Finance charges must be minimized.
1.4 THE GREAT CHALLENGE
In this section, we discuss the requirements and limitations to very large-scale PV energy productionin terms of the amount of land and raw materials needed, the environmental impact, the net energybalance, the reliability, and the readiness of manufacturing capacity.

18 ACHIEVEMENTS AND CHALLENGES OF SOLAR ELECTRICITY FROM PV
First, what is size of the task? Estimating the world’s demand for electricity in 2030 or2050 is complicated by many assumptions. Will a larger fraction of our primary energy be shiftedfrom chemical and thermal to electric (i.e. electric cars)? How large a role will efficiency andsmart growth play in decreasing demand? How large a role will population and economic growthin developed versus developing countries play in increasing demand?
The 2007 Nobel Prize winning organization UN Intergovernmental Panel on Climate Change(UN-IPCC) [29] estimates the world will need the equivalent of 32 000 terawatt hours (1 TW h =109 kW h = 1012 W h) of electrical energy by 2030, but efficiency improvements might reduce this to22 000 TW h. Analysis by their Mitigation Working Group III on how this can be best accomplishedto minimize the cost per ton of avoided CO2 concludes that PV could only meet about ∼1–2%of this demand (∼150–300 TW h), limited largely by cost not technology or resource availability.This would be mostly to meet demand from rural electrification in developing countries. However,other bodies set higher targets for PV. The European Photovoltaic Industry Association (EPIA)predicts that PV could provide 12% of Europe’s energy by 2020. The International Energy Agencyanticipates the PV could provide over 11% of the world’s electricity by 2050 [30]. Californiahas a mandate to produce 33% of their electricity by renewable energy by 2020. Originally, PVwas expected to contribute only about 10% relative (about 3.2% total) but due to recent PV pricedecreases,2 the relative fraction of PV has been increased to 40% (about 15% total). Thus, Europeand California have similar expectations for PV, and are consistent with analysis of the ability ofa well-regulated grid, without storage, to accept a variable energy source such as PV sets an upperlimit of 10–20% by 2030 [31]. For instance, in Spain PV already provides about 2% of the annualdemand, but if we add wind energy, the total intermittent energy is actually 14%.
How can we calculate how many GW (or more precisely GWp) of installed PV would berequired to produce a TW h of electricity?
In fuel power plants the concept of capacity factor (CF) is widely used. It is the ratioof the energy actually produced to the theoretical maximum energy that the plant could producein one year (typically equal to the nameplate power rating times 8760 h). Thus, a 1 GW powerplant operating at full capacity for half the year (or at half capacity for the entire year) hasa CF = 50%, and would produce 1 GW × 8760 h/yr × 0.50 = 4380 GW h/yr. The CF is usuallybelow unity not only because the plants might need to stop for maintenance (the case of nuclearplants) but also because the management of the electric grid requires some plants to idle forcertain periods.
In a PV plant CF is calculated as the effective sun hours (see Section 1.2.1) times perfor-mance ratio divided by the total number of hours in the year (even though the sun only shines50% of the year on any location on earth). The CF for PV generators ranges from 0.08 (Hamburg,fixed panels) to 0.26 (Albuquerque, sun tracking3), so we will use 0.15 as an average. Thus, toprovide 300 TW h in 2030, we would need 230 GW of installed PV capacity, or an installation rateof 11.6 GW per year for the next 20 years. In fact, the world produced about 7 GW in 2009, and
2 In 2008, with installed system costs of $US7/W or $US0.30/kW h, it was expected most of California’s 3.2%PV demand would be large, centralized power plants. By 2009, system costs fell to $US3.70/W or $US0.17/kW hdue to availability of lower-cost thin film modules. Combined with land use permitting and transmission accessdifficulties for the large PV power plants, distributed small-scale PV looked more attractive to provide much ofthe 15% demand (from Garrett Hering in Photon International December 2009, 12–14.)3 Sun tracking increases the CF. The number of equivalent hours in a sun-facing plane (called a two-axis tracker)increases by about 40% with respect to the fixed optimally oriented module. This is discussed further in Chapters 19and 22.

THE GREAT CHALLENGE 19
104
1990 2000 2010 2020 2030 2040 2050 2060
Pessimistic
Probable
Optimistic
High LCOE
Quick Learning
Real
RIGES
Tot
al in
stal
led
pow
er (
GW
p)
Year
103
102
101
100
10–1
10–2
Figure 1.9 Forecast of the cumulative global PV installed power by year. (see [32] for details).“Real” represents the actual installed power (from P. Maycock, Photovoltaic News , 19(3) 1 (2000),more recent data from the Photon International yearly reports in the March issue). The dots labeled“RIGES” are the goals in Reference [33]
expects around 10–12 GW in 2010. So meeting the relatively low expectations of the UN-IPCCfor PV will be easy, requiring no growth or scale-up at all.
In 2001 one of us published a paper [32] in which a differential equation for the evolutionof the yearly market was formed by coupling the learning curve (Figure 1.4) and the demandelasticity (the relative reduction of price in a certain year divided by the relative increase of theyearly market). The price evolution was deduced as well as the cumulative sales for every year. Forthe initial forecasting period, the model parameters were extracted from past experience in yearlymarkets and prizes. The cumulative sales, approximately equating the total installed PV power, arerepresented in Figure 1.9 for several parameter choices.
The three curves: “optimistic” (developed countries are willing to spend 0.1% of their GDPon higher cost PV electricity), “probable” (spending 0.05%), and “pessimistic” (spending 0.025%)show a rapid increase followed by a slowing in growth as markets saturate compared with a givenprice of electricity. Note the striking coincidence between the actual PV installations up through2008 (labeled “real” in the figure) and the “optimistic” forecast predicted in 2001. This coincidencegives credibility to the other implications predicted by this model. For 2030 this model predicted1.6% of the total demand of 22 000 TW h forecasted by the IPCC under the hypothesis considered“probable” in 2001. This is not very different from the modest contribution of 1.4% assumed by theIPCC. But if we look at the real installations trend, which follows closely the “optimistic” forecast,the result is that by 2030 PV will be supplying the 4.4% of the demand. This is more than threetimes the prediction of the IPCC, but still modest.
So, let us assume that PV is to supply 12% (2,640 TW h) of the world’s electricity by2030, hence we would need to install on average 100 GW (∼=2640/(365 × 24 × 0.15 × 20)) peryear (a nice round number) for the next 20 years. In fact a constant average annual production iscompletely unrealistic, but it serves to give the scale of the task. Some studies assume producing

20 ACHIEVEMENTS AND CHALLENGES OF SOLAR ELECTRICITY FROM PV
20–30 GW/yr of PV until 2020 then ramping up an order of magnitude each decade until 2050 [34]while others see rapid initial growth followed by slowing as the installed capacity reaches its limit.
The paper which developed the model in Figure 1.9 stated in 2001:
First we predict several years of explosive market growth. . . . But this period cannot last toolong. Not more than a decade. If it does, the capital involved will become excessive. Powerfulvoices will cease to consider PV as a curiosity and will question cost effectiveness. Othervoices, not less powerful, will support PV. The equilibrium will determine subsequent growth.This equilibrium will induce a slower market growth, but at levels that are no longer negligible,at least in terms of business volume, but probably not enough for pollution abatement. Pricedecrease will continue, but slowly. For the next half-century they will be not competitive withcommon electricity unless some of the following facts happen.
(a) Electricity prices rise.(b) Commercial schemes substantially reduce commercialization, installation and financing
costs.(c) New inventions of lower initial costs or with more cost reducing potential appear.
As the paper predicted, PV has become a substantial business (about ¤50 billion in 2008) butsociety has started to question its cost effectiveness, especially in view of the worldwide financialproblems of 2009. For instance, there was the dramatic reduction of public support in Spain in2009 discussed above, and less dramatic reduction in Germany in 2010, the world’s two mostactive markets in 2008.
But let us examine now whether the conditions for competitiveness in the second part ofthe statement are being fulfilled or not. The model, intended to be simple, considers PV competingwith only the wholesale price of the electricity, but if the retail price is taken into account instead,this would allow for a substantial growth within the first half of the century. The case is consideredin the curve labeled “High LCOE”. With this choice of parameters (consult the paper for details) avertical asymptote appears around 2040 (assuming a module price of $1.25/Wp). Since the actualtrend is following the curve “optimistic”, according to the model, the asymptote will appear beforethis date, maybe towards 2025. Thus, if a contract offered by the regional electric power provideris based on the retail price of electricity (essentially net metering), including the price paid to PVpower plants, condition (a) would be automatically fulfilled.
The steep asymptotic increase in “High LCOE” is just an artifact of the model caused bythe assumption that the electricity market is infinite. This is valid only if one knows when theLCOE “tipping point” is reached, not for studying the subsequent growth. In reality this asymptotewill appear as a surge in the installations which will inevitably saturate and slow when sales to thenew market sector are exhausted.
But, in addition, the model assumed that the cost of a PV installation was distributed inequal thirds, one for the module, one for the BOS and one for the commercialization, installationand financing. This is a reasonable assumption for distributed small home markets (prevalent whenthe model was developed) but the recent development of big power plants has drastically reducedthe commercialization costs, leading to a situation where the plant cost is about twice (and notthree times) the module’s cost, according to the SAM model presented in Table 1.4. This fulfillscondition (b) and brings the date of the surge in installations even closer.
Thus, what the model explains is what is already anticipated by many analysts, including thestudy presented in Figure 1.8 for a system price of $US 2/Wp. This price is already being offeredin Spain for big ground-mounted PV power plants, and we think that expected surge will take placewithin the next five years in several countries (or US States) where the combination of insolationand the electricity retail price are high enough to reach grid parity with the retail electricity price.

THE GREAT CHALLENGE 21
Note that the retail electricity price includes the cost of generation as well as transmission,distribution and commercialization; therefore, it is only fairly applicable to homes and commercialPV plants. Utility-scale PV power plants should compete with the much lower wholesale price ofgeneration. The application of the retail price to big plants is dependent on political decisions thatwaive the cost of the distribution for the big PV producers. Yet the application of FIT incentivesuggests that this policy can be adopted in many countries.
Thus we have justified why the goal of meeting 12% of the world’s electric demand by2020 or 2030 with PV is not just wishful thinking, at least from the point of view of reachingreasonable prices.
But this is not enough. At the end of this century, many analysts expect solar energy toprovide a large part of the demand, i.e. about 60% of the energy demand (not only electricity) [34].This requires fulfilling condition (c), a technological breakthrough with a faster learning curve (curvelabeled “quick learning”). It might happen at any time (2015 is assumed in the figure). It is possiblethat it is already happening. Consider the recent success of First Solar, a thin film manufacturer,who became the biggest solar cell producer in the world in 2009. Maybe the breakthrough willappear in 5–10 years with the concentrator systems intended to exploit the ultra-high-efficiency(over 40%) MJ solar cells. Or maybe, at an even later moment, the exploitation of novel conceptsfor a higher efficiency will permit this faster learning curve and therefore dominate the wholesaleproduction of electricity. Certainly the so-called third-generation concepts aim at this. This is whywe said that PV has more technological options than concentrating solar thermal electricity and wequalified PV as a winning option.
But this high penetration (>20%) will only be possible if some cheap and efficient procedurefor electricity storage is developed. Advanced PV and storage have to be among the leading tasksfor all this century for scientists and technologists.
Let us concentrate now on other constraints and challenges associated with our immediate12% goal implying the installation of 100 GWp per year, on average, during the next 20 years.
1.4.1 How Much Land Is Needed?
Estimates of household electricity usage from various sources for the US, Japan and Europe indicateabout 5 kW h/person/day, or 20 kW h/day per family of four. With a CF of 0.15 this demand can besatisfied with a PV installation 20/(24 × 0.15) = 5.5 kWp. For a rated module efficiency (at STC) of15% (150 Wp/m2) this requires an area of 5500/150 = 37 m2 of modules. There are many properlyoriented roofs (with a lot of flexibility in the tilt and orientation, but generally facing southwardsif in the northern hemisphere) with 37 m2 of well-oriented roof available (see Chapter 23 forarchitectural integration). In fact, many roofs are larger, and many homes have sunny areas of thissize around them, so it is possible for a family of four, with all the conveniences of a typicalmodern home, to provide all their power averaged over a year from PV modules on their house oron racks on their yard.
Let us assume that of the 100 GW we must fabricate each year 25 GWp are grid-connectedhomes of 5 kWp. This will imply installing 5 million residential generators per year. This is certainlya challenge, but is not impossible if we consider that the car industry produces more than 60 millioncars per year. Neither is the availability of capital a problem, if the business is profitable.
Perhaps it is illustrative to know that the 125 more densely populated towns in the world [35],(whose density of population ranks from 26 650 people/km2 in Mumbai to 1550 in Denver) witha total of 619 million inhabitants occupy an area of 124 000 km2. With the same daily electricityconsumption of 5 kW h per person and the same capacity factor of 0.15, the area of 15% efficientmodules required is 129 000 km2, practically the same as the total town area. Obviously in Mumbai

22 ACHIEVEMENTS AND CHALLENGES OF SOLAR ELECTRICITY FROM PV
there will not be enough room for this, but in Denver it will be easy. There are many more townsless densely populated. We think this clarifies that space is not a limitation for generating a sizeablefraction of the electricity we use with PV, or for meeting our goal of 25 GWp per year.
In the first edition we calculated how much land it would take to replace a 1000 MW coalor nuclear power plant. The answer was 60 km2 (or 24 square miles). This is a square 8 km (or 5miles) on a side. For the same electricity production, this is equivalent to the area for coal miningduring a coal-powered plant’s life cycle, if it is surface mining, or three times the area for a nuclearplant, counting the uranium mining area [36].
But building this size of PV plant is not a solution adopted by PV investors for the moment.Actually the 34 biggest plants built in the world comprise 1010 MW, occupying an area similarto the one calculated above. The size of these plants ranges between the 60 MW of the Olmedilla(Spain) plant to the 19.4 MW of the Helmeringen (Germany) plant. Figure 1.10 is a picture ofthe 10 MW plant at Jerez de los Caballeros (Spain) showing how PV is well integrated in theenvironment, permitting for instance, cattle raising. The PV “trees” are about the same size as theoak trees around, but collect solar energy about 100 times more effectively.
In any case we must not hide the fact that the annual electric energy (MW h) produced bythe 1000 MW plant (or ensemble of plants) is less than the one powered by coal or nuclear energybecause of the smaller capacity factor (0.15 in our example compared with at least 0.5 for thefuel plants).
Finally, how much land would be needed for PV to supply the 12% of worldwide demand(2 TW) we want for 2030. Others have analyzed very large-scale PV (VLS-PV) at seven extremelysunny, arid desert locations worldwide, roughly one per major geopolitical land area [37]. In thosedeserts, they would produce about 50% more energy per area than our typical, mid-latitude arrayanalyzed above, so 100 MW requires approximately 1.7 km2 of barren land. Scaling these areas fromthe VLS-PV study to our hypothetical 2 TW yields an area of 34 000 km2, or about 5000 km2 ineach of the seven deserts. Certainly, an area of 70 × 70 km2 (43 × 43 miles) could be found in thesedeserts where the installation of PV arrays would be accommodated without significant disruptionof the natural surroundings. (We point out again that PV does not require water for its operation.)
Figure 1.10 The Jerez de los Caballeros 10 MW PV plant. Reproduced by permission of GuascorSolar SAW

THE GREAT CHALLENGE 23
But following the actual trend, the construction of 1000 plants per year of average sizeof 75 MW will lead to the 75 GW that, added to the 25 GW in buildings, will complete our goalof 100 GW per year. This will be a challenge, but not impossible if the business is profitable.Remember that in the last 2–3 years 1000 plants of average size 4.5 MW have been built (totaling4.5 GW) and the biggest are approaching the 75 MW size.
1.4.2 Raw Materials Availability
Are there sufficient raw materials on Earth to make enough PV modules to provide a significantfraction of our energy in the future? This is an important question, because if the answer is “no”,then PV will be ultimately relegated to a minor role.
The main material used today to make solar cells is silicon. Being the second most abundantmaterial in the Earth’s crust (after the oxygen), there is not a foreseeable shortage. High-purityquartzite (SiO2) ore is used to produce Si today. The present production of Si is about 50 times morethan needed for PV use and can be easily increased, so that producing 12% of the electricity withPV, which implies an increase of the cell production by at most, 15 times, can be easily supplied.
But for non-Si based cells, this is a very complex question, requiring decisions about howmuch of a given element is economically recoverable and at what rate (ton/yr or equivalentlyconverted to GW/yr of PV). Several studies [38–40] are in general agreement that the potentiallylimiting materials for PV are Ag for contacts to Si cells (but Ag is not essential), In for Cu(InGa)Se2,Te for CdTe, and Ge for Ge substrates commonly used for III–V concentrators cells or a-SiGe cells.In and Te metals are not actually mined, but are dilute by-products of other metal refining; i.e. Tefrom Cu ore; In and Ge from Zn ore and also from ashes in the combustion of coal. Conclusionsdiffer significantly as do the assumptions, but generally these studies find that solar cells based onIn or Te could provide a few percent of the world’s future electricity without significant reductionsin utilization (i.e. thickness), thus potentially meeting the entire, although trivial, requirement forPV assigned by the IPCC. Another view suggests that historical production rates of In and Tecould easily provide 20 GW/yr [39], thus meeting about 20% of our hypothetical PV requirementof 100 GW/yr with CdTe and Cu(InGa)Se2. This does not mean they should not be considered,since it is unlikely a single PV technology will dominate. Supplies of In and Te can enable multi-billion dollar annual PV industries4. Reducing the cell thickness, recycling of waste and expiredmodules, and increasing efficiency in manufacturing will reduce the total demand for a given rawmaterial and extend its ability to meet these targets. These are all promising and active areasof research.
As for III–V/Ge concentrator devices, operating at 500–1000×, there are not major prob-lems in producing 100 GW/year [41]. The main limitation comes from the Ge, and from plastic forlenses. The use of hybrid glass–silicone lenses, beginning to be common today, would remove thelimitation on plastics (because they use a very thin layer of silicone). As for the Ge, it is probablethat enough can be found in other sources, but it could be recycled or substituted by Si.
1.4.3 Is Photovoltaics a Clean Green Technology?
Would large-scale PV manufacturing and deployment degrade the environment, although in a dif-ferent way from conventional energy production?
4 There are also competing technological uses to consider. For example, Indium usage has increased substantiallyin recent years due to the need for transparent conductive indium tin oxide (ITO) layers in flat panel displays.

24 ACHIEVEMENTS AND CHALLENGES OF SOLAR ELECTRICITY FROM PV
One of the most valuable characteristics of photovoltaics is its well-deserved image asan environmentally clean and “green” technology, resulting from the cleaner operation of a PVelectricity generator compared with a fossil-fuel or nuclear-fired generator. But this must alsoextend to the manufacturing process itself as well as the recycling of discarded modules. Let it bestated at the beginning that the present Si-based PV technology which dominates the market hasfew environmental concerns and is considered totally safe to the public.
Hazards can be classified by whether they affect workers at a PV manufacturing plant,customers with photovoltaics on or near their homes, or members of the public who consume airand water near the PV plant. Very little risk is associated with the public or the PV owner or installer;the main risk being that of electric shock already existing with conventional electricity, but moresevere because large areas can be electrically live. Adequate grounding is strongly recommended.
Safe handling procedures for some of the materials and processes are already well estab-lished from the integrated circuit or glass coating industries. But in the case of some unique materialsand processes, safety procedures had to be developed by the PV industry. The PV EnvironmentalHealth Safety Assistance Center at Brookhaven National Laboratory in New York, USA providesworldwide leadership in risk analysis and safety recommendations for the PV industry [42]. Anindustry-focused PV Safety Working Group has been established in Europe [43].
Si modules, currently the most widely used, are totally free from the suspicion of releasingdangerous materials. Si module manufacturers have long used Pb-based solder to interconnect thewafers, as did the electronic chip manufacturers. This represents a minor risk that nevertheless isbeing further reduced through the use of Pb-free solders.
There has been considerable research into occupational and accidental exposure and riskanalysis of one PV material in particular – thin films of CdTe – since Cd is a known carcinogen.The general conclusion is that CdTe thin film modules do not pose a risk to the public [44]. Muchof the concern is misguided for two reasons: there are significant toxicological differences betweenelemental Cd (toxic) and compound CdTe (much less so), and because the CdTe is hermeticallysealed between two sheets of glass. Those concerned about Cd sealed in CdTe modules shouldconsider that most Cd in our environment is released directly into the atmosphere by combustionof coal and oil. Chapter 14 has more about Cd environmental issues. Even in the event of a housefire, studies have shown that roof-mounted PV modules do not release any potentially hazardousmaterials [45], and this is also true for those containing cadmium.
A related issue is what to do with PV modules at the end of their projected 25- to 30-yearlife. An excellent strategy is to recycle the modules. This solves two problems at once, namely,keeping potentially hazardous materials out of the environment and reducing the need for additionalmining and/or refining of new materials. Semiconductor vendors have indicated a willingness toaccept used modules, and to extract and purify the CdTe, CdS, or Cu(InGa)Se2 for resale and reuse.As for the recycled Si, it is inherently purer than the Si used today as raw material.
Thus, we can say with confidence that PV is the cleanest and safest technology with whichto generate electricity even at the GW production scale.
1.4.4 Energy Payback
Can PV modules produce much more energy over their lifetime than it took to make them; i.e. arethey net energy producers? This oft-expressed concern is baseless. This concept is quantified by the“energy payback time ” or EPT, which is how many years the PV system must operate to producethe energy required for its manufacture. After the payback time, all of the energy produced is trulynew energy.

THE GREAT CHALLENGE 25
Many studies have concluded that EPT’s have steadily decreased over the past decades,now estimated at 1.5 to 2.5 years for crystalline Si and 1 to 1.5 years for thin films [45, 46]. Thus,all the energy needed to produce our fictional 100 GW every year will be paid back to the gridwithin the next two years.
For crystalline Si, melting and forming the crystalline wafers is the major energy require-ment. For thin films, where the semiconductor layers are 100 times thinner, and deposited at muchlower temperature, their energy requirement is negligible. Instead, it is the energy embodied in theglass or stainless steel substrate, which is the major energy sink. The cosmetic Al frame around themodule is responsible for a surprisingly large fraction of energy, and is being phased out. Althoughthin film modules have a shorter energy payback, they also have lower efficiency, which means alarger BOS is needed to support the larger number of modules. Thus, a larger amount of energy isembodied in the BOS for thin film photovoltaics compared to crystalline Si photovoltaics.
The case of concentrators is less studied, but again the use of semiconductor is reduced andthe BOS becomes more important than even for the thin films because the concentrating structuresare more massive. However, their efficiency is much higher. In summary, we can guess that theirEPT will be similar to the case of thin films.
Recently, PV has been examined in terms of its potential for Carbon reduction [46–48]. Theamount of CO2 released during manufacture of PV systems is much less than the CO2 avoided bythe power it produces during its lifetime. PV technologies are responsible for about 30–50 g CO2
emission per kW h produced over their life-cycle (all due to fossil fuel energy consumed duringmanufacturing) while coal-powered generating plants release about 20–30 times more. As the CO2
load from our energy sources decreases, the amount of CO2 per kW h of PV will decrease as well.Thus, PV is an excellent strategy to mitigate global climate change.
1.4.5 Reliability
Most modules seem to lose about 0.5–1% of their relative output annually for a variety of rea-sons. For the past few years, most modules have been sold with guarantees to maintain at least90% of their rated output after 10 years and at least 80% after 20 or 25 years. They must passrigorous reliability testing using accelerated extreme weather conditions. A recent study of >200modules [49] produced in the early 1980s, before many of today’s more rigorous standards andimproved encapsulation methods and materials were available, found that after >20 years continu-ous operation outdoors, only 18% of them had lost more than 20% of their rated power (and theywere only warranted for 10 years back then!). And remember, even if they lose 20% of their outputafter 20 years, they are still providing free electricity! Also, solar modules have been operating inspace, a very harsh environment, for decades.
1.4.6 Dispatchability: Providing Energy on Demand
Could PV meet all of the world’s needs today if we would just pass laws requiring photovoltaicsand halting all fossil and nuclear plants?
The first technical problem faced would be the intermittent nature of the solar radiation,available only during the day and strongly reduced in overcast skies. Energy storage would solve thisproblem, but no cheap storage method appears on the horizon, although pumped hydro storage [50]is already used and compressed air [51], grid-tied electric vehicle batteries (when parked andplugged in) called V2G [52], and new battery technology (Chapter 20) are being actively explored.
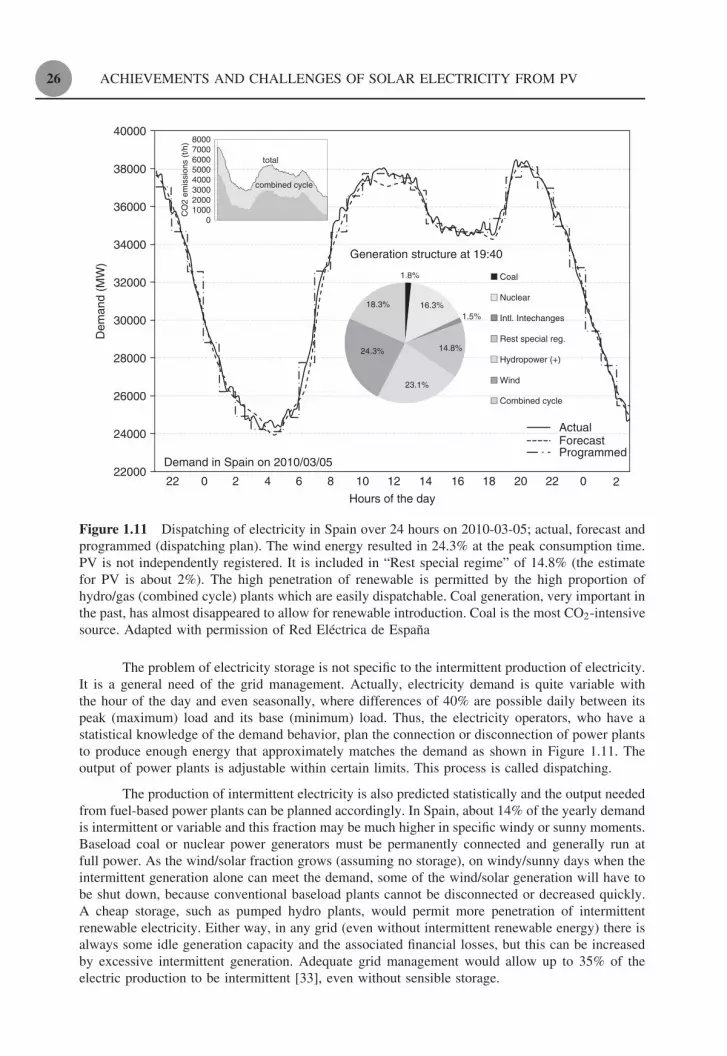
26 ACHIEVEMENTS AND CHALLENGES OF SOLAR ELECTRICITY FROM PV
38000
36000
34000
32000
30000
28000
26000
24000
22000
40000
ActualForecastProgrammed
Dem
and
(MW
)
8000700060005000400030002000
01000C
O2
emis
sion
s (t
/h)
total
combined cycle
Demand in Spain on 2010/03/05
222 0 2 4 6 8 10 12
Hours of the day
14 16 18 20 22 0
1.8%
16.3%1.5%
14.8%
23.1%
24.3%
18.3%
Coal
Nuclear
Intl. Intechanges
Rest special reg.
Hydropower (+)
Wind
Combined cycle
Generation structure at 19:40
Figure 1.11 Dispatching of electricity in Spain over 24 hours on 2010-03-05; actual, forecast andprogrammed (dispatching plan). The wind energy resulted in 24.3% at the peak consumption time.PV is not independently registered. It is included in “Rest special regime” of 14.8% (the estimatefor PV is about 2%). The high penetration of renewable is permitted by the high proportion ofhydro/gas (combined cycle) plants which are easily dispatchable. Coal generation, very important inthe past, has almost disappeared to allow for renewable introduction. Coal is the most CO2-intensivesource. Adapted with permission of Red Electrica de Espana
The problem of electricity storage is not specific to the intermittent production of electricity.It is a general need of the grid management. Actually, electricity demand is quite variable withthe hour of the day and even seasonally, where differences of 40% are possible daily between itspeak (maximum) load and its base (minimum) load. Thus, the electricity operators, who have astatistical knowledge of the demand behavior, plan the connection or disconnection of power plantsto produce enough energy that approximately matches the demand as shown in Figure 1.11. Theoutput of power plants is adjustable within certain limits. This process is called dispatching.
The production of intermittent electricity is also predicted statistically and the output neededfrom fuel-based power plants can be planned accordingly. In Spain, about 14% of the yearly demandis intermittent or variable and this fraction may be much higher in specific windy or sunny moments.Baseload coal or nuclear power generators must be permanently connected and generally run atfull power. As the wind/solar fraction grows (assuming no storage), on windy/sunny days when theintermittent generation alone can meet the demand, some of the wind/solar generation will have tobe shut down, because conventional baseload plants cannot be disconnected or decreased quickly.A cheap storage, such as pumped hydro plants, would permit more penetration of intermittentrenewable electricity. Either way, in any grid (even without intermittent renewable energy) there isalways some idle generation capacity and the associated financial losses, but this can be increasedby excessive intermittent generation. Adequate grid management would allow up to 35% of theelectric production to be intermittent [33], even without sensible storage.

TRENDS IN TECHNOLOGY 27
1.5 TRENDS IN TECHNOLOGY
Most of this book’s chapters deal with technology. This section will give a broader perspective thatthe specific chapter authors cannot provide.
In 2008 almost 8 GWp of modules were manufactured. The breakdown among the differenttechnologies appears in Table 1.5 for 2003 and 2008. The crystalline Si (c-Si) modules dominatedthe market (87% in 2008) and are divided into multicrystalline (multi-Si), single- or monocrystalline(mono-Si), or ribbon silicon, depending on the type of Si wafer used. The thin film modules, aminority, but whose market share is expanding, are divided into a-Si, CdTe and CIS modules. Therest of the technological options are yet too immature to appear in the market breakdown.
As shown in Figure 1.8a, efficiencies are one of the most critical factors to reduce cost ofelectricity generated. “Champion” cell efficiencies are presented in Figure 1.12 for several technolo-gies. Two technologies not yet commercially significantly appear in this figure (ironically havingthe highest and lowest efficiencies). Improvements in champion cell efficiency have slowed in thelast decade, except for the III–V based multijunctions and CIGS. The efficiency of champion cellsis typically 25–50% higher than the efficiency of the commercial products because the techniquesused for making the highest efficiencies are seldom acceptable for cost effective manufacturing. Thisseems to be in contradiction with the statement that efficiency is the main driver of cost reduction,so we will qualify it as follows: the industry goal is to obtain the highest module efficiency com-patible with a reasonably cheap, high-throughput, high-yield and reproducible process. Figure 6.18in Chapter 6 shows a historic view of the evolution of the breakdown among technologies.
1.5.1 Crystalline Silicon Progress and Challenges
Table 1.5 show that c-Si, as either single or multicrystalline wafers or ribbons, was responsible foralmost 90% of worldwide PV production. How did its dominance occur? First, Si cell technologyhas benefitted from the tremendous development of microelectronics that is also based on thesame Si. While thin film cell researchers had to develop their own manufacturing equipment, Si
Table 1.5 Total MW of production and percentage of thethree Si wafer and three thin film technologies in 2003 (whenthe first edition was published) and 2008
Technology 2003 2008
MW % MW %
Multi-Si 429 57 3773 48Mono-Si 242 32 3024 38Ribbon-Si 33 4 118 1a-Si 34 4.5 403 5CdTe 8 1 506 7Cu(InGa)Se2 4 0.5 79 1
Total Crystalline Si 704 93 6915 87Total Thin Films 46 7 988 13
total 750 100 7910 100
Data from Photon International , March 2009, p. 190

28 ACHIEVEMENTS AND CHALLENGES OF SOLAR ELECTRICITY FROM PV
5
10
15
20
25
30
35
40
45
1990 2000 2010
III-V MJ Conc
c-Si
multi-Si
CIGS
CdTe
a-Si MJ
DSSC
year
Effi
cien
cy (
%)
Figure 1.12 Best small-area (0.5–5 cm2) efficiency for various cell technologies measured understandard laboratory test conditions as of 1990, 2000, 2010. MJ concentrators are double junctionsbefore 1995, and triple junctions after. MJ a-Si represents stabilized efficiency after extended lightsoaking (see Chapter 12). Data for 2000 and 2010 from independently verified Solar Cell EfficiencyTables (Progress in Photovoltaics , John Wiley & Sons, Ltd, UK)
cell researchers could use that already developed for microelectronics, sometimes off-the-shelf andsometimes with some minor modifications. Second, the silicon bandgap, of 1.1 eV, is almost optimalto make a good solar converter (see Figure 4.3 in Chapter 4). Furthermore it is very abundant, cleanand nontoxic. Finally, Si solar cells are very stable, even without encapsulation.
However, Si has mechanical limitations (it is brittle) and optical limitations (it absorbssunlight weakly), requiring relatively thick cells. Therefore, some of the electrons pumped by thephotons to the conduction band have to travel distances of the order of the thickness, to be extractedby the front face through the selective contact (the one-way valve of Figure 1.2 representing thepn junction). Consequently, a good material with high chemical purity and structural perfectionis required to fight the natural tendency of the conduction-band electrons to return to the valenceband. To avoid this loss process, called recombination , the electrons must be highly mobile, as theyare in perfect silicon. Impurities and imperfections must be avoided as they can absorb the extraenergy of the conduction-band electrons, thus eliminating the free electron.
Metallurgical grade (MG) Silicon is obtained by reduction of quarzite (SiO2) with charcoalin an arc furnace. PV only uses about 2% of the world production of MG-Si. Then it is highlypurified, commonly by a method developed by and named after the Siemens Company, consistingof the fractional distillation of chlorosilanes, which are obtained from the reaction of a chlorinatedsource with Si. Finally, chlorosilanes are reduced with hydrogen at high temperatures to producehyperpure silicon, usually called semiconductor grade (SG) silicon or just polysilicon which hasmany random grains of crystalline Si, typically of about 1 mm. Methods to produce polysilicon ora lower-cost form called solar grade Si are described in Chapters 5 and 6.
In the past, the polysilicon was produced by about half a dozen factories for the microelec-tronic manufacturers. Today PV is the biggest user of this polysilicon and more new factories areappearing now specializing in solar grade polysilicon. The definition of this grade is the subject ofcontroversy as some manufacturers obtain it as enhanced MG-Si with reduced impurities, leadingto a cheaper material, but unable to make high-efficiency cells; others want to keep the high purity,even with higher cost, necessary for the higher efficiency. More about this debate can be found inChapters 5 and 7.
TRENDS IN TECHNOLOGY 29
By melting and recrystallizing polysilicon, the wafer producers grow either single mono-Sicrystal ingots by the Czochralski (Cz) technique or cast multi-Si blocks (grain size about 1 cm). Bothmethods yield large solid blocks which must be sliced into wafers (150–250 μm thick). ConventionalSi cells are made by diffusing the junction and screen printing the contacts. Mono-Si wafers producecell efficiencies of about 16–17% while the multi-Si wafers produce cells of about 13–15%. Mono-Si wafers are necessary to implement the unconventional and higher-efficiency structures such asthe HIT and IBC cells, both with champion cell efficiencies of over 20% (see Chapter 7 for details).
Wafering the silicon blocks implies kerf losses and a sizeable proportion (40%) of theexpensive polysilicon is lost in “sawdust”. To avoid this, sheets of silicon can be grown as “ribbons”.However the cell efficiency is not quite as high as multi-Si. The same few factories making Siribbon also integrate it into cells.
Most crystalline solar cells are fabricated from wafers by the screen printing technology thatis described in Chapter 7. There are some exceptions, such as the IBC and HIT cells also explainedin that chapter. The bigger cell factories integrate the crystal growth and wafering processes.
The mono-Si technology comes directly from the microelectronics industry and was thefirst to be used for solar cells. The multi-Si technology was developed specifically for PV to avoidthe high costs of the Cz growth process. But it has not been able to clearly dominate the marketbecause of the slightly lower efficiency. There is considerable research to develop processingsteps to reduce the efficiency gap between mono-Si and multi-Si. Concerning ribbon, besides thelow efficiency, the growth per cm2 is slower than for wafers, leading to higher capital costs. Theproduction of fast ribbon growth without losing efficiency is the desired goal, but it is difficult, inpart because the ingot formation is also a purifying step that is incompatible, for physical reasons,with fast ribbon growth (Chapter 6).
Once the cells are manufactured they are assembled into encapsulated modules, as describedin Chapter 7. This is done, either in the cell factories or in module assembly factories that purchasecells from a variety cell factories. Thus nearly identical Si cells can be bought from a variety of sup-pliers and integrated into modules. This is an important origin for double counting the module pro-duction in market studies (because the cell manufacturers may count all their cells as MWp producedand then the module manufacturer counts them again). This may cause discrepancies in the reportson manufacturing as well as in the breakdown between technologies (that are not very substantial).
A consortium of European Si PV companies and research groups (CrystalClear) has beencollaborating on reducing the cost per watt of various Si PV cell technologies [53]. They establishedthe cost structure for the current baseline standard multicrystalline Si module, called Basepower,averaging 2.1 ¤/W (2005 reference technology). Figure 1.13a presents the costs in terms of processstep and Figure 1.13b is the cost in terms of manufacturing cost category.
The fraction of polysilicon cost (i.e. feedstock) is only ∼14%, but during 2008 (in theexplosion of the Spanish market) a shortage of polysilicon caused its price to rise occasionally inthe spot market to about 10 times its normal price (of about US$50/kg). The combined shortagesand high prices of Si modules gave an opportunity to less-mature technologies, such as TFSC andCPV to find a place in the market. Not everyone was prepared to profit from this, but we thinkthat the extraordinary success of First Solar (the world’s biggest company in 2009) with its thinfilm CdTe modules is partially due to this unique opportunity.
Increasing efficiency, followed at a distance by reducing the polysilicon cost, are the mainsingle drivers of cost reduction in Si technology. In this respect the appearance of such technologiesas the IBC of SunPower and HIT of Sanyo, both able to produce wafer-sized cells of more than20%, are very promising. It is not really known if they are more cost effective than conventionalscreen printed cell technology (still largely dominating). But in 2008 they became the ninth and

30 ACHIEVEMENTS AND CHALLENGES OF SOLAR ELECTRICITY FROM PV
Cost Structure of Basepower technology
CellProcessing
27%
Wafering11%
IngotGrowth
8%
Feedstock14%
ModuleAssembly
40%
Breakdown by cost category
Equipment10%
Labor17%
Material46%
Yield Losses12%
Fixed15%
(a) (b)
Figure 1.13 Breakdown of costs in the fabrication of a Si-wafer-based PV module. (a) Theleft-hand side is the percentage in terms of technical process steps; (b) the right-hand side is thepercentage in terms of financial activities (adapted from del Canizo et al. Progress in Photovoltaics17, 199–209 (2009)). About half of the module assembly costs are materials
tenth largest solar cell manufacturing companies in the world, SunPower with 3% of world marketand Sanyo with the 2.7%.
1.5.2 Thin Film Progress and Challenges
Why develop a totally different semiconductor technology for photovoltaics when Si is so wellestablished? The simplest answer is in order to achieve lower cost and improved manufacturabilityat larger scales than could be envisioned for Si wafer-based modules.
The TFSC are based on materials that strongly absorb sunlight so that the cells can be verythin (1–3 micrometers). The electrons freed by the photons need to travel only this short distanceinside the cell to the cell contacts (and from there to the external circuit to produce power). Thisreduces the demand for high purification and crystallinity of the material, one of the causes of thehigh cost of the Si cells. However, where the thin films have a real business advantage is that theyare made directly into modules and not in cells. In other words, while Si cells are manufacturedfrom wafers, then processed and assembled to form a module, in TFSC technology many cells aremade and simultaneously formed as a module.
But there are disadvantages and in fact they have not yet dominated the market. We mustunderstand why.
It was recognized almost as early as c-Si PV cells were developed in the 1950s that thinfilm semiconductors could make good solar cells. When fabricated into useful devices, they are sothin that they must be deposited on a foreign material, called a substrate, for mechanical support.This can be a glass and metal or a sheet of plastic, all of them of low cost (at least as comparedwith the self-supporting Si wafer). A framework for analyzing the material properties, devicestructures, device physics, and manufacturing issues unique to TFSC had to be developed since theydiffered considerably from Si wafers [54, 55]. Between 1981 and 82, four thin film technologiesdemonstrated the ability to cross the magical 10% efficiency barrier, thus becoming candidatesfor serious consideration: Cu2S/CdS [56], a-Si [57], CuInSe2/CdS [58], and CdTe/CdS [59]. Of

TRENDS IN TECHNOLOGY 31
these four TFSC technologies, Cu2S/CdS would soon be rejected for commercialization due tofundamental and fatal stability problems related to electrochemical decomposition [60]. In contrast,a-Si has a minor stability problem that, once stabilized, is predictable, reversible and seasonal, asdiscussed in Chapter 12. No fundamental stability problem has been found with Cu(InGa)Se2 andCdTe modules, although they can develop unique degradation modes if not properly encapsulated.Consequently, significant industrial and government-sponsored research and resources have beendirected worldwide at TFSC technology. This led to steady progress in champion cell efficienciesthrough the 1990s, as seen in Figure 1.12.
But the efficiency of TF modules is 25–50% lower than for Si modules which makes itdifficult to translate the low cost per m2 of TFSC modules to cost per Wp. This lower efficiencycauses a higher area-related BOS cost when a TF array is installed, partially negating the naturalcost advantage of TFSC, as discussed in connection with Figure 1.8b.
To obtain low manufacturing costs, TFSC plants must be operated at high volume throughputto offset the initial capital investment5. A detailed study of thin film module manufacturing optionsconcluded that costs of current technologies would decrease 30–50% as the production facilityincreased from 25 to 200 MW per year [61].
The TFSC manufacturing process is designed such that they are deposited sequentiallyon moving substrates as in a continuous ‘in-line’ process or on many substrates at a time ina stationary batch process. This minimizes handling and facilitates automation, including laserscribing, to isolate and interconnect individual cells on the module, called monolithic integration.They are deposited at relatively low temperature (200–500 ◦C compared with ∼800–1450 ◦C forthe different main processes of c-Si). TFSC are either polycrystalline with small ∼1 μm sized grainssuch as Cu(InGa)Se2 or CdTe, amorphous like a-Si, or mixed amorphous/crystalline Si phases callednanocrystalline Si. The noncrystalline structure is a consequence of being deposited at temperaturestoo low and at rates too fast to allow perfect crystalline bond formation. TFSC typically consistof 5–10 different layers whose functions include reducing resistance, forming the pn junction,reducing reflection losses, and providing a robust layer for contacting and interconnection betweencells. Some of the layers are only ∼20 atoms thick (10 nm), yet they may be a meter wide! Thisrequires excellent process control.
Besides the lower efficiencies (so far), TFSC have a much less-developed knowledge andtechnology base compared with c-Si, and their properties are more difficult to control. Consequently,under-capitalized companies have had to struggle to develop not only an understanding of thematerials and devices, but also the equipment and processing to manufacture them. The thin filmPV industry has had to develop the technologies all by itself with considerably less financialresources than the Si PV industry had. They were not able to adopt a mature technology fromthe Si electronics industry. These factors can lead a purchaser to hesitate to buy a product that isless mature, and not so cheap (because of the small manufacturing volume), and thus to prefer thestandard Si wafer-based product.
What are the strengths and remaining challenges for the TFSC industry? We will reviewthe salient characteristics of the three leaders: a-Si, Cu(InGa)Se2/CdS, and CdTe/CdS.
Amorphous Si (Chapter 12) is deposited from hydride gases such as SiH4 using plasmato decompose the gas. This is called plasma-enhanced CVD (PECVD) and allows for large areasto be coated rather uniformly and with excellent control, using the same technology as large-areaflat panel displays. The a-Si film has 1–10% hydrogen bonded to the Si, and is often designated
5 This is being proven by First Solar which has been manufacturing CdTe thin film modules for 10 years, achievingthe lowest manufactured price per watt since 2008 (<1.00 $US/W), becoming the world leader in PV moduleproduction in 2009.
32 ACHIEVEMENTS AND CHALLENGES OF SOLAR ELECTRICITY FROM PV
as a-Si:H . The H atoms passivate a large number of the defects resulting from the incompletebonding of the Si atoms. The atomic structure lacks the long-range order of other crystalline orpolycrystalline materials. This can be an advantage because the light absorption is increased withrespect to c-Si. Films are typically deposited between 150 and 250 ◦C, the lowest temperatureof any of the TFSC materials, allowing the use of lower-cost, low-temperature substrates. a-Sisolar cells are deposited on glass, stainless steel foil, or plastic. The last two substrates are flexibleallowing for “roll-to-roll” manufacturing where all the layers are deposited as the roll moves throughtheir process zone. Nearly all a-Si modules contain multiple junction devices where two or threejunctions are grown on top of each other. This allows for more efficient utilization of the sunlight.Increasingly, a nanocrystalline form of thin Si is being used as the low bandgap partner in making“micromorph” a-Si/nc-Si multijunction cells (Chapter 12, Section 12.5). The highest reported cellefficiency was 15% for a triple junction, which degraded to about 13% before stabilizing [62].Micromorph modules 1.4 m2 or larger are being reported with 8–10% stabilized efficiency, asdiscussed in Section 12.6, but standard products (not micromorph) are in the 5–7% range. Thethree major challenges for a-Si technology are: (1) to improve the standard module efficiency to10–12%; (2) to minimize or eliminate the self-limited degradation which reduces efficiency by2–3% (absolute); and (3) to increase the deposition rate of the layers and utilization of the gases,especially the nanocrystalline layer to allow faster, lower-cost manufacturing.
Polycrystalline layers of Cu(InGa)Se2 (Chapter 13) alloys have produced the highest effi-ciency TFSC devices and modules. TFSCs based on CuInSe2 (no Ga) achieved 12–15% efficiency,but were limited by the low bandgap. Alloying with Ga and/or S increases the bandgap and increasesthe efficiency of delivering the electrons to the circuit. While many deposition methods have beenexplored in the laboratory, there are two different processes under commercial development. Co-evaporation forms the alloy by simultaneous evaporation of the Cu, In, Ga, and Se from sourcesonto a heated substrate. The other process is called selenization , because layers of Cu, In, and Gaare deposited by a wide variety of methods onto a substrate, then heated in the presence of Se froma gas such as H2Se or a Se vapor, thus contributing the fourth constituent of the alloy. A veryactive area of research is developing methods to incorporate these atoms and others into low-defectalloys to increase the bandgap even further.
Substrate temperatures typically reach 500–600 ◦C during some stage of the growth unlessthe substrate is a polymer, in which case 450 ◦C is the maximum. Substrates of Mo-coated glassare typically used although Mo-coated metal foils or plastic are in manufacturing. If sodium isnot available from the substrate (diffusing from glass), it must be provided directly, either duringor after deposition, to enhance electronic quality of the Cu(InGa)Se2 and increase voltage. TheCu(InGa)Se2 films are p-type, typically 1–3 μm thick and have crystallites or grains on the orderof 1μm. The pn junction is formed by depositing an n-type layer of CdS, ZnO, or other newmaterials under development to replace the CdS (largely for “environmentally friendly” braggingrights). The highest reported cell efficiency is presently 20.0% [63] and several companies havelimited manufacturing capacity (<20 MW) of modules with 10–13% efficiency. Transferring ahigh-efficiency small scale laboratory process on a stationary substrate to manufacturing on a largearea moving substrate has proven more difficult for Cu(InGa)Se2 than for a-Si or CdTe. The threemajor challenges for Cu(InGa)Se2-related technology are: (1) to control the composition (Ga, S,Se, or Na) of the alloy through the film in a manufacturing environment on a moving substrate;(2) to find alternative junction partners to replace CdS; and (3) to find new alloys (with Ag, S, Te)or new deposition methods to give high-performance devices with higher-bandgap alloys.
Polycrystalline layers of CdTe (Chapter 14) have been investigated for photovoltaics sincethe 1970s. In contrast to limited process options for a-Si or Cu(InGa)Se2, there are over 10 methodsto deposit the CdTe films that have produced CdTe solar cells exceeding 10% efficiency. Fourhave reached precommercialization: spray pyrolysis (SP), electrodeposition (ED), vapor deposition(VD) and close-spaced sublimation (CSS). Some take place in liquid baths that are barely warm

TRENDS IN TECHNOLOGY 33
∼50 ◦C, with CdTe deposition rates of μm/h (ED) while others take place in vacuum systemsat temperatures high enough to soften glass ∼600 ◦C, with CdTe deposition rates of μm/min(CSS). There seem to be three critical steps, however, that all efficient CdTe solar cells require.First, they need a post-deposition anneal in the presence of Cl and O2 at around 400 ◦C. Thischemical/thermal treatment enlarges the grains, passivates the grain boundaries, and improves theelectronic quality of the CdTe. Second, all CdTe layers need a surface treatment before applyinga contact. This treatment can be a wet or dry process and prepares the CdTe surface by etchingaway unwanted oxides and leaving a Te-rich layer needed to make a low-resistance contact. Third,nearly all high- efficiency devices have a Cu-containing material somewhere in their CdTe contactprocess but again, there are many ways this can be achieved. Details of these three process stepstend to be very proprietary. Whichever process is used to deposit the CdTe, it has been foundthat the entire device process is highly coupled since processing steps strongly influence previouslayers. This is partially due to the CdTe grain boundaries which act like paths for interdiffusion.
The pn junction is formed by first depositing an n-type layer of CdS on a glass substrate witha transparent conductive oxide contact layer (typically SnO2) followed by the 2- to 8-μm-thick CdTelayer and appropriate chemical annealing. Once the solar cell is made, the CdTe films are slightly p-type with crystallites or grains of the order of 1 μm. The highest reported efficiency for a CdTe/CdSdevice is presently 16.5% [64] and modules are around 10–11%. Some CdTe modules have been inoutdoor field-testing for over 10 years with negligible degradation. Of the three leading TFSC tech-nologies, CdTe has surged into first place in terms of manufacturing capacity and lowest cost on thestrength of a single company. The three key challenges are: (1) to better understand the various post-deposition optimizing treatments so they can be simplified and transferred into production; (2) toincrease the output voltage commensurate with its bandgap; and (3) to maintain and evolve the safeand cost-effective Cd usage in the workplace, followed by recycling at the end of the module’s life.
Technically astute investors know that other factors can be more important than efficiencyin selecting a technology for development. This point is made obvious by examining therelative performance of the three major TFSC technologies – Cu(InGa)Se2, CdTe, and a-Si – inFigure 1.12. Note that a-Si has always had the lowest efficiency. Yet, of the three, it was a-Si thatwas commercialized much earlier and more widely. This is partly because there has only been onegeneric deposition technology – PECVD – while CdTe and Cu(InGa)Se2 have a wide range oftechnologies, meaning each company must develop the unique process technology and equipmentthemselves. a-Si also had a stronger scientific research base, partly due to the other applicationssuch as flat panel displays, which ensured that the relation between deposition conditions andfundamental material and device properties were well characterized, which comforted investors.In contrast, CdTe and Cu(InGa)Se2 are “orphans” because they have no real application outsideof photovoltaics. In 2008, Table 1.5 shows that a-Si accounted for about 4%, CdTe for 7%, andCu(InGa)Se2 still about 1%. Yet Cu(InGa)Se2 has had the highest laboratory efficiency for twodecades (Figure 1.12). This shows that translating research-grade champion cell performance intoproduction modules coming off the production line day after day is a very challenging task. Thephenomenal growth of CdTe is due to one company, First Solar, whose modules are among thelowest priced on the market. But it took them over 15 years of research and development withsignificant public and private investment to get there.
Conjecturing that the ideal PV technology would have some of the merits of c-Si (abundance,nontoxicity, stability) but be deposited as a thin film a few micrometers thick, several groups havetried to achieve the “best of both worlds” by developing thin films of multi-Si deposited on aninexpensive non-Si substrate. This is the subject of Chapter 11. At present, the best thin film multi-Si modules have the same efficiency ∼10% as their CuInGaSe2, CdTe, or a-Si based predecessors.This is partly because multi-Si thin-film photovoltaics also inherits some of the problems of bothc-Si and thin films. In particular, passivation of grain boundaries and surfaces seems to be a major

34 ACHIEVEMENTS AND CHALLENGES OF SOLAR ELECTRICITY FROM PV
problem, yet many of the well-established passivation methods from c-Si are not applicable tomulti-Si thin films due to temperature limitations (<600 ◦C).
There are new thin-film technologies such as the solid–liquid junction dye-sensitized(Chapter 15) and polymer-based organic (Chapter 16) solar cells that operate on very differentprinciples than an all-solid-state solar cell. Their main attraction is the potential for very lowcost. However, these fascinating new technologies present many new challenges, including strongsensitivity to air and water vapor, hence the need for excellent encapsulation. There are someprivate investment efforts to scale them to manufacturing.
1.5.3 Concentrator Photovoltaics Progress and Challenges
Concentrator Photovoltaic Technology or CPV is based on separating the area for collection ofsunlight from its conversion. The collection area is an optical element, mirror or lens, whichcasts the light into a much smaller area of solar cells. This allows using high-efficiency but moreexpensive solar cells since the area of cells is >100 times smaller than the light collection area.The design and operation of CPV is described in Chapter 10.
PV technologists were aware of this possibility from the beginning of PV development. Ingeneral CPV needs sun-tracking systems that makes it unsuitable for small-scale applications ofPV. There were attempts in the 1980s when Si solar cells were still too expensive and the marketswere still too small.
The interest in CPV has spread in the last five years when MJ III–V-based solar cells,discussed in Chapter 8, developed for space applications, started to approach 40% efficiency, whichthey have already surpassed, as shown in Figure 1.12. CPV can take advantage of these ultra-high-efficiency cells, which are inherently very expensive, because the total cell area is reduced underhigh concentration, thus mitigating their high cost. Concentration levels of 500× (the cell is 500times smaller than the optical aperture) are common with this technology and there is a trend tomove towards the 1000× which presently operates at slightly less efficiency. Projected costs ofsuch concentrator systems might be very small [65]. Concentration helps to increase the efficiencywhich theoretically increases as the logarithm of the intensity, until it reaches too high a value ofcurrent density, leading to ohmic losses that reduce the efficiency. Thus concentrator cells must bespecially designed to have very low series resistance.
However, there are disadvantages. First, CPV does not utilize diffuse radiation, thus losingability to convert at least 10% of the global radiation even in the best climates, and often muchmore. Second, at 500–1000×, CPV requires tracking the position of the sun very accurately everyminute of the day which adds cost and complexity to the installation. Non-imaging optics is anew scientific tool that may soften this requirement. Third, the optical elements reduce the overallefficiency. Nevertheless module efficiencies of 30% have been presented at conferences and areabout to appear commercially. Finally, CPV modules must be able to dissipate a significant amountof heat, leading to complex construction and reliability issues.
Another temporary issue is the rating. An array is usually formed by modules mounted ona tracking system, but only when mounted can the efficiency of the array be determined becausethe tracking itself affects the efficiency. Even in a good tracking system it varies in about 5% fromsecond to second because of small misalignments, so that defining the kW rating of an array, andhow to measure it, is not yet decided. Under these conditions the bankability of a concentratorsystem is still difficult to assess or guarantee. Nevertheless, under the silicon module shortage in2008 the Spanish company Guascor Solar, with license of the American Amonix, installed over9 MW of concentrators, being so far the first in installed CPV.

CONCLUSIONS 35
With the short learning curve in CPV, competing with the cheap Si modules from China, andto some extent with the cheap CdTe modules from First Solar, is very difficult. It will be necessaryto demonstrate good credibility in performance at low installed prices to see this technology widelydeployed. The recently created Institute of CPV systems in Spain (ISFOC), has subsidized theinstallation of 3 MW from seven companies (three from Spain, two from the USA, one fromGermany and one from Taiwan) to provide accredited performance data to help gain this credibilityand to establish the rules for measuring CPV performance.
Some think that they will be able to make a low-concentration system with Si cells thatwill beat in prices the complex high-CPV systems and the flat panel systems alike. As matter offact the Guascor Photon sales have been obtained using highly efficient (∼25%) IBC-silicon cells,although they are moving now to MJ III–V cells.
So the result is that many companies, start-ups and established, are today involved indeveloping CPV options in the high and low concentration ranges. The next years will tell us aboutthe success of these efforts.
1.5.4 Third-Generation Concepts
In 1961 Shockley and Queisser (SQ) published a paper [66] setting the thermodynamic efficiencylimit6 of a single-junction solar cell of about 40% under certain hypotheses that were thought tobe fundamental and absolute. Cells based on principles that violate some of these hypotheses arecalled third- [67] or next-generation [68] solar cells.
The most studied (called by some revolutionary) third-generation solar cells [69] are: theIntermediate band solar cell [70] which discards the SQ hypothesis that photons below the bandgapare not absorbed, the multi exciton generation solar cell [71], which discards the SQ hypothesisthat a photon can only pump one electron; and the hot carrier solar cell [72] which discards theQS hypothesis that the electrons are at the lattice temperature.
Some progress has been made in all three concepts since the first edition of this book, but ahigh-efficiency cell has not been produced with any of them. The 1st and 2nd generation solar cellsused today have required decades to yield reasonably high efficiencies and a reliable manufacturingprocess. It will be the same with these new concepts. They will probably not be available to meetthe 2030 challenge. Third-generation concepts may enable TFSC to operate with efficiencies above20% or may permit achieving efficiencies of 50% in CPV cells permitting modules of 40%. Toaccomplish this, we will need detailed knowledge of these new fundamental concepts and moreimportantly how to integrate them into a functional device.
1.6 CONCLUSIONS
The human race is increasingly aware of the need for sustainable development. Solar energy isalmost the only, and certainly the most developed way of producing energy for this sustainabledevelopment. This will be possible mainly through PV.
PV constitutes a new form of producing electric energy that is environmentally clean andvery modular. It is highly appreciated by the public. It is unique for many applications of high socialvalue such as providing electricity to people who lack it in remote areas. In recent years PV hasexperienced an unprecedented burst of growth. Today PV is a big business of around $US 50 billion
6 This limit applies to the individual cells in a MJ stack, but not to the stack as a whole.

36 ACHIEVEMENTS AND CHALLENGES OF SOLAR ELECTRICITY FROM PV
worldwide and growing at ∼50% annually. PV-powered homes, commercial buildings, and powerplants have been built around the world. It has been recently shown (in Spain) that PV electricitycan be installed five times faster than nuclear power plants and that a penetration of intermittentelectricity of around 15% can be handled by the electric grids with positive environmental effects.
Common forecasts predict that PV electricity will contribute only a few percent by 2030. Wehave shown that there is easily enough land, raw materials, safety protocols, capital, technologicalknowledge and social support to allow PV to provide over 12% of our electrical needs by 2030. Andwe have to be much more ambitious for the future because PV has to become the biggest supplierof electricity by the end of the century. This will require finding new ways of energy storage.
The present PV development has been possible by the public support, driven by publicopinion, which has led to governments spending substantial money to subsidize PV. However, thishas not been a waste. It has been an investment. Today PV electricity is very close to grid parity.Thanks to this we predict that PV will continue to grow at a fast pace towards the 12% goal by2030. Still strong political support will be necessary. And the promise of significant growth inemployment – due to raw materials processing, module manufacturing, installation, and non-PVsystem components – is becoming a major driving force behind that political support.
PV possesses a panoply of novel technologies that ensure a continuous advance in thereduction of costs throughout the whole century. In this PV is unique compared with other energytechnologies. Nations that want to lead this irrepressible movement will have to support it byinvesting in R&D, industry and markets.
REFERENCES1. Benka S, Physics Today 38, 39 (2002); adapted from Pasternak A, Lawrence Livermore Natl.
Lab report UCRL-ID-140773 (October 2000).2. Lewis N, Material Research Society Bulletin 32, 808–820 (2007).3. Gustavson M R, Limits to Wind Power Utilization. Science 204, 13–17 (1979).4. Zweibel K, Mason J, Fthenakis V, Scientific American 298, 64–73 (2008).5. The Effect of Tilt, Orientation, Array Size, etc Can be Effectively Determined for Many Loca-
tions Using the PV Watts On-Line Solar Calculator at www.nrel.gov/rredc/pvwatts/version1.html.
6. Monthly Module Price Index, Photon International (November 2009), pp 84–87.7. Fath P, Keller S, Winter P, Joos W, Herbst W, Proceedings of the 34 IEEE PVSC , Philadelphia,
pp 002471-76 (2009).8. Wiser R, Barbose G, Peterman C, Darghouth N, Tracking the Sun – II: Installed costs of PV in
the US from 1998–2008, US Department of Energy Lawrence Livermore Berkley Laboratory(on-line) 2009. At http://eetd.lbl.gov/ea/emp/re-pubs.html.)
9. Fritts C, Proceedings of the American Association for the Advancement of Science 33, 97(1883).
10. Chapin D, Fuller C, Pearson G, Journal of Applied Physics 25, 676–677 (1954).11. Reynolds D, Leies G, Antes L, Marburger R, Physical Review 96, 533–534 (1954).12. Jenny D, Loferski J, Rappaport P, Physical Review 101, 1208–1209 (1956).13. Prince M, Journal of Applied Physics 26, 534–540 (1955).14. Loferski J, Journal of Applied Physics 27, 777–784 (1956).15. Wysocki J, Rappaport P, Journal of Applied Physics 31, 571–578 (1960).16. Shockley W, Queisser H, Journal of Applied Physics 32, 510–519 (1961).17. Cusano D, Solid State Electronics 6, 217–232 (1963).18. Wysocki J et al., Applied Physics Letters 9, 44–46 (1966).19. Alferov ZhI, Fizika i Tekhnika Poluprovodnikov 4, 2378 (1970).

REFERENCES 37
20. Lindmayer J, Allsion J, COMSAT Technical Review 3, 1–22 (1973).21. Hovel H, Woodall J, Proceedings of the 10th IEEE Photovoltaic Specialist Conference,
pp 25–30 (1973).22. Perlin J, From Space to Earth . Ann Arbor, MI: Aatech Publications, 1999.23. Annual Survey, Photon International 2009-3 (March 2009), pp 170–206.24. Photovoltaics International , 2nd Quarter 2009, 160–162 www.pv-tech.org; also 2008 Annual
Report (Table 3), IEA-PVPS www.iea-pvps.org.25. Data for 1996, 2000, and 2004 from Maycock PV Market Update, published annually in Renew-
able Energy World August Issue (until 2007). Data for 2008 for grid and utility connected fromIEA-PVPS Trends in Photovoltaic Applications http://www.iea-pvps.org/products/rep1_18.htm.Data for 2008 off-grid from several sources reporting 300-400 MW off-grid installations.
26. PV Resources http://www.pvresources.com.27. US Department of Energy Solar Energy Technologies Mult-year Program Plan 2001-2011.28. Gilman P, Blair N, Mehos M, Christensen C, Janzou S, Cameron C, Solar Advisor Model User
Guide for Version 2.0 , NREL Report No. TP-670-43704, 2008.29. UN IPCC Fourth Assessment Report: Climate Change 2007 , Working Group III – Mitigation
of Climate Change, Section 4.4.3.3.30. IEA Technology Roadmap: Solar Photovoltaic Energy (released May 11, 2010) at www.iea
.org/papers/2010/pv_roadmap.pdf.31. The first paper by these two authors shows that PV might provide 10–20% of the load of a
traditional grid system while the second looks at what changes might be made to allow upto 50% penetration of PV: Denholm P, Margolis R, Energy Policy 35, 2852–2861 (2007);Denholm P, Margolis R, Energy Policy 35, 4424–4433 (2007).
32. Luque A, Progress in Photovoltaics 9, 303–312 (2001).33. Johansson T B, Kelly H, Reddy A K N, Williams R H, Burnham L, Renewable Energy Sources
for Fuel and Electricity . Washington DC: Island Press, 1993.34. German Advisory Council on Climate Change (WGBU) Energy in Transition, (2003), www
.wgbu.de.35. http://www.citymayors.com/statistics/largest-cities-density-125.html.36. Energy System Emissions and Material Requirements , Meridian Corporation (Alexandria, VA)
report prepared for the Deputy Assistant Secretary for Renewable Energy of the USA (1989).37. Ito M, Kato K, Komoto K, Kichimi T, Sugihara H, Kurokawa K, Proceedings of the 19th
European PVSEC , pp 2113–2116 (2004).38. Andersonn B, Progress in Photovoltaics 16, 61–76 (2000).39. Feltrin A, Freundlich A, Renewable Energy 33, 180–185 (2008).40. PV FAQs from www.nrel.gov/ncpv.41. Sala G, Luque A, Past Experiences and New Challenges in PV Concentrators. in: A Luque,
V M Andreev (eds), Concentrator Photovoltaics , Berlin: Springer, 2007, pp 1–24.42. National Photovoltaic Environmental Health and Safety Assistance Center at www.pv.bnl.gov43. European PV Environmental Health and Safety Working Group http://www.iea-pvps.org/tasks/
task12.htm.44. Fthenakis V, Morris S, Moskowitz P, Morgan D, Progress in Photovoltaics 7, 489–497 (1999);
or www.nrel.gov/cdte.45. Fthenakis V M, Fuhrmann M, Heiser J. Lanzirotti A, Fitts J, Wang W, Progress in Photovoltaics
13, 713–723 (2005).46. Fthenakis V, Alsema E, Progress in Photovoltaics 14, 275–280 (2006).47. Ito M, Kato K, Komoto K, Kichimi T, Kurokawa K, Progress in Photovoltaics 16, 17–30
(2008).48. Fthenakis V, Kim H, Alsema E, Environmental Science and Technology 42, 2168–2174 (2008).49. Skoczek A, Sample T, Dunlop E, Progress in Photovoltaics 17, 227–240 (2009).50. Denholm P, Kulcinski G, Energy Conversion and Management 45, 2153–2172 (2004).

38 ACHIEVEMENTS AND CHALLENGES OF SOLAR ELECTRICITY FROM PV
51. Fthenakis V, Mason J, Zweibel K, Energy Policy 37, 387–389 (2009).52. Kempton W, Tomic J, Journal of Power Sources 44, 268–279 (2005).53. del Canizo C, del Coso G, Sinke W, Progress in Photovoltaics 17, 199–209 (2009).54. Barnett A, Rothwarf A, IEEE Transactions of the Electron Devices 27, 615–630 (1980).55. A truly pioneering classic text on photovoltaic devices is sadly out of print, and only available
at a very high price from used book sellers: Fahrenbruch A, Bube R, Fundamentals of SolarCells . New York: Academic Press, 1983.
56. Hall R, Birkmire R, Phillips J, Meakin J, Applied Physics Letters 38, 925–926 (1981).57. Catalano A et al., Proceedings of the 16th IEEE Photovoltaic Specialist Conference,
pp 1421–1422 (1982).58. Mickelson R, Chen W, Proceedings of the 16th IEEE Photovoltaic Specialist Conference,
pp 781–785 (1982).59. Tyan Y, Perez-Albuerne E, Proceedings of the 16th IEEE Photovoltaic Specialist Conference,
pp 794–799 (1982).60. Phillips J, Birkmire R, Lasswell P, Proceedings of the 16th IEEE Photovoltaic Specialist Con-
ference, pp 719–722 (1982).61. Zweibel K, The Terawatt Challenge, NREL Technical Report NREL/TP-520-38350 (2005),
p 25, available at www.nrel.gov.62. Yan, B, Yue G, Owens J, Yang J, Guha S, Proceedings of the 4th IEEE WCPEC , Waikoloa,
pp 1477–1482 (2006).63. Repins I, Contreras M, Egaas B, Dehart C, Scharf J, Perkins C, To B, Noufi R, Progress in
Photovoltaics 16, 235–239 (2008).64. Wu X et al., Proceedings of the 17th European PVSEC Munich, pp 995–1000 (2001).65. Yamaguchi M, Luque A, IEEE Transactions on Electron Devices 46, 2139–2144 (1999).66. Shockley W, Queisser H, Journal of Applied Physics 32, 510–519 (1961).67. Green M, Third Generation Photovoltaics . Berlin: Springer, 2003.68. Martı A, and Luque A, (eds), Next Generation Photovoltaics: High Efficiency through Full
Spectrum Utilization . Bristol: Institute of Physics Publishing, 2004.69. Lewis L, Crabtree G, Nozik A, Wasielewski M, Alivisatos P, Basic Research Needs for Solar
Energy Utilization . US Department of Energy, Office of Basic Science, 2005.70. Luque A, and Martı A, Physical Review Letters 78, 5014–5017 (1997).71. Kolodinski S, Werner J, Wittchen T, Queisser H, Applied Physics Letters 63, 2405–2407
(1993).72. Ross R, Nozik A, Journal of Applied Physics 53, 3813–3818 (1982).