project pre-feasibility updated ni 43-101 technical report on the
TRANSCRIPT

Project Pre-Feasibility Updated NI 43-101 Technical Report on the Cerro Quema Project
Province of Los Santos, Panama
Prepared for:
202 – 595 Howe Street
Vancouver, BC, V6C 2T5 Canada
Prepared by:
Report Effective Date: 18 January 2022 Mineral Resource Effective Date: 2 November 2021
Mineral Reserve Effective Date: 22 April 2021
Authors: Carl Defilippi, Kappes, Cassiday & Associates, RM SME
Sue Bird, Moose Mountain Technical Services, P. Eng. Jesse Aarsen, Moose Mountain Technical Services, P. Eng.
Denys Parra, Anddes Asociados SAC, RM SME Dr. Matthew Gray, Resource Geosciences Incorporated, CPG
Brent Johnson, HydroGeoLogica, Inc. RM SME, P.G. Lee Josselyn, Linkan Engineering, P. E.
Wade Brunham, Environmental Resources Management, M.Sc. PWS, R.P.Bio.
Kappes, Cassiday & Associates 7950 Security Circle
Reno, NV 89506

Updated Cerro Quema Pre-Feasibility Study NI 43-101 Technical Report
Kappes, Cassiday & Associates Contents January, 2022 Page 1-2
Forward Looking Information This document contains “forward-looking information” as defined in applicable securities laws. Forward looking information includes, but is not limited to, statements with respect to the PFS, including but not limited to future production, costs and expenses of the Project; estimates of Mineral Reserves and Mineral Resources; commodity prices and exchange rates; mine production plans; projected mining and process recovery rates; mining dilution assumptions; sustaining costs and operating costs; interpretations and assumptions regarding joint venture and potential contract terms; closure costs and requirements; government regulations and permitting timelines; requirements for additional capital; environmental, permitting and social risks; and general business and economic conditions. Often, but not always, forward-looking information can be identified by the use of words such as “plans”, “expects”, “is expected”, “budget”, “scheduled”, “estimates”, “continues”, “forecasts”, “projects”, “predicts”, “intends”, “anticipates” or “believes”, or variations of, or the negatives of, such words and phrases, or statements that certain actions, events or results “may”, “could”, “would”, “should”, “might” or “will” be taken, occur or be achieved. Forward-looking information is based on a number of assumptions which may prove to be incorrect, including, but not limited to, the availability of financing for production, development and exploration activities; the timelines for exploration and development activities on the Project; the availability of certain consumables and services; assumptions made in Mineral Resource and Mineral Reserve estimates, including geological interpretation grade, recovery rates, price assumption, and operational costs; and general business and economic conditions. Forward-looking information involves known and unknown risks, uncertainties and other factors which may cause the actual results, performance or achievements to be materially different from any of the future results, performance or achievements expressed or implied by the forward-looking information. These risks, uncertainties and other factors include, but are not limited to, the assumptions underlying the production estimates not being realized, changes to the cost of production, variations in quantity of mineralized material, grade or recovery rates, geotechnical or hydrogeological considerations during mining differing from what has been assumed, failure of plant, equipment or processes, changes to availability of power or the power rates used in the cost estimates, changes to salvage values, ability to maintain social license, changes to interest or tax rates, decrease of future gold prices, cost of labour, supplies, fuel and equipment rising, the availability of financing on attractive terms, actual results of current exploration, changes in project parameters, exchange rate fluctuations, delays and costs inherent to consulting and accommodating rights of local communities, environmental risks, reclamation expenses, title risks, regulatory risks and uncertainties with respect to obtaining necessary permits or delays in obtaining same, and other risks involved in the gold production, development and exploration industry, as well as those risk factors discussed in Orla’s latest Annual Information Form and its other SEDAR filings from time to time.
Updated Cerro Quema Pre-Feasibility Study NI 43-101 Technical Report
Kappes, Cassiday & Associates Contents January, 2022 Page 1-3
All forward-looking information herein is qualified by this cautionary statement. Accordingly, readers should not place undue reliance on forward-looking information. Orla and the authors of this Technical Report undertake no obligation to update publicly or otherwise revise any forward-looking information whether as a result of new information or future events or otherwise, except as may be required by applicable law. Non-IFRS Measures Orla has included certain non-International Financial Reporting Standards (IFRS) performance measures as detailed below. In the gold mining industry, these are common performance measures but may not be comparable to similar measures presented by other issuers and the non-IFRS measures do not have any standardized meaning. Accordingly, it is intended to provide additional information and should not be considered in isolation or as a substitute for measures of performance prepared in accordance with IFRS. Cash Costs per Ounce – Orla calculated cash costs per ounce by dividing the sum of operating costs, royalty costs, production taxes, refining and shipping costs, net of by-product silver credits, by payable gold ounces. While there is no standardized meaning of the measure across the industry, Orla believes that this measure will be useful to external users in assessing operating performance. All-In Sustaining Costs (“AISC”) – Orla has disclosed an AISC performance measure that reflects all of the expenditures that are required to produce an ounce of gold from operations. While there is no standardized meaning of the measure across the industry, Orla’s definition conforms to the all-in sustaining cost definition as set out by the World Gold Council in its guidance dated 27 June 2013. Orla believes that this measure will be useful to external users in assessing operating performance and the ability to generate free cash flow from current operations. Except of the purposes legislated under provincial securities laws, any use of this Technical Report by any third party is at that party’s sole risk.
Updated Cerro Quema Pre-Feasibility Study NI 43-101 Technical Report
Kappes, Cassiday & Associates Contents January, 2022 Page 1
Introduction & Overview ............................................................................................ 1-1 Property Description and Location ............................................................................ 1-2 Accessibility, Climate, Local Resources and Physiography ....................................... 1-2 History ...................................................................................................................... 1-3 Geological Setting ..................................................................................................... 1-4 Mineralization ............................................................................................................ 1-5 Deposit Types ........................................................................................................... 1-5 Exploration and Drilling ............................................................................................. 1-6 Sample Preparation, Analyses and Security ............................................................. 1-6
Data Verification ....................................................................................................... 1-7 Metallurgical Testing ................................................................................................. 1-7
Cerro Quema ..................................................................................................... 1-7 Caballito ............................................................................................................. 1-8
Mineral Resource Estimate ....................................................................................... 1-8 Mineral Reserve Estimate ....................................................................................... 1-10 Mining Operation .................................................................................................... 1-11 Mineral Processing ................................................................................................. 1-12 Project Infrastructure ............................................................................................... 1-13 Market Study and Contracts .................................................................................... 1-14 Environmental Studies, Permitting and Social Impact ............................................. 1-14 Capital and Operating Cost ..................................................................................... 1-15 Economic Analysis .................................................................................................. 1-16 Adjacent Properties ................................................................................................. 1-20 Interpretations and Conclusions .............................................................................. 1-20
Conclusions ..................................................................................................... 1-20 Opportunities ................................................................................................... 1-20
Risks ....................................................................................................................... 1-20 Resource ......................................................................................................... 1-20 Mining .............................................................................................................. 1-20 Metallurgy and Process ................................................................................... 1-21 Access, Title and Permitting ............................................................................. 1-21 Other Risks ...................................................................................................... 1-22
Recommendations .................................................................................................. 1-23 KCA Recommendations ................................................................................... 1-23 MMTS Recommendations................................................................................ 1-24
Assaying and QAQC .................................................................................................. 1-24 Exploration ............................................................................................................... 1-24
Updated Cerro Quema Pre-Feasibility Study NI 43-101 Technical Report
Kappes, Cassiday & Associates Contents January, 2022 Page 2
Feasibility Study Mine Planning ............................................................................... 1-25 RGI Recommendations .................................................................................... 1-25 AA Recommendations ..................................................................................... 1-25
Site Geotechnical ..................................................................................................... 1-25 Mine Geotechnical ................................................................................................... 1-26 Sediment Control ..................................................................................................... 1-26 Seismic Hazard ......................................................................................................... 1-26
HGL Recommendations ................................................................................... 1-26 Linkan Recommendations................................................................................ 1-27 ERM Recommendations .................................................................................. 1-27
Introduction and Overview ........................................................................................ 2-1 Project Scope and Terms of Reference .................................................................... 2-2
Scope of Work ................................................................................................... 2-2 Terms of Reference ........................................................................................... 2-3
Sources of Information .............................................................................................. 2-4 Qualified Persons and Site Visits .............................................................................. 2-5 Frequently Used Acronyms, Abbreviations, Definitions and Units of Measure ........... 2-7
Area and Location ..................................................................................................... 4-1 Claims and Title ........................................................................................................ 4-1 Surface Rights .......................................................................................................... 4-6 Environmental Liability .............................................................................................. 4-7 Permits ..................................................................................................................... 4-7 Access, Title, Permit and Security Risks ................................................................... 4-9
Access Risks ..................................................................................................... 4-9 Title Risks .......................................................................................................... 4-9 Permit Risks....................................................................................................... 4-9 Security Risks .................................................................................................. 4-10
Accessibility .............................................................................................................. 5-1 Physiography, Climate and Vegetation ..................................................................... 5-3 Local Resources and Infrastructure .......................................................................... 5-5
Prior Ownership ........................................................................................................ 6-1

Updated Cerro Quema Pre-Feasibility Study NI 43-101 Technical Report
Kappes, Cassiday & Associates Contents January, 2022 Page 3
Prior Exploration ....................................................................................................... 6-2 Historical Metallurgical Studies ................................................................................. 6-4 Historical Resource Estimates .................................................................................. 6-6 Prior Production ........................................................................................................ 6-7
Sources of Information .............................................................................................. 7-1 Regional Geology ..................................................................................................... 7-1 Local Geology ........................................................................................................... 7-3
General Deposit Geology ................................................................................... 7-3 Structural Setting ............................................................................................... 7-8 Mineralization..................................................................................................... 7-8 Alteration ......................................................................................................... 7-10
Oxidation ................................................................................................................ 7-12 La Pava Gold Deposit ............................................................................................. 7-13 Quema-Quemita Gold Deposit ................................................................................ 7-17 Caballito Gold-Copper Sulphide Deposit ................................................................. 7-19
Caballito Faults ................................................................................................ 7-20 Caballito Paragenesis ...................................................................................... 7-22
Conclusions ............................................................................................................ 7-23
Summary of Drilling ................................................................................................. 10-1 Quema-Quemita Deposit ................................................................................. 10-1 La Pava Deposit .............................................................................................. 10-3 Caballito Deposit .............................................................................................. 10-5 Remainder of Property ..................................................................................... 10-6
2017-2021 Drilling – Orla Mining ............................................................................. 10-7 2011-2014 Drilling – Pershimco .............................................................................. 10-8
2010 Drilling ..................................................................................................... 10-8 2011-2012 Drilling ............................................................................................ 10-9 September to December 2012 Drilling ........................................................... 10-10 2013 Drilling ................................................................................................... 10-10 2013-2014 Drilling .......................................................................................... 10-12
1990-1996 Drilling – Cyprus/Campbell .................................................................. 10-12
Sampling Protocols and Principal Laboratories ....................................................... 11-1
Updated Cerro Quema Pre-Feasibility Study NI 43-101 Technical Report
Kappes, Cassiday & Associates Contents January, 2022 Page 4
Sampling by Orla Mining 2017-2018 ................................................................ 11-1 Sampling by Pershimco 2010-2014 ................................................................. 11-2 Sampling by Cyprus 1990-1994 ....................................................................... 11-2
Cerro Quema QAQC Summary ............................................................................... 11-3 La Pava Deposit QAQC .......................................................................................... 11-4
La Pava Deposit Blanks ................................................................................... 11-4 La Pava Deposit Certified Reference Materials ................................................ 11-5
La Pava Deposit CRM Gold ....................................................................................... 11-5 La Pava Deposit CRM Copper ................................................................................... 11-9
La Pava Deposit Duplicates ........................................................................... 11-10 Quema-Quemita Deposit QAQC ........................................................................... 11-13
Quema-Quemita Deposit Blanks .................................................................... 11-13 Quema-Quemita Deposit Certified Reference Materials ................................. 11-14
Quema-Quemita Deposit CRM Gold ...................................................................... 11-14 Quema-Quemita Deposit CRM Copper .................................................................. 11-17
Quema-Quemita Deposit Duplicates .............................................................. 11-19 Caballito Deposit QAQC ....................................................................................... 11-22
Caballito Deposit Blanks ................................................................................ 11-22 Caballito Deposit Certified Reference Materials ............................................. 11-23
Caballito Deposit CRM Gold ................................................................................... 11-23 Caballito Deposit CRM Copper ............................................................................... 11-24
Caballito Deposit Duplicates .......................................................................... 11-25 QAQC Conclusions and Recommendations.......................................................... 11-27
Site Visit .................................................................................................................. 12-1 Assay Data Audit .................................................................................................... 12-4
Corrections to Database .................................................................................. 12-4 Certificate Checks ............................................................................................ 12-4
Check Assays ......................................................................................................... 12-4 Twinned Holes ........................................................................................................ 12-6 Validation of Historic Data and RC Drilling – CPPs ................................................. 12-8 MMTS Conclusions ............................................................................................... 12-11
Summary of Test Results ........................................................................................ 13-1 Material Types ........................................................................................................ 13-3 Column Test Results ............................................................................................... 13-3 Column Recovery by Size ....................................................................................... 13-6 Bottle Roll Test Results ........................................................................................... 13-9
Updated Cerro Quema Pre-Feasibility Study NI 43-101 Technical Report
Kappes, Cassiday & Associates Contents January, 2022 Page 5
Comminution Tests ............................................................................................... 13-11 Crusher Work Index ....................................................................................... 13-11 Abrasion Index ............................................................................................... 13-11
Crush Size ............................................................................................................ 13-12 Sample Location and Depth .................................................................................. 13-12 Leach Cycle Duration ............................................................................................ 13-13
Metal Recovery Projection .................................................................................... 13-14 Reagent Consumption Projection .......................................................................... 13-15
Cyanide ......................................................................................................... 13-15 Lime Consumption ......................................................................................... 13-16
Silica Material ......................................................................................................... 13-16 Clay Material .......................................................................................................... 13-16
Mixed Ore ............................................................................................................. 13-17 Caballito Metallurgical Testing .............................................................................. 13-20
Sample Identification, Location and Preparation ............................................ 13-20 Flotation Test Results .................................................................................... 13-21 Cyanidation Test Results ............................................................................... 13-22 Caballito Metallurgical Test Conclusion and Recommendation ...................... 13-22
Key Assumptions and Data used for the Resource Estimate .................................. 14-6 Geologic Modelling ................................................................................................. 14-8 Capping and Assay / Composite Statistics ............................................................ 14-12 Composite Length ................................................................................................. 14-16 Bulk Density Assignment ...................................................................................... 14-17 Block Model Builds ................................................................................................ 14-19
Outlier Restrictions during Interpolations ........................................................ 14-19 Variography ................................................................................................... 14-20 Search Parameters ........................................................................................ 14-26
Classification ......................................................................................................... 14-29 Model Validation ................................................................................................... 14-31
Grade Comparisons ....................................................................................... 14-31 Grade – Tonnage Curves .............................................................................. 14-31 Visual Comparison ......................................................................................... 14-35
Reasonable Prospects of Eventual Economic Extraction ...................................... 14-39 Factors That May Affect the Mineral Resource Estimate ....................................... 14-40 Risk Assessment .................................................................................................. 14-40
Cut-off Grade .......................................................................................................... 15-1 Dilution .................................................................................................................... 15-2
Updated Cerro Quema Pre-Feasibility Study NI 43-101 Technical Report
Kappes, Cassiday & Associates Contents January, 2022 Page 6
Mineral Reserves .................................................................................................... 15-3
Introduction ............................................................................................................. 16-1 Mining Study Basis ................................................................................................. 16-1
Mine Planning Datum ....................................................................................... 16-1 Resource Classes ............................................................................................ 16-1 Other Mine Planning Criteria ............................................................................ 16-1
Economic Pit Limits ................................................................................................. 16-1 LG Cost Inputs ................................................................................................. 16-2 LG Slope Inputs ............................................................................................... 16-2 LG Sensitivity Cases ........................................................................................ 16-3
Detailed Pit Designs ................................................................................................ 16-8 Pit Phase Selection .......................................................................................... 16-8 Pit Design Slope Inputs and Bench Configuration ............................................ 16-8 Haul Road Design Parameters ........................................................................ 16-8 Pit Design Results ......................................................................................... 16-10
Quema Pit Design Results ...................................................................................... 16-10 La Pava Pit Design Results ...................................................................................... 16-12
Rock Storage Facilities ......................................................................................... 16-15 Chontal Waste Rock Dump ............................................................................ 16-15 Backfill Designs ............................................................................................. 16-17
Ore Stockpiles ...................................................................................................... 16-18 Mine Production Schedule .................................................................................... 16-18
End of Period Maps ....................................................................................... 16-23 Pre-Production Mine Operation (Year -1) ....................................................... 16-23 End of Year 1 ................................................................................................. 16-24 End of Year 4 ................................................................................................. 16-25 End of Year 7 (LOM) ...................................................................................... 16-27
Mine Operations ................................................................................................... 16-28 Production Drilling .......................................................................................... 16-29 Production Blasting ........................................................................................ 16-30 Loading .......................................................................................................... 16-31 Hauling .......................................................................................................... 16-34 Pit Services .................................................................................................... 16-34 Mine Fleet Maintenance ................................................................................. 16-35 GME and Technical ....................................................................................... 16-36 Operations Setup for Equipment Utilization Planning ..................................... 16-37 Mine Operations Organizational Chart ........................................................... 16-38

Updated Cerro Quema Pre-Feasibility Study NI 43-101 Technical Report
Kappes, Cassiday & Associates Contents January, 2022 Page 7
Process Design Basis ............................................................................................. 17-1 Process Summary................................................................................................... 17-2 Crushing ................................................................................................................. 17-7 Reclamation and Conveyor Stacking ...................................................................... 17-8 Leach Pad Design................................................................................................... 17-9 Solution Storage ................................................................................................... 17-12 Solution Application .............................................................................................. 17-13 Process Water Balance ........................................................................................ 17-14 Solution Treatment................................................................................................ 17-14
HLF Process Solution Treatment ................................................................... 17-17 Cyanide Neutralization ........................................................................................... 17-17 HLF Solution Treatment Plant ................................................................................ 17-18
Waste Rock Facility Solution Treatment ......................................................... 17-20 HLF and WRD Passive Treatment ................................................................. 17-22
Adsorption, Desorption and Recovery (ADR) ........................................................ 17-25 Adsorption ..................................................................................................... 17-26 Carbon Acid Wash ......................................................................................... 17-26 Desorption ..................................................................................................... 17-27 Recovery & Refining ...................................................................................... 17-27 Carbon Handling & Regeneration .................................................................. 17-29 ADR Reagents and Consumables ................................................................. 17-29
Acid Wash Dilute Hydrochloric Acid ...................................................................... 17-29 Acid Wash Caustic .................................................................................................. 17-30 Strip Solution Cyanide ............................................................................................ 17-30 Strip Solution Caustic ............................................................................................. 17-30 Activated Carbon .................................................................................................... 17-30 Fluxes to Smelt ....................................................................................................... 17-30
Process Reagents and Consumables ................................................................... 17-31 Pebble Lime ................................................................................................... 17-31 Sodium Cyanide ............................................................................................ 17-31 Caustic........................................................................................................... 17-32 Sodium Metabisulfite ...................................................................................... 17-32 Copper Sulfate ............................................................................................... 17-32 Hydrated Lime ............................................................................................... 17-33
Infrastructure ........................................................................................................... 18-1 Existing Installations ........................................................................................ 18-1 Site Roads ....................................................................................................... 18-1
Main Site Access ....................................................................................................... 18-1
Updated Cerro Quema Pre-Feasibility Study NI 43-101 Technical Report
Kappes, Cassiday & Associates Contents January, 2022 Page 8
Internal Access ......................................................................................................... 18-1 Mine External Haul Roads ............................................................................... 18-2
Mine External Haul Road Network Design Inputs .................................................... 18-2 Mine External Haul Road Network Designs ............................................................. 18-2
Project Buildings .............................................................................................. 18-3 Administrative Building and Clinic .................................................................... 18-3 Construction Camp Facilities ........................................................................... 18-6 ADR Process Area ........................................................................................... 18-6 Refinery ........................................................................................................... 18-6 Laboratory ....................................................................................................... 18-6
Process Maintenance Workshop...................................................................... 18-7 Reagent Storage .............................................................................................. 18-7 Mine Truck Shop and Warehouse .................................................................... 18-7 Fuel Storage and Dispensing ........................................................................... 18-8 Explosives Storage .......................................................................................... 18-8
Explosives Magazine ................................................................................................ 18-8 Explosive Isotank Laydown Area .............................................................................. 18-8
Guard Shack and Security ............................................................................... 18-9 Temporary Medical Clinic................................................................................. 18-9 Fenced Areas .................................................................................................. 18-9 Transportation .................................................................................................. 18-9 Waste Disposal .............................................................................................. 18-10
Sanitary Waste ....................................................................................................... 18-10 Solid Waste ............................................................................................................ 18-10 Liquid Waste ........................................................................................................... 18-10 Hazardous Waste ................................................................................................... 18-11
Power Supply, Communications and IT ................................................................ 18-11 Power Supply................................................................................................. 18-11 Communication Systems & IT ........................................................................ 18-12
Water Supply ........................................................................................................ 18-12 Raw Water ..................................................................................................... 18-12 Potable Water ................................................................................................ 18-13 Fire Water ...................................................................................................... 18-13
Mine Waste Rock Facilities ................................................................................... 18-13
Environmental Studies ............................................................................................ 20-1

Updated Cerro Quema Pre-Feasibility Study NI 43-101 Technical Report
Kappes, Cassiday & Associates Contents January, 2022 Page 9
Project Area Description .................................................................................. 20-1 Climate ..................................................................................................................... 20-1 Soils .......................................................................................................................... 20-2 Hydrology ................................................................................................................. 20-3 Physiography ............................................................................................................ 20-4 Seismicity ................................................................................................................. 20-5 Vegetation ................................................................................................................ 20-5 Fauna ........................................................................................................................ 20-7
Environmental Management Plans ................................................................ 20-10 Surface Water Management .................................................................................. 20-10 Ground Water Management.................................................................................. 20-12 Consideration of Climate Change .......................................................................... 20-12 Sediment Controls .................................................................................................. 20-14 Air Quality Management ........................................................................................ 20-14 Flora and Fauna Management ............................................................................... 20-15 Cyanide Management Plan .................................................................................... 20-16
Waste Handling ............................................................................................. 20-16 Hazardous Wastes .................................................................................................. 20-16 Non-hazardous Wastes .......................................................................................... 20-17 Putrescible (Domestic) Waste Disposal ................................................................. 20-17 Boneyard Storage ................................................................................................... 20-17 On-site BioRemediation Cell .................................................................................. 20-17 Waste Water (Sewage) Disposal ............................................................................ 20-18
Reclamation and Closure ............................................................................... 20-18 Soil Handling........................................................................................................... 20-21 Operating Areas ..................................................................................................... 20-21 Mine Pits ................................................................................................................ 20-21 Waste Rock Dump .................................................................................................. 20-22 Roads ...................................................................................................................... 20-24
Closure Activities – Heap Leach Facilities ...................................................... 20-24 Chemistry ............................................................................................................... 20-24 Permanent Surface Water Diversion Works & Erosion Controls ........................... 20-26 Permanent Slope Stabilization ............................................................................... 20-26 Final Engineering and Monitoring Plans ................................................................ 20-26 Heap Rinsing, Neutralization and Solution Management of HLF Seepage ............ 20-26 Heap Slope Grooming ............................................................................................ 20-26 Cover, Topsoil Placement and Revegetation of Heap and Surrounding Areas ...... 20-27 Ponds ...................................................................................................................... 20-27
Updated Cerro Quema Pre-Feasibility Study NI 43-101 Technical Report
Kappes, Cassiday & Associates Contents January, 2022 Page 10
Physical and Mobile Equipment ............................................................................. 20-28 Fencing ................................................................................................................... 20-28
Post Closure Activities ................................................................................... 20-28 Physical Monitoring and Maintenance .................................................................. 20-28 Environmental Monitoring and Maintenance ....................................................... 20-29 Biological Monitoring and Maintenance ................................................................ 20-29 Surplus Water Management .................................................................................. 20-29
Closure Cost Estimates – Heap Leach Facilities ............................................ 20-29 Permitting ............................................................................................................. 20-30
Environmental Assessment Regulatory Requirements ................................... 20-31 Previous Permitting Activities ......................................................................... 20-33 Permits for Project Development.................................................................... 20-33
Environmental Permits .......................................................................................... 20-33 Social Security ........................................................................................................ 20-34 Municipal Permits .................................................................................................. 20-34 Ministry of Commerce and Industry ...................................................................... 20-34 Ministry of Labor .................................................................................................... 20-34 Comisión Nacional para el Estudio y la Prevención de los Delitos Relacionados con
Drogas - CONAPRED ................................................................................................................... 20-34 Sectorial Permits .................................................................................................... 20-34 IFC Performance Standard and Industry Best Practices......................................... 20-35
Social and Community Impact .............................................................................. 20-35 Panama – General Aspects ........................................................................... 20-35 Project Social Studies .................................................................................... 20-36 Social Description .......................................................................................... 20-36
Social Area of Influence.......................................................................................... 20-36 Land Use ................................................................................................................. 20-37 Indigenous Communities ....................................................................................... 20-38 Inhabitants, Age and Gender ................................................................................. 20-39 Education ............................................................................................................... 20-40 Health and Access to Water ................................................................................... 20-40 Infrastructure and Public Services ......................................................................... 20-41 Economic Activity, Income and Food. .................................................................... 20-43 Ecosystem Services ................................................................................................ 20-44
Organization and Community Participation........................................................... 20-46 Project Community Perception .............................................................................. 20-46
Social Impacts ............................................................................................... 20-47 20.1.1.1 Approach to SIA Stakeholder Engagement ............................................................ 20-50
Social Impact Assessment and Management System .................................... 20-50

Updated Cerro Quema Pre-Feasibility Study NI 43-101 Technical Report
Kappes, Cassiday & Associates Contents January, 2022 Page 11
Capital Expenditures ............................................................................................... 21-2 Mining Capital Costs ........................................................................................ 21-4 Process and Infrastructure Capital Cost Estimate ............................................ 21-7
Process and Infrastructure Capital Cost Basis .......................................................... 21-7 Major Earthworks and Liner ..................................................................................... 21-8 Civils ......................................................................................................................... 21-9 Structural Steel ......................................................................................................... 21-9 Platework ................................................................................................................. 21-9 Mechanical Equipment ............................................................................................ 21-9 Solution Treatment Plants ..................................................................................... 21-10 Piping ...................................................................................................................... 21-13 Electrical ................................................................................................................. 21-13
Instrumentation ..................................................................................................... 21-14 Infrastructure & Buildings ...................................................................................... 21-14 Supplier Engineering and Installation Supervision / Commissioning ..................... 21-15 Process Mobile Equipment .................................................................................... 21-15 Spare Parts ............................................................................................................. 21-15 Process & Infrastructure Contingency ................................................................... 21-15
Construction Indirect Costs ............................................................................ 21-16 Other Owner’s Construction Costs ................................................................. 21-17 Working Capital ............................................................................................. 21-18 Initial Fills Inventory ....................................................................................... 21-18 Engineering, Procurement & Construction Management ................................ 21-19 ITBMS............................................................................................................ 21-19 Exclusions ..................................................................................................... 21-19
Operating Costs .................................................................................................... 21-19 Mining Operating Costs ................................................................................. 21-20 Process and G&A Operating Costs ................................................................ 21-24
Personnel and Staffing ........................................................................................... 21-25 Power ..................................................................................................................... 21-26 Consumable Items.................................................................................................. 21-26 Heap Leach Consumables ...................................................................................... 21-27 Recovery Plant Consumables ................................................................................. 21-27 Solution Treatment Plant ....................................................................................... 21-28 Laboratory .............................................................................................................. 21-32 Fuel ......................................................................................................................... 21-32 Wear, Miscellaneous Operating & Maintenance Supplies .................................... 21-32
Mobile / Support Equipment ................................................................................. 21-32
Updated Cerro Quema Pre-Feasibility Study NI 43-101 Technical Report
Kappes, Cassiday & Associates Contents January, 2022 Page 12
G&A Expenses ........................................................................................................ 21-32 Reclamation & Closure Costs ............................................................................... 21-33
Summary ................................................................................................................ 22-1 Methodology ........................................................................................................... 22-4 General Assumptions .............................................................................................. 22-4
Capital Expenditures ........................................................................................ 22-6 Operating Costs ............................................................................................... 22-8 Taxes and Import Duties .................................................................................. 22-8 Metal Production and Revenues ...................................................................... 22-8 Royalties .......................................................................................................... 22-9 Depreciation .................................................................................................... 22-9 Exploration and Evaluation Costs .................................................................... 22-9 Loss Carry Forward ....................................................................................... 22-10 Closure Costs ................................................................................................ 22-10
Economic Model and Cashflow ............................................................................. 22-10 Sensitivity Analysis ............................................................................................... 22-13
Project Implementation ........................................................................................... 24-1 Project Development ........................................................................................ 24-1 Project Controls ............................................................................................... 24-1 Procurement and Logistics............................................................................... 24-2 Construction .................................................................................................... 24-2 Construction Schedule ..................................................................................... 24-3
Site Geotechnical Analyses .................................................................................... 24-6 Heap Leach Pad Stability ................................................................................. 24-6 Waste Dump Stability ....................................................................................... 24-6 Pit Slope Design .............................................................................................. 24-7
IFC Performance Standards and Industry Best Practices ........................................ 24-8
Conclusions ............................................................................................................ 25-1 Resource Estimate........................................................................................... 25-1 Mining .............................................................................................................. 25-1 Metallurgy and Process ................................................................................... 25-2 Environmental and Permitting .......................................................................... 25-2
Opportunities .......................................................................................................... 25-3

Updated Cerro Quema Pre-Feasibility Study NI 43-101 Technical Report
Kappes, Cassiday & Associates Contents January, 2022 Page 13
Mineral Resource and Exploration Potential .................................................... 25-3 Mining .............................................................................................................. 25-3 Metallurgy and Process ................................................................................... 25-3 Other Opportunities.......................................................................................... 25-3
Risks ....................................................................................................................... 25-5 Resource ......................................................................................................... 25-5 Mining .............................................................................................................. 25-5 Metallurgy and Process ................................................................................... 25-5 Access, Title and Permitting ............................................................................. 25-6 Other Risks ...................................................................................................... 25-6
KCA Recommendations .......................................................................................... 26-1 Moose Mountain Technical Services Recommendations ........................................ 26-1
Assaying and QAQC ........................................................................................ 26-1 Exploration ....................................................................................................... 26-1 Feasibility Study Mine Planning ....................................................................... 26-2
Anddes Recommendations ..................................................................................... 26-2 Site Geotechnical ............................................................................................. 26-2 Mine Geotechnical ........................................................................................... 26-3 Sediment Control ............................................................................................. 26-3 Seismic Hazard ................................................................................................ 26-3
HGL Recommendations .......................................................................................... 26-3 Geochemistry ................................................................................................... 26-3 Hydrology/Hydrogeology .................................................................................. 26-4 Site Water Balance .......................................................................................... 26-4
RGI Recommendations ........................................................................................... 26-4 Linkan Recommendations ....................................................................................... 26-5 ERM Recommendations ......................................................................................... 26-5

Updated Cerro Quema Pre-Feasibility Study NI 43-101 Technical Report
Kappes, Cassiday & Associates Contents January, 2022 Page 14
FIGURES Figure 1-1 After-Tax IRR vs. Gold Price, Capital Cost and Operating Cost (KCA, 2021) ...... 1-19 Figure 1-2 NPV @ 5% vs. Gold Price, Capital Cost and Operating Cost (KCA, 2021) ......... 1-19 Figure 4-1 Location Map, Cerro Quema Project ..................................................................... 4-2 Figure 4-2 Mining Concessions, Cerro Quema Property ........................................................ 4-5 Figure 4-3 Surface Rights Owned by MCQ and Proposed Project Layout .............................. 4-6 Figure 5-1 Project Location and Infrastructure Map ................................................................ 5-2 Figure 5-2 View of Typical Topography and Vegetation at Cerro Quema (M. Gray, 2017) (view from La Pava E-NE to Cerro Quema and Quemita, Chontal pad in midground) ...................... 5-3 Figure 6-1 Historical Drillhole Locations ................................................................................. 6-4 Figure 7-1 Regional Geologic Map ......................................................................................... 7-3 Figure 7-2 Stratigraphic Section of the Río Quema Formation ............................................... 7-5 Figure 7-3 Local Geology, Cerro Quema ................................................................................ 7-6 Figure 7-4 Geologic Setting of Cerro Quema Deposits (Longo 2018) ..................................... 7-7 Figure 7-5 Relationship of Mineralization and Alteration to Dacitic Dome Complex Deposits (Longo 2018) .......................................................................................................................... 7-7 Figure 7-6 Location Map of Mineralized Zones (Source: Minera Cerro Quema, 2021) ........... 7-9 Figure 7-7 Drillcore from PDH11004, ~11.5m - La Pava Deposit (M. Gray, 2017) ................ 7-12 Figure 7-8 Drillcore from PDH91014, 56.3m - Quema-Quemita Deposit (M. Gray, 2017) ..... 7-12 Figure 7-9 Left: Outcrop of gold mineralized brecciated vuggy silica rock at La Pava. Right: detail of fine breccia texture. Sample of outcrop assayed 1.55 gpt Au. (M. Gray, 2017) ................ 7-14 Figure 7-10 La Pava Alteration Cross Section (Looking East) .............................................. 7-15 Figure 7-11 La Pava Drillhole Gold Assay Cross Section (Looking East) ............................. 7-16 Figure 7-12 Iron oxide stained, locally gossanous vuggy silica exposed in surface cut, Quema-Quemita zone. Left: outcrop. Right: detail of gossanous breccia. (M. Gray, 2017) .............. 7-17 Figure 7-13 Quema-Quemita Alteration Cross Section (Looking East) ................................. 7-18 Figure 7-14 Quema-Quemita Drillhole Gold Assay Cross Section (Looking East, Showing Silica Alteration) ............................................................................................................................. 7-19 Figure 7-15 Caballito Deposit - Section 554360E, looking West (MMTS, 2021) ................... 7-21 Figure 7-16 Caballito Deposit Section 834,850N, Looking North (MMTS, 2021) .................. 7-22 Figure 9-1 IP and Magnetic Survey Locations ........................................................................ 9-3 Figure 9-2 IP Chargeability Map, 100m Depth Slice ............................................................... 9-4 Figure 9-3 IP Resistivity Map, 50m Depth Slice ...................................................................... 9-5 Figure 9-4 Magnetic Total Intensity Map ................................................................................ 9-6 Figure 9-5 Orla Rock Chip Samples, Au in ppm ..................................................................... 9-7 Figure 10-1 Overview of Drilling at the Project looking Northeast (MMTS, 2021) ................. 10-1 Figure 10-2 Quema Deposit Plan View with Collar Locations (MMTS, 2021) ....................... 10-3 Figure 10-3 La Pava Deposit Plan View with Collar Locations (MMTS, 2021) ....................... 10-5 Figure 10-4 Caballito Deposit Plan View with Collar Locations (MMTS, 2021) ..................... 10-6
Updated Cerro Quema Pre-Feasibility Study NI 43-101 Technical Report
Kappes, Cassiday & Associates Contents January, 2022 Page 15
Figure 11-1 La Pava Deposit Blanks (MMTS, 2020)............................................................. 11-4 Figure 11-2 La Pava Deposit All Au CRM Samples Normalized (MMTS, 2020) ................... 11-6 Figure 11-3 La Pava Deposit CRM OXH82 (Au = 1.278 g/t) Process Control Chart (MMTS, 2020) ............................................................................................................................................. 11-7 Figure 11-4 La Pava Deposit CRM OXD87 (Au = 0.417 g/t) Process Control Chart (MMTS, 2020) ............................................................................................................................................. 11-8 Figure 11-5 La Pava Deposit CRM OXK94 (Au=3.562g/t) Process Control Chart (MMTS, 2020) ............................................................................................................................................. 11-9 Figure 11-6 La Pava Deposit All Cu CRM Samples Normalized (MMTS, 2020) ................. 11-10 Figure 11-7 La Pava Deposit Au 2011-2013 Duplicates Scatter Plot (MMTS, 2020) .......... 11-11 Figure 11-8 La Pava Deposit Au 2011-2013 Duplicates HARD Plot (MMTS, 2020) ........... 11-12 Figure 11-9 La Pava Deposit Cu Duplicates 2011-2013 Scatter Plot (MMTS, 2020) .......... 11-12 Figure 11-10 Quema-Quemita Deposit Blanks (MMTS, 2020) ........................................... 11-13 Figure 11-11 Quema-Quemita Deposit All Au CRM Samples Normalized (MMTS, 2020) .. 11-15 Figure 11-12 Quema-Quemita Deposit CRM OXC129 (Au=0.205 g/t) Process Control Chart (MMTS, 2020) ..................................................................................................................... 11-15 Figure 11-13 Quema-Quemita Deposit CRM SF57 (Au = 0.848 g/t) Process Control Chart (MMTS, 2020) ..................................................................................................................... 11-16 Figure 11-14 Quema-Quemita Deposit CRM SP49 (Au=18.34 g/t) Process Control Chart (MMTS, 2020) .................................................................................................................................. 11-17 Figure 11-15 Quema-Quemita Deposit CRM Cu Normalized (n=445) (MMTS, 2020) ........ 11-18 Figure 11-16 Quema-Quemita Deposit All Cu CRM Samples Normalized (MMTS, 2020) .. 11-18 Figure 11-17 Quema-Quemita Deposit Cu Duplicates 1993-2014 Scatter Plot (MMTS, 2020) .... ........................................................................................................................................... 11-19 Figure 11-18 Quema-Quemita Deposit Au 1993-2014 Au Duplicates HARD Plot (MMTS, 2020) ........................................................................................................................................... 11-20 Figure 11-19 Quema-Quemita Deposit Au Core Duplicates 2017-2018 Scatter Plot (MMTS, 2020) ........................................................................................................................................... 11-21 Figure 11-20 Quema-Quemita Deposit Au 2017-2018 Duplicates HARD Plot (MMTS, 2020) ..... ........................................................................................................................................... 11-21 Figure 11-21 Quema-Quemita Deposit 2017-2018 Cu Core Duplicates Scatter Plot (MMTS, 2020) .................................................................................................................................. 11-22 Figure 11-22 Caballito Deposit Blanks (MMTS, 2020) ........................................................ 11-23 Figure 11-23 Caballito Deposit all Au Samples Normalized (MMTS, 2020) ........................ 11-24 Figure 11-24 Caballito Deposit All Cu Samples Normalized (MMTS, 2020) ....................... 11-25 Figure 11-25 Caballito Deposit Au Duplicates 2012-2013 Scatter Plot (MMTS, 2020)........ 11-26 Figure 11-26 Caballito Deposit Au Field Duplicates 2017-2018 (MMTS, 2020) .................. 11-27 Figure 12-1 Core Storage Building (MMTS, 2021) ............................................................... 12-1 Figure 12-2 Office buildings (MMTS, 2021) .......................................................................... 12-2 Figure 12-3 La Pava (foreground) and Quemita (MMTS, 2021) ........................................... 12-2
Updated Cerro Quema Pre-Feasibility Study NI 43-101 Technical Report
Kappes, Cassiday & Associates Contents January, 2022 Page 16
Figure 12-4 Caballito Drillhole Locations (MMTS, 2021) ...................................................... 12-3 Figure 12-5 Example of Drillhole Collar Location (MMTS, 2021) .......................................... 12-3 Figure 12-6 2020 Re-Assay Scatter Plot Gold (MMTS, 2020) .............................................. 12-6 Figure 12-7 Twinned Holes PRH92085, PRH91026 and PRD10005 Twinned Hole Au Assay Comparison (MMTS, 2020) ................................................................................................... 12-7 Figure 12-8 Twinned Holes PRH91025 and PRH10007 Au Assay Comparison (MMTS, 2020) ............................................................................................................................................. 12-8 Figure 12-9 CPP – Comparison of Au by DH Type and Oxidation Zone – Pava (MMTS, 2020) ............................................................................................................................................. 12-9 Figure 12-10 CPP – Comparison of Au by DH Type and Oxidation Zone – Quema (MMTS, 2020) ............................................................................................................................................. 12-9 Figure 12-11 CPP – Comparison of Historic (pre-2000) to Recent Drilling - DDH (MMTS, 2020) ........................................................................................................................................... 12-10 Figure 12-12 CPP – Comparison of Historic (pre-2000) to Recent Drilling - RC (MMTS, 2020) ........................................................................................................................................... 12-10 Figure 13-1 Column Recovery by Size Fraction 1995 Report Data (KCA, 2021) .................. 13-7 Figure 13-2 Column Recovery by Size Fraction 1995 Report Data (KCA, 2021) .................. 13-7 Figure 13-3 Column Recovery by Size Fraction 2018 Report (KCA, 2021) .......................... 13-8 Figure 13-4 Column Recovery by Particle Size (P80), Historical and Current Data (KCA, 2021) ............................................................................................................................................. 13-8 Figure 13-5 Column Recovery by Head Grade, Historical and Current Data (KCA, 2021) .... 13-9 Figure 13-6 Bottle Roll Gold Recovery by Crush/Grind Size (KCA, 2021) .......................... 13-10 Figure 13-7 Effect of Sulphur Content on Recovery (KCA, 2021) ....................................... 13-18 Figure 13-8 Effect of Sulphur Content on Cyanide Consumption (KCA, 2021) ................... 13-19 Figure 13-9 Effect of Sulphur Content on Lime Consumption (KCA, 2021) ........................ 13-19 Figure 13-10 Caballito Metallurgical Sample Drill Hole Location ........................................ 13-20 Figure 14-1 Alteration Domains used for Interpolation, looking Az=340o - Quema-Quemita (MMTS, 2021) ....................................................................................................................... 14-9 Figure 14-2 Alteration Domains used for Interpolation, looking Az=020o - La Pava (MMTS, 2021) ............................................................................................................................................. 14-9 Figure 14-3 Alteration Domains used for Interpolation looking North at 834859N – Caballito (MMTS, 2021) ..................................................................................................................... 14-10 Figure 14-4 Oxidation Zones used for Interpolation, looking Az=340o – Quema-Quemita (MMTS, 2021) .................................................................................................................................. 14-10 Figure 14-5 Oxidation Zones used for Interpolation, looking Az=020o - La Pava (MMTS, 2021) ........................................................................................................................................... 14-11 Figure 14-6 Oxidation Zones used for Interpolation looking North at 834859N - - Caballito (MMTS, 2021) ..................................................................................................................... 14-11 Figure 14-7 CPP in Quema-Quemita in the Oxide Zone by Alteration Domain – Au (MMTS, 2021) ........................................................................................................................................... 14-13
Updated Cerro Quema Pre-Feasibility Study NI 43-101 Technical Report
Kappes, Cassiday & Associates Contents January, 2022 Page 17
Figure 14-8 CPP in Quema-Quemita in the Oxide Zone by Alteration Domain – Ag (MMTS, 2021) ........................................................................................................................................... 14-13 Figure 14-9 CPP of Caballito in the Sulphide Zone by Alteration Domain – Cu (MMTS, 2021) .... ........................................................................................................................................... 14-14 Figure 14-10 CPP of Idaida in the Sulphide Zone by Alteration Domain – Cu (MMTS, 2021) ...... ........................................................................................................................................... 14-14 Figure 14-11 Histogram of Assay Lengths (MMTS, 2021) .................................................. 14-17 Figure 14-12 Core Recovery Zones used for Density Assignments – Quema-Quemita (MMTS, 2021) .................................................................................................................................. 14-18 Figure 14-13 Correlogram Models of Major and Minor Axes for Au in the SV Domain – Quema-Quemita (MMTS, 2021) ....................................................................................................... 14-21 Figure 14-14 Correlogram Models of the Major and Minor Axis for Au in the SV Domain – La Pava (MMTS, 2021) ............................................................................................................ 14-22 Figure 14-15 Correlogram Models of the Major and Minor Axis for Cu in Sulphides – Caballito (MMTS, 2021) ..................................................................................................................... 14-23 Figure 14-16 Classification – Quema-Quemita (MMTS, 2021) ........................................... 14-29 Figure 14-17 Classification – La Pava (MMTS, 2021) ........................................................ 14-30 Figure 14-18 Classification – Caballito (MMTS, 2021) ........................................................ 14-30 Figure 14-19 Grade-Tonnage Curve – Quema-Quemita – Au (MMTS, 2021) .................... 14-32 Figure 14-20 Grade-Tonnage Curve – Quema-Quemita – Ag (MMTS, 2021) .................... 14-32 Figure 14-21 Grade-Tonnage Curve – La Pava – Au (MMTS, 2021) .................................. 14-33 Figure 14-22 Grade-Tonnage Curve – La Pava – Ag (MMTS, 2021) .................................. 14-33 Figure 14-23 Grade-Tonnage Curve – Caballito – Cu (MMTS, 2021) ................................. 14-34 Figure 14-24 Grade-Tonnage Curve – La Pava – Au (MMTS, 2021) .................................. 14-34 Figure 14-25 Grade-Tonnage Curve – La Pava – Ag (MMTS, 2021) .................................. 14-35 Figure 14-26 Section at 553020E – Quema-Quemita – Comparison of Modelled and Composite Au (MMTS, 2021) ................................................................................................................ 14-36 Figure 14-27 Section at 553020E – Quema-Quemita – Comparison of Modelled and Composite Ag (MMTS, 2021) ................................................................................................................ 14-36 Figure 14-28 Section at 553160E – Quema-Quemita – Comparison of Modelled and Composite Au (MMTS, 2021) ................................................................................................................ 14-37 Figure 14-29 Section at 553160E – Quema-Quemita – Comparison of Modelled and Composite Ag Grades (+/- 15m) (MMTS, 2021) .................................................................................... 14-37 Figure 14-30 Section at 553020E – La Pava – Comparison of Modelled and Composite Au (MMTS, 2021) ..................................................................................................................... 14-38 Figure 14-31 Section at 553020E – Caballito – Comparison of Modelled and Composite Cu (MMTS, 2021) ..................................................................................................................... 14-38 Figure 16-1 La Pava Pit Shell Resource (MMTS, 2021) ....................................................... 16-5 Figure 16-2 Quema Pit Shell Pit Resource by % Case (MMTS, 2021) ................................. 16-5 Figure 16-3 La Pava 90% Price Case Pit Shell (MMTS, 2021) ............................................. 16-6
Updated Cerro Quema Pre-Feasibility Study NI 43-101 Technical Report
Kappes, Cassiday & Associates Contents January, 2022 Page 18
Figure 16-4 Quema 90% Price Case Pit Shell (MMTS, 2021) .............................................. 16-7 Figure 16-5 Quema Access Cut Phase 1 (MMTS, 2021) .................................................... 16-11 Figure 16-6 Quema Ultimate Pit, All Phases (MMTS, 2021) ............................................... 16-12 Figure 16-7 La Pava Access Cut and Phase 1 (MMTS, 2021) ........................................... 16-13 Figure 16-8 La Pava Addition of Phase 2E and 2W (MMTS, 2021) .................................... 16-14 Figure 16-9 La Pava Ultimate Pit, all Phases (MMTS, 2021) .............................................. 16-15 Figure 16-10 WRD Location (MMTS, 2021) ....................................................................... 16-16 Figure 16-11 La Pava Backfill Shapes (MMTS, 2021) ........................................................ 16-17 Figure 16-12 ROM Stockpiles (KCA, 2021) ........................................................................ 16-18 Figure 16-13 Material Movement and NSR grade by Year (MMTS, 2021) .......................... 16-21 Figure 16-14 Quema Pit, End of Year -1 (MMTS, 2021) ..................................................... 16-23 Figure 16-15 Quema Pit, End of Year 1 (MMTS, 2021) ...................................................... 16-24 Figure 16-16 La Pava Pit, End of Year 1 (MMTS, 2021) .................................................... 16-25 Figure 16-17 Quema Pit, End of Year 4 (MMTS, 2021) ...................................................... 16-26 Figure 16-18 La Pava Pit, End of Year 4 (MMTS, 2021) .................................................... 16-26 Figure 16-19 Quema Pit, End of Year 7 (LOM) (MMTS, 2021) ........................................... 16-27 Figure 16-20 La Pava Pit, End of Year 7 (LOM) (MMTS, 2021) ......................................... 16-28 Figure 16-21 Mine Operations Organizational Chart (MMTS, 2021) ................................... 16-39 Figure 17-1 Crushing and Conveying General Arrangement (KCA, 2021) ............................ 17-4 Figure 17-2 Process General Arrangement (KCA, 2021) ..................................................... 17-5 Figure 17-3 Simplified Process Flowsheet (KCA, 2021) ....................................................... 17-6 Figure 17-4 Maricela HLF - Plan View (AA, 2021) .............................................................. 17-10 Figure 17-5 Maricela HLF – Section (AA, 2021) ................................................................. 17-11 Figure 17-6 HLF Active Plant Process Flow Diagram (LE, 2021) ....................................... 17-19 Figure 17-7 HLF Active Plant General Arrangement (LE, 2021) ......................................... 17-19 Figure 17-8 WRD Active Plant Process Flow Diagram (LE, 2021) ...................................... 17-21 Figure 17-9 WRD Active Plant General Arrangement (LE, 2021) ....................................... 17-22 Figure 17-10 WRD PTS Process Flow Diagram (LE, 2021) ............................................... 17-23 Figure 17-11 HLF PTS Process Flow Diagram (LE, 2021) ................................................. 17-24 Figure 17-12 WRD PTS Layout (LE, 2021) ........................................................................ 17-24 Figure 17-13 HLF PTS Layout (LE, 2021) .......................................................................... 17-25 Figure 18-1 Cerro Quema Project General Arrangement (KCA, 2021) ................................. 18-5 Figure 18-2 Upper Chontal WRD - Plan View (AA, 2021) ................................................... 18-14 Figure 18-3 Upper Chontal WRD – Section (AA, 2021) ...................................................... 18-15 Figure 20-1 Site Drainages and Surface Water Monitoring Locations (HGL, 2021) .............. 20-4 Figure 20-2 Site Wide Water Balance Operational Conceptual Model (HGL 2021a) .......... 20-11 Figure 20-3 Cerro Quema Project Closure Schedule (KCA, 2021) ..................................... 20-20 Figure 20-4 La Pava Pit and Externally Draining Areas (HGL, 2021) ................................. 20-22 Figure 20-5 Location of Communities in the Project’s AoI (SNC, 2015) .............................. 20-37 Figure 20-6 Current Land Use in the Project’s AoI (SNC, 2015) ......................................... 20-38
Updated Cerro Quema Pre-Feasibility Study NI 43-101 Technical Report
Kappes, Cassiday & Associates Contents January, 2022 Page 19
Figure 20-7 Economic Activities in the Project’s AoI (SNC, 2015) ...................................... 20-43 Figure 20-8 Average Income in the Project’s AoI (SNC, 2015) ........................................... 20-44 Figure 20-9 Fish Consumption from the rivers or creeks in the Project’s AoI (SNC, 2015) . 20-45 Figure 20-10 Household leader Project perception – July 2014 (SNC, 2015) ..................... 20-47 Figure 22-1 Annual Gold Production, Equivalent Ounces (KCA, 2021) ................................ 22-9 Figure 22-2 After-Tax Sensitivity – IRR (KCA, 2021) .......................................................... 22-14 Figure 22-3 After-Tax Sensitivity – NPV @ 5% (KCA, 2021) .............................................. 22-14 Figure 24-1 Project Development & Implementation Schedule (KCA, 2021) ........................ 24-5

Updated Cerro Quema Pre-Feasibility Study NI 43-101 Technical Report
Kappes, Cassiday & Associates Contents January, 2022 Page 20
TABLES Table 1-1 Oxide & Mixed Resource Estimate for the Project (effective date: November 2, 2021) ............................................................................................................................................... 1-9 Table 1-2 Sulphide Resource Estimate for the Project (effective date: November 2, 2021) .. 1-10 Table 1-3 Cerro Quema Mineral Reserve Statement ............................................................ 1-11 Table 1-4 Capital Cost Summary ......................................................................................... 1-15 Table 1-5 Operating Cost Summary ..................................................................................... 1-16 Table 1-6 Economic Analysis Summary ............................................................................... 1-18 Table 1-7 Drilling Budget ...................................................................................................... 1-24 Table 1-8 ERM Recommendations ...................................................................................... 1-28 Table 4-1 Listing of Mining Concessions ................................................................................ 4-4 Table 6-1 Summary of Historic Metallurgical Testwork ........................................................... 6-4 Table 6-2 Mineral Resource and Mineral Reserve, 2014 PFS ................................................ 6-6 Table 9-1 Summary of Geophysical Surveys ......................................................................... 9-2 Table 10-1 Summary of Drilling Quema Deposit .................................................................. 10-2 Table 10-2 Summary of Drilling in Pava Deposit .................................................................. 10-4 Table 10-3 Summary of Drilling Caballito Deposit ................................................................ 10-5 Table 10-4 Summary of Remaining Drilling .......................................................................... 10-7 Table 11-1 Cerro Quema QAQC Sample Summary ............................................................. 11-3 Table 11-2 La Pava Deposit CRM Analysis Results Gold .................................................... 11-5 Table 11-3 La Pava Deposit CRM Analysis Results Copper ................................................ 11-9 Table 11-4 La Pava Deposit Duplicates Simple Statistics .................................................. 11-10 Table 11-5 Quema-Quemita Deposit CRM Analysis Results Gold ..................................... 11-14 Table 11-6 Quema-Quemita Deposit CRM Analysis Results Copper ................................. 11-17 Table 11-7 Quema-Quemita Deposit Duplicates Simple Statistics ..................................... 11-19 Table 11-8 Caballito Deposit CRM Analysis Results Gold .................................................. 11-23 Table 11-9 Caballito Deposit CRM Analysis Results Copper .............................................. 11-24 Table 11-10 Caballito Duplicates Simple Statistics ............................................................. 11-25 Table 12-1 2011-2012 Assays During Period of Poor CRM Performance ............................ 12-5 Table 12-2 2010 Verification Twinned Holes ........................................................................ 12-7 Table 13-1 Summary of Process Test Work ......................................................................... 13-2 Table 13-2 Domain Types in Mineralized Pits ...................................................................... 13-3 Table 13-3 Cerro Quema Individual Column Test Results - Gold ......................................... 13-4 Table 13-4 Cerro Quema Individual Column Test Results - Silver ........................................ 13-5 Table 13-5 Summary of Cerro Quema Column Test Results ................................................ 13-6 Table 13-6 Summary of Cerro Quema Bottle Roll Test Results .......................................... 13-10 Table 13-7 Crushing Work Index, Allis Mineral Systems 1995 ........................................... 13-11 Table 13-8 Abrasion Index Testing, Allis Mineral Systems 1995 ........................................ 13-12 Table 13-9 Abrasion Index Testing, ALS Metallurgy 2014 .................................................. 13-12
Updated Cerro Quema Pre-Feasibility Study NI 43-101 Technical Report
Kappes, Cassiday & Associates Contents January, 2022 Page 21
Table 13-10 Cerro Quema Leach Cycle Result Summary .................................................. 13-14 Table 13-14 Cerro Quema Laboratory and Field Metals Recovery Summary ..................... 13-15 Table 13-15 Permeability of Silica-Clay Composites .......................................................... 13-17 Table 13-11 Rougher Flotation Test Summary ................................................................... 13-21 Table 13-12 Cleaner Flotation Test Summary .................................................................... 13-21 Table 13-13 Cyanidation Test Summary ............................................................................ 13-22 Table 14-1 Oxide & Mixed Resource Estimate for the Project (effective date: November 2, 2021) ............................................................................................................................................. 14-2 Table 14-2 Sulphide Resource Estimate for the Project (effective date: November 2, 2021) 14-2 Table 14-3 Indicated Resource - Oxides .............................................................................. 14-3 Table 14-4 Indicated Resource – Mixed Zone ...................................................................... 14-4 Table 14-5 Indicated Resource – Sulphide Zone .................................................................. 14-4 Table 14-6 Inferred Resource – Oxide Zone ........................................................................ 14-5 Table 14-7 Inferred Resource – Mixed Zone ........................................................................ 14-6 Table 14-8 Inferred Resource – Sulphide Zone .................................................................... 14-6 Table 14-9 Summary of DH and Assays used for the Quema-Quemita Resource Estimate . 14-7 Table 14-10 Summary of DH and Assays used for the La Pava Resource Estimate ............ 14-7 Table 14-11 Summary of DH and Assays used for the Caballito Resource Estimate ........... 14-7 Table 14-12 Summary of Interpolation Domains .................................................................. 14-8 Table 14-13 Summary of Capping at Caballito / Idaida ...................................................... 14-12 Table 14-14 Summary Statistics of Assays and Composites – Quema-Quemita ................ 14-15 Table 14-15 Summary Statistics of Assays and Composites – La Pava ............................. 14-16 Table 14-16 Density by Deposit, Zone and Recovery......................................................... 14-18 Table 14-17 Summary of Block Model Extents ................................................................... 14-19 Table 14-18 Summary of Outlier Restriction Values ........................................................... 14-20 Table 14-19 Variogram Parameters for Quema-Quemita ................................................... 14-24 Table 14-20 Variogram Parameters for La Pava ................................................................ 14-25 Table 14-21 Rotation Parameters for Caballito ................................................................... 14-25 Table 14-22 Variogram Parameters for Caballito ............................................................... 14-26 Table 14-23 Search Parameters for Quema-Quemita ........................................................ 14-27 Table 14-24 Search Parameters for La Pava ..................................................................... 14-27 Table 14-25 Search Parameters for Caballito .................................................................... 14-28 Table 14-26 Sample Selection Criteria for Interpolations .................................................... 14-28 Table 14-27 Global Grade Comparison .............................................................................. 14-31 Table 14-28 Summary of Base Case Economic Inputs for NSR Calculation ...................... 14-39 Table 14-29 Summary of Cost Parameters used for Lerchs-Grossman Pits ....................... 14-40 Table 14-30 List of Risks and Mitigations/Justifications ...................................................... 14-41 Table 15-1 Metal Prices and NSP (in US$) .......................................................................... 15-1 Table 15-2 Process Recoveries for NSR Coding .................................................................. 15-1 Table 15-3 NSR Cut-off Grade by Pit Area and Zone ........................................................... 15-2
Updated Cerro Quema Pre-Feasibility Study NI 43-101 Technical Report
Kappes, Cassiday & Associates Contents January, 2022 Page 22
Table 15-4 Dilution Grades by Pit Area ................................................................................ 15-3 Table 15-5 Cerro Quema Mineral Reserve Statement .......................................................... 15-4 Table 16-1 LG Operating Cost Inputs ................................................................................... 16-2 Table 16-2 LG Price Cases .................................................................................................. 16-4 Table 16-3 Economic Pit Limit Contents (90% Price Case) .................................................. 16-6 Table 16-4 Pit Shell Contents by Slope Angle ...................................................................... 16-7 Table 16-5 Slope Parameters .............................................................................................. 16-8 Table 16-6 In-Pit Haul Road Design Widths ......................................................................... 16-9 Table 16-7 Production Schedule Summary ........................................................................ 16-20 Table 16-8 Production Schedule Summary, by Pit Area ..................................................... 16-22 Table 16-9 Drilling Parameters ........................................................................................... 16-30 Table 16-10 Blasting Parameters ....................................................................................... 16-31 Table 16-11 Loader Productivity Assumptions ................................................................... 16-33 Table 16-12 Hauler Cycle Time Assumptions..................................................................... 16-34 Table 16-13 Support and Ancillary Mine Fleet Utilization ................................................... 16-36 Table 16-14 Operations Setup for Equipment Utilization Planning ..................................... 16-38 Table 17-1 Processing Design Criteria Summary ................................................................. 17-1 Table 17-2 Maricela HLF Design Specifications ................................................................... 17-9 Table 17-3 Total Required Storage Volumes in Process Ponds ......................................... 17-13 Table 17-4 Cerro Quema – Water Treatment – Basis of Design ........................................ 17-16 Table 17-5 Projected Annual Reagents and Consumables ................................................ 17-31 Table 18-1 Haul Road Material Density Inputs ..................................................................... 18-2 Table 18-2 Ex-Pit Haul Road Construction Quantities .......................................................... 18-3 Table 18-3 Cerro Quema Power Demand by Phase .......................................................... 18-12 Table 18-4 Upper Chontal WRD design specifications ....................................................... 18-13 Table 20-1 Cerro Quema Precipitation and Pan Evaporation ............................................... 20-2 Table 20-2 Protected Flora Species in Project Area ............................................................. 20-7 Table 20-3 Protected Fauna in Project Area ........................................................................ 20-9 Table 20-4 Summary of Cerro Quema Closure Costs ........................................................ 20-30 Table 20-5 Energy Service in the Project’s AoI as per Census 2010 .................................. 20-42 Table 20-6 Fish Consumed by the 12 Communities Surveyed in the Project’s AoI ............. 20-45 Table 20-7 Anticipated Social Impacts and Risks ............................................................... 20-48 Table 21-1 Capital Cost Summary ....................................................................................... 21-1 Table 21-2 Operating Cost Summary ................................................................................... 21-1 Table 21-3 Summary of Pre-Production Capital Costs by Area ............................................ 21-3 Table 21-4 Summary of Mining Initial and Sustaining Capital ............................................... 21-4 Table 21-5 Capitalized Pre-Production Mining Costs Break Down ....................................... 21-5 Table 21-6 Capitalized GME Items ....................................................................................... 21-5 Table 21-7 Mine Fleet Initial Capital Units, Capital, and Operating Costs ............................. 21-6 Table 21-8 Capitalized Miscellaneous Mining Equipment ..................................................... 21-7

Updated Cerro Quema Pre-Feasibility Study NI 43-101 Technical Report
Kappes, Cassiday & Associates Contents January, 2022 Page 23
Table 21-9 Process & Infrastructure Pre-Production Capital Costs by Discipline .................. 21-8 Table 21-10 CAPEX – WRD Active, 320 m³/hr Capacity .................................................... 21-11 Table 21-11 CAPEX – HLF Active, 80 m³/hr Capacity ........................................................ 21-12 Table 21-12 CAPEX – WRD Passive, 20 m³/hr Capacity ................................................... 21-12 Table 21-13 CAPEX – HLF Passive, 20 m³/hr Capacity ..................................................... 21-13 Table 21-14 Process Mobile Equipment ............................................................................. 21-15 Table 21-15 Process & Infrastructure Contingency ............................................................ 21-16 Table 21-16 Construction Indirect Costs ............................................................................ 21-17 Table 21-17 Initial Fills ....................................................................................................... 21-18 Table 21-18 Labour Hourly................................................................................................. 21-21 Table 21-19 Labour Salaried .............................................................................................. 21-21 Table 21-20 Summarized Mining Operating Costs (During Production) ............................. 21-23 Table 21-21 Mining Costs per Tonne Material Mined (US$/Tonne) .................................... 21-23 Table 21-22 Mining Costs per Tonne Material Milled (US$/Tonne) .................................... 21-23 Table 21-23 Average Process, Support & G&A Operating Cost ......................................... 21-24 Table 21-24 Personnel & Staffing Summary ...................................................................... 21-26 Table 21-25 OPEX – WRD Active, 320 m³/hr Capacity ...................................................... 21-30 Table 21-26 OPEX – HLF Active, 80 m³/hr Capacity .......................................................... 21-30 Table 21-27 OPEX – WRD & HLF Passive Treatment, 20 m³/hr Capacity – Cost for Each 21-31 Table 22-1 Key Economic Parameters ................................................................................. 22-2 Table 22-2 Economic Analysis Summary ............................................................................. 22-3 Table 22-3 Capital Expenditures Summary .......................................................................... 22-7 Table 22-4 Operating Cost Summary ................................................................................... 22-8 Table 22-5 Cashflow Model Summary ............................................................................... 22-11 Table 22-6 Sensitivity Analysis (After Tax) ......................................................................... 22-13 Table 26-1 Exploration and Infill Drilling Budget ................................................................... 26-2 Table 26-2 ERM Recommendations .................................................................................... 26-5
Updated Cerro Quema Pre-Feasibility Study NI 43-101 Technical Report
Kappes, Cassiday & Associates 1.0 Summary January, 2022 Page 1-1
1.0 EXECUTIVE SUMMARY
Introduction & Overview
The Cerro Quema deposit is 100% owned by Orla Mining Ltd. (Orla) through its subsidiary Minera Cerro Quema SA (MCQ). This Technical Report is an update of a previously completed Technical Report and Pre-Feasibility Study on the Cerro Quema deposit. The scope of this updated study includes the addition of sulphide resources from the Caballito Project. The development of a gold oxide mine production schedule and the costing for all mining, process and infrastructure required for the Cerro Quema operation has not changed in this updated Technical Report and was previously prepared by Kappes, Cassiday and Associates (KCA), Moose Mountain Technical Services (Moose Mountain or MMTS), Resource Geosciences Incorporated (RGI), Anddes Asociados SAC (Anddes or AA), HydroGeoLogica (HGL), Linkan Engineering (Linkan) and Environmental Resources Management (ERM) with input from other consultant groups. Revisions to this Technical Report were prepared by MMTS, KCA and RGI with review by the other groups. This Technical Report has been prepared at the request of Orla and forms the basis of an updated NI 43-101 Technical Report in accordance with disclosure and reporting requirements set forth in the Canadian Securities Administrations’ current “Standards of Disclosure for Mineral Projects” under the provisions of National Instrument 43-101, Companion Policy 43-101 CP and Form 43-101F1 and supersedes a Technical Report prepared by KCA dated 27 July 2021, “Project Pre-Feasibility NI 43-101 Technical Report on the Cerro Quema Gold Oxide Project, Province of Los Santos, Panama”. The project considers open pit mining of 21.7 million tonnes of ore from the La Pava and Quema-Quemita pits and will be developed in multiple phases. Ore will be crushed in a single stage and lime will be added to the crushed ore for pH control before being conveyor stacked and leached with a dilute cyanide solution. Pregnant leach solution will flow by gravity to a pregnant solution pond and is then pumped to an ADR (Adsorption, Desorption, Recovery) plant for recovery of metal values. Gold and silver will be loaded onto activated carbon (Adsorption) and then periodically stripped from the carbon in a desorption circuit (Desorption), electrowon (Recovery) and smelted to produce the final doré product. Based on an established processing rate of 10,000 tonnes/day ore, the project has an estimated six-year mine life.
Updated Cerro Quema Pre-Feasibility Study NI 43-101 Technical Report
Kappes, Cassiday & Associates 1.0 Summary January, 2022 Page 1-2
Property Description and Location
The Cerro Quema property is located in the Azuero Peninsula, Los Santos Province, Panama, 45 km S-SW of the village of Chitré. The property lies 193 straight line kilometres (km) SW of Panama City, 45 km S-SW of the town of Chitré. (Figure 4.1). Driving distance from Panama City is 255 km. The Project area is centered at approximately 551500E 835500N UTM WGS84 Zone 17N. The Cerro Quema Project comprises three contracts between the Republic of Panama and MCQ that grant exclusive rights for mineral extraction of class IV metallic minerals (silver and gold) over 14,893 hectares (ha), dated between February 26, 1997 and March 3, 1997. The original 20-year term for the concessions expired on February 26, 2017 (Contracts 19 and 20) and March 3, 2017 (Contract 21). MCQ has applied for the prescribed 10-year extension to these contracts as it is entitled to under Panamanian mineral law. The renewal of the mining rights has been duly accredited by the Minister of Commerce and the renewal is pending endorsement by the Comptroller General of the Nation. MCQ owns the surface rights for 2,274.5 ha of the land required to mine the Cerro Quema Mineral Reserves discussed in Section 15.0 of this Technical Report and to construct and operate a heap leach facility and part of the land required for proposed upgrades to the project access road.
Accessibility, Climate, Local Resources and Physiography
The Cerro Quema project is located in the Los Santos Province, Panama, 82 km by road from Chitré, of which 75 km are on paved Federal highways. A 7 km unsurfaced road connects the project to the Federal highway. With the exception of temporal road closings during extreme rain events, the project is road accessible through all seasons. Equipment and supplies can be internationally sourced, shipped through the Panama Canal, and then trucked to site. Road access within the project area is limited to exploration drill roads. The climate is tropical. A high-humidity wet season occurs between mid-May and November and the majority of annual precipitation occurs during this period. The warm dry season occurs between December and mid-May. The average annual precipitation at the Cerro Quema project site is about 2,233 mm with September and October typically the wettest months and January through March the driest. Average maximum and minimum monthly temperatures during the rainy season range from 34°C to 20°C respectively, whereas during the dry season average maximum and minimum monthly temperatures range from 34°C to 19°C. The Property is moderately rugged and mountainous (Figure 5-2), comprising an elongate E-NE trending highland bounded to the north and to the west by the Rio Quema, and to the south by an E-NE trending unnamed drainage. The terrain is characterized by steep slopes, incised
Updated Cerro Quema Pre-Feasibility Study NI 43-101 Technical Report
Kappes, Cassiday & Associates 1.0 Summary January, 2022 Page 1-3
drainages, and an elevation range from 200 masl along the Rio Quema to 950 masl at the Cerro Quema peak where the Quemita deposit crops out. Macaracas and Tonosí are the largest towns near the project and are the local commercial centers for their respective districts with dispersed population of approximately 10,000 persons each. Basic goods can be acquired in these villages, but most exploration and operating supplies will be sourced from Chitré or Panama City via Chitré, which provides basic commercial services to a regional population of approximately 80,000 and has regular commercial air service with daily flights to Panama City. A helipad at the MCQ camp allows helicopter access for emergency services. MCQ has a main camp site and administration offices located near the Project area. This includes: administration and geology offices; accommodation facilities; kitchen and recreational facilities; helipad; an equipment laydown area; geological sample logging and storage facilities; workshop and support facilities, all under the control of MCQ. The camp and offices are connected to the electric grid and have back up emergency generators.
History
Cerro Quema was initially identified as a potential economic mineral deposit during United Nations supported national surveys in the late 1960’s. The Compañía de Exploración Minera, S.A. (CEMSA) investigated the area in 1986 and obtained the exploration concession for Cerro Quema in 1988. Cyprus Minerals Company (Cyprus) formed a joint venture with CEMSA in 1990 through Cyprus Minera de Panama, S.A. (Cyprus Minera). From 1990 to 1994, Cyprus Minera conducted advanced exploration drilling of the La Pava, Quema and Quemita zones. Cyprus Minera merged with Amax Gold Inc. (Amax) in 1993 to form Cyprus Amax Minerals and formed Minera Cerro Quema S.A. (MCQ) to proceed with permitting and development. Campbell Resources Inc. (Campbell) purchased the right of first refusal on the Project from CEMSA and subsequently exercised that right when Cyprus Minera put the property up for sale in 1996. Campbell subsequently earned a 100% interest in the Project, carried out an infill drilling program to further define the resources, and completed a Project Feasibility Study. Campbell sold its 100% interest in the Project to Carena Equities Corporation of Panama (Carena) in August 2001. RNC Resources Ltd. (RNC) entered into an agreement with Carena in January 2002 wherein RNC agreed to complete a “bankable” Feasibility Study on the Cerro Quema Project and to place the Project into production for a 50% participation in the Project. On September 27, 2007, Bellhaven signed a definitive agreement with Carena to acquire a 40% interest in the Project. Pershimco Resources Inc. acquired the property in September 2010 through an agreement with Bellhaven, RNC, Carena, MCQ, Central Sun Mining Inc. and Julio Benedetti to acquire all interests in the Cerro Quema Mining Project held by the corporation MCQ. Under the terms of this agreement, Pershimco acquired all interests and obligations of MCQ.
Updated Cerro Quema Pre-Feasibility Study NI 43-101 Technical Report
Kappes, Cassiday & Associates 1.0 Summary January, 2022 Page 1-4
In 2014 Pershimco publicly released a Pre-Feasibility Study (PFS) which disclosed a Mineral Resource and Mineral Reserve for the Project. The PFS reported Measured and Indicated Resources included 552,000 oxide-derived ounces of gold and Proven and Probable Reserves of 488,000 ounces of gold. Since the effective date of the 2014 PFS, significant additional drillhole data has become available, rendering the 2014 Mineral Resource and Mineral Reserve obsolete. The 2014 Resource and Reserve estimate are not current, have not been verified by the authors, and should not be relied upon. Orla is not treating the 2014 estimates as current estimates. The 2014 Mineral Resource and Mineral Reserve is superseded by the current Mineral Resource and Mineral Reserve described in Sections 13.13 and 15.0 of this Technical Report. On September 14, 2016, Orla and Pershimco entered into a definitive arrangement agreement to amalgamate the two companies by way of a court-approved arrangement. On December 6, 2016, Orla announced the completion of the arrangement and Minera Cerro Quema SA is now a wholly owned subsidiary of Orla, thus the property is 100% owned by Orla. On September 7, 2021, Orla filed a National Instrument 43-101 Technical Report comprising a Pre-Feasibility Study for its Cerro Quema Oxide Gold Project. This Technical Report is an update to the 7 September 2021 report, differing only in the addition of a Mineral Resource estimate for the Caballito Cu-Au deposit.
Geological Setting
Panama is located at the junction of 4 tectonic plates, the South American, Caribbean, Cocos, and Nazca plates. Late Cretaceous subduction of the Farallon plate (remnants of which today are the Cocos and Nazca plates) beneath the Caribbean plate triggered development of a volcanic arc. Radiometric ages dates of arc-related volcanic rocks indicate that onset of subduction was approximately 75Ma. The Cerro Quema project is located on the Panamanian Azuero Peninsula, which has been interpreted to be the uplifted western margin of the Caribbean plate. Subduction related compression and transpression along the South Panama Deformed Belt, where the Nazca plate meets the Panama micro-plate, is likely responsible for the major tectonic structures, including faults and folds, observed in the Azuero Peninsula. The subduction of the Farallon plate and subsequent volcanic arc formation resulted in deposition of arc-related intrusive, volcanic and volcanoclastic sequences within and upon the uplifted basement of the Azuero Peninsula. The Cerro Quema Au deposits are hosted exclusively in rocks that are part of a submarine dacitic dome complex developed upon marine sandstones and siltstones. These rocks are exposed in
Updated Cerro Quema Pre-Feasibility Study NI 43-101 Technical Report
Kappes, Cassiday & Associates 1.0 Summary January, 2022 Page 1-5
an elongate E-W trending belt north of and parallel to the Rio Joaquin Fault, a reverse movement, dip-slip fault that has juxtaposed Azuero igneous basement against the Azuero arc group units.
Mineralization
Discrete gold mineralized zones have been identified by drilling and surface mapping along an E-W trending zone of hydrothermal alteration of dacitic volcanic rocks of the Rio Quema Formation. The mineralized belt extends from La Pava West at the western end to La Pelona, 11 km further east. Distinct styles of mineralization observed today are due primarily to supergene effects on the primary mineralization. The known mineralized zones (Pava, Quema-Quemita, Idaida-Caballito, Pelona) were likely similar to Caballito before oxidation. Three mineralization styles are observed:
1. Epithermal high sulfidation Au mineralization, associated with variably intensely developed advanced argillic alteration of dacitic rocks with local areas of silicification and leaching resulting in vuggy silica alteration typical of high sulfidation epithermal deposits. This style is manifested in the mineralized deposits at La Pava and Quema-Quemita
2. Cu-Au mineralization, exemplified by the Idaida-Caballito mineralized zone, differs from
the other mineralized zones in its relatively high Cu content and a strong Cu-Au association. Copper mineralization is associated with hypogene pyrite, bornite, chalcopyrite, and enargite and occurs as an irregular breccia body with sulphide cement. Type 2 mineralization post dates formation of the Type 1 high sulfidation mineralization and is superimposed upon it but formed as part of the same mineralizing event.
3. Cu-Au mineralization as seen at La Prieta, an altered and mineralized zone centred upon
a Miocene quartz diorite intrusion, 2.6 km south of the main E-W belt of mineralization. Disseminated and fracture-controlled pyrite and chalcopyrite is associated with intermediate argillic alteration. This mineralized zone has not been studied in detail or drilled.
Deposit Types
The observed geological and geochemical characteristics of the La Pava and Quema-Quemita gold deposits at Cerro Quema are consistent with those of volcanic hosted, epithermal, high sulfidation (HS) gold-silver deposits. The Caballito Cu-Au sulphide deposit is preserved below unaltered Rio Quema dacitic dome rocks and is interpreted to represent the proxy for an eroded and oxidized La Pava and Quemita high-sulphidation Au deposit.

Updated Cerro Quema Pre-Feasibility Study NI 43-101 Technical Report
Kappes, Cassiday & Associates 1.0 Summary January, 2022 Page 1-6
Exploration and Drilling
The Cerro Quema deposit was discovered by researchers and private companies following up on anomalous results from a 1965 regional stream sediment geochemical survey of the Azuero Peninsula conducted by the United Nations Development Program. The Cyprus Minerals company conducted the first known exploration drilling at the project in 1990, and during the period 1990 to 1994, Cyprus completed geologic mapping and geochemical studies and a total of 7,228 metres (m) of at Quema-Quemita, 16,171 metres of drilling at La Pava and 248 metres of drilling at Caballito. Active exploration resumed in 2010 when Pershimco acquired the project. Pershimco’s exploration efforts included drilling, lithological and structural mapping, channel sampling and geochemical sampling, and airborne geophysics including radiometric, magnetic and VTEM surveys over the entire property. Following the completion of airborne geophysical studies in early 2012, Pershimco conducted ground IP surveys on various geophysical targets. A total of 144.6 line-km of IP survey work was completed, 66.9 km at Quema-Quemita and Idaida, 57.1 km at La Pelona and 20.6 km at La Pava. The IP geophysics program identified resistivity and chargeability anomalies on all four target areas. In 2014, a regional mapping and surface rock chip sampling program focused on a first-pass reconnaissance investigation over the priority targets identified by the airborne geophysical survey. A total of 12,307 line-metres were mapped and a total of 1,204 surface rock chip samples were collected. Pershimco completed 16,905 metres of drilling at Quema-Quemita, 32,710 metres of drilling at La Pava and 816 metres of drilling at Caballito. Since acquiring the project, Orla has completed a total of 8,117 metres in 64 diamond core drillholes at the Quema-Quemita deposit; and 4,454 metres in 23 diamond core drillholes at the Caballito deposit. Orla has also completed metallurgical sampling drill programs of 345.6 metres in three diamond core holes at the La Pava deposit and 283.5 metres in three diamond core holes at the Quema deposit. In 2017, 2018 and 2021, Orla completed 158.37 line-km of IP ground surveys and 138.71 line-km of magnetic ground surveys.
Sample Preparation, Analyses and Security
The review and sampling analyses done by the QP concludes that the sampling, preparation and security programs described are consistent with requirements and suitable for resource estimation. Similarly, the QAQC programs employed during 2010 and later assaying at Cerro Quema and Caballito are consistent with the requirements for resource estimation.

Updated Cerro Quema Pre-Feasibility Study NI 43-101 Technical Report
Kappes, Cassiday & Associates 1.0 Summary January, 2022 Page 1-7
Data Verification
The QP for the resource estimate and QAQC visited the site on May 4, 2021. During this visit, collar locations at all three deposits were verified, as were the core storage, security and sampling techniques. Mineralization in the core for each deposit was verified. The database provide to MMTS by Orla Mining has been checked with minor corrections made to the database based on Certificate checks. Check assays and twinned holes done previously, as well as check assays done based on MMTS recommendations in 2020 all conclude that the database is suitable for resource estimation. Historic drilling and RC drilling were validated statistically and did not show a material bias. Therefore, the QP concluded that historic drilling is not bias and it has been used for the resource estimate.
Metallurgical Testing
Cerro Quema
Historical metallurgical test work programs on the Cerro Quema property were commissioned by the prior operators of the Project. A confirmatory metallurgical test program was commissioned by Orla in 2018 to confirm the results and conclusions from the previous campaigns. In total, 43 column leach tests, 67 bottle roll tests and 30 vat leach tests have been completed to date on the Cerro Quema ore body. Based on the metallurgical testing completed on the deposit, key design parameters for the Project include:
• A constant field gold recovery of 88% for all La Pava oxide material and 86% for Quema-Quemita oxides;
• Oxide material from La Pava responds very well to cyanide bottle roll and column leaching yielding high gold extractions and low reagent consumptions;
• La Pava and Quema-Quemita mixed materials are less amenable to heap leaching and are discounted based on sulphur content to recoveries of 57% for La Pava and 62% for Quema-Quemita.
• The data shows no dependence of gold extraction on crush size for the materials and size ranges tested (150 mm to 12.5 mm);
• A constant field silver recovery of 30% for all La Pava oxide material and 15% for Quema-Quemita oxides;
• A constant field silver recovery of 25% for all La Pava mixed material and 10% for Quema-Quemita mixed;
• Silica clay material shows poor permeability and will require blending with silica material to maintain heap permeability without cement agglomeration;
Updated Cerro Quema Pre-Feasibility Study NI 43-101 Technical Report
Kappes, Cassiday & Associates 1.0 Summary January, 2022 Page 1-8
• Design leach cycle of 70 days; • Agglomeration with cement not required for permeability or stability; • Average cyanide consumption of 0.19 kilograms per tonne (kg/t) ore for La Pava, and 0.18
kg/t ore for Quema-Quemita; • Average lime consumption of 1.4 kg/t ore for La Pava and 2.5 kg/t ore for Quema-Quemita.
The key design parameters are based on a substantial number of metallurgical tests including 43 column leach tests on samples representative of domains in the current deposit model. These 43 representative samples from documented drillholes with good spatial distribution in the proposed pit. In general, the Cerro Quema deposit shows variability in gold and silver recoveries based on material type and alteration type with sulphur being the only significant deleterious element identified, which is primarily associated with the mixed material at depth. Recoveries for the oxide material are good and will yield acceptable results using conventional heap leaching methods with cyanide. Recoveries for the mixed material are lower and reagent consumptions are higher when compared with the oxide for conventional leaching.
Caballito
Preliminary flotation and cyanidation tests on samples from the Caballito deposit were completed by Orla in 2018 by Bureau Vertis Commodities Canada Ltd (BV). Based on the results from these tests, the Caballito Resource estimate used metallurgical recoveries within the sulphides of 90% for copper, 55% for gold and 45% for silver and payable metal factors of 90% for gold and 90% for silver and 96% for copper.
Mineral Resource Estimate
The Mineral Resource Estimate (MRE) for the Cerro Quema Project has an effective date of November 2, 2021. La Pava and Quemita consist of an Au-Ag oxide zone and mixed zone. Caballito consists primarily of a Cu-Au-Ag sulphide zone and a minor Au-Ag oxide zone. The sulphide zone for the La Pava and Quemita deposits is not included in this resource estimate. A summary of the total resource is presented in Table 1-1 and Table 1-2 for oxide/mixed and sulphides respectively at the base case NSR cutoff grades as indicated in the table. Sensitivity of the Resource Estimate to cutoff grade is summarized by area and zone in Table 14-3 through Table 14-8. The base case cutoff is highlighted for each deposit and zone. Mineral Resources are reported inclusive of those mineral resources converted to mineral reserves. The Mineral Resource Estimate includes Inferred mineral resources that are considered too speculative geologically to have economic considerations applied to them that would enable them to be categorized as mineral reserves. Mineral Resources that are not Mineral Reserves do not have demonstrated economic viability. Mineral Resources were estimated using the 2019 CIM Best Practice Guidelines and are reported using the 2014 CIM Definition Standards.
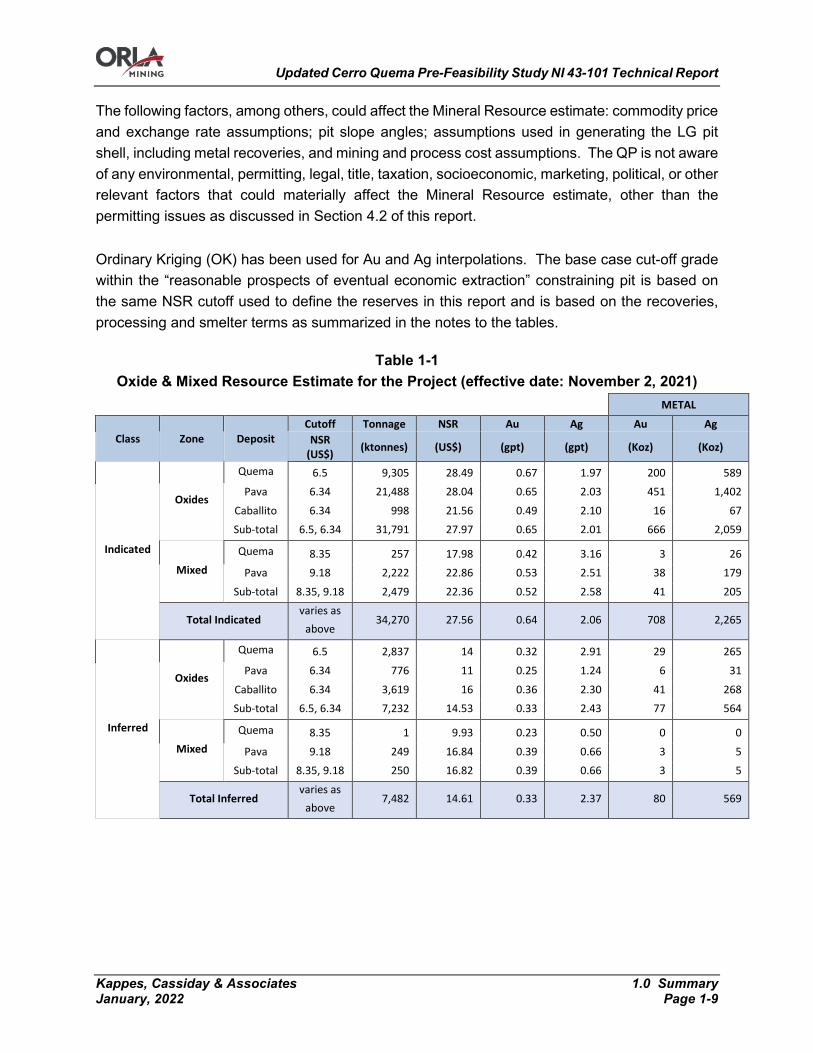
Updated Cerro Quema Pre-Feasibility Study NI 43-101 Technical Report
Kappes, Cassiday & Associates 1.0 Summary January, 2022 Page 1-9
The following factors, among others, could affect the Mineral Resource estimate: commodity price and exchange rate assumptions; pit slope angles; assumptions used in generating the LG pit shell, including metal recoveries, and mining and process cost assumptions. The QP is not aware of any environmental, permitting, legal, title, taxation, socioeconomic, marketing, political, or other relevant factors that could materially affect the Mineral Resource estimate, other than the permitting issues as discussed in Section 4.2 of this report. Ordinary Kriging (OK) has been used for Au and Ag interpolations. The base case cut-off grade within the “reasonable prospects of eventual economic extraction” constraining pit is based on the same NSR cutoff used to define the reserves in this report and is based on the recoveries, processing and smelter terms as summarized in the notes to the tables.
Table 1-1 Oxide & Mixed Resource Estimate for the Project (effective date: November 2, 2021)
METAL
Class Zone Deposit Cutoff Tonnage NSR Au Ag Au Ag
NSR (US$) (ktonnes) (US$) (gpt) (gpt) (Koz) (Koz)
Indicated
Oxides
Quema 6.5 9,305 28.49 0.67 1.97 200 589 Pava 6.34 21,488 28.04 0.65 2.03 451 1,402
Caballito 6.34 998 21.56 0.49 2.10 16 67 Sub-total 6.5, 6.34 31,791 27.97 0.65 2.01 666 2,059
Mixed Quema 8.35 257 17.98 0.42 3.16 3 26
Pava 9.18 2,222 22.86 0.53 2.51 38 179 Sub-total 8.35, 9.18 2,479 22.36 0.52 2.58 41 205
Total Indicated varies as
above 34,270 27.56 0.64 2.06 708 2,265
Inferred
Oxides
Quema 6.5 2,837 14 0.32 2.91 29 265 Pava 6.34 776 11 0.25 1.24 6 31
Caballito 6.34 3,619 16 0.36 2.30 41 268 Sub-total 6.5, 6.34 7,232 14.53 0.33 2.43 77 564
Mixed Quema 8.35 1 9.93 0.23 0.50 0 0
Pava 9.18 249 16.84 0.39 0.66 3 5 Sub-total 8.35, 9.18 250 16.82 0.39 0.66 3 5
Total Inferred varies as
above 7,482 14.61 0.33 2.37 80 569
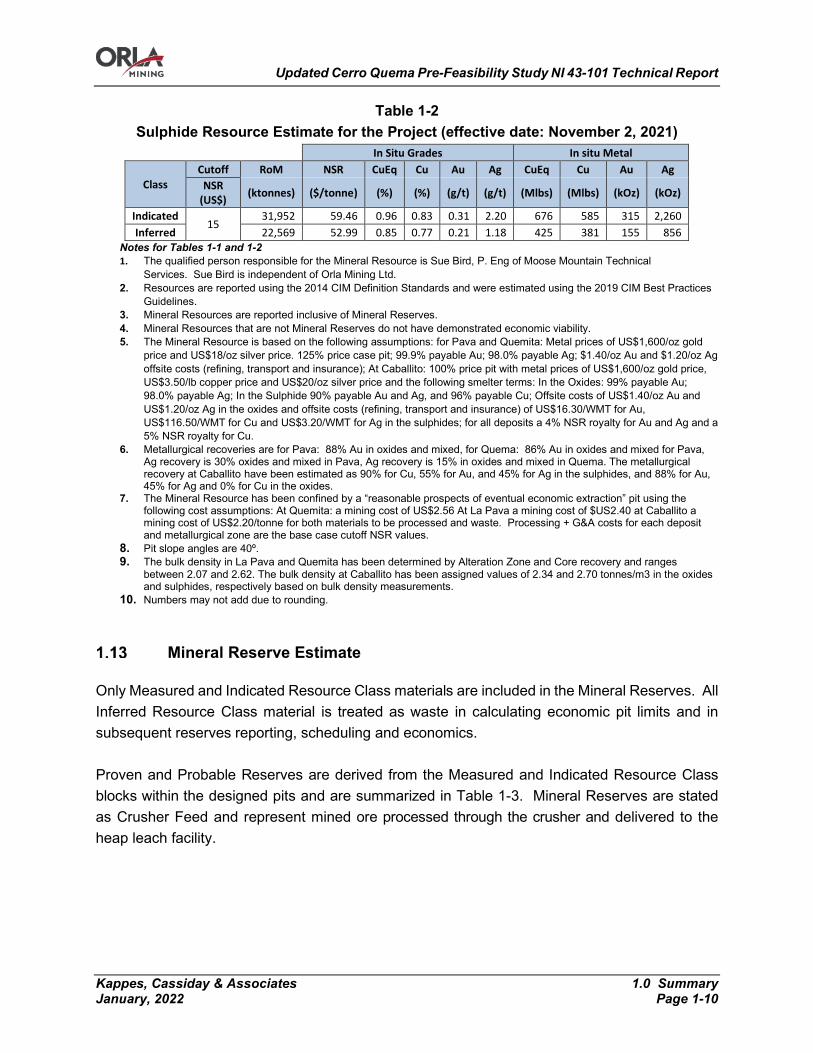
Updated Cerro Quema Pre-Feasibility Study NI 43-101 Technical Report
Kappes, Cassiday & Associates 1.0 Summary January, 2022 Page 1-10
Table 1-2 Sulphide Resource Estimate for the Project (effective date: November 2, 2021)
In Situ Grades In situ Metal
Class Cutoff RoM NSR CuEq Cu Au Ag CuEq Cu Au Ag
NSR (US$) (ktonnes) ($/tonne) (%) (%) (g/t) (g/t) (Mlbs) (Mlbs) (kOz) (kOz)
Indicated 15
31,952 59.46 0.96 0.83 0.31 2.20 676 585 315 2,260 Inferred 22,569 52.99 0.85 0.77 0.21 1.18 425 381 155 856
Notes for Tables 1-1 and 1-2 1. The qualified person responsible for the Mineral Resource is Sue Bird, P. Eng of Moose Mountain Technical
Services. Sue Bird is independent of Orla Mining Ltd. 2. Resources are reported using the 2014 CIM Definition Standards and were estimated using the 2019 CIM Best Practices
Guidelines. 3. Mineral Resources are reported inclusive of Mineral Reserves. 4. Mineral Resources that are not Mineral Reserves do not have demonstrated economic viability. 5. The Mineral Resource is based on the following assumptions: for Pava and Quemita: Metal prices of US$1,600/oz gold
price and US$18/oz silver price. 125% price case pit; 99.9% payable Au; 98.0% payable Ag; $1.40/oz Au and $1.20/oz Ag offsite costs (refining, transport and insurance); At Caballito: 100% price pit with metal prices of US$1,600/oz gold price, US$3.50/lb copper price and US$20/oz silver price and the following smelter terms: In the Oxides: 99% payable Au; 98.0% payable Ag; In the Sulphide 90% payable Au and Ag, and 96% payable Cu; Offsite costs of US$1.40/oz Au and US$1.20/oz Ag in the oxides and offsite costs (refining, transport and insurance) of US$16.30/WMT for Au, US$116.50/WMT for Cu and US$3.20/WMT for Ag in the sulphides; for all deposits a 4% NSR royalty for Au and Ag and a 5% NSR royalty for Cu.
6. Metallurgical recoveries are for Pava: 88% Au in oxides and mixed, for Quema: 86% Au in oxides and mixed for Pava, Ag recovery is 30% oxides and mixed in Pava, Ag recovery is 15% in oxides and mixed in Quema. The metallurgical recovery at Caballito have been estimated as 90% for Cu, 55% for Au, and 45% for Ag in the sulphides, and 88% for Au, 45% for Ag and 0% for Cu in the oxides.
7. The Mineral Resource has been confined by a “reasonable prospects of eventual economic extraction” pit using the following cost assumptions: At Quemita: a mining cost of US$2.56 At La Pava a mining cost of $US2.40 at Caballito a mining cost of US$2.20/tonne for both materials to be processed and waste. Processing + G&A costs for each deposit and metallurgical zone are the base case cutoff NSR values.
8. Pit slope angles are 40º. 9. The bulk density in La Pava and Quemita has been determined by Alteration Zone and Core recovery and ranges
between 2.07 and 2.62. The bulk density at Caballito has been assigned values of 2.34 and 2.70 tonnes/m3 in the oxides and sulphides, respectively based on bulk density measurements.
10. Numbers may not add due to rounding.
Mineral Reserve Estimate
Only Measured and Indicated Resource Class materials are included in the Mineral Reserves. All Inferred Resource Class material is treated as waste in calculating economic pit limits and in subsequent reserves reporting, scheduling and economics. Proven and Probable Reserves are derived from the Measured and Indicated Resource Class blocks within the designed pits and are summarized in Table 1-3. Mineral Reserves are stated as Crusher Feed and represent mined ore processed through the crusher and delivered to the heap leach facility.
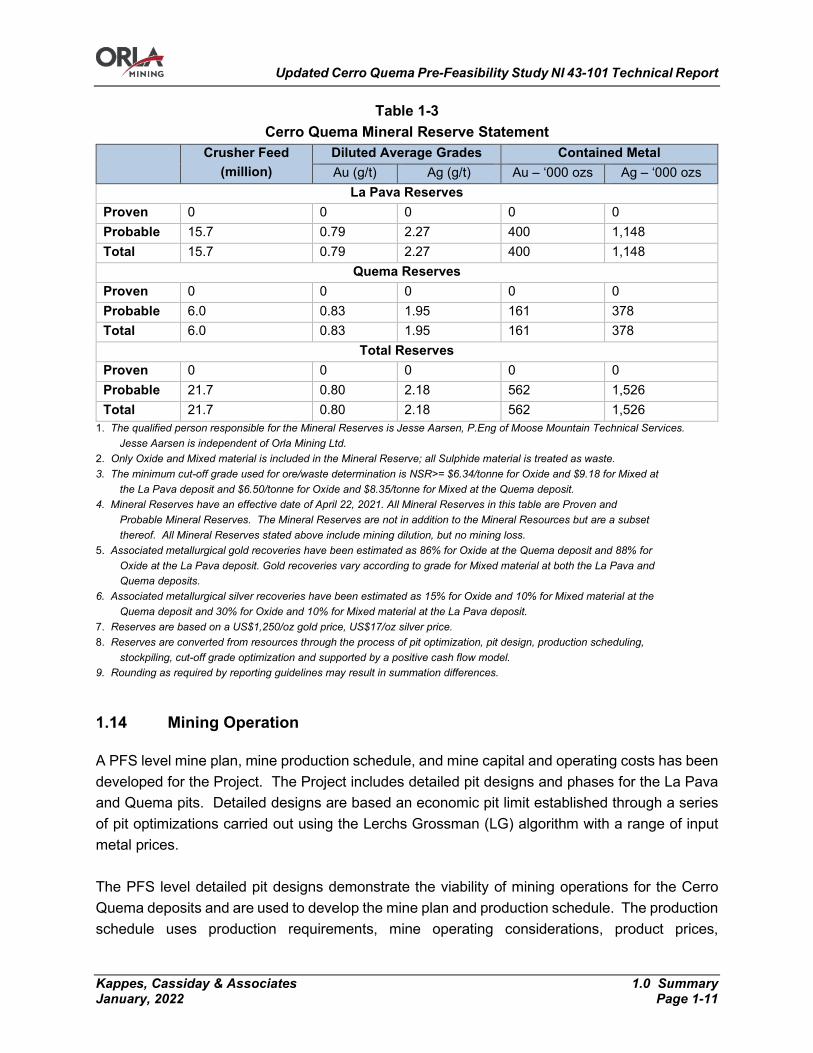
Updated Cerro Quema Pre-Feasibility Study NI 43-101 Technical Report
Kappes, Cassiday & Associates 1.0 Summary January, 2022 Page 1-11
Table 1-3 Cerro Quema Mineral Reserve Statement
Crusher Feed (million)
Diluted Average Grades Contained Metal Au (g/t) Ag (g/t) Au – ‘000 ozs Ag – ‘000 ozs
La Pava Reserves Proven 0 0 0 0 0 Probable 15.7 0.79 2.27 400 1,148 Total 15.7 0.79 2.27 400 1,148
Quema Reserves Proven 0 0 0 0 0 Probable 6.0 0.83 1.95 161 378 Total 6.0 0.83 1.95 161 378
Total Reserves Proven 0 0 0 0 0 Probable 21.7 0.80 2.18 562 1,526 Total 21.7 0.80 2.18 562 1,526
1. The qualified person responsible for the Mineral Reserves is Jesse Aarsen, P.Eng of Moose Mountain Technical Services. Jesse Aarsen is independent of Orla Mining Ltd.
2. Only Oxide and Mixed material is included in the Mineral Reserve; all Sulphide material is treated as waste. 3. The minimum cut-off grade used for ore/waste determination is NSR>= $6.34/tonne for Oxide and $9.18 for Mixed at
the La Pava deposit and $6.50/tonne for Oxide and $8.35/tonne for Mixed at the Quema deposit. 4. Mineral Reserves have an effective date of April 22, 2021. All Mineral Reserves in this table are Proven and
Probable Mineral Reserves. The Mineral Reserves are not in addition to the Mineral Resources but are a subset thereof. All Mineral Reserves stated above include mining dilution, but no mining loss.
5. Associated metallurgical gold recoveries have been estimated as 86% for Oxide at the Quema deposit and 88% for Oxide at the La Pava deposit. Gold recoveries vary according to grade for Mixed material at both the La Pava and Quema deposits.
6. Associated metallurgical silver recoveries have been estimated as 15% for Oxide and 10% for Mixed material at the Quema deposit and 30% for Oxide and 10% for Mixed material at the La Pava deposit.
7. Reserves are based on a US$1,250/oz gold price, US$17/oz silver price. 8. Reserves are converted from resources through the process of pit optimization, pit design, production scheduling,
stockpiling, cut-off grade optimization and supported by a positive cash flow model. 9. Rounding as required by reporting guidelines may result in summation differences.
Mining Operation
A PFS level mine plan, mine production schedule, and mine capital and operating costs has been developed for the Project. The Project includes detailed pit designs and phases for the La Pava and Quema pits. Detailed designs are based an economic pit limit established through a series of pit optimizations carried out using the Lerchs Grossman (LG) algorithm with a range of input metal prices. The PFS level detailed pit designs demonstrate the viability of mining operations for the Cerro Quema deposits and are used to develop the mine plan and production schedule. The production schedule uses production requirements, mine operating considerations, product prices,

Updated Cerro Quema Pre-Feasibility Study NI 43-101 Technical Report
Kappes, Cassiday & Associates 1.0 Summary January, 2022 Page 1-12
recoveries, destination capacities, equipment performance, haul cycle times and operating costs to provide an optimized 6-year mine plan with an average annual throughput of 3.65 Mtpa of Crusher Feed and average annual tonnes moved of 6 Mtpa. Mine operations are planned to be typical of similar small scale open pit operations, consisting of conventional drill, blast, load, haul, and stockpile operations. Direct Mining and Mine Maintenance is planned as Owner operated mining operations. The Owner will be responsible for all equipment mob/demob, operating, and labour costs as well as maintenance of the mining equipment. Blasting unit operations will be performed by a specific blasting company contractor. Supervision, geology and mine planning will be done by the Owner.
Mineral Processing
The Cerro Quema project will be a 10,000 tonne per day heap leach operation with a single stage crushing circuit and conveyor stacking system on a single use pad. Gold will be leached from the ore with a dilute cyanide solution and recovered in a carbon adsorption-desorption-recovery (ADR) plant to produce doré bars. Ore will be mined using standard open pit mining methods and delivered to the crushing circuit using haul trucks which will direct dump into a dump hopper; a front-end loader will feed material to the dump hopper as needed from a ROM stockpile located near the primary crusher. Ore will be crushed to a final product size of 80% passing 105 mm in a single stage jaw crusher. The crushing circuit will operate 7 days/week, 24 hours/day, 365 days/year with an overall estimated availability of 75%. The crushed product will be conveyed from the crushing circuit and stockpiled using a fixed stacker near the heap. Stockpiled material will be reclaimed by belt feeders and conveyed to the conveyor stacking system. Pebble lime will be added to the reclaim conveyor for pH control before being stacked onto the heap; barren process solution will be added to the ore once it is over the lined leach pad. Stacked ore will be leached using a drip and/or sprinkler irrigation system for solution application depending on water balance requirements. After percolating through the ore, the gold and silver-bearing solution will drain by gravity to a pregnant solution pond where it will be collected and pumped to a carbon in column (CIC) adsorption circuit. Gold and silver values will be loaded onto activated carbon in one train of five cascade columns. Barren solution from the final column will flow by gravity to a barren tank and will then be pumped to the heap for further leaching. High strength cyanide solution will be injected into the barren solution to maintain the cyanide concentration in the leach solutions at the desired level.
Updated Cerro Quema Pre-Feasibility Study NI 43-101 Technical Report
Kappes, Cassiday & Associates 1.0 Summary January, 2022 Page 1-13
Loaded carbon from the CIC will be stripped using a pressure Zadra desorption circuit in 2.5 tonne batches. During the desorption process, gold and silver will be continuously extracted by electrowinning from the pregnant eluate concurrently with desorption. The gold sludge will be washed from the electrowinning cell cathodes, treated in a mercury retort to recovery mercury values, and smelted to produce the final doré product. Carbon from the adsorption circuit will be acid washed prior to each stripping cycle in an acid wash vessel. A portion of the carbon will be thermally regenerated using a kiln after each strip to maintain carbon activity. Diesel generators will be used to supply electric power to all elements of the process plant. An excess solution (stormwater) pond is included to contain any leach solutions and/or precipitation events that cannot be managed during normal operations. The excess solution will be returned to the barren tank as a make-up solution during average precipitation years. During wet years, excess solution will need to be treated and discharged. Cyanide present in the excess solution will be neutralized using sodium metabisulfite followed by additional treatment in a heap leach water treatment plant to remove any other deleterious elements; solutions being discharged will pass through a pair of scavenger carbon columns to recover any metal values in solution prior to treatment. Make-up water will be from a combination of excess solution and wells.
Project Infrastructure
An existing site access road intersects with Via Tonosi approximately 32 km south of Macaracas. The access road runs north approximately 7 km to the location of the platform constructed between La Pava and Quema-Quemita by Orla. Improvements to the existing road will be required and include widening to approximately 9 m to allow two over-the-road trucks to pass; re-contouring to eliminate grades in excess of 7%; and grading to a ditch on one side for drainage. Raw water will be supplied by Well Number 4-2013 located approximately 1.1 km north, north east of the existing platform at an elevation of 190 masl. Raw water will be stored in a tank located approximately south-southeast of the existing platform near the access road to La Pava at an elevation of 480 masl. The raw water will be used for dust control, fire water, and process water make-up. The diesel fuel used for equipment will be offloaded and stored in a cylindrical horizontal steel tank located on the western end of the existing platform at 423 masl. This tank will supply fuel for the mine fleet and light vehicles. For power generation, two 100 m3 horizontal diesel storage tanks will ensure adequate fuel supply is available to operate the generators.

Updated Cerro Quema Pre-Feasibility Study NI 43-101 Technical Report
Kappes, Cassiday & Associates 1.0 Summary January, 2022 Page 1-14
A medical clinic will be located in the administration office building on the existing platform and is intended to be staffed by medical professionals that can provide proper treatment. Medical treatment will be limited to the attendance of minor accidents and stabilization of patients that have received minor trauma. In the event high level medical care is needed, the ambulance will be equipped and prepared for emergency transport to the nearest medical facility. Internal communications will be by radio frequency which is already installed at the Cerro Quema site. External communications will be through a mix of landline, cellular and VOIP. Primary communications and any required equipment will be located within the server room in the administration building. Buildings and facilities are located throughout the project area. The facilities include:
• Administration Building and Clinic; • Mine Shop and Warehouse; • Generators Platform; • ADR Area; • Refinery; • Reagent Storage; • Process Maintenance and Warehouse; • Laboratory; • Powder Magazine.
Market Study and Contracts
Gold and silver production can generally be sold to any of a number of financial institutions or refining houses and therefore no market studies are required. It is assumed that the doré produced at Cerro Quema will be of a specification comparable with other gold and silver producers and as such, acceptable to all refineries.
Environmental Studies, Permitting and Social Impact
Environmental assessment requirements in Panama are regulated by Decree Law #123 which specifies measures by which the process of submitting and reviewing an Environmental Impact Study (Estudio de Impacto Ambiental – EIA) for a proposed project shall be carried out, in accordance with the provisions of Law No. 41 of July 1, 1998 – Environmental Protection Law of the Republic of Panama. The proposed Cerro Quema mining project falls under Article 16 of the Decree (Associated International Standard Industrial Classification of All Economic Activities [ISIC] Code # 1310). In accordance with the Decree, Cerro Quema project is classified as a Category III EIA.

Updated Cerro Quema Pre-Feasibility Study NI 43-101 Technical Report
Kappes, Cassiday & Associates 1.0 Summary January, 2022 Page 1-15
Prior project operator Pershimco completed an environmental impact assessment (EIA) and permits are in place for a continuous vat leach operation previously proposed by Pershimco. However, as the current project will utilize heap leach processing methods, an application for the required Category 3 EIA permit was submitted in 2015. The Ministry has completed the technical evaluation of the EIA, and MCQ believes the Ministry is in the process of preparing the formal resolution to approve it. Timing of approval is presently not known. In 2020 MCQ contracted ERM Consultants Canada Ltd. to assess if the information presented in the EIA is in accordance with the requirements established by Panamanian regulations, International Finance Corporation Performance Standards 2012 (IFC PS), and currently accepted industry best practices. ERM found no fatal flaws with respect to Panamanian regulations but identified areas where environmental permitting studies and management plans should be improved to fully meet local requirements, International Standards and currently accepted industry practices (ERM Consultants Canada Ltd.). ERM provided recommendations that should be followed as the project advances, as summarized in Section 24.3 and Section 26.7 of this Technical Report.
Capital and Operating Cost
Capital and operating costs for the process and general and administration components of the Cerro Quema Project were estimated by KCA with information from Anddes and Linkan. Costs for the mining components were provided by Moose Mountain. The estimated costs are considered to have an accuracy of +/-25%. The total Life of Mine (LOM) capital cost for the Project is US$211.7 million, including US$7.2 million in working capital and initial fills, not including reclamation and closure costs estimated at US$15.4 million, ITBMS (value added tax) or other taxes; Cerro Quema is assumed to be fully exempt from ITBMS. Table 1-4 presents the capital requirements for the Cerro Quema Project.
Table 1-4 Capital Cost Summary
Description Cost (US$) Pre-Production Capital $163,671,000 Working Capital & Initial Fills $7,216,000 Sustaining Capital – Mine & Process $40,797,000 Total excluding ITBMS $211,685,000
The average life of mine operating cost for the Project is US$10.34 per tonne of ore processed. Table 1-5 presents the LOM operating cost requirements for the Cerro Quema Project.
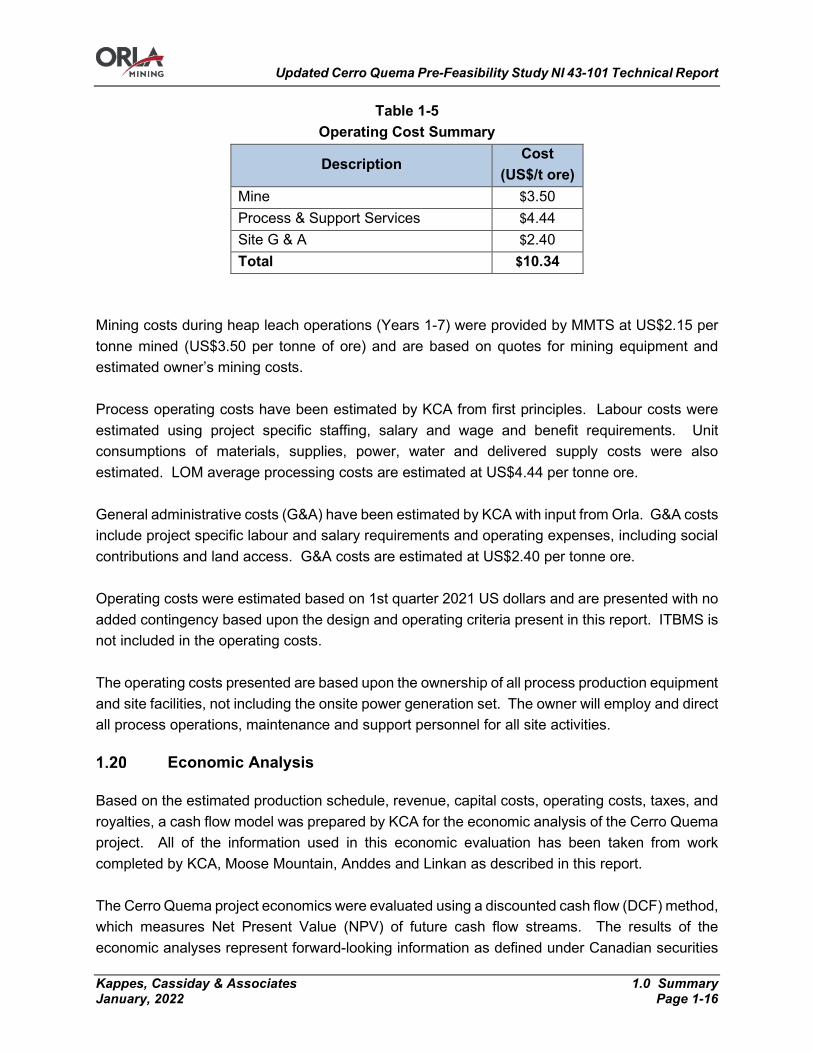
Updated Cerro Quema Pre-Feasibility Study NI 43-101 Technical Report
Kappes, Cassiday & Associates 1.0 Summary January, 2022 Page 1-16
Table 1-5 Operating Cost Summary
Description Cost
(US$/t ore) Mine $3.50 Process & Support Services $4.44 Site G & A $2.40 Total $10.34
Mining costs during heap leach operations (Years 1-7) were provided by MMTS at US$2.15 per tonne mined (US$3.50 per tonne of ore) and are based on quotes for mining equipment and estimated owner’s mining costs. Process operating costs have been estimated by KCA from first principles. Labour costs were estimated using project specific staffing, salary and wage and benefit requirements. Unit consumptions of materials, supplies, power, water and delivered supply costs were also estimated. LOM average processing costs are estimated at US$4.44 per tonne ore. General administrative costs (G&A) have been estimated by KCA with input from Orla. G&A costs include project specific labour and salary requirements and operating expenses, including social contributions and land access. G&A costs are estimated at US$2.40 per tonne ore. Operating costs were estimated based on 1st quarter 2021 US dollars and are presented with no added contingency based upon the design and operating criteria present in this report. ITBMS is not included in the operating costs. The operating costs presented are based upon the ownership of all process production equipment and site facilities, not including the onsite power generation set. The owner will employ and direct all process operations, maintenance and support personnel for all site activities.
Economic Analysis
Based on the estimated production schedule, revenue, capital costs, operating costs, taxes, and royalties, a cash flow model was prepared by KCA for the economic analysis of the Cerro Quema project. All of the information used in this economic evaluation has been taken from work completed by KCA, Moose Mountain, Anddes and Linkan as described in this report. The Cerro Quema project economics were evaluated using a discounted cash flow (DCF) method, which measures Net Present Value (NPV) of future cash flow streams. The results of the economic analyses represent forward-looking information as defined under Canadian securities
Updated Cerro Quema Pre-Feasibility Study NI 43-101 Technical Report
Kappes, Cassiday & Associates 1.0 Summary January, 2022 Page 1-17
law. The results depend on inputs that are subject to a number of known and unknown risks, uncertainties and other factors that may cause actual results to differ materially from those presented here. The final economic model was developed by KCA using the following assumptions:
• The cashflow model is based on the mine production schedule from Moose Mountain; • The period of analysis of 12 years includes two years of pre-production and investment,
seven years of production and three years for closure and reclamation; • Gold price of US$1,600/oz; • Silver price of US$20/oz; • Processing rate of 10,000 tpd ore; • Overall recoveries of 87% for gold and 26% for silver as discussed in Section 13.0 of this
Report; • Capital and operating costs as developed in Section 21.0 of this Report; • Net Smelter Royalties of 4%; • Income Tax Rate of 25%; • ITBMS Exempt.
The Project economics based on these criteria from the cash flow model are summarized Table 1-6.

Updated Cerro Quema Pre-Feasibility Study NI 43-101 Technical Report
Kappes, Cassiday & Associates 1.0 Summary January, 2022 Page 1-18
Table 1-6 Economic Analysis Summary
Production Data Life of Mine 6.0 Years Design Production Throughput per day 10,000 Tonnes Ore /day Design Production Throughput per year 3,650,000 Tonnes Ore /year Total Tonnes to Crusher 21,738,000 Tonnes Ore Grade Au (Avg.) 0.80 g/t Grade Ag (Avg.) 2.18 g/t Contained Au oz 562,000 Ounces Contained Ag oz 1,526,000 Ounces Metallurgical Recovery Au (Overall) 87% Metallurgical Recovery Ag (Overall) 26% Average Annual Gold Production 81,000 Ounces Average Annual Silver Production 66,000 Ounces Total Gold Produced 489,000 Ounces Total Silver Produced 399,000 Ounces LOM Strip Ratio (W:O) 0.66 Operating Costs (Average LOM) Mining (including preproduction tonnes & costs) $2.26 /Tonne mined Mining (Years 1-7 tonnes & costs) $2.15 /Tonne mined Mining (processed) $3.50 /Tonne Ore processed Processing & Support $4.44 /Tonne Ore processed G&A $2.40 /Tonne Ore processed Total Operating Cost $10.34 /Tonne Ore processed Total By-Product Cash Cost $511 /Ounce Au All-in Sustaining Cost $626 /Ounce Au Capital Costs (Excluding IVA and Closure) Initial Capital $164 million LOM Sustaining Capital $41 million Total LOM Capital $204 million Working Capital & Initial Fills $7 million Closure Costs $15 million Financial Analysis Gold Price Assumption $1,600 /Ounce Silver Price Assumption $20 /Ounce Average Annual Cashflow (Pre-Tax) $72 million Average Annual Cashflow (After-Tax) $62 million Internal Rate of Return (IRR), Pre-Tax 47.8% Internal Rate of Return (IRR), After-Tax 37.8%
NPV @ 5% (Pre-Tax) $233 million NPV @ 5% (After-Tax) $176 million
Pay-Back Period (Years based on After-Tax) 1.7 Years
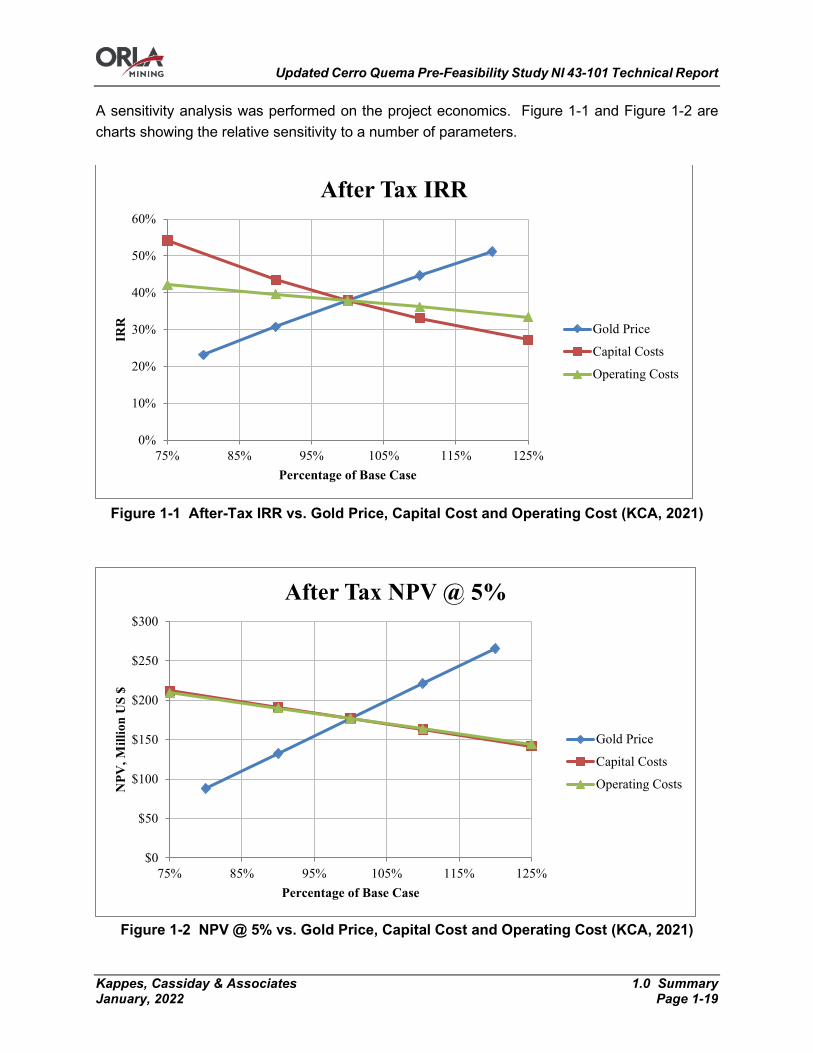
Updated Cerro Quema Pre-Feasibility Study NI 43-101 Technical Report
Kappes, Cassiday & Associates 1.0 Summary January, 2022 Page 1-19
A sensitivity analysis was performed on the project economics. Figure 1-1 and Figure 1-2 are charts showing the relative sensitivity to a number of parameters.
Figure 1-1 After-Tax IRR vs. Gold Price, Capital Cost and Operating Cost (KCA, 2021)
Figure 1-2 NPV @ 5% vs. Gold Price, Capital Cost and Operating Cost (KCA, 2021)
0%
10%
20%
30%
40%
50%
60%
75% 85% 95% 105% 115% 125%
IRR
Percentage of Base Case
After Tax IRR
Gold Price
Capital Costs
Operating Costs
$0
$50
$100
$150
$200
$250
$300
75% 85% 95% 105% 115% 125%
NPV
, Mill
ion
US
$
Percentage of Base Case
After Tax NPV @ 5%
Gold Price
Capital Costs
Operating Costs
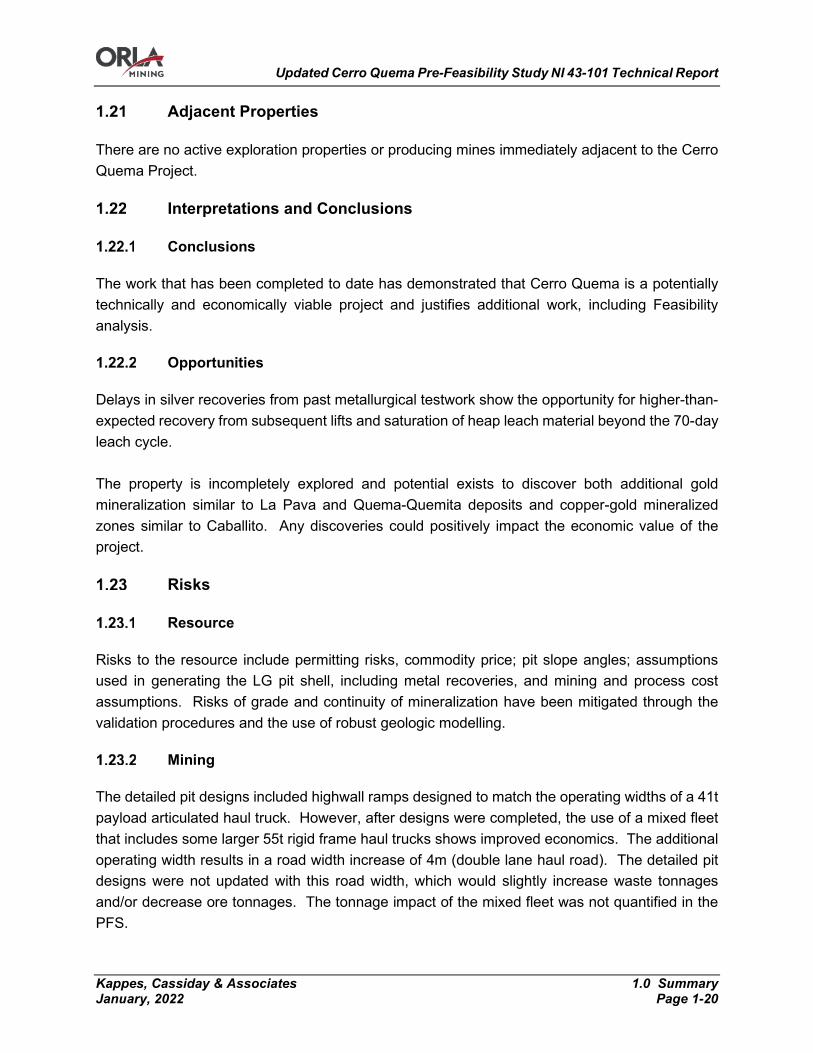
Updated Cerro Quema Pre-Feasibility Study NI 43-101 Technical Report
Kappes, Cassiday & Associates 1.0 Summary January, 2022 Page 1-20
Adjacent Properties
There are no active exploration properties or producing mines immediately adjacent to the Cerro Quema Project.
Interpretations and Conclusions
Conclusions
The work that has been completed to date has demonstrated that Cerro Quema is a potentially technically and economically viable project and justifies additional work, including Feasibility analysis.
Opportunities
Delays in silver recoveries from past metallurgical testwork show the opportunity for higher-than-expected recovery from subsequent lifts and saturation of heap leach material beyond the 70-day leach cycle. The property is incompletely explored and potential exists to discover both additional gold mineralization similar to La Pava and Quema-Quemita deposits and copper-gold mineralized zones similar to Caballito. Any discoveries could positively impact the economic value of the project.
Risks
Resource
Risks to the resource include permitting risks, commodity price; pit slope angles; assumptions used in generating the LG pit shell, including metal recoveries, and mining and process cost assumptions. Risks of grade and continuity of mineralization have been mitigated through the validation procedures and the use of robust geologic modelling.
Mining
The detailed pit designs included highwall ramps designed to match the operating widths of a 41t payload articulated haul truck. However, after designs were completed, the use of a mixed fleet that includes some larger 55t rigid frame haul trucks shows improved economics. The additional operating width results in a road width increase of 4m (double lane haul road). The detailed pit designs were not updated with this road width, which would slightly increase waste tonnages and/or decrease ore tonnages. The tonnage impact of the mixed fleet was not quantified in the PFS.

Updated Cerro Quema Pre-Feasibility Study NI 43-101 Technical Report
Kappes, Cassiday & Associates 1.0 Summary January, 2022 Page 1-21
There is risk associated with the limited geotechnical data for both the La Pava and Quema-Quemita pits. Although the design slope angles are not excessive, slope angles will be flatter than design if further investigation warrants it. This could reduce the amount of material mined and the ore available for processing. Additional risks exist in the mine plan due to absence of any mining loss considerations. Typically, a small amount of ore tonnes are lost between loading and hauling to the crusher. While this is a small reduction in ore tonnes, it should be quantified.
Metallurgy and Process
Although metallurgical testwork has shown minimal issues with clay material being blended with silica material, stacked ore will rely on close observation of crusher feed. The possibility of high clay material being fed to the crusher becomes greater without proper sampling, labeling of high clay areas and accurate ongoing lab testwork. In order to ensure suitable material is being stacked on the heap, crusher feed will need to be closely monitored and blended when appropriate. Cerro Quema sulphide material is higher in sulphur, copper and other elements that negatively affect gold and silver recoveries. During operation, accurate reserve accounting and well-defined ore boundaries will need to be established to ensure minimal sulphides are processed in the heap leach facilities.
Access, Title and Permitting
A specific title risk for Minera Cerro Quema is a failure of the Panamanian government to renew mining concessions as permitted by law. Prior operators and Minera Cerro Quema have met legal requirements to maintain in good standing the mining concession titles, however, as discussed in Section 4.2 of this Technical Report, the response of Panamanian authorities has been inconsistent with the mining law, and legally permitted concession renewals have repeatedly been delayed. Similarly, failure of the Panamanian government to approve the copper extraction rights for the same exploration contracts for which gold and silver rights were granted, will affect the viability of potential development of the Caballito zone. An Environmental Impact Assessment (EIA) and permits are in place for a continuous vat leach operation, however, the current project described in this Technical Report requires a modification to the existing permits. To develop a mine at Cerro Quema, a Category 3 EIA permit is required from the Ministry of Environment. An application for this permit was submitted in 2015 and the Ministry has completed the technical evaluation of the EIA. Timing of approval is presently not

Updated Cerro Quema Pre-Feasibility Study NI 43-101 Technical Report
Kappes, Cassiday & Associates 1.0 Summary January, 2022 Page 1-22
known but the Ministry’s response time has exceeded the time periods specified in Article 41 of the Decree Law 23 applicable to EIA permit resolutions.
Other Risks
• In closure, the pit lake may overflow if hydraulic conductivity values are very low in the base of the pit, requiring additional surface water controls and possibly storage to manage potentially poor-quality water flow overland. Planned hydrogeological activities will address this uncertainty.
• Pit water infiltrating into the groundwater system may migrate and discharge to surface water with potential water quality impacts. Planned hydrogeological activities will address this more quantitatively.
• Limestone amendment of cover systems may be required if sufficient topsoil is not available.
• Additional evaluation of borrow source suitability for use in operations and closure is warranted, including geochemical and hydraulic characteristics (particularly for use as cover).
• Dense vegetation led to potential inaccuracies in the site topography. Also, field investigations have been limited due to access restrictions in the heap leach facility and waste rock dump areas. Because of the dense vegetation in the area, a detailed investigation of topsoil thickness, unsuitable soil extension, steep slopes and harsh terrain areas, will be challenging. Therefore, final estimates of topsoil and unsuitable soil quantities, and final grading design may be delayed until tree removal and clearing and grubbing of the area have been completed. Based on the actual terrain condition encountered, an engineering design update may be required prior to construction.
• Further characterization of springs in the WRD footprint is warranted for flow, chemistry, and location. The springs will need to be characterized in detail to support design of drainage systems, mainly in the WRD footprint; otherwise.
• If the design basis (water quality and/or flow rate) changes for the water treatment plants then there is a risk of poor performance. This could mean process issues that require treatment equipment changes to meet discharge criteria or inadequate treatment capacity and the need to expand the plant size or increase pre-treated storage capacity. Linkan used some safety factors in sizing the equipment for the Pre-Feasibility report and selected systems that have some robustness to account for some potential process water changes.
• The water treatment designs are based on discharge standards from PR 351, Panama Resolution 351 for the discharge of liquid effluents to surface water and groundwater. If this changes to be more stringent, then the water treatment plants may have to be redesigned to accommodate the requirements. This would typically mean adding process

Updated Cerro Quema Pre-Feasibility Study NI 43-101 Technical Report
Kappes, Cassiday & Associates 1.0 Summary January, 2022 Page 1-23
equipment for additional polishing steps. This would increase both CAPEX and OPEX costs.
• Both the active and passive water treatment systems will produce solids wastes. The active treatment plants will generate backwash and precipitation residues and the passive systems will have (at some point) used media to dispose of. We have assumed that these solids can be managed on-site by incorporation into existing waste facilities or by “landfilling” as non-hazardous. It is typical to handle water treatment wastes in these ways and impractical to predict the exact solid waste make-up at this point. If there is a hazardous component, in many cases, the solid wastes can be further processed at reasonable cost to eliminate or sequester the hazardous component. There is also a possibility that waste residues or spent media can be processed for their mineral content to reduce disposal costs.
• Water characteristics are unique from site to site, source to source, and season to season. There are many interactive constituents that make each water distinctive and potentially not align with common treatment practices or standard expectations. Testing of the process water prior to commitment to the treatment process, design, and equipment may avoid significant troubleshooting, rework, and process underachievement issues. Bench and pilot testing has been included in the costs.
• Active treatment requires not only good process design but adequate hydraulic, electrical, structural, and controls design. The hydraulic gradient through a passive treatment system is just as important as the appropriate process/ media selections and cell sizing. Components need to have properly integrated infrastructure and controls to function effectively and efficiently as a whole system. Good engineering support and quality control during construction are key to implementation of the design.
Recommendations
KCA Recommendations
The PFS presents an economically robust project. Based on these results, KCA recommends the following future work in regards to process and infrastructure development:
• The project should proceed to the feasibility study or basic engineering level for the oxide heap leach and further investigation should begin for the sulphide resource;
• Confirmatory metallurgical test work should be completed on oxide samples, specifically column leach tests on coarse crushed material and draindown chemistry;
• Metallurgical test work should be completed on sulphide samples and optimal recovery methods should be established;
• Additional studies and cost estimates for Project surface and groundwater flows, quality, storage and treatment should be considered;

Updated Cerro Quema Pre-Feasibility Study NI 43-101 Technical Report
Kappes, Cassiday & Associates 1.0 Summary January, 2022 Page 1-24
• Perform additional geotechnical studies at the proposed heap leach, pit and processing areas;
• Availability of local services and personnel should be evaluated to maximize their utilization;
• Investigate the opportunity for power generation from the overland conveying system to help alleviate the on-site power generation requirements.
The estimated cost for the additional metallurgical test work and infrastructure development studies is approximately US$2.5M.
MMTS Recommendations
Assaying and QAQC
• It is recommended that Orla ensure all re-assays due to QAQC failures are reviewed and maintained in the QAQC and resource databases as appropriate.
• For future exploration programs, ICP-OES prepared by a 4-acid digestion is recommended as opposed to Aqua Regia currently used, which may result in higher recovery at the assay level.
Exploration
The QP recommends that additional drilling is undertaken at all three deposits to increase the extent and confidence of the current resource. The drilling should also include step-out drilling at Caballito and drilling for metallurgical testing. There is also potential to further explore the sulphide resource with priority drill targets defined at Quemita, La Pelona and La Prieta. The recommended exploration and drilling budget is summarized in the table below.
Table 1-7 Drilling Budget
Deposit / Item US$ (000) Caballito 2,000 Quemita - Pava 1,000 Exploration of additional Targets 1,500 Assaying 500
Total 5,000
Updated Cerro Quema Pre-Feasibility Study NI 43-101 Technical Report
Kappes, Cassiday & Associates 1.0 Summary January, 2022 Page 1-25
Feasibility Study Mine Planning
A feasibility level mine plan and production schedule are recommended, which would incorporate results from additional studies as follows:
• Detailed drilling and blasting study; • Detailed equipment size trade-off study; • Contractor mining cost trade-off study; • Short range mining operability study.
The estimated cost for the Feasibility level mining studies is approximately US$150,000.
RGI Recommendations
RGI recommends an exploration program to seek satellite deposits to the La Pava and Quema-Quemita deposits, and to discover additional mineralization along the Caballito mineralized trend. The recommended program will utilize induced polarization geophysical surveys to define areas which will then be tested by diamond core drilling. A total budget of US$1.5M is recommended.
AA Recommendations
Site Geotechnical
It is recommended that additional work be done to ensure that the currently planned site layout is feasible from a geotechnical standpoint. Some of the assumptions made in designing project facilities require field verification. Specific areas requiring additional field evaluation include:
• Building foundations; • Primary crusher structure and conveyor supports; • Access roads; • HLF foundation; • WRD foundation; • Unsuitable stockpiles; • Topsoil stockpiles.
Standard geotechnical drilling, test pits, in situ testing, sampling and geotechnical laboratory testing need to be performed to allow detailed design of the facilities. Also, additional laboratory testing is needed for the characterization of the ore from both open pits and waste rock. The estimated cost for the additional geotechnical work is approximately US$250,000.
Updated Cerro Quema Pre-Feasibility Study NI 43-101 Technical Report
Kappes, Cassiday & Associates 1.0 Summary January, 2022 Page 1-26
Mine Geotechnical
Additional geotechnical drilling should be completed within the planned open pits to design the pit slopes. This will confirm the current pit slope design basis and potentially allow an increase in the pit slope angles. Additional drilling, testing and analyses are required to develop a detailed plan for dewatering. This will involve several oriented core and vertical drillholes properly distributed along both pits, with production of detailed stratigraphic logs and sampling for laboratory testing. Drillholes would be completed as monitoring wells, and multiple-well aquifer testing will be performed to better assess the dewatering requirements for the material. Detailed pit slope design and mining plans must then be developed. The estimated cost for the additional geotechnical work is approximately US$250,000.
Sediment Control
The disturbed area should be minimized during construction and, whenever possible, temporary sediment control works such as soil compaction and installation of silt fences, among other measures, should be implemented, to be prepared before the beginning of each rainy season. Automated flow and sediment concentration measurement stations should be implemented to continuously record flow discharges. A sediment control and erosion study should be conducted during the operation stage, considering actual particle-size distribution analysis and the results of sediment concentration monitoring. The estimated cost for the sediment control study is approximately US$100,000.
Seismic Hazard
Seismic hazard study prepared by Golder (2014b) should be updated since there are new seismic wave attenuation models that allow a more accurate characterization of ground motion in terms of spectral accelerations. The estimated cost for an updated seismic hazard study is approximately US$20,000.
HGL Recommendations
HGL recommends advancement of baseline studies to support water management, water treatment design, and closure studies. Recommendations are as follows:
• Geochemistry o Advance geochemical characterization of deposit materials, including: completion
of ongoing kinetic testing, additional characterization of spent ore, and further identification and characterization of cover and borrow source materials.
o Additional hydraulic evaluations of potential cover materials, cover performance, and the heap leach pad draindown.
Updated Cerro Quema Pre-Feasibility Study NI 43-101 Technical Report
Kappes, Cassiday & Associates 1.0 Summary January, 2022 Page 1-27
o Update the pit lake chemistry modeling with results of updated hydrology and hydrogeology studies.
o Evaluation and modeling of potential impacts to the groundwater and surface water systems from the pit lakes, incorporating updated information from ongoing geochemistry, hydrology, and hydrogeology studies.
• Hydrology/Hydrogeology o Continued monitoring of established surface water monitoring locations for flow
and chemistry. o Installation of additional groundwater monitoring locations. o Monitoring of groundwater elevations and chemistry. o Characterization of hydraulic properties in the area of the pits. o Construction of a groundwater model to assess potential mining impacts, advance
dewatering requirement evaluations, and support closure planning and the pit lake water balance.
o Update the pit lake water balance models and evaluate potential impacts to groundwater.
• Water Balance o Update and advance the site water balance, incorporating new mine plans, mining
schedules, facility-specific water balances, hydrologic monitoring data, potential climate variability, and updated water requirements.
Linkan Recommendations
Linkan recommends feasibility level design and costing of active and passive water treatment facilities. For this phase of the project, Linkan has assumed that the design basis will change from developments and advancements to a feasibility level Project and that Linkan will adjust the treatment system as needed to meet the new criteria. This would include a new design basis, revised process flow diagrams and drawings, and revised CAPEX, OPEX costs. These criteria can also include revised discharge standards. The cost for this design is estimated to be $113,000.
ERM Recommendations
ERM has made recommendations to close gaps in order to meet the Panamanian standards and best international practices, which are summarised in Table 1-8. A total budget US$1.0M is estimated.
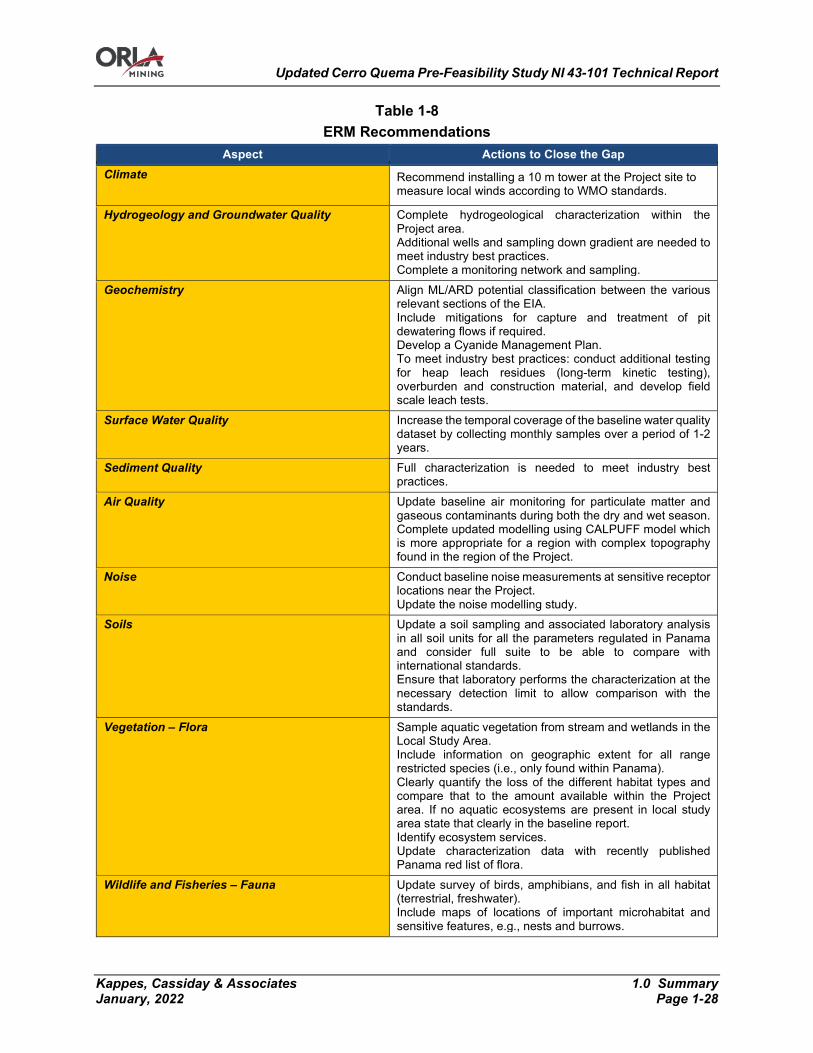
Updated Cerro Quema Pre-Feasibility Study NI 43-101 Technical Report
Kappes, Cassiday & Associates 1.0 Summary January, 2022 Page 1-28
Table 1-8 ERM Recommendations
Aspect Actions to Close the Gap Climate Recommend installing a 10 m tower at the Project site to
measure local winds according to WMO standards.
Hydrogeology and Groundwater Quality Complete hydrogeological characterization within the Project area. Additional wells and sampling down gradient are needed to meet industry best practices. Complete a monitoring network and sampling.
Geochemistry Align ML/ARD potential classification between the various relevant sections of the EIA. Include mitigations for capture and treatment of pit dewatering flows if required. Develop a Cyanide Management Plan. To meet industry best practices: conduct additional testing for heap leach residues (long-term kinetic testing), overburden and construction material, and develop field scale leach tests.
Surface Water Quality Increase the temporal coverage of the baseline water quality dataset by collecting monthly samples over a period of 1-2 years.
Sediment Quality Full characterization is needed to meet industry best practices.
Air Quality Update baseline air monitoring for particulate matter and gaseous contaminants during both the dry and wet season. Complete updated modelling using CALPUFF model which is more appropriate for a region with complex topography found in the region of the Project.
Noise Conduct baseline noise measurements at sensitive receptor locations near the Project. Update the noise modelling study.
Soils Update a soil sampling and associated laboratory analysis in all soil units for all the parameters regulated in Panama and consider full suite to be able to compare with international standards. Ensure that laboratory performs the characterization at the necessary detection limit to allow comparison with the standards.
Vegetation – Flora Sample aquatic vegetation from stream and wetlands in the Local Study Area. Include information on geographic extent for all range restricted species (i.e., only found within Panama). Clearly quantify the loss of the different habitat types and compare that to the amount available within the Project area. If no aquatic ecosystems are present in local study area state that clearly in the baseline report. Identify ecosystem services. Update characterization data with recently published Panama red list of flora.
Wildlife and Fisheries – Fauna Update survey of birds, amphibians, and fish in all habitat (terrestrial, freshwater). Include maps of locations of important microhabitat and sensitive features, e.g., nests and burrows.
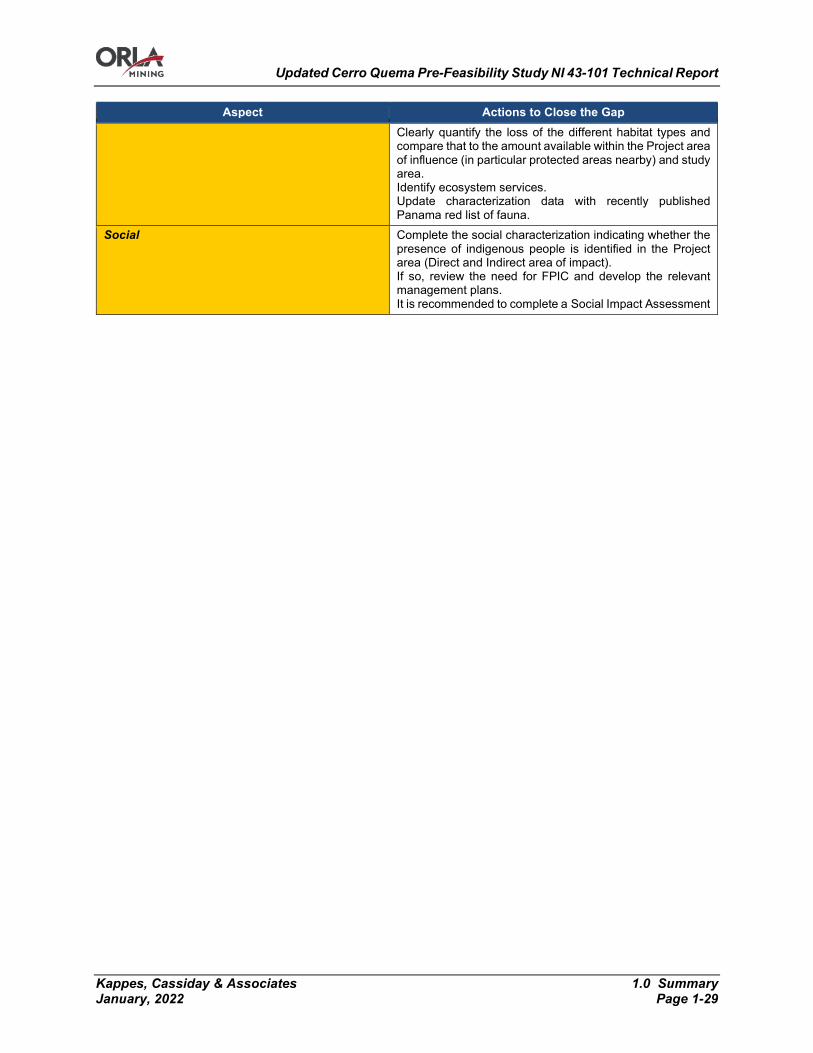
Updated Cerro Quema Pre-Feasibility Study NI 43-101 Technical Report
Kappes, Cassiday & Associates 1.0 Summary January, 2022 Page 1-29
Aspect Actions to Close the Gap Clearly quantify the loss of the different habitat types and compare that to the amount available within the Project area of influence (in particular protected areas nearby) and study area. Identify ecosystem services. Update characterization data with recently published Panama red list of fauna.
Social Complete the social characterization indicating whether the presence of indigenous people is identified in the Project area (Direct and Indirect area of impact). If so, review the need for FPIC and develop the relevant management plans. It is recommended to complete a Social Impact Assessment
Updated Cerro Quema Pre-Feasibility Study NI 43-101 Technical Report
Kappes, Cassiday & Associates 2.0 Introduction January, 2022 Page 2-1
2.0 INTRODUCTION
Introduction and Overview
This Technical Report is an update of a previously completed Technical Report and Pre-Feasibility Study on the Cerro Quema Project and has been prepared at the request of Orla and forms the basis of a NI 43-101 Technical Report in accordance with the disclosure and reporting requirements set forth in the Canadian Securities Administrations’ current “Standards of Disclosure for Mineral Projects” under the provisions of National Instrument 43-101, Companion Policy 43-101 CP and Form 43-101F and supersedes a Technical Report prepared by KCA dated 27 July 2021, “Project Pre-Feasibility NI 43-101 Technical Report on the Cerro Quema Gold Oxide Project, Province of Los Santos, Panama”. This Technical Report is issued to Orla Mining Ltd. (Orla). Orla is listed on the Toronto Stock Exchange (TSX: OLA) and the New York Stock Exchange (NYSE: ORLA) and holds a 100% interest in the Cerro Quema deposit through its subsidiary Minera Cerro Quema SA. This report was prepared by Kappes, Cassiday and Associates (KCA), Moose Mountain Technical Services (Moose Mountain or MMTS), Resource Geosciences Incorporated (RGI), Anddes Asociados SAC (Anddes or AA), HydroGeoLogica (HGL), Linkan Engineering (Linkan or LE) and Environmental Resources Management (ERM) with input from other consultant groups. This Technical Report considers the potential feasibility of the proposed development and includes information on:
• Recent and historical exploration work, description of the property, geology and nature of mineralization;
• Recent and historical metallurgical studies; • An updated Mineral Resource estimate; • The April 2021 Mineral Reserve estimate; • Recent mining studies; • Recent engineering, designs and drawings of the proposed development option; • Recent and ongoing investigations of site environmental status and regulatory
requirements necessary for production; • Recent and ongoing social survey results and potential impacts on the local population; • Recent analysis of infrastructure and logistic strategies; • Recent costing studies; and • Recent economic model based upon the results of those studies.
Updated Cerro Quema Pre-Feasibility Study NI 43-101 Technical Report
Kappes, Cassiday & Associates 2.0 Introduction January, 2022 Page 2-2
Project Scope and Terms of Reference
Scope of Work
Orla commissioned KCA to evaluate the Cerro Quema Project to Pre-Feasibility study standards. This study is led by KCA and incorporates work from other groups including HGL for site wide water balance, geochemical modeling, pit lake modeling, and Heap Leach Facility (HLF) and Waste Rock Dump (WRD) geochemistry, Moose Mountain for resource and mine development and costs, Anddes for waste rock dump design, heap leach pad design and the process water balance, Linkan for solution treatment and RGI for the property descriptions and geology. A more detailed scope description for each group is included below. KCA’s scope of work for the project is summarized as follows:
• Review of new and historical metallurgical tests and interpretation; • Process plant design and recovery methods; • Heap rinsing and drain down; • Infrastructure design; • Infrastructure and process capital and operating costs; • General and administrative (G&A) costs with input from Orla; • Economic analysis; • Caballito metallurgical interpretation; and • Overall report preparation and compilation.
Mouse Mountain’s scope of work for the project is summarized as follows:
• Audit the drill hole database for the Cerro Quema deposit; • Develop the Mineral Resource block model for the deposit; • Estimate Mineral Resources; • Estimate Mineral Reserves; • Develop an operational mine plan for the open pit; • Mining capital and operating costs; and • Development of the Caballito mineral estimate.
Anddes’ scope of work for the project is summarized as follows:
• HLF design and phasing; • WRD design and phasing; • Process water balance.

Updated Cerro Quema Pre-Feasibility Study NI 43-101 Technical Report
Kappes, Cassiday & Associates 2.0 Introduction January, 2022 Page 2-3
RGI’s scope of work for the project is summarized as follows:
• Property description, including reporting on exploration work completed by Orla, geology and mineralization, environmental liabilities, location, access, physiography, infrastructure, claim ownership, and surface rights ownership;
• Assessment of regulatory requirements and description of the steps required to obtain construction and operating permits for the mine plan described in this Technical Report;
• Assess risks to project development related to access, title, permits, and security. HydroGeoLogica’s scope of the work for the project is summarized as follows:
• Site wide water balance; • Acid rock drainage and metal leaching potential; • Heap and waste rock facility closure plans; and • Pit lake model.
Linkan’s scope of the work for the project is summarized as follows:
• Design and costing of HLF and WRD active treatment plants; • Design and costing of HLF and WRD passive treatment post-closure.
ERM’s scope of the work for the project is summarized as follows:
• Gap assessment for Environmental and Social Impact Assessment; • Social Impact Assessment (SIA) Scoping; and • Review of closure and reclamation tasks of the Pre-Feasibility Study.
The scope of this report also includes a study of information obtained from public documents; other literature sources cited; and cost information from public documents and recent estimates from previous studies conducted by KCA. This Pre-Feasibility Study is intended to provide the project’s economics and to give guidance for further investigations of the feasibility of the Cerro Quema project.
Terms of Reference
The units of measure presented in this report, unless noted otherwise, are in the metric system. The currency used for all costs is presented in US Dollars (US$), unless specified otherwise. The costs were estimated based on quotes and cost data as of 1st Quarter 2021.

Updated Cerro Quema Pre-Feasibility Study NI 43-101 Technical Report
Kappes, Cassiday & Associates 2.0 Introduction January, 2022 Page 2-4
The economic evaluation of the Project has been conducted on a constant dollar basis (Q1 2021) with a gold price of US$1,600 per ounce and a silver price of US$20 per ounce for the Base Case. Economic evaluation is done on a Project Basis and from the point of view of a private investor, after deductions for royalties, income taxes, and various taxes and duties paid to the government of Panama.
Sources of Information
KCA has taken all reasonable care in producing the information contained in this Technical Report and all of the conclusions and estimates contained are consistent with information available at the time of preparation. Data supplied by outside sources, assumptions, conditions and qualifications are set forth in this Technical Report. The Authors of this Technical Report are Carl Defilippi, Sue Bird, Jesse Aarsen, Denys Parra, Matt Gray, Brent Johnson, Lee Joselyn and Wade Brunham, each of whom is a Qualified Person as defined under NI 43-101. The information in this Technical Report is not a substitute for independent professional advice before making any investment decisions. Any information in this Technical Report cannot be modified without the express written permission from KCA. The primary sources of information used for this Technical Report are set out in Section 27.0, References, and include:
• The digital drillhole database. This includes work developed during Pershimco and Orla tenures;
• The original assay certificates for the holes; • Various geologic solids that were developed (interpreted) by Orla geologists; • Various reports, including previous technical reports, on sampling methodology, quality
control and quality assurance (QA/QC), resource modeling, geotechnical and slope stability, mine planning, and economic evaluations;
• Various new technical reports for water production and supply and site geotechnical evaluations;
• Various reports on metallurgical testing, process recovery, and mineral processing that were developed by Pershimco, Orla and other consultants;
• Published reports on Panamanian taxes and duties • Jacob Waples (PG-WY), HydroGeoLogica, Golden, Colorado provided information
regarding the geochemical characterization, geochemical modeling for the pits, WRD, and HLF, and closure planning.
• Pamela Rohal, HydroGeoLogica, Golden, Colorado provided information regarding the site-wide water balance.
Updated Cerro Quema Pre-Feasibility Study NI 43-101 Technical Report
Kappes, Cassiday & Associates 2.0 Introduction January, 2022 Page 2-5
KCA, Moose Mountain, Anddes, RGI, Linkan, ERM and HGL reviewed the data and only used data that was deemed reliable for this report.
Qualified Persons and Site Visits
The processing studies, cost estimations, and financial analysis and review of current and historical metallurgical data were conducted by KCA under the auspices of Carl Defilippi, RM SME, of Reno, NV. Mr. Defilippi is an independent Qualified Person under NI 43-101 and is responsible for Sections 1.1, 1.11, 1.15, 1.16, 1.17, 1.19, 1.20, 1.20, 1.21, 1.22, 1.23.3, 1.24.5, 1.24.1, 2, 3, 13.0, 16.6, 17.1, 17.2, 17.3, 17.4, 17.7, 17.9.1.1, 17.10, 17.11, 18 (excluding 18.1.3 and 18.4), 19.0, 20.1, 20.1.2, 20.1.2.7, 20.1.3, 20.1.4, 20.1.4.1, 20.1.4.2, 20.1.4.5, 20.1.5.5, 20.1.5.9, 20.1.5.10, 20.1.6.1, 20.1.7, 21 (excluding 21.1.1, 21.1.2.7, 21.2.1 and 21.2.2.6), 22.0, 24.1, 25.0, 25.1, 25.1.3, 25.2.3, 25.2.4, 25.3.3, 25.3.5, 26.1, 27 and 28 of the Report. Mr. Defilippi visited the site on 30 and 31 January 2012. On these dates, Mr. Defilippi inspected the Project site and proposed locations for the process facilities and site infrastructure, examined drill core, and discussed geology and site conditions with site personnel. There is no new scientific or technical information since the date of last inspection for sections Mr. Defilippi responsible for. Mr. Defilippi has been involved with the Project, including supervising the 2014 PFS and inspecting the core samples for metallurgical testing by Orla. The samples were compared to historic core intervals either with those in KCA’s possession or from photos of core. Sue Bird, P. Eng. Of MMTS is the qualified person (QP) according to the definition as set forth in Canadian National Instrument NI 43-101, “Standards of Disclosure for Mineral Projects”, visited the Cerro Quema project 3 May 2021. During the site visit, the three deposits: Quema-Quemita, La Pava and Caballito were each visited with drillhole collar location confirmed at each deposit. The core shed, coarse reject storage, splitting and photographing areas were toured, with representative core within each deposit examined. In addition, the site layout, offices, infrastructure, access roads, leach pad and waste dump sites were visited. Sue Bird is responsible for Sections 1.9, 1.10, 1.12, 1.23.1, 1.24.2.1, 1.24.2.2, 7.7, 10, 11, 12, 14, 25.1.1, 25.2.1, 25.3.1, 26.2.1 and 26.2.2 of the Report. Jesse Aarsen, qualified person (QP) according to the definition as set forth in Canadian National Instrument NI 43-101, “Standards of disclosure for Mineral Projects” is responsible for Sections 1.13, 1.14, 1.23.2, 1.24.2.3, 15, 16 (excluding 16.5.1 and 16.6), 18.1.3, 21.1.1, 21.2.1, 25.1.2, 25.2.2, 25.3.2 and 26.2.3 of the Report. Denys Parra, qualified person (QP) according to the definition as set forth in Canadian National Instrument NI 43-101, “Standards of disclosure for Mineral Projects”, visited the Cerro Quema project on December 8 and 9, 2020. During the site visit Mr. Parra performed a site inspection of the Maricela HLF and Chontal WRD and other areas where project related facilities will be constructed. Also, samples collected during the site investigations were inspected. He is

Updated Cerro Quema Pre-Feasibility Study NI 43-101 Technical Report
Kappes, Cassiday & Associates 2.0 Introduction January, 2022 Page 2-6
responsible for Sections 1.24.4, 16.5.1, 17.5, 17.6, 17.8, 18.4, 20.1.1.5, 20.1.2.4, 20.1.4.4, 20.1.5.2, 20.1.5.3, 20.1.5.4, 20.1.5.6, 20.1.5.7, 20.1.5.8, 24.2 and 26.3 of the Report. Matthew D. Gray, Ph.D., C.P.G, the Qualified Person responsible for Sections 1.2, 1.3, 1.4, 1.5, 1.6, 1.7, 1.8, 1.18, 1.21, 1.23.4, 1.24.3, 4, 5, 6, 7.1, 7.2, 7.3, 7.4, 7.5, 7.6, 7.8, 8, 9, 20.1.1.2, 20.1.1.4, 20.1.1.6, 20.1.1.7, 20.1.2.5, 20.1.2.6, 20.1.6.2, 20.1.6.3, 20.2, 23, 24.3, 25.1.4, 25.3.4 and 26.5 of this Technical Report, conducted field visits to the Cerro Quema Gold Project, Los Santos Province, Panama, during the period 11 to 15 July 2016 as part of Orla’s due diligence review of the project, which at the time was owned and operated by Pershimco. During his visit, Dr. Gray reviewed drill core, the geologic and resource model created by Pershimco, assay and geologic data, and site infrastructure. In 2017, Dr Gray visited again during the period 17 to 18 May. During the 2017 site visit, Dr. Gray: designed and implemented drill program QA QC protocols; reviewed new drill core; verified drill data; checked the new geologic and resource model for consistency with drillhole data. Since the time of the most recent site visit, Dr. Gray has remained engaged with the project, including review of consultant’s studies of environmental and permitting issues; discussing with Orla’s Panamanian representatives the status of land, mineral, and water rights agreements; and reviewing the results of regional exploration programs. Dr. Gray has determined that as of the effective date of this Technical Report there has been no material change to the scientific and technical information about the property related to those sections for which he is responsible since that personal inspection. Dr. Gray is an independent Qualified Person under National Instrument 43-101. Brent Johnson, qualified person (QP) according to the definition as set forth in Canadian National Instrument NI 43-101, “Standards of disclosure for Mineral Projects” is responsible for Sections 1.24.5, 20.1.1.1, 20.1.1.3, 20.1.2.1, 20.1.2.2, 20.1.2.3, 20.1.4.3, 20.1.5.1, 20.1.6.4 and 26.4 of the Report. Lee Josselyn, qualified person (QP) according to the definition as set forth in Canadian National Instrument NI 43-101, “Standards of disclosure for Mineral Projects” is responsible for Sections 1.24.6, 17.9 (excluding 17.9.1.1), 21.1.2.7, 21.2.2.6 and 26.6 of the Report. Wade Brunham, qualified person (QP) according to the definition as set forth in Canadian National Instrument NI 43-101, “Standards of disclosure for Mineral Projects” is responsible for Sections 1.24.7, 20.3 and 26.7 of the Report. There is no affiliation between the authors as listed in Section 2.4 and Orla Mining Ltd., except that of an independent consultant / client relationship. The effective date of the Mineral Resource is 2 November 2021. The effective date of this Technical Report is 18 January 2022.
Updated Cerro Quema Pre-Feasibility Study NI 43-101 Technical Report
Kappes, Cassiday & Associates 2.0 Introduction January, 2022 Page 2-7
Frequently Used Acronyms, Abbreviations, Definitions and Units of Measure
All costs are presented in United States dollars. Units of measurement are metric. Only common and standard abbreviations were used wherever possible. A list of abbreviations used is as follows: Distances: mm – millimetre cm – centimetre m – metre km – kilometre mbgl – metres below ground level masl – metres above sea level Areas: m2 or sqm – square metre ha – hectare km2 – square kilometre Weights: oz – troy ounces Koz – 1,000 troy ounces Moz – 1,000,000 troy ounces g – grams kg – kilograms T or t – tonne (1000 kg) Kt – 1,000 tonnes Mt – 1,000,000 tonnes Time: min – minute h or hr – hour op hr – operating hour d – day yr – year Ma – Mega-annum (one million years) Volume/Flow: m3 or cu m – cubic metre m3/h – cubic metres per hour cc or cm3 – cubic centimetres L/s – litres per second Assay/Grade: g/t – grams per tonne kg/t – kilograms per tonne g Au/t – grams gold per tonne g Ag/t – grams silver per tonne g Cu/t – grams copper per tonne ppm – parts per million;

Updated Cerro Quema Pre-Feasibility Study NI 43-101 Technical Report
Kappes, Cassiday & Associates 2.0 Introduction January, 2022 Page 2-8
ppb – parts per billion Other: TPD or tpd – metric tonnes per day ktpy – 1,000 tonnes per year m3/h/m2 – cubic metres per hour per square metre Lph/m2 – litres per hour per square metre L/s/km2 – litres per second per square kilometres g/L – grams per litre Ag – silver As – arsenic Au – gold Ba – barium Cu – copper Hg – mercury Pb – lead Sb – antimony Zn – zinc US$ or $ – United States dollar US$ M – Millions of United States dollars NaCN – sodium cyanide TSS – total suspended solids TDS – total dissolved solids DDH – diamond drill boreholes LOM – life of mine kWh – Kilowatt-hours P80 – 80% passing P100 – 100% passing CMU – concrete masonry unit WRD – waste rock dump HLF – heap leach facility NYSE – New York Stock Exchange TSX – Toronto Stock Exchange Owner – Orla Mining LTD. ITMBS - Impuesto de Transferencia de Bienes Muebles y
Servicios UTM - Universal Transverse Mercator coordinates WGS84 – World Geodetic System (1984) coordinates BCR – Biochemical Reactor MBBR – Moving Bed Biofilm Reactor SWBM – Site-wide Water Balance Model
Updated Cerro Quema Pre-Feasibility Study NI 43-101 Technical Report
Kappes, Cassiday & Associates 3.0 Reliance on Other Experts January, 2022 Page 3-1
3.0 RELIANCE ON OTHER EXPERTS
All of the work summarized in this Technical Report has been prepared under the supervision of a Qualified Person or has been reviewed and approved by a Qualified Person. The authors are not experts in Panamanian legal, political, environmental or tax matters and accordingly for Items 4.2, 4.3, 4.4, 4.5, 4.6, and 20.2 insofar as the information relates to legal ownership and environmental matters at Cerro Quema, the author (Gray) has relied upon information and a letter of opinion dated 2 November 2021 provided by Lic. José Castillo Dopeso, head of the Legal Department of Orla’s Panamanian subsidiary Minera Cerro Quema SA. Lic. Castillo provided specific information and legal opinions on project ownership (Orla’s control of Panamanian company), mining concessions, surface rights (ownership and exploration access agreements), water rights, and environmental permits (Castillo Dopeso 2021).
Updated Cerro Quema Pre-Feasibility Study NI 43-101 Technical Report
Kappes, Cassiday & Associates 4.0 Property Description and Location January, 2022 Page 4-1
4.0 PROPERTY DESCRIPTION AND LOCATION
Area and Location
The Cerro Quema property is located in the Azuero Peninsula, Los Santos Province, Panama, 45 km S-SW of the village of Chitré. The property lies 193 straight line km SW of Panama City, 45 km S-SW of the town of Chitré. (Figure 4.1). Driving distance from Panama City is 255 km. The Project area is centered at approximately 551500E 835500N UTM WGS84 Zone 17N. All geographic references in this Technical Report utilize UTM Zone 17N datum WGS84 unless otherwise stated.
Claims and Title
The author is not an expert in Panamanian mining law. The author has relied upon Orla’s legal manager in Panama, Lic. Jose Castillo Dopeso, for a review of the concession titles and legal framework regarding the mining rights held by Orla through Minera Cerro Quema SA, as shown in Table 4-1. The Cerro Quema Project comprises three contracts between the Republic of Panama and MCQ that grant exclusive rights for mineral extraction of class IV metallic minerals (silver and gold) over 14,893 ha, dated between February 26, 1997 and March 3, 1997. The original 20-year term for the concessions expired on February 26, 2017 (Contracts 19 and 20) and March 3, 2017 (Contract 21). MCQ has applied for the prescribed 10-year extension to these contracts as it is entitled to under Panamanian mineral law. MCQ believes it has complied with all legal requirements in relation to the concessions. On March 6, 2017, the Ministry of Commerce and Industry provided written confirmation to MCQ that the extension applications were received, and that exploration work could continue while the MCQ waits for the renewal of the concessions. MCQ has also received verbal assurances from government officials that the renewal applications are complete with no outstanding legal issues. The renewal of the mining rights has been duly accredited by the Minister of Commerce, identified with registration numbers 0-08-0-10393814-2021, 0-08-0-10393872-2021, and 0-08-0-10393847-2021 and the renewal is pending endorsement by the Comptroller General of the Nation. On April 26, 2017, MCQ received authorization from the Ministry of Environment to drill in two areas outside of the existing permitted drill area. On June 28, 2017, MCQ received a permit to use water for drilling. A permit was received on May 8, 2018 to drill in the Sombrero zone and on May 11, 2018 two permits to use water for drilling were received. An existing permit that allows drilling in the areas of the current resources was extended for two years in May 2018.
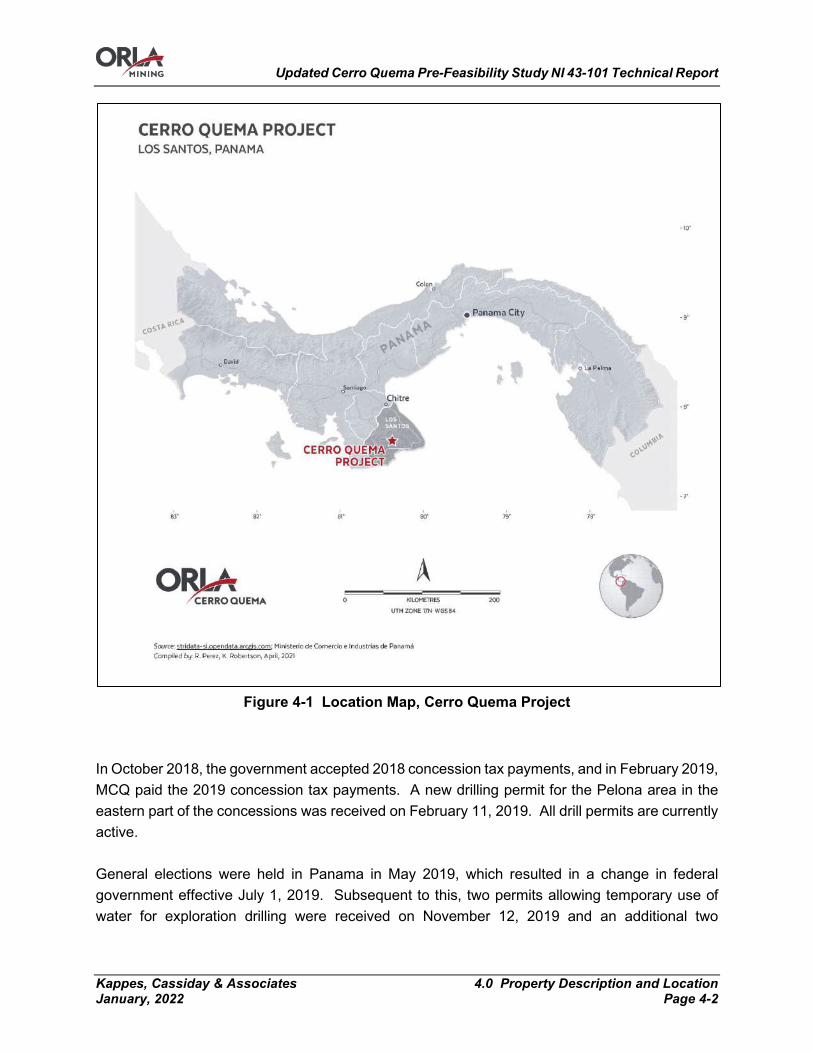
Updated Cerro Quema Pre-Feasibility Study NI 43-101 Technical Report
Kappes, Cassiday & Associates 4.0 Property Description and Location January, 2022 Page 4-2
Figure 4-1 Location Map, Cerro Quema Project
In October 2018, the government accepted 2018 concession tax payments, and in February 2019, MCQ paid the 2019 concession tax payments. A new drilling permit for the Pelona area in the eastern part of the concessions was received on February 11, 2019. All drill permits are currently active. General elections were held in Panama in May 2019, which resulted in a change in federal government effective July 1, 2019. Subsequent to this, two permits allowing temporary use of water for exploration drilling were received on November 12, 2019 and an additional two
Updated Cerro Quema Pre-Feasibility Study NI 43-101 Technical Report
Kappes, Cassiday & Associates 4.0 Property Description and Location January, 2022 Page 4-3
temporary water permits were received on January 13, 2020. On February 3, 2020, the 2020 annual report and concession payments were made and accepted. As of the date of this Technical Report, final concession renewals have not been received and are still under revision. Lic. José Castillo Dopeso verified that the concessions are in currently in good standing and ownership of all concessions has been registered to MCQ while the renewal of the contracts for an additional 10-year period is in process. After the first extension is granted, the contracts can be extended for two additional extensions of five years each. The Government of Panama retains a 4% net smelter royalty. Other than the 4% Federal royalty, the project is unencumbered by other royalties, net profit interests, participation rights, or back-in options. Mineral extraction contract details are:
• Contract No. 19, dated February 26, 1997, for the exclusive rights for the extraction of Class IV metallic minerals (gold and silver) for 5,000 ha and effective for 20 years, identified in the National Directorate of Mineral Resources with the symbol MCQSAEXTR (gold and silver) 96-63;
• Contract No. 20, dated February 26, 1997, for the exclusive rights for the extraction of Class IV metallic minerals (gold and silver) for 5,000 ha and effective for 20 years, identified in the National Directorate of Mineral Resources with the symbol MCQSAEXTR (gold and silver) 96-62;
• Contract No. 21, dated March 3, 1997, for the exclusive rights for the extraction of Class IV metallic minerals (gold and silver) for 4,893 ha and effective for 20 years, identified in the National Directorate of Mineral Resources with the symbol MCQSA-EXTR (gold and silver) 96-64.
The concession contracts held by MCQ include the following provisions:
• The state reserves the right to explore and extract under the granted area, by itself or by concessions to third parties, other natural resources including different minerals to those granted under the contract;
• A land tax and royalty against production must be paid to the government as per Article 211 of the Mining Resources Code;
• The concession holder must submit to the government a detailed work plan each year including approximate cost;
• The concession holder has the right to import equipment, parts, and supplies to be used in any mining operation free of importation taxes and custom fees, except for fuel and vehicles that are not used in the mining operation;
• A warranty fund in the amount of 100,000 Panamanian balboas (“PAB”) (equivalent to US$100,000) in the form of an insurance company deposit must be put in place to
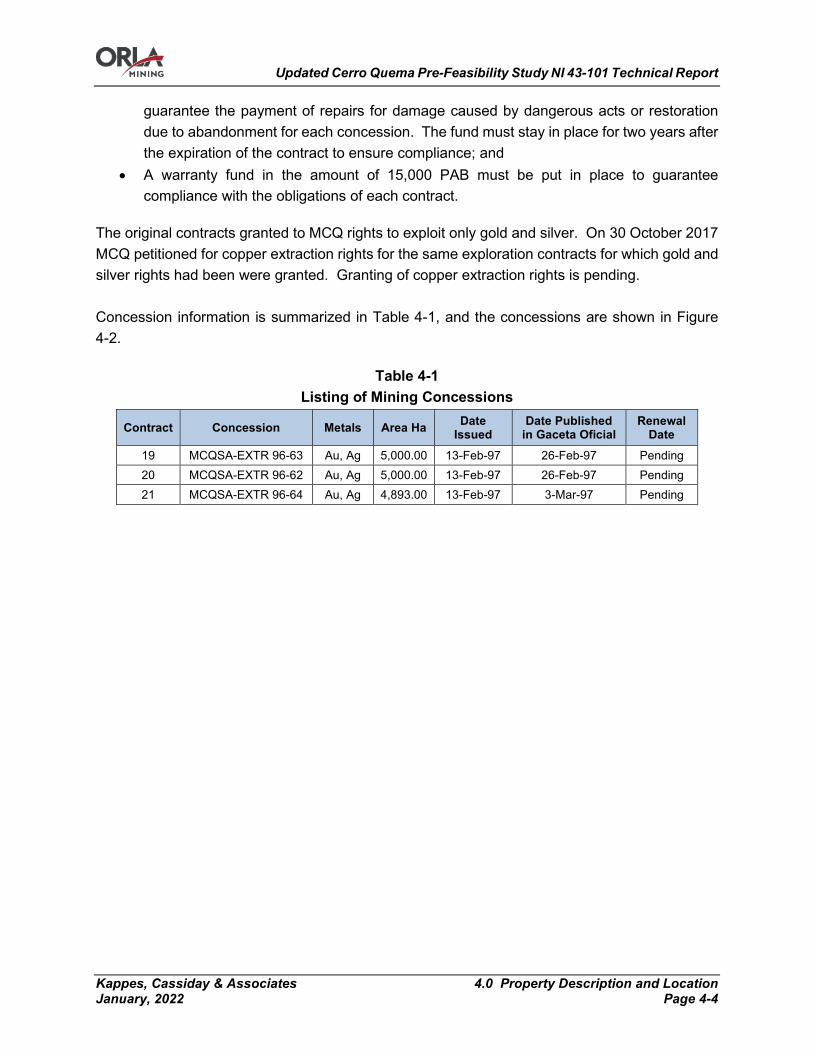
Updated Cerro Quema Pre-Feasibility Study NI 43-101 Technical Report
Kappes, Cassiday & Associates 4.0 Property Description and Location January, 2022 Page 4-4
guarantee the payment of repairs for damage caused by dangerous acts or restoration due to abandonment for each concession. The fund must stay in place for two years after the expiration of the contract to ensure compliance; and
• A warranty fund in the amount of 15,000 PAB must be put in place to guarantee compliance with the obligations of each contract.
The original contracts granted to MCQ rights to exploit only gold and silver. On 30 October 2017 MCQ petitioned for copper extraction rights for the same exploration contracts for which gold and silver rights had been were granted. Granting of copper extraction rights is pending. Concession information is summarized in Table 4-1, and the concessions are shown in Figure 4-2.
Table 4-1 Listing of Mining Concessions
Contract Concession Metals Area Ha Date Issued
Date Published in Gaceta Oficial
Renewal Date
19 MCQSA-EXTR 96-63 Au, Ag 5,000.00 13-Feb-97 26-Feb-97 Pending 20 MCQSA-EXTR 96-62 Au, Ag 5,000.00 13-Feb-97 26-Feb-97 Pending 21 MCQSA-EXTR 96-64 Au, Ag 4,893.00 13-Feb-97 3-Mar-97 Pending
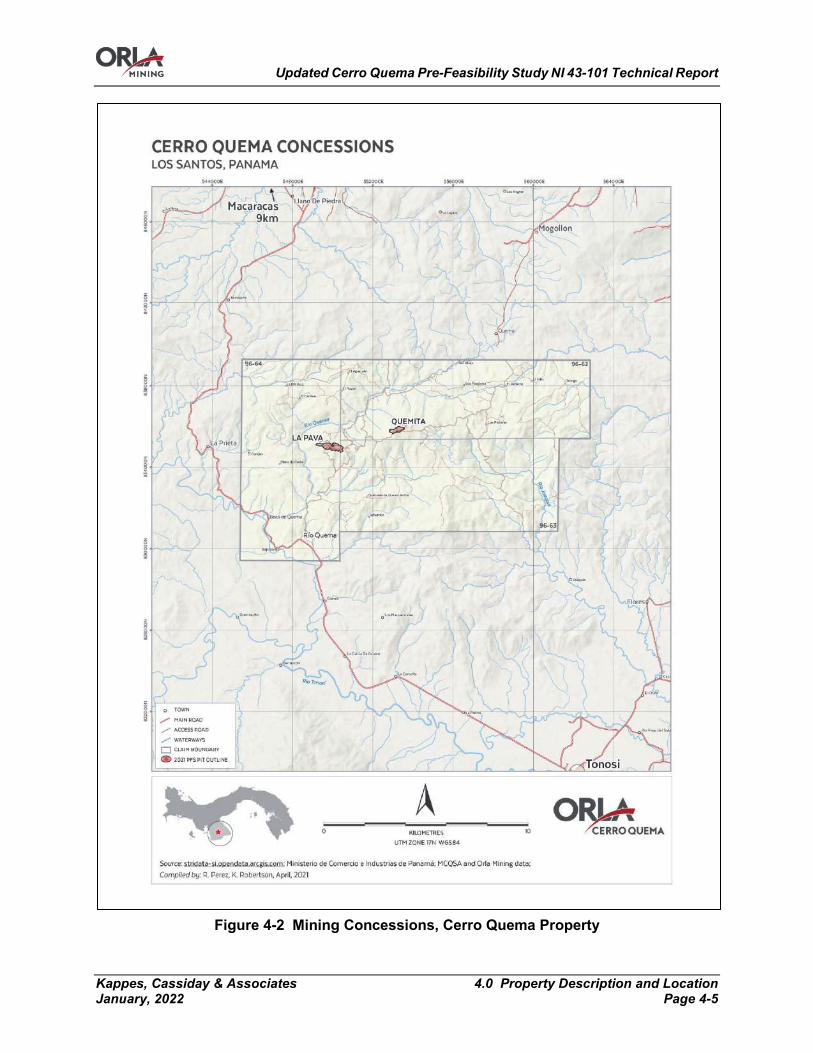
Updated Cerro Quema Pre-Feasibility Study NI 43-101 Technical Report
Kappes, Cassiday & Associates 4.0 Property Description and Location January, 2022 Page 4-5
Figure 4-2 Mining Concessions, Cerro Quema Property

Updated Cerro Quema Pre-Feasibility Study NI 43-101 Technical Report
Kappes, Cassiday & Associates 4.0 Property Description and Location January, 2022 Page 4-6
Surface Rights
The author is not an expert in Panamanian legal surface rights or contract law. The author has relied upon Orla’s legal manager in Panama, Lic. Jose Castillo Dopeso, for a review of the Project surface rights as discussed in Section 3.0 of this Technical Report. MCQ owns the surface rights for the land required to mine the Cerro Quema Mineral Reserves discussed in Section 15.0 of this Technical Report and to construct and operate a heap leach facility and part of the land required for proposed upgrades to the project access road. Total land ownership of MCQ is 2,274.5 Ha as shown in Figure 4-3.
Figure 4-3 Surface Rights Owned by MCQ and Proposed Project Layout
Updated Cerro Quema Pre-Feasibility Study NI 43-101 Technical Report
Kappes, Cassiday & Associates 4.0 Property Description and Location January, 2022 Page 4-7
Exploration work on land not controlled by MCQ has been carried out under the terms of surface access agreements negotiated with private landowners.
Environmental Liability
The property does not contain active or historic mines or prospects, there are no plant facilities present within the Project area, nor are tailings piles present, and all exploration work has been carried out by prior operators in accordance with Panamanian environmental standards. The extreme topography and resultant erosion during periods of high rain create an environmental liability related to siltation of waterways. Erosion is exacerbated by the road building required for exploration drilling. MCQ has constructed engineered sediment traps to prevent on site erosion from impacting surrounding waterways. The mineralizing system created a naturally occurring sulphide enrichment in the bedrock which has undergone natural weathering and oxidation, resulting in local areas of naturally occurring acidic conditions.
Permits
The author is not an expert in Panamanian environmental law. The author has relied upon Orla’s legal manager in Panama, Lic. Jose Castillo Dopeso for a summary review of the Project environmental permits and the discussion of permitting requirements in this Technical Report. Castillo Dopeso reported that current exploration activities at the project are being conducted under valid environmental permits issued by the Ministry of Environment. Environmental assessment requirements in Panama are regulated by Decree Law #123 (the Decree, August 14, 2009). The Decree describes detailed measures by which the process of submitting and reviewing an Environmental Impact Study (Estudio de Impacto Ambiental – EIA) for a proposed project shall be carried out, in accordance with the provisions of Law No. 41 of July 1, 1998 – Environmental Protection Law of the Republic of Panama. The proposed Cerro Quema mining project falls under Article 16 of the Decree (Associated International Standard Industrial Classification of All Economic Activities [ISIC] Code # 1310). In accordance with the Decree, Cerro Quema project is classified as a Category III EIA, defined as: • The project may cause negative environmental effects that are of indirect, cumulative and/or
synergistic nature and which are quantitatively and qualitatively significant, and therefore must be subjected to a more in-depth evaluation of effects, and identification and implementation of appropriate mitigation measures.

Updated Cerro Quema Pre-Feasibility Study NI 43-101 Technical Report
Kappes, Cassiday & Associates 4.0 Property Description and Location January, 2022 Page 4-8
Regardless of category, an EIA must meet the minimum content specified in Article 26 of the Decree, to ensure the adequate prediction, identification and interpretation of environmental effects, as well as the technical suitability of the proposed mitigation measures. Once the EIA is submitted by the proponent to the Autoridad Nacional del Ambiente (ANAM), the EIA evaluation process begins, which consists of the following phases (as per Article 41 of the Decree): • Admission Phase: This phase begins with the formal electronic submission of the EIA, along
with the application for environmental assessment if it is a Category II or III EIA. During this phase it will be verified if the EIA meets the minimum requirements established in Article 26 of the Decree. This phase shall not exceed five (5) business days.
• Assessment and Analysis Phase: During this phase, ANAM and the pertinent municipal and sectorial environmental units evaluate the EIA by looking at the technical, environmental and sustainability aspects of the respective study. Information requests may be issued to the proponent if they are deemed necessary. This phase should be completed within a period not exceeding thirty- five (35) business days for a Category II EIA, and fifty-five (55) business days for a Category III EIA. A report will be issued at the end of this phase.
• Decision Phase: During this phase ANAM formalizes its decision to approve/reject the EIA through an Environmental Resolution. This phase should not exceed five (5) business days.
Once approved, the proponent must submit evidence demonstrating compliance with the follow-up monitoring outlined in the Environmental Management Plan section of the EIA with the frequency and detail set out in the Environmental Resolution issued by ANAM. An environmental impact assessment (EIA) and permits are in place for a continuous vat leach operation previously proposed by Pershimco. However, as the current project will utilize heap leach processing methods, MCQ initiated an update of the EIA and associated permits based on the new project design to meet Panamanian ANAM requirements. An application for the required Category 3 EIA permit was submitted in 2015. The Ministry has completed the technical evaluation of the EIA, and MCQ believes the Ministry is in the process of preparing the formal resolution to approve it. Timing of approval is presently not known. In 2020 MCQ contracted ERM Consultants Canada Ltd. to assess if the information presented in the EIA is in accordance with the requirements established by Panamanian regulations, International Finance Corporation Performance Standards 2012 (IFC PS), and currently accepted industry best practices. ERM found no fatal flaws with respect to Panamanian regulations but identified areas where environmental permitting studies and management plans should be improved to fully meet local requirements, International Standards and currently accepted industry practices (ERM Consultants Canada Ltd., 2021). ERM provided recommendations that should

Updated Cerro Quema Pre-Feasibility Study NI 43-101 Technical Report
Kappes, Cassiday & Associates 4.0 Property Description and Location January, 2022 Page 4-9
be followed as the project advances beyond the Pre-Feasibility level, as summarized in Section 24.3 and Section 26.7 of this Technical Report.
Access, Title, Permit and Security Risks
Access Risks
The Project has had a productive relationship with the local community and surface owners and no extraordinary risks to Project access were discerned. MCQ owns the surface rights for land required to mine the Cerro Quema Mineral Reserves and to construct and operate a heap leach facility and part of the land required for proposed upgrades to the project access road (Figure 4-3). MCQ is currently negotiating to obtain valid surface access agreements allowing development of the Project described for the Pre-Feasibility Study base case summarized herein.
Title Risks
Panama lacks a significant history of mining investment and development thus consequently lacks a history of modern legal precedents that determine the regulatory framework for mining. Panamanian authorities have demonstrated inconsistencies and ambiguities in the interpretation and application of mining laws. A specific title risk for Minera Cerro Quema is a failure of the Panamanian government to renew mining concessions as permitted by law. Prior operators and Minera Cerro Quema have met legal requirements to maintain in good standing the mining concession titles, however, as discussed in Section 4.2 of this Technical Report, the response of Federal authorities has been inconsistent with the mining law, and legally permitted concession renewals have repeatedly been delayed. Similarly, failure of the Panamanian government to approve the copper extraction rights for the same exploration contracts for which gold and silver rights had been granted, will affect the viability of potential development of the Caballito zone. Other risks are exemplified by the 2018 ruling of the Panamanian Supreme Court that called into question the validity of the law that assigned mining concessions to Minera Panama SA, a subsidiary of First Quantum Mining, that in 2019 commissioned the Cobre de Panama mine, scheduled to produce 175,000 tonne per year copper. Final resolution of the validity of the concession transfer is pending.
Permit Risks
Prior operators and Minera Cerro Quema have been compliant with Panamanian environmental regulations and conditional upon continued compliance, permits for normal exploration activities
Updated Cerro Quema Pre-Feasibility Study NI 43-101 Technical Report
Kappes, Cassiday & Associates 4.0 Property Description and Location January, 2022 Page 4-10
are expected to be readily attainable. MCQ obtained permits or extensions to existing permits required for exploration drilling conducted in 2017 and 2018. An environmental impact assessment (EIA) and permits are in place for a continuous vat leach operation, however, the current project described in this Technical Report requires a modification to the existing permits. To develop a mine at Cerro Quema, a Category 3 EIA is required from the Ministry of Environment. An application for this permit was submitted in 2015 and the Ministry has completed the technical evaluation of the EIA. Timing of approval is presently not known but the Ministry’s response time has exceeded the time periods specified in Article 41 of the Decree Law 23 applicable to EIA permit resolutions.
Security Risks
The Project area, similar to the region in general, is subject to property crimes and unattended valuables and infrastructure are at risk of theft or vandalism. Violent criminal activity has not been a concern in the region, nor has community antipathy. Security issues have not affected the ability of Orla or previous operators to explore the Cerro Quema project.
Updated Cerro Quema Pre-Feasibility Study NI 43-101 Technical Report
Kappes, Cassiday & Associates 5.0 Accessibility, Climate, Local Resources and Physiography January, 2022 Page 5-1
5.0 ACCESSIBILITY, CLIMATE, LOCAL RESOURCES, AND PHYSIOGRAPHY
Accessibility
The Cerro Quema project is located in the Los Santos Province, Panama, 82 km by road from Chitré, of which 75 km are on paved Federal highways Via Chitré-Macaracas and Via Macaracas-Tonosí (Figure 5-1). A 7 km unsurfaced road connects the project to the Federal highway. Driving time from Chitré is approximately 1.5 hours, and with the exception of temporal road closings during extreme rain events, the project is road accessible through all seasons. Equipment and supplies can be internationally sourced, shipped through the Panama Canal, and then trucked to site. Chitré provides basic commercial services to a regional population of approximately 80,000. Alonso Valderrama airport in Chitré has regular commercial air service with daily flights to Panama City. A helipad at the MCQ camp allows helicopter access for emergency services. Road access within the project area is limited to exploration drill roads. Outside of the drilled resource areas and infrastructure sites, the project area is not generally road accessible. The Project area is centred at approximately 551500E 835500N UTM WGS84 Zone 17N. All geographic references in this Technical Report utilize UTM Zone 17N datum WGS84 unless otherwise stated.
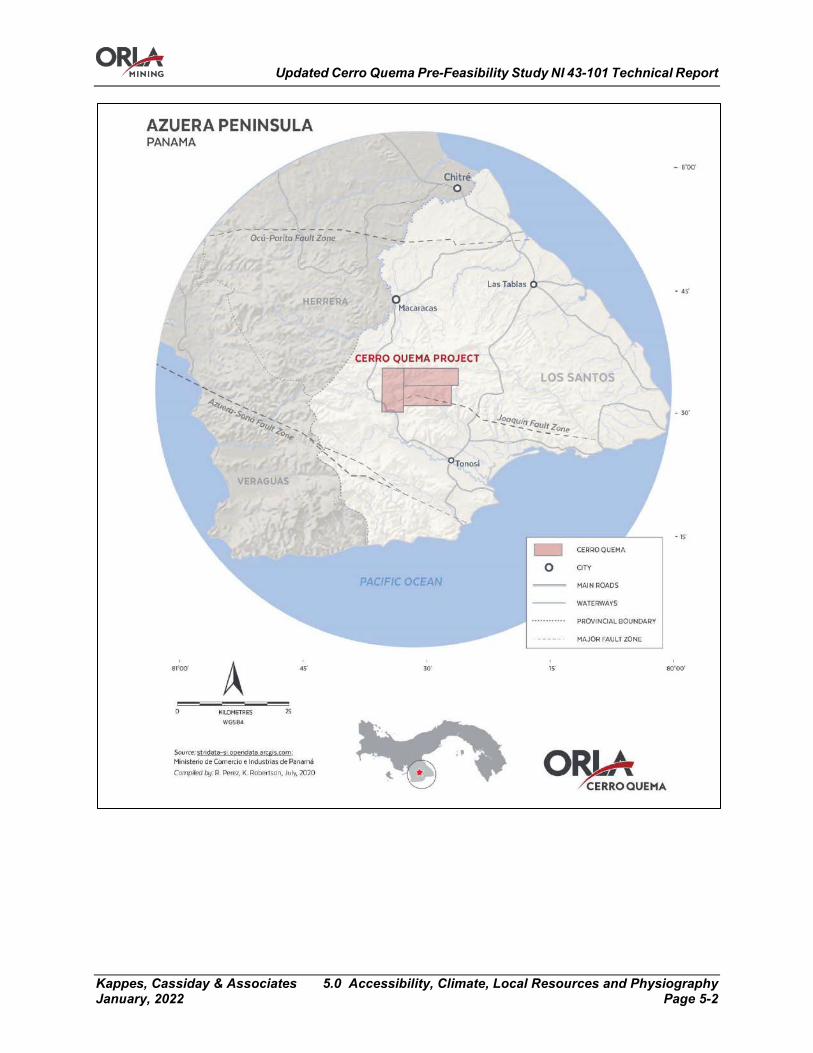
Updated Cerro Quema Pre-Feasibility Study NI 43-101 Technical Report
Kappes, Cassiday & Associates 5.0 Accessibility, Climate, Local Resources and Physiography January, 2022 Page 5-2
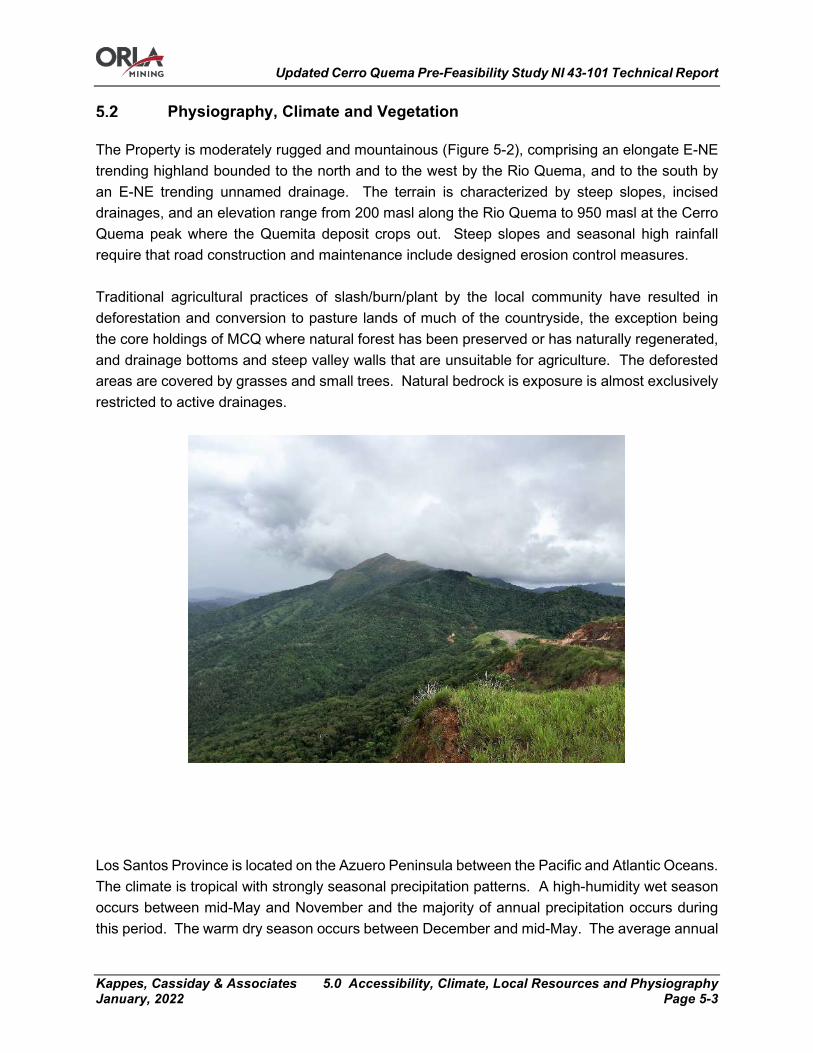
Updated Cerro Quema Pre-Feasibility Study NI 43-101 Technical Report
Kappes, Cassiday & Associates 5.0 Accessibility, Climate, Local Resources and Physiography January, 2022 Page 5-3
Physiography, Climate and Vegetation
The Property is moderately rugged and mountainous (Figure 5-2), comprising an elongate E-NE trending highland bounded to the north and to the west by the Rio Quema, and to the south by an E-NE trending unnamed drainage. The terrain is characterized by steep slopes, incised drainages, and an elevation range from 200 masl along the Rio Quema to 950 masl at the Cerro Quema peak where the Quemita deposit crops out. Steep slopes and seasonal high rainfall require that road construction and maintenance include designed erosion control measures. Traditional agricultural practices of slash/burn/plant by the local community have resulted in deforestation and conversion to pasture lands of much of the countryside, the exception being the core holdings of MCQ where natural forest has been preserved or has naturally regenerated, and drainage bottoms and steep valley walls that are unsuitable for agriculture. The deforested areas are covered by grasses and small trees. Natural bedrock is exposure is almost exclusively restricted to active drainages.
Los Santos Province is located on the Azuero Peninsula between the Pacific and Atlantic Oceans. The climate is tropical with strongly seasonal precipitation patterns. A high-humidity wet season occurs between mid-May and November and the majority of annual precipitation occurs during this period. The warm dry season occurs between December and mid-May. The average annual

Updated Cerro Quema Pre-Feasibility Study NI 43-101 Technical Report
Kappes, Cassiday & Associates 5.0 Accessibility, Climate, Local Resources and Physiography January, 2022 Page 5-4
precipitation at the Cerro Quema project site is about 2,233 mm with September and October typically the wettest months and February and March the driest. Temperatures are less variable than precipitation. Average maximum and minimum monthly temperatures during the rainy season range from 34°C to 20°C respectively, whereas during the dry season average maximum and minimum monthly temperatures range from 34°C to 19°C (SNC-Lavalin Panama 2015). The Project area has been greatly affected by anthropogenic activities, with logging and burning practices widely practiced by locals. Within lands acquired and protected by MCQ, significant natural regeneration has occurred, and secondary forest is the dominant vegetation type. The following discussion of vegetation in the project area is directly sourced and/or summarized from the 2014 PFS completed at the project (P&E Mining Consultants, Golder Associates, Kappes Cassiday and Associates 2014) and the 2015 Environmental Impact Statement (SNC-Lavalin Panama 2015). A more detailed discussion of flora of the region is presented in Section 20.1.1.6 of this Technical Report. The Project area comprises six general types of vegetation:
1. Immature secondary forests. This type of vegetation covers most of the study area (~54%). It is made up of bushes of different pioneer species and some scattered trees. Representative species are pore (Cochlospermum vitifolium), raft (Ochroma pyramidale), aguacatillo (Clethra lanata) and nance (Byrsonima crassifolia). Developed in abandoned paddocks or crop lands by natural regeneration of plant species.
2. Mature secondary forests. Covers ~4% of the study area. Hosts the tallest and largest diameter trees in the study area. Representative species are berbá (Brosimum alicastrum), fig (Ficus insipida), ceiba (Ceiba pentandra), espavé (Anacardium excelsum), satra (Garcinia intermedia), cerrito (Eugenia sp.), and maria trees (Calophyllum Brasiliense).
3. Grasslands. The grassland areas are found in the upper areas of the Project, mainly on the tops of the hills and areas most exposed to wind and comprise ~9% of the study area. The plant diversity they present is minimal. Dominated by Eleocharis, Scleria and Andropogon genuses and fire-resistant ferns and herbs.
4. Pine forest. Occupies 2% of the study area, produced as part of a reforestation plan developed by MCQ in 1997.
5. Agricultural use lands. Comprise 15% of study area and are areas of recent agricultural use such as paddocks, and abandoned plantations of native and exotic fruits.
6. Acacia plantations. Comprise 1% of project area, produced as part of a reforestation plan developed by MCQ in 1997.
Updated Cerro Quema Pre-Feasibility Study NI 43-101 Technical Report
Kappes, Cassiday & Associates 5.0 Accessibility, Climate, Local Resources and Physiography January, 2022 Page 5-5
Local Resources and Infrastructure
Macaracas and Tonosí are the largest towns near the project and are the local commercial centers for their respective districts with dispersed population of approximately 10,000 persons each. Basic goods can be acquired in these villages, but most exploration and operating supplies will be sourced from Chitré or Panama City via Chitré. Federally maintained paved highways provide year-round access to the entrance to the property. Power from the Federal electric grid might be sourced from a high voltage substation at Las Tablas, 35 km NE of the Project. MCQ has constructed a well within its surface holdings at the Project, tested to have an equilibrium capacity of 27.5 m3/h, and MCQ has all water rights necessary for use of this water and MCQ has five water use permits, valid and up to date, that allow MCQ use of superficial water for the development of the project. The water rights are registered as MI Ambiente Number 007-2021, 008-2021, 009-2021, 010-2021, and 011-2021 which grant use of 6,220.8m3 per annum (Castillo Dopeso 2021). There is sufficient area at the Project for leach pads, waste dumps, crushing facilities, and process plants, however the site is mountainous with scant areas of low relief, thus considerable engineered earth works will be required to develop the Project, as discussed in Sections 17.0 and 18.0 of this Technical Report. MCQ is the owner of 2,274.5 Ha and owns almost all of the terrain required for pit, waste storage, leach pad, and processing plant development. Additional surface rights are required for improvement of the Project access road. MCQ has a main camp site and administration offices located near the Project area. This includes: administration and geology offices; accommodation facilities; kitchen and recreational facilities; helipad; an equipment laydown area; geological sample logging and storage facilities; workshop and support facilities, all under the control of MCQ. The camp and offices are connected to the electric grid and have back up emergency generators.
Updated Cerro Quema Pre-Feasibility Study NI 43-101 Technical Report
Kappes, Cassiday & Associates 6.0 History January, 2022 Page 6-1
6.0 HISTORY
Prior Ownership
The following section on ownership prior to the acquisition of the Project by Pershimco is summarized from the 2014 PFS (P&E Mining Consultants, Golder Associates, Kappes Cassiday and Associates 2014) and reports prepared by various consulting groups (RNC Resources Ltd. 2002), (BJ Price Geological Consultants 2007), (Scott Wilson Roscoe Postle Associates 2011). Cerro Quema was initially identified as a potential economic mineral deposit during United Nations supported national surveys in the late 1960’s. The Compañía de Exploración Minera, S.A. (CEMSA) investigated the area in 1986 and obtained the exploration concession for Cerro Quema in 1988. Cyprus Minerals Company (Cyprus) formed a joint venture with CEMSA in 1990 through Cyprus Minera de Panama, S.A. (Cyprus Minera). From 1990 to 1994, Cyprus Minera conducted advanced exploration drilling of the La Pava, Quema and Quemita zones. Cyprus Minera merged with Amax Gold Inc. (Amax) in 1993 to form Cyprus Amax Minerals and formed Minera Cerro Quema S.A. (MCQ) to proceed with permitting and development. Campbell Resources Inc. (Campbell) purchased the right of first refusal on the Project from CEMSA and subsequently exercised that right when Cyprus Minera put the property up for sale in 1996. Campbell subsequently earned a 100% interest in the Project, carried out an infill drilling program to further define the resources, and completed a Project Feasibility Study. Campbell sold its 100% interest in the Project to Carena Equities Corporation of Panama (Carena) in August 2001. RNC Resources Ltd. (RNC) entered into an agreement with Carena in January 2002 wherein RNC agreed to complete a “bankable” Feasibility Study on the Cerro Quema Project and to place the Project into production for a 50% participation in the Project. On September 27, 2007, Bellhaven signed a definitive agreement with Carena to acquire a 40% interest in the Project. Pershimco Resources Inc. acquired the property in September 2010 through an agreement with Bellhaven, RNC, Carena, MCQ, Central Sun Mining Inc. and Julio Benedetti to acquire all interests in the Cerro Quema Mining Project held by the corporation MCQ. Under the terms of this agreement, Pershimco acquired all interests and obligations of MCQ. On September 14, 2016, Orla and Pershimco entered into a definitive arrangement agreement to amalgamate the two companies by way of a court-approved arrangement. On December 6, 2016, Orla announced the completion of the arrangement and Minera Cerro Quema SA is now a wholly owned subsidiary or Orla, thus the property is 100% owned by Orla.
Updated Cerro Quema Pre-Feasibility Study NI 43-101 Technical Report
Kappes, Cassiday & Associates 6.0 History January, 2022 Page 6-2
Prior Exploration
The Cerro Quema deposit was discovered by researchers and private companies following up on anomalous results from a 1965 regional stream sediment geochemical survey of the Azuero Peninsula conducted by the United Nations Development Program (Anonymous 1969) (Del Giudice 1969). In 1988, Compañía de Exploración Mineral SA. (CEMSA) evaluated the Cerro Quema anomaly and discovered outcropping gold mineralization. Cyprus Minerals company conducted the first known exploration drilling at the project in 1990, and during the period 1990 to 1994, Cyprus completed geologic mapping and geochemical studies, and conducted diamond core and reverse circulation drilling as described in Section 10 of this Technical Report. In 1996, Campbell Resources is reported to have completed 1,749.6m of diamond core drilling, but records of this drilling are not preserved and results are unknown. Active exploration resumed in 2010 when Pershimco acquired the project. In 2010 and 2011, Pershimco’s exploration efforts focused on drilling but lithological and structural mapping, channel sampling and geochemical sampling were also conducted in 2011. In 2012, Geotech Ltd., under contract to Pershimco, completed airborne geophysics including radiometric, magnetic and VTEM surveys over the entire property. These surveys identified the mineralized trend and highlighted areas of coincident low magnetic susceptibility with low potassium and low Th/K ratios associated with the La Pava and Quema-Quemita deposits. Additionally, the survey identified two previously unknown corridors to the north of the main trend which highlighted areas of coincident low magnetic susceptibility with low potassium and low Th/K ratios similar to those associated with the La Pava and Quema-Quemita mineralized trend. Following the completion of airborne geophysical studies in early 2012, Pershimco conducted ground IP surveys on various geophysical targets. The first surveys done were over the Quema-Quemita target in late 2012. Surveys were completed over La Pava and a new exploration target, Idaida in 2013. Each survey revealed the presence of large chargeable bodies at depth and show a generally inversed cone geometry. These large chargeable bodies are located over more than 11 km along the Cerro Quema Mineralized Corridor, which has been identified to extend for approximately 15 km within the concessions. A total of 144.6 line-km of IP survey work was completed, 66.9 km at Quema-Quemita and Idaida, 57.1 km at La Pelona and 20.6 km at La Pava. The IP geophysics program identified resistivity and chargeability anomalies on all four target areas. In 2014, a regional mapping and surface rock chip sampling program focused on a first-pass reconnaissance investigation over the priority targets identified by the airborne geophysical survey. A total of 12,307 line-metres were mapped and a total of 1,204 surface rock chip samples were collected. Pershimco contracted an independent petrology consultant in Australia to conduct petrographic analysis on 70 samples. Samples were selected from various drill holes at La Pava, Quema-Quemita, Idaida and Pelona areas. Samples were selected from the deeper feeder structures at

Updated Cerro Quema Pre-Feasibility Study NI 43-101 Technical Report
Kappes, Cassiday & Associates 6.0 History January, 2022 Page 6-3
La Pava, the oxide gold zone at La Pava, the supergene enriched copper-gold zones at La Pava, both the oxide and sulphide zones at the Pelona and Idaida projects, as well as the oxide and supergene zones at Quema-Quemita. The aim of the petrographic studies was to gather further information about alteration phases, mineralogy, and mineralization sequence within the various deposits in the concession area. X-ray diffraction studies were conducted to identify clay minerals as well as the composition of ‘sericite’-like white mica and various sulphates. Since acquiring the Cerro Quema Project in 2010, to the date of the 2014 PFS Report, Pershimco completed over 50,000 metres of core and RC drilling, bringing the sum total of historic drilling, up to the date of Orla’s acquisition of the Project in 2016, to over 73,000 metres of combined diamond core and RC drilling, as described in Section 10 of this Technical Report.

Updated Cerro Quema Pre-Feasibility Study NI 43-101 Technical Report
Kappes, Cassiday & Associates 6.0 History January, 2022 Page 6-4
Figure 6-1 Historical Drillhole Locations
Historical Metallurgical Studies
Prior operators completed metallurgical testing of material from the Cerro Quema deposits, as summarized in Table 6-1. These studies have been augmented by metallurgical testing conducted by Orla, results of which are presented in Section 13.0 of this Technical Report.
Table 6-1 Summary of Historic Metallurgical Testwork
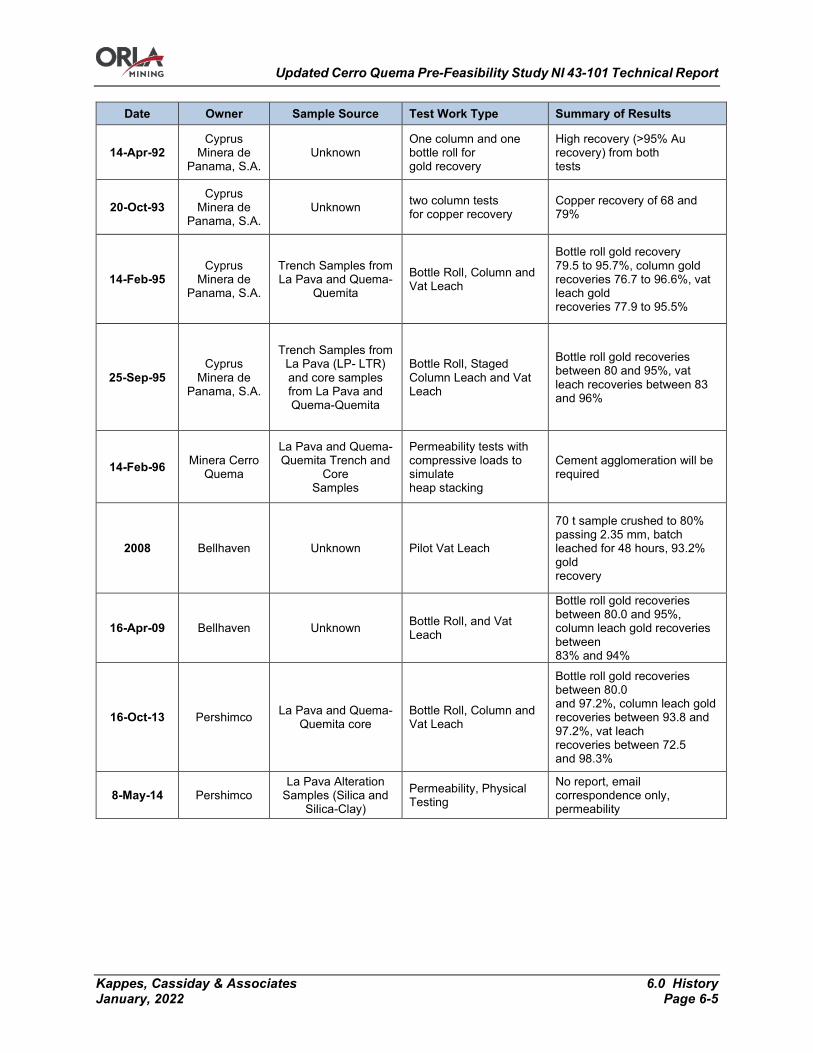
Updated Cerro Quema Pre-Feasibility Study NI 43-101 Technical Report
Kappes, Cassiday & Associates 6.0 History January, 2022 Page 6-5
Date Owner Sample Source Test Work Type Summary of Results
14-Apr-92 Cyprus
Minera de Panama, S.A.
Unknown One column and one bottle roll for gold recovery
High recovery (>95% Au recovery) from both tests
20-Oct-93 Cyprus
Minera de Panama, S.A.
Unknown two column tests for copper recovery
Copper recovery of 68 and 79%
14-Feb-95 Cyprus
Minera de Panama, S.A.
Trench Samples from La Pava and Quema-
Quemita
Bottle Roll, Column and Vat Leach
Bottle roll gold recovery 79.5 to 95.7%, column gold recoveries 76.7 to 96.6%, vat leach gold recoveries 77.9 to 95.5%
25-Sep-95 Cyprus
Minera de Panama, S.A.
Trench Samples from La Pava (LP- LTR) and core samples from La Pava and Quema-Quemita
Bottle Roll, Staged Column Leach and Vat Leach
Bottle roll gold recoveries between 80 and 95%, vat leach recoveries between 83 and 96%
14-Feb-96 Minera Cerro Quema
La Pava and Quema-Quemita Trench and
Core Samples
Permeability tests with compressive loads to simulate heap stacking
Cement agglomeration will be required
2008 Bellhaven Unknown Pilot Vat Leach
70 t sample crushed to 80% passing 2.35 mm, batch leached for 48 hours, 93.2% gold recovery
16-Apr-09 Bellhaven Unknown Bottle Roll, and Vat Leach
Bottle roll gold recoveries between 80.0 and 95%, column leach gold recoveries between 83% and 94%
16-Oct-13 Pershimco La Pava and Quema-Quemita core
Bottle Roll, Column and Vat Leach
Bottle roll gold recoveries between 80.0 and 97.2%, column leach gold recoveries between 93.8 and 97.2%, vat leach recoveries between 72.5 and 98.3%
8-May-14 Pershimco La Pava Alteration
Samples (Silica and Silica-Clay)
Permeability, Physical Testing
No report, email correspondence only, permeability

Updated Cerro Quema Pre-Feasibility Study NI 43-101 Technical Report
Kappes, Cassiday & Associates 6.0 History January, 2022 Page 6-6
Historical Resource Estimates
Various operators of the Project commissioned Mineral Resource and Mineral Reserve estimates in 1996 (Campbell Resources), 2002 (RNC Resources), and 2011 (Pershimco, Pava deposit only). These reserve and resource estimates are historical in nature, have not been verified by the author, and should not be relied upon. Orla is not treating these historical estimates as current estimates and they are not discussed in this Technical Report. In 2014 Pershimco publicly released a PFS, prepared in accordance with the disclosure and reporting requirements set forth in CSA NI43-101, which disclosed a Mineral Resource and Mineral Reserve for the Project. Since the effective date of the 2014 PFS, significant additional drillhole data has become available, rendering the 2014 Mineral Resource and Mineral Reserve obsolete. The 2014 Mineral Resource and Mineral Reserves are presented as summarized in Table 6-2 to provide historical context to the development of the project but, the 2014 Resource and Reserve estimate are not current, have not been verified by the authors, and should not be relied upon. Orla is not treating the 2014 estimates as current estimates. The 2014 Mineral Resource and Mineral Reserve is superseded by the current Mineral Resource and Mineral Reserve described in Sections 13.13 and 15.0 of this Technical Report.
Table 6-2 Mineral Resource and Mineral Reserve, 2014 PFS
Mineral Reserves - Gold Tonnes, 000's
Gold grade, (g/t)
Contained gold (koz)
Proven 6,820 0.80 176 Probable 12,890 0.75 312
Proven and Probable 19,710 0.77 488
Mineral Resources - Gold Tonnes, 000's
Gold grade, (g/t)
Contained gold (koz)
Measured Oxide 7,053 0.82 185 Measured Sulphide 802 0.44 11 Measured Total 7,855 0.78 196 Indicated Oxide 16,880 0.67 367 Indicated Sulphide 10,204 0.42 136 Indicated Total 27,084 0.58 503 Measured & Indicated Oxide 23,932 0.72 552 Measured & Indicated Sulphide
11,006 0.41 146
Measured & Indicated Total 34,938 0.62 698

Updated Cerro Quema Pre-Feasibility Study NI 43-101 Technical Report
Kappes, Cassiday & Associates 6.0 History January, 2022 Page 6-7
Prior Production
There has been no recorded mineral production from the property.

Updated Cerro Quema Pre-Feasibility Study NI 43-101 Technical Report
Kappes, Cassiday & Associates 7.0 Geological Setting and Mineralization January, 2022 Page 7-1
7.0 GEOLOGICAL SETTING AND MINERALIZATION
Sources of Information
The following geological discussion is derived from peer-reviewed professional papers focused on regional and deposit geology (Nelson 1995), (I. G.-G.-F. Corral 2011), (Isaac Corral 2016), field and diamond drill core observations by Dr. Matthew Gray (M. D. Gray 2016), (M. D. Gray 2017), private company reports prepared by Dr. Anthony Longo (Longo 2018), and geologic summaries presented in previously published Technical Reports (P&E Mining Consultants, Golder Associates, Kappes Cassiday and Associates 2014).
Regional Geology
Panama is located at the junction of 4 tectonic plates, the South American, Caribbean, Cocos, and Nazca plates. Late Cretaceous subduction of the Farallon plate (remnants of which today are the Cocos and Nazca plates) beneath the Caribbean plate triggered development of a volcanic arc. Radiometric ages dates of arc-related volcanic rocks indicate that onset of subduction was approximately 75Ma. Arc magmatism persisted through the Miocene and migrated north during the mid-Miocene due to a change of subduction direction caused by collision of the Panamanian volcanic arc with Columbia. The following geological discussion is derived from peer-reviewed professional papers focused on regional and deposit geology (Nelson 1995), (I. G.-G.-F. Corral 2011), (Isaac Corral 2016), field and diamond drill core observations by Dr. Matthew Gray (M. D. Gray 2016), (M. D. Gray 2017), private company reports prepared by Dr. Anthony Longo (Longo 2018), and geologic summaries presented in previously published Technical Reports (P&E Mining Consultants, Golder Associates, Kappes Cassiday and Associates 2014). Subduction related compression and transpression along the South Panama Deformed Belt, where the Nazca plate meets the Panama micro-plate, is likely responsible for the major tectonic structures, including faults and folds, observed in the Azuero Peninsula. The subduction of the Farallon plate and subsequent volcanic arc formation resulted in deposition of arc-related intrusive, volcanic and volcanoclastic sequences within and upon the uplifted basement of the Azuero Peninsula. Corral et al (I. G.-G.-F. Corral 2011) (Isaac Corral 2016), building upon the work of previous researchers (D. &.-M. Buchs 2010), (Wegner 2011), subdivided the regional stratigraphy of the Azuero Peninsula into 5 major units and compiled a regional geologic map of the Azuero Peninsula (Figure 7-1).
Updated Cerro Quema Pre-Feasibility Study NI 43-101 Technical Report
Kappes, Cassiday & Associates 7.0 Geological Setting and Mineralization January, 2022 Page 7-2
The postulated relative timing and environment of formation for the major units were described as:
1) Azuero Igneous Basement, composed of basalt, diabase, gabbro and lesser occurrences of hemipelagic sediments interlayered with lavas. Interpreted as arc basement.
2) Azuero Proto Arc Group, composed of tholeiitic basalts and volcaniclastic rocks, interbedded with hemipelagic limestones. Corresponds to the initial stages of arc volcanism.
3) Azuero Arc Unit, composed of volcanosedimentary, volcanic, and calc-alkaline arc-related intrusive rocks. Represents Cretaceous and Paleogene volcanic arcs and includes the Rio Quema Formation, the host of the Cerro Quema deposits.
4) Tonosí Formation, a middle Eocene to early Miocene sedimentary sequence unconformably overlying the older units.
5) Azuero accretionary complex composed of Paleocene to middle Eocene seamounts, oceanic plateaus and melanges accreted along the ancient subduction trench.
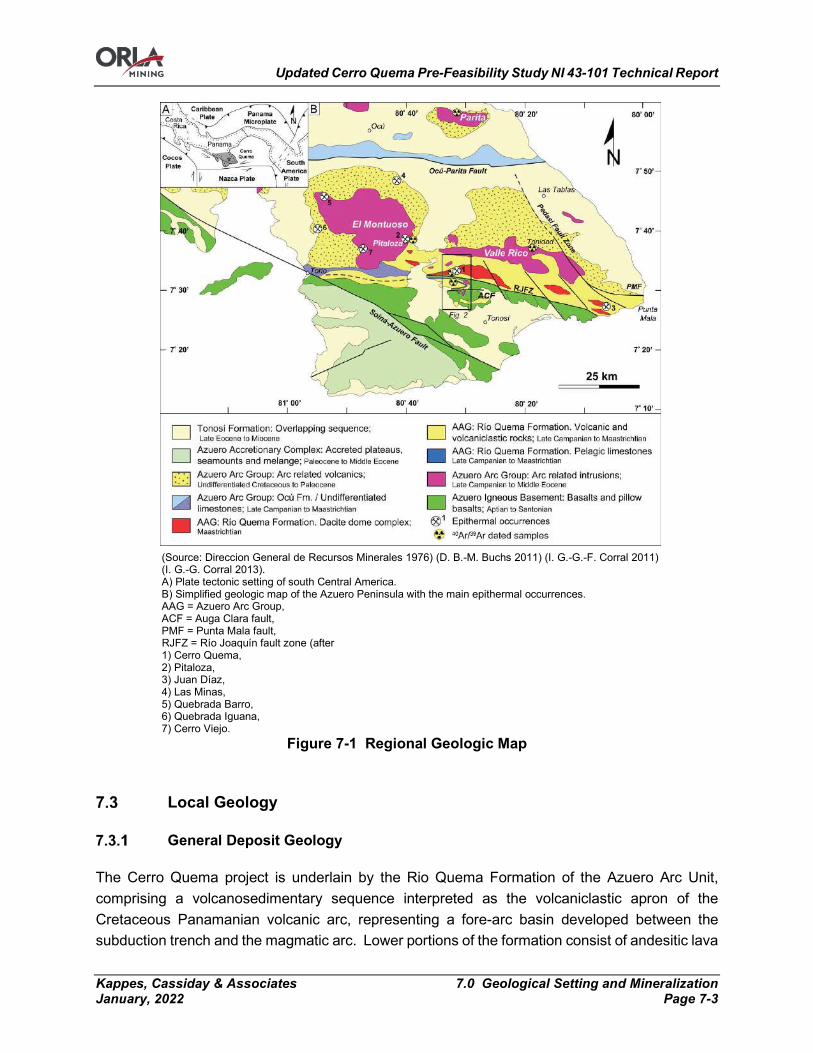
Updated Cerro Quema Pre-Feasibility Study NI 43-101 Technical Report
Kappes, Cassiday & Associates 7.0 Geological Setting and Mineralization January, 2022 Page 7-3
(Source: Direccion General de Recursos Minerales 1976) (D. B.-M. Buchs 2011) (I. G.-G.-F. Corral 2011) (I. G.-G. Corral 2013). A) Plate tectonic setting of south Central America. B) Simplified geologic map of the Azuero Peninsula with the main epithermal occurrences. AAG = Azuero Arc Group, ACF = Auga Clara fault, PMF = Punta Mala fault, RJFZ = Río Joaquín fault zone (after 1) Cerro Quema, 2) Pitaloza, 3) Juan Díaz, 4) Las Minas, 5) Quebrada Barro, 6) Quebrada Iguana, 7) Cerro Viejo.
Figure 7-1 Regional Geologic Map
Local Geology
General Deposit Geology
The Cerro Quema project is underlain by the Rio Quema Formation of the Azuero Arc Unit, comprising a volcanosedimentary sequence interpreted as the volcaniclastic apron of the Cretaceous Panamanian volcanic arc, representing a fore-arc basin developed between the subduction trench and the magmatic arc. Lower portions of the formation consist of andesitic lava
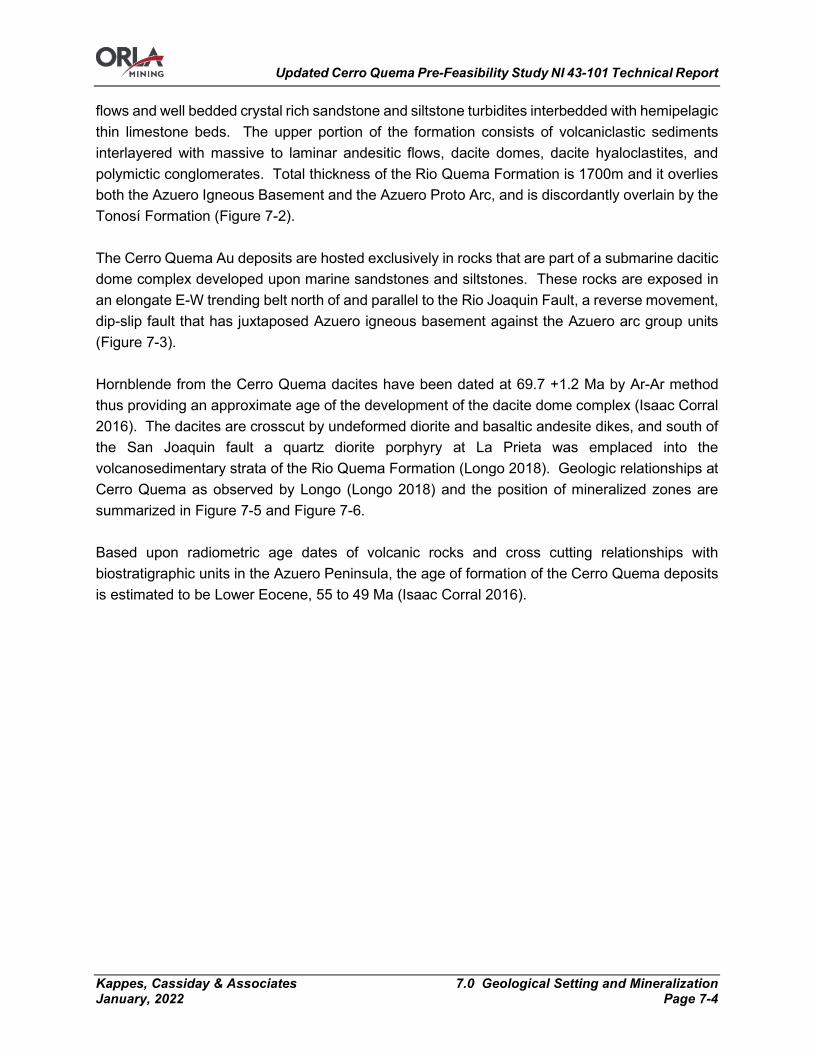
Updated Cerro Quema Pre-Feasibility Study NI 43-101 Technical Report
Kappes, Cassiday & Associates 7.0 Geological Setting and Mineralization January, 2022 Page 7-4
flows and well bedded crystal rich sandstone and siltstone turbidites interbedded with hemipelagic thin limestone beds. The upper portion of the formation consists of volcaniclastic sediments interlayered with massive to laminar andesitic flows, dacite domes, dacite hyaloclastites, and polymictic conglomerates. Total thickness of the Rio Quema Formation is 1700m and it overlies both the Azuero Igneous Basement and the Azuero Proto Arc, and is discordantly overlain by the Tonosí Formation (Figure 7-2). The Cerro Quema Au deposits are hosted exclusively in rocks that are part of a submarine dacitic dome complex developed upon marine sandstones and siltstones. These rocks are exposed in an elongate E-W trending belt north of and parallel to the Rio Joaquin Fault, a reverse movement, dip-slip fault that has juxtaposed Azuero igneous basement against the Azuero arc group units (Figure 7-3). Hornblende from the Cerro Quema dacites have been dated at 69.7 +1.2 Ma by Ar-Ar method thus providing an approximate age of the development of the dacite dome complex (Isaac Corral 2016). The dacites are crosscut by undeformed diorite and basaltic andesite dikes, and south of the San Joaquin fault a quartz diorite porphyry at La Prieta was emplaced into the volcanosedimentary strata of the Rio Quema Formation (Longo 2018). Geologic relationships at Cerro Quema as observed by Longo (Longo 2018) and the position of mineralized zones are summarized in Figure 7-5 and Figure 7-6. Based upon radiometric age dates of volcanic rocks and cross cutting relationships with biostratigraphic units in the Azuero Peninsula, the age of formation of the Cerro Quema deposits is estimated to be Lower Eocene, 55 to 49 Ma (Isaac Corral 2016).
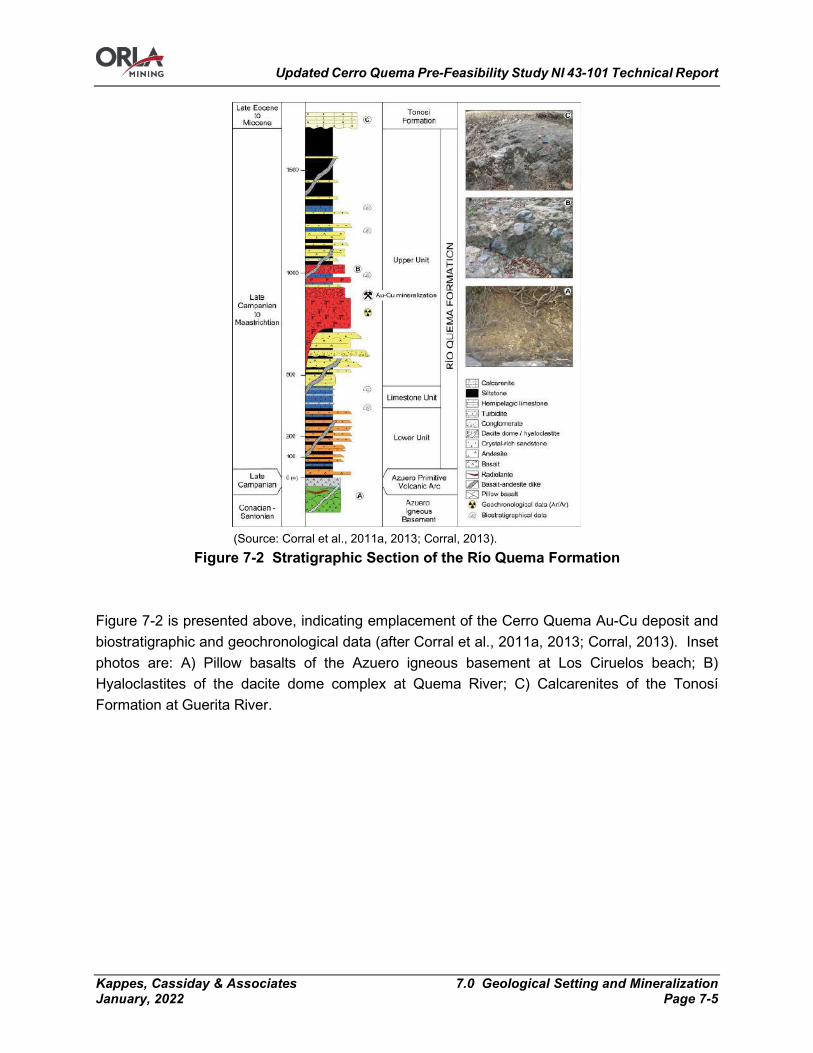
Updated Cerro Quema Pre-Feasibility Study NI 43-101 Technical Report
Kappes, Cassiday & Associates 7.0 Geological Setting and Mineralization January, 2022 Page 7-5
(Source: Corral et al., 2011a, 2013; Corral, 2013).
Figure 7-2 Stratigraphic Section of the Río Quema Formation Figure 7-2 is presented above, indicating emplacement of the Cerro Quema Au-Cu deposit and biostratigraphic and geochronological data (after Corral et al., 2011a, 2013; Corral, 2013). Inset photos are: A) Pillow basalts of the Azuero igneous basement at Los Ciruelos beach; B) Hyaloclastites of the dacite dome complex at Quema River; C) Calcarenites of the Tonosí Formation at Guerita River.

Updated Cerro Quema Pre-Feasibility Study NI 43-101 Technical Report
Kappes, Cassiday & Associates 7.0 Geological Setting and Mineralization January, 2022 Page 7-6
Figure 7-3 Local Geology, Cerro Quema
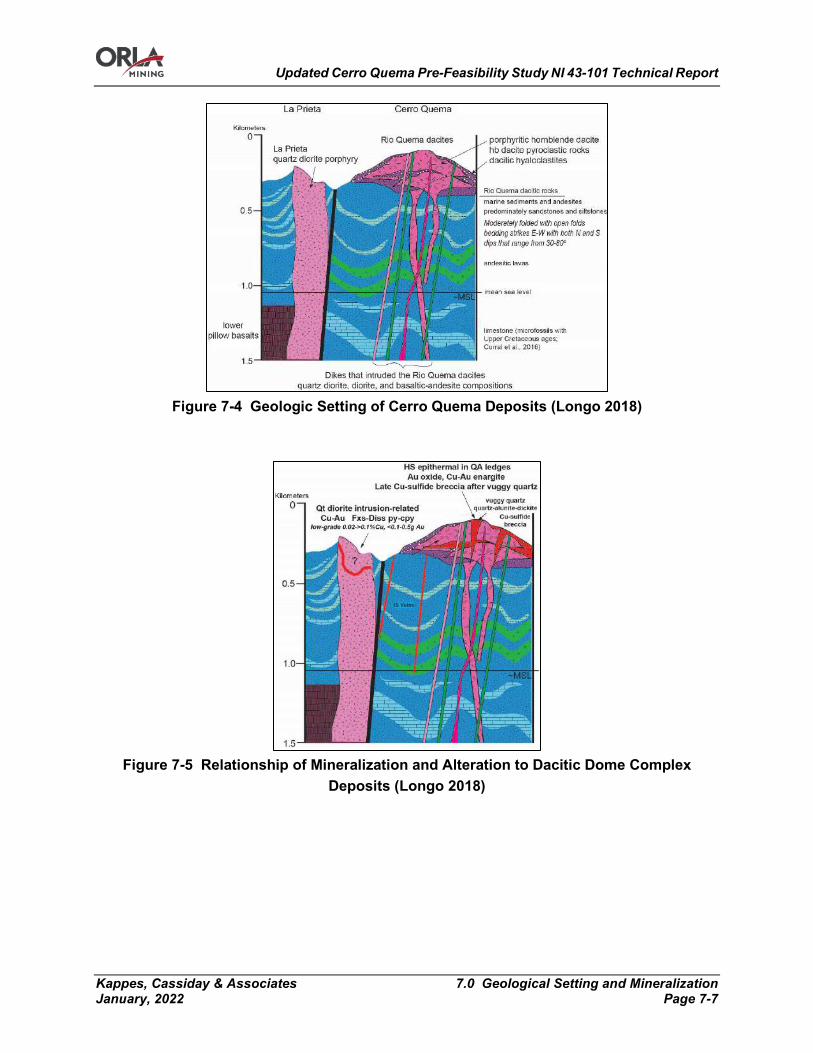
Updated Cerro Quema Pre-Feasibility Study NI 43-101 Technical Report
Kappes, Cassiday & Associates 7.0 Geological Setting and Mineralization January, 2022 Page 7-7
Figure 7-4 Geologic Setting of Cerro Quema Deposits (Longo 2018)
Figure 7-5 Relationship of Mineralization and Alteration to Dacitic Dome Complex
Deposits (Longo 2018)

Updated Cerro Quema Pre-Feasibility Study NI 43-101 Technical Report
Kappes, Cassiday & Associates 7.0 Geological Setting and Mineralization January, 2022 Page 7-8
Structural Setting
The Cerro Quema project is spatially associated with the E-trending regional Rio Joaquin fault system. The fault zone is 30 km long and shows evidence of reverse dip-slip movement. It juxtaposed Azuero Igneous basement rocks against Azuero Arc Group rocks. Mesoscale open folds in the region have SW plunging axes and moderate limb dips, indicative of dextral transpression with dominant reverse dip-slip motion (Isaac Corral 2016). The Cerro Quema mineralized zone lies 1.5 to 3 km north of the Rio Joaquin fault. MCQ has mapped numerous steeply dipping NE and NW striking faults (Figure 7-3) that may be second order features related to the Rio Joaquin fault. Longo has postulated sinestral movement along the most prominent of the NE striking faults, possibly resulting in dismemberment of an originally continuous mineralized zone with the La Pava zone being the left lateral offset of the Quema-Quemita deposit (Longo 2018).
Mineralization
Discrete gold mineralized zones have been identified by drilling and surface mapping along an E-W trending zone of hydrothermal alteration of dacitic volcanic rocks of the Rio Quema Formation. The mineralized belt extends from La Pava West at the western end to La Pelona, 11 km further east (Figure 7-6).
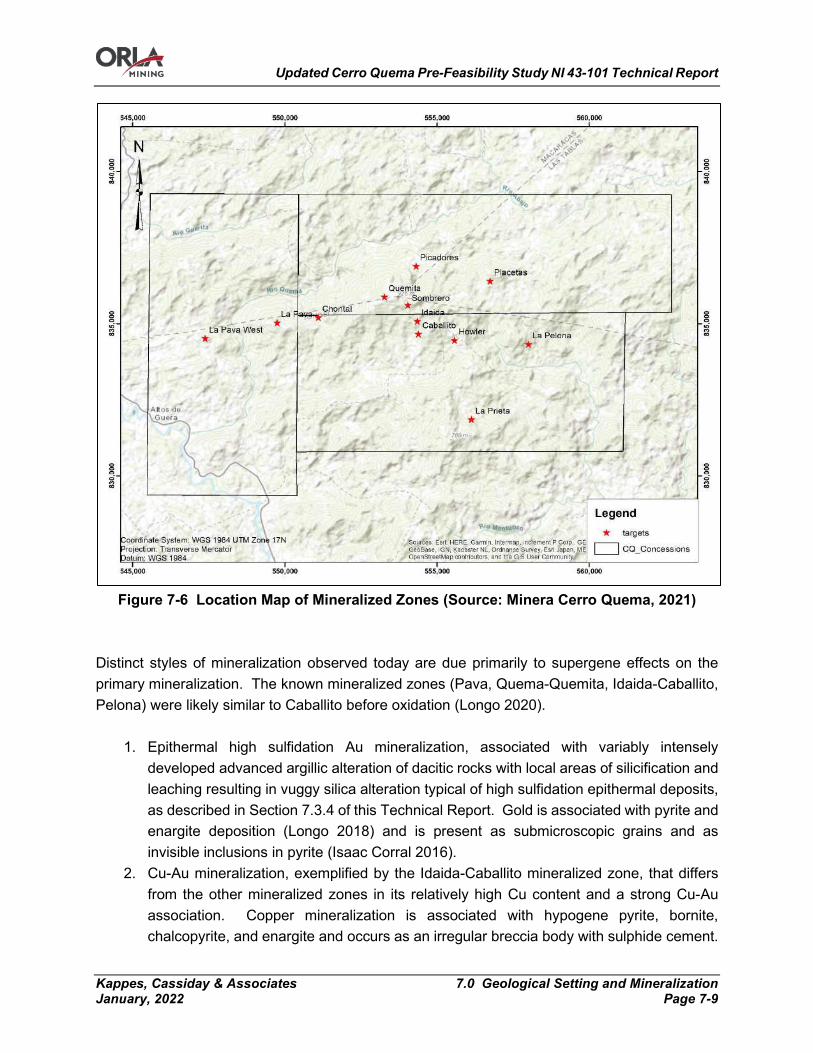
Updated Cerro Quema Pre-Feasibility Study NI 43-101 Technical Report
Kappes, Cassiday & Associates 7.0 Geological Setting and Mineralization January, 2022 Page 7-9
Figure 7-6 Location Map of Mineralized Zones (Source: Minera Cerro Quema, 2021)
Distinct styles of mineralization observed today are due primarily to supergene effects on the primary mineralization. The known mineralized zones (Pava, Quema-Quemita, Idaida-Caballito, Pelona) were likely similar to Caballito before oxidation (Longo 2020).
1. Epithermal high sulfidation Au mineralization, associated with variably intensely developed advanced argillic alteration of dacitic rocks with local areas of silicification and leaching resulting in vuggy silica alteration typical of high sulfidation epithermal deposits, as described in Section 7.3.4 of this Technical Report. Gold is associated with pyrite and enargite deposition (Longo 2018) and is present as submicroscopic grains and as invisible inclusions in pyrite (Isaac Corral 2016).
2. Cu-Au mineralization, exemplified by the Idaida-Caballito mineralized zone, that differs from the other mineralized zones in its relatively high Cu content and a strong Cu-Au association. Copper mineralization is associated with hypogene pyrite, bornite, chalcopyrite, and enargite and occurs as an irregular breccia body with sulphide cement.
Updated Cerro Quema Pre-Feasibility Study NI 43-101 Technical Report
Kappes, Cassiday & Associates 7.0 Geological Setting and Mineralization January, 2022 Page 7-10
Type 2 mineralization post dates formation of the Type 1 high sulfidation mineralization and is superimposed upon it, but formed as part of the same mineralizing event as ore fluid chemistry evolved from high sulfidation to intermediate sulfidation conditions (Longo 2018) (Longo 2020).
3. Cu-Au mineralization at La Prieta, an altered and mineralized zone centred upon a Miocene quartz diorite intrusion, occurs 2.6 km south of the main E-W belt of mineralization. Disseminated and fracture-controlled pyrite and chalcopyrite is associated with intermediate argillic alteration conditions (Longo 2018). This mineralized zone has not been studied in detail nor drilled.
Mineralization style 1 corresponds to the mineralized deposits at La Pava and Quema-Quemita as described in Section 7.5 and 7.6 of this Technical Report, and style 2 corresponds to the Caballito Cu-Au deposit described in Section 7.7 of this Technical Report. Mineralized zones thus far identified, and their type, high sulfidation (HS) or intermediate sulfidation (IS) and metals of interest (gold, copper, silver), include:
• La Pava West, HS, Au; • La Pava, HS, Au; • Chontal, HS, Au; • Quema-Quemita, HS, Au; • Sombrero, HS, Au; • Idaida, IS, Cu, Au; • Caballito, IS, Cu, Au; • Howler, LS vein, Au; • Picadores, unstudied, Au; • Placetas, unstudied, Au; • La Pelona, HS, Au; • La Prieta (south of main trend, younger), Cu, Au.
Conflicting ages of mineralization are documented for the Cerro Quema deposits. The age of mineralization is estimated by Re/Os dating of molybdenum at 70.7 Ma from the La Pava deposit (Perello et al., 2020) and by 40Ar/39Ar of alunite at 49 Ma from the Quemita deposit (Corral, 2021).
Alteration
Alteration zoning at Cerro Quema was studied and documented by Corral et al (Isaac Corral 2016) and Longo (Longo 2018, Longo 2020) and is summarized herein. Hydrothermal alteration is almost wholly confined to the dacitic rocks of the Cerro Quema formation, possibly as a result of permeability and porosity contrasts with the volcanosedimentary strata.
Updated Cerro Quema Pre-Feasibility Study NI 43-101 Technical Report
Kappes, Cassiday & Associates 7.0 Geological Setting and Mineralization January, 2022 Page 7-11
Residual vuggy and granular quartz alteration, the result of extreme acid-leaching in the Rio Quema dacites, occurs as irregular funnel and tabular shaped bodies. Vuggy quartz developed below the water table as rising magmatic vapors condensed and generated acidic fluids that leached primary feldspar and mafic minerals out of Rio Quema dacitic rocks leaving only a dense residual quartz matrix of microcrystalline anhedral quartz grains with rutile surrounding empty phenocryst sites (Longo, 2020). Residual granular silica completely obliterates the original rock texture and results in a texture that resembles sandstone to a beach sand. At depth below the oxiidation, vuggy quartz contains disseminated pyrite, enargite, bornite, chalcopyrite, tennantite, chalcocite, and covellite (Isaac Corral 2016; Longo, 2020). Vugs are filled with enargite, pyrite, barite, covellite, bornite, chalcopyrite and chalcocite (Longo 2020). Traces of sphalerite have been observed (Isaac Corral 2016). Oxidation of sulphides resulted in formation of gossanous zones where limonites fill the vugs in vuggy quartz, and intensely iron oxide pigmented exposures crop out at surface. Vuggy quartz alteration zones are contained within an irregular halo of advanced argillic alteration defined by silicification accompanied by the presence of alunite and/or dickite, pyrophyllite, barite, illite, and diaspore. The advanced argillic alteration assemblage observed at Cerro Quema is typical of high-sulfidation epithermal deposits. Advanced argillic alteration zones are in turn surrounded by a halo of intermediate argillic alteration that preserves original rock textures and is dominated by illite-smectite and illite-smectite-chlorite alteration composed of kaolinite, illite, smectite, chlorite, magnetite and pyrite. A propylitic alteration assemblage defined by chlorite, epidote, carbonate, albiteand pyrite ±zeolites lies outboard of the argillic zone. Epithermal high sulfidation gold mineralization is hosted predominantly by silicified and leached zones found within broader zones of advanced argillic alteration. Advanced argillic and argillic alteration zones host lesser amounts of gold mineralization. Figure 7-7 displays gold mineralized vuggy silica altered dacitic tuff that assayed 2.86 gpt Au, from drillhole PDH11004 at 11.5m depth in the La Pava deposit. Figure 7-8 shows gold mineralized vuggy silica altered dacitic volcanic that assayed 0.89 gpt Au, from drillhole PDH9104, 56.3m, at the Quema-Quemita deposit.

Updated Cerro Quema Pre-Feasibility Study NI 43-101 Technical Report
Kappes, Cassiday & Associates 7.0 Geological Setting and Mineralization January, 2022 Page 7-12
Figure 7-7 Drillcore from PDH11004, ~11.5m - La Pava Deposit (M. Gray, 2017)
Figure 7-8 Drillcore from PDH91014, 56.3m - Quema-Quemita Deposit (M. Gray, 2017)
Oxidation
Complete oxidation is observed in the uppermost portions of both the La Pava and Quema-Quemita mineralized zones. At Quema-Quemita, complete oxidation forms an irregular zone mimicking topography and extends to depths of as much as 100m below the present topographic surface. Nearly the entirety of the vuggy silica altered zone is oxidized, and in places the oxide boundary forms a downward prominence following the shape of the vuggy silica zone, apparently as a function of increased
Updated Cerro Quema Pre-Feasibility Study NI 43-101 Technical Report
Kappes, Cassiday & Associates 7.0 Geological Setting and Mineralization January, 2022 Page 7-13
downward percolation of meteoric waters within the highly permeable vuggy silica zones. The contact with underlying non-oxidized rock is generally sharp. At Quema-Quemita, the oxidation boundary often corresponds with the limit of vuggy silica or argillic alteration. At La Pava the oxidation zone mimics topography but is more irregular than that of Quema-Quemita, and pods of oxidized material within unoxidized material, and vice versa, are more common. At La Pava oxidation extends to maximum depths of 150m below surface but is typically less than 100m. In contrast to Quema-Quemita, at La Pava, significant volumes of the vuggy silica alteration zone are not oxidized and the oxidation boundary does not closely follow the alteration zones. At Caballito, the mineralized zone lies almost entirely beneath the oxide zone and Caballito comprises sulphide mineralization. The Mineral Resources and Mineral Reserves for La Pava and Quema-Quemita, discussed in Sections 13.13 and 15.0 of this Technical Report are oxide material, whereas the Mineral Resource for the Caballito deposit discussed in Section 13.13 of this Technical Report comprises sulphide material.
La Pava Gold Deposit
The La Pava gold deposit is hosted in dacitic dome rocks of the Rio Quema Formation, comprising dacitic porphyritic intrusive rocks and extrusive rocks that include dacitic lavas, hyaloclastic carapace breccias, dacitic tuffs and dacitic volcaniclastic sedimentary strata. Gold is hosted preferentially in volumes of vuggy silica altered rock, as described in Section 7.3.4 of this Technical Report, often hydrothermally brecciated, originally cemented by sulphide minerals, now weathered to oxides or removed by supergene leaching. Gold mineralized brecciated siliceous rock crops out along the La Pava ridge (Figure 7-9) and drillhole data shows that brecciated and vuggy silica forms an irregular zone within a broader zone of argillic alteration that has a moderate to steep northerly dip (Figure 7-10). Drillhole gold assays demonstrate that significant gold concentrations are predominantly in the silica altered rock, as seen in Figure 7-11. Supergene enrichment of copper in the form of chalcocite has formed an irregular, tabular, subhorizontal zone of secondary copper mineralization lying just below the La Pava oxide gold zone. Using drillhole data, Orla geologists interpreted three coherent alteration zones at La Pava and created three dimensional solid models of each: 1) a silicified domain (SV) comprised of residual granular and vuggy silica, and silica breccia; 2) a zone strong of advanced argillic alteration (quarts dickite, AA2), as described in Section 7.3.4 of this Technical Report, and; 3) a narrow zone of less intense advanced argillic alteration (AA1) outboard of (AA2), in which the alteration minerals present are the same, but silicification and pervasive alteration is less. These alteration

Updated Cerro Quema Pre-Feasibility Study NI 43-101 Technical Report
Kappes, Cassiday & Associates 7.0 Geological Setting and Mineralization January, 2022 Page 7-14
zones define the domains used for resource modeling as described in Section 14.0 of this Technical Report.
Figure 7-9 Left: Outcrop of gold mineralized brecciated vuggy silica rock at La Pava. Right: detail of fine breccia texture. Sample of outcrop assayed 1.55 gpt Au. (M. Gray,
2017)
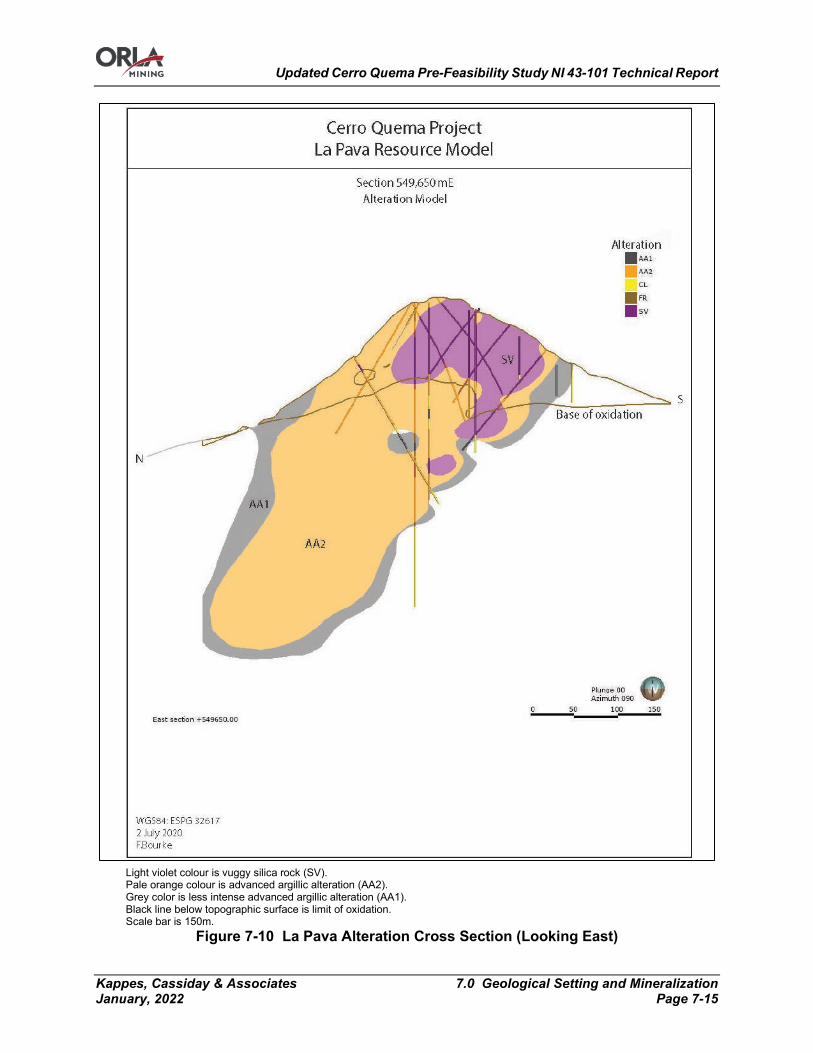
Updated Cerro Quema Pre-Feasibility Study NI 43-101 Technical Report
Kappes, Cassiday & Associates 7.0 Geological Setting and Mineralization January, 2022 Page 7-15
Light violet colour is vuggy silica rock (SV). Pale orange colour is advanced argillic alteration (AA2). Grey color is less intense advanced argillic alteration (AA1). Black line below topographic surface is limit of oxidation. Scale bar is 150m.
Figure 7-10 La Pava Alteration Cross Section (Looking East)

Updated Cerro Quema Pre-Feasibility Study NI 43-101 Technical Report
Kappes, Cassiday & Associates 7.0 Geological Setting and Mineralization January, 2022 Page 7-16
Light violet colour is vuggy silica rock (SV). Pale orange colour is advanced argillic alteration (AA2). Grey color is less intense advanced argillic alteration (AA1). Black line below topographic surface is limit of oxidation. Scale bar is 75m.
Figure 7-11 La Pava Drillhole Gold Assay Cross Section (Looking East)

Updated Cerro Quema Pre-Feasibility Study NI 43-101 Technical Report
Kappes, Cassiday & Associates 7.0 Geological Setting and Mineralization January, 2022 Page 7-17
Quema-Quemita Gold Deposit
The Quema-Quemita gold deposit is analogous to the La Pava deposit, and may be a structurally offset portion of the same (Longo, Cerro Quema update June 29, 2018, private report prepared for Orla Mining Ltd 2018). It too is hosted in dacitic dome complex rocks of the Rio Quema Formation, comprising dacitic porphyritic intrusive rocks and extrusive dacitic volcanic rocks that consist of lavas with hyaloclastic carapace breccias, and pyroclastic rocks sometimes interbedded with volcaniclastic sedimentary strata. Gold is hosted preferentially in volumes of vuggy silica altered rock, as described in Section 7.3.4 of this Technical Report, often hydrothermally brecciated, originally cemented by sulphide minerals, now weathered to oxides or removed by leaching. Gold mineralized brecciated silicified rock crops out on the flanks of Cerro Quema and Cerro Quemita. Figure 7-12 displays a gossanous oxidized surface exposure of vuggy silica altered dacitic volcanic rock at Cerro Quema that assayed 7.78 gpt Au. Drillhole data shows that brecciated and vuggy silica forms an irregular zone within a broader zone of argillic alteration that has a moderate to steep northerly dip (Figure 7-13). Drillhole gold assays demonstrate that significant gold concentrations are predominantly in the silica altered rock, as seen in Figure 7-14. Using drillhole data, Orla geologists interpreted three primary coherent alteration zones at Quema-Quemita and created three dimensional solid models of each: 1) a silicified domain comprised of residual granular and vuggy silica, and silica breccia (SV); 2) a zone of strong advanced argillic alteration with quartz-dickite (AA2); and 3) an outer zone of weaker advanced argillic alteration with quartz-kaolinite (AA1). Combined, these three alteration zones define the domains used for resource modeling as described in Section 13.13 of this Technical Report.
Figure 7-12 Iron oxide stained, locally gossanous vuggy silica exposed in surface cut,
Quema-Quemita zone. Left: outcrop. Right: detail of gossanous breccia. (M. Gray, 2017)
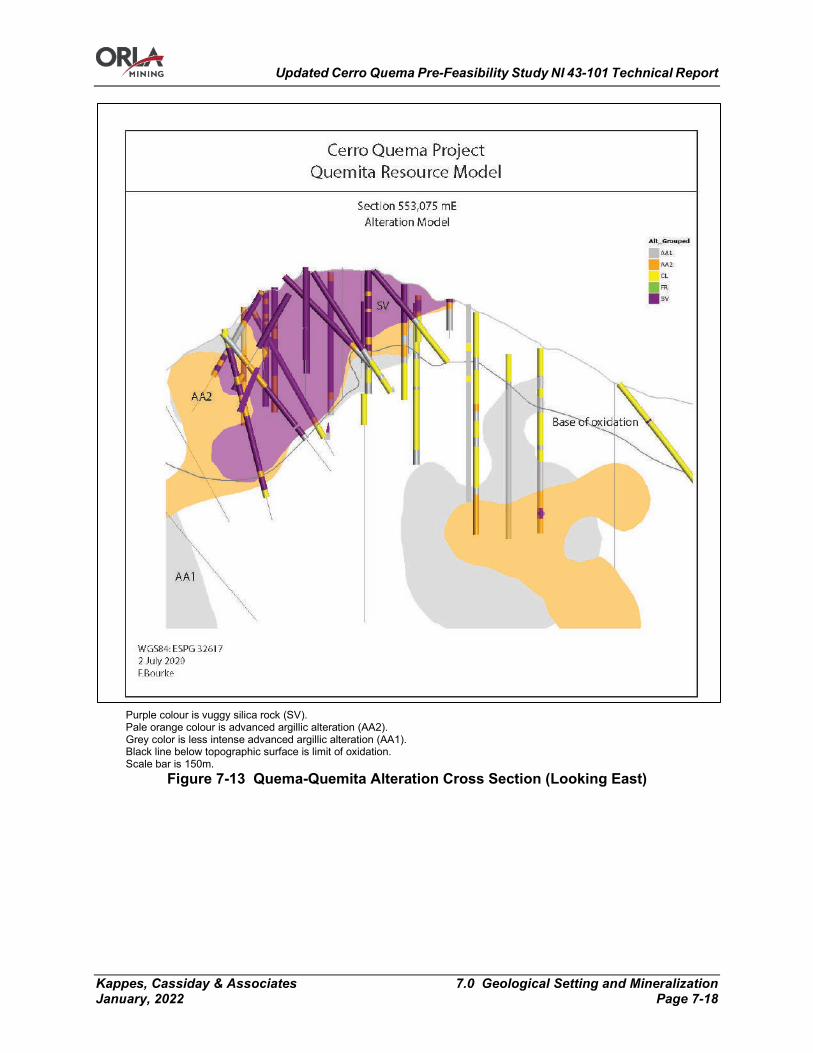
Updated Cerro Quema Pre-Feasibility Study NI 43-101 Technical Report
Kappes, Cassiday & Associates 7.0 Geological Setting and Mineralization January, 2022 Page 7-18
Purple colour is vuggy silica rock (SV). Pale orange colour is advanced argillic alteration (AA2). Grey color is less intense advanced argillic alteration (AA1). Black line below topographic surface is limit of oxidation. Scale bar is 150m.
Figure 7-13 Quema-Quemita Alteration Cross Section (Looking East)
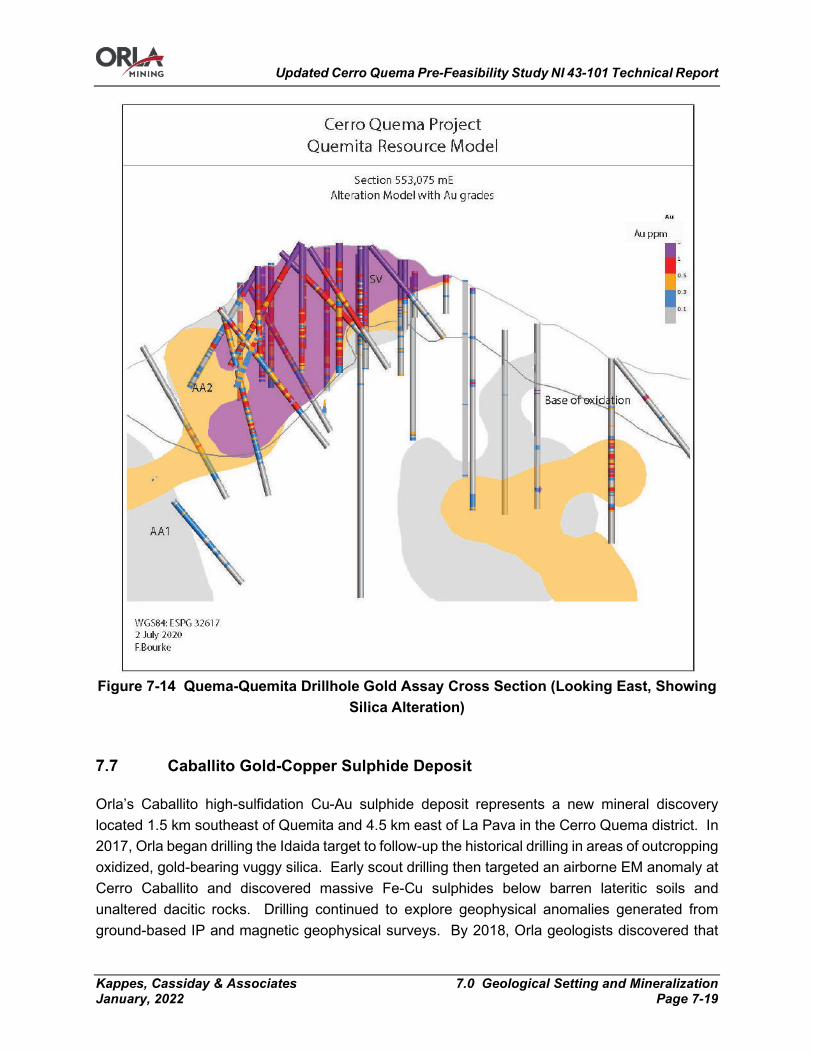
Updated Cerro Quema Pre-Feasibility Study NI 43-101 Technical Report
Kappes, Cassiday & Associates 7.0 Geological Setting and Mineralization January, 2022 Page 7-19
Figure 7-14 Quema-Quemita Drillhole Gold Assay Cross Section (Looking East, Showing
Silica Alteration)
Caballito Gold-Copper Sulphide Deposit
Orla’s Caballito high-sulfidation Cu-Au sulphide deposit represents a new mineral discovery located 1.5 km southeast of Quemita and 4.5 km east of La Pava in the Cerro Quema district. In 2017, Orla began drilling the Idaida target to follow-up the historical drilling in areas of outcropping oxidized, gold-bearing vuggy silica. Early scout drilling then targeted an airborne EM anomaly at Cerro Caballito and discovered massive Fe-Cu sulphides below barren lateritic soils and unaltered dacitic rocks. Drilling continued to explore geophysical anomalies generated from ground-based IP and magnetic geophysical surveys. By 2018, Orla geologists discovered that
Updated Cerro Quema Pre-Feasibility Study NI 43-101 Technical Report
Kappes, Cassiday & Associates 7.0 Geological Setting and Mineralization January, 2022 Page 7-20
coincident magnetic lows and conductivity highs correspond to zones of high-grade Cu-Au sulphide. A total of 30 diamond drill holes (totaling 5,405 metres) completed by Orla within the current Caballito model led to the definition of the Idaida zone and the concealed Caballito zone. The Caballito Cu-Au deposit incorporates two distinct mineral zones in the Quema dacites (Figure 7-15):
1. The Caballito zone, in the hanging wall that hosts most of the resource, is dominated by a gently dipping tabular zone of bornite-chalcopyrite-pyrite and quartz cemented breccia in vuggy silica. Bornite-chalcopyrite are the dominant Fe-Cu sulphides, and minor chalcocite and covellite replaces bornite.
2. The Idaida zone, in the footwall, features a deep near vertical zone of enargite-pyrite and covellite that coalesces upward into a tabular mineral zone with enargite-covellite-pyrite ±bornite-chalcopyrite.
Both zones feature high-sulphidation epithermal alteration defined by a central core of residual vuggy silica that zones rapidly outward to quartz-dickite (AA2), quartz kaolinite (AA1), illite-smectite±kaolinite and illite-smectite-chlorite to unaltered Rio Quema dacite. The Caballito zone developed in a stratiform breccia within the domain of high-sulfidation epithermal alteration (Figure 7-16). Areas of vuggy silica were later silicified to massive silica (SM) and define a silica core that hosts the bulk of the Cu-Au sulphide mineralization. Some mineralization extends into the AA2 domain of dominantly quartz-dickite alteration. Outer alteration assemblages (i.e., illite-smectite ± kaolinite-chlorite) that halo AA1 and the silica core are narrow (3-75 m-width) and completely surrounded by unaltered dacite. Breccias may have been focused along beds of dacitic hyaloclastites (submarine dome carapace breccias) interlayered with lobes of dacitic lavas and pyroclastic rocks. Numerous dikes of quartz diorite, diorite and basaltic-andesite, variable altered to illite-smectite, intruded the breccia.
Caballito Faults
Orla geologists document three primary faults known as the Idaida fault, the CAB fault, and the NW fault based on geologic outcrop mapping and drill core data. The Idaida fault represents a prominent northeast-striking normal fault that dips ~60° east, separates the Caballito zone from the Idaida zone, and down drops Caballito ~200 m southeast. The CAB fault potentially constrains the Cu-Au sulphide mineralization along the west end of the Caballito zone. The presence of this fault is supported by the drilling in 2017-2018 in the Caballito zone, and by the IP and magnetic geophysics models. The CAB2 fault crops out with Au-bearing quartz-dickite altered dacites south of the main Idaida zone, strikes northwest, and may be an extension of the CAB fault. Further drilling is necessary to determine the relative displacement and extensions of the CAB fault to the northwest and southeast of the main Caballito zone of mineralization. The NW fault bounds the Caballito deposit to the northeast and extends northwest where it also
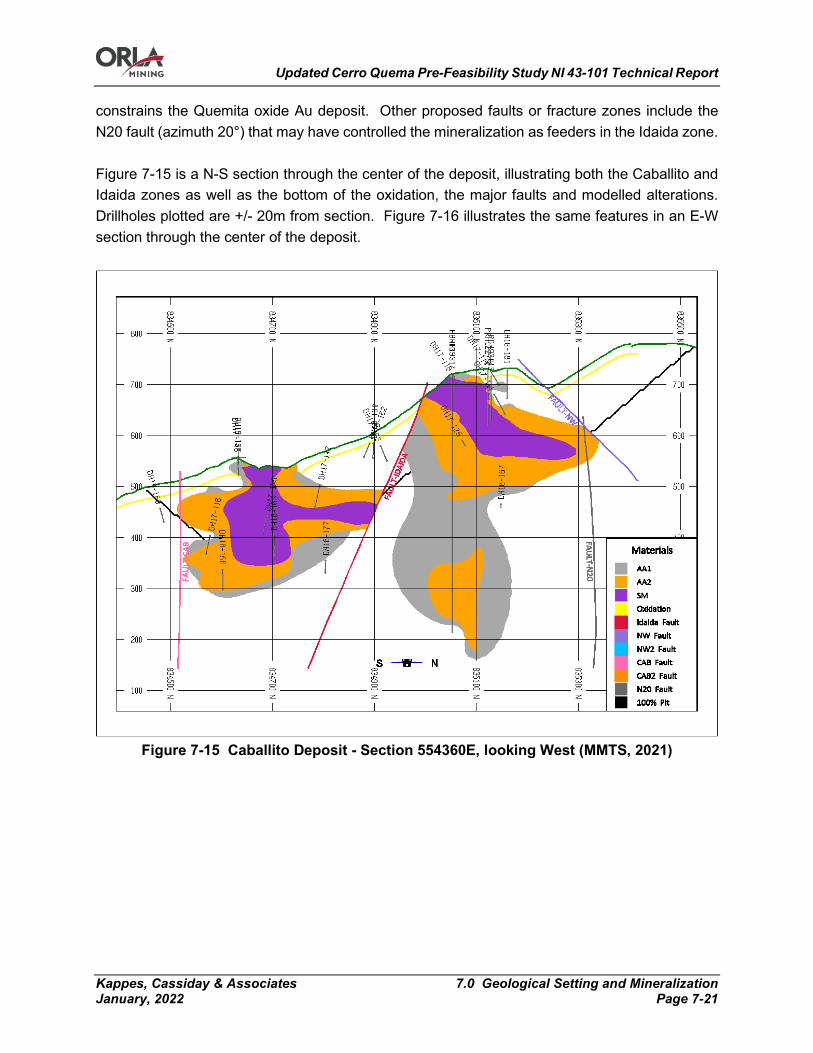
Updated Cerro Quema Pre-Feasibility Study NI 43-101 Technical Report
Kappes, Cassiday & Associates 7.0 Geological Setting and Mineralization January, 2022 Page 7-21
constrains the Quemita oxide Au deposit. Other proposed faults or fracture zones include the N20 fault (azimuth 20°) that may have controlled the mineralization as feeders in the Idaida zone. Figure 7-15 is a N-S section through the center of the deposit, illustrating both the Caballito and Idaida zones as well as the bottom of the oxidation, the major faults and modelled alterations. Drillholes plotted are +/- 20m from section. Figure 7-16 illustrates the same features in an E-W section through the center of the deposit.
Figure 7-15 Caballito Deposit - Section 554360E, looking West (MMTS, 2021)
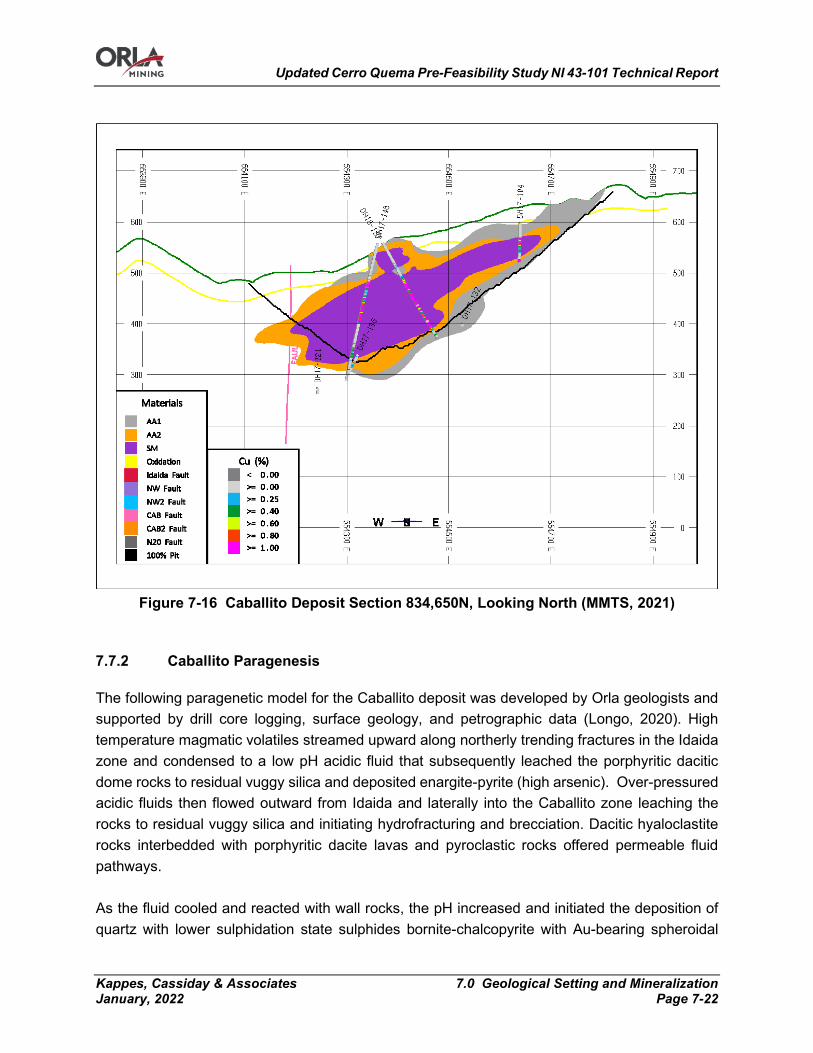
Updated Cerro Quema Pre-Feasibility Study NI 43-101 Technical Report
Kappes, Cassiday & Associates 7.0 Geological Setting and Mineralization January, 2022 Page 7-22
Figure 7-16 Caballito Deposit Section 834,650N, Looking North (MMTS, 2021)
Caballito Paragenesis
The following paragenetic model for the Caballito deposit was developed by Orla geologists and supported by drill core logging, surface geology, and petrographic data (Longo, 2020). High temperature magmatic volatiles streamed upward along northerly trending fractures in the Idaida zone and condensed to a low pH acidic fluid that subsequently leached the porphyritic dacitic dome rocks to residual vuggy silica and deposited enargite-pyrite (high arsenic). Over-pressured acidic fluids then flowed outward from Idaida and laterally into the Caballito zone leaching the rocks to residual vuggy silica and initiating hydrofracturing and brecciation. Dacitic hyaloclastite rocks interbedded with porphyritic dacite lavas and pyroclastic rocks offered permeable fluid pathways. As the fluid cooled and reacted with wall rocks, the pH increased and initiated the deposition of quartz with lower sulphidation state sulphides bornite-chalcopyrite with Au-bearing spheroidal

Updated Cerro Quema Pre-Feasibility Study NI 43-101 Technical Report
Kappes, Cassiday & Associates 7.0 Geological Setting and Mineralization January, 2022 Page 7-23
pyrite (low arsenic) that cemented the breccia and fractures; as cooling progressed these sulphides were replaced with chalcocite. Progressive rapid cooling initiated covellite replacement of all earlier sulphide phases.
Conclusions
Hypogene Au-Cu mineralization at Cerro Quema is hosted by a submarine dacitic dome complex that developed during the Cretaceous-Paleocene island arc magmatism from ~71 to 65 Ma (Corral,et al., 2016; Longo 2020). Conflicting ages of mineralization are documented for the Cerro Quema deposits. The age of mineralization is estimated by Re/Os dating of molybdenum at 70.7 Ma from the La Pava deposit (Perello et al., 2020) and by 40Ar/39Ar of alunite at 49 Ma from the Quemita deposit (Corral, 2021). Multiple hydrothermal plumes related to the magmatic event were localized at structural intersections that mineralogically altered the dacitic rocks, creating advanced argillic mineral assemblages and leached silicified rock (vuggy silica). The Au-Cu mineral zones are localized in vuggy silica rock and hydrothermal breccias, forming irregular tabular-shaped ore zones. Deep (350-450 m-depth) structurally controlled, subvertical feeders with covellite and enargite underlie the tabular Idaida zone at the Caballito deposit. Meteoric oxidation and supergene leaching resulted in Cu depletion and Au enrichment in the oxidized vuggy silica bodies at Quemita and La Pava. An oxidation zone, defined by complete destruction of sulphide minerals, extends to depths of as much as 150 m below surface at Quemita and La Pava, resulting in oxidized Au deposits. Minor oxidation developed near surface in the Caballito sulphide deposit. Supergene concentrations of Cu as chalcocite developed below the oxide gold zone at La Pava. At both La Pava and Quemita, unoxidized primary sulphide mineralization with variable amounts of Cu and Au are present, but do not form any of the Mineral Resources or Reserves discussed in Sections 14.0 and 15.0 of this Technical Report.
Updated Cerro Quema Pre-Feasibility Study NI 43-101 Technical Report
Kappes, Cassiday & Associates 8.0 Deposit Types January, 2022 Page 8-1
8.0 DEPOSIT TYPES
The observed geological and geochemical characteristics of the La Pava and Quema-Quemita gold deposits at Cerro Quema are consistent with those of volcanic hosted, epithermal, high sulfidation (HS) gold-silver deposits. Such deposits may be present as veins and/or disseminated deposits. Some of the most intensely studied and described HS deposits include Summitville, Colorado (Stoffregen, 1987; Gray and Coolbaugh, 1994); Goldfield, Nevada (Ransome 1909; Ashley, 1974; Vikre, 1989); Yanacocha, Peru (Harvey et al., 1999; Longo et al., 2010; Teal et al., 2010); Lepanto, Philippines (Hedenquist et al., 1998); and Julcani, Peru (Petersen, 1977; Deen, 1994). Based upon these studies and others, excellent compilations of general characteristics and genetic and empirical models have been presented by Hayba et al. (Hayba 1985), Heald et al. (1987), Bonham (1988), Berger and Henley (1989), and Arribas (1995). General characteristics of HS deposits include:
• Located within plutonic-volcanic arcs; • Associated with intermediate calc-alkaline rocks, often associated with volcanic dome
complexes; • Alteration mineral assemblages indicative of high-temperature acidic hydrothermal fluids,
including an advanced argillic assemblage characterized by residual silica, and one or more of pyrophyllite, alunite, dickite, kaolinite, and diaspore;
• Acid leaching and subsequent silicification of principal hydrothermal fluid conduits forming residual “vuggy” silica alteration;
• Presence of sulphide minerals indicative of high-sulphidation states, principally the sulfosalt enargite, or its low temperature polymorph luzonite;
• Economically important quantities of Au and/or Ag and/or Cu; • Alteration zoning typified by a central zone of silica alteration flanked by a zone of
advanced argillic alteration, which in turn is surrounded by illite dominated argillic alteration.
Genetic models proposed for HS systems are summarized by Simmons et al. (2005) and call upon shallow emplacement of an oxidized calc-alkaline magma. As the magma crystallizes, a metal- and volatile-rich fluid phase exsolves, and at relatively low confining pressures will separate into a low salinity vapour and a hypersaline liquid. The vapour phase ascends and when absorbed into connate or meteoric waters, forms a high temperature, sulphate-rich, acidic hydrothermal fluid. As this hydrothermal fluid ascends and cools, acidity progressively increases, resulting in a vertical zonation where advanced argillic assemblages overly illite-dominated argillic assemblages. Neutralization and cooling of the fluid during lateral fluid flow repeats this zoning pattern, with proximal silicified and leached zones flanked first by advanced argillic alteration, and then by more distal illite dominated alteration. As the hydrothermal system evolves, younger, more reduced hydrothermal fluids, probably generated by interactions between ascending

Updated Cerro Quema Pre-Feasibility Study NI 43-101 Technical Report
Kappes, Cassiday & Associates 8.0 Deposit Types January, 2022 Page 8-2
hypersaline magmatic fluid and meteoric water dominated convection cells, then transport and deposit metals (Au-Ag-Cu) along the same conduits utilized previously. Metals may be sourced directly from the magmatic fluids or leached from country rocks. The Caballito Cu-Au sulphide deposit is preserved below unaltered Rio Quema dacitic dome rocks and is interpreted to represent an unoxidized proxy for an eroded and oxidized La Pava and Quemita high-sulphidation Au deposit. Mineralization involved a two stage process that includes: 1) early high-sulphidation state sulfosalt enargite with pyrite, and 2) late fine-grained spheroidal pyrite with bornite, chalcopyrite, and chalcocite indicative of lower sulfidation states with Au. Exploration drilling below the oxidized Au ore at La Pava and Quemita revealed lower sulfidation state Caballito-style sulphide assemblages (bornite-chalcopyrite-chalcocite); however, economic resources have yet to be discovered below the oxidized Au ore at La Pava and Quemita.

Updated Cerro Quema Pre-Feasibility Study NI 43-101 Technical Report
Kappes, Cassiday & Associates 9.0 Exploration January, 2022 Page 9-1
9.0 EXPLORATION
Since acquiring the project in 2017, Orla has actively explored the property seeking to better define the known mineralized zones and to discover additional mineralization. In addition to the drill programs described in Section 10.0 of this Technical Report, exploration activities in 2017 and 2018 included geologic mapping; rock chip geochemical sampling; and induced polarization and magnetic terrestrial geophysical surveys. Field exploration activities in 2019 and 2020 were nil as work focussed on engineering, environmental, and permitting matters. As of the effective date of this Technical Report, Orla has completed ~137 line-km of induced polarization geophysical surveys in 9 separate grids. Concurrent with the IP survey, magnetic data was collected over ~106 line-km on the same grids. Data collection was contracted to SJ Geophysics Ltd with data interpretation by Buks Lubbe Geophysics. Line spacing was typically 100m with station spacings of 20 to 50m depending on the grid and target sought. Dipole spacing was selected to search for features at depths of 100 to 250m. Surveys details are summarized in Table 9-1 and locations of the IP and magnetic surveys completed prior to 2021 are shown in Figure 9-1. Chargeability and resistivity anomalies at Sombrero, Idaida, and Caballito were successfully used to define drill targets and as an aid in interpreting the orientation and limits of sulphide mineralization (Figure 9-2, Figure 9-3). Magnetic anomalies mapped igneous intrusions and zones of suspected magnetite destructive hydrothermal alteration (Figure 9-4). Resistive features at La Pava mapped the extent of silica alteration. Resistive features at La Pelona correlated with silica alteration mapped at surface and deep resistive features were identified that were recommended for drill testing. Resistivity highs with associated magnetic lows were identified at Las Placetas and recommended for drill testing. Linear conductive and magnetic anomalies, untested by drilling, were identified at Picadores and recommended for drill testing. Geophysical surveys at Howler failed to detect any features that correlated with the exposed vein mineralization, however resistivity anomalies with associated high chargeability were identified and a possible high angle mineralized conduit was inferred from the data. IP surveys at La Prieta completed in 2021 delineated a well-defined chargeability anomaly consisting of a circular outer ring (~ 1400 m in diameter) of chargeability high values and a core of elevated chargeability values with a diameter of about 600 m (Figure 9-2). The anomaly extends for the depth of investigation (~400 m below surface. Associated with the core of the chargeability anomaly is a donut shaped resistivity low (200 to 500 ohm m) of roughly the same dimension (Figure 9-3). In the center of the resistivity donut shaped anomaly the calculated values are 1200 ohm m. The chargeability and resistivity pattern delineated on the La Prieta grid have visual characteristics and physical parameters that are typical of porphyry systems (Lubbe, 2021).

Updated Cerro Quema Pre-Feasibility Study NI 43-101 Technical Report
Kappes, Cassiday & Associates 9.0 Exploration January, 2022 Page 9-2
Table 9-1 Summary of Geophysical Surveys
Year Area Activity Units Amount Activity Units Amount 2017 Kill Devil (La Pava West) IP Survey line-km 8.86 Magnetic Survey line-km 9.00 2017 Picadores IP Survey line-km 27.30 Magnetic Survey line-km 27.30 2017 Las Placetas IP Survey line-km 12.60 Magnetic Survey line-km 12.60 2017 Chontal IP Survey line-km 14.90 Magnetic Survey line-km 14.90 2017 Howler IP Survey line-km 7.46 Magnetic Survey line-km 7.46 2017 La Prieta IP Survey line-km 5.10 Magnetic Survey line-km 0.00 2018 Quema-Quemita IP Survey line-km 25.30 Magnetic Survey line-km 25.30 2018 Pelona IP Survey line-km 9.00 Magnetic Survey line-km 9.00 2018 Sombrero/Idaida/Caballito IP Survey line-km 26.40 Magnetic Survey line-km 26.40 2021 La Prieta IP Survey line-km 21.45 Magnetic Survey line-km 6.75
Totals 158.37 138.71
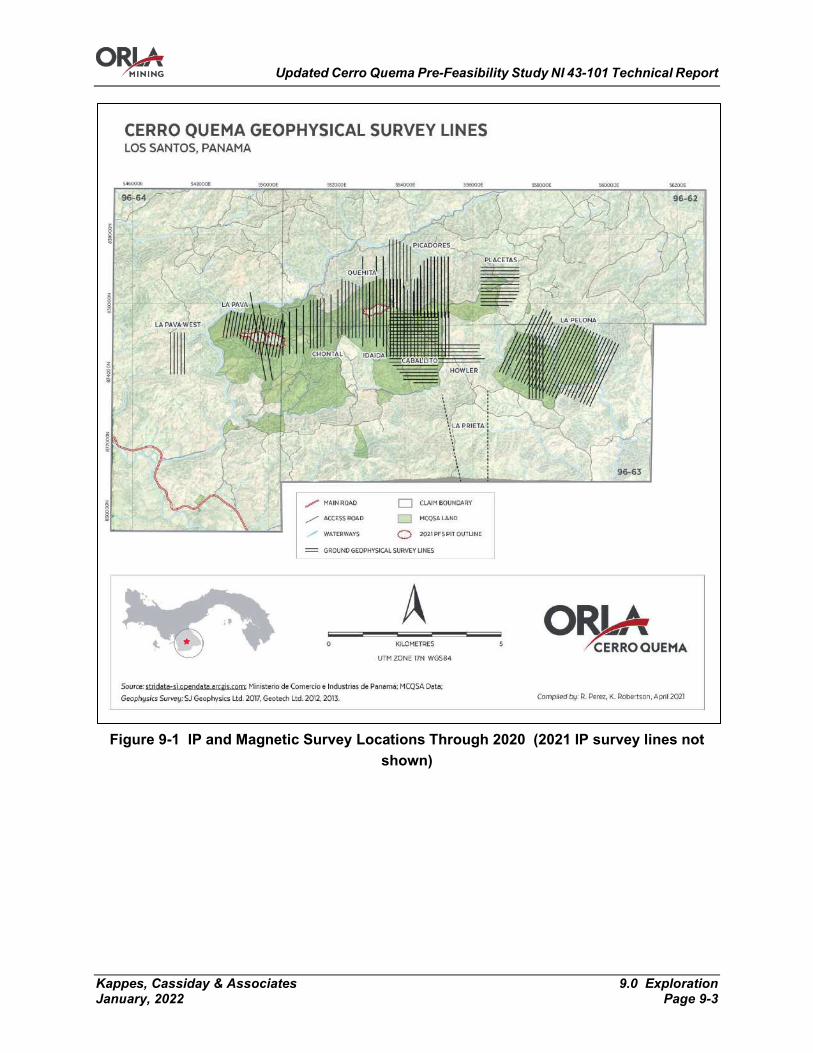
Updated Cerro Quema Pre-Feasibility Study NI 43-101 Technical Report
Kappes, Cassiday & Associates 9.0 Exploration January, 2022 Page 9-3
Figure 9-1 IP and Magnetic Survey Locations Through 2020 (2021 IP survey lines not
shown)
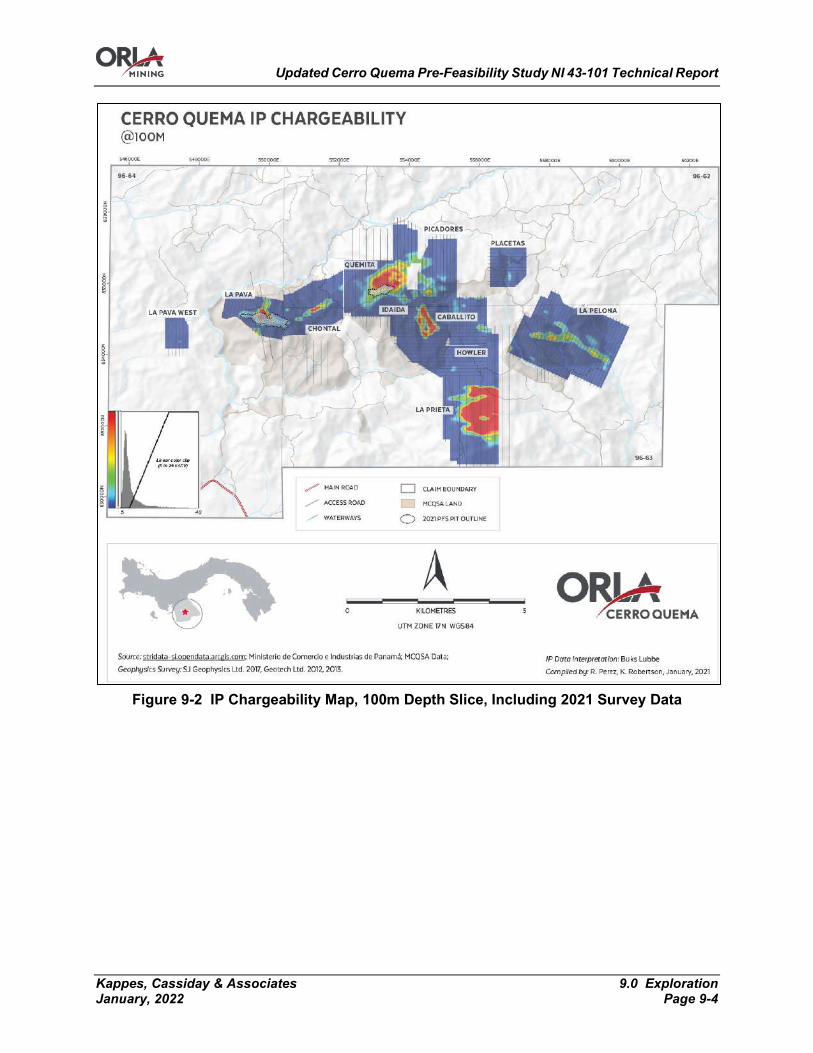
Updated Cerro Quema Pre-Feasibility Study NI 43-101 Technical Report
Kappes, Cassiday & Associates 9.0 Exploration January, 2022 Page 9-4
Figure 9-2 IP Chargeability Map, 100m Depth Slice, Including 2021 Survey Data
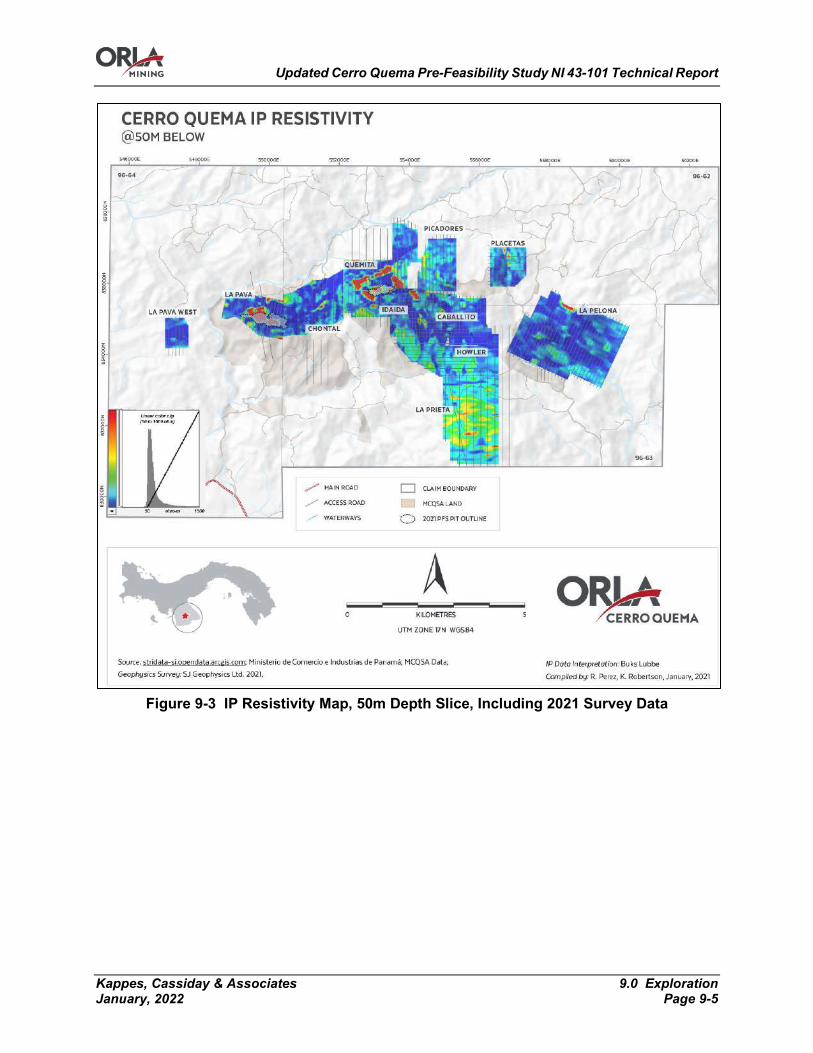
Updated Cerro Quema Pre-Feasibility Study NI 43-101 Technical Report
Kappes, Cassiday & Associates 9.0 Exploration January, 2022 Page 9-5
Figure 9-3 IP Resistivity Map, 50m Depth Slice, Including 2021 Survey Data

Updated Cerro Quema Pre-Feasibility Study NI 43-101 Technical Report
Kappes, Cassiday & Associates 9.0 Exploration January, 2022 Page 9-6
Figure 9-4 Magnetic Total Intensity Map
Geologic mapping and concurrent rock chip geochemical sampling were conducted at 1:5,000 scale over approximately 3,000 Ha, focussed on the Quema-Quemita, La Pava, Chontal, Monte Bonito, Las Placetas, Filo Monte Bonito, Idaida, and Caballito targets. As of the effective date of this Technical Report, Orla has collected an analysed a total of 84 rock chip samples. Sampling was conducted by MCQ staff and geologic consultants contracted by Orla. Rock chip samples were submitted to an ALS Chemex preparation facility on site, and pulps then sent to an ALS laboratory in Lima, Peru for analysis. ALS Chemex is independent of Orla.
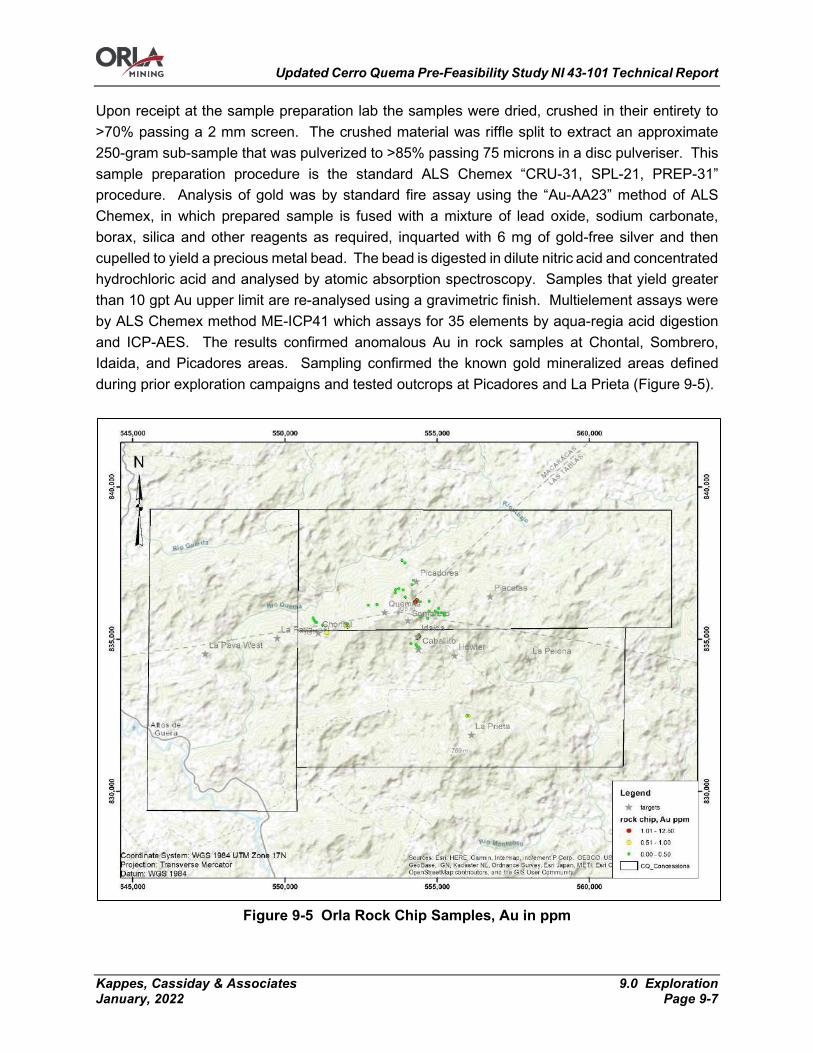
Updated Cerro Quema Pre-Feasibility Study NI 43-101 Technical Report
Kappes, Cassiday & Associates 9.0 Exploration January, 2022 Page 9-7
Upon receipt at the sample preparation lab the samples were dried, crushed in their entirety to >70% passing a 2 mm screen. The crushed material was riffle split to extract an approximate 250-gram sub-sample that was pulverized to >85% passing 75 microns in a disc pulveriser. This sample preparation procedure is the standard ALS Chemex “CRU-31, SPL-21, PREP-31” procedure. Analysis of gold was by standard fire assay using the “Au-AA23” method of ALS Chemex, in which prepared sample is fused with a mixture of lead oxide, sodium carbonate, borax, silica and other reagents as required, inquarted with 6 mg of gold-free silver and then cupelled to yield a precious metal bead. The bead is digested in dilute nitric acid and concentrated hydrochloric acid and analysed by atomic absorption spectroscopy. Samples that yield greater than 10 gpt Au upper limit are re-analysed using a gravimetric finish. Multielement assays were by ALS Chemex method ME-ICP41 which assays for 35 elements by aqua-regia acid digestion and ICP-AES. The results confirmed anomalous Au in rock samples at Chontal, Sombrero, Idaida, and Picadores areas. Sampling confirmed the known gold mineralized areas defined during prior exploration campaigns and tested outcrops at Picadores and La Prieta (Figure 9-5).
Figure 9-5 Orla Rock Chip Samples, Au in ppm
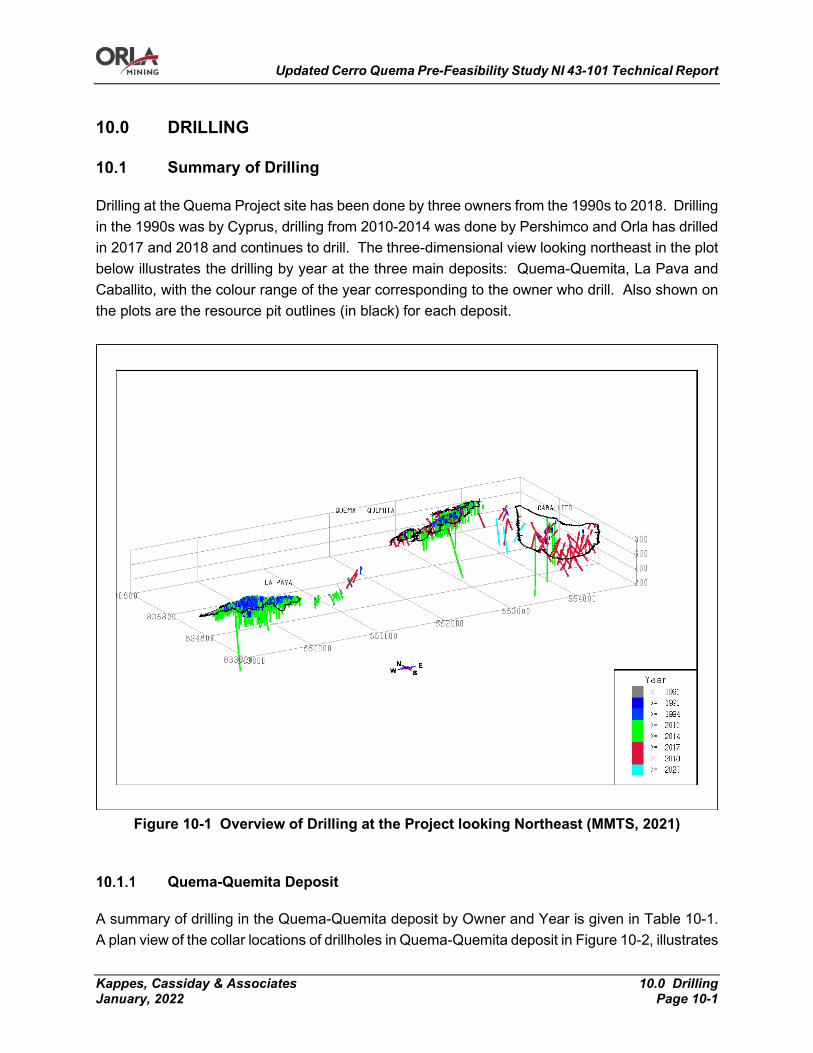
Updated Cerro Quema Pre-Feasibility Study NI 43-101 Technical Report
Kappes, Cassiday & Associates 10.0 Drilling January, 2022 Page 10-1
10.0 DRILLING
Summary of Drilling
Drilling at the Quema Project site has been done by three owners from the 1990s to 2018. Drilling in the 1990s was by Cyprus, drilling from 2010-2014 was done by Pershimco and Orla has drilled in 2017 and 2018 and continues to drill. The three-dimensional view looking northeast in the plot below illustrates the drilling by year at the three main deposits: Quema-Quemita, La Pava and Caballito, with the colour range of the year corresponding to the owner who drill. Also shown on the plots are the resource pit outlines (in black) for each deposit.
Figure 10-1 Overview of Drilling at the Project looking Northeast (MMTS, 2021)
Quema-Quemita Deposit
A summary of drilling in the Quema-Quemita deposit by Owner and Year is given in Table 10-1. A plan view of the collar locations of drillholes in Quema-Quemita deposit in Figure 10-2, illustrates
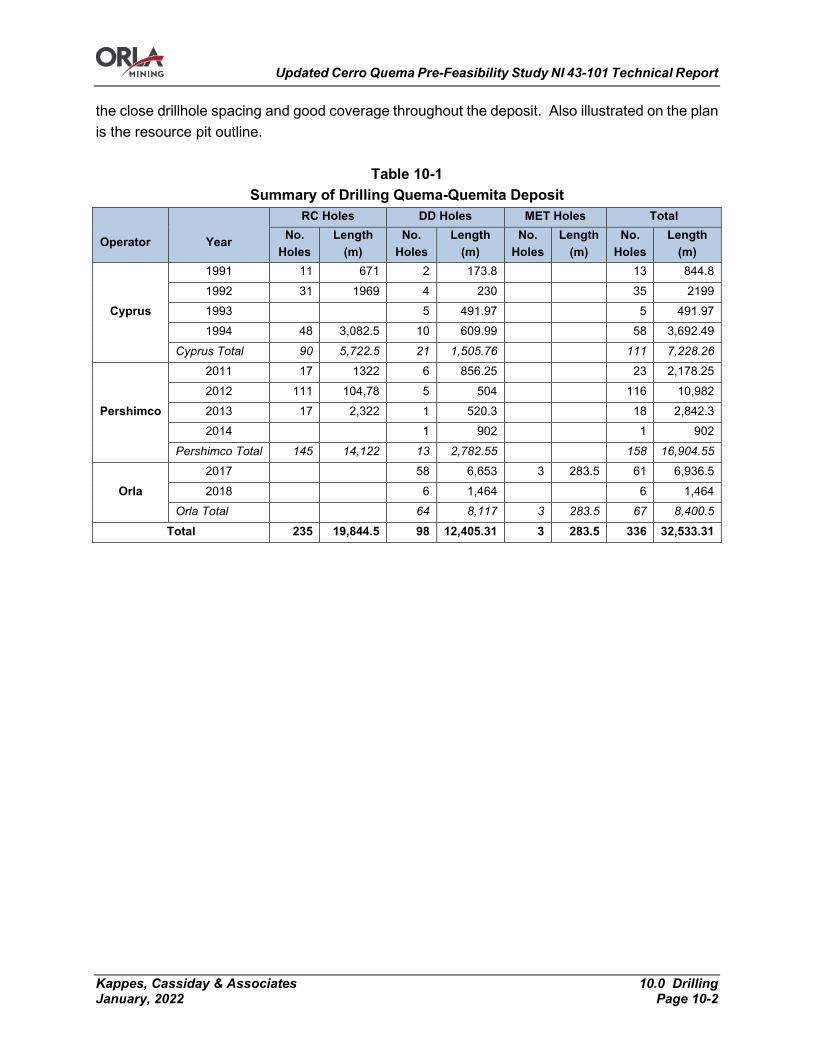
Updated Cerro Quema Pre-Feasibility Study NI 43-101 Technical Report
Kappes, Cassiday & Associates 10.0 Drilling January, 2022 Page 10-2
the close drillhole spacing and good coverage throughout the deposit. Also illustrated on the plan is the resource pit outline.
Table 10-1 Summary of Drilling Quema-Quemita Deposit
Operator
Year
RC Holes DD Holes MET Holes Total No.
Holes Length
(m) No.
Holes Length
(m) No.
Holes Length
(m) No.
Holes Length
(m)
Cyprus
1991 11 671 2 173.8 13 844.8 1992 31 1969 4 230 35 2199 1993 5 491.97 5 491.97 1994 48 3,082.5 10 609.99 58 3,692.49
Cyprus Total 90 5,722.5 21 1,505.76 111 7,228.26
Pershimco
2011 17 1322 6 856.25 23 2,178.25 2012 111 104,78 5 504 116 10,982 2013 17 2,322 1 520.3 18 2,842.3 2014 1 902 1 902
Pershimco Total 145 14,122 13 2,782.55 158 16,904.55
Orla 2017 58 6,653 3 283.5 61 6,936.5 2018 6 1,464 6 1,464
Orla Total 64 8,117 3 283.5 67 8,400.5
Total 235 19,844.5 98 12,405.31 3 283.5 336 32,533.31
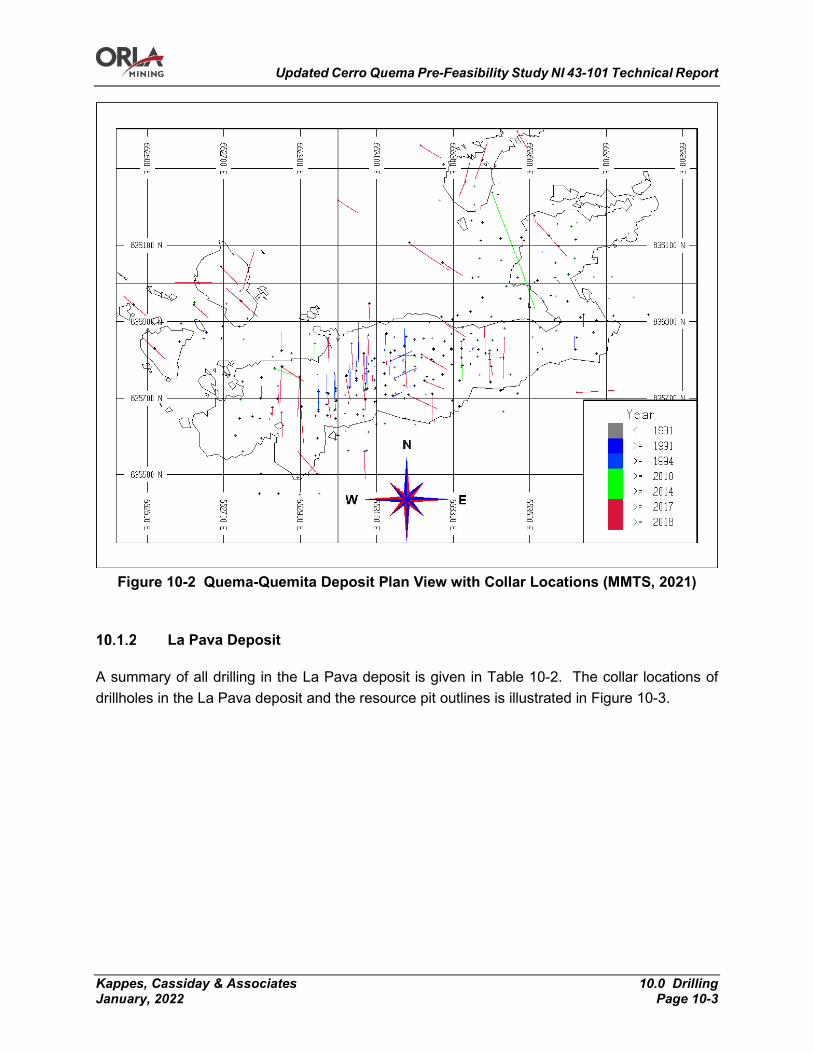
Updated Cerro Quema Pre-Feasibility Study NI 43-101 Technical Report
Kappes, Cassiday & Associates 10.0 Drilling January, 2022 Page 10-3
Figure 10-2 Quema-Quemita Deposit Plan View with Collar Locations (MMTS, 2021)
La Pava Deposit
A summary of all drilling in the La Pava deposit is given in Table 10-2. The collar locations of drillholes in the La Pava deposit and the resource pit outlines is illustrated in Figure 10-3.
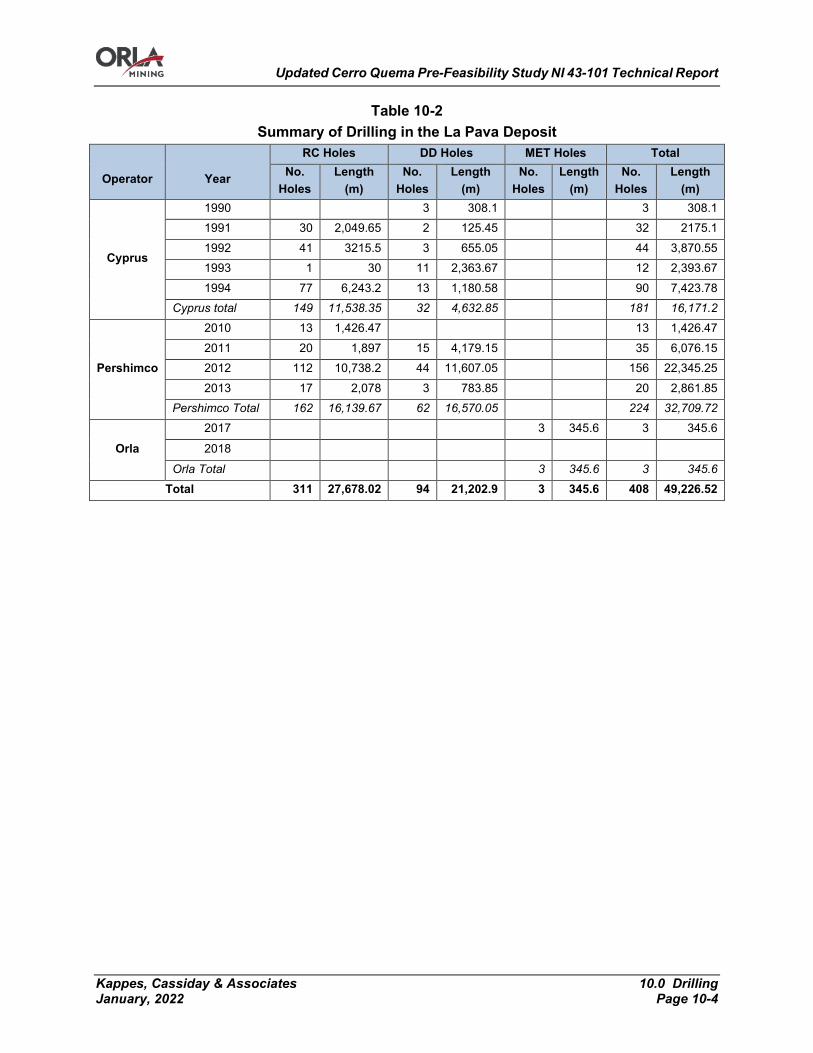
Updated Cerro Quema Pre-Feasibility Study NI 43-101 Technical Report
Kappes, Cassiday & Associates 10.0 Drilling January, 2022 Page 10-4
Table 10-2 Summary of Drilling in the La Pava Deposit
Operator
Year
RC Holes DD Holes MET Holes Total No.
Holes Length
(m) No.
Holes Length
(m) No.
Holes Length
(m) No.
Holes Length
(m)
Cyprus
1990 3 308.1 3 308.1 1991 30 2,049.65 2 125.45 32 2175.1 1992 41 3215.5 3 655.05 44 3,870.55 1993 1 30 11 2,363.67 12 2,393.67 1994 77 6,243.2 13 1,180.58 90 7,423.78
Cyprus total 149 11,538.35 32 4,632.85 181 16,171.2
Pershimco
2010 13 1,426.47 13 1,426.47 2011 20 1,897 15 4,179.15 35 6,076.15 2012 112 10,738.2 44 11,607.05 156 22,345.25 2013 17 2,078 3 783.85 20 2,861.85
Pershimco Total 162 16,139.67 62 16,570.05 224 32,709.72
Orla 2017 3 345.6 3 345.6
2018
Orla Total 3 345.6 3 345.6
Total 311 27,678.02 94 21,202.9 3 345.6 408 49,226.52
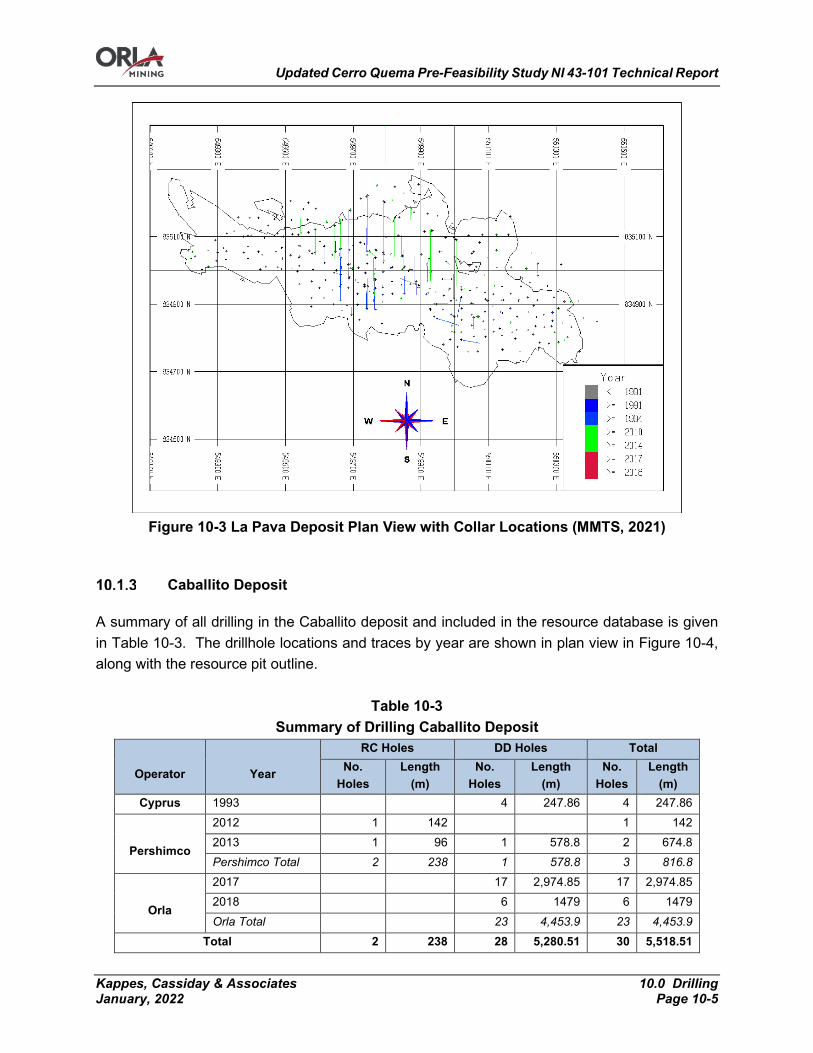
Updated Cerro Quema Pre-Feasibility Study NI 43-101 Technical Report
Kappes, Cassiday & Associates 10.0 Drilling January, 2022 Page 10-5
Figure 10-3 La Pava Deposit Plan View with Collar Locations (MMTS, 2021)
Caballito Deposit
A summary of all drilling in the Caballito deposit and included in the resource database is given in Table 10-3. The drillhole locations and traces by year are shown in plan view in Figure 10-4, along with the resource pit outline.
Table 10-3 Summary of Drilling Caballito Deposit
Operator
Year
RC Holes DD Holes Total No.
Holes Length
(m) No.
Holes Length
(m) No.
Holes Length
(m) Cyprus 1993 4 247.86 4 247.86
Pershimco
2012 1 142 1 142 2013 1 96 1 578.8 2 674.8 Pershimco Total 2 238 1 578.8 3 816.8
Orla
2017 17 2,974.85 17 2,974.85 2018 6 1479 6 1479 Orla Total 23 4,453.9 23 4,453.9
Total 2 238 28 5,280.51 30 5,518.51
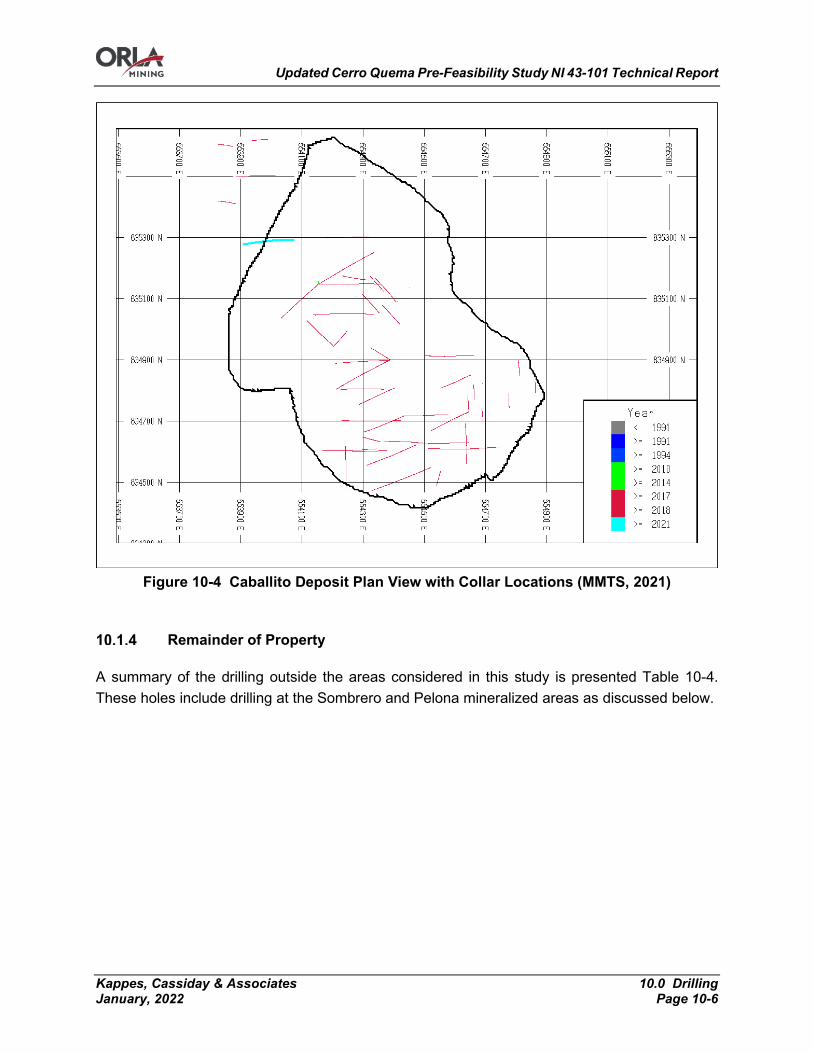
Updated Cerro Quema Pre-Feasibility Study NI 43-101 Technical Report
Kappes, Cassiday & Associates 10.0 Drilling January, 2022 Page 10-6
Figure 10-4 Caballito Deposit Plan View with Collar Locations (MMTS, 2021)
Remainder of Property
A summary of the drilling outside the areas considered in this study is presented Table 10-4. These holes include drilling at the Sombrero and Pelona mineralized areas as discussed below.
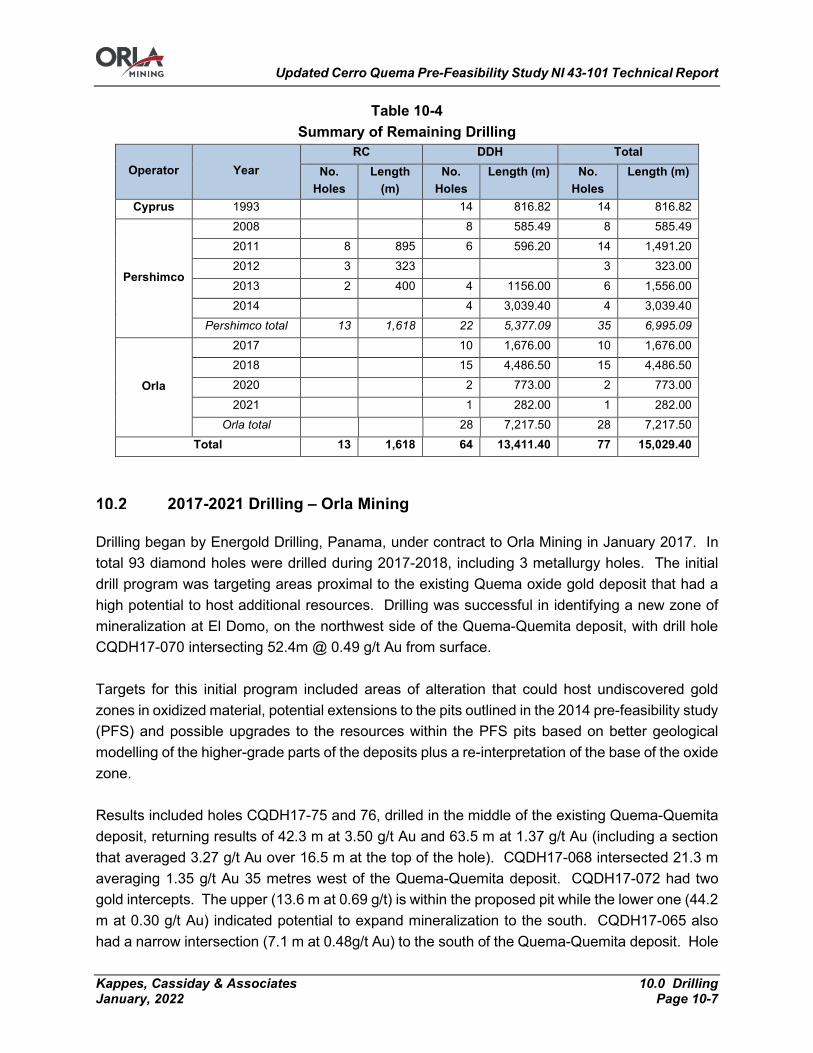
Updated Cerro Quema Pre-Feasibility Study NI 43-101 Technical Report
Kappes, Cassiday & Associates 10.0 Drilling January, 2022 Page 10-7
Table 10-4 Summary of Remaining Drilling
Operator Year RC DDH Total
No. Holes
Length (m)
No. Holes
Length (m) No. Holes
Length (m)
Cyprus 1993
14 816.82 14 816.82
Pershimco
2008
8 585.49 8 585.49 2011 8 895 6 596.20 14 1,491.20 2012 3 323
3 323.00
2013 2 400 4 1156.00 6 1,556.00 2014
4 3,039.40 4 3,039.40
Pershimco total 13 1,618 22 5,377.09 35 6,995.09
Orla
2017
10 1,676.00 10 1,676.00 2018
15 4,486.50 15 4,486.50
2020 2 773.00 2 773.00 2021 1 282.00 1 282.00
Orla total
28 7,217.50 28 7,217.50 Total 13 1,618 64 13,411.40 77 15,029.40
2017-2021 Drilling – Orla Mining
Drilling began by Energold Drilling, Panama, under contract to Orla Mining in January 2017. In total 93 diamond holes were drilled during 2017-2018, including 3 metallurgy holes. The initial drill program was targeting areas proximal to the existing Quema oxide gold deposit that had a high potential to host additional resources. Drilling was successful in identifying a new zone of mineralization at El Domo, on the northwest side of the Quema-Quemita deposit, with drill hole CQDH17-070 intersecting 52.4m @ 0.49 g/t Au from surface. Targets for this initial program included areas of alteration that could host undiscovered gold zones in oxidized material, potential extensions to the pits outlined in the 2014 pre-feasibility study (PFS) and possible upgrades to the resources within the PFS pits based on better geological modelling of the higher-grade parts of the deposits plus a re-interpretation of the base of the oxide zone. Results included holes CQDH17-75 and 76, drilled in the middle of the existing Quema-Quemita deposit, returning results of 42.3 m at 3.50 g/t Au and 63.5 m at 1.37 g/t Au (including a section that averaged 3.27 g/t Au over 16.5 m at the top of the hole). CQDH17-068 intersected 21.3 m averaging 1.35 g/t Au 35 metres west of the Quema-Quemita deposit. CQDH17-072 had two gold intercepts. The upper (13.6 m at 0.69 g/t) is within the proposed pit while the lower one (44.2 m at 0.30 g/t Au) indicated potential to expand mineralization to the south. CQDH17-065 also had a narrow intersection (7.1 m at 0.48g/t Au) to the south of the Quema-Quemita deposit. Hole

Updated Cerro Quema Pre-Feasibility Study NI 43-101 Technical Report
Kappes, Cassiday & Associates 10.0 Drilling January, 2022 Page 10-8
CQDH17-115 intersected 84.8m @ 0.23 g/t gold 170 metres to the northeast of the Quema-Quemita deposit. Near the end of 2017 Orla began drilling at the Caballito zone with an initial 7-hole drill program targeting mineralization near surface on the ridge top. This program only had limited success with only 2 of the holes drilled down slope hitting Au mineralization (CQDH17-089 & 099). The program was however successful in identifying a zone of previously unknown copper mineralization with hole CQDH17-089 returning 66.0m @ 0.52% Cu (+0.24 g/t Au). In early August 2017, Orla drill tested an airborne EM anomaly at Caballito. This resulted in the Cu-Au discovery hole at Caballito being drilled with hole CQDH-17-116 returning 104.8 metres grading 0.38 g/t gold and 1.71% copper in two zones separated by lower grade material. Further drilling in CQDH17-127 and CQDH132, drilled 150m east and 200m northeast of CQDH17-116, intersected similar styles of mineralization. The intersection in CQDH17-127 averaged 50.7m @ 0.13 g/t Au and 0.80% Cu from 111.2 to 161.9m. Hole 127 also intersected two oxide intervals higher up in the hole: 24.1 m @ 1.14 g/t Au starting at 4.5m and 17.4m @ 0.42 g/t Au starting at 58.9m. CQDH17-132 intersected 53.0m @ 0.43g/t Au and 0.64% Cu from 111.0 to 164.0m, including 13.0 m @ 1.09 g/t Au and 0.85% Cu from 111.0 to 124.0m. It also had an oxide gold intercept with 34.5m @ 0.24 g/t Au starting at the top of the hole. CQDH17-136 intersected 158.7 metres grading 0.62 g/t Au and 0.62% Cu. Drilling in late 2018 intersected a new zone of mineralization at Sombrero. A previously untested geophysical anomaly halfway between Caballito and Quema-Quemita. Highlights in the oxide zone included: CQDH-18-175 intersecting 13.4m @2.1 g.t Au, CQDH-18-176 intersecting 21m @ 0.56 g/t Au. Deeper drilling in these holes intersected an approximate 200m interval of strong advanced argillic alteration with anomalous Cu. During the same time a small drill program of 4 holes was drilled at Chontal to test a WSW IP chargeability anomaly. Drilling was unsuccessful in defining any significant mineralization. The three holes drilled in 2020 and 2021 by Orla were located between the Quema-Quemita and Caballito deposits. Significant intersections include Hole DH20-184 averaging 0.43g/t Au and 0.17% Cu over 4.5m from 342.8m to 347.3m.
2011-2014 Drilling – Pershimco
2010 Drilling
The below information on the drilling in 2010 is paraphrased from a previous NI43-101 report (RPA, 2011).
Updated Cerro Quema Pre-Feasibility Study NI 43-101 Technical Report
Kappes, Cassiday & Associates 10.0 Drilling January, 2022 Page 10-9
Pershimco completed a 12-hole RC drilling program in the La Pava deposit from May 2010 to September 2010. The first six holes were drilled by Palo Verde Drilling, drilling 4 7/8” holes. The last six holes were drilled by Swissboring Rodio, using 5” holes. The holes were designed to twin 12 holes from previous campaigns that intersected representative mineralization. The holes were all vertical and ranged over the entire length of the La Pava deposit.
2011-2012 Drilling
The below information on the drilling in 2011 and 2012 comes from P&E, 2012.
Drilling in 2011 was mainly focussed on validation drilling in the La Pava and Quema-Quemita deposit areas and resource expansion by testing the Chontal (between La Pava and Quema-Quemita), Mesita (east of Quema-Quemita) and Pava Norte (north of La Pava) targets.
Drilling highlights at the La Pava deposit include PDH-11-005 that intersected 130 m from surface grading 1.26 g/t Au (Eq); and PDH-11-10 that intersected 98 m for surface grading 0.914 g/t Au and 4.47 g/t Ag. RC drill holes PRH-11-021 and 022 on the south side of the La Pava deposit extended surface mineralization with intersections of 45 m of 2.01 g/t Au and 43 m of 2.08 g/t Au, respectively. Deeper sulphide intersections at La Pava included: PRH-11-017/PDH-11-517 that intersected 144.0 m from 18.0 to 162.0 m grading 0.26 % Cu (Eq), including 8.0 m from 119.0 m to 127.0 m grading 0.99% Cu (Eq); hole PDH-11-018 that intersected 3.0 m from 153.0 to 156.0 m grading 0.88% Cu (Eq); hole PDH-11-022 that intersected 8.0 m from 102.0 m to 110.0 m grading 1.78% Cu (Eq); and hole PDH-11-011 that intersected 13.0 m from 159.0 to 172.0 m grading 3.06% Cu, 0.919 g/t Au and 6.215 g/t Ag.
Highlights at Quema-Quemita include: PRH-11-002/PDH-11-502 that intersected 86.0 m from surface grading 0.97 g/t Au (Eq); PRH-11-001/PDH-11-501 that intersected 100.0 m from surface grading 1.03 g/t Au (Eq); PRH-11-007 that intersected 47.0 m from surface grading 1.43g/t Au (Eq); PRH-11-009 that intersected 94.0 m from 6.0 m to 100.0 m grading 1.11 g/t Au (Eq); PRH-11-011 that intersected 70.0 m from 3.0 m to 73.0 m grading 2.25 g/t Au (Eq).
Pershimco’s drilling in 2012 had a primary focus of expanding oxide gold resources and deeper sulphide mineralization at the known deposits. In addition, Pershimco tested additional targets on the mineralized trend.
A series of short RC holes drilled at La Mesita and El Domo were successful in delineating shallow low grade gold mineralization, particularly at La Mesita.
Drilling in 2012 has also shown that a supergene copper zone is present at the base of the oxidized zone and that primary gold-copper sulphide mineralization is significant in the deeper parts of the deposit. Highlights of deeper drilling at La Pava includes: hole PDH-11-013 that
Updated Cerro Quema Pre-Feasibility Study NI 43-101 Technical Report
Kappes, Cassiday & Associates 10.0 Drilling January, 2022 Page 10-10
intersected 28.0 m from 90.0 to 118.0 m grading 2.08% Cu; hole PRH-11-030 that intersected 17.0 m from 94.0 to 111.0 grading 1.07% Cu; hole PRH-12-138 that intersected 74.0 m from 76.0 m to 150.0 m grading 0.50% Cu; hole PDH-11-014 that intersected 120.0 m from 147.0.m to 267.0 m grading 0.56% Cu and 0.60 g/t Au including 11.0 m from 153.0 m to 164.0 m that intersected 2.97% Cu and 1.45 g/t Au; and PDH-11-14 that intersected 267.0 m from surface grading 0.89 g/t Au.
September to December 2012 Drilling
The below information on the drilling from September to December 2012 comes from Kappes, Cassiday and Associates, 2014.
Following the September 2012 P&E technical report, 5,718 m of RC drilling and 4,239 m of diamond drill were completed on the Property, totalling 9,957 m of drilling. Pershimco’s drilling in the final four months of 2012 continued its resource definition drilling at the La Pava and Quema-Quemita deposits and also commenced the initial validation drilling at the Idaida target. Drilling extended a mineralized structure along the northern flank of the Quema-Quemita deposit to 750 m. This structure trends SW-NE and is located 100-200 m north-northeast of the Quema-Quemita open pit perimeter and southeast of the La Mesita deposit and the El Domo zone. Drilling conducted close to the perimeter of the southwestern and central north sections of the open pit design have intercepted new gold oxide and/or supergene copper mineralization. Supergene copper mineralization was encountered in the western area of the open pit design. The gold oxide drilling program returned intercepts including 14 m averaging 1.61 g/t Au in PRH-12178 within a larger intercept of 71 m averaging 0.49 g/t Au. Hole PRH-12147 intercepted 27 m averaging 1.38 g/t Au. Two RC drill holes totalling 255 were completed on the Idaida exploration target. These drill holes were m based on historical holes completed in 1993 and intercepted oxide gold halo and supergene copper-gold mineralization. Hole PRH-12275 intersected 137 m averaging 0.28 g/t Au and 0.34% Cu beginning at a depth of 5 m and 2.5 % Cu between 137 m and 142 m. Hole PRH-12279 intersected 52 m, between 61 m and 113 m, averaging 1.29% including 4 m averaging 3.32 % Cu between 86 m and 90 m.
2013 Drilling
The below information on the drilling in 2013 comes from Kappes, Cassiday and Associates, 2014.
Updated Cerro Quema Pre-Feasibility Study NI 43-101 Technical Report
Kappes, Cassiday & Associates 10.0 Drilling January, 2022 Page 10-11
Drilling in 2013 focused on resource definition at the La Pava and Quema-Quemita deposits as well as investigating geophysical anomalies at new exploration targets Idaida and Pelona. Exploration drilling on the Idaida target has revealed both near surface and deeper mineralized feeder structures analogous to the La Pava and Quema-Quemita deposits. Ten holes drilled on La Pava, located outside or within 10 to 15 m of the southern and northwestern sides of the open pit design have intercepted significant new gold and copper mineralization. In the Southern Zone, drill hole PRH12188, located approximately 30 m outside the southern margin of the open pit design, intercepted 5m grading 4.08 g/t Au. Drill hole PRH12255, located approximately 25m outside the southern margin of the open pit design, intercepted 13 m grading 0.72 g/t Au and 0.34 % Cu in the sulphide zone. Drill hole PRH12250, collared 8m north of the southern margin of the open pit design, intercepted 18 m grading 2.4% Cu and 0.22 g/t Au (including 7 m at 5.26% Cu) within the sulphide zone. In the Central East Zone, drill hole PRH1211 returned 47 m of 1.23 g/t Au and drill hole PRH 1221 intersected 61 m of 0.86 g/t Au (including 40 m at 1.04 g/t Au). The drill results show the width and continuity of the mineralized zone within the area. Drill hole PDH12037, in the Central South Zone, intercepted 7 m grading 1.92 g/t Au. Further drilling is required to determine the extent of the mineralization. Two drill holes in the Western Extension Zone confirmed that mineralized widths of gold and copper are present in the zone. Drill hole PRH12199 intersected 37 m, from surface, grading 0.41 g/t Au and 28 m grading 0.42% Cu and 0.22 g/t Au within the sulphide zone. Drill hole 12207 intersected 19 m grading 0.79% Cu, including 5 m grading 2.14% Cu. The mineralization in this zone remains open. Similar to the drilling at the La Pava deposit, the drilling at the Quema-Quemita deposit increased the overall resource as well as identified mineralization outside of the current open pit design. Four drill holes located near the perimeter on the south-western and central north sections of the open pit design have intercepted gold oxide and/or supergene copper mineralization, providing new targets for future resource definition and upgrade drilling. In the North Central Zone, drill hole PRH12252 intersected 18 m grading 0.71% copper and 0.44 g/t Au within the sulphide zone. The mineralized intersection is between the central and eastern open pit designs. Additional drilling may allow for the two pits to be combined into one larger pit. Drill hole PRH12246 intersected 102m grading 0.46% Cu, including 29 m of 0.92% Cu, in the sulphide zone. PRH12246 is located 130 m west of PRH12252, near the northern flank of central pit limit, where mineralization remains open. In the South-Central Zone, drill holes PRH12259, PRH12238 and PRH12178 returned oxide gold intercepted 8 m grading 3.84 g/t Au, 45 m grading 0.61 g/t Au, and 14 m grading 1.61 g/t Au, respectively. The three drill holes were collared near the southern perimeter of the open pit design, demonstrating the continuity of mineralization in this area. Drill hole PRH12241, located approximately 50 m outside the southern perimeter of the current open pit design, intercepted 19 m of 0.53% Cu within the sulphide zone. Mineralization remains open to the south. In the South Eastern Zone, drill

Updated Cerro Quema Pre-Feasibility Study NI 43-101 Technical Report
Kappes, Cassiday & Associates 10.0 Drilling January, 2022 Page 10-12
hole PRH12200 intercepted 32 m, from surface, of 0.44 g/t oxide gold, including 10 grading 0.67 g/t Au. This drill hole was collared on the southeastern perimeter of the current open pit design. Reverse circulation drilling (RC) was initiated to investigate geophysical anomalies in the new exploration target at Cerro Idaida. Upon completion of the RC drill holes (PRH13316 and PRH13317), a diamond drill hole “tail” program was initiated to test for additional Cu-Au mineralization within the high sulfidation (HS) system at depth. Both diamond drill hole ‘tails’ (PDH135316 and PDH135317) encountered additional high-grade copper (enargite-covellite) mineralization as veinlets, disseminations and breccia matrix fill below the final depth of the reverse circulation holes. In addition, PDH135317 intercepted a deeper, higher temperature (pyrophyllite-rich) feeder zone containing copper and gold mineralization.
2013-2014 Drilling
The following information on 6 deep exploratory drill holes comes from Kappes, Cassiday and Associates, 2014.
Deep exploratory drilling was initiated in November 2013 utilizing a Longyear LF-70 diamond drill rig. This first phase of the deep drilling program was completed with six holes totalling 4,459.15 meters of drill core002E The objective of the first phase of this program was to target and validate the strong (+40 mV/V) Induced Polarization (IP) chargeability anomalies below and adjacent to the high sulfidation (HS) Au-in-oxide and Cu-Au in sulphide mineralization at La Pava, Quema-Quemita and Idaida. The targeting of the IP anomalies included correlative aeromagnetic (magnetic susceptibility lows) and radiometric (K40 depletion) signatures, as well as supportive geology (structure, lithology, alteration and mineralization). All holes, based on core log estimates, encountered abundant sulphide (mainly pyrite) mineralization at and below the targeted IP chargeability zones.
1990-1996 Drilling – Cyprus/Campbell
Few details remain on drilling by Cyprus and Campbell during this period. The below summary of drilling on the property during this period is taken from RPA, 2010.
Drilling by Cyprus in the La Pava area mostly intersects the deposit with vertical holes, with only 10 inclined holes. Drilling was on a grid with approximately 40 to 50m spacing. All drill hole collars were reportedly surveyed, with downhole surveys on the deeper holes.

Updated Cerro Quema Pre-Feasibility Study NI 43-101 Technical Report
Kappes, Cassiday & Associates 10.0 Drilling January, 2022 Page 10-13
Drilling by Campbell in 1996 consisted of 29 holes, totalling 1,749.6m, 11 of which were twin holes to check previous drilling. The data from the Campbell drilling was not recovered.
Orla Mining confirms non-receipt of the Campbell data and states that the core from this campaign is not found in the coreshack.
Updated Cerro Quema Pre-Feasibility Study NI 43-101 Technical Report
Kappes, Cassiday & Associates 11.0 Sample Preparation, Analyses and Security January, 2022 Page 11-1
11.0 SAMPLE PREPARATION, ANALYSES AND SECURITY
Sampling Protocols and Principal Laboratories
Sampling by Orla Mining 2017-2018
ALS personnel place samples in aluminum trays which are transferred to ovens where they are dried for 12 hours at 90°C. The entire sample is then crushed to -10 mesh (2 mm) using a Rock labs Boyd crusher. Sieve tests are conducted at least twice a day to ensure that material is being crushed to the appropriate size. If the quantity passing falls below 80%, crusher jaws are adjusted accordingly. A written record of this test is available for review. The crusher is cleaned with high-pressure air after every sample. After every 10 samples a coarse blank sample is passed through the crusher. Each crushed sample weighs approximately 5 kg. This material is split using a Jones riffle splitter. A 500-gram aliquot of each sample is taken for assay, placed and heat-sealed in a small plastic bag marked with a bar-coded sample tag. The remaining material is returned to the original sample bag and stored on site. The standards, blanks and duplicates are introduced into the assay stream by Orla geologists before shipping. All custody and packing process protocol is executed by ALS representatives on site for shipment by air courier to ALS Chemex in Lima, Perú, for analysis. At the Lima laboratory, all gold results are obtained by ALS Minerals (Au-AA23) using fire assay fusion and atomic absorption spectroscopy finish. All samples are also analyzed for multi-elements, including silver and copper, using Aqua Regia with ICP-AES. Samples with copper values in excess of 1% by ICP analysis are re-run with Cu AA46 aqua regia and atomic absorption analysis. During the 2017-2018 Orla drill programs, drill collar locations were identified in the field using a GARMIN GPS-60CSx hand-held GPS unit. After each drill hole was completed, a cement monument with hole number and depth was constructed at the site. The collar locations were surveyed using a differential GPS system and base station (RTK). This system is accurate to 5 cm. All exploration drill holes are surveyed with the FLEXIT smart-tool single shot. Measurements with the FLEXIT are taken at 50 m intervals throughout the hole. Drill program design, QAQC and interpretation of results are performed by qualified persons employing a QAQC program consistent with National Instrument ("NI") 43-101 and industry best practices.

Updated Cerro Quema Pre-Feasibility Study NI 43-101 Technical Report
Kappes, Cassiday & Associates 11.0 Sample Preparation, Analyses and Security January, 2022 Page 11-2
Sampling by Pershimco 2010-2014
The following information on sampling and assaying related to drilling by Pershimco is taken from Kappes, Cassidy and Associates, 2014.
Diamond drill core and reverse circulation (“RC”) cuttings samples were collected, approximately each one meter. In the event there was a loss of core or cuttings, a change in lithological contact, vein contact or a change in matrix from oxide to sulphide, the minimum sample size allowed was 0.5 meters and maximum sample size allowed was 1.5 meters. Lithological contacts, vein contacts and sulphide content were respected with an appropriate sample interval where possible. A thorough quality assurance/quality control (“QA/QC”, or “QC”) program was implemented, which included one field blank and at least one certified reference material, (also referred to as a standard), for every batch of 20 samples sent to the laboratory. The principal lab used by Pershimco was Activation Laboratories (“Actlabs”). Samples were sent to Actlab’s Panama lab for preparation and the resulting pulps were sent to Actlabs in Ancaster, ON, Canada for analysis. Samples were initially sent to the sample preparation facilities in Panama. Individual samples were entered into the Laboratory Information Management System (“LIMS”) by Actlabs personnel, dried, and finely crushed to 85% passing <2 mm. The samples are then returned for a second time to the dryer, and immediately upon their removal from the dryer, they are pulverized to 85% passing 200 mesh, and riffle-split to 150 grams. Prepared samples are then placed into air-deprived zip lock bags and then into 5-gallon plastic containers, which are sealed and shipped by courier services to Actlabs in Ancaster, Ontario, Canada for assaying. Silver and copper sample tenors are determined using a multi-element ICP method, and gold is determined using fire assay method with atomic absorption finish. Gold values exceeding the 2.5 g/t Au are rerun using fire assay with a gravimetric finish. The Actlabs’ Quality System is accredited to international quality standards through the International Organization for Standardization /International Electrotechnical Commission (ISO/IEC) 17025 (ISO/IEC 17025 includes ISO 9001 and ISO 9002 specifications) with CAN-P-1758 (Forensics), CAN-P-1579 (Mineral Analysis) and CAN-P-1585 (Environmental) for specific registered tests by the SCC. The accreditation program includes ongoing audits, which verify the QA system and all applicable registered test methods. Actlabs is also accredited by the National Environmental Laboratory Accreditation Conference (NELAC) program and Health Canada.
Sampling by Cyprus 1990-1994
The following information was reported by RPA in 2010.

Updated Cerro Quema Pre-Feasibility Study NI 43-101 Technical Report
Kappes, Cassiday & Associates 11.0 Sample Preparation, Analyses and Security January, 2022 Page 11-3
Written descriptions of the methods used for sampling, sample preparation, and analysis were not available for review by Scott Wilson RPA. Thomas Baxter, the geologist who worked on the exploration projects, reports that half of the split core and a split of the RC cuttings were sent to the Bondar Clegg (BC) laboratory in Santiago, Panama, for sample preparation. The samples were dried in an oven, crushed in a jaw crusher, pulverized to minus 200 mesh size, and a 500-gram split was sent to the BC laboratory in Vancouver, British Columbia, for assaying by fire assay for Au and Ag. Mr. Baxter also reports that blanks and duplicate samples were included in each batch of samples sent to the laboratory at a rate of about one check sample in every 20 to 30 exploration samples. Inter-laboratory checks were conducted by sending sample splits apparently to Monitor Geochemical Laboratory in Elko, Nevada. It is unknown if the laboratories were certified by any standards association at the time of the sample preparation and analyses. The quality assurance/quality (QA/QC) control procedures at the laboratories are unknown.
Cerro Quema QAQC Summary
The database of assays including QAQC samples was received from Orla Mining in June 2020. QAQC samples were included in the drilling for years 2010 and after, as well as the assays of 74 samples from one 1993 drill hole in the Quema-Quemita deposit. The percentage of drilling which included QAQC is summarized in Table 11-1 by deposit, indicating that the rate of QAQC sampling is acceptable.
Table 11-1 Cerro Quema QAQC Sample Summary
Sample Type La Pava Quema-Quemita
Caballito
Blanks 1,839 1,137 112 Au Standards 1,622 1,117 101 Cu Standards 893 445 55 Duplicates 1,716 1,112 118 Total QAQC 6,070 3,811 386 Assays 30,089 22,340 3,867 % QAQC 17% 15% 9%
Within the three deposits, the database of duplicate samples provided contains 2,946 pairs of duplicate samples. Drilling before 2014 included both RC and DDH types of holes and sample preparation was done prior to being sent to the laboratory, hence, all samples up through 2013 submitted to the lab were either crushed rock or pulps. The division between coarse rejects and pulps cannot be ascertained in the data provided, so all 2013 and earlier duplicate samples are analyzed together. Drilling in 2014 and after is exclusively DDH and these samples were submitted as core and prepared at the laboratory, hence all of these are considered field core duplicates and analyzed separately.

Updated Cerro Quema Pre-Feasibility Study NI 43-101 Technical Report
Kappes, Cassiday & Associates 11.0 Sample Preparation, Analyses and Security January, 2022 Page 11-4
La Pava Deposit QAQC
La Pava Deposit Blanks
A total of 1,839 samples of blank material were included in the La Pava assay stream from years 2010 through 2013. Because the assays were done with tests that had different detection limits, 0.005g/t and 0.02g/t, the results are normalized by dividing by the detection limit for analysis. The normalized results are presented in Figure 11-1 and shows there are 26 failures at the 5*detection limit value. This failure rate of 1.4% is somewhat higher than desired, but not considered material to the resource estimate. Of the 26 failures, 10 high values were investigated by checking the certificates and only one followed an assay with a high grade which normally is considered indicative of potential contamination. Most failures followed samples with little to no gold. Several have the potential to be mislabeled standards, and no other explanation is offered for the remaining failures.
Figure 11-1 La Pava Deposit Blanks (MMTS, 2020)
There is some evidence that the failures were monitored and re-assays were undertaken. For example, blank sample PRO-36999 failed at 0.148g/t, and appears on certificate A12-09692.
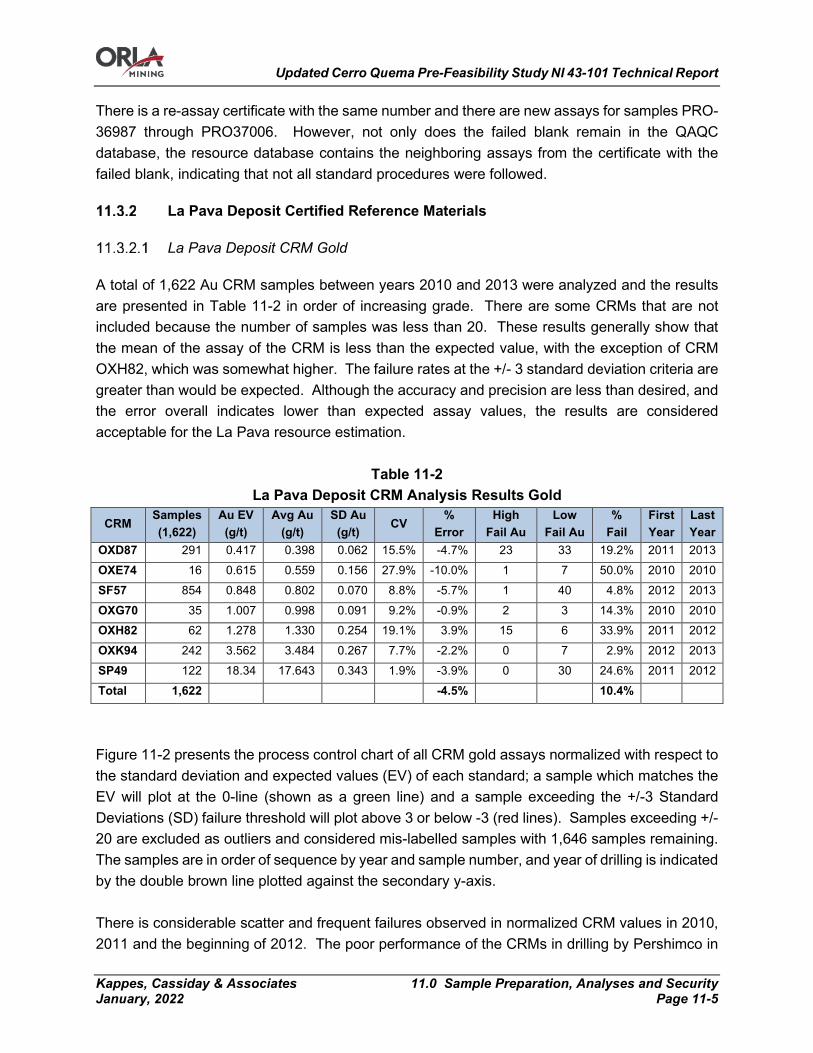
Updated Cerro Quema Pre-Feasibility Study NI 43-101 Technical Report
Kappes, Cassiday & Associates 11.0 Sample Preparation, Analyses and Security January, 2022 Page 11-5
There is a re-assay certificate with the same number and there are new assays for samples PRO-36987 through PRO37006. However, not only does the failed blank remain in the QAQC database, the resource database contains the neighboring assays from the certificate with the failed blank, indicating that not all standard procedures were followed.
La Pava Deposit Certified Reference Materials
La Pava Deposit CRM Gold
A total of 1,622 Au CRM samples between years 2010 and 2013 were analyzed and the results are presented in Table 11-2 in order of increasing grade. There are some CRMs that are not included because the number of samples was less than 20. These results generally show that the mean of the assay of the CRM is less than the expected value, with the exception of CRM OXH82, which was somewhat higher. The failure rates at the +/- 3 standard deviation criteria are greater than would be expected. Although the accuracy and precision are less than desired, and the error overall indicates lower than expected assay values, the results are considered acceptable for the La Pava resource estimation.
Table 11-2 La Pava Deposit CRM Analysis Results Gold
CRM Samples (1,622)
Au EV (g/t)
Avg Au (g/t)
SD Au (g/t)
CV %
Error High
Fail Au Low
Fail Au %
Fail First Year
Last Year
OXD87 291 0.417 0.398 0.062 15.5% -4.7% 23 33 19.2% 2011 2013 OXE74 16 0.615 0.559 0.156 27.9% -10.0% 1 7 50.0% 2010 2010 SF57 854 0.848 0.802 0.070 8.8% -5.7% 1 40 4.8% 2012 2013 OXG70 35 1.007 0.998 0.091 9.2% -0.9% 2 3 14.3% 2010 2010 OXH82 62 1.278 1.330 0.254 19.1% 3.9% 15 6 33.9% 2011 2012 OXK94 242 3.562 3.484 0.267 7.7% -2.2% 0 7 2.9% 2012 2013 SP49 122 18.34 17.643 0.343 1.9% -3.9% 0 30 24.6% 2011 2012 Total 1,622 -4.5% 10.4%
Figure 11-2 presents the process control chart of all CRM gold assays normalized with respect to the standard deviation and expected values (EV) of each standard; a sample which matches the EV will plot at the 0-line (shown as a green line) and a sample exceeding the +/-3 Standard Deviations (SD) failure threshold will plot above 3 or below -3 (red lines). Samples exceeding +/-20 are excluded as outliers and considered mis-labelled samples with 1,646 samples remaining. The samples are in order of sequence by year and sample number, and year of drilling is indicated by the double brown line plotted against the secondary y-axis. There is considerable scatter and frequent failures observed in normalized CRM values in 2010, 2011 and the beginning of 2012. The poor performance of the CRMs in drilling by Pershimco in
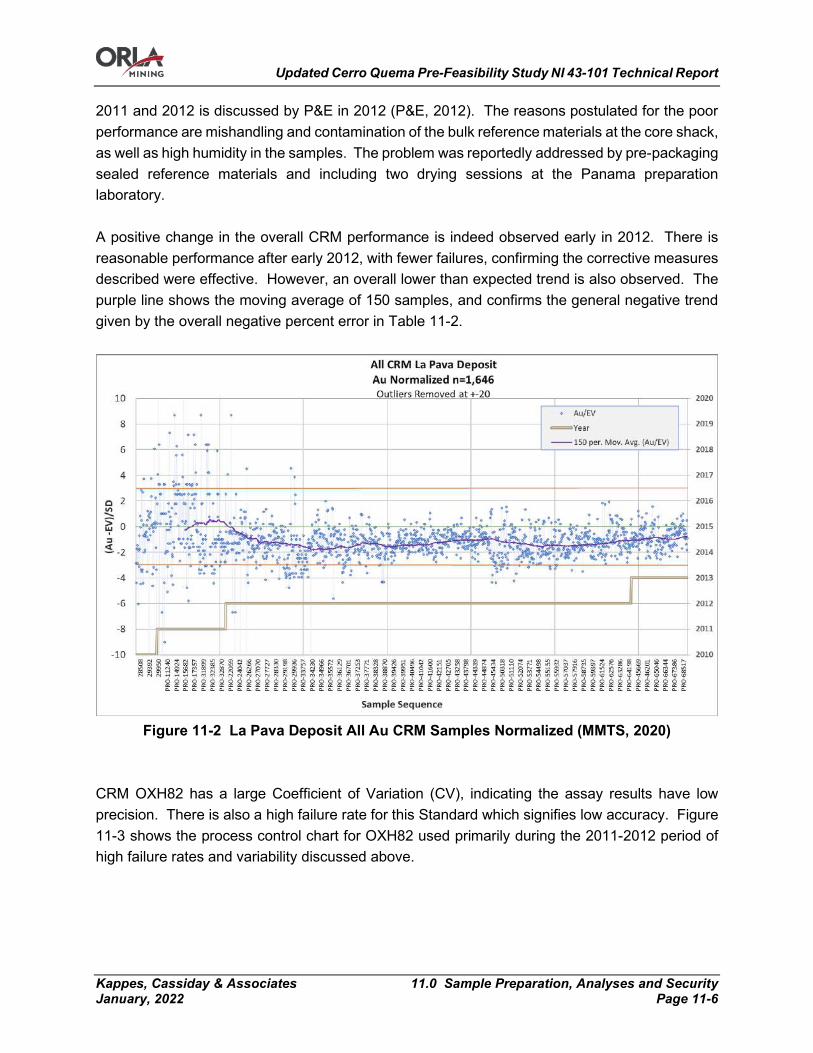
Updated Cerro Quema Pre-Feasibility Study NI 43-101 Technical Report
Kappes, Cassiday & Associates 11.0 Sample Preparation, Analyses and Security January, 2022 Page 11-6
2011 and 2012 is discussed by P&E in 2012 (P&E, 2012). The reasons postulated for the poor performance are mishandling and contamination of the bulk reference materials at the core shack, as well as high humidity in the samples. The problem was reportedly addressed by pre-packaging sealed reference materials and including two drying sessions at the Panama preparation laboratory. A positive change in the overall CRM performance is indeed observed early in 2012. There is reasonable performance after early 2012, with fewer failures, confirming the corrective measures described were effective. However, an overall lower than expected trend is also observed. The purple line shows the moving average of 150 samples, and confirms the general negative trend given by the overall negative percent error in Table 11-2.
Figure 11-2 La Pava Deposit All Au CRM Samples Normalized (MMTS, 2020)
CRM OXH82 has a large Coefficient of Variation (CV), indicating the assay results have low precision. There is also a high failure rate for this Standard which signifies low accuracy. Figure 11-3 shows the process control chart for OXH82 used primarily during the 2011-2012 period of high failure rates and variability discussed above.
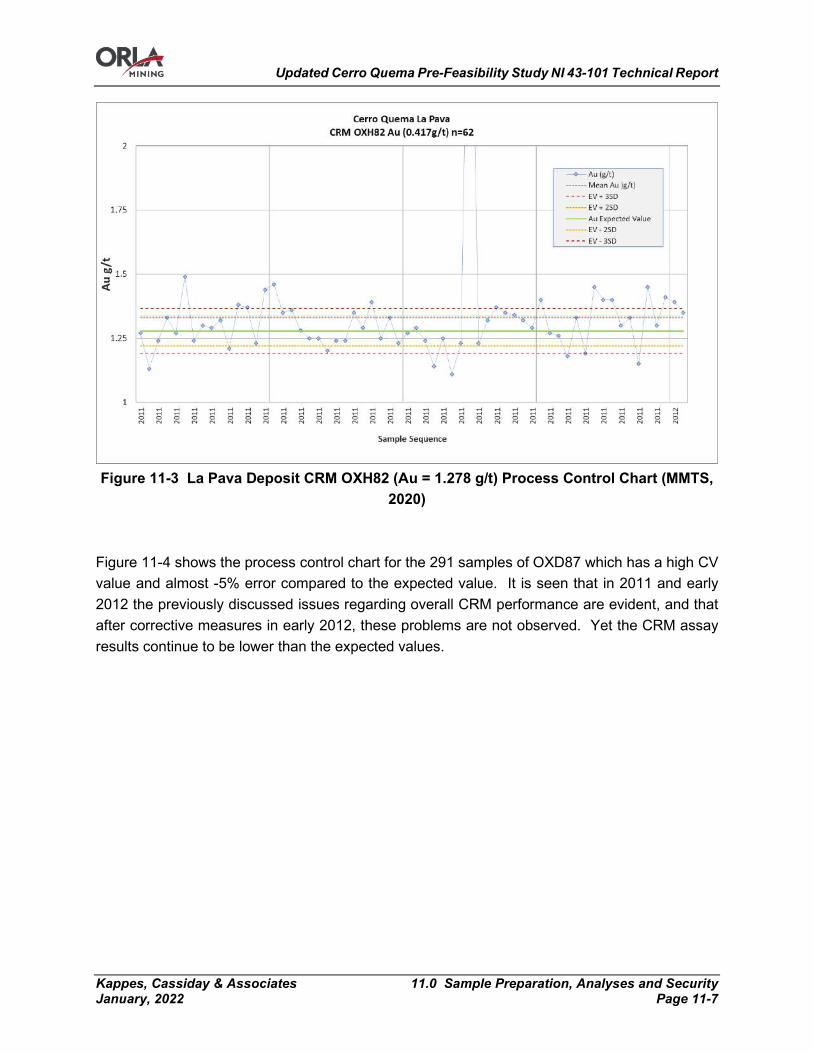
Updated Cerro Quema Pre-Feasibility Study NI 43-101 Technical Report
Kappes, Cassiday & Associates 11.0 Sample Preparation, Analyses and Security January, 2022 Page 11-7
Figure 11-3 La Pava Deposit CRM OXH82 (Au = 1.278 g/t) Process Control Chart (MMTS,
2020) Figure 11-4 shows the process control chart for the 291 samples of OXD87 which has a high CV value and almost -5% error compared to the expected value. It is seen that in 2011 and early 2012 the previously discussed issues regarding overall CRM performance are evident, and that after corrective measures in early 2012, these problems are not observed. Yet the CRM assay results continue to be lower than the expected values.
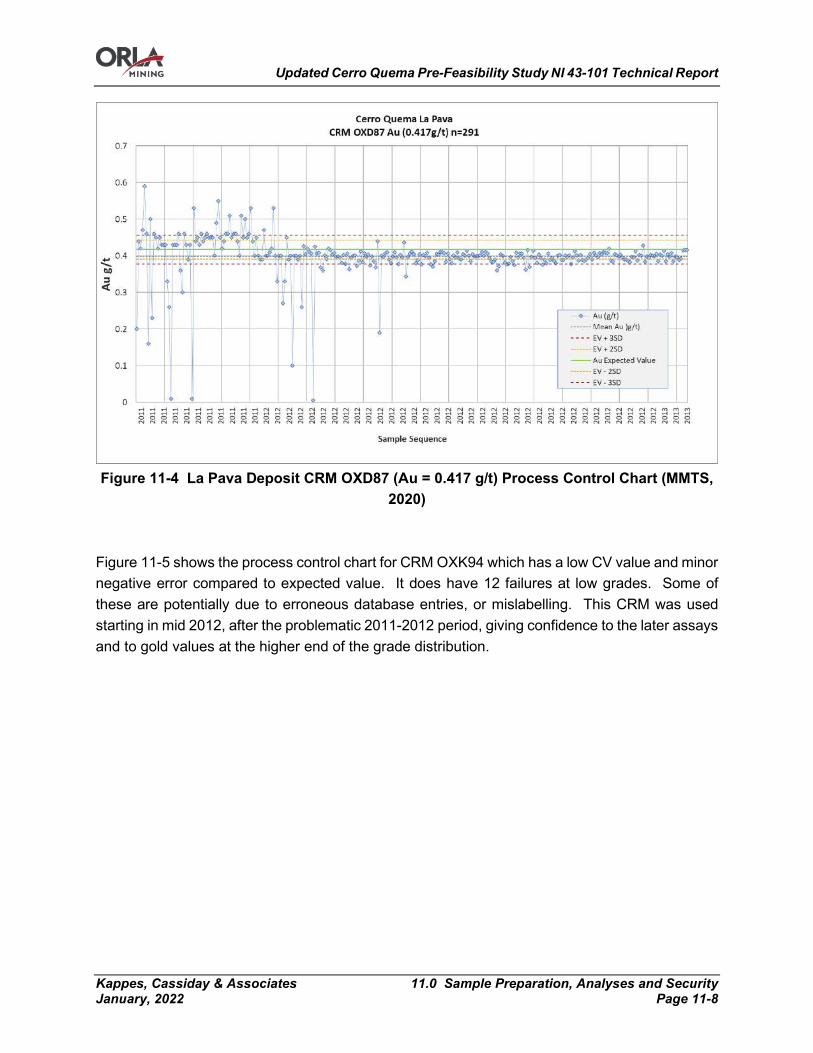
Updated Cerro Quema Pre-Feasibility Study NI 43-101 Technical Report
Kappes, Cassiday & Associates 11.0 Sample Preparation, Analyses and Security January, 2022 Page 11-8
Figure 11-4 La Pava Deposit CRM OXD87 (Au = 0.417 g/t) Process Control Chart (MMTS,
2020) Figure 11-5 shows the process control chart for CRM OXK94 which has a low CV value and minor negative error compared to expected value. It does have 12 failures at low grades. Some of these are potentially due to erroneous database entries, or mislabelling. This CRM was used starting in mid 2012, after the problematic 2011-2012 period, giving confidence to the later assays and to gold values at the higher end of the grade distribution.
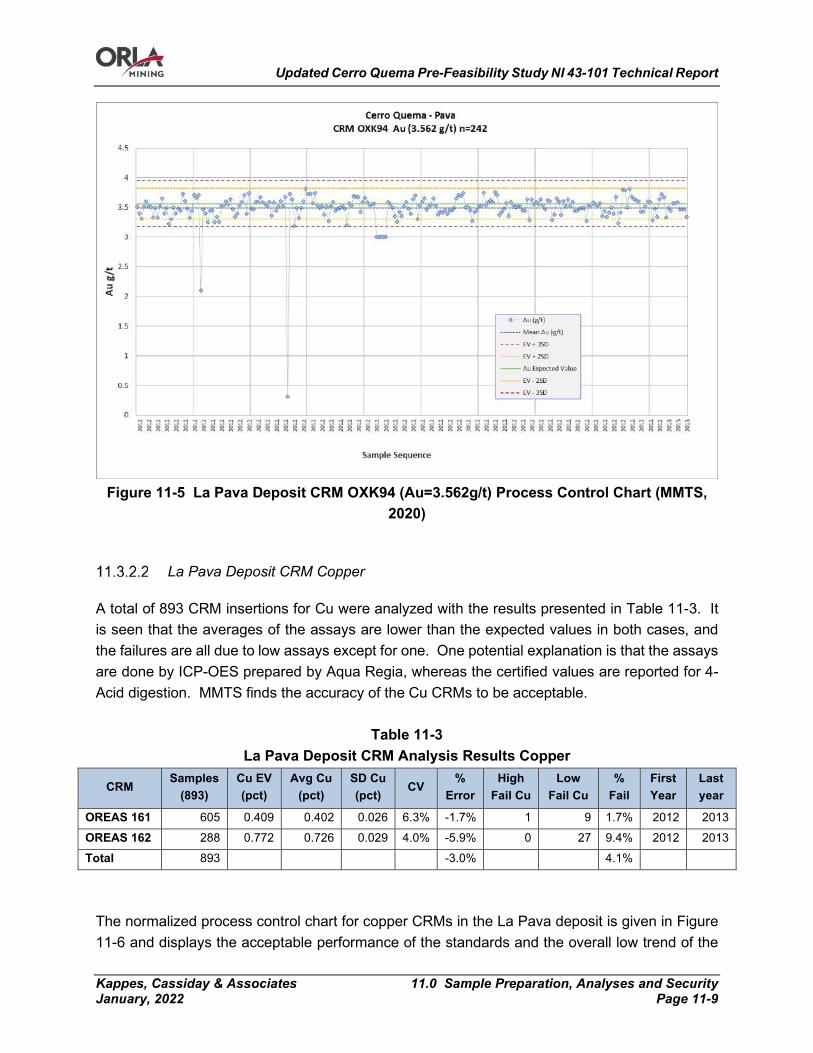
Updated Cerro Quema Pre-Feasibility Study NI 43-101 Technical Report
Kappes, Cassiday & Associates 11.0 Sample Preparation, Analyses and Security January, 2022 Page 11-9
Figure 11-5 La Pava Deposit CRM OXK94 (Au=3.562g/t) Process Control Chart (MMTS,
2020)
La Pava Deposit CRM Copper
A total of 893 CRM insertions for Cu were analyzed with the results presented in Table 11-3. It is seen that the averages of the assays are lower than the expected values in both cases, and the failures are all due to low assays except for one. One potential explanation is that the assays are done by ICP-OES prepared by Aqua Regia, whereas the certified values are reported for 4-Acid digestion. MMTS finds the accuracy of the Cu CRMs to be acceptable.
Table 11-3 La Pava Deposit CRM Analysis Results Copper
CRM Samples
(893) Cu EV (pct)
Avg Cu (pct)
SD Cu (pct)
CV %
Error High
Fail Cu Low
Fail Cu %
Fail First Year
Last year
OREAS 161 605 0.409 0.402 0.026 6.3% -1.7% 1 9 1.7% 2012 2013
OREAS 162 288 0.772 0.726 0.029 4.0% -5.9% 0 27 9.4% 2012 2013
Total 893 -3.0% 4.1%
The normalized process control chart for copper CRMs in the La Pava deposit is given in Figure 11-6 and displays the acceptable performance of the standards and the overall low trend of the
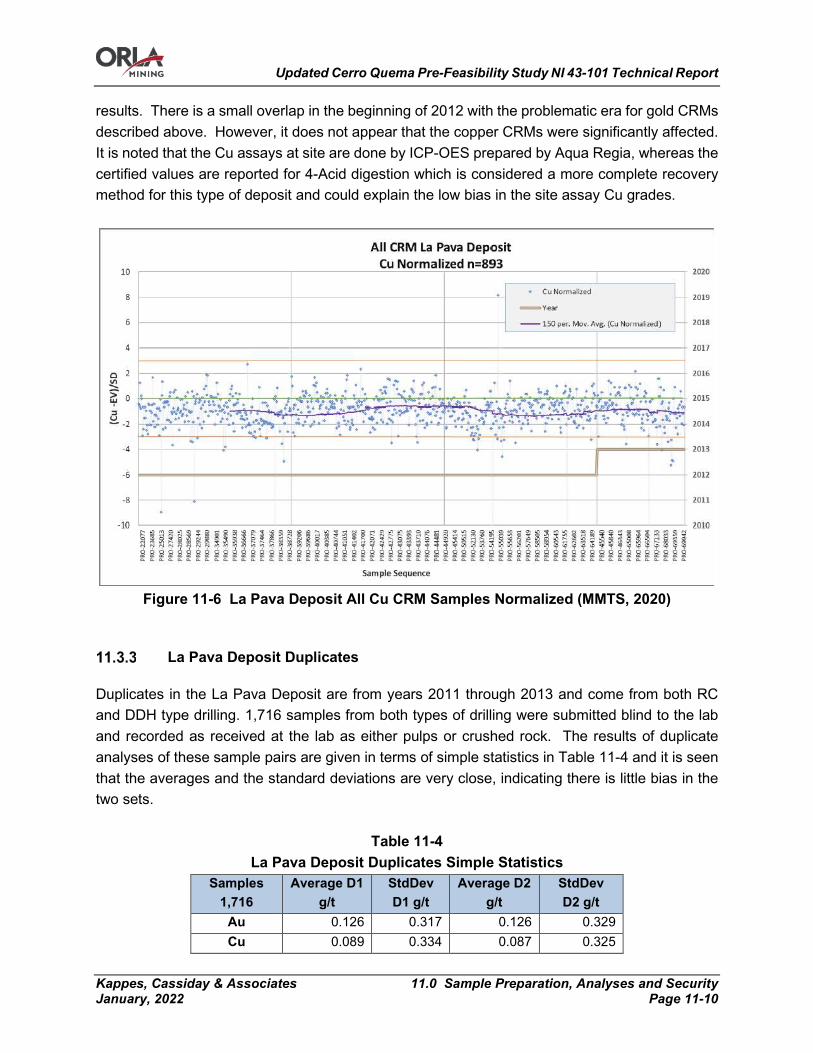
Updated Cerro Quema Pre-Feasibility Study NI 43-101 Technical Report
Kappes, Cassiday & Associates 11.0 Sample Preparation, Analyses and Security January, 2022 Page 11-10
results. There is a small overlap in the beginning of 2012 with the problematic era for gold CRMs described above. However, it does not appear that the copper CRMs were significantly affected. It is noted that the Cu assays at site are done by ICP-OES prepared by Aqua Regia, whereas the certified values are reported for 4-Acid digestion which is considered a more complete recovery method for this type of deposit and could explain the low bias in the site assay Cu grades.
Figure 11-6 La Pava Deposit All Cu CRM Samples Normalized (MMTS, 2020)
La Pava Deposit Duplicates
Duplicates in the La Pava Deposit are from years 2011 through 2013 and come from both RC and DDH type drilling. 1,716 samples from both types of drilling were submitted blind to the lab and recorded as received at the lab as either pulps or crushed rock. The results of duplicate analyses of these sample pairs are given in terms of simple statistics in Table 11-4 and it is seen that the averages and the standard deviations are very close, indicating there is little bias in the two sets.
Table 11-4 La Pava Deposit Duplicates Simple Statistics
Samples 1,716
Average D1 g/t
StdDev D1 g/t
Average D2 g/t
StdDev D2 g/t
Au 0.126 0.317 0.126 0.329 Cu 0.089 0.334 0.087 0.325
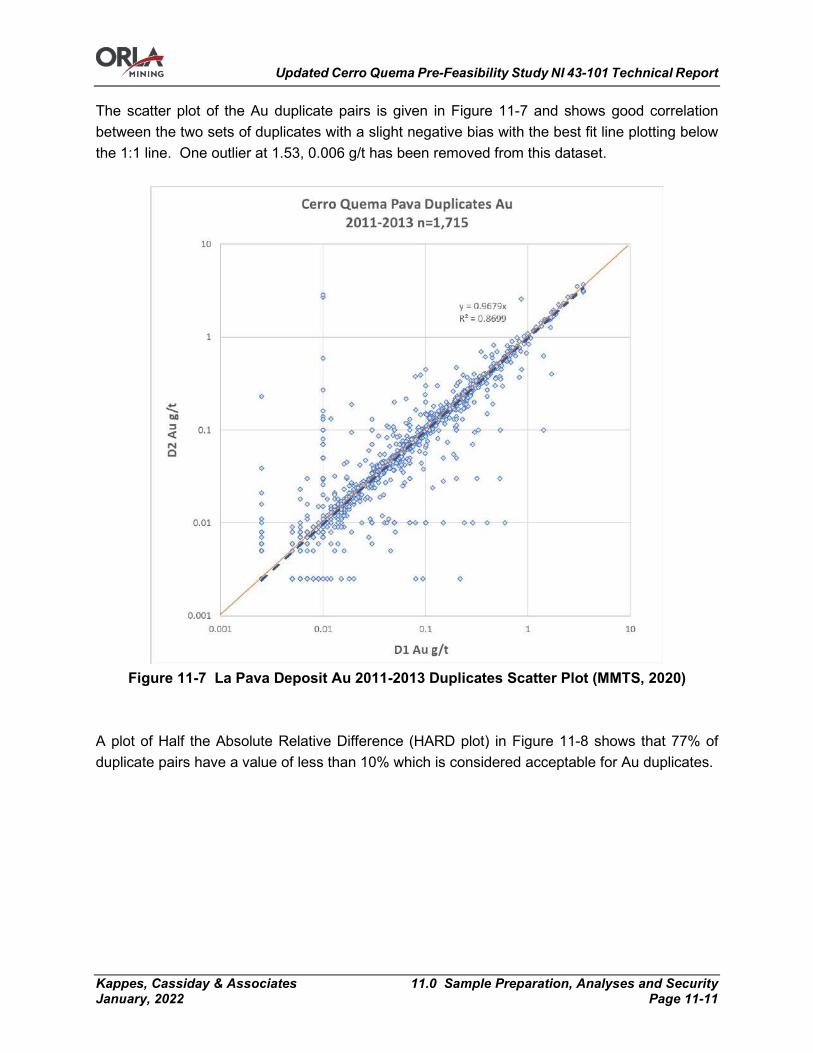
Updated Cerro Quema Pre-Feasibility Study NI 43-101 Technical Report
Kappes, Cassiday & Associates 11.0 Sample Preparation, Analyses and Security January, 2022 Page 11-11
The scatter plot of the Au duplicate pairs is given in Figure 11-7 and shows good correlation between the two sets of duplicates with a slight negative bias with the best fit line plotting below the 1:1 line. One outlier at 1.53, 0.006 g/t has been removed from this dataset.
Figure 11-7 La Pava Deposit Au 2011-2013 Duplicates Scatter Plot (MMTS, 2020)
A plot of Half the Absolute Relative Difference (HARD plot) in Figure 11-8 shows that 77% of duplicate pairs have a value of less than 10% which is considered acceptable for Au duplicates.
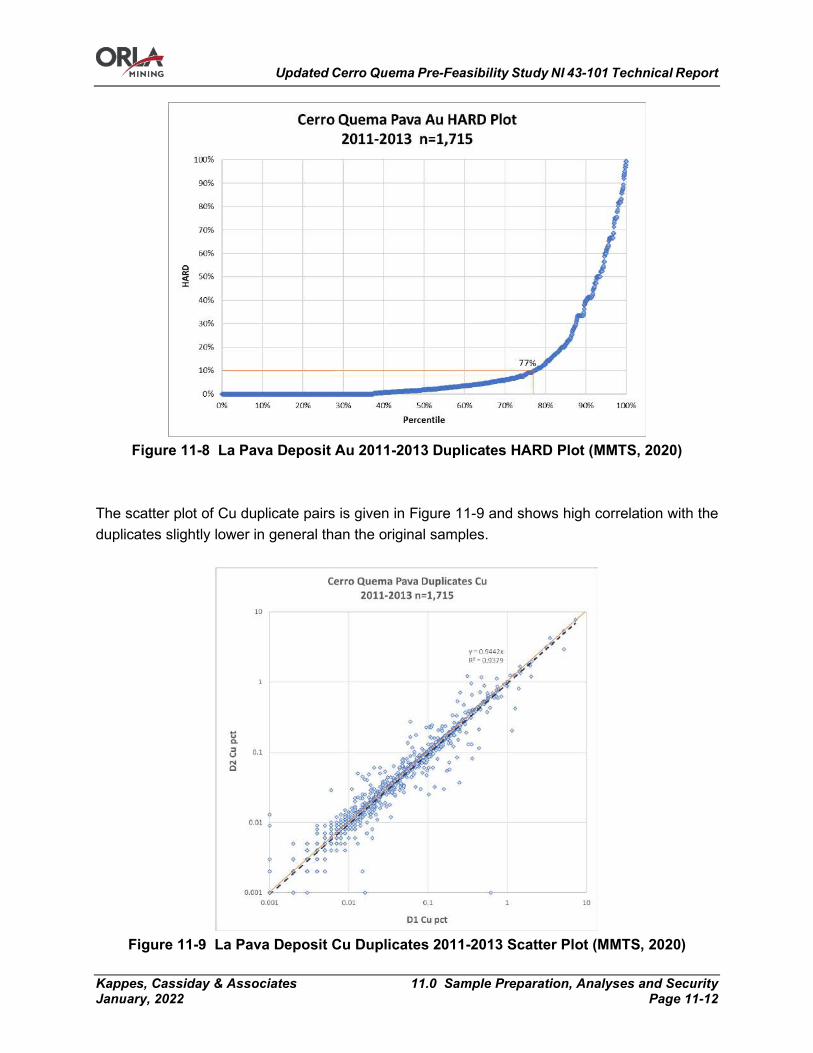
Updated Cerro Quema Pre-Feasibility Study NI 43-101 Technical Report
Kappes, Cassiday & Associates 11.0 Sample Preparation, Analyses and Security January, 2022 Page 11-12
Figure 11-8 La Pava Deposit Au 2011-2013 Duplicates HARD Plot (MMTS, 2020)
The scatter plot of Cu duplicate pairs is given in Figure 11-9 and shows high correlation with the duplicates slightly lower in general than the original samples.
Figure 11-9 La Pava Deposit Cu Duplicates 2011-2013 Scatter Plot (MMTS, 2020)
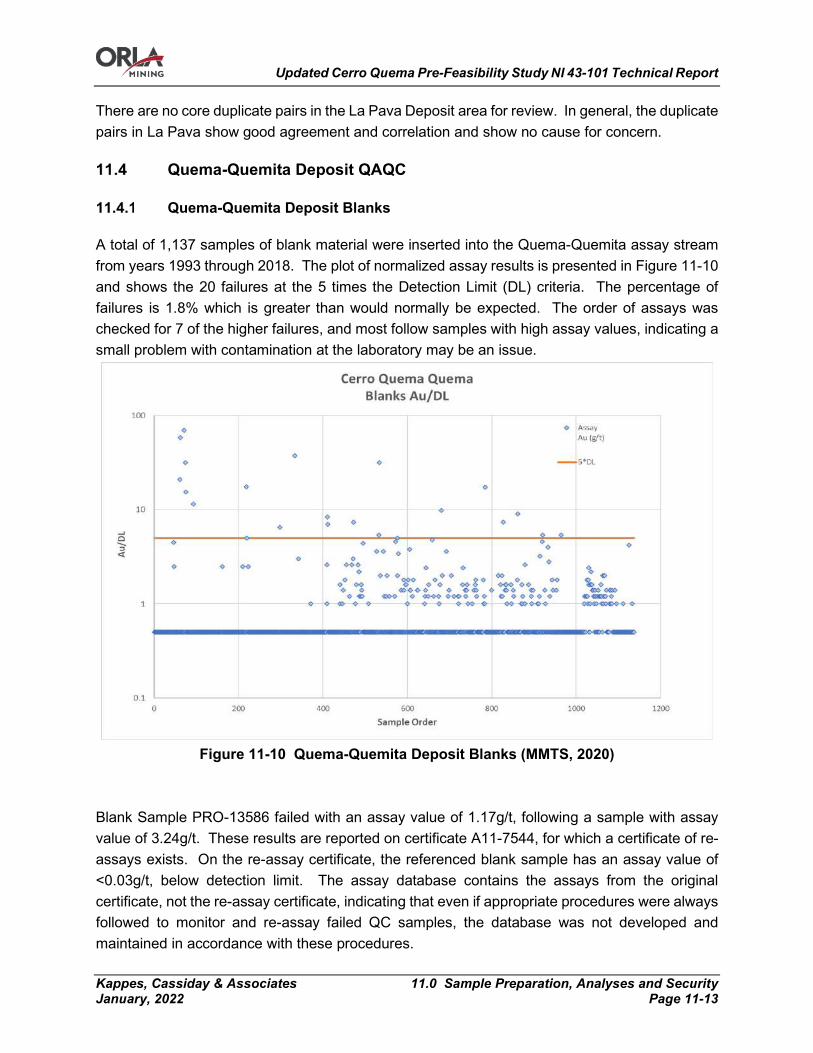
Updated Cerro Quema Pre-Feasibility Study NI 43-101 Technical Report
Kappes, Cassiday & Associates 11.0 Sample Preparation, Analyses and Security January, 2022 Page 11-13
There are no core duplicate pairs in the La Pava Deposit area for review. In general, the duplicate pairs in La Pava show good agreement and correlation and show no cause for concern.
Quema-Quemita Deposit QAQC
Quema-Quemita Deposit Blanks
A total of 1,137 samples of blank material were inserted into the Quema-Quemita assay stream from years 1993 through 2018. The plot of normalized assay results is presented in Figure 11-10 and shows the 20 failures at the 5 times the Detection Limit (DL) criteria. The percentage of failures is 1.8% which is greater than would normally be expected. The order of assays was checked for 7 of the higher failures, and most follow samples with high assay values, indicating a small problem with contamination at the laboratory may be an issue.
Figure 11-10 Quema-Quemita Deposit Blanks (MMTS, 2020)
Blank Sample PRO-13586 failed with an assay value of 1.17g/t, following a sample with assay value of 3.24g/t. These results are reported on certificate A11-7544, for which a certificate of re-assays exists. On the re-assay certificate, the referenced blank sample has an assay value of <0.03g/t, below detection limit. The assay database contains the assays from the original certificate, not the re-assay certificate, indicating that even if appropriate procedures were always followed to monitor and re-assay failed QC samples, the database was not developed and maintained in accordance with these procedures.

Updated Cerro Quema Pre-Feasibility Study NI 43-101 Technical Report
Kappes, Cassiday & Associates 11.0 Sample Preparation, Analyses and Security January, 2022 Page 11-14
Quema-Quemita Deposit Certified Reference Materials
Quema-Quemita Deposit CRM Gold
A total of 1,117 CRM instances for gold are analyzed and the results are presented in Table 11-5 in order of increasing grade. It is seen that the weighted average of the error is -2.4%, indicating that the overall error is in the conservative direction. The failure rates at the +/- 3 standard deviation level are greater than expected particularly for the CRMs with the greater number of samples. The CV value is higher than 10% for 4 of the CRMs indicating high variability in assay values. Although the accuracy and precision are less than desired, and the failure rate is significant, because the error overall indicates lower than expected assay values, the results are considered acceptable for resource estimation at this level.
Table 11-5 Quema-Quemita Deposit CRM Analysis Results Gold
CRM Samples Au EV (g/t)
Avg Au (g/t)
SD Au (g/t)
CV Error High Fail Au
Low Fail Au
% Fail
First Year
Last Year
OXC129 45 0.205 0.203 0.016 7.8% -0.9% 1 0 2.2% 2012 2018 CDN-ME-1414 9 0.284 0.285 0.009 3.3% 0.2% 0 0 0.0% 2018 2018 OXD108 45 0.414 0.420 0.015 3.7% 1.3% 1 0 2.2% 2012 2018 OXD87 206 0.417 0.409 0.088 21.5% -1.8% 45 17 30.1% 1993 2013 SF67 100 0.835 0.828 0.047 5.7% -0.9% 0 1 1.0% 1993 2017 SF57 269 0.848 0.799 0.061 7.7% -6.1% 0 23 8.6% 2012 2013 CDN-ME-1404 12 0.897 0.890 0.033 3.7% -0.8% 0 0 0.0% 2018 2018 OXH82 112 1.278 1.336 0.372 27.8% 4.3% 24 17 36.6% 2011 2012 OXI121 22 1.834 1.840 0.035 1.9% 0.3% 0 0 0.0% 2017 2017 OXJ80 47 2.331 2.279 0.261 11.5% -2.3% 10 13 48.9% 2011 2011 OXK94 147 3.562 3.476 0.405 12.0% -2.5% 0 5 3.4% 2012 2017 SP49 103 18.34 17.488 0.383 2.2% -4.9% 0 39 37.9% 2011 2012 Total 1,117 -2.4% 17.5%
The normalized process control chart for Au samples in the Quema-Quemita deposit is given in Figure 11-11 with outliers removed at the +/-20 level, shows the poor performance of the standards in 2011 and nearly half the sampling in 2012. The reasons for this, and the mitigation has already been discussed above as described by P&E, 2012.
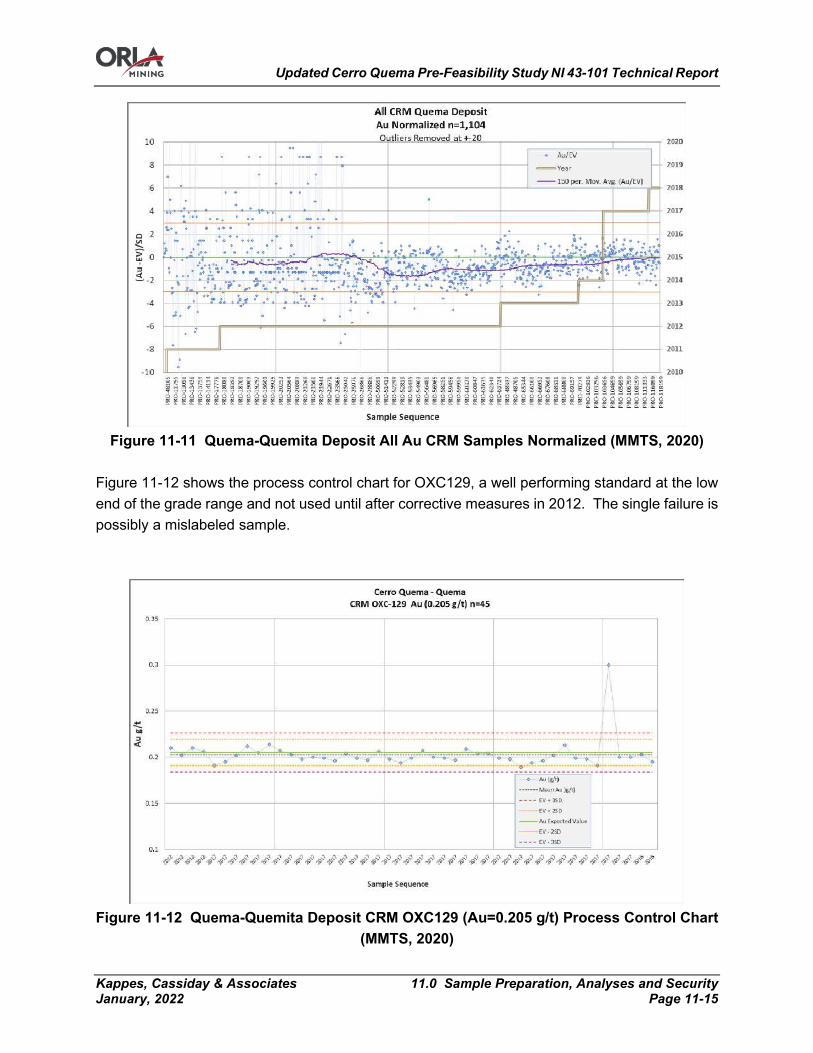
Updated Cerro Quema Pre-Feasibility Study NI 43-101 Technical Report
Kappes, Cassiday & Associates 11.0 Sample Preparation, Analyses and Security January, 2022 Page 11-15
Figure 11-11 Quema-Quemita Deposit All Au CRM Samples Normalized (MMTS, 2020)
Figure 11-12 shows the process control chart for OXC129, a well performing standard at the low end of the grade range and not used until after corrective measures in 2012. The single failure is possibly a mislabeled sample.
Figure 11-12 Quema-Quemita Deposit CRM OXC129 (Au=0.205 g/t) Process Control Chart
(MMTS, 2020)
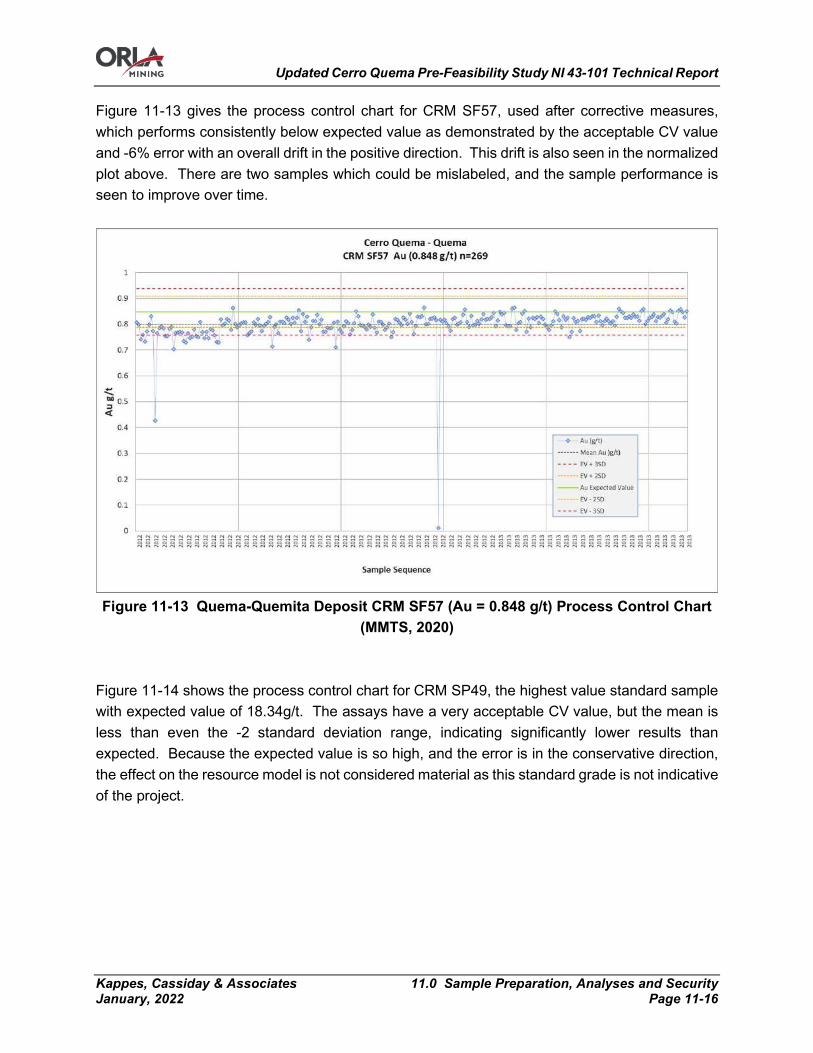
Updated Cerro Quema Pre-Feasibility Study NI 43-101 Technical Report
Kappes, Cassiday & Associates 11.0 Sample Preparation, Analyses and Security January, 2022 Page 11-16
Figure 11-13 gives the process control chart for CRM SF57, used after corrective measures, which performs consistently below expected value as demonstrated by the acceptable CV value and -6% error with an overall drift in the positive direction. This drift is also seen in the normalized plot above. There are two samples which could be mislabeled, and the sample performance is seen to improve over time.
Figure 11-13 Quema-Quemita Deposit CRM SF57 (Au = 0.848 g/t) Process Control Chart
(MMTS, 2020) Figure 11-14 shows the process control chart for CRM SP49, the highest value standard sample with expected value of 18.34g/t. The assays have a very acceptable CV value, but the mean is less than even the -2 standard deviation range, indicating significantly lower results than expected. Because the expected value is so high, and the error is in the conservative direction, the effect on the resource model is not considered material as this standard grade is not indicative of the project.

Updated Cerro Quema Pre-Feasibility Study NI 43-101 Technical Report
Kappes, Cassiday & Associates 11.0 Sample Preparation, Analyses and Security January, 2022 Page 11-17
Figure 11-14 Quema-Quemita Deposit CRM SP49 (Au=18.34 g/t) Process Control Chart
(MMTS, 2020)
Quema-Quemita Deposit CRM Copper
A total of 445 CRM insertions for Cu were analyzed and the results are presented in Table 11-6. It is seen that the error is primarily in the low direction and OREAS 162 is the lowest performing sample with the highest CV and a failure rate of almost 8 percent. MMTS finds the performance of the CRMs acceptable at this level of study.
Table 11-6 Quema-Quemita Deposit CRM Analysis Results Copper
CRM Samples
(445) Cu EV (pct)
Avg Cu
(pct)
SD Cu
(pct) CV
% Error
High Fail Cu
Low Fail Cu
% Fail First Year
Last year
CDN-ME-1404 12 0.484 0.494 0.013 2.6% 2.1% 1 0 8.3% 2018 2018 CDN-ME-1414 9 0.219 0.222 0.005 2.1% 1.2% 0 0 0.0% 2018 2018 OREAS161 283 0.409 0.407 0.024 5.8% -0.4% 2 4 2.1% 1993 2014 OREAS162 141 0.772 0.718 0.081 11.3% -7.0% 0 11 7.8% 1993 2017 Total 445 -2.4 4.0%
Figure 11-16 gives the process control chart for all 445 samples of copper CRMs in the Quema-Quemita deposit. The early part of 2012 does not appear to be affected by the problems described for gold CRMs although there is some overlap. The overall low error of the results is apparent and could be due to ICP-OES prepared by Aqua Regia used for the site assays as opposed to 4-acid digestion used for the Standard sample, as discussed above for La Pava.
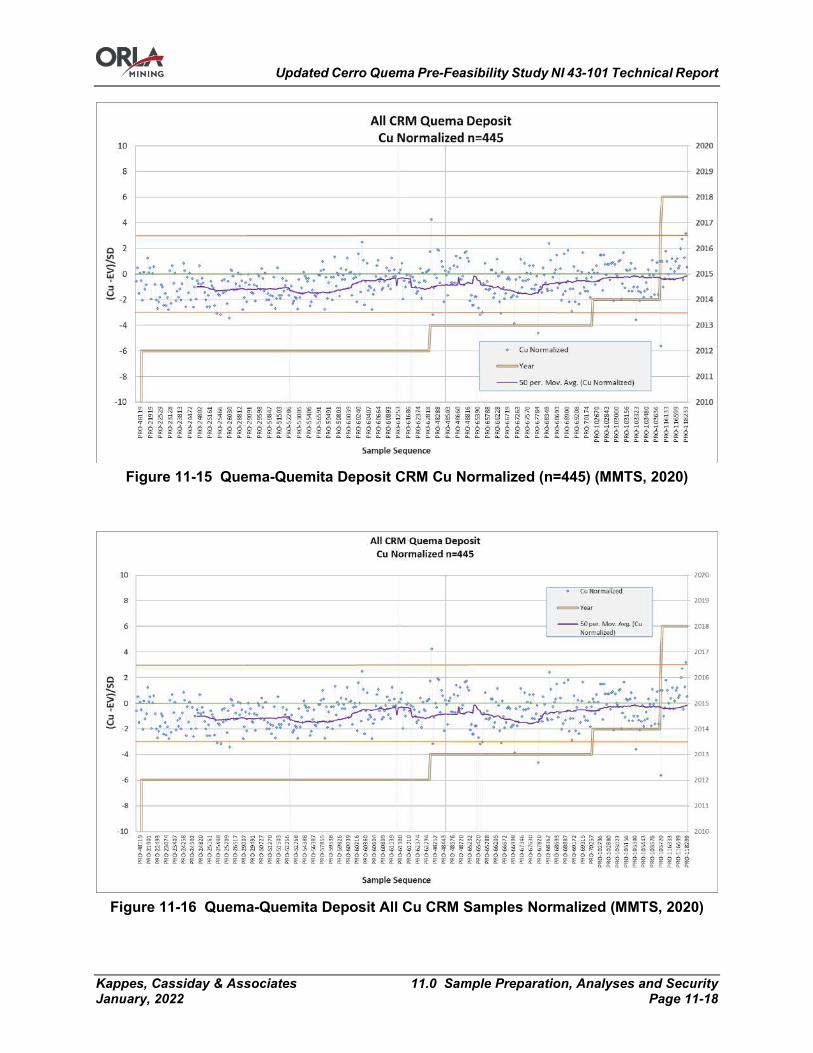
Updated Cerro Quema Pre-Feasibility Study NI 43-101 Technical Report
Kappes, Cassiday & Associates 11.0 Sample Preparation, Analyses and Security January, 2022 Page 11-18
Figure 11-15 Quema-Quemita Deposit CRM Cu Normalized (n=445) (MMTS, 2020)
Figure 11-16 Quema-Quemita Deposit All Cu CRM Samples Normalized (MMTS, 2020)

Updated Cerro Quema Pre-Feasibility Study NI 43-101 Technical Report
Kappes, Cassiday & Associates 11.0 Sample Preparation, Analyses and Security January, 2022 Page 11-19
Quema-Quemita Deposit Duplicates
Duplicates in the Quema-Quemita Deposit are from both RC and DDH drilling in years 1993 through 2013 as well as core duplicates from 2017-2018. All samples were submitted blind to the lab and recorded as received at the lab as either pulps or crushed rock for drilling through 2014, and rock core for later samples. The results of duplicate analyses of these sample pairs are given in terms of simple statistics in Table 11-7. It is seen that the averages and the standard deviations are very close for both sets of data, indicating there is little bias in the two sets.
Table 11-7 Quema-Quemita Deposit Duplicates Simple Statistics
Years Type Samples Element Average D1
g/t StdDev D1
g/t Average D2
g/t StdDev D2
g/t 1993-2014 Pulps and
Crushed Rock 956 Au 0.098 0.318 0.096 0.315
Cu 0.053 0.106 0.053 0.105 2017-2018 Core 156 Au 0.154 0.499 0.154 0.514
Cu 0.057 0.130 0.061 0.140
The scatter plot for the 956 pairs of Au duplicates from years 1993 through 2014 is given in Figure 11-18 and show good agreement with a slope nearly 1 and good correlation.
Figure 11-17 Quema-Quemita Deposit Cu Duplicates 1993-2014 Scatter Plot (MMTS,
2020)
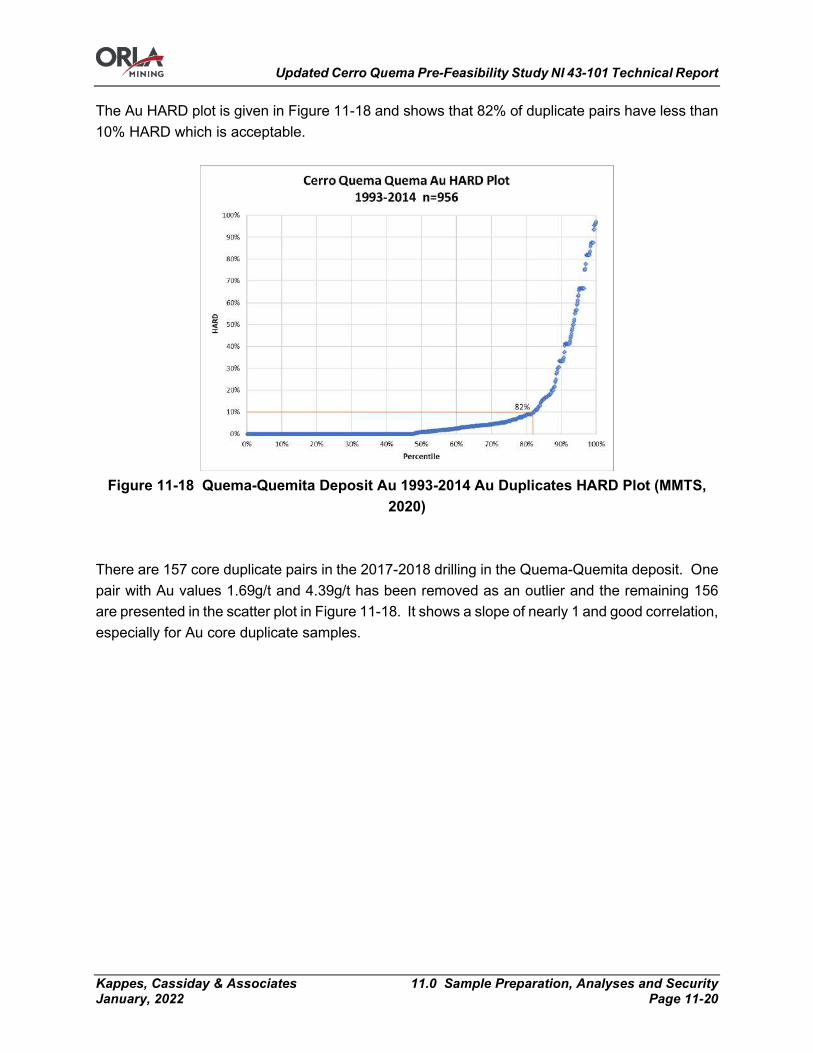
Updated Cerro Quema Pre-Feasibility Study NI 43-101 Technical Report
Kappes, Cassiday & Associates 11.0 Sample Preparation, Analyses and Security January, 2022 Page 11-20
The Au HARD plot is given in Figure 11-18 and shows that 82% of duplicate pairs have less than 10% HARD which is acceptable.
Figure 11-18 Quema-Quemita Deposit Au 1993-2014 Au Duplicates HARD Plot (MMTS,
2020) There are 157 core duplicate pairs in the 2017-2018 drilling in the Quema-Quemita deposit. One pair with Au values 1.69g/t and 4.39g/t has been removed as an outlier and the remaining 156 are presented in the scatter plot in Figure 11-18. It shows a slope of nearly 1 and good correlation, especially for Au core duplicate samples.

Updated Cerro Quema Pre-Feasibility Study NI 43-101 Technical Report
Kappes, Cassiday & Associates 11.0 Sample Preparation, Analyses and Security January, 2022 Page 11-21
Figure 11-19 Quema-Quemita Deposit Au Core Duplicates 2017-2018 Scatter Plot (MMTS,
2020) The HARD plot of Au duplicate pairs is given in Figure 11-20 and shows 69% having less than 10% HARD which is good for Au core duplicates.
Figure 11-20 Quema-Quemita Deposit Au 2017-2018 Duplicates HARD Plot (MMTS, 2020)
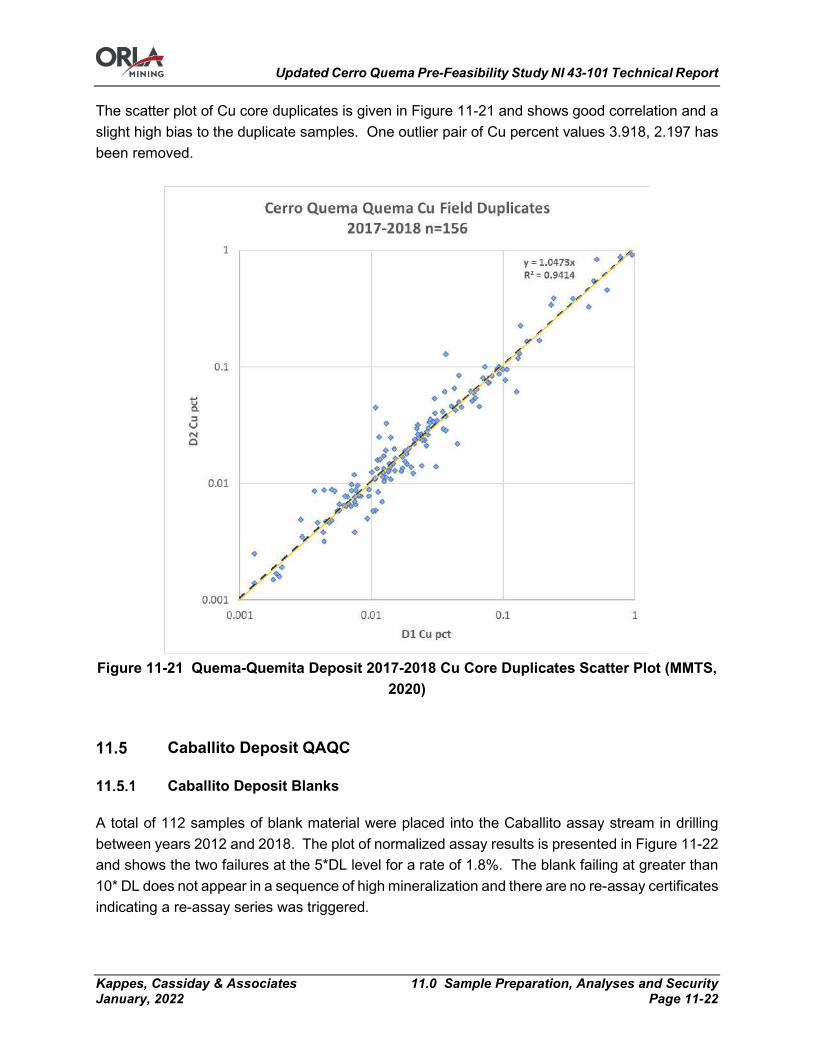
Updated Cerro Quema Pre-Feasibility Study NI 43-101 Technical Report
Kappes, Cassiday & Associates 11.0 Sample Preparation, Analyses and Security January, 2022 Page 11-22
The scatter plot of Cu core duplicates is given in Figure 11-21 and shows good correlation and a slight high bias to the duplicate samples. One outlier pair of Cu percent values 3.918, 2.197 has been removed.
Figure 11-21 Quema-Quemita Deposit 2017-2018 Cu Core Duplicates Scatter Plot (MMTS,
2020)
Caballito Deposit QAQC
Caballito Deposit Blanks
A total of 112 samples of blank material were placed into the Caballito assay stream in drilling between years 2012 and 2018. The plot of normalized assay results is presented in Figure 11-22 and shows the two failures at the 5*DL level for a rate of 1.8%. The blank failing at greater than 10* DL does not appear in a sequence of high mineralization and there are no re-assay certificates indicating a re-assay series was triggered.
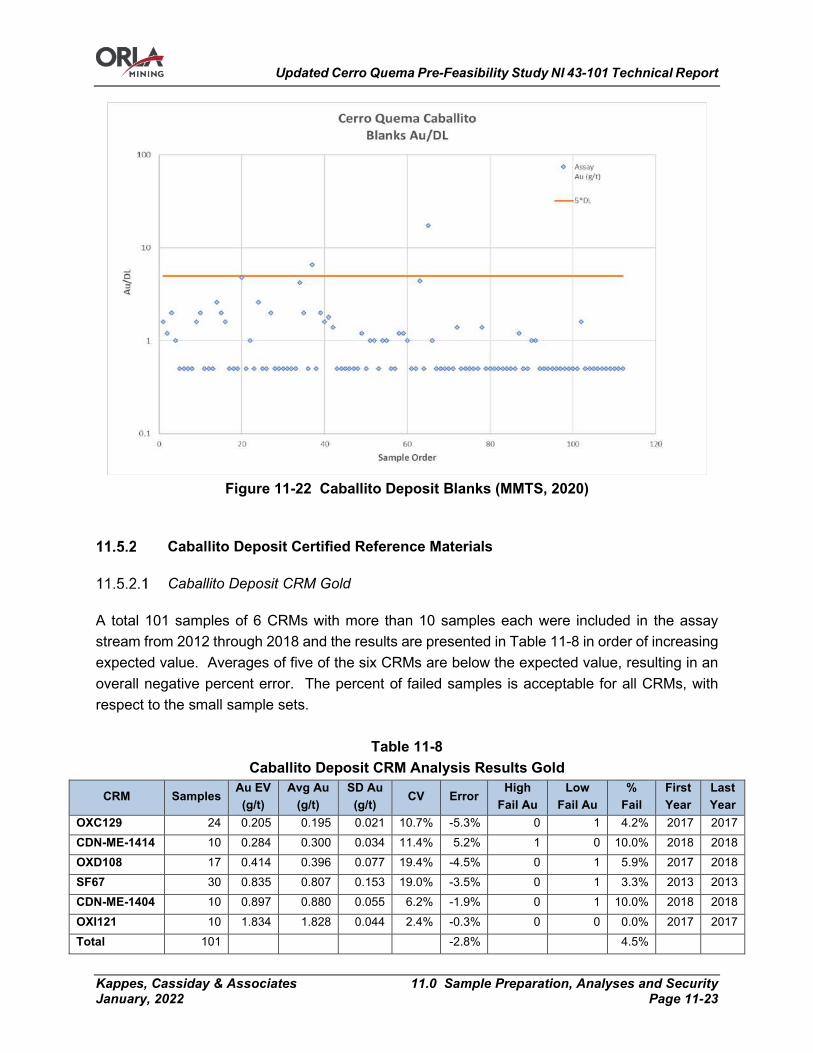
Updated Cerro Quema Pre-Feasibility Study NI 43-101 Technical Report
Kappes, Cassiday & Associates 11.0 Sample Preparation, Analyses and Security January, 2022 Page 11-23
Figure 11-22 Caballito Deposit Blanks (MMTS, 2020)
Caballito Deposit Certified Reference Materials
Caballito Deposit CRM Gold
A total 101 samples of 6 CRMs with more than 10 samples each were included in the assay stream from 2012 through 2018 and the results are presented in Table 11-8 in order of increasing expected value. Averages of five of the six CRMs are below the expected value, resulting in an overall negative percent error. The percent of failed samples is acceptable for all CRMs, with respect to the small sample sets.
Table 11-8 Caballito Deposit CRM Analysis Results Gold
CRM Samples Au EV (g/t)
Avg Au (g/t)
SD Au (g/t)
CV Error High
Fail Au Low
Fail Au %
Fail First Year
Last Year
OXC129 24 0.205 0.195 0.021 10.7% -5.3% 0 1 4.2% 2017 2017 CDN-ME-1414 10 0.284 0.300 0.034 11.4% 5.2% 1 0 10.0% 2018 2018 OXD108 17 0.414 0.396 0.077 19.4% -4.5% 0 1 5.9% 2017 2018 SF67 30 0.835 0.807 0.153 19.0% -3.5% 0 1 3.3% 2013 2013 CDN-ME-1404 10 0.897 0.880 0.055 6.2% -1.9% 0 1 10.0% 2018 2018 OXI121 10 1.834 1.828 0.044 2.4% -0.3% 0 0 0.0% 2017 2017 Total 101
-2.8%
4.5%

Updated Cerro Quema Pre-Feasibility Study NI 43-101 Technical Report
Kappes, Cassiday & Associates 11.0 Sample Preparation, Analyses and Security January, 2022 Page 11-24
The normalized process control chart for all Au CRM samples in Caballito with outliers removed at the +/- 20 level is given in Figure 11-23. It shows that for the most part the results approximate the expected value with the low error occurring mostly in the 2018 drilling. Drilling in 2012 in Caballito is not affected by the performance issues observed in La Pava and Quema-Quemita.
Figure 11-23 Caballito Deposit all Au Samples Normalized (MMTS, 2020)
Caballito Deposit CRM Copper
A total of 55 samples of 4 different CRMs for copper were included in the Caballito sample stream, the analysis of these samples is presented in Table 11-9. The results show acceptable failure rates and the CV values indicating reasonable performance for all 4 standards.
Table 11-9 Caballito Deposit CRM Analysis Results Copper
CRM Samples Cu EV Avg Cu
(pct)
SD Cu
(pct) CV
% Error
High Fail Cu
Low Fail Cu
% Fail Cu
First Year
Last year
CDN-ME-1404 10 0.484 0.488 0.013 2.7% 0.9% 0 0 0.0% 2018 2018 CDN-ME-1414 10 0.219 0.226 0.007 3.0% 3.1% 1 0 10.0% 2018 2018 OREAS161 24 0.409 0.400 0.010 2.5% -2.2% 0 0 0.0% 2012 2013 OREAS162 11 0.772 0.731 0.024 3.3% -5.3% 0 0 0.0% 2012 2013 Total 55
-1.3%
1.8%

Updated Cerro Quema Pre-Feasibility Study NI 43-101 Technical Report
Kappes, Cassiday & Associates 11.0 Sample Preparation, Analyses and Security January, 2022 Page 11-25
The process control chart for all copper standards samples in Caballito is given in Figure 11-24 and shows the acceptable perfomance of CRMs with the overall small negative error and increasing trend towards a slight positive error in 2018 drilling.
Figure 11-24 Caballito Deposit All Cu Samples Normalized (MMTS, 2020)
Caballito Deposit Duplicates
Duplicates in the Caballito Deposit are from both RC and DDH drilling in years 2012 and 2013 as well as core duplicates from 2017-2018. All samples were submitted blind to the lab and recorded as received at the lab as either pulps or crushed rock for drilling through 2014, and rock core for later samples. The results of duplicate analyses of these sample pairs are given in terms of simple statistics in Table 11-10. It is seen that the averages and the standard deviations are reasonably close for both sets of data, indicating there is little bias in the two sets.
Table 11-10 Caballito Duplicates Simple Statistics
Years Type Samples Element Average D1
g/t StdDev D1
g/t Average D2
g/t StdDev D2
g/t
2012-2013 Pulps and Crushed Rock
45 Au 0.122 0.168 0.123 0.171 Cu 0.225 0.685 0.255 0.867
2017-2018 Core 73 Au 0.135 0.242 0.138 0.235 Cu 0.162 0.365 0.164 0.367

Updated Cerro Quema Pre-Feasibility Study NI 43-101 Technical Report
Kappes, Cassiday & Associates 11.0 Sample Preparation, Analyses and Security January, 2022 Page 11-26
The scatter plot of 2012-2013 duplicates is given in Figure 11-25 with one outlier removed, and shows good correlation along a nearly 1:1 slope with some scatter at values below 0.01 g/t. The HARD plot is not presented, however, 87% of sample pairs give less than 10% which is acceptable.
Figure 11-25 Caballito Deposit Au Duplicates 2012-2013 Scatter Plot (MMTS, 2020)
The scatter plot of 2017-2018 field duplicates for gold in Caballito is presented in Figure 11-26 and shows good agreement. Copper is seen to also show good agreement on a scatter plot, not shown. Analysis of the HARD values for Au give 71% less than 10% which is acceptable for field duplicates.
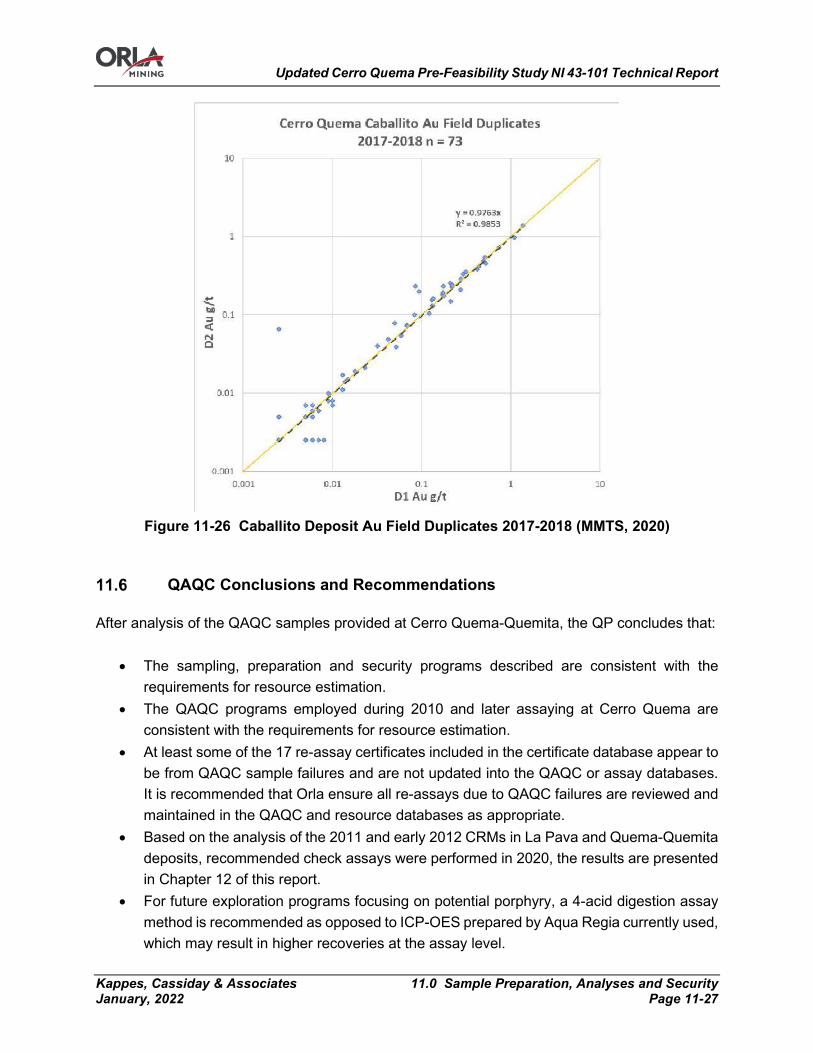
Updated Cerro Quema Pre-Feasibility Study NI 43-101 Technical Report
Kappes, Cassiday & Associates 11.0 Sample Preparation, Analyses and Security January, 2022 Page 11-27
Figure 11-26 Caballito Deposit Au Field Duplicates 2017-2018 (MMTS, 2020)
QAQC Conclusions and Recommendations
After analysis of the QAQC samples provided at Cerro Quema-Quemita, the QP concludes that:
• The sampling, preparation and security programs described are consistent with the requirements for resource estimation.
• The QAQC programs employed during 2010 and later assaying at Cerro Quema are consistent with the requirements for resource estimation.
• At least some of the 17 re-assay certificates included in the certificate database appear to be from QAQC sample failures and are not updated into the QAQC or assay databases. It is recommended that Orla ensure all re-assays due to QAQC failures are reviewed and maintained in the QAQC and resource databases as appropriate.
• Based on the analysis of the 2011 and early 2012 CRMs in La Pava and Quema-Quemita deposits, recommended check assays were performed in 2020, the results are presented in Chapter 12 of this report.
• For future exploration programs focusing on potential porphyry, a 4-acid digestion assay method is recommended as opposed to ICP-OES prepared by Aqua Regia currently used, which may result in higher recoveries at the assay level.
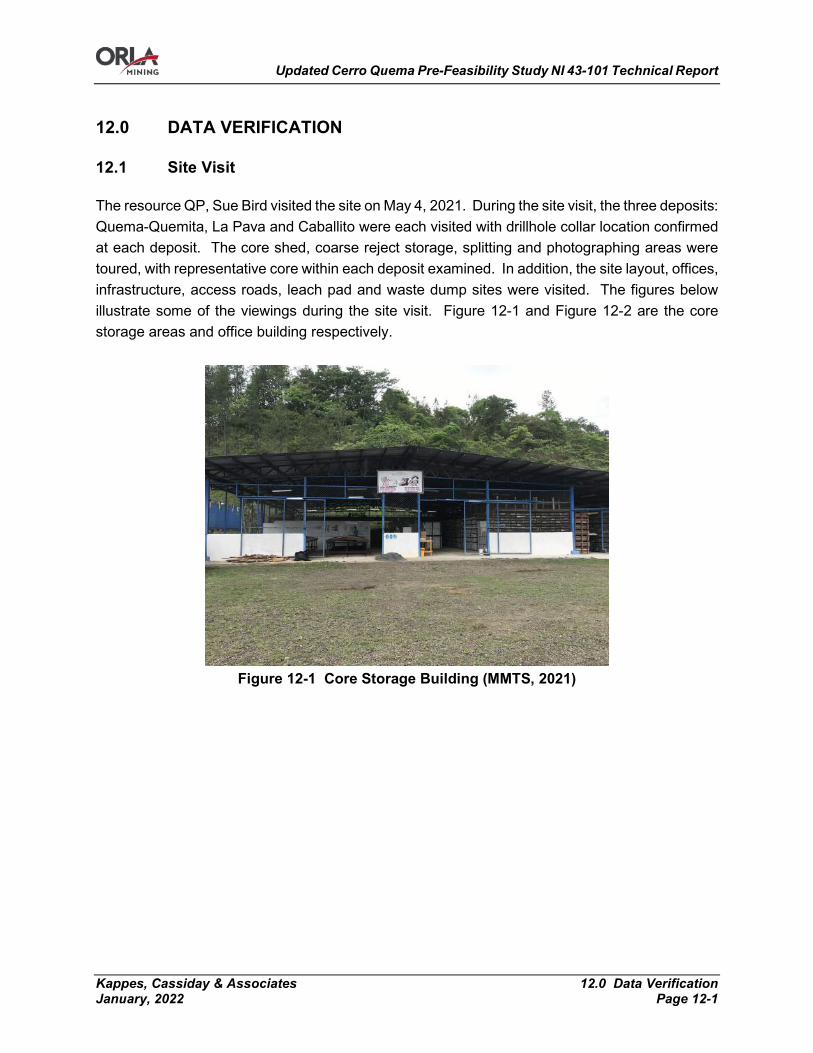
Updated Cerro Quema Pre-Feasibility Study NI 43-101 Technical Report
Kappes, Cassiday & Associates 12.0 Data Verification January, 2022 Page 12-1
12.0 DATA VERIFICATION
Site Visit
The resource QP, Sue Bird visited the site on May 4, 2021. During the site visit, the three deposits: Quema-Quemita, La Pava and Caballito were each visited with drillhole collar location confirmed at each deposit. The core shed, coarse reject storage, splitting and photographing areas were toured, with representative core within each deposit examined. In addition, the site layout, offices, infrastructure, access roads, leach pad and waste dump sites were visited. The figures below illustrate some of the viewings during the site visit. Figure 12-1 and Figure 12-2 are the core storage areas and office building respectively.
Figure 12-1 Core Storage Building (MMTS, 2021)
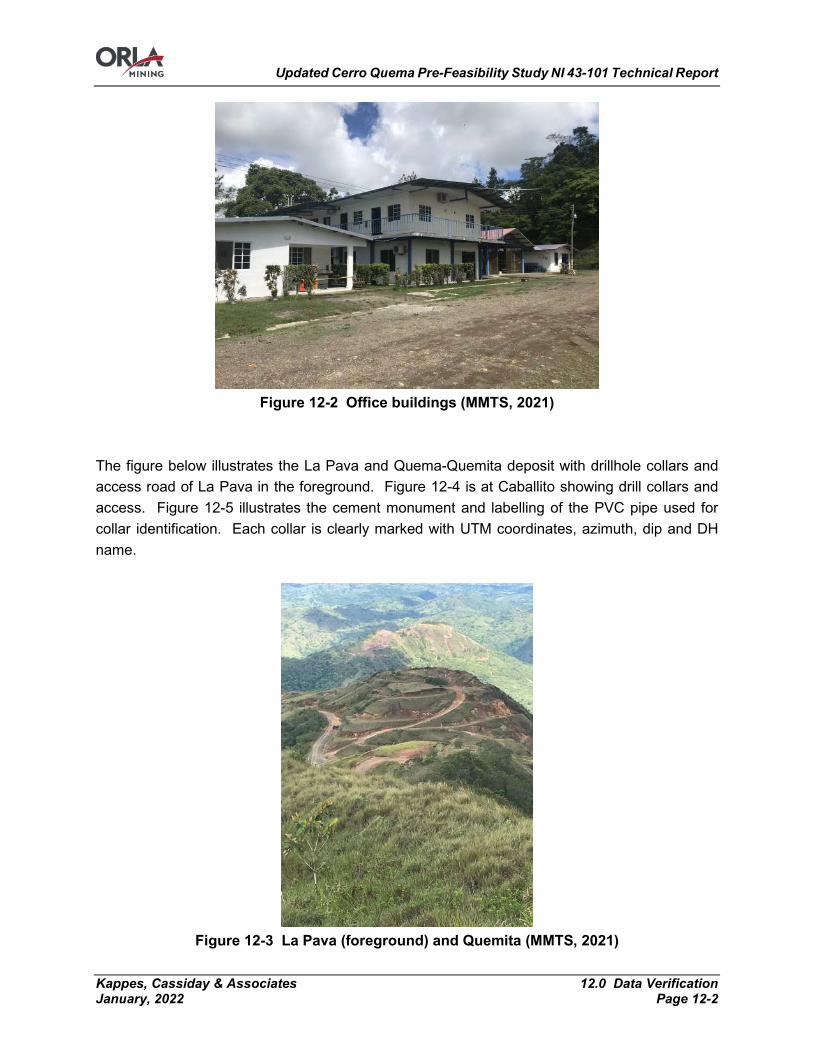
Updated Cerro Quema Pre-Feasibility Study NI 43-101 Technical Report
Kappes, Cassiday & Associates 12.0 Data Verification January, 2022 Page 12-2
Figure 12-2 Office buildings (MMTS, 2021)
The figure below illustrates the La Pava and Quema-Quemita deposit with drillhole collars and access road of La Pava in the foreground. Figure 12-4 is at Caballito showing drill collars and access. Figure 12-5 illustrates the cement monument and labelling of the PVC pipe used for collar identification. Each collar is clearly marked with UTM coordinates, azimuth, dip and DH name.
Figure 12-3 La Pava (foreground) and Quemita (MMTS, 2021)

Updated Cerro Quema Pre-Feasibility Study NI 43-101 Technical Report
Kappes, Cassiday & Associates 12.0 Data Verification January, 2022 Page 12-3
Figure 12-4 Caballito Drillhole Locations (MMTS, 2021)
Figure 12-5 Example of Drillhole Collar Location (MMTS, 2021)
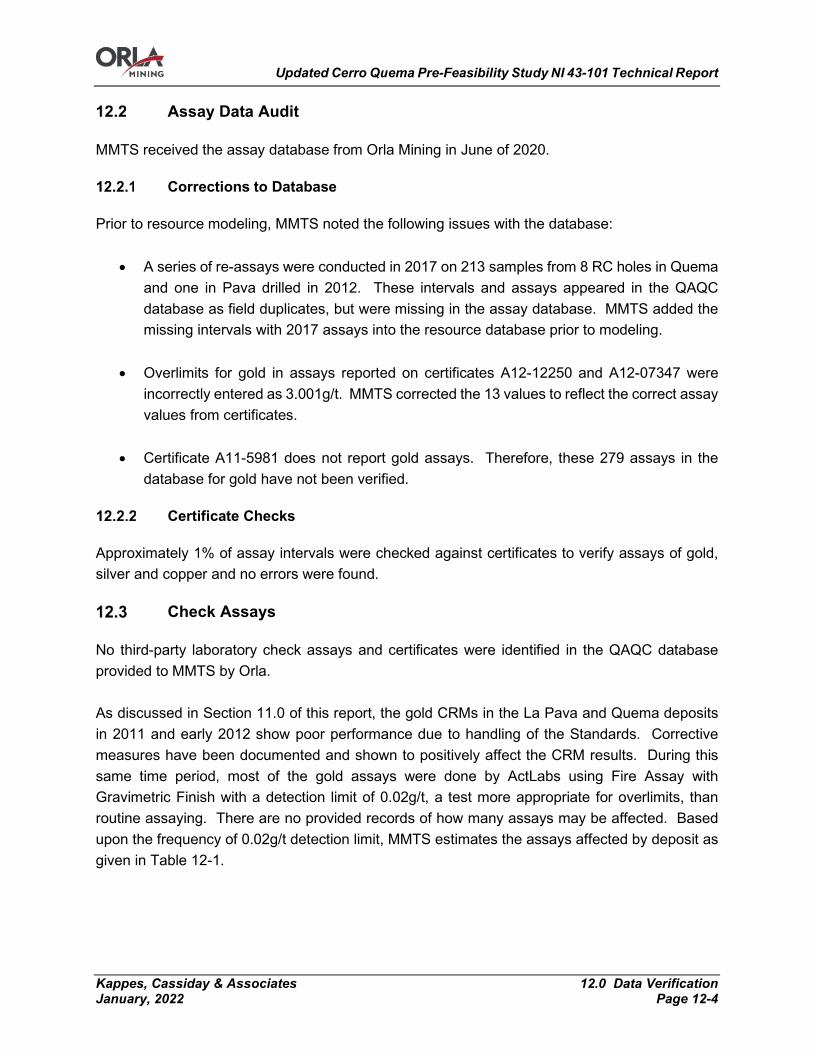
Updated Cerro Quema Pre-Feasibility Study NI 43-101 Technical Report
Kappes, Cassiday & Associates 12.0 Data Verification January, 2022 Page 12-4
Assay Data Audit
MMTS received the assay database from Orla Mining in June of 2020.
Corrections to Database
Prior to resource modeling, MMTS noted the following issues with the database:
• A series of re-assays were conducted in 2017 on 213 samples from 8 RC holes in Quema and one in Pava drilled in 2012. These intervals and assays appeared in the QAQC database as field duplicates, but were missing in the assay database. MMTS added the missing intervals with 2017 assays into the resource database prior to modeling.
• Overlimits for gold in assays reported on certificates A12-12250 and A12-07347 were
incorrectly entered as 3.001g/t. MMTS corrected the 13 values to reflect the correct assay values from certificates.
• Certificate A11-5981 does not report gold assays. Therefore, these 279 assays in the
database for gold have not been verified.
Certificate Checks
Approximately 1% of assay intervals were checked against certificates to verify assays of gold, silver and copper and no errors were found.
Check Assays
No third-party laboratory check assays and certificates were identified in the QAQC database provided to MMTS by Orla. As discussed in Section 11.0 of this report, the gold CRMs in the La Pava and Quema deposits in 2011 and early 2012 show poor performance due to handling of the Standards. Corrective measures have been documented and shown to positively affect the CRM results. During this same time period, most of the gold assays were done by ActLabs using Fire Assay with Gravimetric Finish with a detection limit of 0.02g/t, a test more appropriate for overlimits, than routine assaying. There are no provided records of how many assays may be affected. Based upon the frequency of 0.02g/t detection limit, MMTS estimates the assays affected by deposit as given in Table 12-1.
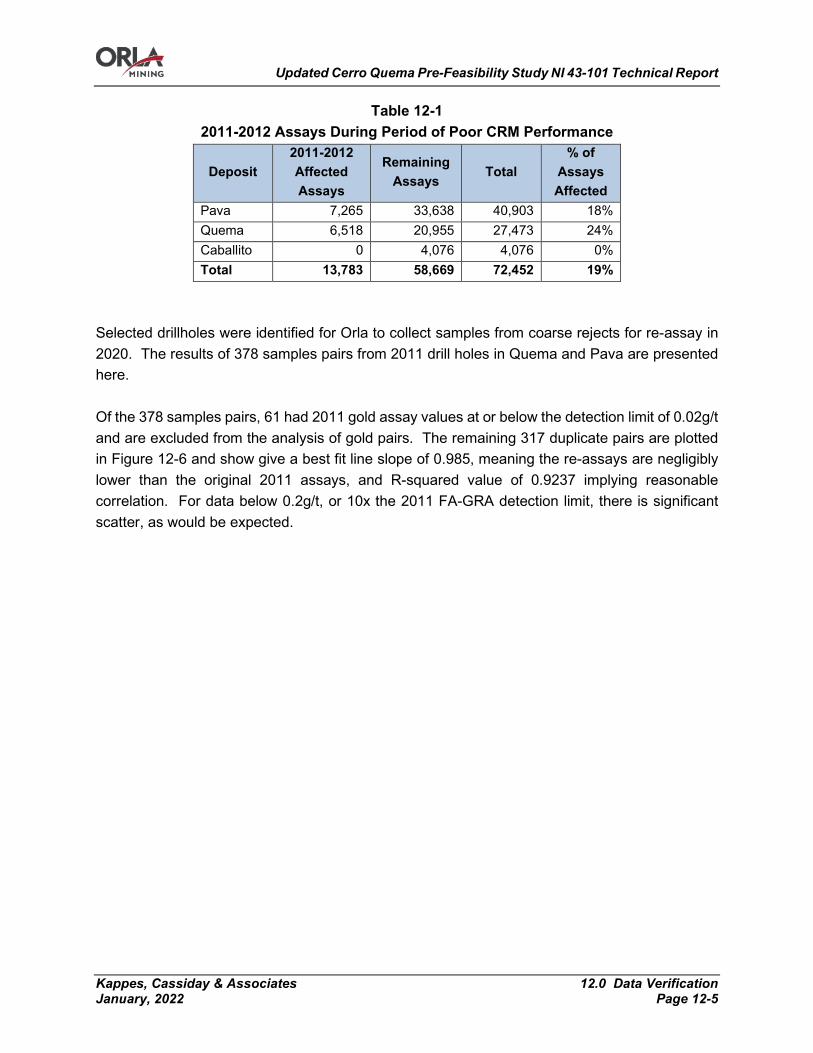
Updated Cerro Quema Pre-Feasibility Study NI 43-101 Technical Report
Kappes, Cassiday & Associates 12.0 Data Verification January, 2022 Page 12-5
Table 12-1 2011-2012 Assays During Period of Poor CRM Performance
Deposit 2011-2012 Affected Assays
Remaining Assays
Total % of
Assays Affected
Pava 7,265 33,638 40,903 18% Quema 6,518 20,955 27,473 24% Caballito 0 4,076 4,076 0% Total 13,783 58,669 72,452 19%
Selected drillholes were identified for Orla to collect samples from coarse rejects for re-assay in 2020. The results of 378 samples pairs from 2011 drill holes in Quema and Pava are presented here. Of the 378 samples pairs, 61 had 2011 gold assay values at or below the detection limit of 0.02g/t and are excluded from the analysis of gold pairs. The remaining 317 duplicate pairs are plotted in Figure 12-6 and show give a best fit line slope of 0.985, meaning the re-assays are negligibly lower than the original 2011 assays, and R-squared value of 0.9237 implying reasonable correlation. For data below 0.2g/t, or 10x the 2011 FA-GRA detection limit, there is significant scatter, as would be expected.
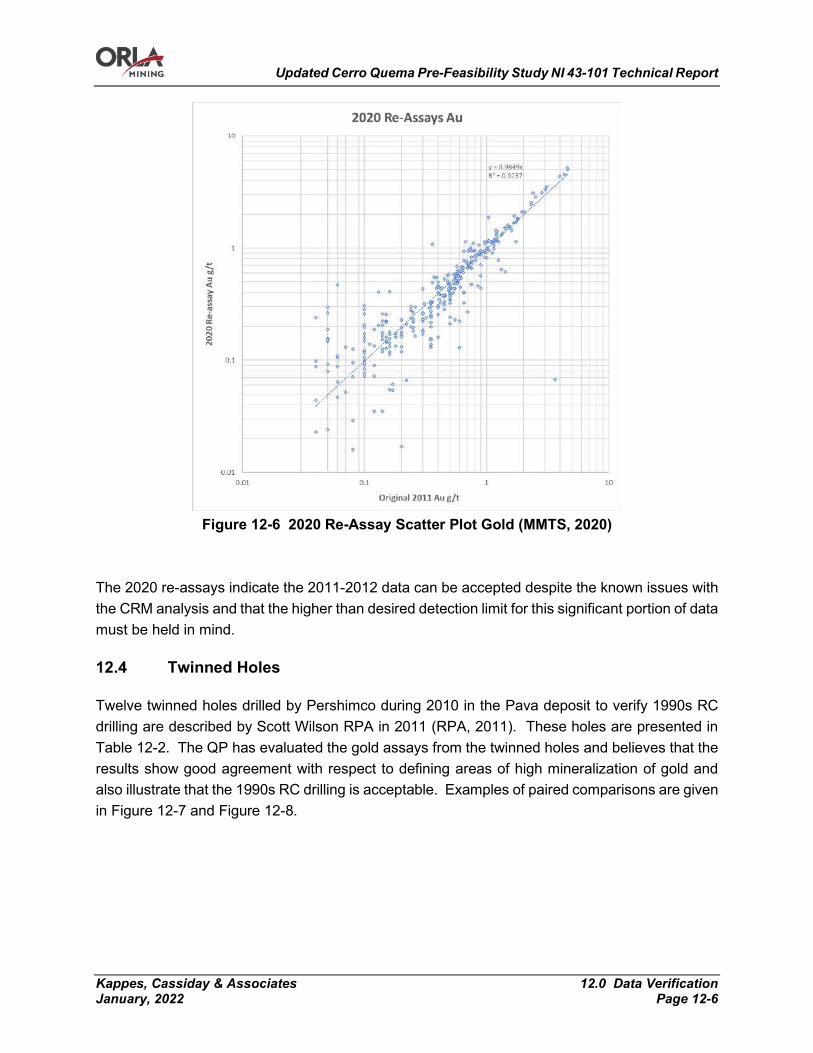
Updated Cerro Quema Pre-Feasibility Study NI 43-101 Technical Report
Kappes, Cassiday & Associates 12.0 Data Verification January, 2022 Page 12-6
Figure 12-6 2020 Re-Assay Scatter Plot Gold (MMTS, 2020)
The 2020 re-assays indicate the 2011-2012 data can be accepted despite the known issues with the CRM analysis and that the higher than desired detection limit for this significant portion of data must be held in mind.
Twinned Holes
Twelve twinned holes drilled by Pershimco during 2010 in the Pava deposit to verify 1990s RC drilling are described by Scott Wilson RPA in 2011 (RPA, 2011). These holes are presented in Table 12-2. The QP has evaluated the gold assays from the twinned holes and believes that the results show good agreement with respect to defining areas of high mineralization of gold and also illustrate that the 1990s RC drilling is acceptable. Examples of paired comparisons are given in Figure 12-7 and Figure 12-8.

Updated Cerro Quema Pre-Feasibility Study NI 43-101 Technical Report
Kappes, Cassiday & Associates 12.0 Data Verification January, 2022 Page 12-7
Table 12-2 2010 Verification Twinned Holes
1990s Hole 2010 Hole Separation (m) PRH92081 PRH10001 4.8 PRH94132 & PRH10002 4.5 PRH91012 & PRH92084 PRH10003 8.8 PdH92010 & PRH91013 PRH10004 7.0 PRH92085 & PRH91026 PRH10005 11.8 PDH93011 & PRH10006 3.6 PRH91025 & PRH10007 3.9 PRH94127 & PRH94127A PRH10008 5.4 PRH94140 & PRH91001 PRH10009 9.2 PRH92087 & PRH10011B 5.4 PRH91034 & PRH10012 5.0 PRH92067 & PRH10013 6.6
Figure 12-7 Twinned Holes PRH92085, PRH91026 and PRD10005 Twinned Hole Au Assay
Comparison (MMTS, 2020)
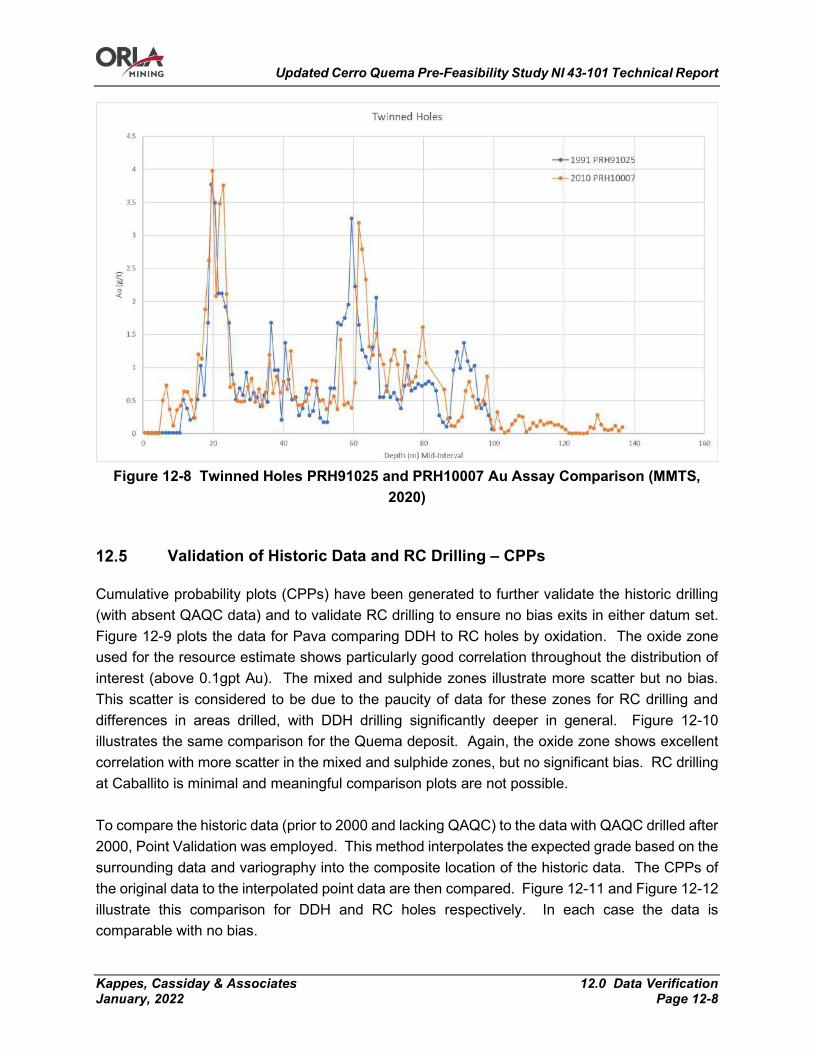
Updated Cerro Quema Pre-Feasibility Study NI 43-101 Technical Report
Kappes, Cassiday & Associates 12.0 Data Verification January, 2022 Page 12-8
Figure 12-8 Twinned Holes PRH91025 and PRH10007 Au Assay Comparison (MMTS,
2020)
Validation of Historic Data and RC Drilling – CPPs
Cumulative probability plots (CPPs) have been generated to further validate the historic drilling (with absent QAQC data) and to validate RC drilling to ensure no bias exits in either datum set. Figure 12-9 plots the data for Pava comparing DDH to RC holes by oxidation. The oxide zone used for the resource estimate shows particularly good correlation throughout the distribution of interest (above 0.1gpt Au). The mixed and sulphide zones illustrate more scatter but no bias. This scatter is considered to be due to the paucity of data for these zones for RC drilling and differences in areas drilled, with DDH drilling significantly deeper in general. Figure 12-10 illustrates the same comparison for the Quema deposit. Again, the oxide zone shows excellent correlation with more scatter in the mixed and sulphide zones, but no significant bias. RC drilling at Caballito is minimal and meaningful comparison plots are not possible. To compare the historic data (prior to 2000 and lacking QAQC) to the data with QAQC drilled after 2000, Point Validation was employed. This method interpolates the expected grade based on the surrounding data and variography into the composite location of the historic data. The CPPs of the original data to the interpolated point data are then compared. Figure 12-11 and Figure 12-12 illustrate this comparison for DDH and RC holes respectively. In each case the data is comparable with no bias.
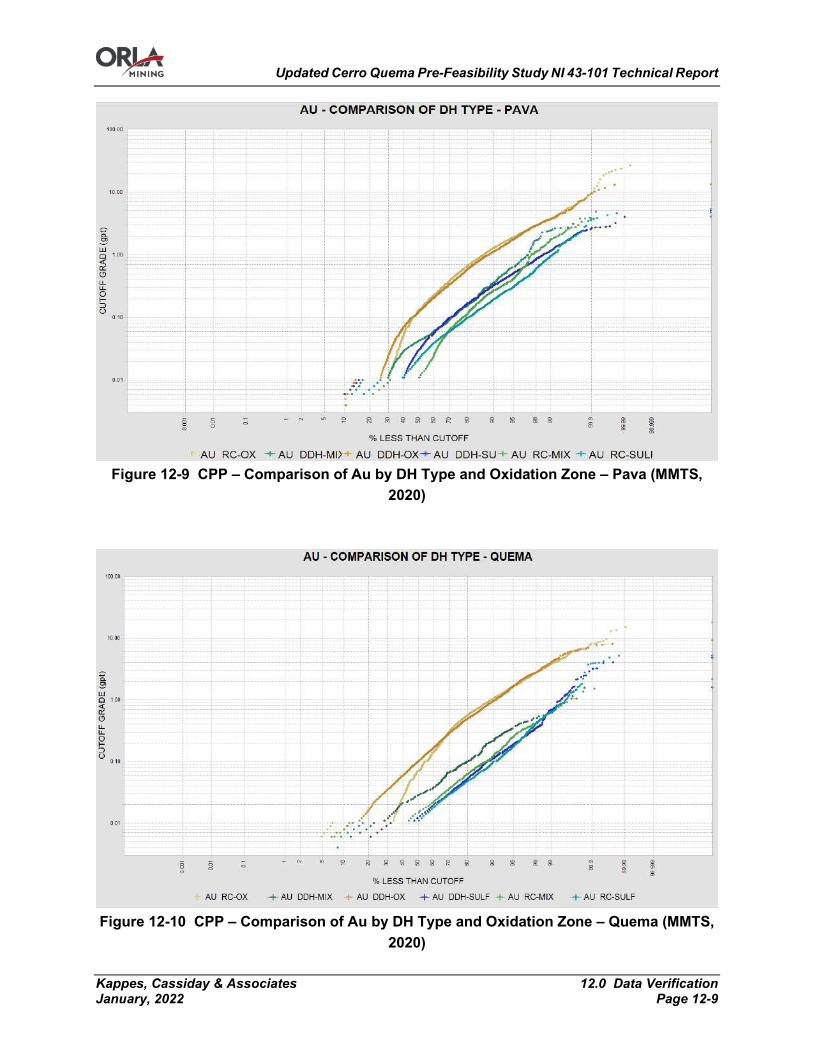
Updated Cerro Quema Pre-Feasibility Study NI 43-101 Technical Report
Kappes, Cassiday & Associates 12.0 Data Verification January, 2022 Page 12-9
Figure 12-9 CPP – Comparison of Au by DH Type and Oxidation Zone – Pava (MMTS,
2020)
Figure 12-10 CPP – Comparison of Au by DH Type and Oxidation Zone – Quema (MMTS,
2020)
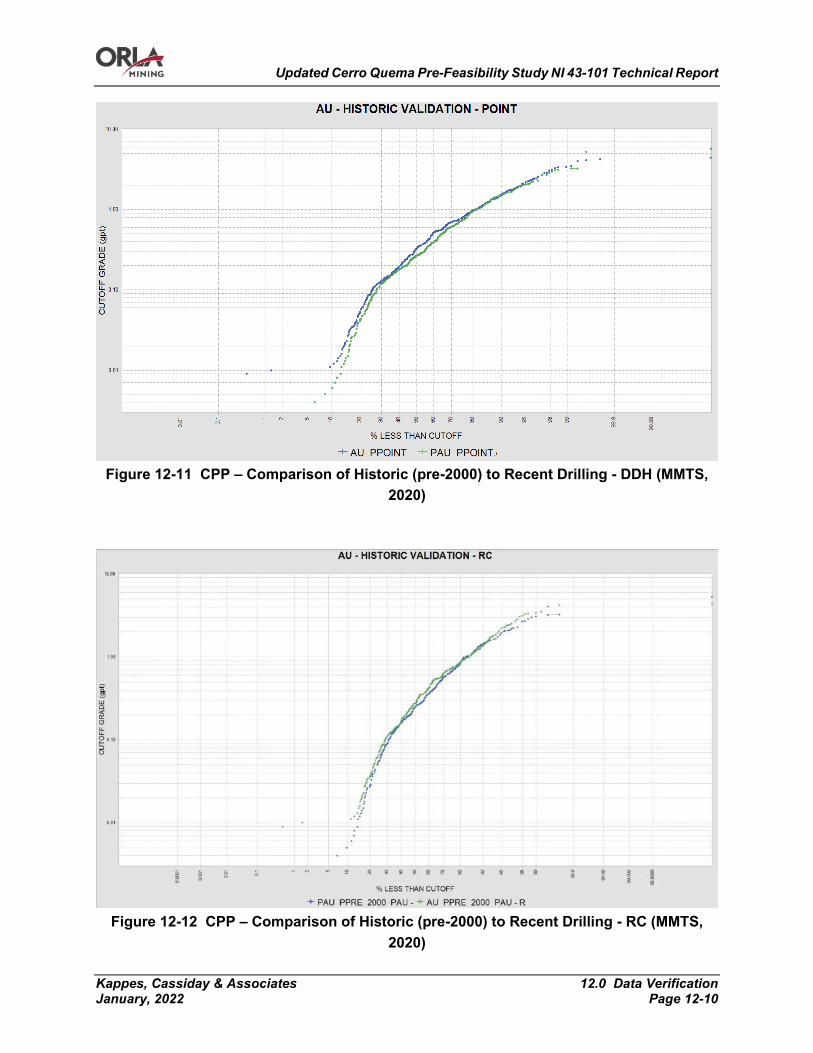
Updated Cerro Quema Pre-Feasibility Study NI 43-101 Technical Report
Kappes, Cassiday & Associates 12.0 Data Verification January, 2022 Page 12-10
Figure 12-11 CPP – Comparison of Historic (pre-2000) to Recent Drilling - DDH (MMTS,
2020)
Figure 12-12 CPP – Comparison of Historic (pre-2000) to Recent Drilling - RC (MMTS,
2020)

Updated Cerro Quema Pre-Feasibility Study NI 43-101 Technical Report
Kappes, Cassiday & Associates 12.0 Data Verification January, 2022 Page 12-11
MMTS Conclusions
The QP has verified the resource database and concludes that:
• The few errors and omissions found in the assay database are not outside the norm and were corrected prior to resource modelling;
• The assays of the 2011 and 2012 drilling are admissible for resource modeling despite the issues identified and corrected after analysis of the 2011 and 2012 CRMs;
• RC drilling does not show any appreciable bias when compared to DDH drilling; • The historic 1990s assay data is not appreciably different from the 2010 and later drilling
and is admissible for resource modelling
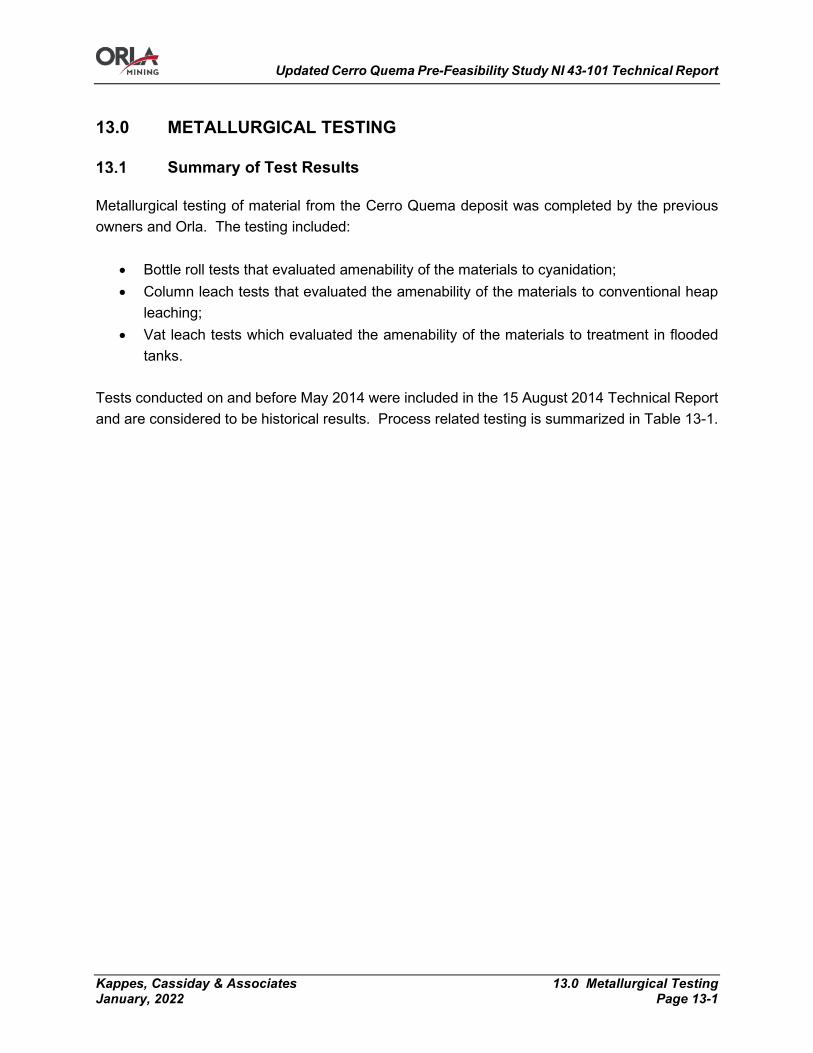
Updated Cerro Quema Pre-Feasibility Study NI 43-101 Technical Report
Kappes, Cassiday & Associates 13.0 Metallurgical Testing January, 2022 Page 13-1
13.0 METALLURGICAL TESTING
Summary of Test Results
Metallurgical testing of material from the Cerro Quema deposit was completed by the previous owners and Orla. The testing included:
• Bottle roll tests that evaluated amenability of the materials to cyanidation; • Column leach tests that evaluated the amenability of the materials to conventional heap
leaching; • Vat leach tests which evaluated the amenability of the materials to treatment in flooded
tanks. Tests conducted on and before May 2014 were included in the 15 August 2014 Technical Report and are considered to be historical results. Process related testing is summarized in Table 13-1.
Updated Cerro Quema Pre-Feasibility Study NI 43-101 Technical Report
Kappes, Cassiday & Associates 13.0 Metallurgical Testing January, 2022 Page 13-2
Table 13-1 Summary of Process Test Work
Date Owner Sample Source Test Work Type Summary of Results
14-Apr-92 Cyprus Minera de
Panama, S.A. Unknown
One column and one bottle roll for gold recovery
High recovery (>95% Au recovery) from both tests
20-Oct-93 Cyprus Minera de Panama, S.A.
Unknown two column tests for copper recovery
Copper recovery of 68 and 79%
14-Feb-95 Cyprus Minera de
Panama, S.A.
Trench Samples from La Pava and Quema-Quemita
Bottle Roll, Column and Vat Leach
Bottle roll gold recovery 79.5 to 95.7%, column gold recoveries 76.7 to 96.6%, vat leach gold recoveries 77.9 to 95.5%
25-Sep-95 Cyprus Minera de
Panama, S.A.
Trench Samples from La Pava (LP-LTR) and core samples from La Pava and Quema-Quemita
Bottle Roll, Staged Column Leach and Vat Leach
Bottle roll gold recoveries between 80 and 95%, vat leach recoveries between 83 and 96%
14-Feb-96 Minera Cerro Quema La Pava and Quema-Quemita Trench and Core Samples
Permeability tests with compressive loads to simulate heap stacking
Cement agglomeration will be required
2008 Bellhaven Unknown Pilot Vat Leach
70 t sample crushed to 80% passing 2.35 mm, batch leached for 48 hours, 93.2% gold recovery
16-Apr-09 Bellhaven Unknown Bottle Roll, and Vat Leach
Bottle roll gold recoveries between 80.0 and 95%, column leach gold recoveries between 83% and 94%
16-Oct-13 Pershimco La Pava and Quema-Quemita core
Bottle Roll, Column and Vat Leach
Bottle roll gold recoveries between 80.0 and 97.2%, column leach gold recoveries between 93.8 and 97.2%, vat leach recoveries between 72.5 and 98.3%
08-May-14 Pershimco La Pava Alteration Samples (Silica and Silica-Clay)
Permeability, Physical Testing
No report, email correspondence only, permeability
1-May-15 Pershimco La Pava Bulk Samples (Silica / Clay Blend, 50/50 to 90/10 blend)
Permeability
No cement additions, all blends failed permeability @ 80-180 meter simulated heap height
1-Jan-16 Pershimco
La Pava / Quemita (Silica / Silica Clay blended composite, mixed with La Pava / Quemita clay, 50/50 to 90/10 blends)
Permeability, Column Leach
No cement additions, all blends passed permeability except 50/50 Quemita blend Column leach gold recoveries between 92% and 96%
1-Aug-18 Orla La Pava / Quemita Core simples (8 composites)
Permeability, Bottle Roll and Column Leach
Bottle roll gold recoveries between 77 and 96%, column leach gold recoveries between 88% and 97 %
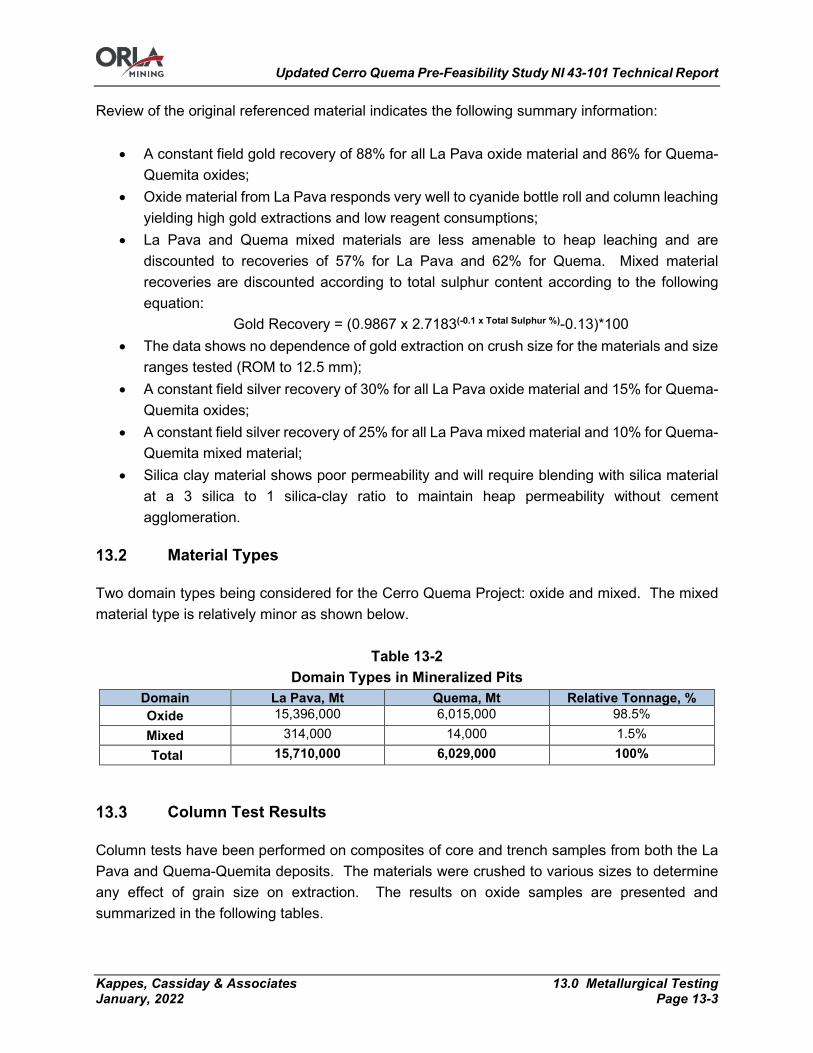
Updated Cerro Quema Pre-Feasibility Study NI 43-101 Technical Report
Kappes, Cassiday & Associates 13.0 Metallurgical Testing January, 2022 Page 13-3
Review of the original referenced material indicates the following summary information:
• A constant field gold recovery of 88% for all La Pava oxide material and 86% for Quema-Quemita oxides;
• Oxide material from La Pava responds very well to cyanide bottle roll and column leaching yielding high gold extractions and low reagent consumptions;
• La Pava and Quema mixed materials are less amenable to heap leaching and are discounted to recoveries of 57% for La Pava and 62% for Quema. Mixed material recoveries are discounted according to total sulphur content according to the following equation:
Gold Recovery = (0.9867 x 2.7183(-0.1 x Total Sulphur %)-0.13)*100 • The data shows no dependence of gold extraction on crush size for the materials and size
ranges tested (ROM to 12.5 mm); • A constant field silver recovery of 30% for all La Pava oxide material and 15% for Quema-
Quemita oxides; • A constant field silver recovery of 25% for all La Pava mixed material and 10% for Quema-
Quemita mixed material; • Silica clay material shows poor permeability and will require blending with silica material
at a 3 silica to 1 silica-clay ratio to maintain heap permeability without cement agglomeration.
Material Types
Two domain types being considered for the Cerro Quema Project: oxide and mixed. The mixed material type is relatively minor as shown below.
Table 13-2 Domain Types in Mineralized Pits
Domain La Pava, Mt Quema, Mt Relative Tonnage, % Oxide 15,396,000 6,015,000 98.5% Mixed 314,000 14,000 1.5% Total 15,710,000 6,029,000 100%
Column Test Results
Column tests have been performed on composites of core and trench samples from both the La Pava and Quema-Quemita deposits. The materials were crushed to various sizes to determine any effect of grain size on extraction. The results on oxide samples are presented and summarized in the following tables.

Updated Cerro Quema Pre-Feasibility Study NI 43-101 Technical Report
Kappes, Cassiday & Associates 13.0 Metallurgical Testing January, 2022 Page 13-4
Table 13-3 Cerro Quema Individual Column Test Results - Gold
Grade, Au g/t Extracted, Au %
Consumption, kg/t Test No. Description Material Crush Size Head Tails NaCN Lime3 Cement Report4
LP-LTR1 La Pava ROM 0.99 0.1 89.7 0.04 1.3 0 Feb-95 LP-LTR1 La Pava -12.5 mm 0.99 0.14 86.2 0.11 1.3 0 Feb-95 LP-LTR1 La Pava -25 mm 1.03 0.07 93.3 0.10 1.3 0 Feb-95 LP-LTR1 La Pava -25 mm 1.03 0.07 93.3 0.17 1.3 0 Feb-95 LP-LTR1 La Pava -12.5 mm 1.03 0.1 90.0 0.05 0.0 5 Feb-95 LP-LTR1 La Pava -75 mm 1.06 0.1 90.3 0.05 1.3 0 Feb-95 LPE-TR1 La Pava -75 mm 1.51 0.14 90.9 0.06 0.8 0 Feb-95 LPE-TR1 La Pava -12.5 mm 1.58 0.07 95.7 0.08 0.8 0 Feb-95 LPE-TR1 La Pava -25 mm 1.61 0.07 95.7 0.08 0.8 0 Feb-95 LPE-TR1 La Pava -25 mm 1.61 0.1 93.6 0.16 0.8 0 Feb-95 LPW-HGT1 La Pava -12.5 mm 2.61 0.14 95.0 0.03 0.8 0 Feb-95 LPW-HGT1 La Pava -75 mm 2.85 0.1 96.5 0.12 0.8 0 Feb-95 LPW-HGT1 La Pava -25 mm 2.92 0.14 95.5 0.06 0.8 0 Feb-95 QMP-TR1 Quema -75 mm 0.99 0.07 93.1 0.13 3.3 0 Feb-95 QMP-TR1 Quema -25 mm 0.99 0.07 93.1 0.13 3.3 0 Feb-95 QMP-TR1 Quema -12.5 mm 0.99 0.03 96.6 0.08 3.3 0 Feb-95 QMP-HGT1 Quema -25 mm 3.46 0.48 86.1 0.18 3.3 0 Feb-95 QMP-HGT1 Quema -12.5 mm 3.53 0.82 76.7 0.10 3.3 0 Feb-95
Test #7 LP-LTR1 La Pava -12.5 mm 0.99 0.1 89.7 0.48 0.0 5 Sep-95 Test #8 LP-LTR1 La Pava -12.5 mm 1.17 0.14 88.2 0.50 0.0 5 Sep-95 Test #1 LP1-C2 La Pava -25 mm 1.27 0.07 94.6 0.46 1.3 0 Sep-95 Test #6 LP1-C2 La Pava -12.5 mm 1.27 0.03 97.3 0.51 1.3 0 Sep-95 Test #3 LP1-C2 La Pava -12.5 mm 1.34 0.03 97.4 0.73 1.3 0 Sep-95 Test #9 LP1-C2 La Pava -12.5 mm 1.37 0.03 97.5 0.69 1.3 0 Sep-95 Test #5 LP1-C2 La Pava -25 mm 1.37 0.07 95.0 0.94 1.3 0 Sep-95 Test #10 LP2-C2 La Pava -25 mm 4.60 0.07 98.5 2.26 1.3 0 Sep-95 Test #11 LP2-C2 La Pava -12.5 mm 4.77 0.07 98.6 1.82 1.3 0 Sep-95 Test #2 Q1-C2 Quema -25 mm 1.03 0.07 93.3 0.40 1.3 0 Sep-95 Test #4 Q1-C2 Quema -12.5 mm 1.03 0.07 93.3 0.44 1.3 0 Sep-95 Test #12 Q2-C2 Quema -12.5 mm 2.54 0.1 95.9 1.70 1.3 5 Sep-95
P-5 PO-112 La Pava -25 mm 0.67 0.02 97.0 0.67 1.8 4 Sep-13 P-2 PO-152 La Pava -25 mm 0.71 0.02 97.2 1.01 2.9 0 Sep-13 P-1 PO-082 La Pava -25 mm 0.81 0.05 93.8 1.28 0.9 0 Sep-13 P-3 PO-162 La Pava -25 mm 0.90 0.03 96.7 1.16 4.1 0 Sep-13
73810 A 740061 La Pava -62.5 mm 0.37 0.03 92.1 0.97 3.5 0 Jan-16 74004 A 740091 La Pava -62.5 mm 0.44 0.02 95.8 0.78 3.5 0 Jan-16 74005 A 740121 Quema -62.5 mm 0.94 0.04 95.5 0.86 3.6 0 Jan-16 81714 A 817162 Quema -150 mm 0.66 0.06 91.0 0.30 2.0 0 Aug-18 81714 B 817192 Quema -50 mm 0.44 0.05 88.0 0.46 2.0 0 Aug-18 81714 C 817222 Quema -12.5 mm 0.63 0.05 93.0 0.85 2.0 0 Aug-18 81715 A 817252 La Pava -150 mm 1.09 0.04 96.0 0.25 2.5 0 Aug-18 81715 B 817282 La Pava -50 mm 1.09 0.05 95.0 0.38 2.5 0 Aug-18 81715 C 817312 La Pava -12.5 mm 1.08 0.04 97.0 0.74 2.5 0 Aug-18 1. Composites of surface material collected from excavator trenches; 2. Composites of drill core; 3. Hydrated lime was used (Ca(OH)2) in the 2013, 2016, and 2018 test campaigns, the other samples were treated with pebble
lime (CaO); 4. Reports dated prior to 2014 are considered historical and were included in the 15 August 2014 Technical Report.
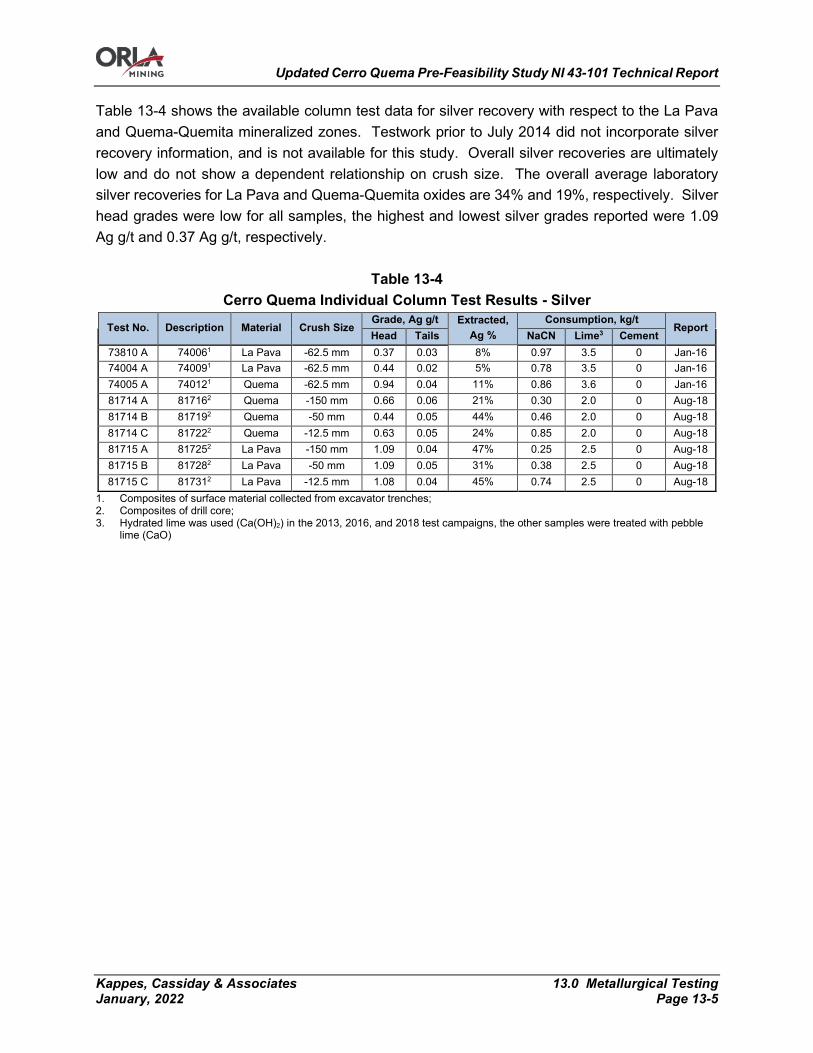
Updated Cerro Quema Pre-Feasibility Study NI 43-101 Technical Report
Kappes, Cassiday & Associates 13.0 Metallurgical Testing January, 2022 Page 13-5
Table 13-4 shows the available column test data for silver recovery with respect to the La Pava and Quema-Quemita mineralized zones. Testwork prior to July 2014 did not incorporate silver recovery information, and is not available for this study. Overall silver recoveries are ultimately low and do not show a dependent relationship on crush size. The overall average laboratory silver recoveries for La Pava and Quema-Quemita oxides are 34% and 19%, respectively. Silver head grades were low for all samples, the highest and lowest silver grades reported were 1.09 Ag g/t and 0.37 Ag g/t, respectively.
Table 13-4 Cerro Quema Individual Column Test Results - Silver
Test No. Description Material Crush Size Grade, Ag g/t Extracted,
Ag % Consumption, kg/t
Report Head Tails NaCN Lime3 Cement
73810 A 740061 La Pava -62.5 mm 0.37 0.03 8% 0.97 3.5 0 Jan-16 74004 A 740091 La Pava -62.5 mm 0.44 0.02 5% 0.78 3.5 0 Jan-16 74005 A 740121 Quema -62.5 mm 0.94 0.04 11% 0.86 3.6 0 Jan-16 81714 A 817162 Quema -150 mm 0.66 0.06 21% 0.30 2.0 0 Aug-18 81714 B 817192 Quema -50 mm 0.44 0.05 44% 0.46 2.0 0 Aug-18 81714 C 817222 Quema -12.5 mm 0.63 0.05 24% 0.85 2.0 0 Aug-18 81715 A 817252 La Pava -150 mm 1.09 0.04 47% 0.25 2.5 0 Aug-18 81715 B 817282 La Pava -50 mm 1.09 0.05 31% 0.38 2.5 0 Aug-18 81715 C 817312 La Pava -12.5 mm 1.08 0.04 45% 0.74 2.5 0 Aug-18
1. Composites of surface material collected from excavator trenches; 2. Composites of drill core; 3. Hydrated lime was used (Ca(OH)2) in the 2013, 2016, and 2018 test campaigns, the other samples were treated with pebble
lime (CaO)
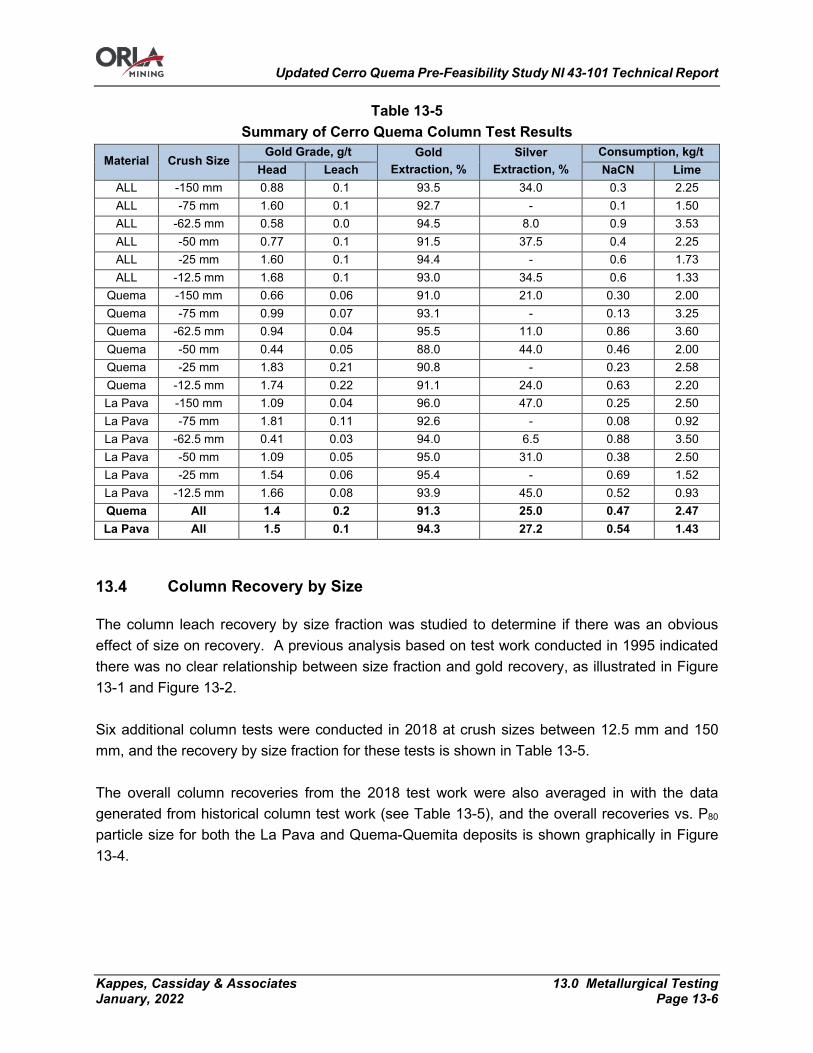
Updated Cerro Quema Pre-Feasibility Study NI 43-101 Technical Report
Kappes, Cassiday & Associates 13.0 Metallurgical Testing January, 2022 Page 13-6
Table 13-5 Summary of Cerro Quema Column Test Results
Material Crush Size Gold Grade, g/t Gold
Extraction, % Silver
Extraction, % Consumption, kg/t
Head Leach
NaCN Lime ALL -150 mm 0.88 0.1 93.5 34.0 0.3 2.25 ALL -75 mm 1.60 0.1 92.7 - 0.1 1.50 ALL -62.5 mm 0.58 0.0 94.5 8.0 0.9 3.53 ALL -50 mm 0.77 0.1 91.5 37.5 0.4 2.25 ALL -25 mm 1.60 0.1 94.4 - 0.6 1.73 ALL -12.5 mm 1.68 0.1 93.0 34.5 0.6 1.33
Quema -150 mm 0.66 0.06 91.0 21.0 0.30 2.00 Quema -75 mm 0.99 0.07 93.1 - 0.13 3.25 Quema -62.5 mm 0.94 0.04 95.5 11.0 0.86 3.60 Quema -50 mm 0.44 0.05 88.0 44.0 0.46 2.00 Quema -25 mm 1.83 0.21 90.8 - 0.23 2.58 Quema -12.5 mm 1.74 0.22 91.1 24.0 0.63 2.20 La Pava -150 mm 1.09 0.04 96.0 47.0 0.25 2.50 La Pava -75 mm 1.81 0.11 92.6 - 0.08 0.92 La Pava -62.5 mm 0.41 0.03 94.0 6.5 0.88 3.50 La Pava -50 mm 1.09 0.05 95.0 31.0 0.38 2.50 La Pava -25 mm 1.54 0.06 95.4 - 0.69 1.52 La Pava -12.5 mm 1.66 0.08 93.9
45.0 0.52 0.93 Quema All 1.4 0.2 91.3 25.0 0.47 2.47 La Pava All 1.5 0.1 94.3 27.2 0.54 1.43
Column Recovery by Size
The column leach recovery by size fraction was studied to determine if there was an obvious effect of size on recovery. A previous analysis based on test work conducted in 1995 indicated there was no clear relationship between size fraction and gold recovery, as illustrated in Figure 13-1 and Figure 13-2. Six additional column tests were conducted in 2018 at crush sizes between 12.5 mm and 150 mm, and the recovery by size fraction for these tests is shown in Table 13-5. The overall column recoveries from the 2018 test work were also averaged in with the data generated from historical column test work (see Table 13-5), and the overall recoveries vs. P80
particle size for both the La Pava and Quema-Quemita deposits is shown graphically in Figure 13-4.
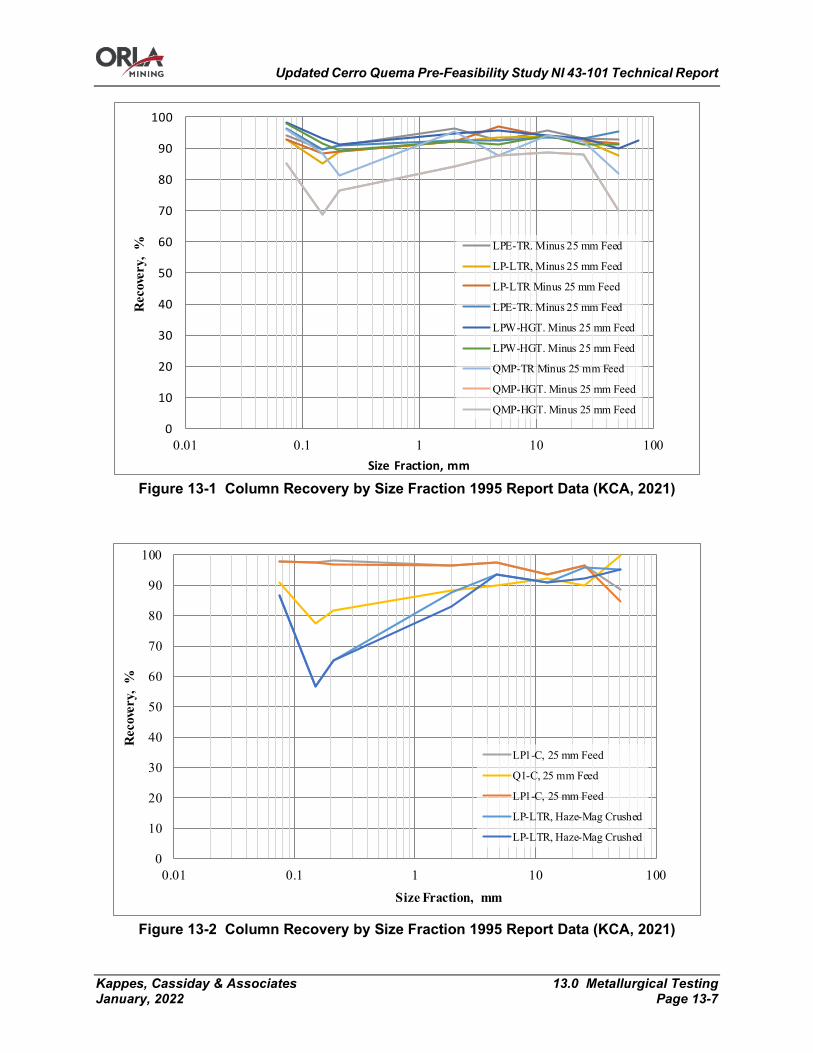
Updated Cerro Quema Pre-Feasibility Study NI 43-101 Technical Report
Kappes, Cassiday & Associates 13.0 Metallurgical Testing January, 2022 Page 13-7
Figure 13-1 Column Recovery by Size Fraction 1995 Report Data (KCA, 2021)
Figure 13-2 Column Recovery by Size Fraction 1995 Report Data (KCA, 2021)
0
10
20
30
40
50
60
70
80
90
100
0.01 0.1 1 10 100
Rec
over
y, %
Size Fraction, mm
LPE-TR. Minus 25 mm Feed
LP-LTR, Minus 25 mm Feed
LP-LTR Minus 25 mm Feed
LPE-TR. Minus 25 mm Feed
LPW-HGT. Minus 25 mm Feed
LPW-HGT. Minus 25 mm Feed
QMP-TR Minus 25 mm Feed
QMP-HGT. Minus 25 mm Feed
QMP-HGT. Minus 25 mm Feed
0
10
20
30
40
50
60
70
80
90
100
0.01 0.1 1 10 100
Rec
over
y, %
Size Fraction, mm
LP1-C, 25 mm Feed
Q1-C, 25 mm Feed
LP1-C, 25 mm Feed
LP-LTR, Haze-Mag Crushed
LP-LTR, Haze-Mag Crushed
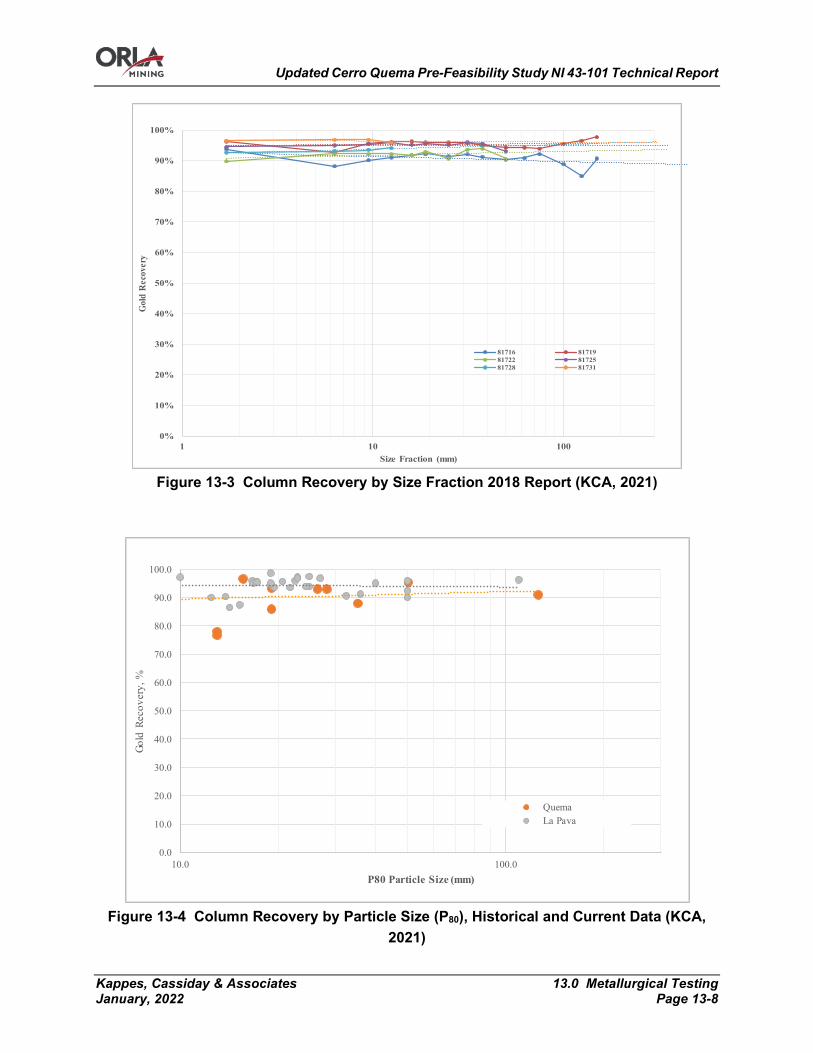
Updated Cerro Quema Pre-Feasibility Study NI 43-101 Technical Report
Kappes, Cassiday & Associates 13.0 Metallurgical Testing January, 2022 Page 13-8
Figure 13-3 Column Recovery by Size Fraction 2018 Report (KCA, 2021)
Figure 13-4 Column Recovery by Particle Size (P80), Historical and Current Data (KCA,
2021)
0%
10%
20%
30%
40%
50%
60%
70%
80%
90%
100%
1 10 100
Gol
d R
ecov
ery
Size Fraction (mm)
81716 8171981722 8172581728 81731
0.0
10.0
20.0
30.0
40.0
50.0
60.0
70.0
80.0
90.0
100.0
10.0 100.0
Gold
Rec
over
y, %
P80 Particle Size (mm)
QuemaLa Pava

Updated Cerro Quema Pre-Feasibility Study NI 43-101 Technical Report
Kappes, Cassiday & Associates 13.0 Metallurgical Testing January, 2022 Page 13-9
The results shown in Figure 13-3 and Figure 13-4 confirm previous test work, which indicates there is no correlation between recovery and particle size. The column tests from Table 13-5 were also plotted for gold extraction versus head grade, which is illustrated in Figure 13-5. The data indicate no or very minor grade-recovery relationships.
Figure 13-5 Column Recovery by Head Grade, Historical and Current Data (KCA, 2021)
Bottle Roll Test Results
Bottle roll tests have been completed on composites of core and trench samples from both the La Pava and Quema-Quemita deposits. The materials were crushed and milled, if necessary, to various sizes to determine any effect of grain size on extraction. A total of 64 bottle rolls, including 54 historical and 10 recent bottle rolls, are considered in the analysis. The results are summarized in Table 13-6 as averages by crush/grind size. The results are also graphically presented in Figure 13-6.
60
65
70
75
80
85
90
95
100
0 0.2 0.4 0.6 0.8 1 1.2 1.4 1.6 1.8 2
Au, R
ecov
ery
%
Au Head Grade, g/t
ALL Quema La Pava
Linear (ALL) Linear (Quema) Linear (La Pava)
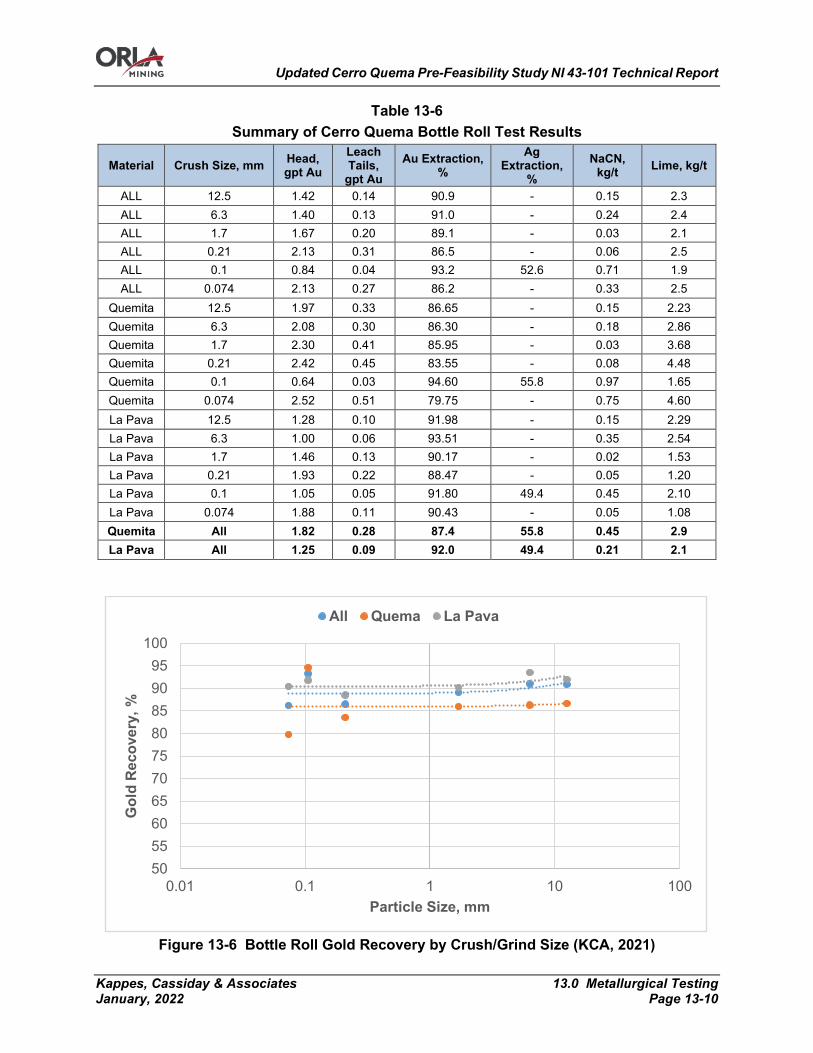
Updated Cerro Quema Pre-Feasibility Study NI 43-101 Technical Report
Kappes, Cassiday & Associates 13.0 Metallurgical Testing January, 2022 Page 13-10
Table 13-6 Summary of Cerro Quema Bottle Roll Test Results
Material Crush Size, mm Head, gpt Au
Leach Tails,
gpt Au Au Extraction,
% Ag
Extraction, %
NaCN, kg/t Lime, kg/t
ALL 12.5 1.42 0.14 90.9 - 0.15 2.3 ALL 6.3 1.40 0.13 91.0 - 0.24 2.4 ALL 1.7 1.67 0.20 89.1 - 0.03 2.1 ALL 0.21 2.13 0.31 86.5 - 0.06 2.5 ALL 0.1 0.84 0.04 93.2 52.6 0.71 1.9 ALL 0.074 2.13 0.27 86.2 - 0.33 2.5
Quemita 12.5 1.97 0.33 86.65 - 0.15 2.23 Quemita 6.3 2.08 0.30 86.30 - 0.18 2.86 Quemita 1.7 2.30 0.41 85.95 - 0.03 3.68 Quemita 0.21 2.42 0.45 83.55 - 0.08 4.48 Quemita 0.1 0.64 0.03 94.60 55.8 0.97 1.65 Quemita 0.074 2.52 0.51 79.75 - 0.75 4.60 La Pava 12.5 1.28 0.10 91.98 - 0.15 2.29 La Pava 6.3 1.00 0.06 93.51 - 0.35 2.54 La Pava 1.7 1.46 0.13 90.17 - 0.02 1.53 La Pava 0.21 1.93 0.22 88.47 - 0.05 1.20 La Pava 0.1 1.05 0.05 91.80 49.4 0.45 2.10 La Pava 0.074 1.88 0.11 90.43 - 0.05 1.08 Quemita All 1.82 0.28 87.4 55.8 0.45 2.9 La Pava All 1.25 0.09 92.0 49.4 0.21 2.1
Figure 13-6 Bottle Roll Gold Recovery by Crush/Grind Size (KCA, 2021)
50556065707580859095
100
0.01 0.1 1 10 100
Gol
d R
ecov
ery,
%
Particle Size, mm
All Quema La Pava

Updated Cerro Quema Pre-Feasibility Study NI 43-101 Technical Report
Kappes, Cassiday & Associates 13.0 Metallurgical Testing January, 2022 Page 13-11
The results of the bottle roll tests are similar to that of the column tests and show no dependence of gold extraction on particle size. The available bottle roll data on core composites indicates no significant relationship between core hole depth and recovery. As is common with oxide-sulphide transition materials, the mineralized material at Cerro Quema suggests a general increase in soluble copper content. Bottle roll and column test results show that an increase in contained copper correlates with an increased lime consumption. The presence of cyanide soluble copper is a small concern to process operations based on available test results.
Comminution Tests
Crusher Work Index
The crusher work indices were tested on trench samples is 1995 by Allis Mineral Systems. The results were:
Table 13-7 Crushing Work Index, Allis Mineral Systems 1995
Sample Work Index, kWh/t LP-LTR 4.29
LPE-LTR 5.27 LPW-HGT 5.66 QMP-TR 6.70
Allis Mineral System mentioned the material would be easy to crush but may tend to pack in the crusher. These samples were all surface trenches so the sample quality will be lower than core samples. A bulk silica rock sample taken from the La Pava area in early 2014 was found to have a work index of 6.0 kWh/t by ALS Metallurgy. The core examined at site and was found to be very soft and would break easily in by hand. This observation supports the results of Allis Mineral Systems.
Abrasion Index
Allis Mineral Systems also conducted abrasion tests on the trench samples above. The crusher work indices were tested on trench samples is 1995 by Allis Mineral Systems.

Updated Cerro Quema Pre-Feasibility Study NI 43-101 Technical Report
Kappes, Cassiday & Associates 13.0 Metallurgical Testing January, 2022 Page 13-12
Table 13-8 Abrasion Index Testing, Allis Mineral Systems 1995
Sample Abrasion Index LP-LTR 0.0715
LPE-LTR 0.2624 LPW-HGT 0.2071 QMP-TR 0.1721
Two bulk samples (silica and silica clay) were taken in 2014 from the La Pava area. The results were:
Table 13-9 Abrasion Index Testing, ALS Metallurgy 2014
Sample Abrasion Index Silica 0.019
Silica Clay 0.003 A value of 0.2 is used to calculate steel consumption due to wear in the crushing circuit.
Crush Size
The materials tested from Cerro Quema do not appear to have a size-sensitivity relative to gold extraction. KCA believes that the material should be crushed to -150 mm. This size of crushing will require a single stage crushing facility. No benefit will be gained from finer crushing. Finer crushing does not aid extraction and may produce more fines that will require cement and make agglomeration necessary.
Sample Location and Depth
The location of the samples tested by McClelland Laboratories from La Pava and Quema-Quemita were reviewed to ensure there was no obvious bias with respect to spatial representation. The samples from La Pava are distributed across the deposit in an area that is 750 m long (east to west) x 150 m wide (north to south). Visually the samples seem to be distributed fairly evenly with respect to drill hole frequency. Future testing might include a sample from the eastern and northern extremes of the deposit if enough mineralized material exists in these areas to justify the expense. The La Pava core samples used to create the metallurgical composites for testing ranged in depth from 1 to 146 m.

Updated Cerro Quema Pre-Feasibility Study NI 43-101 Technical Report
Kappes, Cassiday & Associates 13.0 Metallurgical Testing January, 2022 Page 13-13
The metallurgical samples from Quema-Quemita are clustered in the two mineralized zones described by previous authors as Quema-Quemita East and Quemita. The samples seem to be distributed fairly evenly with respect to drill hole frequency and do not seem to be otherwise biased. The Quema-Quemita core samples used to create the metallurgical composites for testing ranged in depth from 0 to 167 m.
Leach Cycle Duration
KCA estimates the field leach cycle duration from column leach test data. The method includes studying the shape of the Recovery versus Solution to Solids Ratio curve to determine where it bends or flattens. The “Solution to Solids Ratio” at the bend is converted to field time using the heap’s solution application rate. The Recovery versus Time curve is then studied to estimate the days between bend and when leaching is complete. The days are summed to determine a total leach time. The Recovery versus Solution to Solids Ratio curve bends near a Solution to Solid Ratio value of 0.67. The heap design criteria results in a solution application rate of 0.02 t solution per t ore per day. The equivalent time in the field will be:
0.67 t solution/t ore / (0.02 t solution/t ore/day) = 33 days
The Recovery versus Days curve is studied to determine the days between when the Recovery versus Solution to Solids curve flattens and when recovery is complete. In the curve above, this is a period of 25 days. The total leach cycle is the sum of these values or 58 days. The Cerro Quema oxide column test results for -25 mm and coarser crush sizes were considered to determine a value for the leach cycle. Some historical and current column tests were conducted at 12.5 mm crush size but these were not considered in the analysis as these are significantly finer than a primary crush or ROM size distribution. The column leach cycle results are shown in Table 13-10.

Updated Cerro Quema Pre-Feasibility Study NI 43-101 Technical Report
Kappes, Cassiday & Associates 13.0 Metallurgical Testing January, 2022 Page 13-14
Table 13-10 Cerro Quema Leach Cycle Result Summary
Bending Point Recovery Complete
Test Crush Material S/O at bend
Rec. at Bend
Lab Days
Field Days Recovery Lab
Days Total Field Days
P-1 -25mm PO-08 1.05 82.8 14 52.3 93.8 44 96 P-2 -25mm PO-15 0.67 91.1 9 33.3 97.2 25 58 P-3 -25mm PO-16 0.59 86.8 8 29.5 96.7 45 75 P-5 -25mm PO-11 1.71 35.2 23 85.5 97 22 108 Test 1 -25mm LP1C 0.56 91.1 10 27.8 94.6 25 43 Test 2 -25mm Q1C 0.56 87 10 28.1 93.3 20 38 Test 5 -25mm LP1C 0.29 78.6 6 14.3 95 45 53 Test 10 -25mm LP2C 0.57 76 6 28.3 98.5 65 87 LP-LTR -75 mm LP-LTR 0.77 86.4 28 38.6 90.3 40 51 LPE-TR -75 mm LPE-TR 0.27 75.9 15 13.5 90.9 50 49 LPW-HGT -75 mm LPW-
HGT 0.78 85.6 30 39 96.5 64 73
QMP-TR -75 mm QMP-TR 0.59 80 25 29.7 93.1 65 70 74006 -62.5mm La Pava 0.82 84 15 41 90.7 48 74 74009 -62.5mm La Pava 0.83 88.1 15 42 95.1 42 69 74012 -62.5mm Quemita 1.1 87.1 17 55 95.4 48 86
81716 -150mm Quemita Comp. 0.83 82.5 19 42 89.4 40 63
81719 -150mm La Pava Comp. 0.85 88.3 15 43 95.5 41 69
81722 -50mm Quemita Comp. 0.56 75.5 8 28 86.4 36 56
81725 -50mm La Pava Comp. 0.58 89.3 8 29 94.9 28 49
The average of the tests is 64 days. A value of 70 days was chosen for the Cerro Quema heap leach project.
Metal Recovery Projection
The summary of the column and bottle roll tests, considering all historical and recent test work, is shown in Table 13-11.

Updated Cerro Quema Pre-Feasibility Study NI 43-101 Technical Report
Kappes, Cassiday & Associates 13.0 Metallurgical Testing January, 2022 Page 13-15
Table 13-11 Cerro Quema Laboratory and Field Metals Recovery Summary
Deposit Material Type
Average Au Recovery, %
Average Ag Recovery, %
Selected Field Au Recovery, %
Selected Field Ag Recovery, %
La Pava Oxide 94 34 88% 30%
La Pava Mixed1 - - 57% 25%
Quemita Oxide 91 19 86% 15%
Quemita Mixed1 - - 62% 10% 1. Mixed recoveries are discounted in relation to sulphur content according to the following equation:
% Au recovery = 0.9867*2.7183^(-0.1*% total sulphur*100)-13% Average bottle roll and column test recoveries are similar for both low grade and high-grade samples. There is no discernable decrease in recovery with increasing particle size and so no adjustment has been made to the projected gold recovery for a primary crush feed. However, KCA recommends a deduction be applied to the laboratory recoveries. KCA has noted that in particular with high laboratory column test recoveries (>90%) the observed recovery in the field is often significantly lower. For Cerro Quema, KCA estimated the La Pava field projected gold recovery to be 88% and the Quema-Quemita field projected gold recovery to be 86%. There was a 4% field deduction for silver recovery included for oxide ores. Silver recoveries for mixed ore were estimated to be 5% less than oxides for both La Pava and Quema-Quemita.
Reagent Consumption Projection
Cyanide
The column leach test cyanide consumptions were studied to provide a basis for the expected field cyanide consumption. Column test results show that trench samples consume an overall average of 0.09 kg NaCN/t for all La Pava samples and 0.12 kg NaCN/t for all Quema-Quemita samples. Column test results show that core samples consume an overall average of 0.54 kg NaCN/t for all La Pava samples and 0.47 kg NaCN/t for all Quema-Quemita samples. The trench samples would have been mostly surface material, where core samples represent a variety of depths within the deposits, suggesting there may be an effect of depth or rock type on cyanide consumption. Recent column test work (August 2018) on core samples crushed/screened to 150mm, one each from the La Pava and Quema-Quemita deposits, show low cyanide consumptions of 0.25 kg NaCN/t and 0.30 kg NaCN/t respectively, which may suggest an advantage of lower cyanide consumption for a coarse primary crush or ROM heap leach feed. However, due to the limited
Updated Cerro Quema Pre-Feasibility Study NI 43-101 Technical Report
Kappes, Cassiday & Associates 13.0 Metallurgical Testing January, 2022 Page 13-16
sample size at 150 mm and a large amount of cyanide consumption data at other (finer) particle sizes, KCA recommends using an overall average of all core sample data for each deposit to select the cyanide consumption, noting that there may be an opportunity to reduce the field cyanide consumption with additional supporting column test work from coarse crush sizes at a later date. KCA generally applies a deduction to the laboratory column cyanide consumption in selecting the expected field cyanide consumption, based on a large body of data from KCA’s field experience from previous projects. For Cerro Quema KCA recommends applying a value of 33% to the average laboratory cyanide consumption, which results in a nominal field heap leach cyanide consumption of 0.19 kg/t for La Pava ore, 0.18 kg/t for Quema-Quemita ore and 0.48 kg/t ore for mixed ore from both deposits.
Lime Consumption
Silica material is competent material and represents approximately 81% of the orebody at Cerro Quema. KCA believes this will cause no percolation problems if fed to the heap leach as primary crushed ore. Lime will be required for pH control. The lime dose selected for La Pava and Quema-Quemita is based on the simple average lime dose used in the column tests for each ore (considering both historic and current test data). Column tests conducted in 2013, 2016, and 2018 used hydrated lime and so the dosages in these tests were adjusted to an equivalent pebble lime (CaO) basis before including in the averaged values. The lime doses selected are 1.4 kg/t for La Pava ore, 2.5 kg/t for Quema-Quemita ore and 4.8 kt/t for mixed ore. The argillized mineralized portions of the pits account for roughly 19% of the total specified ore tonnage for both the La Pava and Quema-Quemita Pits. This material has shown to have poor permeability characteristics based on previous test work. This material must be blended with the more competent silica material under a primary crush scenario to maintain adequate heap leach percolation.
Silica Material
KCA believes silica material is more amenable to heap leaching and will not cause percolation problems when crushed to 100% passing 150 mm. Further, KCA believe this material will require no cement or agglomeration.
Clay Material
An examination of core on site indicates that near surface material is known to contain clay and little or no competent rock or gravel. Agglomeration and permeability tests were conducted in

Updated Cerro Quema Pre-Feasibility Study NI 43-101 Technical Report
Kappes, Cassiday & Associates 13.0 Metallurgical Testing January, 2022 Page 13-17
1996 on mostly surface material and in 2014 on material that is thought to be typical of high clay material. The results were reported in a memo dated November 14, 1996 titled “Results of Cerro Quema Agglomeration & Permeability Testing”. Most samples were from trenches excavated on site. Compacted permeability tests on an un-agglomerated silica-clay composites at a 3 silica to 1 clay ratio on core from the 2018 test program were tested at loadings equivalent to heap heights between 80 and 180 m. The results of the blended samples at the maximum heap height tested are shown in Table 13-12.
Table 13-12 Permeability of Silica-Clay Composites
KCA Composite
No.
Crush Size P100, mm
Cement Added, kg/MT
Effective Height, meters
Flow Rate,
L/hr/m2
Flow Rate
cm/sec
Cumulative Slump,
% Flow
Pass/Fail 73827 A 63 0 180 778 0.022 8% Pass 73827 B 63 0 180 876 0.024 9% Pass 73827 C 63 0 180 1,517 0.042 7% Pass 73827 D 63 0 180 2,806 0.078 8% Pass 73827 E 63 0 180 3,869 0.107 8% Pass 73857 A 63 0 140 2 0.000 6% Fail 73858 A 63 0 180 113 0.003 6% Pass 73859 A 63 0 180 160 0.004 7% Pass 73860 A 63 0 180 301 0.008 6% Pass 73861 A 63 0 180 1,081 0.030 8% Pass
During operation, high clay material will be blended with silica material to ensure permeability of the heap. Crusher feed will have to be monitored to ensure proper blending occurs. Ore samples will be closely monitored by the on-site laboratory to ensure that the stacked material has adequate strength and permeability.
Mixed Ore
The effect of total sulphide concentration was evaluated to determine the impact of sulphur concentration on gold recovery and reagent consumptions for mixed material. Bottle roll, vat leach and column test work were conducted on La Pava oxide and mixed sulphide samples in the 2013 McClelland laboratories report. A total of 22 composite samples were included in this analysis, 5 samples contained total sulphide concentrations greater than 1%. The La Pava mixed sulphide composite samples contained 1.04%, 6.83%, 7.18%, and 18.85% total sulphur content. Mixed sulphide composite samples reported lower gold recoveries for all tests when compared to samples with less than 1% total sulphur content. The average gold recovery of the mixed sulphide samples, greater than 1% total sulphur, averaged 44.8% gold recovery for P80 -6.3 mm bottle roll
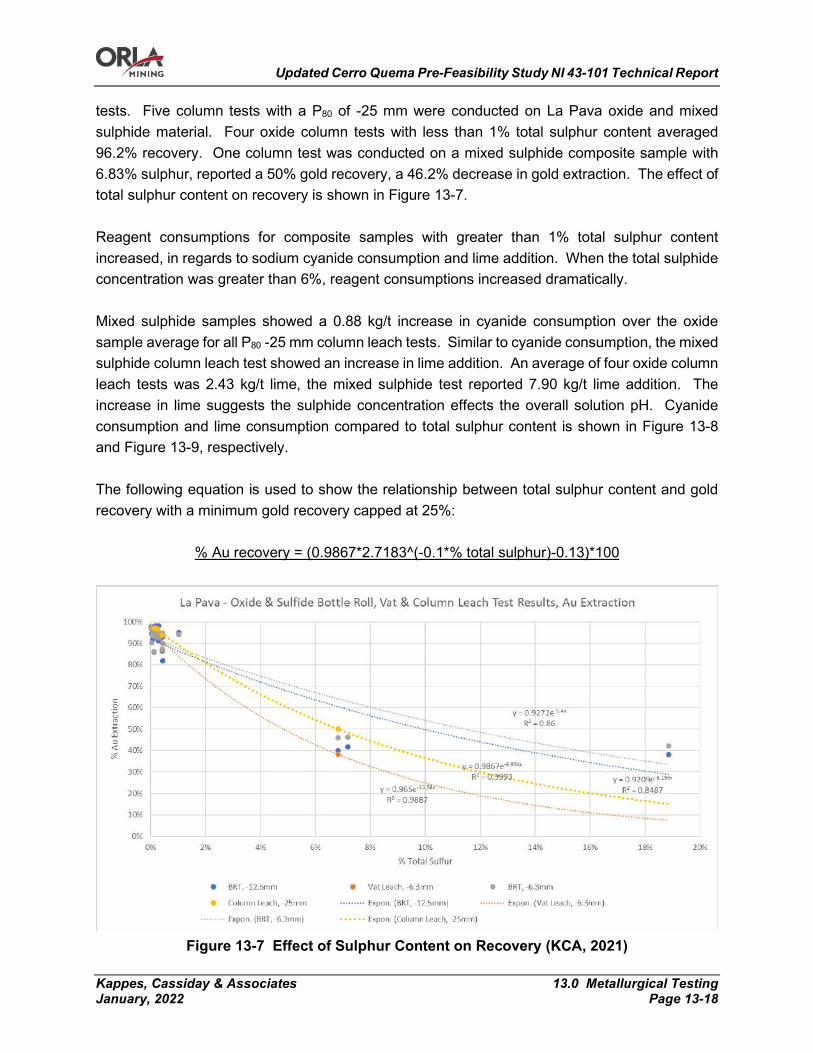
Updated Cerro Quema Pre-Feasibility Study NI 43-101 Technical Report
Kappes, Cassiday & Associates 13.0 Metallurgical Testing January, 2022 Page 13-18
tests. Five column tests with a P80 of -25 mm were conducted on La Pava oxide and mixed sulphide material. Four oxide column tests with less than 1% total sulphur content averaged 96.2% recovery. One column test was conducted on a mixed sulphide composite sample with 6.83% sulphur, reported a 50% gold recovery, a 46.2% decrease in gold extraction. The effect of total sulphur content on recovery is shown in Figure 13-7. Reagent consumptions for composite samples with greater than 1% total sulphur content increased, in regards to sodium cyanide consumption and lime addition. When the total sulphide concentration was greater than 6%, reagent consumptions increased dramatically. Mixed sulphide samples showed a 0.88 kg/t increase in cyanide consumption over the oxide sample average for all P80 -25 mm column leach tests. Similar to cyanide consumption, the mixed sulphide column leach test showed an increase in lime addition. An average of four oxide column leach tests was 2.43 kg/t lime, the mixed sulphide test reported 7.90 kg/t lime addition. The increase in lime suggests the sulphide concentration effects the overall solution pH. Cyanide consumption and lime consumption compared to total sulphur content is shown in Figure 13-8 and Figure 13-9, respectively. The following equation is used to show the relationship between total sulphur content and gold recovery with a minimum gold recovery capped at 25%:
% Au recovery = (0.9867*2.7183^(-0.1*% total sulphur)-0.13)*100
Figure 13-7 Effect of Sulphur Content on Recovery (KCA, 2021)
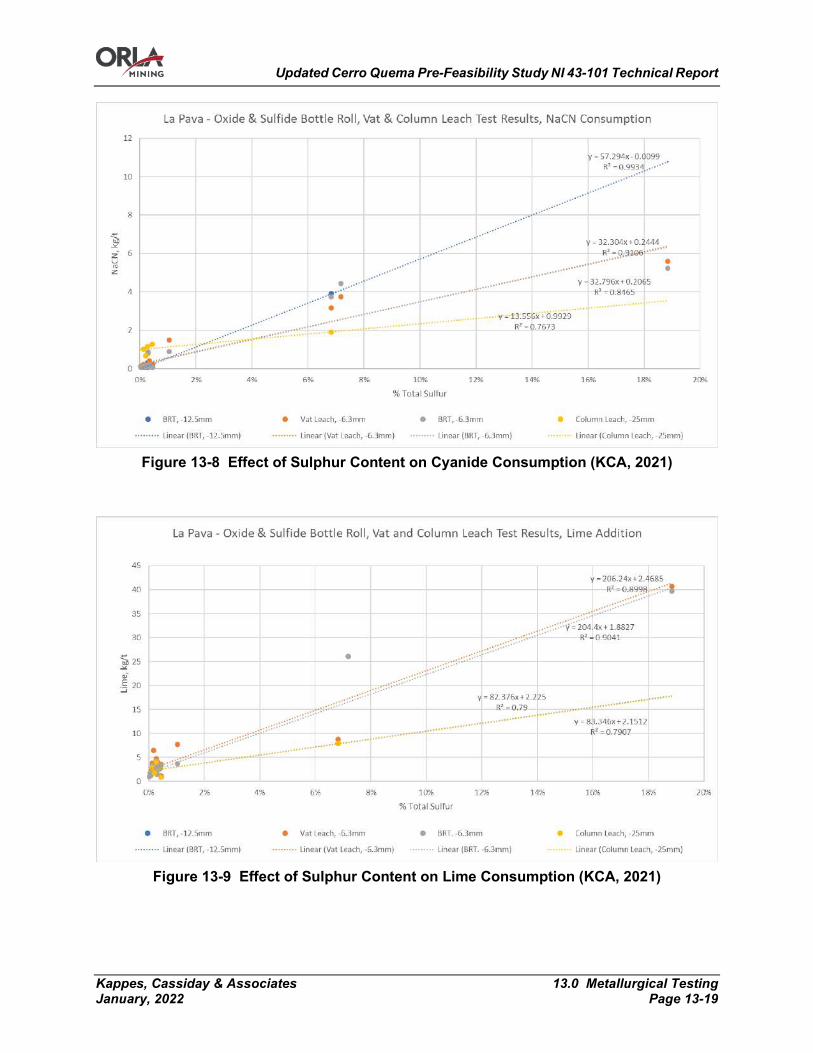
Updated Cerro Quema Pre-Feasibility Study NI 43-101 Technical Report
Kappes, Cassiday & Associates 13.0 Metallurgical Testing January, 2022 Page 13-19
Figure 13-8 Effect of Sulphur Content on Cyanide Consumption (KCA, 2021)
Figure 13-9 Effect of Sulphur Content on Lime Consumption (KCA, 2021)
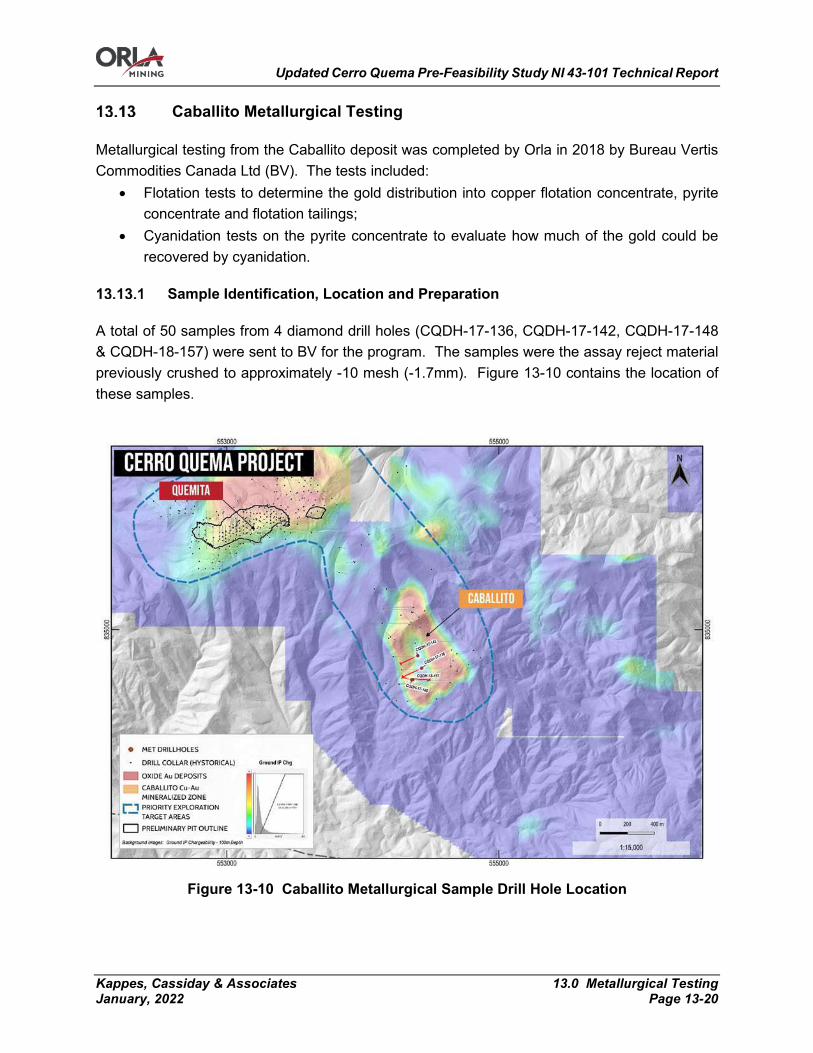
Updated Cerro Quema Pre-Feasibility Study NI 43-101 Technical Report
Kappes, Cassiday & Associates 13.0 Metallurgical Testing January, 2022 Page 13-20
Caballito Metallurgical Testing
Metallurgical testing from the Caballito deposit was completed by Orla in 2018 by Bureau Vertis Commodities Canada Ltd (BV). The tests included:
• Flotation tests to determine the gold distribution into copper flotation concentrate, pyrite concentrate and flotation tailings;
• Cyanidation tests on the pyrite concentrate to evaluate how much of the gold could be recovered by cyanidation.
Sample Identification, Location and Preparation
A total of 50 samples from 4 diamond drill holes (CQDH-17-136, CQDH-17-142, CQDH-17-148 & CQDH-18-157) were sent to BV for the program. The samples were the assay reject material previously crushed to approximately -10 mesh (-1.7mm). Figure 13-10 contains the location of these samples.
Figure 13-10 Caballito Metallurgical Sample Drill Hole Location
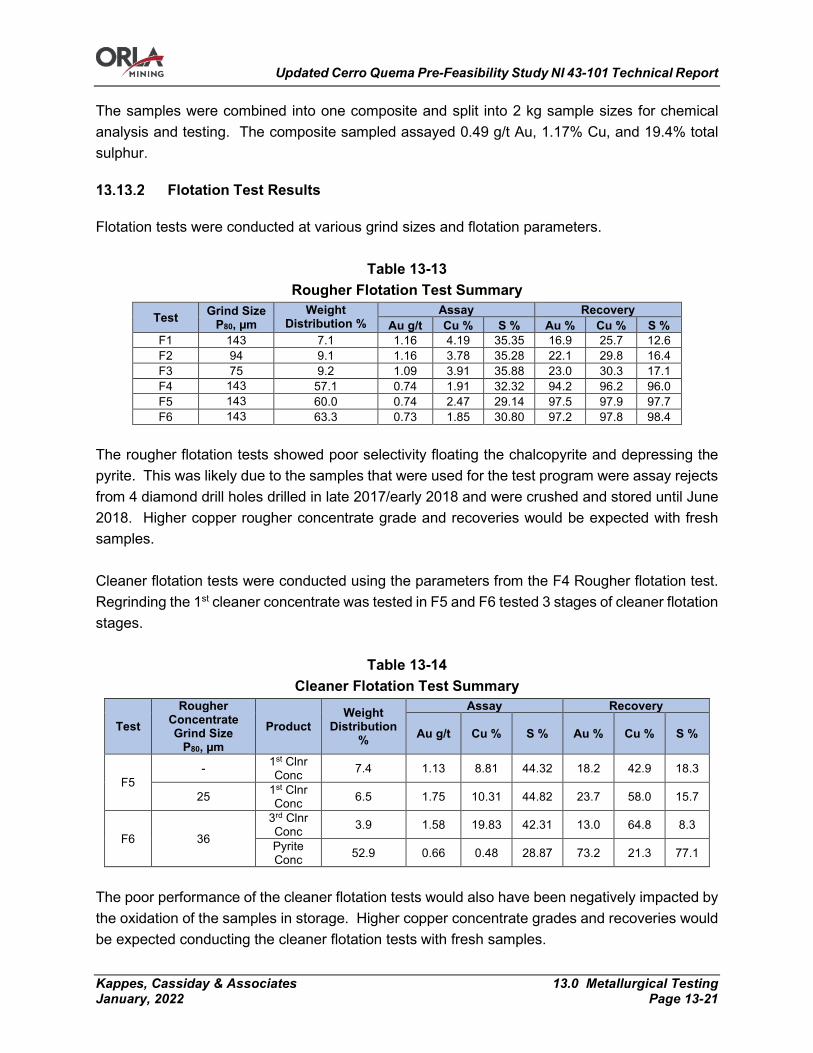
Updated Cerro Quema Pre-Feasibility Study NI 43-101 Technical Report
Kappes, Cassiday & Associates 13.0 Metallurgical Testing January, 2022 Page 13-21
The samples were combined into one composite and split into 2 kg sample sizes for chemical analysis and testing. The composite sampled assayed 0.49 g/t Au, 1.17% Cu, and 19.4% total sulphur.
Flotation Test Results
Flotation tests were conducted at various grind sizes and flotation parameters.
Table 13-13 Rougher Flotation Test Summary
Test Grind Size P80, µm
Weight Distribution %
Assay Recovery Au g/t Cu % S % Au % Cu % S %
F1 143 7.1 1.16 4.19 35.35 16.9 25.7 12.6 F2 94 9.1 1.16 3.78 35.28 22.1 29.8 16.4 F3 75 9.2 1.09 3.91 35.88 23.0 30.3 17.1 F4 143 57.1 0.74 1.91 32.32 94.2 96.2 96.0 F5 143 60.0 0.74 2.47 29.14 97.5 97.9 97.7 F6 143 63.3 0.73 1.85 30.80 97.2 97.8 98.4
The rougher flotation tests showed poor selectivity floating the chalcopyrite and depressing the pyrite. This was likely due to the samples that were used for the test program were assay rejects from 4 diamond drill holes drilled in late 2017/early 2018 and were crushed and stored until June 2018. Higher copper rougher concentrate grade and recoveries would be expected with fresh samples. Cleaner flotation tests were conducted using the parameters from the F4 Rougher flotation test. Regrinding the 1st cleaner concentrate was tested in F5 and F6 tested 3 stages of cleaner flotation stages.
Table 13-14 Cleaner Flotation Test Summary
Test Rougher
Concentrate Grind Size
P80, µm Product
Weight Distribution
%
Assay Recovery
Au g/t Cu % S % Au % Cu % S %
F5 - 1st Clnr
Conc 7.4 1.13 8.81 44.32 18.2 42.9 18.3
25 1st Clnr Conc 6.5 1.75 10.31 44.82 23.7 58.0 15.7
F6 36
3rd Clnr Conc 3.9 1.58 19.83 42.31 13.0 64.8 8.3
Pyrite Conc 52.9 0.66 0.48 28.87 73.2 21.3 77.1
The poor performance of the cleaner flotation tests would also have been negatively impacted by the oxidation of the samples in storage. Higher copper concentrate grades and recoveries would be expected conducting the cleaner flotation tests with fresh samples.
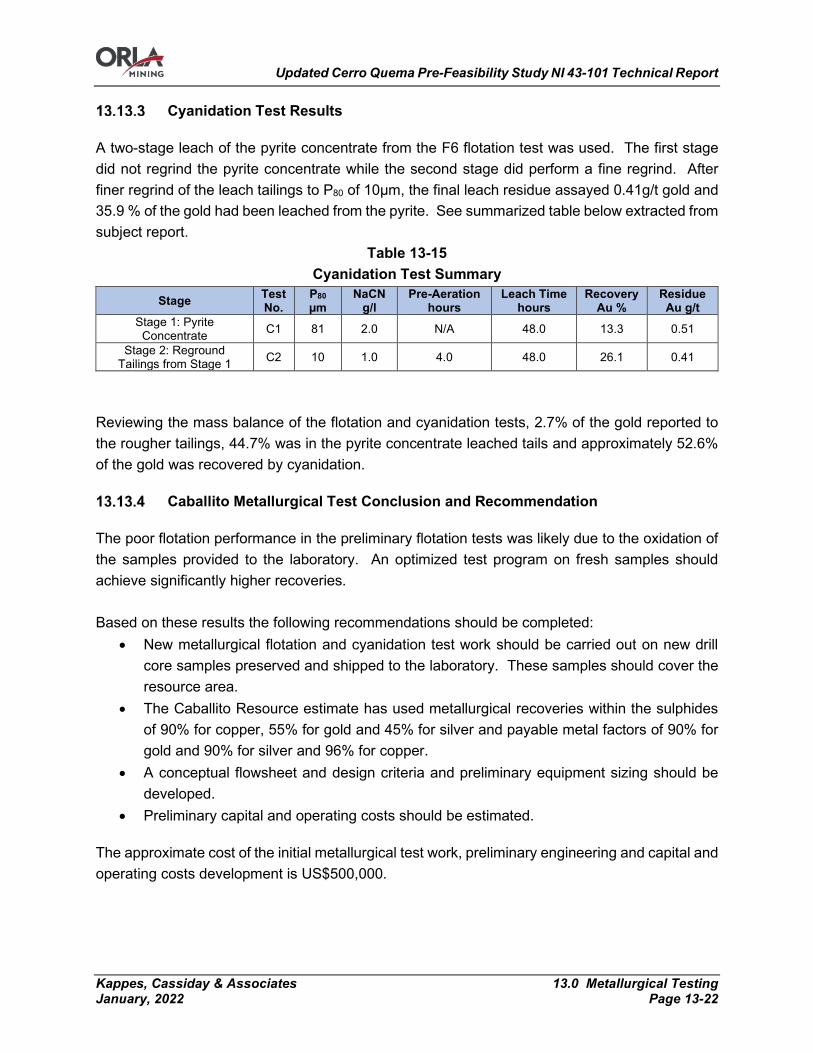
Updated Cerro Quema Pre-Feasibility Study NI 43-101 Technical Report
Kappes, Cassiday & Associates 13.0 Metallurgical Testing January, 2022 Page 13-22
Cyanidation Test Results
A two-stage leach of the pyrite concentrate from the F6 flotation test was used. The first stage did not regrind the pyrite concentrate while the second stage did perform a fine regrind. After finer regrind of the leach tailings to P80 of 10μm, the final leach residue assayed 0.41g/t gold and 35.9 % of the gold had been leached from the pyrite. See summarized table below extracted from subject report.
Table 13-15 Cyanidation Test Summary
Stage Test No.
P80 µm
NaCN g/l
Pre-Aeration hours
Leach Time hours
Recovery Au %
Residue Au g/t
Stage 1: Pyrite Concentrate C1 81 2.0 N/A 48.0 13.3 0.51
Stage 2: Reground Tailings from Stage 1 C2 10 1.0 4.0 48.0 26.1 0.41
Reviewing the mass balance of the flotation and cyanidation tests, 2.7% of the gold reported to the rougher tailings, 44.7% was in the pyrite concentrate leached tails and approximately 52.6% of the gold was recovered by cyanidation.
Caballito Metallurgical Test Conclusion and Recommendation
The poor flotation performance in the preliminary flotation tests was likely due to the oxidation of the samples provided to the laboratory. An optimized test program on fresh samples should achieve significantly higher recoveries. Based on these results the following recommendations should be completed:
• New metallurgical flotation and cyanidation test work should be carried out on new drill core samples preserved and shipped to the laboratory. These samples should cover the resource area.
• The Caballito Resource estimate has used metallurgical recoveries within the sulphides of 90% for copper, 55% for gold and 45% for silver and payable metal factors of 90% for gold and 90% for silver and 96% for copper.
• A conceptual flowsheet and design criteria and preliminary equipment sizing should be developed.
• Preliminary capital and operating costs should be estimated.
The approximate cost of the initial metallurgical test work, preliminary engineering and capital and operating costs development is US$500,000.
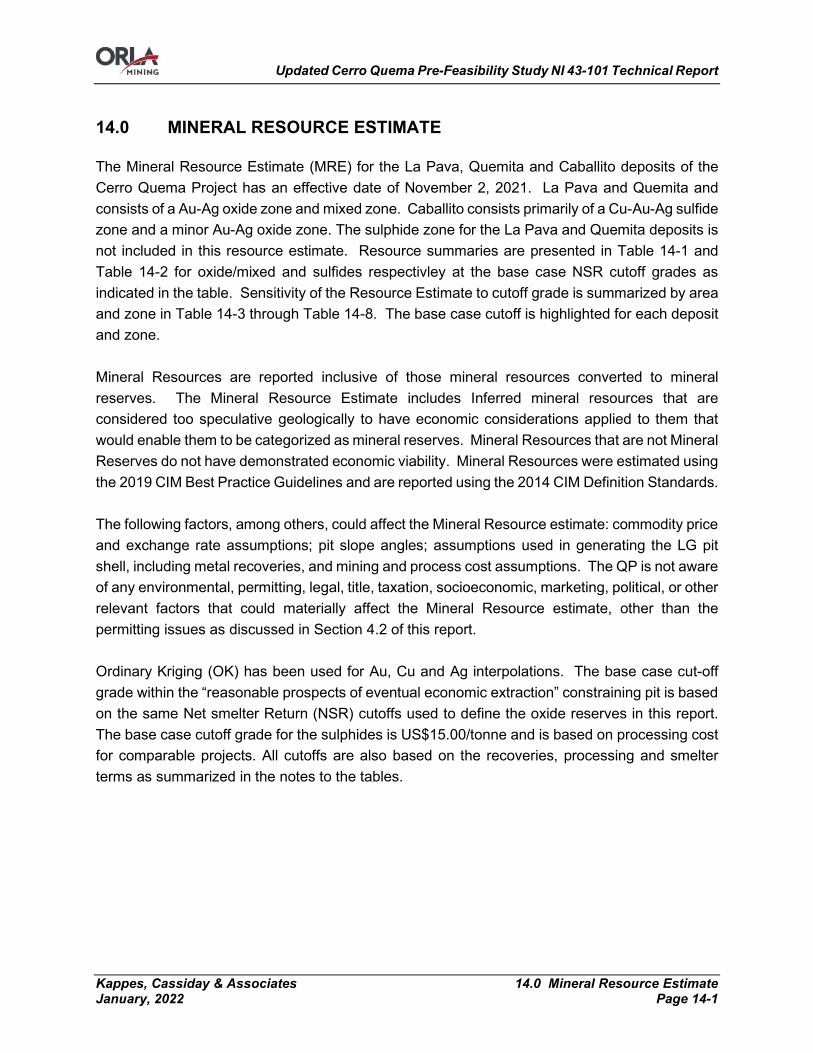
Updated Cerro Quema Pre-Feasibility Study NI 43-101 Technical Report
Kappes, Cassiday & Associates 14.0 Mineral Resource Estimate January, 2022 Page 14-1
14.0 MINERAL RESOURCE ESTIMATE
The Mineral Resource Estimate (MRE) for the La Pava, Quemita and Caballito deposits of the Cerro Quema Project has an effective date of November 2, 2021. La Pava and Quemita and consists of a Au-Ag oxide zone and mixed zone. Caballito consists primarily of a Cu-Au-Ag sulfide zone and a minor Au-Ag oxide zone. The sulphide zone for the La Pava and Quemita deposits is not included in this resource estimate. Resource summaries are presented in Table 14-1 and Table 14-2 for oxide/mixed and sulfides respectivley at the base case NSR cutoff grades as indicated in the table. Sensitivity of the Resource Estimate to cutoff grade is summarized by area and zone in Table 14-3 through Table 14-8. The base case cutoff is highlighted for each deposit and zone. Mineral Resources are reported inclusive of those mineral resources converted to mineral reserves. The Mineral Resource Estimate includes Inferred mineral resources that are considered too speculative geologically to have economic considerations applied to them that would enable them to be categorized as mineral reserves. Mineral Resources that are not Mineral Reserves do not have demonstrated economic viability. Mineral Resources were estimated using the 2019 CIM Best Practice Guidelines and are reported using the 2014 CIM Definition Standards. The following factors, among others, could affect the Mineral Resource estimate: commodity price and exchange rate assumptions; pit slope angles; assumptions used in generating the LG pit shell, including metal recoveries, and mining and process cost assumptions. The QP is not aware of any environmental, permitting, legal, title, taxation, socioeconomic, marketing, political, or other relevant factors that could materially affect the Mineral Resource estimate, other than the permitting issues as discussed in Section 4.2 of this report. Ordinary Kriging (OK) has been used for Au, Cu and Ag interpolations. The base case cut-off grade within the “reasonable prospects of eventual economic extraction” constraining pit is based on the same Net smelter Return (NSR) cutoffs used to define the oxide reserves in this report. The base case cutoff grade for the sulphides is US$15.00/tonne and is based on processing cost for comparable projects. All cutoffs are also based on the recoveries, processing and smelter terms as summarized in the notes to the tables.
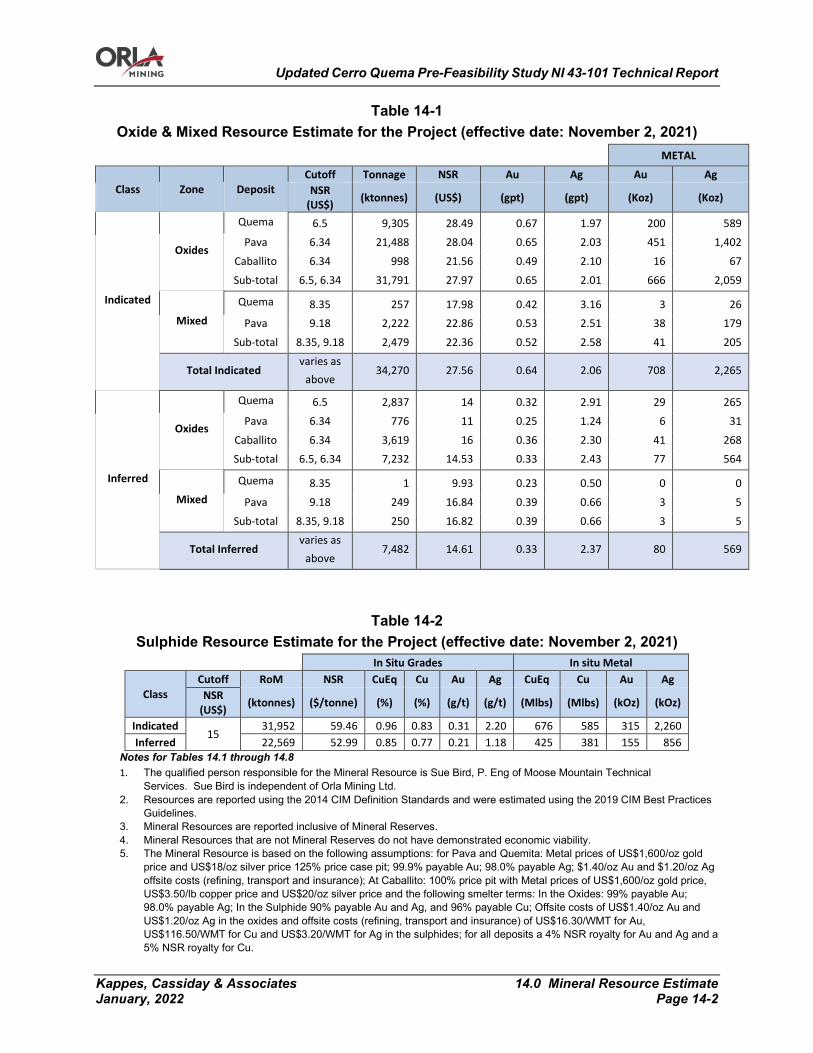
Updated Cerro Quema Pre-Feasibility Study NI 43-101 Technical Report
Kappes, Cassiday & Associates 14.0 Mineral Resource Estimate January, 2022 Page 14-2
Table 14-1 Oxide & Mixed Resource Estimate for the Project (effective date: November 2, 2021)
METAL
Class Zone Deposit Cutoff Tonnage NSR Au Ag Au Ag
NSR (US$) (ktonnes) (US$) (gpt) (gpt) (Koz) (Koz)
Indicated
Oxides
Quema 6.5 9,305 28.49 0.67 1.97 200 589 Pava 6.34 21,488 28.04 0.65 2.03 451 1,402
Caballito 6.34 998 21.56 0.49 2.10 16 67 Sub-total 6.5, 6.34 31,791 27.97 0.65 2.01 666 2,059
Mixed
Quema 8.35 257 17.98 0.42 3.16 3 26 Pava 9.18 2,222 22.86 0.53 2.51 38 179
Sub-total 8.35, 9.18 2,479 22.36 0.52 2.58 41 205
Total Indicated varies as
above 34,270 27.56 0.64 2.06 708 2,265
Inferred
Oxides
Quema 6.5 2,837 14 0.32 2.91 29 265 Pava 6.34 776 11 0.25 1.24 6 31
Caballito 6.34 3,619 16 0.36 2.30 41 268 Sub-total 6.5, 6.34 7,232 14.53 0.33 2.43 77 564
Mixed Quema 8.35 1 9.93 0.23 0.50 0 0
Pava 9.18 249 16.84 0.39 0.66 3 5 Sub-total 8.35, 9.18 250 16.82 0.39 0.66 3 5
Total Inferred varies as
above 7,482 14.61 0.33 2.37 80 569
Table 14-2 Sulphide Resource Estimate for the Project (effective date: November 2, 2021)
In Situ Grades In situ Metal
Class Cutoff RoM NSR CuEq Cu Au Ag CuEq Cu Au Ag
NSR (US$) (ktonnes) ($/tonne) (%) (%) (g/t) (g/t) (Mlbs) (Mlbs) (kOz) (kOz)
Indicated 15
31,952 59.46 0.96 0.83 0.31 2.20 676 585 315 2,260 Inferred 22,569 52.99 0.85 0.77 0.21 1.18 425 381 155 856
Notes for Tables 14.1 through 14.8 1. The qualified person responsible for the Mineral Resource is Sue Bird, P. Eng of Moose Mountain Technical
Services. Sue Bird is independent of Orla Mining Ltd. 2. Resources are reported using the 2014 CIM Definition Standards and were estimated using the 2019 CIM Best Practices
Guidelines. 3. Mineral Resources are reported inclusive of Mineral Reserves. 4. Mineral Resources that are not Mineral Reserves do not have demonstrated economic viability. 5. The Mineral Resource is based on the following assumptions: for Pava and Quemita: Metal prices of US$1,600/oz gold
price and US$18/oz silver price 125% price case pit; 99.9% payable Au; 98.0% payable Ag; $1.40/oz Au and $1.20/oz Ag offsite costs (refining, transport and insurance); At Caballito: 100% price pit with Metal prices of US$1,600/oz gold price, US$3.50/lb copper price and US$20/oz silver price and the following smelter terms: In the Oxides: 99% payable Au; 98.0% payable Ag; In the Sulphide 90% payable Au and Ag, and 96% payable Cu; Offsite costs of US$1.40/oz Au and US$1.20/oz Ag in the oxides and offsite costs (refining, transport and insurance) of US$16.30/WMT for Au, US$116.50/WMT for Cu and US$3.20/WMT for Ag in the sulphides; for all deposits a 4% NSR royalty for Au and Ag and a 5% NSR royalty for Cu.
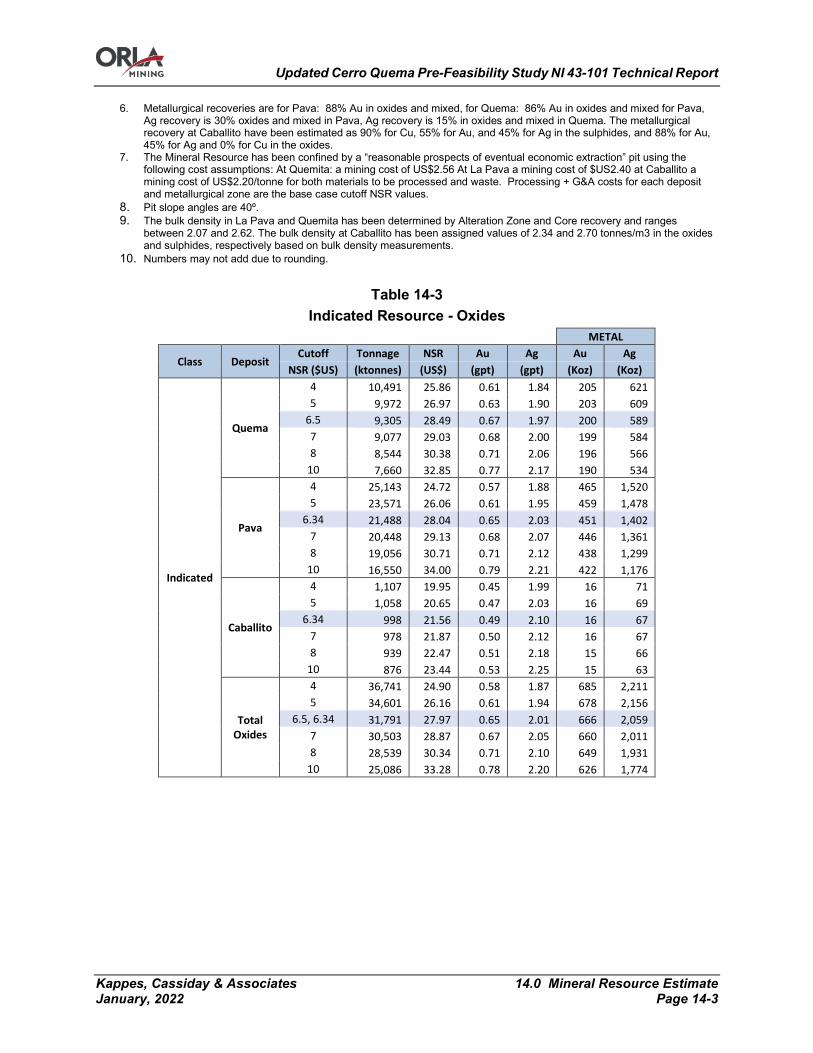
Updated Cerro Quema Pre-Feasibility Study NI 43-101 Technical Report
Kappes, Cassiday & Associates 14.0 Mineral Resource Estimate January, 2022 Page 14-3
6. Metallurgical recoveries are for Pava: 88% Au in oxides and mixed, for Quema: 86% Au in oxides and mixed for Pava, Ag recovery is 30% oxides and mixed in Pava, Ag recovery is 15% in oxides and mixed in Quema. The metallurgical recovery at Caballito have been estimated as 90% for Cu, 55% for Au, and 45% for Ag in the sulphides, and 88% for Au, 45% for Ag and 0% for Cu in the oxides.
7. The Mineral Resource has been confined by a “reasonable prospects of eventual economic extraction” pit using the following cost assumptions: At Quemita: a mining cost of US$2.56 At La Pava a mining cost of $US2.40 at Caballito a mining cost of US$2.20/tonne for both materials to be processed and waste. Processing + G&A costs for each deposit and metallurgical zone are the base case cutoff NSR values.
8. Pit slope angles are 40º. 9. The bulk density in La Pava and Quemita has been determined by Alteration Zone and Core recovery and ranges
between 2.07 and 2.62. The bulk density at Caballito has been assigned values of 2.34 and 2.70 tonnes/m3 in the oxides and sulphides, respectively based on bulk density measurements.
10. Numbers may not add due to rounding.
Table 14-3 Indicated Resource - Oxides
METAL
Class Deposit Cutoff Tonnage NSR Au Ag Au Ag
NSR ($US) (ktonnes) (US$) (gpt) (gpt) (Koz) (Koz)
Indicated
Quema
4 10,491 25.86 0.61 1.84 205 621 5 9,972 26.97 0.63 1.90 203 609
6.5 9,305 28.49 0.67 1.97 200 589 7 9,077 29.03 0.68 2.00 199 584 8 8,544 30.38 0.71 2.06 196 566
10 7,660 32.85 0.77 2.17 190 534
Pava
4 25,143 24.72 0.57 1.88 465 1,520 5 23,571 26.06 0.61 1.95 459 1,478
6.34 21,488 28.04 0.65 2.03 451 1,402 7 20,448 29.13 0.68 2.07 446 1,361 8 19,056 30.71 0.71 2.12 438 1,299
10 16,550 34.00 0.79 2.21 422 1,176
Caballito
4 1,107 19.95 0.45 1.99 16 71 5 1,058 20.65 0.47 2.03 16 69
6.34 998 21.56 0.49 2.10 16 67 7 978 21.87 0.50 2.12 16 67 8 939 22.47 0.51 2.18 15 66
10 876 23.44 0.53 2.25 15 63
Total Oxides
4 36,741 24.90 0.58 1.87 685 2,211 5 34,601 26.16 0.61 1.94 678 2,156
6.5, 6.34 31,791 27.97 0.65 2.01 666 2,059 7 30,503 28.87 0.67 2.05 660 2,011 8 28,539 30.34 0.71 2.10 649 1,931
10 25,086 33.28 0.78 2.20 626 1,774
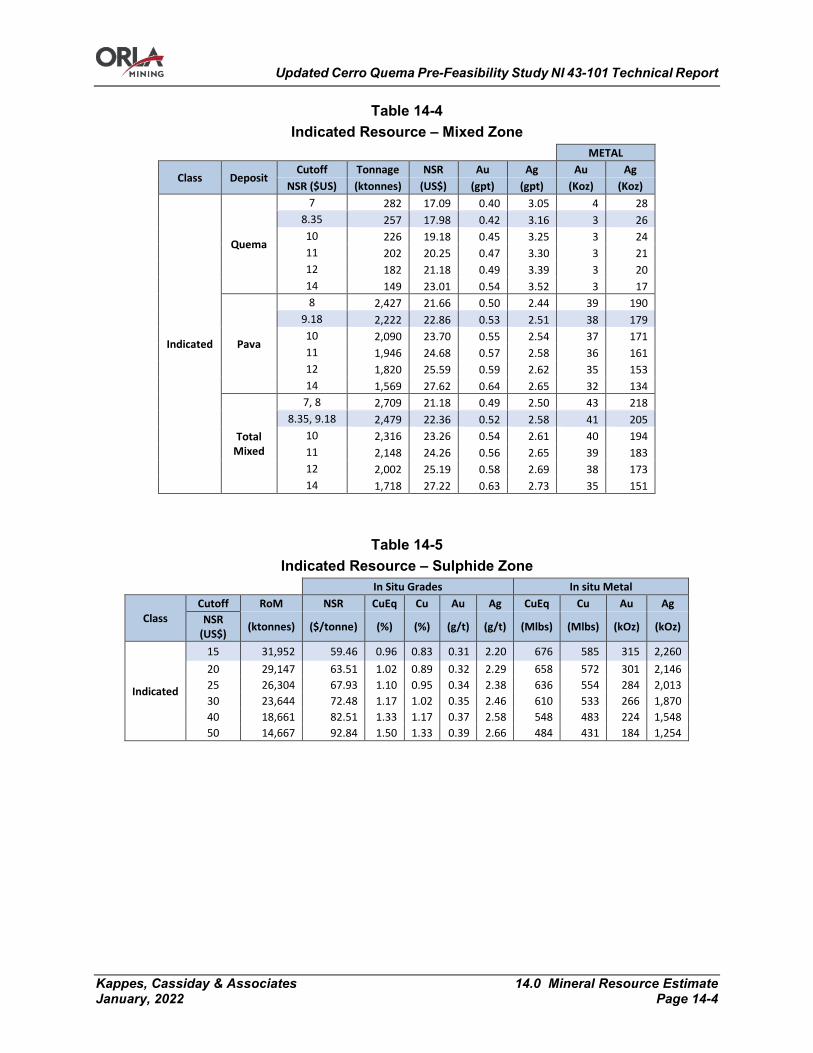
Updated Cerro Quema Pre-Feasibility Study NI 43-101 Technical Report
Kappes, Cassiday & Associates 14.0 Mineral Resource Estimate January, 2022 Page 14-4
Table 14-4 Indicated Resource – Mixed Zone
METAL
Class Deposit Cutoff Tonnage NSR Au Ag Au Ag
NSR ($US) (ktonnes) (US$) (gpt) (gpt) (Koz) (Koz)
Indicated
Quema
7 282 17.09 0.40 3.05 4 28 8.35 257 17.98 0.42 3.16 3 26 10 226 19.18 0.45 3.25 3 24 11 202 20.25 0.47 3.30 3 21 12 182 21.18 0.49 3.39 3 20 14 149 23.01 0.54 3.52 3 17
Pava
8 2,427 21.66 0.50 2.44 39 190 9.18 2,222 22.86 0.53 2.51 38 179 10 2,090 23.70 0.55 2.54 37 171 11 1,946 24.68 0.57 2.58 36 161 12 1,820 25.59 0.59 2.62 35 153 14 1,569 27.62 0.64 2.65 32 134
Total Mixed
7, 8 2,709 21.18 0.49 2.50 43 218 8.35, 9.18 2,479 22.36 0.52 2.58 41 205
10 2,316 23.26 0.54 2.61 40 194 11 2,148 24.26 0.56 2.65 39 183 12 2,002 25.19 0.58 2.69 38 173 14 1,718 27.22 0.63 2.73 35 151
Table 14-5 Indicated Resource – Sulphide Zone
In Situ Grades In situ Metal
Class Cutoff RoM NSR CuEq Cu Au Ag CuEq Cu Au Ag
NSR (US$) (ktonnes) ($/tonne) (%) (%) (g/t) (g/t) (Mlbs) (Mlbs) (kOz) (kOz)
Indicated
15 31,952 59.46 0.96 0.83 0.31 2.20 676 585 315 2,260 20 29,147 63.51 1.02 0.89 0.32 2.29 658 572 301 2,146 25 26,304 67.93 1.10 0.95 0.34 2.38 636 554 284 2,013 30 23,644 72.48 1.17 1.02 0.35 2.46 610 533 266 1,870 40 18,661 82.51 1.33 1.17 0.37 2.58 548 483 224 1,548 50 14,667 92.84 1.50 1.33 0.39 2.66 484 431 184 1,254

Updated Cerro Quema Pre-Feasibility Study NI 43-101 Technical Report
Kappes, Cassiday & Associates 14.0 Mineral Resource Estimate January, 2022 Page 14-5
Table 14-6 Inferred Resource – Oxide Zone
METAL
Class Deposit Cutoff Tonnage NSR Au Ag Au Ag
NSR ($US) (ktonnes) (US$) (gpt) (gpt) (Koz) (Koz)
Inferred
Quema
4 3,517 12.18 0.28 2.53 32 286 5 3,285 12.72 0.30 2.62 31 277
6.5 2,837 13.81 0.32 2.91 29 265 7 2,453 14.92 0.35 3.22 27 254 8 2,047 16.39 0.38 3.61 25 238
10 1,465 19.36 0.45 4.56 21 215
Pava
4 952 9.88 0.23 1.17 7 36 5 895 10.22 0.24 1.17 7 34
6.34 776 10.91 0.25 1.24 6 31 7 685 11.47 0.27 1.26 6 28 8 554 12.43 0.29 1.24 5 22
10 291 15.36 0.36 1.47 3 14
Caballito
4 4,142 14.54 0.33 2.18 43 290 5 3,938 15.05 0.34 2.22 43 281
6.34 3,619 15.88 0.36 2.30 41 268 7 3,408 16.45 0.37 2.33 40 255 8 3,097 17.35 0.39 2.43 39 242
10 2,510 19.28 0.43 2.44 35 197
Total Oxides
4 8,611 13.06 0.30 2.21 82 612 5 8,118 13.58 0.31 2.27 81 591
6.5, 6.34 7,232 14.53 0.33 2.43 77 564 7 6,546 15.35 0.35 2.55 74 537 8 5,698 16.53 0.38 2.74 69 502
10 4,266 19.04 0.43 3.10 59 425
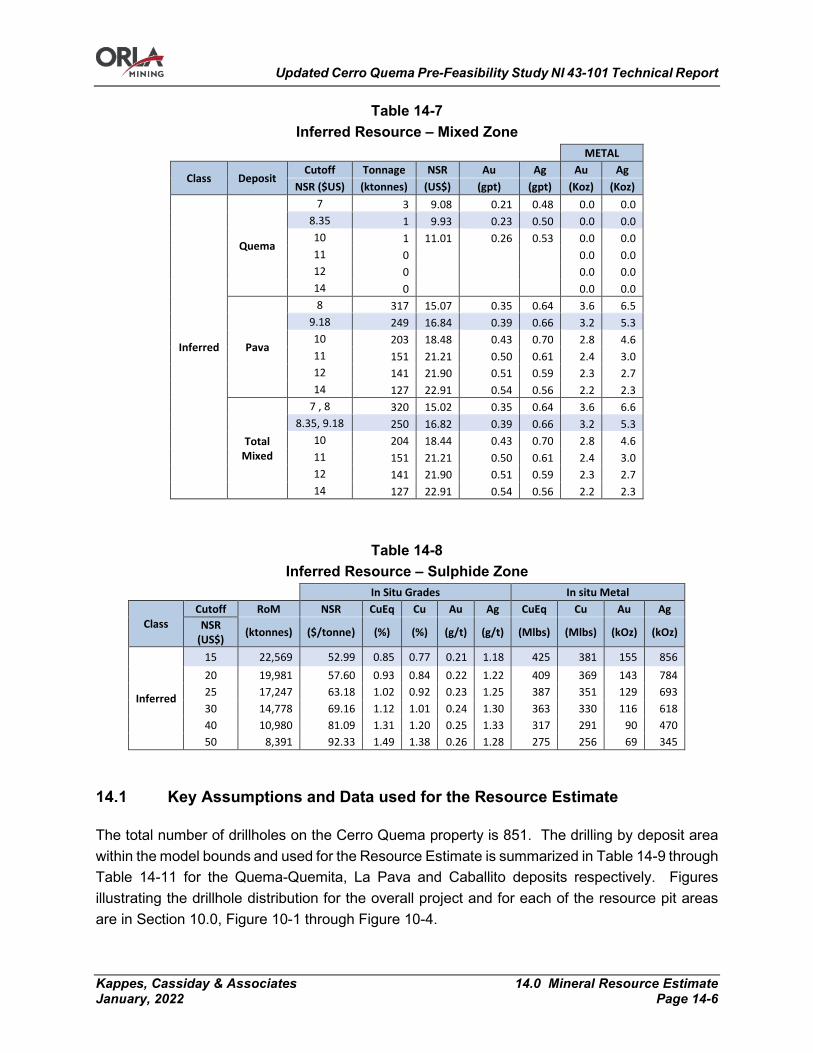
Updated Cerro Quema Pre-Feasibility Study NI 43-101 Technical Report
Kappes, Cassiday & Associates 14.0 Mineral Resource Estimate January, 2022 Page 14-6
Table 14-7 Inferred Resource – Mixed Zone
METAL
Class Deposit Cutoff Tonnage NSR Au Ag Au Ag
NSR ($US) (ktonnes) (US$) (gpt) (gpt) (Koz) (Koz)
Inferred
Quema
7 3 9.08 0.21 0.48 0.0 0.0 8.35 1 9.93 0.23 0.50 0.0 0.0 10 1 11.01 0.26 0.53 0.0 0.0 11 0 0.0 0.0 12 0 0.0 0.0 14 0 0.0 0.0
Pava
8 317 15.07 0.35 0.64 3.6 6.5 9.18 249 16.84 0.39 0.66 3.2 5.3 10 203 18.48 0.43 0.70 2.8 4.6 11 151 21.21 0.50 0.61 2.4 3.0 12 141 21.90 0.51 0.59 2.3 2.7 14 127 22.91 0.54 0.56 2.2 2.3
Total Mixed
7 , 8 320 15.02 0.35 0.64 3.6 6.6 8.35, 9.18 250 16.82 0.39 0.66 3.2 5.3
10 204 18.44 0.43 0.70 2.8 4.6 11 151 21.21 0.50 0.61 2.4 3.0 12 141 21.90 0.51 0.59 2.3 2.7 14 127 22.91 0.54 0.56 2.2 2.3
Table 14-8 Inferred Resource – Sulphide Zone
In Situ Grades In situ Metal
Class Cutoff RoM NSR CuEq Cu Au Ag CuEq Cu Au Ag
NSR (US$) (ktonnes) ($/tonne) (%) (%) (g/t) (g/t) (Mlbs) (Mlbs) (kOz) (kOz)
Inferred
15 22,569 52.99 0.85 0.77 0.21 1.18 425 381 155 856 20 19,981 57.60 0.93 0.84 0.22 1.22 409 369 143 784 25 17,247 63.18 1.02 0.92 0.23 1.25 387 351 129 693 30 14,778 69.16 1.12 1.01 0.24 1.30 363 330 116 618 40 10,980 81.09 1.31 1.20 0.25 1.33 317 291 90 470 50 8,391 92.33 1.49 1.38 0.26 1.28 275 256 69 345
Key Assumptions and Data used for the Resource Estimate
The total number of drillholes on the Cerro Quema property is 851. The drilling by deposit area within the model bounds and used for the Resource Estimate is summarized in Table 14-9 through Table 14-11 for the Quema-Quemita, La Pava and Caballito deposits respectively. Figures illustrating the drillhole distribution for the overall project and for each of the resource pit areas are in Section 10.0, Figure 10-1 through Figure 10-4.
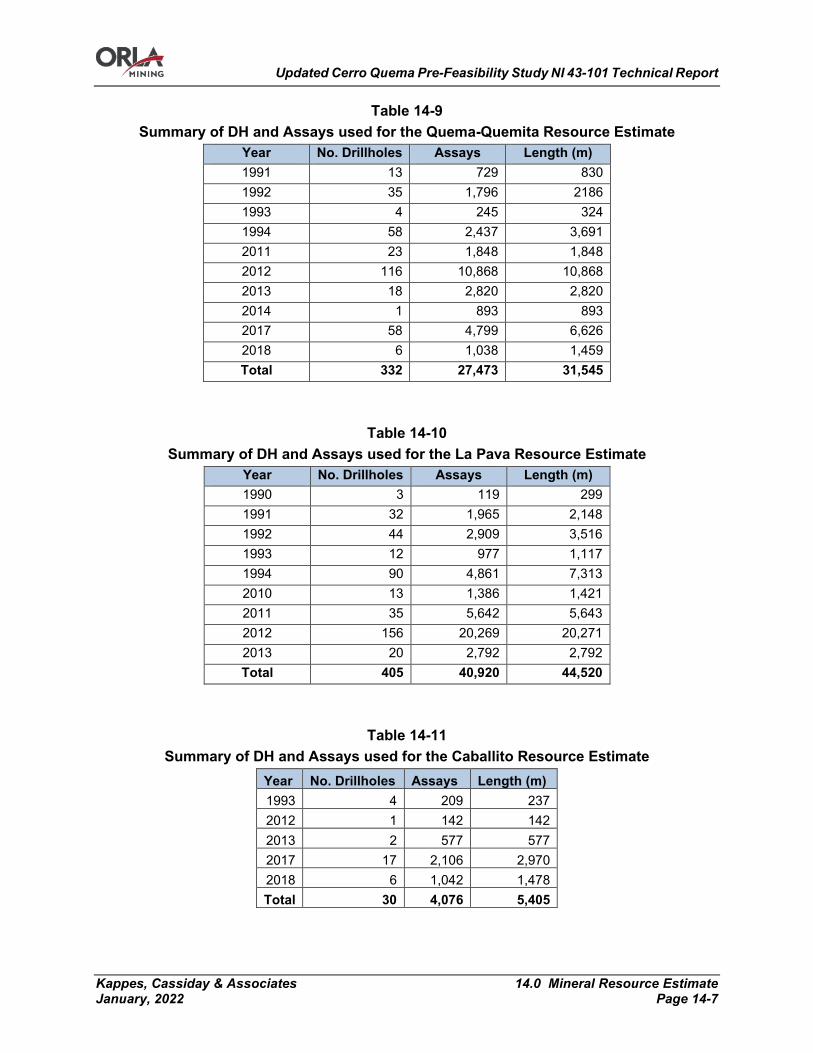
Updated Cerro Quema Pre-Feasibility Study NI 43-101 Technical Report
Kappes, Cassiday & Associates 14.0 Mineral Resource Estimate January, 2022 Page 14-7
Table 14-9 Summary of DH and Assays used for the Quema-Quemita Resource Estimate
Year No. Drillholes Assays Length (m) 1991 13 729 830 1992 35 1,796 2186 1993 4 245 324 1994 58 2,437 3,691 2011 23 1,848 1,848 2012 116 10,868 10,868 2013 18 2,820 2,820 2014 1 893 893 2017 58 4,799 6,626 2018 6 1,038 1,459 Total 332 27,473 31,545
Table 14-10 Summary of DH and Assays used for the La Pava Resource Estimate
Year No. Drillholes Assays Length (m) 1990 3 119 299 1991 32 1,965 2,148 1992 44 2,909 3,516 1993 12 977 1,117 1994 90 4,861 7,313 2010 13 1,386 1,421 2011 35 5,642 5,643 2012 156 20,269 20,271 2013 20 2,792 2,792 Total 405 40,920 44,520
Table 14-11 Summary of DH and Assays used for the Caballito Resource Estimate
Year No. Drillholes Assays Length (m) 1993 4 209 237 2012 1 142 142 2013 2 577 577 2017 17 2,106 2,970 2018 6 1,042 1,478 Total 30 4,076 5,405

Updated Cerro Quema Pre-Feasibility Study NI 43-101 Technical Report
Kappes, Cassiday & Associates 14.0 Mineral Resource Estimate January, 2022 Page 14-8
Geologic Modelling
The La Pava and Quema-Quemita deposits are volcanic hosted, epithermal, high sulfidation (HS) gold-silver deposits. As discussed in Section 7.0 of this report, gold and silver mineralization is hosted predominantly by silicified and leached zones found within broader zones of advanced argillic alteration. Advanced argillic and argillic alteration zones host lesser amounts of gold mineralization. Oxidation is extensive at both Quema-Quemita and La Pava to a depth of approximately 150m and 100m respectively, following topography. Oxidation at Caballito is limited to a depth of approximately 25m with the majority of the deposit in sulphides. The Caballito deposit is divided by the Idaida fault with mineralization west of the fault defined as the Idaida zone and east of the fault the Caballito zone. The entire deposit, including both zones is referred to as the Caballito deposit. Orla geologists have interpreted three alteration zones at all three deposits, and have created three dimensional solid models of each. The geologic models have been used to code the drillholes and the block model with domains as summarized Table 14-12 below. Orla geologists have also interpreted zones of oxidation used for the resource estimate which includes the oxidized, and mixed and sulphide zones. The underlying supergene sulphide and sulphide zones are included for the Caballito deposit only.
Table 14-12 Summary of Interpolation Domains
Deposits Domain Description
La Pava, Quemita
1 Less intense advanced argillic alteration with less silicification and alteration
2 Advanced argillic alteration 3 Intense silicification comprised of residual silica, vuggy silica, and
silica breccia
Caballito 1
Less intense advanced argillic alteration with less silicification and alteration
2 Advanced argillic alteration 4 Massive sulphides
Representative long sections through the center of each deposit showing the modelled alteration zones are presented in Figure 14-1 through Figure 14-3 for Quema-Quemita, La Pava and Caballito respectively. Sections of the oxidation zones are presented in Figure 14-4 through Figure 14-6 for Quema-Quemita, La Pava and Caballito respectively. The final resource pit shape is illustrated in black on all sections for reference.

Updated Cerro Quema Pre-Feasibility Study NI 43-101 Technical Report
Kappes, Cassiday & Associates 14.0 Mineral Resource Estimate January, 2022 Page 14-9
Figure 14-1 Alteration Domains used for Interpolation, looking Az=340o - Quema-Quemita
(MMTS, 2021)
Figure 14-2 Alteration Domains used for Interpolation, looking Az=020o - La Pava
(MMTS, 2021)

Updated Cerro Quema Pre-Feasibility Study NI 43-101 Technical Report
Kappes, Cassiday & Associates 14.0 Mineral Resource Estimate January, 2022 Page 14-10
Figure 14-3 Alteration Domains used for Interpolation looking North at 834859N –
Caballito (MMTS, 2021)
Figure 14-4 Oxidation Zones used for Interpolation, looking Az=340o – Quema-Quemita
(MMTS, 2021)

Updated Cerro Quema Pre-Feasibility Study NI 43-101 Technical Report
Kappes, Cassiday & Associates 14.0 Mineral Resource Estimate January, 2022 Page 14-11
Figure 14-5 Oxidation Zones used for Interpolation, looking Az=020o - La Pava
(MMTS, 2021)
Figure 14-6 Oxidation Zones used for Interpolation looking North at 834859N - Caballito
(MMTS, 2021)
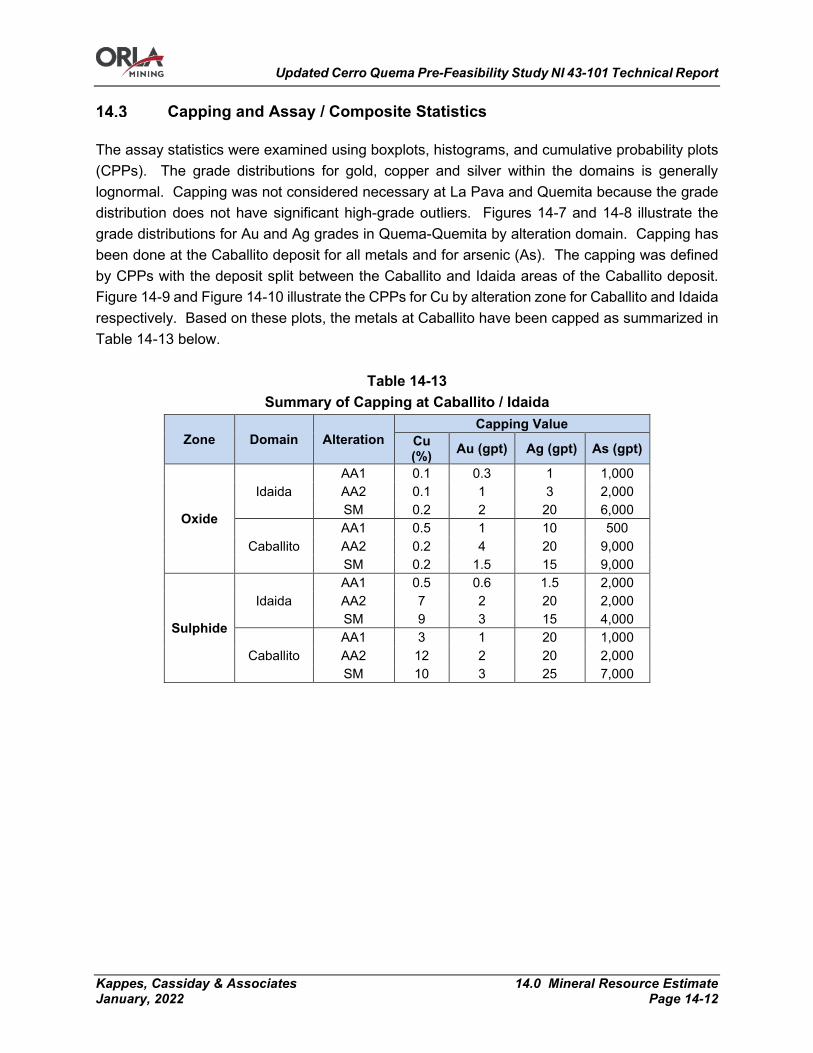
Updated Cerro Quema Pre-Feasibility Study NI 43-101 Technical Report
Kappes, Cassiday & Associates 14.0 Mineral Resource Estimate January, 2022 Page 14-12
Capping and Assay / Composite Statistics
The assay statistics were examined using boxplots, histograms, and cumulative probability plots (CPPs). The grade distributions for gold, copper and silver within the domains is generally lognormal. Capping was not considered necessary at La Pava and Quemita because the grade distribution does not have significant high-grade outliers. Figures 14-7 and 14-8 illustrate the grade distributions for Au and Ag grades in Quema-Quemita by alteration domain. Capping has been done at the Caballito deposit for all metals and for arsenic (As). The capping was defined by CPPs with the deposit split between the Caballito and Idaida areas of the Caballito deposit. Figure 14-9 and Figure 14-10 illustrate the CPPs for Cu by alteration zone for Caballito and Idaida respectively. Based on these plots, the metals at Caballito have been capped as summarized in Table 14-13 below.
Table 14-13 Summary of Capping at Caballito / Idaida
Zone Domain Alteration Capping Value
Cu (%) Au (gpt) Ag (gpt) As (gpt)
Oxide
Idaida AA1 0.1 0.3 1 1,000 AA2 0.1 1 3 2,000 SM 0.2 2 20 6,000
Caballito AA1 0.5 1 10 500 AA2 0.2 4 20 9,000 SM 0.2 1.5 15 9,000
Sulphide
Idaida AA1 0.5 0.6 1.5 2,000 AA2 7 2 20 2,000 SM 9 3 15 4,000
Caballito AA1 3 1 20 1,000 AA2 12 2 20 2,000 SM 10 3 25 7,000

Updated Cerro Quema Pre-Feasibility Study NI 43-101 Technical Report
Kappes, Cassiday & Associates 14.0 Mineral Resource Estimate January, 2022 Page 14-13
Figure 14-7 CPP in Quema-Quemita in the Oxide Zone by Alteration Domain – Au
(MMTS, 2021)
Figure 14-8 CPP in Quema-Quemita in the Oxide Zone by Alteration Domain – Ag
(MMTS, 2021)

Updated Cerro Quema Pre-Feasibility Study NI 43-101 Technical Report
Kappes, Cassiday & Associates 14.0 Mineral Resource Estimate January, 2022 Page 14-14
Figure 14-9 CPP of Caballito in the Sulphide Zone by Alteration Domain – Cu
(MMTS, 2021)
Figure 14-10 CPP of Idaida in the Sulphide Zone by Alteration Domain – Cu
(MMTS, 2021)
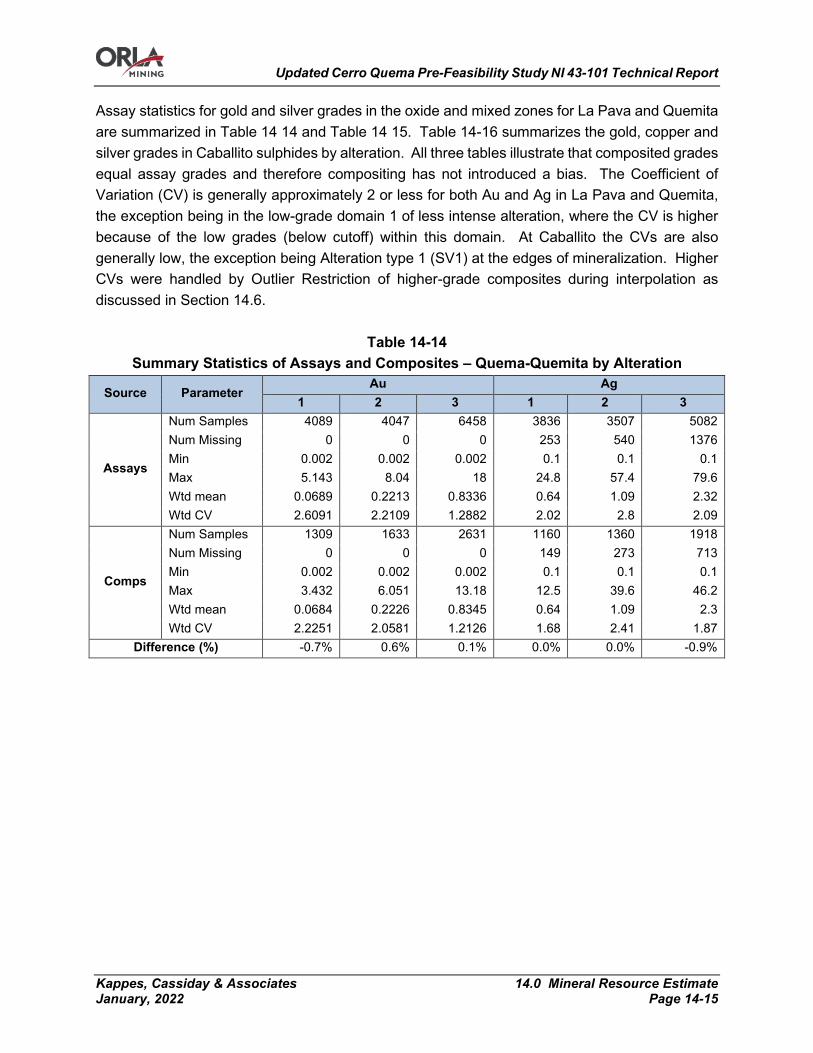
Updated Cerro Quema Pre-Feasibility Study NI 43-101 Technical Report
Kappes, Cassiday & Associates 14.0 Mineral Resource Estimate January, 2022 Page 14-15
Assay statistics for gold and silver grades in the oxide and mixed zones for La Pava and Quemita are summarized in Table 14 14 and Table 14 15. Table 14-16 summarizes the gold, copper and silver grades in Caballito sulphides by alteration. All three tables illustrate that composited grades equal assay grades and therefore compositing has not introduced a bias. The Coefficient of Variation (CV) is generally approximately 2 or less for both Au and Ag in La Pava and Quemita, the exception being in the low-grade domain 1 of less intense alteration, where the CV is higher because of the low grades (below cutoff) within this domain. At Caballito the CVs are also generally low, the exception being Alteration type 1 (SV1) at the edges of mineralization. Higher CVs were handled by Outlier Restriction of higher-grade composites during interpolation as discussed in Section 14.6.
Table 14-14 Summary Statistics of Assays and Composites – Quema-Quemita by Alteration
Source Parameter Au Ag
1 2 3 1 2 3
Assays
Num Samples 4089 4047 6458 3836 3507 5082 Num Missing 0 0 0 253 540 1376 Min 0.002 0.002 0.002 0.1 0.1 0.1 Max 5.143 8.04 18 24.8 57.4 79.6 Wtd mean 0.0689 0.2213 0.8336 0.64 1.09 2.32 Wtd CV 2.6091 2.2109 1.2882 2.02 2.8 2.09
Comps
Num Samples 1309 1633 2631 1160 1360 1918 Num Missing 0 0 0 149 273 713 Min 0.002 0.002 0.002 0.1 0.1 0.1 Max 3.432 6.051 13.18 12.5 39.6 46.2 Wtd mean 0.0684 0.2226 0.8345 0.64 1.09 2.3 Wtd CV 2.2251 2.0581 1.2126 1.68 2.41 1.87
Difference (%) -0.7% 0.6% 0.1% 0.0% 0.0% -0.9%
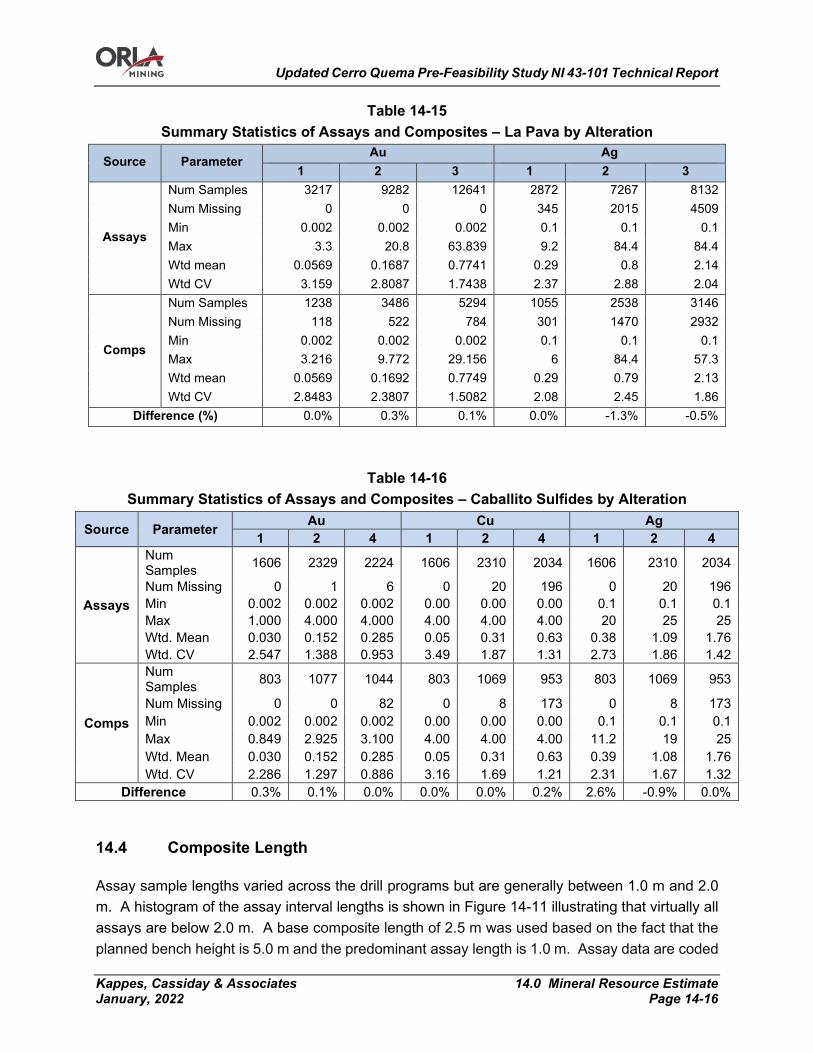
Updated Cerro Quema Pre-Feasibility Study NI 43-101 Technical Report
Kappes, Cassiday & Associates 14.0 Mineral Resource Estimate January, 2022 Page 14-16
Table 14-15 Summary Statistics of Assays and Composites – La Pava by Alteration
Source Parameter Au Ag
1 2 3 1 2 3
Assays
Num Samples 3217 9282 12641 2872 7267 8132 Num Missing 0 0 0 345 2015 4509 Min 0.002 0.002 0.002 0.1 0.1 0.1 Max 3.3 20.8 63.839 9.2 84.4 84.4 Wtd mean 0.0569 0.1687 0.7741 0.29 0.8 2.14 Wtd CV 3.159 2.8087 1.7438 2.37 2.88 2.04
Comps
Num Samples 1238 3486 5294 1055 2538 3146 Num Missing 118 522 784 301 1470 2932 Min 0.002 0.002 0.002 0.1 0.1 0.1 Max 3.216 9.772 29.156 6 84.4 57.3 Wtd mean 0.0569 0.1692 0.7749 0.29 0.79 2.13 Wtd CV 2.8483 2.3807 1.5082 2.08 2.45 1.86
Difference (%) 0.0% 0.3% 0.1% 0.0% -1.3% -0.5%
Table 14-16 Summary Statistics of Assays and Composites – Caballito Sulfides by Alteration
Source Parameter Au Cu Ag 1 2 4 1 2 4 1 2 4
Assays
Num Samples 1606 2329 2224 1606 2310 2034 1606 2310 2034
Num Missing 0 1 6 0 20 196 0 20 196 Min 0.002 0.002 0.002 0.00 0.00 0.00 0.1 0.1 0.1 Max 1.000 4.000 4.000 4.00 4.00 4.00 20 25 25 Wtd. Mean 0.030 0.152 0.285 0.05 0.31 0.63 0.38 1.09 1.76 Wtd. CV 2.547 1.388 0.953 3.49 1.87 1.31 2.73 1.86 1.42
Comps
Num Samples 803 1077 1044 803 1069 953 803 1069 953
Num Missing 0 0 82 0 8 173 0 8 173 Min 0.002 0.002 0.002 0.00 0.00 0.00 0.1 0.1 0.1 Max 0.849 2.925 3.100 4.00 4.00 4.00 11.2 19 25 Wtd. Mean 0.030 0.152 0.285 0.05 0.31 0.63 0.39 1.08 1.76 Wtd. CV 2.286 1.297 0.886 3.16 1.69 1.21 2.31 1.67 1.32
Difference 0.3% 0.1% 0.0% 0.0% 0.0% 0.2% 2.6% -0.9% 0.0%
Composite Length
Assay sample lengths varied across the drill programs but are generally between 1.0 m and 2.0 m. A histogram of the assay interval lengths is shown in Figure 14-11 illustrating that virtually all assays are below 2.0 m. A base composite length of 2.5 m was used based on the fact that the planned bench height is 5.0 m and the predominant assay length is 1.0 m. Assay data are coded
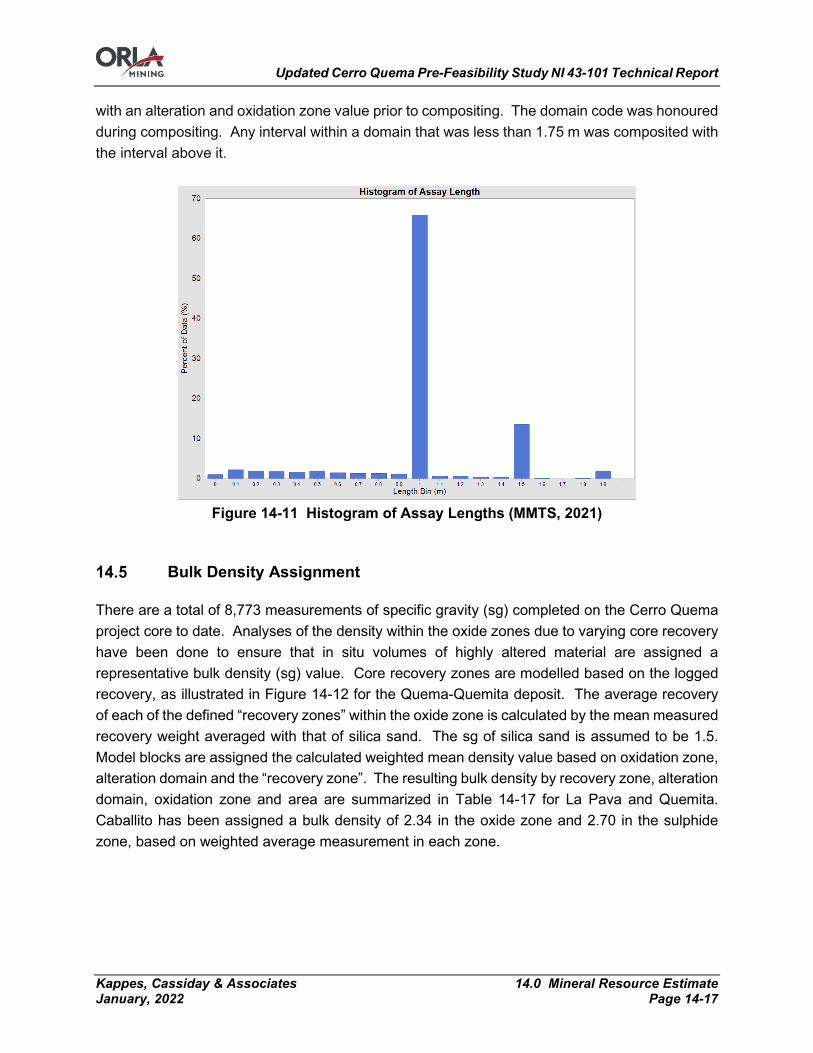
Updated Cerro Quema Pre-Feasibility Study NI 43-101 Technical Report
Kappes, Cassiday & Associates 14.0 Mineral Resource Estimate January, 2022 Page 14-17
with an alteration and oxidation zone value prior to compositing. The domain code was honoured during compositing. Any interval within a domain that was less than 1.75 m was composited with the interval above it.
Figure 14-11 Histogram of Assay Lengths (MMTS, 2021)
Bulk Density Assignment
There are a total of 8,773 measurements of specific gravity (sg) completed on the Cerro Quema project core to date. Analyses of the density within the oxide zones due to varying core recovery have been done to ensure that in situ volumes of highly altered material are assigned a representative bulk density (sg) value. Core recovery zones are modelled based on the logged recovery, as illustrated in Figure 14-12 for the Quema-Quemita deposit. The average recovery of each of the defined “recovery zones” within the oxide zone is calculated by the mean measured recovery weight averaged with that of silica sand. The sg of silica sand is assumed to be 1.5. Model blocks are assigned the calculated weighted mean density value based on oxidation zone, alteration domain and the “recovery zone”. The resulting bulk density by recovery zone, alteration domain, oxidation zone and area are summarized in Table 14-17 for La Pava and Quemita. Caballito has been assigned a bulk density of 2.34 in the oxide zone and 2.70 in the sulphide zone, based on weighted average measurement in each zone.

Updated Cerro Quema Pre-Feasibility Study NI 43-101 Technical Report
Kappes, Cassiday & Associates 14.0 Mineral Resource Estimate January, 2022 Page 14-18
Table 14-17 Density by Deposit, Zone and Recovery
Area Zone High Recovery Moderate Recovery Low Recovery
Alteration Domain Alteration Domain Alteration Domain 1 2 3 none 1 2 3 none 1 2 3 none
Quema-Quemita
Oxide 2.41 2.36 2.23 2.32 2.35 2.31 2.13 2.27 2.27 2.23 2.12 2.2 Mixed 2.58 2.51 2.36 2.64 2.58 2.51 2.36 2.64 2.58 2.51 2.36 2.64 Sulphides 2.67 2.7 2.62 2.64 2.67 2.7 2.62 2.64 2.67 2.7 2.62 2.64
Pava Oxide 2.46 2.42 2.27 2.44 --- --- --- --- 2.24 2.21 2.12 2.22 Mixed 2.64 2.66 2.56 2.71 --- --- --- --- 2.64 2.66 2.56 2.71 Sulphides 2.71 2.71 2.75 2.67 --- --- --- --- 2.71 2.71 2.75 2.67
Figure 14-12 Core Recovery Zones used for Density Assignments – Quema-Quemita
(MMTS, 2021)
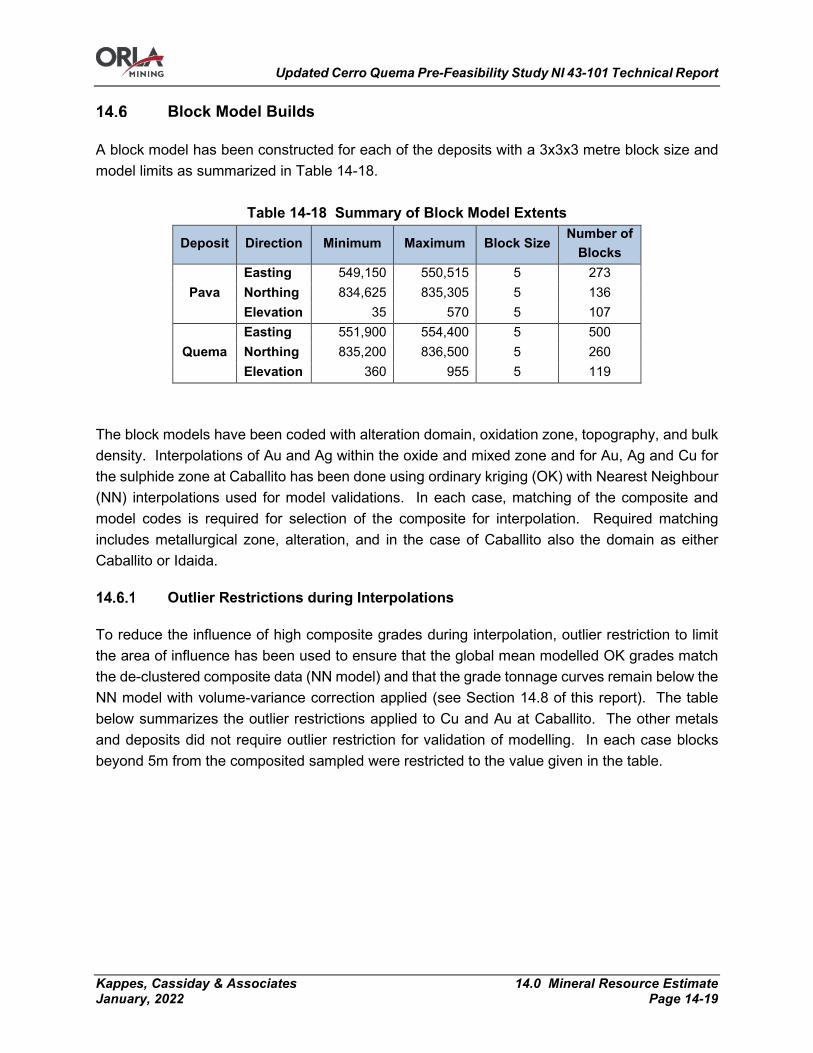
Updated Cerro Quema Pre-Feasibility Study NI 43-101 Technical Report
Kappes, Cassiday & Associates 14.0 Mineral Resource Estimate January, 2022 Page 14-19
Block Model Builds
A block model has been constructed for each of the deposits with a 3x3x3 metre block size and model limits as summarized in Table 14-18.
Table 14-18 Summary of Block Model Extents
Deposit Direction Minimum Maximum Block Size Number of
Blocks
Pava Easting 549,150 550,515 5 273 Northing 834,625 835,305 5 136 Elevation 35 570 5 107
Quema Easting 551,900 554,400 5 500 Northing 835,200 836,500 5 260 Elevation 360 955 5 119
The block models have been coded with alteration domain, oxidation zone, topography, and bulk density. Interpolations of Au and Ag within the oxide and mixed zone and for Au, Ag and Cu for the sulphide zone at Caballito has been done using ordinary kriging (OK) with Nearest Neighbour (NN) interpolations used for model validations. In each case, matching of the composite and model codes is required for selection of the composite for interpolation. Required matching includes metallurgical zone, alteration, and in the case of Caballito also the domain as either Caballito or Idaida.
Outlier Restrictions during Interpolations
To reduce the influence of high composite grades during interpolation, outlier restriction to limit the area of influence has been used to ensure that the global mean modelled OK grades match the de-clustered composite data (NN model) and that the grade tonnage curves remain below the NN model with volume-variance correction applied (see Section 14.8 of this report). The table below summarizes the outlier restrictions applied to Cu and Au at Caballito. The other metals and deposits did not require outlier restriction for validation of modelling. In each case blocks beyond 5m from the composited sampled were restricted to the value given in the table.
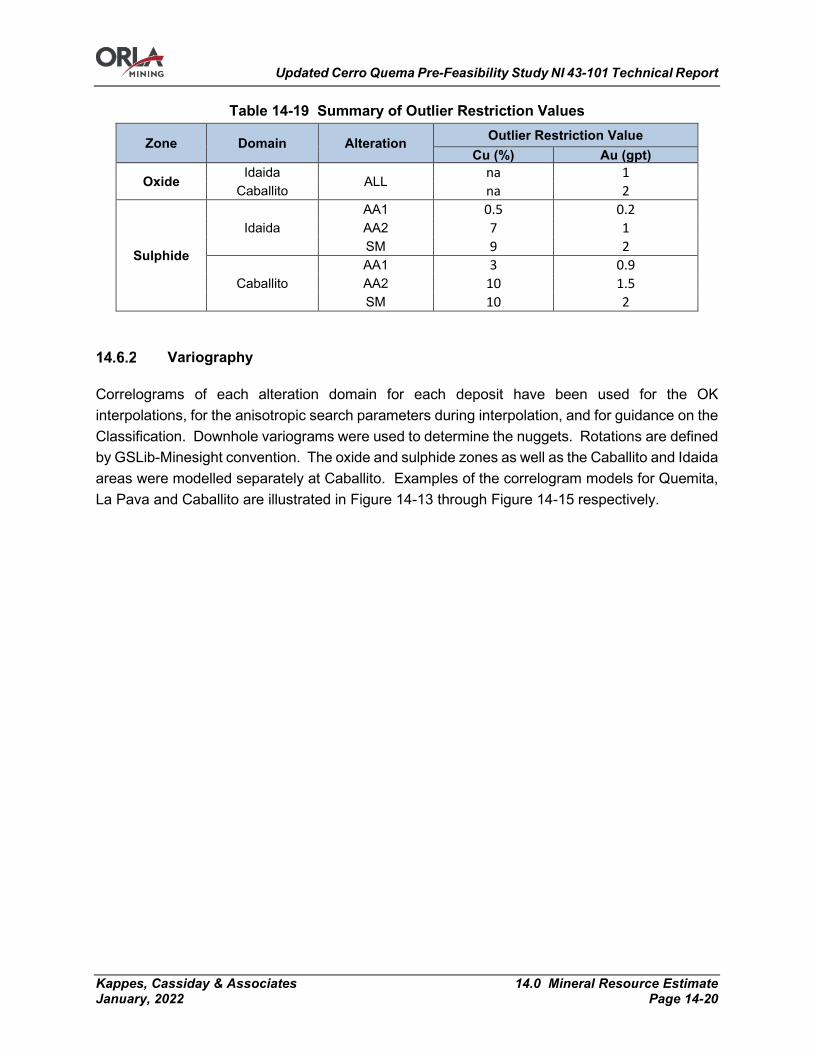
Updated Cerro Quema Pre-Feasibility Study NI 43-101 Technical Report
Kappes, Cassiday & Associates 14.0 Mineral Resource Estimate January, 2022 Page 14-20
Table 14-19 Summary of Outlier Restriction Values
Zone Domain Alteration Outlier Restriction Value Cu (%) Au (gpt)
Oxide Idaida ALL
na 1 Caballito na 2
Sulphide
Idaida AA1 0.5 0.2 AA2 7 1 SM 9 2
Caballito AA1 3 0.9 AA2 10 1.5 SM 10 2
Variography
Correlograms of each alteration domain for each deposit have been used for the OK interpolations, for the anisotropic search parameters during interpolation, and for guidance on the Classification. Downhole variograms were used to determine the nuggets. Rotations are defined by GSLib-Minesight convention. The oxide and sulphide zones as well as the Caballito and Idaida areas were modelled separately at Caballito. Examples of the correlogram models for Quemita, La Pava and Caballito are illustrated in Figure 14-13 through Figure 14-15 respectively.
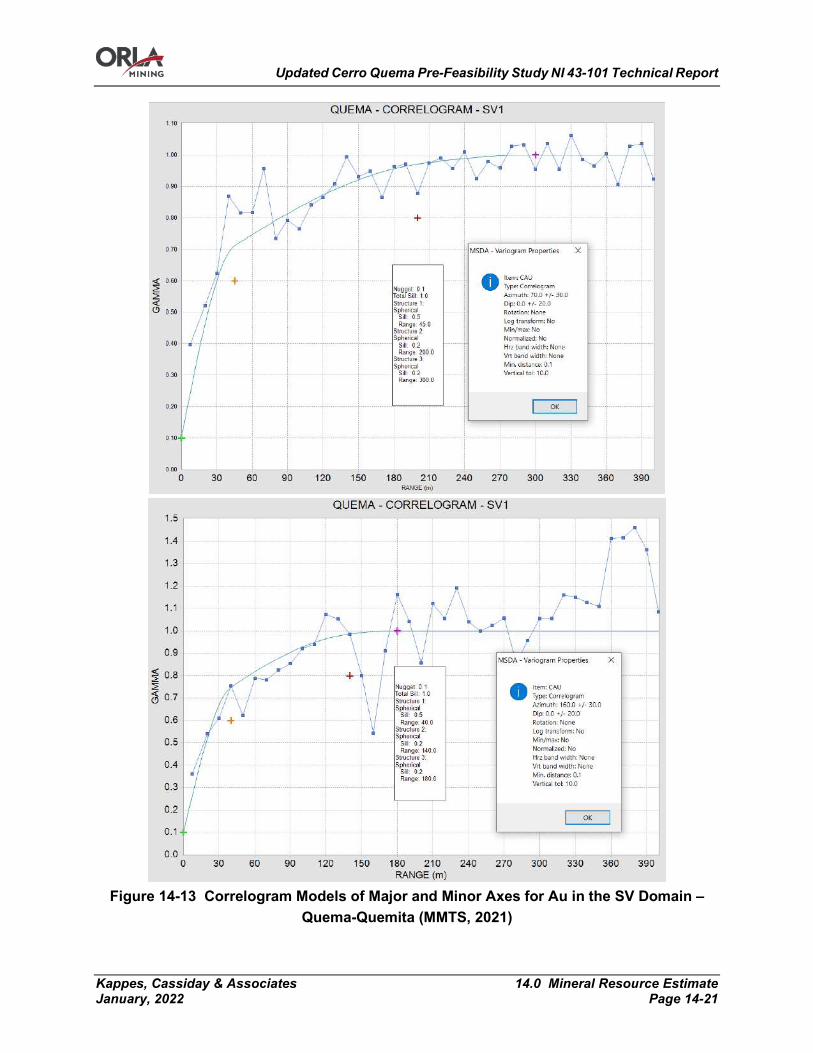
Updated Cerro Quema Pre-Feasibility Study NI 43-101 Technical Report
Kappes, Cassiday & Associates 14.0 Mineral Resource Estimate January, 2022 Page 14-21
Figure 14-13 Correlogram Models of Major and Minor Axes for Au in the SV Domain –
Quema-Quemita (MMTS, 2021)
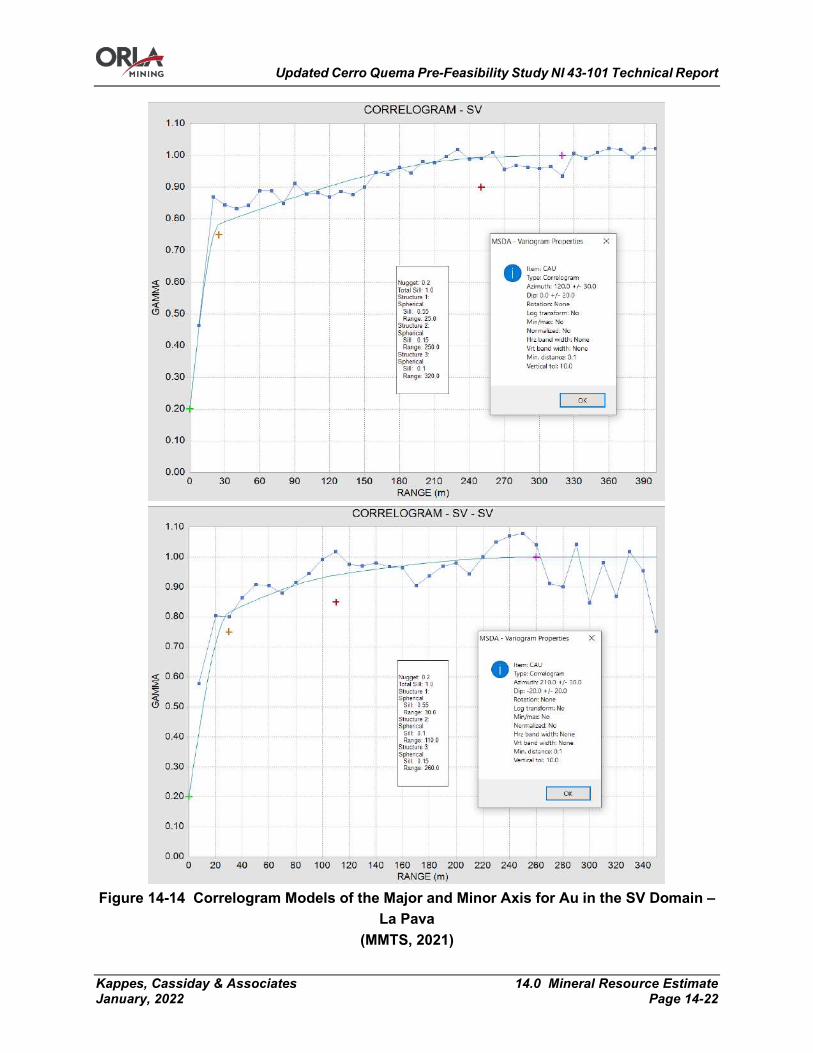
Updated Cerro Quema Pre-Feasibility Study NI 43-101 Technical Report
Kappes, Cassiday & Associates 14.0 Mineral Resource Estimate January, 2022 Page 14-22
Figure 14-14 Correlogram Models of the Major and Minor Axis for Au in the SV Domain –
La Pava (MMTS, 2021)
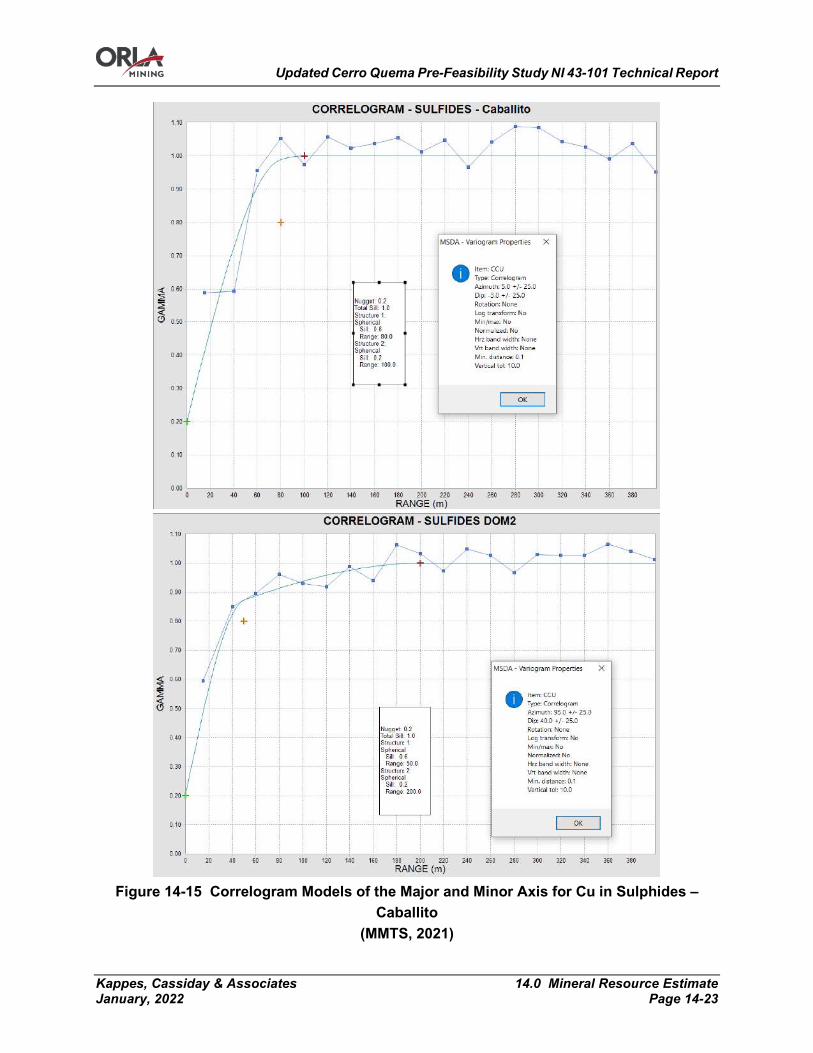
Updated Cerro Quema Pre-Feasibility Study NI 43-101 Technical Report
Kappes, Cassiday & Associates 14.0 Mineral Resource Estimate January, 2022 Page 14-23
Figure 14-15 Correlogram Models of the Major and Minor Axis for Cu in Sulphides –
Caballito (MMTS, 2021)

Updated Cerro Quema Pre-Feasibility Study NI 43-101 Technical Report
Kappes, Cassiday & Associates 14.0 Mineral Resource Estimate January, 2022 Page 14-24
The tables below summarize the variogram parameters for Quema-Quemita, La Pava and Caballito respectively. In the tables the following rotation conventions apply: RotZ-rotation about the z-axis (azimuth), DipN=rotation about the x-axis, or plunge of the new north axis, and DipE is the rotation about the y-axis or plunge of the x-axis.
Table 14-20 Variogram Parameters for Quema-Quemita
METAL ALTERATION Rotation (GSLIB-
MS) Axis
Total Range
(m) Nugget Sill1 Sill2 Sill3
Range 1 (m)
Range 2 (m)
Range 3 (m)
AU
AA1 ROT 70 Major 300
0.1 0.6 0.1 0.2 40 200 300
DIPN 0 Minor 200 20 120 200 DIPE 25 Vert 140 20 120 140
AA2 ROT 70 Major 300
0.1 0.6 0.1 0.2 40 200 300
DIPN 0 Minor 200 20 120 200 DIPE 25 Vert 140 20 120 140
SV1 ROT 70 Major 300
0.1 0.5 0.2 0.2 45 200 300
DIPN 0 Minor 180 40 140 180 DIPE 0 Vert 120 20 80 120
AG
AA1 ROT 60 Major 120
0.2 0.6 0.2 30 120
DIPN 0 Minor 100 20 100 DIPE 25 Vert 50 15 50
AA2 ROT 60 Major 120
0.2 0.6 0.2 30 120
DIPN 0 Minor 100 20 100 DIPE 25 Vert 50 15 50
SV1 ROT 115 Major 120
0.3 0.3 0.3 0.1 40 90 120
DIPN 0 Minor 100 30 80 100 DIPE -10 Vert 90 15 70 90
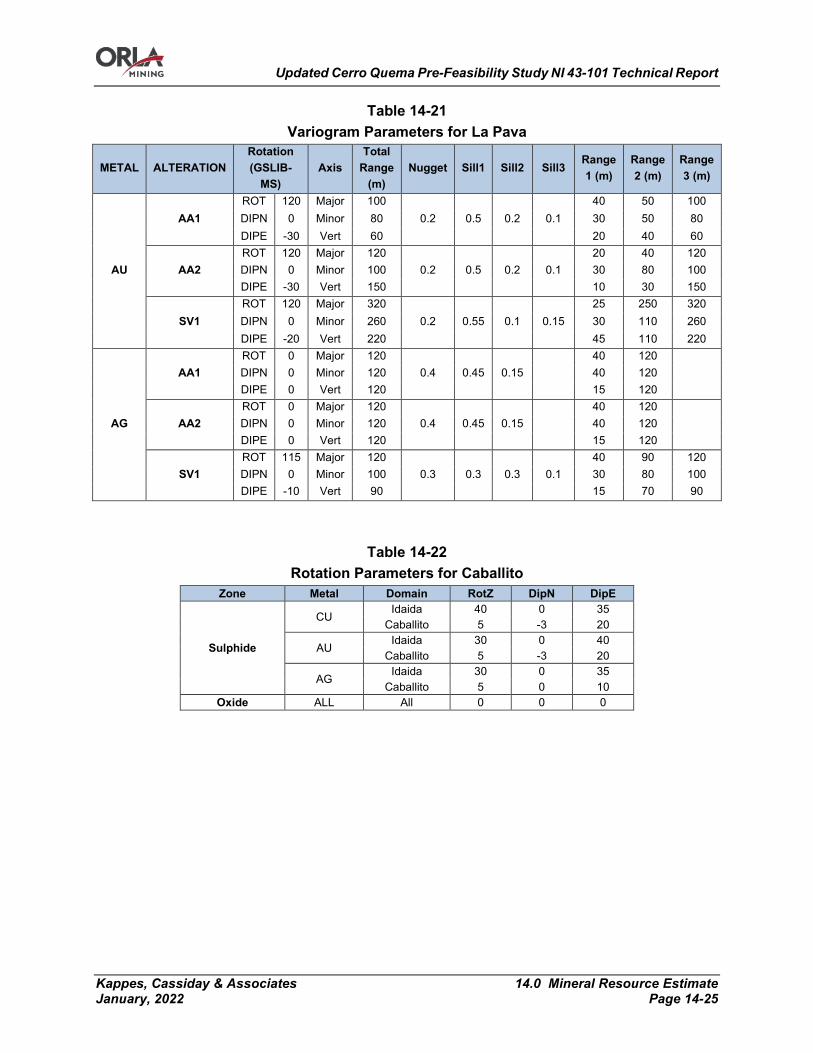
Updated Cerro Quema Pre-Feasibility Study NI 43-101 Technical Report
Kappes, Cassiday & Associates 14.0 Mineral Resource Estimate January, 2022 Page 14-25
Table 14-21 Variogram Parameters for La Pava
METAL ALTERATION Rotation (GSLIB-
MS) Axis
Total Range
(m) Nugget Sill1 Sill2 Sill3
Range 1 (m)
Range 2 (m)
Range 3 (m)
AU
AA1 ROT 120 Major 100
0.2 0.5 0.2 0.1 40 50 100
DIPN 0 Minor 80 30 50 80 DIPE -30 Vert 60 20 40 60
AA2 ROT 120 Major 120
0.2 0.5 0.2 0.1 20 40 120
DIPN 0 Minor 100 30 80 100 DIPE -30 Vert 150 10 30 150
SV1 ROT 120 Major 320
0.2 0.55 0.1 0.15 25 250 320
DIPN 0 Minor 260 30 110 260 DIPE -20 Vert 220 45 110 220
AG
AA1 ROT 0 Major 120
0.4 0.45 0.15 40 120
DIPN 0 Minor 120 40 120 DIPE 0 Vert 120 15 120
AA2 ROT 0 Major 120
0.4 0.45 0.15 40 120
DIPN 0 Minor 120 40 120 DIPE 0 Vert 120 15 120
SV1 ROT 115 Major 120
0.3 0.3 0.3 0.1 40 90 120
DIPN 0 Minor 100 30 80 100 DIPE -10 Vert 90 15 70 90
Table 14-22 Rotation Parameters for Caballito
Zone Metal Domain RotZ DipN DipE
Sulphide
CU Idaida 40 0 35
Caballito 5 -3 20
AU Idaida 30 0 40
Caballito 5 -3 20
AG Idaida 30 0 35
Caballito 5 0 10 Oxide ALL All 0 0 0

Updated Cerro Quema Pre-Feasibility Study NI 43-101 Technical Report
Kappes, Cassiday & Associates 14.0 Mineral Resource Estimate January, 2022 Page 14-26
Table 14-23 Variogram Parameters for Caballito
Ranges - Spherical - 1 Ranges - Spherical - 2
Zone Metal Domain C0 C1 C2 Y ("Major")
X ("Minor")
Z ("Vert")
Y ("Major")
X ("Minor")
Z ("Vert")
Sulphide
AU Idaida 0.3 0.3 0.4 60 50 25 300 200 100 Caballito 0.1 0.7 0.2 170 110 120 200 160 160
CU Idaida 0.2 0.6 0.2 90 30 18 220 200 30 Caballito 0.2 0.6 0.2 80 50 30 100 200 140
AG Idaida 0.1 0.7 0.2 60 80 20 350 300 80 Caballito 0.1 0.7 0.2 50 50 25 250 180 150
Oxide AU
All 0.2 0.8 180 180 18
CU 0.2 0.6 0.2 60 60 18 180 180 25 AG 0.4 0.4 0.2 20 20 20 60 60 60
Search Parameters
The interpolations were completed in 5 passes of varying search distances and sample selection criterion. Table 14-24 through Table 14-26 summarize the search parameters for each pass in Quema-Quemita, La Pava and Caballito respectively. Table 14-27 summarizes the sample selection criteria, ensuring at least 2 drillholes from 2 different quadrant are used for the interpolations.
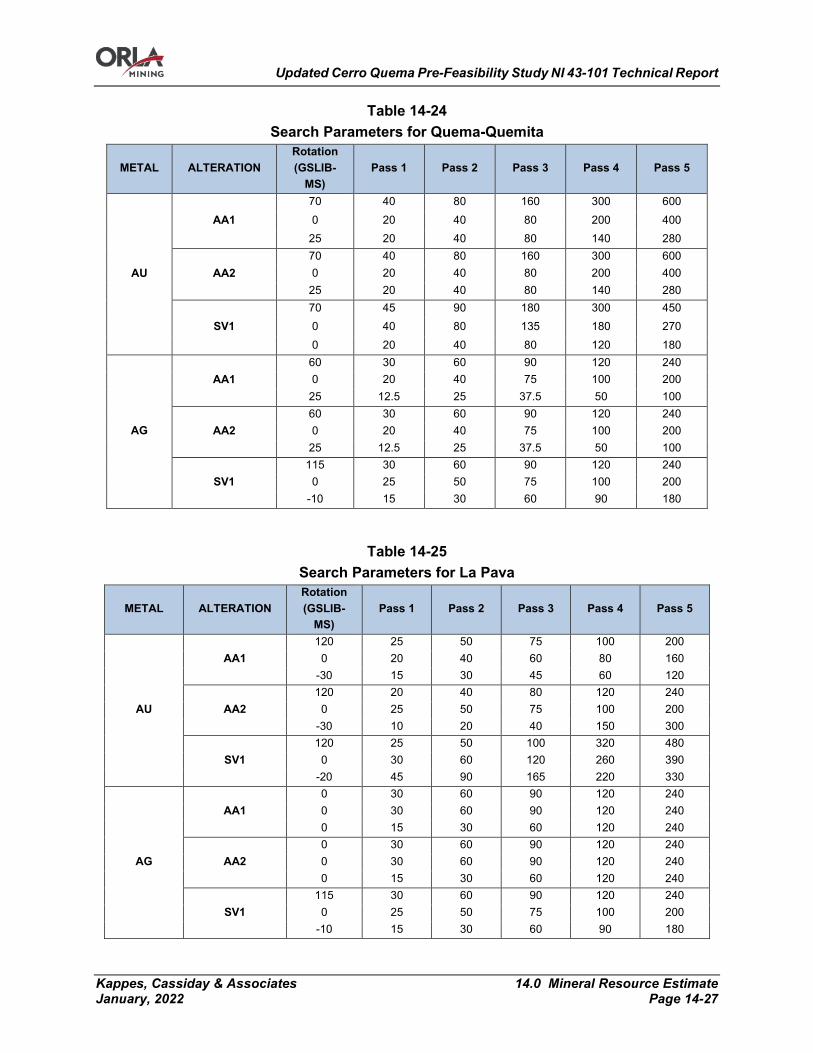
Updated Cerro Quema Pre-Feasibility Study NI 43-101 Technical Report
Kappes, Cassiday & Associates 14.0 Mineral Resource Estimate January, 2022 Page 14-27
Table 14-24 Search Parameters for Quema-Quemita
METAL ALTERATION Rotation (GSLIB-
MS) Pass 1 Pass 2 Pass 3 Pass 4 Pass 5
AU
AA1 70 40 80 160 300 600 0 20 40 80 200 400
25 20 40 80 140 280
AA2 70 40 80 160 300 600 0 20 40 80 200 400
25 20 40 80 140 280
SV1 70 45 90 180 300 450 0 40 80 135 180 270 0 20 40 80 120 180
AG
AA1 60 30 60 90 120 240 0 20 40 75 100 200
25 12.5 25 37.5 50 100
AA2 60 30 60 90 120 240 0 20 40 75 100 200
25 12.5 25 37.5 50 100
SV1 115 30 60 90 120 240
0 25 50 75 100 200 -10 15 30 60 90 180
Table 14-25 Search Parameters for La Pava
METAL ALTERATION Rotation (GSLIB-
MS) Pass 1 Pass 2 Pass 3 Pass 4 Pass 5
AU
AA1 120 25 50 75 100 200
0 20 40 60 80 160 -30 15 30 45 60 120
AA2 120 20 40 80 120 240
0 25 50 75 100 200 -30 10 20 40 150 300
SV1 120 25 50 100 320 480
0 30 60 120 260 390 -20 45 90 165 220 330
AG
AA1 0 30 60 90 120 240 0 30 60 90 120 240 0 15 30 60 120 240
AA2 0 30 60 90 120 240 0 30 60 90 120 240 0 15 30 60 120 240
SV1 115 30 60 90 120 240
0 25 50 75 100 200 -10 15 30 60 90 180

Updated Cerro Quema Pre-Feasibility Study NI 43-101 Technical Report
Kappes, Cassiday & Associates 14.0 Mineral Resource Estimate January, 2022 Page 14-28
Table 14-26 Search Parameters for Caballito
Cu
Zone Domain Axis Dist1 Dist2 Dist3 Dist4 Dist5
Sulphides
Idaida Major 55 110 165 220 440 Minor 30 60 90 200 400
Vertical 7.5 15 22.5 30 60
Caballito Major 25 50 75 100 200 Minor 50 100 150 200 400
Vertical 30 60 90 140 280
Oxides All Major 45 90 135 180 360 Minor 45 90 135 180 360
Vertical 6.25 12.5 18.75 25 50
Au
Sulphides
Idaida Major 60 120 180 300 600 Minor 50 100 150 200 400
Vertical 25 50 75 100 200
Caballito Major 50 100 150 200 400 Minor 40 80 120 160 320
Vertical 40 80 120 160 320
Oxides All Major 45 90 135 180 360 Minor 45 90 135 180 360
Vertical 4.5 9 13.5 18 36
Ag
Sulphides
Idaida Major 55 110 165 220 440 Minor 30 60 90 200 400
Vertical 7.5 15 22.5 30 60
Caballito Major 25 50 75 100 200 Minor 50 100 150 200 400
Vertical 30 60 90 140 280
Oxides All Major 45 90 135 180 360 Minor 45 90 135 180 360
Vertical 6.25 12.5 18.75 25 50
Table 14-27 Sample Selection Criteria for Interpolations
Criteria All Passes Minimum # composites 4 Maximum # composites 12 Maximum / drillhole 3 Maximum / quadrant 2
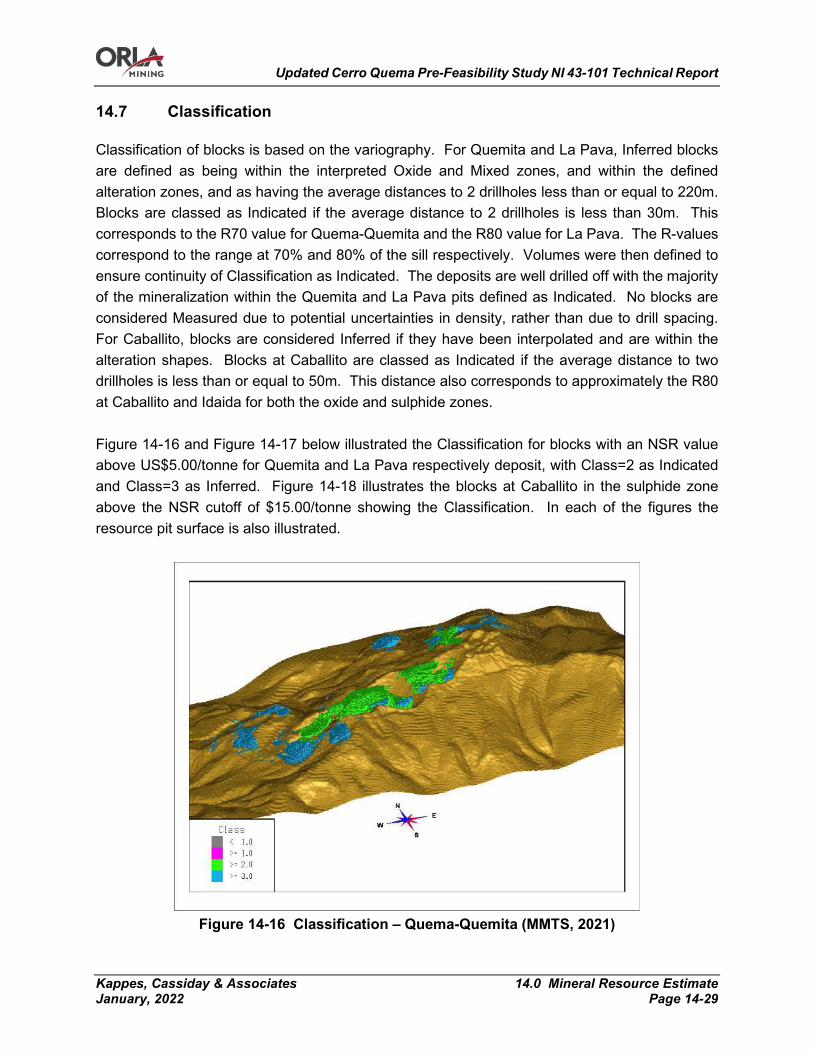
Updated Cerro Quema Pre-Feasibility Study NI 43-101 Technical Report
Kappes, Cassiday & Associates 14.0 Mineral Resource Estimate January, 2022 Page 14-29
Classification
Classification of blocks is based on the variography. For Quemita and La Pava, Inferred blocks are defined as being within the interpreted Oxide and Mixed zones, and within the defined alteration zones, and as having the average distances to 2 drillholes less than or equal to 220m. Blocks are classed as Indicated if the average distance to 2 drillholes is less than 30m. This corresponds to the R70 value for Quema-Quemita and the R80 value for La Pava. The R-values correspond to the range at 70% and 80% of the sill respectively. Volumes were then defined to ensure continuity of Classification as Indicated. The deposits are well drilled off with the majority of the mineralization within the Quemita and La Pava pits defined as Indicated. No blocks are considered Measured due to potential uncertainties in density, rather than due to drill spacing. For Caballito, blocks are considered Inferred if they have been interpolated and are within the alteration shapes. Blocks at Caballito are classed as Indicated if the average distance to two drillholes is less than or equal to 50m. This distance also corresponds to approximately the R80 at Caballito and Idaida for both the oxide and sulphide zones. Figure 14-16 and Figure 14-17 below illustrated the Classification for blocks with an NSR value above US$5.00/tonne for Quemita and La Pava respectively deposit, with Class=2 as Indicated and Class=3 as Inferred. Figure 14-18 illustrates the blocks at Caballito in the sulphide zone above the NSR cutoff of $15.00/tonne showing the Classification. In each of the figures the resource pit surface is also illustrated.
Figure 14-16 Classification – Quema-Quemita (MMTS, 2021)
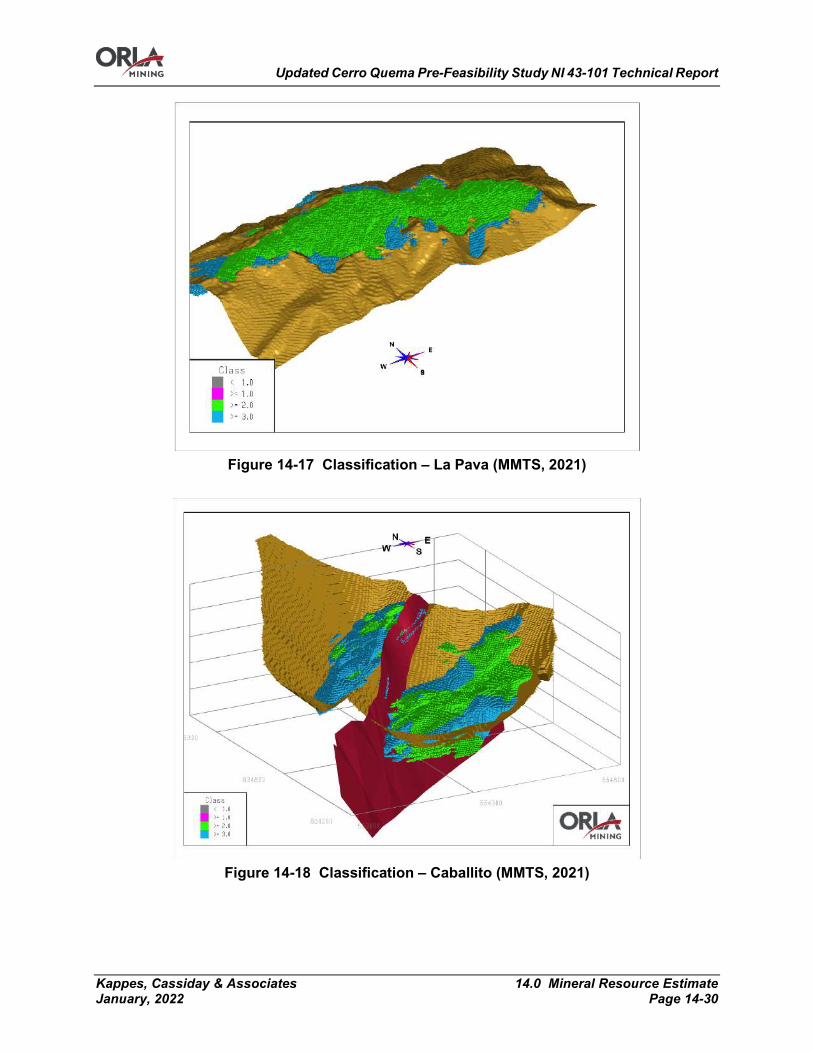
Updated Cerro Quema Pre-Feasibility Study NI 43-101 Technical Report
Kappes, Cassiday & Associates 14.0 Mineral Resource Estimate January, 2022 Page 14-30
Figure 14-17 Classification – La Pava (MMTS, 2021)
Figure 14-18 Classification – Caballito (MMTS, 2021)
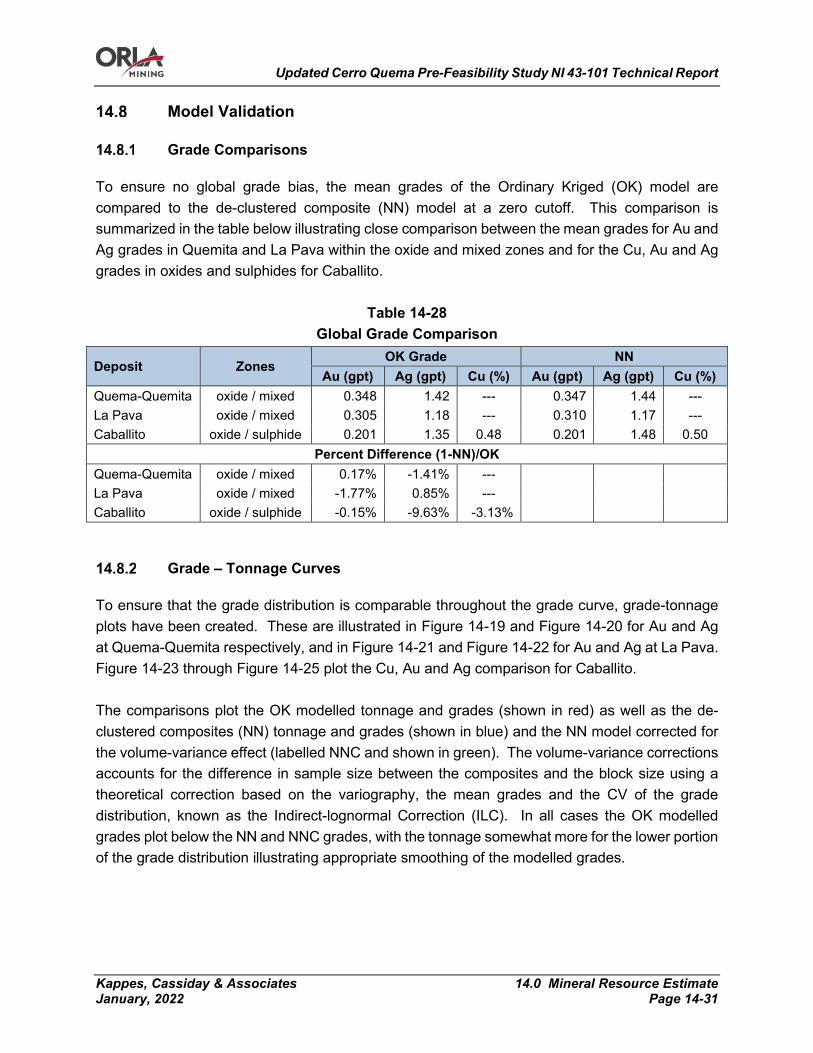
Updated Cerro Quema Pre-Feasibility Study NI 43-101 Technical Report
Kappes, Cassiday & Associates 14.0 Mineral Resource Estimate January, 2022 Page 14-31
Model Validation
Grade Comparisons
To ensure no global grade bias, the mean grades of the Ordinary Kriged (OK) model are compared to the de-clustered composite (NN) model at a zero cutoff. This comparison is summarized in the table below illustrating close comparison between the mean grades for Au and Ag grades in Quemita and La Pava within the oxide and mixed zones and for the Cu, Au and Ag grades in oxides and sulphides for Caballito.
Table 14-28 Global Grade Comparison
Deposit Zones OK Grade NN
Au (gpt) Ag (gpt) Cu (%) Au (gpt) Ag (gpt) Cu (%) Quema-Quemita oxide / mixed 0.348 1.42 --- 0.347 1.44 --- La Pava oxide / mixed 0.305 1.18 --- 0.310 1.17 --- Caballito oxide / sulphide 0.201 1.35 0.48 0.201 1.48 0.50
Percent Difference (1-NN)/OK Quema-Quemita oxide / mixed 0.17% -1.41% --- La Pava oxide / mixed -1.77% 0.85% --- Caballito oxide / sulphide -0.15% -9.63% -3.13%
Grade – Tonnage Curves
To ensure that the grade distribution is comparable throughout the grade curve, grade-tonnage plots have been created. These are illustrated in Figure 14-19 and Figure 14-20 for Au and Ag at Quema-Quemita respectively, and in Figure 14-21 and Figure 14-22 for Au and Ag at La Pava. Figure 14-23 through Figure 14-25 plot the Cu, Au and Ag comparison for Caballito. The comparisons plot the OK modelled tonnage and grades (shown in red) as well as the de-clustered composites (NN) tonnage and grades (shown in blue) and the NN model corrected for the volume-variance effect (labelled NNC and shown in green). The volume-variance corrections accounts for the difference in sample size between the composites and the block size using a theoretical correction based on the variography, the mean grades and the CV of the grade distribution, known as the Indirect-lognormal Correction (ILC). In all cases the OK modelled grades plot below the NN and NNC grades, with the tonnage somewhat more for the lower portion of the grade distribution illustrating appropriate smoothing of the modelled grades.

Updated Cerro Quema Pre-Feasibility Study NI 43-101 Technical Report
Kappes, Cassiday & Associates 14.0 Mineral Resource Estimate January, 2022 Page 14-32
Figure 14-19 Grade-Tonnage Curve – Quema-Quemita – Au (MMTS, 2021)
Figure 14-20 Grade-Tonnage Curve – Quema-Quemita – Ag (MMTS, 2021)

Updated Cerro Quema Pre-Feasibility Study NI 43-101 Technical Report
Kappes, Cassiday & Associates 14.0 Mineral Resource Estimate January, 2022 Page 14-33
Figure 14-21 Grade-Tonnage Curve – La Pava – Au (MMTS, 2021)
Figure 14-22 Grade-Tonnage Curve – La Pava – Ag (MMTS, 2021)
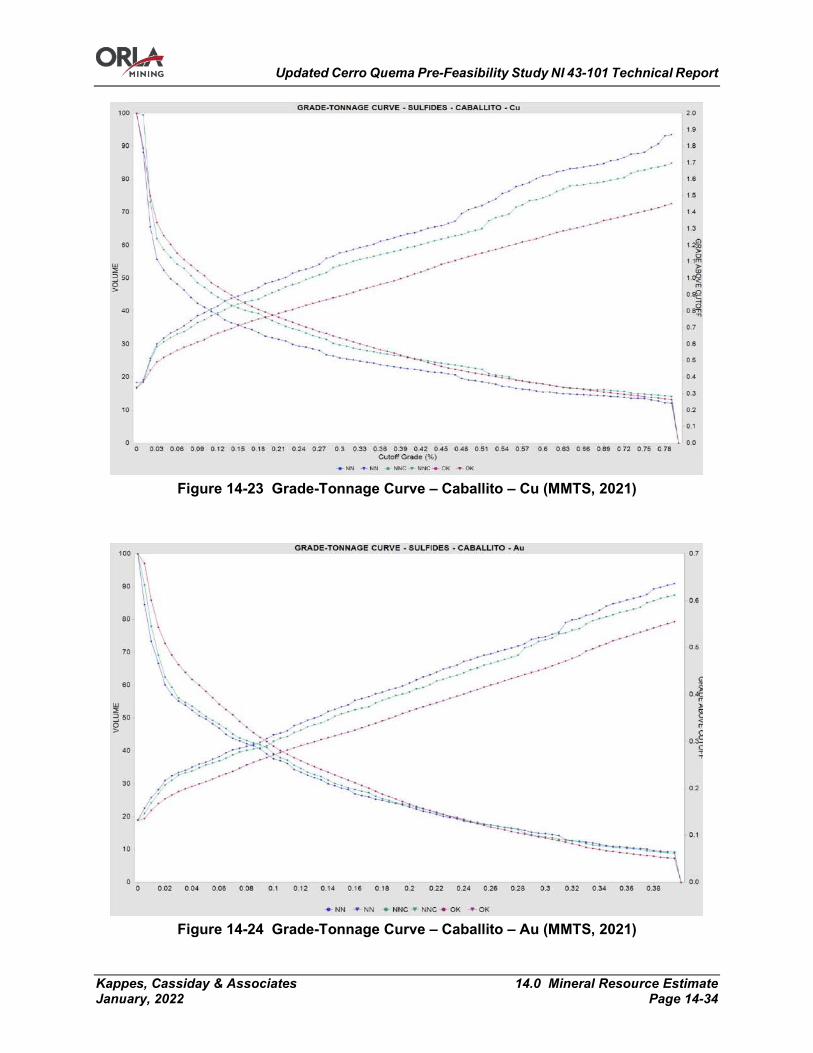
Updated Cerro Quema Pre-Feasibility Study NI 43-101 Technical Report
Kappes, Cassiday & Associates 14.0 Mineral Resource Estimate January, 2022 Page 14-34
Figure 14-23 Grade-Tonnage Curve – Caballito – Cu (MMTS, 2021)
Figure 14-24 Grade-Tonnage Curve – Caballito – Au (MMTS, 2021)

Updated Cerro Quema Pre-Feasibility Study NI 43-101 Technical Report
Kappes, Cassiday & Associates 14.0 Mineral Resource Estimate January, 2022 Page 14-35
Figure 14-25 Grade-Tonnage Curve – Caballito – Ag (MMTS, 2021)
Visual Comparison
The gold and silver grades have been compared for both deposits in section and plan views to ensure that grades conform to the distribution of the drillholes and alteration domains. Figure 14-26 and Figure 14-27 are cross-sections through the west areas of the Quema-Quemita pit illustrating the Au and Ag grade comparisons. Figure 14-28 and Figure 14-29 are cross sections through the east portion of the Quema-Quemita pit illustrating the Au and Ag grade comparisons. Figure 14-30 illustrated the Au grade comparison through the central area of the La Pava resource pit and Figure 14-31 is the Cu grade comparison through the Caballito resource pit. In each section illustrated, and throughout the deposit, the modelled grade distribution correlates with the assay grades.
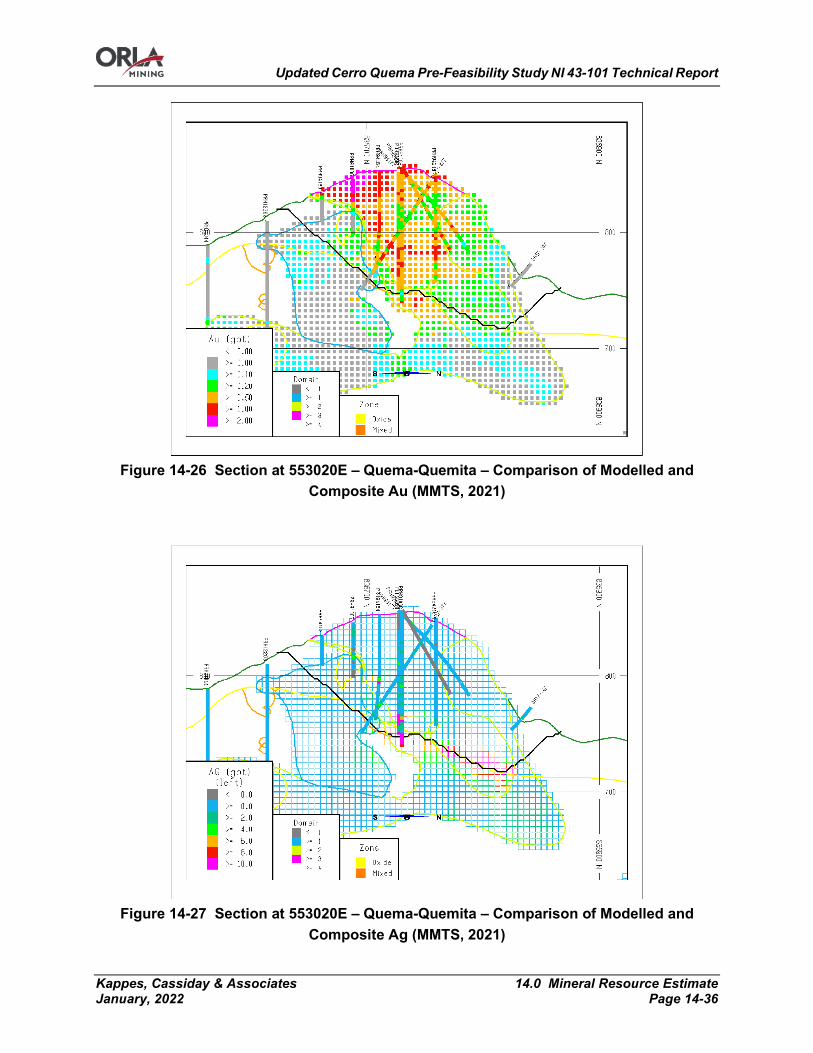
Updated Cerro Quema Pre-Feasibility Study NI 43-101 Technical Report
Kappes, Cassiday & Associates 14.0 Mineral Resource Estimate January, 2022 Page 14-36
Figure 14-26 Section at 553020E – Quema-Quemita – Comparison of Modelled and
Composite Au (MMTS, 2021)
Figure 14-27 Section at 553020E – Quema-Quemita – Comparison of Modelled and
Composite Ag (MMTS, 2021)

Updated Cerro Quema Pre-Feasibility Study NI 43-101 Technical Report
Kappes, Cassiday & Associates 14.0 Mineral Resource Estimate January, 2022 Page 14-37
Figure 14-28 Section at 553160E – Quema-Quemita – Comparison of Modelled and
Composite Au (MMTS, 2021)
Figure 14-29 Section at 553160E – Quema-Quemita – Comparison of Modelled and
Composite Ag Grades (+/- 15m) (MMTS, 2021)
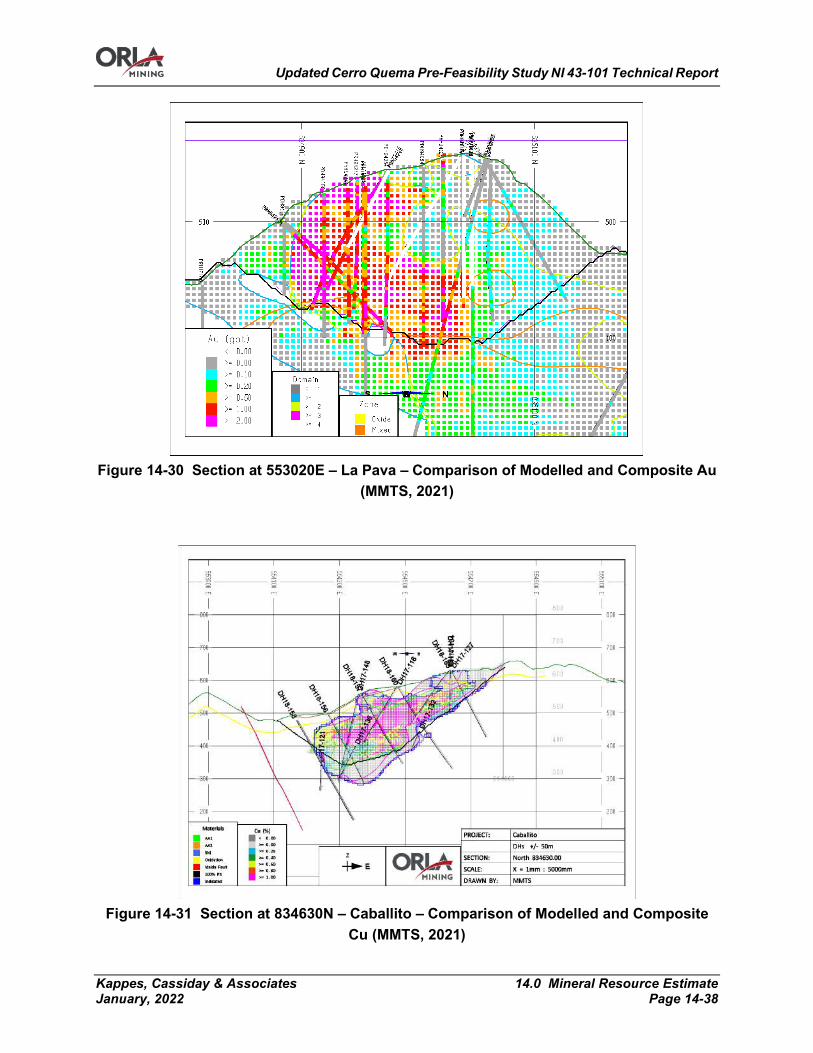
Updated Cerro Quema Pre-Feasibility Study NI 43-101 Technical Report
Kappes, Cassiday & Associates 14.0 Mineral Resource Estimate January, 2022 Page 14-38
Figure 14-30 Section at 553020E – La Pava – Comparison of Modelled and Composite Au
(MMTS, 2021)
Figure 14-31 Section at 834630N – Caballito – Comparison of Modelled and Composite
Cu (MMTS, 2021)

Updated Cerro Quema Pre-Feasibility Study NI 43-101 Technical Report
Kappes, Cassiday & Associates 14.0 Mineral Resource Estimate January, 2022 Page 14-39
Reasonable Prospects of Eventual Economic Extraction
Open pits to define the “reasonable prospects of eventual economic extraction” shapes have been created using Lerchs–Grossmann (LG) pit optimization on a series of pits with varying price assumptions. The base case parameters to calculate the Net Smelter Prices (NSPs) along with the recoveries used to calculate the Net Smelter Returns (NSR) are summarized in Table 14-29. by deposit and oxidation zone. For the LG pit optimizations, the processing and mining costs given in Table 14-30 are used. Constant pit slopes at 40º are used for the resource pit for all three deposits.
Table 14-29 Summary of Base Case Economic Inputs for NSR Calculation
Parameter Quemita / La Pava
Caballito - Oxides
Units Caballito - Sulphides
Units
Gold Price $1,600 $1,600 US$/oz $1,600 US$/oz Silver Price $18 $20 US$/oz $20 US$/oz Copper Price na na US$/lb $3.50 US$/lb
Gold Payable 99.9 99 % 90 % Silver Payable 98.0 98.0 % 90 % Copper Payable na na 96 % Gold Offsites 1.40 1.40 US$/oz 16.30 US$/WMT Silver Offsites 1.20 1.20 US$/oz 3.20 US$/WMT Copper Offsites na na 116.50 US$/WMT
Royalty – Au, Ag 4 4 % 4 % Royalty - Cu na na 5 %
Process Recoveries: Deposit Zones Recovery Units
Quema-Quemita - Gold
Oxide / Mixed
86 % Quema-Quemita - Silver 15 %
La Pava - Gold 88 % La Pava - Silver 30 %
Caballito – Gold Oxide
88 % Caballito – Silver 45 %
Caballito – Gold 55 % Caballito – Silver Sulphide 45 % Caballito - Copper 90 %

Updated Cerro Quema Pre-Feasibility Study NI 43-101 Technical Report
Kappes, Cassiday & Associates 14.0 Mineral Resource Estimate January, 2022 Page 14-40
Table 14-30 Summary of Cost Parameters used for Lerchs-Grossman Pits
Processing Costs and G&A Costs Quema-Quemita 5.80 US$/tonne mineralized material La Pava 6.34 US$/tonne mineralized material Caballito - Oxides 6.34 US$/tonne mineralized material Caballito - Sulphides 15.00 US$/tonne mineralized material
Mining Costs Quema-Quemita - Mineralized 2.56 US$/tonne mined Quema-Quemita - Waste 2.40 US$/tonne mined La Pava - Mineralized 2.04 US$/tonne mined La Pava - Waste 2.29 US$/tonne mined Caballito – all 2.20 US$/tonne mined
The reasonable prospects for eventual economic extraction pits have been created using the above parameters, the 125% price case pit for La Pava and Quemita, and the 100% price case pit for Caballito. The cutoff grade used for the resource tables is the same as that used for the reserves and is based on the estimated Processing and General and Administration (G&A) costs. The resulting pit shapes for “reasonable prospects of eventual economic extraction” are illustrated in all previous figures showing grade comparisons, classification, drilling, etc. both in this chapter and in Section 10.
Factors That May Affect the Mineral Resource Estimate
Areas of uncertainty that may materially impact the Mineral Resource estimate include:
• Commodity price assumptions; • Metal recovery assumptions; • Mining and processing cost assumptions.
There are no other known factors or issues known to the QP that materially affect the estimate other than normal risks faced by mining projects in terms of environmental, permitting, taxation, socio-economic, marketing, and political factors.
Risk Assessment
A description of potential risk factors is given in Table 14-31 along with either the justification for the approach taken or mitigating factors in place to reduce any risk.
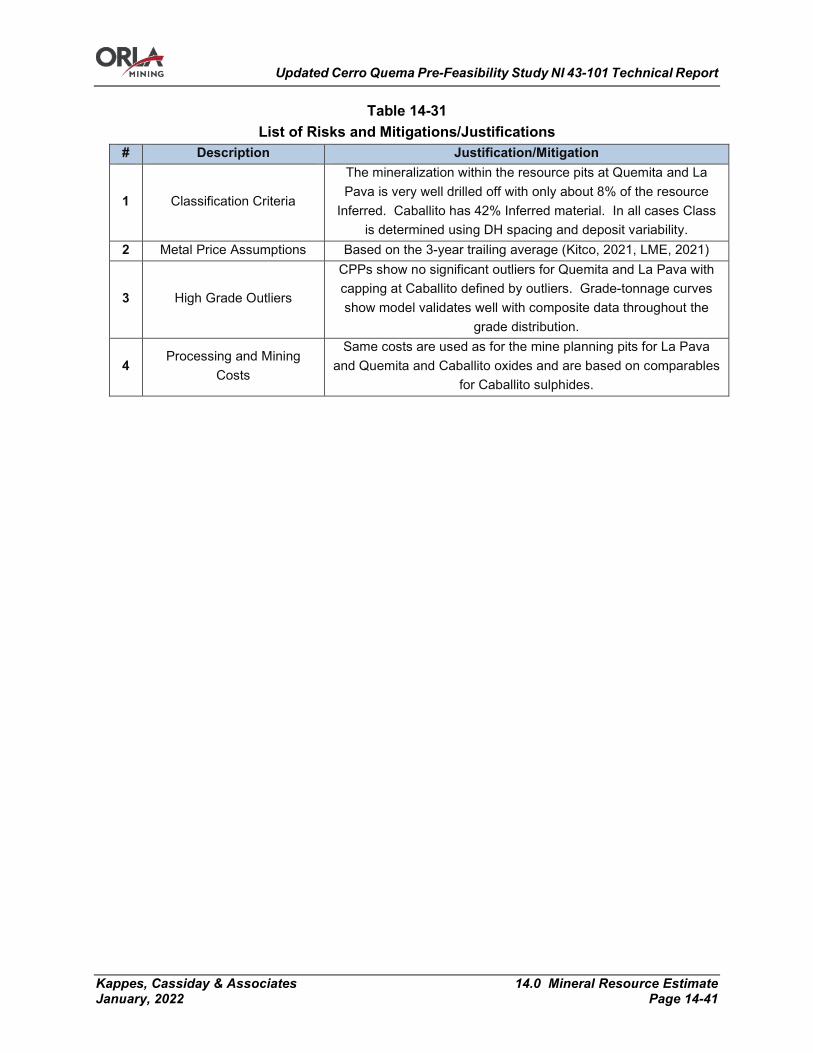
Updated Cerro Quema Pre-Feasibility Study NI 43-101 Technical Report
Kappes, Cassiday & Associates 14.0 Mineral Resource Estimate January, 2022 Page 14-41
Table 14-31 List of Risks and Mitigations/Justifications
# Description Justification/Mitigation
1 Classification Criteria
The mineralization within the resource pits at Quemita and La Pava is very well drilled off with only about 8% of the resource
Inferred. Caballito has 42% Inferred material. In all cases Class is determined using DH spacing and deposit variability.
2 Metal Price Assumptions Based on the 3-year trailing average (Kitco, 2021, LME, 2021)
3 High Grade Outliers
CPPs show no significant outliers for Quemita and La Pava with capping at Caballito defined by outliers. Grade-tonnage curves show model validates well with composite data throughout the
grade distribution.
4 Processing and Mining
Costs
Same costs are used as for the mine planning pits for La Pava and Quemita and Caballito oxides and are based on comparables
for Caballito sulphides.

Updated Cerro Quema Pre-Feasibility Study NI 43-101 Technical Report
Kappes, Cassiday & Associates 15.0 Mineral Reserve Estimate January, 2022 Page 15-1
15.0 MINERAL RESERVE ESTIMATE
Detailed pit designs are engineered from the results of the Lerchs-Grossman (LG) analysis outlined in Section 13.13. The contents of these designed pits are run through production scheduling software utilizing cut-off grade optimization and stockpiling to improve project NPV where possible. The Mineral Reserve estimate is based on the Crusher Feed tonnes and grades produced by the mine production schedule with the following minimum cut-off grades and dilution factors.
Cut-off Grade
The multiple metals along with varying metal grade ratios and process recoveries require that an economic cut-off grade is used for ore/waste definition. Net-Smelter-Return (NSR) values ($/t) are calculated for each mineralized block in the resource model using Base Case Net Smelter Prices (NSP). NSP is based on the market price and applies refining and transport costs to arrive at an internal price value. The NSP is used along with the metal grades and process recoveries to calculate the $/t value (NSR) of each mineralized block. NSP values used in the cut-off grade calculation are shown in the table below:
Table 15-1 Metal Prices and NSP (in US$)
Au Ag Metal Price ($/oz) $1,250 $17
% Payable 99.90% 98.00% Refining & Transport Cost ($/oz) $1.40 $1.20
Royalty (%) 4% 4% NSP ($/oz) $1,197.82 $14.84
NSP ($/gram) $38.51 $0.48 The process recoveries used in the NSR calculations are shown in the Table below:
Table 15-2 Process Recoveries for NSR Coding
Zone Au (La Pava) Au (Quema) Ag (La Pava) Ag (Quema) Oxide 88% 86% 30% 15% Mixed See formula See formula 10% 10%
Sulphide 55% 55% 0% 0%

Updated Cerro Quema Pre-Feasibility Study NI 43-101 Technical Report
Kappes, Cassiday & Associates 15.0 Mineral Reserve Estimate January, 2022 Page 15-2
Au Recovery in Mixed Zone: Rec Au = 0.9867*2.7183^(-0.1*% total sulphur)*100%-13% (where Rec Au cannot be less than 25%) NSR is calculated for and stored for each block as follows: NSR($/t) = [NSPAu($/g) * Au(g/t) *RecAu] + [NSPAg($/g) * Ag(g/t) * RecAg)] Where:
• NSPAu = Net Smelter Price for gold ($/gram)
• NSPAg = Net Smelter Price for silver ($/gram)
• Au(g/t) = Gold grade of the block in grams/tonne
• Ag(g/t) = Silver grade of the block in grams/tonne RecAu = Process Recovery for gold (%)
• RecAg = Process Recovery for silver (%)
The NSR value is used as the cut-off grade for Mineral Reserve calculations. Only the Oxide and Mixed zones are given economic value (Sulphides are not recovered). The Cut-off grade is summarized by pit and zone in Table 15-3. Blocks with NSR values lower than these cut-off grades are treated as waste.
Table 15-3 NSR Cut-off Grade by Pit Area and Zone
Zone La Pava ($/tonne)
Quema ($/tonne)
Oxide $6.34 $6.50 Mixed $9.18 $8.35 Sulphide n/a n/a
Dilution
Dilution is applied to in-situ material based on the number of waste contact edges of each block in the block model. The dilution per edge is estimated to be 15%, based on the size of the bucket of the primary loading unit relative to the 5x5x5 metre dimensions of the block model. Dilution grades are estimated based on the average grade of all blocks below the NSR cutoffs listed in Table 15-3, effectively the average grade of a waste block. Dilution grades are summarized in the table below:
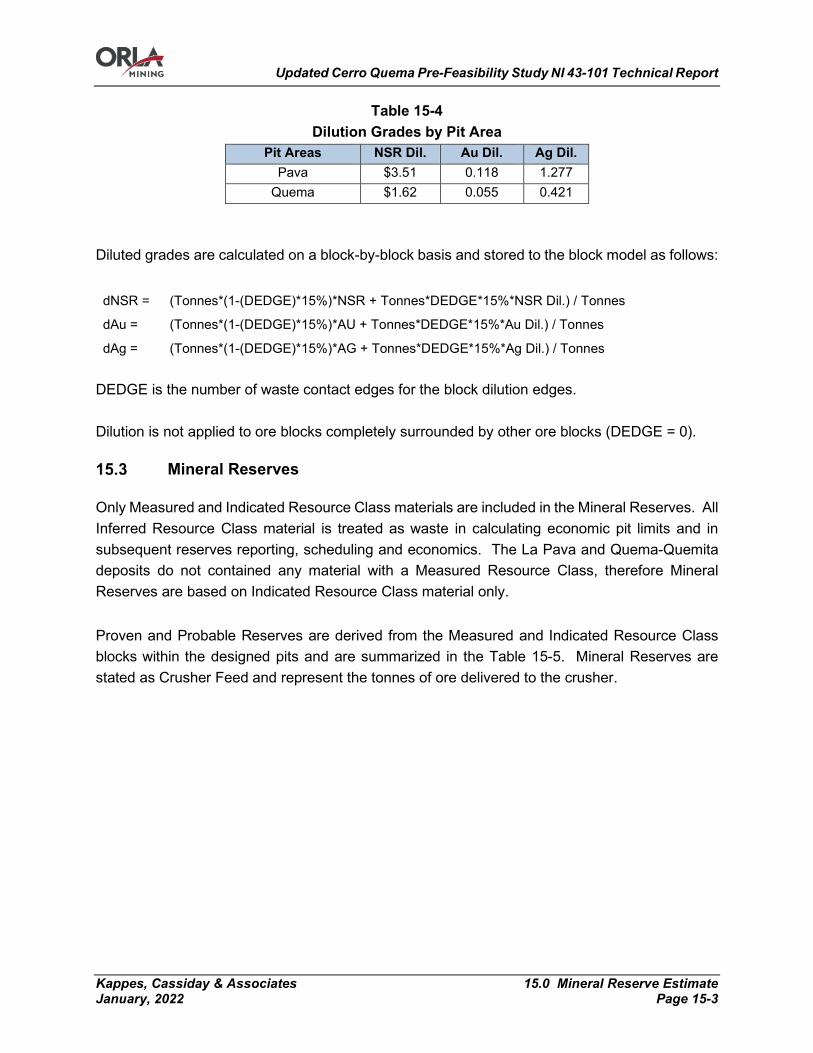
Updated Cerro Quema Pre-Feasibility Study NI 43-101 Technical Report
Kappes, Cassiday & Associates 15.0 Mineral Reserve Estimate January, 2022 Page 15-3
Table 15-4 Dilution Grades by Pit Area
Pit Areas NSR Dil. Au Dil. Ag Dil. Pava $3.51 0.118 1.277
Quema $1.62 0.055 0.421 Diluted grades are calculated on a block-by-block basis and stored to the block model as follows: dNSR = (Tonnes*(1-(DEDGE)*15%)*NSR + Tonnes*DEDGE*15%*NSR Dil.) / Tonnes
dAu = (Tonnes*(1-(DEDGE)*15%)*AU + Tonnes*DEDGE*15%*Au Dil.) / Tonnes
dAg = (Tonnes*(1-(DEDGE)*15%)*AG + Tonnes*DEDGE*15%*Ag Dil.) / Tonnes
DEDGE is the number of waste contact edges for the block dilution edges. Dilution is not applied to ore blocks completely surrounded by other ore blocks (DEDGE = 0).
Mineral Reserves
Only Measured and Indicated Resource Class materials are included in the Mineral Reserves. All Inferred Resource Class material is treated as waste in calculating economic pit limits and in subsequent reserves reporting, scheduling and economics. The La Pava and Quema-Quemita deposits do not contained any material with a Measured Resource Class, therefore Mineral Reserves are based on Indicated Resource Class material only. Proven and Probable Reserves are derived from the Measured and Indicated Resource Class blocks within the designed pits and are summarized in the Table 15-5. Mineral Reserves are stated as Crusher Feed and represent the tonnes of ore delivered to the crusher.

Updated Cerro Quema Pre-Feasibility Study NI 43-101 Technical Report
Kappes, Cassiday & Associates 15.0 Mineral Reserve Estimate January, 2022 Page 15-4
Table 15-5 Cerro Quema Mineral Reserve Statement
Crusher Feed (million)
Diluted Average Grades Contained Metal Au (g/t) Ag (g/t) Au – ‘000 ozs Ag – ‘000 ozs
La Pava Reserves Proven 0 0 0 0 0 Probable 15.7 0.79 2.27 400 1,148 Total 15.7 0.79 2.27 400 1,148
Quema Reserves Proven 0 0 0 0 0 Probable 6.0 0.83 1.95 161 378 Total 6.0 0.83 1.95 161 378
Total Reserves Proven 0 0 0 0 0 Probable 21.7 0.80 2.18 562 1,526 Total 21.7 0.80 2.18 562 1,526
1. The qualified person responsible for the Mineral Reserves is Jesse Aarsen, P.Eng of Moose Mountain Technical Services. Jesse Aarsen is independent of Orla Mining Ltd.
2. Only Oxide and Mixed material is included in the Mineral Reserve; all Sulphide material is treated as waste. 3. The minimum cut-off grade used for ore/waste determination is NSR>= $6.34/tonne for Oxide and $9.18 for Mixed at
the La Pava deposit and $6.50/tonne for Oxide and $8.35/tonne for Mixed at the Quema deposit. 4. Mineral Reserves have an effective date of April 22, 2021. All Mineral Reserves in this table are Proven and
Probable Mineral Reserves. The Mineral Reserves are not in addition to the Mineral Resources but are a subset thereof. All Mineral Reserves stated above include mining dilution, but no mining loss.
5. Associated metallurgical gold recoveries have been estimated as 86% for Oxide at the Quema deposit and 88% for Oxide at the La Pava deposit. Gold recoveries vary according to grade for Mixed material at both the La Pava and Quema deposits.
6. Associated metallurgical silver recoveries have been estimated as 15% for Oxide and 10% for Mixed material at the Quema deposit and 30% for Oxide and 10% for Mixed material at the La Pava deposit.
7. Reserves are based on a US$1,250/oz gold price, US$17/oz silver price. 8. Reserves are converted from resources through the process of pit optimization, pit design, production scheduling,
stockpiling, cut-off grade optimization and supported by a positive cash flow model. 9. Rounding as required by reporting guidelines may result in summation differences.
Updated Cerro Quema Pre-Feasibility Study NI 43-101 Technical Report
Kappes, Cassiday & Associates 16.0 Mining Methods January, 2022 Page 16-1
16.0 MINING METHODS
Introduction
A PFS level mine plan, mine production schedule, and mine capital and operating costs have been developed for the Project. The following section describes the results of the mine planning completed for this study, including: selection of ultimate pit limits, pit phase designs, haul road designs, mine production scheduling, mine operations planning, and mine fleet selection. The mine engineering in this study has been done with the Hexagon MinePlan® suite of programs. The mining model considers whole block tonnes and grades. All costs in this section are in US$ unless stated otherwise.
Mining Study Basis
Mine Planning Datum
Topography is based on UTM-WGS 1984 datum, Zone 17 North, Meter. 1-meter contour lines generated from this survey are used to form the topography surface used for Mineral Reserve and volume calculations.
Resource Classes
Only Indicated Resources are included in the Cerro Quema mine plan. There is no material in the block model with Measured Resource classification. Inferred Resources are treated as waste.
Other Mine Planning Criteria
Mine planning criteria includes process recoveries, cutoff grade estimation, and mining dilution, which are discussed in Section 15.0.
Economic Pit Limits
The economic pit limit is determined using the Lerchs Grossman (LG) algorithm. The algorithm considers the grades and tonnages for each block in the 3D block model and compares the expected costs to extract and process the block to the potential revenue from processing the block (if the block has grade in it). Each block is assigned with a net value (either positive or negative). Pit wall angle inputs determine which upper blocks need to be mined to extract lower economic blocks. The routine uses input economic and engineering parameters and expands upwards and outwards until incremental tonnages of the next thin skin or pushback would generate negative economics.
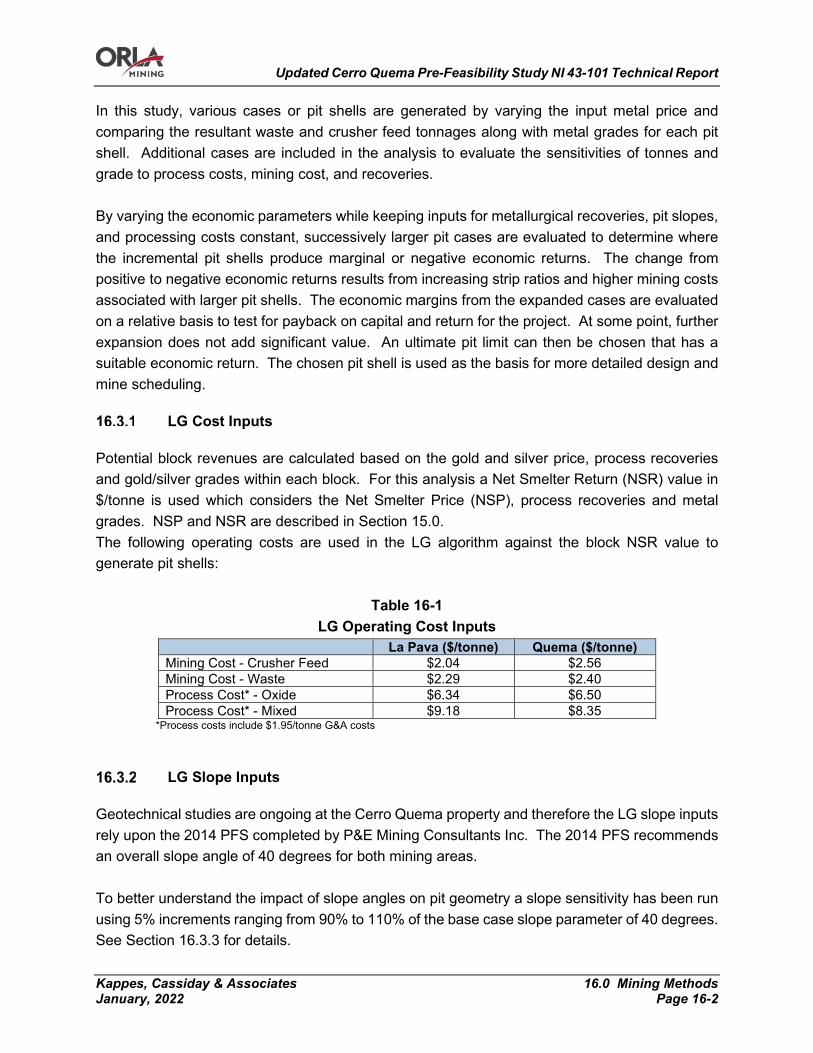
Updated Cerro Quema Pre-Feasibility Study NI 43-101 Technical Report
Kappes, Cassiday & Associates 16.0 Mining Methods January, 2022 Page 16-2
In this study, various cases or pit shells are generated by varying the input metal price and comparing the resultant waste and crusher feed tonnages along with metal grades for each pit shell. Additional cases are included in the analysis to evaluate the sensitivities of tonnes and grade to process costs, mining cost, and recoveries. By varying the economic parameters while keeping inputs for metallurgical recoveries, pit slopes, and processing costs constant, successively larger pit cases are evaluated to determine where the incremental pit shells produce marginal or negative economic returns. The change from positive to negative economic returns results from increasing strip ratios and higher mining costs associated with larger pit shells. The economic margins from the expanded cases are evaluated on a relative basis to test for payback on capital and return for the project. At some point, further expansion does not add significant value. An ultimate pit limit can then be chosen that has a suitable economic return. The chosen pit shell is used as the basis for more detailed design and mine scheduling.
LG Cost Inputs
Potential block revenues are calculated based on the gold and silver price, process recoveries and gold/silver grades within each block. For this analysis a Net Smelter Return (NSR) value in $/tonne is used which considers the Net Smelter Price (NSP), process recoveries and metal grades. NSP and NSR are described in Section 15.0. The following operating costs are used in the LG algorithm against the block NSR value to generate pit shells:
Table 16-1 LG Operating Cost Inputs
La Pava ($/tonne) Quema ($/tonne) Mining Cost - Crusher Feed $2.04 $2.56 Mining Cost - Waste $2.29 $2.40 Process Cost* - Oxide $6.34 $6.50 Process Cost* - Mixed $9.18 $8.35
*Process costs include $1.95/tonne G&A costs
LG Slope Inputs
Geotechnical studies are ongoing at the Cerro Quema property and therefore the LG slope inputs rely upon the 2014 PFS completed by P&E Mining Consultants Inc. The 2014 PFS recommends an overall slope angle of 40 degrees for both mining areas. To better understand the impact of slope angles on pit geometry a slope sensitivity has been run using 5% increments ranging from 90% to 110% of the base case slope parameter of 40 degrees. See Section 16.3.3 for details.

Updated Cerro Quema Pre-Feasibility Study NI 43-101 Technical Report
Kappes, Cassiday & Associates 16.0 Mining Methods January, 2022 Page 16-3
LG Sensitivity Cases
The economic pit limits are based on the current cost and metal price assumptions. Since these economic parameters are estimates prior to detailed cost estimations, the sensitivity of the ultimate economic pit limits is evaluated to test the robustness of the selected pit limit. This is done by varying the economic parameters in a series of cases. The pit shells generated from these cases are also used to evaluate potential pit pushbacks or phases. For this analysis, the input gold and silver prices are varied in 5% increments ranging from 30% to 130% of the base case prices. This results in metal prices as outlined in Table 16-2. The operating costs and slope angle are kept constant in this analysis. This is not a price sensitivity, as cut-off grades are not varied when calculating the contents of the resultant pit shells.
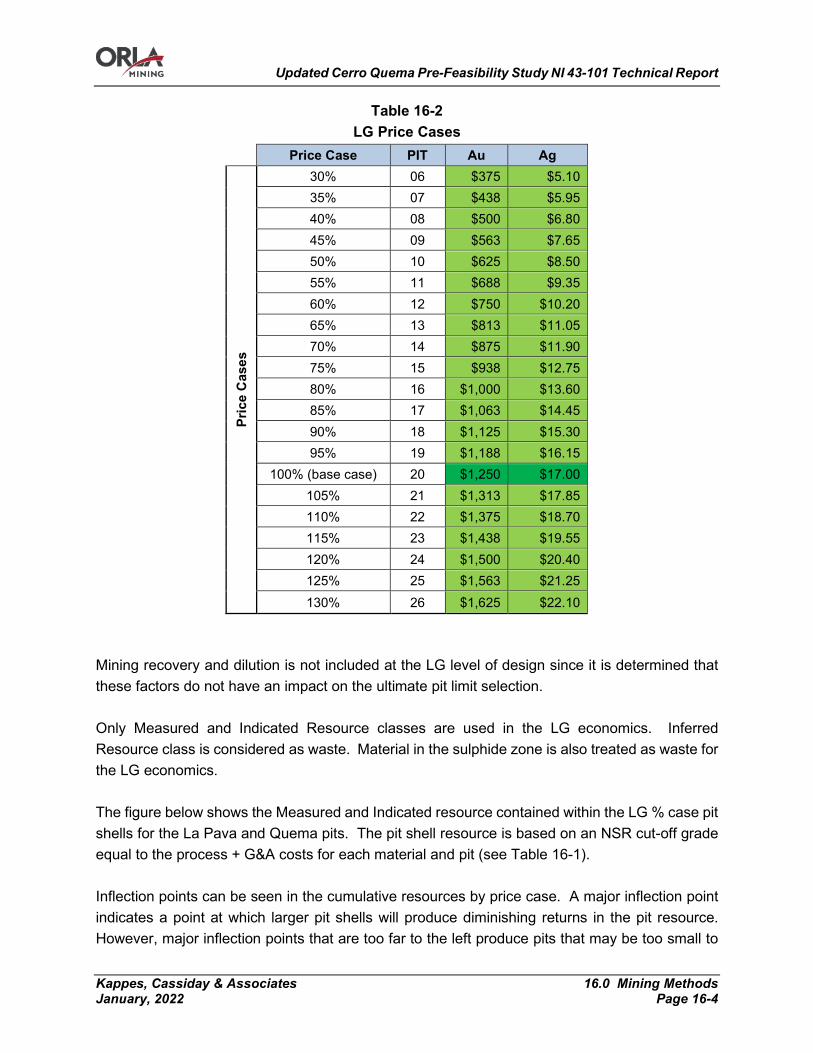
Updated Cerro Quema Pre-Feasibility Study NI 43-101 Technical Report
Kappes, Cassiday & Associates 16.0 Mining Methods January, 2022 Page 16-4
Table 16-2 LG Price Cases
Price Case PIT Au Ag
Pric
e C
ases
30% 06 $375 $5.10 35% 07 $438 $5.95 40% 08 $500 $6.80 45% 09 $563 $7.65 50% 10 $625 $8.50 55% 11 $688 $9.35 60% 12 $750 $10.20 65% 13 $813 $11.05 70% 14 $875 $11.90 75% 15 $938 $12.75 80% 16 $1,000 $13.60 85% 17 $1,063 $14.45 90% 18 $1,125 $15.30 95% 19 $1,188 $16.15
100% (base case) 20 $1,250 $17.00 105% 21 $1,313 $17.85 110% 22 $1,375 $18.70 115% 23 $1,438 $19.55 120% 24 $1,500 $20.40 125% 25 $1,563 $21.25 130% 26 $1,625 $22.10
Mining recovery and dilution is not included at the LG level of design since it is determined that these factors do not have an impact on the ultimate pit limit selection. Only Measured and Indicated Resource classes are used in the LG economics. Inferred Resource class is considered as waste. Material in the sulphide zone is also treated as waste for the LG economics. The figure below shows the Measured and Indicated resource contained within the LG % case pit shells for the La Pava and Quema pits. The pit shell resource is based on an NSR cut-off grade equal to the process + G&A costs for each material and pit (see Table 16-1). Inflection points can be seen in the cumulative resources by price case. A major inflection point indicates a point at which larger pit shells will produce diminishing returns in the pit resource. However, major inflection points that are too far to the left produce pits that may be too small to

Updated Cerro Quema Pre-Feasibility Study NI 43-101 Technical Report
Kappes, Cassiday & Associates 16.0 Mining Methods January, 2022 Page 16-5
mine from a practical standpoint. Typical economic pit limits fall between the 70-90% price case, capturing a significant portion of the resource while ensuring some insulation from revenue fluctuations (metal price decreases, opex increases, etc.) by targeting a case that is less than 100% price case.
Figure 16-1 La Pava Pit Shell Resource (MMTS, 2021)
Figure 16-2 Quema Pit Shell Pit Resource by % Case (MMTS, 2021)
4
6
8
10
12
14
16
18
20
20% 40% 60% 80% 100% 120% 140%
M T
onne
s
% of Case
Price Cases Pit Slope Cases
0
1
2
3
4
5
6
7
8
20% 40% 60% 80% 100% 120% 140%
M T
onne
s
% of Case
Price Cases Pit Slope Cases

Updated Cerro Quema Pre-Feasibility Study NI 43-101 Technical Report
Kappes, Cassiday & Associates 16.0 Mining Methods January, 2022 Page 16-6
The La Pava and Quema pit both show minor inflection points at the 90% price case (identified by arrows in the figures above). This case is selected as the economic pit limit for both pits and is used as the basis for detailed pit designs which include berms and ramps. The LG pit limited resources for La Pava and Quema is shown in the table below.
Table 16-3 Economic Pit Limit Contents (90% Price Case)
Contents La Pava Quema Units MI Resource 16,110 6,022 kt Gold Grade 0.81 0.87 g/t
Silver Grade 2.21 1.94 g/t Contained Gold 417 169 k oz
Contained Silver 1,147 375 k oz Waste 6,916 3,906 kt
Strip Ratio 0.43 0.65 Waste / Resource Total Pit Contents 23,026 9,928 kt
Figure 16-3 and Figure 16-4 show a plan view of the 90% Price Case pit shells for La Pava and Quema respectively.
Figure 16-3 La Pava 90% Price Case Pit Shell (MMTS, 2021)
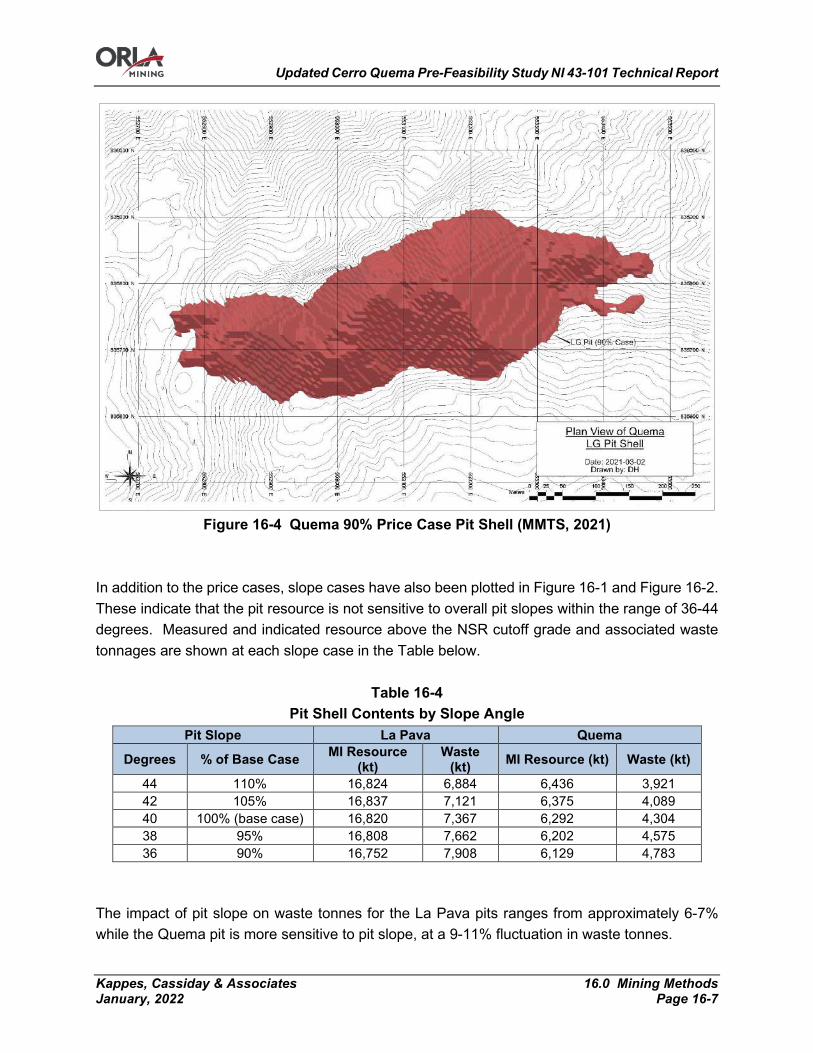
Updated Cerro Quema Pre-Feasibility Study NI 43-101 Technical Report
Kappes, Cassiday & Associates 16.0 Mining Methods January, 2022 Page 16-7
Figure 16-4 Quema 90% Price Case Pit Shell (MMTS, 2021)
In addition to the price cases, slope cases have also been plotted in Figure 16-1 and Figure 16-2. These indicate that the pit resource is not sensitive to overall pit slopes within the range of 36-44 degrees. Measured and indicated resource above the NSR cutoff grade and associated waste tonnages are shown at each slope case in the Table below.
Table 16-4 Pit Shell Contents by Slope Angle
Pit Slope La Pava Quema
Degrees % of Base Case MI Resource (kt)
Waste (kt) MI Resource (kt) Waste (kt)
44 110% 16,824 6,884 6,436 3,921 42 105% 16,837 7,121 6,375 4,089 40 100% (base case) 16,820 7,367 6,292 4,304 38 95% 16,808 7,662 6,202 4,575 36 90% 16,752 7,908 6,129 4,783
The impact of pit slope on waste tonnes for the La Pava pits ranges from approximately 6-7% while the Quema pit is more sensitive to pit slope, at a 9-11% fluctuation in waste tonnes.

Updated Cerro Quema Pre-Feasibility Study NI 43-101 Technical Report
Kappes, Cassiday & Associates 16.0 Mining Methods January, 2022 Page 16-8
Detailed Pit Designs
MMTS has completed Pre-Feasibility level pit designs using standards for road widths and minimum mining widths, based on efficient operation for the size of mining equipment chosen for the project. Pits are designed that demonstrate the viability of accessing and mining the Cerro Quema deposits.
Pit Phase Selection
Both the La Pava and Quema ultimate pit limits are split into phases or pushbacks to target higher economic material earlier in the mine life and provide operational flexibility for scheduling purposes.
Pit Design Slope Inputs and Bench Configuration
Pit designs are configured on 5m bench heights with catch berms every two benches. The slope design parameters include variable bench face and inter-ramp slope angles by wall azimuth as recommended by in a technical memo produced for the PFS by Anddes geomechanical staff prepared based on a review of the existing and limited geomechanical information, to be improved with further investigation (Anddes, 2021d). The parameters applied are shown in the table below:
Table 16-5 Slope Parameters
Wall Azimuth Face Slope Angle (degrees)
Inter-Ramp Angle (degrees)
Double Bench Berm Width (m)
0-50 62 40 6.5 50-360 65 42 6.5
Haul Road Design Parameters
Haul road widths are designed to the following general specifications: • For dual lane traffic a travel width of not less than 3.0 times the width of the widest haulage
vehicle used on the road. • For single lane traffic a travel width of not less than 2.0 times the width of the widest
haulage vehicle used on the road (only used on bottom two pit benches, for temporary low traffic access).
• Shoulder barriers are 3/4 of the height of the largest tire on any vehicle hauling on the road wherever a drop-off greater than 3m.
• The shoulder barriers are filled onto the road allowance and have allowance for 1.5:1 (Horizontal: Vertical) slopes.

Updated Cerro Quema Pre-Feasibility Study NI 43-101 Technical Report
Kappes, Cassiday & Associates 16.0 Mining Methods January, 2022 Page 16-9
An allowance for ditch width is not included in the in-pit road widths. There is adequate water drainage at the edge of the road between the crowned surface and lateral embankments such as highwalls or the shoulder barriers. In practice, excavated ditches in haul roads quickly get filled in by road grading; and when maintained as open ditches can create a hazard if haul trucks or light vehicles catch a wheel in them. Avoiding the addition of ditch width to the 3-truck travel width on the in-pit high wall roads can significantly reduce the pit waste stripping. Diligent road maintenance will be required to ensure the travel lanes are not reduced by windrows, run-off water, or accumulated snow. The haul road design considered the articulated 41t payload truck. After completion of the mine plan, the use of larger rigid frame 55t payload class haulers showed improved economics. The double lane haul road width for a 55t rigid frame truck is 4m wider than the same road for a 41t articulated truck. The impact of this change will either be additional waste tonnage or reduced ore tonnage. Future studies will be able to incorporate and quantify this design change. The haul road design basis considers the articulated 41t payload truck, as shown in the Table 16-6 below.
Table 16-6 In-Pit Haul Road Design Widths
Hauler Class Articulated, 41t payload
Hauler Width (m) 3.5 Hauler Tire (m) 1.8
Hauler Tire Height (m) 1.8 Berm Height (3/4 * Tire Height) (m) 1.4
Berm Width (1.5:1 Slope) (m) 4 Two Way Traffic Haul Road Width
-In pit Highwall (m) 14.5
One Way Traffic Haul Road Width -In pit Highwall (m) 11
Haul Road Grades are limited to 12%, except for the bottom two benches of the pit, where grades are increased to 15%. Switchbacks are designed flat, with ramps entering and exiting at design grade. In practice however, grades will be transitioned such that visibility and haul speeds are optimized going around the switchback. In the current study, two-way haul roads are designed in most cases where high traffic volumes require the extra width to allow efficient passing of trucks. The bottom two ramped benches of the pit use one-way haul roads since bench volumes and traffic flow are reduced. This reduces the extra waste mining required for wider roads in the pit highwall. Access ramps are not designed for the lowest bench, on the assumption that the bottom ramp segment will be removed using some form of retreat mining.
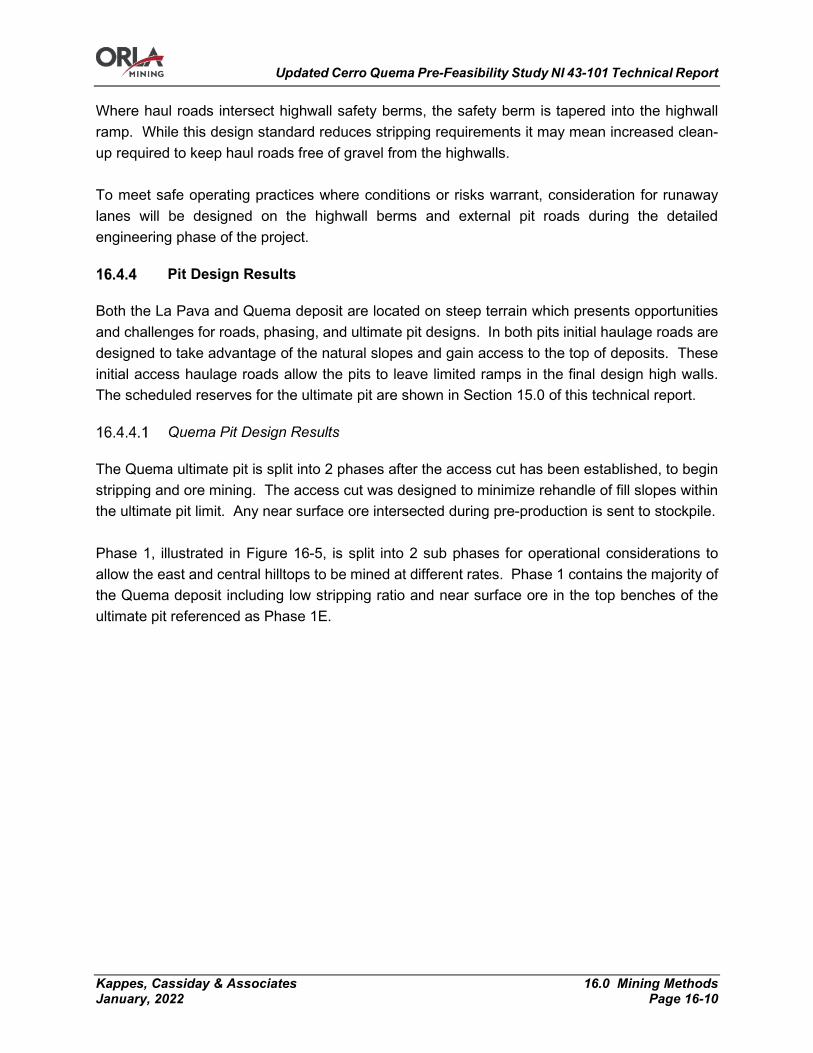
Updated Cerro Quema Pre-Feasibility Study NI 43-101 Technical Report
Kappes, Cassiday & Associates 16.0 Mining Methods January, 2022 Page 16-10
Where haul roads intersect highwall safety berms, the safety berm is tapered into the highwall ramp. While this design standard reduces stripping requirements it may mean increased clean-up required to keep haul roads free of gravel from the highwalls. To meet safe operating practices where conditions or risks warrant, consideration for runaway lanes will be designed on the highwall berms and external pit roads during the detailed engineering phase of the project.
Pit Design Results
Both the La Pava and Quema deposit are located on steep terrain which presents opportunities and challenges for roads, phasing, and ultimate pit designs. In both pits initial haulage roads are designed to take advantage of the natural slopes and gain access to the top of deposits. These initial access haulage roads allow the pits to leave limited ramps in the final design high walls. The scheduled reserves for the ultimate pit are shown in Section 15.0 of this technical report.
Quema Pit Design Results
The Quema ultimate pit is split into 2 phases after the access cut has been established, to begin stripping and ore mining. The access cut was designed to minimize rehandle of fill slopes within the ultimate pit limit. Any near surface ore intersected during pre-production is sent to stockpile. Phase 1, illustrated in Figure 16-5, is split into 2 sub phases for operational considerations to allow the east and central hilltops to be mined at different rates. Phase 1 contains the majority of the Quema deposit including low stripping ratio and near surface ore in the top benches of the ultimate pit referenced as Phase 1E.
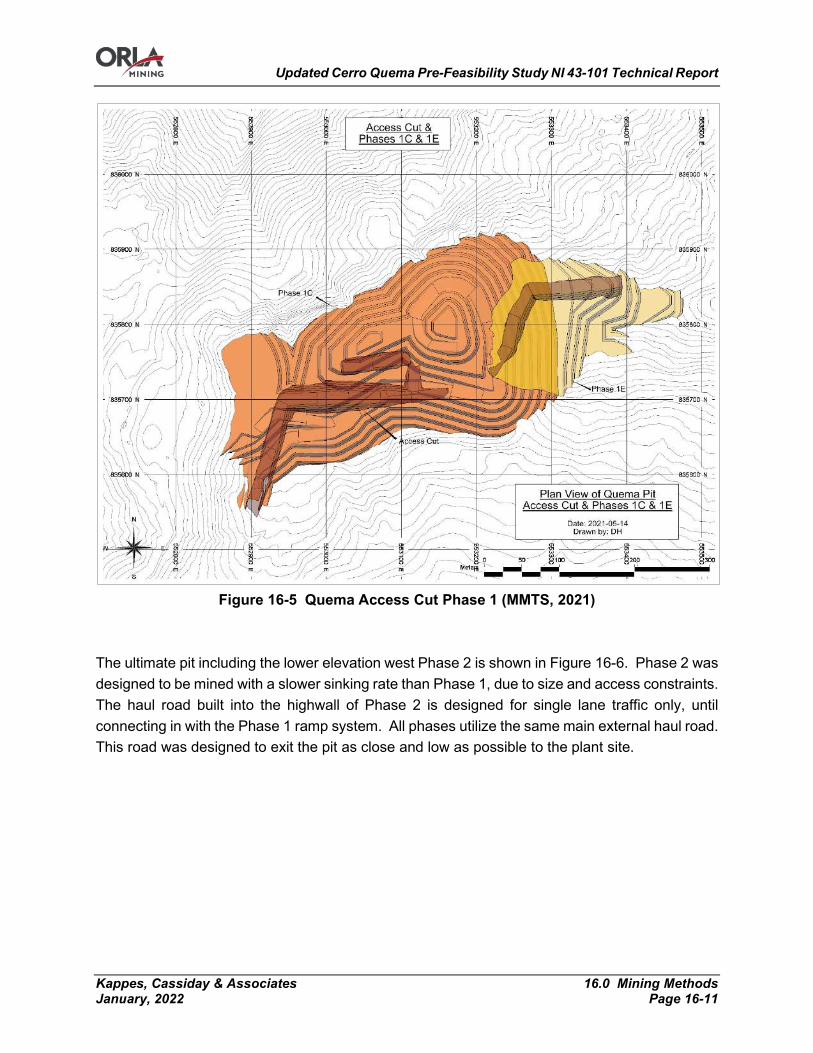
Updated Cerro Quema Pre-Feasibility Study NI 43-101 Technical Report
Kappes, Cassiday & Associates 16.0 Mining Methods January, 2022 Page 16-11
Figure 16-5 Quema Access Cut Phase 1 (MMTS, 2021)
The ultimate pit including the lower elevation west Phase 2 is shown in Figure 16-6. Phase 2 was designed to be mined with a slower sinking rate than Phase 1, due to size and access constraints. The haul road built into the highwall of Phase 2 is designed for single lane traffic only, until connecting in with the Phase 1 ramp system. All phases utilize the same main external haul road. This road was designed to exit the pit as close and low as possible to the plant site.
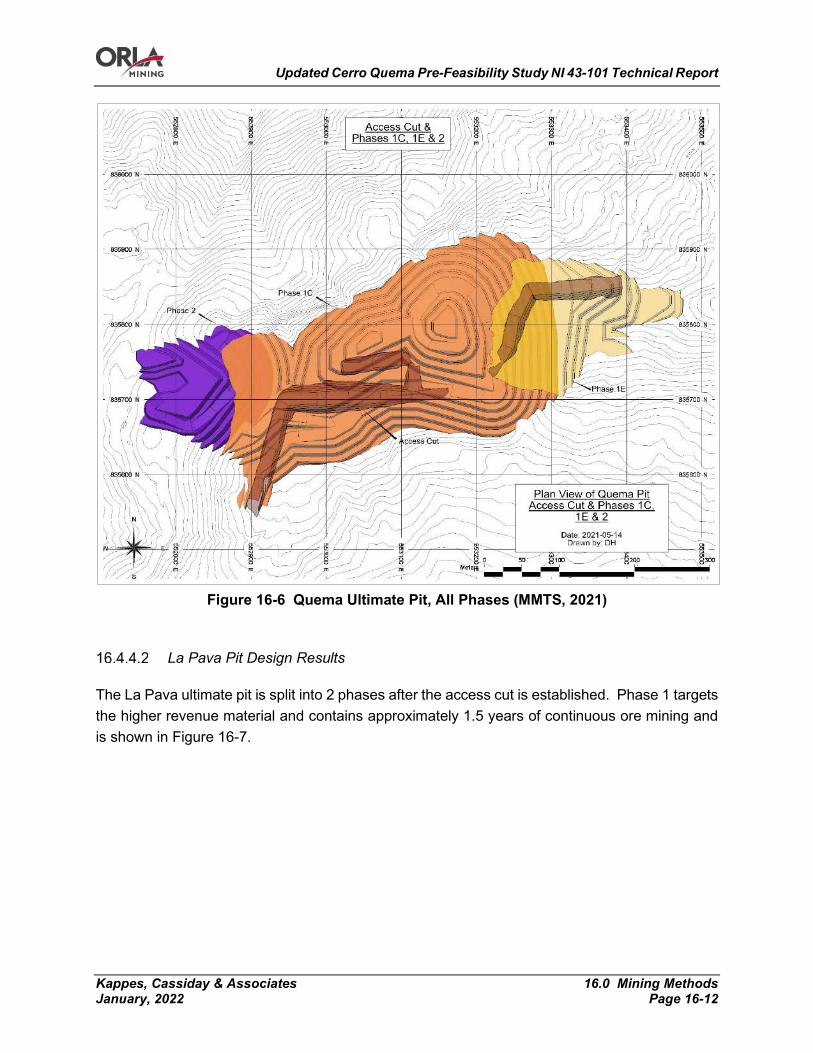
Updated Cerro Quema Pre-Feasibility Study NI 43-101 Technical Report
Kappes, Cassiday & Associates 16.0 Mining Methods January, 2022 Page 16-12
Figure 16-6 Quema Ultimate Pit, All Phases (MMTS, 2021)
La Pava Pit Design Results
The La Pava ultimate pit is split into 2 phases after the access cut is established. Phase 1 targets the higher revenue material and contains approximately 1.5 years of continuous ore mining and is shown in Figure 16-7.
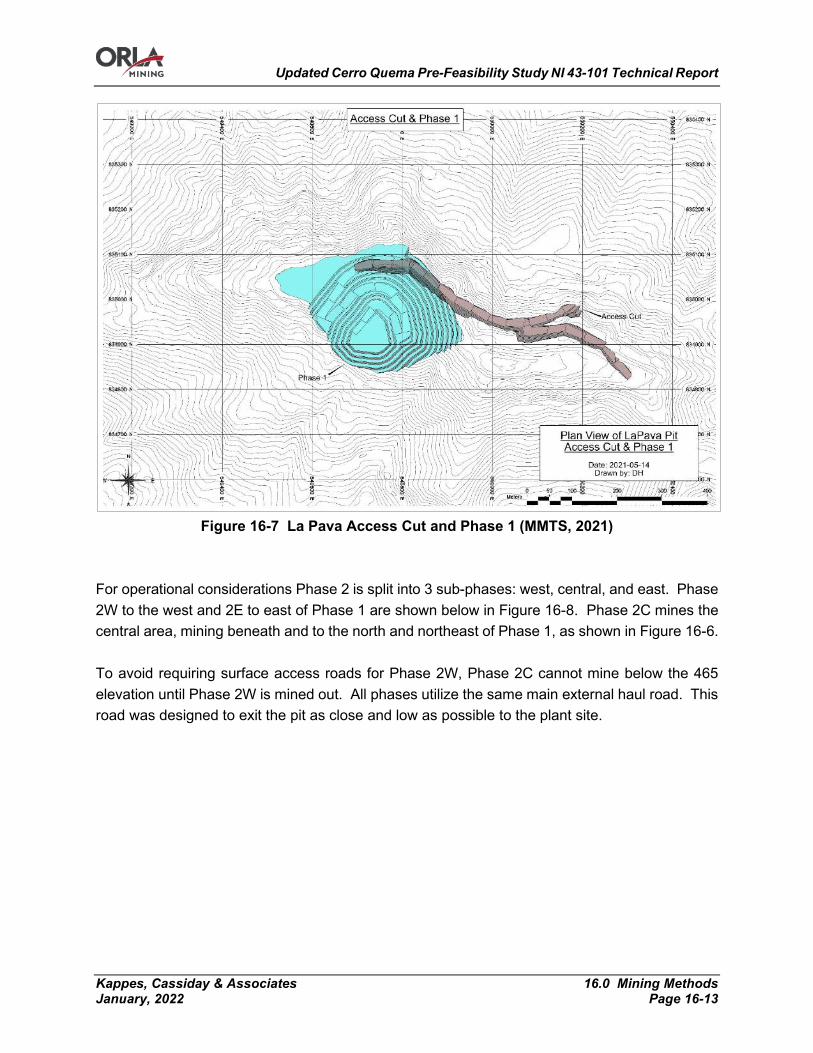
Updated Cerro Quema Pre-Feasibility Study NI 43-101 Technical Report
Kappes, Cassiday & Associates 16.0 Mining Methods January, 2022 Page 16-13
Figure 16-7 La Pava Access Cut and Phase 1 (MMTS, 2021)
For operational considerations Phase 2 is split into 3 sub-phases: west, central, and east. Phase 2W to the west and 2E to east of Phase 1 are shown below in Figure 16-8. Phase 2C mines the central area, mining beneath and to the north and northeast of Phase 1, as shown in Figure 16-6. To avoid requiring surface access roads for Phase 2W, Phase 2C cannot mine below the 465 elevation until Phase 2W is mined out. All phases utilize the same main external haul road. This road was designed to exit the pit as close and low as possible to the plant site.

Updated Cerro Quema Pre-Feasibility Study NI 43-101 Technical Report
Kappes, Cassiday & Associates 16.0 Mining Methods January, 2022 Page 16-14
Figure 16-8 La Pava Addition of Phase 2E and 2W (MMTS, 2021)
The ultimate pit in La Pava depletes the central area of the deposit and minimizes ramps in the final wall as shown in Figure 16-9.

Updated Cerro Quema Pre-Feasibility Study NI 43-101 Technical Report
Kappes, Cassiday & Associates 16.0 Mining Methods January, 2022 Page 16-15
Figure 16-9 La Pava Ultimate Pit, all Phases (MMTS, 2021)
Rock Storage Facilities
Material that does not meet economic cut-off grade will be stored in the Chontal Waste Rock Dump located between the La Pava and Quema ultimate pit limits.
Chontal Waste Rock Dump
The Chontal Waste Rock Dump (WRD) design has been completed by Anddes and accommodates 9.1 Mm3 (18.2 Mtonnes). This represents sufficient capacity to contain all waste rock produced by the production schedule (13.6M tonnes). The proposed WRD has a maximum height of 89 m and will be constructed at 2.5H:1V benched slopes with a 2.75H:1V overall slope angle. The following inputs are used as design criteria for the WRD:
• Max lift height – 25 m; • Face angle for each lift – 21.8 degrees (angle of repose); • Maximum overall slope angle – 19.98 degrees (2.75H:1V);

Updated Cerro Quema Pre-Feasibility Study NI 43-101 Technical Report
Kappes, Cassiday & Associates 16.0 Mining Methods January, 2022 Page 16-16
• Swell factor – 20%; • Average Bank Density – 2.43 (t/m3); • Average Placed Density – 2.0 (t/m3); • Maximum ramp grade – 10%.
More details for the WRD can be found in Section 18.4. Topsoil will be salvaged as required from all disturbed areas and stockpiled in designated locations. Also, unsuitable soil from the WRD Phase 1 footprint will be stockpiled within the same area of the WRD and covered during the waste rock expansion. The location and designed capacities of the WRD’s are shown below:
Figure 16-10 WRD Location (MMTS, 2021)
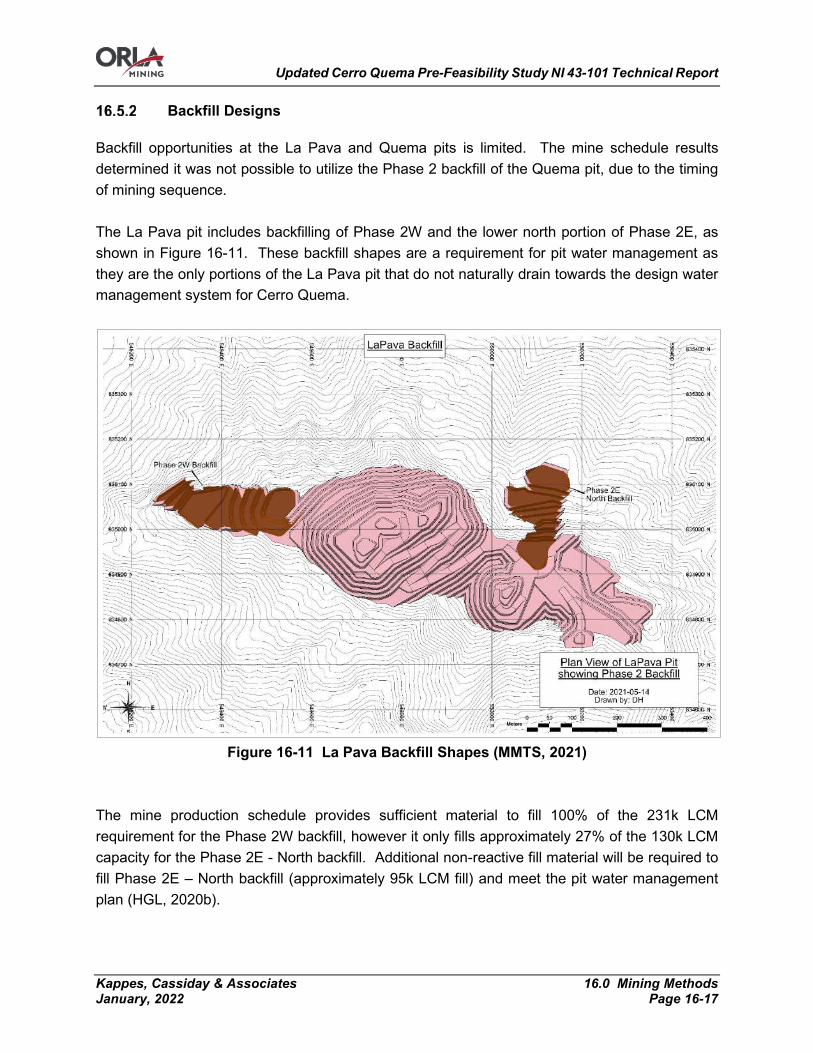
Updated Cerro Quema Pre-Feasibility Study NI 43-101 Technical Report
Kappes, Cassiday & Associates 16.0 Mining Methods January, 2022 Page 16-17
Backfill Designs
Backfill opportunities at the La Pava and Quema pits is limited. The mine schedule results determined it was not possible to utilize the Phase 2 backfill of the Quema pit, due to the timing of mining sequence. The La Pava pit includes backfilling of Phase 2W and the lower north portion of Phase 2E, as shown in Figure 16-11. These backfill shapes are a requirement for pit water management as they are the only portions of the La Pava pit that do not naturally drain towards the design water management system for Cerro Quema.
Figure 16-11 La Pava Backfill Shapes (MMTS, 2021)
The mine production schedule provides sufficient material to fill 100% of the 231k LCM requirement for the Phase 2W backfill, however it only fills approximately 27% of the 130k LCM capacity for the Phase 2E - North backfill. Additional non-reactive fill material will be required to fill Phase 2E – North backfill (approximately 95k LCM fill) and meet the pit water management plan (HGL, 2020b).
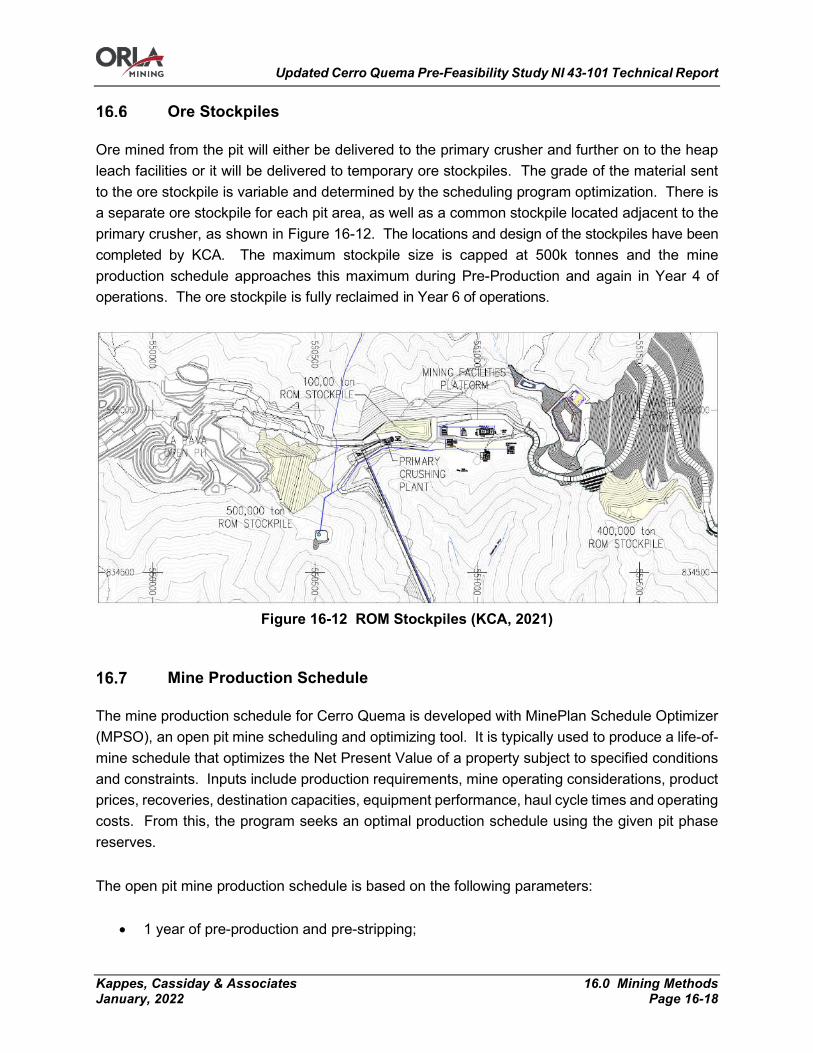
Updated Cerro Quema Pre-Feasibility Study NI 43-101 Technical Report
Kappes, Cassiday & Associates 16.0 Mining Methods January, 2022 Page 16-18
Ore Stockpiles
Ore mined from the pit will either be delivered to the primary crusher and further on to the heap leach facilities or it will be delivered to temporary ore stockpiles. The grade of the material sent to the ore stockpile is variable and determined by the scheduling program optimization. There is a separate ore stockpile for each pit area, as well as a common stockpile located adjacent to the primary crusher, as shown in Figure 16-12. The locations and design of the stockpiles have been completed by KCA. The maximum stockpile size is capped at 500k tonnes and the mine production schedule approaches this maximum during Pre-Production and again in Year 4 of operations. The ore stockpile is fully reclaimed in Year 6 of operations.
Figure 16-12 ROM Stockpiles (KCA, 2021)
Mine Production Schedule
The mine production schedule for Cerro Quema is developed with MinePlan Schedule Optimizer (MPSO), an open pit mine scheduling and optimizing tool. It is typically used to produce a life-of-mine schedule that optimizes the Net Present Value of a property subject to specified conditions and constraints. Inputs include production requirements, mine operating considerations, product prices, recoveries, destination capacities, equipment performance, haul cycle times and operating costs. From this, the program seeks an optimal production schedule using the given pit phase reserves. The open pit mine production schedule is based on the following parameters:
• 1 year of pre-production and pre-stripping;
Updated Cerro Quema Pre-Feasibility Study NI 43-101 Technical Report
Kappes, Cassiday & Associates 16.0 Mining Methods January, 2022 Page 16-19
• Quarterly scheduling periods for first 2 years, then annual periods after that; • Scheduling window size set to 4 periods (i.e., 4 periods are optimized simultaneously); • Crusher throughput of 10,000 tpd; • Phased pit bench reserves are used as input to the mine production schedule; • Maximum 12 benches mined from a single phase in one year (1 bench per month), with
the exception of Quema Phase 2 which has a maximum of 6 benches per year; • Partial bench mining is allowed, however, partial cuts from previous periods must be
completed in following periods; • Variable cut-off grade strategy is used to maximize NPV, with excess ore tonnes above
minimum cutoff grade sent to ore stockpiles; • Simultaneous operations in both the La Pava and Quema pit areas when appropriate.
For the purposes of the mine production schedule, to track pit phases in both pit areas within the same schedule, the following nomenclature is used to identify pit phases: Quema Phase
• Access Cut: Q640; • Phase 1 East: Q641E; • Phase 1 Central: Q641C; • Phase 2: Q642.
La Pava Phases
• Access Cut: P640; • Phase 1: P641; • Phase 2 East: P642E; • Phase 2 Central: P642C; • Phase 2 West: P642W.
The mine production schedule is shown in the following tables and graphs. Diluted grades are reported. Crusher feed is dependent on a variable cut-off grade, with minimum NSR cut-off grades as per Table 16-7.
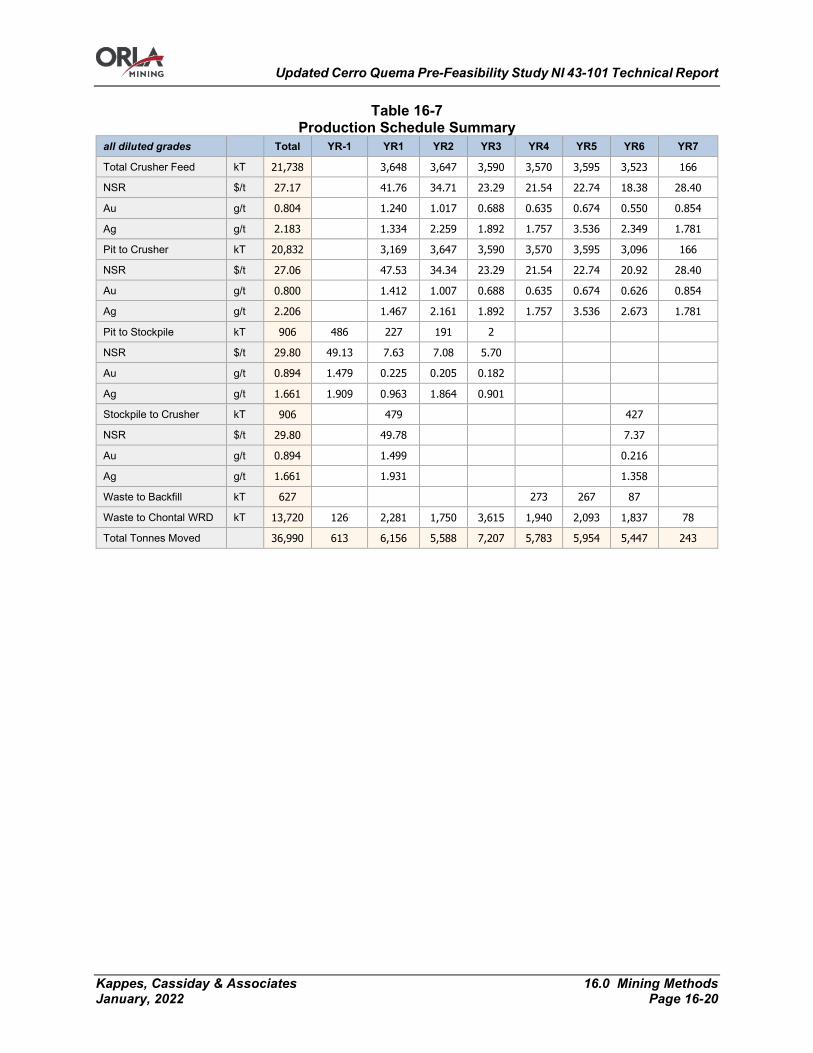
Updated Cerro Quema Pre-Feasibility Study NI 43-101 Technical Report
Kappes, Cassiday & Associates 16.0 Mining Methods January, 2022 Page 16-20
Table 16-7 Production Schedule Summary
all diluted grades Total YR-1 YR1 YR2 YR3 YR4 YR5 YR6 YR7
Total Crusher Feed kT 21,738 3,648 3,647 3,590 3,570 3,595 3,523 166
NSR $/t 27.17 41.76 34.71 23.29 21.54 22.74 18.38 28.40
Au g/t 0.804 1.240 1.017 0.688 0.635 0.674 0.550 0.854
Ag g/t 2.183 1.334 2.259 1.892 1.757 3.536 2.349 1.781
Pit to Crusher kT 20,832 3,169 3,647 3,590 3,570 3,595 3,096 166
NSR $/t 27.06 47.53 34.34 23.29 21.54 22.74 20.92 28.40
Au g/t 0.800 1.412 1.007 0.688 0.635 0.674 0.626 0.854
Ag g/t 2.206 1.467 2.161 1.892 1.757 3.536 2.673 1.781
Pit to Stockpile kT 906 486 227 191 2
NSR $/t 29.80 49.13 7.63 7.08 5.70
Au g/t 0.894 1.479 0.225 0.205 0.182
Ag g/t 1.661 1.909 0.963 1.864 0.901
Stockpile to Crusher kT 906 479 427
NSR $/t 29.80 49.78 7.37
Au g/t 0.894 1.499 0.216
Ag g/t 1.661 1.931 1.358
Waste to Backfill kT 627 273 267 87
Waste to Chontal WRD kT 13,720 126 2,281 1,750 3,615 1,940 2,093 1,837 78
Total Tonnes Moved 36,990 613 6,156 5,588 7,207 5,783 5,954 5,447 243
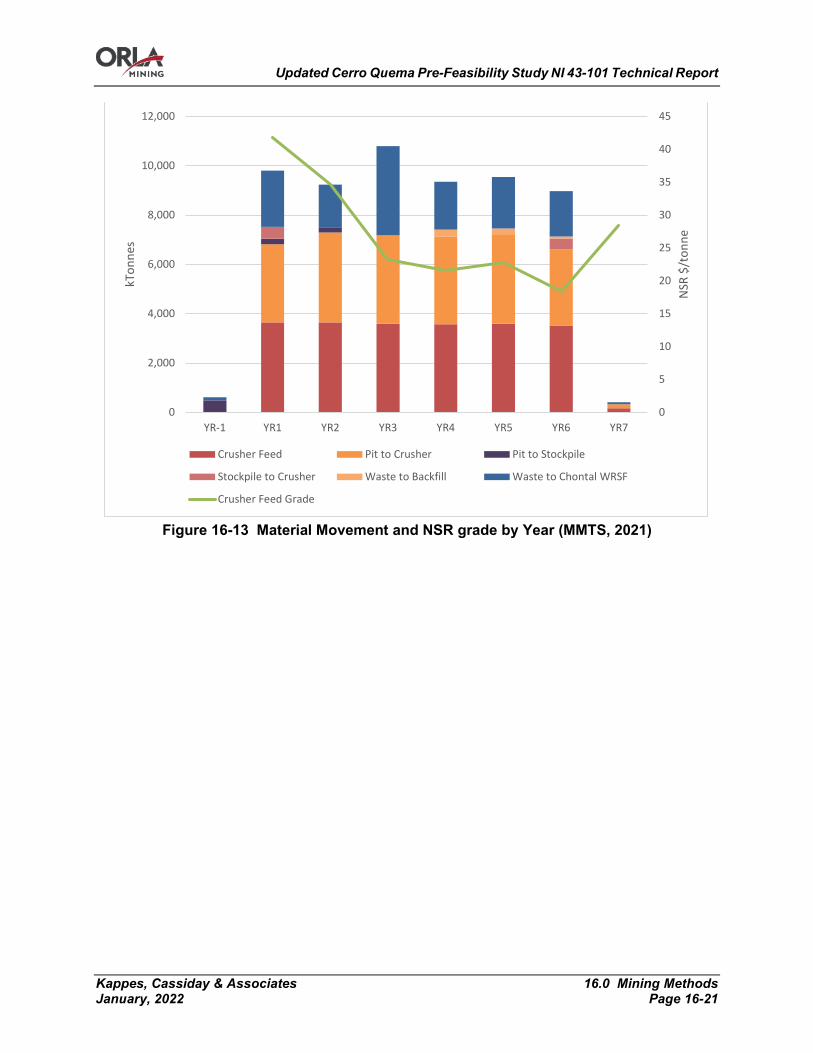
Updated Cerro Quema Pre-Feasibility Study NI 43-101 Technical Report
Kappes, Cassiday & Associates 16.0 Mining Methods January, 2022 Page 16-21
Figure 16-13 Material Movement and NSR grade by Year (MMTS, 2021)
0
5
10
15
20
25
30
35
40
45
0
2,000
4,000
6,000
8,000
10,000
12,000
YR-1 YR1 YR2 YR3 YR4 YR5 YR6 YR7
NSR
$/t
onne
kTon
nes
Crusher Feed Pit to Crusher Pit to Stockpile
Stockpile to Crusher Waste to Backfill Waste to Chontal WRSF
Crusher Feed Grade
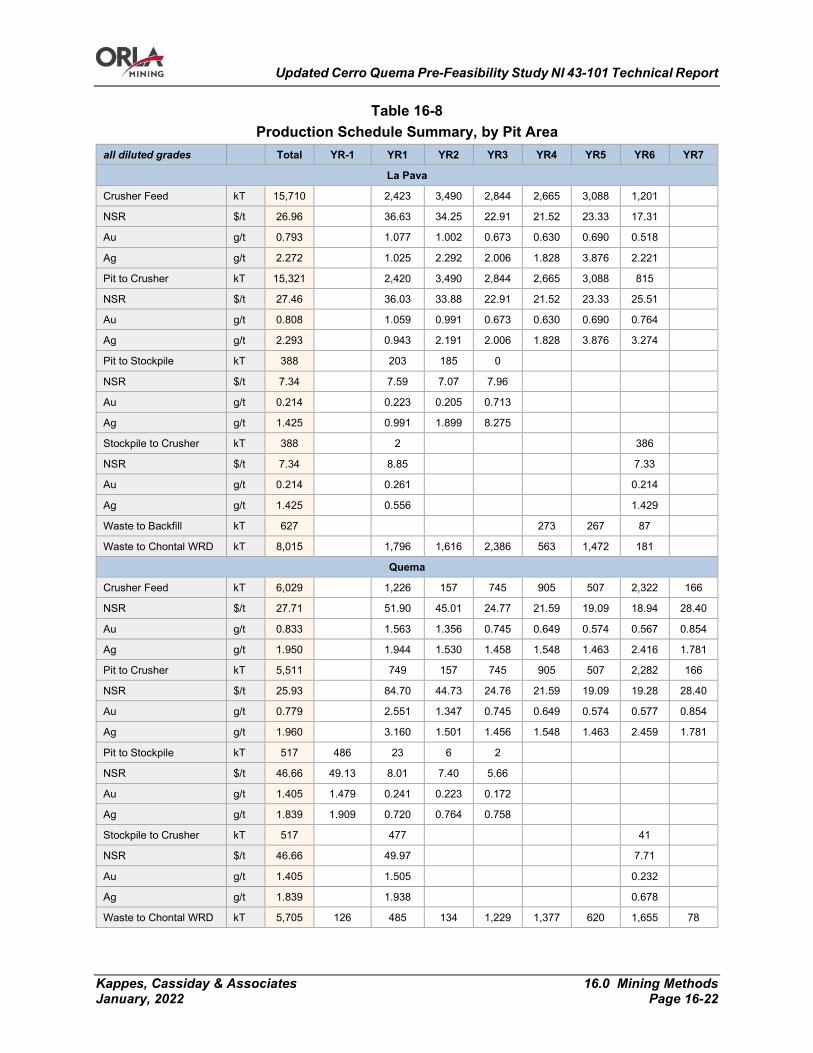
Updated Cerro Quema Pre-Feasibility Study NI 43-101 Technical Report
Kappes, Cassiday & Associates 16.0 Mining Methods January, 2022 Page 16-22
Table 16-8 Production Schedule Summary, by Pit Area
all diluted grades Total YR-1 YR1 YR2 YR3 YR4 YR5 YR6 YR7
La Pava
Crusher Feed kT 15,710 2,423 3,490 2,844 2,665 3,088 1,201
NSR $/t 26.96 36.63 34.25 22.91 21.52 23.33 17.31
Au g/t 0.793 1.077 1.002 0.673 0.630 0.690 0.518
Ag g/t 2.272 1.025 2.292 2.006 1.828 3.876 2.221
Pit to Crusher kT 15,321 2,420 3,490 2,844 2,665 3,088 815
NSR $/t 27.46 36.03 33.88 22.91 21.52 23.33 25.51
Au g/t 0.808 1.059 0.991 0.673 0.630 0.690 0.764
Ag g/t 2.293 0.943 2.191 2.006 1.828 3.876 3.274
Pit to Stockpile kT 388 203 185 0
NSR $/t 7.34 7.59 7.07 7.96
Au g/t 0.214 0.223 0.205 0.713
Ag g/t 1.425 0.991 1.899 8.275
Stockpile to Crusher kT 388 2 386
NSR $/t 7.34 8.85 7.33
Au g/t 0.214 0.261 0.214
Ag g/t 1.425 0.556 1.429
Waste to Backfill kT 627 273 267 87
Waste to Chontal WRD kT 8,015 1,796 1,616 2,386 563 1,472 181
Quema
Crusher Feed kT 6,029 1,226 157 745 905 507 2,322 166
NSR $/t 27.71 51.90 45.01 24.77 21.59 19.09 18.94 28.40
Au g/t 0.833 1.563 1.356 0.745 0.649 0.574 0.567 0.854
Ag g/t 1.950 1.944 1.530 1.458 1.548 1.463 2.416 1.781
Pit to Crusher kT 5,511 749 157 745 905 507 2,282 166
NSR $/t 25.93 84.70 44.73 24.76 21.59 19.09 19.28 28.40
Au g/t 0.779 2.551 1.347 0.745 0.649 0.574 0.577 0.854
Ag g/t 1.960 3.160 1.501 1.456 1.548 1.463 2.459 1.781
Pit to Stockpile kT 517 486 23 6 2
NSR $/t 46.66 49.13 8.01 7.40 5.66
Au g/t 1.405 1.479 0.241 0.223 0.172
Ag g/t 1.839 1.909 0.720 0.764 0.758
Stockpile to Crusher kT 517 477 41
NSR $/t 46.66 49.97 7.71
Au g/t 1.405 1.505 0.232
Ag g/t 1.839 1.938 0.678
Waste to Chontal WRD kT 5,705 126 485 134 1,229 1,377 620 1,655 78
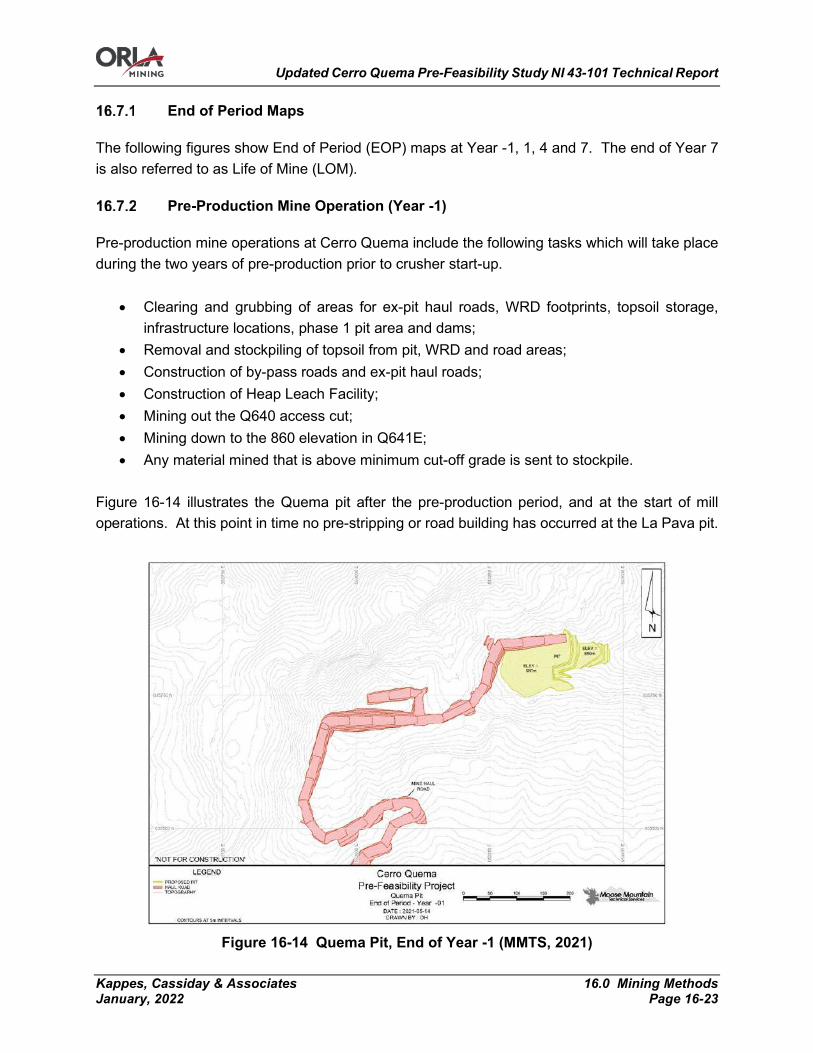
Updated Cerro Quema Pre-Feasibility Study NI 43-101 Technical Report
Kappes, Cassiday & Associates 16.0 Mining Methods January, 2022 Page 16-23
End of Period Maps
The following figures show End of Period (EOP) maps at Year -1, 1, 4 and 7. The end of Year 7 is also referred to as Life of Mine (LOM).
Pre-Production Mine Operation (Year -1)
Pre-production mine operations at Cerro Quema include the following tasks which will take place during the two years of pre-production prior to crusher start-up.
• Clearing and grubbing of areas for ex-pit haul roads, WRD footprints, topsoil storage, infrastructure locations, phase 1 pit area and dams;
• Removal and stockpiling of topsoil from pit, WRD and road areas; • Construction of by-pass roads and ex-pit haul roads; • Construction of Heap Leach Facility; • Mining out the Q640 access cut; • Mining down to the 860 elevation in Q641E; • Any material mined that is above minimum cut-off grade is sent to stockpile.
Figure 16-14 illustrates the Quema pit after the pre-production period, and at the start of mill operations. At this point in time no pre-stripping or road building has occurred at the La Pava pit.
Figure 16-14 Quema Pit, End of Year -1 (MMTS, 2021)
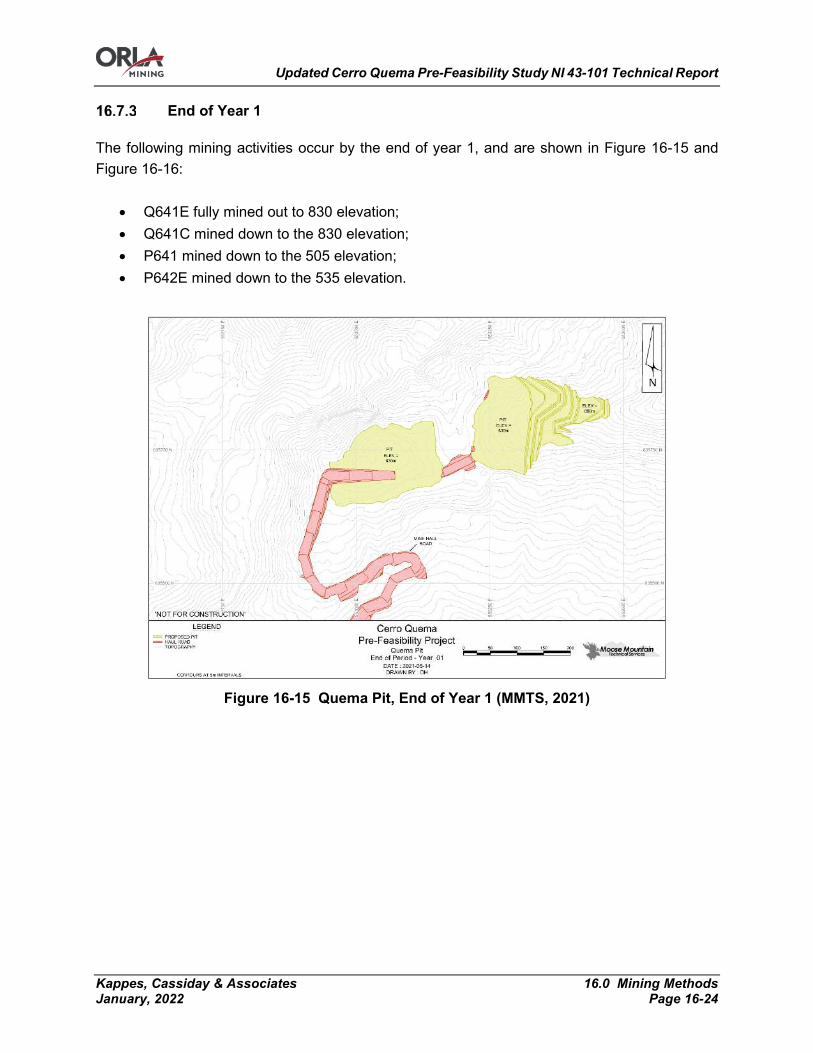
Updated Cerro Quema Pre-Feasibility Study NI 43-101 Technical Report
Kappes, Cassiday & Associates 16.0 Mining Methods January, 2022 Page 16-24
End of Year 1
The following mining activities occur by the end of year 1, and are shown in Figure 16-15 and Figure 16-16:
• Q641E fully mined out to 830 elevation; • Q641C mined down to the 830 elevation; • P641 mined down to the 505 elevation; • P642E mined down to the 535 elevation.
Figure 16-15 Quema Pit, End of Year 1 (MMTS, 2021)
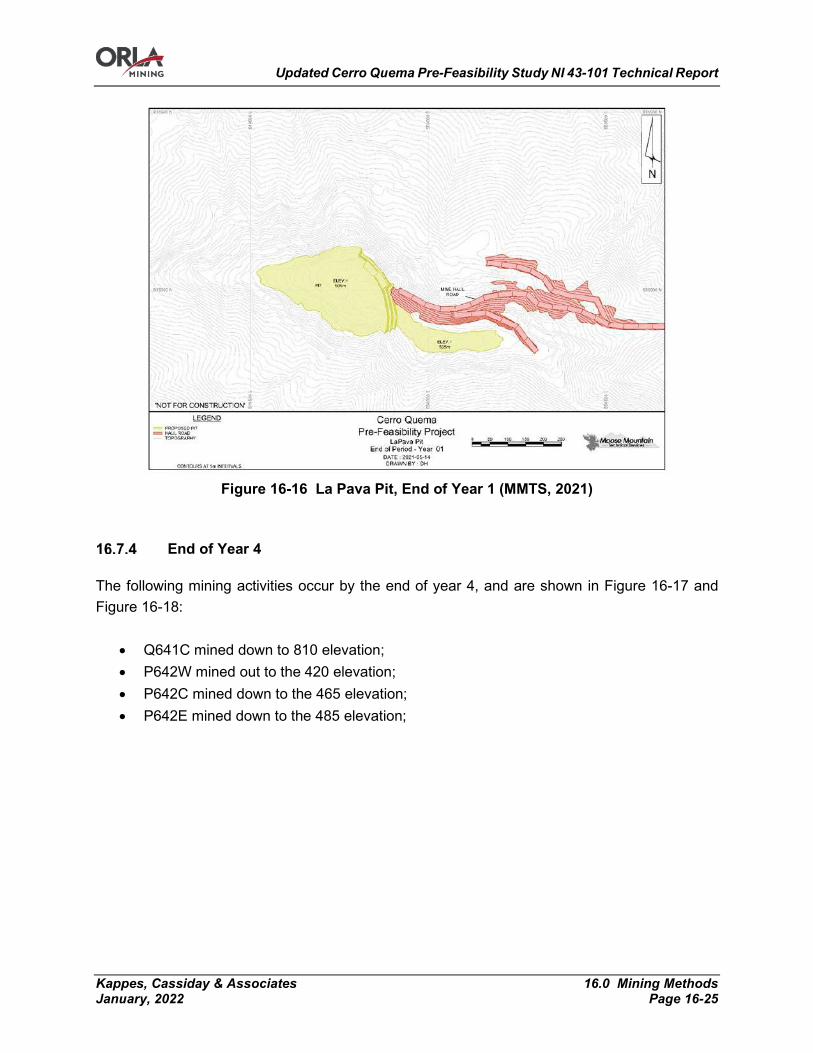
Updated Cerro Quema Pre-Feasibility Study NI 43-101 Technical Report
Kappes, Cassiday & Associates 16.0 Mining Methods January, 2022 Page 16-25
Figure 16-16 La Pava Pit, End of Year 1 (MMTS, 2021)
End of Year 4
The following mining activities occur by the end of year 4, and are shown in Figure 16-17 and Figure 16-18:
• Q641C mined down to 810 elevation; • P642W mined out to the 420 elevation; • P642C mined down to the 465 elevation; • P642E mined down to the 485 elevation;
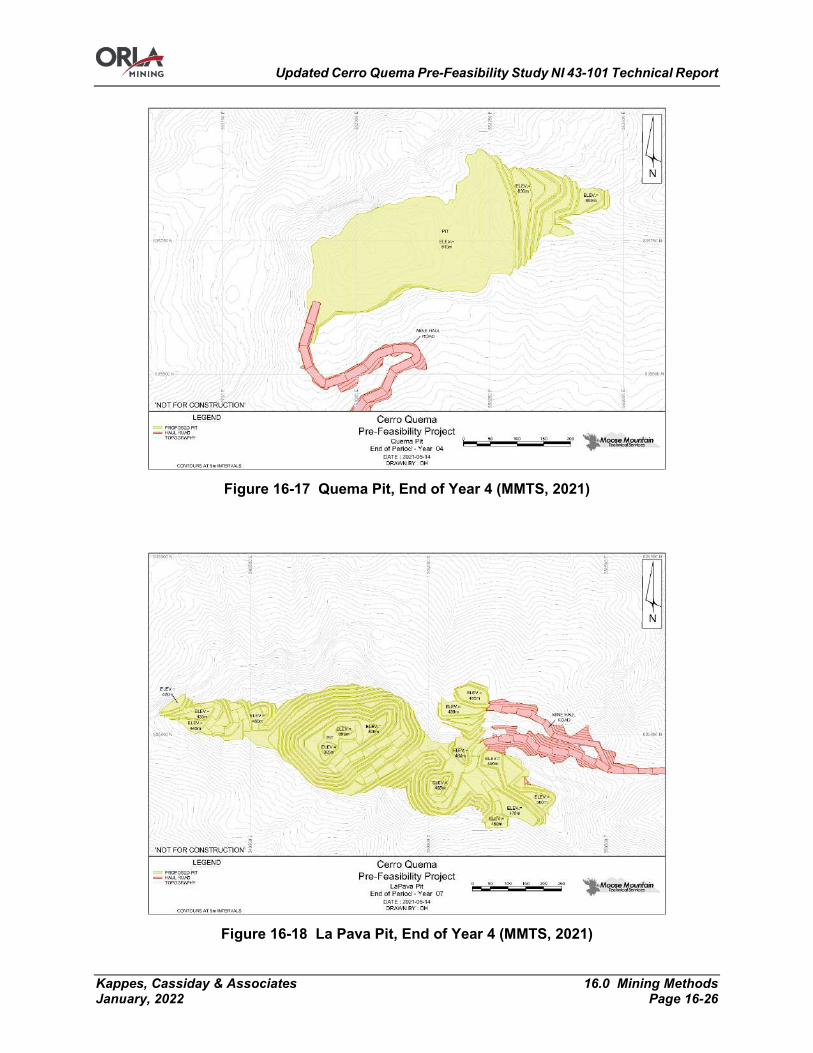
Updated Cerro Quema Pre-Feasibility Study NI 43-101 Technical Report
Kappes, Cassiday & Associates 16.0 Mining Methods January, 2022 Page 16-26
Figure 16-17 Quema Pit, End of Year 4 (MMTS, 2021)
Figure 16-18 La Pava Pit, End of Year 4 (MMTS, 2021)
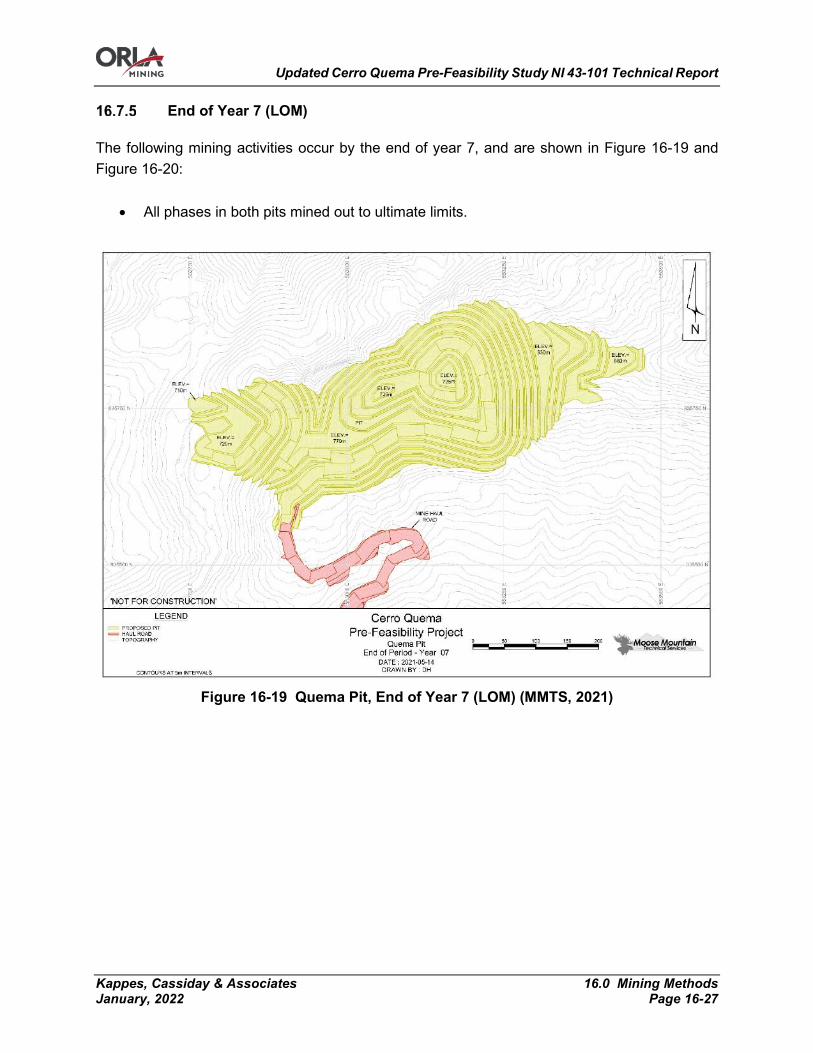
Updated Cerro Quema Pre-Feasibility Study NI 43-101 Technical Report
Kappes, Cassiday & Associates 16.0 Mining Methods January, 2022 Page 16-27
End of Year 7 (LOM)
The following mining activities occur by the end of year 7, and are shown in Figure 16-19 and Figure 16-20:
• All phases in both pits mined out to ultimate limits.
Figure 16-19 Quema Pit, End of Year 7 (LOM) (MMTS, 2021)
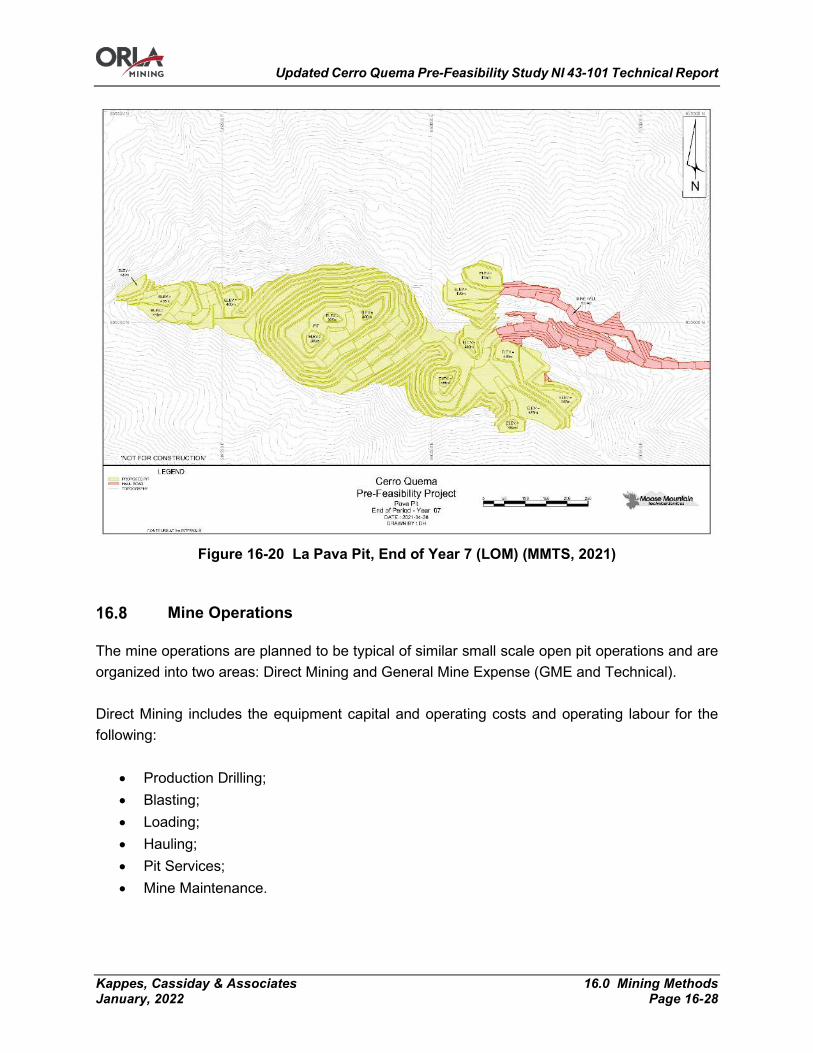
Updated Cerro Quema Pre-Feasibility Study NI 43-101 Technical Report
Kappes, Cassiday & Associates 16.0 Mining Methods January, 2022 Page 16-28
Figure 16-20 La Pava Pit, End of Year 7 (LOM) (MMTS, 2021)
Mine Operations
The mine operations are planned to be typical of similar small scale open pit operations and are organized into two areas: Direct Mining and General Mine Expense (GME and Technical). Direct Mining includes the equipment capital and operating costs and operating labour for the following:
• Production Drilling; • Blasting; • Loading; • Hauling; • Pit Services; • Mine Maintenance.
Updated Cerro Quema Pre-Feasibility Study NI 43-101 Technical Report
Kappes, Cassiday & Associates 16.0 Mining Methods January, 2022 Page 16-29
Each unit operation accounts for all equipment consumables and parts, manpower required (both operating and maintenance) and all material costs (blasting). This also includes the distributed mine maintenance items such as maintenance labour and repair parts plus off-site repairs which contribute to the hourly operating cost of the equipment. GME includes the supervision for the direct mining activities. GME also includes technical support requirements from Mine Engineering and Geology functions. More detailed descriptions of the mine organization and unit mining activities follows. In this study Direct Mining and Mine Maintenance is planned as Owner operated mining operations. The Owner will be responsible for all equipment mob/demob, operating, and labour costs as well as maintenance of the mining equipment. Blasting unit operations will be performed by a specific blasting company contractor. Supervision, geology and mine planning will be done by the Owner.
Production Drilling
The rock at both deposits will require drilling and blasting to create suitable fragmentation for efficient loading and hauling for both ore and waste. No drilling or blasting is assumed in topsoil and overburden materials. Drilling and blasting is planned on 5 m benches in selectively mined areas with Down the Hole (DTH) drills, Diesel drills are required as external power is not planned for the pits. Hole spacing and collar heights are modified to achieve targeted powder factors. Various penetration rates are also estimated based on the rock type. Representative samples through the on-bench cuttings pile are taken and assayed at the on-site laboratory (blasthole sampling). Drilling production parameters are listed below:
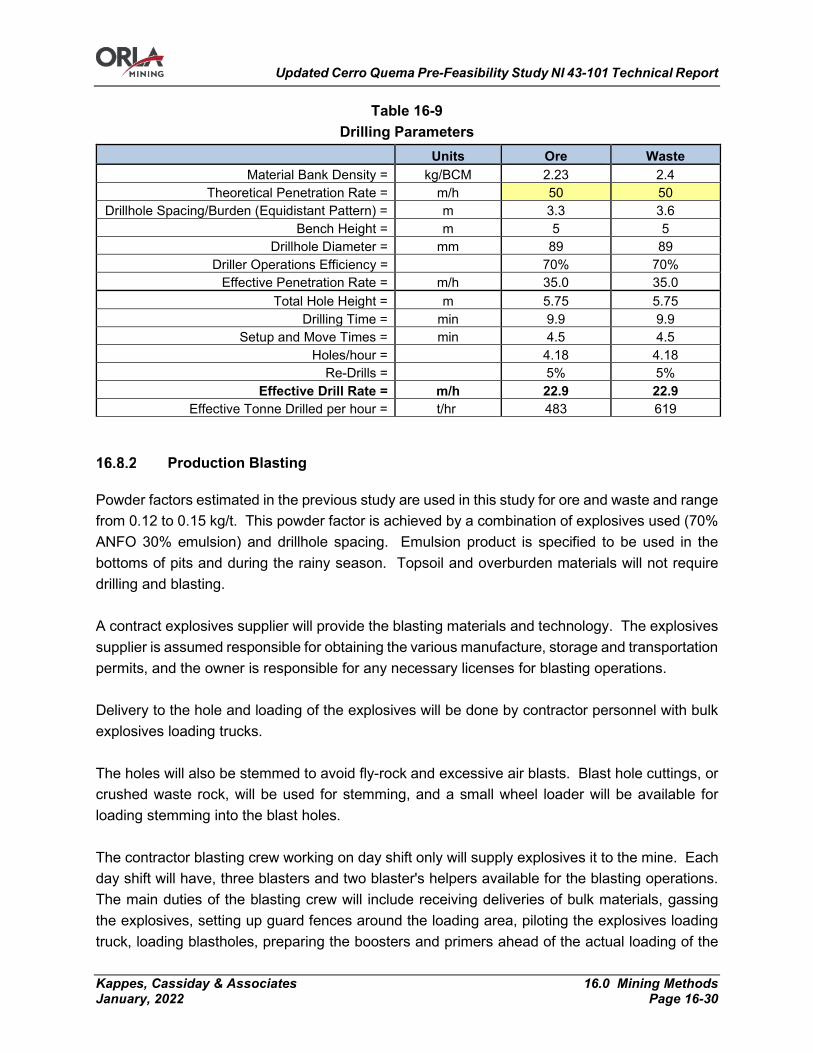
Updated Cerro Quema Pre-Feasibility Study NI 43-101 Technical Report
Kappes, Cassiday & Associates 16.0 Mining Methods January, 2022 Page 16-30
Table 16-9 Drilling Parameters
Units Ore Waste Material Bank Density = kg/BCM 2.23 2.4
Theoretical Penetration Rate = m/h 50 50 Drillhole Spacing/Burden (Equidistant Pattern) = m 3.3 3.6
Bench Height = m 5 5 Drillhole Diameter = mm 89 89
Driller Operations Efficiency = 70% 70% Effective Penetration Rate = m/h 35.0 35.0
Total Hole Height = m 5.75 5.75 Drilling Time = min 9.9 9.9
Setup and Move Times = min 4.5 4.5 Holes/hour = 4.18 4.18
Re-Drills = 5% 5% Effective Drill Rate = m/h 22.9 22.9
Effective Tonne Drilled per hour = t/hr 483 619
Production Blasting
Powder factors estimated in the previous study are used in this study for ore and waste and range from 0.12 to 0.15 kg/t. This powder factor is achieved by a combination of explosives used (70% ANFO 30% emulsion) and drillhole spacing. Emulsion product is specified to be used in the bottoms of pits and during the rainy season. Topsoil and overburden materials will not require drilling and blasting. A contract explosives supplier will provide the blasting materials and technology. The explosives supplier is assumed responsible for obtaining the various manufacture, storage and transportation permits, and the owner is responsible for any necessary licenses for blasting operations. Delivery to the hole and loading of the explosives will be done by contractor personnel with bulk explosives loading trucks. The holes will also be stemmed to avoid fly-rock and excessive air blasts. Blast hole cuttings, or crushed waste rock, will be used for stemming, and a small wheel loader will be available for loading stemming into the blast holes. The contractor blasting crew working on day shift only will supply explosives it to the mine. Each day shift will have, three blasters and two blaster's helpers available for the blasting operations. The main duties of the blasting crew will include receiving deliveries of bulk materials, gassing the explosives, setting up guard fences around the loading area, piloting the explosives loading truck, loading blastholes, preparing the boosters and primers ahead of the actual loading of the

Updated Cerro Quema Pre-Feasibility Study NI 43-101 Technical Report
Kappes, Cassiday & Associates 16.0 Mining Methods January, 2022 Page 16-31
holes, stemming the blast holes after they are loaded, tie-in of the blast patterns and detonating of the blasts. Subgrades, or sub-drilling will be used to reduce high spots between holes on bench floors. The height of the explosive column is calculated from the explosive density and hole diameter to give the required powder factor. The remainder of the hole is backfilled with drill cuttings or crushed rock. The owner’s pit supervisor and technical services team will coordinate the drilling and blasting activities to ensure a minimum two weeks of broken material inventory is maintained for each loader and will ensure drilling areas will be prepared in suitable time for the next pattern. The production blasting specifications are shown in the Table below.
Table 16-10 Blasting Parameters
Blasting Scenario Ore Waste Equidistant Drillhole Spacing/Burden (m) 3.3 3.6 Hole Size (mm) 89 89 Hole Size (inch) 3.5 3.5 Explosive In-Hole Density (g/cc) 1.08 1.08 Re-Blasts 2% 2% Bench Height (m) 5 5 Sub-drill (m) 0.75 0.75 Charge per hole (kg) 18 18 Tonnes per hole 121 156 Powder factor (kg/t) 0.15 0.12
Loading
The operations require up to two 6.5 m3 bucket hydraulic excavators and two 8 m3 bucket front end wheel loaders, which are sized to meet the production requirements of the mining schedule and to match the 55-tonne payload rigid frame haulers and 41-tonne payload articulated frame haulers. The hydraulic excavators are specified to handle most of the excavation from the pits, including all identified ore and waste zones. The wheel loader is specified for supporting the excavators mining ore and waste zones of the pit, re-handling stockpiled material, pit clean up and road construction.
Updated Cerro Quema Pre-Feasibility Study NI 43-101 Technical Report
Kappes, Cassiday & Associates 16.0 Mining Methods January, 2022 Page 16-32
Material hauled from the pit is planned for direct dumping at the crusher. An allowance for 25% of the crusher feed from an active ROM stockpile is planned. Wheel loaders are planned for the rehandle requirements. Loading Productivities are based on 0.5-minute passes for the hydraulic excavator and 0.7-minute passes for the wheel loader. Table 16-11 below shows calculations for effective loader productivities for every planned operating hour. The operations efficiencies account for times when the loader is operating at the loading face but not actively loading haulers, is loading in an inefficient manner, or inexperienced operators. Selected efficiencies are based on experience at similar operations.
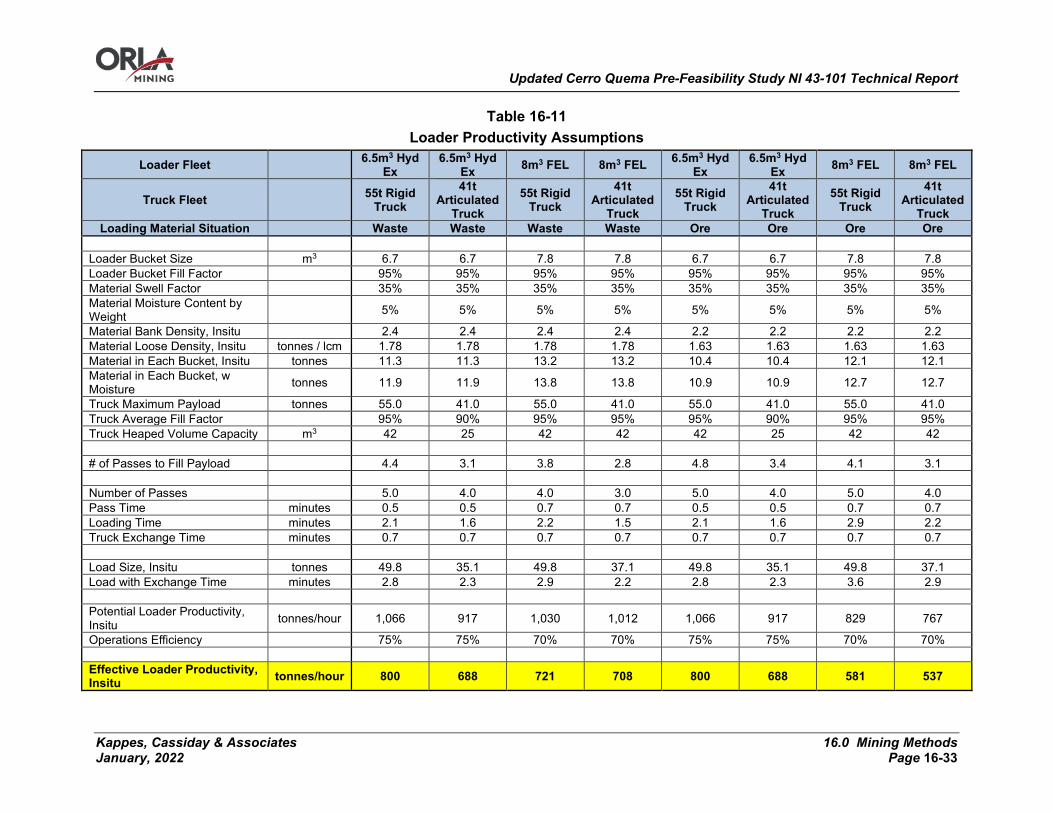
Updated Cerro Quema Pre-Feasibility Study NI 43-101 Technical Report
Kappes, Cassiday & Associates 16.0 Mining Methods January, 2022 Page 16-33
Table 16-11 Loader Productivity Assumptions
Loader Fleet 6.5m3 Hyd Ex
6.5m3 Hyd Ex 8m3 FEL 8m3 FEL 6.5m3 Hyd
Ex 6.5m3 Hyd
Ex 8m3 FEL 8m3 FEL
Truck Fleet 55t Rigid Truck
41t Articulated
Truck 55t Rigid
Truck 41t
Articulated Truck
55t Rigid Truck
41t Articulated
Truck 55t Rigid
Truck 41t
Articulated Truck
Loading Material Situation Waste Waste Waste Waste Ore Ore Ore Ore Loader Bucket Size m3 6.7 6.7 7.8 7.8 6.7 6.7 7.8 7.8 Loader Bucket Fill Factor 95% 95% 95% 95% 95% 95% 95% 95% Material Swell Factor 35% 35% 35% 35% 35% 35% 35% 35% Material Moisture Content by Weight 5% 5% 5% 5% 5% 5% 5% 5%
Material Bank Density, Insitu 2.4 2.4 2.4 2.4 2.2 2.2 2.2 2.2 Material Loose Density, Insitu tonnes / lcm 1.78 1.78 1.78 1.78 1.63 1.63 1.63 1.63 Material in Each Bucket, Insitu tonnes 11.3 11.3 13.2 13.2 10.4 10.4 12.1 12.1 Material in Each Bucket, w Moisture tonnes 11.9 11.9 13.8 13.8 10.9 10.9 12.7 12.7
Truck Maximum Payload tonnes 55.0 41.0 55.0 41.0 55.0 41.0 55.0 41.0 Truck Average Fill Factor 95% 90% 95% 95% 95% 90% 95% 95% Truck Heaped Volume Capacity m3 42 25 42 42 42 25 42 42 # of Passes to Fill Payload 4.4 3.1 3.8 2.8 4.8 3.4 4.1 3.1 Number of Passes 5.0 4.0 4.0 3.0 5.0 4.0 5.0 4.0 Pass Time minutes 0.5 0.5 0.7 0.7 0.5 0.5 0.7 0.7 Loading Time minutes 2.1 1.6 2.2 1.5 2.1 1.6 2.9 2.2 Truck Exchange Time minutes 0.7 0.7 0.7 0.7 0.7 0.7 0.7 0.7 Load Size, Insitu tonnes 49.8 35.1 49.8 37.1 49.8 35.1 49.8 37.1 Load with Exchange Time minutes 2.8 2.3 2.9 2.2 2.8 2.3 3.6 2.9 Potential Loader Productivity, Insitu tonnes/hour 1,066 917 1,030 1,012 1,066 917 829 767
Operations Efficiency 75% 75% 70% 70% 75% 75% 70% 70% Effective Loader Productivity, Insitu tonnes/hour 800 688 721 708 800 688 581 537
Updated Cerro Quema Pre-Feasibility Study NI 43-101 Technical Report
Kappes, Cassiday & Associates 16.0 Mining Methods January, 2022 Page 16-34
Hauling
Ore and waste rock haulage will be handled by two classes of off-highway haul trucks: 55-tonne payload rigid frame haulers and 41-tonne payload articulated frame haulers. The articulated haulers are assumed to be utilized on smaller pit benches and during wet periods. Rigid frame trucks will be utilized in larger benches and long hauls due to their increased productivity and reduced unit operating cost. Haulage profiles are estimated from selected benches in each phase to designated dumping points using a “top-middle-bottom approach”. This approach uses 3 specific haul profiles per phase (top-middle-bottom). The haul profiles are input to a haul cycle simulation program and the resulting cycle times are calculated. The remaining cycle times are interpolated for all benches, and used to estimate required hauler operating hours in each scheduled period. The following hauler productivity parameters are applied to calculate the cycle times. Note that the payloads and load factors are listed in the loading section above.
Table 16-12 Hauler Cycle Time Assumptions Description Quantity Unit
Maximum Haul Grade = 12 % Rolling Resistance on Hauls = 3 %
Truck Speed Limit 50 kph Hauler Operator Efficiency = 90 %
Loading + Spot + Waiting Time 2.2 - 2.9 mins Haul operating hours are originally calculated for the 55-tonne payload rigid frame haulers, it is assumed that 41-tonne payload articulated haulers would only be purchased in the pre-production to cover the operating hours initially assigned to the rigid frame hauler fleet at a ratio of 37/53. Any haulers purchased after pre-production would be rigid frame haulers and the existing fleet of articulated trucks would be utilized throughout the mine life.
Pit Services
Pit services include:
• Haul road development and maintenance; • Pit floor and ramp maintenance; • Stockpile maintenance; • Mobile fleet fuel and lube support;
Updated Cerro Quema Pre-Feasibility Study NI 43-101 Technical Report
Kappes, Cassiday & Associates 16.0 Mining Methods January, 2022 Page 16-35
• Topsoil excavation; • Secondary blasting and rock breaking; • Lighting; • Transporting personnel and operating supplies; • Mine safety and rescue.
A fleet of mobile equipment is specified to handle these pit support activities. These activities will be directed by the Mine General Foreman. General pit labourers are also included under the GME department described below to help accomplish these support services.
Mine Fleet Maintenance
Mine fleet maintenance activities will be generally performed in the maintenance facilities located near the plant site. Mine fleet maintenance activities will be performed under the direction of the Mine Maintenance Superintendent who will assume overall responsibility for mine maintenance and will report to the Mine Superintendent. The Mine Maintenance department will perform break-down maintenance, field maintenance and repairs, regular PMs, component change-outs, and field fuel, lube and tire change-outs. Fuel, lube and maintenance support in the pit will be by a mobile service truck. The mobile maintenance fleet is tracked as a category under direct mining unit operations. The following Table 16-13 lists the specified support to complete pit services and mine fleet maintenance tasks described above, as well as planned utilization of this equipment.
Updated Cerro Quema Pre-Feasibility Study NI 43-101 Technical Report
Kappes, Cassiday & Associates 16.0 Mining Methods January, 2022 Page 16-36
Table 16-13 Support and Ancillary Mine Fleet Utilization
Unit Function Utilization Haul Road Support Motor Grader (4.9 m blade) Haul Road Maintenance 1h per 11 hauler operating hours Motor Grader (4.4 m blade) Haul Road Maintenance 1h per 11 hauler operating hours
Water/Gravel Truck Haul Road Maintenance, Gravel Hauling 1h per 7 hauler operating hours
Waste Support
Track Dozer, 447 kW Stockpile Maintenance 0.40 * waste loading hours (not applied to BKFL waste) + 0.1 * loading hours
Compactor, 117 kW Stockpile Maintenance 2,000 hours per Year Primary Pit Support
Track Dozer, 223 kW Pit Maintenance, Shovel Support, Site Prep, Construction
0.30 hours * Loading Operating Hours
Wheel Loader (4.5 m3) Pit Support, Construction 0.2 hours per Loading Operating Hours
Hydraulic Excavator (3.0 m3) Pit Support, Ditching, Construction Activities 0.2 hours per Loading Operating Hours
Fuel and Lube Truck Mobile Fuel/Lube Service 0.3 hours per Loading Operating Hours Ancillary Crew Shuttle Employee Transportation 1,000 hours per Year per Unit Pickup Trucks (1/4t) Staff Transportation 2,000 hours per Year per Unit Light Plants (6 kW) Pit Lighting 3,500 hours per Year per Unit On-Highway Dump Truck Utility Material Movement 1,500 hours per Year per Unit Emergency Response Vehicle First Aid, Mine Rescue 300 hours per Year
Environmental ATV Environmental Support 500h per year Mobile Maintenance Fleet
Maintenance Trucks Mobile Maintenance Crew and Tool Transport 2,000 hours per Year per Unit
Mobile Crane (36t capacity) Mobile Maintenance Material Handling 1,000 hours per Year
Float Trailer (150t capacity) Material Equipment Transport 1000 hours per Year
Forklift (3t capacity) Shop Material and Tire Handling 1,000 hours per Year
Mobile Steam Cleaner Mobile Maintenance equipment cleaning 1,000 hours per Year
GME and Technical
Mine GME will include mine operations and maintenance supervision down to the Supervisor level. General pit labourers are also included under the GME. The Mine Superintendent will assume responsibility for overall supervision for the mine operations.
Updated Cerro Quema Pre-Feasibility Study NI 43-101 Technical Report
Kappes, Cassiday & Associates 16.0 Mining Methods January, 2022 Page 16-37
The Mine Manager will assume responsibility for overall supervision for the mine operations, maintenance, and technical services departments. A Clerk will be assigned to support this role. The Mine Superintendent will direct the operations activities and report to the Mine Manager. Mine Supervisors (Foremen) will be responsible for overall open pit supervision and equipment coordination, and are required on each 12-hour shift, with overall responsibility for the shift operation. A Mine Maintenance Superintendent will direct the maintenance activities and report to the Mine Manager. Mine Maintenance Supervisors will be responsible for overall open mine fleet maintenance department supervision. Maintenance Planners will plan out all scheduled maintenance activities on the mobile mine fleet. A Maintenance Administrator (Clerk) will be available to support the maintenance department staff. Mine Maintenance Shift Foreman are assumed not required, with responsibility for the shift activities falling on the maintenance personnel themselves. Initial and ongoing training will be provided by experienced operators under the direction of Safety/Training Officers. The Technical Service Superintendent will oversee all technical services departments. Mine Planning Engineers will coordinate the mine planning group, including the Surveyor and Technician functions. Surveying will use GPS based systems. The engineering department will include a dedicated Drill and Blast Engineer that will liaise with the contracted blasting operators and their management. The engineering department will include a dedicated geotechnical engineer for supervision of open pit and stockpile stability performance. The Geology department will include a Chief Geologist, Geologists and Ore Grade Technicians. This department will be responsible for local step out, infill drill programs for onsite exploration activities and updating of the long-range ore body models. The Geology department will also provide grade control support to mine operations, managing and executing the blast hole sampling, managing ore control models, and field demarcation of ore and waste dig limits. Ore control modeling based on results of exploration drilling will be managed by the Chief Geologist. Ore Grade technicians are included under this department for running the grade control samples through the PAL assay laboratory.
Operations Setup for Equipment Utilization Planning
For the primary mining fleet (drills, excavators, loaders, and haulers) the amount of available operating hours is calculated based on the inputs and results in the following Tables, which is based on two twelve-hour shifts operated per day, 365 operating days per year.
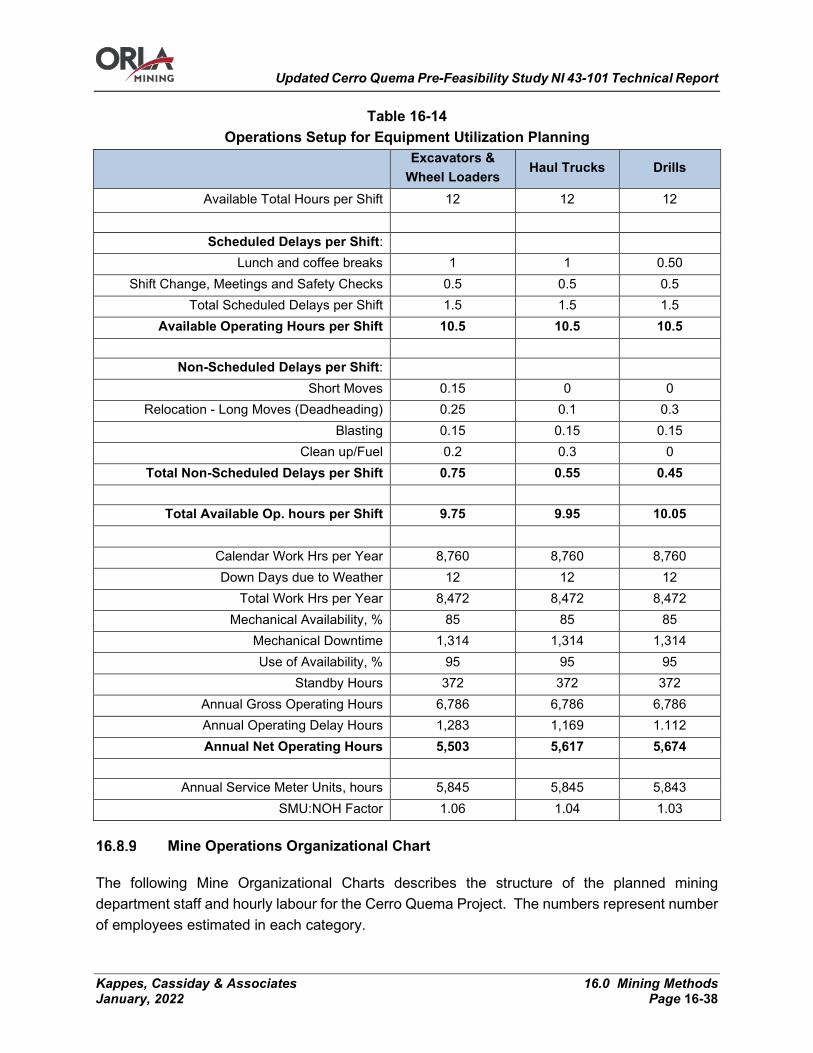
Updated Cerro Quema Pre-Feasibility Study NI 43-101 Technical Report
Kappes, Cassiday & Associates 16.0 Mining Methods January, 2022 Page 16-38
Table 16-14 Operations Setup for Equipment Utilization Planning
Excavators &
Wheel Loaders Haul Trucks Drills
Available Total Hours per Shift 12 12 12
Scheduled Delays per Shift:
Lunch and coffee breaks 1 1 0.50 Shift Change, Meetings and Safety Checks 0.5 0.5 0.5
Total Scheduled Delays per Shift 1.5 1.5 1.5 Available Operating Hours per Shift 10.5 10.5 10.5
Non-Scheduled Delays per Shift:
Short Moves 0.15 0 0 Relocation - Long Moves (Deadheading) 0.25 0.1 0.3
Blasting 0.15 0.15 0.15 Clean up/Fuel 0.2 0.3 0
Total Non-Scheduled Delays per Shift 0.75 0.55 0.45
Total Available Op. hours per Shift 9.75 9.95 10.05
Calendar Work Hrs per Year 8,760 8,760 8,760 Down Days due to Weather 12 12 12
Total Work Hrs per Year 8,472 8,472 8,472 Mechanical Availability, % 85 85 85
Mechanical Downtime 1,314 1,314 1,314 Use of Availability, % 95 95 95
Standby Hours 372 372 372 Annual Gross Operating Hours 6,786 6,786 6,786 Annual Operating Delay Hours 1,283 1,169 1.112 Annual Net Operating Hours 5,503 5,617 5,674
Annual Service Meter Units, hours 5,845 5,845 5,843 SMU:NOH Factor 1.06 1.04 1.03
Mine Operations Organizational Chart
The following Mine Organizational Charts describes the structure of the planned mining department staff and hourly labour for the Cerro Quema Project. The numbers represent number of employees estimated in each category.
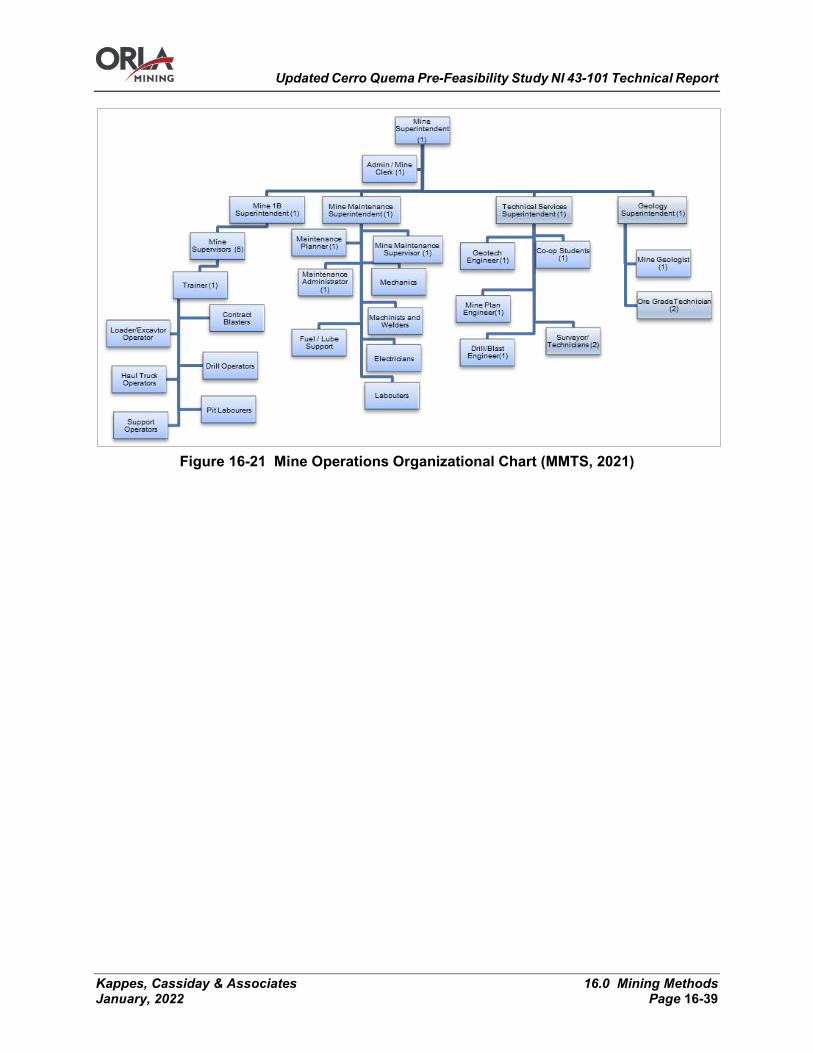
Updated Cerro Quema Pre-Feasibility Study NI 43-101 Technical Report
Kappes, Cassiday & Associates 16.0 Mining Methods January, 2022 Page 16-39
Figure 16-21 Mine Operations Organizational Chart (MMTS, 2021)
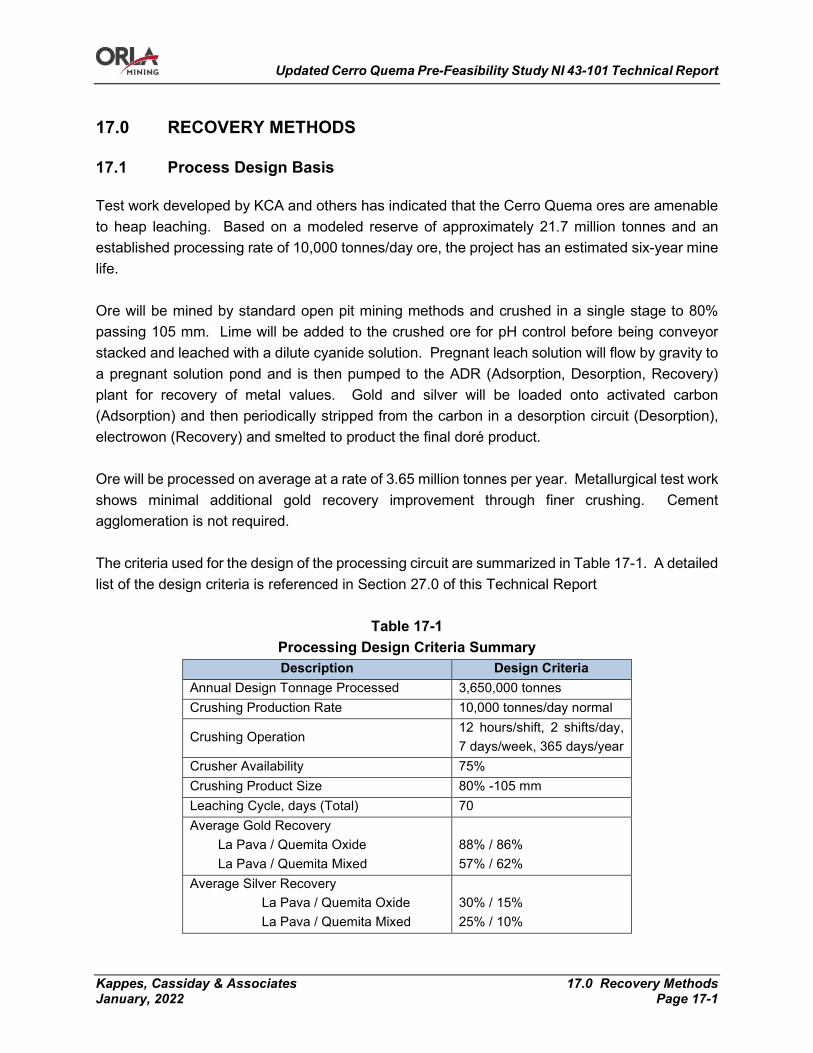
Updated Cerro Quema Pre-Feasibility Study NI 43-101 Technical Report
Kappes, Cassiday & Associates 17.0 Recovery Methods January, 2022 Page 17-1
17.0 RECOVERY METHODS
Process Design Basis
Test work developed by KCA and others has indicated that the Cerro Quema ores are amenable to heap leaching. Based on a modeled reserve of approximately 21.7 million tonnes and an established processing rate of 10,000 tonnes/day ore, the project has an estimated six-year mine life. Ore will be mined by standard open pit mining methods and crushed in a single stage to 80% passing 105 mm. Lime will be added to the crushed ore for pH control before being conveyor stacked and leached with a dilute cyanide solution. Pregnant leach solution will flow by gravity to a pregnant solution pond and is then pumped to the ADR (Adsorption, Desorption, Recovery) plant for recovery of metal values. Gold and silver will be loaded onto activated carbon (Adsorption) and then periodically stripped from the carbon in a desorption circuit (Desorption), electrowon (Recovery) and smelted to product the final doré product. Ore will be processed on average at a rate of 3.65 million tonnes per year. Metallurgical test work shows minimal additional gold recovery improvement through finer crushing. Cement agglomeration is not required. The criteria used for the design of the processing circuit are summarized in Table 17-1. A detailed list of the design criteria is referenced in Section 27.0 of this Technical Report
Table 17-1 Processing Design Criteria Summary Description Design Criteria
Annual Design Tonnage Processed 3,650,000 tonnes Crushing Production Rate 10,000 tonnes/day normal
Crushing Operation 12 hours/shift, 2 shifts/day, 7 days/week, 365 days/year
Crusher Availability 75% Crushing Product Size 80% -105 mm Leaching Cycle, days (Total) 70 Average Gold Recovery La Pava / Quemita Oxide La Pava / Quemita Mixed
88% / 86% 57% / 62%
Average Silver Recovery La Pava / Quemita Oxide La Pava / Quemita Mixed
30% / 15% 25% / 10%

Updated Cerro Quema Pre-Feasibility Study NI 43-101 Technical Report
Kappes, Cassiday & Associates 17.0 Recovery Methods January, 2022 Page 17-2
Process Summary
Ore will be mined using standard open pit mining methods and delivered to the crushing circuit using haul trucks which will direct dump into a dump hopper; a front-end loader will feed material to the dump hopper as needed from a ROM stockpile located near the primary crusher. Ore will be crushed at an average rate of 10,000 tonnes per day to a final product size of 80% passing 105 mm in a single stage jaw crusher. The crushing circuit will operate 7 days/week, 24 hours/day, 365 days/year with an overall estimated availability of 75%. The crushed product will be conveyed from the crushing circuit and stockpiled using a fixed stacker near the heap. Stockpiled material will be reclaimed by belt feeders and conveyed to the conveyor stacking system. Pebble lime will be added to the reclaim conveyor for pH control before being stacked onto the heap; cement agglomeration is not required. Barren process solution will be added to the ore once it is over the lined leach pad. Stacked ore will be leached using a drip and/or sprinkler irrigation system for solution application depending on water balance requirements. After percolating through the ore, the gold and silver-bearing solution will drain by gravity to a pregnant solution pond where it will be collected and pumped to a carbon in column (CIC) adsorption circuit. Gold and silver values will be loaded onto activated carbon in one train of five cascade columns. Barren solution from the final column will flow by gravity to a barren tank and will then be pumped to the heap for further leaching. High strength cyanide solution will be injected into the barren solution to maintain the cyanide concentration in the leach solutions at the desired level. Loaded carbon from the CIC will be stripped using a pressure Zadra desorption circuit in 2.5-tonne batches. During the desorption process, gold and silver will be continuously extracted by electrowinning from the pregnant eluate concurrently with desorption. The gold sludge will be washed from the electrowinning cell cathodes, treated in a mercury retort to recovery mercury values, and smelted to produce the final doré product. Carbon from the adsorption circuit will be acid washed prior to each stripping cycle in an acid wash vessel. A portion of the carbon will be thermally regenerated using a kiln after each strip to maintain carbon activity. Diesel generators will be used to supply electric power to all elements of the process plant. An excess solution (stormwater) pond is included to contain any leach solutions and/or precipitation events that cannot be managed during normal operations. The excess solution will be returned to the barren tank as a make-up solution during average precipitation years. During wet years, excess solution will need to be treated and discharged. Cyanide present in the excess
Updated Cerro Quema Pre-Feasibility Study NI 43-101 Technical Report
Kappes, Cassiday & Associates 17.0 Recovery Methods January, 2022 Page 17-3
solution will be neutralized using sodium metabisulfite followed by additional treatment in a heap leach water treatment plant to remove any other deleterious elements; solutions being discharged will pass through a pair of scavenger carbon columns to recover any metal values in solution. Make-up water will be from a combination of excess solution and wells. The process general arrangement drawings are shown in Figure 17-1 and Figure 17-2, the simplified flow sheet is shown in Figure 17-3. Additional General Arrangement Drawings, Process Flowsheets and equipment list are referenced in Section 27.0 of this Technical Report.
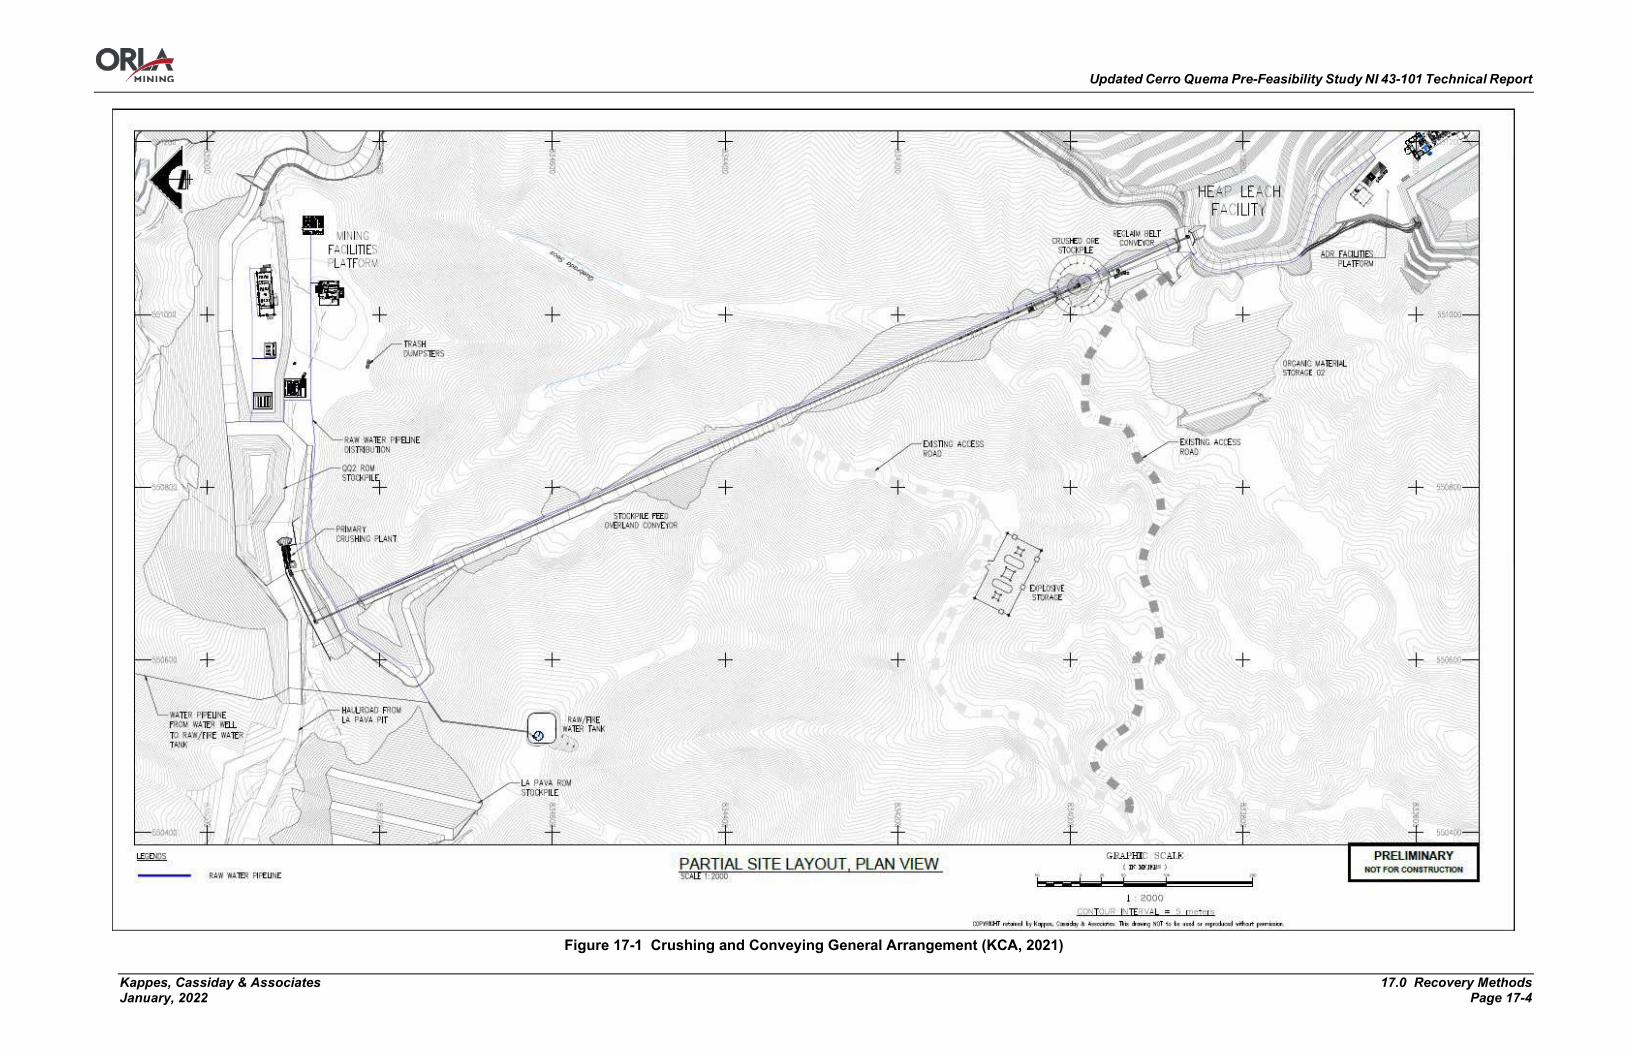
Updated Cerro Quema Pre-Feasibility Study NI 43-101 Technical Report
Kappes, Cassiday & Associates 17.0 Recovery Methods January, 2022 Page 17-4
Figure 17-1 Crushing and Conveying General Arrangement (KCA, 2021)
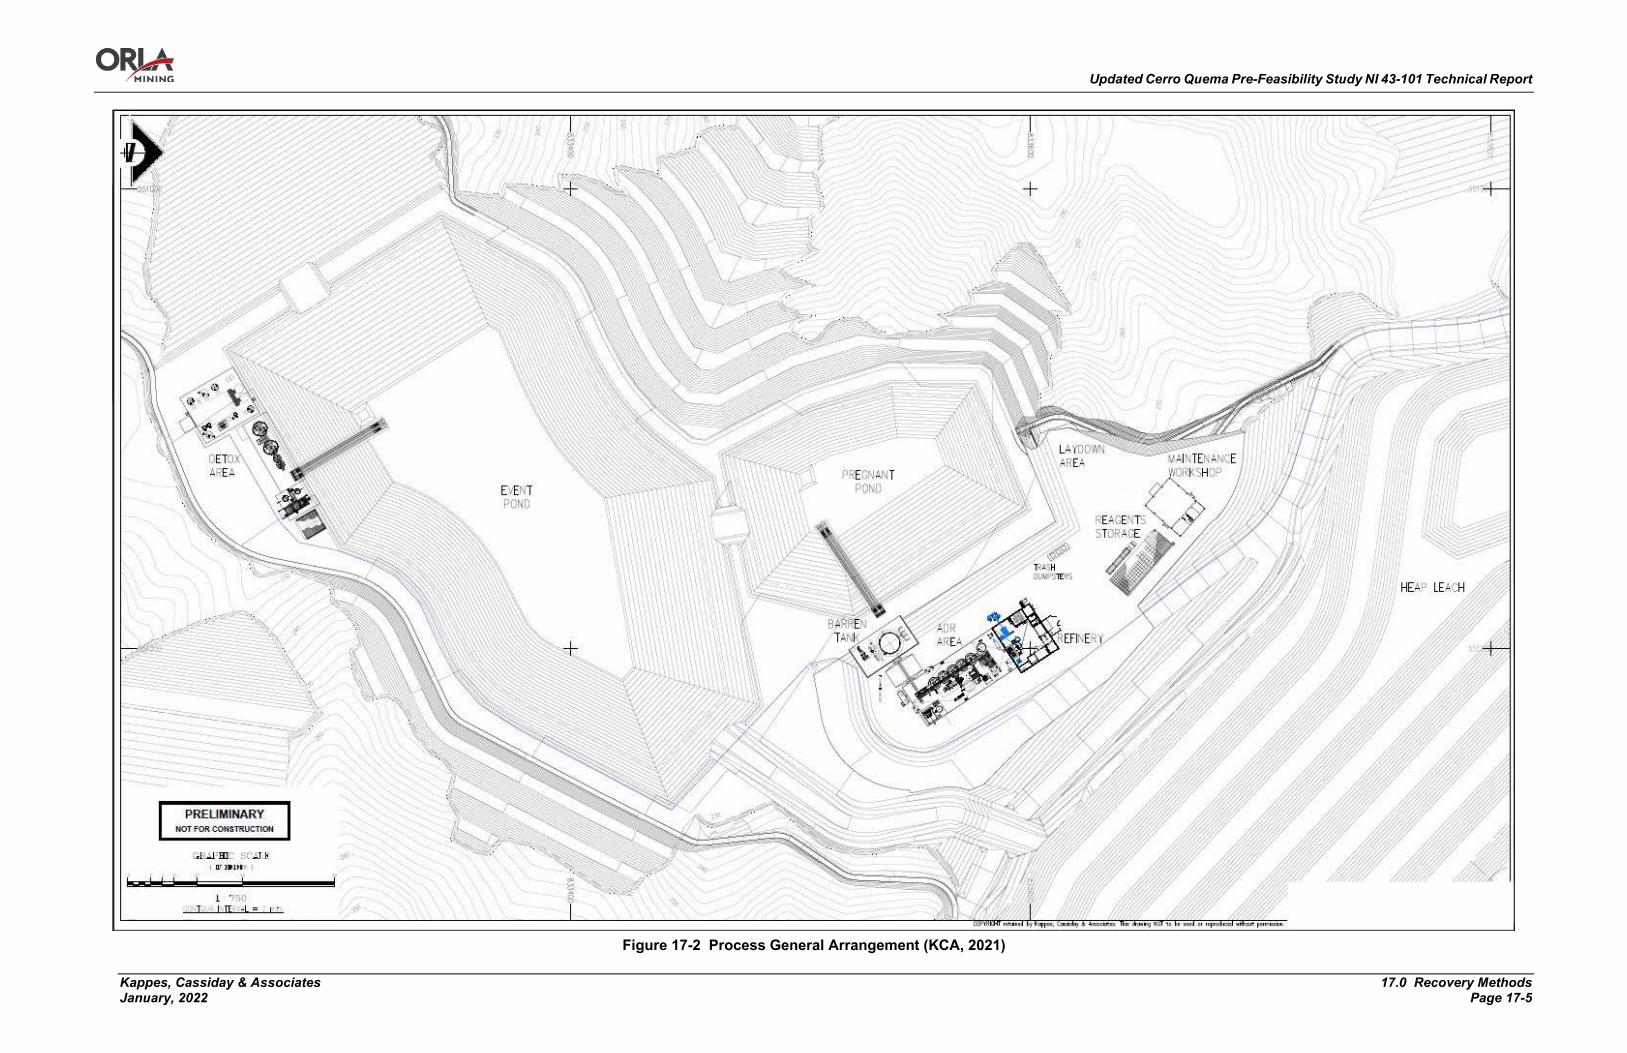
Updated Cerro Quema Pre-Feasibility Study NI 43-101 Technical Report
Kappes, Cassiday & Associates 17.0 Recovery Methods January, 2022 Page 17-5
Figure 17-2 Process General Arrangement (KCA, 2021)

Updated Cerro Quema Pre-Feasibility Study NI 43-101 Technical Report
Kappes, Cassiday & Associates 17.0 Recovery Methods January, 2022 Page 17-6
Figure 17-3 Simplified Process Flowsheet (KCA, 2021)

Updated Cerro Quema Pre-Feasibility Study NI 43-101 Technical Report
Kappes, Cassiday & Associates 17.0 Recovery Methods January, 2022 Page 17-7
Crushing
The following modular components are included in the crushing facility:
• ROM dump hopper with stationary grizzly; • A primary crushing plant with an apron feeder, vibrating grizzly, primary jaw crusher, and
a crusher discharge conveyor; and • A crushed product overland conveyor with fixed stacker; and • Associated transfer chutes and instruments.
Run-of-mine ore from the La Pava or Quema-Quemita open pits will be delivered to the primary crusher station in 41 and 55-tonne capacity haul trucks and dumped directly into the ROM dump hopper or stockpiled in a ROM stockpile. Stockpiled ore from the ROM stockpile will be reclaimed by a front-end loader and fed to the dump hopper as needed. Oversized rocks or large lumps will be broken up using a rock breaker. The crushing plant will process and average of 10,000 tonnes of ore per day. Ore will be fed from the ROM dump hopper to a vibrating grizzly feeder via. an apron feeder. The vibrating grizzly feeder will have parallel bars spaced 100 mm apart with grizzly oversize being fed to the primary jaw crusher and the grizzly undersize being recombined with the jaw crusher product on the primary crusher discharge conveyor. The primary crusher will operate with a 120 mm discharge setting. The final crushed product will be 80% passing 105 mm. The crushed product will be delivered to the heap leach pad area and stockpiled in a conical 26,000-tonne stockpile by a crushed product transfer conveyor and overland crushed ore stockpile feed conveyor. The crushed product transfer conveyor will be equipped with a belt scale and tramp metal electromagnet and metal detector. A modular motor control center will be housed in a separate room or container and will be located proximal to the crushing area. A crusher operator control cabin will also be included. All of the conveyors will be interlocked so that if one conveyor trips out, all upstream conveyors and the vibrating grizzly feeder will also trip. This interlocking will prevent large spills and equipment damage. Both of these features are considered necessary to meet the design utilization for the system. Water sprays will be located at all material transfer points to reduce dust generation by the crushing circuit.

Updated Cerro Quema Pre-Feasibility Study NI 43-101 Technical Report
Kappes, Cassiday & Associates 17.0 Recovery Methods January, 2022 Page 17-8
Reclamation and Conveyor Stacking
The crushed product stockpile is sized to accommodate a total capacity of approximately 26,000 tonnes, or approximately 5,300 tonnes live capacity. Crushed ore will be reclaimed from the stockpile by two reclaim belt feeders to a reclaim conveyor in a tunnel below the stockpile. Pebble lime (CaO) for pH control will be added to the ore on the reclaim tunnel conveyor from an 80-tonne lime silo equipped with a bin activator, variable speed screw feeder and dust collector; lime addition will vary by pit and material type. Barren process solution will be added to the ore on the reclaim tunnel conveyor once the conveyor is over the lined leach pad containment area. The heaps will be constructed in 8 m high lifts using a mobile conveyor stacking system. The conveyor stacking system includes the following components:
• "Ramp" portable transfer conveyors, each approximately 35 m in length for conveying crushed ore up ramps;
• "Grasshopper" portable transfer conveyors, each approximately 35 m in length for conveying crushed material across relatively flat areas;
• A 35 m long horizontal “Index Feed Conveyor” that transfers crushed material from the grasshopper conveyors to a “Horizontal Feed Conveyor”;
• A moveable 35 m long “Horizontal Index Conveyor” that transfers crushed material to the radial stacker; and
• A 33.5 m long “Radial Stacking Conveyor” capable of powered height adjustment, slewing and stacking to a height of 8 m.
Portable grasshopper and ramp transfer conveyors will transfer ore from the reclaim conveyor to the conveyor stacking system in the active stacking zone. The conveyor stacking system includes the index feed conveyor, horizontal index, and radial stacker conveyors. The horizontal index conveyor and radial stacker will be able to retreat or forward (top) stack ore onto the heap. As the stacker advances, the system will be periodically stopped to add or remove portable transfer conveyors. The number of portable transfer conveyors will vary depending on the area of the heap being stacked with a maximum of 20 transfer conveyors (10 each ramp and grasshopper conveyors) during Phase 1. Once a lift of cells has finished leaching and is sufficiently drained, a new lift can be stacked over the top of the old lift. The old lift will be cross-ripped prior to stacking new material on top of any old heap area or access ramp to break up any cemented sections. Stacked lifts will progress in a stair-step manner. The maximum planned heap height is 80 m over the composite liner system, or 10 total lifts.

Updated Cerro Quema Pre-Feasibility Study NI 43-101 Technical Report
Kappes, Cassiday & Associates 17.0 Recovery Methods January, 2022 Page 17-9
Leach Pad Design
The Heap Leach Facility (HLF) located in the Quebrada Maricela, will be a multiple-lift, single-use type leach pad designed to accommodate approximately 27.3 million tonnes of crushed ore. The HLF has been designed with a liner system in accordance with International Cyanide Code requirements and meets or exceeds North American standards and practices for liner systems, piping systems, and process ponds, which are intended to lessen the environmental risk of the facilities to impact the local soils, surface water, and ground water in and around the site. The 43.2-hectare HLF has been sized using an average stacked ore density of 1.5 tonnes per cubic meter and a maximum heap height of 125 meters. Ore will be conveyor-stacked at a rate of 10,000 tonnes per day (tpd). Ore will be crushed, then placed on the leach pad using portable conveyors feeding a conveyor-stacker. Ore will be stacked in approximately 8-meter lifts, and 9.2 meters wide benches between lifts to create an average overall ore slope of 2.5H:1V, which will provide operational and post-closure stability of the heap, and minimizes grading during reclamation. The HLF will be lined with a composite liner system consisting of a prepared subgrade, a 300 mm thick low-permeability soil bedding layer or a geosynthetic clay liner (GCL), overlain by a 2 mm single-side textured (SST) linear low-density polyethylene (LLDPE) geomembrane liner. Table 17.2 summarizes the design specifications for the HLF and Figures 17.3 and 17.4 show the plan view and section of this facility.
Table 17-2 Maricela HLF Design Specifications
Description Specification Phase 1 Capacity 7.3 Mt Phase 2 Capacity 10.6 Mt Phase 3 Capacity 9.4 Mt Total WRD Capacity 27.3 Mt Dump Crest Elevation 385 Meters Elevation Lift Height 8 Meters Lift Angle 1.35H:1V Lift Bench Width 9.2 Meters Overall Slope 2.5H:1V
Composite Liner System 2 mm SST LLLPE Geomembrane 300 mm Low-Permeability Soil or GCL
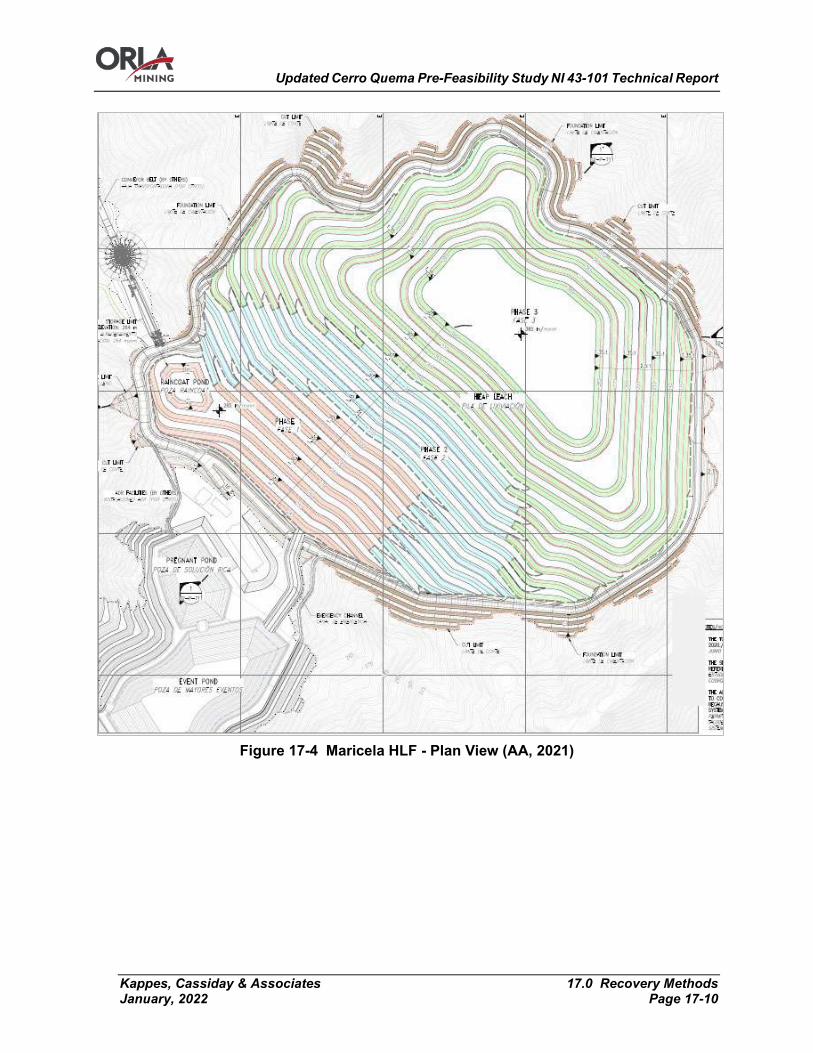
Updated Cerro Quema Pre-Feasibility Study NI 43-101 Technical Report
Kappes, Cassiday & Associates 17.0 Recovery Methods January, 2022 Page 17-10
Figure 17-4 Maricela HLF - Plan View (AA, 2021)
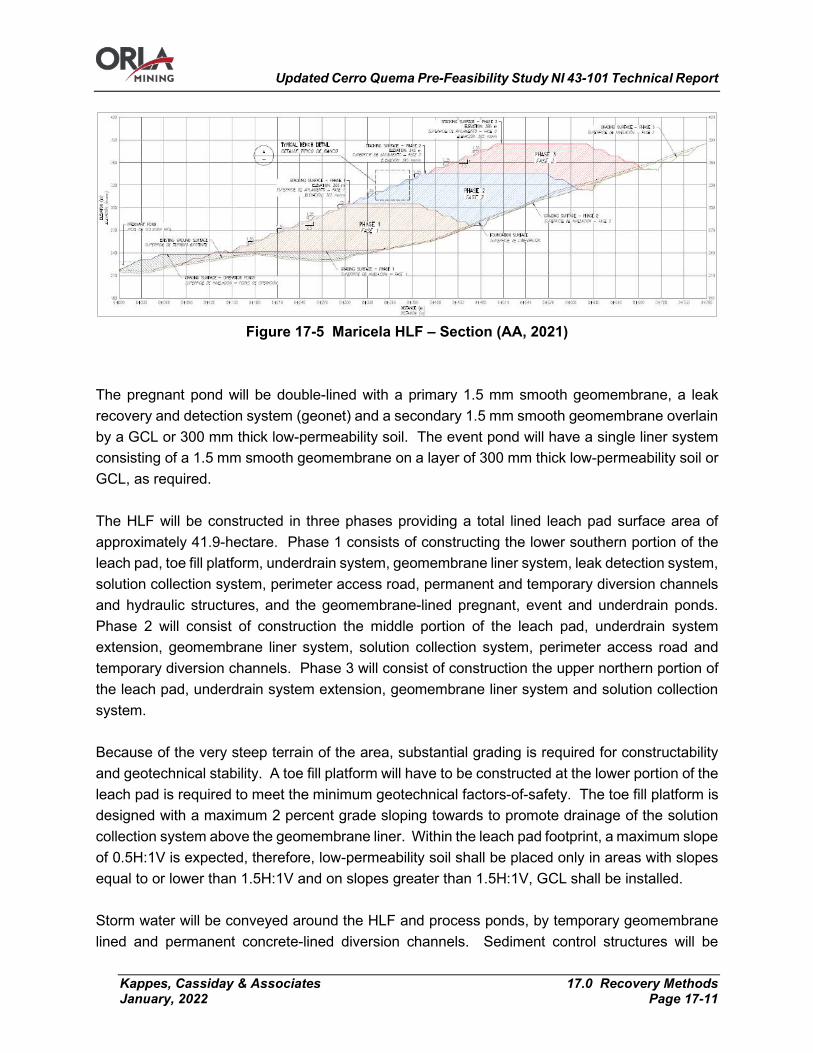
Updated Cerro Quema Pre-Feasibility Study NI 43-101 Technical Report
Kappes, Cassiday & Associates 17.0 Recovery Methods January, 2022 Page 17-11
Figure 17-5 Maricela HLF – Section (AA, 2021)
The pregnant pond will be double-lined with a primary 1.5 mm smooth geomembrane, a leak recovery and detection system (geonet) and a secondary 1.5 mm smooth geomembrane overlain by a GCL or 300 mm thick low-permeability soil. The event pond will have a single liner system consisting of a 1.5 mm smooth geomembrane on a layer of 300 mm thick low-permeability soil or GCL, as required. The HLF will be constructed in three phases providing a total lined leach pad surface area of approximately 41.9-hectare. Phase 1 consists of constructing the lower southern portion of the leach pad, toe fill platform, underdrain system, geomembrane liner system, leak detection system, solution collection system, perimeter access road, permanent and temporary diversion channels and hydraulic structures, and the geomembrane-lined pregnant, event and underdrain ponds. Phase 2 will consist of construction the middle portion of the leach pad, underdrain system extension, geomembrane liner system, solution collection system, perimeter access road and temporary diversion channels. Phase 3 will consist of construction the upper northern portion of the leach pad, underdrain system extension, geomembrane liner system and solution collection system. Because of the very steep terrain of the area, substantial grading is required for constructability and geotechnical stability. A toe fill platform will have to be constructed at the lower portion of the leach pad is required to meet the minimum geotechnical factors-of-safety. The toe fill platform is designed with a maximum 2 percent grade sloping towards to promote drainage of the solution collection system above the geomembrane liner. Within the leach pad footprint, a maximum slope of 0.5H:1V is expected, therefore, low-permeability soil shall be placed only in areas with slopes equal to or lower than 1.5H:1V and on slopes greater than 1.5H:1V, GCL shall be installed. Storm water will be conveyed around the HLF and process ponds, by temporary geomembrane lined and permanent concrete-lined diversion channels. Sediment control structures will be

Updated Cerro Quema Pre-Feasibility Study NI 43-101 Technical Report
Kappes, Cassiday & Associates 17.0 Recovery Methods January, 2022 Page 17-12
constructed, such as silt fences parallel to the diversion channels and check dams downstream of the facilities for sediment control. Raincoat system consisting of 1.5 mm smooth HDPE geomembrane, will be used during the operation to reduce de rainwater infiltration into the heap, prevent solution dilution and reduce water treatment. A raincoat pond will be constructed on the third lift and at the west portion of the HLF.
Solution Storage
The pregnant and event ponds, called process ponds, have been designed to allow for no excess water discharge under average and wetted year precipitation up to the second year of operation. An 80 m³/hr water treatment plant has been incorporated into the process fluid system to remove excess process water in case of a large storm event or wetter than average annual climate conditions. The HLF process ponds include provisions to accommodate the minimum volume storage requirements from the following combined upset conditions, below 1.0 meter of freeboard across both ponds: Pregnant Pond
• Minimum operation volume; • 24-hours of drain-down of the leach pad due to upset conditions such as a loss of power; • 24-hour operating volume to maintain production of the ADR plant at 700 m³/hr during
low inflow event; • 110% of the total barren tank volume; • Allowance.
Event Pond
• Minimum operation volume; • 100 yr, 24-h storm volume on last stage lined areas; • Annual fluid accumulation volume to eliminate needs of treated water into the natural
drainage during two first years of operation. Total required storage volumes in the process ponds are shown in Table 17-3.

Updated Cerro Quema Pre-Feasibility Study NI 43-101 Technical Report
Kappes, Cassiday & Associates 17.0 Recovery Methods January, 2022 Page 17-13
Table 17-3 Total Required Storage Volumes in Process Ponds
Criteria Required Storage Volume (m³)
Pregnant Pond Event Pond Minimum operating volume 10,000 40,000
24-hr drain-down volume 16,800
24-hr operation volume 16,800
110% barren tank volume 600
100-yr, 24-hr storm on last stage area 92,000
Annual fluid accumulation volume allowance 182,000
Allowance 7,400
Pond capacity 51,000 314,000
Total combined capacity 365,000
Solution Application
Ore will be leached in a single stage using barren solution consisting of a dilute sodium cyanide solution. Additional residual leaching of ore will occur as leach solution from higher lifts percolates downward. Barren solution will be pumped from the barren solution tank to the active leach site using a dedicated split-case horizontal centrifugal pump (one operating, one warehouse spare) and will be applied to the heap by a system of drip emitters and/or wobbler sprinklers depending on the water balance requirements. Barren solution will be applied to the heap at an average rate of 10 L/h/m2. Based on metallurgical test work results, a leach cycle of 70 days has been estimated. Concentrated cyanide will be added to the barren solution tank by metering pumps to maintain the cyanide in solution at 300-500 ppm NaCN. The barren solution tank is sized for 45 minutes of residence time at the ADR plant design flow rate of 734 m3/h. Antiscalant polymer will continuously be added to the leach solutions at an average rate of 10 ppm to reduce the potential for scaling problems within the irrigation system. Pregnant solution containing gold and silver values from the heap drains by gravity to a pregnant solution pond from the heap. The pregnant solution pond will be equipped with two submersible pumps (one operating, one standby) which will pump pregnant solution to the carbon adsorption circuit. The submersible pumps will be mounted on a pump slide on the pond side wall to facilitate the placement and extraction of the pumps in the pond. Gold and silver will be adsorbed onto carbon in the adsorption circuit and the resulting barren solution will be returned to the barren solution tank.
Updated Cerro Quema Pre-Feasibility Study NI 43-101 Technical Report
Kappes, Cassiday & Associates 17.0 Recovery Methods January, 2022 Page 17-14
Process Water Balance
A deterministic water balance GoldSim© model that accounts for inflows such as rain and leach solution, outflows such as evaporation, and consumptive loss due to ore wetting, was developed. To estimate inflow and outflow water requirements, the following criteria were considered:
• Operation, active closure, and passive closure periods simulation; • Phased leach pad areas; • Solution application flow rate and areas; • HLF phased capacity; • Synthetic 30-yr length and deterministic climatic series for the site, including conditions for
average, 1 in 100-year dry, and 1 in 100-year wet years; • Water treatment plant rates; • Make-up water volume: the solution will be applied with a wobbler-type spray; • HLF ore capacity of 22 Mt; • Average as-mined moisture content and specific moisture retention of the ore; • Nominal solution application rate is 10 l/hr/m²; • Nominal and maximum solution flow rate is 583 m3/hr and 700 m3/hr; • Nominal rinse flow rate of 10 l/hr/m²; • Progressive construction of vegetated cap during active closure; • Analysis of measures to reduce risk of overflow: raincoats, enhanced evaporation via fan
evaporators in event pond, adjust water treatment plant capacity, basic rules of pond operation (water stage for water treatment plant on/off).
Based on the modeling results, it was concluded that maximum daily make-up peaks to 1,440 m3/d is expected in year 2, and it is approximately the same for the following 5 years but gradually with less chance from 50 % to 5 %, disregarding the drop to 1,128 m3/d in the 7th year. Also, surplus water is appreciably predicted since the 4th year of operation (and marginally predicted since the 3rd) and to contain it is suggested to use raincoats and prepare the operation of water treatment plant since year 3. 40% of the HLF area covered by raincoats may be the convenient option since is near to the HLF side slope area which may leave the platform free for leaching operations and which reduces water treatment plant needed capacity to 80 m3/hr.
Solution Treatment
Water treatment facilities will be required for discharging impacted water from the mine site and are described in the following sections. There will be two main sources of impacted water to be treated, one from the waste rock dump (WRD) area and one from the heap leach facility (HLF) area. During the operational mining period, active water treatment systems will be required to

Updated Cerro Quema Pre-Feasibility Study NI 43-101 Technical Report
Kappes, Cassiday & Associates 17.0 Recovery Methods January, 2022 Page 17-15
handle the concentrations, variability, and flow rates from each area. During post closure when flow rates and variability have subsided, the water will be treated using passive treatment systems for each area. The treatment facilities required include:
1. WRD Active Treatment Plant; 2. HLF Active Treatment Plant; 3. WRD Passive Treatment System; 4. HLF Passive Treatment System.
Table 17-4 presents the design basis for all four water treatment facilities. It includes the mining years for operation, design maximum and average flow rates, the discharge standards (PR 351: Panama Resolution 351 for the discharge of liquid effluents to surface water and groundwater), and the predicted influent water quality for each facility. The contaminants of concern are shown in red. This includes any constituent that is predicted to be higher or within 80% of the discharge standard. Within 80% of the discharge standard, a predicted constituent is still considered to be a treatment risk at this level of mine development.
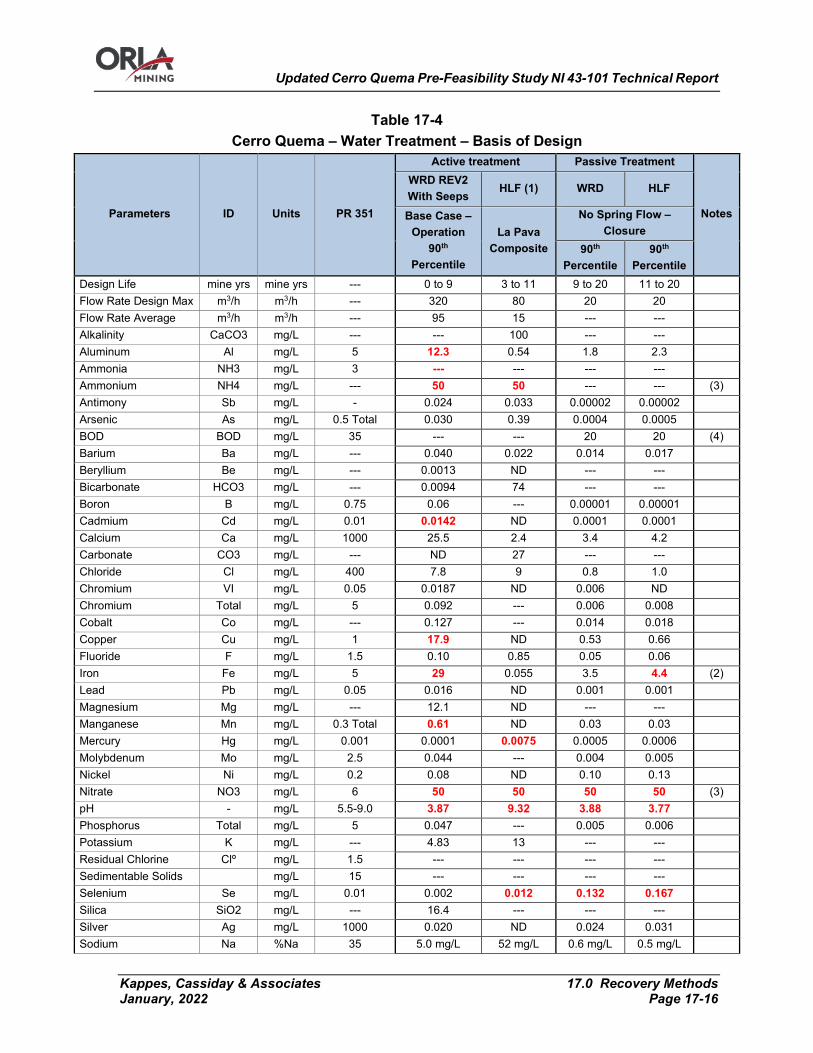
Updated Cerro Quema Pre-Feasibility Study NI 43-101 Technical Report
Kappes, Cassiday & Associates 17.0 Recovery Methods January, 2022 Page 17-16
Table 17-4 Cerro Quema – Water Treatment – Basis of Design
Parameters ID Units PR 351
Active treatment Passive Treatment
Notes
WRD REV2 With Seeps
HLF (1) WRD HLF
Base Case – Operation
90th Percentile
La Pava Composite
No Spring Flow – Closure
90th Percentile
90th Percentile
Design Life mine yrs mine yrs --- 0 to 9 3 to 11 9 to 20 11 to 20 Flow Rate Design Max m3/h m3/h --- 320 80 20 20 Flow Rate Average m3/h m3/h --- 95 15 --- --- Alkalinity CaCO3 mg/L --- --- 100 --- --- Aluminum Al mg/L 5 12.3 0.54 1.8 2.3 Ammonia NH3 mg/L 3 --- --- --- --- Ammonium NH4 mg/L --- 50 50 --- --- (3) Antimony Sb mg/L - 0.024 0.033 0.00002 0.00002 Arsenic As mg/L 0.5 Total 0.030 0.39 0.0004 0.0005 BOD BOD mg/L 35 --- --- 20 20 (4) Barium Ba mg/L --- 0.040 0.022 0.014 0.017 Beryllium Be mg/L --- 0.0013 ND --- --- Bicarbonate HCO3 mg/L --- 0.0094 74 --- --- Boron B mg/L 0.75 0.06 --- 0.00001 0.00001 Cadmium Cd mg/L 0.01 0.0142 ND 0.0001 0.0001 Calcium Ca mg/L 1000 25.5 2.4 3.4 4.2 Carbonate CO3 mg/L --- ND 27 --- --- Chloride Cl mg/L 400 7.8 9 0.8 1.0 Chromium VI mg/L 0.05 0.0187 ND 0.006 ND Chromium Total mg/L 5 0.092 --- 0.006 0.008 Cobalt Co mg/L --- 0.127 --- 0.014 0.018 Copper Cu mg/L 1 17.9 ND 0.53 0.66 Fluoride F mg/L 1.5 0.10 0.85 0.05 0.06 Iron Fe mg/L 5 29 0.055 3.5 4.4 (2) Lead Pb mg/L 0.05 0.016 ND 0.001 0.001 Magnesium Mg mg/L --- 12.1 ND --- --- Manganese Mn mg/L 0.3 Total 0.61 ND 0.03 0.03 Mercury Hg mg/L 0.001 0.0001 0.0075 0.0005 0.0006 Molybdenum Mo mg/L 2.5 0.044 --- 0.004 0.005 Nickel Ni mg/L 0.2 0.08 ND 0.10 0.13 Nitrate NO3 mg/L 6 50 50 50 50 (3) pH - mg/L 5.5-9.0 3.87 9.32 3.88 3.77 Phosphorus Total mg/L 5 0.047 --- 0.005 0.006 Potassium K mg/L --- 4.83 13 --- --- Residual Chlorine Clº mg/L 1.5 --- --- --- --- Sedimentable Solids mg/L 15 --- --- --- --- Selenium Se mg/L 0.01 0.002 0.012 0.132 0.167 Silica SiO2 mg/L --- 16.4 --- --- --- Silver Ag mg/L 1000 0.020 ND 0.024 0.031 Sodium Na %Na 35 5.0 mg/L 52 mg/L 0.6 mg/L 0.5 mg/L
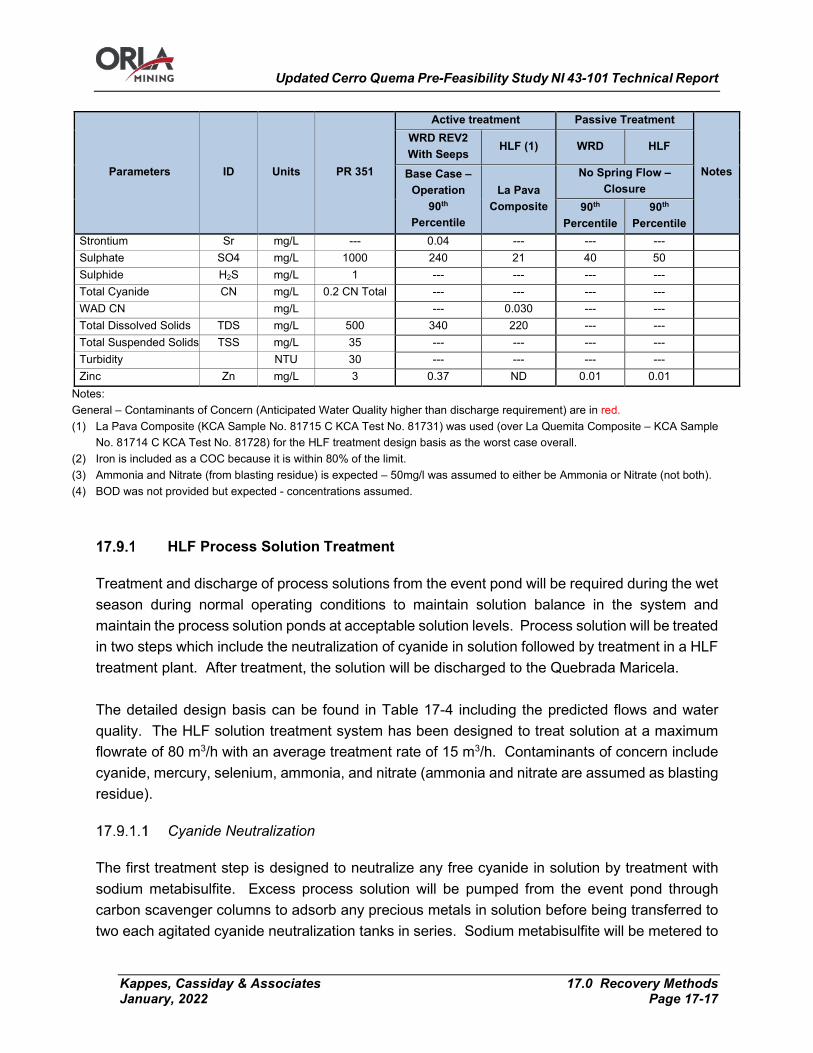
Updated Cerro Quema Pre-Feasibility Study NI 43-101 Technical Report
Kappes, Cassiday & Associates 17.0 Recovery Methods January, 2022 Page 17-17
Parameters ID Units PR 351
Active treatment Passive Treatment
Notes
WRD REV2 With Seeps
HLF (1) WRD HLF
Base Case – Operation
90th Percentile
La Pava Composite
No Spring Flow – Closure
90th Percentile
90th Percentile
Strontium Sr mg/L --- 0.04 --- --- --- Sulphate SO4 mg/L 1000 240 21 40 50 Sulphide H2S mg/L 1 --- --- --- --- Total Cyanide CN mg/L 0.2 CN Total --- --- --- --- WAD CN mg/L --- 0.030 --- --- Total Dissolved Solids TDS mg/L 500 340 220 --- --- Total Suspended Solids TSS mg/L 35 --- --- --- --- Turbidity NTU 30 --- --- --- --- Zinc Zn mg/L 3 0.37 ND 0.01 0.01
Notes: General – Contaminants of Concern (Anticipated Water Quality higher than discharge requirement) are in red. (1) La Pava Composite (KCA Sample No. 81715 C KCA Test No. 81731) was used (over La Quemita Composite – KCA Sample
No. 81714 C KCA Test No. 81728) for the HLF treatment design basis as the worst case overall. (2) Iron is included as a COC because it is within 80% of the limit. (3) Ammonia and Nitrate (from blasting residue) is expected – 50mg/l was assumed to either be Ammonia or Nitrate (not both). (4) BOD was not provided but expected - concentrations assumed.
HLF Process Solution Treatment
Treatment and discharge of process solutions from the event pond will be required during the wet season during normal operating conditions to maintain solution balance in the system and maintain the process solution ponds at acceptable solution levels. Process solution will be treated in two steps which include the neutralization of cyanide in solution followed by treatment in a HLF treatment plant. After treatment, the solution will be discharged to the Quebrada Maricela. The detailed design basis can be found in Table 17-4 including the predicted flows and water quality. The HLF solution treatment system has been designed to treat solution at a maximum flowrate of 80 m3/h with an average treatment rate of 15 m3/h. Contaminants of concern include cyanide, mercury, selenium, ammonia, and nitrate (ammonia and nitrate are assumed as blasting residue).
Cyanide Neutralization
The first treatment step is designed to neutralize any free cyanide in solution by treatment with sodium metabisulfite. Excess process solution will be pumped from the event pond through carbon scavenger columns to adsorb any precious metals in solution before being transferred to two each agitated cyanide neutralization tanks in series. Sodium metabisulfite will be metered to
Updated Cerro Quema Pre-Feasibility Study NI 43-101 Technical Report
Kappes, Cassiday & Associates 17.0 Recovery Methods January, 2022 Page 17-18
the neutralization tanks which will generate the sulfur dioxide required for the cyanide neutralization process along with hydrated lime to maintain an alkaline pH and air. Copper sulfate will be added as required as a catalyst for the reaction; however, copper sulfate addition is anticipated to be minimal due to the presence of copper in the process solutions. The cyanide neutralization circuit has a design residence time of one hour and will reduce the free cyanide levels to below 0.5 ppm.
HLF Solution Treatment Plant
After the cyanide neutralization process is complete, solution will be treated in a treatment plant. The HLF treatment includes the following major components:
• Reaction System i. Two mixed reaction tanks with a minimum design retention time of 15 minutes
• Disc filtration system to remove metals • Biological Systems
i. A Moving Bed Biofilm Reactor (MBBR) ii. A fixed film denitrification filter
• Solids Handling i. A sludge holding/thickener tank
The HLF plant process includes precipitation/solids removal and biological MBBR and denitrification systems. A precipitant and a coagulant will be added to the mixed reaction tanks for precipitation of contaminants, focused on mercury and selenium. Solids will be removed by disc filtration with the total solids loading expected to be low. Two biological systems will be included to treat for the anticipated ammonia and nitrate loadings. The Moving Bed Biofilm Reactor (MBBR) will convert ammonia to nitrate, and the fixed film denitrification filter will convert nitrate to nitrogen gas. The fixed film denitrification filter will provide the growth media for the biological conversion of nitrate to nitrogen gas with an addition of digestible carbon (glycerin or ethanol) being planned for growth of the microorganisms. The pH will be adjusted in the MBBR to optimize conditions. It is expected that the biological denitrification process will also remove the remaining selenium to the stringent discharge standards. Solids from the disc filter, and occasionally from the MBBR and fixed film denitrification systems, will be collected and transferred to a sludge holding/thickener tank. The thickened sludge will be disposed of by pumping into geotubes with the supernatant being pumped back to the reaction tanks. The plant process and layout are presented in Figure 17-6 and Figure 17-7, respectively.

Updated Cerro Quema Pre-Feasibility Study NI 43-101 Technical Report
Kappes, Cassiday & Associates 17.0 Recovery Methods January, 2022 Page 17-19
Figure 17-6 HLF Active Plant Process Flow Diagram (LE, 2021)
Figure 17-7 HLF Active Plant General Arrangement (LE, 2021)
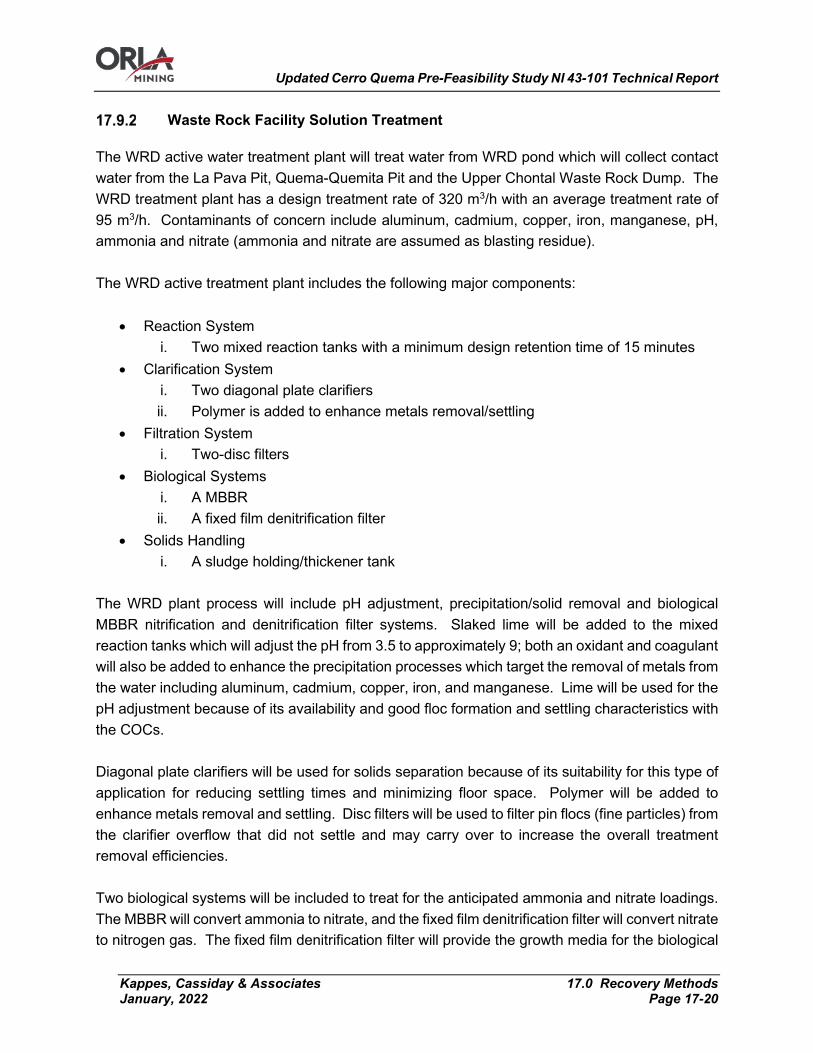
Updated Cerro Quema Pre-Feasibility Study NI 43-101 Technical Report
Kappes, Cassiday & Associates 17.0 Recovery Methods January, 2022 Page 17-20
Waste Rock Facility Solution Treatment
The WRD active water treatment plant will treat water from WRD pond which will collect contact water from the La Pava Pit, Quema-Quemita Pit and the Upper Chontal Waste Rock Dump. The WRD treatment plant has a design treatment rate of 320 m3/h with an average treatment rate of 95 m3/h. Contaminants of concern include aluminum, cadmium, copper, iron, manganese, pH, ammonia and nitrate (ammonia and nitrate are assumed as blasting residue). The WRD active treatment plant includes the following major components:
• Reaction System i. Two mixed reaction tanks with a minimum design retention time of 15 minutes
• Clarification System i. Two diagonal plate clarifiers ii. Polymer is added to enhance metals removal/settling
• Filtration System i. Two-disc filters
• Biological Systems i. A MBBR ii. A fixed film denitrification filter
• Solids Handling i. A sludge holding/thickener tank
The WRD plant process will include pH adjustment, precipitation/solid removal and biological MBBR nitrification and denitrification filter systems. Slaked lime will be added to the mixed reaction tanks which will adjust the pH from 3.5 to approximately 9; both an oxidant and coagulant will also be added to enhance the precipitation processes which target the removal of metals from the water including aluminum, cadmium, copper, iron, and manganese. Lime will be used for the pH adjustment because of its availability and good floc formation and settling characteristics with the COCs. Diagonal plate clarifiers will be used for solids separation because of its suitability for this type of application for reducing settling times and minimizing floor space. Polymer will be added to enhance metals removal and settling. Disc filters will be used to filter pin flocs (fine particles) from the clarifier overflow that did not settle and may carry over to increase the overall treatment removal efficiencies. Two biological systems will be included to treat for the anticipated ammonia and nitrate loadings. The MBBR will convert ammonia to nitrate, and the fixed film denitrification filter will convert nitrate to nitrogen gas. The fixed film denitrification filter will provide the growth media for the biological

Updated Cerro Quema Pre-Feasibility Study NI 43-101 Technical Report
Kappes, Cassiday & Associates 17.0 Recovery Methods January, 2022 Page 17-21
conversion of nitrate to nitrogen gas with an addition of digestible carbon (glycerin or ethanol) being planned for growth of the microorganisms. The pH will be adjusted in the MBBR to optimize conditions. It is expected that the biological denitrification process will also remove the remaining selenium to the stringent discharge standards. Solids from the disc filter, MBBR and fixed film denitrification systems, will be collected and transferred to a sludge holding/thickener tank. The thickened sludge will be disposed of by pumping into geotubes with the supernatant being pumped back to the reaction tanks. The plant process and layout are presented in Figure 17-8 and Figure 17-9, respectively.
Figure 17-8 WRD Active Plant Process Flow Diagram (LE, 2021)
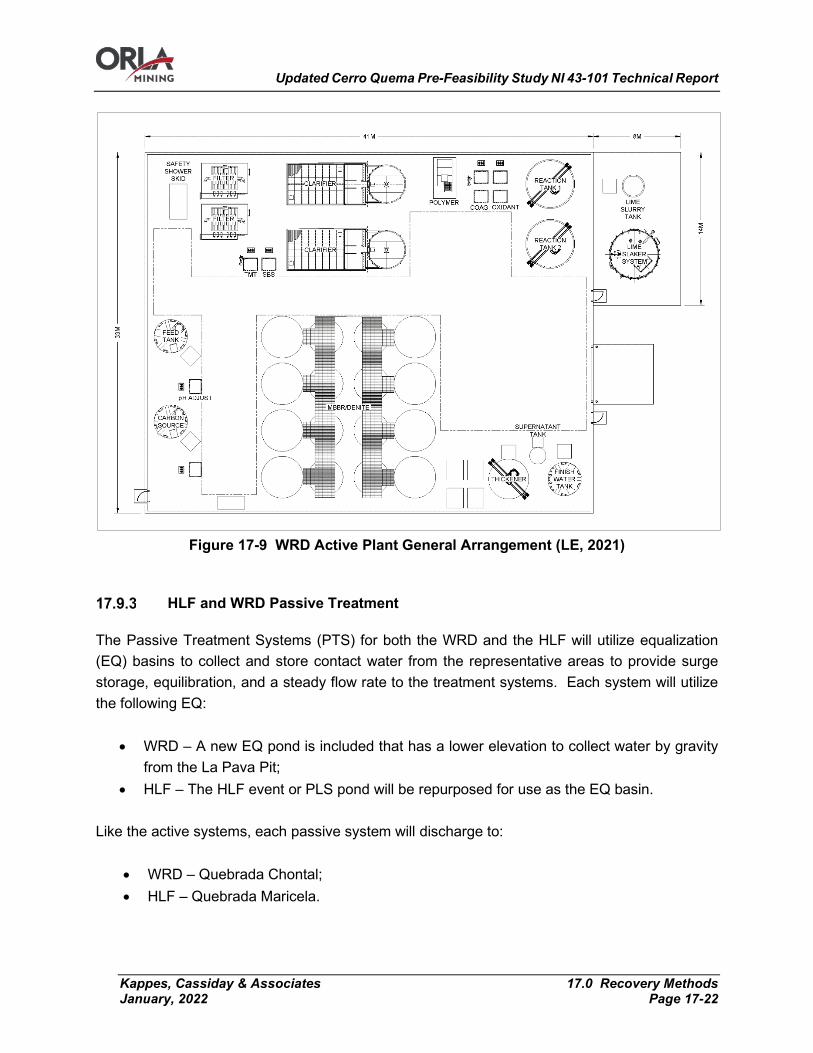
Updated Cerro Quema Pre-Feasibility Study NI 43-101 Technical Report
Kappes, Cassiday & Associates 17.0 Recovery Methods January, 2022 Page 17-22
Figure 17-9 WRD Active Plant General Arrangement (LE, 2021)
HLF and WRD Passive Treatment
The Passive Treatment Systems (PTS) for both the WRD and the HLF will utilize equalization (EQ) basins to collect and store contact water from the representative areas to provide surge storage, equilibration, and a steady flow rate to the treatment systems. Each system will utilize the following EQ:
• WRD – A new EQ pond is included that has a lower elevation to collect water by gravity from the La Pava Pit;
• HLF – The HLF event or PLS pond will be repurposed for use as the EQ basin. Like the active systems, each passive system will discharge to:
• WRD – Quebrada Chontal; • HLF – Quebrada Maricela.
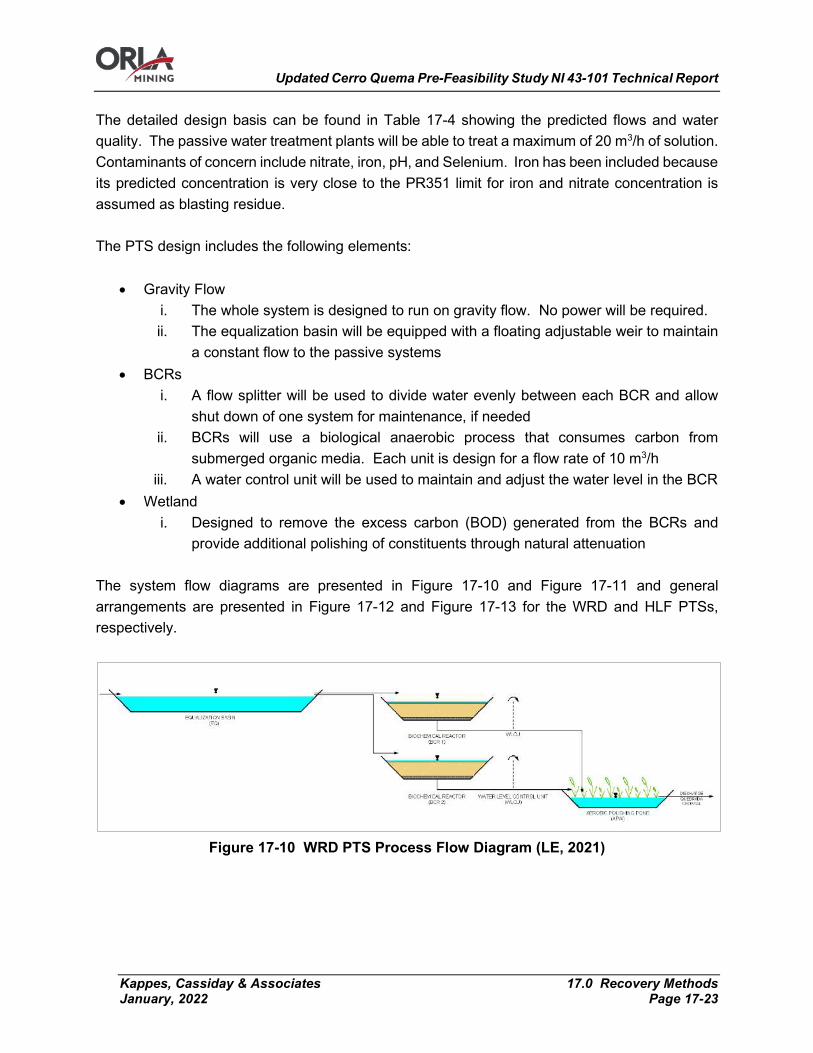
Updated Cerro Quema Pre-Feasibility Study NI 43-101 Technical Report
Kappes, Cassiday & Associates 17.0 Recovery Methods January, 2022 Page 17-23
The detailed design basis can be found in Table 17-4 showing the predicted flows and water quality. The passive water treatment plants will be able to treat a maximum of 20 m3/h of solution. Contaminants of concern include nitrate, iron, pH, and Selenium. Iron has been included because its predicted concentration is very close to the PR351 limit for iron and nitrate concentration is assumed as blasting residue. The PTS design includes the following elements:
• Gravity Flow i. The whole system is designed to run on gravity flow. No power will be required. ii. The equalization basin will be equipped with a floating adjustable weir to maintain
a constant flow to the passive systems • BCRs
i. A flow splitter will be used to divide water evenly between each BCR and allow shut down of one system for maintenance, if needed
ii. BCRs will use a biological anaerobic process that consumes carbon from submerged organic media. Each unit is design for a flow rate of 10 m3/h
iii. A water control unit will be used to maintain and adjust the water level in the BCR • Wetland
i. Designed to remove the excess carbon (BOD) generated from the BCRs and provide additional polishing of constituents through natural attenuation
The system flow diagrams are presented in Figure 17-10 and Figure 17-11 and general arrangements are presented in Figure 17-12 and Figure 17-13 for the WRD and HLF PTSs, respectively.
Figure 17-10 WRD PTS Process Flow Diagram (LE, 2021)

Updated Cerro Quema Pre-Feasibility Study NI 43-101 Technical Report
Kappes, Cassiday & Associates 17.0 Recovery Methods January, 2022 Page 17-24
Figure 17-11 HLF PTS Process Flow Diagram (LE, 2021)
Figure 17-12 WRD PTS Layout (LE, 2021)
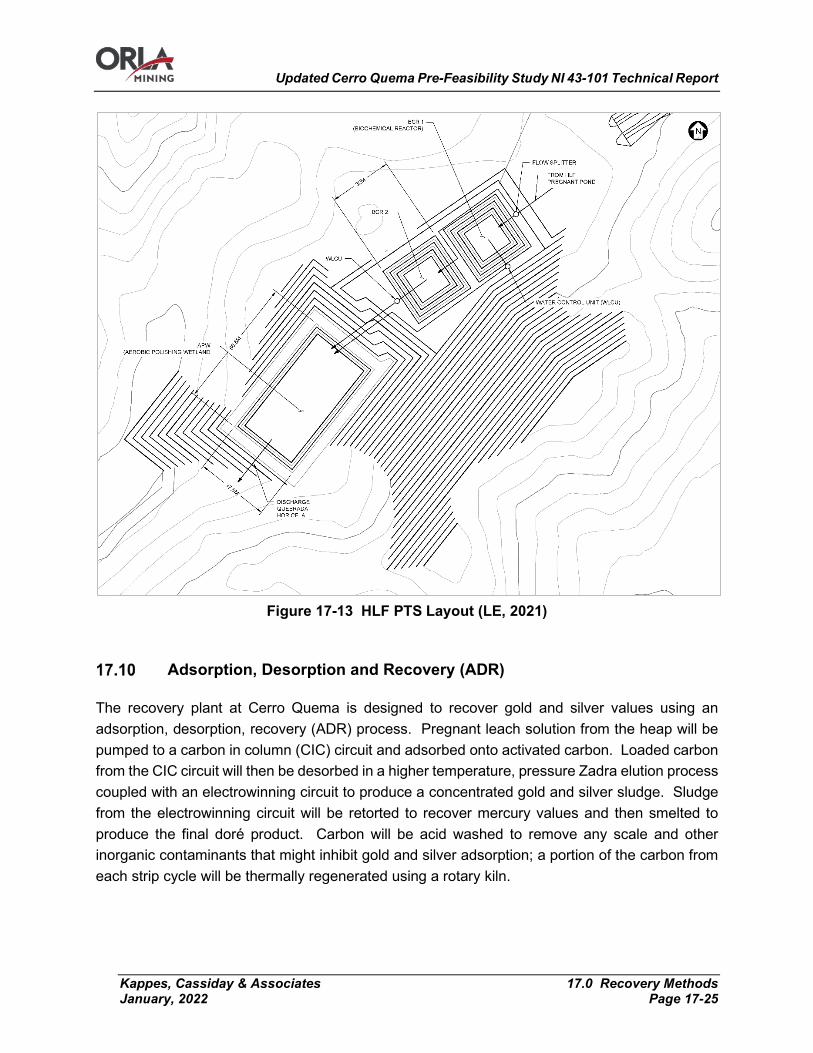
Updated Cerro Quema Pre-Feasibility Study NI 43-101 Technical Report
Kappes, Cassiday & Associates 17.0 Recovery Methods January, 2022 Page 17-25
Figure 17-13 HLF PTS Layout (LE, 2021)
Adsorption, Desorption and Recovery (ADR)
The recovery plant at Cerro Quema is designed to recover gold and silver values using an adsorption, desorption, recovery (ADR) process. Pregnant leach solution from the heap will be pumped to a carbon in column (CIC) circuit and adsorbed onto activated carbon. Loaded carbon from the CIC circuit will then be desorbed in a higher temperature, pressure Zadra elution process coupled with an electrowinning circuit to produce a concentrated gold and silver sludge. Sludge from the electrowinning circuit will be retorted to recover mercury values and then smelted to produce the final doré product. Carbon will be acid washed to remove any scale and other inorganic contaminants that might inhibit gold and silver adsorption; a portion of the carbon from each strip cycle will be thermally regenerated using a rotary kiln.

Updated Cerro Quema Pre-Feasibility Study NI 43-101 Technical Report
Kappes, Cassiday & Associates 17.0 Recovery Methods January, 2022 Page 17-26
Adsorption
The adsorption facility at Cerro Quema will consist of one train of five up-flow, open-top carbon columns (CICs). Each column will be 3.76 m in diameter and 3.76 m tall and has been sized to hold 4.8 tonnes of carbon. Pregnant solution will be pumped to the adsorption-feed head-tank of the CICs at a nominal flow rate of 611 m3/h. A magnetic flow meter and a wire sampler will be installed on the feed to the CICs to allow the calculation of total gold ounces fed to the carbon columns. Pregnant solution will flow by gravity through the set of five carbon columns, exiting the last column as barren solution. The barren solution will be continuously sampled by a wire sampler for metallurgical accounting then discharged to the carbon safety screen to recover any floating carbon particles. Underflow from the safety screen will flow by gravity to the barren solution tank. Any carbon recovered on the safety screen will be collected into a carbon super-sack for reuse. Adsorption of gold and silver from pregnant leach solutions from the heap circuit will be a continuous process. Once the carbon in the lead column achieves the desired precious metal load it will be advanced to the elution (desorption) circuit using screw-type centrifugal pumps. Carbon in the remaining columns will be advanced counter current to the solution flow to the next column in series. New or acid washed/regenerated carbon will be added to the last column in the train.
Carbon Acid Wash
Acid washing will consist of circulating a dilute acid solution through the bed of carbon to dissolve and remove scale from the carbon. Acid washing will be performed in 2.5-tonne batches before each desorption cycle. After carbon has been transferred into the acid wash column, but before any acid is introduced, fresh water will be circulated through the bed of carbon to remove any entrained cyanide solution. The rinse solution will be pumped to the carbon safety screen using the acid wash circulation pump. A dilute acid solution will then be prepared in the mix tank, and circulation established between the acid wash vessel and the acid mix tank. Concentrated acid will be injected into the recycle stream to achieve and maintain a pH ranging from 1.0 to 2.0. Completion of the cycle will be indicated when the pH stabilizes between 1.0 and 2.0 without acid addition for a minimum of one full hour of circulation. After acid washing has been completed, the acid wash pump will pump spent acid solution from the acid mix tank and wash vessel to the carbon safety screen. The carbon will then be rinsed with raw water followed by rinsing with dilute caustic solution to remove any residual acid. Total

Updated Cerro Quema Pre-Feasibility Study NI 43-101 Technical Report
Kappes, Cassiday & Associates 17.0 Recovery Methods January, 2022 Page 17-27
time required for acid washing a batch of carbon will be four to six hours. After acid washing has been completed, a carbon transfer pump will transfer the carbon to the desorption circuit.
Desorption
Cerro Quema will use a pressure Zadra hot caustic desorption circuit for the stripping of metal values from loaded carbon, which requires 18 hours or less to complete a cycle. During the elution or strip cycle, gold and silver are continuously extracted by electrowinning from the pregnant eluant concurrently with desorption. The desorption circuit has been sized to strip carbon in 2.5-tonne batches. After a batch of carbon has been transferred to the elution vessel, barren strip solution (eluant) containing sodium hydroxide and sodium cyanide will be pumped through the heat recovery and primary heat exchangers, and introduced to the elution vessel at a temperature of 135°C and a nominal operating pressure of approximately 483 kPa (70 psig). Final stripped-carbon gold and silver content will typically be less than 160 grams per tonne of carbon. Under normal operating conditions, barren eluant solution from the solution storage tank will pass through the heat recovery exchanger to be preheated by hot pregnant eluant leaving the elution column. The barren eluant solution will then passes through the primary heat exchanger to raise the temperature up to 135°C using pressurized hot water (~180°C) from the boiler system. The elution column will contain internal stainless steel inlet screens to hold carbon in the column and to distribute incoming stripping solution evenly in the column. Pregnant eluant solution leaving the elution column will pass through two external stainless-steel screens before passing the cooling heat exchanger to reduce the eluate temperature to about 75°C (to prevent boiling). The cooled pregnant eluate solution will then be sent to the electrowinning cells. After desorption is complete, the stripped carbon is transferred to the carbon reactivation dewatering screens to remove water and carbon fines, and transferred to carbon regeneration. A portion of the carbon will be regenerated after every strip.
Recovery & Refining
The electrowinning, or recovery, circuit will be operated in series with the desorption circuit. Solution is pumped continuously from the barren eluant tank, through the elution vessel, through the electrowinning cells and back to the barren eluant tank in a continuous closed loop process. After passing through the cooling heat exchanger, pregnant eluant will pass through two electrowinning cells operating in parallel where gold and silver will be won from the eluant using stainless steel cathodes and a current density of approximately 50 amperes per square meter of
Updated Cerro Quema Pre-Feasibility Study NI 43-101 Technical Report
Kappes, Cassiday & Associates 17.0 Recovery Methods January, 2022 Page 17-28
anode surface. Caustic soda (sodium hydroxide) in the eluate solution will act as an electrolyte to encourage free flow of electrons and promote the precious metal winning from solution. To keep the electrical resistance of the solution low during desorption and the electrowinning cycle, make-up caustic soda will occasionally be added to the barren eluant tank. Barren eluate solution leaving the electrolytic cells will discharge to the E-cell discharge tank where it is pumped back to the barren eluate storage tank to be recycled through the elution column. Periodically, all or part of the barren eluant will be dumped to the heap barren circuit and new solution is added to the tank. Typically, about one-third of the barren eluant will discarded after each elution or strip cycle. Sodium hydroxide and sodium cyanide will be added as required from the reagent handling systems to the barren eluant tank during fresh solution make-up. The precious metal-laden cathodes in the electrolytic cells will be removed about once per week and processed to produce the final doré product. Loaded cathodes will be transferred to a cathode wash box where precipitated precious metals are removed from the cathodes with a pressure washer. The resulting sludge is then pumped to a plate-and-frame filter press to remove water and the resulting filter cake is then loaded into pans for treatment in a mercury retort. The mercury retort will operate at temperatures up to 650 °C under vacuum. Condensers cool the retort gas stream, condensing most of the mercury which has been vaporised, which is collected while the final gas stream is further cooled by aftercoolers and then passes through sulphonated carbon columns before being discharged to ensure there is no remaining mercury in the emissions stream. Recovered mercury is considered as a hazardous waste and will be transported off site for disposal. After retorting, the dried sludge will be mixed with fluxes and fed to a diesel-fired smelting furnace. After melting, slag will be poured off into cascading cast iron moulds until the remaining molten furnace charge is mostly molten metal (doré). Doré will be poured off into 40 kg bar moulds, cooled, cleaned, and stored in a vault pending shipment to a third-party refiner. The doré poured from the furnace will represent the final product of the processing circuit. Slag will be reprocessed using a slag jaw crusher and re-smelted to recover any remaining metal values.

Updated Cerro Quema Pre-Feasibility Study NI 43-101 Technical Report
Kappes, Cassiday & Associates 17.0 Recovery Methods January, 2022 Page 17-29
Carbon Handling & Regeneration
The carbon handling and regeneration circuit includes all equipment required to store, prepare, transfer and regenerate carbon. The carbon preparation and storage system will include a one tonne agitated carbon attritioning tank, a 1.5-tonne carbon storage tank, carbon dewatering screen, carbon fines storage tank, carbon fines filter press and carbon transfer pumps. New and acid washed/regenerated carbon will be stored in the carbon storage tank to be returned to the CIC circuit as makeup carbon. Carbon being transferred to the carbon storage tank will pass through a carbon fines/dewatering screen in order to remove any carbon fines from the system. Carbon fines will be stored in a carbon fines storage tank, which will be periodically pumped through the carbon fines filter press; carbon fines from the filter press will be stored in bulk bags for removal from the system. New carbon being added to the system will first be attritioned in the carbon attritioning tank before being pumped to the carbon dewatering screen to remove carbon fines and then being transferred to the carbon storage tank. Thermal regeneration will consist of drying the carbon thoroughly and heating it to approximately 750oC for ten minutes in order to maintain carbon activity levels. Carbon to be thermally reactivated will be dewatered on a vibrating screen, transferred to the regeneration kiln feed hopper and fed to the regeneration kiln by a screw feeder. Hot, regenerated carbon leaving the kiln will discharge into a water-filled quench tank for cooling and storage. Ultimately, quenched regenerated carbon is pumped to the CIC dewatering screen to remove any fines and the coarse carbon is added to the CIC circuit. Approximately 50% of the carbon will be regenerated after every desorption cycle.
ADR Reagents and Consumables
Acid Wash Dilute Hydrochloric Acid
Dilute hydrochloric acid will be prepared by metering concentrated hydrochloric acid into the raw water that is circulating through the acid wash vessel and back to the acid mix tank. The addition of acid will be controlled based on pH measurements of the water made either with a meter or pH paper. Concentrated hydrochloric acid will be purchased in 1 m3 polyethylene totes and fed using a small metering pump. Hydrochloric acid consumption is estimated at 150 L per tonne of carbon stripped.

Updated Cerro Quema Pre-Feasibility Study NI 43-101 Technical Report
Kappes, Cassiday & Associates 17.0 Recovery Methods January, 2022 Page 17-30
Acid Wash Caustic
Caustic solution from the reagent area caustic mix/storage tank, will be used to neutralize excess acid in the acid wash. The caustic will be fed to the system using a small metering pump. Caustic addition will be controlled based on pH measurements
Strip Solution Cyanide
Prior to the start of a strip, the cyanide metering pump will be used to add cyanide to the strip barren eluant tank to produce a solution that is 0.5% NaCN by weight. Operators will periodically sample and titrate the barren solution for free NaCN using silver nitrate. Cyanide will be added as needed to the barren eluant tank batchwise to maintain free cyanide in solution. It is assumed that a new batch of solution will be required every three strips.
Strip Solution Caustic
Prior to the start of a strip, the caustic transfer pump will be used to add caustic to the strip barren solution tank to produce a solution that is 2% caustic by weight. Operators will periodically sample and titrate the barren solution for NaOH using standardized hydrochloric acid. Caustic will be added to the barren eluant tank batchwise as needed to maintain the required caustic grade in solution. It is assumed that a new batch of solution will be required every three strips.
Activated Carbon
Activated carbon will be used to adsorb precious metals from the leach solution in the adsorption columns. Make-up carbon will be 6 x 12 mesh and will be delivered in 500 kg supersacks. It is estimated that approximately 3% of the carbon stripped will have to be replaced due to carbon fines losses.
Fluxes to Smelt
A standard smelting flux will be used, composed approximately of the following components:
• Silica – 7%; • Borax – 40%; • Niter – 15%; • Soda Ash – 28%.
Flux will be prepared by blending in a cement mixer. It will then be added to the dried sludge from the mercury retort. The flux contains oxidants which will cause base metals to react so they can be dissolved in the slag phase.
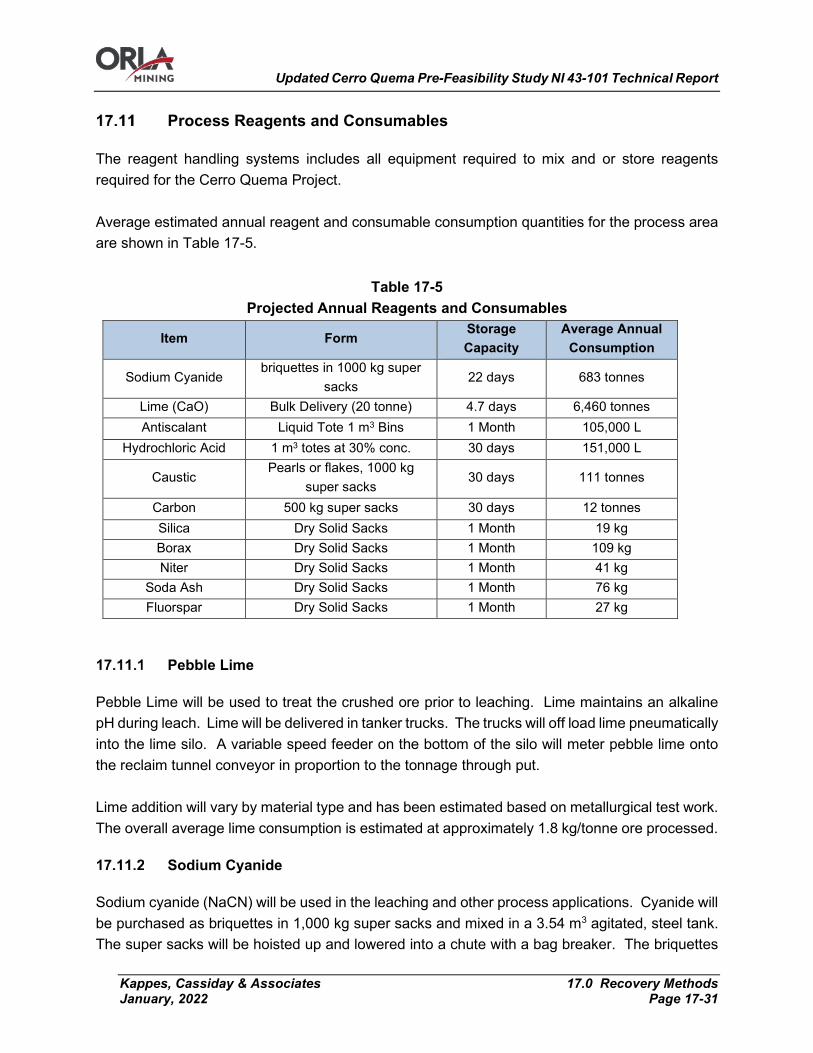
Updated Cerro Quema Pre-Feasibility Study NI 43-101 Technical Report
Kappes, Cassiday & Associates 17.0 Recovery Methods January, 2022 Page 17-31
Process Reagents and Consumables
The reagent handling systems includes all equipment required to mix and or store reagents required for the Cerro Quema Project. Average estimated annual reagent and consumable consumption quantities for the process area are shown in Table 17-5.
Table 17-5 Projected Annual Reagents and Consumables
Item Form Storage Capacity
Average Annual Consumption
Sodium Cyanide briquettes in 1000 kg super
sacks 22 days 683 tonnes
Lime (CaO) Bulk Delivery (20 tonne) 4.7 days 6,460 tonnes Antiscalant Liquid Tote 1 m3 Bins 1 Month 105,000 L
Hydrochloric Acid 1 m3 totes at 30% conc. 30 days 151,000 L
Caustic Pearls or flakes, 1000 kg
super sacks 30 days 111 tonnes
Carbon 500 kg super sacks 30 days 12 tonnes Silica Dry Solid Sacks 1 Month 19 kg Borax Dry Solid Sacks 1 Month 109 kg Niter Dry Solid Sacks 1 Month 41 kg
Soda Ash Dry Solid Sacks 1 Month 76 kg Fluorspar Dry Solid Sacks 1 Month 27 kg
Pebble Lime
Pebble Lime will be used to treat the crushed ore prior to leaching. Lime maintains an alkaline pH during leach. Lime will be delivered in tanker trucks. The trucks will off load lime pneumatically into the lime silo. A variable speed feeder on the bottom of the silo will meter pebble lime onto the reclaim tunnel conveyor in proportion to the tonnage through put. Lime addition will vary by material type and has been estimated based on metallurgical test work. The overall average lime consumption is estimated at approximately 1.8 kg/tonne ore processed.
Sodium Cyanide
Sodium cyanide (NaCN) will be used in the leaching and other process applications. Cyanide will be purchased as briquettes in 1,000 kg super sacks and mixed in a 3.54 m3 agitated, steel tank. The super sacks will be hoisted up and lowered into a chute with a bag breaker. The briquettes
Updated Cerro Quema Pre-Feasibility Study NI 43-101 Technical Report
Kappes, Cassiday & Associates 17.0 Recovery Methods January, 2022 Page 17-32
will fall into the tank and be dissolved to a 25% NaCN solution by weight. After mixing, the cyanide solution will be transferred to a storage tank with capacity for approximately 3 dry t NaCN (12 m3), approximately 1.6 days of NaCN. Cyanide consumption will vary by material type and has been estimated based on metallurgical test work. The overall average cyanide consumption is estimated at approximately 0.19 kg/tonne ore processed.
Caustic
Caustic (NaOH) will be used in the elution and acid wash processes. Caustic is a convenient way to add alkalinity to process solutions without causing large amounts of scale. Caustic will be purchased as flakes or pearls in 1 tonne super sacks. Caustic will be mixed in a 3.1 m3 agitated tank. The caustic sacks will be added to the tank and dissolved to approximately 25% NaOH by weight. After mixing, the caustic solution will be fed directly from the mix tank. Combined storage will be approximately 10 days of caustic.
Sodium Metabisulfite
Sodium metabisulfite (SMBS, Na2S2O5) will be used in the cyanide destruction process. Sodium metabisulfite is a solid and convenient source of SO2 for the cyanide neutralization process. Sodium metabisulfite will be purchased as a solid in 1 tonne super sacks. The sodium metabisulfite will be mixed in a 4.2 m3 agitated, polyethylene tank. The super sack will be hoisted up and lowered into a chute with a bag breaker. The solid will fall into the tank and dissolve to a grade of 20% by weight. After mixing, the sodium metabisulfite solution will be transferred to a storage tank that can contain approximately 2 dry tonnes of sodium metabisulfite (8.6 m3). Sodium Metabisulfite consumption is estimated at 7 g SMBS per g WAD cyanide treated.
Copper Sulfate
Copper sulfate pentahydrate (CuSO4·5H2O) will also be used as a catalyst in the cyanide neutralization process. Copper sulfate provides the cupric copper cation (Cu+2) that catalyzes the cyanide neutralization reaction. Copper sulfate will be purchased as a solid in 1 t super sacks and will be mixed in a 3.4 m3 agitated, polyethylene tank. The super sack will be hoisted up and lowered into a chute with a bag breaker. The solid will fall into the tank and dissolve to a grade of 25% by weight. After mixing, the copper sulfate solution will be transferred to a storage tank that can contain approximately 1.5 dry tonnes of copper sulfate. Copper sulfate will be added as required for the

Updated Cerro Quema Pre-Feasibility Study NI 43-101 Technical Report
Kappes, Cassiday & Associates 17.0 Recovery Methods January, 2022 Page 17-33
cyanide destruction process. Copper sulfate consumption is expected to be minimal due to the presence of copper in the process leach solutions.
Hydrated Lime
Hydrated lime or calcium hydroxide (Ca(OH)2) will be used in the cyanide destruction process to consume excess acid and maintain the pH between 8 and 9. Hydrated lime will be purchased as a solid in 1 t super sacks. The lime sack will be hoisted onto a dry feeder system. The dry feeder will auger hydrated lime into an agitated tank where it will be mixed with water. The resulting slurry will be pumped to the neutralization tanks. Hydrated lime consumption is estimated at 10 g lime per g WAD cyanide treated.

Updated Cerro Quema Pre-Feasibility Study NI 43-101 Technical Report
Kappes, Cassiday & Associates 18.0 Project Infrastructure January, 2022 Page 18-1
18.0 PROJECT INFRASTRUCTURE
Infrastructure
Existing Installations
Orla operates a gated office and core shed facility located on Via Tonosi approximately 0.5 kilometers east of the property access road. It includes the following facilities:
• Administration and Geology Offices; • Helipad; • Sample Preparation Facility and Laboratory; • Sample Logging and Storage Area; • Dormitories; • Showers and Bathroom; • Kitchen; • Laundry; • Dining Hall; • Clinic and Ambulance.
Finished containers will be located at the gated site for use as living facilities by the construction staff.
Site Roads
An existing site access road intersects with Via Tonosi approximately 32 km south of Macaracas.
Main Site Access
The access road runs north approximately 7 km to the location of the platform constructed between Quema and La Pava by Orla. The road climbs approximately 321 m in elevation at an average grade of approximately 5%. This access road will be the route that contractors and equipment access the site during construction and Orla personnel and supplies access the site during operation. The current road will be widened to approximately 9 m to allow two over-the-road trucks to pass each other, re-contoured to eliminate grades in excess of 7%, and sloped to a ditch on one side of the road to improve drainage.
Internal Access
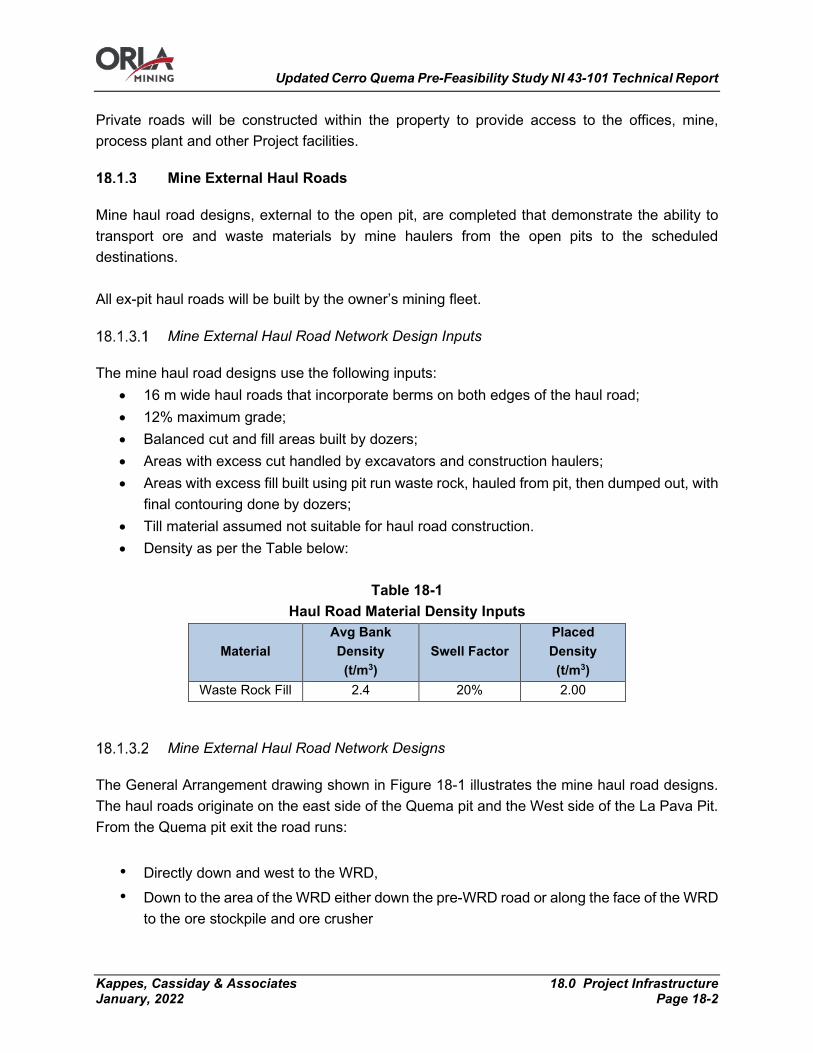
Updated Cerro Quema Pre-Feasibility Study NI 43-101 Technical Report
Kappes, Cassiday & Associates 18.0 Project Infrastructure January, 2022 Page 18-2
Private roads will be constructed within the property to provide access to the offices, mine, process plant and other Project facilities.
Mine External Haul Roads
Mine haul road designs, external to the open pit, are completed that demonstrate the ability to transport ore and waste materials by mine haulers from the open pits to the scheduled destinations. All ex-pit haul roads will be built by the owner’s mining fleet.
Mine External Haul Road Network Design Inputs
The mine haul road designs use the following inputs: • 16 m wide haul roads that incorporate berms on both edges of the haul road; • 12% maximum grade; • Balanced cut and fill areas built by dozers; • Areas with excess cut handled by excavators and construction haulers; • Areas with excess fill built using pit run waste rock, hauled from pit, then dumped out, with
final contouring done by dozers; • Till material assumed not suitable for haul road construction. • Density as per the Table below:
Table 18-1
Haul Road Material Density Inputs
Material Avg Bank Density (t/m3)
Swell Factor Placed Density (t/m3)
Waste Rock Fill 2.4 20% 2.00
Mine External Haul Road Network Designs
The General Arrangement drawing shown in Figure 18-1 illustrates the mine haul road designs. The haul roads originate on the east side of the Quema pit and the West side of the La Pava Pit. From the Quema pit exit the road runs:
• Directly down and west to the WRD, • Down to the area of the WRD either down the pre-WRD road or along the face of the WRD
to the ore stockpile and ore crusher

Updated Cerro Quema Pre-Feasibility Study NI 43-101 Technical Report
Kappes, Cassiday & Associates 18.0 Project Infrastructure January, 2022 Page 18-3
From the La Pava pit exit the road runs:
• Directly east to the ore stockpile and ore crusher. • Further east and up to the WRD
All ex-pit haul roads will be built during the construction phase of the project, except for the expansion built into the WRD throughout the mine life. The following Table 18-2 lists the cut and fill quantities estimated to construct the designed ex-pit mine haul roads.
Table 18-2 Ex-Pit Haul Road Construction Quantities
Road Cut
Volume (kBCM)
Fill Volume (kLCM)
Total Mine Haul Roads 238 249
Project Buildings
Buildings and facilities are located throughout the project area. Figure 18-1 shows the location of facilities relative to each other. Facilities include:
• Mine Truck Shop and Warehouse; • Laboratory; • Guard Shack & Security; • Explosives Storage – Magazine; • Explosives Storage - Isotanks Laydown Area; • Administration Building; • ADR Area; • Refinery; • Reagent Storage; • Process Maintenance Workshop.
Administrative Building and Clinic
A 760 m2, single story Administration Building will be constructed at the location of the existing mining platform, 7 km from the Via Tonosi intersection at an elevation of 425 masl. The building will provide space for employee lockers, medical treatment room, office space, a meeting room and utilities for site managers and their staff. The treatment room is intended to be

Updated Cerro Quema Pre-Feasibility Study NI 43-101 Technical Report
Kappes, Cassiday & Associates 18.0 Project Infrastructure January, 2022 Page 18-4
staffed by a nurse who can provide skilled medical treatment to sick or injured operators. The treatment room has space for two beds and an office for the nurse on duty. The ambulance, which can be used to transport employees from the mine, mine shop or crusher, will be relocated in a bay located adjacent to the permanent treatment room. When needed, medical transportation will be provided to one of the nearest medical facilities in either Chitre or Tonosi.
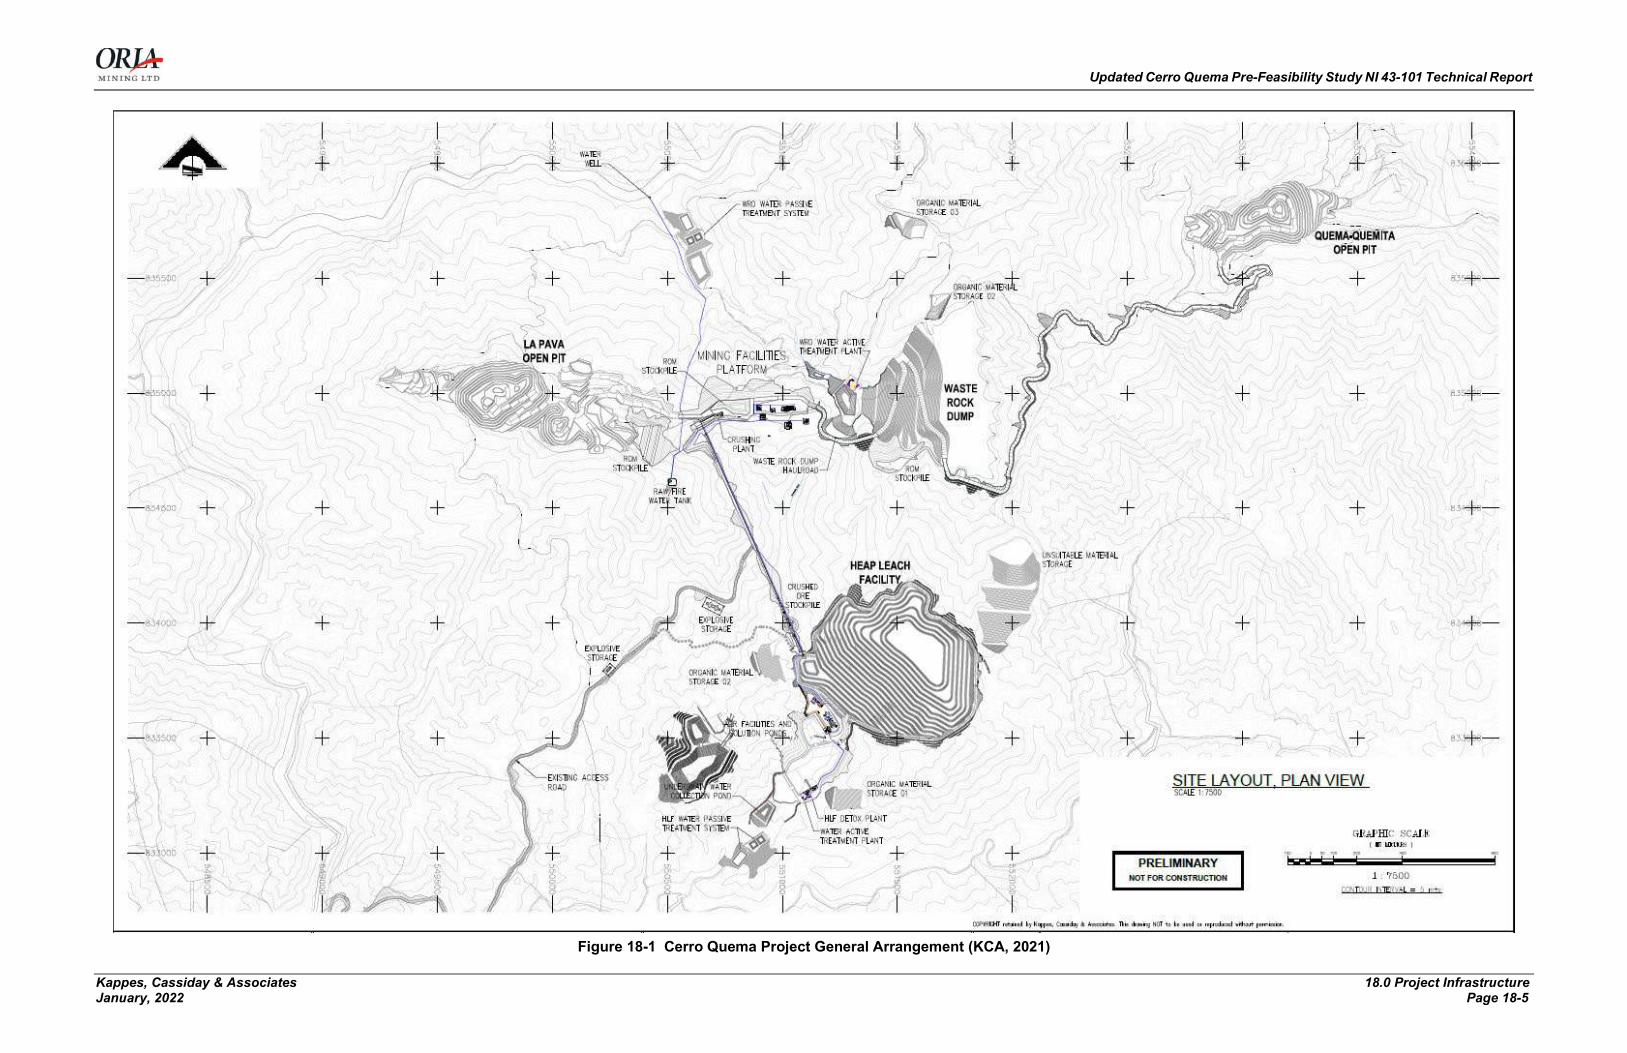
Updated Cerro Quema Pre-Feasibility Study NI 43-101 Technical Report
Kappes, Cassiday & Associates 18.0 Project Infrastructure January, 2022 Page 18-5
Figure 18-1 Cerro Quema Project General Arrangement (KCA, 2021)

Updated Cerro Quema Pre-Feasibility Study NI 43-101 Technical Report
Kappes, Cassiday & Associates 18.0 Project Infrastructure January, 2022 Page 18-6
Construction Camp Facilities
A temporary construction camp will be built at Orla’s gated facilities on Via Tonosi approximately 0.5 kilometers east of the property access road. The camp will provide contractors with secure living facilities at a location convenient to the work site while discouraging them from disrupting local residents. The construction facilities will include:
• Dormitories; • Showers and Restrooms; • Kitchen; • Laundry; • Dining Hall.
On the existing mining platform, additional facilities supporting the construction will be located including:
• Construction Offices; • Construction Warehouse; • Construction Laydown Area.
The construction offices will be modular, finished containers. The Construction Warehouse and Laydown Areas will later become the permanent Mine Shop Warehouse and Laydown area. These will be built early in the site construction schedule to serve this purpose.
ADR Process Area
The ADR Area includes a 950 m2 concrete slab that will house the five carbon columns, kiln and strip facilities. The ADR Area will be located at an elevation of 230 masl near the north side of the pregnant pond. A 32 m2 building adjacent to the ADR Area will house the motor control center.
Refinery
The Refinery is a 456 m2 CMU brick building adjacent to the ADR Area. The refinery houses the electrowinning and smelting equipment. The building also includes an office that allows security to monitor the electrowinning and smelting processes.
Laboratory
The Laboratory is a 460 m2 single story steel building constructed adjacent to the Mine Warehouse and Workshop building near the center of the existing platform area.
Updated Cerro Quema Pre-Feasibility Study NI 43-101 Technical Report
Kappes, Cassiday & Associates 18.0 Project Infrastructure January, 2022 Page 18-7
The laboratory will include sample receiving, sample preparation, fire assay, a wet laboratory complete with an atomic adsorption unit and a metallurgical laboratory. The building will also include office space and utilities for a Chief Chemist and his staff. The laboratory will be able to receive, prepare and analyze ore control 150 samples per day from the mine and process samples from the leach facility.
Process Maintenance Workshop
Process equipment will be repaired and maintained in a process maintenance workshop. A three-sided, steel walled, uninsulated 334 m2 facility will be located near the ADR Plant. This will include an open shop area, men and women’s washrooms, a break room and two offices. The work shop will be equipped with air supply and distribution, welding plug sockets, wash water and firewater supply and distribution.
Reagent Storage
The Reagent Storage Area is 302 m2 concrete slab located 15 m north east of the ADR area. The storage area is divided into separate areas so cyanide, caustic and acid can be segregated. The storage area has a roof to protect reagents from the weather. The building can be accessed by a forklift. Flatbed delivery trucks can drive up to the Reagent Storage Area and turn around in a 25 m wide yard.
Mine Truck Shop and Warehouse
The Mine Truck Shop and Warehouse is an 1,151 m2 single-story steel building constructed near the center of the existing platform area. The warehouse will be a 260 m2 section of the building that will store parts that require protection from the environment for mine and process maintenance. Adjacent to the warehouse, a laydown area is provided for storage of larger, weatherproof parts. The mine workshop area includes three enclosed repair bays that occupy 630 m2 of the building. Mine maintenance personnel can repair mobile equipment in enclosed bays while protected from wind and rain. A 260 m2 outdoor vehicle wash facility is located to the south of the mine workshop bays. The wash facility floor will slope to a collection sump which will overflow into a settling sump. Skimming equipment will remove contaminates and a recirculation pump will recycle the water to the wash bay. A high-pressure washing system will be included to remove dirt and grease from heavy equipment.
Updated Cerro Quema Pre-Feasibility Study NI 43-101 Technical Report
Kappes, Cassiday & Associates 18.0 Project Infrastructure January, 2022 Page 18-8
Fuel Storage and Dispensing
The majority of the diesel fuel used at Cerro Quema will be offloaded and stored in a single cylindrical, horizontal steel tanks located on the western end of the existing platform at 423 masl, adjacent to the generators. The tank is 3.3 m diameter x 11.9 m long for a storage capacity of approximately 100 m3. Diesel will be delivered by tanker truck and offloaded using a dedicated horizontal, centrifugal pump. It will then be distributed to the mine fleet by dedicated pumps. A fueling station for light and heavy-duty vehicles will be a 214 m2 paved, concrete pad located to the east of the storage tanks. Fuel dispensing equipment will be included for light and heavy-duty equipment. A 1.91 m diameter x 4.86 m long cylindrical, horizontal steel tank will be located in the process area. Diesel will be delivered by tanker truck and offloaded to this tank using a dedicated horizontal, centrifugal pump. Diesel will then be distributed to process equipment using a dedicated supply loop. It is anticipated that the regularly scheduled diesel delivery trucks will occasionally be diverted to the process diesel tank to top it off with a partial load of fuel. All fuel tanks will be installed on concrete containment facilities with capacity to contain 110% of the fuel stored.
Explosives Storage
Explosives Magazine
An Explosives Magazine will be located approximately 700 m south of the existing pad along the access road. The magazine will be a fenced, gated area approximately 84 m by 43 m. The magazine will be divided into three areas separated by two 3 m-tall berms. Each of these three areas will have a CMU storage building for explosive components as follows:
• Detonators, 36 m2 building; • Boosters, 100 m2 building; • Packaged Explosives, 36 m2 building.
Explosive Isotank Laydown Area
An Explosives Isotank Laydown Area will be located approximately 1,200 m south of the existing pad along the access road. The isotanks will store the bulk explosives to be used onsite.
Updated Cerro Quema Pre-Feasibility Study NI 43-101 Technical Report
Kappes, Cassiday & Associates 18.0 Project Infrastructure January, 2022 Page 18-9
The Explosives Isotank Laydown Area will be a fenced, gated area approximately 45 m wide by 31 m deep, enough space for four isotanks. The area will need to be leveled and covered with gravel for vehicle access.
Guard Shack and Security
A Guard Shack and security check point will be located on the main access road approximately 3.0 km north of Via Tonosi. The Guard Shack will be a 15 m² container that will contain the security station and two washrooms, one for the security personnel and one for visitors.
Temporary Medical Clinic
During construction, a temporary first aid clinic will be put in place on the existing platform. The clinic is intended to be staffed by a nurse who can provide skilled medical treatment to sick or injured workers. An ambulance is available at the existing office located on Via Tonosi during construction. When needed, injured or sick personnel are driven to one of the nearest medical facilities.
Fenced Areas
Currently, a security check point exists approximately 1.5 km north of Via Tonosi. The security checkpoint will be relocated to allow security to safely control access to the magazines. A three-strand barbed wire fence will be erected in all locations where livestock can access mining and process areas. Cattle guards will be installed in roadways where they cross fence lines to prevent livestock from entering process areas via roadways. Cyclone fencing, approximately 2.4 m tall, will be installed around the process ponds. The fence will assure that foraging livestock and wild game cannot enter the ponds. Warning signs will be mounted on the fence to alert personnel that the process ponds have water containing cyanide.
Transportation
Transportation will be provided for the workers from Macaracas and surrounding areas to the mine via buses and vans on scheduled shift changes. Light vehicles and pickups will be provided to transport mine workers on the project site to their respective work areas.

Updated Cerro Quema Pre-Feasibility Study NI 43-101 Technical Report
Kappes, Cassiday & Associates 18.0 Project Infrastructure January, 2022 Page 18-10
Waste Disposal
Sanitary Waste
The facilities for domestic wastewater treatment will be designed to comply with Panama regulations and standards MCQSA Environmental Issues. The Project's operation will involve the generation of domestic wastewater in an approximate volume of 3.5 m3 / d (considering a generation rate of 35 L/person/day and 150 employees on average). A domestic wastewater treatment plant will be installed on the platform of the mining facilities to treat domestic effluents from the bathrooms of the offices, workshop, warehouse, and laboratory. The treated, clarified, and disinfected wastewater will be discharged to the Quebrada Chontal complying with the parameters of COPANIT 35-2000, after quality control by MCQSA.
Solid Waste
In the construction and operation phases, solid waste will be managed in garbage dumps or other appropriate waste containers. All containers will be covered (or covered and heavy, if covers are not attached) to reduce the possibility of trash spillage and to prevent access to wildlife. Containers used on site will be labeled. The trash from the office and dining rooms will be disposed of in bags. The Project's operation will imply a domestic solid waste generation rate of around 1.5 MT/month (considering a generation rate of 0.5 kg/person/day and an average of 100 employees). A licensed waste management company will take care of transporting the collected waste to a third-party landfill. The burning of material waste, vegetation, household waste, etc., will be prohibited.
Liquid Waste
During the construction phase, 30 portable toilets will be enabled to treat the waste of a maximum population of 300 personnel on the site. A specialized and authorized company will service portable toilets on a weekly basis. During operation, there will be domestic service facilities throughout the Project site. Liquid household waste from these services will flow by gravity into a septic system for further treatment and disposal. Likewise, a minimum number of portable toilets installed in the isolated areas of the Project may be maintained.

Updated Cerro Quema Pre-Feasibility Study NI 43-101 Technical Report
Kappes, Cassiday & Associates 18.0 Project Infrastructure January, 2022 Page 18-11
Hazardous Waste
Hazardous waste will be placed in drums, put on pallets, and stored in secure, impermeable, and appropriately sized containers, providing the required secondary containment until being hauled offsite by a licensed contractor. Hazardous waste will be disposed of in a safe and environmentally sound manner using outside contractors.
Power Supply, Communications and IT
Power Supply
Power supply to the Project will be generated on site using four 1050 kW diesel generator units with one additional generator on standby. Power will be generated at 4160 V, 3 phase, 60 Hz and meet the average and peak power demands based on detailed electrical loads with estimated utilization and demand factors. The general operating philosophy for the temporary site power plant will be that four of the generators will normally be running with one on standby. As loads routinely fluctuate (for example when the stacking conveyors are down for a new stacking arrangement) the generators will automatically switch to fewer generators operating as required to maintain maximum efficiency. Power demand by Project phase is shown in Table 18-3. Adjacent to the generators, there will be a central containerized switchgear with all of the synchronization, control panels, disconnects, circuit breakers, instrumentation, data logging, and 1,200-amp bus. Each genset will have a fuel day tank with 15,000 L capacity and horizontal air coolers. Two each 100 m3 horizontal diesel storage tanks are also included to ensure adequate fuel supply is available to operate the generators. The site power supply will include the following standard voltages:
• Generation 480 V, 3 ph, 60 Hz • Distribution 4,160 V, 3 ph, 60 Hz • Low Voltage 480 V, 3 ph, 60 Hz • Control Voltage 110 V, 1 ph, 60 Hz

Updated Cerro Quema Pre-Feasibility Study NI 43-101 Technical Report
Kappes, Cassiday & Associates 18.0 Project Infrastructure January, 2022 Page 18-12
Table 18-3 Cerro Quema Power Demand by Phase
Area Phase 1 Demand
(kW)
Phase 2 Demand
(kW)
Phase 3 Demand
(kW) Site, General 25 25 25 Ancillary Buildings, Laboratory 146 146 146 Water Management, General 239 294 294 Water Management, Water System & Storage 109 109 109 Fuel Storage & Distribution, Diesel Fuel System 2 2 2 Ore Handling & Crushing, Crushing 149 149 149 Ore Handling & Crushing, Crushed Ore Reclaim & Lime System 162 162 162 Ore Handling & Crushing, Transfer & Stacker Conveyors 357 420 483 Heap Leach & Solution Handling 473 473 473 Heap Leach Solution Handling, Detoxification Plant 277 277 277 Heap Leach Solution Handling, Detoxification Reagent 18 18 18 ADR, Adsorption 11 11 11 ADR, Acid Wash & Elution 26 26 26 ADR, Electrowinning & Refining 91 91 91 ADR, Carbon Handling & Regeneration 18 18 18 ADR, Reagents 32 32 32 Process Utilities, Air 34 34 34 Process Utilities, Process Diesel Fuel 2 2 2
Overall Totals 2169 2287 2350
Communication Systems & IT
Communications systems required to support mining, processing and general administration activities will require multiple transmission modes for fail-safe redundancy. Internal communications will be by radio frequency. External communications will be through a mix of landline, cellular and VOIP. Primary communications and any required equipment will be located within the server room in the administration building.
Water Supply
Raw Water
Raw water will be supplied by Well Number 4-2013 located approximately 1.1 km north, north-east of the existing platform at an elevation of 190 masl. The well was tested to have an equilibrium capacity of 27.5 m3/h. The well will be fitted with a pump capable of producing at approximately 200 m of hydraulic head. Installation of a well field is anticipated in order to meet makeup water demands during the dry season.
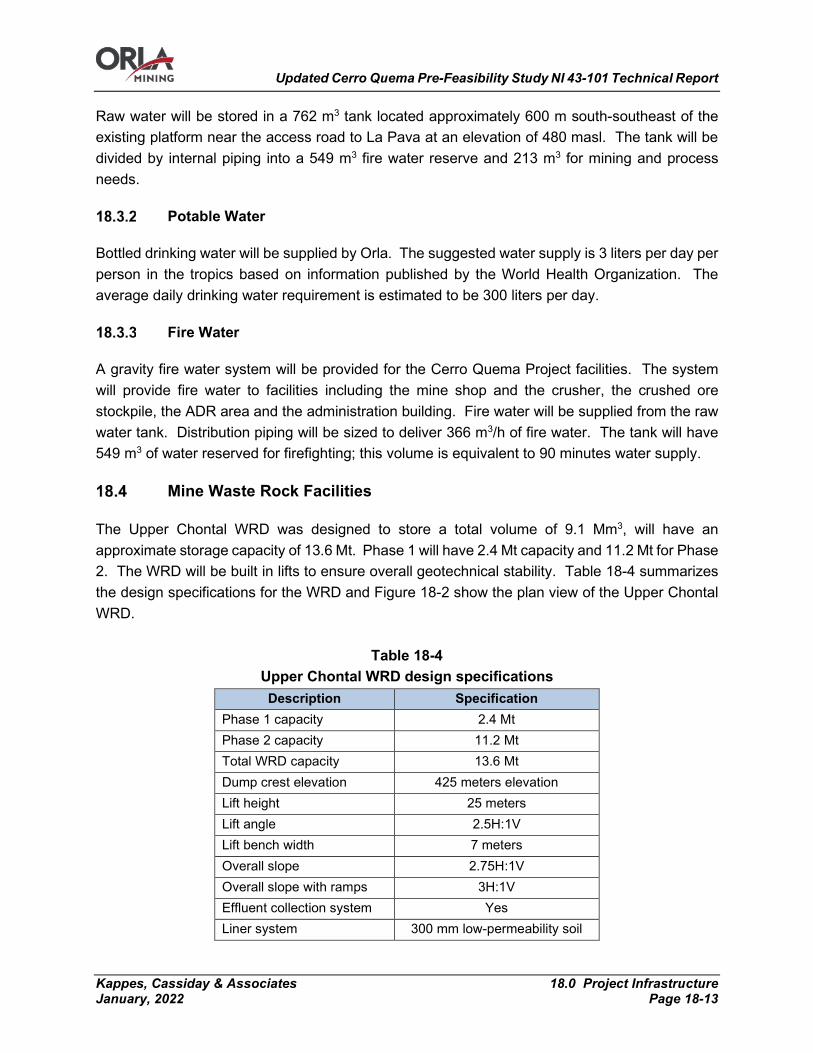
Updated Cerro Quema Pre-Feasibility Study NI 43-101 Technical Report
Kappes, Cassiday & Associates 18.0 Project Infrastructure January, 2022 Page 18-13
Raw water will be stored in a 762 m3 tank located approximately 600 m south-southeast of the existing platform near the access road to La Pava at an elevation of 480 masl. The tank will be divided by internal piping into a 549 m3 fire water reserve and 213 m3 for mining and process needs.
Potable Water
Bottled drinking water will be supplied by Orla. The suggested water supply is 3 liters per day per person in the tropics based on information published by the World Health Organization. The average daily drinking water requirement is estimated to be 300 liters per day.
Fire Water
A gravity fire water system will be provided for the Cerro Quema Project facilities. The system will provide fire water to facilities including the mine shop and the crusher, the crushed ore stockpile, the ADR area and the administration building. Fire water will be supplied from the raw water tank. Distribution piping will be sized to deliver 366 m3/h of fire water. The tank will have 549 m3 of water reserved for firefighting; this volume is equivalent to 90 minutes water supply.
Mine Waste Rock Facilities
The Upper Chontal WRD was designed to store a total volume of 9.1 Mm3, will have an approximate storage capacity of 13.6 Mt. Phase 1 will have 2.4 Mt capacity and 11.2 Mt for Phase 2. The WRD will be built in lifts to ensure overall geotechnical stability. Table 18-4 summarizes the design specifications for the WRD and Figure 18-2 show the plan view of the Upper Chontal WRD.
Table 18-4 Upper Chontal WRD design specifications Description Specification
Phase 1 capacity 2.4 Mt Phase 2 capacity 11.2 Mt Total WRD capacity 13.6 Mt Dump crest elevation 425 meters elevation Lift height 25 meters Lift angle 2.5H:1V Lift bench width 7 meters Overall slope 2.75H:1V Overall slope with ramps 3H:1V Effluent collection system Yes Liner system 300 mm low-permeability soil
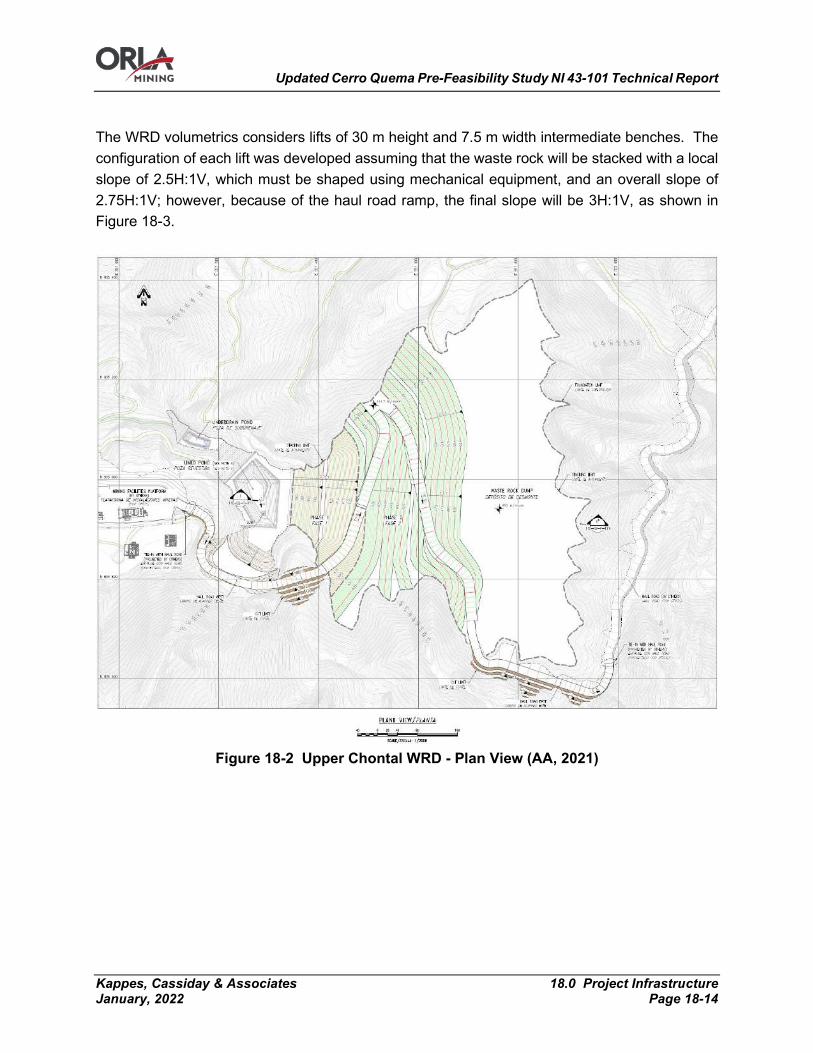
Updated Cerro Quema Pre-Feasibility Study NI 43-101 Technical Report
Kappes, Cassiday & Associates 18.0 Project Infrastructure January, 2022 Page 18-14
The WRD volumetrics considers lifts of 30 m height and 7.5 m width intermediate benches. The configuration of each lift was developed assuming that the waste rock will be stacked with a local slope of 2.5H:1V, which must be shaped using mechanical equipment, and an overall slope of 2.75H:1V; however, because of the haul road ramp, the final slope will be 3H:1V, as shown in Figure 18-3.
Figure 18-2 Upper Chontal WRD - Plan View (AA, 2021)

Updated Cerro Quema Pre-Feasibility Study NI 43-101 Technical Report
Kappes, Cassiday & Associates 18.0 Project Infrastructure January, 2022 Page 18-15
Figure 18-3 Upper Chontal WRD – Section (AA, 2021)
The following complementary facilities have been projected: lined pond seepage water collection through the WRD, underdrain pond for the underground water and springs collection below WRD and liner pond, unsuitable stockpile and two topsoil stockpiles. Seepage water through WRD will be collected by an effluent collection system. A low-permeability soil layer of at least 300 mm thick will be placed on the lower WRD platform located and also on the top of the underdrain system in the gorges to avoid or minimize contact water entering into the underdrain system. Effluent collection system will discharge into the lined pond located downstream of the WRD. The lined pond has a storage capacity of 32,900 m3 with a maximum operation level at 375.5 meters elevation. The underdrain pond has a storage capacity of 2,500 m3 with a maximum operation level at 352 meters elevation. A smooth 1.5 mm HDPE geomembrane will be installed in both ponds. The topsoil stockpiles will have 3.5H:1V slope and were designed to temporarily store topsoil from the clearing, stripping and removal of topsoil from the footprint of WRD, operation ponds, haul roads, among others and to be used in the progressive closure stage. The unsuitable soil stockpile will have of 3.5H:1V slope and will be located within the WRD footprint to store the unsuitable material from the WRD Phase 1 footprint.
Updated Cerro Quema Pre-Feasibility Study NI 43-101 Technical Report
Kappes, Cassiday & Associates 19.0 Market Studies and Contracts January, 2022 Page 19-1
19.0 MARKET STUDIES AND CONTRACTS
No market studies were completed and no contracts are in place in support of this Technical Report. Gold and silver production can generally be sold to any of a number of financial institutions or refining houses and therefore no market studies are required. It is assumed that the doré produced at Cerro Quema will be of a specification comparable with other gold and silver producers and as such, acceptable to all refineries. Gold and silver produced by the Cerro Quema Project would be sold to refineries or other financial institutions and the settlement price would be based on the then-current spot price for gold and silver on public markets. There would be no direct marketing of the metal. The base case financial model for the Cerro Quema Project utilizes a gold price of US$1,600 per ounce and a silver price of US$20 per ounce. The base case gold and silver prices have been selected based on forecasted commodities pricing with consideration to the three-year trailing average.
Updated Cerro Quema Pre-Feasibility Study NI 43-101 Technical Report
Kappes, Cassiday & Associates 20.0 Environmental Studies, Permitting and Social or Community Impact
January, 2022 Page 20-1
20.0 ENVIRONMENTAL STUDIES, PERMITTING AND SOCIAL OR COMMUNITY IMPACT
Environmental Studies
Some baseline environmental studies were completed by previous operators of the Project. For this Report, Orla commissioned independent consultants to conduct more complete baseline environmental studies over the project area.
Project Area Description
Climate
HGL (2020a) developed a climate evaluation for the Project site. There are seven regional weather stations within 25 km of the Project site with various periods of record for precipitation, evaporation, temperature, and wind data. In addition, nine climate stations were installed at the Project site, also with various periods, and completeness, of record from late 2015 to present. Regional climate is characterized as tropical with hot and humid conditions throughout the year. The annual average temperature is 27 degrees Celsius (˚C) and is generally consistent throughout the year. Sub-regional variability in climate is primarily controlled by topography, elevation, and location relative to the Atlantic and Caribbean coasts. The Cerro Quema Project is located in Los Santos, a province on the Azuero Peninsula, a region known for having distinctive wet and dry seasons. Table 20-1 summarizes the monthly averages of precipitation and evaporation at the Project as compiled by HGL (2020a). Annual precipitation at the Project ranges from 1,561 to 2,757 mm/yr with an average of 2,233 mm/yr. Nearly all precipitation occurs between March and October. Virtually no precipitation occurs in the Project area in December through February. The lack of precipitation during the dry season will require site water management strategies to ensure sufficient and consistent make-up water sources for operations. The elevated rainfall during the rainy season will require that adequate storage, management, and treatment capacity is in place for operations and closure. The 24-hour, 100-year storm event and the 24-hour, 1,000-year storm events are approximately 230 mm and 300 mm, respectively. Annual average pan evaporation data for the site is approximately 1,390 mm annually with the most evaporation occurring in March and the least in October.

Updated Cerro Quema Pre-Feasibility Study NI 43-101 Technical Report
Kappes, Cassiday & Associates 20.0 Environmental Studies, Permitting and Social or Community Impact
January, 2022 Page 20-2
Table 20-1 Cerro Quema Precipitation and Pan Evaporation
Month Average Monthly
Precipitation (mm)
Average Monthly Pan Evaporation
(mm) January 9.0 166 February 4.4 175 March 13 209 April 71 181 May 261 113 June 298 76 July 241 70 August 290 76 September 335 72 October 351 68 November 307 74 December 53 110
Annual Total 2233 1390
Soils
The soil description presented herein is summarized from permitting documents prepared by SNC Lavalin (SNC Lavalin Panama SA 2015). The soil taxonomy of the United States Department of Agriculture (USDA) was used. SNC-Lavalin Panamá (SLP), carried out soil mapping for Project baseline studies in order to identify and classify soil types and their structures based on pedogenic and morphological characteristics. Soils in the Project area are medium to slightly acidic with pH ranges between 6.30 to 5.40. Soils analyzed are poor in organic matter, with a high content of iron and aluminum, and are oxisol soils according to the USDA classification. Oxisol soils are tropical soils, rich in hydrous oxides of iron and aluminum, with the following characteristics:
• Formed on old humid tropic soils; • Heavily weathered; • Low fertility soils; • Tend to present fine textures; • Highly evolved, related to humid and very humid climates; • Due to high precipitation, they are leached soils and acidic.

Updated Cerro Quema Pre-Feasibility Study NI 43-101 Technical Report
Kappes, Cassiday & Associates 20.0 Environmental Studies, Permitting and Social or Community Impact
January, 2022 Page 20-3
Soils in the Project area are locally classified as lateritic and iron-rich as a result of prolonged and intense tropical leaching. Soil Cation Exchange Capacity (CEC) is the amount of cations (substances that have a positive charge) retained in the soil at a pH of 7.0 and is expressed in milliequivalents per 100 grams (meq / 100 g) or centimoles per kilogram (cmol kg). CEC is an indicator of the potential of the soil to retain and exchange plant nutrients, by estimating its capacity to retain cations. CEC for Project area soils is generally low (7-11) although 30% of samples analyzed yielded moderate CIC values (23 to 29). These results are compatible with the sandy loam to loam soils observed. Despite the high soil erodibility, low organic matter content, and steep slopes, Project soils are classified within the 2007 National Atlas as suitable for the cultivation of pastures and fruit trees, as well as for forest use (Instituto Geográfico Nacional Tommy Guardia 2007), however the Project soils are of low productivity due to their morphological setting, poor nutrient content, and susceptibility to erosion by water and wind. Within the Project area the soils are generally not used for agricultural purposes, neither for livestock nor planting agricultural crops (rice, corn, cassava, fruit, etc.). Using the USDA classification system, 90% of the soils in the project area, and all soil affected by the proposed operation described in this report, are classified as VII Non-Arable. These soils are considered to be among the least fertile, with the following characteristics:
• Erosion is classified as severe to very severe; • Slopes greater than 45°; • Very shallow soils with fine clay texture and poor to very poor drainage; • Suitable for natural forest management, but even forest plantations are not recommended
on class VII soils.
Hydrology
Figure 20-1 shows the Project area basin map with stream reaches by type, including perennial, intermittent, and ephemeral. Rio Quema is the primary river draining the area and borders the Project on the north and west. Rio Quema is perennial along its entire length through the Project area. Quebrada De Quema borders the Project on the south and is also perennial in the Project area. Numerous smaller, intermittent and ephemeral streams flow during the rainy season, draining the Project area, flowing to either Rio Quema or Quebrada De Quema. Flows in all drainages vary significantly depending on season. A flow and water quality monitoring program was expanded in the first quarter of 2021 to include sites on Rio Quema, Quebrada De Quema, and on tributary drainages. Monitoring is ongoing and flow and water quality data are planned to be collected at least quarterly for a minimum of a year for sites shown on Figure 20-1. The surface

Updated Cerro Quema Pre-Feasibility Study NI 43-101 Technical Report
Kappes, Cassiday & Associates 20.0 Environmental Studies, Permitting and Social or Community Impact
January, 2022 Page 20-4
water chemistry is generally near-neutral (average pH of 7.3) with relatively low concentrations of total dissolved solids and metals, with the exception of iron and manganese. One naturally-occurring acidic seep (average pH of 3.6) has been identified and monitored regularly north of the La Pava pit location; this seep has elevated copper concentrations, but low concentrations of other metals and total dissolved solids.
Figure 20-1 Site Drainages and Surface Water Monitoring Locations (HGL, 2021)
Physiography
Terrain elevations at the Project range from 200 masl to 950 masl. The terrain is mountainous, with large ranges, steep slopes, and narrow gorge-shaped valleys. Approximately 80% of the Project area has slopes greater than 55%. Bedrock outcrop is sparse, less than 5%, with bedrock typically exposed only in stream beds. According to the National Atlas (Instituto Geográfico Nacional Tommy Guardia 2007), the Project area corresponds to mountains and massifs of igneous origin located within the unit of the massifs and chains of Las Palmas and Azuero.
Updated Cerro Quema Pre-Feasibility Study NI 43-101 Technical Report
Kappes, Cassiday & Associates 20.0 Environmental Studies, Permitting and Social or Community Impact
January, 2022 Page 20-5
The Project area has been divided into three clearly distinguishable geomorphological units (SNC Lavalin Panama SA 2015):
• Geomorphological Unit 1: Corresponds to hills between 200 and 400 meters above sea level, which make up 10% of the Project area, with slopes between 30 and 45 degrees, semi-flat valleys, ravines and rivers. This corresponds to the area of Quebrada Maricela.
• Geomorphological Unit 2: Corresponds to the area of La Pava and surroundings and represents 70% of the study area. Altitudes between 400 and 599 masl, with slopes between 45° and 60°, leached soils of low fertility. Erosion processes and formation of gullies predominate.
• Geomorphological Unit 3: Corresponds to the area of Cerro Quema and its surroundings, represents 20% of the area, characterized by elevations above 600 masl and slopes greater than 60°, where streams (many intermittent) form waterfalls, causing soil erosion. The dominant geomorphological processes are erosion, landslides, and mass movements on steep slopes.
Seismicity
Seismic hazard analysis was performed by Golder (2014b) presenting site seismic hazard model containing eight (8) area sources, five cortical fault sources, and two subduction zone sources. Disaggregation results indicate that the main contributors to peak ground acceleration and 0.2 second spectral accelerations at 475- and 2,475-year return periods are earthquakes with Mw < 7. The main contributors to 1 second spectral accelerations at 475- and 2,475-year return periods are major earthquakes (Mw < 7.7). A site-specific Probabilistic Seismic Hazard Analysis (PSHA) for weak rock/very stiff soil (Vs30 = 760 m/s) was conducted. The PSHA results indicate that the 5%-damped horizontal PGA values for a Class B site are 0.238 g and 0.422 g for 475- and 2.475 years return period events, respectively. Deterministic results indicate an 84th percentile PGA value equal to 0.383 g for weak rock/very stiff soil site. Ground motion at short spectral periods (0.5 seconds or less) are generated from a 6.9 magnitude MCE at about 12 km from the Cerro Quema project site. The contributing source for longer spectral periods (0.75 seconds or more) is an 8.0 magnitude MCE at the Azuero-Soná fault, at approximately 18 km.
Vegetation
The vegetation description presented herein is summarized from permitting documents prepared by SNC Lavalin (SNC Lavalin Panama SA 2015).
Updated Cerro Quema Pre-Feasibility Study NI 43-101 Technical Report
Kappes, Cassiday & Associates 20.0 Environmental Studies, Permitting and Social or Community Impact
January, 2022 Page 20-6
The entire area has been greatly affected by anthropogenic activities, principally logging and burning practices that are widely practiced by locals. Within lands acquired and protected by MCQ, significant natural regeneration has occurred and secondary forest is the dominant vegetation type. The Project area comprises six general types of vegetation:
• Immature secondary forests. This type of vegetation covers most of the study area (~54%). It is made up of bushes of different pioneer species and some scattered trees. Representative species are pore (Cochlospermum vitifolium), raft (Ochroma pyramidale), aguacatillo (Clethra lanata) and nance (Byrsonima crassifolia). Developed in abandoned paddocks or crop lands by natural regeneration of plant species.
• Mature secondary forests. Covers ~4% of the study area. Hosts the tallest and largest diameter trees in the study area. Representative species are berbá (Brosimum alicastrum), fig (Ficus insipida), ceiba (Ceiba pentandra), espavé (Anacardium excelsum), satra (Garcinia intermedia), cerrito (Eugenia sp.), and maria trees (Calophyllum Brasiliense).
• Grasslands. The grassland areas are found in the upper areas of the Project, mainly on the tops of the hills and areas most exposed to wind and comprise ~9% of the study area. The plant diversity is minimal, and is dominated by Eleocharis, Scleria and Andropogon genuses and fire-resistant ferns and herbs. A species of the Orchidiaceae family of the genus Sobralia, and specimens of Drosera cayennensis, a carnivorous plant that grows in poor soils and is not often observed, are present.
• Pine forest. Occupies 2% of the study area, produced as part of a reforestation plan developed by MCQ in 1997. Two species with the capacity to adapt to highly degraded soils were selected and introduced, Pinus caribaea and Acacia mangium.
• Agricultural use lands. Comprise 15% of study area, and are areas of recent agricultural use such as paddocks, and abandoned plantations of native and exotic fruits, such as avocado (Persea sp.), mango (Manguifera sp.), caimito (Chrysophyllum sp.) and guava (Psidium sp.).
• Acacia plantations: Comprise 1% of project area, produced as part of a reforestation plan developed by MCQ in 1997.
Devegetated lands comprise 15% of study area, and are caused by local agricultural slash and burn practices. The flora species registered for the Project area are common and widely distributed in Panama, none are endemic to the region. Species in the region that are under some level of protection by the laws of Panama regulated by the Autoridad Nacional de Ambiente (ANAM), the International
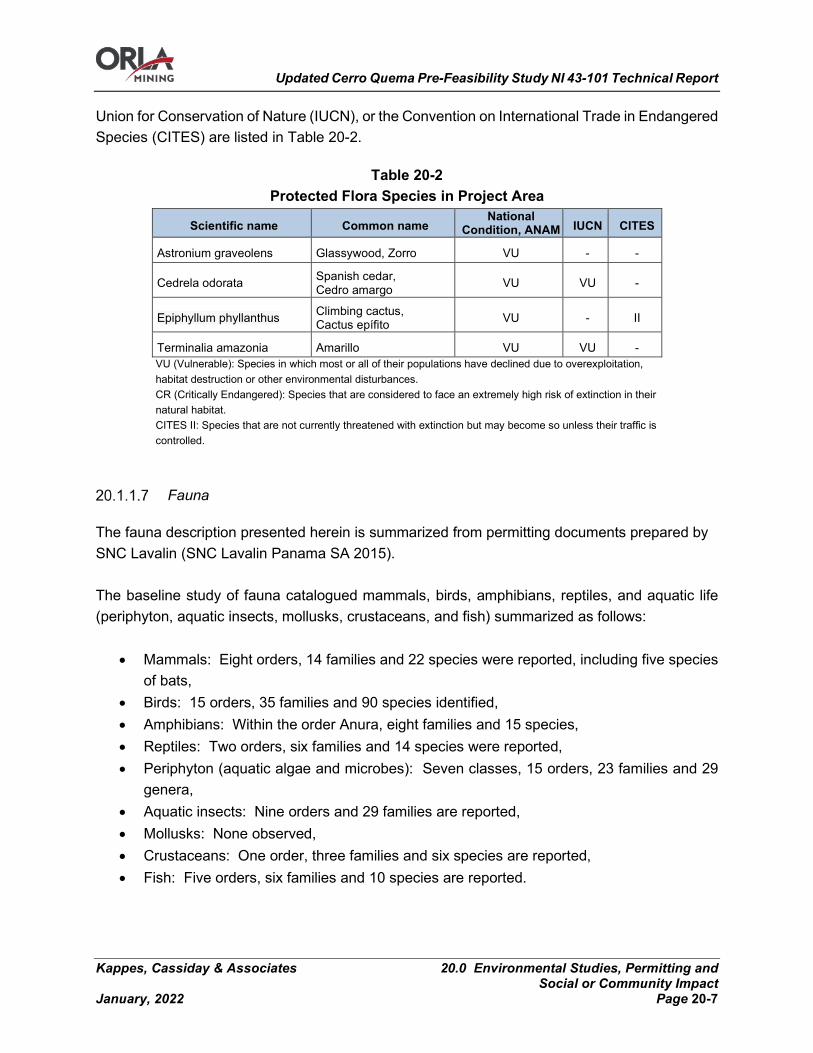
Updated Cerro Quema Pre-Feasibility Study NI 43-101 Technical Report
Kappes, Cassiday & Associates 20.0 Environmental Studies, Permitting and Social or Community Impact
January, 2022 Page 20-7
Union for Conservation of Nature (IUCN), or the Convention on International Trade in Endangered Species (CITES) are listed in Table 20-2.
Table 20-2 Protected Flora Species in Project Area
Scientific name Common name National
Condition, ANAM IUCN CITES
Astronium graveolens Glassywood, Zorro VU - -
Cedrela odorata Spanish cedar, Cedro amargo VU VU -
Epiphyllum phyllanthus Climbing cactus, Cactus epífito VU - II
Terminalia amazonia Amarillo VU VU - VU (Vulnerable): Species in which most or all of their populations have declined due to overexploitation, habitat destruction or other environmental disturbances. CR (Critically Endangered): Species that are considered to face an extremely high risk of extinction in their natural habitat. CITES II: Species that are not currently threatened with extinction but may become so unless their traffic is controlled.
Fauna
The fauna description presented herein is summarized from permitting documents prepared by SNC Lavalin (SNC Lavalin Panama SA 2015). The baseline study of fauna catalogued mammals, birds, amphibians, reptiles, and aquatic life (periphyton, aquatic insects, mollusks, crustaceans, and fish) summarized as follows:
• Mammals: Eight orders, 14 families and 22 species were reported, including five species of bats,
• Birds: 15 orders, 35 families and 90 species identified, • Amphibians: Within the order Anura, eight families and 15 species, • Reptiles: Two orders, six families and 14 species were reported, • Periphyton (aquatic algae and microbes): Seven classes, 15 orders, 23 families and 29
genera, • Aquatic insects: Nine orders and 29 families are reported, • Mollusks: None observed, • Crustaceans: One order, three families and six species are reported, • Fish: Five orders, six families and 10 species are reported.

Updated Cerro Quema Pre-Feasibility Study NI 43-101 Technical Report
Kappes, Cassiday & Associates 20.0 Environmental Studies, Permitting and Social or Community Impact
January, 2022 Page 20-8
The vast majority of species of mammals, birds, amphibians, and reptiles (with the exception of those endemic or under some category of threat) are common representatives in areas with different degrees of human intervention. The reported periphyton species are common in undisturbed aquatic ecosystems. The vast majority of aquatic insect families are sensitive to contamination and habitat alteration. The reported genera of fish and crustaceans are common in tropical and subtropical regions. According to the analysis of heavy metals in fish, there is no evidence of heavy metal contamination. A total of 24 endemic species or species under the “some threat” category were registered. Three species of mammals; 18 species of birds and three species of amphibians, as listed in Table 20-3.
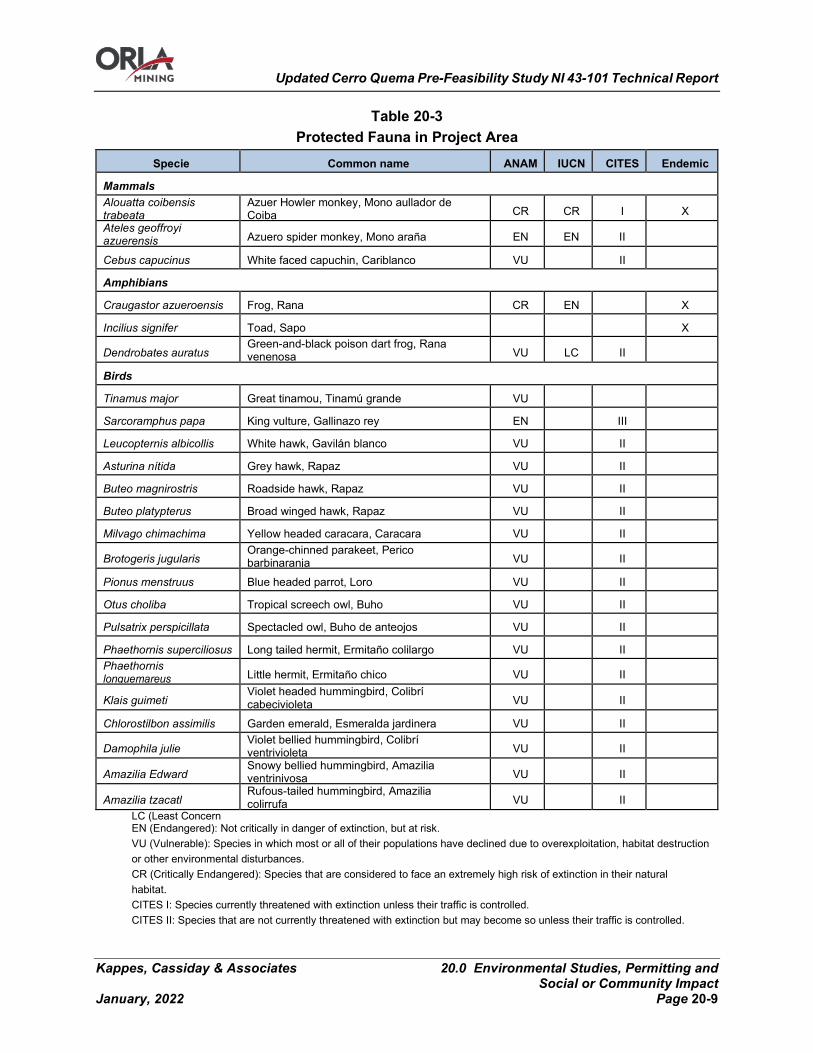
Updated Cerro Quema Pre-Feasibility Study NI 43-101 Technical Report
Kappes, Cassiday & Associates 20.0 Environmental Studies, Permitting and Social or Community Impact
January, 2022 Page 20-9
Table 20-3 Protected Fauna in Project Area
Specie Common name ANAM IUCN CITES Endemic
Mammals Alouatta coibensis trabeata
Azuer Howler monkey, Mono aullador de Coiba CR CR I X
Ateles geoffroyi azuerensis Azuero spider monkey, Mono araña EN EN II
Cebus capucinus White faced capuchin, Cariblanco VU II
Amphibians
Craugastor azueroensis Frog, Rana CR EN X
Incilius signifer Toad, Sapo X
Dendrobates auratus Green-and-black poison dart frog, Rana venenosa VU LC II
Birds
Tinamus major Great tinamou, Tinamú grande VU
Sarcoramphus papa King vulture, Gallinazo rey EN III
Leucopternis albicollis White hawk, Gavilán blanco VU II
Asturina nítida Grey hawk, Rapaz VU II
Buteo magnirostris Roadside hawk, Rapaz VU II
Buteo platypterus Broad winged hawk, Rapaz VU II
Milvago chimachima Yellow headed caracara, Caracara VU II
Brotogeris jugularis Orange-chinned parakeet, Perico barbinaranja VU II
Pionus menstruus Blue headed parrot, Loro VU II
Otus choliba Tropical screech owl, Buho VU II
Pulsatrix perspicillata Spectacled owl, Buho de anteojos VU II
Phaethornis superciliosus Long tailed hermit, Ermitaño colilargo VU II Phaethornis longuemareus Little hermit, Ermitaño chico VU II
Klais guimeti Violet headed hummingbird, Colibrí cabecivioleta VU II
Chlorostilbon assimilis Garden emerald, Esmeralda jardinera VU II
Damophila julie Violet bellied hummingbird, Colibrí ventrivioleta VU II
Amazilia Edward Snowy bellied hummingbird, Amazilia ventrinivosa VU II
Amazilia tzacatl Rufous-tailed hummingbird, Amazilia colirrufa VU II
LC (Least Concern EN (Endangered): Not critically in danger of extinction, but at risk. VU (Vulnerable): Species in which most or all of their populations have declined due to overexploitation, habitat destruction or other environmental disturbances. CR (Critically Endangered): Species that are considered to face an extremely high risk of extinction in their natural habitat. CITES I: Species currently threatened with extinction unless their traffic is controlled. CITES II: Species that are not currently threatened with extinction but may become so unless their traffic is controlled.

Updated Cerro Quema Pre-Feasibility Study NI 43-101 Technical Report
Kappes, Cassiday & Associates 20.0 Environmental Studies, Permitting and Social or Community Impact
January, 2022 Page 20-10
CITES III: Species that are protected in at least one country, which has asked other CITES Parties for assistance in controlling the trade in the species.
Environmental Management Plans
A key objective is to design and build the project in such a way that it does not cause significant adverse effects during construction, operation, closure and post-closure. To aid this objective, a number of Environmental Management Plans will be developed. An outline of some of the key plans is given in this section. These plans will need to be developed further before construction begins. They will also need to be reviewed and revised during the life of the project. Costs for environmental monitoring, management plans and environmental protection measures are included in this study.
Surface Water Management
A detailed, site-wide water balance model (SWBM) was developed in GoldSim to simulate site-wide flows during operations, closure, and post-closure periods. Figure 20-2 shows a conceptual model of the operational SWBM that includes all major mine facilities. The model calculates flow for process make-up water demand, direct discharge, contact water for management and treatment, and storage requirements. The model was used to assess wet and dry seasons, various scenarios for overall wet and dry climate conditions, and sensitivity to hydraulic parameters. Predicted flow rates from the SWBM were used as the basis for treatment plant design, evaluation of process-water makeup, pond sizing, development of water management strategies, and assessment of other critical facility design needs.
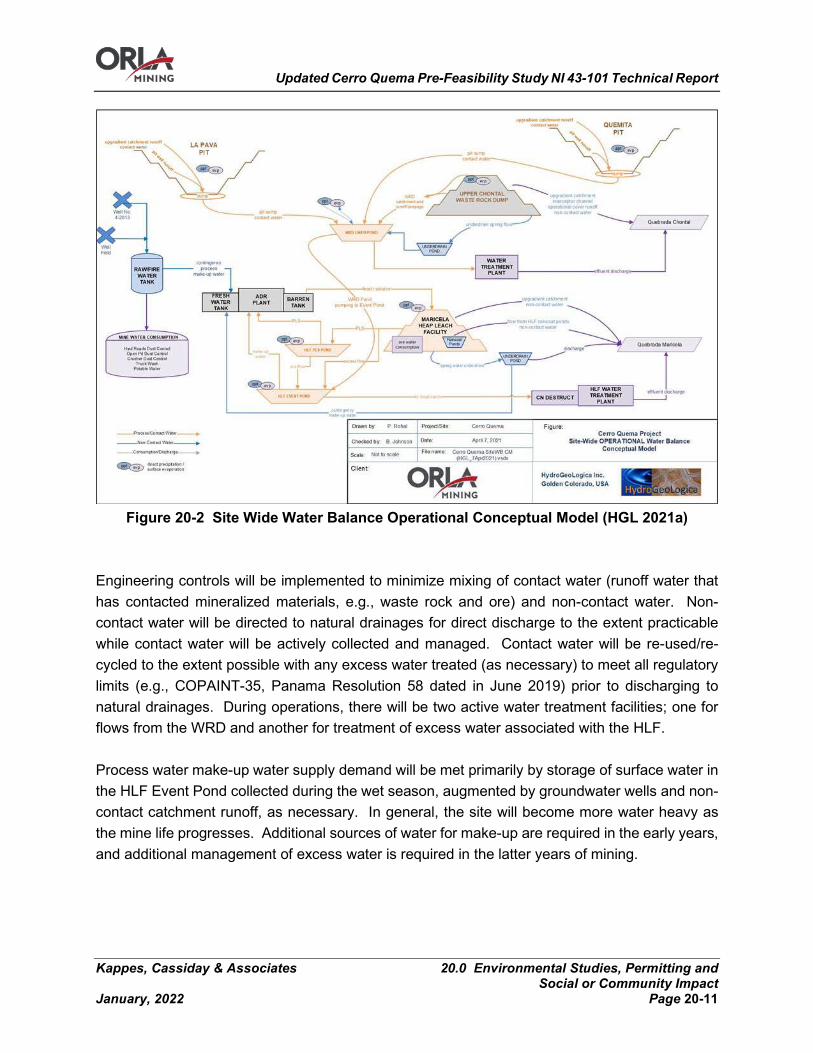
Updated Cerro Quema Pre-Feasibility Study NI 43-101 Technical Report
Kappes, Cassiday & Associates 20.0 Environmental Studies, Permitting and Social or Community Impact
January, 2022 Page 20-11
Figure 20-2 Site Wide Water Balance Operational Conceptual Model (HGL 2021a)
Engineering controls will be implemented to minimize mixing of contact water (runoff water that has contacted mineralized materials, e.g., waste rock and ore) and non-contact water. Non-contact water will be directed to natural drainages for direct discharge to the extent practicable while contact water will be actively collected and managed. Contact water will be re-used/re-cycled to the extent possible with any excess water treated (as necessary) to meet all regulatory limits (e.g., COPAINT-35, Panama Resolution 58 dated in June 2019) prior to discharging to natural drainages. During operations, there will be two active water treatment facilities; one for flows from the WRD and another for treatment of excess water associated with the HLF. Process water make-up water supply demand will be met primarily by storage of surface water in the HLF Event Pond collected during the wet season, augmented by groundwater wells and non-contact catchment runoff, as necessary. In general, the site will become more water heavy as the mine life progresses. Additional sources of water for make-up are required in the early years, and additional management of excess water is required in the latter years of mining.
Updated Cerro Quema Pre-Feasibility Study NI 43-101 Technical Report
Kappes, Cassiday & Associates 20.0 Environmental Studies, Permitting and Social or Community Impact
January, 2022 Page 20-12
Ground Water Management
Groundwater in the Project area will be affected through pit dewatering, water supply pumping, and management of spring flows, as required for mine operations. Both proposed open pits will intersect the water table; however, due to the location of the pits on the top of a ridge, it is not expected that long-term groundwater inflows to the pit will occur after the initial groundwater in storage is removed. Management of groundwater inflow and dewatering will likely be conducted by in-pit sumping and draining. No dewatering wells are currently anticipated, though additional evaluation will be conducted to determine if dewatering wells will be required. As noted in Section 20.1.2.1, groundwater will also be used to augment make-up water for process. Currently there is a single water-supply well being used periodically for drilling, as needed. Additional wells will be added to ensure sufficient water supply during the dry season. Springs in the Project area will be left to discharge to natural ground to the extent practicable. In cases where spring discharge could interfere with design and/or operations, water will be collected and managed, including treatment (as needed) and discharge to local drainages. In some cases (e.g., springs beneath facilities) spring water will be captured and incorporated into the site water circuit for use as make-up water.
Consideration of Climate Change
The PFS-level water balance and hydrologic modeling predictions for the Cerro Quema Project are based on precipitation and evaporation data compiled as part of the climate analysis for the Project, as presented in the Cerro Quema Climate Data Analysis technical memorandum (HGL, 2020a). The hydrologic models provide predictions based on average climate conditions with consideration of variability by implementing ranges of climate data (as different scenarios) into the modeling evaluations and analyses. Both the site-wide water balance model (HGL, 2021a) and the pit lake model (HGL, 2020b and 2021b) are sensitive to Site precipitation rates and volumes, and therefore this variable (precipitation input) was the focus of climate sensitivity modeling. Future climate variability in Panama has been evaluated by a partnership between the Global Facility for Disaster Reduction and Recovery (GFDRR) and the Climate Change Team of the Environment Department of the World Bank, as summarized in their report, Vulnerability, Risk Reduction, and Adaptation to Climate Change – Panama (GFDRR, 2011). This study relied on a suite of general circulation models (GCMs) used by the Intergovernmental Panel on Climate Change (Magrin et al., 2007) as well as downscaled analysis using the PRECIS RCM (and the Hadley CM3 model) as explored by Cathalac (2008). From this study, the following insights were derived for the Central and South American region:
Updated Cerro Quema Pre-Feasibility Study NI 43-101 Technical Report
Kappes, Cassiday & Associates 20.0 Environmental Studies, Permitting and Social or Community Impact
January, 2022 Page 20-13
Dry season temperatures are projected to increase between 0.4⁰C and 1.1⁰C by 2020, 1.0⁰C and 3⁰C by 2050, and 1.0⁰C and 5.0⁰C by 2080. It is not possible yet to get a clear picture of annual precipitation change due to large model uncertainties. GCMs project changes in dry season rainfall from -7% to +7% by 2020, -12% to +5% by 2050 and -20% to +9% by 2080. What is clear, however, is that future climate will increase variability and intensity of extreme events. Under one particular downscaling study (PRECIS), extreme precipitation events (greater than 40 mm per day) are expected to increase by as much as half under the A2 emissions scenario (Cathalac, UNDP, GEF).
The Cerro Quema PFS site water balance model was run for a 15-year projected time period using data for a selected ‘average climate’ year from the synthetic record with total annual precipitation of 2,213 mm, which was near the average annual precipitation over the 30-year record (2,233 mm). A ‘wet climate’ scenario was also run using data from a high-precipitation year (2,592 mm/year), which represents approximately the 95th percentile of total annual precipitation from the 30-year synthetic record. A ‘dry climate’ scenario was run using data from a low-precipitation year (1,619 mm/year), which represents approximately the 5th percentile of total precipitation. These scenarios represent +17 and -27% changes in annual rainfall at the Site, which is consistent with the projections of the GCMs (GDFRR, 2011). The pit lake water balance models were run with a range of climate scenarios, including a dry condition (-10% precipitation) and a wet condition (+10% precipitation) to evaluate climate variation. The Cerro Quema Project PFS studies have utilized modeling results that take these climate variations into account with regard to operational planning including pond, channel, treatment, and water storage designs. The GDFRR (2011) study provides recommendations for adaptation options in the water resources management sector including:
• Increasing water supply, e.g., by using groundwater, building reservoirs, improving or stabilizing watershed management, desalination;
• Decreasing water demands, e.g., by increasing efficiency, reducing water losses, water recycling, changing irrigation practices;
• Improving or developing water management; • Developing and introducing flood and drought monitoring and control systems; • Strengthening of water and weather station network to better predict future changes in
the water regime, including floods and droughts; • Developing new irrigation technologies; and • Promoting conservation and rational use of water resources.
Updated Cerro Quema Pre-Feasibility Study NI 43-101 Technical Report
Kappes, Cassiday & Associates 20.0 Environmental Studies, Permitting and Social or Community Impact
January, 2022 Page 20-14
The Cerro Quema project design to date incorporates a number of the recommendations applicable to the proposed mining operation, such as concurrent reclamation to minimize contact water and building in water conveyance and storage flexibility to account for the potential of more extreme storms events related to climate change. CMCQ will continue to optimize water resources and prepare for storm events and adequate water storage in operations and post closure.
Sediment Controls
The permanent sediment control system during the construction and operation stages of the HLF and WRD will consist of a set of measures at the source and at the discharge levels that will allow the non-contact water flows to be diverted first to the diversion channels and then to the natural streams, downstream of the HLF and WRD underdrain ponds. For the HLF and WRD, at the source level, silt fences parallel to the diversion channels will be installed; at the discharge level, a system of barriers consisting of check dams and silt fences for sediment retention is proposed. The check dams will be designed with efficiency for the 2-year 24-hour storm, on major waterbodies intercepted by the diversion channels to retain sediments. Sediments will be cleaned up and taken to the unsuitable soil dump or to the WRD where they will be placed at the rear of those facilities to avoid stability issues.
Air Quality Management
The primary potential effect on air quality will be generation of dust. During the construction and operating phases of the Project, mitigation measures will be employed to reduce the generation of particulate material (particles and dust) produced during mining and transport operations, and measures will be implemented to reduce the generation of polluting gases produced by equipment, internal combustion engines, and resulting from the refining of mined ore. Measures employed will include:
• Water application to haul roads and areas prone to generate particulate matter in the dry season (approximately December to April) or during long periods without rain in the rainy season;
• Use of water sprinkler suppression systems in the crushing circuit to avoid the generation of dust;
• Forbid incineration of solid waste in the Project area; • Control emissions from the laboratory using a bag filter; • Use of low sulfur fuels for vehicles and mining equipment;
Updated Cerro Quema Pre-Feasibility Study NI 43-101 Technical Report
Kappes, Cassiday & Associates 20.0 Environmental Studies, Permitting and Social or Community Impact
January, 2022 Page 20-15
• Emissions from the smelting furnace will be controlled through bag filters and the smelting furnace will operate only four times a week for four hours each time, minimizing operation to 16 hours per week;
• The ash generated during the smelting process will be collected in containers duly marked as hazardous material and disposed of as discussed in Section 20.1.3.1 of this Technical Report;
• The auxiliary power plant will use low NOX burners to mitigate the emissions; and • Employ a filter chamber to mitigate the emission of particulate matter.
Flora and Fauna Management
Prior to creating surface disturbances, MCQ will need to monitor the protected plants and other plants of interest according to National law, and these plants will be identified, rescued and re-established in suitable natural habitats that are not affected by construction of the mine, as far as possible. The species listed in some conservation category will have a highest priority for relocation (Table 20-2). In accordance with Panamanian laws and permit conditions, prior to construction qualified biologists will survey areas to be disturbed to identify nesting areas, dens, and lairs of animals present. During the construction stage, rescue and relocation activities will be carried out for wildlife not naturally prone to leave the area. All protected species of fauna will be rescued and relocated to areas that meet similar conditions of vegetation, climate and diversity of fauna species, which have been previously defined and approved by ANAM, prior to commencement of operations. In order to avoid or reduce the effects on habitats, to the extent possible, operations will use areas that have been previously disturbed. Key points of the wildlife management plan include:
• Relocate, as far away as possible, those isolated populations with endemic species such as Alouatta coibensis trabeata (Coiba howler monkey) and Incilius signifer (toad) that will be affected by the Project's footprint;
• Avoid the construction of unnecessary barriers for the movement of fauna (fences or roads outside the main fences of the facilities or roads that are not important to the Project);
• Train employees in defensive driving to avoid wildlife encounters; • Use buses to transport personnel and reduce traffic load; • Establish signage or consider building funnel-shaped culverts and fences at specific
locations that may be important to wildlife movement during construction; • Prohibit hunting and feeding of fauna by employees; • Ensure that waste is managed appropriately, so that species are not exposed to
dangerous pollutants;
Updated Cerro Quema Pre-Feasibility Study NI 43-101 Technical Report
Kappes, Cassiday & Associates 20.0 Environmental Studies, Permitting and Social or Community Impact
January, 2022 Page 20-16
• Avoid intervention or removal of riparian vegetation. Construction works must be at least 10 m away from the riparian waterways. Prior to construction activities near a river or stream, the protection area of 10 m of the coastal strip will be delimited with a reflective marking tape;
• Permanently control erosion in riparian zones of water courses, mainly at the intersections of existing and new roads, to stabilize these areas;
• Restrict construction activities to the dry season, when the wet width of the channel and the flow are reduced, reducing the transport of sediments and the reach of the sedimentation zone;
• Properly use screens at water intakes during hydraulic tests to prevent the transfer of aquatic organisms between water courses.
Cyanide Management Plan
Orla will develop a cyanide management plan which will include measures to prevent interaction of wildlife with heap leach solutions. All lining and containment systems will be designed to meet International Cyanide Code requirements and will be constructed according to North American standards.
Waste Handling
Hazardous Wastes
Solid waste management in the project will be carried out based on the following. All hazardous waste generated within site, be it domestic or industrial waste:
• They will be temporarily disposed of in tanks and stored in safe, waterproof, and appropriately sized containers, including due secondary containment until transported off-site by a licensed contractor,
• Will be transported off-site by a contractor company, duly authorized for such purposes, for final disposal; and the only exception to this rule will be the used oils generated in the mining equipment workshop, part of which may be reused in the blasting process.
All used hydraulic oils, greases, or fluids will be temporarily stored in suitable covered containers. Storage containers as established in point 4 of DGNTI-COPANIT 43-2001 " Sobre higiene y seguridad industrial para la contaminación atmosférica en ambientes de trabajo " will be stored at the mining facilities platform from where they will be sent to their final disposal sites by a certified contractor. The proposed mitigation measures regarding handling hazardous materials are based on the provisions of the DGNTI-COPANIT 43 2001 Panamanian norm “Sobre higiene y seguridad
Updated Cerro Quema Pre-Feasibility Study NI 43-101 Technical Report
Kappes, Cassiday & Associates 20.0 Environmental Studies, Permitting and Social or Community Impact
January, 2022 Page 20-17
industrial para la contaminación atmosférica en ambientes de trabajo." In any event of a spill or leak of hazardous materials, the Contingency Plan provisions (EIAS, section 10.9) must be followed. Likewise, for all activities, the specific measures of the risk prevention plan related to handling hazardous materials must be taken into account (EIAS, section 10.6.6).
Non-hazardous Wastes
Non-hazardous domestic waste generated both in the construction and operation stages will be disposed of in appropriate containers located within the limits of the project. Non-hazardous construction and industrial wastes will be disposed of in proper containers located in their respective areas, to be used according to the following alternatives, ordered by priority:
• Reuse in mining activities; • Recycled at the mine; • Recycled outside the mine (including donation to the community); • Final off-site disposal by a licensed contractor.
Putrescible (Domestic) Waste Disposal
Non-hazardous putrescible organic food wastes generated from the operational facilities will be composted and used as an organic enrichment to stockpiled soil. If not suitable for composting, wastes will be managed in dumpsters and other appropriate waste containers. All containers will be covered (or covered and weighted, if covers are not attached) to reduce the potential for blowing trash to prevent wildlife access. Containers used on site will be labeled. A licensed waste management company will transport collected waste to a dedicated off-site, third-party-controlled landfill site. On-site burning of any waste materials, vegetation, domestic waste, etc., will not be allowed.
Boneyard Storage
A location on the mine site will be designated as outdoor storage or ‘boneyard’ area for placement of items that are not yet ready for disposal but may still be of use for spare parts. These items are likely to include equipment parts, vehicles, pieces of equipment, and metal components. As much of this material as possible will be utilized during the mine life. Materials remaining in the boneyard at the end of mine life will either be shipped off site for salvage value, recycled, or appropriately disposed of.
On-site BioRemediation Cell
“Land farming” is a commonly used soil remediation method for hydrocarbon contaminated soil that relies on the natural breakdown of hydrocarbons by microbial action. This is done by
Updated Cerro Quema Pre-Feasibility Study NI 43-101 Technical Report
Kappes, Cassiday & Associates 20.0 Environmental Studies, Permitting and Social or Community Impact
January, 2022 Page 20-18
spreading a shallow layer of contaminated soil onto a lined "bermed" area referred to as a biocell. In the event of a minor hydrocarbon spill on-site, the contaminated materials will be treated using a biocell as authorized. This lined biocell will be located near the Mine Truck Shop.
Waste Water (Sewage) Disposal
The wastewater disposal systems for the office and maintenance areas will be engineered, constructed, and maintained under the direction of a qualified professional and will comprise separate septic systems for facilities as described in Section 18.0.
Reclamation and Closure
Reclamation will be undertaken during mining activities where possible, but the majority of reclamation work will occur after the completion of mining and final gold recovery. The reclamation land use objective will be to return the land to its traditional use as local wildlife habitat. Closure objectives include securing the site to assure physical safety of people, protecting wildlife, protecting surface and groundwater quality and quantity, minimizing erosion, and controlling fugitive dust. To accomplish these objectives, the following key elements will be included in the reclamation plan:
• Chemical stabilization, accomplished through: o Rinsing and neutralizing the heap leach solutions and materials and then covering
the heap leach facility; o Covering the waste rock dump; and o Monitoring formation of pit lakes, including water levels and chemistry;
• Physical stabilization, accomplished through slope grooming, and the application of topsoil and revegetation;
• Control of surface waters; and • Monitoring effluent chemistry from the heap leach facility, seepage from the waste rock
dump, water draining the pit areas, and pit lake water chemistry. Water management may include treating draindown and seepage flows when necessary.
Reclamation and closure will be accomplished in three stages:
• Concurrent (2 Years): measures implemented during the operating life of the project, • Final (3 Years): measures implemented after cessation of operations; and • Post-closure (10 Years): provides for short-term maintenance and long-term monitoring
of the closed facilities. An outline of the key components of the reclamation and closure plan is described in this section. Further detailing of these components will be required before construction commences. During

Updated Cerro Quema Pre-Feasibility Study NI 43-101 Technical Report
Kappes, Cassiday & Associates 20.0 Environmental Studies, Permitting and Social or Community Impact
January, 2022 Page 20-19
operation, the reclamation and closure plan will be revised based on operational monitoring analysis. An expected timeline of Project closure is presented in Figure 20-3.
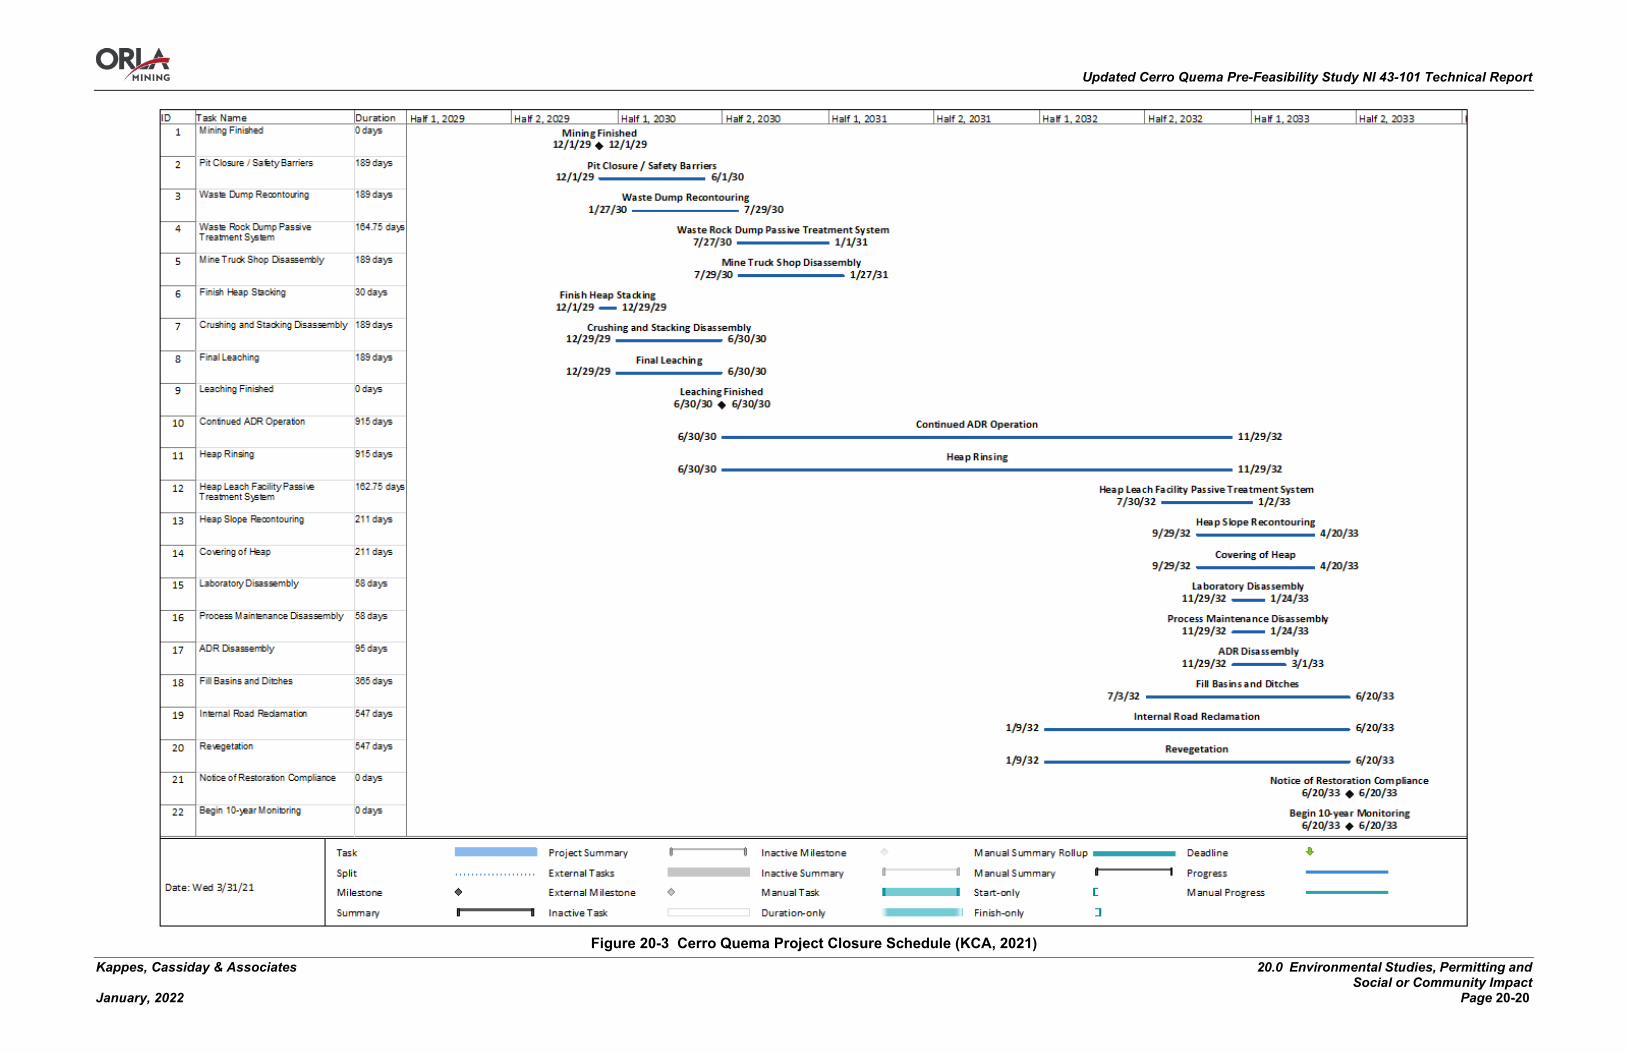
Updated Cerro Quema Pre-Feasibility Study NI 43-101 Technical Report
Kappes, Cassiday & Associates 20.0 Environmental Studies, Permitting and Social or Community Impact
January, 2022 Page 20-20
Figure 20-3 Cerro Quema Project Closure Schedule (KCA, 2021)
Updated Cerro Quema Pre-Feasibility Study NI 43-101 Technical Report
Kappes, Cassiday & Associates 20.0 Environmental Studies, Permitting and Social or Community Impact
January, 2022 Page 20-21
Soil Handling
All topsoil harvested during construction will be stockpiled for future use. However, the site is expected to be deficient of organic matter volume to support revegetation. Therefore, during operations topsoil will be created. This will be done by combining compostable materials with suitable native soils and natural topsoil. The produced topsoil will be stockpiled for future use; this process must start early since green wastes require time to compost before they are suitable to use as soil amendments. Possible sources for organic matter include:
• Chipped wood, bark and brush from site clearing activities (from the entire site including the mine and waste dumps), beginning with the initial site clearing and including subsequent phases of expansion of the heap, waste dumps and open pits;
• Composted organic fractions from solid wastes (especially food wastes); and, • Composted sewage sludge from the on-site disposal systems (ideally composted with the
solid waste organic fraction).
Operating Areas
Prior to final reclamation, all hazardous material will be removed from site. All equipment and building in the central operating area, including the office and warehouse, mine truck shop, ADR plant, generators and fuel handling facility will be dismantled and removed, and the area graded and seeded.
Mine Pits
Closure of the pits will include restricting access to the pits and allowing pit lakes to form naturally. In order to prevent the inflow of natural water runoff, catchment berms preventing upstream, non-contact flow into the pits will be retained after closure. A screening-level evaluation of the post-closure pit lakes was conducted (HGL, 2020b, 2021a, and 2021c), including prediction of pit filling and chemistry. Both pits (Quemita and La Pava) are predicted to contain lakes post closure, with the equilibrium pit lake levels balanced by inflows from direct precipitation and runoff and by outflows of evaporation and infiltration to groundwater. The ultimate equilibrium water level in the pits will depend on the permeability of the pit floors and walls. Regardless, both pits are expected to reach hydraulic equilibrium relatively quickly, within 20 years. The predicted pit water chemistries range from neutral to slightly acidic with overall low total dissolved solids and metals concentrations, with the exception of elevated copper, which is consistent with local, natural spring water in the Project area. Most portions of both excavated ore bodies (Quemita and La Pava) drain internally toward their respective pit. Some areas of the excavated ore body, however, drain externally, away from the
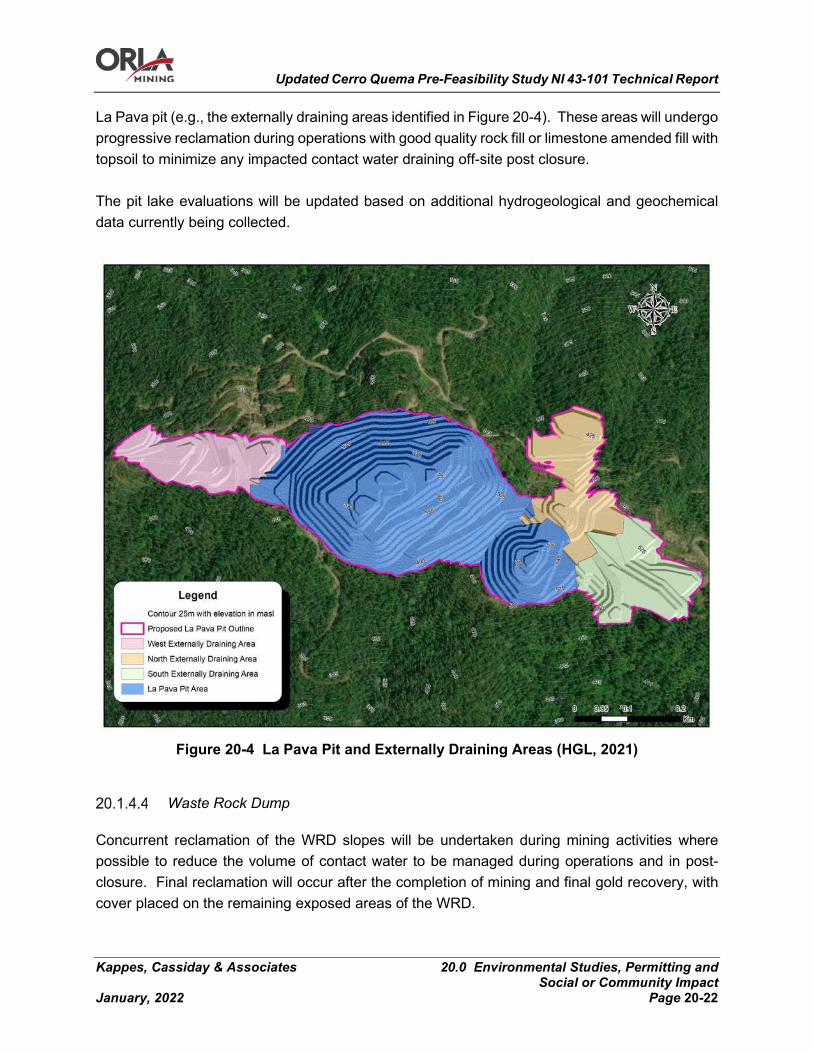
Updated Cerro Quema Pre-Feasibility Study NI 43-101 Technical Report
Kappes, Cassiday & Associates 20.0 Environmental Studies, Permitting and Social or Community Impact
January, 2022 Page 20-22
La Pava pit (e.g., the externally draining areas identified in Figure 20-4). These areas will undergo progressive reclamation during operations with good quality rock fill or limestone amended fill with topsoil to minimize any impacted contact water draining off-site post closure. The pit lake evaluations will be updated based on additional hydrogeological and geochemical data currently being collected.
Figure 20-4 La Pava Pit and Externally Draining Areas (HGL, 2021)
Waste Rock Dump
Concurrent reclamation of the WRD slopes will be undertaken during mining activities where possible to reduce the volume of contact water to be managed during operations and in post-closure. Final reclamation will occur after the completion of mining and final gold recovery, with cover placed on the remaining exposed areas of the WRD.
Updated Cerro Quema Pre-Feasibility Study NI 43-101 Technical Report
Kappes, Cassiday & Associates 20.0 Environmental Studies, Permitting and Social or Community Impact
January, 2022 Page 20-23
During operations, waste rock will be stacked in 25-m lifts, with lift slopes of 2.5H:1V and intermediate benches of 7.5 m in width where channels are required for the management of surface runoff. This configuration will allow the placement of the cover system during operations for progressive reclamation, to limit operations treatment requirements, and to limit regrading requirements at closure. Closure of WRD operation ponds will be conducted considering two phases, active closure and post-closure period. The active closure corresponds to a three-year period where construction works are needed such as regrading the slopes, closure cover system installation, rearrangement of the ponds and water control structures, and initiation of revegetation, after which the post-closure period begins. During the active closure period the lined pond capturing flow from the effluent collection system with contact water will be repurposed to form the EQ pond to support passive treatment in the post-closure period (Section 17.9.3). The underdrain pond, which is expected to capture underground and non-contact spring water, will discharge to the drainage. During the post-closure period all infrastructure related to the active water treatment plant will be disassembled and dismantled. However, after a chemical stability assessment, if there is indication that the treatment is still required, then the active water treatment plant will remain open until the discharge reaches permitted concentration levels or the passive treatment system is constructed. The passive treatment system will then treat contact-water seepage from the WRD in the post-closure period. For the closure of the topsoil stockpile close to the WRD, all the materials of the retaining dykes will be removed to be used as fill for the surroundings areas. In the areas where the topsoil will be placed, soil homogenization works will be conducted to promote the natural runoff of rainwater. The progressive reclamation and closure cover for the slopes and benches will consist of a soil layer of 500 mm thickness, covered by a topsoil layer of 500 mm thickness to allow local vegetation growth. The actual thickness of the covers may be adjusted based on site-specific soil properties and availability and will be refined as more data becomes available on climate, soil properties, and material balance. During construction and operations, topsoil in the footprint of the proposed waste rock storage area will be scraped and stored in a topsoil storage pile for the duration of the Project mine life for use in the reclamation cover. For the closure of the topsoil stockpiles, all the materials of the retaining dykes will be removed to be used as fill. All the remaining geotechnical instrumentation after operation will be monitored by a period of at least five years after closure; the monitored conditions will allow to decide if further time is necessary for monitoring (Section 20.1.6.1). The cover will be seeded/vegetated using appropriate, progressive seed mixes to provide quick growth to stabilize soils prior to the wet season to minimize erosion and encourage slope and soil stability. Experience has shown that locally harvested seeds have the highest survival rates and
Updated Cerro Quema Pre-Feasibility Study NI 43-101 Technical Report
Kappes, Cassiday & Associates 20.0 Environmental Studies, Permitting and Social or Community Impact
January, 2022 Page 20-24
are the best suited to local soil and climate factors. The closure cost estimate includes harvesting and purchasing seed and fertilizer annually for the first three years; afterwards the maturing vegetation will generate sufficient seed and organic mass to support robust growth. The overall cover design objective is to minimize seepage requiring treatment in post closure by the passive treatment system. As a part of closure, the active water treatment system will be converted to a passive treatments system to manage WRD seepage as described previously (see also Section 17.9.3). Components of the operational treatment system (which will have treated WRD seepage and pit wall runoff) will be converted to a passive system to treat the WRD seepage alone. The existing underdrain system of the WRD will be used to separate underground and non-contact spring flows from under the WRD (if applicable) to limit the volume of water to be treated. Both the active and passive treatment systems were designed by Linkan Engineering. Long-term seepage from the WRD is expected to have a pH between 3 and 4 with low metals and low total dissolved solids concentrations, consistent with natural seeps in the Project area. Given the oxide nature of the deposit, flushing of acidic secondary minerals associated with the oxide mineralization will occur with time, potentially resulting in future water quality improvement. Long-term geochemical kinetic testing is currently underway to further evaluate rinsing and residual sulphide oxidation, and will provide additional information with respect to the post-closure water chemistry. Water chemistry of the WRD seepage and passive treatment effluent will be monitored per Section 20.1.6.2. If WRD seepage meets applicable water quality criteria with time, the passive system may be removed with direct discharge of WRD seepage to Quebrada Chontal.
Roads
Roads and diversion works that are to remain in service post-closure will be upgraded to meet the closure design. Generally, this will mean that the surfacing will be more robust and that the dimensions of drainage facilities will be enlarged to meet a larger design storm. Culverts will be replaced with surface crossings since culverts are only serviceable for 10-20 years (and are targets for theft).
Closure Activities – Heap Leach Facilities
The following activities will be completed after the operating life of the project, beginning in Year 7 of the mine life:
Chemistry
Once placement of ore is completed, the HLF will be operated and closed in four phases: final leaching, rinsing, early draindown, and late draindown. Final leaching and PLS processing will continue until a cutoff grade for gold recovery is reached. At that point active leaching will cease
Updated Cerro Quema Pre-Feasibility Study NI 43-101 Technical Report
Kappes, Cassiday & Associates 20.0 Environmental Studies, Permitting and Social or Community Impact
January, 2022 Page 20-25
and the HLF will be rinsed. The heap rinsing process consists primarily of recirculating cleaner water through the heap to flush cyanide and metals from the HLF. Individual areas of the HLF will be rinsed so that the capacity of the drainage system and treatment plant are properly utilized. Based on metallurgical testing, rinsing will reduce cyanide and metals concentrations. During rinsing, leachate and runoff will continue to be collected and treated by the cyanide destruction and active treatment plants until cyanide and metals concentrations and flow rates are low enough to meet applicable discharge standards or target levels for the passive treatment system. Following rinsing, the HLF will be closed and covered. The HLF will be constructed such that the operational slopes can be covered with minimal regrading (Section 20.1.5.6). The cover (described in Section 20.1.5.7) will enhance runoff and limit infiltration into the HLF, reducing post-closure water management requirements. Non-contact water from upgradient will continue to be diverted around the facility (Section 20.1.5.2). Non-contact surface runoff from the cover will be directly discharged to Quebrada Maricela. In the early draindown phase, the HLF will initially have a high moisture content from residual rinsing and leaching solutions. During this initial, early draindown period, flow rates will be similar to that of operations, but will decrease rapidly as the coarser materials drain. Following the bulk of draindown, seepage rates will approach a long-term, steady-state condition as a part of the late draindown phase. Long-term seepage rates will be governed by precipitation, evaporation, and the runoff and infiltration characteristics of the cover system. During early draindown, solutions will be collected and directed to the active treatment plant (Section 17.9.1). Treated water from the active treatment plant will be discharged to Quebrada Marciela. Once the flow rates from the HLF decline to steady-state flow rates, solution will be directed to a passive treatment facility for long-term treatment as long as seepage chemistry does not meet applicable criteria (e.g., COPAINT-35, Panama Resolution 58 dated in June 2019); the passive treatment system is described in Section 17.9.3. The chemistry of these draindown solutions was predicted using available process, metallurgical testing, and geochemical data (HGL, 2021b). While the initial draindown will be alkaline to neutral, lime added during processing is expected to be flushed and residual sulphides in the ore may oxidize, resulting in lower pH solutions (pH near 4) with low metals and low total dissolved solids concentrations. The active and passive treatment systems were designed by Linkan Engineering to treat these waters. Construction of the passive system will be facilitated by conversion of active treatment systems as described in Section 20.1.5.8. If long-term HLF seepage meets applicable water quality criteria with time, the passive system may be removed with direct discharge to Quebrada Maricela.
Updated Cerro Quema Pre-Feasibility Study NI 43-101 Technical Report
Kappes, Cassiday & Associates 20.0 Environmental Studies, Permitting and Social or Community Impact
January, 2022 Page 20-26
Permanent Surface Water Diversion Works & Erosion Controls
As the leach pad expands the lower portions of the surface water diversion systems will be in their final locations. The hydraulic structures designed for the ultimate operational phase already meet permanent standards for erosion and storm size, therefore they will remain for the post-closure period. Hydraulic structures will include diversion channels, intake structure, by-pass structure and outlet structures.
Permanent Slope Stabilization
Once heap slopes are in their permanent configuration and leaching has ceased, final grooming, capping and revegetation of these slopes, along with associated surface water and erosion controls, will be implemented.
Final Engineering and Monitoring Plans
The closure of the HLF will consist of earthworks for slope grading to the closure configuration and for reconfiguration of the pregnant and event ponds, concrete lined diversion channels around the heap leach pad and hydraulic structures. All the remaining geotechnical instrumentation after operation must be monitored by a period of at least five years after closure; the monitored conditions will allow to decide if further time is necessary for monitoring.
Heap Rinsing, Neutralization and Solution Management of HLF Seepage
The heap rinsing process consists primarily of recirculating cleaner water through the heap. Initially the recirculated solutions will be process solutions, diluted by normal rainfall, with pH buffered to normal leaching levels to allow complete extraction of gold, silver and other metals. Individual areas of the heap, simulating approximately the normal leach areas, will be rinsed so that the capacity of the drainage system and plant are properly utilized. Once the target levels for the controlled constituents (pH, metals and CN) are reached, the heap will be allowed to sit idle through at least one wet season and the effluent chemistry monitored to ensure the targets are maintained. If any of the constituents exceed the targets, then rinsing will be repeated. Following rinsing, the HLF may be regraded as needed and a cover will be placed on the HLF to reduce infiltration and subsequent seepage that may require management.
Heap Slope Grooming
The volumetric configuration for the closure of the heap leach pad considers to keep the 2.5H:1V overall operational slope. Uncompacted cut and fill works in the slopes and benches of the operation stage will be needed to form 24 m height lifts with local slopes of 2.25H:1V and benches
Updated Cerro Quema Pre-Feasibility Study NI 43-101 Technical Report
Kappes, Cassiday & Associates 20.0 Environmental Studies, Permitting and Social or Community Impact
January, 2022 Page 20-27
6 m wide to prevent erosion, allow the placement of the cover system and build the channels for the internal management of the runoff drainage. In general, in all benches and crest of the heap, the closure surface must have a minimum slope of 2% in the direction of the channels to drain precipitation flows. The lower portions of the entire perimeter of the heap will be graded so that all exposed liner is covered but such that the liner will still capture draindown and seepage solutions for short term and long-term water management.
Cover, Topsoil Placement and Revegetation of Heap and Surrounding Areas
The closure cover system for the heap leach pad, any mineralized stockpile materials, and any mineralized, disturbed ground in the vicinity (except roads and diversions to remain), will consist of a 500 mm thick layer of low-permeability soil and a 500 mm thick layer of topsoil. Cover design may be updated as more information is collected during operations regarding climate, soil properties, and material availability. The cover will provide for protection of surface water runoff quality, limit infiltration into the HLP, reducing post-closure water management requirements, and promote vegetation growth. The topsoil will be obtained from the topsoil stockpile footprint, after that the retaining dyke and the entire underdrain system of this facility will be removed. In the areas where the topsoil will be placed, soil homogenization works will be conducted to promote the natural runoff of rainwater. Post-closure monitoring will be carried out to assess vegetation cover success and establishment. Five years of post-closure monitoring is recommended; however, this will depend on ensuring at least 80% success and establishment of the vegetation. For the HLF, non-food species will be preferred to avoid accumulation of any metals in the food chain. The cost estimate includes harvesting and purchasing seed and purchasing fertilizer annually for the first three years; thereafter, the maturing vegetation will generate sufficient seed and organic mass to support robust growth.
Ponds
During the active closure period, the pregnant and event ponds will collect the flows from the leached ore rinsing during two years, for subsequent pumping to the ARD plant in case of continuing with the rinsing of the heap, or to the water treatment plant for neutralization before discharge to the natural drainage; the rinsing of the heap leach pad will continue up to the water quality meets the discharge criteria. The Passive Cell Pond, formerly known as the underdrain pond, will collect the underdrain flows in the area where the leach pad and ponds are located. At the end of the active closure period, the pregnant pond will be filled up to the platform level, the EQ pond will have been built at the location of the former event pond, and all infrastructure associated with the water treatment plant will have been dismantled and disassembled.

Updated Cerro Quema Pre-Feasibility Study NI 43-101 Technical Report
Kappes, Cassiday & Associates 20.0 Environmental Studies, Permitting and Social or Community Impact
January, 2022 Page 20-28
During the post-closure period, the EQ pond is expected to capture flows from the HLF cover to be discharged by gravity into the Passive Cell Pond and, subsequently, into the Maricela creek. Water flows are expected to be of acceptable quality to allow their direct discharge into the natural drainage. The design and determination of the storage level will be developed in following engineering stages. Details of the passive water treatment systems are described in Section 17.9.3.
Physical and Mobile Equipment
Except for the light mobile equipment (truck, backhoe, bulldozer) to remain on-site during the post-closure care and monitoring period, all equipment will be removed. Most of this equipment will be in serviceable condition and thus will probably be sold at a profit (i.e., sales proceeds exceed decommissioning costs). Equipment not saleable as functioning equipment will be recycled, sold for scrap, or suitably disposed of.
Fencing
All fencing around areas not utilized for post-closure activities will be removed as the land is intended to return to grazing and wildlife habitat. Further, maintaining fencing would not likely to be successful in the long-term.
Post Closure Activities
Physical Monitoring and Maintenance
After the completion of final closure, the site will require regular maintenance for the first approximately 10 years post-closure or until there is no further signs of changing conditions. During this period, the site will be inspected every calendar quarter (3 months) and maintenance activities will be planned immediately following each wet season and following any unseasonal major storm events. The purpose of this is to ensure the drainage and erosion control measures are working as planned, and to allow the recently revegetated areas to mature and properly take hold. Maintenance work will consist of light manual labour (ditch tending, rubble removal, and so forth), and light equipment (backhoe and bulldozer) work to regrade or groom any areas showing signs of distress or erosion. Once the site stops showing signs of seasonal distress, the functionality of the facilities has been field proofed, and when the geochemical performance matches predictive modeling, periodic inspection and maintenance activities can be reduced in frequency; initially to annually and eventually to only after unusually high rainfall periods.
Updated Cerro Quema Pre-Feasibility Study NI 43-101 Technical Report
Kappes, Cassiday & Associates 20.0 Environmental Studies, Permitting and Social or Community Impact
January, 2022 Page 20-29
Environmental Monitoring and Maintenance
Environmental monitoring will be conducted post closure for the following sites: • Water levels and chemistry at selected upgradient and downgradient monitoring wells; • Water flow and chemistry at selected surface water stations; • Water flow and chemistry at selected spring locations; • Water levels and chemistry at both pit lakes; • Inspection of the waste rock and heap leach facility cover (for physical and erosional
integrity) and sampling of any seeps; • Water flow and chemistry at all ponds and passive treatment systems ponds and
components; • Water flow and chemistry at passive treatment system discharge points; and • Climate data collection.
The final monitoring plan will be developed during permitting; however, it is anticipated that most of the monitoring will be conducted quarterly for the first two years post closure and then reduced to annual thereafter for a period of 10 years post closure.
Biological Monitoring and Maintenance
For a period of 5 years post mine closure, regular environmental monitoring will include inspections of revegetated areas at the end of the dry season and the germination success rate of the vegetative cover seeded during closure will be evaluated. As needed, areas will be improved by adding seeds and nutrients to achieve a more robust vegetation cover.
Surplus Water Management
Surplus water will be actively monitored and managed post closure as needed. The strategy is to minimize contact water flow rates as effectively as possible over the mine life and in post closure, including diverting non-contact water, minimizing the mixing of contact and non-contact water, implementing concurrent reclamation when and where possible, and timing closure to take advantage of the dry season to draw down water inventories near the end of mine life. Excess contact water will be monitored and treated by the passive treatment systems (Section 17.9.3), as required, prior to discharge. Active treatment will cease when flow rates of contact water for treatment are low enough to be treated by passive systems.
Closure Cost Estimates – Heap Leach Facilities
Costs for concurrent reclamation and closure costs have been estimated at US$1.03 per tonne of material processed, or approximately US$22.4 million over the life of the project. These costs

Updated Cerro Quema Pre-Feasibility Study NI 43-101 Technical Report
Kappes, Cassiday & Associates 20.0 Environmental Studies, Permitting and Social or Community Impact
January, 2022 Page 20-30
are in addition to any reclamation and closure costs considered in the normal operating and sustaining cost estimates. Costs for concurrent reclamation are considered to begin during Year 6 of production and continue throughout the life of the mine. Costs for heap rinsing and G&A costs during closure are considered as normal operating cost and are accounted for separately from the reclamation and closure allowance. A breakdown of the reclamation costs can be seen in Table 20-4 below:
Table 20-4 Summary of Cerro Quema Closure Costs
Description Cost per Year US$
Total Cost US$
Total Cost per Tonne Processed
US$
Labor $750,000 $2,249,000 $0.103 Heap Rinsing & Neutralization $1,262,000 $3,787,000 $0.174 Support Services $116,000 $347,000 $0.016 Leach Pad, Ponds & Water Diversions Infrastructure $1,742,000 $5,225,000 $0.240
Process Plant, Buildings, Camp & Other Infrastructure $267,000 $800,000 $0.037
Roads $65,000 $194,000 $0.009 Monitoring $33,000 $100,000 $0.005 Closure (Regulatory Approval) $33,000 $100,000 $0.005 Subtotal $4,234,000 $12,803,000 $0.589 Contingency (20%) $847,000 $2,561,000 $0.118 Total (not including G&A) $5,081,000 $15,363,000 $0.707 G&A $2,334,000 $7,003,000 $0.322 Total (including G&A) $7,415,000 $22,366,000 $1.029
Permitting
The authors are not experts in Panamanian environmental law or legal permitting requirements, and accordingly for this summary the authors have relied upon the professional opinion of upon Orla’s legal manager in Panama, Lic. Jose Castillo Dopeso. The summary of permitting steps borrows heavily from the 2014 PFS (P&E Mining Consultants, Golder Associates, Kappes Cassiday and Associates 2014) and the EISA prepared in 2015 (SNC-Lavalin Panama 2015) and Castillo Dopeso has confirmed that the regulatory framework outlined in these reports is currently valid and correct.
Updated Cerro Quema Pre-Feasibility Study NI 43-101 Technical Report
Kappes, Cassiday & Associates 20.0 Environmental Studies, Permitting and Social or Community Impact
January, 2022 Page 20-31
An environmental assessment document and permits are in place for a previously proposed continuous vat leach operation, as summarized in Section 20.2.2. However, as the current project will utilize heap leach processing methods, MCQ updated the environmental assessment and permit application to reflect the new project design. The environmental assessment and permit applications, including the closure plan, was submitted to the Panamanian government in 2015. The Ministry has completed the technical evaluation of the EIA, and MCQ believes the Ministry is in the process of preparing the formal resolution to approve it. Timing of approval is presently not known. In 2020 MCQ contracted ERM Consultants Canada Ltd., to assess if the information presented in the EIA is in accordance with the requirements established by Panamanian regulations, International Finance Corporation Performance Standards 2012 (IFC PS), and currently accepted industry best practices. ERM found no fatal flaws with respect to Panamanian regulations but identified areas where environmental permitting studies and management plans should be improved to fully meet local requirements International Standards and currently accepted industry practices (ERM Consultants Canada Ltd. 2021). ERM provided recommendations that should be followed as the project advances beyond the Pre-Feasibility level, as summarized in Section 24.3 and Section 26.7 of this Technical Report. A Federal agency, the Autoridad Nacional de Ambiente (National Environmental authority) known by its Spanish acronym ANAM is the lead regulatory agency for permitting of the Cerro Quema Project. Section 20.2.1 of this Technical Report provides a summary of the Panamanian regulatory requirements to prepare an environmental impact assessment (EIA) to ANAM requirements and obtain associated permits.
Environmental Assessment Regulatory Requirements
Environmental assessment requirements in Panama are regulated by Decree Law #123 (the Decree, August 14, 2009). The Decree provides detailed measures by which the process of submitting and reviewing an Environmental Impact Study (Estudio de Impacto Ambiental – EIA) for a proposed project shall be carried out, in accordance with the provisions of Law No. 41 of July 1, 1998 – Environmental Protection Law of the Republic of Panama. Proposed project types that require an EIA are indicated under Article 16 of the Decree or can also be determined by ANAM based on the environmental risk that the proposed project may cause. The proposed Cerro Quema mining project falls under Article 16 of the Decree (Associated International Standard Industrial Classification of All Economic Activities [ISIC] Code # 1310). In accordance with the Decree a proposed project may fall under one of three EIA categories based on environmental criteria provided under Article 23 of the Decree. The Cerro Quema project is classified as a Category III EIA, summarized as follows:

Updated Cerro Quema Pre-Feasibility Study NI 43-101 Technical Report
Kappes, Cassiday & Associates 20.0 Environmental Studies, Permitting and Social or Community Impact
January, 2022 Page 20-32
Category III EIA: The project may cause negative environmental effects that are of indirect, cumulative and/or synergistic nature and which are quantitatively and qualitatively significant, and therefore must be subjected to a more in-depth evaluation of effects, and identification and implementation of appropriate mitigation measures.
An EIA must meet the minimum content specified in Article 26 of the Decree, to ensure the adequate prediction, identification and interpretation of environmental effects, as well as the technical suitability of the proposed mitigation measures. The proponent of the EIA is required to engage the public in the early stages of the project and in the evaluation process of the corresponding EIA, meeting requirements established in the Decree and in the Citizen Participation Regulation. The proponent shall document in the EIA all activities carried out to engage and/or consult the public and/or community. The proponent shall carry out public participation and engagement throughout the EIA using mechanisms outlined in Article 29 of the Decree, and based on the assigned EIA category. Additionally, as per Article 30 of the Decree, the proponent shall develop a Public Consultation and Engagement Plan. The proponent must hold a public forum at their cost during the evaluation stage of a Category III EIA at a date coordinated with ANAM, which would serve as the moderator of the forum. Once the EIA is submitted by the proponent to ANAM, the EIA evaluation process begins, which consists of the following phases (as per Article 41 of the Decree):
• Admission Phase: This phase begins with the formal electronic submission of the EIA, along with the application for environmental assessment if it is a Category II or III EIA, or a duly notarized affidavit if it is a Category I EIA. During this phase it will be verified, according to its category, if the EIA meets the minimum requirements established in Article 26 of the Decree. This phase shall not exceed five business days.
• Assessment and Analysis Phase: During this phase, ANAM and the pertinent municipal and sectorial environmental units evaluate the EIA by looking at the technical, environmental and sustainability aspects of the respective study. Information requests may be issued to the proponent if they are deemed necessary. This phase should be completed within a period not exceeding thirty- five business days for a Category II EIA, and fifty-five business days for a Category III EIA. A report will be issued at the end of this phase.
• Decision Phase: During this phase ANAM formalizes its decision to approve/reject the EIA through an Environmental Resolution. This phase should not exceed five business days.

Updated Cerro Quema Pre-Feasibility Study NI 43-101 Technical Report
Kappes, Cassiday & Associates 20.0 Environmental Studies, Permitting and Social or Community Impact
January, 2022 Page 20-33
Once approved, the proponent must submit evidence demonstrating compliance with the follow-up monitoring outlined in the Environmental Management Plan section of the EIA with the frequency and detail set out in the Environmental Resolution issued by ANAM.
Previous Permitting Activities
In 1996, under Decree 23 of 1963 an Environmental Viability Report (Informe de Viabilidad Ambiental - IVA) was approved by Resolución No. 070 INRENARE of December 24, 1996. The project included the development of 3 pits La Pava, Quema and Quemita in an area of 110 hectares. In 2004, under Decree 57 of 2004 an Environmental Management Program (so called Programa de Adecuación y Manejo Ambiental - PAMA) was approved by Resolución DINAPROCA-PAMA No.017-2004 of July 30, 2004. This PAMA was first amended by Resolución AG-0211-2010 of February 22, 2010 and this was further amended by a second addenda presented to ANAM on October 23, 2012 which it was approved by Resolución AG-07422012 of December 27, 2012. The latest PAMA approval is valid until December 31, 2017. The project included a first phase to develop only the La Pava deposit. The development of Quema and Quemita pits (Phase II) would be determined based on the results of the Phase I study. The total area for project development was 817.17 hectares and there was no mention of main access road to the project. Monitoring work related with this approval is associated with the direct area of influence of the proposed La Pava pit.
Permits for Project Development
MCQ has identified the following Panamanian permits that must be acquired for the Project. Permits that have been approved at the time of writing of this PFS report are noted.
Environmental Permits
• Application for surface water and groundwater concessions; • Groundwater exploration • Temporary use of water; • Building permit for work on water channels; • Reforestation Plans and Financial Reports approval certification; • Tree cutting permit; • Ecological Compensation; • Wildlife Rescue and Relocation Plans approval certification; • Category I Environmental Impact Assessment (EIA) for electric plant (approval granted); • Category II EIA for road rehabilitation (km 0 to km 7).

Updated Cerro Quema Pre-Feasibility Study NI 43-101 Technical Report
Kappes, Cassiday & Associates 20.0 Environmental Studies, Permitting and Social or Community Impact
January, 2022 Page 20-34
Social Security
• Industrial Permit – permit to be granted based on Occupational Health and Safety Program, risk maps and procedures, physical-chemical monitoring.
Municipal Permits
• Construction of infrastructure (offices and plant infrastructure, bridges, fords, dam, road up to km 7).
• Movement of land for construction.
Ministry of Commerce and Industry
• Commercial Registration (approval granted).
Ministry of Labor
• Internal Labor Regulations (approval granted).
Comisión Nacional para el Estudio y la Prevención de los Delitos Relacionados con Drogas - CONAPRED
• Controlled use of reagents.
Sectorial Permits
The EIA is not required to include details regarding sectorial permits, but in addition to the EIA approval, ERM reports that the project must obtain the following approvals (ERM Consultants Canada Ltd., 2021):
• Construction Municipal permit; • Working permits and social security for the workers; • Concessions permits; • Water use permit; • Wells permit and pumping testing, hydrology; • Ecological payment; • Reforestation plan approval; • Rescue and relocation of species plan permit; • Chance find procedure.
The permits require supplemental information to the EIA and are managed as independent studies and processes.
Updated Cerro Quema Pre-Feasibility Study NI 43-101 Technical Report
Kappes, Cassiday & Associates 20.0 Environmental Studies, Permitting and Social or Community Impact
January, 2022 Page 20-35
IFC Performance Standard and Industry Best Practices
Orla intends to develop the project in accordance with these international standards and to this end ERM provided recommendations as discussed in Section 24.3 and Section 26.7 of this Technical Report
Social and Community Impact
The information for this section was mostly obtained from the Environmental Impact Study prepared by SNC Lavalin in 2014 and submitted to the Panamanian authorities in 2015. Social information was also collected from the Gap Assessment and Social Impact Assessment Scoping (draft) prepared by ERM in 2021.
Panama – General Aspects
According to the Panamanian Constitution (2004), the independent and sovereign state of Panama is divided in provinces, districts and “corregimientos”. There are three legal powers: Legislative, Judicial and Executive which act independently and limited but in harmoniums collaboration. According to the 2010 Census, the Panama’s estimated population 3,405,813 inhabitants (50.2% male an 49.6% female), in a total of 74,177.3 km2, with a 52% in the metropolitan area of Panama City. Sixty-seven percent (67%) of the population is in urban areas de la población and 33% in rural areas. The growth rate was estimated at 1.44 for the period 2010-2015 (SNC Lavalin 2015). The EIA 2015 indicated that the national indigenous population in 2010 was estimated at 417,559 of which most are of the following ethnicities: Ngäbe (260,058), Gunas (80,526), Emberas (31,284), Bugle (24,912), Wounaan (7,279), Naso Tjerdi (4,046), and Bokota (1,068), the rest are registered as others and non-declared. Afrodescent population was estimated at 313,280. The poverty level decreased from 42.1% in 1991 to 26.5% in 2012. Various factors contributed to the poverty reduction including the Social Protection System, directed to vulnerable communities and in extreme poverty initiated in 2016 and expanded in 2009. The subsidies are distributed through the following programs: “Red de Oportunidades”, “Cien a los 70” and “Beca Universal”. In 2021, the Instituto para la Formación y Aprovechamiento de Recursos Humanos (IFARHU) indicates that the Beca Universal programme continues providing support to students. Also, the Ministerio de Desarrollo Social (MIDES) indicates that the program “Cien a los 70” continues in 2021 and now it is “120 a los 70”. The 2013 economically active population, over 15 years of age, was estimated at 64.1%. The increase in immigration from Colombia, Nicaragua, Venezuela and other was indicated as a
Updated Cerro Quema Pre-Feasibility Study NI 43-101 Technical Report
Kappes, Cassiday & Associates 20.0 Environmental Studies, Permitting and Social or Community Impact
January, 2022 Page 20-36
reflection of employment opportunities for the foreigners but also indicated the need for improving local skilled labour (EIA 2015).
Project Social Studies
The Environmental Impact Assessment submitted for approval in 2015 included community studies providing a general understanding of the social fabric and stakeholders associated with the Project. In 2020, Orla engaged an independent consultant to conduct an EIS gap assessment (ERM 2021a) and also to provide a Social Impact Assessment (SIA) Scoping (ERM 2021b) to complete a full SIA for the Project. Although Panamanian regulations do not require mining projects to present a detailed social assessment, Orla is committed to preparing a comprehensive SIA in compliance with existing local requirements and international guidelines.
Social Description
The Project’s access road goes through the Province of Herrera and the Project site is located in the Province of Los Santos, both are in the central region of Panama, known as the Azuero Region. Seven districts and 80 “corregimientos integrate this region”. The District of Tonosí has the largest surface (1,294.30 km2) and the District of Macaracas has 504.4 km2. Within the Province of Los Santos, the Project interacts with three districts with the majority of its footprint (985) in the Corregimiento Altos de Güera, Tonosí District. The other two districts are Villa de Los Santos - Corregimiento Bayano and Macaracas – Corregimiento Mogollón. Detailed characteristics of the District of Tonosí and Macaracas can be found in the EIA 2015 Table 8.1-1 and Table 8.1-2.
Social Area of Influence
The Social Area of Indirect Impact (AII) described in the EIA 2015 included the following districts and communities:
• Macaracas; • Tonosí; and • Communities that interact with the access roads to the Project.
The Social Area of Direct Impact (AoI or ADI) comprised 12 km around the Project footprint and included the following 12 communities (Figure 20-5):
• Bajo de Güera; • Boca de Quema; • Guaniquito; • Joaquín Abajo;
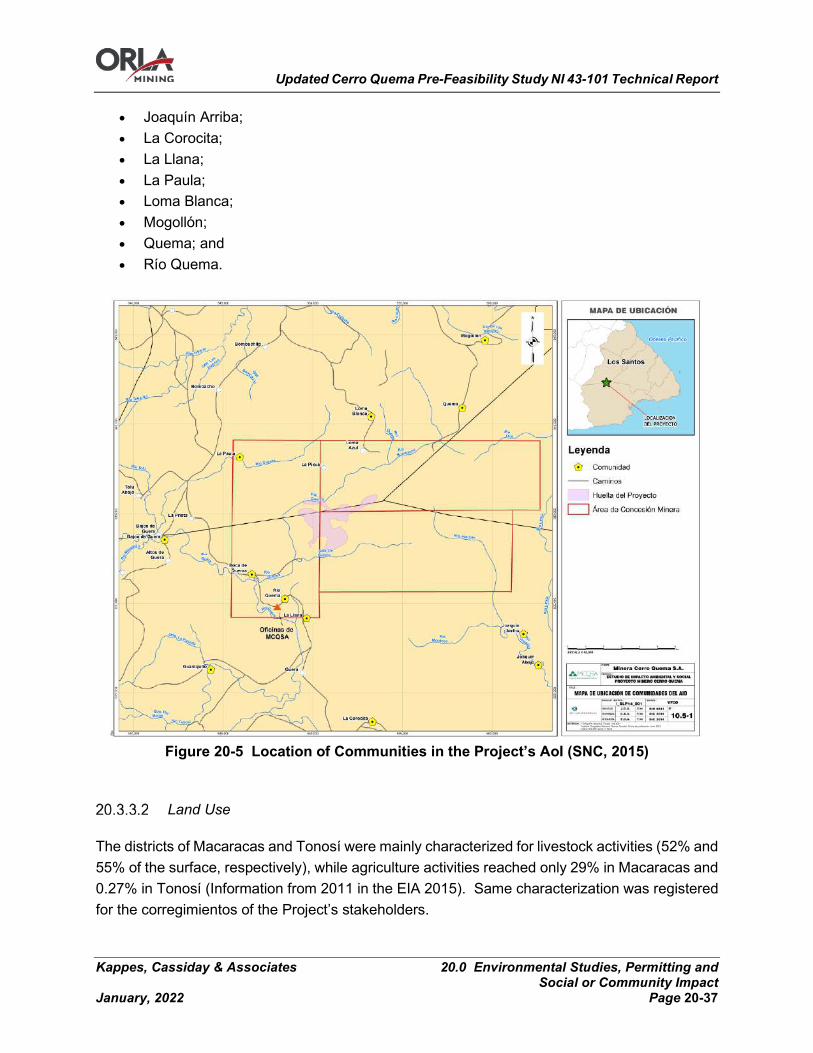
Updated Cerro Quema Pre-Feasibility Study NI 43-101 Technical Report
Kappes, Cassiday & Associates 20.0 Environmental Studies, Permitting and Social or Community Impact
January, 2022 Page 20-37
• Joaquín Arriba; • La Corocita; • La Llana; • La Paula; • Loma Blanca; • Mogollón; • Quema; and • Río Quema.
Figure 20-5 Location of Communities in the Project’s AoI (SNC, 2015)
Land Use
The districts of Macaracas and Tonosí were mainly characterized for livestock activities (52% and 55% of the surface, respectively), while agriculture activities reached only 29% in Macaracas and 0.27% in Tonosí (Information from 2011 in the EIA 2015). Same characterization was registered for the corregimientos of the Project’s stakeholders.

Updated Cerro Quema Pre-Feasibility Study NI 43-101 Technical Report
Kappes, Cassiday & Associates 20.0 Environmental Studies, Permitting and Social or Community Impact
January, 2022 Page 20-38
The area surrounding the Project is reported in the EIA 2015 as large extensions of pastures of grasses or improved pastures that are used for extensive cattle raising. The characteristics of the soils in the AoI limit the development of agricultural activities, as they are tropical and fragile, therefore a soil management plan including special measures and techniques to support the effort to develop the agriculture was suggested in the EIA. The Figure 20-6 shows the land use in the Project’s AoI. The current land use within the Project footprint is not described in the EIA.
Figure 20-6 Current Land Use in the Project’s AoI (SNC, 2015)
Indigenous Communities
The EIA 2015 reported the presence of Indigenous Peoples (IP) at the national level. The 2018-2019 local development plans for Macaracas and Tonosí report the presence of indigenous population in these districts. Tonosí cabecera has approximately 48% of indigenous communities (Strategic Plan of Tonosí), while Macaracas has 0.53% (Strategic Plan of Macaracas). Also, according to the National Institute of Statistics and Census of Panama (INEC) the 2010 census registered the following ethnic groups in the Los Santos Province, the location of the Project: Ngabe (62.3%), Kuna (19.3%), Emberá (7.5%), Wounaam (1.7%), Teribe/Naso (1%), Other (6%), Not declared (1.4%) and in less than 1% the Bokota, Buglé and Bri Bra.
Updated Cerro Quema Pre-Feasibility Study NI 43-101 Technical Report
Kappes, Cassiday & Associates 20.0 Environmental Studies, Permitting and Social or Community Impact
January, 2022 Page 20-39
In order to characterize the Project area, the SIA, to be developed by Orla, will include the identification of potential presence of IP in the Project area of influence in consideration of the following characteristics “in varying degrees”:
• Self-identification as members of a distinct indigenous cultural group and recognition of this identity by others;
• Collective attachment to geographically distinct habitats or ancestral territories in the project area and to the natural resources in these habitats and territories;
• Customary cultural, economic, social, or political institutions that are separate from those of the mainstream society or culture; or
• A distinct language or dialect, often different from the official language or languages of the country or region in which they reside.
Inhabitants, Age and Gender
According to the Panamanian 2010 census, there are 351 households in the AoI, and additional communities will be associated to the Project’s access road. The EIA 2015 indicated that the population of the districts of Tonosí and Macaracas decreased between 2000 and 2010 and the reduction in the number of inhabitants for the period 2010 - 2020 will likely continue, as the access to essential services were deficient and job opportunities in the area were also decreasing. The decrease in population was perceived during the household survey studies performed in 2014 for the EIA, in particular in the communities of La Paula, Loma Blanca, Río Quema, and Joaquín Arriba. The 2014 survey showed fewer or empty houses in practically every community of the AoI, compared to the number of houses identified in the 2010 official Census. The trend showed a decrease in indicators such as birth rates, from 16.0% in 1998 to 12.0% in 2012, while natural growth varies from 10.6% to 5.5% (per thousand inhabitants) in the same period. While the 2014 survey detected a population that remained in the area since before the year 2000, there was also evidence of a demographic transition process by the young and mature population, who tended to leave the area, indicating significant mobility or migration behavior in the AoI’s communities. The most critical cases were found in the communities of most difficult access, such as La Paula, Loma Blanca, and Mogollón. The migration is likely due to the aspiration to improving living conditions (health, housing, education). Macaracas and las Tablas were the two main communities identified in the Census 2010, as the origin of migrants. This survey also detected that approximately 63% of the surveyed community had lived more than 11 years in the area, 8% has lived for more than 50 years. The bird rate trend obtained for the Los Santos Province to 2030 show a reduction in particular for the years 2020-2030 while lifespan for the province has increased (EIA 2015). The life span projection incremented from 75 years in 2020, 78 in 2010, 80 in 2020 and 81 in 2030. Mortality rate was reported as 6.2% greater than the districts of Maracas (5.6%) and Tonosí (4.8%). The
Updated Cerro Quema Pre-Feasibility Study NI 43-101 Technical Report
Kappes, Cassiday & Associates 20.0 Environmental Studies, Permitting and Social or Community Impact
January, 2022 Page 20-40
EIA 205 indicates that there are lagoons or substantial reductions in age ranges, in particular in Guaniquito, Joaquin Arriba, La Paula and Loma Blanca. The 2014 survey showed that 3% of the community was less than one year, 17% was between 1 to 5 years, 6% between 6 and 10 years, 8% is older than 50 years (3% of the surveyed did not answer). The male population is reduced in some age ranges as well, which is a reflection of the migration in the area as reported by the surveyed communities.
Education
The illiteracy rate in Los Santos Province was reported at 6.76% in the 2010 census, for the Macaracas District was at 11.79% and Tonosí District at 11.33%, while the rate for the country is 5.45%. In July 2014 most of the educational centers in the AoI operated under the "multi-grade" modality, which is a typical form of education in rural areas of Panama, where students from various education levels are taught by one teacher in a common classroom. The communities surveyed had low enrolment rates and educational levels from 1st to 6th grade, except for the communities of Guaniquito and Quema, which had the remote-basic modality for students who passed the 6th grade. Families with more resources send their kids, or the entire family migrates, to other areas such as Macaracas, Tonosí and Chitré to continue the medium or “bachillerato” studies. The State supports students through the program universal scholarship (Programa de Beca Universal) In 2014, the community of Guaniquito was the only one that surpassed the school capacity and used the church as an education facility. From the 2014 survey, 76 from the 439 people registered in the Project’s AoI were less than 10 years. From the total of 363 people in age to attend school (10 or older), 110 people had not completed the medium level or “bachillerato”. In comparison, 71 had completed it and 19 people reached university, others either had not attended or finished school or had achieved a lower level of education. The local education is financed through subsides granted by the State, as the number of students in the Project’s AoI is low, the funds received are also low. Between low enrolment and families that having the resources prefer to send their kids to study in other areas, there was an indication that some schools would be closing such as the ones in the community of La Paula and Loma Blanca.
Health and Access to Water
The 2014 survey indicated that the 12 communities close to the Project do not have health services nor prevention or health posts.

Updated Cerro Quema Pre-Feasibility Study NI 43-101 Technical Report
Kappes, Cassiday & Associates 20.0 Environmental Studies, Permitting and Social or Community Impact
January, 2022 Page 20-41
The most frequent cause of morbidity in both Macaracas and Tonosí districts was rhinopharyngitis (common cold), while in the province diarrhea was the leading cause (EIA 2015). Other causes of morbidity in the Los Santos Province are HIV, syphilis, malaria, dengue, leishmaniasis, hepatitis and tuberculosis, and hantavirus in the Corregimiento Tonosí (Table 8.2-3, Table 8.2-4 EIA 2015). The 2014 survey to the project’s AoI showed that the health issues reported were common colds, hypertension, gastrointestinal and diabetes. The EIA 2015 indicates that the consumption of untreated water causes the gastrointestinal problems. The 2010 Census indicated that only three percent (3%) of the communities of the Project’s AoI does not have access to water. The 2014 household survey reported that access to water for domestic use was critical, the 12 communities within the Project’s AoI depended on rural systems (73%) operated with very little support from the Ministry of Health (MINSA), who has the legal responsibility. It was detected also that some community had private aqueduct or supplied directly from rivers, creeks, or springs. The lack of technical and administrative support for the operation of the system had resulted in water scarcity, mainly during dry season, or risks associated to the potential of water contamination with agrochemicals or biological contamination from animals in the area. The survey indicated that the community does not have access to potable water, contrary to the information provided by the census. In addition, the water committees’ directives are frustrated due to the lack of participation of the members, affecting the operation of the committee.
Infrastructure and Public Services
The EIA 2015 indicates that the access roads are a favorable aspect of public infrastructure in the Project’s region, most of the communities have good roads and the houses are located along the roadside, which facilitated the transportation of the community to the district capitals of Macaracas and Tonosí to access health services. Most homes had power service (79%), with the most remote communities such as Loma Blanca and La Paula having the lowest number of homes with this service (20% and 33%, respectively) (Table 20-5).
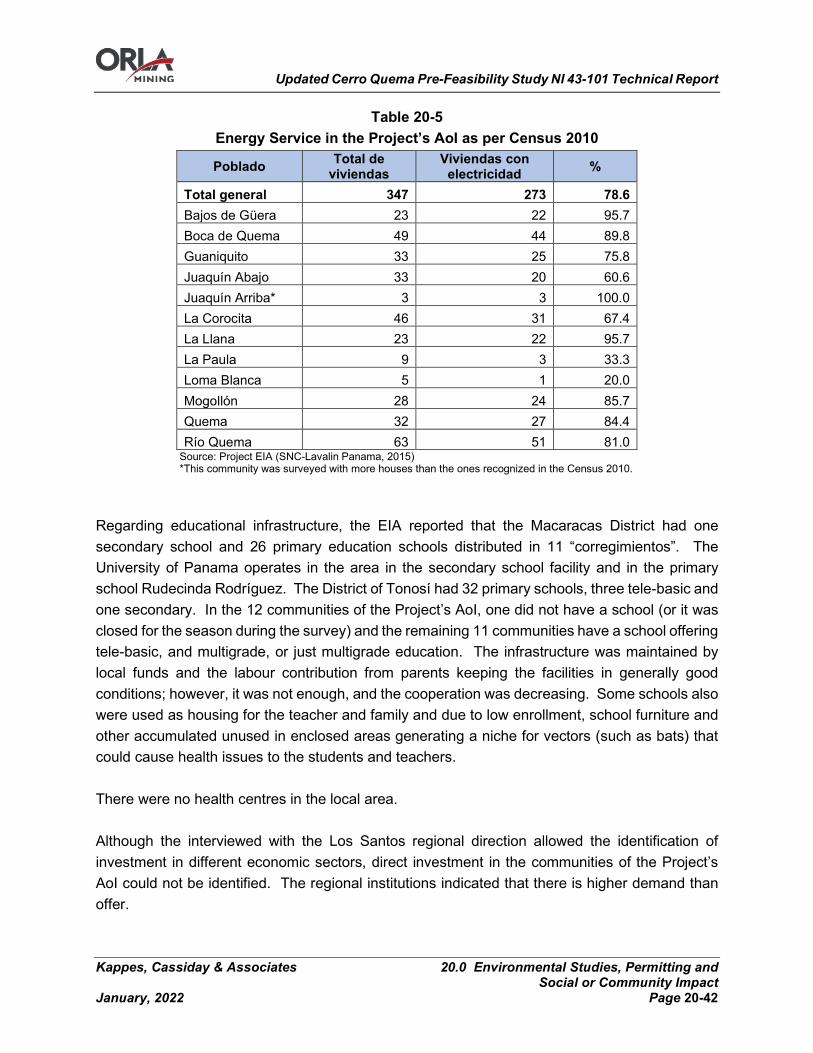
Updated Cerro Quema Pre-Feasibility Study NI 43-101 Technical Report
Kappes, Cassiday & Associates 20.0 Environmental Studies, Permitting and Social or Community Impact
January, 2022 Page 20-42
Table 20-5 Energy Service in the Project’s AoI as per Census 2010
Poblado Total de viviendas
Viviendas con electricidad %
Total general 347 273 78.6 Bajos de Güera 23 22 95.7 Boca de Quema 49 44 89.8 Guaniquito 33 25 75.8 Juaquín Abajo 33 20 60.6 Juaquín Arriba* 3 3 100.0 La Corocita 46 31 67.4 La Llana 23 22 95.7 La Paula 9 3 33.3 Loma Blanca 5 1 20.0 Mogollón 28 24 85.7 Quema 32 27 84.4 Río Quema 63 51 81.0
Source: Project EIA (SNC-Lavalin Panama, 2015) *This community was surveyed with more houses than the ones recognized in the Census 2010.
Regarding educational infrastructure, the EIA reported that the Macaracas District had one secondary school and 26 primary education schools distributed in 11 “corregimientos”. The University of Panama operates in the area in the secondary school facility and in the primary school Rudecinda Rodríguez. The District of Tonosí had 32 primary schools, three tele-basic and one secondary. In the 12 communities of the Project’s AoI, one did not have a school (or it was closed for the season during the survey) and the remaining 11 communities have a school offering tele-basic, and multigrade, or just multigrade education. The infrastructure was maintained by local funds and the labour contribution from parents keeping the facilities in generally good conditions; however, it was not enough, and the cooperation was decreasing. Some schools also were used as housing for the teacher and family and due to low enrollment, school furniture and other accumulated unused in enclosed areas generating a niche for vectors (such as bats) that could cause health issues to the students and teachers. There were no health centres in the local area. Although the interviewed with the Los Santos regional direction allowed the identification of investment in different economic sectors, direct investment in the communities of the Project’s AoI could not be identified. The regional institutions indicated that there is higher demand than offer.
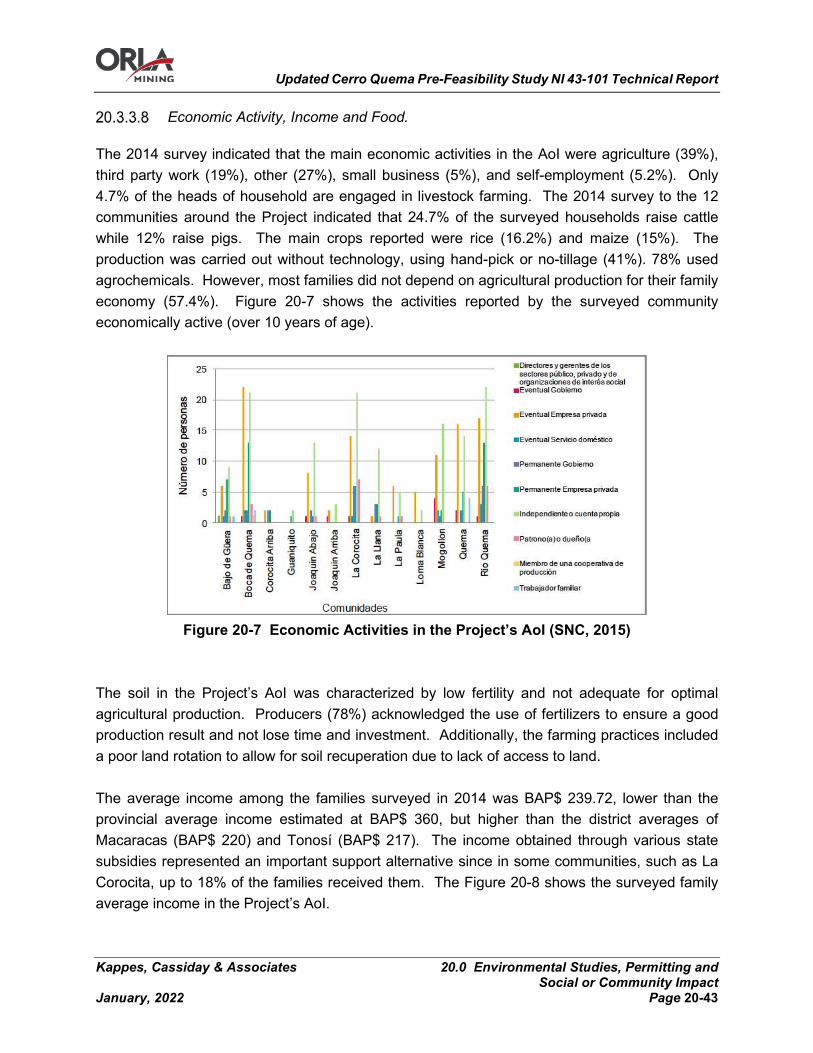
Updated Cerro Quema Pre-Feasibility Study NI 43-101 Technical Report
Kappes, Cassiday & Associates 20.0 Environmental Studies, Permitting and Social or Community Impact
January, 2022 Page 20-43
Economic Activity, Income and Food.
The 2014 survey indicated that the main economic activities in the AoI were agriculture (39%), third party work (19%), other (27%), small business (5%), and self-employment (5.2%). Only 4.7% of the heads of household are engaged in livestock farming. The 2014 survey to the 12 communities around the Project indicated that 24.7% of the surveyed households raise cattle while 12% raise pigs. The main crops reported were rice (16.2%) and maize (15%). The production was carried out without technology, using hand-pick or no-tillage (41%). 78% used agrochemicals. However, most families did not depend on agricultural production for their family economy (57.4%). Figure 20-7 shows the activities reported by the surveyed community economically active (over 10 years of age).
Figure 20-7 Economic Activities in the Project’s AoI (SNC, 2015)
The soil in the Project’s AoI was characterized by low fertility and not adequate for optimal agricultural production. Producers (78%) acknowledged the use of fertilizers to ensure a good production result and not lose time and investment. Additionally, the farming practices included a poor land rotation to allow for soil recuperation due to lack of access to land. The average income among the families surveyed in 2014 was BAP$ 239.72, lower than the provincial average income estimated at BAP$ 360, but higher than the district averages of Macaracas (BAP$ 220) and Tonosí (BAP$ 217). The income obtained through various state subsidies represented an important support alternative since in some communities, such as La Corocita, up to 18% of the families received them. The Figure 20-8 shows the surveyed family average income in the Project’s AoI.
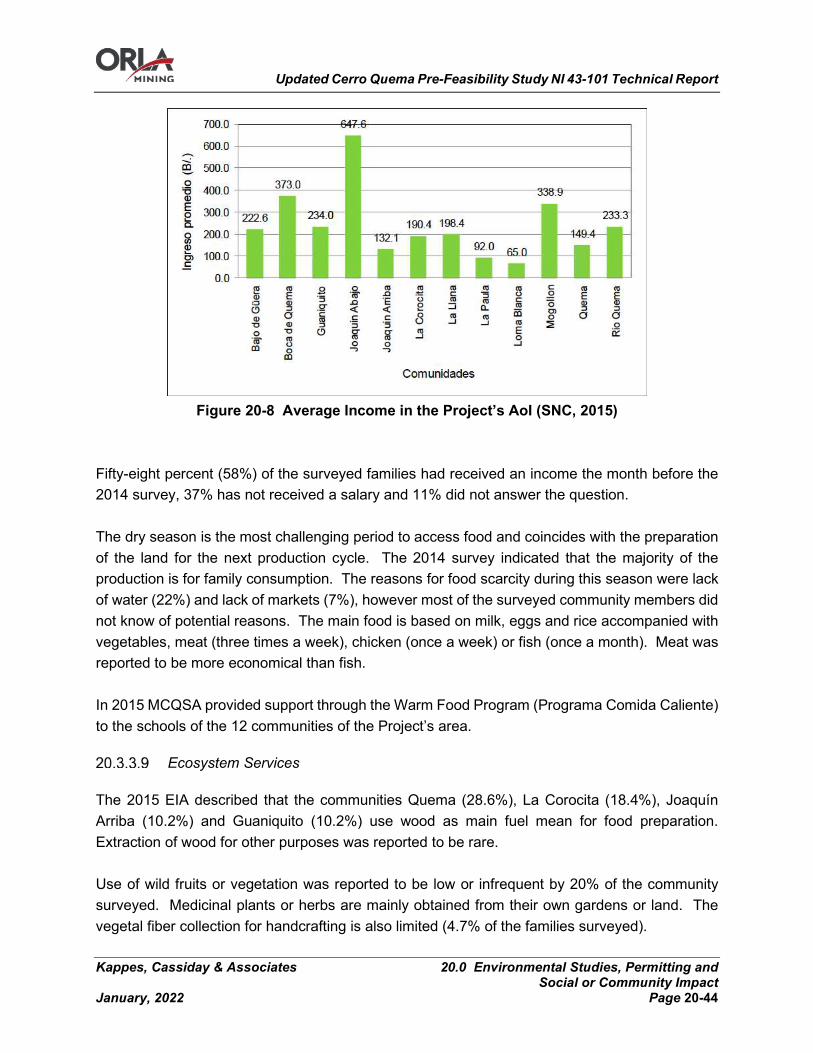
Updated Cerro Quema Pre-Feasibility Study NI 43-101 Technical Report
Kappes, Cassiday & Associates 20.0 Environmental Studies, Permitting and Social or Community Impact
January, 2022 Page 20-44
Figure 20-8 Average Income in the Project’s AoI (SNC, 2015)
Fifty-eight percent (58%) of the surveyed families had received an income the month before the 2014 survey, 37% has not received a salary and 11% did not answer the question. The dry season is the most challenging period to access food and coincides with the preparation of the land for the next production cycle. The 2014 survey indicated that the majority of the production is for family consumption. The reasons for food scarcity during this season were lack of water (22%) and lack of markets (7%), however most of the surveyed community members did not know of potential reasons. The main food is based on milk, eggs and rice accompanied with vegetables, meat (three times a week), chicken (once a week) or fish (once a month). Meat was reported to be more economical than fish. In 2015 MCQSA provided support through the Warm Food Program (Programa Comida Caliente) to the schools of the 12 communities of the Project’s area.
Ecosystem Services
The 2015 EIA described that the communities Quema (28.6%), La Corocita (18.4%), Joaquín Arriba (10.2%) and Guaniquito (10.2%) use wood as main fuel mean for food preparation. Extraction of wood for other purposes was reported to be rare. Use of wild fruits or vegetation was reported to be low or infrequent by 20% of the community surveyed. Medicinal plants or herbs are mainly obtained from their own gardens or land. The vegetal fiber collection for handcrafting is also limited (4.7% of the families surveyed).
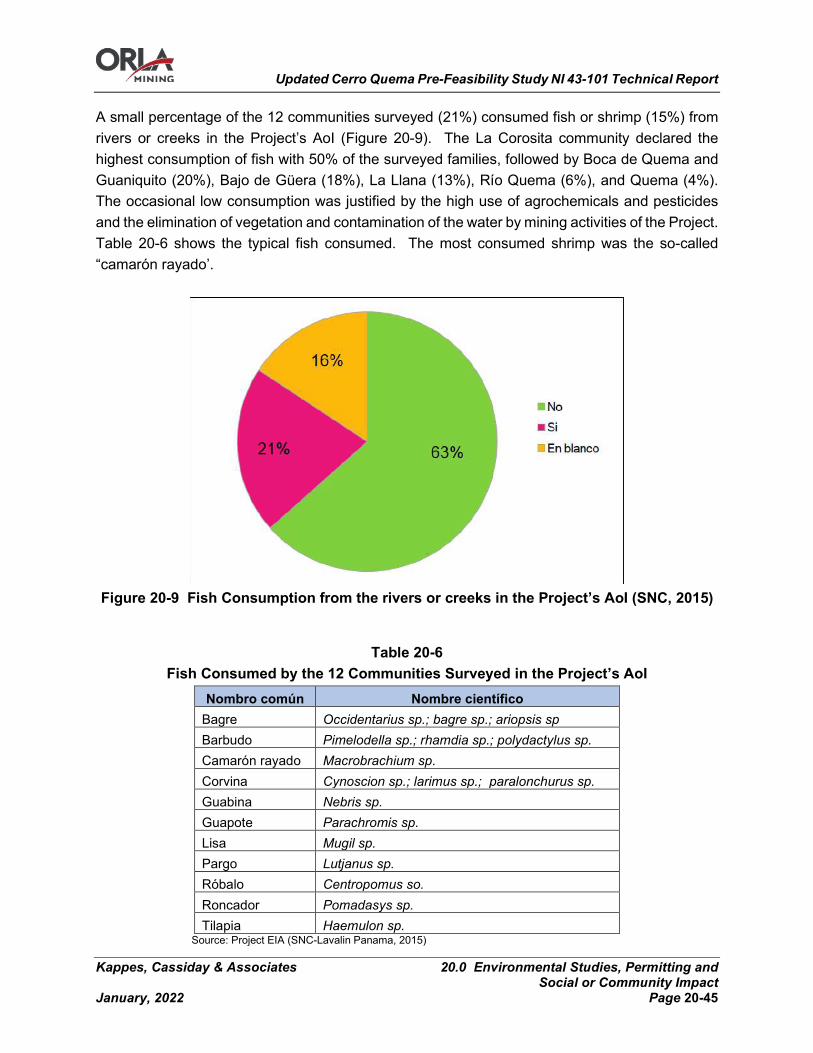
Updated Cerro Quema Pre-Feasibility Study NI 43-101 Technical Report
Kappes, Cassiday & Associates 20.0 Environmental Studies, Permitting and Social or Community Impact
January, 2022 Page 20-45
A small percentage of the 12 communities surveyed (21%) consumed fish or shrimp (15%) from rivers or creeks in the Project’s AoI (Figure 20-9). The La Corosita community declared the highest consumption of fish with 50% of the surveyed families, followed by Boca de Quema and Guaniquito (20%), Bajo de Güera (18%), La Llana (13%), Río Quema (6%), and Quema (4%). The occasional low consumption was justified by the high use of agrochemicals and pesticides and the elimination of vegetation and contamination of the water by mining activities of the Project. Table 20-6 shows the typical fish consumed. The most consumed shrimp was the so-called “camarón rayado’.
Figure 20-9 Fish Consumption from the rivers or creeks in the Project’s AoI (SNC, 2015)
Table 20-6 Fish Consumed by the 12 Communities Surveyed in the Project’s AoI
Nombro común Nombre científico Bagre Occidentarius sp.; bagre sp.; ariopsis sp Barbudo Pimelodella sp.; rhamdia sp.; polydactylus sp. Camarón rayado Macrobrachium sp. Corvina Cynoscion sp.; larimus sp.; paralonchurus sp. Guabina Nebris sp. Guapote Parachromis sp. Lisa Mugil sp. Pargo Lutjanus sp. Róbalo Centropomus so. Roncador Pomadasys sp. Tilapia Haemulon sp.
Source: Project EIA (SNC-Lavalin Panama, 2015)
Updated Cerro Quema Pre-Feasibility Study NI 43-101 Technical Report
Kappes, Cassiday & Associates 20.0 Environmental Studies, Permitting and Social or Community Impact
January, 2022 Page 20-46
Organization and Community Participation
The survey 2014 indicated that 80% of the community recognised the existence of community groups, the community members had little incentive to participate. The 2014 survey indicated that only 25% of the interviewees could identify a community leader. The community organization most mentioned was the Rural Water Administration (JAAR) but with very low participation, one to three community members. Significant participation was registered in religious groups and festivities (90% Catholic, 6% Evangelist, 0.5% Protestant and others did not respond or declare agnostic). The “Fiestas patronales” was mentioned as the central religious activities. The following are the community groups mentioned by the community surveyed:
• Water group (JAAR); • Family Clubs or associations; • Church committees; • Frente Santeño against mining.
The public officers interviewed indicated that the Frente Santeño is supported by different communities with the participation of around 30 people. The participants were characterized as professionals that do not live in the Project’s AoI. The leaders could not be interviewed. The EIA indicated that the USAID in 2004 characterized the municipal government agencies as low efficiency or non-functioning and usually ignored by the Ministries of Panamá. Therefore, the investment is typically discussed between the Ministries and the communities or Corregimientos.
Project Community Perception
The 2014 family survey and the 10 workshops completed for the EIA 2015 provided a general picture of the Project perception. Most of the comments provided during the survey were positive (35%) in almost all of the 12 communities surveyed (Figure 20-10). Others (29%) made positive and negatives comments about the Project. The surveyed showed that closest communities to the 2014 camp and project office registered the highest percentage of positive comments (40% Boca de Quema and 39% Río Quema). However, the EIA 2015 indicated that most workshop participants from these same communities considered the project less or no favorable, mainly due to lack of employment and benefits.

Updated Cerro Quema Pre-Feasibility Study NI 43-101 Technical Report
Kappes, Cassiday & Associates 20.0 Environmental Studies, Permitting and Social or Community Impact
January, 2022 Page 20-47
Figure 20-10 Household leader Project perception – July 2014 (SNC, 2015)
The workshops indicated that 41% of the participants (a total of 138) has a positive perception of the Project, and 22% considered the Project of little benefit. The following were registered as the main community concerns:
• Lack of project information (Project’s owner, phase, timelines etc.); • Water contamination (rivers, creeks, springs); • Biodiversity effects (elimination of fauna species); • Soil and other natural resources contamination; • Health risks; • Land access (land acquisition at low price and displacement); • Economic benefits (employment, social support -school, health, roads etc.); • Employment insecurity (high rotation and frequent ownership change).
Social Impacts
The EIA 2015 identified the following socioeconomic impacts (positives and negatives): • Population – positive effect with a decrease in the reduction of people in the community; • New employment opportunities, training capacity and local tax and permits payments; • Road improvements; • Traffic increase; • Archaeological and Cultural impacts;
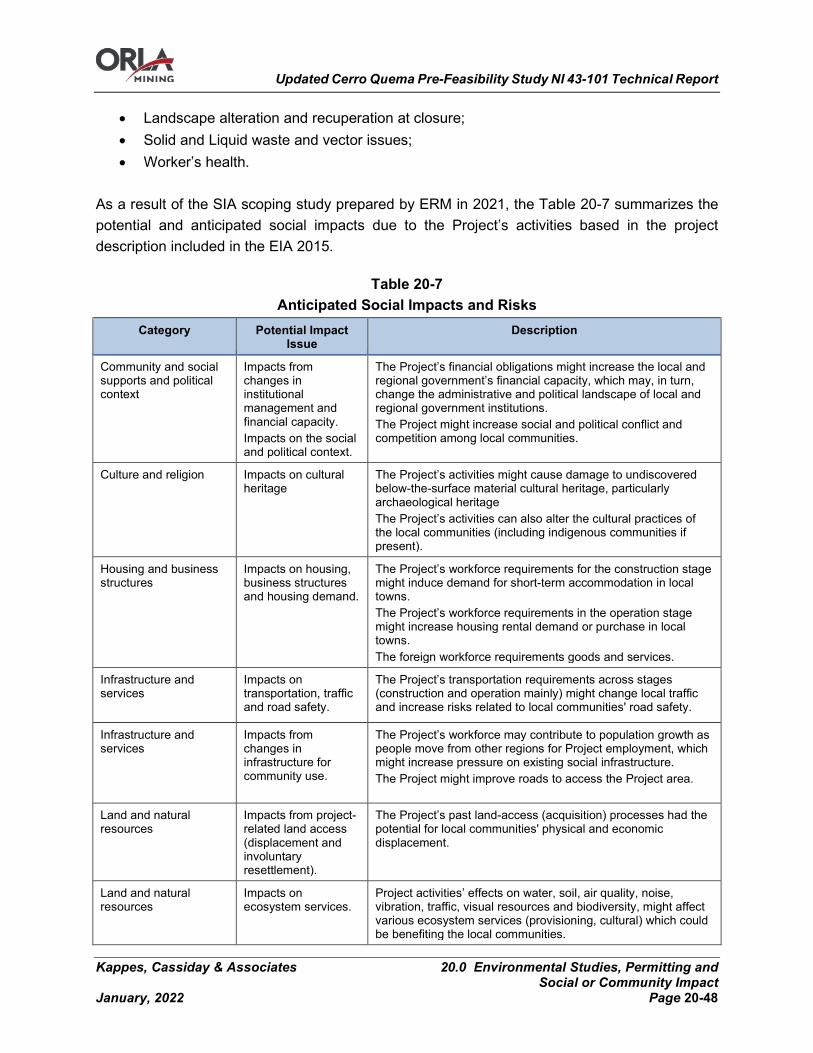
Updated Cerro Quema Pre-Feasibility Study NI 43-101 Technical Report
Kappes, Cassiday & Associates 20.0 Environmental Studies, Permitting and Social or Community Impact
January, 2022 Page 20-48
• Landscape alteration and recuperation at closure; • Solid and Liquid waste and vector issues; • Worker’s health.
As a result of the SIA scoping study prepared by ERM in 2021, the Table 20-7 summarizes the potential and anticipated social impacts due to the Project’s activities based in the project description included in the EIA 2015.
Table 20-7 Anticipated Social Impacts and Risks
Category Potential Impact Issue
Description
Community and social supports and political context
Impacts from changes in institutional management and financial capacity. Impacts on the social and political context.
The Project’s financial obligations might increase the local and regional government’s financial capacity, which may, in turn, change the administrative and political landscape of local and regional government institutions. The Project might increase social and political conflict and competition among local communities.
Culture and religion Impacts on cultural heritage
The Project’s activities might cause damage to undiscovered below-the-surface material cultural heritage, particularly archaeological heritage The Project’s activities can also alter the cultural practices of the local communities (including indigenous communities if present).
Housing and business structures
Impacts on housing, business structures and housing demand.
The Project’s workforce requirements for the construction stage might induce demand for short-term accommodation in local towns. The Project’s workforce requirements in the operation stage might increase housing rental demand or purchase in local towns. The foreign workforce requirements goods and services.
Infrastructure and services
Impacts on transportation, traffic and road safety.
The Project’s transportation requirements across stages (construction and operation mainly) might change local traffic and increase risks related to local communities' road safety.
Infrastructure and services
Impacts from changes in infrastructure for community use.
The Project’s workforce may contribute to population growth as people move from other regions for Project employment, which might increase pressure on existing social infrastructure. The Project might improve roads to access the Project area.
Land and natural resources
Impacts from project-related land access (displacement and involuntary resettlement).
The Project’s past land-access (acquisition) processes had the potential for local communities' physical and economic displacement.
Land and natural resources
Impacts on ecosystem services.
Project activities’ effects on water, soil, air quality, noise, vibration, traffic, visual resources and biodiversity, might affect various ecosystem services (provisioning, cultural) which could be benefiting the local communities.
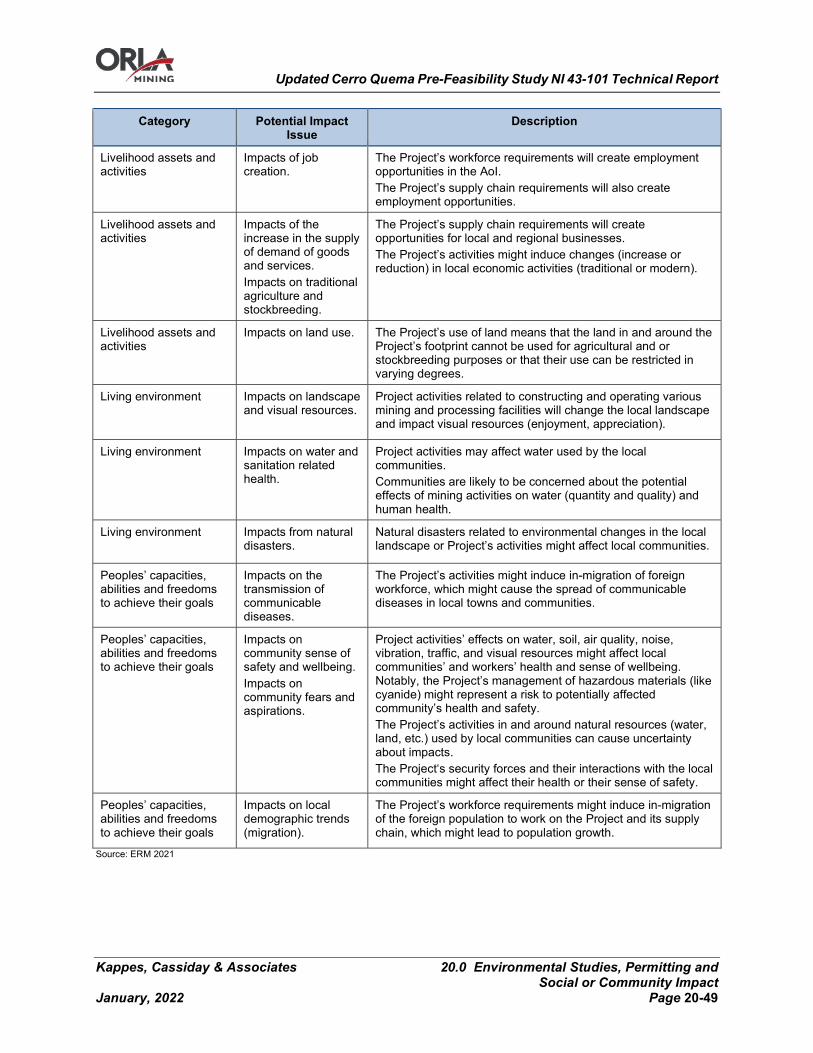
Updated Cerro Quema Pre-Feasibility Study NI 43-101 Technical Report
Kappes, Cassiday & Associates 20.0 Environmental Studies, Permitting and Social or Community Impact
January, 2022 Page 20-49
Category Potential Impact Issue
Description
Livelihood assets and activities
Impacts of job creation.
The Project’s workforce requirements will create employment opportunities in the AoI. The Project’s supply chain requirements will also create employment opportunities.
Livelihood assets and activities
Impacts of the increase in the supply of demand of goods and services. Impacts on traditional agriculture and stockbreeding.
The Project’s supply chain requirements will create opportunities for local and regional businesses. The Project’s activities might induce changes (increase or reduction) in local economic activities (traditional or modern).
Livelihood assets and activities
Impacts on land use. The Project’s use of land means that the land in and around the Project’s footprint cannot be used for agricultural and or stockbreeding purposes or that their use can be restricted in varying degrees.
Living environment Impacts on landscape and visual resources.
Project activities related to constructing and operating various mining and processing facilities will change the local landscape and impact visual resources (enjoyment, appreciation).
Living environment Impacts on water and sanitation related health.
Project activities may affect water used by the local communities. Communities are likely to be concerned about the potential effects of mining activities on water (quantity and quality) and human health.
Living environment Impacts from natural disasters.
Natural disasters related to environmental changes in the local landscape or Project’s activities might affect local communities.
Peoples’ capacities, abilities and freedoms to achieve their goals
Impacts on the transmission of communicable diseases.
The Project’s activities might induce in-migration of foreign workforce, which might cause the spread of communicable diseases in local towns and communities.
Peoples’ capacities, abilities and freedoms to achieve their goals
Impacts on community sense of safety and wellbeing. Impacts on community fears and aspirations.
Project activities’ effects on water, soil, air quality, noise, vibration, traffic, and visual resources might affect local communities’ and workers’ health and sense of wellbeing. Notably, the Project’s management of hazardous materials (like cyanide) might represent a risk to potentially affected community’s health and safety. The Project’s activities in and around natural resources (water, land, etc.) used by local communities can cause uncertainty about impacts. The Project‘s security forces and their interactions with the local communities might affect their health or their sense of safety.
Peoples’ capacities, abilities and freedoms to achieve their goals
Impacts on local demographic trends (migration).
The Project’s workforce requirements might induce in-migration of the foreign population to work on the Project and its supply chain, which might lead to population growth.
Source: ERM 2021
Updated Cerro Quema Pre-Feasibility Study NI 43-101 Technical Report
Kappes, Cassiday & Associates 20.0 Environmental Studies, Permitting and Social or Community Impact
January, 2022 Page 20-50
20.1.1.1 Approach to SIA Stakeholder Engagement The Project has already started stakeholder engagement with the citizen participation processes conducted as part of the EIA (SNC-Lavalin Panama 2015). Orla will continue to engage with potentially affected communities with a focus on:
• Project information disclosure; • Discussion of environmental and social impacts and risks from the Project; • Mitigation measures; and • Strategic community investment.
Orla will develop and periodically update a stakeholder map and a stakeholder management plan aligned with international standards and best practices such as IFC and IADB. The main objectives in these efforts will be:
• To further identify and analyse Project stakeholders, including local communities, local organizations, local authorities and leaders, government agencies, and members of the public and other interested parties (national and international NGOs, press and media);
• To continue to engage with community stakeholders, the government and the public about the Project;
• To seek additional detailed inputs from key stakeholders on the components of the Project; and
• To identify and respond to local concerns and interests regarding the Project.
Social Impact Assessment and Management System
Orla will commence the SIA preparation and consider the TOR proposed in the 2021 SIA scoping study prepared by ERM, including the list below. More detailed information is included in the ERM 2021 report Cerro Quema Project Social Impact Assessment Scoping report. The Social Management System will be completed after the completion of the SIA. Executive Summary:
1. Introduction 2. Project Summary 3. Applicable Regulation and Standards 4. Social Baseline
a. Governance b. Demographics c. Economy and livelihoods d. Natural resources and land use and ownership

Updated Cerro Quema Pre-Feasibility Study NI 43-101 Technical Report
Kappes, Cassiday & Associates 20.0 Environmental Studies, Permitting and Social or Community Impact
January, 2022 Page 20-51
e. Social infrastructure and services f. Culture g. Education and skills h. Health
5. Proposed Studies a. Household surveys b. Stakeholder interviews, focus groups and other qualitative techniques c. Land tenure and use d. Ecosystem services identification e. Indigenous peoples identification; potential impacts assessment f. Epidemiological profile g. Cultural heritage identification h. Potential impacts assessment i. Cyanide transportation routing
6. Social Impacts and Risks 7. SIA Methodology 8. Assessment 9. Resettlement 10. Management Plans and Mitigation Measures 11. Monitoring Plan 12. References 13. Appendices
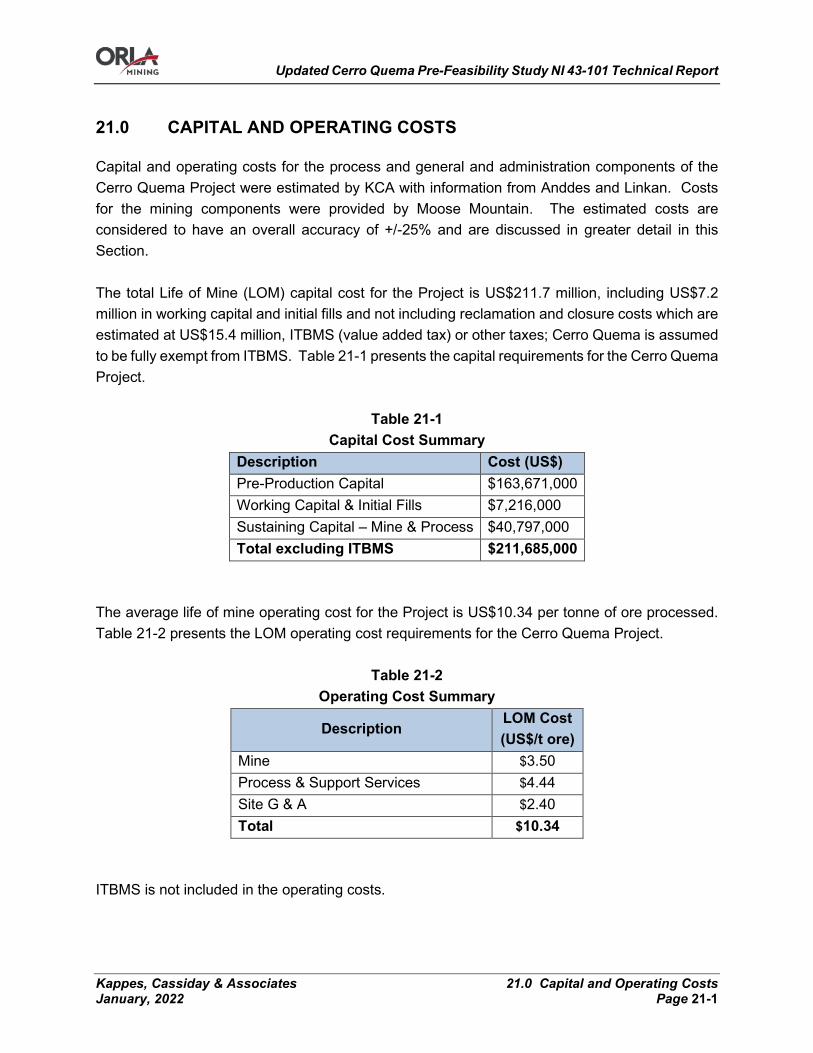
Updated Cerro Quema Pre-Feasibility Study NI 43-101 Technical Report
Kappes, Cassiday & Associates 21.0 Capital and Operating Costs January, 2022 Page 21-1
21.0 CAPITAL AND OPERATING COSTS
Capital and operating costs for the process and general and administration components of the Cerro Quema Project were estimated by KCA with information from Anddes and Linkan. Costs for the mining components were provided by Moose Mountain. The estimated costs are considered to have an overall accuracy of +/-25% and are discussed in greater detail in this Section. The total Life of Mine (LOM) capital cost for the Project is US$211.7 million, including US$7.2 million in working capital and initial fills and not including reclamation and closure costs which are estimated at US$15.4 million, ITBMS (value added tax) or other taxes; Cerro Quema is assumed to be fully exempt from ITBMS. Table 21-1 presents the capital requirements for the Cerro Quema Project.
Table 21-1 Capital Cost Summary
Description Cost (US$) Pre-Production Capital $163,671,000 Working Capital & Initial Fills $7,216,000 Sustaining Capital – Mine & Process $40,797,000 Total excluding ITBMS $211,685,000
The average life of mine operating cost for the Project is US$10.34 per tonne of ore processed. Table 21-2 presents the LOM operating cost requirements for the Cerro Quema Project.
Table 21-2 Operating Cost Summary
Description LOM Cost (US$/t ore)
Mine $3.50 Process & Support Services $4.44 Site G & A $2.40 Total $10.34
ITBMS is not included in the operating costs.
Updated Cerro Quema Pre-Feasibility Study NI 43-101 Technical Report
Kappes, Cassiday & Associates 21.0 Capital and Operating Costs January, 2022 Page 21-2
Capital Expenditures
The required capital cost estimates have been based on the design outlined in this report. The scope of these costs includes all expenditures for process facilities, infrastructure, construction indirect costs, and owner mining capital costs for the Project. The costs presented have primarily been estimated by KCA with input from Moose Mountain on owner mining costs and Linkan for solution treatment costs. Material take-offs for earthworks, concrete and major piping have been estimated by KCA with information from Anddes for the leach pad, waste rock dump and site water diversion quantities. All equipment and material requirements are based on design information described in previous sections of this Report. Capital cost estimates have been made primarily using budgetary supplier quotes for all major and most minor equipment as well as contractor quotes for major construction contracts. Where Project specific quotes were not available a reasonable estimate or allowance was made based on recent quotes in KCA’s, Moose Mountain’s or Linkan’s files. All capital cost estimates are based on the purchase of equipment quoted new from the manufacturer or estimated to be fabricated new. The total pre-production capital cost estimate for the Cerro Quema Project is estimated at US$170.9 million, including all process equipment and infrastructure, construction indirect costs, mining costs and working capital. Total sustaining capital is estimated at US$40.8 million. Pre-production capital costs required for the Cerro Quema Project by area are presented in Table 21-3.
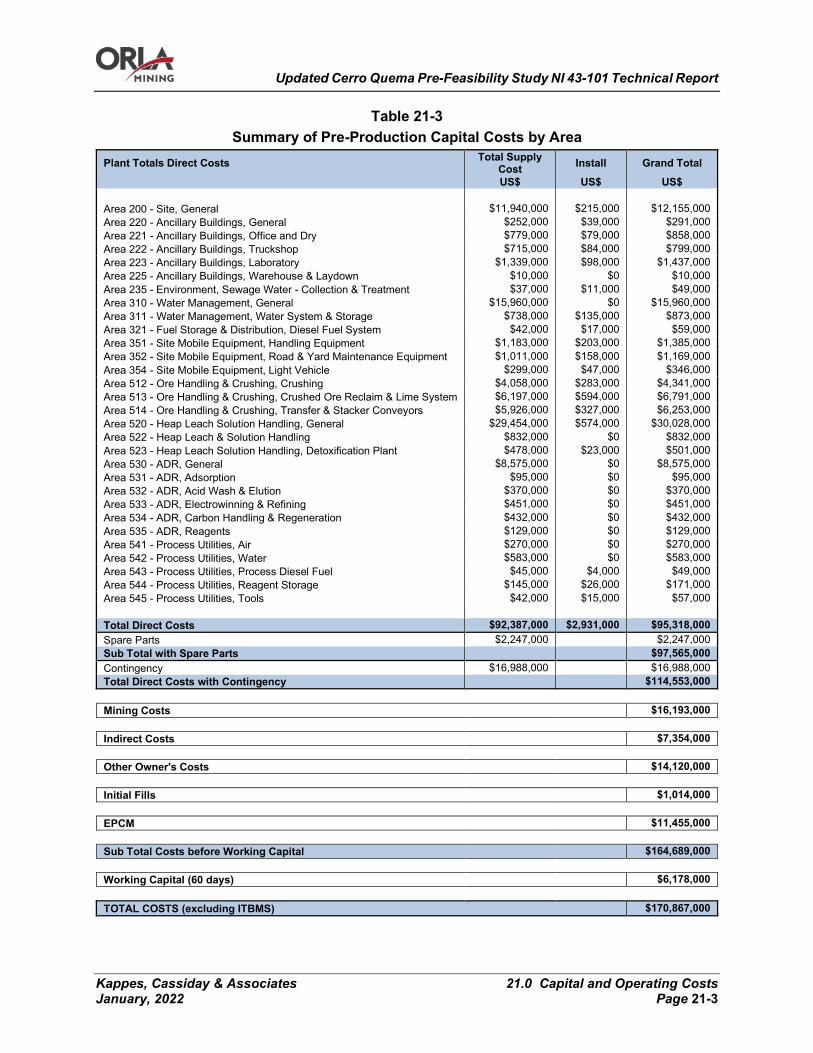
Updated Cerro Quema Pre-Feasibility Study NI 43-101 Technical Report
Kappes, Cassiday & Associates 21.0 Capital and Operating Costs January, 2022 Page 21-3
Table 21-3 Summary of Pre-Production Capital Costs by Area
Plant Totals Direct Costs Total Supply Cost Install Grand Total
US$ US$ US$ Area 200 - Site, General $11,940,000 $215,000 $12,155,000 Area 220 - Ancillary Buildings, General $252,000 $39,000 $291,000 Area 221 - Ancillary Buildings, Office and Dry $779,000 $79,000 $858,000 Area 222 - Ancillary Buildings, Truckshop $715,000 $84,000 $799,000 Area 223 - Ancillary Buildings, Laboratory $1,339,000 $98,000 $1,437,000 Area 225 - Ancillary Buildings, Warehouse & Laydown $10,000 $0 $10,000 Area 235 - Environment, Sewage Water - Collection & Treatment $37,000 $11,000 $49,000 Area 310 - Water Management, General $15,960,000 $0 $15,960,000 Area 311 - Water Management, Water System & Storage $738,000 $135,000 $873,000 Area 321 - Fuel Storage & Distribution, Diesel Fuel System $42,000 $17,000 $59,000 Area 351 - Site Mobile Equipment, Handling Equipment $1,183,000 $203,000 $1,385,000 Area 352 - Site Mobile Equipment, Road & Yard Maintenance Equipment $1,011,000 $158,000 $1,169,000 Area 354 - Site Mobile Equipment, Light Vehicle $299,000 $47,000 $346,000 Area 512 - Ore Handling & Crushing, Crushing $4,058,000 $283,000 $4,341,000 Area 513 - Ore Handling & Crushing, Crushed Ore Reclaim & Lime System $6,197,000 $594,000 $6,791,000 Area 514 - Ore Handling & Crushing, Transfer & Stacker Conveyors $5,926,000 $327,000 $6,253,000 Area 520 - Heap Leach Solution Handling, General $29,454,000 $574,000 $30,028,000 Area 522 - Heap Leach & Solution Handling $832,000 $0 $832,000 Area 523 - Heap Leach Solution Handling, Detoxification Plant $478,000 $23,000 $501,000 Area 530 - ADR, General $8,575,000 $0 $8,575,000 Area 531 - ADR, Adsorption $95,000 $0 $95,000 Area 532 - ADR, Acid Wash & Elution $370,000 $0 $370,000 Area 533 - ADR, Electrowinning & Refining $451,000 $0 $451,000 Area 534 - ADR, Carbon Handling & Regeneration $432,000 $0 $432,000 Area 535 - ADR, Reagents $129,000 $0 $129,000 Area 541 - Process Utilities, Air $270,000 $0 $270,000 Area 542 - Process Utilities, Water $583,000 $0 $583,000 Area 543 - Process Utilities, Process Diesel Fuel $45,000 $4,000 $49,000 Area 544 - Process Utilities, Reagent Storage $145,000 $26,000 $171,000 Area 545 - Process Utilities, Tools $42,000 $15,000 $57,000 Total Direct Costs $92,387,000 $2,931,000 $95,318,000 Spare Parts $2,247,000 $2,247,000 Sub Total with Spare Parts $97,565,000 Contingency $16,988,000 $16,988,000 Total Direct Costs with Contingency $114,553,000
Mining Costs $16,193,000
Indirect Costs $7,354,000
Other Owner's Costs $14,120,000
Initial Fills $1,014,000
EPCM $11,455,000
Sub Total Costs before Working Capital $164,689,000
Working Capital (60 days) $6,178,000
TOTAL COSTS (excluding ITBMS) $170,867,000
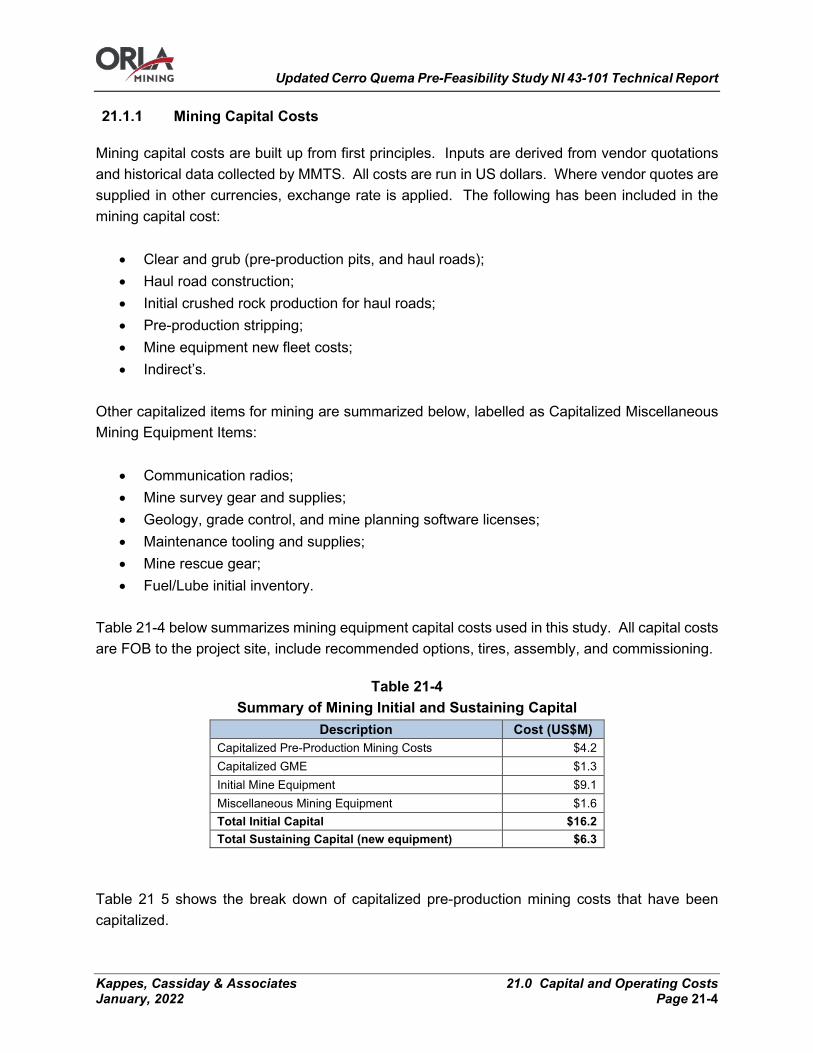
Updated Cerro Quema Pre-Feasibility Study NI 43-101 Technical Report
Kappes, Cassiday & Associates 21.0 Capital and Operating Costs January, 2022 Page 21-4
Mining Capital Costs
Mining capital costs are built up from first principles. Inputs are derived from vendor quotations and historical data collected by MMTS. All costs are run in US dollars. Where vendor quotes are supplied in other currencies, exchange rate is applied. The following has been included in the mining capital cost:
• Clear and grub (pre-production pits, and haul roads); • Haul road construction; • Initial crushed rock production for haul roads; • Pre-production stripping; • Mine equipment new fleet costs; • Indirect’s.
Other capitalized items for mining are summarized below, labelled as Capitalized Miscellaneous Mining Equipment Items:
• Communication radios; • Mine survey gear and supplies; • Geology, grade control, and mine planning software licenses; • Maintenance tooling and supplies; • Mine rescue gear; • Fuel/Lube initial inventory.
Table 21-4 below summarizes mining equipment capital costs used in this study. All capital costs are FOB to the project site, include recommended options, tires, assembly, and commissioning.
Table 21-4 Summary of Mining Initial and Sustaining Capital
Description Cost (US$M) Capitalized Pre-Production Mining Costs $4.2 Capitalized GME $1.3 Initial Mine Equipment $9.1 Miscellaneous Mining Equipment $1.6 Total Initial Capital $16.2 Total Sustaining Capital (new equipment) $6.3
Table 21 5 shows the break down of capitalized pre-production mining costs that have been capitalized.

Updated Cerro Quema Pre-Feasibility Study NI 43-101 Technical Report
Kappes, Cassiday & Associates 21.0 Capital and Operating Costs January, 2022 Page 21-5
Table 21-5 Capitalized Pre-Production Mining Costs Break Down
Description Cost (US$M) Drilling $0.10 Blasting $0.33 Loading $0.11 Hauling $0.42 Support $0.46 Site Development $2.55 Unallocated Labour $0.22 Total Capitalized Pre-Production Mining Cost $4.20
Capitalized GME items are detailed below:
Table 21-6 Capitalized GME Items
Capitalized GME Items Cost (US$M) Mine Operations GME $0.48 Mine Maintenance GME $0.25 Technical Services GME $0.61 Total Capitalized GME Items $1.34
A summary of all mining equipment capital and operating cost inputs used can be found below in Table 21-7. The capital and operating cost estimates are from vendor quotations and the Moose Mountain equipment cost database.
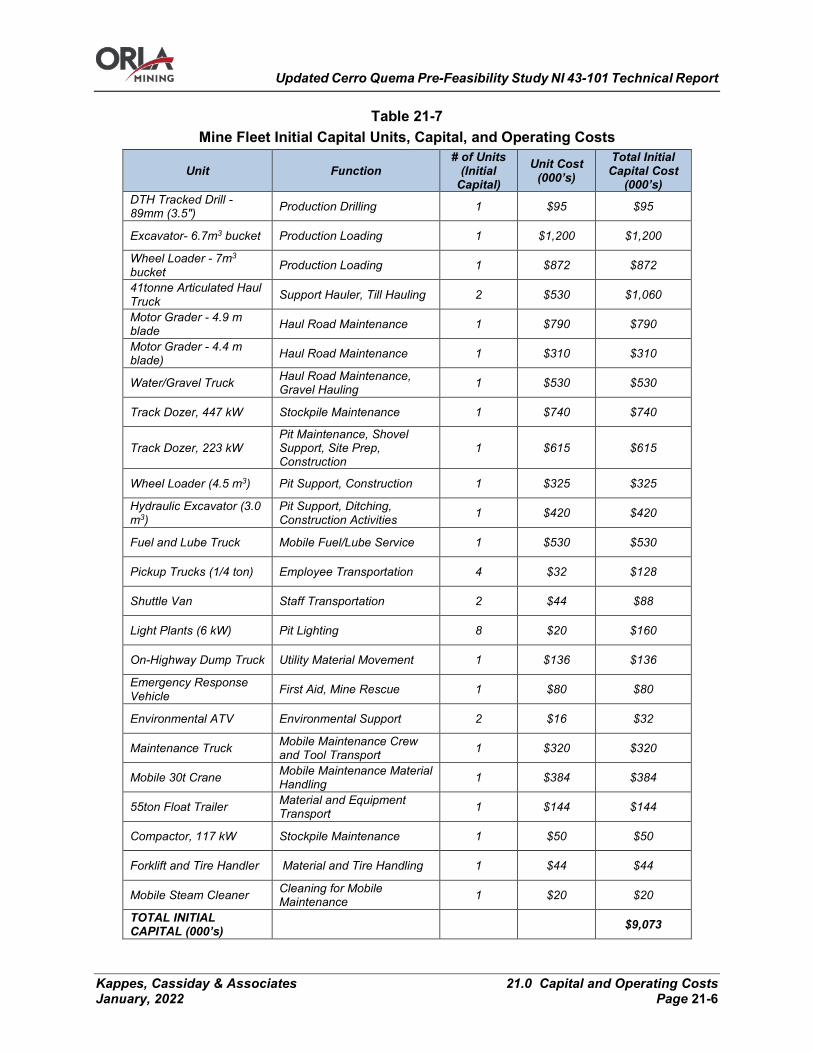
Updated Cerro Quema Pre-Feasibility Study NI 43-101 Technical Report
Kappes, Cassiday & Associates 21.0 Capital and Operating Costs January, 2022 Page 21-6
Table 21-7 Mine Fleet Initial Capital Units, Capital, and Operating Costs
Unit Function # of Units
(Initial Capital)
Unit Cost (000’s)
Total Initial Capital Cost
(000’s) DTH Tracked Drill - 89mm (3.5") Production Drilling 1 $95 $95
Excavator- 6.7m3 bucket Production Loading 1 $1,200 $1,200
Wheel Loader - 7m3 bucket Production Loading 1 $872 $872
41tonne Articulated Haul Truck Support Hauler, Till Hauling 2 $530 $1,060
Motor Grader - 4.9 m blade Haul Road Maintenance 1 $790 $790
Motor Grader - 4.4 m blade) Haul Road Maintenance 1 $310 $310
Water/Gravel Truck Haul Road Maintenance, Gravel Hauling 1 $530 $530
Track Dozer, 447 kW Stockpile Maintenance 1 $740 $740
Track Dozer, 223 kW Pit Maintenance, Shovel Support, Site Prep, Construction
1 $615 $615
Wheel Loader (4.5 m3) Pit Support, Construction 1 $325 $325
Hydraulic Excavator (3.0 m3)
Pit Support, Ditching, Construction Activities 1 $420 $420
Fuel and Lube Truck Mobile Fuel/Lube Service 1 $530 $530
Pickup Trucks (1/4 ton) Employee Transportation 4 $32 $128
Shuttle Van Staff Transportation 2 $44 $88
Light Plants (6 kW) Pit Lighting 8 $20 $160
On-Highway Dump Truck Utility Material Movement 1 $136 $136
Emergency Response Vehicle First Aid, Mine Rescue 1 $80 $80
Environmental ATV Environmental Support 2 $16 $32
Maintenance Truck Mobile Maintenance Crew and Tool Transport 1 $320 $320
Mobile 30t Crane Mobile Maintenance Material Handling 1 $384 $384
55ton Float Trailer Material and Equipment Transport 1 $144 $144
Compactor, 117 kW Stockpile Maintenance 1 $50 $50
Forklift and Tire Handler Material and Tire Handling 1 $44 $44
Mobile Steam Cleaner Cleaning for Mobile Maintenance 1 $20 $20
TOTAL INITIAL CAPITAL (000’s)
$9,073

Updated Cerro Quema Pre-Feasibility Study NI 43-101 Technical Report
Kappes, Cassiday & Associates 21.0 Capital and Operating Costs January, 2022 Page 21-7
Table 21-8 Capitalized Miscellaneous Mining Equipment
Description Cost (US$M) Communication System (inclusion for plant and general site radios, security systems) $0.10
Mine Survey Gear and Survey Supplies $0.24 Mine Rescue and Safety Supplies $0.28 Software Licenses $0.16 Maintenance Tools and Initial Supplies $0.80 Total Capitalized Miscellaneous Mining Equipment $1.58
Process and Infrastructure Capital Cost Estimate
Process and Infrastructure Capital Cost Basis
Process and infrastructure costs have been estimated by KCA with information from Anddes for heap leach pad, waste dump and water diversion earthworks take-offs and Linkan for the solution treatment plants. All equipment and material requirements are based on the design information described in previous sections of this Report. Budgetary capital costs have been estimated primarily based on Project specific quotes for all major and most minor equipment as well as contractor quotes for all major construction contracts. At least one quote was received for all major packages with multiple supplier quotes for most major equipment packages. Supplier and contractor quotes used in the cost estimates were selected based on a combination of factors including price, completeness of proposal and vendor capabilities. Where project specific quotes were not available, a reasonable estimate or allowance was made based on recent quotes in KCA’s files. All capital cost estimates are based on the purchase of equipment quoted new from the manufacturer or to be fabricated new. Each area in the process cost build-up has been separated into the following disciplines:
• Major earthworks & liner; • Civil (concrete); • Structural steel; • Platework; • Mechanical equipment; • Piping; • Electrical; • Instrumentation; • Infrastructure & Buildings; • Supplier Engineering; and • Commissioning & Supervision.

Updated Cerro Quema Pre-Feasibility Study NI 43-101 Technical Report
Kappes, Cassiday & Associates 21.0 Capital and Operating Costs January, 2022 Page 21-8
Pre-production process and infrastructure costs by discipline are presented in Table 21-9.
Table 21-9 Process & Infrastructure Pre-Production Capital Costs by Discipline
Discipline Totals Cost @ Source Freight
Customs Fees & Duties
Total Supply Cost Install Grand Total
US$ US$ US$ US$ US$ US$ Major Earthworks $39,772,000 $0 $0 $39,772,000 $578,000 $40,350,000
Civils (Supply & Install) $4,616,000 $0 $0 $4,616,000 $0 $4,616,000 Structural Steelwork (Supply & Install)
$583,000 $0 $0 $583,000 $0 $583,000
Platework (Supply & Install) $189,000 $0 $0 $189,000 $0 $189,000
Mechanical Equipment $37,443,000 $1,443,000 $1,029,000 $39,915,000 $1,607,000 $41,522,000
Piping $1,618,000 $162,000 $113,000 $1,893,000 $131,000 $2,024,000
Electrical $1,054,000 $105,000 $74,000 $1,233,000 $260,000 $1,493,000
Instrumentation $58,000 $6,000 $4,000 $67,000 $25,000 $92,000 Infrastructure & Buildings $1,761,000 $176,000 $123,000 $2,060,000 $330,000 $2,390,000 Supplier Engineering $1,180,000 $0 $0 $1,180,000 $0 $1,180,000 Commissioning & Supervision
$0 $0 $0 $0 $878,000 $878,000
Spare Parts $2,247,000 $0 $0 $2,247,000 $0 $2,247,000
Contingency $16,988,000 $0 $0 $16,988,000 $0 $16,988,000
Total Direct Costs $107,509,000 $1,892,000 $1,343,000 $110,743,000 $3,809,000 $114,552,000
Freight, customs fees and duties, and installation costs are also considered for each discipline. Freight costs are based on loads as bulk freight and have been estimated at 10% of the equipment cost. Where applicable, supplier quoted freight cost estimates for equipment were used in place of estimated freight. Customs fees and duties have been estimated at an average of 7% of the material supply costs. Installation costs are based on estimated local contractor hourly rates and installation hours based on the supply costs. Contractor rates are estimated at US$39.11/hr and include all labour, tools and support equipment required for proper placement and installation of equipment. Engineering, procurement, and construction management (EPCM), indirect costs, and initial fills inventory are also considered as part of the capital cost estimate.
Major Earthworks and Liner
Earthworks and liner quantities for the Project have been estimated by KCA with information provided by Anddes for the heap leach pad, waste rock dump and site water diversions. Unit
Updated Cerro Quema Pre-Feasibility Study NI 43-101 Technical Report
Kappes, Cassiday & Associates 21.0 Capital and Operating Costs January, 2022 Page 21-9
rates for site earthworks and liner supply and installation are based on quotes from local contractors. Total preproduction earthworks and liner costs are estimated at US$40.3 million. Sustaining capital for earthworks will be required during Year 1 for expansion of the Waste Rock Dump and in Years 2 and 5 for expansion of the heap leach pad. Total earthworks sustaining costs are estimated at US$15.9 million.
Civils
Civils include detailed earthworks and concrete. Concrete quantities have been estimated by KCA based on layouts, similar equipment installations, vibrating equipment, major equipment weights and on slab areas. Unit costs for concrete supply, which include production (supply of aggregates, water and cement, batching and mixing), and delivery of concrete and concrete installation which includes all excavations, formwork, rebar, placement and curing are based on local contractor quotes. Total costs for concrete are estimated at US$4.6 million.
Structural Steel
Costs for all structural steel, including steel grating, structural steel, and handrails have been estimated by take-off lists developed from general arrangement drawings or have been included as part of quoted equipment supply packages. Unit costs for steel, including installation labor and equipment requirements have been estimated based on quotes from recent KCA projects. The total cost for structural steel not included as part of vendor packages is estimated at US$583,000.
Platework
The platework discipline includes costs for the supply and installation of steel tanks, bins, and chutes. Platework costs have been primarily quoted as part of complete equipment supply packages or have been estimated based on calculated weights and unit costs from recent KCA projects. Total platework costs not included in the equipment supply costs are estimated at US$189,000.
Mechanical Equipment
Costs for mechanical equipment are based on a detailed equipment list developed of all major equipment for the process. Costs for all major and most minor equipment items are based on budgetary quotes from suppliers. Where Project specific supplier quotes were not available, reasonable allowances were made based on recent quotes from KCA’s files. All costs assume equipment purchased new from the manufacturer or to be fabricated new.

Updated Cerro Quema Pre-Feasibility Study NI 43-101 Technical Report
Kappes, Cassiday & Associates 21.0 Capital and Operating Costs January, 2022 Page 21-10
The mechanical equipment costs consider a complete turn-key bid for the recovery plant including the refinery, cyanide dissolution mix and cyanide destruction circuits, complete equipment supply package for the crushing system and various equipment supply packages by several different suppliers. Installation estimates are based on equipment type and estimated local contractor rates. Installation hours have been estimated based on the equipment supply cost. The total installed mechanical equipment cost is estimated at US$41.5 million.
Solution Treatment Plants
Solution treatment plants will be required to treat impacted water from the heap leach and waste rock facilities and include:
• A Waste Rock Dump Active Treatment Plant; • A Heap Leach Facility Active Treatment Plant; • A Waste Rock Dump Passive Treatment System; • A Heap Leach Facility Passive Treatment System.
Cost estimates for the solution treatment plants have been completed in accordance with AACE International Recommended Practice No. 18R-97, Class 5, for concept screening using capacity factors, parametric models, judgment, and analogy. Gross estimates were performed for civil, material, substrate, labour, and equipment quantities where project specific unit rates were applied. The following assumptions have been considered for the solution treatment plant capital cost estimates:
• Costs are in US Dollars; • Predicted water quality and flow rates were used. System may require adjustment for
actual conditions; • Plant processes and sizing that drive the cost estimates were based on the design basis
as stated in Section 17.0 of this Technical Report; i. Verification of the final design should include bench and pilot scale testing with the
actual water to be treated. • For the WRD active plant that is scheduled to be operational in year 1 of the mine life, the
plant design is split into two phases. The first phase includes a base plant that can handle the lower flow rates and concentrations in the first years of operations. The base plant will include infrastructure (space and capacity) for expansion to handle future predicted flow rates and process equipment additions. Delaying Phase 2, to complete the plant, will allow bench and pilot testing to be done before the second phase is undertaken;
• Unit costs were either provided as project specific rates or were estimated based on Linkan Engineering experience on similar projects in US and South America;
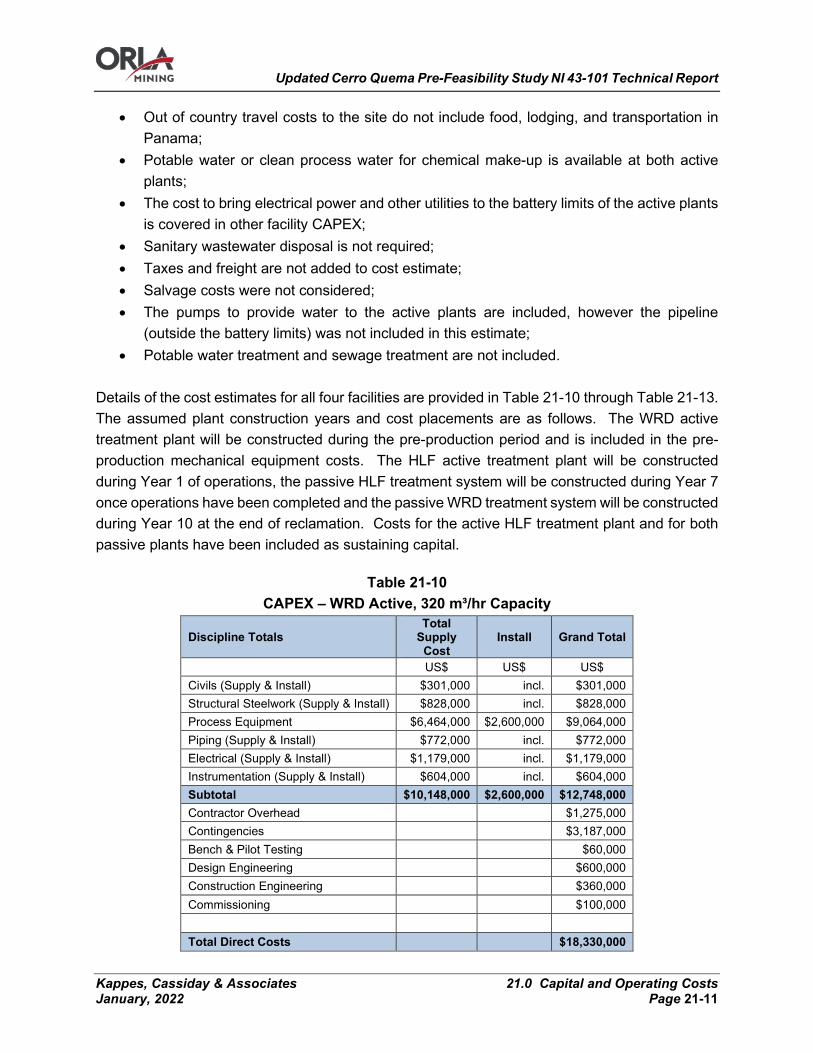
Updated Cerro Quema Pre-Feasibility Study NI 43-101 Technical Report
Kappes, Cassiday & Associates 21.0 Capital and Operating Costs January, 2022 Page 21-11
• Out of country travel costs to the site do not include food, lodging, and transportation in Panama;
• Potable water or clean process water for chemical make-up is available at both active plants;
• The cost to bring electrical power and other utilities to the battery limits of the active plants is covered in other facility CAPEX;
• Sanitary wastewater disposal is not required; • Taxes and freight are not added to cost estimate; • Salvage costs were not considered; • The pumps to provide water to the active plants are included, however the pipeline
(outside the battery limits) was not included in this estimate; • Potable water treatment and sewage treatment are not included.
Details of the cost estimates for all four facilities are provided in Table 21-10 through Table 21-13. The assumed plant construction years and cost placements are as follows. The WRD active treatment plant will be constructed during the pre-production period and is included in the pre-production mechanical equipment costs. The HLF active treatment plant will be constructed during Year 1 of operations, the passive HLF treatment system will be constructed during Year 7 once operations have been completed and the passive WRD treatment system will be constructed during Year 10 at the end of reclamation. Costs for the active HLF treatment plant and for both passive plants have been included as sustaining capital.
Table 21-10 CAPEX – WRD Active, 320 m³/hr Capacity
Discipline Totals Total
Supply Cost
Install Grand Total
US$ US$ US$ Civils (Supply & Install) $301,000 incl. $301,000 Structural Steelwork (Supply & Install) $828,000 incl. $828,000 Process Equipment $6,464,000 $2,600,000 $9,064,000 Piping (Supply & Install) $772,000 incl. $772,000 Electrical (Supply & Install) $1,179,000 incl. $1,179,000 Instrumentation (Supply & Install) $604,000 incl. $604,000 Subtotal $10,148,000 $2,600,000 $12,748,000 Contractor Overhead $1,275,000 Contingencies $3,187,000 Bench & Pilot Testing $60,000 Design Engineering $600,000 Construction Engineering $360,000 Commissioning $100,000 Total Direct Costs $18,330,000

Updated Cerro Quema Pre-Feasibility Study NI 43-101 Technical Report
Kappes, Cassiday & Associates 21.0 Capital and Operating Costs January, 2022 Page 21-12
Table 21-11 CAPEX – HLF Active, 80 m³/hr Capacity
Discipline Totals Total
Supply Cost
Install Grand Total
US$ US$ US$ Civils (Supply & Install) $138,000 incl. $138,000 Structural Steelwork (Supply & Install) $351,000 incl. $351,000 Process Equipment $1,885,000 $754,000 $2,639,000 Piping (Supply & Install) $265,000 incl. $265,000 Electrical (Supply & Install) $345,000 incl. $345,000 Instrumentation (Supply & Install) $282,000 incl. $282,000 Subtotal $3,266,000 $754,000 $4,020,000 Contractor Overhead $402,000 Contingencies $1,005,000 Bench & Pilot Testing $60,000 Design Engineering $300,000 Construction Engineering $220,000 Commissioning $70,000 Total Direct Costs $6,077,000
Table 21-12 CAPEX – WRD Passive, 20 m³/hr Capacity
Discipline Totals Total
Supply Cost
Install Grand Total
US$ US$ US$ Major Earthworks $1,086,000 incl. $1,086,000 Equalization Basin Liner $104,000 incl. $104,000 BCR’s $81,000 incl. $81,000 Wetland Liner $45,000 incl. $45,000 Subtotal $1,316,000 incl. $1,316,000 Contractor Overhead $132,000 Contingencies $330,000 Bench & Pilot Testing $250,000 Design Engineering $240,000 Construction Admin. $60,000 Commissioning $20,000 Total Direct Costs $2,348,000
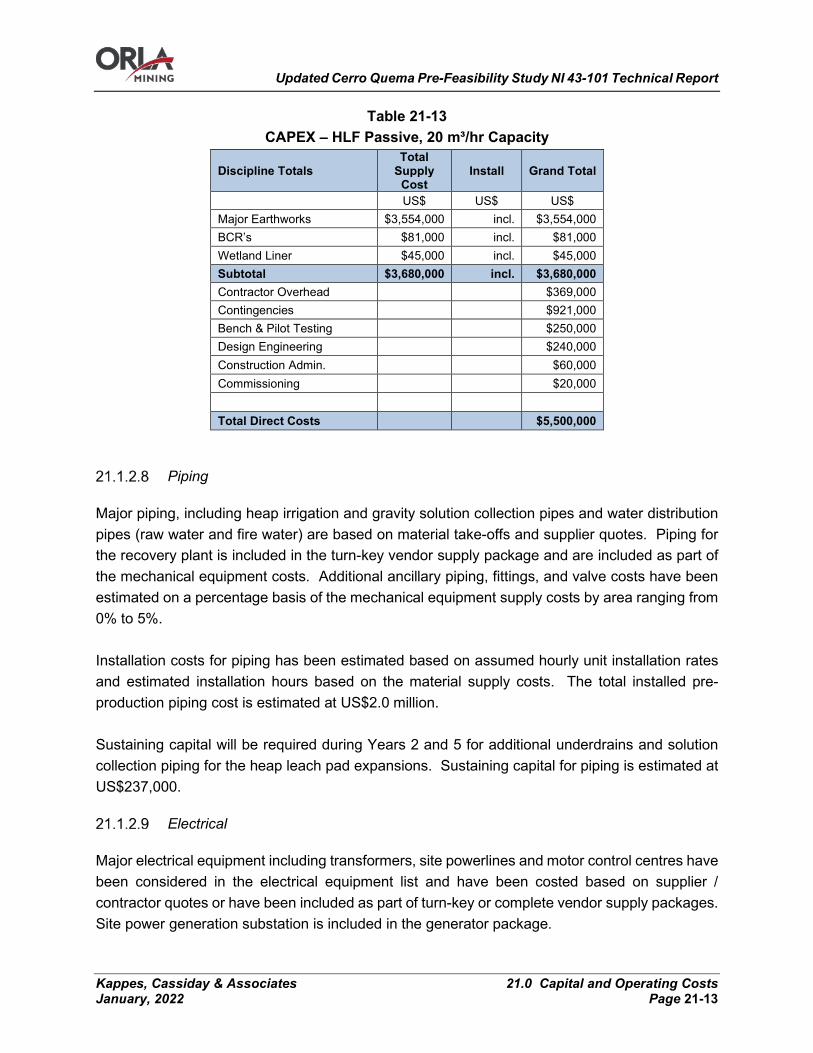
Updated Cerro Quema Pre-Feasibility Study NI 43-101 Technical Report
Kappes, Cassiday & Associates 21.0 Capital and Operating Costs January, 2022 Page 21-13
Table 21-13 CAPEX – HLF Passive, 20 m³/hr Capacity
Discipline Totals Total
Supply Cost
Install Grand Total
US$ US$ US$ Major Earthworks $3,554,000 incl. $3,554,000 BCR’s $81,000 incl. $81,000 Wetland Liner $45,000 incl. $45,000 Subtotal $3,680,000 incl. $3,680,000 Contractor Overhead $369,000 Contingencies $921,000 Bench & Pilot Testing $250,000 Design Engineering $240,000 Construction Admin. $60,000 Commissioning $20,000 Total Direct Costs $5,500,000
Piping
Major piping, including heap irrigation and gravity solution collection pipes and water distribution pipes (raw water and fire water) are based on material take-offs and supplier quotes. Piping for the recovery plant is included in the turn-key vendor supply package and are included as part of the mechanical equipment costs. Additional ancillary piping, fittings, and valve costs have been estimated on a percentage basis of the mechanical equipment supply costs by area ranging from 0% to 5%. Installation costs for piping has been estimated based on assumed hourly unit installation rates and estimated installation hours based on the material supply costs. The total installed pre-production piping cost is estimated at US$2.0 million. Sustaining capital will be required during Years 2 and 5 for additional underdrains and solution collection piping for the heap leach pad expansions. Sustaining capital for piping is estimated at US$237,000.
Electrical
Major electrical equipment including transformers, site powerlines and motor control centres have been considered in the electrical equipment list and have been costed based on supplier / contractor quotes or have been included as part of turn-key or complete vendor supply packages. Site power generation substation is included in the generator package.
Updated Cerro Quema Pre-Feasibility Study NI 43-101 Technical Report
Kappes, Cassiday & Associates 21.0 Capital and Operating Costs January, 2022 Page 21-14
Miscellaneous electrical costs have been estimated as percentages of the mechanical equipment supply cost for each process area and range between 0 and 5%. Installation of electrical equipment and ancillary electrical items not included in turn-key vendor packages have been estimated based on assumed unit installation rates and estimated installation hours based on the material supply costs. The total installed electrical cost is estimated at US$1.5 million.
Instrumentation
Instrumentation costs are primarily included as part of turn-key or complete vendor supply packages. Minor miscellaneous instrumentation costs have been estimated as percentages of the mechanical equipment supply cost for each process area and range between 0 and 5%. The total installed instrumentation cost is estimated at US$92,000.
Infrastructure & Buildings
Infrastructure and buildings for the Cerro Quema Project include the construction of an administration building, mine truck shop and warehouse, guard house, and powder magazines. Process buildings including the process maintenance and reagent storage building are also included. Water supply to the raw/fire water tank will be by production wells. One production well is in place. An additional production well will be developed to provide redundancy. The production well has an estimated cost of US$350,000 including the cost of the well pump, discharge pipe and cabling. An allowance of US$225,000 is also included for three monitoring wells. The total infrastructure and buildings cost is estimated at US$2.4 million.
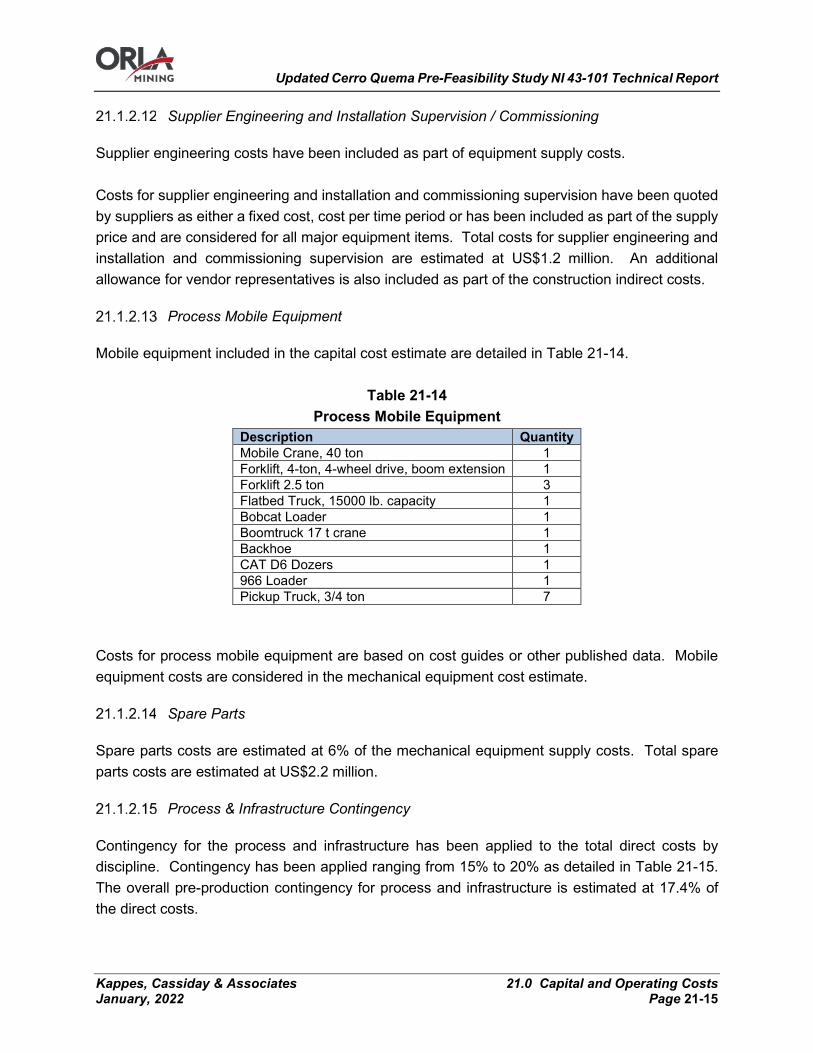
Updated Cerro Quema Pre-Feasibility Study NI 43-101 Technical Report
Kappes, Cassiday & Associates 21.0 Capital and Operating Costs January, 2022 Page 21-15
Supplier Engineering and Installation Supervision / Commissioning
Supplier engineering costs have been included as part of equipment supply costs. Costs for supplier engineering and installation and commissioning supervision have been quoted by suppliers as either a fixed cost, cost per time period or has been included as part of the supply price and are considered for all major equipment items. Total costs for supplier engineering and installation and commissioning supervision are estimated at US$1.2 million. An additional allowance for vendor representatives is also included as part of the construction indirect costs.
Process Mobile Equipment
Mobile equipment included in the capital cost estimate are detailed in Table 21-14.
Table 21-14 Process Mobile Equipment
Description Quantity Mobile Crane, 40 ton 1 Forklift, 4-ton, 4-wheel drive, boom extension 1 Forklift 2.5 ton 3 Flatbed Truck, 15000 lb. capacity 1 Bobcat Loader 1 Boomtruck 17 t crane 1 Backhoe 1 CAT D6 Dozers 1 966 Loader 1 Pickup Truck, 3/4 ton 7
Costs for process mobile equipment are based on cost guides or other published data. Mobile equipment costs are considered in the mechanical equipment cost estimate.
Spare Parts
Spare parts costs are estimated at 6% of the mechanical equipment supply costs. Total spare parts costs are estimated at US$2.2 million.
Process & Infrastructure Contingency
Contingency for the process and infrastructure has been applied to the total direct costs by discipline. Contingency has been applied ranging from 15% to 20% as detailed in Table 21-15. The overall pre-production contingency for process and infrastructure is estimated at 17.4% of the direct costs.
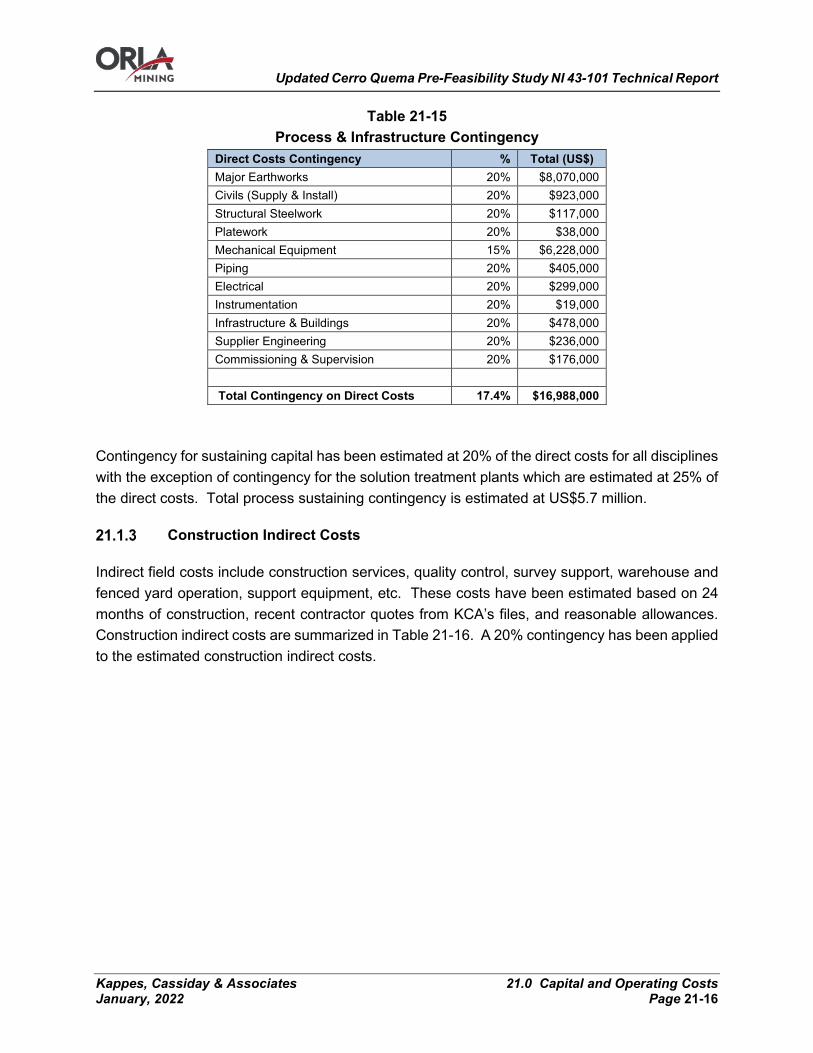
Updated Cerro Quema Pre-Feasibility Study NI 43-101 Technical Report
Kappes, Cassiday & Associates 21.0 Capital and Operating Costs January, 2022 Page 21-16
Table 21-15 Process & Infrastructure Contingency
Direct Costs Contingency % Total (US$) Major Earthworks 20% $8,070,000 Civils (Supply & Install) 20% $923,000 Structural Steelwork 20% $117,000 Platework 20% $38,000 Mechanical Equipment 15% $6,228,000 Piping 20% $405,000 Electrical 20% $299,000 Instrumentation 20% $19,000 Infrastructure & Buildings 20% $478,000 Supplier Engineering 20% $236,000 Commissioning & Supervision 20% $176,000 Total Contingency on Direct Costs 17.4% $16,988,000
Contingency for sustaining capital has been estimated at 20% of the direct costs for all disciplines with the exception of contingency for the solution treatment plants which are estimated at 25% of the direct costs. Total process sustaining contingency is estimated at US$5.7 million.
Construction Indirect Costs
Indirect field costs include construction services, quality control, survey support, warehouse and fenced yard operation, support equipment, etc. These costs have been estimated based on 24 months of construction, recent contractor quotes from KCA’s files, and reasonable allowances. Construction indirect costs are summarized in Table 21-16. A 20% contingency has been applied to the estimated construction indirect costs.
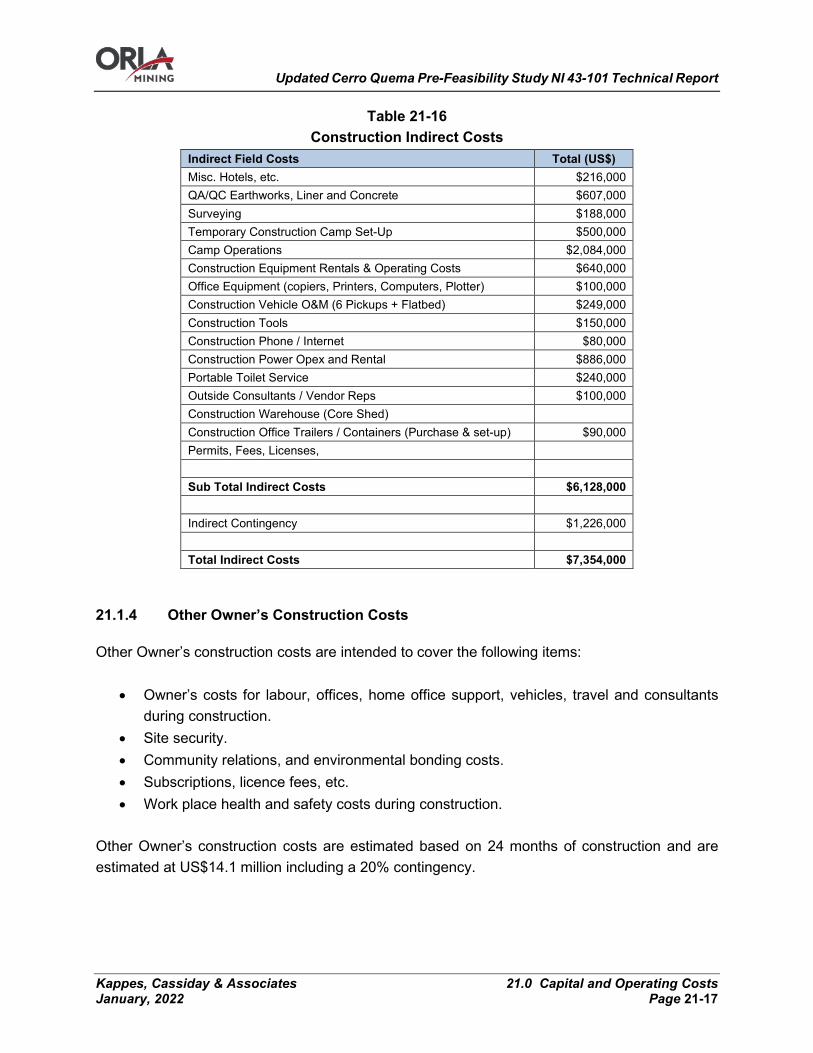
Updated Cerro Quema Pre-Feasibility Study NI 43-101 Technical Report
Kappes, Cassiday & Associates 21.0 Capital and Operating Costs January, 2022 Page 21-17
Table 21-16 Construction Indirect Costs
Indirect Field Costs Total (US$) Misc. Hotels, etc. $216,000 QA/QC Earthworks, Liner and Concrete $607,000 Surveying $188,000 Temporary Construction Camp Set-Up $500,000 Camp Operations $2,084,000 Construction Equipment Rentals & Operating Costs $640,000 Office Equipment (copiers, Printers, Computers, Plotter) $100,000 Construction Vehicle O&M (6 Pickups + Flatbed) $249,000 Construction Tools $150,000 Construction Phone / Internet $80,000 Construction Power Opex and Rental $886,000 Portable Toilet Service $240,000 Outside Consultants / Vendor Reps $100,000 Construction Warehouse (Core Shed) Construction Office Trailers / Containers (Purchase & set-up) $90,000 Permits, Fees, Licenses, Sub Total Indirect Costs $6,128,000 Indirect Contingency $1,226,000 Total Indirect Costs $7,354,000
Other Owner’s Construction Costs
Other Owner’s construction costs are intended to cover the following items:
• Owner’s costs for labour, offices, home office support, vehicles, travel and consultants during construction.
• Site security. • Community relations, and environmental bonding costs. • Subscriptions, licence fees, etc. • Work place health and safety costs during construction.
Other Owner’s construction costs are estimated based on 24 months of construction and are estimated at US$14.1 million including a 20% contingency.

Updated Cerro Quema Pre-Feasibility Study NI 43-101 Technical Report
Kappes, Cassiday & Associates 21.0 Capital and Operating Costs January, 2022 Page 21-18
Working Capital
Working capital is money that is used to cover operating costs from start-up until a positive cash flow is achieved. Once a positive cash flow is attained, Project expenses will be paid from earnings. Working capital for the Project is estimated to be US$6.2 million based on 60 days of operation and includes all mine, process and G&A operating costs as well as process pre-production costs.
Initial Fills Inventory
The initial fills consist of consumable items stored on site at the outset of operations, which includes sodium cyanide (NaCN), cement, carbon, caustic soda, hydrochloric acid, copper sulfate, sodium metabisulfite, antiscalant and fluxes. Initial fills are summarized in Table 21-17.
Table 21-17 Initial Fills
Item Basis Needed Weight
Truck-loads
Quantity to Order
Unit Price Shipping
Total Cost (Excluding
ITBMS) kg or L kg or L US$ US$
NaCN 3 weeks 70,283 3.5 75,000 $2.50 $187,500
Carbon Full Circuit 30 0.0 30,000 $2.76 $82,800
Antiscalant 4 weeks 5,151 0.3 6,000 $2.48 $14,900 Caustic Soda 4 weeks 2,808 0.1 3,000 $0.98 $2,900 Hydrochloric Acid 4 weeks 1,147 0.1 2,000 $0.52 $1,000 Copper Sulfate 4 weeks 267 1.0 1,000 $2.73 $2,700 Sodium Metabisulfite 4 weeks 16,714 1.0 20,000 $0.73 $14,600 Hydrated Lime 1 week 4,067 1.0 5,000 $0.51 $2,600 Diesel (L) Total Fill 272,475 13.6 260,000 $0.70 $182,000 Flux 4 weeks SiO2 229 1,000 $0.47 $500 Borax 366 1,000 $2.00 $2,000 Niter 183 1,000 $1.80 $1,800 Soda Ash 137 1,000 $0.70 $700 Lab Consumables 1 $200,000 $20,000 $220,000 Lab Supplies, Process 1 $100,000 $10,000 $110,000 Process Operator Tools 1 $10,000 $1,000 $11,000 Tools, Mill Wright 10 $4,483 $448 $49,300 Tools, Mine Shop 1 $100,000 $10,000 $110,000 Tools, Heap Leach 1 $16,355 $1,635 $18,000 TOTAL $1,014,300

Updated Cerro Quema Pre-Feasibility Study NI 43-101 Technical Report
Kappes, Cassiday & Associates 21.0 Capital and Operating Costs January, 2022 Page 21-19
Engineering, Procurement & Construction Management
The estimated costs for engineering, procurement and construction management (EPCM) for the development, construction, and commissioning is US$11.9 million based on 10% of the direct capital cost. The EPCM costs cover services and expenses for the following areas:
• Project Management; • Detailed Engineering; • Engineering Support; • Procurement; • Construction Management; • Commissioning; • Vendors Reps.
For some major equipment packages, costs associated with detailed engineering, commissioning, and installation supervision have been included in the vendor’s quotes; these costs are reflected in the supplier engineering or equipment supply costs of the capital costs estimate.
ITBMS
ITBMS (Impuesto a las Transferencias de Bienes Corporales Mueblas y la Prestación de Servicios) is a value added tax which is applied at 7% to all goods and services in Panama. The Cerro Quema Project is exempt from paying ITMBS.
Exclusions
The following capital cost considerations have been excluded from the scope of supply and estimate:
• Finance charges and interests on corporate loans during construction; • Escalation costs.
Operating Costs
Process operating costs for the Cerro Quema Project have been estimated based on information presented in earlier sections of this Report. Mining costs were provided by Moose Mountain at US$3.50 per tonne processed (excluding pre-production costs which are considered in the capital costs and are based on owner mining).
Updated Cerro Quema Pre-Feasibility Study NI 43-101 Technical Report
Kappes, Cassiday & Associates 21.0 Capital and Operating Costs January, 2022 Page 21-20
Process operating costs have been estimated by KCA from first principles and include solution treatment plant operating costs provided by Linkan. Labour costs were estimated using project specific staffing, salary and wage and benefit requirements. Unit consumptions of materials, supplies, power, water and delivered supply costs were also estimated. LOM average processing costs are estimated at US$4.44 per tonne ore. General administrative costs (G&A) have been estimated by KCA with input from Orla. G&A costs include project specific labour and salary requirements and operating expenses including social contributions and land and water rights. G&A costs are estimated at US$2.40 per tonne ore. Operating costs were estimated based on 1st quarter 2021 US dollars and are presented with no added contingency based upon the design and operating criteria present in this report. Operating costs are considered to have an accuracy of +/- 20%. ITBMS is not included in the operating cost estimate. The operating costs presented are based upon the ownership of all process production equipment and site facilities, including the onsite laboratory. The owner will employ and direct all operating maintenance and support personnel for all site activities. Operating costs estimates have been based upon information obtained from the following sources:
• Owner mining costs from Moose Mountain; • Solution treatment plant costs from Linkan; • G&A costs estimated by KCA with input from Orla; • Project metallurgical test work and process engineering; • Supplier quotes for reagents and fuel; • Recent KCA project file data; and • Experience of KCA staff with other similar operations.
Where specific data do not exist, cost allowances have been based upon consumption and operating requirements from other similar properties for which reliable data exist. Freight costs have been estimated where delivered prices were not available.
Mining Operating Costs
Mining operating costs are built up from first principles. Inputs are derived from vendor quotations and historical data collected by Moose Mountain Technical Services. This includes quoted cost and consumption rates for such inputs as fuel, lubes, explosives, tires, undercarriage, GET, drill bits/rods/strings, machine parts, machine major components, and operating and maintenance
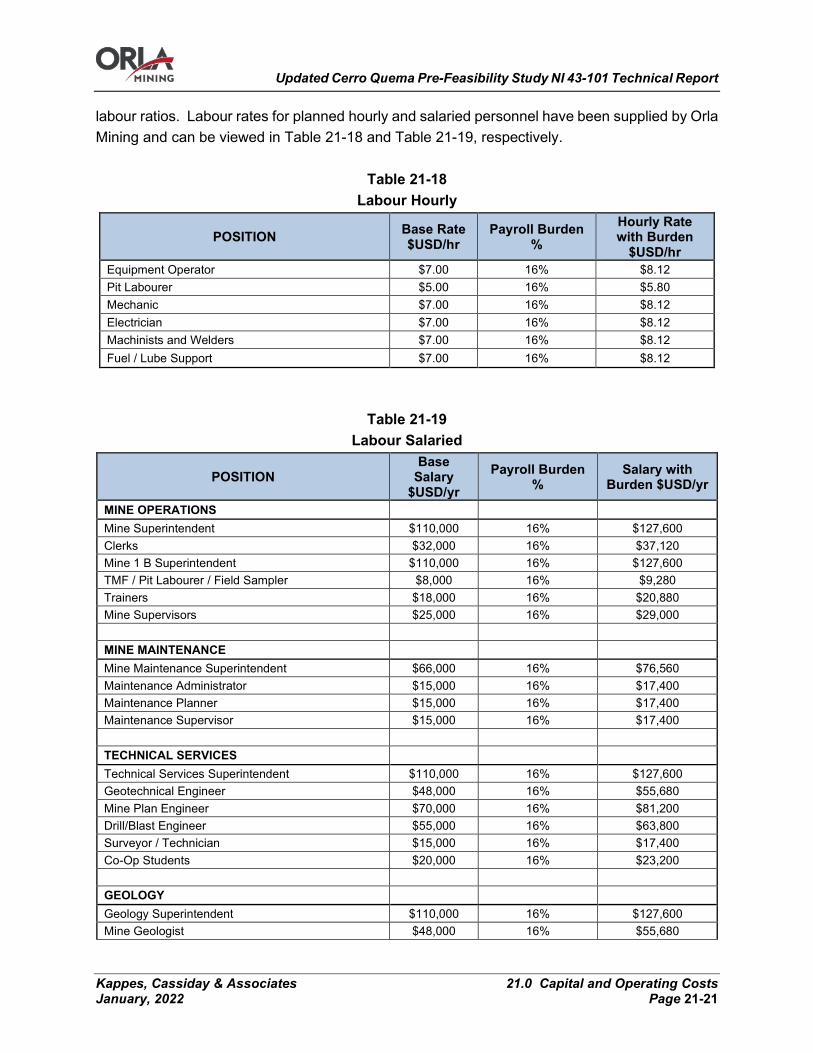
Updated Cerro Quema Pre-Feasibility Study NI 43-101 Technical Report
Kappes, Cassiday & Associates 21.0 Capital and Operating Costs January, 2022 Page 21-21
labour ratios. Labour rates for planned hourly and salaried personnel have been supplied by Orla Mining and can be viewed in Table 21-18 and Table 21-19, respectively.
Table 21-18 Labour Hourly
POSITION Base Rate $USD/hr
Payroll Burden %
Hourly Rate with Burden
$USD/hr Equipment Operator $7.00 16% $8.12 Pit Labourer $5.00 16% $5.80 Mechanic $7.00 16% $8.12 Electrician $7.00 16% $8.12 Machinists and Welders $7.00 16% $8.12 Fuel / Lube Support $7.00 16% $8.12
Table 21-19 Labour Salaried
POSITION Base
Salary $USD/yr
Payroll Burden %
Salary with Burden $USD/yr
MINE OPERATIONS Mine Superintendent $110,000 16% $127,600 Clerks $32,000 16% $37,120 Mine 1 B Superintendent $110,000 16% $127,600 TMF / Pit Labourer / Field Sampler $8,000 16% $9,280 Trainers $18,000 16% $20,880 Mine Supervisors $25,000 16% $29,000 MINE MAINTENANCE Mine Maintenance Superintendent $66,000 16% $76,560 Maintenance Administrator $15,000 16% $17,400 Maintenance Planner $15,000 16% $17,400 Maintenance Supervisor $15,000 16% $17,400 TECHNICAL SERVICES Technical Services Superintendent $110,000 16% $127,600 Geotechnical Engineer $48,000 16% $55,680 Mine Plan Engineer $70,000 16% $81,200 Drill/Blast Engineer $55,000 16% $63,800 Surveyor / Technician $15,000 16% $17,400 Co-Op Students $20,000 16% $23,200 GEOLOGY Geology Superintendent $110,000 16% $127,600 Mine Geologist $48,000 16% $55,680
Updated Cerro Quema Pre-Feasibility Study NI 43-101 Technical Report
Kappes, Cassiday & Associates 21.0 Capital and Operating Costs January, 2022 Page 21-22
Ore Grade Technicians $10,000 16% $11,600 From the basic operating capacities of the equipment, and requirements of the mine production schedule, running hours (SMU) on each piece of equipment are estimated. These SMU hours are multiplied by the hourly consumables consumption rates and unit hourly operating costs to calculate the total equipment operating costs for each year. A summary of all mining equipment capital and operating cost inputs used can be found above in Table 21-7. The mining operating costs are broken down into two major categories: Direct Costs and GME Costs. The Direct Costs are broken out into ten categories:
• Production Drilling; • Blasting; • Loading; • Hauling; • Haul Road Maintenance; • Stockpile Maintenance; • Pit Support; • Mine Maintenance Fleet; • Site Development; • Unallocated Labour.
The GME Costs are broken into three categories:
• Mine Operations GME; • Mine Maintenance GME; • Technical Services GME.
The schedule of estimated costs follows the same setup as the mine production schedule, quarterly from YR1 - YR2, and annually in pre-production and after YR2. Mining operating costs incurred before mill start-up are capitalized. Costs are summarized for periods after mill start-up in Table 21-20 and detailed in Table 21-21 and Table 21-22.
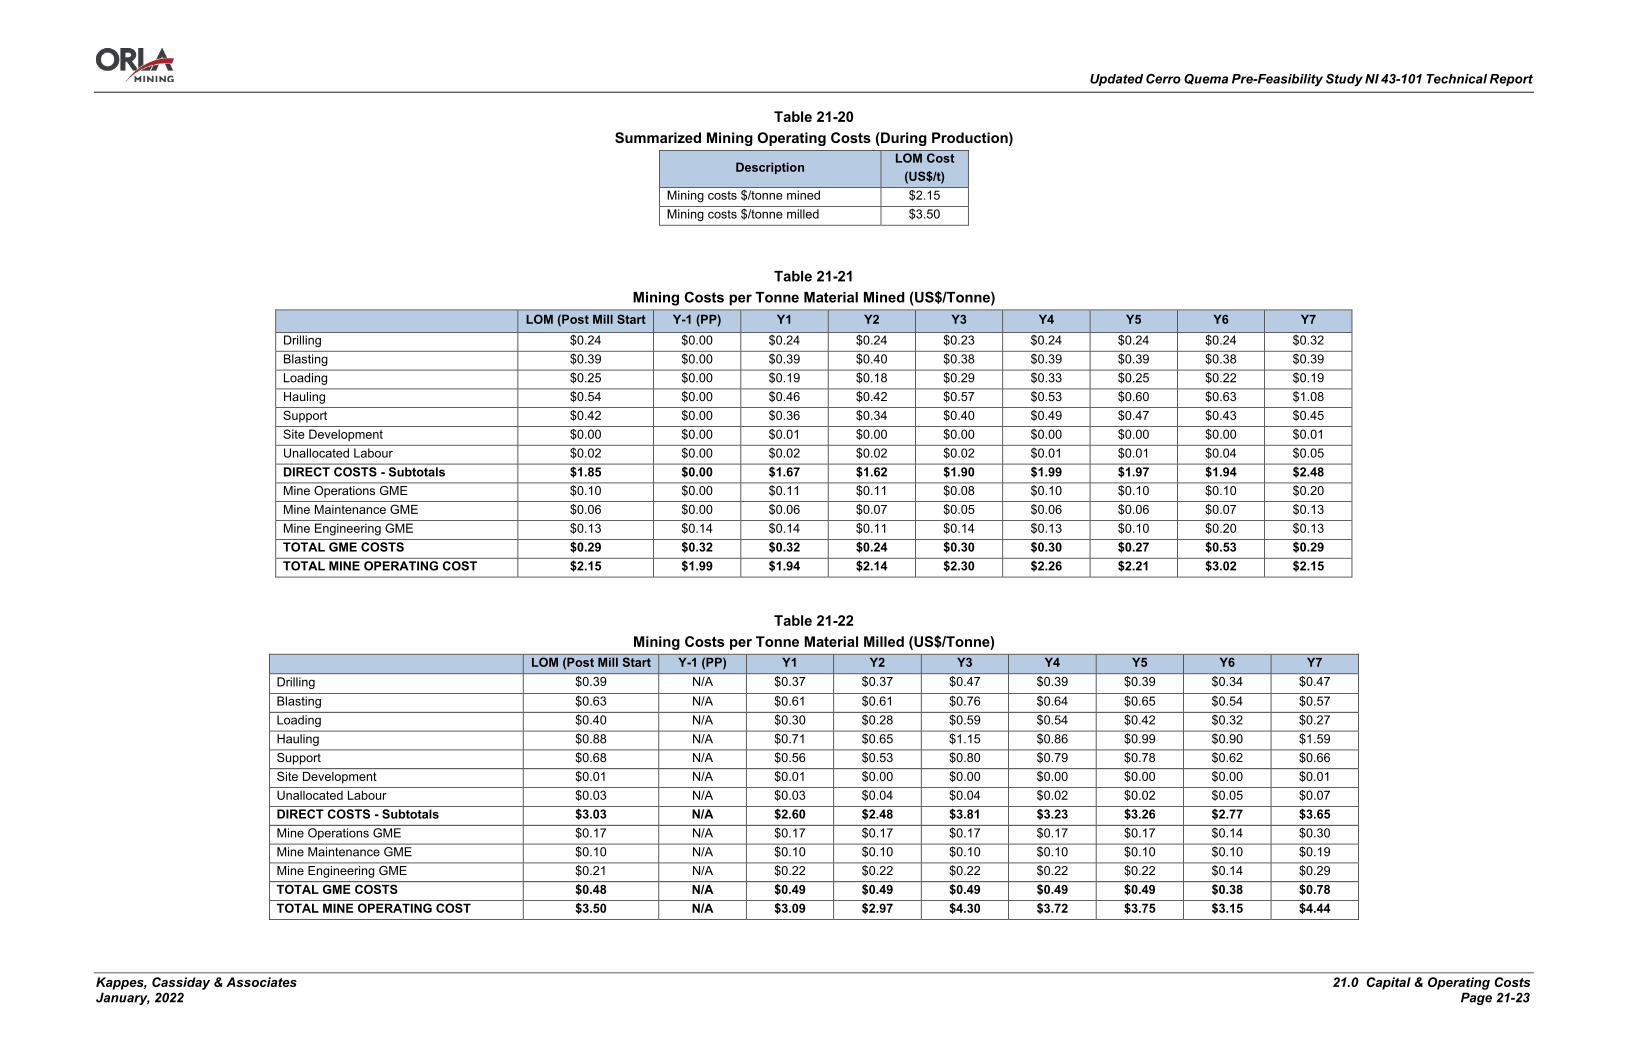
Updated Cerro Quema Pre-Feasibility Study NI 43-101 Technical Report
Kappes, Cassiday & Associates 21.0 Capital & Operating Costs January, 2022 Page 21-23
Table 21-20 Summarized Mining Operating Costs (During Production)
Description LOM Cost
(US$/t) Mining costs $/tonne mined $2.15 Mining costs $/tonne milled $3.50
Table 21-21 Mining Costs per Tonne Material Mined (US$/Tonne)
LOM (Post Mill Start Y-1 (PP) Y1 Y2 Y3 Y4 Y5 Y6 Y7 Drilling $0.24 $0.00 $0.24 $0.24 $0.23 $0.24 $0.24 $0.24 $0.32 Blasting $0.39 $0.00 $0.39 $0.40 $0.38 $0.39 $0.39 $0.38 $0.39 Loading $0.25 $0.00 $0.19 $0.18 $0.29 $0.33 $0.25 $0.22 $0.19 Hauling $0.54 $0.00 $0.46 $0.42 $0.57 $0.53 $0.60 $0.63 $1.08 Support $0.42 $0.00 $0.36 $0.34 $0.40 $0.49 $0.47 $0.43 $0.45 Site Development $0.00 $0.00 $0.01 $0.00 $0.00 $0.00 $0.00 $0.00 $0.01 Unallocated Labour $0.02 $0.00 $0.02 $0.02 $0.02 $0.01 $0.01 $0.04 $0.05 DIRECT COSTS - Subtotals $1.85 $0.00 $1.67 $1.62 $1.90 $1.99 $1.97 $1.94 $2.48 Mine Operations GME $0.10 $0.00 $0.11 $0.11 $0.08 $0.10 $0.10 $0.10 $0.20 Mine Maintenance GME $0.06 $0.00 $0.06 $0.07 $0.05 $0.06 $0.06 $0.07 $0.13 Mine Engineering GME $0.13 $0.14 $0.14 $0.11 $0.14 $0.13 $0.10 $0.20 $0.13 TOTAL GME COSTS $0.29 $0.32 $0.32 $0.24 $0.30 $0.30 $0.27 $0.53 $0.29 TOTAL MINE OPERATING COST $2.15 $1.99 $1.94 $2.14 $2.30 $2.26 $2.21 $3.02 $2.15
Table 21-22 Mining Costs per Tonne Material Milled (US$/Tonne)
LOM (Post Mill Start Y-1 (PP) Y1 Y2 Y3 Y4 Y5 Y6 Y7 Drilling $0.39 N/A $0.37 $0.37 $0.47 $0.39 $0.39 $0.34 $0.47 Blasting $0.63 N/A $0.61 $0.61 $0.76 $0.64 $0.65 $0.54 $0.57 Loading $0.40 N/A $0.30 $0.28 $0.59 $0.54 $0.42 $0.32 $0.27 Hauling $0.88 N/A $0.71 $0.65 $1.15 $0.86 $0.99 $0.90 $1.59 Support $0.68 N/A $0.56 $0.53 $0.80 $0.79 $0.78 $0.62 $0.66 Site Development $0.01 N/A $0.01 $0.00 $0.00 $0.00 $0.00 $0.00 $0.01 Unallocated Labour $0.03 N/A $0.03 $0.04 $0.04 $0.02 $0.02 $0.05 $0.07 DIRECT COSTS - Subtotals $3.03 N/A $2.60 $2.48 $3.81 $3.23 $3.26 $2.77 $3.65 Mine Operations GME $0.17 N/A $0.17 $0.17 $0.17 $0.17 $0.17 $0.14 $0.30 Mine Maintenance GME $0.10 N/A $0.10 $0.10 $0.10 $0.10 $0.10 $0.10 $0.19 Mine Engineering GME $0.21 N/A $0.22 $0.22 $0.22 $0.22 $0.22 $0.14 $0.29 TOTAL GME COSTS $0.48 N/A $0.49 $0.49 $0.49 $0.49 $0.49 $0.38 $0.78 TOTAL MINE OPERATING COST $3.50 N/A $3.09 $2.97 $4.30 $3.72 $3.75 $3.15 $4.44
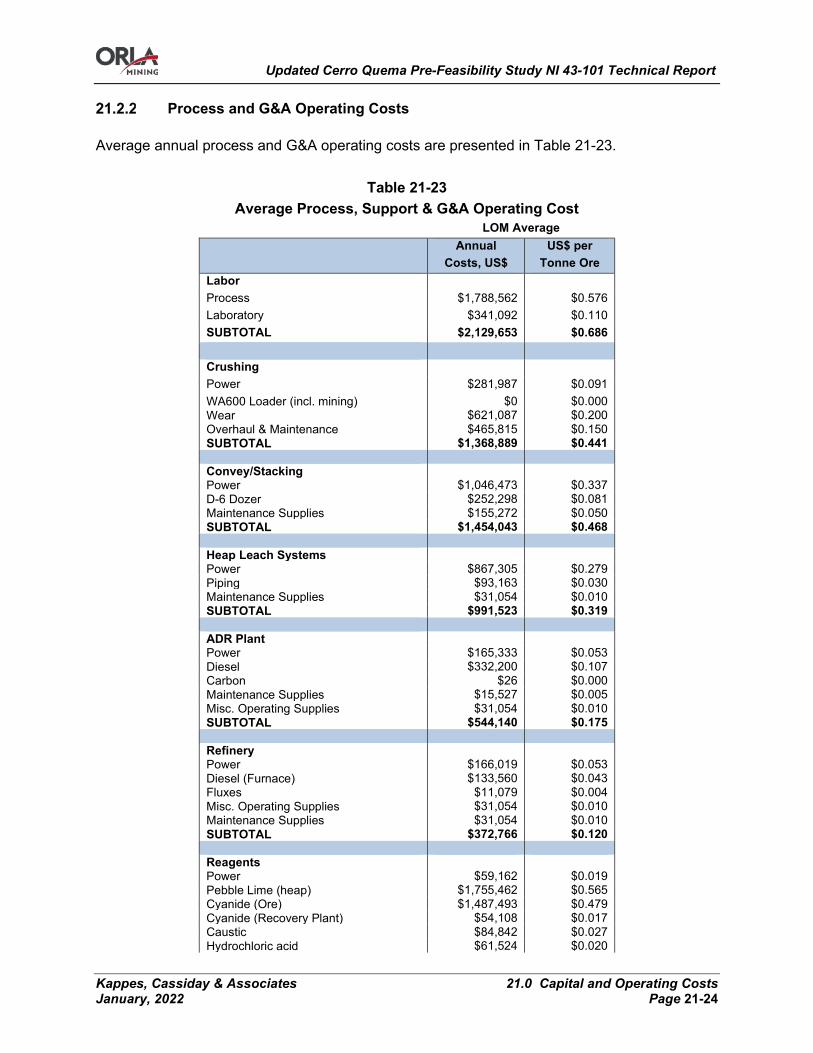
Updated Cerro Quema Pre-Feasibility Study NI 43-101 Technical Report
Kappes, Cassiday & Associates 21.0 Capital and Operating Costs January, 2022 Page 21-24
Process and G&A Operating Costs
Average annual process and G&A operating costs are presented in Table 21-23.
Table 21-23 Average Process, Support & G&A Operating Cost
LOM Average
Annual
Costs, US$ US$ per
Tonne Ore Labor Process $1,788,562 $0.576 Laboratory $341,092 $0.110 SUBTOTAL $2,129,653 $0.686
Crushing
Power $281,987 $0.091 WA600 Loader (incl. mining) $0 $0.000 Wear $621,087 $0.200 Overhaul & Maintenance $465,815 $0.150 SUBTOTAL $1,368,889 $0.441
Convey/Stacking
Power $1,046,473 $0.337 D-6 Dozer $252,298 $0.081 Maintenance Supplies $155,272 $0.050 SUBTOTAL $1,454,043 $0.468
Heap Leach Systems
Power $867,305 $0.279 Piping $93,163 $0.030 Maintenance Supplies $31,054 $0.010 SUBTOTAL $991,523 $0.319
ADR Plant
Power $165,333 $0.053 Diesel $332,200 $0.107 Carbon $26 $0.000 Maintenance Supplies $15,527 $0.005 Misc. Operating Supplies $31,054 $0.010 SUBTOTAL $544,140 $0.175
Refinery
Power $166,019 $0.053 Diesel (Furnace) $133,560 $0.043 Fluxes $11,079 $0.004 Misc. Operating Supplies $31,054 $0.010 Maintenance Supplies $31,054 $0.010 SUBTOTAL $372,766 $0.120 Reagents Power $59,162 $0.019 Pebble Lime (heap) $1,755,462 $0.565 Cyanide (Ore) $1,487,493 $0.479 Cyanide (Recovery Plant) $54,108 $0.017 Caustic $84,842 $0.027 Hydrochloric acid $61,524 $0.020

Updated Cerro Quema Pre-Feasibility Study NI 43-101 Technical Report
Kappes, Cassiday & Associates 21.0 Capital and Operating Costs January, 2022 Page 21-25
LOM Average
Annual
Costs, US$ US$ per
Tonne Ore Antiscalant $328,332 $0.106 Maintenance Supplies $31,054 $0.010 SUBTOTAL $3,861,978 $1.244
Water Supply & Monitoring & Dist.
Power $704,281 $0.227 Pit Dewatering (diesel pumps) $142,827 $0.046 Maintenance Supplies $62,109 $0.020 SUBTOTAL $909,217 $0.293
Water Treatment / NaCN Neutralization
Power $443,041 $0.143 Sodium Metabisulfite (SMBS) $11,778 $0.004 Hydrated Lime $11,755 $0.004 Copper Sulfate $7,714 $0.002 HLF Water Treatment $64,706 $0.021 Waste Dump Water Treatment $321,971 $0.104 Misc. Operating Supplies $69,758 $0.022 SUBTOTAL $930,725 $0.300
Laboratory
Power $266,855 $0.086 Assays, Solids $331,055 $0.107 Assays, Solutions $164,250 $0.053 Misc. Supplies $62,109 $0.020 SUBTOTAL $824,269 $0.265 Support Services / Facilities Power $50,345 $0.016 Fork Lift, 2.5 t $10,975 $0.004 Fork lift, 4-wheel w/ boom extension $24,983 $0.008 Boom Truck 10 t $11,409 $0.004 Backhoe/loader $36,952 $0.012 Pickup Trucks (7) $152,057 $0.049 Maintenance Truck $22,644 $0.007 Crane - Rough Terrain, 40t $7,672 $0.002 Bobcat $14,880 $0.005 Maintenance Supplies $62,109 $0.020 SUBTOTAL $394,025 $0.127 Sub-TOTAL COST (process Only) $13,781,227 $4.438
G&A
G&A Labor $2,227,413 $0.717 G&A Expenses $2,452,476 $0.790 Social Contribution $790,440 $0.255 Other Social Commitments $977,041 $0.315 TOTAL COST G&A $6,447,371 $2.076
TOTAL COST (excluding duties) $20,228,598 $6.514 *Note: Average G&A does not include G&A costs during the reclamation and closure period
Personnel and Staffing
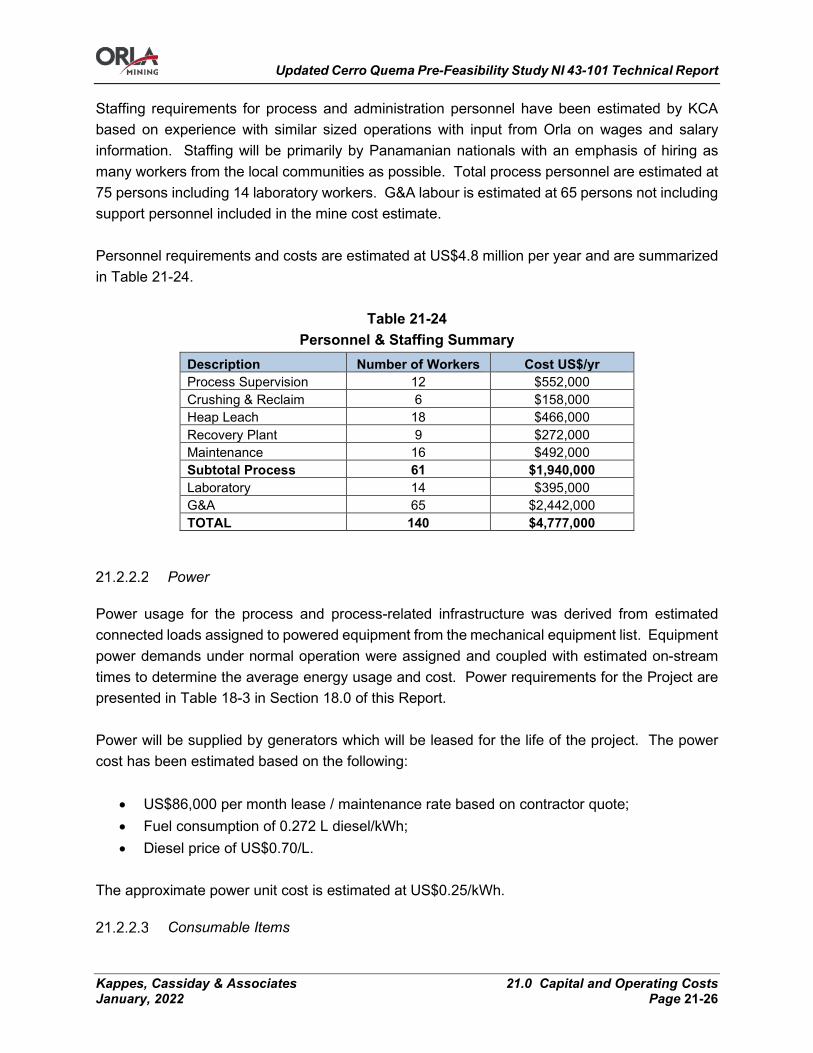
Updated Cerro Quema Pre-Feasibility Study NI 43-101 Technical Report
Kappes, Cassiday & Associates 21.0 Capital and Operating Costs January, 2022 Page 21-26
Staffing requirements for process and administration personnel have been estimated by KCA based on experience with similar sized operations with input from Orla on wages and salary information. Staffing will be primarily by Panamanian nationals with an emphasis of hiring as many workers from the local communities as possible. Total process personnel are estimated at 75 persons including 14 laboratory workers. G&A labour is estimated at 65 persons not including support personnel included in the mine cost estimate. Personnel requirements and costs are estimated at US$4.8 million per year and are summarized in Table 21-24.
Table 21-24 Personnel & Staffing Summary
Description Number of Workers Cost US$/yr Process Supervision 12 $552,000 Crushing & Reclaim 6 $158,000 Heap Leach 18 $466,000 Recovery Plant 9 $272,000 Maintenance 16 $492,000 Subtotal Process 61 $1,940,000 Laboratory 14 $395,000 G&A 65 $2,442,000 TOTAL 140 $4,777,000
Power
Power usage for the process and process-related infrastructure was derived from estimated connected loads assigned to powered equipment from the mechanical equipment list. Equipment power demands under normal operation were assigned and coupled with estimated on-stream times to determine the average energy usage and cost. Power requirements for the Project are presented in Table 18-3 in Section 18.0 of this Report. Power will be supplied by generators which will be leased for the life of the project. The power cost has been estimated based on the following:
• US$86,000 per month lease / maintenance rate based on contractor quote; • Fuel consumption of 0.272 L diesel/kWh; • Diesel price of US$0.70/L.
The approximate power unit cost is estimated at US$0.25/kWh.
Consumable Items
Updated Cerro Quema Pre-Feasibility Study NI 43-101 Technical Report
Kappes, Cassiday & Associates 21.0 Capital and Operating Costs January, 2022 Page 21-27
Operating supplies have been estimated based upon unit costs and consumption rates predicted by metallurgical tests and have been broken down by area. Freight costs are included in all operating supply and reagent estimates. Reagent consumptions have been derived from test work and from design criteria considerations. Other consumable items have been estimated by KCA based on KCA’s experience with other similar operations. Operating costs for consumable items have been distributed based on tonnage and gold/silver production or smelting batches, as appropriate.
Heap Leach Consumables
Pipes, Fittings and Emitters – The heap pipe costs include expenses for broken pipe, fittings and valves, and abandoned tubing. The heap pipe costs are estimated to be US$0.03/t ore, and are based on previous detailed studies conducted by KCA on similar projects. Sodium Cyanide (NaCN) – Delivered sodium cyanide is estimated at US$2.50/kg based on recent supplier quotes. Sodium cyanide will be primarily consumed during leaching and varies by material type. Based on metallurgical test work, cyanide consumption is estimated at 0.19 kg/t for the La Pava Oxide ore, 0.18 kg/t for the Quema Oxide ore and 0.48 kg/t for the La Pava and Quema mixed ore. Sodium cyanide will also be consumed as part of the recovery plant operations which consumption estimated at 70 kg/strip. Pebble Lime (CaO) – Pebble lime will be added to the crushed ore for pH control at the heap with consumptions varying by material type. Based on metallurgical test work, lime will be consumed at an estimated 1.4 kg/t for La Pava Oxide ore, 2.5 kg/t for Quema Oxide ore and 4.8 kg/t for La Pava and Quema mixed ore. Pebble lime is estimated to be supplied at US$320/tonne based on recent supplier quotes. Antiscale Agent (Scale Inhibitor) – Antiscalant consumption is based on an average dosage of 10 ppm to the suctions of the barren and pregnant pumps. A delivered price of US$2.48/kg has been used based on recent supplier quotes in KCA’s files.
Recovery Plant Consumables
Carbon –Carbon will be used for the adsorption of gold and silver from pregnant leach solution. Carbon is estimated at US$2.76/kg based on a recent supplier quote and will be consumed at an estimated 3% per strip batch due to attrition. Hydrochloric Acid –Hydrochloric acid will be used in the acid wash circuit to remove scale from the carbon which inhibits the adsorption of gold and silver. Hydrochloric acid consumption is

Updated Cerro Quema Pre-Feasibility Study NI 43-101 Technical Report
Kappes, Cassiday & Associates 21.0 Capital and Operating Costs January, 2022 Page 21-28
estimated at 150 L per tonne of carbon stripped. Hydrochloric acid will be delivered at 32% HCl by weight with a supply cost of US$0.52/L based on recent supplier quotes. Caustic Soda (NaOH) – Caustic will be delivered to site as a liquid at 50% concentration by weight. Caustic will be used in the recovery plant and is consumed in the strip and acid wash circuits. Caustic consumption is based on a 2% caustic strip solution with approximately one third of the solution discarded each strip. Caustic supply is estimated at US$0.98/kg based on recent supplier quotes. Sodium Metabisulfite – Sodium metabisulfite (SMBS) will be used for treating process solutions containing cyanide before additional treatment and discharge to the environment. Sodium metabisulfite will be delivered in 1,000 kg bulk bags and mixed to 20% SMBS by weight. SMBS is estimated at US$0.73/kg and is consumed at an estimated 7 grams of SMBS per g WAD cyanide. Hydrated Lime – Hydrated lime (Ca(OH)2) will be added at the cyanide neutralization circuit to maintain a pH around 9. Hydrated lime is estimated at US$0.51/kg based on recent supplier quotes and will be consumed at an estimated 10 g of lime per g WAD cyanide. Smelting Fluxes – It has been estimated that 0.054 kg of mixed fluxes per troy ounce of precious metal produced will be required. The estimated delivered cost of these fluxes, which includes borax, silica, niter, and soda ash, is based on quoted costs and assumed flux composition.
Solution Treatment Plant
Operating costs for the four solution treatment facilities required for the project as described in Section 17.9 have been estimated by Linkan based on the following assumptions:
• Costs are in US Dollars; • Predicted water quality and flow rates were used. System may require adjustment for
actual conditions; • Plant processes and sizing that drive the cost estimates were based on the design basis
as stated; • Verification of the final design should include bench and pilot scale testing with the actual
water to be treated; • Unit costs were either provided as project specific rates or were estimated based on
Linkan Engineering experience on similar projects in US and South America; • Potable water or clean process water for chemical make-up is available at both active
plants; • Taxes and freight are not added to cost estimate; • Salvage costs were not considered;
Updated Cerro Quema Pre-Feasibility Study NI 43-101 Technical Report
Kappes, Cassiday & Associates 21.0 Capital and Operating Costs January, 2022 Page 21-29
• Active Plants; o Average flow rates were used for the OPEX media and power consumption
estimates. o Solid residues from the plants are assumed to be readily disposable on-site.
• Passive Systems; o The OPEX estimates are based on generic annual costs that assume some limited
maintenance will be done on berms and ditches each year and periodic costs based on the retrofitting or refurbishing the process units (basically a percentage of the CAPEX cost for each BCR that is dependent on the extent of work to be done) with an estimated return interval in years. As a rule of thumb, a BCR should last for 20 years. The OPEX costs are provided for the first 20-year period. Until water quality and flow rates improve to discharge standards the passive systems will continue operating.
o It was assumed that the “spent” BCR substrate can be disposed of on-site. If the Panamanian environmental regulations require treating this material as hazardous and requiring preparing a site plan disposal the cost was not included in this study.
The operational mining period active water treatment systems have been designed to handle the concentrations, variability, and flow rates from each of the WRD and HLF areas. During post closure when flow rates and variability have subsided, the water will be treated using passive treatment systems for each area. Operating costs for each to the solution treatment plants have been based on the following maximum and average treatment rates:
• WRD Active Treatment Plant 320 m3/h MAX, 95 m3/h AVERAGE; • HLF Active Treatment Plant 80 m3/h MAX, 15 m3/h AVERAGE; • WRD Passive Treatment System 20 m3/h MAX; • HLF Passive Treatment System 20 m3/h MAX.
Cost estimates were completed in accordance with AACE International Recommended Practice No. 18R-97, Class 5, for concept screening using capacity factors, parametric models, judgment, and analogy. Gross estimates were performed for civil, material, substrate, labour, and equipment quantities where project specific unit rates were applied. Operating costs for each of the solution treatment plants are presented in Table 21-25 through Table 21-27.
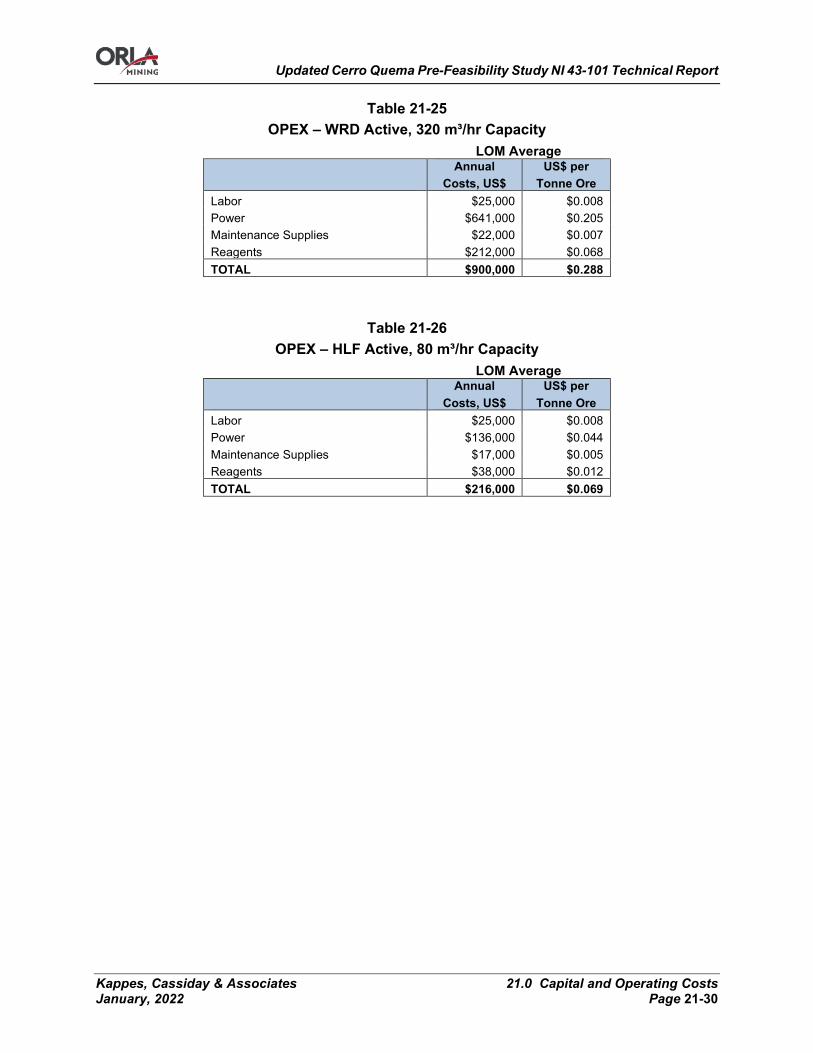
Updated Cerro Quema Pre-Feasibility Study NI 43-101 Technical Report
Kappes, Cassiday & Associates 21.0 Capital and Operating Costs January, 2022 Page 21-30
Table 21-25 OPEX – WRD Active, 320 m³/hr Capacity
LOM Average
Annual
Costs, US$ US$ per
Tonne Ore Labor $25,000 $0.008 Power $641,000 $0.205 Maintenance Supplies $22,000 $0.007 Reagents $212,000 $0.068 TOTAL $900,000 $0.288
Table 21-26 OPEX – HLF Active, 80 m³/hr Capacity
LOM Average
Annual
Costs, US$ US$ per
Tonne Ore Labor $25,000 $0.008 Power $136,000 $0.044 Maintenance Supplies $17,000 $0.005 Reagents $38,000 $0.012 TOTAL $216,000 $0.069

Updated Cerro Quema Pre-Feasibility Study NI 43-101 Technical Report
Kappes, Cassiday & Associates 21.0 Capital and Operating Costs January, 2022 Page 21-31
Table 21-27 OPEX – WRD & HLF Passive Treatment, 20 m³/hr Capacity – Cost for Each
Year Monitoring (1)
Maintenance, US$ (2) Refurbishment, US$ (3) Totals Labor, US$ Analytical, US$
1 $4,800 $23,600 $3,400 $31,800 2 $1,600 $7,900 $3,400 $12,900 3 $800 $4,000 $3,400 $8,200 4 $400 $2,000 $3,400 $5,800 5 $400 $2,000 $3,400 $5,800 6 $400 $2,000 $3,400 $5,800 7 $400 $2,000 $3,400 $5,800 8 $400 $2,000 $3,400 $5,800 9 $400 $2,000 $3,400 $5,800 10 $400 $2,000 $3,400 $5,800 11 $400 $2,000 $3,400 $5,800 12 $400 $2,000 $3,400 $5,800 13 $400 $2,000 $3,400 $5,800 14 $400 $2,000 $3,400 $5,800 15 $400 $2,000 $3,400 $5,800 16 $400 $2,000 $3,400 $5,800 17 $400 $2,000 $3,400 $5,800 18 $400 $2,000 $3,400 $5,800 19 $400 $2,000 $3,400 $5,800 20 $400 $2,000 $3,400 $60,000 $65,800
(1) Monitoring assumes 2 persons visiting the site to take field parameters and lab samples for system performance eval. (not compliance). Cost calculation: 2 persons x $20/hr x 10 hr Monitoring req. taper off as follows: YEAR 1: Every month (12 days per yr 1) YEAR 2: Change to monitoring every quarter (4 days per yr) YEAR 3: Change to monitoring every 6 months (2 days per yr) YEAR 4: to 20: Change to monitoring every year (1 day per yr)
(2) Maintenance assumes berm and flow conveyance maintenance, overall inspection, and some basic process unit maintenance (weeding, removing debris, clean-up, etc.) Maintenance calculation (Once per year): 1 foreman, 1 operator (backhoe) for one week = 3 persons x $20/hr x 40hrs + $25/hr backhoe x 40 hrs.
(3) Refurbish both BCRs @ 70% of CAPEX

Updated Cerro Quema Pre-Feasibility Study NI 43-101 Technical Report
Kappes, Cassiday & Associates 21.0 Capital and Operating Costs January, 2022 Page 21-32
Laboratory
Fire assaying and solution assaying of samples will be conducted in the on-site laboratory. It is estimated that approximately 150 solids assays and 150 solution assays at US$7.00 and US$3.00 per assay, respectively, will need to be performed each day.
Fuel
Diesel fuel will be required for power generation, heavy equipment operation and vehicles. Diesel is quoted at US$0.70/L.
Wear, Miscellaneous Operating & Maintenance Supplies
Overhaul and maintenance of equipment along with wear components and miscellaneous operating supplies for each area have been estimated as allowances based on tonnes of ore processed. The allowances for each area were developed based on published data as well as KCA’s experience with similar operations. LOM maintenance and operating supplies costs are estimated at US$0.34 per tonne ore processed.
Mobile / Support Equipment
Mobile and support equipment are required for the process and include three fork lifts, one 4-t telehandler with boom extension, one 10-t boom truck, one backhoe, seven pickup trucks, one maintenance truck and one 40-t rough terrain. The costs to operate and maintain each piece of equipment have been estimated primarily using published information and project specific fuel costs. Where published information was not available, allowances were made based on KCA’s experience from similar operations. LOM support equipment annual operating costs are estimated at US$282,000 or US$0.09 per tonne of ore.
G&A Expenses
General and administrative expenses are expected to average US$4.2 million per year (not including G&A costs during closure) and include costs for offsite offices, insurance, office supplies, communications, environmental and social management, health and safety supplies, security, travel and camp operations. For the cost estimate G&A expenses are represented primarily as fixed costs or have been structured based on existing agreements between Orla and the surrounding communities.
Updated Cerro Quema Pre-Feasibility Study NI 43-101 Technical Report
Kappes, Cassiday & Associates 21.0 Capital and Operating Costs January, 2022 Page 21-33
Reclamation & Closure Costs
A cost estimate for reclamation and closure was made by KCA with input from Moose Mountain and Linkan. Costs for reclamation and closure were estimated to be US$15.4 million and are based on a 5-year closure period (plus ongoing monitoring) and are summarized in Section 20.1.7. The costs include work to be conducted from the closure of the mine, end of operation activities and concurrent rehabilitation work, excluding G&A costs during closure. G&A costs during closure are estimated at US$7.0 million and are included in the operating costs estimate. The main objectives of the reclamation and closure plan include:
• Progressive rehabilitation to allow rapid recovery of the vegetation cover and early recovery of the ecosystem;
• Sustainability of rehabilitation work including water and wind erosion; • Recovery of land uses; and • Implementation of a post-closure monitoring program.
Activities included as part of reclamation and closure are described in Section 20.0 of this Technical Report.

Updated Cerro Quema Pre-Feasibility Study NI 43-101 Technical Report
Kappes, Cassiday & Associates 22.0 Economic Analysis January, 2022 Page 22-1
22.0 ECONOMIC ANALYSIS
Summary
Based on the estimated production schedule, revenue, capital costs, operating costs, taxes, and royalties, a cash flow model was prepared by KCA for the economic analysis of the Cerro Quema project. All of the information used in this economic evaluation has been taken from work completed by KCA, Moose Mountain, Anddes and Linkan as described in previous sections of this report. The Cerro Quema project economics were evaluated using a discounted cash flow (DCF) method, which measures Net Present Value (NPV) of future cash flow streams. The results of the economic analyses represent forward-looking information as defined under Canadian securities law. The results depend on inputs that are subject to a number of known and unknown risks, uncertainties and other factors that may cause actual results to differ materially from those presented here. The final economic model was developed by KCA using the following assumptions:
• The cashflow model is based on the mine production schedule from Moose Mountain; • The period of analysis of 12 years includes two years of pre-production and investment,
seven years of production and three years for closure and reclamation; • Gold price of US$1,600/oz; • Silver price of US$20/oz; • Processing rate of 10,000 tpd ore; • Overall recoveries of 87% for gold and 26% for silver as discussed in Section 13.0 of this
Report; • Capital and operating costs as developed in Section 21.0 of this Report; • Net Smelter Royalties of 4%; • Income Tax Rate of 25%; • ITBMS Exempt.
The key economic parameters are presented in Table 22-1 and the economic summary is presented in Table 22-2.
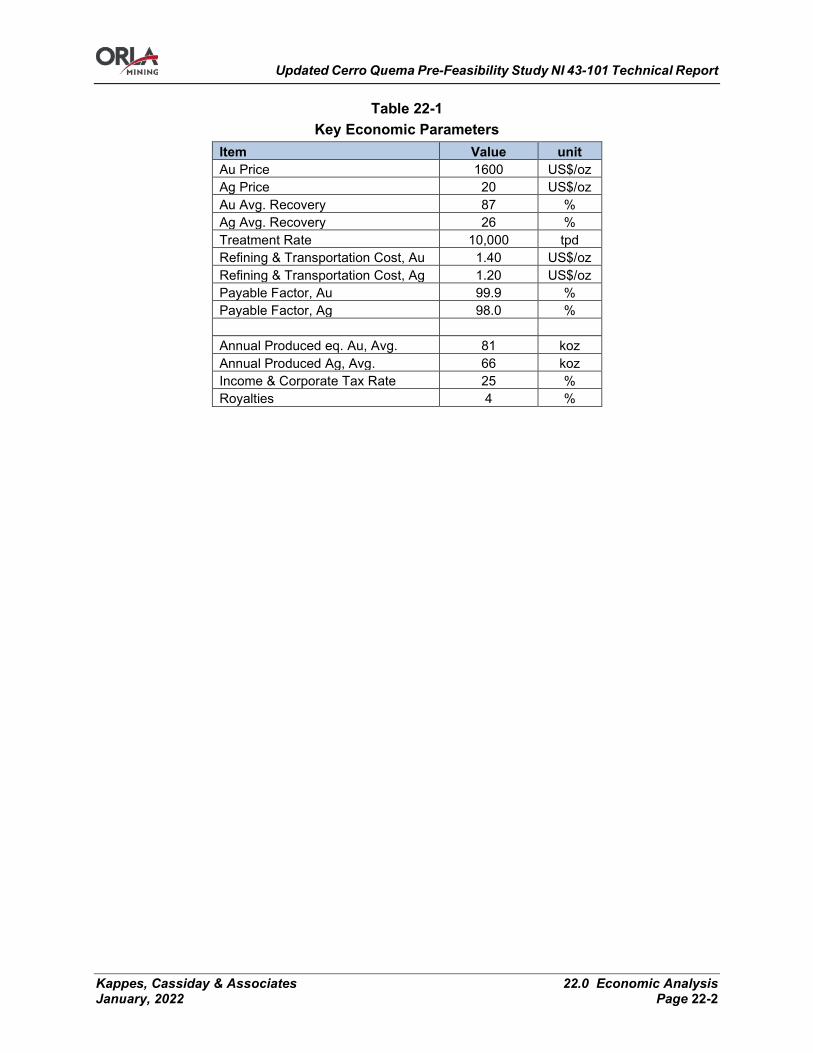
Updated Cerro Quema Pre-Feasibility Study NI 43-101 Technical Report
Kappes, Cassiday & Associates 22.0 Economic Analysis January, 2022 Page 22-2
Table 22-1 Key Economic Parameters
Item Value unit Au Price 1600 US$/oz Ag Price 20 US$/oz Au Avg. Recovery 87 % Ag Avg. Recovery 26 % Treatment Rate 10,000 tpd Refining & Transportation Cost, Au 1.40 US$/oz Refining & Transportation Cost, Ag 1.20 US$/oz Payable Factor, Au 99.9 % Payable Factor, Ag 98.0 % Annual Produced eq. Au, Avg. 81 koz Annual Produced Ag, Avg. 66 koz Income & Corporate Tax Rate 25 % Royalties 4 %
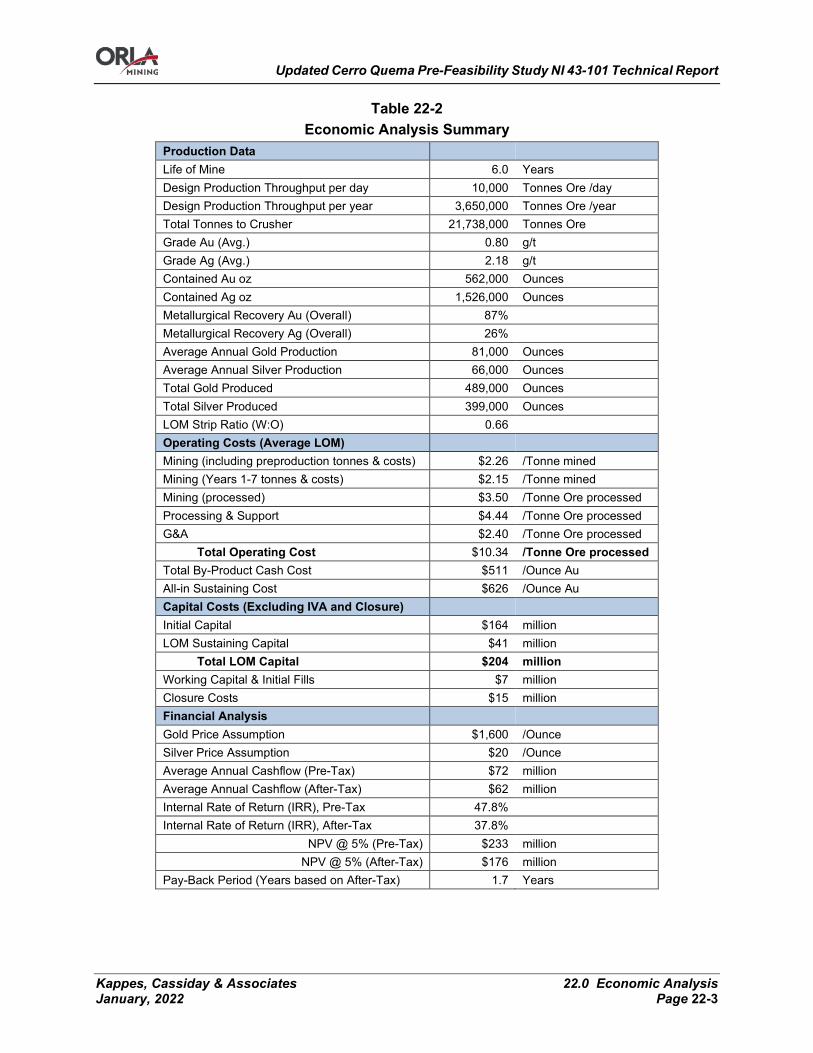
Updated Cerro Quema Pre-Feasibility Study NI 43-101 Technical Report
Kappes, Cassiday & Associates 22.0 Economic Analysis January, 2022 Page 22-3
Table 22-2 Economic Analysis Summary
Production Data Life of Mine 6.0 Years Design Production Throughput per day 10,000 Tonnes Ore /day Design Production Throughput per year 3,650,000 Tonnes Ore /year Total Tonnes to Crusher 21,738,000 Tonnes Ore Grade Au (Avg.) 0.80 g/t Grade Ag (Avg.) 2.18 g/t Contained Au oz 562,000 Ounces Contained Ag oz 1,526,000 Ounces Metallurgical Recovery Au (Overall) 87% Metallurgical Recovery Ag (Overall) 26% Average Annual Gold Production 81,000 Ounces Average Annual Silver Production 66,000 Ounces Total Gold Produced 489,000 Ounces Total Silver Produced 399,000 Ounces LOM Strip Ratio (W:O) 0.66 Operating Costs (Average LOM) Mining (including preproduction tonnes & costs) $2.26 /Tonne mined Mining (Years 1-7 tonnes & costs) $2.15 /Tonne mined Mining (processed) $3.50 /Tonne Ore processed Processing & Support $4.44 /Tonne Ore processed G&A $2.40 /Tonne Ore processed Total Operating Cost $10.34 /Tonne Ore processed Total By-Product Cash Cost $511 /Ounce Au All-in Sustaining Cost $626 /Ounce Au Capital Costs (Excluding IVA and Closure) Initial Capital $164 million LOM Sustaining Capital $41 million Total LOM Capital $204 million Working Capital & Initial Fills $7 million Closure Costs $15 million Financial Analysis Gold Price Assumption $1,600 /Ounce Silver Price Assumption $20 /Ounce Average Annual Cashflow (Pre-Tax) $72 million Average Annual Cashflow (After-Tax) $62 million Internal Rate of Return (IRR), Pre-Tax 47.8% Internal Rate of Return (IRR), After-Tax 37.8%
NPV @ 5% (Pre-Tax) $233 million NPV @ 5% (After-Tax) $176 million
Pay-Back Period (Years based on After-Tax) 1.7 Years
Updated Cerro Quema Pre-Feasibility Study NI 43-101 Technical Report
Kappes, Cassiday & Associates 22.0 Economic Analysis January, 2022 Page 22-4
Methodology
The Cerro Quema project economics are evaluated using a discounted cash flow (DCF) method. The DCF method requires that annual estimated cash inflows and outflows are converted to equivalent dollars in the year of evaluation. Considerations for this analysis include the following:
• The cash flow model was prepared by KCA with input from Orla; • The cash flow model is based on the mine production schedule from Moose Mountain; • The period of analysis is 12 years including two years of pre-production and investment,
7 years of production and 3 years for closure and reclamation; • Gold and silver production and revenue in the model are delayed from the time ore is
stacked based on the mine production schedule and leach curves to account for time required for metal values to be recovered from the heap;
• All cash flow amounts are in US dollars (US$). All costs are considered to be first quarter 2021 costs. Inflation is not considered in this model;
• The Internal Rate of Return (IRR) is calculated as the discount rate that yields a Net Present Value (NPV) of zero;
• The NPV is calculated by discounting the annual cash back to Year -2 at a rate of 5%. All annual cash flows are assumed to occur at the end of each respective year;
• The payback period is the amount of time, in years, required to recover the initial construction capital cost;
• Working capital and initial fills are considered in this model and includes mining, processing and general administrative operating costs. The model assumes working capital and initial fills are recovered during the final two years of operation;
• Taxes on capital and operating costs are included. Where necessary, they have been added as separate annual expenses. Additionally, relevant local and land use taxes have been added;
• Royalties are included in the model, totaling 4.0% (NSR); • Sustaining Capital, Reclamation and Closure costs are included in the model.
The economic analysis is performed on a before and after-tax basis in constant dollar terms, with the cash flows estimated on a project basis.
General Assumptions
A summary of the general assumptions for cost inputs, parameters, royalties, and taxes used in the economic analysis are as follows:
• Basic and detailed engineering begins fourth quarter 2022 with site construction expected to begin in 1st quarter 2023;
Updated Cerro Quema Pre-Feasibility Study NI 43-101 Technical Report
Kappes, Cassiday & Associates 22.0 Economic Analysis January, 2022 Page 22-5
• Gold price of US$1,600/oz is used as the base case commodity price; • Silver prize of US$20/oz as the base commodity price; • Gold and silver production and revenue in the model are delayed from the time material
is stacked based on the mine production schedule and material leach curves to account for time required for gold to be recovered from the heap;
• Average operating costs of US$10.34/t ore including a mining cost of US$3.50/t ore (US$2.15/ tonne mined), processing cost of US$4.44/t ore and G&A cost of US$2.40/t ore;
• Pre-production capital costs for the Project are spent entirely in Years -2 and -1. Sustaining capital for the heap leach pad and waste rock expansion is spent in Years 1, 2 and 5. Sustaining capital for passive solution treatment facilities are spent in Years 7 and 10;
• Working capital equal to 60 days of operating costs during the pre-production and ramp up period is included for mining, process and G&A costs as well as initial fills for process reagents and consumables. The assumption is made that all working capital and initial fills can be recovered in the final years of operation and the effective sum of working capital and initial fills over the life of mine is zero;
• Depreciation allowances for eligible items are included in the model based on “Sum of Digits” depreciation schedules. Buildings and other non-movable items are depreciated based on a useful life of 30 years. All other items are depreciated over a minimum period of 3 years;
• ITBMS is not included and the project is assumed to ITBMS exempt; • A 4% NSR royalty payable to the Government of Panama is included; • An income tax of 25% is considered; • A refinery and transportation cost of US$1.40/oz for gold and US$1.20/oz for silver is used
in the model, including insurance. Gold and silver are assumed to be 99.9% and 98% payable, respectively;
• A loss carried forward of US$900,000, which includes expenses for the Project to date, is included;
• Deferred exploration and evaluation costs of US$61.7 million are included and have been amortized over a seven-year period.
• By-product cash operating costs per payable ounce represent the mine site operating costs including mining, processing, metal transport, refining, administration costs and royalties with a credit for silver produced. Operating costs are presented in greater detail in Section 21.2 of this report;
• All in sustaining costs per payable ounce represent the mine site operating costs including mining, processing, metal transport, refining, administration costs and royalties with a credit for silver produced as well as the LOM sustaining capital and reclamation and closure costs;
Updated Cerro Quema Pre-Feasibility Study NI 43-101 Technical Report
Kappes, Cassiday & Associates 22.0 Economic Analysis January, 2022 Page 22-6
• The cash flow analysis evaluates the Project on a stand-alone basis. No withholding taxes or dividends are included. No head office or overheads for the parent company are included.
Capital Expenditures
Capital expenditures include initial capital (pre-production or construction costs), sustaining capital and working capital. The capital expenditures are presented in detail in Section 21.1 of this Report. The capital expenditures for the project are summarized in Table 22-3.
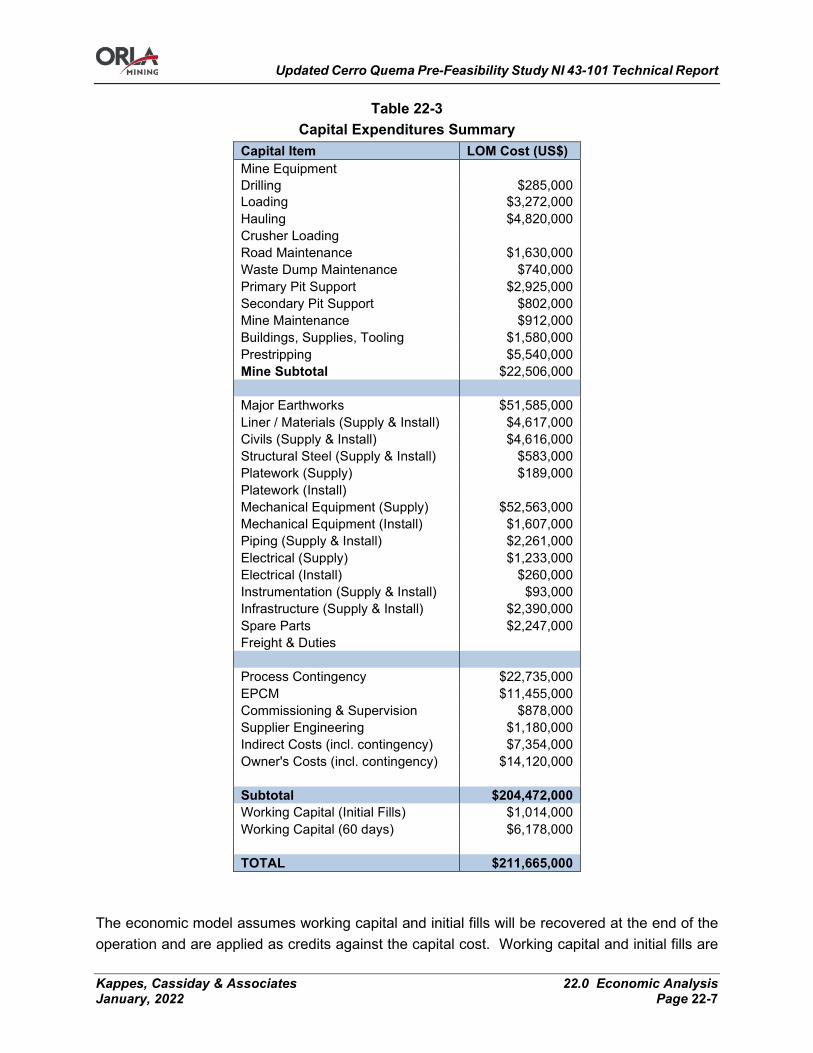
Updated Cerro Quema Pre-Feasibility Study NI 43-101 Technical Report
Kappes, Cassiday & Associates 22.0 Economic Analysis January, 2022 Page 22-7
Table 22-3 Capital Expenditures Summary
Capital Item LOM Cost (US$) Mine Equipment Drilling $285,000 Loading $3,272,000 Hauling $4,820,000 Crusher Loading Road Maintenance $1,630,000 Waste Dump Maintenance $740,000 Primary Pit Support $2,925,000 Secondary Pit Support $802,000 Mine Maintenance $912,000 Buildings, Supplies, Tooling $1,580,000 Prestripping $5,540,000 Mine Subtotal $22,506,000 Major Earthworks $51,585,000 Liner / Materials (Supply & Install) $4,617,000 Civils (Supply & Install) $4,616,000 Structural Steel (Supply & Install) $583,000 Platework (Supply) $189,000 Platework (Install) Mechanical Equipment (Supply) $52,563,000 Mechanical Equipment (Install) $1,607,000 Piping (Supply & Install) $2,261,000 Electrical (Supply) $1,233,000 Electrical (Install) $260,000 Instrumentation (Supply & Install) $93,000 Infrastructure (Supply & Install) $2,390,000 Spare Parts $2,247,000 Freight & Duties Process Contingency $22,735,000 EPCM $11,455,000 Commissioning & Supervision $878,000 Supplier Engineering $1,180,000 Indirect Costs (incl. contingency) $7,354,000 Owner's Costs (incl. contingency) $14,120,000 Subtotal $204,472,000 Working Capital (Initial Fills) $1,014,000 Working Capital (60 days) $6,178,000 TOTAL $211,665,000
The economic model assumes working capital and initial fills will be recovered at the end of the operation and are applied as credits against the capital cost. Working capital and initial fills are

Updated Cerro Quema Pre-Feasibility Study NI 43-101 Technical Report
Kappes, Cassiday & Associates 22.0 Economic Analysis January, 2022 Page 22-8
assumed to be recovered during Years 6 and 7. Salvage value for equipment is considered as taxable income and is applied during Years 8 through 10 after equipment items are no longer in service. Costs presented in Table 22-3 do not include the recovery of working capital or salvage income.
Operating Costs
Operating costs were estimated by KCA for all process and support services. G&A operating costs were estimated by KCA with input from Orla. Mining costs were estimated by Moose Mountain. LOM operating costs for the Cerro Quema project are summarized in Table 22 4. A detailed description of the operating cost build-up is included in Section 21.2 of this report.
Table 22-4 Operating Cost Summary
Description Cost
(US$/t) Mine $3.50 Process & Support Services $4.44 Site G & A $2.40 Total $10.34
Taxes and Import Duties
Federal income tax is applied at 25% of the Project income after deductions of eligible expenses including depreciation of assets and any losses carried forward. Customs and import duties are assumed to be 7% on average and have been included as part of the capital cost estimates. Imported mining equipment is assumed to be exempt from duties. The project is assumed to be exempt from ITBMS and other indirect taxes.
Metal Production and Revenues
Total metal production for the Cerro Quema oxide deposit is estimated at 489,000 ounces of recovered gold and 399,000 ounces of recovered silver. Annual production profiles for gold equivalent ounces are presented in Figure 22-1.
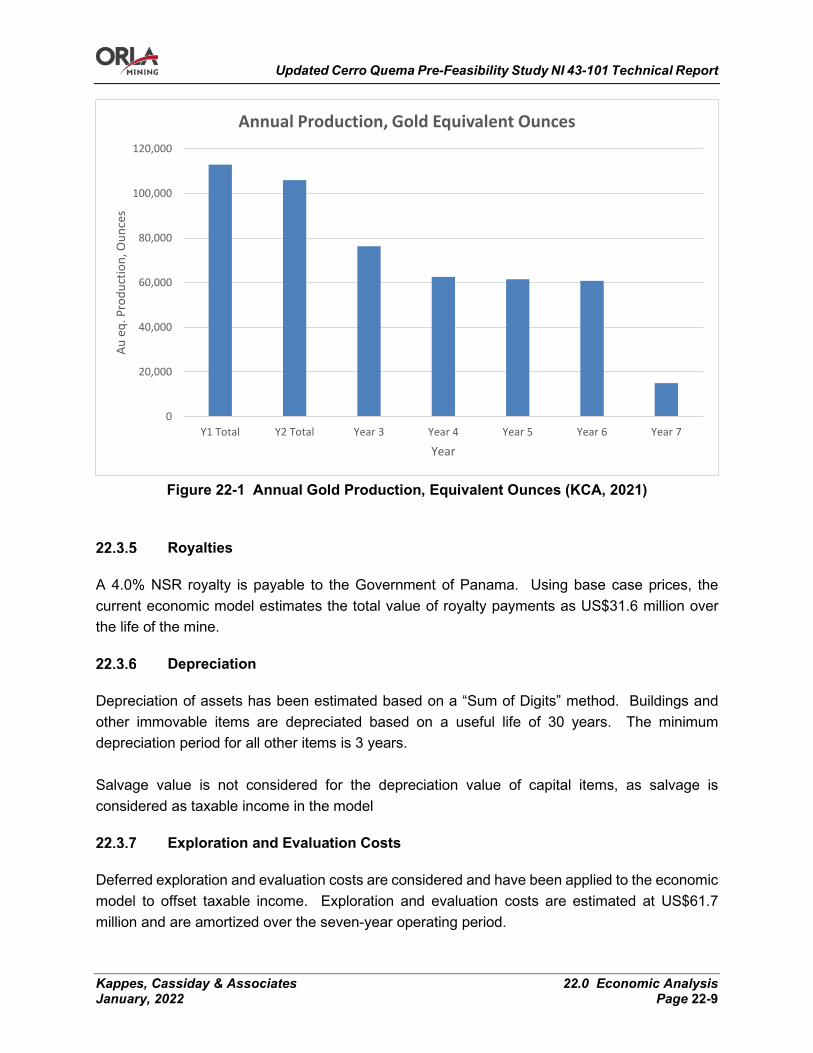
Updated Cerro Quema Pre-Feasibility Study NI 43-101 Technical Report
Kappes, Cassiday & Associates 22.0 Economic Analysis January, 2022 Page 22-9
Figure 22-1 Annual Gold Production, Equivalent Ounces (KCA, 2021)
Royalties
A 4.0% NSR royalty is payable to the Government of Panama. Using base case prices, the current economic model estimates the total value of royalty payments as US$31.6 million over the life of the mine.
Depreciation
Depreciation of assets has been estimated based on a “Sum of Digits” method. Buildings and other immovable items are depreciated based on a useful life of 30 years. The minimum depreciation period for all other items is 3 years. Salvage value is not considered for the depreciation value of capital items, as salvage is considered as taxable income in the model
Exploration and Evaluation Costs
Deferred exploration and evaluation costs are considered and have been applied to the economic model to offset taxable income. Exploration and evaluation costs are estimated at US$61.7 million and are amortized over the seven-year operating period.
0
20,000
40,000
60,000
80,000
100,000
120,000
Y1 Total Y2 Total Year 3 Year 4 Year 5 Year 6 Year 7
Au e
q. P
rodu
ctio
n, O
unce
s
Year
Annual Production, Gold Equivalent Ounces

Updated Cerro Quema Pre-Feasibility Study NI 43-101 Technical Report
Kappes, Cassiday & Associates 22.0 Economic Analysis January, 2022 Page 22-10
Loss Carry Forward
Panamanian tax laws allow for the carry-forward of operating losses for the development of a property. The loss carry-forward is estimated at US$900,000. A maximum of 20% of the loss may be applied each year and cannot reduce the net taxable income for a given fiscal year by more than 50%.
Closure Costs
Reclamation and closure include costs for works to be conducted for the closure of the mine at the end of operations and have been estimated primarily by KCA with input from Moose Mountain. The estimated LOM reclamation and closure costs is US$15.4 million, not including G&A, or US$0.70 per tonne ore processed based on a closure period of three years after the completion of operations. Reclamation and closure activities are summarized in Section 20.1.4 and costs are summarized in Section 21.3.
Economic Model and Cashflow
The discounted cash flow model for the Cerro Quema Project is presented in Table 22-5 and is based on the inputs and assumptions detailed in this Section. The Cerro Quema cash flows are net of royalties and taxes. The project yields an after-tax internal rate of return of 37.9%.
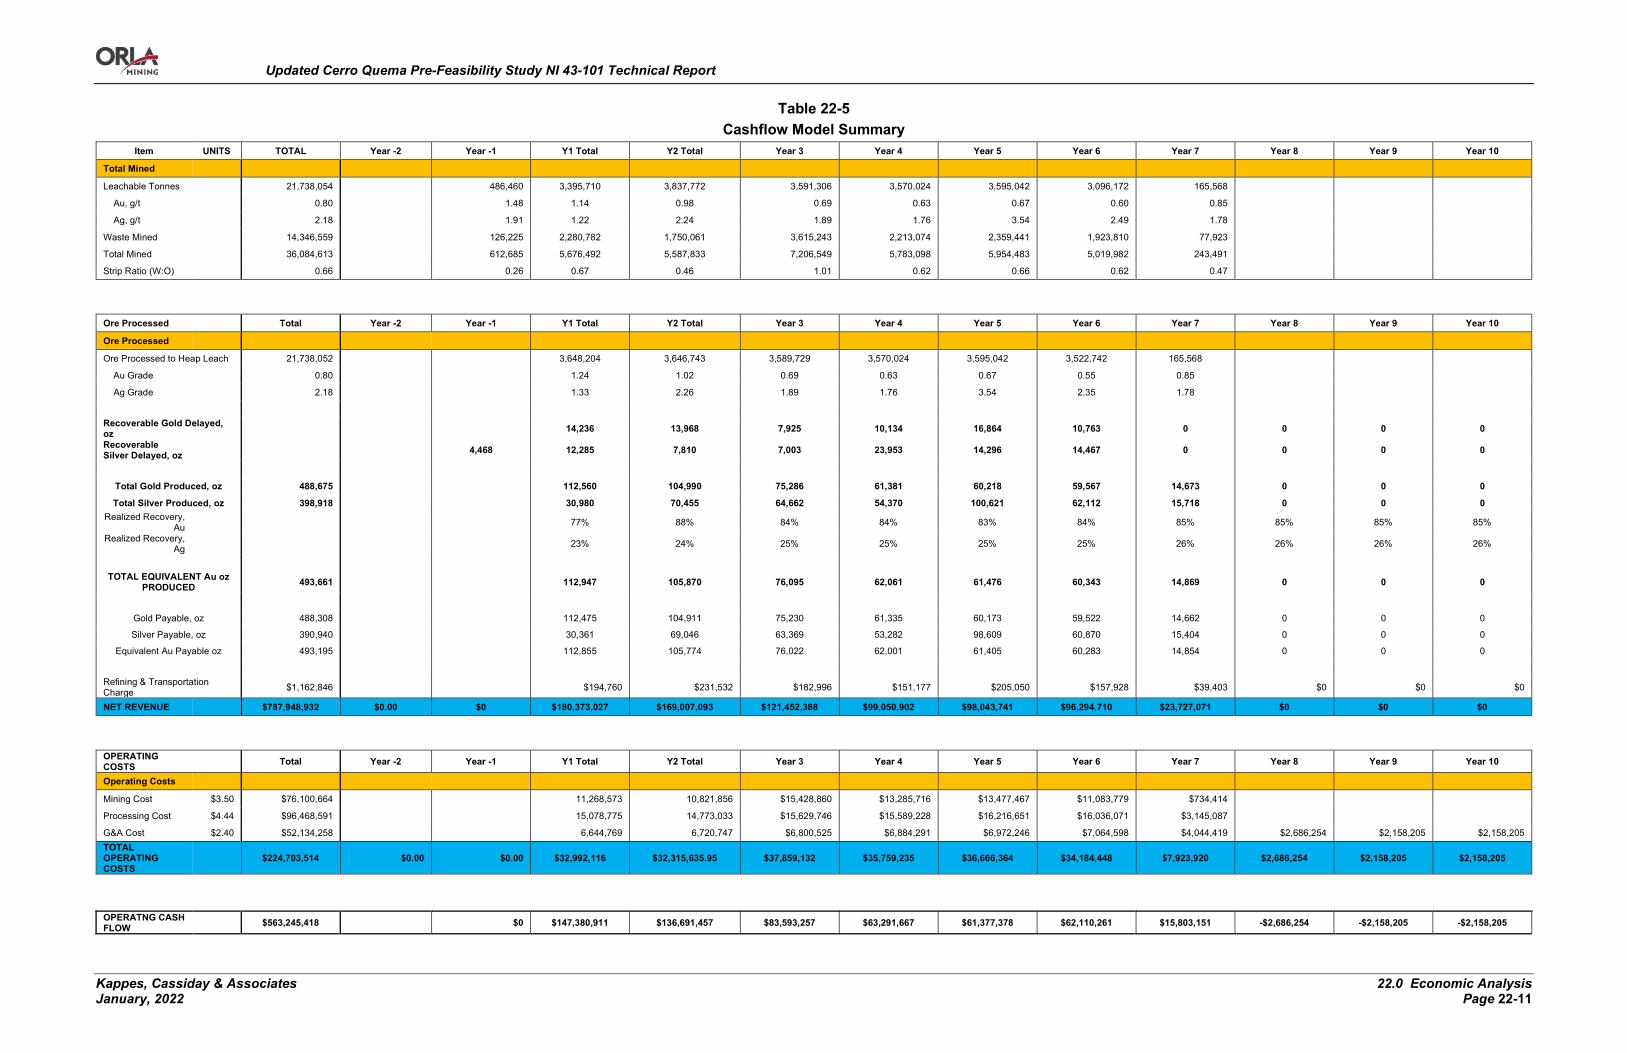
Updated Cerro Quema Pre-Feasibility Study NI 43-101 Technical Report
Kappes, Cassiday & Associates 22.0 Economic Analysis January, 2022 Page 22-11
Table 22-5 Cashflow Model Summary
Item UNITS TOTAL Year -2 Year -1 Y1 Total Y2 Total Year 3 Year 4 Year 5 Year 6 Year 7 Year 8 Year 9 Year 10
Total Mined
Leachable Tonnes 21,738,054 486,460 3,395,710 3,837,772 3,591,306 3,570,024 3,595,042 3,096,172 165,568
Au, g/t 0.80 1.48 1.14 0.98 0.69 0.63 0.67 0.60 0.85
Ag, g/t 2.18 1.91 1.22 2.24 1.89 1.76 3.54 2.49 1.78
Waste Mined 14,346,559 126,225 2,280,782 1,750,061 3,615,243 2,213,074 2,359,441 1,923,810 77,923
Total Mined 36,084,613 612,685 5,676,492 5,587,833 7,206,549 5,783,098 5,954,483 5,019,982 243,491
Strip Ratio (W:O) 0.66 0.26 0.67 0.46 1.01 0.62 0.66 0.62 0.47
Ore Processed Total Year -2 Year -1 Y1 Total Y2 Total Year 3 Year 4 Year 5 Year 6 Year 7 Year 8 Year 9 Year 10
Ore Processed
Ore Processed to Heap Leach 21,738,052 3,648,204 3,646,743 3,589,729 3,570,024 3,595,042 3,522,742 165,568
Au Grade 0.80 1.24 1.02 0.69 0.63 0.67 0.55 0.85
Ag Grade 2.18 1.33 2.26 1.89 1.76 3.54 2.35 1.78
Recoverable Gold Delayed, oz 14,236 13,968 7,925 10,134 16,864 10,763 0 0 0 0 Recoverable Silver Delayed, oz
4,468 12,285 7,810 7,003 23,953 14,296 14,467 0 0 0 0
Total Gold Produced, oz 488,675 112,560 104,990 75,286 61,381 60,218 59,567 14,673 0 0 0
Total Silver Produced, oz 398,918 30,980 70,455 64,662 54,370 100,621 62,112 15,718 0 0 0 Realized Recovery,
Au 77% 88% 84% 84% 83% 84% 85% 85% 85% 85%
Realized Recovery, Ag
23% 24% 25% 25% 25% 25% 26% 26% 26% 26%
TOTAL EQUIVALENT Au oz
PRODUCED 493,661 112,947 105,870 76,095 62,061 61,476 60,343 14,869 0 0 0
Gold Payable, oz 488,308 112,475 104,911 75,230 61,335 60,173 59,522 14,662 0 0 0
Silver Payable, oz 390,940 30,361 69,046 63,369 53,282 98,609 60,870 15,404 0 0 0
Equivalent Au Payable oz 493,195 112,855 105,774 76,022 62,001 61,405 60,283 14,854 0 0 0
Refining & Transportation Charge $1,162,846 $194,760 $231,532 $182,996 $151,177 $205,050 $157,928 $39,403 $0 $0 $0
NET REVENUE $787,948,932 $0.00 $0 $180,373,027 $169,007,093 $121,452,388 $99,050,902 $98,043,741 $96,294,710 $23,727,071 $0 $0 $0
OPERATING COSTS Total Year -2 Year -1 Y1 Total Y2 Total Year 3 Year 4 Year 5 Year 6 Year 7 Year 8 Year 9 Year 10
Operating Costs
Mining Cost $3.50 $76,100,664 11,268,573 10,821,856 $15,428,860 $13,285,716 $13,477,467 $11,083,779 $734,414
Processing Cost $4.44 $96,468,591 15,078,775 14,773,033 $15,629,746 $15,589,228 $16,216,651 $16,036,071 $3,145,087
G&A Cost $2.40 $52,134,258 6,644,769 6,720,747 $6,800,525 $6,884,291 $6,972,246 $7,064,598 $4,044,419 $2,686,254 $2,158,205 $2,158,205 TOTAL OPERATING COSTS
$224,703,514 $0.00 $0.00 $32,992,116 $32,315,635.95 $37,859,132 $35,759,235 $36,666,364 $34,184,448 $7,923,920 $2,686,254 $2,158,205 $2,158,205
OPERATNG CASH FLOW $563,245,418 $0 $147,380,911 $136,691,457 $83,593,257 $63,291,667 $61,377,378 $62,110,261 $15,803,151 -$2,686,254 -$2,158,205 -$2,158,205
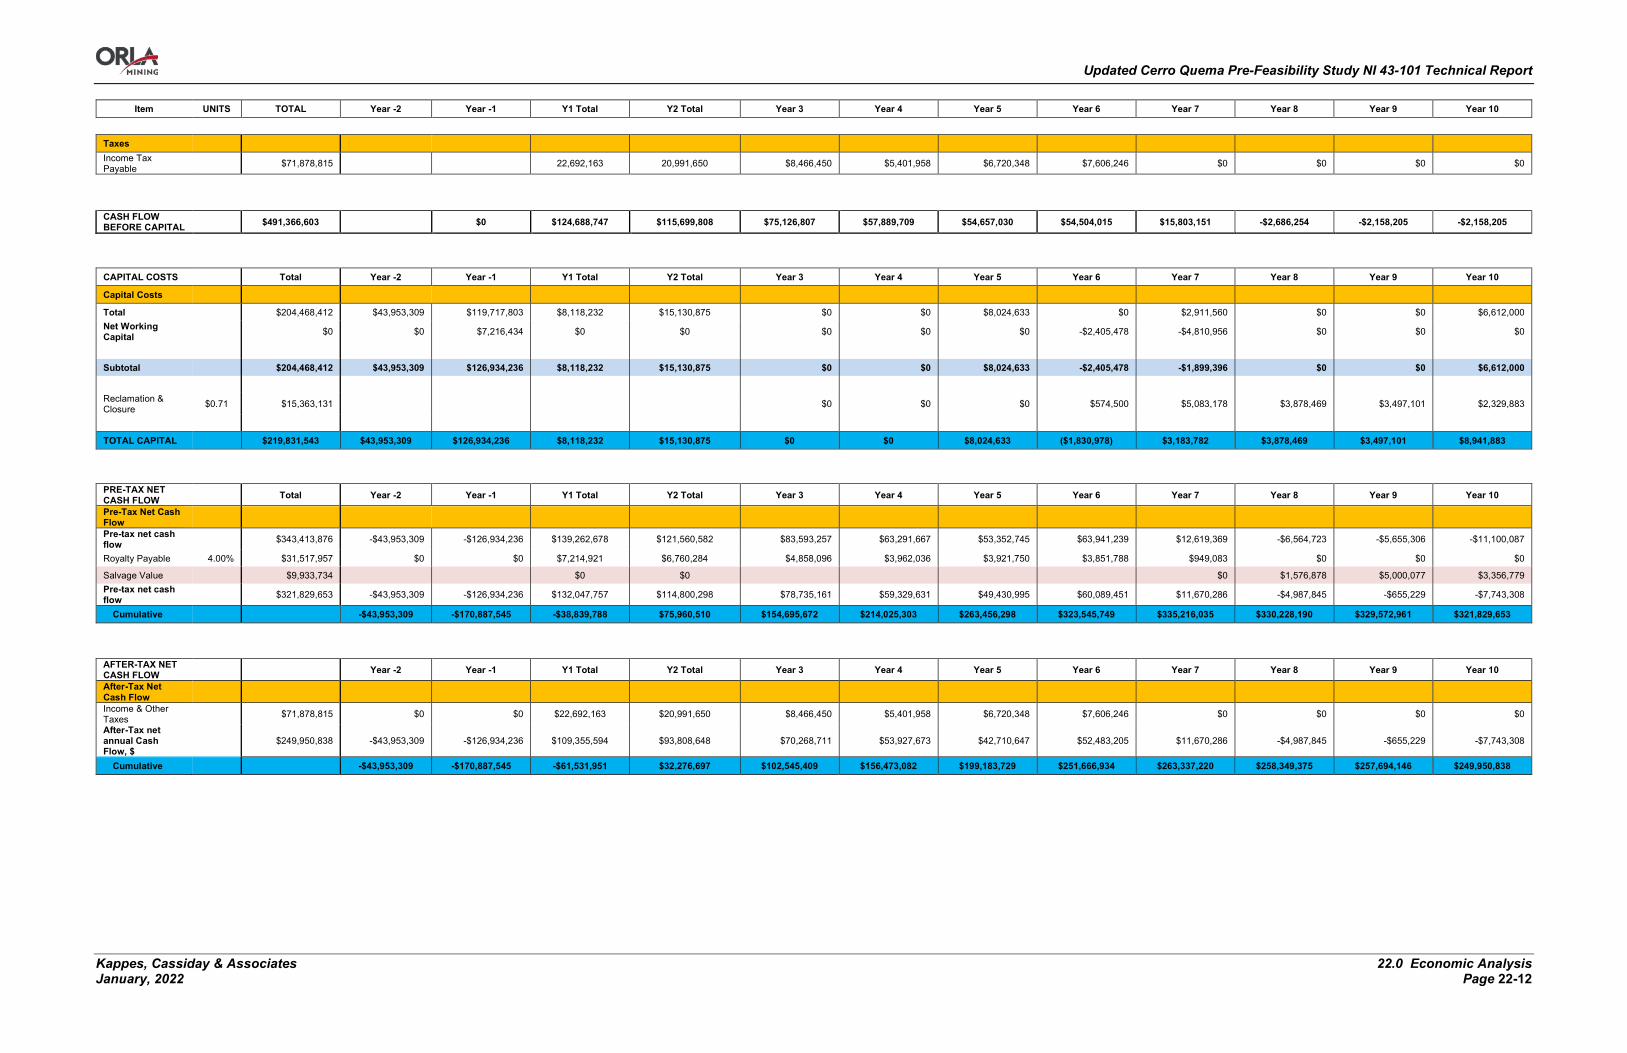
Updated Cerro Quema Pre-Feasibility Study NI 43-101 Technical Report
Kappes, Cassiday & Associates 22.0 Economic Analysis January, 2022 Page 22-12
Item UNITS TOTAL Year -2 Year -1 Y1 Total Y2 Total Year 3 Year 4 Year 5 Year 6 Year 7 Year 8 Year 9 Year 10
Taxes Income Tax Payable
$71,878,815 22,692,163 20,991,650 $8,466,450 $5,401,958 $6,720,348 $7,606,246 $0 $0 $0 $0
CASH FLOW BEFORE CAPITAL $491,366,603 $0 $124,688,747 $115,699,808 $75,126,807 $57,889,709 $54,657,030 $54,504,015 $15,803,151 -$2,686,254 -$2,158,205 -$2,158,205
CAPITAL COSTS Total Year -2 Year -1 Y1 Total Y2 Total Year 3 Year 4 Year 5 Year 6 Year 7 Year 8 Year 9 Year 10
Capital Costs
Total $204,468,412 $43,953,309 $119,717,803 $8,118,232 $15,130,875 $0 $0 $8,024,633 $0 $2,911,560 $0 $0 $6,612,000 Net Working Capital
$0 $0 $7,216,434 $0 $0 $0 $0 $0 -$2,405,478 -$4,810,956 $0 $0 $0
Subtotal $204,468,412 $43,953,309 $126,934,236 $8,118,232 $15,130,875 $0 $0 $8,024,633 -$2,405,478 -$1,899,396 $0 $0 $6,612,000
Reclamation & Closure $0.71 $15,363,131 $0 $0 $0 $574,500 $5,083,178 $3,878,469 $3,497,101 $2,329,883
TOTAL CAPITAL $219,831,543 $43,953,309 $126,934,236 $8,118,232 $15,130,875 $0 $0 $8,024,633 ($1,830,978) $3,183,782 $3,878,469 $3,497,101 $8,941,883
PRE-TAX NET CASH FLOW Total Year -2 Year -1 Y1 Total Y2 Total Year 3 Year 4 Year 5 Year 6 Year 7 Year 8 Year 9 Year 10
Pre-Tax Net Cash Flow
Pre-tax net cash flow $343,413,876 -$43,953,309 -$126,934,236 $139,262,678 $121,560,582 $83,593,257 $63,291,667 $53,352,745 $63,941,239 $12,619,369 -$6,564,723 -$5,655,306 -$11,100,087
Royalty Payable 4.00% $31,517,957 $0 $0 $7,214,921 $6,760,284 $4,858,096 $3,962,036 $3,921,750 $3,851,788 $949,083 $0 $0 $0
Salvage Value $9,933,734 $0 $0 $0 $1,576,878 $5,000,077 $3,356,779 Pre-tax net cash flow
$321,829,653 -$43,953,309 -$126,934,236 $132,047,757 $114,800,298 $78,735,161 $59,329,631 $49,430,995 $60,089,451 $11,670,286 -$4,987,845 -$655,229 -$7,743,308
Cumulative -$43,953,309 -$170,887,545 -$38,839,788 $75,960,510 $154,695,672 $214,025,303 $263,456,298 $323,545,749 $335,216,035 $330,228,190 $329,572,961 $321,829,653
AFTER-TAX NET CASH FLOW Year -2 Year -1 Y1 Total Y2 Total Year 3 Year 4 Year 5 Year 6 Year 7 Year 8 Year 9 Year 10
After-Tax Net Cash Flow
Income & Other Taxes $71,878,815 $0 $0 $22,692,163 $20,991,650 $8,466,450 $5,401,958 $6,720,348 $7,606,246 $0 $0 $0 $0
After-Tax net annual Cash Flow, $
$249,950,838 -$43,953,309 -$126,934,236 $109,355,594 $93,808,648 $70,268,711 $53,927,673 $42,710,647 $52,483,205 $11,670,286 -$4,987,845 -$655,229 -$7,743,308
Cumulative -$43,953,309 -$170,887,545 -$61,531,951 $32,276,697 $102,545,409 $156,473,082 $199,183,729 $251,666,934 $263,337,220 $258,349,375 $257,694,146 $249,950,838
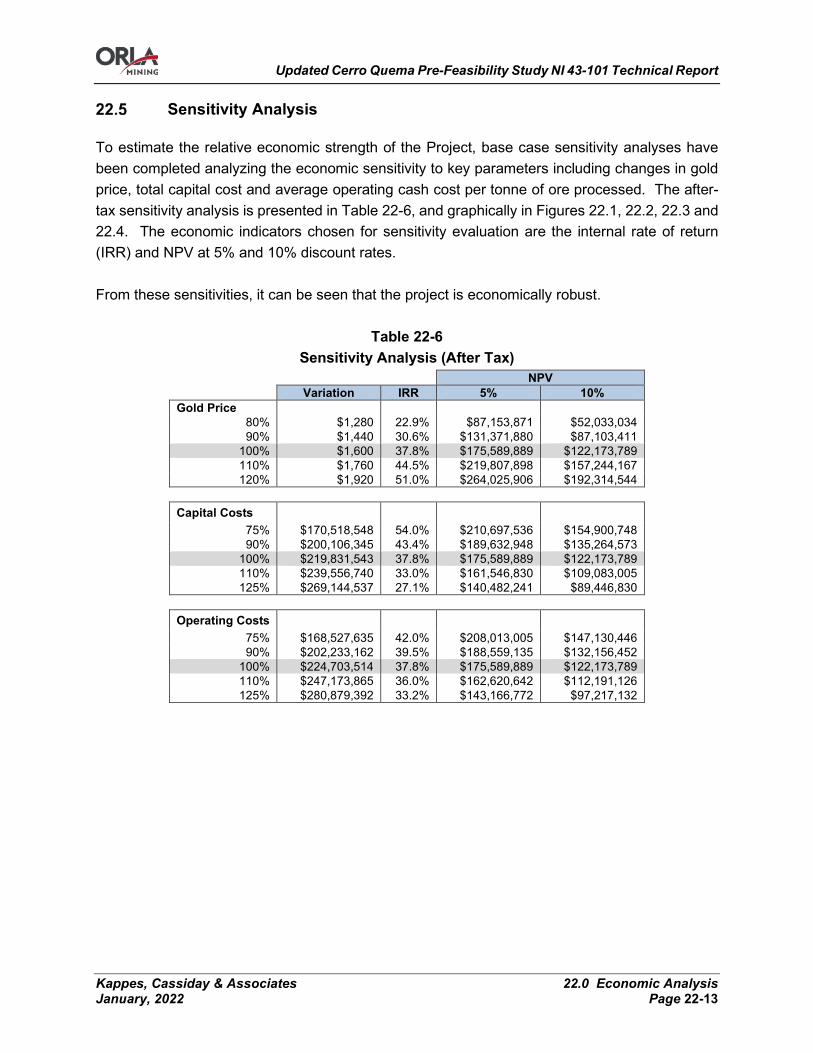
Updated Cerro Quema Pre-Feasibility Study NI 43-101 Technical Report
Kappes, Cassiday & Associates 22.0 Economic Analysis January, 2022 Page 22-13
Sensitivity Analysis
To estimate the relative economic strength of the Project, base case sensitivity analyses have been completed analyzing the economic sensitivity to key parameters including changes in gold price, total capital cost and average operating cash cost per tonne of ore processed. The after-tax sensitivity analysis is presented in Table 22-6, and graphically in Figures 22.1, 22.2, 22.3 and 22.4. The economic indicators chosen for sensitivity evaluation are the internal rate of return (IRR) and NPV at 5% and 10% discount rates. From these sensitivities, it can be seen that the project is economically robust.
Table 22-6 Sensitivity Analysis (After Tax)
NPV Variation IRR 5% 10% Gold Price
80% $1,280 22.9% $87,153,871 $52,033,034 90% $1,440 30.6% $131,371,880 $87,103,411
100% $1,600 37.8% $175,589,889 $122,173,789 110% $1,760 44.5% $219,807,898 $157,244,167 120% $1,920 51.0% $264,025,906 $192,314,544
Capital Costs
75% $170,518,548 54.0% $210,697,536 $154,900,748 90% $200,106,345 43.4% $189,632,948 $135,264,573
100% $219,831,543 37.8% $175,589,889 $122,173,789 110% $239,556,740 33.0% $161,546,830 $109,083,005 125% $269,144,537 27.1% $140,482,241 $89,446,830
Operating Costs
75% $168,527,635 42.0% $208,013,005 $147,130,446 90% $202,233,162 39.5% $188,559,135 $132,156,452
100% $224,703,514 37.8% $175,589,889 $122,173,789 110% $247,173,865 36.0% $162,620,642 $112,191,126 125% $280,879,392 33.2% $143,166,772 $97,217,132

Updated Cerro Quema Pre-Feasibility Study NI 43-101 Technical Report
Kappes, Cassiday & Associates 22.0 Economic Analysis January, 2022 Page 22-14
Figure 22-2 After-Tax Sensitivity – IRR (KCA, 2021)
Figure 22-3 After-Tax Sensitivity – NPV @ 5% (KCA, 2021)
0%
10%
20%
30%
40%
50%
60%
75% 85% 95% 105% 115% 125%
IRR
Percentage of Base Case
After Tax IRR
Gold Price
Capital Costs
Operating Costs
$0
$50
$100
$150
$200
$250
$300
75% 85% 95% 105% 115% 125%
NPV
, Mill
ion
US
$
Percentage of Base Case
After Tax NPV @ 5%
Gold Price
Capital Costs
Operating Costs

Updated Cerro Quema Pre-Feasibility Study NI 43-101 Technical Report
Kappes, Cassiday & Associates 23.0 Adjacent Properties January, 2022 Page 23-1
23.0 ADJACENT PROPERTIES
There are no active exploration properties or producing mines immediately adjacent to the Cerro Quema Project.
Updated Cerro Quema Pre-Feasibility Study NI 43-101 Technical Report
Kappes, Cassiday & Associates 24.0 Other Relevant Data and Information January, 2022 Page 24-1
24.0 OTHER RELEVANT DATA AND INFORMATION
Project Implementation
Project Development
The development philosophy for the Project assumes that Orla will hire an EPCM Project Management Company (PMC) that will act on behalf of the owner to complete the detail engineering and project implementation. The PMC will manage and supervise the engineering consultants. The PMC will also execute the following responsibilities:
• Procurement tasks for all equipment and supplies; • Logistics tasks; • Project controls; • Process all accounts payable documentation; • Scheduling; • Contracts management; • Project safety; • Client reporting.
Project Controls
Standard project controls will be used during the implementation of the Cerro Quema Project. Multiple software packages are normally used to control various aspects of the following:
• Document control; • Tech specifications and manuals; • Project budget; • Contracts; • Purchasing; • Expediting and logistics; • Bidding process and tracking; • Change orders; • Receiving / warehousing and materials management; • Construction job cost system and interface with the accounting system; • Tracking and forecasting costs estimates to completion (“ETC”); • Scheduling; • Safety statistics.

Updated Cerro Quema Pre-Feasibility Study NI 43-101 Technical Report
Kappes, Cassiday & Associates 24.0 Other Relevant Data and Information January, 2022 Page 24-2
A project server will be dedicated to storage and there will be controlled access to all project relevant documents. Weekly progress reports and monthly cost reports of project status will be prepared and distributed.
Procurement and Logistics
The PMC will purchase all material for the Project on behalf of the Owner. This enables direct control over the procurement budget and schedule. The team performs equipment technical reviews and negotiations, analyses the total delivery cost, issues recommendations and produces the purchase orders or contractual documents upon owner’s approval. The team coordinates logistics and assists suppliers. Freight forwarding is managed dynamically to minimize the freight transit times and avoid transportation issues. A weekly expediting report is also generated showing the status of purchase orders and latest estimate of delivery dates for each purchase with latest status of customs clearances, etc.
Construction
The PMC will provide the site construction management team and supplement the site staff with resources as required. Personnel that are planned to be kept after the preproduction period and become operations key personnel will be directly hired by the owner. Lump sum contracts will be considered when practical and cost reimbursable contracts will be awarded when preferable. Early in the project, mobile equipment will be purchased by the owner for use during the construction phase that will be turned over to the operations group shortly after commissioning. This equipment includes:
• 50 t all-terrain crane; • 10 t boom truck; • Forklift; • Telehandler; • Backhoe / loader; • 992 loader; • D6 dozer; • Maintenance truck.
This equipment will be purchased new over the course of the project as the need for each arises. For this study, quotations were received that considered all contractors bringing their own cranes. In practise, it is usually more efficient and less expensive if the owner purchases one crane and

Updated Cerro Quema Pre-Feasibility Study NI 43-101 Technical Report
Kappes, Cassiday & Associates 24.0 Other Relevant Data and Information January, 2022 Page 24-3
rents sufficient additional cranes for each phase of the project. The owner can then globally manage and allocate cranes to each contractor’s activities on an as-needed basis. The owner will contract one concrete batch plant for the site or alternatively operate their own. All concrete requirements for the Project will be supplied at the owner’s cost and delivered to the contractor. The owner will provide sanitary services, domestic water and general services supply throughout the Project site at no cost to the contractors.
Construction Schedule
Assuming permits are awarded on schedule and there are no significant issues or set-backs, it is envisioned for the project construction to begin in the 1st Quarter 2022 and production to start during the 4th Quarter 2023. It is expected to take approximately 24 months from the beginning of site construction to the pouring of the first doré bar. The first six of these months will include:
• Conclusion of detailed engineering; • Detailed execution plan implementation; • Camp expansion; • Final orders for long lead-time equipment items; • Earthworks contractor mobilization; and • Roads, culverts and building diversions.
A proposed project development and implementation schedule is presented in Figure 24-1.

Updated Cerro Quema Pre-Feasibility Study NI 43-101 Technical Report
Kappes, Cassiday & Associates 24.0 Other Relevant Data and Information January, 2022 Page 24-4

Updated Cerro Quema Pre-Feasibility Study NI 43-101 Technical Report
Kappes, Cassiday & Associates 24.0 Other Relevant Data and Information January, 2022 Page 24-5
Figure 24-1 Project Development & Implementation Schedule (KCA, 2021)
Updated Cerro Quema Pre-Feasibility Study NI 43-101 Technical Report
Kappes, Cassiday & Associates 24.0 Other Relevant Data and Information January, 2022 Page 24-6
Site Geotechnical Analyses
Heap Leach Pad Stability
A slope stability analysis was performed on the Maricela HLF to provide minimum design criteria for civil design of heap leach pad. The following tasks were performed:
• Determination of geotechnical material properties of heap leach ore, liner system interface, foundation materials and borrow source materials for the slope stability analyses based on previous and current field works and laboratory investigation;
• Limit-equilibrium slope stability analyses under both static and pseudo-static conditions. Failure surfaces along the liner and foundation of the HLF were analyzed, also, stability of the dikes of the pregnant, event and underdrain ponds, and cut slopes around the HLF and ponds were assessed.
Geotechnical field and laboratory testing programs were performed for past facility designs by Knight Piésold (1994), Tetra Tech (2008) and Golder (2014) to determine foundation soil characteristics. Also, as part of this study, additional field investigations were performed which included: drillholes, test pits, penetration tests, geological-geotechnical mapping, geomechanical stations, hydrogeological mapping, density determination, in situ permeability and piezometers installation. Geotechnical laboratory testing on foundation and borrow source materials was also performed which consisted of soil classification, standard and modified Proctor, unconfined compressive strength, point load test and triaxial shear strength. Ore samples were analyzed by rigid wall hydraulic conductivity and triaxial tests. HLF stability analyses included evaluation of block-type failure surfaces for both static and pseudo-static conditions for the ultimate heap configuration and cut slopes around the leach pad, resulting that the HLF is geotechnically stable under those loading conditions. A dam break analysis was performed to analyze the combined effects of the retention dikes of the pregnant and event ponds considering sunny and rainy-day conditions according to the recommendations of the CDA guidelines. Embankment consequence classification allowed to define the return period of the flood and seismic events and to design the facilities.
Waste Dump Stability
A slope stability analysis was performed on the Upper Chontal Waste Rock Dump (WRD) to provide minimum design criteria for civil design of the WRD. The following tasks were performed:

Updated Cerro Quema Pre-Feasibility Study NI 43-101 Technical Report
Kappes, Cassiday & Associates 24.0 Other Relevant Data and Information January, 2022 Page 24-7
• Determination of geotechnical material properties of waste rock, foundation materials and borrow source materials for the slope stability analysis based on current and previous field work and laboratory investigation;
• Limit-equilibrium slope stability analyses to evaluate potential instabilities through the WRD under both static and pseudo-static conditions.
Geotechnical field and laboratory testing programs were performed for past facility designs by Knight Piésold (1994), Tetra Tech (2008) and Golder (2014) to determine foundation soil characteristics. Also, as part of this study, additional field investigations were performed which included: drillholes, test pits, penetration tests, geological-geotechnical mapping, geomechanical stations, hydrogeological mapping, density determination, in situ permeability and piezometers installation. Geotechnical laboratory testing on foundation materials was also performed which consisted of soil classification, unconfined compressive strength and point load test. WRD stability analyses included evaluation of block-type (non-circular because of the low-permeability soil liner), shallow circular and deep circular potential failure types for both static and seismic loading conditions. Results indicate that the WRD is geotechnically stable under static and seismic loading conditions.
Pit Slope Design
Slope stability analyses were performed by Golder (2013) for the La Pava and Quema Quemita open pits to support slope design recommendations. The following analyses were performed:
• Kinematic analyses to evaluate the potential for development of bench and inter- ramp-scale plane shear and wedge failures in rock;
• Limit-equilibrium analyses to evaluate the potential for development of slope instability in overall slopes due to overstressing of the bedrock.
Fault orientations were collected and summarized, and rock structures were measured and characterized during a site reconnaissance to support the kinematic analyses. Results indicate that wedge and plane-shear failures are not likely to form over large portions of the pit slopes. Geotechnical core logging, field index testing, and focused laboratory testing was performed to develop a model of the geotechnical material properties for the geologic units that comprise the pit slopes. Limit-equilibrium stability analyses included circular failure types for two groundwater conditions. Results indicate that pit slopes are stable for the recommended slope configuration.

Updated Cerro Quema Pre-Feasibility Study NI 43-101 Technical Report
Kappes, Cassiday & Associates 24.0 Other Relevant Data and Information January, 2022 Page 24-8
IFC Performance Standards and Industry Best Practices
Orla intends to develop the project in accordance with international standards. ERM Consultants Canada Ltd. was contracted to assess what further studies and plans must be completed to comply with IFC Performance Standards and Industry Best Practices (ERM Consultants Canada Ltd., 2021). ERM is providing guidance to Orla, and their recommendations will be addressed in the continuing evaluation of the Project.
Updated Cerro Quema Pre-Feasibility Study NI 43-101 Technical Report
Kappes, Cassiday & Associates 25.0 Interpretations and Conclusions January, 2022 Page 25-1
25.0 INTERPRETATIONS AND CONCLUSIONS
Based upon the studies of the Cerro Quema project, the following conclusions, opportunities, and risks have been identified that merit further consideration during future studies and project development:
Conclusions
The work that has been completed to date has demonstrated that Cerro Quema is a potentially technically and economically viable project and justifies additional work, including Feasibility analysis. More specific and detailed conclusions are presented in the Sections below.
Resource Estimate
• The Mineral Resource estimate for the Project conforms to industry best practices, and meets the requirements of CIM (CIM, 2014) following the updated CIM guidelines (CIM, 2019).
• The estimate is based upon geology, alteration and oxidation zones. The database consists of over 81,000 m of assayed length in the La Pava, Quema-Quemita and Caballito resource areas. The drillhole database was supported by over 10,000 quality QA/QC samples.
• The Mineral Resource estimate is based on reasonable assumptions to create a confining shape of reasonable prospects of eventual economic extraction assuming open pit mining methods and NSR cutoffs based on processing costs, smelter terms and metallurgical recoveries that are the same as those used for the reserve estimate.
• Measured and Indicated Mineral Resources of oxide and mixed material that totals 34 Mt at 0.64 g/t Au and Inferred Mineral Resources of 7.5 Mt grading 0.33 g/t Au. The sulphide Measured and Indicated resource at Caballito totals 32Mt at a CuEq grade of 0.96% with an Inferred resource of 23Mt of at a CuEq grade of 0.85%.
• The following factors could affect the Mineral Resources: permitting issues, commodity price and exchange rate assumptions; pit slope angles and other geotechnical factors; assumptions used in generating the LG pit shell, including metal recoveries, and mining and process cost assumptions.
Mining
The PFS mine plan and production schedule demonstrate viable economics for the extraction of approximately 21.7M tonnes of ore with an average gold grade of 0.8g/t and average silver grade of 2.18 g/t. This ore can be economically extracted from phased La Pava and Quema pits using a conventional owner operating mining fleet, resulting in slightly more than 6 years of heap leach feed.

Updated Cerro Quema Pre-Feasibility Study NI 43-101 Technical Report
Kappes, Cassiday & Associates 25.0 Interpretations and Conclusions January, 2022 Page 25-2
The detailed design pits for La Pava and Quema capture a significant portion of the resource while ensuring reasonable insulation from revenue fluctuations caused by metal prices or operating cost variances. The pits also demonstrate that resource tonnes are not significantly impacted by changes in overall pit slope angles.
Metallurgy and Process
The project has been designed as an open-pit mine with heap leach for recovery of gold and silver from oxide and transition material. Leachable material will be crushed to minus 150mm, stockpiled, reclaimed and conveyor stacked onto the heap leach pad at an average rate of 10,000 tonnes/day. Stacked material will be leached using low grade sodium cyanide solution and the resulting pregnant leach solution will be processed in an Adsorption, Desorption and Recovery plant for the recovery of gold and silver. Metallurgical test work completed on samples to date shows that the material is amenable to cyanide leaching for the recovery of precious metals with acceptable recoveries for gold and silver and low to moderate reagent consumptions. Cement agglomeration does not appear to be required based on compaction and permeability tests with only lime being required for pH control. The expected gold recovery is 88% for all La Pava oxide material and 86% for Quema-Quemita oxides. La Pava and Quema-Quemita mixed materials are less amenable to heap leaching and are discounted to recoveries of 57% for La Pava and 62% for Quema-Quemita.
Environmental and Permitting
An environmental impact assessment (EIA) and permits are in place for a continuous vat leach operation previously proposed for the project. However, as the current project will utilize heap leach processing methods, MCQ initiated an update of the EIA and associated permits based on the new project design to meet Panamanian ANAM requirements. An application for the required Category 3 EIA permit was submitted in 2015. The Ministry has completed the technical evaluation of the EIA, and MCQ believes the Ministry is in the process of preparing the formal resolution to approve it. Timing of approval is presently not known. In 2020 MCQ contracted ERM Consultants Canada Ltd. to assess if the information presented in the EIA is in accordance with the requirements established by Panamanian regulations, International Finance Corporation Performance Standards 2012 (IFC PS), and currently accepted industry best practices. ERM found no fatal flaws with respect to Panamanian regulations but identified areas where environmental permitting studies and management plans should be improved to fully meet local requirements, International Standards and currently accepted industry practices (ERM Consultants Canada Ltd., 2021). ERM provided recommendations that should be followed as the project advances beyond the Pre-Feasibility level.
Updated Cerro Quema Pre-Feasibility Study NI 43-101 Technical Report
Kappes, Cassiday & Associates 25.0 Interpretations and Conclusions January, 2022 Page 25-3
Opportunities
Mineral Resource and Exploration Potential
Infill and step out drilling at Caballito, La Pava and Quemita could expand the resource and increase the confidence and classification of the resource. There is also potential to further explore the sulphide resource with priority drill targets defined at Quemita, La Pelona and La Prieta. Further drilling is also recommended to upgrade and potentially grow the Caballito Resources as well as La Pava and Quemita Cu-Au sulphide mineralization. These deposits are mostly open at depth and along strike and offer good potential for additional Cu-Au high sulphidation style mineralization. Any significant resources growth and discoveries could positively impact the economic value of the project.
Mining
Further optimization of phase designs may allow for improvements to the hauling network and increased backfill opportunities, which would reduce mine operating costs. Detailed geotechnical site investigations may allow for the design of steeper bench face angles and/or inter ramp angles. This could allow for steeper pit walls which could reduce waste tonnes and increase ore tonnes.
Metallurgy and Process
Delays in silver recoveries from past metallurgical testwork show the opportunity for higher-than-expected recovery from subsequent lifts and saturation of heap leach material beyond the 70-day leach cycle.
Other Opportunities
• Water quantities from rainfall in the area during the rainy season may result in significant dilution effects directly or indirectly through additional spring or stream flow. This may reduce or eliminate the need for water treatment for different stages of the project. The effect of precipitation and spring flows were accounted for in the evaluations but based were on limited data, so the effects may be greater than that simulated.
• Given the oxide nature of the Quema-Quemita and La Pava deposit, water quality may improve with time in the post-closure period as acidic salts are rinsed and given that residual sulphides, while still present, are relatively low. Long-term geochemical testing is underway to further evaluate post-closure geochemical behavior.

Updated Cerro Quema Pre-Feasibility Study NI 43-101 Technical Report
Kappes, Cassiday & Associates 25.0 Interpretations and Conclusions January, 2022 Page 25-4
• Maricela HLF has been sized with extra capacity which can be used if additional leachable Mineral Resources are found in future. Also, additional expansion could be projected to the North of the projected facilities. Chontal WRD also can be expanded to the East to accommodate additional waste rock mine, if needed.
• As noted by the suppliers for power generation equipment, there is the opportunity for the use of natural gas for fuel supply. Natural gas is cleaner burning, more efficient and can be a more cost-effective method of power generation. At the time of this Technical Report, the natural gas infrastructure in Panama is not adequately developed to support its implementation at Cerro Quema, but the natural gas infrastructure is developing and may be sufficient at the time of construction of the Project.
• The assumption of 50 mg/l nitrate/ammonia from blasting residue may be high depending on the mix of source waters to be treated and the actual good housekeeping practices the mine blasting crews religiously follow that result in minimal nitrate residue. Mines that have a very proactive blasting residue reduction and quality control program can have concentrations as low as 20 mg/l nitrate/ammonia. This would reduce the both the CAPEX and OPEX costs of water treatment. With the WRD treatment system, we have recommended that the nitrate system be procured and installed several years after the start of operations because nitrate concentrations may not increase to action levels immediately.
• Potentially some pre-treatment (pH adjustment, mechanical aeration to drive residual ammonia to nitrate and/or nitrate reduction) of the process water can be achieved in a pond prior to the active treatment systems. This could potentially reduce the active equipment size, media consumption, and solids volume/handling requirements. There would be a trade off with pond “handling” but with a short mine life this may be a more economical approach.
• Preventing the formation of ARD (acid rock drainage) would significantly improve the loadings to the water treatment systems (both active and passive). This can be achieved by preventing/limiting the PAG waste rock (or ore) from contact with air (oxygen) and/or water, and by suppressing the biological component of ARD formation, Acidithiobacillus ferrooxidans. A comprehensive PAG handling plan with some focused anti-bacterial applications are worth evaluation to reduce the acidic nature, metals, and sulfate loading of the water. Any sustainable improvements of this type would reduce the CAPEX and OPEX cost for both the active and passive water treatment systems. Preliminary scoping of potential bactericide benefits could be coupled with ongoing humidity cell tests whose leachates exhibit acidic behavior.
• Passive treatment systems require relatively large flat areas for implementation. The areas that were selected in the Pre-Feasibility report were logistically close to the source water but perhaps not optimized for minimum earth work for construction which would reduce CAPEX.
Updated Cerro Quema Pre-Feasibility Study NI 43-101 Technical Report
Kappes, Cassiday & Associates 25.0 Interpretations and Conclusions January, 2022 Page 25-5
Risks
Resource
Risks to the resource include permitting risks, commodity price; pit slope angles; assumptions used in generating the LG pit shell, including metal recoveries, and mining and process cost assumptions. Risks of grade and continuity of mineralization have been mitigated through the classification and validation procedures and the use of robust geologic modelling.
Mining
The detailed pit designs included highwall ramps designed to match the operating widths of a 41t payload articulated haul truck. However, after designs were completed, the use of a mixed fleet that includes some larger 55t rigid frame haul trucks shows improved economics. The additional operating width results in a road width increase of 4m (double lane haul road). The detailed pit designs were not updated with this road width, which would slightly increase waste tonnages and/or decrease ore tonnages. The tonnage impact of the mixed fleet was not quantified in the PFS. There is risk associated with the limited geotechnical data for both the La Pava and Quema-Quemita pits. Although the design slope angles are not excessive, slope angles will be flatter than design if further investigation warrants it. This could reduce the amount of material mined and the ore available for processing. Additional risks exist in the mine plan due to absence of mining loss considerations. Typically, a small amount of ore tonnes are lost between loading and hauling to the crusher. While this is a small reduction in ore tonnes, it should be quantified.
Metallurgy and Process
Although metallurgical testwork has shown minimal issues with clay material being blended with silica material, stacked ore will rely on close observation of crusher feed. The possibility of high clay material being fed to the crusher becomes greater without proper sampling, labeling of high clay areas and accurate ongoing lab testwork. In order to ensure suitable material is being stacked on the heap, crusher feed will need to be closely monitored and blended when appropriate. Quema-Quemita and La Pava sulphide material is higher in sulphur, copper and other elements that negatively affect gold and silver recoveries. During operation, accurate reserve accounting and well-defined ore boundaries will need to be established to ensure minimal sulphides are processed in the heap leach facilities.
Updated Cerro Quema Pre-Feasibility Study NI 43-101 Technical Report
Kappes, Cassiday & Associates 25.0 Interpretations and Conclusions January, 2022 Page 25-6
Access, Title and Permitting
A specific title risk for Minera Cerro Quema is a failure of the Panamanian government to renew mining concessions as permitted by law. Prior operators and Minera Cerro Quema have met legal requirements to maintain in good standing the mining concession titles, however, as discussed in Section 4.2 of this Technical Report, the response of Panamanian authorities has been inconsistent with the mining law, and legally permitted concession renewals have repeatedly been delayed. Similarly, failure of the Panamanian government to approve the copper extraction rights for the same exploration contracts for which gold and silver rights were granted, will affect the viability of potential development of the Caballito zone. An Environmental Impact Assessment (EIA) and permits are in place for a continuous vat leach operation, however, the current project described in this Technical Report requires a modification to the existing permits. To develop a mine at Cerro Quema, a Category 3 EIA permit is required from the Ministry of Environment. An application for this permit was submitted in 2015 and the Ministry has completed the technical evaluation of the EIA. Timing of approval is presently not known but the Ministry’s response time has exceeded the time periods specified in Article 41 of the Decree Law 23 applicable to EIA permit resolutions.
Other Risks
• In closure, the pit lake may overflow if hydraulic conductivity values are very low in the base of the pit, requiring additional surface water controls and possibly storage to manage potentially poor-quality water flow overland. Planned hydrogeological activities will address this uncertainty.
• Pit water infiltrating into the groundwater system may migrate and discharge to surface water with potential water quality impacts. Planned hydrogeological activities will address this more quantitatively.
• Limestone amendment of cover systems may be required if sufficient topsoil is not available.
• Additional evaluation of borrow source suitability for use in operations and closure is warranted, including geochemical and hydraulic characteristics (particularly for use as cover).
• Dense vegetation led to potential inaccuracies in the site topography. Also, field investigations have been limited because of access restrictions to the heap leach facilities and waste rock dumps. Because of the natural dense vegetation condition of the whole area, a detailed investigation will be difficult to complete to identify topsoil thickness, unsuitable soil extension, steep slopes and harsh terrain areas. Therefore, final quantities of topsoil and unsuitable soil and final grading may have to be delayed until tree removal
Updated Cerro Quema Pre-Feasibility Study NI 43-101 Technical Report
Kappes, Cassiday & Associates 25.0 Interpretations and Conclusions January, 2022 Page 25-7
and clearing and grubbing of the whole area have been completed. Based on the actual terrain condition encountered, an engineering design update may be required prior to construction.
• Further characterization of springs in the WRD footprint is warranted for flow, chemistry, and location. The springs will need to be identified in detail to install finger drains to be connected to the underdrain system mainly in the WRD footprint; otherwise, the spring flow can generate surplus contact water to those predicted.
• If the design basis (water quality and flow rate) change for the water treatment plants then there is a risk of poor performance. This could mean process issues that require treatment equipment changes to meet discharge criteria or inadequate treatment capacity and the need to expand the plant size or increase pre-treated storage capacity. Linkan used some safety factors in sizing the equipment for the Pre-Feasibility report and selected systems that have some robustness to account for some potential process water changes.
• The water treatment designs are based on discharge standards from PR 351, Panama Resolution 351 for the discharge of liquid effluents to surface water and groundwater. If this changes to be more stringent, then the water treatment plants may have to be redesigned to accommodate the requirements. This would typically mean adding process equipment for additional polishing steps. This would increase both CAPEX and OPEX costs.
• Both the active and passive water treatment systems will produce solids wastes. The active plants will have backwash and precipitation residues and the passive systems will have (at some point) used media to dispose of. We have assumed that these solids can be managed on-site by incorporation into existing waste facilities or by “landfilling” as non-hazardous. It is typical to handle water treatment wastes in these ways and impractical to predict the exact solid waste make-up at this point. If there is a hazardous component, in many cases, the solid wastes can be further processed at reasonable cost to eliminate or sequester the hazardous component. There is also a possibility that waste residues or spent media can be processed for their mineral content to reduce disposal costs.
• Water characteristics are unique from site to site, source to source, and season to season. There are many interactive constituents that make each water distinctive and potentially not align with common treatment practices or standard expectations. Testing of the process water prior to commitment to the treatment process, design, and equipment may avoid significant troubleshooting, rework, and process underachievement issues. Bench and pilot testing has been included in the costs.
• Active treatment requires not only good process design but adequate hydraulic, electrical, structural, and controls design. The hydraulic gradient through a passive treatment system is just as important as the appropriate process/ media selections and cell sizing. Components need to have properly integrated infrastructure and controls to function effectively and efficiently as a whole system. Good engineering support and quality control during construction are key to implementation of the design.

Updated Cerro Quema Pre-Feasibility Study NI 43-101 Technical Report
Kappes, Cassiday & Associates 26.0 Recommendations January, 2022 Page 26-1
26.0 RECOMMENDATIONS
KCA Recommendations
The PFS presents an economically robust project. Based on these results, KCA recommends the following future work in regards to process and infrastructure development:
• The project should proceed to the feasibility study or basic engineering level for the oxide heap leach and further investigation should begin for the sulphide resource;
• Confirmatory metallurgical test work should be completed on oxide samples, specifically column leach tests on coarse crushed material and draindown chemistry;
• Metallurgical test work should be completed on sulphide samples and optimal recovery methods should be established.
• Additional studies and cost estimates for Project surface and groundwater flows, quality, storage and treatment should be considered;
• Perform additional geotechnical studies at the proposed heap leach, pit and processing areas;
• Availability of local services and personnel should be evaluated to maximize their utilization;
• Investigate the opportunity for power generation from the overland conveying system to help alleviate the on-site power generation requirements.
The estimated cost for the additional metallurgical test work and project development studies is approximately US$2M.
Moose Mountain Technical Services Recommendations
Assaying and QAQC
• It is recommended that Orla ensure all re-assays due to QAQC failures are reviewed and maintained in the QAQC and resource databases as appropriate.
• For future exploration programs, ICP-OES prepared using a 4-acid digestion is recommended as opposed to by Aqua Regia currently used, which may result in higher metallurgical recovery at the assay level.
Exploration
The QP recommends that additional drilling is undertaken at all three deposits to increase the extent and confidence of the current. The drilling should also include step-out drilling at Caballito and drilling for metallurgical testing. There is potential to further explore the sulphide resource

Updated Cerro Quema Pre-Feasibility Study NI 43-101 Technical Report
Kappes, Cassiday & Associates 26.0 Recommendations January, 2022 Page 26-2
with priority drill targets defined at Quemita, La Pelona and La Prieta. The recommended exploration and drilling budget is summarized in the table below.
Table 26-1 Exploration and Infill Drilling Budget
Deposit / Item US$ (000) Caballito 2,000 Quemita - Pava 1,000 Exploration of additional Targets 1,500 Assaying 500 Total 5,000
Feasibility Study Mine Planning
A feasibility level mine plan and production schedule are recommended, which would incorporate results from additional studies as follows:
• Detailed drilling and blasting study; • Detailed equipment size trade-off study; • Contractor mining cost trade-off study; • Short range mining operability study.
The estimated cost for the Feasibility level mining studies is approximately US$150,000.
Anddes Recommendations
Site Geotechnical
It is recommended that additional work be done to ensure that the currently planned site layout is feasible from a geotechnical standpoint. Some of the assumptions made in designing project facilities require field verification. Specific areas requiring additional field evaluation include:
• Building foundations; • Primary crusher structure and conveyor supports; • Access roads; • HLF foundation; • WRD foundation; • Unsuitable stockpiles; • Topsoil stockpiles.
Updated Cerro Quema Pre-Feasibility Study NI 43-101 Technical Report
Kappes, Cassiday & Associates 26.0 Recommendations January, 2022 Page 26-3
Standard geotechnical drilling, test pits, in situ testing, sampling and geotechnical laboratory testing need to be performed to allow detailed design of the facilities. Also, additional laboratory testing is needed for the characterization of the ore from both open pits and waste rock. The estimated cost for the additional geotechnical work is approximately US$250,000.
Mine Geotechnical
Additional geotechnical drilling should be completed within the planned open pits to design the pit slopes. This will confirm the current pit slope design basis and potentially allow an increase in the pit slope angles. Additional drilling, testing and analyses are required to develop a detailed plan for dewatering. This will involve several oriented core and vertical drillholes properly distributed along both pits, with production of detailed stratigraphic logs and sampling for laboratory testing. Drillholes would be completed as monitoring wells, and multiple-well aquifer testing will be performed to better assess the dewatering requirements for the material. Detailed pit slope design and mining plans must then be developed. The estimated cost for the additional geotechnical supervision is approximately US$250,000.
Sediment Control
The disturbed area should be minimized during construction and, whenever possible, temporary sediment control works such as soil compaction and installation of silt fences, among other measures, should be implemented, to be prepared before the beginning of each rainy season. Automated flow and sediment concentration measurement stations should be implemented to continuously record flow discharges. A sediment control and erosion study should be conducted during the operation stage, considering actual particle-size distribution analysis and the results of sediment concentration monitoring. The estimated cost for the sediment control study is approximately US$100,000.
Seismic Hazard
Seismic hazard study prepared by Golder (2014b) should be updated since there are new seismic wave attenuation models that allow a more accurate characterization of ground motion in terms of spectral accelerations. The estimated cost for an updated seismic hazard study is approximately US$20,000.
HGL Recommendations
Geochemistry
It is recommended that ongoing geochemical characterization of site materials be advanced to refine predictions of contact water chemistry for water treatment and to support water management for operations and closure. Continued geochemical characterization should

Updated Cerro Quema Pre-Feasibility Study NI 43-101 Technical Report
Kappes, Cassiday & Associates 26.0 Recommendations January, 2022 Page 26-4
include: completion of ongoing kinetic testing of waste rock materials; additional characterization of spent ore materials; further identification and characterization of borrow source materials; and identification and characterization of cover material sources. Hydraulic evaluations of the cover materials, cover performance, and the heap leach pad draindown are recommended to support closure water quality evaluations and water treatment design. Additionally, it is recommended that the pit lake chemistry modeling be updated with the results of updated geochemistry, hydrology and hydrogeology baseline studies, groundwater modeling, and pit lake water balance evaluations. Evaluation and modeling of potential impacts and treatment requirements to the groundwater and surface water systems from the pit lake are recommended. The estimated cost for the geochemistry investigations is approximately US$220,000.
Hydrology/Hydrogeology
Recommendations for the baseline hydrology and hydrogeology include:
• Continued monitoring of established surface water monitoring locations for flow and chemistry;
• Installation of additional groundwater monitoring wells; • Monitoring of groundwater elevations and chemistry; and • Characterization of hydraulic properties in the area of the pits.
Following collection of additional baseline and field data, construction of a groundwater model and updating of the pit lake model are recommended to reduce uncertainty in the pit lake predictions and to assess potential impacts from the pit lakes, as well as advance dewatering and closure evaluations. The estimated cost for the hydrology and hydrogeology field and modeling investigations is approximately US$850,000.
Site Water Balance
It is recommended that the site water balance model in GoldSim be updated and advanced to the FS level. The FS site water balance would incorporate updated information, such as: mine plan layouts, mining schedules, facility-specific water balances, hydrologic monitoring data, and future climate variability. The site water balance can then be used to test and optimize water usage, re-use, storage, pit water management, and flexibility to the wet/dry seasonality at the site. An FS-level site water balance is estimated to cost approximately US$100,000.
RGI Recommendations
RGI recommends an exploration program to seek satellite deposits to the La Pava and Quema-Quemita deposits, and to discover additional mineralization along the Caballito mineralized trend.
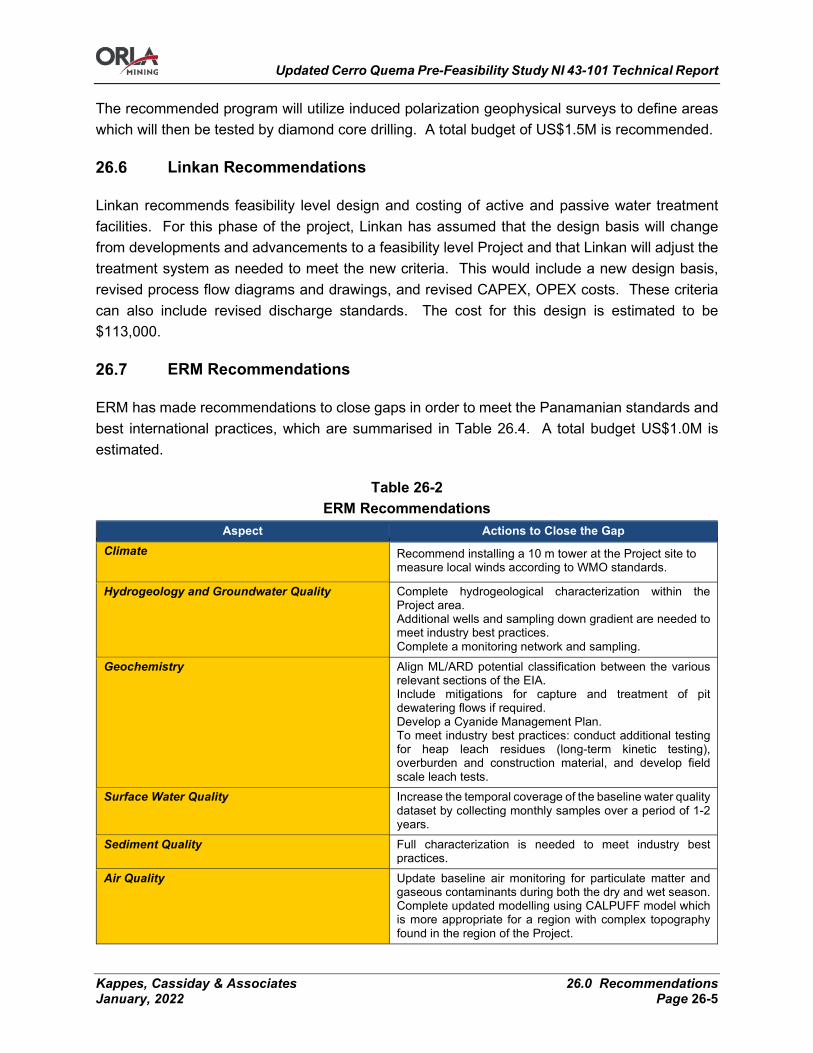
Updated Cerro Quema Pre-Feasibility Study NI 43-101 Technical Report
Kappes, Cassiday & Associates 26.0 Recommendations January, 2022 Page 26-5
The recommended program will utilize induced polarization geophysical surveys to define areas which will then be tested by diamond core drilling. A total budget of US$1.5M is recommended.
Linkan Recommendations
Linkan recommends feasibility level design and costing of active and passive water treatment facilities. For this phase of the project, Linkan has assumed that the design basis will change from developments and advancements to a feasibility level Project and that Linkan will adjust the treatment system as needed to meet the new criteria. This would include a new design basis, revised process flow diagrams and drawings, and revised CAPEX, OPEX costs. These criteria can also include revised discharge standards. The cost for this design is estimated to be $113,000.
ERM Recommendations
ERM has made recommendations to close gaps in order to meet the Panamanian standards and best international practices, which are summarised in Table 26.4. A total budget US$1.0M is estimated.
Table 26-2 ERM Recommendations
Aspect Actions to Close the Gap Climate Recommend installing a 10 m tower at the Project site to
measure local winds according to WMO standards.
Hydrogeology and Groundwater Quality Complete hydrogeological characterization within the Project area. Additional wells and sampling down gradient are needed to meet industry best practices. Complete a monitoring network and sampling.
Geochemistry Align ML/ARD potential classification between the various relevant sections of the EIA. Include mitigations for capture and treatment of pit dewatering flows if required. Develop a Cyanide Management Plan. To meet industry best practices: conduct additional testing for heap leach residues (long-term kinetic testing), overburden and construction material, and develop field scale leach tests.
Surface Water Quality Increase the temporal coverage of the baseline water quality dataset by collecting monthly samples over a period of 1-2 years.
Sediment Quality Full characterization is needed to meet industry best practices.
Air Quality Update baseline air monitoring for particulate matter and gaseous contaminants during both the dry and wet season. Complete updated modelling using CALPUFF model which is more appropriate for a region with complex topography found in the region of the Project.
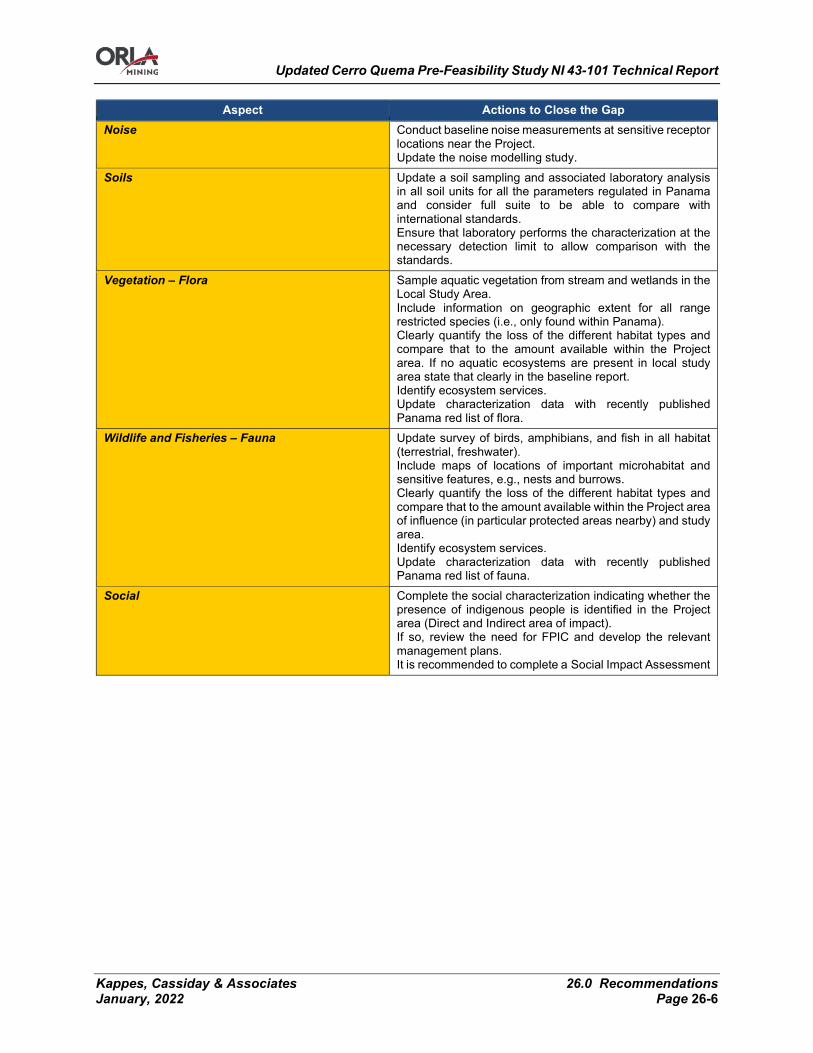
Updated Cerro Quema Pre-Feasibility Study NI 43-101 Technical Report
Kappes, Cassiday & Associates 26.0 Recommendations January, 2022 Page 26-6
Aspect Actions to Close the Gap Noise Conduct baseline noise measurements at sensitive receptor
locations near the Project. Update the noise modelling study.
Soils Update a soil sampling and associated laboratory analysis in all soil units for all the parameters regulated in Panama and consider full suite to be able to compare with international standards. Ensure that laboratory performs the characterization at the necessary detection limit to allow comparison with the standards.
Vegetation – Flora Sample aquatic vegetation from stream and wetlands in the Local Study Area. Include information on geographic extent for all range restricted species (i.e., only found within Panama). Clearly quantify the loss of the different habitat types and compare that to the amount available within the Project area. If no aquatic ecosystems are present in local study area state that clearly in the baseline report. Identify ecosystem services. Update characterization data with recently published Panama red list of flora.
Wildlife and Fisheries – Fauna Update survey of birds, amphibians, and fish in all habitat (terrestrial, freshwater). Include maps of locations of important microhabitat and sensitive features, e.g., nests and burrows. Clearly quantify the loss of the different habitat types and compare that to the amount available within the Project area of influence (in particular protected areas nearby) and study area. Identify ecosystem services. Update characterization data with recently published Panama red list of fauna.
Social Complete the social characterization indicating whether the presence of indigenous people is identified in the Project area (Direct and Indirect area of impact). If so, review the need for FPIC and develop the relevant management plans. It is recommended to complete a Social Impact Assessment
Updated Cerro Quema Pre-Feasibility Study NI 43-101 Technical Report
Kappes, Cassiday & Associates 27.0 References January, 2022 Page 27-1
27.0 REFERENCES
Alberto Einstein Ruiz De León and Francisco Iturralde 2009 – Estudio Hidrológico de las
Quebradas "Chontal" y "Seca" para Minera Cerro Quema S.A. November 15, 2009. Anddes, 2021a. Water Balance of the Waste Rock Dump. Cerro Quema Project. 2004.10.02-
12-100-2230-09-ITE-001. Lima, Peru. May 2021. Anddes, 2021b. Water Balance of the Heap Leach Facility. Cerro Quema Project. 2004.10.01-
3-100-09-ITE-002. Lima, Peru. May 2021. Anddes, 2021c. La Pava and Quema Quemita Open Pit Slopes. Cerro Quema Project.
Memorandum. 2004.10.01-2-210-24-MTE-001. Lima, Peru. May 2021 Anddes, 2021d. Heap Leach Pad Pre-Feasibility Study and Waste Rock Pre-Feasibility
Geotechnical Characterization. Cerro Quema Project. Final Report. 2004.10.01-3-100-09-ITE-001.Lima, Peru. May 2021
Anonymous. 1969. Results of detailed investigations in the Azuero area, Panama: United Nations
Development Program - Mineral Survey of the Azuero Area. United Nations. Arribas, A. 1995. "Characteristics of high-sulfidation epithermal deposits and their relation to
magmatic fluid." Mineralogical Association of Canada Short Course Series, v.23. Mineralogical Association of Canada.
Ashley, R.P. 1974. Goldfield Mining District, Nevada Bureau of Mines Geologic Report 19. Reno,
Nevada: Nevada Bureau of Mines. Basilio Pérez Ramos 2009 – Proyecto de Reforestación - Inventario Forestal de Plantaciones de
Pino y Acacia. May 2009. Berger, B.R, and Henley, R.W. 1989. "Advances in the understanding of epithermal gold silver
deposits with special reference to the western United States." The Geology of Gold Deposits, the Perspective in 1988, Economic Geology Monograph 6 Keays, W.R., Ramsey, W.R.H., and Groves, D.I., editor. Littleton, Colorado: Society of Economic Geologists.

Updated Cerro Quema Pre-Feasibility Study NI 43-101 Technical Report
Kappes, Cassiday & Associates 27.0 References January, 2022 Page 27-2
BJ Price Geological Consultants. 2007. General Summary and Opinion of Value Cerro Quema Gold Property, Azuero Peninsula, Los Santos Provinces, Republic of Panama. BJ Price Geological Consultants.
Bonham, H.F. 1988. "Models for volcanic-hosted epithermal precious metal deposits." Bulk
minable precious metal deposits of the western United States Symposium Proceedings, Schafer, R.W., Cooper, J.J., and Vikre, P.G. editors. Reno, Nevada: Geological Society of Nevada.
Buchs, D.M., Baumgartner, P.O., Baumgartber-Mora, C. Flore, K., Bandini, A.N. 2011. "Upper
Cretaceous to Miocene tectonostratigraphy of the Azuero area (Panama) and the discontinuous accretion and subduction erosion along the Middle American margin." Tectonophysics 31-46.
Buchs, David & Arculus, Richard & Baumgartner, Peter & Baumgartner-Mora, Claudia & Ulianov,
Alexey. 2010. "Late Cretaceous arc development on the SW margin of the Caribbean Plate: Insights from the Golfito, Costa Rica, and Azuero, Panama, complexes." Geochemistry Geophysics Geosystems.
Cathalac, 2008. Capacity Building for State II Adaptation to Climate Change in Central America,
Mexico and Cuba. 2008. Cathalac, UNDP, GEF. Castillo Dopeso, Jose. 12 March 2021. Letter of Legal Opinion, corporation, mining concessions,
surface rights, water rights, environmental permits, Minera Cerro Quema. Letter of opinion, Chitre, Panama: Minera Cerro Quema SA.
Canadian Securities Administrators (CSA), 2011: National Instrument 43-101, Standards of
Disclosure for Mineral Projects, Canadian Securities Administrators. Canadian Institute of Mining, Metallurgy and Petroleum (CIM), 2019: Estimation of Mineral
Resources and Mineral Reserves, Best Practice Guidelines: Canadian Institute of Mining, Metallurgy and Petroleum, November 29, 2019.
Canadian Institute of Mining, Metallurgy and Petroleum (CIM), 2014: CIM Standards for Mineral
Resources and Mineral Reserves, Definitions and Guidelines: Canadian Institute of Mining, Metallurgy and Petroleum, May, 2014.
Consultoría, Estudios y Diseños S.A. (CEDSA) 2013 - Medición hidrológica (aforo) de seis sitios
ubicados en las inmediaciones de Minera Cerro Quema localizada en Distrito de Tonosí, Provincia de Los Santos. January 9, 2013.
Updated Cerro Quema Pre-Feasibility Study NI 43-101 Technical Report
Kappes, Cassiday & Associates 27.0 References January, 2022 Page 27-3
Corral, I, Griera, A., Gomez-Gras, D., Corbella, M., Canals, A., Pineda-Falconett, M., Cardellach, E. 2011. "Geology of the Cerro Quema Au-Cu deposit (Azuero Peninsula, Panama)." Geologia Acta 481-498.
Corral, I., Gomez-Gras, D., Griera, A., Corbella, M., Cardellach, E. 2013. "Sedimentation and
volcanism in the Panamanian Cretaceous intra-oceanic arc and fore-arc, new insights from the Azuero Peninsula (SW Panama)." Bullletin de la Societe Geologique de France 35-45.
Corral, I., 2021, New 40Ar/39Ar Dating of Alunite from the Cerro Quema Au-Cu Deposit, Azuero
Peninsula, Panama: Economic Geology, 116(1), 211-226. Deen, J.A., Rye, R.O., Munoz, J.L, and Drexler, J.W. 1994. "The magmatic hydrothermal system
at Julcani, Peru: Evidence from fluid inclusions and hydrogen and oxygen isotopes." Economic Geology 1924-1938.
Del Giudice, D., Recchi, G. 1969. Informe técnico preparado para el gobierno de la República de
Panamá por las Naciones Unidas. Panamá City (Panamá), Gobierno de la República de Panamá. United Nations Development Program.
Direccion General de Recursos Minerales. 1976. "Panama geologic map (mapa Geologico de
Panama) 1:500,000 scale." Panama City: Direccion General de Recursos Minerales. Dyer Engineering Consultants 2013 – Cerro Quema Gold Mine Hydrological Study. February
2013. Dyer, 2013. Cerro Quema Mine, Hydrologic Study. Prepared for Minera Cerro Quema, S.A. by
Dyer Engineering Consultants Inc. Dated April 2013. Edgar R. Mojica C. and Basilio Pérez Ramos 2012a - Inventario Forestal: Área de Depósito de
Estéril (Botadero) y Camino Adyacente de Circunvalación. Edgar R. Mojica C. and Basilio Pérez Ramos 2012b – Inventario Forestal: Ampliación y
Adecuación del Camino de Acceso a La Mina Cerro Quema Del Kilómetro 0 Al Kilómetro 5.
ERM Consultants Canada Ltd. 2021. Cerro Quema Gap Assessment Project No.: 0567407-3000.
ERM.

Updated Cerro Quema Pre-Feasibility Study NI 43-101 Technical Report
Kappes, Cassiday & Associates 27.0 References January, 2022 Page 27-4
Evidelio Adames Arjona 2008 – Especies Biológicas Acuáticas en las Quebradas Chontal, Bruja y Seca. June 3, 2008.
FlowMaster, 2009. Version 8i, build date November 4, 2009 developed by Bentley Systems, Inc. Francisco Delgado 1994 – Biology Study, Cerro Quema Project. February 1994. GDFRR 2011. Climate Risk and Adaptation Country Profile: Vulnerability, Risk Reduction, and
Adaptation to Climate Change – Panama. Global Facility for Disaster Reduction and Recovery (GFDRR) and the Climate Change Team of the Environmental Department of the World Bank. Product of the World Bank Group, Washington D.C., April 2011.
Golder Associates Incorporated, 2014. Conceptual Water Management Plan, Cerro Quema
Project. Prepared for Pershimco Resources, Inc. December 2014 Golder Associates Incorporated, 2016. Final Design Report Heap Leach and Waste Rock Dump
Facilities, Cerro Quema Project. Submitted to: Minera Cerro Quema, SA. Submitted by: Golder Associates, Inc., Reno, NV. May 20, 2016.
Golder Associates Incorporated, August 29, 2014, Site-Specific Seismic Hazard Analysis Report,
Cerro Quema Project, Los Santos Province, Panama Gray, J.E., and Coolbaugh, M.F. 1994. Geology and geochemistry of Summitville, Colorado: An
epithermal acid-sulfate deposit in a volcanic dome. Economic Geology 1906-1923. Gray, Matthew D. 2017. QA/QC field review of drilling and drill core handling practices at Orla
Mining Ltd.'s Cerro Quema Project, Los Santos Province, Panama. Rio Rico, Arizona: Resource Geosciences Inc.
Gray, Matthew D. 2016. Site visit report, Cerro Quema Gold Project (Pershimco Mining), Panama,
prepared for Orla Mining Ltd. Rio Rico, Arizona: Resource Geosciences Incorporated. Harvey, B., Myers, S., and Klein, T., 1999, Yanacocha Gold District, Northern Peru: PacRim ‘99
Congress, Bali, Indonesia, October 10–13, Australasian Institute of Mining and Metallurgy, Proceedings, p. 445–459.
Hayba, D.O., Bethke, P.M., Heald, P., and Foley, N.K. 1985. "Geologic, mineralogic, and
geochemical characteristics of volcanic-hosted epithermal precious metal deposits." Reviews in Economic Geology v. 2. Littleton, Colorado: Society of Economic Geologists.
Updated Cerro Quema Pre-Feasibility Study NI 43-101 Technical Report
Kappes, Cassiday & Associates 27.0 References January, 2022 Page 27-5
Heald, P., Foley, N.K., and Hayba, D.O. 1987. "Comparative anatomy of volcanic-hosted epithermal deposits: acid-sulfate and adularia-sericite types." Economic Geology 1-26.
HEC-HMS, 2010. Version 3.5, build date August 10, 2010 developed by U.S. Army Corp of
Engineers (USACE). Hedenquist, J.W. and Arribas, A. 1998. "Evolution of an intrusion-centered hydrothermal system:
Far Southeast Lepanto porphyry and epithermal Cu-Au deposits, Philippines." Economic Geology 373-404.
HydroGeoLogica (HGL), 2020a. Technical Memorandum: Preliminary Cerro Quema Monthly
Synthetic Data Analysis. Prepared for: Sean Spraggett and Hans Smit, Orla Mining Ltd. Prepared by: Brent Johnson, HGL. December 10, 2020.
HydroGeoLogica (HGL), 2020b. Technical Memorandum: Cerro Quema screening-level, post-
closure water balances for the La Pava and Quemita Pits. Prepared for: Sean Spraggett and Hans Smit, Orla Mining Ltd. Prepared by: Brent Johnson, HGL. September 14, 2020.
HydroGeoLogica (HGL), 2021a. Technical Memorandum: Cerro Quema Project, Site-Wide Water
Balance Model. Prepared for: Sean Spraggett, Minera Cerro Quema, S.A. Prepared by Pam Rohal and Brent Johnson, HGL. In preparation
HydroGeoLogica (HG) 2021b. Cerro Quema – Interim Geochemical Characterization Program
and Waste Management Recommendations. Report by HydroGeoLogica Inc., Golden, Colorado, USA. In preparation
HydroGeoLogica (HG) 2021c. Cerro Quema – Preliminary Pit Lake Geochemistry Model. Report
by HydroGeoLogica Inc., Golden, Colorado, USA. In preparation IFARHU, www.ifarhu.gob.pa/institucional/historia/. INAP (International Network for Acid Prevention). 2014. Global Acid Rock Drainage (GARD)
Guide. www.gardguide.com Innovat 2009 – Feasibility Study, Cerro Quema Project. January 12, 2009. INNOVAT Limited, December 16, 2008, Cerro Quema Project Feasibility Study 2500 T/D Case INNOVAT Limited, January 12, 2009, Cerro Quema Project Feasibility Study
Updated Cerro Quema Pre-Feasibility Study NI 43-101 Technical Report
Kappes, Cassiday & Associates 27.0 References January, 2022 Page 27-6
Instituto Geográfico Nacional Tommy Guardia. 2007. Atlas Nacional de la República de Panamá. Panama City: Instituto Geográfico Nacional Tommy Guardia.
Isaac Corral, Esteve Cardellach, Mercè Corbella, Àngels Canals, David Gómez-Gras, Albert
Griera, Michael A. Cosca. 2016. "Cerro Quema (Azuero Peninsula, Panama): Geology, Alteration, Mineralization, and Geochronology of a Volcanic Dome-Hosted High-Sulfidation Au-Cu Deposit." Economic Geology 287-310.
International Finance Corporation “IFC Performance Standards on Environmental and Social
Sustainability”. January 2012 International Finance Corporation “Stakeholder Engagement: A Good Practice Handbook for
Companies Doing Business in Emerging Markets”. May 2007 Kappes Cassiday and Associates, August 2018: Quemita and La Pava Composites Report of
Metallurgical Test Work. Kappes Cassiday and Associates, August 2014: Cerro Quema Project - Pre-Feasibility Study on
the La Pava and Quemita Oxide Gold Deposits, NI 43-101 Report. Kappes Cassiday and Associates, January 2016: Cerro Quema Project Report of Compaction
and Column Leach Test Work, La Pava and Quemita Material. Kappes Cassiday and Associates, May 2015: Cerro Quema Project Report of Metallurgical Test
Work. Kappes Cassiday and Associates, November 14, 1996: Results of Cerro Quema Agglomeration
& Permeability Testing (Queanv12.doc). Kappes Cassiday and Associates, September 1996: Cerro Quema Heap Leach Project Feasibility
Study. Kappes Cassiday and Associates, September 2014: Cerro Quema Project Report of Metallurgical
Test Work. Kitco, 2021. Gold and Silver historical price charts: www.kitco.com. Knight Piésold 1996 – Environmental Viability Report, Cerro Quema Project. November 4, 1996.
Updated Cerro Quema Pre-Feasibility Study NI 43-101 Technical Report
Kappes, Cassiday & Associates 27.0 References January, 2022 Page 27-7
Knight Piésold, 1993. Waste Rock and Pit Geochemical Characterization Report, Cerro Quema Project. Prepared for Cyprus Mineral Company by Knight Piésold and Co. June, 1993.
Knight Piésold, 1996b. Cerro Quema Project, Geotechnical Investigation Report. Prepared for
Kappes, Cassiday & Associates by Knight Piésold LLC. Dated November 6, 1996. Knight Piésold, 2005. Cerro Quema Project, Seismic Hazard Assessment. Prepared for RNC
Gold, Inc. by knight Piésold and Co. Dated February 1, 2005. Kvam, Reidar. Inter-American Development Bank “Meaningful Stakeholder Consultation”. 2007 London Metal Exchange, Copper price charts, December, 2021, lme.com Longo, A.A., Dilles, J.H., Grunder, A.L., Duncan, R., 2010, Evolution of calcalkaline volcanism and associated hydrothermal gold deposits at Yanacocha, Peru, Economic Geology, v. 105, p. 1191–1241. Longo, A. 2018. "Cerro Quema update June 29, 2018, private report prepared for Orla Mining
Ltd." Longo, A, 2020, Cerro Quema geology workshop - October 25, 2020; in house Orla Mining Ltd
workshop, October 25, 2020, 47 p. Lubbe, Buks, 2021, La Prieta Geophysics, private report prepared for Orla Mining Ltd, 23 p. Magrin et al., 2007. Latin America. Climate Change 2007: Impacts, Adaptation and Vulnerability.
Contribution of Working Group II to the Fourth Assessment Report of the IPCC. McClelland Laboratories, February 14, 1995: Report on Heap Leach Cyanidation Testwork –
Cerro Quema Trench Composites, MLI Job No. 2103 McClelland Laboratories, October 16, 2013: Report on Heap Leach Cyanidation Testwork – Cerro
Quema Composites, MLI Job No. 3740 McClelland Laboratories, September 25, 1995: Report on Phase II Metallurgical Evaluation –
Cerro Quema Composites, MLI Job No. 2103 CO#1 Medina, Juan. “Plan Estratégico Distrito de Macaracas” 2018-2019

Updated Cerro Quema Pre-Feasibility Study NI 43-101 Technical Report
Kappes, Cassiday & Associates 27.0 References January, 2022 Page 27-8
MEND, 2009. Prediction Manual for Drainage Chemistry from Sulphidic Geologic Materials. MEND Report 1.20.1. Mining Environment Neutral Drainage Program, Natural Resources Canada. December 2009.
Mendieta, Elías. “Plan Estratégico Distrital de Tonosí” September 2017 MIDES, www.mides.gob.pa/programas/120-a-los-70/. NAVFAC, 1986. Soil Mechanics. Design Manual DM-7.0, Change 1. Prepared by the Naval
Facilities Engineering Command. Dated September 1986. Nelson, Carl E. 1995. "Porphyry copper deposits of southern Central America." In Arizona
Geological Society Digest vol.20, 553-565. Arizona Geological Society. P&E, 2012. Technical Report and Mineral Resource Estimate on the Cerro Quema Project, Los
Santos Province, Panama. Prepared for Pershimco Resources, Inc. by P&E Mining Consultants Inc. Dated November 2, 2012.
P&E Mining Consultants, Golder Associates, Kappes Cassiday and Associates. 2014. Cerro
Quema Project - Pre-Feasibility Study on the La Pava and Quemita Oxide Gold Deposits. P&E Mining Consultants, Golder Associates, Kappes Cassiday and Associates.
Perelló, J., García, A., Creaser, R.A., 2020, Porphyry-related high-sulfidation mineralization early
in Central American Arc Development: Cerro Quema deposit, Azuero Peninsula, Panama: Boletín de la Sociedad Geológica Mexicana, 72(3)
Pershimco, 2013. Fact Sheet available at http://www.pershimco.ca/s/FactSheet.asp Prepared by
Pershimco Resources, Inc. Dated July 2013. Petersen, U., Noble, D.C., Arenas, M.J., and Goodell, P.C. 1977. "Geology of the Julcani mining
district, Peru." Economic Geology 921-949. Price, W.A., 1997. Draft Guidelines and Recommended Methods for the Prediction of Metal
Leaching and Acid Rock Drainage at Minesites in British Columbia, Ministry of Energy and Mines. p. 159.
Ransome, F.L. 1909. "The association of alunite with gold in the Goldfield district." Economic
Geology 667-692.
Updated Cerro Quema Pre-Feasibility Study NI 43-101 Technical Report
Kappes, Cassiday & Associates 27.0 References January, 2022 Page 27-9
RNC Resources Ltd. 2002. Feasibility Study of the Cerro Quema Project, Los Santos Province, Republic of Panama. Prepared by RNC Resources Ltd. And Bikerman Engineering and Technology Associates, RNC.
Rocscience, 2011. Phase2, Version 8.0 developed by Rocscience Inc. Rocscience, 2012. Slide, Version 6.0, build date June 24, 2010 developed by Rocscience Inc. RPA (Scott Wilson Roscoe Postle Associates Inc.), September 10, 2010, Technical Report on the
Cerro Quema Project, Panama, NI 43-101 Report RPA (Scott Wilson Roscoe Postle Associates Inc.), January 14, 2011, Technical Report on the
Cerro Quema Project, Panama, NI 43-101 Report Seed, H.B. (1982). The Selection of Design Earthquakes for Critical Structures. Bulletin of the
Seismological Society of America, Vol. 27, No. 6, pp. S7-S12. SGS Lakefield Research Limited, April 16, 2009, The Recovery of Gold from Bellhaven’s Cerro
Quema Project Samples, Project 11834-001 - Report No. 1 Simmons, S.F., White, N.C, and John, D.A, 2005, Geological Characteristics of Epithermal
Precious and Base Metal Deposits, Economic Geology 100th Anniversary Volume, pp. 485-522.
SNC Lavalin Panama SA. 2015. Estudio de impacto ambiental Categoria III Proyecto Minera
Cerro Quema para la extraccion de oxidos de oro. Panama City: SNC Lavalin Panama SA.
Stoffregen, R.E. 1987. "Genesis of acid-sulfate alteration and Au-Cu-Ag mineralization at Summitville, Colorado." Economic Geology 1575-1591.
Teal, L., and Benavides, A., 2010, History and geologic overview of the Yanacocha mining district,
Cajamarca, Peru, Economic Geology, v. 105, p.1173–1190. Tetra Tech, 2008. Cerro Quema Project, Sediment Dam and Waste Dump Technical
Memorandum of Geotechnical Investigation and Stability Analysis Results. Prepared for Bellhaven Copper & Gold Inc. by Tetra Tech. Dated June 2008.
Trenkamp, Robert & Kellogg, James & Freymueller, Jeffrey & Mora-Paez, Hector. 2002. "Wide
plate margin deformation, southern Central America and northwestern South America, CASA GPS observations." Journal of South American Earth Sciences 157-171.
Updated Cerro Quema Pre-Feasibility Study NI 43-101 Technical Report
Kappes, Cassiday & Associates 27.0 References January, 2022 Page 27-10
USACE, 1994. Hydraulic Design of Flood Control Channels. Engineering Manual 1110- 2-1601. Prepared by the US Army Corps of Engineers. Dated June 30, 1994.
VIDA-Proyectos S.A. 2004 – Auditoria Ambiental, Programa de Adecuación y Manejo Ambiental.
April 1, 2004. Vikre, P.G. 1989. "Ledge formation at the Sandstorm and Kendall gold mines, Goldfield, Nevada."
Economic Geology 2115-2138. Wegner, Wencke & Wörner, Gerhard & Harmon, Russell & Jicha, Brian. 2011. "Magmatic history
and evolution of the Central American Land Bridge in Panama since Cretaceous times." Geological Society of America Bulletin 703-724.
WinTR-55, 2011. Version 1.00.10 developed by U.S. Department of Agriculture, Natural
Resources Conservation Service (NRCS). Zoran Pacic, April 14, 1992, Cerro Quema Ore, Panama, Gold Extraction Zoran Pacic, October 20, 1993, Cerro Quema Ore, Copper Recovery in Column Leach Tests
Updated Cerro Quema Pre-Feasibility Study NI 43-101 Technical Report
Kappes, Cassiday & Associates 28.0 Date and Signatures January, 2022 Page 28-1
28.0 DATE AND SIGNATURES
This report, entitled “Project Pre-Feasibility Updated NI 43-101 Technical Report on the Cerro Quema Project, Province of Los Santos, Panama” has the following report dates: Report Date is: 18 January 2022 Mineral Resource Effective Date is: 2 November 2021 Mineral Reserve Effective Date is: 22 April 2021 The report was prepared and signed by the authors as shown in the following QP certificates:
CERTIFICATE OF QUALIFIED PERSON
I, Carl Defilippi, RM SME, of Reno, Nevada, USA, Sr. Project Engineer at Kappes, Cassiday & Associates, as an author of this report entitled “Project Pre-Feasibility Updated NI 43-101 Technical Report on the Cerro Quema Project, Province of Los Santos, Panama” dated 18 January, 2022, prepared for Orla Mining Ltd. (the “Issuer”) do hereby certify that:
1. I am employed as a Sr. Project Engineer at Kappes, Cassiday & Associates, an independent metallurgical consulting firm, whose address is 7950 Security Circle, Reno, Nevada 89506.
2. This certificate applies to the technical report “Project Pre-Feasibility Updated NI 43-101 Technical Report on the Cerro Quema Project, Province of Los Santos, Panama” dated 18 January, 2022 (the “Technical Report”).
3. I am a registered member with the Society of Mining, Metallurgy and Exploration (SME) since 2011 and my qualifications include experience applicable to the subject matter of the Technical Report. In particular, I am a graduate of the University of Nevada with a B.S. in Chemical Engineering (1978) and a M.S. in Metallurgical Engineer (1981). I have practiced my profession continuously since 1982. Most of my professional practice has focused on the development of gold-silver leaching projects. I have successfully managed numerous studies at all levels on various cyanidation projects.
4. I am familiar with National Instrument 43-101 – Standards of Disclosure for Mineral Projects (“NI 43-101”) and by reason of education, experience and professional registration I fulfill the requirements of a “qualified person” as defined in NI 43-101.
5. I visited the Cerro Quema property for a total of two days on 30-31 January 2012. 6. I am responsible for Sections 1.1, 1.11, 1.15, 1.16, 1.17, 1.19, 1.20, 1.20, 1.21, 1.22,
1.23.3, 1.24.5, 1.24.1, 2, 3, 13.0, 16.6, 17.1, 17.2, 17.3, 17.4, 17.7, 17.9.1.1, 17.10, 17.11, 18 (excluding 18.1.3 and 18.4), 19.0, 20.1, 20.1.2, 20.1.2.7, 20.1.3, 20.1.4, 20.1.4.1, 20.1.4.2, 20.1.4.5, 20.1.5.5, 20.1.5.9, 20.1.5.10, 20.1.6.1, 20.1.7, 21 (excluding 21.1.1, 21.1.2.7, 21.2.1 and 21.2.2.6), 22.0, 24.1, 25.0, 25.1, 25.1.3, 25.2.3, 25.2.4, 25.3.3, 25.3.5, 26.1, 27 and 28 of the Technical Report.
7. I am independent of the Issuer as described in section 1.5 of NI 43-101. 8. I have had no prior involvement with the property that is the subject of the Technical
Report, other than as an author of the previous technical report entitled “Cerro Quema Project - Pre-Feasibility study on the La Pava and Quemita Oxide Gold Deposits”, dated 30 June 2014.
9. I have read NI 43-101 and the Technical Report has been prepared in compliance with NI 43-101.
10. As of the effective date of the Technical Report, to the best of my knowledge, information and belief, the Technical Report contains all scientific and technical information that is required to be disclosed to make the Technical Report not misleading.

Dated this 18th day of January, 2022
“Carl E. Defilippi”
Carl Defilippi, RM SME Sr. Project Engineer at Kappes, Cassiday & Associates

CERTIFICATE OF QUALIFIED PERSON
I, Sue Bird, P.Eng., am employed as a Geological Engineer with Moose Mountain Technical Services, as an author of this report entitled “Project Pre-Feasibility Updated NI 43-101 Technical Report on the Cerro Quema Project, Province of Los Santos, Panama” dated 18 January, 2022, prepared for Orla Mining Ltd. (the “Issuer”) do hereby certify that:
1. I am employed as a Principal of Moose Mountain Technical Services, an independent consulting firm, whose address is #210 1510 2nd Street North Cranbrook, BC V1C 3L2.
2. This certificate applies to the technical report “Project Pre-Feasibility Updated NI 43-101 Technical Report on the Cerro Quema Project, Province of Los Santos, Panama”, dated 18 January, 2022 (the “Technical Report”).
3. I am a member of the self-regulating Association of Professional Engineers and Geoscientists of British Columbia (#25007). I graduated with a Geologic Engineering degree (B.Sc.) from the Queen’s University in 1989 and a M.Sc. in Mining from Queen’s University in 1993.
4. I have worked as an engineering geologist for over 25 years since my graduation from university. I have worked on precious metals, base metals and coal mining projects, including mine operations and evaluations. Similar resource estimate projects specifically include those done for Artemis Gold, Spanish Mountain, BC, Marban, QB, Garrison, ON, as well as numerous due diligence gold projects in the southern US done confidentially for various clients.
5. I am familiar with National Instrument 43-101 – Standards of Disclosure for Mineral Projects (“NI 43-101”) and by reason of education, experience and professional registration I fulfill the requirements of a “qualified person” as defined in NI 43-101.
6. I visited the Cerro Quema property on May 4, 2021 for one day. 7. I am responsible for Sections 1.9, 1.10, 1.12, 1.23.1, 1.24.2.1, 1.24.2.2, 7.7, 10, 11, 12,
14, 25.1.1, 25.2.1, 25.3.1, 26.2.1 and 26.2.2 of the Technical Report. 8. I am independent of the Issuer as described in section 1.5 of NI 43-101. 9. I have had no prior involvement with the property that is the subject of the Technical
Report. 10. I have read NI 43-101 and the Technical Report has been prepared in compliance with NI
43-101. 11. As of the effective date of the Technical Report, to the best of my knowledge, information
and belief, the Technical Report contains all scientific and technical information that is required to be disclosed to make the Technical Report not misleading.

Dated this 18th day of January, 2022
“Susan Bird”
Sue Bird, P.Eng. Principal and V.P. at Moose Mountain Technical Services

CERTIFICATE OF QUALIFIED PERSON
I, Jesse J. Aarsen, B.Sc. Mining Engineering, P.Eng., of Penticton, BC, Canada, as an author of this report entitled “Project Pre-Feasibility Updated NI 43-101 Technical Report on the Cerro Quema Project, Province of Los Santos, Panama” dated 18 January 2022, prepared for Orla Mining Ltd. (the “Issuer”) do hereby certify that:
1. I am a Principal - Mining with Moose Mountain Technical Services, an independent consulting firm, whose address is 1975-1st Avenue South, Cranbrook, BC, Canada, V1C 6Y3.
2. This certificate applies to the technical report “Project Pre-Feasibility Updated NI 43-101 Technical Report on the Cerro Quema Project, Province of Los Santos, Panama”, dated 18 Janaury 2022 (the “Technical Report”).
3. I am a member in good standing of the Association of Professional Engineers and Geoscientists of British Columbia (#38709) and my qualifications include experience applicable to the subject matter of the Technical Report. I am a graduate of the University of Alberta with a B.Sc. in Mining Engineering Co-op Program (2002). I have worked as a mining engineer for a total of 17 years since my graduation from university. My professional practice has included coal mining and base metals (copper, gold, silver) projects, primarily in North and South America.
4. I am familiar with National Instrument 43-101 – Standards of Disclosure for Mineral Projects (“NI 43-101”) and by reason of education, experience and professional registration I fulfill the requirements of a “qualified person” as defined in NI 43-101.
5. I have not visited the Cerro Quema property. 6. I am responsible for Sections 1.13, 1.14, 1.23.2, 1.24.2.3, 15, 16 (excluding 16.5.1 and
16.6), 18.1.3, 21.1.1, 21.2.1, 25.1.2, 25.2.2, 25.3.2 and 26.2.3 of the Technical Report. 7. I am independent of the Issuer as described in section 1.5 of NI 43-101. 8. I have had no prior involvement with the property that is the subject of the Technical
Report. 9. I have read NI 43-101 and the Technical Report has been prepared in compliance with NI
43-101. 10. As of the effective date of the Technical Report, to the best of my knowledge, information
and belief, the Technical Report contains all scientific and technical information that is required to be disclosed to make the Technical Report not misleading.

Dated this 18th day of January, 2022
“Jesse Aarsen”
Jesse Aarsen. P.Eng. Principal - Mining Moose Mountain Technical Services

CERTIFICATE OF QUALIFIED PERSON
I, Denys Parra, RM SME N°4222036, of Lima, Peru, Sr. Geotechnical Engineer at Anddes Asociados SAC, as an author of this report entitled “Project Prefeasibility Updated NI 43-101 Technical Report on the Cerro Quema Project, Province of Los Santos, Panama” dated January 18, 2022, prepared for Orla Mining Ltd. (the “Issuer”) do hereby certify that:
1. I am employed as a General Manager at Anddes Asociados SAC, an independent geotechnical and engineering consulting firm, whose address is Av. Circunvalación El Golf Los Incas, 154, Piso 13, Lima 15023, Peru.
2. This certificate applies to the technical report “Project Prefeasibility Updated NI 43-101 Technical Report on the Cerro Quema Gold Oxide Project, Province of Los Santos, Panama”, dated January 18, 2022 (the “Technical Report”).
3. I am a registered member with the Society of Mining, Metallurgy and Exploration (SME) since 2011 and my qualifications include experience applicable to the subject matter of the Technical Report. In particular, I am a graduate of the National University of Engineering with a B.S. in Civil Engineering (1989) and a Master in Engineering (1996) at Pontifical Catholic University of Rio de Janeiro, Brazil. I have practiced my profession continuously since 1991. Most of my professional practice has focused on the geotechnical and civil design of mining facilities.
4. I am familiar with National Instrument 43-101 – Standards of Disclosure for Mineral Projects (“NI 43-101”) and by reason of education, experience and professional registration I fulfill the requirements of a “qualified person” as defined in NI 43-101.
5. I visited the Cerro Quema property for a total of two days on 8-9 December, 2020.
6. I am responsible for Sections 1.24.4, 16.5.1, 17.5, 17.6, 17.8, 18.4, 20.1.1.5, 20.1.2.4, 20.1.4.4, 20.1.5.2, 20.1.5.3, 20.1.5.4, 20.1.5.6, 20.1.5.7, 20.1.5.8, 24.2 and 26.3 of the Technical Report.
7. I am independent of the Issuer as described in section 1.5 of NI 43-101.
8. I have had no prior involvement with the property that is the subject of the Technical Report.
9. I have read NI 43-101 and the Technical Report has been prepared in compliance with NI 43-101.
10. As of the effective date of the Technical Report, to the best of my knowledge, information and belief, the Technical Report contains all scientific and technical information that is required to be disclosed to make the Technical Report not misleading.

Dated this 18th day of January 2022
“Denys Parra”
Denys Parra, RM SME Sr. Geotechnical Engineer at Anddes Asociados SAC
CERTIFICATE OF QUALIFIED PERSON
I, Matthew D. Gray, Ph.D., C.P.G. #10688, of Rio Rico, Arizona, USA, Geologist at Resource Geosciences Incorporated, as an author of this report entitled “Project Pre-Feasibility Updated NI 43-101 Technical Report on the Cerro Quema Project, Province of Los Santos, Panama” dated 18 January 2022, prepared for Orla Mining Ltd. (the “Issuer”) do hereby certify that:
1. I am employed as a geologist at Resource Geosciences Incorporated, (RGI) an independent consulting geosciences firm, whose address is 765A Dorotea Ct, Rio Rico, Arizona, 85648 USA.
2. This certificate applies to the technical report “Project Pre-Feasibility Updated NI 43-101 Technical Report on the Cerro Quema Project, Province of Los Santos, Panama” dated 18 January 2022 (the “Technical Report”).
3. I am a Certified Professional Geologist (#10688) with the American Institute of Professional Geologists since 2003 and my qualifications include experience applicable to the subject matter of this Technical Report. In particular, I am a graduate of the Colorado School of Mines (Ph.D., Geology with Minor in Mineral Economics, 1994; B.Sc., Geological Engineering, 1985) and the University of Arizona (M.Sc., Geosciences, 1988) and I have practiced my profession continuously since 1988. Most of my professional practice has focused on exploration metallic mineral deposits, the creation of resource models, and the economic development of gold and copper deposits.
4. I am familiar with National Instrument 43-101 – Standards of Disclosure for Mineral Projects (“NI 43-101”) and by reason of education, experience and professional registration I fulfill the requirements of a “qualified person” as defined in NI 43-101.
5. I visited the Cerro Quema property during the periods 11 to 15 July, 2016 and 17 to 18 May, 2017.
6. I am responsible for Sections 1.2, 1.3, 1.4, 1.5, 1.6, 1.7, 1.8, 1.18, 1.21, 1.22.2, 1.23.4, 1.24.3, 4, 5, 6, 7.1, 7.2, 7.3, 7.4, 7.5, 7.6, 7.8, 8, 9, 20.1.1.2, 20.1.1.4, 20.1.1.6, 20.1.1.7, 20.1.2.5, 20.1.2.6, 20.1.6.2, 20.1.6.3, 20.2, 23, 24.3, 25.1.4, 25.3.4 and 26.5 of the Technical Report.
7. I am an independent qualified person as described in section 1.5 of NI 43-101.
8. I have had no prior involvement with the property that is the subject of the Technical Report.
9. I have read NI 43-101 and the Technical Report has been prepared in compliance with NI 43-101.
10. As of the effective date of the Technical Report, to the best of my knowledge, information and belief, the Technical Report contains all scientific and technical information that is required to be disclosed to make the Technical Report not misleading.

Dated this 18th day of January, 2022 “Matthew D. Gray” __________________________ Matthew D. Gray, Ph.D., C.P.G. #10688 Geologist at Resource Geosciences Incorporated
CERTIFICATE OF QUALIFIED PERSON
I, Brent Johnson, RM SME, of Golden, Colorado, USA, Principal Geochemist/Hydrogeologist at HydroGeoLogica, Inc., as an author of this report entitled “Project Prefeasibility Updated NI 43-101 Technical Report on the Cerro Quema Project, Province of Los Santos, Panama”, dated 18 January 2022, prepared for Orla Mining Ltd. (the “Issuer”) do hereby certify that:
1. I am employed as a Principal Geochemist/Hydrogeologist at HydroGeoLogica, Inc., an independent mine water and mine waste consulting firm, whose address is 1019 8th St, Suite 303, Golden, Colorado, USA, 80401.
2. This certificate applies to the technical report “Project Prefeasibility Updated NI 43-101 Technical Report on the Cerro Quema Project, Province of Los Santos, Panama”, dated 18 January 2022 (the “Technical Report”).
3. I am a registered member with the Society of Mining, Metallurgy and Exploration (SME) since 2021 and my qualifications include experience applicable to the subject matter of the Technical Report. In particular, I am a graduate of Virginia Polytechnic Institute and State University, with a B.S. in Geology (1989), and a B.A. in Spanish (1989), an M.S. in Geology (1994) from the University of Colorado – Boulder. I have practiced my profession continuously since 1994. Most of my professional practice has focused on mine water and mine waste management projects worldwide. I have successfully managed numerous, similar studies at all levels, in similar site geochemical and climatic conditions.
4. I am familiar with National Instrument 43-101 – Standards of Disclosure for Mineral Projects (“NI 43-101”) and by reason of education, experience and professional registration I fulfill the requirements of a “qualified person” as defined in NI 43-101.
5. I have not visited the Cerro Quema property.
6. I am responsible for Sections 1.24.5, 20.1.1.1, 20.1.1.3, 20.1.2.1, 20.1.2.2, 20.1.2.3, 20.1.4.3, 20.1.5.1, 20.1.6.4, and 26.4 of the Technical Report.
7. I am independent of the Issuer as described in section 1.5 of NI 43-101.
8. I have had no prior involvement with the property that is the subject of the Technical Report.
9. I have read NI 43-101 and the Technical Report has been prepared in compliance with NI 43-101.
10. As of the effective date of the Technical Report, to the best of my knowledge, information and belief, the Technical Report contains all scientific and technical information that is required to be disclosed to make the Technical Report not misleading.

Dated this 18th day of January, 2022
“Brent Johnson”
Brent Johnson Principal Geochemist/Hydrogeologist at HydroGeoLogica, Inc.
CERTIFICATE OF QUALIFIED PERSON
I, Lee Josselyn, P.E. of Golden Colorado, USA, Sr. Project Manager at Linkan Engineering, as an author of this report entitled “Project Pre-Feasibility Updated NI 43-101 Technical Report on the Cerro Quema Project, Province of Los Santos, Panama” dated 18 January, 2022, prepared for Orla Mining Ltd. (the “Issuer”) do hereby certify that:
1. I am employed as a Sr. Project Manager at Linkan Engineering, an independent water management and treatment company, whose corporate address is 2720 Ruby Vista Drive, Suite 101, Elko, NV 89801.
2. This certificate applies to the technical report “Project Pre-Feasibility Updated NI 43-101 Technical Report on the Cerro Quema Project, Province of Los Santos, Panama” dated 18 January, 2022 (the “Technical Report”).
3. I am a registered professional engineer in Colorado and my qualifications include experience applicable to the subject matter of the Technical Report. I am a graduate of the Colorado State University with a B.S. in Civil Engineering (1986) and from Colorado School of Mines with a M.S. in Environmental Engineer (1993). I have practiced my profession continuously since 1987. Most of my professional practice has focused on water treatment projects. I have successfully managed numerous projects from studies, to scale testing, to design, installation and operations.
4. I am familiar with National Instrument 43-101 – Standards of Disclosure for Mineral Projects (“NI 43-101”) and by reason of education, experience and professional registration I fulfill the requirements of a “qualified person” as defined in NI 43-101.
5. I have not visited the Cerro Quema property.
6. I am responsible for Sections 1.24.6, 17.9 (excluding 17.9.1.1), 21.1.2.7, 21.2.2.6 and 26.6 of the Technical Report.
7. I am independent of the Issuer as described in section 1.5 of NI 43-101.
8. I have had no prior involvement with the property that is the subject of the Technical Report.
9. I have read NI 43-101 and the Technical Report has been prepared in compliance with NI 43-101.
10. As of the effective date of the Technical Report, to the best of my knowledge, information and belief, the Technical Report contains all scientific and technical information that is required to be disclosed to make the Technical Report not misleading.

Dated this 18th day of January 2022
“Lee Josselyn”
Lee Josselyn, P.E. Sr. Project Manager Linkan Engineering

CERTIFICATE OF QUALIFIED PERSON
I, Wade Brunham, of Creston BC Canada, Partner at ERM Consultants Canada Ltd. as an author of this report entitled “Project Pre-Feasibility Updated NI 43-101 Technical Report on the Cerro Quema Project, Province of Los Santos, Panama” dated 18 January, 2022, prepared for Orla Mining Ltd. (the “Issuer”) do hereby certify that:
1. I am employed as a Partner at ERM an independent sustainability and environmental consultingfirm, whose address is 15th Floor 1111 West Hastings Vancouver BC V6E 2J3.
2. This certificate applies to the technical report “Project Pre-Feasibility Updated NI 43-101 Technical Report on the Cerro Quema Project, Province of Los Santos, Panama” dated 18 January, 2022 (the “Technical Report”).
3. I am a registered member with the British Columbia College of Applied Biology and the Societyof Wetland Scientists and my qualifications include experience applicable to the subject matter ofthe Technical Report. In particular, I am a graduate of Simon Fraser University with a M.Sc. inBiology (2009), Royal Roads University with a B.Sc. in Environmental Science (2003), and SelkirkCollege with a Technical Diploma in Environmental Planning (2002). I have practiced myprofession continuously since 2002. Most of my professional practice has focused onenvironmental social governance at exploration gold-and copper projects.
4. I am familiar with National Instrument 43-101 – Standards of Disclosure for Mineral Projects (“NI43-101”) and by reason of education, experience and professional registration I fulfill therequirements of a “qualified person” as defined in NI 43-101.
5. I have not visited the Cerro Quema.
6. I am responsible for Sections 1.24.7, 20.3 and 26.7 of the Technical Report.
7. I am independent of the Issuer as described in section 1.5 of NI 43-101.
8. I have had no prior involvement with the property that is the subject of the Technical Report.
9. I have read NI 43-101 and the Technical Report has been prepared in compliance with NI 43-101.
10. As of the effective date of the Technical Report, to the best of my knowledge, information andbelief, the Technical Report contains all scientific and technical information that is required to bedisclosed to make the Technical Report not misleading.

Dated this 18th day of January 2022
“Wade Brunham” Wade Brunham, Partner at ERM