mabilo project national instrument 43-101 technical report
TRANSCRIPT
Lycopodium Minerals Pty Ltd, ABN: 34 055 880 209, Level 5, 1 Adelaide Terrace, East Perth, Western Australia 6004
RTG MINING INC MABILO PROJECT NATIONAL INSTRUMENT 43-101 TECHNICAL REPORT
Authors:
Mr D Gordon, Manager of Process, Lycopodium Minerals Pty Ltd
Dr N Reynolds, Principal Geologist, CSA Global Pty Ltd
Mr A Green, Principal Resource Geologist, CSA Global Pty Ltd
Mr C Moormann, Principal Mining Consultant, Orelogy Consulting Pty Ltd
Mr R Frew, Senior Associate, Behre Dolbear Suatralia Pty Ltd
Mr J McIntyre, Director, Behre Dolbear Australia Pty Ltd
Mr A Brett, Senior Associate, Behre Dolbear Australia Pty Ltd
Ms J Epps, Senior Associate, Behre Dolbear Australia Pty Ltd
Mr D Morgan, Managing Director, Knight Piésold Pty Ltd
1913-000-GEREP-0003
2 May 2016
File Location: 24.04 Rev: D
MABILO PROJECT
NATIONAL INSTRUMENT 43-101 TECHNICAL REPORT 1913-000-GEREP-0003
Table of Contents Page
1913\24.04\1913-000-GEREP-0003_D
2 May 2016 Lycopodium Minerals Pty Ltd
1.0 SUMMARY 1.1 1.1 Executive Summary 1.1 1.2 Introduction 1.1 1.3 Legal, Ownership and Permitting 1.2 1.4 Geology and Mineralization 1.3 1.5 Exploration 1.4 1.6 Drilling 1.4 1.7 Sample Preparation, Analysis and Security 1.5 1.8 Mineral Resource Estimate 1.5 1.9 Mining 1.8
1.9.1 Mineral Reserve Estimating Approach 1.8 1.9.2 Mining Method 1.8 1.9.3 Pit Optimization 1.8 1.9.4 Mine Design 1.9 1.9.5 Mining Schedule 1.10 1.9.6 Mineral Reserves 1.13 1.9.7 Project Economics 1.14 1.9.8 Alternative Mine Schedule – 1.35 Mtpa 1.14
1.10 Metallurgy 1.15 1.11 Process Plant 1.24
1.11.1 Selected Process Flowsheet 1.25 1.11.2 Processing Upside 1.26
1.12 Infrastructure 1.26 1.12.1 Overview 1.26 1.12.2 Seismic Assessment 1.27 1.12.3 Surface Water Management 1.27 1.12.4 Power Supply and Distribution 1.28 1.12.5 Telecommunications 1.29 1.12.6 Tailings Storage and Site Water Balance 1.31 1.12.7 Project Buildings 1.34 1.12.8 Access and Site Roads 1.35 1.12.9 Port Facilities 1.37 1.12.10 Port – Product Analysis 1.37
1.13 Marketing 1.38 1.14 Environment and Social Impact 1.41 1.15 Project Implementation 1.42
1.15.1 Project Execution Strategy 1.42 1.15.2 Schedule 1.42
1.16 Operations 1.43 1.17 Operating Costs 1.45
1.17.1 Mining Operating Costs 1.46 1.17.2 Processing Costs 1.48
1.18 Capital Cost Estimate 1.50 1.19 Economics 1.52 1.20 Recommendations 1.54
1.20.1 Mineral Resource Estimate 1.54 1.20.2 Mineral Reserve Estimate 1.55 1.20.3 Processing 1.55
MABILO PROJECT
NATIONAL INSTRUMENT 43-101 TECHNICAL REPORT 1913-000-GEREP-0003
Table of Contents Page
1913\24.04\1913-000-GEREP-0003_D
2 May 2016 Lycopodium Minerals Pty Ltd
1.20.4 Infrastructure 1.56 1.21 Risks and Opportunities 1.56
1.21.1 Risks 1.56 1.21.2 Opportunities 1.57
2.0 INTRODUCTION 2.1 2.1 Introduction 2.1 2.2 Contributing Consultants 2.1 2.3 Site Visits 2.2 2.4 Information and Data Sources 2.2
3.0 RELIANCE ON OTHER EXPERTS 3.1 3.1 Reports and Contributions from Other Experts 3.1
4.0 PROPERTY DESCRIPTION AND LOCATION 4.1 4.1 Location 4.1 4.2 Philippines Mining Law and Regulations 4.2 4.3 Land Tenure 4.4 4.4 Ownership and the Mining Code 4.5 4.5 Rights Royalties and Encumbrances 4.6
4.5.1 Eldore Royalty Agreements 4.6 4.5.2 Galeo Equipment Corporation Joint Venture Partner 4.7 4.5.3 Contracts 4.8
4.6 Landowner Issues 4.9 4.6.1 Overview 4.9 4.6.2 Land Acquisition Process 4.9 4.6.3 Acquisition Phases 4.9
4.7 Indigenous People 4.10 4.8 Water Rights 4.10
5.0 ACCESSIBILITY, CLIMATE, LOCAL RESOURCES, INFRASTRUCTURE AND PHYSIOGRAPHY 5.1 5.1 Accessibility 5.1 5.2 Topography 5.1 5.3 Climate 5.2 5.4 Local Infrastructure 5.2
ERROR! CANNOT OPEN FILE REFERENCED ON PAGE 14
7.0 GEOLOGICAL SETTING AND MINERALIZATION 7.1 7.1 Regional Setting 7.1 7.2 Paracale District Geology 7.2 7.3 Paracale District Mineralization 7.3 7.4 Mabilo Property Geology 7.4 7.5 Mabilo Area Alteration and Mineralization 7.6
8.0 DEPOSIT TYPES 8.1 8.1 Mabilo Deposit Types 8.1
MABILO PROJECT
NATIONAL INSTRUMENT 43-101 TECHNICAL REPORT 1913-000-GEREP-0003
Table of Contents Page
1913\24.04\1913-000-GEREP-0003_D
2 May 2016 Lycopodium Minerals Pty Ltd
9.0 EXPLORATION 9.1 9.1 Previous Exploration 9.1 9.2 Exploration by MLEDC 9.1
9.2.1 2012 Drilling Programme 9.1 9.3 Mt. Labo 2012 Ground Magnetic Reprocessing 9.4 9.4 Mt. Labo 2013 Ground Magnetic Survey 9.4 9.5 Regional Exploration Potential 9.7 9.6 Porphyry Copper Potential 9.7
10.0 DRILLING, LOGGING AND SAMPLING SECTION 10.1 10.1 Mabilo Drilling 10.1 10.2 Collar Surveying 10.5 10.3 Downhole Surveying 10.5 10.4 Core Orientation 10.5 10.5 Core Quality and Recovery 10.5 10.6 Drill Site Security and Drill Core Handling 10.5 10.7 Drill Results 10.6
11.0 SAMPLE PREPARATION, ANALYSES AND SECURITY 11.1 11.1 Logging 11.1 11.2 Sub-sampling Techniques and Sample Preparation 11.2 11.3 Sample Handling and Security 11.2 11.4 Magnetic Susceptibility Measurements 11.3 11.5 Bulk Dry Density Determinations 11.3 11.6 Sample Analysis 11.3 11.7 Quality Control 11.4
11.7.1 Overview 11.4 11.7.2 Field Duplicates 11.5 11.7.3 Laboratory Check Assays 11.8 11.7.4 Blanks 11.8 11.7.5 Standards 11.9 11.7.6 Umpire Laboratory Assay 11.13
11.8 Data Management and Database 11.14 11.9 Adequacy of Sampling, QAQC and Data Management 11.14
12.0 DATA VERIFICATION 12.1 12.1 Sample Type Review 12.1 12.2 Geological Logging 12.1 12.3 Bulk Density 12.1 12.4 QAQC Data Verification and Validation 12.1 12.5 Database Verification and Validation 12.2 12.6 Site Visit 12.2
13.0 MINERAL PROCESSING AND METALLURGICAL TESTING 13.1 13.1 Overview 13.1 13.2 Introduction 13.1 13.3 Sample Selection 13.3
13.3.1 Background Geology 13.3 13.3.2 Sample Locations 13.4 13.3.3 Phase I Samples 13.5
MABILO PROJECT
NATIONAL INSTRUMENT 43-101 TECHNICAL REPORT 1913-000-GEREP-0003
Table of Contents Page
1913\24.04\1913-000-GEREP-0003_D
2 May 2016 Lycopodium Minerals Pty Ltd
13.3.4 Phase II Samples 13.6 13.4 Mineralogy 13.12
13.4.1 Phase I Samples 13.12 13.4.2 Phase II Samples 13.13
13.5 Previous Testwork (Phase I) 13.16 13.5.1 Reference Documents 13.16 13.5.2 Head Analysis 13.17 13.5.3 Comminution Testwork 13.18 13.5.4 Flotation Testwork 13.19 13.5.5 Flotation Tails Gold Leach Testwork 13.21 13.5.6 Magnetite Recovery Testwork 13.22
13.6 Current Testwork (Phase II) Programme 13.23 13.6.1 Testwork Programme 13.24
13.7 Phase II Comminution Testwork 13.27 13.7.1 Abrasion Indices 13.27 13.7.2 SMC Test 13.28 13.7.3 Rod and Ball Mill Work Indices 13.28 13.7.4 Regrinding Tests 13.29
13.8 Phase II Flotation Testwork 13.30 13.8.1 Head Assays 13.30 13.8.2 Sighter Cleaner Flotation Tests 13.30 13.8.3 Primary Grind Size Optimization Tests 13.33 13.8.4 Alternate Collector Trials 13.38 13.8.5 Bulk Rougher Flotation Test 13.42 13.8.6 Concentrate Regrind Optimization Tests 13.44 13.8.7 Additional Cleaner Tests 13.51 13.8.8 Cleaner Gold Promoter Tests 13.53 13.8.9 Bulk Cleaner Flotation Test 13.56 13.8.10 Comprehensive Flotation Product Assays 13.58 13.8.11 Flotation Response for Oxidized Ore 13.59
13.9 Gold Leach Testwork 13.61 13.9.1 Introduction 13.61 13.9.2 Gold Leach Testing Results 13.61 13.9.3 Gold Leach Tails Solution Assays 13.63 13.9.4 Gold Leaching Viability Assessment 13.65
13.10 Magnetite Recovery 13.68 13.11 Variability Testing 13.70
13.11.1 Introduction 13.70 13.11.2 Variability Flotation – Baseline 13.70 13.11.3 Variability Flotation Testing – Round 2 13.74 13.11.4 Variability Flotation Testing – Round 3 13.77 13.11.5 Desliming Tests for Clay Samples 13.82 13.11.6 Variability Flotation Testing – Recovery Improvement
Opportunities 13.84 13.11.7 Variability Magnetite Recovery 13.85
13.12 High Pyrite Variability Testwork 13.86 13.12.1 Introduction 13.86 13.12.2 High Pyrite Variability Samples - First Round Flotation
Testwork 13.89 13.12.3 Master Composite Grind Series 13.90
MABILO PROJECT
NATIONAL INSTRUMENT 43-101 TECHNICAL REPORT 1913-000-GEREP-0003
Table of Contents Page
1913\24.04\1913-000-GEREP-0003_D
2 May 2016 Lycopodium Minerals Pty Ltd
13.12.4 Cleaner Tests on the High Pyrite Composite 13.92 13.12.5 Repeat Testing of the High Pyrite Variability Samples 13.94 13.12.6 Mineralogical Examination of the High Pyrite Samples 13.98 13.12.7 Metallurgical Recovery Estimation for the High Pyrite
Samples 13.99 13.13 Ancillary Testwork 13.100
13.13.1 Slurry Rheology Testwork 13.100 13.13.2 Particle Size Distributions 13.102 13.13.3 Thickening Testwork 13.102 13.13.4 Filtration Testwork 13.103
13.14 Metallurgical Recoveries 13.104 13.14.1 Background 13.104 13.14.2 Metallurgical Recovery Estimates 13.105 13.14.3 Pyrite Product Recovery 13.111 13.14.4 Magnetite Recovery 13.114 13.14.5 Variability Test Results Summary 13.116
14.0 MINERAL RESOURCE ESTIMATES 14.1 14.1 Geological Models 14.1
14.1.1 Geological Interpretation 14.1 14.1.2 Surfaces 14.1
14.2 Domain Modeling 14.1 14.2.1 Software 14.1 14.2.2 Mineralization 14.1 14.2.3 Sulphur Domains 14.6 14.2.4 Weathering 14.9 14.2.5 Topography 14.9
14.3 Statistical Analysis 14.9 14.3.1 Software Used 14.9 14.3.2 Drillhole Coding 14.9 14.3.3 Drillhole Selection 14.11 14.3.4 Sample Length and Compositing 14.11 14.3.5 Summary Statistics 14.12 14.3.6 Balancing Cuts 14.17 14.3.7 Density 14.20
14.4 Variography 14.22 14.4.1 Methodology 14.22 14.4.2 Spatial Variograms 14.24
14.5 Block Model 14.28 14.5.1 Block Model Extents and Block Size 14.28
14.6 Grade Estimation 14.30 14.6.1 Data Used 14.30 14.6.2 Methodology 14.30 14.6.3 Density Assignments 14.34
14.7 Model Validation 14.34 14.7.1 Visual Validation 14.34 14.7.2 Statistical Validation 14.35 14.7.3 Swath Plots 14.37
14.8 Classification 14.42 14.8.1 Guidelines 14.42
MABILO PROJECT
NATIONAL INSTRUMENT 43-101 TECHNICAL REPORT 1913-000-GEREP-0003
Table of Contents Page
1913\24.04\1913-000-GEREP-0003_D
2 May 2016 Lycopodium Minerals Pty Ltd
14.9 Mineral Resource Reporting 14.44 14.9.1 Resource Tabulation 14.44 14.9.2 Comparison with Previous Estimate 14.44 14.9.3 Grade Tonnage Tables 14.45
14.10 Recommendations 14.48 14.11 References 14.48
15.0 MINERAL RESERVE ESTIMATES 15.1 15.1 Mineral Reserve Estimating Approach 15.1 15.2 Pit Optimization Key Assumptions 15.1
15.2.1 Resource Model 15.1 15.2.2 Geology Zones 15.2 15.2.3 Ore Types 15.2 15.2.4 Lease Boundaries 15.3 15.2.5 Geotechnical Considerations 15.4 15.2.6 Geo-hydrological Considerations 15.4 15.2.7 Oreloss and Dilution 15.6 15.2.8 Processing – Throughputs, Recoveries, Concentrate Grades
and Moisture 15.9 15.2.9 Optimization Costs General 15.11 15.2.10 Mining Costs 15.11 15.2.11 Processing Costs 15.13 15.2.12 Metal Prices 15.15 15.2.13 Selling Costs and Royalties 15.15 15.2.14 Discount Rate 15.15
15.3 Pit Optimization Results 15.16 15.3.1 Base Case Results 15.16 15.3.2 Optimization Sensitivities 15.18 15.3.3 Shell Selection 15.22
15.4 Mine Design 15.22 15.4.1 Mine Design Process 15.22 15.4.2 Bench Height 15.22 15.4.3 Pit Slopes 15.22 15.4.4 Ramps and Switchbacks 15.23 15.4.5 Minimum Mining Width 15.25 15.4.6 Lease Boundary 15.25 15.4.7 Ultimate Pit Design 15.26 15.4.8 Ultimate Pit Design and Optimization Shell Comparison 15.27 15.4.9 Stage Designs 15.31 15.4.10 Waste Dump Design 15.34 15.4.11 Site Layout at Project Completion 15.36
15.5 Mineral Reserves 15.36 15.5.1 Reserve Calculations 15.36 15.5.2 Project Economics 15.37 15.5.3 Mabilo Ore Reserve 15.38
16.0 MINING METHODS 16.1 16.1 Mining Activities 16.1
16.1.1 Mining Method - General Description 16.1 16.1.2 Clearing, Topsoil Removal and Storage 16.1
MABILO PROJECT
NATIONAL INSTRUMENT 43-101 TECHNICAL REPORT 1913-000-GEREP-0003
Table of Contents Page
1913\24.04\1913-000-GEREP-0003_D
2 May 2016 Lycopodium Minerals Pty Ltd
16.1.3 Grade Control 16.1 16.1.4 Drilling and Blasting – Oxide Materials 16.2 16.1.5 Drilling and Blasting – Fresh Materials 16.2 16.1.6 Drilling Equipment 16.3 16.1.7 Explosive Storage 16.3 16.1.8 Loading and Hauling 16.4 16.1.9 Rehandle 16.7 16.1.10 Pit Dewatering 16.7 16.1.11 Dust Suppression 16.7 16.1.12 Dump Rehabilitation 16.7 16.1.13 Mine Closure 16.7
16.2 Mining Productivities 16.8 16.2.1 Operating Hours 16.8 16.2.2 Ore and Waste - Densities, Swell and Moisture 16.9 16.2.3 Excavator Productivities 16.9 16.2.4 Truck Productivities 16.9 16.2.5 Drill Productivity 16.12
16.3 Mining and Processing Schedule 16.12 16.3.1 Scheduling Methodology 16.12 16.3.2 Scheduling Model 16.13 16.3.3 Scheduling Targets 16.13 16.3.4 Scheduling Constraints 16.14 16.3.5 Scheduling Results - Mining 16.15 16.3.6 Site Development 16.24 16.3.7 Scheduling Results - Processing 16.28 16.3.8 Stockpiling 16.30
16.4 Alternative Mine Schedule – 1.35 Mtpa 16.31 16.4.1 Schedule Constraints 16.31 16.4.2 Schedule Results 16.31
17.0 RECOVERY METHODS 17.1 17.1 Introduction 17.1
17.1.1 Selected Process Flowsheet 17.2 17.1.2 Plant Design Basis 17.4 17.1.3 Key Process Design Criteria 17.10
17.2 Plant Description 17.11 17.2.1 Crushing and Coarse Ore Storage 17.13 17.2.2 Grinding 17.13 17.2.3 Deslime 17.13 17.2.4 Bulk Sulphide Flotation 17.13 17.2.5 Concentrate Regrind 17.14 17.2.6 Cleaner Flotation 17.14 17.2.7 Magnetic Separation 17.15 17.2.8 Concentrate Handling 17.15 17.2.9 Copper and Pyrite Concentrate Storage 17.16 17.2.10 Magnetite Concentrate Storage 17.16 17.2.11 Tailings Disposal 17.17 17.2.12 Reagents and Services 17.17 17.2.13 Services 17.19
17.3 Plant Area Design 17.20
MABILO PROJECT
NATIONAL INSTRUMENT 43-101 TECHNICAL REPORT 1913-000-GEREP-0003
Table of Contents Page
1913\24.04\1913-000-GEREP-0003_D
2 May 2016 Lycopodium Minerals Pty Ltd
17.3.1 General 17.20 17.3.2 Site Location 17.21 17.3.3 General 17.21 17.3.4 Primary Crushing 17.21 17.3.5 Surge Bin and Stockpile 17.22 17.3.6 Grinding and Classification Circuit 17.22 17.3.7 Rougher and Cleaner Flotation and Regrind 17.23 17.3.8 Copper and Pyrite Concentrate Dewatering 17.23 17.3.9 Magnetite Recovery and Dewatering 17.23 17.3.10 Tailings Disposal 17.24 17.3.11 Reagents 17.24 17.3.12 Air and Water Services 17.25 17.3.13 Spillage Containment 17.25
17.4 Electrical Design 17.26 17.4.1 Installed Load and Maximum Demand 17.26 17.4.2 Power Generation 17.26 17.4.3 Electrical Distribution 17.26 17.4.4 Electrical Buildings 17.27 17.4.5 Transformers and Compounds 17.27 17.4.6 4.16 kV Switchboards 17.27 17.4.7 SAG Mill Variable Speed Drive 17.28 17.4.8 LV Electronic Variable Speed Drives and Soft Starters 17.28 17.4.9 380 V Motor Control Centre 17.28 17.4.10 Fire Protection 17.28 17.4.11 Cable Ladders 17.28 17.4.12 Cables 17.29 17.4.13 Lighting 17.29 17.4.14 Earthing System and Lightning Protection 17.29
17.5 Control System 17.29 17.5.1 General Overview 17.29 17.5.2 Drive Controls 17.31 17.5.3 Control Loops 17.31 17.5.4 Crushing Circuit 17.31 17.5.5 Milling 17.31 17.5.6 Desliming 17.32 17.5.7 Flotation 17.32 17.5.8 Thickening 17.32 17.5.9 Filtration 17.33 17.5.10 Magnetic Separation 17.33 17.5.11 Tailings Disposal 17.33 17.5.12 Services 17.33 17.5.13 Control Interfaces 17.34
17.6 Metallurgical Accounting 17.34 17.7 1.35 Mtpa Processing Case 17.35
17.7.1 Processing Upside 17.35 17.7.2 Capital Cost Estimate 17.35 17.7.3 Operating Cost Estimate 17.37
18.0 PROJECT INFRASTRUCTURE 18.1 18.1 Introduction 18.1
MABILO PROJECT
NATIONAL INSTRUMENT 43-101 TECHNICAL REPORT 1913-000-GEREP-0003
Table of Contents Page
1913\24.04\1913-000-GEREP-0003_D
2 May 2016 Lycopodium Minerals Pty Ltd
18.2 Seismic Hazard Assessment 18.1 18.3 Site Overview 18.2 18.4 Construction Camp 18.4 18.5 Plant Buildings 18.4
18.5.1 Site Administration 18.4 18.5.2 Process Plant Buildings 18.4 18.5.3 Mine Services Buildings 18.5
18.6 Accommodation Camp 18.5 18.6.1 Overview 18.5 18.6.2 Power and Water Supply 18.6 18.6.3 Sewage Disposal 18.7 18.6.4 Rubbish Disposal 18.7 18.6.5 Landscaping 18.7
18.7 Relocation Housing 18.7 18.8 Water Supply 18.7
18.8.1 Local Water Supply 18.7 18.8.2 Process Plant Water Supply 18.8
18.9 Water Balance 18.8 18.9.1 Climate 18.8 18.9.2 Surface Water Management Development 18.8 18.9.3 Water Balance Design Parameters 18.11 18.9.4 Water Balance Modeling 18.11 18.9.5 Potable Water 18.12
18.10 Stream Diversions and Environmental Control Dams 18.12 18.10.1 Phase 1 – Oxide Pit in Years 1 and 2 18.13 18.10.2 Phase 2 – Medium Pit 18.14 18.10.3 Phase 3 – Primary Pit 18.14 18.10.4 Phase 4 – Completion of Mining 18.14 18.10.5 Surface Water Management Structures 18.14
18.11 Storage Facilities for Hazardous Materials 18.15 18.11.1 Blasting Agents 18.15 18.11.2 Fuel 18.15 18.11.3 Flotation Reagents 18.16 18.11.4 Hydrated Lime and Quick Lime 18.16
18.12 Product Haulage 18.16 18.12.1 Overview 18.16 18.12.2 Product Tonnes 18.17 18.12.3 Ports 18.17 18.12.4 Routes 18.18 18.12.5 Traffic 18.19 18.12.6 Traffic Impact 18.20 18.12.7 Equivalent Single Axle Load (ESAL) 18.21 18.12.8 Traffic Recommendations 18.21 18.12.9 Costs 18.22
18.13 Access Roads 18.22 18.13.1 Overview 18.22 18.13.2 Mine Access Road 18.23 18.13.3 Process Facility Service Roads 18.24 18.13.4 Water Supply and Environmental Control Service Road 18.24 18.13.5 Village Connection Road 18.24
MABILO PROJECT
NATIONAL INSTRUMENT 43-101 TECHNICAL REPORT 1913-000-GEREP-0003
Table of Contents Page
1913\24.04\1913-000-GEREP-0003_D
2 May 2016 Lycopodium Minerals Pty Ltd
18.13.6 Community Diversion Roads 18.24 18.13.7 Mine Roads 18.25 18.13.8 Logistics 18.25
18.14 Telecommunications 18.26 18.14.1 General Overview 18.26 18.14.2 Network Topology 18.26 18.14.3 Server / Computer Infrastructure 18.27 18.14.4 Voice Services 18.28 18.14.5 UHF Site Radio 18.29 18.14.6 CCTV / Access Control 18.30 18.14.7 Camp Entertainment Services 18.30
18.15 Catering and Janitorial 18.30 18.16 Power Supply and Distribution 18.30
18.16.1 Power Supply 18.30 18.16.2 HV Power Distribution 18.32
18.17 Port 18.33 18.17.1 Overview 18.33 18.17.2 Product Analysis 18.33 18.17.3 Port Options Analysis 18.33 18.17.4 Larap Causeway 18.36 18.17.5 Larap Port Upgrade 18.38
18.18 Tailings Storage Facility 18.40 18.18.1 Tailings Geochemistry 18.40 18.18.2 Tailings Storage 18.41
19.0 MARKET STUDIES AND CONTRACTS 19.1 19.1 Executive Summary 19.1 19.2 Gold Cap Ore 19.3
19.2.1 Product Specification 19.3 19.2.2 Marketing Strategy 19.4 19.2.3 Pricing 19.4
19.3 Oxide Skarn Ore DSO 19.4 19.3.1 Product Specification 19.4 19.3.2 Marketing Strategy 19.5 19.3.3 Pricing 19.5
19.4 Supergene Chalcocite 19.5 19.4.1 Product Specification 19.5 19.4.2 Marketing Strategy 19.5 19.4.3 Pricing 19.6
19.5 Copper Concentrate 19.6 19.5.1 Product Specification 19.6 19.5.2 Copper Demand Forecast 19.6 19.5.3 Copper Market Supply 2016 – 2019 19.8 19.5.4 Marketing Strategy 19.9 19.5.5 Pricing 19.11
19.6 Magnetite Concentrate 19.11 19.6.1 Product Specification 19.11 19.6.2 Demand Forecast 19.11 19.6.3 Supply Forecast 19.13 19.6.4 Marketing Strategy 19.14
MABILO PROJECT
NATIONAL INSTRUMENT 43-101 TECHNICAL REPORT 1913-000-GEREP-0003
Table of Contents Page
1913\24.04\1913-000-GEREP-0003_D
2 May 2016 Lycopodium Minerals Pty Ltd
19.6.5 Pricing 19.14 19.7 Pyrite Concentrate 19.14
19.7.1 Product Specification 19.14 19.7.2 Marketing Strategy 19.15 19.7.3 Pricing 19.15
19.8 Revenue Forecasts 19.15 19.9 Marketing Resources and Organization 19.16 19.10 Product Shipping, Storage and Distribution 19.16
19.10.1 Ocean Freight Market Overview 19.16 19.10.2 Shipping Freight Rates 19.22 19.10.3 Vessel Loading 19.24 19.10.4 Port Storage Optimization 19.24 19.10.5 Weighing, Sampling, Moisture Determination 19.24
19.11 Contracts 19.25
20.0 ENVIRONMENTAL STUDIES, PERMITTING AND COMMUNITY IMPACT 20.1 20.1 Introduction 20.1 20.2 Baseline Monitoring and Data 20.3
20.2.1 Surface Flow Monitoring Stations 20.3 20.2.2 Stream Water Quality 20.3 20.2.3 Ground Water Level Monitoring Stations 20.4 20.2.4 Ground Water Quality 20.4 20.2.5 Potable Water Quality 20.4 20.2.6 Tailings Discharge Quality and Management 20.5 20.2.7 Air Quality 20.6
20.3 Environmental Risk Assessment 20.7 20.3.1 Physical Environment 20.7 20.3.2 Biological Environment 20.8 20.3.3 Environment Management 20.9
20.4 Socio Development Plans 20.10 20.4.1 Methodology 20.10 20.4.2 Overall Findings and Observations 20.11 20.4.3 Socio Conclusions 20.11 20.4.4 Recommendations 20.12
20.5 Relocation 20.13 20.6 Rehabilitation 20.16
20.6.1 Rehabilitation Requirements 20.16 20.6.2 Rehabilitation Programme 20.16 20.6.3 Post Closure Monitoring 20.17
21.0 CAPITAL AND OPERATING COSTS 21.1 21.1 Capital Cost Estimate 21.1
21.1.1 Overview 21.1 21.1.2 Oxide Mining 21.1 21.1.3 Primary Ore Capital Estimate 21.2 21.1.4 Capital Expenditure (Life of Mine) 21.7
21.2 Operating Cost Estimate 21.7 21.2.1 Overview 21.7 21.2.2 Mining Operating Costs 21.8
MABILO PROJECT
NATIONAL INSTRUMENT 43-101 TECHNICAL REPORT 1913-000-GEREP-0003
Table of Contents Page
1913\24.04\1913-000-GEREP-0003_D
2 May 2016 Lycopodium Minerals Pty Ltd
21.2.3 Primary Ore Process Operating Costs 21.10 21.2.4 Gold Cap Oxide Ore Operating Costs 21.13 21.2.5 Supergene / Oxide Skarn Operating Costs 21.14
22.0 ECONOMIC ANALYSIS 22.1 22.1 Introduction 22.1 22.2 Assumptions and Qualifications 22.3 22.3 Cash Flow Model 22.5 22.4 Financial Outcomes 22.6 22.5 Sensitivity Analysis 22.8
23.0 ADJACENT PROPERTIES 23.1
24.0 OTHER RELEVANT DATA AND INFORMATION 24.1 24.1 Operating Management Organizational Structure 24.1
24.1.1 General Operating Structure 24.1 24.1.2 Operating Statutory Coverage 24.2 24.1.3 Workplace Occupational Health and Safety 24.3 24.1.4 Roster Arrangements 24.5
24.2 Contractor Supplied Services 24.5 24.2.1 Mining Contractor 24.5 24.2.2 Product Haulage 24.6 24.2.3 Metallurgical, Assay and Environmental Laboratory 24.6 24.2.4 Maintenance Labor 24.6 24.2.5 Catering and Janitorial Services 24.6 24.2.6 Personnel Transport 24.6 24.2.7 Port Operations 24.6 24.2.8 Purchasing Services 24.6 24.2.9 Bulk Freight Movement 24.6
24.3 Project Implementation 24.7 24.3.1 Project Objectives 24.7 24.3.2 Project Execution Strategy 24.7 24.3.3 Schedule 24.7
24.4 Legal Aspects 24.8 24.5 Community Relations 24.8 24.6 Risks and Opportunities 24.8
24.6.1 Risks 24.9 24.6.2 Opportunities 24.10
25.0 INTERPRETATION AND CONCLUSIONS 25.1 25.1 Interpretation and Conclusions 25.1 25.2 Mineral Resource Estimate 25.1 25.3 Mineral Reserve 25.3 25.4 Metallurgy and Processing 25.4 25.5 Infrastructure 25.5
26.0 RECOMMENDATIONS 26.1 26.1 Introduction 26.1 26.2 Mineral Resource Estimate 26.1 26.3 Mineral Reserve Estimate 26.2
MABILO PROJECT
NATIONAL INSTRUMENT 43-101 TECHNICAL REPORT 1913-000-GEREP-0003
Table of Contents Page
1913\24.04\1913-000-GEREP-0003_D
2 May 2016 Lycopodium Minerals Pty Ltd
26.4 Processing 26.2 26.5 Infrastructure 26.2
27.0 REFERENCES 27.1 27.1 References 27.1
28.0 DATES AND SIGNATURES 28.1
29.0 CERTIFICATE OF AUTHORS 29.1 TABLES Table 1.1 MLEDC Tenements 1.3 Table 1.2 Mabilo Project Mineral Resource Estimate Results as at November
2015 1.7 Table 1.3 Ore Mined - Tonnages and Grades by Year 1.11 Table 1.4 Mabilo Mineral Reserve Summary 1.13 Table 1.5 Financial vs Pit Optimization Comparison 1.14 Table 1.6 Bulk Rougher Flotation Testwork Result Summary 1.18 Table 1.7 Bulk Cleaner Flotation Test Results 1.19 Table 1.8 Cleaner Flotation Product Assays 1.19 Table 1.9 Magnetite Concentrate 1.21 Table 1.10 Commercial Export Product and Destination Chart 1.37 Table 1.11 Product Expected Revenues 1.39 Table 1.12 Operating Personnel Numbers 1.45 Table 1.13 Summary of Mabilo Site Operating Cost Estimate (1.0 Mt/y)
(US$, 4Q2015) 1.46 Table 1.14 Summary Mabilo Mining Cost Estimate (1.0 Mt/y) 1.47 Table 1.15 Summary of Mabilo Fresh Ore Processing Operating Cost Estimate
(1.0 Mt/y) (US$, 4Q2015) 1.49 Table 1.16 Oxide Ore Initial Capital Cost Estimate Summary (US$, 4Q2015,
±15%) 1.51 Table 1.17 Primary Ore Initial Capital Cost Estimate Summary (US$, 4Q2015,
±15%) 1.51 Table 1.18 Life of Mine Capital Cost Estimate 1.52 Table 1.19 Project Financial Measures Summary (1 Mtpa) 1.54 Table 4.1 MLEDC Tenements 4.4 Table 6.1 Mineral Resource Estimate as at November 2014 for the Mabilo
Project 6.3 Table 9.1 Table Showing 2012 MLEDC Drillhole Locations and Orientations.
Coordinates in WGS84 (51N) Projection 9.2 Table 10.1 Mabilo Drill Locations, Orientations and Depths 10.2 Table 10.2 Significant Drillhole Intersections (cut-off of 0.5% Cu or 0.5 ppm Au
with minimum 2 m width and internal waste as 2 m) 10.9 Table 11.1 Assay Methods and Detection Levels 11.4 Table 11.2 Field Duplicate Statistics 11.6 Table 11.3 Au CRMs used at Mabilo – Au Detection Limit 0.005 ppm 11.10 Table 11.4 Cu CRMs used at Mabilo – Cu Detection Limit 20 ppm 11.11 Table 11.5 Fe CRMs used at Mabilo – Fe Detection Limit 0.01% 11.11 Table 11.6 Ag CRMs used at Mabilo – Ag Detection Limit 0.5 ppm 11.11
MABILO PROJECT
NATIONAL INSTRUMENT 43-101 TECHNICAL REPORT 1913-000-GEREP-0003
Table of Contents Page
1913\24.04\1913-000-GEREP-0003_D
2 May 2016 Lycopodium Minerals Pty Ltd
Table 11.7 Umpire Assay Statistics 11.13 Table 13.1 Phase I Sample Composite 13.6 Table 13.2 Phase II Master Composite Samples 13.8 Table 13.3 Comminution Samples 13.9 Table 13.4 Variability Samples 13.11 Table 13.5 Phase I Composite Head Assay 13.17 Table 13.6 Cleaner Flotation Grades and Recoveries 13.20 Table 13.7 Flotation Concentrate Assays 13.21 Table 13.8 Tails Gold Leach Summary 13.22 Table 13.9 Magnetite Concentrate Assay 13.23 Table 13.10 Comminution Test Results 13.27 Table 13.11 Head Assay – Master Composite 13.30 Table 13.12 Tap Water and Site Water Concentrate and Tails Assays 13.31 Table 13.13 Grind Series Testwork Result Summary 13.34 Table 13.14 Alternate Collector Testwork Result Summary 13.40 Table 13.15 Bulk Rougher Flotation Testwork Result Summary 13.43 Table 13.16 Cleaner Flotation Testwork Result Summary Following Regrind 13.46 Table 13.17 Cleaner Flotation - Depressant Series 13.53 Table 13.18 Phase I Cleaner Flotation - Depressant Addition Comparison 13.53 Table 13.19 Gold Promoter Test Results 13.56 Table 13.20 Bulk Cleaner Flotation Test Results (combined result for six tests) 13.58 Table 13.21 Cleaner Flotation Product Assays 13.58 Table 13.22 Oxidized Feed Flotation Test Results 13.60 Table 13.23 Gold Distribution in Flotation Products 13.61 Table 13.24 Rougher Tails Leach Results 13.62 Table 13.25 Cleaner Tails Leach Results 13.62 Table 13.26 Leach Tails Solution Assays 13.64 Table 13.27 Cyanide Speciation – Leach Tails Solution 13.64 Table 13.28 Capital Cost of Gold Circuits 13.67 Table 13.29 Operating Cost of Gold Circuits 13.67 Table 13.30 Magnetite Concentrate 13.69 Table 13.31 Baseline Variability Flotation Test Results Summary 13.73 Table 13.32 Variability Round 2 Results Summary 13.76 Table 13.33 Variability #6a Results Summary 13.79 Table 13.34 Variability Testing Round 3 Results Summary 13.81 Table 13.35 Desliming Tests Results Summary 13.83 Table 13.36 Variability Grade Improvement Test Results 13.85 Table 13.37 Variability Magnetite Recovery Test Results 13.86 Table 13.38 High Pyrite Sample Selection 13.87 Table 13.39 Sample Head Assays 13.88 Table 13.40 High Pyrite Variability Flotation Recovery Data (First Round) 13.89 Table 13.41 High Pyrite Composite Grind Series Results 13.91 Table 13.42 High Pyrite Composite Cleaner Flotation 13.93 Table 13.43 Repeat High Pyrite Variability Cleaner Flotation Tests 13.95 Table 13.44 Solids SGs for Various Products 13.100 Table 13.45 Particle Size Distributions for Various Products 13.102 Table 13.46 Dynamic Thickening Testwork Results 13.103 Table 13.47 Variability Sample Flotation Results 13.116 Table 14.2 Raw vs Composite Drill Data 14.11 Table 14.3 Summary Statistics by Mineralized Lithological Domain Zone 14.14
MABILO PROJECT
NATIONAL INSTRUMENT 43-101 TECHNICAL REPORT 1913-000-GEREP-0003
Table of Contents Page
1913\24.04\1913-000-GEREP-0003_D
2 May 2016 Lycopodium Minerals Pty Ltd
Table 14.4 Sulphur Summary Statistics by ZONE and Sulphur Domain 14.15 Table 14.5 Summary Statistics SMZ Copper-gold Depleted and Enriched
Magnetite Skarn 14.16 Table 14.6 Correlation Matrices by ZONE 14.17 Table 14.7 Balancing Cuts Applied to Grade Variables 14.18 Table 14.8 Effect of Balancing Cuts on Mean Composite Grade 14.19 Table 14.9 Effect of Balancing Cuts on Mean S Composite Grade 14.20 Table 14.10 Variogram Parameters 14.25 Table 14.11 Adjusted Variogram Rotation Angles 14.26 Table 14.12 Block Model Parameters 14.29 Table 14.13 Estimation Search Ellipse Dimensions and Orientation in Datamine
Axis Rotation Convention 3-2-1 (Z-Y-X) 14.32 Table 14.14 Estimation Sample Number Parameters 14.33 Table 14.15 Mean Model OK vs IDS vs Drill Composite Grades 14.36 Table 14.16 Mabilo Project SMZ and NMZ Combined MRE Results as at
November 2015 14.44 Table 14.17 Mabilo Project - Mineral Resource Estimate Results as at November
2014 14.45 Table 14.18 Mabilo SMZ and NMZ November 2015 MRE – Cu % Grade Tonnage
Table 14.46 Table 14.19 Mabilo SMZ and NMZ November 2015 MRE – Au g/t Grade Tonnage
Table 14.47 Table 15.1 November 2015 Mabilo Resource 15.2 Table 15.2 Geology Zones 15.2 Table 15.3 Ore Types 15.3 Table 15.4 Insitu Ore Moisture Content 15.3 Table 15.5 Optimization Slope Angles 15.4 Table 15.6 Effects of Edge Dilution 15.7 Table 15.7 Ratios - After Edge Dilution / Original Resource 15.7 Table 15.8 Effects of Edge Dilution and Internal Dilution 15.8 Table 15.9 Ratios - After Edge Dilution and Ore Mixing / Original Resource 15.8 Table 15.10 Resource by Ore Type - After Edge Dilution and Ore Mixing 15.9 Table 15.11 Throughput Assumptions 15.9 Table 15.12 Processing Recoveries and Concentrate Grades 15.10 Table 15.13 Concentrate Moisture Content 15.10 Table 15.14 Waste Mining Cost by Bench 15.12 Table 15.15 Ore Mining Premium 15.13 Table 15.16 Ore and Concentrate Processing Costs - Summary 15.13 Table 15.17 Gold Cap Ore Processing Cost - Details 15.13 Table 15.18 Supergene Ore Processing Cost Details 15.14 Table 15.19 Fresh Ore Processing Cost Details 15.14 Table 15.20 Metal Prices 15.15 Table 15.21 Royalties and Charges 15.15 Table 15.22 Base Case Optimization Results 15.17 Table 15.23 Optimization Results – Sensitivity Details 15.20 Table 15.24 Sensitivity Results by Pit Size and DCF 15.21 Table 15.25 Slope Design Parameters 15.23 Table 15.26 Ramp Design Criteria 15.24 Table 15.27 Minimum Mining Widths 15.25 Table 15.28 Comparison Between Design and Optimization Shell 15.27
MABILO PROJECT
NATIONAL INSTRUMENT 43-101 TECHNICAL REPORT 1913-000-GEREP-0003
Table of Contents Page
1913\24.04\1913-000-GEREP-0003_D
2 May 2016 Lycopodium Minerals Pty Ltd
Table 15.29 Cut-off Grades 15.37 Table 15.30 Financial vs Pit Optimisation Comparison 15.38 Table 15.31 Mabilo Mineral Reserve 15.38 Table 16.1 Grade Control Costs 16.2 Table 16.2 Drill and Blast Cost for Ore and Waste 16.3 Table 16.3 Load and Haul Unit Rates per Operating Hour 16.5 Table 16.4 Mabilo Annual Operating Hours 16.8 Table 16.5 Material Properties 16.9 Table 16.6 Excavator Productivities 16.10 Table 16.7 Fresh Rock Drill Productivity 16.12 Table 16.8 Mining - Weather Lost Days 16.14 Table 16.9 Fresh Ore Processing Ramp Up Schedule 16.15 Table 16.10 Ore Mined - Tonnages and Grades by Year 16.16 Table 16.11 Annual Mining Activities - 1 Mtpa 16.26 Table 16.12 Annual Mining Costs – 1.0 Mtpa 16.27 Table 16.13 Ore Mined - Tonnages and Grades by Year – 1.35 Mtpa 16.33 Table 16.14 Annual Mining Costs – 1.35 Mtpa 16.34 Table 17.1 Summary of Selected Milling Parameters 17.5 Table 17.2 Summary of Proposed Milling Circuit Design 17.6 Table 17.3 Comminution Consumables 17.6 Table 17.4 Summary of Key Process Design Criteria 17.10 Table 17.5 Installed Load and Maximum Demand 17.26 Table 17.6 1.35 Mtpa Indicative Estimate Summary (US$, 4Q2015, ±25%) 17.36 Table 17.7 Process Plant Operating Cost Estimate (1.35 Mt/y, +/- 25%) 17.37 Table 18.1 Accommodation Camp Breakdown 18.6 Table 18.2 Short Duration Storm Event Summary 18.8 Table 18.3 Commercial Export Product and Destination Chart 18.17 Table 18.4 Summary Logistics Route Analysis 18.19 Table 18.5 Site Radio System Hardware 18.29 Table 18.6 Basis for HFO vs Diesel vs IPP Power Plant Comparison 18.31 Table 18.7 Commercial Export Product and Destination Chart 18.33 Table 18.8 Summary of Port Site Assessment 18.35 Table 18.9 Summary of Capital Costs - Larap Port Upgrading (VAT Exclusive) 18.37 Table 18.10 Operating Costs - Larap Barge Loading 18.38 Table 18.11 Capital Cost, Proposed Larap Port Upgrade (VAT Exclusive) 18.39 Table 18.12 Operating Cost, Proposed Larap Port Upgrade Years 3-10 (VAT
Exclusive) 18.40 Table 19.1 Product Expected Revenues 19.1 Table 19.2 Main Elements in Gold Cap Ore 19.4 Table 19.3 Main Elements in Oxide Skarn Ore 19.5 Table 19.4 Main Elements in Supergene Chalcocite 19.5 Table 19.5 Main Elements in Copper Concentrate 19.6 Table 19.6 Chinese Regulatory Limits on Deleterious Elements in Imported
Copper Concentrates 19.7 Table 19.7 Main Elements in Magnetite Concentrate 19.11 Table 19.8 Main Elements in Pyrite Concentrate 19.14 Table 19.9 Product Expected Revenues 19.15 Table 19.10 Indicative Freight Rates 19.23 Table 20.1 Status of Environmental Permits 20.2 Table 20.2 Community Impact by Phase 20.13
MABILO PROJECT
NATIONAL INSTRUMENT 43-101 TECHNICAL REPORT 1913-000-GEREP-0003
Table of Contents Page
1913\24.04\1913-000-GEREP-0003_D
2 May 2016 Lycopodium Minerals Pty Ltd
Table 20.3 Relocation Budget 20.15 Table 20.4 Projected Final Land Use after Abandonment 20.17 Table 21.1 Oxide Ore Initial Capital Cost Estimate Summary (US$, 4Q2015,
±15%) 21.1 Table 21.2 Primary Ore Initial Capital Cost Estimate Summary (US$, 4Q2015,
±15%) 21.3 Table 21.3 Capital Cost Estimate Basis 21.5 Table 21.4 Capital Cost Estimate Methodology 21.5 Table 21.5 Life of Mine Capital Cost Estimate 21.7 Table 21.6 Summary of Mabilo Site Operating Cost Estimate (1.0 Mt/y)
(US$, 4Q2015) 21.8 Table 21.7 Summary Mabilo Mining Cost Estimate (1.0 Mt/y) 21.9 Table 21.8 Summary of Mabilo Process Plant Operating Cost Estimate (1.0 Mt/y)
(US$, 4Q2015, +/-15%) 21.11 Table 22.1 Project Production Summary 22.2 Table 22.2 Tax and Royalty Obligations 22.4 Table 22.3 Project Net Profit After Tax Summary (1.0 Mtpa) 22.6 Table 22.4 Project Financial Measures Summary 22.7 Table 22.5 Key Statistics of the Financial Evaluation (1.0 Mtpa) 22.7 Table 22.6 Project NPVs 22.8 Table 22.7 Sensitivity Analysis 22.9 Table 24.1 Operating Personnel Numbers 24.2 Table 25.1 Financial vs Pit Optimization Comparison 25.4 Table 25.2 Commercial Export Product and Destination 25.6 FIGURES Figure 1.1 MLEDC Tenements Map 1.3 Figure 1.2 Ultimate Pit Design 1.10 Figure 1.3 Ore and Waste Mining by Stage 1.12 Figure 1.4 Ore Mining by Ore Type 1.12 Figure 1.5 Network Topology 1.30 Figure 1.6 Road Network of the Project Site 1.36 Figure 1.7 Concept Long Term Port Facility 1.38 Figure 1.8 Mabilo Project Table of Organization 1.44 Figure 1.9 Breakdown of Total Mining Costs 1.48 Figure 1.10 Process Plant Operating Cost Breakdown 1.50 Figure 4.1 Mabilo Project Location 4.1 Figure 4.2 MLEDC Tenements Map 4.5 Figure 5.1 Mabilo Topography Looking North Towards the Labo River and
Mt Bagacay 5.1 Figure 5.2 Barangay Road Access to Drill Sites 5.2 Figure 6.1 Venida Pit Looking to the North 6.4 Figure 6.2 Black Ferruginous Clays 6.4 Figure 7.1 Philippine Magmatic Arc Belts 7.1 Figure 7.2 Summary Geology and Mineral Occurrences in the Paracale District 7.3 Figure 7.3 Quartz Diorite 7.4 Figure 7.4 Mabilo Local Geology 7.5 Figure 7.5 Massive Magnetite Skarn 7.7
MABILO PROJECT
NATIONAL INSTRUMENT 43-101 TECHNICAL REPORT 1913-000-GEREP-0003
Table of Contents Page
1913\24.04\1913-000-GEREP-0003_D
2 May 2016 Lycopodium Minerals Pty Ltd
Figure 7.6 Crudely Banded Massive Magnetite Skarn with Remnant Calc-silicate Band on Left 7.8
Figure 7.7 High-grade Chalcopyrite in Magnetite Skarn 7.8 Figure 7.8 Garnet (gt) Skarn with High-grade Chalcopyrite (cpy) Mineralization
and no Magnetite 7.9 Figure 7.9 Massive Garnet Skarn Strongly Retrogressed to Epidote, Sericite and
Chlorite 7.9 Figure 7.10 Hornfels after Siltstone and Calcareous Siltstone 7.10 Figure 7.11 Magnetite Skarn with Strong Retrograde Pyrite Overprint 7.11 Figure 7.12 Vuggy Silica-pyrite Altered Breccia with Arsenopyrite 7.11 Figure 7.13 High-grade Bornite Associated with Pyrite Overprint of Magnetite
Skarn 7.12 Figure 7.14 Oxidized Hematitic Mineralization After Massive Magnetite Skarn 7.13 Figure 8.1 Diagrammatic Illustration of Skarn Formation 8.1 Figure 9.1 Modeled Magnetic Anomalies from Eldore in 2007 9.3 Figure 9.2 2012 Drillhole Location Map 9.4 Figure 9.3 RTP Image of Ground Magnetic Data for the Mabilo Property 9.5 Figure 9.4 2013 survey 3D magnetic models on TMI RTP image 9.6 Figure 9.5 Local RTP Magnetic Image of the 2013 survey for the Mabilo Deposit
showing 3D magnetic models and drill collars 9.6 Figure 9.6 Areas of Proposed Ground Magnetic Surveys in EXPA 188 9.7 Figure 10.1 Drill Collar Plan for Drilling by Mt. Labo on the Mabilo Property 10.4 Figure 10.2 Cross sections through the SMZ 10.7 Figure 10.3 Cross Section through the NMZ 10.8 Figure 11.1 Field Duplicate Scatter Plots 11.7 Figure 11.2 Q-Q Plots Original vs. Field Duplicate 11.8 Figure 11.3 QAQC Coarse Blanks Submitted 11.9 Figure 11.4 CRM Performance OREAS 701 11.12 Figure 13.1 Mabilo Testwork Samples - Drillhole Intercept Locations (Sections) 13.4 Figure 13.2 Mabilo Testwork Samples - Drillhole Intercept Locations (Plans) 13.5 Figure 13.3 Relative Abundance of Minerals in the Samples 13.13 Figure 13.4 Mineral Assay Ore Characterization 13.16 Figure 13.5 Copper Diagnostic Leaching 13.18 Figure 13.6 Gold Diagnostic Leaching 13.18 Figure 13.7 Comminution Testwork Summary Flowsheet 13.24 Figure 13.8 Flotation Process Development Programme 13.25 Figure 13.9 Physical Testwork Programme 13.26 Figure 13.10 Levin Test Results 13.29 Figure 13.11 Sighter Flotation Testing 13.30 Figure 13.12 Phase I Grind Flotation Testing 13.34 Figure 13.13 Copper and Gold Recovery Grind Kinetic Data 13.35 Figure 13.14 Copper and Gold Recovery Grind Kinetic Data 13.36 Figure 13.15 Copper Grade Recovery Curves 13.37 Figure 13.16 Economic Evaluation of Optimum Grind Size 13.38 Figure 13.17 Copper, Gold and Sulphide Recovery with Flotation Time 13.41 Figure 13.18 Copper Grade Recovery Curves 13.42 Figure 13.19 Copper Grade Recovery Curves 13.44 Figure 13.20 Phase I Cleaner Flotation Testing – Copper Grade / Recovery Curves 13.45 Figure 13.21 Copper and Gold Residues vs Grind Data 13.47 Figure 13.22 Copper and Gold Recovery Grind Kinetic Data 13.48
MABILO PROJECT
NATIONAL INSTRUMENT 43-101 TECHNICAL REPORT 1913-000-GEREP-0003
Table of Contents Page
1913\24.04\1913-000-GEREP-0003_D
2 May 2016 Lycopodium Minerals Pty Ltd
Figure 13.23 Copper Grade Recovery Curves – Regrind Series 13.49 Figure 13.24 Economic Evaluation of Optimum Grind Size 13.50 Figure 13.25 Copper Grade Recovery Curves – Depressant Series 13.52 Figure 13.26 Copper Grade Recovery Curve – Gold Promoter Tests 13.55 Figure 13.27 Gold Grade Recovery Curve – Gold Promoter Tests 13.55 Figure 13.28 Copper Grade Recovery – Bulk Cleaner Flotation 13.57 Figure 13.29 Oxidation Test – Copper Grade Recovery Curves 13.60 Figure 13.30 Metal Extraction Rates – Bulk Cleaner Tails Leach 13.63 Figure 13.31 Baseline Variability Flotation Grade – Recovery Curves 13.72 Figure 13.32 Variability Round 2 Grade Recovery Curves (Part 1) 13.75 Figure 13.33 Variability Round 2 Grade Recovery Curves (Part 2) 13.75 Figure 13.34 Scavenger Cleaner Grade Recovery Curve for Var #14 13.77 Figure 13.35 Variability #6a Grade Recovery Curves 13.78 Figure 13.36 Variability Testing Round 3 Grade Recovery Curves (Part 1) 13.80 Figure 13.37 Variability Testing Round 3 Grade Recovery Curves (Part 2) 13.81 Figure 13.38 Desliming Tests – Grade Recovery Curves 13.82 Figure 13.39 Grade Improvement Tests – Grade Recovery Curves 13.84 Figure 13.40 High Pyrite Sample Locations 13.88 Figure 13.41 Grade Recovery Curves for the Grind Series Rougher Tests 13.92 Figure 13.42 High Pyrite Composite Cleaner Grade Recovery Curves 13.93 Figure 13.43 Cleaner Flotation Grade Recovery Curves – Low Grade Variability 13.96 Figure 13.44 Cleaner Flotation Grade Recovery Curves – Medium Grade Variability 13.97 Figure 13.45 Cleaner Flotation Grade Recovery Curves – High Grade Variability 13.97 Figure 13.46 Grade*Recovery Data with Model Estimates 13.99 Figure 13.47 Viscosity vs Shear Rate, Magnetite and Tailings 13.101 Figure 13.48 Viscosity vs Shear Rate, Copper and Pyrite Concentrates 13.101 Figure 13.49 Copper Grade Recovery Product (Round 2) vs Copper Head Grade 13.106 Figure 13.50 Copper Grade Recovery Product (Final) vs Copper Head Grade 13.106 Figure 13.51 Grade Recovery Product Data with Model Estimates 13.108 Figure 13.52 Concentrate Copper Upgrade Ratio Model Fit 13.109 Figure 13.53 Gold Recovery to Cleaner Concentrate vs S:Cu Ratio 13.110 Figure 13.54 Estimated Silver Recovery to Cleaner Concentrate 13.111 Figure 13.55 Rougher Flotation Mass Pull vs Sulphur Head Grade 13.112 Figure 13.56 Cleaner Flotation Mass Pull vs Copper Head Grade 13.112 Figure 13.57 Gold Recovery to Rougher Concentrate vs Ro Mass Pull 13.113 Figure 13.58 Magnetite Recovery vs Adjusted Head Grade 13.115 Figure 14.1 Magnetite Skarn – SMZ (Oblique view top, Cross-section below) 14.3 Figure 14.2 SMZ – Plan and Section Views of Mineralized Zones 14.4 Figure 14.3 NMZ – Plan and Section Views of Mineralized Zones 14.5 Figure 14.4 SMZ Plan and Section Views of Sulphur Domains (>5% <10% orange,
>10% pink) 14.7 Figure 14.5 NMZ Plan and Section Views of Sulphur Domains (>5% <10% orange,
>10% pink) 14.8 Figure 14.6 CMPZON Coding for the SMZ Magnetite Skarn (S-N Cross-section on
476,150 m E) 14.11 Figure 14.7 Histogram of Raw Sample Lengths within Mabilo Resource
Wireframes 14.12 Figure 14.8 Combined Log (Probability Plot Cu, Fe, Au for ZONE = 1 and 11) 14.12 Figure 14.9 SMZ Magnetite Skarn Zone Showing Gold and Copper Depleted and
Enriched Zones 14.16
MABILO PROJECT
NATIONAL INSTRUMENT 43-101 TECHNICAL REPORT 1913-000-GEREP-0003
Table of Contents Page
1913\24.04\1913-000-GEREP-0003_D
2 May 2016 Lycopodium Minerals Pty Ltd
Figure 14.10 Log Histogram and Probability Plots Au SMZ Magnetite Skarn 14.19 Figure 14.11 Fe vs SG Scatter Plot 14.21 Figure 14.12 Histograms of ZONE = 1 Fe, Au, Cu and Ag 14.23 Figure 14.13 Histograms of ZONE = 1 Sulphur 14.24 Figure 14.14 ZONE 1 Gaussian-transformed Au Variograms 14.27 Figure 14.15 ZONE 1 Back-transformed Au Variograms 14.28 Figure 14.16 Visual Validation SMZ, Cu % (Section Bearing at 050°) 14.35 Figure 14.17 Log Histogram Overlay Cu Model (brown) and Cu Drillhole (blue) 14.36 Figure 14.18 Swath Plot for Fe by Northing SMZ all Zones (above) SMZ Magnetite
Skarn (below) 14.37 Figure 14.19 Swath Plot for Cu by Northing SMZ All Zones (above) SMZ Magnetite
Skarn (below) 14.38 Figure 14.20 Swath Plot for Au by Northing SMZ All Zones (above) SMZ Magnetite
Skarn (below) 14.39 Figure 14.21 Swath Plot for Ag by Northing SMZ All Zones (above) SMZ Magnetite
Skarn (below) 14.40 Figure 14.22 Swath Plot for S by Northing SMZ All Zones (above) SMZ Magnetite
Skarn (below) 14.41 Figure 14.23 Mabilo Model SMZ and NMZ (Yellow = Indicated, Green = Inferred) 14.43 Figure 14.24 Mabilo SMZ and NMZ Cu Grade Tonnage Curve 14.46 Figure 14.25 Mabilo SMZ and NMZ Au Grade Tonnage Curve 14.47 Figure 15.1 Site Plan with Surface Water Diversion Structures 15.5 Figure 15.2 Resource Model Ore and Waste Blocks – Illustration 15.6 Figure 15.3 Edge Dilution Mechanism Applied – Illustration 15.7 Figure 15.4 Base Case Optimization Results 15.18 Figure 15.5 Dual Lane Ramp Configuration 15.24 Figure 15.6 Single Lane Ramp Configuration 15.24 Figure 15.7 Switchback Designs 15.25 Figure 15.8 Ultimate Pit Design – Plan View 15.27 Figure 15.9 Ultimate Pit Design and Optimization Shell – Plan View 15.28 Figure 15.10 Section A-A' 15.29 Figure 15.11 Section B-B' 15.29 Figure 15.12 Section C-C' 15.30 Figure 15.13 Section D-D' 15.30 Figure 15.14 Mabilo Stage 1 15.31 Figure 15.15 Mabilo Stage 2 15.32 Figure 15.16 Mabilo Stage 3 15.33 Figure 15.17 Mabilo Stage 4 15.34 Figure 15.18 Final Waste Dump and TSF 15.35 Figure 15.19 Waste Dump Construction and Final Landform Slopes - Schematic 15.35 Figure 15.20 Site Layout after Completion of Mining 15.36 Figure 15.21 Supergene Copper Ore Cut-off Grade 15.37 Figure 16.1 Locations of Explosive Storage Facilities 16.4 Figure 16.2 Labo Rainfall Records 16.13 Figure 16.3 Ore and Waste Mining by Stage 16.17 Figure 16.4 Ore Mining by Stage 16.17 Figure 16.5 Ore Mining by Ore Type 16.18 Figure 16.6 Pit at Completion of Year 1 16.19 Figure 16.7 Pit at Completion of Year 2 16.19 Figure 16.8 Pit at Completion of Year 3 16.20
MABILO PROJECT
NATIONAL INSTRUMENT 43-101 TECHNICAL REPORT 1913-000-GEREP-0003
Table of Contents Page
1913\24.04\1913-000-GEREP-0003_D
2 May 2016 Lycopodium Minerals Pty Ltd
Figure 16.9 Pit at Completion of Year 4 16.20 Figure 16.10 Pit at Completion of Year 5 16.21 Figure 16.11 Pit at Completion of Year 6 16.21 Figure 16.12 Pit at Completion of Year 7 16.22 Figure 16.13 Pit at Completion of Year 8 16.22 Figure 16.14 Pit at Completion of Year 9 16.23 Figure 16.15 Pit at Completion of Year 10 16.23 Figure 16.16 Site at Completion of Year 1 16.24 Figure 16.17 Site at Completion of Year 5 16.25 Figure 16.18 Site at Completion of Year 10 16.25 Figure 16.19 Ore Processing Tonnages 16.28 Figure 16.20 Gold Ore Processing Feed 16.29 Figure 16.21 Copper Concentrate Production 16.29 Figure 16.22 Magnetite Concentrate Production 16.30 Figure 16.23 Ore and Waste Mining by Stage – 1.35 Mtpa 16.35 Figure 16.24 Ore Mining by Stage – 1.35 Mtpa 16.35 Figure 16.25 Ore Mining by Ore Type – 1.35 Mtpa 16.36 Figure 17.1 Overall Process Flowsheet 17.3 Figure 17.2 Process Plant General Arrangement Drawing 17.12 Figure 18.1 Overall Site Layout 18.3 Figure 18.2 Surface Water Management 18.9 Figure 18.3 Port Locations and Road Network of the Project Site 18.18 Figure 18.4 Road Network of the Project Site 18.22 Figure 18.5 Mine Access Road 18.23 Figure 18.6 Proposed Community Bypass Road Alignment Layout 18.25 Figure 18.7 Network Topology 18.27 Figure 18.8 IT Server Topology 18.28 Figure 18.9 VoIP Service Topology 18.29 Figure 18.10 HFO vs Diesel vs IPP Power Plant NPC Comparison 18.32 Figure 18.11 Concept Long Term Larap Port Facility 18.34 Figure 18.12 Larap Causeway Concept Design 18.36 Figure 19.1 Copper Supply / Demand (million tonnes) 19.9 Figure 19.2 Moderate Grown in Iron Ore Demand 19.12 Figure 19.3 Substantial Steel Potential for Developing Asia 19.13 Figure 19.4 Baltic Dry Index (BDI) 19.17 Figure 19.5 Small Handysize 19.18 Figure 19.6 Traditional Handysize 19.19 Figure 19.7 Large Handysize 19.20 Figure 19.8 Handysize Annual Oversupply 19.21 Figure 19.9 Handysize Supply - Demand 19.22 Figure 20.2 Example Flooded Open Pit Rehabilitated (Korokan pit, Philippines) 20.16 Figure 20.3 Progressive Waste Dump Rehabilitation, Masbate, Philippines 20.17 Figure 21.1 Breakdown of Total Mining Costs 21.10 Figure 21.2 Process Plant Operating Cost Breakdown 21.12 Figure 22.1 Undiscounted Project Cash Flows 22.8 Figure 22.2 Sensitivity of Project IRR to Variation in Key Cost Inputs 22.10 Figure 22.3 Sensitivity of Project Pay-back to Variation in Key Cost Inputs 22.11 Figure 22.4 Sensitivity of Project NPV5 to Variation in Key Cost Inputs 22.12 Figure 24.1 Mabilo Project Table of Organization 24.1
MABILO PROJECT
NATIONAL INSTRUMENT 43-101 TECHNICAL REPORT
1913-000-GEREP-0003
Table of Contents Page
1.0 SUMMARY 1.1 1.1 Executive Summary 1.1 1.2 Introduction 1.1 1.3 Legal, Ownership and Permitting 1.2 1.4 Geology and Mineralization 1.3 1.5 Exploration 1.4 1.6 Drilling 1.4 1.7 Sample Preparation, Analysis and Security 1.5 1.8 Mineral Resource Estimate 1.5 1.9 Mining 1.8
1.9.1 Mineral Reserve Estimating Approach 1.8 1.9.2 Mining Method 1.8 1.9.3 Pit Optimization 1.8 1.9.4 Mine Design 1.9 1.9.5 Mining Schedule 1.10 1.9.6 Mineral Reserves 1.13 1.9.7 Project Economics 1.14 1.9.8 Alternative Mine Schedule – 1.35 Mtpa 1.14
1.10 Metallurgy 1.15 1.11 Process Plant 1.24
1.11.1 Selected Process Flowsheet 1.25 1.11.2 Processing Upside 1.26
1.12 Infrastructure 1.26 1.12.1 Overview 1.26 1.12.2 Seismic Assessment 1.27 1.12.3 Surface Water Management 1.27 1.12.4 Power Supply and Distribution 1.28 1.12.5 Telecommunications 1.29 1.12.6 Tailings Storage and Site Water Balance 1.31 1.12.7 Project Buildings 1.34 1.12.8 Access and Site Roads 1.35 1.12.9 Port Facilities 1.37 1.12.10 Port – Product Analysis 1.37
1.13 Marketing 1.38 1.14 Environment and Social Impact 1.41 1.15 Project Implementation 1.42
1.15.1 Project Execution Strategy 1.42 1.15.2 Schedule 1.42
1.16 Operations 1.43 1.17 Operating Costs 1.45
1.17.1 Mining Operating Costs 1.46 1.17.2 Processing Costs 1.48
1.18 Capital Cost Estimate 1.50 1.19 Economics 1.52 1.20 Recommendations 1.54
1.20.1 Mineral Resource Estimate 1.54 1.20.2 Mineral Reserve Estimate 1.55 1.20.3 Processing 1.55 1.20.4 Infrastructure 1.56
1.21 Risks and Opportunities 1.56
1913\24.04\1913-000-GEREP-0003_D S1 May 2016 Lycopodium Minerals Pty Ltd / MJV / Orelogy / KP
MABILO PROJECT
NATIONAL INSTRUMENT 43-101 TECHNICAL REPORT
1913-000-GEREP-0003
Table of Contents (Continued)
Page
1913\24.04\1913-000-GEREP-0003_D S1
May 2016 Lycopodium Minerals Pty Ltd / MJV / Orelogy / KP
1.21.1 Risks 1.56 1.21.2 Opportunities 1.57
TABLES Table 1.1 MLEDC Tenements 1.3 Table 1.2 Mabilo Project Mineral Resource Estimate Results as at November
2015 1.7 Table 1.3 Ore Mined - Tonnages and Grades by Year 1.11 Table 1.4 Mabilo Mineral Reserve Summary 1.13 Table 1.5 Financial vs Pit Optimization Comparison 1.14 Table 1.6 Bulk Rougher Flotation Testwork Result Summary 1.18 Table 1.7 Bulk Cleaner Flotation Test Results 1.19 Table 1.8 Cleaner Flotation Product Assays 1.19 Table 1.9 Magnetite Concentrate 1.21 Table 1.10 Commercial Export Product and Destination Chart 1.37 Table 1.11 Product Expected Revenues 1.39 Table 1.12 Operating Personnel Numbers 1.45 Table 1.13 Summary of Mabilo Site Operating Cost Estimate (1.0 Mt/y)
(US$, 4Q2015) 1.46 Table 1.14 Summary Mabilo Mining Cost Estimate (1.0 Mt/y) 1.47 Table 1.15 Summary of Mabilo Fresh Ore Processing Operating Cost Estimate
(1.0 Mt/y) (US$, 4Q2015) 1.49 Table 1.16 Oxide Ore Initial Capital Cost Estimate Summary (US$, 4Q2015,
±15%) 1.51 Table 1.17 Primary Ore Initial Capital Cost Estimate Summary (US$, 4Q2015,
±15%) 1.51 Table 1.18 Life of Mine Capital Cost Estimate 1.52 Table 1.19 Project Financial Measures Summary (1 Mtpa) 1.54 FIGURES Figure 1.1 MLEDC Tenements Map 1.3 Figure 1.2 Ultimate Pit Design 1.10 Figure 1.3 Ore and Waste Mining by Stage 1.12 Figure 1.4 Ore Mining by Ore Type 1.12 Figure 1.5 Network Topology 1.30 Figure 1.6 Road Network of the Project Site 1.36 Figure 1.7 Concept Long Term Port Facility 1.38 Figure 1.8 Mabilo Project Table of Organization 1.44 Figure 1.9 Breakdown of Total Mining Costs 1.48 Figure 1.10 Process Plant Operating Cost Breakdown 1.50
MABILO PROJECT NATIONAL INSTRUMENT 43-101 TECHNICAL REPORT
1913\24.04\1913-000-GEREP-0003_D S1
Page 1.1
May 2016 Lycopodium Minerals Pty Ltd / MJV / Orelogy / KP
1.0 SUMMARY
1.1 Executive Summary
A Feasibility Study has been completed on the Mabilo Project which has involved a technical and economic study of the selected development option. This has included mining, processing and infrastructure and a detailed financial analysis. This Technical Report is based on the results of that Feasibility Study.
The Mineral Resource is classified as Indicated where in the Qualified Person's opinion, sufficient data exists to reasonably assume geological and mineralization continuity. For areas with more limited data density, and limited along-strike or down-dip continuity, there is sufficient evidence to imply but not verify geological and grade continuity and these areas are classified as Inferred.
Further drilling is recommended to test the potential for extensions to the current Mineral Resource in the SMZ and NMZ along strike and at depth.
A review of the financial model against the pit optimization confirmed that the project was profitable and that there were no significant deviations from the original optimization input parameters.
The project will be developed in two phases:
• Phase 1 Mining of the oxide and chalcocite orebodies
• Phase 2 Mining and processing of the primary orebody
The Mabilo Project is an economically viable project based on the metal prices used in the evaluation. The project is estimated to have an after tax NPV of $US 126.7 million at a 5% discount rate and a payback of 2.5 years. The initial capital cost, inclusive of mining working capital and contingency has been estimated as US$17.4 million for the first phase and US$169.9 million for the second phase including VAT and pre-strip.
Residual risks include the granting of mining licenses, finalization of mine geotechnical data and water management and some uncertainty in regard to metallurgical variability.
1.2 Introduction
RTG is an Australia-based mining and exploration company with a principal listing on the main board of the Toronto Stock Exchange (TSX:RTG). RTG also has a secondary listing on the Australian Stock Exchange (ASX:RTG) as a result of its merger with Sierra Mining Limited ('Sierra') on 5 June 2014.
The Mabilo Project is held in joint venture by Mt. Labo Exploration and Development Corporation ('Mt. Labo'), with RTG holding an indirect interest through Mt. Labo.
MABILO PROJECT NATIONAL INSTRUMENT 43-101 TECHNICAL REPORT
1913\24.04\1913-000-GEREP-0003_D S1
Page 1.2
May 2016 Lycopodium Minerals Pty Ltd / MJV / Orelogy / KP
Galeo Equipment and Mining Company Inc ('Galeo') is the joint venture partner with Mt. Labo and is earning up to a 42% interest in the Mabilo Project. The Qualified Person (QP) understands that Galeo’s current ownership of the Property stands at 36%.
Mabilo Joint Venture (MJV) is a joint venture formed to develop the Mabilo copper / magnetite deposit in Camarines Norte region of the island of Luzon, Philippines. The Mabilo Project is located in the Republic of the Philippines.
The Mabilo Property is located in the Paracale district of the Pacific Cordillera magmatic arc belt of the Philippines archipelago. The Paracale district has a long history of gold and iron mining. The Property comprises one granted Exploration Permit (EP-014-2013-V) and two Exploration Permit Applications (EXPA-000188-V and EXPA-000209-V). The Property area is relatively flat lying and is accessed by 15 km of all-weather road from the nearby town of Labo.
1.3 Legal, Ownership and Permitting
The Mabilo Project is a proposed open pit mining and processing project based upon an unincorporated Joint Venture between Mt. Labo Exploration and Development Corporation (64% - 'MLEDC'); and Galeo Equipment Corporation (36% - 'Galeo') signed on 10 May, 2013 and titled the Mabilo JV (MJV). The primary tenement is held by MLEDC, whilst either party may acquire additional tenements within a 15 km Cooperation Zone under the same conditions as the JVA.
Mt. Labo Exploration and Development Corporation ('MLEDC') is the grantee / lessee / applicant of tenements classified in two distinct projects both covering mining properties located in the Bicol Peninsula in the south of Luzon Island in Municipality of Labo, Camarines Norte Province, Philippines namely the Mabilo and Nalesbitan properties. This report concerns the Mabilo Property only.
• The Mabilo Property consists of:
- EP - 014-2013-V ('EP14') covering 497.7 ha. – granted.
- EXPA - 000209-V covering 497.7 ha. - applicant.
- EXPA - 000188-V covering 2,820.4 ha. – applicant.
In July 2015, EP14 completed its first 2-year renewable exploration period out of a possible six years. A work program for the second 2-year period was submitted to MGB and remains pending.
Obtaining an MPSA for the mining phase of the project is in an advanced state. MLEDC has compiled the vast majority of requirements for the Declaration of Mining Project Feasibility (DMPF), which amongst others include the Environmental Compliance Certificate (ECC), Technical Feasibility Study and 3-year Work Program. Upon review and approval by the MGB of the DMPF the Company will apply for the MPSA, which is an administrative application for approval by the Department of Environment and Natural Resources (DENR) Secretary.
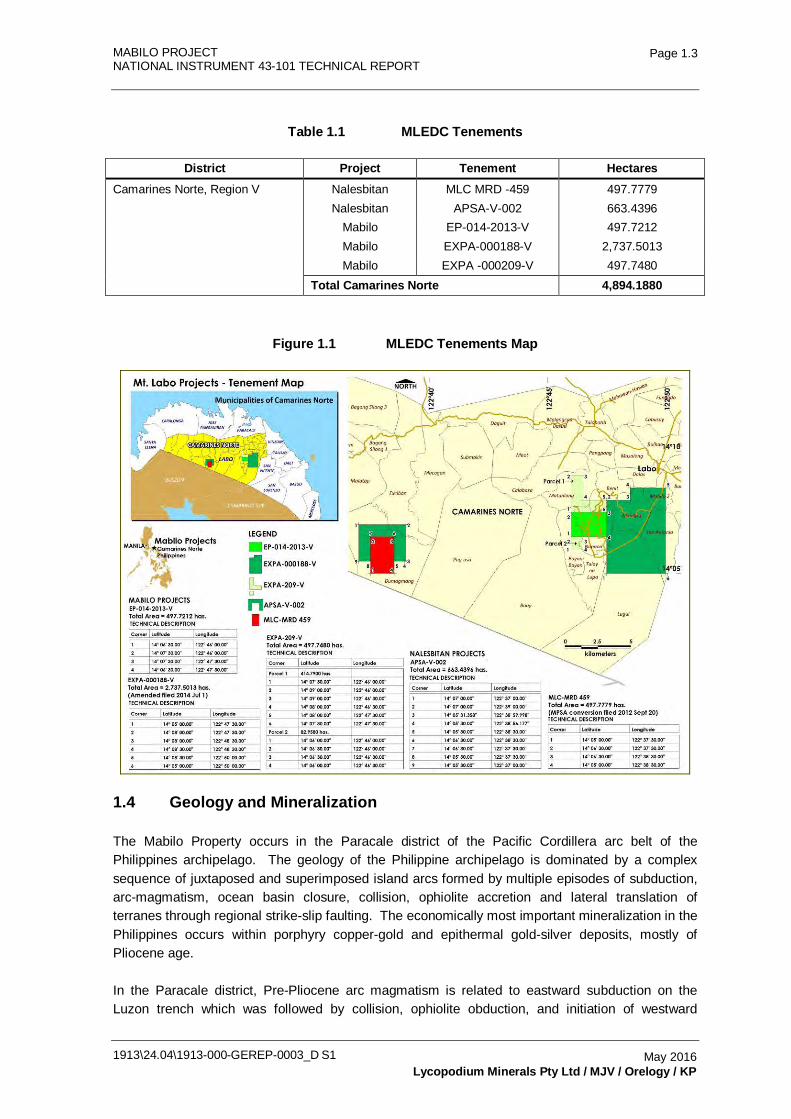
The process to secure an MPSA for the processing phase is yet to be commenced Table 1.1 and Figure 1.1 show the tenements.
MABILO PROJECT NATIONAL INSTRUMENT 43-101 TECHNICAL REPORT
1913\24.04\1913-000-GEREP-0003_D S1
Page 1.3
May 2016 Lycopodium Minerals Pty Ltd / MJV / Orelogy / KP
Table 1.1 MLEDC Tenements
District Project Tenement Hectares Camarines Norte, Region V Nalesbitan MLC MRD -459 497.7779
Nalesbitan APSA-V-002 663.4396 Mabilo EP-014-2013-V 497.7212 Mabilo EXPA-000188-V 2,737.5013 Mabilo EXPA -000209-V 497.7480
Total Camarines Norte 4,894.1880
Figure 1.1 MLEDC Tenements Map
1.4 Geology and Mineralization
The Mabilo Property occurs in the Paracale district of the Pacific Cordillera arc belt of the Philippines archipelago. The geology of the Philippine archipelago is dominated by a complex sequence of juxtaposed and superimposed island arcs formed by multiple episodes of subduction, arc-magmatism, ocean basin closure, collision, ophiolite accretion and lateral translation of terranes through regional strike-slip faulting. The economically most important mineralization in the Philippines occurs within porphyry copper-gold and epithermal gold-silver deposits, mostly of Pliocene age.
In the Paracale district, Pre-Pliocene arc magmatism is related to eastward subduction on the Luzon trench which was followed by collision, ophiolite obduction, and initiation of westward
MABILO PROJECT NATIONAL INSTRUMENT 43-101 TECHNICAL REPORT
1913\24.04\1913-000-GEREP-0003_D S1
Page 1.4
May 2016 Lycopodium Minerals Pty Ltd / MJV / Orelogy / KP
subduction. The Paracale Granodiorite (trondhjemite) intrudes the Cretaceous ultramafic basement. The ophiolite basement is un-conformably overlain by Eocene sediments overlain by the Oligocene Larap Volcanics. Late Miocene-Pliocene dacitic intrusions cut the sedimentary belt. All these units are overlain to the south by Pliocene andesitic and dacitic pyroclastics and tuffs of the Macogon Formation, covered in turn by southeast-thickening lahar and tuff deposits of the Quaternary Labo Volcanic Complex.
Total historical gold production from the Paracale Mining District is estimated to have been five million ounces, predominantly from narrow quartz-sulphide veins and including alluvial gold. The Eocene sedimentary sequence hosts a number of magnetite skarns and base metal occurrences within the base metal or iron belt, including the historical Larap mine. The mineralization is anomalous in copper, gold, and molybdenum. Low-grade porphyry copper mineralization is also reported in the same belt.
The Mabilo skarn deposit lies about 20 km southeast of Larap and appears to be of the same style and association, although with higher grades of copper and gold. The deposit is 500 m south of the small Venida pit, concealed under cover of the Labo volcanics. The Mabilo deposit occurs in two bodies, the North Mineralized Zone ('NMZ') and South Mineralized Zone ('SMZ'), separated by an offsetting fault. The magnetite skarn is hosted by marble and calcareous sediments in the hornfelsed contact zone of a quartz-diorite intrusion. The main skarn horizon replaces a clean limestone or marble unit and has a true thickness of up to 40 to 90 m, dipping west to southwest at 20 to 40 degrees.
Primary mineralization comprises massive magnetite intergrown with minor calc-silicate minerals, chalcopyrite and late interstitial calcite. Copper and gold grades are closely correlated and commonly reach 5% Cu and 5 g/t Au in hypogene mineralization. The copper-gold grade of magnetite skarn is variable and barren magnetite also occurs. The magnetite skarn is variably overprinted by quartz-pyrite-arsenopyrite veining and brecciation. This event may be associated with high-grade hypogene bornite.
The upper part of the skarn is strongly oxidized with associated supergene alteration to hematite and secondary copper minerals. The oxide zone may be up to 20 m to 30 m thick and a supergene zone of high-grade sooty chalcocite locally occurs at its base. This weathering event pre-dates the Labo volcanic unconformity.
1.5 Exploration
Mt Labo commenced a drill programme at Mabilo in 2012, initially targeting magnetic bodies modeled from the magnetic survey completed by previous owners. Mt Labo subsequently completed its own ground magnetic surveys and revised the magnetic models. Mt Labo drilled 12 holes in late 2012, completed a new magnetic survey in early 2013, and commenced a second phase of drilling after the grant of the tenement in July 2013. Initial drilling encountered broad intersections of magnetite skarn with significant copper-gold-silver mineralization.
1.6 Drilling
The Mabilo MRE is based on the data obtained from 99 diamond drillholes for 18,188.5 m as of end September 2015 in the SMZ and NMZ areas. Holes are drilled on a nominal 40 m by 40 m drill
MABILO PROJECT NATIONAL INSTRUMENT 43-101 TECHNICAL REPORT
1913\24.04\1913-000-GEREP-0003_D S1
Page 1.5
May 2016 Lycopodium Minerals Pty Ltd / MJV / Orelogy / KP
pattern along strike, with infill to a nominal 20 m by 20 m in parts. Approximately 30% of the holes have been drilled vertically. Roughly 40% of the holes have been drilled at 60⁰ and the remainder drilled at angles between 45° and 80°. The direction of these holes is broadly perpendicular to the mineralization, with a number of holes drilled in directions intended to help with the understanding and interpretation of structures, which appear to be offsetting the mineralization.
1.7 Sample Preparation, Analysis and Security
Drill-core handling, sampling and security were reviewed and concluded to be of good industry standard. Sampling is to geological boundaries with half-core cut using a diamond saw, with core wrapped in plastic when broken or friable. Where the core is very broken or predominantly clay, material from half of the 'core' is collected using a small plastic scoop. Samples are placed in numbered plastic sample bags with sample tickets and sealed with a cable tie. The sealed samples are placed in plastic drums with Chain of Custody, Sample Dispatch and Sample Submission Forms and sent directly to the ISO-accredited Intertek Mcphar laboratory in Manila using either company vehicles or a local transport company. Remaining core is kept in the fenced and guarded company core yard in Daet. Gold was analyzed by 50 g fire assay and the other elements after 4-acid digestion by ICP-MS (Inductively Coupled Plasma Mass Spectrometry) or ICP-OES.
Bulk dry density determinations were conducted on selected samples of core from all the different types of mineralization and lithologies using the wax-coated, water immersion method. Earlier density determinations were completed before half core sampling, but are now completed prior to cutting which is more appropriate. There is a risk of positive density bias resulting from measurement bias towards intact core rather than broken core which may result from open cavities associated especially with the late pyrite overprint and partial oxidation.
Quality control completed by Mt. Labo has included analysis of standards, blanks, duplicates, and external umpire analyses. In addition, Intertek conducted their own extensive check sampling as part of their own internal QA processes which are reported in the assay sheets. Pulp samples have been sent to three independent laboratories for umpire assay checks. Examination of all the QAQC data indicates that the laboratory performance has been generally satisfactory with good performance of standards, blanks and field duplicates. Although umpire assay results appear to indicate an upward bias in the primary laboratory assay results compared to the umpire assay laboratories, this is not considered to be a significant failure as all other measures tested have performed well. Therefore the original assay results are considered suitable for use in a Mineral Resource estimate.
1.8 Mineral Resource Estimate
For the SMZ the MRE is based on 3,073.71 m of assay data, from 61 holes which intersected the interpreted mineralization zones. For the NMZ the MRE is based on 1,149.9 m of assay data, from 21 holes which intersected the interpreted mineralization zones.
A geological model was provided by Mt. Labo, based on implicit modeling of the logged lithology using LeapFrog® software and understanding of deposit geometry developed over time. The model includes interpreted structures, the boundary contact surface of the overlying Labo volcanic sequence and an oxide weathering boundary surface. This model formed the basis for the
MABILO PROJECT NATIONAL INSTRUMENT 43-101 TECHNICAL REPORT
1913\24.04\1913-000-GEREP-0003_D S1
Page 1.6
May 2016 Lycopodium Minerals Pty Ltd / MJV / Orelogy / KP
interpretation of 41 separate 3-D mineralized lithological envelopes that were constructed using CAE Studio 3 ('Datamine') software. The smoothed Leapfrog generated Labo and Oxide boundary surfaces were also modified to better fit the actual drill logging data.
Modeled magnetite skarn envelopes were interpreted based on drillhole lithological logging, since this unit is high in magnetite content. The unit was limited against interpreted structures. Within the magnetite skarn unit small zones along sections of the edges are not mineralized with Au and Cu above the selected 0.3 g/t Au or 0.3% Cu grade cut-off. Separate Au / Cu mineralized magnetite skarn envelopes were generated to ensure that the grade continuity can be more accurately represented during grade estimation. Other lithological units modeled in the system are also not necessarily mineralized to potentially economic levels of Au, Cu and Fe throughout their full extent. These envelopes were modeled using lithological logging and nominal lower cut-off grades of 0.3 g/t Au or 0.3% Cu. The 3-D envelopes representing the mineralized zones were grouped into 14 domains based on lithology type and deposit location for estimation and reporting.
A block model constrained by the interpreted mineralized envelopes and boundary surfaces was constructed using Datamine. A parent cell size of 10 m E by 10 m N by 5 m RL was adopted. 1 m composited samples were used to interpolate Cu, Au, Ag and Fe grades into the block model. Block grades validated by means of swath plots, overlapping histograms of sample and block model data and comparison of mean sample and block model grades for each domain. Cross sections showing the block model and drillhole data were also reviewed.
Density was assigned to the model based on linear regression formulas determined for the weathered and unweathered zones. The regression formulas are based on the correlation between density and Fe which followed statistical analysis. The overall average density of the mineralized weathered zones is 2.96 t/m3 compared to 3.70 t/m3 for the unweathered zones. The average density from measured samples taken outside the interpreted mineralized zones was assigned to waste blocks: 2.2 t/m3 was assigned in the Labo volcanic sequence, 2.33 t/m3 was assigned in the weathered zone and 2.71 t/m3 was assigned in the unweathered zone.
MABILO PROJECT NATIONAL INSTRUMENT 43-101 TECHNICAL REPORT
1913\24.04\1913-000-GEREP-0003_D S1
Page 1.7
May 2016 Lycopodium Minerals Pty Ltd / MJV / Orelogy / KP
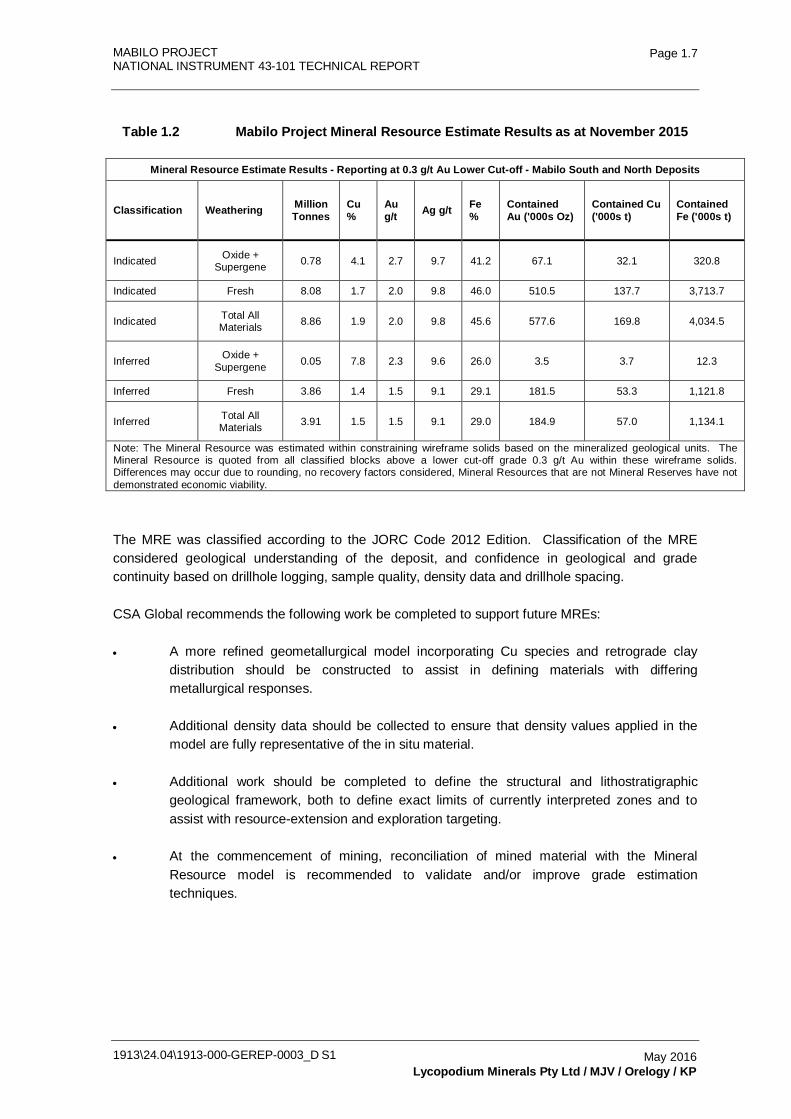
Table 1.2 Mabilo Project Mineral Resource Estimate Results as at November 2015
Mineral Resource Estimate Results - Reporting at 0.3 g/t Au Lower Cut-off - Mabilo South and North Deposits
Classification Weathering Million Tonnes
Cu %
Au g/t Ag g/t Fe
% Contained Au ('000s Oz)
Contained Cu ('000s t)
Contained Fe ('000s t)
Indicated Oxide + Supergene 0.78 4.1 2.7 9.7 41.2 67.1 32.1 320.8
Indicated Fresh 8.08 1.7 2.0 9.8 46.0 510.5 137.7 3,713.7
Indicated Total All Materials 8.86 1.9 2.0 9.8 45.6 577.6 169.8 4,034.5
Inferred Oxide + Supergene 0.05 7.8 2.3 9.6 26.0 3.5 3.7 12.3
Inferred Fresh 3.86 1.4 1.5 9.1 29.1 181.5 53.3 1,121.8
Inferred Total All Materials 3.91 1.5 1.5 9.1 29.0 184.9 57.0 1,134.1
Note: The Mineral Resource was estimated within constraining wireframe solids based on the mineralized geological units. The Mineral Resource is quoted from all classified blocks above a lower cut-off grade 0.3 g/t Au within these wireframe solids. Differences may occur due to rounding, no recovery factors considered, Mineral Resources that are not Mineral Reserves have not demonstrated economic viability.
The MRE was classified according to the JORC Code 2012 Edition. Classification of the MRE considered geological understanding of the deposit, and confidence in geological and grade continuity based on drillhole logging, sample quality, density data and drillhole spacing.
CSA Global recommends the following work be completed to support future MREs:
• A more refined geometallurgical model incorporating Cu species and retrograde clay distribution should be constructed to assist in defining materials with differing metallurgical responses.
• Additional density data should be collected to ensure that density values applied in the model are fully representative of the in situ material.
• Additional work should be completed to define the structural and lithostratigraphic geological framework, both to define exact limits of currently interpreted zones and to assist with resource-extension and exploration targeting.
• At the commencement of mining, reconciliation of mined material with the Mineral Resource model is recommended to validate and/or improve grade estimation techniques.
MABILO PROJECT NATIONAL INSTRUMENT 43-101 TECHNICAL REPORT
1913\24.04\1913-000-GEREP-0003_D S1
Page 1.8
May 2016 Lycopodium Minerals Pty Ltd / MJV / Orelogy / KP
1.9 Mining
1.9.1 Mineral Reserve Estimating Approach
The key activities in estimating the mineral reserves were:
• Pit Optimization – Whittle-4X™ pit optimization software was used to identify the optimum pit shell in terms of value and tonnage, using the parameters and the shell selection process described in Section 15.
• Mine Design – An ultimate pit was designed in MineSight™ general mine planning software, with the guidance of the selected shell, and pit design inputs summarized in Section 15. Internal stages were designed to target higher value areas in accordance with the intermediate Whittle-4X shell information, pit design criteria and an iterative process using mine scheduling feedback.
• Mine Scheduling – Maptek’s Evolution™ software was used to generate a practical Life of Mine (LOM) production schedule aimed at meeting all scheduling objectives and constraints. The scheduling process is detailed in Section 16.
• Mining Cost Estimation – The mining costs were estimated, for a contract mining operation from first principals using the physicals generated by the LOM schedule. The assumptions in the mining cost estimate have been outlined in Section 15 and 16 and the resulting cost estimates have been provided in Section 21.
• Economic Verification of the Feasibility Study – Overall project cash flow projections were reviewed to confirm that the Project is economically viable.
• Risk Assessment – A risk assessment was undertaken to identify the factors that could materially impact the mineral reserve estimate.
1.9.2 Mining Method
Open pit mining is the method selected for the Mabilo mining operation. Pit optimization has demonstrated that application of this method results in favorable project economics. The method deploys conventional drilling, blasting, loading and hauling techniques to excavate and transport ore and waste materials.
Mining activities also include clearing of land, stripping and storage of topsoil, ore rehandle, pit dewatering, dust suppression and dump rehabilitation. All activities will be performed by mining contractors except for grade control, mine planning and mine management being undertaken by the mine owners.
1.9.3 Pit Optimization
Pit optimizations were based on the November 2015 resource model, geotechnical guidelines and estimates for costs, dilution and oreloss, processing recoveries, concentrate grades, excise tax and metal prices. Key assumptions were as follows:
MABILO PROJECT NATIONAL INSTRUMENT 43-101 TECHNICAL REPORT
1913\24.04\1913-000-GEREP-0003_D S1
Page 1.9
May 2016 Lycopodium Minerals Pty Ltd / MJV / Orelogy / KP
• The resource model used in the optimization process was generated by CSA Global Pty Ltd (CSA) in February 2016 with 10 m x 10 m x 5 m (x, y, z) parent block sizes and 2.5 m x 2.5 m x 2.5 m sub-cells.
• Geological zones were defined and allocated a process stream and cost. Four ore types were defined and processing costs and recoveries assigned.
• Slope angle criteria were provided by Chris Orr of George, Orr and Associates based on reviews and reports. Allowances were made for surface and ground water management.
• Oreloss and dilution were estimated in two steps. Step 1 estimates oreloss and dilution along the ore-waste boundary, this is referred to as 'edge dilution' while Step 2 estimates the oreloss and dilution within the ore zones (Internal Dilution) due to mixing from blasting movement and grade control delineation of ore types.
• The mining costs were derived based on IMC’s Mabilo Mine Operating Cost Estimate report followed by a review by Orelogy Consulting.
Metal prices and selling costs were advised by MJV. Discount rate was set at 10%.
The discounted cash flow curves indicate that all shells are economic if mined at a breakeven cost. However, the majority of the discounted cash flow is obtained at Shell 18 (revenue factor of 0.64) and any shell after this is only adding minimal additional value. This means that other criteria can be used to select the shell for design purposes. The shell selection was made by M JV on the basis that the following objective were met:
• Minimum 8 year mine life.
• Economic at 30% lower revenues.
• Strip ratio of 10:1 or less.
This objective is best met by selecting Base Case Shell 21 (i.e. the shell at Revenue Factor 0.7).
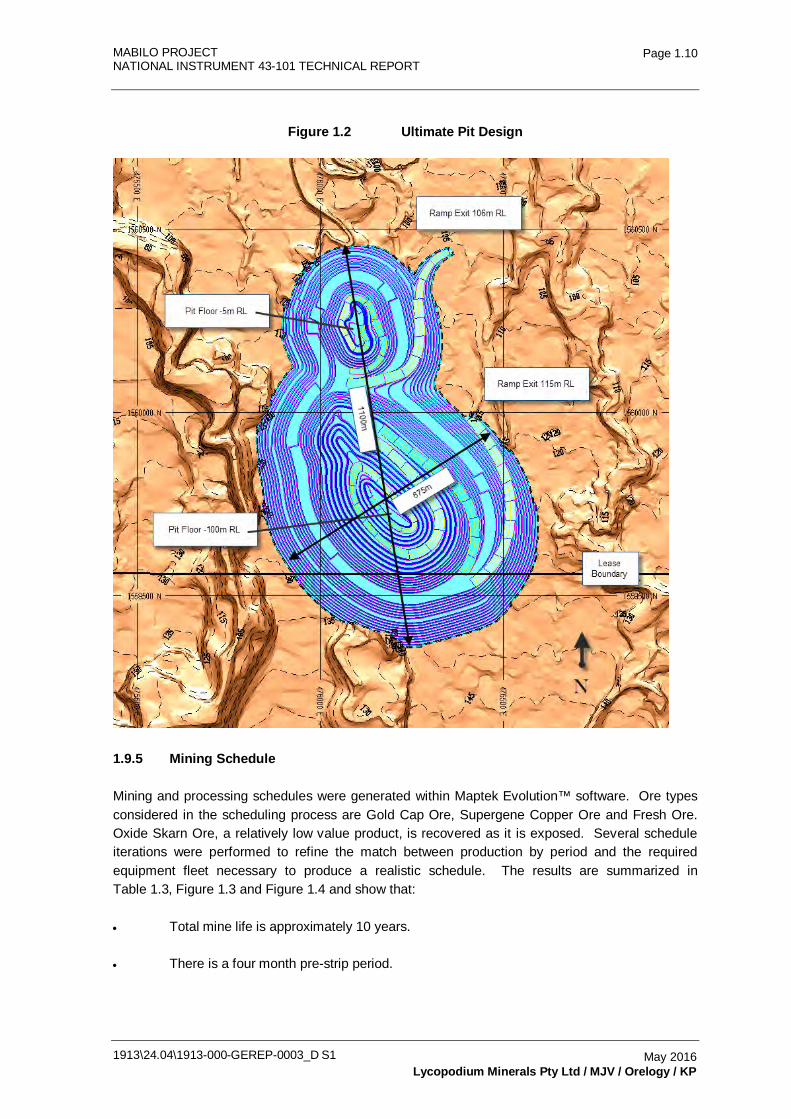
1.9.4 Mine Design
The pit design was based on shells generated with Indicated resource materials only (there were no Measured materials in the resource model and Inferred materials were deemed waste). The final pit design is shown in Figure 1.2. The pit design is in accordance with the pit optimization inputs such as slope angles and bench heights and matches the selected equipment size.
MABILO PROJECT NATIONAL INSTRUMENT 43-101 TECHNICAL REPORT
1913\24.04\1913-000-GEREP-0003_D S1
Page 1.10
May 2016 Lycopodium Minerals Pty Ltd / MJV / Orelogy / KP
Figure 1.2 Ultimate Pit Design
1.9.5 Mining Schedule
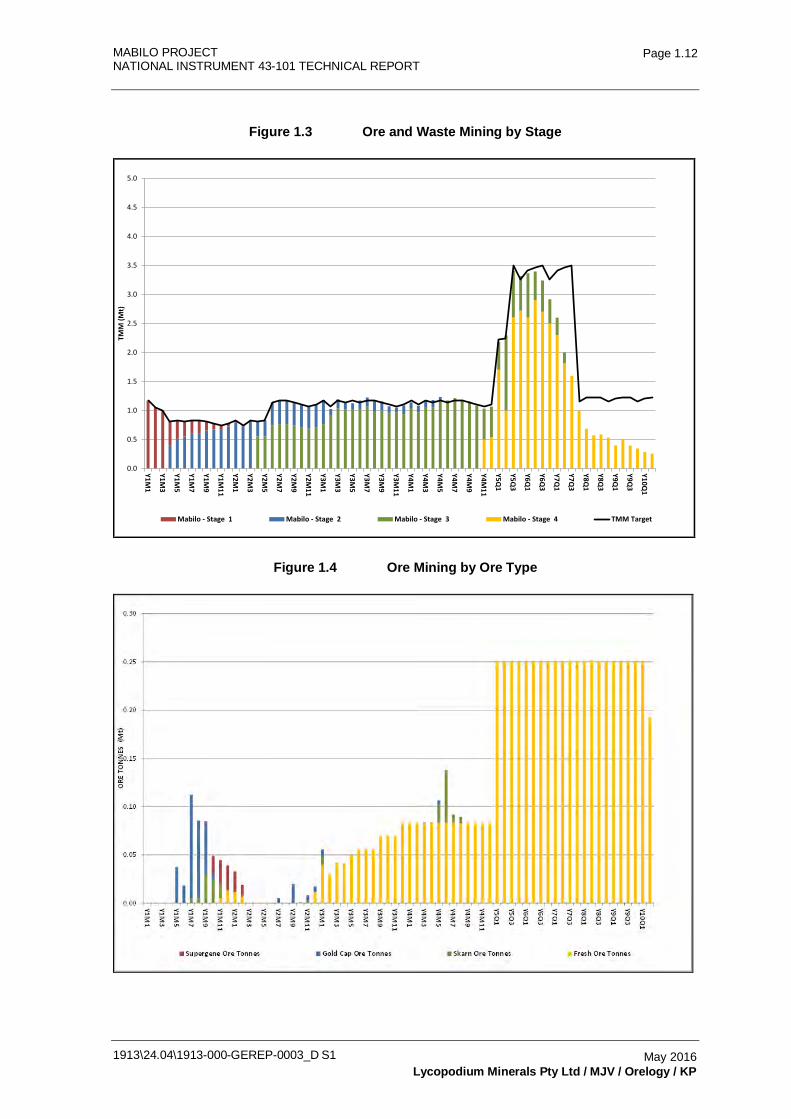
Mining and processing schedules were generated within Maptek Evolution™ software. Ore types considered in the scheduling process are Gold Cap Ore, Supergene Copper Ore and Fresh Ore. Oxide Skarn Ore, a relatively low value product, is recovered as it is exposed. Several schedule iterations were performed to refine the match between production by period and the required equipment fleet necessary to produce a realistic schedule. The results are summarized in Table 1.3, Figure 1.3 and Figure 1.4 and show that:
• Total mine life is approximately 10 years.
• There is a four month pre-strip period.
MABILO PROJECT NATIONAL INSTRUMENT 43-101 TECHNICAL REPORT
1913\24.04\1913-000-GEREP-0003_D S1
Page 1.11
May 2016 Lycopodium Minerals Pty Ltd / MJV / Orelogy / KP
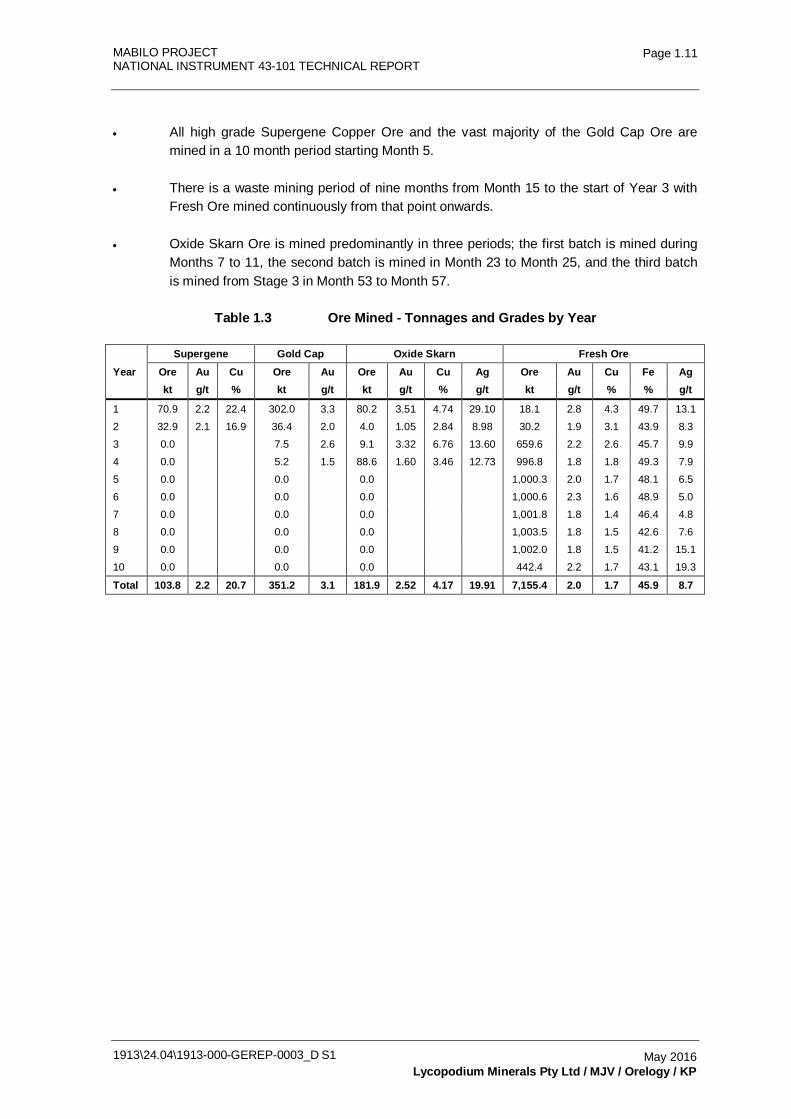
• All high grade Supergene Copper Ore and the vast majority of the Gold Cap Ore are mined in a 10 month period starting Month 5.
• There is a waste mining period of nine months from Month 15 to the start of Year 3 with Fresh Ore mined continuously from that point onwards.
• Oxide Skarn Ore is mined predominantly in three periods; the first batch is mined during Months 7 to 11, the second batch is mined in Month 23 to Month 25, and the third batch is mined from Stage 3 in Month 53 to Month 57.
Table 1.3 Ore Mined - Tonnages and Grades by Year
Supergene Gold Cap Oxide Skarn Fresh Ore
Year Ore Au Cu Ore Au Ore Au Cu Ag Ore Au Cu Fe Ag
kt g/t % kt g/t kt g/t % g/t kt g/t % % g/t
1 70.9 2.2 22.4 302.0 3.3 80.2 3.51 4.74 29.10 18.1 2.8 4.3 49.7 13.1
2 32.9 2.1 16.9 36.4 2.0 4.0 1.05 2.84 8.98 30.2 1.9 3.1 43.9 8.3
3 0.0
7.5 2.6 9.1 3.32 6.76 13.60 659.6 2.2 2.6 45.7 9.9
4 0.0
5.2 1.5 88.6 1.60 3.46 12.73 996.8 1.8 1.8 49.3 7.9
5 0.0
0.0
0.0
1,000.3 2.0 1.7 48.1 6.5
6 0.0
0.0
0.0
1,000.6 2.3 1.6 48.9 5.0
7 0.0
0.0
0.0
1,001.8 1.8 1.4 46.4 4.8
8 0.0
0.0
0.0
1,003.5 1.8 1.5 42.6 7.6
9 0.0
0.0
0.0
1,002.0 1.8 1.5 41.2 15.1
10 0.0
0.0
0.0
442.4 2.2 1.7 43.1 19.3
Total 103.8 2.2 20.7 351.2 3.1 181.9 2.52 4.17 19.91 7,155.4 2.0 1.7 45.9 8.7
MABILO PROJECT NATIONAL INSTRUMENT 43-101 TECHNICAL REPORT
1913\24.04\1913-000-GEREP-0003_D S1
Page 1.12
May 2016 Lycopodium Minerals Pty Ltd / MJV / Orelogy / KP
Figure 1.3 Ore and Waste Mining by Stage
0.0
0.5
1.0
1.5
2.0
2.5
3.0
3.5
4.0
4.5
5.0
Y1M1
Y1M3
Y1M5
Y1M7
Y1M9
Y1M11
Y2M1
Y2M3
Y2M5
Y2M7
Y2M9
Y2M11
Y3M1
Y3M3
Y3M5
Y3M7
Y3M9
Y3M11
Y4M1
Y4M3
Y4M5
Y4M7
Y4M9
Y4M11
Y5Q1
Y5Q3
Y6Q1
Y6Q3
Y7Q1
Y7Q3
Y8Q1
Y8Q3
Y9Q1
Y9Q3
Y10Q1
TMM
(Mt)
Mabilo - Stage 1 Mabilo - Stage 2 Mabilo - Stage 3 Mabilo - Stage 4 TMM Target
Figure 1.4 Ore Mining by Ore Type
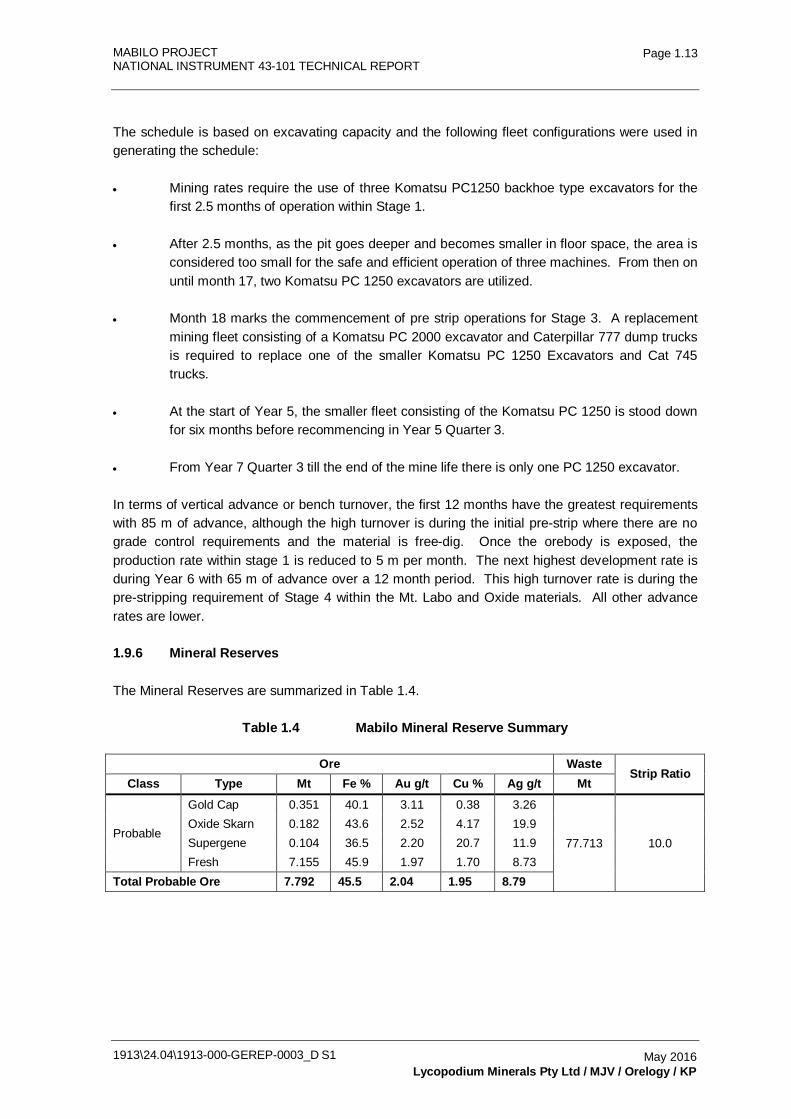
MABILO PROJECT NATIONAL INSTRUMENT 43-101 TECHNICAL REPORT
1913\24.04\1913-000-GEREP-0003_D S1
Page 1.13
May 2016 Lycopodium Minerals Pty Ltd / MJV / Orelogy / KP
The schedule is based on excavating capacity and the following fleet configurations were used in generating the schedule:
• Mining rates require the use of three Komatsu PC1250 backhoe type excavators for the first 2.5 months of operation within Stage 1.
• After 2.5 months, as the pit goes deeper and becomes smaller in floor space, the area is considered too small for the safe and efficient operation of three machines. From then on until month 17, two Komatsu PC 1250 excavators are utilized.
• Month 18 marks the commencement of pre strip operations for Stage 3. A replacement mining fleet consisting of a Komatsu PC 2000 excavator and Caterpillar 777 dump trucks is required to replace one of the smaller Komatsu PC 1250 Excavators and Cat 745 trucks.
• At the start of Year 5, the smaller fleet consisting of the Komatsu PC 1250 is stood down for six months before recommencing in Year 5 Quarter 3.
• From Year 7 Quarter 3 till the end of the mine life there is only one PC 1250 excavator.
In terms of vertical advance or bench turnover, the first 12 months have the greatest requirements with 85 m of advance, although the high turnover is during the initial pre-strip where there are no grade control requirements and the material is free-dig. Once the orebody is exposed, the production rate within stage 1 is reduced to 5 m per month. The next highest development rate is during Year 6 with 65 m of advance over a 12 month period. This high turnover rate is during the pre-stripping requirement of Stage 4 within the Mt. Labo and Oxide materials. All other advance rates are lower.
1.9.6 Mineral Reserves
The Mineral Reserves are summarized in Table 1.4.
Table 1.4 Mabilo Mineral Reserve Summary
Ore Waste Strip Ratio
Class Type Mt Fe % Au g/t Cu % Ag g/t Mt
Probable
Gold Cap 0.351 40.1 3.11 0.38 3.26
77.713 10.0 Oxide Skarn 0.182 43.6 2.52 4.17 19.9 Supergene 0.104 36.5 2.20 20.7 11.9 Fresh 7.155 45.9 1.97 1.70 8.73
Total Probable Ore 7.792 45.5 2.04 1.95 8.79
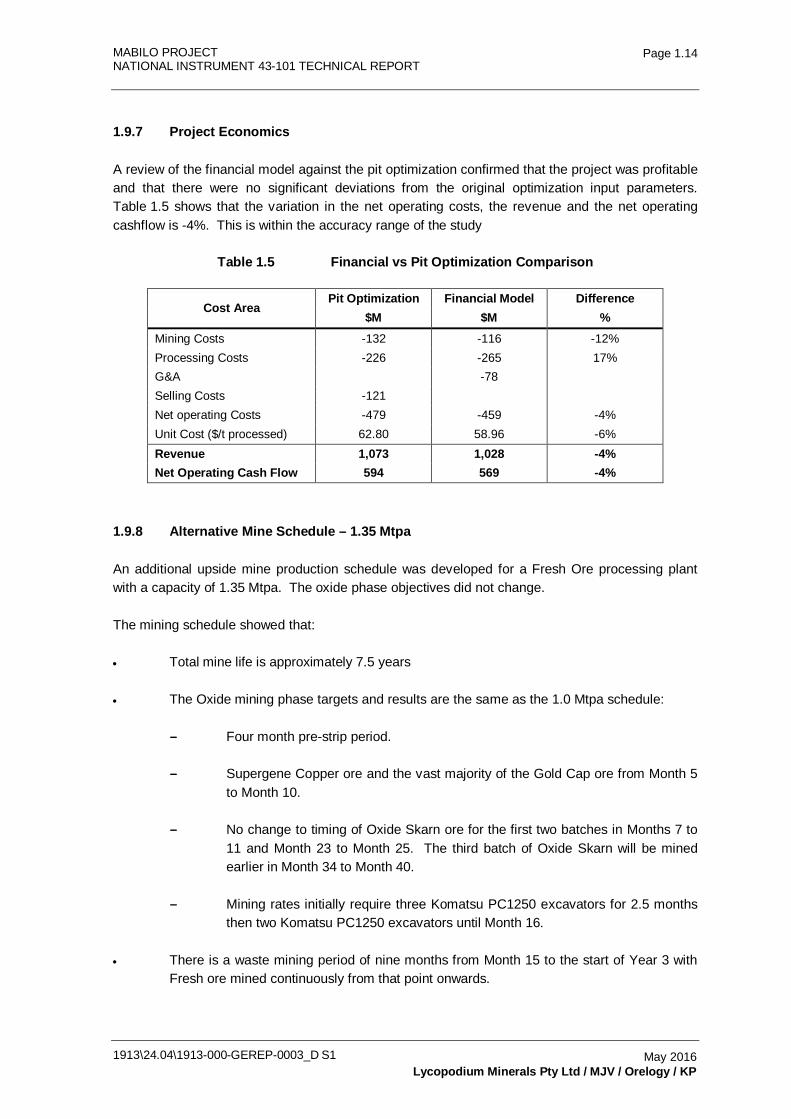
MABILO PROJECT NATIONAL INSTRUMENT 43-101 TECHNICAL REPORT
1913\24.04\1913-000-GEREP-0003_D S1
Page 1.14
May 2016 Lycopodium Minerals Pty Ltd / MJV / Orelogy / KP
1.9.7 Project Economics
A review of the financial model against the pit optimization confirmed that the project was profitable and that there were no significant deviations from the original optimization input parameters. Table 1.5 shows that the variation in the net operating costs, the revenue and the net operating cashflow is -4%. This is within the accuracy range of the study
Table 1.5 Financial vs Pit Optimization Comparison
Cost Area Pit Optimization Financial Model Difference
$M $M % Mining Costs -132 -116 -12% Processing Costs -226 -265 17% G&A
-78
Selling Costs -121
Net operating Costs -479 -459 -4% Unit Cost ($/t processed) 62.80 58.96 -6% Revenue 1,073 1,028 -4% Net Operating Cash Flow 594 569 -4%
1.9.8 Alternative Mine Schedule – 1.35 Mtpa
An additional upside mine production schedule was developed for a Fresh Ore processing plant with a capacity of 1.35 Mtpa. The oxide phase objectives did not change.
The mining schedule showed that:
• Total mine life is approximately 7.5 years
• The Oxide mining phase targets and results are the same as the 1.0 Mtpa schedule:
- Four month pre-strip period.
- Supergene Copper ore and the vast majority of the Gold Cap ore from Month 5 to Month 10.
- No change to timing of Oxide Skarn ore for the first two batches in Months 7 to 11 and Month 23 to Month 25. The third batch of Oxide Skarn will be mined earlier in Month 34 to Month 40.
- Mining rates initially require three Komatsu PC1250 excavators for 2.5 months then two Komatsu PC1250 excavators until Month 16.
• There is a waste mining period of nine months from Month 15 to the start of Year 3 with Fresh ore mined continuously from that point onwards.
MABILO PROJECT NATIONAL INSTRUMENT 43-101 TECHNICAL REPORT
1913\24.04\1913-000-GEREP-0003_D S1
Page 1.15
May 2016 Lycopodium Minerals Pty Ltd / MJV / Orelogy / KP
• Month 17 marks the commencement of pre strip operations in Stage 3. A replacement mining fleet consisting of a Komatsu PC 2000 excavator and Caterpillar 777 dump trucks is required to replace all of the trucks and one of the smaller Komatsu PC 1250 Excavators.
• From Month 20 a second Komatsu PC 2000 excavator is required to replace the smaller Komatsu PC 1250 Excavator in order to meet material movement needs.
• Both Komatsu PC 2000 Excavators are utilized until the first month of Year 6 when one of the units is demobilized. The remaining Komatsu PC 2000 excavator remains on site until mining is completed in the third quarter of Year 8.
• The mining rate for the 1.35 Mtpa schedule is better suited for steady state mining operations as there is no longer a requirement to place an excavator on standby for six months at the end of Year 5 as occurs in the 1.0 Mtpa schedule.
In terms of vertical advance or bench turnover, they are the same as those of the 1.0 Mtpa schedule (85m of advance in 12 months). The next highest development rate is during Year 5 with 65 m of advance over a 12 month period. This high turnover rate is during the pre-stripping requirement of Stage 4 within the Mt. Labo and Oxide materials. All other advance rates are lower.
1.10 Metallurgy
Introduction
The metallurgical testwork for the Mabilo Project was conducted in two stages: a scoping stage (Phase I) to identify a potential treatment route and a definitive testing programme (Phase II) to optimize parameters and define data required for engineering design.
The original testwork (Phase I, completed in 2014 at ALS Metallurgy (ALS)) established that a bulk sulphide flotation route was appropriate for the magnetite skarn to maximize the copper recovery. Regrinding of the rougher concentrate and cleaning at high pH to depress the pyrite achieved readily saleable copper concentrate grades. The bulk sulphide flotation route had additional benefits, allowing separate containment of the acid generating pyrite tails and preserving this fraction with elevated gold grades for potential future treatment or sale. The definitive testwork programme (Phase II) focused on optimizing the processing route for the bulk sulphide flotation and cleaning to upgrade the copper concentrate.
Testwork Sample Selection
A basic understanding of the geology of the Mabilo deposits and the genesis of the mineralization was required to guide the sample selection process for each phase of the testwork. The MJV site geologist, Bob Ayres, assisted at all stages of sample selection and confirmed that selections were appropriately representative for the intended purpose. Comminution and flotation samples were taken from drillhole intercepts to provide comprehensive coverage of the Mabilo mineralized zones both geographically and with depth. Samples were selected to make up master composites representative of the magnetite skarn at the average resource grades. Additional samples were
MABILO PROJECT NATIONAL INSTRUMENT 43-101 TECHNICAL REPORT
1913\24.04\1913-000-GEREP-0003_D S1
Page 1.16
May 2016 Lycopodium Minerals Pty Ltd / MJV / Orelogy / KP
selected for variability testing to cover the range of host rock types and mineralization styles identified.
Mineralogy
Mineralogical investigations indicated that almost all of the copper was in chalcopyrite with occasional bornite, chalcocite and covellite. Most of the remaining sulphide mineralization was pyrite. The pyrite was arsenic rich and showed variable arsenic content. The pyrite and chalcopyrite were closely associated with each other with chalcopyrite grains occurring as attachments to, or inclusions in, the pyrite.
Iron-rich oxides (mainly magnetite, less hematite), oxyhydroxides (goethite) and carbonates (siderite) made up over 60% of the sample mass.
Comminution Testwork
A suite of comminution tests was conducted on samples prepared from ¼ HQ core. The SMC Test is used to characterize the breakage of quartered drill core by generating a relationship between input energy (kWh/t) and the percent of broken product. The test output is termed the drop weight index (DWi). The JK rock breakage parameters A and b are derived from the DWi result. The A*b values for the Mabilo skarn samples, typically 55 - 61, indicate that the ore is generally soft to moderately soft with medium hardness for some variability samples.
Rod mill work indices, 18 - 21 kWh/t, were generally higher than would be expected from the SMC impact test results which suggested that the rock was fairly easily broken at a coarse size. It was inferred that the coarser particles would break relatively easily under impact stresses, but required more energy to abrade to finer sizes. The ball mill work indices for the magnetite skarn samples, 14.7 - 16.3 kWh/t, were generally below average for the database. The testwork indicated that abrasion for this ore would be moderate to low (Ai = 0.1 - 0.4).
A Levin test was used to determine the fine grinding energy required for regrinding the rougher flotation concentrate.
Sighter Flotation Testwork
Sighter cleaner flotation tests were conducted on the Phase II composite sample under the conditions established during the Phase I testwork to confirm that the reagent suite and grind were an appropriate starting point for the detailed test programme. The sighter tests were also used to compare site water with Perth tap water to confirm that results were similar enough to proceed with the programme using Perth tap water.
The sighter tests were conducted at a primary grind P80 of 106 µm at natural pH for the roughing stage. A copper selective dialkyl thionocarbamate collector, A3894 was used with MIBC frother. The rougher concentrate was reground to a P80 of 53 µm and the pH was raised to 10.5 with lime while cyanide was added to depress the pyrite in the cleaner stage. Copper recoveries were distinctly lower than for the Phase I composite (average results of 85% compared with 95% for Phase 1). The Phase II composite had a lower head grade and more examples of pyrite
MABILO PROJECT NATIONAL INSTRUMENT 43-101 TECHNICAL REPORT
1913\24.04\1913-000-GEREP-0003_D S1
Page 1.17
May 2016 Lycopodium Minerals Pty Ltd / MJV / Orelogy / KP
overprinted mineralization than the Phase I composite. Reduced recoveries were mainly thought to result from liberation issues.
Copper cleaner grades remained high (31%) with the cleaner concentrate being over 90% chalcopyrite.
Gold recoveries to the cleaner concentrate were lower (average 55% compared with 63%) with the losses split between the rougher and cleaner tails.
The majority of the arsenic recovered to the rougher concentrate was rejected to the cleaner tail.
The site water results were similar enough to the Perth tap water test to recommend that all further testwork be conducted in Perth tap water.
Grind Size Optimization Tests
The primary grind size optimization test series aimed to confirm that the P80 grind size of 106 µm established during Phase I was optimal for the Phase II composite. Following a series of rougher tests (P80 = 150 - 90 µm) it was apparent that recoveries were increasing with decreasing grind size so a test at 75 µm was added to the series.
The 75 µm test yielded a slightly lower recovery suggesting that a P80 of 90 µm was the optimum grind. This was confirmed by an economic evaluation which demonstrated that the recovery improvement at each stage outweighed the increased capital and operating costs required to achieve the finer grind.
A further grind optimization test series was conducted on the rougher concentrate to establish the optimum P80 regrind size for separation of a clean copper concentrate from the bulk sulphide rougher concentrate. Following a series of cleaner flotation tests (P80 = 90 µm (no regrind), 53 and 38 µm) it was apparent that copper grade and recovery increased with decreasing grind size so a test at 27 µm was added to the series.
The 27 µm test yielded a slightly lower recovery and grade and following a review of the metallurgical performance and an economic evaluation, a P80 of 38 µm was selected as the grind size for further testing.
Alternate Collector Trials
A broad based xanthate collector (SIPX) was trialed as an alternative to, and in conjunction with, the selective A3894 used for testing to date. The testwork aimed to achieve a less selective, higher mass pull rougher concentrate with possibly improved copper and gold recoveries.
These tests were relatively unsuccessful with the xanthate increasing sulphur recoveries, but copper and gold recoveries were lower. It was decided to continue testing using the selective A3894 collector as before.
Gold specific promoters were also trialed under various flotation conditions to increase the gold recovered to copper concentrate. Promoters trialed included MaxGold MX900, 3418A and use of
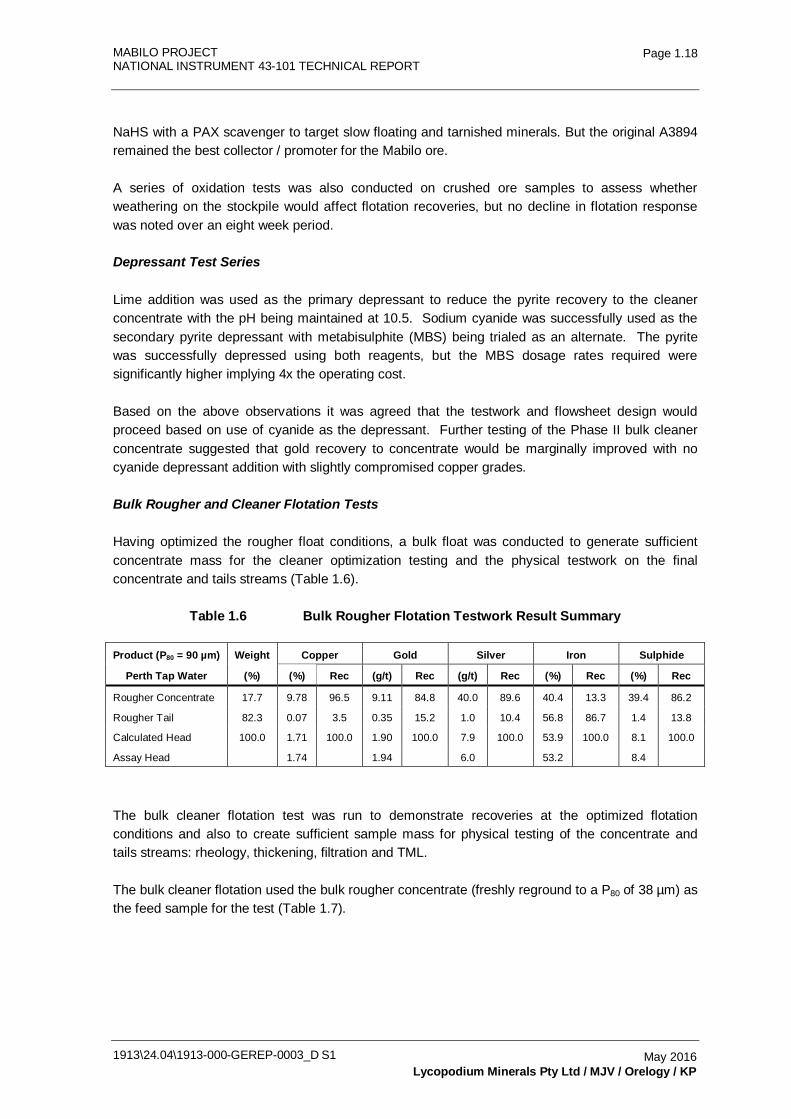
MABILO PROJECT NATIONAL INSTRUMENT 43-101 TECHNICAL REPORT
1913\24.04\1913-000-GEREP-0003_D S1
Page 1.18
May 2016 Lycopodium Minerals Pty Ltd / MJV / Orelogy / KP
NaHS with a PAX scavenger to target slow floating and tarnished minerals. But the original A3894 remained the best collector / promoter for the Mabilo ore.
A series of oxidation tests was also conducted on crushed ore samples to assess whether weathering on the stockpile would affect flotation recoveries, but no decline in flotation response was noted over an eight week period.
Depressant Test Series
Lime addition was used as the primary depressant to reduce the pyrite recovery to the cleaner concentrate with the pH being maintained at 10.5. Sodium cyanide was successfully used as the secondary pyrite depressant with metabisulphite (MBS) being trialed as an alternate. The pyrite was successfully depressed using both reagents, but the MBS dosage rates required were significantly higher implying 4x the operating cost.
Based on the above observations it was agreed that the testwork and flowsheet design would proceed based on use of cyanide as the depressant. Further testing of the Phase II bulk cleaner concentrate suggested that gold recovery to concentrate would be marginally improved with no cyanide depressant addition with slightly compromised copper grades.
Bulk Rougher and Cleaner Flotation Tests
Having optimized the rougher float conditions, a bulk float was conducted to generate sufficient concentrate mass for the cleaner optimization testing and the physical testwork on the final concentrate and tails streams (Table 1.6).
Table 1.6 Bulk Rougher Flotation Testwork Result Summary
Product (P80 = 90 µm) Weight Copper Gold Silver Iron Sulphide
Perth Tap Water (%) (%) Rec (g/t) Rec (g/t) Rec (%) Rec (%) Rec
Rougher Concentrate 17.7 9.78 96.5 9.11 84.8 40.0 89.6 40.4 13.3 39.4 86.2
Rougher Tail 82.3 0.07 3.5 0.35 15.2 1.0 10.4 56.8 86.7 1.4 13.8
Calculated Head 100.0 1.71 100.0 1.90 100.0 7.9 100.0 53.9 100.0 8.1 100.0
Assay Head
1.74
1.94
6.0
53.2
8.4
The bulk cleaner flotation test was run to demonstrate recoveries at the optimized flotation conditions and also to create sufficient sample mass for physical testing of the concentrate and tails streams: rheology, thickening, filtration and TML.
The bulk cleaner flotation used the bulk rougher concentrate (freshly reground to a P80 of 38 µm) as the feed sample for the test (Table 1.7).
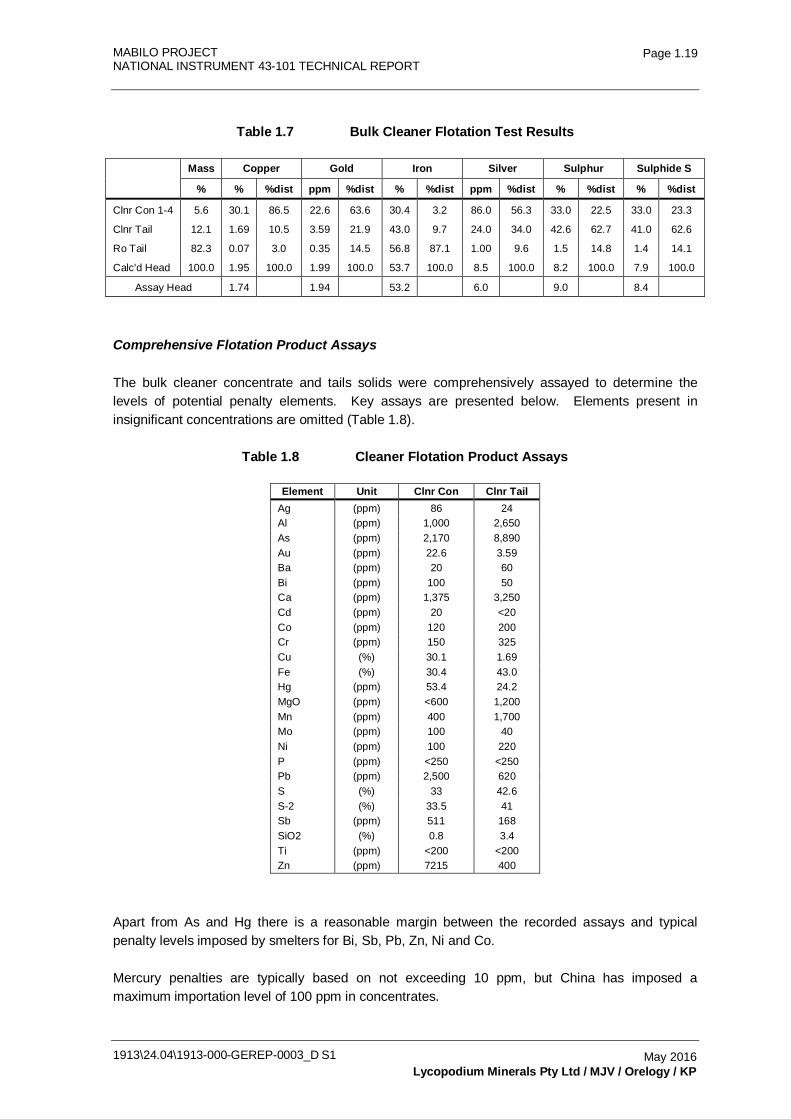
MABILO PROJECT NATIONAL INSTRUMENT 43-101 TECHNICAL REPORT
1913\24.04\1913-000-GEREP-0003_D S1
Page 1.19
May 2016 Lycopodium Minerals Pty Ltd / MJV / Orelogy / KP
Table 1.7 Bulk Cleaner Flotation Test Results
Mass Copper Gold Iron Silver Sulphur Sulphide S
% % %dist ppm %dist % %dist ppm %dist % %dist % %dist
Clnr Con 1-4 5.6 30.1 86.5 22.6 63.6 30.4 3.2 86.0 56.3 33.0 22.5 33.0 23.3
Clnr Tail 12.1 1.69 10.5 3.59 21.9 43.0 9.7 24.0 34.0 42.6 62.7 41.0 62.6
Ro Tail 82.3 0.07 3.0 0.35 14.5 56.8 87.1 1.00 9.6 1.5 14.8 1.4 14.1
Calc'd Head 100.0 1.95 100.0 1.99 100.0 53.7 100.0 8.5 100.0 8.2 100.0 7.9 100.0
Assay Head 1.74
1.94
53.2
6.0
9.0
8.4
Comprehensive Flotation Product Assays
The bulk cleaner concentrate and tails solids were comprehensively assayed to determine the levels of potential penalty elements. Key assays are presented below. Elements present in insignificant concentrations are omitted (Table 1.8).
Table 1.8 Cleaner Flotation Product Assays
Element Unit Clnr Con Clnr Tail Ag (ppm) 86 24 Al (ppm) 1,000 2,650 As (ppm) 2,170 8,890 Au (ppm) 22.6 3.59 Ba (ppm) 20 60 Bi (ppm) 100 50 Ca (ppm) 1,375 3,250 Cd (ppm) 20 <20 Co (ppm) 120 200 Cr (ppm) 150 325 Cu (%) 30.1 1.69 Fe (%) 30.4 43.0 Hg (ppm) 53.4 24.2 MgO (ppm) <600 1,200 Mn (ppm) 400 1,700 Mo (ppm) 100 40 Ni (ppm) 100 220 P (ppm) <250 <250 Pb (ppm) 2,500 620 S (%) 33 42.6 S-2 (%) 33.5 41 Sb (ppm) 511 168 SiO2 (%) 0.8 3.4 Ti (ppm) <200 <200 Zn (ppm) 7215 400
Apart from As and Hg there is a reasonable margin between the recorded assays and typical penalty levels imposed by smelters for Bi, Sb, Pb, Zn, Ni and Co.
Mercury penalties are typically based on not exceeding 10 ppm, but China has imposed a maximum importation level of 100 ppm in concentrates.
MABILO PROJECT NATIONAL INSTRUMENT 43-101 TECHNICAL REPORT
1913\24.04\1913-000-GEREP-0003_D S1
Page 1.20
May 2016 Lycopodium Minerals Pty Ltd / MJV / Orelogy / KP
Arsenic was previously removed from the copper concentrate to cleaner tails, but with the efforts to increase gold recovery to concentrate (and as a result, pyrite associated arsenic), the arsenic level now marginally exceeds the typical smelter limit of 2,000 ppm.
Gold Leach Testwork
Leaching of the gold from the flotation tails was justified based on typically less than 60% of the gold being recovered to the copper flotation concentrate and potentially high cyanidation gold extractions from the tails streams.
The rougher and cleaner flotation tails streams were leached separately to keep the pyritic cleaner tails apart as a potentially saleable product and also to allow intensive leaching conditions on the potentially more refractory, high grade, low tonnage pyrite stream. The gold was generally fairly evenly distributed between the rougher and cleaner tails streams such that neither could be considered discardable without leaching.
Leach recoveries from the higher grade Phase I composite were acceptable, but with the lower grade Phase II composite, recoveries decreased.
The low gold leach recovery and high cyanide usage rates motivated an economic review of the viability of the tails leach stages. This showed that the revenue from recovered gold at the study gold price barely covered the operating cost due to the low leach extractions and high cyanide consumption. Taking account of detoxification requirements with a positive site water balance and potential issues with mercury leaching from the tails streams, it was agreed to defer further planned leach testing and to exclude these stages from the process flowsheet.
Magnetite Recovery
Magnetite susceptibility testing on the rougher flotation tails stream during Phase I demonstrated that 73% of the rougher tails mass could be recovered to a magnetic concentrate with a 66% Fe grade. Investigation of cleaning at lower field strengths proved unsuccessful and the response with finer grinding suggested that the liberation size to achieve an upgrade would be significantly finer than would be justified by the product premium.
Detailed assays of the bulk magnetic separation magnetite product are presented in Table 1.9. The product has very low levels of sulphur, silica and phosphorous, making it readily saleable to a smelter.
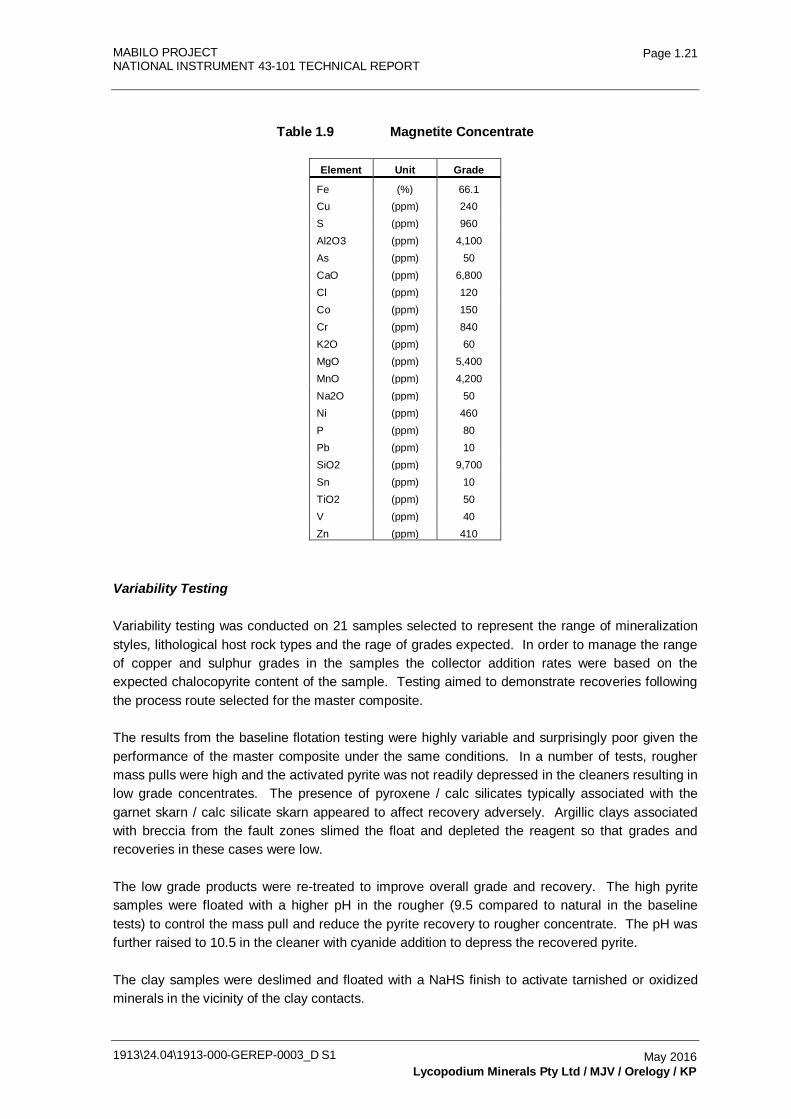
MABILO PROJECT NATIONAL INSTRUMENT 43-101 TECHNICAL REPORT
1913\24.04\1913-000-GEREP-0003_D S1
Page 1.21
May 2016 Lycopodium Minerals Pty Ltd / MJV / Orelogy / KP
Table 1.9 Magnetite Concentrate
Element Unit Grade
Fe (%) 66.1 Cu (ppm) 240 S (ppm) 960 Al2O3 (ppm) 4,100 As (ppm) 50 CaO (ppm) 6,800 Cl (ppm) 120 Co (ppm) 150 Cr (ppm) 840 K2O (ppm) 60 MgO (ppm) 5,400 MnO (ppm) 4,200 Na2O (ppm) 50 Ni (ppm) 460 P (ppm) 80 Pb (ppm) 10 SiO2 (ppm) 9,700 Sn (ppm) 10 TiO2 (ppm) 50 V (ppm) 40 Zn (ppm) 410
Variability Testing
Variability testing was conducted on 21 samples selected to represent the range of mineralization styles, lithological host rock types and the rage of grades expected. In order to manage the range of copper and sulphur grades in the samples the collector addition rates were based on the expected chalocopyrite content of the sample. Testing aimed to demonstrate recoveries following the process route selected for the master composite.
The results from the baseline flotation testing were highly variable and surprisingly poor given the performance of the master composite under the same conditions. In a number of tests, rougher mass pulls were high and the activated pyrite was not readily depressed in the cleaners resulting in low grade concentrates. The presence of pyroxene / calc silicates typically associated with the garnet skarn / calc silicate skarn appeared to affect recovery adversely. Argillic clays associated with breccia from the fault zones slimed the float and depleted the reagent so that grades and recoveries in these cases were low.
The low grade products were re-treated to improve overall grade and recovery. The high pyrite samples were floated with a higher pH in the rougher (9.5 compared to natural in the baseline tests) to control the mass pull and reduce the pyrite recovery to rougher concentrate. The pH was further raised to 10.5 in the cleaner with cyanide addition to depress the recovered pyrite.
The clay samples were deslimed and floated with a NaHS finish to activate tarnished or oxidized minerals in the vicinity of the clay contacts.
MABILO PROJECT NATIONAL INSTRUMENT 43-101 TECHNICAL REPORT
1913\24.04\1913-000-GEREP-0003_D S1
Page 1.22
May 2016 Lycopodium Minerals Pty Ltd / MJV / Orelogy / KP
For the pyrite samples, depression of the pyrite in the rougher float generally resulted in a small loss in recovery, but grade improvements were significant. Desliming improved the flotation recoveries and grades for the clay samples, but the low head grade samples remained poor performers. The low grade samples (<0.5% Cu) were not pursued further, as most of these would not be included in the mineable reserves.
There was still room to improve both grade and recovery for a number of the high pyrite samples. Scavenging the copper associated with the pyrite in the rougher tail boosted copper recovery, but this concentrate required regrinding to upgrade the copper in the cleaners. It was not clear from the available samples that the recovery benefit would justify the capital and operating costs for the additional regrind stage, so further testing is recommended in this area.
High Pyrite Variability Testwork
The poor recoveries from the high pyrite samples observed when testing the variability samples from the Mabilo ore bodies suggested that better support was required for the recovery model, particularly in areas of high pyrite, since the pyrite replacement of the magnetite was pervasive in some zones and affected more of the orebody than originally thought.
Eleven high pyrite composites were made up from remaining coarse ore assay rejects (stored in nitrogen purged bags and drums in cool conditions) as well as a high pyrite master composite sample. The high pyrite variability samples were tested using the optimized flotation regime and reagent suite developed for the low recovery variability samples to improve copper recovery and concentrate grade. The master composite was used to investigate opportunities for recovery and flowsheet improvement.
The best opportunity for recovery improvement was seen as improving liberation of the chalcopyrite. Liberation has to occur ahead of the roughers such that depression of the pyrite is more selective. The primary grind size series trialed P80 grinds of 90, 75 and 53 microns, with finer sizes deemed impractical for the whole of ore. Although the grind series tests indicated improving recoveries with finer grinds, the incremental benefits from the additional copper recovery were too minor to offset the additional operating cost that would be incurred.
It was agreed to retain the 90 µm P80 grind size for repeat variability testing while extending the rougher flotation times following poorer than expected initial recoveries with slow flotation kinetics. The stronger A407 collector was used to ‘scavenge’ the rougher tails in the last rougher flotation stage before progressing to true scavenging to maximize pyrite recovery for sale. The pyrite scavenger used PAX to collect the remaining sulphides to overcome the depressant effect of the lime.
Mineralogical investigation of the high pyrite intercepts indicated relatively coarse mineralization, particularly for the chalcopyrite grains, and a generally high degree of liberation with binary chalcopyrite / pyrite particles that should be readily recovered in the rougher and liberated at the concentrate regrind size. Although there is a fraction of the chalcopyrite that is locked, the quantity of locked particles did not explain the poor flotation recoveries achieved for some samples and there must be additional surface effects that are hampering floatability.
MABILO PROJECT NATIONAL INSTRUMENT 43-101 TECHNICAL REPORT
1913\24.04\1913-000-GEREP-0003_D S1
Page 1.23
May 2016 Lycopodium Minerals Pty Ltd / MJV / Orelogy / KP
It was agreed not to revise the recovery algorithm based on this additional testing since there were unresolved issues relating to sample quality and the distribution of pyrite mineralization in the resource is not sufficiently well defined to allow the poor performing samples to be related to geological domains. A true reflection of metallurgical performance can only be obtained by testing fresh drill core to eliminate sample quality as one of the possible variants.
The recovery model predicted the recoveries for these samples reasonably accurately with the exception of two poor performing intercepts.
Ancillary Testwork
True solid specific gravity measurements were determined for the various flotation products.
Viscosity measurements were determined for various slurry streams at a range of densities. With the high solids SGs the volumetric % solids at the nominated slurry density is relatively low, so measured viscosities tend to be low, suggesting that no issues will arise with pumping and agitation.
Samples of rougher tails, non magnetic tails, copper concentrate and pyrite were submitted to Outotec for dynamic thickener testing. Settling rates were fast with high underflow densities and good overflow clarities.
Bench scale filtration testwork was conducted by GBL Process to determine filtration rates, achievable cake moisture and air blow / cake displacement wash water requirements.
The copper concentrate filtered readily to 7 - 10% w/w moisture with air blowing to dry it. The pyrite could be filtered to 8 - 10% moisture with air blowing. The magnetite could be filtered to 7 - 9% moisture using air blowing. Filtration rates are highly dependent on process conditions and filter chamber thickness.
Metallurgical Recoveries
Metallurgical recoveries were based on the flotation recoveries for the variability samples since the samples selected appear to reflect the range of mineralization styles in the resource with much of the magnetite skarn being overprinted with pyrite to some degree. However, only limited variability samples were selected which did not allow separate recovery relationships with geological domains to be developed.
It was noted that the S:Cu ratio in the head sample correlates with much of the observed process behavior. Models were fitted to the testwork data to allow copper, gold and silver recoveries to be estimated by on the sample head grades. It was necessary to exclude some low grade, very high pyrite and clay altered samples to achieve representative recovery relationships for pit optimization, as these samples did not follow the trends.
Metal recovery with head grade relationships were formulated and applied to all the blocks in the resource model to generate metal recoveries in each case for the optimization exercise. Average copper recovery to the concentrate for the resource was estimated to be 82.6% at a concentrate grade of 26% Cu. Gold recovery to the copper concentrate was 52.9%. These estimates are lower
MABILO PROJECT NATIONAL INSTRUMENT 43-101 TECHNICAL REPORT
1913\24.04\1913-000-GEREP-0003_D S1
Page 1.24
May 2016 Lycopodium Minerals Pty Ltd / MJV / Orelogy / KP
than the master composite recoveries of 86.5% copper to the concentrate and 63.6% gold. This was then modified based on the algorithm supplied to provide data for the mine reserve used in the financial model. Resulting averages were 83.7% for copper, 55.1% for gold and 60.7% for silver. Iron recovery to magnetite was 60.7% of total iron. It should be noted that this approach does not provide recovery relationships with geological domains and further work should be completed to improve understanding in this area.
The magnetite recovery (iron in feed reporting to magnetite product) must first take into account the Fe reporting to the pyrite and chalcopyrite concentrates. Thereafter a simple linear head grade recovery correlation is used to estimate recovery. The iron grade feeding the magnetic separation section is estimated assuming all the feed sulphur is distributed as pyrite and chalcopyrite with associated iron. It was estimated that 42.4% of the feed mass would be recovered as magnetite.
1.11 Process Plant
The proposed process plant design for the Mabilo Project is based on a robust metallurgical flowsheet designed for optimum recovery with minimum operating costs. The flowsheet is constructed from unit operations that are well proven in industry.
The key criteria for equipment selection are the suitability for duty and the mine life of the operation while considering reliability and ease of maintenance. The plant layout provides ease of access to all equipment for operating and maintenance requirements while maintaining a compact footprint to minimize construction costs.
The Mabilo plant will process a range of ore types with variable ore characteristics, copper, magnetite and pyrite levels and metallurgical treatment requirements.
MJV has advised that ores will be mined in the following sequence:
• Gold cap ores will be mined, crushed and shipped to a local processing facility (14 months).
• Supergene and oxide skarn ores will be mined, crushed and shipped to an offsite processing facility (18 months).
Primary ores will be mined after completion of these operations and will be processed on site at the Mabilo process plant.
The key project and ore specific design criteria that the plant design must meet are as follows:
• 1,000,000 t/y of primary ore.
• Crushing plant mechanical availability of 80%.
• Mechanical availability for the remainder of the plant of 91.3% supported by crushed ore storage and stand-by equipment in critical areas.
MABILO PROJECT NATIONAL INSTRUMENT 43-101 TECHNICAL REPORT
1913\24.04\1913-000-GEREP-0003_D S1
Page 1.25
May 2016 Lycopodium Minerals Pty Ltd / MJV / Orelogy / KP
• Sufficient automated plant control to minimize the need for continuous operator intervention and allow manual override and control if and when required.
A process design criteria document has been prepared incorporating the engineering and key metallurgical design criteria derived from the results of metallurgical testwork and comminution circuit modeling. The design document forms the basis for the design of the processing plant and required site services.
1.11.1 Selected Process Flowsheet
The treatment plant design incorporates the following unit process operations:
• Single stage open circuit primary crushing to produce a crushed product size of 80% passing (P80) 120 mm.
• A crushed ore surge bin with a nominal capacity of 120 t. Surge bin overflow will be conveyed to a dead stockpile of 20,000 tonnes. Ore from the dead stockpile will be reclaimed by front end loader (FEL) to feed the mill during periods when the crushing circuit is off-line.
• Grinding of ore in a SAG mill circuit in closed circuit with hydrocyclones to produce a P80 grind size of 90 µm.
• Bulk sulphide flotation to recover copper sulphides and gold bearing pyrite.
• Two-stage cleaner flotation to recover copper sulphides into a copper concentrate and pyrite.
• Concentrate thickening and pressure filtration to produce a copper concentrate filter cake.
• Pyrite thickening and either pressure filtration to produce a pyrite concentrate filter cake or discharge direct to tailings.
• Magnetic separation of the bulk sulphide tails to recover magnetite into concentrate.
• Concentrate thickening and pressure filtration to produce a magnetite concentrate filter cake.
• Combined tailings pumping to the tailings storage facility (TSF).
MABILO PROJECT NATIONAL INSTRUMENT 43-101 TECHNICAL REPORT
1913\24.04\1913-000-GEREP-0003_D S1
Page 1.26
May 2016 Lycopodium Minerals Pty Ltd / MJV / Orelogy / KP
1.11.2 Processing Upside
MJV has indicated a desire to treat ore at up to 1.35 Mtpa. No specific design allowance for this treatment rate has been made in the base case 1.0 Mtpa facility. However, Lycopodium reviewed the process plant design and costs at a pre-feasibility level of engineering and identified the following:
• Crushing – The capacity of this facility will meet the throughput target. However increases in some conveyor drives will be required.
• Milling - The mill size will need to increase from 3.4 MW to 4.2 MW to treat the increased throughput. An increase in the number of classifying cyclones is required as well as increases in associated pumps.
• Flotation – To maintain residence time an increase in the number of rougher and cleaner flotation cells together with increases in associated pumps.
• Regrind – An increase in the regrind mill size together with increases in associated pumps will be required.
• Filter capacity – An increase in filtration capacity together with increases in associated pumps will be required.
• Services – Increases in water pumps and air systems will be required.
• An indicative capital and operating cost estimate for this scenario sees the capital cost rise by 7.3% and the process operating cost drop by $1.0/t.
1.12 Infrastructure
1.12.1 Overview
Infrastructure will be developed in two stages:
• The oxide and chalcocite mining operations will require establishment of limited infrastructure. This will include the following:
- Phase 1 Surface Water Management structures.
- Port Upgrade.
- Mining Facilities.
- Access and export road development.
- Temporary power and water supplies.
MABILO PROJECT NATIONAL INSTRUMENT 43-101 TECHNICAL REPORT
1913\24.04\1913-000-GEREP-0003_D S1
Page 1.27
May 2016 Lycopodium Minerals Pty Ltd / MJV / Orelogy / KP
• Remaining infrastructure will be developed for the commencement of primary ore treatment in Year 3.
1.12.2 Seismic Assessment
The Philippines is located in a tectonic region known as the 'Ring of Fire' and Mabilo is located approximately 11 km north of the potentially active Mount Labo. The site is located in an area of high seismic activity.
It is recommended that the following seismic design parameters are used for the Tailing Storage Facility and Waste Dump:
• Operating basis earthquake (OBE) is based on a 1:1,000 year event, M6.45 and with a peak rock ground acceleration of 0.36 g.
• Maximum design earthquake (MDE) is based on a 1:10,000 year event, M6.5 and with a peak rock ground acceleration of 0.65 g.
• Maximum Credible earthquake (MCE) is an M6.5 and with a peak rock ground acceleration of 0.65 g.
In accordance with the International Building Code (IBC) for structural design, the maximum considered earthquake ground motion has been defined as the ground motion with a 1% probability of exceedance in 50 years (return period of about 5,000 years).
There is presently ongoing geothermal activity at Mount Labo which is considered a potentially active volcano. The last eruption was about 27,000 years ago and produced pyroclastic flows from the summit cone, although it has not erupted since. We cannot preclude future eruptions of Mount Labo, but would consider the potential of resumed activity during the operating life of the facility as having only a very low likelihood.
1.12.3 Surface Water Management
It is critical for the Project that the surface water management structures are complete prior to the oxide mining and Knight Piésold has outlined a phased approach to this as follows:
• Phase 1 – Environmental control structures to the north of the tenement and a single diversion in the south for the starter pit.
• Phase 2 – Diversions on the south side of the main pit and south of the waste dump / TSF.
• Phase 3 – Additional diversion structure to the south to allow for ultimate pit.
• Phase 4 – Final northern ECD.
MABILO PROJECT NATIONAL INSTRUMENT 43-101 TECHNICAL REPORT
1913\24.04\1913-000-GEREP-0003_D S1
Page 1.28
May 2016 Lycopodium Minerals Pty Ltd / MJV / Orelogy / KP
Following completion of the access tracks to these structures, MJV will contract a local earthmoving contractor to complete these structures using technical support from a geotechnical consultant.
1.12.4 Power Supply and Distribution
Owing to the significant site load requirements and lack of local supply capacity, no current opportunities exist for any major connection of the site to the power utility.
Multiple power generation tenders were received during the feasibility study representing a market spread of providers for diesel (Gasoil) and Heavy Fuel Oil (HFO) solutions, with both capital and contract power economic models evaluated. The low capital outlay requirements of the independent power producer (IPP) option and four year payback compared to a capital HFO capital purchase has led to the selection of the IPP power option being included in the study as the preferred option. This also presents the least technical risk to the Project, removes the maintenance skill set requirement from the mine operation and provides the quickest implementation time.
Power will be provided by a site power station located to the west (downwind) of the process plant. The power station will utilize high speed generators running on Gasoil (diesel) as this provides the optimum balance of capital and operating cost over life of mine.
The power station will be supplied fuel from the bulk fuel storage facility and will include necessary fuel treatment, day tank storage and ancillary fluid systems to support standalone operation of the facility.
The proposed configuration of the power station is:
• 8 x 1.6 MW 4,160 V high speed generators (6 duty, 2 stand-by).
• Step down auxiliary transformer 4.16 / 0.380 kV.
• Neutral earthing resistor.
• 4.16 kV switchroom and control room.
• The electrical system is based on 4.16 kV distribution and 380 V working voltage. System frequency is designed at 60 Hz. A 4.16 kV feeder from the power station will feed the plant 4.16 kV distribution switchboard, with a second feeder supplying the overhead powerline.
• Within the process plant the 4.16 kV supply will be stepped down from 4.16 kV to 380 V at the switchrooms using four separate 4.16 kV / 380 V distribution transformers fed from the HV switchboard.
• Approximately 5.5 km of 4.16 kV overhead power line between the power station and various remote facilities (raw water supply, mine services, bore pumps and camp) has
MABILO PROJECT NATIONAL INSTRUMENT 43-101 TECHNICAL REPORT
1913\24.04\1913-000-GEREP-0003_D S1
Page 1.29
May 2016 Lycopodium Minerals Pty Ltd / MJV / Orelogy / KP
been allowed. Three off 4.16 / 0.380 kV 500 kVA and five off 4.16 / 0.380 kV 100 kVA transformers are required at the various sites.
• The tailings storage facility decant return pump station will be supplied by local diesel generator owing to its remote location from the plant and the potential for overhead powerline clashes with mining infrastructure.
1.12.5 Telecommunications
The project communications infrastructure is an extension of the existing network infrastructure to allow the integration of the new Mabilo site. This includes provision of data and voice services, CCTV / access control, UHF mine radio and camp entertainment systems.
Network Topology
The onsite communications network is designed around a site wide fiber optic backbone which will be shared by all services (Figure 1.5). This will minimize cabling and related communications equipment. The services that will use the common fiber optic backbone include the following:
• Corporate LAN including telephony (Voice over Internet Protocol – VoIP).
• Plant control system.
• CCTV and security access.
To provide external connectivity to the site, a high speed radio link is proposed to be utilized between the existing Daet exploration camp and the new site. The link requires the installation of communications towers at both Mabilo and Daet to allow line of site between the two points. Two thirty meter guyed towers have been included in the cost estimate along with air conditioned communications equipment huts to house the required equipment.
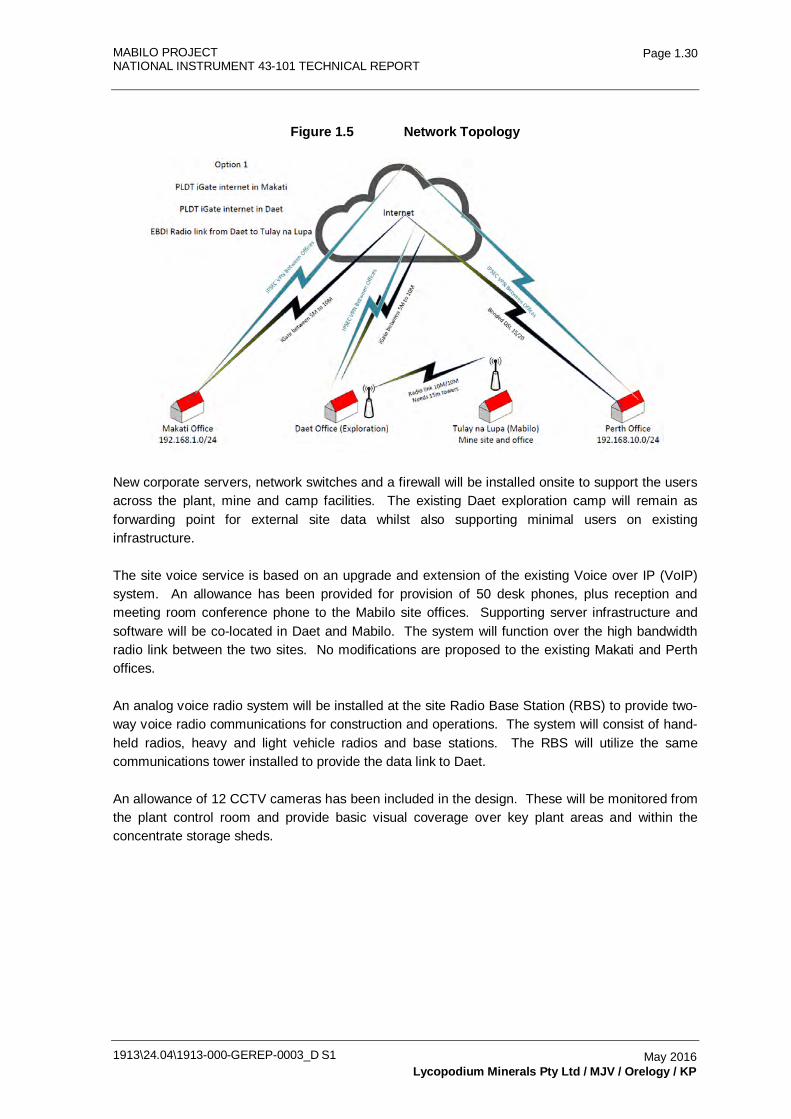
MABILO PROJECT NATIONAL INSTRUMENT 43-101 TECHNICAL REPORT
1913\24.04\1913-000-GEREP-0003_D S1
Page 1.30
May 2016 Lycopodium Minerals Pty Ltd / MJV / Orelogy / KP
Figure 1.5 Network Topology
New corporate servers, network switches and a firewall will be installed onsite to support the users across the plant, mine and camp facilities. The existing Daet exploration camp will remain as forwarding point for external site data whilst also supporting minimal users on existing infrastructure.
The site voice service is based on an upgrade and extension of the existing Voice over IP (VoIP) system. An allowance has been provided for provision of 50 desk phones, plus reception and meeting room conference phone to the Mabilo site offices. Supporting server infrastructure and software will be co-located in Daet and Mabilo. The system will function over the high bandwidth radio link between the two sites. No modifications are proposed to the existing Makati and Perth offices.
An analog voice radio system will be installed at the site Radio Base Station (RBS) to provide two-way voice radio communications for construction and operations. The system will consist of hand-held radios, heavy and light vehicle radios and base stations. The RBS will utilize the same communications tower installed to provide the data link to Daet.
An allowance of 12 CCTV cameras has been included in the design. These will be monitored from the plant control room and provide basic visual coverage over key plant areas and within the concentrate storage sheds.
MABILO PROJECT NATIONAL INSTRUMENT 43-101 TECHNICAL REPORT
1913\24.04\1913-000-GEREP-0003_D S1
Page 1.31
May 2016 Lycopodium Minerals Pty Ltd / MJV / Orelogy / KP
1.12.6 Tailings Storage and Site Water Balance
Tailings Geochemistry
One pyrite sample and one non-magnetic tailings sample were geochemically tested. Both tailings samples were found to be potentially acid forming, with the pyrite tailings also shown to be highly reactive recording a paste pH of 4. Geochemistry testing of the pyrite and non-magnetic tailings samples received indicate that:
• the solids contain 14,000 ppm of arsenic in the pyrite tailings and 5,000 ppm in the non-magnetic tailings
• the pyrite solids generate 1.3 t of sulphuric acid per tonne of tailings and the non-magnetic tailings 0.25 t/t. The solids are enriched with mercury and other metals
• the pyrite liquid sample was acidic as slurry and high in arsenic, copper, cobalt, cadmium and iron. The non-magnetic sample contained moderate levels of these metals.
The supernatant quality of the pyrite tailings was found to be poor with a low pH and several metals elevated above the assessment criteria. The facility containing the pyrite will require a robust liner system. The supernatant quality of the non-magnetic tailings was reasonable. Water treatment of the supernatant will be required prior to discharge to surface waters.
Based on this assessment, a robust liner system will be required on the base and sides of the facility to reduce seepage and the tailings should be maintained at saturation to reduce acid generation. Based on the acid generating potential of both samples, there appears to be limited merit in separating the tailings streams into two TSF cells if both streams are to remain as waste. However, the pyrite supernatant and non-magnetic supernatant should be evaluated further to optimize the management approach.
Tailings Storage
The Tailings Storage Facility (TSF) will comprise a four sided paddock storage facility formed by a multi-zoned earthfill embankment with high density polyethylene (HDPE) liner and compacted soil liner. The TSF will be located towards the northern end of the waste dump in a combined tailings and waste facility. To limit the acid generating potential of the tailings, the tailings deposition will be sub-aqueous. A leachate collection recovery system (LCRS) will be installed beneath the basin composite liner to limit potential seepage from the TSF basin. This consists of a system of 100 mm diameter corrugated polyethylene tubing (CPT) drain coil pipes which will be installed to direct seepage water to the LCRS sump.
It is envisaged that a market may be identified for the pyrite tailings and this will be transported off site. Currently the TSF is sized for co-disposal of both tailings streams. The TSF is designed with a storage capacity of 3.55 Mt, sufficient for 10 years of operation. The Stage 1 is designed with a two year storage capacity.
The tailings facility is proposed to be constructed on volcanic tuff materials with a groundwater table close to the surface. The natural ground is at risk of liquefaction under a seismic event. The
MABILO PROJECT NATIONAL INSTRUMENT 43-101 TECHNICAL REPORT
1913\24.04\1913-000-GEREP-0003_D S1
Page 1.32
May 2016 Lycopodium Minerals Pty Ltd / MJV / Orelogy / KP
additional confining pressure applied to the natural ground by the tailings storage facility and waste dump will reduce this risk to an acceptable level. However the ground close to the toe of the mine waste will remain at risk due to the lower level of additional load applied. A sacrificial earthworks bund is proposed to be constructed around the external perimeter of the structural zone of the TSF, such that in the event of liquefaction, the structural zone of the TSF has sufficient confining pressure to be non-liquefiable and only the bund is at risk of high deformations. Preliminary sizing indicates that the bund is required to be 50 m wide at the crest and a minimum of half the height of the TSF embankment.
The natural ground below the inside face of the TSF will similarly be at risk of liquefaction until sufficient tailings are deposited to confine this layer. During the early stages of operation there is a risk of high deformation occurring due to seismically induced liquefaction. This risk is primarily a commercial risk as the HDPE lining will prevent loss of containment.
Tailings will be deposited using perimeter deposition. The supernatant water will be removed from the TSF via submersible pumps located on a floating pontoon.
Site Water Balance
Site climate characteristics pertinent to the infrastructure are summarized below:
• The average annual rainfall for the Project site is 3,538 mm (based on 68 years of data for Daet climate station).
• The magnitude of a 1 in 100 year recurrence interval, annual wet rainfall sequence in 5,778 mm.
• The magnitude of a 1 in 100 year recurrence interval, annual dry rainfall sequence in 1,464 mm.
• The average annual evaporation for the Project site is 1,646 mm (based on Pili climate station data).
The main water supply for the process plant will come from surface water management. There are three existing creeks running through the tenement. These streams will need to be modified. The main water source will then be from the most north-westerly of these environmental control dams. A submersible pump and overland pipeline will supply raw water to the process plant raw water tank.
The following is assumed for the water balance of the site:
• The decant and under drainage from the TSF will be returned to the plant site and the plant site will feed excess water to a water treatment plant as required before off site discharge.
• In pit dewatering will be pumped to a wetland facility prior to discharge to the ECDs.
MABILO PROJECT NATIONAL INSTRUMENT 43-101 TECHNICAL REPORT
1913\24.04\1913-000-GEREP-0003_D S1
Page 1.33
May 2016 Lycopodium Minerals Pty Ltd / MJV / Orelogy / KP
• Water from the waste dump and other operational areas, and any dewatering wells around the pit perimeter will be discharged to the ECDs.
• Areas undisturbed by the mine operations will continue to shed water along their natural drainage path. Disturbed areas shall be kept to a minimum.
A water balance model was set up and a range of climatic conditions were considered to ensure continual operation for design events:
• Average rainfall conditions with 'treatment and release' allowed.
• 100 year ARI, wet year sequence with 'treatment and release' allowed.
• 100 year ARI, dry year sequence with 'treatment and release' allowed.
• 100 year ARI 72 hour storm event with no evaporation, no decant return and no release allowed.
Based on the modeling undertaken, the following conclusions are drawn:
• Under average climatic conditions, the TSF will operate in a water positive condition during the life of mine. The supernatant pond will generally increase over time and decant return will be sufficient to supply the water demand of the plant. Therefore, an additional external water supply is not required.
• The supernatant pond will cover the deposited tailings over the life of mine, resulting in undrained layer density in the facility and ponding against the embankment at all times.
• Under extreme wet conditions, excessive rainfall will control the required embankment level to prevent any spillway flow. The embankment elevation is governed by a combination of 1 in 100 year ARI / 72 hour storm event (with no evaporation; no decant return and no discharge) and 100 year ARI, wet year sequence (with treatment release allowed).
• A treatment release rate of 72 m³/h is determined as an effective rate, balancing discharge rate and stored volume.
• If drier climatic conditions are experienced in the first year of TSF operation, a start-up pond volume of 340,000 m³ will be required to maintain the minimum 2 m pond cover.
• The accuracy of the water balance model depends on the characteristics of the tailings.
The design embankment can be optimized by cost analysis of TSF embankment versus water treatment plant costs.
MABILO PROJECT NATIONAL INSTRUMENT 43-101 TECHNICAL REPORT
1913\24.04\1913-000-GEREP-0003_D S1
Page 1.34
May 2016 Lycopodium Minerals Pty Ltd / MJV / Orelogy / KP
1.12.7 Project Buildings
Relocation Housing
Provision has been made to relocate and re-house up to 100 families and housing will be provided. The housing will consist of terraced pre-fabricated units.
Construction Camp
The construction workforce is expected to peak at 800 personnel which will be made up of a mix of expatriate supervision, Philippines supervision and trades and local unskilled labor. Local unskilled labor is expected to be recruited from the local towns and will reside locally. The rates used for developing the construction estimate include provision for accommodation and messing, consequently an allowance has been made for temporary services but no camp accommodation will be provided.
Accommodation Camp
The accommodation camp will be located approximately 3 km south east of the process plant on the outskirts of the Barangay Tulay na Lupa. It will provide accommodation for salaried and security staff not originating from the local area. A new access road will run from the existing main road north approximately 500 meters to the accommodation camp. Costing has been based on the use of container based prefabricated units.
Breakdown is as follows:
Units Title Per Unit No. Housed 7 Executive 1 7 22 Single attached 1 22 36 Twin attached 2 72 5 Quad Attached 4 20 3 Dormitory 72 216 Total 337
Plant Buildings
The following facilities will be located within the fenced area of the process plant:
• Main entrance gatehouse with turnstile and entry boom gate control (16.5 m x 22 m).
• Plant area gatehouse (3 m x 3.5 m).
• Plant office (26.6 m x 13 m).
• First aid / clinic (10 m x 6 m).
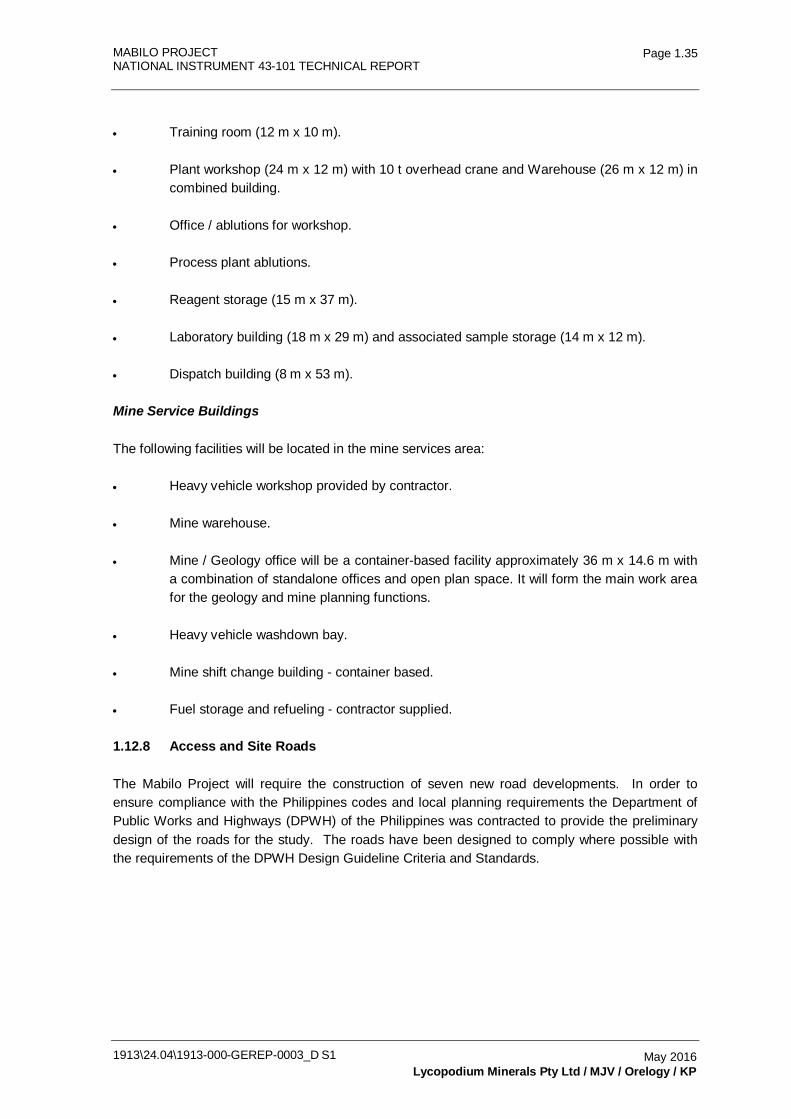
MABILO PROJECT NATIONAL INSTRUMENT 43-101 TECHNICAL REPORT
1913\24.04\1913-000-GEREP-0003_D S1
Page 1.35
May 2016 Lycopodium Minerals Pty Ltd / MJV / Orelogy / KP
• Training room (12 m x 10 m).
• Plant workshop (24 m x 12 m) with 10 t overhead crane and Warehouse (26 m x 12 m) in combined building.
• Office / ablutions for workshop.
• Process plant ablutions.
• Reagent storage (15 m x 37 m).
• Laboratory building (18 m x 29 m) and associated sample storage (14 m x 12 m).
• Dispatch building (8 m x 53 m).
Mine Service Buildings
The following facilities will be located in the mine services area:
• Heavy vehicle workshop provided by contractor.
• Mine warehouse.
• Mine / Geology office will be a container-based facility approximately 36 m x 14.6 m with a combination of standalone offices and open plan space. It will form the main work area for the geology and mine planning functions.
• Heavy vehicle washdown bay.
• Mine shift change building - container based.
• Fuel storage and refueling - contractor supplied.
1.12.8 Access and Site Roads
The Mabilo Project will require the construction of seven new road developments. In order to ensure compliance with the Philippines codes and local planning requirements the Department of Public Works and Highways (DPWH) of the Philippines was contracted to provide the preliminary design of the roads for the study. The roads have been designed to comply where possible with the requirements of the DPWH Design Guideline Criteria and Standards.
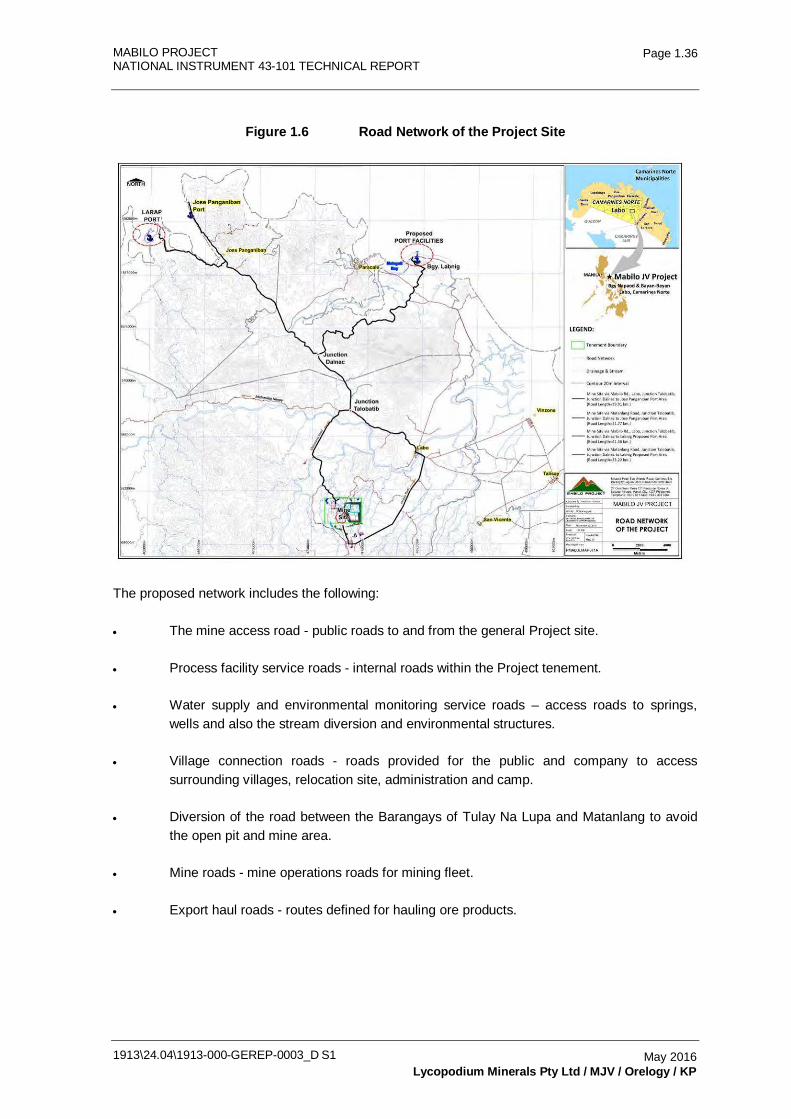
MABILO PROJECT NATIONAL INSTRUMENT 43-101 TECHNICAL REPORT
1913\24.04\1913-000-GEREP-0003_D S1
Page 1.36
May 2016 Lycopodium Minerals Pty Ltd / MJV / Orelogy / KP
Figure 1.6 Road Network of the Project Site
The proposed network includes the following:
• The mine access road - public roads to and from the general Project site.
• Process facility service roads - internal roads within the Project tenement.
• Water supply and environmental monitoring service roads – access roads to springs, wells and also the stream diversion and environmental structures.
• Village connection roads - roads provided for the public and company to access surrounding villages, relocation site, administration and camp.
• Diversion of the road between the Barangays of Tulay Na Lupa and Matanlang to avoid the open pit and mine area.
• Mine roads - mine operations roads for mining fleet.
• Export haul roads - routes defined for hauling ore products.
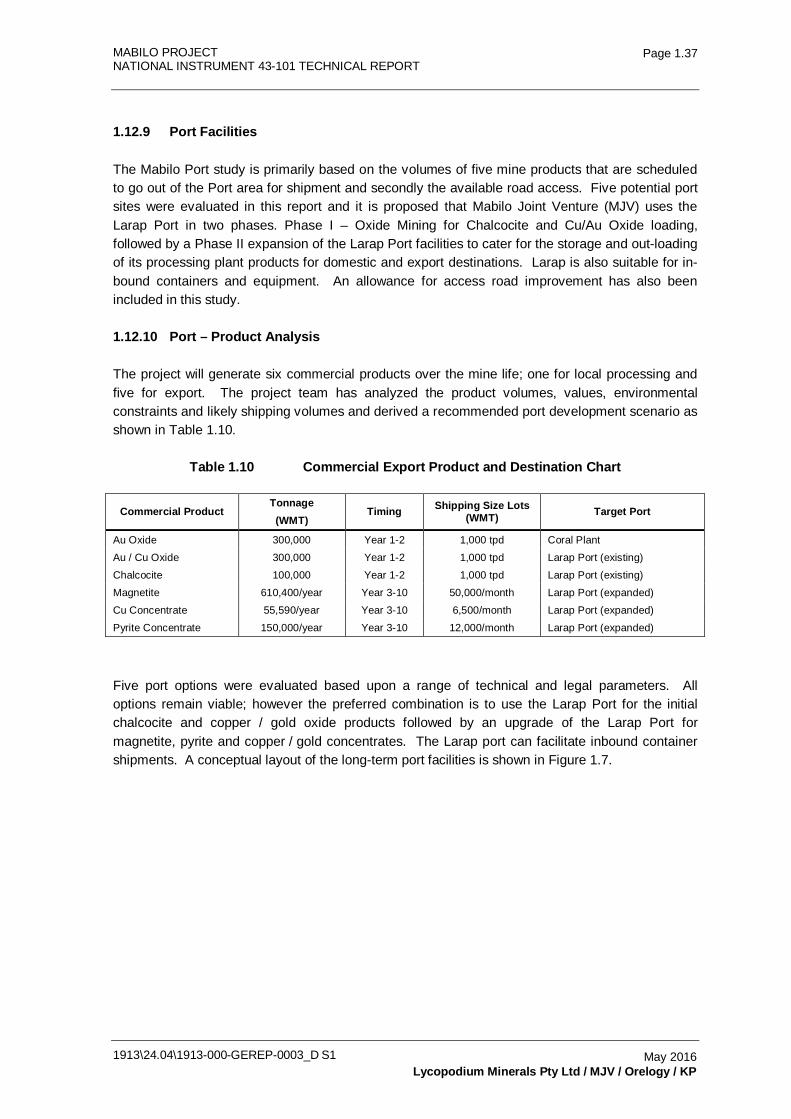
MABILO PROJECT NATIONAL INSTRUMENT 43-101 TECHNICAL REPORT
1913\24.04\1913-000-GEREP-0003_D S1
Page 1.37
May 2016 Lycopodium Minerals Pty Ltd / MJV / Orelogy / KP
1.12.9 Port Facilities
The Mabilo Port study is primarily based on the volumes of five mine products that are scheduled to go out of the Port area for shipment and secondly the available road access. Five potential port sites were evaluated in this report and it is proposed that Mabilo Joint Venture (MJV) uses the Larap Port in two phases. Phase I – Oxide Mining for Chalcocite and Cu/Au Oxide loading, followed by a Phase II expansion of the Larap Port facilities to cater for the storage and out-loading of its processing plant products for domestic and export destinations. Larap is also suitable for in-bound containers and equipment. An allowance for access road improvement has also been included in this study.
1.12.10 Port – Product Analysis
The project will generate six commercial products over the mine life; one for local processing and five for export. The project team has analyzed the product volumes, values, environmental constraints and likely shipping volumes and derived a recommended port development scenario as shown in Table 1.10.
Table 1.10 Commercial Export Product and Destination Chart
Commercial Product Tonnage (WMT)
Timing Shipping Size Lots (WMT) Target Port
Au Oxide 300,000 Year 1-2 1,000 tpd Coral Plant
Au / Cu Oxide 300,000 Year 1-2 1,000 tpd Larap Port (existing)
Chalcocite 100,000 Year 1-2 1,000 tpd Larap Port (existing)
Magnetite 610,400/year Year 3-10 50,000/month Larap Port (expanded)
Cu Concentrate 55,590/year Year 3-10 6,500/month Larap Port (expanded)
Pyrite Concentrate 150,000/year Year 3-10 12,000/month Larap Port (expanded)
Five port options were evaluated based upon a range of technical and legal parameters. All options remain viable; however the preferred combination is to use the Larap Port for the initial chalcocite and copper / gold oxide products followed by an upgrade of the Larap Port for magnetite, pyrite and copper / gold concentrates. The Larap port can facilitate inbound container shipments. A conceptual layout of the long-term port facilities is shown in Figure 1.7.
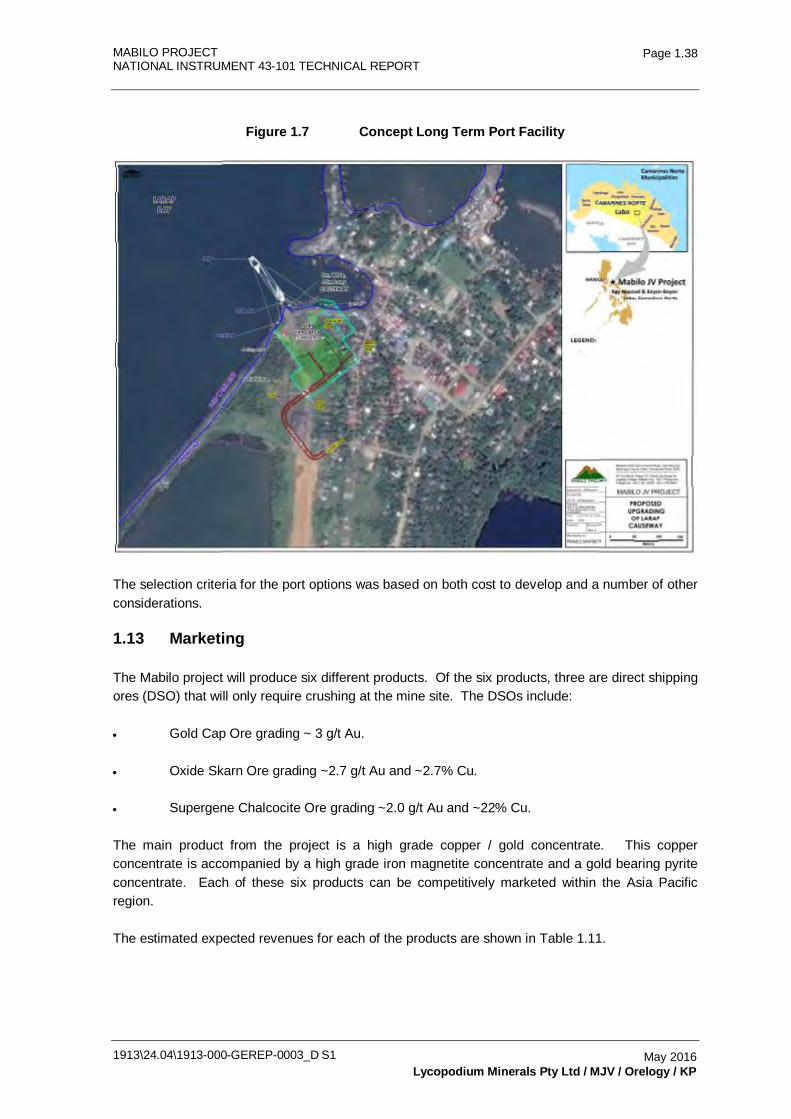
MABILO PROJECT NATIONAL INSTRUMENT 43-101 TECHNICAL REPORT
1913\24.04\1913-000-GEREP-0003_D S1
Page 1.38
May 2016 Lycopodium Minerals Pty Ltd / MJV / Orelogy / KP
Figure 1.7 Concept Long Term Port Facility
The selection criteria for the port options was based on both cost to develop and a number of other considerations.
1.13 Marketing
The Mabilo project will produce six different products. Of the six products, three are direct shipping ores (DSO) that will only require crushing at the mine site. The DSOs include:
• Gold Cap Ore grading ~ 3 g/t Au.
• Oxide Skarn Ore grading ~2.7 g/t Au and ~2.7% Cu.
• Supergene Chalcocite Ore grading ~2.0 g/t Au and ~22% Cu.
The main product from the project is a high grade copper / gold concentrate. This copper concentrate is accompanied by a high grade iron magnetite concentrate and a gold bearing pyrite concentrate. Each of these six products can be competitively marketed within the Asia Pacific region.
The estimated expected revenues for each of the products are shown in Table 1.11.
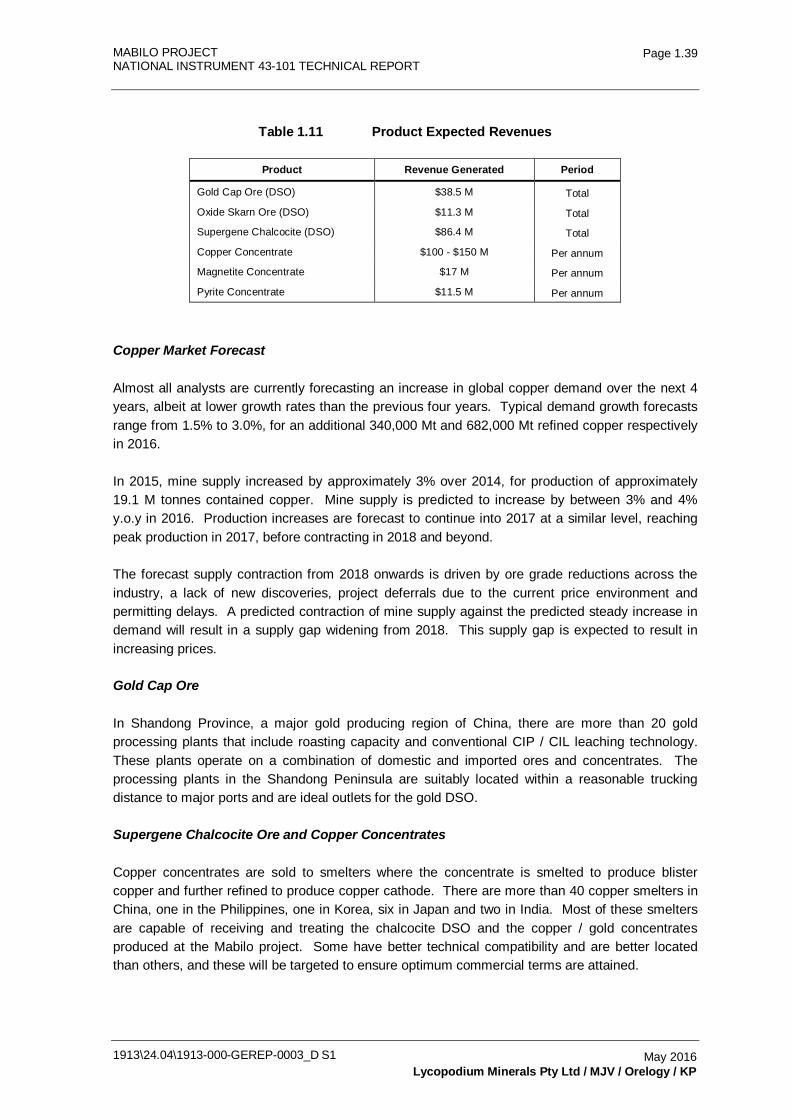
MABILO PROJECT NATIONAL INSTRUMENT 43-101 TECHNICAL REPORT
1913\24.04\1913-000-GEREP-0003_D S1
Page 1.39
May 2016 Lycopodium Minerals Pty Ltd / MJV / Orelogy / KP
Table 1.11 Product Expected Revenues
Product Revenue Generated Period
Gold Cap Ore (DSO) $38.5 M Total
Oxide Skarn Ore (DSO) $11.3 M Total
Supergene Chalcocite (DSO) $86.4 M Total
Copper Concentrate $100 - $150 M Per annum
Magnetite Concentrate $17 M Per annum
Pyrite Concentrate $11.5 M Per annum
Copper Market Forecast
Almost all analysts are currently forecasting an increase in global copper demand over the next 4 years, albeit at lower growth rates than the previous four years. Typical demand growth forecasts range from 1.5% to 3.0%, for an additional 340,000 Mt and 682,000 Mt refined copper respectively in 2016.
In 2015, mine supply increased by approximately 3% over 2014, for production of approximately 19.1 M tonnes contained copper. Mine supply is predicted to increase by between 3% and 4% y.o.y in 2016. Production increases are forecast to continue into 2017 at a similar level, reaching peak production in 2017, before contracting in 2018 and beyond.
The forecast supply contraction from 2018 onwards is driven by ore grade reductions across the industry, a lack of new discoveries, project deferrals due to the current price environment and permitting delays. A predicted contraction of mine supply against the predicted steady increase in demand will result in a supply gap widening from 2018. This supply gap is expected to result in increasing prices.
Gold Cap Ore
In Shandong Province, a major gold producing region of China, there are more than 20 gold processing plants that include roasting capacity and conventional CIP / CIL leaching technology. These plants operate on a combination of domestic and imported ores and concentrates. The processing plants in the Shandong Peninsula are suitably located within a reasonable trucking distance to major ports and are ideal outlets for the gold DSO.
Supergene Chalcocite Ore and Copper Concentrates
Copper concentrates are sold to smelters where the concentrate is smelted to produce blister copper and further refined to produce copper cathode. There are more than 40 copper smelters in China, one in the Philippines, one in Korea, six in Japan and two in India. Most of these smelters are capable of receiving and treating the chalcocite DSO and the copper / gold concentrates produced at the Mabilo project. Some have better technical compatibility and are better located than others, and these will be targeted to ensure optimum commercial terms are attained.
MABILO PROJECT NATIONAL INSTRUMENT 43-101 TECHNICAL REPORT
1913\24.04\1913-000-GEREP-0003_D S1
Page 1.40
May 2016 Lycopodium Minerals Pty Ltd / MJV / Orelogy / KP
Also located in China and Korea are three major blending facilities that receive complex copper concentrates from various producers around the world. Complex concentrates are defined as those which contain a range of elements deleterious to the copper smelting process, and are blended with clean copper concentrates to reduce the concentration of deleterious elements to within acceptable technical and regulatory limits. The Mabilo copper concentrates would be compatible for processing at these facilities.
Negotiations for 2016 annual TC / RC’s were settled at $97.35 TC and $0.09735 RC.
Magnetite Concentrate
China is the world’s biggest steel producer and accounts for almost 50% of the world’s steel production, producing over 800 million tonnes of steel in 2015. Japan, Korea and India account for a further 260 million tonnes of steel production. The high grade magnetite concentrate will be sold into the Asian steel producing market at a price referencing a 62% Fe ore Index.
Pyrite Concentrate
There are a variety of markets into which the gold bearing pyrite concentrate can be sold. As a gold sulphide concentrate it can be processed to recover the gold. This will require a roasting or oxidation stage prior to recovery of the gold. It can also be used as a source of fuel for copper and gold smelters. This high sulphur concentrate can be blended with other lower sulphur copper / gold concentrates and ores to render them suitable for smelting, whilst at the same time allowing for the recovery of the gold contained within them.
Elemental sulphur and sulphide concentrates (pyrite) are burned in to produce sulphuric acid for industrial and agricultural (fertilizer) use. Pyrites make up about 7% of the global sulphur supply. China is a key market for sulphuric acid trade and imports about one million tonnes per year. India is also a major market for acid and fertilizer production. The economics of the sulphuric acid market at the time of the pyrite concentrate production will dictate which option returns the highest revenue.
Shipping
Current global dry-bulk freight rates are at their lowest levels in more than 20 years. This is due to a combination of vessel oversupply (relative to demand) and low fuel (bunker) prices. Basis current data, the freight market is expected to remain weak in 2016, before beginning to strengthen in 2017, reaching a more balanced market in 2019.
The Mabilo project will ship the bulk of its products from the Larap Port, which is located adjacent to major shipping routes that service China, South Korea and Japan. This location provides direct access to deep water shipping routes to North Asia and Eastward via the North Pacific Ocean, and to South Asia and Westward via the Sulu Sea to the South China Sea, extending to Indian Ocean ports via Sunda or Malacca Straits. It is therefore well positioned to access vessels at competitive freight rates.
MABILO PROJECT NATIONAL INSTRUMENT 43-101 TECHNICAL REPORT
1913\24.04\1913-000-GEREP-0003_D S1
Page 1.41
May 2016 Lycopodium Minerals Pty Ltd / MJV / Orelogy / KP
It is expected that each of the products will be sold on a Cost Insurance and Freight (CIF) basis, where the seller is responsible for all shipping costs up to the vessels arrival at the receiving port. The buyer pays for the vessel unloading and transport to the smelter.
Note: The Marketing section of this report has been prepared by Conrad Partners, an established and experienced consultancy. However, it has not been signed off by any of the listed Qualified Persons as they did not have the relevant experience.
1.14 Environment and Social Impact
The Mabilo Project is located in Barangay Napaod, , Municipality of Labo, the Province of Camarines Norte, Philippines (latitude 14°07' North, longitude 122°46'30'' East), approximately 190 aerial kilometers east-southeast of Manila or 315 kilometers by the Maharlika Highway from Manila (311 km) and then by 12 kilometers of concreted road from the town of Labo.
Labo is a first class municipality with ten barangays (villages) and a population of 92,041. Its land area is 649 square kilometers and is 25% of Camarines Norte's size. The Mabilo Project directly impacts two barangays and indirectly an additional four barangays.
The project will affect 144 surface lots and 114 households subject to voluntary resettlement. Eleven of the fifteen lots covering the resource have been acquired and the remaining four are available subject to price.
The Project is sparsely populated and is not subject to any indigenous land owner claims. Vegetation is mostly degraded secondary forest cover or cleared land and the terrain is moderately flat with elevation of ~130 m ASL rising to the inactive Mt. Labo volcano at an elevation of 1,572 m ASL. The elevated areas in the locality are forested, given the high precipitation over the region. The lower lands are agricultural and are mainly planted with rice, coconut, abaca, and other fruit trees.
Water and air sampling shows the Project is in environmental compliance except for two contaminated community water bores.
The Mabilo Project is on the foothills of Mt. Labo, a stratovolcanic mound with a peak elevation of over 4,600 meters. The Project has flat to slightly undulating topography that is transected by several north-flowing streams which moderately to deeply incise the soft Quaternary tuffs (pyroclastic rock). Principal drainage meanders for over 10 kilometers through the Labo River which flows out to a delta east of the centre of Daet municipality.
Baseline Monitoring and Data
The project monitoring and gauging stations were established by GAIA South environmental consultants in early 2014 and MJV has continued monitoring these stations and others which were added as required. Once the footprint of the Project is finalized, the Project team will establish permanent stations and expand the monitoring program as proposed in the statutory Environmental Management Plan (EMP).
MABILO PROJECT NATIONAL INSTRUMENT 43-101 TECHNICAL REPORT
1913\24.04\1913-000-GEREP-0003_D S1
Page 1.42
May 2016 Lycopodium Minerals Pty Ltd / MJV / Orelogy / KP
1.15 Project Implementation
The strategic objectives for the Project can be summarized as follows:
• Zero lost time and medical treatment injuries.
• Zero environmental incidents.
• 100% compliance with all approvals.
• Positive community relations.
• Implementation and delivery of a project which achieves the performance criteria.
• Low cost and fast track approach to delivery.
1.15.1 Project Execution Strategy
The Project execution strategy selected by MJV for the design and construction management of the Project is, in general terms, based on a MJV team self performing the management of all works outside the process plant fence line as well as bulk earthworks for the process plant site itself with an Engineering, Procurement and Construction Management (EPCM) Engineer (the Engineer) providing design, procurement and certain project management services as well as construction management for the greater part of the processing plant and associated infrastructure. MJV believes this will offer a cost effective approach to project delivery and enable it to monitor and control the budget, schedule and quality of the end product through all stages of project development and execution.
The Project capital cost estimate and schedule has been developed in conjunction with MJV on the basis of their preferred execution strategy.
Project implementation is based on contract mining, however, the study assumes that the mine services area will be built and owned by MJV and this is reflected in the capital estimates.
1.15.2 Schedule
The Overall Project schedule has been developed based on the following key dates:
• Early Works Design Award Month 1
• Environmental Permit Issued Month 2
• Mining License Issued Month 2
• Oxide Pre-strip Month 3
• Oxide Ore Mining Month 7
MABILO PROJECT NATIONAL INSTRUMENT 43-101 TECHNICAL REPORT
1913\24.04\1913-000-GEREP-0003_D S1
Page 1.43
May 2016 Lycopodium Minerals Pty Ltd / MJV / Orelogy / KP
• Front End Engineering (FEED) Month 9
• Permitting for Primary Plant Month 11
• Primary Cut back Month 11
• EPCM Award Month 13
• Supergene production commences Month 14
• SAG mill Award Month 14
• Earthworks and Piling Commence Month 16
• SAG mill on site Month 25
• TSF complete Month 29
• Power On Month 29
• Ore through crusher Month 30
• First concentrate Month 31
These activities have been combined into an overall project schedule with total project duration of 31 months from the commencement of early works design to first concentrate production.
1.16 Operations
The Mabilo Project will be operated by 738 personnel including contractors. Eight division managers will report to a Resident or Project Manager as shown in the figure below. Divisions further comprise of 21 departments headed up by Department Managers and further broken down into supervisory sectors if required. Those specialized skills that are not available in the Philippines will be provided by external consultants on the basis of technology transfer. Short term requirements, such as ball mill relining, geotechnical stability analysis, and metallurgical optimizations, will be provided on short term contracts.
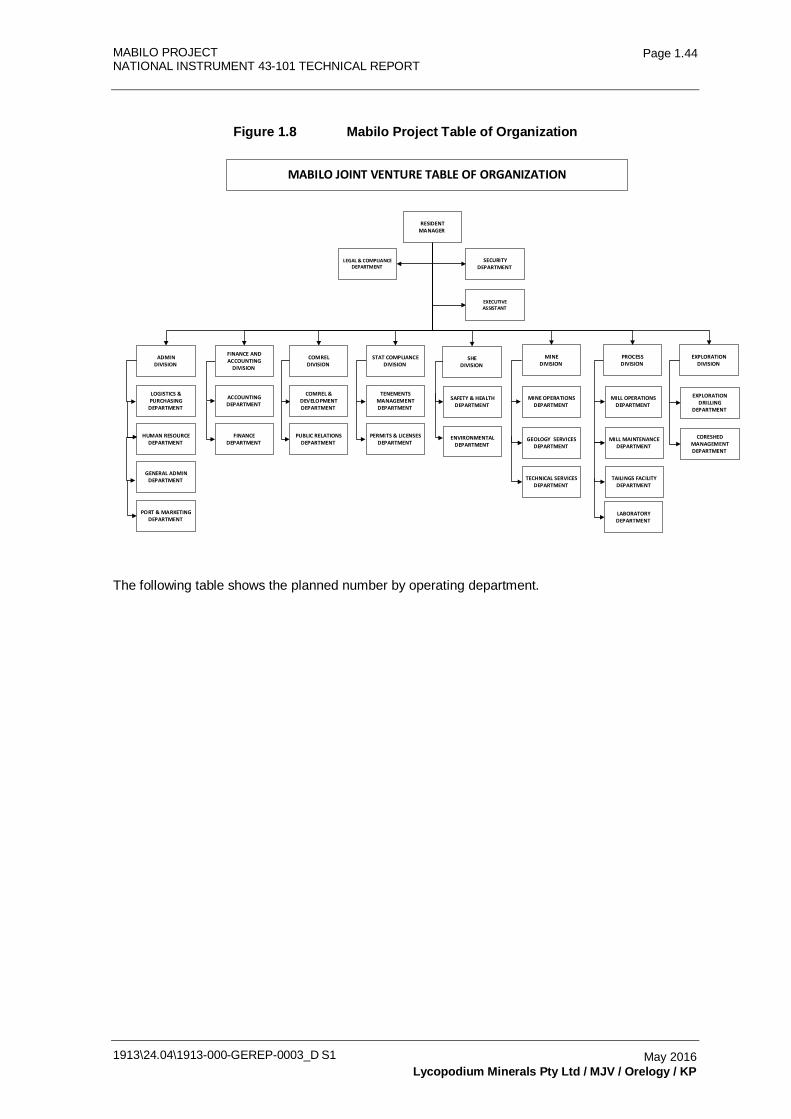
MABILO PROJECT NATIONAL INSTRUMENT 43-101 TECHNICAL REPORT
1913\24.04\1913-000-GEREP-0003_D S1
Page 1.44
May 2016 Lycopodium Minerals Pty Ltd / MJV / Orelogy / KP
Figure 1.8 Mabilo Project Table of Organization
EXECUTIVE ASSISTANT
RESIDENT MANAGER
LEGAL & COMPLIANCE DEPARTMENT
COMREL DIVISION
COMREL & DEVELOPMENT DEPARTMENT
PUBLIC RELATIONSDEPARTMENT
SECURITY DEPARTMENT
SHE DIVISION
SAFETY & HEALTHDEPARTMENT
ENVIRONMENTAL DEPARTMENT
MINE DIVISION
MINE OPERATIONSDEPARTMENT
TECHNICAL SERVICES DEPARTMENT
PROCESS DIVISION
MILL OPERATIONS DEPARTMENT
MILL MAINTENANCEDEPARTMENT
ADMINDIVISION
LOGISTICS & PURCHASING
DEPARTMENT
FINANCE AND ACCOUNTING
DIVISION
HUMAN RESOURCEDEPARTMENT
GENERAL ADMIN DEPARTMENT
PORT & MARKETING DEPARTMENT
TENEMENTS MANAGEMENTDEPARTMENT
TAILINGS FACILITYDEPARTMENT
LABORATORYDEPARTMENT
PERMITS & LICENSESDEPARTMENT
ACCOUNTING DEPARTMENT
MABILO JOINT VENTURE TABLE OF ORGANIZATION
STAT COMPLIANCE DIVISION
EXPLORATIONDIVISION
GEOLOGY SERVICES DEPARTMENT
FINANCEDEPARTMENT
EXPLORATION DRILLING
DEPARTMENT
CORESHED MANAGEMENTDEPARTMENT
The following table shows the planned number by operating department.
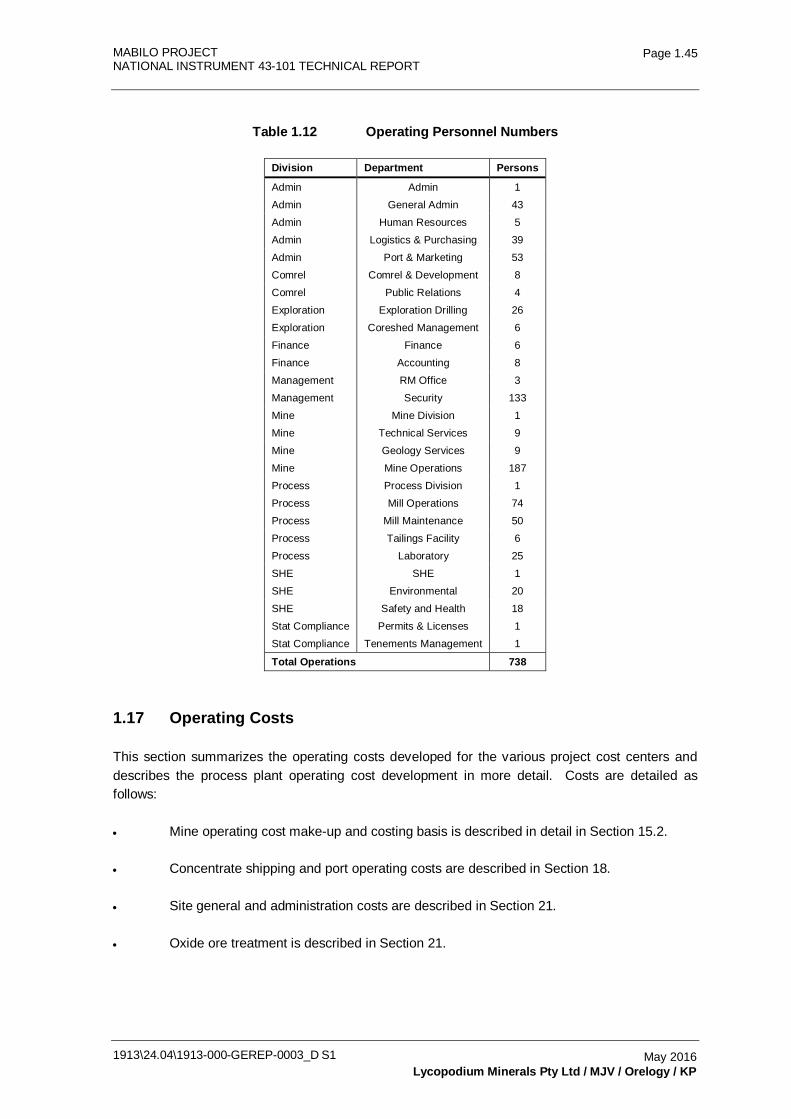
MABILO PROJECT NATIONAL INSTRUMENT 43-101 TECHNICAL REPORT
1913\24.04\1913-000-GEREP-0003_D S1
Page 1.45
May 2016 Lycopodium Minerals Pty Ltd / MJV / Orelogy / KP
Table 1.12 Operating Personnel Numbers
Division Department Persons
Admin Admin 1
Admin General Admin 43
Admin Human Resources 5
Admin Logistics & Purchasing 39
Admin Port & Marketing 53
Comrel Comrel & Development 8
Comrel Public Relations 4
Exploration Exploration Drilling 26
Exploration Coreshed Management 6
Finance Finance 6
Finance Accounting 8
Management RM Office 3
Management Security 133
Mine Mine Division 1
Mine Technical Services 9
Mine Geology Services 9
Mine Mine Operations 187
Process Process Division 1
Process Mill Operations 74
Process Mill Maintenance 50
Process Tailings Facility 6
Process Laboratory 25
SHE SHE 1
SHE Environmental 20
SHE Safety and Health 18
Stat Compliance Permits & Licenses 1
Stat Compliance Tenements Management 1
Total Operations 738
1.17 Operating Costs
This section summarizes the operating costs developed for the various project cost centers and describes the process plant operating cost development in more detail. Costs are detailed as follows:
• Mine operating cost make-up and costing basis is described in detail in Section 15.2.
• Concentrate shipping and port operating costs are described in Section 18.
• Site general and administration costs are described in Section 21.
• Oxide ore treatment is described in Section 21.
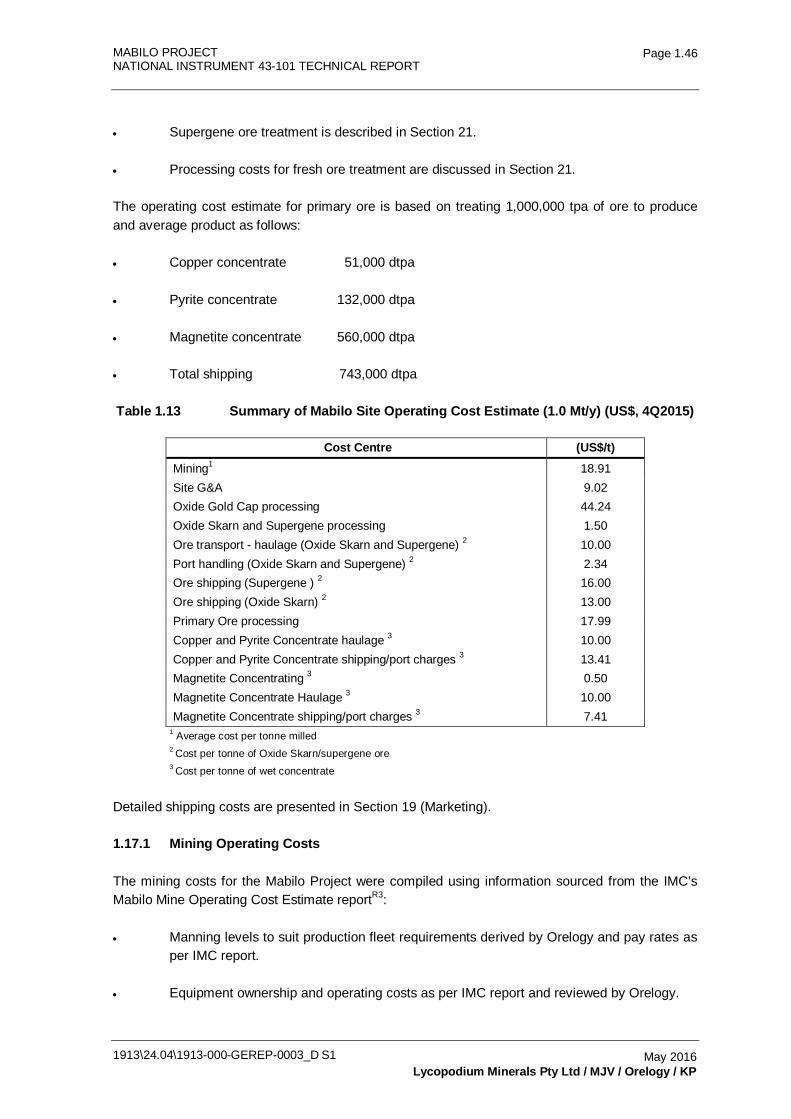
MABILO PROJECT NATIONAL INSTRUMENT 43-101 TECHNICAL REPORT
1913\24.04\1913-000-GEREP-0003_D S1
Page 1.46
May 2016 Lycopodium Minerals Pty Ltd / MJV / Orelogy / KP
• Supergene ore treatment is described in Section 21.
• Processing costs for fresh ore treatment are discussed in Section 21.
The operating cost estimate for primary ore is based on treating 1,000,000 tpa of ore to produce and average product as follows:
• Copper concentrate 51,000 dtpa
• Pyrite concentrate 132,000 dtpa
• Magnetite concentrate 560,000 dtpa
• Total shipping 743,000 dtpa
Table 1.13 Summary of Mabilo Site Operating Cost Estimate (1.0 Mt/y) (US$, 4Q2015)
Cost Centre (US$/t) Mining1 18.91 Site G&A 9.02 Oxide Gold Cap processing 44.24 Oxide Skarn and Supergene processing 1.50 Ore transport - haulage (Oxide Skarn and Supergene) 2 10.00 Port handling (Oxide Skarn and Supergene) 2 2.34 Ore shipping (Supergene ) 2 16.00 Ore shipping (Oxide Skarn) 2 13.00 Primary Ore processing 17.99 Copper and Pyrite Concentrate haulage 3 10.00 Copper and Pyrite Concentrate shipping/port charges 3 13.41 Magnetite Concentrating 3 0.50 Magnetite Concentrate Haulage 3 10.00 Magnetite Concentrate shipping/port charges 3 7.41
1 Average cost per tonne milled 2 Cost per tonne of Oxide Skarn/supergene ore 3 Cost per tonne of wet concentrate
Detailed shipping costs are presented in Section 19 (Marketing).
1.17.1 Mining Operating Costs
The mining costs for the Mabilo Project were compiled using information sourced from the IMC’s Mabilo Mine Operating Cost Estimate reportR3:
• Manning levels to suit production fleet requirements derived by Orelogy and pay rates as per IMC report.
• Equipment ownership and operating costs as per IMC report and reviewed by Orelogy.
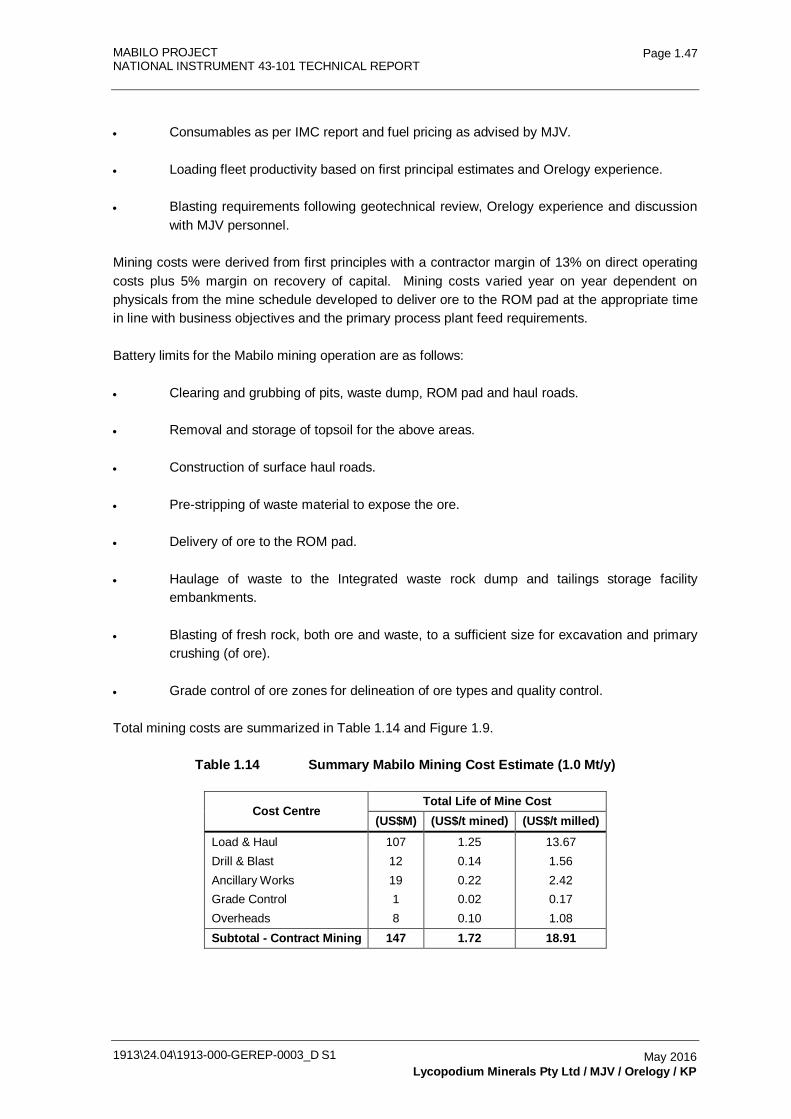
MABILO PROJECT NATIONAL INSTRUMENT 43-101 TECHNICAL REPORT
1913\24.04\1913-000-GEREP-0003_D S1
Page 1.47
May 2016 Lycopodium Minerals Pty Ltd / MJV / Orelogy / KP
• Consumables as per IMC report and fuel pricing as advised by MJV.
• Loading fleet productivity based on first principal estimates and Orelogy experience.
• Blasting requirements following geotechnical review, Orelogy experience and discussion with MJV personnel.
Mining costs were derived from first principles with a contractor margin of 13% on direct operating costs plus 5% margin on recovery of capital. Mining costs varied year on year dependent on physicals from the mine schedule developed to deliver ore to the ROM pad at the appropriate time in line with business objectives and the primary process plant feed requirements.
Battery limits for the Mabilo mining operation are as follows:
• Clearing and grubbing of pits, waste dump, ROM pad and haul roads.
• Removal and storage of topsoil for the above areas.
• Construction of surface haul roads.
• Pre-stripping of waste material to expose the ore.
• Delivery of ore to the ROM pad.
• Haulage of waste to the Integrated waste rock dump and tailings storage facility embankments.
• Blasting of fresh rock, both ore and waste, to a sufficient size for excavation and primary crushing (of ore).
• Grade control of ore zones for delineation of ore types and quality control.
Total mining costs are summarized in Table 1.14 and Figure 1.9.
Table 1.14 Summary Mabilo Mining Cost Estimate (1.0 Mt/y)
Cost Centre Total Life of Mine Cost
(US$M) (US$/t mined) (US$/t milled) Load & Haul 107 1.25 13.67 Drill & Blast 12 0.14 1.56 Ancillary Works 19 0.22 2.42 Grade Control 1 0.02 0.17 Overheads 8 0.10 1.08 Subtotal - Contract Mining 147 1.72 18.91
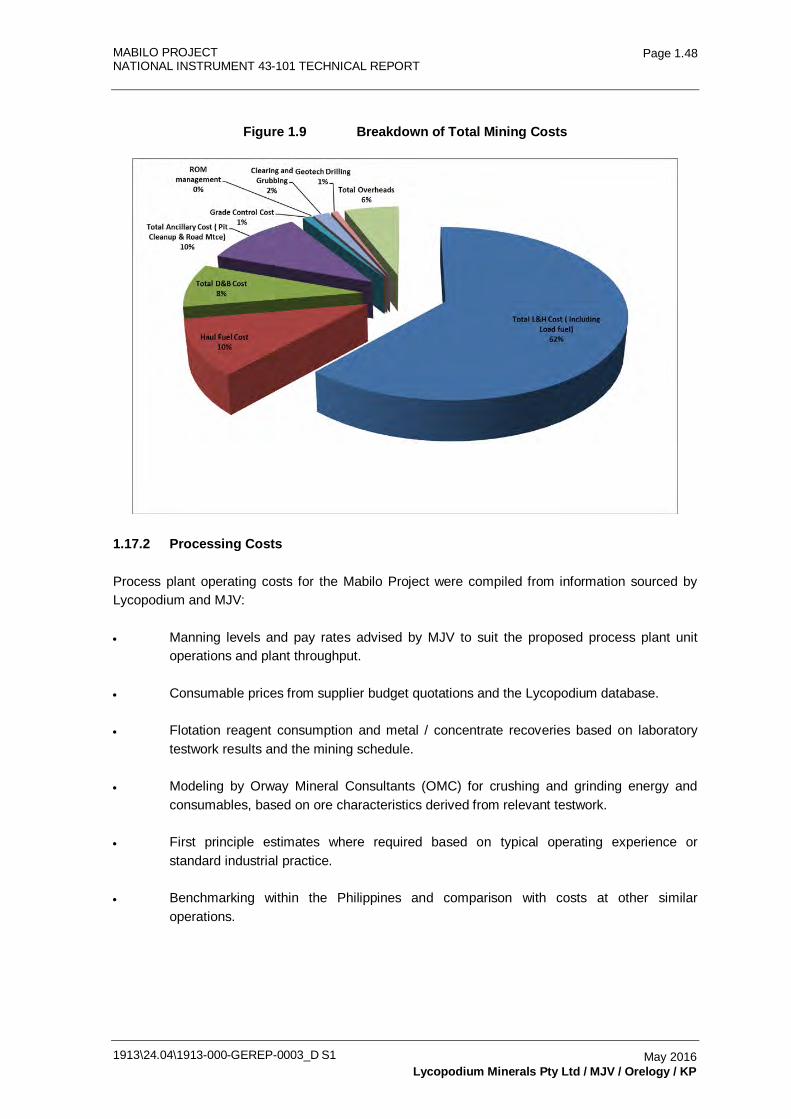
MABILO PROJECT NATIONAL INSTRUMENT 43-101 TECHNICAL REPORT
1913\24.04\1913-000-GEREP-0003_D S1
Page 1.48
May 2016 Lycopodium Minerals Pty Ltd / MJV / Orelogy / KP
Figure 1.9 Breakdown of Total Mining Costs
1.17.2 Processing Costs
Process plant operating costs for the Mabilo Project were compiled from information sourced by Lycopodium and MJV:
• Manning levels and pay rates advised by MJV to suit the proposed process plant unit operations and plant throughput.
• Consumable prices from supplier budget quotations and the Lycopodium database.
• Flotation reagent consumption and metal / concentrate recoveries based on laboratory testwork results and the mining schedule.
• Modeling by Orway Mineral Consultants (OMC) for crushing and grinding energy and consumables, based on ore characteristics derived from relevant testwork.
• First principle estimates where required based on typical operating experience or standard industrial practice.
• Benchmarking within the Philippines and comparison with costs at other similar operations.
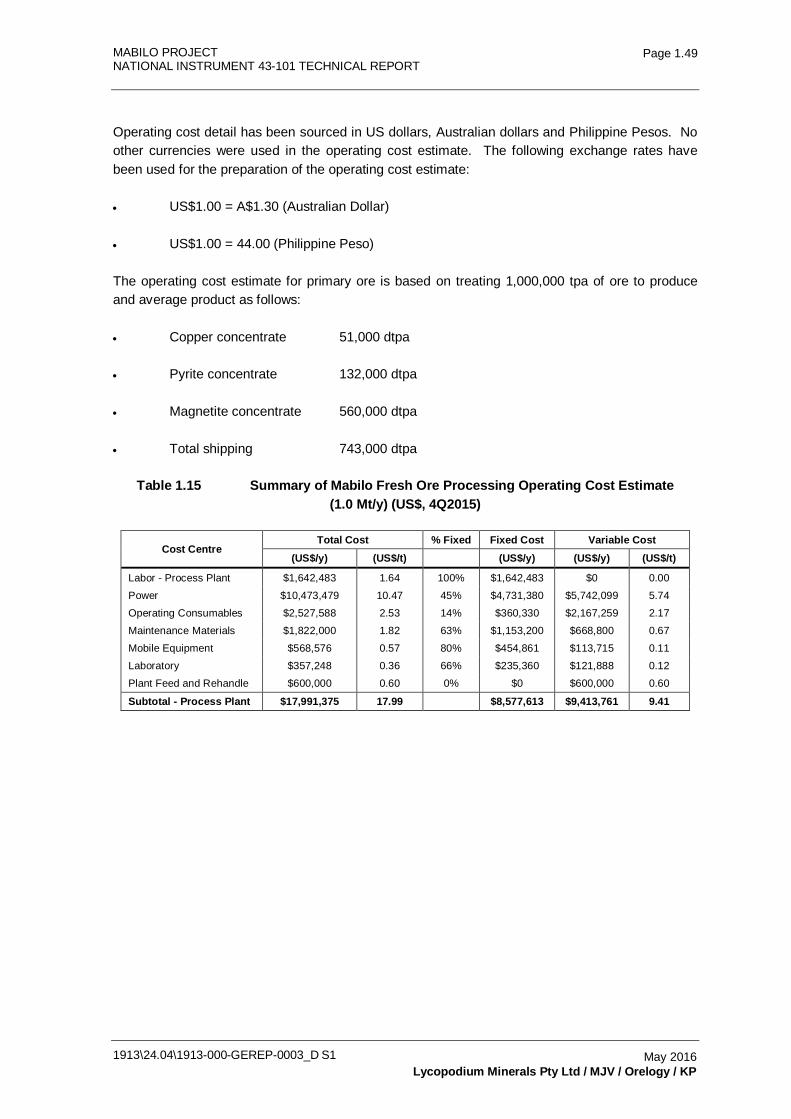
MABILO PROJECT NATIONAL INSTRUMENT 43-101 TECHNICAL REPORT
1913\24.04\1913-000-GEREP-0003_D S1
Page 1.49
May 2016 Lycopodium Minerals Pty Ltd / MJV / Orelogy / KP
Operating cost detail has been sourced in US dollars, Australian dollars and Philippine Pesos. No other currencies were used in the operating cost estimate. The following exchange rates have been used for the preparation of the operating cost estimate:
• US$1.00 = A$1.30 (Australian Dollar)
• US$1.00 = 44.00 (Philippine Peso)
The operating cost estimate for primary ore is based on treating 1,000,000 tpa of ore to produce and average product as follows:
• Copper concentrate 51,000 dtpa
• Pyrite concentrate 132,000 dtpa
• Magnetite concentrate 560,000 dtpa
• Total shipping 743,000 dtpa
Table 1.15 Summary of Mabilo Fresh Ore Processing Operating Cost Estimate (1.0 Mt/y) (US$, 4Q2015)
Cost Centre Total Cost % Fixed Fixed Cost Variable Cost
(US$/y) (US$/t)
(US$/y) (US$/y) (US$/t)
Labor - Process Plant $1,642,483 1.64 100% $1,642,483 $0 0.00
Power $10,473,479 10.47 45% $4,731,380 $5,742,099 5.74
Operating Consumables $2,527,588 2.53 14% $360,330 $2,167,259 2.17
Maintenance Materials $1,822,000 1.82 63% $1,153,200 $668,800 0.67
Mobile Equipment $568,576 0.57 80% $454,861 $113,715 0.11
Laboratory $357,248 0.36 66% $235,360 $121,888 0.12
Plant Feed and Rehandle $600,000 0.60 0% $0 $600,000 0.60
Subtotal - Process Plant $17,991,375 17.99
$8,577,613 $9,413,761 9.41
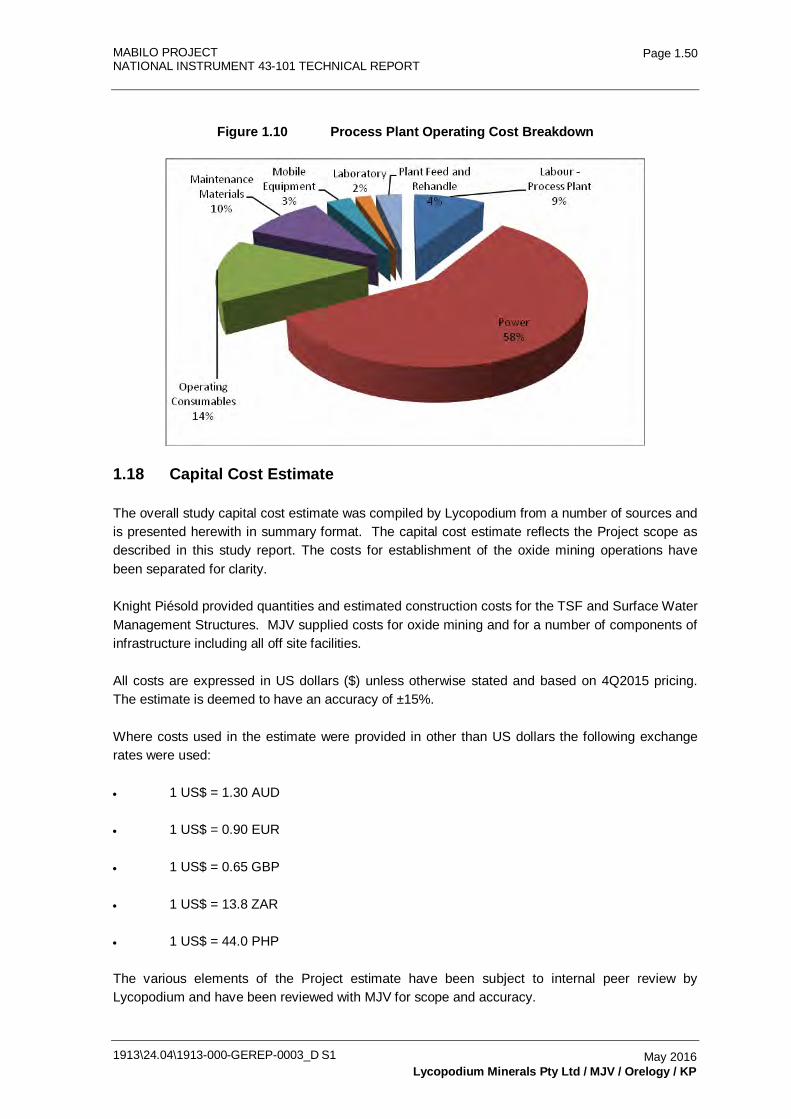
MABILO PROJECT NATIONAL INSTRUMENT 43-101 TECHNICAL REPORT
1913\24.04\1913-000-GEREP-0003_D S1
Page 1.50
May 2016 Lycopodium Minerals Pty Ltd / MJV / Orelogy / KP
Figure 1.10 Process Plant Operating Cost Breakdown
1.18 Capital Cost Estimate
The overall study capital cost estimate was compiled by Lycopodium from a number of sources and is presented herewith in summary format. The capital cost estimate reflects the Project scope as described in this study report. The costs for establishment of the oxide mining operations have been separated for clarity.
Knight Piésold provided quantities and estimated construction costs for the TSF and Surface Water Management Structures. MJV supplied costs for oxide mining and for a number of components of infrastructure including all off site facilities.
All costs are expressed in US dollars ($) unless otherwise stated and based on 4Q2015 pricing. The estimate is deemed to have an accuracy of ±15%.
Where costs used in the estimate were provided in other than US dollars the following exchange rates were used:
• 1 US$ = 1.30 AUD
• 1 US$ = 0.90 EUR
• 1 US$ = 0.65 GBP
• 1 US$ = 13.8 ZAR
• 1 US$ = 44.0 PHP
The various elements of the Project estimate have been subject to internal peer review by Lycopodium and have been reviewed with MJV for scope and accuracy.
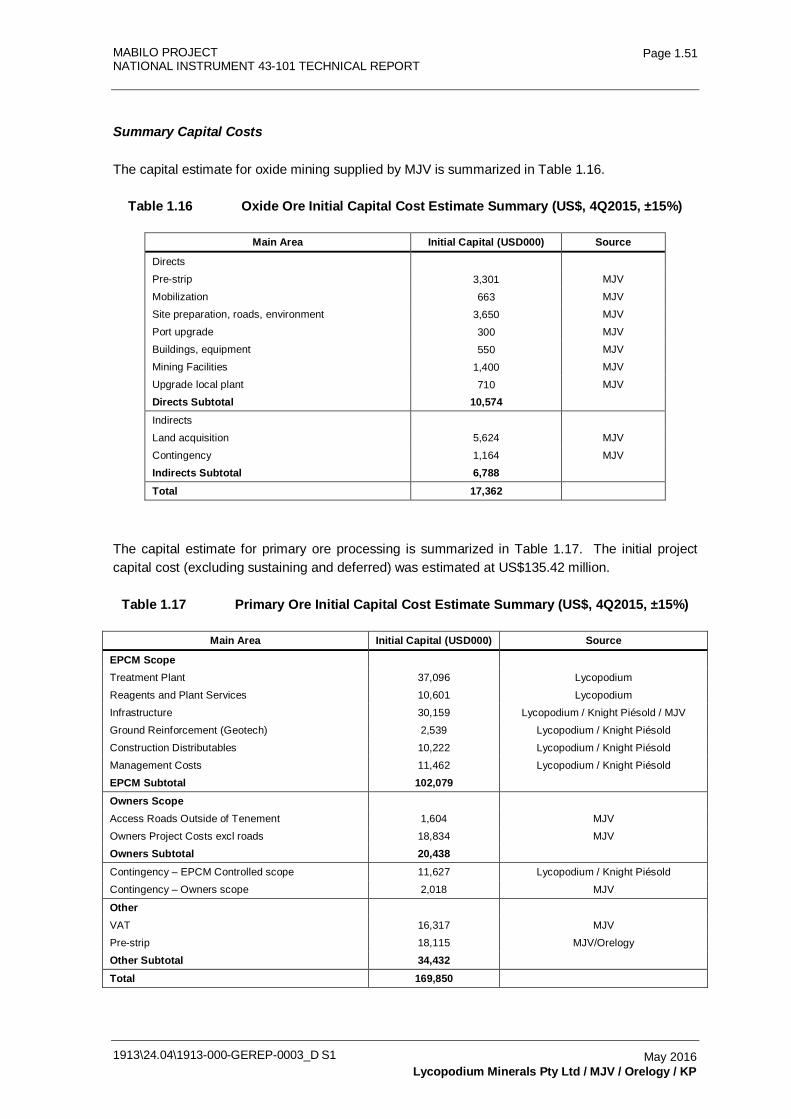
MABILO PROJECT NATIONAL INSTRUMENT 43-101 TECHNICAL REPORT
1913\24.04\1913-000-GEREP-0003_D S1
Page 1.51
May 2016 Lycopodium Minerals Pty Ltd / MJV / Orelogy / KP
Summary Capital Costs
The capital estimate for oxide mining supplied by MJV is summarized in Table 1.16.
Table 1.16 Oxide Ore Initial Capital Cost Estimate Summary (US$, 4Q2015, ±15%)
Main Area Initial Capital (USD000) Source
Directs
Pre-strip 3,301 MJV
Mobilization 663 MJV
Site preparation, roads, environment 3,650 MJV
Port upgrade 300 MJV
Buildings, equipment 550 MJV
Mining Facilities 1,400 MJV
Upgrade local plant 710 MJV
Directs Subtotal 10,574
Indirects
Land acquisition 5,624 MJV
Contingency 1,164 MJV
Indirects Subtotal 6,788
Total 17,362
The capital estimate for primary ore processing is summarized in Table 1.17. The initial project capital cost (excluding sustaining and deferred) was estimated at US$135.42 million.
Table 1.17 Primary Ore Initial Capital Cost Estimate Summary (US$, 4Q2015, ±15%)
Main Area Initial Capital (USD000) Source
EPCM Scope
Treatment Plant 37,096 Lycopodium
Reagents and Plant Services 10,601 Lycopodium
Infrastructure 30,159 Lycopodium / Knight Piésold / MJV
Ground Reinforcement (Geotech) 2,539 Lycopodium / Knight Piésold
Construction Distributables 10,222 Lycopodium / Knight Piésold
Management Costs 11,462 Lycopodium / Knight Piésold
EPCM Subtotal 102,079 Owners Scope
Access Roads Outside of Tenement 1,604 MJV
Owners Project Costs excl roads 18,834 MJV
Owners Subtotal 20,438 Contingency – EPCM Controlled scope 11,627 Lycopodium / Knight Piésold
Contingency – Owners scope 2,018 MJV
Other
VAT 16,317 MJV
Pre-strip 18,115 MJV/Orelogy
Other Subtotal 34,432
Total 169,850
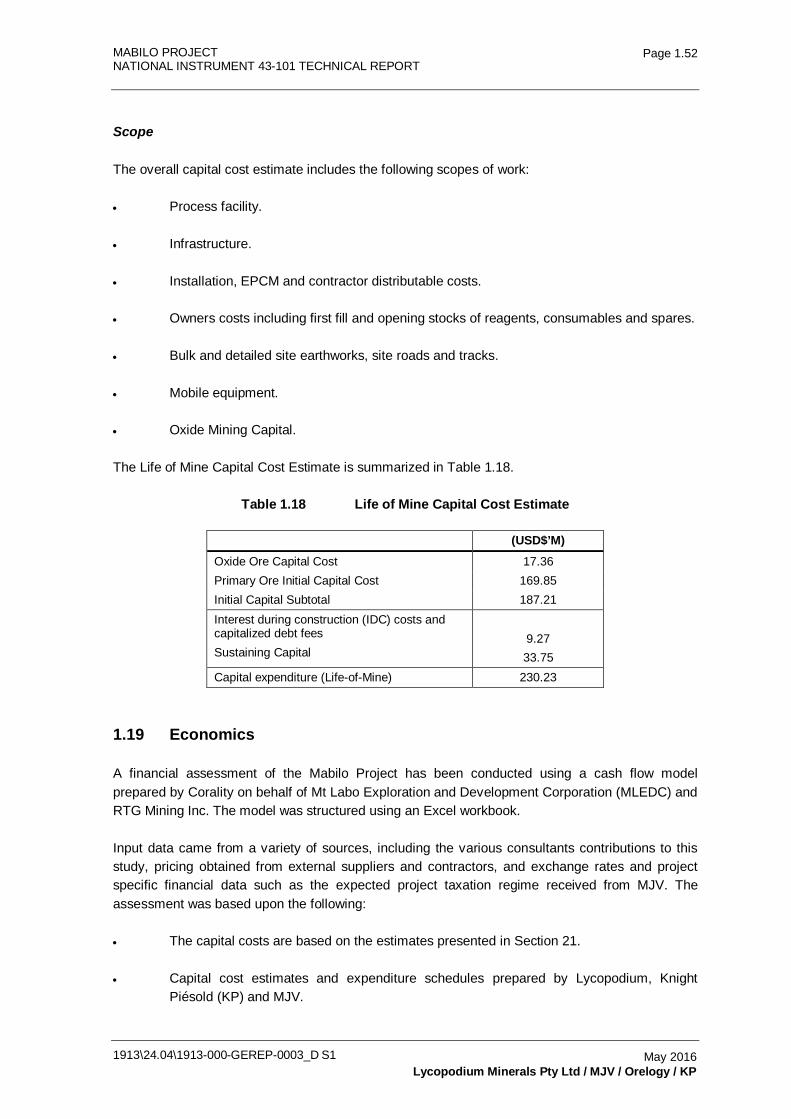
MABILO PROJECT NATIONAL INSTRUMENT 43-101 TECHNICAL REPORT
1913\24.04\1913-000-GEREP-0003_D S1
Page 1.52
May 2016 Lycopodium Minerals Pty Ltd / MJV / Orelogy / KP
Scope
The overall capital cost estimate includes the following scopes of work:
• Process facility.
• Infrastructure.
• Installation, EPCM and contractor distributable costs.
• Owners costs including first fill and opening stocks of reagents, consumables and spares.
• Bulk and detailed site earthworks, site roads and tracks.
• Mobile equipment.
• Oxide Mining Capital.
The Life of Mine Capital Cost Estimate is summarized in Table 1.18.
Table 1.18 Life of Mine Capital Cost Estimate
(USD$’M) Oxide Ore Capital Cost 17.36 Primary Ore Initial Capital Cost 169.85 Initial Capital Subtotal 187.21 Interest during construction (IDC) costs and capitalized debt fees Sustaining Capital
9.27 33.75
Capital expenditure (Life-of-Mine) 230.23
1.19 Economics
A financial assessment of the Mabilo Project has been conducted using a cash flow model prepared by Corality on behalf of Mt Labo Exploration and Development Corporation (MLEDC) and RTG Mining Inc. The model was structured using an Excel workbook.
Input data came from a variety of sources, including the various consultants contributions to this study, pricing obtained from external suppliers and contractors, and exchange rates and project specific financial data such as the expected project taxation regime received from MJV. The assessment was based upon the following:
• The capital costs are based on the estimates presented in Section 21.
• Capital cost estimates and expenditure schedules prepared by Lycopodium, Knight Piésold (KP) and MJV.
MABILO PROJECT NATIONAL INSTRUMENT 43-101 TECHNICAL REPORT
1913\24.04\1913-000-GEREP-0003_D S1
Page 1.53
May 2016 Lycopodium Minerals Pty Ltd / MJV / Orelogy / KP
• Owners capital cost estimates prepared by Lycopodium and MJV.
• Sustaining capital cost estimates for the tailings dam calculated using stage development quantities supplied by KP.
• The mining, processing and administration costs are presented in Sections 21.
• Mine schedule and mining operation cost estimates based on the mining operations being contractor-operated, as developed by Orelogy for the study.
• Process operating costs estimates prepared by Lycopodium, with contributions from MJV and other members of the study team.
• Site general and administration costs prepared by MJV.
• Galeo Equipment Corporation's obligation to fund 1.5 Mt of initial pre-strip under its joint venture with RTG (Galeo Prestrip).
• Closure costs estimated by KP (TMF) and MJV. A provision for closure and rehabilitation costs of $8.48M has been allowed.
• Metallurgical performance characterized by testwork conducted for the study (Section 13).
• The metal prices were supplied by MJV based on the spot commodity prices at the time of feasibility completion.
• Offtake terms and pricing for the Project's products were supplied by Conrad Partners. Refining costs, deductions and penalties have been applied against revenue.
• Royalty, tax, discount rates and other model inputs provided by MJV and SGV & Co.
• The cash flow model assumes full funding through equity and debt.
• The cash flow analysis excludes any effects due to inflation and all dollars are expressed as real United States dollars as at 1Q2016.
The results of the modeling are summarized in Table 1.19.
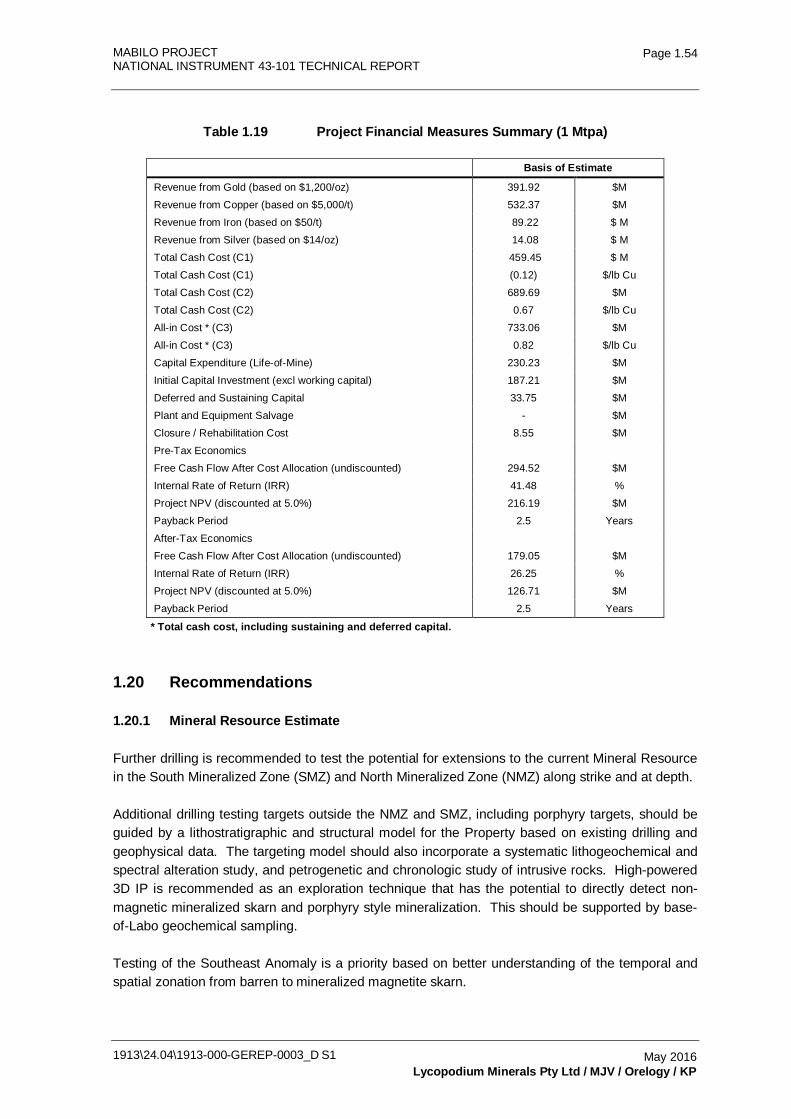
MABILO PROJECT NATIONAL INSTRUMENT 43-101 TECHNICAL REPORT
1913\24.04\1913-000-GEREP-0003_D S1
Page 1.54
May 2016 Lycopodium Minerals Pty Ltd / MJV / Orelogy / KP
Table 1.19 Project Financial Measures Summary (1 Mtpa)
Basis of Estimate
Revenue from Gold (based on $1,200/oz) 391.92 $M
Revenue from Copper (based on $5,000/t) 532.37 $M
Revenue from Iron (based on $50/t) 89.22 $ M
Revenue from Silver (based on $14/oz) 14.08 $ M
Total Cash Cost (C1) 459.45 $ M
Total Cash Cost (C1) (0.12) $/lb Cu
Total Cash Cost (C2) 689.69 $M
Total Cash Cost (C2) 0.67 $/lb Cu
All-in Cost * (C3) 733.06 $M
All-in Cost * (C3) 0.82 $/lb Cu
Capital Expenditure (Life-of-Mine) 230.23 $M
Initial Capital Investment (excl working capital) 187.21 $M
Deferred and Sustaining Capital 33.75 $M
Plant and Equipment Salvage - $M
Closure / Rehabilitation Cost 8.55 $M
Pre-Tax Economics
Free Cash Flow After Cost Allocation (undiscounted) 294.52 $M
Internal Rate of Return (IRR) 41.48 %
Project NPV (discounted at 5.0%) 216.19 $M
Payback Period 2.5 Years
After-Tax Economics
Free Cash Flow After Cost Allocation (undiscounted) 179.05 $M
Internal Rate of Return (IRR) 26.25 %
Project NPV (discounted at 5.0%) 126.71 $M
Payback Period 2.5 Years
* Total cash cost, including sustaining and deferred capital.
1.20 Recommendations
1.20.1 Mineral Resource Estimate
Further drilling is recommended to test the potential for extensions to the current Mineral Resource in the South Mineralized Zone (SMZ) and North Mineralized Zone (NMZ) along strike and at depth.
Additional drilling testing targets outside the NMZ and SMZ, including porphyry targets, should be guided by a lithostratigraphic and structural model for the Property based on existing drilling and geophysical data. The targeting model should also incorporate a systematic lithogeochemical and spectral alteration study, and petrogenetic and chronologic study of intrusive rocks. High-powered 3D IP is recommended as an exploration technique that has the potential to directly detect non-magnetic mineralized skarn and porphyry style mineralization. This should be supported by base-of-Labo geochemical sampling.
Testing of the Southeast Anomaly is a priority based on better understanding of the temporal and spatial zonation from barren to mineralized magnetite skarn.
MABILO PROJECT NATIONAL INSTRUMENT 43-101 TECHNICAL REPORT
1913\24.04\1913-000-GEREP-0003_D S1
Page 1.55
May 2016 Lycopodium Minerals Pty Ltd / MJV / Orelogy / KP
A refined geometallurgical model is recommended to take account of the metallurgical variability that is not represented in the current model. A pilot study to assess the contribution of hyperspectral analysis of pulps in modeling clay distribution should be undertaken. Otherwise the geometallurgical model should be based on logging and multi-element geochemistry.
Additional density data should be collected to ensure that density values applied in the model are fully representative of the in situ material to increase confidence in the results of the Mineral Resource Estimate (MRE). These measurements should be directed towards collecting sufficient density data from within each different mineralized lithology type to ensure that more robust estimates of density by lithotype can be completed.
Additional Certified Reference Material (CRM) standards that are matrix matched to the mineralization at Mabilo should be sourced with certification assay method matching intended assay method. These standards should also be selected to match the mean and higher grade range of the mineralization at Mabilo as current matrix matched standards are at the lower end of the grade range.
Additional umpire laboratory analysis of sample pulps should be completed to resolve the uncertainty arising from the existing umpire analysis. This should include assay of the same pulp samples by the three laboratories used for the existing umpire assays
1.20.2 Mineral Reserve Estimate
Further geotechnical drilling investigations are recommended to provide information on ground conditions in areas of the proposed pit walls particularly those required for the final Stage 5, where information is currently absent.
It is recommended that a final decision on choosing appropriate elevations for the 10 m berm (as applicable) and the 30 m wide berm be based on future interpretations made from vertical contoured plots illustrating the range in elevation of the base of the Labo Volcanics within the proposed mining areas.
Blasting optimization is recommended to ensure productivity assumptions can be achieved for excavation of ore and waste and primary crusher feed. This should tie into the assessment of aligning the blast bench to the batter / berm configuration.
With a strip ratio of 10:1, waste haulage makes up a significant component of the mining cost. Development of an integrated mine production schedule that includes a waste dump construction sequence is recommended to reduce haulage costs over the life of mine.
1.20.3 Processing
Additional metallurgical testwork should be completed as a priority to determine processing options from the oxide zone through transition (with multiple supergene copper species) into fresh magnetite skarn and to determine how this affects copper and gold recoveries. This should also focus on the pyrite-arsenopyrite overprint and determine whether any associated gold is present.
MABILO PROJECT NATIONAL INSTRUMENT 43-101 TECHNICAL REPORT
1913\24.04\1913-000-GEREP-0003_D S1
Page 1.56
May 2016 Lycopodium Minerals Pty Ltd / MJV / Orelogy / KP
1.20.4 Infrastructure
Further site geotechnical testing is recommended to determine critical parameters for the waste dump / TSF site.
Further evaluation of groundwater inflow is recommended.
1.21 Risks and Opportunities
During the study the participants have identified a number of risks and opportunities. The key items are presented below.
1.21.1 Risks
• The domains in the resource model have been developed based on geology and grade distribution, however they do not take into account all the variability in mineralization type that is significant for metallurgical performance. This importantly includes the degree of clay-silica-pyrite overprint and brecciation, as well as hypogene bornite domains. An initial geometallurgical model has been developed using a combination of logging and multi-element analytical data but requires further refinement in tandem with metallurgical optimization.
• Access Risk - Tenement Rights. Approval needs to be obtained via a Mineral Production Sharing Agreement (MPSA), this is the mechanism to secure the Mabilo 'Contract Area' which is a term comparable to a mining lease in other jurisdictions. MPSA approval for the oxide mining phase (no processing) to secure the Mabilo 'Contract Area' has been entered into but not yet granted. During this phase ore and waste are mined and all ore is transported away without onsite treatment.
• Wall failure risk – slope angles. Pit optimization sensitivity indicates that the ultimate pit size is relatively sensitive to slope angle variation and that the cash flow is moderately sensitive. Slope failure will result in higher costs due to additional excavating requirements and/or delays in ore supplies causing revenue delays. Both will affect cash flow but are unlikely to affect the viability of the Project.
• Geotechnical Conditions – Slightly steeper wall angles have been used in the pit design than those specified in the Geotechnical report. The risks can be managed by:
- ensuring that the slopes are adequately drained
- adopting appropriate mining practices
- utilization of slope monitoring radars for example.
• Groundwater Inflow. Groundwater is likely to be encountered as the pit is developed with potential delays from flooding as a result of high water inflows. In accordance with the IMC mining cost assumptions much of this risk is mitigated through the planned dewatering program using a borefield around the pit limit.
MABILO PROJECT NATIONAL INSTRUMENT 43-101 TECHNICAL REPORT
1913\24.04\1913-000-GEREP-0003_D S1
Page 1.57
May 2016 Lycopodium Minerals Pty Ltd / MJV / Orelogy / KP
• Sampling of the orebody was limited and the calculation of recoveries was not completed on a geological domain basis as there were insufficient samples in each identified domain. Further definition of domains and subsequent sampling may vary the calculated recoveries.
• Limited piling under the process plant facilities has been allowed. In particular, crushing, milling and flotation. Other facilities such as water storage may be disrupted if an earthquake occurs.
• Geochemical testing of mine waste is currently being undertaken. It is currently assumed that approximately 50% of waste will be potentially acid forming (PAF) or leachable. This value is based on a review of geology database where 42% of material that was not considered ore grade returned sulfur values of less than 0.3% which is generally considered to be the lower limit at which acid generation is likely to occur. In addition, the cover materials are likely to possess lower sulfur values.
• The rainfall at the site is high and sediment loads will naturally be high within the stream courses. The environmental control dams have limited ability to reduce sediment loads and the primary means of sediment control will be to limit sediment runoff at source (from localized areas).
• The site water model currently assumes that in pit dewatering will be treated through a wetland system and perimeter pit dewatering discharged directly to the site streams. The quality and quantity of pit water is to be confirmed.
• The feasibility level site investigation was limited in scope and only one shallow borehole was undertaken in the tailings storage facility and waste dump area. The investigation comprised a broad assessment of the typical ground conditions present across the overall site area. Further geotechnical investigation will be required at detailed design stage.
• Approval for road upgrades is still required.
• No allowances for treatment of pit dewatering water or TSF reclaim water. This may increase reagent costs.
• Lack of qualified process plant operations and maintenance staff may increase usage of reagents.
1.21.2 Opportunities
• The bulk of the resource tonnes are within a very continuous stratabound magnetite skarn body that has been offset along a fault separating the South and North Mineralized Zones. The skarn remains open in the southeast of the South Mineralized Zone and to the North of the North Mineralized Zone.
MABILO PROJECT NATIONAL INSTRUMENT 43-101 TECHNICAL REPORT
1913\24.04\1913-000-GEREP-0003_D S1
Page 1.58
May 2016 Lycopodium Minerals Pty Ltd / MJV / Orelogy / KP
• There is also exploration potential for additional zones of skarn mineralization, including mineralized magnetite skarn and mineralized garnet skarn which has not been identified by magnetic surveys:
- Targets with anomalous magnetic response that have not been fully tested include the Venida pit and the Southeast Anomaly. Limited drilling of the Southeast Anomaly to date has intersected magnetite skarn without significant copper or gold, however additional testing is required.
- Drilling on the South Mineralized Zone has shown that high-grade copper-gold mineralization occurs in garnet skarn without significant magnetite. Exploration and discovery at Mabilo has been driven by testing of modeled magnetic bodies, potential for non-magnetic skarn mineralization remains untested.
- There is additional untested exploration potential for porphyry copper-gold style mineralization at Mabilo. Although, where drilled, the quartz-diorite stock at Mabilo is not significantly altered, strongly altered porphyry dykes have been intersected in the contact zone of the stock and veins similar to D-veins in a porphyry-copper system have been intersected in intrusive rock and altered host metasediments. This suggests that the main stock may not be the causative intrusion for the mineralized skarn and that potential exists for porphyry-style mineralization. The silica-clay-pyrite alteration and hydraulic brecciation are also suggestive of acid steam driven argillic alteration above or peripheral to a mineralizing porphyry.
• Slope Angles. If steeper slope angles can be substantiated through additional geotechnical investigation and also through slope monitoring as the pit is being excavated, there is a potential to reduce the strip ratio and hence mining costs..
• A dedicated gold leaching programme on the flotation tails streams is recommended to trial sulphide oxidation processes to improve gold extraction and to investigate specific measures to reduce cyanide consumption. An increase in gold price or leach recoveries would make this step profitable. Retrofitting a gold leach section to the process would be relatively simple with all the infrastructure in place and treating already fine ground tailings.
• Staff numbers in the operation are significant (738). Review of the organization chart and simplification of the organization is recommended to improve the operation.
• Explore utilizing in country supply to a greater extent rather than imported. This will minimize freight costs and may also have tax benefits.
• Consider self perform for portions of the scope such as earthworks and accommodation.
• General and Administration costs are significant and should be reviewed.
• Selection of a Heavy Fuel Oil power station may reduce power unit cost although it will incur additional capital.
MABILO PROJECT NATIONAL INSTRUMENT 43-101 TECHNICAL REPORT
1913\24.04\1913-000-GEREP-0003_D S1
Page 1.59
May 2016 Lycopodium Minerals Pty Ltd / MJV / Orelogy / KP
• Reagent addition levels in practice are often lower than in laboratory testwork due to recirculation in the process water.
MABILO PROJECT
NATIONAL INSTRUMENT 43-101 TECHNICAL REPORT
1913-000-GEREP-0003
Table of Contents Page
2.0 INTRODUCTION 2.1 2.1 Introduction 2.1 2.2 Contributing Consultants 2.1 2.3 Site Visits 2.2 2.4 Information and Data Sources 2.2
1913\24.04\1913-000-GEREP-0003_D S2 May 2016 Lycopodium Minerals Pty Ltd
MABILO PROJECT NATIONAL INSTRUMENT 43-101 TECHNICAL REPORT
1913\24.04\1913-000-GEREP-0003_D S2
Page 2.1
May 2016 Lycopodium Minerals Pty Ltd
2.0 INTRODUCTION
2.1 Introduction
RTG is an Australian-based mining and exploration company with a principal listing on the main board of the Toronto Stock Exchange (TSX:RTG). RTG also has a secondary listing on the Australian Stock Exchange (ASX:RTG) as a result of its merger with Sierra Mining Limited ('Sierra') on 5 June 2014.
The Mabilo Project is held in joint venture by Mt. Labo Exploration and Development Corporation ('Mt. Labo'), with RTG holding an indirect interest through Mt. Labo.
Galeo Equipment and Mining Company Inc ('Galeo') is the joint venture partner with Mt. Labo and is earning up to a 42% interest in the Mabilo Project. The Qualified Person understands that Galeo’s current ownership of the Property stands at 36%.
2.2 Contributing Consultants
Lycopodium Minerals Pty Ltd is a subsidiary of Lycopodium Limited, an Australian listed public corporation, and has provided engineering and project management services to the international mining industry for over 20 years. The Perth, Western Australia, office of Lycopodium Minerals undertook the compilation of this report.
Sections of this report were co-authored by Qualified Persons from CSA Global Pty Ltd (CSA Global), Perth, Orelogy Consulting Pty Ltd (Orelogy), Perth, Knight Piésold Consulting (KP), Perth and Behre Dolbear.
Orelogy is a mining consultancy established in 2005, providing services exclusively to the minerals sector. Orelogy is headquartered in Perth, Western Australia.
CSA Global is a provider of exploration, geology, mineral resource and reserve estimation and mining consulting services to the international minerals industry, and has been providing such services for 30 years. The company is headquartered in Perth, Western Australia and has offices in Darwin, Brisbane, Jakarta, Singapore, Moscow and Vancouver as well as the UK and South Africa. The Perth Office compiled the resource estimate for this report.
Knight Piésold is an international firm of consulting engineers and scientists with over 90 years of experience in the mining and power sectors. The firm has over 25 offices worldwide and specialises in environmental, civil and geotechnical engineering associated with mining projects in a wide range of commodities and geographical locations. The Australian offices of KP conducted studies for tailings management, surface water management and groundwater evaluations for the project.
Behre Dolbear Group Inc. is a mineral industry advisory consultancy with more than 100 years of experience in mineral industry project studies and evaluations, with offices or agencies in Beijing, Chicago, Denver, Guadalajara, Hong Kong, London, New York, Santiago, Sydney, Toronto and Vancouver. BDA, a subsidiary of Behre Dolbear, has been engaged in the Philippines since 1996,
MABILO PROJECT NATIONAL INSTRUMENT 43-101 TECHNICAL REPORT
1913\24.04\1913-000-GEREP-0003_D S2
Page 2.2
May 2016 Lycopodium Minerals Pty Ltd
operating on numerous mining projects as an Independent Engineer on behalf of bankers, financiers and mining operators. Projects in the Philippines on which BDA has been engaged as independent engineer include Didipio, Runruno, Lepanto, Padcal, Paracale, Masbate, Siana, Palawan and Cebu/Toledo. BDA has reviewed the technical aspects of all these projects as part of the due diligence process for financing.
This report is based on information provided by MJV including documents, data and reports compiled by MJV management and technical staff and reports by other independent experts (refer Section 3.0).
2.3 Site Visits
QP Mr David Gordon (Lycopodium) has not visited site. However, Mr Aidan Ryan, Study Manager with Lycopodium and a representative of Mr David Gordon has undertaken a site visit to Mabilo and has assessed the site and the available core samples for testwork. In addition, the country / region is well known as Lycopodium has attended multiple visits to the region in association with other project briefs.
Dr Neal Reynolds, a representative from CSA Global, has undertaken site visits while the diamond drilling program was underway and was able to review drilling and sampling procedures as well as examine the mineralisation occurrence and associated geological features.
Mr Carel Moormann of Orelogy Consulting has visited the site and viewed the core. He has also viewed the site access, the topography of the site and the local infrastructure.
Mr David Morgan of Knight Piésold has undertaken a site visit and viewed the site as well as discussing the geotechnical issues with site personnel.
Neither Mr Richard Frew nor Mr John McIntyre has visited the site.
Mr Adrian Brett and Ms Janet Epps have visited the site and have assessed the environmental management and social management plans.
2.4 Information and Data Sources
This report is provided to RTG following the completion of the Feasibility Study and its obligations under NI 43-101 requirements and should not be used or relied upon for any other purpose. The report is based in part on information provided by MJV and others including documents, data and reports compiled by MJV management and technical staff and previous reports by other independent experts.
MABILO PROJECT
NATIONAL INSTRUMENT 43-101 TECHNICAL REPORT
1913-000-GEREP-0003
Table of Contents Page
3.0 RELIANCE ON OTHER EXPERTS 3.1 3.1 Reports and Contributions from Other Experts 3.1
1913\24.04\1913-000-GEREP-0003_D S3 May 2016 Lycopodium Minerals Pty Ltd
MABILO PROJECT NATIONAL INSTRUMENT 43-101 TECHNICAL REPORT
1913\24.04\1913-000-GEREP-0003_D S3
Page 3.1
May 2016 Lycopodium Minerals Pty Ltd
3.0 RELIANCE ON OTHER EXPERTS
3.1 Reports and Contributions from Other Experts
In preparing the feasibility study report on which this Technical Report is based the Qualified Persons have relied on previous work, reports and opinions form a number of sources including:
• MJV supplied geological data including drillhole data (export from a master database in CSV format), QAQC report and data, geological interpretation, topographic, overburden and weathering boundary surfaces.
• Slope angle criteria were provided by Chris Orr of George, Orr and Associates.
• GHD water and traffic reports.
• IMC consulting report.
• Aquadyne report.
• AB Cumpio - Ports report.
• GAIA South Environmental - Environmental Impact Assessment.
• DWPH road reports.
• Antrak logistics report.
• ALS metallurgical testwork reports (16064, 16558 and 16958).
• Geotechnica core test reports.
• Corality financial model
In all above cases the content of the contributory information and reports have been reviewed and are believed to be appropriate and factually correct for the purposes of this Technical Report.
Note: The Marketing section of this report has been prepared by Conrad Partners, an established and experienced consultancy. However, it has not been signed off by any of the listed Qualified Persons as they did not have the relevant experience.
MABILO PROJECT
NATIONAL INSTRUMENT 43-101 TECHNICAL REPORT
1913-000-GEREP-0003
Table of Contents Page
4.0 PROPERTY DESCRIPTION AND LOCATION 4.1 4.1 Location 4.1 4.2 Philippines Mining Law and Regulations 4.2 4.3 Land Tenure 4.4 4.4 Ownership and the Mining Code 4.5 4.5 Rights Royalties and Encumbrances 4.6
4.5.1 Eldore Royalty Agreements 4.6 4.5.2 Galeo Equipment Corporation Joint Venture Partner 4.7 4.5.3 Contracts 4.8
4.6 Landowner Issues 4.9 4.6.1 Overview 4.9 4.6.2 Land Acquisition Process 4.9 4.6.3 Acquisition Phases 4.9
4.7 Indigenous People 4.10 4.8 Water Rights 4.10
TABLES Table 4.1 MLEDC Tenements 4.4 FIGURES Figure 4.1 Mabilo Project Location 4.1 Figure 4.2 MLEDC Tenements Map 4.5
1913\24.04\1913-000-GEREP-0003_D S4 May 2016 MJV
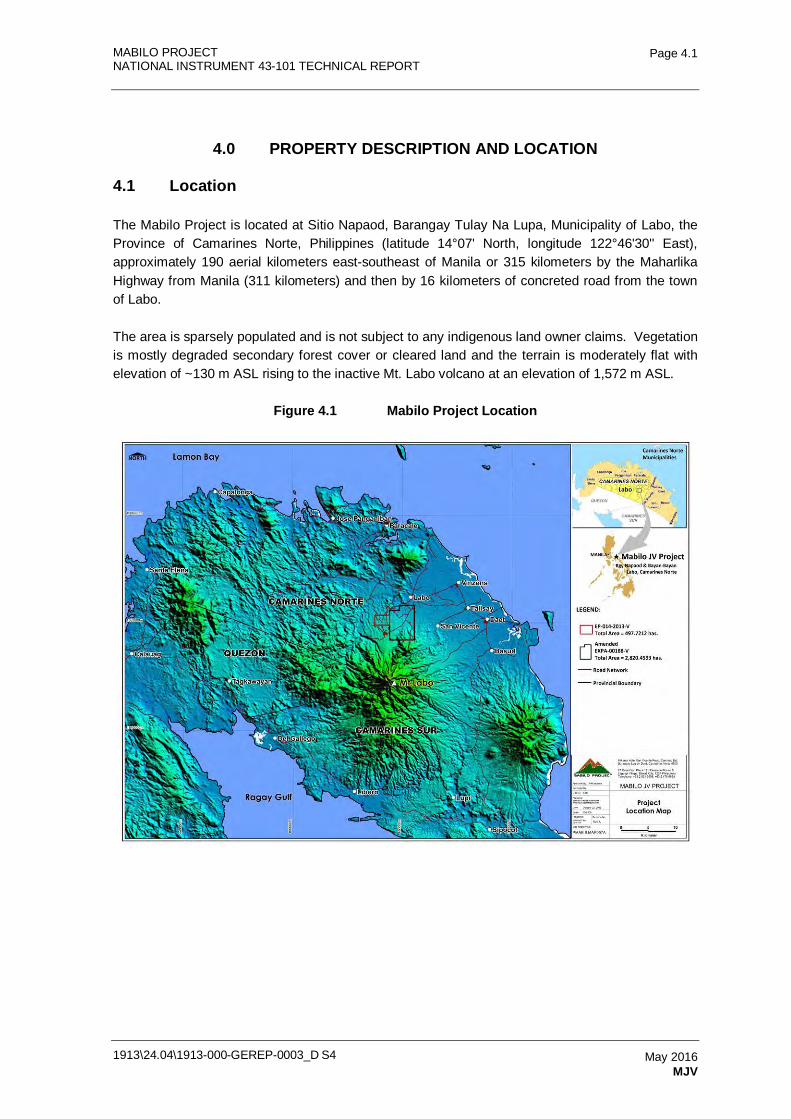
MABILO PROJECT NATIONAL INSTRUMENT 43-101 TECHNICAL REPORT
1913\24.04\1913-000-GEREP-0003_D S4
Page 4.1
May 2016 MJV
4.0 PROPERTY DESCRIPTION AND LOCATION
4.1 Location
The Mabilo Project is located at Sitio Napaod, Barangay Tulay Na Lupa, Municipality of Labo, the Province of Camarines Norte, Philippines (latitude 14°07' North, longitude 122°46'30'' East), approximately 190 aerial kilometers east-southeast of Manila or 315 kilometers by the Maharlika Highway from Manila (311 kilometers) and then by 16 kilometers of concreted road from the town of Labo.
The area is sparsely populated and is not subject to any indigenous land owner claims. Vegetation is mostly degraded secondary forest cover or cleared land and the terrain is moderately flat with elevation of ~130 m ASL rising to the inactive Mt. Labo volcano at an elevation of 1,572 m ASL.
Figure 4.1 Mabilo Project Location
MABILO PROJECT NATIONAL INSTRUMENT 43-101 TECHNICAL REPORT
1913\24.04\1913-000-GEREP-0003_D S4
Page 4.2
May 2016 MJV
4.2 Philippines Mining Law and Regulations
Mining and exploration tenure in the Philippines is governed by the 1995 Mining Act and its Implementing Rules and Regulations which are administered by the Department of Environment and Natural Resources ('DENR') and the Mines and Geosciences Bureau ('MGB') (MGB, 2013).
The main types of mining permits available under the Philippine Mining Act are:
• Exploration Permit ('EP')
• Mineral Agreement ('MA') which include Mineral Production Sharing Agreements ('MPSA'), Joint Venture Agreements ('JVA'), and Co-Production Agreements ('CPA')
• Financial or Technical Assistance Agreement ('FTAA') and
• Mineral Processing Permit ('MPP').
Mineral tenements are only granted to 'Qualified Persons'. A legally registered foreign-owned corporation is deemed a Qualified Person with respect to EPs, FTAAs and MPPs. Mineral Agreements are available only to Philippine citizens or corporations with at least 60% Philippine shareholding.
Exploration can be undertaken under an EP, MA or an FTAA. Mining can only be undertaken under a MPSA or an FTAA.
EP
An EP allows a Qualified Person to undertake exploration activities for mineral resources in certain areas open to mining in the country. EPs have a term of two years renewable for additional two year terms to a maximum of six years for metallic minerals. Mandatory area relinquishments of 25% after two years and 10% per year thereafter are applied.
The maximum area allowed for a corporation is 16,200 ha in any one province or 32,400 ha in the entire country.
The holder of an Exploration Permit may apply for a MA or a FTAA to conduct mining operations.
MA
Under a MA, the Government grants the holder the exclusive right to conduct exploration, development and mining of mineral resources within the contract area. The most common form of MA is a MPSA. An MPSA has a term of 25 years renewable for another 25 years under the same terms and conditions. The Government applies mandated taxes and royalties.
The maximum allowable area which can be held by a corporation under a MPSA is 8,100 ha in any one province or 16,200 ha in the entire country. The agreement provides for mandatory relinquishment such that the maximum final area shall not exceed 5,000 ha for metallic minerals.
MABILO PROJECT NATIONAL INSTRUMENT 43-101 TECHNICAL REPORT
1913\24.04\1913-000-GEREP-0003_D S4
Page 4.3
May 2016 MJV
A government moratorium on issue of MPSAs is currently in place under presidential Executive Order EO79. This reflected the view that the government share of projects exploited under an MPSA was too low and a push to raise their interest. Agreement has not been reached between Congress and the President and this issue will not be resolved before the presidential election in May 2016.
FTAA
An FTAA is an agreement for exploration, development and large scale mining of metallic minerals which allows 100% foreign equity in the project. An FTAA requires a minimum authorised capital of four million dollars (US$4,000,000) and a capital investment of fifty million dollars (US$50,000,000) for infrastructure and development in the contract area. The maximum area allowed is 81,000 ha and the maximum term is 25 years which can be renewed for another 25 years. Mandatory area relinquishments of 25% after two years and 10% per year thereafter are applied. A maximum final area of 5,000 ha for each mining area is allowed and no further relinquishments are required.
The following are the phase of mining operations of an FTAA:
• Exploration - up to two years from date of FTAA execution, extendible for another two years.
• Pre-feasibility study - if warranted - up to two years from expiration of the exploration period.
• Feasibility study - up to two years from the expiration of the exploration / pre-feasibility study period or from declaration of mining project feasibility.
• Development, construction and utilisation - remaining years of FTAA.
MPP
A Mineral Processing Permit (MPP) is granted to a Qualified Person for mineral processing. This covers the milling, beneficiation, leaching, smelting, cyanidation, calcination or upgrading of ores, minerals, rocks, mill tailings, mine waste and/or other metallurgical by-products or by similar means to convert the same into marketable products.
The term of a Mineral Processing Permit is for a period of five years from date of issuance and renewable for similar periods but must not to exceed a total term of 25 years.
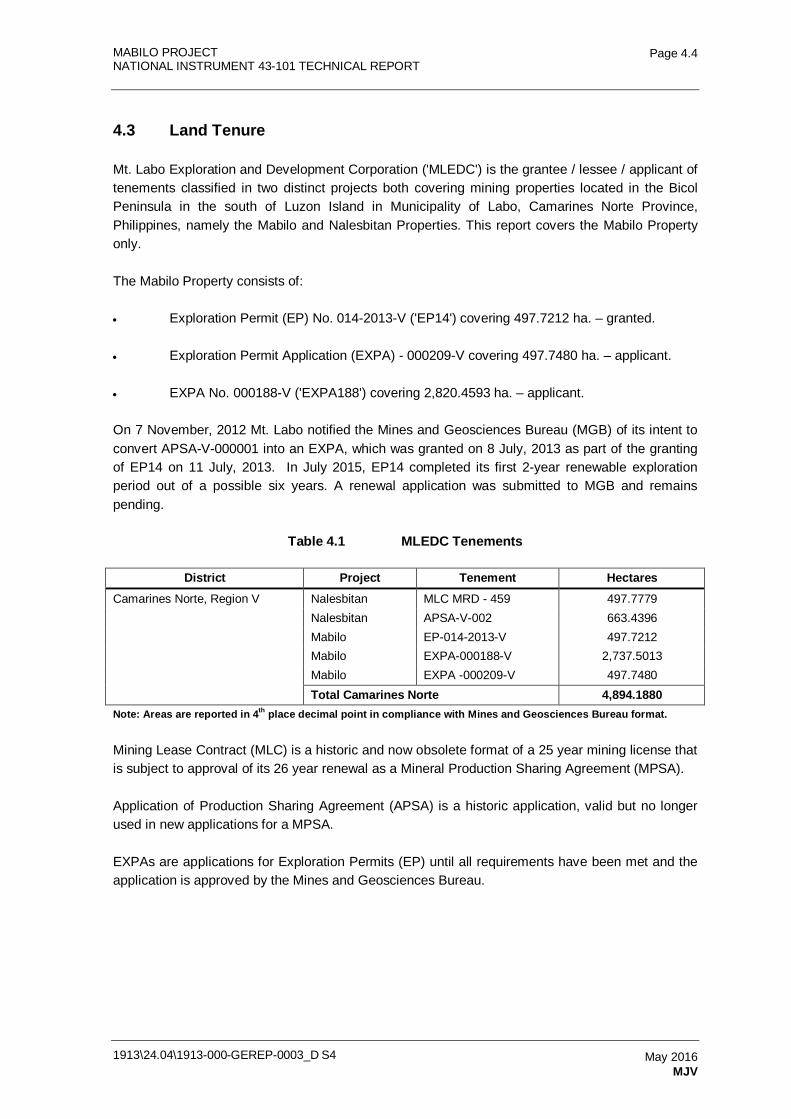
MABILO PROJECT NATIONAL INSTRUMENT 43-101 TECHNICAL REPORT
1913\24.04\1913-000-GEREP-0003_D S4
Page 4.4
May 2016 MJV
4.3 Land Tenure
Mt. Labo Exploration and Development Corporation ('MLEDC') is the grantee / lessee / applicant of tenements classified in two distinct projects both covering mining properties located in the Bicol Peninsula in the south of Luzon Island in Municipality of Labo, Camarines Norte Province, Philippines, namely the Mabilo and Nalesbitan Properties. This report covers the Mabilo Property only.
The Mabilo Property consists of:
• Exploration Permit (EP) No. 014-2013-V ('EP14') covering 497.7212 ha. – granted.
• Exploration Permit Application (EXPA) - 000209-V covering 497.7480 ha. – applicant.
• EXPA No. 000188-V ('EXPA188') covering 2,820.4593 ha. – applicant.
On 7 November, 2012 Mt. Labo notified the Mines and Geosciences Bureau (MGB) of its intent to convert APSA-V-000001 into an EXPA, which was granted on 8 July, 2013 as part of the granting of EP14 on 11 July, 2013. In July 2015, EP14 completed its first 2-year renewable exploration period out of a possible six years. A renewal application was submitted to MGB and remains pending.
Table 4.1 MLEDC Tenements
District Project Tenement Hectares Camarines Norte, Region V Nalesbitan MLC MRD - 459 497.7779
Nalesbitan APSA-V-002 663.4396 Mabilo EP-014-2013-V 497.7212 Mabilo EXPA-000188-V 2,737.5013 Mabilo EXPA -000209-V 497.7480 Total Camarines Norte 4,894.1880
Note: Areas are reported in 4th place decimal point in compliance with Mines and Geosciences Bureau format.
Mining Lease Contract (MLC) is a historic and now obsolete format of a 25 year mining license that is subject to approval of its 26 year renewal as a Mineral Production Sharing Agreement (MPSA).
Application of Production Sharing Agreement (APSA) is a historic application, valid but no longer used in new applications for a MPSA.
EXPAs are applications for Exploration Permits (EP) until all requirements have been met and the application is approved by the Mines and Geosciences Bureau.
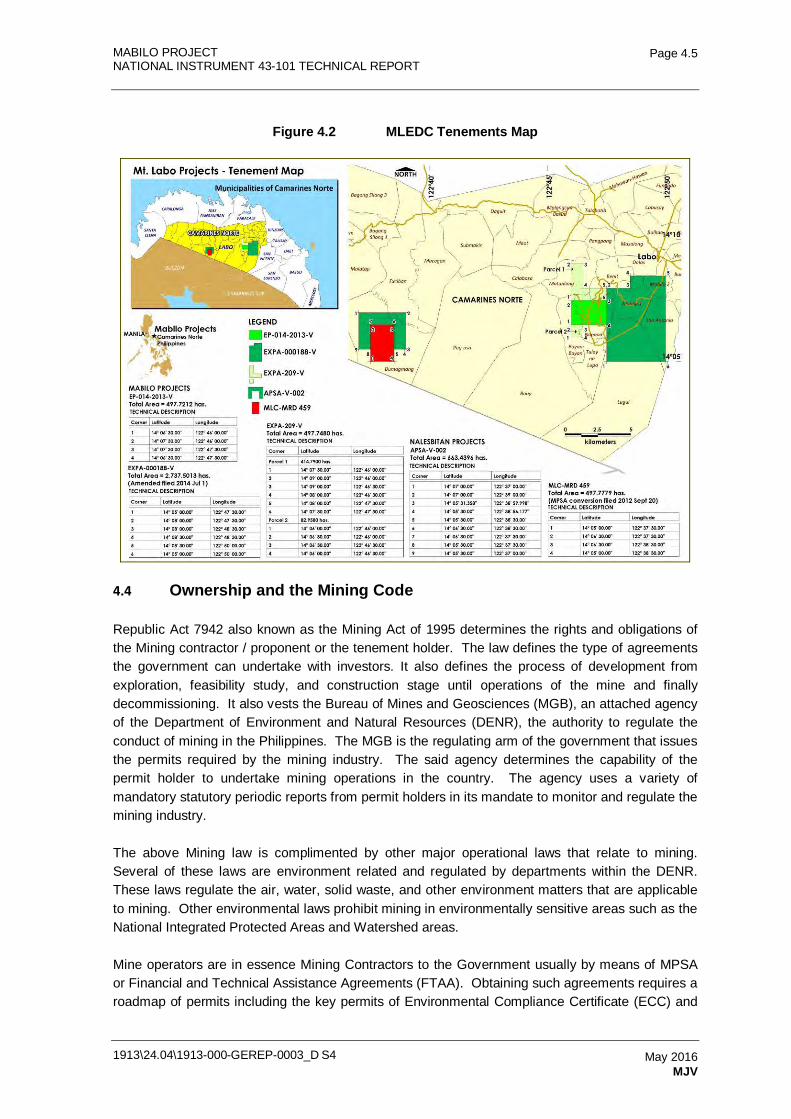
MABILO PROJECT NATIONAL INSTRUMENT 43-101 TECHNICAL REPORT
1913\24.04\1913-000-GEREP-0003_D S4
Page 4.5
May 2016 MJV
Figure 4.2 MLEDC Tenements Map
4.4 Ownership and the Mining Code
Republic Act 7942 also known as the Mining Act of 1995 determines the rights and obligations of the Mining contractor / proponent or the tenement holder. The law defines the type of agreements the government can undertake with investors. It also defines the process of development from exploration, feasibility study, and construction stage until operations of the mine and finally decommissioning. It also vests the Bureau of Mines and Geosciences (MGB), an attached agency of the Department of Environment and Natural Resources (DENR), the authority to regulate the conduct of mining in the Philippines. The MGB is the regulating arm of the government that issues the permits required by the mining industry. The said agency determines the capability of the permit holder to undertake mining operations in the country. The agency uses a variety of mandatory statutory periodic reports from permit holders in its mandate to monitor and regulate the mining industry.
The above Mining law is complimented by other major operational laws that relate to mining. Several of these laws are environment related and regulated by departments within the DENR. These laws regulate the air, water, solid waste, and other environment matters that are applicable to mining. Other environmental laws prohibit mining in environmentally sensitive areas such as the National Integrated Protected Areas and Watershed areas.
Mine operators are in essence Mining Contractors to the Government usually by means of MPSA or Financial and Technical Assistance Agreements (FTAA). Obtaining such agreements requires a roadmap of permits including the key permits of Environmental Compliance Certificate (ECC) and

MABILO PROJECT NATIONAL INSTRUMENT 43-101 TECHNICAL REPORT
1913\24.04\1913-000-GEREP-0003_D S4
Page 4.6
May 2016 MJV
Declaration of Mine Project feasibility (DMPF), both which MLEDC has advanced for the mining phase of the project.
Besides mineral tenement issues the Contractor has to deal with real property issues since surface areas are mostly owned by individuals. The surface rights are generally covered by titles of ownership or interest. These titles issued by government are either in the form of Original Certificates of Title (OCT), Transfer Certificates of Title (TCT), Certificates of Land Ownership (CLOA) or Certificates of Ancestral Land Title (CALT) or native titles and in some cases, Tax Declarations. The rigorous process of land acquisition has to be undertaken by the proponent or tenement holder. The acquisition process is discussed in detail in Section 4.5 below.
The titles or real property ownership covering the Mabilo Project Area issued by the Government to the residents in the area are Original Certificates of Title (OCT) and Transfer Certificates of Titles (TCT) under the Commonwealth Act 141 (The Public Land Act). The Register of Deeds (ROD) under the Land Registration Authority (LRA) of each Province / City issues these titles. Most of these titles were issued by means of Free Patents, which essentially is a free right by the Government to the farmer. Another title issued to individuals is Certificates of Land Ownership Award (CLOA) issued by the Department of Agrarian Reform (DAR) by virtue of its mandate under the Comprehensive Agrarian Reform Program (CARP) of the government. The CLOA are similar to OCT and TCT under the Public Land Act.
On October 29, 1997, the government enacted Republic Act 8371 or the Indigenous People Rights Act (IPRA Law). This law created the National Commission on Indigenous People (NCIP) Office whose primary function is to oversee the rights of the Indigenous Cultural Communities (ICC) or Indigenous People (IP). One of the functions of the Commission is the issuance of the so called 'Certificate of Ancestral Land Title (CALT)' and/or 'Certificate of Ancestral Domain Title (CADT)'. These titles are issued if there are Indigenous People living in the area. In the case of the Mabilo Project, there is no ICC or IP's residing in the area as certified by the NCIP.
Those residents without OCT's, TCT's or CLOA's, the title issued to the residents in the project area were Tax Declarations or Declaration of Real Property issued by the Municipal Assessor's Office of the Municipality of Labo. Although these Tax Declarations are not evidence of ownership, they are considered evidence of possession by the owners and considered by the government as prior possessory rights.
The JV holds numerous titles and rights over surface properties. These are currently held in the name of the individual companies and/or its nominees and are yet to be integrated into the JV structure in a form to be agreed upon, which either involves assignment of rights to MLEDC or formation of a special purpose surface rights vehicle or similar.
4.5 Rights Royalties and Encumbrances
4.5.1 Eldore Royalty Agreements
On 11 November, 2011, El Dore Mining Corporation (EMC), represented by Manuel G. Acenas, entered into a Royalty Agreement with Mining Consultants Limited of Australia (MC), represented by Timothy Edgar Collver. The Royalty Agreement called 'Heads Agreement' provides that EMC
MABILO PROJECT NATIONAL INSTRUMENT 43-101 TECHNICAL REPORT
1913\24.04\1913-000-GEREP-0003_D S4
Page 4.7
May 2016 MJV
shall pay MC, one percent (1%) royalty of Net Mining Revenue (NMR). In the agreement, Net Mining Revenue means the Gross Output for a quarter less deductible expenses.
The major provisions in the agreement states that royalty shall be paid to MC within 30 days of the end of each quarter. Within 90 calendar days from end of financial year, EMC must calculate the Net Mining Revenue from that year and pay MC.
EMC must provide MC regular quarterly production reports regarding all mining and processing activities and accounting records therein which at MC election and expense may be subject to an independent audit each year and every quarter with respect to all Net Mining Revenue (NMR) generated.
As stated above, on 5 November, 2011, Mt. Labo Exploration and Development Corporation (MLEDC) completed its one hundred percent (100%) acquisition of EMC.
4.5.2 Galeo Equipment Corporation Joint Venture Partner
On 10 May, 2013 Mt. Labo Exploration and Development Corporation (MLED), Sierra Mining Limited (Sierra) and Galeo Equipment Corporation ('GALEO') entered into an unincorporated Joint Venture Agreement ('JVA') wherein Galeo could earn up to 36% share of the Project from surface down to 200 m by fulfilling certain obligations. The parties will jointly prospect, explore and possibly develop all minerals within the tenements held by MLEDC down to 200 m below surface. The parties entered into an agreement on 19 November, 2013 to remove the depth restriction.
Galeo fulfilled all of the earn-in obligations on 19 August, 2015 and now holds 36% interest in the Joint Venture. The parties also entered into a Memorandum of Understanding on 22 November, 2013 whereby Galeo can increase its holdings to 42% by meeting certain criteria.
The Mabilo Mining Project ('MMP') is managed by a Project Manager appointed by the Joint Venture partners whilst the JVA is managed by a five-member management committee.
Shallows
In the above Joint Venture, it is stipulated that Galeo can earn up to 36% of the project from Surface down to 200 m by providing management services such as Security, Community Relations, permitting and Management Services to the project during the Earn-In period. It has also to provide drilling metreage of up to 8,919 m during the Earn-In period.
Finally, Galeo has to contribute 36% share in the project's expenditures by fulfilling the cash calls needed by the project on a quarterly basis.
As of 31 July, 2015, Galeo earned its 36% share of the project.
Deeps
Under the JV agreement, Epithermal gold veins within the Cooperation Zone may be mined below the 200 m as long as they remain economic and do not encroach on any porphyry copper deposits, as determined by the management committee.
MABILO PROJECT NATIONAL INSTRUMENT 43-101 TECHNICAL REPORT
1913\24.04\1913-000-GEREP-0003_D S4
Page 4.8
May 2016 MJV
If MLED wishes to develop with a local third party below the 200 m depth limit of the Cooperation Zone, MLED shall first negotiate in good faith with Galeo.
As of 19 August, 2015, the Earn-In for the Deeps was satisfied by Galeo and they earn 36% of the JV.
4.5.3 Contracts
Lease Contracts
In the conduct of its business, MLEDC entered into various commercial transactions to carry its major undertaking of exploration. Foremost agreements were lease contracts for its Head Office located at No. 121, 2nd floor, Corinthian Plaza, Paseo De Roxas Street, Legazpi Village, Makati City. Its 4,000 square meters Project Site office and Core House is located at Canimog Extension, Barangay Lag-on, Daet, Camarines Norte that caters to its Project Management, Engineering, Planning, Geology, Human Resource and Administration, Accounting and Legal and Compliance Departments. Likewise, Project Mabilo has its Field Office at located Barangay Tulay na Lupa, Municipality of Labo, Camarines Norte that houses its Community Relations, Safety, and Environment Departments and for its field personnel.
There are lease contracts entered into by project to cater for the housing and accommodation of its key personnel particularly at Daet, Lugui and Tulay na Lupa.
MLEDC also entered into lease contracts for its various needs of transporting its employees to and from field works. These leased vehicles are likewise utilized to transport officers and consultants from Head Office to project site office to conduct various meetings and field updates.
Security Contract
The project has entered into a Security Services Contract for its Daet and Core Handling Services with a local Security Agency. The latter provides two security guards for the project's Office and Core yard on a 24 hour basis.
Drilling Contract
Galeo provides for the drilling operations of the project during the exploration stage. There was no drilling contract post earn in although some drilling was carried out by Galeo as an extension of the existing drilling activities.
Employment Contracts
Since the project is in its exploration stage for two years, the majority of the Employment Contracts have a fixed term period. The Human Resource and Administration Division handle the recruitment and the employment contracts of 78 employees of 31 August, 2015. Drilling contract employees of Galeo are 96.
MABILO PROJECT NATIONAL INSTRUMENT 43-101 TECHNICAL REPORT
1913\24.04\1913-000-GEREP-0003_D S4
Page 4.9
May 2016 MJV
4.6 Landowner Issues
4.6.1 Overview
The land in the project is covered by valid Original Certificate of Title ('OCT'), Transfer Certificate of Title ('TCT'), Certificate of Land Ownership Award ('CLOA') or Tax Declarations as determined by a review of land registration records and validated on the ground by the community relations team. It is necessary for the Joint Venture to negotiate with land owners for acquisition of these lands for mining purposes. Consultants were hired by the Joint Venture to undertake the acquisition of the lands and relocation of affected land owners.
During the exploration stages, the access to drill sites was handled by the Land Access Team under the Community Relations and eventual agreements were signed by the Company representatives and the land owners.
4.6.2 Land Acquisition Process
The JV acquired numerous titles and rights over surface properties in the form of deeds of absolute sale, lease agreements and land access agreements. These are currently held in the name of the individual companies and/or its nominees and are yet to be integrated into the JV structure in a form to be agreed upon.
4.6.3 Acquisition Phases
In order to commence the initial site establishment, pre-strip and oxide mining, the land acquisition program of 100 lots is implemented in three separately critical phases with Phase 1 approaching completion as of April, 2016 with the acquisition of 32 lots. 44 additional lots will have to be acquired over time as the project grows:
• Phase 1: A 'Soft Acquisition' focused on purchasing Priority 1 and 2 lots through independent real property brokers and parking the same with individual nominees and/or registered corporations.
• Phase 2: Once Phase 1 has reached its saturation point and the MLEDC is advancing into the permitting stage of acquiring an MPSA through a joint venture corporation under a 60-40% Filipino-Foreign equity sharing; the finalization of the mine development designs and the commencement of the public information dissemination campaigns within the host communities and stakeholders, Phase 2 is the official declaration of the intent of the joint venture mining company to acquire the surface rights of all land directly affected and identified within its mining area.
MABILO PROJECT NATIONAL INSTRUMENT 43-101 TECHNICAL REPORT
1913\24.04\1913-000-GEREP-0003_D S4
Page 4.10
May 2016 MJV
• Phase 3: While it is ideal that the target land will be acquired through voluntary dealings with the landowners, it is reasonable to expect that there will be those who will refuse the maximum compensation offered to them. At no less than 70-80% voluntary acquisition, MLEDC may invoke Section 76, Chapter XII of the Mining Law – providing for entry into private lands through posting of a bond ; and Section 77 that allows for the settlement of just compensation for the taking of the land by the mining operators.
A legal opinion on the access to land outside the tenement was obtained.
4.7 Indigenous People
Under the IPRA Law or Republic Act No. 8371, Native Titles such as Certificate of Ancestral Land Title (CALT) and Certificate of Ancestral Domain Title (CADT) are issued to Indigenous Cultural Communities (ICC) or indigenous People (IP). The said law introduced the native titles wherein they were defined that these landholdings were held by the ICC's or IP's since time in memorial. The area subject of the Exploration Permit No. 2013-14-V was certified by the NCIP that there is no ICC or IP residing in the area and that the area does not overlap any CADT or CALT held by ICC or IP.
4.8 Water Rights
MJV will apply for water rights and stream diversion rights with the National Water Resources Board as part of its statutory requirements for operation. As the project is net water positive, it is not expected to compete for water resources with current downstream or deep well users.
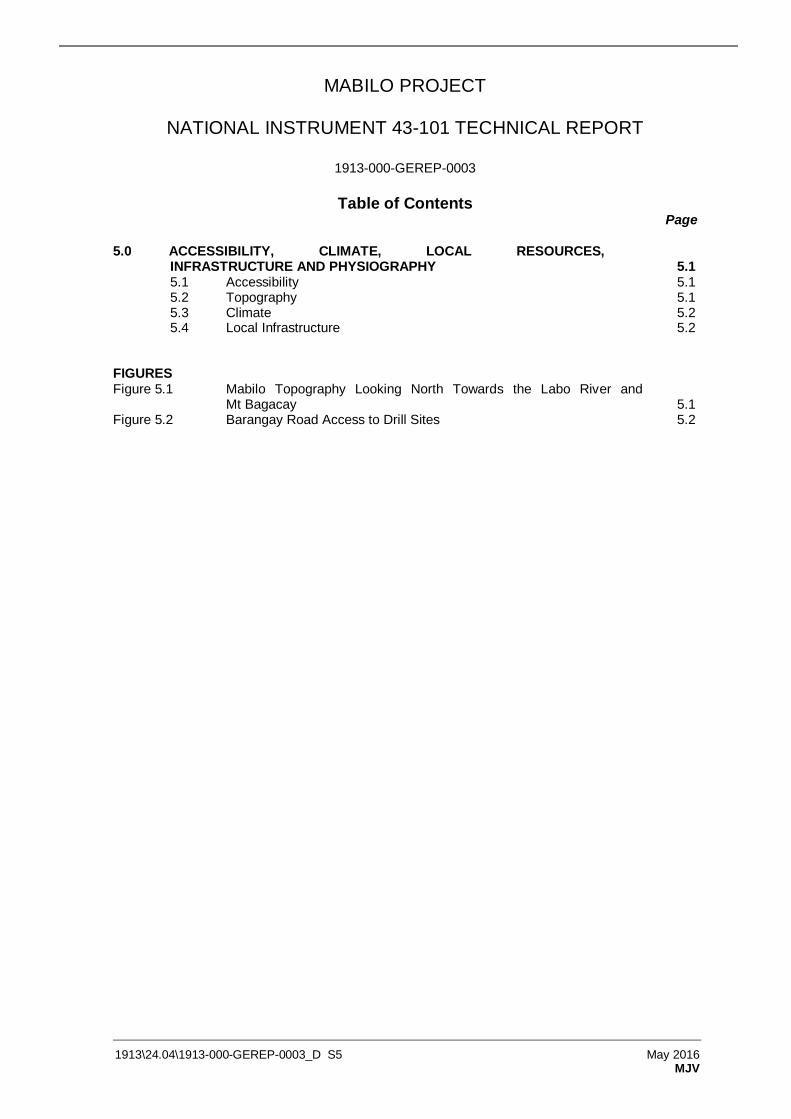
MABILO PROJECT
NATIONAL INSTRUMENT 43-101 TECHNICAL REPORT
1913-000-GEREP-0003
Table of Contents Page
5.0 ACCESSIBILITY, CLIMATE, LOCAL RESOURCES, INFRASTRUCTURE AND PHYSIOGRAPHY 5.1 5.1 Accessibility 5.1 5.2 Topography 5.1 5.3 Climate 5.2 5.4 Local Infrastructure 5.2
FIGURES Figure 5.1 Mabilo Topography Looking North Towards the Labo River and
Mt Bagacay 5.1 Figure 5.2 Barangay Road Access to Drill Sites 5.2
1913\24.04\1913-000-GEREP-0003_D S5 May 2016 MJV
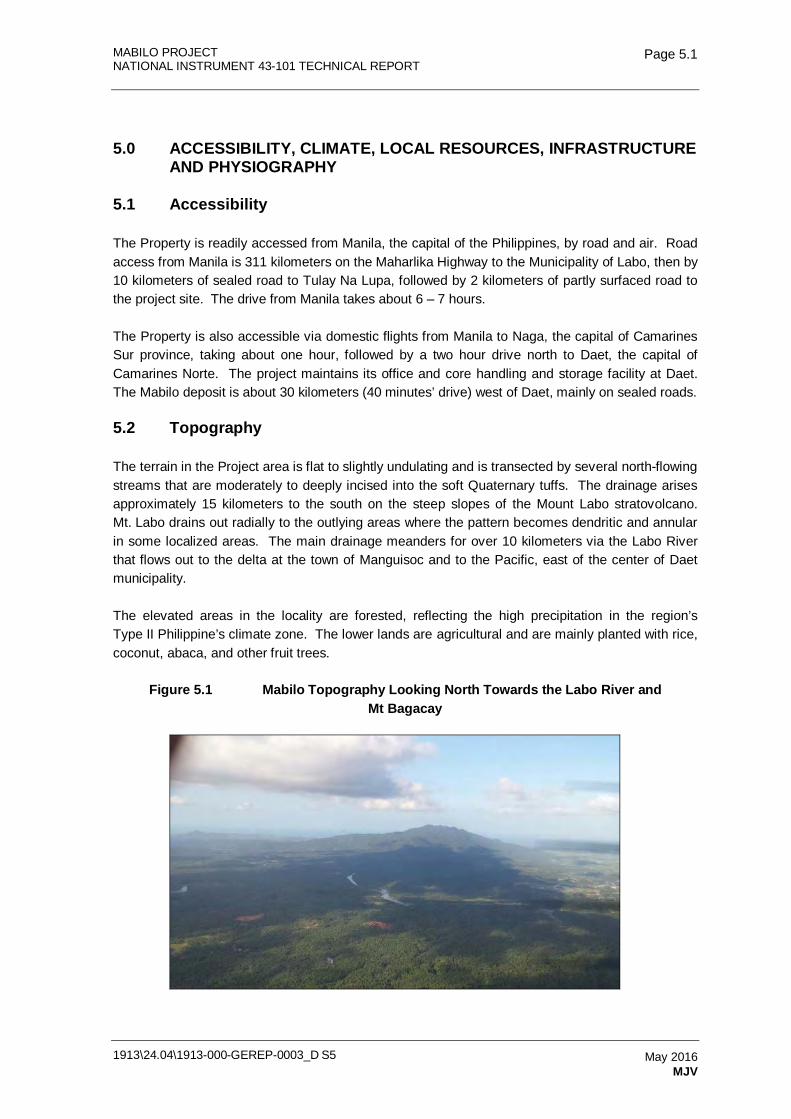
MABILO PROJECT NATIONAL INSTRUMENT 43-101 TECHNICAL REPORT
1913\24.04\1913-000-GEREP-0003_D S5
Page 5.1
May 2016 MJV
5.0 ACCESSIBILITY, CLIMATE, LOCAL RESOURCES, INFRASTRUCTURE AND PHYSIOGRAPHY
5.1 Accessibility
The Property is readily accessed from Manila, the capital of the Philippines, by road and air. Road access from Manila is 311 kilometers on the Maharlika Highway to the Municipality of Labo, then by 10 kilometers of sealed road to Tulay Na Lupa, followed by 2 kilometers of partly surfaced road to the project site. The drive from Manila takes about 6 – 7 hours.
The Property is also accessible via domestic flights from Manila to Naga, the capital of Camarines Sur province, taking about one hour, followed by a two hour drive north to Daet, the capital of Camarines Norte. The project maintains its office and core handling and storage facility at Daet. The Mabilo deposit is about 30 kilometers (40 minutes’ drive) west of Daet, mainly on sealed roads.
5.2 Topography
The terrain in the Project area is flat to slightly undulating and is transected by several north-flowing streams that are moderately to deeply incised into the soft Quaternary tuffs. The drainage arises approximately 15 kilometers to the south on the steep slopes of the Mount Labo stratovolcano. Mt. Labo drains out radially to the outlying areas where the pattern becomes dendritic and annular in some localized areas. The main drainage meanders for over 10 kilometers via the Labo River that flows out to the delta at the town of Manguisoc and to the Pacific, east of the center of Daet municipality.
The elevated areas in the locality are forested, reflecting the high precipitation in the region’s Type II Philippine’s climate zone. The lower lands are agricultural and are mainly planted with rice, coconut, abaca, and other fruit trees.
Figure 5.1 Mabilo Topography Looking North Towards the Labo River and Mt Bagacay
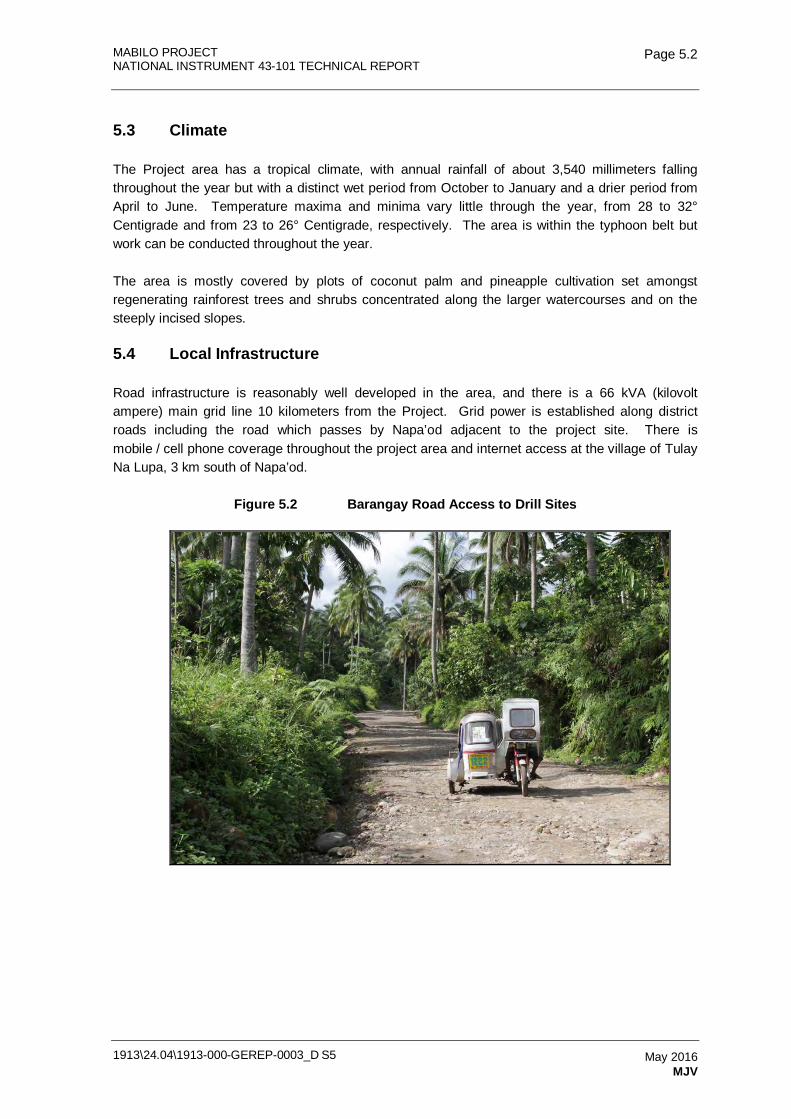
MABILO PROJECT NATIONAL INSTRUMENT 43-101 TECHNICAL REPORT
1913\24.04\1913-000-GEREP-0003_D S5
Page 5.2
May 2016 MJV
5.3 Climate
The Project area has a tropical climate, with annual rainfall of about 3,540 millimeters falling throughout the year but with a distinct wet period from October to January and a drier period from April to June. Temperature maxima and minima vary little through the year, from 28 to 32° Centigrade and from 23 to 26° Centigrade, respectively. The area is within the typhoon belt but work can be conducted throughout the year.
The area is mostly covered by plots of coconut palm and pineapple cultivation set amongst regenerating rainforest trees and shrubs concentrated along the larger watercourses and on the steeply incised slopes.
5.4 Local Infrastructure
Road infrastructure is reasonably well developed in the area, and there is a 66 kVA (kilovolt ampere) main grid line 10 kilometers from the Project. Grid power is established along district roads including the road which passes by Napa’od adjacent to the project site. There is mobile / cell phone coverage throughout the project area and internet access at the village of Tulay Na Lupa, 3 km south of Napa’od.
Figure 5.2 Barangay Road Access to Drill Sites
MABILO PROJECT
NATIONAL INSTRUMENT 43-101 TECHNICAL REPORT
1913-000-GEREP-0003
Table of Contents Page
6.0 HISTORY 6.1 6.1 Philippines Mining 6.1 6.2 Paracale Mining District 6.1 6.3 Mabilo Property Historical Ownership 6.2 6.4 Mabilo Property Historical Exploration 6.2 6.5 Historic Resource Estimate 6.3 6.6 Production from the Property 6.3
TABLES Table 6.1 Mineral Resource Estimate as at November 2014 for the Mabilo
Project 6.3 FIGURES Figure 6.1 Venida Pit Looking to the North 6.4 Figure 6.2 Black Ferruginous Clays 6.4
1913\24.04\1913-000-GEREP-0003_D S6 May 2016 MJV / CSA Global
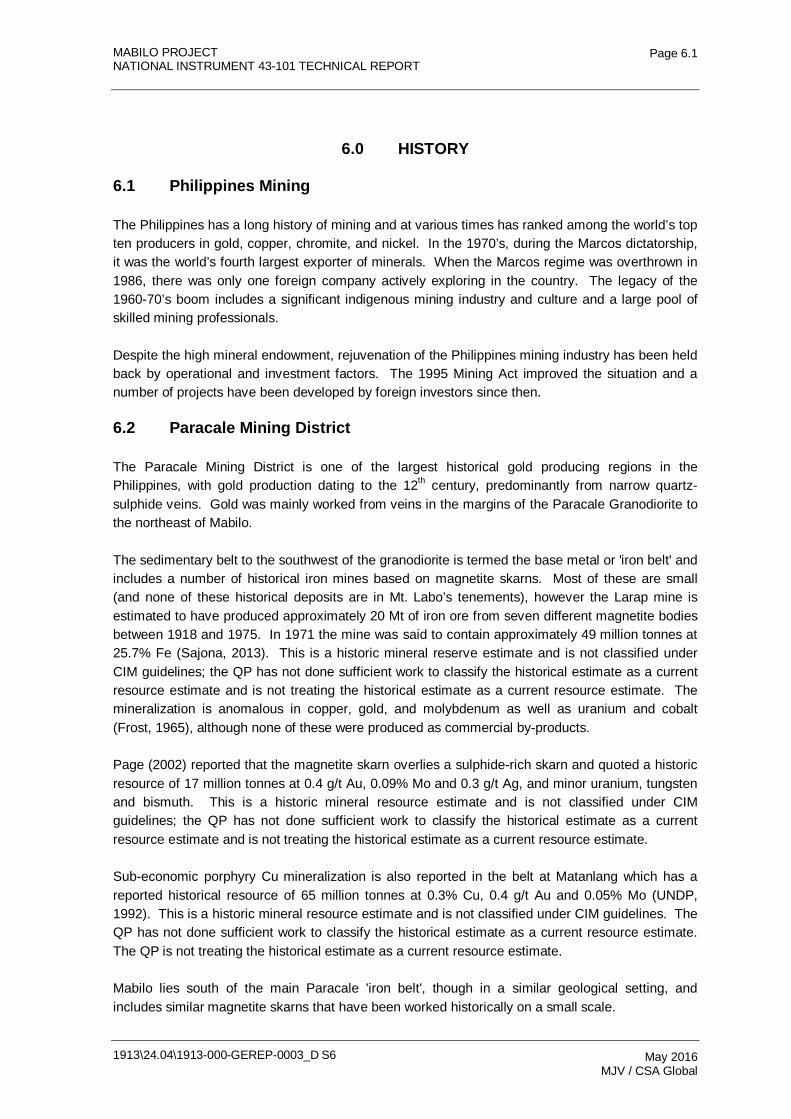
MABILO PROJECT NATIONAL INSTRUMENT 43-101 TECHNICAL REPORT
1913\24.04\1913-000-GEREP-0003_D S6
Page 6.1
May 2016 MJV / CSA Global
6.0 HISTORY
6.1 Philippines Mining
The Philippines has a long history of mining and at various times has ranked among the world’s top ten producers in gold, copper, chromite, and nickel. In the 1970’s, during the Marcos dictatorship, it was the world’s fourth largest exporter of minerals. When the Marcos regime was overthrown in 1986, there was only one foreign company actively exploring in the country. The legacy of the 1960-70’s boom includes a significant indigenous mining industry and culture and a large pool of skilled mining professionals.
Despite the high mineral endowment, rejuvenation of the Philippines mining industry has been held back by operational and investment factors. The 1995 Mining Act improved the situation and a number of projects have been developed by foreign investors since then.
6.2 Paracale Mining District
The Paracale Mining District is one of the largest historical gold producing regions in the Philippines, with gold production dating to the 12th century, predominantly from narrow quartz-sulphide veins. Gold was mainly worked from veins in the margins of the Paracale Granodiorite to the northeast of Mabilo.
The sedimentary belt to the southwest of the granodiorite is termed the base metal or 'iron belt' and includes a number of historical iron mines based on magnetite skarns. Most of these are small (and none of these historical deposits are in Mt. Labo’s tenements), however the Larap mine is estimated to have produced approximately 20 Mt of iron ore from seven different magnetite bodies between 1918 and 1975. In 1971 the mine was said to contain approximately 49 million tonnes at 25.7% Fe (Sajona, 2013). This is a historic mineral reserve estimate and is not classified under CIM guidelines; the QP has not done sufficient work to classify the historical estimate as a current resource estimate and is not treating the historical estimate as a current resource estimate. The mineralization is anomalous in copper, gold, and molybdenum as well as uranium and cobalt (Frost, 1965), although none of these were produced as commercial by-products.
Page (2002) reported that the magnetite skarn overlies a sulphide-rich skarn and quoted a historic resource of 17 million tonnes at 0.4 g/t Au, 0.09% Mo and 0.3 g/t Ag, and minor uranium, tungsten and bismuth. This is a historic mineral resource estimate and is not classified under CIM guidelines; the QP has not done sufficient work to classify the historical estimate as a current resource estimate and is not treating the historical estimate as a current resource estimate.
Sub-economic porphyry Cu mineralization is also reported in the belt at Matanlang which has a reported historical resource of 65 million tonnes at 0.3% Cu, 0.4 g/t Au and 0.05% Mo (UNDP, 1992). This is a historic mineral resource estimate and is not classified under CIM guidelines. The QP has not done sufficient work to classify the historical estimate as a current resource estimate. The QP is not treating the historical estimate as a current resource estimate.
Mabilo lies south of the main Paracale 'iron belt', though in a similar geological setting, and includes similar magnetite skarns that have been worked historically on a small scale.
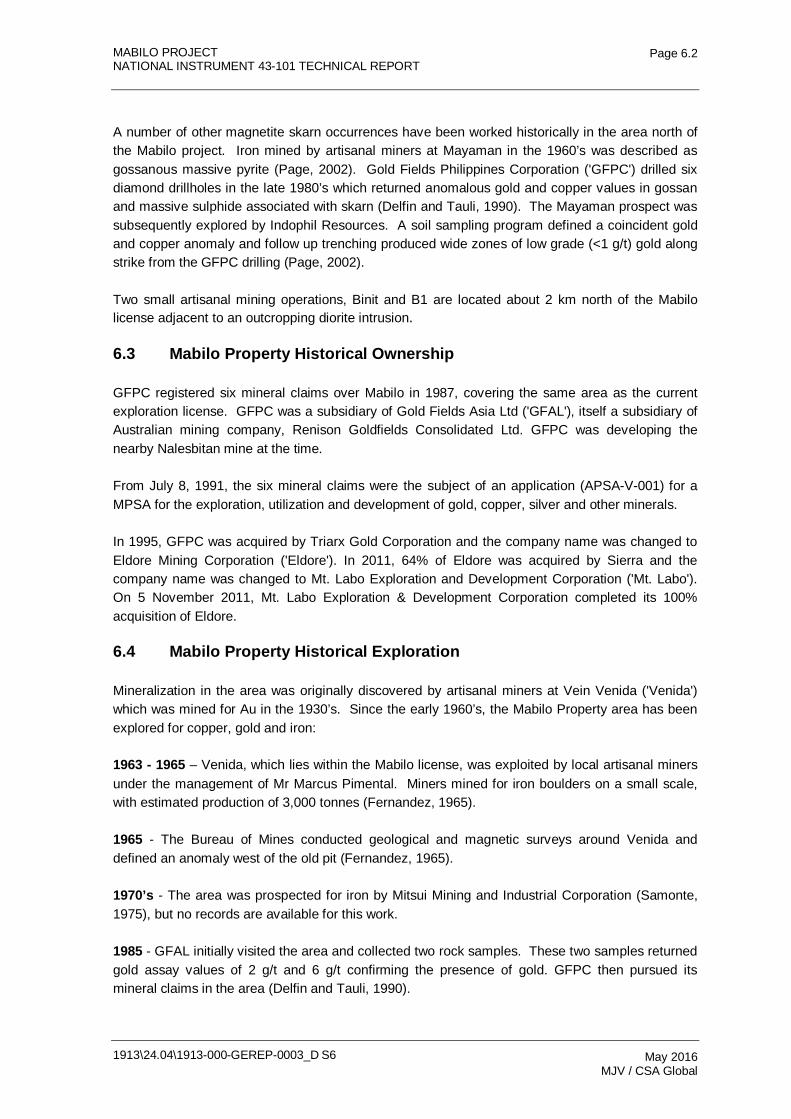
MABILO PROJECT NATIONAL INSTRUMENT 43-101 TECHNICAL REPORT
1913\24.04\1913-000-GEREP-0003_D S6
Page 6.2
May 2016 MJV / CSA Global
A number of other magnetite skarn occurrences have been worked historically in the area north of the Mabilo project. Iron mined by artisanal miners at Mayaman in the 1960’s was described as gossanous massive pyrite (Page, 2002). Gold Fields Philippines Corporation ('GFPC') drilled six diamond drillholes in the late 1980’s which returned anomalous gold and copper values in gossan and massive sulphide associated with skarn (Delfin and Tauli, 1990). The Mayaman prospect was subsequently explored by Indophil Resources. A soil sampling program defined a coincident gold and copper anomaly and follow up trenching produced wide zones of low grade (<1 g/t) gold along strike from the GFPC drilling (Page, 2002).
Two small artisanal mining operations, Binit and B1 are located about 2 km north of the Mabilo license adjacent to an outcropping diorite intrusion.
6.3 Mabilo Property Historical Ownership
GFPC registered six mineral claims over Mabilo in 1987, covering the same area as the current exploration license. GFPC was a subsidiary of Gold Fields Asia Ltd ('GFAL'), itself a subsidiary of Australian mining company, Renison Goldfields Consolidated Ltd. GFPC was developing the nearby Nalesbitan mine at the time.
From July 8, 1991, the six mineral claims were the subject of an application (APSA-V-001) for a MPSA for the exploration, utilization and development of gold, copper, silver and other minerals.
In 1995, GFPC was acquired by Triarx Gold Corporation and the company name was changed to Eldore Mining Corporation ('Eldore'). In 2011, 64% of Eldore was acquired by Sierra and the company name was changed to Mt. Labo Exploration and Development Corporation ('Mt. Labo'). On 5 November 2011, Mt. Labo Exploration & Development Corporation completed its 100% acquisition of Eldore.
6.4 Mabilo Property Historical Exploration
Mineralization in the area was originally discovered by artisanal miners at Vein Venida ('Venida') which was mined for Au in the 1930’s. Since the early 1960’s, the Mabilo Property area has been explored for copper, gold and iron:
1963 - 1965 – Venida, which lies within the Mabilo license, was exploited by local artisanal miners under the management of Mr Marcus Pimental. Miners mined for iron boulders on a small scale, with estimated production of 3,000 tonnes (Fernandez, 1965).
1965 - The Bureau of Mines conducted geological and magnetic surveys around Venida and defined an anomaly west of the old pit (Fernandez, 1965).
1970’s - The area was prospected for iron by Mitsui Mining and Industrial Corporation (Samonte, 1975), but no records are available for this work.
1985 - GFAL initially visited the area and collected two rock samples. These two samples returned gold assay values of 2 g/t and 6 g/t confirming the presence of gold. GFPC then pursued its mineral claims in the area (Delfin and Tauli, 1990).
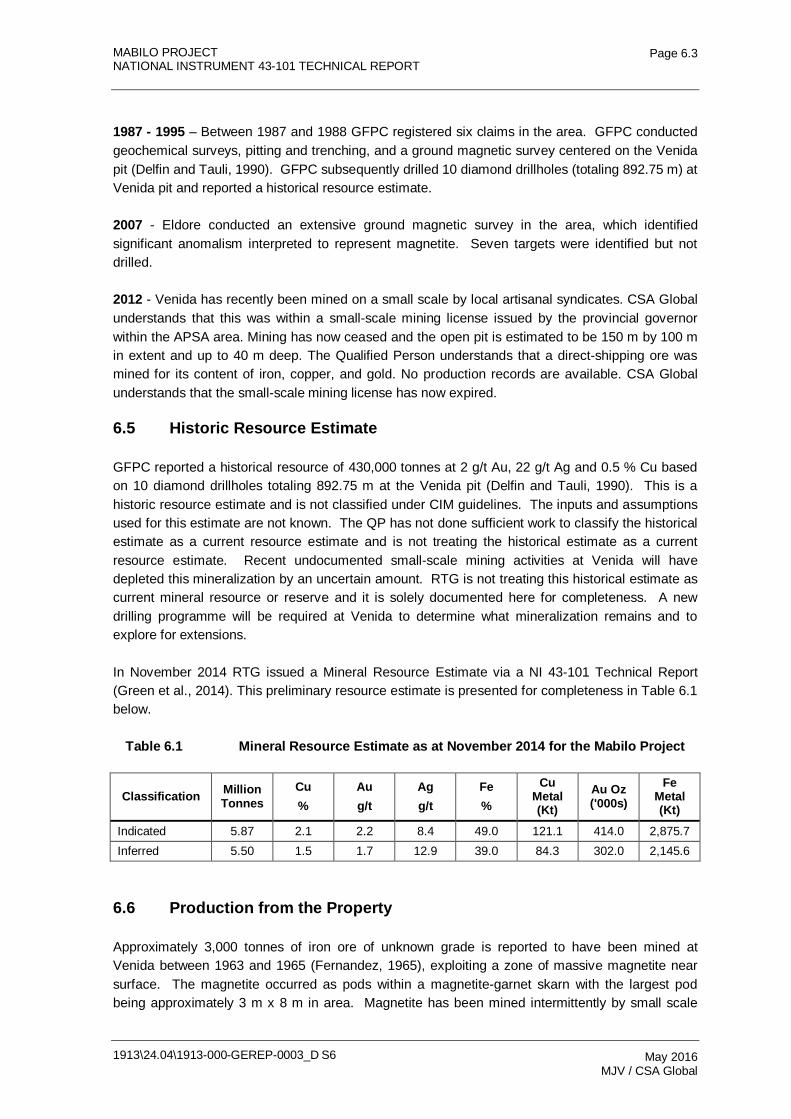
MABILO PROJECT NATIONAL INSTRUMENT 43-101 TECHNICAL REPORT
1913\24.04\1913-000-GEREP-0003_D S6
Page 6.3
May 2016 MJV / CSA Global
1987 - 1995 – Between 1987 and 1988 GFPC registered six claims in the area. GFPC conducted geochemical surveys, pitting and trenching, and a ground magnetic survey centered on the Venida pit (Delfin and Tauli, 1990). GFPC subsequently drilled 10 diamond drillholes (totaling 892.75 m) at Venida pit and reported a historical resource estimate.
2007 - Eldore conducted an extensive ground magnetic survey in the area, which identified significant anomalism interpreted to represent magnetite. Seven targets were identified but not drilled.
2012 - Venida has recently been mined on a small scale by local artisanal syndicates. CSA Global understands that this was within a small-scale mining license issued by the provincial governor within the APSA area. Mining has now ceased and the open pit is estimated to be 150 m by 100 m in extent and up to 40 m deep. The Qualified Person understands that a direct-shipping ore was mined for its content of iron, copper, and gold. No production records are available. CSA Global understands that the small-scale mining license has now expired.
6.5 Historic Resource Estimate
GFPC reported a historical resource of 430,000 tonnes at 2 g/t Au, 22 g/t Ag and 0.5 % Cu based on 10 diamond drillholes totaling 892.75 m at the Venida pit (Delfin and Tauli, 1990). This is a historic resource estimate and is not classified under CIM guidelines. The inputs and assumptions used for this estimate are not known. The QP has not done sufficient work to classify the historical estimate as a current resource estimate and is not treating the historical estimate as a current resource estimate. Recent undocumented small-scale mining activities at Venida will have depleted this mineralization by an uncertain amount. RTG is not treating this historical estimate as current mineral resource or reserve and it is solely documented here for completeness. A new drilling programme will be required at Venida to determine what mineralization remains and to explore for extensions.
In November 2014 RTG issued a Mineral Resource Estimate via a NI 43-101 Technical Report (Green et al., 2014). This preliminary resource estimate is presented for completeness in Table 6.1 below.
Table 6.1 Mineral Resource Estimate as at November 2014 for the Mabilo Project
Classification Million Tonnes
Cu %
Au g/t
Ag g/t
Fe %
Cu Metal (Kt)
Au Oz ('000s)
Fe Metal (Kt)
Indicated 5.87 2.1 2.2 8.4 49.0 121.1 414.0 2,875.7 Inferred 5.50 1.5 1.7 12.9 39.0 84.3 302.0 2,145.6
6.6 Production from the Property
Approximately 3,000 tonnes of iron ore of unknown grade is reported to have been mined at Venida between 1963 and 1965 (Fernandez, 1965), exploiting a zone of massive magnetite near surface. The magnetite occurred as pods within a magnetite-garnet skarn with the largest pod being approximately 3 m x 8 m in area. Magnetite has been mined intermittently by small scale
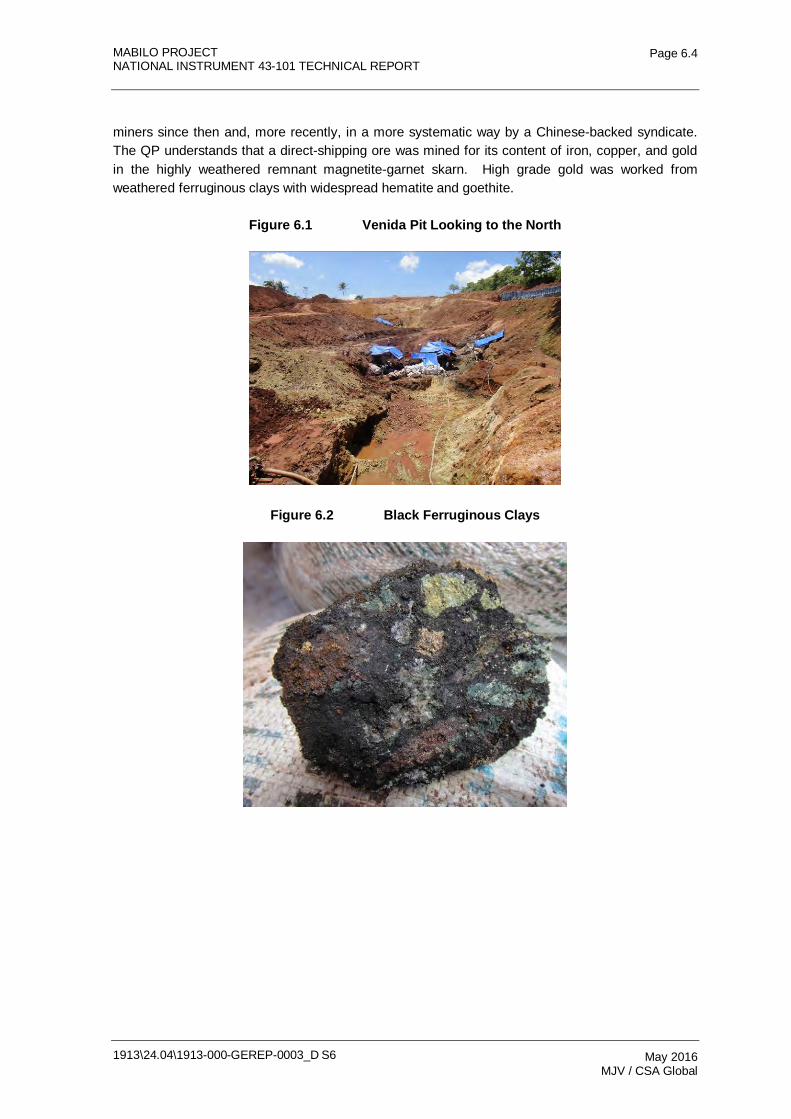
MABILO PROJECT NATIONAL INSTRUMENT 43-101 TECHNICAL REPORT
1913\24.04\1913-000-GEREP-0003_D S6
Page 6.4
May 2016 MJV / CSA Global
miners since then and, more recently, in a more systematic way by a Chinese-backed syndicate. The QP understands that a direct-shipping ore was mined for its content of iron, copper, and gold in the highly weathered remnant magnetite-garnet skarn. High grade gold was worked from weathered ferruginous clays with widespread hematite and goethite.
Figure 6.1 Venida Pit Looking to the North
Figure 6.2 Black Ferruginous Clays
MABILO PROJECT
NATIONAL INSTRUMENT 43-101 TECHNICAL REPORT
1913-000-GEREP-0003
Table of Contents Page
7.0 GEOLOGICAL SETTING AND MINERALIZATION 7.1 7.1 Regional Setting 7.1 7.2 Paracale District Geology 7.2 7.3 Paracale District Mineralization 7.3 7.4 Mabilo Property Geology 7.4 7.5 Mabilo Area Alteration and Mineralization 7.6
FIGURES Figure 7.1 Philippine Magmatic Arc Belts 7.1 Figure 7.2 Summary Geology and Mineral Occurrences in the Paracale District 7.3 Figure 7.3 Quartz Diorite 7.4 Figure 7.4 Mabilo Local Geology 7.5 Figure 7.5 Massive Magnetite Skarn 7.7 Figure 7.6 Crudely Banded Massive Magnetite Skarn with Remnant Calc-silicate
Band on Left 7.8 Figure 7.7 High-grade Chalcopyrite in Magnetite Skarn 7.8 Figure 7.8 Garnet (gt) Skarn with High-grade Chalcopyrite (cpy) Mineralization
and no Magnetite 7.9 Figure 7.9 Massive Garnet Skarn Strongly Retrogressed to Epidote, Sericite and
Chlorite 7.9 Figure 7.10 Hornfels after Siltstone and Calcareous Siltstone 7.10 Figure 7.11 Magnetite Skarn with Strong Retrograde Pyrite Overprint 7.11 Figure 7.12 Vuggy Silica-pyrite Altered Breccia with Arsenopyrite 7.11 Figure 7.13 High-grade Bornite Associated with Pyrite Overprint of Magnetite
Skarn 7.12 Figure 7.14 Oxidized Hematitic Mineralization After Massive Magnetite Skarn 7.13
1913\24.04\1913-000-GEREP-0003_D S7 May 2016 CSA Global
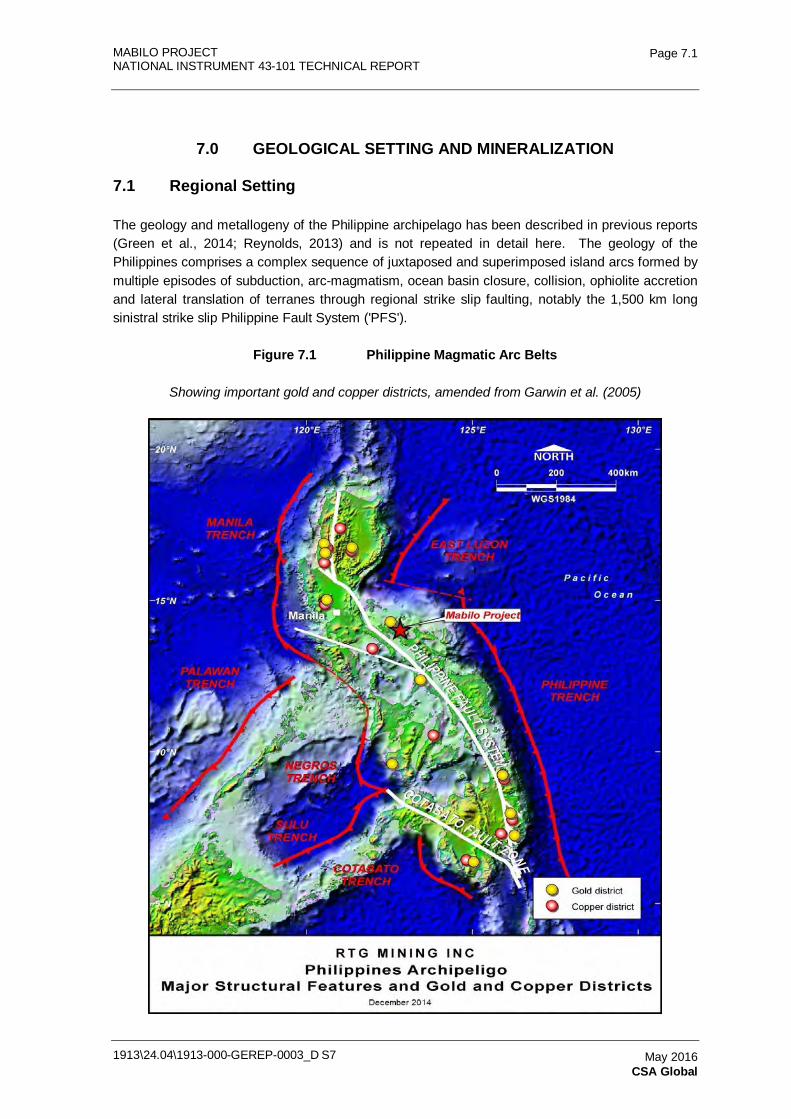
MABILO PROJECT NATIONAL INSTRUMENT 43-101 TECHNICAL REPORT
1913\24.04\1913-000-GEREP-0003_D S7
Page 7.1
May 2016 CSA Global
7.0 GEOLOGICAL SETTING AND MINERALIZATION
7.1 Regional Setting
The geology and metallogeny of the Philippine archipelago has been described in previous reports (Green et al., 2014; Reynolds, 2013) and is not repeated in detail here. The geology of the Philippines comprises a complex sequence of juxtaposed and superimposed island arcs formed by multiple episodes of subduction, arc-magmatism, ocean basin closure, collision, ophiolite accretion and lateral translation of terranes through regional strike slip faulting, notably the 1,500 km long sinistral strike slip Philippine Fault System ('PFS').
Figure 7.1 Philippine Magmatic Arc Belts
Showing important gold and copper districts, amended from Garwin et al. (2005)
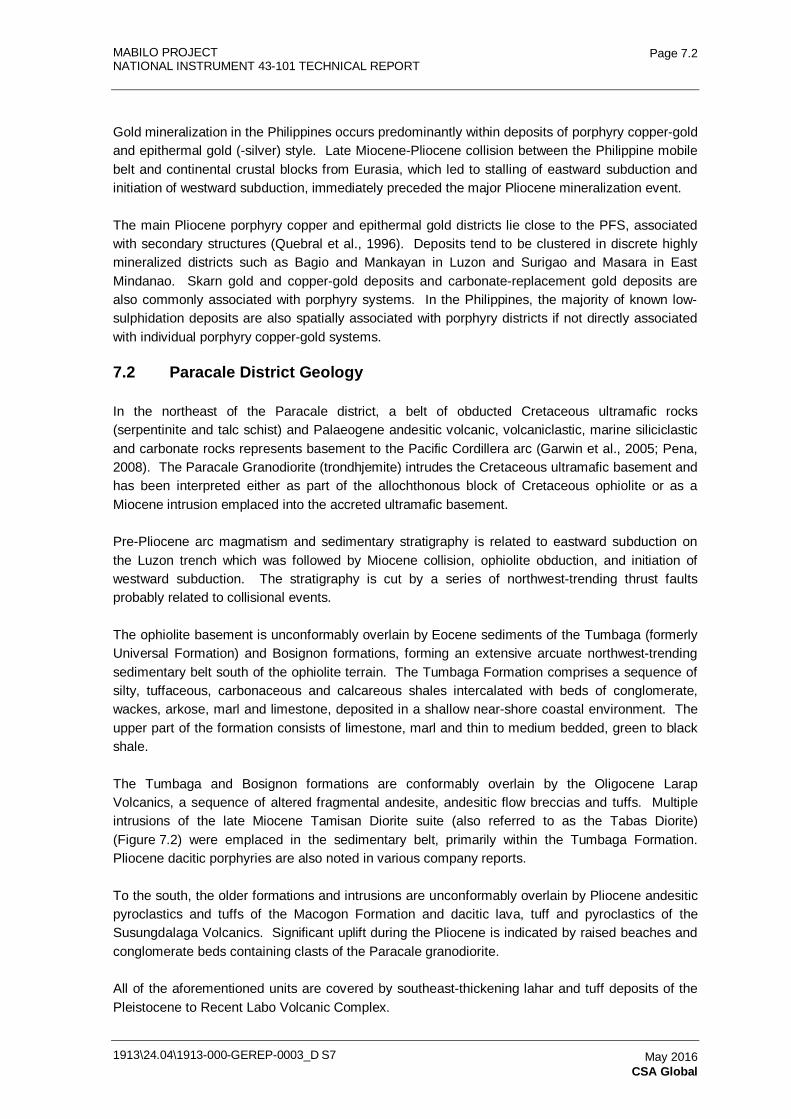
MABILO PROJECT NATIONAL INSTRUMENT 43-101 TECHNICAL REPORT
1913\24.04\1913-000-GEREP-0003_D S7
Page 7.2
May 2016 CSA Global
Gold mineralization in the Philippines occurs predominantly within deposits of porphyry copper-gold and epithermal gold (-silver) style. Late Miocene-Pliocene collision between the Philippine mobile belt and continental crustal blocks from Eurasia, which led to stalling of eastward subduction and initiation of westward subduction, immediately preceded the major Pliocene mineralization event.
The main Pliocene porphyry copper and epithermal gold districts lie close to the PFS, associated with secondary structures (Quebral et al., 1996). Deposits tend to be clustered in discrete highly mineralized districts such as Bagio and Mankayan in Luzon and Surigao and Masara in East Mindanao. Skarn gold and copper-gold deposits and carbonate-replacement gold deposits are also commonly associated with porphyry systems. In the Philippines, the majority of known low-sulphidation deposits are also spatially associated with porphyry districts if not directly associated with individual porphyry copper-gold systems.
7.2 Paracale District Geology
In the northeast of the Paracale district, a belt of obducted Cretaceous ultramafic rocks (serpentinite and talc schist) and Palaeogene andesitic volcanic, volcaniclastic, marine siliciclastic and carbonate rocks represents basement to the Pacific Cordillera arc (Garwin et al., 2005; Pena, 2008). The Paracale Granodiorite (trondhjemite) intrudes the Cretaceous ultramafic basement and has been interpreted either as part of the allochthonous block of Cretaceous ophiolite or as a Miocene intrusion emplaced into the accreted ultramafic basement.
Pre-Pliocene arc magmatism and sedimentary stratigraphy is related to eastward subduction on the Luzon trench which was followed by Miocene collision, ophiolite obduction, and initiation of westward subduction. The stratigraphy is cut by a series of northwest-trending thrust faults probably related to collisional events.
The ophiolite basement is unconformably overlain by Eocene sediments of the Tumbaga (formerly Universal Formation) and Bosignon formations, forming an extensive arcuate northwest-trending sedimentary belt south of the ophiolite terrain. The Tumbaga Formation comprises a sequence of silty, tuffaceous, carbonaceous and calcareous shales intercalated with beds of conglomerate, wackes, arkose, marl and limestone, deposited in a shallow near-shore coastal environment. The upper part of the formation consists of limestone, marl and thin to medium bedded, green to black shale.
The Tumbaga and Bosignon formations are conformably overlain by the Oligocene Larap Volcanics, a sequence of altered fragmental andesite, andesitic flow breccias and tuffs. Multiple intrusions of the late Miocene Tamisan Diorite suite (also referred to as the Tabas Diorite) (Figure 7.2) were emplaced in the sedimentary belt, primarily within the Tumbaga Formation. Pliocene dacitic porphyries are also noted in various company reports.
To the south, the older formations and intrusions are unconformably overlain by Pliocene andesitic pyroclastics and tuffs of the Macogon Formation and dacitic lava, tuff and pyroclastics of the Susungdalaga Volcanics. Significant uplift during the Pliocene is indicated by raised beaches and conglomerate beds containing clasts of the Paracale granodiorite.
All of the aforementioned units are covered by southeast-thickening lahar and tuff deposits of the Pleistocene to Recent Labo Volcanic Complex.
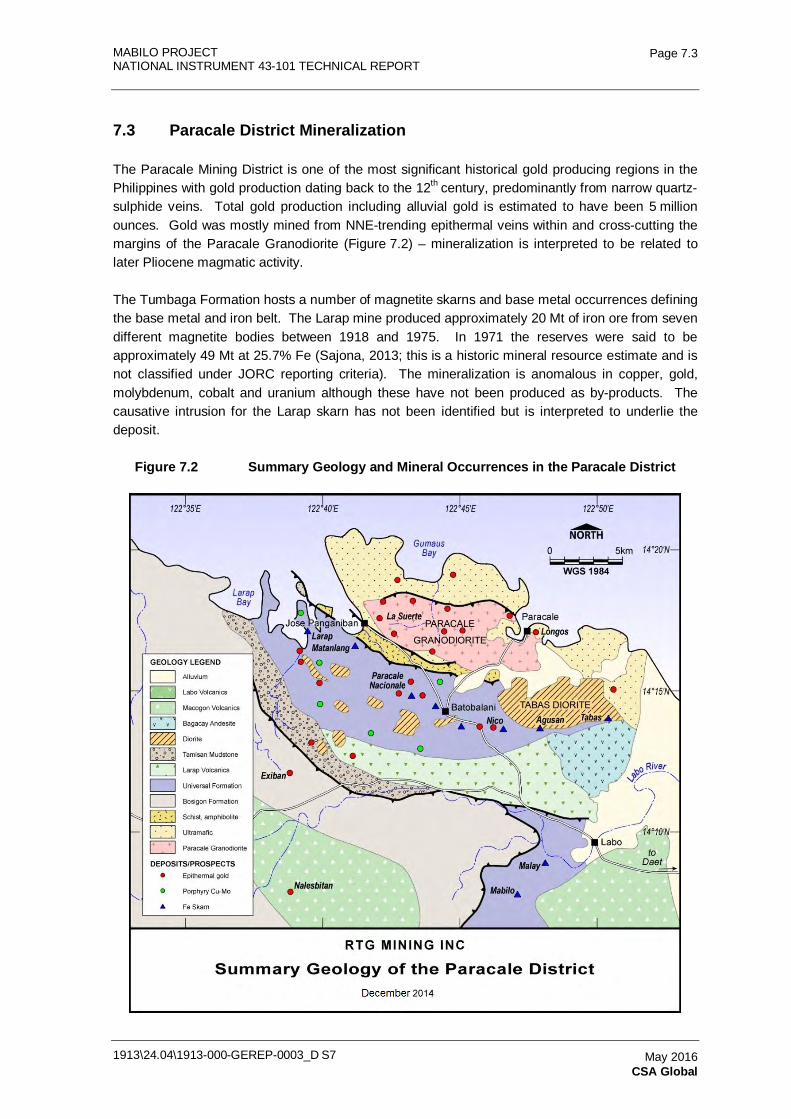
MABILO PROJECT NATIONAL INSTRUMENT 43-101 TECHNICAL REPORT
1913\24.04\1913-000-GEREP-0003_D S7
Page 7.3
May 2016 CSA Global
7.3 Paracale District Mineralization
The Paracale Mining District is one of the most significant historical gold producing regions in the Philippines with gold production dating back to the 12th century, predominantly from narrow quartz-sulphide veins. Total gold production including alluvial gold is estimated to have been 5 million ounces. Gold was mostly mined from NNE-trending epithermal veins within and cross-cutting the margins of the Paracale Granodiorite (Figure 7.2) – mineralization is interpreted to be related to later Pliocene magmatic activity.
The Tumbaga Formation hosts a number of magnetite skarns and base metal occurrences defining the base metal and iron belt. The Larap mine produced approximately 20 Mt of iron ore from seven different magnetite bodies between 1918 and 1975. In 1971 the reserves were said to be approximately 49 Mt at 25.7% Fe (Sajona, 2013; this is a historic mineral resource estimate and is not classified under JORC reporting criteria). The mineralization is anomalous in copper, gold, molybdenum, cobalt and uranium although these have not been produced as by-products. The causative intrusion for the Larap skarn has not been identified but is interpreted to underlie the deposit.
Figure 7.2 Summary Geology and Mineral Occurrences in the Paracale District
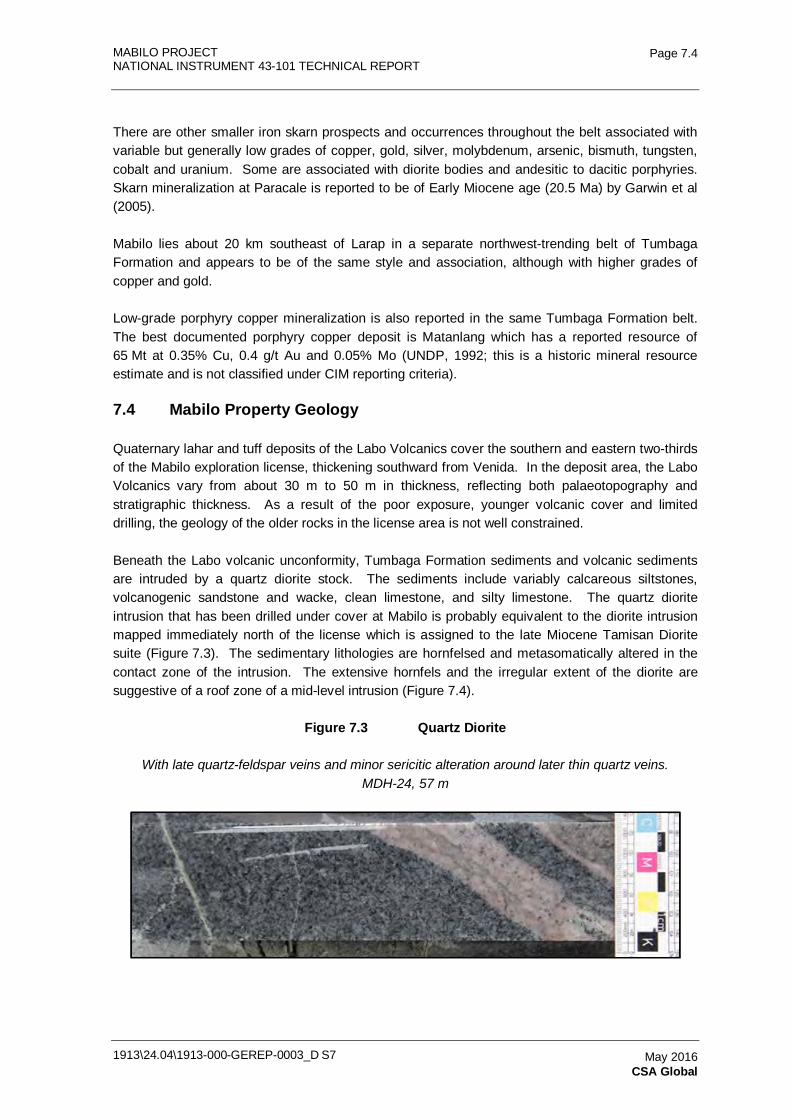
MABILO PROJECT NATIONAL INSTRUMENT 43-101 TECHNICAL REPORT
1913\24.04\1913-000-GEREP-0003_D S7
Page 7.4
May 2016 CSA Global
There are other smaller iron skarn prospects and occurrences throughout the belt associated with variable but generally low grades of copper, gold, silver, molybdenum, arsenic, bismuth, tungsten, cobalt and uranium. Some are associated with diorite bodies and andesitic to dacitic porphyries. Skarn mineralization at Paracale is reported to be of Early Miocene age (20.5 Ma) by Garwin et al (2005).
Mabilo lies about 20 km southeast of Larap in a separate northwest-trending belt of Tumbaga Formation and appears to be of the same style and association, although with higher grades of copper and gold.
Low-grade porphyry copper mineralization is also reported in the same Tumbaga Formation belt. The best documented porphyry copper deposit is Matanlang which has a reported resource of 65 Mt at 0.35% Cu, 0.4 g/t Au and 0.05% Mo (UNDP, 1992; this is a historic mineral resource estimate and is not classified under CIM reporting criteria).
7.4 Mabilo Property Geology
Quaternary lahar and tuff deposits of the Labo Volcanics cover the southern and eastern two-thirds of the Mabilo exploration license, thickening southward from Venida. In the deposit area, the Labo Volcanics vary from about 30 m to 50 m in thickness, reflecting both palaeotopography and stratigraphic thickness. As a result of the poor exposure, younger volcanic cover and limited drilling, the geology of the older rocks in the license area is not well constrained.
Beneath the Labo volcanic unconformity, Tumbaga Formation sediments and volcanic sediments are intruded by a quartz diorite stock. The sediments include variably calcareous siltstones, volcanogenic sandstone and wacke, clean limestone, and silty limestone. The quartz diorite intrusion that has been drilled under cover at Mabilo is probably equivalent to the diorite intrusion mapped immediately north of the license which is assigned to the late Miocene Tamisan Diorite suite (Figure 7.3). The sedimentary lithologies are hornfelsed and metasomatically altered in the contact zone of the intrusion. The extensive hornfels and the irregular extent of the diorite are suggestive of a roof zone of a mid-level intrusion (Figure 7.4).
Figure 7.3 Quartz Diorite
With late quartz-feldspar veins and minor sericitic alteration around later thin quartz veins. MDH-24, 57 m
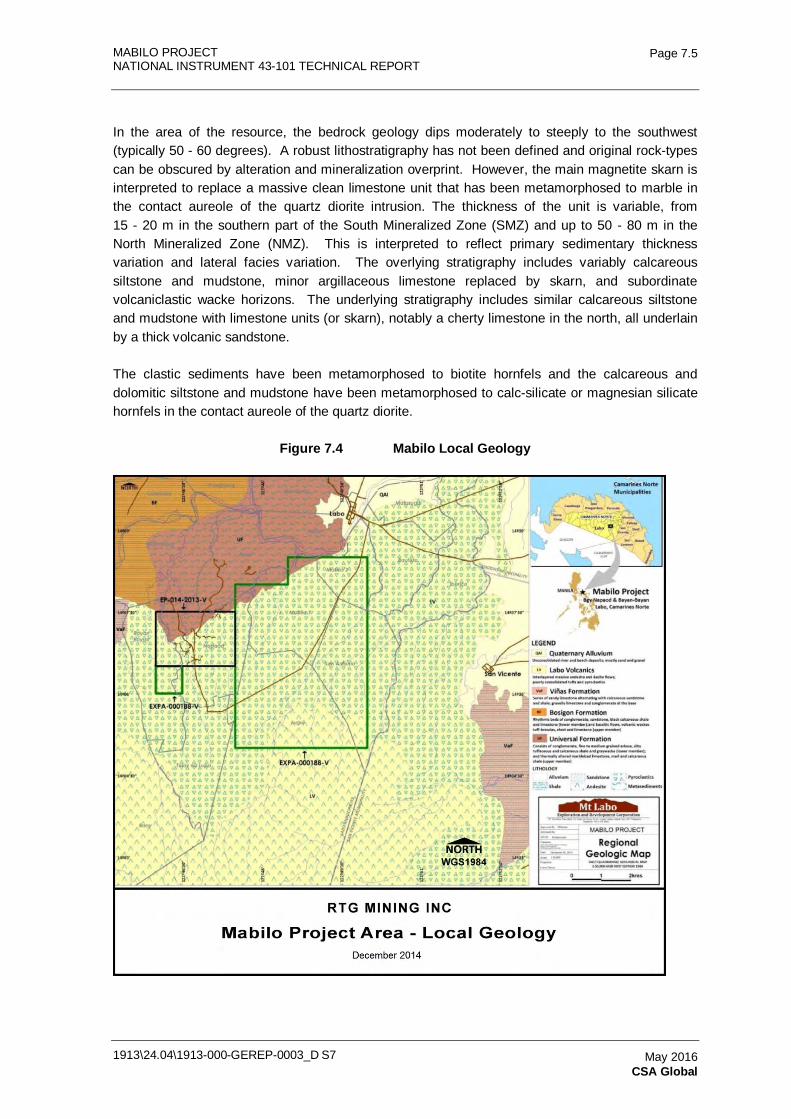
MABILO PROJECT NATIONAL INSTRUMENT 43-101 TECHNICAL REPORT
1913\24.04\1913-000-GEREP-0003_D S7
Page 7.5
May 2016 CSA Global
In the area of the resource, the bedrock geology dips moderately to steeply to the southwest (typically 50 - 60 degrees). A robust lithostratigraphy has not been defined and original rock-types can be obscured by alteration and mineralization overprint. However, the main magnetite skarn is interpreted to replace a massive clean limestone unit that has been metamorphosed to marble in the contact aureole of the quartz diorite intrusion. The thickness of the unit is variable, from 15 - 20 m in the southern part of the South Mineralized Zone (SMZ) and up to 50 - 80 m in the North Mineralized Zone (NMZ). This is interpreted to reflect primary sedimentary thickness variation and lateral facies variation. The overlying stratigraphy includes variably calcareous siltstone and mudstone, minor argillaceous limestone replaced by skarn, and subordinate volcaniclastic wacke horizons. The underlying stratigraphy includes similar calcareous siltstone and mudstone with limestone units (or skarn), notably a cherty limestone in the north, all underlain by a thick volcanic sandstone.
The clastic sediments have been metamorphosed to biotite hornfels and the calcareous and dolomitic siltstone and mudstone have been metamorphosed to calc-silicate or magnesian silicate hornfels in the contact aureole of the quartz diorite.
Figure 7.4 Mabilo Local Geology
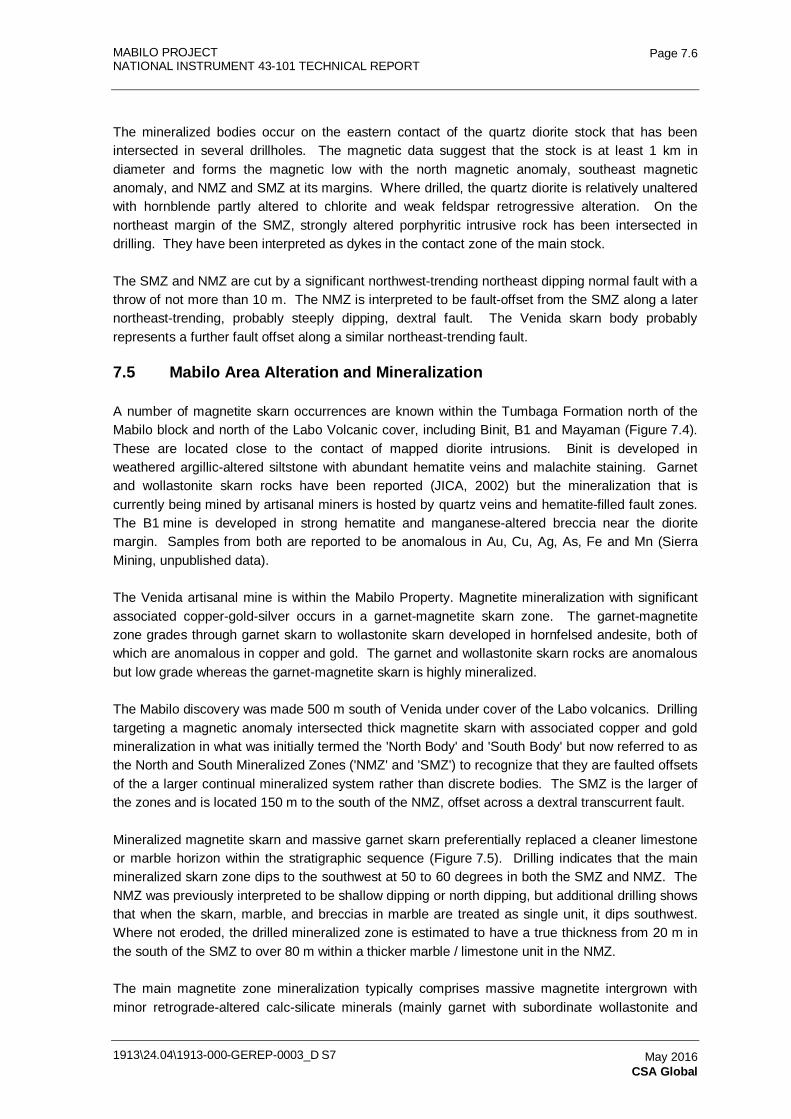
MABILO PROJECT NATIONAL INSTRUMENT 43-101 TECHNICAL REPORT
1913\24.04\1913-000-GEREP-0003_D S7
Page 7.6
May 2016 CSA Global
The mineralized bodies occur on the eastern contact of the quartz diorite stock that has been intersected in several drillholes. The magnetic data suggest that the stock is at least 1 km in diameter and forms the magnetic low with the north magnetic anomaly, southeast magnetic anomaly, and NMZ and SMZ at its margins. Where drilled, the quartz diorite is relatively unaltered with hornblende partly altered to chlorite and weak feldspar retrogressive alteration. On the northeast margin of the SMZ, strongly altered porphyritic intrusive rock has been intersected in drilling. They have been interpreted as dykes in the contact zone of the main stock.
The SMZ and NMZ are cut by a significant northwest-trending northeast dipping normal fault with a throw of not more than 10 m. The NMZ is interpreted to be fault-offset from the SMZ along a later northeast-trending, probably steeply dipping, dextral fault. The Venida skarn body probably represents a further fault offset along a similar northeast-trending fault.
7.5 Mabilo Area Alteration and Mineralization
A number of magnetite skarn occurrences are known within the Tumbaga Formation north of the Mabilo block and north of the Labo Volcanic cover, including Binit, B1 and Mayaman (Figure 7.4). These are located close to the contact of mapped diorite intrusions. Binit is developed in weathered argillic-altered siltstone with abundant hematite veins and malachite staining. Garnet and wollastonite skarn rocks have been reported (JICA, 2002) but the mineralization that is currently being mined by artisanal miners is hosted by quartz veins and hematite-filled fault zones. The B1 mine is developed in strong hematite and manganese-altered breccia near the diorite margin. Samples from both are reported to be anomalous in Au, Cu, Ag, As, Fe and Mn (Sierra Mining, unpublished data).
The Venida artisanal mine is within the Mabilo Property. Magnetite mineralization with significant associated copper-gold-silver occurs in a garnet-magnetite skarn zone. The garnet-magnetite zone grades through garnet skarn to wollastonite skarn developed in hornfelsed andesite, both of which are anomalous in copper and gold. The garnet and wollastonite skarn rocks are anomalous but low grade whereas the garnet-magnetite skarn is highly mineralized.
The Mabilo discovery was made 500 m south of Venida under cover of the Labo volcanics. Drilling targeting a magnetic anomaly intersected thick magnetite skarn with associated copper and gold mineralization in what was initially termed the 'North Body' and 'South Body' but now referred to as the North and South Mineralized Zones ('NMZ' and 'SMZ') to recognize that they are faulted offsets of the a larger continual mineralized system rather than discrete bodies. The SMZ is the larger of the zones and is located 150 m to the south of the NMZ, offset across a dextral transcurrent fault.
Mineralized magnetite skarn and massive garnet skarn preferentially replaced a cleaner limestone or marble horizon within the stratigraphic sequence (Figure 7.5). Drilling indicates that the main mineralized skarn zone dips to the southwest at 50 to 60 degrees in both the SMZ and NMZ. The NMZ was previously interpreted to be shallow dipping or north dipping, but additional drilling shows that when the skarn, marble, and breccias in marble are treated as single unit, it dips southwest. Where not eroded, the drilled mineralized zone is estimated to have a true thickness from 20 m in the south of the SMZ to over 80 m within a thicker marble / limestone unit in the NMZ.
The main magnetite zone mineralization typically comprises massive magnetite intergrown with minor retrograde-altered calc-silicate minerals (mainly garnet with subordinate wollastonite and
MABILO PROJECT NATIONAL INSTRUMENT 43-101 TECHNICAL REPORT
1913\24.04\1913-000-GEREP-0003_D S7
Page 7.7
May 2016 CSA Global
pyroxene), chalcopyrite and late interstitial calcite (Figure 7.6, Figure 7.7). Copper and gold grades are closely correlated and commonly reach 5% Cu and 5 g/t Au in hypogene mineralization. The copper-gold grade of magnetite skarn is variable but averages about 1.7% Cu and 1.9 g/t Au with 7 g/t Ag and 40% Fe. In the deep southeast part of the SMZ, hypogene bornite in magnetite skarn is associated with high copper and gold grades (up to 3-8% Cu and 3-24 g/t Au).
There are indications of zonation within the skarn in time and space, with probably early barren magnetite, strongly mineralized magnetite showing equilibrium textures with chalcopyrite, and later barren magnetite. Typically magnetite skarn is in direct replacive contact with marble at the down-dip contact of the skarn zone without any zonation (Figure 7.5). Locally however, magnetite skarn grades down-dip into garnet skarn. More typically, garnet skarn occurs stratigraphically above or below magnetite skarn and shows zonation from red to green garnet, with variable copper-gold mineralization which can be of significant grade. In the SMZ, a separate mineralized garnet skarn horizon occurs in the stratigraphic hangingwall of the main magnetite skarn.
Figure 7.5 Massive Magnetite Skarn
In sharp interfingering down-dip contact with white marble after limestone. MDH-46, 280 m
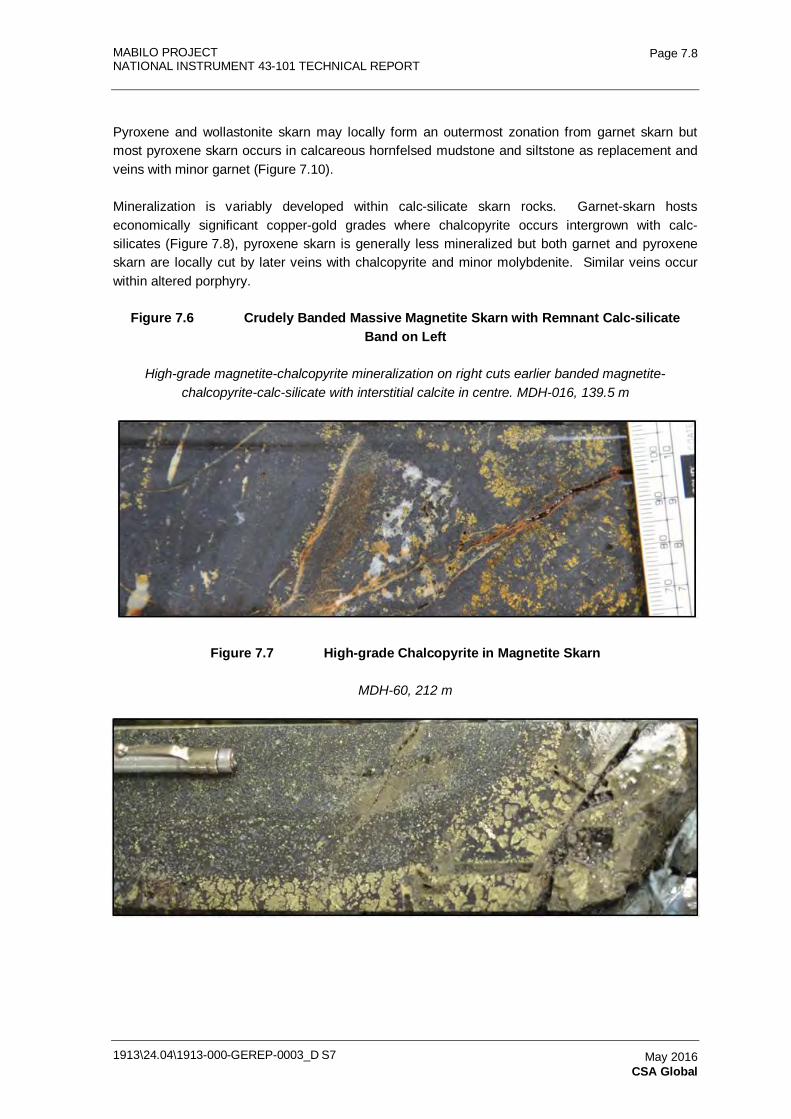
MABILO PROJECT NATIONAL INSTRUMENT 43-101 TECHNICAL REPORT
1913\24.04\1913-000-GEREP-0003_D S7
Page 7.8
May 2016 CSA Global
Pyroxene and wollastonite skarn may locally form an outermost zonation from garnet skarn but most pyroxene skarn occurs in calcareous hornfelsed mudstone and siltstone as replacement and veins with minor garnet (Figure 7.10).
Mineralization is variably developed within calc-silicate skarn rocks. Garnet-skarn hosts economically significant copper-gold grades where chalcopyrite occurs intergrown with calc-silicates (Figure 7.8), pyroxene skarn is generally less mineralized but both garnet and pyroxene skarn are locally cut by later veins with chalcopyrite and minor molybdenite. Similar veins occur within altered porphyry.
Figure 7.6 Crudely Banded Massive Magnetite Skarn with Remnant Calc-silicate Band on Left
High-grade magnetite-chalcopyrite mineralization on right cuts earlier banded magnetite-chalcopyrite-calc-silicate with interstitial calcite in centre. MDH-016, 139.5 m
Figure 7.7 High-grade Chalcopyrite in Magnetite Skarn
MDH-60, 212 m
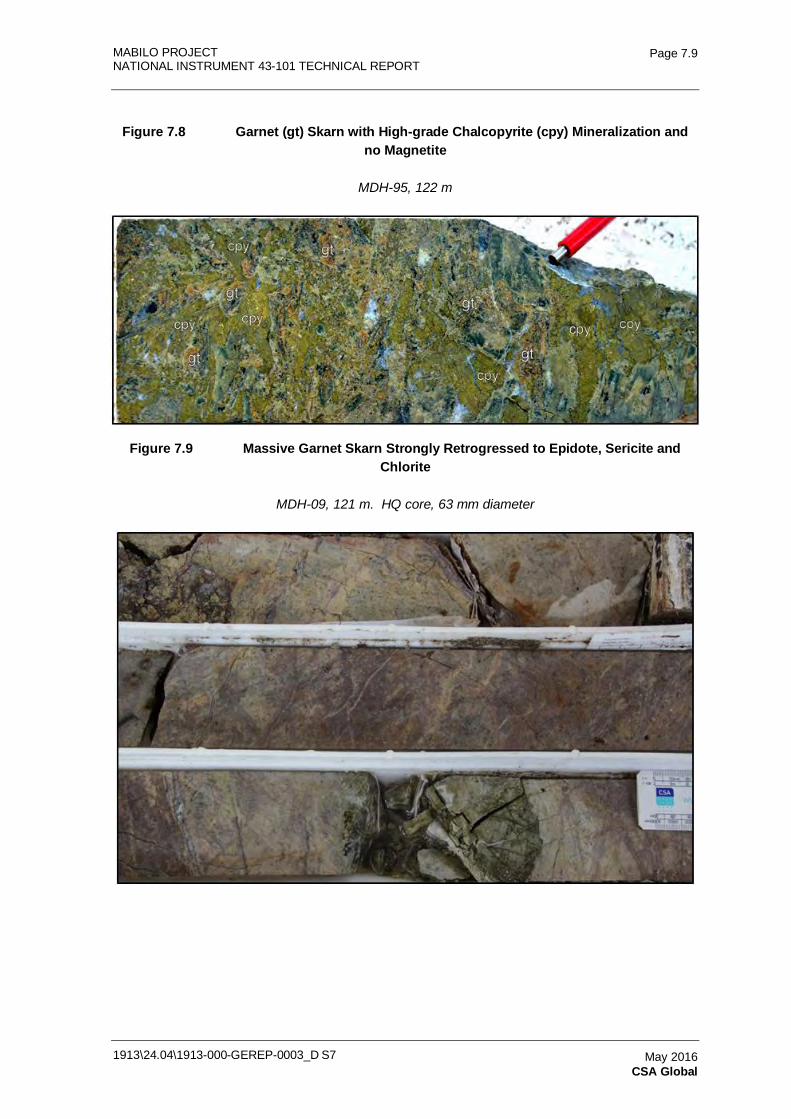
MABILO PROJECT NATIONAL INSTRUMENT 43-101 TECHNICAL REPORT
1913\24.04\1913-000-GEREP-0003_D S7
Page 7.9
May 2016 CSA Global
Figure 7.8 Garnet (gt) Skarn with High-grade Chalcopyrite (cpy) Mineralization and no Magnetite
MDH-95, 122 m
Figure 7.9 Massive Garnet Skarn Strongly Retrogressed to Epidote, Sericite and Chlorite
MDH-09, 121 m. HQ core, 63 mm diameter
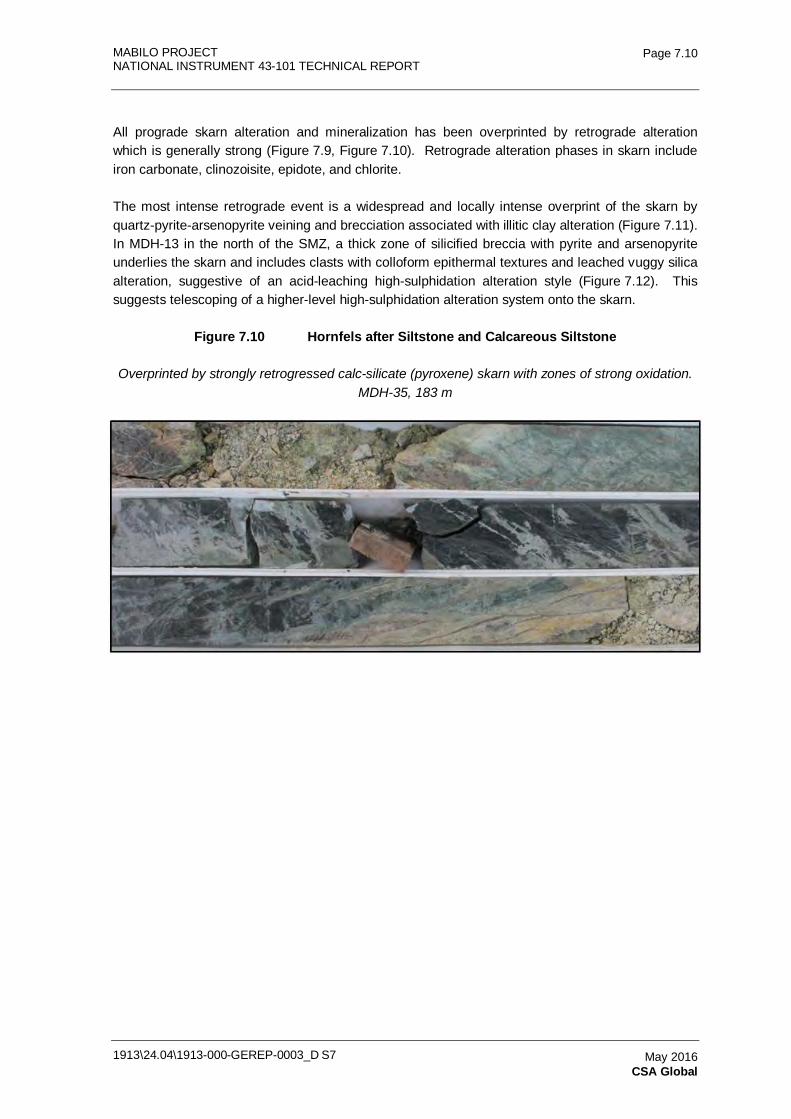
MABILO PROJECT NATIONAL INSTRUMENT 43-101 TECHNICAL REPORT
1913\24.04\1913-000-GEREP-0003_D S7
Page 7.10
May 2016 CSA Global
All prograde skarn alteration and mineralization has been overprinted by retrograde alteration which is generally strong (Figure 7.9, Figure 7.10). Retrograde alteration phases in skarn include iron carbonate, clinozoisite, epidote, and chlorite.
The most intense retrograde event is a widespread and locally intense overprint of the skarn by quartz-pyrite-arsenopyrite veining and brecciation associated with illitic clay alteration (Figure 7.11). In MDH-13 in the north of the SMZ, a thick zone of silicified breccia with pyrite and arsenopyrite underlies the skarn and includes clasts with colloform epithermal textures and leached vuggy silica alteration, suggestive of an acid-leaching high-sulphidation alteration style (Figure 7.12). This suggests telescoping of a higher-level high-sulphidation alteration system onto the skarn.
Figure 7.10 Hornfels after Siltstone and Calcareous Siltstone
Overprinted by strongly retrogressed calc-silicate (pyroxene) skarn with zones of strong oxidation. MDH-35, 183 m
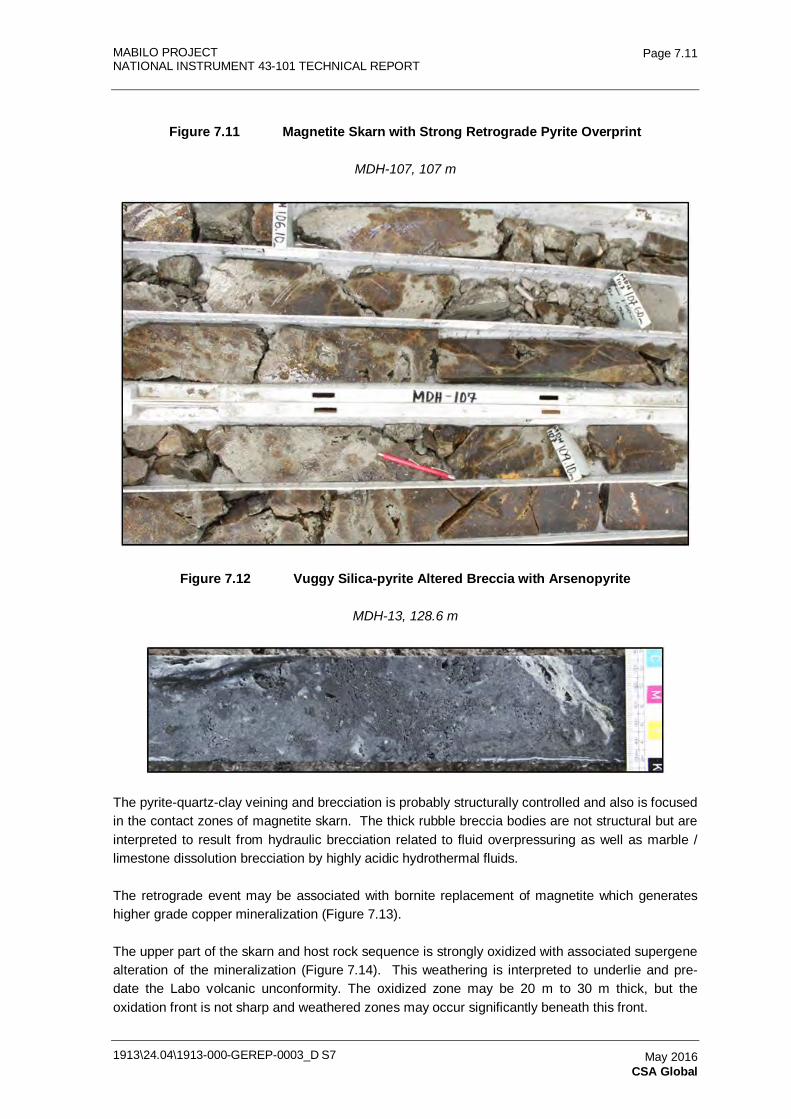
MABILO PROJECT NATIONAL INSTRUMENT 43-101 TECHNICAL REPORT
1913\24.04\1913-000-GEREP-0003_D S7
Page 7.11
May 2016 CSA Global
Figure 7.11 Magnetite Skarn with Strong Retrograde Pyrite Overprint
MDH-107, 107 m
Figure 7.12 Vuggy Silica-pyrite Altered Breccia with Arsenopyrite
MDH-13, 128.6 m
The pyrite-quartz-clay veining and brecciation is probably structurally controlled and also is focused in the contact zones of magnetite skarn. The thick rubble breccia bodies are not structural but are interpreted to result from hydraulic brecciation related to fluid overpressuring as well as marble / limestone dissolution brecciation by highly acidic hydrothermal fluids.
The retrograde event may be associated with bornite replacement of magnetite which generates higher grade copper mineralization (Figure 7.13).
The upper part of the skarn and host rock sequence is strongly oxidized with associated supergene alteration of the mineralization (Figure 7.14). This weathering is interpreted to underlie and pre-date the Labo volcanic unconformity. The oxidized zone may be 20 m to 30 m thick, but the oxidation front is not sharp and weathered zones may occur significantly beneath this front.
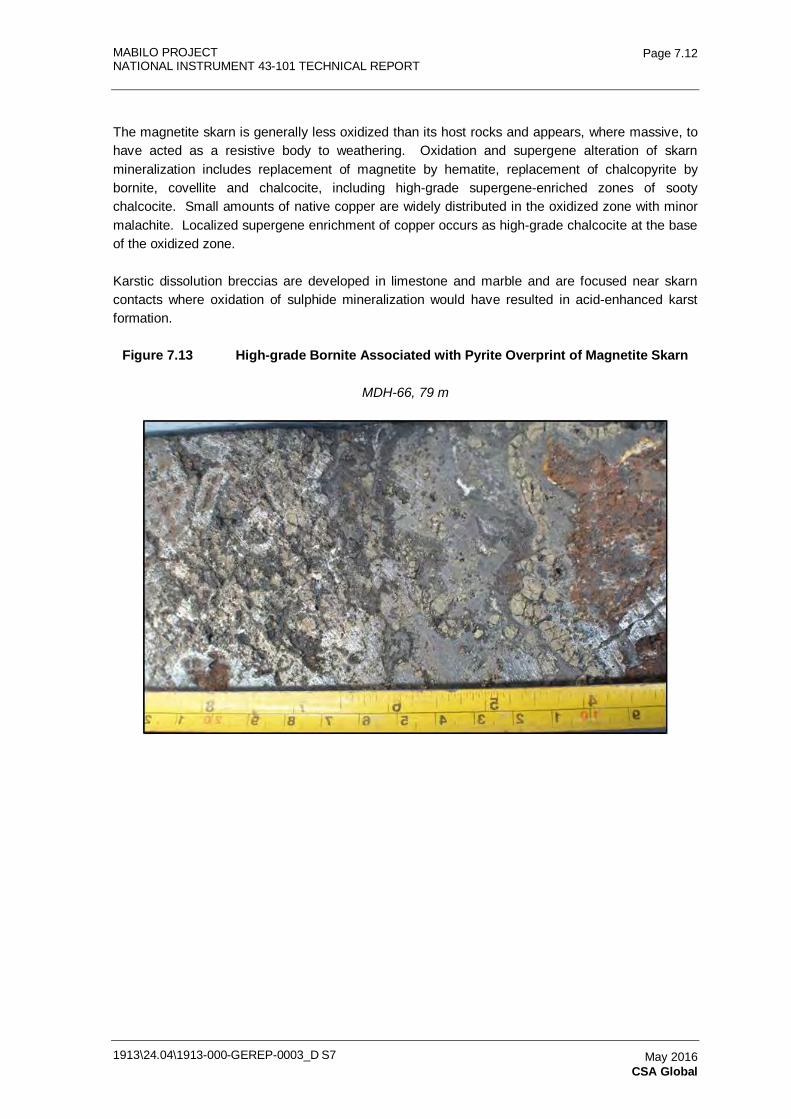
MABILO PROJECT NATIONAL INSTRUMENT 43-101 TECHNICAL REPORT
1913\24.04\1913-000-GEREP-0003_D S7
Page 7.12
May 2016 CSA Global
The magnetite skarn is generally less oxidized than its host rocks and appears, where massive, to have acted as a resistive body to weathering. Oxidation and supergene alteration of skarn mineralization includes replacement of magnetite by hematite, replacement of chalcopyrite by bornite, covellite and chalcocite, including high-grade supergene-enriched zones of sooty chalcocite. Small amounts of native copper are widely distributed in the oxidized zone with minor malachite. Localized supergene enrichment of copper occurs as high-grade chalcocite at the base of the oxidized zone.
Karstic dissolution breccias are developed in limestone and marble and are focused near skarn contacts where oxidation of sulphide mineralization would have resulted in acid-enhanced karst formation.
Figure 7.13 High-grade Bornite Associated with Pyrite Overprint of Magnetite Skarn
MDH-66, 79 m
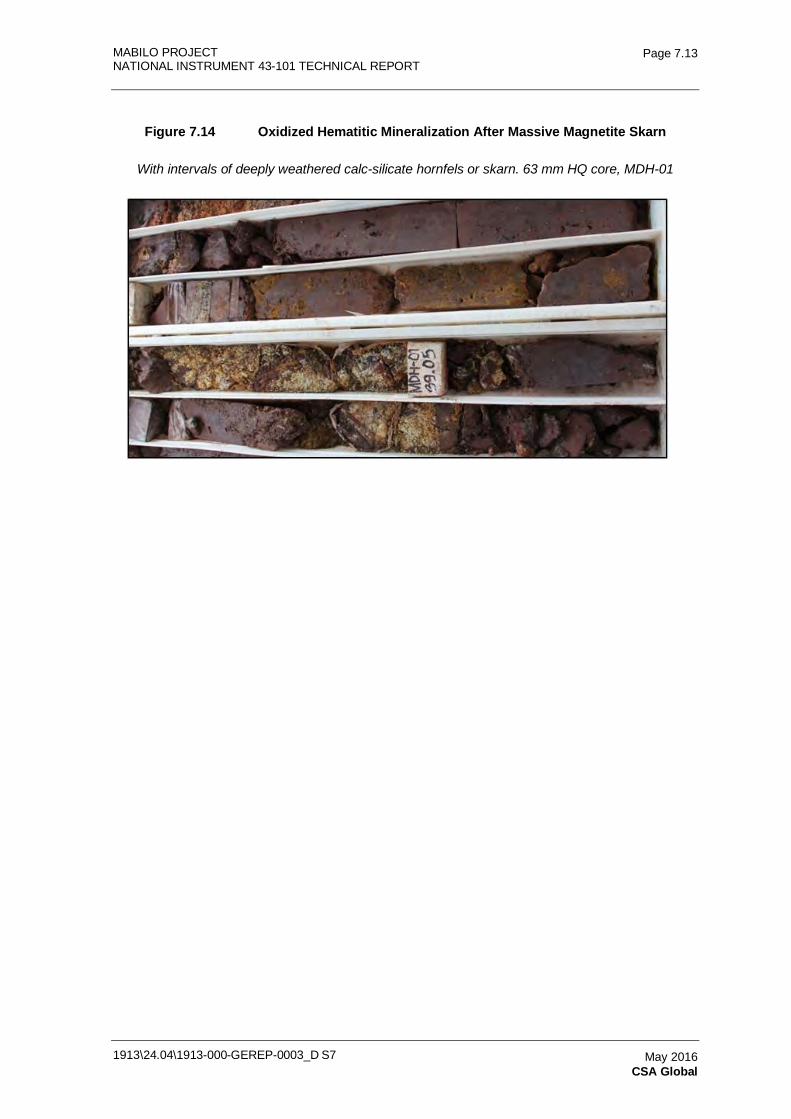
MABILO PROJECT NATIONAL INSTRUMENT 43-101 TECHNICAL REPORT
1913\24.04\1913-000-GEREP-0003_D S7
Page 7.13
May 2016 CSA Global
Figure 7.14 Oxidized Hematitic Mineralization After Massive Magnetite Skarn
With intervals of deeply weathered calc-silicate hornfels or skarn. 63 mm HQ core, MDH-01
MABILO PROJECT
NATIONAL INSTRUMENT 43-101 TECHNICAL REPORT
1913-000-GEREP-0003
Table of Contents Page
8.0 DEPOSIT TYPES 8.1 8.1 Mabilo Deposit Types 8.1
FIGURES Figure 8.1 Diagrammatic Illustration of Skarn Formation 8.1
1913\24.04\1913-000-GEREP-0003_D S8 May 2016 CSA Global
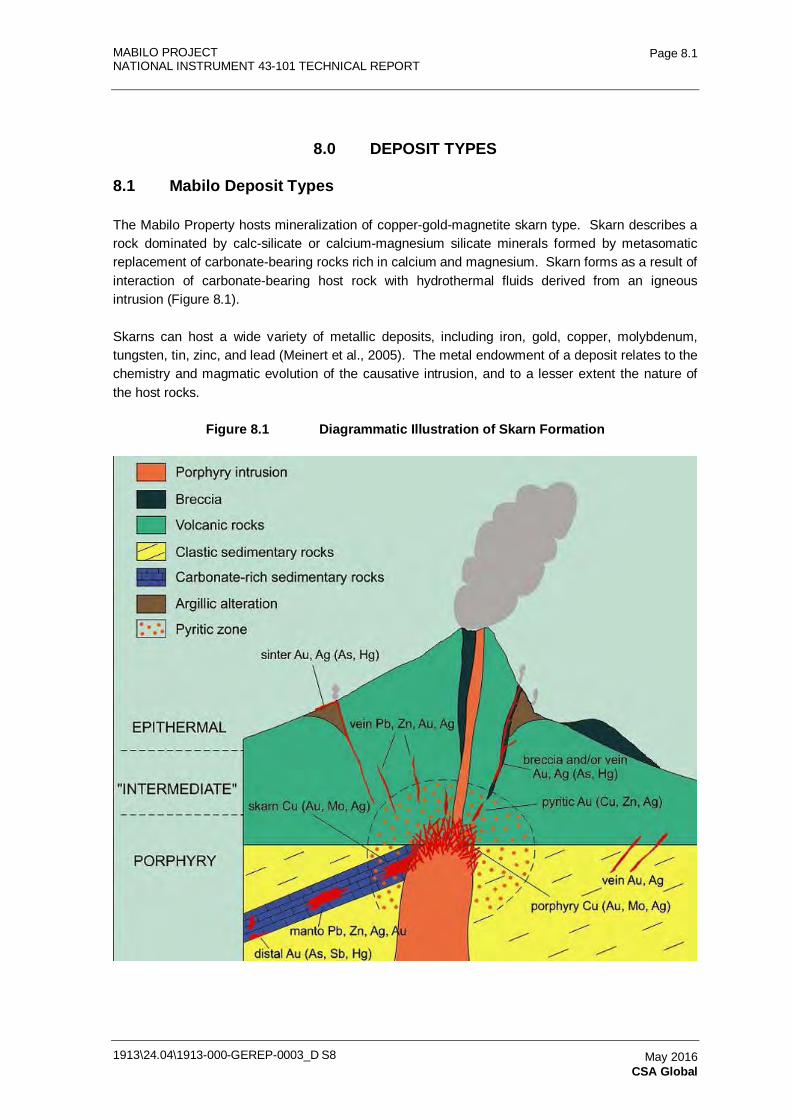
MABILO PROJECT NATIONAL INSTRUMENT 43-101 TECHNICAL REPORT
1913\24.04\1913-000-GEREP-0003_D S8
Page 8.1
May 2016 CSA Global
8.0 DEPOSIT TYPES
8.1 Mabilo Deposit Types
The Mabilo Property hosts mineralization of copper-gold-magnetite skarn type. Skarn describes a rock dominated by calc-silicate or calcium-magnesium silicate minerals formed by metasomatic replacement of carbonate-bearing rocks rich in calcium and magnesium. Skarn forms as a result of interaction of carbonate-bearing host rock with hydrothermal fluids derived from an igneous intrusion (Figure 8.1).
Skarns can host a wide variety of metallic deposits, including iron, gold, copper, molybdenum, tungsten, tin, zinc, and lead (Meinert et al., 2005). The metal endowment of a deposit relates to the chemistry and magmatic evolution of the causative intrusion, and to a lesser extent the nature of the host rocks.
Figure 8.1 Diagrammatic Illustration of Skarn Formation
MABILO PROJECT NATIONAL INSTRUMENT 43-101 TECHNICAL REPORT
1913\24.04\1913-000-GEREP-0003_D S8
Page 8.2
May 2016 CSA Global
Copper-gold-magnetite skarn deposits are a relatively common type of skarn deposit, typically associated with mid-level intermediate calc-alkaline intrusions cutting carbonate rocks in magmatic arcs. Copper-gold-magnetite skarn deposits are commonly associated with mineralized copper-gold porphyry systems; the largest example is the Ertsberg and other skarn deposits associated with the Grasberg porphyry deposit in the Papua province of Indonesia. However skarn deposits may also be associated with porphyries that do not host economic porphyry-style mineralization and with deeper level intrusions.
Skarn copper-gold-magnetite is considered to be the primary target at the Mabilo Property. While the occurrence of copper-gold-magnetite skarn may suggest some potential for porphyry copper-gold mineralization, no indication of this type of mineralization has been encountered and no porphyritic intrusions have been identified. There may also be potential for epithermal gold mineralization, but this is also a secondary target; pyrite-quartz overprint of the known skarn is of epithermal style, but is not known to be gold-mineralized.
MABILO PROJECT
NATIONAL INSTRUMENT 43-101 TECHNICAL REPORT
1913-000-GEREP-0003
Table of Contents Page
9.0 EXPLORATION 9.1 9.1 Previous Exploration 9.1 9.2 Exploration by MLEDC 9.1
9.2.1 2012 Drilling Programme 9.1 9.3 Mt. Labo 2012 Ground Magnetic Reprocessing 9.4 9.4 Mt. Labo 2013 Ground Magnetic Survey 9.4 9.5 Regional Exploration Potential 9.7 9.6 Porphyry Copper Potential 9.7
TABLES Table 9.1 Table Showing 2012 MLEDC Drillhole Locations and Orientations.
Coordinates in WGS84 (51N) Projection 9.2 FIGURES Figure 9.1 Modeled Magnetic Anomalies from Eldore in 2007 9.3 Figure 9.2 2012 Drillhole Location Map 9.4 Figure 9.3 RTP Image of Ground Magnetic Data for the Mabilo Property 9.5 Figure 9.4 2013 survey 3D magnetic models on TMI RTP image 9.6 Figure 9.5 Local RTP Magnetic Image of the 2013 survey for the Mabilo Deposit
showing 3D magnetic models and drill collars 9.6 Figure 9.6 Areas of Proposed Ground Magnetic Surveys in EXPA 188 9.7
1913\24.04\1913-000-GEREP-0003_D S9 May 2016 CSA Global
MABILO PROJECT NATIONAL INSTRUMENT 43-101 TECHNICAL REPORT
1913\24.04\1913-000-GEREP-0003_D S9
Page 9.1
May 2016 CSA Global
9.0 EXPLORATION
9.1 Previous Exploration
The only significant previous exploration on the Property was by GFPC in 1988-89. GFPC conducted regional stream sediment sampling, base of soil profile sampling on 50 m intervals, channel sampling of pits and trenches, and a ground magnetic survey over an 800 m by 300 m area centered on and including the Venida pit (Delfin and Tauli, 1990).
GFPC subsequently drilled 10 diamond drillholes (totaling 892.75 m) in the garnet-magnetite skarn surrounding the magnetite zones previously mined in the Venida pit. A number of gold-silver-copper mineralized intersections were reported. GFPC concluded that their drill pattern had not closed off the southern extension of the shallowly dipping deposit and recommended that at least two further holes be completed, but these were not drilled. Detailed information regarding drilling at Venida is not available.
In 1995, GFPC was acquired by Triarx Gold Corporation and the company name was changed to Eldore Mining Corporation ('Eldore'). Eldore conducted an extensive ground magnetic survey in the area in 2007 (Figure 9.1). The survey was initially conducted on 100 m spaced east-west lines and then infilled on 50 m spaced lines over a section of a large magnetic anomaly located to the south of Venida.
The survey used company staff and equipment hired from Alpha Geoscience in New South Wales, Australia. Modeling and drill targeting was completed by Dr Clive Foss of Encom Technology ('Encom'), in Sydney, Australia (Maude, 2012). Encom noted that the magnetic susceptibilities in the area to the south of Venida were extremely high and that the strong anomalous ‘lows’ (indicating highly magnetic rocks) were indicating magnetite mineralization. Encom modeled seven target bodies interpreted as the sources for the magnetic anomalies but Eldore did not drill the targets.
9.2 Exploration by MLEDC
9.2.1 2012 Drilling Programme
Sierra acquired its interest in Eldore and changed its name to Mt. Labo Exploration and Development Corporation (MLEDC) in November 2011, and commenced a 12 hole drilling program in 2012 for 1,660 meters (Table 9.1, Figure 9.2). MLEDC used models of the magnetic data as the primary tool for drill targeting (Figure 9.1). The first drilling program (MDH-01 to 12) targeted anomalies A, B, D, F and G from the Eldore magnetic survey and Encom modelling.
The reconnaissance drilling program resulted in the successful intersection of the NMZ and SMZ, discovering the two blind bodies of high grade Au and Cu mineralization in magnetite skarn within extensive zones of calcic skarn alteration of the Tumbaga Formation sediments.
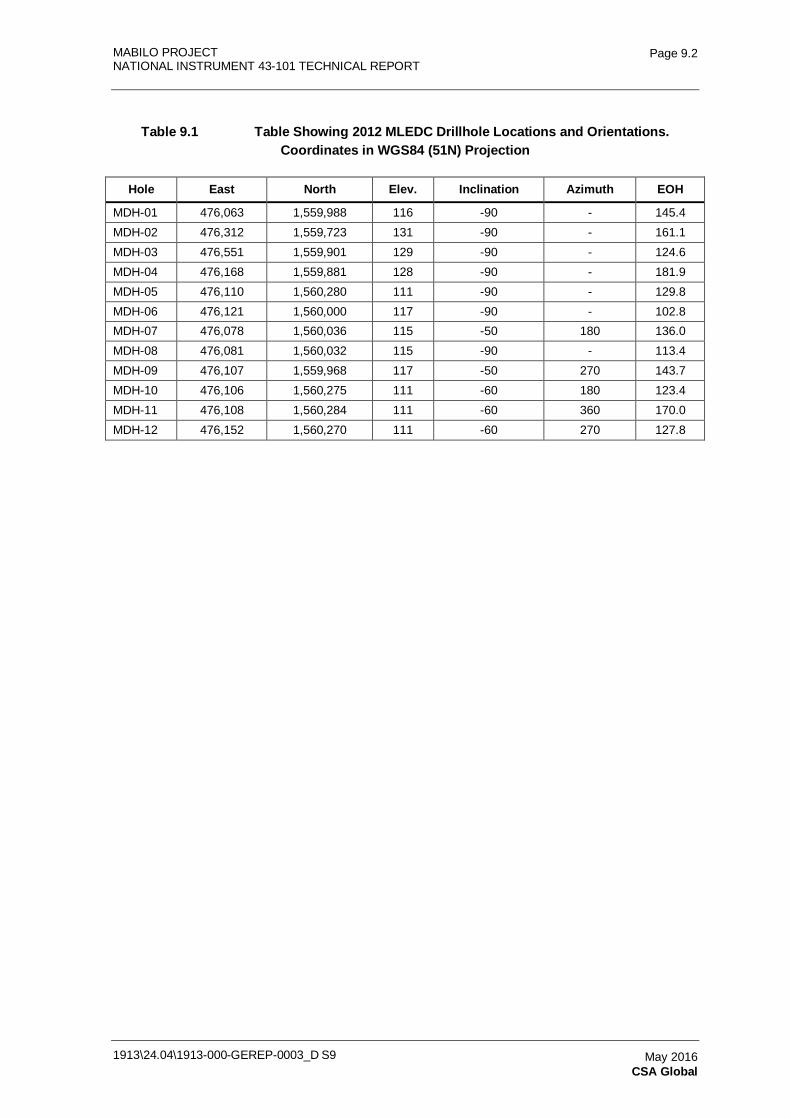
MABILO PROJECT NATIONAL INSTRUMENT 43-101 TECHNICAL REPORT
1913\24.04\1913-000-GEREP-0003_D S9
Page 9.2
May 2016 CSA Global
Table 9.1 Table Showing 2012 MLEDC Drillhole Locations and Orientations. Coordinates in WGS84 (51N) Projection
Hole East North Elev. Inclination Azimuth EOH
MDH-01 476,063 1,559,988 116 -90 - 145.4 MDH-02 476,312 1,559,723 131 -90 - 161.1 MDH-03 476,551 1,559,901 129 -90 - 124.6 MDH-04 476,168 1,559,881 128 -90 - 181.9 MDH-05 476,110 1,560,280 111 -90 - 129.8 MDH-06 476,121 1,560,000 117 -90 - 102.8 MDH-07 476,078 1,560,036 115 -50 180 136.0 MDH-08 476,081 1,560,032 115 -90 - 113.4 MDH-09 476,107 1,559,968 117 -50 270 143.7 MDH-10 476,106 1,560,275 111 -60 180 123.4 MDH-11 476,108 1,560,284 111 -60 360 170.0 MDH-12 476,152 1,560,270 111 -60 270 127.8
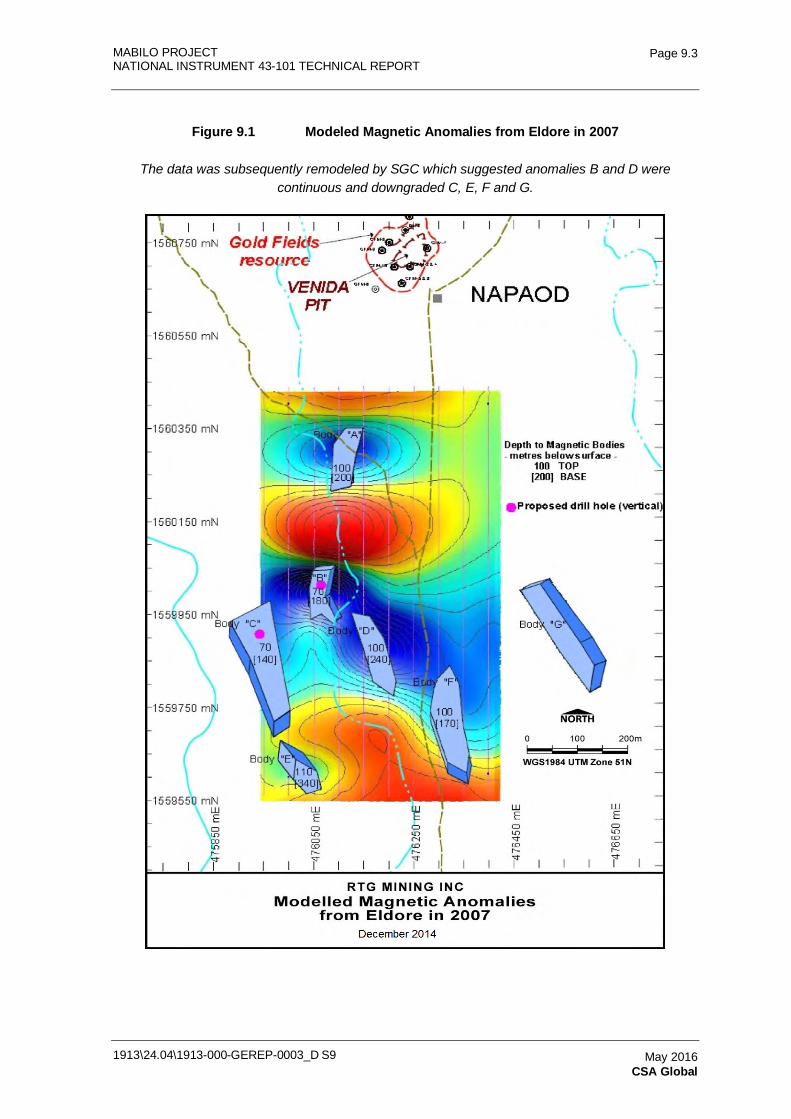
MABILO PROJECT NATIONAL INSTRUMENT 43-101 TECHNICAL REPORT
1913\24.04\1913-000-GEREP-0003_D S9
Page 9.3
May 2016 CSA Global
Figure 9.1 Modeled Magnetic Anomalies from Eldore in 2007
The data was subsequently remodeled by SGC which suggested anomalies B and D were continuous and downgraded C, E, F and G.
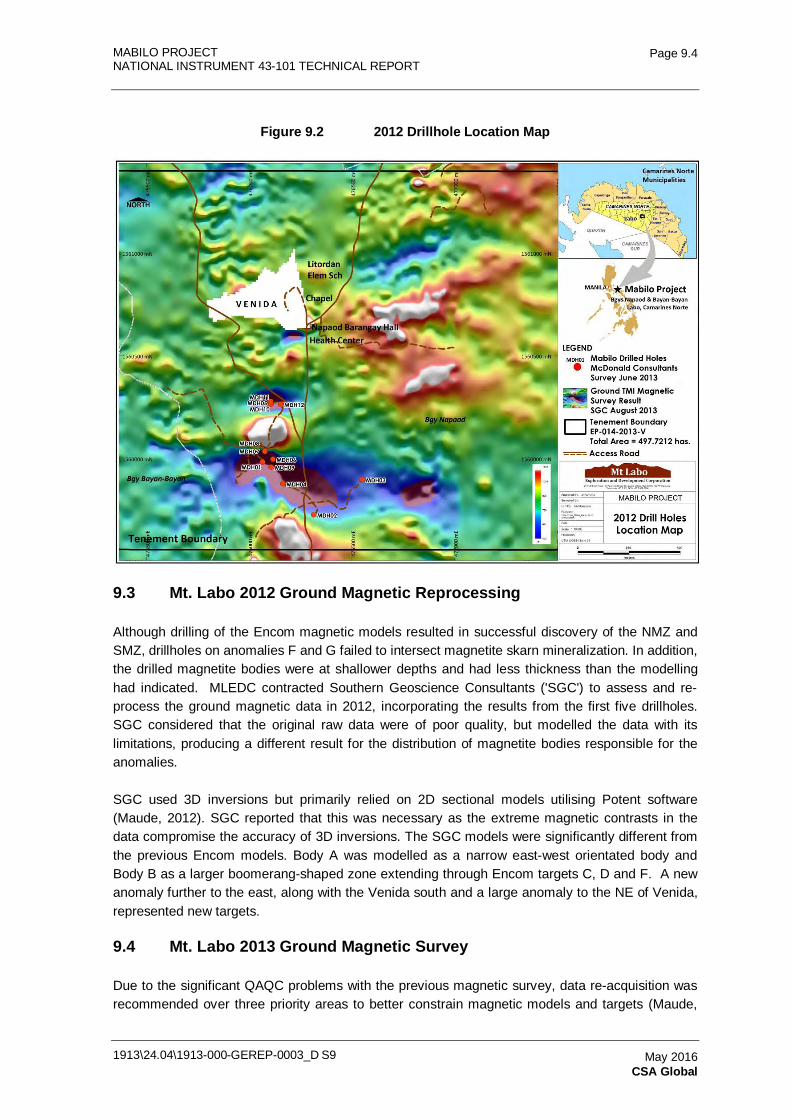
MABILO PROJECT NATIONAL INSTRUMENT 43-101 TECHNICAL REPORT
1913\24.04\1913-000-GEREP-0003_D S9
Page 9.4
May 2016 CSA Global
Figure 9.2 2012 Drillhole Location Map
9.3 Mt. Labo 2012 Ground Magnetic Reprocessing
Although drilling of the Encom magnetic models resulted in successful discovery of the NMZ and SMZ, drillholes on anomalies F and G failed to intersect magnetite skarn mineralization. In addition, the drilled magnetite bodies were at shallower depths and had less thickness than the modelling had indicated. MLEDC contracted Southern Geoscience Consultants ('SGC') to assess and re-process the ground magnetic data in 2012, incorporating the results from the first five drillholes. SGC considered that the original raw data were of poor quality, but modelled the data with its limitations, producing a different result for the distribution of magnetite bodies responsible for the anomalies.
SGC used 3D inversions but primarily relied on 2D sectional models utilising Potent software (Maude, 2012). SGC reported that this was necessary as the extreme magnetic contrasts in the data compromise the accuracy of 3D inversions. The SGC models were significantly different from the previous Encom models. Body A was modelled as a narrow east-west orientated body and Body B as a larger boomerang-shaped zone extending through Encom targets C, D and F. A new anomaly further to the east, along with the Venida south and a large anomaly to the NE of Venida, represented new targets.
9.4 Mt. Labo 2013 Ground Magnetic Survey
Due to the significant QAQC problems with the previous magnetic survey, data re-acquisition was recommended over three priority areas to better constrain magnetic models and targets (Maude,
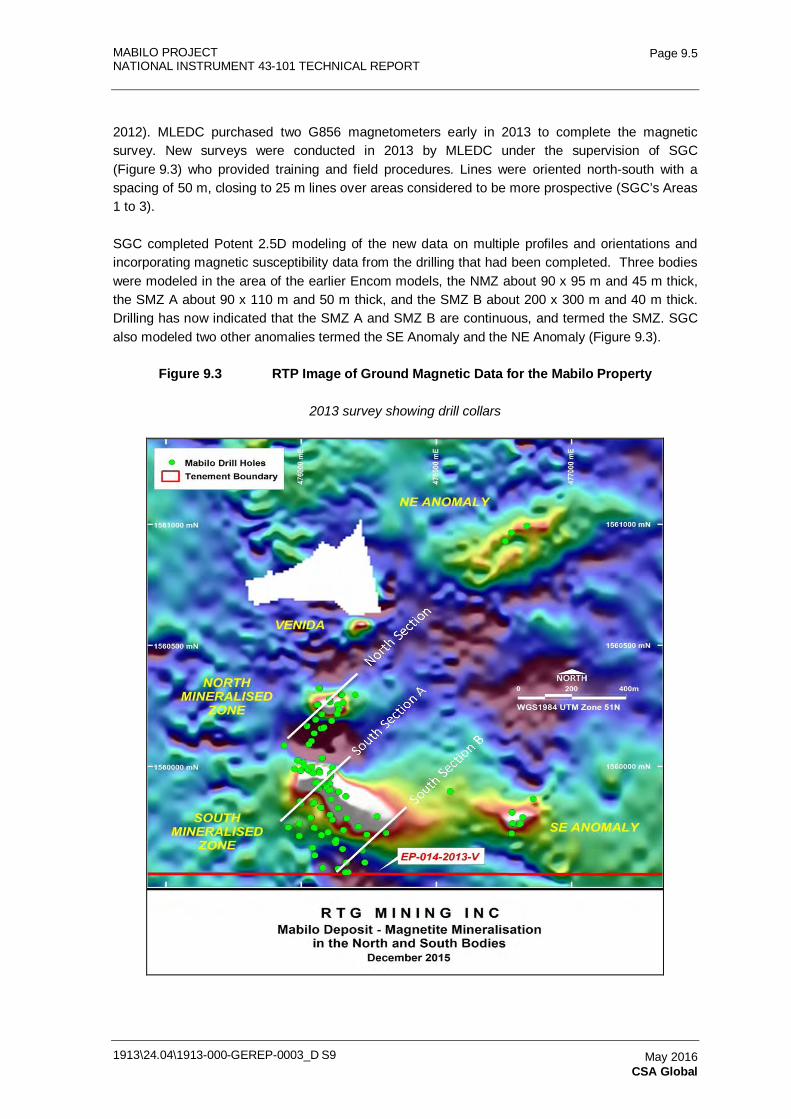
MABILO PROJECT NATIONAL INSTRUMENT 43-101 TECHNICAL REPORT
1913\24.04\1913-000-GEREP-0003_D S9
Page 9.5
May 2016 CSA Global
2012). MLEDC purchased two G856 magnetometers early in 2013 to complete the magnetic survey. New surveys were conducted in 2013 by MLEDC under the supervision of SGC (Figure 9.3) who provided training and field procedures. Lines were oriented north-south with a spacing of 50 m, closing to 25 m lines over areas considered to be more prospective (SGC’s Areas 1 to 3).
SGC completed Potent 2.5D modeling of the new data on multiple profiles and orientations and incorporating magnetic susceptibility data from the drilling that had been completed. Three bodies were modeled in the area of the earlier Encom models, the NMZ about 90 x 95 m and 45 m thick, the SMZ A about 90 x 110 m and 50 m thick, and the SMZ B about 200 x 300 m and 40 m thick. Drilling has now indicated that the SMZ A and SMZ B are continuous, and termed the SMZ. SGC also modeled two other anomalies termed the SE Anomaly and the NE Anomaly (Figure 9.3).
Figure 9.3 RTP Image of Ground Magnetic Data for the Mabilo Property
2013 survey showing drill collars
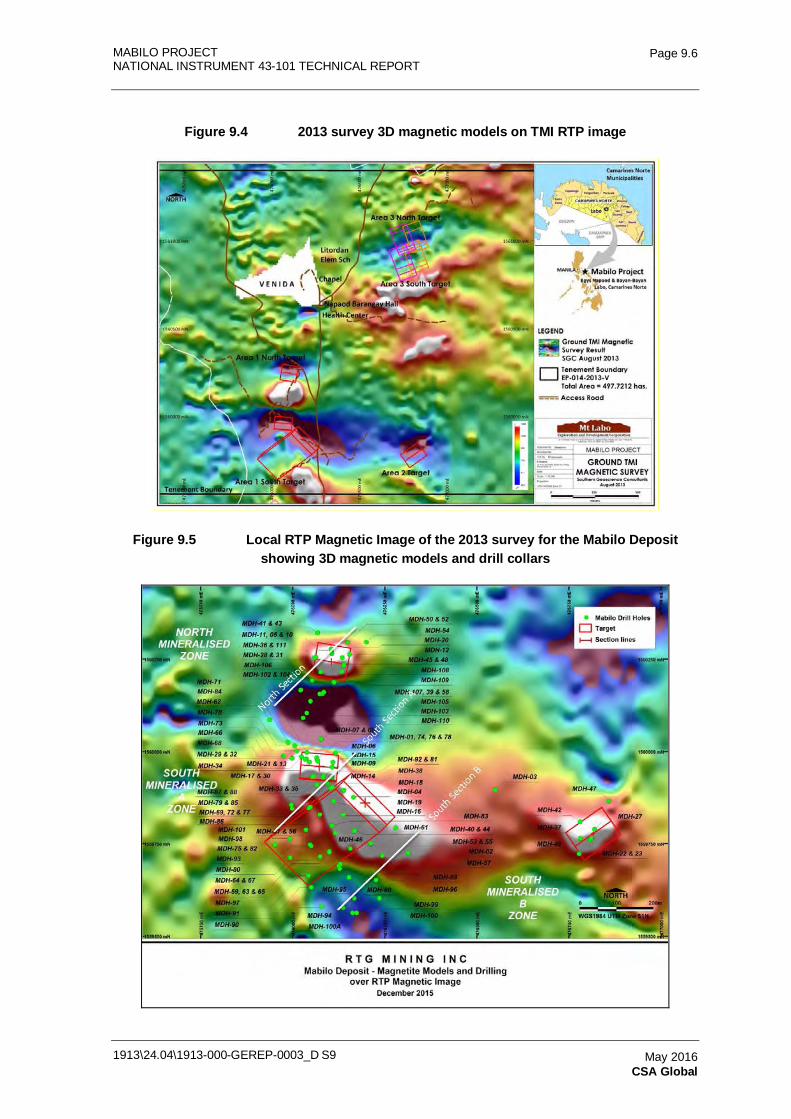
MABILO PROJECT NATIONAL INSTRUMENT 43-101 TECHNICAL REPORT
1913\24.04\1913-000-GEREP-0003_D S9
Page 9.6
May 2016 CSA Global
Figure 9.4 2013 survey 3D magnetic models on TMI RTP image
Figure 9.5 Local RTP Magnetic Image of the 2013 survey for the Mabilo Deposit showing 3D magnetic models and drill collars
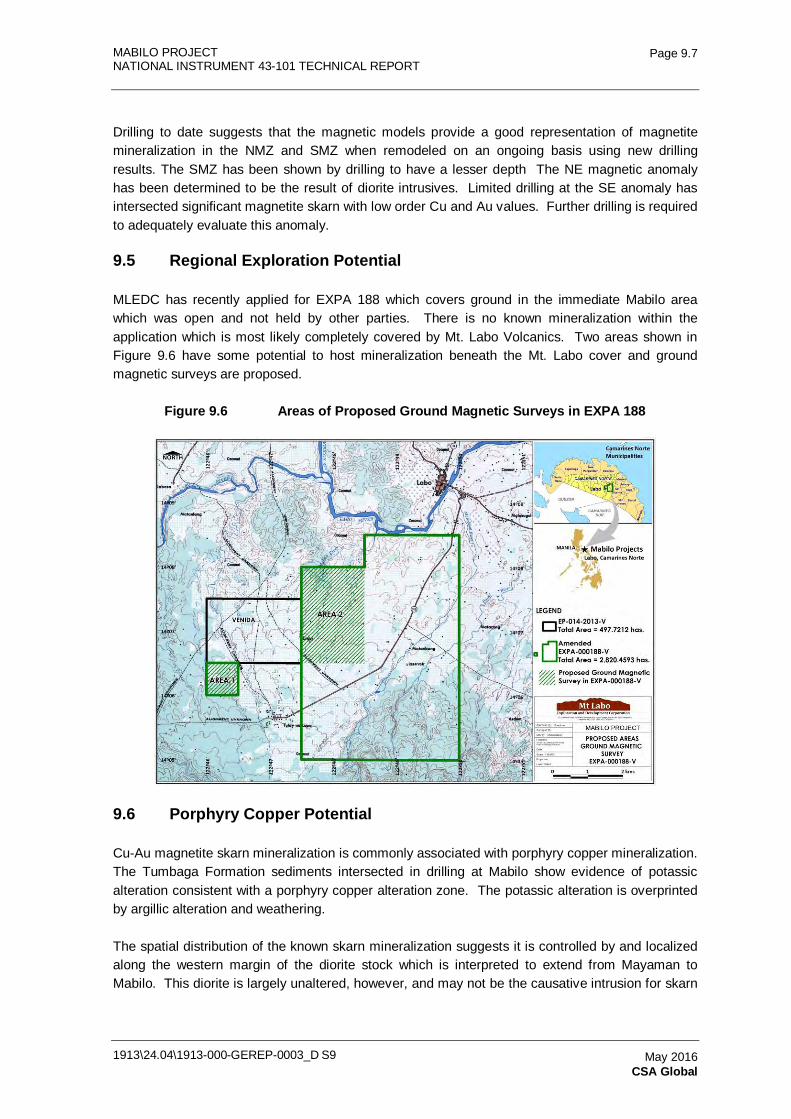
MABILO PROJECT NATIONAL INSTRUMENT 43-101 TECHNICAL REPORT
1913\24.04\1913-000-GEREP-0003_D S9
Page 9.7
May 2016 CSA Global
Drilling to date suggests that the magnetic models provide a good representation of magnetite mineralization in the NMZ and SMZ when remodeled on an ongoing basis using new drilling results. The SMZ has been shown by drilling to have a lesser depth The NE magnetic anomaly has been determined to be the result of diorite intrusives. Limited drilling at the SE anomaly has intersected significant magnetite skarn with low order Cu and Au values. Further drilling is required to adequately evaluate this anomaly.
9.5 Regional Exploration Potential
MLEDC has recently applied for EXPA 188 which covers ground in the immediate Mabilo area which was open and not held by other parties. There is no known mineralization within the application which is most likely completely covered by Mt. Labo Volcanics. Two areas shown in Figure 9.6 have some potential to host mineralization beneath the Mt. Labo cover and ground magnetic surveys are proposed.
Figure 9.6 Areas of Proposed Ground Magnetic Surveys in EXPA 188
9.6 Porphyry Copper Potential
Cu-Au magnetite skarn mineralization is commonly associated with porphyry copper mineralization. The Tumbaga Formation sediments intersected in drilling at Mabilo show evidence of potassic alteration consistent with a porphyry copper alteration zone. The potassic alteration is overprinted by argillic alteration and weathering.
The spatial distribution of the known skarn mineralization suggests it is controlled by and localized along the western margin of the diorite stock which is interpreted to extend from Mayaman to Mabilo. This diorite is largely unaltered, however, and may not be the causative intrusion for skarn
MABILO PROJECT NATIONAL INSTRUMENT 43-101 TECHNICAL REPORT
1913\24.04\1913-000-GEREP-0003_D S9
Page 9.8
May 2016 CSA Global
mineralization. The causative porphyry may be at depth with the mineralizing fluids migrating up and along the older diorite-sediment contact.
Altered diorite has been intersected immediately to the east of the magnetite skarn at both the NMZ and SMZ and further to the east in MDH-03. Altered diorite includes endoskarn and propylitic to argillic alteration and in places chalcopyrite occurs in fractures. Porphyry type stockwork veining has not been noted to date. This diorite may be a separate intrusive body to the main stock and directly related to mineralization.
MABILO PROJECT
NATIONAL INSTRUMENT 43-101 TECHNICAL REPORT
1913-000-GEREP-0003
Table of Contents Page
10.0 DRILLING, LOGGING AND SAMPLING SECTION 10.1 10.1 Mabilo Drilling 10.1 10.2 Collar Surveying 10.5 10.3 Downhole Surveying 10.5 10.4 Core Orientation 10.5 10.5 Core Quality and Recovery 10.5 10.6 Drill Site Security and Drill Core Handling 10.5 10.7 Drill Results 10.6
TABLES Table 10.1 Mabilo Drill Locations, Orientations and Depths 10.2 Table 10.2 Significant Drillhole Intersections (cut-off of 0.5% Cu or 0.5 ppm Au
with minimum 2 m width and internal waste as 2 m) 10.9 FIGURES Figure 10.1 Drill Collar Plan for Drilling by Mt. Labo on the Mabilo Property 10.4 Figure 10.2 Cross sections through the SMZ 10.7 Figure 10.3 Cross Section through the NMZ 10.8
1913\24.04\1913-000-GEREP-0003_D S10 May 2016 CSA Global
MABILO PROJECT NATIONAL INSTRUMENT 43-101 TECHNICAL REPORT
1913\24.04\1913-000-GEREP-0003_D S10
Page 10.1
May 2016 CSA Global
10.0 DRILLING, LOGGING AND SAMPLING SECTION
10.1 Mabilo Drilling
All drilling at the Mabilo Property has been conducted by Mt. Labo and was completed in two phases. Both phases have exclusively utilized diamond core drilling. All of the Mabilo drillholes used in the 2015 MRE are tabulated in Table 10.1, and shown in Figure 10.1.
The first phase was completed from September 2012 to December 2012 and comprised 12 holes (MDH-01 to -12) for 1660 meters of mainly PQ and HQ triple tube diamond drilling completed by drilling contractor, Quest Exploration Drilling.
The second phase of drilling commenced in July 2013 and was suspended in July 2015 pending renewal of exploration permit EP-014-2013-V. The application for renewal of the license is with the MGB in Manila and remains pending. The second phase of drilling has been completed by Galeo which was engaged in the capacity as contractor to provide drilling and limited non-technical management services for earn-in of up to 36% of the Mabilo Property under the terms of the Joint Venture Agreement with Mt. Labo.
As at 5 November 2015, a total of 112 drillholes had been drilled by Mt. Labo on the property for 19,541.90 m of PQ, HQ and NQ triple tube diamond core. This includes one re-drilled hole. The last two holes, MDH-110 and 111, were not completed to target depth as a result of suspension of drilling on the EP in July 2015.
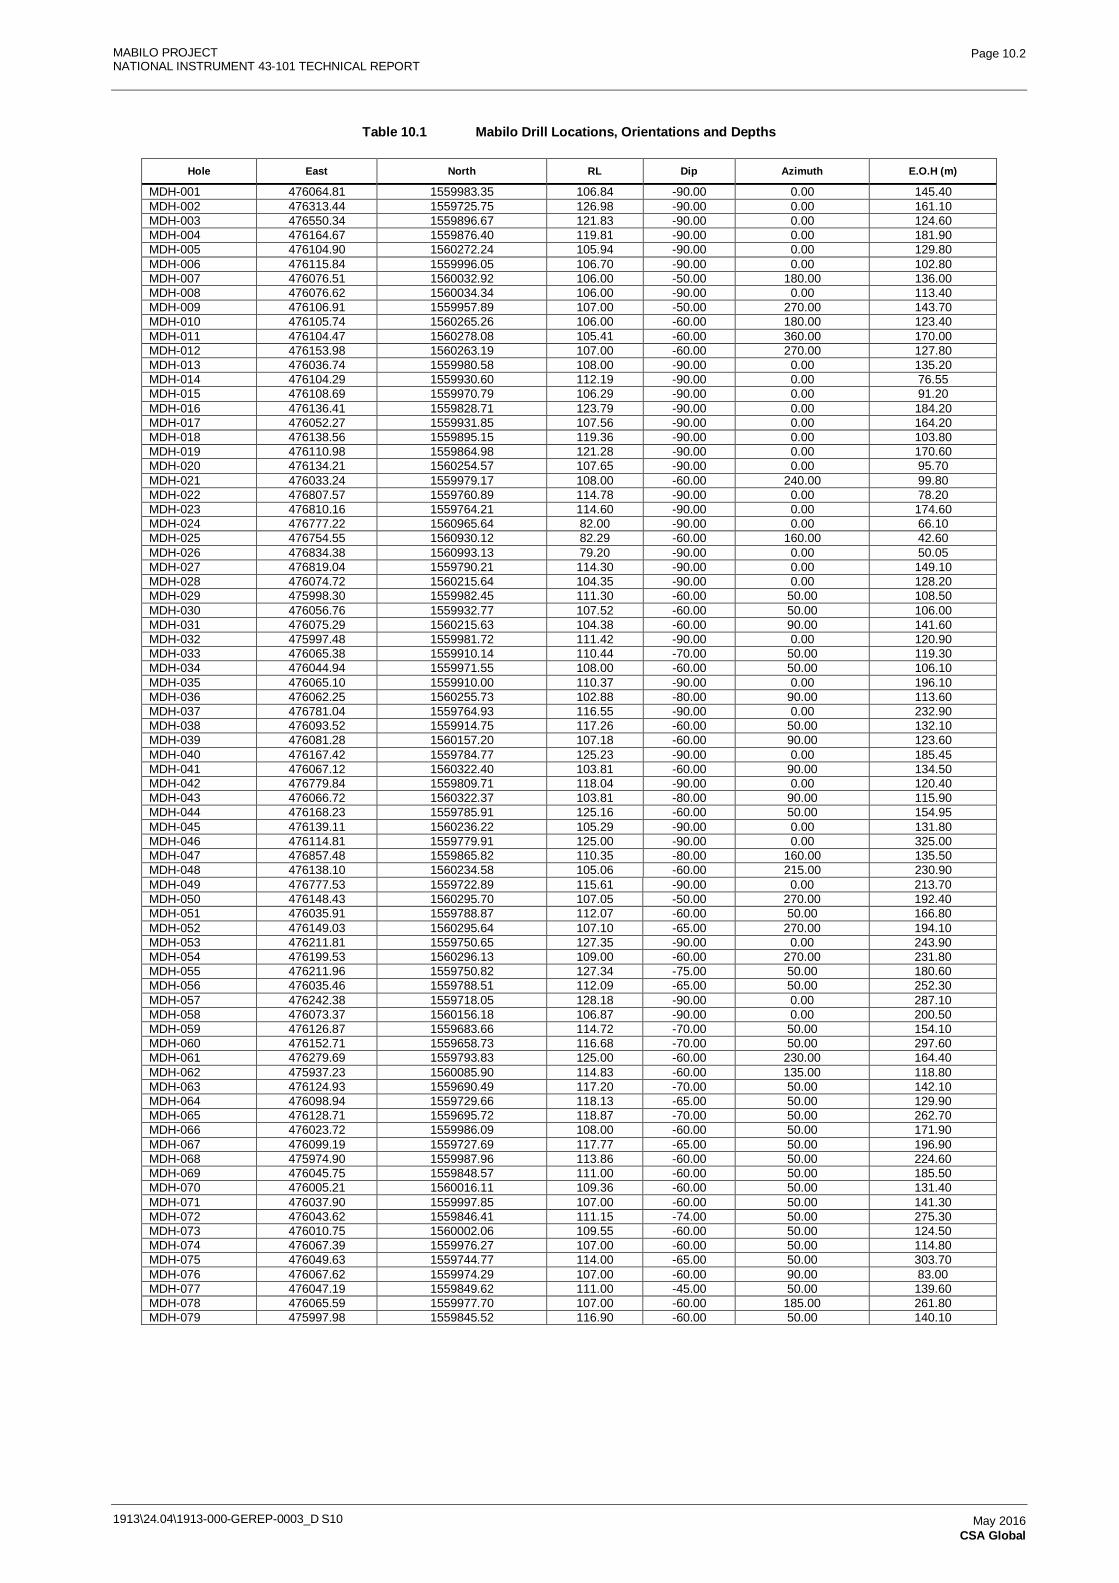
MABILO PROJECT NATIONAL INSTRUMENT 43-101 TECHNICAL REPORT
1913\24.04\1913-000-GEREP-0003_D S10
Page 10.2
May 2016 CSA Global
Table 10.1 Mabilo Drill Locations, Orientations and Depths
Hole East North RL Dip Azimuth E.O.H (m)
MDH-001 476064.81 1559983.35 106.84 -90.00 0.00 145.40 MDH-002 476313.44 1559725.75 126.98 -90.00 0.00 161.10 MDH-003 476550.34 1559896.67 121.83 -90.00 0.00 124.60 MDH-004 476164.67 1559876.40 119.81 -90.00 0.00 181.90 MDH-005 476104.90 1560272.24 105.94 -90.00 0.00 129.80 MDH-006 476115.84 1559996.05 106.70 -90.00 0.00 102.80 MDH-007 476076.51 1560032.92 106.00 -50.00 180.00 136.00 MDH-008 476076.62 1560034.34 106.00 -90.00 0.00 113.40 MDH-009 476106.91 1559957.89 107.00 -50.00 270.00 143.70 MDH-010 476105.74 1560265.26 106.00 -60.00 180.00 123.40 MDH-011 476104.47 1560278.08 105.41 -60.00 360.00 170.00 MDH-012 476153.98 1560263.19 107.00 -60.00 270.00 127.80 MDH-013 476036.74 1559980.58 108.00 -90.00 0.00 135.20 MDH-014 476104.29 1559930.60 112.19 -90.00 0.00 76.55 MDH-015 476108.69 1559970.79 106.29 -90.00 0.00 91.20 MDH-016 476136.41 1559828.71 123.79 -90.00 0.00 184.20 MDH-017 476052.27 1559931.85 107.56 -90.00 0.00 164.20 MDH-018 476138.56 1559895.15 119.36 -90.00 0.00 103.80 MDH-019 476110.98 1559864.98 121.28 -90.00 0.00 170.60 MDH-020 476134.21 1560254.57 107.65 -90.00 0.00 95.70 MDH-021 476033.24 1559979.17 108.00 -60.00 240.00 99.80 MDH-022 476807.57 1559760.89 114.78 -90.00 0.00 78.20 MDH-023 476810.16 1559764.21 114.60 -90.00 0.00 174.60 MDH-024 476777.22 1560965.64 82.00 -90.00 0.00 66.10 MDH-025 476754.55 1560930.12 82.29 -60.00 160.00 42.60 MDH-026 476834.38 1560993.13 79.20 -90.00 0.00 50.05 MDH-027 476819.04 1559790.21 114.30 -90.00 0.00 149.10 MDH-028 476074.72 1560215.64 104.35 -90.00 0.00 128.20 MDH-029 475998.30 1559982.45 111.30 -60.00 50.00 108.50 MDH-030 476056.76 1559932.77 107.52 -60.00 50.00 106.00 MDH-031 476075.29 1560215.63 104.38 -60.00 90.00 141.60 MDH-032 475997.48 1559981.72 111.42 -90.00 0.00 120.90 MDH-033 476065.38 1559910.14 110.44 -70.00 50.00 119.30 MDH-034 476044.94 1559971.55 108.00 -60.00 50.00 106.10 MDH-035 476065.10 1559910.00 110.37 -90.00 0.00 196.10 MDH-036 476062.25 1560255.73 102.88 -80.00 90.00 113.60 MDH-037 476781.04 1559764.93 116.55 -90.00 0.00 232.90 MDH-038 476093.52 1559914.75 117.26 -60.00 50.00 132.10 MDH-039 476081.28 1560157.20 107.18 -60.00 90.00 123.60 MDH-040 476167.42 1559784.77 125.23 -90.00 0.00 185.45 MDH-041 476067.12 1560322.40 103.81 -60.00 90.00 134.50 MDH-042 476779.84 1559809.71 118.04 -90.00 0.00 120.40 MDH-043 476066.72 1560322.37 103.81 -80.00 90.00 115.90 MDH-044 476168.23 1559785.91 125.16 -60.00 50.00 154.95 MDH-045 476139.11 1560236.22 105.29 -90.00 0.00 131.80 MDH-046 476114.81 1559779.91 125.00 -90.00 0.00 325.00 MDH-047 476857.48 1559865.82 110.35 -80.00 160.00 135.50 MDH-048 476138.10 1560234.58 105.06 -60.00 215.00 230.90 MDH-049 476777.53 1559722.89 115.61 -90.00 0.00 213.70 MDH-050 476148.43 1560295.70 107.05 -50.00 270.00 192.40 MDH-051 476035.91 1559788.87 112.07 -60.00 50.00 166.80 MDH-052 476149.03 1560295.64 107.10 -65.00 270.00 194.10 MDH-053 476211.81 1559750.65 127.35 -90.00 0.00 243.90 MDH-054 476199.53 1560296.13 109.00 -60.00 270.00 231.80 MDH-055 476211.96 1559750.82 127.34 -75.00 50.00 180.60 MDH-056 476035.46 1559788.51 112.09 -65.00 50.00 252.30 MDH-057 476242.38 1559718.05 128.18 -90.00 0.00 287.10 MDH-058 476073.37 1560156.18 106.87 -90.00 0.00 200.50 MDH-059 476126.87 1559683.66 114.72 -70.00 50.00 154.10 MDH-060 476152.71 1559658.73 116.68 -70.00 50.00 297.60 MDH-061 476279.69 1559793.83 125.00 -60.00 230.00 164.40 MDH-062 475937.23 1560085.90 114.83 -60.00 135.00 118.80 MDH-063 476124.93 1559690.49 117.20 -70.00 50.00 142.10 MDH-064 476098.94 1559729.66 118.13 -65.00 50.00 129.90 MDH-065 476128.71 1559695.72 118.87 -70.00 50.00 262.70 MDH-066 476023.72 1559986.09 108.00 -60.00 50.00 171.90 MDH-067 476099.19 1559727.69 117.77 -65.00 50.00 196.90 MDH-068 475974.90 1559987.96 113.86 -60.00 50.00 224.60 MDH-069 476045.75 1559848.57 111.00 -60.00 50.00 185.50 MDH-070 476005.21 1560016.11 109.36 -60.00 50.00 131.40 MDH-071 476037.90 1559997.85 107.00 -60.00 50.00 141.30 MDH-072 476043.62 1559846.41 111.15 -74.00 50.00 275.30 MDH-073 476010.75 1560002.06 109.55 -60.00 50.00 124.50 MDH-074 476067.39 1559976.27 107.00 -60.00 50.00 114.80 MDH-075 476049.63 1559744.77 114.00 -65.00 50.00 303.70 MDH-076 476067.62 1559974.29 107.00 -60.00 90.00 83.00 MDH-077 476047.19 1559849.62 111.00 -45.00 50.00 139.60 MDH-078 476065.59 1559977.70 107.00 -60.00 185.00 261.80 MDH-079 475997.98 1559845.52 116.90 -60.00 50.00 140.10
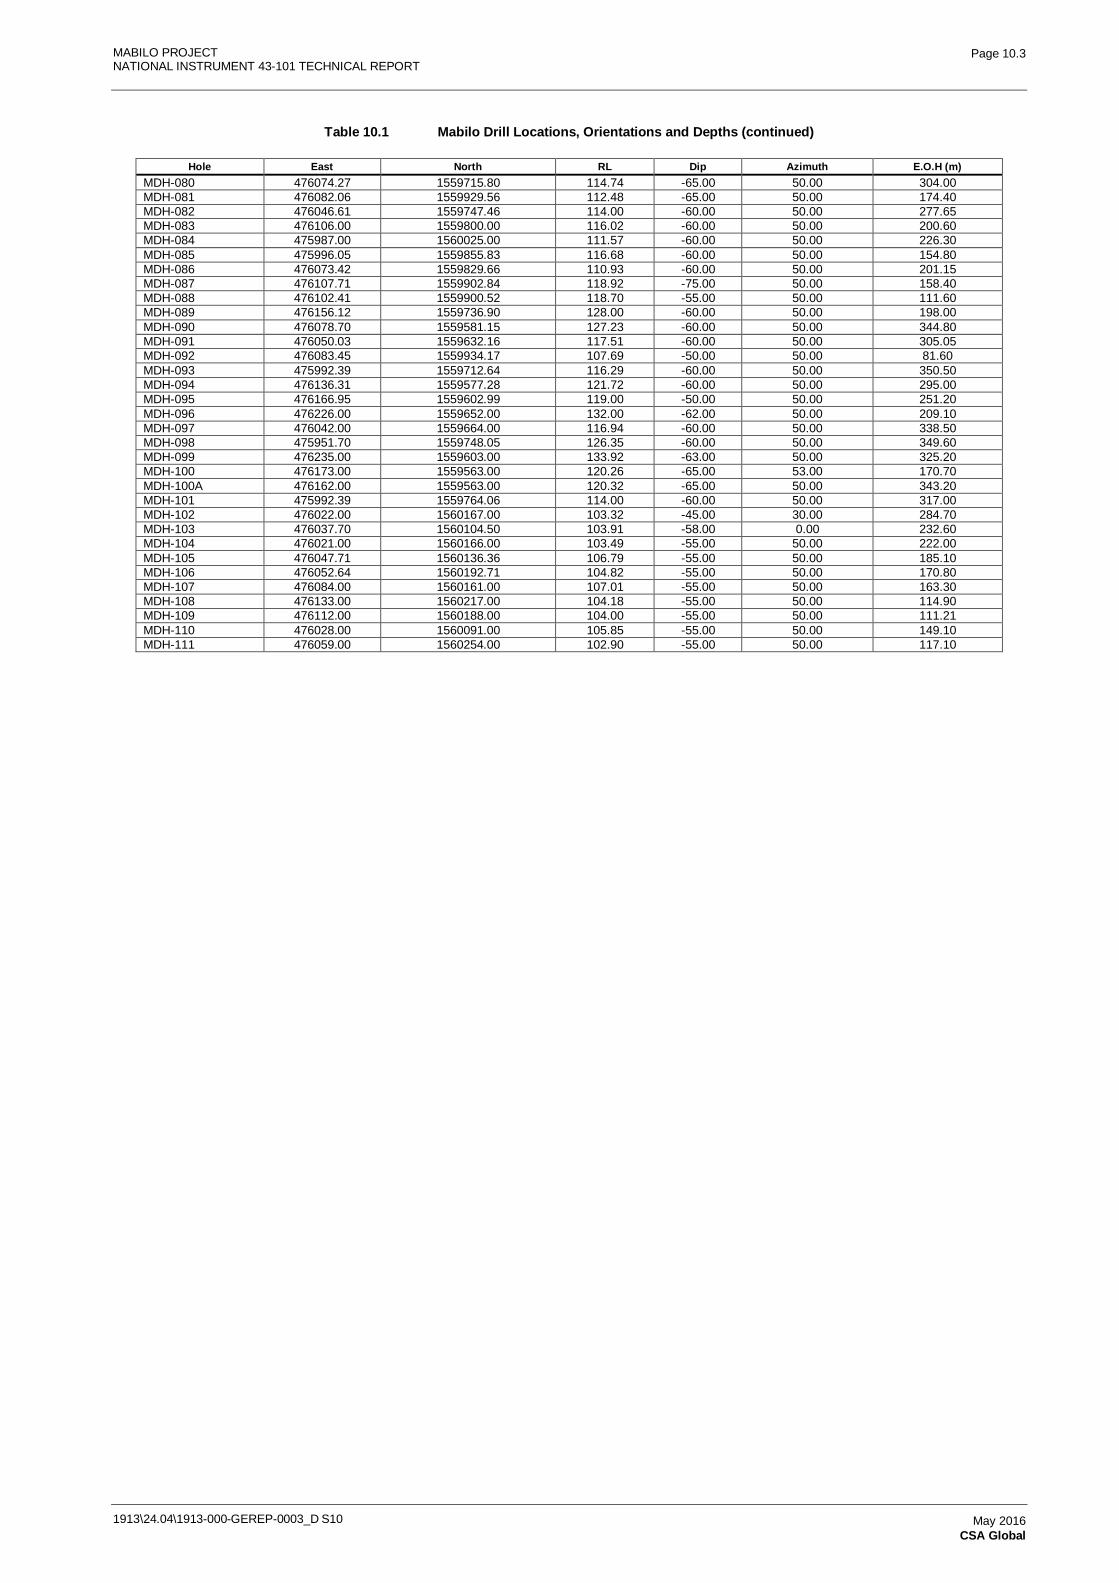
MABILO PROJECT NATIONAL INSTRUMENT 43-101 TECHNICAL REPORT
1913\24.04\1913-000-GEREP-0003_D S10
Page 10.3
May 2016 CSA Global
Table 10.1 Mabilo Drill Locations, Orientations and Depths (continued)
Hole East North RL Dip Azimuth E.O.H (m) MDH-080 476074.27 1559715.80 114.74 -65.00 50.00 304.00 MDH-081 476082.06 1559929.56 112.48 -65.00 50.00 174.40 MDH-082 476046.61 1559747.46 114.00 -60.00 50.00 277.65 MDH-083 476106.00 1559800.00 116.02 -60.00 50.00 200.60 MDH-084 475987.00 1560025.00 111.57 -60.00 50.00 226.30 MDH-085 475996.05 1559855.83 116.68 -60.00 50.00 154.80 MDH-086 476073.42 1559829.66 110.93 -60.00 50.00 201.15 MDH-087 476107.71 1559902.84 118.92 -75.00 50.00 158.40 MDH-088 476102.41 1559900.52 118.70 -55.00 50.00 111.60 MDH-089 476156.12 1559736.90 128.00 -60.00 50.00 198.00 MDH-090 476078.70 1559581.15 127.23 -60.00 50.00 344.80 MDH-091 476050.03 1559632.16 117.51 -60.00 50.00 305.05 MDH-092 476083.45 1559934.17 107.69 -50.00 50.00 81.60 MDH-093 475992.39 1559712.64 116.29 -60.00 50.00 350.50 MDH-094 476136.31 1559577.28 121.72 -60.00 50.00 295.00 MDH-095 476166.95 1559602.99 119.00 -50.00 50.00 251.20 MDH-096 476226.00 1559652.00 132.00 -62.00 50.00 209.10 MDH-097 476042.00 1559664.00 116.94 -60.00 50.00 338.50 MDH-098 475951.70 1559748.05 126.35 -60.00 50.00 349.60 MDH-099 476235.00 1559603.00 133.92 -63.00 50.00 325.20 MDH-100 476173.00 1559563.00 120.26 -65.00 53.00 170.70 MDH-100A 476162.00 1559563.00 120.32 -65.00 50.00 343.20 MDH-101 475992.39 1559764.06 114.00 -60.00 50.00 317.00 MDH-102 476022.00 1560167.00 103.32 -45.00 30.00 284.70 MDH-103 476037.70 1560104.50 103.91 -58.00 0.00 232.60 MDH-104 476021.00 1560166.00 103.49 -55.00 50.00 222.00 MDH-105 476047.71 1560136.36 106.79 -55.00 50.00 185.10 MDH-106 476052.64 1560192.71 104.82 -55.00 50.00 170.80 MDH-107 476084.00 1560161.00 107.01 -55.00 50.00 163.30 MDH-108 476133.00 1560217.00 104.18 -55.00 50.00 114.90 MDH-109 476112.00 1560188.00 104.00 -55.00 50.00 111.21 MDH-110 476028.00 1560091.00 105.85 -55.00 50.00 149.10 MDH-111 476059.00 1560254.00 102.90 -55.00 50.00 117.10
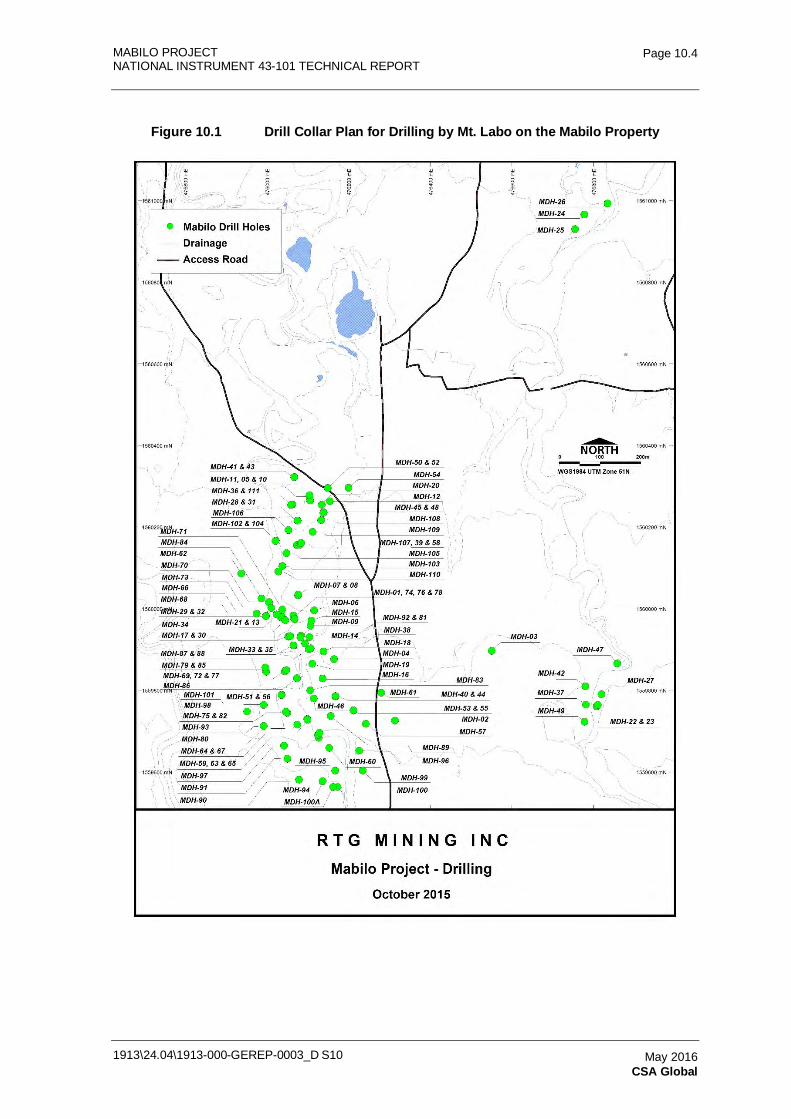
MABILO PROJECT NATIONAL INSTRUMENT 43-101 TECHNICAL REPORT
1913\24.04\1913-000-GEREP-0003_D S10
Page 10.4
May 2016 CSA Global
Figure 10.1 Drill Collar Plan for Drilling by Mt. Labo on the Mabilo Property
MABILO PROJECT NATIONAL INSTRUMENT 43-101 TECHNICAL REPORT
1913\24.04\1913-000-GEREP-0003_D S10
Page 10.5
May 2016 CSA Global
10.2 Collar Surveying
Drill sites at Mabilo are initially pegged utilizing hand-held GPS and, once drilled, the collars are again surveyed using hand-held GPS. All drill collars were subsequently surveyed by independent consultant, McDonald Consultants Inc. of Manila, using a CHC X90 Dual Frequency Differential GPS to an accuracy of 1 cm. Surveying is in UTM WGS84 Zone 51.
For the November 2015 MRE used in the Mabile Feasibility Study, DGPS surveys were not available for a total of 30 holes (MDH-083 to MDH-111). The DGPS surveys were subsequently obtained from Mt. Labo and mineralized sections of drillholes were compared between GPS and DGPS survey pick-ups. Although changes in X-Y coordinates of up to 8 meters resulted, the variation in holes affecting the MRE has been judged not to be material.
10.3 Downhole Surveying
All inclined drillholes were surveyed using a combination of Reflex EZ-TRAC downhole survey tool and Reflex GYRO. The Reflex EZ-TRAC collar result is used to process the Reflex GYRO survey data and QAQC of survey results is strictly applied to avoid erroneous data arising from magnetite skarn. The majority of holes that were vertical are less than 150 m in depth, however deviation may still be significant for vertical holes.
10.4 Core Orientation
Core orientation was attempted but was not successful due to fractured and broken ground. Drilling of angled holes and a program of down-hole televiewing is planned for future work to help understand the geology of the deposit, orientation of lithological units and skarn, structures, and for geotechnical logging.
10.5 Core Quality and Recovery
The host rocks at Mabilo are strongly altered and deeply weathered. In general the magnetite skarn is less weathered and more competent, although the upper part includes broken oxidized hematitic zones. The use of PQ triple-tube coring has generally ensured good recovery. High recoveries are normally recorded in the magnetite skarn with consecutive runs of 100% common. There is some core loss in faulted and breccia zones within the magnetite, along the margins of the bodies, and in the hematite skarn zones. The overall average recovery is greater than 90% within mineralized zones.
10.6 Drill Site Security and Drill Core Handling
Mt. Labo employs experienced geologists and geotechnical staff and has trained local recruits to assist in drill site monitoring under the supervision of the project and drill site geologist. A company core checker is present 24 hours per day at every drill site during drilling operations. The core checkers ensure the core is transported from the core barrel to the core tray safely and placed correctly in the tray with respect to the top and bottom of the core run. The checkers ensure all core trays are labeled (Hole ID, From-To, box number, start and end) and that wooden blocks marking the downhole depth are placed in the core tray between each core run. All drill site activities including core recovery, core runs, bit changes, casing and reaming times, break down
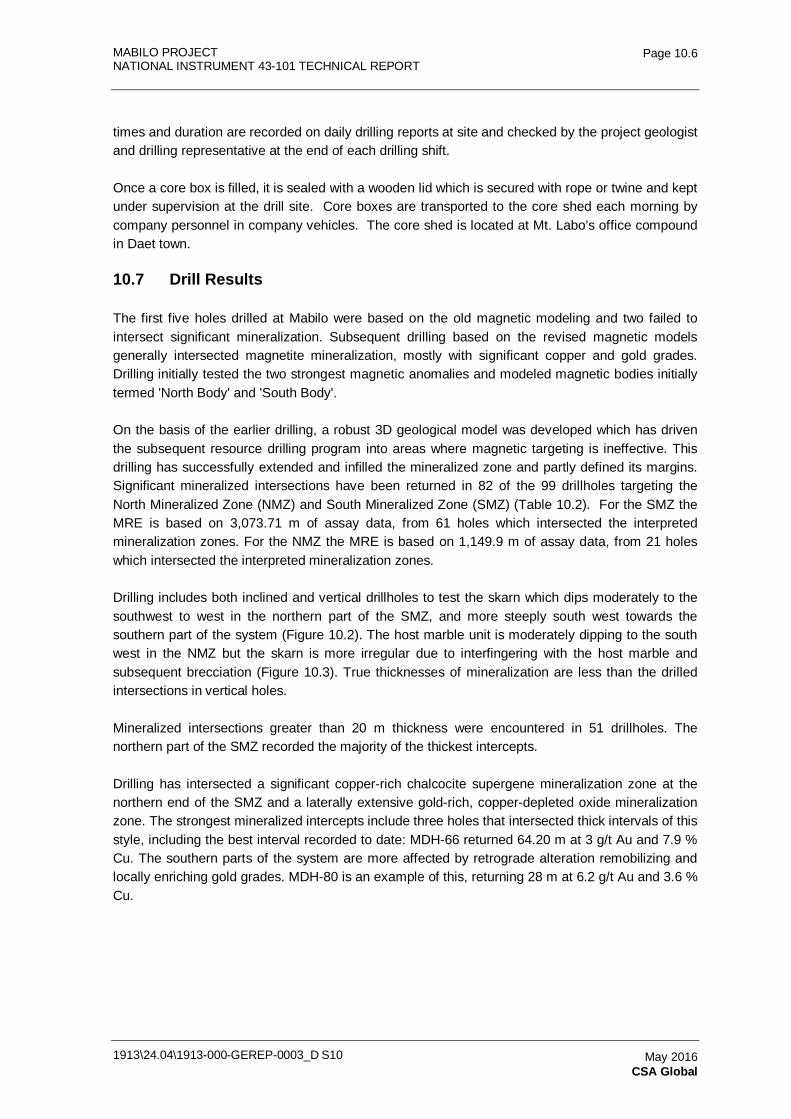
MABILO PROJECT NATIONAL INSTRUMENT 43-101 TECHNICAL REPORT
1913\24.04\1913-000-GEREP-0003_D S10
Page 10.6
May 2016 CSA Global
times and duration are recorded on daily drilling reports at site and checked by the project geologist and drilling representative at the end of each drilling shift.
Once a core box is filled, it is sealed with a wooden lid which is secured with rope or twine and kept under supervision at the drill site. Core boxes are transported to the core shed each morning by company personnel in company vehicles. The core shed is located at Mt. Labo’s office compound in Daet town.
10.7 Drill Results
The first five holes drilled at Mabilo were based on the old magnetic modeling and two failed to intersect significant mineralization. Subsequent drilling based on the revised magnetic models generally intersected magnetite mineralization, mostly with significant copper and gold grades. Drilling initially tested the two strongest magnetic anomalies and modeled magnetic bodies initially termed 'North Body' and 'South Body'.
On the basis of the earlier drilling, a robust 3D geological model was developed which has driven the subsequent resource drilling program into areas where magnetic targeting is ineffective. This drilling has successfully extended and infilled the mineralized zone and partly defined its margins. Significant mineralized intersections have been returned in 82 of the 99 drillholes targeting the North Mineralized Zone (NMZ) and South Mineralized Zone (SMZ) (Table 10.2). For the SMZ the MRE is based on 3,073.71 m of assay data, from 61 holes which intersected the interpreted mineralization zones. For the NMZ the MRE is based on 1,149.9 m of assay data, from 21 holes which intersected the interpreted mineralization zones.
Drilling includes both inclined and vertical drillholes to test the skarn which dips moderately to the southwest to west in the northern part of the SMZ, and more steeply south west towards the southern part of the system (Figure 10.2). The host marble unit is moderately dipping to the south west in the NMZ but the skarn is more irregular due to interfingering with the host marble and subsequent brecciation (Figure 10.3). True thicknesses of mineralization are less than the drilled intersections in vertical holes.
Mineralized intersections greater than 20 m thickness were encountered in 51 drillholes. The northern part of the SMZ recorded the majority of the thickest intercepts.
Drilling has intersected a significant copper-rich chalcocite supergene mineralization zone at the northern end of the SMZ and a laterally extensive gold-rich, copper-depleted oxide mineralization zone. The strongest mineralized intercepts include three holes that intersected thick intervals of this style, including the best interval recorded to date: MDH-66 returned 64.20 m at 3 g/t Au and 7.9 % Cu. The southern parts of the system are more affected by retrograde alteration remobilizing and locally enriching gold grades. MDH-80 is an example of this, returning 28 m at 6.2 g/t Au and 3.6 % Cu.
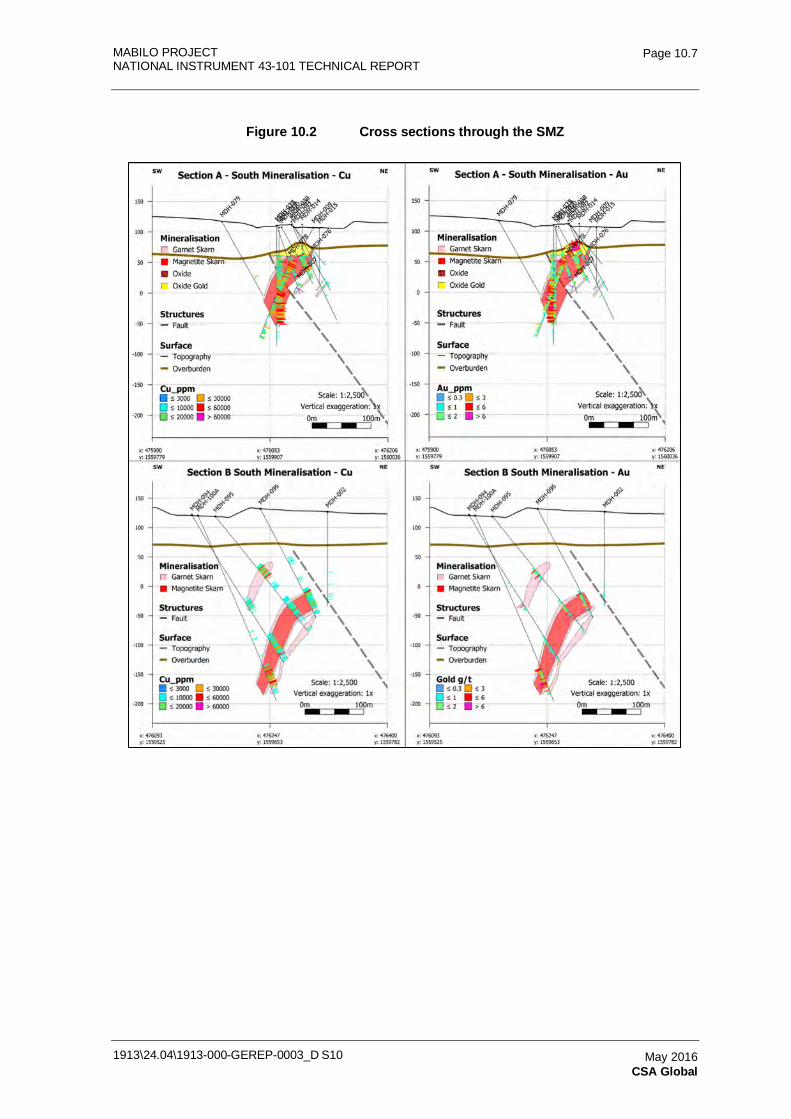
MABILO PROJECT NATIONAL INSTRUMENT 43-101 TECHNICAL REPORT
1913\24.04\1913-000-GEREP-0003_D S10
Page 10.7
May 2016 CSA Global
Figure 10.2 Cross sections through the SMZ
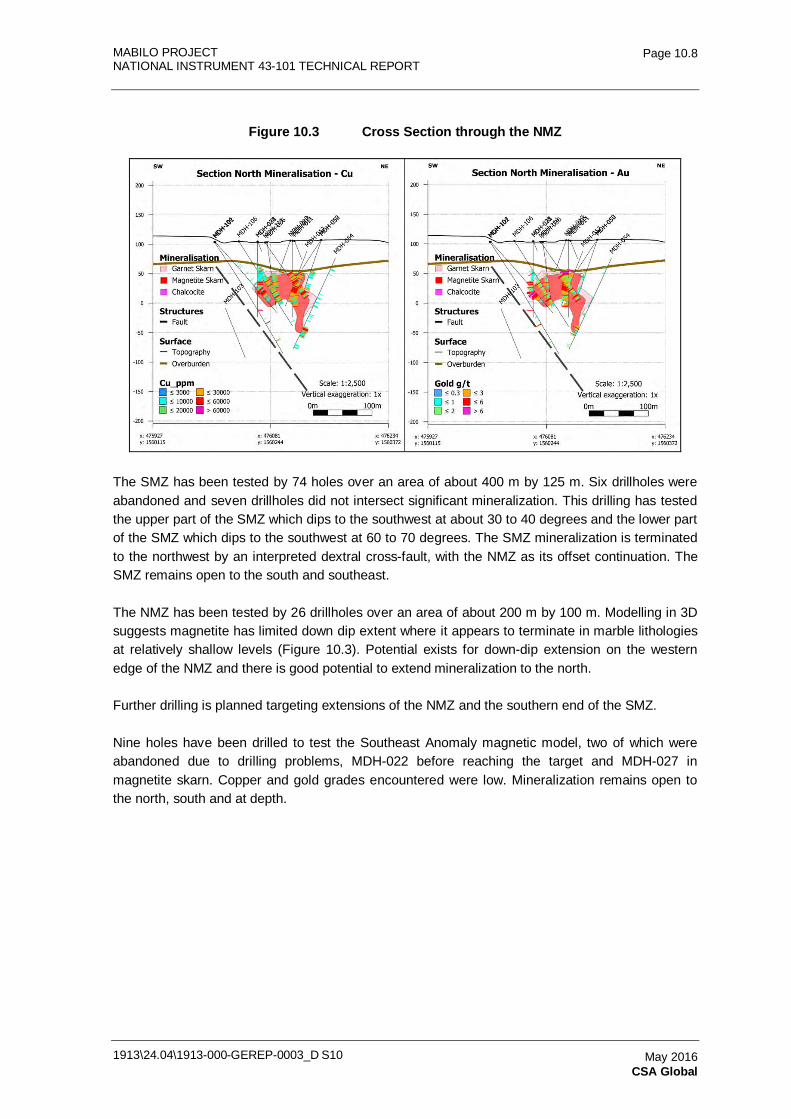
MABILO PROJECT NATIONAL INSTRUMENT 43-101 TECHNICAL REPORT
1913\24.04\1913-000-GEREP-0003_D S10
Page 10.8
May 2016 CSA Global
Figure 10.3 Cross Section through the NMZ
The SMZ has been tested by 74 holes over an area of about 400 m by 125 m. Six drillholes were abandoned and seven drillholes did not intersect significant mineralization. This drilling has tested the upper part of the SMZ which dips to the southwest at about 30 to 40 degrees and the lower part of the SMZ which dips to the southwest at 60 to 70 degrees. The SMZ mineralization is terminated to the northwest by an interpreted dextral cross-fault, with the NMZ as its offset continuation. The SMZ remains open to the south and southeast.
The NMZ has been tested by 26 drillholes over an area of about 200 m by 100 m. Modelling in 3D suggests magnetite has limited down dip extent where it appears to terminate in marble lithologies at relatively shallow levels (Figure 10.3). Potential exists for down-dip extension on the western edge of the NMZ and there is good potential to extend mineralization to the north.
Further drilling is planned targeting extensions of the NMZ and the southern end of the SMZ.
Nine holes have been drilled to test the Southeast Anomaly magnetic model, two of which were abandoned due to drilling problems, MDH-022 before reaching the target and MDH-027 in magnetite skarn. Copper and gold grades encountered were low. Mineralization remains open to the north, south and at depth.
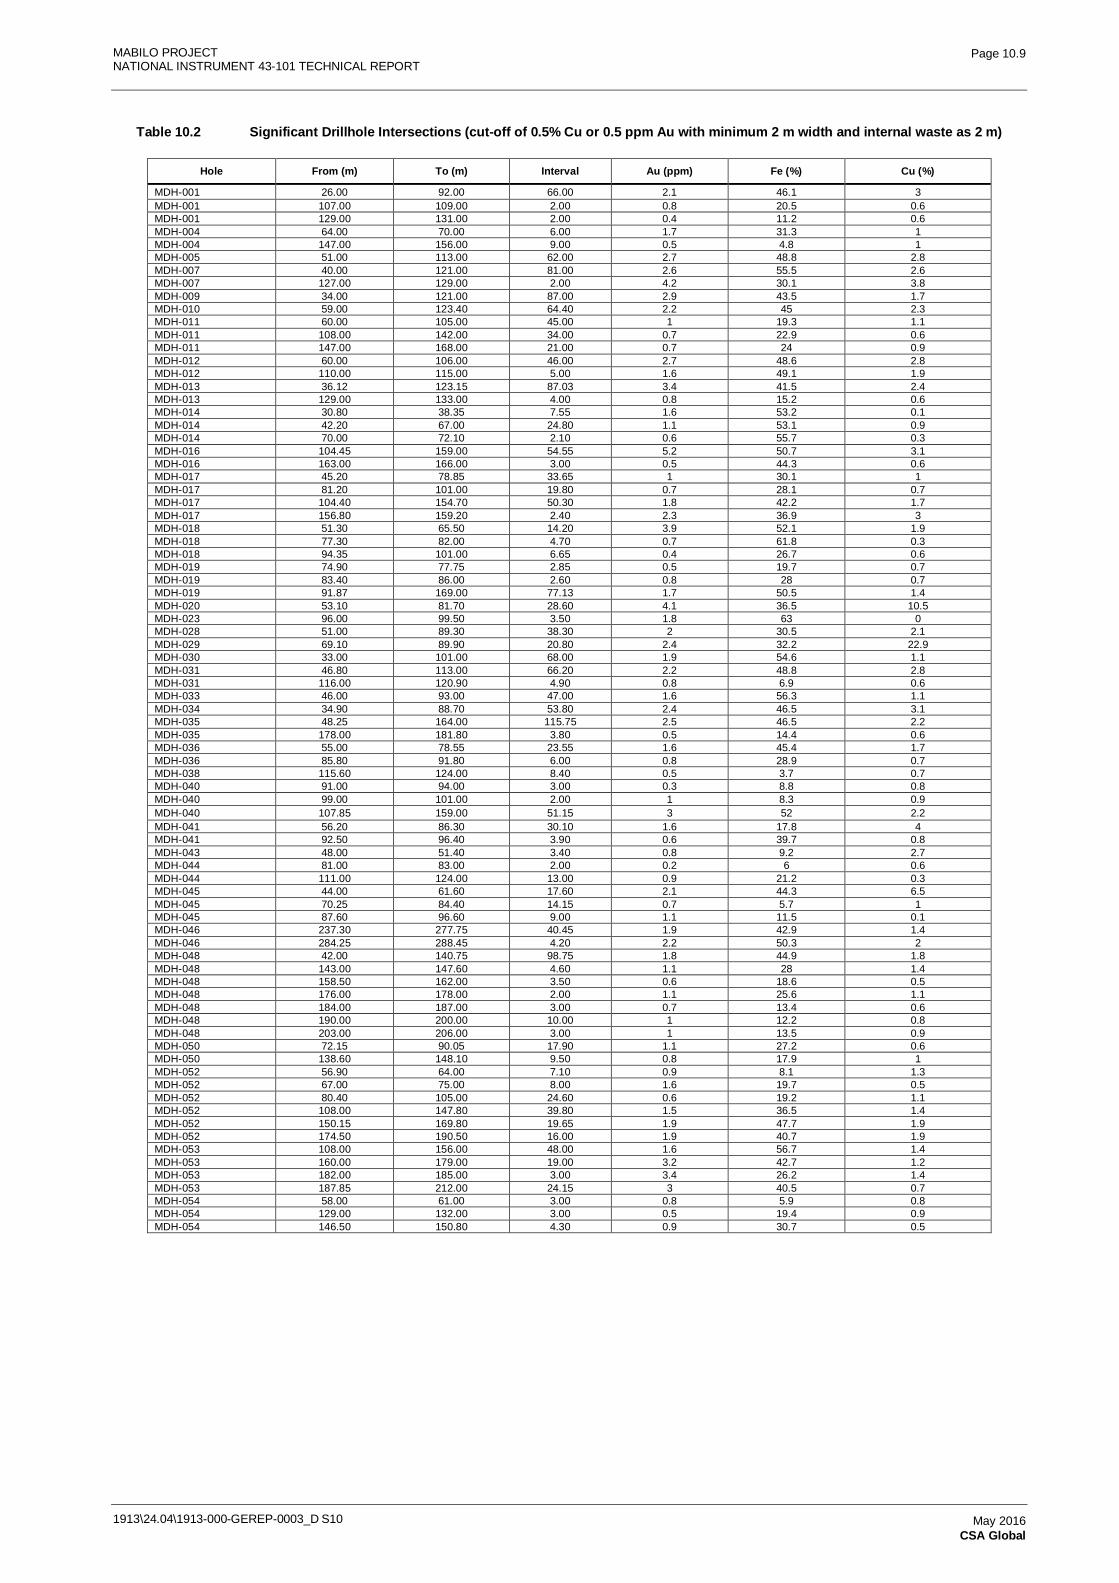
MABILO PROJECT NATIONAL INSTRUMENT 43-101 TECHNICAL REPORT
1913\24.04\1913-000-GEREP-0003_D S10
Page 10.9
May 2016 CSA Global
Table 10.2 Significant Drillhole Intersections (cut-off of 0.5% Cu or 0.5 ppm Au with minimum 2 m width and internal waste as 2 m)
Hole From (m) To (m) Interval Au (ppm) Fe (%) Cu (%)
MDH-001 26.00 92.00 66.00 2.1 46.1 3 MDH-001 107.00 109.00 2.00 0.8 20.5 0.6 MDH-001 129.00 131.00 2.00 0.4 11.2 0.6 MDH-004 64.00 70.00 6.00 1.7 31.3 1 MDH-004 147.00 156.00 9.00 0.5 4.8 1 MDH-005 51.00 113.00 62.00 2.7 48.8 2.8 MDH-007 40.00 121.00 81.00 2.6 55.5 2.6 MDH-007 127.00 129.00 2.00 4.2 30.1 3.8 MDH-009 34.00 121.00 87.00 2.9 43.5 1.7 MDH-010 59.00 123.40 64.40 2.2 45 2.3 MDH-011 60.00 105.00 45.00 1 19.3 1.1 MDH-011 108.00 142.00 34.00 0.7 22.9 0.6 MDH-011 147.00 168.00 21.00 0.7 24 0.9 MDH-012 60.00 106.00 46.00 2.7 48.6 2.8 MDH-012 110.00 115.00 5.00 1.6 49.1 1.9 MDH-013 36.12 123.15 87.03 3.4 41.5 2.4 MDH-013 129.00 133.00 4.00 0.8 15.2 0.6 MDH-014 30.80 38.35 7.55 1.6 53.2 0.1 MDH-014 42.20 67.00 24.80 1.1 53.1 0.9 MDH-014 70.00 72.10 2.10 0.6 55.7 0.3 MDH-016 104.45 159.00 54.55 5.2 50.7 3.1 MDH-016 163.00 166.00 3.00 0.5 44.3 0.6 MDH-017 45.20 78.85 33.65 1 30.1 1 MDH-017 81.20 101.00 19.80 0.7 28.1 0.7 MDH-017 104.40 154.70 50.30 1.8 42.2 1.7 MDH-017 156.80 159.20 2.40 2.3 36.9 3 MDH-018 51.30 65.50 14.20 3.9 52.1 1.9 MDH-018 77.30 82.00 4.70 0.7 61.8 0.3 MDH-018 94.35 101.00 6.65 0.4 26.7 0.6 MDH-019 74.90 77.75 2.85 0.5 19.7 0.7 MDH-019 83.40 86.00 2.60 0.8 28 0.7 MDH-019 91.87 169.00 77.13 1.7 50.5 1.4 MDH-020 53.10 81.70 28.60 4.1 36.5 10.5 MDH-023 96.00 99.50 3.50 1.8 63 0 MDH-028 51.00 89.30 38.30 2 30.5 2.1 MDH-029 69.10 89.90 20.80 2.4 32.2 22.9 MDH-030 33.00 101.00 68.00 1.9 54.6 1.1 MDH-031 46.80 113.00 66.20 2.2 48.8 2.8 MDH-031 116.00 120.90 4.90 0.8 6.9 0.6 MDH-033 46.00 93.00 47.00 1.6 56.3 1.1 MDH-034 34.90 88.70 53.80 2.4 46.5 3.1 MDH-035 48.25 164.00 115.75 2.5 46.5 2.2 MDH-035 178.00 181.80 3.80 0.5 14.4 0.6 MDH-036 55.00 78.55 23.55 1.6 45.4 1.7 MDH-036 85.80 91.80 6.00 0.8 28.9 0.7 MDH-038 115.60 124.00 8.40 0.5 3.7 0.7 MDH-040 91.00 94.00 3.00 0.3 8.8 0.8 MDH-040 99.00 101.00 2.00 1 8.3 0.9 MDH-040 107.85 159.00 51.15 3 52 2.2 MDH-041 56.20 86.30 30.10 1.6 17.8 4 MDH-041 92.50 96.40 3.90 0.6 39.7 0.8 MDH-043 48.00 51.40 3.40 0.8 9.2 2.7 MDH-044 81.00 83.00 2.00 0.2 6 0.6 MDH-044 111.00 124.00 13.00 0.9 21.2 0.3 MDH-045 44.00 61.60 17.60 2.1 44.3 6.5 MDH-045 70.25 84.40 14.15 0.7 5.7 1 MDH-045 87.60 96.60 9.00 1.1 11.5 0.1 MDH-046 237.30 277.75 40.45 1.9 42.9 1.4 MDH-046 284.25 288.45 4.20 2.2 50.3 2 MDH-048 42.00 140.75 98.75 1.8 44.9 1.8 MDH-048 143.00 147.60 4.60 1.1 28 1.4 MDH-048 158.50 162.00 3.50 0.6 18.6 0.5 MDH-048 176.00 178.00 2.00 1.1 25.6 1.1 MDH-048 184.00 187.00 3.00 0.7 13.4 0.6 MDH-048 190.00 200.00 10.00 1 12.2 0.8 MDH-048 203.00 206.00 3.00 1 13.5 0.9 MDH-050 72.15 90.05 17.90 1.1 27.2 0.6 MDH-050 138.60 148.10 9.50 0.8 17.9 1 MDH-052 56.90 64.00 7.10 0.9 8.1 1.3 MDH-052 67.00 75.00 8.00 1.6 19.7 0.5 MDH-052 80.40 105.00 24.60 0.6 19.2 1.1 MDH-052 108.00 147.80 39.80 1.5 36.5 1.4 MDH-052 150.15 169.80 19.65 1.9 47.7 1.9 MDH-052 174.50 190.50 16.00 1.9 40.7 1.9 MDH-053 108.00 156.00 48.00 1.6 56.7 1.4 MDH-053 160.00 179.00 19.00 3.2 42.7 1.2 MDH-053 182.00 185.00 3.00 3.4 26.2 1.4 MDH-053 187.85 212.00 24.15 3 40.5 0.7 MDH-054 58.00 61.00 3.00 0.8 5.9 0.8 MDH-054 129.00 132.00 3.00 0.5 19.4 0.9 MDH-054 146.50 150.80 4.30 0.9 30.7 0.5
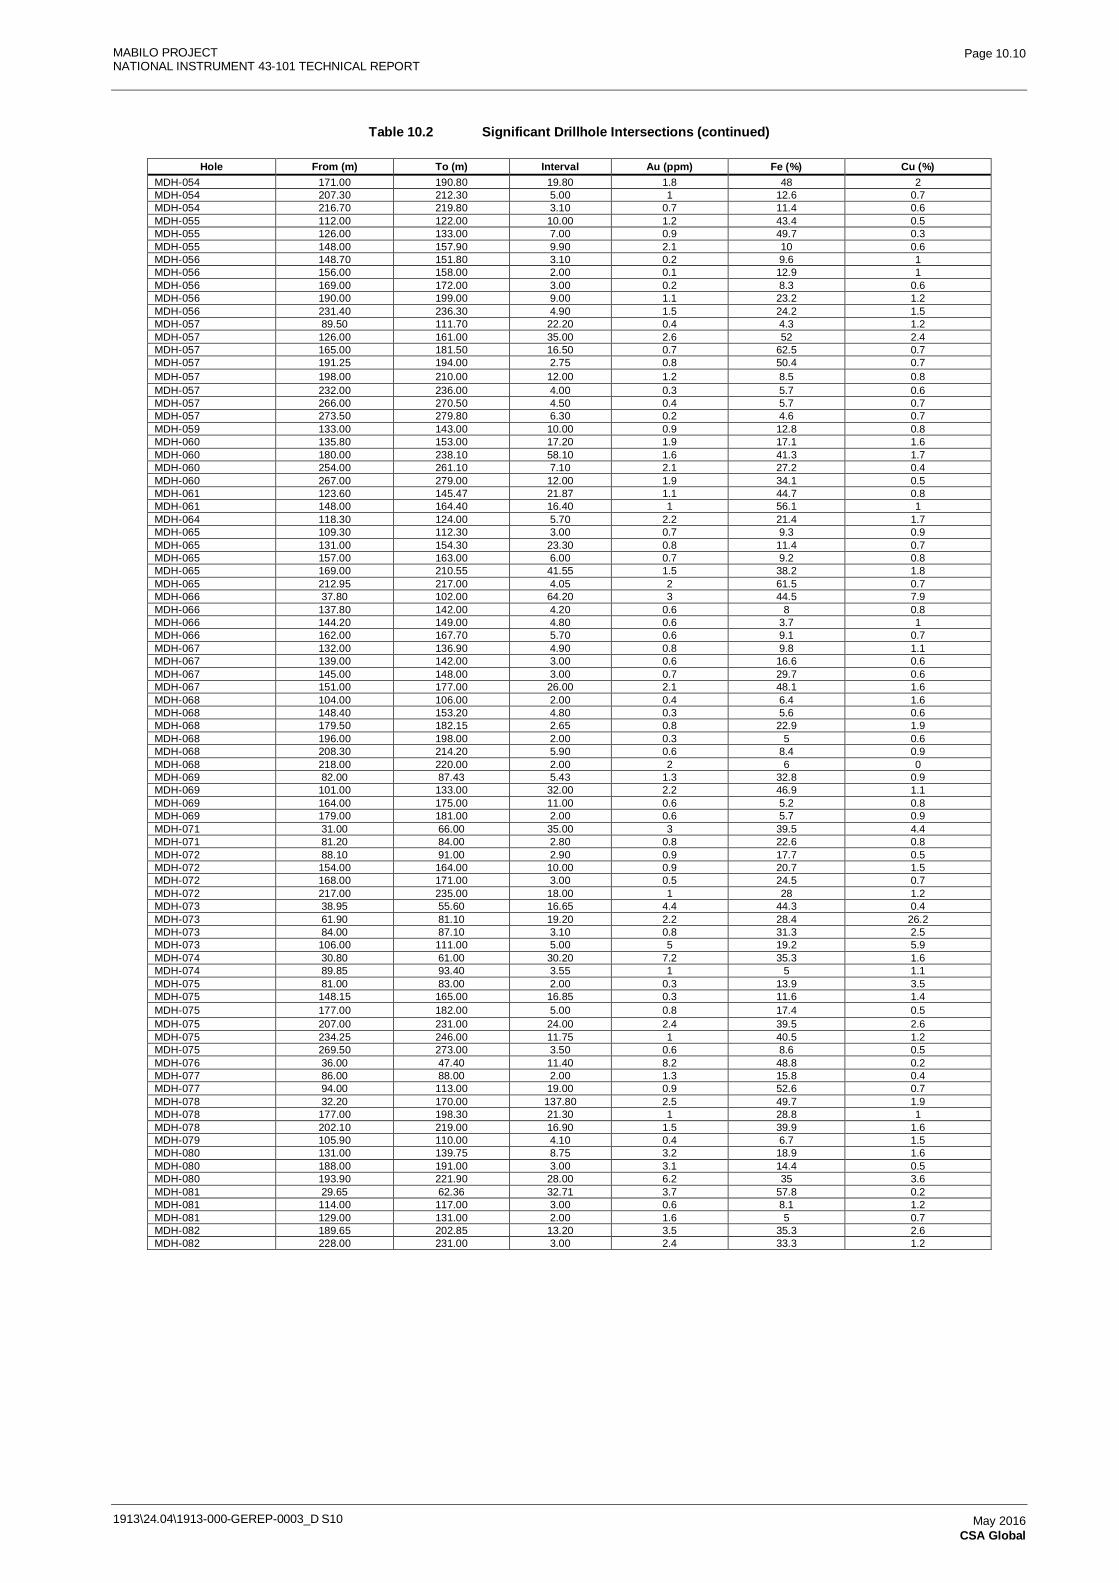
MABILO PROJECT NATIONAL INSTRUMENT 43-101 TECHNICAL REPORT
1913\24.04\1913-000-GEREP-0003_D S10
Page 10.10
May 2016 CSA Global
Table 10.2 Significant Drillhole Intersections (continued)
Hole From (m) To (m) Interval Au (ppm) Fe (%) Cu (%) MDH-054 171.00 190.80 19.80 1.8 48 2 MDH-054 207.30 212.30 5.00 1 12.6 0.7 MDH-054 216.70 219.80 3.10 0.7 11.4 0.6 MDH-055 112.00 122.00 10.00 1.2 43.4 0.5 MDH-055 126.00 133.00 7.00 0.9 49.7 0.3 MDH-055 148.00 157.90 9.90 2.1 10 0.6 MDH-056 148.70 151.80 3.10 0.2 9.6 1 MDH-056 156.00 158.00 2.00 0.1 12.9 1 MDH-056 169.00 172.00 3.00 0.2 8.3 0.6 MDH-056 190.00 199.00 9.00 1.1 23.2 1.2 MDH-056 231.40 236.30 4.90 1.5 24.2 1.5 MDH-057 89.50 111.70 22.20 0.4 4.3 1.2 MDH-057 126.00 161.00 35.00 2.6 52 2.4 MDH-057 165.00 181.50 16.50 0.7 62.5 0.7 MDH-057 191.25 194.00 2.75 0.8 50.4 0.7 MDH-057 198.00 210.00 12.00 1.2 8.5 0.8 MDH-057 232.00 236.00 4.00 0.3 5.7 0.6 MDH-057 266.00 270.50 4.50 0.4 5.7 0.7 MDH-057 273.50 279.80 6.30 0.2 4.6 0.7 MDH-059 133.00 143.00 10.00 0.9 12.8 0.8 MDH-060 135.80 153.00 17.20 1.9 17.1 1.6 MDH-060 180.00 238.10 58.10 1.6 41.3 1.7 MDH-060 254.00 261.10 7.10 2.1 27.2 0.4 MDH-060 267.00 279.00 12.00 1.9 34.1 0.5 MDH-061 123.60 145.47 21.87 1.1 44.7 0.8 MDH-061 148.00 164.40 16.40 1 56.1 1 MDH-064 118.30 124.00 5.70 2.2 21.4 1.7 MDH-065 109.30 112.30 3.00 0.7 9.3 0.9 MDH-065 131.00 154.30 23.30 0.8 11.4 0.7 MDH-065 157.00 163.00 6.00 0.7 9.2 0.8 MDH-065 169.00 210.55 41.55 1.5 38.2 1.8 MDH-065 212.95 217.00 4.05 2 61.5 0.7 MDH-066 37.80 102.00 64.20 3 44.5 7.9 MDH-066 137.80 142.00 4.20 0.6 8 0.8 MDH-066 144.20 149.00 4.80 0.6 3.7 1 MDH-066 162.00 167.70 5.70 0.6 9.1 0.7 MDH-067 132.00 136.90 4.90 0.8 9.8 1.1 MDH-067 139.00 142.00 3.00 0.6 16.6 0.6 MDH-067 145.00 148.00 3.00 0.7 29.7 0.6 MDH-067 151.00 177.00 26.00 2.1 48.1 1.6 MDH-068 104.00 106.00 2.00 0.4 6.4 1.6 MDH-068 148.40 153.20 4.80 0.3 5.6 0.6 MDH-068 179.50 182.15 2.65 0.8 22.9 1.9 MDH-068 196.00 198.00 2.00 0.3 5 0.6 MDH-068 208.30 214.20 5.90 0.6 8.4 0.9 MDH-068 218.00 220.00 2.00 2 6 0 MDH-069 82.00 87.43 5.43 1.3 32.8 0.9 MDH-069 101.00 133.00 32.00 2.2 46.9 1.1 MDH-069 164.00 175.00 11.00 0.6 5.2 0.8 MDH-069 179.00 181.00 2.00 0.6 5.7 0.9 MDH-071 31.00 66.00 35.00 3 39.5 4.4 MDH-071 81.20 84.00 2.80 0.8 22.6 0.8 MDH-072 88.10 91.00 2.90 0.9 17.7 0.5 MDH-072 154.00 164.00 10.00 0.9 20.7 1.5 MDH-072 168.00 171.00 3.00 0.5 24.5 0.7 MDH-072 217.00 235.00 18.00 1 28 1.2 MDH-073 38.95 55.60 16.65 4.4 44.3 0.4 MDH-073 61.90 81.10 19.20 2.2 28.4 26.2 MDH-073 84.00 87.10 3.10 0.8 31.3 2.5 MDH-073 106.00 111.00 5.00 5 19.2 5.9 MDH-074 30.80 61.00 30.20 7.2 35.3 1.6 MDH-074 89.85 93.40 3.55 1 5 1.1 MDH-075 81.00 83.00 2.00 0.3 13.9 3.5 MDH-075 148.15 165.00 16.85 0.3 11.6 1.4 MDH-075 177.00 182.00 5.00 0.8 17.4 0.5 MDH-075 207.00 231.00 24.00 2.4 39.5 2.6 MDH-075 234.25 246.00 11.75 1 40.5 1.2 MDH-075 269.50 273.00 3.50 0.6 8.6 0.5 MDH-076 36.00 47.40 11.40 8.2 48.8 0.2 MDH-077 86.00 88.00 2.00 1.3 15.8 0.4 MDH-077 94.00 113.00 19.00 0.9 52.6 0.7 MDH-078 32.20 170.00 137.80 2.5 49.7 1.9 MDH-078 177.00 198.30 21.30 1 28.8 1 MDH-078 202.10 219.00 16.90 1.5 39.9 1.6 MDH-079 105.90 110.00 4.10 0.4 6.7 1.5 MDH-080 131.00 139.75 8.75 3.2 18.9 1.6 MDH-080 188.00 191.00 3.00 3.1 14.4 0.5 MDH-080 193.90 221.90 28.00 6.2 35 3.6 MDH-081 29.65 62.36 32.71 3.7 57.8 0.2 MDH-081 114.00 117.00 3.00 0.6 8.1 1.2 MDH-081 129.00 131.00 2.00 1.6 5 0.7 MDH-082 189.65 202.85 13.20 3.5 35.3 2.6 MDH-082 228.00 231.00 3.00 2.4 33.3 1.2
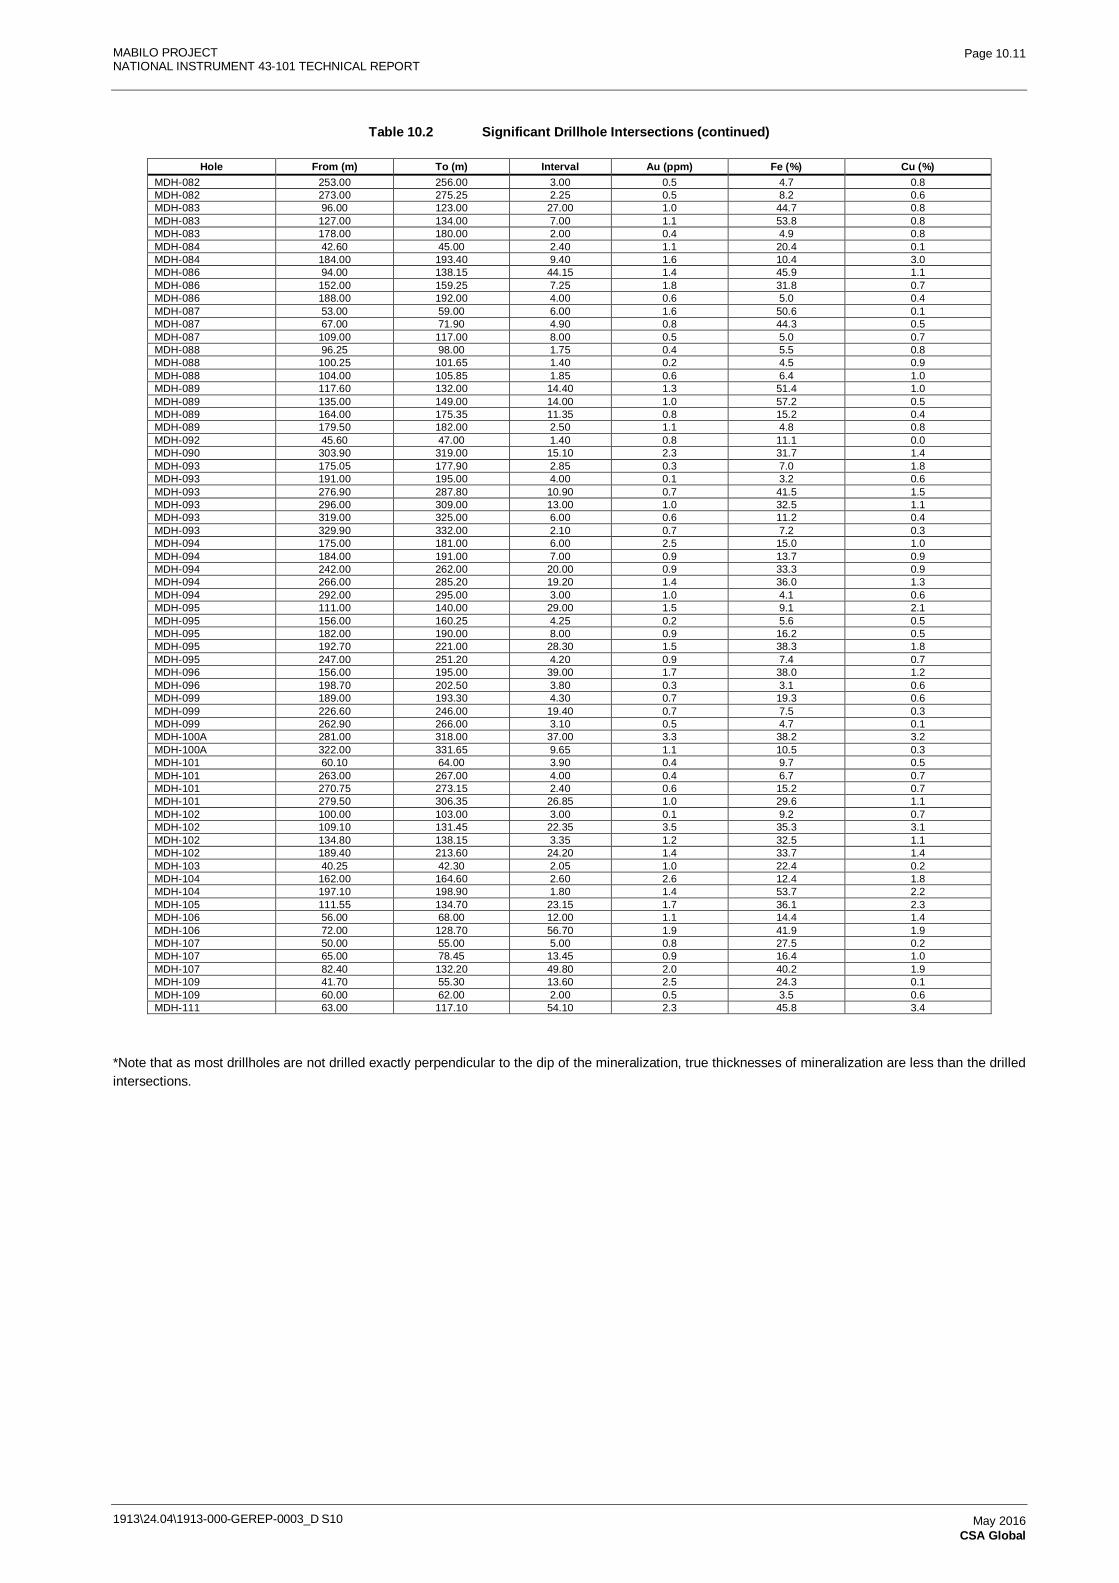
MABILO PROJECT NATIONAL INSTRUMENT 43-101 TECHNICAL REPORT
1913\24.04\1913-000-GEREP-0003_D S10
Page 10.11
May 2016 CSA Global
Table 10.2 Significant Drillhole Intersections (continued)
Hole From (m) To (m) Interval Au (ppm) Fe (%) Cu (%) MDH-082 253.00 256.00 3.00 0.5 4.7 0.8 MDH-082 273.00 275.25 2.25 0.5 8.2 0.6 MDH-083 96.00 123.00 27.00 1.0 44.7 0.8 MDH-083 127.00 134.00 7.00 1.1 53.8 0.8 MDH-083 178.00 180.00 2.00 0.4 4.9 0.8 MDH-084 42.60 45.00 2.40 1.1 20.4 0.1 MDH-084 184.00 193.40 9.40 1.6 10.4 3.0 MDH-086 94.00 138.15 44.15 1.4 45.9 1.1 MDH-086 152.00 159.25 7.25 1.8 31.8 0.7 MDH-086 188.00 192.00 4.00 0.6 5.0 0.4 MDH-087 53.00 59.00 6.00 1.6 50.6 0.1 MDH-087 67.00 71.90 4.90 0.8 44.3 0.5 MDH-087 109.00 117.00 8.00 0.5 5.0 0.7 MDH-088 96.25 98.00 1.75 0.4 5.5 0.8 MDH-088 100.25 101.65 1.40 0.2 4.5 0.9 MDH-088 104.00 105.85 1.85 0.6 6.4 1.0 MDH-089 117.60 132.00 14.40 1.3 51.4 1.0 MDH-089 135.00 149.00 14.00 1.0 57.2 0.5 MDH-089 164.00 175.35 11.35 0.8 15.2 0.4 MDH-089 179.50 182.00 2.50 1.1 4.8 0.8 MDH-092 45.60 47.00 1.40 0.8 11.1 0.0 MDH-090 303.90 319.00 15.10 2.3 31.7 1.4 MDH-093 175.05 177.90 2.85 0.3 7.0 1.8 MDH-093 191.00 195.00 4.00 0.1 3.2 0.6 MDH-093 276.90 287.80 10.90 0.7 41.5 1.5 MDH-093 296.00 309.00 13.00 1.0 32.5 1.1 MDH-093 319.00 325.00 6.00 0.6 11.2 0.4 MDH-093 329.90 332.00 2.10 0.7 7.2 0.3 MDH-094 175.00 181.00 6.00 2.5 15.0 1.0 MDH-094 184.00 191.00 7.00 0.9 13.7 0.9 MDH-094 242.00 262.00 20.00 0.9 33.3 0.9 MDH-094 266.00 285.20 19.20 1.4 36.0 1.3 MDH-094 292.00 295.00 3.00 1.0 4.1 0.6 MDH-095 111.00 140.00 29.00 1.5 9.1 2.1 MDH-095 156.00 160.25 4.25 0.2 5.6 0.5 MDH-095 182.00 190.00 8.00 0.9 16.2 0.5 MDH-095 192.70 221.00 28.30 1.5 38.3 1.8 MDH-095 247.00 251.20 4.20 0.9 7.4 0.7 MDH-096 156.00 195.00 39.00 1.7 38.0 1.2 MDH-096 198.70 202.50 3.80 0.3 3.1 0.6 MDH-099 189.00 193.30 4.30 0.7 19.3 0.6 MDH-099 226.60 246.00 19.40 0.7 7.5 0.3 MDH-099 262.90 266.00 3.10 0.5 4.7 0.1 MDH-100A 281.00 318.00 37.00 3.3 38.2 3.2 MDH-100A 322.00 331.65 9.65 1.1 10.5 0.3 MDH-101 60.10 64.00 3.90 0.4 9.7 0.5 MDH-101 263.00 267.00 4.00 0.4 6.7 0.7 MDH-101 270.75 273.15 2.40 0.6 15.2 0.7 MDH-101 279.50 306.35 26.85 1.0 29.6 1.1 MDH-102 100.00 103.00 3.00 0.1 9.2 0.7 MDH-102 109.10 131.45 22.35 3.5 35.3 3.1 MDH-102 134.80 138.15 3.35 1.2 32.5 1.1 MDH-102 189.40 213.60 24.20 1.4 33.7 1.4 MDH-103 40.25 42.30 2.05 1.0 22.4 0.2 MDH-104 162.00 164.60 2.60 2.6 12.4 1.8 MDH-104 197.10 198.90 1.80 1.4 53.7 2.2 MDH-105 111.55 134.70 23.15 1.7 36.1 2.3 MDH-106 56.00 68.00 12.00 1.1 14.4 1.4 MDH-106 72.00 128.70 56.70 1.9 41.9 1.9 MDH-107 50.00 55.00 5.00 0.8 27.5 0.2 MDH-107 65.00 78.45 13.45 0.9 16.4 1.0 MDH-107 82.40 132.20 49.80 2.0 40.2 1.9 MDH-109 41.70 55.30 13.60 2.5 24.3 0.1 MDH-109 60.00 62.00 2.00 0.5 3.5 0.6 MDH-111 63.00 117.10 54.10 2.3 45.8 3.4
*Note that as most drillholes are not drilled exactly perpendicular to the dip of the mineralization, true thicknesses of mineralization are less than the drilled intersections.
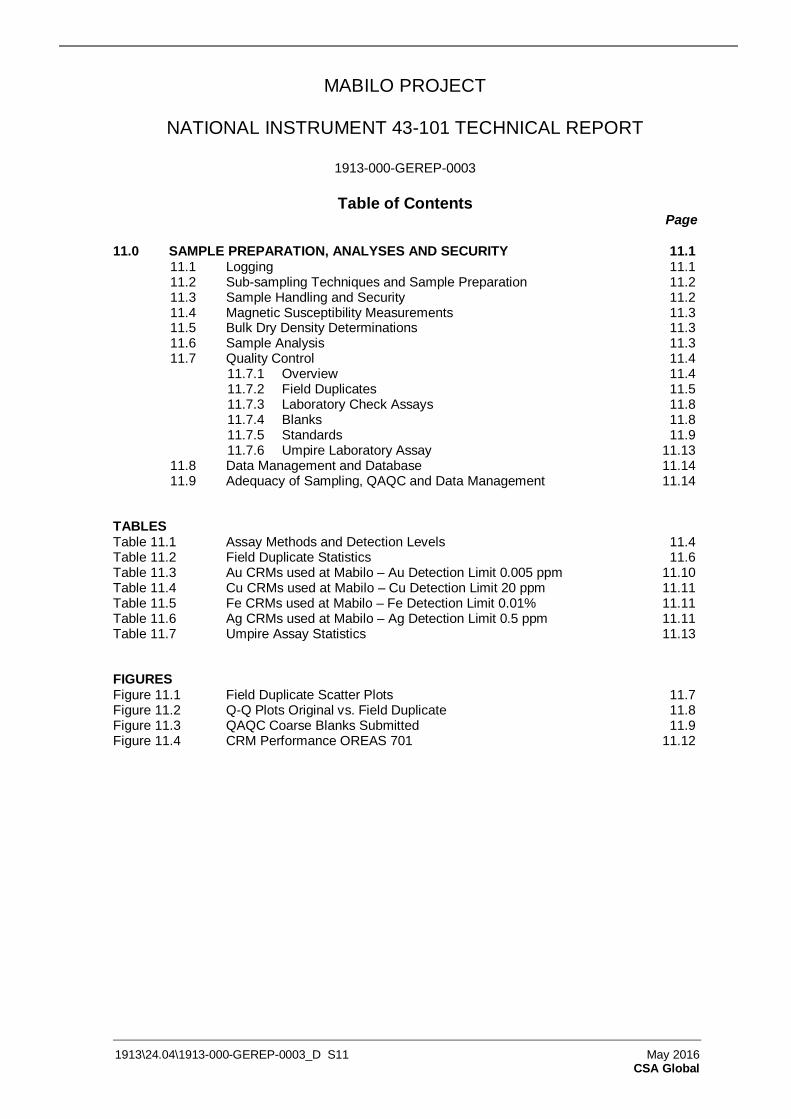
MABILO PROJECT
NATIONAL INSTRUMENT 43-101 TECHNICAL REPORT
1913-000-GEREP-0003
Table of Contents Page
11.0 SAMPLE PREPARATION, ANALYSES AND SECURITY 11.1 11.1 Logging 11.1 11.2 Sub-sampling Techniques and Sample Preparation 11.2 11.3 Sample Handling and Security 11.2 11.4 Magnetic Susceptibility Measurements 11.3 11.5 Bulk Dry Density Determinations 11.3 11.6 Sample Analysis 11.3 11.7 Quality Control 11.4
11.7.1 Overview 11.4 11.7.2 Field Duplicates 11.5 11.7.3 Laboratory Check Assays 11.8 11.7.4 Blanks 11.8 11.7.5 Standards 11.9 11.7.6 Umpire Laboratory Assay 11.13
11.8 Data Management and Database 11.14 11.9 Adequacy of Sampling, QAQC and Data Management 11.14
TABLES Table 11.1 Assay Methods and Detection Levels 11.4 Table 11.2 Field Duplicate Statistics 11.6 Table 11.3 Au CRMs used at Mabilo – Au Detection Limit 0.005 ppm 11.10 Table 11.4 Cu CRMs used at Mabilo – Cu Detection Limit 20 ppm 11.11 Table 11.5 Fe CRMs used at Mabilo – Fe Detection Limit 0.01% 11.11 Table 11.6 Ag CRMs used at Mabilo – Ag Detection Limit 0.5 ppm 11.11 Table 11.7 Umpire Assay Statistics 11.13 FIGURES Figure 11.1 Field Duplicate Scatter Plots 11.7 Figure 11.2 Q-Q Plots Original vs. Field Duplicate 11.8 Figure 11.3 QAQC Coarse Blanks Submitted 11.9 Figure 11.4 CRM Performance OREAS 701 11.12
1913\24.04\1913-000-GEREP-0003_D S11 May 2016 CSA Global
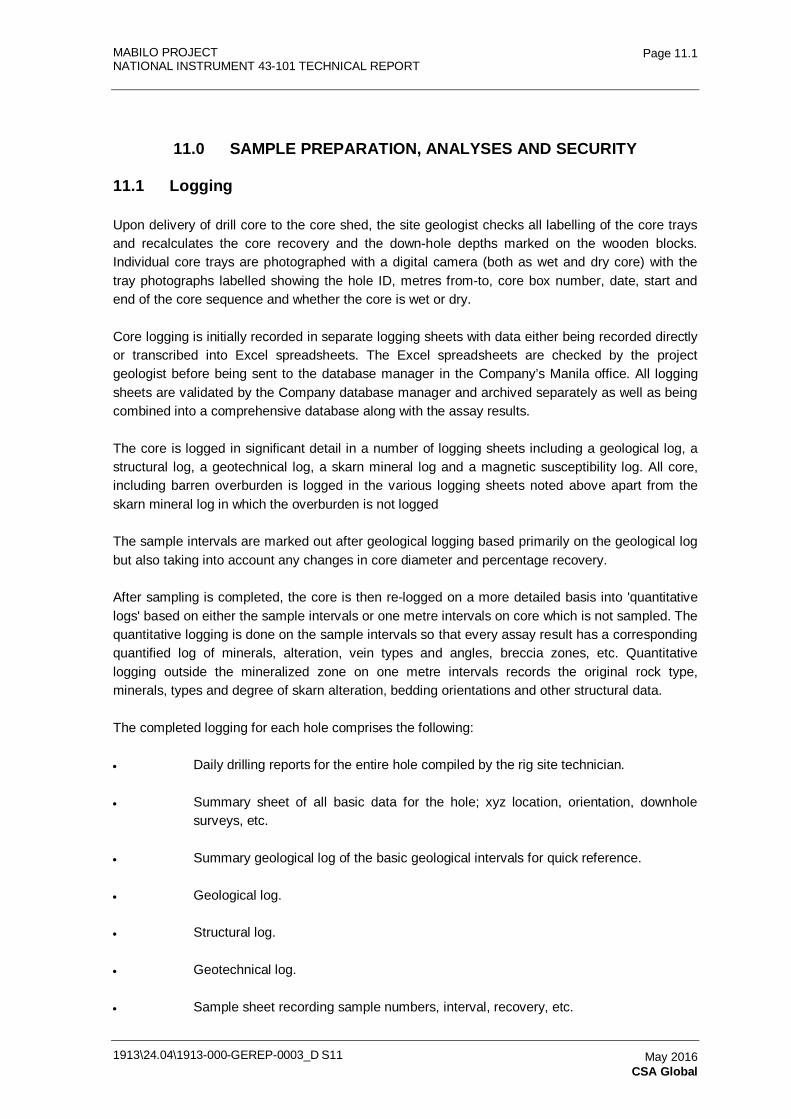
MABILO PROJECT NATIONAL INSTRUMENT 43-101 TECHNICAL REPORT
1913\24.04\1913-000-GEREP-0003_D S11
Page 11.1
May 2016 CSA Global
11.0 SAMPLE PREPARATION, ANALYSES AND SECURITY
11.1 Logging
Upon delivery of drill core to the core shed, the site geologist checks all labelling of the core trays and recalculates the core recovery and the down-hole depths marked on the wooden blocks. Individual core trays are photographed with a digital camera (both as wet and dry core) with the tray photographs labelled showing the hole ID, metres from-to, core box number, date, start and end of the core sequence and whether the core is wet or dry.
Core logging is initially recorded in separate logging sheets with data either being recorded directly or transcribed into Excel spreadsheets. The Excel spreadsheets are checked by the project geologist before being sent to the database manager in the Company’s Manila office. All logging sheets are validated by the Company database manager and archived separately as well as being combined into a comprehensive database along with the assay results.
The core is logged in significant detail in a number of logging sheets including a geological log, a structural log, a geotechnical log, a skarn mineral log and a magnetic susceptibility log. All core, including barren overburden is logged in the various logging sheets noted above apart from the skarn mineral log in which the overburden is not logged
The sample intervals are marked out after geological logging based primarily on the geological log but also taking into account any changes in core diameter and percentage recovery.
After sampling is completed, the core is then re-logged on a more detailed basis into 'quantitative logs' based on either the sample intervals or one metre intervals on core which is not sampled. The quantitative logging is done on the sample intervals so that every assay result has a corresponding quantified log of minerals, alteration, vein types and angles, breccia zones, etc. Quantitative logging outside the mineralized zone on one metre intervals records the original rock type, minerals, types and degree of skarn alteration, bedding orientations and other structural data.
The completed logging for each hole comprises the following:
• Daily drilling reports for the entire hole compiled by the rig site technician.
• Summary sheet of all basic data for the hole; xyz location, orientation, downhole surveys, etc.
• Summary geological log of the basic geological intervals for quick reference.
• Geological log.
• Structural log.
• Geotechnical log.
• Sample sheet recording sample numbers, interval, recovery, etc.
MABILO PROJECT NATIONAL INSTRUMENT 43-101 TECHNICAL REPORT
1913\24.04\1913-000-GEREP-0003_D S11
Page 11.2
May 2016 CSA Global
• Bulk density log recording sample weights and bulk density calculations.
• Magnetic susceptibility logs.
• Quantitative drill logs.
11.2 Sub-sampling Techniques and Sample Preparation
Sampling of mineralized core in the first phase of drilling (MDH-01 to 12) was conducted on standard 1 m intervals. Subsequently the sample intervals have been determined by the Project Geologist such that most intervals were approximately 1 m and none was more than 2 m. Intervals take account of geological boundaries from logging but also take into account any changes in core diameter and percentage recovery so that no single sample interval contains core of different lithology, different diameter or significantly different core recovery. All magnetite skarn, adjacent calcic skarn and ferruginous zones were sampled. Labo Volcanic Complex cover sequence was not sampled.
The sampling intervals are initially marked out on the core box with indelible pen by the core shed geologist and recorded on the sample sheet log. The core shed geologist also marks intervals for duplicate sampling as well as numbers assigned for blanks and standards on the sample sheet. Intervals marked for duplicate sampling are assigned two numbers and one interval of half core is cut again to produce two quarter core samples which are sampled and numbered separately.
Core samples are cut into two halves using an electric diamond saw supervised by the core shed geologist. The core is cut in a core cutting shed located 30 m away from the logging area.
Un-orientated core is cut along the core axis marked by the core shed geologist to produce two equal half or quarter core sections. Where core is broken or friable it is wrapped in clear cling plastic prior to sawing to allow a representative half sample to be collected without loss of material. Where the core is broken all individual pieces greater than 5 cm diameter are cut along the axis of symmetry to produce two identical half core samples. Where the core is very broken (fragments below 5 cm diameter) or predominantly clay, half of the 'core' is collected using a small plastic scoop supervised by the core shed geologist to ensure that the fragments are taken uniformly along the core length and mineralized materials are represented properly. The cut core is initially placed back into the core tray in its correct position prior to half core being removed for sampling.
11.3 Sample Handling and Security
Samples (including duplicates, standards and blanks) are placed in numbered plastic sample bags in accordance with the sample sheet and laid out in sequence. The sample tickets are filled out and double checked against the label on the sample plastic bags prior to being placed in the sample bag and the bag is sealed with a cable tie. A duplicate sample submission ticket is attached to the core tray at the top of the sample interval.
Standards (CRMs) and blank samples are submitted routinely as discussed further below. The blank samples are sourced from a local basalt quarry and kept in a large drum at the core yard. Blanks samples of approximately 3 kg are prepared by spreading the basalt on a plastic sheet,
MABILO PROJECT NATIONAL INSTRUMENT 43-101 TECHNICAL REPORT
1913\24.04\1913-000-GEREP-0003_D S11
Page 11.3
May 2016 CSA Global
breaking larger pieces to less than 5 cm diameter and mixing the sample thoroughly before bagging samples in numbered bags.
The core shed geologist checks that all samples are in the correct bags, that the sample intervals and numbers correspond to that of the sample sheet and sample ticket, and ensures standards and blanks are placed as required within the sample number sequence. The sealed samples are placed in plastic drums for transport to the laboratory by a local courier company. The drums are labelled with the sample numbers contained in the drums and batch number. Appropriate documentation (Sample Dispatch and Sample Submission forms) are placed in the drums which are sealed with tamper-proof cable ties.
Remaining core is kept in the company core yard which is in a secure compound at the company regional office in Daet town and guarded at night.
11.4 Magnetic Susceptibility Measurements
Magnetic susceptibility readings are taken every 20 cm along all core, and averaged to coincide with sample intervals. Readings are taken on the flat surfaces of half core intervals and on the rounded surface of uncut core. The core size diameter and whether the core is uncut or half cut is noted in the magnetic susceptibility logs for calibrating and assessing readings in modelling of the magnetic data.
11.5 Bulk Dry Density Determinations
Bulk dry density determinations are conducted on selected samples of core from all the different types of lithologies as determined by the core shed geologist. The wax-coated, water immersion method is used due to the significant porosity of most rock types (particular the magnetite mineralization) and the very weathered nature of most of the country rock core. Initially, density determinations were completed on remaining half core for sampled sections. Since 2014, density determinations have been completed on full core prior to cutting.
Samples are oven dried for four hours at 150° Celsius. Readings of the weight of the dried sample, wax-coated sample in air and wax-coated sample suspended in water are taken to 0.01 g accuracy. The scale is recalibrated between different readings and is calibrated to zero with the wire basket attached for weighing the wax-coated sample suspended in water. An independent determination of the wax density was undertaken by the analytical laboratory (Intertek) which yielded 0.88, 0.89 and 0.90 g per cubic cm. The average of 0.89 has been utilized in all calculations.
CSA Global has noted that excessive wax has been used for density determinations primarily in the overburden and weathered waste materials. Analysis of the data has shown that this is not expected to be a significant issue for the mineralized parts of the system. CSA Global has recommended a revised practice.
11.6 Sample Analysis
Analytical samples are sent to the Intertek laboratory in Manila which is an ISO 9001-2000 accredited laboratory which follows internationally-accepted laboratory standards in sample
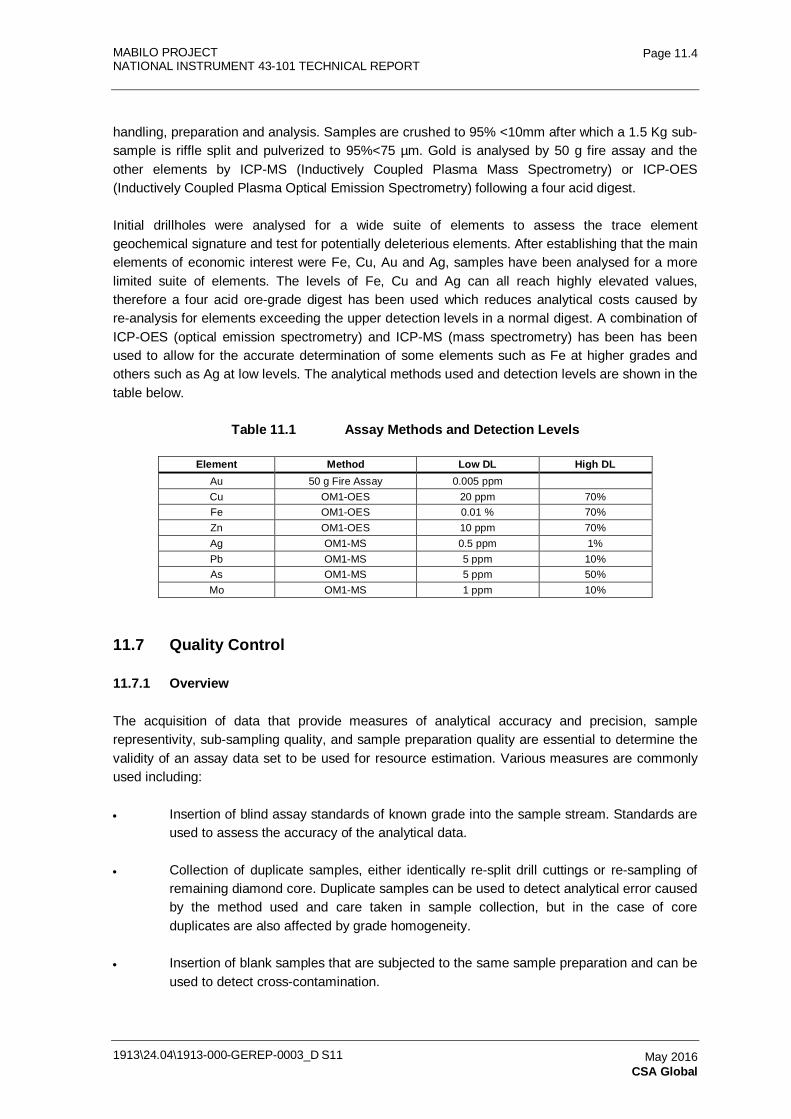
MABILO PROJECT NATIONAL INSTRUMENT 43-101 TECHNICAL REPORT
1913\24.04\1913-000-GEREP-0003_D S11
Page 11.4
May 2016 CSA Global
handling, preparation and analysis. Samples are crushed to 95% <10mm after which a 1.5 Kg sub-sample is riffle split and pulverized to 95%<75 µm. Gold is analysed by 50 g fire assay and the other elements by ICP-MS (Inductively Coupled Plasma Mass Spectrometry) or ICP-OES (Inductively Coupled Plasma Optical Emission Spectrometry) following a four acid digest.
Initial drillholes were analysed for a wide suite of elements to assess the trace element geochemical signature and test for potentially deleterious elements. After establishing that the main elements of economic interest were Fe, Cu, Au and Ag, samples have been analysed for a more limited suite of elements. The levels of Fe, Cu and Ag can all reach highly elevated values, therefore a four acid ore-grade digest has been used which reduces analytical costs caused by re-analysis for elements exceeding the upper detection levels in a normal digest. A combination of ICP-OES (optical emission spectrometry) and ICP-MS (mass spectrometry) has been has been used to allow for the accurate determination of some elements such as Fe at higher grades and others such as Ag at low levels. The analytical methods used and detection levels are shown in the table below.
Table 11.1 Assay Methods and Detection Levels
Element Method Low DL High DL Au 50 g Fire Assay 0.005 ppm Cu OM1-OES 20 ppm 70% Fe OM1-OES 0.01 % 70% Zn OM1-OES 10 ppm 70% Ag OM1-MS 0.5 ppm 1% Pb OM1-MS 5 ppm 10% As OM1-MS 5 ppm 50% Mo OM1-MS 1 ppm 10%
11.7 Quality Control
11.7.1 Overview
The acquisition of data that provide measures of analytical accuracy and precision, sample representivity, sub-sampling quality, and sample preparation quality are essential to determine the validity of an assay data set to be used for resource estimation. Various measures are commonly used including:
• Insertion of blind assay standards of known grade into the sample stream. Standards are used to assess the accuracy of the analytical data.
• Collection of duplicate samples, either identically re-split drill cuttings or re-sampling of remaining diamond core. Duplicate samples can be used to detect analytical error caused by the method used and care taken in sample collection, but in the case of core duplicates are also affected by grade homogeneity.
• Insertion of blank samples that are subjected to the same sample preparation and can be used to detect cross-contamination.
MABILO PROJECT NATIONAL INSTRUMENT 43-101 TECHNICAL REPORT
1913\24.04\1913-000-GEREP-0003_D S11
Page 11.5
May 2016 CSA Global
• Repeat assaying of replicate samples from same sample pulps. These data provide a measure of the analytical precision achieved by the laboratory. This data is usually acquired as part of the normal service provided by the laboratory.
• Repeat or check assays determined at a different analytical laboratory. This can be used to detect laboratory bias.
Quality control completed by Mt. Labo has included analysis of standards, blanks, and duplicates. Commercial Certified Reference Materials ('CRMs') were inserted into sample batches every 20th sample for the first phase of drilling and every 40th sample thereafter. Blank samples, sourced and prepared from a local quarry, were inserted every 20th sample. One in every 20 core samples was cut into two quarter-core samples which were submitted independently as field duplicates. In addition, Intertek conducted their own extensive check sampling as part of internal QAQC processes which is reported to Mt. Labo. A record of results for duplicates, blanks and standards is maintained for ongoing QAQC assessment.
Umpire laboratory testing has shown a reasonable correlation between primary assay and umpire assay. An upward bias in the mean grade of the primary compared to umpire assay is not considered to be significant, as all other QAQC protocols have performed well. Examination of the QAQC data indicates satisfactory performance of field sampling protocols and the assay laboratory.
11.7.2 Field Duplicates
Duplicate sampling has been completed on every 20th core sample. The selected intervals of half core were cut again to produce two quarter-core samples which were sampled, numbered and submitted separately. The submitted duplicates generally performed well for Cu, Au, Ag and Fe, all with a correlation co-efficient above 96% as shown in Table 11.2.
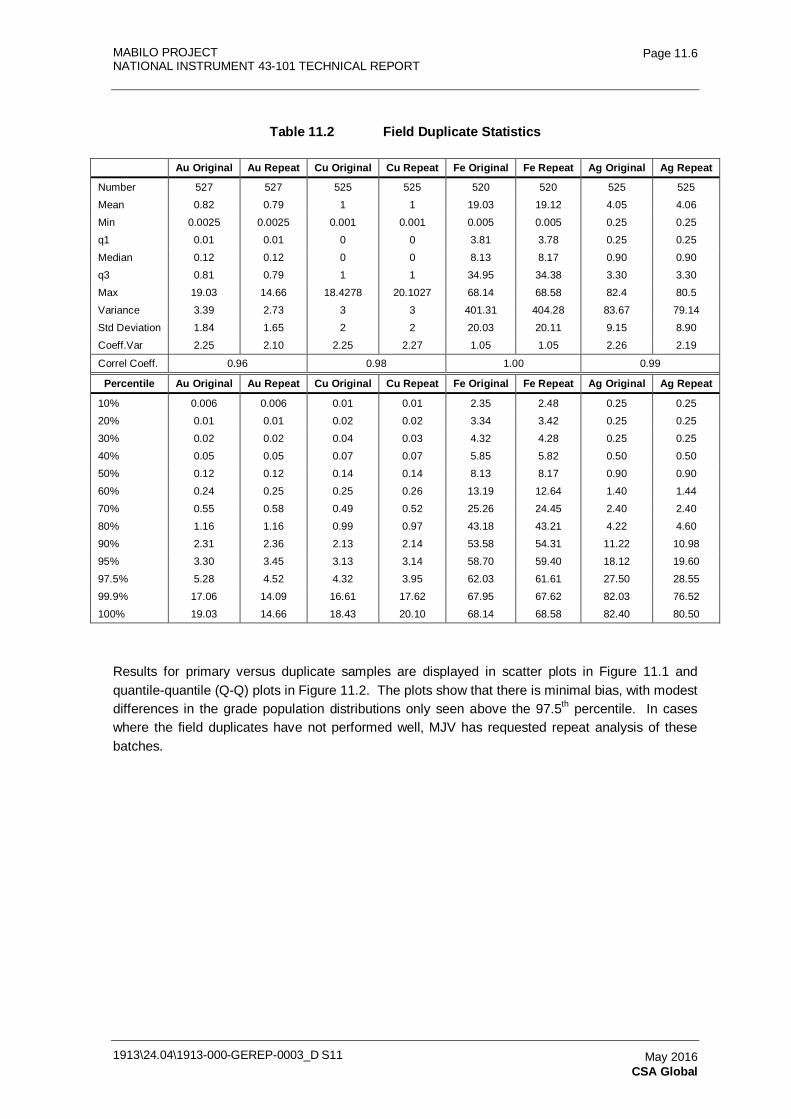
MABILO PROJECT NATIONAL INSTRUMENT 43-101 TECHNICAL REPORT
1913\24.04\1913-000-GEREP-0003_D S11
Page 11.6
May 2016 CSA Global
Table 11.2 Field Duplicate Statistics
Au Original Au Repeat Cu Original Cu Repeat Fe Original Fe Repeat Ag Original Ag Repeat
Number 527 527 525 525 520 520 525 525
Mean 0.82 0.79 1 1 19.03 19.12 4.05 4.06
Min 0.0025 0.0025 0.001 0.001 0.005 0.005 0.25 0.25
q1 0.01 0.01 0 0 3.81 3.78 0.25 0.25
Median 0.12 0.12 0 0 8.13 8.17 0.90 0.90
q3 0.81 0.79 1 1 34.95 34.38 3.30 3.30
Max 19.03 14.66 18.4278 20.1027 68.14 68.58 82.4 80.5
Variance 3.39 2.73 3 3 401.31 404.28 83.67 79.14
Std Deviation 1.84 1.65 2 2 20.03 20.11 9.15 8.90
Coeff.Var 2.25 2.10 2.25 2.27 1.05 1.05 2.26 2.19
Correl Coeff. 0.96 0.98 1.00 0.99
Percentile Au Original Au Repeat Cu Original Cu Repeat Fe Original Fe Repeat Ag Original Ag Repeat
10% 0.006 0.006 0.01 0.01 2.35 2.48 0.25 0.25
20% 0.01 0.01 0.02 0.02 3.34 3.42 0.25 0.25
30% 0.02 0.02 0.04 0.03 4.32 4.28 0.25 0.25
40% 0.05 0.05 0.07 0.07 5.85 5.82 0.50 0.50
50% 0.12 0.12 0.14 0.14 8.13 8.17 0.90 0.90
60% 0.24 0.25 0.25 0.26 13.19 12.64 1.40 1.44
70% 0.55 0.58 0.49 0.52 25.26 24.45 2.40 2.40
80% 1.16 1.16 0.99 0.97 43.18 43.21 4.22 4.60
90% 2.31 2.36 2.13 2.14 53.58 54.31 11.22 10.98
95% 3.30 3.45 3.13 3.14 58.70 59.40 18.12 19.60
97.5% 5.28 4.52 4.32 3.95 62.03 61.61 27.50 28.55
99.9% 17.06 14.09 16.61 17.62 67.95 67.62 82.03 76.52
100% 19.03 14.66 18.43 20.10 68.14 68.58 82.40 80.50
Results for primary versus duplicate samples are displayed in scatter plots in Figure 11.1 and quantile-quantile (Q-Q) plots in Figure 11.2. The plots show that there is minimal bias, with modest differences in the grade population distributions only seen above the 97.5th percentile. In cases where the field duplicates have not performed well, MJV has requested repeat analysis of these batches.
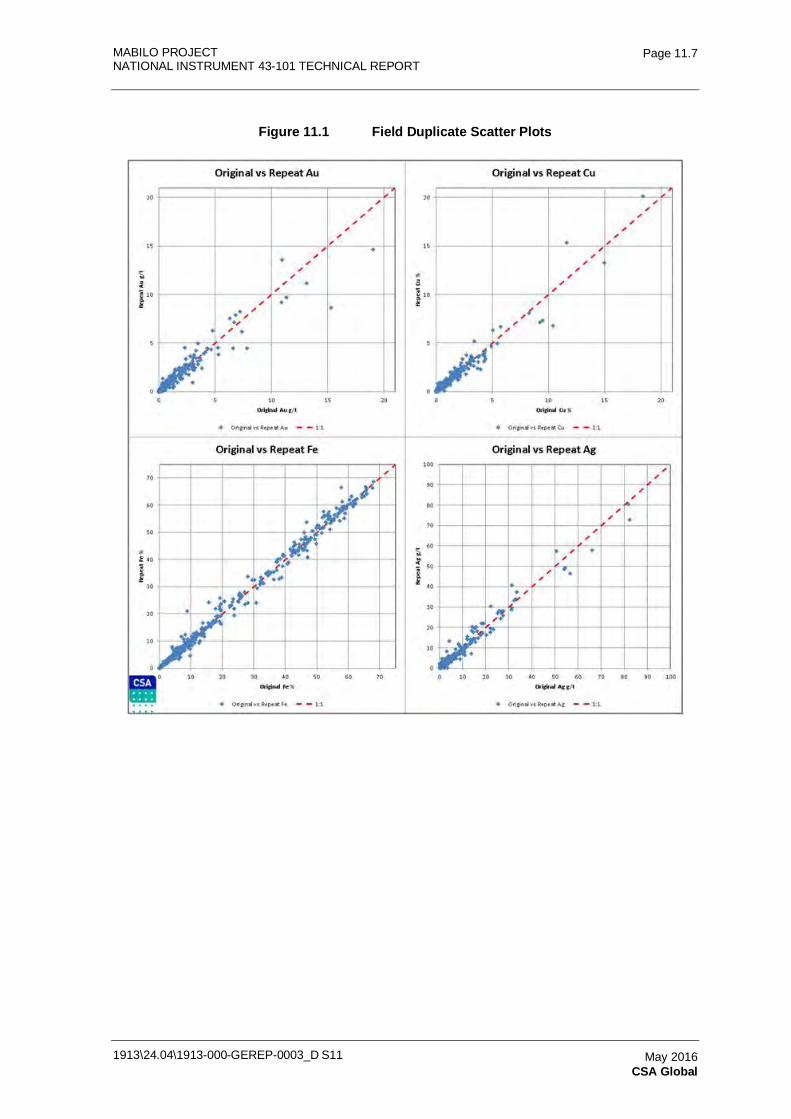
MABILO PROJECT NATIONAL INSTRUMENT 43-101 TECHNICAL REPORT
1913\24.04\1913-000-GEREP-0003_D S11
Page 11.7
May 2016 CSA Global
Figure 11.1 Field Duplicate Scatter Plots
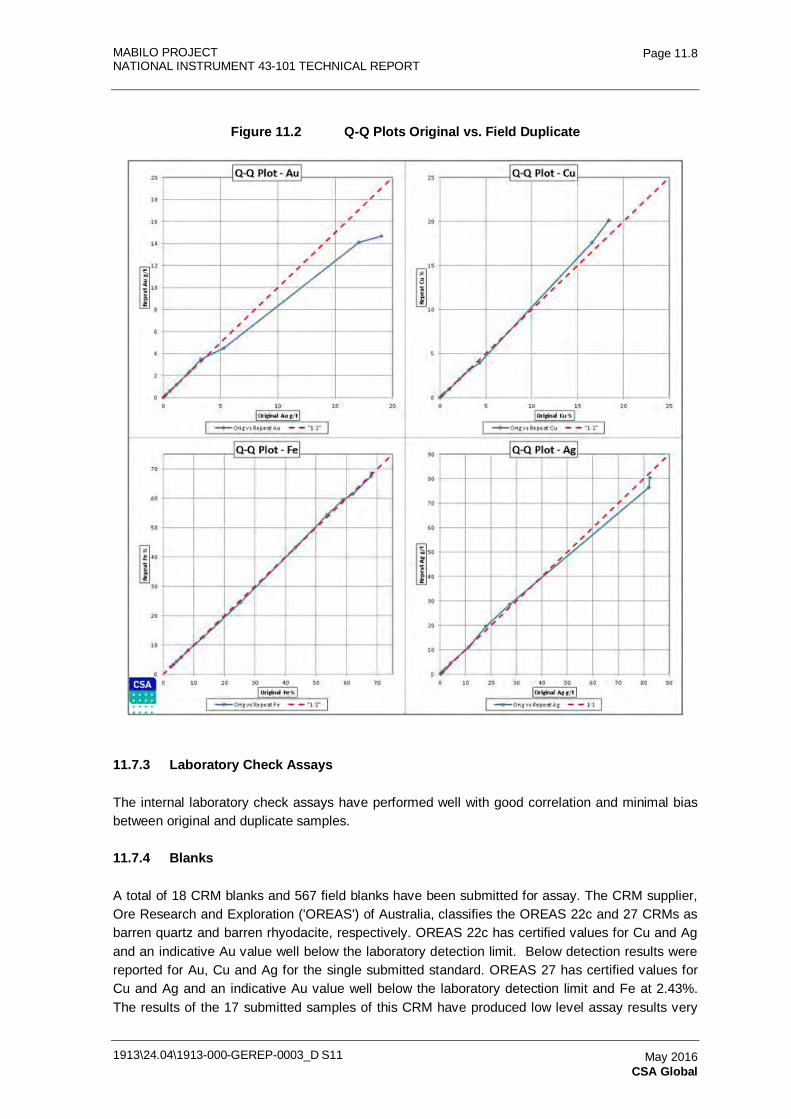
MABILO PROJECT NATIONAL INSTRUMENT 43-101 TECHNICAL REPORT
1913\24.04\1913-000-GEREP-0003_D S11
Page 11.8
May 2016 CSA Global
Figure 11.2 Q-Q Plots Original vs. Field Duplicate
11.7.3 Laboratory Check Assays
The internal laboratory check assays have performed well with good correlation and minimal bias between original and duplicate samples.
11.7.4 Blanks
A total of 18 CRM blanks and 567 field blanks have been submitted for assay. The CRM supplier, Ore Research and Exploration ('OREAS') of Australia, classifies the OREAS 22c and 27 CRMs as barren quartz and barren rhyodacite, respectively. OREAS 22c has certified values for Cu and Ag and an indicative Au value well below the laboratory detection limit. Below detection results were reported for Au, Cu and Ag for the single submitted standard. OREAS 27 has certified values for Cu and Ag and an indicative Au value well below the laboratory detection limit and Fe at 2.43%. The results of the 17 submitted samples of this CRM have produced low level assay results very
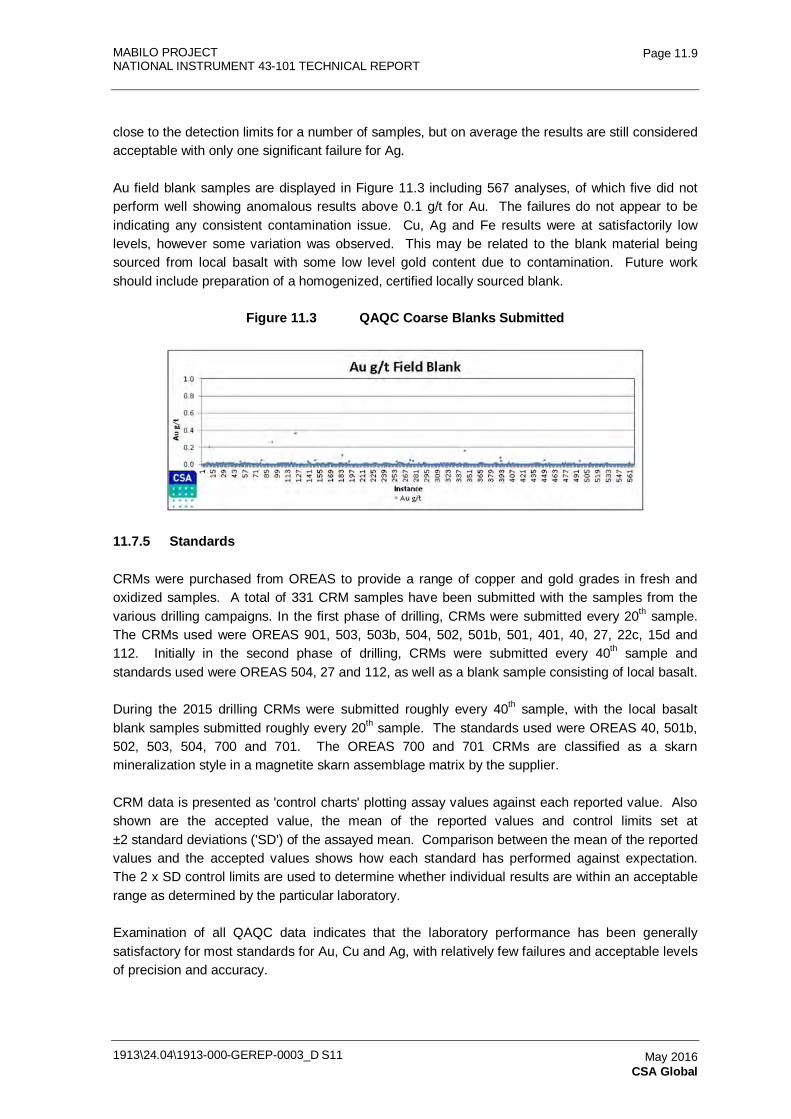
MABILO PROJECT NATIONAL INSTRUMENT 43-101 TECHNICAL REPORT
1913\24.04\1913-000-GEREP-0003_D S11
Page 11.9
May 2016 CSA Global
close to the detection limits for a number of samples, but on average the results are still considered acceptable with only one significant failure for Ag.
Au field blank samples are displayed in Figure 11.3 including 567 analyses, of which five did not perform well showing anomalous results above 0.1 g/t for Au. The failures do not appear to be indicating any consistent contamination issue. Cu, Ag and Fe results were at satisfactorily low levels, however some variation was observed. This may be related to the blank material being sourced from local basalt with some low level gold content due to contamination. Future work should include preparation of a homogenized, certified locally sourced blank.
Figure 11.3 QAQC Coarse Blanks Submitted
11.7.5 Standards
CRMs were purchased from OREAS to provide a range of copper and gold grades in fresh and oxidized samples. A total of 331 CRM samples have been submitted with the samples from the various drilling campaigns. In the first phase of drilling, CRMs were submitted every 20th sample. The CRMs used were OREAS 901, 503, 503b, 504, 502, 501b, 501, 401, 40, 27, 22c, 15d and 112. Initially in the second phase of drilling, CRMs were submitted every 40th sample and standards used were OREAS 504, 27 and 112, as well as a blank sample consisting of local basalt.
During the 2015 drilling CRMs were submitted roughly every 40th sample, with the local basalt blank samples submitted roughly every 20th sample. The standards used were OREAS 40, 501b, 502, 503, 504, 700 and 701. The OREAS 700 and 701 CRMs are classified as a skarn mineralization style in a magnetite skarn assemblage matrix by the supplier.
CRM data is presented as 'control charts' plotting assay values against each reported value. Also shown are the accepted value, the mean of the reported values and control limits set at ±2 standard deviations ('SD') of the assayed mean. Comparison between the mean of the reported values and the accepted values shows how each standard has performed against expectation. The 2 x SD control limits are used to determine whether individual results are within an acceptable range as determined by the particular laboratory.
Examination of all QAQC data indicates that the laboratory performance has been generally satisfactory for most standards for Au, Cu and Ag, with relatively few failures and acceptable levels of precision and accuracy.
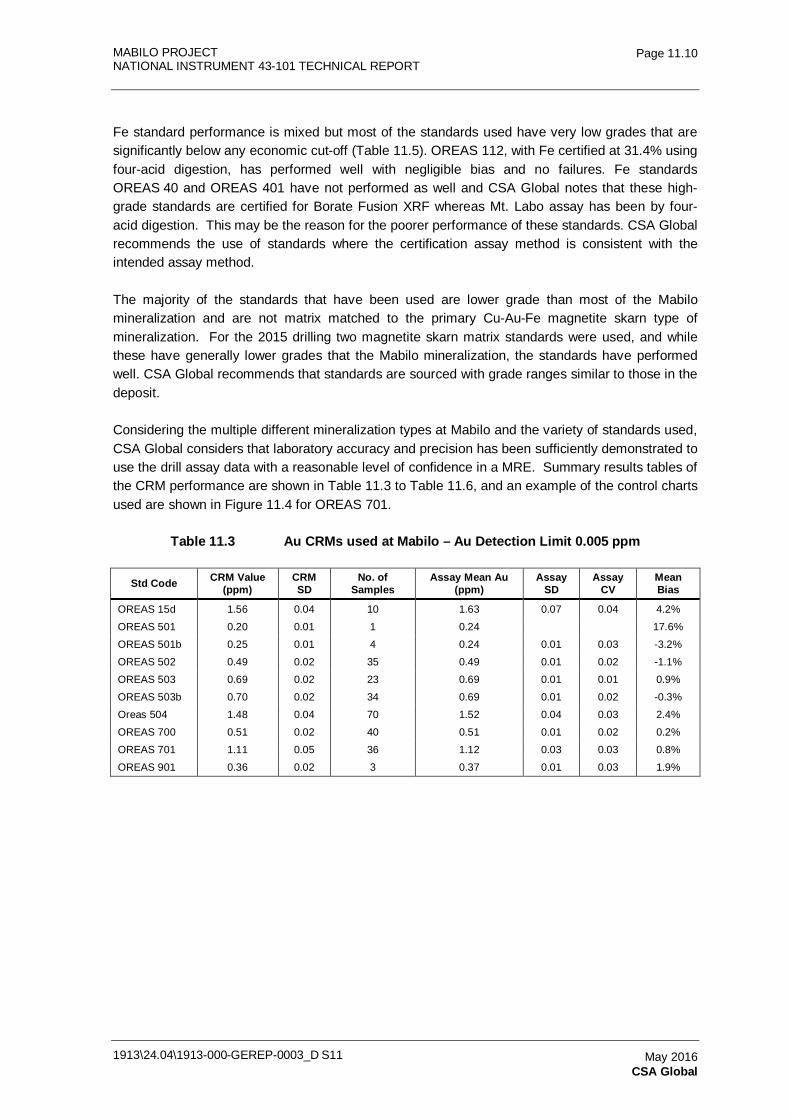
MABILO PROJECT NATIONAL INSTRUMENT 43-101 TECHNICAL REPORT
1913\24.04\1913-000-GEREP-0003_D S11
Page 11.10
May 2016 CSA Global
Fe standard performance is mixed but most of the standards used have very low grades that are significantly below any economic cut-off (Table 11.5). OREAS 112, with Fe certified at 31.4% using four-acid digestion, has performed well with negligible bias and no failures. Fe standards OREAS 40 and OREAS 401 have not performed as well and CSA Global notes that these high-grade standards are certified for Borate Fusion XRF whereas Mt. Labo assay has been by four-acid digestion. This may be the reason for the poorer performance of these standards. CSA Global recommends the use of standards where the certification assay method is consistent with the intended assay method.
The majority of the standards that have been used are lower grade than most of the Mabilo mineralization and are not matrix matched to the primary Cu-Au-Fe magnetite skarn type of mineralization. For the 2015 drilling two magnetite skarn matrix standards were used, and while these have generally lower grades that the Mabilo mineralization, the standards have performed well. CSA Global recommends that standards are sourced with grade ranges similar to those in the deposit.
Considering the multiple different mineralization types at Mabilo and the variety of standards used, CSA Global considers that laboratory accuracy and precision has been sufficiently demonstrated to use the drill assay data with a reasonable level of confidence in a MRE. Summary results tables of the CRM performance are shown in Table 11.3 to Table 11.6, and an example of the control charts used are shown in Figure 11.4 for OREAS 701.
Table 11.3 Au CRMs used at Mabilo – Au Detection Limit 0.005 ppm
Std Code CRM Value (ppm)
CRM SD
No. of Samples
Assay Mean Au (ppm)
Assay SD
Assay CV
Mean Bias
OREAS 15d 1.56 0.04 10 1.63 0.07 0.04 4.2%
OREAS 501 0.20 0.01 1 0.24
17.6%
OREAS 501b 0.25 0.01 4 0.24 0.01 0.03 -3.2%
OREAS 502 0.49 0.02 35 0.49 0.01 0.02 -1.1%
OREAS 503 0.69 0.02 23 0.69 0.01 0.01 0.9%
OREAS 503b 0.70 0.02 34 0.69 0.01 0.02 -0.3%
Oreas 504 1.48 0.04 70 1.52 0.04 0.03 2.4%
OREAS 700 0.51 0.02 40 0.51 0.01 0.02 0.2%
OREAS 701 1.11 0.05 36 1.12 0.03 0.03 0.8%
OREAS 901 0.36 0.02 3 0.37 0.01 0.03 1.9%
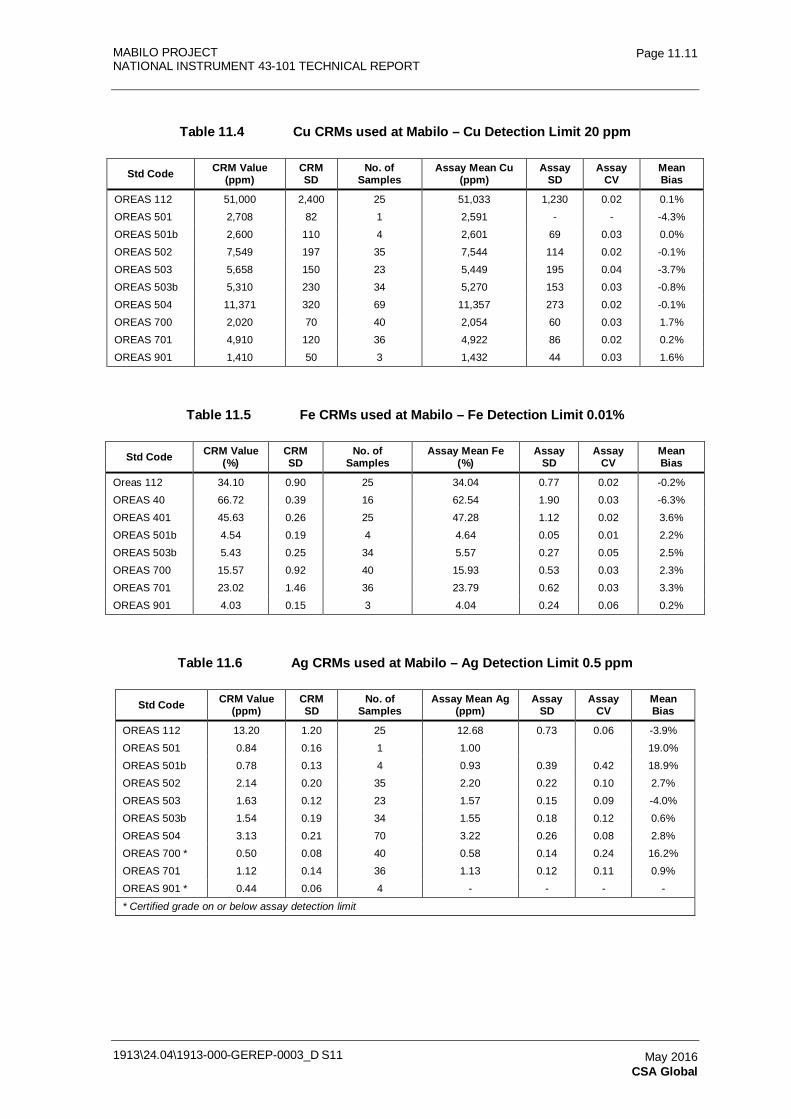
MABILO PROJECT NATIONAL INSTRUMENT 43-101 TECHNICAL REPORT
1913\24.04\1913-000-GEREP-0003_D S11
Page 11.11
May 2016 CSA Global
Table 11.4 Cu CRMs used at Mabilo – Cu Detection Limit 20 ppm
Std Code CRM Value (ppm)
CRM SD
No. of Samples
Assay Mean Cu (ppm)
Assay SD
Assay CV
Mean Bias
OREAS 112 51,000 2,400 25 51,033 1,230 0.02 0.1%
OREAS 501 2,708 82 1 2,591 - - -4.3%
OREAS 501b 2,600 110 4 2,601 69 0.03 0.0%
OREAS 502 7,549 197 35 7,544 114 0.02 -0.1%
OREAS 503 5,658 150 23 5,449 195 0.04 -3.7%
OREAS 503b 5,310 230 34 5,270 153 0.03 -0.8%
OREAS 504 11,371 320 69 11,357 273 0.02 -0.1%
OREAS 700 2,020 70 40 2,054 60 0.03 1.7%
OREAS 701 4,910 120 36 4,922 86 0.02 0.2%
OREAS 901 1,410 50 3 1,432 44 0.03 1.6%
Table 11.5 Fe CRMs used at Mabilo – Fe Detection Limit 0.01%
Std Code CRM Value (%)
CRM SD
No. of Samples
Assay Mean Fe (%)
Assay SD
Assay CV
Mean Bias
Oreas 112 34.10 0.90 25 34.04 0.77 0.02 -0.2%
OREAS 40 66.72 0.39 16 62.54 1.90 0.03 -6.3%
OREAS 401 45.63 0.26 25 47.28 1.12 0.02 3.6%
OREAS 501b 4.54 0.19 4 4.64 0.05 0.01 2.2%
OREAS 503b 5.43 0.25 34 5.57 0.27 0.05 2.5%
OREAS 700 15.57 0.92 40 15.93 0.53 0.03 2.3%
OREAS 701 23.02 1.46 36 23.79 0.62 0.03 3.3%
OREAS 901 4.03 0.15 3 4.04 0.24 0.06 0.2%
Table 11.6 Ag CRMs used at Mabilo – Ag Detection Limit 0.5 ppm
Std Code CRM Value (ppm)
CRM SD
No. of Samples
Assay Mean Ag (ppm)
Assay SD
Assay CV
Mean Bias
OREAS 112 13.20 1.20 25 12.68 0.73 0.06 -3.9%
OREAS 501 0.84 0.16 1 1.00
19.0%
OREAS 501b 0.78 0.13 4 0.93 0.39 0.42 18.9%
OREAS 502 2.14 0.20 35 2.20 0.22 0.10 2.7%
OREAS 503 1.63 0.12 23 1.57 0.15 0.09 -4.0%
OREAS 503b 1.54 0.19 34 1.55 0.18 0.12 0.6%
OREAS 504 3.13 0.21 70 3.22 0.26 0.08 2.8%
OREAS 700 * 0.50 0.08 40 0.58 0.14 0.24 16.2%
OREAS 701 1.12 0.14 36 1.13 0.12 0.11 0.9%
OREAS 901 * 0.44 0.06 4 - - - -
* Certified grade on or below assay detection limit
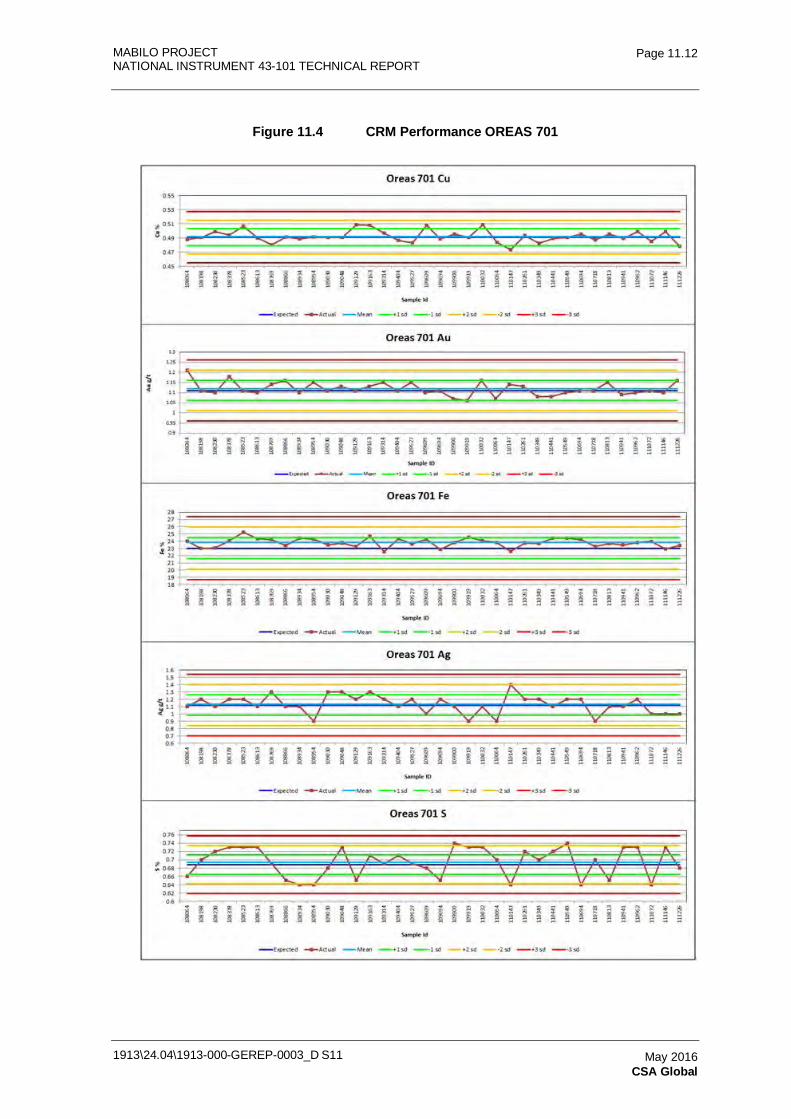
MABILO PROJECT NATIONAL INSTRUMENT 43-101 TECHNICAL REPORT
1913\24.04\1913-000-GEREP-0003_D S11
Page 11.12
May 2016 CSA Global
Figure 11.4 CRM Performance OREAS 701
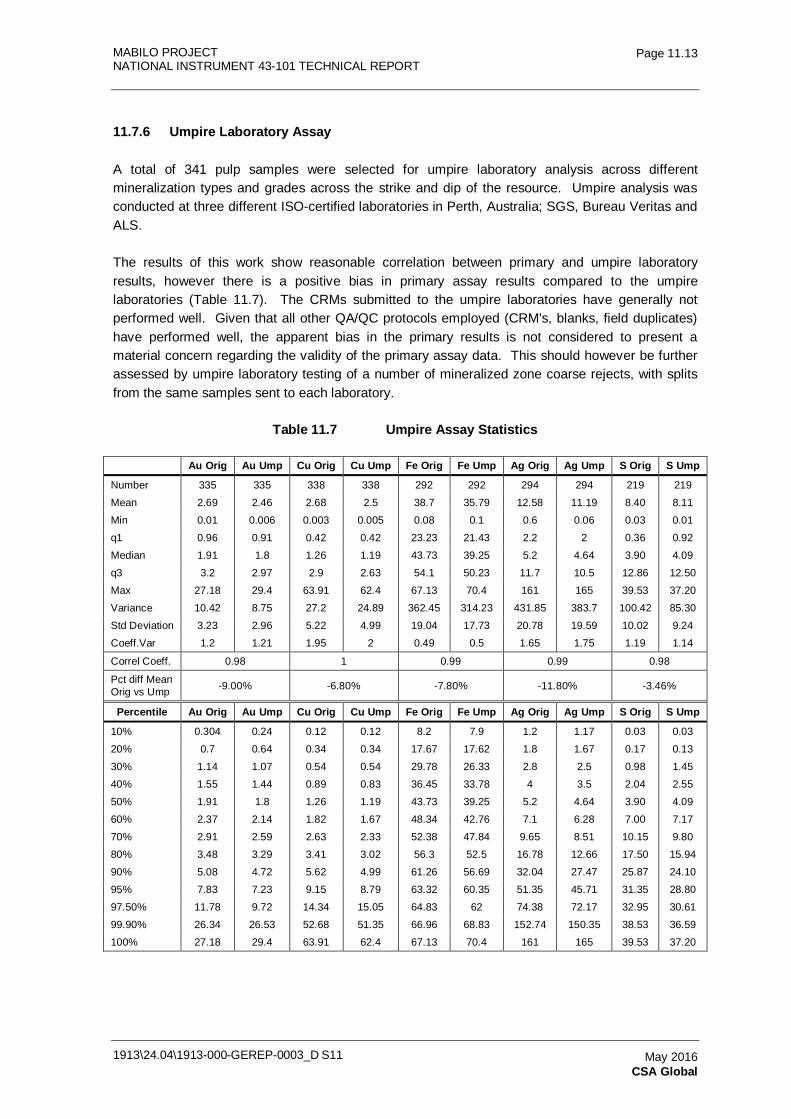
MABILO PROJECT NATIONAL INSTRUMENT 43-101 TECHNICAL REPORT
1913\24.04\1913-000-GEREP-0003_D S11
Page 11.13
May 2016 CSA Global
11.7.6 Umpire Laboratory Assay
A total of 341 pulp samples were selected for umpire laboratory analysis across different mineralization types and grades across the strike and dip of the resource. Umpire analysis was conducted at three different ISO-certified laboratories in Perth, Australia; SGS, Bureau Veritas and ALS.
The results of this work show reasonable correlation between primary and umpire laboratory results, however there is a positive bias in primary assay results compared to the umpire laboratories (Table 11.7). The CRMs submitted to the umpire laboratories have generally not performed well. Given that all other QA/QC protocols employed (CRM's, blanks, field duplicates) have performed well, the apparent bias in the primary results is not considered to present a material concern regarding the validity of the primary assay data. This should however be further assessed by umpire laboratory testing of a number of mineralized zone coarse rejects, with splits from the same samples sent to each laboratory.
Table 11.7 Umpire Assay Statistics
Au Orig Au Ump Cu Orig Cu Ump Fe Orig Fe Ump Ag Orig Ag Ump S Orig S Ump
Number 335 335 338 338 292 292 294 294 219 219
Mean 2.69 2.46 2.68 2.5 38.7 35.79 12.58 11.19 8.40 8.11
Min 0.01 0.006 0.003 0.005 0.08 0.1 0.6 0.06 0.03 0.01
q1 0.96 0.91 0.42 0.42 23.23 21.43 2.2 2 0.36 0.92
Median 1.91 1.8 1.26 1.19 43.73 39.25 5.2 4.64 3.90 4.09
q3 3.2 2.97 2.9 2.63 54.1 50.23 11.7 10.5 12.86 12.50
Max 27.18 29.4 63.91 62.4 67.13 70.4 161 165 39.53 37.20
Variance 10.42 8.75 27.2 24.89 362.45 314.23 431.85 383.7 100.42 85.30
Std Deviation 3.23 2.96 5.22 4.99 19.04 17.73 20.78 19.59 10.02 9.24
Coeff.Var 1.2 1.21 1.95 2 0.49 0.5 1.65 1.75 1.19 1.14
Correl Coeff. 0.98 1 0.99 0.99 0.98
Pct diff Mean Orig vs Ump -9.00% -6.80% -7.80% -11.80% -3.46%
Percentile Au Orig Au Ump Cu Orig Cu Ump Fe Orig Fe Ump Ag Orig Ag Ump S Orig S Ump
10% 0.304 0.24 0.12 0.12 8.2 7.9 1.2 1.17 0.03 0.03
20% 0.7 0.64 0.34 0.34 17.67 17.62 1.8 1.67 0.17 0.13
30% 1.14 1.07 0.54 0.54 29.78 26.33 2.8 2.5 0.98 1.45
40% 1.55 1.44 0.89 0.83 36.45 33.78 4 3.5 2.04 2.55
50% 1.91 1.8 1.26 1.19 43.73 39.25 5.2 4.64 3.90 4.09
60% 2.37 2.14 1.82 1.67 48.34 42.76 7.1 6.28 7.00 7.17
70% 2.91 2.59 2.63 2.33 52.38 47.84 9.65 8.51 10.15 9.80
80% 3.48 3.29 3.41 3.02 56.3 52.5 16.78 12.66 17.50 15.94
90% 5.08 4.72 5.62 4.99 61.26 56.69 32.04 27.47 25.87 24.10
95% 7.83 7.23 9.15 8.79 63.32 60.35 51.35 45.71 31.35 28.80
97.50% 11.78 9.72 14.34 15.05 64.83 62 74.38 72.17 32.95 30.61
99.90% 26.34 26.53 52.68 51.35 66.96 68.83 152.74 150.35 38.53 36.59
100% 27.18 29.4 63.91 62.4 67.13 70.4 161 165 39.53 37.20
MABILO PROJECT NATIONAL INSTRUMENT 43-101 TECHNICAL REPORT
1913\24.04\1913-000-GEREP-0003_D S11
Page 11.14
May 2016 CSA Global
11.8 Data Management and Database
The database is managed by Mt. Labo's GIS and Database Administrator using Maxwell Geoservices DataShed software, an industry standard database-management system designed for geological data. All drillhole data are stored in the database.
The database was supplied to CSA Global’s data management division in the form of CSV files. CSA Global’s validation process found no fatal flaws in the data, with a few minor issues such as missing intervals that related to waste intervals that were not sampled. Issues were highlighted and corrected by RTG.
11.9 Adequacy of Sampling, QAQC and Data Management
CSA Global considers that adequate procedures are in place to ensure security of drill core and samples from the drill rig to the laboratory.
CSA Global considers that the quality assurance procedures and quality control results are generally adequate, however the bias in umpire laboratory assay results requires additional assessment. In addition, matrix matched CRM's of appropriate grade range should be used and the local blank should be homogenised and certified by the laboratory.
MABILO PROJECT
NATIONAL INSTRUMENT 43-101 TECHNICAL REPORT
1913-000-GEREP-0003
Table of Contents Page
12.0 DATA VERIFICATION 12.1 12.1 Sample Type Review 12.1 12.2 Geological Logging 12.1 12.3 Bulk Density 12.1 12.4 QAQC Data Verification and Validation 12.1 12.5 Database Verification and Validation 12.2 12.6 Site Visit 12.2
1913\24.04\1913-000-GEREP-0003_D S12 May 2016 CSA Global
MABILO PROJECT NATIONAL INSTRUMENT 43-101 TECHNICAL REPORT
1913\24.04\1913-000-GEREP-0003_D S12
Page 12.1
May 2016 CSA Global
12.0 DATA VERIFICATION
12.1 Sample Type Review
All samples used in the MRE have been generated by diamond drilling by Mt. Labo (up to May 2013) and thereafter MJV, consisting of half or quarter cut-core samples. High recoveries are recorded in the magnetite skarn, with consecutive runs of 100% common. There is some core loss in narrow fracture and breccia zones within the magnetite, along the margins of the bodies, and in the hematite skarn zones. The overall average recovery is greater than 90%.
Based on the review work under taken by CSA Global staff as well as on site observations it is believed that the drill sampling data are sufficiently reliable to be included in the MRE.
12.2 Geological Logging
CSA Global considers the onsite procedures employed to collect and capture geological observations are of a high standard and are appropriate to support the MRE.
12.3 Bulk Density
Bulk density measurements taken by means of the wax-coated water displacement method have been appropriate. It was noted that some individual lithological units did not have sufficient samples to develop robust relationship between grade variables and bulk density. CSA Global recommends that additional bulk density measurements targeting the various mineralized lithological units be taken, especially those currently underrepresented in the data. A reasonable correlation between Fe grade and bulk density was found for all mineralized weathered and unweathered material separately; the application of the resultant linear regression equations to the modeled grades have resulted in reasonable overall average bulk density assignment to the model.
12.4 QAQC Data Verification and Validation
No fatal flaws were noted in the QAQC review which indicates that the QAQC procedures implemented at Mabilo are generally sufficient to ensure the quality of drillhole samples and to assess the reliability, accuracy and precision of the assay results obtained. CSA Global does note that the CRMs employed are not grade and matrix-matched to the deposit material. This is not considered a fatal flaw as the range of CRMs employed have generally performed well and there is significant variety of mineralization in the Mabilo deposits. CSA Global recommends that suitable grade and matrix matched CRMs are sourced or developed by MJV.
MABILO PROJECT NATIONAL INSTRUMENT 43-101 TECHNICAL REPORT
1913\24.04\1913-000-GEREP-0003_D S12
Page 12.2
May 2016 CSA Global
12.5 Database Verification and Validation
Following previous recommendations by CSA Global, MJV has instituted Maxwell Geoservices DataShed software, an industry standard database management system designed for capturing and storing Geological data. A data audit on the provided csv format drill data files was completed by CSA Global. Data issues that are flagged in this step are as follows:
• Missing Data for entire holes.
• Missing Collar Co-ords.
• Overlapping Intervals.
• Interval > EOH.
• Missing Intervals.
• Missing downhole survey data.
• Azimuth or Dip change > 5.00 degrees.
• From >= To.
• From does not start from 0.
The data in the database is comprehensive and of a high standard and all issues noted were minor and were corrected by Mt. Labo prior to commencement of the MRE work.
12.6 Site Visit
Site visits have been completed by Dr Neal Reynolds of CSA Global on three occasions. These visits occurred between 18 December and 20 December 2013, 12 February and 14 February 2014 and 13 May to 19 May 2014. Drilling was underway during these visits and the drilling and sampling process was observed to follow appropriate procedures and protocols. The location and orientation of several drill collars were confirmed, the core handling and storage facilities were visited and aspects of the drilling program and geological interpretation were assessed in detail with the site team.
CSA Global has not undertaken any check sampling or analysis, but has observed visible mineralization in drill core that appears to correspond well with reported grades. CSA Global has no reason to consider that reported analytical results are not reliable.
As a result of the verification process, CSA Global is confident the quality of the data is of a high standard suitable for use in the resource estimation process.
MABILO PROJECT
NATIONAL INSTRUMENT 43-101 TECHNICAL REPORT
1913-000-GEREP-0003
Table of Contents Page
13.0 MINERAL PROCESSING AND METALLURGICAL TESTING 13.1 13.1 Overview 13.1 13.2 Introduction 13.1 13.3 Sample Selection 13.3
13.3.1 Background Geology 13.3 13.3.2 Sample Locations 13.4 13.3.3 Phase I Samples 13.5 13.3.4 Phase II Samples 13.6
13.4 Mineralogy 13.12 13.4.1 Phase I Samples 13.12 13.4.2 Phase II Samples 13.13
13.5 Previous Testwork (Phase I) 13.16 13.5.1 Reference Documents 13.16 13.5.2 Head Analysis 13.17 13.5.3 Comminution Testwork 13.18 13.5.4 Flotation Testwork 13.19 13.5.5 Flotation Tails Gold Leach Testwork 13.21 13.5.6 Magnetite Recovery Testwork 13.22
13.6 Current Testwork (Phase II) Programme 13.23 13.6.1 Testwork Programme 13.24
13.7 Phase II Comminution Testwork 13.27 13.7.1 Abrasion Indices 13.27 13.7.2 SMC Test 13.28 13.7.3 Rod and Ball Mill Work Indices 13.28 13.7.4 Regrinding Tests 13.29
13.8 Phase II Flotation Testwork 13.30 13.8.1 Head Assays 13.30 13.8.2 Sighter Cleaner Flotation Tests 13.30 13.8.3 Primary Grind Size Optimization Tests 13.33 13.8.4 Alternate Collector Trials 13.38 13.8.5 Bulk Rougher Flotation Test 13.42 13.8.6 Concentrate Regrind Optimization Tests 13.44 13.8.7 Additional Cleaner Tests 13.51 13.8.8 Cleaner Gold Promoter Tests 13.53 13.8.9 Bulk Cleaner Flotation Test 13.56 13.8.10 Comprehensive Flotation Product Assays 13.58 13.8.11 Flotation Response for Oxidized Ore 13.59
13.9 Gold Leach Testwork 13.61 13.9.1 Introduction 13.61 13.9.2 Gold Leach Testing Results 13.61 13.9.3 Gold Leach Tails Solution Assays 13.63 13.9.4 Gold Leaching Viability Assessment 13.65
13.10 Magnetite Recovery 13.68 13.11 Variability Testing 13.70
13.11.1 Introduction 13.70 13.11.2 Variability Flotation – Baseline 13.70 13.11.3 Variability Flotation Testing – Round 2 13.74 13.11.4 Variability Flotation Testing – Round 3 13.77 13.11.5 Desliming Tests for Clay Samples 13.82
1913\24.04\1913-000-GEREP-0003_D S13 May 2016 Lycopodium Minerals Pty Ltd
MABILO PROJECT
NATIONAL INSTRUMENT 43-101 TECHNICAL REPORT
1913-000-GEREP-0003
Table of Contents (Continued)
Page
1913\24.04\1913-000-GEREP-0003_D S13
May 2016 Lycopodium Minerals Pty Ltd
13.11.6 Variability Flotation Testing – Recovery Improvement Opportunities 13.84
13.11.7 Variability Magnetite Recovery 13.85 13.12 High Pyrite Variability Testwork 13.86
13.12.1 Introduction 13.86 13.12.2 High Pyrite Variability Samples - First Round Flotation
Testwork 13.89 13.12.3 Master Composite Grind Series 13.90 13.12.4 Cleaner Tests on the High Pyrite Composite 13.92 13.12.5 Repeat Testing of the High Pyrite Variability Samples 13.94 13.12.6 Mineralogical Examination of the High Pyrite Samples 13.98 13.12.7 Metallurgical Recovery Estimation for the High Pyrite
Samples 13.99 13.13 Ancillary Testwork 13.100
13.13.1 Slurry Rheology Testwork 13.100 13.13.2 Particle Size Distributions 13.102 13.13.3 Thickening Testwork 13.102 13.13.4 Filtration Testwork 13.103
13.14 Metallurgical Recoveries 13.104 13.14.1 Background 13.104 13.14.2 Metallurgical Recovery Estimates 13.105 13.14.3 Pyrite Product Recovery 13.111 13.14.4 Magnetite Recovery 13.114 13.14.5 Variability Test Results Summary 13.116
TABLES Table 13.1 Phase I Sample Composite 13.6 Table 13.2 Phase II Master Composite Samples 13.8 Table 13.3 Comminution Samples 13.9 Table 13.4 Variability Samples 13.11 Table 13.5 Phase I Composite Head Assay 13.17 Table 13.6 Cleaner Flotation Grades and Recoveries 13.20 Table 13.7 Flotation Concentrate Assays 13.21 Table 13.8 Tails Gold Leach Summary 13.22 Table 13.9 Magnetite Concentrate Assay 13.23 Table 13.10 Comminution Test Results 13.27 Table 13.11 Head Assay – Master Composite 13.30 Table 13.12 Tap Water and Site Water Concentrate and Tails Assays 13.31 Table 13.13 Grind Series Testwork Result Summary 13.34 Table 13.14 Alternate Collector Testwork Result Summary 13.40 Table 13.15 Bulk Rougher Flotation Testwork Result Summary 13.43 Table 13.16 Cleaner Flotation Testwork Result Summary Following Regrind 13.46 Table 13.17 Cleaner Flotation - Depressant Series 13.53 Table 13.18 Phase I Cleaner Flotation - Depressant Addition Comparison 13.53 Table 13.19 Gold Promoter Test Results 13.56 Table 13.20 Bulk Cleaner Flotation Test Results (combined result for six tests) 13.58 Table 13.21 Cleaner Flotation Product Assays 13.58 Table 13.22 Oxidized Feed Flotation Test Results 13.60 Table 13.23 Gold Distribution in Flotation Products 13.61 Table 13.24 Rougher Tails Leach Results 13.62
MABILO PROJECT
NATIONAL INSTRUMENT 43-101 TECHNICAL REPORT
1913-000-GEREP-0003
Table of Contents (Continued)
Page
1913\24.04\1913-000-GEREP-0003_D S13
May 2016 Lycopodium Minerals Pty Ltd
Table 13.25 Cleaner Tails Leach Results 13.62 Table 13.26 Leach Tails Solution Assays 13.64 Table 13.27 Cyanide Speciation – Leach Tails Solution 13.64 Table 13.28 Capital Cost of Gold Circuits 13.67 Table 13.29 Operating Cost of Gold Circuits 13.67 Table 13.30 Magnetite Concentrate 13.69 Table 13.31 Baseline Variability Flotation Test Results Summary 13.73 Table 13.32 Variability Round 2 Results Summary 13.76 Table 13.33 Variability #6a Results Summary 13.79 Table 13.34 Variability Testing Round 3 Results Summary 13.81 Table 13.35 Desliming Tests Results Summary 13.83 Table 13.36 Variability Grade Improvement Test Results 13.85 Table 13.37 Variability Magnetite Recovery Test Results 13.86 Table 13.38 High Pyrite Sample Selection 13.87 Table 13.39 Sample Head Assays 13.88 Table 13.40 High Pyrite Variability Flotation Recovery Data (First Round) 13.89 Table 13.41 High Pyrite Composite Grind Series Results 13.91 Table 13.42 High Pyrite Composite Cleaner Flotation 13.93 Table 13.43 Repeat High Pyrite Variability Cleaner Flotation Tests 13.95 Table 13.44 Solids SGs for Various Products 13.100 Table 13.45 Particle Size Distributions for Various Products 13.102 Table 13.46 Dynamic Thickening Testwork Results 13.103 Table 13.47 Variability Sample Flotation Results 13.116 FIGURES Figure 13.1 Mabilo Testwork Samples - Drillhole Intercept Locations (Sections) 13.4 Figure 13.2 Mabilo Testwork Samples - Drillhole Intercept Locations (Plans) 13.5 Figure 13.3 Relative Abundance of Minerals in the Samples 13.13 Figure 13.4 Mineral Assay Ore Characterization 13.16 Figure 13.5 Copper Diagnostic Leaching 13.18 Figure 13.6 Gold Diagnostic Leaching 13.18 Figure 13.7 Comminution Testwork Summary Flowsheet 13.24 Figure 13.8 Flotation Process Development Programme 13.25 Figure 13.9 Physical Testwork Programme 13.26 Figure 13.10 Levin Test Results 13.29 Figure 13.11 Sighter Flotation Testing 13.30 Figure 13.12 Phase I Grind Flotation Testing 13.34 Figure 13.13 Copper and Gold Recovery Grind Kinetic Data 13.35 Figure 13.14 Copper and Gold Recovery Grind Kinetic Data 13.36 Figure 13.15 Copper Grade Recovery Curves 13.37 Figure 13.16 Economic Evaluation of Optimum Grind Size 13.38 Figure 13.17 Copper, Gold and Sulphide Recovery with Flotation Time 13.41 Figure 13.18 Copper Grade Recovery Curves 13.42 Figure 13.19 Copper Grade Recovery Curves 13.44 Figure 13.20 Phase I Cleaner Flotation Testing – Copper Grade / Recovery Curves 13.45 Figure 13.21 Copper and Gold Residues vs Grind Data 13.47 Figure 13.22 Copper and Gold Recovery Grind Kinetic Data 13.48 Figure 13.23 Copper Grade Recovery Curves – Regrind Series 13.49 Figure 13.24 Economic Evaluation of Optimum Grind Size 13.50 Figure 13.25 Copper Grade Recovery Curves – Depressant Series 13.52
MABILO PROJECT
NATIONAL INSTRUMENT 43-101 TECHNICAL REPORT
1913-000-GEREP-0003
Table of Contents (Continued)
Page
1913\24.04\1913-000-GEREP-0003_D S13
May 2016 Lycopodium Minerals Pty Ltd
Figure 13.26 Copper Grade Recovery Curve – Gold Promoter Tests 13.55 Figure 13.27 Gold Grade Recovery Curve – Gold Promoter Tests 13.55 Figure 13.28 Copper Grade Recovery – Bulk Cleaner Flotation 13.57 Figure 13.29 Oxidation Test – Copper Grade Recovery Curves 13.60 Figure 13.30 Metal Extraction Rates – Bulk Cleaner Tails Leach 13.63 Figure 13.31 Baseline Variability Flotation Grade – Recovery Curves 13.72 Figure 13.32 Variability Round 2 Grade Recovery Curves (Part 1) 13.75 Figure 13.33 Variability Round 2 Grade Recovery Curves (Part 2) 13.75 Figure 13.34 Scavenger Cleaner Grade Recovery Curve for Var #14 13.77 Figure 13.35 Variability #6a Grade Recovery Curves 13.78 Figure 13.36 Variability Testing Round 3 Grade Recovery Curves (Part 1) 13.80 Figure 13.37 Variability Testing Round 3 Grade Recovery Curves (Part 2) 13.81 Figure 13.38 Desliming Tests – Grade Recovery Curves 13.82 Figure 13.39 Grade Improvement Tests – Grade Recovery Curves 13.84 Figure 13.40 High Pyrite Sample Locations 13.88 Figure 13.41 Grade Recovery Curves for the Grind Series Rougher Tests 13.92 Figure 13.42 High Pyrite Composite Cleaner Grade Recovery Curves 13.93 Figure 13.43 Cleaner Flotation Grade Recovery Curves – Low Grade Variability 13.96 Figure 13.44 Cleaner Flotation Grade Recovery Curves – Medium Grade Variability 13.97 Figure 13.45 Cleaner Flotation Grade Recovery Curves – High Grade Variability 13.97 Figure 13.46 Grade*Recovery Data with Model Estimates 13.99 Figure 13.47 Viscosity vs Shear Rate, Magnetite and Tailings 13.101 Figure 13.48 Viscosity vs Shear Rate, Copper and Pyrite Concentrates 13.101 Figure 13.49 Copper Grade Recovery Product (Round 2) vs Copper Head Grade 13.106 Figure 13.50 Copper Grade Recovery Product (Final) vs Copper Head Grade 13.106 Figure 13.51 Grade Recovery Product Data with Model Estimates 13.108 Figure 13.52 Concentrate Copper Upgrade Ratio Model Fit 13.109 Figure 13.53 Gold Recovery to Cleaner Concentrate vs S:Cu Ratio 13.110 Figure 13.54 Estimated Silver Recovery to Cleaner Concentrate 13.111 Figure 13.55 Rougher Flotation Mass Pull vs Sulphur Head Grade 13.112 Figure 13.56 Cleaner Flotation Mass Pull vs Copper Head Grade 13.112 Figure 13.57 Gold Recovery to Rougher Concentrate vs Ro Mass Pull 13.113 Figure 13.58 Magnetite Recovery vs Adjusted Head Grade 13.115
MABILO PROJECT NATIONAL INSTRUMENT 43-101 TECHNICAL REPORT
1913\24.04\1913-000-GEREP-0003_D S13
Page 13.1
May 2016 Lycopodium Minerals Pty Ltd
13.0 MINERAL PROCESSING AND METALLURGICAL TESTING
13.1 Overview
The Mabilo deposit is overlain by the quaternary lahar and tuff deposits of the Labo Volcanics as a thick overburden / cover ranging from 20 m to 60 m thick. Underlying the volcanics are two types of high grade oxide ores, the gold oxide cap and copper / gold oxide cap, as well as a chalcocite orebody. Next to the oxides are the Tumbaga formation sediments with magnetite skarns which comprise the main primary magnetite orebody.
The oxide and chalcocite orebodies will not be subjected to on-site processing but will be primary crushed using a mobile crushing plant for transport off site. The primary orebody will be treated in a conventional flotation and magnetic separation plant to recover copper sulphides, pyrite in concentrate and magnetite.
The oxide gold cap and chalcocite orebodies were subjected to limited testwork which is reported in a separate in-house feasibility study prepared by MJV. This section discusses testwork on the primary orebody only.
13.2 Introduction
Lycopodium Minerals Pty Ltd (Lycopodium) was commissioned by MLEDC / Galeo JV Pty Ltd (MJV) to manage a detailed metallurgical testwork programme on samples from the Mabilo Project.
The original testwork (Phase I completed in 2014 at ALS Metallurgy (ALS)) identified a flotation route for the magnetite skarn ores using bulk sulphide flotation to maximize the copper recovery with regrinding of the rougher concentrate and cleaning at high pH to depress the pyrite and achieve saleable copper concentrate grades. The results from this testwork were reported by ALS in their Metallurgical Testwork Programme Report No. A16064 (Phase I Report) in February 2015. Further testwork was conducted on the Phase I composite sample to generate samples for geochemical testing. This interim work was reported by ALS as Report No. A16064 Part B and served to confirm the recoveries from the proposed flotation route and allowed the opportunity to investigate some process alternatives.
The bulk sulphide flotation route had additional benefits, allowing separate containment of the acid generating pyrite tails and preserving this fraction with elevated gold grades for potential future treatment or sale. The testwork programme (Phase II) has therefore focused on optimizing the processing route for the bulk sulphide flotation and cleaning to upgrade the copper concentrate. The scope of work included the following:
• Develop a detailed testwork programme based on findings from the previous testwork.
• Coordinate, manage and supervise the laboratory testwork.
• Interpret the testwork programme in consultation with MJV.
• Prepare a detailed metallurgical write up of the results.
MABILO PROJECT NATIONAL INSTRUMENT 43-101 TECHNICAL REPORT
1913\24.04\1913-000-GEREP-0003_D S13
Page 13.2
May 2016 Lycopodium Minerals Pty Ltd
The Phase II testwork programme was designed to define and optimize the following key process parameters:
• Comminution circuit design parameters.
• Flotation parameters and metal recovery to copper concentrate at grade.
• Gold leaching requirements and recovery.
• Magnetite recovery and grade.
• Thickening requirements for the copper concentrate and other process streams, filtration and transportable moisture limit (TML) for the saleable products.
• Tails thickening and requirements for disposal.
The detailed Phase II testwork programme has been completed and the results can be used to generate the process design criteria and metallurgical recovery estimates for the feasibility study. Sample preparation, comminution testwork and all metallurgical work was conducted at ALS Metallurgy in Perth (Report No A16558). Outotec Pty Ltd completed the concentrate and tails thickening and copper concentrate filtration testwork. GBL Process Pty Ltd performed independent filtration tests on the copper, pyrite and magnetite concentrates. Cyanide speciation was performed by the WA Chem Centre. TML testing was completed at Jenike and Johanson in Perth. All sub-consultant and vendor reports are included in the ALS testwork report. Knight Piésold Pty Ltd conducted geochemical and settling tests on the tailings samples, and this is reported under tailings management in Section 18.
This section presents the results of the testwork programmes completed to date and the interpretation of the testwork to define the basis for the process plant design.
Testwork Outcomes
The testwork programme completed achieved its objectives of defining a process flowsheet and engineering parameters that can be used for design to allow estimation of the plant capital cost component for the feasibility study as well as defining the metal recoveries and operating consumables to allow estimation of project revenues and process operating costs.
Comminution testwork was comprehensive with good agreement between the indices for the examples of magnetite skarn with varying degrees of contained pyrite. The variability samples tested provided an indication of the likely range of competencies that could be expected and were factored into the design approach using relative weightings based on the fraction of ore represented and providing flexibility in the design to cater for the range of feed ores.
The bench flotation testwork was considered reliable with a high degree of repeatability. In addition, use of large cells for the bulk flotation concentrate production showed consistent results. The flowsheet indicated by the testwork is relatively simple so locked cycle testing was not required. There are opportunities for further optimization of flotation parameters including reagent dosing and circuit configuration as well as regrind requirements but this will be best done during
MABILO PROJECT NATIONAL INSTRUMENT 43-101 TECHNICAL REPORT
1913\24.04\1913-000-GEREP-0003_D S13
Page 13.3
May 2016 Lycopodium Minerals Pty Ltd
operations once the steady state concentrations of reagent in the water circuits have been established.
Testing of additional samples would be beneficial to demonstrate the proposed metal recovery models and also to determine if a scavenger regrind stage would be an economic addition to the proposed flowsheet.
Recovery of the gold in the flotation tails was not considered viable at the study gold price given the high cyanide consumptions experienced, but higher gold prices would indicate that this decision be reviewed and further testing would be required to define the optimum process route and associated recovery processes.
Marketing of the magnetite product may indicate that a higher grade may attract a premium selling price, suggesting that finer grinding of the feed would be warranted to improve liberation and facilitate further magnetic cleaning. No testing has been conducted to this point of magnetite liberation with size, with the grind being dictated by the sulphide mineral liberation requirements.
The ancillary testwork conducted provided all the necessary data to specify the relevant equipment for the process conditions selected.
13.3 Sample Selection
13.3.1 Background Geology
A basic understanding of the geology of the Mabilo deposits and the genesis of the mineralization was required to guide the sample selection process for each phase of the testwork. The MJV site geologist assisted at all stages of sample selection and confirmed that selections were appropriately representative for the intended purpose.
The Mabilo resource currently comprises two adjacent magnetite skarn bodies, the North and South Mineralized Zones. Mineralization occurs as magnetite skarn replacement of the limestone marble lithologies in the host carbonate unit. The skarn lenses are up to 40 – 90 m thick dipping W to SW at 20 – 40°. The magnetite skarn contains significant Cu, Au and Ag mineralization. The magnetite skarn mineralization is covered by more than 30 m of post mineralization lahar and tuff deposits of the Mt. Labo Volcanic Complex. Parts of both bodies are interpreted to have been near surface or outcropping prior to the emplacement of the overlying volcanics and have been extensively oxidized and weathered in the upper parts. The surrounding country rocks were altered to hornfels and garnet skarn prior to the magnetite mineralization. The magnetite was subsequently altered by retrograde argillic alteration and weathering.
The oxidized 'cap' and high grade chalcocite supergene zone above the northern end of the South Mineralized Zone (SMZ) will be processed separately and are not included in the scope of this study.
Copper and gold grades in the mineralized zones are closely correlated and commonly reach 3% Cu and 3 g/t Au. Average grades are about 1.7% Cu and 1.9 g/t Au with 7 g/t Ag and 40% Fe. Massive barren magnetite skarn intersections imply that that magnetic anomalies may not all reflect
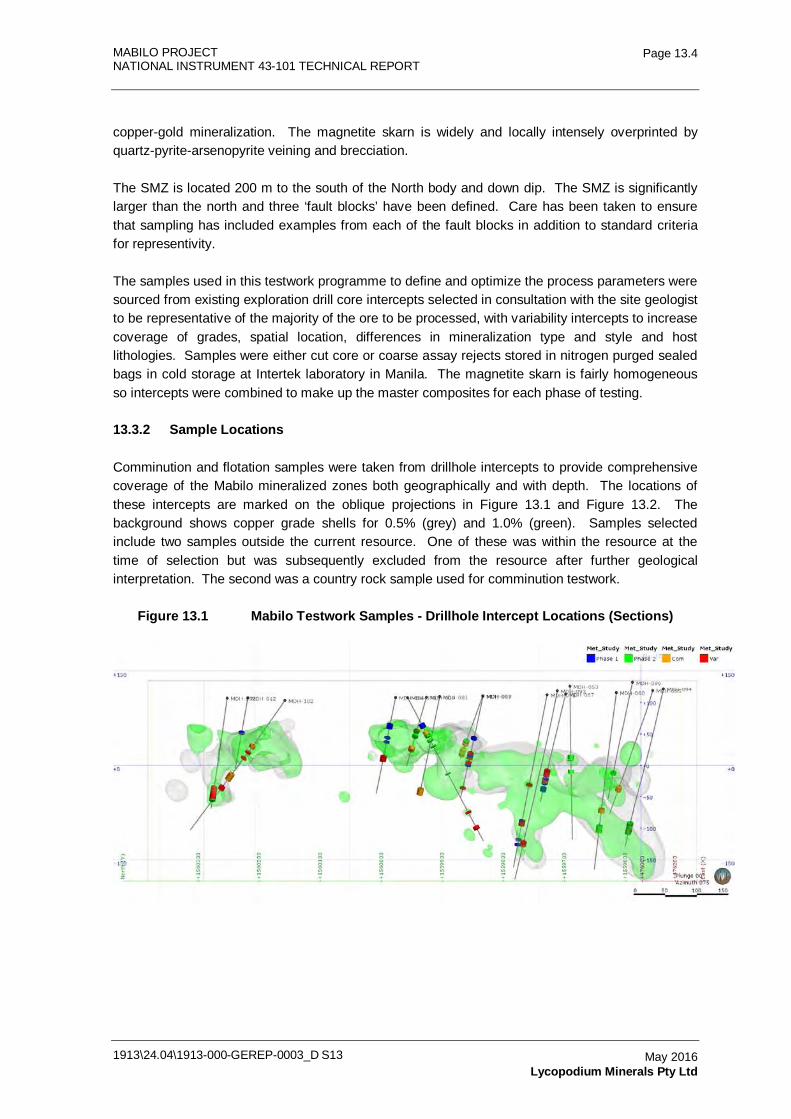
MABILO PROJECT NATIONAL INSTRUMENT 43-101 TECHNICAL REPORT
1913\24.04\1913-000-GEREP-0003_D S13
Page 13.4
May 2016 Lycopodium Minerals Pty Ltd
copper-gold mineralization. The magnetite skarn is widely and locally intensely overprinted by quartz-pyrite-arsenopyrite veining and brecciation.
The SMZ is located 200 m to the south of the North body and down dip. The SMZ is significantly larger than the north and three ‘fault blocks’ have been defined. Care has been taken to ensure that sampling has included examples from each of the fault blocks in addition to standard criteria for representivity.
The samples used in this testwork programme to define and optimize the process parameters were sourced from existing exploration drill core intercepts selected in consultation with the site geologist to be representative of the majority of the ore to be processed, with variability intercepts to increase coverage of grades, spatial location, differences in mineralization type and style and host lithologies. Samples were either cut core or coarse assay rejects stored in nitrogen purged sealed bags in cold storage at Intertek laboratory in Manila. The magnetite skarn is fairly homogeneous so intercepts were combined to make up the master composites for each phase of testing.
13.3.2 Sample Locations
Comminution and flotation samples were taken from drillhole intercepts to provide comprehensive coverage of the Mabilo mineralized zones both geographically and with depth. The locations of these intercepts are marked on the oblique projections in Figure 13.1 and Figure 13.2. The background shows copper grade shells for 0.5% (grey) and 1.0% (green). Samples selected include two samples outside the current resource. One of these was within the resource at the time of selection but was subsequently excluded from the resource after further geological interpretation. The second was a country rock sample used for comminution testwork.
Figure 13.1 Mabilo Testwork Samples - Drillhole Intercept Locations (Sections)
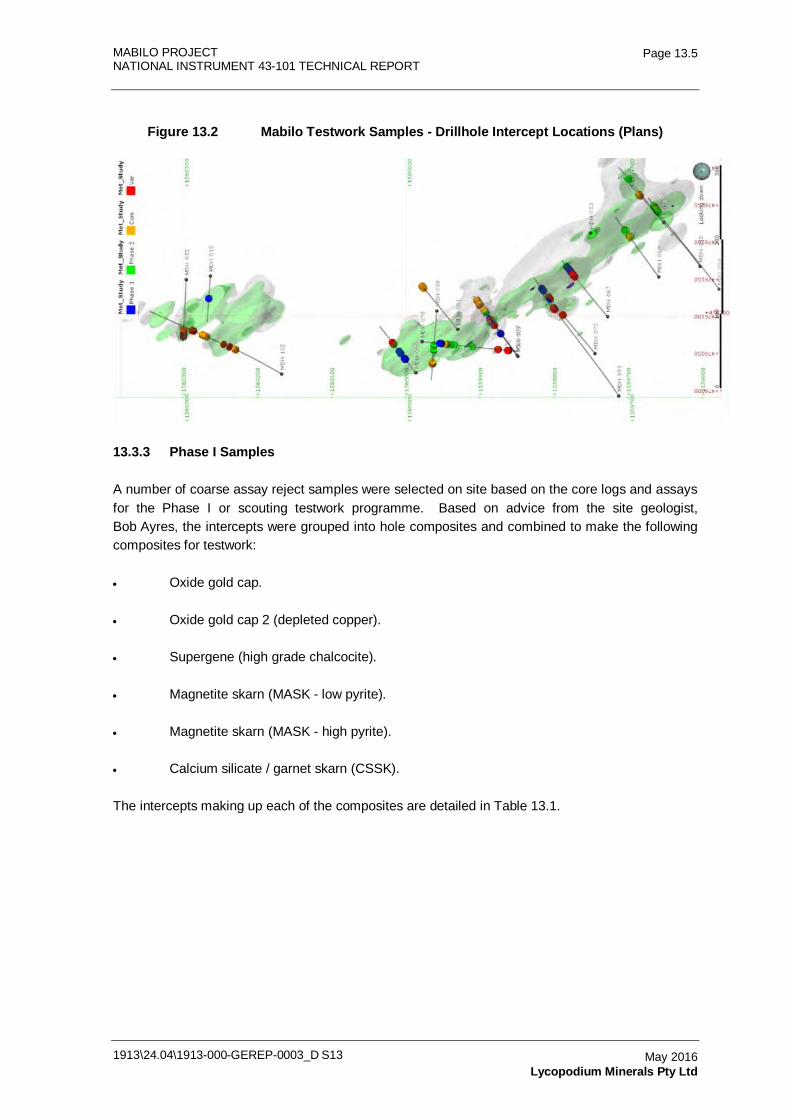
MABILO PROJECT NATIONAL INSTRUMENT 43-101 TECHNICAL REPORT
1913\24.04\1913-000-GEREP-0003_D S13
Page 13.5
May 2016 Lycopodium Minerals Pty Ltd
Figure 13.2 Mabilo Testwork Samples - Drillhole Intercept Locations (Plans)
13.3.3 Phase I Samples
A number of coarse assay reject samples were selected on site based on the core logs and assays for the Phase I or scouting testwork programme. Based on advice from the site geologist, Bob Ayres, the intercepts were grouped into hole composites and combined to make the following composites for testwork:
• Oxide gold cap.
• Oxide gold cap 2 (depleted copper).
• Supergene (high grade chalcocite).
• Magnetite skarn (MASK - low pyrite).
• Magnetite skarn (MASK - high pyrite).
• Calcium silicate / garnet skarn (CSSK).
The intercepts making up each of the composites are detailed in Table 13.1.
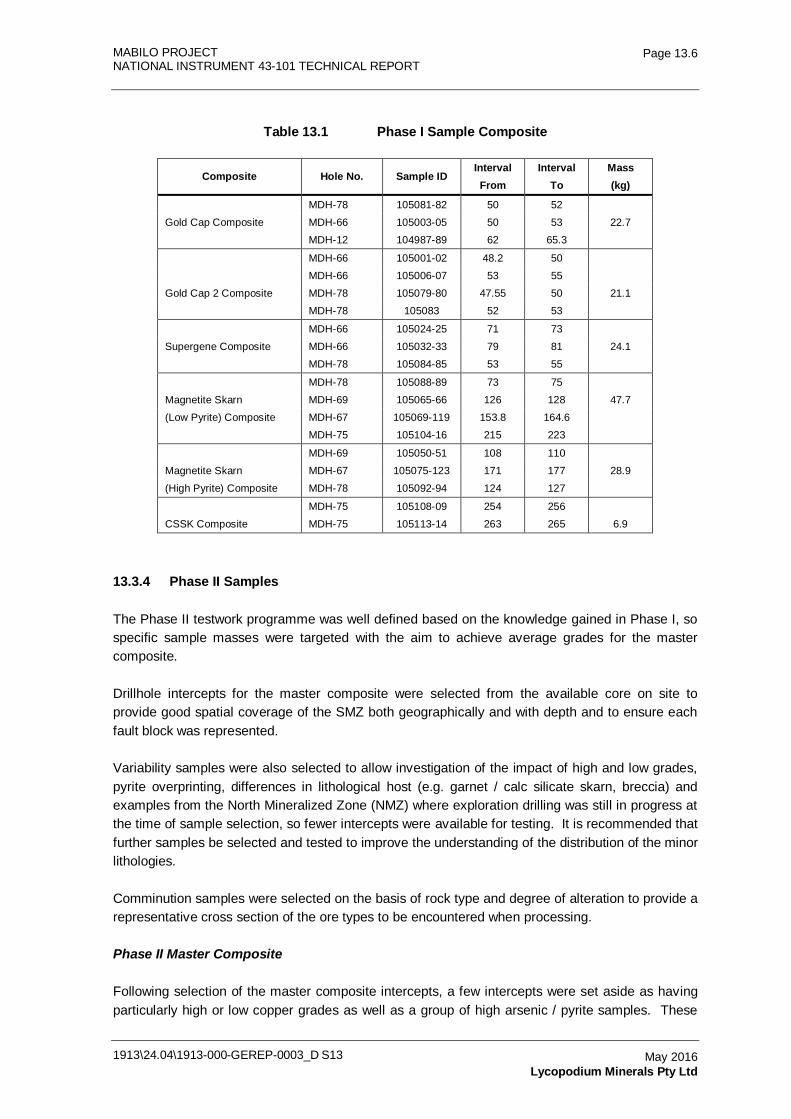
MABILO PROJECT NATIONAL INSTRUMENT 43-101 TECHNICAL REPORT
1913\24.04\1913-000-GEREP-0003_D S13
Page 13.6
May 2016 Lycopodium Minerals Pty Ltd
Table 13.1 Phase I Sample Composite
Composite Hole No. Sample ID Interval From
Interval To
Mass (kg)
MDH-78 105081-82 50 52
Gold Cap Composite MDH-66 105003-05 50 53 22.7
MDH-12 104987-89 62 65.3
MDH-66 105001-02 48.2 50
MDH-66 105006-07 53 55
Gold Cap 2 Composite MDH-78 105079-80 47.55 50 21.1
MDH-78 105083 52 53
MDH-66 105024-25 71 73
Supergene Composite MDH-66 105032-33 79 81 24.1
MDH-78 105084-85 53 55
MDH-78 105088-89 73 75
Magnetite Skarn MDH-69 105065-66 126 128 47.7
(Low Pyrite) Composite MDH-67 105069-119 153.8 164.6
MDH-75 105104-16 215 223
MDH-69 105050-51 108 110
Magnetite Skarn MDH-67 105075-123 171 177 28.9
(High Pyrite) Composite MDH-78 105092-94 124 127
MDH-75 105108-09 254 256
CSSK Composite MDH-75 105113-14 263 265 6.9
13.3.4 Phase II Samples
The Phase II testwork programme was well defined based on the knowledge gained in Phase I, so specific sample masses were targeted with the aim to achieve average grades for the master composite.
Drillhole intercepts for the master composite were selected from the available core on site to provide good spatial coverage of the SMZ both geographically and with depth and to ensure each fault block was represented.
Variability samples were also selected to allow investigation of the impact of high and low grades, pyrite overprinting, differences in lithological host (e.g. garnet / calc silicate skarn, breccia) and examples from the North Mineralized Zone (NMZ) where exploration drilling was still in progress at the time of sample selection, so fewer intercepts were available for testing. It is recommended that further samples be selected and tested to improve the understanding of the distribution of the minor lithologies.
Comminution samples were selected on the basis of rock type and degree of alteration to provide a representative cross section of the ore types to be encountered when processing.
Phase II Master Composite
Following selection of the master composite intercepts, a few intercepts were set aside as having particularly high or low copper grades as well as a group of high arsenic / pyrite samples. These
MABILO PROJECT NATIONAL INSTRUMENT 43-101 TECHNICAL REPORT
1913\24.04\1913-000-GEREP-0003_D S13
Page 13.7
May 2016 Lycopodium Minerals Pty Ltd
intercepts were assigned to variability testing since the mineralization was too different to the average for inclusion in the master composite.
The Phase II master composite drillhole intercepts used for flotation testwork are shown in Table 13.2.
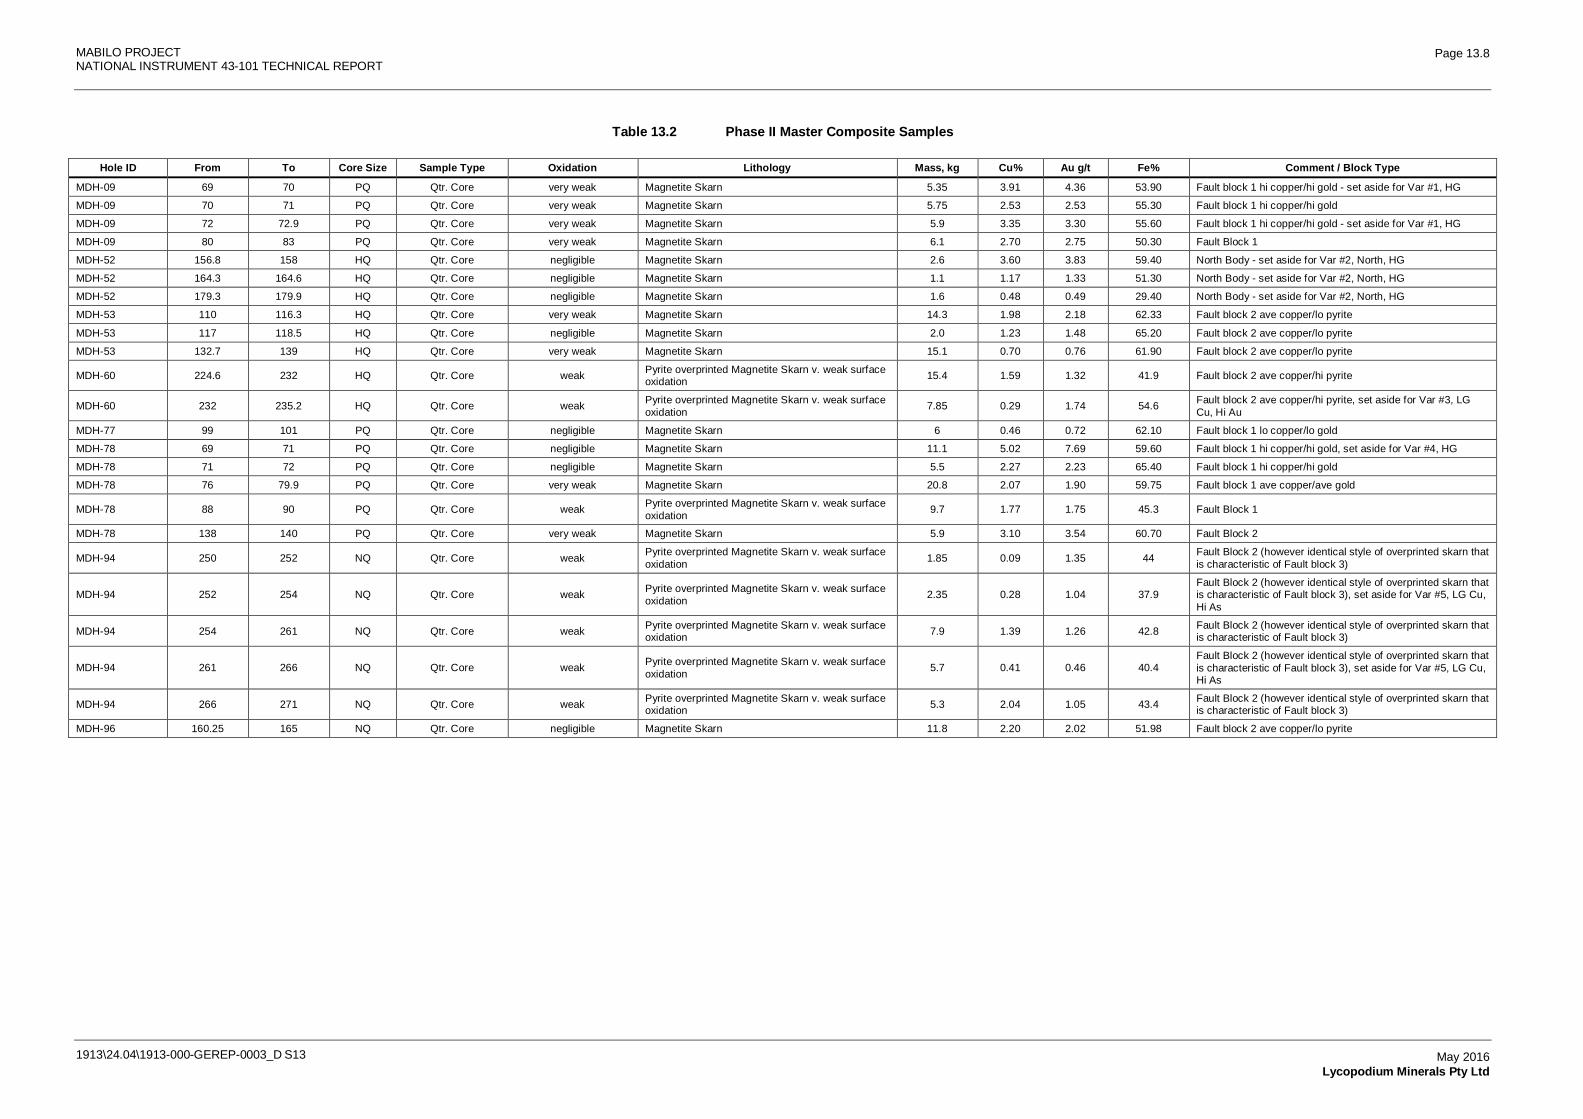
MABILO PROJECT NATIONAL INSTRUMENT 43-101 TECHNICAL REPORT
1913\24.04\1913-000-GEREP-0003_D S13
Page 13.8
May 2016 Lycopodium Minerals Pty Ltd
Table 13.2 Phase II Master Composite Samples
Hole ID From To Core Size Sample Type Oxidation Lithology Mass, kg Cu% Au g/t Fe% Comment / Block Type
MDH-09 69 70 PQ Qtr. Core very weak Magnetite Skarn 5.35 3.91 4.36 53.90 Fault block 1 hi copper/hi gold - set aside for Var #1, HG
MDH-09 70 71 PQ Qtr. Core very weak Magnetite Skarn 5.75 2.53 2.53 55.30 Fault block 1 hi copper/hi gold
MDH-09 72 72.9 PQ Qtr. Core very weak Magnetite Skarn 5.9 3.35 3.30 55.60 Fault block 1 hi copper/hi gold - set aside for Var #1, HG
MDH-09 80 83 PQ Qtr. Core very weak Magnetite Skarn 6.1 2.70 2.75 50.30 Fault Block 1
MDH-52 156.8 158 HQ Qtr. Core negligible Magnetite Skarn 2.6 3.60 3.83 59.40 North Body - set aside for Var #2, North, HG
MDH-52 164.3 164.6 HQ Qtr. Core negligible Magnetite Skarn 1.1 1.17 1.33 51.30 North Body - set aside for Var #2, North, HG
MDH-52 179.3 179.9 HQ Qtr. Core negligible Magnetite Skarn 1.6 0.48 0.49 29.40 North Body - set aside for Var #2, North, HG
MDH-53 110 116.3 HQ Qtr. Core very weak Magnetite Skarn 14.3 1.98 2.18 62.33 Fault block 2 ave copper/lo pyrite
MDH-53 117 118.5 HQ Qtr. Core negligible Magnetite Skarn 2.0 1.23 1.48 65.20 Fault block 2 ave copper/lo pyrite
MDH-53 132.7 139 HQ Qtr. Core very weak Magnetite Skarn 15.1 0.70 0.76 61.90 Fault block 2 ave copper/lo pyrite
MDH-60 224.6 232 HQ Qtr. Core weak Pyrite overprinted Magnetite Skarn v. weak surface oxidation 15.4 1.59 1.32 41.9 Fault block 2 ave copper/hi pyrite
MDH-60 232 235.2 HQ Qtr. Core weak Pyrite overprinted Magnetite Skarn v. weak surface oxidation 7.85 0.29 1.74 54.6 Fault block 2 ave copper/hi pyrite, set aside for Var #3, LG
Cu, Hi Au
MDH-77 99 101 PQ Qtr. Core negligible Magnetite Skarn 6 0.46 0.72 62.10 Fault block 1 lo copper/lo gold
MDH-78 69 71 PQ Qtr. Core negligible Magnetite Skarn 11.1 5.02 7.69 59.60 Fault block 1 hi copper/hi gold, set aside for Var #4, HG
MDH-78 71 72 PQ Qtr. Core negligible Magnetite Skarn 5.5 2.27 2.23 65.40 Fault block 1 hi copper/hi gold
MDH-78 76 79.9 PQ Qtr. Core very weak Magnetite Skarn 20.8 2.07 1.90 59.75 Fault block 1 ave copper/ave gold
MDH-78 88 90 PQ Qtr. Core weak Pyrite overprinted Magnetite Skarn v. weak surface oxidation 9.7 1.77 1.75 45.3 Fault Block 1
MDH-78 138 140 PQ Qtr. Core very weak Magnetite Skarn 5.9 3.10 3.54 60.70 Fault Block 2
MDH-94 250 252 NQ Qtr. Core weak Pyrite overprinted Magnetite Skarn v. weak surface oxidation 1.85 0.09 1.35 44 Fault Block 2 (however identical style of overprinted skarn that
is characteristic of Fault block 3)
MDH-94 252 254 NQ Qtr. Core weak Pyrite overprinted Magnetite Skarn v. weak surface oxidation 2.35 0.28 1.04 37.9
Fault Block 2 (however identical style of overprinted skarn that is characteristic of Fault block 3), set aside for Var #5, LG Cu, Hi As
MDH-94 254 261 NQ Qtr. Core weak Pyrite overprinted Magnetite Skarn v. weak surface oxidation 7.9 1.39 1.26 42.8 Fault Block 2 (however identical style of overprinted skarn that
is characteristic of Fault block 3)
MDH-94 261 266 NQ Qtr. Core weak Pyrite overprinted Magnetite Skarn v. weak surface oxidation 5.7 0.41 0.46 40.4
Fault Block 2 (however identical style of overprinted skarn that is characteristic of Fault block 3), set aside for Var #5, LG Cu, Hi As
MDH-94 266 271 NQ Qtr. Core weak Pyrite overprinted Magnetite Skarn v. weak surface oxidation 5.3 2.04 1.05 43.4 Fault Block 2 (however identical style of overprinted skarn that
is characteristic of Fault block 3)
MDH-96 160.25 165 NQ Qtr. Core negligible Magnetite Skarn 11.8 2.20 2.02 51.98 Fault block 2 ave copper/lo pyrite
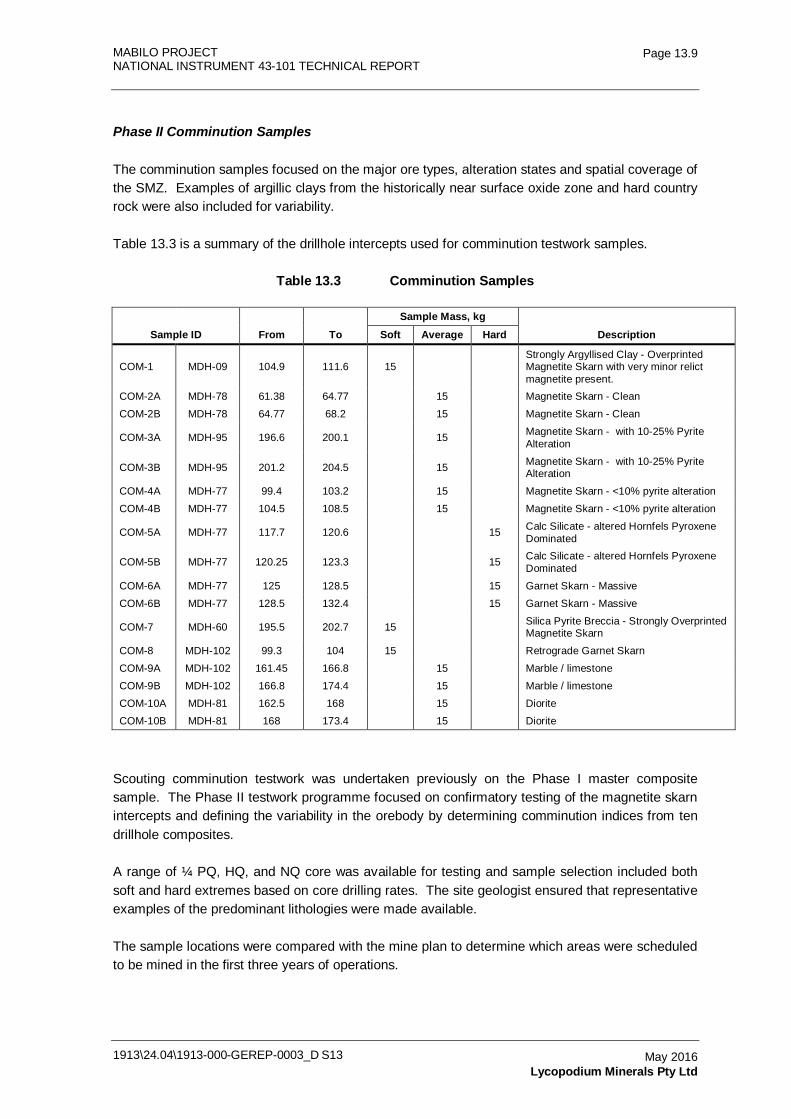
MABILO PROJECT NATIONAL INSTRUMENT 43-101 TECHNICAL REPORT
1913\24.04\1913-000-GEREP-0003_D S13
Page 13.9
May 2016 Lycopodium Minerals Pty Ltd
Phase II Comminution Samples
The comminution samples focused on the major ore types, alteration states and spatial coverage of the SMZ. Examples of argillic clays from the historically near surface oxide zone and hard country rock were also included for variability.
Table 13.3 is a summary of the drillhole intercepts used for comminution testwork samples.
Table 13.3 Comminution Samples
Sample Mass, kg Sample ID From To Soft Average Hard Description
COM-1 MDH-09 104.9 111.6 15
Strongly Argyllised Clay - Overprinted Magnetite Skarn with very minor relict magnetite present.
COM-2A MDH-78 61.38 64.77
15
Magnetite Skarn - Clean
COM-2B MDH-78 64.77 68.2
15
Magnetite Skarn - Clean
COM-3A MDH-95 196.6 200.1
15
Magnetite Skarn - with 10-25% Pyrite Alteration
COM-3B MDH-95 201.2 204.5
15
Magnetite Skarn - with 10-25% Pyrite Alteration
COM-4A MDH-77 99.4 103.2
15
Magnetite Skarn - <10% pyrite alteration
COM-4B MDH-77 104.5 108.5
15
Magnetite Skarn - <10% pyrite alteration
COM-5A MDH-77 117.7 120.6
15 Calc Silicate - altered Hornfels Pyroxene Dominated
COM-5B MDH-77 120.25 123.3
15 Calc Silicate - altered Hornfels Pyroxene Dominated
COM-6A MDH-77 125 128.5
15 Garnet Skarn - Massive
COM-6B MDH-77 128.5 132.4
15 Garnet Skarn - Massive
COM-7 MDH-60 195.5 202.7 15
Silica Pyrite Breccia - Strongly Overprinted Magnetite Skarn
COM-8 MDH-102 99.3 104 15
Retrograde Garnet Skarn
COM-9A MDH-102 161.45 166.8
15
Marble / limestone
COM-9B MDH-102 166.8 174.4
15
Marble / limestone
COM-10A MDH-81 162.5 168
15
Diorite
COM-10B MDH-81 168 173.4
15
Diorite
Scouting comminution testwork was undertaken previously on the Phase I master composite sample. The Phase II testwork programme focused on confirmatory testing of the magnetite skarn intercepts and defining the variability in the orebody by determining comminution indices from ten drillhole composites.
A range of ¼ PQ, HQ, and NQ core was available for testing and sample selection included both soft and hard extremes based on core drilling rates. The site geologist ensured that representative examples of the predominant lithologies were made available.
The sample locations were compared with the mine plan to determine which areas were scheduled to be mined in the first three years of operations.
MABILO PROJECT NATIONAL INSTRUMENT 43-101 TECHNICAL REPORT
1913\24.04\1913-000-GEREP-0003_D S13
Page 13.10
May 2016 Lycopodium Minerals Pty Ltd
Phase II Variability Samples
A number of variability samples were selected with specific differences from the main composite in terms of grade, mineralization and lithology to allow assessment of the impact on the processing route selected (Table 13.4).
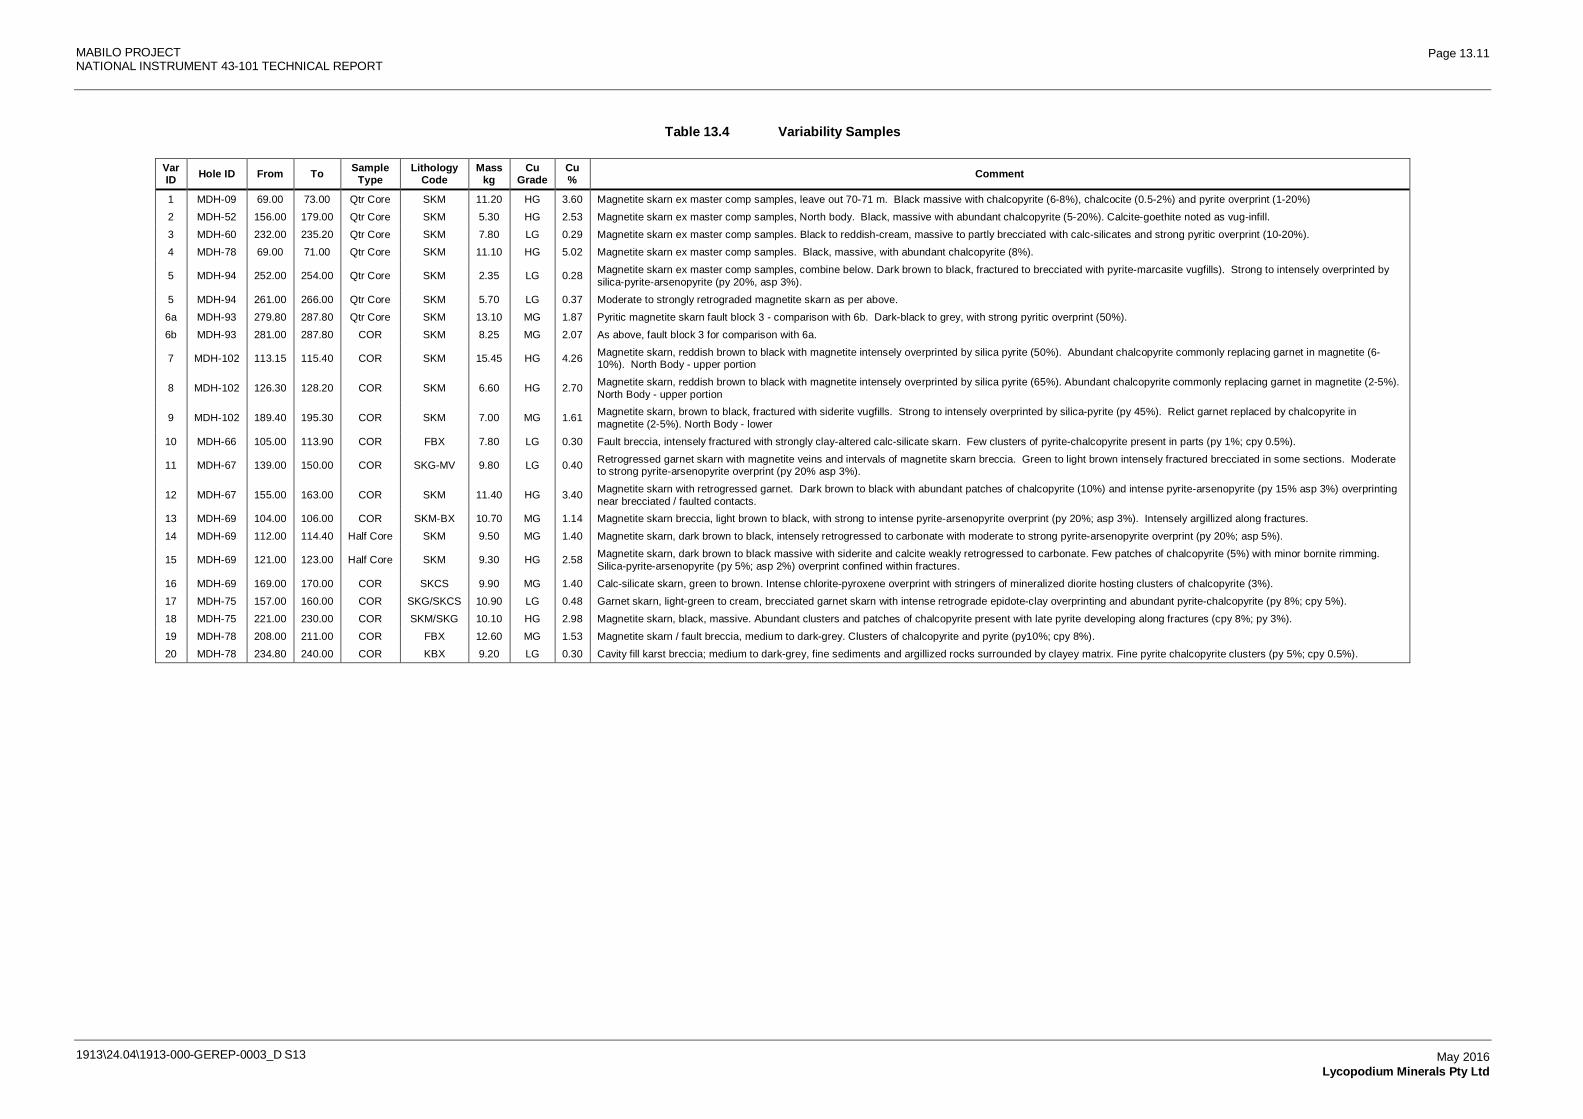
MABILO PROJECT NATIONAL INSTRUMENT 43-101 TECHNICAL REPORT
1913\24.04\1913-000-GEREP-0003_D S13
Page 13.11
May 2016 Lycopodium Minerals Pty Ltd
Table 13.4 Variability Samples
Var ID Hole ID From To Sample
Type Lithology
Code Mass
kg Cu
Grade Cu% Comment
1 MDH-09 69.00 73.00 Qtr Core SKM 11.20 HG 3.60 Magnetite skarn ex master comp samples, leave out 70-71 m. Black massive with chalcopyrite (6-8%), chalcocite (0.5-2%) and pyrite overprint (1-20%)
2 MDH-52 156.00 179.00 Qtr Core SKM 5.30 HG 2.53 Magnetite skarn ex master comp samples, North body. Black, massive with abundant chalcopyrite (5-20%). Calcite-goethite noted as vug-infill.
3 MDH-60 232.00 235.20 Qtr Core SKM 7.80 LG 0.29 Magnetite skarn ex master comp samples. Black to reddish-cream, massive to partly brecciated with calc-silicates and strong pyritic overprint (10-20%).
4 MDH-78 69.00 71.00 Qtr Core SKM 11.10 HG 5.02 Magnetite skarn ex master comp samples. Black, massive, with abundant chalcopyrite (8%).
5 MDH-94 252.00 254.00 Qtr Core SKM 2.35 LG 0.28 Magnetite skarn ex master comp samples, combine below. Dark brown to black, fractured to brecciated with pyrite-marcasite vugfills). Strong to intensely overprinted by silica-pyrite-arsenopyrite (py 20%, asp 3%).
5 MDH-94 261.00 266.00 Qtr Core SKM 5.70 LG 0.37 Moderate to strongly retrograded magnetite skarn as per above.
6a MDH-93 279.80 287.80 Qtr Core SKM 13.10 MG 1.87 Pyritic magnetite skarn fault block 3 - comparison with 6b. Dark-black to grey, with strong pyritic overprint (50%).
6b MDH-93 281.00 287.80 COR SKM 8.25 MG 2.07 As above, fault block 3 for comparison with 6a.
7 MDH-102 113.15 115.40 COR SKM 15.45 HG 4.26 Magnetite skarn, reddish brown to black with magnetite intensely overprinted by silica pyrite (50%). Abundant chalcopyrite commonly replacing garnet in magnetite (6-10%). North Body - upper portion
8 MDH-102 126.30 128.20 COR SKM 6.60 HG 2.70 Magnetite skarn, reddish brown to black with magnetite intensely overprinted by silica pyrite (65%). Abundant chalcopyrite commonly replacing garnet in magnetite (2-5%). North Body - upper portion
9 MDH-102 189.40 195.30 COR SKM 7.00 MG 1.61 Magnetite skarn, brown to black, fractured with siderite vugfills. Strong to intensely overprinted by silica-pyrite (py 45%). Relict garnet replaced by chalcopyrite in magnetite (2-5%). North Body - lower
10 MDH-66 105.00 113.90 COR FBX 7.80 LG 0.30 Fault breccia, intensely fractured with strongly clay-altered calc-silicate skarn. Few clusters of pyrite-chalcopyrite present in parts (py 1%; cpy 0.5%).
11 MDH-67 139.00 150.00 COR SKG-MV 9.80 LG 0.40 Retrogressed garnet skarn with magnetite veins and intervals of magnetite skarn breccia. Green to light brown intensely fractured brecciated in some sections. Moderate to strong pyrite-arsenopyrite overprint (py 20% asp 3%).
12 MDH-67 155.00 163.00 COR SKM 11.40 HG 3.40 Magnetite skarn with retrogressed garnet. Dark brown to black with abundant patches of chalcopyrite (10%) and intense pyrite-arsenopyrite (py 15% asp 3%) overprinting near brecciated / faulted contacts.
13 MDH-69 104.00 106.00 COR SKM-BX 10.70 MG 1.14 Magnetite skarn breccia, light brown to black, with strong to intense pyrite-arsenopyrite overprint (py 20%; asp 3%). Intensely argillized along fractures.
14 MDH-69 112.00 114.40 Half Core SKM 9.50 MG 1.40 Magnetite skarn, dark brown to black, intensely retrogressed to carbonate with moderate to strong pyrite-arsenopyrite overprint (py 20%; asp 5%).
15 MDH-69 121.00 123.00 Half Core SKM 9.30 HG 2.58 Magnetite skarn, dark brown to black massive with siderite and calcite weakly retrogressed to carbonate. Few patches of chalcopyrite (5%) with minor bornite rimming. Silica-pyrite-arsenopyrite (py 5%; asp 2%) overprint confined within fractures.
16 MDH-69 169.00 170.00 COR SKCS 9.90 MG 1.40 Calc-silicate skarn, green to brown. Intense chlorite-pyroxene overprint with stringers of mineralized diorite hosting clusters of chalcopyrite (3%).
17 MDH-75 157.00 160.00 COR SKG/SKCS 10.90 LG 0.48 Garnet skarn, light-green to cream, brecciated garnet skarn with intense retrograde epidote-clay overprinting and abundant pyrite-chalcopyrite (py 8%; cpy 5%).
18 MDH-75 221.00 230.00 COR SKM/SKG 10.10 HG 2.98 Magnetite skarn, black, massive. Abundant clusters and patches of chalcopyrite present with late pyrite developing along fractures (cpy 8%; py 3%).
19 MDH-78 208.00 211.00 COR FBX 12.60 MG 1.53 Magnetite skarn / fault breccia, medium to dark-grey. Clusters of chalcopyrite and pyrite (py10%; cpy 8%).
20 MDH-78 234.80 240.00 COR KBX 9.20 LG 0.30 Cavity fill karst breccia; medium to dark-grey, fine sediments and argillized rocks surrounded by clayey matrix. Fine pyrite chalcopyrite clusters (py 5%; cpy 0.5%).
MABILO PROJECT NATIONAL INSTRUMENT 43-101 TECHNICAL REPORT
1913\24.04\1913-000-GEREP-0003_D S13
Page 13.12
May 2016 Lycopodium Minerals Pty Ltd
13.4 Mineralogy
13.4.1 Phase I Samples
Only the low pyrite magnetic skarn, supergene and oxide gold cap were submitted for mineralogical investigation using QEMSCAN.
The findings of the mineralogical investigation were as follows.
Magnetite Skarn (Low Pyrite)
The copper grade in the magnetite skarn was 2.9%. Almost all of the copper (96.3%) was in chalcopyrite with the remainder in bornite, chalcocite and covellite. Liberation was high, with 97% reporting to the ‘well-liberated’ category (particles with >90% by area of combined copper sulphides). Association data showed that poorly liberated copper sulphides tended to be associated with iron oxides (mainly magnetite) and iron carbonates (siderite). Iron oxides and carbonates accounted for 74% of the sample mass.
Supergene Composite
The supergene copper grade was significantly higher (8.2% Cu) than that of the magnetite skarn. About 79% of the copper was hosted by chalcocite, with other copper sulphide minerals accounting for 14%. Copper sulphates, native copper, copper oxides and copper carbonates hosted the remaining 7% of copper. Magnetite was the most abundant iron oxide mineral, but the amount of hematite in this sample appeared to be higher than in the magnetite skarn.
Gold Cap Composite
This sample contained 1.16% Cu. The copper was hosted by a large number of minerals, and the copper content of several of them (in particular limonite) was poorly defined. The results indicated that only 44% of the copper was hosted by copper sulphides with the remainder present in limonite, copper sulphates and native copper.
The copper sulphides were fine grained and poorly liberated.
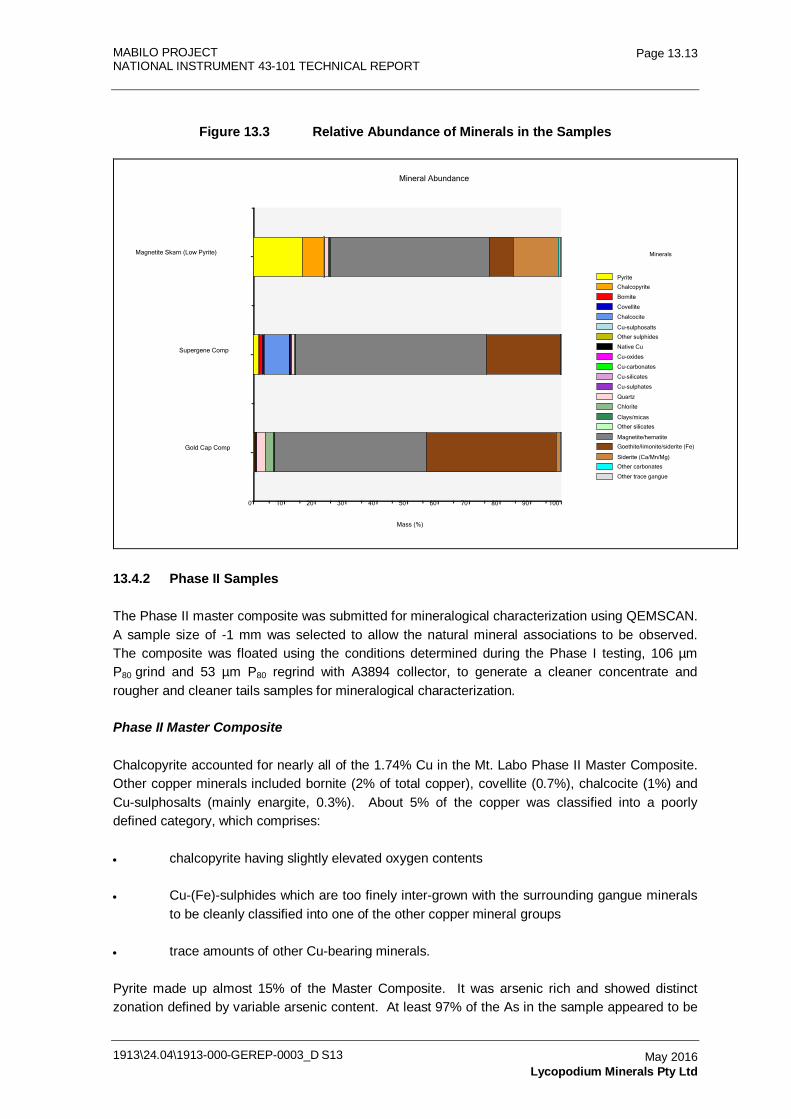
MABILO PROJECT NATIONAL INSTRUMENT 43-101 TECHNICAL REPORT
1913\24.04\1913-000-GEREP-0003_D S13
Page 13.13
May 2016 Lycopodium Minerals Pty Ltd
Figure 13.3 Relative Abundance of Minerals in the Samples
Mineral Abundance
Minerals
Pyrite
Chalcopyrite
Bornite
Covellite
Chalcocite
Cu-sulphosalts
Other sulphides
Native Cu
Cu-oxides
Cu-carbonates
Cu-silicates
Cu-sulphates
Quartz
Chlorite
Clays/micas
Other silicates
Magnetite/hematite
Goethite/limonite/siderite (Fe)
Siderite (Ca/Mn/Mg)
Other carbonates
Other trace gangue
Gold Cap Comp
Supergene Comp
Magnetite Skarn (Low Pyrite)
Mass (%)
0 10 20 30 40 50 60 70 80 90 100
13.4.2 Phase II Samples
The Phase II master composite was submitted for mineralogical characterization using QEMSCAN. A sample size of -1 mm was selected to allow the natural mineral associations to be observed. The composite was floated using the conditions determined during the Phase I testing, 106 µm P80 grind and 53 µm P80 regrind with A3894 collector, to generate a cleaner concentrate and rougher and cleaner tails samples for mineralogical characterization.
Phase II Master Composite
Chalcopyrite accounted for nearly all of the 1.74% Cu in the Mt. Labo Phase II Master Composite. Other copper minerals included bornite (2% of total copper), covellite (0.7%), chalcocite (1%) and Cu-sulphosalts (mainly enargite, 0.3%). About 5% of the copper was classified into a poorly defined category, which comprises:
• chalcopyrite having slightly elevated oxygen contents
• Cu-(Fe)-sulphides which are too finely inter-grown with the surrounding gangue minerals to be cleanly classified into one of the other copper mineral groups
• trace amounts of other Cu-bearing minerals.
Pyrite made up almost 15% of the Master Composite. It was arsenic rich and showed distinct zonation defined by variable arsenic content. At least 97% of the As in the sample appeared to be
MABILO PROJECT NATIONAL INSTRUMENT 43-101 TECHNICAL REPORT
1913\24.04\1913-000-GEREP-0003_D S13
Page 13.14
May 2016 Lycopodium Minerals Pty Ltd
hosted by pyrite. Similar to the chalcopyrite, about 10% of the pyrite was classified into a poorly defined category with partially oxidized and finely inter-grown examples.
The pyrite and chalcopyrite were closely associated with each other with chalcopyrite grains ranging from very coarse (>200 µm) to very fine (<1 µm) and occurring as attachments to, or inclusions in, the pyrite.
Iron-rich oxides (mainly magnetite, less hematite), oxyhydroxides (goethite) and carbonates (siderite) made up 63% of the master composite mass. The siderite had variable Ca, Mg and Mn contents. The most Fe-rich siderite was grouped with hematite and goethite due to the overlap between these minerals using the QEMSCAN analysis method. Similar to pyrite, this combined iron-oxide / oxy-hydroxide / carbonate group was closely associated with chalcopyrite, which occurred as very coarse (>200 µm) to very fine (<1 µm) inclusions in this combined mineral group.
Quartz and other less abundant silicate minerals together accounted for 3% of the Master Composite.
CT5008 Cleaner Concentrate
Chalcopyrite made up 88% of the Cleaner Con and accounted for 93% of the copper; bornite, covellite, chalcocite, Cu-sulphosalts and the poorly defined phases / intergrowths accounted for the remaining copper.
Pyrite made up about 4% of the Cleaner Con. It was finer-grained (P50 14 µm) than the chalcopyrite (P50 25 µm). Pyrite was reasonably well-liberated with 44% classified as 'liberated' and another 24% classified as 'high grade middlings'. Unliberated pyrite mainly occurred in binary particles with chalcopyrite.
Combined Fe-oxides and carbonates (P50 19 µm) made up just over 2% of the Cleaner Con. The combined Fe-oxides / carbonates were less liberated than the pyrite with almost half classified into the 'low grade middlings' or 'locked' categories. Poorly liberated Fe-oxides / carbonates were also nearly all hosted by binary particles with chalcopyrite.
Silicates accounted for 0.3% of the Cleaner Con with grain size, liberation and locking characteristics similar to those of the other gangue minerals.
CT5008 Cleaner Tail
Pyrite comprised 92% of the cleaner tail; it is very well liberated and has a P50 of 26 µm.
Other minerals reporting to this product included chalcopyrite (<2%) and minor amounts of other Cu minerals, almost 5% of the combined Fe-oxides / carbonates and 1.5% of combined silicates.
The chalcopyrite had a P50 of 21 µm and was reasonably well liberated, with 46% classified as 'liberated' and 19% classified as 'high grade middlings'. Unliberated chalcopyrite occurred almost exclusively in binary pyrite-chalcopyrite particles.
MABILO PROJECT NATIONAL INSTRUMENT 43-101 TECHNICAL REPORT
1913\24.04\1913-000-GEREP-0003_D S13
Page 13.15
May 2016 Lycopodium Minerals Pty Ltd
The combined Fe-oxides / carbonates had a P50 of 19 µm and were reasonably well liberated (75% is classified as ‘liberated’ or ‘high grade middlings’) with unliberated Fe-oxides / carbonates hosted by binary pyrite-Fe-oxide / carbonate particles.
The combined silicate minerals had a P50 of 18 µm and were reasonably well-liberated with 63% classified as ‘liberated’ or ‘high grade middlings’. About 30% of the silicate minerals were classified into ‘other’ complex locking categories and generally occur in particles containing both pyrite and Fe-oxides / carbonates.
CT5008 Rougher Tail
The Cu grade of the rougher tail was 0.20%. Chalcopyrite was estimated to account for 83% of the copper. Although the proportion of bornite appears to be higher in this product when compared with the feed and other products, the data was skewed by a single large, bornite-rich particle. Very fine-grained copper and partially oxidized chalcopyrite, together classified into the 'Cu-(Fe)-sulphide intergrowth or oxidized' group, were relatively abundant in this product and accounted for 7% of the total copper.
The chalcopyrite reporting to the rougher tail was, on average, only slightly coarser-grained (P50 28 µm) than that reporting to the post-regrind cleaner con (P50 25 µm) or cleaner tail (P50 21 µm). It was relatively poorly liberated with 25% classified as 'low grade middlings' and about 37% classified as either 'locked' or 'enclosed'. The unliberated chalcopyrite had a wide range of associations with Fe-oxides / carbonates, silicates and / or pyrite.
Pyrite (P50 of 53 µm) made up almost 10% of the sample. On average it was much coarser than in the other products. It was reasonably well liberated (more than 80% is either 'liberated' or 'high grade middlings') with unliberated pyrite mainly present in relatively complex gangue particles.
The combined Fe-oxides / carbonates made up the bulk of the rougher tails; together they comprised 85% of the sample. This combined mineral group had a P50 of 60 µm and grains were very well-liberated with 91% classified as ‘liberated’ and a further 7% classified as 'high grade middlings'.
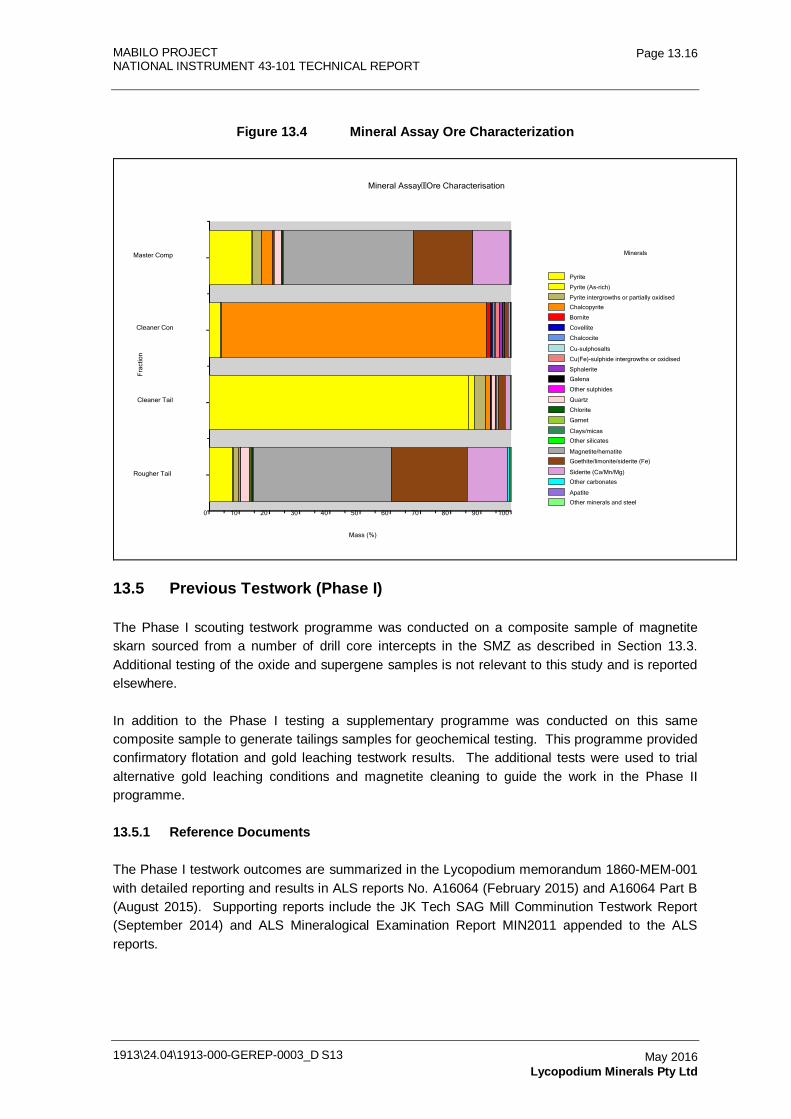
MABILO PROJECT NATIONAL INSTRUMENT 43-101 TECHNICAL REPORT
1913\24.04\1913-000-GEREP-0003_D S13
Page 13.16
May 2016 Lycopodium Minerals Pty Ltd
Figure 13.4 Mineral Assay Ore Characterization
Mineral Assay Ore Characterisation
Minerals
Pyrite
Pyrite (As-rich)
Pyrite intergrowths or partially oxidised
Chalcopyrite
Bornite
Covellite
Chalcocite
Cu-sulphosalts
Cu(Fe)-sulphide intergrowths or oxidised
Sphalerite
Galena
Other sulphides
Quartz
Chlorite
Garnet
Clays/micas
Other silicates
Magnetite/hematite
Goethite/limonite/siderite (Fe)
Siderite (Ca/Mn/Mg)
Other carbonates
Apatite
Other minerals and steel
Frac
tion
Rougher Tail
Cleaner Tail
Cleaner Con
Master Comp
Mass (%)
0 10 20 30 40 50 60 70 80 90 100
13.5 Previous Testwork (Phase I)
The Phase I scouting testwork programme was conducted on a composite sample of magnetite skarn sourced from a number of drill core intercepts in the SMZ as described in Section 13.3. Additional testing of the oxide and supergene samples is not relevant to this study and is reported elsewhere.
In addition to the Phase I testing a supplementary programme was conducted on this same composite sample to generate tailings samples for geochemical testing. This programme provided confirmatory flotation and gold leaching testwork results. The additional tests were used to trial alternative gold leaching conditions and magnetite cleaning to guide the work in the Phase II programme.
13.5.1 Reference Documents
The Phase I testwork outcomes are summarized in the Lycopodium memorandum 1860-MEM-001 with detailed reporting and results in ALS reports No. A16064 (February 2015) and A16064 Part B (August 2015). Supporting reports include the JK Tech SAG Mill Comminution Testwork Report (September 2014) and ALS Mineralogical Examination Report MIN2011 appended to the ALS reports.
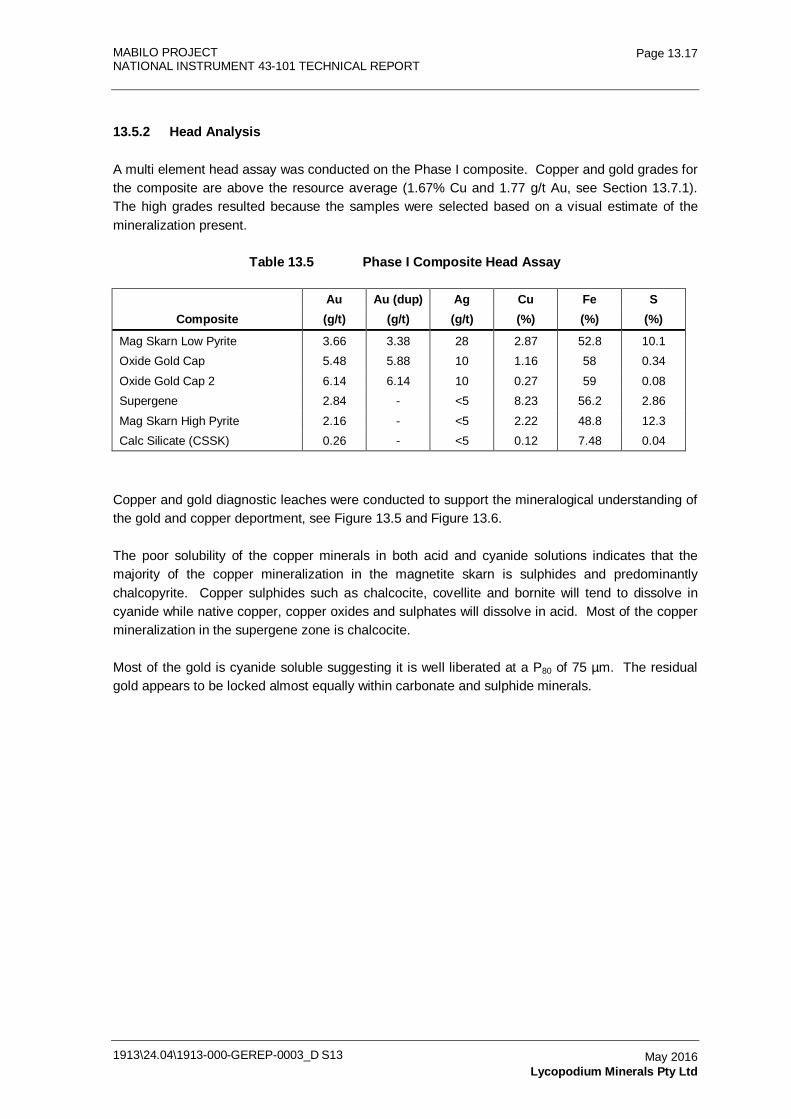
MABILO PROJECT NATIONAL INSTRUMENT 43-101 TECHNICAL REPORT
1913\24.04\1913-000-GEREP-0003_D S13
Page 13.17
May 2016 Lycopodium Minerals Pty Ltd
13.5.2 Head Analysis
A multi element head assay was conducted on the Phase I composite. Copper and gold grades for the composite are above the resource average (1.67% Cu and 1.77 g/t Au, see Section 13.7.1). The high grades resulted because the samples were selected based on a visual estimate of the mineralization present.
Table 13.5 Phase I Composite Head Assay
Composite Au Au (dup) Ag Cu Fe S (g/t) (g/t) (g/t) (%) (%) (%)
Mag Skarn Low Pyrite 3.66 3.38 28 2.87 52.8 10.1 Oxide Gold Cap 5.48 5.88 10 1.16 58 0.34 Oxide Gold Cap 2 6.14 6.14 10 0.27 59 0.08 Supergene 2.84 - <5 8.23 56.2 2.86 Mag Skarn High Pyrite 2.16 - <5 2.22 48.8 12.3 Calc Silicate (CSSK) 0.26 - <5 0.12 7.48 0.04
Copper and gold diagnostic leaches were conducted to support the mineralogical understanding of the gold and copper deportment, see Figure 13.5 and Figure 13.6.
The poor solubility of the copper minerals in both acid and cyanide solutions indicates that the majority of the copper mineralization in the magnetite skarn is sulphides and predominantly chalcopyrite. Copper sulphides such as chalcocite, covellite and bornite will tend to dissolve in cyanide while native copper, copper oxides and sulphates will dissolve in acid. Most of the copper mineralization in the supergene zone is chalcocite.
Most of the gold is cyanide soluble suggesting it is well liberated at a P80 of 75 µm. The residual gold appears to be locked almost equally within carbonate and sulphide minerals.
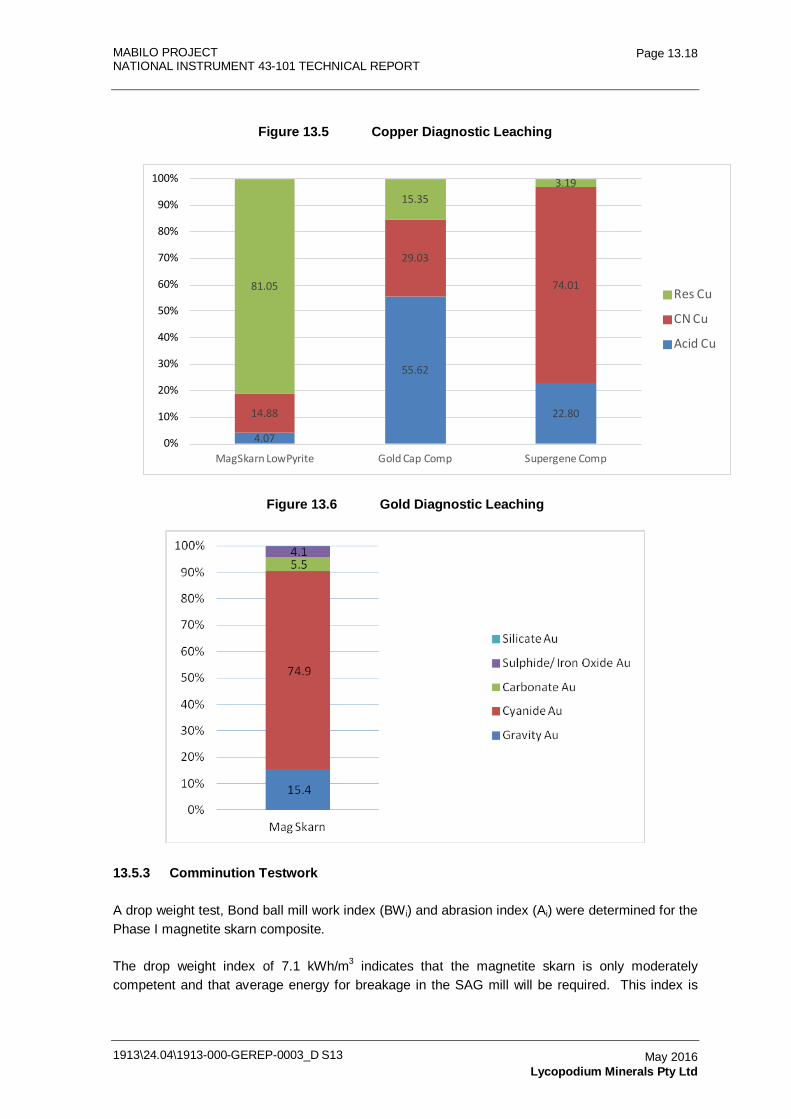
MABILO PROJECT NATIONAL INSTRUMENT 43-101 TECHNICAL REPORT
1913\24.04\1913-000-GEREP-0003_D S13
Page 13.18
May 2016 Lycopodium Minerals Pty Ltd
Figure 13.5 Copper Diagnostic Leaching
Figure 13.6 Gold Diagnostic Leaching
13.5.3 Comminution Testwork
A drop weight test, Bond ball mill work index (BWi) and abrasion index (Ai) were determined for the Phase I magnetite skarn composite.
The drop weight index of 7.1 kWh/m3 indicates that the magnetite skarn is only moderately competent and that average energy for breakage in the SAG mill will be required. This index is
4.07
55.62
22.8014.88
29.03
74.0181.05
15.353.19
0%
10%
20%
30%
40%
50%
60%
70%
80%
90%
100%
MagSkarn LowPyrite Gold Cap Comp Supergene Comp
Res Cu
CN Cu
Acid Cu
MABILO PROJECT NATIONAL INSTRUMENT 43-101 TECHNICAL REPORT
1913\24.04\1913-000-GEREP-0003_D S13
Page 13.19
May 2016 Lycopodium Minerals Pty Ltd
directly correlated with the A and b values in the JK Tech comminution model and the Axb value for this composite is 60.9.
A true SG of 4.33 was determined for the sample.
The Bond ball mill work index, BWi, for the Phase I composite was 14.2 kWh/t at a closing screen size of 150 µm indicating that the grinding energy required will be below average. The Bond abrasion index, Ai, was 0.20 indicating that media and liner wear rates will be relatively low.
13.5.4 Flotation Testwork
The flotation testwork aimed to demonstrate suitable baseline conditions to generate a saleable grade copper – gold concentrate at maximum metals recovery with minimum detrimental elements.
Rougher flotation tests were conducted at natural pH at P80 grinds of 150, 106 and 75 µm to select the optimum grind following sighter tests to determine satisfactory reagent types and addition rates. A flotation time of 11 minutes was established with 50 g/t selective A3894 promoter followed by a 10 g/t PAX scavenger stage.
No benefit was seen in grinding finer than a grind P80 of 106 µm with 97.3% copper and 86.9% gold recovery to concentrate.
Cleaner flotation tests were conducted to improve concentrate grade with minimal value mineral loss. Depression of the pyrite with lime (high pH) and alternatively sodium cyanide (NaCN) or sodium metabisulphite (MBS) was trialed with and without regrinding. Dilution of the cleaner float was also necessary to improve the selectivity.
Testing was not comprehensive, but a recovery of 95.7% Cu at a grade of 33% was achieved with 59.4% of the gold reporting to concentrate following regrinding to a P80 of 53 µm. Comparative cleaner flotation results are presented in Table 13.6 with 20 g/L NaCN addition.
Selective Rougher Flotation Trial
The process route selection to this point assumed bulk sulphide flotation was optimal. A selective flotation trial was proposed with a finer primary grind (P80 = 75 µm) and depression of the pyrite in the rougher stage. This aimed to:
• simplify the process with a single flotation tail stream
• simplify the grinding requirements by eliminating the regrind circuit
• check the adequacy of a finer primary grind in terms of copper / pyrite separation and determine if rougher copper recovery improved
• confirm that the sulphides were rejected in the magnetic separation stage, so the quality of the magnetite product was not impacted.
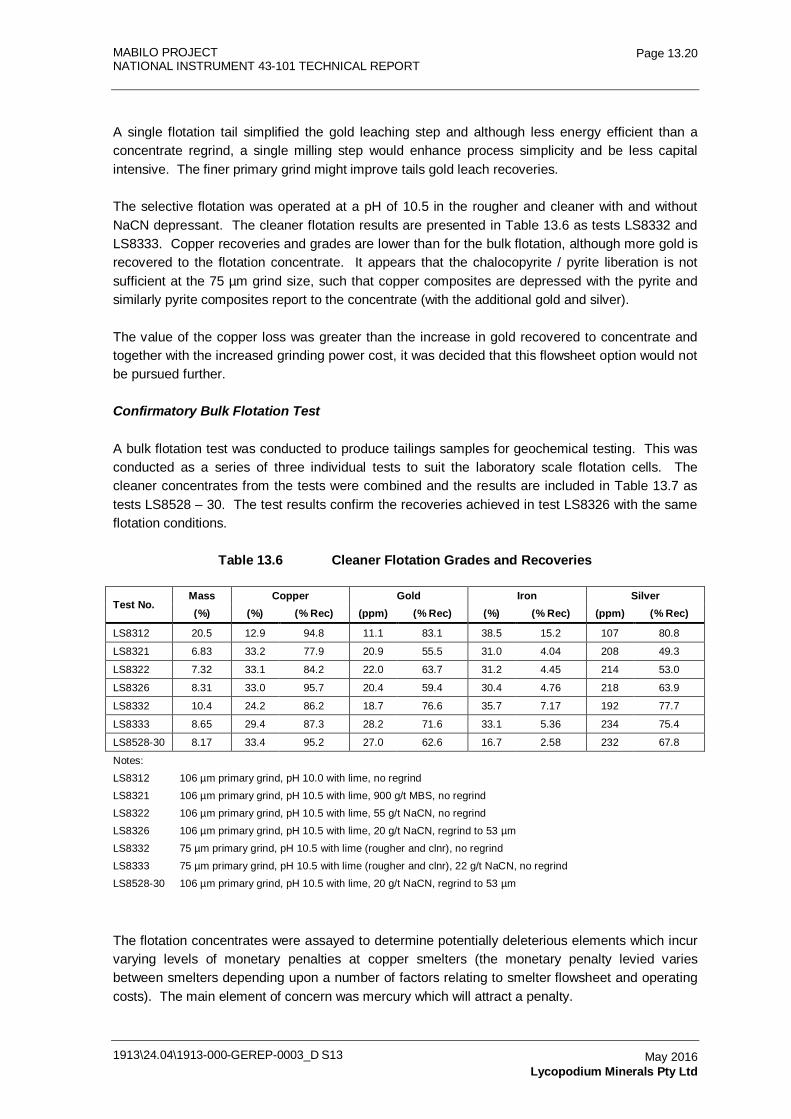
MABILO PROJECT NATIONAL INSTRUMENT 43-101 TECHNICAL REPORT
1913\24.04\1913-000-GEREP-0003_D S13
Page 13.20
May 2016 Lycopodium Minerals Pty Ltd
A single flotation tail simplified the gold leaching step and although less energy efficient than a concentrate regrind, a single milling step would enhance process simplicity and be less capital intensive. The finer primary grind might improve tails gold leach recoveries.
The selective flotation was operated at a pH of 10.5 in the rougher and cleaner with and without NaCN depressant. The cleaner flotation results are presented in Table 13.6 as tests LS8332 and LS8333. Copper recoveries and grades are lower than for the bulk flotation, although more gold is recovered to the flotation concentrate. It appears that the chalocopyrite / pyrite liberation is not sufficient at the 75 µm grind size, such that copper composites are depressed with the pyrite and similarly pyrite composites report to the concentrate (with the additional gold and silver).
The value of the copper loss was greater than the increase in gold recovered to concentrate and together with the increased grinding power cost, it was decided that this flowsheet option would not be pursued further.
Confirmatory Bulk Flotation Test
A bulk flotation test was conducted to produce tailings samples for geochemical testing. This was conducted as a series of three individual tests to suit the laboratory scale flotation cells. The cleaner concentrates from the tests were combined and the results are included in Table 13.7 as tests LS8528 – 30. The test results confirm the recoveries achieved in test LS8326 with the same flotation conditions.
Table 13.6 Cleaner Flotation Grades and Recoveries
Test No. Mass Copper Gold Iron Silver (%) (%) (% Rec) (ppm) (% Rec) (%) (% Rec) (ppm) (% Rec)
LS8312 20.5 12.9 94.8 11.1 83.1 38.5 15.2 107 80.8
LS8321 6.83 33.2 77.9 20.9 55.5 31.0 4.04 208 49.3
LS8322 7.32 33.1 84.2 22.0 63.7 31.2 4.45 214 53.0
LS8326 8.31 33.0 95.7 20.4 59.4 30.4 4.76 218 63.9
LS8332 10.4 24.2 86.2 18.7 76.6 35.7 7.17 192 77.7
LS8333 8.65 29.4 87.3 28.2 71.6 33.1 5.36 234 75.4
LS8528-30 8.17 33.4 95.2 27.0 62.6 16.7 2.58 232 67.8
Notes:
LS8312 106 µm primary grind, pH 10.0 with lime, no regrind
LS8321 106 µm primary grind, pH 10.5 with lime, 900 g/t MBS, no regrind
LS8322 106 µm primary grind, pH 10.5 with lime, 55 g/t NaCN, no regrind
LS8326 106 µm primary grind, pH 10.5 with lime, 20 g/t NaCN, regrind to 53 µm
LS8332 75 µm primary grind, pH 10.5 with lime (rougher and clnr), no regrind
LS8333 75 µm primary grind, pH 10.5 with lime (rougher and clnr), 22 g/t NaCN, no regrind
LS8528-30 106 µm primary grind, pH 10.5 with lime, 20 g/t NaCN, regrind to 53 µm
The flotation concentrates were assayed to determine potentially deleterious elements which incur varying levels of monetary penalties at copper smelters (the monetary penalty levied varies between smelters depending upon a number of factors relating to smelter flowsheet and operating costs). The main element of concern was mercury which will attract a penalty.
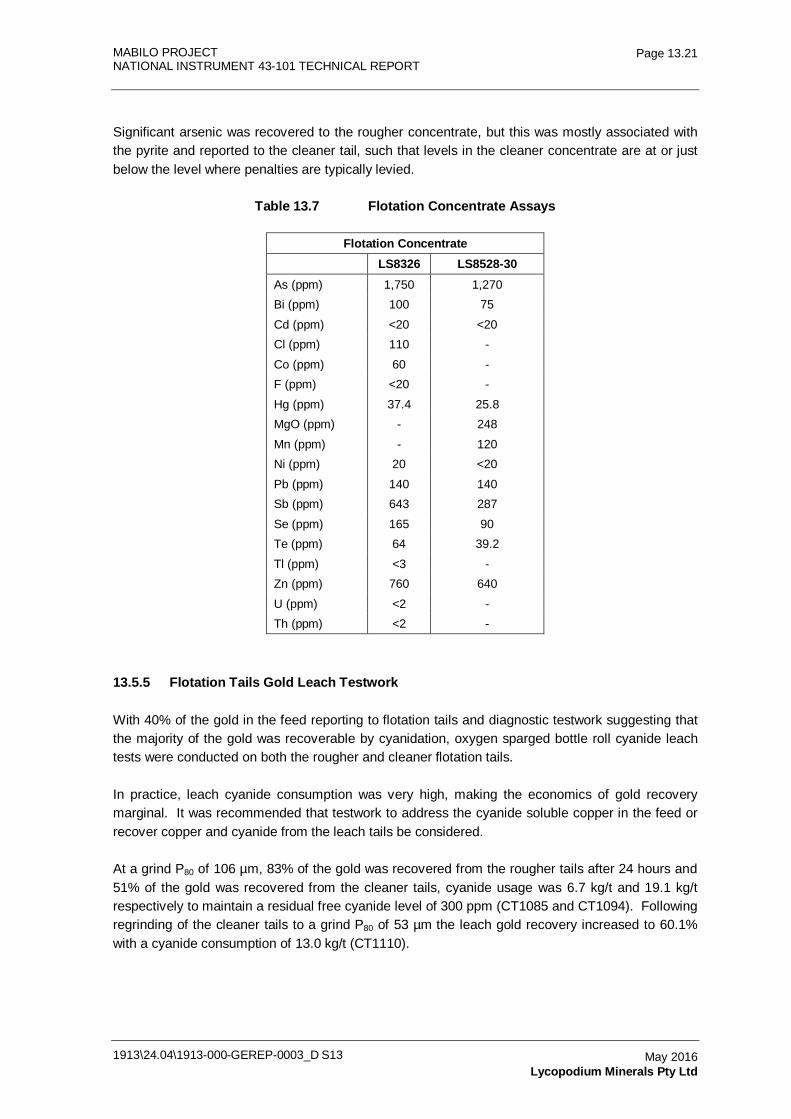
MABILO PROJECT NATIONAL INSTRUMENT 43-101 TECHNICAL REPORT
1913\24.04\1913-000-GEREP-0003_D S13
Page 13.21
May 2016 Lycopodium Minerals Pty Ltd
Significant arsenic was recovered to the rougher concentrate, but this was mostly associated with the pyrite and reported to the cleaner tail, such that levels in the cleaner concentrate are at or just below the level where penalties are typically levied.
Table 13.7 Flotation Concentrate Assays
Flotation Concentrate
LS8326 LS8528-30 As (ppm) 1,750 1,270 Bi (ppm) 100 75 Cd (ppm) <20 <20 Cl (ppm) 110 - Co (ppm) 60 - F (ppm) <20 - Hg (ppm) 37.4 25.8 MgO (ppm) - 248 Mn (ppm) - 120 Ni (ppm) 20 <20 Pb (ppm) 140 140 Sb (ppm) 643 287 Se (ppm) 165 90 Te (ppm) 64 39.2 Tl (ppm) <3 - Zn (ppm) 760 640 U (ppm) <2 - Th (ppm) <2 -
13.5.5 Flotation Tails Gold Leach Testwork
With 40% of the gold in the feed reporting to flotation tails and diagnostic testwork suggesting that the majority of the gold was recoverable by cyanidation, oxygen sparged bottle roll cyanide leach tests were conducted on both the rougher and cleaner flotation tails.
In practice, leach cyanide consumption was very high, making the economics of gold recovery marginal. It was recommended that testwork to address the cyanide soluble copper in the feed or recover copper and cyanide from the leach tails be considered.
At a grind P80 of 106 µm, 83% of the gold was recovered from the rougher tails after 24 hours and 51% of the gold was recovered from the cleaner tails, cyanide usage was 6.7 kg/t and 19.1 kg/t respectively to maintain a residual free cyanide level of 300 ppm (CT1085 and CT1094). Following regrinding of the cleaner tails to a grind P80 of 53 µm the leach gold recovery increased to 60.1% with a cyanide consumption of 13.0 kg/t (CT1110).
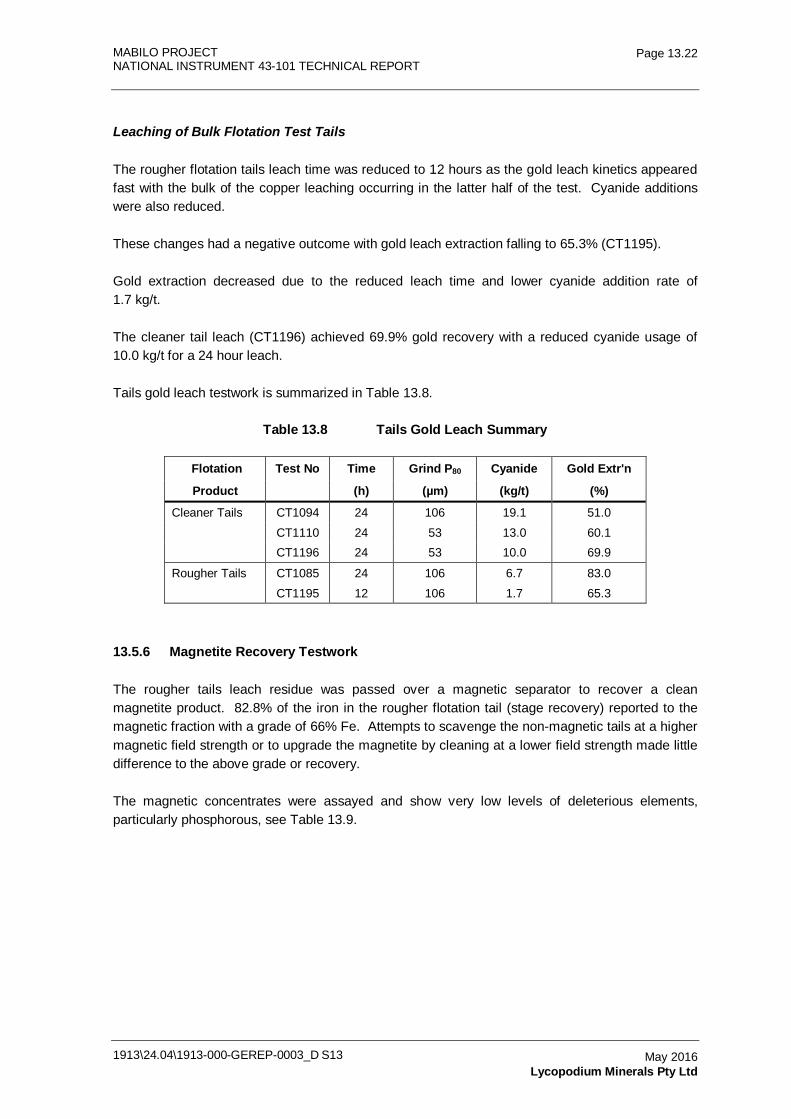
MABILO PROJECT NATIONAL INSTRUMENT 43-101 TECHNICAL REPORT
1913\24.04\1913-000-GEREP-0003_D S13
Page 13.22
May 2016 Lycopodium Minerals Pty Ltd
Leaching of Bulk Flotation Test Tails
The rougher flotation tails leach time was reduced to 12 hours as the gold leach kinetics appeared fast with the bulk of the copper leaching occurring in the latter half of the test. Cyanide additions were also reduced.
These changes had a negative outcome with gold leach extraction falling to 65.3% (CT1195).
Gold extraction decreased due to the reduced leach time and lower cyanide addition rate of 1.7 kg/t.
The cleaner tail leach (CT1196) achieved 69.9% gold recovery with a reduced cyanide usage of 10.0 kg/t for a 24 hour leach.
Tails gold leach testwork is summarized in Table 13.8.
Table 13.8 Tails Gold Leach Summary
Flotation Test No Time Grind P80 Cyanide Gold Extr'n
Product
(h) (µm) (kg/t) (%)
Cleaner Tails CT1094 24 106 19.1 51.0 CT1110 24 53 13.0 60.1 CT1196 24 53 10.0 69.9
Rougher Tails CT1085 24 106 6.7 83.0 CT1195 12 106 1.7 65.3
13.5.6 Magnetite Recovery Testwork
The rougher tails leach residue was passed over a magnetic separator to recover a clean magnetite product. 82.8% of the iron in the rougher flotation tail (stage recovery) reported to the magnetic fraction with a grade of 66% Fe. Attempts to scavenge the non-magnetic tails at a higher magnetic field strength or to upgrade the magnetite by cleaning at a lower field strength made little difference to the above grade or recovery.
The magnetic concentrates were assayed and show very low levels of deleterious elements, particularly phosphorous, see Table 13.9.
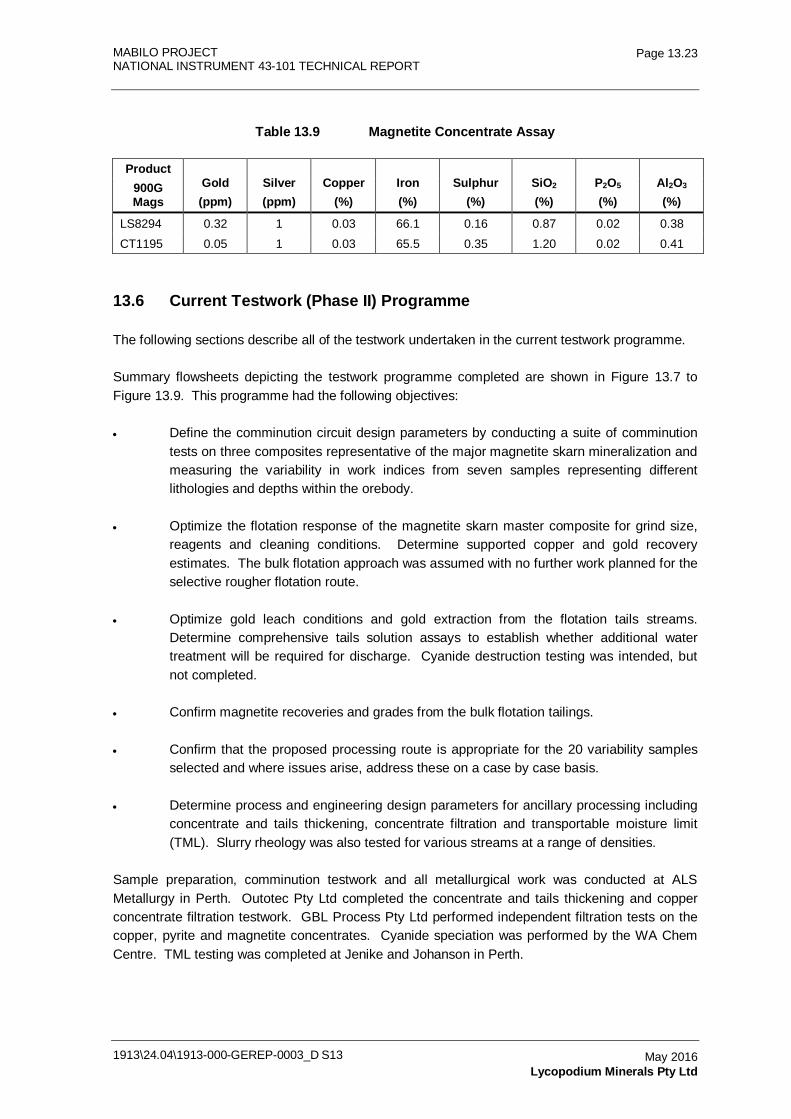
MABILO PROJECT NATIONAL INSTRUMENT 43-101 TECHNICAL REPORT
1913\24.04\1913-000-GEREP-0003_D S13
Page 13.23
May 2016 Lycopodium Minerals Pty Ltd
Table 13.9 Magnetite Concentrate Assay
Product Gold (ppm)
Silver (ppm)
Copper (%)
Iron (%)
Sulphur (%)
SiO2 (%)
P2O5 (%)
Al2O3 (%)
900G Mags
LS8294 0.32 1 0.03 66.1 0.16 0.87 0.02 0.38 CT1195 0.05 1 0.03 65.5 0.35 1.20 0.02 0.41
13.6 Current Testwork (Phase II) Programme
The following sections describe all of the testwork undertaken in the current testwork programme.
Summary flowsheets depicting the testwork programme completed are shown in Figure 13.7 to Figure 13.9. This programme had the following objectives:
• Define the comminution circuit design parameters by conducting a suite of comminution tests on three composites representative of the major magnetite skarn mineralization and measuring the variability in work indices from seven samples representing different lithologies and depths within the orebody.
• Optimize the flotation response of the magnetite skarn master composite for grind size, reagents and cleaning conditions. Determine supported copper and gold recovery estimates. The bulk flotation approach was assumed with no further work planned for the selective rougher flotation route.
• Optimize gold leach conditions and gold extraction from the flotation tails streams. Determine comprehensive tails solution assays to establish whether additional water treatment will be required for discharge. Cyanide destruction testing was intended, but not completed.
• Confirm magnetite recoveries and grades from the bulk flotation tailings.
• Confirm that the proposed processing route is appropriate for the 20 variability samples selected and where issues arise, address these on a case by case basis.
• Determine process and engineering design parameters for ancillary processing including concentrate and tails thickening, concentrate filtration and transportable moisture limit (TML). Slurry rheology was also tested for various streams at a range of densities.
Sample preparation, comminution testwork and all metallurgical work was conducted at ALS Metallurgy in Perth. Outotec Pty Ltd completed the concentrate and tails thickening and copper concentrate filtration testwork. GBL Process Pty Ltd performed independent filtration tests on the copper, pyrite and magnetite concentrates. Cyanide speciation was performed by the WA Chem Centre. TML testing was completed at Jenike and Johanson in Perth.
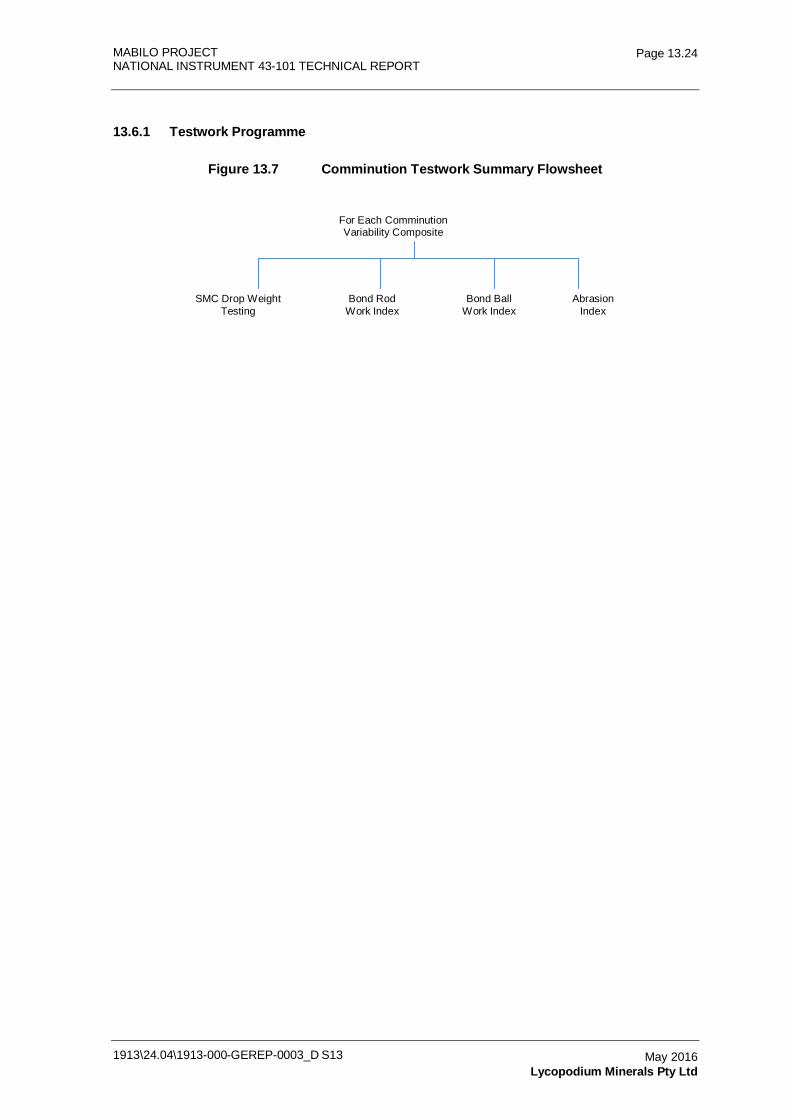
MABILO PROJECT NATIONAL INSTRUMENT 43-101 TECHNICAL REPORT
1913\24.04\1913-000-GEREP-0003_D S13
Page 13.24
May 2016 Lycopodium Minerals Pty Ltd
13.6.1 Testwork Programme
Figure 13.7 Comminution Testwork Summary Flowsheet
For Each Comminution Variability Composite
SMC Drop Weight Testing
Bond Rod Work Index
Bond Ball Work Index
Abrasion Index
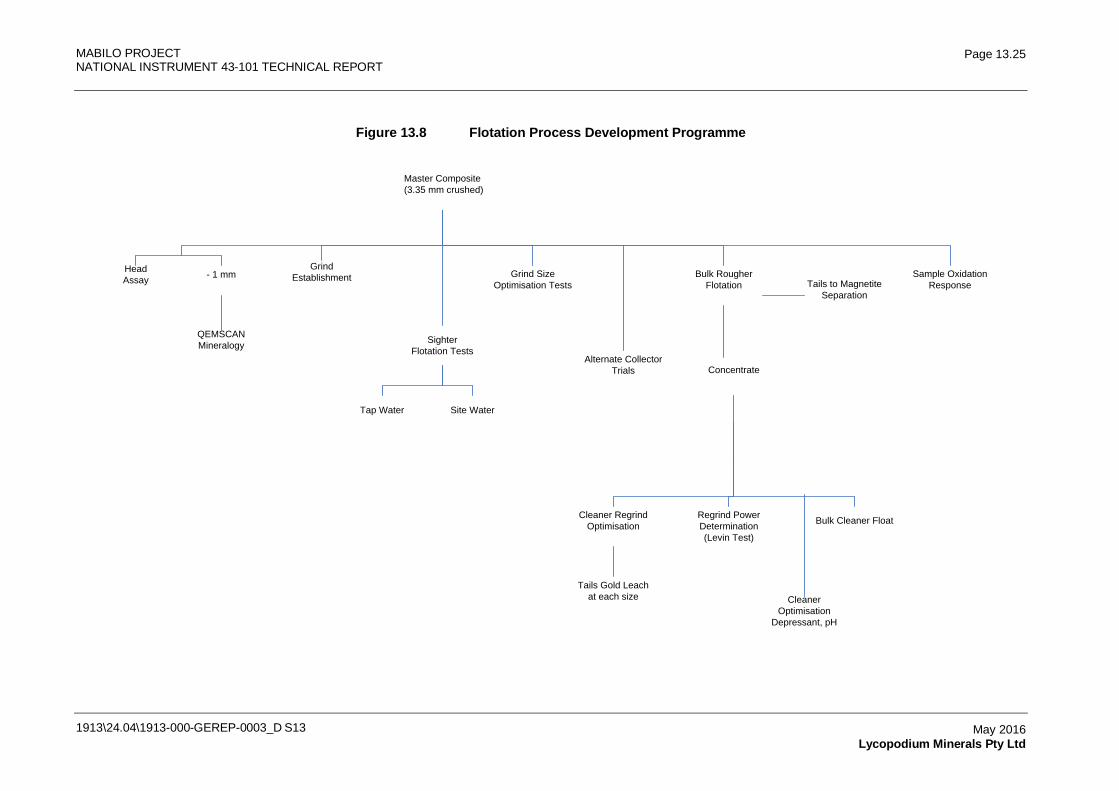
MABILO PROJECT NATIONAL INSTRUMENT 43-101 TECHNICAL REPORT
1913\24.04\1913-000-GEREP-0003_D S13
Page 13.25
May 2016 Lycopodium Minerals Pty Ltd
Figure 13.8 Flotation Process Development Programme
Master Composite (3.35 mm crushed)
Head Assay
- 1 mm
QEMSCAN Mineralogy
Grind Establishment
SighterFlotation Tests
Tap Water
Site Water
Grind Size Optimisation Tests
Alternate Collector Trials
Bulk Rougher Flotation
Concentrate
Tails to Magnetite Separation
Sample Oxidation Response
Cleaner Regrind Optimisation
Regrind Power Determination(Levin Test)
Tails Gold Leach at each size
Cleaner
Optimisation Depressant, pH
Bulk Cleaner Float
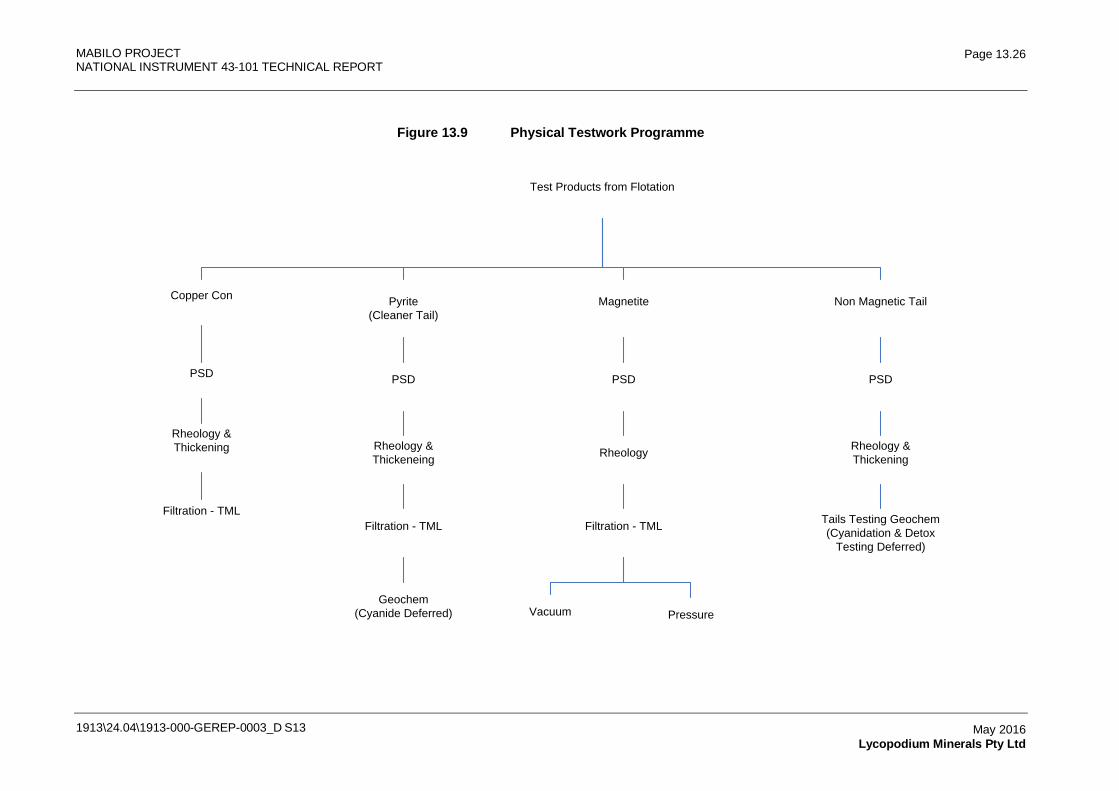
MABILO PROJECT NATIONAL INSTRUMENT 43-101 TECHNICAL REPORT
1913\24.04\1913-000-GEREP-0003_D S13
Page 13.26
May 2016 Lycopodium Minerals Pty Ltd
Figure 13.9 Physical Testwork Programme
Test Products from Flotation
Filtration - TML
PSD
Copper Con
PSD
Rheology & Thickening
Rheology & Thickeneing
Pyrite(Cleaner Tail)
Magnetite
Vacuum
PSD
Non Magnetic Tail
PSD
Filtration - TML
Rheology
Geochem(Cyanide Deferred)
Filtration - TML
Pressure
Rheology & Thickening
Tails Testing Geochem(Cyanidation & Detox
Testing Deferred)
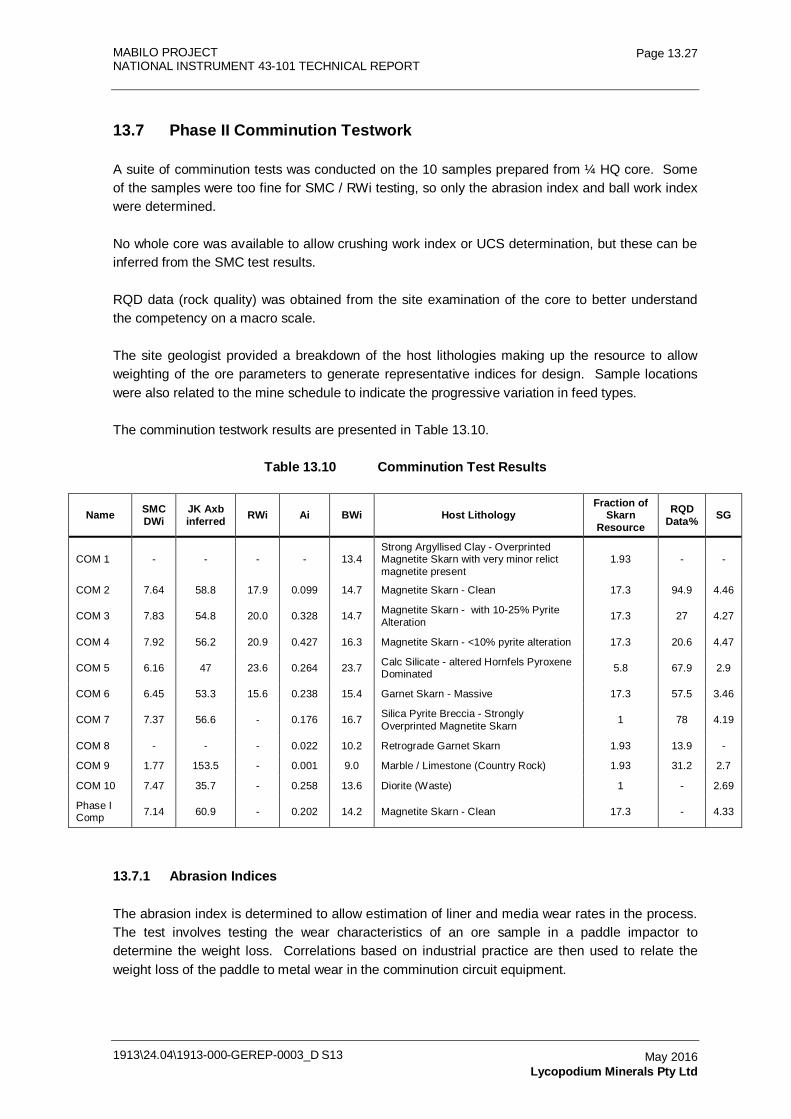
MABILO PROJECT NATIONAL INSTRUMENT 43-101 TECHNICAL REPORT
1913\24.04\1913-000-GEREP-0003_D S13
Page 13.27
May 2016 Lycopodium Minerals Pty Ltd
13.7 Phase II Comminution Testwork
A suite of comminution tests was conducted on the 10 samples prepared from ¼ HQ core. Some of the samples were too fine for SMC / RWi testing, so only the abrasion index and ball work index were determined.
No whole core was available to allow crushing work index or UCS determination, but these can be inferred from the SMC test results.
RQD data (rock quality) was obtained from the site examination of the core to better understand the competency on a macro scale.
The site geologist provided a breakdown of the host lithologies making up the resource to allow weighting of the ore parameters to generate representative indices for design. Sample locations were also related to the mine schedule to indicate the progressive variation in feed types.
The comminution testwork results are presented in Table 13.10.
Table 13.10 Comminution Test Results
Name SMC DWi
JK Axb inferred RWi Ai BWi Host Lithology
Fraction of Skarn
Resource
RQD Data% SG
COM 1 - - - - 13.4 Strong Argyllised Clay - Overprinted Magnetite Skarn with very minor relict magnetite present
1.93 - -
COM 2 7.64 58.8 17.9 0.099 14.7 Magnetite Skarn - Clean 17.3 94.9 4.46
COM 3 7.83 54.8 20.0 0.328 14.7 Magnetite Skarn - with 10-25% Pyrite Alteration 17.3 27 4.27
COM 4 7.92 56.2 20.9 0.427 16.3 Magnetite Skarn - <10% pyrite alteration 17.3 20.6 4.47
COM 5 6.16 47 23.6 0.264 23.7 Calc Silicate - altered Hornfels Pyroxene Dominated 5.8 67.9 2.9
COM 6 6.45 53.3 15.6 0.238 15.4 Garnet Skarn - Massive 17.3 57.5 3.46
COM 7 7.37 56.6 - 0.176 16.7 Silica Pyrite Breccia - Strongly Overprinted Magnetite Skarn 1 78 4.19
COM 8 - - - 0.022 10.2 Retrograde Garnet Skarn 1.93 13.9 -
COM 9 1.77 153.5 - 0.001 9.0 Marble / Limestone (Country Rock) 1.93 31.2 2.7
COM 10 7.47 35.7 - 0.258 13.6 Diorite (Waste) 1 - 2.69
Phase I Comp 7.14 60.9 - 0.202 14.2 Magnetite Skarn - Clean 17.3 - 4.33
13.7.1 Abrasion Indices
The abrasion index is determined to allow estimation of liner and media wear rates in the process. The test involves testing the wear characteristics of an ore sample in a paddle impactor to determine the weight loss. Correlations based on industrial practice are then used to relate the weight loss of the paddle to metal wear in the comminution circuit equipment.
MABILO PROJECT NATIONAL INSTRUMENT 43-101 TECHNICAL REPORT
1913\24.04\1913-000-GEREP-0003_D S13
Page 13.28
May 2016 Lycopodium Minerals Pty Ltd
Abrasion index is reported on a relative scale between 0 and 1. Based on the testwork results, abrasion for this ore is expected to be moderate to low although increasing pyrite in Com #3 and #4 appears to increase abrasivity.
13.7.2 SMC Test
The SMC Test is used to determine the breakage characterization of quartered drill core and it generates a relationship between input energy (kWh/t) and the percent of broken product passing a specified sieve size. The results are used to determine the drop weight index (DWi), which is a measure of the strength of the rock when broken under impact conditions and has the units kWh/m3. The DWi is directly related to the JK rock breakage parameters A and b (from the originally developed test on whole PQ core fractions) and hence can be used to estimate the values of these parameters as well as being correlated with the JK abrasion parameter - ta.
The SMC test was developed to provide a cost effective means of obtaining the comminution modeling parameters from quartered drill core or in situations where limited quantities of sample material are available. The SMC test results can also be used to determine the parameters for crusher modeling.
The value of A*b (product of the derived JK parameters), which is a measure of resistance to impact breakage, is calculated for each sample. Note that in contrast to the DWi, a high value of A*b means that an ore is soft whilst a low value means that it is hard.
The A*b values for the Mabilo samples indicate that is ore is generally soft to moderately soft with medium hardness for variability’s Com #5 and #6 and hard for the variability Com #10 (diorite waste).
13.7.3 Rod and Ball Mill Work Indices
The Bond rod and ball mill work indices (RWi and BWi) are determined using a standardized test to define the specific power (kWh/t) required to reduce the sample to a selected P80 product grind. A series of batch grinds is conducted where the products are sized, the undersize removed and replaced with an equal mass of new feed. Grind time is adjusted for each cycle until the oversize fraction is consistently 2.5x the undersize. These conditions intend to approximate the closed circuit performance of a continuous mill with a recycle load of 250%.
The work indices are then used in Bond’s law to determine the power draw for a given throughput and feed size. A number of correction factors are applied to the work indices to cater for deviations from Bond’s standard equipment size and operating conditions.
The ball mill work indices for the magnetite skarn samples are generally below average for the database, but Com #5 has an uncharacteristically high value. Rod mill work indices are generally higher than would be expected from the SMC impact test results and the RQD data which suggests that the rock is fairly easily broken at a coarse size. It is inferred that the coarser particles break relatively easily under impact stresses, but require more energy to abrade to finer sizes.
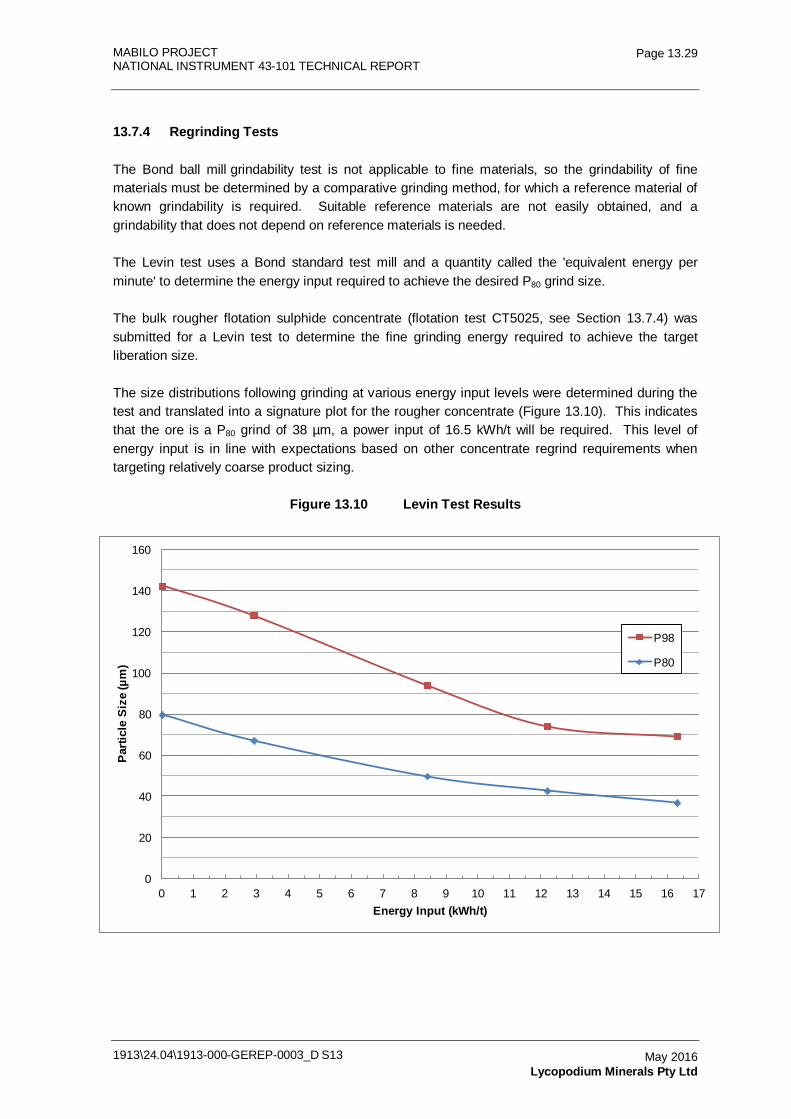
MABILO PROJECT NATIONAL INSTRUMENT 43-101 TECHNICAL REPORT
1913\24.04\1913-000-GEREP-0003_D S13
Page 13.29
May 2016 Lycopodium Minerals Pty Ltd
13.7.4 Regrinding Tests
The Bond ball mill grindability test is not applicable to fine materials, so the grindability of fine materials must be determined by a comparative grinding method, for which a reference material of known grindability is required. Suitable reference materials are not easily obtained, and a grindability that does not depend on reference materials is needed.
The Levin test uses a Bond standard test mill and a quantity called the 'equivalent energy per minute' to determine the energy input required to achieve the desired P80 grind size.
The bulk rougher flotation sulphide concentrate (flotation test CT5025, see Section 13.7.4) was submitted for a Levin test to determine the fine grinding energy required to achieve the target liberation size.
The size distributions following grinding at various energy input levels were determined during the test and translated into a signature plot for the rougher concentrate (Figure 13.10). This indicates that the ore is a P80 grind of 38 µm, a power input of 16.5 kWh/t will be required. This level of energy input is in line with expectations based on other concentrate regrind requirements when targeting relatively coarse product sizing.
Figure 13.10 Levin Test Results
0
20
40
60
80
100
120
140
160
0 1 2 3 4 5 6 7 8 9 10 11 12 13 14 15 16 17
Parti
cle
Size
(µm
)
Energy Input (kWh/t)
P98
P80
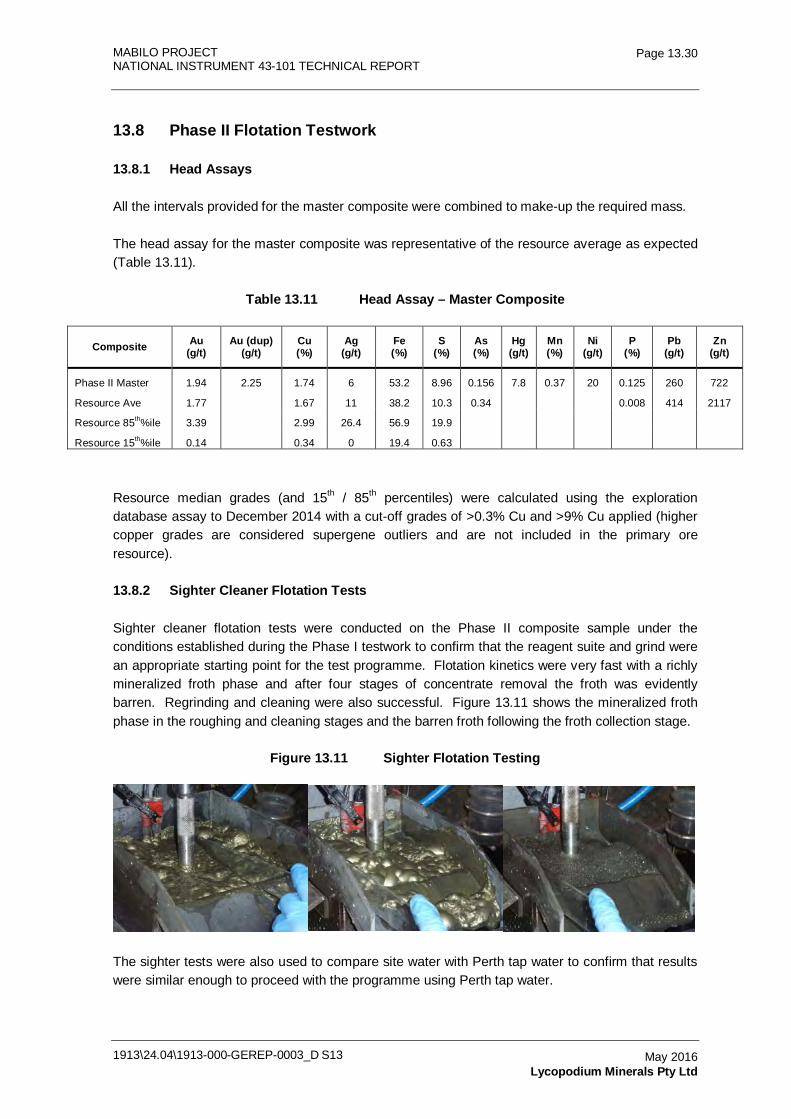
MABILO PROJECT NATIONAL INSTRUMENT 43-101 TECHNICAL REPORT
1913\24.04\1913-000-GEREP-0003_D S13
Page 13.30
May 2016 Lycopodium Minerals Pty Ltd
13.8 Phase II Flotation Testwork
13.8.1 Head Assays
All the intervals provided for the master composite were combined to make-up the required mass.
The head assay for the master composite was representative of the resource average as expected (Table 13.11).
Table 13.11 Head Assay – Master Composite
Composite Au (g/t)
Au (dup) (g/t)
Cu (%)
Ag (g/t)
Fe (%)
S (%)
As (%)
Hg (g/t)
Mn (%)
Ni (g/t)
P (%)
Pb (g/t)
Zn (g/t)
Phase II Master 1.94 2.25 1.74 6 53.2 8.96 0.156 7.8 0.37 20 0.125 260 722
Resource Ave 1.77 1.67 11 38.2 10.3 0.34 0.008 414 2117
Resource 85th%ile 3.39
2.99 26.4 56.9 19.9
Resource 15th%ile 0.14 0.34 0 19.4 0.63
Resource median grades (and 15th / 85th percentiles) were calculated using the exploration database assay to December 2014 with a cut-off grades of >0.3% Cu and >9% Cu applied (higher copper grades are considered supergene outliers and are not included in the primary ore resource).
13.8.2 Sighter Cleaner Flotation Tests
Sighter cleaner flotation tests were conducted on the Phase II composite sample under the conditions established during the Phase I testwork to confirm that the reagent suite and grind were an appropriate starting point for the test programme. Flotation kinetics were very fast with a richly mineralized froth phase and after four stages of concentrate removal the froth was evidently barren. Regrinding and cleaning were also successful. Figure 13.11 shows the mineralized froth phase in the roughing and cleaning stages and the barren froth following the froth collection stage.
Figure 13.11 Sighter Flotation Testing
The sighter tests were also used to compare site water with Perth tap water to confirm that results were similar enough to proceed with the programme using Perth tap water.
MABILO PROJECT NATIONAL INSTRUMENT 43-101 TECHNICAL REPORT
1913\24.04\1913-000-GEREP-0003_D S13
Page 13.31
May 2016 Lycopodium Minerals Pty Ltd
Sighter Test Results
The sighter tests were conducted at a primary grind P80 of 106 µm at natural pH for the roughing stage. A copper selective dialkyl thionocarbamate collector, A3894 was used with MIBC frother. The primary concentrate was reground to an approximate P80 of 53 µm and the pH was raised to 10.5 with lime while cyanide was added to depress the pyrite in the cleaner stage. The concentrates and tails from the tests were collected and submitted for assay.
Key differences from the Phase I test sample are:
• the copper and gold grades are more representative of the resource average being 1.74% and 1.9 g/t, respectively vs 2.87% and 3.5 g/t for the Phase I composite
• the ratio of pyrite to chalcopyrite (based on simple mineral balance assumptions) is significantly higher in the Phase II composite at approximately 2.5 times vs 1.5 times in the Phase I composite.
Summary results are presented in Table 13.12 for comparison and discussion below.
Table 13.12 Tap Water and Site Water Concentrate and Tails Assays
Product (P80=106µm) Weight Copper Gold Silver Sulphide Arsenic
(%) (%) (Rec) (g/t) (Rec) (g/t) (Rec) (%) (Rec) (%) (Rec)
Perth Tap Water Rougher Concentrate 12.9 11.4 89.4 9.87 70.3 42.1 75.7 41.3 64.3 0.62 53.9
Cleaner Concentrate 4.42 31.7 85.0 22.4 54.6 80.7 49.7 33.1 17.6 0.16 4.71
Cleaner Tail 8.50 0.86 4.41 3.34 15.7 22.0 26.1 45.6 46.7 0.86 49.2
Rougher Tail 87.1 0.20 10.6 0.62 29.7 2.00 24.3 3.40 35.7 0.08 46.1
Site Water
Rougher Concentrate 11.7 13.2 86.7 11.1 69.0 46.3 60.6 41.2 57.4 0.59 44.2
Cleaner Concentrate 4.80 30.4 82.3 22.2 56.6 81.3 43.6 33.8 19.3 0.18 5.62
Cleaner Tail 6.90 1.14 4.42 3.39 12.4 22.0 16.9 46.4 38.1 0.87 38.6
Rougher Tail 88.3 0.27 13.3 0.66 31.0 4.00 39.4 4.06 42.6 0.10 55.8
• Copper recoveries are distinctly lower than for the Phase I composite (89% rougher recovery or 0.2% tails grade compared with 97% and 0.08% tails previously). Copper cleaner recoveries are also slightly lower with 4% reporting to the cleaner tail as opposed to 2% previously.
• Copper cleaner grades remain high with the cleaner concentrate being over 90% chalcopyrite.
• Gold recoveries to the cleaner concentrate are similarly down by 10 - 15% with the majority of the losses remaining in the rougher tail.
• Sulphide recovery to the rougher concentrate reduced from 83% to 64%.
MABILO PROJECT NATIONAL INSTRUMENT 43-101 TECHNICAL REPORT
1913\24.04\1913-000-GEREP-0003_D S13
Page 13.32
May 2016 Lycopodium Minerals Pty Ltd
• The majority of the arsenic recovered to the rougher con is rejected to the cleaner tail as before.
• The site water results suggest generally lower copper and sulphide recoveries than the Perth tap water test, but gold recovery to the copper concentrate is actually higher than the tap water test.
• Products from the tap water sighter test were submitted for mineralogical analysis.
Discussion of Sighter Test Results
The lower recoveries observed were believed to result primarily from a liberation issue. Lower recoveries would be expected with a lower head grade assuming a relatively constant tail loss, but the increase in tail grade suggests a degree of difference in the type of mineralization in this composite.
The core selected for the Phase II composite included some intercepts with surface tarnishing to achieve good spatial coverage of the resource, and this may have contributed to some of the additional copper losses as non-floatable minerals. The presence of slower floating minerals and the potential need for more collector addition could also have contributed to the lower recoveries.
The lower sulphide recovery, particularly with a relatively higher pyrite content, supports the reduced liberation argument and suggests that there is a degree of fine / inter-grown pyrite mineralization associated with the host iron minerals. It is likely that much of the gold loss to rougher tail is in this pyrite.
The differences between the water tests are difficult to explain as the site water is very clean with a natural pH of 7.2. The lower recoveries could relate to pulp chemistry, but most likely are simply an indication of the sample and test variability.
Although the recovery loss is significant, this is only relative to the high recoveries achieved for the Phase I composite and 90% is a good recovery at this high concentrate grade.
In summary:
• the fast flotation kinetics and evidently high recovery of the floatable minerals suggested that no change to the reagent suite or flotation approach was warranted
• grind optimization testing was the first planned test stage, so this would demonstrate the potential improvement in recovery if liberation was an issue
• the recoveries in the site water test were slightly lower, but the overall product grade was unaffected and this result did not justify the balance of the testwork being conducted using site water.
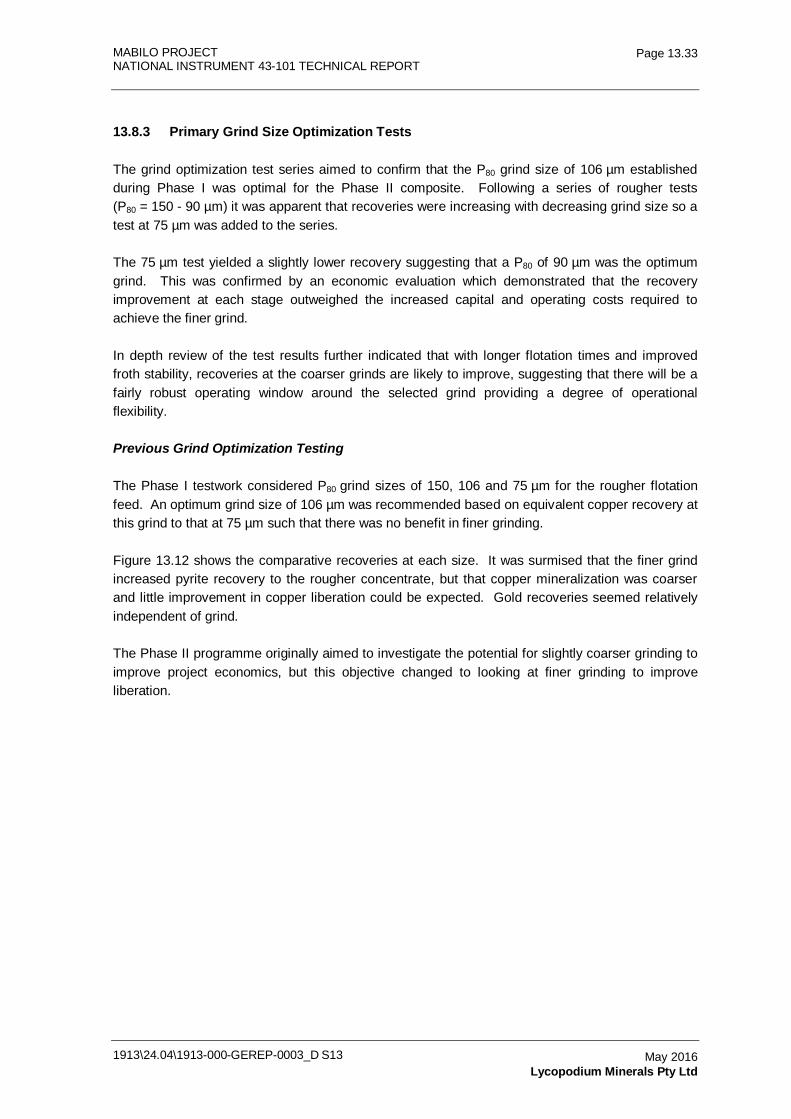
MABILO PROJECT NATIONAL INSTRUMENT 43-101 TECHNICAL REPORT
1913\24.04\1913-000-GEREP-0003_D S13
Page 13.33
May 2016 Lycopodium Minerals Pty Ltd
13.8.3 Primary Grind Size Optimization Tests
The grind optimization test series aimed to confirm that the P80 grind size of 106 µm established during Phase I was optimal for the Phase II composite. Following a series of rougher tests (P80 = 150 - 90 µm) it was apparent that recoveries were increasing with decreasing grind size so a test at 75 µm was added to the series.
The 75 µm test yielded a slightly lower recovery suggesting that a P80 of 90 µm was the optimum grind. This was confirmed by an economic evaluation which demonstrated that the recovery improvement at each stage outweighed the increased capital and operating costs required to achieve the finer grind.
In depth review of the test results further indicated that with longer flotation times and improved froth stability, recoveries at the coarser grinds are likely to improve, suggesting that there will be a fairly robust operating window around the selected grind providing a degree of operational flexibility.
Previous Grind Optimization Testing
The Phase I testwork considered P80 grind sizes of 150, 106 and 75 µm for the rougher flotation feed. An optimum grind size of 106 µm was recommended based on equivalent copper recovery at this grind to that at 75 µm such that there was no benefit in finer grinding.
Figure 13.12 shows the comparative recoveries at each size. It was surmised that the finer grind increased pyrite recovery to the rougher concentrate, but that copper mineralization was coarser and little improvement in copper liberation could be expected. Gold recoveries seemed relatively independent of grind.
The Phase II programme originally aimed to investigate the potential for slightly coarser grinding to improve project economics, but this objective changed to looking at finer grinding to improve liberation.
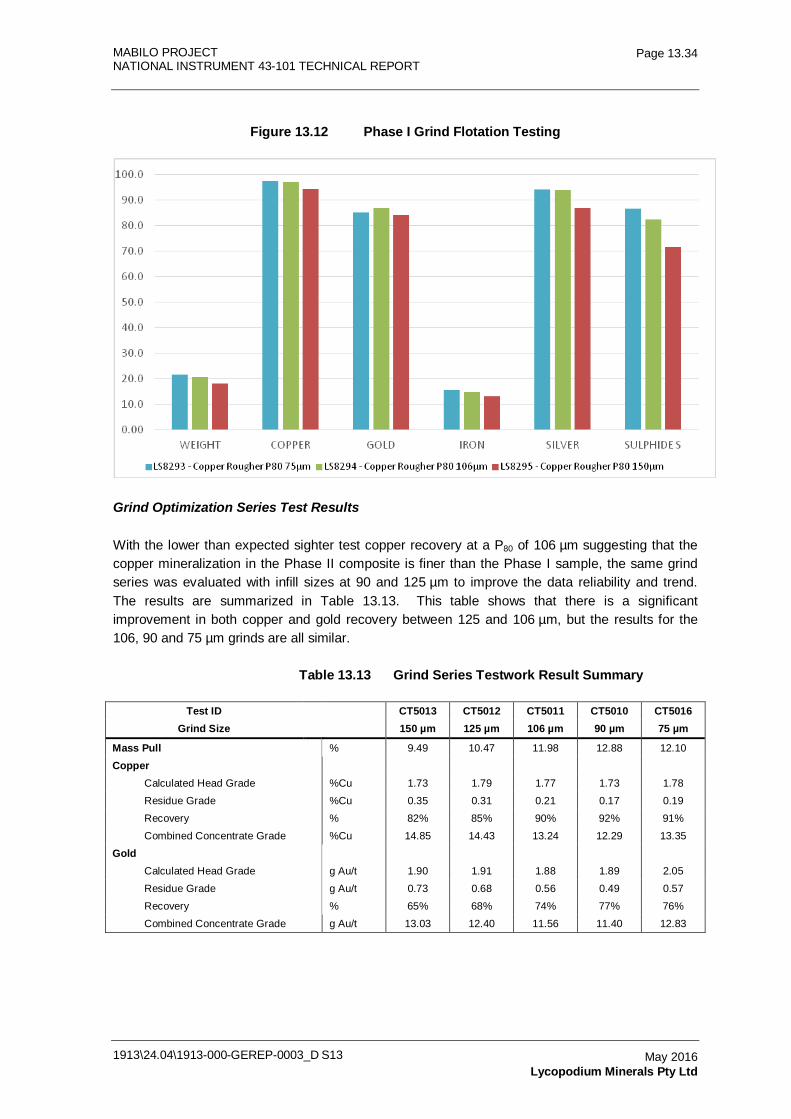
MABILO PROJECT NATIONAL INSTRUMENT 43-101 TECHNICAL REPORT
1913\24.04\1913-000-GEREP-0003_D S13
Page 13.34
May 2016 Lycopodium Minerals Pty Ltd
Figure 13.12 Phase I Grind Flotation Testing
Grind Optimization Series Test Results
With the lower than expected sighter test copper recovery at a P80 of 106 µm suggesting that the copper mineralization in the Phase II composite is finer than the Phase I sample, the same grind series was evaluated with infill sizes at 90 and 125 µm to improve the data reliability and trend. The results are summarized in Table 13.13. This table shows that there is a significant improvement in both copper and gold recovery between 125 and 106 µm, but the results for the 106, 90 and 75 µm grinds are all similar.
Table 13.13 Grind Series Testwork Result Summary
Test ID CT5013 CT5012 CT5011 CT5010 CT5016 Grind Size 150 µm 125 µm 106 µm 90 µm 75 µm
Mass Pull
% 9.49 10.47 11.98 12.88 12.10
Copper
Calculated Head Grade
%Cu 1.73 1.79 1.77 1.73 1.78
Residue Grade
%Cu 0.35 0.31 0.21 0.17 0.19
Recovery
% 82% 85% 90% 92% 91%
Combined Concentrate Grade %Cu 14.85 14.43 13.24 12.29 13.35
Gold
Calculated Head Grade
g Au/t 1.90 1.91 1.88 1.89 2.05
Residue Grade
g Au/t 0.73 0.68 0.56 0.49 0.57
Recovery
% 65% 68% 74% 77% 76%
Combined Concentrate Grade g Au/t 13.03 12.40 11.56 11.40 12.83
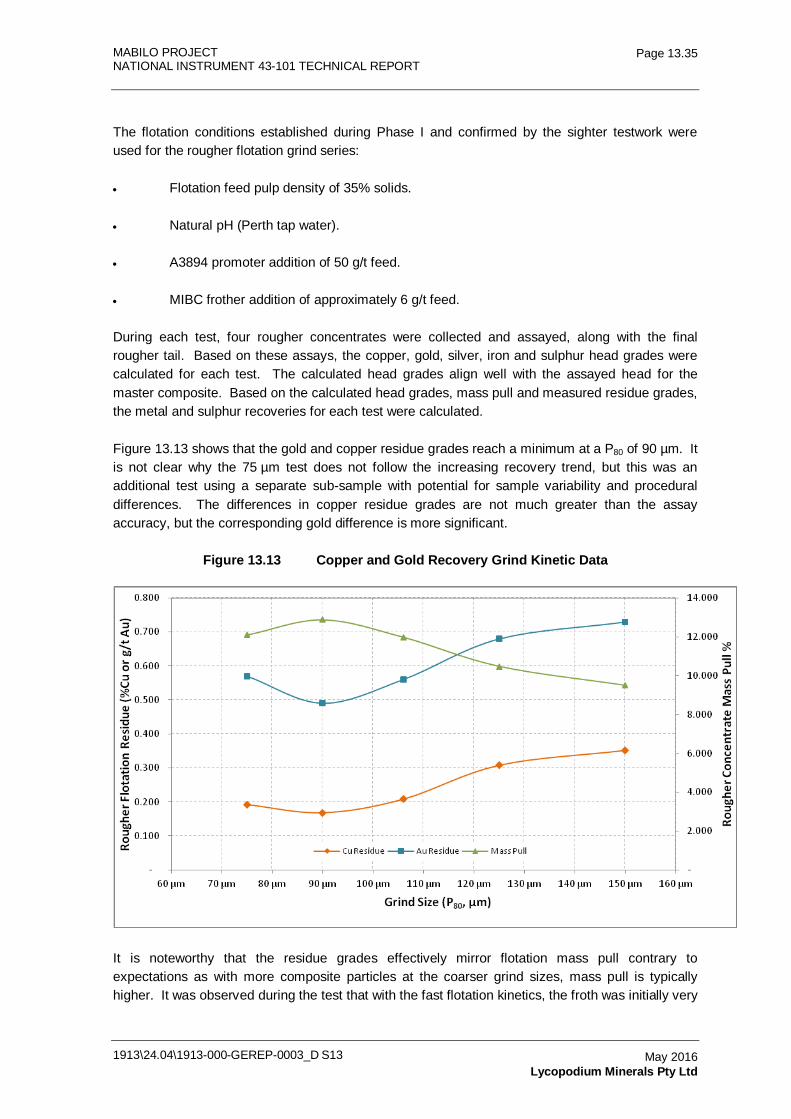
MABILO PROJECT NATIONAL INSTRUMENT 43-101 TECHNICAL REPORT
1913\24.04\1913-000-GEREP-0003_D S13
Page 13.35
May 2016 Lycopodium Minerals Pty Ltd
The flotation conditions established during Phase I and confirmed by the sighter testwork were used for the rougher flotation grind series:
• Flotation feed pulp density of 35% solids.
• Natural pH (Perth tap water).
• A3894 promoter addition of 50 g/t feed.
• MIBC frother addition of approximately 6 g/t feed.
During each test, four rougher concentrates were collected and assayed, along with the final rougher tail. Based on these assays, the copper, gold, silver, iron and sulphur head grades were calculated for each test. The calculated head grades align well with the assayed head for the master composite. Based on the calculated head grades, mass pull and measured residue grades, the metal and sulphur recoveries for each test were calculated.
Figure 13.13 shows that the gold and copper residue grades reach a minimum at a P80 of 90 µm. It is not clear why the 75 µm test does not follow the increasing recovery trend, but this was an additional test using a separate sub-sample with potential for sample variability and procedural differences. The differences in copper residue grades are not much greater than the assay accuracy, but the corresponding gold difference is more significant.
Figure 13.13 Copper and Gold Recovery Grind Kinetic Data
It is noteworthy that the residue grades effectively mirror flotation mass pull contrary to expectations as with more composite particles at the coarser grind sizes, mass pull is typically higher. It was observed during the test that with the fast flotation kinetics, the froth was initially very
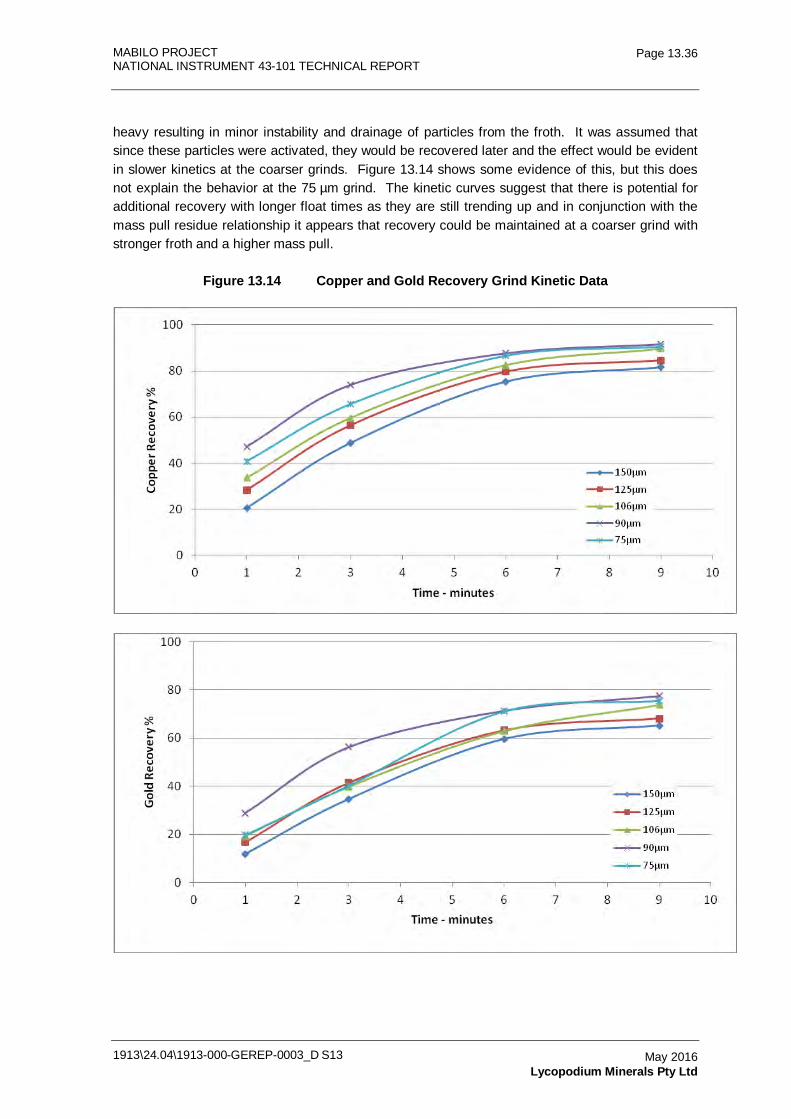
MABILO PROJECT NATIONAL INSTRUMENT 43-101 TECHNICAL REPORT
1913\24.04\1913-000-GEREP-0003_D S13
Page 13.36
May 2016 Lycopodium Minerals Pty Ltd
heavy resulting in minor instability and drainage of particles from the froth. It was assumed that since these particles were activated, they would be recovered later and the effect would be evident in slower kinetics at the coarser grinds. Figure 13.14 shows some evidence of this, but this does not explain the behavior at the 75 µm grind. The kinetic curves suggest that there is potential for additional recovery with longer float times as they are still trending up and in conjunction with the mass pull residue relationship it appears that recovery could be maintained at a coarser grind with stronger froth and a higher mass pull.
Figure 13.14 Copper and Gold Recovery Grind Kinetic Data
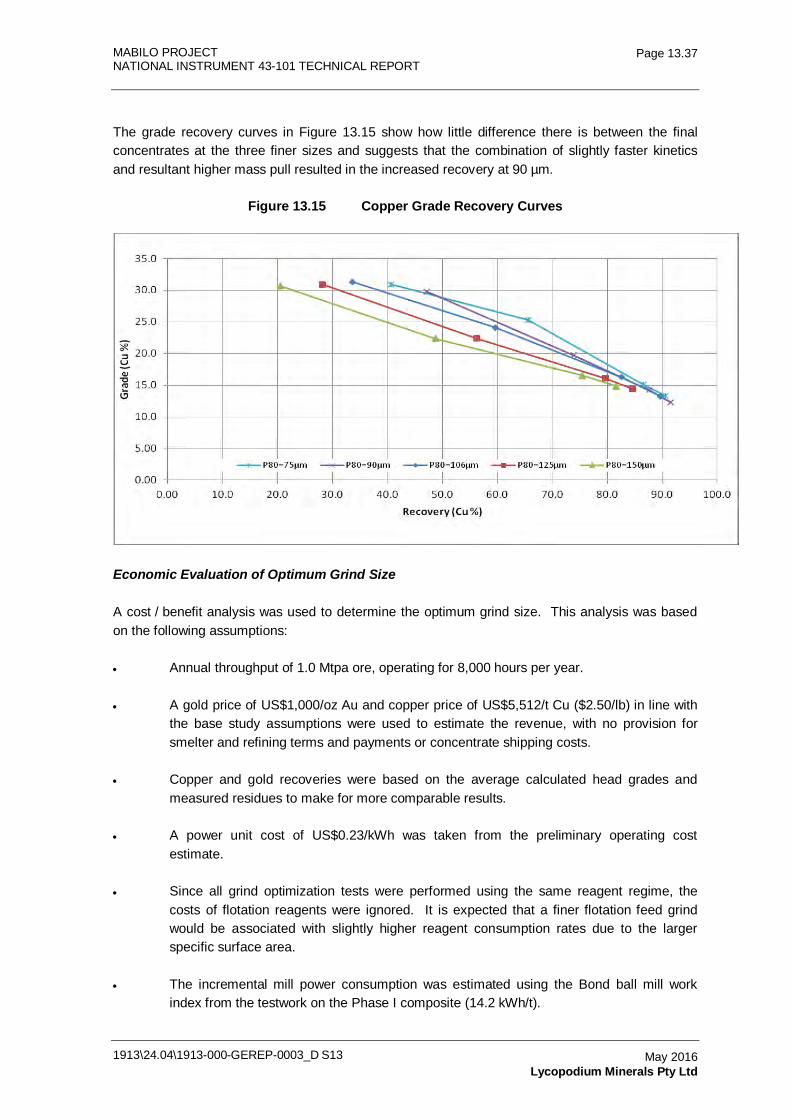
MABILO PROJECT NATIONAL INSTRUMENT 43-101 TECHNICAL REPORT
1913\24.04\1913-000-GEREP-0003_D S13
Page 13.37
May 2016 Lycopodium Minerals Pty Ltd
The grade recovery curves in Figure 13.15 show how little difference there is between the final concentrates at the three finer sizes and suggests that the combination of slightly faster kinetics and resultant higher mass pull resulted in the increased recovery at 90 µm.
Figure 13.15 Copper Grade Recovery Curves
Economic Evaluation of Optimum Grind Size
A cost / benefit analysis was used to determine the optimum grind size. This analysis was based on the following assumptions:
• Annual throughput of 1.0 Mtpa ore, operating for 8,000 hours per year.
• A gold price of US$1,000/oz Au and copper price of US$5,512/t Cu ($2.50/lb) in line with the base study assumptions were used to estimate the revenue, with no provision for smelter and refining terms and payments or concentrate shipping costs.
• Copper and gold recoveries were based on the average calculated head grades and measured residues to make for more comparable results.
• A power unit cost of US$0.23/kWh was taken from the preliminary operating cost estimate.
• Since all grind optimization tests were performed using the same reagent regime, the costs of flotation reagents were ignored. It is expected that a finer flotation feed grind would be associated with slightly higher reagent consumption rates due to the larger specific surface area.
• The incremental mill power consumption was estimated using the Bond ball mill work index from the testwork on the Phase I composite (14.2 kWh/t).
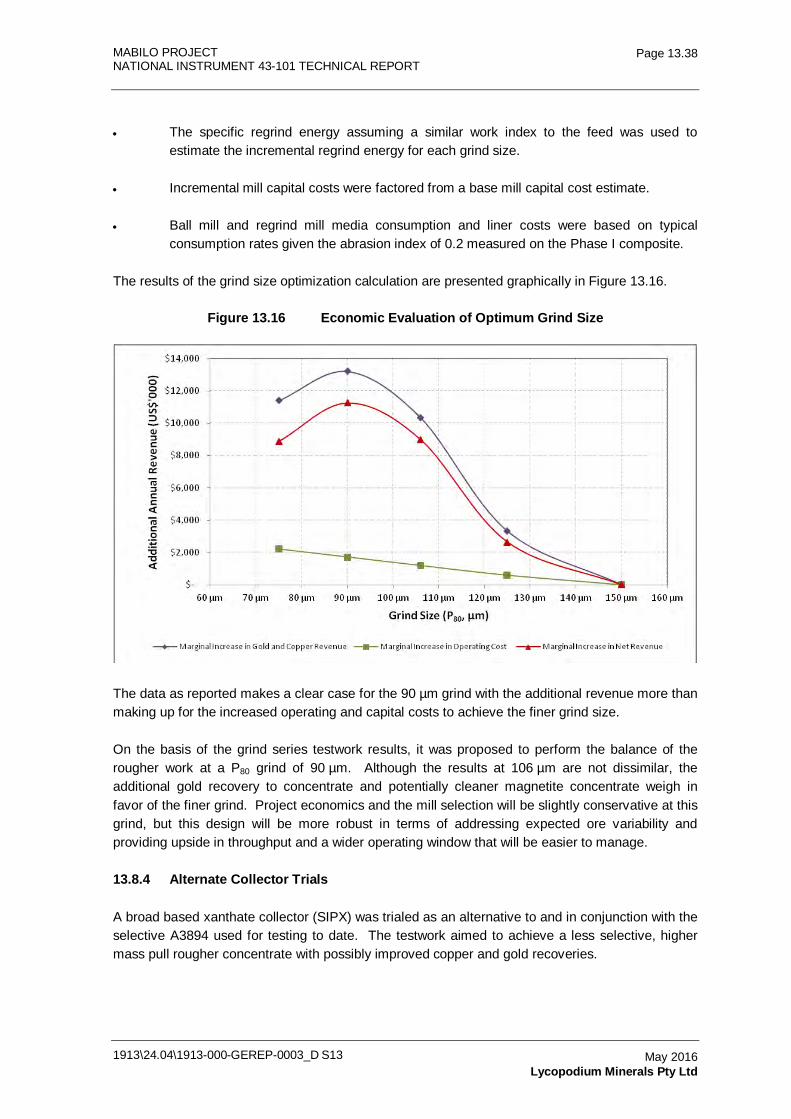
MABILO PROJECT NATIONAL INSTRUMENT 43-101 TECHNICAL REPORT
1913\24.04\1913-000-GEREP-0003_D S13
Page 13.38
May 2016 Lycopodium Minerals Pty Ltd
• The specific regrind energy assuming a similar work index to the feed was used to estimate the incremental regrind energy for each grind size.
• Incremental mill capital costs were factored from a base mill capital cost estimate.
• Ball mill and regrind mill media consumption and liner costs were based on typical consumption rates given the abrasion index of 0.2 measured on the Phase I composite.
The results of the grind size optimization calculation are presented graphically in Figure 13.16.
Figure 13.16 Economic Evaluation of Optimum Grind Size
The data as reported makes a clear case for the 90 µm grind with the additional revenue more than making up for the increased operating and capital costs to achieve the finer grind size.
On the basis of the grind series testwork results, it was proposed to perform the balance of the rougher work at a P80 grind of 90 µm. Although the results at 106 µm are not dissimilar, the additional gold recovery to concentrate and potentially cleaner magnetite concentrate weigh in favor of the finer grind. Project economics and the mill selection will be slightly conservative at this grind, but this design will be more robust in terms of addressing expected ore variability and providing upside in throughput and a wider operating window that will be easier to manage.
13.8.4 Alternate Collector Trials
A broad based xanthate collector (SIPX) was trialed as an alternative to and in conjunction with the selective A3894 used for testing to date. The testwork aimed to achieve a less selective, higher mass pull rougher concentrate with possibly improved copper and gold recoveries.
MABILO PROJECT NATIONAL INSTRUMENT 43-101 TECHNICAL REPORT
1913\24.04\1913-000-GEREP-0003_D S13
Page 13.39
May 2016 Lycopodium Minerals Pty Ltd
These tests were relatively unsuccessful with the xanthate increasing sulphur recoveries, but copper and gold recoveries were lower. It was decided to continue testing using the selective A3894 collector as before.
Background
Good success had been achieved using the A3894 (dialkyl thionocarbamate) selective copper promoter / collector for the Mabilo magnetite skarn ores. Copper recoveries were generally over 90% with concentrate grades of over 30% Cu in the cleaner concentrate with moderate reagent addition rates. Dosage rate optimization was not possible at a batch laboratory scale, but there was potential to reduce addition rate of the more expensive selective collector by using a low cost broad based xanthate reagent in the rougher. This was expected to lower the grade of the concentrate, but would potentially increase the recovery of copper with increased mass pull and capture of mineralized composites.
SIPX (sodium iso-propyl xanthate) was selected as the trial collector being powerful, but slightly more selective than PAX (potassium amyl xanthate) and widely used in copper flotation operations. Tests for comparison with the A3894 baseline were a 50/50 mix of A3894 and SIPX (added sequentially) and a SIPX only test.
Rougher only tests were run as the intent was to boost recovery through increased mass pull since the rougher concentrates upgrade well in the cleaning stage.
Alternate Collector Test Results
The alternate collector test results were disappointing since both copper and gold recoveries to the rougher concentrate decreased and mass pull was similar to the selective A3894 collector. The tests were conducted at a P80 grind size of 106 µm as the analysis of the grind series results had not yet been completed to indicate 90 µm would be optimal. The results are summarized in Table 13.14 although the comparative graphs shown in Figure 13.17 are more informative.
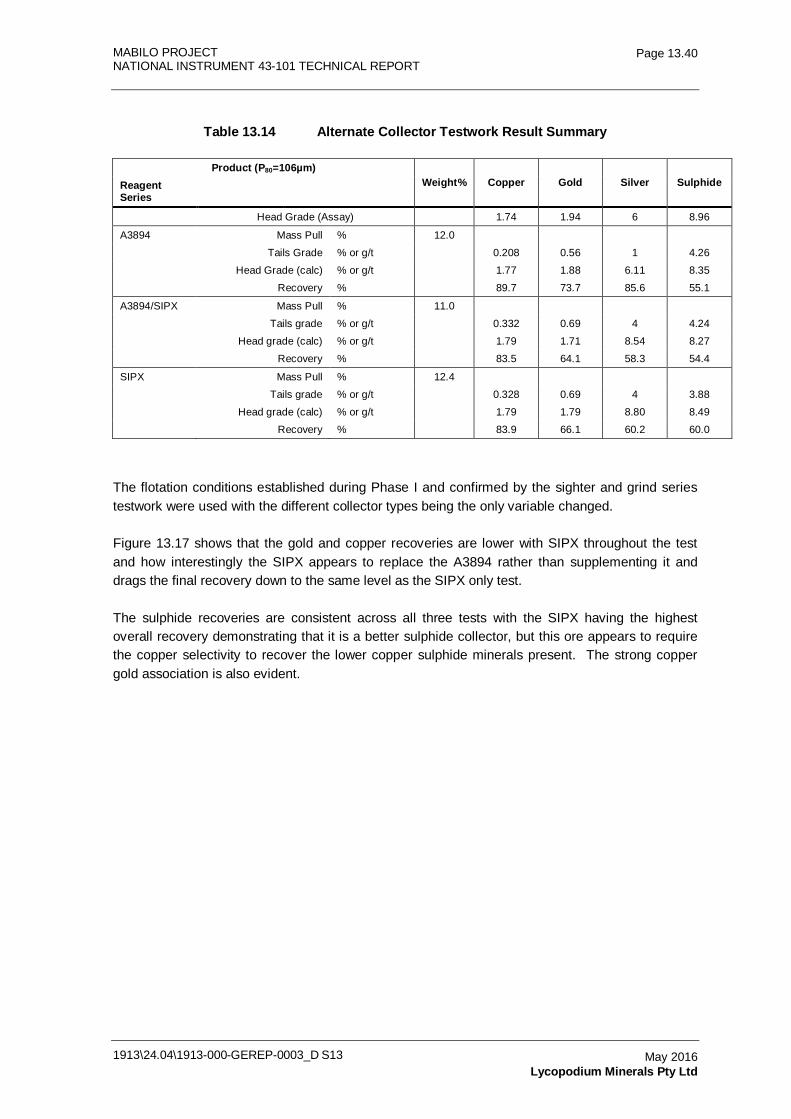
MABILO PROJECT NATIONAL INSTRUMENT 43-101 TECHNICAL REPORT
1913\24.04\1913-000-GEREP-0003_D S13
Page 13.40
May 2016 Lycopodium Minerals Pty Ltd
Table 13.14 Alternate Collector Testwork Result Summary
Product (P80=106µm) Weight% Copper Gold Silver Sulphide Reagent
Series
Head Grade (Assay)
1.74 1.94 6 8.96
A3894 Mass Pull % 12.0
Tails Grade % or g/t
0.208 0.56 1 4.26
Head Grade (calc) % or g/t
1.77 1.88 6.11 8.35
Recovery % 89.7 73.7 85.6 55.1
A3894/SIPX Mass Pull % 11.0
Tails grade % or g/t
0.332 0.69 4 4.24
Head grade (calc) % or g/t
1.79 1.71 8.54 8.27
Recovery %
83.5 64.1 58.3 54.4
SIPX Mass Pull % 12.4
Tails grade % or g/t
0.328 0.69 4 3.88
Head grade (calc) % or g/t
1.79 1.79 8.80 8.49
Recovery % 83.9 66.1 60.2 60.0
The flotation conditions established during Phase I and confirmed by the sighter and grind series testwork were used with the different collector types being the only variable changed.
Figure 13.17 shows that the gold and copper recoveries are lower with SIPX throughout the test and how interestingly the SIPX appears to replace the A3894 rather than supplementing it and drags the final recovery down to the same level as the SIPX only test.
The sulphide recoveries are consistent across all three tests with the SIPX having the highest overall recovery demonstrating that it is a better sulphide collector, but this ore appears to require the copper selectivity to recover the lower copper sulphide minerals present. The strong copper gold association is also evident.
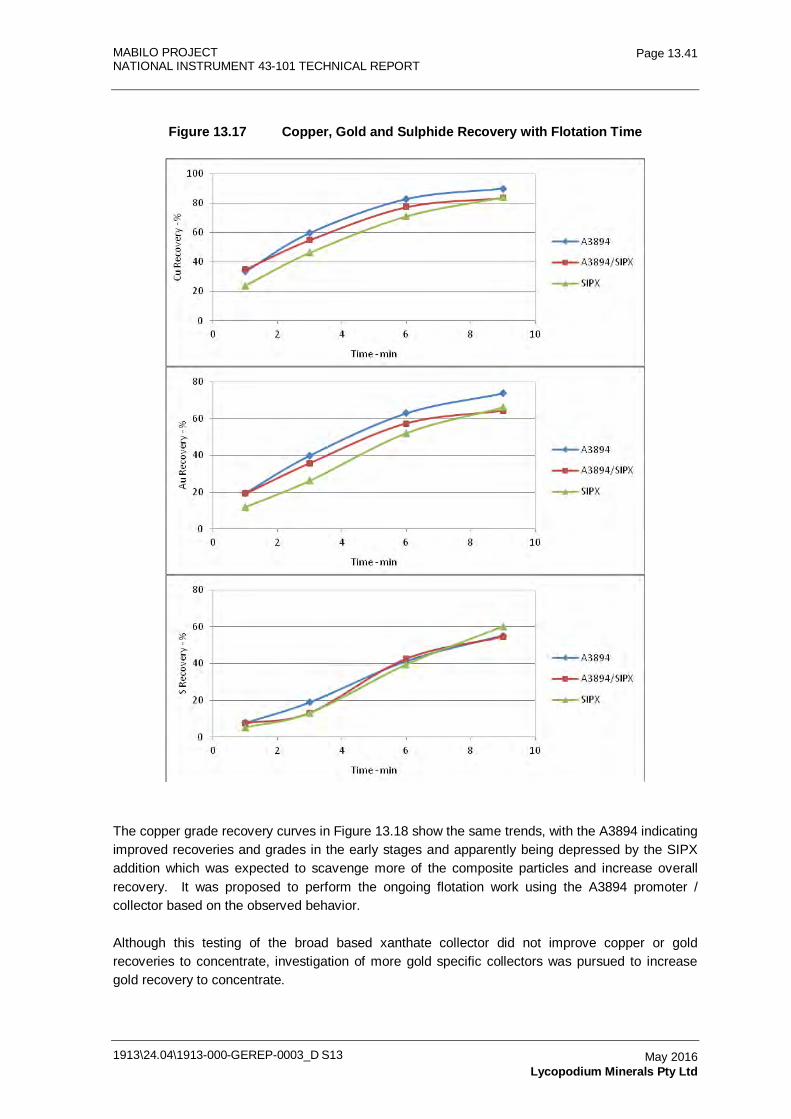
MABILO PROJECT NATIONAL INSTRUMENT 43-101 TECHNICAL REPORT
1913\24.04\1913-000-GEREP-0003_D S13
Page 13.41
May 2016 Lycopodium Minerals Pty Ltd
Figure 13.17 Copper, Gold and Sulphide Recovery with Flotation Time
The copper grade recovery curves in Figure 13.18 show the same trends, with the A3894 indicating improved recoveries and grades in the early stages and apparently being depressed by the SIPX addition which was expected to scavenge more of the composite particles and increase overall recovery. It was proposed to perform the ongoing flotation work using the A3894 promoter / collector based on the observed behavior.
Although this testing of the broad based xanthate collector did not improve copper or gold recoveries to concentrate, investigation of more gold specific collectors was pursued to increase gold recovery to concentrate.
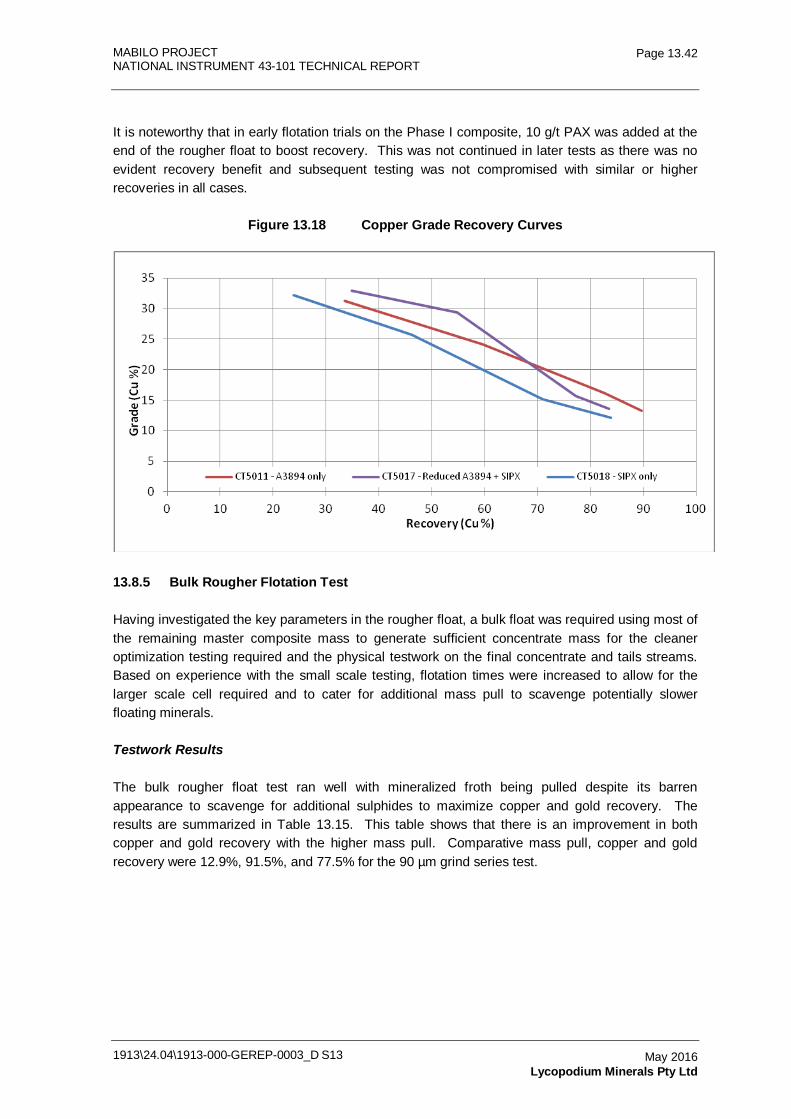
MABILO PROJECT NATIONAL INSTRUMENT 43-101 TECHNICAL REPORT
1913\24.04\1913-000-GEREP-0003_D S13
Page 13.42
May 2016 Lycopodium Minerals Pty Ltd
It is noteworthy that in early flotation trials on the Phase I composite, 10 g/t PAX was added at the end of the rougher float to boost recovery. This was not continued in later tests as there was no evident recovery benefit and subsequent testing was not compromised with similar or higher recoveries in all cases.
Figure 13.18 Copper Grade Recovery Curves
13.8.5 Bulk Rougher Flotation Test
Having investigated the key parameters in the rougher float, a bulk float was required using most of the remaining master composite mass to generate sufficient concentrate mass for the cleaner optimization testing required and the physical testwork on the final concentrate and tails streams. Based on experience with the small scale testing, flotation times were increased to allow for the larger scale cell required and to cater for additional mass pull to scavenge potentially slower floating minerals.
Testwork Results
The bulk rougher float test ran well with mineralized froth being pulled despite its barren appearance to scavenge for additional sulphides to maximize copper and gold recovery. The results are summarized in Table 13.15. This table shows that there is an improvement in both copper and gold recovery with the higher mass pull. Comparative mass pull, copper and gold recovery were 12.9%, 91.5%, and 77.5% for the 90 µm grind series test.
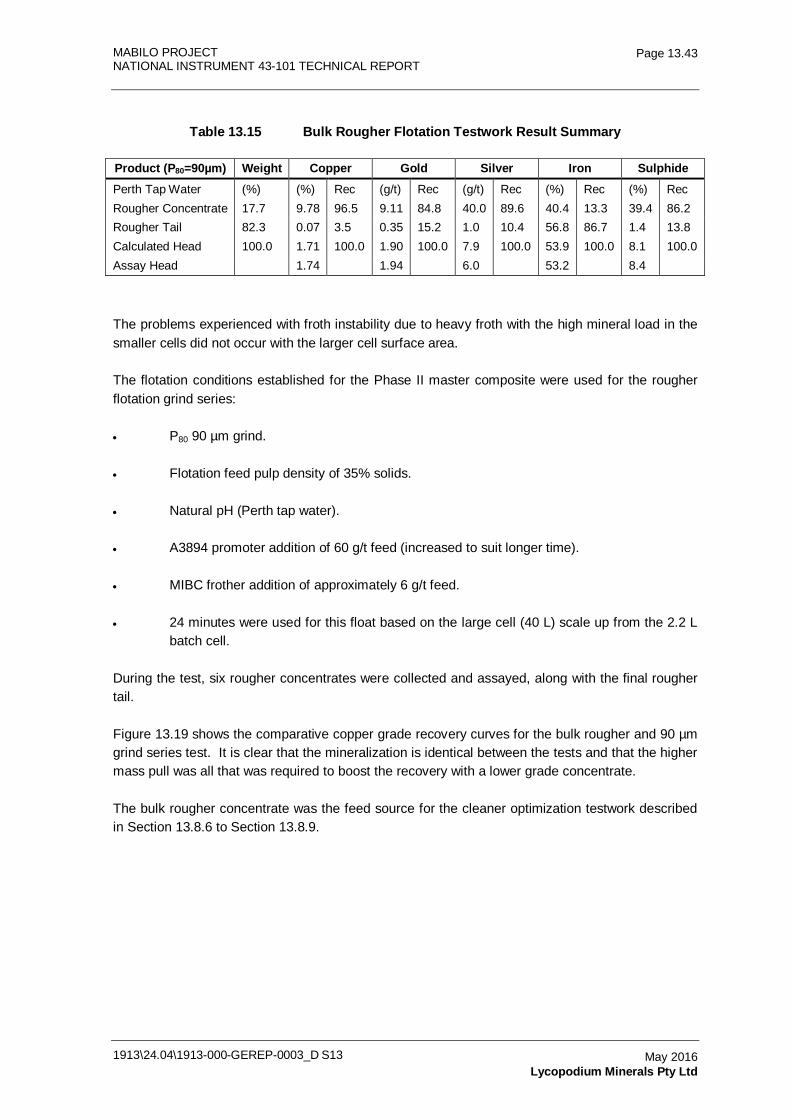
MABILO PROJECT NATIONAL INSTRUMENT 43-101 TECHNICAL REPORT
1913\24.04\1913-000-GEREP-0003_D S13
Page 13.43
May 2016 Lycopodium Minerals Pty Ltd
Table 13.15 Bulk Rougher Flotation Testwork Result Summary
Product (P80=90µm) Weight Copper Gold Silver Iron Sulphide Perth Tap Water (%) (%) Rec (g/t) Rec (g/t) Rec (%) Rec (%) Rec Rougher Concentrate 17.7 9.78 96.5 9.11 84.8 40.0 89.6 40.4 13.3 39.4 86.2 Rougher Tail 82.3 0.07 3.5 0.35 15.2 1.0 10.4 56.8 86.7 1.4 13.8 Calculated Head 100.0 1.71 100.0 1.90 100.0 7.9 100.0 53.9 100.0 8.1 100.0 Assay Head
1.74
1.94
6.0
53.2
8.4
The problems experienced with froth instability due to heavy froth with the high mineral load in the smaller cells did not occur with the larger cell surface area.
The flotation conditions established for the Phase II master composite were used for the rougher flotation grind series:
• P80 90 µm grind.
• Flotation feed pulp density of 35% solids.
• Natural pH (Perth tap water).
• A3894 promoter addition of 60 g/t feed (increased to suit longer time).
• MIBC frother addition of approximately 6 g/t feed.
• 24 minutes were used for this float based on the large cell (40 L) scale up from the 2.2 L batch cell.
During the test, six rougher concentrates were collected and assayed, along with the final rougher tail.
Figure 13.19 shows the comparative copper grade recovery curves for the bulk rougher and 90 µm grind series test. It is clear that the mineralization is identical between the tests and that the higher mass pull was all that was required to boost the recovery with a lower grade concentrate.
The bulk rougher concentrate was the feed source for the cleaner optimization testwork described in Section 13.8.6 to Section 13.8.9.
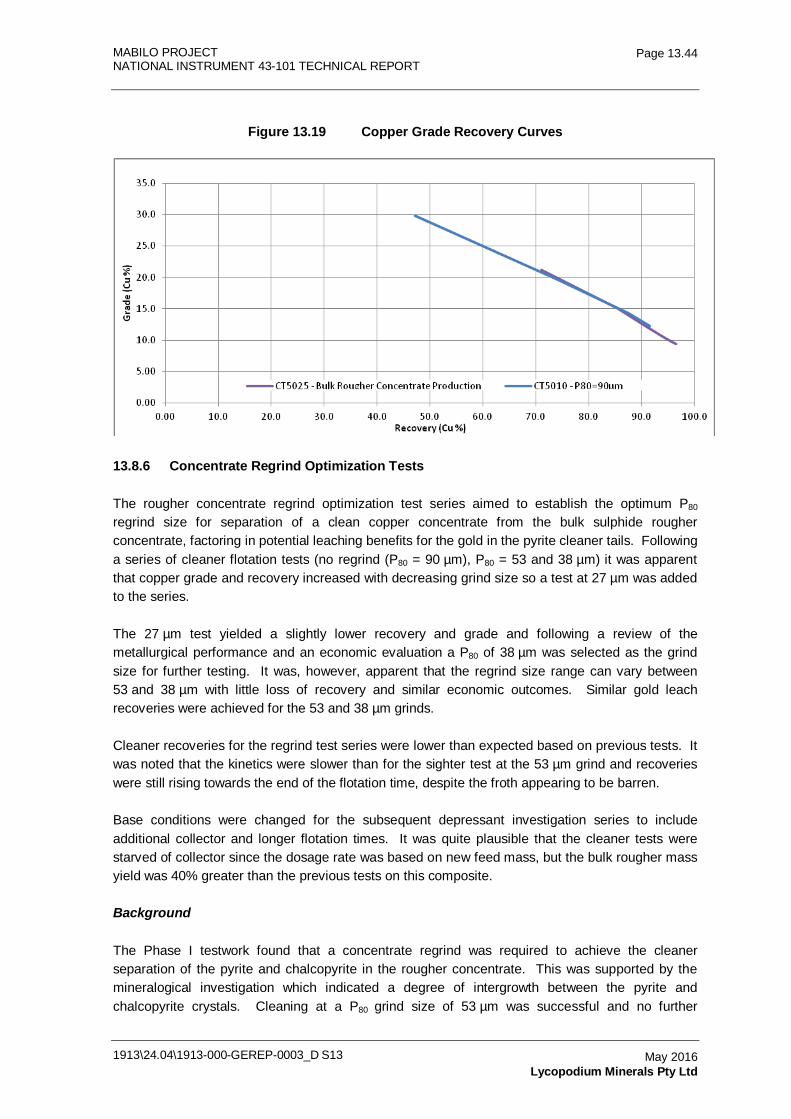
MABILO PROJECT NATIONAL INSTRUMENT 43-101 TECHNICAL REPORT
1913\24.04\1913-000-GEREP-0003_D S13
Page 13.44
May 2016 Lycopodium Minerals Pty Ltd
Figure 13.19 Copper Grade Recovery Curves
13.8.6 Concentrate Regrind Optimization Tests
The rougher concentrate regrind optimization test series aimed to establish the optimum P80 regrind size for separation of a clean copper concentrate from the bulk sulphide rougher concentrate, factoring in potential leaching benefits for the gold in the pyrite cleaner tails. Following a series of cleaner flotation tests (no regrind (P80 = 90 µm), P80 = 53 and 38 µm) it was apparent that copper grade and recovery increased with decreasing grind size so a test at 27 µm was added to the series.
The 27 µm test yielded a slightly lower recovery and grade and following a review of the metallurgical performance and an economic evaluation a P80 of 38 µm was selected as the grind size for further testing. It was, however, apparent that the regrind size range can vary between 53 and 38 µm with little loss of recovery and similar economic outcomes. Similar gold leach recoveries were achieved for the 53 and 38 µm grinds.
Cleaner recoveries for the regrind test series were lower than expected based on previous tests. It was noted that the kinetics were slower than for the sighter test at the 53 µm grind and recoveries were still rising towards the end of the flotation time, despite the froth appearing to be barren.
Base conditions were changed for the subsequent depressant investigation series to include additional collector and longer flotation times. It was quite plausible that the cleaner tests were starved of collector since the dosage rate was based on new feed mass, but the bulk rougher mass yield was 40% greater than the previous tests on this composite.
Background
The Phase I testwork found that a concentrate regrind was required to achieve the cleaner separation of the pyrite and chalcopyrite in the rougher concentrate. This was supported by the mineralogical investigation which indicated a degree of intergrowth between the pyrite and chalcopyrite crystals. Cleaning at a P80 grind size of 53 µm was successful and no further
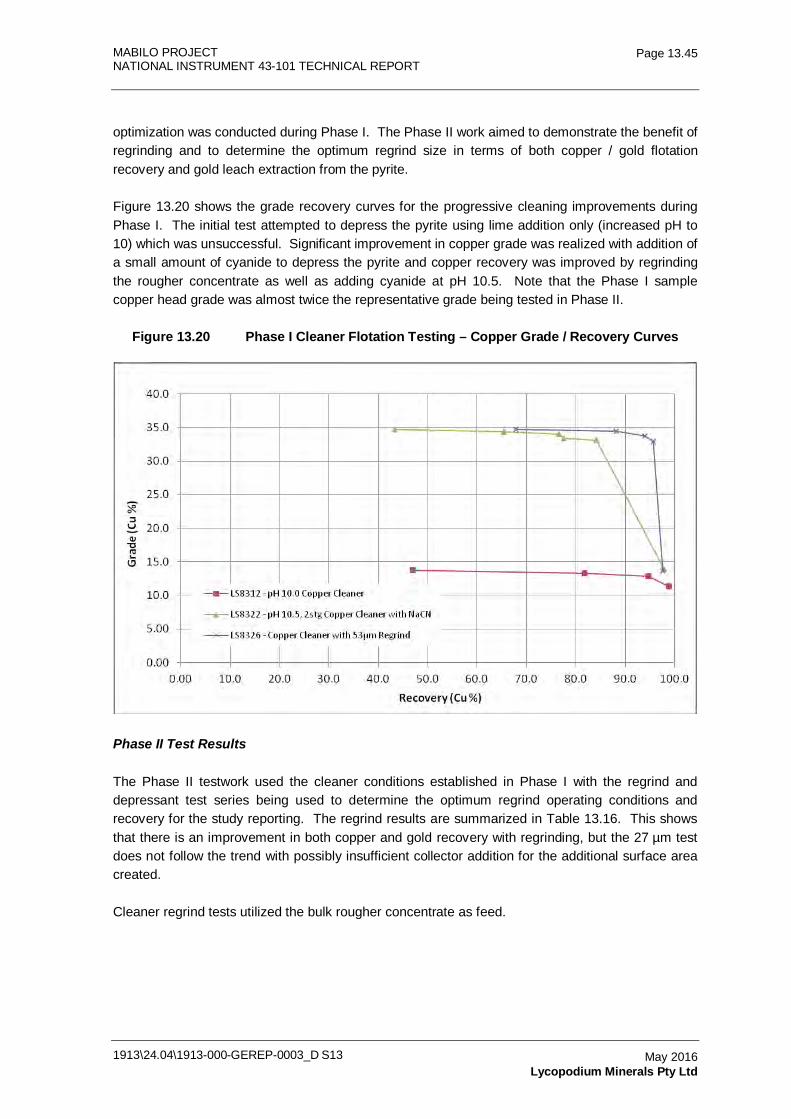
MABILO PROJECT NATIONAL INSTRUMENT 43-101 TECHNICAL REPORT
1913\24.04\1913-000-GEREP-0003_D S13
Page 13.45
May 2016 Lycopodium Minerals Pty Ltd
optimization was conducted during Phase I. The Phase II work aimed to demonstrate the benefit of regrinding and to determine the optimum regrind size in terms of both copper / gold flotation recovery and gold leach extraction from the pyrite.
Figure 13.20 shows the grade recovery curves for the progressive cleaning improvements during Phase I. The initial test attempted to depress the pyrite using lime addition only (increased pH to 10) which was unsuccessful. Significant improvement in copper grade was realized with addition of a small amount of cyanide to depress the pyrite and copper recovery was improved by regrinding the rougher concentrate as well as adding cyanide at pH 10.5. Note that the Phase I sample copper head grade was almost twice the representative grade being tested in Phase II.
Figure 13.20 Phase I Cleaner Flotation Testing – Copper Grade / Recovery Curves
Phase II Test Results
The Phase II testwork used the cleaner conditions established in Phase I with the regrind and depressant test series being used to determine the optimum regrind operating conditions and recovery for the study reporting. The regrind results are summarized in Table 13.16. This shows that there is an improvement in both copper and gold recovery with regrinding, but the 27 µm test does not follow the trend with possibly insufficient collector addition for the additional surface area created.
Cleaner regrind tests utilized the bulk rougher concentrate as feed.
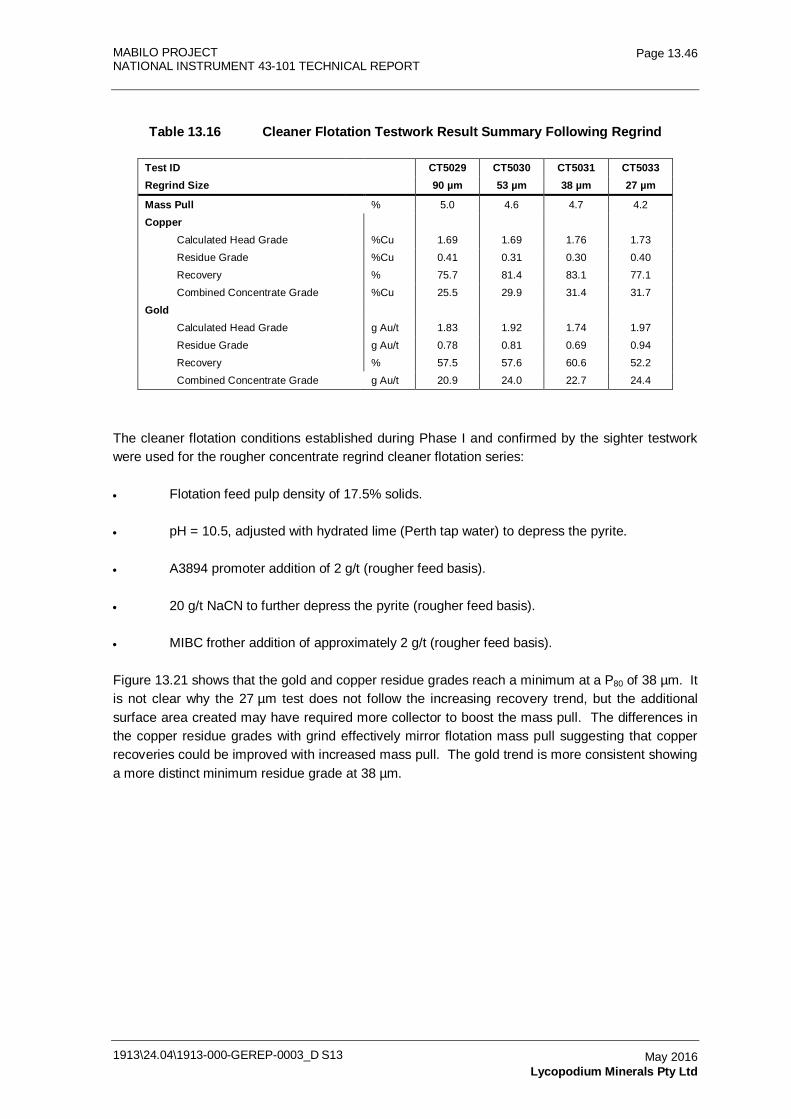
MABILO PROJECT NATIONAL INSTRUMENT 43-101 TECHNICAL REPORT
1913\24.04\1913-000-GEREP-0003_D S13
Page 13.46
May 2016 Lycopodium Minerals Pty Ltd
Table 13.16 Cleaner Flotation Testwork Result Summary Following Regrind
Test ID CT5029 CT5030 CT5031 CT5033 Regrind Size 90 µm 53 µm 38 µm 27 µm
Mass Pull
% 5.0 4.6 4.7 4.2
Copper
Calculated Head Grade
%Cu 1.69 1.69 1.76 1.73
Residue Grade
%Cu 0.41 0.31 0.30 0.40
Recovery
% 75.7 81.4 83.1 77.1
Combined Concentrate Grade %Cu 25.5 29.9 31.4 31.7
Gold
Calculated Head Grade
g Au/t 1.83 1.92 1.74 1.97
Residue Grade
g Au/t 0.78 0.81 0.69 0.94
Recovery
% 57.5 57.6 60.6 52.2
Combined Concentrate Grade g Au/t 20.9 24.0 22.7 24.4
The cleaner flotation conditions established during Phase I and confirmed by the sighter testwork were used for the rougher concentrate regrind cleaner flotation series:
• Flotation feed pulp density of 17.5% solids.
• pH = 10.5, adjusted with hydrated lime (Perth tap water) to depress the pyrite.
• A3894 promoter addition of 2 g/t (rougher feed basis).
• 20 g/t NaCN to further depress the pyrite (rougher feed basis).
• MIBC frother addition of approximately 2 g/t (rougher feed basis).
Figure 13.21 shows that the gold and copper residue grades reach a minimum at a P80 of 38 µm. It is not clear why the 27 µm test does not follow the increasing recovery trend, but the additional surface area created may have required more collector to boost the mass pull. The differences in the copper residue grades with grind effectively mirror flotation mass pull suggesting that copper recoveries could be improved with increased mass pull. The gold trend is more consistent showing a more distinct minimum residue grade at 38 µm.
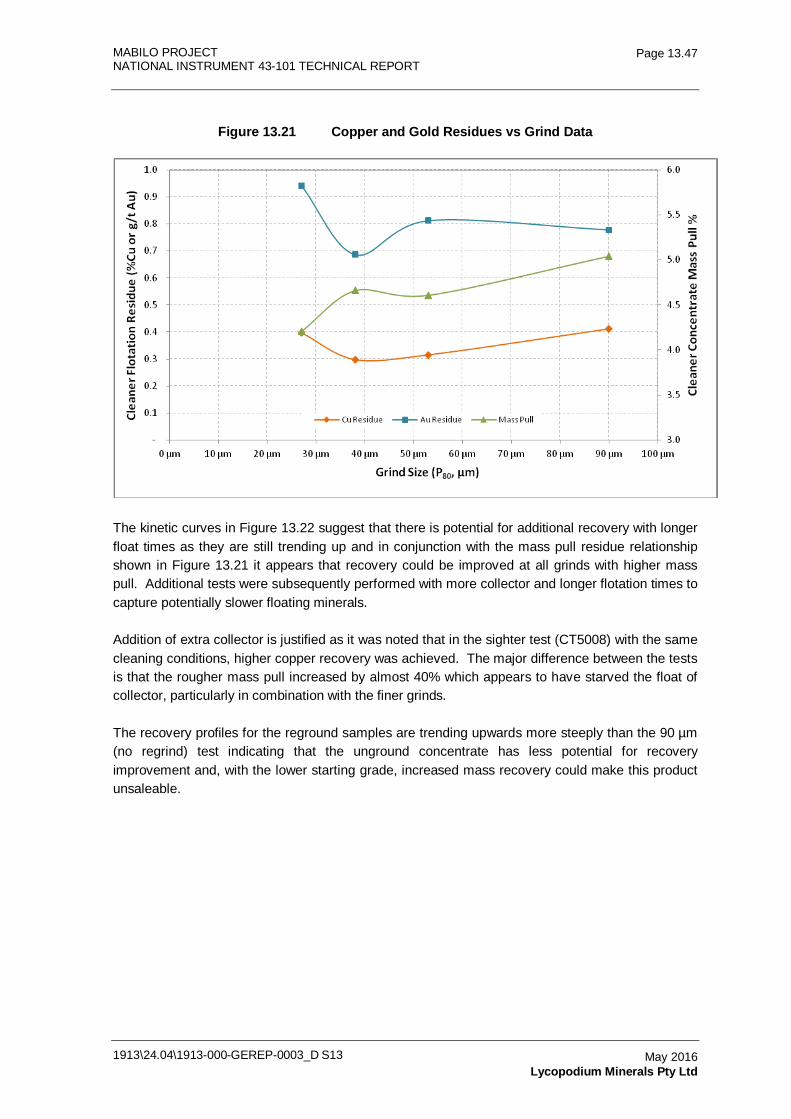
MABILO PROJECT NATIONAL INSTRUMENT 43-101 TECHNICAL REPORT
1913\24.04\1913-000-GEREP-0003_D S13
Page 13.47
May 2016 Lycopodium Minerals Pty Ltd
Figure 13.21 Copper and Gold Residues vs Grind Data
The kinetic curves in Figure 13.22 suggest that there is potential for additional recovery with longer float times as they are still trending up and in conjunction with the mass pull residue relationship shown in Figure 13.21 it appears that recovery could be improved at all grinds with higher mass pull. Additional tests were subsequently performed with more collector and longer flotation times to capture potentially slower floating minerals.
Addition of extra collector is justified as it was noted that in the sighter test (CT5008) with the same cleaning conditions, higher copper recovery was achieved. The major difference between the tests is that the rougher mass pull increased by almost 40% which appears to have starved the float of collector, particularly in combination with the finer grinds.
The recovery profiles for the reground samples are trending upwards more steeply than the 90 µm (no regrind) test indicating that the unground concentrate has less potential for recovery improvement and, with the lower starting grade, increased mass recovery could make this product unsaleable.
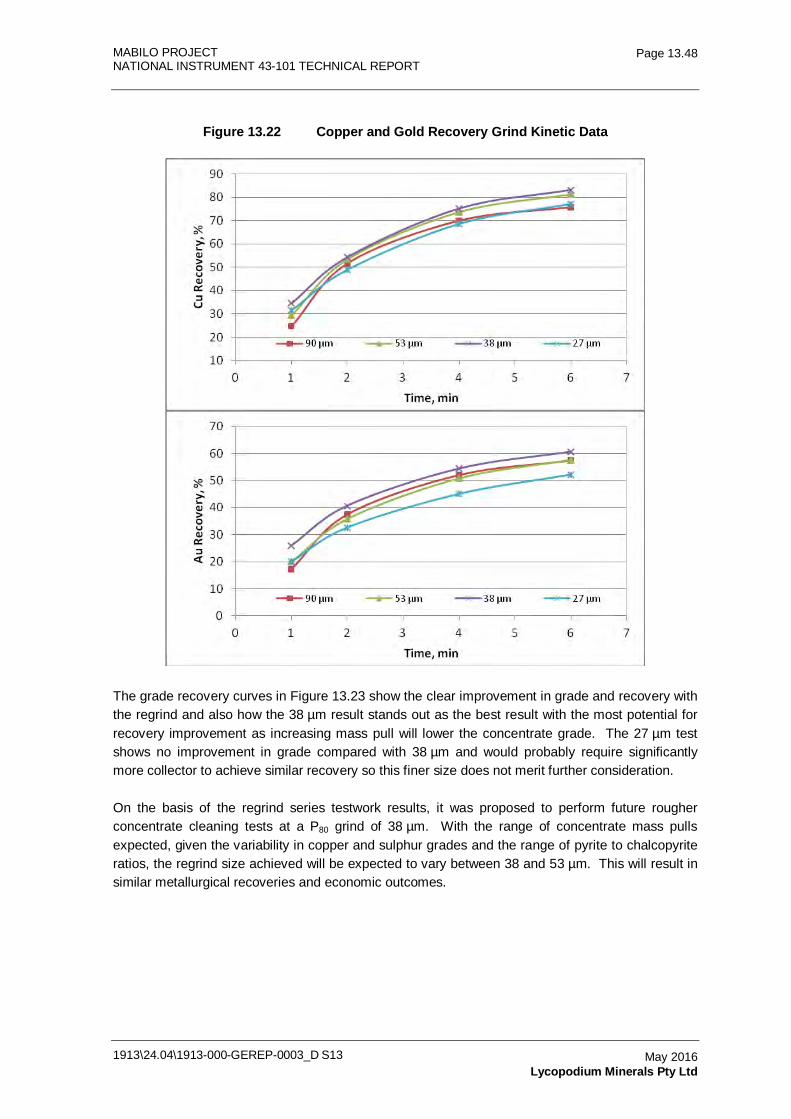
MABILO PROJECT NATIONAL INSTRUMENT 43-101 TECHNICAL REPORT
1913\24.04\1913-000-GEREP-0003_D S13
Page 13.48
May 2016 Lycopodium Minerals Pty Ltd
Figure 13.22 Copper and Gold Recovery Grind Kinetic Data
The grade recovery curves in Figure 13.23 show the clear improvement in grade and recovery with the regrind and also how the 38 µm result stands out as the best result with the most potential for recovery improvement as increasing mass pull will lower the concentrate grade. The 27 µm test shows no improvement in grade compared with 38 µm and would probably require significantly more collector to achieve similar recovery so this finer size does not merit further consideration.
On the basis of the regrind series testwork results, it was proposed to perform future rougher concentrate cleaning tests at a P80 grind of 38 µm. With the range of concentrate mass pulls expected, given the variability in copper and sulphur grades and the range of pyrite to chalcopyrite ratios, the regrind size achieved will be expected to vary between 38 and 53 µm. This will result in similar metallurgical recoveries and economic outcomes.
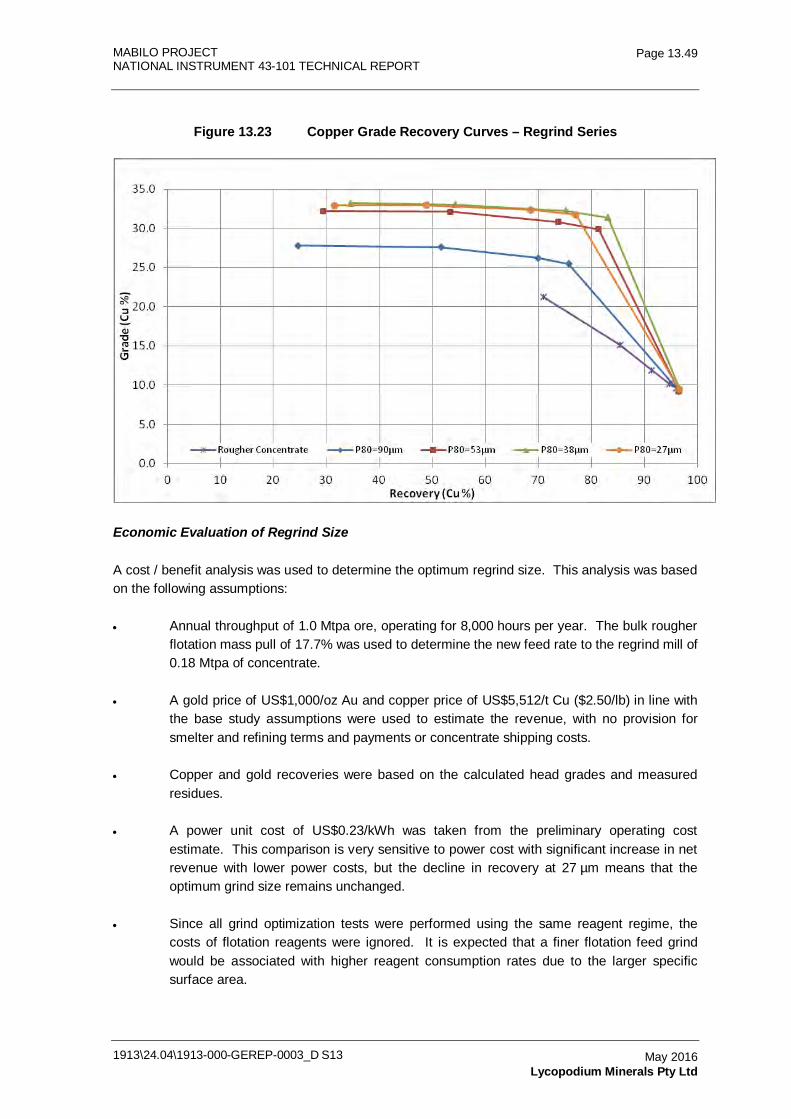
MABILO PROJECT NATIONAL INSTRUMENT 43-101 TECHNICAL REPORT
1913\24.04\1913-000-GEREP-0003_D S13
Page 13.49
May 2016 Lycopodium Minerals Pty Ltd
Figure 13.23 Copper Grade Recovery Curves – Regrind Series
Economic Evaluation of Regrind Size
A cost / benefit analysis was used to determine the optimum regrind size. This analysis was based on the following assumptions:
• Annual throughput of 1.0 Mtpa ore, operating for 8,000 hours per year. The bulk rougher flotation mass pull of 17.7% was used to determine the new feed rate to the regrind mill of 0.18 Mtpa of concentrate.
• A gold price of US$1,000/oz Au and copper price of US$5,512/t Cu ($2.50/lb) in line with the base study assumptions were used to estimate the revenue, with no provision for smelter and refining terms and payments or concentrate shipping costs.
• Copper and gold recoveries were based on the calculated head grades and measured residues.
• A power unit cost of US$0.23/kWh was taken from the preliminary operating cost estimate. This comparison is very sensitive to power cost with significant increase in net revenue with lower power costs, but the decline in recovery at 27 µm means that the optimum grind size remains unchanged.
• Since all grind optimization tests were performed using the same reagent regime, the costs of flotation reagents were ignored. It is expected that a finer flotation feed grind would be associated with higher reagent consumption rates due to the larger specific surface area.
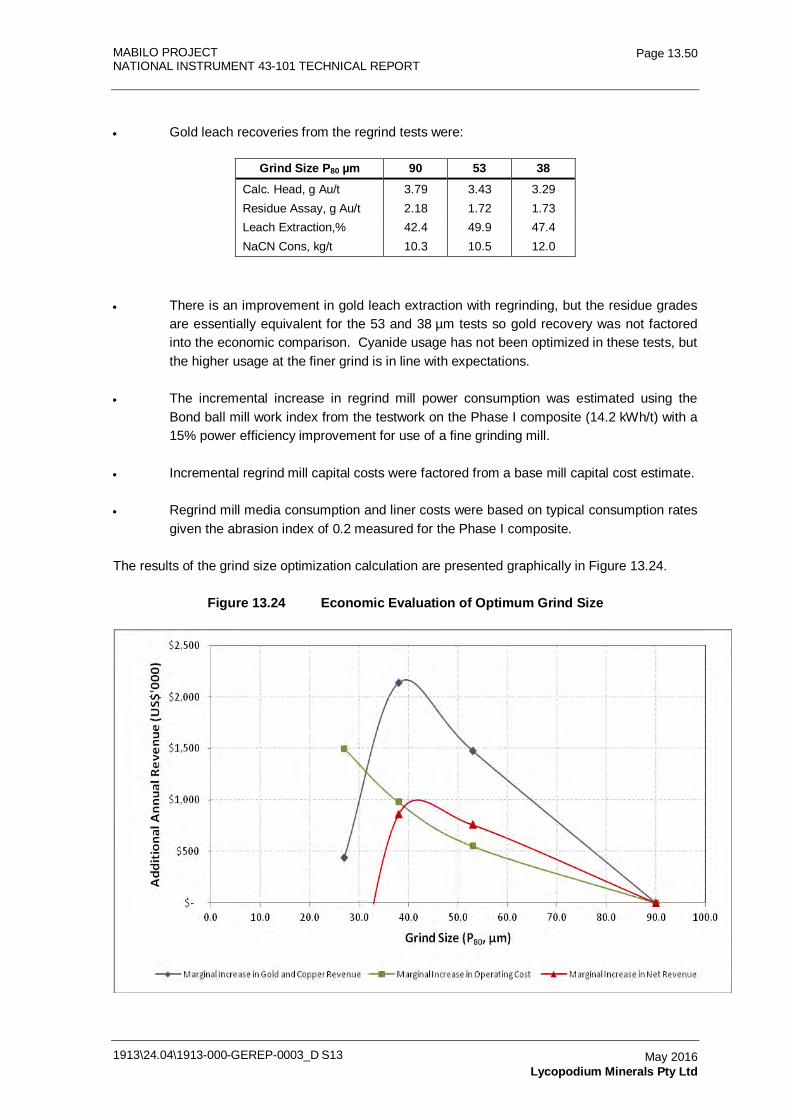
MABILO PROJECT NATIONAL INSTRUMENT 43-101 TECHNICAL REPORT
1913\24.04\1913-000-GEREP-0003_D S13
Page 13.50
May 2016 Lycopodium Minerals Pty Ltd
• Gold leach recoveries from the regrind tests were:
Grind Size P80 µm 90 53 38 Calc. Head, g Au/t 3.79 3.43 3.29 Residue Assay, g Au/t 2.18 1.72 1.73 Leach Extraction,% 42.4 49.9 47.4 NaCN Cons, kg/t 10.3 10.5 12.0
• There is an improvement in gold leach extraction with regrinding, but the residue grades are essentially equivalent for the 53 and 38 µm tests so gold recovery was not factored into the economic comparison. Cyanide usage has not been optimized in these tests, but the higher usage at the finer grind is in line with expectations.
• The incremental increase in regrind mill power consumption was estimated using the Bond ball mill work index from the testwork on the Phase I composite (14.2 kWh/t) with a 15% power efficiency improvement for use of a fine grinding mill.
• Incremental regrind mill capital costs were factored from a base mill capital cost estimate.
• Regrind mill media consumption and liner costs were based on typical consumption rates given the abrasion index of 0.2 measured for the Phase I composite.
The results of the grind size optimization calculation are presented graphically in Figure 13.24.
Figure 13.24 Economic Evaluation of Optimum Grind Size
MABILO PROJECT NATIONAL INSTRUMENT 43-101 TECHNICAL REPORT
1913\24.04\1913-000-GEREP-0003_D S13
Page 13.51
May 2016 Lycopodium Minerals Pty Ltd
The economic evaluation puts this exercise in context as the differential costs and benefits are relatively small in magnitude for the regrind comparison. Other factors such as ore mineralogy and concentrate grade achieved need to be factored in to the selection as well. The economic evaluation supports the observations from the grade recovery data and endorses the selection of P80 38 µm for the concentrate regrind size.
The economic evaluation will favor the finer grind size more if a lower power cost is used as this will reduce the operating cost penalty for finer grinding.
13.8.7 Additional Cleaner Tests
In order to demonstrate the improvement in cleaner recovery with increased collector and flotation time, the scope of the depressant optimization testing was increased to include a baseline test at the enhanced conditions.
• Collector (A3894) addition was increased from 2 to 3 g/t (rougher feed basis) with an additional dose of 1 g/t for the extra scavenging time.
• Flotation time was increased from 6 to 8 minutes to allow scavenging of the slower floating copper minerals.
• pH = 10.5, adjusted with hydrated lime for the baseline with pH 11.0 being trialed for the depressant optimization.
• 20 g/t NaCN to further depress the pyrite in the baseline and one high pH cleaner test with the second high pH test trialing no cyanide.
Cyanide was successfully used as the pyrite depressant in the flotation cleaning stage during the Phase I testwork. It was planned to investigate alternatives during the Phase II programme since having cyanide in the cleaner flotation circuit means that this water must be kept separate and that there is a chance that some gold dissolution may occur in the cleaner cells.
The most suitable alternate depressant is metabisulphite (MBS). Sighter tests were performed with cyanide and MBS during Phase I. The pyrite was successfully depressed in both cases yielding very clean copper concentrates (33% Cu), although recoveries (around 85%) could potentially be improved as dosage rates were slightly high.
The cyanide dosage rate was 55 g/t and the MBS was 900 g/t. At these rates cyanide operating cost would be $140,000/year while the MBS would cost $570,000/year.
Repeat testing with cyanide at 20 g/t improved recovery to 95% (following regrinding and operating at reduced density). A similar reduction in the MBS dosage rate is less likely based on the initial performance, but even at 40% of the initial dosage, this still represents a $230,000/year operating cost penalty.
Based on the above observations and in the interests of expediting the testwork programme and minimizing unnecessary additional testing it was agreed that the testwork and flowsheet design would proceed based on use of cyanide as the depressant.
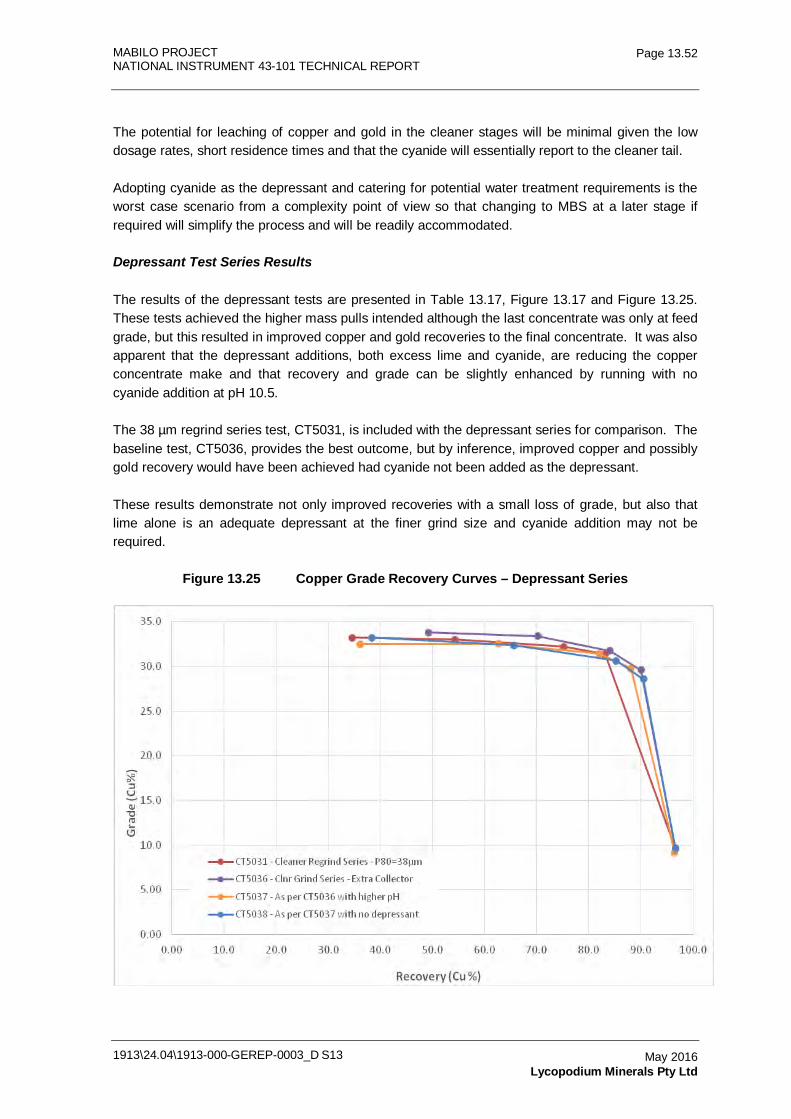
MABILO PROJECT NATIONAL INSTRUMENT 43-101 TECHNICAL REPORT
1913\24.04\1913-000-GEREP-0003_D S13
Page 13.52
May 2016 Lycopodium Minerals Pty Ltd
The potential for leaching of copper and gold in the cleaner stages will be minimal given the low dosage rates, short residence times and that the cyanide will essentially report to the cleaner tail.
Adopting cyanide as the depressant and catering for potential water treatment requirements is the worst case scenario from a complexity point of view so that changing to MBS at a later stage if required will simplify the process and will be readily accommodated.
Depressant Test Series Results
The results of the depressant tests are presented in Table 13.17, Figure 13.17 and Figure 13.25. These tests achieved the higher mass pulls intended although the last concentrate was only at feed grade, but this resulted in improved copper and gold recoveries to the final concentrate. It was also apparent that the depressant additions, both excess lime and cyanide, are reducing the copper concentrate make and that recovery and grade can be slightly enhanced by running with no cyanide addition at pH 10.5.
The 38 µm regrind series test, CT5031, is included with the depressant series for comparison. The baseline test, CT5036, provides the best outcome, but by inference, improved copper and possibly gold recovery would have been achieved had cyanide not been added as the depressant.
These results demonstrate not only improved recoveries with a small loss of grade, but also that lime alone is an adequate depressant at the finer grind size and cyanide addition may not be required.
Figure 13.25 Copper Grade Recovery Curves – Depressant Series
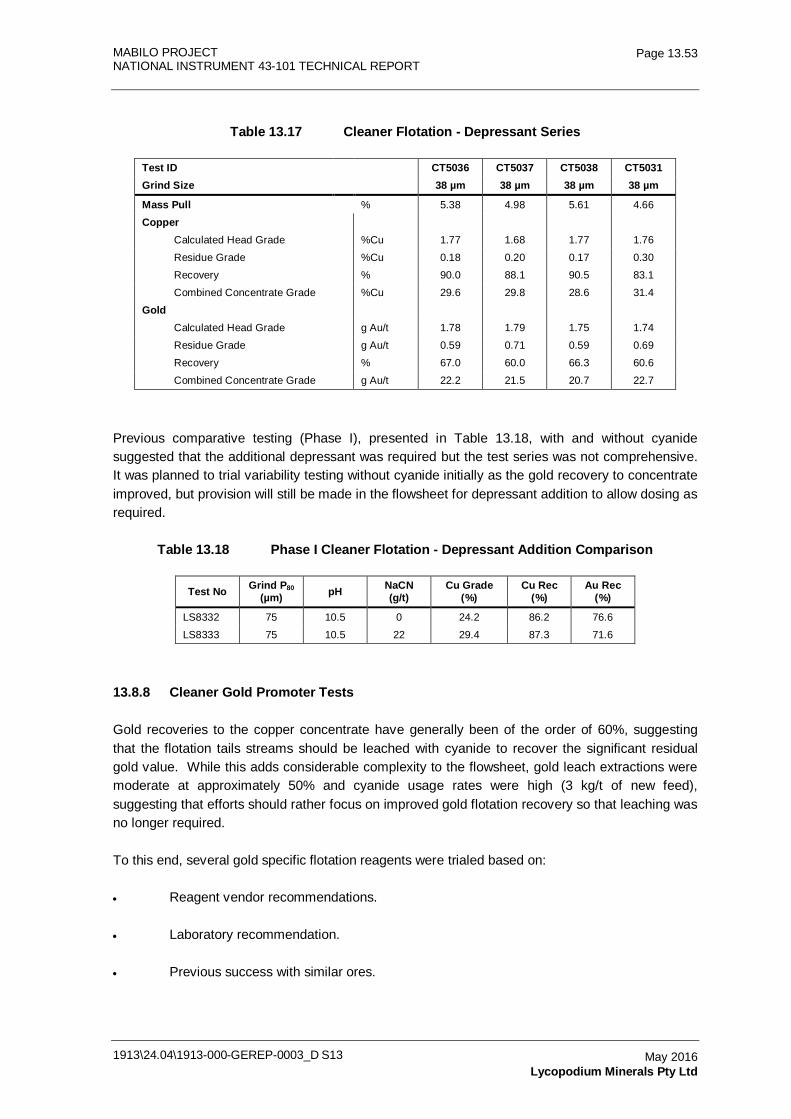
MABILO PROJECT NATIONAL INSTRUMENT 43-101 TECHNICAL REPORT
1913\24.04\1913-000-GEREP-0003_D S13
Page 13.53
May 2016 Lycopodium Minerals Pty Ltd
Table 13.17 Cleaner Flotation - Depressant Series
Test ID CT5036 CT5037 CT5038 CT5031 Grind Size 38 µm 38 µm 38 µm 38 µm
Mass Pull
% 5.38 4.98 5.61 4.66
Copper
Calculated Head Grade
%Cu 1.77 1.68 1.77 1.76
Residue Grade
%Cu 0.18 0.20 0.17 0.30
Recovery
% 90.0 88.1 90.5 83.1
Combined Concentrate Grade %Cu 29.6 29.8 28.6 31.4
Gold
Calculated Head Grade
g Au/t 1.78 1.79 1.75 1.74
Residue Grade
g Au/t 0.59 0.71 0.59 0.69
Recovery
% 67.0 60.0 66.3 60.6
Combined Concentrate Grade g Au/t 22.2 21.5 20.7 22.7
Previous comparative testing (Phase I), presented in Table 13.18, with and without cyanide suggested that the additional depressant was required but the test series was not comprehensive. It was planned to trial variability testing without cyanide initially as the gold recovery to concentrate improved, but provision will still be made in the flowsheet for depressant addition to allow dosing as required.
Table 13.18 Phase I Cleaner Flotation - Depressant Addition Comparison
Test No Grind P80 (µm) pH NaCN
(g/t) Cu Grade
(%) Cu Rec
(%) Au Rec
(%)
LS8332 75 10.5 0 24.2 86.2 76.6
LS8333 75 10.5 22 29.4 87.3 71.6
13.8.8 Cleaner Gold Promoter Tests
Gold recoveries to the copper concentrate have generally been of the order of 60%, suggesting that the flotation tails streams should be leached with cyanide to recover the significant residual gold value. While this adds considerable complexity to the flowsheet, gold leach extractions were moderate at approximately 50% and cyanide usage rates were high (3 kg/t of new feed), suggesting that efforts should rather focus on improved gold flotation recovery so that leaching was no longer required.
To this end, several gold specific flotation reagents were trialed based on:
• Reagent vendor recommendations.
• Laboratory recommendation.
• Previous success with similar ores.
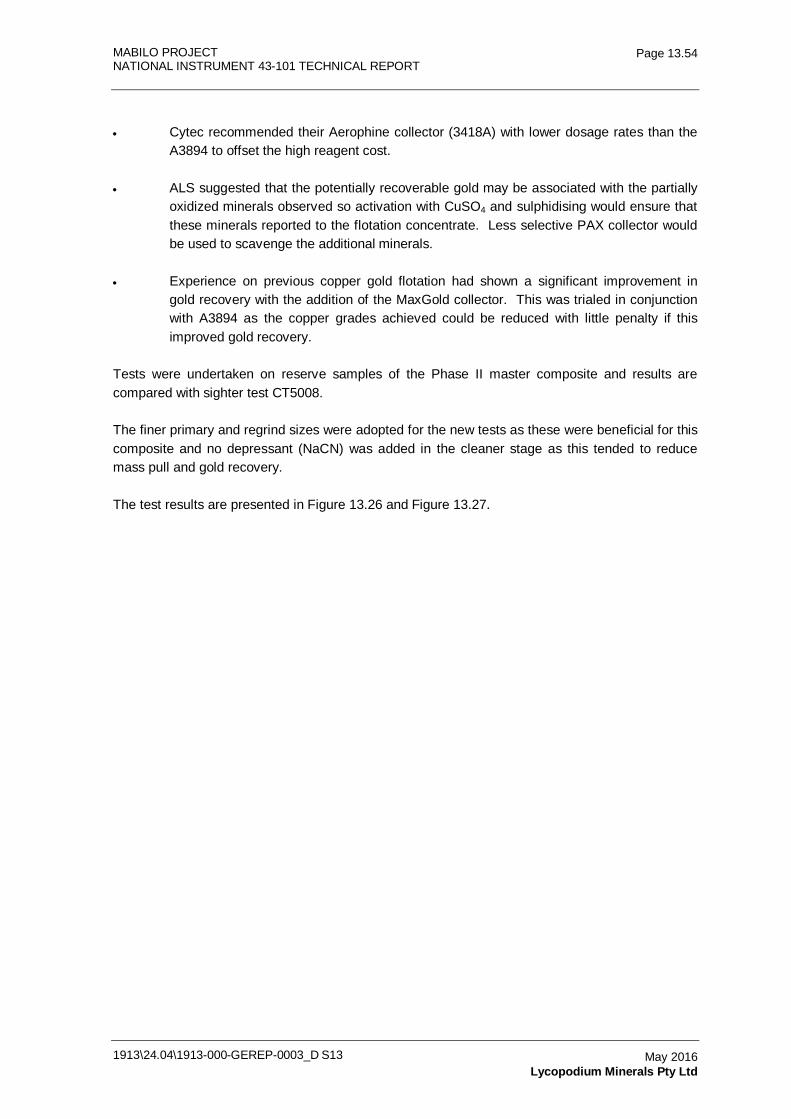
MABILO PROJECT NATIONAL INSTRUMENT 43-101 TECHNICAL REPORT
1913\24.04\1913-000-GEREP-0003_D S13
Page 13.54
May 2016 Lycopodium Minerals Pty Ltd
• Cytec recommended their Aerophine collector (3418A) with lower dosage rates than the A3894 to offset the high reagent cost.
• ALS suggested that the potentially recoverable gold may be associated with the partially oxidized minerals observed so activation with CuSO4 and sulphidising would ensure that these minerals reported to the flotation concentrate. Less selective PAX collector would be used to scavenge the additional minerals.
• Experience on previous copper gold flotation had shown a significant improvement in gold recovery with the addition of the MaxGold collector. This was trialed in conjunction with A3894 as the copper grades achieved could be reduced with little penalty if this improved gold recovery.
Tests were undertaken on reserve samples of the Phase II master composite and results are compared with sighter test CT5008.
The finer primary and regrind sizes were adopted for the new tests as these were beneficial for this composite and no depressant (NaCN) was added in the cleaner stage as this tended to reduce mass pull and gold recovery.
The test results are presented in Figure 13.26 and Figure 13.27.
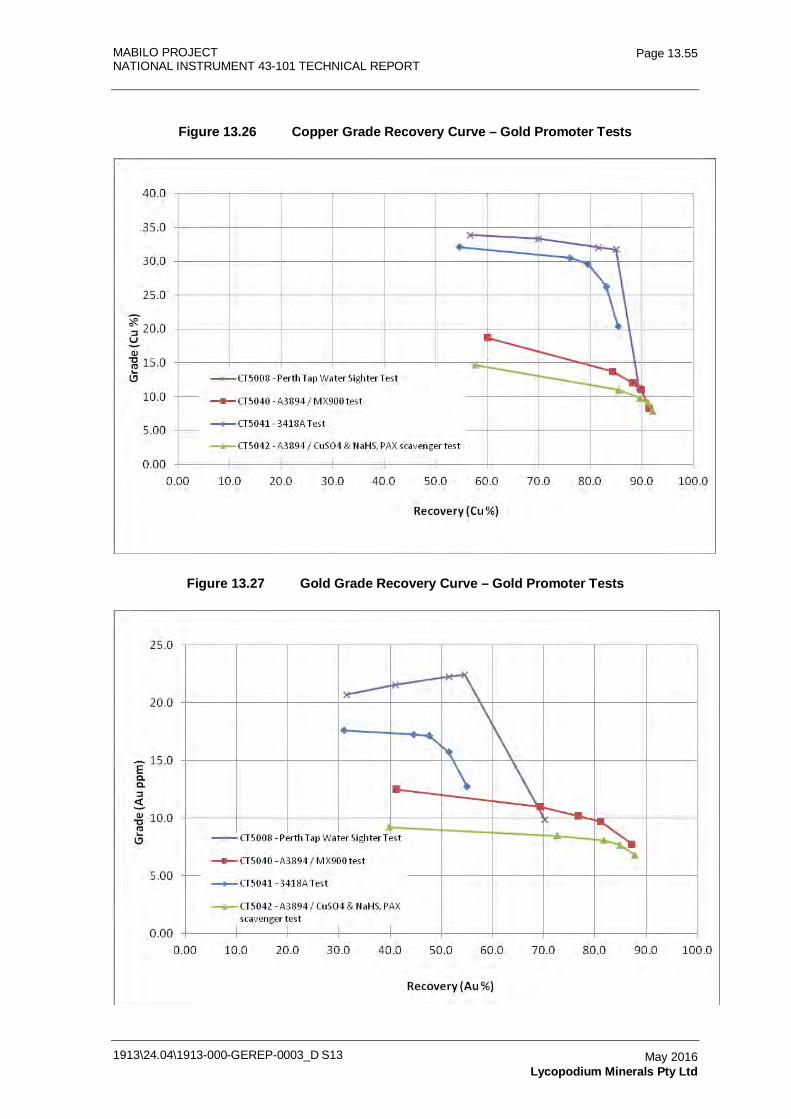
MABILO PROJECT NATIONAL INSTRUMENT 43-101 TECHNICAL REPORT
1913\24.04\1913-000-GEREP-0003_D S13
Page 13.55
May 2016 Lycopodium Minerals Pty Ltd
Figure 13.26 Copper Grade Recovery Curve – Gold Promoter Tests
Figure 13.27 Gold Grade Recovery Curve – Gold Promoter Tests
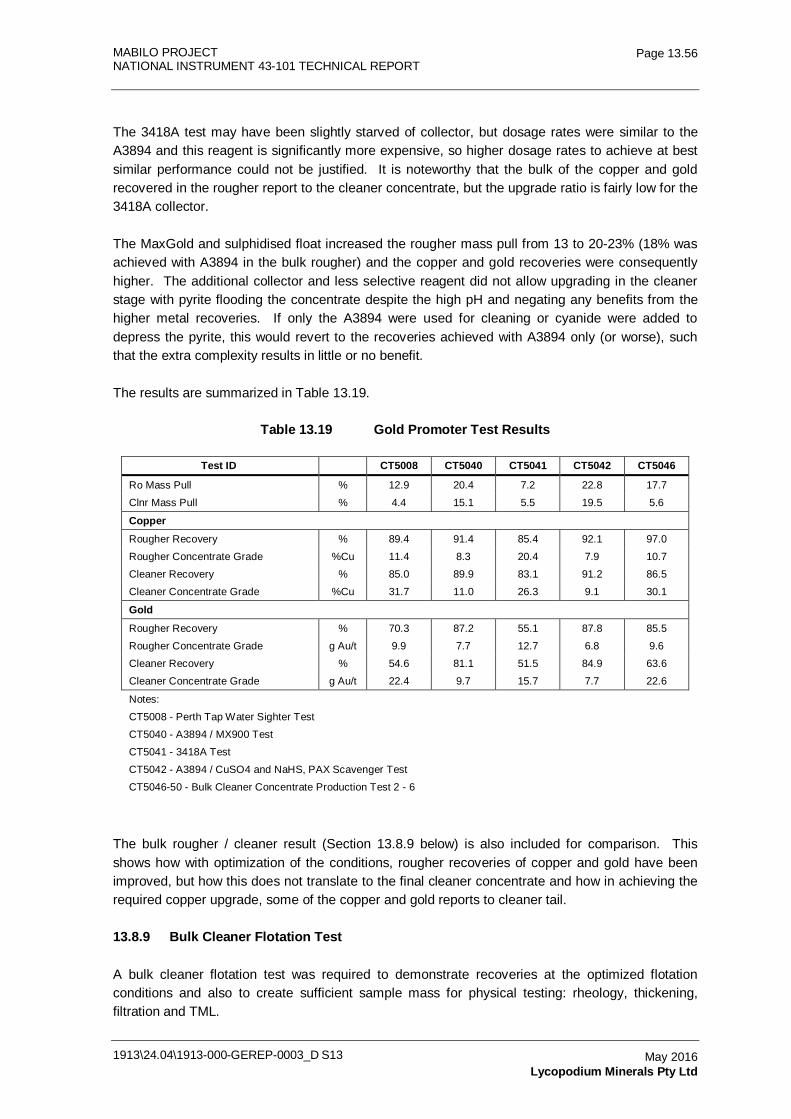
MABILO PROJECT NATIONAL INSTRUMENT 43-101 TECHNICAL REPORT
1913\24.04\1913-000-GEREP-0003_D S13
Page 13.56
May 2016 Lycopodium Minerals Pty Ltd
The 3418A test may have been slightly starved of collector, but dosage rates were similar to the A3894 and this reagent is significantly more expensive, so higher dosage rates to achieve at best similar performance could not be justified. It is noteworthy that the bulk of the copper and gold recovered in the rougher report to the cleaner concentrate, but the upgrade ratio is fairly low for the 3418A collector.
The MaxGold and sulphidised float increased the rougher mass pull from 13 to 20-23% (18% was achieved with A3894 in the bulk rougher) and the copper and gold recoveries were consequently higher. The additional collector and less selective reagent did not allow upgrading in the cleaner stage with pyrite flooding the concentrate despite the high pH and negating any benefits from the higher metal recoveries. If only the A3894 were used for cleaning or cyanide were added to depress the pyrite, this would revert to the recoveries achieved with A3894 only (or worse), such that the extra complexity results in little or no benefit.
The results are summarized in Table 13.19.
Table 13.19 Gold Promoter Test Results
Test ID CT5008 CT5040 CT5041 CT5042 CT5046
Ro Mass Pull % 12.9 20.4 7.2 22.8 17.7
Clnr Mass Pull % 4.4 15.1 5.5 19.5 5.6
Copper Rougher Recovery % 89.4 91.4 85.4 92.1 97.0
Rougher Concentrate Grade %Cu 11.4 8.3 20.4 7.9 10.7
Cleaner Recovery % 85.0 89.9 83.1 91.2 86.5
Cleaner Concentrate Grade %Cu 31.7 11.0 26.3 9.1 30.1
Gold Rougher Recovery % 70.3 87.2 55.1 87.8 85.5
Rougher Concentrate Grade g Au/t 9.9 7.7 12.7 6.8 9.6
Cleaner Recovery % 54.6 81.1 51.5 84.9 63.6
Cleaner Concentrate Grade g Au/t 22.4 9.7 15.7 7.7 22.6
Notes:
CT5008 - Perth Tap Water Sighter Test
CT5040 - A3894 / MX900 Test
CT5041 - 3418A Test
CT5042 - A3894 / CuSO4 and NaHS, PAX Scavenger Test
CT5046-50 - Bulk Cleaner Concentrate Production Test 2 - 6
The bulk rougher / cleaner result (Section 13.8.9 below) is also included for comparison. This shows how with optimization of the conditions, rougher recoveries of copper and gold have been improved, but how this does not translate to the final cleaner concentrate and how in achieving the required copper upgrade, some of the copper and gold reports to cleaner tail.
13.8.9 Bulk Cleaner Flotation Test
A bulk cleaner flotation test was required to demonstrate recoveries at the optimized flotation conditions and also to create sufficient sample mass for physical testing: rheology, thickening, filtration and TML.
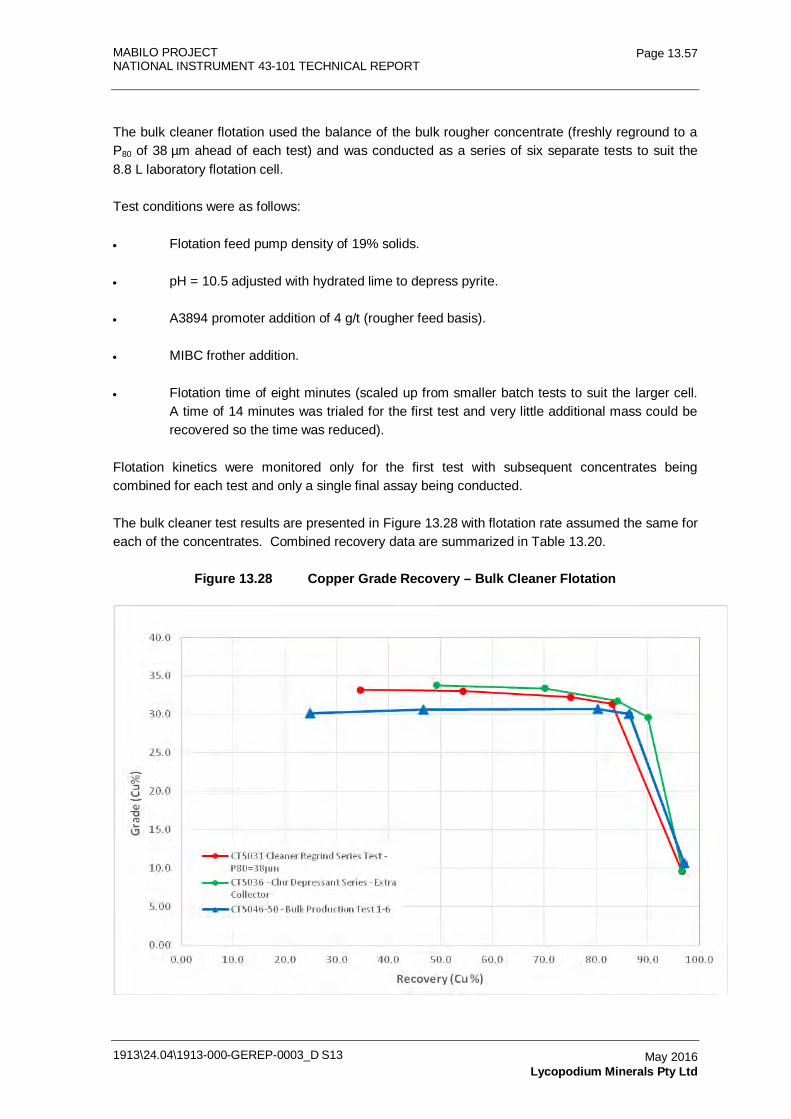
MABILO PROJECT NATIONAL INSTRUMENT 43-101 TECHNICAL REPORT
1913\24.04\1913-000-GEREP-0003_D S13
Page 13.57
May 2016 Lycopodium Minerals Pty Ltd
The bulk cleaner flotation used the balance of the bulk rougher concentrate (freshly reground to a P80 of 38 µm ahead of each test) and was conducted as a series of six separate tests to suit the 8.8 L laboratory flotation cell.
Test conditions were as follows:
• Flotation feed pump density of 19% solids.
• pH = 10.5 adjusted with hydrated lime to depress pyrite.
• A3894 promoter addition of 4 g/t (rougher feed basis).
• MIBC frother addition.
• Flotation time of eight minutes (scaled up from smaller batch tests to suit the larger cell. A time of 14 minutes was trialed for the first test and very little additional mass could be recovered so the time was reduced).
Flotation kinetics were monitored only for the first test with subsequent concentrates being combined for each test and only a single final assay being conducted.
The bulk cleaner test results are presented in Figure 13.28 with flotation rate assumed the same for each of the concentrates. Combined recovery data are summarized in Table 13.20.
Figure 13.28 Copper Grade Recovery – Bulk Cleaner Flotation
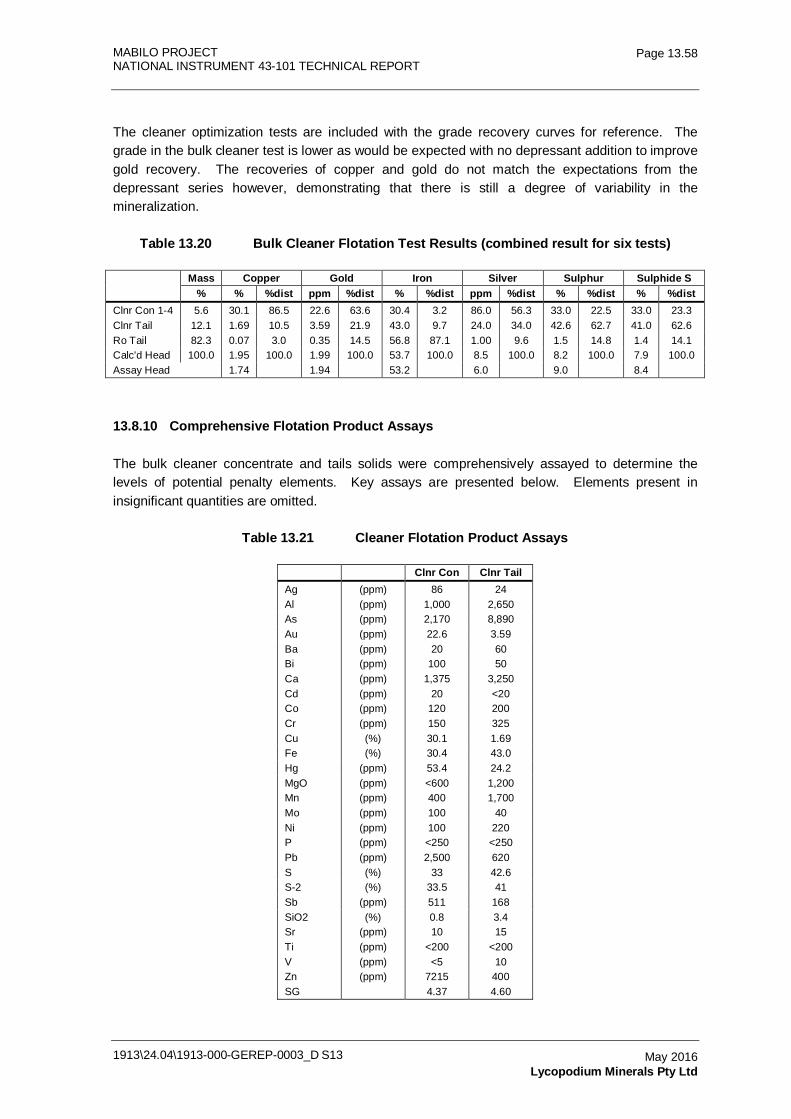
MABILO PROJECT NATIONAL INSTRUMENT 43-101 TECHNICAL REPORT
1913\24.04\1913-000-GEREP-0003_D S13
Page 13.58
May 2016 Lycopodium Minerals Pty Ltd
The cleaner optimization tests are included with the grade recovery curves for reference. The grade in the bulk cleaner test is lower as would be expected with no depressant addition to improve gold recovery. The recoveries of copper and gold do not match the expectations from the depressant series however, demonstrating that there is still a degree of variability in the mineralization.
Table 13.20 Bulk Cleaner Flotation Test Results (combined result for six tests)
Mass Copper Gold Iron Silver Sulphur Sulphide S
% % %dist ppm %dist % %dist ppm %dist % %dist % %dist Clnr Con 1-4 5.6 30.1 86.5 22.6 63.6 30.4 3.2 86.0 56.3 33.0 22.5 33.0 23.3 Clnr Tail 12.1 1.69 10.5 3.59 21.9 43.0 9.7 24.0 34.0 42.6 62.7 41.0 62.6 Ro Tail 82.3 0.07 3.0 0.35 14.5 56.8 87.1 1.00 9.6 1.5 14.8 1.4 14.1 Calc'd Head 100.0 1.95 100.0 1.99 100.0 53.7 100.0 8.5 100.0 8.2 100.0 7.9 100.0 Assay Head 1.74
1.94
53.2
6.0
9.0
8.4
13.8.10 Comprehensive Flotation Product Assays
The bulk cleaner concentrate and tails solids were comprehensively assayed to determine the levels of potential penalty elements. Key assays are presented below. Elements present in insignificant quantities are omitted.
Table 13.21 Cleaner Flotation Product Assays
Clnr Con Clnr Tail Ag (ppm) 86 24 Al (ppm) 1,000 2,650 As (ppm) 2,170 8,890 Au (ppm) 22.6 3.59 Ba (ppm) 20 60 Bi (ppm) 100 50 Ca (ppm) 1,375 3,250 Cd (ppm) 20 <20 Co (ppm) 120 200 Cr (ppm) 150 325 Cu (%) 30.1 1.69 Fe (%) 30.4 43.0 Hg (ppm) 53.4 24.2 MgO (ppm) <600 1,200 Mn (ppm) 400 1,700 Mo (ppm) 100 40 Ni (ppm) 100 220 P (ppm) <250 <250 Pb (ppm) 2,500 620 S (%) 33 42.6 S-2 (%) 33.5 41 Sb (ppm) 511 168 SiO2 (%) 0.8 3.4 Sr (ppm) 10 15 Ti (ppm) <200 <200 V (ppm) <5 10 Zn (ppm) 7215 400 SG
4.37 4.60
MABILO PROJECT NATIONAL INSTRUMENT 43-101 TECHNICAL REPORT
1913\24.04\1913-000-GEREP-0003_D S13
Page 13.59
May 2016 Lycopodium Minerals Pty Ltd
Apart from As and Hg there is a reasonable safety margin between the recorded assays and typical penalty levels imposed by smelters for Bi, Sb, Pb, Zn, Ni and Co.
Mercury penalties are typically based on not exceeding 10 ppm, but China has imposed a maximum importation level of 100 ppm in concentrates.
Arsenic was previously removed from the copper concentrate to cleaner tails, but with the efforts to increase gold recovery to concentrate (and as a result pyrite associated arsenic), the arsenic level now marginally exceeds the typical smelter limit of 2,000 ppm.
13.8.11 Flotation Response for Oxidized Ore
Following crushing of the individual hole composites to 3.35 mm to allow representative sample splitting, a coarse reserve sample was set aside for testing the flotation response of oxidized ore.
This sample had the same make up as the master composite, but instead of being stored in the cool room to prevent oxidation the sample was stored in humid conditions at 30°C to simulate conditions in the crushed ore stockpile on site.
Rougher flotation tests were conducted at weekly intervals initially with longer periods between tests once it was apparent that oxidation rates were low.
Flotation tests were conducted at optimized rougher conditions with a P80 90 µm grind. The grind series test result on the un-oxidized master composite is provided for comparison.
Rougher recoveries are summarized in Table 13.22. Although surface oxidation was apparent on the crushed ore feed samples, milling appears to have freshened the surfaces significantly so that there was no impact on flotation response. In fact, oxidation recoveries generally exceed the baseline, but this can be attributed to a degree of variability in:
• sample mineralization
• assay values
• flotation technique.
Most apparent is the increased recovery with higher rougher mass pull which has been a consistent trend across the flotation testwork.
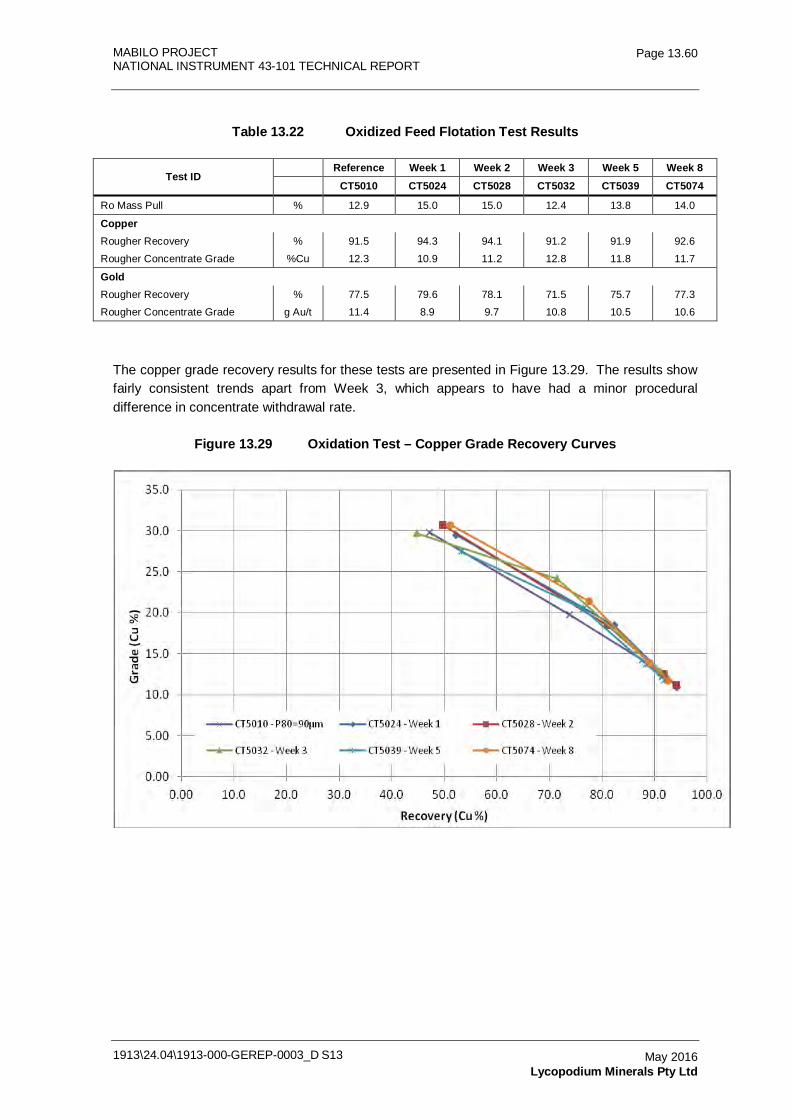
MABILO PROJECT NATIONAL INSTRUMENT 43-101 TECHNICAL REPORT
1913\24.04\1913-000-GEREP-0003_D S13
Page 13.60
May 2016 Lycopodium Minerals Pty Ltd
Table 13.22 Oxidized Feed Flotation Test Results
Test ID Reference Week 1 Week 2 Week 3 Week 5 Week 8
CT5010 CT5024 CT5028 CT5032 CT5039 CT5074
Ro Mass Pull % 12.9 15.0 15.0 12.4 13.8 14.0
Copper Rougher Recovery % 91.5 94.3 94.1 91.2 91.9 92.6
Rougher Concentrate Grade %Cu 12.3 10.9 11.2 12.8 11.8 11.7
Gold Rougher Recovery % 77.5 79.6 78.1 71.5 75.7 77.3
Rougher Concentrate Grade g Au/t 11.4 8.9 9.7 10.8 10.5 10.6
The copper grade recovery results for these tests are presented in Figure 13.29. The results show fairly consistent trends apart from Week 3, which appears to have had a minor procedural difference in concentrate withdrawal rate.
Figure 13.29 Oxidation Test – Copper Grade Recovery Curves
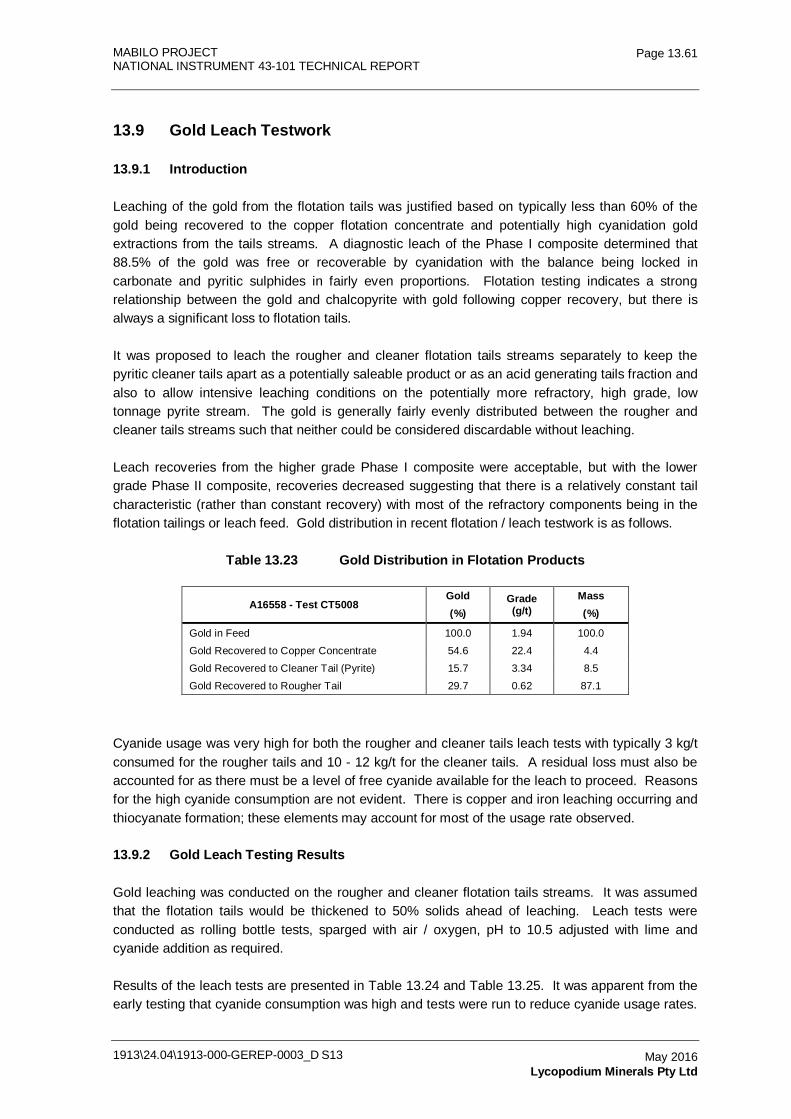
MABILO PROJECT NATIONAL INSTRUMENT 43-101 TECHNICAL REPORT
1913\24.04\1913-000-GEREP-0003_D S13
Page 13.61
May 2016 Lycopodium Minerals Pty Ltd
13.9 Gold Leach Testwork
13.9.1 Introduction
Leaching of the gold from the flotation tails was justified based on typically less than 60% of the gold being recovered to the copper flotation concentrate and potentially high cyanidation gold extractions from the tails streams. A diagnostic leach of the Phase I composite determined that 88.5% of the gold was free or recoverable by cyanidation with the balance being locked in carbonate and pyritic sulphides in fairly even proportions. Flotation testing indicates a strong relationship between the gold and chalcopyrite with gold following copper recovery, but there is always a significant loss to flotation tails.
It was proposed to leach the rougher and cleaner flotation tails streams separately to keep the pyritic cleaner tails apart as a potentially saleable product or as an acid generating tails fraction and also to allow intensive leaching conditions on the potentially more refractory, high grade, low tonnage pyrite stream. The gold is generally fairly evenly distributed between the rougher and cleaner tails streams such that neither could be considered discardable without leaching.
Leach recoveries from the higher grade Phase I composite were acceptable, but with the lower grade Phase II composite, recoveries decreased suggesting that there is a relatively constant tail characteristic (rather than constant recovery) with most of the refractory components being in the flotation tailings or leach feed. Gold distribution in recent flotation / leach testwork is as follows.
Table 13.23 Gold Distribution in Flotation Products
A16558 - Test CT5008 Gold (%)
Grade (g/t)
Mass (%)
Gold in Feed 100.0 1.94 100.0
Gold Recovered to Copper Concentrate 54.6 22.4 4.4
Gold Recovered to Cleaner Tail (Pyrite) 15.7 3.34 8.5
Gold Recovered to Rougher Tail 29.7 0.62 87.1
Cyanide usage was very high for both the rougher and cleaner tails leach tests with typically 3 kg/t consumed for the rougher tails and 10 - 12 kg/t for the cleaner tails. A residual loss must also be accounted for as there must be a level of free cyanide available for the leach to proceed. Reasons for the high cyanide consumption are not evident. There is copper and iron leaching occurring and thiocyanate formation; these elements may account for most of the usage rate observed.
13.9.2 Gold Leach Testing Results
Gold leaching was conducted on the rougher and cleaner flotation tails streams. It was assumed that the flotation tails would be thickened to 50% solids ahead of leaching. Leach tests were conducted as rolling bottle tests, sparged with air / oxygen, pH to 10.5 adjusted with lime and cyanide addition as required.
Results of the leach tests are presented in Table 13.24 and Table 13.25. It was apparent from the early testing that cyanide consumption was high and tests were run to reduce cyanide usage rates.
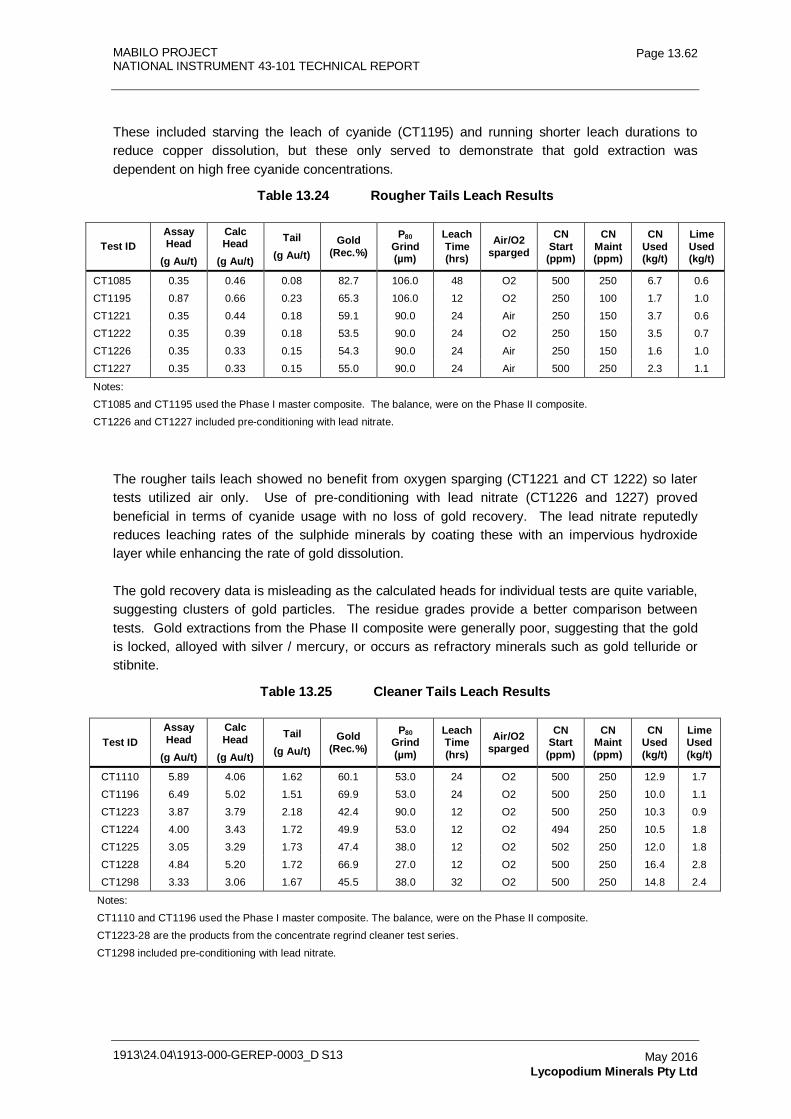
MABILO PROJECT NATIONAL INSTRUMENT 43-101 TECHNICAL REPORT
1913\24.04\1913-000-GEREP-0003_D S13
Page 13.62
May 2016 Lycopodium Minerals Pty Ltd
These included starving the leach of cyanide (CT1195) and running shorter leach durations to reduce copper dissolution, but these only served to demonstrate that gold extraction was dependent on high free cyanide concentrations.
Table 13.24 Rougher Tails Leach Results
Test ID Assay Head
(g Au/t)
Calc Head
(g Au/t)
Tail (g Au/t)
Gold (Rec.%)
P80 Grind (µm)
Leach Time (hrs)
Air/O2 sparged
CN Start (ppm)
CN Maint (ppm)
CN Used (kg/t)
Lime Used (kg/t)
CT1085 0.35 0.46 0.08 82.7 106.0 48 O2 500 250 6.7 0.6
CT1195 0.87 0.66 0.23 65.3 106.0 12 O2 250 100 1.7 1.0
CT1221 0.35 0.44 0.18 59.1 90.0 24 Air 250 150 3.7 0.6
CT1222 0.35 0.39 0.18 53.5 90.0 24 O2 250 150 3.5 0.7
CT1226 0.35 0.33 0.15 54.3 90.0 24 Air 250 150 1.6 1.0
CT1227 0.35 0.33 0.15 55.0 90.0 24 Air 500 250 2.3 1.1
Notes:
CT1085 and CT1195 used the Phase I master composite. The balance, were on the Phase II composite.
CT1226 and CT1227 included pre-conditioning with lead nitrate.
The rougher tails leach showed no benefit from oxygen sparging (CT1221 and CT 1222) so later tests utilized air only. Use of pre-conditioning with lead nitrate (CT1226 and 1227) proved beneficial in terms of cyanide usage with no loss of gold recovery. The lead nitrate reputedly reduces leaching rates of the sulphide minerals by coating these with an impervious hydroxide layer while enhancing the rate of gold dissolution.
The gold recovery data is misleading as the calculated heads for individual tests are quite variable, suggesting clusters of gold particles. The residue grades provide a better comparison between tests. Gold extractions from the Phase II composite were generally poor, suggesting that the gold is locked, alloyed with silver / mercury, or occurs as refractory minerals such as gold telluride or stibnite.
Table 13.25 Cleaner Tails Leach Results
Test ID Assay Head
(g Au/t)
Calc Head
(g Au/t)
Tail (g Au/t)
Gold (Rec.%)
P80 Grind (µm)
Leach Time (hrs)
Air/O2 sparged
CN Start (ppm)
CN Maint (ppm)
CN Used (kg/t)
Lime Used (kg/t)
CT1110 5.89 4.06 1.62 60.1 53.0 24 O2 500 250 12.9 1.7
CT1196 6.49 5.02 1.51 69.9 53.0 24 O2 500 250 10.0 1.1
CT1223 3.87 3.79 2.18 42.4 90.0 12 O2 500 250 10.3 0.9
CT1224 4.00 3.43 1.72 49.9 53.0 12 O2 494 250 10.5 1.8
CT1225 3.05 3.29 1.73 47.4 38.0 12 O2 502 250 12.0 1.8
CT1228 4.84 5.20 1.72 66.9 27.0 12 O2 500 250 16.4 2.8
CT1298 3.33 3.06 1.67 45.5 38.0 32 O2 500 250 14.8 2.4
Notes:
CT1110 and CT1196 used the Phase I master composite. The balance, were on the Phase II composite.
CT1223-28 are the products from the concentrate regrind cleaner test series.
CT1298 included pre-conditioning with lead nitrate.
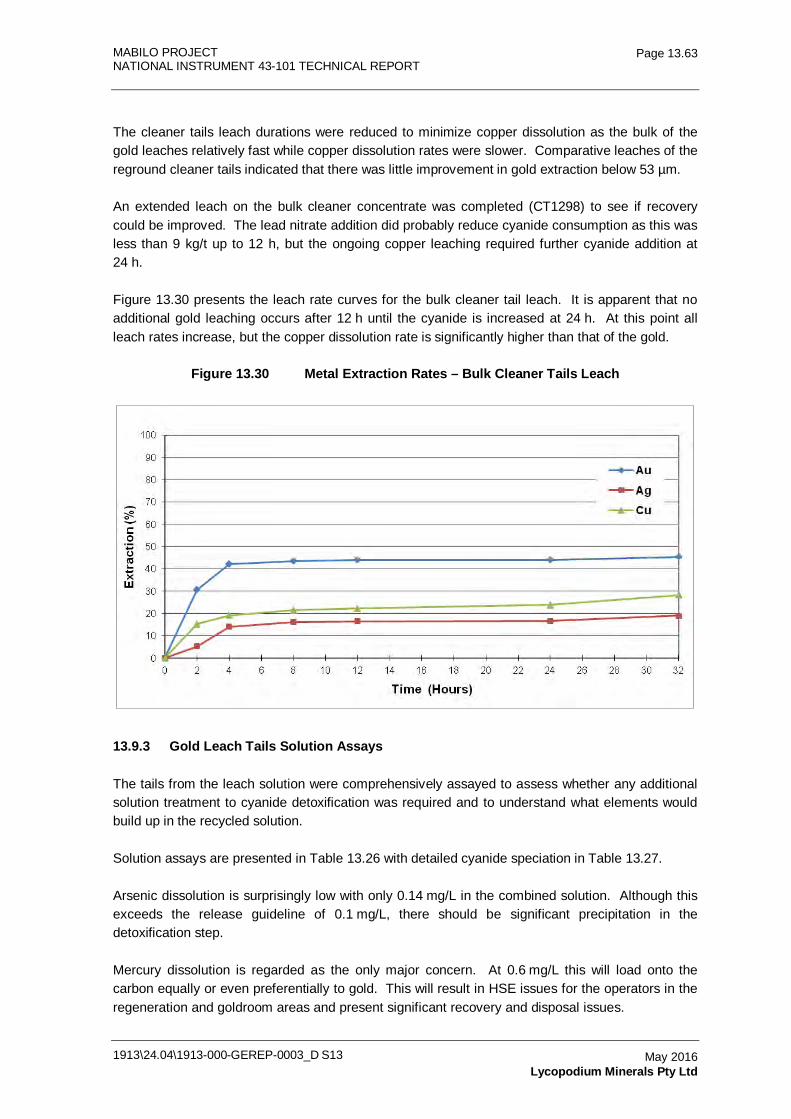
MABILO PROJECT NATIONAL INSTRUMENT 43-101 TECHNICAL REPORT
1913\24.04\1913-000-GEREP-0003_D S13
Page 13.63
May 2016 Lycopodium Minerals Pty Ltd
The cleaner tails leach durations were reduced to minimize copper dissolution as the bulk of the gold leaches relatively fast while copper dissolution rates were slower. Comparative leaches of the reground cleaner tails indicated that there was little improvement in gold extraction below 53 µm.
An extended leach on the bulk cleaner concentrate was completed (CT1298) to see if recovery could be improved. The lead nitrate addition did probably reduce cyanide consumption as this was less than 9 kg/t up to 12 h, but the ongoing copper leaching required further cyanide addition at 24 h.
Figure 13.30 presents the leach rate curves for the bulk cleaner tail leach. It is apparent that no additional gold leaching occurs after 12 h until the cyanide is increased at 24 h. At this point all leach rates increase, but the copper dissolution rate is significantly higher than that of the gold.
Figure 13.30 Metal Extraction Rates – Bulk Cleaner Tails Leach
13.9.3 Gold Leach Tails Solution Assays
The tails from the leach solution were comprehensively assayed to assess whether any additional solution treatment to cyanide detoxification was required and to understand what elements would build up in the recycled solution.
Solution assays are presented in Table 13.26 with detailed cyanide speciation in Table 13.27.
Arsenic dissolution is surprisingly low with only 0.14 mg/L in the combined solution. Although this exceeds the release guideline of 0.1 mg/L, there should be significant precipitation in the detoxification step.
Mercury dissolution is regarded as the only major concern. At 0.6 mg/L this will load onto the carbon equally or even preferentially to gold. This will result in HSE issues for the operators in the regeneration and goldroom areas and present significant recovery and disposal issues.
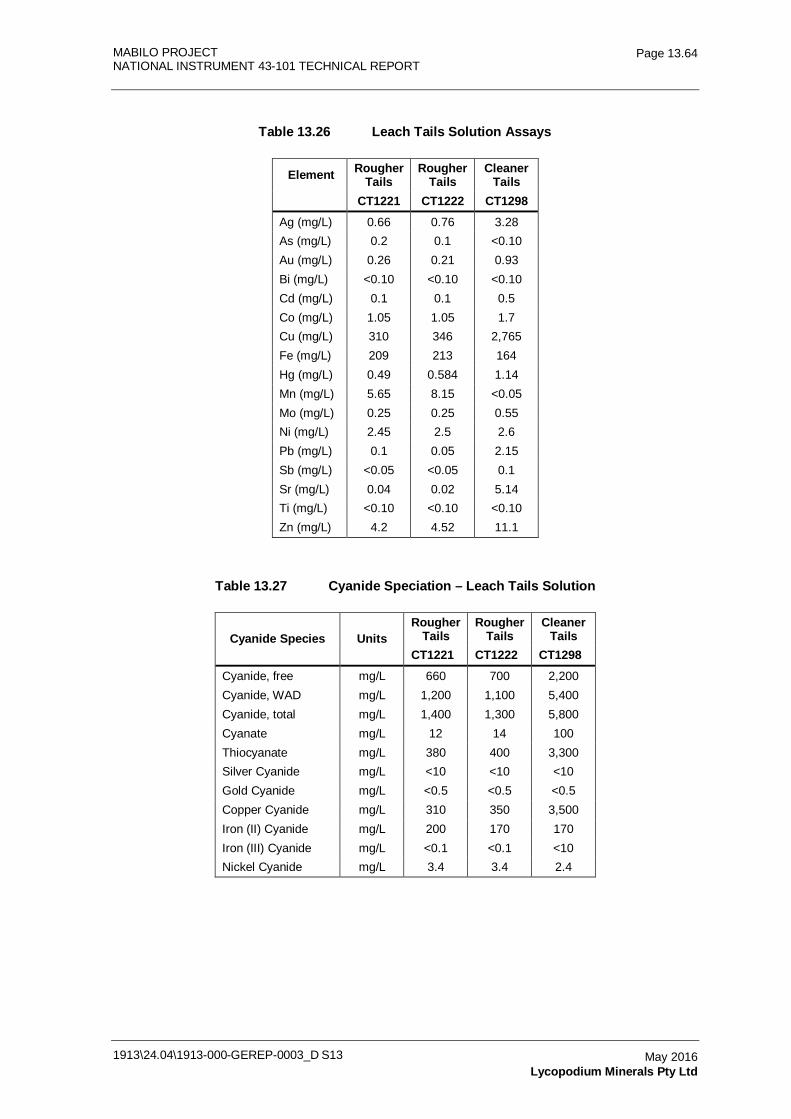
MABILO PROJECT NATIONAL INSTRUMENT 43-101 TECHNICAL REPORT
1913\24.04\1913-000-GEREP-0003_D S13
Page 13.64
May 2016 Lycopodium Minerals Pty Ltd
Table 13.26 Leach Tails Solution Assays
Element Rougher Tails
Rougher Tails
Cleaner Tails
CT1221 CT1222 CT1298
Ag (mg/L) 0.66 0.76 3.28 As (mg/L) 0.2 0.1 <0.10 Au (mg/L) 0.26 0.21 0.93 Bi (mg/L) <0.10 <0.10 <0.10 Cd (mg/L) 0.1 0.1 0.5 Co (mg/L) 1.05 1.05 1.7 Cu (mg/L) 310 346 2,765 Fe (mg/L) 209 213 164 Hg (mg/L) 0.49 0.584 1.14 Mn (mg/L) 5.65 8.15 <0.05 Mo (mg/L) 0.25 0.25 0.55 Ni (mg/L) 2.45 2.5 2.6 Pb (mg/L) 0.1 0.05 2.15 Sb (mg/L) <0.05 <0.05 0.1 Sr (mg/L) 0.04 0.02 5.14 Ti (mg/L) <0.10 <0.10 <0.10 Zn (mg/L) 4.2 4.52 11.1
Table 13.27 Cyanide Speciation – Leach Tails Solution
Cyanide Species Units Rougher
Tails Rougher
Tails Cleaner
Tails CT1221 CT1222 CT1298
Cyanide, free mg/L 660 700 2,200 Cyanide, WAD mg/L 1,200 1,100 5,400 Cyanide, total mg/L 1,400 1,300 5,800 Cyanate mg/L 12 14 100 Thiocyanate mg/L 380 400 3,300 Silver Cyanide mg/L <10 <10 <10 Gold Cyanide mg/L <0.5 <0.5 <0.5 Copper Cyanide mg/L 310 350 3,500 Iron (II) Cyanide mg/L 200 170 170 Iron (III) Cyanide mg/L <0.1 <0.1 <10 Nickel Cyanide mg/L 3.4 3.4 2.4
MABILO PROJECT NATIONAL INSTRUMENT 43-101 TECHNICAL REPORT
1913\24.04\1913-000-GEREP-0003_D S13
Page 13.65
May 2016 Lycopodium Minerals Pty Ltd
13.9.4 Gold Leaching Viability Assessment
The low leach gold recovery and high cyanide usage rates motivated an economic review of the viability of the tails leach stages. This must be a profitable step to offset a number of real and perceived issues associated with adding the leaching steps to the process.
• An economic evaluation of leaching gold from the flotation tails showed that the revenue from recovered gold at the study gold price barely covers the operating cost due to the low leach extractions and high cyanide consumption.
• The high cyanide levels will require high detoxification reagent addition with associated cost, handling and storage risks.
• A fraction of the contained mercury solubilises in the leach, placing costly and onerous requirements on the operator for mercury capture to prevent emissions and personnel exposure and results in a lasting storage and disposal problem.
The poor leach extractions and lack of success achieving significant reduction in cyanide consumption motivated deferring further planned leach testing. Cleaner flotation optimization was used to increase the gold recovery to the flotation concentrate.
The plant engineering and design will make provision for retrofitting the leach circuits as this would be viable if the gold price increased or an alternative, more viable processing approach was determined. It is planned to market the pyrite product to obtain a credit for the contained gold.
Cyanide Usage in the Leach Solutions
What is most notable from the leach solution assays, Table 13.14, is that the dissolved copper and iron exceed the gold in solution by several orders of magnitude. High cyanide residuals will have to be maintained to ensure that the Cu(CN)4
3- complex predominates as this species adsorbs poorly onto the carbon. Less negative copper cyanide complexes adsorb more readily and compete with gold for active sites on the carbon which can be detrimental to gold recovery and elution / electrowinning.
It is clear from the cyanide speciation, Table 13.15 that the unwanted copper, iron and sulphide dissolution are demanding the very high cyanide additions observed.
Although subsequent testing with lead nitrate pre-conditioning reduced the cyanide consumed to 1.61 kg/t, this is still a high usage rate and the process will not allow recycle of the free cyanide residual without a cyanide recovery and concentration process, so the net reduction in total cyanide will only be of the order of 20%.
Also the mercury concentration in solution is higher than the gold value and will load onto the carbon more readily than the other dissolved metals. This does not generally interfere with gold loading, but requires removal downstream to prevent environmental emissions and occupational hazards.
MABILO PROJECT NATIONAL INSTRUMENT 43-101 TECHNICAL REPORT
1913\24.04\1913-000-GEREP-0003_D S13
Page 13.66
May 2016 Lycopodium Minerals Pty Ltd
Discussion
The above observations from the solution assays and cyanide speciation have significant implications for downstream processing:
1) The high cyanide addition rates required for dissolution of the gold (and unwanted iron, copper and sulphur) result in high cyanide in the solution tails requiring high detoxification reagent addition rates.
Cyanide detoxification is essential because the process requires internal water recycle and the presence of cyanide would depress the sulphides, particularly the pyrite associated copper. The operation will also have a positive water balance such that discharge of water to the natural environment will be required. The criticality of achieving successful detoxification implies that still more reagent is likely to be required to ensure a stoichiometric excess at all times.
Sourcing, transport, mixing and storage of the large quantities of both cyanide and sodium metabisulphite (equivalent to a tanker load each day) will add considerable social and occupational risk to the project.
Such high levels of cyanide in the leach tails would motivate for implementation of a cyanide recovery process or looking at alternative leaching approaches, but this work is beyond the scope of the current testwork programme and would need to be addressed as a separate study.
2) The high mercury head grades result in a low but significant extraction of mercury into the leach solution. This will load onto the carbon and would require a number of gas scrubbers to treat off gas from the kiln, electrowinning cells and smelting furnace. A mercury retort and condenser will be required to remove the recovered mercury ahead of smelting to ensure safe working conditions. Elemental mercury and carbon loaded with mercury from the off gases will be a lifetime legacy for the project as these products cannot readily be disposed as trade in mercury is being internationally discouraged.
Penalties for mercury emissions can be severe, so effective capture facilities need to be installed and efficiently operated.
3) Much of the gold in the tailings appears to be refractory so cyanide leaching is relatively ineffective with gold recoveries of only 50 - 60%. Improved gold recoveries would offset the production costs significantly. Alternative approaches to gold extraction could be considered, but this work was considered beyond the scope of the current testwork programme and will need to be addressed as a separate study.
Capital and Operating Cost Implications
Indicative capital and operating costs are presented for the gold circuits to allow evaluation of the merits of including these circuits. The capital estimate is based on major mechanical supply costs factored up for installation to provide indicative costs. Operating costs presented are only direct costs for major consumables and power as these far outweigh associated labor, maintenance and
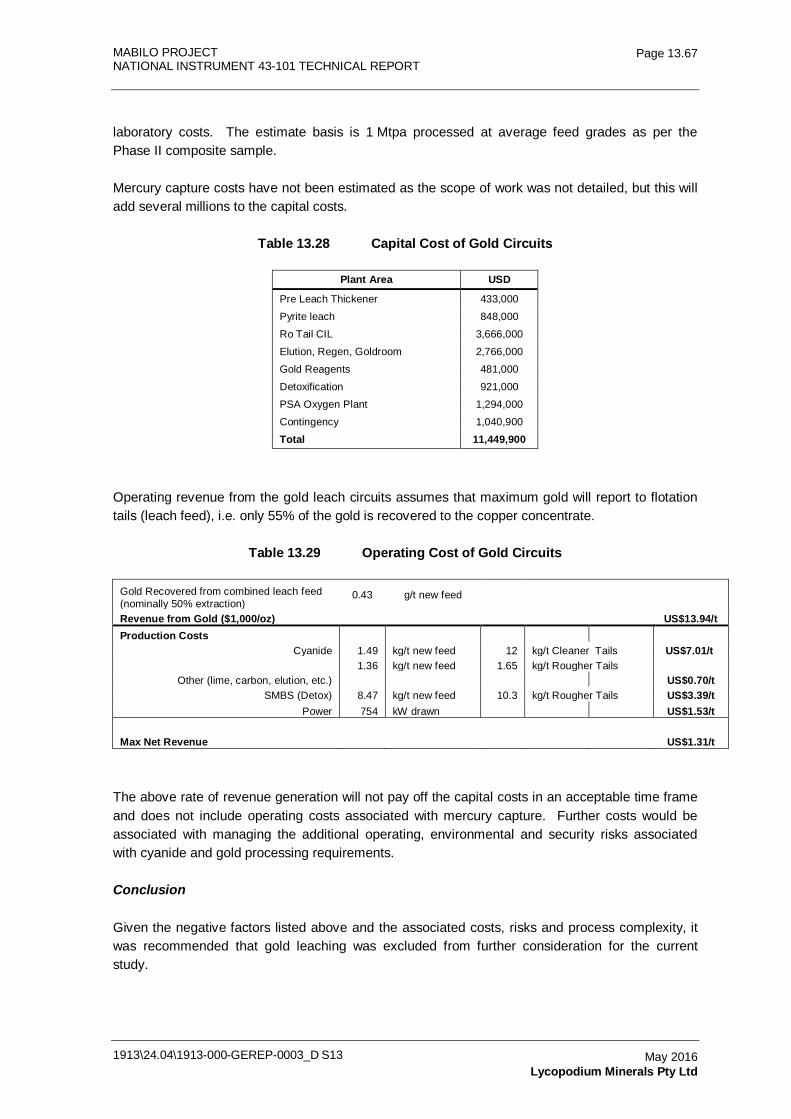
MABILO PROJECT NATIONAL INSTRUMENT 43-101 TECHNICAL REPORT
1913\24.04\1913-000-GEREP-0003_D S13
Page 13.67
May 2016 Lycopodium Minerals Pty Ltd
laboratory costs. The estimate basis is 1 Mtpa processed at average feed grades as per the Phase II composite sample.
Mercury capture costs have not been estimated as the scope of work was not detailed, but this will add several millions to the capital costs.
Table 13.28 Capital Cost of Gold Circuits
Plant Area USD
Pre Leach Thickener 433,000
Pyrite leach 848,000
Ro Tail CIL 3,666,000
Elution, Regen, Goldroom 2,766,000
Gold Reagents 481,000
Detoxification 921,000
PSA Oxygen Plant 1,294,000
Contingency 1,040,900
Total 11,449,900
Operating revenue from the gold leach circuits assumes that maximum gold will report to flotation tails (leach feed), i.e. only 55% of the gold is recovered to the copper concentrate.
Table 13.29 Operating Cost of Gold Circuits
Gold Recovered from combined leach feed (nominally 50% extraction)
0.43 g/t new feed Revenue from Gold ($1,000/oz)
US$13.94/t
Production Costs
Cyanide 1.49 kg/t new feed 12 kg/t Cleaner Tails US$7.01/t
1.36 kg/t new feed 1.65 kg/t Rougher Tails Other (lime, carbon, elution, etc.)
US$0.70/t
SMBS (Detox) 8.47 kg/t new feed 10.3 kg/t Rougher Tails US$3.39/t Power 754 kW drawn
US$1.53/t
Max Net Revenue
US$1.31/t
The above rate of revenue generation will not pay off the capital costs in an acceptable time frame and does not include operating costs associated with mercury capture. Further costs would be associated with managing the additional operating, environmental and security risks associated with cyanide and gold processing requirements.
Conclusion
Given the negative factors listed above and the associated costs, risks and process complexity, it was recommended that gold leaching was excluded from further consideration for the current study.
MABILO PROJECT NATIONAL INSTRUMENT 43-101 TECHNICAL REPORT
1913\24.04\1913-000-GEREP-0003_D S13
Page 13.68
May 2016 Lycopodium Minerals Pty Ltd
There may be alternative processing routes that can be considered to improve gold recovery, reduce cyanide usage, recover cyanide from the tails or replace cyanide as the leaching agent. The testwork required and associated engineering are outside the scope of the current study and some of these approaches should be reviewed as a separate exercise as the potential value of the gold loss is significant.
13.10 Magnetite Recovery
Magnetite susceptibility testing on the rougher flotation tails stream during Phase I demonstrated that 73% of the rougher tails mass could be recovered to a magnetic concentrate with a 66% Fe grade. This was slightly lower than the target of 68% Fe, but investigation of the response with finer grinding suggests that the liberation size to achieve an upgrade would be significantly finer than would be justified by the product premium.
The above concentrate was recovered with a field strength of 900 G. Susceptibility was tested up to 4,000 G, but very little additional material indicated a magnetic response and the recovered grade was low. Cleaning of the product at 750 and 600 G also rejected very little material.
Detailed assays of the bulk magnetic separation magnetite products are presented in Table 13.30. Cleaning of the bulk rougher was mainly required to remove entrained gangue and the iron upgrade achieved resulted from the mass loss in addition to the rejection of some less magnetic composites. The product has very low levels of sulphur, silica and phosphorous, making it readily saleable to a smelter.
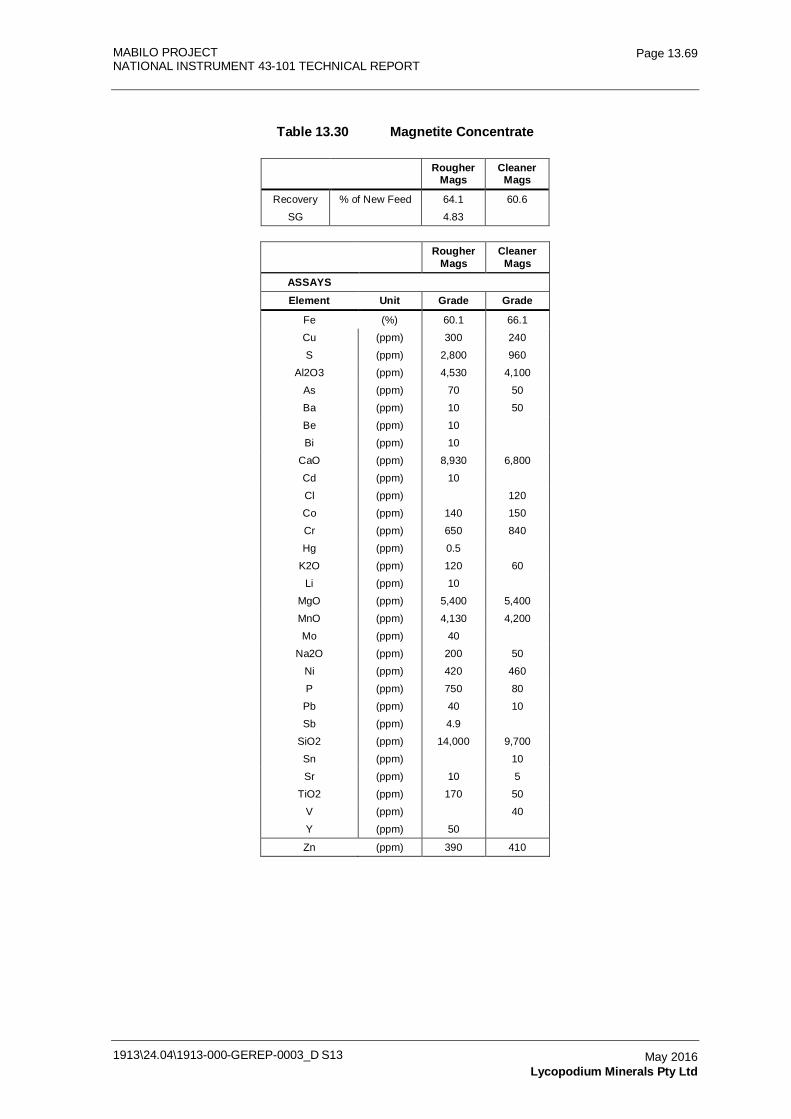
MABILO PROJECT NATIONAL INSTRUMENT 43-101 TECHNICAL REPORT
1913\24.04\1913-000-GEREP-0003_D S13
Page 13.69
May 2016 Lycopodium Minerals Pty Ltd
Table 13.30 Magnetite Concentrate
Rougher
Mags Cleaner
Mags
Recovery % of New Feed 64.1 60.6
SG 4.83
Rougher
Mags Cleaner
Mags
ASSAYS Element Unit Grade Grade
Fe (%) 60.1 66.1
Cu (ppm) 300 240
S (ppm) 2,800 960
Al2O3 (ppm) 4,530 4,100
As (ppm) 70 50
Ba (ppm) 10 50
Be (ppm) 10
Bi (ppm) 10
CaO (ppm) 8,930 6,800
Cd (ppm) 10
Cl (ppm) 120
Co (ppm) 140 150
Cr (ppm) 650 840
Hg (ppm) 0.5
K2O (ppm) 120 60
Li (ppm) 10
MgO (ppm) 5,400 5,400
MnO (ppm) 4,130 4,200
Mo (ppm) 40
Na2O (ppm) 200 50
Ni (ppm) 420 460
P (ppm) 750 80
Pb (ppm) 40 10
Sb (ppm) 4.9
SiO2 (ppm) 14,000 9,700
Sn (ppm) 10
Sr (ppm) 10 5
TiO2 (ppm) 170 50
V (ppm) 40
Y (ppm) 50
Zn (ppm) 390 410
MABILO PROJECT NATIONAL INSTRUMENT 43-101 TECHNICAL REPORT
1913\24.04\1913-000-GEREP-0003_D S13
Page 13.70
May 2016 Lycopodium Minerals Pty Ltd
13.11 Variability Testing
13.11.1 Introduction
Variability testing was conducted on 21 samples selected to represent the range of mineralization styles, lithological host rock types and the rage of grades expected. Sample selection also aimed to improve the spatial coverage of the resource.
Testing aimed to demonstrate recoveries following the process route selected for the master composite, i.e.:
• Primary P80 grind of 90 µm.
• Rougher flotation at natural pH using A3894 promoter.
• Regrind rougher concentrate P80 38 µm.
• Cleaner flotation at pH 10.5 adjusted with lime with A3894.
With the range of copper and sulphur grades in the samples it was decided to base the collector addition rates on the expected chalocopyrite content of the sample. Also the high pyrite and arsenopyrite content of some samples suggested that an extended scavenging stage may be required to maximize the sulphide recovery so this could be added to the cleaner tail for separate disposal to ensure the supernatant from the non-magnetic tail remained suitable for discharge to the local water courses.
The scavenging stage would also maximize the recovery of pyrite and the associated gold to the potentially saleable pyrite product.
It was planned to use PAX for the scavenger collector as A3894 is more selective against pyrite. The PAX was substituted with A407 in later testing as this was an equally good broad sulphide collector, but could be more readily depressed in the subsequent cleaner stage.
It was originally intended to leach the variability flotation tails to recover the gold, but this process was removed from the flowsheet ahead of variability testing.
13.11.2 Variability Flotation – Baseline
The results from the baseline flotation testing were highly variable and surprisingly poor given the performance of the master composite under the same conditions. Of the 21 samples tested only four or five were unaffected by the mineralization style with only seven meeting the criteria for acceptable product grade and recovery (>80% recovery at >24% Cu).
MABILO PROJECT NATIONAL INSTRUMENT 43-101 TECHNICAL REPORT
1913\24.04\1913-000-GEREP-0003_D S13
Page 13.71
May 2016 Lycopodium Minerals Pty Ltd
In a number of tests, rougher mass pulls were high and the activated pyrite was not readily depressed in the cleaners resulting in low grade concentrates. The presence of pyroxene / calc silicates typically associated with the garnet skarn / calc silicate skarn appears to affect recovery adversely. Argillic clays associated with breccia from the fault zones slimed the float and depleted the reagent so that grades and recoveries in these cases were low.
Grade recovery curves are presented in Figure 13.31 with a result summary in Table 13.31.
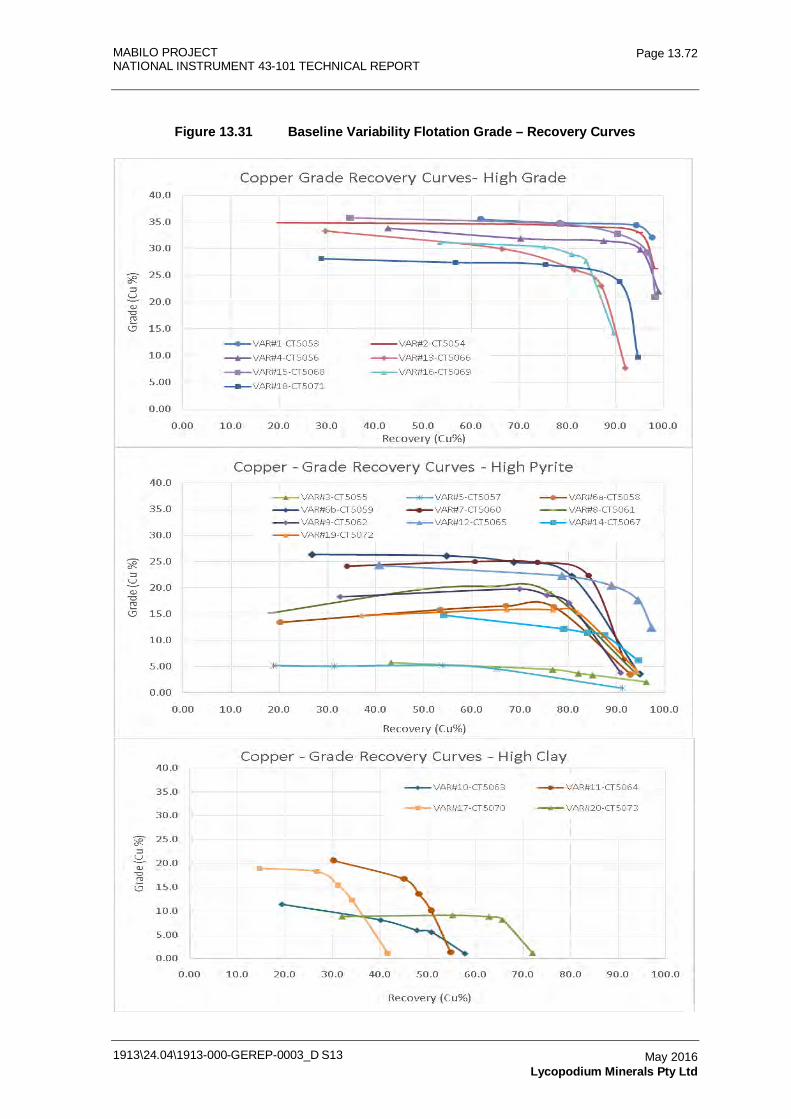
MABILO PROJECT NATIONAL INSTRUMENT 43-101 TECHNICAL REPORT
1913\24.04\1913-000-GEREP-0003_D S13
Page 13.72
May 2016 Lycopodium Minerals Pty Ltd
Figure 13.31 Baseline Variability Flotation Grade – Recovery Curves
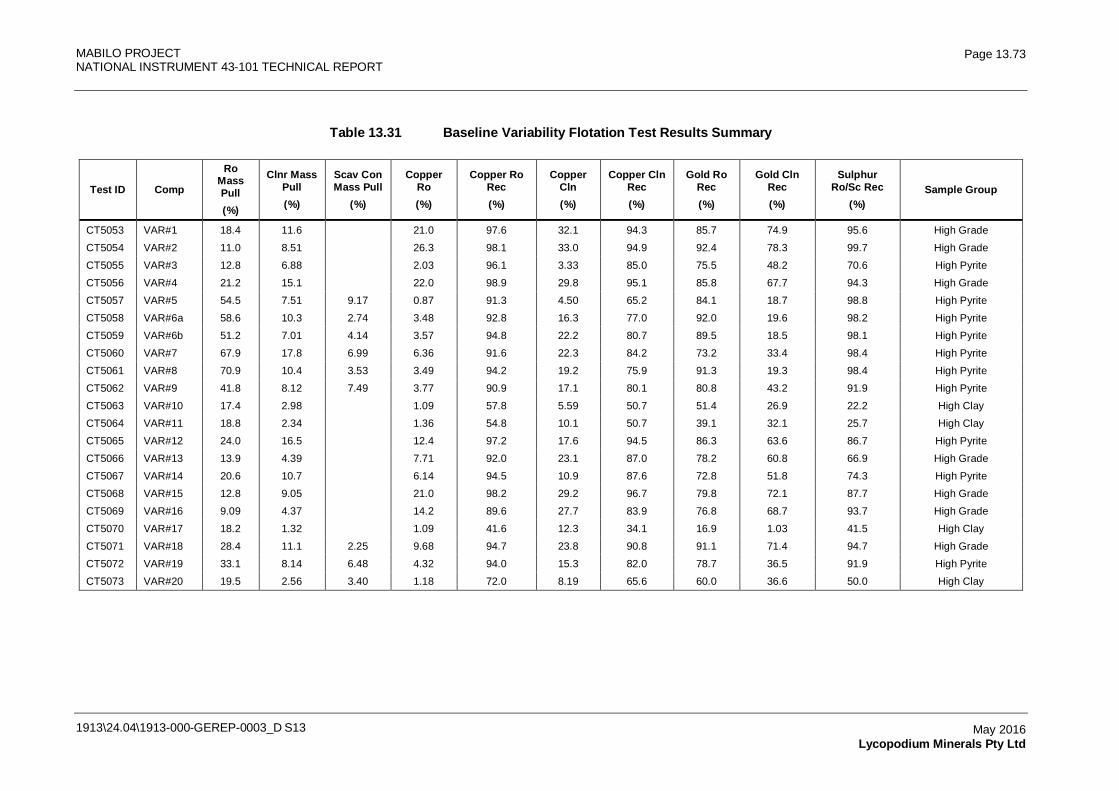
MABILO PROJECT NATIONAL INSTRUMENT 43-101 TECHNICAL REPORT
1913\24.04\1913-000-GEREP-0003_D S13
Page 13.73
May 2016 Lycopodium Minerals Pty Ltd
Table 13.31 Baseline Variability Flotation Test Results Summary
Test ID Comp
Ro Mass Pull (%)
Clnr Mass Pull (%)
Scav Con Mass Pull
(%)
Copper Ro (%)
Copper Ro Rec (%)
Copper Cln (%)
Copper Cln Rec (%)
Gold Ro Rec (%)
Gold Cln Rec (%)
Sulphur Ro/Sc Rec
(%) Sample Group
CT5053 VAR#1 18.4 11.6
21.0 97.6 32.1 94.3 85.7 74.9 95.6 High Grade
CT5054 VAR#2 11.0 8.51
26.3 98.1 33.0 94.9 92.4 78.3 99.7 High Grade
CT5055 VAR#3 12.8 6.88
2.03 96.1 3.33 85.0 75.5 48.2 70.6 High Pyrite
CT5056 VAR#4 21.2 15.1
22.0 98.9 29.8 95.1 85.8 67.7 94.3 High Grade
CT5057 VAR#5 54.5 7.51 9.17 0.87 91.3 4.50 65.2 84.1 18.7 98.8 High Pyrite
CT5058 VAR#6a 58.6 10.3 2.74 3.48 92.8 16.3 77.0 92.0 19.6 98.2 High Pyrite
CT5059 VAR#6b 51.2 7.01 4.14 3.57 94.8 22.2 80.7 89.5 18.5 98.1 High Pyrite
CT5060 VAR#7 67.9 17.8 6.99 6.36 91.6 22.3 84.2 73.2 33.4 98.4 High Pyrite
CT5061 VAR#8 70.9 10.4 3.53 3.49 94.2 19.2 75.9 91.3 19.3 98.4 High Pyrite
CT5062 VAR#9 41.8 8.12 7.49 3.77 90.9 17.1 80.1 80.8 43.2 91.9 High Pyrite
CT5063 VAR#10 17.4 2.98
1.09 57.8 5.59 50.7 51.4 26.9 22.2 High Clay
CT5064 VAR#11 18.8 2.34
1.36 54.8 10.1 50.7 39.1 32.1 25.7 High Clay
CT5065 VAR#12 24.0 16.5
12.4 97.2 17.6 94.5 86.3 63.6 86.7 High Pyrite
CT5066 VAR#13 13.9 4.39
7.71 92.0 23.1 87.0 78.2 60.8 66.9 High Grade
CT5067 VAR#14 20.6 10.7
6.14 94.5 10.9 87.6 72.8 51.8 74.3 High Pyrite
CT5068 VAR#15 12.8 9.05
21.0 98.2 29.2 96.7 79.8 72.1 87.7 High Grade
CT5069 VAR#16 9.09 4.37
14.2 89.6 27.7 83.9 76.8 68.7 93.7 High Grade
CT5070 VAR#17 18.2 1.32
1.09 41.6 12.3 34.1 16.9 1.03 41.5 High Clay
CT5071 VAR#18 28.4 11.1 2.25 9.68 94.7 23.8 90.8 91.1 71.4 94.7 High Grade
CT5072 VAR#19 33.1 8.14 6.48 4.32 94.0 15.3 82.0 78.7 36.5 91.9 High Pyrite
CT5073 VAR#20 19.5 2.56 3.40 1.18 72.0 8.19 65.6 60.0 36.6 50.0 High Clay
MABILO PROJECT NATIONAL INSTRUMENT 43-101 TECHNICAL REPORT
1913\24.04\1913-000-GEREP-0003_D S13
Page 13.74
May 2016 Lycopodium Minerals Pty Ltd
The samples were grouped into:
• acceptable grade and recovery
• low grade products, typically high pyrite samples requiring further cleaning to upgrade the copper concentrate
• low grade and recovery products, typically high clay, low head grade samples.
It was proposed to re-treat the low grade products to improve overall grade and recovery. The high pyrite samples would be floated with a higher pH in the rougher (9.5) to control the mass pull and reduce the pyrite recovery to rougher concentrate.
The pH would be further raised to 10.5 in the cleaner with cyanide addition to depress the recovered pyrite.
The clay samples would be deslimed and floated with a NaHS finish to activate tarnished or oxidized minerals in the vicinity of the clay contacts.
13.11.3 Variability Flotation Testing – Round 2
Following sighter tests to confirm that the proposed approach was beneficial, the pyrite and clay samples were re-tested to improve grades and recoveries.
For the pyrite samples, a small loss in recovery frequently resulted, but grade improvements were significant. The grade curves in Figure 13.32 and Figure 13.33 best illustrate the changes. The baseline grade recovery is the solid line with the improved result shown in the same color, but as a dashed line. Results for the Round 2 tests are summarized in Table 13.32.
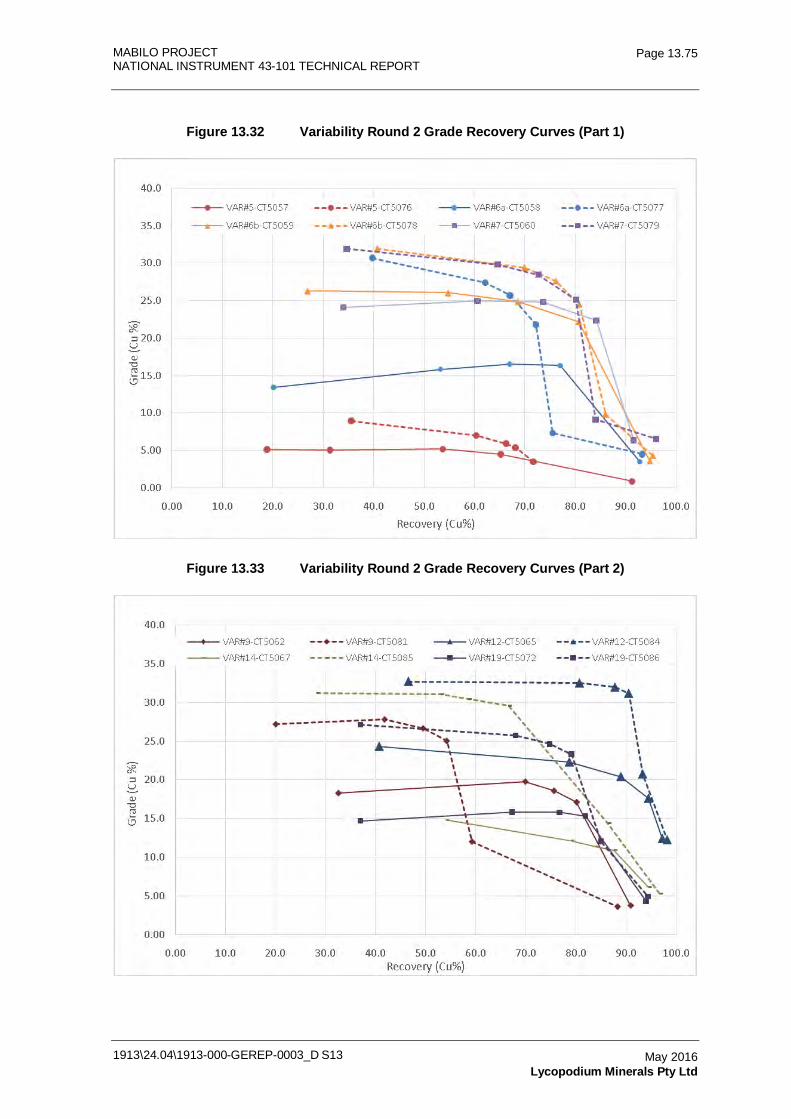
MABILO PROJECT NATIONAL INSTRUMENT 43-101 TECHNICAL REPORT
1913\24.04\1913-000-GEREP-0003_D S13
Page 13.75
May 2016 Lycopodium Minerals Pty Ltd
Figure 13.32 Variability Round 2 Grade Recovery Curves (Part 1)
Figure 13.33 Variability Round 2 Grade Recovery Curves (Part 2)
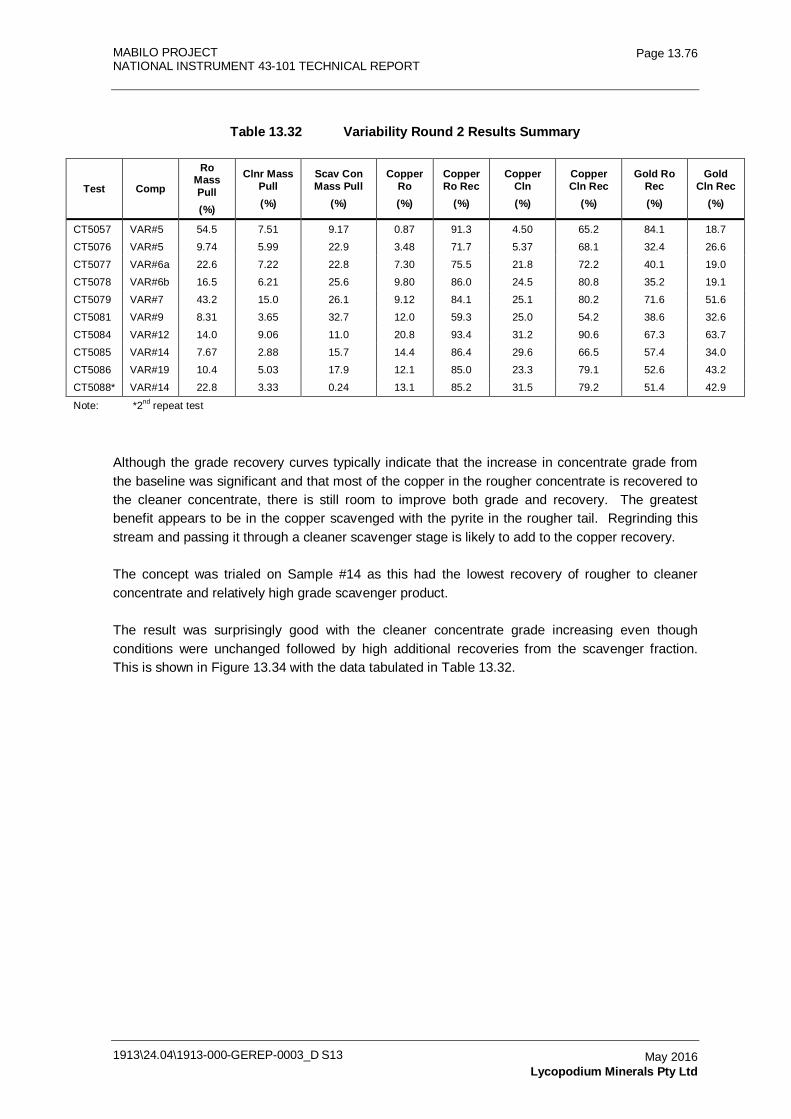
MABILO PROJECT NATIONAL INSTRUMENT 43-101 TECHNICAL REPORT
1913\24.04\1913-000-GEREP-0003_D S13
Page 13.76
May 2016 Lycopodium Minerals Pty Ltd
Table 13.32 Variability Round 2 Results Summary
Test Comp
Ro Mass Pull (%)
Clnr Mass Pull (%)
Scav Con Mass Pull
(%)
Copper Ro (%)
Copper Ro Rec
(%)
Copper Cln (%)
Copper Cln Rec
(%)
Gold Ro Rec (%)
Gold Cln Rec
(%)
CT5057 VAR#5 54.5 7.51 9.17 0.87 91.3 4.50 65.2 84.1 18.7
CT5076 VAR#5 9.74 5.99 22.9 3.48 71.7 5.37 68.1 32.4 26.6
CT5077 VAR#6a 22.6 7.22 22.8 7.30 75.5 21.8 72.2 40.1 19.0
CT5078 VAR#6b 16.5 6.21 25.6 9.80 86.0 24.5 80.8 35.2 19.1
CT5079 VAR#7 43.2 15.0 26.1 9.12 84.1 25.1 80.2 71.6 51.6
CT5081 VAR#9 8.31 3.65 32.7 12.0 59.3 25.0 54.2 38.6 32.6
CT5084 VAR#12 14.0 9.06 11.0 20.8 93.4 31.2 90.6 67.3 63.7
CT5085 VAR#14 7.67 2.88 15.7 14.4 86.4 29.6 66.5 57.4 34.0
CT5086 VAR#19 10.4 5.03 17.9 12.1 85.0 23.3 79.1 52.6 43.2
CT5088* VAR#14 22.8 3.33 0.24 13.1 85.2 31.5 79.2 51.4 42.9
Note: *2nd repeat test
Although the grade recovery curves typically indicate that the increase in concentrate grade from the baseline was significant and that most of the copper in the rougher concentrate is recovered to the cleaner concentrate, there is still room to improve both grade and recovery. The greatest benefit appears to be in the copper scavenged with the pyrite in the rougher tail. Regrinding this stream and passing it through a cleaner scavenger stage is likely to add to the copper recovery.
The concept was trialed on Sample #14 as this had the lowest recovery of rougher to cleaner concentrate and relatively high grade scavenger product.
The result was surprisingly good with the cleaner concentrate grade increasing even though conditions were unchanged followed by high additional recoveries from the scavenger fraction. This is shown in Figure 13.34 with the data tabulated in Table 13.32.
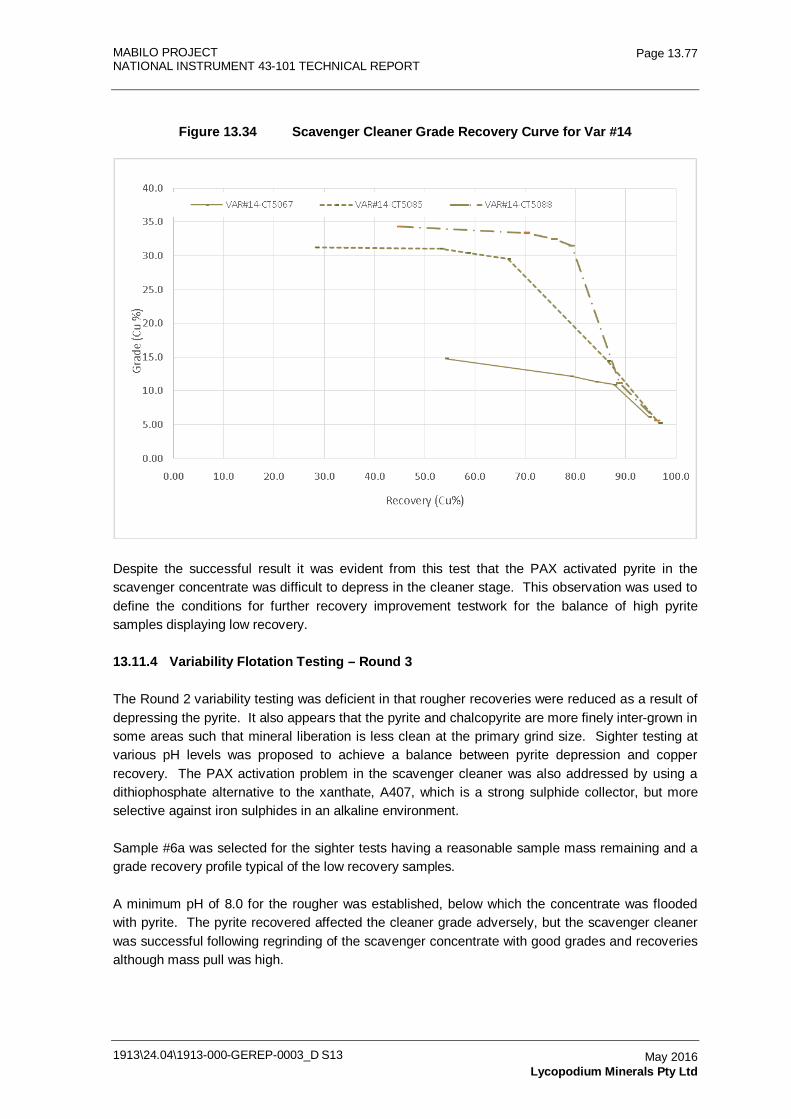
MABILO PROJECT NATIONAL INSTRUMENT 43-101 TECHNICAL REPORT
1913\24.04\1913-000-GEREP-0003_D S13
Page 13.77
May 2016 Lycopodium Minerals Pty Ltd
Figure 13.34 Scavenger Cleaner Grade Recovery Curve for Var #14
Despite the successful result it was evident from this test that the PAX activated pyrite in the scavenger concentrate was difficult to depress in the cleaner stage. This observation was used to define the conditions for further recovery improvement testwork for the balance of high pyrite samples displaying low recovery.
13.11.4 Variability Flotation Testing – Round 3
The Round 2 variability testing was deficient in that rougher recoveries were reduced as a result of depressing the pyrite. It also appears that the pyrite and chalcopyrite are more finely inter-grown in some areas such that mineral liberation is less clean at the primary grind size. Sighter testing at various pH levels was proposed to achieve a balance between pyrite depression and copper recovery. The PAX activation problem in the scavenger cleaner was also addressed by using a dithiophosphate alternative to the xanthate, A407, which is a strong sulphide collector, but more selective against iron sulphides in an alkaline environment.
Sample #6a was selected for the sighter tests having a reasonable sample mass remaining and a grade recovery profile typical of the low recovery samples.
A minimum pH of 8.0 for the rougher was established, below which the concentrate was flooded with pyrite. The pyrite recovered affected the cleaner grade adversely, but the scavenger cleaner was successful following regrinding of the scavenger concentrate with good grades and recoveries although mass pull was high.
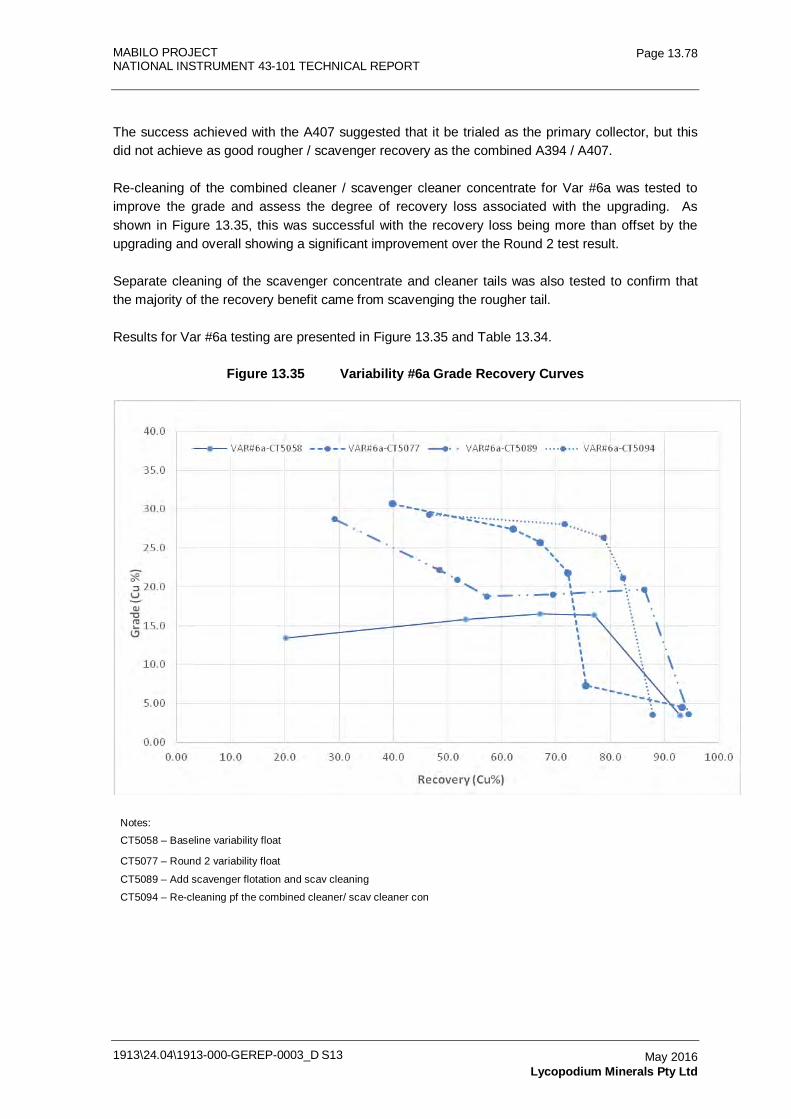
MABILO PROJECT NATIONAL INSTRUMENT 43-101 TECHNICAL REPORT
1913\24.04\1913-000-GEREP-0003_D S13
Page 13.78
May 2016 Lycopodium Minerals Pty Ltd
The success achieved with the A407 suggested that it be trialed as the primary collector, but this did not achieve as good rougher / scavenger recovery as the combined A394 / A407.
Re-cleaning of the combined cleaner / scavenger cleaner concentrate for Var #6a was tested to improve the grade and assess the degree of recovery loss associated with the upgrading. As shown in Figure 13.35, this was successful with the recovery loss being more than offset by the upgrading and overall showing a significant improvement over the Round 2 test result.
Separate cleaning of the scavenger concentrate and cleaner tails was also tested to confirm that the majority of the recovery benefit came from scavenging the rougher tail.
Results for Var #6a testing are presented in Figure 13.35 and Table 13.34.
Figure 13.35 Variability #6a Grade Recovery Curves
Notes:
CT5058 – Baseline variability float
CT5077 – Round 2 variability float
CT5089 – Add scavenger flotation and scav cleaning
CT5094 – Re-cleaning pf the combined cleaner/ scav cleaner con
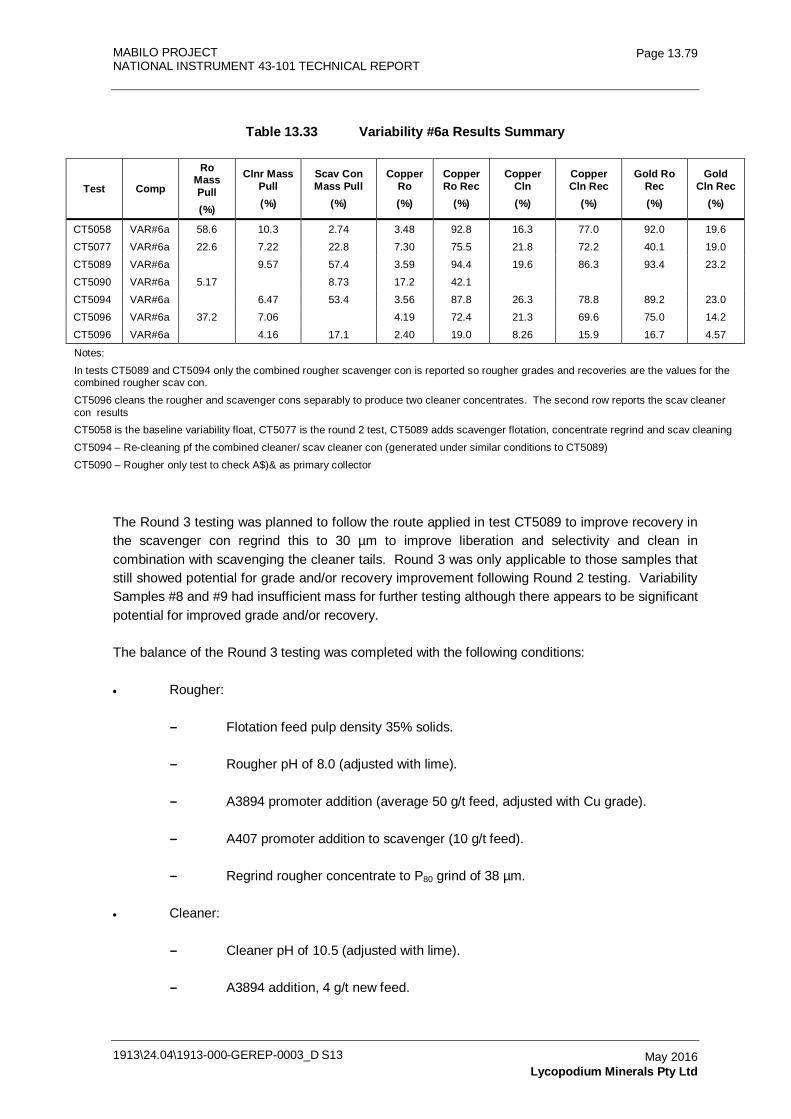
MABILO PROJECT NATIONAL INSTRUMENT 43-101 TECHNICAL REPORT
1913\24.04\1913-000-GEREP-0003_D S13
Page 13.79
May 2016 Lycopodium Minerals Pty Ltd
Table 13.33 Variability #6a Results Summary
Test Comp
Ro Mass Pull (%)
Clnr Mass Pull (%)
Scav Con Mass Pull
(%)
Copper Ro (%)
Copper Ro Rec
(%)
Copper Cln (%)
Copper Cln Rec
(%)
Gold Ro Rec (%)
Gold Cln Rec
(%)
CT5058 VAR#6a 58.6 10.3 2.74 3.48 92.8 16.3 77.0 92.0 19.6
CT5077 VAR#6a 22.6 7.22 22.8 7.30 75.5 21.8 72.2 40.1 19.0
CT5089 VAR#6a 9.57 57.4 3.59 94.4 19.6 86.3 93.4 23.2
CT5090 VAR#6a 5.17 8.73 17.2 42.1
CT5094 VAR#6a 6.47 53.4 3.56 87.8 26.3 78.8 89.2 23.0
CT5096 VAR#6a 37.2 7.06 4.19 72.4 21.3 69.6 75.0 14.2
CT5096 VAR#6a 4.16 17.1 2.40 19.0 8.26 15.9 16.7 4.57
Notes:
In tests CT5089 and CT5094 only the combined rougher scavenger con is reported so rougher grades and recoveries are the values for the combined rougher scav con.
CT5096 cleans the rougher and scavenger cons separably to produce two cleaner concentrates. The second row reports the scav cleaner con results CT5058 is the baseline variability float, CT5077 is the round 2 test, CT5089 adds scavenger flotation, concentrate regrind and scav cleaning
CT5094 – Re-cleaning pf the combined cleaner/ scav cleaner con (generated under similar conditions to CT5089)
CT5090 – Rougher only test to check A$)& as primary collector
The Round 3 testing was planned to follow the route applied in test CT5089 to improve recovery in the scavenger con regrind this to 30 µm to improve liberation and selectivity and clean in combination with scavenging the cleaner tails. Round 3 was only applicable to those samples that still showed potential for grade and/or recovery improvement following Round 2 testing. Variability Samples #8 and #9 had insufficient mass for further testing although there appears to be significant potential for improved grade and/or recovery.
The balance of the Round 3 testing was completed with the following conditions:
• Rougher:
- Flotation feed pulp density 35% solids.
- Rougher pH of 8.0 (adjusted with lime).
- A3894 promoter addition (average 50 g/t feed, adjusted with Cu grade).
- A407 promoter addition to scavenger (10 g/t feed).
- Regrind rougher concentrate to P80 grind of 38 µm.
• Cleaner:
- Cleaner pH of 10.5 (adjusted with lime).
- A3894 addition, 4 g/t new feed.
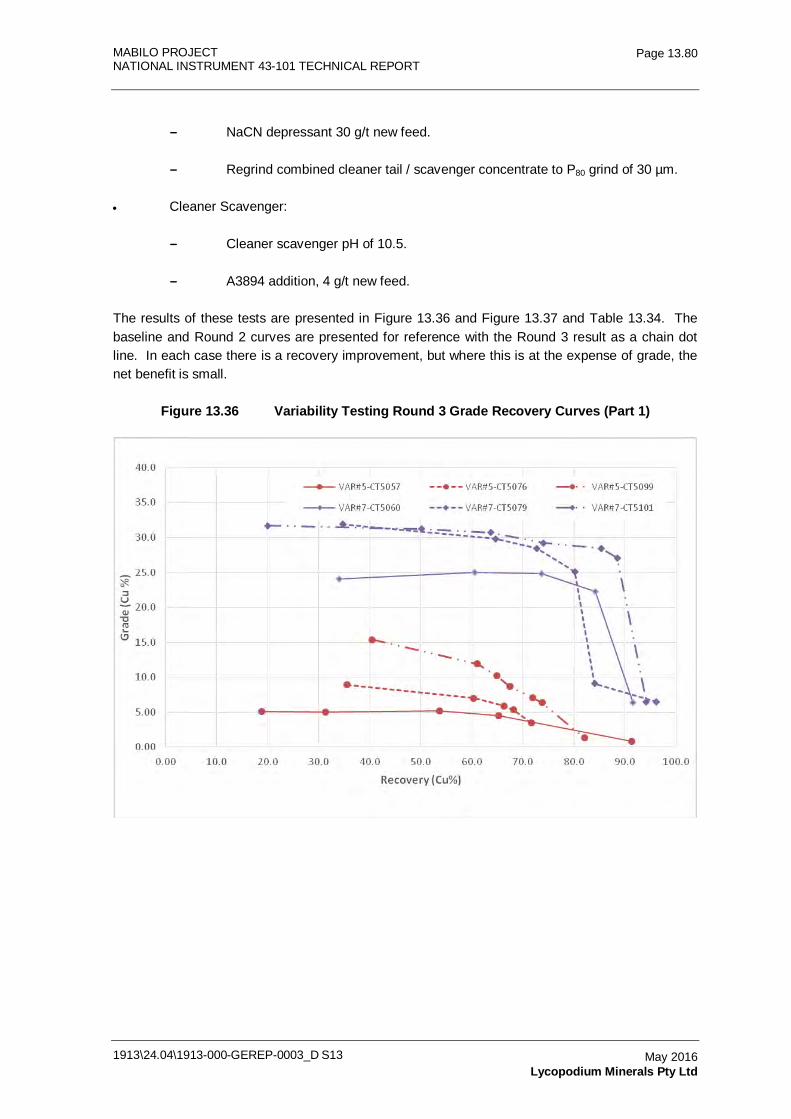
MABILO PROJECT NATIONAL INSTRUMENT 43-101 TECHNICAL REPORT
1913\24.04\1913-000-GEREP-0003_D S13
Page 13.80
May 2016 Lycopodium Minerals Pty Ltd
- NaCN depressant 30 g/t new feed.
- Regrind combined cleaner tail / scavenger concentrate to P80 grind of 30 µm.
• Cleaner Scavenger:
- Cleaner scavenger pH of 10.5.
- A3894 addition, 4 g/t new feed.
The results of these tests are presented in Figure 13.36 and Figure 13.37 and Table 13.34. The baseline and Round 2 curves are presented for reference with the Round 3 result as a chain dot line. In each case there is a recovery improvement, but where this is at the expense of grade, the net benefit is small.
Figure 13.36 Variability Testing Round 3 Grade Recovery Curves (Part 1)
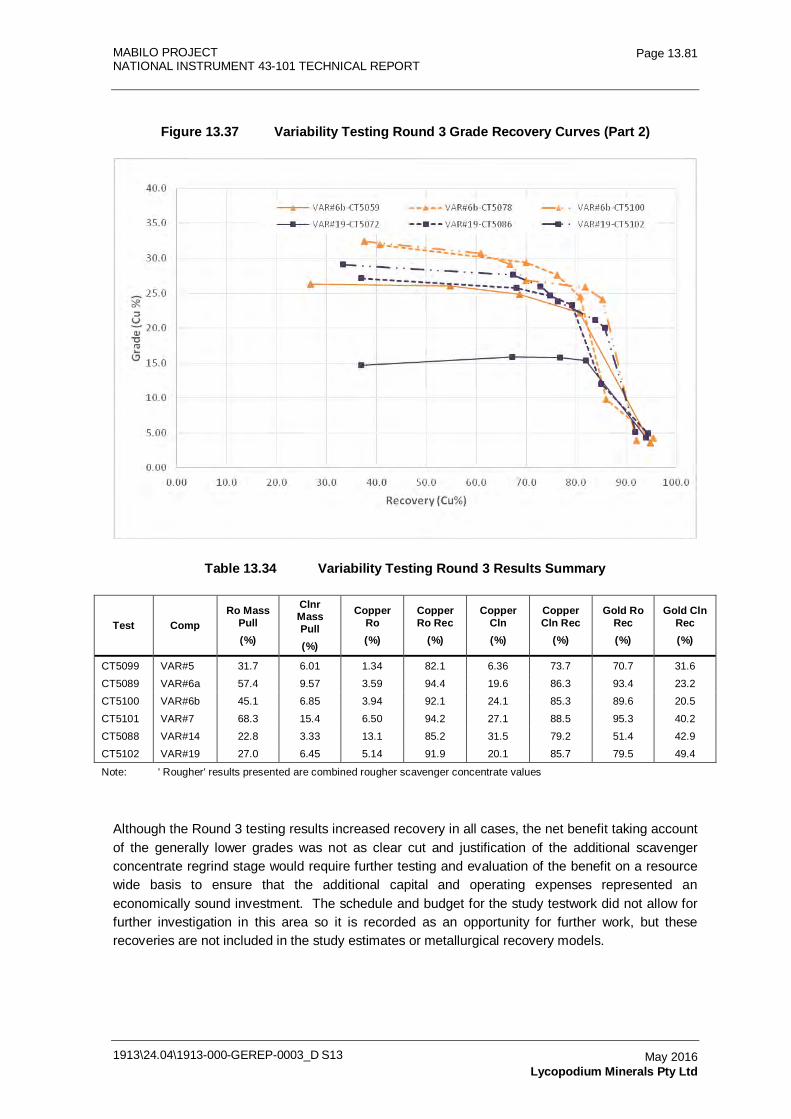
MABILO PROJECT NATIONAL INSTRUMENT 43-101 TECHNICAL REPORT
1913\24.04\1913-000-GEREP-0003_D S13
Page 13.81
May 2016 Lycopodium Minerals Pty Ltd
Figure 13.37 Variability Testing Round 3 Grade Recovery Curves (Part 2)
Table 13.34 Variability Testing Round 3 Results Summary
Test Comp Ro Mass
Pull (%)
Clnr Mass Pull (%)
Copper Ro (%)
Copper Ro Rec
(%)
Copper Cln (%)
Copper Cln Rec
(%)
Gold Ro Rec (%)
Gold Cln Rec (%)
CT5099 VAR#5 31.7 6.01 1.34 82.1 6.36 73.7 70.7 31.6
CT5089 VAR#6a 57.4 9.57 3.59 94.4 19.6 86.3 93.4 23.2
CT5100 VAR#6b 45.1 6.85 3.94 92.1 24.1 85.3 89.6 20.5
CT5101 VAR#7 68.3 15.4 6.50 94.2 27.1 88.5 95.3 40.2
CT5088 VAR#14 22.8 3.33 13.1 85.2 31.5 79.2 51.4 42.9
CT5102 VAR#19 27.0 6.45 5.14 91.9 20.1 85.7 79.5 49.4
Note: ' Rougher' results presented are combined rougher scavenger concentrate values
Although the Round 3 testing results increased recovery in all cases, the net benefit taking account of the generally lower grades was not as clear cut and justification of the additional scavenger concentrate regrind stage would require further testing and evaluation of the benefit on a resource wide basis to ensure that the additional capital and operating expenses represented an economically sound investment. The schedule and budget for the study testwork did not allow for further investigation in this area so it is recorded as an opportunity for further work, but these recoveries are not included in the study estimates or metallurgical recovery models.
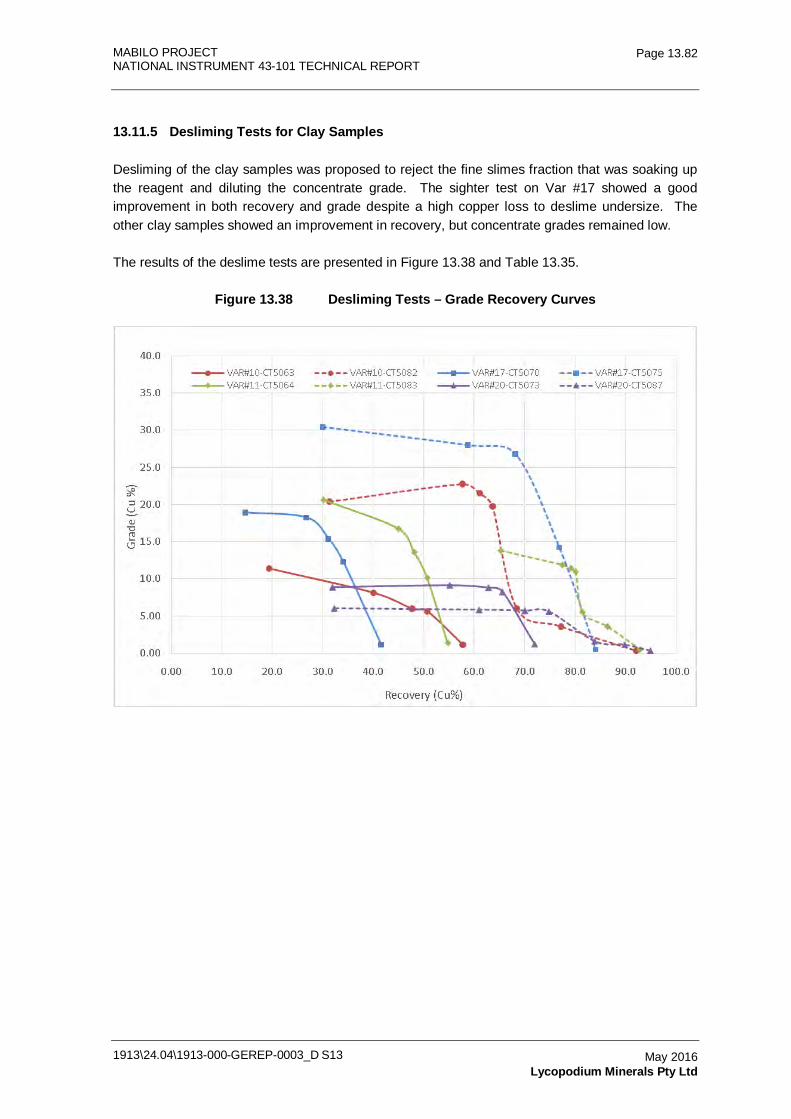
MABILO PROJECT NATIONAL INSTRUMENT 43-101 TECHNICAL REPORT
1913\24.04\1913-000-GEREP-0003_D S13
Page 13.82
May 2016 Lycopodium Minerals Pty Ltd
13.11.5 Desliming Tests for Clay Samples
Desliming of the clay samples was proposed to reject the fine slimes fraction that was soaking up the reagent and diluting the concentrate grade. The sighter test on Var #17 showed a good improvement in both recovery and grade despite a high copper loss to deslime undersize. The other clay samples showed an improvement in recovery, but concentrate grades remained low.
The results of the deslime tests are presented in Figure 13.38 and Table 13.35.
Figure 13.38 Desliming Tests – Grade Recovery Curves
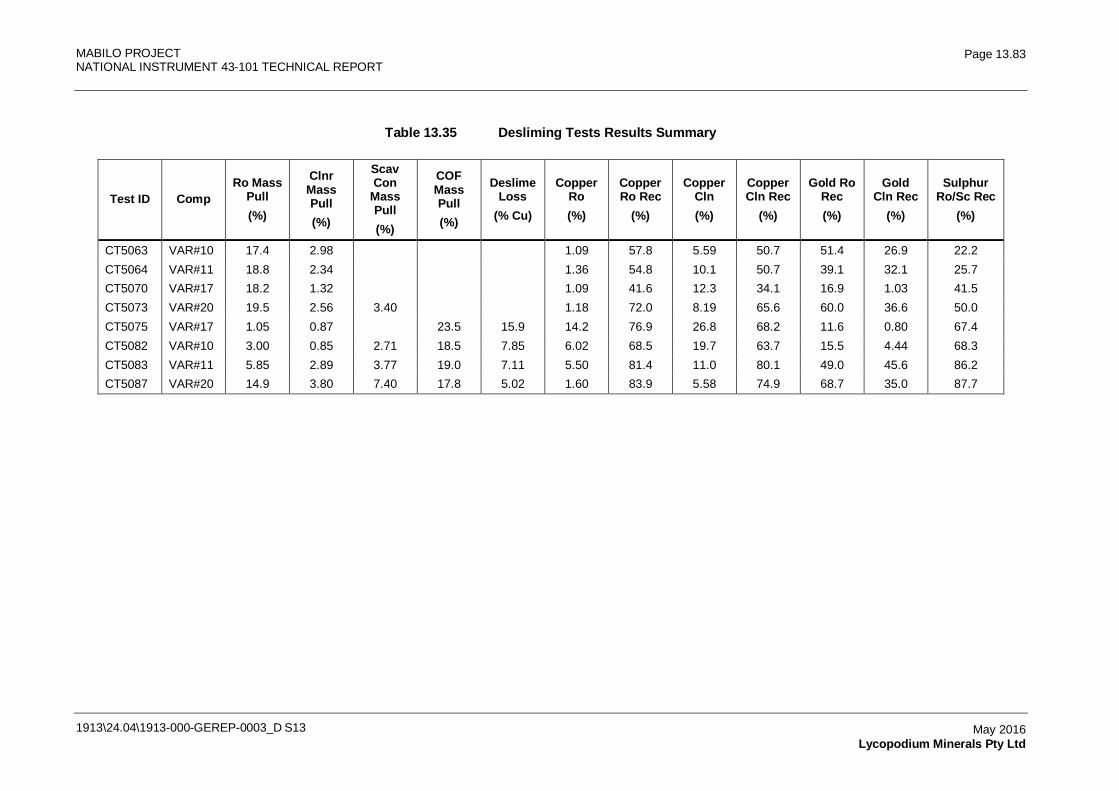
MABILO PROJECT NATIONAL INSTRUMENT 43-101 TECHNICAL REPORT
1913\24.04\1913-000-GEREP-0003_D S13
Page 13.83
May 2016 Lycopodium Minerals Pty Ltd
Table 13.35 Desliming Tests Results Summary
Test ID Comp Ro Mass
Pull (%)
Clnr Mass Pull (%)
Scav Con
Mass Pull (%)
COF Mass Pull (%)
Deslime Loss
(% Cu)
Copper Ro (%)
Copper Ro Rec
(%)
Copper Cln (%)
Copper Cln Rec
(%)
Gold Ro Rec (%)
Gold Cln Rec
(%)
Sulphur Ro/Sc Rec
(%)
CT5063 VAR#10 17.4 2.98
1.09 57.8 5.59 50.7 51.4 26.9 22.2 CT5064 VAR#11 18.8 2.34
1.36 54.8 10.1 50.7 39.1 32.1 25.7
CT5070 VAR#17 18.2 1.32
1.09 41.6 12.3 34.1 16.9 1.03 41.5 CT5073 VAR#20 19.5 2.56 3.40
1.18 72.0 8.19 65.6 60.0 36.6 50.0
CT5075 VAR#17 1.05 0.87
23.5 15.9 14.2 76.9 26.8 68.2 11.6 0.80 67.4 CT5082 VAR#10 3.00 0.85 2.71 18.5 7.85 6.02 68.5 19.7 63.7 15.5 4.44 68.3 CT5083 VAR#11 5.85 2.89 3.77 19.0 7.11 5.50 81.4 11.0 80.1 49.0 45.6 86.2 CT5087 VAR#20 14.9 3.80 7.40 17.8 5.02 1.60 83.9 5.58 74.9 68.7 35.0 87.7
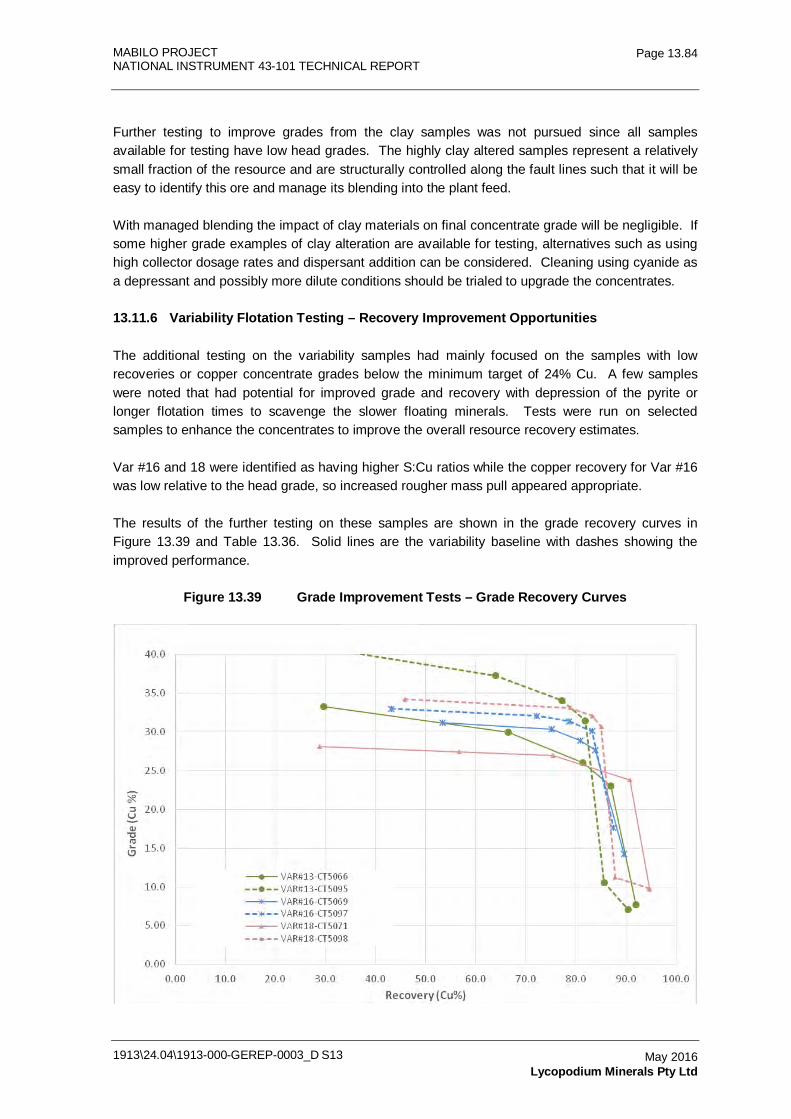
MABILO PROJECT NATIONAL INSTRUMENT 43-101 TECHNICAL REPORT
1913\24.04\1913-000-GEREP-0003_D S13
Page 13.84
May 2016 Lycopodium Minerals Pty Ltd
Further testing to improve grades from the clay samples was not pursued since all samples available for testing have low head grades. The highly clay altered samples represent a relatively small fraction of the resource and are structurally controlled along the fault lines such that it will be easy to identify this ore and manage its blending into the plant feed.
With managed blending the impact of clay materials on final concentrate grade will be negligible. If some higher grade examples of clay alteration are available for testing, alternatives such as using high collector dosage rates and dispersant addition can be considered. Cleaning using cyanide as a depressant and possibly more dilute conditions should be trialed to upgrade the concentrates.
13.11.6 Variability Flotation Testing – Recovery Improvement Opportunities
The additional testing on the variability samples had mainly focused on the samples with low recoveries or copper concentrate grades below the minimum target of 24% Cu. A few samples were noted that had potential for improved grade and recovery with depression of the pyrite or longer flotation times to scavenge the slower floating minerals. Tests were run on selected samples to enhance the concentrates to improve the overall resource recovery estimates.
Var #16 and 18 were identified as having higher S:Cu ratios while the copper recovery for Var #16 was low relative to the head grade, so increased rougher mass pull appeared appropriate.
The results of the further testing on these samples are shown in the grade recovery curves in Figure 13.39 and Table 13.36. Solid lines are the variability baseline with dashes showing the improved performance.
Figure 13.39 Grade Improvement Tests – Grade Recovery Curves
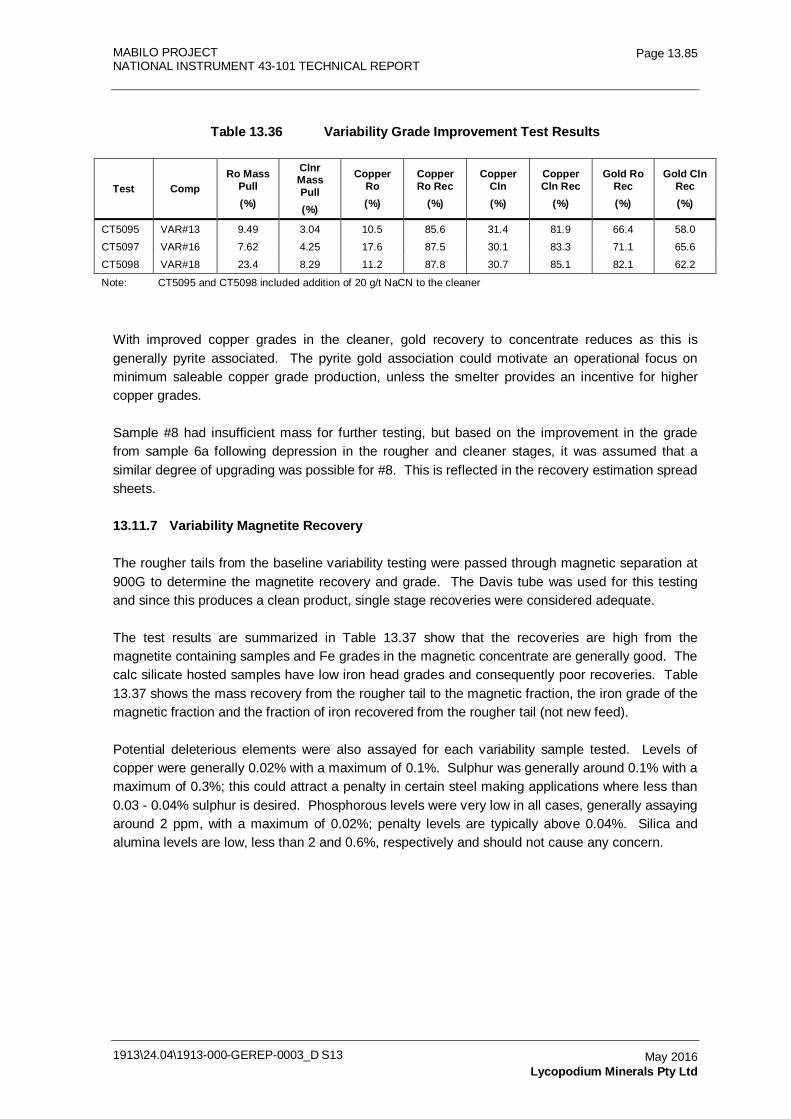
MABILO PROJECT NATIONAL INSTRUMENT 43-101 TECHNICAL REPORT
1913\24.04\1913-000-GEREP-0003_D S13
Page 13.85
May 2016 Lycopodium Minerals Pty Ltd
Table 13.36 Variability Grade Improvement Test Results
Test Comp Ro Mass
Pull (%)
Clnr Mass Pull (%)
Copper Ro (%)
Copper Ro Rec
(%)
Copper Cln (%)
Copper Cln Rec
(%)
Gold Ro Rec (%)
Gold Cln Rec (%)
CT5095 VAR#13 9.49 3.04 10.5 85.6 31.4 81.9 66.4 58.0
CT5097 VAR#16 7.62 4.25 17.6 87.5 30.1 83.3 71.1 65.6
CT5098 VAR#18 23.4 8.29 11.2 87.8 30.7 85.1 82.1 62.2
Note: CT5095 and CT5098 included addition of 20 g/t NaCN to the cleaner
With improved copper grades in the cleaner, gold recovery to concentrate reduces as this is generally pyrite associated. The pyrite gold association could motivate an operational focus on minimum saleable copper grade production, unless the smelter provides an incentive for higher copper grades.
Sample #8 had insufficient mass for further testing, but based on the improvement in the grade from sample 6a following depression in the rougher and cleaner stages, it was assumed that a similar degree of upgrading was possible for #8. This is reflected in the recovery estimation spread sheets.
13.11.7 Variability Magnetite Recovery
The rougher tails from the baseline variability testing were passed through magnetic separation at 900G to determine the magnetite recovery and grade. The Davis tube was used for this testing and since this produces a clean product, single stage recoveries were considered adequate.
The test results are summarized in Table 13.37 show that the recoveries are high from the magnetite containing samples and Fe grades in the magnetic concentrate are generally good. The calc silicate hosted samples have low iron head grades and consequently poor recoveries. Table 13.37 shows the mass recovery from the rougher tail to the magnetic fraction, the iron grade of the magnetic fraction and the fraction of iron recovered from the rougher tail (not new feed).
Potential deleterious elements were also assayed for each variability sample tested. Levels of copper were generally 0.02% with a maximum of 0.1%. Sulphur was generally around 0.1% with a maximum of 0.3%; this could attract a penalty in certain steel making applications where less than 0.03 - 0.04% sulphur is desired. Phosphorous levels were very low in all cases, generally assaying around 2 ppm, with a maximum of 0.02%; penalty levels are typically above 0.04%. Silica and alumina levels are low, less than 2 and 0.6%, respectively and should not cause any concern.
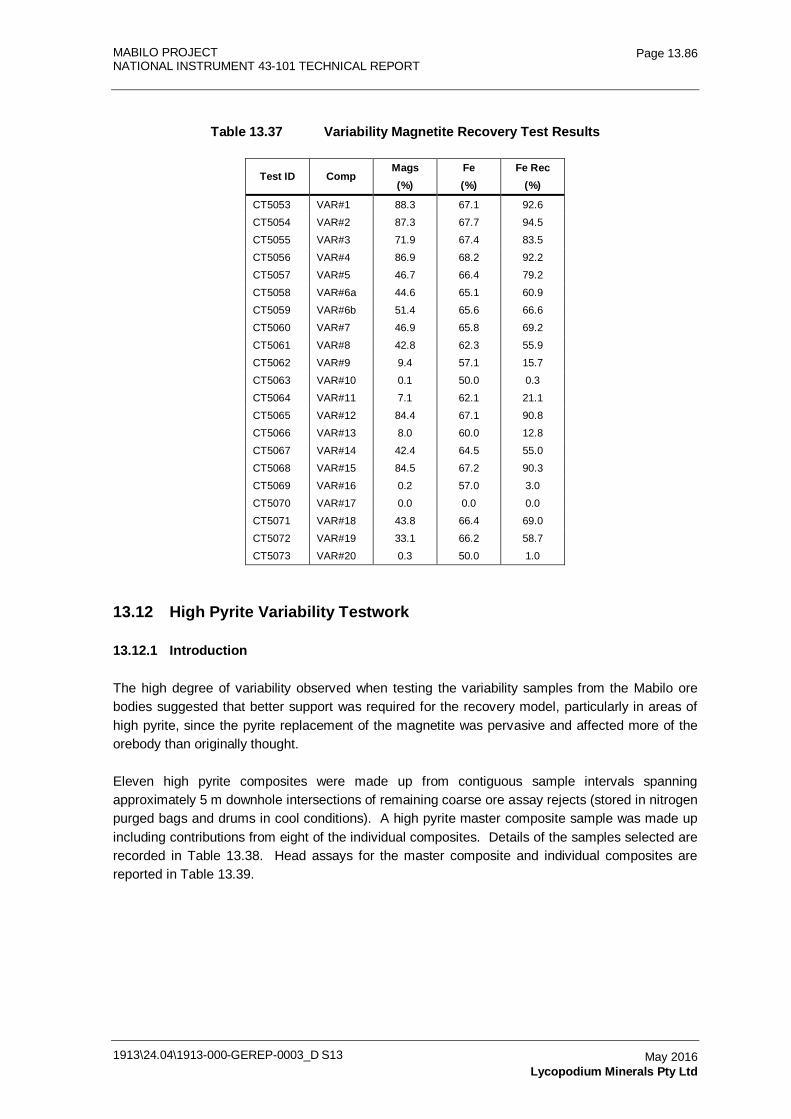
MABILO PROJECT NATIONAL INSTRUMENT 43-101 TECHNICAL REPORT
1913\24.04\1913-000-GEREP-0003_D S13
Page 13.86
May 2016 Lycopodium Minerals Pty Ltd
Table 13.37 Variability Magnetite Recovery Test Results
Test ID Comp Mags (%)
Fe (%)
Fe Rec (%)
CT5053 VAR#1 88.3 67.1 92.6
CT5054 VAR#2 87.3 67.7 94.5
CT5055 VAR#3 71.9 67.4 83.5
CT5056 VAR#4 86.9 68.2 92.2
CT5057 VAR#5 46.7 66.4 79.2
CT5058 VAR#6a 44.6 65.1 60.9
CT5059 VAR#6b 51.4 65.6 66.6
CT5060 VAR#7 46.9 65.8 69.2
CT5061 VAR#8 42.8 62.3 55.9
CT5062 VAR#9 9.4 57.1 15.7
CT5063 VAR#10 0.1 50.0 0.3
CT5064 VAR#11 7.1 62.1 21.1
CT5065 VAR#12 84.4 67.1 90.8
CT5066 VAR#13 8.0 60.0 12.8
CT5067 VAR#14 42.4 64.5 55.0
CT5068 VAR#15 84.5 67.2 90.3
CT5069 VAR#16 0.2 57.0 3.0
CT5070 VAR#17 0.0 0.0 0.0
CT5071 VAR#18 43.8 66.4 69.0
CT5072 VAR#19 33.1 66.2 58.7
CT5073 VAR#20 0.3 50.0 1.0
13.12 High Pyrite Variability Testwork
13.12.1 Introduction
The high degree of variability observed when testing the variability samples from the Mabilo ore bodies suggested that better support was required for the recovery model, particularly in areas of high pyrite, since the pyrite replacement of the magnetite was pervasive and affected more of the orebody than originally thought.
Eleven high pyrite composites were made up from contiguous sample intervals spanning approximately 5 m downhole intersections of remaining coarse ore assay rejects (stored in nitrogen purged bags and drums in cool conditions). A high pyrite master composite sample was made up including contributions from eight of the individual composites. Details of the samples selected are recorded in Table 13.38. Head assays for the master composite and individual composites are reported in Table 13.39.
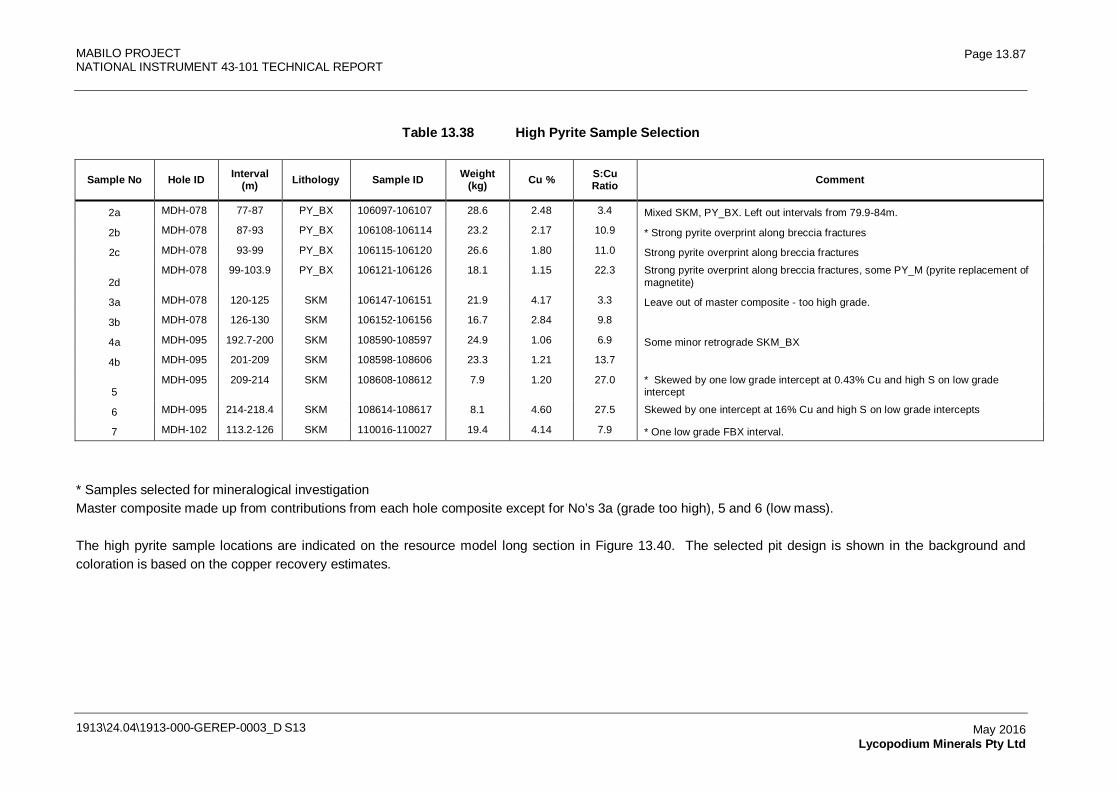
MABILO PROJECT NATIONAL INSTRUMENT 43-101 TECHNICAL REPORT
1913\24.04\1913-000-GEREP-0003_D S13
Page 13.87
May 2016 Lycopodium Minerals Pty Ltd
Table 13.38 High Pyrite Sample Selection
Sample No Hole ID Interval (m) Lithology Sample ID Weight
(kg) Cu % S:Cu Ratio Comment
2a MDH-078 77-87 PY_BX 106097-106107 28.6 2.48 3.4 Mixed SKM, PY_BX. Left out intervals from 79.9-84m.
2b MDH-078 87-93 PY_BX 106108-106114 23.2 2.17 10.9 * Strong pyrite overprint along breccia fractures
2c MDH-078 93-99 PY_BX 106115-106120 26.6 1.80 11.0 Strong pyrite overprint along breccia fractures
2d MDH-078 99-103.9 PY_BX 106121-106126 18.1 1.15 22.3 Strong pyrite overprint along breccia fractures, some PY_M (pyrite replacement of
magnetite)
3a MDH-078 120-125 SKM 106147-106151 21.9 4.17 3.3 Leave out of master composite - too high grade.
3b MDH-078 126-130 SKM 106152-106156 16.7 2.84 9.8
4a MDH-095 192.7-200 SKM 108590-108597 24.9 1.06 6.9 Some minor retrograde SKM_BX
4b MDH-095 201-209 SKM 108598-108606 23.3 1.21 13.7
5
MDH-095 209-214 SKM 108608-108612 7.9 1.20 27.0 * Skewed by one low grade intercept at 0.43% Cu and high S on low grade intercept
6 MDH-095 214-218.4 SKM 108614-108617 8.1 4.60 27.5 Skewed by one intercept at 16% Cu and high S on low grade intercepts
7 MDH-102 113.2-126 SKM 110016-110027 19.4 4.14 7.9 * One low grade FBX interval.
* Samples selected for mineralogical investigation Master composite made up from contributions from each hole composite except for No’s 3a (grade too high), 5 and 6 (low mass).
The high pyrite sample locations are indicated on the resource model long section in Figure 13.40. The selected pit design is shown in the background and coloration is based on the copper recovery estimates.
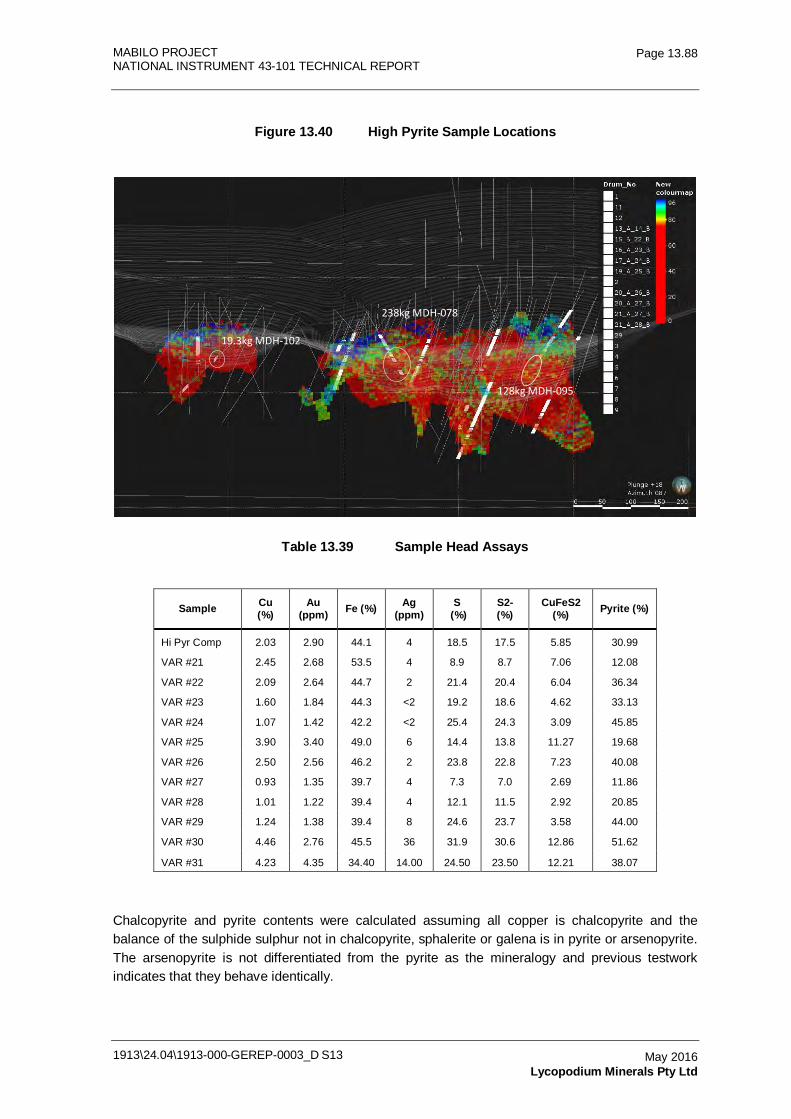
MABILO PROJECT NATIONAL INSTRUMENT 43-101 TECHNICAL REPORT
1913\24.04\1913-000-GEREP-0003_D S13
Page 13.88
May 2016 Lycopodium Minerals Pty Ltd
Figure 13.40 High Pyrite Sample Locations
19.3kg MDH-102
238kg MDH-078
128kg MDH-095
Table 13.39 Sample Head Assays
Sample Cu (%)
Au (ppm) Fe (%) Ag
(ppm) S
(%) S2- (%)
CuFeS2 (%) Pyrite (%)
Hi Pyr Comp 2.03 2.90 44.1 4 18.5 17.5 5.85 30.99
VAR #21 2.45 2.68 53.5 4 8.9 8.7 7.06 12.08
VAR #22 2.09 2.64 44.7 2 21.4 20.4 6.04 36.34
VAR #23 1.60 1.84 44.3 <2 19.2 18.6 4.62 33.13
VAR #24 1.07 1.42 42.2 <2 25.4 24.3 3.09 45.85
VAR #25 3.90 3.40 49.0 6 14.4 13.8 11.27 19.68
VAR #26 2.50 2.56 46.2 2 23.8 22.8 7.23 40.08
VAR #27 0.93 1.35 39.7 4 7.3 7.0 2.69 11.86
VAR #28 1.01 1.22 39.4 4 12.1 11.5 2.92 20.85
VAR #29 1.24 1.38 39.4 8 24.6 23.7 3.58 44.00
VAR #30 4.46 2.76 45.5 36 31.9 30.6 12.86 51.62
VAR #31 4.23 4.35 34.40 14.00 24.50 23.50 12.21 38.07
Chalcopyrite and pyrite contents were calculated assuming all copper is chalcopyrite and the balance of the sulphide sulphur not in chalcopyrite, sphalerite or galena is in pyrite or arsenopyrite. The arsenopyrite is not differentiated from the pyrite as the mineralogy and previous testwork indicates that they behave identically.
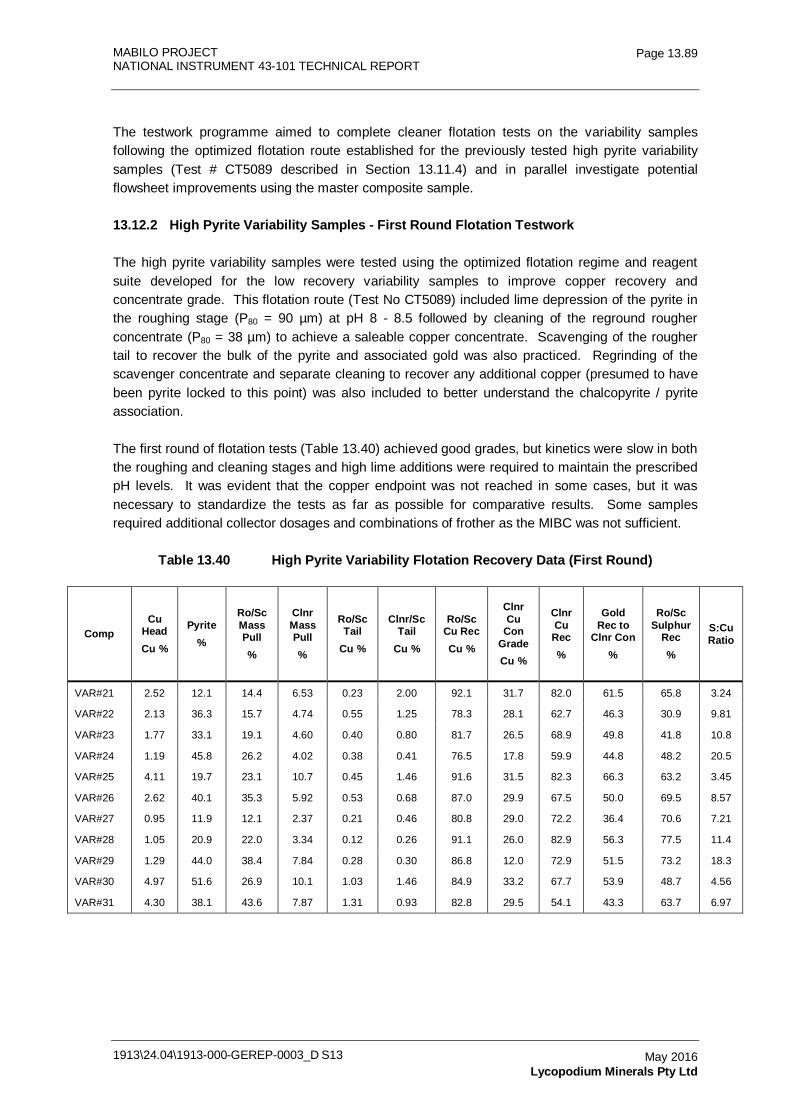
MABILO PROJECT NATIONAL INSTRUMENT 43-101 TECHNICAL REPORT
1913\24.04\1913-000-GEREP-0003_D S13
Page 13.89
May 2016 Lycopodium Minerals Pty Ltd
The testwork programme aimed to complete cleaner flotation tests on the variability samples following the optimized flotation route established for the previously tested high pyrite variability samples (Test # CT5089 described in Section 13.11.4) and in parallel investigate potential flowsheet improvements using the master composite sample.
13.12.2 High Pyrite Variability Samples - First Round Flotation Testwork
The high pyrite variability samples were tested using the optimized flotation regime and reagent suite developed for the low recovery variability samples to improve copper recovery and concentrate grade. This flotation route (Test No CT5089) included lime depression of the pyrite in the roughing stage (P80 = 90 µm) at pH 8 - 8.5 followed by cleaning of the reground rougher concentrate (P80 = 38 µm) to achieve a saleable copper concentrate. Scavenging of the rougher tail to recover the bulk of the pyrite and associated gold was also practiced. Regrinding of the scavenger concentrate and separate cleaning to recover any additional copper (presumed to have been pyrite locked to this point) was also included to better understand the chalcopyrite / pyrite association.
The first round of flotation tests (Table 13.40) achieved good grades, but kinetics were slow in both the roughing and cleaning stages and high lime additions were required to maintain the prescribed pH levels. It was evident that the copper endpoint was not reached in some cases, but it was necessary to standardize the tests as far as possible for comparative results. Some samples required additional collector dosages and combinations of frother as the MIBC was not sufficient.
Table 13.40 High Pyrite Variability Flotation Recovery Data (First Round)
Comp Cu
Head Cu %
Pyrite %
Ro/Sc Mass Pull %
Clnr Mass Pull %
Ro/Sc Tail
Cu %
Clnr/Sc Tail
Cu %
Ro/Sc Cu Rec Cu %
Clnr Cu
Con Grade Cu %
Clnr Cu Rec %
Gold Rec to
Clnr Con %
Ro/Sc Sulphur
Rec %
S:Cu Ratio
VAR#21 2.52 12.1 14.4 6.53 0.23 2.00 92.1 31.7 82.0 61.5 65.8 3.24
VAR#22 2.13 36.3 15.7 4.74 0.55 1.25 78.3 28.1 62.7 46.3 30.9 9.81
VAR#23 1.77 33.1 19.1 4.60 0.40 0.80 81.7 26.5 68.9 49.8 41.8 10.8
VAR#24 1.19 45.8 26.2 4.02 0.38 0.41 76.5 17.8 59.9 44.8 48.2 20.5
VAR#25 4.11 19.7 23.1 10.7 0.45 1.46 91.6 31.5 82.3 66.3 63.2 3.45
VAR#26 2.62 40.1 35.3 5.92 0.53 0.68 87.0 29.9 67.5 50.0 69.5 8.57
VAR#27 0.95 11.9 12.1 2.37 0.21 0.46 80.8 29.0 72.2 36.4 70.6 7.21
VAR#28 1.05 20.9 22.0 3.34 0.12 0.26 91.1 26.0 82.9 56.3 77.5 11.4
VAR#29 1.29 44.0 38.4 7.84 0.28 0.30 86.8 12.0 72.9 51.5 73.2 18.3
VAR#30 4.97 51.6 26.9 10.1 1.03 1.46 84.9 33.2 67.7 53.9 48.7 4.56
VAR#31 4.30 38.1 43.6 7.87 1.31 0.93 82.8 29.5 54.1 43.3 63.7 6.97
MABILO PROJECT NATIONAL INSTRUMENT 43-101 TECHNICAL REPORT
1913\24.04\1913-000-GEREP-0003_D S13
Page 13.90
May 2016 Lycopodium Minerals Pty Ltd
It was apparent from the first round testwork results that:
• a few of the samples had significant copper tails grades even after the scavenger stage suggesting that the pyrite and chalcopyrite are inter-grown to a degree such that depressing the pyrite was causing an unavoidable loss of copper
• high cleaner scavenger tails suggested that even after fine grinding of the scavenger con there were still locking issues causing copper to report with the pyrite
• the additional copper recovery in the scavenger con was significant in some cases and repeat testing was recommended to ascertain if this resulted from inadequate time and collector strength in the rougher, or if this was only possible following additional regrinding of the scavenger concentrate
• the additional scavenger recovery could not be taken into account as this testing approach did not reflect the study process flowsheet and was only intended as a diagnostic feature. Only cleaner recoveries were considered for comparative purposes
• gold recoveries to cleaner concentrate were fairly randomly distributed. Gold recoveries followed the copper in some cases, but there were a number of distinct outliers, both high and low
• sulphur recovery in the overall rougher scavenger concentrate was generally quite low compared to previous samples (typically >90%) suggesting that a stronger collector is required to make the pyrite concentrate for sale and recovery of the associated gold.
13.12.3 Master Composite Grind Series
Testwork planned for the master composite to further optimize the flotation process included:
• primary grind size optimization
• optimization of depressant addition
• investigation of pyrite pre-flotation to reduce the need for depression in the rougher.
The best opportunity for recovery improvement was seen as improving liberation of the chalcopyrite. Liberation has to occur ahead of the roughers such that depression of the pyrite is more selective. The primary grind size series trialed P80 grinds of 90, 75 and 53 microns, with finer sizes being deemed impractical for the whole of ore.
The rougher flotation results following the grind optimization test series for the master composite are presented in Table 13.41. As has been the case previously, the master composite samples appeared to perform better metallurgically than the average of the individual components. This should be a positive characteristic for process operations.
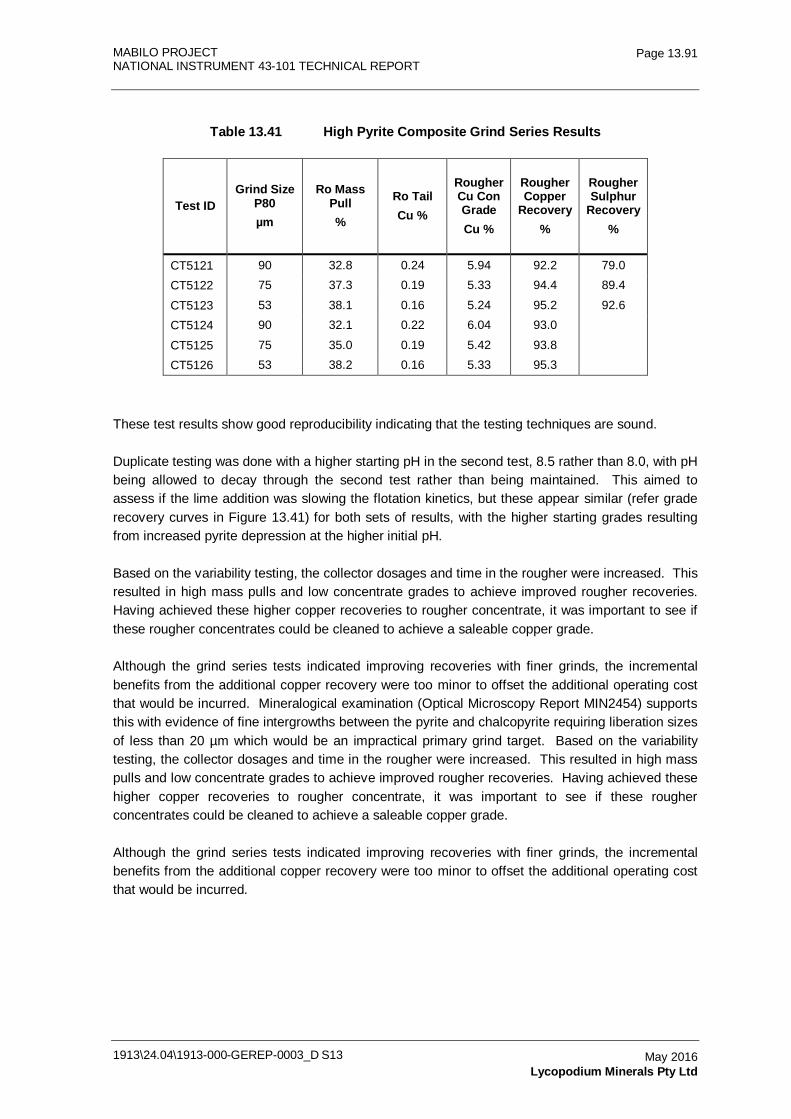
MABILO PROJECT NATIONAL INSTRUMENT 43-101 TECHNICAL REPORT
1913\24.04\1913-000-GEREP-0003_D S13
Page 13.91
May 2016 Lycopodium Minerals Pty Ltd
Table 13.41 High Pyrite Composite Grind Series Results
Test ID Grind Size
P80 µm
Ro Mass Pull %
Ro Tail Cu %
Rougher Cu Con Grade Cu %
Rougher Copper
Recovery %
Rougher Sulphur
Recovery %
CT5121 90 32.8 0.24 5.94 92.2 79.0 CT5122 75 37.3 0.19 5.33 94.4 89.4
CT5123 53 38.1 0.16 5.24 95.2 92.6 CT5124 90 32.1 0.22 6.04 93.0
CT5125 75 35.0 0.19 5.42 93.8
CT5126 53 38.2 0.16 5.33 95.3
These test results show good reproducibility indicating that the testing techniques are sound.
Duplicate testing was done with a higher starting pH in the second test, 8.5 rather than 8.0, with pH being allowed to decay through the second test rather than being maintained. This aimed to assess if the lime addition was slowing the flotation kinetics, but these appear similar (refer grade recovery curves in Figure 13.41) for both sets of results, with the higher starting grades resulting from increased pyrite depression at the higher initial pH.
Based on the variability testing, the collector dosages and time in the rougher were increased. This resulted in high mass pulls and low concentrate grades to achieve improved rougher recoveries. Having achieved these higher copper recoveries to rougher concentrate, it was important to see if these rougher concentrates could be cleaned to achieve a saleable copper grade.
Although the grind series tests indicated improving recoveries with finer grinds, the incremental benefits from the additional copper recovery were too minor to offset the additional operating cost that would be incurred. Mineralogical examination (Optical Microscopy Report MIN2454) supports this with evidence of fine intergrowths between the pyrite and chalcopyrite requiring liberation sizes of less than 20 µm which would be an impractical primary grind target. Based on the variability testing, the collector dosages and time in the rougher were increased. This resulted in high mass pulls and low concentrate grades to achieve improved rougher recoveries. Having achieved these higher copper recoveries to rougher concentrate, it was important to see if these rougher concentrates could be cleaned to achieve a saleable copper grade.
Although the grind series tests indicated improving recoveries with finer grinds, the incremental benefits from the additional copper recovery were too minor to offset the additional operating cost that would be incurred.
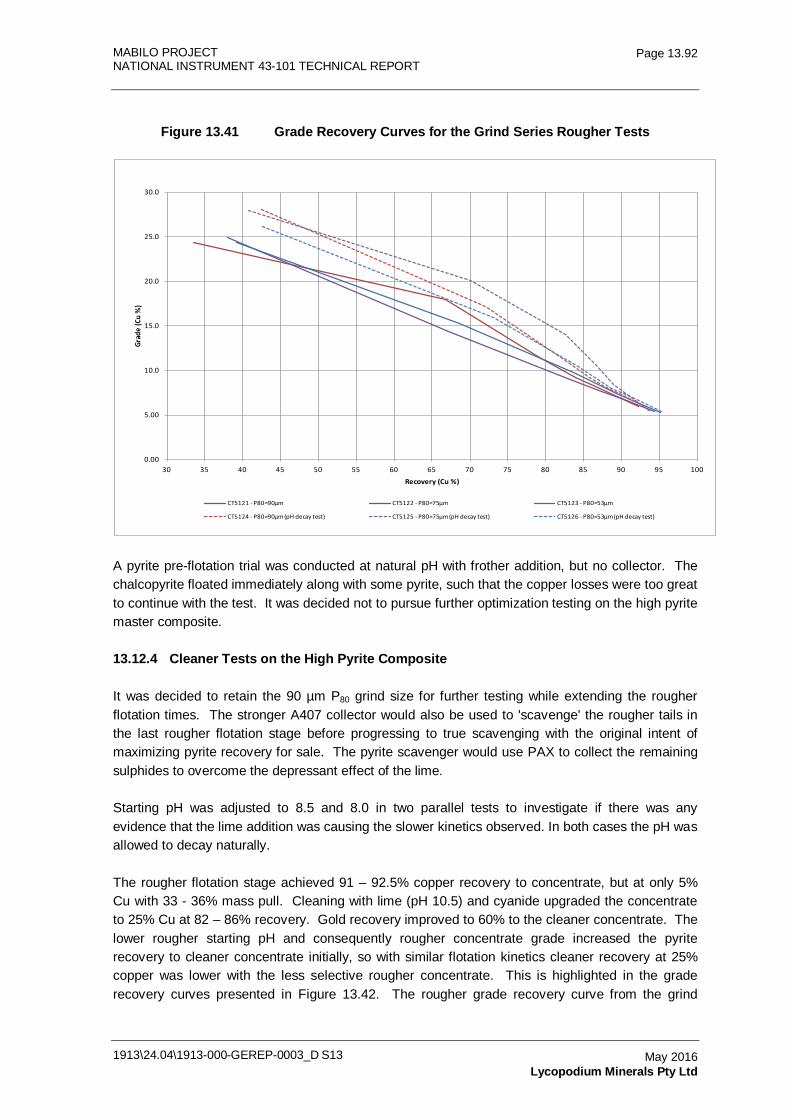
MABILO PROJECT NATIONAL INSTRUMENT 43-101 TECHNICAL REPORT
1913\24.04\1913-000-GEREP-0003_D S13
Page 13.92
May 2016 Lycopodium Minerals Pty Ltd
Figure 13.41 Grade Recovery Curves for the Grind Series Rougher Tests
0.00
5.00
10.0
15.0
20.0
25.0
30.0
30 35 40 45 50 55 60 65 70 75 80 85 90 95 100
Grad
e (C
u %
)
Recovery (Cu %)
CT5121 - P80=90µm CT5122 - P80=75µm CT5123 - P80=53µm
CT5124 - P80=90µm (pH decay test) CT5125 - P80=75µm (pH decay test) CT5126 - P80=53µm (pH decay test)
A pyrite pre-flotation trial was conducted at natural pH with frother addition, but no collector. The chalcopyrite floated immediately along with some pyrite, such that the copper losses were too great to continue with the test. It was decided not to pursue further optimization testing on the high pyrite master composite.
13.12.4 Cleaner Tests on the High Pyrite Composite
It was decided to retain the 90 µm P80 grind size for further testing while extending the rougher flotation times. The stronger A407 collector would also be used to 'scavenge' the rougher tails in the last rougher flotation stage before progressing to true scavenging with the original intent of maximizing pyrite recovery for sale. The pyrite scavenger would use PAX to collect the remaining sulphides to overcome the depressant effect of the lime.
Starting pH was adjusted to 8.5 and 8.0 in two parallel tests to investigate if there was any evidence that the lime addition was causing the slower kinetics observed. In both cases the pH was allowed to decay naturally.
The rougher flotation stage achieved 91 – 92.5% copper recovery to concentrate, but at only 5% Cu with 33 - 36% mass pull. Cleaning with lime (pH 10.5) and cyanide upgraded the concentrate to 25% Cu at 82 – 86% recovery. Gold recovery improved to 60% to the cleaner concentrate. The lower rougher starting pH and consequently rougher concentrate grade increased the pyrite recovery to cleaner concentrate initially, so with similar flotation kinetics cleaner recovery at 25% copper was lower with the less selective rougher concentrate. This is highlighted in the grade recovery curves presented in Figure 13.42. The rougher grade recovery curve from the grind
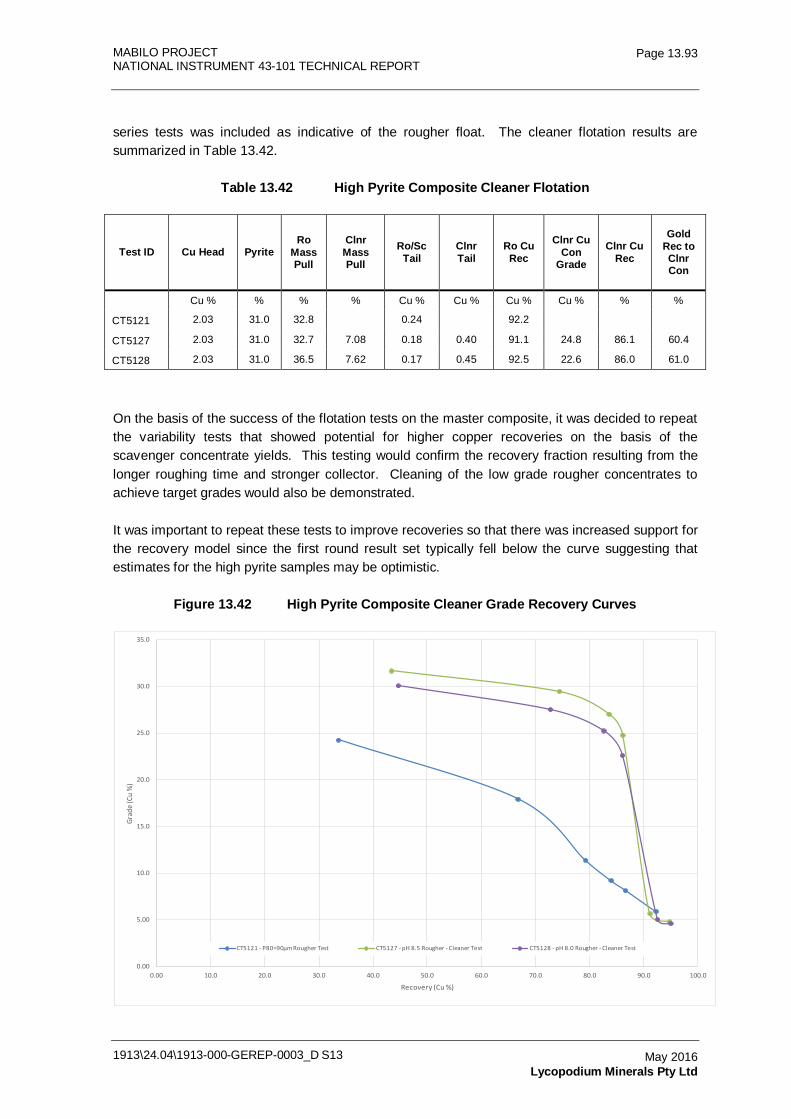
MABILO PROJECT NATIONAL INSTRUMENT 43-101 TECHNICAL REPORT
1913\24.04\1913-000-GEREP-0003_D S13
Page 13.93
May 2016 Lycopodium Minerals Pty Ltd
series tests was included as indicative of the rougher float. The cleaner flotation results are summarized in Table 13.42.
Table 13.42 High Pyrite Composite Cleaner Flotation
Test ID Cu Head Pyrite Ro
Mass Pull
Clnr Mass Pull
Ro/Sc Tail
Clnr Tail
Ro Cu Rec
Clnr Cu Con
Grade
Clnr Cu Rec
Gold Rec to Clnr Con
Cu % % % % Cu % Cu % Cu % Cu % % %
CT5121 2.03 31.0 32.8
0.24
92.2
CT5127 2.03 31.0 32.7 7.08 0.18 0.40 91.1 24.8 86.1 60.4
CT5128 2.03 31.0 36.5 7.62 0.17 0.45 92.5 22.6 86.0 61.0
On the basis of the success of the flotation tests on the master composite, it was decided to repeat the variability tests that showed potential for higher copper recoveries on the basis of the scavenger concentrate yields. This testing would confirm the recovery fraction resulting from the longer roughing time and stronger collector. Cleaning of the low grade rougher concentrates to achieve target grades would also be demonstrated.
It was important to repeat these tests to improve recoveries so that there was increased support for the recovery model since the first round result set typically fell below the curve suggesting that estimates for the high pyrite samples may be optimistic.
Figure 13.42 High Pyrite Composite Cleaner Grade Recovery Curves
0.00
5.00
10.0
15.0
20.0
25.0
30.0
35.0
0.00 10.0 20.0 30.0 40.0 50.0 60.0 70.0 80.0 90.0 100.0
Grad
e (C
u %
)
Recovery (Cu %)
CT5121 - P80=90µm Rougher Test CT5127 - pH 8.5 Rougher - Cleaner Test CT5128 - pH 8.0 Rougher - Cleaner Test
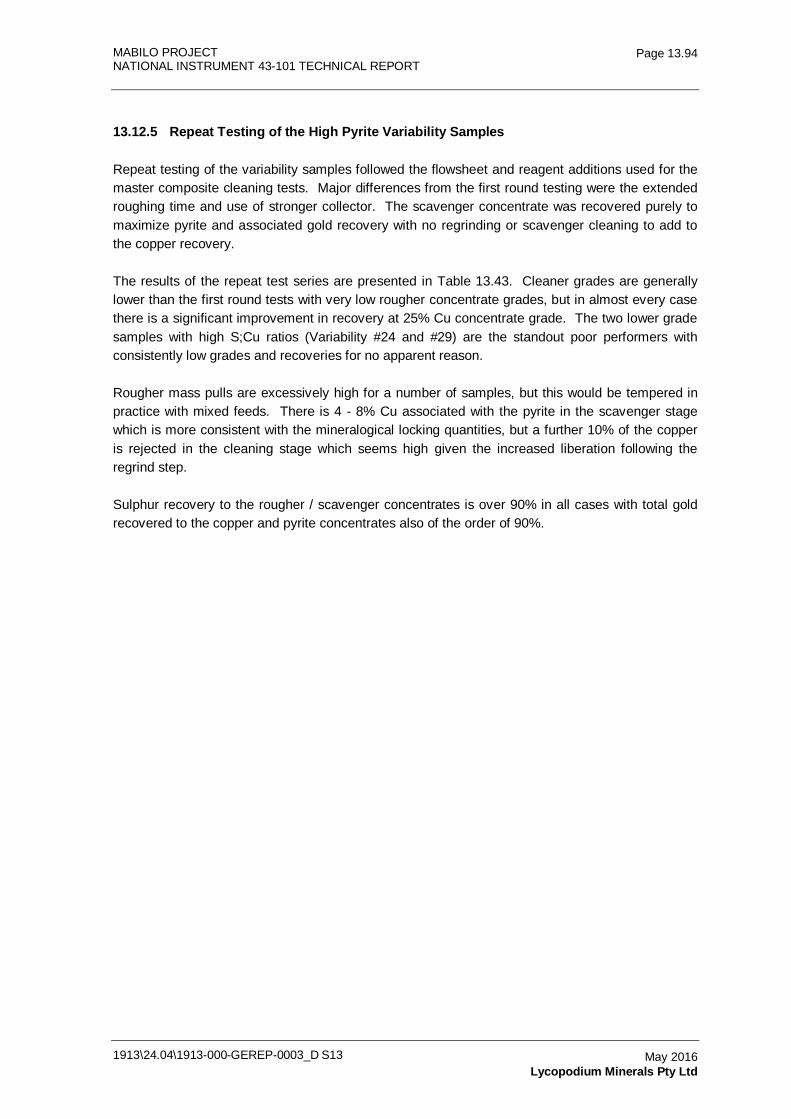
MABILO PROJECT NATIONAL INSTRUMENT 43-101 TECHNICAL REPORT
1913\24.04\1913-000-GEREP-0003_D S13
Page 13.94
May 2016 Lycopodium Minerals Pty Ltd
13.12.5 Repeat Testing of the High Pyrite Variability Samples
Repeat testing of the variability samples followed the flowsheet and reagent additions used for the master composite cleaning tests. Major differences from the first round testing were the extended roughing time and use of stronger collector. The scavenger concentrate was recovered purely to maximize pyrite and associated gold recovery with no regrinding or scavenger cleaning to add to the copper recovery.
The results of the repeat test series are presented in Table 13.43. Cleaner grades are generally lower than the first round tests with very low rougher concentrate grades, but in almost every case there is a significant improvement in recovery at 25% Cu concentrate grade. The two lower grade samples with high S;Cu ratios (Variability #24 and #29) are the standout poor performers with consistently low grades and recoveries for no apparent reason.
Rougher mass pulls are excessively high for a number of samples, but this would be tempered in practice with mixed feeds. There is 4 - 8% Cu associated with the pyrite in the scavenger stage which is more consistent with the mineralogical locking quantities, but a further 10% of the copper is rejected in the cleaning stage which seems high given the increased liberation following the regrind step.
Sulphur recovery to the rougher / scavenger concentrates is over 90% in all cases with total gold recovered to the copper and pyrite concentrates also of the order of 90%.
MABILO PROJECT NATIONAL INSTRUMENT 43-101 TECHNICAL REPORT
1913\24.04\1913-000-GEREP-0003_D S13
Page 13.95
May 2016 Lycopodium Minerals Pty Ltd
Table 13.43 Repeat High Pyrite Variability Cleaner Flotation Tests
Test ID
Comp Cu
Head Cu %
Pyrite %
Ro Mass Pull %
Ro/Sc Mass Pull %
Clnr Mass Pull %
Ro/Sc Tail
Cu %
Ro Cu Rec %
Ro/Sc Cu Rec
%
Clnr Cu Con
Grade Cu %
Clnr Cu Rec %
Gold Rec to Clnr
Con %
Gold Rec to ClnrSc
Con %
Ro/Sc Sulphur
Rec %
S:Cu Ratio
CT5134 VAR # 22 2.14 36.3 35.6 48.0 6.33 0.28 84.7 93.2 25.2 74.4 54.1 34.8 94.3 9.91
CT5135 VAR # 23 1.71 33.1 30.5 43.6 5.87 0.14 88.9 95.4 23.4 80.2 58.0 33.6 93.0 11.3
CT5136 VAR # 24 1.20 45.8 43.2 53.0 6.44 0.29 80.7 88.7 13.1 70.6 47.1 40.7 91.7 20.6
CT5137 VAR # 26 2.61 40.1 31.8 48.1 7.11 0.29 85.8 94.2 28.9 78.6 56.6 33.9 93.1 8.67
CT5138 VAR # 29 1.35 44.0 45.2 49.7 11.9 0.24 87.9 91.1 8.81 77.5 50.5 40.1 91.1 18.0
CT5139 VAR # 30 5.00 51.6 40.2 51.0 12.6 0.33 92.2 96.7 30.5 76.6 61.2 35.3 92.5 4.66
CT5140 VAR # 31 4.26 38.1 61.1 69.4 12.1 0.60 91.1 95.7 27.4 77.9 37.3 59.5 95.4 7.18
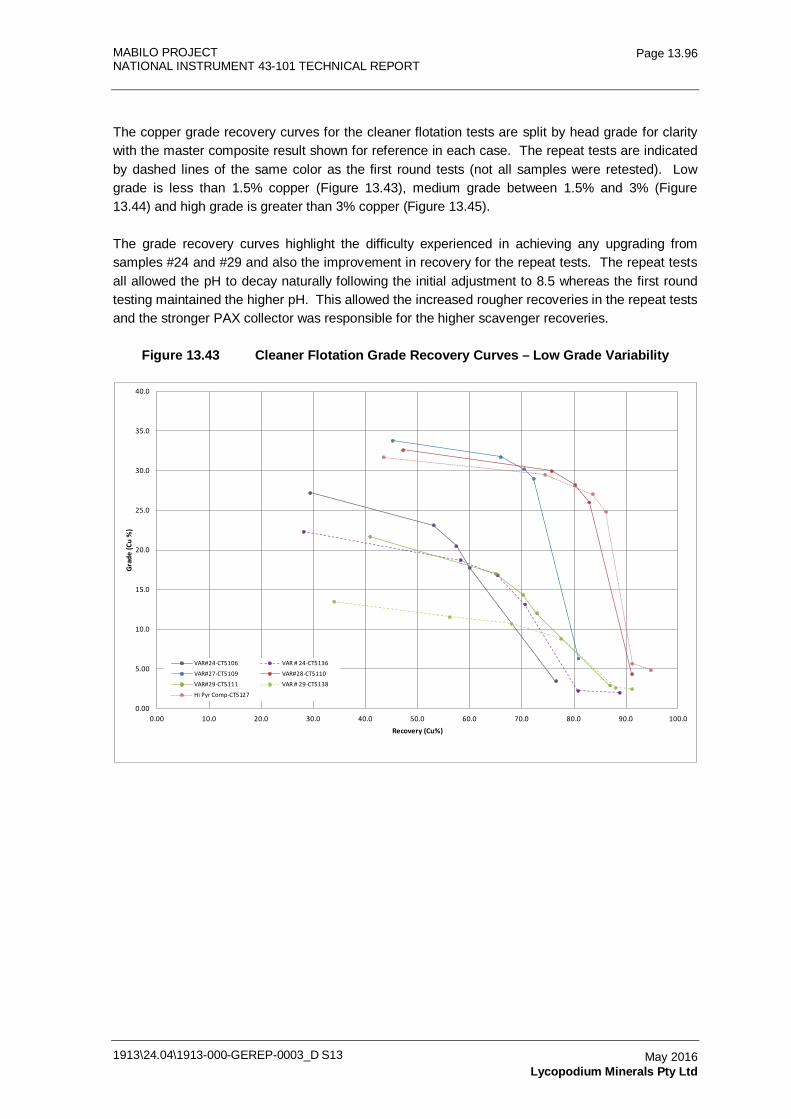
MABILO PROJECT NATIONAL INSTRUMENT 43-101 TECHNICAL REPORT
1913\24.04\1913-000-GEREP-0003_D S13
Page 13.96
May 2016 Lycopodium Minerals Pty Ltd
The copper grade recovery curves for the cleaner flotation tests are split by head grade for clarity with the master composite result shown for reference in each case. The repeat tests are indicated by dashed lines of the same color as the first round tests (not all samples were retested). Low grade is less than 1.5% copper (Figure 13.43), medium grade between 1.5% and 3% (Figure 13.44) and high grade is greater than 3% copper (Figure 13.45).
The grade recovery curves highlight the difficulty experienced in achieving any upgrading from samples #24 and #29 and also the improvement in recovery for the repeat tests. The repeat tests all allowed the pH to decay naturally following the initial adjustment to 8.5 whereas the first round testing maintained the higher pH. This allowed the increased rougher recoveries in the repeat tests and the stronger PAX collector was responsible for the higher scavenger recoveries.
Figure 13.43 Cleaner Flotation Grade Recovery Curves – Low Grade Variability
0.00
5.00
10.0
15.0
20.0
25.0
30.0
35.0
40.0
0.00 10.0 20.0 30.0 40.0 50.0 60.0 70.0 80.0 90.0 100.0
Grad
e (C
u %
)
Recovery (Cu%)
VAR#24-CT5106 VAR # 24-CT5136
VAR#27-CT5109 VAR#28-CT5110
VAR#29-CT5111 VAR # 29-CT5138
Hi Pyr Comp-CT5127
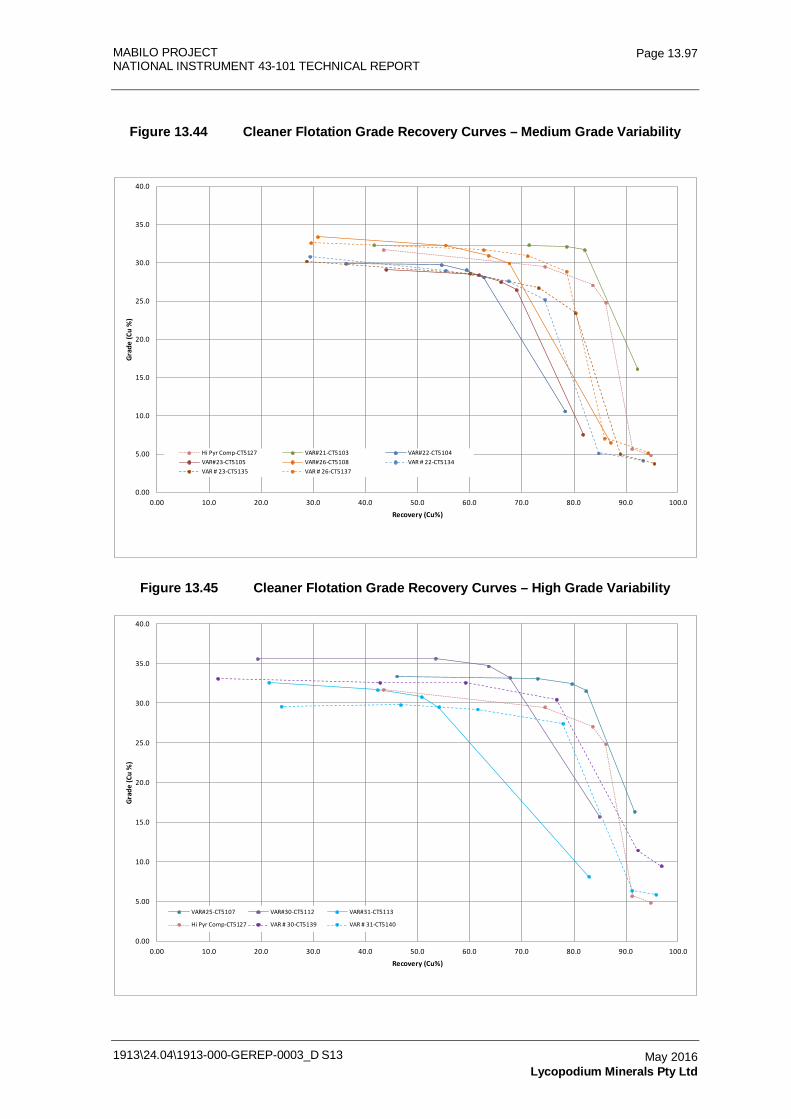
MABILO PROJECT NATIONAL INSTRUMENT 43-101 TECHNICAL REPORT
1913\24.04\1913-000-GEREP-0003_D S13
Page 13.97
May 2016 Lycopodium Minerals Pty Ltd
Figure 13.44 Cleaner Flotation Grade Recovery Curves – Medium Grade Variability
0.00
5.00
10.0
15.0
20.0
25.0
30.0
35.0
40.0
0.00 10.0 20.0 30.0 40.0 50.0 60.0 70.0 80.0 90.0 100.0
Grad
e (C
u %
)
Recovery (Cu%)
Hi Pyr Comp-CT5127 VAR#21-CT5103 VAR#22-CT5104VAR#23-CT5105 VAR#26-CT5108 VAR # 22-CT5134VAR # 23-CT5135 VAR # 26-CT5137
Figure 13.45 Cleaner Flotation Grade Recovery Curves – High Grade Variability
0.00
5.00
10.0
15.0
20.0
25.0
30.0
35.0
40.0
0.00 10.0 20.0 30.0 40.0 50.0 60.0 70.0 80.0 90.0 100.0
Grad
e (C
u %
)
Recovery (Cu%)
VAR#25-CT5107 VAR#30-CT5112 VAR#31-CT5113
Hi Pyr Comp-CT5127 VAR # 30-CT5139 VAR # 31-CT5140
MABILO PROJECT NATIONAL INSTRUMENT 43-101 TECHNICAL REPORT
1913\24.04\1913-000-GEREP-0003_D S13
Page 13.98
May 2016 Lycopodium Minerals Pty Ltd
13.12.6 Mineralogical Examination of the High Pyrite Samples
To date the hypothesis that higher pyrite samples were more finely mineralized with a greater degree of intergrowth between the pyrite and chalcopyrite appeared to be supported by the testwork outcomes. Mineralogical investigation of these examples of high pyrite intercepts was initiated to demonstrate that this was the case and to provide more conclusive evidence to explain the lower recoveries from these ores.
In practice, the mineralogical investigation indicates relatively coarse mineralization, particularly for the chalcopyrite grains, and a generally high degree of liberation with binary chalcopyrite / pyrite particles that should be readily recovered in the rougher and liberated at the concentrate regrind size. Although there is a fraction of the chalcopyrite that is locked, the quantity of locked particles does not explain the poor flotation recoveries achieved for some samples.
Preliminary mineralogical examination (optical) indicated that the crushing / grinding techniques used in the original sample preparation had left the coarser particles highly fractured which would have resulted in increased surface for oxidation. The QEMSCAN investigation indicated that surface oxidation is evident on the pyrite particles with iron sulphate and hydroxides being present on the particle rims and there may be further sub micron oxidation that wouldn’t be picked up by QEMSCAN (2.5 micron resolution), but which may impair floatability.
The mineralogy reports on examples of the high pyrite intercepts include liberation tables (based on area rather than perimeter) indicating that only 8-11% of the copper sulphides fall into the locked and enclosed categories.
While the evidence that mineral liberation is not an issue is positive for the project, there is still no clear reason for the poorer performance of the high S:Cu ratio samples. Oxidation of the chalcopyrite surfaces is less likely, but metal dissolution and precipitation as surface coatings on the chalcopyrite is a possible, particularly with the low pH environment associated with the sulphide particles. Operation of the mill in a high pH environment with collector addition to attach to fresh surfaces as they are formed is recommended to counteract this potential problem.
The mineralogical findings and potential for surface coatings on liberated chalcopyrite particles suggest that the additional recovery from finer grinding of the scavenger concentrate in the first round of variability testing may have resulted from the creation of fresh surfaces as much as any additional liberation. The surface oxidation is also likely to be responsible for the slow flotation kinetics. Progressive attritioning of the fine oxide layer in the flotation cell may have allowed additional mineral flotation given more time.
The pyrite oxidation in these samples is also of concern from a representivity viewpoint, as less active pyrite surface may be responsible for the high copper concentrate grades achieved and the relative ease with which the low grade rougher concentrates were cleaned.
It was decided not to revise the recovery algorithm based on this additional testing since there are unresolved issues relating to sample quality and the distribution of pyrite mineralization. The quality of these coarse assay reject samples remains questionable because they were prepared over two years earlier. Despite good care having been taken during sample storage and the high rougher recoveries achieved on the master composite, the low initial pH is evidence of surface
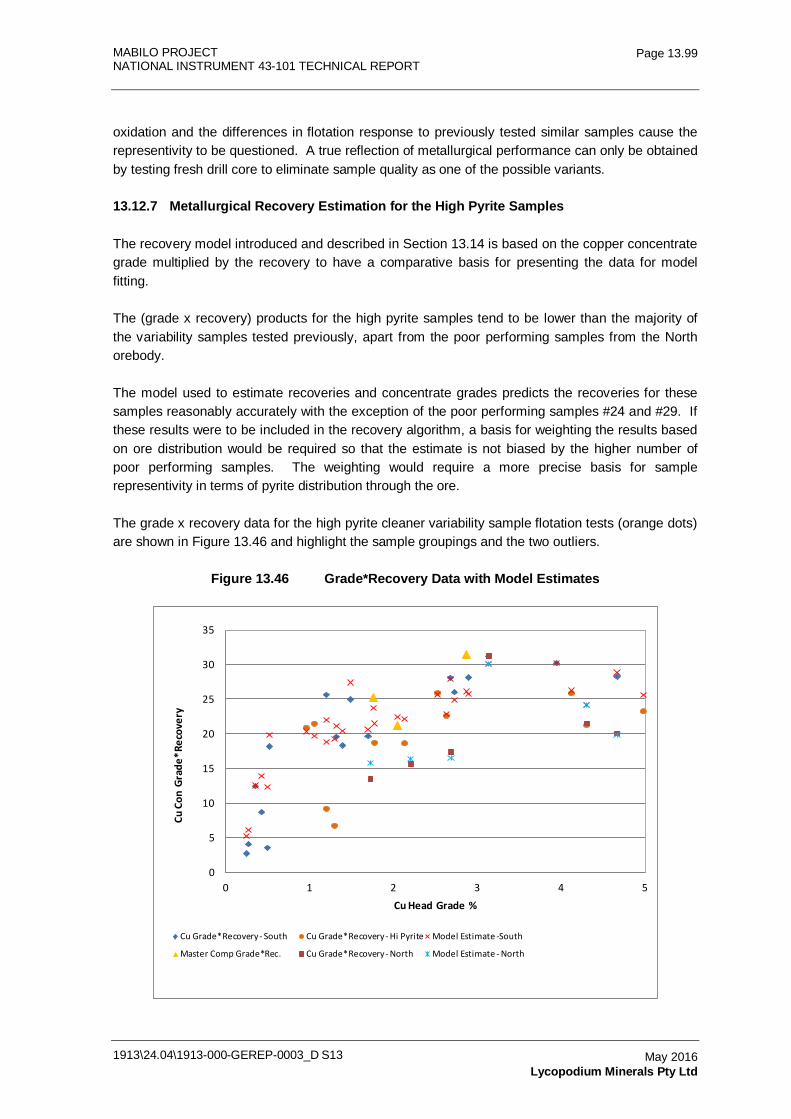
MABILO PROJECT NATIONAL INSTRUMENT 43-101 TECHNICAL REPORT
1913\24.04\1913-000-GEREP-0003_D S13
Page 13.99
May 2016 Lycopodium Minerals Pty Ltd
oxidation and the differences in flotation response to previously tested similar samples cause the representivity to be questioned. A true reflection of metallurgical performance can only be obtained by testing fresh drill core to eliminate sample quality as one of the possible variants.
13.12.7 Metallurgical Recovery Estimation for the High Pyrite Samples
The recovery model introduced and described in Section 13.14 is based on the copper concentrate grade multiplied by the recovery to have a comparative basis for presenting the data for model fitting.
The (grade x recovery) products for the high pyrite samples tend to be lower than the majority of the variability samples tested previously, apart from the poor performing samples from the North orebody.
The model used to estimate recoveries and concentrate grades predicts the recoveries for these samples reasonably accurately with the exception of the poor performing samples #24 and #29. If these results were to be included in the recovery algorithm, a basis for weighting the results based on ore distribution would be required so that the estimate is not biased by the higher number of poor performing samples. The weighting would require a more precise basis for sample representivity in terms of pyrite distribution through the ore.
The grade x recovery data for the high pyrite cleaner variability sample flotation tests (orange dots) are shown in Figure 13.46 and highlight the sample groupings and the two outliers.
Figure 13.46 Grade*Recovery Data with Model Estimates
0
5
10
15
20
25
30
35
0 1 2 3 4 5
Cu C
on G
rade
*Rec
over
y
Cu Head Grade %
Cu Grade*Recovery - South Cu Grade*Recovery - Hi Pyrite Model Estimate -South
Master Comp Grade*Rec. Cu Grade*Recovery - North Model Estimate - North
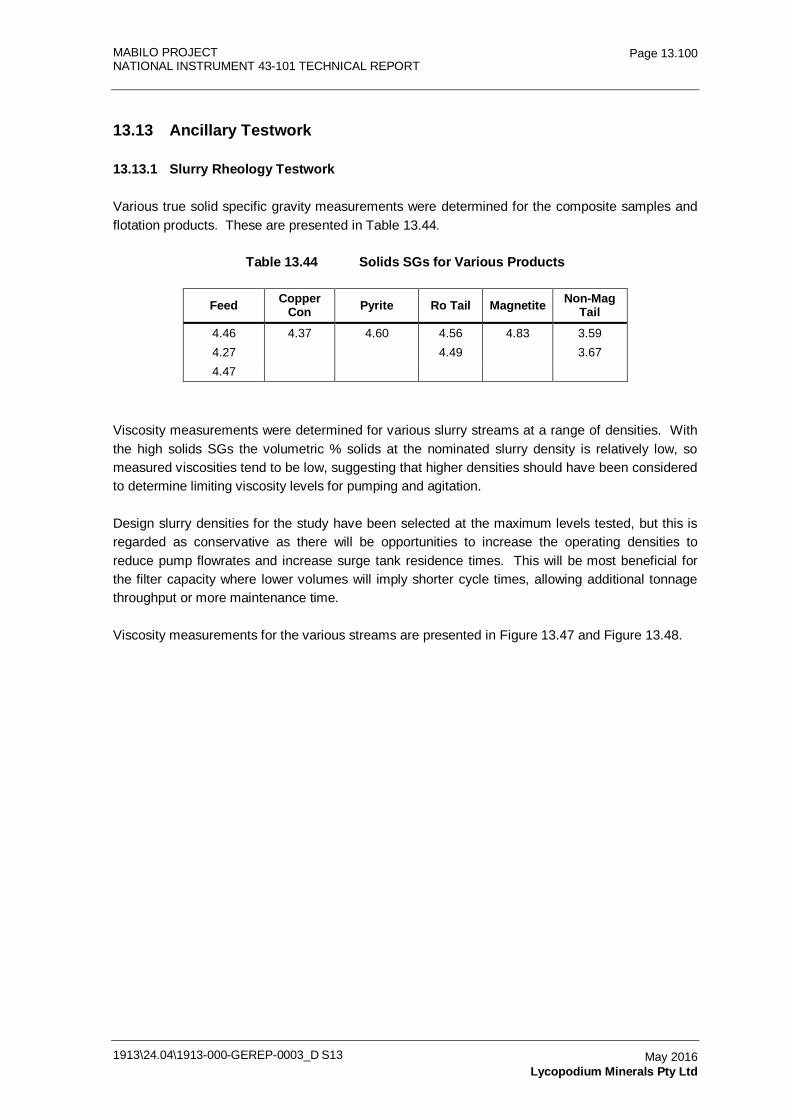
MABILO PROJECT NATIONAL INSTRUMENT 43-101 TECHNICAL REPORT
1913\24.04\1913-000-GEREP-0003_D S13
Page 13.100
May 2016 Lycopodium Minerals Pty Ltd
13.13 Ancillary Testwork
13.13.1 Slurry Rheology Testwork
Various true solid specific gravity measurements were determined for the composite samples and flotation products. These are presented in Table 13.44.
Table 13.44 Solids SGs for Various Products
Feed Copper Con Pyrite Ro Tail Magnetite Non-Mag
Tail 4.46 4.37 4.60 4.56 4.83 3.59 4.27 4.49 3.67 4.47
Viscosity measurements were determined for various slurry streams at a range of densities. With the high solids SGs the volumetric % solids at the nominated slurry density is relatively low, so measured viscosities tend to be low, suggesting that higher densities should have been considered to determine limiting viscosity levels for pumping and agitation.
Design slurry densities for the study have been selected at the maximum levels tested, but this is regarded as conservative as there will be opportunities to increase the operating densities to reduce pump flowrates and increase surge tank residence times. This will be most beneficial for the filter capacity where lower volumes will imply shorter cycle times, allowing additional tonnage throughput or more maintenance time.
Viscosity measurements for the various streams are presented in Figure 13.47 and Figure 13.48.
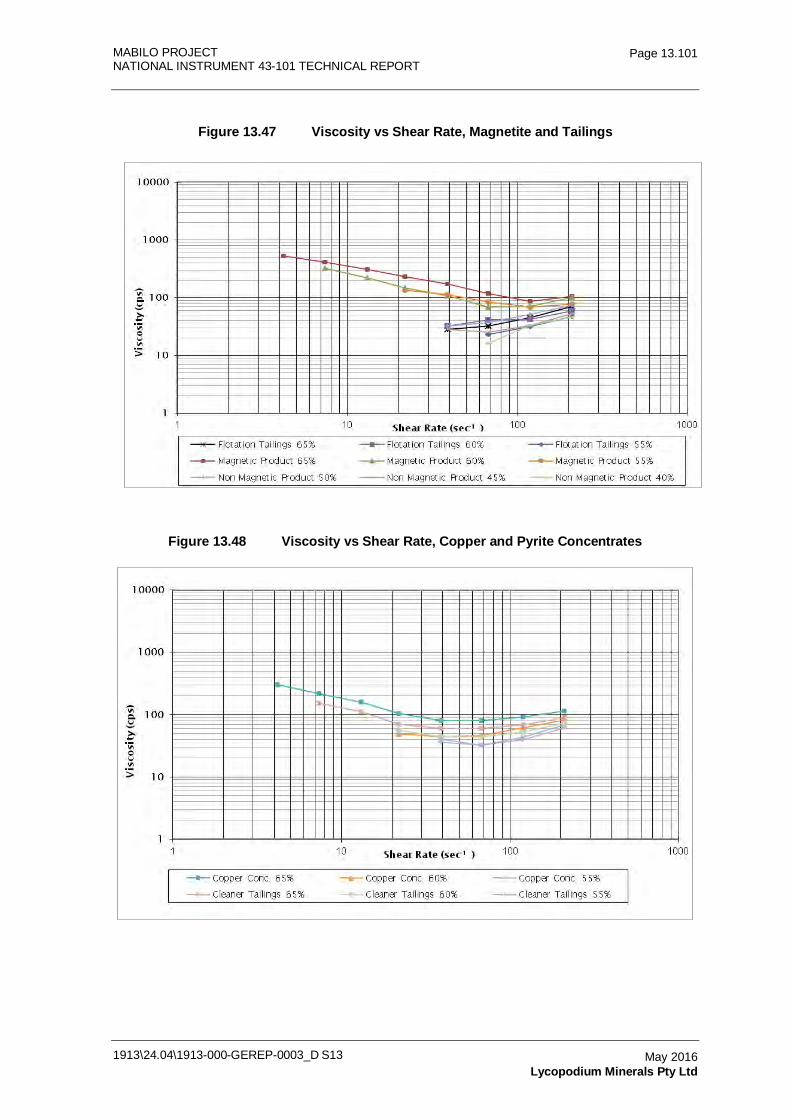
MABILO PROJECT NATIONAL INSTRUMENT 43-101 TECHNICAL REPORT
1913\24.04\1913-000-GEREP-0003_D S13
Page 13.101
May 2016 Lycopodium Minerals Pty Ltd
Figure 13.47 Viscosity vs Shear Rate, Magnetite and Tailings
Figure 13.48 Viscosity vs Shear Rate, Copper and Pyrite Concentrates
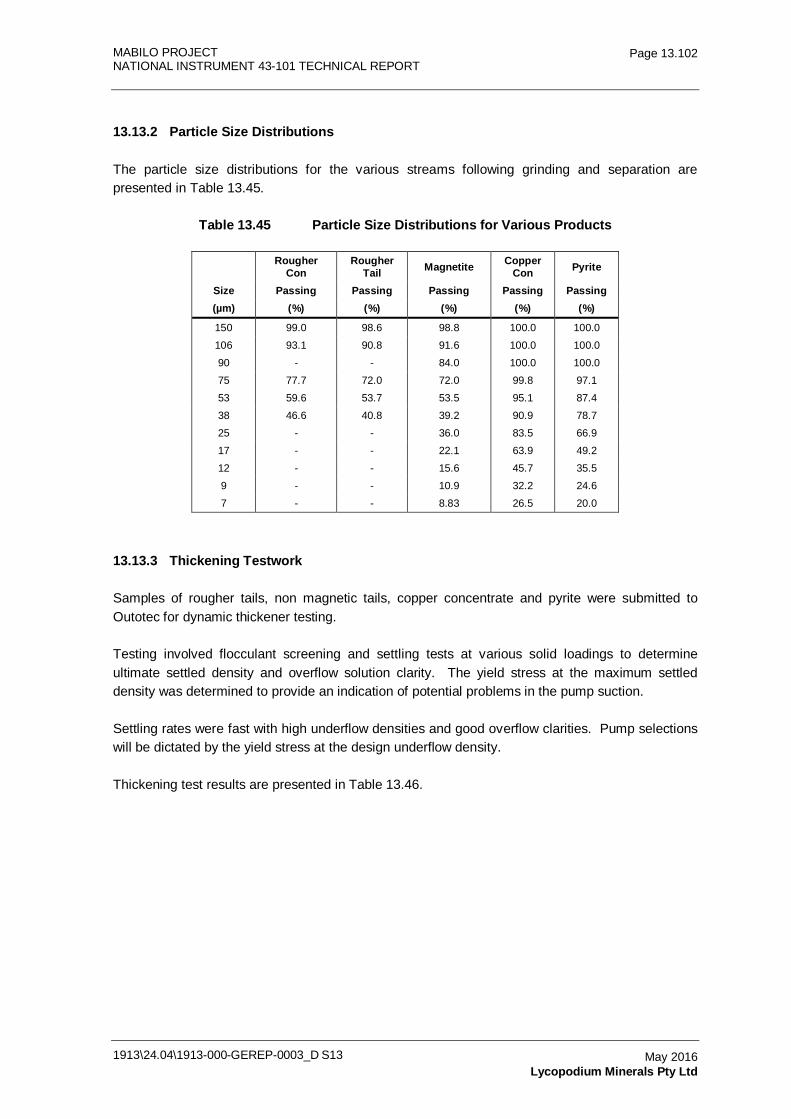
MABILO PROJECT NATIONAL INSTRUMENT 43-101 TECHNICAL REPORT
1913\24.04\1913-000-GEREP-0003_D S13
Page 13.102
May 2016 Lycopodium Minerals Pty Ltd
13.13.2 Particle Size Distributions
The particle size distributions for the various streams following grinding and separation are presented in Table 13.45.
Table 13.45 Particle Size Distributions for Various Products
Rougher
Con Rougher
Tail Magnetite Copper Con Pyrite
Size Passing Passing Passing Passing Passing (µm) (%) (%) (%) (%) (%)
150 99.0 98.6 98.8 100.0 100.0
106 93.1 90.8 91.6 100.0 100.0
90 - - 84.0 100.0 100.0
75 77.7 72.0 72.0 99.8 97.1
53 59.6 53.7 53.5 95.1 87.4
38 46.6 40.8 39.2 90.9 78.7
25 - - 36.0 83.5 66.9
17 - - 22.1 63.9 49.2
12 - - 15.6 45.7 35.5
9 - - 10.9 32.2 24.6
7 - - 8.83 26.5 20.0
13.13.3 Thickening Testwork
Samples of rougher tails, non magnetic tails, copper concentrate and pyrite were submitted to Outotec for dynamic thickener testing.
Testing involved flocculant screening and settling tests at various solid loadings to determine ultimate settled density and overflow solution clarity. The yield stress at the maximum settled density was determined to provide an indication of potential problems in the pump suction.
Settling rates were fast with high underflow densities and good overflow clarities. Pump selections will be dictated by the yield stress at the design underflow density.
Thickening test results are presented in Table 13.46.
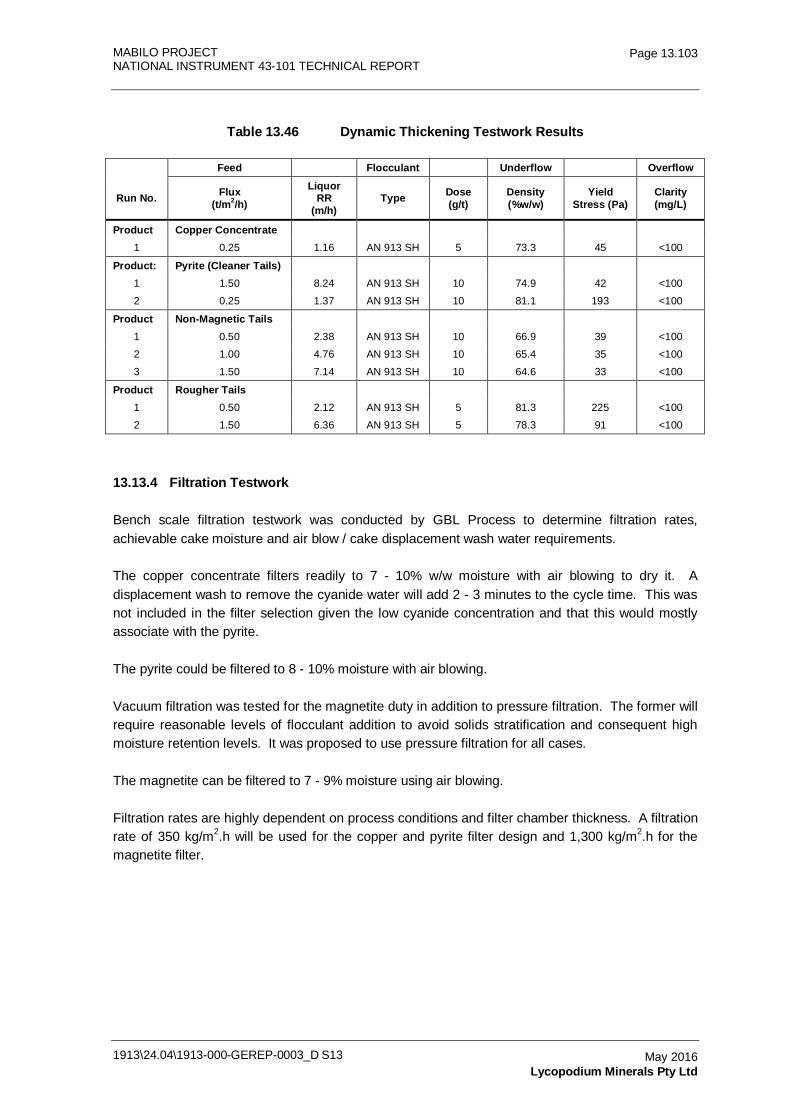
MABILO PROJECT NATIONAL INSTRUMENT 43-101 TECHNICAL REPORT
1913\24.04\1913-000-GEREP-0003_D S13
Page 13.103
May 2016 Lycopodium Minerals Pty Ltd
Table 13.46 Dynamic Thickening Testwork Results
Feed Flocculant Underflow Overflow
Run No. Flux (t/m2/h)
Liquor RR
(m/h) Type Dose
(g/t) Density (%w/w)
Yield Stress (Pa)
Clarity (mg/L)
Product Copper Concentrate 1 0.25 1.16 AN 913 SH 5 73.3 45 <100
Product: Pyrite (Cleaner Tails)
1 1.50 8.24 AN 913 SH 10 74.9 42 <100
2 0.25 1.37 AN 913 SH 10 81.1 193 <100
Product Non-Magnetic Tails 1 0.50 2.38 AN 913 SH 10 66.9 39 <100
2 1.00 4.76 AN 913 SH 10 65.4 35 <100
3 1.50 7.14 AN 913 SH 10 64.6 33 <100
Product Rougher Tails
1 0.50 2.12 AN 913 SH 5 81.3 225 <100
2 1.50 6.36 AN 913 SH 5 78.3 91 <100
13.13.4 Filtration Testwork
Bench scale filtration testwork was conducted by GBL Process to determine filtration rates, achievable cake moisture and air blow / cake displacement wash water requirements.
The copper concentrate filters readily to 7 - 10% w/w moisture with air blowing to dry it. A displacement wash to remove the cyanide water will add 2 - 3 minutes to the cycle time. This was not included in the filter selection given the low cyanide concentration and that this would mostly associate with the pyrite.
The pyrite could be filtered to 8 - 10% moisture with air blowing.
Vacuum filtration was tested for the magnetite duty in addition to pressure filtration. The former will require reasonable levels of flocculant addition to avoid solids stratification and consequent high moisture retention levels. It was proposed to use pressure filtration for all cases.
The magnetite can be filtered to 7 - 9% moisture using air blowing.
Filtration rates are highly dependent on process conditions and filter chamber thickness. A filtration rate of 350 kg/m2.h will be used for the copper and pyrite filter design and 1,300 kg/m2.h for the magnetite filter.
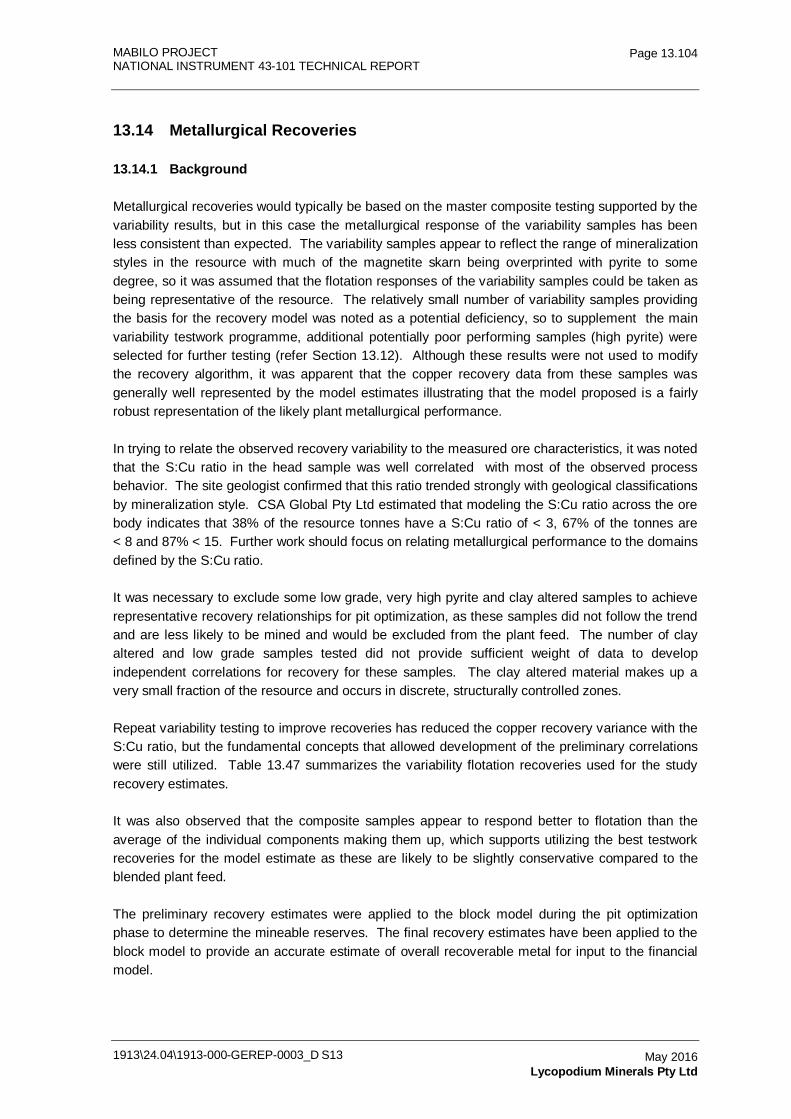
MABILO PROJECT NATIONAL INSTRUMENT 43-101 TECHNICAL REPORT
1913\24.04\1913-000-GEREP-0003_D S13
Page 13.104
May 2016 Lycopodium Minerals Pty Ltd
13.14 Metallurgical Recoveries
13.14.1 Background
Metallurgical recoveries would typically be based on the master composite testing supported by the variability results, but in this case the metallurgical response of the variability samples has been less consistent than expected. The variability samples appear to reflect the range of mineralization styles in the resource with much of the magnetite skarn being overprinted with pyrite to some degree, so it was assumed that the flotation responses of the variability samples could be taken as being representative of the resource. The relatively small number of variability samples providing the basis for the recovery model was noted as a potential deficiency, so to supplement the main variability testwork programme, additional potentially poor performing samples (high pyrite) were selected for further testing (refer Section 13.12). Although these results were not used to modify the recovery algorithm, it was apparent that the copper recovery data from these samples was generally well represented by the model estimates illustrating that the model proposed is a fairly robust representation of the likely plant metallurgical performance.
In trying to relate the observed recovery variability to the measured ore characteristics, it was noted that the S:Cu ratio in the head sample was well correlated with most of the observed process behavior. The site geologist confirmed that this ratio trended strongly with geological classifications by mineralization style. CSA Global Pty Ltd estimated that modeling the S:Cu ratio across the ore body indicates that 38% of the resource tonnes have a S:Cu ratio of < 3, 67% of the tonnes are < 8 and 87% < 15. Further work should focus on relating metallurgical performance to the domains defined by the S:Cu ratio.
It was necessary to exclude some low grade, very high pyrite and clay altered samples to achieve representative recovery relationships for pit optimization, as these samples did not follow the trend and are less likely to be mined and would be excluded from the plant feed. The number of clay altered and low grade samples tested did not provide sufficient weight of data to develop independent correlations for recovery for these samples. The clay altered material makes up a very small fraction of the resource and occurs in discrete, structurally controlled zones.
Repeat variability testing to improve recoveries has reduced the copper recovery variance with the S:Cu ratio, but the fundamental concepts that allowed development of the preliminary correlations were still utilized. Table 13.47 summarizes the variability flotation recoveries used for the study recovery estimates.
It was also observed that the composite samples appear to respond better to flotation than the average of the individual components making them up, which supports utilizing the best testwork recoveries for the model estimate as these are likely to be slightly conservative compared to the blended plant feed.
The preliminary recovery estimates were applied to the block model during the pit optimization phase to determine the mineable reserves. The final recovery estimates have been applied to the block model to provide an accurate estimate of overall recoverable metal for input to the financial model.
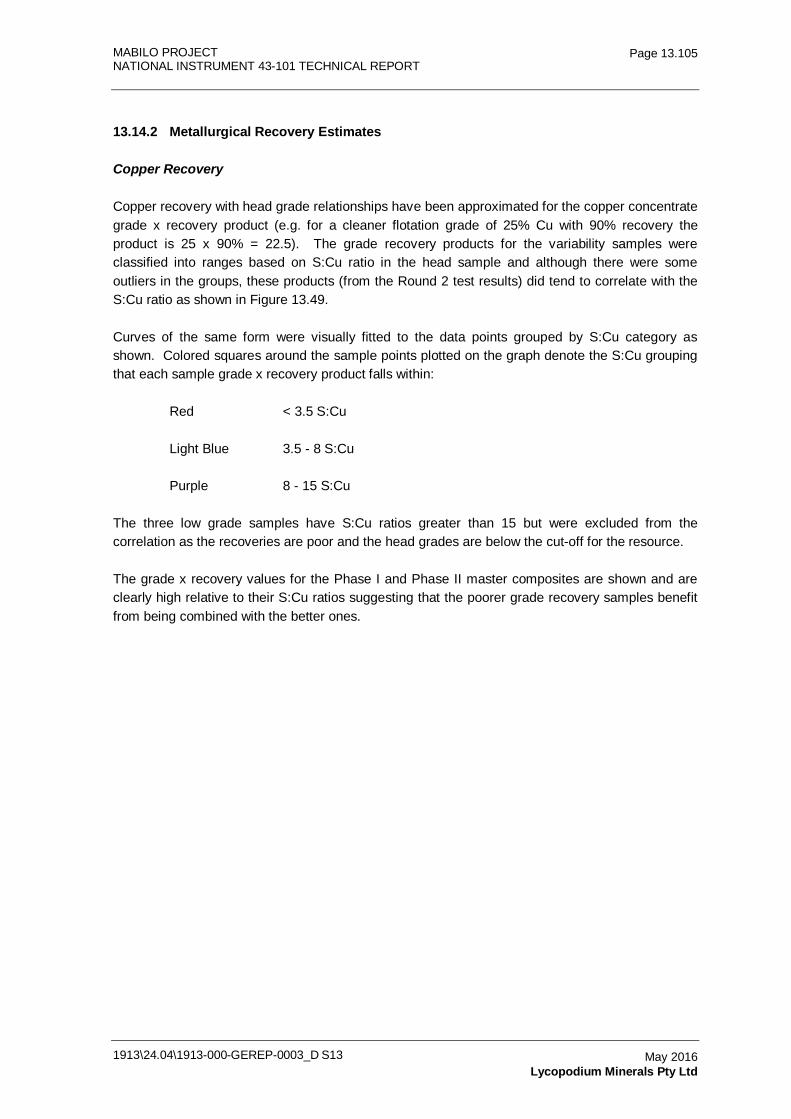
MABILO PROJECT NATIONAL INSTRUMENT 43-101 TECHNICAL REPORT
1913\24.04\1913-000-GEREP-0003_D S13
Page 13.105
May 2016 Lycopodium Minerals Pty Ltd
13.14.2 Metallurgical Recovery Estimates
Copper Recovery
Copper recovery with head grade relationships have been approximated for the copper concentrate grade x recovery product (e.g. for a cleaner flotation grade of 25% Cu with 90% recovery the product is 25 x 90% = 22.5). The grade recovery products for the variability samples were classified into ranges based on S:Cu ratio in the head sample and although there were some outliers in the groups, these products (from the Round 2 test results) did tend to correlate with the S:Cu ratio as shown in Figure 13.49.
Curves of the same form were visually fitted to the data points grouped by S:Cu category as shown. Colored squares around the sample points plotted on the graph denote the S:Cu grouping that each sample grade x recovery product falls within:
Red < 3.5 S:Cu
Light Blue 3.5 - 8 S:Cu
Purple 8 - 15 S:Cu
The three low grade samples have S:Cu ratios greater than 15 but were excluded from the correlation as the recoveries are poor and the head grades are below the cut-off for the resource.
The grade x recovery values for the Phase I and Phase II master composites are shown and are clearly high relative to their S:Cu ratios suggesting that the poorer grade recovery samples benefit from being combined with the better ones.
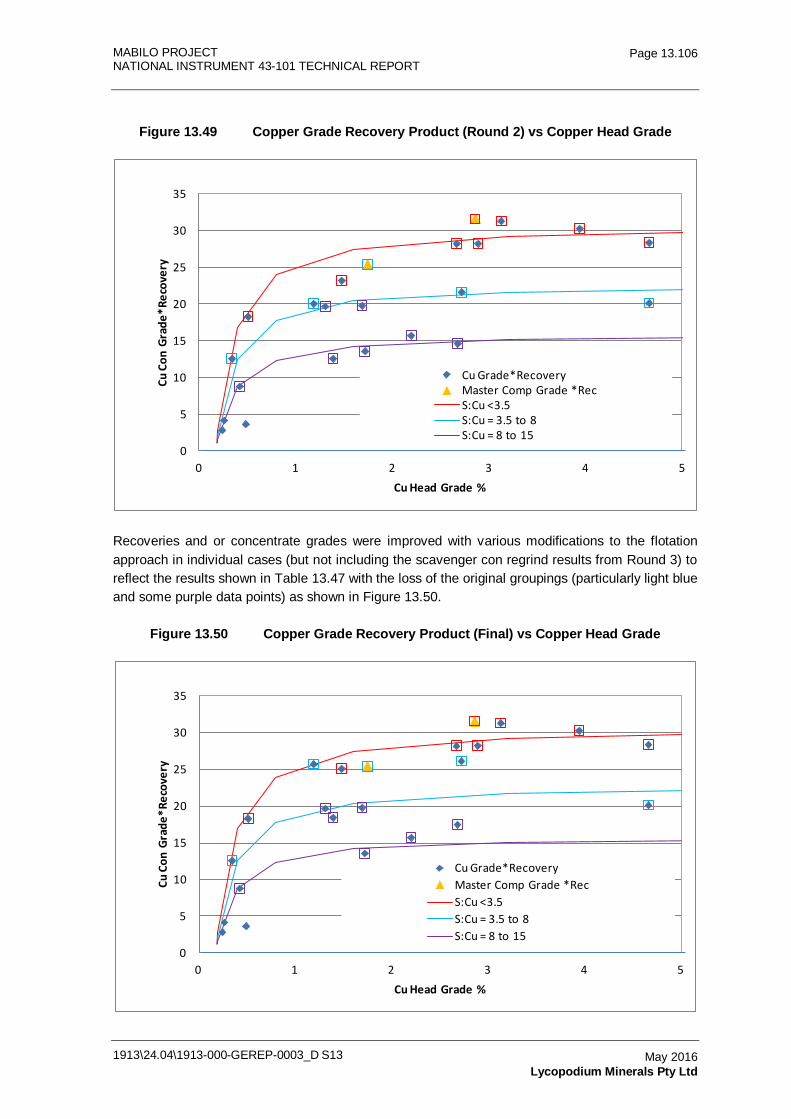
MABILO PROJECT NATIONAL INSTRUMENT 43-101 TECHNICAL REPORT
1913\24.04\1913-000-GEREP-0003_D S13
Page 13.106
May 2016 Lycopodium Minerals Pty Ltd
Figure 13.49 Copper Grade Recovery Product (Round 2) vs Copper Head Grade
0
5
10
15
20
25
30
35
0 1 2 3 4 5
Cu C
on G
rade
*Rec
over
y
Cu Head Grade %
Cu Grade*RecoveryMaster Comp Grade *RecS:Cu <3.5S:Cu = 3.5 to 8S:Cu = 8 to 15
Recoveries and or concentrate grades were improved with various modifications to the flotation approach in individual cases (but not including the scavenger con regrind results from Round 3) to reflect the results shown in Table 13.47 with the loss of the original groupings (particularly light blue and some purple data points) as shown in Figure 13.50.
Figure 13.50 Copper Grade Recovery Product (Final) vs Copper Head Grade
0
5
10
15
20
25
30
35
0 1 2 3 4 5
Cu C
on G
rade
*Rec
over
y
Cu Head Grade %
Cu Grade*RecoveryMaster Comp Grade *RecS:Cu <3.5S:Cu = 3.5 to 8S:Cu = 8 to 15
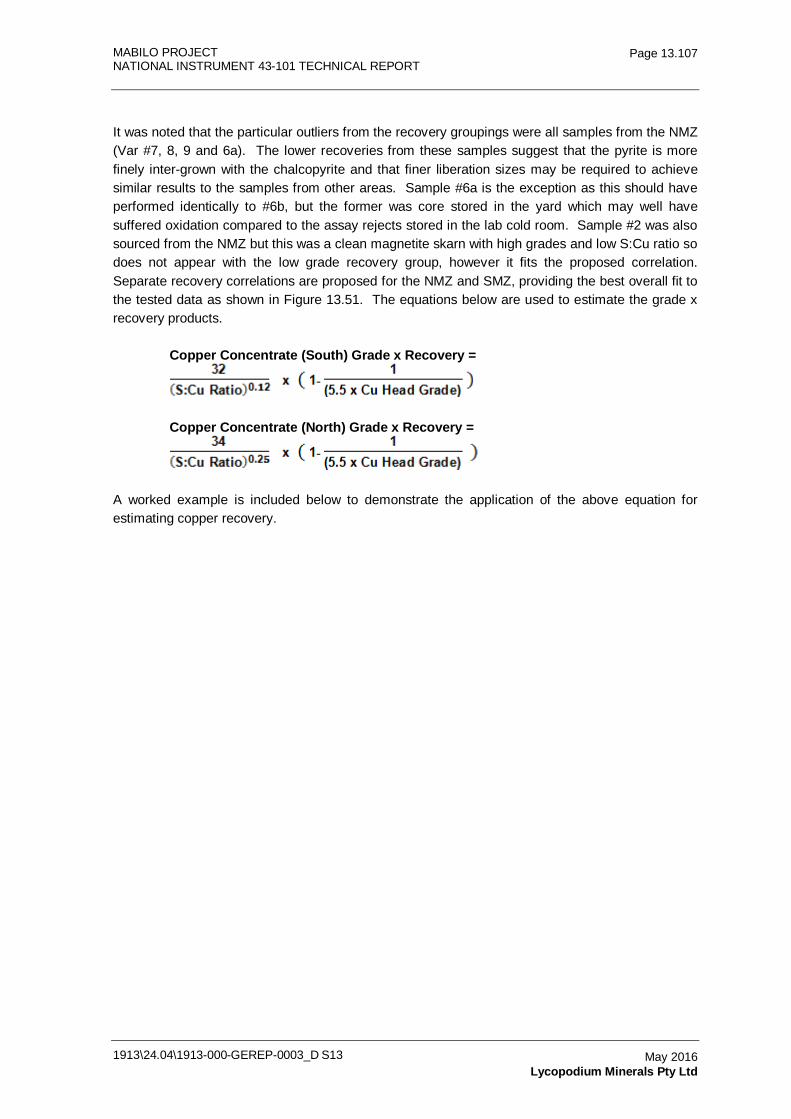
MABILO PROJECT NATIONAL INSTRUMENT 43-101 TECHNICAL REPORT
1913\24.04\1913-000-GEREP-0003_D S13
Page 13.107
May 2016 Lycopodium Minerals Pty Ltd
It was noted that the particular outliers from the recovery groupings were all samples from the NMZ (Var #7, 8, 9 and 6a). The lower recoveries from these samples suggest that the pyrite is more finely inter-grown with the chalcopyrite and that finer liberation sizes may be required to achieve similar results to the samples from other areas. Sample #6a is the exception as this should have performed identically to #6b, but the former was core stored in the yard which may well have suffered oxidation compared to the assay rejects stored in the lab cold room. Sample #2 was also sourced from the NMZ but this was a clean magnetite skarn with high grades and low S:Cu ratio so does not appear with the low grade recovery group, however it fits the proposed correlation. Separate recovery correlations are proposed for the NMZ and SMZ, providing the best overall fit to the tested data as shown in Figure 13.51. The equations below are used to estimate the grade x recovery products.
Copper Concentrate (South) Grade x Recovery =
Copper Concentrate (North) Grade x Recovery =
A worked example is included below to demonstrate the application of the above equation for estimating copper recovery.
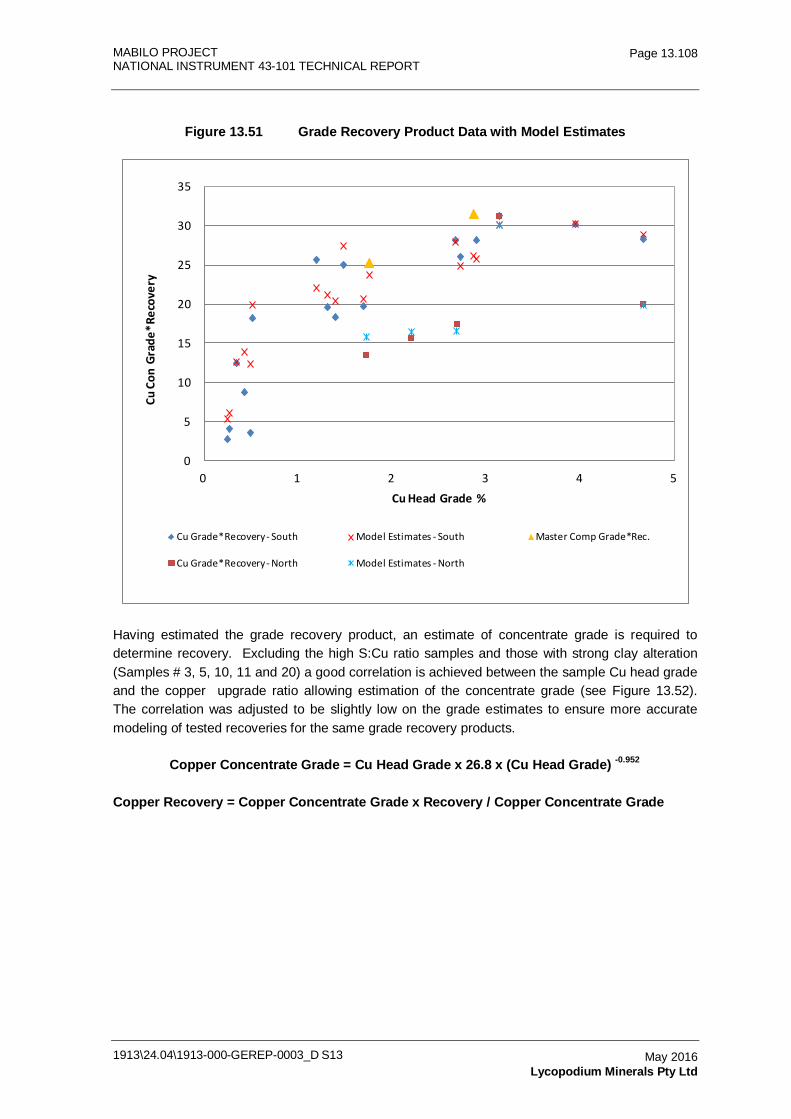
MABILO PROJECT NATIONAL INSTRUMENT 43-101 TECHNICAL REPORT
1913\24.04\1913-000-GEREP-0003_D S13
Page 13.108
May 2016 Lycopodium Minerals Pty Ltd
Figure 13.51 Grade Recovery Product Data with Model Estimates
0
5
10
15
20
25
30
35
0 1 2 3 4 5
Cu C
on G
rade
*Rec
over
y
Cu Head Grade %
Cu Grade*Recovery - South Model Estimates - South Master Comp Grade*Rec.
Cu Grade*Recovery - North Model Estimates - North
Having estimated the grade recovery product, an estimate of concentrate grade is required to determine recovery. Excluding the high S:Cu ratio samples and those with strong clay alteration (Samples # 3, 5, 10, 11 and 20) a good correlation is achieved between the sample Cu head grade and the copper upgrade ratio allowing estimation of the concentrate grade (see Figure 13.52). The correlation was adjusted to be slightly low on the grade estimates to ensure more accurate modeling of tested recoveries for the same grade recovery products.
Copper Concentrate Grade = Cu Head Grade x 26.8 x (Cu Head Grade) -0.952
Copper Recovery = Copper Concentrate Grade x Recovery / Copper Concentrate Grade
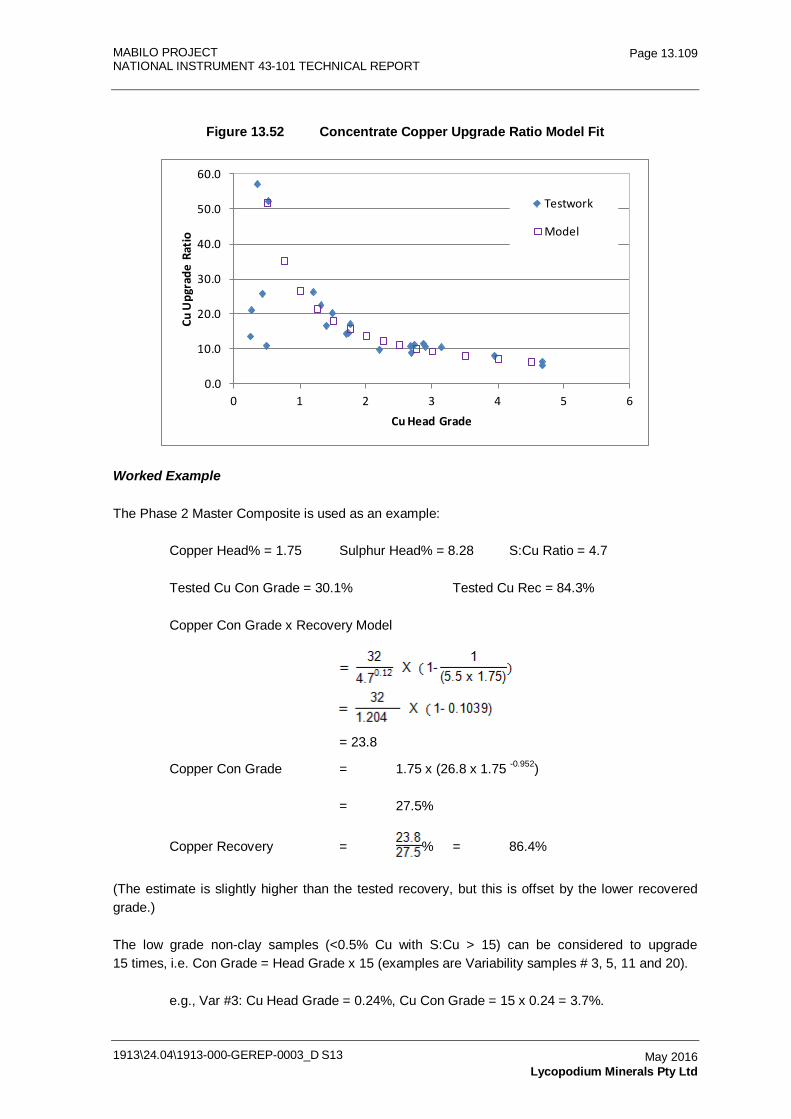
MABILO PROJECT NATIONAL INSTRUMENT 43-101 TECHNICAL REPORT
1913\24.04\1913-000-GEREP-0003_D S13
Page 13.109
May 2016 Lycopodium Minerals Pty Ltd
Figure 13.52 Concentrate Copper Upgrade Ratio Model Fit
0.0
10.0
20.0
30.0
40.0
50.0
60.0
0 1 2 3 4 5 6
Cu U
pgra
de R
atio
Cu Head Grade
Testwork
Model
Worked Example
The Phase 2 Master Composite is used as an example:
Copper Head% = 1.75 Sulphur Head% = 8.28 S:Cu Ratio = 4.7
Tested Cu Con Grade = 30.1% Tested Cu Rec = 84.3%
Copper Con Grade x Recovery Model
= 23.8
Copper Con Grade = 1.75 x (26.8 x 1.75 -0.952)
= 27.5%
Copper Recovery = % = 86.4%
(The estimate is slightly higher than the tested recovery, but this is offset by the lower recovered grade.)
The low grade non-clay samples (<0.5% Cu with S:Cu > 15) can be considered to upgrade 15 times, i.e. Con Grade = Head Grade x 15 (examples are Variability samples # 3, 5, 11 and 20).
e.g., Var #3: Cu Head Grade = 0.24%, Cu Con Grade = 15 x 0.24 = 3.7%.
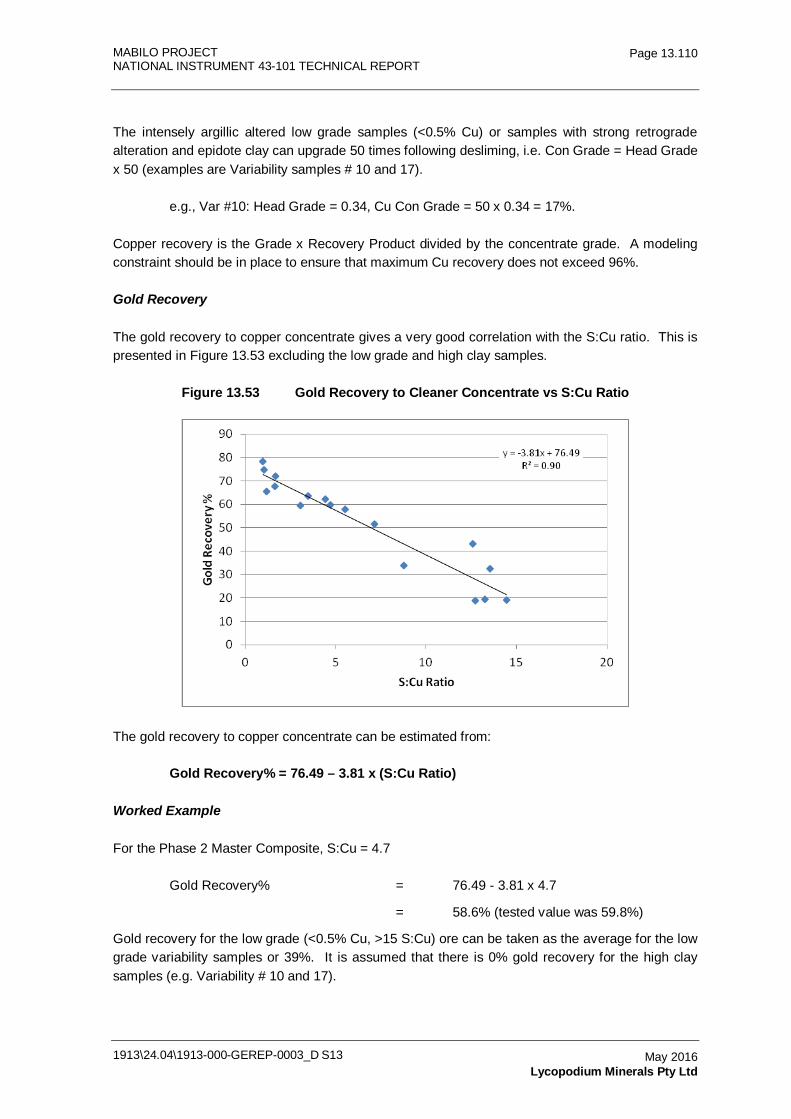
MABILO PROJECT NATIONAL INSTRUMENT 43-101 TECHNICAL REPORT
1913\24.04\1913-000-GEREP-0003_D S13
Page 13.110
May 2016 Lycopodium Minerals Pty Ltd
The intensely argillic altered low grade samples (<0.5% Cu) or samples with strong retrograde alteration and epidote clay can upgrade 50 times following desliming, i.e. Con Grade = Head Grade x 50 (examples are Variability samples # 10 and 17).
e.g., Var #10: Head Grade = 0.34, Cu Con Grade = 50 x 0.34 = 17%.
Copper recovery is the Grade x Recovery Product divided by the concentrate grade. A modeling constraint should be in place to ensure that maximum Cu recovery does not exceed 96%.
Gold Recovery
The gold recovery to copper concentrate gives a very good correlation with the S:Cu ratio. This is presented in Figure 13.53 excluding the low grade and high clay samples.
Figure 13.53 Gold Recovery to Cleaner Concentrate vs S:Cu Ratio
The gold recovery to copper concentrate can be estimated from:
Gold Recovery% = 76.49 – 3.81 x (S:Cu Ratio)
Worked Example
For the Phase 2 Master Composite, S:Cu = 4.7
Gold Recovery% = 76.49 - 3.81 x 4.7
= 58.6% (tested value was 59.8%)
Gold recovery for the low grade (<0.5% Cu, >15 S:Cu) ore can be taken as the average for the low grade variability samples or 39%. It is assumed that there is 0% gold recovery for the high clay samples (e.g. Variability # 10 and 17).
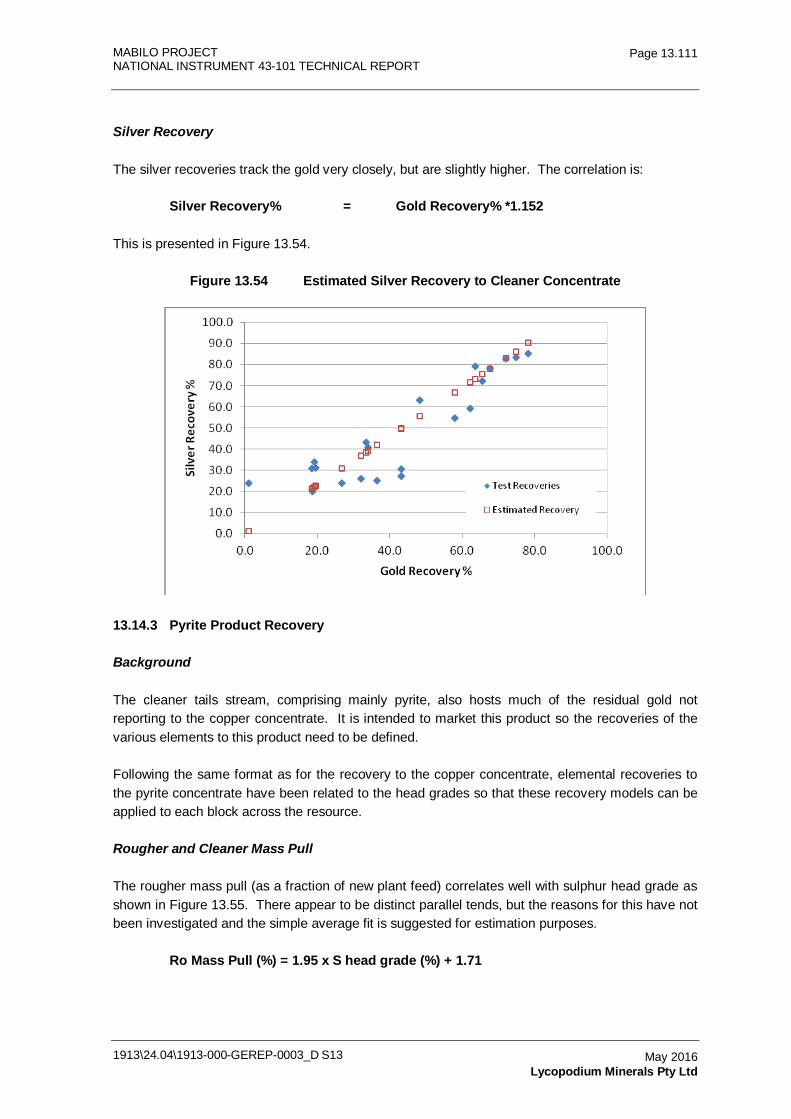
MABILO PROJECT NATIONAL INSTRUMENT 43-101 TECHNICAL REPORT
1913\24.04\1913-000-GEREP-0003_D S13
Page 13.111
May 2016 Lycopodium Minerals Pty Ltd
Silver Recovery
The silver recoveries track the gold very closely, but are slightly higher. The correlation is:
Silver Recovery% = Gold Recovery% *1.152
This is presented in Figure 13.54.
Figure 13.54 Estimated Silver Recovery to Cleaner Concentrate
13.14.3 Pyrite Product Recovery
Background
The cleaner tails stream, comprising mainly pyrite, also hosts much of the residual gold not reporting to the copper concentrate. It is intended to market this product so the recoveries of the various elements to this product need to be defined.
Following the same format as for the recovery to the copper concentrate, elemental recoveries to the pyrite concentrate have been related to the head grades so that these recovery models can be applied to each block across the resource.
Rougher and Cleaner Mass Pull
The rougher mass pull (as a fraction of new plant feed) correlates well with sulphur head grade as shown in Figure 13.55. There appear to be distinct parallel tends, but the reasons for this have not been investigated and the simple average fit is suggested for estimation purposes.
Ro Mass Pull (%) = 1.95 x S head grade (%) + 1.71
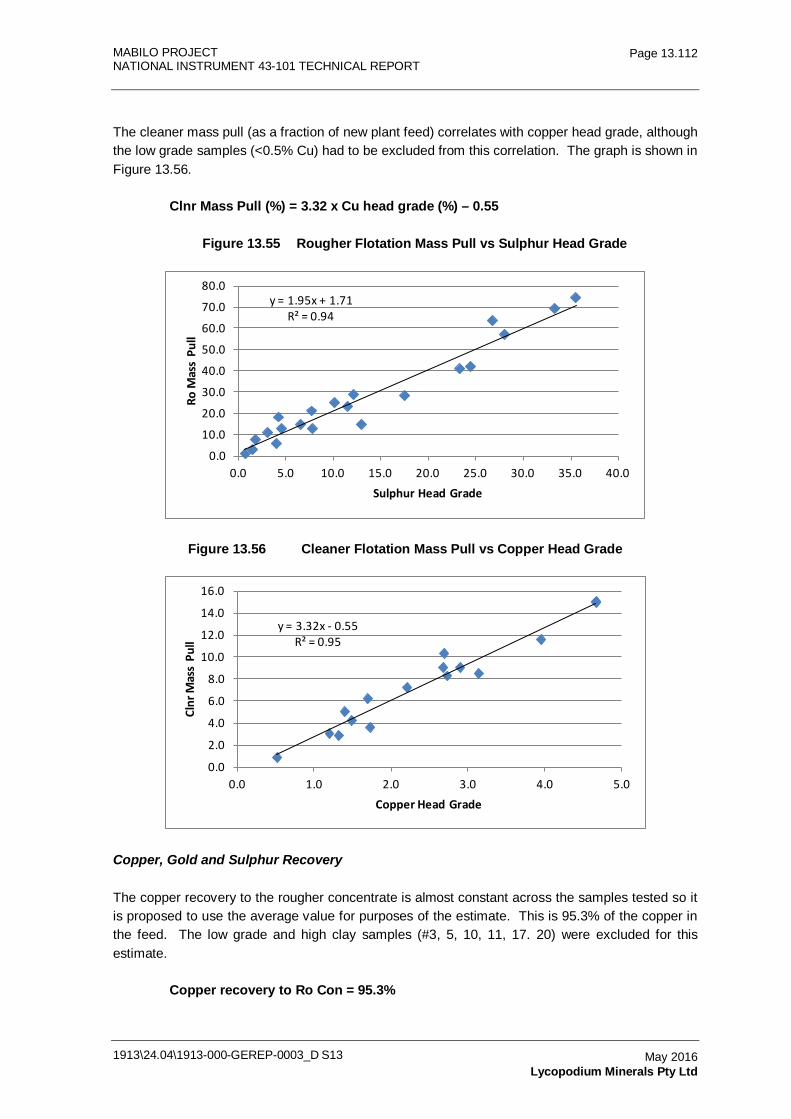
MABILO PROJECT NATIONAL INSTRUMENT 43-101 TECHNICAL REPORT
1913\24.04\1913-000-GEREP-0003_D S13
Page 13.112
May 2016 Lycopodium Minerals Pty Ltd
The cleaner mass pull (as a fraction of new plant feed) correlates with copper head grade, although the low grade samples (<0.5% Cu) had to be excluded from this correlation. The graph is shown in Figure 13.56.
Clnr Mass Pull (%) = 3.32 x Cu head grade (%) – 0.55
Figure 13.55 Rougher Flotation Mass Pull vs Sulphur Head Grade
y = 1.95x + 1.71R² = 0.94
0.0
10.0
20.0
30.0
40.0
50.0
60.0
70.0
80.0
0.0 5.0 10.0 15.0 20.0 25.0 30.0 35.0 40.0
Ro M
ass
Pull
Sulphur Head Grade
Figure 13.56 Cleaner Flotation Mass Pull vs Copper Head Grade
y = 3.32x - 0.55R² = 0.95
0.0
2.0
4.0
6.0
8.0
10.0
12.0
14.0
16.0
0.0 1.0 2.0 3.0 4.0 5.0
Clnr
Mas
s Pu
ll
Copper Head Grade
Copper, Gold and Sulphur Recovery
The copper recovery to the rougher concentrate is almost constant across the samples tested so it is proposed to use the average value for purposes of the estimate. This is 95.3% of the copper in the feed. The low grade and high clay samples (#3, 5, 10, 11, 17. 20) were excluded for this estimate.
Copper recovery to Ro Con = 95.3%
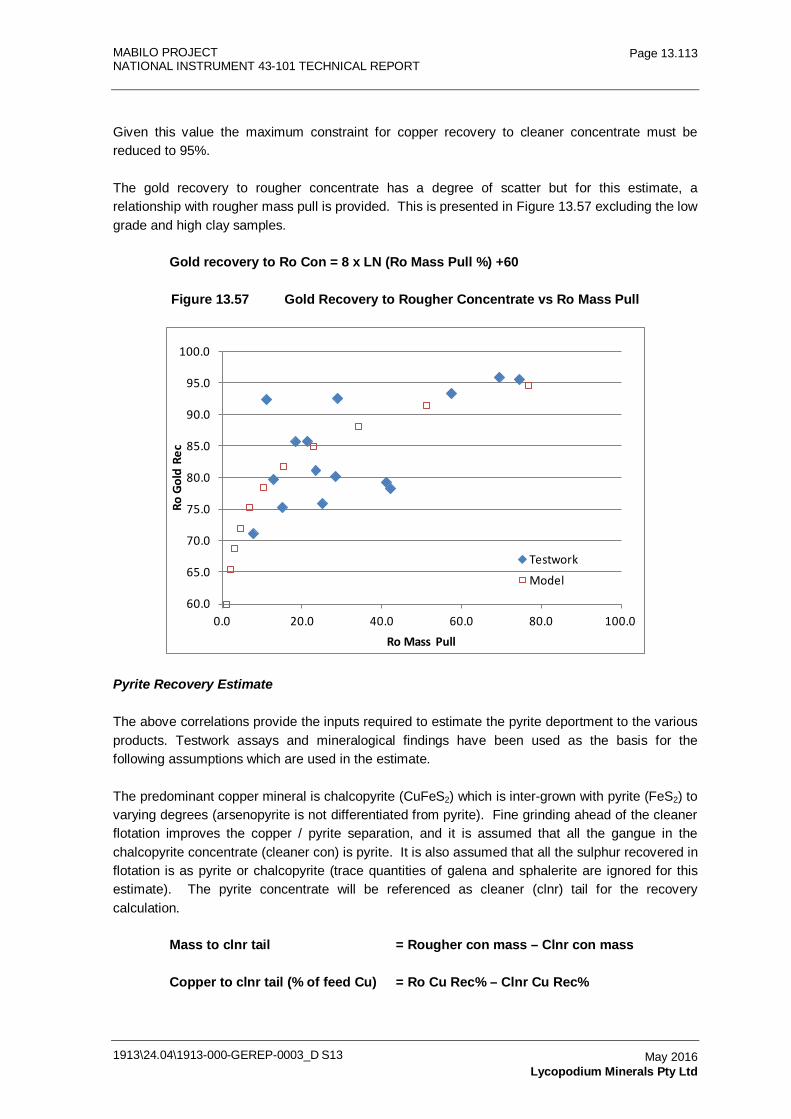
MABILO PROJECT NATIONAL INSTRUMENT 43-101 TECHNICAL REPORT
1913\24.04\1913-000-GEREP-0003_D S13
Page 13.113
May 2016 Lycopodium Minerals Pty Ltd
Given this value the maximum constraint for copper recovery to cleaner concentrate must be reduced to 95%.
The gold recovery to rougher concentrate has a degree of scatter but for this estimate, a relationship with rougher mass pull is provided. This is presented in Figure 13.57 excluding the low grade and high clay samples.
Gold recovery to Ro Con = 8 x LN (Ro Mass Pull %) +60
Figure 13.57 Gold Recovery to Rougher Concentrate vs Ro Mass Pull
60.0
65.0
70.0
75.0
80.0
85.0
90.0
95.0
100.0
0.0 20.0 40.0 60.0 80.0 100.0
Ro G
old
Rec
Ro Mass Pull
Testwork
Model
Pyrite Recovery Estimate
The above correlations provide the inputs required to estimate the pyrite deportment to the various products. Testwork assays and mineralogical findings have been used as the basis for the following assumptions which are used in the estimate.
The predominant copper mineral is chalcopyrite (CuFeS2) which is inter-grown with pyrite (FeS2) to varying degrees (arsenopyrite is not differentiated from pyrite). Fine grinding ahead of the cleaner flotation improves the copper / pyrite separation, and it is assumed that all the gangue in the chalcopyrite concentrate (cleaner con) is pyrite. It is also assumed that all the sulphur recovered in flotation is as pyrite or chalcopyrite (trace quantities of galena and sphalerite are ignored for this estimate). The pyrite concentrate will be referenced as cleaner (clnr) tail for the recovery calculation.
Mass to clnr tail = Rougher con mass – Clnr con mass
Copper to clnr tail (% of feed Cu) = Ro Cu Rec% – Clnr Cu Rec%
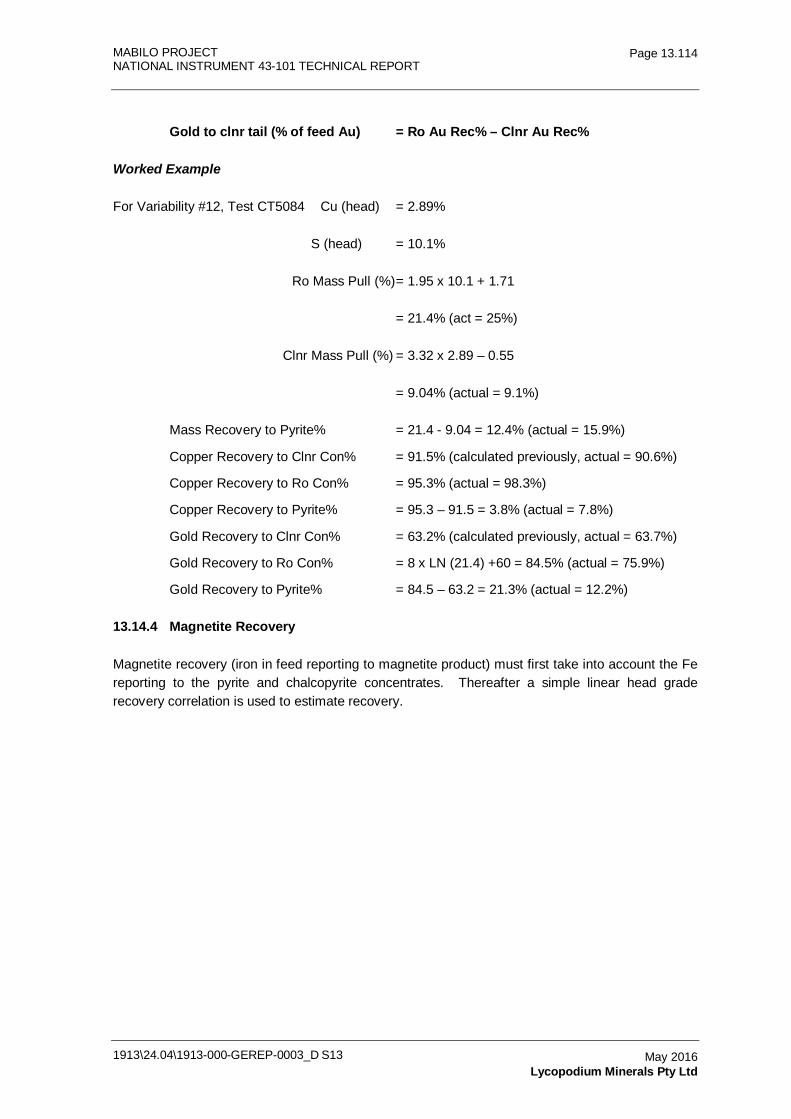
MABILO PROJECT NATIONAL INSTRUMENT 43-101 TECHNICAL REPORT
1913\24.04\1913-000-GEREP-0003_D S13
Page 13.114
May 2016 Lycopodium Minerals Pty Ltd
Gold to clnr tail (% of feed Au) = Ro Au Rec% – Clnr Au Rec%
Worked Example
For Variability #12, Test CT5084 Cu (head) = 2.89%
S (head) = 10.1%
Ro Mass Pull (%) = 1.95 x 10.1 + 1.71
= 21.4% (act = 25%)
Clnr Mass Pull (%) = 3.32 x 2.89 – 0.55
= 9.04% (actual = 9.1%)
Mass Recovery to Pyrite% = 21.4 - 9.04 = 12.4% (actual = 15.9%)
Copper Recovery to Clnr Con% = 91.5% (calculated previously, actual = 90.6%)
Copper Recovery to Ro Con% = 95.3% (actual = 98.3%)
Copper Recovery to Pyrite% = 95.3 – 91.5 = 3.8% (actual = 7.8%)
Gold Recovery to Clnr Con% = 63.2% (calculated previously, actual = 63.7%)
Gold Recovery to Ro Con% = 8 x LN (21.4) +60 = 84.5% (actual = 75.9%)
Gold Recovery to Pyrite% = 84.5 – 63.2 = 21.3% (actual = 12.2%)
13.14.4 Magnetite Recovery
Magnetite recovery (iron in feed reporting to magnetite product) must first take into account the Fe reporting to the pyrite and chalcopyrite concentrates. Thereafter a simple linear head grade recovery correlation is used to estimate recovery.
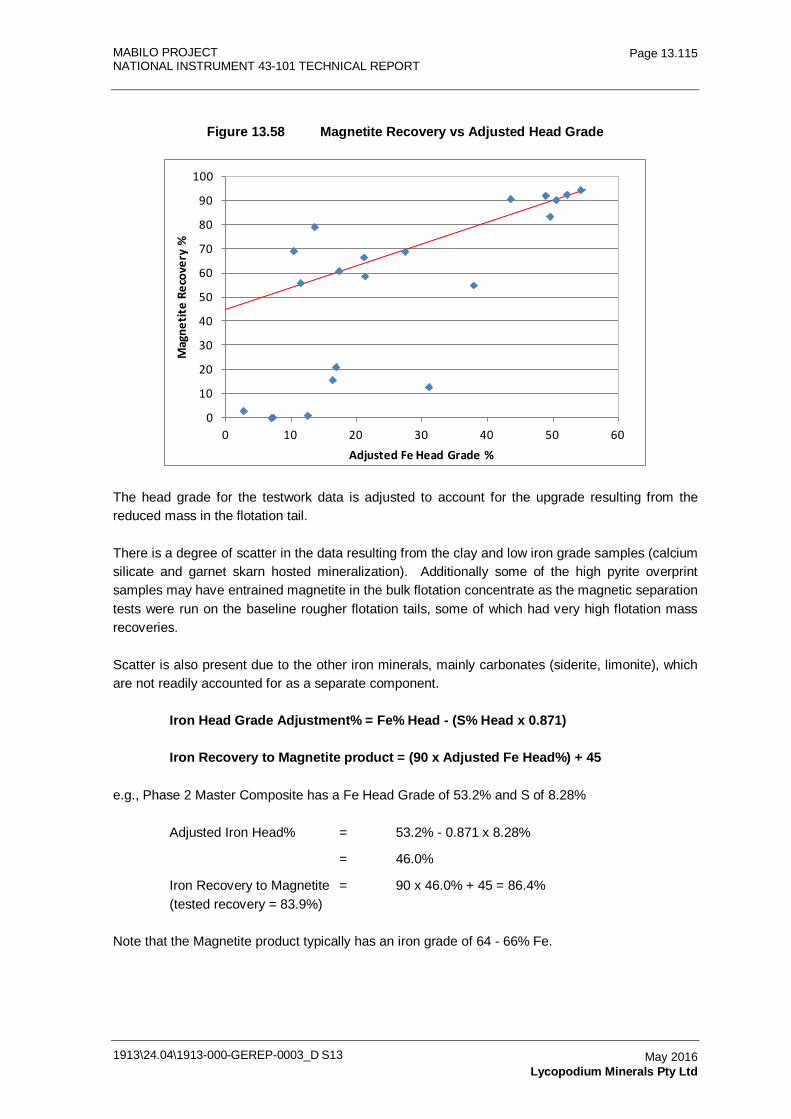
MABILO PROJECT NATIONAL INSTRUMENT 43-101 TECHNICAL REPORT
1913\24.04\1913-000-GEREP-0003_D S13
Page 13.115
May 2016 Lycopodium Minerals Pty Ltd
Figure 13.58 Magnetite Recovery vs Adjusted Head Grade
0
10
20
30
40
50
60
70
80
90
100
0 10 20 30 40 50 60
Mag
netit
e Re
cove
ry %
Adjusted Fe Head Grade %
The head grade for the testwork data is adjusted to account for the upgrade resulting from the reduced mass in the flotation tail.
There is a degree of scatter in the data resulting from the clay and low iron grade samples (calcium silicate and garnet skarn hosted mineralization). Additionally some of the high pyrite overprint samples may have entrained magnetite in the bulk flotation concentrate as the magnetic separation tests were run on the baseline rougher flotation tails, some of which had very high flotation mass recoveries.
Scatter is also present due to the other iron minerals, mainly carbonates (siderite, limonite), which are not readily accounted for as a separate component.
Iron Head Grade Adjustment% = Fe% Head - (S% Head x 0.871)
Iron Recovery to Magnetite product = (90 x Adjusted Fe Head%) + 45
e.g., Phase 2 Master Composite has a Fe Head Grade of 53.2% and S of 8.28%
Adjusted Iron Head% = 53.2% - 0.871 x 8.28%
= 46.0%
Iron Recovery to Magnetite = 90 x 46.0% + 45 = 86.4% (tested recovery = 83.9%)
Note that the Magnetite product typically has an iron grade of 64 - 66% Fe.
MABILO PROJECT NATIONAL INSTRUMENT 43-101 TECHNICAL REPORT
1913\24.04\1913-000-GEREP-0003_D S13
Page 13.116
May 2016 Lycopodium Minerals Pty Ltd
Samples with head grades of < 15% Fe and clay samples tend to have lower recoveries. A nominal magnetite recovery of 15% should be assigned to the low iron grade samples and 0% to the high clay samples.
13.14.5 Variability Test Results Summary
The best variability test results following the proposed processing flowsheet have been tabulated below to support the recovery correlations presented. Although the recovery estimates have been based on the best results, this is justified by the improved performance noted for both of the blended master composite samples where recoveries exceeded their expected values given the relative sulphur to copper ratios of the composite and the inclusion of concentrate recleaning.
Table 13.47 Variability Sample Flotation Results
Head Sample Rougher Cleaner
Comp S:Cu Head Grade
Copper
Ro Mass Pull
Copper Rougher Recovery
Gold Clnr Mass Pull
Copper Cleaner
Recovery
Copper Cleaner Assay
Gold to Cleaner
Con
(% Cu) (%) (Ro
Rec%) (Ro
Rec%) (%) (Cln Rec%) (Cln%) (Cln
Rec%)
VAR#1 1.1 3.94 18.4 97.6 85.7 11.6 94.3 32.1 74.9
VAR#2 1.0 3.13 11.0 98.1 92.4 8.5 94.9 33.0 78.3
VAR#3 31.7 0.244 12.8 96.1 75.5 6.9 85.0 3.3 48.2
VAR#4 1.7 4.66 21.2 98.9 85.8 15.1 95.1 29.8 67.7
VAR#5 54.7 0.488 9.7 71.7 32.4 6.0 68.1 5.4 26.6
VAR#6a 12.7 2.2 22.6 75.5 40.1 7.2 72.2 21.8 19.0
VAR#6b 14.4 1.69 16.5 86.0 35.2 6.2 80.8 24.5 19.1
VAR#7 7.1 4.66 43.2 84.1 71.6 15.0 80.2 25.1 51.6
VAR#8 13.2 2.68 70.9 94.2 91.3 10.4 75.9 19.2 19.3
VAR#9 13.5 1.72 8.3 59.3 38.6 3.6 54.2 25.0 32.6
VAR#10 4.3 0.344 3.0 68.5 15.5 0.9 63.7 19.7 4.4
VAR#11 9.3 0.424 5.9 81.4 49.0 2.9 80.1 11.0 45.6
VAR#12 3.5 2.89 14.0 93.4 67.3 9.1 90.6 31.2 63.7
VAR#13 5.5 1.19 9.5 85.6 66.4 3.0 81.9 31.4 58.0
VAR#14 8.8 1.31 7.7 86.4 57.4 2.9 66.5 29.6 34.0
VAR#15 1.7 2.67 12.8 98.2 79.8 9.0 96.7 29.2 72.1
VAR#16 1.2 1.48 7.6 87.5 71.1 4.3 83.3 30.1 65.6
VAR#17 1.3 0.512 1.1 14.2 11.6 0.9 68.2 26.8 0.8
VAR#18 4.4 2.72 23.4 87.8 82.1 8.3 85.1 30.7 62.2
VAR#19 12.6 1.39 10.4 85.0 52.6 5.0 79.1 23.3 43.2
VAR#20 48.9 0.264 14.9 83.9 68.7 3.8 74.9 5.6 35.0
Phase 1 Master comp LS8326 3.1 2.86
8.2 95.7 33.0 59.4
Phase 2 Master comp CT5045-50 4.7 1.75
84.3 30.1 59.8
Low Grade Samples
Low Grade and Clay Samples (#20 and 11 can be included in this category at times)
North Ore Body Samples
MABILO PROJECT
NATIONAL INSTRUMENT 43-101 TECHNICAL REPORT
1913-000-GEREP-0003
Table of Contents Page
14.0 MINERAL RESOURCE ESTIMATES 14.1 14.1 Geological Models 14.1
14.1.1 Geological Interpretation 14.1 14.1.2 Surfaces 14.1
14.2 Domain Modeling 14.1 14.2.1 Software 14.1 14.2.2 Mineralization 14.1 14.2.3 Sulphur Domains 14.6 14.2.4 Weathering 14.9 14.2.5 Topography 14.9
14.3 Statistical Analysis 14.9 14.3.1 Software Used 14.9 14.3.2 Drillhole Coding 14.9 14.3.3 Drillhole Selection 14.11 14.3.4 Sample Length and Compositing 14.11 14.3.5 Summary Statistics 14.12 14.3.6 Balancing Cuts 14.17 14.3.7 Density 14.20
14.4 Variography 14.22 14.4.1 Methodology 14.22 14.4.2 Spatial Variograms 14.24
14.5 Block Model 14.28 14.5.1 Block Model Extents and Block Size 14.28
14.6 Grade Estimation 14.30 14.6.1 Data Used 14.30 14.6.2 Methodology 14.30 14.6.3 Density Assignments 14.34
14.7 Model Validation 14.34 14.7.1 Visual Validation 14.34 14.7.2 Statistical Validation 14.35 14.7.3 Swath Plots 14.37
14.8 Classification 14.42 14.8.1 Guidelines 14.42
14.9 Mineral Resource Reporting 14.44 14.9.1 Resource Tabulation 14.44 14.9.2 Comparison with Previous Estimate 14.44 14.9.3 Grade Tonnage Tables 14.45
14.10 Recommendations 14.48 14.11 References 14.48
TABLES Table 14.2 Raw vs Composite Drill Data 14.11 Table 14.3 Summary Statistics by Mineralized Lithological Domain Zone 14.14 Table 14.4 Sulphur Summary Statistics by ZONE and Sulphur Domain 14.15 Table 14.5 Summary Statistics SMZ Copper-gold Depleted and Enriched
Magnetite Skarn 14.16 Table 14.6 Correlation Matrices by ZONE 14.17 Table 14.7 Balancing Cuts Applied to Grade Variables 14.18 Table 14.8 Effect of Balancing Cuts on Mean Composite Grade 14.19
1913\24.04\1913-000-GEREP-0003_D S14 May 2016 CSA Global
MABILO PROJECT
NATIONAL INSTRUMENT 43-101 TECHNICAL REPORT
1913-000-GEREP-0003
Table of Contents (Continued)
Page
1913\24.04\1913-000-GEREP-0003_D S14
May 2016 CSA Global
Table 14.9 Effect of Balancing Cuts on Mean S Composite Grade 14.20 Table 14.10 Variogram Parameters 14.25 Table 14.11 Adjusted Variogram Rotation Angles 14.26 Table 14.12 Block Model Parameters 14.29 Table 14.13 Estimation Search Ellipse Dimensions and Orientation in Datamine
Axis Rotation Convention 3-2-1 (Z-Y-X) 14.32 Table 14.14 Estimation Sample Number Parameters 14.33 Table 14.15 Mean Model OK vs IDS vs Drill Composite Grades 14.36 Table 14.16 Mabilo Project SMZ and NMZ Combined MRE Results as at
November 2015 14.44 Table 14.17 Mabilo Project - Mineral Resource Estimate Results as at November
2014 14.45 Table 14.18 Mabilo SMZ and NMZ November 2015 MRE – Cu % Grade Tonnage
Table 14.46 Table 14.19 Mabilo SMZ and NMZ November 2015 MRE – Au g/t Grade Tonnage
Table 14.47 FIGURES Figure 14.1 Magnetite Skarn – SMZ (Oblique view top, Cross-section below) 14.3 Figure 14.2 SMZ – Plan and Section Views of Mineralized Zones 14.4 Figure 14.3 NMZ – Plan and Section Views of Mineralized Zones 14.5 Figure 14.4 SMZ Plan and Section Views of Sulphur Domains (>5% <10% orange,
>10% pink) 14.7 Figure 14.5 NMZ Plan and Section Views of Sulphur Domains (>5% <10% orange,
>10% pink) 14.8 Figure 14.6 CMPZON Coding for the SMZ Magnetite Skarn (S-N Cross-section on
476,150 m E) 14.11 Figure 14.7 Histogram of Raw Sample Lengths within Mabilo Resource
Wireframes 14.12 Figure 14.8 Combined Log (Probability Plot Cu, Fe, Au for ZONE = 1 and 11) 14.12 Figure 14.9 SMZ Magnetite Skarn Zone Showing Gold and Copper Depleted and
Enriched Zones 14.16 Figure 14.10 Log Histogram and Probability Plots Au SMZ Magnetite Skarn 14.19 Figure 14.11 Fe vs SG Scatter Plot 14.21 Figure 14.12 Histograms of ZONE = 1 Fe, Au, Cu and Ag 14.23 Figure 14.13 Histograms of ZONE = 1 Sulphur 14.24 Figure 14.14 ZONE 1 Gaussian-transformed Au Variograms 14.27 Figure 14.15 ZONE 1 Back-transformed Au Variograms 14.28 Figure 14.16 Visual Validation SMZ, Cu % (Section Bearing at 050°) 14.35 Figure 14.17 Log Histogram Overlay Cu Model (brown) and Cu Drillhole (blue) 14.36 Figure 14.18 Swath Plot for Fe by Northing SMZ all Zones (above) SMZ Magnetite
Skarn (below) 14.37 Figure 14.19 Swath Plot for Cu by Northing SMZ All Zones (above) SMZ Magnetite
Skarn (below) 14.38 Figure 14.20 Swath Plot for Au by Northing SMZ All Zones (above) SMZ Magnetite
Skarn (below) 14.39 Figure 14.21 Swath Plot for Ag by Northing SMZ All Zones (above) SMZ Magnetite
Skarn (below) 14.40 Figure 14.22 Swath Plot for S by Northing SMZ All Zones (above) SMZ Magnetite
Skarn (below) 14.41
MABILO PROJECT
NATIONAL INSTRUMENT 43-101 TECHNICAL REPORT
1913-000-GEREP-0003
Table of Contents (Continued)
Page
1913\24.04\1913-000-GEREP-0003_D S14
May 2016 CSA Global
Figure 14.23 Mabilo Model SMZ and NMZ (Yellow = Indicated, Green = Inferred) 14.43 Figure 14.24 Mabilo SMZ and NMZ Cu Grade Tonnage Curve 14.46 Figure 14.25 Mabilo SMZ and NMZ Au Grade Tonnage Curve 14.47
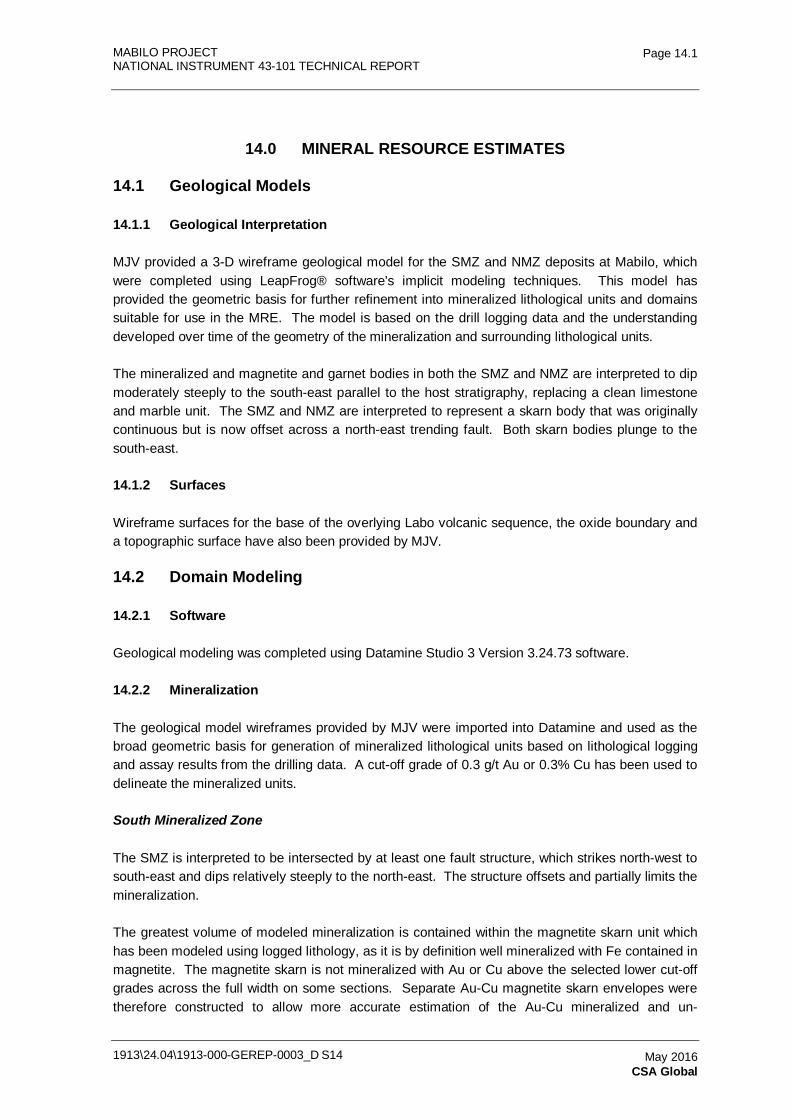
MABILO PROJECT NATIONAL INSTRUMENT 43-101 TECHNICAL REPORT
1913\24.04\1913-000-GEREP-0003_D S14
Page 14.1
May 2016 CSA Global
14.0 MINERAL RESOURCE ESTIMATES
14.1 Geological Models
14.1.1 Geological Interpretation
MJV provided a 3-D wireframe geological model for the SMZ and NMZ deposits at Mabilo, which were completed using LeapFrog® software's implicit modeling techniques. This model has provided the geometric basis for further refinement into mineralized lithological units and domains suitable for use in the MRE. The model is based on the drill logging data and the understanding developed over time of the geometry of the mineralization and surrounding lithological units.
The mineralized and magnetite and garnet bodies in both the SMZ and NMZ are interpreted to dip moderately steeply to the south-east parallel to the host stratigraphy, replacing a clean limestone and marble unit. The SMZ and NMZ are interpreted to represent a skarn body that was originally continuous but is now offset across a north-east trending fault. Both skarn bodies plunge to the south-east.
14.1.2 Surfaces
Wireframe surfaces for the base of the overlying Labo volcanic sequence, the oxide boundary and a topographic surface have also been provided by MJV.
14.2 Domain Modeling
14.2.1 Software
Geological modeling was completed using Datamine Studio 3 Version 3.24.73 software.
14.2.2 Mineralization
The geological model wireframes provided by MJV were imported into Datamine and used as the broad geometric basis for generation of mineralized lithological units based on lithological logging and assay results from the drilling data. A cut-off grade of 0.3 g/t Au or 0.3% Cu has been used to delineate the mineralized units.
South Mineralized Zone
The SMZ is interpreted to be intersected by at least one fault structure, which strikes north-west to south-east and dips relatively steeply to the north-east. The structure offsets and partially limits the mineralization.
The greatest volume of modeled mineralization is contained within the magnetite skarn unit which has been modeled using logged lithology, as it is by definition well mineralized with Fe contained in magnetite. The magnetite skarn is not mineralized with Au or Cu above the selected lower cut-off grades across the full width on some sections. Separate Au-Cu magnetite skarn envelopes were therefore constructed to allow more accurate estimation of the Au-Cu mineralized and un-
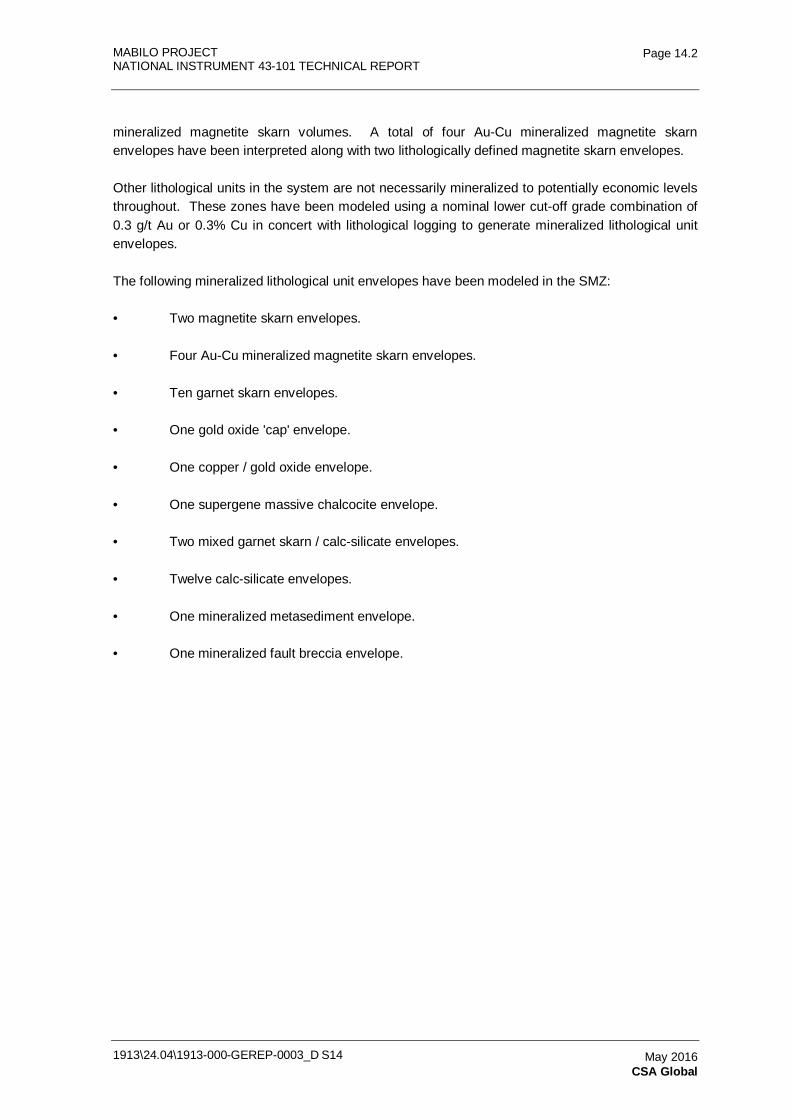
MABILO PROJECT NATIONAL INSTRUMENT 43-101 TECHNICAL REPORT
1913\24.04\1913-000-GEREP-0003_D S14
Page 14.2
May 2016 CSA Global
mineralized magnetite skarn volumes. A total of four Au-Cu mineralized magnetite skarn envelopes have been interpreted along with two lithologically defined magnetite skarn envelopes.
Other lithological units in the system are not necessarily mineralized to potentially economic levels throughout. These zones have been modeled using a nominal lower cut-off grade combination of 0.3 g/t Au or 0.3% Cu in concert with lithological logging to generate mineralized lithological unit envelopes.
The following mineralized lithological unit envelopes have been modeled in the SMZ:
• Two magnetite skarn envelopes.
• Four Au-Cu mineralized magnetite skarn envelopes.
• Ten garnet skarn envelopes.
• One gold oxide 'cap' envelope.
• One copper / gold oxide envelope.
• One supergene massive chalcocite envelope.
• Two mixed garnet skarn / calc-silicate envelopes.
• Twelve calc-silicate envelopes.
• One mineralized metasediment envelope.
• One mineralized fault breccia envelope.
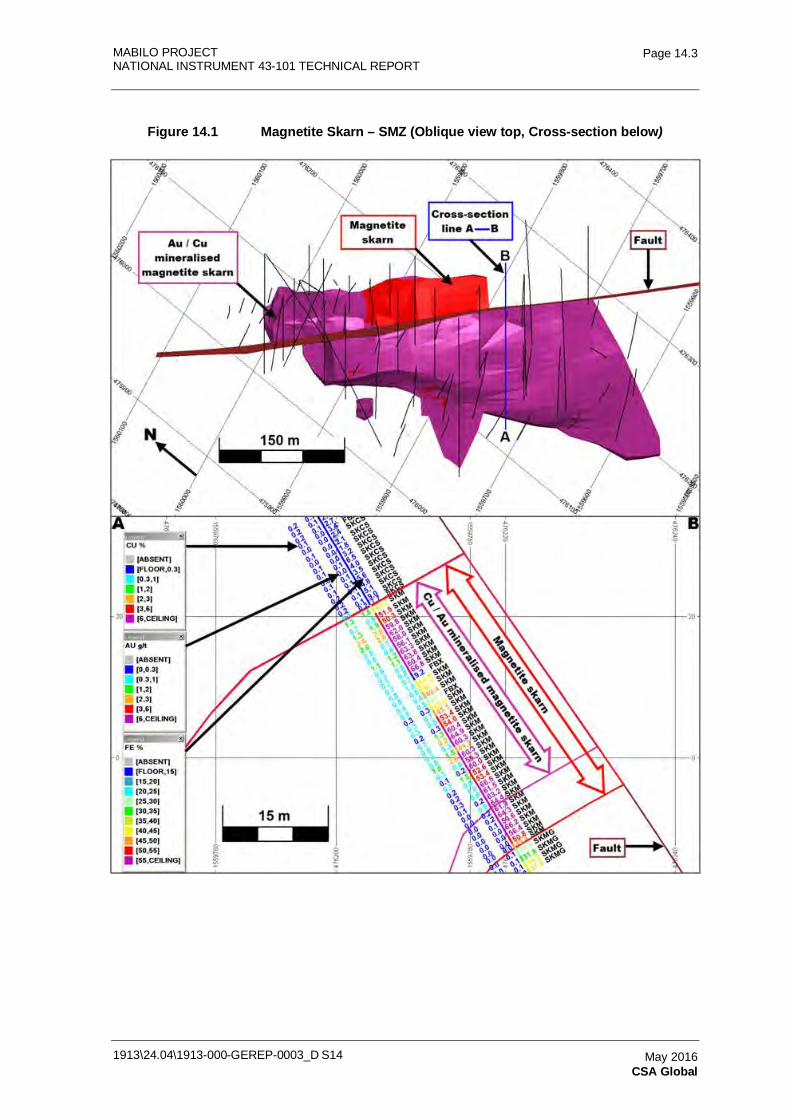
MABILO PROJECT NATIONAL INSTRUMENT 43-101 TECHNICAL REPORT
1913\24.04\1913-000-GEREP-0003_D S14
Page 14.3
May 2016 CSA Global
Figure 14.1 Magnetite Skarn – SMZ (Oblique view top, Cross-section below)
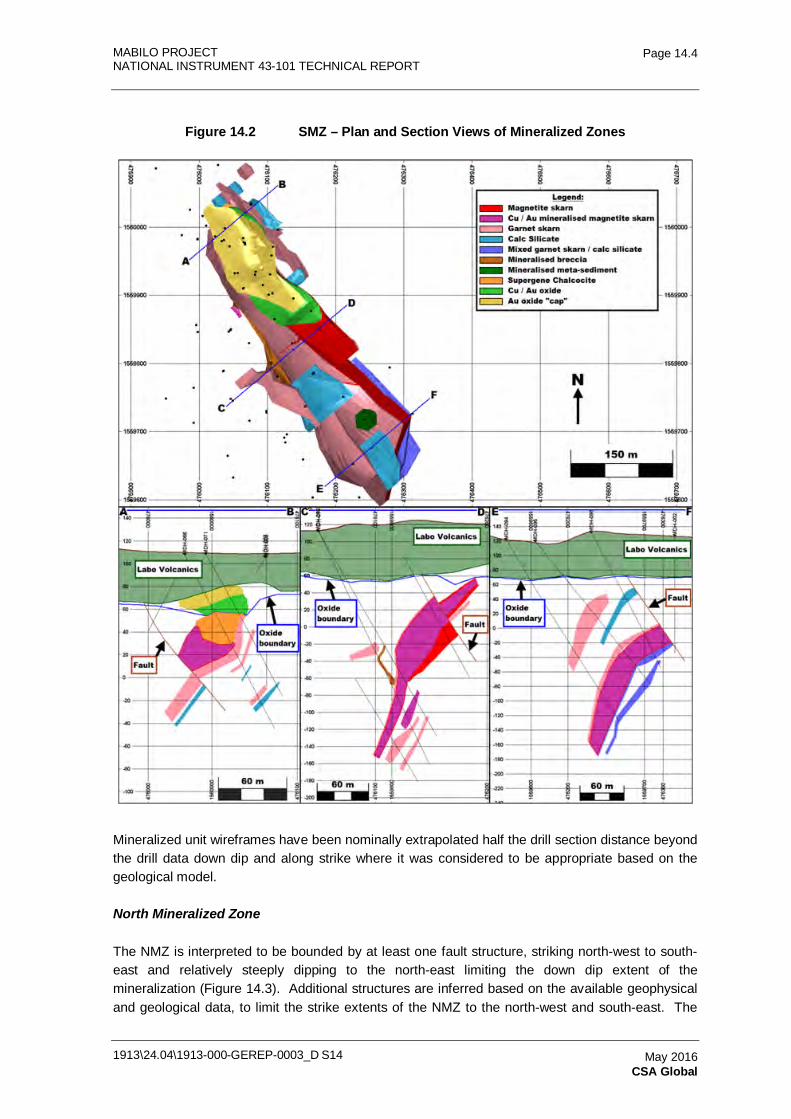
MABILO PROJECT NATIONAL INSTRUMENT 43-101 TECHNICAL REPORT
1913\24.04\1913-000-GEREP-0003_D S14
Page 14.4
May 2016 CSA Global
Figure 14.2 SMZ – Plan and Section Views of Mineralized Zones
Mineralized unit wireframes have been nominally extrapolated half the drill section distance beyond the drill data down dip and along strike where it was considered to be appropriate based on the geological model.
North Mineralized Zone
The NMZ is interpreted to be bounded by at least one fault structure, striking north-west to south-east and relatively steeply dipping to the north-east limiting the down dip extent of the mineralization (Figure 14.3). Additional structures are inferred based on the available geophysical and geological data, to limit the strike extents of the NMZ to the north-west and south-east. The
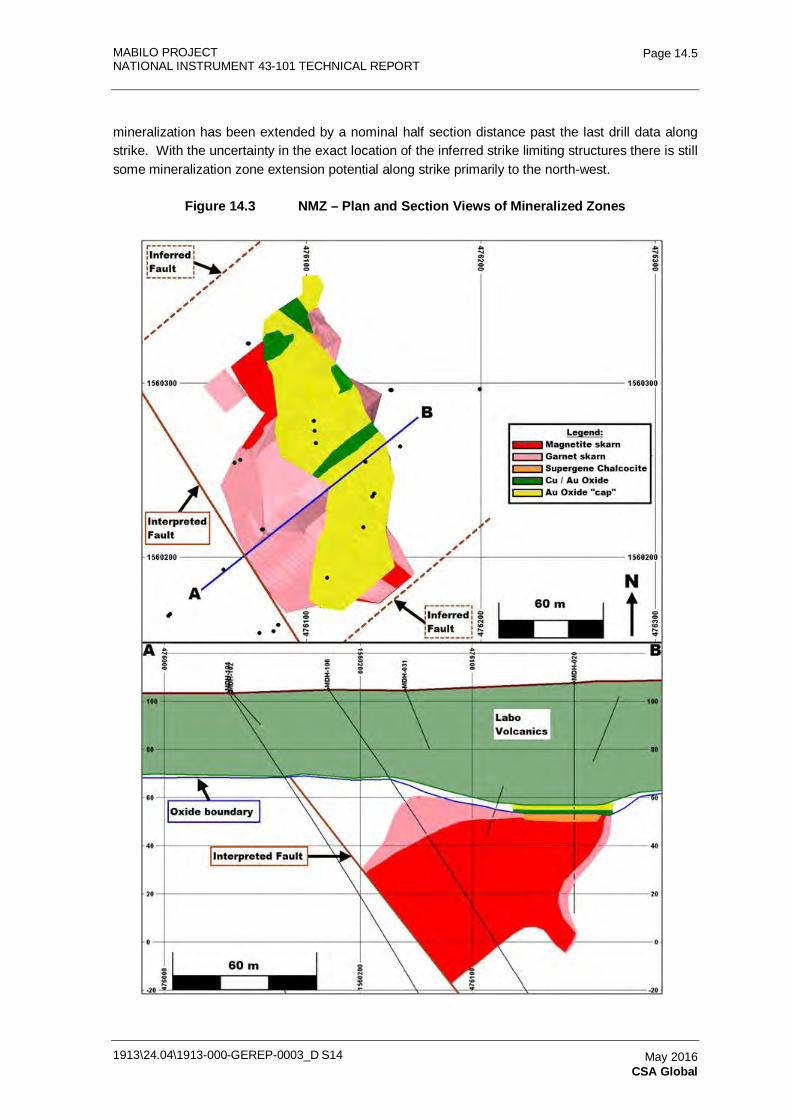
MABILO PROJECT NATIONAL INSTRUMENT 43-101 TECHNICAL REPORT
1913\24.04\1913-000-GEREP-0003_D S14
Page 14.5
May 2016 CSA Global
mineralization has been extended by a nominal half section distance past the last drill data along strike. With the uncertainty in the exact location of the inferred strike limiting structures there is still some mineralization zone extension potential along strike primarily to the north-west.
Figure 14.3 NMZ – Plan and Section Views of Mineralized Zones
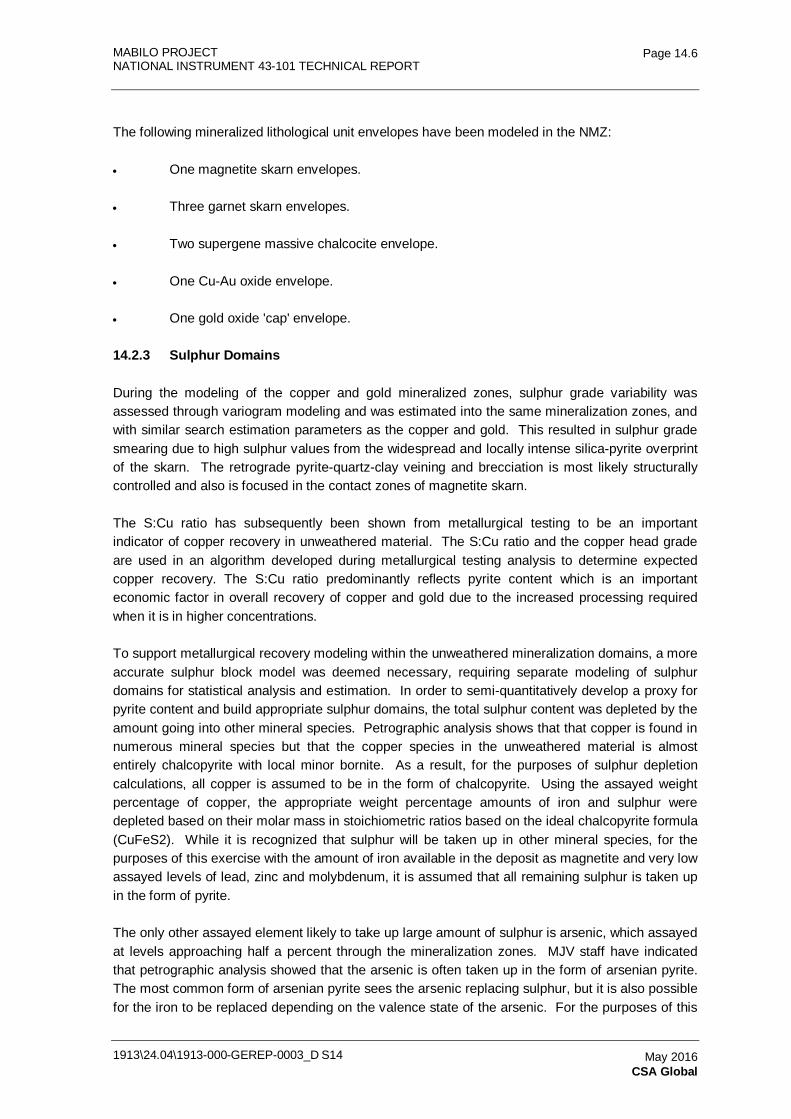
MABILO PROJECT NATIONAL INSTRUMENT 43-101 TECHNICAL REPORT
1913\24.04\1913-000-GEREP-0003_D S14
Page 14.6
May 2016 CSA Global
The following mineralized lithological unit envelopes have been modeled in the NMZ:
• One magnetite skarn envelopes.
• Three garnet skarn envelopes.
• Two supergene massive chalcocite envelope.
• One Cu-Au oxide envelope.
• One gold oxide 'cap' envelope.
14.2.3 Sulphur Domains
During the modeling of the copper and gold mineralized zones, sulphur grade variability was assessed through variogram modeling and was estimated into the same mineralization zones, and with similar search estimation parameters as the copper and gold. This resulted in sulphur grade smearing due to high sulphur values from the widespread and locally intense silica-pyrite overprint of the skarn. The retrograde pyrite-quartz-clay veining and brecciation is most likely structurally controlled and also is focused in the contact zones of magnetite skarn.
The S:Cu ratio has subsequently been shown from metallurgical testing to be an important indicator of copper recovery in unweathered material. The S:Cu ratio and the copper head grade are used in an algorithm developed during metallurgical testing analysis to determine expected copper recovery. The S:Cu ratio predominantly reflects pyrite content which is an important economic factor in overall recovery of copper and gold due to the increased processing required when it is in higher concentrations.
To support metallurgical recovery modeling within the unweathered mineralization domains, a more accurate sulphur block model was deemed necessary, requiring separate modeling of sulphur domains for statistical analysis and estimation. In order to semi-quantitatively develop a proxy for pyrite content and build appropriate sulphur domains, the total sulphur content was depleted by the amount going into other mineral species. Petrographic analysis shows that that copper is found in numerous mineral species but that the copper species in the unweathered material is almost entirely chalcopyrite with local minor bornite. As a result, for the purposes of sulphur depletion calculations, all copper is assumed to be in the form of chalcopyrite. Using the assayed weight percentage of copper, the appropriate weight percentage amounts of iron and sulphur were depleted based on their molar mass in stoichiometric ratios based on the ideal chalcopyrite formula (CuFeS2). While it is recognized that sulphur will be taken up in other mineral species, for the purposes of this exercise with the amount of iron available in the deposit as magnetite and very low assayed levels of lead, zinc and molybdenum, it is assumed that all remaining sulphur is taken up in the form of pyrite.
The only other assayed element likely to take up large amount of sulphur is arsenic, which assayed at levels approaching half a percent through the mineralization zones. MJV staff have indicated that petrographic analysis showed that the arsenic is often taken up in the form of arsenian pyrite. The most common form of arsenian pyrite sees the arsenic replacing sulphur, but it is also possible for the iron to be replaced depending on the valence state of the arsenic. For the purposes of this
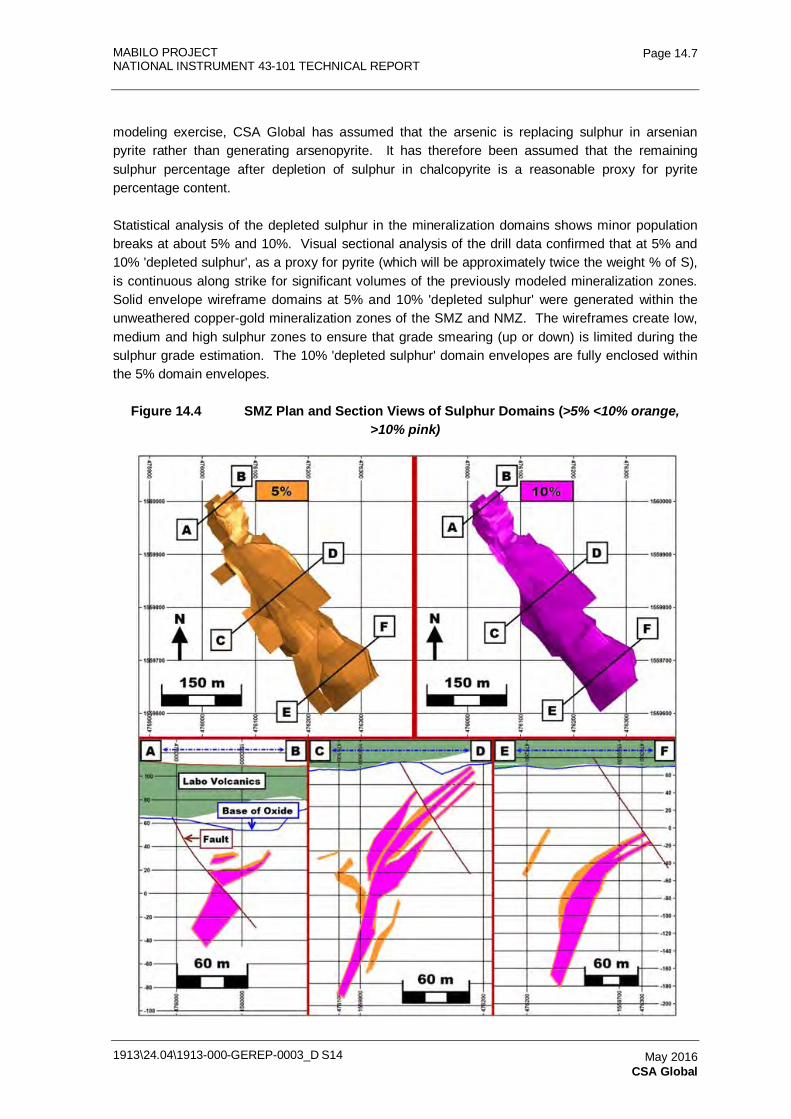
MABILO PROJECT NATIONAL INSTRUMENT 43-101 TECHNICAL REPORT
1913\24.04\1913-000-GEREP-0003_D S14
Page 14.7
May 2016 CSA Global
modeling exercise, CSA Global has assumed that the arsenic is replacing sulphur in arsenian pyrite rather than generating arsenopyrite. It has therefore been assumed that the remaining sulphur percentage after depletion of sulphur in chalcopyrite is a reasonable proxy for pyrite percentage content.
Statistical analysis of the depleted sulphur in the mineralization domains shows minor population breaks at about 5% and 10%. Visual sectional analysis of the drill data confirmed that at 5% and 10% 'depleted sulphur', as a proxy for pyrite (which will be approximately twice the weight % of S), is continuous along strike for significant volumes of the previously modeled mineralization zones. Solid envelope wireframe domains at 5% and 10% 'depleted sulphur' were generated within the unweathered copper-gold mineralization zones of the SMZ and NMZ. The wireframes create low, medium and high sulphur zones to ensure that grade smearing (up or down) is limited during the sulphur grade estimation. The 10% 'depleted sulphur' domain envelopes are fully enclosed within the 5% domain envelopes.
Figure 14.4 SMZ Plan and Section Views of Sulphur Domains (>5% <10% orange, >10% pink)
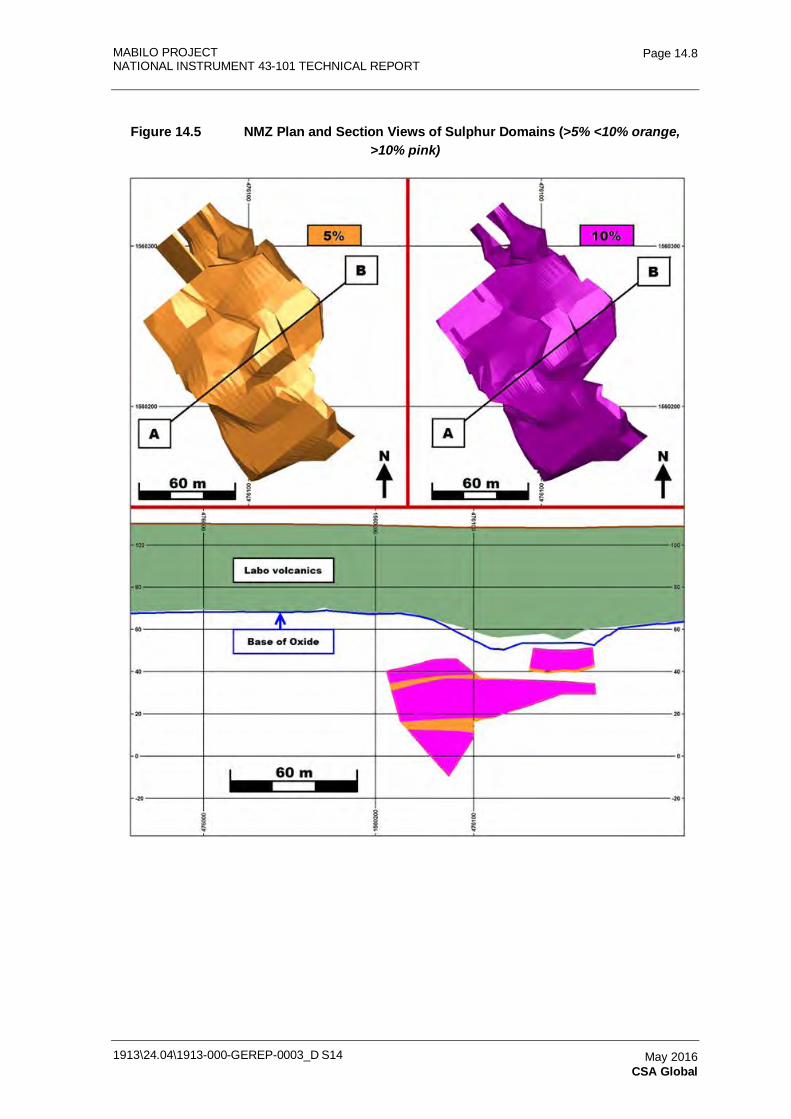
MABILO PROJECT NATIONAL INSTRUMENT 43-101 TECHNICAL REPORT
1913\24.04\1913-000-GEREP-0003_D S14
Page 14.8
May 2016 CSA Global
Figure 14.5 NMZ Plan and Section Views of Sulphur Domains (>5% <10% orange, >10% pink)
MABILO PROJECT NATIONAL INSTRUMENT 43-101 TECHNICAL REPORT
1913\24.04\1913-000-GEREP-0003_D S14
Page 14.9
May 2016 CSA Global
South Mineralized Zone
In the SMZ, a total of 12 individual 5% and six individual 10% sulphur domains have been interpreted in the unweathered material. In Figure 14.4, the plan view extents and cross sections of the interpreted domains are shown. These are the same sections as in Figure 14.2 above with geology excluded from Figure 14.4 for clarity.
North Mineralized Zone
In the NMZ, a total of four individual 5% and two individual 10% remaining sulphur domains have been interpreted in the unweathered material. In Figure 14.5 the plan view extents and a cross section of the interpreted domains are shown. This is the same section as in Figure 14.3 above with geology excluded from Figure 14.5 for clarity.
14.2.4 Weathering
MJV provided an oxide boundary surface wireframe produced by implicit modeling in Leapfrog. CSA Global imported the wireframe into Datamine and refined this surface to exactly honor all logged oxide boundary intercepts in the drill-hole logs. The oxide surface has been used to limit the interpreted mineralization envelopes. The overlying Labo Formation basal surface wireframe provided by MJV was also imported, refined and used to limit the top of the mineralization envelope interpretations of the deposits as demonstrated in Figure 14.2 and Figure 14.3.
14.2.5 Topography
MJV has provided a topographic surface wireframe which was imported into Datamine and used to limit the top of the Labo Formation.
14.3 Statistical Analysis
14.3.1 Software Used
Geostatistical analysis was conducted using GeoAccess Professional software from Widenbar and Associates and spatial analysis was undertaken using Isatis 2015 (v2015.01).
14.3.2 Drillhole Coding
Drill-hole sample intervals were numerically coded using the field 'MINZON' based on the mineralized lithological unit they fall within. Weathering state was coded using the field 'OXIDE' where OXIDE = 1 for weathered material and OXIDE = 3 for unweathered material.
Based on the broad lithology type and deposit, the mineralized lithological units were grouped into 14 domains using the field 'ZONE' as shown in Table 14.1.
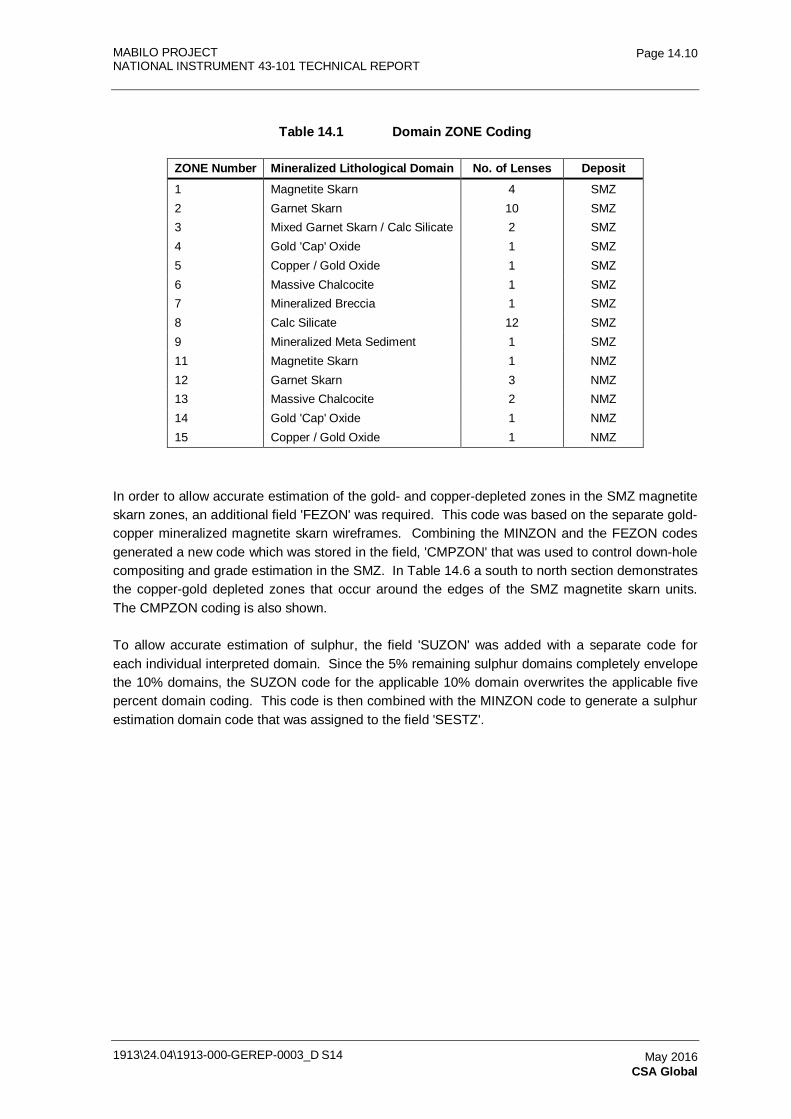
MABILO PROJECT NATIONAL INSTRUMENT 43-101 TECHNICAL REPORT
1913\24.04\1913-000-GEREP-0003_D S14
Page 14.10
May 2016 CSA Global
Table 14.1 Domain ZONE Coding
ZONE Number Mineralized Lithological Domain No. of Lenses Deposit 1 Magnetite Skarn 4 SMZ 2 Garnet Skarn 10 SMZ 3 Mixed Garnet Skarn / Calc Silicate 2 SMZ 4 Gold 'Cap' Oxide 1 SMZ 5 Copper / Gold Oxide 1 SMZ 6 Massive Chalcocite 1 SMZ 7 Mineralized Breccia 1 SMZ 8 Calc Silicate 12 SMZ 9 Mineralized Meta Sediment 1 SMZ 11 Magnetite Skarn 1 NMZ 12 Garnet Skarn 3 NMZ 13 Massive Chalcocite 2 NMZ 14 Gold 'Cap' Oxide 1 NMZ 15 Copper / Gold Oxide 1 NMZ
In order to allow accurate estimation of the gold- and copper-depleted zones in the SMZ magnetite skarn zones, an additional field 'FEZON' was required. This code was based on the separate gold-copper mineralized magnetite skarn wireframes. Combining the MINZON and the FEZON codes generated a new code which was stored in the field, 'CMPZON' that was used to control down-hole compositing and grade estimation in the SMZ. In Table 14.6 a south to north section demonstrates the copper-gold depleted zones that occur around the edges of the SMZ magnetite skarn units. The CMPZON coding is also shown.
To allow accurate estimation of sulphur, the field 'SUZON' was added with a separate code for each individual interpreted domain. Since the 5% remaining sulphur domains completely envelope the 10% domains, the SUZON code for the applicable 10% domain overwrites the applicable five percent domain coding. This code is then combined with the MINZON code to generate a sulphur estimation domain code that was assigned to the field 'SESTZ'.
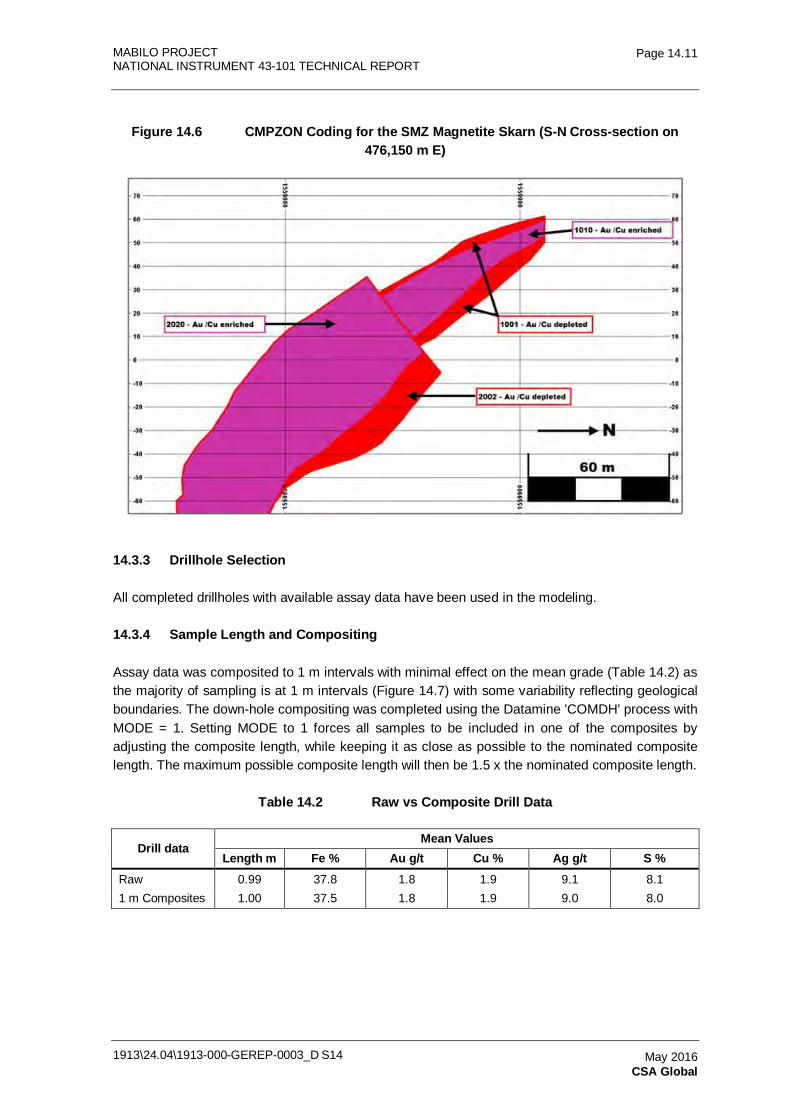
MABILO PROJECT NATIONAL INSTRUMENT 43-101 TECHNICAL REPORT
1913\24.04\1913-000-GEREP-0003_D S14
Page 14.11
May 2016 CSA Global
Figure 14.6 CMPZON Coding for the SMZ Magnetite Skarn (S-N Cross-section on 476,150 m E)
14.3.3 Drillhole Selection
All completed drillholes with available assay data have been used in the modeling.
14.3.4 Sample Length and Compositing
Assay data was composited to 1 m intervals with minimal effect on the mean grade (Table 14.2) as the majority of sampling is at 1 m intervals (Figure 14.7) with some variability reflecting geological boundaries. The down-hole compositing was completed using the Datamine 'COMDH' process with MODE = 1. Setting MODE to 1 forces all samples to be included in one of the composites by adjusting the composite length, while keeping it as close as possible to the nominated composite length. The maximum possible composite length will then be 1.5 x the nominated composite length.
Table 14.2 Raw vs Composite Drill Data
Drill data Mean Values
Length m Fe % Au g/t Cu % Ag g/t S % Raw 0.99 37.8 1.8 1.9 9.1 8.1 1 m Composites 1.00 37.5 1.8 1.9 9.0 8.0
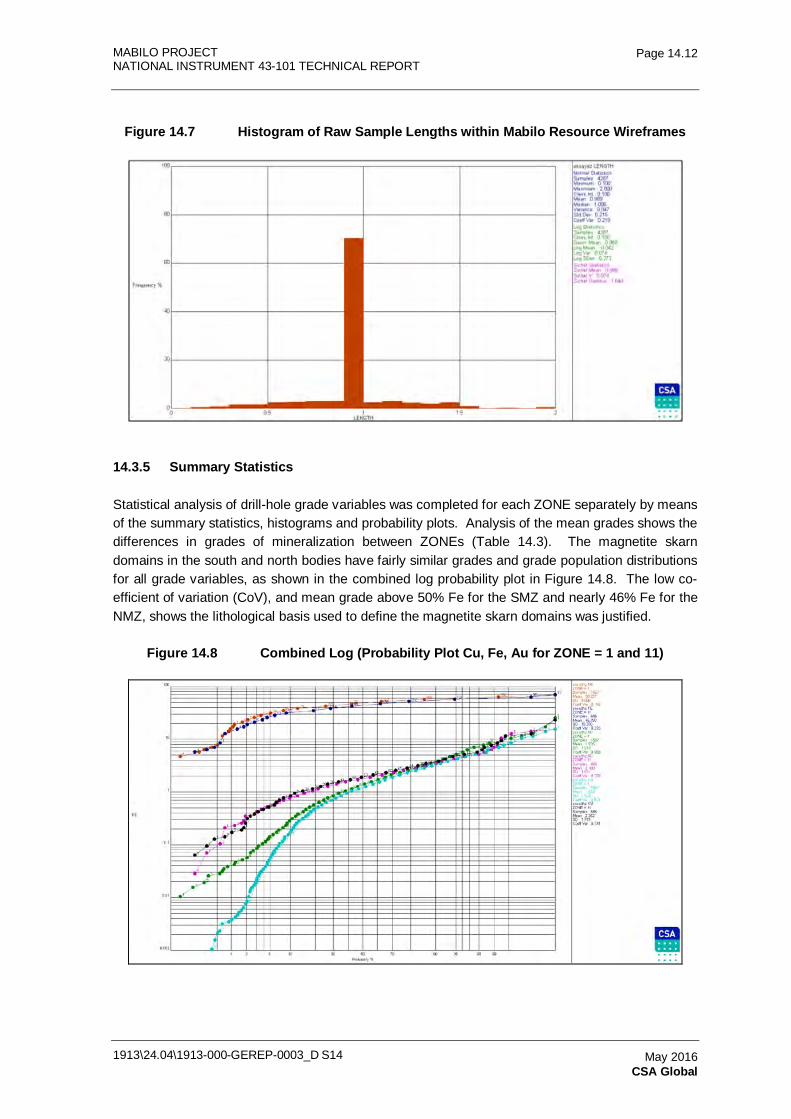
MABILO PROJECT NATIONAL INSTRUMENT 43-101 TECHNICAL REPORT
1913\24.04\1913-000-GEREP-0003_D S14
Page 14.12
May 2016 CSA Global
Figure 14.7 Histogram of Raw Sample Lengths within Mabilo Resource Wireframes
14.3.5 Summary Statistics
Statistical analysis of drill-hole grade variables was completed for each ZONE separately by means of the summary statistics, histograms and probability plots. Analysis of the mean grades shows the differences in grades of mineralization between ZONEs (Table 14.3). The magnetite skarn domains in the south and north bodies have fairly similar grades and grade population distributions for all grade variables, as shown in the combined log probability plot in Figure 14.8. The low co-efficient of variation (CoV), and mean grade above 50% Fe for the SMZ and nearly 46% Fe for the NMZ, shows the lithological basis used to define the magnetite skarn domains was justified.
Figure 14.8 Combined Log (Probability Plot Cu, Fe, Au for ZONE = 1 and 11)
MABILO PROJECT NATIONAL INSTRUMENT 43-101 TECHNICAL REPORT
1913\24.04\1913-000-GEREP-0003_D S14
Page 14.13
May 2016 CSA Global
More grade variability is observed between the SMZ and NMZ for the remaining ZONEs, with broadly higher mean Fe and Au grades in the south. Au and Cu grades are elevated in the mineralized oxide zones while Cu is depleted in the gold 'cap' zones compared with the fresh magnetite skarn.
For the unweathered material, each lithological ZONE can have up to three sulphur domains. The summary statistics for sulphur are shown in Table 14.4 for each ZONE split by sulphur domain. Outside of the sulphur ZONEs higher CoV values are noted. Histograms and probability plots for all grade variables for all zones are available.
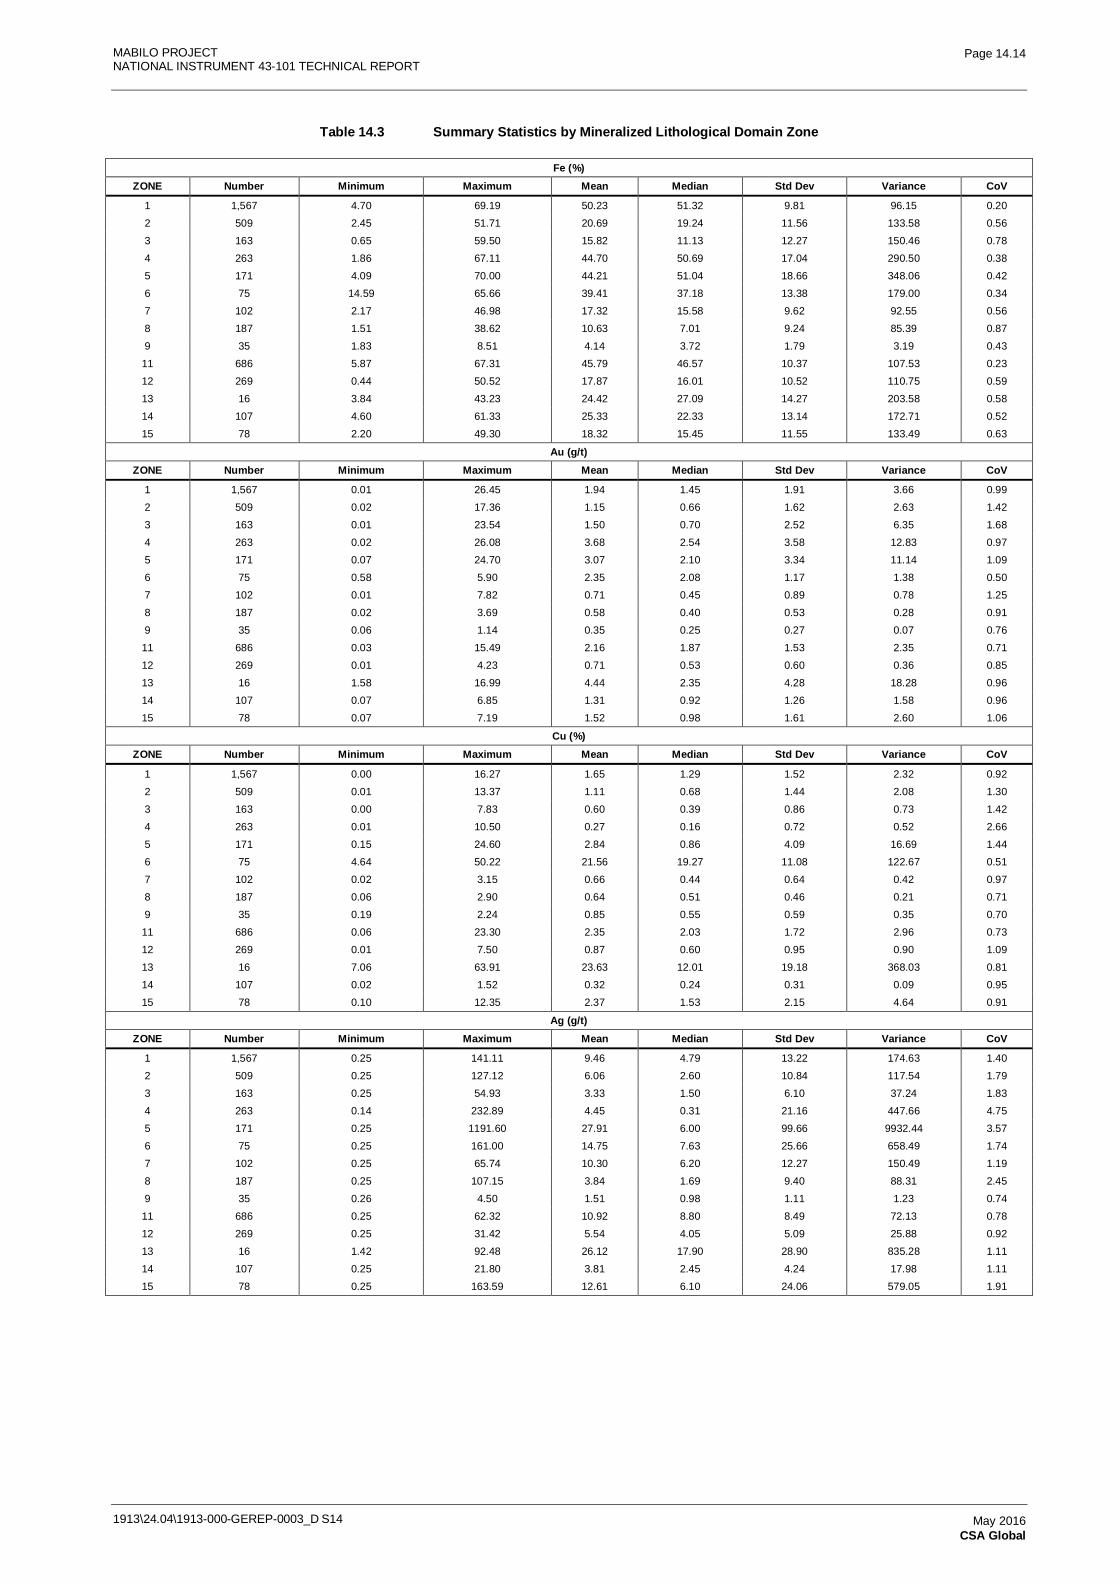
MABILO PROJECT NATIONAL INSTRUMENT 43-101 TECHNICAL REPORT
1913\24.04\1913-000-GEREP-0003_D S14
Page 14.14
May 2016 CSA Global
Table 14.3 Summary Statistics by Mineralized Lithological Domain Zone
Fe (%) ZONE Number Minimum Maximum Mean Median Std Dev Variance CoV
1 1,567 4.70 69.19 50.23 51.32 9.81 96.15 0.20
2 509 2.45 51.71 20.69 19.24 11.56 133.58 0.56
3 163 0.65 59.50 15.82 11.13 12.27 150.46 0.78
4 263 1.86 67.11 44.70 50.69 17.04 290.50 0.38
5 171 4.09 70.00 44.21 51.04 18.66 348.06 0.42
6 75 14.59 65.66 39.41 37.18 13.38 179.00 0.34
7 102 2.17 46.98 17.32 15.58 9.62 92.55 0.56
8 187 1.51 38.62 10.63 7.01 9.24 85.39 0.87
9 35 1.83 8.51 4.14 3.72 1.79 3.19 0.43
11 686 5.87 67.31 45.79 46.57 10.37 107.53 0.23
12 269 0.44 50.52 17.87 16.01 10.52 110.75 0.59
13 16 3.84 43.23 24.42 27.09 14.27 203.58 0.58
14 107 4.60 61.33 25.33 22.33 13.14 172.71 0.52
15 78 2.20 49.30 18.32 15.45 11.55 133.49 0.63
Au (g/t) ZONE Number Minimum Maximum Mean Median Std Dev Variance CoV
1 1,567 0.01 26.45 1.94 1.45 1.91 3.66 0.99
2 509 0.02 17.36 1.15 0.66 1.62 2.63 1.42
3 163 0.01 23.54 1.50 0.70 2.52 6.35 1.68
4 263 0.02 26.08 3.68 2.54 3.58 12.83 0.97
5 171 0.07 24.70 3.07 2.10 3.34 11.14 1.09
6 75 0.58 5.90 2.35 2.08 1.17 1.38 0.50
7 102 0.01 7.82 0.71 0.45 0.89 0.78 1.25
8 187 0.02 3.69 0.58 0.40 0.53 0.28 0.91
9 35 0.06 1.14 0.35 0.25 0.27 0.07 0.76
11 686 0.03 15.49 2.16 1.87 1.53 2.35 0.71
12 269 0.01 4.23 0.71 0.53 0.60 0.36 0.85
13 16 1.58 16.99 4.44 2.35 4.28 18.28 0.96
14 107 0.07 6.85 1.31 0.92 1.26 1.58 0.96
15 78 0.07 7.19 1.52 0.98 1.61 2.60 1.06
Cu (%) ZONE Number Minimum Maximum Mean Median Std Dev Variance CoV
1 1,567 0.00 16.27 1.65 1.29 1.52 2.32 0.92
2 509 0.01 13.37 1.11 0.68 1.44 2.08 1.30
3 163 0.00 7.83 0.60 0.39 0.86 0.73 1.42
4 263 0.01 10.50 0.27 0.16 0.72 0.52 2.66
5 171 0.15 24.60 2.84 0.86 4.09 16.69 1.44
6 75 4.64 50.22 21.56 19.27 11.08 122.67 0.51
7 102 0.02 3.15 0.66 0.44 0.64 0.42 0.97
8 187 0.06 2.90 0.64 0.51 0.46 0.21 0.71
9 35 0.19 2.24 0.85 0.55 0.59 0.35 0.70
11 686 0.06 23.30 2.35 2.03 1.72 2.96 0.73
12 269 0.01 7.50 0.87 0.60 0.95 0.90 1.09
13 16 7.06 63.91 23.63 12.01 19.18 368.03 0.81
14 107 0.02 1.52 0.32 0.24 0.31 0.09 0.95
15 78 0.10 12.35 2.37 1.53 2.15 4.64 0.91
Ag (g/t) ZONE Number Minimum Maximum Mean Median Std Dev Variance CoV
1 1,567 0.25 141.11 9.46 4.79 13.22 174.63 1.40
2 509 0.25 127.12 6.06 2.60 10.84 117.54 1.79
3 163 0.25 54.93 3.33 1.50 6.10 37.24 1.83
4 263 0.14 232.89 4.45 0.31 21.16 447.66 4.75
5 171 0.25 1191.60 27.91 6.00 99.66 9932.44 3.57
6 75 0.25 161.00 14.75 7.63 25.66 658.49 1.74
7 102 0.25 65.74 10.30 6.20 12.27 150.49 1.19
8 187 0.25 107.15 3.84 1.69 9.40 88.31 2.45
9 35 0.26 4.50 1.51 0.98 1.11 1.23 0.74
11 686 0.25 62.32 10.92 8.80 8.49 72.13 0.78
12 269 0.25 31.42 5.54 4.05 5.09 25.88 0.92
13 16 1.42 92.48 26.12 17.90 28.90 835.28 1.11
14 107 0.25 21.80 3.81 2.45 4.24 17.98 1.11
15 78 0.25 163.59 12.61 6.10 24.06 579.05 1.91
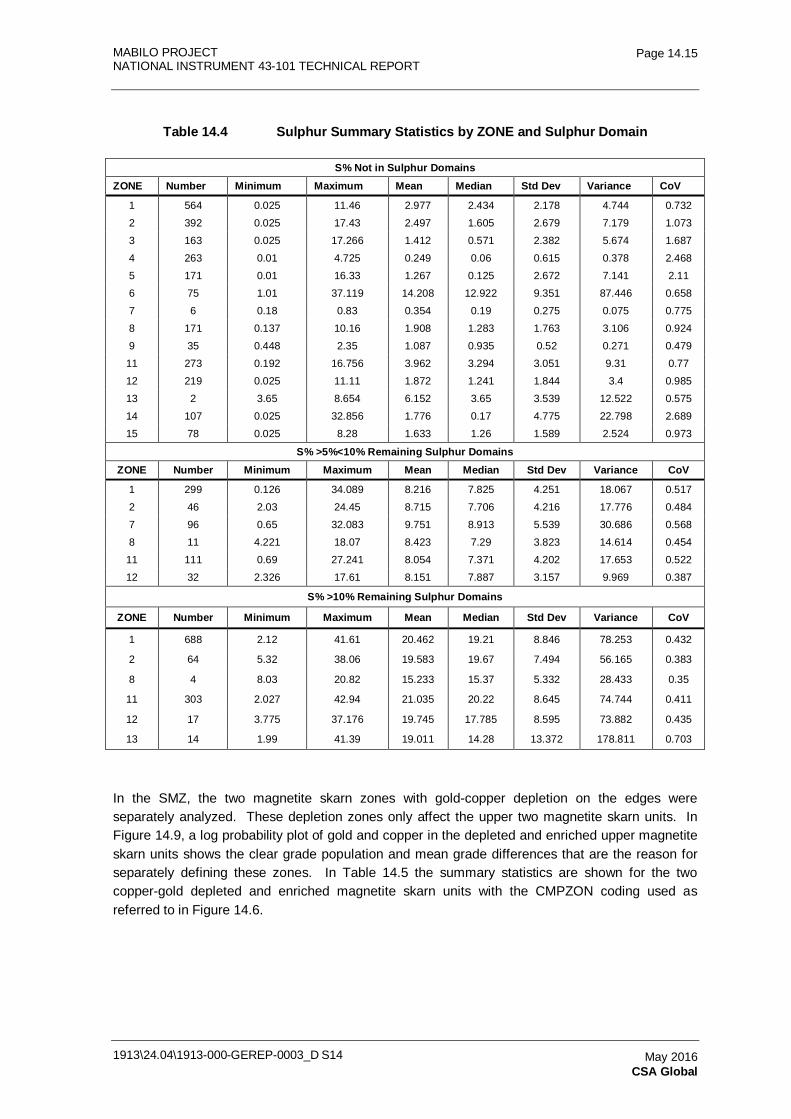
MABILO PROJECT NATIONAL INSTRUMENT 43-101 TECHNICAL REPORT
1913\24.04\1913-000-GEREP-0003_D S14
Page 14.15
May 2016 CSA Global
Table 14.4 Sulphur Summary Statistics by ZONE and Sulphur Domain
S% Not in Sulphur Domains ZONE Number Minimum Maximum Mean Median Std Dev Variance CoV
1 564 0.025 11.46 2.977 2.434 2.178 4.744 0.732
2 392 0.025 17.43 2.497 1.605 2.679 7.179 1.073
3 163 0.025 17.266 1.412 0.571 2.382 5.674 1.687
4 263 0.01 4.725 0.249 0.06 0.615 0.378 2.468
5 171 0.01 16.33 1.267 0.125 2.672 7.141 2.11
6 75 1.01 37.119 14.208 12.922 9.351 87.446 0.658
7 6 0.18 0.83 0.354 0.19 0.275 0.075 0.775
8 171 0.137 10.16 1.908 1.283 1.763 3.106 0.924
9 35 0.448 2.35 1.087 0.935 0.52 0.271 0.479
11 273 0.192 16.756 3.962 3.294 3.051 9.31 0.77
12 219 0.025 11.11 1.872 1.241 1.844 3.4 0.985
13 2 3.65 8.654 6.152 3.65 3.539 12.522 0.575
14 107 0.025 32.856 1.776 0.17 4.775 22.798 2.689
15 78 0.025 8.28 1.633 1.26 1.589 2.524 0.973
S% >5%<10% Remaining Sulphur Domains ZONE Number Minimum Maximum Mean Median Std Dev Variance CoV
1 299 0.126 34.089 8.216 7.825 4.251 18.067 0.517
2 46 2.03 24.45 8.715 7.706 4.216 17.776 0.484
7 96 0.65 32.083 9.751 8.913 5.539 30.686 0.568
8 11 4.221 18.07 8.423 7.29 3.823 14.614 0.454
11 111 0.69 27.241 8.054 7.371 4.202 17.653 0.522
12 32 2.326 17.61 8.151 7.887 3.157 9.969 0.387
S% >10% Remaining Sulphur Domains
ZONE Number Minimum Maximum Mean Median Std Dev Variance CoV
1 688 2.12 41.61 20.462 19.21 8.846 78.253 0.432
2 64 5.32 38.06 19.583 19.67 7.494 56.165 0.383
8 4 8.03 20.82 15.233 15.37 5.332 28.433 0.35
11 303 2.027 42.94 21.035 20.22 8.645 74.744 0.411
12 17 3.775 37.176 19.745 17.785 8.595 73.882 0.435
13 14 1.99 41.39 19.011 14.28 13.372 178.811 0.703
In the SMZ, the two magnetite skarn zones with gold-copper depletion on the edges were separately analyzed. These depletion zones only affect the upper two magnetite skarn units. In Figure 14.9, a log probability plot of gold and copper in the depleted and enriched upper magnetite skarn units shows the clear grade population and mean grade differences that are the reason for separately defining these zones. In Table 14.5 the summary statistics are shown for the two copper-gold depleted and enriched magnetite skarn units with the CMPZON coding used as referred to in Figure 14.6.
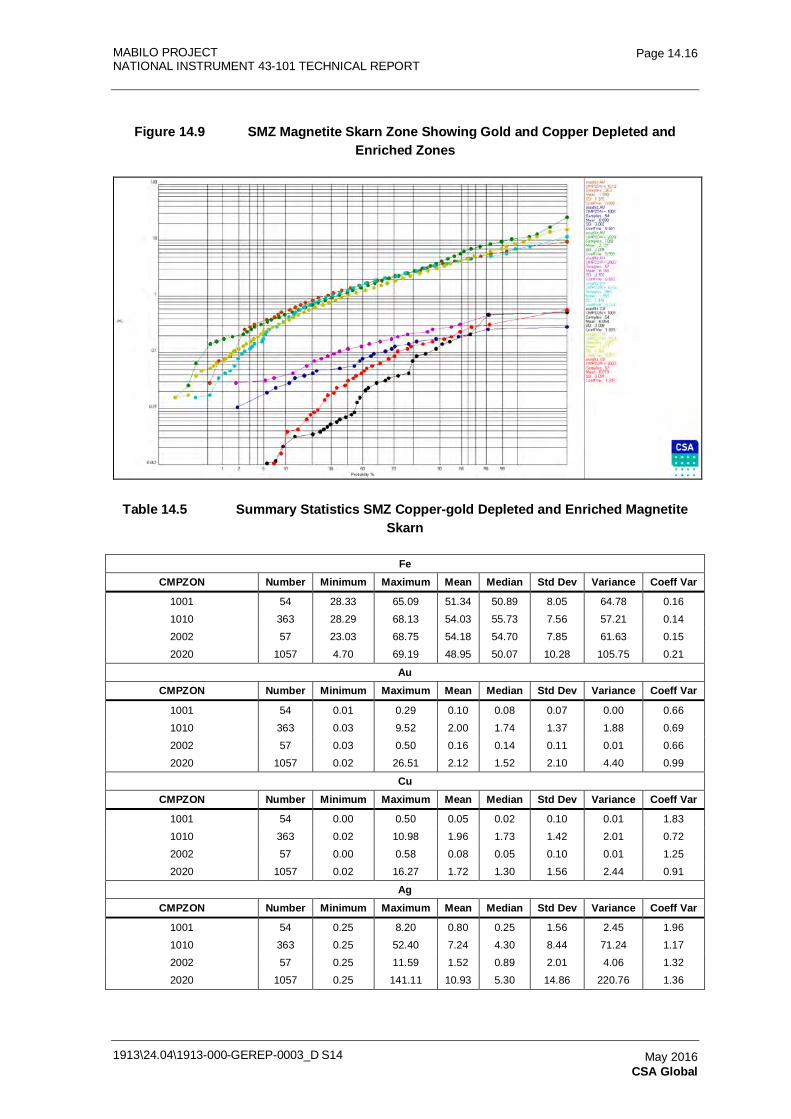
MABILO PROJECT NATIONAL INSTRUMENT 43-101 TECHNICAL REPORT
1913\24.04\1913-000-GEREP-0003_D S14
Page 14.16
May 2016 CSA Global
Figure 14.9 SMZ Magnetite Skarn Zone Showing Gold and Copper Depleted and Enriched Zones
Table 14.5 Summary Statistics SMZ Copper-gold Depleted and Enriched Magnetite Skarn
Fe CMPZON Number Minimum Maximum Mean Median Std Dev Variance Coeff Var
1001 54 28.33 65.09 51.34 50.89 8.05 64.78 0.16
1010 363 28.29 68.13 54.03 55.73 7.56 57.21 0.14
2002 57 23.03 68.75 54.18 54.70 7.85 61.63 0.15
2020 1057 4.70 69.19 48.95 50.07 10.28 105.75 0.21
Au CMPZON Number Minimum Maximum Mean Median Std Dev Variance Coeff Var
1001 54 0.01 0.29 0.10 0.08 0.07 0.00 0.66
1010 363 0.03 9.52 2.00 1.74 1.37 1.88 0.69
2002 57 0.03 0.50 0.16 0.14 0.11 0.01 0.66
2020 1057 0.02 26.51 2.12 1.52 2.10 4.40 0.99
Cu CMPZON Number Minimum Maximum Mean Median Std Dev Variance Coeff Var
1001 54 0.00 0.50 0.05 0.02 0.10 0.01 1.83
1010 363 0.02 10.98 1.96 1.73 1.42 2.01 0.72
2002 57 0.00 0.58 0.08 0.05 0.10 0.01 1.25
2020 1057 0.02 16.27 1.72 1.30 1.56 2.44 0.91
Ag CMPZON Number Minimum Maximum Mean Median Std Dev Variance Coeff Var
1001 54 0.25 8.20 0.80 0.25 1.56 2.45 1.96
1010 363 0.25 52.40 7.24 4.30 8.44 71.24 1.17
2002 57 0.25 11.59 1.52 0.89 2.01 4.06 1.32
2020 1057 0.25 141.11 10.93 5.30 14.86 220.76 1.36
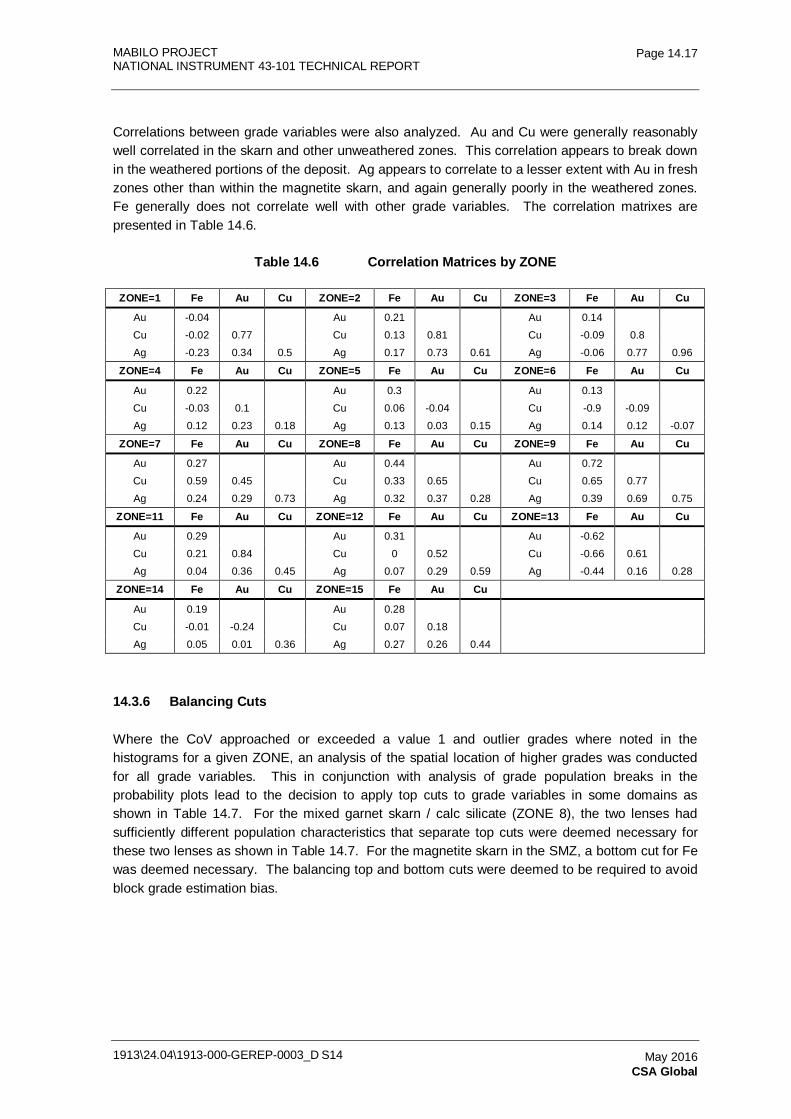
MABILO PROJECT NATIONAL INSTRUMENT 43-101 TECHNICAL REPORT
1913\24.04\1913-000-GEREP-0003_D S14
Page 14.17
May 2016 CSA Global
Correlations between grade variables were also analyzed. Au and Cu were generally reasonably well correlated in the skarn and other unweathered zones. This correlation appears to break down in the weathered portions of the deposit. Ag appears to correlate to a lesser extent with Au in fresh zones other than within the magnetite skarn, and again generally poorly in the weathered zones. Fe generally does not correlate well with other grade variables. The correlation matrixes are presented in Table 14.6.
Table 14.6 Correlation Matrices by ZONE
ZONE=1 Fe Au Cu ZONE=2 Fe Au Cu ZONE=3 Fe Au Cu
Au -0.04
Au 0.21
Au 0.14
Cu -0.02 0.77
Cu 0.13 0.81
Cu -0.09 0.8
Ag -0.23 0.34 0.5 Ag 0.17 0.73 0.61 Ag -0.06 0.77 0.96
ZONE=4 Fe Au Cu ZONE=5 Fe Au Cu ZONE=6 Fe Au Cu
Au 0.22
Au 0.3
Au 0.13
Cu -0.03 0.1
Cu 0.06 -0.04
Cu -0.9 -0.09
Ag 0.12 0.23 0.18 Ag 0.13 0.03 0.15 Ag 0.14 0.12 -0.07
ZONE=7 Fe Au Cu ZONE=8 Fe Au Cu ZONE=9 Fe Au Cu
Au 0.27
Au 0.44
Au 0.72
Cu 0.59 0.45
Cu 0.33 0.65
Cu 0.65 0.77
Ag 0.24 0.29 0.73 Ag 0.32 0.37 0.28 Ag 0.39 0.69 0.75
ZONE=11 Fe Au Cu ZONE=12 Fe Au Cu ZONE=13 Fe Au Cu
Au 0.29
Au 0.31
Au -0.62
Cu 0.21 0.84
Cu 0 0.52
Cu -0.66 0.61
Ag 0.04 0.36 0.45 Ag 0.07 0.29 0.59 Ag -0.44 0.16 0.28
ZONE=14 Fe Au Cu ZONE=15 Fe Au Cu
Au 0.19
Au 0.28
Cu -0.01 -0.24
Cu 0.07 0.18
Ag 0.05 0.01 0.36 Ag 0.27 0.26 0.44
14.3.6 Balancing Cuts
Where the CoV approached or exceeded a value 1 and outlier grades where noted in the histograms for a given ZONE, an analysis of the spatial location of higher grades was conducted for all grade variables. This in conjunction with analysis of grade population breaks in the probability plots lead to the decision to apply top cuts to grade variables in some domains as shown in Table 14.7. For the mixed garnet skarn / calc silicate (ZONE 8), the two lenses had sufficiently different population characteristics that separate top cuts were deemed necessary for these two lenses as shown in Table 14.7. For the magnetite skarn in the SMZ, a bottom cut for Fe was deemed necessary. The balancing top and bottom cuts were deemed to be required to avoid block grade estimation bias.
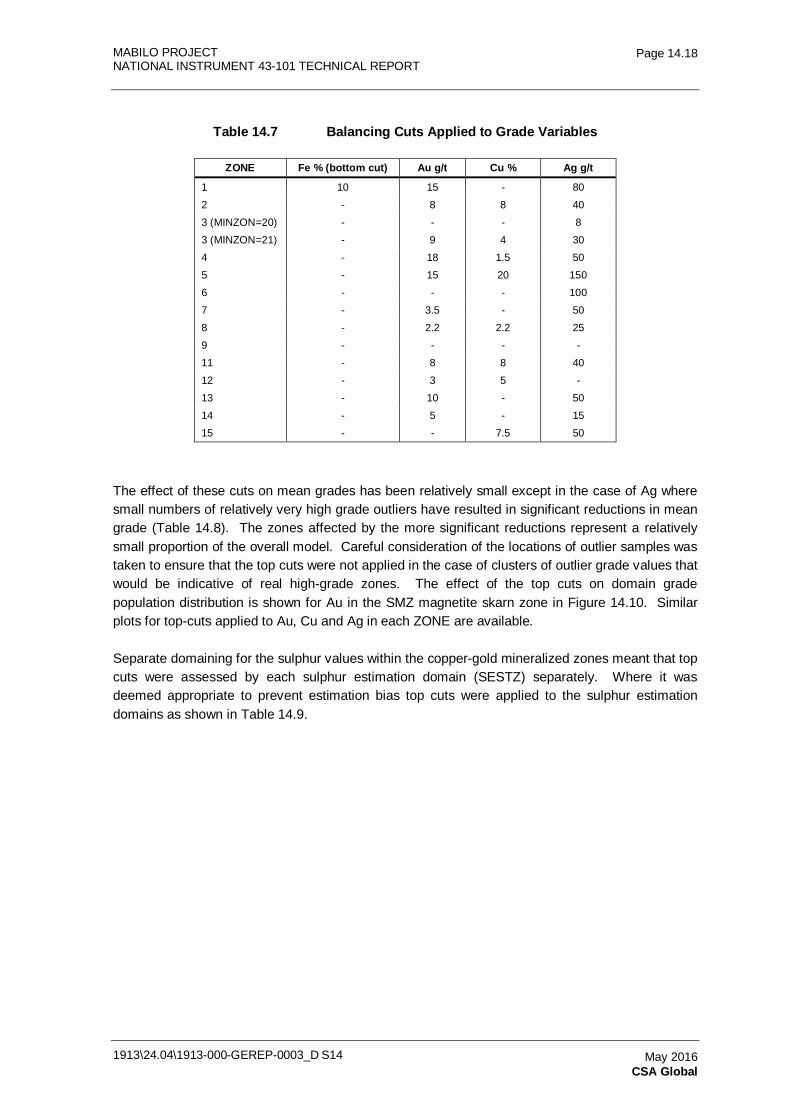
MABILO PROJECT NATIONAL INSTRUMENT 43-101 TECHNICAL REPORT
1913\24.04\1913-000-GEREP-0003_D S14
Page 14.18
May 2016 CSA Global
Table 14.7 Balancing Cuts Applied to Grade Variables
ZONE Fe % (bottom cut) Au g/t Cu % Ag g/t
1 10 15 - 80
2 - 8 8 40
3 (MINZON=20) - - - 8
3 (MINZON=21) - 9 4 30
4 - 18 1.5 50
5 - 15 20 150
6 - - - 100
7 - 3.5 - 50
8 - 2.2 2.2 25
9 - - - -
11 - 8 8 40
12 - 3 5 -
13 - 10 - 50
14 - 5 - 15
15 - - 7.5 50
The effect of these cuts on mean grades has been relatively small except in the case of Ag where small numbers of relatively very high grade outliers have resulted in significant reductions in mean grade (Table 14.8). The zones affected by the more significant reductions represent a relatively small proportion of the overall model. Careful consideration of the locations of outlier samples was taken to ensure that the top cuts were not applied in the case of clusters of outlier grade values that would be indicative of real high-grade zones. The effect of the top cuts on domain grade population distribution is shown for Au in the SMZ magnetite skarn zone in Figure 14.10. Similar plots for top-cuts applied to Au, Cu and Ag in each ZONE are available.
Separate domaining for the sulphur values within the copper-gold mineralized zones meant that top cuts were assessed by each sulphur estimation domain (SESTZ) separately. Where it was deemed appropriate to prevent estimation bias top cuts were applied to the sulphur estimation domains as shown in Table 14.9.
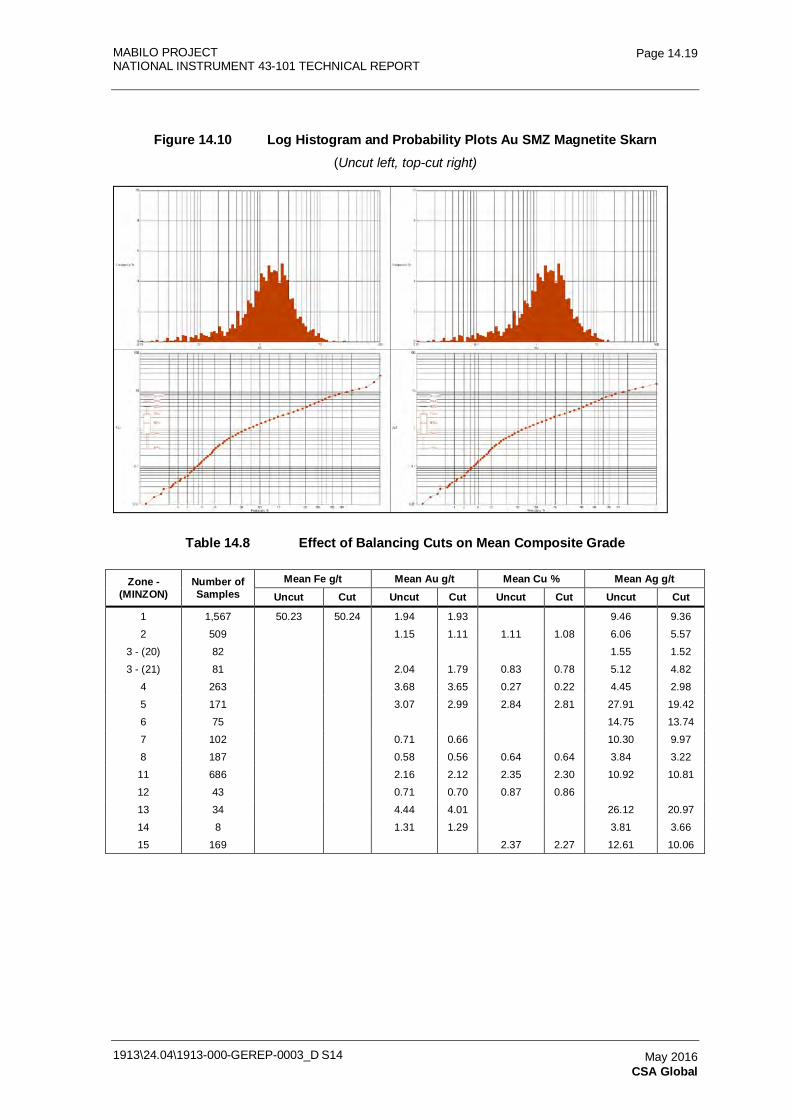
MABILO PROJECT NATIONAL INSTRUMENT 43-101 TECHNICAL REPORT
1913\24.04\1913-000-GEREP-0003_D S14
Page 14.19
May 2016 CSA Global
Figure 14.10 Log Histogram and Probability Plots Au SMZ Magnetite Skarn (Uncut left, top-cut right)
Table 14.8 Effect of Balancing Cuts on Mean Composite Grade
Zone - (MINZON)
Number of Samples
Mean Fe g/t Mean Au g/t Mean Cu % Mean Ag g/t Uncut Cut Uncut Cut Uncut Cut Uncut Cut
1 1,567 50.23 50.24 1.94 1.93
9.46 9.36
2 509
1.15 1.11 1.11 1.08 6.06 5.57
3 - (20) 82
1.55 1.52
3 - (21) 81
2.04 1.79 0.83 0.78 5.12 4.82
4 263
3.68 3.65 0.27 0.22 4.45 2.98
5 171
3.07 2.99 2.84 2.81 27.91 19.42
6 75
14.75 13.74
7 102
0.71 0.66
10.30 9.97
8 187
0.58 0.56 0.64 0.64 3.84 3.22
11 686
2.16 2.12 2.35 2.30 10.92 10.81
12 43
0.71 0.70 0.87 0.86
13 34
4.44 4.01
26.12 20.97
14 8
1.31 1.29
3.81 3.66
15 169
2.37 2.27 12.61 10.06
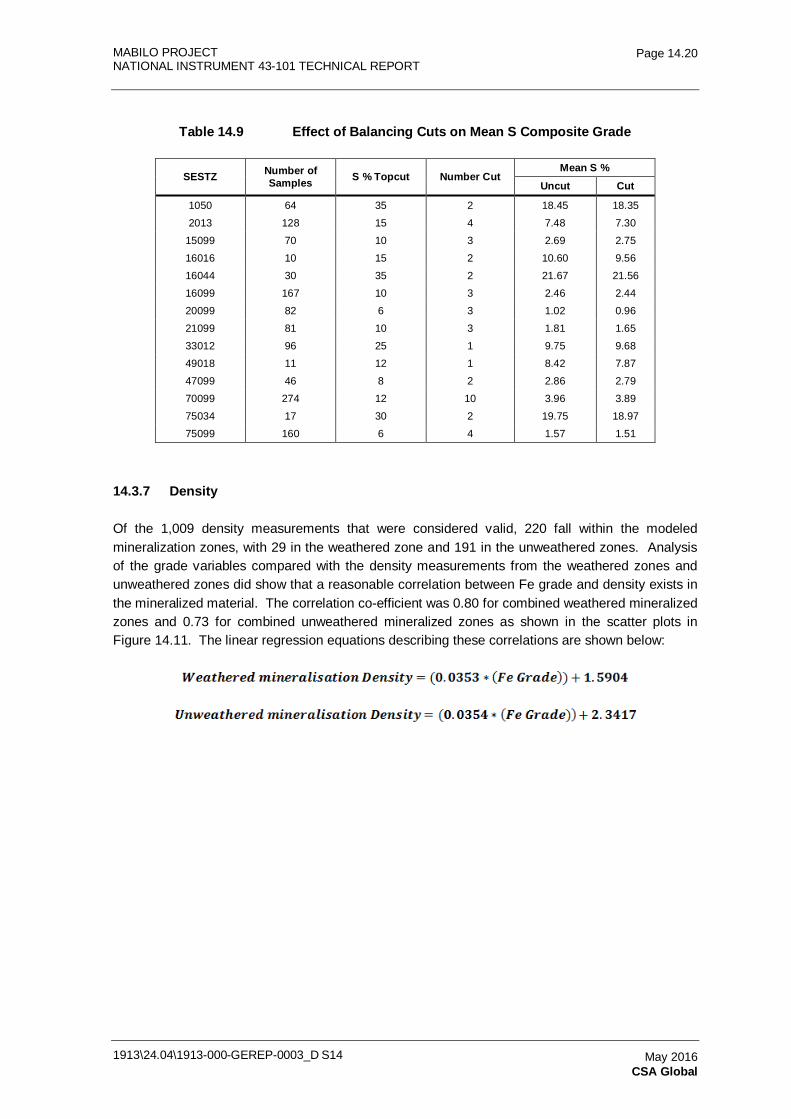
MABILO PROJECT NATIONAL INSTRUMENT 43-101 TECHNICAL REPORT
1913\24.04\1913-000-GEREP-0003_D S14
Page 14.20
May 2016 CSA Global
Table 14.9 Effect of Balancing Cuts on Mean S Composite Grade
SESTZ Number of Samples S % Topcut Number Cut
Mean S % Uncut Cut
1050 64 35 2 18.45 18.35
2013 128 15 4 7.48 7.30
15099 70 10 3 2.69 2.75
16016 10 15 2 10.60 9.56
16044 30 35 2 21.67 21.56
16099 167 10 3 2.46 2.44
20099 82 6 3 1.02 0.96
21099 81 10 3 1.81 1.65
33012 96 25 1 9.75 9.68
49018 11 12 1 8.42 7.87
47099 46 8 2 2.86 2.79
70099 274 12 10 3.96 3.89
75034 17 30 2 19.75 18.97
75099 160 6 4 1.57 1.51
14.3.7 Density
Of the 1,009 density measurements that were considered valid, 220 fall within the modeled mineralization zones, with 29 in the weathered zone and 191 in the unweathered zones. Analysis of the grade variables compared with the density measurements from the weathered zones and unweathered zones did show that a reasonable correlation between Fe grade and density exists in the mineralized material. The correlation co-efficient was 0.80 for combined weathered mineralized zones and 0.73 for combined unweathered mineralized zones as shown in the scatter plots in Figure 14.11. The linear regression equations describing these correlations are shown below:
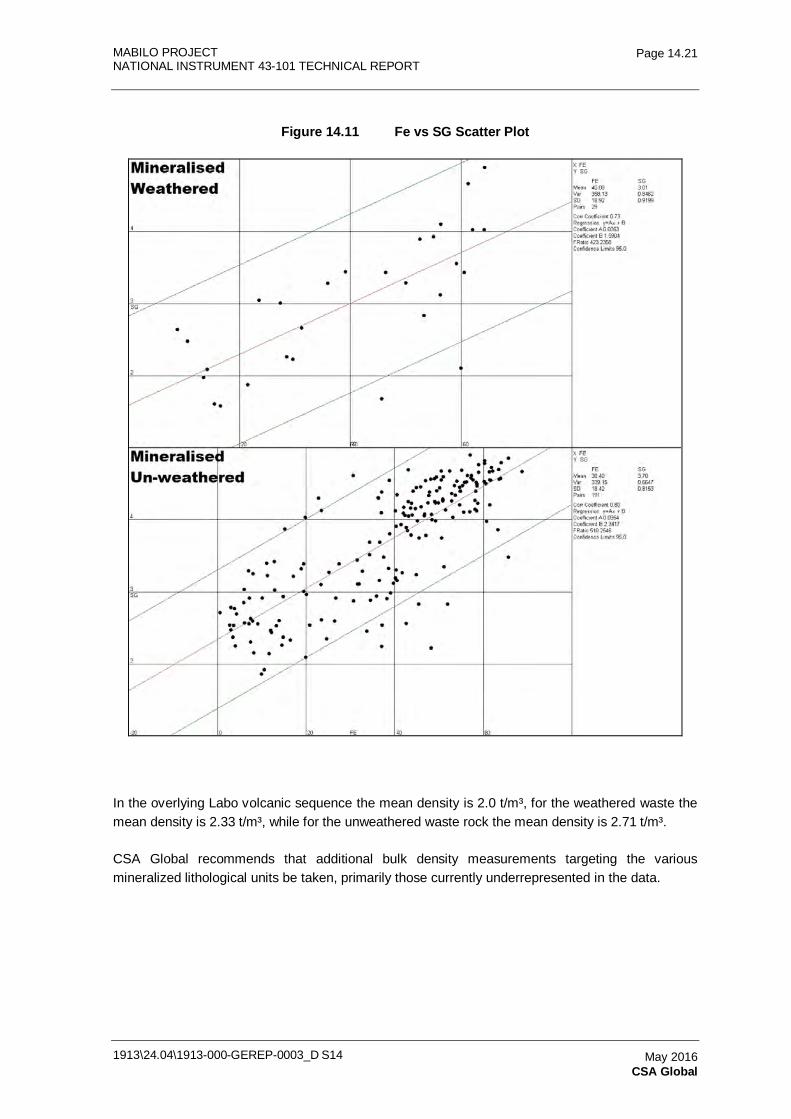
MABILO PROJECT NATIONAL INSTRUMENT 43-101 TECHNICAL REPORT
1913\24.04\1913-000-GEREP-0003_D S14
Page 14.21
May 2016 CSA Global
Figure 14.11 Fe vs SG Scatter Plot
In the overlying Labo volcanic sequence the mean density is 2.0 t/m³, for the weathered waste the mean density is 2.33 t/m³, while for the unweathered waste rock the mean density is 2.71 t/m³.
CSA Global recommends that additional bulk density measurements targeting the various mineralized lithological units be taken, primarily those currently underrepresented in the data.
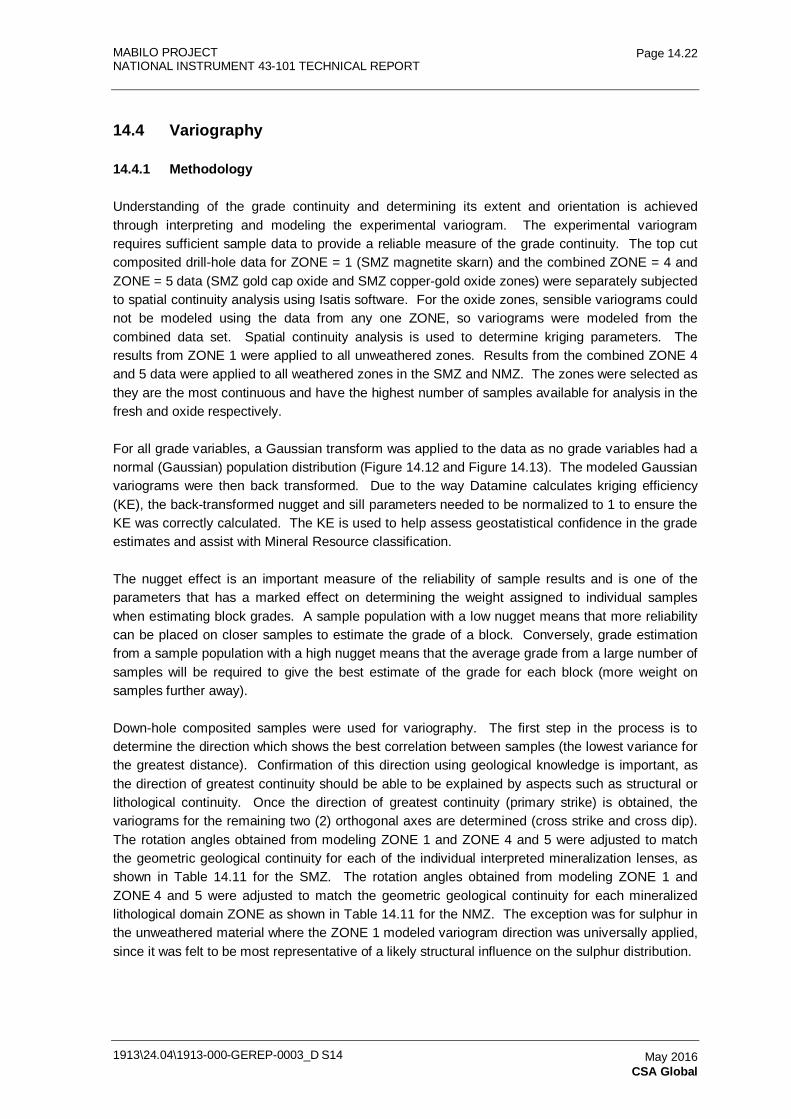
MABILO PROJECT NATIONAL INSTRUMENT 43-101 TECHNICAL REPORT
1913\24.04\1913-000-GEREP-0003_D S14
Page 14.22
May 2016 CSA Global
14.4 Variography
14.4.1 Methodology
Understanding of the grade continuity and determining its extent and orientation is achieved through interpreting and modeling the experimental variogram. The experimental variogram requires sufficient sample data to provide a reliable measure of the grade continuity. The top cut composited drill-hole data for ZONE = 1 (SMZ magnetite skarn) and the combined ZONE = 4 and ZONE = 5 data (SMZ gold cap oxide and SMZ copper-gold oxide zones) were separately subjected to spatial continuity analysis using Isatis software. For the oxide zones, sensible variograms could not be modeled using the data from any one ZONE, so variograms were modeled from the combined data set. Spatial continuity analysis is used to determine kriging parameters. The results from ZONE 1 were applied to all unweathered zones. Results from the combined ZONE 4 and 5 data were applied to all weathered zones in the SMZ and NMZ. The zones were selected as they are the most continuous and have the highest number of samples available for analysis in the fresh and oxide respectively.
For all grade variables, a Gaussian transform was applied to the data as no grade variables had a normal (Gaussian) population distribution (Figure 14.12 and Figure 14.13). The modeled Gaussian variograms were then back transformed. Due to the way Datamine calculates kriging efficiency (KE), the back-transformed nugget and sill parameters needed to be normalized to 1 to ensure the KE was correctly calculated. The KE is used to help assess geostatistical confidence in the grade estimates and assist with Mineral Resource classification.
The nugget effect is an important measure of the reliability of sample results and is one of the parameters that has a marked effect on determining the weight assigned to individual samples when estimating block grades. A sample population with a low nugget means that more reliability can be placed on closer samples to estimate the grade of a block. Conversely, grade estimation from a sample population with a high nugget means that the average grade from a large number of samples will be required to give the best estimate of the grade for each block (more weight on samples further away).
Down-hole composited samples were used for variography. The first step in the process is to determine the direction which shows the best correlation between samples (the lowest variance for the greatest distance). Confirmation of this direction using geological knowledge is important, as the direction of greatest continuity should be able to be explained by aspects such as structural or lithological continuity. Once the direction of greatest continuity (primary strike) is obtained, the variograms for the remaining two (2) orthogonal axes are determined (cross strike and cross dip). The rotation angles obtained from modeling ZONE 1 and ZONE 4 and 5 were adjusted to match the geometric geological continuity for each of the individual interpreted mineralization lenses, as shown in Table 14.11 for the SMZ. The rotation angles obtained from modeling ZONE 1 and ZONE 4 and 5 were adjusted to match the geometric geological continuity for each mineralized lithological domain ZONE as shown in Table 14.11 for the NMZ. The exception was for sulphur in the unweathered material where the ZONE 1 modeled variogram direction was universally applied, since it was felt to be most representative of a likely structural influence on the sulphur distribution.
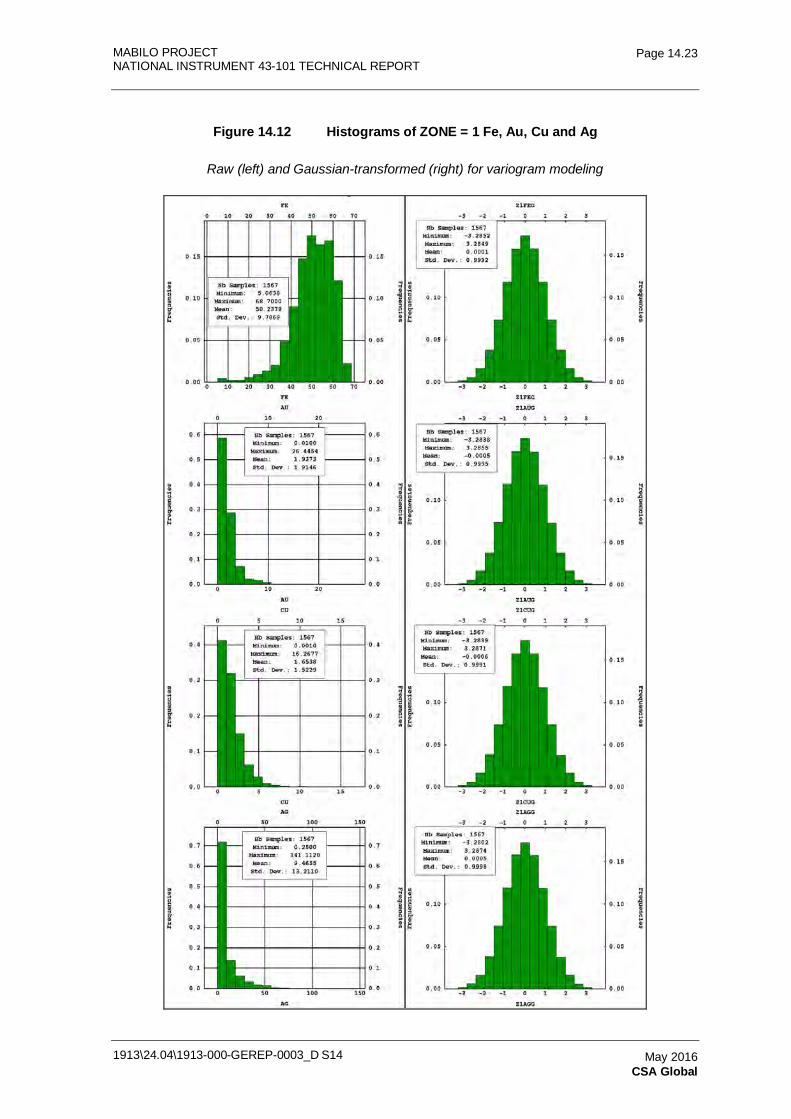
MABILO PROJECT NATIONAL INSTRUMENT 43-101 TECHNICAL REPORT
1913\24.04\1913-000-GEREP-0003_D S14
Page 14.23
May 2016 CSA Global
Figure 14.12 Histograms of ZONE = 1 Fe, Au, Cu and Ag
Raw (left) and Gaussian-transformed (right) for variogram modeling
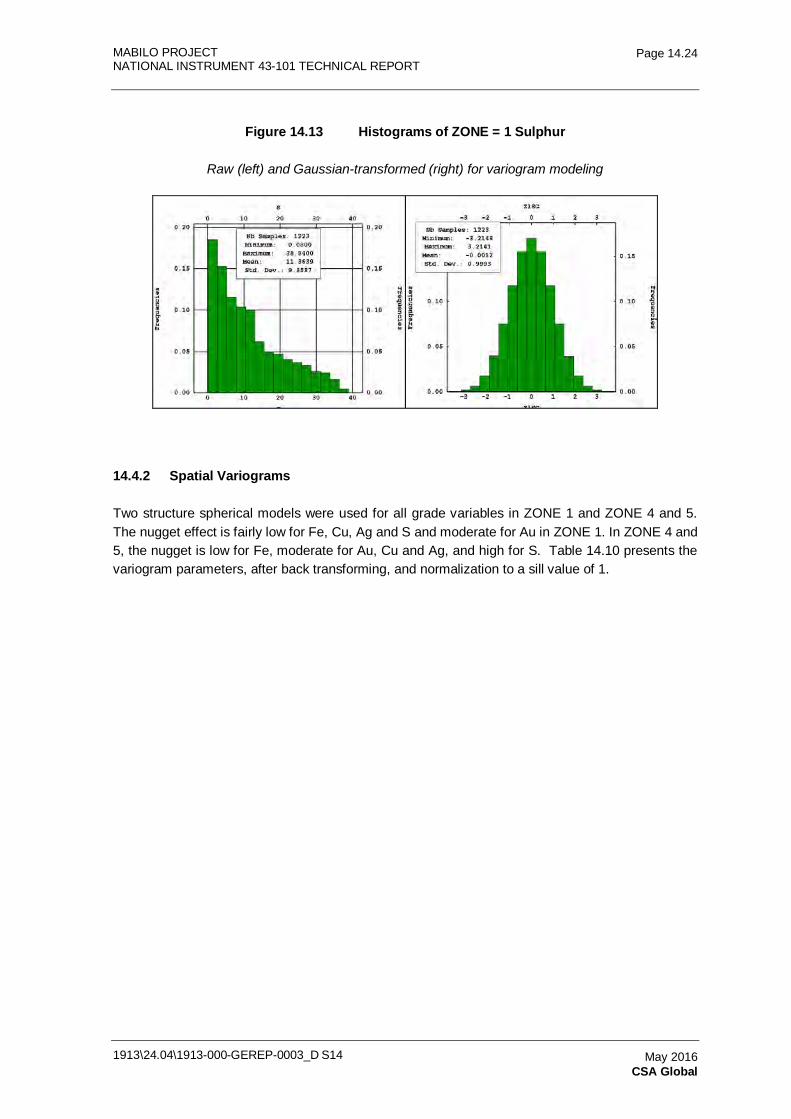
MABILO PROJECT NATIONAL INSTRUMENT 43-101 TECHNICAL REPORT
1913\24.04\1913-000-GEREP-0003_D S14
Page 14.24
May 2016 CSA Global
Figure 14.13 Histograms of ZONE = 1 Sulphur
Raw (left) and Gaussian-transformed (right) for variogram modeling
14.4.2 Spatial Variograms
Two structure spherical models were used for all grade variables in ZONE 1 and ZONE 4 and 5. The nugget effect is fairly low for Fe, Cu, Ag and S and moderate for Au in ZONE 1. In ZONE 4 and 5, the nugget is low for Fe, moderate for Au, Cu and Ag, and high for S. Table 14.10 presents the variogram parameters, after back transforming, and normalization to a sill value of 1.
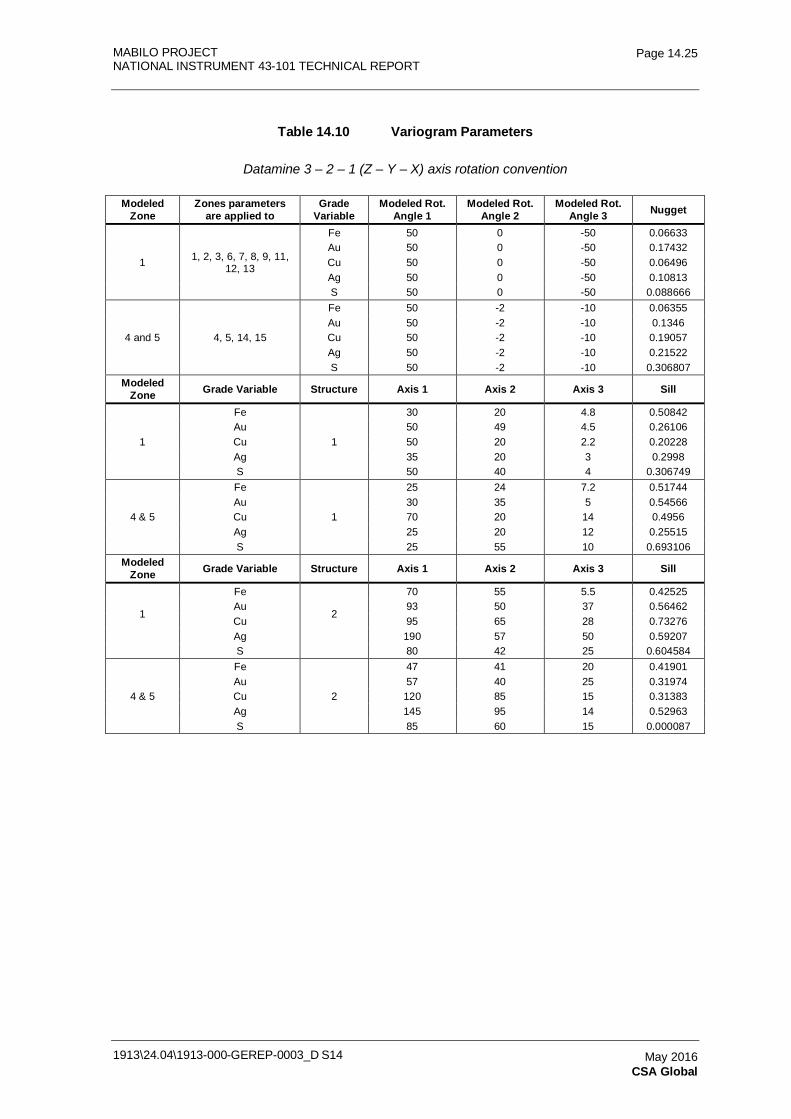
MABILO PROJECT NATIONAL INSTRUMENT 43-101 TECHNICAL REPORT
1913\24.04\1913-000-GEREP-0003_D S14
Page 14.25
May 2016 CSA Global
Table 14.10 Variogram Parameters
Datamine 3 – 2 – 1 (Z – Y – X) axis rotation convention
Modeled Zone
Zones parameters are applied to
Grade Variable
Modeled Rot. Angle 1
Modeled Rot. Angle 2
Modeled Rot. Angle 3 Nugget
1 1, 2, 3, 6, 7, 8, 9, 11, 12, 13
Fe 50 0 -50 0.06633 Au 50 0 -50 0.17432 Cu 50 0 -50 0.06496 Ag 50 0 -50 0.10813 S 50 0 -50 0.088666
4 and 5 4, 5, 14, 15
Fe 50 -2 -10 0.06355 Au 50 -2 -10 0.1346 Cu 50 -2 -10 0.19057 Ag 50 -2 -10 0.21522 S 50 -2 -10 0.306807
Modeled Zone Grade Variable Structure Axis 1 Axis 2 Axis 3 Sill
1
Fe
1
30 20 4.8 0.50842 Au 50 49 4.5 0.26106 Cu 50 20 2.2 0.20228 Ag 35 20 3 0.2998 S 50 40 4 0.306749
4 & 5
Fe
1
25 24 7.2 0.51744 Au 30 35 5 0.54566 Cu 70 20 14 0.4956 Ag 25 20 12 0.25515 S 25 55 10 0.693106
Modeled Zone Grade Variable Structure Axis 1 Axis 2 Axis 3 Sill
1
Fe
2
70 55 5.5 0.42525 Au 93 50 37 0.56462 Cu 95 65 28 0.73276 Ag 190 57 50 0.59207
S 80 42 25 0.604584
4 & 5
Fe
2
47 41 20 0.41901 Au 57 40 25 0.31974 Cu 120 85 15 0.31383 Ag 145 95 14 0.52963 S 85 60 15 0.000087
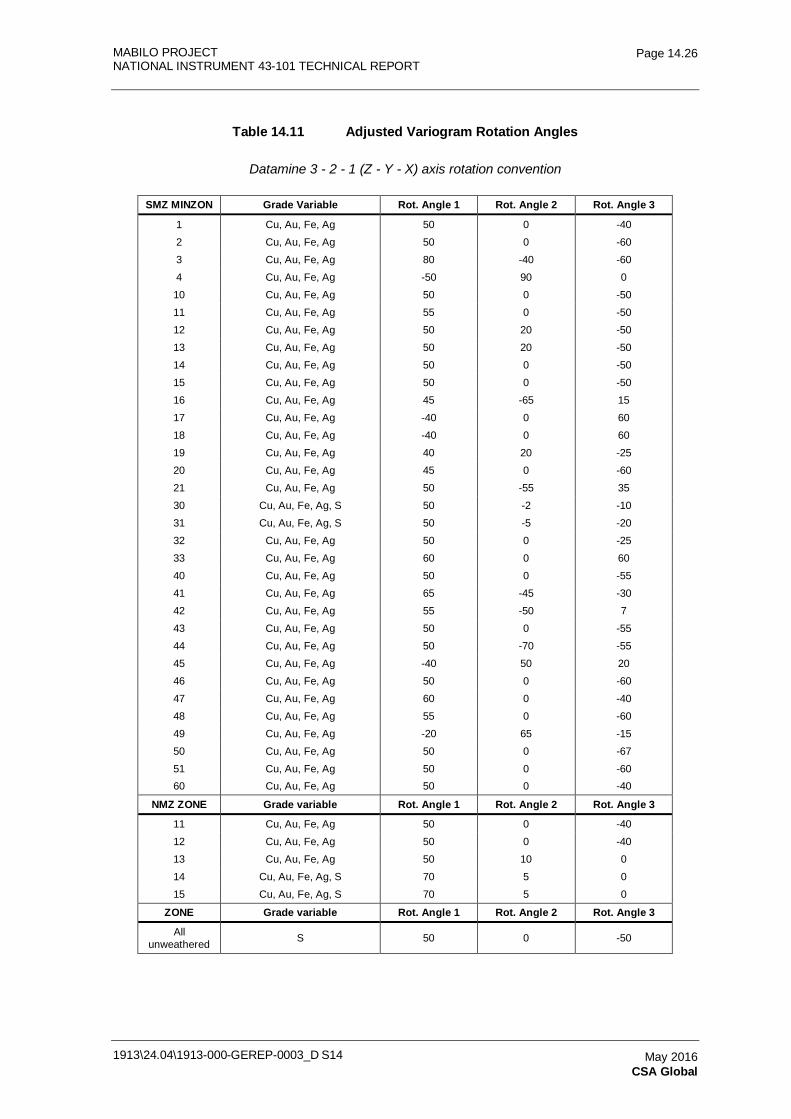
MABILO PROJECT NATIONAL INSTRUMENT 43-101 TECHNICAL REPORT
1913\24.04\1913-000-GEREP-0003_D S14
Page 14.26
May 2016 CSA Global
Table 14.11 Adjusted Variogram Rotation Angles
Datamine 3 - 2 - 1 (Z - Y - X) axis rotation convention
SMZ MINZON Grade Variable Rot. Angle 1 Rot. Angle 2 Rot. Angle 3
1 Cu, Au, Fe, Ag 50 0 -40
2 Cu, Au, Fe, Ag 50 0 -60
3 Cu, Au, Fe, Ag 80 -40 -60
4 Cu, Au, Fe, Ag -50 90 0
10 Cu, Au, Fe, Ag 50 0 -50
11 Cu, Au, Fe, Ag 55 0 -50
12 Cu, Au, Fe, Ag 50 20 -50
13 Cu, Au, Fe, Ag 50 20 -50
14 Cu, Au, Fe, Ag 50 0 -50
15 Cu, Au, Fe, Ag 50 0 -50
16 Cu, Au, Fe, Ag 45 -65 15
17 Cu, Au, Fe, Ag -40 0 60
18 Cu, Au, Fe, Ag -40 0 60
19 Cu, Au, Fe, Ag 40 20 -25
20 Cu, Au, Fe, Ag 45 0 -60
21 Cu, Au, Fe, Ag 50 -55 35
30 Cu, Au, Fe, Ag, S 50 -2 -10
31 Cu, Au, Fe, Ag, S 50 -5 -20
32 Cu, Au, Fe, Ag 50 0 -25
33 Cu, Au, Fe, Ag 60 0 60
40 Cu, Au, Fe, Ag 50 0 -55
41 Cu, Au, Fe, Ag 65 -45 -30
42 Cu, Au, Fe, Ag 55 -50 7
43 Cu, Au, Fe, Ag 50 0 -55
44 Cu, Au, Fe, Ag 50 -70 -55
45 Cu, Au, Fe, Ag -40 50 20
46 Cu, Au, Fe, Ag 50 0 -60
47 Cu, Au, Fe, Ag 60 0 -40
48 Cu, Au, Fe, Ag 55 0 -60
49 Cu, Au, Fe, Ag -20 65 -15
50 Cu, Au, Fe, Ag 50 0 -67
51 Cu, Au, Fe, Ag 50 0 -60 60 Cu, Au, Fe, Ag 50 0 -40
NMZ ZONE Grade variable Rot. Angle 1 Rot. Angle 2 Rot. Angle 3
11 Cu, Au, Fe, Ag 50 0 -40
12 Cu, Au, Fe, Ag 50 0 -40
13 Cu, Au, Fe, Ag 50 10 0
14 Cu, Au, Fe, Ag, S 70 5 0
15 Cu, Au, Fe, Ag, S 70 5 0
ZONE Grade variable Rot. Angle 1 Rot. Angle 2 Rot. Angle 3
All unweathered S 50 0 -50
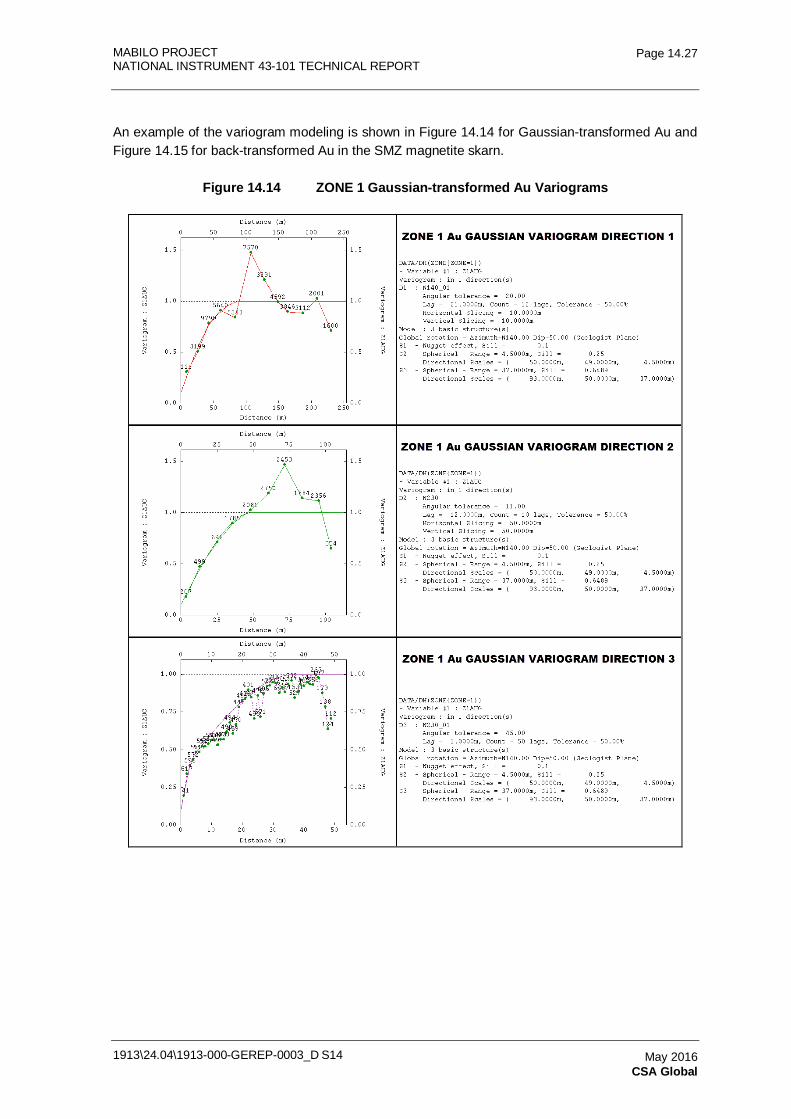
MABILO PROJECT NATIONAL INSTRUMENT 43-101 TECHNICAL REPORT
1913\24.04\1913-000-GEREP-0003_D S14
Page 14.27
May 2016 CSA Global
An example of the variogram modeling is shown in Figure 14.14 for Gaussian-transformed Au and Figure 14.15 for back-transformed Au in the SMZ magnetite skarn.
Figure 14.14 ZONE 1 Gaussian-transformed Au Variograms
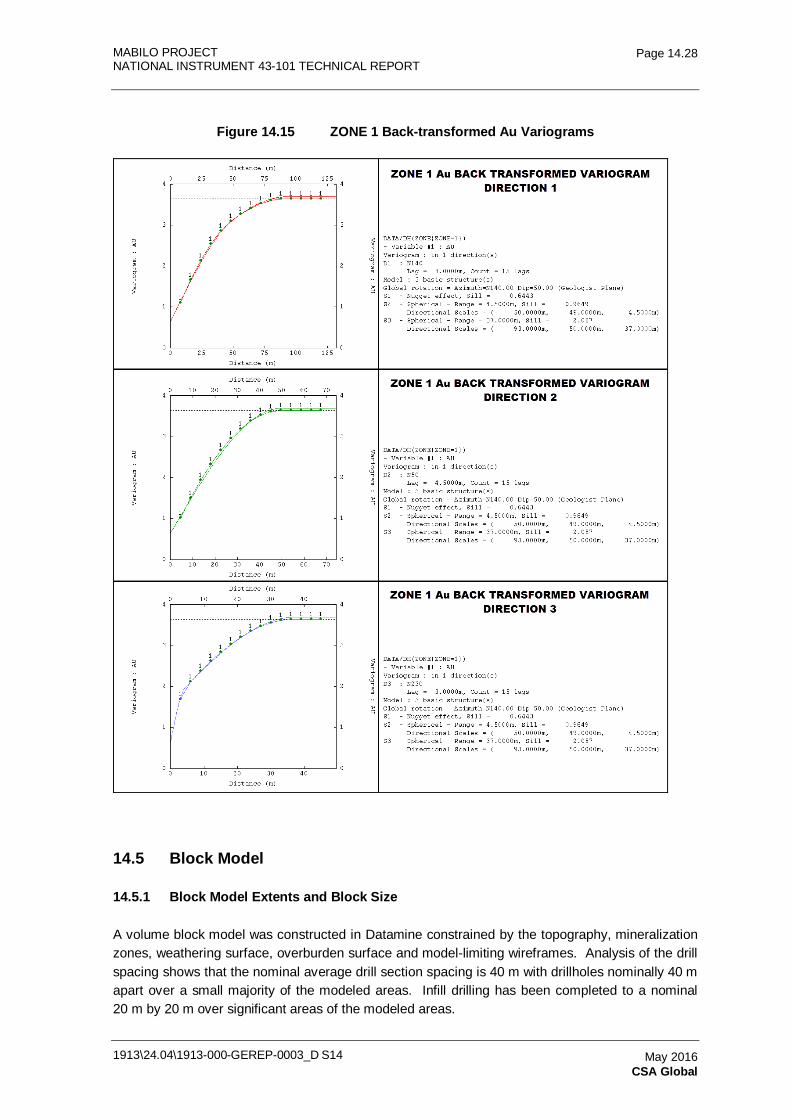
MABILO PROJECT NATIONAL INSTRUMENT 43-101 TECHNICAL REPORT
1913\24.04\1913-000-GEREP-0003_D S14
Page 14.28
May 2016 CSA Global
Figure 14.15 ZONE 1 Back-transformed Au Variograms
14.5 Block Model
14.5.1 Block Model Extents and Block Size
A volume block model was constructed in Datamine constrained by the topography, mineralization zones, weathering surface, overburden surface and model-limiting wireframes. Analysis of the drill spacing shows that the nominal average drill section spacing is 40 m with drillholes nominally 40 m apart over a small majority of the modeled areas. Infill drilling has been completed to a nominal 20 m by 20 m over significant areas of the modeled areas.
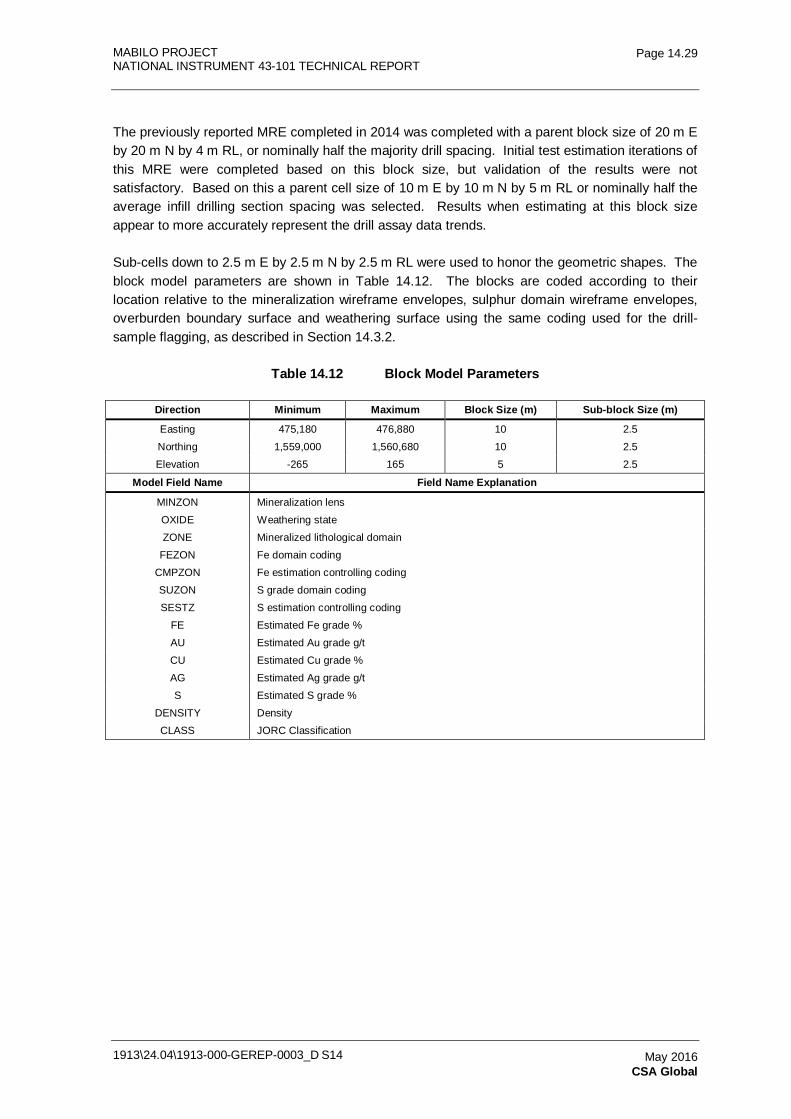
MABILO PROJECT NATIONAL INSTRUMENT 43-101 TECHNICAL REPORT
1913\24.04\1913-000-GEREP-0003_D S14
Page 14.29
May 2016 CSA Global
The previously reported MRE completed in 2014 was completed with a parent block size of 20 m E by 20 m N by 4 m RL, or nominally half the majority drill spacing. Initial test estimation iterations of this MRE were completed based on this block size, but validation of the results were not satisfactory. Based on this a parent cell size of 10 m E by 10 m N by 5 m RL or nominally half the average infill drilling section spacing was selected. Results when estimating at this block size appear to more accurately represent the drill assay data trends.
Sub-cells down to 2.5 m E by 2.5 m N by 2.5 m RL were used to honor the geometric shapes. The block model parameters are shown in Table 14.12. The blocks are coded according to their location relative to the mineralization wireframe envelopes, sulphur domain wireframe envelopes, overburden boundary surface and weathering surface using the same coding used for the drill-sample flagging, as described in Section 14.3.2.
Table 14.12 Block Model Parameters
Direction Minimum Maximum Block Size (m) Sub-block Size (m)
Easting 475,180 476,880 10 2.5
Northing 1,559,000 1,560,680 10 2.5
Elevation -265 165 5 2.5
Model Field Name Field Name Explanation
MINZON Mineralization lens
OXIDE Weathering state
ZONE Mineralized lithological domain
FEZON Fe domain coding
CMPZON Fe estimation controlling coding
SUZON S grade domain coding
SESTZ S estimation controlling coding
FE Estimated Fe grade %
AU Estimated Au grade g/t
CU Estimated Cu grade %
AG Estimated Ag grade g/t
S Estimated S grade %
DENSITY Density
CLASS JORC Classification
MABILO PROJECT NATIONAL INSTRUMENT 43-101 TECHNICAL REPORT
1913\24.04\1913-000-GEREP-0003_D S14
Page 14.30
May 2016 CSA Global
14.6 Grade Estimation
14.6.1 Data Used
All holes with available assay data have been used in the grade estimation. Drillholes were down-hole composited, top cut and flagged as described in Section 14.3.
14.6.2 Methodology
Ordinary kriging (OK) was the selected interpolation method with an inverse distance squared (IDS) check estimate also carried out. Grade estimation was carried out at the parent cell scale, with sub-blocks assigned parent block values. Grade estimation for grade variables other than sulphur was carried out using hard boundaries between each individual lens (MINZON) in the SMZ and each ZONE for the NMZ as discussed in Section 14.3.2. Soft boundaries were used between the lenses within each ZONE for the NMZ. For the sulphur estimation the additional sulphur domaining lead to the use of hard boundaries between each sulphur domain of each MINZON for the grade estimation in both the SMZ and NMZ.
For the magnetite skarn mineralization in the SMZ, as noted in Section 14.3.2, some sections showed a copper-gold depletion zone at the edges (see Figure 14.6 example). For this reason the copper, gold and silver were separately estimated in the un-depleted and depleted zones of the magnetite skarn with hard boundaries between the two within each magnetite skarn lens. Iron was estimated into the full volume of each magnetite skarn lens as no significant change in iron grade in the copper-gold depleted versus un-depleted zones was noted.
The search ellipse size and orientations were defined based on the overall geometry and drill data density of each MINZON for the SMZ and each ZONE for the NMZ for all grade variables except sulphur in the unweathered material. For the sulphur in the unweathered material, a search orientation was kept fixed for all zones in order to reflect the expected structural influence on the sulphur distribution. Similarly in the unweathered material for the sulphur estimate the search distances were fixed for all mineralization. The sulphur search ellipse dimensions are based on the results of a kriging neighborhood analysis and multiple modeling iterations to ensure the model honors the drilling data. The search ellipse was doubled for the second search volume and then increased 20 fold for the third search volume to ensure all blocks found sufficient samples to be estimated. The search ellipse dimensions are designed to ensure that the majority of blocks were estimated from within the first search volume and optimized with reference to validation against drill data from multiple modeling iterations. The search ellipse dimensions and orientations are shown in Table 14.13 with the Datamine 3-2-1 (Z-Y-X) axis rotation convention followed.
The minimum and maximum number of samples used to estimate each block was varied as shown in Table 14.14, dependant on the number of samples available in each estimation zone. The sample numbers were also reduced as shown in Table 14.14 for the second and third search volumes. Test model iteration validations showed some minor issues with copper, gold and silver grade estimates in the third search volume. As a result the minimum required samples for the third search were slightly reduced compared to the iron estimate for some zones (Table 14.14), resulting in more satisfactory validation results. The maximum samples per drillhole allowed was varied according to the number of drillholes and associated drill samples intersecting the estimation zone
MABILO PROJECT NATIONAL INSTRUMENT 43-101 TECHNICAL REPORT
1913\24.04\1913-000-GEREP-0003_D S14
Page 14.31
May 2016 CSA Global
as shown in Table 14.14. Cell discretisation was 5 E by 5 N by 5 Z and no octant based searching was utilized.
Four separate estimation models were required because of the differences in the zones estimated for iron versus those estimated for copper, gold and silver in the SMZ due to the depletion issue, the separate sulphur estimation domaining, and the mineralization lens hard/soft boundary selection differences between the SMZ and NMZ grade estimations. These were:
• the SMZ copper, gold, silver and unweathered material sulphur model
• the SMZ iron model
• the NMZ copper, gold, silver and unweathered material sulphur model
• the SMZ and NMZ unweathered material sulphur estimate model.
These four separately estimated models were added together at the end to form one single grade-estimated model.
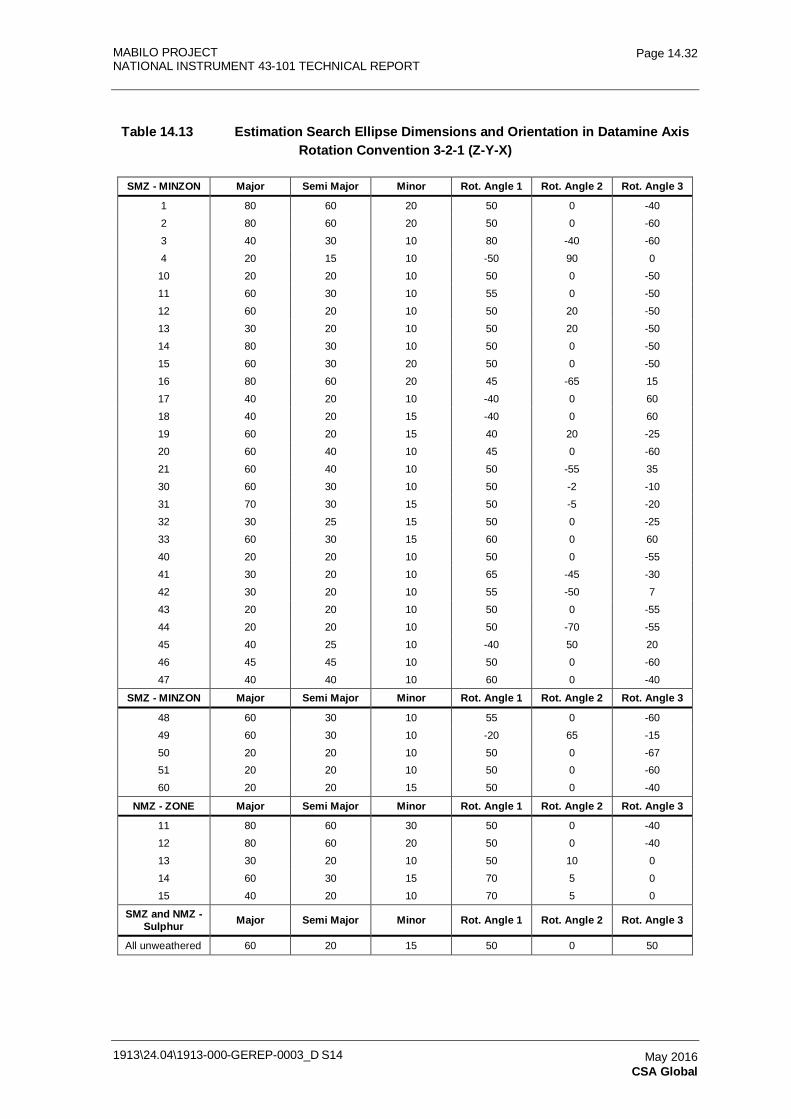
MABILO PROJECT NATIONAL INSTRUMENT 43-101 TECHNICAL REPORT
1913\24.04\1913-000-GEREP-0003_D S14
Page 14.32
May 2016 CSA Global
Table 14.13 Estimation Search Ellipse Dimensions and Orientation in Datamine Axis Rotation Convention 3-2-1 (Z-Y-X)
SMZ - MINZON Major Semi Major Minor Rot. Angle 1 Rot. Angle 2 Rot. Angle 3
1 80 60 20 50 0 -40
2 80 60 20 50 0 -60
3 40 30 10 80 -40 -60
4 20 15 10 -50 90 0
10 20 20 10 50 0 -50
11 60 30 10 55 0 -50
12 60 20 10 50 20 -50
13 30 20 10 50 20 -50
14 80 30 10 50 0 -50
15 60 30 20 50 0 -50
16 80 60 20 45 -65 15
17 40 20 10 -40 0 60
18 40 20 15 -40 0 60
19 60 20 15 40 20 -25
20 60 40 10 45 0 -60
21 60 40 10 50 -55 35
30 60 30 10 50 -2 -10
31 70 30 15 50 -5 -20
32 30 25 15 50 0 -25
33 60 30 15 60 0 60
40 20 20 10 50 0 -55
41 30 20 10 65 -45 -30
42 30 20 10 55 -50 7
43 20 20 10 50 0 -55
44 20 20 10 50 -70 -55
45 40 25 10 -40 50 20
46 45 45 10 50 0 -60
47 40 40 10 60 0 -40
SMZ - MINZON Major Semi Major Minor Rot. Angle 1 Rot. Angle 2 Rot. Angle 3
48 60 30 10 55 0 -60
49 60 30 10 -20 65 -15
50 20 20 10 50 0 -67 51 20 20 10 50 0 -60
60 20 20 15 50 0 -40
NMZ - ZONE Major Semi Major Minor Rot. Angle 1 Rot. Angle 2 Rot. Angle 3
11 80 60 30 50 0 -40
12 80 60 20 50 0 -40
13 30 20 10 50 10 0
14 60 30 15 70 5 0
15 40 20 10 70 5 0
SMZ and NMZ - Sulphur Major Semi Major Minor Rot. Angle 1 Rot. Angle 2 Rot. Angle 3
All unweathered 60 20 15 50 0 50
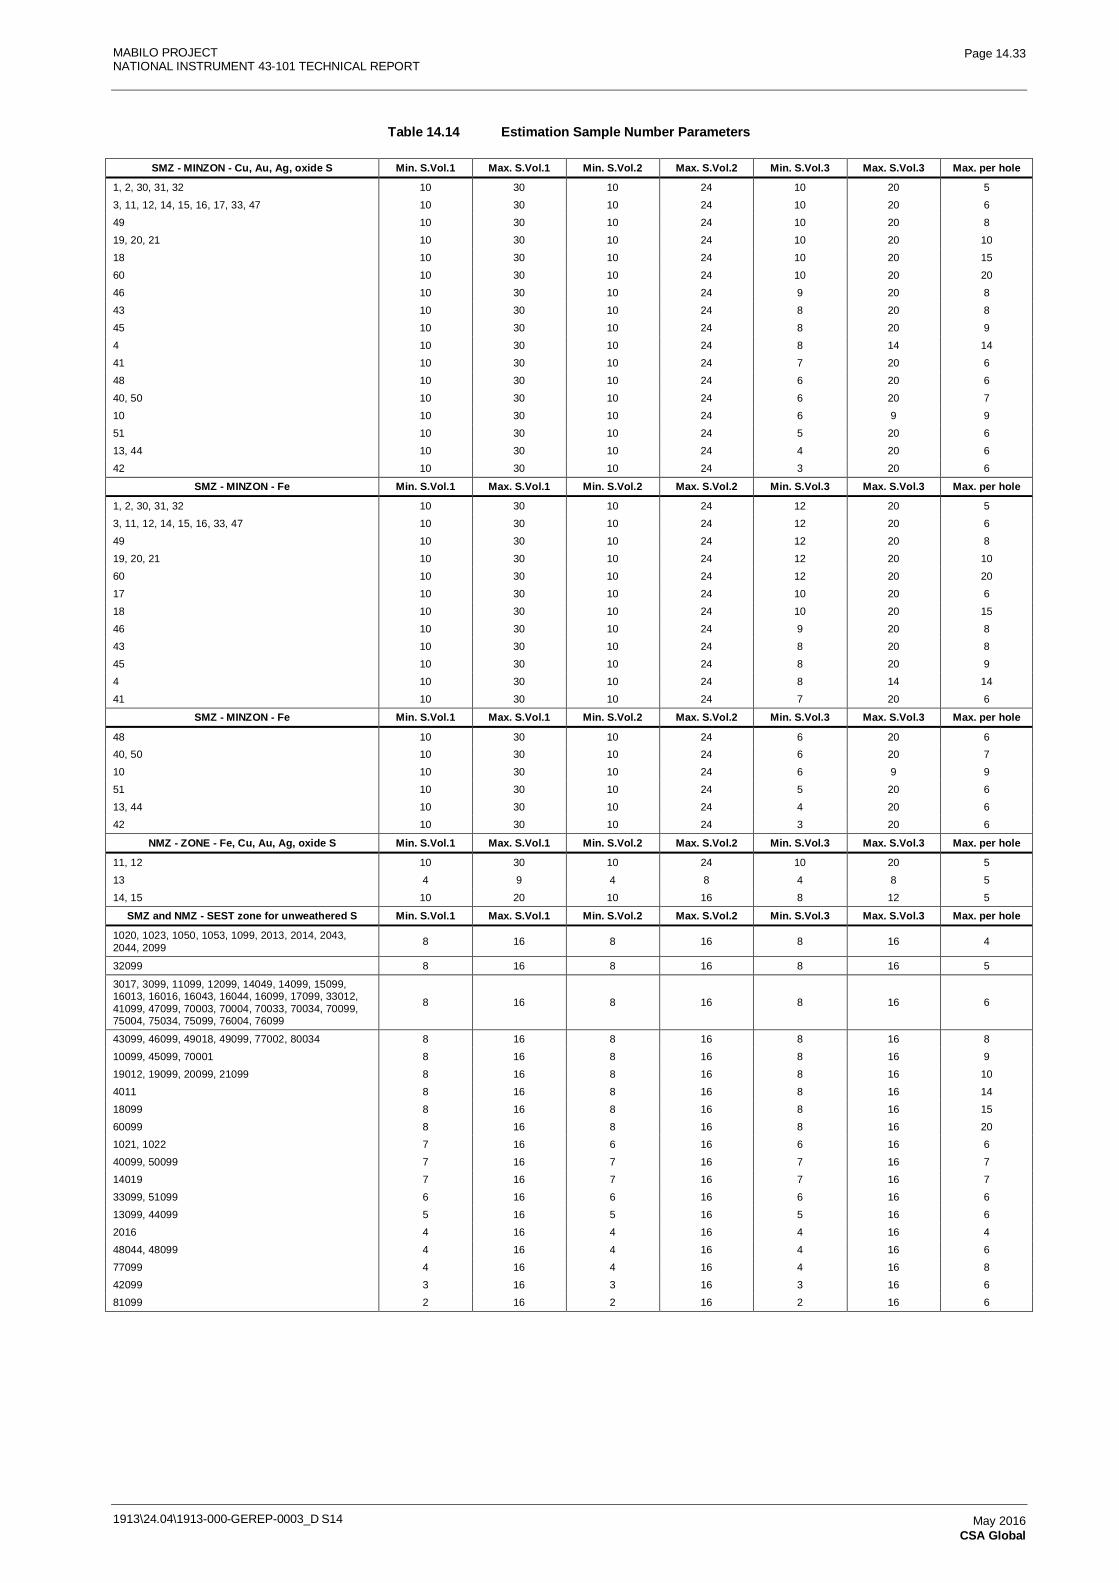
MABILO PROJECT NATIONAL INSTRUMENT 43-101 TECHNICAL REPORT
1913\24.04\1913-000-GEREP-0003_D S14
Page 14.33
May 2016 CSA Global
Table 14.14 Estimation Sample Number Parameters
SMZ - MINZON - Cu, Au, Ag, oxide S Min. S.Vol.1 Max. S.Vol.1 Min. S.Vol.2 Max. S.Vol.2 Min. S.Vol.3 Max. S.Vol.3 Max. per hole
1, 2, 30, 31, 32 10 30 10 24 10 20 5
3, 11, 12, 14, 15, 16, 17, 33, 47 10 30 10 24 10 20 6
49 10 30 10 24 10 20 8
19, 20, 21 10 30 10 24 10 20 10
18 10 30 10 24 10 20 15
60 10 30 10 24 10 20 20
46 10 30 10 24 9 20 8
43 10 30 10 24 8 20 8
45 10 30 10 24 8 20 9
4 10 30 10 24 8 14 14
41 10 30 10 24 7 20 6
48 10 30 10 24 6 20 6
40, 50 10 30 10 24 6 20 7
10 10 30 10 24 6 9 9
51 10 30 10 24 5 20 6
13, 44 10 30 10 24 4 20 6
42 10 30 10 24 3 20 6
SMZ - MINZON - Fe Min. S.Vol.1 Max. S.Vol.1 Min. S.Vol.2 Max. S.Vol.2 Min. S.Vol.3 Max. S.Vol.3 Max. per hole
1, 2, 30, 31, 32 10 30 10 24 12 20 5
3, 11, 12, 14, 15, 16, 33, 47 10 30 10 24 12 20 6
49 10 30 10 24 12 20 8
19, 20, 21 10 30 10 24 12 20 10
60 10 30 10 24 12 20 20
17 10 30 10 24 10 20 6
18 10 30 10 24 10 20 15
46 10 30 10 24 9 20 8
43 10 30 10 24 8 20 8
45 10 30 10 24 8 20 9
4 10 30 10 24 8 14 14
41 10 30 10 24 7 20 6
SMZ - MINZON - Fe Min. S.Vol.1 Max. S.Vol.1 Min. S.Vol.2 Max. S.Vol.2 Min. S.Vol.3 Max. S.Vol.3 Max. per hole
48 10 30 10 24 6 20 6 40, 50 10 30 10 24 6 20 7
10 10 30 10 24 6 9 9
51 10 30 10 24 5 20 6
13, 44 10 30 10 24 4 20 6
42 10 30 10 24 3 20 6
NMZ - ZONE - Fe, Cu, Au, Ag, oxide S Min. S.Vol.1 Max. S.Vol.1 Min. S.Vol.2 Max. S.Vol.2 Min. S.Vol.3 Max. S.Vol.3 Max. per hole
11, 12 10 30 10 24 10 20 5
13 4 9 4 8 4 8 5
14, 15 10 20 10 16 8 12 5
SMZ and NMZ - SEST zone for unweathered S Min. S.Vol.1 Max. S.Vol.1 Min. S.Vol.2 Max. S.Vol.2 Min. S.Vol.3 Max. S.Vol.3 Max. per hole
1020, 1023, 1050, 1053, 1099, 2013, 2014, 2043, 2044, 2099 8 16 8 16 8 16 4
32099 8 16 8 16 8 16 5
3017, 3099, 11099, 12099, 14049, 14099, 15099, 16013, 16016, 16043, 16044, 16099, 17099, 33012, 41099, 47099, 70003, 70004, 70033, 70034, 70099, 75004, 75034, 75099, 76004, 76099
8 16 8 16 8 16 6
43099, 46099, 49018, 49099, 77002, 80034 8 16 8 16 8 16 8
10099, 45099, 70001 8 16 8 16 8 16 9
19012, 19099, 20099, 21099 8 16 8 16 8 16 10
4011 8 16 8 16 8 16 14
18099 8 16 8 16 8 16 15
60099 8 16 8 16 8 16 20
1021, 1022 7 16 6 16 6 16 6
40099, 50099 7 16 7 16 7 16 7
14019 7 16 7 16 7 16 7
33099, 51099 6 16 6 16 6 16 6
13099, 44099 5 16 5 16 5 16 6
2016 4 16 4 16 4 16 4
48044, 48099 4 16 4 16 4 16 6
77099 4 16 4 16 4 16 8
42099 3 16 3 16 3 16 6
81099 2 16 2 16 2 16 6
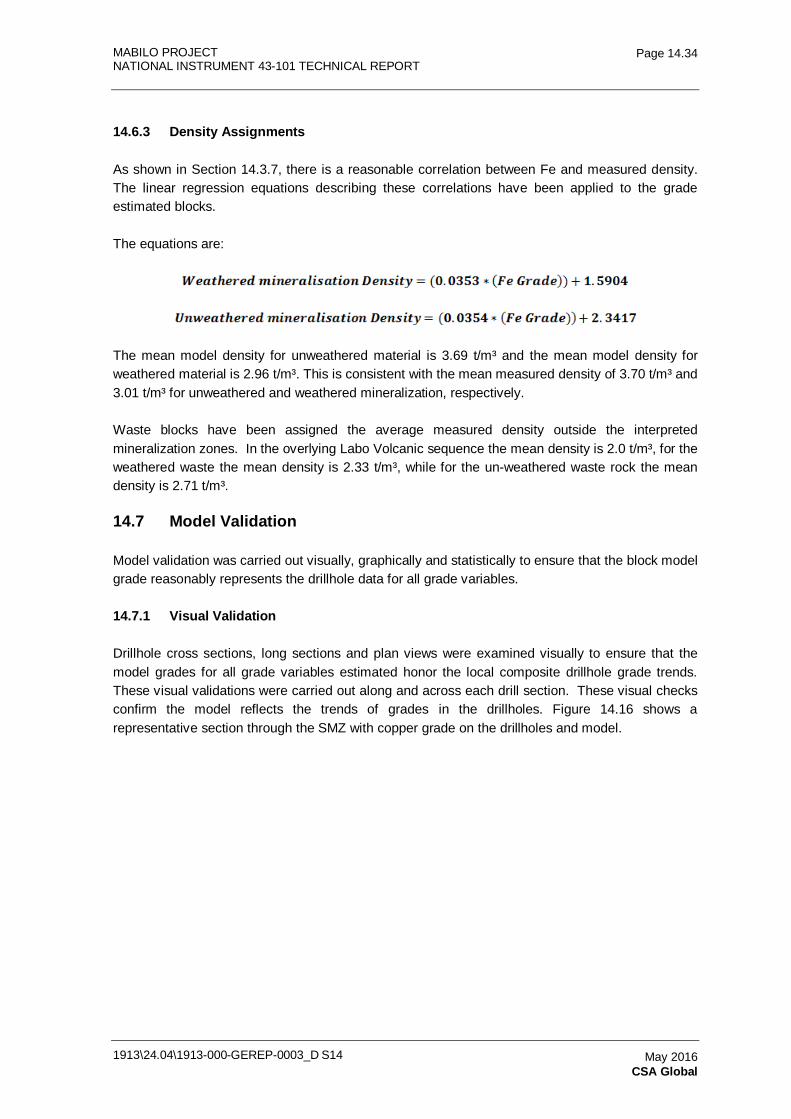
MABILO PROJECT NATIONAL INSTRUMENT 43-101 TECHNICAL REPORT
1913\24.04\1913-000-GEREP-0003_D S14
Page 14.34
May 2016 CSA Global
14.6.3 Density Assignments
As shown in Section 14.3.7, there is a reasonable correlation between Fe and measured density. The linear regression equations describing these correlations have been applied to the grade estimated blocks.
The equations are:
The mean model density for unweathered material is 3.69 t/m³ and the mean model density for weathered material is 2.96 t/m³. This is consistent with the mean measured density of 3.70 t/m³ and 3.01 t/m³ for unweathered and weathered mineralization, respectively.
Waste blocks have been assigned the average measured density outside the interpreted mineralization zones. In the overlying Labo Volcanic sequence the mean density is 2.0 t/m³, for the weathered waste the mean density is 2.33 t/m³, while for the un-weathered waste rock the mean density is 2.71 t/m³.
14.7 Model Validation
Model validation was carried out visually, graphically and statistically to ensure that the block model grade reasonably represents the drillhole data for all grade variables.
14.7.1 Visual Validation
Drillhole cross sections, long sections and plan views were examined visually to ensure that the model grades for all grade variables estimated honor the local composite drillhole grade trends. These visual validations were carried out along and across each drill section. These visual checks confirm the model reflects the trends of grades in the drillholes. Figure 14.16 shows a representative section through the SMZ with copper grade on the drillholes and model.
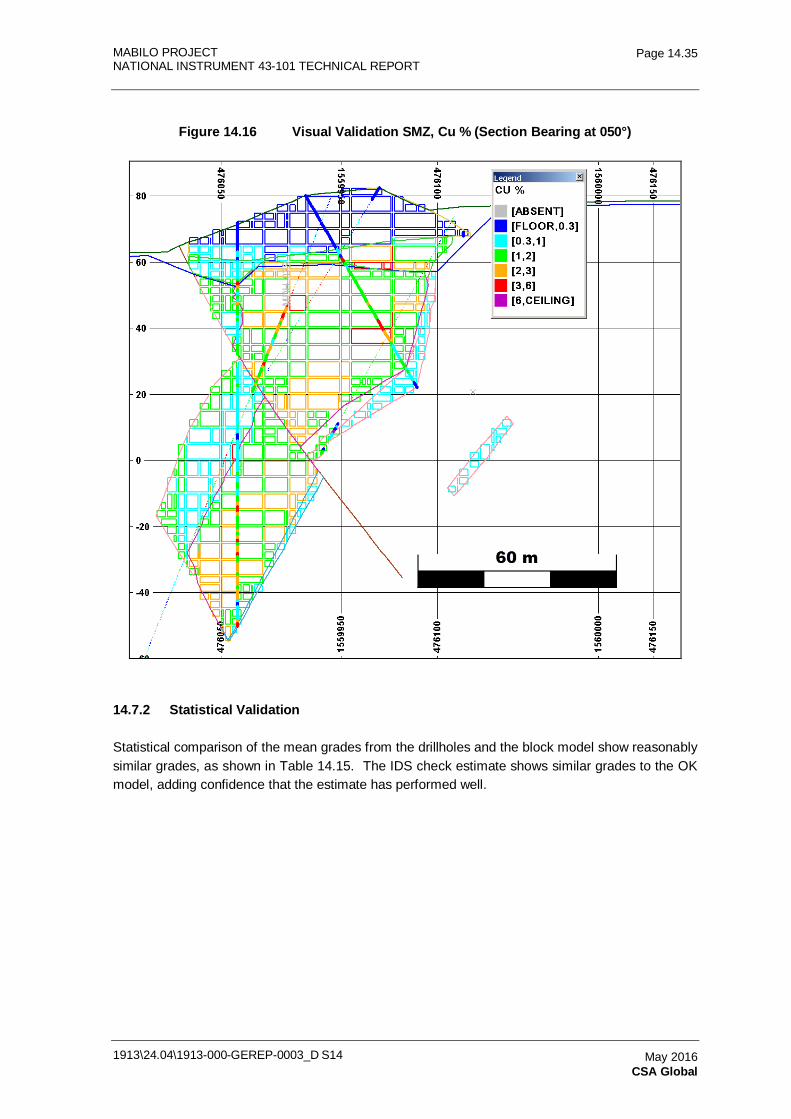
MABILO PROJECT NATIONAL INSTRUMENT 43-101 TECHNICAL REPORT
1913\24.04\1913-000-GEREP-0003_D S14
Page 14.35
May 2016 CSA Global
Figure 14.16 Visual Validation SMZ, Cu % (Section Bearing at 050°)
14.7.2 Statistical Validation
Statistical comparison of the mean grades from the drillholes and the block model show reasonably similar grades, as shown in Table 14.15. The IDS check estimate shows similar grades to the OK model, adding confidence that the estimate has performed well.
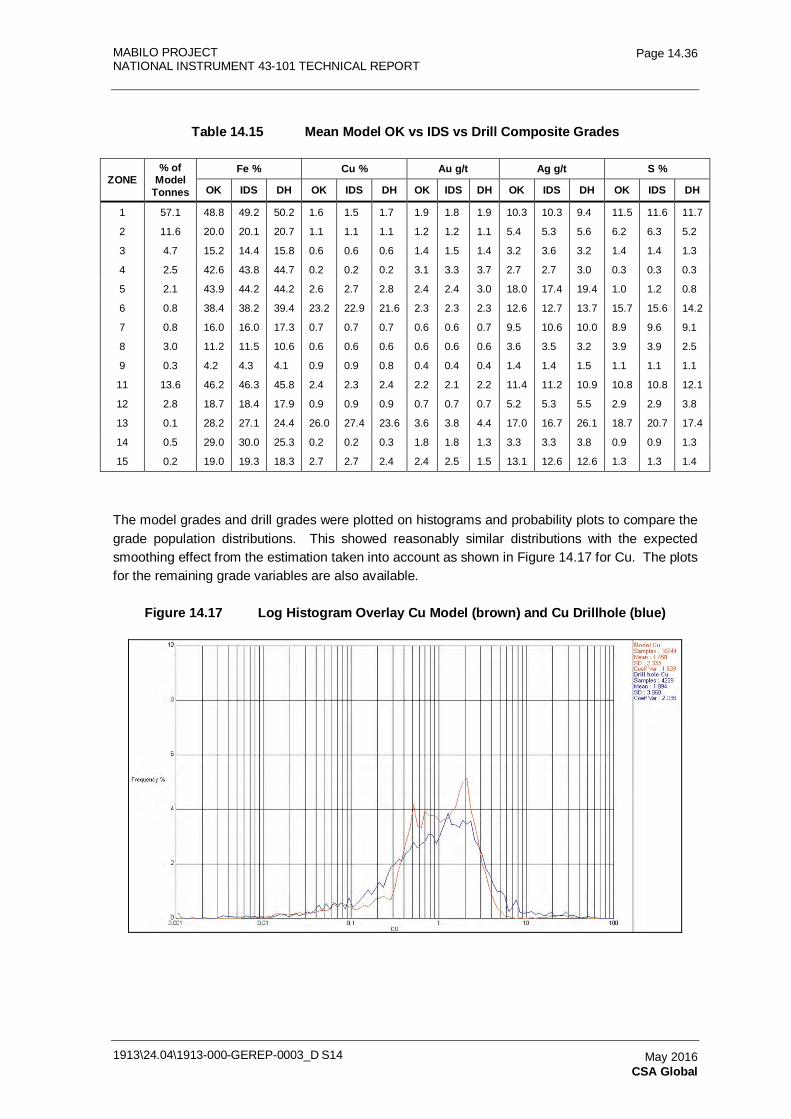
MABILO PROJECT NATIONAL INSTRUMENT 43-101 TECHNICAL REPORT
1913\24.04\1913-000-GEREP-0003_D S14
Page 14.36
May 2016 CSA Global
Table 14.15 Mean Model OK vs IDS vs Drill Composite Grades
ZONE % of
Model Tonnes
Fe % Cu % Au g/t Ag g/t S %
OK IDS DH OK IDS DH OK IDS DH OK IDS DH OK IDS DH
1 57.1 48.8 49.2 50.2 1.6 1.5 1.7 1.9 1.8 1.9 10.3 10.3 9.4 11.5 11.6 11.7
2 11.6 20.0 20.1 20.7 1.1 1.1 1.1 1.2 1.2 1.1 5.4 5.3 5.6 6.2 6.3 5.2
3 4.7 15.2 14.4 15.8 0.6 0.6 0.6 1.4 1.5 1.4 3.2 3.6 3.2 1.4 1.4 1.3
4 2.5 42.6 43.8 44.7 0.2 0.2 0.2 3.1 3.3 3.7 2.7 2.7 3.0 0.3 0.3 0.3
5 2.1 43.9 44.2 44.2 2.6 2.7 2.8 2.4 2.4 3.0 18.0 17.4 19.4 1.0 1.2 0.8
6 0.8 38.4 38.2 39.4 23.2 22.9 21.6 2.3 2.3 2.3 12.6 12.7 13.7 15.7 15.6 14.2
7 0.8 16.0 16.0 17.3 0.7 0.7 0.7 0.6 0.6 0.7 9.5 10.6 10.0 8.9 9.6 9.1
8 3.0 11.2 11.5 10.6 0.6 0.6 0.6 0.6 0.6 0.6 3.6 3.5 3.2 3.9 3.9 2.5
9 0.3 4.2 4.3 4.1 0.9 0.9 0.8 0.4 0.4 0.4 1.4 1.4 1.5 1.1 1.1 1.1
11 13.6 46.2 46.3 45.8 2.4 2.3 2.4 2.2 2.1 2.2 11.4 11.2 10.9 10.8 10.8 12.1
12 2.8 18.7 18.4 17.9 0.9 0.9 0.9 0.7 0.7 0.7 5.2 5.3 5.5 2.9 2.9 3.8
13 0.1 28.2 27.1 24.4 26.0 27.4 23.6 3.6 3.8 4.4 17.0 16.7 26.1 18.7 20.7 17.4
14 0.5 29.0 30.0 25.3 0.2 0.2 0.3 1.8 1.8 1.3 3.3 3.3 3.8 0.9 0.9 1.3
15 0.2 19.0 19.3 18.3 2.7 2.7 2.4 2.4 2.5 1.5 13.1 12.6 12.6 1.3 1.3 1.4
The model grades and drill grades were plotted on histograms and probability plots to compare the grade population distributions. This showed reasonably similar distributions with the expected smoothing effect from the estimation taken into account as shown in Figure 14.17 for Cu. The plots for the remaining grade variables are also available.
Figure 14.17 Log Histogram Overlay Cu Model (brown) and Cu Drillhole (blue)
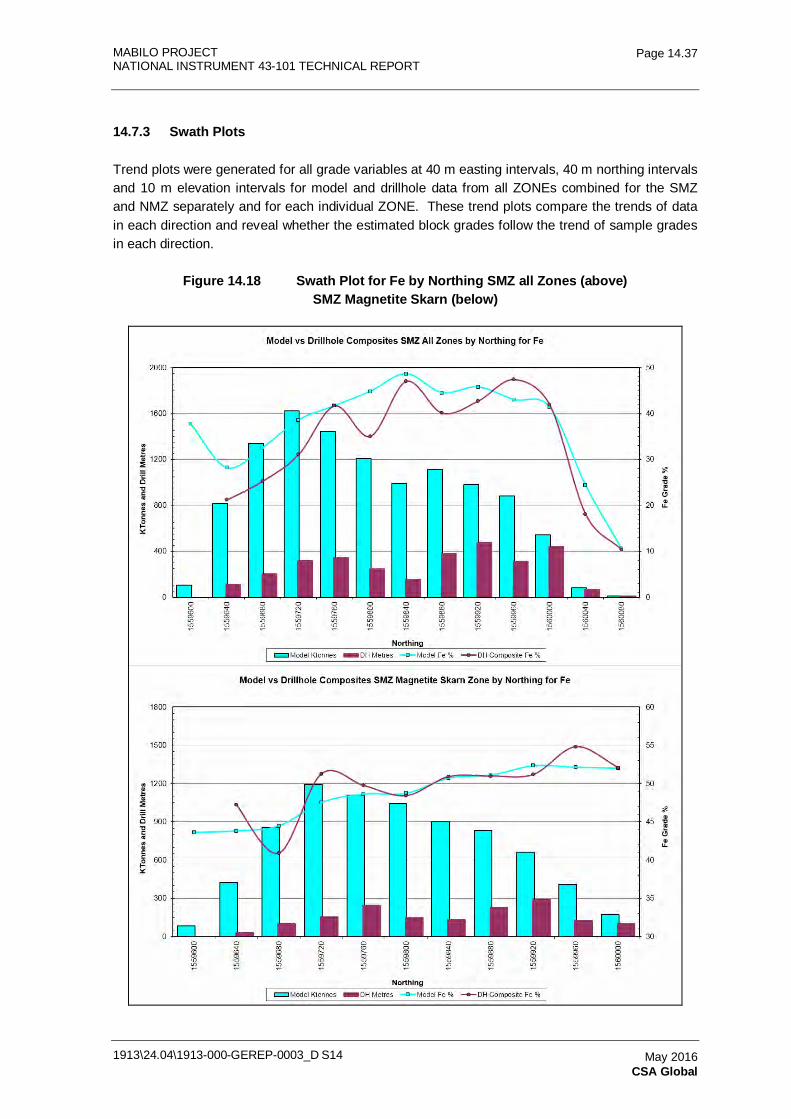
MABILO PROJECT NATIONAL INSTRUMENT 43-101 TECHNICAL REPORT
1913\24.04\1913-000-GEREP-0003_D S14
Page 14.37
May 2016 CSA Global
14.7.3 Swath Plots
Trend plots were generated for all grade variables at 40 m easting intervals, 40 m northing intervals and 10 m elevation intervals for model and drillhole data from all ZONEs combined for the SMZ and NMZ separately and for each individual ZONE. These trend plots compare the trends of data in each direction and reveal whether the estimated block grades follow the trend of sample grades in each direction.
Figure 14.18 Swath Plot for Fe by Northing SMZ all Zones (above) SMZ Magnetite Skarn (below)
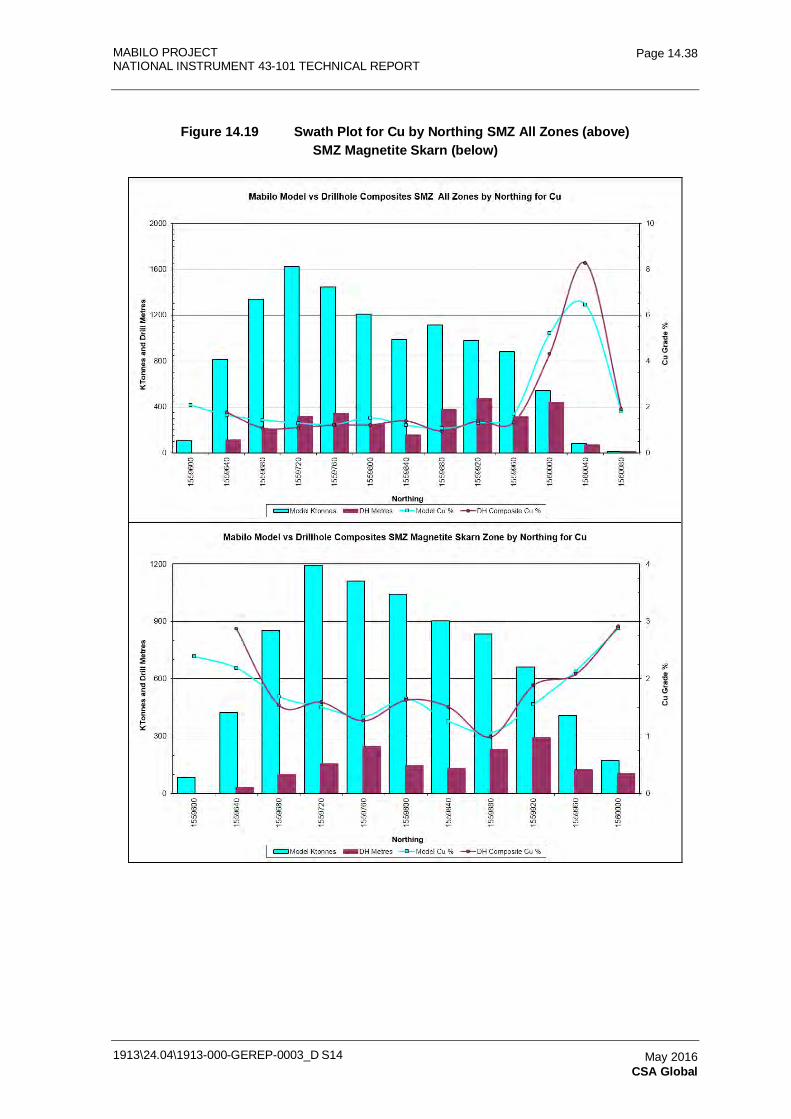
MABILO PROJECT NATIONAL INSTRUMENT 43-101 TECHNICAL REPORT
1913\24.04\1913-000-GEREP-0003_D S14
Page 14.38
May 2016 CSA Global
Figure 14.19 Swath Plot for Cu by Northing SMZ All Zones (above) SMZ Magnetite Skarn (below)
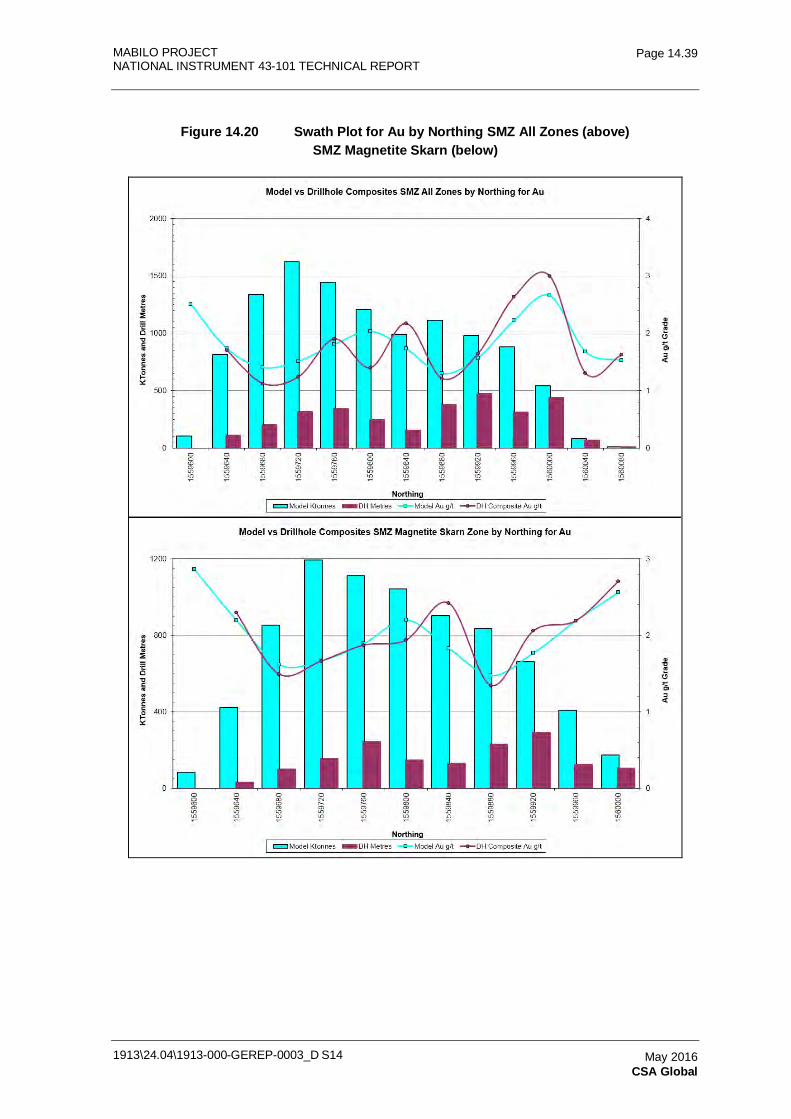
MABILO PROJECT NATIONAL INSTRUMENT 43-101 TECHNICAL REPORT
1913\24.04\1913-000-GEREP-0003_D S14
Page 14.39
May 2016 CSA Global
Figure 14.20 Swath Plot for Au by Northing SMZ All Zones (above) SMZ Magnetite Skarn (below)
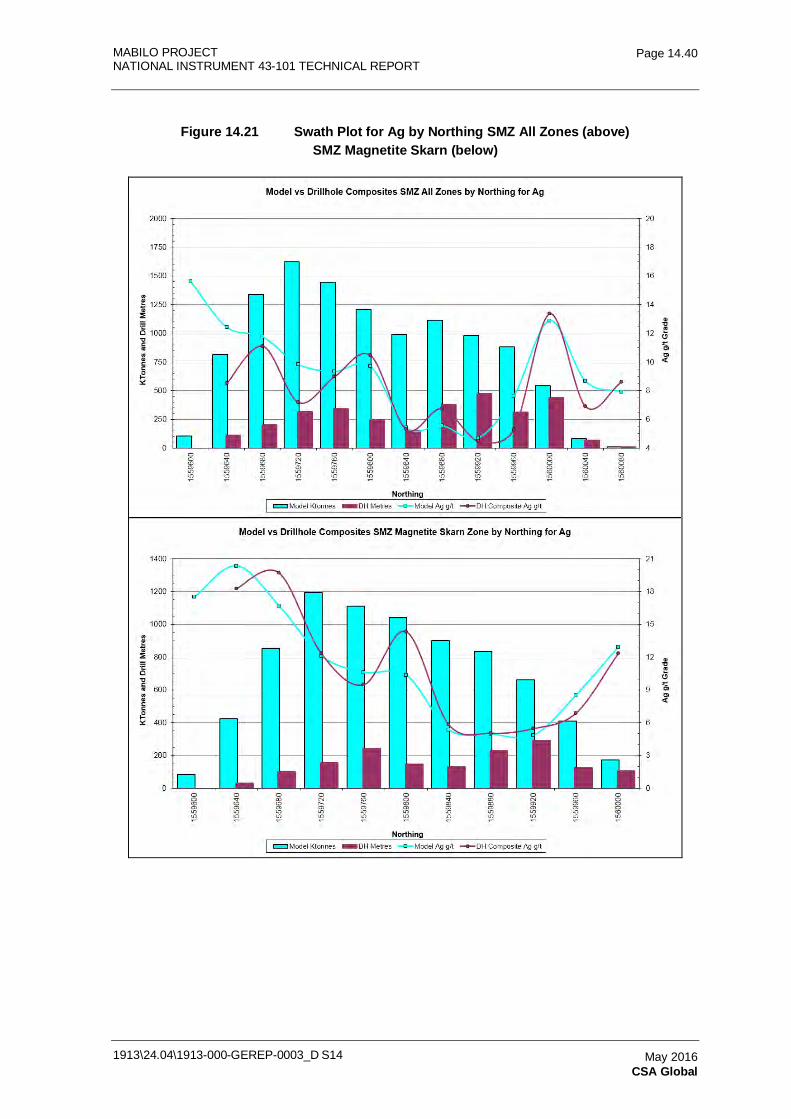
MABILO PROJECT NATIONAL INSTRUMENT 43-101 TECHNICAL REPORT
1913\24.04\1913-000-GEREP-0003_D S14
Page 14.40
May 2016 CSA Global
Figure 14.21 Swath Plot for Ag by Northing SMZ All Zones (above) SMZ Magnetite Skarn (below)
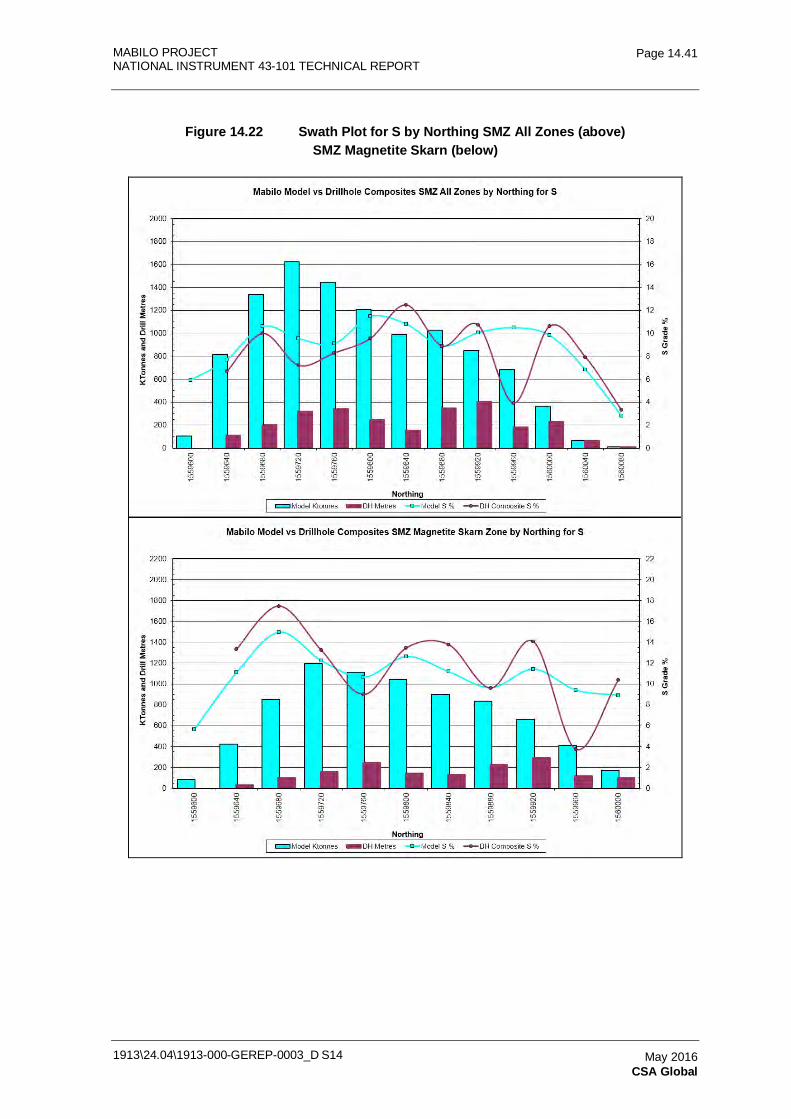
MABILO PROJECT NATIONAL INSTRUMENT 43-101 TECHNICAL REPORT
1913\24.04\1913-000-GEREP-0003_D S14
Page 14.41
May 2016 CSA Global
Figure 14.22 Swath Plot for S by Northing SMZ All Zones (above) SMZ Magnetite Skarn (below)
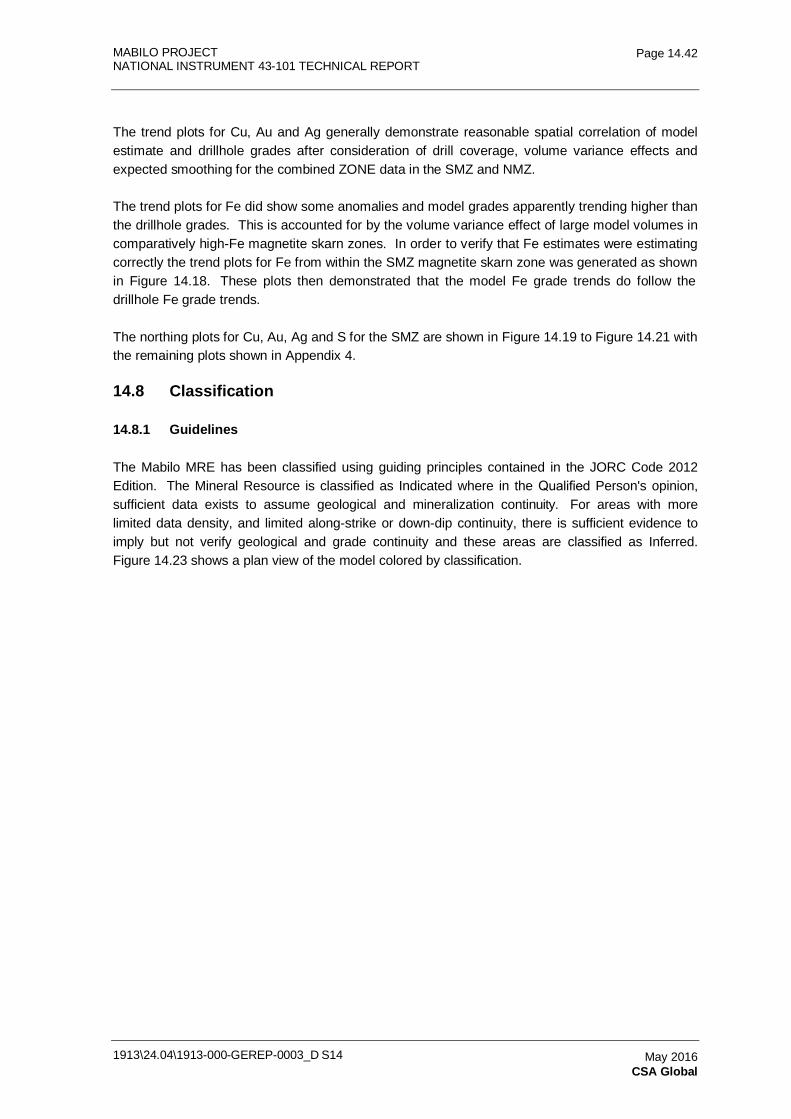
MABILO PROJECT NATIONAL INSTRUMENT 43-101 TECHNICAL REPORT
1913\24.04\1913-000-GEREP-0003_D S14
Page 14.42
May 2016 CSA Global
The trend plots for Cu, Au and Ag generally demonstrate reasonable spatial correlation of model estimate and drillhole grades after consideration of drill coverage, volume variance effects and expected smoothing for the combined ZONE data in the SMZ and NMZ.
The trend plots for Fe did show some anomalies and model grades apparently trending higher than the drillhole grades. This is accounted for by the volume variance effect of large model volumes in comparatively high-Fe magnetite skarn zones. In order to verify that Fe estimates were estimating correctly the trend plots for Fe from within the SMZ magnetite skarn zone was generated as shown in Figure 14.18. These plots then demonstrated that the model Fe grade trends do follow the drillhole Fe grade trends.
The northing plots for Cu, Au, Ag and S for the SMZ are shown in Figure 14.19 to Figure 14.21 with the remaining plots shown in Appendix 4.
14.8 Classification
14.8.1 Guidelines
The Mabilo MRE has been classified using guiding principles contained in the JORC Code 2012 Edition. The Mineral Resource is classified as Indicated where in the Qualified Person's opinion, sufficient data exists to assume geological and mineralization continuity. For areas with more limited data density, and limited along-strike or down-dip continuity, there is sufficient evidence to imply but not verify geological and grade continuity and these areas are classified as Inferred. Figure 14.23 shows a plan view of the model colored by classification.
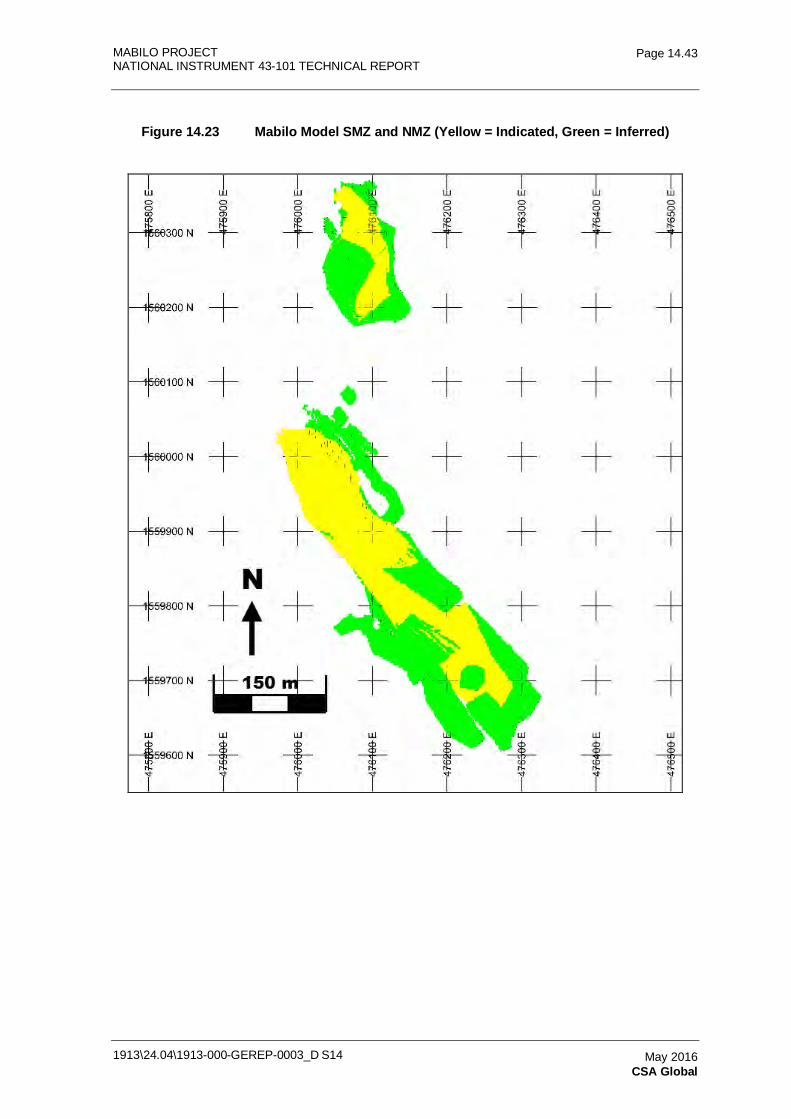
MABILO PROJECT NATIONAL INSTRUMENT 43-101 TECHNICAL REPORT
1913\24.04\1913-000-GEREP-0003_D S14
Page 14.43
May 2016 CSA Global
Figure 14.23 Mabilo Model SMZ and NMZ (Yellow = Indicated, Green = Inferred)
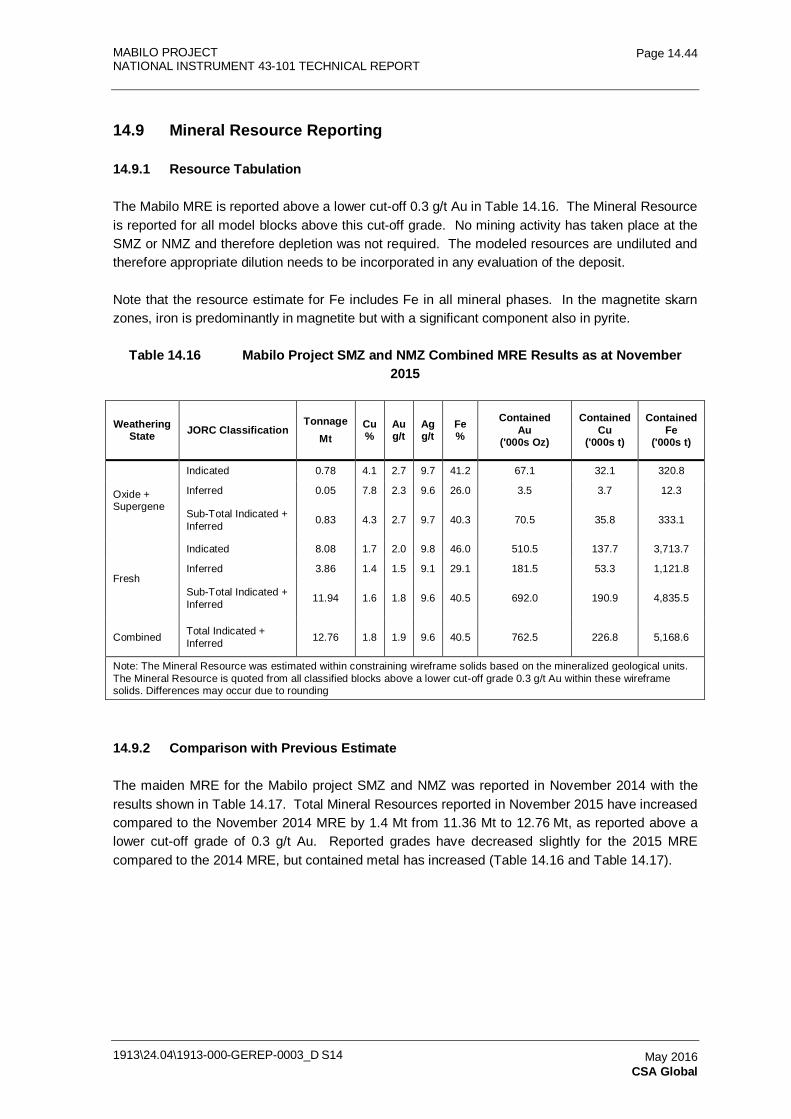
MABILO PROJECT NATIONAL INSTRUMENT 43-101 TECHNICAL REPORT
1913\24.04\1913-000-GEREP-0003_D S14
Page 14.44
May 2016 CSA Global
14.9 Mineral Resource Reporting
14.9.1 Resource Tabulation
The Mabilo MRE is reported above a lower cut-off 0.3 g/t Au in Table 14.16. The Mineral Resource is reported for all model blocks above this cut-off grade. No mining activity has taken place at the SMZ or NMZ and therefore depletion was not required. The modeled resources are undiluted and therefore appropriate dilution needs to be incorporated in any evaluation of the deposit.
Note that the resource estimate for Fe includes Fe in all mineral phases. In the magnetite skarn zones, iron is predominantly in magnetite but with a significant component also in pyrite.
Table 14.16 Mabilo Project SMZ and NMZ Combined MRE Results as at November 2015
Weathering State JORC Classification
Tonnage Mt
Cu %
Au g/t
Ag g/t
Fe %
Contained Au
('000s Oz)
Contained Cu
('000s t)
Contained Fe
('000s t)
Oxide + Supergene
Indicated 0.78 4.1 2.7 9.7 41.2 67.1 32.1 320.8
Inferred 0.05 7.8 2.3 9.6 26.0 3.5 3.7 12.3
Sub-Total Indicated + Inferred 0.83 4.3 2.7 9.7 40.3 70.5 35.8 333.1
Fresh
Indicated 8.08 1.7 2.0 9.8 46.0 510.5 137.7 3,713.7
Inferred 3.86 1.4 1.5 9.1 29.1 181.5 53.3 1,121.8
Sub-Total Indicated + Inferred 11.94 1.6 1.8 9.6 40.5 692.0 190.9 4,835.5
Combined Total Indicated + Inferred 12.76 1.8 1.9 9.6 40.5 762.5 226.8 5,168.6
Note: The Mineral Resource was estimated within constraining wireframe solids based on the mineralized geological units. The Mineral Resource is quoted from all classified blocks above a lower cut-off grade 0.3 g/t Au within these wireframe solids. Differences may occur due to rounding
14.9.2 Comparison with Previous Estimate
The maiden MRE for the Mabilo project SMZ and NMZ was reported in November 2014 with the results shown in Table 14.17. Total Mineral Resources reported in November 2015 have increased compared to the November 2014 MRE by 1.4 Mt from 11.36 Mt to 12.76 Mt, as reported above a lower cut-off grade of 0.3 g/t Au. Reported grades have decreased slightly for the 2015 MRE compared to the 2014 MRE, but contained metal has increased (Table 14.16 and Table 14.17).
MABILO PROJECT NATIONAL INSTRUMENT 43-101 TECHNICAL REPORT
1913\24.04\1913-000-GEREP-0003_D S14
Page 14.45
May 2016 CSA Global
Table 14.17 Mabilo Project - Mineral Resource Estimate Results as at November 2014
Weathering State Classification Million
Tonnes Cu % Au g/t Ag g/t Fe % Cu
Metal (Kt)
Au Oz ('000s)
Fe Metal (Kt)
Oxide + Supergene
Indicated 0.73 4.4 2.8 9.5 42.6 67 32.2 313
Inferred 0.13 3.1 2.2 10.4 34.9 9 3.9 44
Sub-Total Indicated + Inferred 0.86 4.2 2.8 9.7 41.5 76 36.1 356
Fresh
Indicated 5.13 1.7 2.1 8.3 49.9 347 88.9 2,563
Inferred 5.37 1.5 1.7 12.9 39.1 293 80.4 2,102
Sub-Total Indicated + Inferred 10.50 1.6 1.9 10.7 44.4 640 169.3 4,665
Combined Total Indicated + Inferred 11.36 1.8 2.0 10.6 44.2 716 205.5 5,021
Note: The Mineral Resource was estimated within constraining wireframe solids based on the mineralized geological units. This resource table is quoted from all classified blocks above a lower cut-off grade 0.3 g/t Au within these wireframe solids. Differences may occur due to rounding
The majority of the additional interpreted mineralization (~1 Mt) is in mineralized garnet skarn, calc silicate and breccia zones. These zones have lower Au, Cu, Fe and Ag grades than the remaining interpreted mineralization zones, resulting in the lower overall model grades reported in November 2015.
Drilling in 2015 has concentrated on infill with some extension drill testing in the two deposit areas. The primary goal of the drilling campaign has been to improve the geological knowledge of the boundaries, geometry and grade continuity of the deposits. This resulted in sufficient confidence in the updated interpretation and modeling to report an additional 3 Mt of Indicated Mineral Resources, increasing from 5.86 Mt in November 2014 to 8.86 Mt in November 2015.
14.9.3 Grade Tonnage Tables
A grade-tonnage table and curve can be produced for each of the estimated grade variables. The grade tonnage table and grade tonnage curve for Cu and Au are presented, Table 14.18 and Table 14.19, and Figure 14.24 and Figure 14.25, respectively.
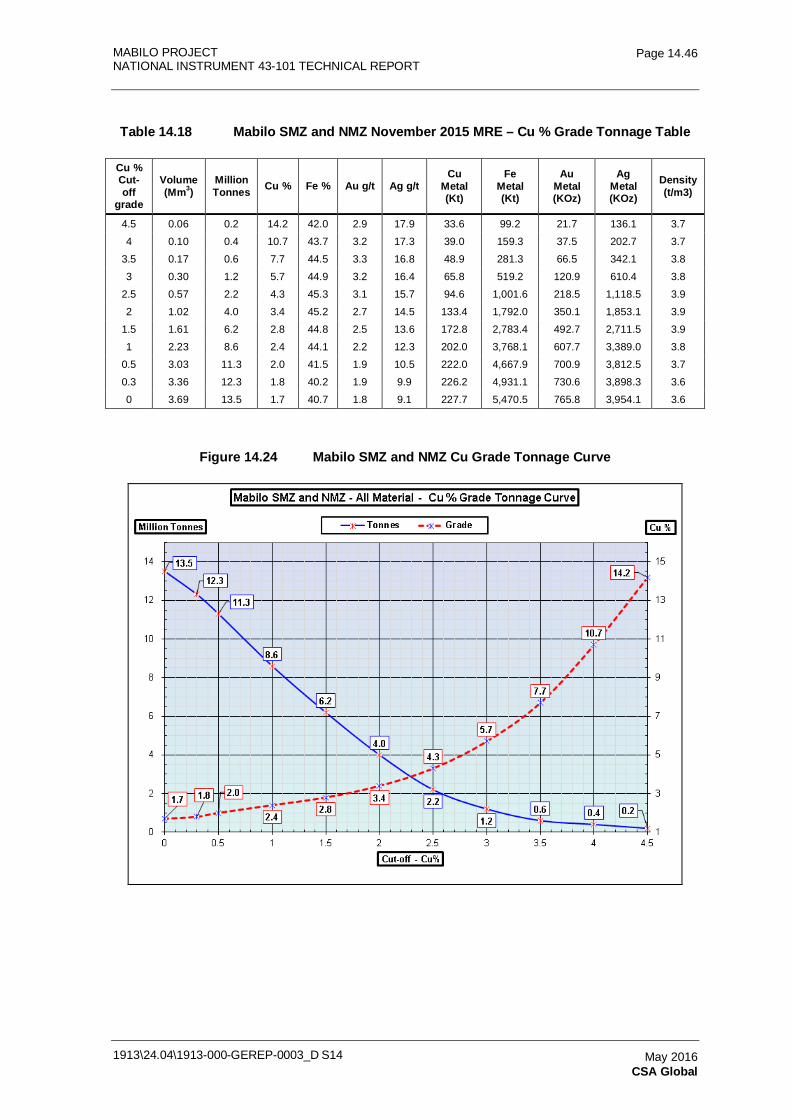
MABILO PROJECT NATIONAL INSTRUMENT 43-101 TECHNICAL REPORT
1913\24.04\1913-000-GEREP-0003_D S14
Page 14.46
May 2016 CSA Global
Table 14.18 Mabilo SMZ and NMZ November 2015 MRE – Cu % Grade Tonnage Table
Cu % Cut-off
grade
Volume (Mm3)
Million Tonnes Cu % Fe % Au g/t Ag g/t
Cu Metal (Kt)
Fe Metal (Kt)
Au Metal (KOz)
Ag Metal (KOz)
Density (t/m3)
4.5 0.06 0.2 14.2 42.0 2.9 17.9 33.6 99.2 21.7 136.1 3.7
4 0.10 0.4 10.7 43.7 3.2 17.3 39.0 159.3 37.5 202.7 3.7
3.5 0.17 0.6 7.7 44.5 3.3 16.8 48.9 281.3 66.5 342.1 3.8
3 0.30 1.2 5.7 44.9 3.2 16.4 65.8 519.2 120.9 610.4 3.8
2.5 0.57 2.2 4.3 45.3 3.1 15.7 94.6 1,001.6 218.5 1,118.5 3.9
2 1.02 4.0 3.4 45.2 2.7 14.5 133.4 1,792.0 350.1 1,853.1 3.9
1.5 1.61 6.2 2.8 44.8 2.5 13.6 172.8 2,783.4 492.7 2,711.5 3.9
1 2.23 8.6 2.4 44.1 2.2 12.3 202.0 3,768.1 607.7 3,389.0 3.8
0.5 3.03 11.3 2.0 41.5 1.9 10.5 222.0 4,667.9 700.9 3,812.5 3.7
0.3 3.36 12.3 1.8 40.2 1.9 9.9 226.2 4,931.1 730.6 3,898.3 3.6
0 3.69 13.5 1.7 40.7 1.8 9.1 227.7 5,470.5 765.8 3,954.1 3.6
Figure 14.24 Mabilo SMZ and NMZ Cu Grade Tonnage Curve
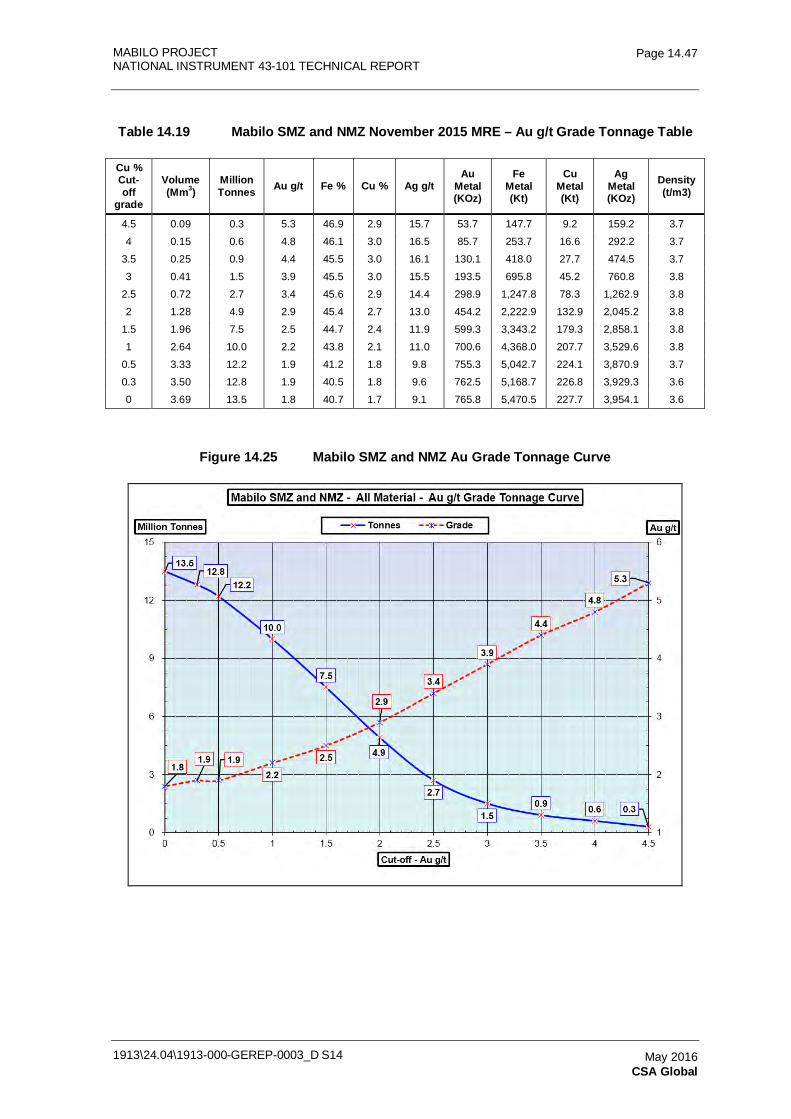
MABILO PROJECT NATIONAL INSTRUMENT 43-101 TECHNICAL REPORT
1913\24.04\1913-000-GEREP-0003_D S14
Page 14.47
May 2016 CSA Global
Table 14.19 Mabilo SMZ and NMZ November 2015 MRE – Au g/t Grade Tonnage Table
Cu % Cut-off
grade
Volume (Mm3)
Million Tonnes Au g/t Fe % Cu % Ag g/t
Au Metal (KOz)
Fe Metal (Kt)
Cu Metal (Kt)
Ag Metal (KOz)
Density (t/m3)
4.5 0.09 0.3 5.3 46.9 2.9 15.7 53.7 147.7 9.2 159.2 3.7
4 0.15 0.6 4.8 46.1 3.0 16.5 85.7 253.7 16.6 292.2 3.7
3.5 0.25 0.9 4.4 45.5 3.0 16.1 130.1 418.0 27.7 474.5 3.7
3 0.41 1.5 3.9 45.5 3.0 15.5 193.5 695.8 45.2 760.8 3.8
2.5 0.72 2.7 3.4 45.6 2.9 14.4 298.9 1,247.8 78.3 1,262.9 3.8
2 1.28 4.9 2.9 45.4 2.7 13.0 454.2 2,222.9 132.9 2,045.2 3.8
1.5 1.96 7.5 2.5 44.7 2.4 11.9 599.3 3,343.2 179.3 2,858.1 3.8
1 2.64 10.0 2.2 43.8 2.1 11.0 700.6 4,368.0 207.7 3,529.6 3.8
0.5 3.33 12.2 1.9 41.2 1.8 9.8 755.3 5,042.7 224.1 3,870.9 3.7
0.3 3.50 12.8 1.9 40.5 1.8 9.6 762.5 5,168.7 226.8 3,929.3 3.6
0 3.69 13.5 1.8 40.7 1.7 9.1 765.8 5,470.5 227.7 3,954.1 3.6
Figure 14.25 Mabilo SMZ and NMZ Au Grade Tonnage Curve
MABILO PROJECT NATIONAL INSTRUMENT 43-101 TECHNICAL REPORT
1913\24.04\1913-000-GEREP-0003_D S14
Page 14.48
May 2016 CSA Global
14.10 Recommendations
CSA Global makes the following recommendations, listed in no particular order:
• A more refined geometallurgical model incorporating Cu species and retrograde clay distribution should be constructed to assist in defining materials with differing metallurgical responses.
• Additional density data should be collected to ensure that density values applied in the model are fully representative of the in situ material.
• Additional work should be completed to define the structural and lithostratigraphic geological framework, both to define exact limits of currently interpreted zones and to assist with resource-extension and exploration targeting.
• At the commencement of mining, reconciliation of mined material with the Mineral Resource model is recommended to validate and/or improve grade estimation techniques.
• The model is undiluted and therefore appropriate dilution has been incorporated during mine planning.
14.11 References
Garwin, S., Hall, R., and Watanabe, Y., 2005: Tectonic Setting, Geology, and Gold and Copper Mineralization in Cenozoic Magmatic Arcs of Southeast Asia and the West Pacific, Economic Geology 100th Anniversary Volume.
Green, A., Reynolds, N., and Louw, G., 2014, NI.43-101Technical Report, Mabilo Copper-Gold-Iron Project. CSA Global Report R312.2014 to RTG Mining Inc.
JICA, 2002; Report on Co-operative Mineral Exploration in the Bicol North Area, The Republic of Philippines, Consolidated Report, Japan International Cooperation Agency, Metal Mining Agency of Japan.
Lallemand, S.E., Popoff, M., Cadet, J., Bader, A., Pubellier, M., Rangin, C. and Deffontaines, B., 1998: Genetic relations between the central and southern Philippine Trench and the Sangihe Trench. Journal of Geophysical Research 103, p. 933-950.
Pubellier, M, Quebral, R.D., Defontaines, B and Ragin, C., 1993: Neotectonic Map of Mindanao Island, Explanatory Notes, Mines and Geosciences Bureau, DNR, Philippines.
Quebral, R., Pubellier, M. and Rangin, C., 1996, The onset of movement on the Philippine fault in eastern Mindanao: A transition from a collision to strike slip environment. Tectonics, V15.
Reynolds, N., 2014, R118.2014. NI43-101 Technical Report RTG Mining Inc. Mabilo Copper-Gold-Iron Project.
MABILO PROJECT NATIONAL INSTRUMENT 43-101 TECHNICAL REPORT
1913\24.04\1913-000-GEREP-0003_D S14
Page 14.49
May 2016 CSA Global
RTG, 2014. Unpublished QAQCR Summary Report produced 17/11/2014 for RTG
Taylor, D., 2014. CSA Global unpublished report, RTG MRE Data Audit Final Report
Yumul, G. P., Jr., Dimalanta, C., and Maglambayan, V.B., 2008: Tectonic setting of a composite terrane; A review of the Philippine island arc system, Geosciences Journal, V12.
MABILO PROJECT
NATIONAL INSTRUMENT 43-101 TECHNICAL REPORT
1913-000-GEREP-0003
Table of Contents Page
15.0 MINERAL RESERVE ESTIMATES 15.1 15.1 Mineral Reserve Estimating Approach 15.1 15.2 Pit Optimization Key Assumptions 15.1
15.2.1 Resource Model 15.1 15.2.2 Geology Zones 15.2 15.2.3 Ore Types 15.2 15.2.4 Lease Boundaries 15.3 15.2.5 Geotechnical Considerations 15.4 15.2.6 Geo-hydrological Considerations 15.4 15.2.7 Oreloss and Dilution 15.6 15.2.8 Processing – Throughputs, Recoveries, Concentrate Grades
and Moisture 15.9 15.2.9 Optimization Costs General 15.11 15.2.10 Mining Costs 15.11 15.2.11 Processing Costs 15.13 15.2.12 Metal Prices 15.15 15.2.13 Selling Costs and Royalties 15.15 15.2.14 Discount Rate 15.15
15.3 Pit Optimization Results 15.16 15.3.1 Base Case Results 15.16 15.3.2 Optimization Sensitivities 15.18 15.3.3 Shell Selection 15.22
15.4 Mine Design 15.22 15.4.1 Mine Design Process 15.22 15.4.2 Bench Height 15.22 15.4.3 Pit Slopes 15.22 15.4.4 Ramps and Switchbacks 15.23 15.4.5 Minimum Mining Width 15.25 15.4.6 Lease Boundary 15.25 15.4.7 Ultimate Pit Design 15.26 15.4.8 Ultimate Pit Design and Optimization Shell Comparison 15.27 15.4.9 Stage Designs 15.31 15.4.10 Waste Dump Design 15.34 15.4.11 Site Layout at Project Completion 15.36
15.5 Mineral Reserves 15.36 15.5.1 Reserve Calculations 15.36 15.5.2 Project Economics 15.37 15.5.3 Mabilo Ore Reserve 15.38
TABLES Table 15.1 November 2015 Mabilo Resource 15.2 Table 15.2 Geology Zones 15.2 Table 15.3 Ore Types 15.3 Table 15.4 Insitu Ore Moisture Content 15.3 Table 15.5 Optimization Slope Angles 15.4 Table 15.6 Effects of Edge Dilution 15.7 Table 15.7 Ratios - After Edge Dilution / Original Resource 15.7 Table 15.8 Effects of Edge Dilution and Internal Dilution 15.8 Table 15.9 Ratios - After Edge Dilution and Ore Mixing / Original Resource 15.8
1913\24.04\1913-000-GEREP-0003_D S15 May 2016 Orelogy Consulting
MABILO PROJECT
NATIONAL INSTRUMENT 43-101 TECHNICAL REPORT
1913-000-GEREP-0003
Table of Contents (Continued)
Page
1913\24.04\1913-000-GEREP-0003_D S15
May 2016 Orelogy Consulting
Table 15.10 Resource by Ore Type - After Edge Dilution and Ore Mixing 15.9 Table 15.11 Throughput Assumptions 15.9 Table 15.12 Processing Recoveries and Concentrate Grades 15.10 Table 15.13 Concentrate Moisture Content 15.10 Table 15.14 Waste Mining Cost by Bench 15.12 Table 15.15 Ore Mining Premium 15.13 Table 15.16 Ore and Concentrate Processing Costs - Summary 15.13 Table 15.17 Gold Cap Ore Processing Cost - Details 15.13 Table 15.18 Supergene Ore Processing Cost Details 15.14 Table 15.19 Fresh Ore Processing Cost Details 15.14 Table 15.20 Metal Prices 15.15 Table 15.21 Royalties and Charges 15.15 Table 15.22 Base Case Optimization Results 15.17 Table 15.23 Optimization Results – Sensitivity Details 15.20 Table 15.24 Sensitivity Results by Pit Size and DCF 15.21 Table 15.25 Slope Design Parameters 15.23 Table 15.26 Ramp Design Criteria 15.24 Table 15.27 Minimum Mining Widths 15.25 Table 15.28 Comparison Between Design and Optimization Shell 15.27 Table 15.29 Cut-off Grades 15.37 Table 15.30 Financial vs Pit Optimisation Comparison 15.38 Table 15.31 Mabilo Mineral Reserve 15.38 FIGURES Figure 15.1 Site Plan with Surface Water Diversion Structures 15.5 Figure 15.2 Resource Model Ore and Waste Blocks – Illustration 15.6 Figure 15.3 Edge Dilution Mechanism Applied – Illustration 15.7 Figure 15.4 Base Case Optimization Results 15.18 Figure 15.5 Dual Lane Ramp Configuration 15.24 Figure 15.6 Single Lane Ramp Configuration 15.24 Figure 15.7 Switchback Designs 15.25 Figure 15.8 Ultimate Pit Design – Plan View 15.27 Figure 15.9 Ultimate Pit Design and Optimization Shell – Plan View 15.28 Figure 15.10 Section A-A' 15.29 Figure 15.11 Section B-B' 15.29 Figure 15.12 Section C-C' 15.30 Figure 15.13 Section D-D' 15.30 Figure 15.14 Mabilo Stage 1 15.31 Figure 15.15 Mabilo Stage 2 15.32 Figure 15.16 Mabilo Stage 3 15.33 Figure 15.17 Mabilo Stage 4 15.34 Figure 15.18 Final Waste Dump and TSF 15.35 Figure 15.19 Waste Dump Construction and Final Landform Slopes - Schematic 15.35 Figure 15.20 Site Layout after Completion of Mining 15.36 Figure 15.21 Supergene Copper Ore Cut-off Grade 15.37
MABILO PROJECT NATIONAL INSTRUMENT 43-101 TECHNICAL REPORT
1913\24.04\1913-000-GEREP-0003_D S15
Page 15.1
May 2016 Orelogy Consulting
15.0 MINERAL RESERVE ESTIMATES
15.1 Mineral Reserve Estimating Approach
This section of the report summarizes the activities undertaken in the Mineral Reserve estimation process. The key activities were:
• Pit Optimization – Whittle-4X™ pit optimization software was used to identify the optimum pit shell in terms of value and tonnage, using the parameters described in Section 15.2 with the shell selection process described in Section 15.3.
• Mine Design – An ultimate pit was designed in MineSight™ general mine planning software, with the guidance of the selected shell, and pit design inputs summarized in Section 15.4.1. Internal stages were designed to target higher value areas in accordance with the intermediate Whittle-4X shell information, pit design criteria and an iterative process using mine scheduling feedback.
• Mine Scheduling – Maptek’s Evolution™ software was used to generate a practical Life of Mine (LOM) production schedule aimed at meeting all scheduling objectives and constraints. The scheduling process is detailed in Section 16.
• Mining Cost Estimation – The mining costs were estimated by applying mining unit costs to the physicals generated by the LOM schedule. The assumptions in the mining cost estimate have been outlined in Section 16 and the resulting cost estimates have been provided in Section 21.
• Economic Verification of the Feasibility Study – Overall project cash flow projections were reviewed to confirm that the project is economically viable.
• Risk Assessment – A risk assessment was undertaken to identify the factors that could materially impact the mineral reserve estimate.
15.2 Pit Optimization Key Assumptions
15.2.1 Resource Model
The resource model used in the optimization process was generated by CSA Global Pty Ltd (CSA) in February 2016 with 10 m x 10 m x 5 m (x, y, z) parent block sizes and 2.5 m x 2.5 m x 2.5 m sub-cells. The resource is summarized in Table 15.1.
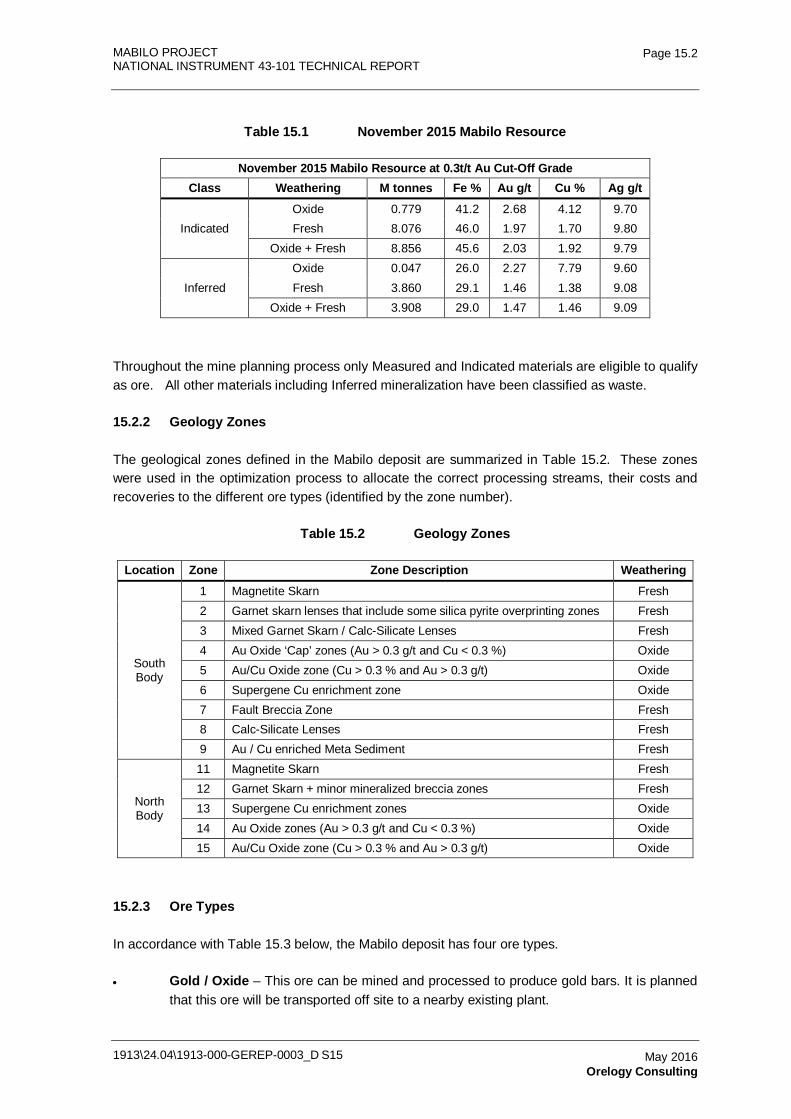
MABILO PROJECT NATIONAL INSTRUMENT 43-101 TECHNICAL REPORT
1913\24.04\1913-000-GEREP-0003_D S15
Page 15.2
May 2016 Orelogy Consulting
Table 15.1 November 2015 Mabilo Resource
November 2015 Mabilo Resource at 0.3t/t Au Cut-Off Grade Class Weathering M tonnes Fe % Au g/t Cu % Ag g/t
Indicated Oxide 0.779 41.2 2.68 4.12 9.70 Fresh 8.076 46.0 1.97 1.70 9.80
Oxide + Fresh 8.856 45.6 2.03 1.92 9.79
Inferred Oxide 0.047 26.0 2.27 7.79 9.60 Fresh 3.860 29.1 1.46 1.38 9.08
Oxide + Fresh 3.908 29.0 1.47 1.46 9.09
Throughout the mine planning process only Measured and Indicated materials are eligible to qualify as ore. All other materials including Inferred mineralization have been classified as waste.
15.2.2 Geology Zones
The geological zones defined in the Mabilo deposit are summarized in Table 15.2. These zones were used in the optimization process to allocate the correct processing streams, their costs and recoveries to the different ore types (identified by the zone number).
Table 15.2 Geology Zones
Location Zone Zone Description Weathering
South Body
1 Magnetite Skarn Fresh 2 Garnet skarn lenses that include some silica pyrite overprinting zones Fresh 3 Mixed Garnet Skarn / Calc-Silicate Lenses Fresh 4 Au Oxide ‘Cap’ zones (Au > 0.3 g/t and Cu < 0.3 %) Oxide 5 Au/Cu Oxide zone (Cu > 0.3 % and Au > 0.3 g/t) Oxide 6 Supergene Cu enrichment zone Oxide 7 Fault Breccia Zone Fresh 8 Calc-Silicate Lenses Fresh 9 Au / Cu enriched Meta Sediment Fresh
North Body
11 Magnetite Skarn Fresh 12 Garnet Skarn + minor mineralized breccia zones Fresh 13 Supergene Cu enrichment zones Oxide 14 Au Oxide zones (Au > 0.3 g/t and Cu < 0.3 %) Oxide 15 Au/Cu Oxide zone (Cu > 0.3 % and Au > 0.3 g/t) Oxide
15.2.3 Ore Types
In accordance with Table 15.3 below, the Mabilo deposit has four ore types.
• Gold / Oxide – This ore can be mined and processed to produce gold bars. It is planned that this ore will be transported off site to a nearby existing plant.
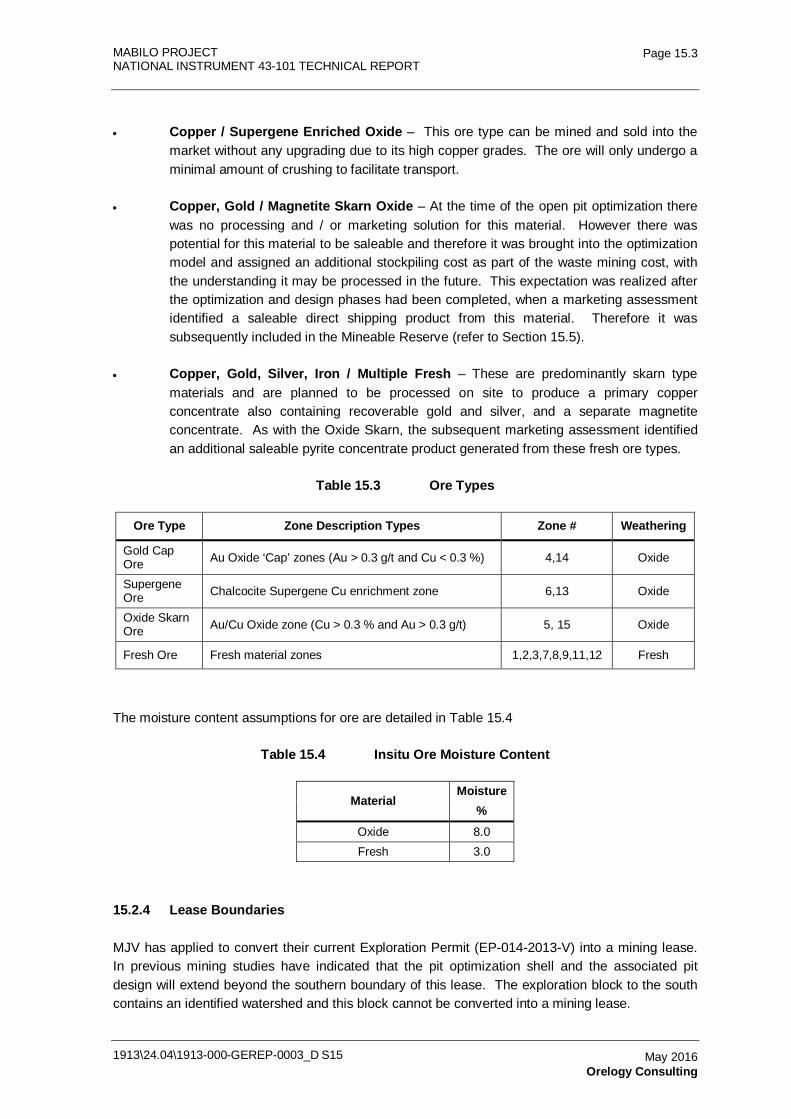
MABILO PROJECT NATIONAL INSTRUMENT 43-101 TECHNICAL REPORT
1913\24.04\1913-000-GEREP-0003_D S15
Page 15.3
May 2016 Orelogy Consulting
• Copper / Supergene Enriched Oxide – This ore type can be mined and sold into the market without any upgrading due to its high copper grades. The ore will only undergo a minimal amount of crushing to facilitate transport.
• Copper, Gold / Magnetite Skarn Oxide – At the time of the open pit optimization there was no processing and / or marketing solution for this material. However there was potential for this material to be saleable and therefore it was brought into the optimization model and assigned an additional stockpiling cost as part of the waste mining cost, with the understanding it may be processed in the future. This expectation was realized after the optimization and design phases had been completed, when a marketing assessment identified a saleable direct shipping product from this material. Therefore it was subsequently included in the Mineable Reserve (refer to Section 15.5).
• Copper, Gold, Silver, Iron / Multiple Fresh – These are predominantly skarn type materials and are planned to be processed on site to produce a primary copper concentrate also containing recoverable gold and silver, and a separate magnetite concentrate. As with the Oxide Skarn, the subsequent marketing assessment identified an additional saleable pyrite concentrate product generated from these fresh ore types.
Table 15.3 Ore Types
Ore Type Zone Description Types Zone # Weathering
Gold Cap Ore Au Oxide ‘Cap’ zones (Au > 0.3 g/t and Cu < 0.3 %) 4,14 Oxide
Supergene Ore Chalcocite Supergene Cu enrichment zone 6,13 Oxide
Oxide Skarn Ore Au/Cu Oxide zone (Cu > 0.3 % and Au > 0.3 g/t) 5, 15 Oxide
Fresh Ore Fresh material zones 1,2,3,7,8,9,11,12 Fresh
The moisture content assumptions for ore are detailed in Table 15.4
Table 15.4 Insitu Ore Moisture Content
Material Moisture
% Oxide 8.0 Fresh 3.0
15.2.4 Lease Boundaries
MJV has applied to convert their current Exploration Permit (EP-014-2013-V) into a mining lease. In previous mining studies have indicated that the pit optimization shell and the associated pit design will extend beyond the southern boundary of this lease. The exploration block to the south contains an identified watershed and this block cannot be converted into a mining lease.
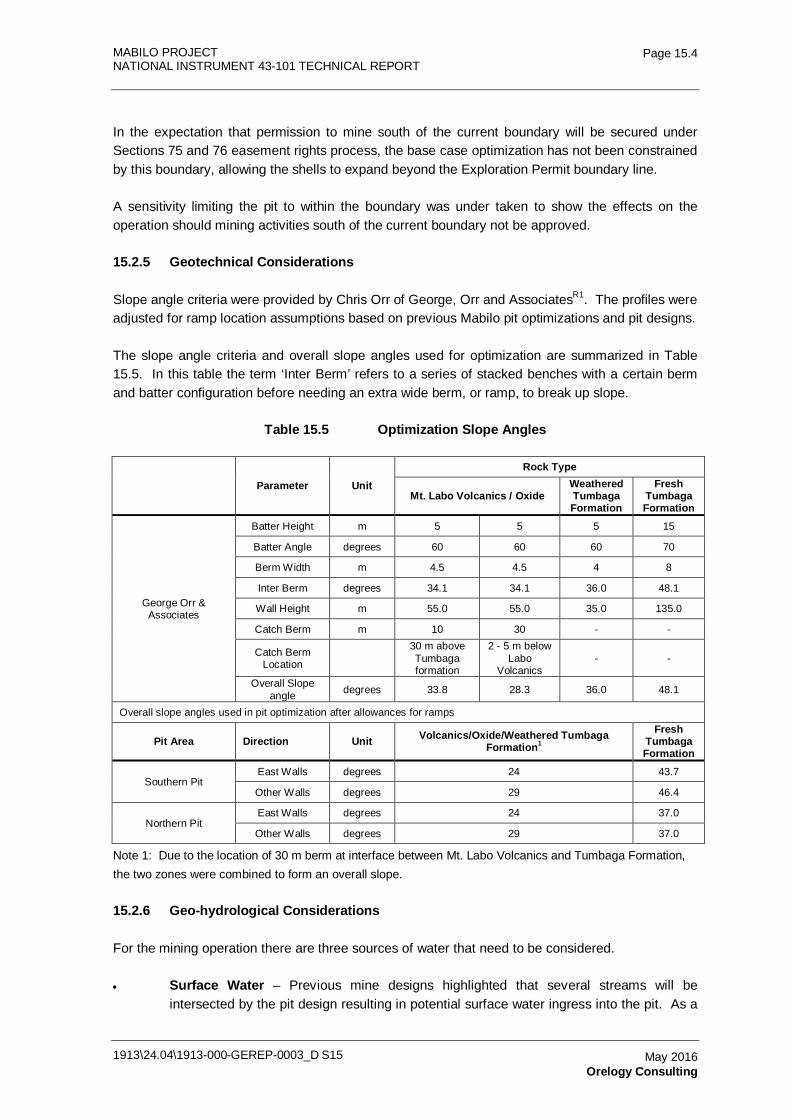
MABILO PROJECT NATIONAL INSTRUMENT 43-101 TECHNICAL REPORT
1913\24.04\1913-000-GEREP-0003_D S15
Page 15.4
May 2016 Orelogy Consulting
In the expectation that permission to mine south of the current boundary will be secured under Sections 75 and 76 easement rights process, the base case optimization has not been constrained by this boundary, allowing the shells to expand beyond the Exploration Permit boundary line.
A sensitivity limiting the pit to within the boundary was under taken to show the effects on the operation should mining activities south of the current boundary not be approved.
15.2.5 Geotechnical Considerations
Slope angle criteria were provided by Chris Orr of George, Orr and AssociatesR1. The profiles were adjusted for ramp location assumptions based on previous Mabilo pit optimizations and pit designs.
The slope angle criteria and overall slope angles used for optimization are summarized in Table 15.5. In this table the term ‘Inter Berm’ refers to a series of stacked benches with a certain berm and batter configuration before needing an extra wide berm, or ramp, to break up slope.
Table 15.5 Optimization Slope Angles
Parameter Unit
Rock Type
Mt. Labo Volcanics / Oxide Weathered Tumbaga Formation
Fresh Tumbaga Formation
George Orr & Associates
Batter Height m 5 5 5 15
Batter Angle degrees 60 60 60 70
Berm Width m 4.5 4.5 4 8
Inter Berm degrees 34.1 34.1 36.0 48.1
Wall Height m 55.0 55.0 35.0 135.0
Catch Berm m 10 30 - -
Catch Berm Location
30 m above Tumbaga formation
2 - 5 m below Labo
Volcanics - -
Overall Slope angle degrees 33.8 28.3 36.0 48.1
Overall slope angles used in pit optimization after allowances for ramps
Pit Area Direction Unit Volcanics/Oxide/Weathered Tumbaga Formation1
Fresh Tumbaga Formation
Southern Pit East Walls degrees 24 43.7
Other Walls degrees 29 46.4
Northern Pit East Walls degrees 24 37.0
Other Walls degrees 29 37.0
Note 1: Due to the location of 30 m berm at interface between Mt. Labo Volcanics and Tumbaga Formation, the two zones were combined to form an overall slope.
15.2.6 Geo-hydrological Considerations
For the mining operation there are three sources of water that need to be considered.
• Surface Water – Previous mine designs highlighted that several streams will be intersected by the pit design resulting in potential surface water ingress into the pit. As a
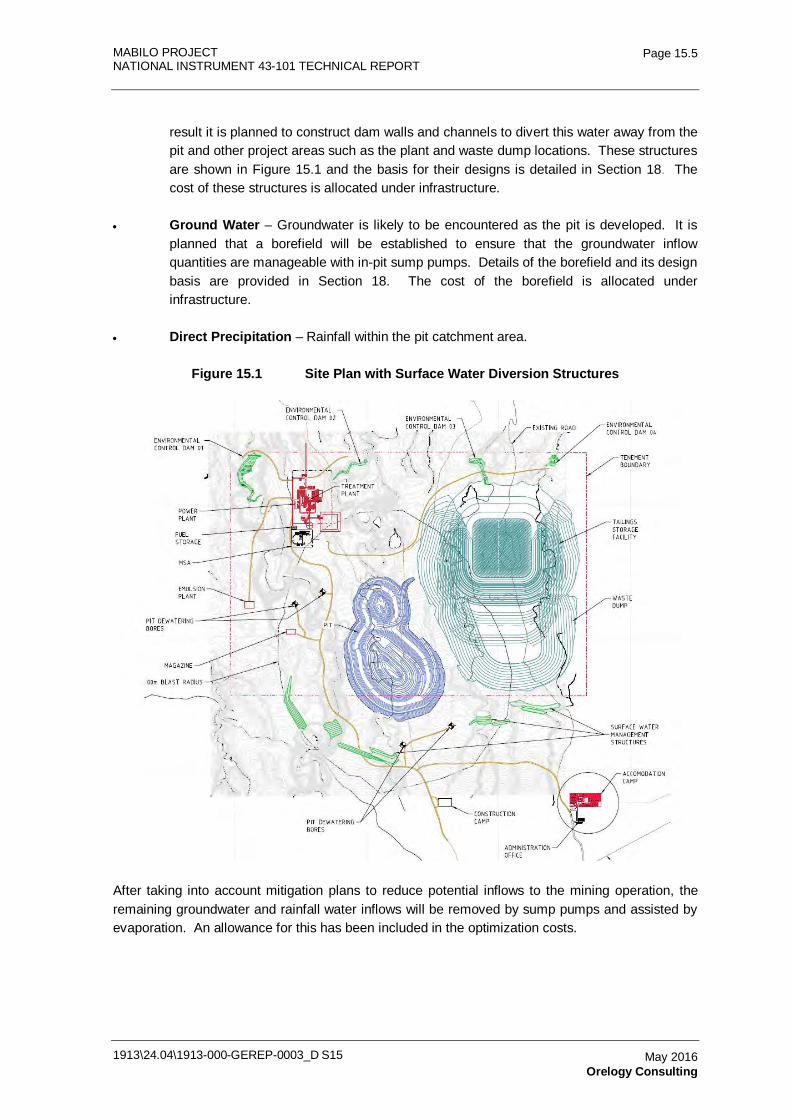
MABILO PROJECT NATIONAL INSTRUMENT 43-101 TECHNICAL REPORT
1913\24.04\1913-000-GEREP-0003_D S15
Page 15.5
May 2016 Orelogy Consulting
result it is planned to construct dam walls and channels to divert this water away from the pit and other project areas such as the plant and waste dump locations. These structures are shown in Figure 15.1 and the basis for their designs is detailed in Section 18. The cost of these structures is allocated under infrastructure.
• Ground Water – Groundwater is likely to be encountered as the pit is developed. It is planned that a borefield will be established to ensure that the groundwater inflow quantities are manageable with in-pit sump pumps. Details of the borefield and its design basis are provided in Section 18. The cost of the borefield is allocated under infrastructure.
• Direct Precipitation – Rainfall within the pit catchment area.
Figure 15.1 Site Plan with Surface Water Diversion Structures
After taking into account mitigation plans to reduce potential inflows to the mining operation, the remaining groundwater and rainfall water inflows will be removed by sump pumps and assisted by evaporation. An allowance for this has been included in the optimization costs.
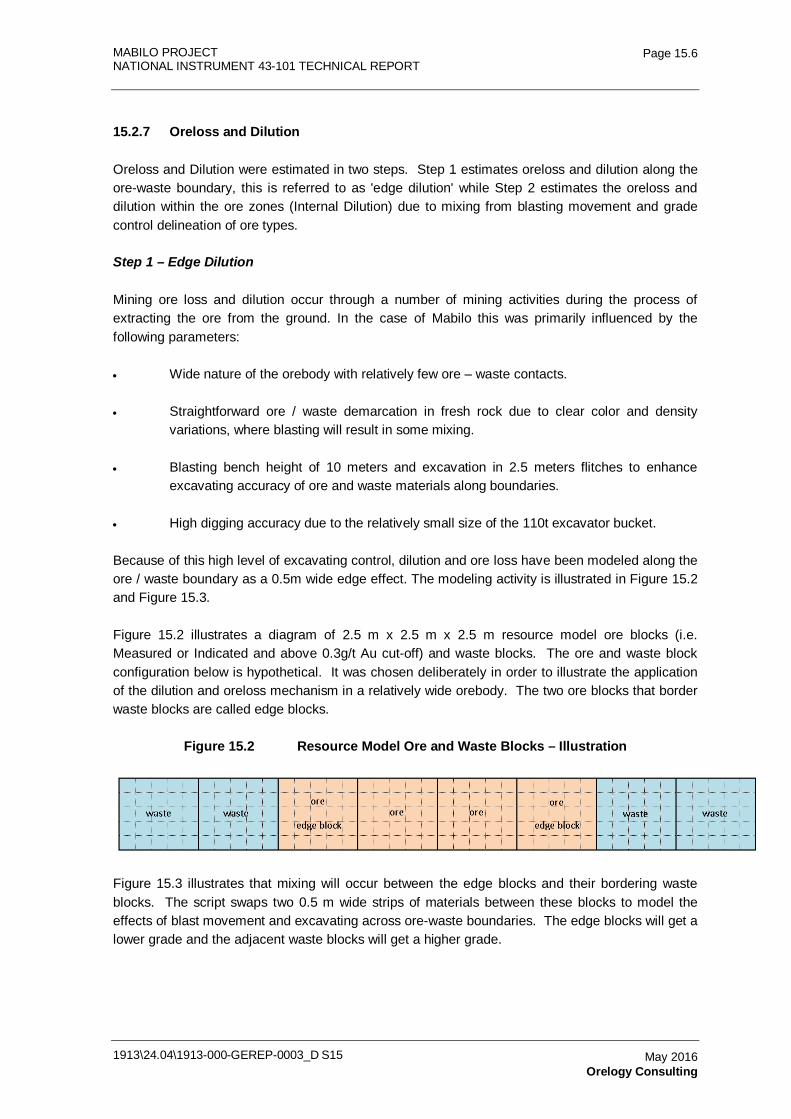
MABILO PROJECT NATIONAL INSTRUMENT 43-101 TECHNICAL REPORT
1913\24.04\1913-000-GEREP-0003_D S15
Page 15.6
May 2016 Orelogy Consulting
15.2.7 Oreloss and Dilution
Oreloss and Dilution were estimated in two steps. Step 1 estimates oreloss and dilution along the ore-waste boundary, this is referred to as 'edge dilution' while Step 2 estimates the oreloss and dilution within the ore zones (Internal Dilution) due to mixing from blasting movement and grade control delineation of ore types.
Step 1 – Edge Dilution
Mining ore loss and dilution occur through a number of mining activities during the process of extracting the ore from the ground. In the case of Mabilo this was primarily influenced by the following parameters:
• Wide nature of the orebody with relatively few ore – waste contacts.
• Straightforward ore / waste demarcation in fresh rock due to clear color and density variations, where blasting will result in some mixing.
• Blasting bench height of 10 meters and excavation in 2.5 meters flitches to enhance excavating accuracy of ore and waste materials along boundaries.
• High digging accuracy due to the relatively small size of the 110t excavator bucket.
Because of this high level of excavating control, dilution and ore loss have been modeled along the ore / waste boundary as a 0.5m wide edge effect. The modeling activity is illustrated in Figure 15.2 and Figure 15.3.
Figure 15.2 illustrates a diagram of 2.5 m x 2.5 m x 2.5 m resource model ore blocks (i.e. Measured or Indicated and above 0.3g/t Au cut-off) and waste blocks. The ore and waste block configuration below is hypothetical. It was chosen deliberately in order to illustrate the application of the dilution and oreloss mechanism in a relatively wide orebody. The two ore blocks that border waste blocks are called edge blocks.
Figure 15.2 Resource Model Ore and Waste Blocks – Illustration
Figure 15.3 illustrates that mixing will occur between the edge blocks and their bordering waste blocks. The script swaps two 0.5 m wide strips of materials between these blocks to model the effects of blast movement and excavating across ore-waste boundaries. The edge blocks will get a lower grade and the adjacent waste blocks will get a higher grade.
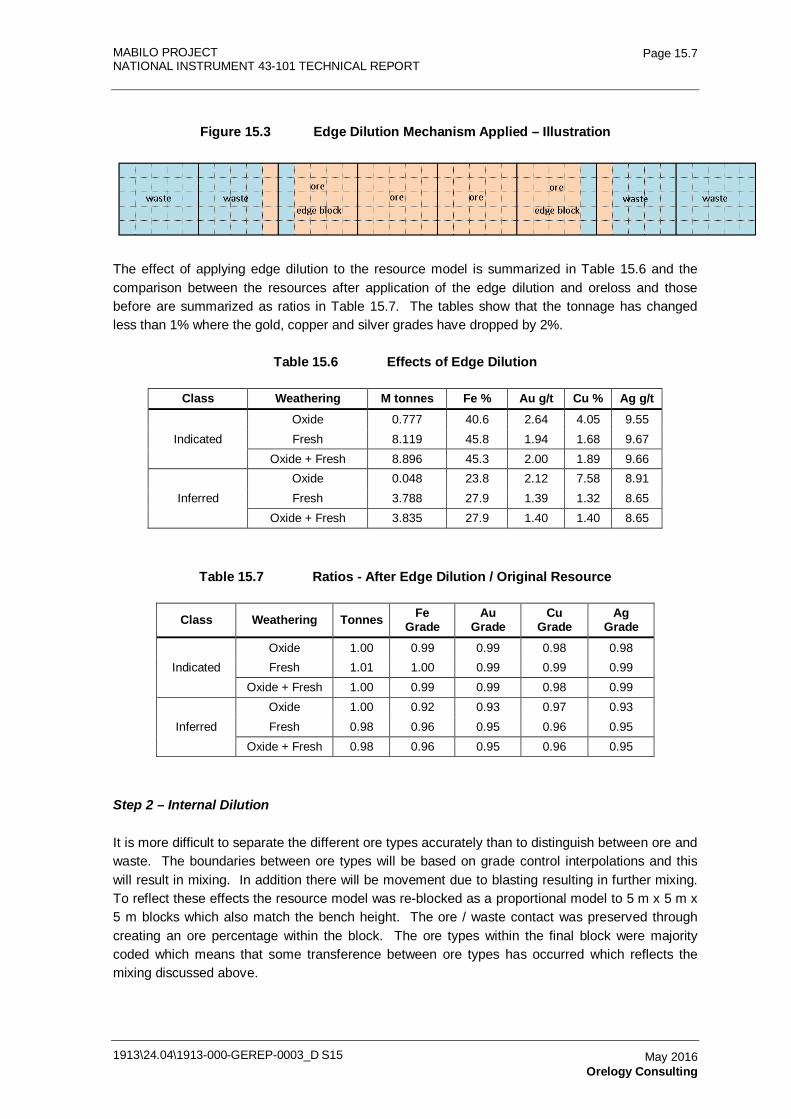
MABILO PROJECT NATIONAL INSTRUMENT 43-101 TECHNICAL REPORT
1913\24.04\1913-000-GEREP-0003_D S15
Page 15.7
May 2016 Orelogy Consulting
Figure 15.3 Edge Dilution Mechanism Applied – Illustration
The effect of applying edge dilution to the resource model is summarized in Table 15.6 and the comparison between the resources after application of the edge dilution and oreloss and those before are summarized as ratios in Table 15.7. The tables show that the tonnage has changed less than 1% where the gold, copper and silver grades have dropped by 2%.
Table 15.6 Effects of Edge Dilution
Class Weathering M tonnes Fe % Au g/t Cu % Ag g/t
Indicated Oxide 0.777 40.6 2.64 4.05 9.55 Fresh 8.119 45.8 1.94 1.68 9.67
Oxide + Fresh 8.896 45.3 2.00 1.89 9.66
Inferred Oxide 0.048 23.8 2.12 7.58 8.91 Fresh 3.788 27.9 1.39 1.32 8.65
Oxide + Fresh 3.835 27.9 1.40 1.40 8.65
Table 15.7 Ratios - After Edge Dilution / Original Resource
Class Weathering Tonnes Fe Grade
Au Grade
Cu Grade
Ag Grade
Indicated Oxide 1.00 0.99 0.99 0.98 0.98 Fresh 1.01 1.00 0.99 0.99 0.99
Oxide + Fresh 1.00 0.99 0.99 0.98 0.99
Inferred Oxide 1.00 0.92 0.93 0.97 0.93 Fresh 0.98 0.96 0.95 0.96 0.95
Oxide + Fresh 0.98 0.96 0.95 0.96 0.95
Step 2 – Internal Dilution
It is more difficult to separate the different ore types accurately than to distinguish between ore and waste. The boundaries between ore types will be based on grade control interpolations and this will result in mixing. In addition there will be movement due to blasting resulting in further mixing. To reflect these effects the resource model was re-blocked as a proportional model to 5 m x 5 m x 5 m blocks which also match the bench height. The ore / waste contact was preserved through creating an ore percentage within the block. The ore types within the final block were majority coded which means that some transference between ore types has occurred which reflects the mixing discussed above.
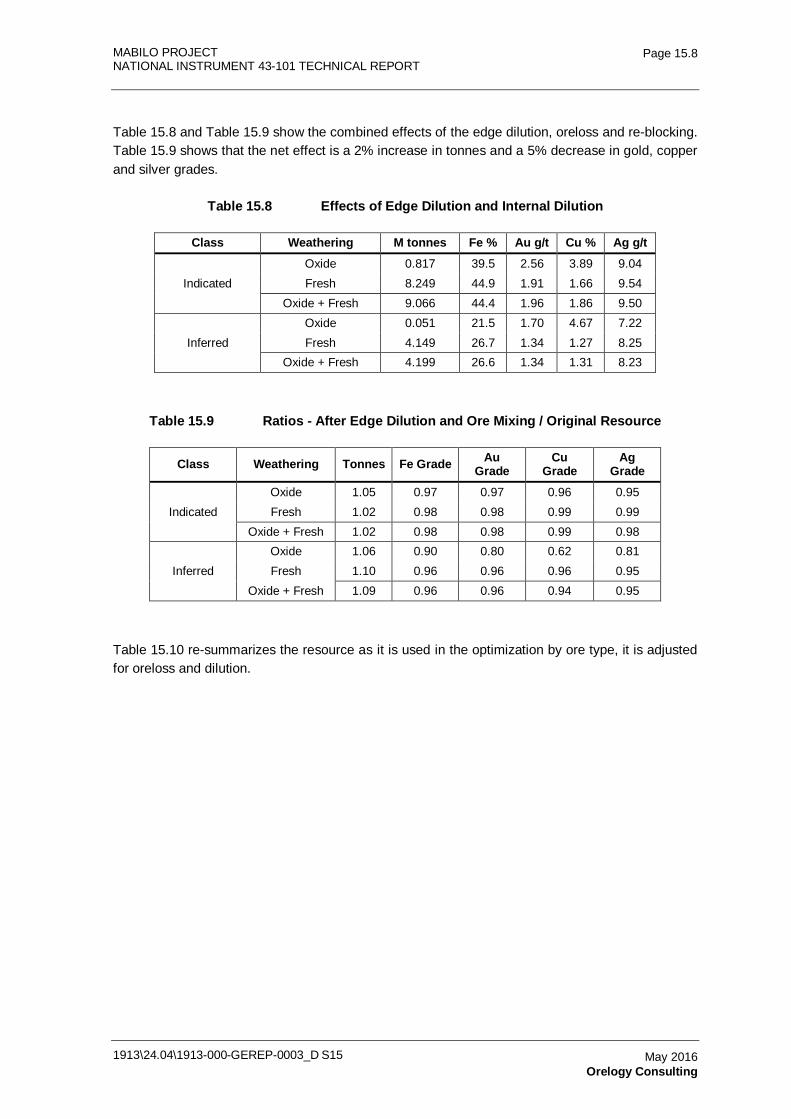
MABILO PROJECT NATIONAL INSTRUMENT 43-101 TECHNICAL REPORT
1913\24.04\1913-000-GEREP-0003_D S15
Page 15.8
May 2016 Orelogy Consulting
Table 15.8 and Table 15.9 show the combined effects of the edge dilution, oreloss and re-blocking. Table 15.9 shows that the net effect is a 2% increase in tonnes and a 5% decrease in gold, copper and silver grades.
Table 15.8 Effects of Edge Dilution and Internal Dilution
Class Weathering M tonnes Fe % Au g/t Cu % Ag g/t
Indicated Oxide 0.817 39.5 2.56 3.89 9.04 Fresh 8.249 44.9 1.91 1.66 9.54
Oxide + Fresh 9.066 44.4 1.96 1.86 9.50
Inferred Oxide 0.051 21.5 1.70 4.67 7.22 Fresh 4.149 26.7 1.34 1.27 8.25
Oxide + Fresh 4.199 26.6 1.34 1.31 8.23
Table 15.9 Ratios - After Edge Dilution and Ore Mixing / Original Resource
Class Weathering Tonnes Fe Grade Au Grade
Cu Grade
Ag Grade
Indicated Oxide 1.05 0.97 0.97 0.96 0.95 Fresh 1.02 0.98 0.98 0.99 0.99
Oxide + Fresh 1.02 0.98 0.98 0.99 0.98
Inferred Oxide 1.06 0.90 0.80 0.62 0.81 Fresh 1.10 0.96 0.96 0.96 0.95
Oxide + Fresh 1.09 0.96 0.96 0.94 0.95
Table 15.10 re-summarizes the resource as it is used in the optimization by ore type, it is adjusted for oreloss and dilution.
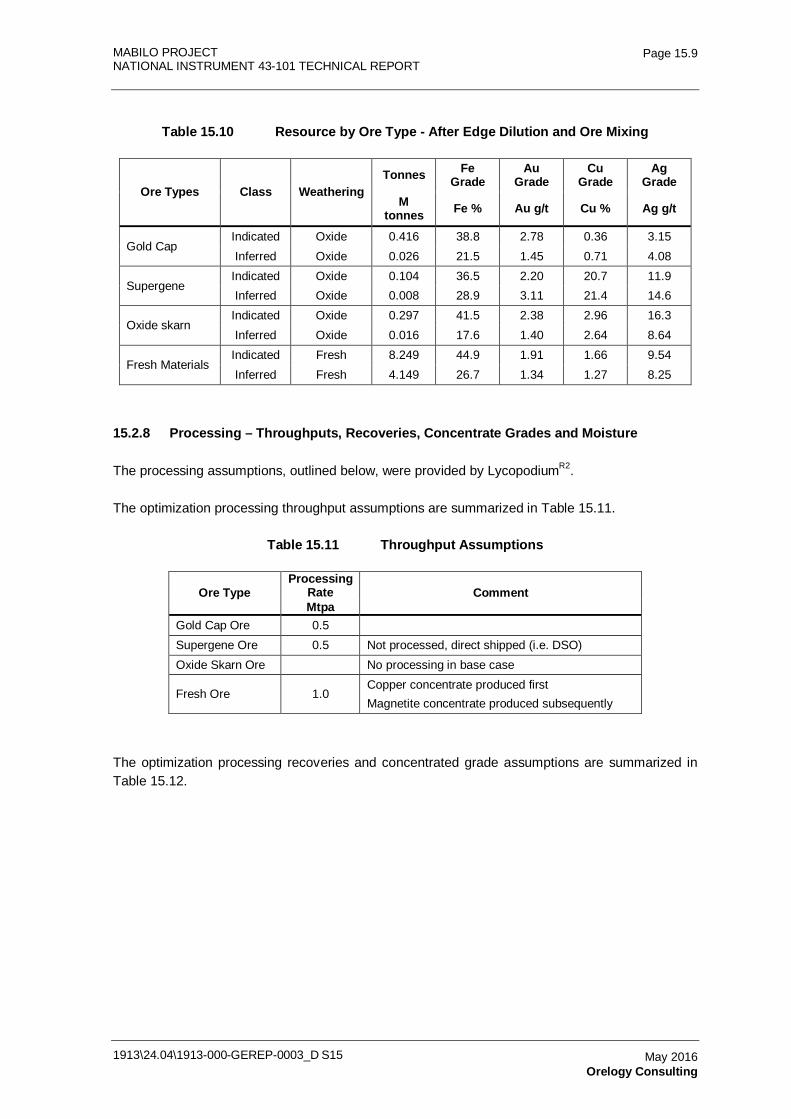
MABILO PROJECT NATIONAL INSTRUMENT 43-101 TECHNICAL REPORT
1913\24.04\1913-000-GEREP-0003_D S15
Page 15.9
May 2016 Orelogy Consulting
Table 15.10 Resource by Ore Type - After Edge Dilution and Ore Mixing
Ore Types Class Weathering Tonnes Fe
Grade Au
Grade Cu
Grade Ag
Grade M
tonnes Fe % Au g/t Cu % Ag g/t
Gold Cap Indicated Oxide 0.416 38.8 2.78 0.36 3.15 Inferred Oxide 0.026 21.5 1.45 0.71 4.08
Supergene Indicated Oxide 0.104 36.5 2.20 20.7 11.9 Inferred Oxide 0.008 28.9 3.11 21.4 14.6
Oxide skarn Indicated Oxide 0.297 41.5 2.38 2.96 16.3 Inferred Oxide 0.016 17.6 1.40 2.64 8.64
Fresh Materials Indicated Fresh 8.249 44.9 1.91 1.66 9.54 Inferred Fresh 4.149 26.7 1.34 1.27 8.25
15.2.8 Processing – Throughputs, Recoveries, Concentrate Grades and Moisture
The processing assumptions, outlined below, were provided by LycopodiumR2.
The optimization processing throughput assumptions are summarized in Table 15.11.
Table 15.11 Throughput Assumptions
Ore Type Processing
Rate Comment Mtpa
Gold Cap Ore 0.5 Supergene Ore 0.5 Not processed, direct shipped (i.e. DSO) Oxide Skarn Ore No processing in base case
Fresh Ore 1.0 Copper concentrate produced first Magnetite concentrate produced subsequently
The optimization processing recoveries and concentrated grade assumptions are summarized in Table 15.12.
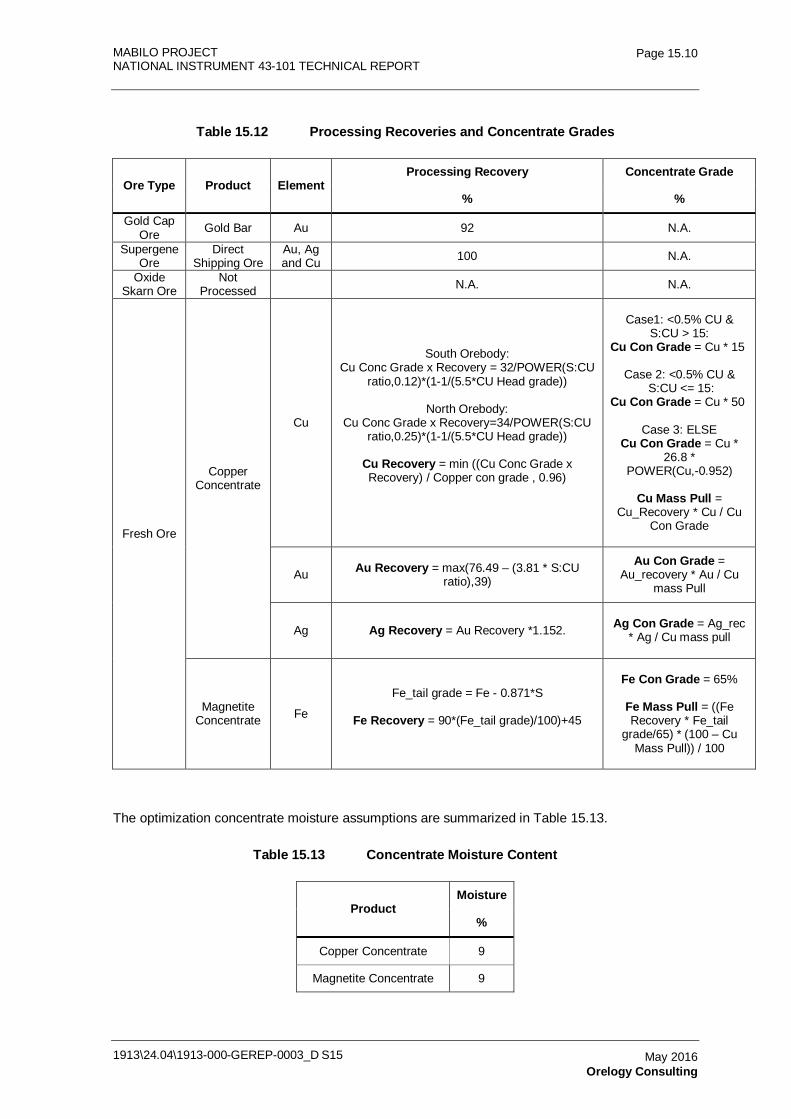
MABILO PROJECT NATIONAL INSTRUMENT 43-101 TECHNICAL REPORT
1913\24.04\1913-000-GEREP-0003_D S15
Page 15.10
May 2016 Orelogy Consulting
Table 15.12 Processing Recoveries and Concentrate Grades
Ore Type Product Element Processing Recovery Concentrate Grade
% %
Gold Cap Ore Gold Bar Au 92 N.A.
Supergene Ore
Direct Shipping Ore
Au, Ag and Cu 100 N.A.
Oxide Skarn Ore
Not Processed N.A. N.A.
Fresh Ore
Copper Concentrate
Cu
South Orebody:
Cu Conc Grade x Recovery = 32/POWER(S:CU ratio,0.12)*(1-1/(5.5*CU Head grade))
North Orebody:
Cu Conc Grade x Recovery=34/POWER(S:CU ratio,0.25)*(1-1/(5.5*CU Head grade))
Cu Recovery = min ((Cu Conc Grade x Recovery) / Copper con grade , 0.96)
Case1: <0.5% CU &
S:CU > 15: Cu Con Grade = Cu * 15
Case 2: <0.5% CU & S:CU <= 15:
Cu Con Grade = Cu * 50
Case 3: ELSE Cu Con Grade = Cu *
26.8 * POWER(Cu,-0.952)
Cu Mass Pull =
Cu_Recovery * Cu / Cu Con Grade
Au
Au Recovery = max(76.49 – (3.81 * S:CU
ratio),39)
Au Con Grade = Au_recovery * Au / Cu
mass Pull
Ag
Ag Recovery = Au Recovery *1.152.
Ag Con Grade = Ag_rec
* Ag / Cu mass pull
Magnetite Concentrate Fe
Fe_tail grade = Fe - 0.871*S
Fe Recovery = 90*(Fe_tail grade)/100)+45
Fe Con Grade = 65%
Fe Mass Pull = ((Fe Recovery * Fe_tail
grade/65) * (100 – Cu Mass Pull)) / 100
The optimization concentrate moisture assumptions are summarized in Table 15.13.
Table 15.13 Concentrate Moisture Content
Product Moisture
%
Copper Concentrate 9
Magnetite Concentrate 9
MABILO PROJECT NATIONAL INSTRUMENT 43-101 TECHNICAL REPORT
1913\24.04\1913-000-GEREP-0003_D S15
Page 15.11
May 2016 Orelogy Consulting
15.2.9 Optimization Costs General
This section outlines the cost assumptions in the optimization. All costs are categorized as either a mining cost or a processing cost as outlined below.
However as the WHITTLE optimization process calculates cut-off grade on the fly, ore is also defined on the fly. Therefore specifically ore related mining costs (e.g. grade control, rehandle, etc.) cannot be accurately assigned by material in advance of the optimization process. They have to be assigned by WHITTLE and the only way to do this is to assign them to the processing cost. In a similar fashion fixed annual costs (e.g. general and administration) cannot be applied as a $/tonne cost to all material as the total material movement by year is either variable or unknown. Therefore, as ore processing rate is invariably the only fixed rate known, G&A costs must be applied to the ore as a processing cost.
As a result the processing cost category includes items that may appear out of place to persons unfamiliar with pit optimizations. All the mining related ore costs applied to the processing cost are referred to as the Ore Mining Premium (OMP), in other word the additional ‘premium’ paid for mining ore.
15.2.10 Mining Costs
The mining costs were derived based on IMC’s Mabilo Mine Operating Cost Estimate reportR3 following a review by Orelogy Consulting. All costs are in 2015 US dollars. The costs are based on a contract mining operation with bench rates ($/bcm) plus annual fixed mining overheads.
Average mining costs by bench are summarized in Table 15.14. The average unit rates include a contractor margin of 13% on direct operating costs plus 5% margin on recovery of capital.
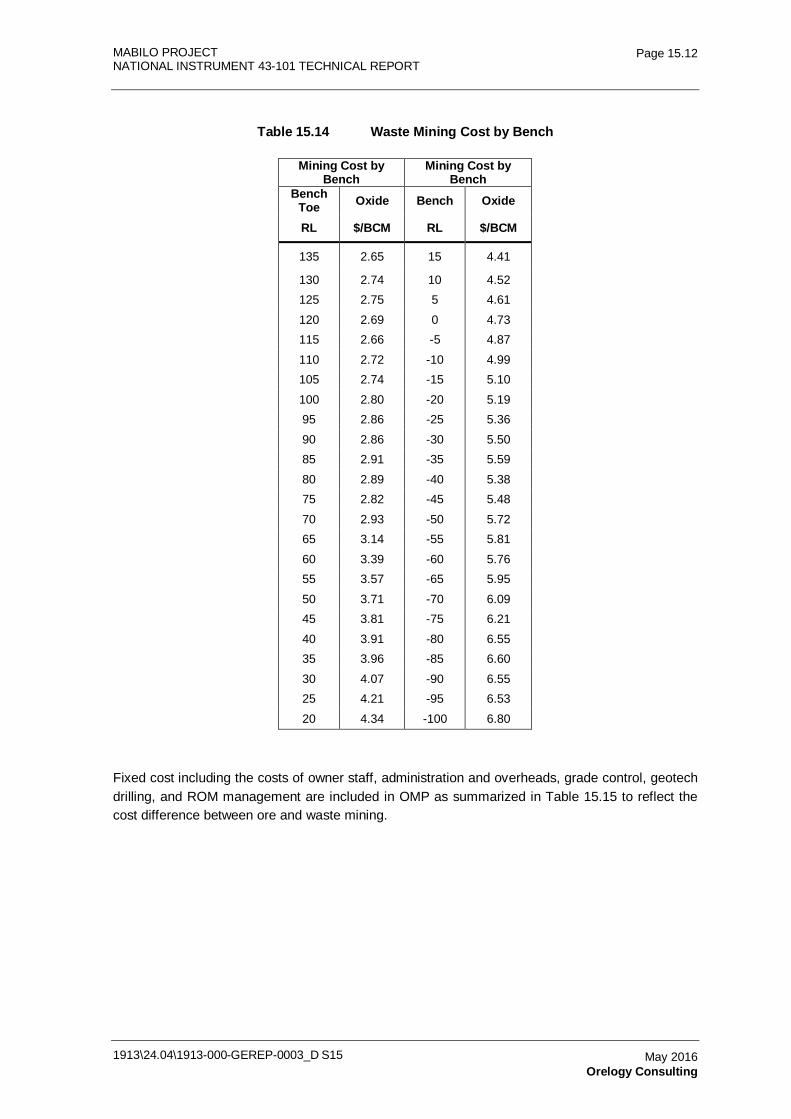
MABILO PROJECT NATIONAL INSTRUMENT 43-101 TECHNICAL REPORT
1913\24.04\1913-000-GEREP-0003_D S15
Page 15.12
May 2016 Orelogy Consulting
Table 15.14 Waste Mining Cost by Bench
Mining Cost by Bench
Mining Cost by Bench
Bench Toe Oxide Bench Oxide
RL $/BCM RL $/BCM
135 2.65 15 4.41
130 2.74 10 4.52 125 2.75 5 4.61 120 2.69 0 4.73 115 2.66 -5 4.87 110 2.72 -10 4.99 105 2.74 -15 5.10 100 2.80 -20 5.19 95 2.86 -25 5.36 90 2.86 -30 5.50 85 2.91 -35 5.59 80 2.89 -40 5.38 75 2.82 -45 5.48 70 2.93 -50 5.72 65 3.14 -55 5.81 60 3.39 -60 5.76 55 3.57 -65 5.95 50 3.71 -70 6.09 45 3.81 -75 6.21 40 3.91 -80 6.55 35 3.96 -85 6.60 30 4.07 -90 6.55 25 4.21 -95 6.53 20 4.34 -100 6.80
Fixed cost including the costs of owner staff, administration and overheads, grade control, geotech drilling, and ROM management are included in OMP as summarized in Table 15.15 to reflect the cost difference between ore and waste mining.
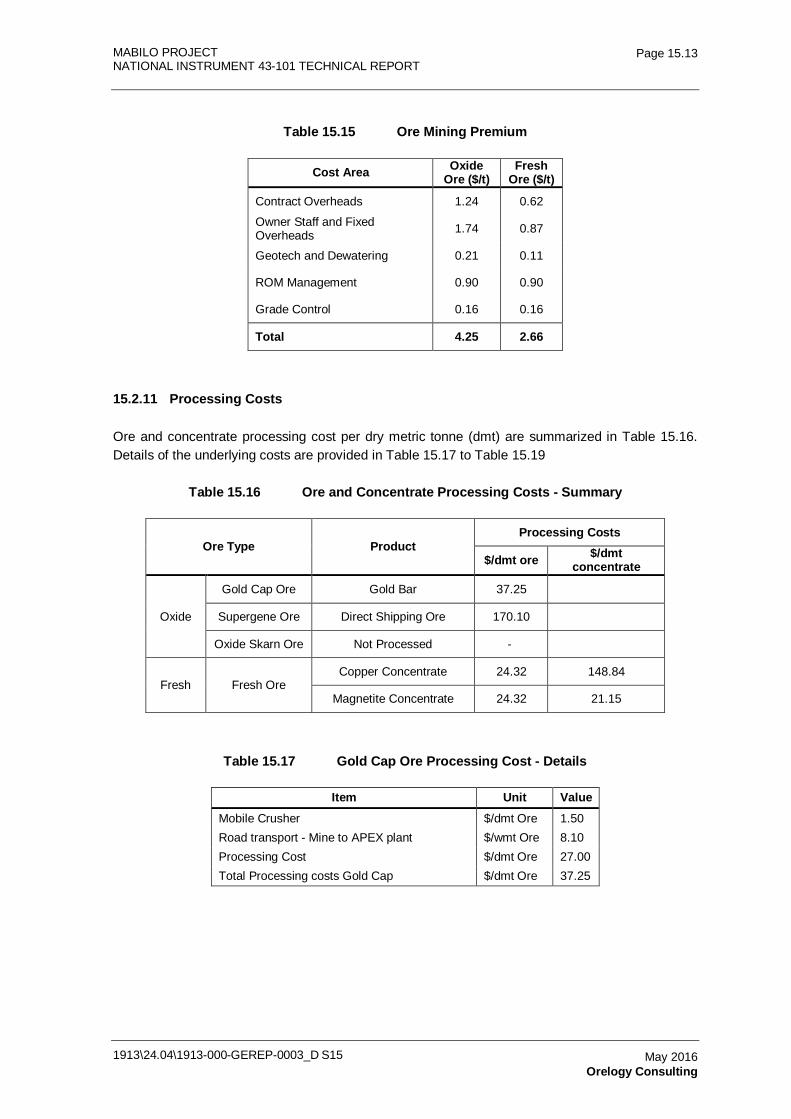
MABILO PROJECT NATIONAL INSTRUMENT 43-101 TECHNICAL REPORT
1913\24.04\1913-000-GEREP-0003_D S15
Page 15.13
May 2016 Orelogy Consulting
Table 15.15 Ore Mining Premium
Cost Area Oxide Ore ($/t)
Fresh Ore ($/t)
Contract Overheads 1.24 0.62
Owner Staff and Fixed Overheads 1.74 0.87
Geotech and Dewatering 0.21 0.11
ROM Management 0.90 0.90
Grade Control 0.16 0.16
Total 4.25 2.66
15.2.11 Processing Costs
Ore and concentrate processing cost per dry metric tonne (dmt) are summarized in Table 15.16. Details of the underlying costs are provided in Table 15.17 to Table 15.19
Table 15.16 Ore and Concentrate Processing Costs - Summary
Ore Type Product Processing Costs
$/dmt ore $/dmt concentrate
Oxide
Gold Cap Ore Gold Bar 37.25
Supergene Ore Direct Shipping Ore 170.10
Oxide Skarn Ore Not Processed -
Fresh Fresh Ore Copper Concentrate 24.32 148.84
Magnetite Concentrate 24.32 21.15
Table 15.17 Gold Cap Ore Processing Cost - Details
Item Unit Value Mobile Crusher $/dmt Ore 1.50 Road transport - Mine to APEX plant $/wmt Ore 8.10 Processing Cost $/dmt Ore 27.00 Total Processing costs Gold Cap $/dmt Ore 37.25
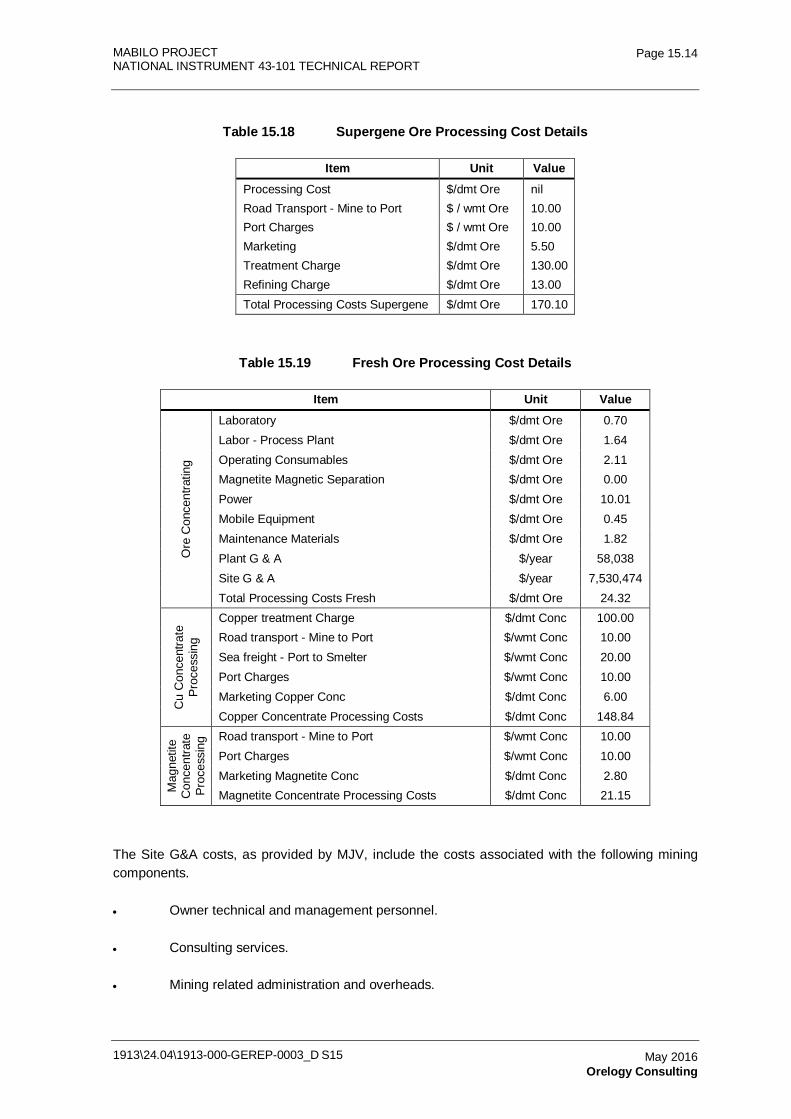
MABILO PROJECT NATIONAL INSTRUMENT 43-101 TECHNICAL REPORT
1913\24.04\1913-000-GEREP-0003_D S15
Page 15.14
May 2016 Orelogy Consulting
Table 15.18 Supergene Ore Processing Cost Details
Item Unit Value Processing Cost $/dmt Ore nil Road Transport - Mine to Port $ / wmt Ore 10.00 Port Charges $ / wmt Ore 10.00 Marketing $/dmt Ore 5.50 Treatment Charge $/dmt Ore 130.00 Refining Charge $/dmt Ore 13.00 Total Processing Costs Supergene $/dmt Ore 170.10
Table 15.19 Fresh Ore Processing Cost Details
Item Unit Value
Ore
Con
cent
ratin
g
Laboratory $/dmt Ore 0.70 Labor - Process Plant $/dmt Ore 1.64 Operating Consumables $/dmt Ore 2.11 Magnetite Magnetic Separation $/dmt Ore 0.00 Power $/dmt Ore 10.01 Mobile Equipment $/dmt Ore 0.45 Maintenance Materials $/dmt Ore 1.82 Plant G & A $/year 58,038 Site G & A $/year 7,530,474 Total Processing Costs Fresh $/dmt Ore 24.32
Cu
Con
cent
rate
Pr
oces
sing
Copper treatment Charge $/dmt Conc 100.00 Road transport - Mine to Port $/wmt Conc 10.00 Sea freight - Port to Smelter $/wmt Conc 20.00 Port Charges $/wmt Conc 10.00 Marketing Copper Conc $/dmt Conc 6.00 Copper Concentrate Processing Costs $/dmt Conc 148.84
Mag
netit
e C
once
ntra
te
Proc
essi
ng Road transport - Mine to Port $/wmt Conc 10.00
Port Charges $/wmt Conc 10.00 Marketing Magnetite Conc $/dmt Conc 2.80 Magnetite Concentrate Processing Costs $/dmt Conc 21.15
The Site G&A costs, as provided by MJV, include the costs associated with the following mining components.
• Owner technical and management personnel.
• Consulting services.
• Mining related administration and overheads.
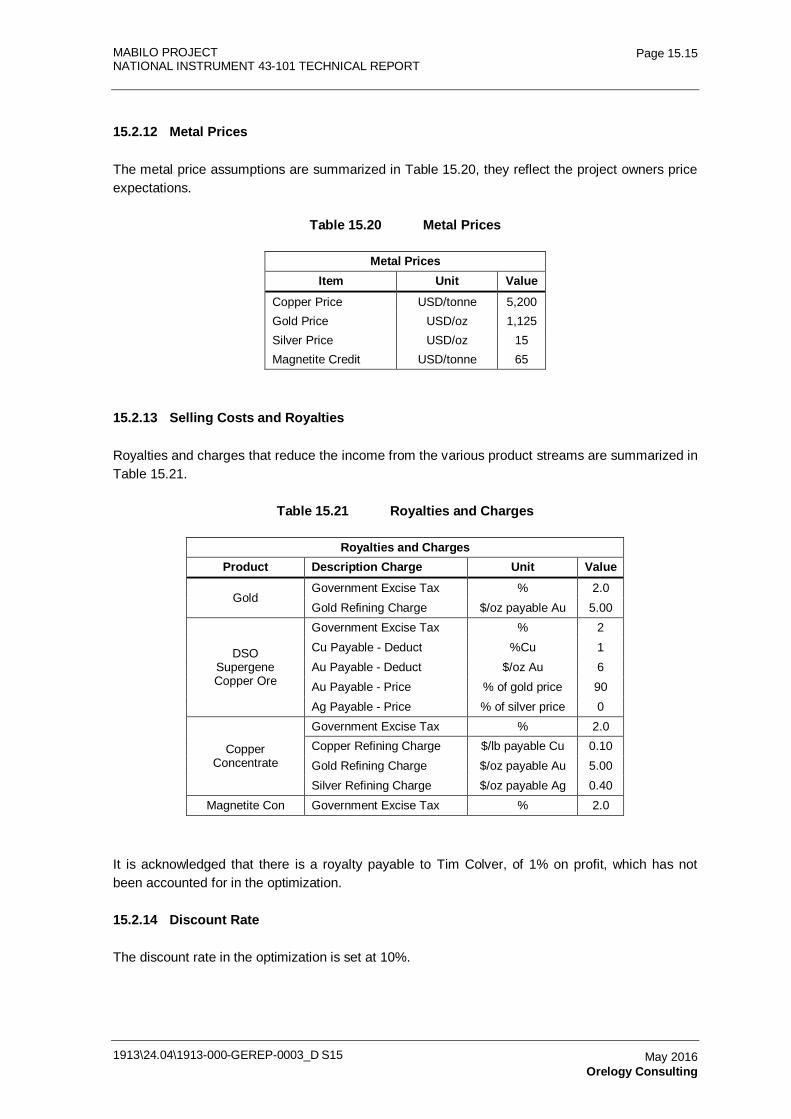
MABILO PROJECT NATIONAL INSTRUMENT 43-101 TECHNICAL REPORT
1913\24.04\1913-000-GEREP-0003_D S15
Page 15.15
May 2016 Orelogy Consulting
15.2.12 Metal Prices
The metal price assumptions are summarized in Table 15.20, they reflect the project owners price expectations.
Table 15.20 Metal Prices
Metal Prices Item Unit Value
Copper Price USD/tonne 5,200 Gold Price USD/oz 1,125 Silver Price USD/oz 15 Magnetite Credit USD/tonne 65
15.2.13 Selling Costs and Royalties
Royalties and charges that reduce the income from the various product streams are summarized in Table 15.21.
Table 15.21 Royalties and Charges
Royalties and Charges Product Description Charge Unit Value
Gold Government Excise Tax % 2.0 Gold Refining Charge $/oz payable Au 5.00
DSO Supergene Copper Ore
Government Excise Tax % 2 Cu Payable - Deduct %Cu 1 Au Payable - Deduct $/oz Au 6 Au Payable - Price % of gold price 90 Ag Payable - Price % of silver price 0
Copper Concentrate
Government Excise Tax % 2.0 Copper Refining Charge $/lb payable Cu 0.10 Gold Refining Charge $/oz payable Au 5.00 Silver Refining Charge $/oz payable Ag 0.40
Magnetite Con Government Excise Tax % 2.0
It is acknowledged that there is a royalty payable to Tim Colver, of 1% on profit, which has not been accounted for in the optimization.
15.2.14 Discount Rate
The discount rate in the optimization is set at 10%.
MABILO PROJECT NATIONAL INSTRUMENT 43-101 TECHNICAL REPORT
1913\24.04\1913-000-GEREP-0003_D S15
Page 15.16
May 2016 Orelogy Consulting
15.3 Pit Optimization Results
15.3.1 Base Case Results
The Base Case optimization results are summarized in Table 15.22 and Figure 15.4. The cash flows shown are exclusive of initial capital costs.
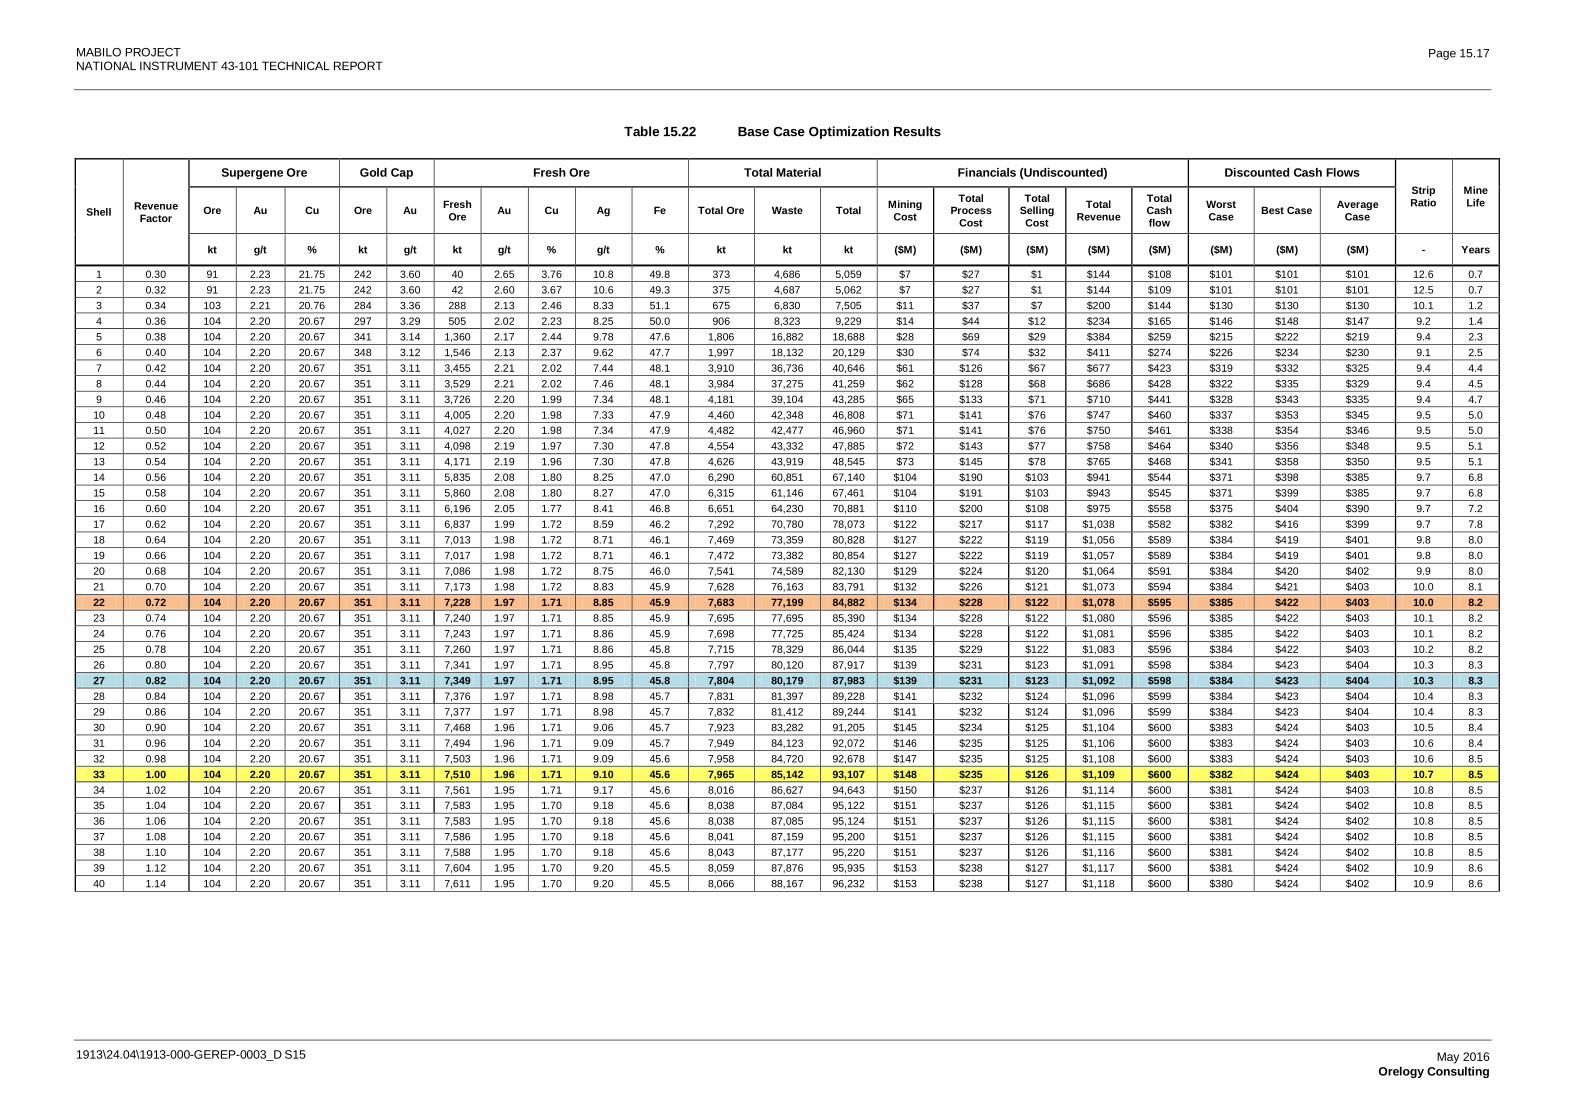
MABILO PROJECT NATIONAL INSTRUMENT 43-101 TECHNICAL REPORT
1913\24.04\1913-000-GEREP-0003_D S15
Page 15.17
May 2016 Orelogy Consulting
Table 15.22 Base Case Optimization Results
Shell Revenue Factor
Supergene Ore Gold Cap Fresh Ore Total Material Financials (Undiscounted) Discounted Cash Flows Strip Ratio
Mine Life
Ore Au Cu Ore Au Fresh Ore Au Cu Ag Fe Total Ore Waste Total Mining
Cost
Total Process
Cost
Total Selling Cost
Total Revenue
Total Cash flow
Worst Case Best Case Average
Case
kt g/t % kt g/t kt g/t % g/t % kt kt kt ($M) ($M) ($M) ($M) ($M) ($M) ($M) ($M) - Years
1 0.30 91 2.23 21.75 242 3.60 40 2.65 3.76 10.8 49.8 373 4,686 5,059 $7 $27 $1 $144 $108 $101 $101 $101 12.6 0.7 2 0.32 91 2.23 21.75 242 3.60 42 2.60 3.67 10.6 49.3 375 4,687 5,062 $7 $27 $1 $144 $109 $101 $101 $101 12.5 0.7 3 0.34 103 2.21 20.76 284 3.36 288 2.13 2.46 8.33 51.1 675 6,830 7,505 $11 $37 $7 $200 $144 $130 $130 $130 10.1 1.2 4 0.36 104 2.20 20.67 297 3.29 505 2.02 2.23 8.25 50.0 906 8,323 9,229 $14 $44 $12 $234 $165 $146 $148 $147 9.2 1.4 5 0.38 104 2.20 20.67 341 3.14 1,360 2.17 2.44 9.78 47.6 1,806 16,882 18,688 $28 $69 $29 $384 $259 $215 $222 $219 9.4 2.3 6 0.40 104 2.20 20.67 348 3.12 1,546 2.13 2.37 9.62 47.7 1,997 18,132 20,129 $30 $74 $32 $411 $274 $226 $234 $230 9.1 2.5 7 0.42 104 2.20 20.67 351 3.11 3,455 2.21 2.02 7.44 48.1 3,910 36,736 40,646 $61 $126 $67 $677 $423 $319 $332 $325 9.4 4.4 8 0.44 104 2.20 20.67 351 3.11 3,529 2.21 2.02 7.46 48.1 3,984 37,275 41,259 $62 $128 $68 $686 $428 $322 $335 $329 9.4 4.5 9 0.46 104 2.20 20.67 351 3.11 3,726 2.20 1.99 7.34 48.1 4,181 39,104 43,285 $65 $133 $71 $710 $441 $328 $343 $335 9.4 4.7 10 0.48 104 2.20 20.67 351 3.11 4,005 2.20 1.98 7.33 47.9 4,460 42,348 46,808 $71 $141 $76 $747 $460 $337 $353 $345 9.5 5.0 11 0.50 104 2.20 20.67 351 3.11 4,027 2.20 1.98 7.34 47.9 4,482 42,477 46,960 $71 $141 $76 $750 $461 $338 $354 $346 9.5 5.0 12 0.52 104 2.20 20.67 351 3.11 4,098 2.19 1.97 7.30 47.8 4,554 43,332 47,885 $72 $143 $77 $758 $464 $340 $356 $348 9.5 5.1 13 0.54 104 2.20 20.67 351 3.11 4,171 2.19 1.96 7.30 47.8 4,626 43,919 48,545 $73 $145 $78 $765 $468 $341 $358 $350 9.5 5.1 14 0.56 104 2.20 20.67 351 3.11 5,835 2.08 1.80 8.25 47.0 6,290 60,851 67,140 $104 $190 $103 $941 $544 $371 $398 $385 9.7 6.8 15 0.58 104 2.20 20.67 351 3.11 5,860 2.08 1.80 8.27 47.0 6,315 61,146 67,461 $104 $191 $103 $943 $545 $371 $399 $385 9.7 6.8 16 0.60 104 2.20 20.67 351 3.11 6,196 2.05 1.77 8.41 46.8 6,651 64,230 70,881 $110 $200 $108 $975 $558 $375 $404 $390 9.7 7.2 17 0.62 104 2.20 20.67 351 3.11 6,837 1.99 1.72 8.59 46.2 7,292 70,780 78,073 $122 $217 $117 $1,038 $582 $382 $416 $399 9.7 7.8 18 0.64 104 2.20 20.67 351 3.11 7,013 1.98 1.72 8.71 46.1 7,469 73,359 80,828 $127 $222 $119 $1,056 $589 $384 $419 $401 9.8 8.0 19 0.66 104 2.20 20.67 351 3.11 7,017 1.98 1.72 8.71 46.1 7,472 73,382 80,854 $127 $222 $119 $1,057 $589 $384 $419 $401 9.8 8.0 20 0.68 104 2.20 20.67 351 3.11 7,086 1.98 1.72 8.75 46.0 7,541 74,589 82,130 $129 $224 $120 $1,064 $591 $384 $420 $402 9.9 8.0 21 0.70 104 2.20 20.67 351 3.11 7,173 1.98 1.72 8.83 45.9 7,628 76,163 83,791 $132 $226 $121 $1,073 $594 $384 $421 $403 10.0 8.1 22 0.72 104 2.20 20.67 351 3.11 7,228 1.97 1.71 8.85 45.9 7,683 77,199 84,882 $134 $228 $122 $1,078 $595 $385 $422 $403 10.0 8.2 23 0.74 104 2.20 20.67 351 3.11 7,240 1.97 1.71 8.85 45.9 7,695 77,695 85,390 $134 $228 $122 $1,080 $596 $385 $422 $403 10.1 8.2 24 0.76 104 2.20 20.67 351 3.11 7,243 1.97 1.71 8.86 45.9 7,698 77,725 85,424 $134 $228 $122 $1,081 $596 $385 $422 $403 10.1 8.2 25 0.78 104 2.20 20.67 351 3.11 7,260 1.97 1.71 8.86 45.8 7,715 78,329 86,044 $135 $229 $122 $1,083 $596 $384 $422 $403 10.2 8.2 26 0.80 104 2.20 20.67 351 3.11 7,341 1.97 1.71 8.95 45.8 7,797 80,120 87,917 $139 $231 $123 $1,091 $598 $384 $423 $404 10.3 8.3 27 0.82 104 2.20 20.67 351 3.11 7,349 1.97 1.71 8.95 45.8 7,804 80,179 87,983 $139 $231 $123 $1,092 $598 $384 $423 $404 10.3 8.3 28 0.84 104 2.20 20.67 351 3.11 7,376 1.97 1.71 8.98 45.7 7,831 81,397 89,228 $141 $232 $124 $1,096 $599 $384 $423 $404 10.4 8.3 29 0.86 104 2.20 20.67 351 3.11 7,377 1.97 1.71 8.98 45.7 7,832 81,412 89,244 $141 $232 $124 $1,096 $599 $384 $423 $404 10.4 8.3 30 0.90 104 2.20 20.67 351 3.11 7,468 1.96 1.71 9.06 45.7 7,923 83,282 91,205 $145 $234 $125 $1,104 $600 $383 $424 $403 10.5 8.4 31 0.96 104 2.20 20.67 351 3.11 7,494 1.96 1.71 9.09 45.7 7,949 84,123 92,072 $146 $235 $125 $1,106 $600 $383 $424 $403 10.6 8.4 32 0.98 104 2.20 20.67 351 3.11 7,503 1.96 1.71 9.09 45.6 7,958 84,720 92,678 $147 $235 $125 $1,108 $600 $383 $424 $403 10.6 8.5 33 1.00 104 2.20 20.67 351 3.11 7,510 1.96 1.71 9.10 45.6 7,965 85,142 93,107 $148 $235 $126 $1,109 $600 $382 $424 $403 10.7 8.5 34 1.02 104 2.20 20.67 351 3.11 7,561 1.95 1.71 9.17 45.6 8,016 86,627 94,643 $150 $237 $126 $1,114 $600 $381 $424 $403 10.8 8.5 35 1.04 104 2.20 20.67 351 3.11 7,583 1.95 1.70 9.18 45.6 8,038 87,084 95,122 $151 $237 $126 $1,115 $600 $381 $424 $402 10.8 8.5 36 1.06 104 2.20 20.67 351 3.11 7,583 1.95 1.70 9.18 45.6 8,038 87,085 95,124 $151 $237 $126 $1,115 $600 $381 $424 $402 10.8 8.5 37 1.08 104 2.20 20.67 351 3.11 7,586 1.95 1.70 9.18 45.6 8,041 87,159 95,200 $151 $237 $126 $1,115 $600 $381 $424 $402 10.8 8.5 38 1.10 104 2.20 20.67 351 3.11 7,588 1.95 1.70 9.18 45.6 8,043 87,177 95,220 $151 $237 $126 $1,116 $600 $381 $424 $402 10.8 8.5 39 1.12 104 2.20 20.67 351 3.11 7,604 1.95 1.70 9.20 45.5 8,059 87,876 95,935 $153 $238 $127 $1,117 $600 $381 $424 $402 10.9 8.6 40 1.14 104 2.20 20.67 351 3.11 7,611 1.95 1.70 9.20 45.5 8,066 88,167 96,232 $153 $238 $127 $1,118 $600 $380 $424 $402 10.9 8.6
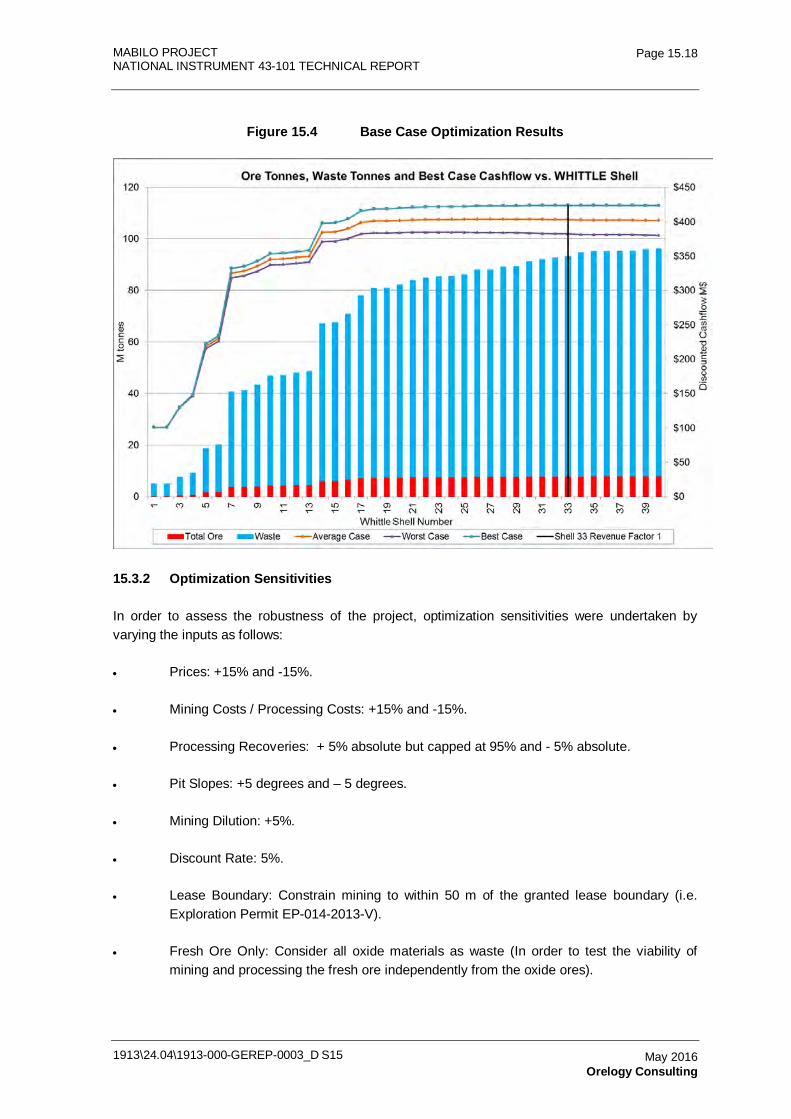
MABILO PROJECT NATIONAL INSTRUMENT 43-101 TECHNICAL REPORT
1913\24.04\1913-000-GEREP-0003_D S15
Page 15.18
May 2016 Orelogy Consulting
Figure 15.4 Base Case Optimization Results
15.3.2 Optimization Sensitivities
In order to assess the robustness of the project, optimization sensitivities were undertaken by varying the inputs as follows:
• Prices: +15% and -15%.
• Mining Costs / Processing Costs: +15% and -15%.
• Processing Recoveries: + 5% absolute but capped at 95% and - 5% absolute.
• Pit Slopes: +5 degrees and – 5 degrees.
• Mining Dilution: +5%.
• Discount Rate: 5%.
• Lease Boundary: Constrain mining to within 50 m of the granted lease boundary (i.e. Exploration Permit EP-014-2013-V).
• Fresh Ore Only: Consider all oxide materials as waste (In order to test the viability of mining and processing the fresh ore independently from the oxide ores).
MABILO PROJECT NATIONAL INSTRUMENT 43-101 TECHNICAL REPORT
1913\24.04\1913-000-GEREP-0003_D S15
Page 15.19
May 2016 Orelogy Consulting
• Oxide Skarn Ore: Allow processing of oxide skarn (to assess the upside potential of the project) using $40/t processing cost and 75% recovery of Au, Cu and Ag.
• Inferred Materials: Allow processing of Inferred materials (to assess the upside potential of the project)
The results are summarized in Table 15.23 and Table 15.24.
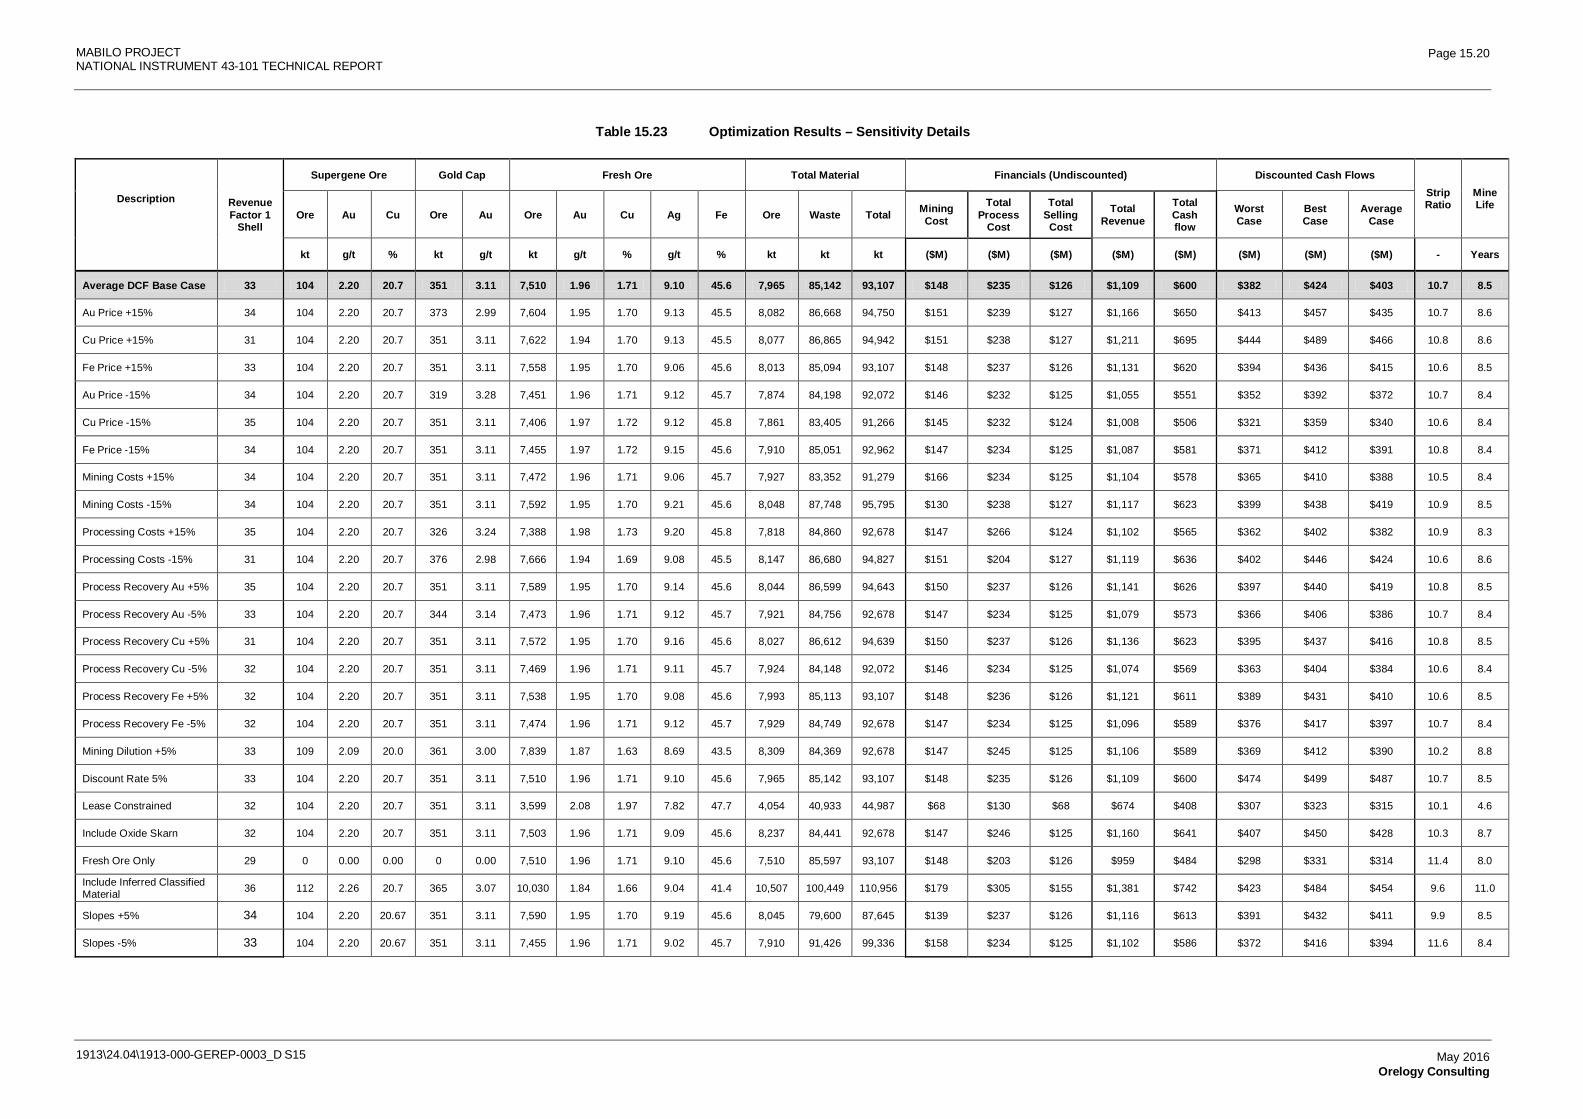
MABILO PROJECT NATIONAL INSTRUMENT 43-101 TECHNICAL REPORT
1913\24.04\1913-000-GEREP-0003_D S15
Page 15.20
May 2016 Orelogy Consulting
Table 15.23 Optimization Results – Sensitivity Details
Description Revenue Factor 1
Shell
Supergene Ore Gold Cap Fresh Ore Total Material Financials (Undiscounted) Discounted Cash Flows Strip Ratio
Mine Life
Ore Au Cu Ore Au Ore Au Cu Ag Fe Ore Waste Total Mining Cost
Total Process
Cost
Total Selling Cost
Total Revenue
Total Cash flow
Worst Case
Best Case
Average Case
kt g/t % kt g/t kt g/t % g/t % kt kt kt ($M) ($M) ($M) ($M) ($M) ($M) ($M) ($M) - Years
Average DCF Base Case 33 104 2.20 20.7 351 3.11 7,510 1.96 1.71 9.10 45.6 7,965 85,142 93,107 $148 $235 $126 $1,109 $600 $382 $424 $403 10.7 8.5
Au Price +15% 34 104 2.20 20.7 373 2.99 7,604 1.95 1.70 9.13 45.5 8,082 86,668 94,750 $151 $239 $127 $1,166 $650 $413 $457 $435 10.7 8.6
Cu Price +15% 31 104 2.20 20.7 351 3.11 7,622 1.94 1.70 9.13 45.5 8,077 86,865 94,942 $151 $238 $127 $1,211 $695 $444 $489 $466 10.8 8.6
Fe Price +15% 33 104 2.20 20.7 351 3.11 7,558 1.95 1.70 9.06 45.6 8,013 85,094 93,107 $148 $237 $126 $1,131 $620 $394 $436 $415 10.6 8.5
Au Price -15% 34 104 2.20 20.7 319 3.28 7,451 1.96 1.71 9.12 45.7 7,874 84,198 92,072 $146 $232 $125 $1,055 $551 $352 $392 $372 10.7 8.4
Cu Price -15% 35 104 2.20 20.7 351 3.11 7,406 1.97 1.72 9.12 45.8 7,861 83,405 91,266 $145 $232 $124 $1,008 $506 $321 $359 $340 10.6 8.4
Fe Price -15% 34 104 2.20 20.7 351 3.11 7,455 1.97 1.72 9.15 45.6 7,910 85,051 92,962 $147 $234 $125 $1,087 $581 $371 $412 $391 10.8 8.4
Mining Costs +15% 34 104 2.20 20.7 351 3.11 7,472 1.96 1.71 9.06 45.7 7,927 83,352 91,279 $166 $234 $125 $1,104 $578 $365 $410 $388 10.5 8.4
Mining Costs -15% 34 104 2.20 20.7 351 3.11 7,592 1.95 1.70 9.21 45.6 8,048 87,748 95,795 $130 $238 $127 $1,117 $623 $399 $438 $419 10.9 8.5
Processing Costs +15% 35 104 2.20 20.7 326 3.24 7,388 1.98 1.73 9.20 45.8 7,818 84,860 92,678 $147 $266 $124 $1,102 $565 $362 $402 $382 10.9 8.3
Processing Costs -15% 31 104 2.20 20.7 376 2.98 7,666 1.94 1.69 9.08 45.5 8,147 86,680 94,827 $151 $204 $127 $1,119 $636 $402 $446 $424 10.6 8.6
Process Recovery Au +5% 35 104 2.20 20.7 351 3.11 7,589 1.95 1.70 9.14 45.6 8,044 86,599 94,643 $150 $237 $126 $1,141 $626 $397 $440 $419 10.8 8.5
Process Recovery Au -5% 33 104 2.20 20.7 344 3.14 7,473 1.96 1.71 9.12 45.7 7,921 84,756 92,678 $147 $234 $125 $1,079 $573 $366 $406 $386 10.7 8.4
Process Recovery Cu +5% 31 104 2.20 20.7 351 3.11 7,572 1.95 1.70 9.16 45.6 8,027 86,612 94,639 $150 $237 $126 $1,136 $623 $395 $437 $416 10.8 8.5
Process Recovery Cu -5% 32 104 2.20 20.7 351 3.11 7,469 1.96 1.71 9.11 45.7 7,924 84,148 92,072 $146 $234 $125 $1,074 $569 $363 $404 $384 10.6 8.4
Process Recovery Fe +5% 32 104 2.20 20.7 351 3.11 7,538 1.95 1.70 9.08 45.6 7,993 85,113 93,107 $148 $236 $126 $1,121 $611 $389 $431 $410 10.6 8.5
Process Recovery Fe -5% 32 104 2.20 20.7 351 3.11 7,474 1.96 1.71 9.12 45.7 7,929 84,749 92,678 $147 $234 $125 $1,096 $589 $376 $417 $397 10.7 8.4
Mining Dilution +5% 33 109 2.09 20.0 361 3.00 7,839 1.87 1.63 8.69 43.5 8,309 84,369 92,678 $147 $245 $125 $1,106 $589 $369 $412 $390 10.2 8.8
Discount Rate 5% 33 104 2.20 20.7 351 3.11 7,510 1.96 1.71 9.10 45.6 7,965 85,142 93,107 $148 $235 $126 $1,109 $600 $474 $499 $487 10.7 8.5
Lease Constrained 32 104 2.20 20.7 351 3.11 3,599 2.08 1.97 7.82 47.7 4,054 40,933 44,987 $68 $130 $68 $674 $408 $307 $323 $315 10.1 4.6
Include Oxide Skarn 32 104 2.20 20.7 351 3.11 7,503 1.96 1.71 9.09 45.6 8,237 84,441 92,678 $147 $246 $125 $1,160 $641 $407 $450 $428 10.3 8.7
Fresh Ore Only 29 0 0.00 0.00 0 0.00 7,510 1.96 1.71 9.10 45.6 7,510 85,597 93,107 $148 $203 $126 $959 $484 $298 $331 $314 11.4 8.0
Include Inferred Classified Material 36 112 2.26 20.7 365 3.07 10,030 1.84 1.66 9.04 41.4 10,507 100,449 110,956 $179 $305 $155 $1,381 $742 $423 $484 $454 9.6 11.0
Slopes +5% 34 104 2.20 20.67 351 3.11 7,590 1.95 1.70 9.19 45.6 8,045 79,600 87,645 $139 $237 $126 $1,116 $613 $391 $432 $411 9.9 8.5
Slopes -5% 33 104 2.20 20.67 351 3.11 7,455 1.96 1.71 9.02 45.7 7,910 91,426 99,336 $158 $234 $125 $1,102 $586 $372 $416 $394 11.6 8.4
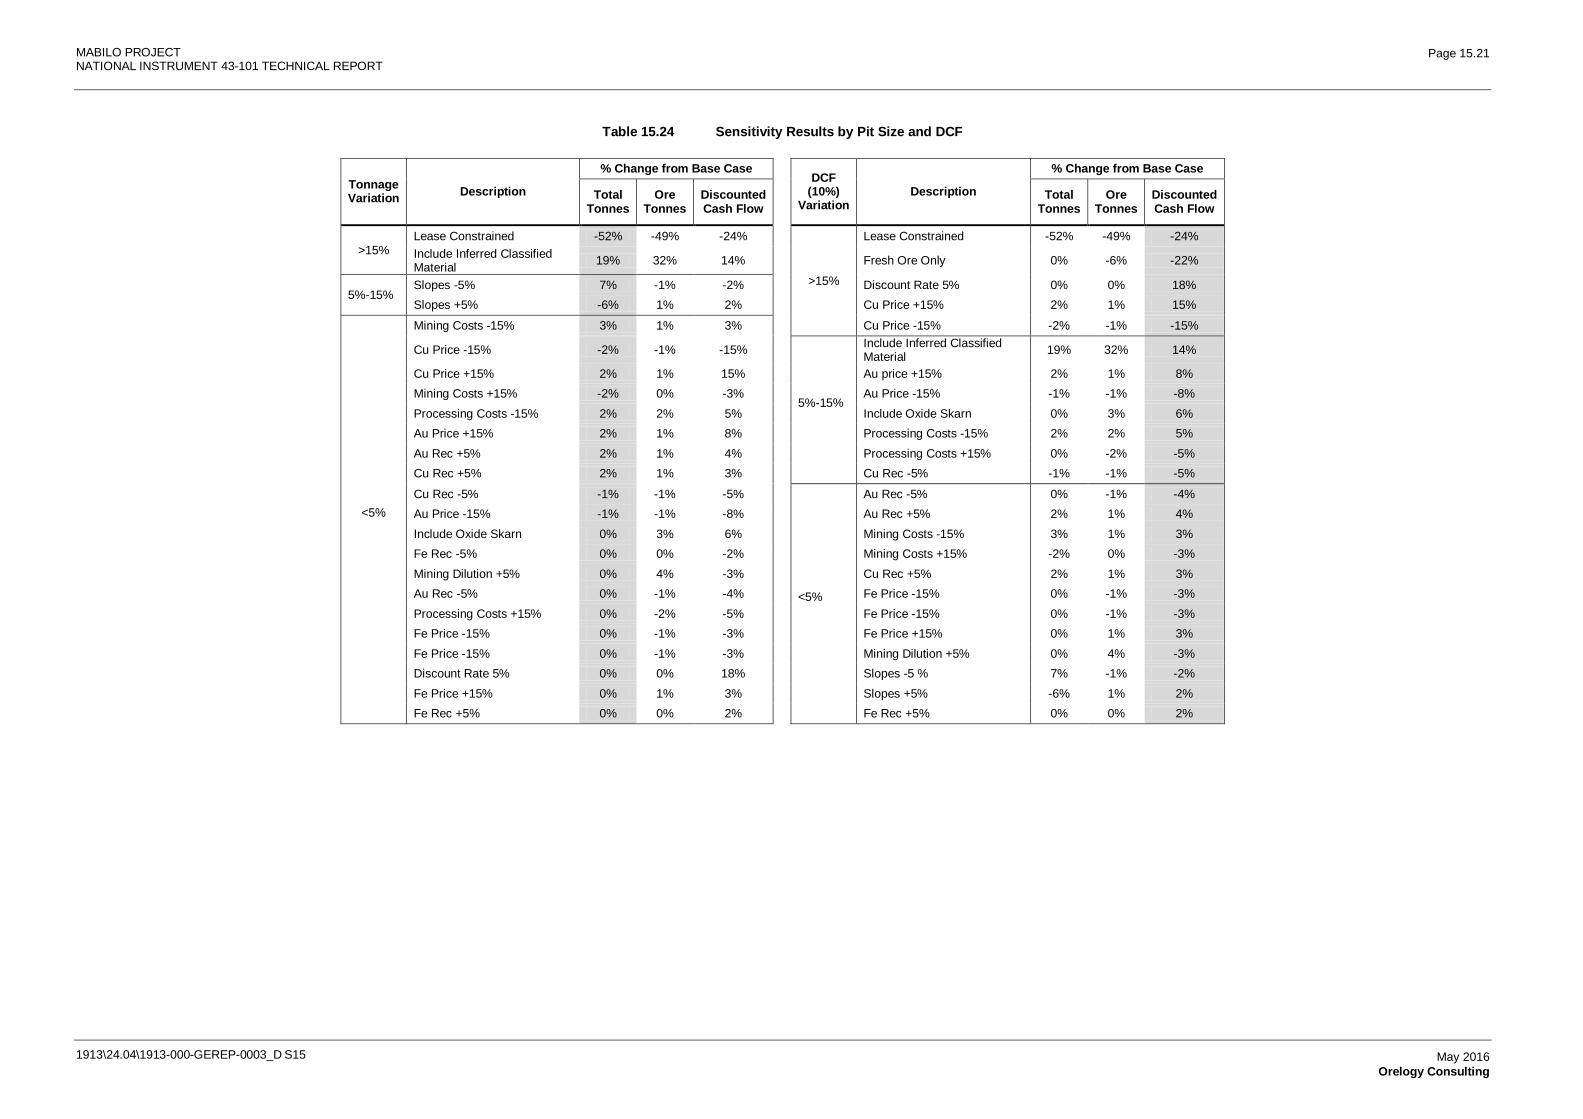
MABILO PROJECT NATIONAL INSTRUMENT 43-101 TECHNICAL REPORT
1913\24.04\1913-000-GEREP-0003_D S15
Page 15.21
May 2016 Orelogy Consulting
Table 15.24 Sensitivity Results by Pit Size and DCF
Tonnage Variation Description
% Change from Base Case DCF
(10%) Variation
Description
% Change from Base Case
Total Tonnes
Ore Tonnes
Discounted Cash Flow
Total Tonnes
Ore Tonnes
Discounted Cash Flow
>15% Lease Constrained -52% -49% -24%
>15%
Lease Constrained -52% -49% -24% Include Inferred Classified Material 19% 32% 14% Fresh Ore Only 0% -6% -22%
5%-15% Slopes -5% 7% -1% -2% Discount Rate 5% 0% 0% 18% Slopes +5% -6% 1% 2% Cu Price +15% 2% 1% 15%
<5%
Mining Costs -15% 3% 1% 3% Cu Price -15% -2% -1% -15%
Cu Price -15% -2% -1% -15%
5%-15%
Include Inferred Classified Material 19% 32% 14%
Cu Price +15% 2% 1% 15% Au price +15% 2% 1% 8% Mining Costs +15% -2% 0% -3% Au Price -15% -1% -1% -8% Processing Costs -15% 2% 2% 5% Include Oxide Skarn 0% 3% 6% Au Price +15% 2% 1% 8% Processing Costs -15% 2% 2% 5% Au Rec +5% 2% 1% 4% Processing Costs +15% 0% -2% -5% Cu Rec +5% 2% 1% 3% Cu Rec -5% -1% -1% -5%
Cu Rec -5% -1% -1% -5%
<5%
Au Rec -5% 0% -1% -4% Au Price -15% -1% -1% -8% Au Rec +5% 2% 1% 4% Include Oxide Skarn 0% 3% 6% Mining Costs -15% 3% 1% 3% Fe Rec -5% 0% 0% -2% Mining Costs +15% -2% 0% -3% Mining Dilution +5% 0% 4% -3% Cu Rec +5% 2% 1% 3% Au Rec -5% 0% -1% -4% Fe Price -15% 0% -1% -3% Processing Costs +15% 0% -2% -5% Fe Price -15% 0% -1% -3% Fe Price -15% 0% -1% -3% Fe Price +15% 0% 1% 3% Fe Price -15% 0% -1% -3% Mining Dilution +5% 0% 4% -3% Discount Rate 5% 0% 0% 18% Slopes -5 % 7% -1% -2% Fe Price +15% 0% 1% 3% Slopes +5% -6% 1% 2% Fe Rec +5% 0% 0% 2% Fe Rec +5% 0% 0% 2%
MABILO PROJECT NATIONAL INSTRUMENT 43-101 TECHNICAL REPORT
1913\24.04\1913-000-GEREP-0003_D S15
Page 15.22
May 2016 Orelogy Consulting
15.3.3 Shell Selection
The discounted cash flow curves indicate that all shells are economic if mined at a breakeven cost. However, the majority of the discounted cash flow is obtained at Shell 18 (revenue factor of 0.64) and any shell after this is only adding minimal additional value. This means that other criteria can be used to select the shell for design purposes. The shell selection was made by MJV on the basis that the following objective were met:
• Minimum 8 year mine life.
• Economic at 30% lower revenues.
• Strip ratio of 10:1 or less.
This objective is best met by selecting Base Case Shell 21 (i.e. the shell at Revenue Factor 0.7).
15.4 Mine Design
15.4.1 Mine Design Process
The final pit and stage designs were produced using MineSight™ mine planning software, utilizing the mining model described in Section 15.2.7 and pit optimization results detailed in Section 15.3. Shell 21 was used to guide the ultimate pit design and intermediate shells were used to assist to locate and size the stages.
The waste dump design was integrated with the tailings dam. Final and staged designs were provided by Knight PiésoldR4.
15.4.2 Bench Height
Previous mine planning studies indicated that 10 m high blast benches were appropriate for this project given the scale of the operation and the equipment planned for the mining operation. A bench height of 10 m mined in four 2½ m flitches results in acceptable dilution and oreloss as indicated in Section 15.2.7.
15.4.3 Pit Slopes
The Stage 1 pit was adopted from the previous study on the request of MJV and has slightly flatter slopes than those adopted for the remainder of the stages. The other stages and the Ultimate pit were designed in accordance with the design criteria summarized in Table 15.25. These criteria were based on minor revisions to the initial geotechnical adviceR5, in particular:
• Berm width in Tumbaga reduced from 8 m to 7.5 m.
• Slope below -45mRL increased from 70 to 75 degrees.
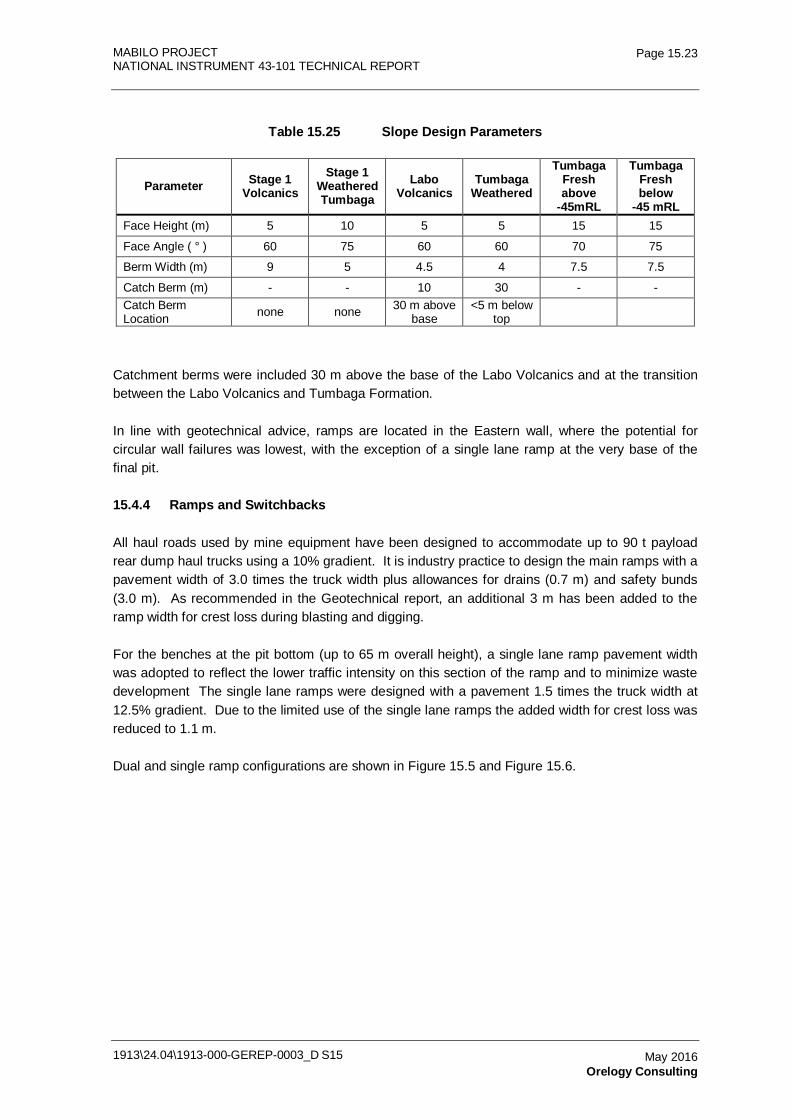
MABILO PROJECT NATIONAL INSTRUMENT 43-101 TECHNICAL REPORT
1913\24.04\1913-000-GEREP-0003_D S15
Page 15.23
May 2016 Orelogy Consulting
Table 15.25 Slope Design Parameters
Parameter Stage 1 Volcanics
Stage 1 Weathered Tumbaga
Labo Volcanics
Tumbaga Weathered
Tumbaga Fresh above
-45mRL
Tumbaga Fresh below
-45 mRL Face Height (m) 5 10 5 5 15 15
Face Angle ( ° ) 60 75 60 60 70 75
Berm Width (m) 9 5 4.5 4 7.5 7.5
Catch Berm (m) - - 10 30 - - Catch Berm Location none none 30 m above
base <5 m below
top
Catchment berms were included 30 m above the base of the Labo Volcanics and at the transition between the Labo Volcanics and Tumbaga Formation.
In line with geotechnical advice, ramps are located in the Eastern wall, where the potential for circular wall failures was lowest, with the exception of a single lane ramp at the very base of the final pit.
15.4.4 Ramps and Switchbacks
All haul roads used by mine equipment have been designed to accommodate up to 90 t payload rear dump haul trucks using a 10% gradient. It is industry practice to design the main ramps with a pavement width of 3.0 times the truck width plus allowances for drains (0.7 m) and safety bunds (3.0 m). As recommended in the Geotechnical report, an additional 3 m has been added to the ramp width for crest loss during blasting and digging.
For the benches at the pit bottom (up to 65 m overall height), a single lane ramp pavement width was adopted to reflect the lower traffic intensity on this section of the ramp and to minimize waste development The single lane ramps were designed with a pavement 1.5 times the truck width at 12.5% gradient. Due to the limited use of the single lane ramps the added width for crest loss was reduced to 1.1 m.
Dual and single ramp configurations are shown in Figure 15.5 and Figure 15.6.
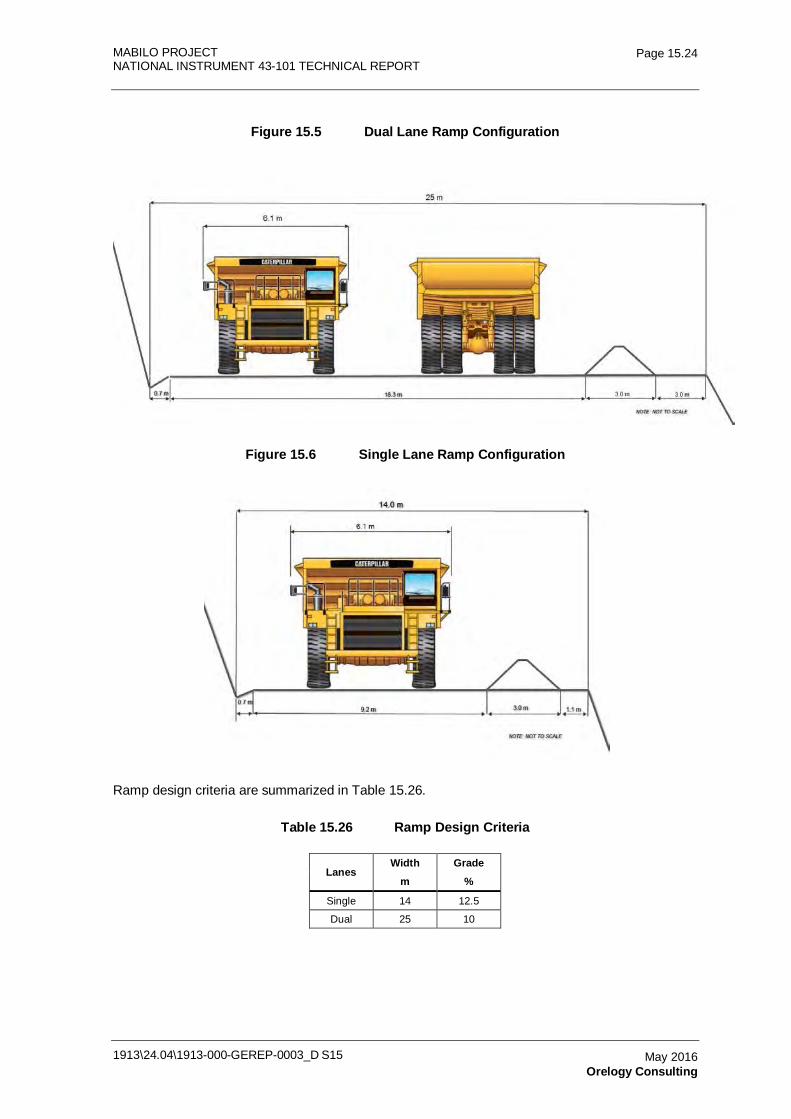
MABILO PROJECT NATIONAL INSTRUMENT 43-101 TECHNICAL REPORT
1913\24.04\1913-000-GEREP-0003_D S15
Page 15.24
May 2016 Orelogy Consulting
Figure 15.5 Dual Lane Ramp Configuration
Figure 15.6 Single Lane Ramp Configuration
Ramp design criteria are summarized in Table 15.26.
Table 15.26 Ramp Design Criteria
Lanes Width Grade
m %
Single 14 12.5
Dual 25 10
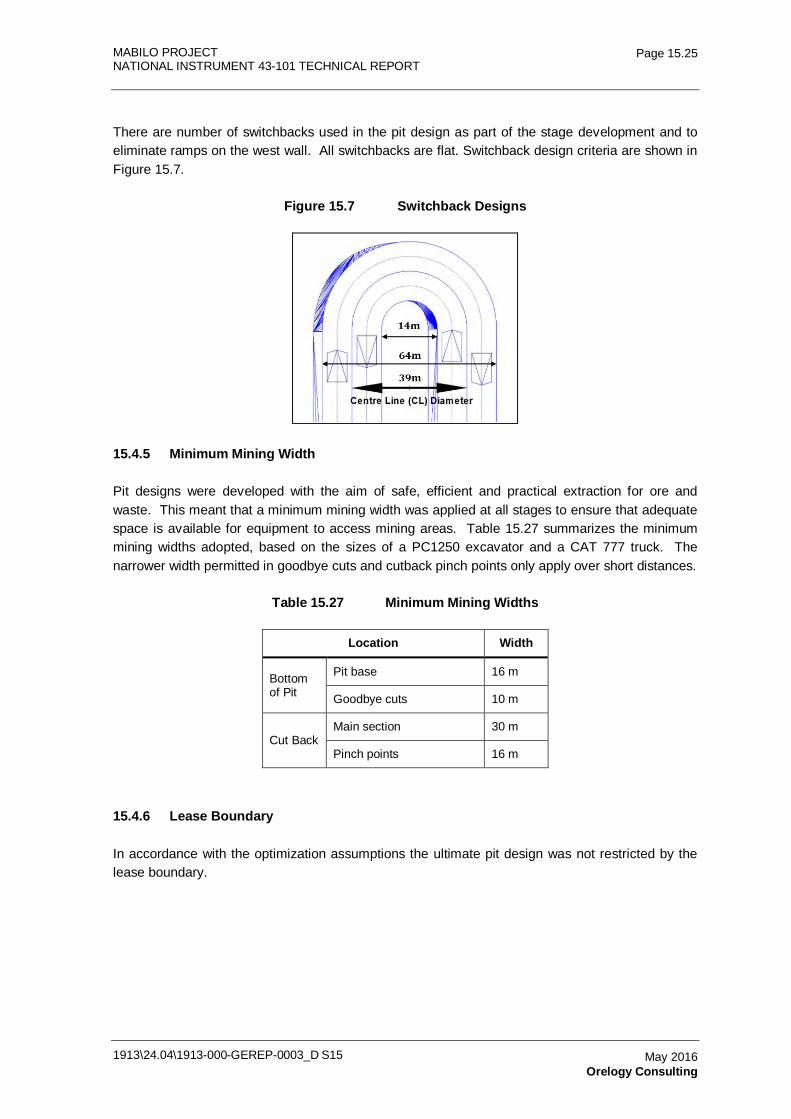
MABILO PROJECT NATIONAL INSTRUMENT 43-101 TECHNICAL REPORT
1913\24.04\1913-000-GEREP-0003_D S15
Page 15.25
May 2016 Orelogy Consulting
There are number of switchbacks used in the pit design as part of the stage development and to eliminate ramps on the west wall. All switchbacks are flat. Switchback design criteria are shown in Figure 15.7.
Figure 15.7 Switchback Designs
15.4.5 Minimum Mining Width
Pit designs were developed with the aim of safe, efficient and practical extraction for ore and waste. This meant that a minimum mining width was applied at all stages to ensure that adequate space is available for equipment to access mining areas. Table 15.27 summarizes the minimum mining widths adopted, based on the sizes of a PC1250 excavator and a CAT 777 truck. The narrower width permitted in goodbye cuts and cutback pinch points only apply over short distances.
Table 15.27 Minimum Mining Widths
Location Width
Bottom of Pit
Pit base 16 m
Goodbye cuts 10 m
Cut Back Main section 30 m
Pinch points 16 m
15.4.6 Lease Boundary
In accordance with the optimization assumptions the ultimate pit design was not restricted by the lease boundary.
MABILO PROJECT NATIONAL INSTRUMENT 43-101 TECHNICAL REPORT
1913\24.04\1913-000-GEREP-0003_D S15
Page 15.26
May 2016 Orelogy Consulting
15.4.7 Ultimate Pit Design
The ultimate pit design is shown in Figure 15.8. Some features of note:
• The deepest part of the pit is at -100 m RL, with a pit ramp exit at 115 m RL, making the pit 215 m deep.
• Ramps are located in the eastern wall at a gradient of 10%, utilizing switchbacks, except in the final single-lane sections.
• Single lane ramps with a maximum gradient of 12.5% were used to access the deepest parts of the orebody with minimal waste mining. The northern single lane ramp runs from 55 m RL to -0 m RL, or 55 meters depth, and the southern single lane ramps runs from -30 m RL to -95 m RL, or 65 meters depth. These areas are located in fresh rock, below the Tumbaga Weathered geotechnical contact.
• Goodbye cuts are mined at 10 m width from the last level with bench access.
• Switchbacks have been located in line with catchment berms to minimize the width impact to pit walls.
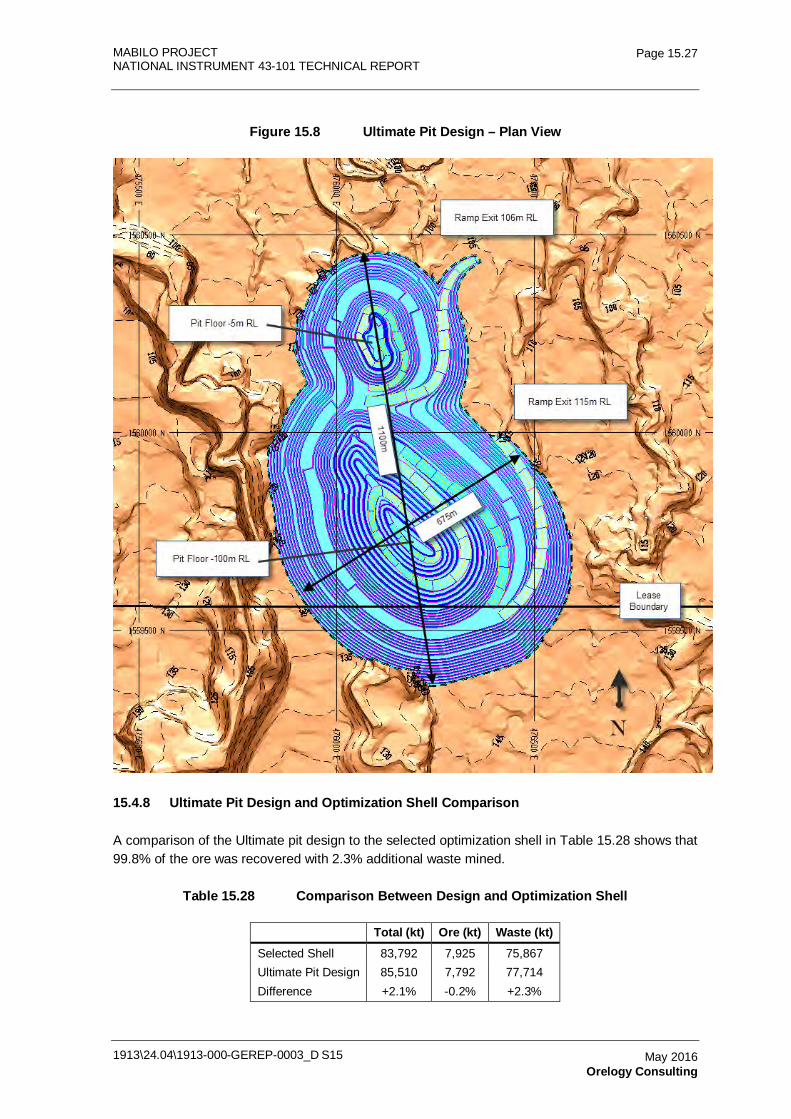
MABILO PROJECT NATIONAL INSTRUMENT 43-101 TECHNICAL REPORT
1913\24.04\1913-000-GEREP-0003_D S15
Page 15.27
May 2016 Orelogy Consulting
Figure 15.8 Ultimate Pit Design – Plan View
15.4.8 Ultimate Pit Design and Optimization Shell Comparison
A comparison of the Ultimate pit design to the selected optimization shell in Table 15.28 shows that 99.8% of the ore was recovered with 2.3% additional waste mined.
Table 15.28 Comparison Between Design and Optimization Shell
Total (kt) Ore (kt) Waste (kt) Selected Shell 83,792 7,925 75,867 Ultimate Pit Design 85,510 7,792 77,714 Difference +2.1% -0.2% +2.3%
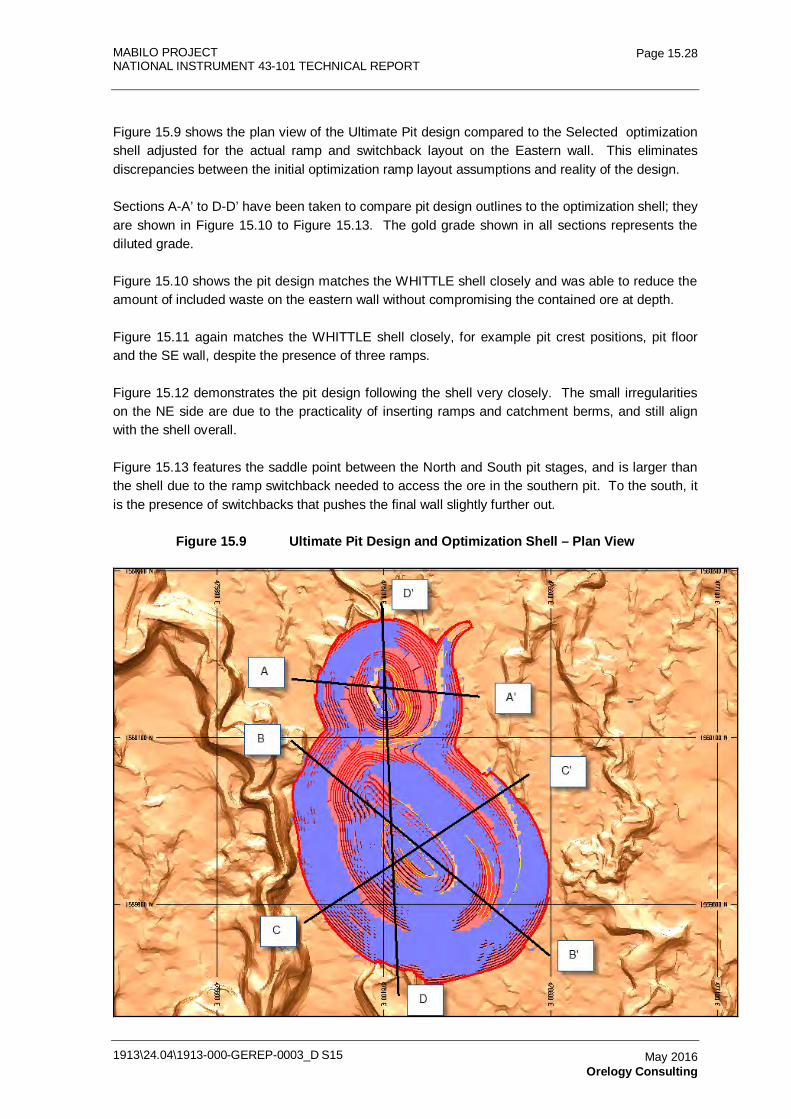
MABILO PROJECT NATIONAL INSTRUMENT 43-101 TECHNICAL REPORT
1913\24.04\1913-000-GEREP-0003_D S15
Page 15.28
May 2016 Orelogy Consulting
Figure 15.9 shows the plan view of the Ultimate Pit design compared to the Selected optimization shell adjusted for the actual ramp and switchback layout on the Eastern wall. This eliminates discrepancies between the initial optimization ramp layout assumptions and reality of the design.
Sections A-A’ to D-D’ have been taken to compare pit design outlines to the optimization shell; they are shown in Figure 15.10 to Figure 15.13. The gold grade shown in all sections represents the diluted grade.
Figure 15.10 shows the pit design matches the WHITTLE shell closely and was able to reduce the amount of included waste on the eastern wall without compromising the contained ore at depth.
Figure 15.11 again matches the WHITTLE shell closely, for example pit crest positions, pit floor and the SE wall, despite the presence of three ramps.
Figure 15.12 demonstrates the pit design following the shell very closely. The small irregularities on the NE side are due to the practicality of inserting ramps and catchment berms, and still align with the shell overall.
Figure 15.13 features the saddle point between the North and South pit stages, and is larger than the shell due to the ramp switchback needed to access the ore in the southern pit. To the south, it is the presence of switchbacks that pushes the final wall slightly further out.
Figure 15.9 Ultimate Pit Design and Optimization Shell – Plan View
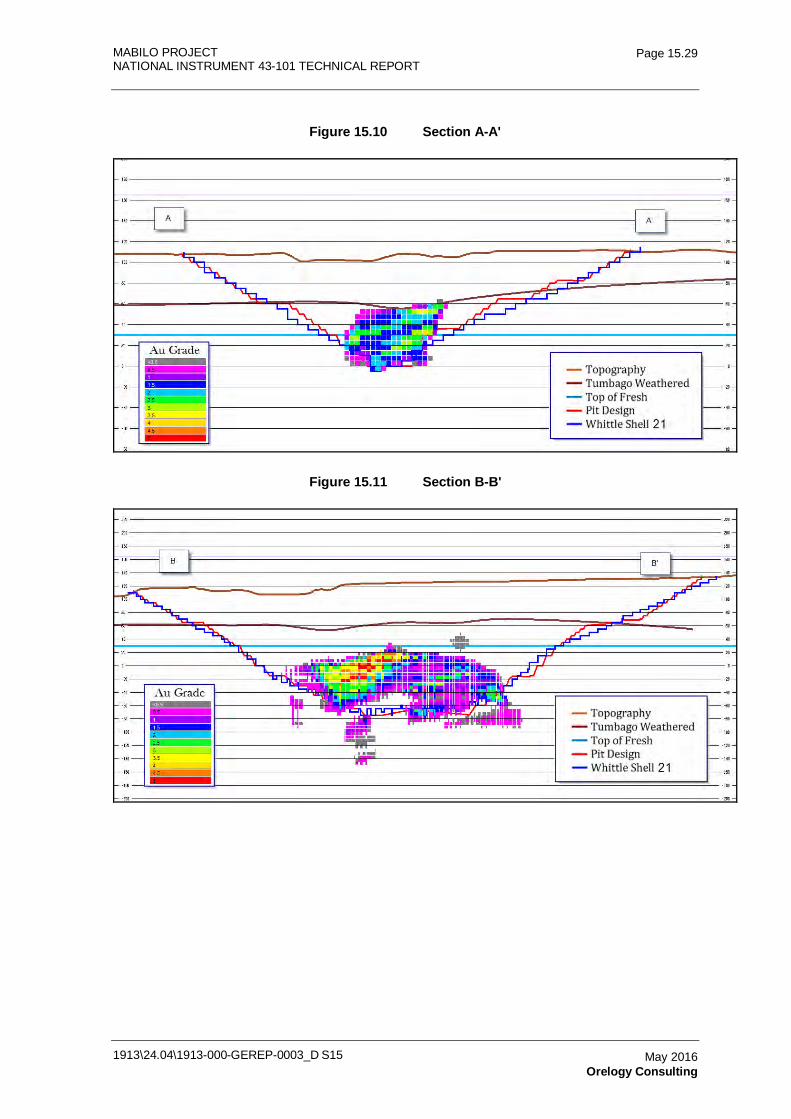
MABILO PROJECT NATIONAL INSTRUMENT 43-101 TECHNICAL REPORT
1913\24.04\1913-000-GEREP-0003_D S15
Page 15.29
May 2016 Orelogy Consulting
Figure 15.10 Section A-A'
Figure 15.11 Section B-B'
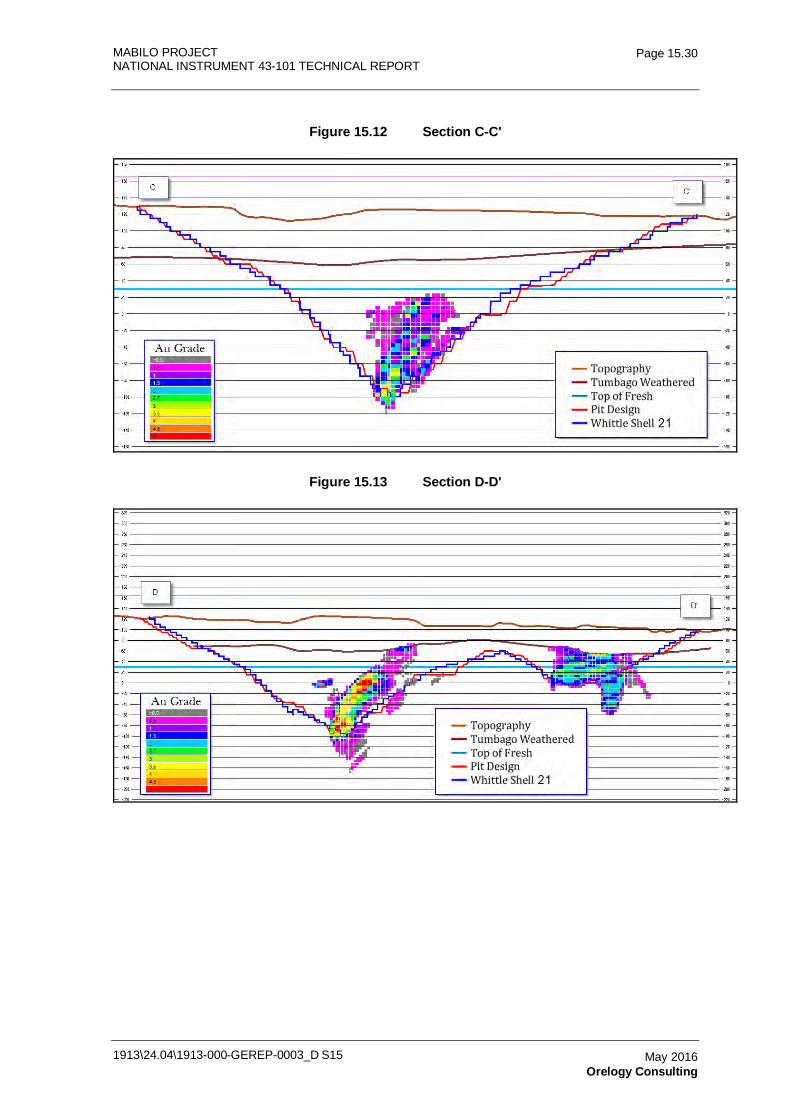
MABILO PROJECT NATIONAL INSTRUMENT 43-101 TECHNICAL REPORT
1913\24.04\1913-000-GEREP-0003_D S15
Page 15.30
May 2016 Orelogy Consulting
Figure 15.12 Section C-C'
Figure 15.13 Section D-D'
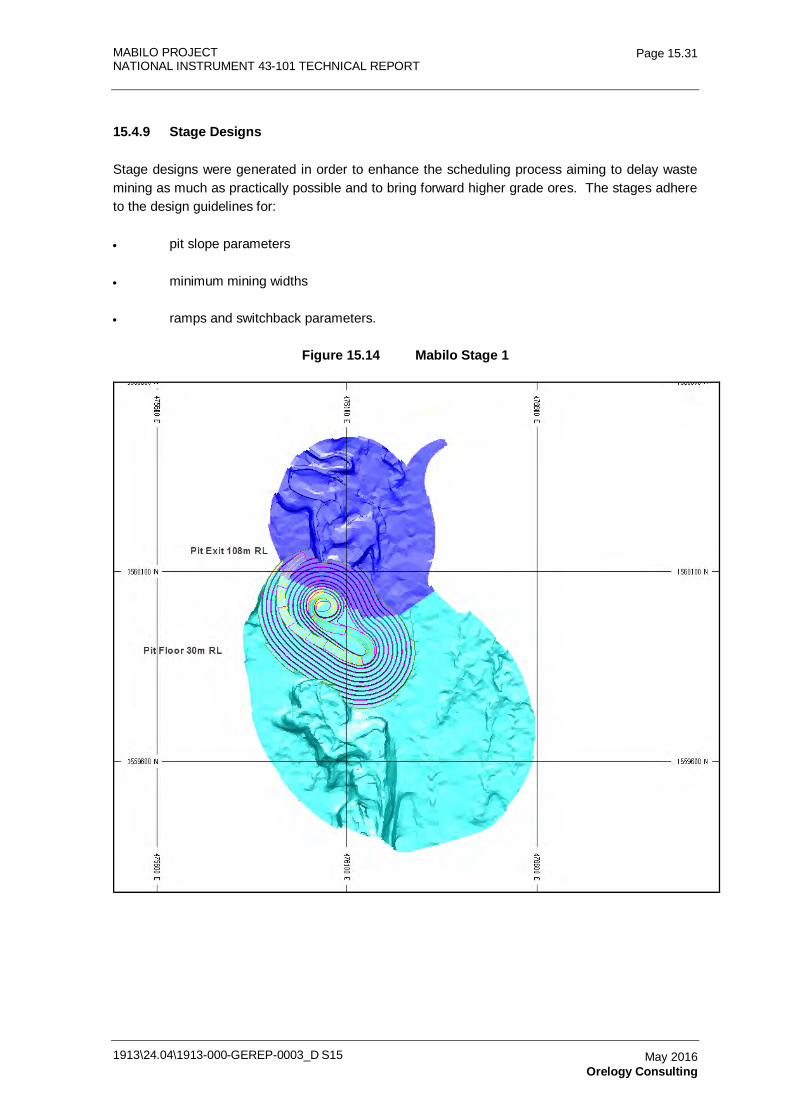
MABILO PROJECT NATIONAL INSTRUMENT 43-101 TECHNICAL REPORT
1913\24.04\1913-000-GEREP-0003_D S15
Page 15.31
May 2016 Orelogy Consulting
15.4.9 Stage Designs
Stage designs were generated in order to enhance the scheduling process aiming to delay waste mining as much as practically possible and to bring forward higher grade ores. The stages adhere to the design guidelines for:
• pit slope parameters
• minimum mining widths
• ramps and switchback parameters.
Figure 15.14 Mabilo Stage 1
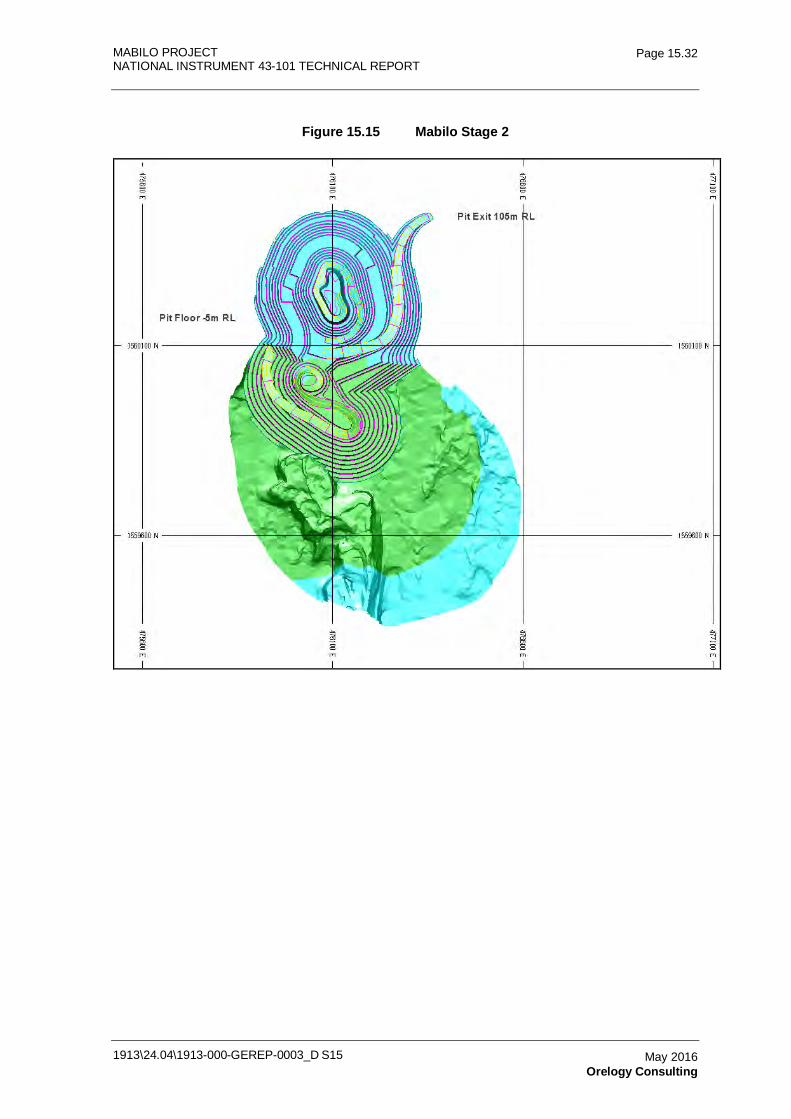
MABILO PROJECT NATIONAL INSTRUMENT 43-101 TECHNICAL REPORT
1913\24.04\1913-000-GEREP-0003_D S15
Page 15.32
May 2016 Orelogy Consulting
Figure 15.15 Mabilo Stage 2
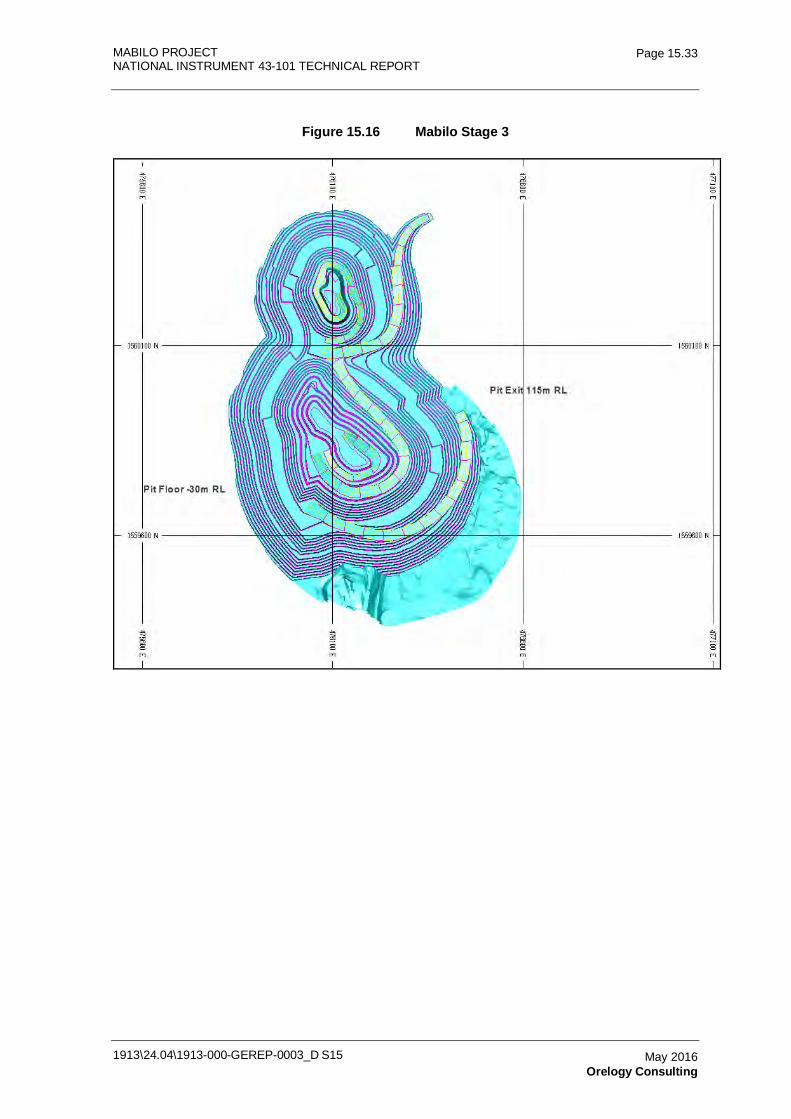
MABILO PROJECT NATIONAL INSTRUMENT 43-101 TECHNICAL REPORT
1913\24.04\1913-000-GEREP-0003_D S15
Page 15.33
May 2016 Orelogy Consulting
Figure 15.16 Mabilo Stage 3
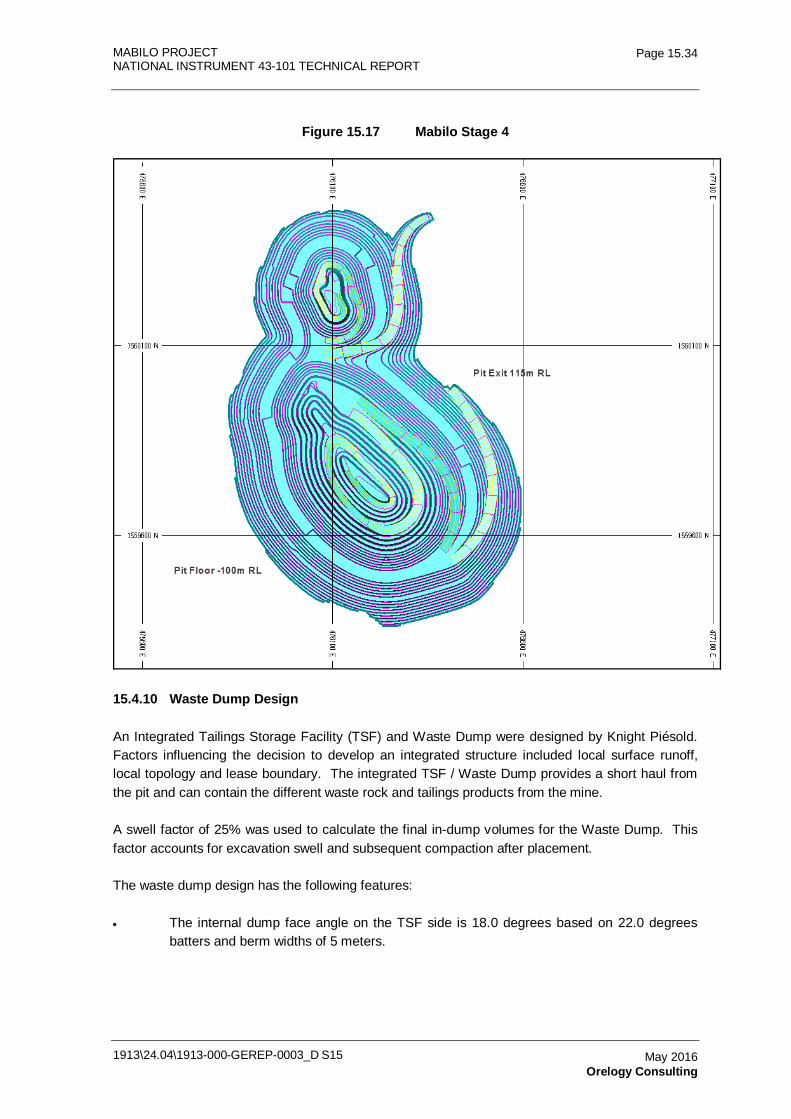
MABILO PROJECT NATIONAL INSTRUMENT 43-101 TECHNICAL REPORT
1913\24.04\1913-000-GEREP-0003_D S15
Page 15.34
May 2016 Orelogy Consulting
Figure 15.17 Mabilo Stage 4
15.4.10 Waste Dump Design
An Integrated Tailings Storage Facility (TSF) and Waste Dump were designed by Knight Piésold. Factors influencing the decision to develop an integrated structure included local surface runoff, local topology and lease boundary. The integrated TSF / Waste Dump provides a short haul from the pit and can contain the different waste rock and tailings products from the mine.
A swell factor of 25% was used to calculate the final in-dump volumes for the Waste Dump. This factor accounts for excavation swell and subsequent compaction after placement.
The waste dump design has the following features:
• The internal dump face angle on the TSF side is 18.0 degrees based on 22.0 degrees batters and berm widths of 5 meters.
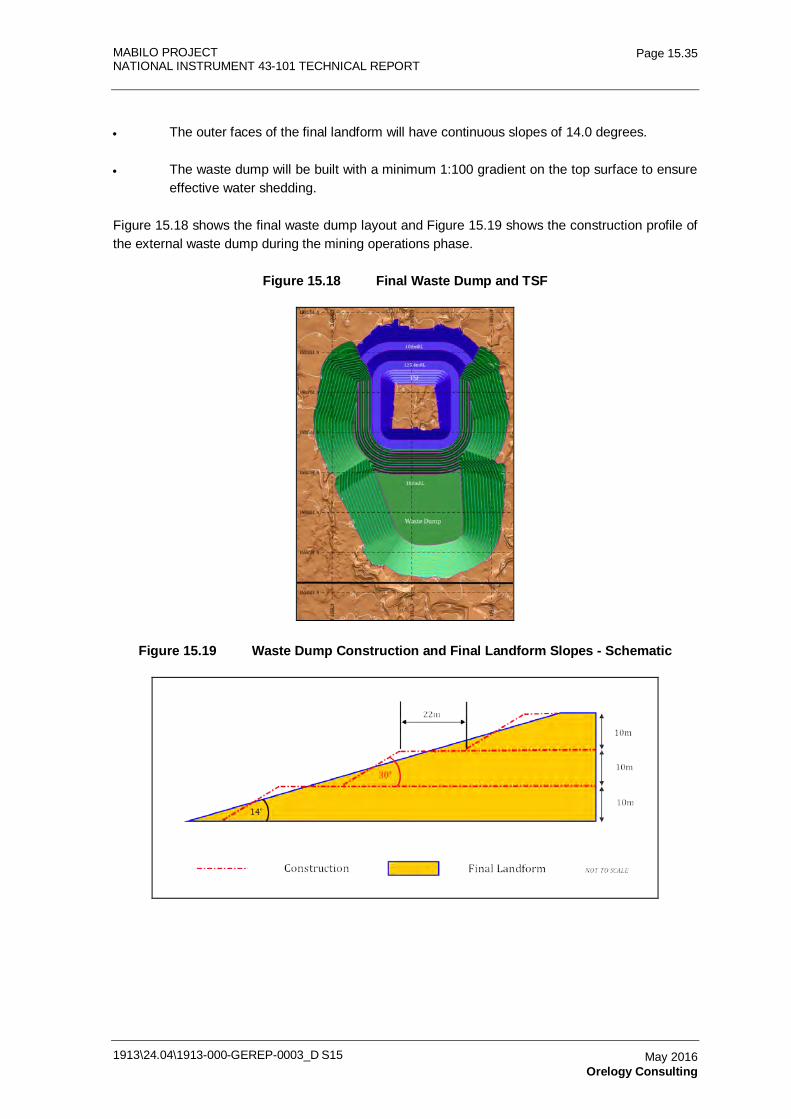
MABILO PROJECT NATIONAL INSTRUMENT 43-101 TECHNICAL REPORT
1913\24.04\1913-000-GEREP-0003_D S15
Page 15.35
May 2016 Orelogy Consulting
• The outer faces of the final landform will have continuous slopes of 14.0 degrees.
• The waste dump will be built with a minimum 1:100 gradient on the top surface to ensure effective water shedding.
Figure 15.18 shows the final waste dump layout and Figure 15.19 shows the construction profile of the external waste dump during the mining operations phase.
Figure 15.18 Final Waste Dump and TSF
Figure 15.19 Waste Dump Construction and Final Landform Slopes - Schematic
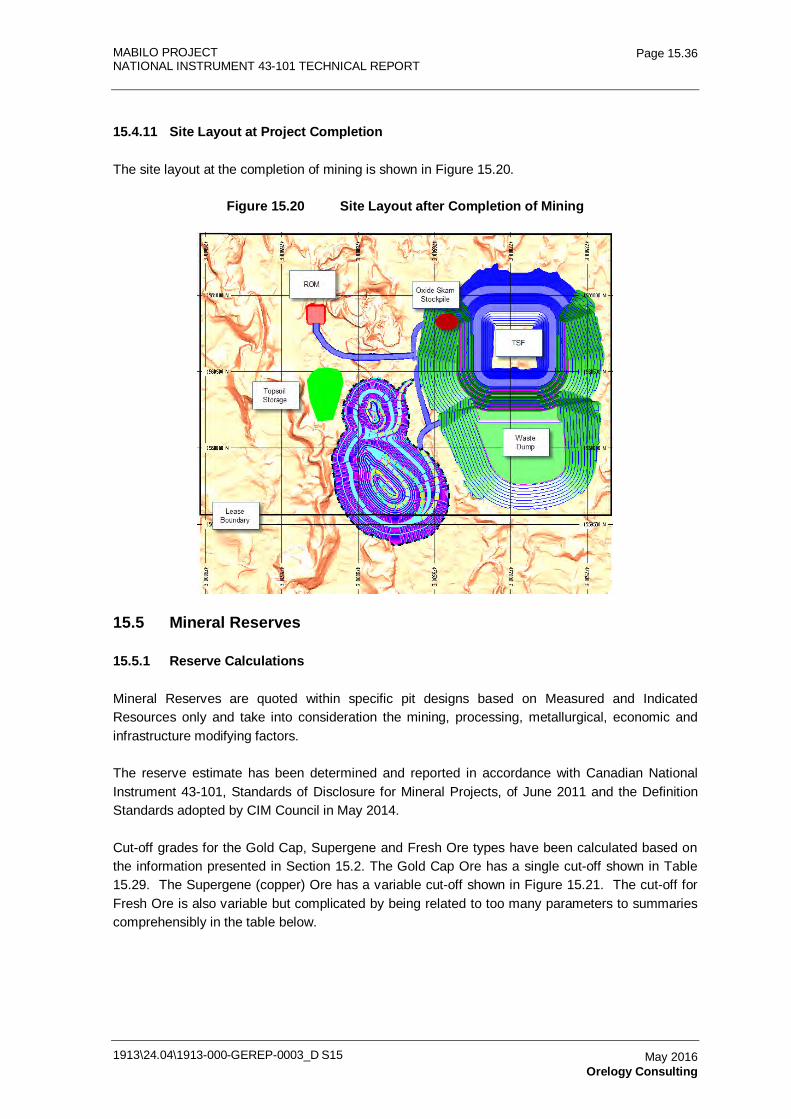
MABILO PROJECT NATIONAL INSTRUMENT 43-101 TECHNICAL REPORT
1913\24.04\1913-000-GEREP-0003_D S15
Page 15.36
May 2016 Orelogy Consulting
15.4.11 Site Layout at Project Completion
The site layout at the completion of mining is shown in Figure 15.20.
Figure 15.20 Site Layout after Completion of Mining
15.5 Mineral Reserves
15.5.1 Reserve Calculations
Mineral Reserves are quoted within specific pit designs based on Measured and Indicated Resources only and take into consideration the mining, processing, metallurgical, economic and infrastructure modifying factors.
The reserve estimate has been determined and reported in accordance with Canadian National Instrument 43-101, Standards of Disclosure for Mineral Projects, of June 2011 and the Definition Standards adopted by CIM Council in May 2014.
Cut-off grades for the Gold Cap, Supergene and Fresh Ore types have been calculated based on the information presented in Section 15.2. The Gold Cap Ore has a single cut-off shown in Table 15.29. The Supergene (copper) Ore has a variable cut-off shown in Figure 15.21. The cut-off for Fresh Ore is also variable but complicated by being related to too many parameters to summaries comprehensibly in the table below.
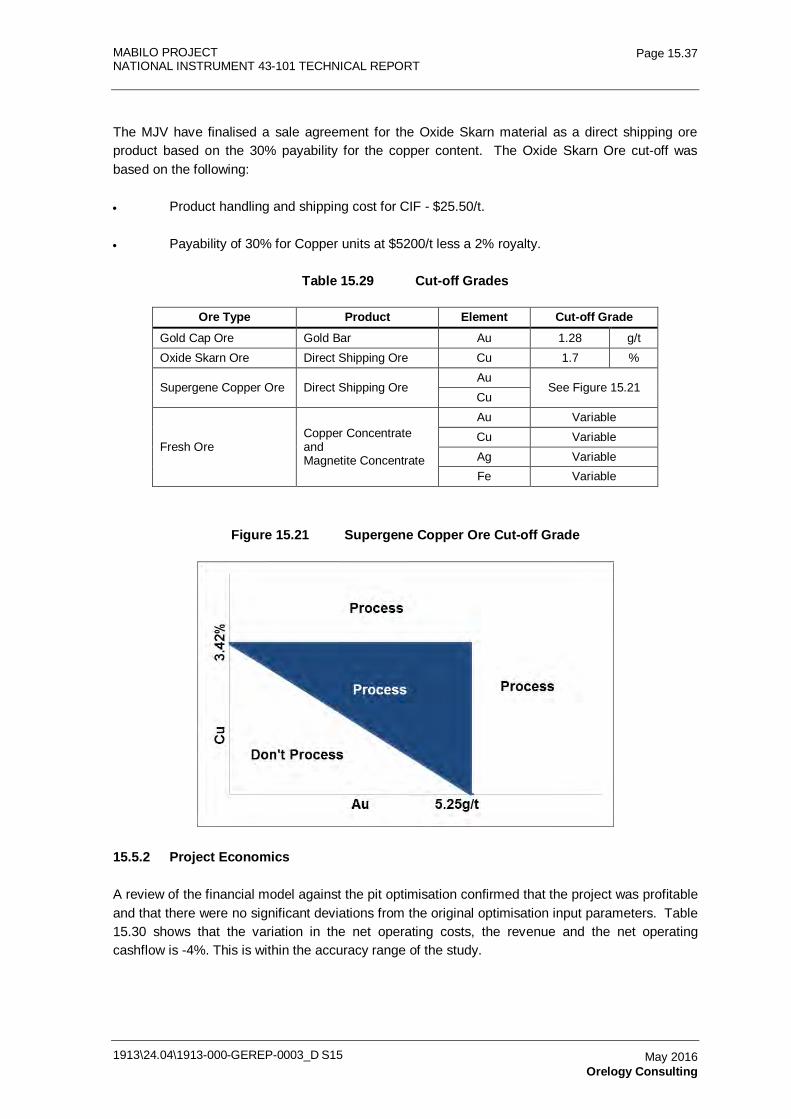
MABILO PROJECT NATIONAL INSTRUMENT 43-101 TECHNICAL REPORT
1913\24.04\1913-000-GEREP-0003_D S15
Page 15.37
May 2016 Orelogy Consulting
The MJV have finalised a sale agreement for the Oxide Skarn material as a direct shipping ore product based on the 30% payability for the copper content. The Oxide Skarn Ore cut-off was based on the following:
• Product handling and shipping cost for CIF - $25.50/t.
• Payability of 30% for Copper units at $5200/t less a 2% royalty.
Table 15.29 Cut-off Grades
Ore Type Product Element Cut-off Grade Gold Cap Ore Gold Bar Au 1.28 g/t Oxide Skarn Ore Direct Shipping Ore Cu 1.7 %
Supergene Copper Ore Direct Shipping Ore Au
See Figure 15.21 Cu
Fresh Ore Copper Concentrate and Magnetite Concentrate
Au Variable Cu Variable Ag Variable Fe Variable
Figure 15.21 Supergene Copper Ore Cut-off Grade
15.5.2 Project Economics
A review of the financial model against the pit optimisation confirmed that the project was profitable and that there were no significant deviations from the original optimisation input parameters. Table 15.30 shows that the variation in the net operating costs, the revenue and the net operating cashflow is -4%. This is within the accuracy range of the study.
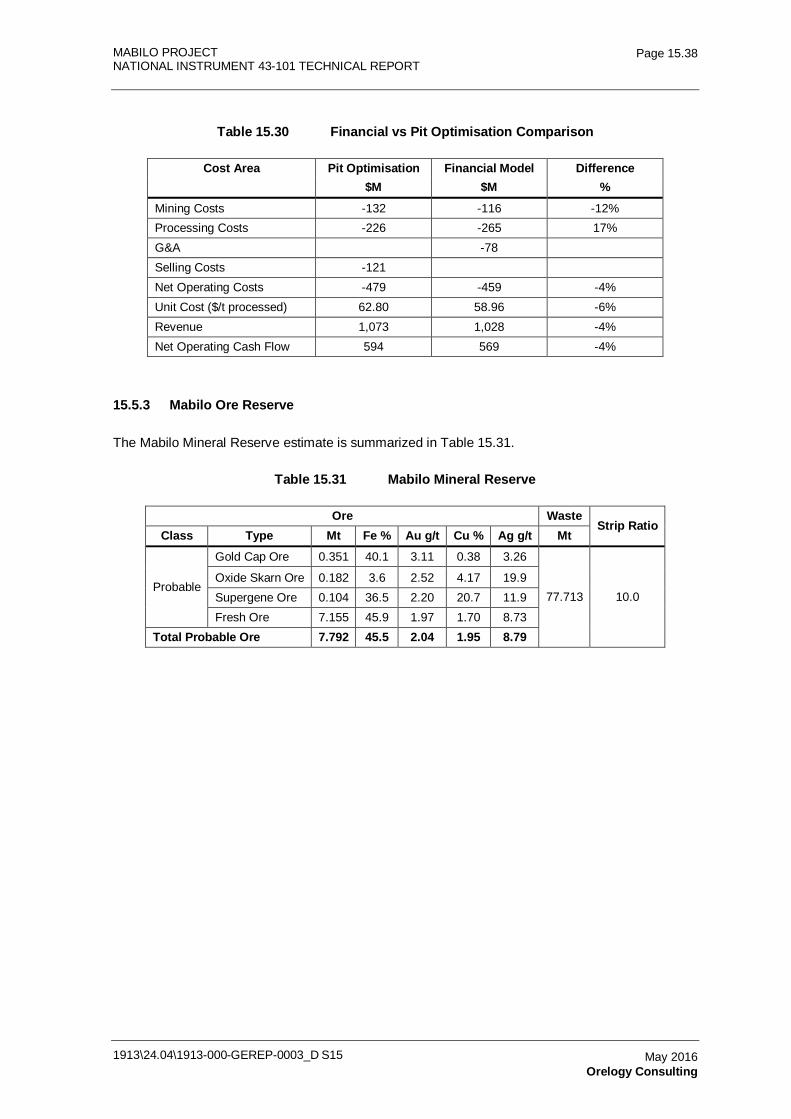
MABILO PROJECT NATIONAL INSTRUMENT 43-101 TECHNICAL REPORT
1913\24.04\1913-000-GEREP-0003_D S15
Page 15.38
May 2016 Orelogy Consulting
Table 15.30 Financial vs Pit Optimisation Comparison
Cost Area Pit Optimisation Financial Model Difference $M $M %
Mining Costs -132 -116 -12% Processing Costs -226 -265 17% G&A
-78
Selling Costs -121
Net Operating Costs -479 -459 -4% Unit Cost ($/t processed) 62.80 58.96 -6% Revenue 1,073 1,028 -4% Net Operating Cash Flow 594 569 -4%
15.5.3 Mabilo Ore Reserve
The Mabilo Mineral Reserve estimate is summarized in Table 15.31.
Table 15.31 Mabilo Mineral Reserve
Ore Waste Strip Ratio
Class Type Mt Fe % Au g/t Cu % Ag g/t Mt
Probable
Gold Cap Ore 0.351 40.1 3.11 0.38 3.26
77.713 10.0 Oxide Skarn Ore 0.182 3.6 2.52 4.17 19.9 Supergene Ore 0.104 36.5 2.20 20.7 11.9 Fresh Ore 7.155 45.9 1.97 1.70 8.73
Total Probable Ore 7.792 45.5 2.04 1.95 8.79
MABILO PROJECT
NATIONAL INSTRUMENT 43-101 TECHNICAL REPORT
1913-000-GEREP-0003
Table of Contents Page
16.0 MINING METHODS 16.1 16.1 Mining Activities 16.1
16.1.1 Mining Method - General Description 16.1 16.1.2 Clearing, Topsoil Removal and Storage 16.1 16.1.3 Grade Control 16.1 16.1.4 Drilling and Blasting – Oxide Materials 16.2 16.1.5 Drilling and Blasting – Fresh Materials 16.2 16.1.6 Drilling Equipment 16.3 16.1.7 Explosive Storage 16.3 16.1.8 Loading and Hauling 16.4 16.1.9 Rehandle 16.7 16.1.10 Pit Dewatering 16.7 16.1.11 Dust Suppression 16.7 16.1.12 Dump Rehabilitation 16.7 16.1.13 Mine Closure 16.7
16.2 Mining Productivities 16.8 16.2.1 Operating Hours 16.8 16.2.2 Ore and Waste - Densities, Swell and Moisture 16.9 16.2.3 Excavator Productivities 16.9 16.2.4 Truck Productivities 16.9 16.2.5 Drill Productivity 16.12
16.3 Mining and Processing Schedule 16.12 16.3.1 Scheduling Methodology 16.12 16.3.2 Scheduling Model 16.13 16.3.3 Scheduling Targets 16.13 16.3.4 Scheduling Constraints 16.14 16.3.5 Scheduling Results - Mining 16.15 16.3.6 Site Development 16.24 16.3.7 Scheduling Results - Processing 16.28 16.3.8 Stockpiling 16.30
16.4 Alternative Mine Schedule – 1.35 Mtpa 16.31 16.4.1 Schedule Constraints 16.31 16.4.2 Schedule Results 16.31
TABLES Table 16.1 Grade Control Costs 16.2 Table 16.2 Drill and Blast Cost for Ore and Waste 16.3 Table 16.3 Load and Haul Unit Rates per Operating Hour 16.5 Table 16.4 Mabilo Annual Operating Hours 16.8 Table 16.5 Material Properties 16.9 Table 16.6 Excavator Productivities 16.10 Table 16.7 Fresh Rock Drill Productivity 16.12 Table 16.8 Mining - Weather Lost Days 16.14 Table 16.9 Fresh Ore Processing Ramp Up Schedule 16.15 Table 16.10 Ore Mined - Tonnages and Grades by Year 16.16 Table 16.11 Annual Mining Activities - 1 Mtpa 16.26 Table 16.12 Annual Mining Costs – 1.0 Mtpa 16.27 Table 16.13 Ore Mined - Tonnages and Grades by Year – 1.35 Mtpa 16.33 Table 16.14 Annual Mining Costs – 1.35 Mtpa 16.34
1913\24.04\1913-000-GEREP-0003_D S16 May 2016 Orelogy Consulting
MABILO PROJECT
NATIONAL INSTRUMENT 43-101 TECHNICAL REPORT
1913-000-GEREP-0003
Table of Contents (Continued)
Page
1913\24.04\1913-000-GEREP-0003_D S16
May 2016 Orelogy Consulting
FIGURES Figure 16.1 Locations of Explosive Storage Facilities 16.4 Figure 16.2 Labo Rainfall Records 16.13 Figure 16.3 Ore and Waste Mining by Stage 16.17 Figure 16.4 Ore Mining by Stage 16.17 Figure 16.5 Ore Mining by Ore Type 16.18 Figure 16.6 Pit at Completion of Year 1 16.19 Figure 16.7 Pit at Completion of Year 2 16.19 Figure 16.8 Pit at Completion of Year 3 16.20 Figure 16.9 Pit at Completion of Year 4 16.20 Figure 16.10 Pit at Completion of Year 5 16.21 Figure 16.11 Pit at Completion of Year 6 16.21 Figure 16.12 Pit at Completion of Year 7 16.22 Figure 16.13 Pit at Completion of Year 8 16.22 Figure 16.14 Pit at Completion of Year 9 16.23 Figure 16.15 Pit at Completion of Year 10 16.23 Figure 16.16 Site at Completion of Year 1 16.24 Figure 16.17 Site at Completion of Year 5 16.25 Figure 16.18 Site at Completion of Year 10 16.25 Figure 16.19 Ore Processing Tonnages 16.28 Figure 16.20 Gold Ore Processing Feed 16.29 Figure 16.21 Copper Concentrate Production 16.29 Figure 16.22 Magnetite Concentrate Production 16.30 Figure 16.23 Ore and Waste Mining by Stage – 1.35 Mtpa 16.35 Figure 16.24 Ore Mining by Stage – 1.35 Mtpa 16.35 Figure 16.25 Ore Mining by Ore Type – 1.35 Mtpa 16.36
MABILO PROJECT NATIONAL INSTRUMENT 43-101 TECHNICAL REPORT
1913\24.04\1913-000-GEREP-0003_D S16
Page 16.1
May 2016 Orelogy Consulting
16.0 MINING METHODS
16.1 Mining Activities
16.1.1 Mining Method - General Description
Open pit mining is the method selected for the Mabilo mining operation. Pit optimization (see Section 15) has demonstrated that application of this method results in favorable project economics. The method deploys conventional drilling, blasting, loading and hauling techniques to excavate and transport ore and waste materials.
Mining activities also include clearing of land, stripping and storage of topsoil, ore rehandle, pit dewatering, dust suppression and dump rehabilitation. All activities will be performed by mining contractors except for grade control, mine planning and mine management being undertaken by the mine owners.
The mining costs for the Mabilo Project were compiled using information sourced from IMC’s Mabilo Mine Operating Cost Estimate reports which included $51,762/month for fixed overheads and an allowance for mobilization of $1,308,744.
16.1.2 Clearing, Topsoil Removal and Storage
Pit, dump and tailings areas will be cleared and the topsoil stored for rehabilitation later in the mine life. The cost of clearing and grubbing is based on the contractor rate of $5000/Ha with topsoil removal applied at $3.00/bcm.
16.1.3 Grade Control
The grade control activities planned for Mabilo aim to minimize oreloss and dilution at the ore-waste boundaries for both oxide and fresh ore types and also aim to effectively separate and minimize the mixing of the different oxide ore materials (Gold Cap, Supergene Copper and Oxide Skarn).
The activities consist of Reverse Circulation (RC) drilling of the ore zones using a 15 m x 5 m pattern plus a 10% factor allowing for additional holes in the waste adjoining the ore. This is to ensure that the ore-waste boundary is delineated correctly and ore loss is minimized. Samples will be taken for every 2.5 m flitch and will be sent off site for analysis.
Grade control unit costs are summarized in Table 16.1.
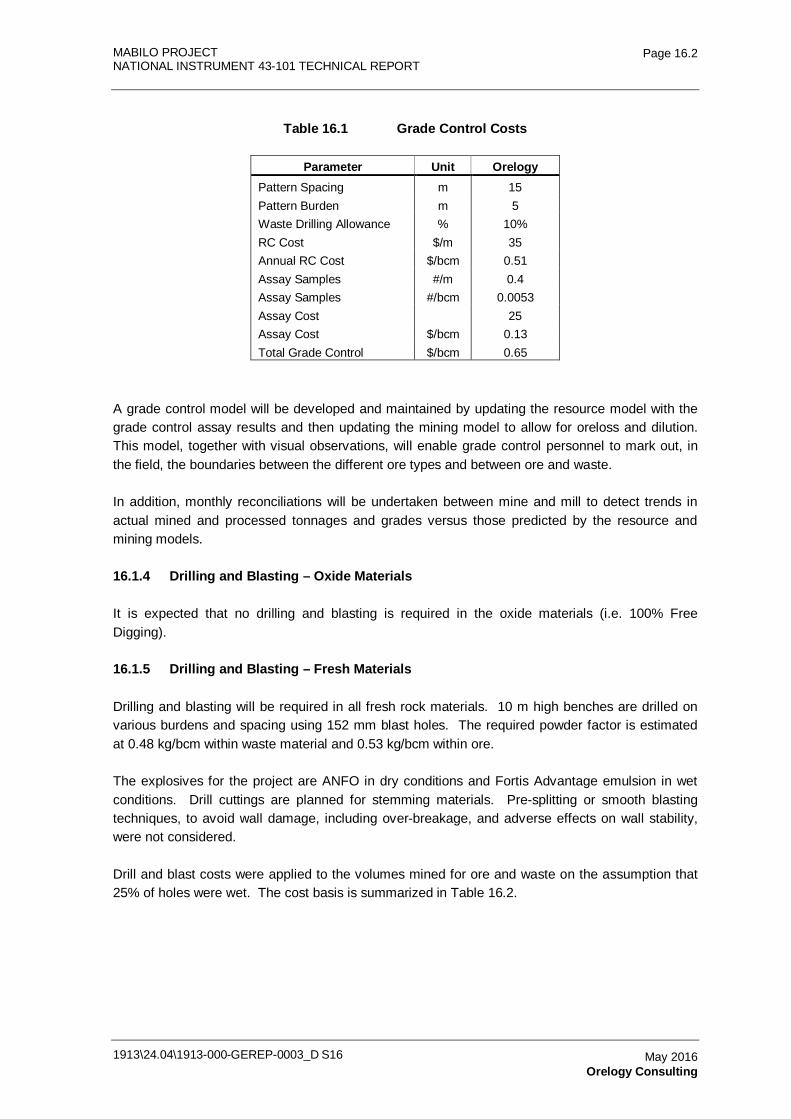
MABILO PROJECT NATIONAL INSTRUMENT 43-101 TECHNICAL REPORT
1913\24.04\1913-000-GEREP-0003_D S16
Page 16.2
May 2016 Orelogy Consulting
Table 16.1 Grade Control Costs
Parameter Unit Orelogy Pattern Spacing m 15 Pattern Burden m 5 Waste Drilling Allowance % 10% RC Cost $/m 35 Annual RC Cost $/bcm 0.51 Assay Samples #/m 0.4 Assay Samples #/bcm 0.0053 Assay Cost
25
Assay Cost $/bcm 0.13 Total Grade Control $/bcm 0.65
A grade control model will be developed and maintained by updating the resource model with the grade control assay results and then updating the mining model to allow for oreloss and dilution. This model, together with visual observations, will enable grade control personnel to mark out, in the field, the boundaries between the different ore types and between ore and waste.
In addition, monthly reconciliations will be undertaken between mine and mill to detect trends in actual mined and processed tonnages and grades versus those predicted by the resource and mining models.
16.1.4 Drilling and Blasting – Oxide Materials
It is expected that no drilling and blasting is required in the oxide materials (i.e. 100% Free Digging).
16.1.5 Drilling and Blasting – Fresh Materials
Drilling and blasting will be required in all fresh rock materials. 10 m high benches are drilled on various burdens and spacing using 152 mm blast holes. The required powder factor is estimated at 0.48 kg/bcm within waste material and 0.53 kg/bcm within ore.
The explosives for the project are ANFO in dry conditions and Fortis Advantage emulsion in wet conditions. Drill cuttings are planned for stemming materials. Pre-splitting or smooth blasting techniques, to avoid wall damage, including over-breakage, and adverse effects on wall stability, were not considered.
Drill and blast costs were applied to the volumes mined for ore and waste on the assumption that 25% of holes were wet. The cost basis is summarized in Table 16.2.
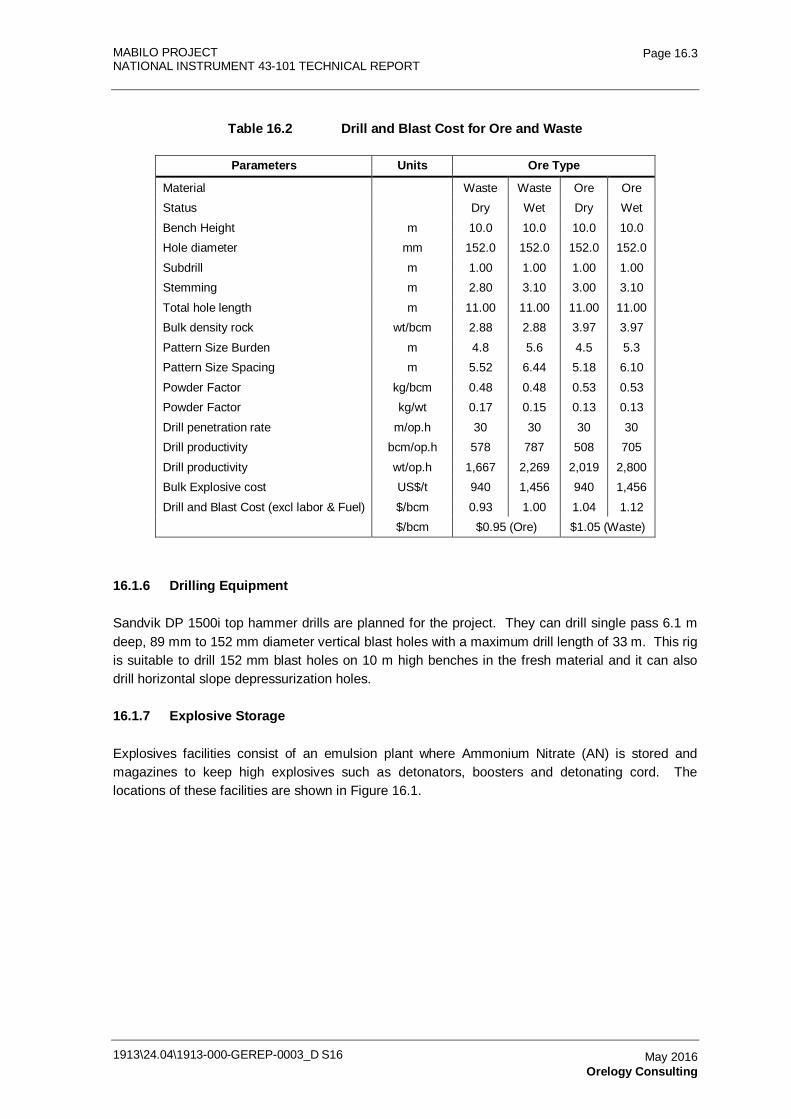
MABILO PROJECT NATIONAL INSTRUMENT 43-101 TECHNICAL REPORT
1913\24.04\1913-000-GEREP-0003_D S16
Page 16.3
May 2016 Orelogy Consulting
Table 16.2 Drill and Blast Cost for Ore and Waste
Parameters Units Ore Type
Material
Waste Waste Ore Ore Status
Dry Wet Dry Wet
Bench Height m 10.0 10.0 10.0 10.0 Hole diameter mm 152.0 152.0 152.0 152.0 Subdrill m 1.00 1.00 1.00 1.00 Stemming m 2.80 3.10 3.00 3.10 Total hole length m 11.00 11.00 11.00 11.00 Bulk density rock wt/bcm 2.88 2.88 3.97 3.97 Pattern Size Burden m 4.8 5.6 4.5 5.3 Pattern Size Spacing m 5.52 6.44 5.18 6.10 Powder Factor kg/bcm 0.48 0.48 0.53 0.53 Powder Factor kg/wt 0.17 0.15 0.13 0.13 Drill penetration rate m/op.h 30 30 30 30 Drill productivity bcm/op.h 578 787 508 705 Drill productivity wt/op.h 1,667 2,269 2,019 2,800 Bulk Explosive cost US$/t 940 1,456 940 1,456 Drill and Blast Cost (excl labor & Fuel) $/bcm 0.93 1.00 1.04 1.12 $/bcm $0.95 (Ore) $1.05 (Waste)
16.1.6 Drilling Equipment
Sandvik DP 1500i top hammer drills are planned for the project. They can drill single pass 6.1 m deep, 89 mm to 152 mm diameter vertical blast holes with a maximum drill length of 33 m. This rig is suitable to drill 152 mm blast holes on 10 m high benches in the fresh material and it can also drill horizontal slope depressurization holes.
16.1.7 Explosive Storage
Explosives facilities consist of an emulsion plant where Ammonium Nitrate (AN) is stored and magazines to keep high explosives such as detonators, boosters and detonating cord. The locations of these facilities are shown in Figure 16.1.
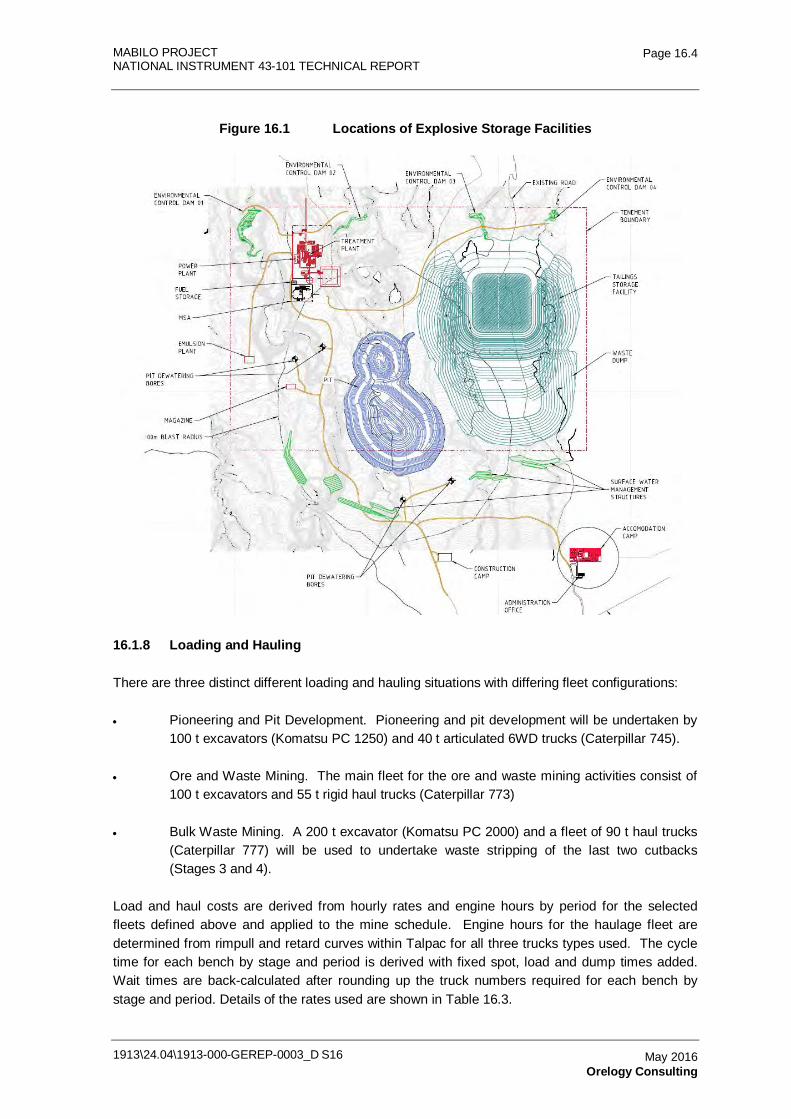
MABILO PROJECT NATIONAL INSTRUMENT 43-101 TECHNICAL REPORT
1913\24.04\1913-000-GEREP-0003_D S16
Page 16.4
May 2016 Orelogy Consulting
Figure 16.1 Locations of Explosive Storage Facilities
16.1.8 Loading and Hauling
There are three distinct different loading and hauling situations with differing fleet configurations:
• Pioneering and Pit Development. Pioneering and pit development will be undertaken by 100 t excavators (Komatsu PC 1250) and 40 t articulated 6WD trucks (Caterpillar 745).
• Ore and Waste Mining. The main fleet for the ore and waste mining activities consist of 100 t excavators and 55 t rigid haul trucks (Caterpillar 773)
• Bulk Waste Mining. A 200 t excavator (Komatsu PC 2000) and a fleet of 90 t haul trucks (Caterpillar 777) will be used to undertake waste stripping of the last two cutbacks (Stages 3 and 4).
Load and haul costs are derived from hourly rates and engine hours by period for the selected fleets defined above and applied to the mine schedule. Engine hours for the haulage fleet are determined from rimpull and retard curves within Talpac for all three trucks types used. The cycle time for each bench by stage and period is derived with fixed spot, load and dump times added. Wait times are back-calculated after rounding up the truck numbers required for each bench by stage and period. Details of the rates used are shown in Table 16.3.
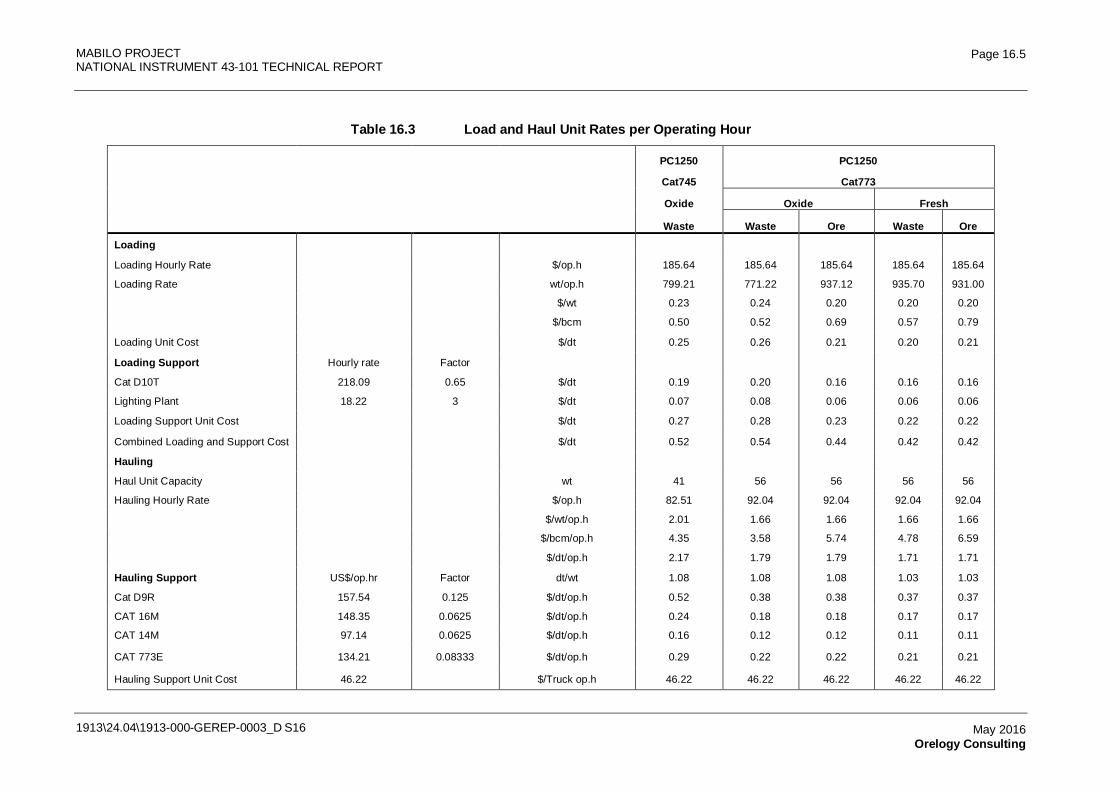
MABILO PROJECT NATIONAL INSTRUMENT 43-101 TECHNICAL REPORT
1913\24.04\1913-000-GEREP-0003_D S16
Page 16.5
May 2016 Orelogy Consulting
Table 16.3 Load and Haul Unit Rates per Operating Hour
PC1250 PC1250
Cat745 Cat773
Oxide Oxide Fresh
Waste Waste Ore Waste Ore
Loading Loading Hourly Rate $/op.h 185.64 185.64 185.64 185.64 185.64
Loading Rate wt/op.h 799.21 771.22 937.12 935.70 931.00
$/wt 0.23 0.24 0.20 0.20 0.20
$/bcm 0.50 0.52 0.69 0.57 0.79
Loading Unit Cost $/dt 0.25 0.26 0.21 0.20 0.21
Loading Support Hourly rate Factor Cat D10T 218.09 0.65 $/dt 0.19 0.20 0.16 0.16 0.16
Lighting Plant 18.22 3 $/dt 0.07 0.08 0.06 0.06 0.06
Loading Support Unit Cost $/dt 0.27 0.28 0.23 0.22 0.22
Combined Loading and Support Cost $/dt 0.52 0.54 0.44 0.42 0.42
Hauling Haul Unit Capacity wt 41 56 56 56 56
Hauling Hourly Rate $/op.h 82.51 92.04 92.04 92.04 92.04
$/wt/op.h 2.01 1.66 1.66 1.66 1.66
$/bcm/op.h 4.35 3.58 5.74 4.78 6.59
$/dt/op.h 2.17 1.79 1.79 1.71 1.71
Hauling Support US$/op.hr Factor dt/wt 1.08 1.08 1.08 1.03 1.03
Cat D9R 157.54 0.125 $/dt/op.h 0.52 0.38 0.38 0.37 0.37
CAT 16M 148.35 0.0625 $/dt/op.h 0.24 0.18 0.18 0.17 0.17
CAT 14M 97.14 0.0625 $/dt/op.h 0.16 0.12 0.12 0.11 0.11
CAT 773E 134.21 0.08333 $/dt/op.h 0.29 0.22 0.22 0.21 0.21
Hauling Support Unit Cost 46.22 $/Truck op.h 46.22 46.22 46.22 46.22 46.22
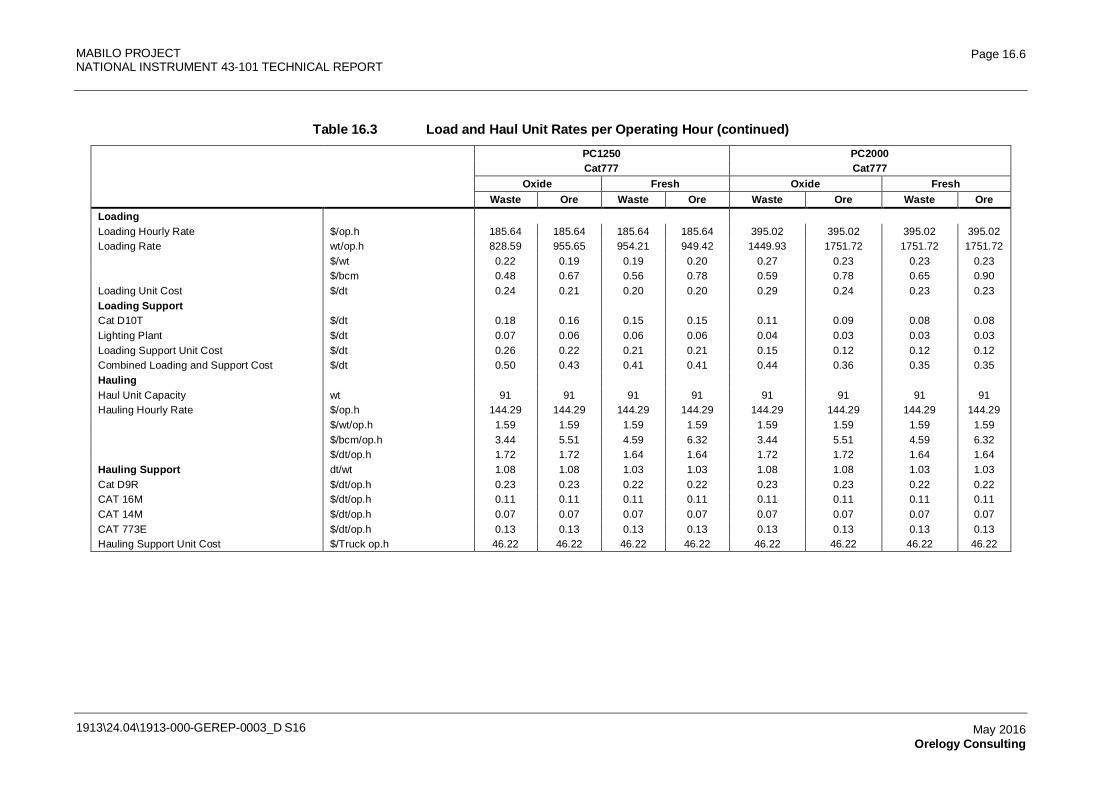
MABILO PROJECT NATIONAL INSTRUMENT 43-101 TECHNICAL REPORT
1913\24.04\1913-000-GEREP-0003_D S16
Page 16.6
May 2016 Orelogy Consulting
Table 16.3 Load and Haul Unit Rates per Operating Hour (continued)
PC1250 PC2000
Cat777 Cat777
Oxide Fresh Oxide Fresh
Waste Ore Waste Ore Waste Ore Waste Ore
Loading
Loading Hourly Rate $/op.h 185.64 185.64 185.64 185.64 395.02 395.02 395.02 395.02 Loading Rate wt/op.h 828.59 955.65 954.21 949.42 1449.93 1751.72 1751.72 1751.72 $/wt 0.22 0.19 0.19 0.20 0.27 0.23 0.23 0.23 $/bcm 0.48 0.67 0.56 0.78 0.59 0.78 0.65 0.90 Loading Unit Cost $/dt 0.24 0.21 0.20 0.20 0.29 0.24 0.23 0.23 Loading Support
Cat D10T $/dt 0.18 0.16 0.15 0.15 0.11 0.09 0.08 0.08 Lighting Plant $/dt 0.07 0.06 0.06 0.06 0.04 0.03 0.03 0.03 Loading Support Unit Cost $/dt 0.26 0.22 0.21 0.21 0.15 0.12 0.12 0.12 Combined Loading and Support Cost $/dt 0.50 0.43 0.41 0.41 0.44 0.36 0.35 0.35 Hauling
Haul Unit Capacity wt 91 91 91 91 91 91 91 91 Hauling Hourly Rate $/op.h 144.29 144.29 144.29 144.29 144.29 144.29 144.29 144.29 $/wt/op.h 1.59 1.59 1.59 1.59 1.59 1.59 1.59 1.59 $/bcm/op.h 3.44 5.51 4.59 6.32 3.44 5.51 4.59 6.32 $/dt/op.h 1.72 1.72 1.64 1.64 1.72 1.72 1.64 1.64 Hauling Support dt/wt 1.08 1.08 1.03 1.03 1.08 1.08 1.03 1.03 Cat D9R $/dt/op.h 0.23 0.23 0.22 0.22 0.23 0.23 0.22 0.22 CAT 16M $/dt/op.h 0.11 0.11 0.11 0.11 0.11 0.11 0.11 0.11 CAT 14M $/dt/op.h 0.07 0.07 0.07 0.07 0.07 0.07 0.07 0.07 CAT 773E $/dt/op.h 0.13 0.13 0.13 0.13 0.13 0.13 0.13 0.13 Hauling Support Unit Cost $/Truck op.h 46.22 46.22 46.22 46.22 46.22 46.22 46.22 46.22
MABILO PROJECT NATIONAL INSTRUMENT 43-101 TECHNICAL REPORT
1913\24.04\1913-000-GEREP-0003_D S16
Page 16.7
May 2016 Orelogy Consulting
Free digging is expected in all oxide materials while fresh rock materials are broken and loosened with drilling and blasting.
Gold Cap Ore, Oxide Skarn Ore and Supergene Copper Ore and Fresh Ore are hauled from the pit to the Run of Mine (ROM) pad. All other materials are categorized as waste and are hauled to the waste dump or the tailings storage facility which is integrated with the waste dump.
16.1.9 Rehandle
All ores dumped on the ROM will be rehandled. The Gold Cap Ore, Oxide Skarn Ore and Supergene Copper Ore will be loaded onto road trucks for transport away from site and all of the Fresh Ore will be picked up from the ROM and fed into the crusher with a Caterpillar 988 frontend loader. The contractor rate for stockpile management was $0.90/dt ore. Reclaim from stockpile is based on the contractor rate of $1.45/dt.
16.1.10 Pit Dewatering
In order to minimize the water inflows into the pit, surface walls and diversion channels will direct surface water away from the pit and a borefield will be established to drain the formations that intersect with the pit (see Figure 16.1). Slopes in both the oxide and fresh materials are planned to be depressurized with 30 m long, near horizontal, drillholes to avoid building up of pore water pressure. Residual groundwater inflows and rainfall into the pit area will be removed by pit dewatering. An allowance for the depressurization holes was made using the contract rate of $21.90/lin.m assuming 400 lin.m drilled per month.
A sump will be established at the bottom of the pit at all times. Water will gravitate to the sump where it can be picked up and pumped into a water cart and used for dust suppression.
16.1.11 Dust Suppression
Dust suppression will be undertaken with Caterpillar 773 water carts included in the load and haul unit rates. Water will be sourced from pit sumps or from a surface water dam.
16.1.12 Dump Rehabilitation
Waste dumps require reshaping into the final landform and rehabilitation will be performed by distributing stockpiled topsoils onto the final landform.
16.1.13 Mine Closure
Mine closure activities involve the establishment of a bund around the pit to avoid people from inadvertently entering the pit area and driving over or falling off the pit crest. The ROM pad will be reshaped to its final landform and rehabilitated. Unwanted haul roads will also be rehabilitated.
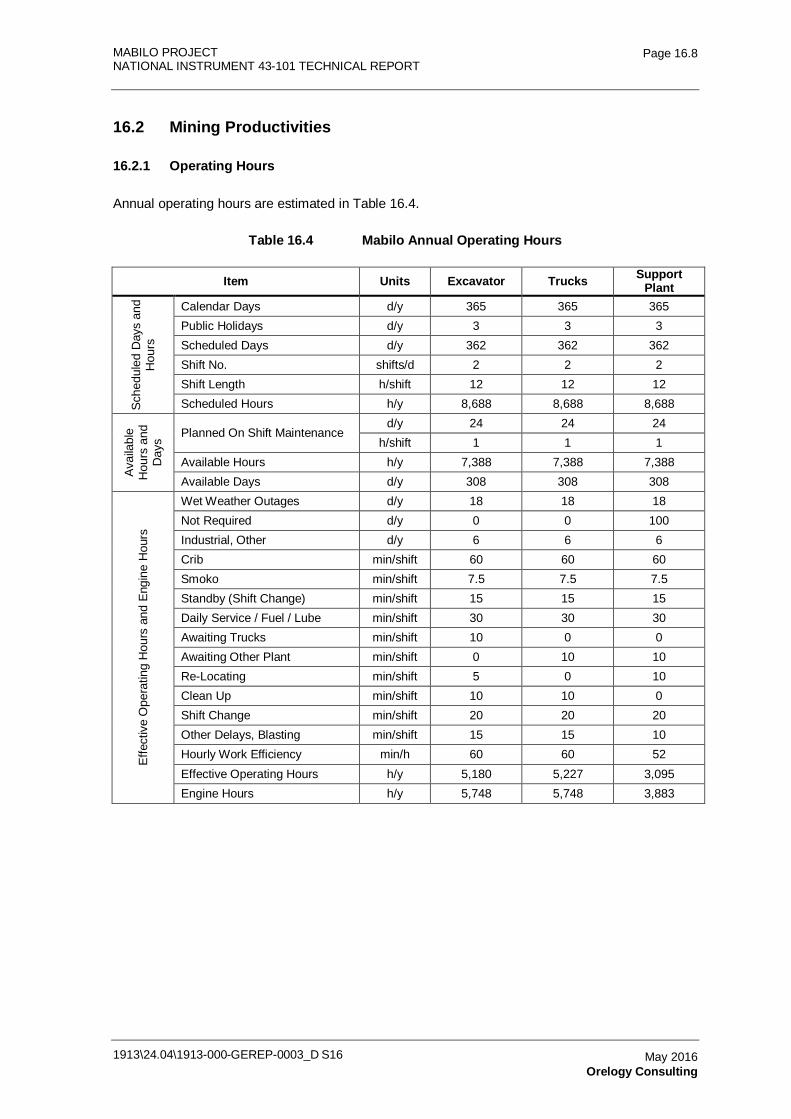
MABILO PROJECT NATIONAL INSTRUMENT 43-101 TECHNICAL REPORT
1913\24.04\1913-000-GEREP-0003_D S16
Page 16.8
May 2016 Orelogy Consulting
16.2 Mining Productivities
16.2.1 Operating Hours
Annual operating hours are estimated in Table 16.4.
Table 16.4 Mabilo Annual Operating Hours
Item Units Excavator Trucks Support Plant
Sche
dule
d D
ays
and
Hou
rs
Calendar Days d/y 365 365 365 Public Holidays d/y 3 3 3 Scheduled Days d/y 362 362 362 Shift No. shifts/d 2 2 2 Shift Length h/shift 12 12 12 Scheduled Hours h/y 8,688 8,688 8,688
Avai
labl
e H
ours
and
D
ays Planned On Shift Maintenance
d/y 24 24 24 h/shift 1 1 1
Available Hours h/y 7,388 7,388 7,388 Available Days d/y 308 308 308
Effe
ctiv
e O
pera
ting
Hou
rs a
nd E
ngin
e H
ours
Wet Weather Outages d/y 18 18 18 Not Required d/y 0 0 100 Industrial, Other d/y 6 6 6 Crib min/shift 60 60 60 Smoko min/shift 7.5 7.5 7.5 Standby (Shift Change) min/shift 15 15 15 Daily Service / Fuel / Lube min/shift 30 30 30 Awaiting Trucks min/shift 10 0 0 Awaiting Other Plant min/shift 0 10 10 Re-Locating min/shift 5 0 10 Clean Up min/shift 10 10 0 Shift Change min/shift 20 20 20 Other Delays, Blasting min/shift 15 15 10 Hourly Work Efficiency min/h 60 60 52 Effective Operating Hours h/y 5,180 5,227 3,095 Engine Hours h/y 5,748 5,748 3,883
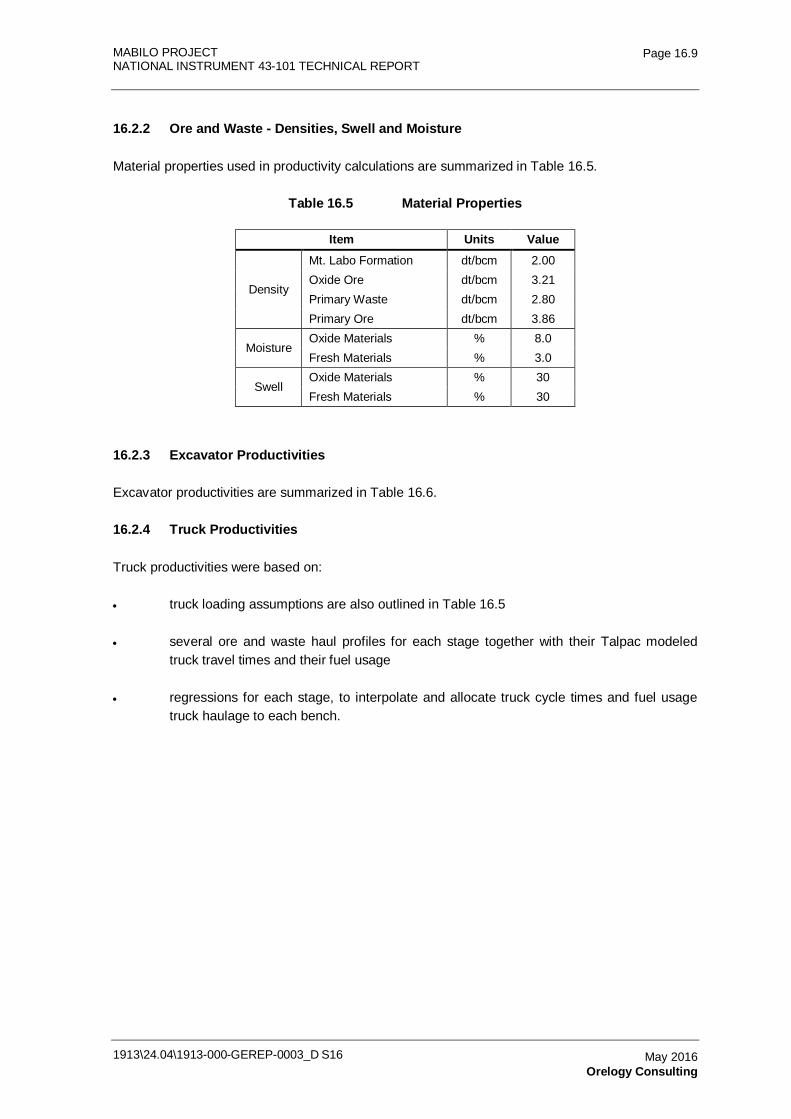
MABILO PROJECT NATIONAL INSTRUMENT 43-101 TECHNICAL REPORT
1913\24.04\1913-000-GEREP-0003_D S16
Page 16.9
May 2016 Orelogy Consulting
16.2.2 Ore and Waste - Densities, Swell and Moisture
Material properties used in productivity calculations are summarized in Table 16.5.
Table 16.5 Material Properties
Item Units Value
Density
Mt. Labo Formation dt/bcm 2.00 Oxide Ore dt/bcm 3.21 Primary Waste dt/bcm 2.80 Primary Ore dt/bcm 3.86
Moisture Oxide Materials % 8.0 Fresh Materials % 3.0
Swell Oxide Materials % 30 Fresh Materials % 30
16.2.3 Excavator Productivities
Excavator productivities are summarized in Table 16.6.
16.2.4 Truck Productivities
Truck productivities were based on:
• truck loading assumptions are also outlined in Table 16.5
• several ore and waste haul profiles for each stage together with their Talpac modeled truck travel times and their fuel usage
• regressions for each stage, to interpolate and allocate truck cycle times and fuel usage truck haulage to each bench.
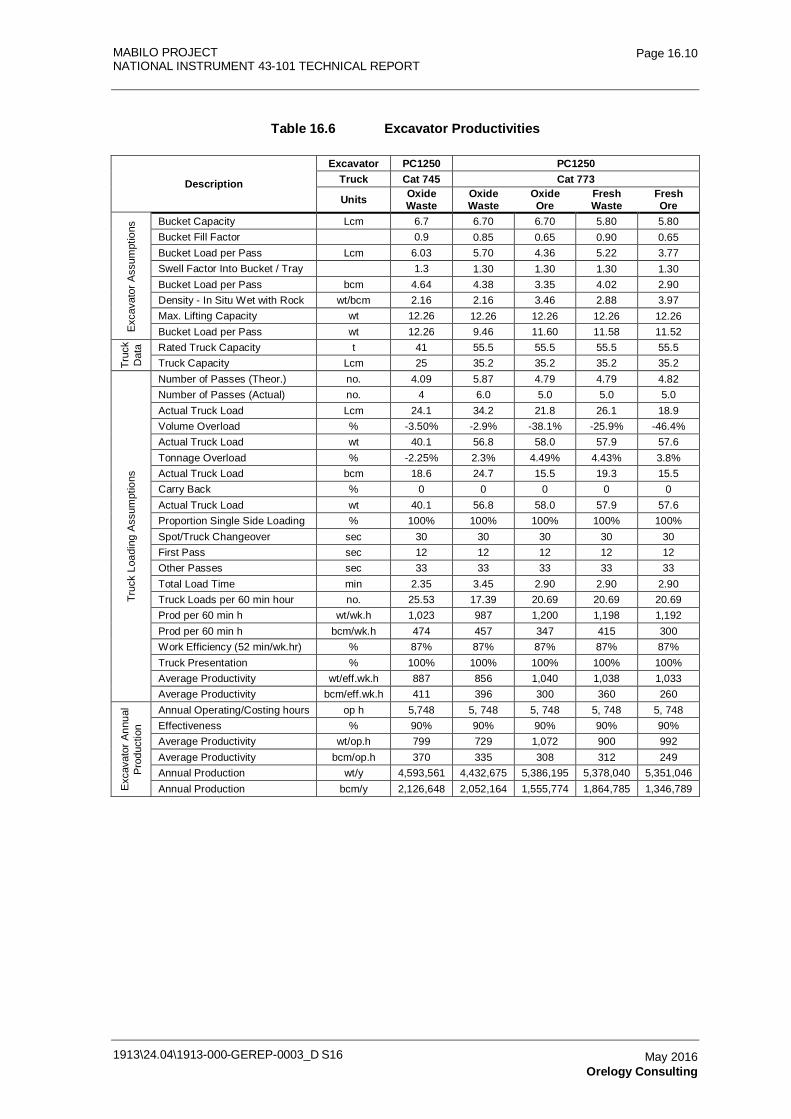
MABILO PROJECT NATIONAL INSTRUMENT 43-101 TECHNICAL REPORT
1913\24.04\1913-000-GEREP-0003_D S16
Page 16.10
May 2016 Orelogy Consulting
Table 16.6 Excavator Productivities
Description
Excavator PC1250 PC1250 Truck Cat 745 Cat 773
Units Oxide Waste
Oxide Waste
Oxide Ore
Fresh Waste
Fresh Ore
Exc
avat
or A
ssum
ptio
ns Bucket Capacity Lcm 6.7 6.70 6.70 5.80 5.80
Bucket Fill Factor 0.9 0.85 0.65 0.90 0.65 Bucket Load per Pass Lcm 6.03 5.70 4.36 5.22 3.77 Swell Factor Into Bucket / Tray 1.3 1.30 1.30 1.30 1.30 Bucket Load per Pass bcm 4.64 4.38 3.35 4.02 2.90 Density - In Situ Wet with Rock wt/bcm 2.16 2.16 3.46 2.88 3.97 Max. Lifting Capacity wt 12.26 12.26 12.26 12.26 12.26 Bucket Load per Pass wt 12.26 9.46 11.60 11.58 11.52
Truc
k D
ata Rated Truck Capacity t 41 55.5 55.5 55.5 55.5
Truck Capacity Lcm 25 35.2 35.2 35.2 35.2
Truc
k Lo
adin
g A
ssum
ptio
ns
Number of Passes (Theor.) no. 4.09 5.87 4.79 4.79 4.82 Number of Passes (Actual) no. 4 6.0 5.0 5.0 5.0 Actual Truck Load Lcm 24.1 34.2 21.8 26.1 18.9 Volume Overload % -3.50% -2.9% -38.1% -25.9% -46.4% Actual Truck Load wt 40.1 56.8 58.0 57.9 57.6 Tonnage Overload % -2.25% 2.3% 4.49% 4.43% 3.8% Actual Truck Load bcm 18.6 24.7 15.5 19.3 15.5 Carry Back % 0 0 0 0 0 Actual Truck Load wt 40.1 56.8 58.0 57.9 57.6 Proportion Single Side Loading % 100% 100% 100% 100% 100% Spot/Truck Changeover sec 30 30 30 30 30 First Pass sec 12 12 12 12 12 Other Passes sec 33 33 33 33 33 Total Load Time min 2.35 3.45 2.90 2.90 2.90 Truck Loads per 60 min hour no. 25.53 17.39 20.69 20.69 20.69 Prod per 60 min h wt/wk.h 1,023 987 1,200 1,198 1,192 Prod per 60 min h bcm/wk.h 474 457 347 415 300 Work Efficiency (52 min/wk.hr) % 87% 87% 87% 87% 87% Truck Presentation % 100% 100% 100% 100% 100% Average Productivity wt/eff.wk.h 887 856 1,040 1,038 1,033 Average Productivity bcm/eff.wk.h 411 396 300 360 260
Exc
avat
or A
nnua
l P
rodu
ctio
n
Annual Operating/Costing hours op h 5,748 5, 748 5, 748 5, 748 5, 748 Effectiveness % 90% 90% 90% 90% 90% Average Productivity wt/op.h 799 729 1,072 900 992 Average Productivity bcm/op.h 370 335 308 312 249 Annual Production wt/y 4,593,561 4,432,675 5,386,195 5,378,040 5,351,046 Annual Production bcm/y 2,126,648 2,052,164 1,555,774 1,864,785 1,346,789
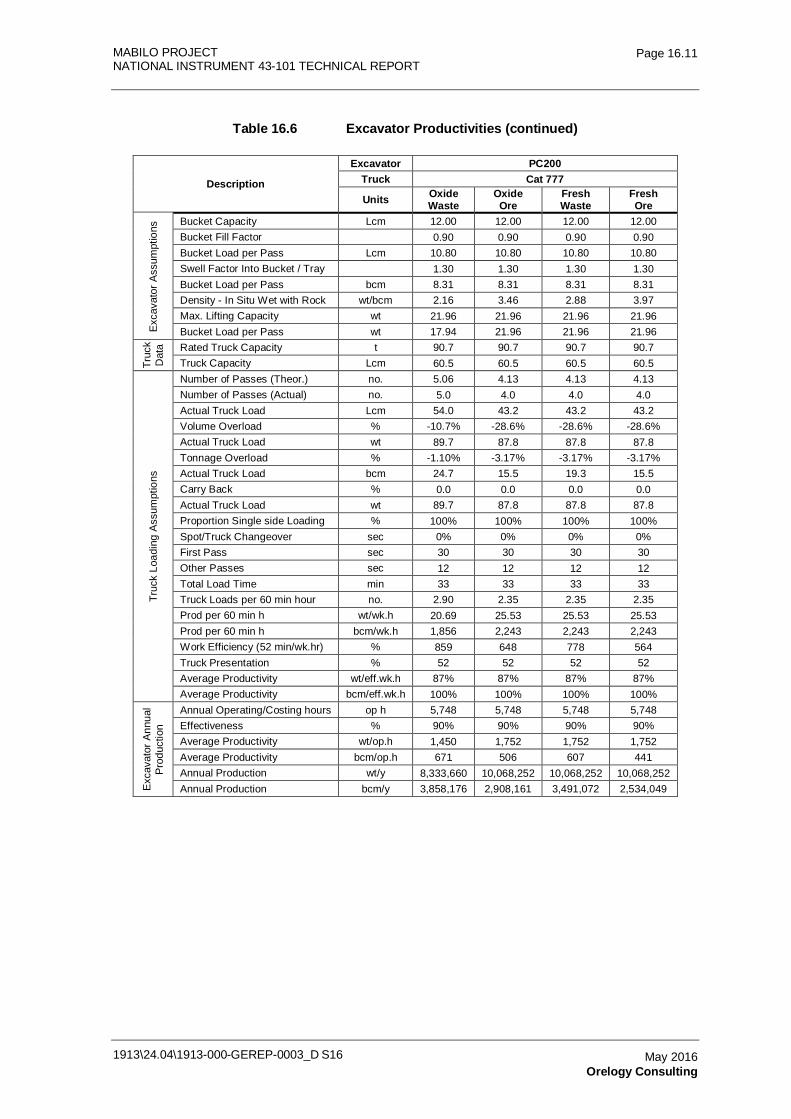
MABILO PROJECT NATIONAL INSTRUMENT 43-101 TECHNICAL REPORT
1913\24.04\1913-000-GEREP-0003_D S16
Page 16.11
May 2016 Orelogy Consulting
Table 16.6 Excavator Productivities (continued)
Description
Excavator PC200 Truck Cat 777
Units Oxide Waste
Oxide Ore
Fresh Waste
Fresh Ore
Exc
avat
or A
ssum
ptio
ns Bucket Capacity Lcm 12.00 12.00 12.00 12.00
Bucket Fill Factor 0.90 0.90 0.90 0.90 Bucket Load per Pass Lcm 10.80 10.80 10.80 10.80 Swell Factor Into Bucket / Tray 1.30 1.30 1.30 1.30 Bucket Load per Pass bcm 8.31 8.31 8.31 8.31 Density - In Situ Wet with Rock wt/bcm 2.16 3.46 2.88 3.97 Max. Lifting Capacity wt 21.96 21.96 21.96 21.96 Bucket Load per Pass wt 17.94 21.96 21.96 21.96
Truc
k D
ata Rated Truck Capacity t 90.7 90.7 90.7 90.7
Truck Capacity Lcm 60.5 60.5 60.5 60.5
Truc
k Lo
adin
g A
ssum
ptio
ns
Number of Passes (Theor.) no. 5.06 4.13 4.13 4.13 Number of Passes (Actual) no. 5.0 4.0 4.0 4.0 Actual Truck Load Lcm 54.0 43.2 43.2 43.2 Volume Overload % -10.7% -28.6% -28.6% -28.6% Actual Truck Load wt 89.7 87.8 87.8 87.8 Tonnage Overload % -1.10% -3.17% -3.17% -3.17% Actual Truck Load bcm 24.7 15.5 19.3 15.5 Carry Back % 0.0 0.0 0.0 0.0 Actual Truck Load wt 89.7 87.8 87.8 87.8 Proportion Single side Loading % 100% 100% 100% 100% Spot/Truck Changeover sec 0% 0% 0% 0% First Pass sec 30 30 30 30 Other Passes sec 12 12 12 12 Total Load Time min 33 33 33 33 Truck Loads per 60 min hour no. 2.90 2.35 2.35 2.35 Prod per 60 min h wt/wk.h 20.69 25.53 25.53 25.53 Prod per 60 min h bcm/wk.h 1,856 2,243 2,243 2,243 Work Efficiency (52 min/wk.hr) % 859 648 778 564 Truck Presentation % 52 52 52 52 Average Productivity wt/eff.wk.h 87% 87% 87% 87% Average Productivity bcm/eff.wk.h 100% 100% 100% 100%
Exc
avat
or A
nnua
l P
rodu
ctio
n
Annual Operating/Costing hours op h 5,748 5,748 5,748 5,748 Effectiveness % 90% 90% 90% 90% Average Productivity wt/op.h 1,450 1,752 1,752 1,752 Average Productivity bcm/op.h 671 506 607 441 Annual Production wt/y 8,333,660 10,068,252 10,068,252 10,068,252 Annual Production bcm/y 3,858,176 2,908,161 3,491,072 2,534,049
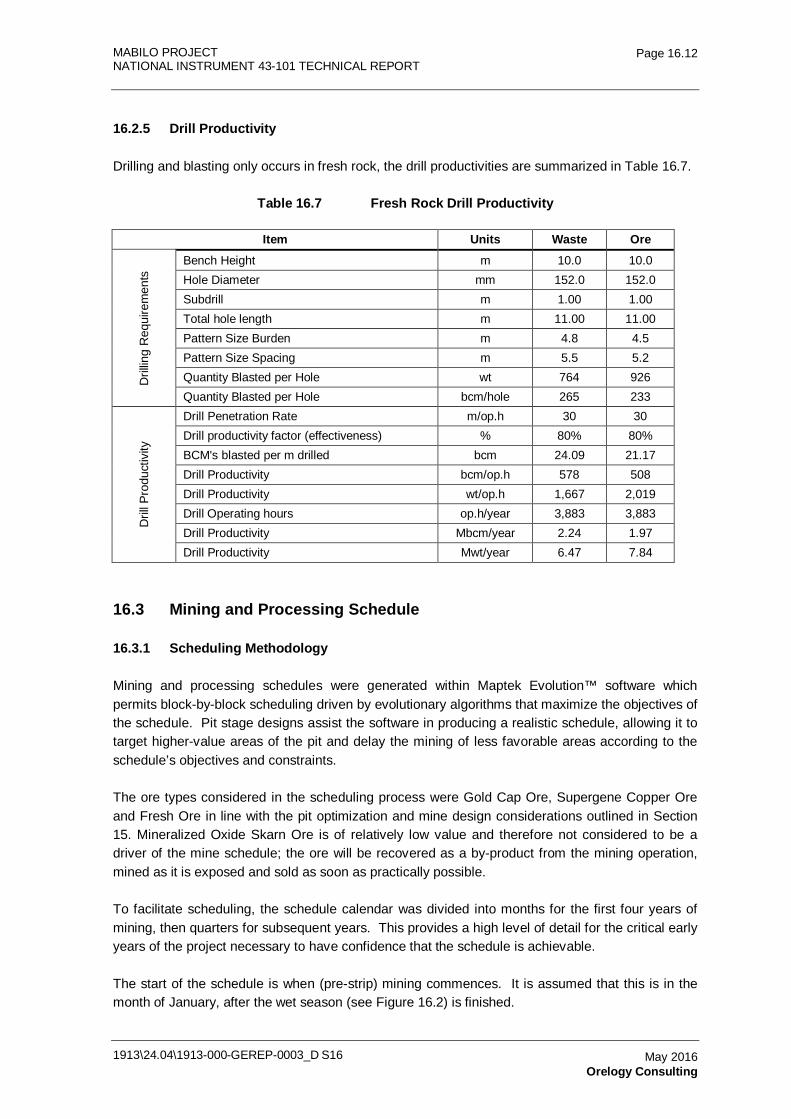
MABILO PROJECT NATIONAL INSTRUMENT 43-101 TECHNICAL REPORT
1913\24.04\1913-000-GEREP-0003_D S16
Page 16.12
May 2016 Orelogy Consulting
16.2.5 Drill Productivity
Drilling and blasting only occurs in fresh rock, the drill productivities are summarized in Table 16.7.
Table 16.7 Fresh Rock Drill Productivity
Item Units Waste Ore
Dril
ling
Req
uire
men
ts Bench Height m 10.0 10.0
Hole Diameter mm 152.0 152.0 Subdrill m 1.00 1.00 Total hole length m 11.00 11.00 Pattern Size Burden m 4.8 4.5 Pattern Size Spacing m 5.5 5.2 Quantity Blasted per Hole wt 764 926 Quantity Blasted per Hole bcm/hole 265 233
Dril
l Pro
duct
ivity
Drill Penetration Rate m/op.h 30 30 Drill productivity factor (effectiveness) % 80% 80% BCM's blasted per m drilled bcm 24.09 21.17 Drill Productivity bcm/op.h 578 508 Drill Productivity wt/op.h 1,667 2,019 Drill Operating hours op.h/year 3,883 3,883 Drill Productivity Mbcm/year 2.24 1.97 Drill Productivity Mwt/year 6.47 7.84
16.3 Mining and Processing Schedule
16.3.1 Scheduling Methodology
Mining and processing schedules were generated within Maptek Evolution™ software which permits block-by-block scheduling driven by evolutionary algorithms that maximize the objectives of the schedule. Pit stage designs assist the software in producing a realistic schedule, allowing it to target higher-value areas of the pit and delay the mining of less favorable areas according to the schedule’s objectives and constraints.
The ore types considered in the scheduling process were Gold Cap Ore, Supergene Copper Ore and Fresh Ore in line with the pit optimization and mine design considerations outlined in Section 15. Mineralized Oxide Skarn Ore is of relatively low value and therefore not considered to be a driver of the mine schedule; the ore will be recovered as a by-product from the mining operation, mined as it is exposed and sold as soon as practically possible.
To facilitate scheduling, the schedule calendar was divided into months for the first four years of mining, then quarters for subsequent years. This provides a high level of detail for the critical early years of the project necessary to have confidence that the schedule is achievable.
The start of the schedule is when (pre-strip) mining commences. It is assumed that this is in the month of January, after the wet season (see Figure 16.2) is finished.
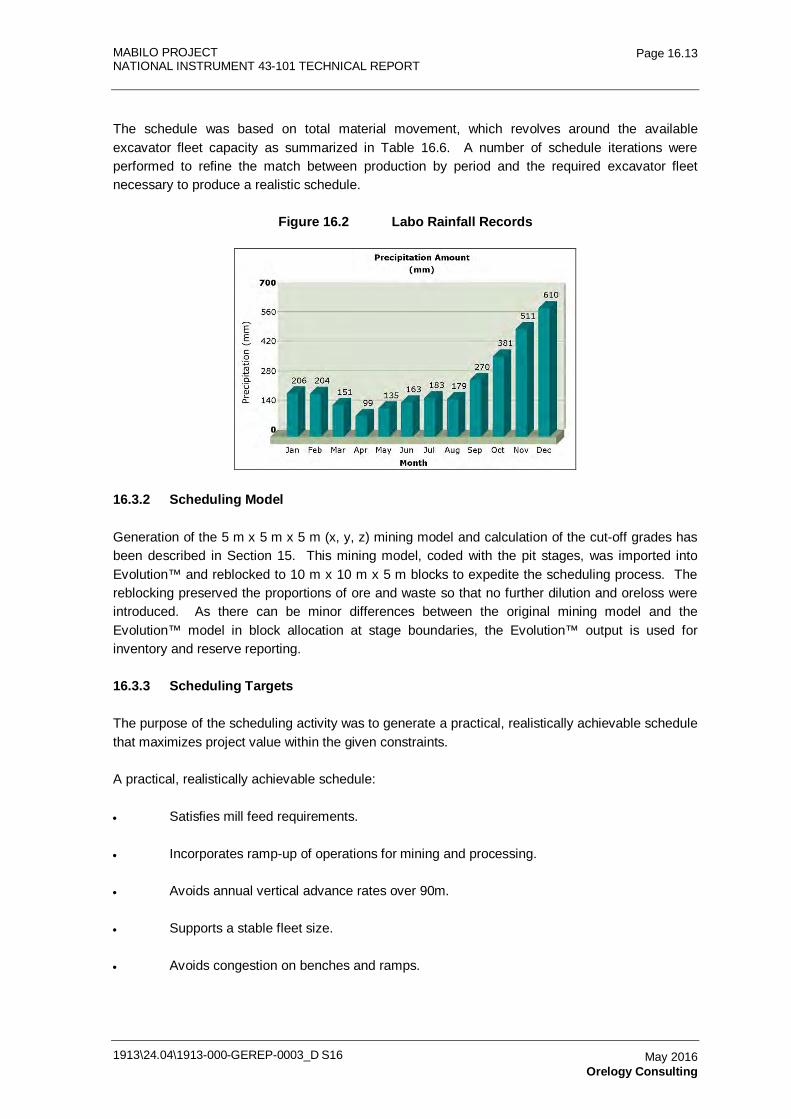
MABILO PROJECT NATIONAL INSTRUMENT 43-101 TECHNICAL REPORT
1913\24.04\1913-000-GEREP-0003_D S16
Page 16.13
May 2016 Orelogy Consulting
The schedule was based on total material movement, which revolves around the available excavator fleet capacity as summarized in Table 16.6. A number of schedule iterations were performed to refine the match between production by period and the required excavator fleet necessary to produce a realistic schedule.
Figure 16.2 Labo Rainfall Records
16.3.2 Scheduling Model
Generation of the 5 m x 5 m x 5 m (x, y, z) mining model and calculation of the cut-off grades has been described in Section 15. This mining model, coded with the pit stages, was imported into Evolution™ and reblocked to 10 m x 10 m x 5 m blocks to expedite the scheduling process. The reblocking preserved the proportions of ore and waste so that no further dilution and oreloss were introduced. As there can be minor differences between the original mining model and the Evolution™ model in block allocation at stage boundaries, the Evolution™ output is used for inventory and reserve reporting.
16.3.3 Scheduling Targets
The purpose of the scheduling activity was to generate a practical, realistically achievable schedule that maximizes project value within the given constraints.
A practical, realistically achievable schedule:
• Satisfies mill feed requirements.
• Incorporates ramp-up of operations for mining and processing.
• Avoids annual vertical advance rates over 90m.
• Supports a stable fleet size.
• Avoids congestion on benches and ramps.
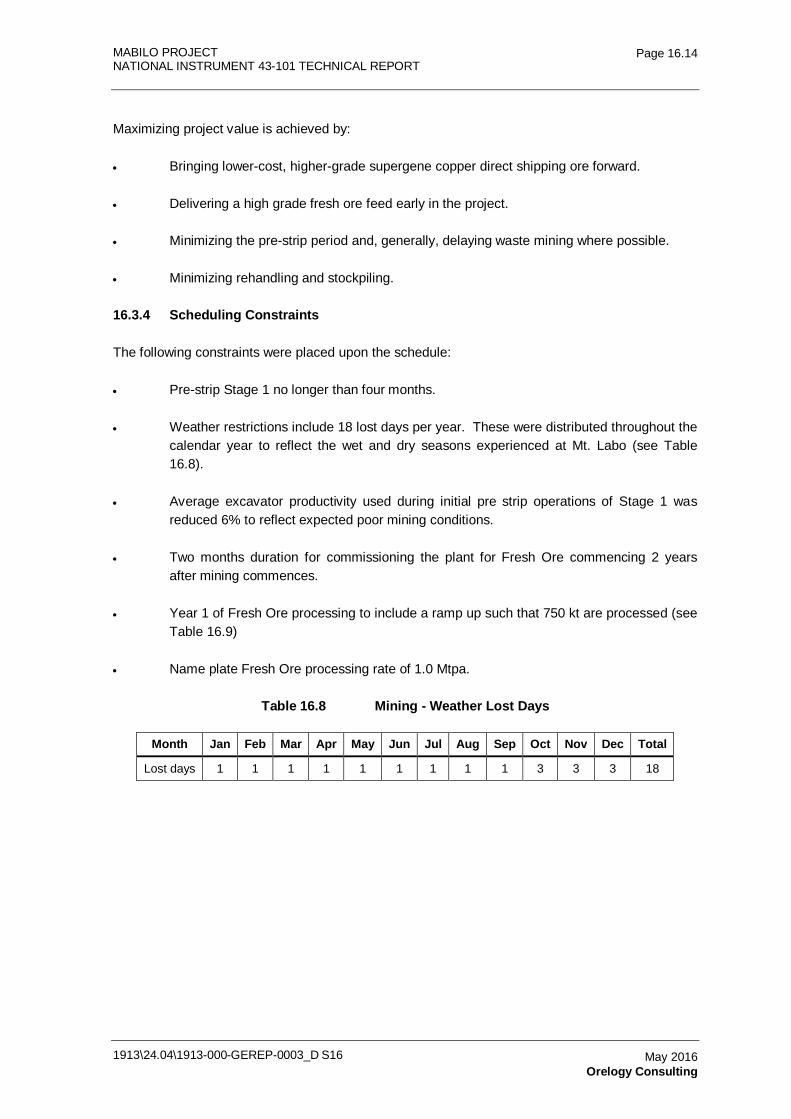
MABILO PROJECT NATIONAL INSTRUMENT 43-101 TECHNICAL REPORT
1913\24.04\1913-000-GEREP-0003_D S16
Page 16.14
May 2016 Orelogy Consulting
Maximizing project value is achieved by:
• Bringing lower-cost, higher-grade supergene copper direct shipping ore forward.
• Delivering a high grade fresh ore feed early in the project.
• Minimizing the pre-strip period and, generally, delaying waste mining where possible.
• Minimizing rehandling and stockpiling.
16.3.4 Scheduling Constraints
The following constraints were placed upon the schedule:
• Pre-strip Stage 1 no longer than four months.
• Weather restrictions include 18 lost days per year. These were distributed throughout the calendar year to reflect the wet and dry seasons experienced at Mt. Labo (see Table 16.8).
• Average excavator productivity used during initial pre strip operations of Stage 1 was reduced 6% to reflect expected poor mining conditions.
• Two months duration for commissioning the plant for Fresh Ore commencing 2 years after mining commences.
• Year 1 of Fresh Ore processing to include a ramp up such that 750 kt are processed (see Table 16.9)
• Name plate Fresh Ore processing rate of 1.0 Mtpa.
Table 16.8 Mining - Weather Lost Days
Month Jan Feb Mar Apr May Jun Jul Aug Sep Oct Nov Dec Total
Lost days 1 1 1 1 1 1 1 1 1 3 3 3 18
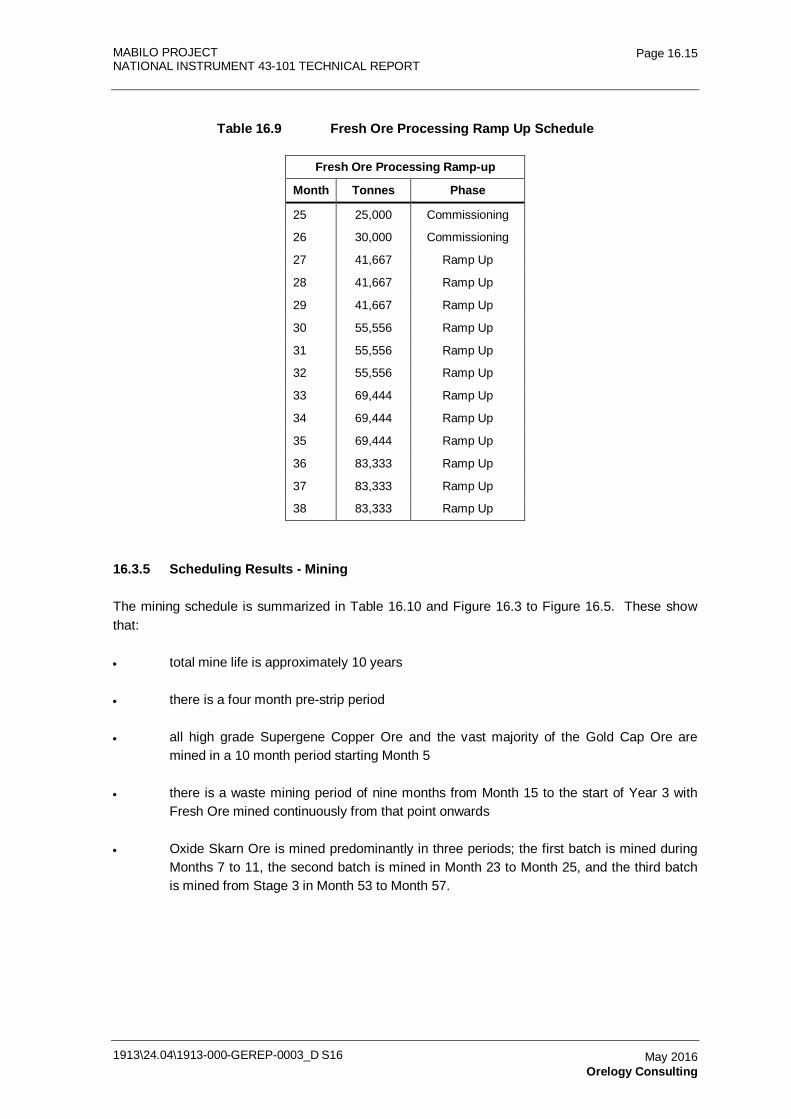
MABILO PROJECT NATIONAL INSTRUMENT 43-101 TECHNICAL REPORT
1913\24.04\1913-000-GEREP-0003_D S16
Page 16.15
May 2016 Orelogy Consulting
Table 16.9 Fresh Ore Processing Ramp Up Schedule
Fresh Ore Processing Ramp-up
Month Tonnes Phase
25 25,000 Commissioning
26 30,000 Commissioning
27 41,667 Ramp Up
28 41,667 Ramp Up
29 41,667 Ramp Up
30 55,556 Ramp Up
31 55,556 Ramp Up
32 55,556 Ramp Up
33 69,444 Ramp Up
34 69,444 Ramp Up
35 69,444 Ramp Up
36 83,333 Ramp Up
37 83,333 Ramp Up
38 83,333 Ramp Up
16.3.5 Scheduling Results - Mining
The mining schedule is summarized in Table 16.10 and Figure 16.3 to Figure 16.5. These show that:
• total mine life is approximately 10 years
• there is a four month pre-strip period
• all high grade Supergene Copper Ore and the vast majority of the Gold Cap Ore are mined in a 10 month period starting Month 5
• there is a waste mining period of nine months from Month 15 to the start of Year 3 with Fresh Ore mined continuously from that point onwards
• Oxide Skarn Ore is mined predominantly in three periods; the first batch is mined during Months 7 to 11, the second batch is mined in Month 23 to Month 25, and the third batch is mined from Stage 3 in Month 53 to Month 57.
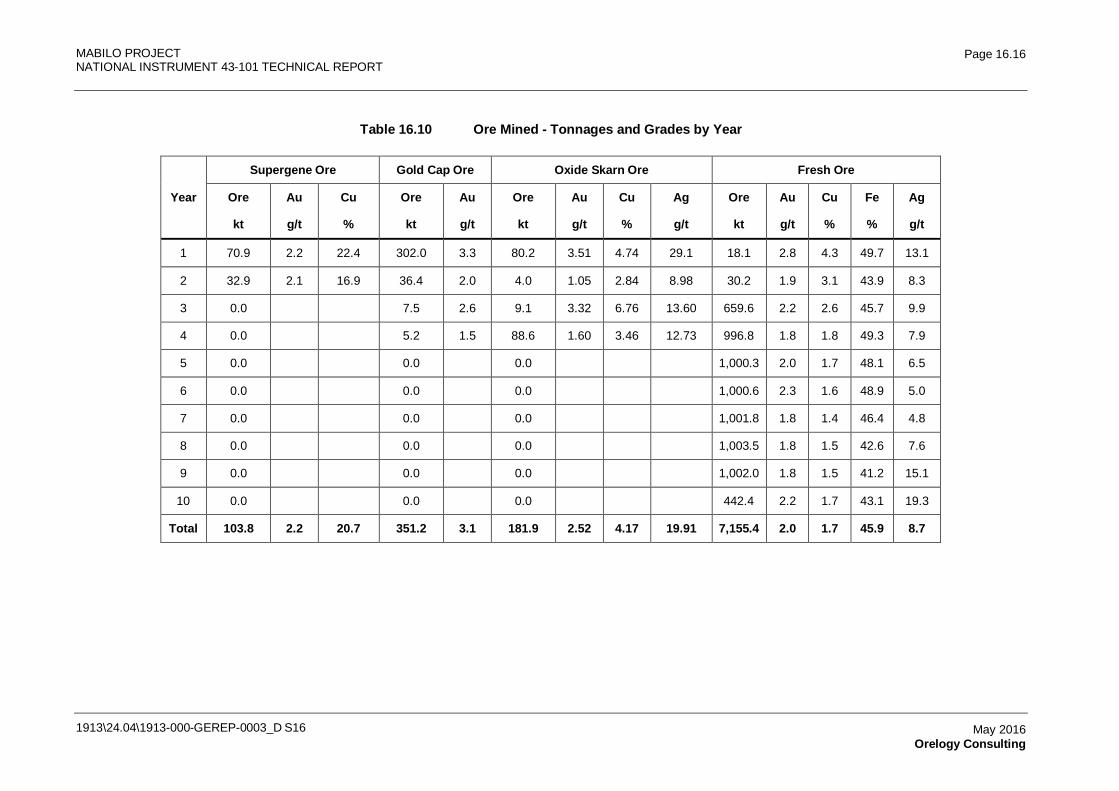
MABILO PROJECT NATIONAL INSTRUMENT 43-101 TECHNICAL REPORT
1913\24.04\1913-000-GEREP-0003_D S16
Page 16.16
May 2016 Orelogy Consulting
Table 16.10 Ore Mined - Tonnages and Grades by Year
Supergene Ore Gold Cap Ore Oxide Skarn Ore Fresh Ore
Year Ore Au Cu Ore Au Ore Au Cu Ag Ore Au Cu Fe Ag
kt g/t % kt g/t kt g/t % g/t kt g/t % % g/t
1 70.9 2.2 22.4 302.0 3.3 80.2 3.51 4.74 29.1 18.1 2.8 4.3 49.7 13.1
2 32.9 2.1 16.9 36.4 2.0 4.0 1.05 2.84 8.98 30.2 1.9 3.1 43.9 8.3
3 0.0 7.5 2.6 9.1 3.32 6.76 13.60 659.6 2.2 2.6 45.7 9.9
4 0.0 5.2 1.5 88.6 1.60 3.46 12.73 996.8 1.8 1.8 49.3 7.9
5 0.0 0.0 0.0 1,000.3 2.0 1.7 48.1 6.5
6 0.0 0.0 0.0 1,000.6 2.3 1.6 48.9 5.0
7 0.0 0.0 0.0 1,001.8 1.8 1.4 46.4 4.8
8 0.0 0.0 0.0 1,003.5 1.8 1.5 42.6 7.6
9 0.0 0.0 0.0 1,002.0 1.8 1.5 41.2 15.1
10 0.0 0.0 0.0 442.4 2.2 1.7 43.1 19.3
Total 103.8 2.2 20.7 351.2 3.1 181.9 2.52 4.17 19.91 7,155.4 2.0 1.7 45.9 8.7
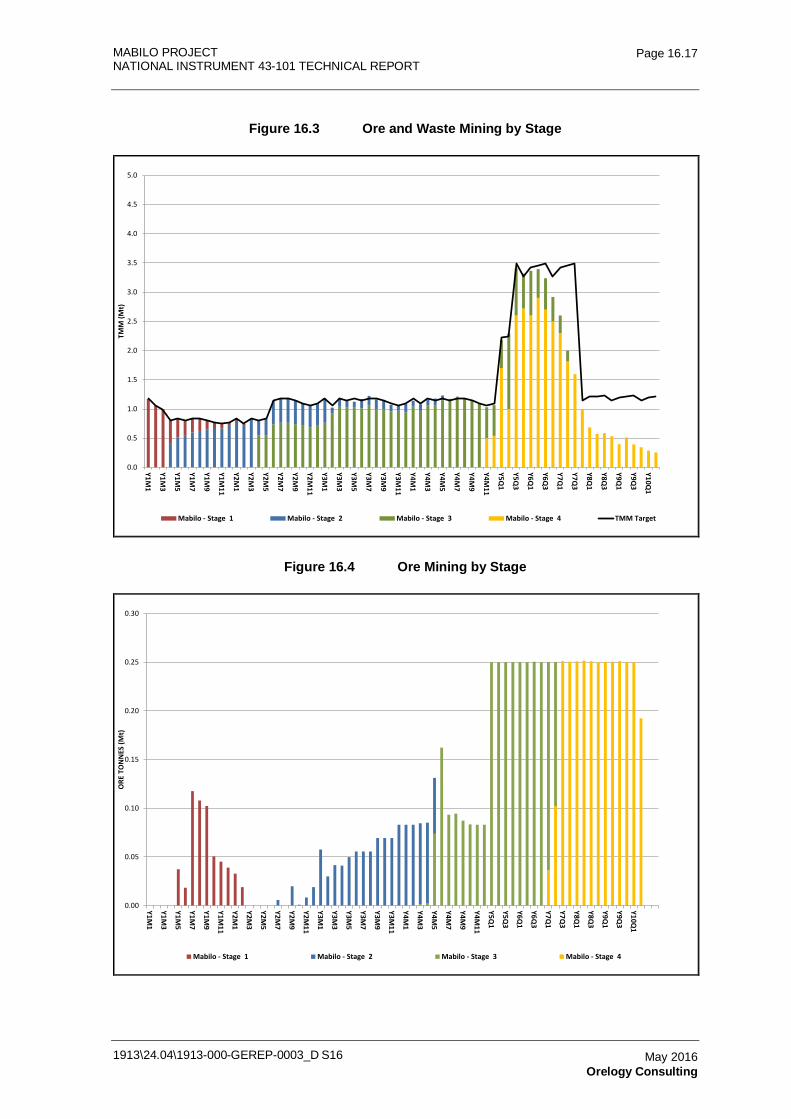
MABILO PROJECT NATIONAL INSTRUMENT 43-101 TECHNICAL REPORT
1913\24.04\1913-000-GEREP-0003_D S16
Page 16.17
May 2016 Orelogy Consulting
Figure 16.3 Ore and Waste Mining by Stage
0.0
0.5
1.0
1.5
2.0
2.5
3.0
3.5
4.0
4.5
5.0
Y1M1
Y1M3
Y1M5
Y1M7
Y1M9
Y1M11
Y2M1
Y2M3
Y2M5
Y2M7
Y2M9
Y2M11
Y3M1
Y3M3
Y3M5
Y3M7
Y3M9
Y3M11
Y4M1
Y4M3
Y4M5
Y4M7
Y4M9
Y4M11
Y5Q1
Y5Q3
Y6Q1
Y6Q3
Y7Q1
Y7Q3
Y8Q1
Y8Q3
Y9Q1
Y9Q3
Y10Q1
TMM
(Mt)
Mabilo - Stage 1 Mabilo - Stage 2 Mabilo - Stage 3 Mabilo - Stage 4 TMM Target
Figure 16.4 Ore Mining by Stage
0.00
0.05
0.10
0.15
0.20
0.25
0.30
Y1M1
Y1M3
Y1M5
Y1M7
Y1M9
Y1M11
Y2M1
Y2M3
Y2M5
Y2M7
Y2M9
Y2M11
Y3M1
Y3M3
Y3M5
Y3M7
Y3M9
Y3M11
Y4M1
Y4M3
Y4M5
Y4M7
Y4M9
Y4M11
Y5Q1
Y5Q3
Y6Q1
Y6Q3
Y7Q1
Y7Q3
Y8Q1
Y8Q3
Y9Q1
Y9Q3
Y10Q1
ORE
TO
NN
ES (M
t)
Mabilo - Stage 1 Mabilo - Stage 2 Mabilo - Stage 3 Mabilo - Stage 4
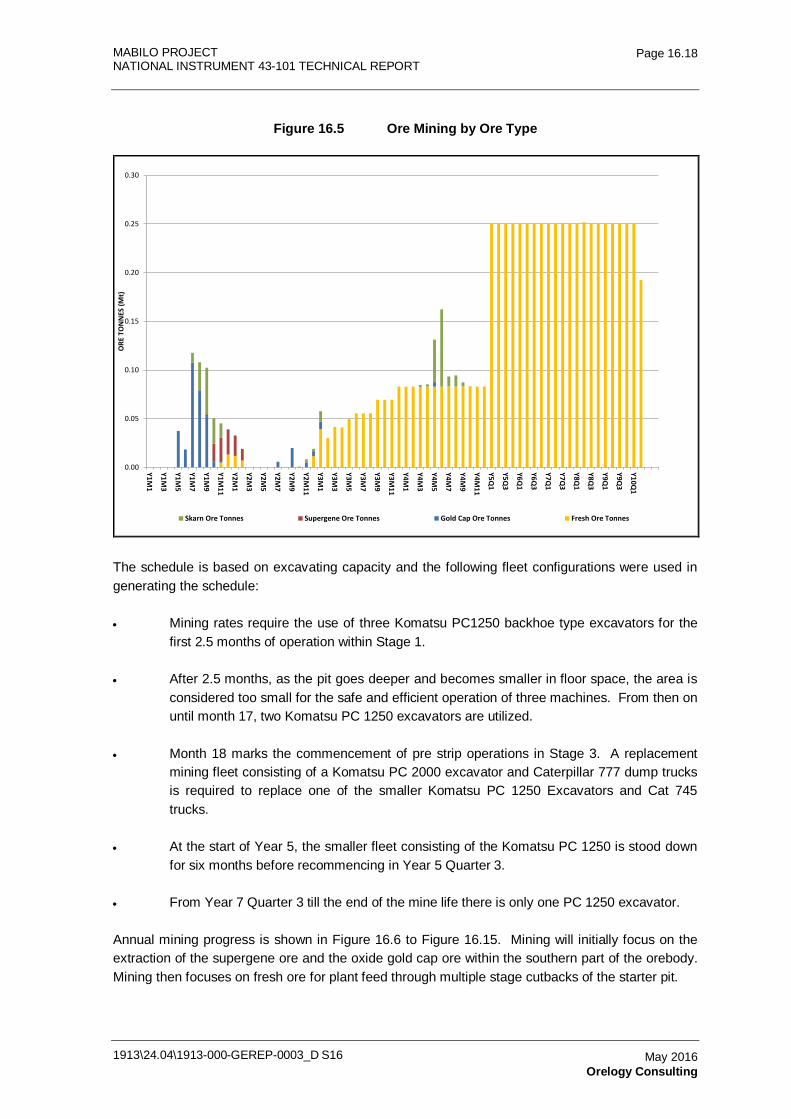
MABILO PROJECT NATIONAL INSTRUMENT 43-101 TECHNICAL REPORT
1913\24.04\1913-000-GEREP-0003_D S16
Page 16.18
May 2016 Orelogy Consulting
Figure 16.5 Ore Mining by Ore Type
0.00
0.05
0.10
0.15
0.20
0.25
0.30
Y1M1
Y1M3
Y1M5
Y1M7
Y1M9
Y1M11
Y2M1
Y2M3
Y2M5
Y2M7
Y2M9
Y2M11
Y3M1
Y3M3
Y3M5
Y3M7
Y3M9
Y3M11
Y4M1
Y4M3
Y4M5
Y4M7
Y4M9
Y4M11
Y5Q1
Y5Q3
Y6Q1
Y6Q3
Y7Q1
Y7Q3
Y8Q1
Y8Q3
Y9Q1
Y9Q3
Y10Q1
ORE
TO
NN
ES (M
t)
Skarn Ore Tonnes Supergene Ore Tonnes Gold Cap Ore Tonnes Fresh Ore Tonnes
The schedule is based on excavating capacity and the following fleet configurations were used in generating the schedule:
• Mining rates require the use of three Komatsu PC1250 backhoe type excavators for the first 2.5 months of operation within Stage 1.
• After 2.5 months, as the pit goes deeper and becomes smaller in floor space, the area is considered too small for the safe and efficient operation of three machines. From then on until month 17, two Komatsu PC 1250 excavators are utilized.
• Month 18 marks the commencement of pre strip operations in Stage 3. A replacement mining fleet consisting of a Komatsu PC 2000 excavator and Caterpillar 777 dump trucks is required to replace one of the smaller Komatsu PC 1250 Excavators and Cat 745 trucks.
• At the start of Year 5, the smaller fleet consisting of the Komatsu PC 1250 is stood down for six months before recommencing in Year 5 Quarter 3.
• From Year 7 Quarter 3 till the end of the mine life there is only one PC 1250 excavator.
Annual mining progress is shown in Figure 16.6 to Figure 16.15. Mining will initially focus on the extraction of the supergene ore and the oxide gold cap ore within the southern part of the orebody. Mining then focuses on fresh ore for plant feed through multiple stage cutbacks of the starter pit.
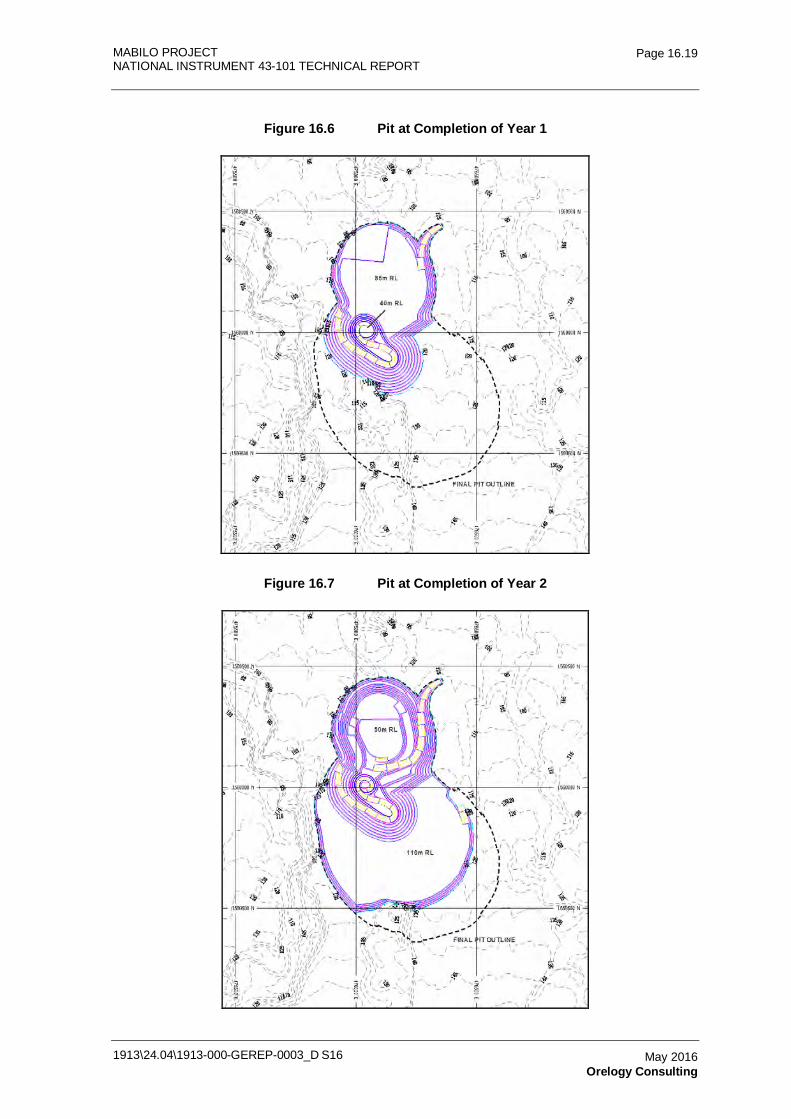
MABILO PROJECT NATIONAL INSTRUMENT 43-101 TECHNICAL REPORT
1913\24.04\1913-000-GEREP-0003_D S16
Page 16.19
May 2016 Orelogy Consulting
Figure 16.6 Pit at Completion of Year 1
Figure 16.7 Pit at Completion of Year 2
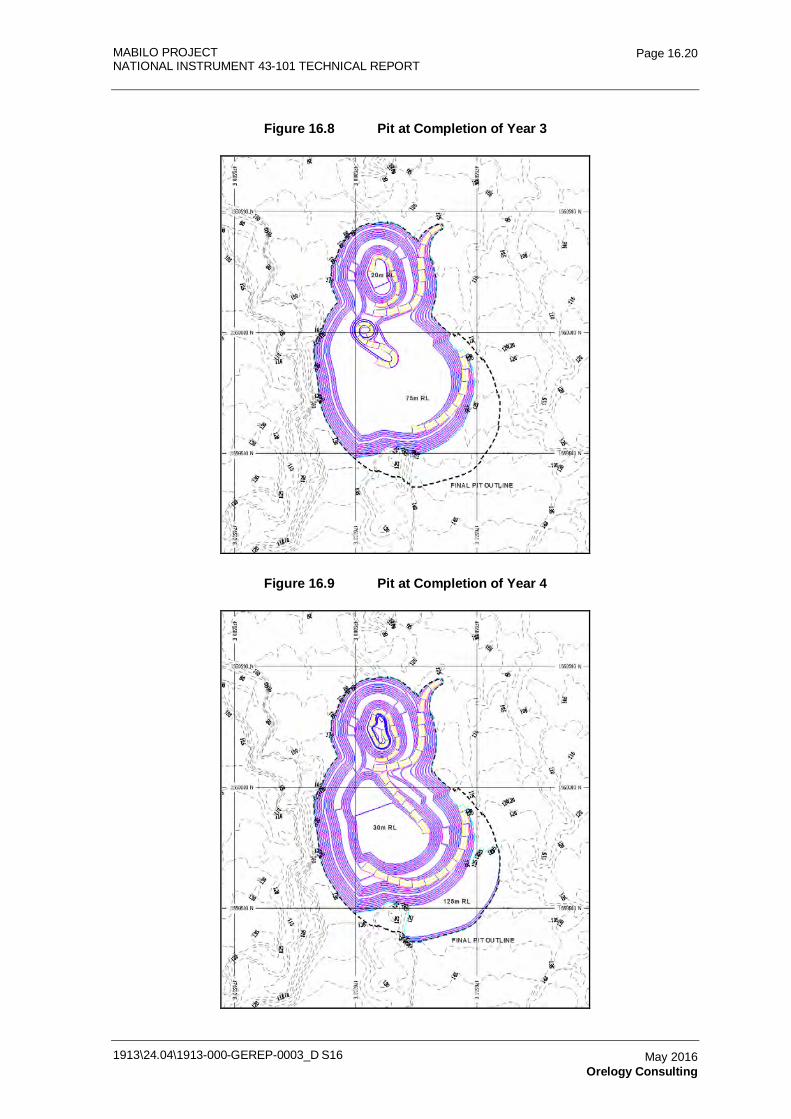
MABILO PROJECT NATIONAL INSTRUMENT 43-101 TECHNICAL REPORT
1913\24.04\1913-000-GEREP-0003_D S16
Page 16.20
May 2016 Orelogy Consulting
Figure 16.8 Pit at Completion of Year 3
Figure 16.9 Pit at Completion of Year 4
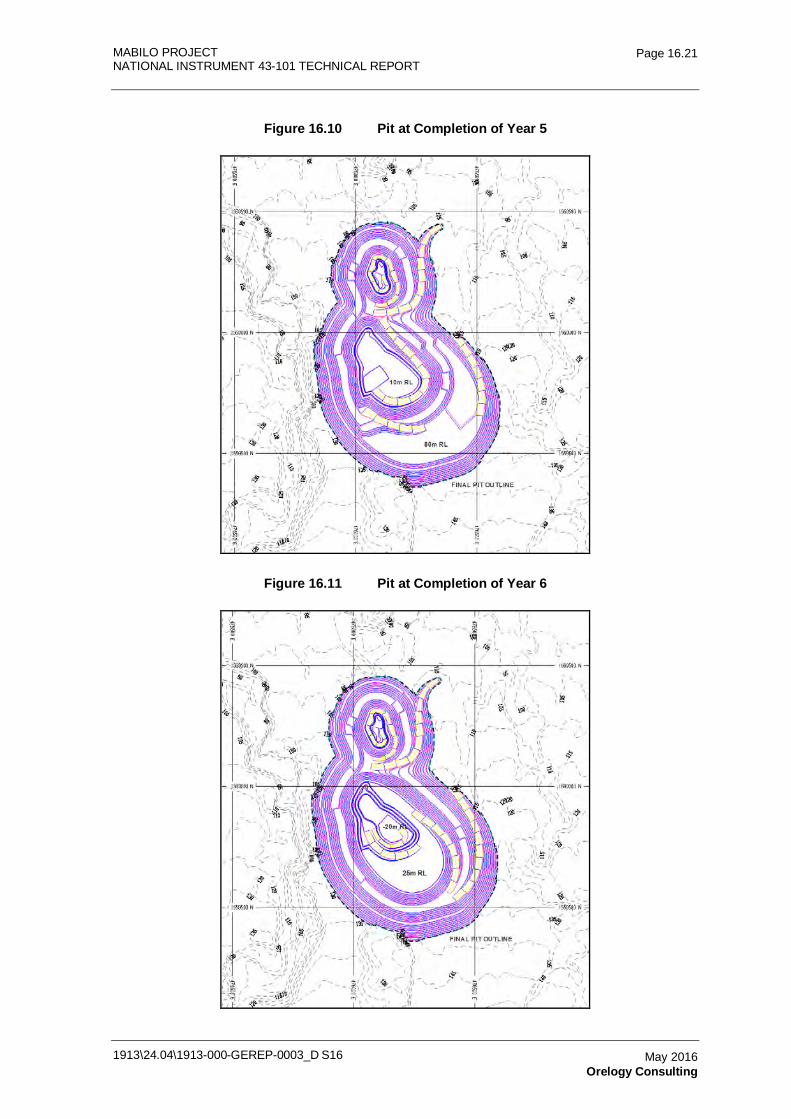
MABILO PROJECT NATIONAL INSTRUMENT 43-101 TECHNICAL REPORT
1913\24.04\1913-000-GEREP-0003_D S16
Page 16.21
May 2016 Orelogy Consulting
Figure 16.10 Pit at Completion of Year 5
Figure 16.11 Pit at Completion of Year 6
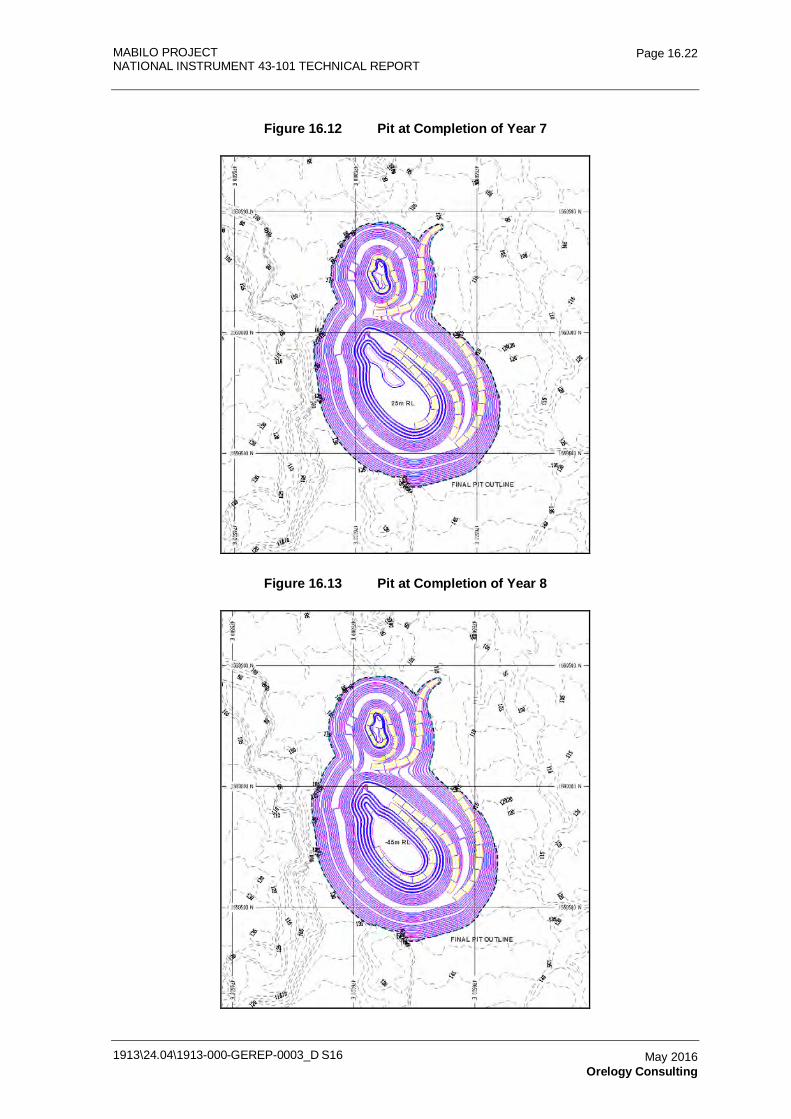
MABILO PROJECT NATIONAL INSTRUMENT 43-101 TECHNICAL REPORT
1913\24.04\1913-000-GEREP-0003_D S16
Page 16.22
May 2016 Orelogy Consulting
Figure 16.12 Pit at Completion of Year 7
Figure 16.13 Pit at Completion of Year 8
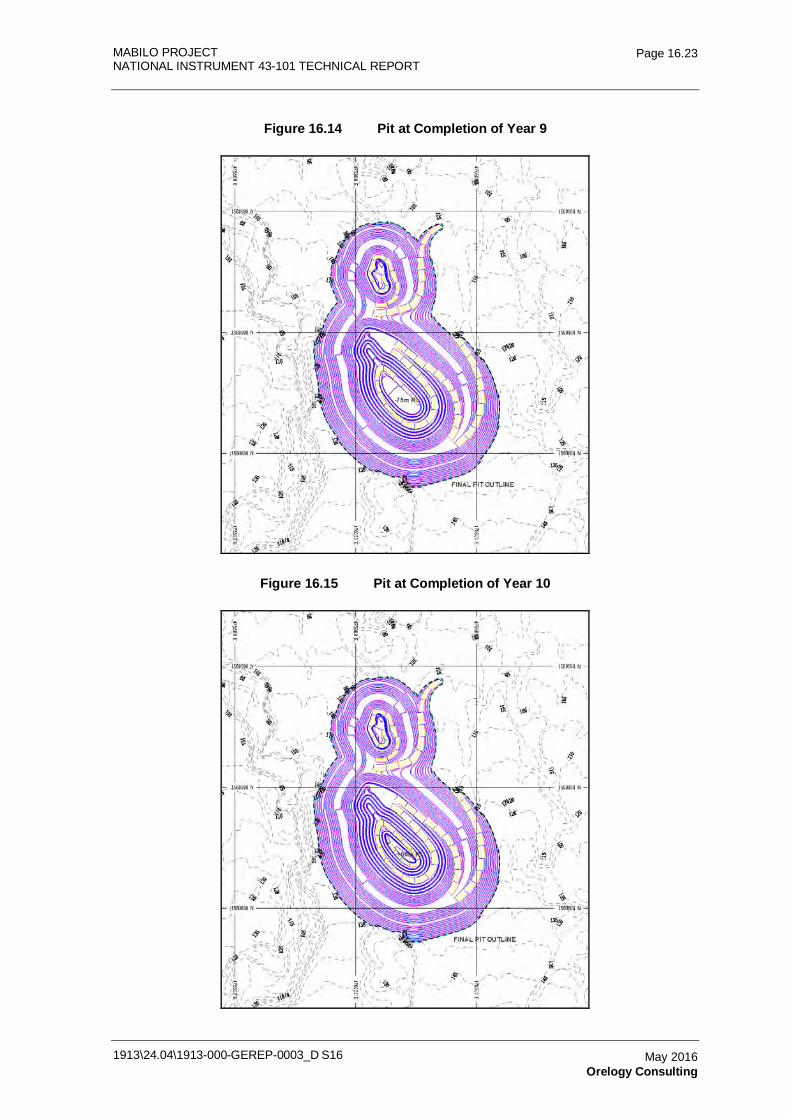
MABILO PROJECT NATIONAL INSTRUMENT 43-101 TECHNICAL REPORT
1913\24.04\1913-000-GEREP-0003_D S16
Page 16.23
May 2016 Orelogy Consulting
Figure 16.14 Pit at Completion of Year 9
Figure 16.15 Pit at Completion of Year 10
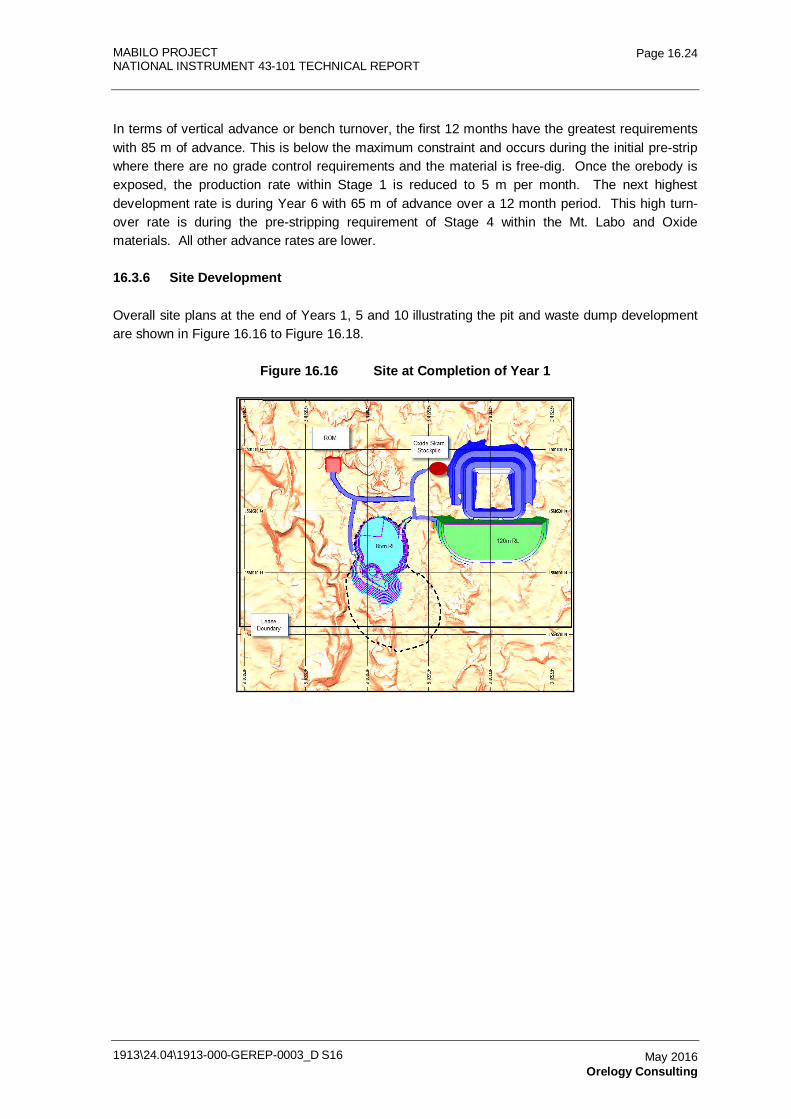
MABILO PROJECT NATIONAL INSTRUMENT 43-101 TECHNICAL REPORT
1913\24.04\1913-000-GEREP-0003_D S16
Page 16.24
May 2016 Orelogy Consulting
In terms of vertical advance or bench turnover, the first 12 months have the greatest requirements with 85 m of advance. This is below the maximum constraint and occurs during the initial pre-strip where there are no grade control requirements and the material is free-dig. Once the orebody is exposed, the production rate within Stage 1 is reduced to 5 m per month. The next highest development rate is during Year 6 with 65 m of advance over a 12 month period. This high turn-over rate is during the pre-stripping requirement of Stage 4 within the Mt. Labo and Oxide materials. All other advance rates are lower.
16.3.6 Site Development
Overall site plans at the end of Years 1, 5 and 10 illustrating the pit and waste dump development are shown in Figure 16.16 to Figure 16.18.
Figure 16.16 Site at Completion of Year 1
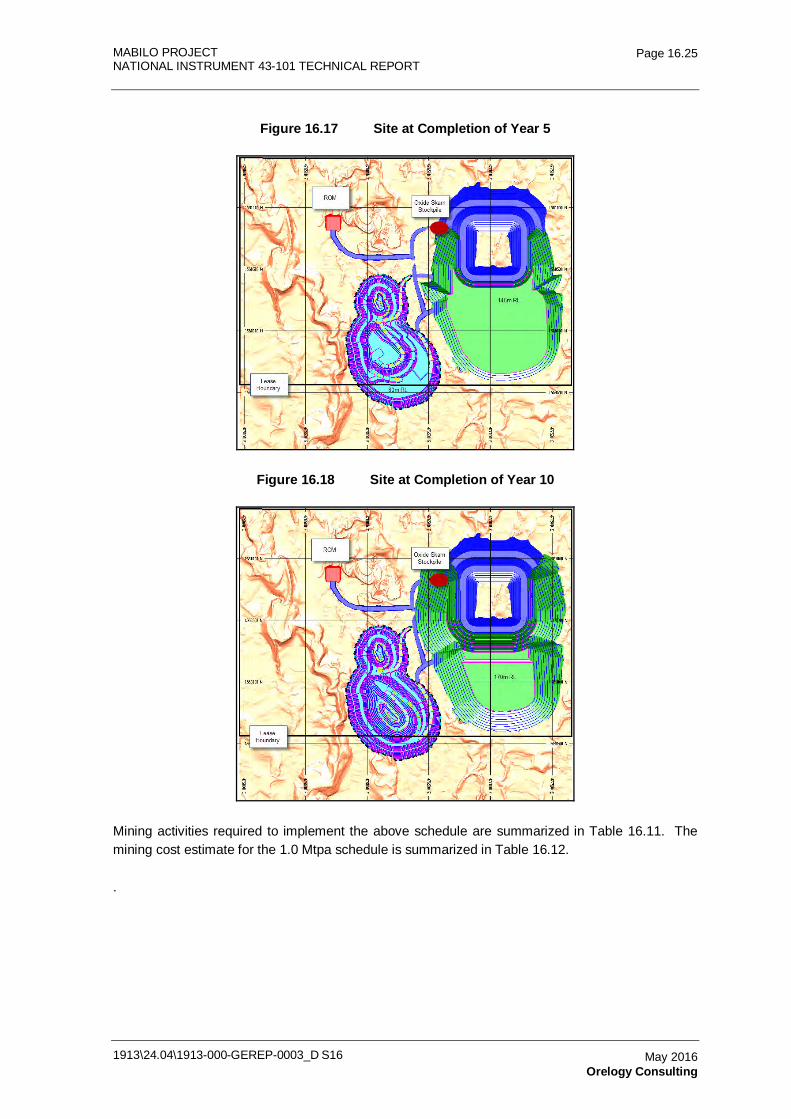
MABILO PROJECT NATIONAL INSTRUMENT 43-101 TECHNICAL REPORT
1913\24.04\1913-000-GEREP-0003_D S16
Page 16.25
May 2016 Orelogy Consulting
Figure 16.17 Site at Completion of Year 5
Figure 16.18 Site at Completion of Year 10
Mining activities required to implement the above schedule are summarized in Table 16.11. The mining cost estimate for the 1.0 Mtpa schedule is summarized in Table 16.12.
.
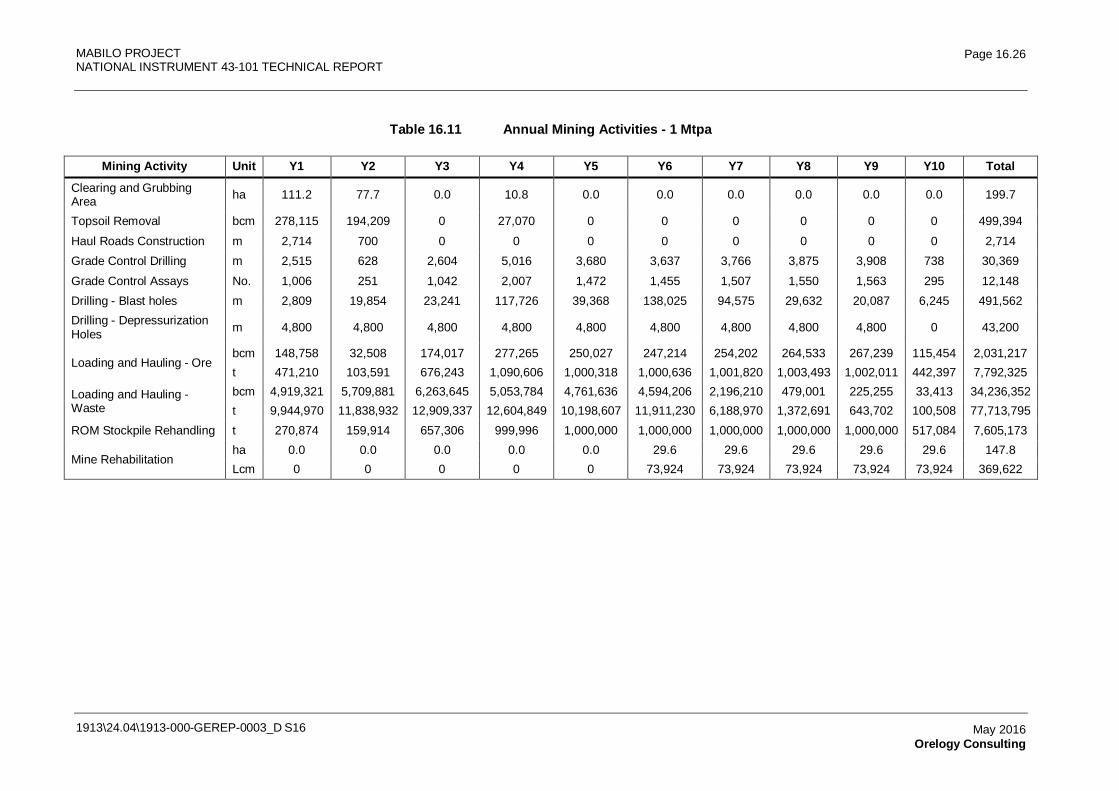
MABILO PROJECT NATIONAL INSTRUMENT 43-101 TECHNICAL REPORT
1913\24.04\1913-000-GEREP-0003_D S16
Page 16.26
May 2016 Orelogy Consulting
Table 16.11 Annual Mining Activities - 1 Mtpa
Mining Activity Unit Y1 Y2 Y3 Y4 Y5 Y6 Y7 Y8 Y9 Y10 Total
Clearing and Grubbing Area ha 111.2 77.7 0.0 10.8 0.0 0.0 0.0 0.0 0.0 0.0 199.7
Topsoil Removal bcm 278,115 194,209 0 27,070 0 0 0 0 0 0 499,394 Haul Roads Construction m 2,714 700 0 0 0 0 0 0 0 0 2,714 Grade Control Drilling m 2,515 628 2,604 5,016 3,680 3,637 3,766 3,875 3,908 738 30,369 Grade Control Assays No. 1,006 251 1,042 2,007 1,472 1,455 1,507 1,550 1,563 295 12,148 Drilling - Blast holes m 2,809 19,854 23,241 117,726 39,368 138,025 94,575 29,632 20,087 6,245 491,562 Drilling - Depressurization Holes m 4,800 4,800 4,800 4,800 4,800 4,800 4,800 4,800 4,800 0 43,200
Loading and Hauling - Ore bcm 148,758 32,508 174,017 277,265 250,027 247,214 254,202 264,533 267,239 115,454 2,031,217 t 471,210 103,591 676,243 1,090,606 1,000,318 1,000,636 1,001,820 1,003,493 1,002,011 442,397 7,792,325
Loading and Hauling - Waste
bcm 4,919,321 5,709,881 6,263,645 5,053,784 4,761,636 4,594,206 2,196,210 479,001 225,255 33,413 34,236,352 t 9,944,970 11,838,932 12,909,337 12,604,849 10,198,607 11,911,230 6,188,970 1,372,691 643,702 100,508 77,713,795
ROM Stockpile Rehandling t 270,874 159,914 657,306 999,996 1,000,000 1,000,000 1,000,000 1,000,000 1,000,000 517,084 7,605,173
Mine Rehabilitation ha 0.0 0.0 0.0 0.0 0.0 29.6 29.6 29.6 29.6 29.6 147.8 Lcm 0 0 0 0 0 73,924 73,924 73,924 73,924 73,924 369,622
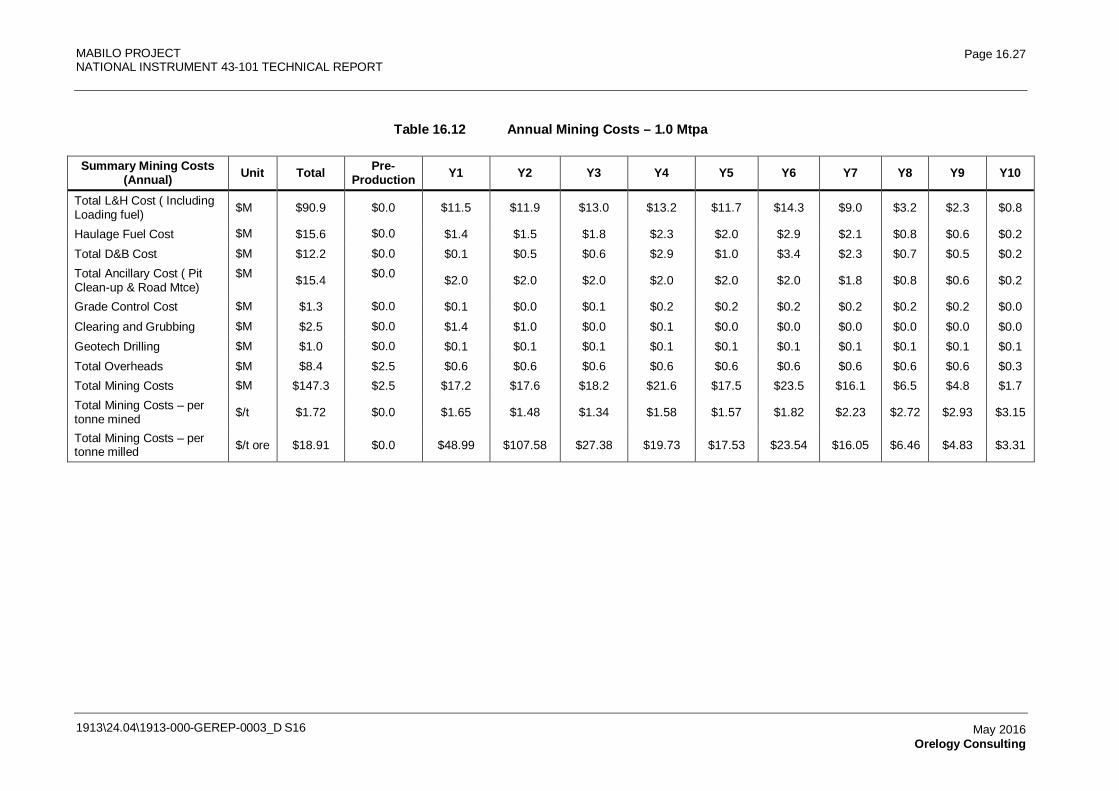
MABILO PROJECT NATIONAL INSTRUMENT 43-101 TECHNICAL REPORT
1913\24.04\1913-000-GEREP-0003_D S16
Page 16.27
May 2016 Orelogy Consulting
Table 16.12 Annual Mining Costs – 1.0 Mtpa
Summary Mining Costs (Annual) Unit Total Pre-
Production Y1 Y2 Y3 Y4 Y5 Y6 Y7 Y8 Y9 Y10
Total L&H Cost ( Including Loading fuel) $M $90.9 $0.0 $11.5 $11.9 $13.0 $13.2 $11.7 $14.3 $9.0 $3.2 $2.3 $0.8
Haulage Fuel Cost $M $15.6 $0.0 $1.4 $1.5 $1.8 $2.3 $2.0 $2.9 $2.1 $0.8 $0.6 $0.2 Total D&B Cost $M $12.2 $0.0 $0.1 $0.5 $0.6 $2.9 $1.0 $3.4 $2.3 $0.7 $0.5 $0.2 Total Ancillary Cost ( Pit Clean-up & Road Mtce)
$M $15.4 $0.0 $2.0 $2.0 $2.0 $2.0 $2.0 $2.0 $1.8 $0.8 $0.6 $0.2
Grade Control Cost $M $1.3 $0.0 $0.1 $0.0 $0.1 $0.2 $0.2 $0.2 $0.2 $0.2 $0.2 $0.0 Clearing and Grubbing $M $2.5 $0.0 $1.4 $1.0 $0.0 $0.1 $0.0 $0.0 $0.0 $0.0 $0.0 $0.0 Geotech Drilling $M $1.0 $0.0 $0.1 $0.1 $0.1 $0.1 $0.1 $0.1 $0.1 $0.1 $0.1 $0.1 Total Overheads $M $8.4 $2.5 $0.6 $0.6 $0.6 $0.6 $0.6 $0.6 $0.6 $0.6 $0.6 $0.3 Total Mining Costs $M $147.3 $2.5 $17.2 $17.6 $18.2 $21.6 $17.5 $23.5 $16.1 $6.5 $4.8 $1.7 Total Mining Costs – per tonne mined $/t $1.72 $0.0 $1.65 $1.48 $1.34 $1.58 $1.57 $1.82 $2.23 $2.72 $2.93 $3.15
Total Mining Costs – per tonne milled $/t ore $18.91 $0.0 $48.99 $107.58 $27.38 $19.73 $17.53 $23.54 $16.05 $6.46 $4.83 $3.31
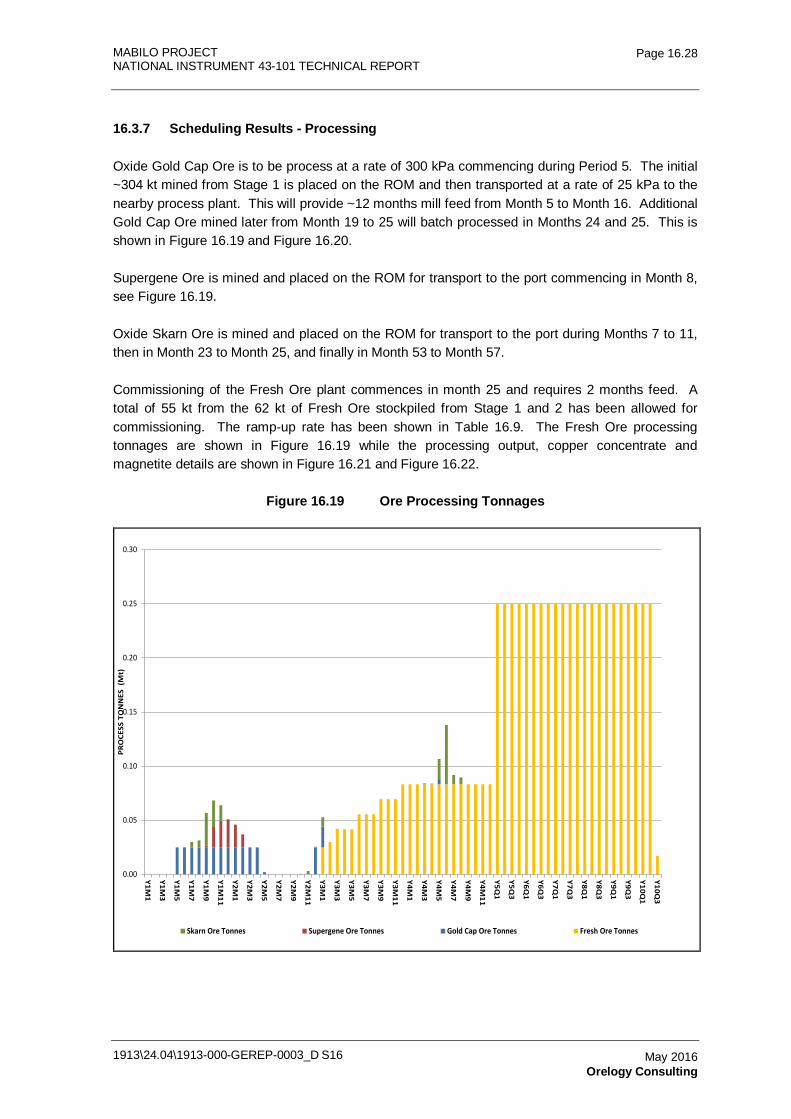
MABILO PROJECT NATIONAL INSTRUMENT 43-101 TECHNICAL REPORT
1913\24.04\1913-000-GEREP-0003_D S16
Page 16.28
May 2016 Orelogy Consulting
16.3.7 Scheduling Results - Processing
Oxide Gold Cap Ore is to be process at a rate of 300 kPa commencing during Period 5. The initial ~304 kt mined from Stage 1 is placed on the ROM and then transported at a rate of 25 kPa to the nearby process plant. This will provide ~12 months mill feed from Month 5 to Month 16. Additional Gold Cap Ore mined later from Month 19 to 25 will batch processed in Months 24 and 25. This is shown in Figure 16.19 and Figure 16.20.
Supergene Ore is mined and placed on the ROM for transport to the port commencing in Month 8, see Figure 16.19.
Oxide Skarn Ore is mined and placed on the ROM for transport to the port during Months 7 to 11, then in Month 23 to Month 25, and finally in Month 53 to Month 57.
Commissioning of the Fresh Ore plant commences in month 25 and requires 2 months feed. A total of 55 kt from the 62 kt of Fresh Ore stockpiled from Stage 1 and 2 has been allowed for commissioning. The ramp-up rate has been shown in Table 16.9. The Fresh Ore processing tonnages are shown in Figure 16.19 while the processing output, copper concentrate and magnetite details are shown in Figure 16.21 and Figure 16.22.
Figure 16.19 Ore Processing Tonnages
0.00
0.05
0.10
0.15
0.20
0.25
0.30
Y1M1
Y1M3
Y1M5
Y1M7
Y1M9
Y1M11
Y2M1
Y2M3
Y2M5
Y2M7
Y2M9
Y2M11
Y3M1
Y3M3
Y3M5
Y3M7
Y3M9
Y3M11
Y4M1
Y4M3
Y4M5
Y4M7
Y4M9
Y4M11
Y5Q1
Y5Q3
Y6Q1
Y6Q3
Y7Q1
Y7Q3
Y8Q1
Y8Q3
Y9Q1
Y9Q3
Y10Q1
Y10Q3
PRO
CESS
TO
NN
ES (
Mt)
Skarn Ore Tonnes Supergene Ore Tonnes Gold Cap Ore Tonnes Fresh Ore Tonnes
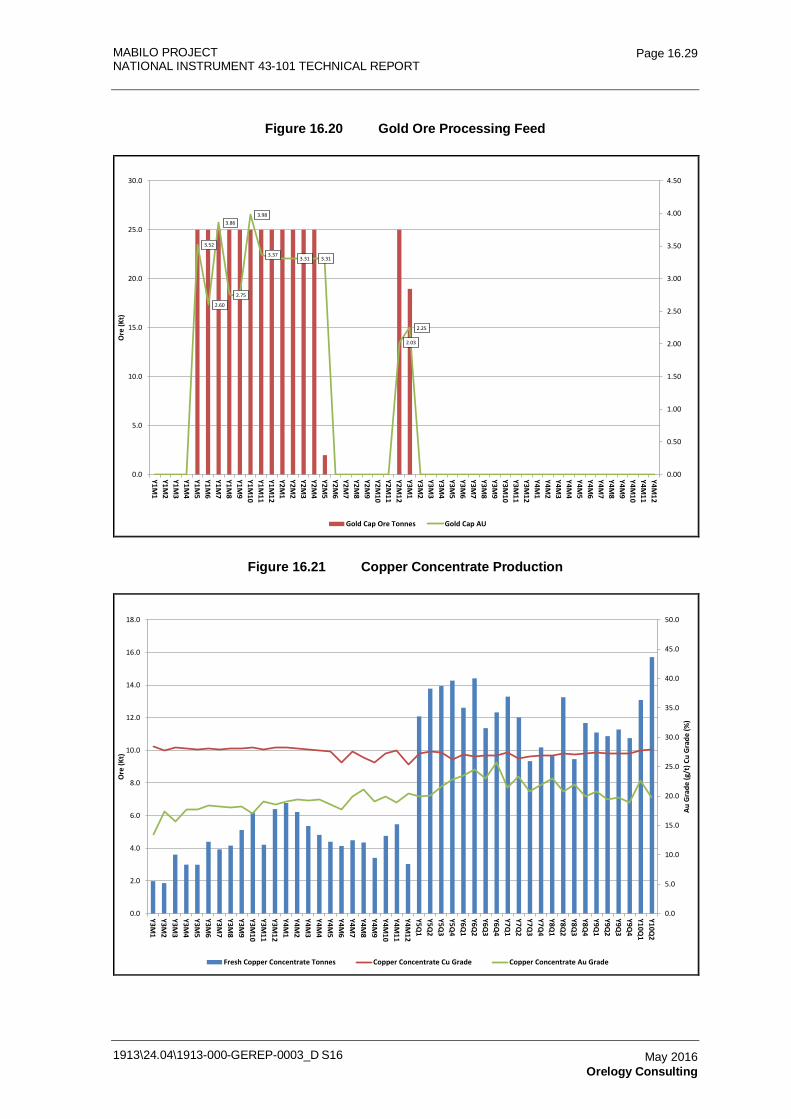
MABILO PROJECT NATIONAL INSTRUMENT 43-101 TECHNICAL REPORT
1913\24.04\1913-000-GEREP-0003_D S16
Page 16.29
May 2016 Orelogy Consulting
Figure 16.20 Gold Ore Processing Feed
3.52
2.60
3.86
2.75
3.98
3.373.31 3.31
2.03
2.25
0.00
0.50
1.00
1.50
2.00
2.50
3.00
3.50
4.00
4.50
0.0
5.0
10.0
15.0
20.0
25.0
30.0
Y1M1
Y1M2
Y1M3
Y1M4
Y1M5
Y1M6
Y1M7
Y1M8
Y1M9
Y1M10
Y1M11
Y1M12
Y2M1
Y2M2
Y2M3
Y2M4
Y2M5
Y2M6
Y2M7
Y2M8
Y2M9
Y2M10
Y2M11
Y2M12
Y3M1
Y3M2
Y3M3
Y3M4
Y3M5
Y3M6
Y3M7
Y3M8
Y3M9
Y3M10
Y3M11
Y3M12
Y4M1
Y4M2
Y4M3
Y4M4
Y4M5
Y4M6
Y4M7
Y4M8
Y4M9
Y4M10
Y4M11
Y4M12
Ore
(Kt)
Gold Cap Ore Tonnes Gold Cap AU
Figure 16.21 Copper Concentrate Production
0.0
5.0
10.0
15.0
20.0
25.0
30.0
35.0
40.0
45.0
50.0
0.0
2.0
4.0
6.0
8.0
10.0
12.0
14.0
16.0
18.0
Y3M1
Y3M2
Y3M3
Y3M4
Y3M5
Y3M6
Y3M7
Y3M8
Y3M9
Y3M10
Y3M11
Y3M12
Y4M1
Y4M2
Y4M3
Y4M4
Y4M5
Y4M6
Y4M7
Y4M8
Y4M9
Y4M10
Y4M11
Y4M12
Y5Q1
Y5Q2
Y5Q3
Y5Q4
Y6Q1
Y6Q2
Y6Q3
Y6Q4
Y7Q1
Y7Q2
Y7Q3
Y7Q4
Y8Q1
Y8Q2
Y8Q3
Y8Q4
Y9Q1
Y9Q2
Y9Q3
Y9Q4
Y10Q1
Y10Q2
Au G
rade
(g/t
) Cu
Gra
de (%
)
Ore
(Kt)
Fresh Copper Concentrate Tonnes Copper Concentrate Cu Grade Copper Concentrate Au Grade
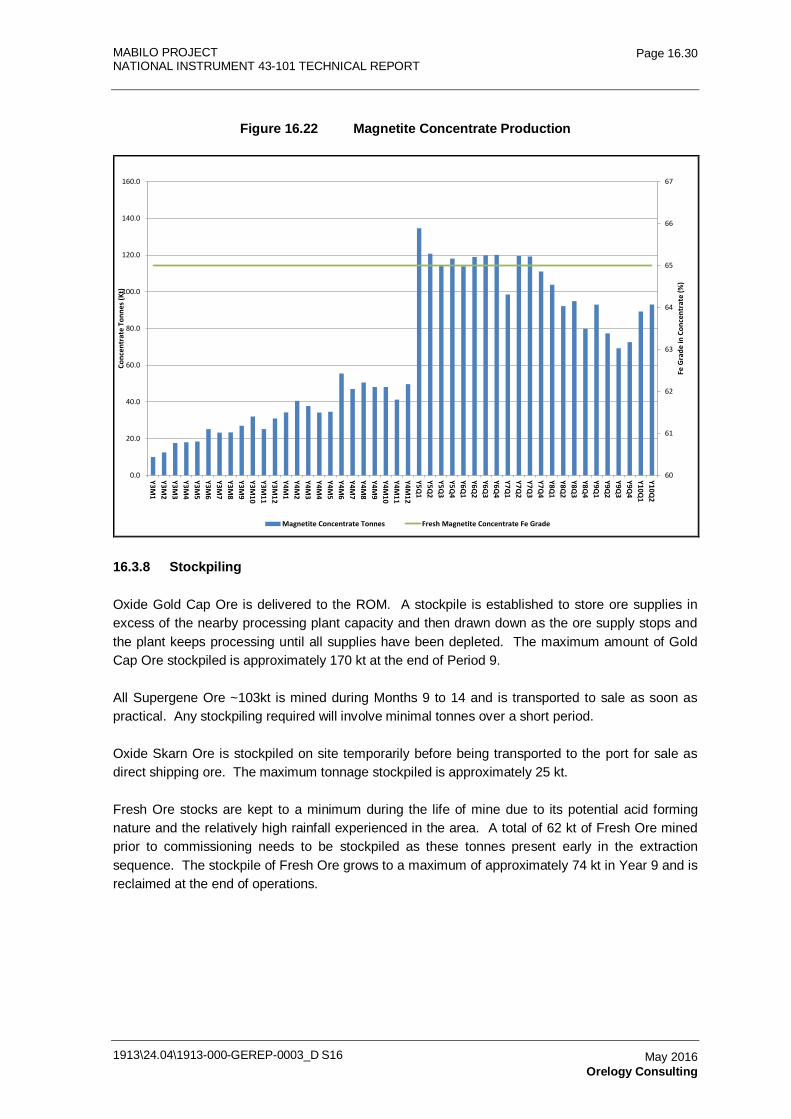
MABILO PROJECT NATIONAL INSTRUMENT 43-101 TECHNICAL REPORT
1913\24.04\1913-000-GEREP-0003_D S16
Page 16.30
May 2016 Orelogy Consulting
Figure 16.22 Magnetite Concentrate Production
60
61
62
63
64
65
66
67
0.0
20.0
40.0
60.0
80.0
100.0
120.0
140.0
160.0
Y3M1
Y3M2
Y3M3
Y3M4
Y3M5
Y3M6
Y3M7
Y3M8
Y3M9
Y3M10
Y3M11
Y3M12
Y4M1
Y4M2
Y4M3
Y4M4
Y4M5
Y4M6
Y4M7
Y4M8
Y4M9
Y4M10
Y4M11
Y4M12
Y5Q1
Y5Q2
Y5Q3
Y5Q4
Y6Q1
Y6Q2
Y6Q3
Y6Q4
Y7Q1
Y7Q2
Y7Q3
Y7Q4
Y8Q1
Y8Q2
Y8Q3
Y8Q4
Y9Q1
Y9Q2
Y9Q3
Y9Q4
Y10Q1
Y10Q2
Fe G
rade
in C
once
ntra
te (%
)
Conc
entr
ate
Tonn
es (K
t)
Magnetite Concentrate Tonnes Fresh Magnetite Concentrate Fe Grade
16.3.8 Stockpiling
Oxide Gold Cap Ore is delivered to the ROM. A stockpile is established to store ore supplies in excess of the nearby processing plant capacity and then drawn down as the ore supply stops and the plant keeps processing until all supplies have been depleted. The maximum amount of Gold Cap Ore stockpiled is approximately 170 kt at the end of Period 9.
All Supergene Ore ~103kt is mined during Months 9 to 14 and is transported to sale as soon as practical. Any stockpiling required will involve minimal tonnes over a short period.
Oxide Skarn Ore is stockpiled on site temporarily before being transported to the port for sale as direct shipping ore. The maximum tonnage stockpiled is approximately 25 kt.
Fresh Ore stocks are kept to a minimum during the life of mine due to its potential acid forming nature and the relatively high rainfall experienced in the area. A total of 62 kt of Fresh Ore mined prior to commissioning needs to be stockpiled as these tonnes present early in the extraction sequence. The stockpile of Fresh Ore grows to a maximum of approximately 74 kt in Year 9 and is reclaimed at the end of operations.
MABILO PROJECT NATIONAL INSTRUMENT 43-101 TECHNICAL REPORT
1913\24.04\1913-000-GEREP-0003_D S16
Page 16.31
May 2016 Orelogy Consulting
16.4 Alternative Mine Schedule – 1.35 Mtpa
An additional upside mine production schedule was developed for a Fresh Ore processing plant with a capacity of 1.35 Mtpa. The oxide phase objectives did not change.
16.4.1 Schedule Constraints
The following constraints were placed upon the schedule:
• Pre-strip Stage 1 no longer than four months.
• Weather restrictions include 18 lost days per year as 1.0 Mtpa schedule.
• Average excavator productivity used during initial pre strip operations of Stage 1 was reduced 6% to reflect expected poor mining conditions.
• Two months duration for commissioning the plant for Fresh Ore commencing two years after mining commences.
• Year 1 of Fresh Ore processing to include a ramp up such that 940 kt were processed.
• Name plate Fresh Ore processing rate of 1.35 Mtpa.
16.4.2 Schedule Results
The mining schedule is summarized in Table 16.13 and Figure 16.23 to Figure 16.25. These show that:
• total mine life is approximately 7.5 years
• the oxide mining phase targets and results are the same as the 1.0 Mtpa schedule
• four month pre-strip period
• Supergene Ore and the vast majority of the Gold Cap Ore are mined from Month 5 to Month 10
• no change to timing of Oxide Skarn Ore for the first two batches in Months 7 to 11 and Month 23 to Month 25. The third batch of Oxide Skarn Ore will be mined earlier in Month 34 to Month 40
• mining rates initially require three Komatsu PC1250 excavators for 2.5 months then two Komatsu PC1250 excavators until Month 16
• there is a waste mining period of nine months from Month 15 to the start of Year 3 with Fresh Ore mined continuously from that point onwards
MABILO PROJECT NATIONAL INSTRUMENT 43-101 TECHNICAL REPORT
1913\24.04\1913-000-GEREP-0003_D S16
Page 16.32
May 2016 Orelogy Consulting
• Month 17 marks the commencement of pre strip operations in Stage 3. A replacement mining fleet consisting of a Komatsu PC 2000 excavator and Caterpillar 777 dump trucks is required to replace all of the trucks and one of the smaller Komatsu PC 1250 Excavators
• from Month 20 a second Komatsu PC 2000 excavator is required to replace the smaller Komatsu PC 1250 Excavator in order to meet material movement needs
• both Komatsu PC 2000 Excavators are utilized until the first month of Year 6 when one of the units is demobilized. The remaining Komatsu PC 2000 excavator remains on site until mining is completed in the third quarter of Year 8
• the mining rate for the1.35 Mtpa schedule is better suited for steady state mining operations as there is no longer a requirement to place an excavator on standby for six months at the end of Year 5 as occurs in the 1.0 Mtpa schedule
• in terms of vertical advance or bench turnover, they are the same as those of the 1.0 Mtpa schedule (85 m of advance in 12 months). The next highest development rate is during Year 5 with 65 m of advance over a 12 month period. This high turn-over rate is during the pre-stripping requirement of Stage 4 within the Mt. Labo and oxide materials. All other advance rates are lower.
Mining costs are summarized in Table 16.14.
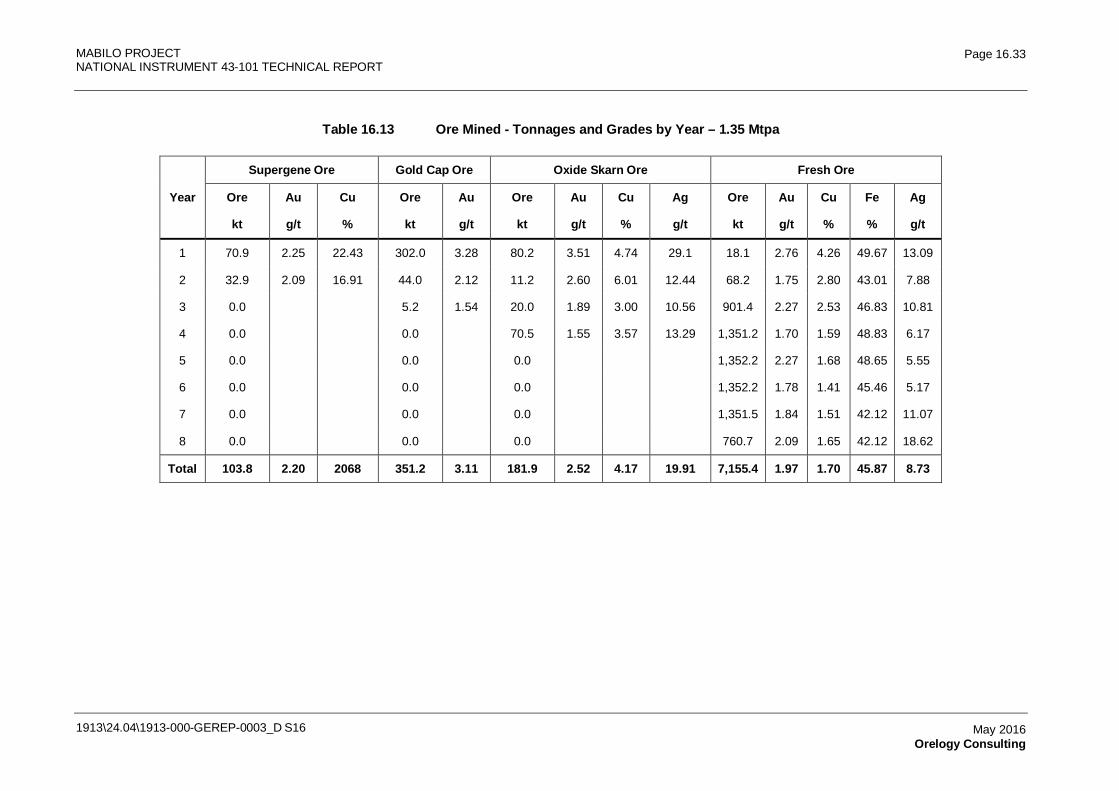
MABILO PROJECT NATIONAL INSTRUMENT 43-101 TECHNICAL REPORT
1913\24.04\1913-000-GEREP-0003_D S16
Page 16.33
May 2016 Orelogy Consulting
Table 16.13 Ore Mined - Tonnages and Grades by Year – 1.35 Mtpa
Supergene Ore Gold Cap Ore Oxide Skarn Ore Fresh Ore
Year Ore Au Cu Ore Au Ore Au Cu Ag Ore Au Cu Fe Ag
kt g/t % kt g/t kt g/t % g/t kt g/t % % g/t
1 70.9 2.25 22.43 302.0 3.28 80.2 3.51 4.74 29.1 18.1 2.76 4.26 49.67 13.09
2 32.9 2.09 16.91 44.0 2.12 11.2 2.60 6.01 12.44 68.2 1.75 2.80 43.01 7.88
3 0.0 5.2 1.54 20.0 1.89 3.00 10.56 901.4 2.27 2.53 46.83 10.81
4 0.0 0.0 70.5 1.55 3.57 13.29 1,351.2 1.70 1.59 48.83 6.17
5 0.0 0.0 0.0 1,352.2 2.27 1.68 48.65 5.55
6 0.0 0.0 0.0 1,352.2 1.78 1.41 45.46 5.17
7 0.0 0.0 0.0 1,351.5 1.84 1.51 42.12 11.07
8 0.0 0.0 0.0 760.7 2.09 1.65 42.12 18.62
Total 103.8 2.20 2068 351.2 3.11 181.9 2.52 4.17 19.91 7,155.4 1.97 1.70 45.87 8.73
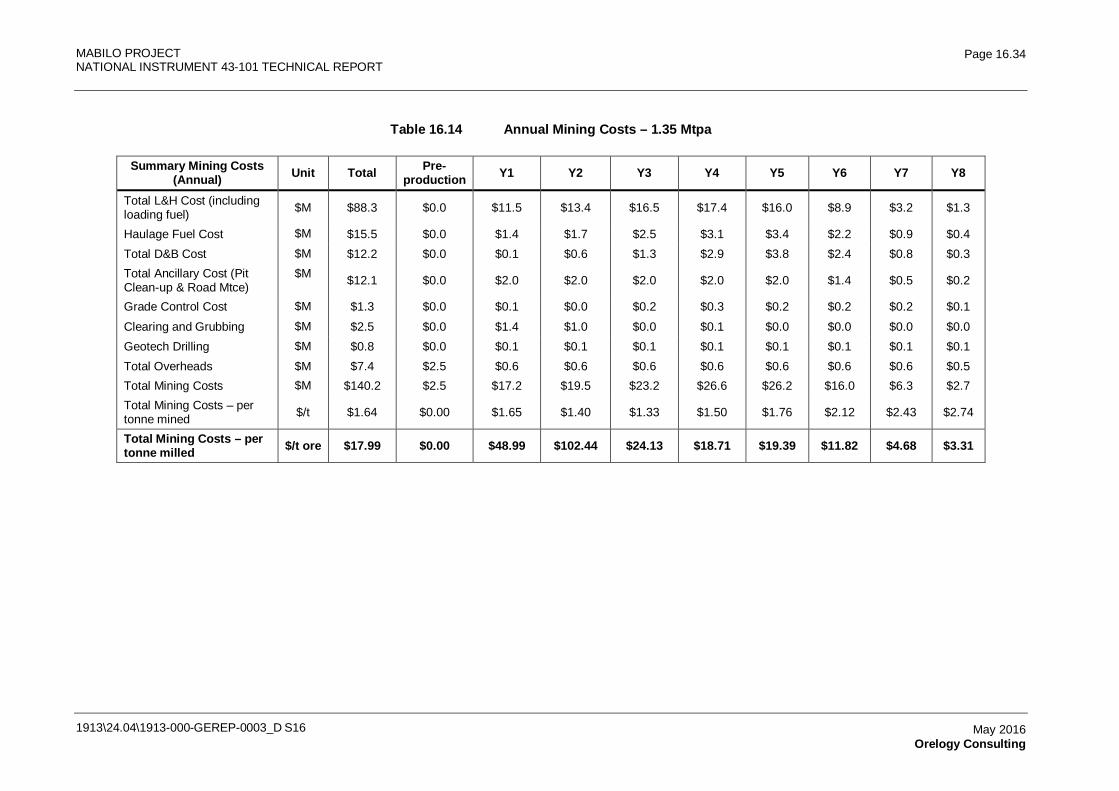
MABILO PROJECT NATIONAL INSTRUMENT 43-101 TECHNICAL REPORT
1913\24.04\1913-000-GEREP-0003_D S16
Page 16.34
May 2016 Orelogy Consulting
Table 16.14 Annual Mining Costs – 1.35 Mtpa
Summary Mining Costs (Annual) Unit Total Pre-
production Y1 Y2 Y3 Y4 Y5 Y6 Y7 Y8
Total L&H Cost (including loading fuel) $M $88.3 $0.0 $11.5 $13.4 $16.5 $17.4 $16.0 $8.9 $3.2 $1.3
Haulage Fuel Cost $M $15.5 $0.0 $1.4 $1.7 $2.5 $3.1 $3.4 $2.2 $0.9 $0.4 Total D&B Cost $M $12.2 $0.0 $0.1 $0.6 $1.3 $2.9 $3.8 $2.4 $0.8 $0.3 Total Ancillary Cost (Pit Clean-up & Road Mtce)
$M $12.1 $0.0 $2.0 $2.0 $2.0 $2.0 $2.0 $1.4 $0.5 $0.2
Grade Control Cost $M $1.3 $0.0 $0.1 $0.0 $0.2 $0.3 $0.2 $0.2 $0.2 $0.1 Clearing and Grubbing $M $2.5 $0.0 $1.4 $1.0 $0.0 $0.1 $0.0 $0.0 $0.0 $0.0 Geotech Drilling $M $0.8 $0.0 $0.1 $0.1 $0.1 $0.1 $0.1 $0.1 $0.1 $0.1 Total Overheads $M $7.4 $2.5 $0.6 $0.6 $0.6 $0.6 $0.6 $0.6 $0.6 $0.5 Total Mining Costs $M $140.2 $2.5 $17.2 $19.5 $23.2 $26.6 $26.2 $16.0 $6.3 $2.7 Total Mining Costs – per tonne mined $/t $1.64 $0.00 $1.65 $1.40 $1.33 $1.50 $1.76 $2.12 $2.43 $2.74
Total Mining Costs – per tonne milled $/t ore $17.99 $0.00 $48.99 $102.44 $24.13 $18.71 $19.39 $11.82 $4.68 $3.31
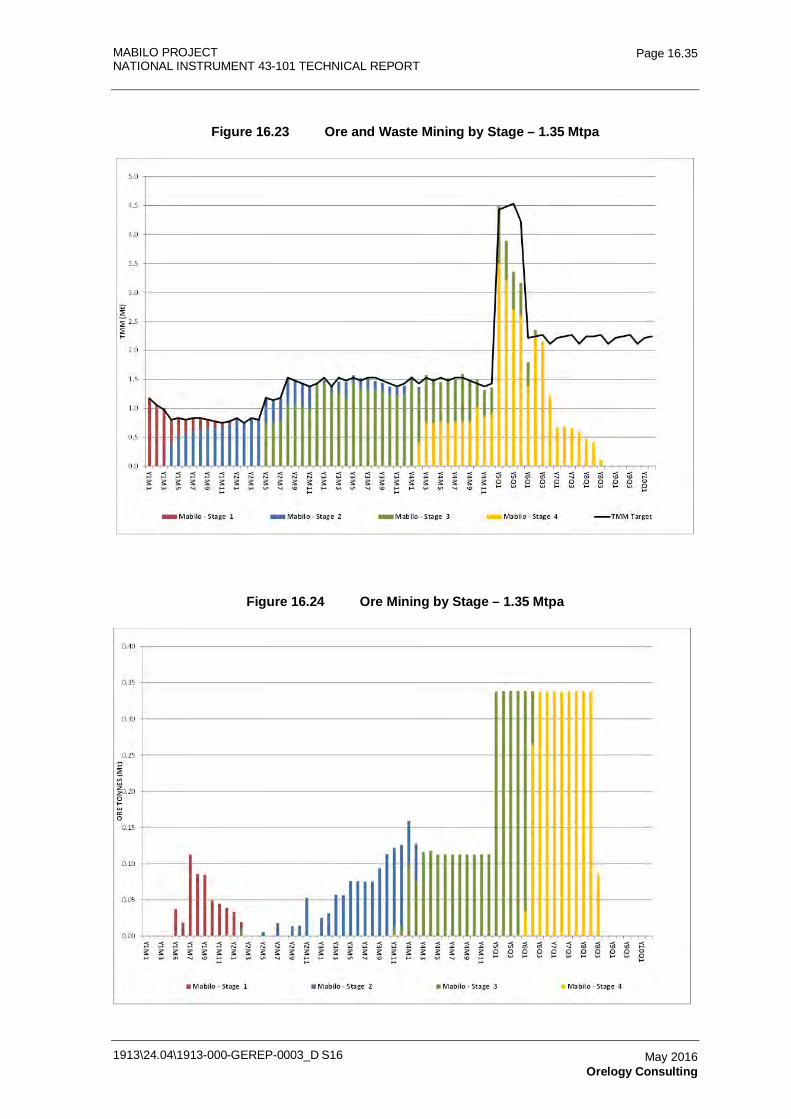
MABILO PROJECT NATIONAL INSTRUMENT 43-101 TECHNICAL REPORT
1913\24.04\1913-000-GEREP-0003_D S16
Page 16.35
May 2016 Orelogy Consulting
Figure 16.23 Ore and Waste Mining by Stage – 1.35 Mtpa
Figure 16.24 Ore Mining by Stage – 1.35 Mtpa
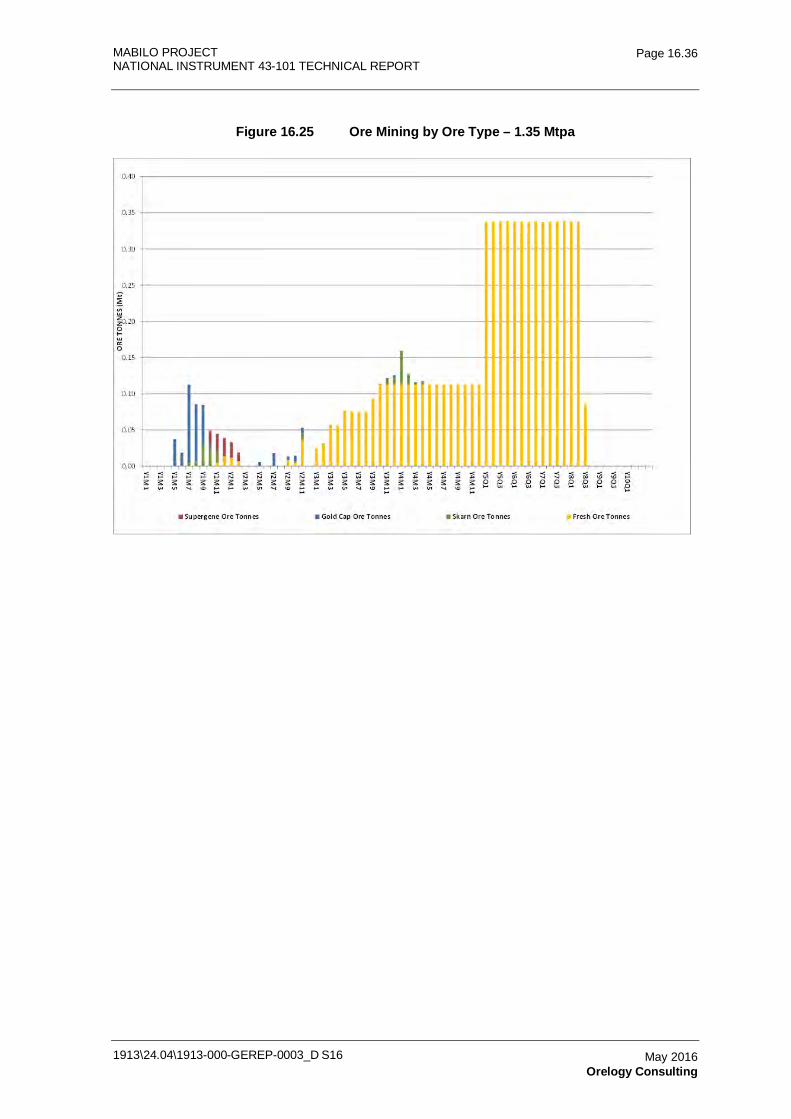
MABILO PROJECT NATIONAL INSTRUMENT 43-101 TECHNICAL REPORT
1913\24.04\1913-000-GEREP-0003_D S16
Page 16.36
May 2016 Orelogy Consulting
Figure 16.25 Ore Mining by Ore Type – 1.35 Mtpa
MABILO PROJECT
NATIONAL INSTRUMENT 43-101 TECHNICAL REPORT
1913-000-GEREP-0003
Table of Contents Page
17.0 RECOVERY METHODS 17.1 17.1 Introduction 17.1
17.1.1 Selected Process Flowsheet 17.2 17.1.2 Plant Design Basis 17.4 17.1.3 Key Process Design Criteria 17.10
17.2 Plant Description 17.11 17.2.1 Crushing and Coarse Ore Storage 17.13 17.2.2 Grinding 17.13 17.2.3 Deslime 17.13 17.2.4 Bulk Sulphide Flotation 17.13 17.2.5 Concentrate Regrind 17.14 17.2.6 Cleaner Flotation 17.14 17.2.7 Magnetic Separation 17.15 17.2.8 Concentrate Handling 17.15 17.2.9 Copper and Pyrite Concentrate Storage 17.16 17.2.10 Magnetite Concentrate Storage 17.16 17.2.11 Tailings Disposal 17.17 17.2.12 Reagents and Services 17.17 17.2.13 Services 17.19
17.3 Plant Area Design 17.20 17.3.1 General 17.20 17.3.2 Site Location 17.21 17.3.3 General 17.21 17.3.4 Primary Crushing 17.21 17.3.5 Surge Bin and Stockpile 17.22 17.3.6 Grinding and Classification Circuit 17.22 17.3.7 Rougher and Cleaner Flotation and Regrind 17.23 17.3.8 Copper and Pyrite Concentrate Dewatering 17.23 17.3.9 Magnetite Recovery and Dewatering 17.23 17.3.10 Tailings Disposal 17.24 17.3.11 Reagents 17.24 17.3.12 Air and Water Services 17.25 17.3.13 Spillage Containment 17.25
17.4 Electrical Design 17.26 17.4.1 Installed Load and Maximum Demand 17.26 17.4.2 Power Generation 17.26 17.4.3 Electrical Distribution 17.26 17.4.4 Electrical Buildings 17.27 17.4.5 Transformers and Compounds 17.27 17.4.6 4.16 kV Switchboards 17.27 17.4.7 SAG Mill Variable Speed Drive 17.28 17.4.8 LV Electronic Variable Speed Drives and Soft Starters 17.28 17.4.9 380 V Motor Control Centre 17.28 17.4.10 Fire Protection 17.28 17.4.11 Cable Ladders 17.28 17.4.12 Cables 17.29 17.4.13 Lighting 17.29 17.4.14 Earthing System and Lightning Protection 17.29
17.5 Control System 17.29 17.5.1 General Overview 17.29
1913\24.04\1913-000-GEREP-0003_D S17 May 2016 Lycopodium Minerals Pty Ltd
MABILO PROJECT
NATIONAL INSTRUMENT 43-101 TECHNICAL REPORT
1913-000-GEREP-0003
Table of Contents (Continued)
Page
1913\24.04\1913-000-GEREP-0003_D S17
May 2016 Lycopodium Minerals Pty Ltd
17.5.2 Drive Controls 17.31 17.5.3 Control Loops 17.31 17.5.4 Crushing Circuit 17.31 17.5.5 Milling 17.31 17.5.6 Desliming 17.32 17.5.7 Flotation 17.32 17.5.8 Thickening 17.32 17.5.9 Filtration 17.33 17.5.10 Magnetic Separation 17.33 17.5.11 Tailings Disposal 17.33 17.5.12 Services 17.33 17.5.13 Control Interfaces 17.34
17.6 Metallurgical Accounting 17.34 17.7 1.35 Mtpa Processing Case 17.35
17.7.1 Processing Upside 17.35 17.7.2 Capital Cost Estimate 17.35 17.7.3 Operating Cost Estimate 17.37
TABLES Table 17.1 Summary of Selected Milling Parameters 17.5 Table 17.2 Summary of Proposed Milling Circuit Design 17.6 Table 17.3 Comminution Consumables 17.6 Table 17.4 Summary of Key Process Design Criteria 17.10 Table 17.5 Installed Load and Maximum Demand 17.26 Table 17.6 1.35 Mtpa Indicative Estimate Summary (US$, 4Q2015, ±25%) 17.36 Table 17.7 Process Plant Operating Cost Estimate (1.35 Mt/y, +/- 25%) 17.37 FIGURES Figure 17.1 Overall Process Flowsheet 17.3 Figure 17.2 Process Plant General Arrangement Drawing 17.12
MABILO PROJECT NATIONAL INSTRUMENT 43-101 TECHNICAL REPORT
1913\24.04\1913-000-GEREP-0003_D S17
Page 17.1
May 2016 Lycopodium Minerals Pty Ltd
17.0 RECOVERY METHODS
17.1 Introduction
The oxide and chalcocite orebodies will not be subjected to on-site treatment but will be transported off site and are therefore not referred to in this section. The primary orebody will be treated in a conventional flotation and magnetic separation plant to recover copper sulphides, pyrite in concentrate and magnetite.
The proposed process plant design for the Mabilo Project is based on a robust metallurgical flowsheet designed for optimum recovery with minimum operating costs. The flowsheet is constructed from unit operations that are well proven in industry.
The key criteria for equipment selection are the suitability for duty and the mine life of the operation while considering reliability and ease of maintenance. The plant layout provides ease of access to all equipment for operating and maintenance requirements while maintaining a compact footprint to minimize construction costs.
The Mabilo plant will process a range of ore types with variable ore characteristics, copper, magnetite and pyrite levels and metallurgical treatment requirements.
Mt. Labo / Galeo JV (MJV) have advised that ores will be mined as follows:
• Gold Cap Ore will be mined and shipped to a local processing facility over the course of 14 months.
• The Supergene Chalcocite and Oxide Skarn Ores will be mined and shipped to an off site processing facility over the course of 18 months.
Primary (or Fresh) Ore will be mined after completion of these operations and will be processed on site at the Mabilo process plant.
The key project and ore specific design criteria that the plant design must meet are as follows:
• 1,000,000 t/y of primary ore.
• Crushing plant mechanical availability of 80%.
• Mechanical availability for the remainder of the plant of 91.3% supported by crushed ore storage and stand-by equipment in critical areas.
• Sufficient automated plant control to minimize the need for continuous operator intervention and allow manual override and control if and when required.
MABILO PROJECT NATIONAL INSTRUMENT 43-101 TECHNICAL REPORT
1913\24.04\1913-000-GEREP-0003_D S17
Page 17.2
May 2016 Lycopodium Minerals Pty Ltd
17.1.1 Selected Process Flowsheet
The treatment plant design incorporates the following unit process operations:
• Single stage open circuit primary crushing to produce a crushed product size of 80% passing (P80) 120 mm.
• A crushed ore surge bin with a nominal capacity of 120 t. Surge bin overflow will be conveyed to a dead stockpile of 20,000 tonnes. Ore from the dead stockpile will be reclaimed by front end loader (FEL) to feed the mill during periods when the crushing circuit is off-line.
• Grinding of ore in a SAG mill circuit in closed circuit with hydrocyclones to produce a P80 grind size of 90 µm.
• Bulk sulphide flotation to recover copper sulphides and gold bearing pyrite.
• Two-stage cleaner flotation to recover copper sulphides into a copper concentrate and pyrite into a product for sale.
• Concentrate thickening and pressure filtration to produce a copper concentrate filter cake.
• Pyrite thickening and either pressure filtration to produce a pyrite concentrate filter cake or discharge direct to tailings.
• Magnetic separation of the bulk sulphide tails to recover magnetite into concentrate.
• Concentrate thickening and pressure filtration to produce a magnetite concentrate filter cake.
• Combined tailings pumping to the tailings storage facility (TSF).
An overall flowsheet for the process is shown in Figure 17.1.
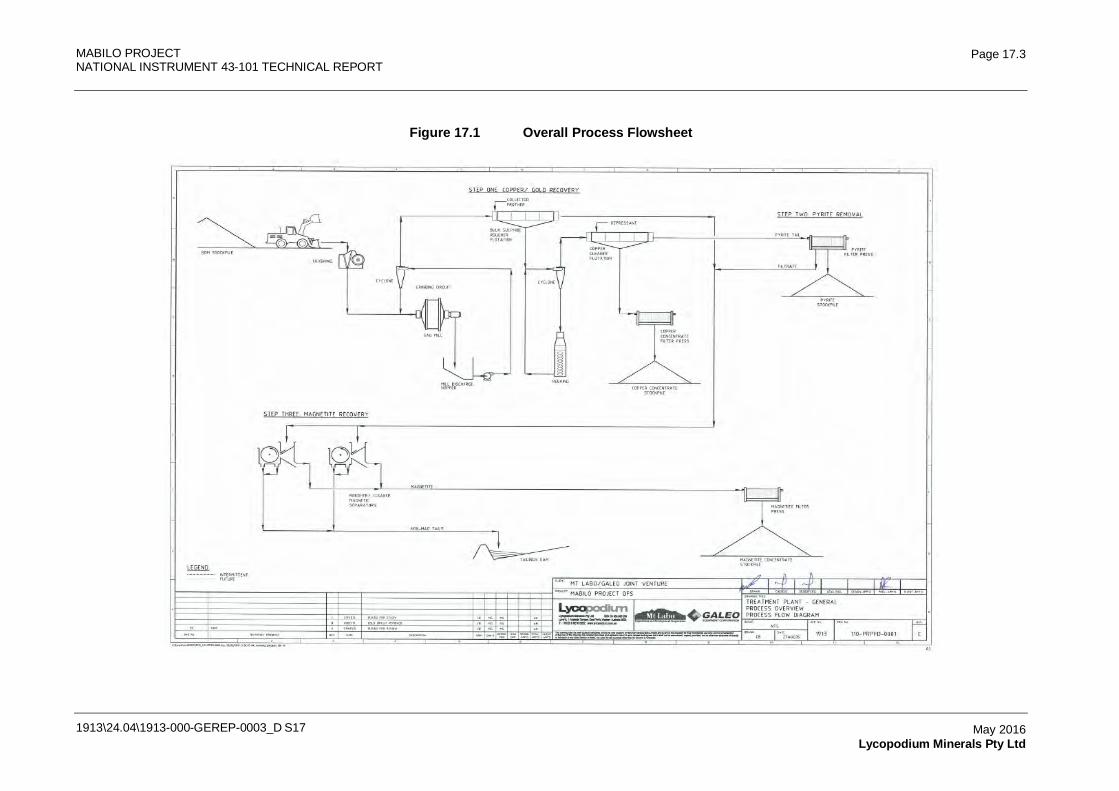
MABILO PROJECT NATIONAL INSTRUMENT 43-101 TECHNICAL REPORT
1913\24.04\1913-000-GEREP-0003_D S17
Page 17.3
May 2016 Lycopodium Minerals Pty Ltd
Figure 17.1 Overall Process Flowsheet
MABILO PROJECT NATIONAL INSTRUMENT 43-101 TECHNICAL REPORT
1913\24.04\1913-000-GEREP-0003_D S17
Page 17.4
May 2016 Lycopodium Minerals Pty Ltd
17.1.2 Plant Design Basis
The key issues considered in the process and equipment selection are outlined in this section.
Process Plant
The plant design has been based on a nominal capacity of 1.0 Mt/y of magnetite skarn or primary ore based on the testwork completed during the study. Treatment of oxide and supergene ore is excluded. The plant design recognizes that the mineral composition of the ore varies in terms of copper minerals, pyrite content and magnetite content and a design envelope for these variables has been included in the design criteria.
ROM Pad
The ROM pad will be used to provide a buffer between the mine and the plant. The ROM stockpile will allow blending of feed stocks and ensure a more consistent feed type and rate to the plant. Should any oversize rocks be encountered, a mobile rock breaker will be used.
Comminution Circuit Selection
Orway Mineral Consultants (OMC) was commissioned to review the comminution data derived from the testwork. OMC provided a report summarizing the testwork results and equipment selection for the Mabilo Project.
A total of 11 rock samples were subjected to testing which included Bond Rod and Ball Work Index, abrasion index and SMC testing to determine the likely milling properties. The design data was weighted to reflect the ore distribution in the resource based on advice from the MJV geologist and this was then used to model the circuit.
This advice indicated that 69% of the orebody was represented by magnetite skarn and 14% by garnet skarn. The remaining rock types represented 6% each or less.
Comminution Circuit Design Basis
The design blend for circuit design was as follows:
• Magnetite skarn 69.2%
• Garnet skarn 14.4%
• Mixed garne t/ calcium silicate 5.8%
• Gold Oxides 2.9%
• Copper oxides 2.9%
• Chalcocite 1.0%
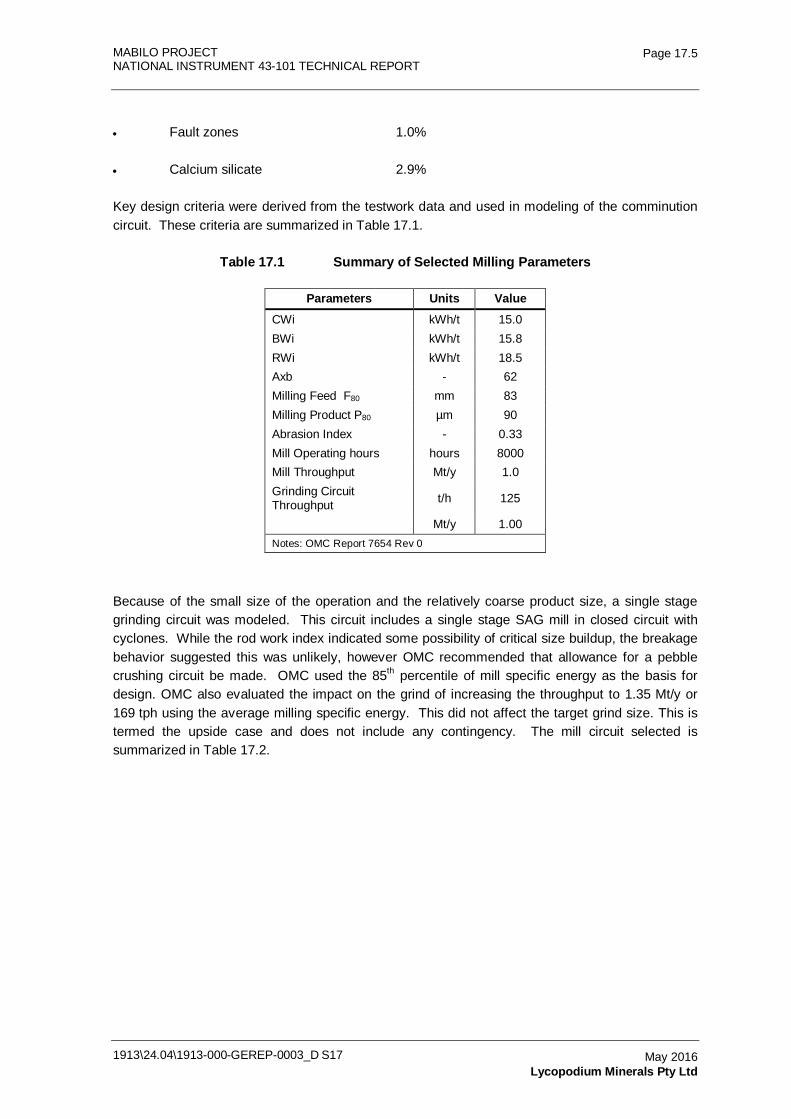
MABILO PROJECT NATIONAL INSTRUMENT 43-101 TECHNICAL REPORT
1913\24.04\1913-000-GEREP-0003_D S17
Page 17.5
May 2016 Lycopodium Minerals Pty Ltd
• Fault zones 1.0%
• Calcium silicate 2.9%
Key design criteria were derived from the testwork data and used in modeling of the comminution circuit. These criteria are summarized in Table 17.1.
Table 17.1 Summary of Selected Milling Parameters
Parameters Units Value CWi kWh/t 15.0 BWi kWh/t 15.8 RWi kWh/t 18.5 Axb - 62 Milling Feed F80 mm 83 Milling Product P80 µm 90 Abrasion Index - 0.33 Mill Operating hours hours 8000 Mill Throughput Mt/y 1.0 Grinding Circuit Throughput t/h 125
Mt/y 1.00 Notes: OMC Report 7654 Rev 0
Because of the small size of the operation and the relatively coarse product size, a single stage grinding circuit was modeled. This circuit includes a single stage SAG mill in closed circuit with cyclones. While the rod work index indicated some possibility of critical size buildup, the breakage behavior suggested this was unlikely, however OMC recommended that allowance for a pebble crushing circuit be made. OMC used the 85th percentile of mill specific energy as the basis for design. OMC also evaluated the impact on the grind of increasing the throughput to 1.35 Mt/y or 169 tph using the average milling specific energy. This did not affect the target grind size. This is termed the upside case and does not include any contingency. The mill circuit selected is summarized in Table 17.2.
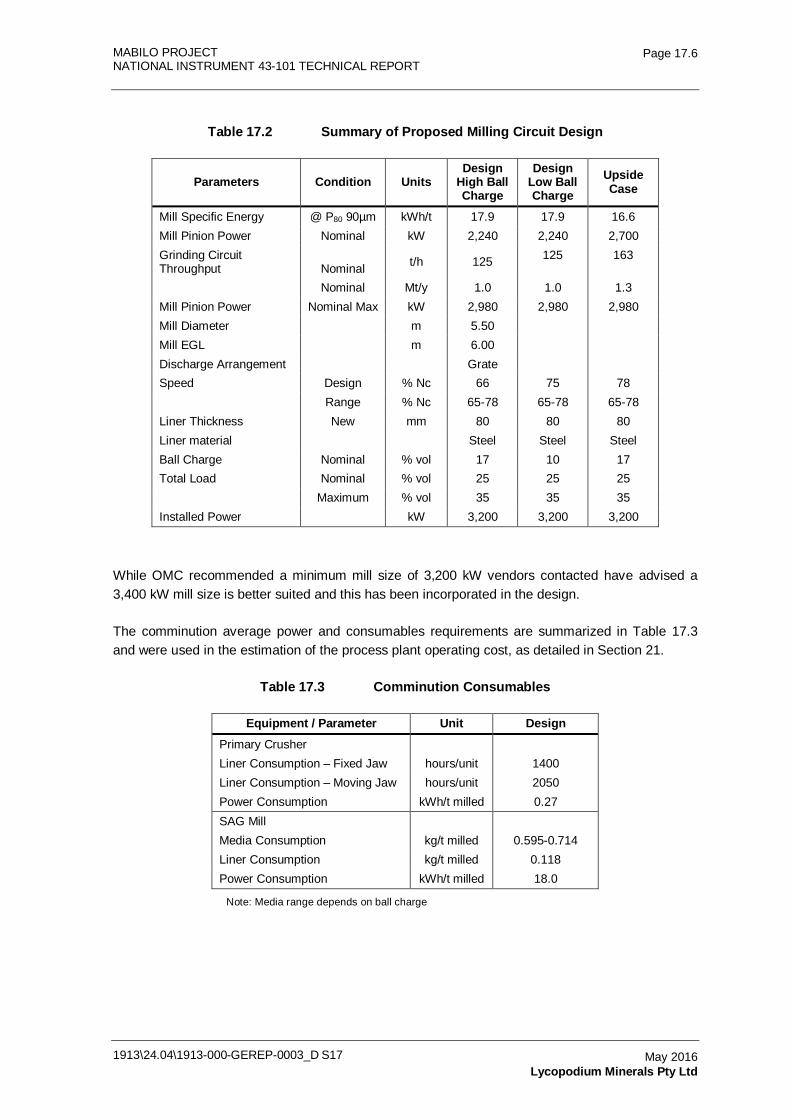
MABILO PROJECT NATIONAL INSTRUMENT 43-101 TECHNICAL REPORT
1913\24.04\1913-000-GEREP-0003_D S17
Page 17.6
May 2016 Lycopodium Minerals Pty Ltd
Table 17.2 Summary of Proposed Milling Circuit Design
Parameters Condition Units Design
High Ball Charge
Design Low Ball Charge
Upside Case
Mill Specific Energy @ P80 90µm kWh/t 17.9 17.9 16.6 Mill Pinion Power Nominal kW 2,240 2,240 2,700 Grinding Circuit Throughput Nominal t/h 125 125 163
Nominal Mt/y 1.0 1.0 1.3 Mill Pinion Power Nominal Max kW 2,980 2,980 2,980 Mill Diameter
m 5.50
Mill EGL
m 6.00 Discharge Arrangement
Grate
Speed Design % Nc 66 75 78 Range % Nc 65-78 65-78 65-78 Liner Thickness New mm 80 80 80 Liner material
Steel Steel Steel
Ball Charge Nominal % vol 17 10 17 Total Load Nominal % vol 25 25 25 Maximum % vol 35 35 35 Installed Power
kW 3,200 3,200 3,200
While OMC recommended a minimum mill size of 3,200 kW vendors contacted have advised a 3,400 kW mill size is better suited and this has been incorporated in the design.
The comminution average power and consumables requirements are summarized in Table 17.3 and were used in the estimation of the process plant operating cost, as detailed in Section 21.
Table 17.3 Comminution Consumables
Equipment / Parameter Unit Design Primary Crusher
Liner Consumption – Fixed Jaw hours/unit 1400 Liner Consumption – Moving Jaw hours/unit 2050 Power Consumption kWh/t milled 0.27 SAG Mill
Media Consumption kg/t milled 0.595-0.714 Liner Consumption kg/t milled 0.118 Power Consumption kWh/t milled 18.0
Note: Media range depends on ball charge
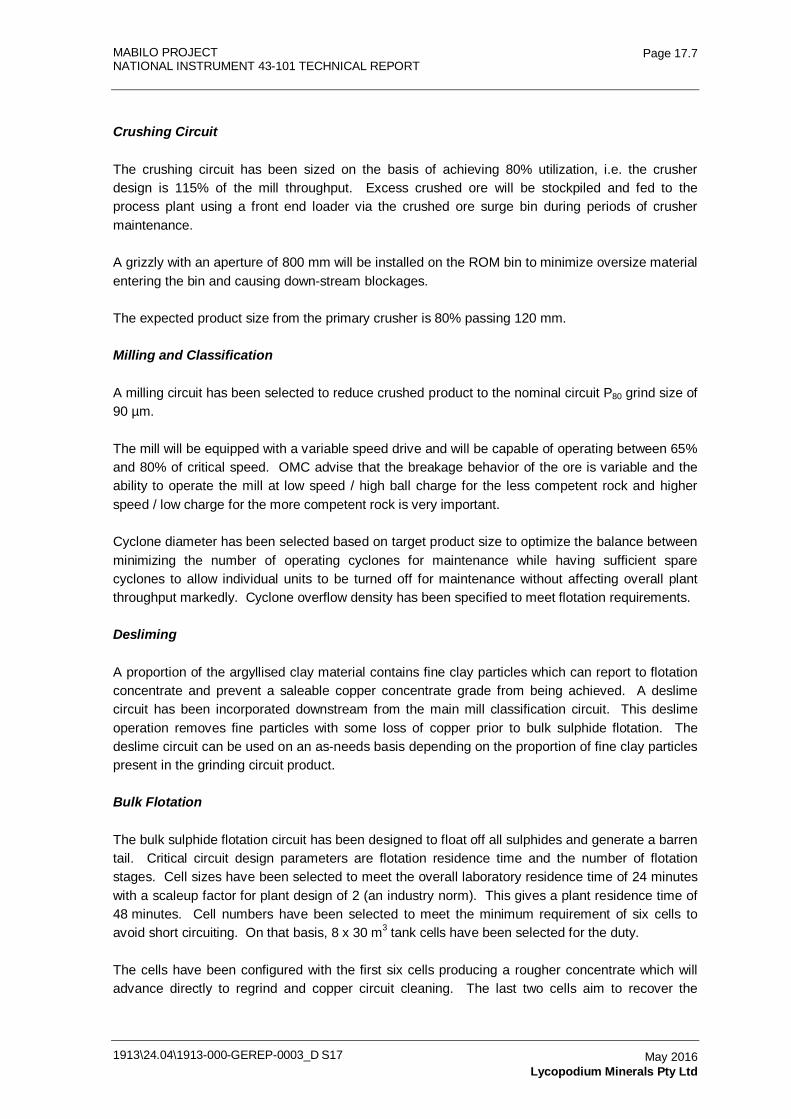
MABILO PROJECT NATIONAL INSTRUMENT 43-101 TECHNICAL REPORT
1913\24.04\1913-000-GEREP-0003_D S17
Page 17.7
May 2016 Lycopodium Minerals Pty Ltd
Crushing Circuit
The crushing circuit has been sized on the basis of achieving 80% utilization, i.e. the crusher design is 115% of the mill throughput. Excess crushed ore will be stockpiled and fed to the process plant using a front end loader via the crushed ore surge bin during periods of crusher maintenance.
A grizzly with an aperture of 800 mm will be installed on the ROM bin to minimize oversize material entering the bin and causing down-stream blockages.
The expected product size from the primary crusher is 80% passing 120 mm.
Milling and Classification
A milling circuit has been selected to reduce crushed product to the nominal circuit P80 grind size of 90 µm.
The mill will be equipped with a variable speed drive and will be capable of operating between 65% and 80% of critical speed. OMC advise that the breakage behavior of the ore is variable and the ability to operate the mill at low speed / high ball charge for the less competent rock and higher speed / low charge for the more competent rock is very important.
Cyclone diameter has been selected based on target product size to optimize the balance between minimizing the number of operating cyclones for maintenance while having sufficient spare cyclones to allow individual units to be turned off for maintenance without affecting overall plant throughput markedly. Cyclone overflow density has been specified to meet flotation requirements.
Desliming
A proportion of the argyllised clay material contains fine clay particles which can report to flotation concentrate and prevent a saleable copper concentrate grade from being achieved. A deslime circuit has been incorporated downstream from the main mill classification circuit. This deslime operation removes fine particles with some loss of copper prior to bulk sulphide flotation. The deslime circuit can be used on an as-needs basis depending on the proportion of fine clay particles present in the grinding circuit product.
Bulk Flotation
The bulk sulphide flotation circuit has been designed to float off all sulphides and generate a barren tail. Critical circuit design parameters are flotation residence time and the number of flotation stages. Cell sizes have been selected to meet the overall laboratory residence time of 24 minutes with a scaleup factor for plant design of 2 (an industry norm). This gives a plant residence time of 48 minutes. Cell numbers have been selected to meet the minimum requirement of six cells to avoid short circuiting. On that basis, 8 x 30 m3 tank cells have been selected for the duty.
The cells have been configured with the first six cells producing a rougher concentrate which will advance directly to regrind and copper circuit cleaning. The last two cells aim to recover the
MABILO PROJECT NATIONAL INSTRUMENT 43-101 TECHNICAL REPORT
1913\24.04\1913-000-GEREP-0003_D S17
Page 17.8
May 2016 Lycopodium Minerals Pty Ltd
residual gold-bearing pyrite to add to the cleaner tail but can also be used to scavenge additional copper from the rougher tail if needed.
One of the features of the Mabilo ore is the varying proportion of pyrite leading to a varying rate of concentrate make in the roughers. This will be addressed by adding lime to the rougher as required to depress pyrite. The duty / stand-by rougher concentrate pumps have been selected to run as duty / duty when required to manage higher concentrate make.
Regrind
The primary grind P80 of 90 microns is sufficient to separate sulphides from non-sulphides in the roughers. However, the separation of copper sulphides from pyrite requires a finer grind. The regrind circuit targets a P80 grind of 38 microns based on the laboratory testwork.
A regrind size of 38 microns can be achieved with either a ball mill or a specialized fine grinding mill. A ball mill is much less efficient at this size than a specialized mill so a specialized vertical mill was selected. The mill will be equipped with a variable speed drive to accommodate varying feed rates of concentrate which are a feature of the Mabilo ore.
Cleaner Flotation
The cleaner flotation circuit has been designed to separate the copper sulphides from the pyrite and generate a pyrite rich tail. Cleaner flotation generally requires a lower feed density and higher froth depth to allow the separation to occur efficiently. The density in the cleaners will be reduced from 34% w/w in the roughers to 16% in the cleaners.
Cleaner flotation will be completed in two stages to maximize the upgrade of concentrate while maintaining recovery of value minerals. As the 1st cleaner stage is open circuit, the residence time has been maintained at 48 minutes. A total of 8 x 16 m3 trough cells have been selected to meet this requirement while also allowing efficient removal of froth.
The cells have been configured with the first five cells producing a Cleaner 1 concentrate which will advance directly to Cleaner 2. The last three cells will be operated as cleaner scavengers and have lower grade material and higher pyrite content and the concentrate can be diverted either to Cleaner 2 or back to the regrind.
Cleaner 2 consists of 5 x 4 m3 trough cells in a 2 - 3 configuration with the tail feeding into the head of Cleaner 1.
The varying concentrate make has been accommodated by use of multiple concentrate pumps in the circuit.
Concentrate Thickening and Filtration
Testwork has indicated the copper concentrate dewaters well so a dewatering circuit including a high rate thickener and a plate and frame pressure filter has been selected. The thickener allows a higher density feed to the filter to be achieved which improves filtration. The thickener allows recycling of the reagent bearing water back into the flotation circuit.
MABILO PROJECT NATIONAL INSTRUMENT 43-101 TECHNICAL REPORT
1913\24.04\1913-000-GEREP-0003_D S17
Page 17.9
May 2016 Lycopodium Minerals Pty Ltd
The plate and frame filter provides a cost-effective solution which meets the concentrate dewatering requirements and is straightforward to maintain.
The study has indicated that a market exists for the cleaner tail as a gold bearing pyrite concentrate. Based on this, testwork on both thickening and filtration of the cleaner tails was undertaken. Results have indicated the pyrite concentrate dewaters well so a dewatering circuit including a high rate thickener and a plate and frame pressure filter has been selected. The thickener allows a higher density feed to the filter to be achieved which improves filtration. The thickener allows recycling of the reagent bearing water back into the flotation circuit.
Provision has also been made to allow the thickened pyrite stream to join the other tailings stream and be pumped to the tailings storage facility if necessary. If this occurs, treatment of the decant water may be required as described in Section 18.
Magnetite Recovery
The non-sulphide rougher flotation tail contains significant magnetite. This will be recovered by two-stage magnetic separation using low-intensity machines. Cleaning of the rougher magnetic concentrate has been included to remove entrained gangue and the iron upgrade achieved results from the mass loss in addition to the rejection of some less magnetic composites.
Magnetite Thickening and Filtration
Testwork has indicated the magnetite concentrate dewaters well so a dewatering circuit including a high rate thickener and a plate and frame pressure filter has been selected. The thickener allows a higher density feed to the filter to be achieved which improves filtration. The thickener also allows recycling of the water back into the milling circuit.
The plate and frame filter provides a cost-effective solution which meets the concentrate dewatering requirements and is straightforward to maintain.
Raw Water
Water for the Project will be sourced from the Minaluli Laki stream on the west side of the tenement. The project requires a number of surface water diversions and environmental control dams to be built. The most north westerly of these (ECD 1) will be used to source clean river water for the process plant. A separate raw water tank which will receive fresh water from ECD 1 has been included in the design to ensure that that the raw water supply is not contaminated by fine solids that may be present in the thickener overflow. The raw water tank will overflow to the process water tank.
Process Water
Process water will be recovered from various product thickeners and filters. Water recovered from concentrate thickeners will be recycled back to flotation to recycle reagents and entrained solids in the system. A bleed stream from the process water will be clarified for filter washing and use as gland water. TSF decant return water will be pumped to the process water tank. The process
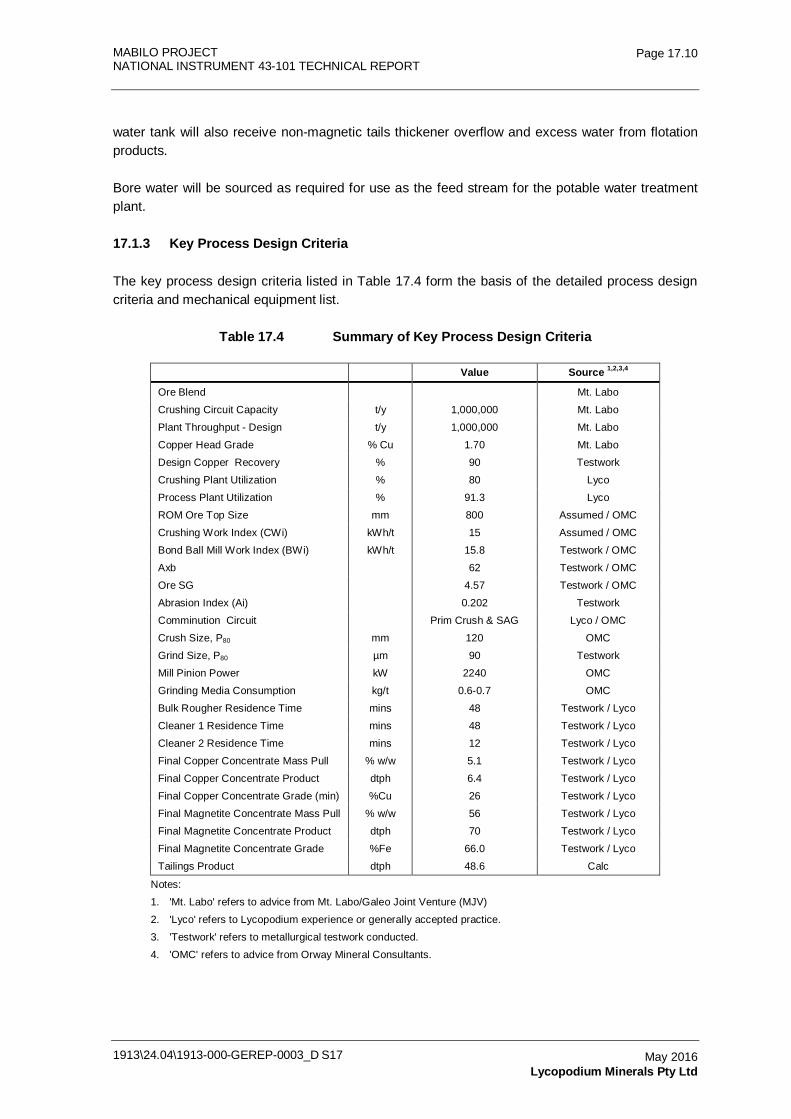
MABILO PROJECT NATIONAL INSTRUMENT 43-101 TECHNICAL REPORT
1913\24.04\1913-000-GEREP-0003_D S17
Page 17.10
May 2016 Lycopodium Minerals Pty Ltd
water tank will also receive non-magnetic tails thickener overflow and excess water from flotation products.
Bore water will be sourced as required for use as the feed stream for the potable water treatment plant.
17.1.3 Key Process Design Criteria
The key process design criteria listed in Table 17.4 form the basis of the detailed process design criteria and mechanical equipment list.
Table 17.4 Summary of Key Process Design Criteria
Value Source 1,2,3,4
Ore Blend Mt. Labo
Crushing Circuit Capacity t/y 1,000,000 Mt. Labo
Plant Throughput - Design t/y 1,000,000 Mt. Labo
Copper Head Grade % Cu 1.70 Mt. Labo
Design Copper Recovery % 90 Testwork
Crushing Plant Utilization % 80 Lyco
Process Plant Utilization % 91.3 Lyco
ROM Ore Top Size mm 800 Assumed / OMC
Crushing Work Index (CWi) kWh/t 15 Assumed / OMC
Bond Ball Mill Work Index (BWi) kWh/t 15.8 Testwork / OMC
Axb 62 Testwork / OMC
Ore SG 4.57 Testwork / OMC
Abrasion Index (Ai) 0.202 Testwork
Comminution Circuit Prim Crush & SAG Lyco / OMC
Crush Size, P80 mm 120 OMC
Grind Size, P80 µm 90 Testwork
Mill Pinion Power kW 2240 OMC
Grinding Media Consumption kg/t 0.6-0.7 OMC
Bulk Rougher Residence Time mins 48 Testwork / Lyco
Cleaner 1 Residence Time mins 48 Testwork / Lyco
Cleaner 2 Residence Time mins 12 Testwork / Lyco
Final Copper Concentrate Mass Pull % w/w 5.1 Testwork / Lyco
Final Copper Concentrate Product dtph 6.4 Testwork / Lyco
Final Copper Concentrate Grade (min) %Cu 26 Testwork / Lyco
Final Magnetite Concentrate Mass Pull % w/w 56 Testwork / Lyco
Final Magnetite Concentrate Product dtph 70 Testwork / Lyco
Final Magnetite Concentrate Grade %Fe 66.0 Testwork / Lyco
Tailings Product dtph 48.6 Calc
Notes:
1. 'Mt. Labo' refers to advice from Mt. Labo/Galeo Joint Venture (MJV)
2. 'Lyco' refers to Lycopodium experience or generally accepted practice.
3. 'Testwork' refers to metallurgical testwork conducted.
4. 'OMC' refers to advice from Orway Mineral Consultants.
MABILO PROJECT NATIONAL INSTRUMENT 43-101 TECHNICAL REPORT
1913\24.04\1913-000-GEREP-0003_D S17
Page 17.11
May 2016 Lycopodium Minerals Pty Ltd
17.2 Plant Description
The Mabilo process plant consists of a mineral processing concentrator with associated services and ancillaries. The plant has been designed to take Run-of-Mine (ROM) ore from the mine and concentrate the copper and magnetite bearing minerals to produce a copper bearing product, a gold-bearing pyrite product, a magnetite bearing product and a barren tail. The process facilities involved include the following:
• Crushing.
• SAG Milling.
• Rougher / Cleaner Flotation.
• Copper and Magnetite Concentrate Thickening and Filtration.
• Product Handling.
• Tailings Disposal.
• Reagents.
• Services and Ancillaries.
The plant has been designed in accordance with accepted industry practice. The following sections describe the plant process in detail and should be read in conjunction with the simplified process plant flowsheet (Figure 17.1) and the plant general arrangement drawing Figure 17.2.
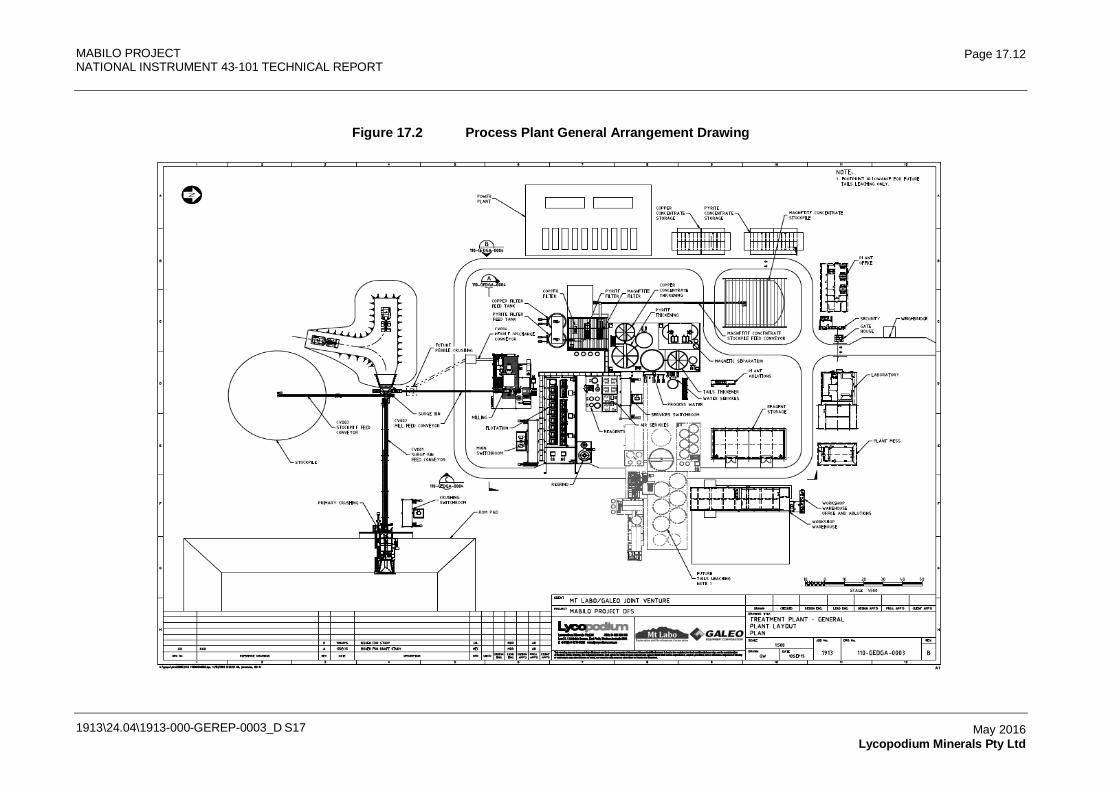
MABILO PROJECT NATIONAL INSTRUMENT 43-101 TECHNICAL REPORT
1913\24.04\1913-000-GEREP-0003_D S17
Page 17.12
May 2016 Lycopodium Minerals Pty Ltd
Figure 17.2 Process Plant General Arrangement Drawing
MABILO PROJECT NATIONAL INSTRUMENT 43-101 TECHNICAL REPORT
1913\24.04\1913-000-GEREP-0003_D S17
Page 17.13
May 2016 Lycopodium Minerals Pty Ltd
17.2.1 Crushing and Coarse Ore Storage
Run of Mine (ROM) ore will be reclaimed from the ROM pad by a front-end loader and fed to the ROM bin or direct tipped by mine trucks. The ROM bin will be fitted with a static grizzly to allow diversion of large rocks for subsequent breakage by mobile rock breaker.
Ore will be drawn from the ROM bin via a variable speed apron feeder and will feed into a 1,300 mm x 1,000 mm single toggle jaw crusher.
The primary crusher product will discharge onto the primary crusher discharge conveyor, which will feed a surge bin. The surge bin will be designed to overflow onto a stockpile feed conveyor which will discharge onto a static stockpile of 20,000 tonne capacity. This stockpile will be used as the major surge capacity in the event of a crusher shutdown. In normal operation, the milling circuit will be fed from the surge bin and the crusher will be operated to generate an excess of feed which will feed the stockpile. The surge bin will be arranged to allow ore reclaimed from the stockpile by front end loader to rejoin the circuit. A hoist has been provided for servicing the primary crusher area.
The crushing circuit will include dust sprays to reduce fugitive dust in the area.
17.2.2 Grinding
Primary crushed ore from the surge bin will be withdrawn by a single apron feeder and will be conveyed to a 5.50 m diameter x 6.1 m EGL Semi-Autogenous Grinding (SAG) mill equipped with a 3,400 kW drive. Water will be added to the mill together with grinding balls to maintain the desired load. Any pebbles from the SAG mill will be conveyed to a bunker for recycling back onto the SAG mill feed conveyor by front end loader. Balls will be charged to the SAG mill via the surge bin.
The ground ore which passes through the SAG mill trommel screen will report to a dedicated SAG mill discharge hopper from which it will be pumped to a cluster of 8 x 350 mm hydrocyclones (6 duty, 2 stand-by) for classification. The coarse underflow will gravitate back to the SAG mill.
Overflow from the hydrocyclones, at 35% solids and a P80 of 90 microns, will gravitate to the bulk flotation circuit.
17.2.3 Deslime
If the ore contains significant clay, the overflow from the SAG mill cyclones will be redirected to a deslime circuit. The slurry will be pumped to a cluster of 26 x 100 mm hydrocyclones (22 duty, 4 stand-by) for desliming at 10 microns. The underflow will advance to the bulk flotation circuit. The overflow containing clays will report to the tails thickener.
17.2.4 Bulk Sulphide Flotation
Cyclone overflow will pass through an in-line sampler before gravitating to a trash screen ahead of an agitated conditioning tank. The trash screen on top of the conditioning tank will remove any plastic or organic trash. Ore types with high pyrite levels will drop the natural pH significantly so the slurry will be conditioned with lime as required to maintain a rougher pH between 7 and 8.
MABILO PROJECT NATIONAL INSTRUMENT 43-101 TECHNICAL REPORT
1913\24.04\1913-000-GEREP-0003_D S17
Page 17.14
May 2016 Lycopodium Minerals Pty Ltd
AERO promoter 3894 will be added as a specialized copper / gold collector in the conditioning tank. The slurry will overflow to the head of the bulk roughing circuit. Flotation will take place in forced aspiration flotation cells to maximize control. Methyl Isobutyl Carbinol (MIBC) frother will be added at the head of the flotation bank to act as a froth stabilizing agent. A secondary collector (A407) will be added to the scavengers to float the slow floating composites.
The bulk flotation circuit will consist of the following equipment:
• Bulk roughing 6 x 30 m3 cells.
• Bulk scavenging 2 x 30 m3 cells.
The roughers will be arranged in a 1-2-3 configuration with a level control step between each drop. The scavengers will be arranged in a single group of two cells. Level control will be via a level sensor and dart valves in the last cell of each bank. Air from low pressure blowers will be added down the shaft to each cell. Control of air will be via a flow meter and control valve.
The tail from the bulk scavenger will be pumped to the magnetite recovery circuit via a sampling point.
The concentrate from the bulk rougher containing copper minerals and pyrite will be pumped to the regrind circuit ahead of the cleaner flotation circuit. The concentrate from the bulk scavengers will either join the bulk rougher concentrate or can be pumped to the pyrite thickener.
17.2.5 Concentrate Regrind
The bulk rougher concentrate will be pumped to a cluster of 6 x 250 mm hydrocyclones (4 duty, 2 stand-by) for classification at a P80 of 38 microns. The oversize will feed the regrind mill. The undersize will report to the cleaner flotation circuit.
The regrind mill will be a vertical tower mill complete with a 500 kW variable speed drive. The mill will be charged with 25 mm diameter media. The product from the mill will report to the regrind cyclone feed pump and join the fresh bulk concentrate for classification. Lime will be added in the mill to pre-condition cleaner feed slurry to a pH 10.5.
17.2.6 Cleaner Flotation
The reground concentrate will be pumped to the feed box at the head of Cleaner 1. Frother will be added before advancing to the first of five Cleaner 1 flotation cells followed by three cleaner scavenger cells. The cells will be as follows:
• Cleaner 1 5 x 16 m3 cells.
• Cleaner Scavenger 3 x 16 m3 cells.
The cleaner cells will be arranged in a 2-2-1 configuration with level control between each bank. The cleaner scavenger cells will be arranged in a 2-1 configuration with level control between each bank. Level control will be via a level sensor and dart valves in the last cell of each bank. Air from
MABILO PROJECT NATIONAL INSTRUMENT 43-101 TECHNICAL REPORT
1913\24.04\1913-000-GEREP-0003_D S17
Page 17.15
May 2016 Lycopodium Minerals Pty Ltd
low pressure blowers will be added down the shaft to each cell. Control of air will be via a flow meter and control valve. Promoter will be dosed in the regrind cyclone overflow and part way down the Cleaner 1 bank. Provision has been made to dose sodium cyanide as a pyrite depressant for some ores to improve final concentrate grade.
Cleaner 1 concentrate will be pumped to the head of Cleaner 2. An option to take the concentrate from the first two Cleaner 1 cells direct to final concentrate will also be provided. Tail from Cleaner 1 will feed the cleaner scavenger cells. Cleaner scavenger concentrate will be pumped to the regrind mill or report directly to Cleaner 2. Cleaner scavenger tail will feed the cleaner tails (pyrite) thickener.
At the head of Cleaner 2, reagents including lime, frother and promoter will be added before advancing to the first of five Cleaner 2 flotation cells. The cells will be as follows:
• Cleaner 2 5 x 4.3 m3 cells.
The Cleaner 2 cells will be arranged in a 2 - 3 configuration with level control between each bank. Level control will be via a level sensor and dart valves in the last cell of each bank. Air from low pressure blowers will be added down the shaft to each cell. Control of air will be via a flow meter and control valve.
Cleaner 2 concentrate as final copper concentrate will be pumped to the copper concentrate thickener via a sampler. Tail from Cleaner 2 will feed Cleaner 1.
17.2.7 Magnetic Separation
Bulk rougher tails from the flotation area will be pumped to one of two rougher / cleaner low intensity magnetic separators (LIMS). These machines are designed as a rougher / cleaner in series with the concentrate from the rougher stage feeding the cleaner stage. The cleaner magnetite concentrate will gravitate to one of two agitated concentrate storage tanks. The concentrate does not require thickening prior to filtration.
The tails from the magnetic separators will feed the non-magnetic tails thickener.
17.2.8 Concentrate Handling
Copper Concentrate Thickening and Filtration
Copper concentrate slurry from the copper cleaner circuit will be pumped via a pressure pipe sampler to a high-rate thickener. The slurry will be mixed with flocculant before being fed to the thickener. Thickener underflow will be pumped, at 65% solids by weight, to an agitated copper concentrate storage tank. The thickener overflow will gravitate to the flotation water tank for recycling to the flotation circuit. Provision has been made to dose hydrogen peroxide to the thickener overflow to oxidize any residual cyanide and prevent depression of sulphides.
The filtration section will consist of a concentrate storage tank, filter feed pumps and filter. Thickened copper concentrate slurry will be pumped from the copper concentrate storage tank to a horizontal plate and frame pressure filter for dewatering. The filter will separate the water and
MABILO PROJECT NATIONAL INSTRUMENT 43-101 TECHNICAL REPORT
1913\24.04\1913-000-GEREP-0003_D S17
Page 17.16
May 2016 Lycopodium Minerals Pty Ltd
solids to produce a filter cake, containing nominally 9% moisture by weight, and a filtrate solution. During the filtration process the cake can be washed with clean water to remove residual reagents. The filtrate solution will gravitate to the copper concentrate thickener. The copper filter cake will discharge into a concentrate bunker under the filter.
Cleaner Tails (Pyrite) Thickening and Filtration
Cleaner tails (pyrite) slurry from the copper cleaner circuit will be pumped, via a pressure pipe sampler, to a high rate thickener. The slurry will be mixed with flocculant before being introduced to the thickener. Thickener underflow will be pumped, at 65% solids by weight, to an agitated copper concentrate storage tank. The thickener overflow will gravitate to the flotation water tank for recycling to the flotation circuit. Provision has been made to dose hydrogen peroxide to the thickener overflow to oxidize any residual cyanide and prevent depression of sulphides.
The filtration section will consist of a concentrate storage tank, filter feed pumps and filter. Thickened pyrite concentrate slurry will be pumped from the pyrite concentrate storage tank to a horizontal plate and frame pressure filter for dewatering. The filter will separate the water and solids to produce a filter cake, containing nominally 9% moisture by weight, and a filtrate solution. During the filtration process the cake can be washed with clean water to remove residual reagents. The filtrate solution will gravitate to the copper concentrate thickener. The pyrite filter cake will discharge into a concentrate bunker under the filter.
Magnetite Concentrate Filtering and Washing
The filtration section will consist of concentrate storage tanks, filter feed pumps and filters. Magnetite concentrate slurry will be pumped from one of the concentrate storage tanks to a horizontal plate and frame pressure filter for dewatering. The filter will separate the water and solids to produce a filter cake, containing nominally 9% moisture by weight, and a filtrate solution. During the filtration process the cake can be washed with clean water to remove residual reagents. The filtrate solution will gravitate to the magnetite filtrate tank for re-use in diluting the feed to the magnetic separators. The magnetite filter cake will discharge onto a conveyor under the filter.
17.2.9 Copper and Pyrite Concentrate Storage
Storage of concentrate for up to 24 hours will be provided under each filter. On a regular basis the concentrate will be loaded into half height containers suitable for transport to the local port. This loading operation will use a front end loader dedicated to the task. A container storage area has been provided on site.
17.2.10 Magnetite Concentrate Storage
As the mass of magnetite concentrate discharging at one time is large, the concentrate will discharge from the filter onto a variable speed feeder which will slowly discharge onto a fixed speed conveyor. The conveyor will dump into a concentrate storage shed. From the discharge point the material will be moved by front end loader. Sufficient under cover storage for three days has been allowed.
MABILO PROJECT NATIONAL INSTRUMENT 43-101 TECHNICAL REPORT
1913\24.04\1913-000-GEREP-0003_D S17
Page 17.17
May 2016 Lycopodium Minerals Pty Ltd
17.2.11 Tailings Disposal
Tailings Thickening and Disposal
Non-magnetic tailings from the non-magnetic tailings thickener will be pumped to the tailings impoundment. The initial tailings storage impoundment can be reached using single stage pumping. In the future the addition of a second stage pump will be required as the TSF wall height rises. Water will be recovered using a decant tower and pumped back to the process plant. Tailings will be deposited subaqueously into the TSF using peripheral discharge. The deposition locations will be moved progressively along the distribution line as required to control the even deposition of tailings and to ensure that all of the tailings are maintained at saturation whilst limiting the pond depth within the centre of the facility.
17.2.12 Reagents and Services
Hydrated Lime
Hydrated lime will be delivered to site in one tonne bulk bags. Bags of hydrated lime will be deposited in a hopper using an electric hoist and will be added at a controlled rate to a mix tank with a variable speed screw feeder. Water will be added to produce a 20% solids w/w slurry. Lime slurry will be dosed to the regrind mill and the cleaner flotation circuit using a lime ring main and on/off valves operated on a timer.
Cyanide
Cyanide will be delivered to site in one tonne boxes containing bulka bags of cyanide briquettes. Cyanide briquettes will be added to the cyanide mixing tank using an electric hoist and enclosed bag breaker and dissolved in process water to achieve the required solution strength. A needle tank will act as a buffer to supply the mixed reagent during the make-up period.
The cyanide solution will be pumped to the cleaner flotation circuit by a variable speed dosing pump.
A3894 Promoter
A3894 promoter will be supplied as a liquid in 200 liter drums. The promoter is supplied and dosed as 100% strength liquid and will be unloaded into a promoter storage tank. A pressurized ring main will supply reagent to a series of variable speed dosing pumps which will control the small flow of promoter to individual dose points in the circuit.
A407 collector
A407 promoter will be supplied as a liquid in 200 liter drums. The promoter is supplied as 100% strength liquid and will be unloaded into a promoter storage tank. The promoter is water soluble and will be diluted as required for use. A variable speed dosing pump will control the small flow of promoter to individual dose points in the circuit.
MABILO PROJECT NATIONAL INSTRUMENT 43-101 TECHNICAL REPORT
1913\24.04\1913-000-GEREP-0003_D S17
Page 17.18
May 2016 Lycopodium Minerals Pty Ltd
Methyl Iso Butyl Carbinol (MIBC)
MIBC frother will be supplied as a liquid in 200 liter drums. The frother is supplied and dosed as 100% strength liquid and will be unloaded into a frother storage tank. A pressurized ring main will supply reagent to a series of variable speed dosing pumps which will control the small flow of frother to individual dose points in the circuit.
Grinding Media
Grinding balls will be delivered to site in 200 liter steel drums. Balls will be charged to the SAG mill via the surge bin as required to achieve the target power draw.
Regrind mill balls will be delivered to site in 200 liter steel drums and added to the mill via a 1 tonne capacity kibble.
Flocculant
Flocculant will be delivered to site in 25 kg bags. Flocculant will be added to the flocculant plant storage hopper manually. The vendor supplied package flocculant mixing plant will automatically mix batches of flocculant with raw water and transfer the mixed flocculant to the storage tank after each mixing cycle is complete.
Dedicated pumps will transfer the flocculant solution to the pyrite thickener, copper concentrate thickener and non-magnetic tails thickener as required.
Hydrogen Peroxide
Liquid hydrogen peroxide will be supplied in 1 m³ IBC containers and will be dosed as required into the flotation water system to oxidize any residual cyanide should this materially affect performance.
Diesel
Diesel will be delivered to site by bulk tankers and transferred to the multiple double skinned diesel storage tanks. The diesel will be used in the power station, the mine and to refuel site vehicles.
Reagents Storage
Reagents will be received on site in shipping containers or by flat bed truck. Sufficient reagents will be stored on site to ensure that supply interruptions due to port, transport or weather delays do not restrict production. Reagent containers will be offloaded from the delivery truck by the site crane and stacked in a laydown area until required. Reagents not supplied in containers will be stored in a covered, ventilated shed prior to use. Empty containers will be returned with the next delivery.
MABILO PROJECT NATIONAL INSTRUMENT 43-101 TECHNICAL REPORT
1913\24.04\1913-000-GEREP-0003_D S17
Page 17.19
May 2016 Lycopodium Minerals Pty Ltd
17.2.13 Services
Raw Water
Water will be pumped from the raw water dam (ECD 1) to the plant raw water tank. The river water will pass through primary filtration to remove any particulates. The raw water tank will have sufficient capacity to minimize the impact of short term supply interruptions. Duty / stand-by water pumps will be provided for the raw water distribution to the plant. Raw water will be used for reagent mixing service points in areas upstream of milling where no reagent is used. The raw water tank will overflow to the process water tank.
Fire Water
Fire water for the process plant will be drawn from the raw water tank. Suctions for other water services fed from the raw water tank will be at an elevated level to ensure a fire water reserve always remains in the raw water tank.
The fire water pumping system will contain:
• an electric jockey pump to maintain fire ring main pressure
• an electric fire water delivery pump to supply fire water at the required pressure and flowrate
• a diesel driven fire water pump that will automatically start in the event that power is not available for the electric fire water pump or that the electric pump fails to maintain pressure in the fire water system.
Fire hydrants and hose reels will be placed throughout the process plant, fuel storage and plant offices at intervals that ensure complete coverage in areas where flammable materials are present.
Gland Water
Flotation water will be clarified for recycling as filter wash water and gland service water. Clarified water will be distributed as gland service water using duty / stand-by gland water pumps. This system will feed all slurry pumps including milling, flotation concentrate handling and tails pumps.
Process Water
Water for the process water tank will be sourced from the following:
• Excess water from the flotation water tank.
• Water pumped from the TSF decant to the plant process water tank.
• Non magnetic tails thickener overflow.
MABILO PROJECT NATIONAL INSTRUMENT 43-101 TECHNICAL REPORT
1913\24.04\1913-000-GEREP-0003_D S17
Page 17.20
May 2016 Lycopodium Minerals Pty Ltd
The process water tank will be located so that the raw water tank overflows to the process water tank allowing the raw water tank to be kept full at all times.
Duty / stand-by process water pumps will be provided for the plant process water supply. Antiscalant will be added as required to condition the water and reduce fouling of pipelines, spray nozzles and screen decks.
Process water will be used for mill make up water, process dilution, reagent mixing and service points. A booster pump will provide spray water for the mine truck wash down bay.
Potable Water
Bore water will be supplied to the plant potable water treatment plant. The water treatment facility will include multi-media filtration, ultra-violet sterilization and chlorination. Potable water will be stored in the plant potable water tank and will be reticulated to the site ablutions, safety showers and other potable water outlets. Additional ultra-violet sterilization units will be installed on outgoing potable water distribution headers.
Dewatering Bores
The mine will incorporate up to four dewatering bores as an alternate source of water. These bores will pump directly to the Minalulu Laki Stream on the west on the tenement and this water will flow to ECD1 for recovery or discharge.
Plant and Instrument Air Supply
Plant and instrument air will be supplied from a number of duty / stand-by air compressors. The air will be filtered and dried before distribution with separate plant and instrument air receivers. A check valve on the instrument air supply will ensure the integrity of instrument air supply such that air from the plant air system serves as a back-up for instrument air, but plant air cannot draw down the instrument air system.
Low Pressure Blowers
Air for flotation will be supplied by three blowers. Blowers will be supplied with air filtration and oil removal to ensure clean air is delivered to the flotation cells.
17.3 Plant Area Design
17.3.1 General
The description of the process plant layout should be read in conjunction with the general arrangement drawing Figure 17.2.
MABILO PROJECT NATIONAL INSTRUMENT 43-101 TECHNICAL REPORT
1913\24.04\1913-000-GEREP-0003_D S17
Page 17.21
May 2016 Lycopodium Minerals Pty Ltd
17.3.2 Site Location
The process plant has been located in the north-west corner of the tenement between two existing creeks. This location is gently falling from south to north and has a straightforward access to the existing road in the north-west corner of the tenement.
Site investigations by Knight Piésold have indicated that the ground comprises soil tuff with an increasing cobble and boulder content with depth. This tuff is believed to extend up to 75 m in depth. Groundwater is close to the surface. A liquefaction assessment was completed and dynamic modeling undertaken which indicated that there was a likelihood of soil liquefaction in the event of a seismic event. To minimize the impact, individual structures in the process plant require piling. This piling will comprise 250 mm diameter skin friction piles 35 m in depth on critical structures. Critical structures include primary crusher, surge bin, mills, flotation area and filtration area.
Structures founded on spread footings or rafts may undergo ground deformation and movement in a seismic event. These include plant buildings, water tanks, concentrate sheds, etc. No allowance for reinforcing footings for these structures has been made.
17.3.3 General
The civil, mechanical and electrical design of the plant facilities is based on industry standard practice and Lycopodium's extensive experience in process plant design and project implementation.
Materials handling, containment and bunding in all plant areas will minimize the possibility of spillages to the environment.
Due consideration will be given to the nature of the various types of process and reagent slurries being pumped around the plant in terms of settling, wear and scaling.
Design of the plant will allow consideration for future expansion. Space has been provided in the plant layout for a future pyrite and flotation tails leach circuit to recover gold values in the tailings should this prove economic.
17.3.4 Primary Crushing
The ROM pad will be located at the SE corner of the plant site. This provides access for mine vehicles from the pit, located SE of the plant site and isolates heavy vehicle movements to this area and the mine services area.
The primary crushing facility will be built into the ROM pad and will consist of a steel ROM bin mounted in a concrete vault. The primary apron feeder mounted off the bin will discharge into the jaw crusher. The jaw crusher will be supported on a concrete platform over the crusher discharge conveyor.
MABILO PROJECT NATIONAL INSTRUMENT 43-101 TECHNICAL REPORT
1913\24.04\1913-000-GEREP-0003_D S17
Page 17.22
May 2016 Lycopodium Minerals Pty Ltd
A crusher maintenance hoist will be provided. Replaceable abrasion resistant linings will be provided in all chutes and conveyor skirtboards at all wear points. A sump pump will also be supplied to pump out rainfall.
Dust collection will not be provided. Dust suppression sprays will be used to control dust emissions.
17.3.5 Surge Bin and Stockpile
The mill surge bin feed conveyor will be inclined to minimize spillage. The 120 tonne surge bin height will be designed as low as practical, thereby minimizing the cost of the concrete and earthworks required for the front-end loader ramp.
Additional stockpile capacity as required, will be created by pushing out of the conical stockpile formed by the stockpile feed conveyor.
17.3.6 Grinding and Classification Circuit
The grinding and classification circuit building will be a combined concrete and steel structure, supporting a single grinding mill with single pinion drive, mill discharge hopper, classification cyclone clusters and associated facilities.
Access to the main mill level platform will be via two stairways from ground level; one at the mill discharge end and one at the cyclone feed elbow floor. Intermediate operating levels including the mill feed conveyor head platform and cyclone platform may be reached via a stairway from the feed elbow floor. Secondary access will also be possible via the mill feed conveyor walkway.
The deslime cyclone cluster will be located on the same floor as the primary milling cyclone cluster with the deslime cyclone feed hopper on the ground floor for ease of maintenance.
Servicing of the 3.4 MW mill drive, the mill discharge trommel and cyclone feed pumps will rely on mobile cranage for all lifting requirements, road access for which will be available adjacent to the structure on two sides. The mill will use a mill liner handler for mill relining. The cyclone platform will be serviced by a one tonne davit crane which can service both primary and deslime cyclones.
A trommel overflow chute will discharge to a pebble transfer conveyor. This will discharge to a pebble bunker which will be cleared using a front-end loader or skid-steer loader. In the event the conveyor trips, an overflow chute will discharge to a drive-in scats bunker. A sump pump will collect floor spillage in the vicinity of the discharge end of the mill, bunker drainage water and pump scuttling slurry and solids from the duty / stand-by cyclone feed pumps. A second sump pump and drive-in sump will be located at the feed end of the mill and will collect local floor spillage and hopper overflows.
The trash screen will be located on the milling building upper level to allow height for feeding the flotation circuit. Oversize material from the screen will be diverted to a bunker at ground level, undersize will flow by gravity into the flotation feed conditioning tank.
MABILO PROJECT NATIONAL INSTRUMENT 43-101 TECHNICAL REPORT
1913\24.04\1913-000-GEREP-0003_D S17
Page 17.23
May 2016 Lycopodium Minerals Pty Ltd
17.3.7 Rougher and Cleaner Flotation and Regrind
The rougher and cleaner flotation facilities have been housed in a building to protect the process from heavy downpours which may affect froth behavior. The rougher and scavenger cells have been arranged in a straight line with a gravity fall between banks to ensure controlled flow from one end to the other. The cleaner cells have also been arranged in a similar way in parallel with the roughers for ease of access. Concentrate launders run down one side and feed across to the concentrate pumps located on the north side of the building. Tails pumps for both rougher scavenger tails and cleaner tails are located at one end of the building for ease of maintenance.
The building will be serviced by an overhead travelling crane with a drop down bay in the north east corner. Sump pumps will be provided at each end of the building for spillage handling.
Access will be provided at each end of the building and will run the length of the flotation banks.
The regrind mill will be housed adjacent to the flotation building in a separate structure with spillage from the mill joining the flotation area. The regrind mill structure will be accessed from the flotation building and will be maintained by mobile crane.
17.3.8 Copper and Pyrite Concentrate Dewatering
The copper concentrate and pyrite (cleaner tails) thickeners will be housed next to each other and adjacent to the filtration building on the west side of the main north-south pipe rack. This will facilitate piping runs to and from the thickeners. The thickener location will allow filtrate from the filters to gravitate to the respective thickener. A common overflow tank will take thickener overflow for recycling back to the flotation plant. The area will be housed in a fully bunded area with sump pump.
The copper filter feed tank and pyrite filter feed tank will be located on the south side of the filter building to facilitate maintenance. The area will be fully bunded with a sump pump.
The filter building will be a fully enclosed structure with a common elevated concrete slab for the three filters (copper, magnetite and pyrite filters). The building will be serviced by an overhead crane and a drop down bay will facilitate maintenance. The copper filter and pyrite filter will be mounted high enough to allow limited storage of concentrate under the filter. This will be removed and loaded into containers for transport by a front end loader.
17.3.9 Magnetite Recovery and Dewatering
The magnetic separators processing the bulk flotation tails will be located on top of the magnetite concentrate agitated storage tanks. This will allow the heavy magnetite concentrate to drain by gravity directly into the tanks. A structure over the tanks will support the agitators and the magnetic separators and provide working access for operations and maintenance staff. The area will be serviced by mobile crane. Concentrate from the agitated tanks will be pumped to the magnetite filter located in the filter building.
The non-magnetic tails, containing much of the dilution water required for magnetic separation will gravitate to a thickener. Water recovered from this stream will overflow into the main process
MABILO PROJECT NATIONAL INSTRUMENT 43-101 TECHNICAL REPORT
1913\24.04\1913-000-GEREP-0003_D S17
Page 17.24
May 2016 Lycopodium Minerals Pty Ltd
water tank and will be recycled to the milling area as well as to the magnetic separators for dilution. The magnetite concentrate tanks and non-magnetic tails thickener will be housed in the same area next to the pipe rack as the copper concentrate thickener to allow service piping to and from the area to be carried on the pipe rack. A separate bund and sump pump will be provided.
The magnetite filter, located in the filter building, will discharge onto a variable speed feeder which will feed a discharge conveyor. This feeder arrangement will allow the large volume of filter discharge to be spread over the full filter cycle time and thus reduce the size of the conveyor. The magnetite conveyor will discharge to a conical stockpile inside a covered building. Concentrate will be moved by front end loader to maximize the use of available space in the concentrate shed. Trucks will be loaded by front end loader and will pass over a weighbridge before transporting concentrate offsite. A loop road around the concentrate shed has been included to facilitate truck movement.
17.3.10 Tailings Disposal
The underflow from the non-magnetic tails thickener together with the underflow from the cleaner tails (pyrite) thickener will form the combined tails stream and will report to a common tails hopper located adjacent to the non-magnetic tails thickener. The tailings pumps will transport the tailings slurry via an HDPE pipe approximately 2.3 to 3.0 km to the discharge point of the tailings storage facility located to the east of the plant.
17.3.11 Reagents
The reagent mixing area will be located on the eastern side of the piperack and adjacent to the flotation building. The area will be serviced by an overhead reagents hoist with separate bunding and sump pumps for cyanide and lime handling.
A separate reagent shed will house bulk reagents with cyanide stored in a fenced off area.
Cyanide
Sodium cyanide briquettes in one tonne bulka bags will be stored in shipping containers next to the cyanide mixing plant. A steel structure with access stairs from ground level will house the enclosed bag breaker, a mixing tank and a dedicated bag lifting hoist. Mixed cyanide will be dosed direct.
Spillage in the area is pumped via a sump pump into the pyrite thickener.
Hydrated Lime
Hydrated lime in one tonne bags will be loaded into a bag breaker on top of a small bin. From here the lime will be conveyed to an agitated mixing tank. Stair access to the top of tank will be provided.
Promoters and Frother
Delivery of promoters and frother will be in 200 liter drums and will be unloaded into the mixing and storage tanks using a drum tipper. The flotation reagent facility will be located within a partitioned
MABILO PROJECT NATIONAL INSTRUMENT 43-101 TECHNICAL REPORT
1913\24.04\1913-000-GEREP-0003_D S17
Page 17.25
May 2016 Lycopodium Minerals Pty Ltd
area of the reagents bund and will have a dedicated sump pump which will dispose of any spillage to the tailings hopper.
Flocculant
Dry flocculant will be transported by forklift from the reagents store to the flocculant mixing area adjacent to the thickeners. The 25 kg bags will be manually loaded into a hopper. From here the dry flocculant will be pneumatically transported to a wetting head located on the top of a small mixing and storage tank. Stair access to the top of tank will be provided.
The dry hopper structure will be partially clad for rain and wind protection.
17.3.12 Air and Water Services
All compressed air services will be housed in a compressor station adjacent to the reagents area consisting of a fully clad steel structure and concrete slab floor. The building will have one permanently open panel for forklift access should any of the package unit compressors or blowers need to be removed for major overhaul. Normal maintenance will be expected to be carried out with the units in situ.
Water services include raw water, process water, fire water and potable water. All tanks, pumps and the potable water treatment plant will be located at the northern end of the process plant. The sewage treatment plant will be located at the northern end of the plant site to service the plant buildings. The potable water and sewage treatment plants will be containerized.
Raw water will be supplied to the raw water tank from the environmental control dam (ECD1). The raw water tank will also hold a volume of 150 m³ of water reserved for firewater use. The fire protection skid of electric with backup diesel pumps and jockey pump will draw from the base of the raw water tank. The raw water distribution pump set will draw from higher up in the tank to prevent depletion of the fire water supply reserve.
Process water consists predominantly of thickener overflows, raw water tank overflow and TSF decant return.
17.3.13 Spillage Containment
All areas in the plant will be self bunded for spillage containment as well as slurry from the tailings pipeline drain. No large event pond has been included.
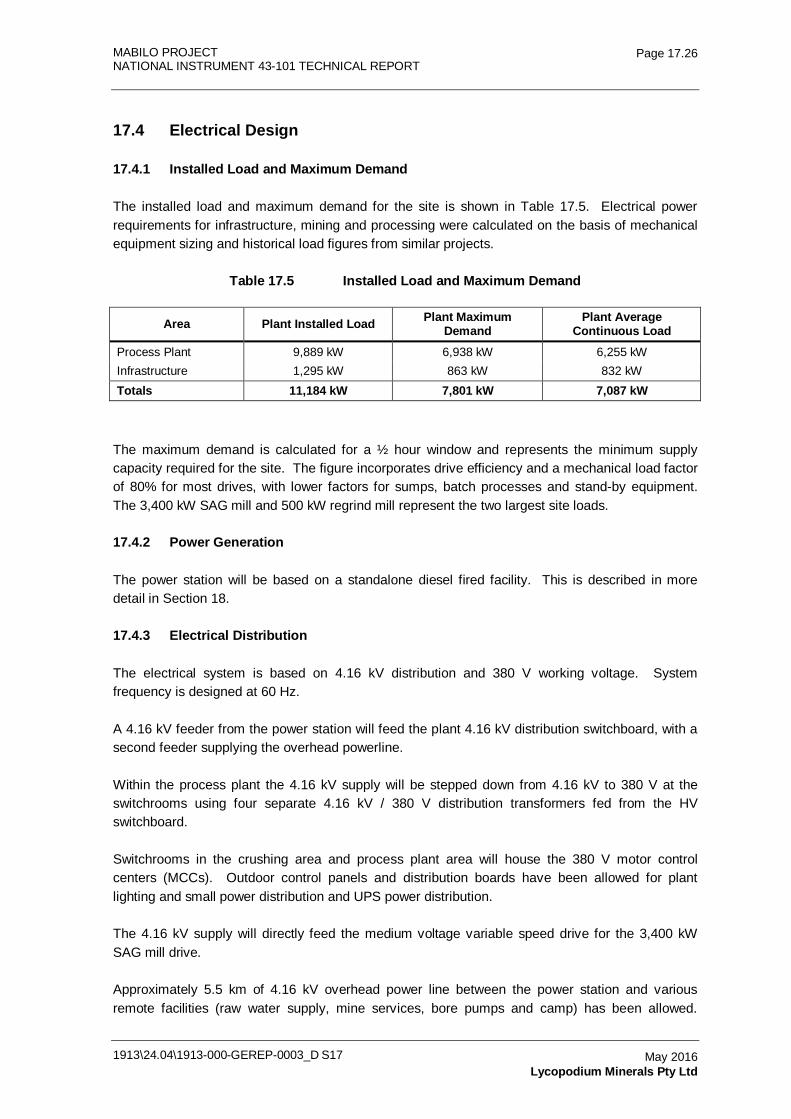
MABILO PROJECT NATIONAL INSTRUMENT 43-101 TECHNICAL REPORT
1913\24.04\1913-000-GEREP-0003_D S17
Page 17.26
May 2016 Lycopodium Minerals Pty Ltd
17.4 Electrical Design
17.4.1 Installed Load and Maximum Demand
The installed load and maximum demand for the site is shown in Table 17.5. Electrical power requirements for infrastructure, mining and processing were calculated on the basis of mechanical equipment sizing and historical load figures from similar projects.
Table 17.5 Installed Load and Maximum Demand
Area Plant Installed Load Plant Maximum Demand
Plant Average Continuous Load
Process Plant 9,889 kW 6,938 kW 6,255 kW Infrastructure 1,295 kW 863 kW 832 kW Totals 11,184 kW 7,801 kW 7,087 kW
The maximum demand is calculated for a ½ hour window and represents the minimum supply capacity required for the site. The figure incorporates drive efficiency and a mechanical load factor of 80% for most drives, with lower factors for sumps, batch processes and stand-by equipment. The 3,400 kW SAG mill and 500 kW regrind mill represent the two largest site loads.
17.4.2 Power Generation
The power station will be based on a standalone diesel fired facility. This is described in more detail in Section 18.
17.4.3 Electrical Distribution
The electrical system is based on 4.16 kV distribution and 380 V working voltage. System frequency is designed at 60 Hz.
A 4.16 kV feeder from the power station will feed the plant 4.16 kV distribution switchboard, with a second feeder supplying the overhead powerline.
Within the process plant the 4.16 kV supply will be stepped down from 4.16 kV to 380 V at the switchrooms using four separate 4.16 kV / 380 V distribution transformers fed from the HV switchboard.
Switchrooms in the crushing area and process plant area will house the 380 V motor control centers (MCCs). Outdoor control panels and distribution boards have been allowed for plant lighting and small power distribution and UPS power distribution.
The 4.16 kV supply will directly feed the medium voltage variable speed drive for the 3,400 kW SAG mill drive.
Approximately 5.5 km of 4.16 kV overhead power line between the power station and various remote facilities (raw water supply, mine services, bore pumps and camp) has been allowed.
MABILO PROJECT NATIONAL INSTRUMENT 43-101 TECHNICAL REPORT
1913\24.04\1913-000-GEREP-0003_D S17
Page 17.27
May 2016 Lycopodium Minerals Pty Ltd
Three off 4.16 / 0.380 kV 500 kVA and five off 4.16 / 0.380 kV 100 kVA transformers are required at the various sites.
The tailings storage facility decant return pump station will be supplied by local diesel generator owing to its remote location from the plant and potential overhead powerline clashes with mining infrastructure.
Accommodation camp power will be supplied from a 500 kVA transformer fed from the 4.16 kV overhead line and will have a 500 kVA emergency backup generator.
17.4.4 Electrical Buildings
The site electrical switchrooms will generally be procured as prefabricated flat packed buildings. Site assembly and lighting / small power / HVAC fitout will precede the installation of the 4.16 kV switchboards, 380 V MCCs and variable speed drives into the buildings. The following buildings are required:
• Two HV switchrooms for the power station and process plant, the latter adjacent combined with one of the plant LV switchrooms.
• One LV switchroom for the crushing plant area.
• One LV switchroom for the milling, floatation, filtration, separation and tails areas (combined with the HV plant switchroom)
• One LV switchroom for the reagents and services area.
17.4.5 Transformers and Compounds
All the 4.16 / 0.380 kV distribution transformers will be of ONAN cooling configuration and vector group Dyn11.
Fire rated concrete walls will be constructed around the pad mounted transformers for protection of the switchrooms.
Outdoor rated 4.16 / 0.380 kV kiosk substations will be used to provide power to the plant and mine services areas.
17.4.6 4.16 kV Switchboards
One 4.16 kV switchboard has been allowed for in the plant and one will be supplied with the onsite power plant. The 4.16 kV switchboards will be fully withdrawable design complete with protection, metering and earthing facilities.
MABILO PROJECT NATIONAL INSTRUMENT 43-101 TECHNICAL REPORT
1913\24.04\1913-000-GEREP-0003_D S17
Page 17.28
May 2016 Lycopodium Minerals Pty Ltd
The design fault level and circuit breaker ratings adopted are:
• 4.16 kV switchboard busbar 1,250 A, 25 kA at 1 sec
• 4.16 kV circuit breakers 630 A
Protection will be provided by microprocessor based protection relays.
17.4.7 SAG Mill Variable Speed Drive
The 3,400 kW SAG Mill main drive will be 4.16 kV SCIM motor controlled by a medium voltage variable speed drive. The speed control of the mill will range from 1 - 80% allowing for inspection and inching without a separate inching drive. The variable speed drive will be fed from the plant 4.16 kV switchboard.
17.4.8 LV Electronic Variable Speed Drives and Soft Starters
LV variable speed drive (VSD) units and soft starters (SS) ratings range from 0.18 up to 500 kW. These will be floor or wall mounted (dependent upon size) along the internal wall of the LV substations.
17.4.9 380 V Motor Control Centre
The LV MCCs will double-sided (back to back) and housed in the three plant LV switchrooms. Construction of all MCCs will have Form 4 segregation, Type 2 coordination. Starters in MCCs will be of demountable design and main incoming circuit breakers will be of withdrawable design complete with protection. Motor starters up to 90 kW will be equipped with thermal overload protection and electronic protection used for all larger drives. The LV MCCs will supply power to the low voltage motors, low voltage variable speed drives and low voltage distribution boards.
17.4.10 Fire Protection
All switchrooms will be provided with local fire detection systems consisting of Very Early Smoke Detection Apparatus (VESDA) sampling for the switchboard. Signals from the fire detection system will be wired to the respective Fire Indication Panel (FIP) in the switchrooms and all signals will be monitored by a master fire detection panel (MFIP) in the Administration Building. Each FIP will also be wired to a local siren with beacon to warn staff of the fire detection.
17.4.11 Cable Ladders
Cable ladders will generally be laid horizontally, with vertical ladders used in areas where spillage may occur. Hot dip galvanized type cable ladders will be used.
Cables of different voltage groups will be installed on separate ladders. If they need to be installed on the same ladder, then complete segregation of the ladders will be provided. Ladder routes will follow the mechanical pipe racks.
MABILO PROJECT NATIONAL INSTRUMENT 43-101 TECHNICAL REPORT
1913\24.04\1913-000-GEREP-0003_D S17
Page 17.29
May 2016 Lycopodium Minerals Pty Ltd
17.4.12 Cables
Direct buried cables will be provided with armoring.
Cables up to 25 mm2 will be PVC insulated and larger cables will be XLPE insulated.
VSD cables will be multiple core 3 x phase and 3 x earth cables symmetrically laid out within an overall shielded cable.
Cables within the plant area will be installed above ground, on cable ladders and follow the mechanical pipe racks wherever possible.
17.4.13 Lighting
All lighting around the process plant will be designed in a fit for purpose manner to suit the operational requirement for each area.
17.4.14 Earthing System and Lightning Protection
The earthing system within the plant will be designed in accordance with relevant ANSI/IEEE Standards (141, 142). The following method of system earthing will be implemented at various voltage levels:
• 4.16 kV Resistance Earthed via Neutral Earthing Resistor.
• 380 V Solidly Earthed System / Multiple Earthed Neutral (MEN) / T-N-C-S.
Lightning protection will be provided for all plant building structures. Plant switchrooms and structural high points will be fitted with lightning masts of sufficient height and quantity to ensure that all exposed points will be covered as per 'Rolling Sphere Method'. Lightning protection systems will have their own independent earthing electrodes and will be interconnected with the power earthing system.
17.5 Control System
17.5.1 General Overview
The general control philosophy for the plant will be one with a moderate level of automation and remote control facilities. Instrumentation will be provided within the plant to measure and control all key process plant parameters.
The main control room, which will be located within the plant offices, will house two PC based operator interface terminals (OIT). Two additional servers will also be located here to act as the control system supervisory control and data acquisition (SCADA) servers in a redundant configuration. The control room is intended to provide a central area from where the plant is operated and monitored and from which the regulatory control loops can be monitored and adjusted. All key process and maintenance parameters will be available for trending and alarming on the process control system (PCS).
MABILO PROJECT NATIONAL INSTRUMENT 43-101 TECHNICAL REPORT
1913\24.04\1913-000-GEREP-0003_D S17
Page 17.30
May 2016 Lycopodium Minerals Pty Ltd
The process control system that will be used for the plant will be a programmable logic controller (PLC) and Citect SCADA based system. The PCS will control the process interlocks and PID control loops for non-packaged equipment. Control loop set-point changes for non-packaged equipment will be made at the OIT.
All PLCs will be linked via a PCS Ethernet network, supported over the site fiber optic cabling between switchrooms and key infrastructure buildings.
In general, the plant process drives will report their ready, run and start pushbutton status to the PCS and will be displayed on the OIT. Local control stations will be located in the field in proximity to the relevant drives. These will, as a minimum, contain start and latch-off-stop (LOS) pushbuttons which will be hard-wired to the drive starter. Plant drives will predominantly be started by the control system in automatic operation.
The OITs will allow drives to be selected to Auto, Local, Remote or Out-of-Service modes via the drive control pop-up. Statutory interlocks such as emergency stops and thermal protection will be hardwired and will apply in all modes of operation. All PLC generated process interlocks will apply in Auto and Remote modes. Process interlocks will be disabled or bypassed in Local mode with the exception of critical interlocks such as lubrication systems on the mill.
Local selection will allow each drive to be operated by the operator in the field via the local start pushbutton. Remote selection will allow the equipment to be started from the control room via the drive control popup. Status indication of process interlocks as well as the selected mode of operation will be displayed on the OIT.
Vendor supplied packages will use vendor standard control systems as required throughout the Project. Vendor packages will generally be operated locally with limited control or set-point changes from the PCS system. General equipment fault alarms from each vendor package will be monitored by the PCS system and displayed on the OIT. Fault diagnostics and troubleshooting of vendor packages will be performed locally.
A remote control panel will be utilized for the following vendor packages:
• SAG mill.
• Regrind mill.
• Plate and frame filters.
• Potable water treatment system.
• Sewage treatment plant
• Compressed air and blower systems.
MABILO PROJECT NATIONAL INSTRUMENT 43-101 TECHNICAL REPORT
1913\24.04\1913-000-GEREP-0003_D S17
Page 17.31
May 2016 Lycopodium Minerals Pty Ltd
17.5.2 Drive Controls
Each drive will be supplied from a Motor Control Centre (MCC) switchboard. All drive control circuits will be hardwired. In the field, each drive will be provided with a stop / start push-button control station.
Variable Speed Control units will be Variable Voltage Variable Frequency (VVVF) utilizing Pulse Width Modulated (PWM) technology. The drive will be mounted in a free standing cubicle. The drive will be provided with an integral control panel for programming and operation at the VVVF unit for commissioning and emergency running.
17.5.3 Control Loops
Regulatory control loops will be provided around the milling, desliming, flotation, thickening and tails disposal circuits.
There will be two modes for loop controlled set points available in the OIT. These are 'Loop Auto Mode' and 'Loop Manual Mode'. In Loop Auto Mode (analogous to cascade control), the setpoint will be predominantly controlled by the applicable 'master' PID loop (e.g. for thickener underflow pumping control the bed pressure PID controller output will supply a set point for the thickener underflow flow control loop which ultimately controls the speed of the thickener underflow pump). In Loop Manual Mode, set point may be entered manually from the loop set point pop up in the OIT.
Where required, analogue set points from the PCS to vendor supplied control panels can be done either via the OIT or via vendor control panels. The selection of whether the set point will come from the OIT or from the vendor control panel will be made in the OIT as a PLC digital output.
17.5.4 Crushing Circuit
The crushing circuit feedrate will be controlled using a variable speed apron feeder based on the output measured on the crusher discharge weightometer. This will be controlled by remote setpoint to ensure sufficient feed is crushed to maintain a surge bin overflow to the static stockpile.
17.5.5 Milling
A level detector in the surge bin will indicate the availability of mill feed at all times.
Ore feed to the SAG mill will be measured on the mill feed conveyor with a belt weigh scale. The speed of the variable speed reclaim feeder which recovers ore from the surge bin will be modulated to achieve the desired mill feed rate. Process water addition to the SAG mill feed will be ratioed to the ore feed rate in order to maintain a relatively constant mill feed slurry density to optimize grinding efficiency. Process water addition to the mill discharge hopper will be automatically controlled to maintain a constant cyclone feed density.
Flowmeters will be provided on the mill feed and mill discharge hopper water addition lines. A nucleonic density gauge located on the cyclone feed line will indicate the cyclone feed density.
MABILO PROJECT NATIONAL INSTRUMENT 43-101 TECHNICAL REPORT
1913\24.04\1913-000-GEREP-0003_D S17
Page 17.32
May 2016 Lycopodium Minerals Pty Ltd
A level element will measure the slurry level in the mill discharge hopper. A PID controller will be used to control the speed of the duty mill discharge pump to maintain the required level. Pressure will be controlled by bringing cyclones on and off. The cyclone pressure, hopper level and pump speed (output) will be trended and recorded by the PCS.
17.5.6 Desliming
A level element will measure the slurry level in the deslime feed hopper. A PID controller will be used to control the speed of the duty pump to maintain the required level. Pressure will be controlled by bringing cyclones on and off. The cyclone pressure, hopper level and pump speed (output) will be trended and recorded by the PCS.
17.5.7 Flotation
Flotation Level Control
Control of the level in the flotation cells will be carried out by a PID controller which will adjust the position of dart valves in the discharge of the cells based on an ultrasonic level measurement in the cells.
Flotation Air Control
Control of the air to the flotation cells will be carried out by a PID controller which will adjust the position of valves in the air inlet line based on flow measurement to the cells.
Hopper Level Control
Control of the level in the hoppers will be carried out by a PID controller which will adjust the speed of the variable speed pumps based on an ultrasonic level measurement in the hopper.
17.5.8 Thickening
Thickener Control
Control of the thickener rakes will be carried out using the vendor supplied thickener control panel and the Plant Control System. Rakes will be controlled to automatically lift when rake torque exceeds a pre-determined set point and will automatically be lowered in stages as rake torque decreases.
Thickener Underflow Control
Thickener underflow can be controlled in two ways:
• Bed Pressure Control - A bed pressure transmitter in the thickener will measure the bed pressure of the slurry within the thickener and a bed pressure PID controller will be used to send a remote set point to the flow controller which controls the speed of the thickener underflow pump.
MABILO PROJECT NATIONAL INSTRUMENT 43-101 TECHNICAL REPORT
1913\24.04\1913-000-GEREP-0003_D S17
Page 17.33
May 2016 Lycopodium Minerals Pty Ltd
• Underflow Density Control - A density element will measure the slurry density of the thickener underflow slurry and a PID density controller will be used to send a remote set point to the flow controller which controls the speed of the thickener underflow pump.
A minimum flow rate will be programmed into the flow controller to ensure that sanding of the line does not occur. The thickener underflow slurry density, volumetric flow rate, calculated mass flow rate and pump speed (output) will be trended and recorded by the PCS.
Thickener Bed Level and Flocculant Dosing Control
The slurry bed level within the thickeners will be measured using an ultrasonic bed level detector. A PID bed level controller will send a remote set point to the flocculant PID flow controller which will adjust the speed of the thickener flocculant dosing pump to maintain the flow set point.
17.5.9 Filtration
The filters will be controlled by standalone PLCs which will control the sequence of close, fill, squeeze, air blow, open and dump.
17.5.10 Magnetic Separation
The magnetic separators will be set up to maintain a constant level in the tanks during commissioning. The flow rate and density fed to the separators will be measured to allow control of the interstage dilution water flowrate.
17.5.11 Tailings Disposal
Non-magnetics tailings and cleaner tailings underflow slurry will be discharged into the tailings hopper. A level element will measure the slurry level in the tailings hopper. Dilution water will be added if required. A PID controller will be used to control the speed of the duty tailings pump set to maintain the required flow rate cascaded with the level control loop.
17.5.12 Services
Sensors will detect the water levels in the raw, potable and process water tanks. High and low level alarms will register in the control room.
The ECD1 pumps and potable bore pumps will be controlled manually.
The potable water treatment system will be controlled from a local control panel. System faults will be alarmed on the PCS. Sensors will detect the water levels in the potable water tanks.
The waste water treatment system will be controlled from a local control panel. System faults will be alarmed on the PCS. Sensors will detect the water level in the treated water tank.
Low pressure alarms will be provided for plant and instrument air, process water, raw water, potable water and fire water.
MABILO PROJECT NATIONAL INSTRUMENT 43-101 TECHNICAL REPORT
1913\24.04\1913-000-GEREP-0003_D S17
Page 17.34
May 2016 Lycopodium Minerals Pty Ltd
17.5.13 Control Interfaces
Main Control Room
The main control room will contain an operator desk and the Operator Interface Terminals (OIT) and associated computers.
An audible alarm will be provided. Alarms will be accepted via the OIT keyboard.
Operator Interface Terminals
Operator interface terminals will be provided in the main plant control room mounted on top of a standard table.
SCADA software running on the OITs will allow control, monitoring and trending of the process plant. Communication between PLCs and the supervisory SCADA software will be via fiber optic network to ensure system performance and reliability.
17.6 Metallurgical Accounting
Weightometers will be located on the indicated conveyors:
• Surge Bin feed conveyor will measure crushing circuit tonnage.
• Mill feed conveyor will measure mill feed tonnes.
• Magnetite concentrate conveyor will measure magnetite concentrate tonnes
The tonnage of crushed ore reporting to the dead stockpile can be estimated from the difference between the crushed ore tonnage and the mill feed tonnes.
Copper and pyrite concentrate production will be measured from load cells on the copper concentrate filter and regular moisture samples. This will be confirmed via weighbridge weights of product.
Routine manual sampling of the flotation feed stream and the final tailings will ensure reliable composite shift samples for head grade and tails grades.
Density and flowmeters on the thickeners and tailings lines will allow the dry tonnage of concentrate and tailings to be determined as a cross check on the mill feed tonnage determined from the mill feed weightometer.
In plant sampling will include feed, concentrate and tails streams from each stage of the flotation and magnetic separation process.
Water supplied and used in the various areas will be continuously monitored with the peroxide dose system used to control cyanide in the water.
MABILO PROJECT NATIONAL INSTRUMENT 43-101 TECHNICAL REPORT
1913\24.04\1913-000-GEREP-0003_D S17
Page 17.35
May 2016 Lycopodium Minerals Pty Ltd
Reconciliation of the amount of reagents used over relatively long periods will be achieved by delivery receipts and stock takes.
17.7 1.35 Mtpa Processing Case
17.7.1 Processing Upside
MJV has indicated a desire to treat ore at up to 1.35 Mtpa. No specific design allowance for this treatment rate has been made in the base case 1.0 Mtpa facility. However, Lycopodium reviewed the process plant design and costs at a pre-feasibility level of engineering and identified the following:
• Crushing – The capacity of this facility will meet the throughput target. However increases in some conveyor drives will be required.
• Milling – The mill size will need to increase from 3.4 MW to 4.2 MW to treat the increased throughput. An increase in the number of classifying cyclones is required as well as increases in associated pumps.
• Flotation – To maintain residence time an increase in the number of rougher and cleaner flotation cells together with increases in associated pumps.
• Regrind – An increase in the regrind mill size together with increases in associated pumps will be required.
• Filter capacity – An increase in filtration capacity together with increases in associated pumps will be required.
• Services – Increases in water pumps and air systems will be required.
• An indicative capital and operating cost estimate for this scenario sees the capital cost rise by 7.3% and the process operating cost drop by $1.0/t.
17.7.2 Capital Cost Estimate
A factored capital estimate is summarized in Table 17.6. The initial project capital cost (excluding sustaining and deferred) was estimated at US$173.95 million.
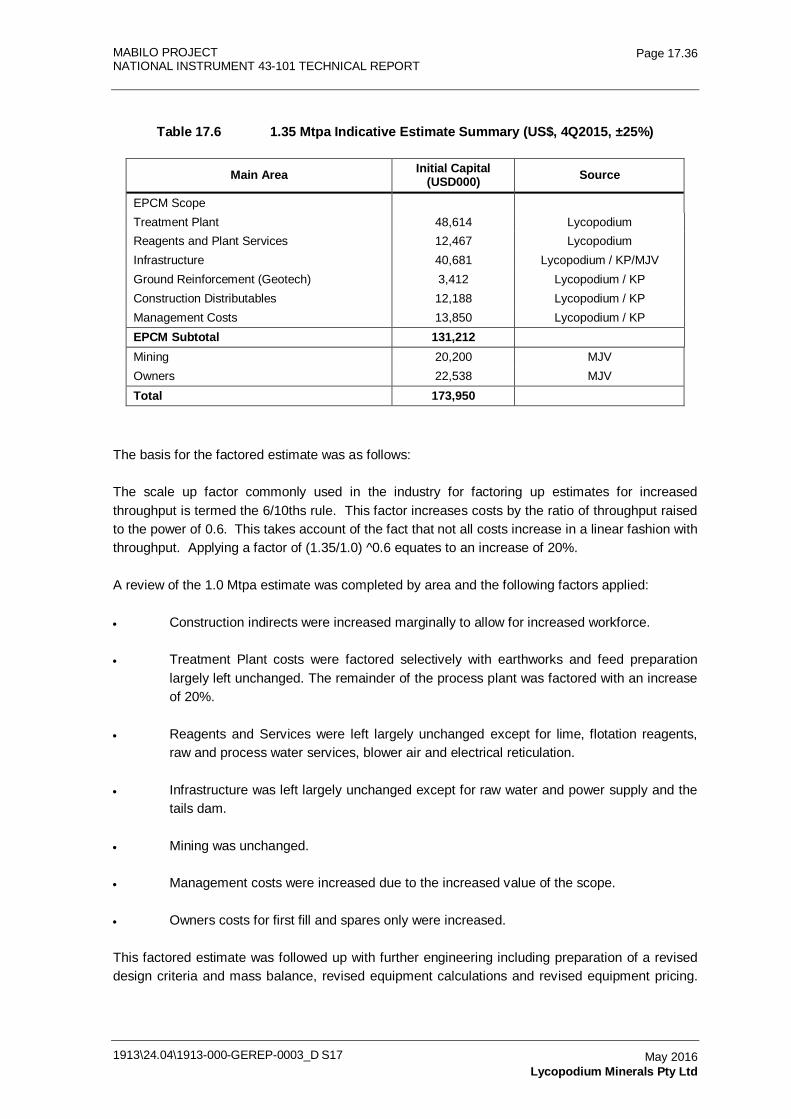
MABILO PROJECT NATIONAL INSTRUMENT 43-101 TECHNICAL REPORT
1913\24.04\1913-000-GEREP-0003_D S17
Page 17.36
May 2016 Lycopodium Minerals Pty Ltd
Table 17.6 1.35 Mtpa Indicative Estimate Summary (US$, 4Q2015, ±25%)
Main Area Initial Capital (USD000) Source
EPCM Scope Treatment Plant 48,614 Lycopodium Reagents and Plant Services 12,467 Lycopodium Infrastructure 40,681 Lycopodium / KP/MJV Ground Reinforcement (Geotech) 3,412 Lycopodium / KP Construction Distributables 12,188 Lycopodium / KP Management Costs 13,850 Lycopodium / KP EPCM Subtotal 131,212 Mining 20,200 MJV Owners 22,538 MJV Total 173,950
The basis for the factored estimate was as follows:
The scale up factor commonly used in the industry for factoring up estimates for increased throughput is termed the 6/10ths rule. This factor increases costs by the ratio of throughput raised to the power of 0.6. This takes account of the fact that not all costs increase in a linear fashion with throughput. Applying a factor of (1.35/1.0) ^0.6 equates to an increase of 20%.
A review of the 1.0 Mtpa estimate was completed by area and the following factors applied:
• Construction indirects were increased marginally to allow for increased workforce.
• Treatment Plant costs were factored selectively with earthworks and feed preparation largely left unchanged. The remainder of the process plant was factored with an increase of 20%.
• Reagents and Services were left largely unchanged except for lime, flotation reagents, raw and process water services, blower air and electrical reticulation.
• Infrastructure was left largely unchanged except for raw water and power supply and the tails dam.
• Mining was unchanged.
• Management costs were increased due to the increased value of the scope.
• Owners costs for first fill and spares only were increased.
This factored estimate was followed up with further engineering including preparation of a revised design criteria and mass balance, revised equipment calculations and revised equipment pricing.
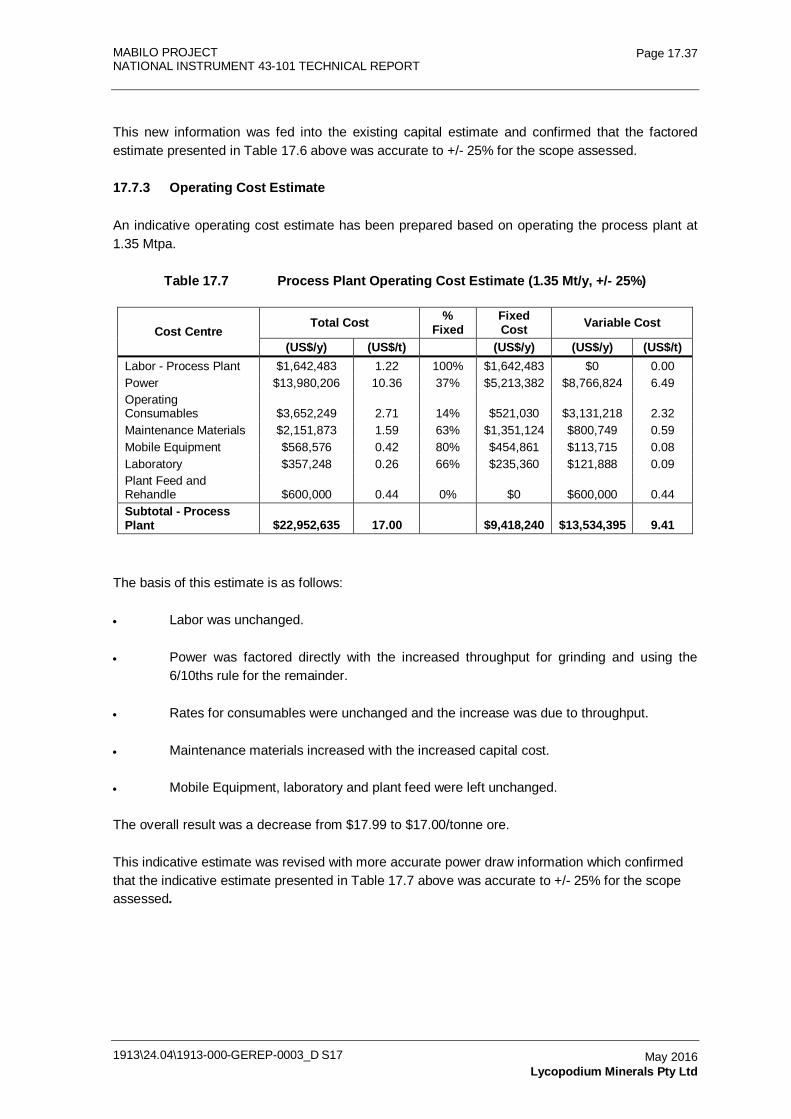
MABILO PROJECT NATIONAL INSTRUMENT 43-101 TECHNICAL REPORT
1913\24.04\1913-000-GEREP-0003_D S17
Page 17.37
May 2016 Lycopodium Minerals Pty Ltd
This new information was fed into the existing capital estimate and confirmed that the factored estimate presented in Table 17.6 above was accurate to +/- 25% for the scope assessed.
17.7.3 Operating Cost Estimate
An indicative operating cost estimate has been prepared based on operating the process plant at 1.35 Mtpa.
Table 17.7 Process Plant Operating Cost Estimate (1.35 Mt/y, +/- 25%)
Cost Centre Total Cost %
Fixed Fixed Cost Variable Cost
(US$/y) (US$/t)
(US$/y) (US$/y) (US$/t) Labor - Process Plant $1,642,483 1.22 100% $1,642,483 $0 0.00 Power $13,980,206 10.36 37% $5,213,382 $8,766,824 6.49 Operating Consumables $3,652,249 2.71 14% $521,030 $3,131,218 2.32 Maintenance Materials $2,151,873 1.59 63% $1,351,124 $800,749 0.59 Mobile Equipment $568,576 0.42 80% $454,861 $113,715 0.08 Laboratory $357,248 0.26 66% $235,360 $121,888 0.09 Plant Feed and Rehandle $600,000 0.44 0% $0 $600,000 0.44 Subtotal - Process Plant $22,952,635 17.00
$9,418,240 $13,534,395 9.41
The basis of this estimate is as follows:
• Labor was unchanged.
• Power was factored directly with the increased throughput for grinding and using the 6/10ths rule for the remainder.
• Rates for consumables were unchanged and the increase was due to throughput.
• Maintenance materials increased with the increased capital cost.
• Mobile Equipment, laboratory and plant feed were left unchanged.
The overall result was a decrease from $17.99 to $17.00/tonne ore.
This indicative estimate was revised with more accurate power draw information which confirmed that the indicative estimate presented in Table 17.7 above was accurate to +/- 25% for the scope assessed.
MABILO PROJECT
NATIONAL INSTRUMENT 43-101 TECHNICAL REPORT
1913-000-GEREP-0003
Table of Contents Page
18.0 PROJECT INFRASTRUCTURE 18.1 18.1 Introduction 18.1 18.2 Seismic Hazard Assessment 18.1 18.3 Site Overview 18.2 18.4 Construction Camp 18.4 18.5 Plant Buildings 18.4
18.5.1 Site Administration 18.4 18.5.2 Process Plant Buildings 18.4 18.5.3 Mine Services Buildings 18.5
18.6 Accommodation Camp 18.5 18.6.1 Overview 18.5 18.6.2 Power and Water Supply 18.6 18.6.3 Sewage Disposal 18.7 18.6.4 Rubbish Disposal 18.7 18.6.5 Landscaping 18.7
18.7 Relocation Housing 18.7 18.8 Water Supply 18.7
18.8.1 Local Water Supply 18.7 18.8.2 Process Plant Water Supply 18.8
18.9 Water Balance 18.8 18.9.1 Climate 18.8 18.9.2 Surface Water Management Development 18.8 18.9.3 Water Balance Design Parameters 18.11 18.9.4 Water Balance Modeling 18.11 18.9.5 Potable Water 18.12
18.10 Stream Diversions and Environmental Control Dams 18.12 18.10.1 Phase 1 – Oxide Pit in Years 1 and 2 18.13 18.10.2 Phase 2 – Medium Pit 18.14 18.10.3 Phase 3 – Primary Pit 18.14 18.10.4 Phase 4 – Completion of Mining 18.14 18.10.5 Surface Water Management Structures 18.14
18.11 Storage Facilities for Hazardous Materials 18.15 18.11.1 Blasting Agents 18.15 18.11.2 Fuel 18.15 18.11.3 Flotation Reagents 18.16 18.11.4 Hydrated Lime and Quick Lime 18.16
18.12 Product Haulage 18.16 18.12.1 Overview 18.16 18.12.2 Product Tonnes 18.17 18.12.3 Ports 18.17 18.12.4 Routes 18.18 18.12.5 Traffic 18.19 18.12.6 Traffic Impact 18.20 18.12.7 Equivalent Single Axle Load (ESAL) 18.21 18.12.8 Traffic Recommendations 18.21 18.12.9 Costs 18.22
18.13 Access Roads 18.22 18.13.1 Overview 18.22 18.13.2 Mine Access Road 18.23 18.13.3 Process Facility Service Roads 18.24
1913\24.04\1913-000-GEREP-0003_D S18 May 2016 Lycopodium Minerals Pty Ltd / MJV / Knight Piésold
MABILO PROJECT
NATIONAL INSTRUMENT 43-101 TECHNICAL REPORT
1913-000-GEREP-0003
Table of Contents (Continued)
Page
1913\24.04\1913-000-GEREP-0003_D S18
April 2016 Lycopodium Minerals Pty Ltd / MJV / Knight Piésold
18.13.4 Water Supply and Environmental Control Service Road 18.24 18.13.5 Village Connection Road 18.24 18.13.6 Community Diversion Roads 18.24 18.13.7 Mine Roads 18.25 18.13.8 Logistics 18.25
18.14 Telecommunications 18.26 18.14.1 General Overview 18.26 18.14.2 Network Topology 18.26 18.14.3 Server / Computer Infrastructure 18.27 18.14.4 Voice Services 18.28 18.14.5 UHF Site Radio 18.29 18.14.6 CCTV / Access Control 18.30 18.14.7 Camp Entertainment Services 18.30
18.15 Catering and Janitorial 18.30 18.16 Power Supply and Distribution 18.30
18.16.1 Power Supply 18.30 18.16.2 HV Power Distribution 18.32
18.17 Port 18.33 18.17.1 Overview 18.33 18.17.2 Product Analysis 18.33 18.17.3 Port Options Analysis 18.33 18.17.4 Larap Causeway 18.36 18.17.5 Larap Port Upgrade 18.38
18.18 Tailings Storage Facility 18.40 18.18.1 Tailings Geochemistry 18.40 18.18.2 Tailings Storage 18.41
TABLES Table 18.1 Accommodation Camp Breakdown 18.6 Table 18.2 Short Duration Storm Event Summary 18.8 Table 18.3 Commercial Export Product and Destination Chart 18.17 Table 18.4 Summary Logistics Route Analysis 18.19 Table 18.5 Site Radio System Hardware 18.29 Table 18.6 Basis for HFO vs Diesel vs IPP Power Plant Comparison 18.31 Table 18.7 Commercial Export Product and Destination Chart 18.33 Table 18.8 Summary of Port Site Assessment 18.35 Table 18.9 Summary of Capital Costs - Larap Port Upgrading (VAT Exclusive) 18.37 Table 18.10 Operating Costs - Larap Barge Loading 18.38 Table 18.11 Capital Cost, Proposed Larap Port Upgrade (VAT Exclusive) 18.39 Table 18.12 Operating Cost, Proposed Larap Port Upgrade Years 3-10 (VAT
Exclusive) 18.40
MABILO PROJECT
NATIONAL INSTRUMENT 43-101 TECHNICAL REPORT
1913-000-GEREP-0003
Table of Contents (Continued)
Page
1913\24.04\1913-000-GEREP-0003_D S18
April 2016 Lycopodium Minerals Pty Ltd / MJV / Knight Piésold
FIGURES Figure 18.1 Overall Site Layout 18.3 Figure 18.2 Surface Water Management 18.9 Figure 18.3 Port Locations and Road Network of the Project Site 18.18 Figure 18.4 Road Network of the Project Site 18.22 Figure 18.5 Mine Access Road 18.23 Figure 18.6 Proposed Community Bypass Road Alignment Layout 18.25 Figure 18.7 Network Topology 18.27 Figure 18.8 IT Server Topology 18.28 Figure 18.9 VoIP Service Topology 18.29 Figure 18.10 HFO vs Diesel vs IPP Power Plant NPC Comparison 18.32 Figure 18.11 Concept Long Term Larap Port Facility 18.34 Figure 18.12 Larap Causeway Concept Design 18.36
MABILO PROJECT NATIONAL INSTRUMENT 43-101 TECHNICAL REPORT
1913\24.04\1913-000-GEREP-0003_D S18
Page 18.1
April 2016 Lycopodium Minerals Pty Ltd / MJV / Knight Piésold
18.0 PROJECT INFRASTRUCTURE
18.1 Introduction
This section of the report summarizes the project infrastructure required for the primary ore project which also includes the oxide ore infrastructure.
The oxide and chalcocite mining operations will require establishment of limited infrastructure. This will include the following:
• Phase 1 Surface Water Management structures - described in Section 18.9.
• Port Upgrade described in Section 18.17.
• Mining Facilities – described in Section 18.4.
• Access and export road development – described in Section 18.12.
• Temporary power and water supplies.
18.2 Seismic Hazard Assessment
The Philippines is located in a tectonic region known as the 'Ring of Fire' and Mabilo is located approximately 11 km north of the potentially active Mount Labo. The site is located in an area of high seismic activity. A Seismic Hazard Assessment was undertaken by Knight Piésold (KP) to recommend the seismic design parameters for the project.
A literature review of the seismicity of Luzon and the Philippines was carried out and probabilistic and deterministic seismic hazard assessments were completed for the Mabilo Project. Available information and historical data, including earthquake catalogues and technical publications on the tectonics and seismicity of the region were reviewed.
The computer program EZ-FRISK by Fugro Risk Engineering group was used to develop a seismic hazard model for the site. Appropriate attenuation functions defining the relationship between earthquake magnitudes, distance from source to site and peak ground acceleration were used in the seismic hazard assessment.
The report recommends that for a Tailings Storage Facility (TSF) with a high consequence of dam failure the 1 in 1,000 year earthquake is adopted as the Operating Basis Earthquake (OBE). The estimated peak ground acceleration (PGA) for this earthquake is 0.36 g. It further recommends that the mean PGA resulting from the maximum magnitude earthquake on the Philippine Trench-upper plate should be adopted as the Maximum Design Earthquake (MDE) and for the Mabilo TSF that the maximum magnitude earthquake on the Philippine Trench-upper plate should be adopted as the Maximum Credible Earthquake (MCE).
MABILO PROJECT NATIONAL INSTRUMENT 43-101 TECHNICAL REPORT
1913\24.04\1913-000-GEREP-0003_D S18
Page 18.2
April 2016 Lycopodium Minerals Pty Ltd / MJV / Knight Piésold
Based on the above recommendations, the seismic design parameters used for the Tailing Storage Facility and Waste Dump are as follows:
• Operating basis earthquake (OBE) is based on a 1:1,000 year event, M6.45 and with a peak rock ground acceleration of 0.36 g.
• Maximum design earthquake (MDE) is based on a 1:10,000 year event, M6.5 and with a peak rock ground acceleration of 0.65 g.
• Maximum Credible Earthquake (MCE) is an M6.5 and with a peak rock ground acceleration of 0.65 g.
In accordance with the International Building Code (IBC) for structural design, the maximum considered earthquake ground motion is defined as the ground motion with a 1% probability of exceedance in 50 years (return period of about 5,000 years). Seismic parameters for use with the IBC for the Mabilo plant site structures are:
• Seismic coefficient, SS = 1.35 g.
• Seismic coefficient, S1 = 0.36 g.
• Peak ground acceleration = 0.58 g.
There is presently ongoing geothermal activity at Mount Labo which is considered a dormant volcano. The last eruption was about 27,000 years ago and produced pyroclastic flows from the summit cone, although it has not erupted since. Future eruptions of Mount Labo cannot be precluded but the potential of resumed activity during the operating life of the facility is considered to have a very low likelihood.
18.3 Site Overview
The overall site layout is shown in the site general arrangement drawing Figure 18.1.
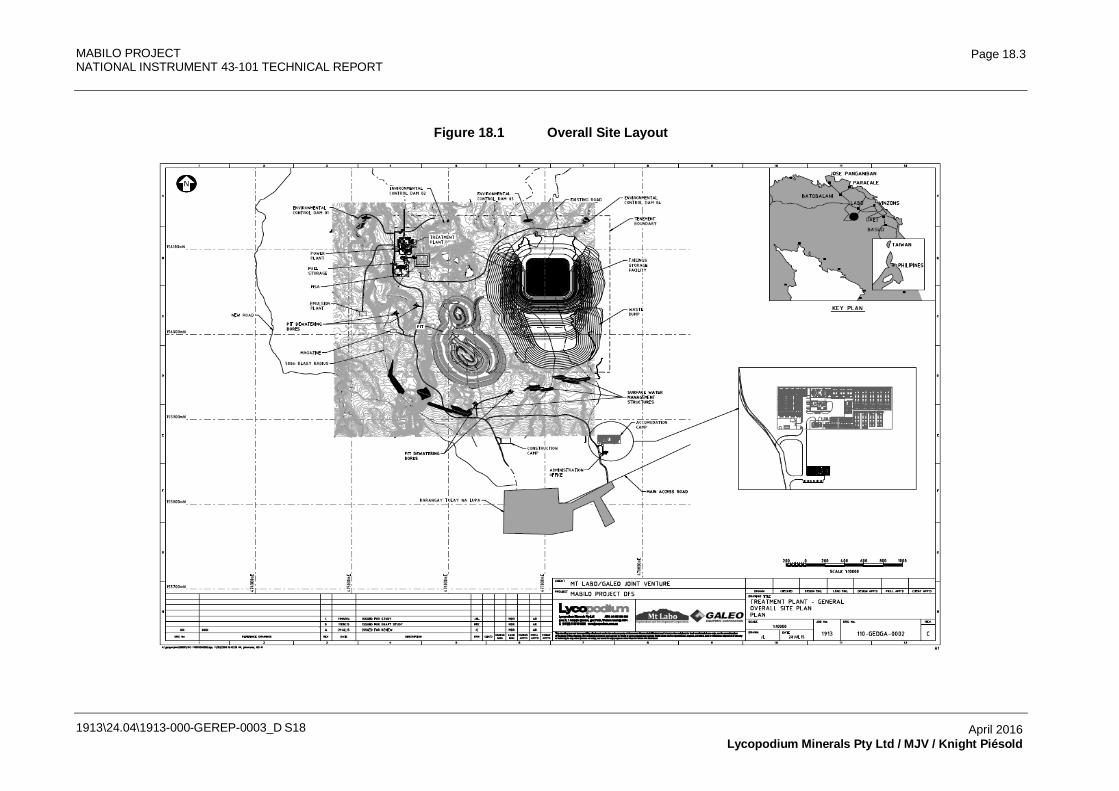
MABILO PROJECT NATIONAL INSTRUMENT 43-101 TECHNICAL REPORT
1913\24.04\1913-000-GEREP-0003_D S18
Page 18.3
April 2016 Lycopodium Minerals Pty Ltd / MJV / Knight Piésold
Figure 18.1 Overall Site Layout
MABILO PROJECT NATIONAL INSTRUMENT 43-101 TECHNICAL REPORT
1913\24.04\1913-000-GEREP-0003_D S18
Page 18.4
April 2016 Lycopodium Minerals Pty Ltd / MJV / Knight Piésold
18.4 Construction Camp
The construction workforce is expected to peak at 800 personnel which will be made up of a mix of expatriate supervision, Philippines supervision and trades and local unskilled labor. Local unskilled labor is expected to be recruited from the local towns and will reside locally. The rates used for developing the construction estimate include provision for accommodation and messing, consequently an allowance has been made for temporary services but no camp accommodation will be provided.
The site for temporary construction camps for those contractors that elect to build such facilities will be located north of Barangay Tulay na Lupa just outside the mining tenement and can be accessed from the existing road. Services (water and power) will be supplied to this site to support the temporary facilities.
The Owners and Engineers teams will initially be housed in the exploration camp until the permanent accommodation is available. The single attached units, kitchen and dining facilities will be prioritized to meet this need.
At the end of construction these facilities will be handed over to operations as the construction activities wind down.
18.5 Plant Buildings
The process plant and mine areas will incorporate a series of buildings and offices. Site buildings will be 'fit for purpose' industrial type structures.
The workshop, warehouse and reagent storage sheds will be constructed of a concrete slab on ground with structural steel frame and metal cladding. Offices and amenity buildings will be prefabricated structures.
The process plant layout is shown on Figure 17.1.1 in Section 17.
18.5.1 Site Administration
The main site administration office will be located adjacent to the accommodation camp and will be a container-based facility approximately 48 m x 14.6 m with a combination of standalone offices and open plan space. It will form the main reception area for the minesite and will include human resources and payroll functions.
18.5.2 Process Plant Buildings
The following facilities will be located within the fenced area of the process plant:
• Main entrance gatehouse with turnstile and entry boom gate control (16.5 m x 22 m).
• Plant area gatehouse (3 m x 3.5 m).
• Plant office (26.6 m x 13 m).
MABILO PROJECT NATIONAL INSTRUMENT 43-101 TECHNICAL REPORT
1913\24.04\1913-000-GEREP-0003_D S18
Page 18.5
April 2016 Lycopodium Minerals Pty Ltd / MJV / Knight Piésold
• First aid / clinic (10 m x 6 m).
• Training room (12 m x 10 m).
• Plant workshop (24 m x 12 m) with 10 t overhead crane and Warehouse (26 m x 12 m) in combined building.
• Office / ablutions for workshop.
• Process plant ablutions.
• Reagent storage (15 m x 37 m).
• Laboratory building (18 m x 29 m) and associated sample storage (14 m x 12 m).
• Dispatch building (8 m x 53 m).
18.5.3 Mine Services Buildings
The following buildings will be located in the mine services area:
• Heavy vehicle workshop provided by contractor.
• Mine warehouse.
• Mine / Geology office will be a container-based facility approximately 36 m x 14.6 m with a combination of standalone offices and open plan space. It will form the main work area for the geology and mine planning functions.
• Heavy vehicle washdown bay.
• Mine shift change building - container based.
• Fuel storage and refueling - contractor supplied.
18.6 Accommodation Camp
18.6.1 Overview
The accommodation camp will be located approximately 3 km south east of the process plant on the outskirts of the Barangay Tulay na Lupa. It will provide accommodation for salaried and security staff not originating from the local area. A new access road will run from the existing main road north approximately 500 meters to the accommodation camp.
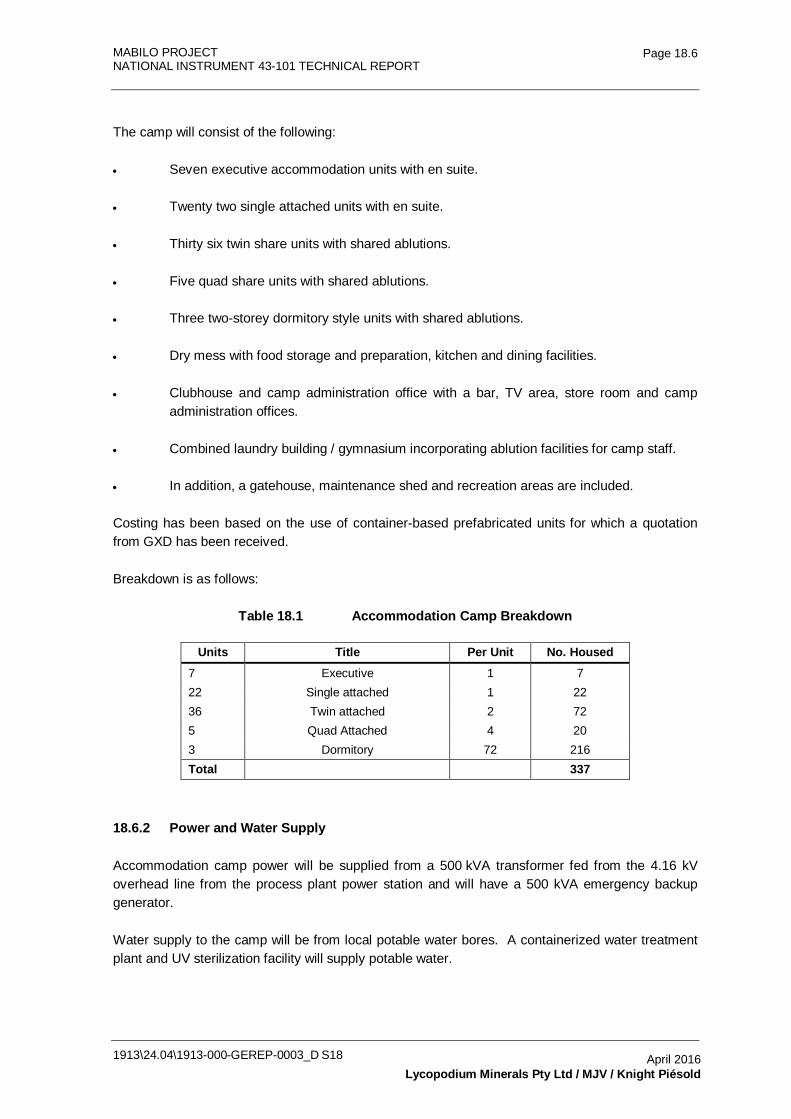
MABILO PROJECT NATIONAL INSTRUMENT 43-101 TECHNICAL REPORT
1913\24.04\1913-000-GEREP-0003_D S18
Page 18.6
April 2016 Lycopodium Minerals Pty Ltd / MJV / Knight Piésold
The camp will consist of the following:
• Seven executive accommodation units with en suite.
• Twenty two single attached units with en suite.
• Thirty six twin share units with shared ablutions.
• Five quad share units with shared ablutions.
• Three two-storey dormitory style units with shared ablutions.
• Dry mess with food storage and preparation, kitchen and dining facilities.
• Clubhouse and camp administration office with a bar, TV area, store room and camp administration offices.
• Combined laundry building / gymnasium incorporating ablution facilities for camp staff.
• In addition, a gatehouse, maintenance shed and recreation areas are included.
Costing has been based on the use of container-based prefabricated units for which a quotation from GXD has been received.
Breakdown is as follows:
Table 18.1 Accommodation Camp Breakdown
Units Title Per Unit No. Housed 7 Executive 1 7 22 Single attached 1 22 36 Twin attached 2 72 5 Quad Attached 4 20 3 Dormitory 72 216 Total 337
18.6.2 Power and Water Supply
Accommodation camp power will be supplied from a 500 kVA transformer fed from the 4.16 kV overhead line from the process plant power station and will have a 500 kVA emergency backup generator.
Water supply to the camp will be from local potable water bores. A containerized water treatment plant and UV sterilization facility will supply potable water.
MABILO PROJECT NATIONAL INSTRUMENT 43-101 TECHNICAL REPORT
1913\24.04\1913-000-GEREP-0003_D S18
Page 18.7
April 2016 Lycopodium Minerals Pty Ltd / MJV / Knight Piésold
18.6.3 Sewage Disposal
Sewage from the accommodation camp will feed a standalone containerized sewage treatment plant. Sludge from the facility will be pumped out by a contractor. Grey water from the plant will be used for dust suppression in the mine or disposed of in a spray field.
18.6.4 Rubbish Disposal
Domestic rubbish from the camp will be disposed of using the existing domestic rubbish service in Barangay Tulay na Lupa.
18.6.5 Landscaping
The area will be landscaped to provide drainage to the local streams.
18.7 Relocation Housing
Provision has been made to relocate and re-house up to 100 families and housing will be provided. The housing will consist of terraced pre-fabricated units.
18.8 Water Supply
18.8.1 Local Water Supply
Overview
The existing local water supply system approximately 2 - 3 km from the project site is maintained and operated by Camarines Norte Water District (CNWD). This was established in 1993 serving local communities of the municipality of Labo. This water system sources its water from combined springs and deep wells. It has three pump stations, one ground reservoir and transmission pipelines that distribute water to the town of Labo and other nearby barangays.
GHD has performed an inspection and assessment study of the existing water supply in the area during the period of 9 - 11 April 2014 and updated their August 2014 report in December 2015 incorporating further investigative reports by Aqua Dyne and concluded that the proposed mine development will not affect the existing Pimentel Spring where the community draws its main water source.
AquaDyne completed a review of available hydrogeological information and concluded:
• The aquifers were highly transmissive and good sources of ground water.
• Replenishment is expected to come from rainwater.
• Measured water levels in wells can be considered to be the water table and the aquifer as unconfined and at atmospheric pressure.
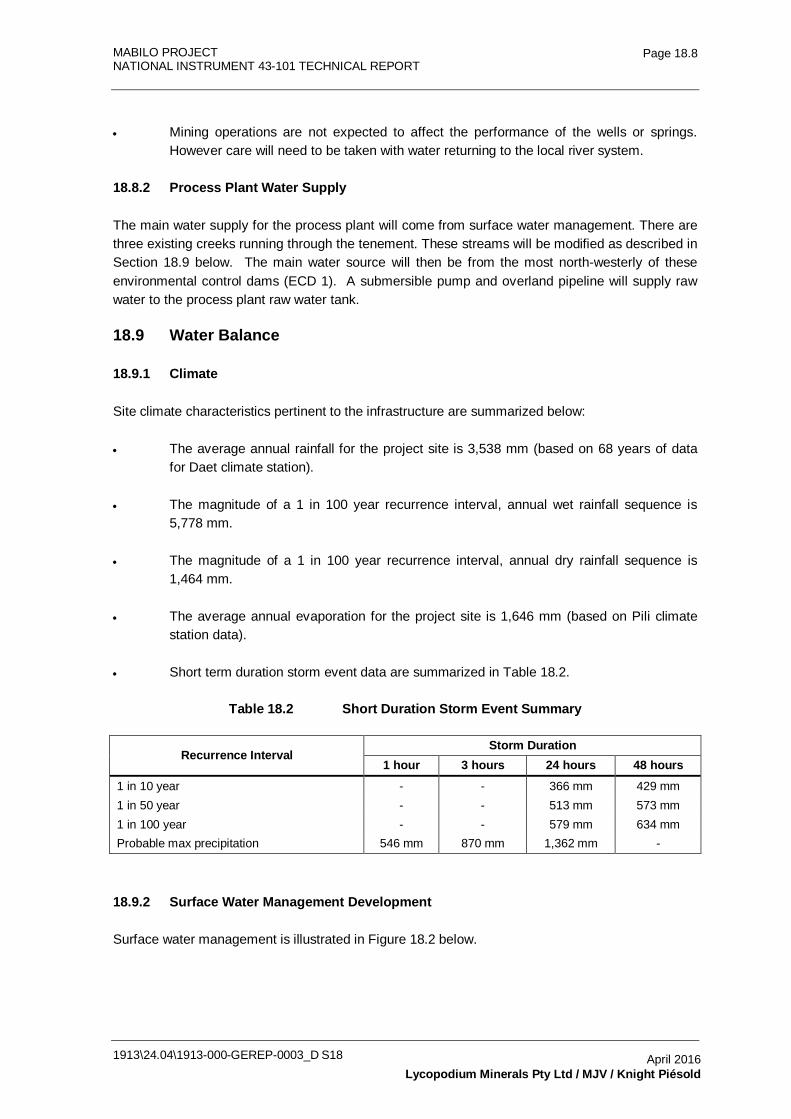
MABILO PROJECT NATIONAL INSTRUMENT 43-101 TECHNICAL REPORT
1913\24.04\1913-000-GEREP-0003_D S18
Page 18.8
April 2016 Lycopodium Minerals Pty Ltd / MJV / Knight Piésold
• Mining operations are not expected to affect the performance of the wells or springs. However care will need to be taken with water returning to the local river system.
18.8.2 Process Plant Water Supply
The main water supply for the process plant will come from surface water management. There are three existing creeks running through the tenement. These streams will be modified as described in Section 18.9 below. The main water source will then be from the most north-westerly of these environmental control dams (ECD 1). A submersible pump and overland pipeline will supply raw water to the process plant raw water tank.
18.9 Water Balance
18.9.1 Climate
Site climate characteristics pertinent to the infrastructure are summarized below:
• The average annual rainfall for the project site is 3,538 mm (based on 68 years of data for Daet climate station).
• The magnitude of a 1 in 100 year recurrence interval, annual wet rainfall sequence is 5,778 mm.
• The magnitude of a 1 in 100 year recurrence interval, annual dry rainfall sequence is 1,464 mm.
• The average annual evaporation for the project site is 1,646 mm (based on Pili climate station data).
• Short term duration storm event data are summarized in Table 18.2.
Table 18.2 Short Duration Storm Event Summary
Recurrence Interval Storm Duration
1 hour 3 hours 24 hours 48 hours 1 in 10 year - - 366 mm 429 mm 1 in 50 year - - 513 mm 573 mm 1 in 100 year - - 579 mm 634 mm Probable max precipitation 546 mm 870 mm 1,362 mm -
18.9.2 Surface Water Management Development
Surface water management is illustrated in Figure 18.2 below.
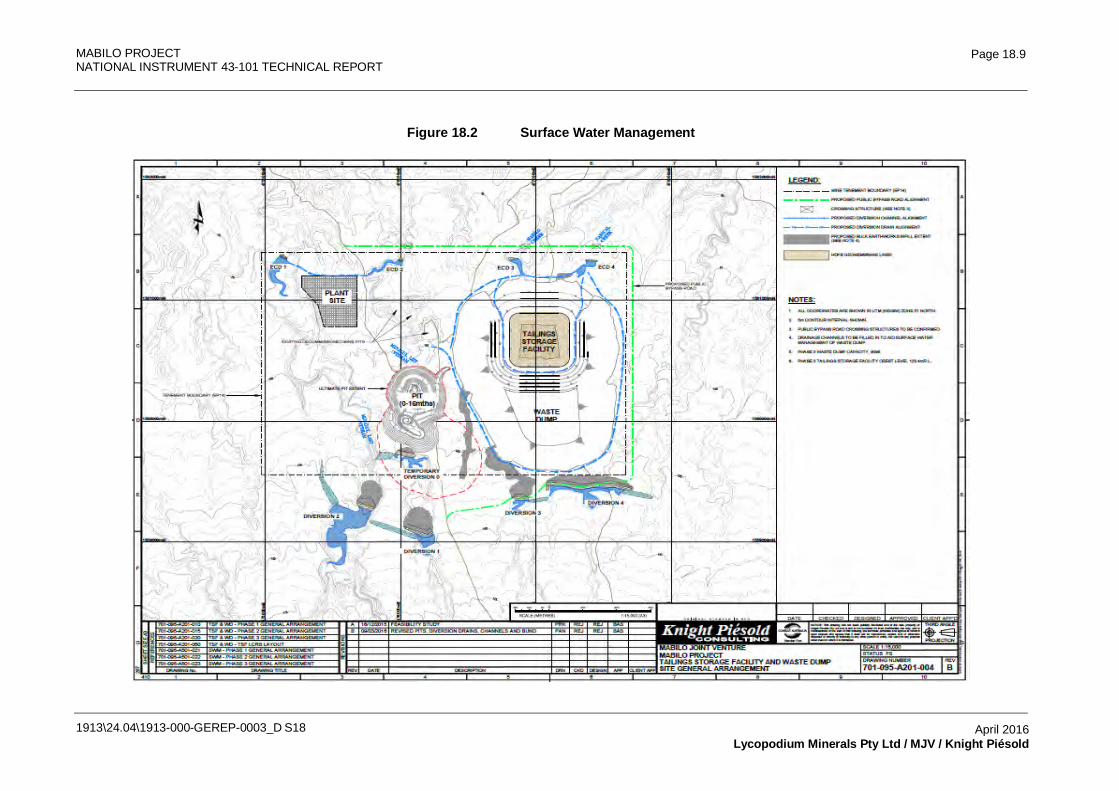
MABILO PROJECT NATIONAL INSTRUMENT 43-101 TECHNICAL REPORT
1913\24.04\1913-000-GEREP-0003_D S18
Page 18.9
April 2016 Lycopodium Minerals Pty Ltd / MJV / Knight Piésold
Figure 18.2 Surface Water Management
MABILO PROJECT NATIONAL INSTRUMENT 43-101 TECHNICAL REPORT
1913\24.04\1913-000-GEREP-0003_D S18
Page 18.10
April 2016 Lycopodium Minerals Pty Ltd / MJV / Knight Piésold
Surface water management will follow the four project development phases:
• Phase 1 – the site infrastructure for site development, pre-stripping and oxide mining.
• Phase 2 – the site infrastructure during the mining of the medium pit.
• Phase 3 - the site infrastructure during the mining of the primary pit.
• Phase 4 – mine closure and rehabilitation.
The design of the surface water management (SWM) is staged to coincide with the development of the mine infrastructure and to suit the availability of mine waste. The SWM incorporates environmental control dams (ECDs) at surface water discharges from the site where the catchment includes runoff from operational areas.
The site’s sandy silt soils are likely to be highly susceptible to erosion and key structures (including large diversion channels, drop / energy dissipation structures and diversion bunds) are proposed to be constructed with a facing of gabion baskets and reno mattresses to provide erosion protection.
To mitigate the risk of liquefaction, deep diversion channels will be provided with a channel base wider than dictated by hydraulic capacity to ensure that the channels remain serviceable if slumping of the channel slopes occurs. The diversion bunds will be buttressed with a sacrificial earthworks bund on their up and downstream faces to provide additional support to the embankment and the upstream beds will be partially infilled to reduce the volume of upstream impoundment.
In approximate order of construction, the SWM is proposed to comprise:
• Phase 1:
- The construction of ECDs at the northern end of the site.
- The diversion of surface water from the three central south to north flowing streams within the site to the two outer streams.
- The infilling of the three deeply incised streams within the footprint and upstream of the integrated waste landform.
- The construction of surface ditches to direct catchments toward the ECDs.
• Phases 2 and 3:
- The progressive diversion of the Minalolong Maliit and Minalolong Malaki streams westwards to accommodate the increasing area of the pit.
MABILO PROJECT NATIONAL INSTRUMENT 43-101 TECHNICAL REPORT
1913\24.04\1913-000-GEREP-0003_D S18
Page 18.11
April 2016 Lycopodium Minerals Pty Ltd / MJV / Knight Piésold
18.9.3 Water Balance Design Parameters
The following is assumed for the water balance of the site:
• The decant and under drainage from the TSF will be returned to the plant site. Provision will be made for a water treatment plant as required before off site discharge. The project has included off-site sales of pyrite so no pyrite is expected to be stored in the TSF. As such, any requirement for a water treatment facility has not been defined at this point so no allowance has been made in the capital estimate.
• In pit dewatering will be pumped to a wetland facility prior to discharge to the ECDs.
• Water from the waste dump and other operational areas, and any dewatering wells around the pit perimeter will be discharged to the ECDs.
• Areas undisturbed by the mine operations will continue to shed water along their natural drainage path. Disturbed areas shall be kept to a minimum.
The design parameters are summarized below:
• Tailings design throughput 355,000 tpa for 10 years
• Plant tailings percent solids 62.5%
• Maximum decant return 85% of water in slurry
• Raw water requirement 15% of water in slurry
• Supernatant production 43%
• Minimum pond cover 2.0 m
• Nominal pond cover 4.0 m (trigger treatment and release)
• Tailings beach angle 1V:100H
• Facility commissioning Nominally January 2018
18.9.4 Water Balance Modeling
The model was set up and a range of climatic conditions were considered to ensure continual operation for design events:
• Average rainfall conditions with 'treatment and release' allowed.
• 100 year ARI, wet year sequence with 'treatment and release' allowed.
• 100 year ARI, dry year sequence with 'treatment and release' allowed.
MABILO PROJECT NATIONAL INSTRUMENT 43-101 TECHNICAL REPORT
1913\24.04\1913-000-GEREP-0003_D S18
Page 18.12
April 2016 Lycopodium Minerals Pty Ltd / MJV / Knight Piésold
• 100 year ARI 72 hour storm event with no evaporation, no decant return and no release allowed.
Based on the modeling undertaken, the following conclusions are drawn:
• Under average climatic conditions, the TSF will operate in a water positive condition during the life of mine. The supernatant pond will generally increase over time and decant return will be sufficient to supply the water demand of the plant. Therefore, an additional external water supply is not required.
• The supernatant pond will cover the deposited tailings over the life of mine, resulting in undrained layer density in the facility and ponding against the embankment at all times.
• Under extreme wet conditions, excessive rainfall will control the required embankment level to prevent any spillway flow. The embankment elevation is governed by a combination of 1 in 100 year ARI / 72 hour storm event (with no evaporation; no decant return and no discharge) and 100 year ARI, wet year sequence (with treatment release allowed).
• A treatment release rate of 72 m³/h is determined as an effective rate, balancing discharge rate and stored volume.
• If drier climatic conditions are experienced in the first year of TSF operation, a start-up pond volume of 340,000 m³ will be required to maintain the minimum 2 m pond cover.
• The accuracy of the water balance model depends on the characteristics of the tailings.
• The design embankment can be optimized by cost analysis of TSF embankment versus water treatment plant costs.
18.9.5 Potable Water
Water supply to the process plant and site buildings will be from local potable water bores. A containerized water treatment plant and UV sterilization facility will supply potable water.
18.10 Stream Diversions and Environmental Control Dams
The conceptual design of the surface water management (SWM) is based on the following key aims:
• The SWM is developed in stages to coincide with the development of the mine and other infrastructure and to defer capital costs associated with the SWM.
• Environmental control dams are provided at surface water discharges from the site where the catchment includes runoff from operational areas. No environmental control dams are proposed for catchments that are to remain undisturbed.
MABILO PROJECT NATIONAL INSTRUMENT 43-101 TECHNICAL REPORT
1913\24.04\1913-000-GEREP-0003_D S18
Page 18.13
April 2016 Lycopodium Minerals Pty Ltd / MJV / Knight Piésold
• Where possible, mine waste will be used for the construction of the SWM earthworks and the works are phased to suit the availability of mine waste.
18.10.1 Phase 1 – Oxide Pit in Years 1 and 2
In approximate order of construction, the conceptual SWM is proposed to comprise:
• The construction of four environmental control dams (ECDs) across streams just within the northern boundary of the mine tenement. These dams are proposed to be approximately 5 m in height. There are six other streams that discharge across the northern boundary and these are proposed to either be diverted to an adjacent ECD or to have surface water channels constructed to direct some of their catchment to an ECD.
• The diversion of surface water from the two central south to north flowing streams within the site to the two outer streams. Three diversion channels and bunds are proposed to be constructed:
- Diversion 0 (temporary) requires the construction of a bund across the Minalolong Maliit stream and the construction of a diversion channel heading westwards to the Minalolong Malaki stream. The Minalolong Malaki stream is deeply incised and approximately 15 m lower in level than the Minalolong Maliit. A discharge structure with a 15 m drop will be required at the outlet of the diversion channel.
- Diversions 3 and 4 are required to divert surface water from two streams westwards. The streams are at similar elevation. Inlets and outlets to the diversion channels will be close to existing bed level.
• Infilling of the three deeply incised streams of approximately 900 m length upstream of the integrated waste landform (IWL). These streams are incised to a depth of approximately 8 m to 10 m and it is proposed that these are infilled over their entire length and the channels reconstructed at ground surface such that the water can then be diverted using shallow channels.
• If insufficient mine waste is available to infill the entirety of the streams, the volume of material could be reduced by grading the bed of the existing streams from 1:40 to approximately 1:200 over a 500 m downstream length to bring the water flow to surface for diversion using shallow channels.
• The construction of surface ditches around the boundary of the IWL and the north side of the plant to direct catchment towards the ECDs.
MABILO PROJECT NATIONAL INSTRUMENT 43-101 TECHNICAL REPORT
1913\24.04\1913-000-GEREP-0003_D S18
Page 18.14
April 2016 Lycopodium Minerals Pty Ltd / MJV / Knight Piésold
18.10.2 Phase 2 – Medium Pit
During this phase of the works the pit will be expanded in area with the IWL increasing in size accordingly. This expansion will require the following:
• Diversion 0 to be replaced with Diversion 1, which will be located approximately 750 m upstream. The Minalolong Malaki stream is very deeply incised at this location and an outlet drop structure of approximately 30 m height will be required. This diversion will require a stilling basin at its discharge.
• Realignment of drainage ditches around the IWL to accommodate its expansion.
The current proposal for the surface water management upstream of the pit is to initially construct Diversion 0 immediately upstream of the oxide pit and to replace this with the larger Diversion 3 as the pit develops in size. An alternative would be to construct Diversion 3 at the outset and infill the downstream section of stream.
18.10.3 Phase 3 – Primary Pit
A section of the Minalolong Malaki stream will need to be diverted when the mine pit is constructed to its full extent. This work is proposed to comprise the diversion of the stream across to a western tributary which will feed back to the main stream beyond the footprint of the pit. The SWM works during Phase 3 are proposed to comprise:
• The construction of an approximately 20 to 25 m high earth dam (Diversion Bund 2) across the deeply incised Minalolong Malaki stream to impound water to a depth of approximately 15 m.
• The construction of an approximately 450 m long diversion channel (Diversion Channel 2) in a north-west direction to discharge to a tributary of the stream.
18.10.4 Phase 4 – Completion of Mining
Surface water management details at the end of mining are subject to the Final Mine Rehabilitation and Development Plan 'FMRDP' is a future statutory requirement and is yet to be finalized.
18.10.5 Surface Water Management Structures
The geotechnical investigation at the site indicates the near surface ground to comprise volcanic tuff. This tuff material typically comprises cobbles and boulders within a sandy silt soil matrix with the proportion of cobbles and boulders increasing with depth. The sandy silt is likely to be highly susceptible to erosion and the deeply incised stream courses suggest this is the case.
MABILO PROJECT NATIONAL INSTRUMENT 43-101 TECHNICAL REPORT
1913\24.04\1913-000-GEREP-0003_D S18
Page 18.15
April 2016 Lycopodium Minerals Pty Ltd / MJV / Knight Piésold
It is proposed that the key surface water management structures (including the large diversion channels, drop / energy dissipation structures and diversion bunds) are constructed with a facing of gabion baskets and reno mattresses to provide erosion protection. Typical details are likely to comprise the following:
• 300 mm thick reno mattresses along the base and sides of diversion channels.
• Reno mattresses and gabion baskets to provide erosion protection at the inlet to diversion channels.
• Reno mattresses or erosion protection stone along the standing water line of the diversion bunds.
• Stepped cascade structures at the outlet of diversion channels where there is a significant drop.
Due to the intensity of rainfall and the nature of the site’s soils the control of erosion and sediment transfer will require on-going maintenance and site assessment. Depending on the nature of the exposed bed materials and placed waste material, it is likely that some channels will also require weirs to control water velocities and sediment loads.
18.11 Storage Facilities for Hazardous Materials
18.11.1 Blasting Agents
During the first four years of operation the project will utilize portable magazines, with specifications compliant to statutory regulations, provided by the explosives supplier together with the provision of safe transportation, management, licenses and permits. The portable magazines will have a capacity of 18,000 kg with a combined maximum of <50,000 kg at any one time. The transportation and use of explosives in the Philippines is monitored by the Philippine National Police.
In the fourth Year, Mabilo JV will commission the necessary Class 1 Magazines for Ammonium Nitrate Fuel Oil (ANFO), emulsion and other explosive accessories to service the mining operation from Year 5 until the end of mine life. An emulsion batch plant will be provided by the explosives contractor while the permanent Class 1 magazines will have a capacity of 50,000 kg and 75,000 kg for ANFO and emulsion, respectively with an additional minor portable detonator magazine.
18.11.2 Fuel
Fuel for the site will be stored in a vendor supplied facility located near the Mine Services Area. This will consist of:
• 10 x 58 m³ self bunded steel storage tanks mounted on concrete pedestals.
• a concrete bunded area with a sump pump.
• fuel transfer and unloading pumps.
MABILO PROJECT NATIONAL INSTRUMENT 43-101 TECHNICAL REPORT
1913\24.04\1913-000-GEREP-0003_D S18
Page 18.16
April 2016 Lycopodium Minerals Pty Ltd / MJV / Knight Piésold
• high and low flow bowsers for fuelling vehicles.
• power station transfer pump and 30 m³ day tank.
Access will be provided for regular delivery for fuel tankers coming in via the main process plant access road to the north.
18.11.3 Flotation Reagents
Flotation reagents at site will include the following:
• Aeropromoter 3894. This is a dialkylthionocarbamate reagent supplied in steel drums. The reagent will be stored in a reagent shed in a cool, dry, well ventilated place until required. It will then be unloaded into a steel storage tank prior to use.
• Aeropromoter 407. This is a collector reagent supplied in steel drums. The reagent will be stored in a reagent shed in a cool, dry, well ventilated place until required. It will then be unloaded into a steel storage tank prior to use.
• Methyl Isobutyl Carbinol. This is an alcohol based frother reagent supplied in steel drums. The reagent will be stored in a reagent shed in a cool, dry, well ventilated place until required. It will then be unloaded into a steel storage tank prior to use.
• Sodium Cyanide. This is a pyrite depressant supplied in bulk bags in wooden boxes. The reagent will be stored in a reagent shed in a cool, dry, well ventilated place in a separate fenced and secure area until required. It will be mixed with water prior to dosing.
18.11.4 Hydrated Lime and Quick Lime
Hydrated lime will be supplied in 1 tonne bulk bags and will be used to control pH. It will be stored in a reagent shed in a cool, dry, well ventilated place until required. When required it will be mixed with water in a steel agitated mixing tank prior to dosing as a slurry.
18.12 Product Haulage
18.12.1 Overview
The Mabilo Joint Venture (MJV) will utilize independent haulage contractors to move its product from the mine site to the ports and toll treating destination. Road haulage of oxide products and concentrates is common and well understood in the Philippines at operations such as Oceana Gold’s Didipio project, Philex’s Padcal mine and various Nickel Laterite sites.
During the initial stages of the mine development (Year 1 and 2), three types of oxide products will be directed to the Larap Port and the Coral process plant in the municipality of Jose Panganiban. Ports have already been the subject of an assessment study and determined viable. With the start-up of the process plant there will be three products of magnetite, pyrite and copper-gold concentrates trucked to the upgraded Larap Port.
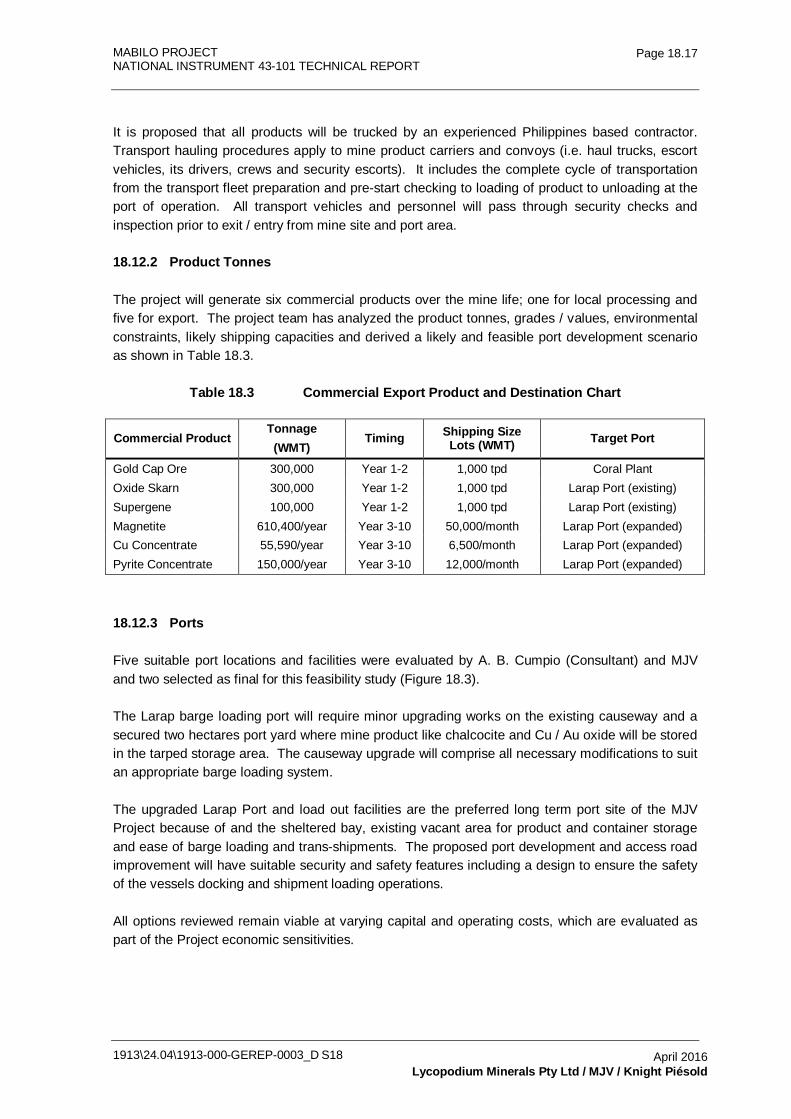
MABILO PROJECT NATIONAL INSTRUMENT 43-101 TECHNICAL REPORT
1913\24.04\1913-000-GEREP-0003_D S18
Page 18.17
April 2016 Lycopodium Minerals Pty Ltd / MJV / Knight Piésold
It is proposed that all products will be trucked by an experienced Philippines based contractor. Transport hauling procedures apply to mine product carriers and convoys (i.e. haul trucks, escort vehicles, its drivers, crews and security escorts). It includes the complete cycle of transportation from the transport fleet preparation and pre-start checking to loading of product to unloading at the port of operation. All transport vehicles and personnel will pass through security checks and inspection prior to exit / entry from mine site and port area.
18.12.2 Product Tonnes
The project will generate six commercial products over the mine life; one for local processing and five for export. The project team has analyzed the product tonnes, grades / values, environmental constraints, likely shipping capacities and derived a likely and feasible port development scenario as shown in Table 18.3.
Table 18.3 Commercial Export Product and Destination Chart
Commercial Product Tonnage (WMT)
Timing Shipping Size Lots (WMT) Target Port
Gold Cap Ore 300,000 Year 1-2 1,000 tpd Coral Plant Oxide Skarn 300,000 Year 1-2 1,000 tpd Larap Port (existing) Supergene 100,000 Year 1-2 1,000 tpd Larap Port (existing) Magnetite 610,400/year Year 3-10 50,000/month Larap Port (expanded) Cu Concentrate 55,590/year Year 3-10 6,500/month Larap Port (expanded) Pyrite Concentrate 150,000/year Year 3-10 12,000/month Larap Port (expanded)
18.12.3 Ports
Five suitable port locations and facilities were evaluated by A. B. Cumpio (Consultant) and MJV and two selected as final for this feasibility study (Figure 18.3).
The Larap barge loading port will require minor upgrading works on the existing causeway and a secured two hectares port yard where mine product like chalcocite and Cu / Au oxide will be stored in the tarped storage area. The causeway upgrade will comprise all necessary modifications to suit an appropriate barge loading system.
The upgraded Larap Port and load out facilities are the preferred long term port site of the MJV Project because of and the sheltered bay, existing vacant area for product and container storage and ease of barge loading and trans-shipments. The proposed port development and access road improvement will have suitable security and safety features including a design to ensure the safety of the vessels docking and shipment loading operations.
All options reviewed remain viable at varying capital and operating costs, which are evaluated as part of the Project economic sensitivities.
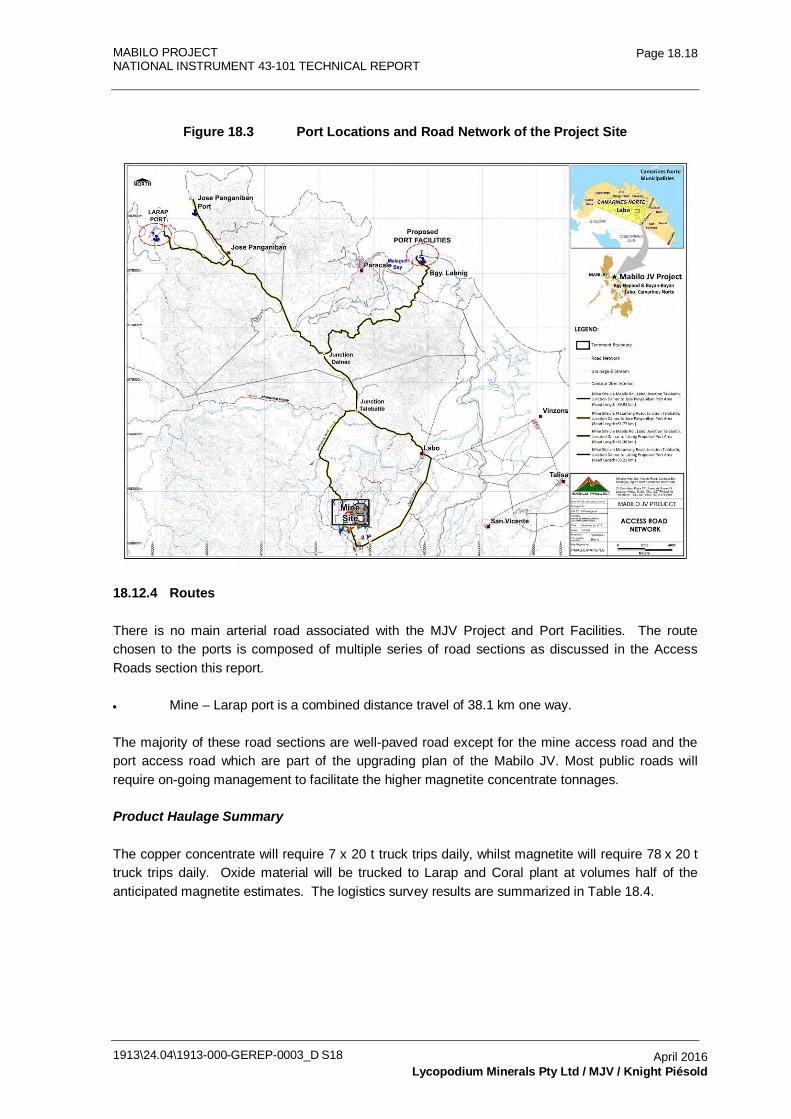
MABILO PROJECT NATIONAL INSTRUMENT 43-101 TECHNICAL REPORT
1913\24.04\1913-000-GEREP-0003_D S18
Page 18.18
April 2016 Lycopodium Minerals Pty Ltd / MJV / Knight Piésold
Figure 18.3 Port Locations and Road Network of the Project Site
18.12.4 Routes
There is no main arterial road associated with the MJV Project and Port Facilities. The route chosen to the ports is composed of multiple series of road sections as discussed in the Access Roads section this report.
• Mine – Larap port is a combined distance travel of 38.1 km one way.
The majority of these road sections are well-paved road except for the mine access road and the port access road which are part of the upgrading plan of the Mabilo JV. Most public roads will require on-going management to facilitate the higher magnetite concentrate tonnages.
Product Haulage Summary
The copper concentrate will require 7 x 20 t truck trips daily, whilst magnetite will require 78 x 20 t truck trips daily. Oxide material will be trucked to Larap and Coral plant at volumes half of the anticipated magnetite estimates. The logistics survey results are summarized in Table 18.4.
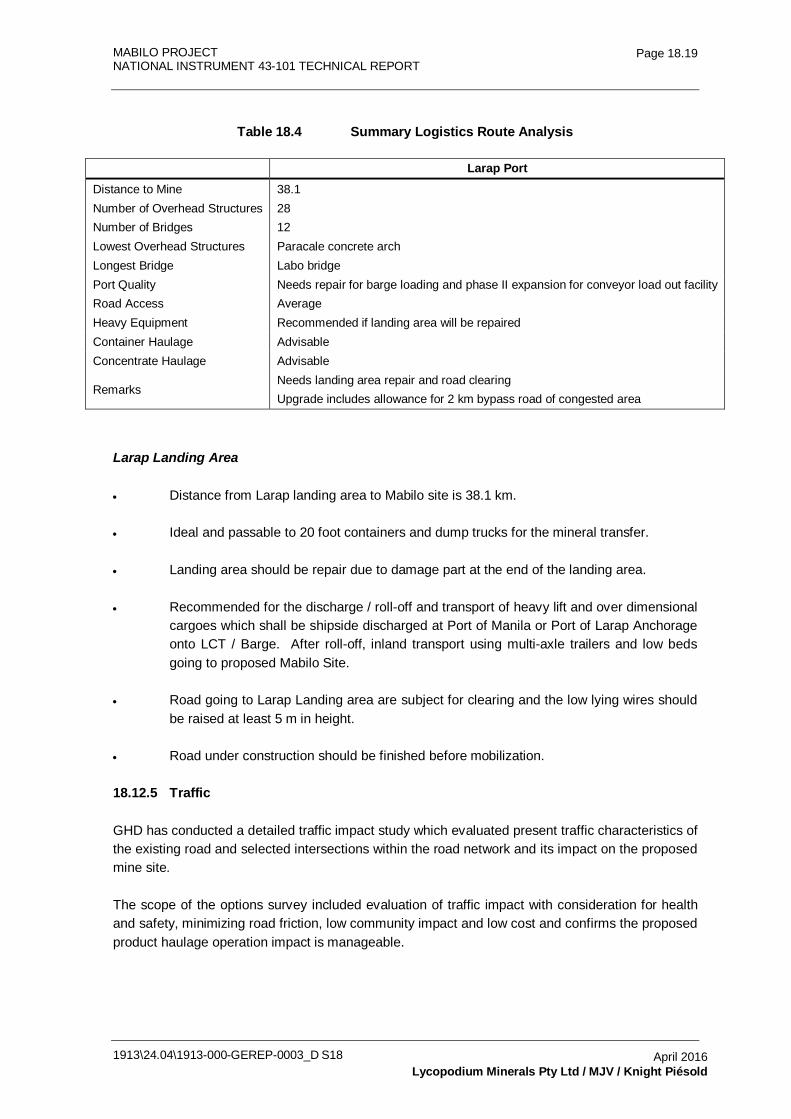
MABILO PROJECT NATIONAL INSTRUMENT 43-101 TECHNICAL REPORT
1913\24.04\1913-000-GEREP-0003_D S18
Page 18.19
April 2016 Lycopodium Minerals Pty Ltd / MJV / Knight Piésold
Table 18.4 Summary Logistics Route Analysis
Larap Port Distance to Mine 38.1 Number of Overhead Structures 28 Number of Bridges 12 Lowest Overhead Structures Paracale concrete arch Longest Bridge Labo bridge Port Quality Needs repair for barge loading and phase II expansion for conveyor load out facility Road Access Average Heavy Equipment Recommended if landing area will be repaired Container Haulage Advisable Concentrate Haulage Advisable
Remarks Needs landing area repair and road clearing Upgrade includes allowance for 2 km bypass road of congested area
Larap Landing Area
• Distance from Larap landing area to Mabilo site is 38.1 km.
• Ideal and passable to 20 foot containers and dump trucks for the mineral transfer.
• Landing area should be repair due to damage part at the end of the landing area.
• Recommended for the discharge / roll-off and transport of heavy lift and over dimensional cargoes which shall be shipside discharged at Port of Manila or Port of Larap Anchorage onto LCT / Barge. After roll-off, inland transport using multi-axle trailers and low beds going to proposed Mabilo Site.
• Road going to Larap Landing area are subject for clearing and the low lying wires should be raised at least 5 m in height.
• Road under construction should be finished before mobilization.
18.12.5 Traffic
GHD has conducted a detailed traffic impact study which evaluated present traffic characteristics of the existing road and selected intersections within the road network and its impact on the proposed mine site.
The scope of the options survey included evaluation of traffic impact with consideration for health and safety, minimizing road friction, low community impact and low cost and confirms the proposed product haulage operation impact is manageable.
MABILO PROJECT NATIONAL INSTRUMENT 43-101 TECHNICAL REPORT
1913\24.04\1913-000-GEREP-0003_D S18
Page 18.20
April 2016 Lycopodium Minerals Pty Ltd / MJV / Knight Piésold
Parameters
• Site development 2016
• Hauling of mineral ores 500,000 t
• Truck trips 4 trips/hour @ 24 hours/day
• Truck loading 15 tonnes/truck trip
• No. of days a year less Sunday, holidays, bad weather
18.12.6 Traffic Impact
The following is GHD’s summary of traffic impact assessment using Traffic Growth Rate:
• The main Roads Loss of Service (LOS) is rated A (free flow with low traffic volume travelling at high speed (v/c ratio < 0.20)) for the projected 500,000 metric tonnes per annum with minimal deterioration to B (stable flow with operating speed start to be restricted by traffic condition (v/c ratio = 0.20 – 0.44)) over time.
• The new development will have a traffic impact on all intersections similar to approaches from minor roads. The key LOS will be the Talobatib intersection with traffic from North to South varying from C (free flow) to F (forced flow very slow speed). MJV will implement design recommendations where possible.
• Portions of the road section from the proposed mine site joining the Napaod-Mabilo section is partially unpaved. Traffic is light but dominated by tricycles and motorcycles along the minor road.
• The existing road two-lane carriageway from Tulay na Lupa to Panganiban Port can accommodate the traffic projected up to Year 2027 with the inclusion of truck-trips in hauling mineral ores.
• Approaches to intersections specific to the Talobatib intersection will be in a saturated condition and warrant modification since LOS in 2027 will reach LOS F.
• Equivalent single axle load (ESAL) is a pavement design factor. The study confirms MJV should be in compliance.
There are four intersections / choke points included in the detailed analysis, considering their role in the road network in Camarines Norte, namely:
• Mabilo Intersection (I-01).
• Labo Intersection (I-02).
MABILO PROJECT NATIONAL INSTRUMENT 43-101 TECHNICAL REPORT
1913\24.04\1913-000-GEREP-0003_D S18
Page 18.21
April 2016 Lycopodium Minerals Pty Ltd / MJV / Knight Piésold
• Talobatib Intersection (I-03).
• Batobalani Intersection (I-04).
These are all T-intersections with major flow along the national highway. Intersection volume count (IVC) or turning movement count was carried out on 23 – 26 June 2014. Classified and directional counts were conducted for 16 hours (6.00 a.m. to 10.00 p.m.). Currently, the intersections are not experiencing congestion. MJV proposes to engage local communities as part of traffic management and implement design recommendations where possible as is customary in the Philippines.
18.12.7 Equivalent Single Axle Load (ESAL)
The ESAL values refer to the measurement and conversion of the equivalent single axle load (ESAL). This type of data gathering and study applies in the design of the roadways pavement structures.
As basis for calculation of vehicle axle loadings for design purposes, the conduct of axle load measurement survey by weighing the axle loads of heavy vehicles such as buses, rigid and articulated trucks was necessary in order to obtain information on the average equivalent single axle load (ESAL) of the road. Light vehicles were not included in the estimate because this vehicle type has no measurable damaging effect on the pavement due to their very low ESAL values.
Heavy vehicles are being weighed by wheel (single or dual tires) and axle loads are converted into ESAL by dividing the axle weight by the 8.2 metric tons equivalent standard axle (ESA) and raised to the fourth power. The conversion is defined by the following:
• ESAL = (axle weight/8.2)4
The Mabilo Project product haulage routes mainly use existing roads series to the port of operation. The ESAL calculation shall just be a transport load weight check by the implementing agency DPWH to verify whether the transport is in compliance to the allowable loading per axle. MJV will ensure its contractors remain in compliance by means of weigh scales.
18.12.8 Traffic Recommendations
The recommendations below are focused on upgrades or improvements that would be needed to ensure continuous traffic flow is maintained, especially at identified choke points. The costs are considered to be public expense and minor, and MJV will work with Local Government Units to implement the recommendations.
• Modification of intersections by increasing the turning radius at the approaches from minor road. Channelisation of the approaches is recommended.
• Installation of barriers at the intersections to minimize accidents and designate proper pedestrian crossing with appropriate signs and warnings to control pedestrian movement in the area.
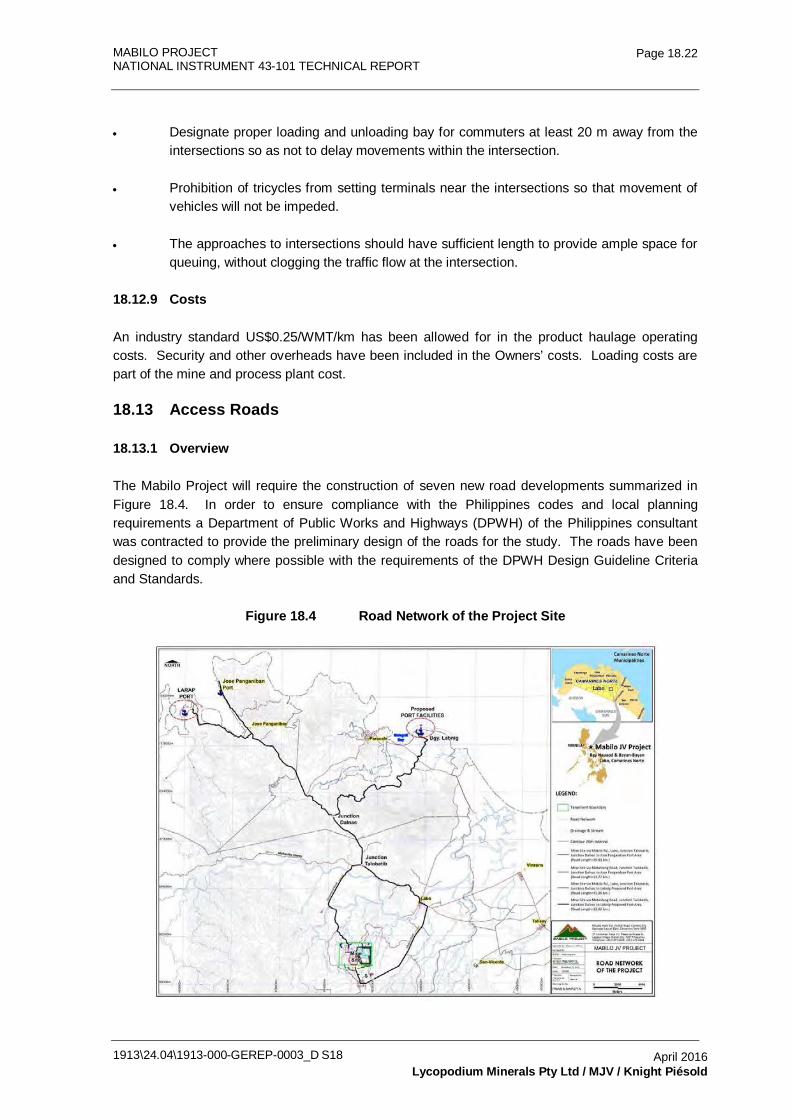
MABILO PROJECT NATIONAL INSTRUMENT 43-101 TECHNICAL REPORT
1913\24.04\1913-000-GEREP-0003_D S18
Page 18.22
April 2016 Lycopodium Minerals Pty Ltd / MJV / Knight Piésold
• Designate proper loading and unloading bay for commuters at least 20 m away from the intersections so as not to delay movements within the intersection.
• Prohibition of tricycles from setting terminals near the intersections so that movement of vehicles will not be impeded.
• The approaches to intersections should have sufficient length to provide ample space for queuing, without clogging the traffic flow at the intersection.
18.12.9 Costs
An industry standard US$0.25/WMT/km has been allowed for in the product haulage operating costs. Security and other overheads have been included in the Owners’ costs. Loading costs are part of the mine and process plant cost.
18.13 Access Roads
18.13.1 Overview
The Mabilo Project will require the construction of seven new road developments summarized in Figure 18.4. In order to ensure compliance with the Philippines codes and local planning requirements a Department of Public Works and Highways (DPWH) of the Philippines consultant was contracted to provide the preliminary design of the roads for the study. The roads have been designed to comply where possible with the requirements of the DPWH Design Guideline Criteria and Standards.
Figure 18.4 Road Network of the Project Site
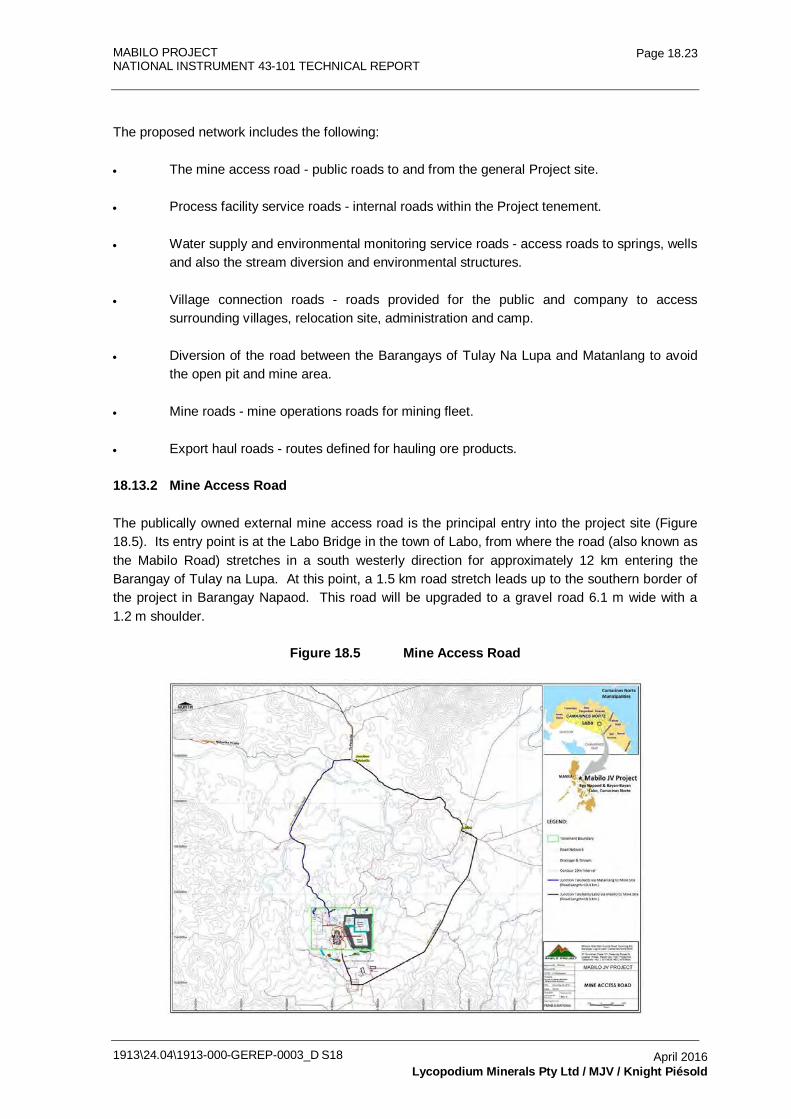
MABILO PROJECT NATIONAL INSTRUMENT 43-101 TECHNICAL REPORT
1913\24.04\1913-000-GEREP-0003_D S18
Page 18.23
April 2016 Lycopodium Minerals Pty Ltd / MJV / Knight Piésold
The proposed network includes the following:
• The mine access road - public roads to and from the general Project site.
• Process facility service roads - internal roads within the Project tenement.
• Water supply and environmental monitoring service roads - access roads to springs, wells and also the stream diversion and environmental structures.
• Village connection roads - roads provided for the public and company to access surrounding villages, relocation site, administration and camp.
• Diversion of the road between the Barangays of Tulay Na Lupa and Matanlang to avoid the open pit and mine area.
• Mine roads - mine operations roads for mining fleet.
• Export haul roads - routes defined for hauling ore products.
18.13.2 Mine Access Road
The publically owned external mine access road is the principal entry into the project site (Figure 18.5). Its entry point is at the Labo Bridge in the town of Labo, from where the road (also known as the Mabilo Road) stretches in a south westerly direction for approximately 12 km entering the Barangay of Tulay na Lupa. At this point, a 1.5 km road stretch leads up to the southern border of the project in Barangay Napaod. This road will be upgraded to a gravel road 6.1 m wide with a 1.2 m shoulder.
Figure 18.5 Mine Access Road
MABILO PROJECT NATIONAL INSTRUMENT 43-101 TECHNICAL REPORT
1913\24.04\1913-000-GEREP-0003_D S18
Page 18.24
April 2016 Lycopodium Minerals Pty Ltd / MJV / Knight Piésold
18.13.3 Process Facility Service Roads
Service roads for the process plant are based on unsealed roads and tracks using appropriate fill and construction methods.
Roads include the following:
• Accommodation camp access road: 0.7 km x 6 m wide.
• Boundary to TSF access road upgrade only: 1.0 km x 6 m wide.
• Construction camp access road: 0.3 km x 6 m wide.
• ECD 1 access track: 0.5 km x 4 m wide.
• ECD 2 access track: 0.15 km x 4 m wide.
• ECD 3 and 4 access track: 1.5 km x 4 m wide.
• Emulsion plant access road: 1.7 km x 6 m wide.
• Magazine access track: 0.5 km x 4 m wide.
• MSA to TSF access road – Section 1: 1.0 km x 6 m wide.
• MSA to TSF access track – Section 2: 0.5 km x 4 m wide.
• Primary crushing access track: 0.5 km x 4 m wide.
18.13.4 Water Supply and Environmental Control Service Road
Water supply and environmental control service roads will access water wells, diversion structures as well as environmental control dams. These roads will link to the mine road network for service maintenance accessibility.
18.13.5 Village Connection Road
The barangay level village connection road ensures continuity of service to the affected communities residing within the area and connects the proposed infrastructures of the project surrounding the mine, such as relocation site, offices and administrative buildings.
18.13.6 Community Diversion Roads
The realignment of the existing road segment from the barangays of Tulay na Lupa, Napaod and Matanlang is required as the existing road crosses the proposed site of the open pit (Figure 18.6).
The objective of the realignment is to bypass the mine facilities area in barangay Napaod heading northward to join at Barangay Matanlang – Benit road section. The realignment length is
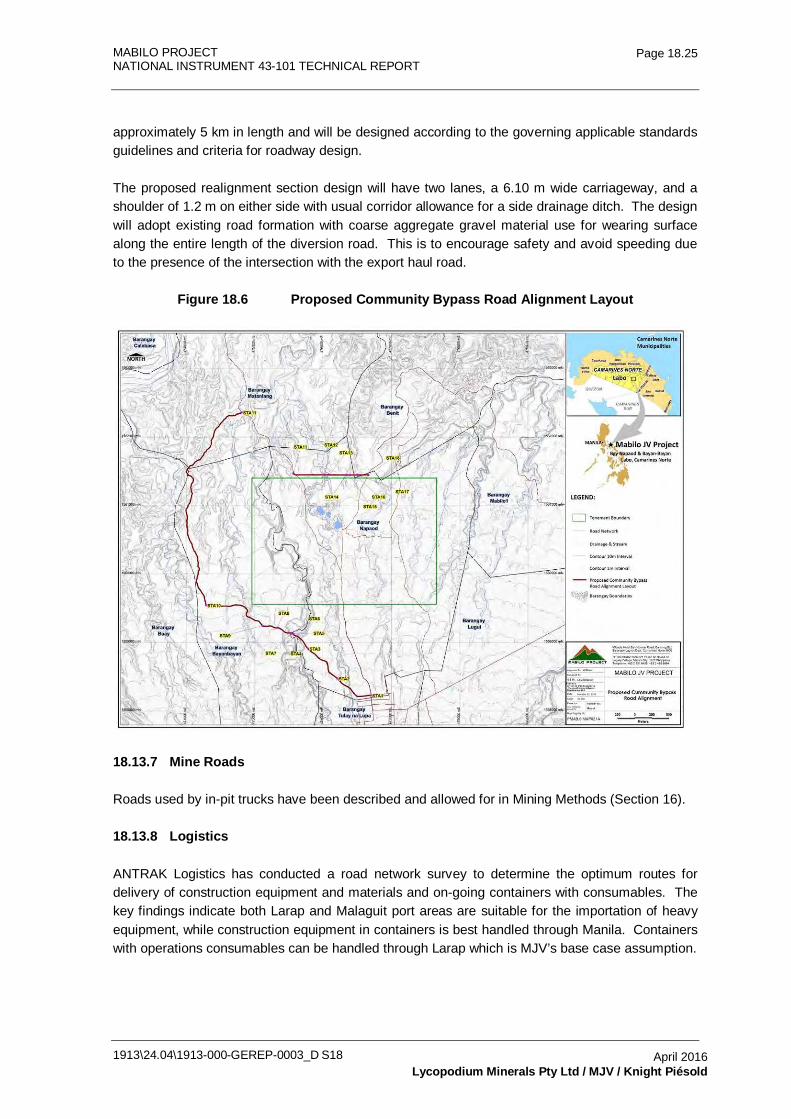
MABILO PROJECT NATIONAL INSTRUMENT 43-101 TECHNICAL REPORT
1913\24.04\1913-000-GEREP-0003_D S18
Page 18.25
April 2016 Lycopodium Minerals Pty Ltd / MJV / Knight Piésold
approximately 5 km in length and will be designed according to the governing applicable standards guidelines and criteria for roadway design.
The proposed realignment section design will have two lanes, a 6.10 m wide carriageway, and a shoulder of 1.2 m on either side with usual corridor allowance for a side drainage ditch. The design will adopt existing road formation with coarse aggregate gravel material use for wearing surface along the entire length of the diversion road. This is to encourage safety and avoid speeding due to the presence of the intersection with the export haul road.
Figure 18.6 Proposed Community Bypass Road Alignment Layout
18.13.7 Mine Roads
Roads used by in-pit trucks have been described and allowed for in Mining Methods (Section 16).
18.13.8 Logistics
ANTRAK Logistics has conducted a road network survey to determine the optimum routes for delivery of construction equipment and materials and on-going containers with consumables. The key findings indicate both Larap and Malaguit port areas are suitable for the importation of heavy equipment, while construction equipment in containers is best handled through Manila. Containers with operations consumables can be handled through Larap which is MJV’s base case assumption.
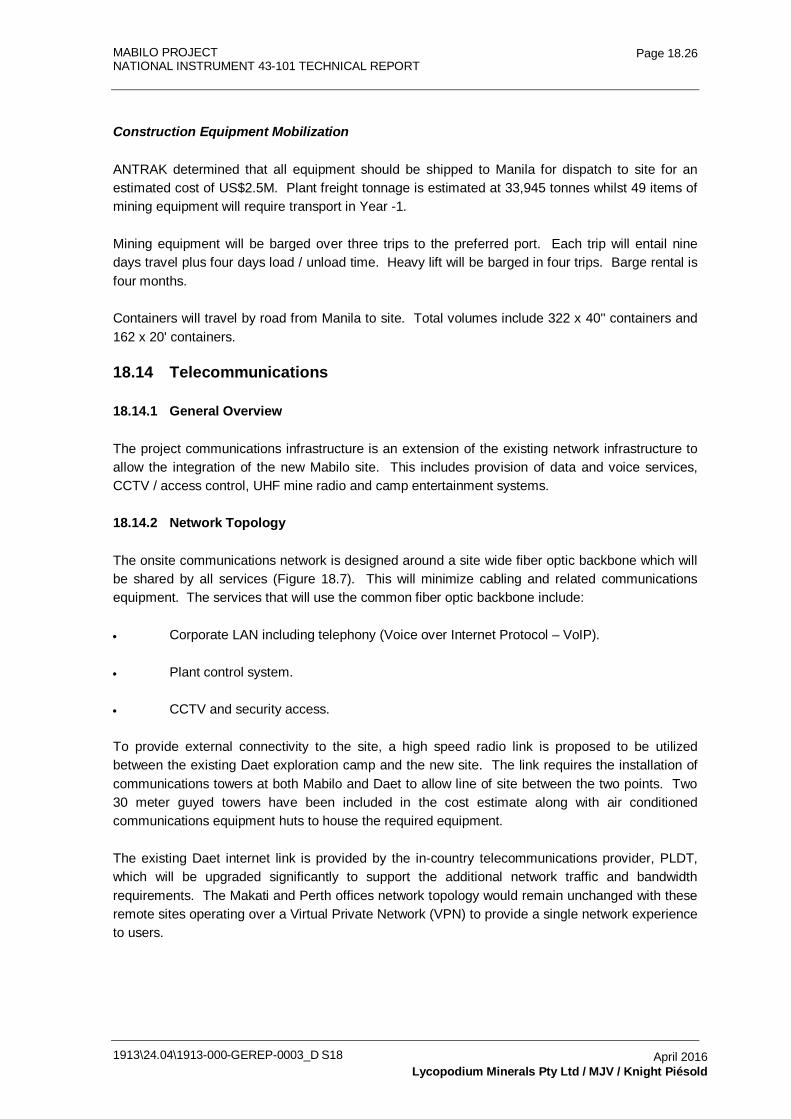
MABILO PROJECT NATIONAL INSTRUMENT 43-101 TECHNICAL REPORT
1913\24.04\1913-000-GEREP-0003_D S18
Page 18.26
April 2016 Lycopodium Minerals Pty Ltd / MJV / Knight Piésold
Construction Equipment Mobilization
ANTRAK determined that all equipment should be shipped to Manila for dispatch to site for an estimated cost of US$2.5M. Plant freight tonnage is estimated at 33,945 tonnes whilst 49 items of mining equipment will require transport in Year -1.
Mining equipment will be barged over three trips to the preferred port. Each trip will entail nine days travel plus four days load / unload time. Heavy lift will be barged in four trips. Barge rental is four months.
Containers will travel by road from Manila to site. Total volumes include 322 x 40'' containers and 162 x 20' containers.
18.14 Telecommunications
18.14.1 General Overview
The project communications infrastructure is an extension of the existing network infrastructure to allow the integration of the new Mabilo site. This includes provision of data and voice services, CCTV / access control, UHF mine radio and camp entertainment systems.
18.14.2 Network Topology
The onsite communications network is designed around a site wide fiber optic backbone which will be shared by all services (Figure 18.7). This will minimize cabling and related communications equipment. The services that will use the common fiber optic backbone include:
• Corporate LAN including telephony (Voice over Internet Protocol – VoIP).
• Plant control system.
• CCTV and security access.
To provide external connectivity to the site, a high speed radio link is proposed to be utilized between the existing Daet exploration camp and the new site. The link requires the installation of communications towers at both Mabilo and Daet to allow line of site between the two points. Two 30 meter guyed towers have been included in the cost estimate along with air conditioned communications equipment huts to house the required equipment.
The existing Daet internet link is provided by the in-country telecommunications provider, PLDT, which will be upgraded significantly to support the additional network traffic and bandwidth requirements. The Makati and Perth offices network topology would remain unchanged with these remote sites operating over a Virtual Private Network (VPN) to provide a single network experience to users.
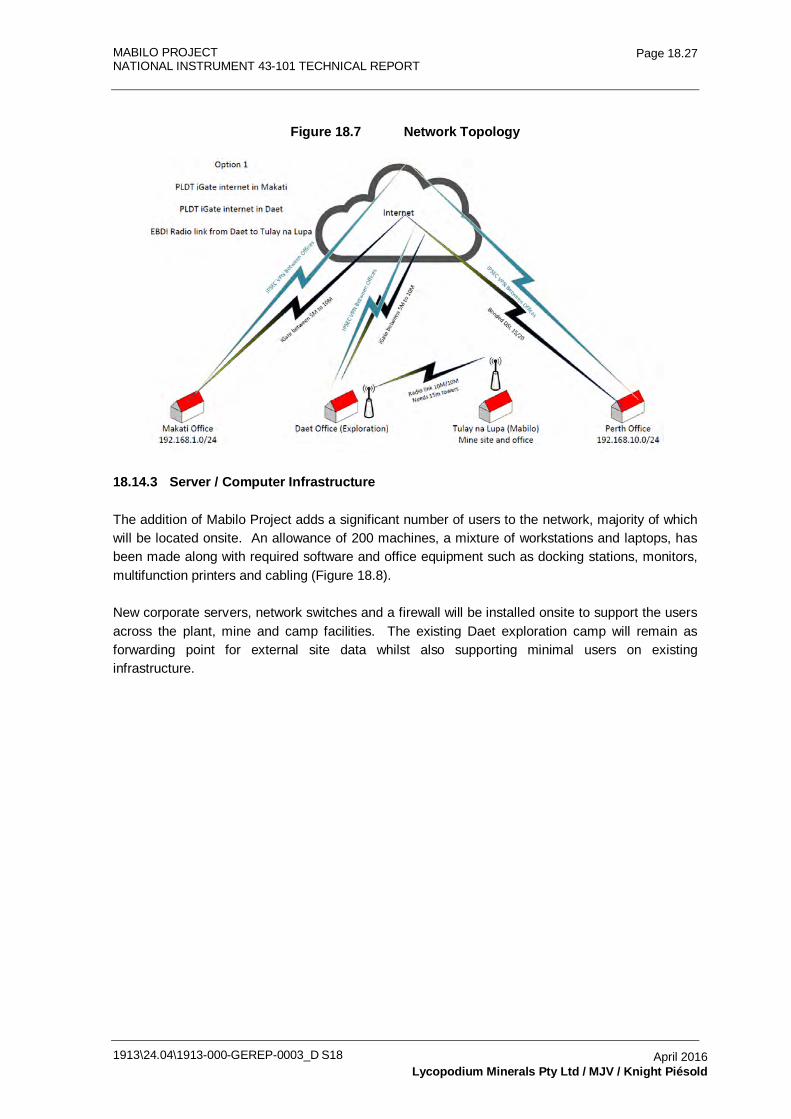
MABILO PROJECT NATIONAL INSTRUMENT 43-101 TECHNICAL REPORT
1913\24.04\1913-000-GEREP-0003_D S18
Page 18.27
April 2016 Lycopodium Minerals Pty Ltd / MJV / Knight Piésold
Figure 18.7 Network Topology
18.14.3 Server / Computer Infrastructure
The addition of Mabilo Project adds a significant number of users to the network, majority of which will be located onsite. An allowance of 200 machines, a mixture of workstations and laptops, has been made along with required software and office equipment such as docking stations, monitors, multifunction printers and cabling (Figure 18.8).
New corporate servers, network switches and a firewall will be installed onsite to support the users across the plant, mine and camp facilities. The existing Daet exploration camp will remain as forwarding point for external site data whilst also supporting minimal users on existing infrastructure.
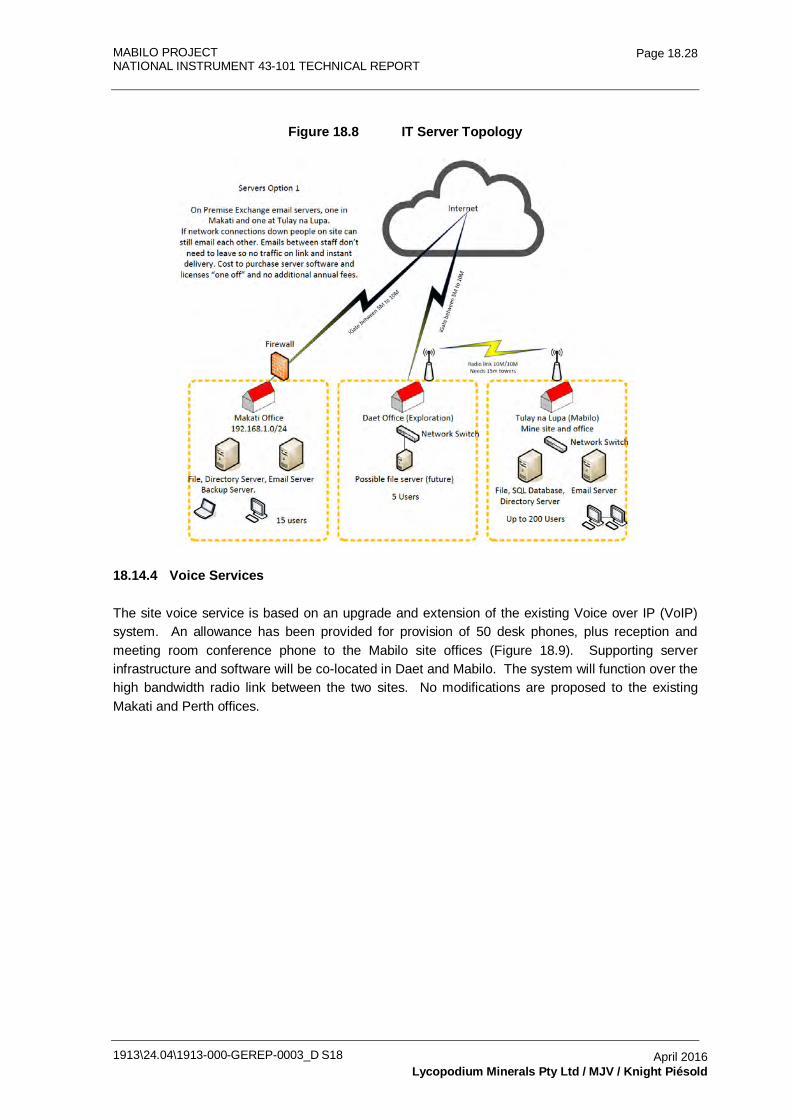
MABILO PROJECT NATIONAL INSTRUMENT 43-101 TECHNICAL REPORT
1913\24.04\1913-000-GEREP-0003_D S18
Page 18.28
April 2016 Lycopodium Minerals Pty Ltd / MJV / Knight Piésold
Figure 18.8 IT Server Topology
18.14.4 Voice Services
The site voice service is based on an upgrade and extension of the existing Voice over IP (VoIP) system. An allowance has been provided for provision of 50 desk phones, plus reception and meeting room conference phone to the Mabilo site offices (Figure 18.9). Supporting server infrastructure and software will be co-located in Daet and Mabilo. The system will function over the high bandwidth radio link between the two sites. No modifications are proposed to the existing Makati and Perth offices.
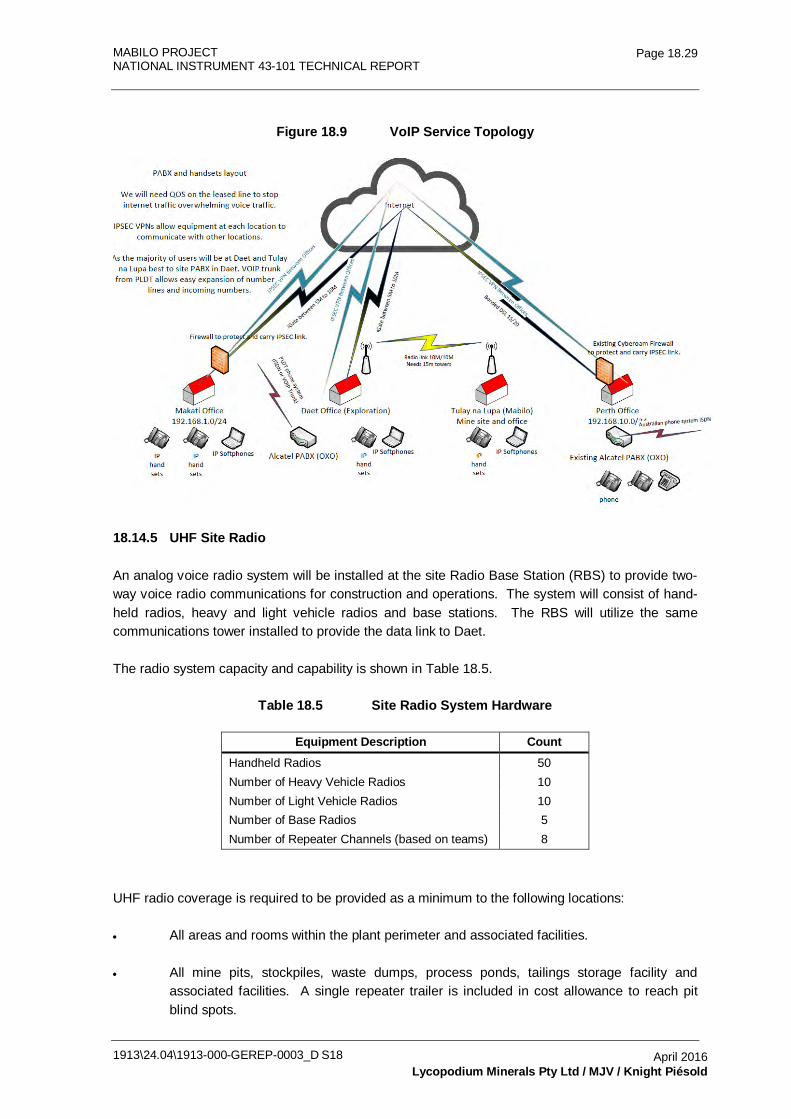
MABILO PROJECT NATIONAL INSTRUMENT 43-101 TECHNICAL REPORT
1913\24.04\1913-000-GEREP-0003_D S18
Page 18.29
April 2016 Lycopodium Minerals Pty Ltd / MJV / Knight Piésold
Figure 18.9 VoIP Service Topology
18.14.5 UHF Site Radio
An analog voice radio system will be installed at the site Radio Base Station (RBS) to provide two-way voice radio communications for construction and operations. The system will consist of hand-held radios, heavy and light vehicle radios and base stations. The RBS will utilize the same communications tower installed to provide the data link to Daet.
The radio system capacity and capability is shown in Table 18.5.
Table 18.5 Site Radio System Hardware
Equipment Description Count Handheld Radios 50 Number of Heavy Vehicle Radios 10 Number of Light Vehicle Radios 10 Number of Base Radios 5 Number of Repeater Channels (based on teams) 8
UHF radio coverage is required to be provided as a minimum to the following locations:
• All areas and rooms within the plant perimeter and associated facilities.
• All mine pits, stockpiles, waste dumps, process ponds, tailings storage facility and associated facilities. A single repeater trailer is included in cost allowance to reach pit blind spots.
MABILO PROJECT NATIONAL INSTRUMENT 43-101 TECHNICAL REPORT
1913\24.04\1913-000-GEREP-0003_D S18
Page 18.30
April 2016 Lycopodium Minerals Pty Ltd / MJV / Knight Piésold
18.14.6 CCTV / Access Control
An allowance of 12 CCTV cameras has been included in the design. These will be monitored from the plant control room and provide basic visual coverage over key plant areas and within the concentrate storage sheds.
An allowance of a main access boom gate and access control for four buildings has been included in the design. The following buildings will be accessible via swipe card and electronic door locks:
• RBS hut.
• Control room.
• Copper concentrate storage.
• Laboratory.
18.14.7 Camp Entertainment Services
The Camp MATV (Master Antenna Television) will provide at least 10 channels of streamed TV media to nominated camp accommodation rooms, and common areas such as the bar and recreation rooms. Reception of MATV services will be via satellite and terrestrial antennae distributed to endpoints throughout the camp complex by RF over coaxial cable.
18.15 Catering and Janitorial
For the purposes of construction, a daily allowance of $20 per person per day has been included in the capital estimate for catering and janitorial.
Owner's costs for administration include the cost of running the main accommodation facility.
18.16 Power Supply and Distribution
18.16.1 Power Supply
With the significant site load requirements and lack of local supply capacity, no current opportunities exist for any major connection of the site to the power utility.
Multiple power generation tenders were received during the feasibility study representing a market spread of providers for diesel (Gasoil) and Heavy Fuel Oil (HFO) solutions, with both capital and contract power alternatives evaluated.
Power will be provided by a site power station located to the west (downwind) of the process plant. The power station will utilize high speed generators running on Gasoil (diesel) as this provides the optimum balance of capital and operating cost over life of mine.
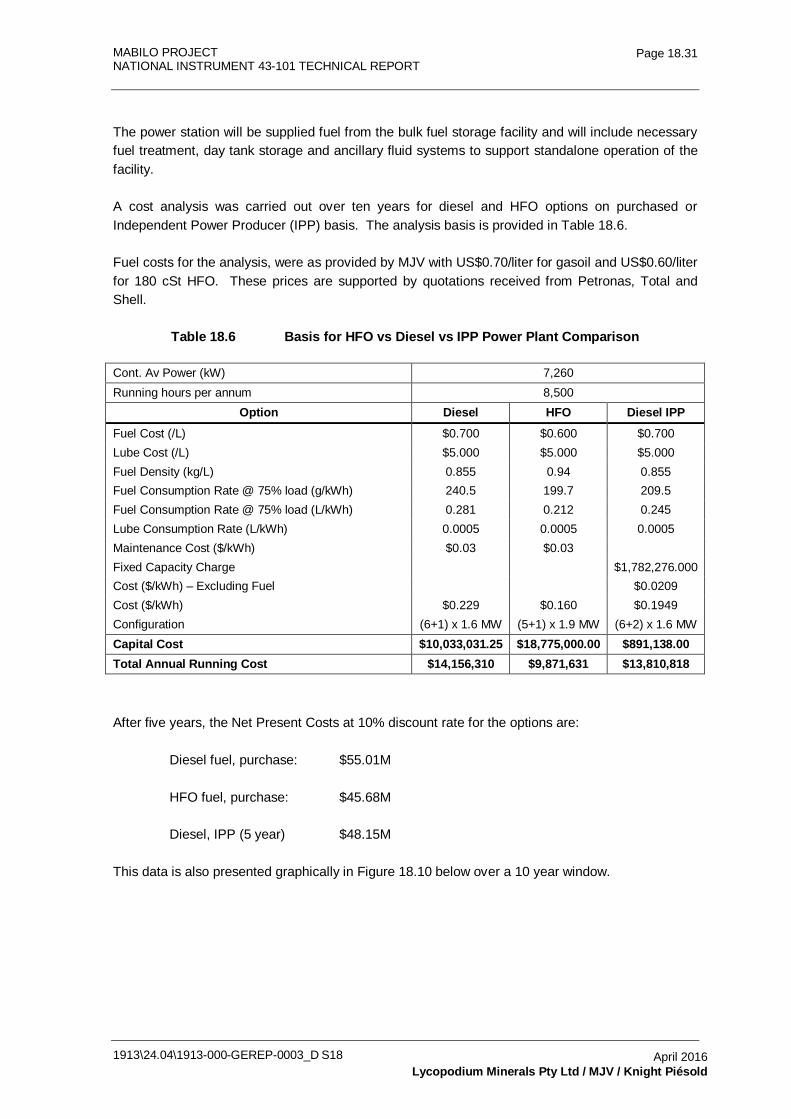
MABILO PROJECT NATIONAL INSTRUMENT 43-101 TECHNICAL REPORT
1913\24.04\1913-000-GEREP-0003_D S18
Page 18.31
April 2016 Lycopodium Minerals Pty Ltd / MJV / Knight Piésold
The power station will be supplied fuel from the bulk fuel storage facility and will include necessary fuel treatment, day tank storage and ancillary fluid systems to support standalone operation of the facility.
A cost analysis was carried out over ten years for diesel and HFO options on purchased or Independent Power Producer (IPP) basis. The analysis basis is provided in Table 18.6.
Fuel costs for the analysis, were as provided by MJV with US$0.70/liter for gasoil and US$0.60/liter for 180 cSt HFO. These prices are supported by quotations received from Petronas, Total and Shell.
Table 18.6 Basis for HFO vs Diesel vs IPP Power Plant Comparison
Cont. Av Power (kW) 7,260 Running hours per annum 8,500
Option Diesel HFO Diesel IPP Fuel Cost (/L) $0.700 $0.600 $0.700 Lube Cost (/L) $5.000 $5.000 $5.000 Fuel Density (kg/L) 0.855 0.94 0.855 Fuel Consumption Rate @ 75% load (g/kWh) 240.5 199.7 209.5 Fuel Consumption Rate @ 75% load (L/kWh) 0.281 0.212 0.245 Lube Consumption Rate (L/kWh) 0.0005 0.0005 0.0005 Maintenance Cost ($/kWh) $0.03 $0.03 Fixed Capacity Charge $1,782,276.000 Cost ($/kWh) – Excluding Fuel $0.0209 Cost ($/kWh) $0.229 $0.160 $0.1949 Configuration (6+1) x 1.6 MW (5+1) x 1.9 MW (6+2) x 1.6 MW Capital Cost $10,033,031.25 $18,775,000.00 $891,138.00 Total Annual Running Cost $14,156,310 $9,871,631 $13,810,818
After five years, the Net Present Costs at 10% discount rate for the options are:
Diesel fuel, purchase: $55.01M
HFO fuel, purchase: $45.68M
Diesel, IPP (5 year) $48.15M
This data is also presented graphically in Figure 18.10 below over a 10 year window.
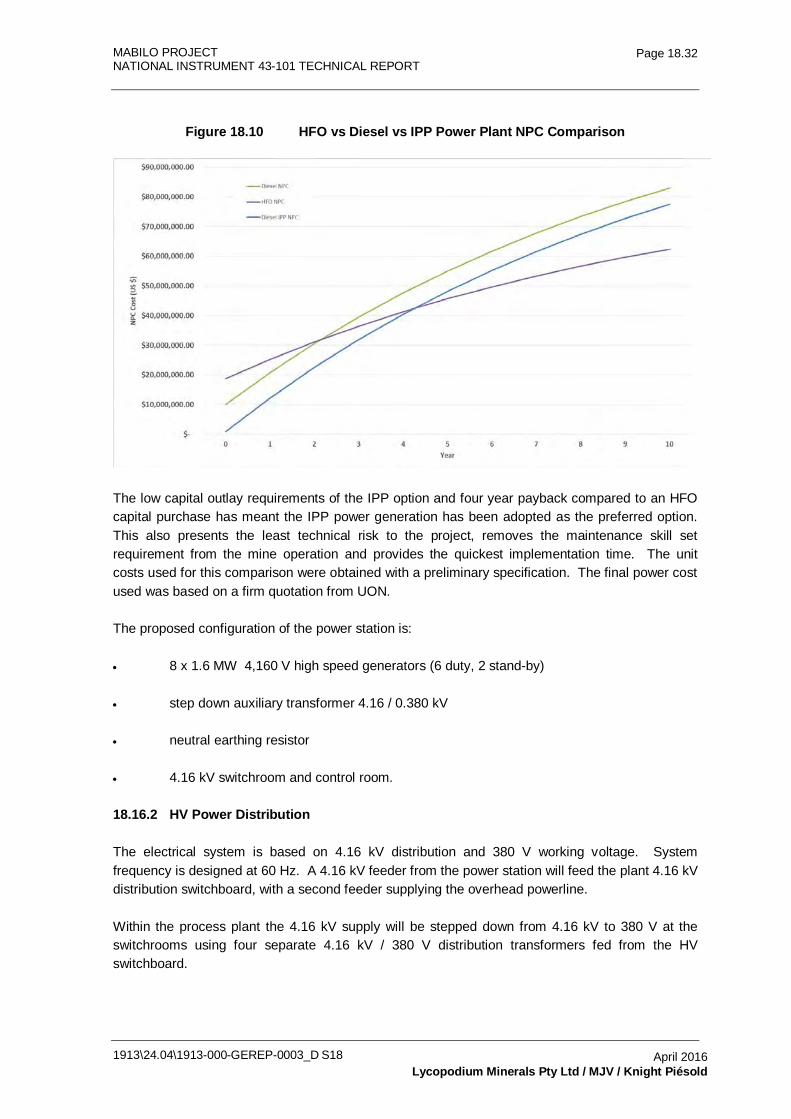
MABILO PROJECT NATIONAL INSTRUMENT 43-101 TECHNICAL REPORT
1913\24.04\1913-000-GEREP-0003_D S18
Page 18.32
April 2016 Lycopodium Minerals Pty Ltd / MJV / Knight Piésold
Figure 18.10 HFO vs Diesel vs IPP Power Plant NPC Comparison
The low capital outlay requirements of the IPP option and four year payback compared to an HFO capital purchase has meant the IPP power generation has been adopted as the preferred option. This also presents the least technical risk to the project, removes the maintenance skill set requirement from the mine operation and provides the quickest implementation time. The unit costs used for this comparison were obtained with a preliminary specification. The final power cost used was based on a firm quotation from UON.
The proposed configuration of the power station is:
• 8 x 1.6 MW 4,160 V high speed generators (6 duty, 2 stand-by)
• step down auxiliary transformer 4.16 / 0.380 kV
• neutral earthing resistor
• 4.16 kV switchroom and control room.
18.16.2 HV Power Distribution
The electrical system is based on 4.16 kV distribution and 380 V working voltage. System frequency is designed at 60 Hz. A 4.16 kV feeder from the power station will feed the plant 4.16 kV distribution switchboard, with a second feeder supplying the overhead powerline.
Within the process plant the 4.16 kV supply will be stepped down from 4.16 kV to 380 V at the switchrooms using four separate 4.16 kV / 380 V distribution transformers fed from the HV switchboard.
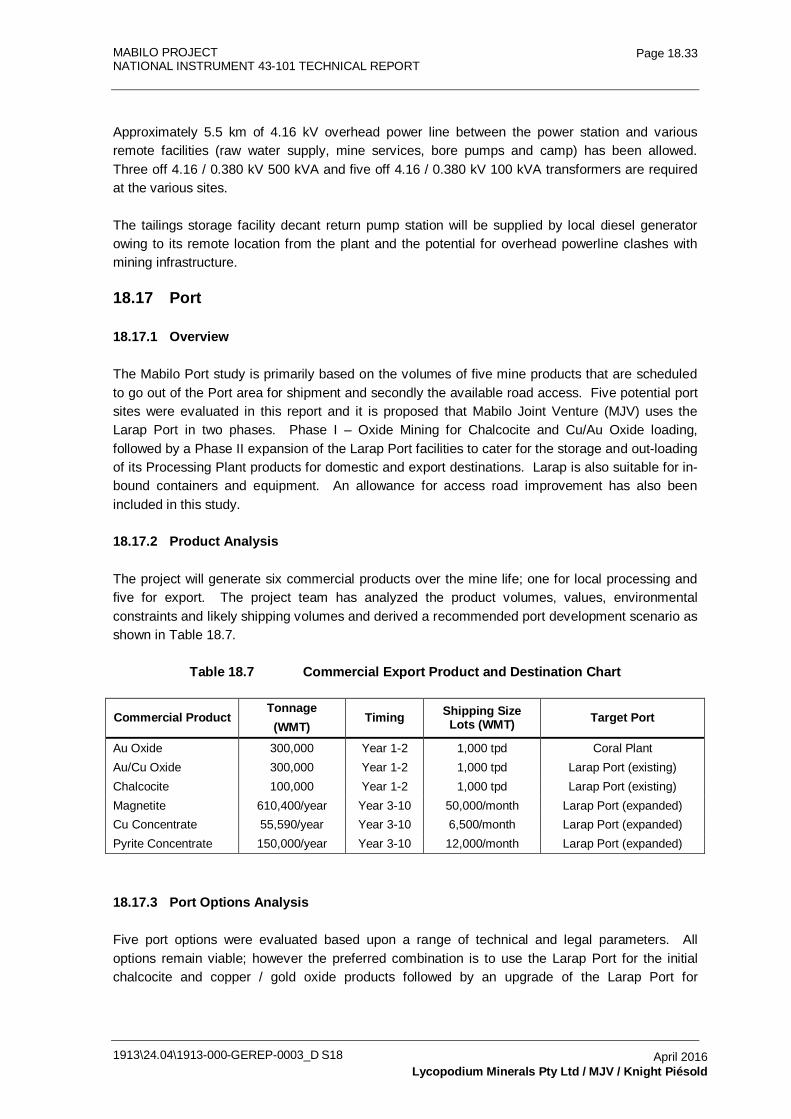
MABILO PROJECT NATIONAL INSTRUMENT 43-101 TECHNICAL REPORT
1913\24.04\1913-000-GEREP-0003_D S18
Page 18.33
April 2016 Lycopodium Minerals Pty Ltd / MJV / Knight Piésold
Approximately 5.5 km of 4.16 kV overhead power line between the power station and various remote facilities (raw water supply, mine services, bore pumps and camp) has been allowed. Three off 4.16 / 0.380 kV 500 kVA and five off 4.16 / 0.380 kV 100 kVA transformers are required at the various sites.
The tailings storage facility decant return pump station will be supplied by local diesel generator owing to its remote location from the plant and the potential for overhead powerline clashes with mining infrastructure.
18.17 Port
18.17.1 Overview
The Mabilo Port study is primarily based on the volumes of five mine products that are scheduled to go out of the Port area for shipment and secondly the available road access. Five potential port sites were evaluated in this report and it is proposed that Mabilo Joint Venture (MJV) uses the Larap Port in two phases. Phase I – Oxide Mining for Chalcocite and Cu/Au Oxide loading, followed by a Phase II expansion of the Larap Port facilities to cater for the storage and out-loading of its Processing Plant products for domestic and export destinations. Larap is also suitable for in-bound containers and equipment. An allowance for access road improvement has also been included in this study.
18.17.2 Product Analysis
The project will generate six commercial products over the mine life; one for local processing and five for export. The project team has analyzed the product volumes, values, environmental constraints and likely shipping volumes and derived a recommended port development scenario as shown in Table 18.7.
Table 18.7 Commercial Export Product and Destination Chart
Commercial Product Tonnage (WMT)
Timing Shipping Size Lots (WMT) Target Port
Au Oxide 300,000 Year 1-2 1,000 tpd Coral Plant Au/Cu Oxide 300,000 Year 1-2 1,000 tpd Larap Port (existing) Chalcocite 100,000 Year 1-2 1,000 tpd Larap Port (existing) Magnetite 610,400/year Year 3-10 50,000/month Larap Port (expanded) Cu Concentrate 55,590/year Year 3-10 6,500/month Larap Port (expanded) Pyrite Concentrate 150,000/year Year 3-10 12,000/month Larap Port (expanded)
18.17.3 Port Options Analysis
Five port options were evaluated based upon a range of technical and legal parameters. All options remain viable; however the preferred combination is to use the Larap Port for the initial chalcocite and copper / gold oxide products followed by an upgrade of the Larap Port for
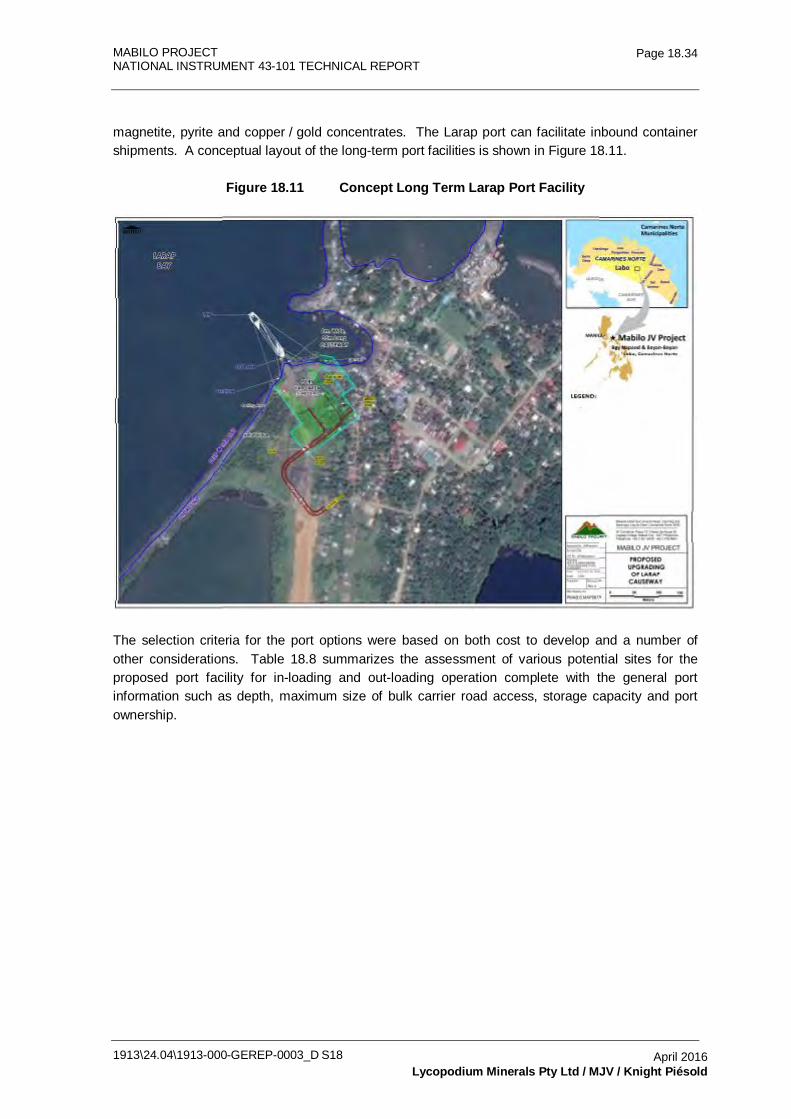
MABILO PROJECT NATIONAL INSTRUMENT 43-101 TECHNICAL REPORT
1913\24.04\1913-000-GEREP-0003_D S18
Page 18.34
April 2016 Lycopodium Minerals Pty Ltd / MJV / Knight Piésold
magnetite, pyrite and copper / gold concentrates. The Larap port can facilitate inbound container shipments. A conceptual layout of the long-term port facilities is shown in Figure 18.11.
Figure 18.11 Concept Long Term Larap Port Facility
The selection criteria for the port options were based on both cost to develop and a number of other considerations. Table 18.8 summarizes the assessment of various potential sites for the proposed port facility for in-loading and out-loading operation complete with the general port information such as depth, maximum size of bulk carrier road access, storage capacity and port ownership.
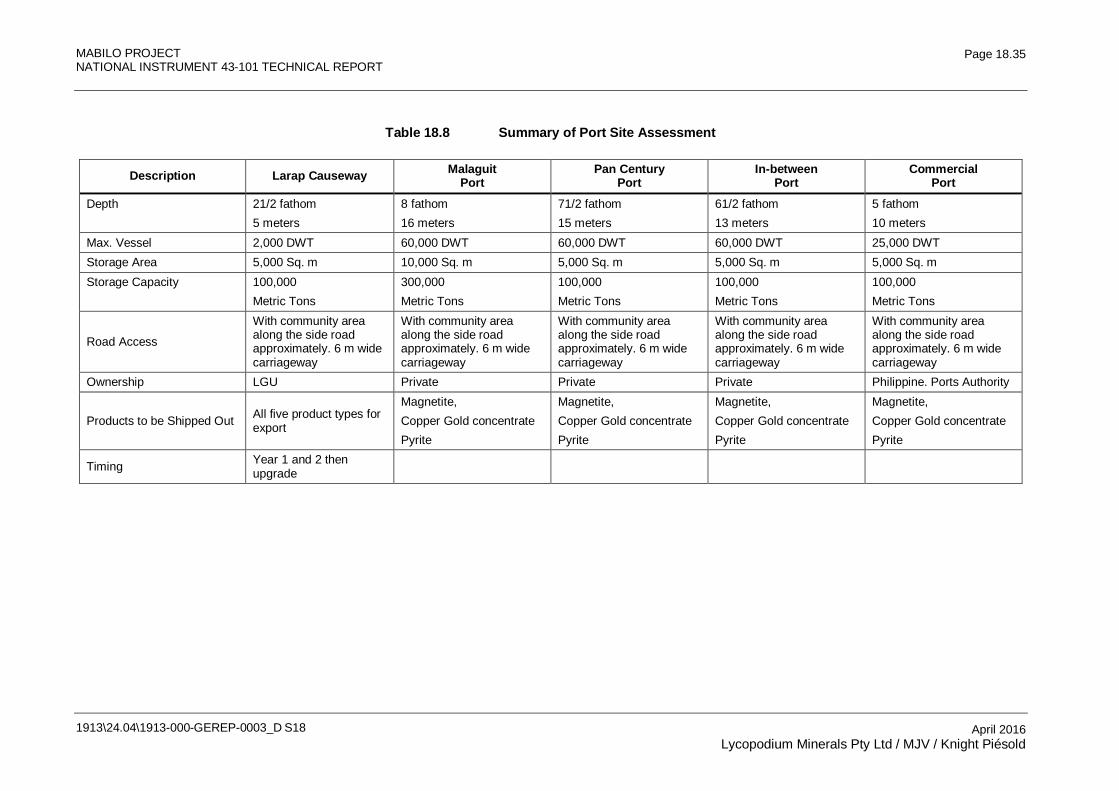
MABILO PROJECT NATIONAL INSTRUMENT 43-101 TECHNICAL REPORT
1913\24.04\1913-000-GEREP-0003_D S18
Page 18.35
April 2016 Lycopodium Minerals Pty Ltd / MJV / Knight Piésold
Table 18.8 Summary of Port Site Assessment
Description Larap Causeway Malaguit Port
Pan Century Port
In-between Port
Commercial Port
Depth 21/2 fathom 5 meters
8 fathom 16 meters
71/2 fathom 15 meters
61/2 fathom 13 meters
5 fathom 10 meters
Max. Vessel 2,000 DWT 60,000 DWT 60,000 DWT 60,000 DWT 25,000 DWT Storage Area 5,000 Sq. m 10,000 Sq. m 5,000 Sq. m 5,000 Sq. m 5,000 Sq. m Storage Capacity 100,000
Metric Tons 300,000 Metric Tons
100,000 Metric Tons
100,000 Metric Tons
100,000 Metric Tons
Road Access
With community area along the side road approximately. 6 m wide carriageway
With community area along the side road approximately. 6 m wide carriageway
With community area along the side road approximately. 6 m wide carriageway
With community area along the side road approximately. 6 m wide carriageway
With community area along the side road approximately. 6 m wide carriageway
Ownership LGU Private Private Private Philippine. Ports Authority
Products to be Shipped Out All five product types for export
Magnetite, Copper Gold concentrate Pyrite
Magnetite, Copper Gold concentrate Pyrite
Magnetite, Copper Gold concentrate Pyrite
Magnetite, Copper Gold concentrate Pyrite
Timing Year 1 and 2 then upgrade
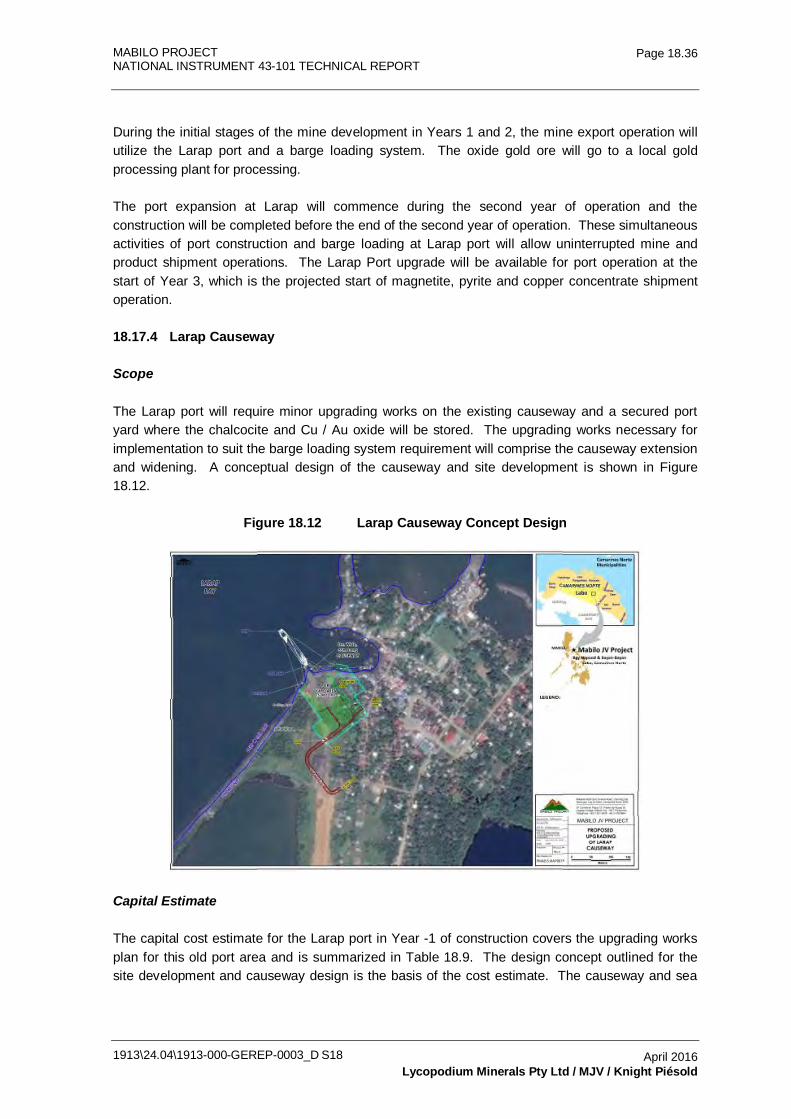
MABILO PROJECT NATIONAL INSTRUMENT 43-101 TECHNICAL REPORT
1913\24.04\1913-000-GEREP-0003_D S18
Page 18.36
April 2016 Lycopodium Minerals Pty Ltd / MJV / Knight Piésold
During the initial stages of the mine development in Years 1 and 2, the mine export operation will utilize the Larap port and a barge loading system. The oxide gold ore will go to a local gold processing plant for processing.
The port expansion at Larap will commence during the second year of operation and the construction will be completed before the end of the second year of operation. These simultaneous activities of port construction and barge loading at Larap port will allow uninterrupted mine and product shipment operations. The Larap Port upgrade will be available for port operation at the start of Year 3, which is the projected start of magnetite, pyrite and copper concentrate shipment operation.
18.17.4 Larap Causeway
Scope
The Larap port will require minor upgrading works on the existing causeway and a secured port yard where the chalcocite and Cu / Au oxide will be stored. The upgrading works necessary for implementation to suit the barge loading system requirement will comprise the causeway extension and widening. A conceptual design of the causeway and site development is shown in Figure 18.12.
Figure 18.12 Larap Causeway Concept Design
Capital Estimate
The capital cost estimate for the Larap port in Year -1 of construction covers the upgrading works plan for this old port area and is summarized in Table 18.9. The design concept outlined for the site development and causeway design is the basis of the cost estimate. The causeway and sea
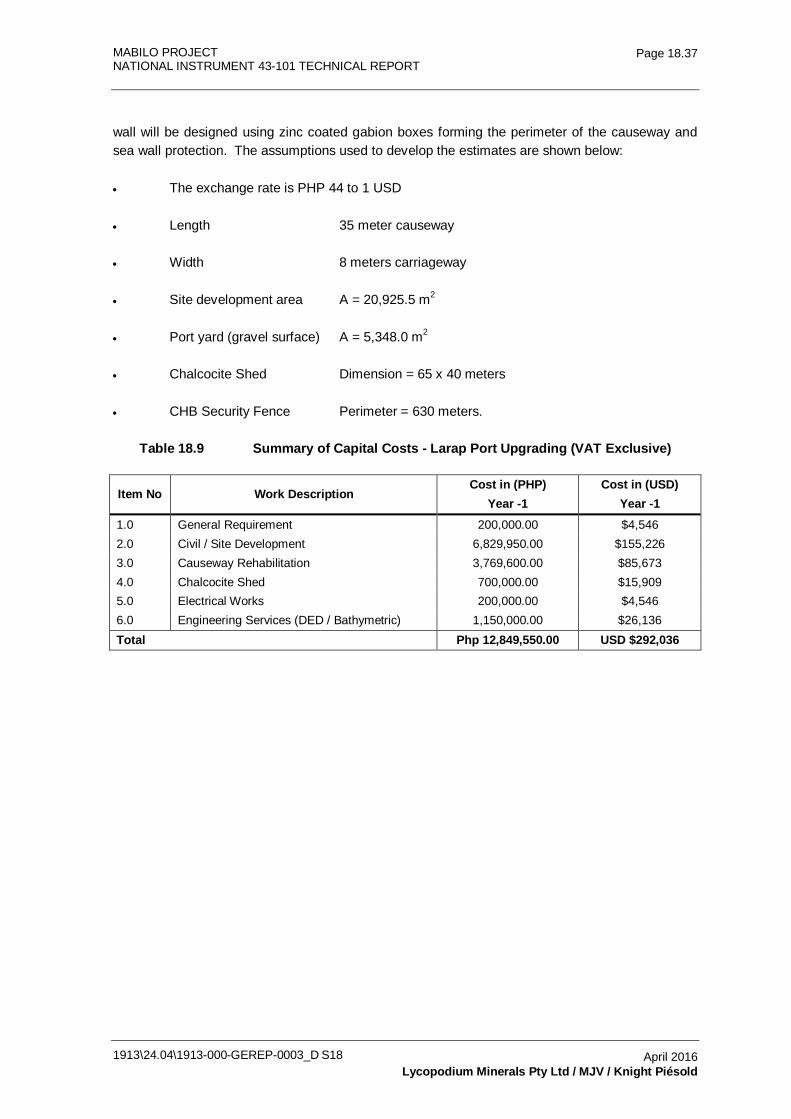
MABILO PROJECT NATIONAL INSTRUMENT 43-101 TECHNICAL REPORT
1913\24.04\1913-000-GEREP-0003_D S18
Page 18.37
April 2016 Lycopodium Minerals Pty Ltd / MJV / Knight Piésold
wall will be designed using zinc coated gabion boxes forming the perimeter of the causeway and sea wall protection. The assumptions used to develop the estimates are shown below:
• The exchange rate is PHP 44 to 1 USD
• Length 35 meter causeway
• Width 8 meters carriageway
• Site development area A = 20,925.5 m2
• Port yard (gravel surface) A = 5,348.0 m2
• Chalcocite Shed Dimension = 65 x 40 meters
• CHB Security Fence Perimeter = 630 meters.
Table 18.9 Summary of Capital Costs - Larap Port Upgrading (VAT Exclusive)
Item No Work Description Cost in (PHP)
Year -1 Cost in (USD)
Year -1 1.0 General Requirement 200,000.00 $4,546 2.0 Civil / Site Development 6,829,950.00 $155,226 3.0 Causeway Rehabilitation 3,769,600.00 $85,673 4.0 Chalcocite Shed 700,000.00 $15,909 5.0 Electrical Works 200,000.00 $4,546 6.0 Engineering Services (DED / Bathymetric) 1,150,000.00 $26,136 Total Php 12,849,550.00 USD $292,036
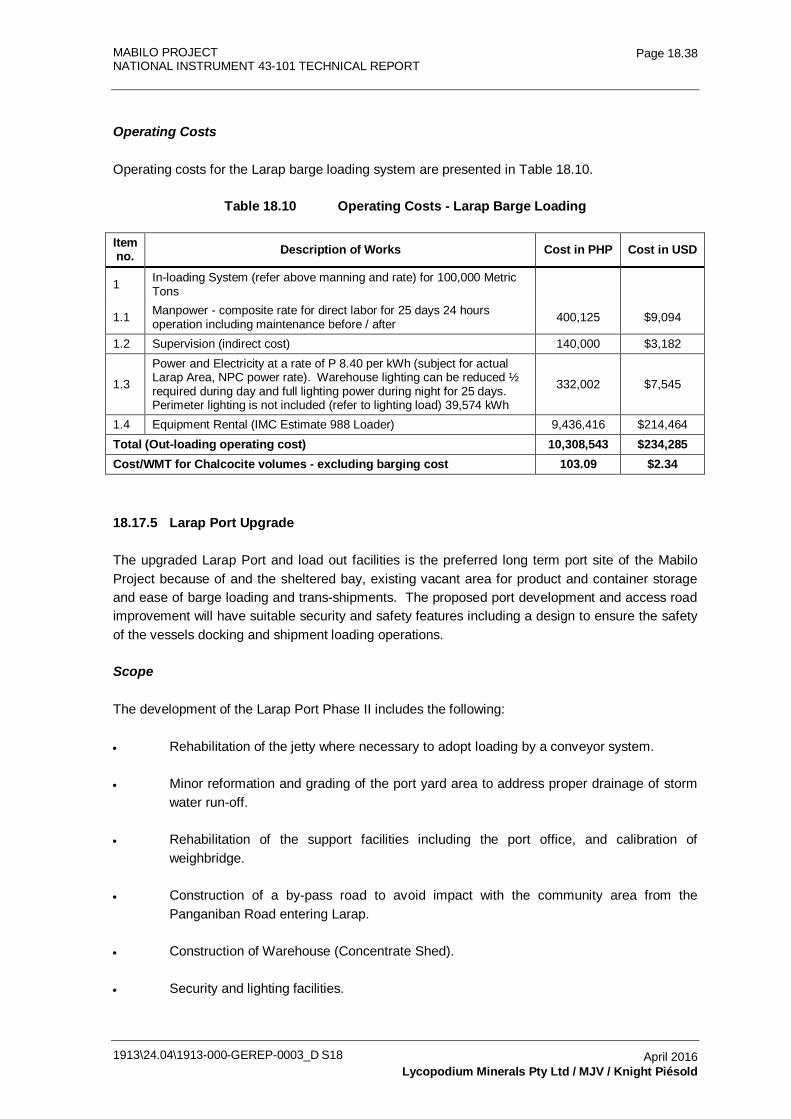
MABILO PROJECT NATIONAL INSTRUMENT 43-101 TECHNICAL REPORT
1913\24.04\1913-000-GEREP-0003_D S18
Page 18.38
April 2016 Lycopodium Minerals Pty Ltd / MJV / Knight Piésold
Operating Costs
Operating costs for the Larap barge loading system are presented in Table 18.10.
Table 18.10 Operating Costs - Larap Barge Loading
Item no. Description of Works Cost in PHP Cost in USD
1 In-loading System (refer above manning and rate) for 100,000 Metric Tons
1.1 Manpower - composite rate for direct labor for 25 days 24 hours operation including maintenance before / after 400,125 $9,094
1.2 Supervision (indirect cost) 140,000 $3,182
1.3
Power and Electricity at a rate of P 8.40 per kWh (subject for actual Larap Area, NPC power rate). Warehouse lighting can be reduced ½ required during day and full lighting power during night for 25 days. Perimeter lighting is not included (refer to lighting load) 39,574 kWh
332,002 $7,545
1.4 Equipment Rental (IMC Estimate 988 Loader) 9,436,416 $214,464 Total (Out-loading operating cost) 10,308,543 $234,285 Cost/WMT for Chalcocite volumes - excluding barging cost 103.09 $2.34
18.17.5 Larap Port Upgrade
The upgraded Larap Port and load out facilities is the preferred long term port site of the Mabilo Project because of and the sheltered bay, existing vacant area for product and container storage and ease of barge loading and trans-shipments. The proposed port development and access road improvement will have suitable security and safety features including a design to ensure the safety of the vessels docking and shipment loading operations.
Scope
The development of the Larap Port Phase II includes the following:
• Rehabilitation of the jetty where necessary to adopt loading by a conveyor system.
• Minor reformation and grading of the port yard area to address proper drainage of storm water run-off.
• Rehabilitation of the support facilities including the port office, and calibration of weighbridge.
• Construction of a by-pass road to avoid impact with the community area from the Panganiban Road entering Larap.
• Construction of Warehouse (Concentrate Shed).
• Security and lighting facilities.
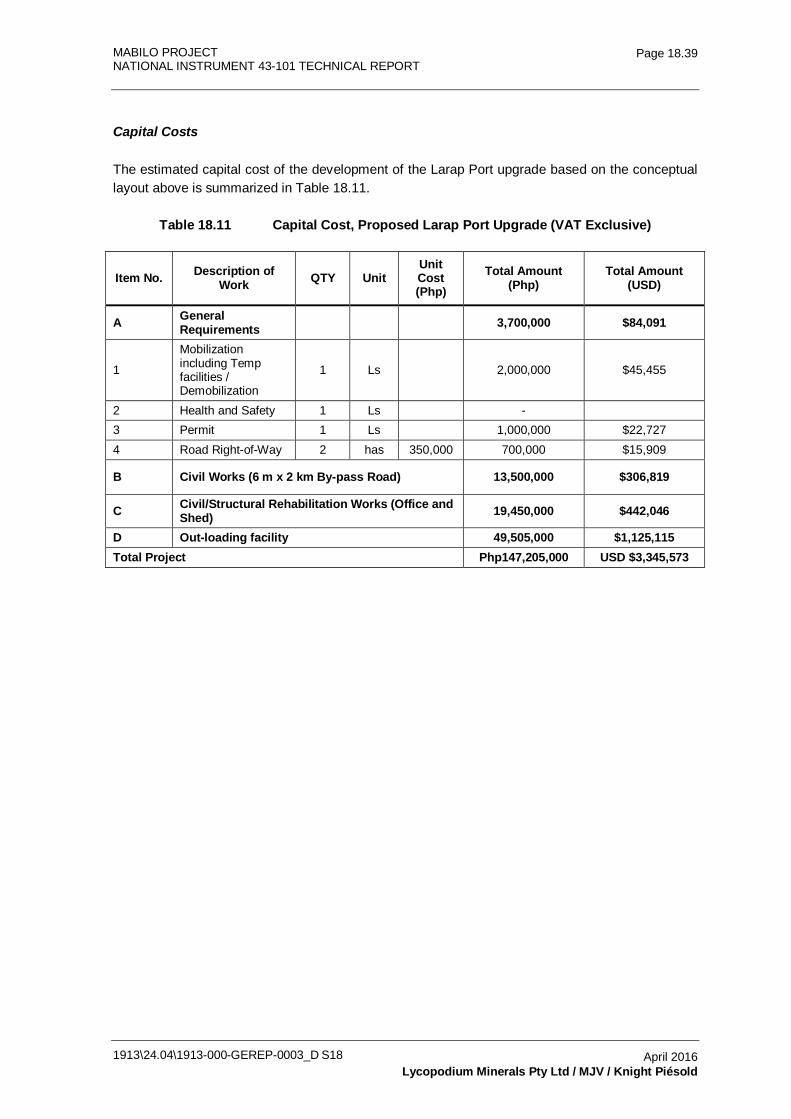
MABILO PROJECT NATIONAL INSTRUMENT 43-101 TECHNICAL REPORT
1913\24.04\1913-000-GEREP-0003_D S18
Page 18.39
April 2016 Lycopodium Minerals Pty Ltd / MJV / Knight Piésold
Capital Costs
The estimated capital cost of the development of the Larap Port upgrade based on the conceptual layout above is summarized in Table 18.11.
Table 18.11 Capital Cost, Proposed Larap Port Upgrade (VAT Exclusive)
Item No. Description of Work QTY Unit
Unit Cost (Php)
Total Amount (Php)
Total Amount (USD)
A General Requirements
3,700,000 $84,091
1
Mobilization including Temp facilities / Demobilization
1 Ls
2,000,000 $45,455
2 Health and Safety 1 Ls
-
3 Permit 1 Ls
1,000,000 $22,727 4 Road Right-of-Way 2 has 350,000 700,000 $15,909
B Civil Works (6 m x 2 km By-pass Road) 13,500,000 $306,819
C Civil/Structural Rehabilitation Works (Office and Shed) 19,450,000 $442,046
D Out-loading facility 49,505,000 $1,125,115 Total Project Php147,205,000 USD $3,345,573
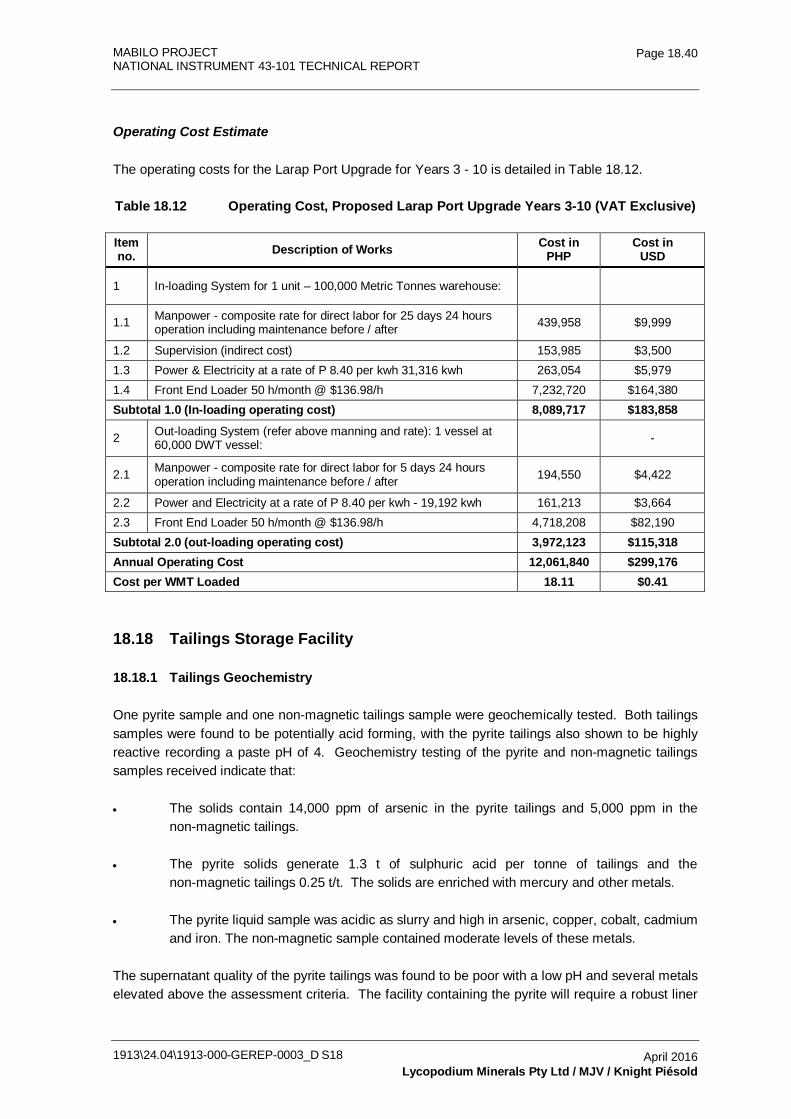
MABILO PROJECT NATIONAL INSTRUMENT 43-101 TECHNICAL REPORT
1913\24.04\1913-000-GEREP-0003_D S18
Page 18.40
April 2016 Lycopodium Minerals Pty Ltd / MJV / Knight Piésold
Operating Cost Estimate
The operating costs for the Larap Port Upgrade for Years 3 - 10 is detailed in Table 18.12.
Table 18.12 Operating Cost, Proposed Larap Port Upgrade Years 3-10 (VAT Exclusive)
Item no. Description of Works Cost in
PHP Cost in
USD
1 In-loading System for 1 unit – 100,000 Metric Tonnes warehouse:
1.1 Manpower - composite rate for direct labor for 25 days 24 hours operation including maintenance before / after 439,958 $9,999
1.2 Supervision (indirect cost) 153,985 $3,500 1.3 Power & Electricity at a rate of P 8.40 per kwh 31,316 kwh 263,054 $5,979 1.4 Front End Loader 50 h/month @ $136.98/h 7,232,720 $164,380 Subtotal 1.0 (In-loading operating cost) 8,089,717 $183,858
2 Out-loading System (refer above manning and rate): 1 vessel at 60,000 DWT vessel:
-
2.1 Manpower - composite rate for direct labor for 5 days 24 hours operation including maintenance before / after 194,550 $4,422
2.2 Power and Electricity at a rate of P 8.40 per kwh - 19,192 kwh 161,213 $3,664 2.3 Front End Loader 50 h/month @ $136.98/h 4,718,208 $82,190 Subtotal 2.0 (out-loading operating cost) 3,972,123 $115,318 Annual Operating Cost 12,061,840 $299,176 Cost per WMT Loaded 18.11 $0.41
18.18 Tailings Storage Facility
18.18.1 Tailings Geochemistry
One pyrite sample and one non-magnetic tailings sample were geochemically tested. Both tailings samples were found to be potentially acid forming, with the pyrite tailings also shown to be highly reactive recording a paste pH of 4. Geochemistry testing of the pyrite and non-magnetic tailings samples received indicate that:
• The solids contain 14,000 ppm of arsenic in the pyrite tailings and 5,000 ppm in the non-magnetic tailings.
• The pyrite solids generate 1.3 t of sulphuric acid per tonne of tailings and the non-magnetic tailings 0.25 t/t. The solids are enriched with mercury and other metals.
• The pyrite liquid sample was acidic as slurry and high in arsenic, copper, cobalt, cadmium and iron. The non-magnetic sample contained moderate levels of these metals.
The supernatant quality of the pyrite tailings was found to be poor with a low pH and several metals elevated above the assessment criteria. The facility containing the pyrite will require a robust liner
MABILO PROJECT NATIONAL INSTRUMENT 43-101 TECHNICAL REPORT
1913\24.04\1913-000-GEREP-0003_D S18
Page 18.41
April 2016 Lycopodium Minerals Pty Ltd / MJV / Knight Piésold
system. The supernatant quality of the non-magnetic tailings was reasonable. Water treatment of the supernatant may be required prior to discharge to surface waters. This will be determined early in the project. No capital allowance has been made at this point.
Based on this assessment, a robust liner system will be required on the base and sides of the facility to reduce seepage and the tailings should be maintained at saturation to reduce acid generation. Based on the acid generating potential of both samples, there appears to be limited merit in separating the tailings streams into two TSF cells if both streams are to remain as waste. However the pyrite supernatant and non-magnetic supernatant should be evaluated further to optimize the management approach.
18.18.2 Tailings Storage
The Tailings Storage Facility (TSF) will comprise a four sided paddock storage facility formed by a multi-zoned earthfill embankment with high density polyethylene (HDPE) liner and compacted soil liner. The TSF will be located towards the northern end of the waste dump in a combined tailings and waste facility. To limit the acid generating potential of the tailings, the tailings deposition will be sub-aqueous. A leachate collection recovery system (LCRS) will be installed beneath the basin composite liner to limit potential seepage from the TSF basin. This consists of a system of 100 mm diameter corrugated polyethylene tubing (CPT) drain coil pipes which will be installed to direct seepage water to the LCRS sump.
It is envisaged that a market may be identified for the pyrite tailings and this will be transported off site. Currently the TSF is sized for co-disposal of both tailings streams. The TSF is designed with a storage capacity of 3.55 Mt, sufficient for 10 years of operation. The Stage 1 facility is designed with a two year storage capacity.
The tailings facility is proposed to be constructed on volcanic tuff materials with a groundwater table close to the surface. The natural ground is at risk of liquefaction under a seismic event. The additional confining pressure applied to the natural ground by the tailings storage facility and waste dump will reduce this risk to an acceptable level. However the ground close to the toe of the mine waste will remain at risk due to the lower level of additional load applied. A sacrificial earthworks bund is proposed to be constructed around the external perimeter of the structural zone of the TSF, such that in the event of liquefaction, the structural zone of the TSF has sufficient confining pressure to be non-liquefiable and only the bund is at risk of high deformations. Preliminary sizing indicates that the bund is required to be 50 m wide at the crest and a minimum of half the height of the TSF embankment.
The natural ground below the inside face of the TSF will similarly be at risk of liquefaction until sufficient tailings are deposited to confine this layer. During the early stages of operation there is a risk of high deformation occurring due to seismically induced liquefaction. This risk is primarily a commercial risk as the HDPE lining will prevent loss of containment.
Tailings will be deposited using perimeter deposition. The supernatant water will be removed from the TSF via submersible pumps located on a floating pontoon.
MABILO PROJECT
NATIONAL INSTRUMENT 43-101 TECHNICAL REPORT
1913-000-GEREP-0003
Table of Contents Page
19.0 MARKET STUDIES AND CONTRACTS 19.1 19.1 Executive Summary 19.1 19.2 Gold Cap Ore 19.3
19.2.1 Product Specification 19.3 19.2.2 Marketing Strategy 19.4 19.2.3 Pricing 19.4
19.3 Oxide Skarn Ore DSO 19.4 19.3.1 Product Specification 19.4 19.3.2 Marketing Strategy 19.5 19.3.3 Pricing 19.5
19.4 Supergene Chalcocite 19.5 19.4.1 Product Specification 19.5 19.4.2 Marketing Strategy 19.5 19.4.3 Pricing 19.6
19.5 Copper Concentrate 19.6 19.5.1 Product Specification 19.6 19.5.2 Copper Demand Forecast 19.6 19.5.3 Copper Market Supply 2016 – 2019 19.8 19.5.4 Marketing Strategy 19.9 19.5.5 Pricing 19.11
19.6 Magnetite Concentrate 19.11 19.6.1 Product Specification 19.11 19.6.2 Demand Forecast 19.11 19.6.3 Supply Forecast 19.13 19.6.4 Marketing Strategy 19.14 19.6.5 Pricing 19.14
19.7 Pyrite Concentrate 19.14 19.7.1 Product Specification 19.14 19.7.2 Marketing Strategy 19.15 19.7.3 Pricing 19.15
19.8 Revenue Forecasts 19.15 19.9 Marketing Resources and Organization 19.16 19.10 Product Shipping, Storage and Distribution 19.16
19.10.1 Ocean Freight Market Overview 19.16 19.10.2 Shipping Freight Rates 19.22 19.10.3 Vessel Loading 19.24 19.10.4 Port Storage Optimization 19.24 19.10.5 Weighing, Sampling, Moisture Determination 19.24
19.11 Contracts 19.25
1913\24.04\1913-000-GEREP-0003_D S19 May 2016 Conrad Partners / MJV
MABILO PROJECT
NATIONAL INSTRUMENT 43-101 TECHNICAL REPORT
1913-000-GEREP-0003
Table of Contents (Continued)
Page
1913\24.04\1913-000-GEREP-0003_D S19
May 2016 Conrad Partners / MJV
TABLES Table 19.1 Product Expected Revenues 19.1 Table 19.2 Main Elements in Gold Cap Ore 19.4 Table 19.3 Main Elements in Oxide Skarn Ore 19.5 Table 19.4 Main Elements in Supergene Chalcocite 19.5 Table 19.5 Main Elements in Copper Concentrate 19.6 Table 19.6 Chinese Regulatory Limits on Deleterious Elements in Imported
Copper Concentrates 19.7 Table 19.7 Main Elements in Magnetite Concentrate 19.11 Table 19.8 Main Elements in Pyrite Concentrate 19.14 Table 19.9 Product Expected Revenues 19.15 Table 19.10 Indicative Freight Rates 19.23 FIGURES Figure 19.1 Copper Supply / Demand (million tonnes) 19.9 Figure 19.2 Moderate Grown in Iron Ore Demand 19.12 Figure 19.3 Substantial Steel Potential for Developing Asia 19.13 Figure 19.4 Baltic Dry Index (BDI) 19.17 Figure 19.5 Small Handysize 19.18 Figure 19.6 Traditional Handysize 19.19 Figure 19.7 Large Handysize 19.20 Figure 19.8 Handysize Annual Oversupply 19.21 Figure 19.9 Handysize Supply - Demand 19.22
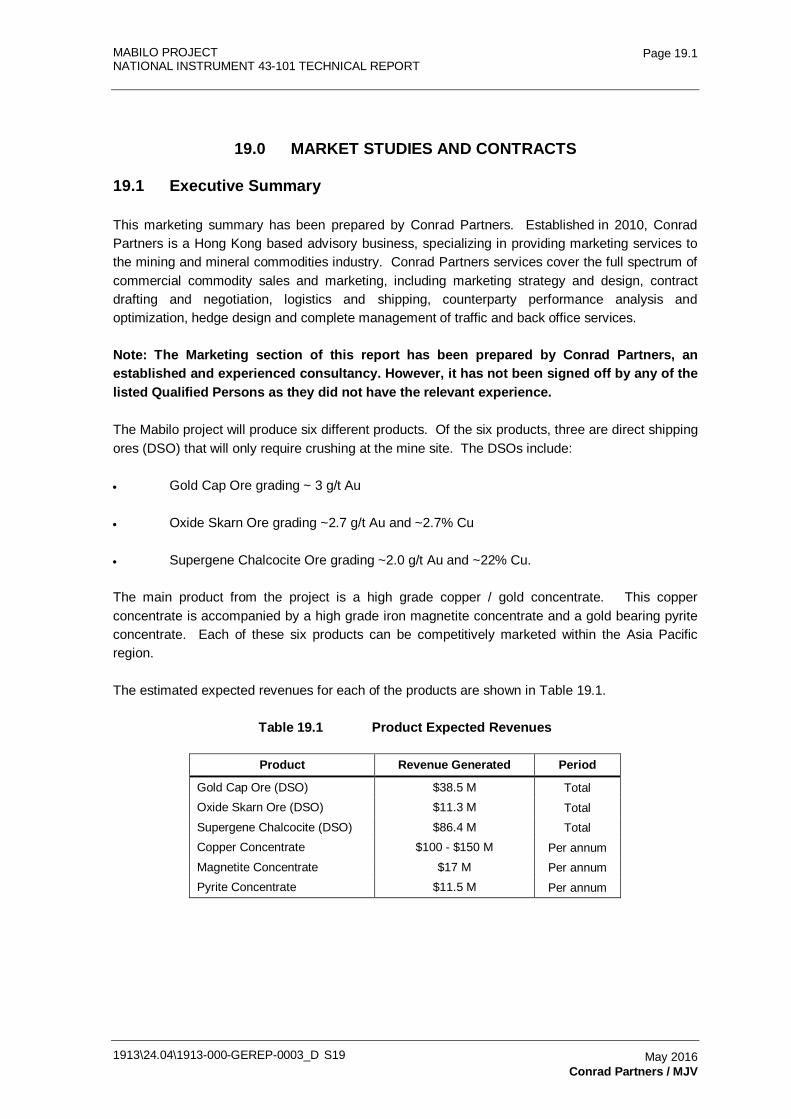
MABILO PROJECT NATIONAL INSTRUMENT 43-101 TECHNICAL REPORT
1913\24.04\1913-000-GEREP-0003_D S19
Page 19.1
May 2016 Conrad Partners / MJV
19.0 MARKET STUDIES AND CONTRACTS
19.1 Executive Summary
This marketing summary has been prepared by Conrad Partners. Established in 2010, Conrad Partners is a Hong Kong based advisory business, specializing in providing marketing services to the mining and mineral commodities industry. Conrad Partners services cover the full spectrum of commercial commodity sales and marketing, including marketing strategy and design, contract drafting and negotiation, logistics and shipping, counterparty performance analysis and optimization, hedge design and complete management of traffic and back office services.
Note: The Marketing section of this report has been prepared by Conrad Partners, an established and experienced consultancy. However, it has not been signed off by any of the listed Qualified Persons as they did not have the relevant experience.
The Mabilo project will produce six different products. Of the six products, three are direct shipping ores (DSO) that will only require crushing at the mine site. The DSOs include:
• Gold Cap Ore grading ~ 3 g/t Au
• Oxide Skarn Ore grading ~2.7 g/t Au and ~2.7% Cu
• Supergene Chalcocite Ore grading ~2.0 g/t Au and ~22% Cu.
The main product from the project is a high grade copper / gold concentrate. This copper concentrate is accompanied by a high grade iron magnetite concentrate and a gold bearing pyrite concentrate. Each of these six products can be competitively marketed within the Asia Pacific region.
The estimated expected revenues for each of the products are shown in Table 19.1.
Table 19.1 Product Expected Revenues
Product Revenue Generated Period
Gold Cap Ore (DSO) $38.5 M Total Oxide Skarn Ore (DSO) $11.3 M Total Supergene Chalcocite (DSO) $86.4 M Total Copper Concentrate $100 - $150 M Per annum Magnetite Concentrate $17 M Per annum Pyrite Concentrate $11.5 M Per annum
MABILO PROJECT NATIONAL INSTRUMENT 43-101 TECHNICAL REPORT
1913\24.04\1913-000-GEREP-0003_D S19
Page 19.2
May 2016 Conrad Partners / MJV
Copper Market Forecast
Almost all analysts are currently forecasting an increase in global copper demand over the next four years, albeit at lower growth rates than the previous four years. Typical demand growth forecasts range from 1.5% to 3.0%, for an additional 340,000 Mt and 682,000 Mt refined copper, respectively in 2016.
In 2015, mine supply increased by approximately 3% over 2014, for production of approximately 19.1 M tonnes contained copper. Mine supply is predicted to increase by between 3% and 4% y.o.y in 2016. Production increases are forecast to continue into 2017 at a similar level, reaching peak production in 2017, before contracting in 2018 and beyond.
The forecast supply contraction from 2018 onwards is driven by ore grade reductions across the industry, a lack of new discoveries, project deferrals due to the current price environment and permitting delays. A predicted contraction of mine supply against the predicted steady increase in demand will result in a supply gap widening from 2018. This supply gap is expected to result in increasing prices.
Gold Cap Ore
In Shandong Province, a major gold producing region of China, there are more than 20 gold processing plants that include roasting capacity and conventional CIP / CIL leaching technology. These plants operate on a combination of domestic and imported ores and concentrates. The processing plants in the Shandong Peninsula are suitably located within a reasonable trucking distance to major ports and are ideal outlets for the gold DSO.
Supergene Chalcocite Ore and Copper Concentrates
Copper concentrates are sold to smelters where the concentrate is smelted to produce blister copper and further refined to produce copper cathode. There are more than 40 copper smelters in China, one in the Philippines, one in Korea, six in Japan and two in India. Most of these smelters are capable of receiving and treating the chalcocite DSO and the copper / gold concentrates produced at the Mabilo project. Some have better technical compatibility and are better located than others, and these will be targeted to ensure optimum commercial terms are attained.
Also located in China and Korea are three major blending facilities that receive complex copper concentrates from various producers around the world. Complex concentrates are defined as those which contain a range of elements deleterious to the copper smelting process, and are blended with clean copper concentrates to reduce the concentration of deleterious elements to within acceptable technical and regulatory limits. The Mabilo copper concentrates would be compatible for processing at these facilities.
Negotiations for 2016 annual TC / RC’s were settled at $97.35 TC and $0.09735 RC.
Magnetite Concentrate
China is the world’s biggest steel producer and accounts for almost 50% of the world’s steel production, producing over 800 million tonnes of steel in 2015. Japan, Korea and India account for
MABILO PROJECT NATIONAL INSTRUMENT 43-101 TECHNICAL REPORT
1913\24.04\1913-000-GEREP-0003_D S19
Page 19.3
May 2016 Conrad Partners / MJV
a further 260 million tonnes of steel production. The high grade magnetite concentrate will be sold into the Asian steel producing market at a price referencing a 62% Fe ore Index.
Pyrite Concentrate
There are a variety of markets into which the gold bearing pyrite concentrate can be sold. As a gold sulphide concentrate it can be processed to recover the gold. This will require a roasting or oxidation stage prior to recovery of the gold. It can also be used as a source of fuel for copper and gold smelters. This high sulphur concentrate can be blended with other lower sulphur copper / gold concentrates and ores to render them suitable for smelting, whilst at the same time allowing for the recovery of the gold contained within them.
Elemental sulphur and sulphide concentrates (pyrite) are burned in to produce sulphuric acid for industrial and agricultural (fertilizer) use. Pyrites make up about 7% of the global sulphur supply. China is a key market for sulphuric acid trade and imports about 1 million tonnes per year. India is also a major market for acid and fertilizer production. The economics of the sulphuric acid market at the time of the pyrite concentrate production will dictate which option returns the highest revenue.
Shipping
Current global dry-bulk freight rates are at their lowest levels in more than 20 years. This is due to a combination of vessel oversupply (relative to demand) and low fuel (bunker) prices. Basis current data, the freight market is expected to remain weak in 2016, before beginning to strengthen in 2017, reaching a more balanced market in 2019.
The Mabilo project will ship the bulk of its products from the Larap Port, which is located adjacent to major shipping routes that service China, South Korea and Japan. This location provides direct access to deep water shipping routes to North Asia and Eastward via the North Pacific Ocean, and to South Asia and Westward via the Sulu Sea to the South China Sea, extending to Indian Ocean ports via Sunda or Malacca Straits. It is therefore well positioned to access vessels at competitive freight rates.
It is expected that each of the products will be sold on a Cost Insurance and Freight (CIF) basis, where the seller is responsible for all shipping costs up to the vessels arrival at the receiving port. The buyer pays for the vessel unloading and transport to the smelter.
19.2 Gold Cap Ore
19.2.1 Product Specification
The Gold Cap Ore material is a gold bearing oxide material with low levels of sulphur, low levels of copper and trace levels of other base metals (Table 19.2). The only element in this ore of recoverable value is the gold.
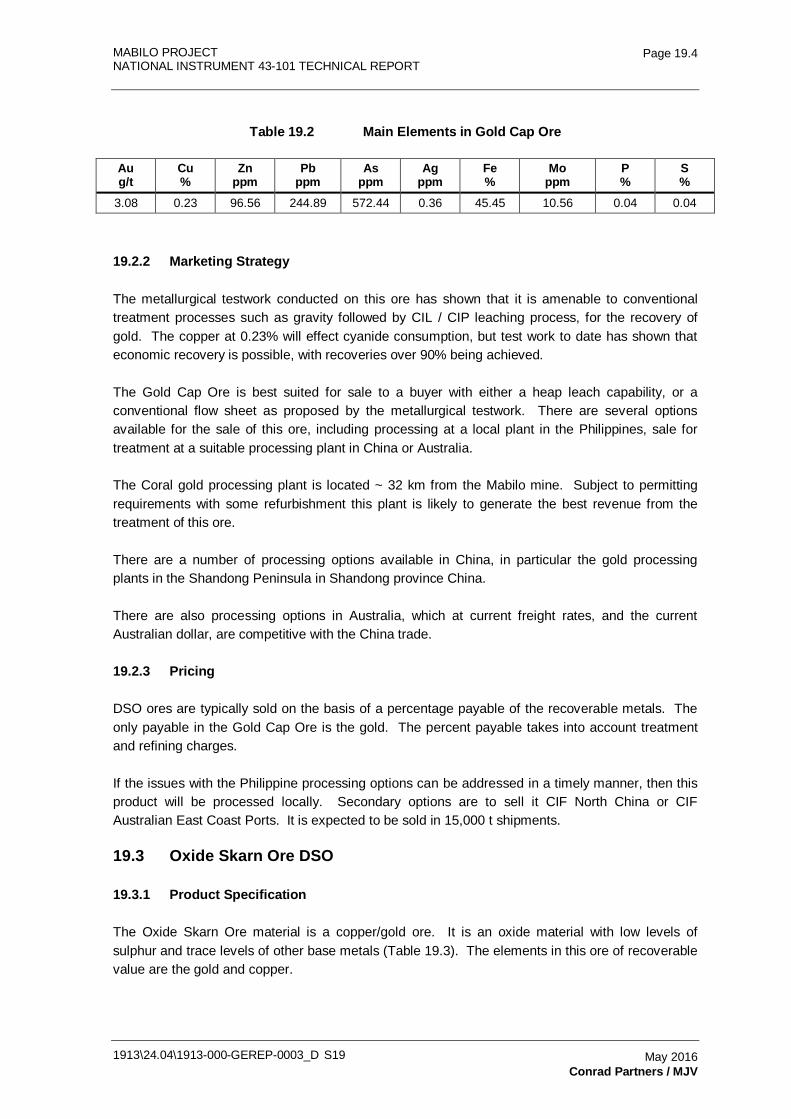
MABILO PROJECT NATIONAL INSTRUMENT 43-101 TECHNICAL REPORT
1913\24.04\1913-000-GEREP-0003_D S19
Page 19.4
May 2016 Conrad Partners / MJV
Table 19.2 Main Elements in Gold Cap Ore
Au g/t
Cu %
Zn ppm
Pb ppm
As ppm
Ag ppm
Fe %
Mo ppm
P %
S %
3.08 0.23 96.56 244.89 572.44 0.36 45.45 10.56 0.04 0.04
19.2.2 Marketing Strategy
The metallurgical testwork conducted on this ore has shown that it is amenable to conventional treatment processes such as gravity followed by CIL / CIP leaching process, for the recovery of gold. The copper at 0.23% will effect cyanide consumption, but test work to date has shown that economic recovery is possible, with recoveries over 90% being achieved.
The Gold Cap Ore is best suited for sale to a buyer with either a heap leach capability, or a conventional flow sheet as proposed by the metallurgical testwork. There are several options available for the sale of this ore, including processing at a local plant in the Philippines, sale for treatment at a suitable processing plant in China or Australia.
The Coral gold processing plant is located ~ 32 km from the Mabilo mine. Subject to permitting requirements with some refurbishment this plant is likely to generate the best revenue from the treatment of this ore.
There are a number of processing options available in China, in particular the gold processing plants in the Shandong Peninsula in Shandong province China.
There are also processing options in Australia, which at current freight rates, and the current Australian dollar, are competitive with the China trade.
19.2.3 Pricing
DSO ores are typically sold on the basis of a percentage payable of the recoverable metals. The only payable in the Gold Cap Ore is the gold. The percent payable takes into account treatment and refining charges.
If the issues with the Philippine processing options can be addressed in a timely manner, then this product will be processed locally. Secondary options are to sell it CIF North China or CIF Australian East Coast Ports. It is expected to be sold in 15,000 t shipments.
19.3 Oxide Skarn Ore DSO
19.3.1 Product Specification
The Oxide Skarn Ore material is a copper/gold ore. It is an oxide material with low levels of sulphur and trace levels of other base metals (Table 19.3). The elements in this ore of recoverable value are the gold and copper.
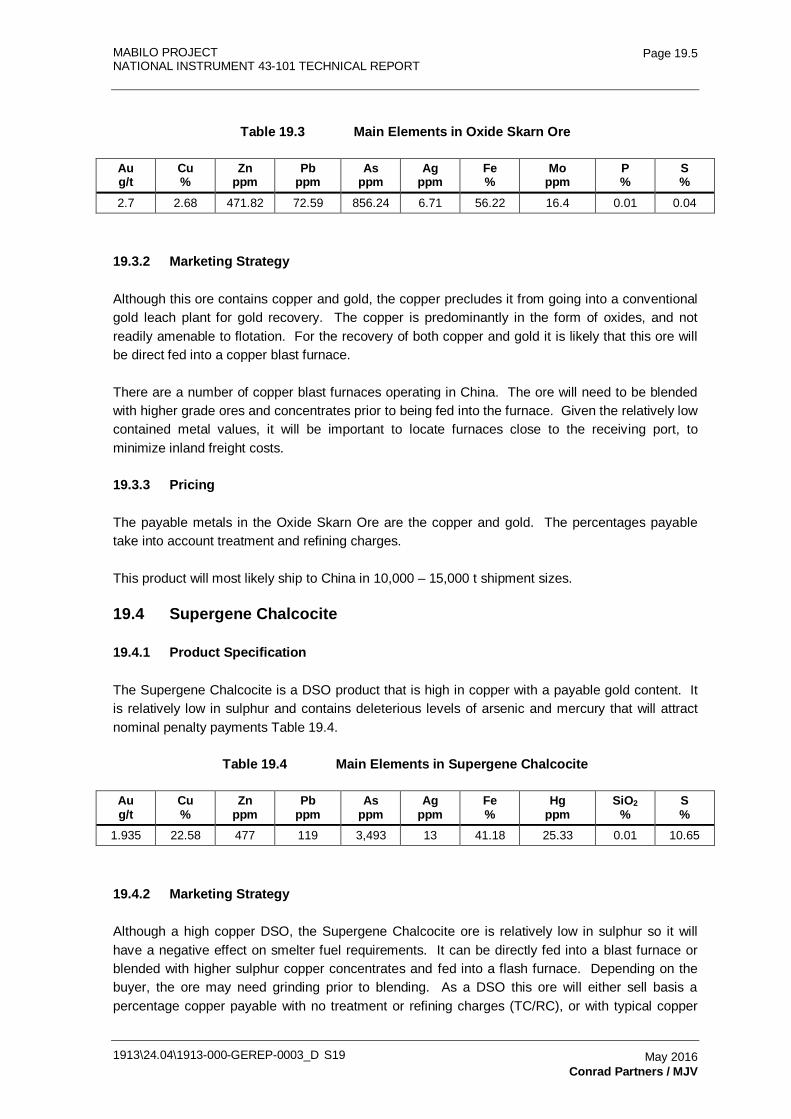
MABILO PROJECT NATIONAL INSTRUMENT 43-101 TECHNICAL REPORT
1913\24.04\1913-000-GEREP-0003_D S19
Page 19.5
May 2016 Conrad Partners / MJV
Table 19.3 Main Elements in Oxide Skarn Ore
Au g/t
Cu %
Zn ppm
Pb ppm
As ppm
Ag ppm
Fe %
Mo ppm
P %
S %
2.7 2.68 471.82 72.59 856.24 6.71 56.22 16.4 0.01 0.04
19.3.2 Marketing Strategy
Although this ore contains copper and gold, the copper precludes it from going into a conventional gold leach plant for gold recovery. The copper is predominantly in the form of oxides, and not readily amenable to flotation. For the recovery of both copper and gold it is likely that this ore will be direct fed into a copper blast furnace.
There are a number of copper blast furnaces operating in China. The ore will need to be blended with higher grade ores and concentrates prior to being fed into the furnace. Given the relatively low contained metal values, it will be important to locate furnaces close to the receiving port, to minimize inland freight costs.
19.3.3 Pricing
The payable metals in the Oxide Skarn Ore are the copper and gold. The percentages payable take into account treatment and refining charges.
This product will most likely ship to China in 10,000 – 15,000 t shipment sizes.
19.4 Supergene Chalcocite
19.4.1 Product Specification
The Supergene Chalcocite is a DSO product that is high in copper with a payable gold content. It is relatively low in sulphur and contains deleterious levels of arsenic and mercury that will attract nominal penalty payments Table 19.4.
Table 19.4 Main Elements in Supergene Chalcocite
Au g/t
Cu %
Zn ppm
Pb ppm
As ppm
Ag ppm
Fe %
Hg ppm
SiO2 %
S %
1.935 22.58 477 119 3,493 13 41.18 25.33 0.01 10.65
19.4.2 Marketing Strategy
Although a high copper DSO, the Supergene Chalcocite ore is relatively low in sulphur so it will have a negative effect on smelter fuel requirements. It can be directly fed into a blast furnace or blended with higher sulphur copper concentrates and fed into a flash furnace. Depending on the buyer, the ore may need grinding prior to blending. As a DSO this ore will either sell basis a percentage copper payable with no treatment or refining charges (TC/RC), or with typical copper
MABILO PROJECT NATIONAL INSTRUMENT 43-101 TECHNICAL REPORT
1913\24.04\1913-000-GEREP-0003_D S19
Page 19.6
May 2016 Conrad Partners / MJV
concentrate sales terms. Regardless of which method, the terms will be calculated with reference to the prevailing copper concentrate market at the time of sale.
The gold in the Supergene Chalcocite, at over 1.0 g/t will be payable. Silver is below the payable level.
The ore contains arsenic above the typical penalty threshold of 2,000 ppm, although this is within the prescribed limits for import into China. The arsenic levels will need to be taken into consideration with the smelters overall intake, and may reduce the number of options for delivery.
The mercury in the chalcocite ore is above a typical penalty trigger. Mercury levels in the ore exceeding 10 ppm will incur a nominal penalty.
19.4.3 Pricing
It is expected that the Supergene Chalcocite Ore will be sold at TC/RC’s with reference to, but higher than the prevailing rate for clean 23% copper concentrates.
At the Hg levels indicated a penalty will likely be incurred. Typical penalty for Hg is $2.00/10 ppm >10 ppm, fractions pro rata.
This product will most likely ship to China in 5,000 – 10,000 t shipment sizes.
19.5 Copper Concentrate
19.5.1 Product Specification
The copper concentrate to be produced at the project is a high grade copper and high precious metals bearing concentrate (Table 19.5). With the exception of mercury, it is a relatively clean concentrate. Mercury at the levels indicated may limit the quantity that a single furnace can process.
Table 19.5 Main Elements in Copper Concentrate
Au g/t
Cu %
F ppm
Cl ppm
As ppm
Ag ppm
Fe %
Hg ppm
SiO2 %
S %
20 30 <20 110 1750 200 30.4 37.4 0.01 33
Testwork has shown a range of concentrate grades from 26 to above 30%. Conrad has advised this does not affect marketability.
19.5.2 Copper Demand Forecast
Copper Market Background
The decision to mine a copper orebody largely rests on the price of the copper received being sustainably higher than the price required to produce the copper.
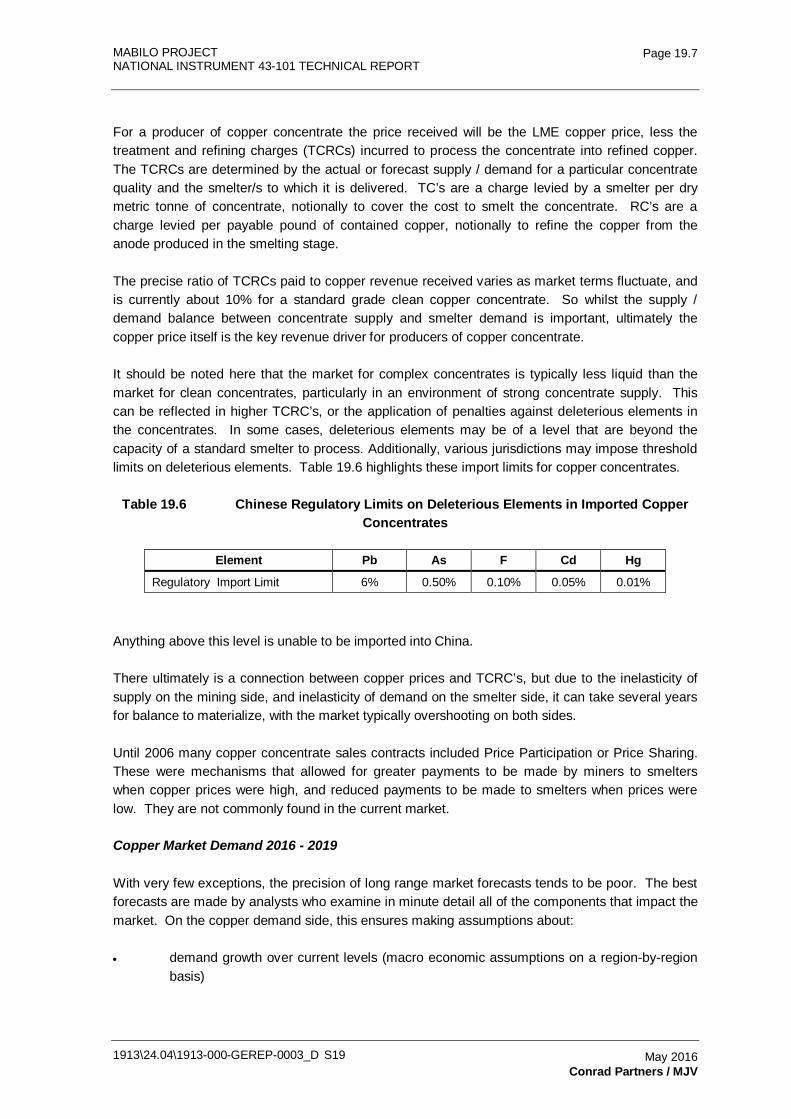
MABILO PROJECT NATIONAL INSTRUMENT 43-101 TECHNICAL REPORT
1913\24.04\1913-000-GEREP-0003_D S19
Page 19.7
May 2016 Conrad Partners / MJV
For a producer of copper concentrate the price received will be the LME copper price, less the treatment and refining charges (TCRCs) incurred to process the concentrate into refined copper. The TCRCs are determined by the actual or forecast supply / demand for a particular concentrate quality and the smelter/s to which it is delivered. TC’s are a charge levied by a smelter per dry metric tonne of concentrate, notionally to cover the cost to smelt the concentrate. RC’s are a charge levied per payable pound of contained copper, notionally to refine the copper from the anode produced in the smelting stage.
The precise ratio of TCRCs paid to copper revenue received varies as market terms fluctuate, and is currently about 10% for a standard grade clean copper concentrate. So whilst the supply / demand balance between concentrate supply and smelter demand is important, ultimately the copper price itself is the key revenue driver for producers of copper concentrate.
It should be noted here that the market for complex concentrates is typically less liquid than the market for clean concentrates, particularly in an environment of strong concentrate supply. This can be reflected in higher TCRC’s, or the application of penalties against deleterious elements in the concentrates. In some cases, deleterious elements may be of a level that are beyond the capacity of a standard smelter to process. Additionally, various jurisdictions may impose threshold limits on deleterious elements. Table 19.6 highlights these import limits for copper concentrates.
Table 19.6 Chinese Regulatory Limits on Deleterious Elements in Imported Copper Concentrates
Element Pb As F Cd Hg
Regulatory Import Limit 6% 0.50% 0.10% 0.05% 0.01%
Anything above this level is unable to be imported into China.
There ultimately is a connection between copper prices and TCRC’s, but due to the inelasticity of supply on the mining side, and inelasticity of demand on the smelter side, it can take several years for balance to materialize, with the market typically overshooting on both sides.
Until 2006 many copper concentrate sales contracts included Price Participation or Price Sharing. These were mechanisms that allowed for greater payments to be made by miners to smelters when copper prices were high, and reduced payments to be made to smelters when prices were low. They are not commonly found in the current market.
Copper Market Demand 2016 - 2019
With very few exceptions, the precision of long range market forecasts tends to be poor. The best forecasts are made by analysts who examine in minute detail all of the components that impact the market. On the copper demand side, this ensures making assumptions about:
• demand growth over current levels (macro economic assumptions on a region-by-region basis)
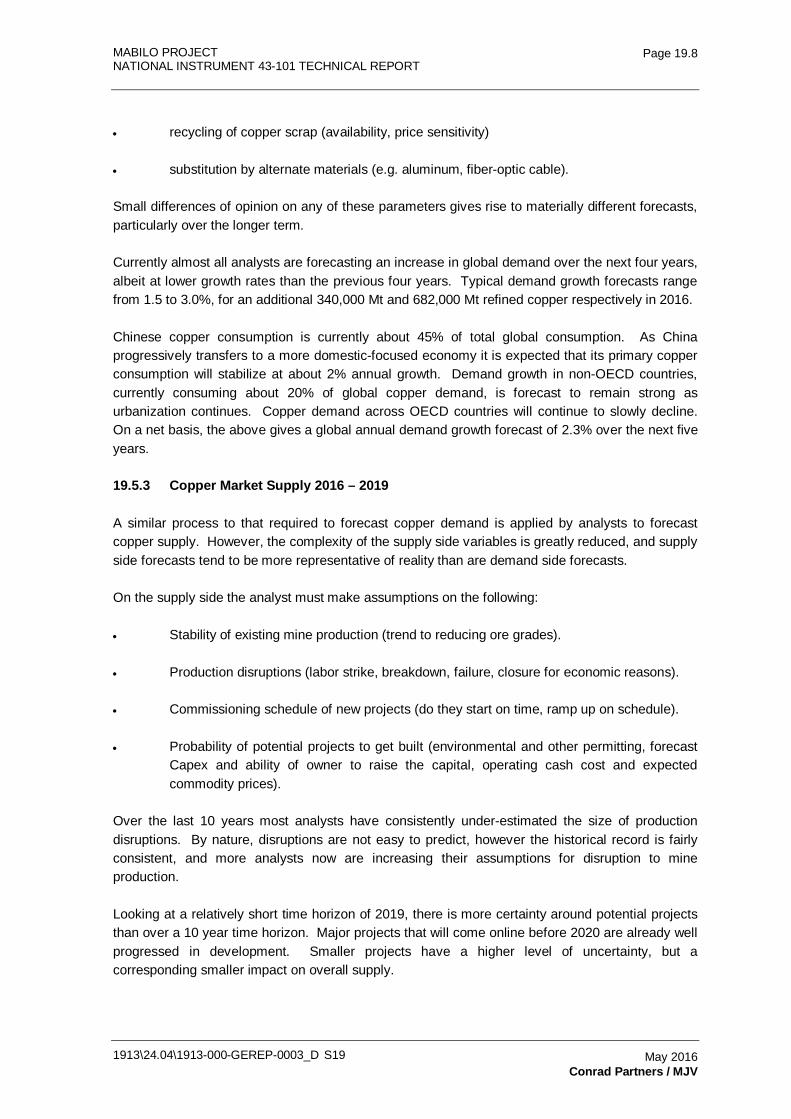
MABILO PROJECT NATIONAL INSTRUMENT 43-101 TECHNICAL REPORT
1913\24.04\1913-000-GEREP-0003_D S19
Page 19.8
May 2016 Conrad Partners / MJV
• recycling of copper scrap (availability, price sensitivity)
• substitution by alternate materials (e.g. aluminum, fiber-optic cable).
Small differences of opinion on any of these parameters gives rise to materially different forecasts, particularly over the longer term.
Currently almost all analysts are forecasting an increase in global demand over the next four years, albeit at lower growth rates than the previous four years. Typical demand growth forecasts range from 1.5 to 3.0%, for an additional 340,000 Mt and 682,000 Mt refined copper respectively in 2016.
Chinese copper consumption is currently about 45% of total global consumption. As China progressively transfers to a more domestic-focused economy it is expected that its primary copper consumption will stabilize at about 2% annual growth. Demand growth in non-OECD countries, currently consuming about 20% of global copper demand, is forecast to remain strong as urbanization continues. Copper demand across OECD countries will continue to slowly decline. On a net basis, the above gives a global annual demand growth forecast of 2.3% over the next five years.
19.5.3 Copper Market Supply 2016 – 2019
A similar process to that required to forecast copper demand is applied by analysts to forecast copper supply. However, the complexity of the supply side variables is greatly reduced, and supply side forecasts tend to be more representative of reality than are demand side forecasts.
On the supply side the analyst must make assumptions on the following:
• Stability of existing mine production (trend to reducing ore grades).
• Production disruptions (labor strike, breakdown, failure, closure for economic reasons).
• Commissioning schedule of new projects (do they start on time, ramp up on schedule).
• Probability of potential projects to get built (environmental and other permitting, forecast Capex and ability of owner to raise the capital, operating cash cost and expected commodity prices).
Over the last 10 years most analysts have consistently under-estimated the size of production disruptions. By nature, disruptions are not easy to predict, however the historical record is fairly consistent, and more analysts now are increasing their assumptions for disruption to mine production.
Looking at a relatively short time horizon of 2019, there is more certainty around potential projects than over a 10 year time horizon. Major projects that will come online before 2020 are already well progressed in development. Smaller projects have a higher level of uncertainty, but a corresponding smaller impact on overall supply.
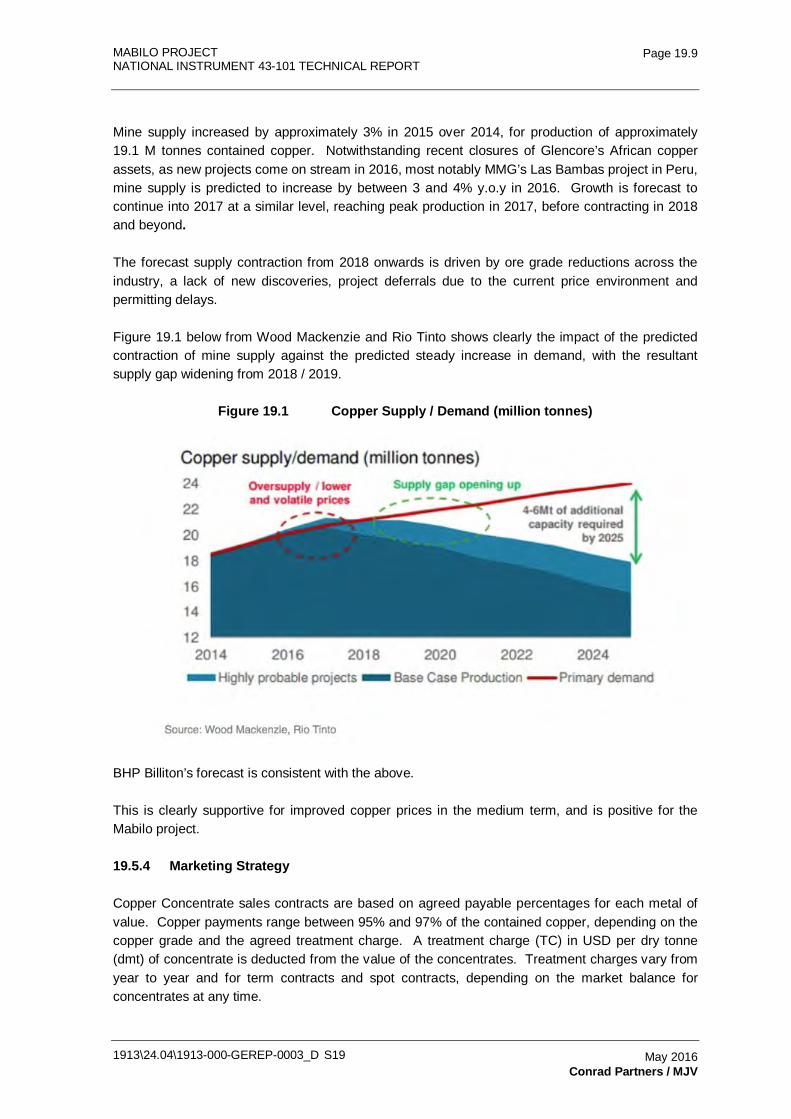
MABILO PROJECT NATIONAL INSTRUMENT 43-101 TECHNICAL REPORT
1913\24.04\1913-000-GEREP-0003_D S19
Page 19.9
May 2016 Conrad Partners / MJV
Mine supply increased by approximately 3% in 2015 over 2014, for production of approximately 19.1 M tonnes contained copper. Notwithstanding recent closures of Glencore’s African copper assets, as new projects come on stream in 2016, most notably MMG’s Las Bambas project in Peru, mine supply is predicted to increase by between 3 and 4% y.o.y in 2016. Growth is forecast to continue into 2017 at a similar level, reaching peak production in 2017, before contracting in 2018 and beyond.
The forecast supply contraction from 2018 onwards is driven by ore grade reductions across the industry, a lack of new discoveries, project deferrals due to the current price environment and permitting delays.
Figure 19.1 below from Wood Mackenzie and Rio Tinto shows clearly the impact of the predicted contraction of mine supply against the predicted steady increase in demand, with the resultant supply gap widening from 2018 / 2019.
Figure 19.1 Copper Supply / Demand (million tonnes)
BHP Billiton’s forecast is consistent with the above.
This is clearly supportive for improved copper prices in the medium term, and is positive for the Mabilo project.
19.5.4 Marketing Strategy
Copper Concentrate sales contracts are based on agreed payable percentages for each metal of value. Copper payments range between 95% and 97% of the contained copper, depending on the copper grade and the agreed treatment charge. A treatment charge (TC) in USD per dry tonne (dmt) of concentrate is deducted from the value of the concentrates. Treatment charges vary from year to year and for term contracts and spot contracts, depending on the market balance for concentrates at any time.
MABILO PROJECT NATIONAL INSTRUMENT 43-101 TECHNICAL REPORT
1913\24.04\1913-000-GEREP-0003_D S19
Page 19.10
May 2016 Conrad Partners / MJV
A refining charge (RC) in US cents per pound of payable copper is deducted. The refining charge also varies from time to time, proportionate to the treatment charge.
Gold in copper concentrates below 1.0 g/t is usually not payable. At 1.0 g/t and above, the gold payable ranges from 90% to 98%, depending on the gold content. A gold refining charge in USD per payable ounce of gold is deducted.
Silver in copper concentrates below 30 g/t are usually not payable. At 30 g/t and above, typically 90% of the silver is paid. A silver refining charge in US cents per payable ounce of silver is deducted.
Penalty charges for any deleterious elements will also be deducted. The penalties are set to compensate smelters and refineries for the costs associated with the management and removal of the deleterious elements. At 37 ppm, the mercury in the copper / gold concentrate can be considered high. It is above a typical penalty trigger of 10 ppm and therefore a mercury penalty will be incurred.
The copper / gold concentrate is high in both copper and gold. It will be important to target smelters that have the capability of good recovery for precious metals. Throughout Asia there are several smelters that can accept and treat concentrates of this quality.
Copper concentrates can be sold under long term offtake agreements with buyers, or on a shipment-by-shipment 'spot' basis. TC/RC’s under long term contracts are typically agreed annually via referencing settlements between major mines and smelters. This is known as the annual benchmark.
In recent years this benchmark is becoming less defined, as some miners attempt to extract maximum value from smelters through quality differentiation of their concentrates. BHP Billiton call this concept 'value in use', and attempt to define a commercial settlement basis the 'value' in their concentrate to the buyer in the context of the current market.
Historically the spot market has been more volatile than the annual benchmark, reflecting more accurately the market at the time of sale. With some exceptions, spot TC/RC’s have been more favorable to the miner over the last 15 years.
Negotiated items for the sale of copper concentrates include the following items:
• Tonnage.
• Duration.
• Treatment and refining charges (TC/RC’s), including reference clause (major settlements).
• Pricing period (known as Quotational Period, or QP, and usually a calendar month).
• Payable metal percentages.
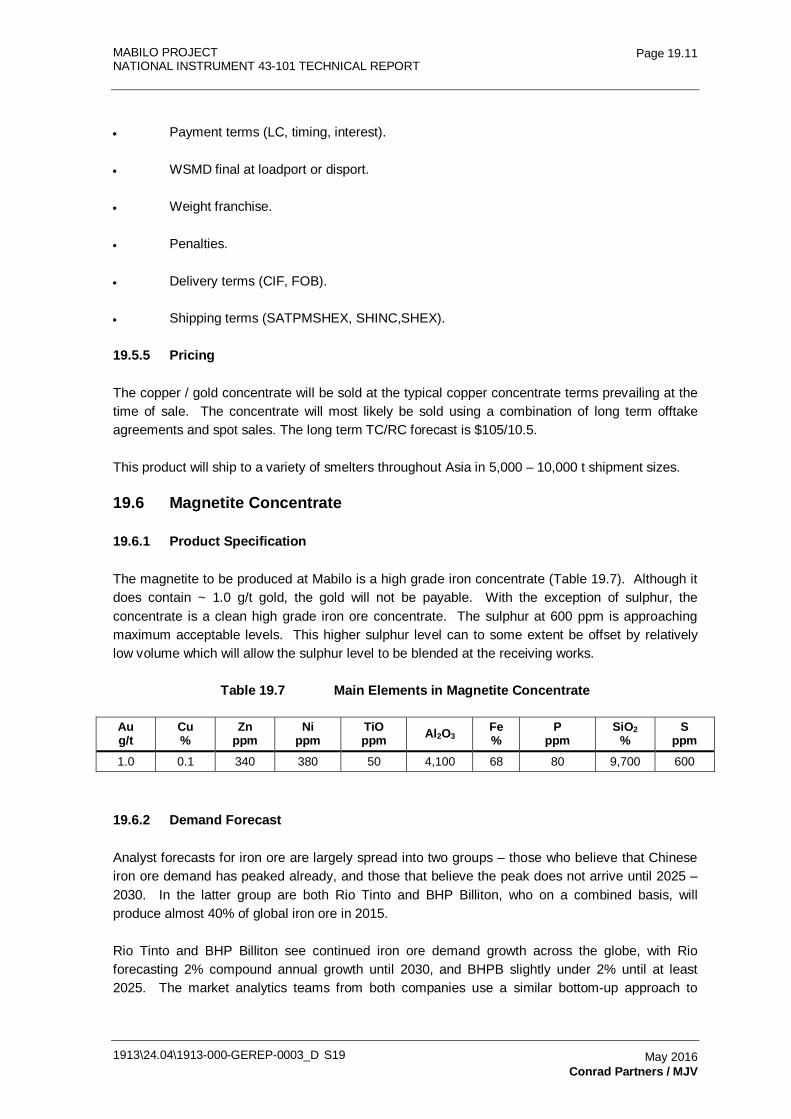
MABILO PROJECT NATIONAL INSTRUMENT 43-101 TECHNICAL REPORT
1913\24.04\1913-000-GEREP-0003_D S19
Page 19.11
May 2016 Conrad Partners / MJV
• Payment terms (LC, timing, interest).
• WSMD final at loadport or disport.
• Weight franchise.
• Penalties.
• Delivery terms (CIF, FOB).
• Shipping terms (SATPMSHEX, SHINC,SHEX).
19.5.5 Pricing
The copper / gold concentrate will be sold at the typical copper concentrate terms prevailing at the time of sale. The concentrate will most likely be sold using a combination of long term offtake agreements and spot sales. The long term TC/RC forecast is $105/10.5.
This product will ship to a variety of smelters throughout Asia in 5,000 – 10,000 t shipment sizes.
19.6 Magnetite Concentrate
19.6.1 Product Specification
The magnetite to be produced at Mabilo is a high grade iron concentrate (Table 19.7). Although it does contain ~ 1.0 g/t gold, the gold will not be payable. With the exception of sulphur, the concentrate is a clean high grade iron ore concentrate. The sulphur at 600 ppm is approaching maximum acceptable levels. This higher sulphur level can to some extent be offset by relatively low volume which will allow the sulphur level to be blended at the receiving works.
Table 19.7 Main Elements in Magnetite Concentrate
Au g/t
Cu %
Zn ppm
Ni ppm
TiO ppm Al2O3 Fe
% P
ppm SiO2
% S
ppm 1.0 0.1 340 380 50 4,100 68 80 9,700 600
19.6.2 Demand Forecast
Analyst forecasts for iron ore are largely spread into two groups – those who believe that Chinese iron ore demand has peaked already, and those that believe the peak does not arrive until 2025 – 2030. In the latter group are both Rio Tinto and BHP Billiton, who on a combined basis, will produce almost 40% of global iron ore in 2015.
Rio Tinto and BHP Billiton see continued iron ore demand growth across the globe, with Rio forecasting 2% compound annual growth until 2030, and BHPB slightly under 2% until at least 2025. The market analytics teams from both companies use a similar bottom-up approach to
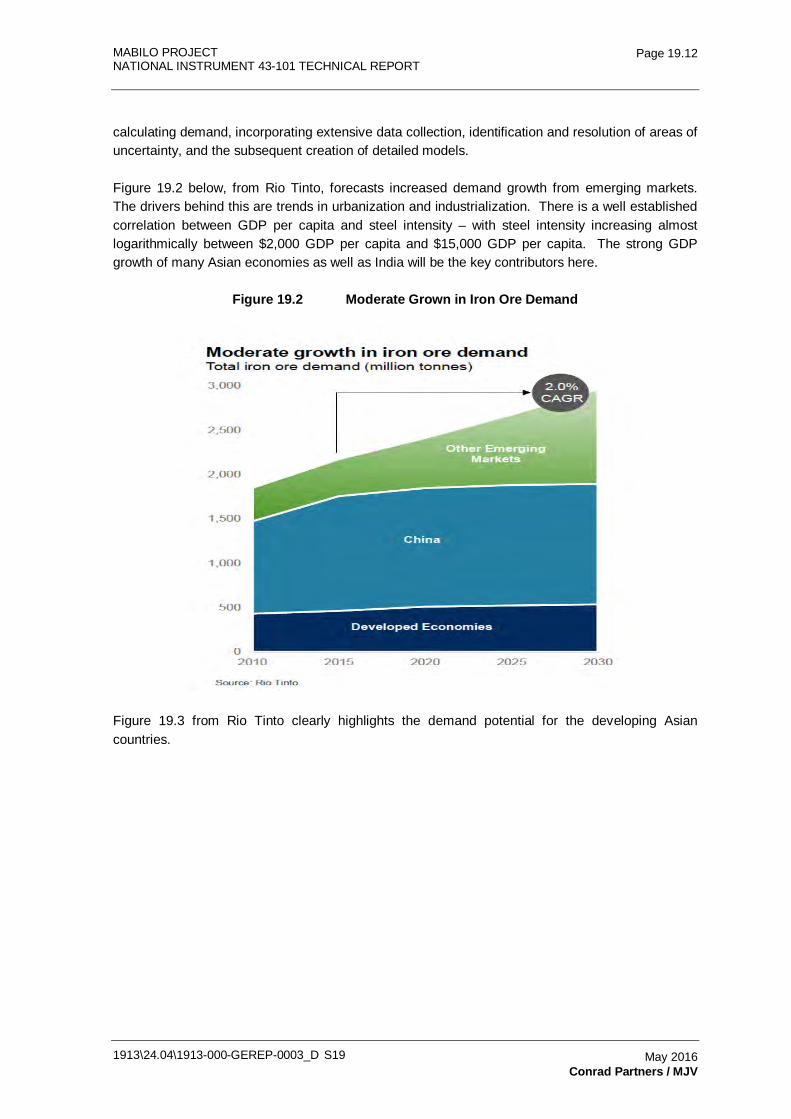
MABILO PROJECT NATIONAL INSTRUMENT 43-101 TECHNICAL REPORT
1913\24.04\1913-000-GEREP-0003_D S19
Page 19.12
May 2016 Conrad Partners / MJV
calculating demand, incorporating extensive data collection, identification and resolution of areas of uncertainty, and the subsequent creation of detailed models.
Figure 19.2 below, from Rio Tinto, forecasts increased demand growth from emerging markets. The drivers behind this are trends in urbanization and industrialization. There is a well established correlation between GDP per capita and steel intensity – with steel intensity increasing almost logarithmically between $2,000 GDP per capita and $15,000 GDP per capita. The strong GDP growth of many Asian economies as well as India will be the key contributors here.
Figure 19.2 Moderate Grown in Iron Ore Demand
Figure 19.3 from Rio Tinto clearly highlights the demand potential for the developing Asian countries.
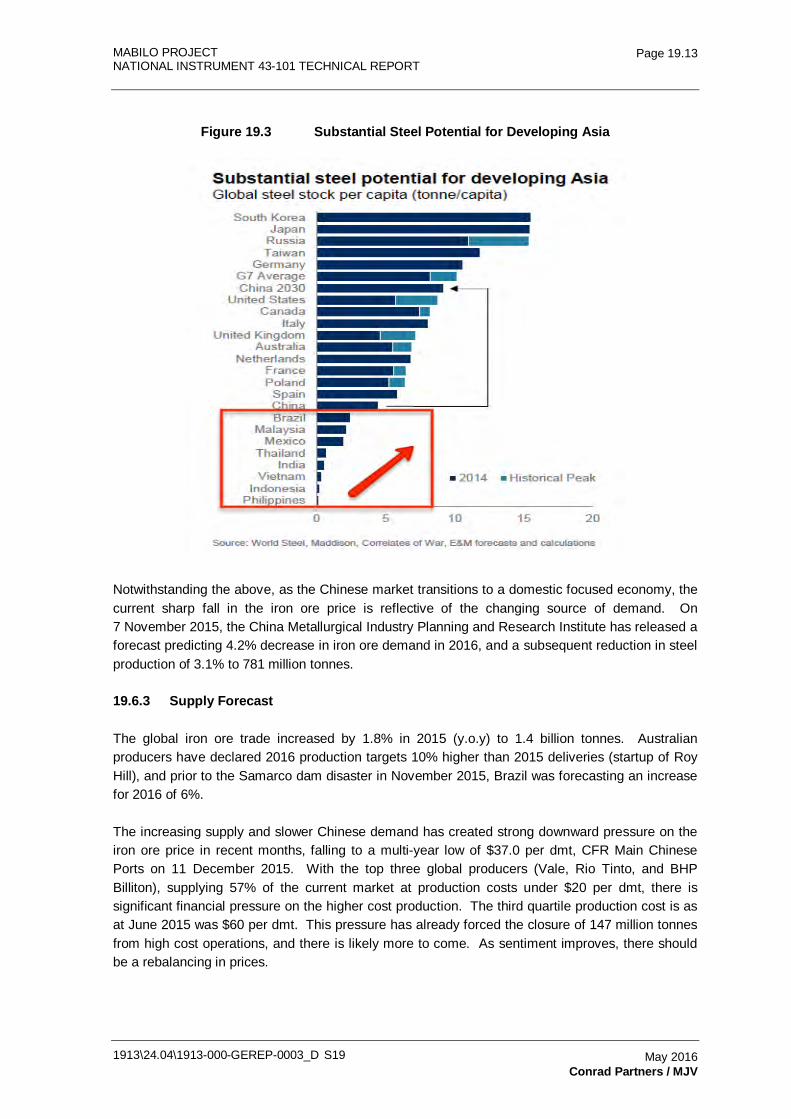
MABILO PROJECT NATIONAL INSTRUMENT 43-101 TECHNICAL REPORT
1913\24.04\1913-000-GEREP-0003_D S19
Page 19.13
May 2016 Conrad Partners / MJV
Figure 19.3 Substantial Steel Potential for Developing Asia
Notwithstanding the above, as the Chinese market transitions to a domestic focused economy, the current sharp fall in the iron ore price is reflective of the changing source of demand. On 7 November 2015, the China Metallurgical Industry Planning and Research Institute has released a forecast predicting 4.2% decrease in iron ore demand in 2016, and a subsequent reduction in steel production of 3.1% to 781 million tonnes.
19.6.3 Supply Forecast
The global iron ore trade increased by 1.8% in 2015 (y.o.y) to 1.4 billion tonnes. Australian producers have declared 2016 production targets 10% higher than 2015 deliveries (startup of Roy Hill), and prior to the Samarco dam disaster in November 2015, Brazil was forecasting an increase for 2016 of 6%.
The increasing supply and slower Chinese demand has created strong downward pressure on the iron ore price in recent months, falling to a multi-year low of $37.0 per dmt, CFR Main Chinese Ports on 11 December 2015. With the top three global producers (Vale, Rio Tinto, and BHP Billiton), supplying 57% of the current market at production costs under $20 per dmt, there is significant financial pressure on the higher cost production. The third quartile production cost is as at June 2015 was $60 per dmt. This pressure has already forced the closure of 147 million tonnes from high cost operations, and there is likely more to come. As sentiment improves, there should be a rebalancing in prices.
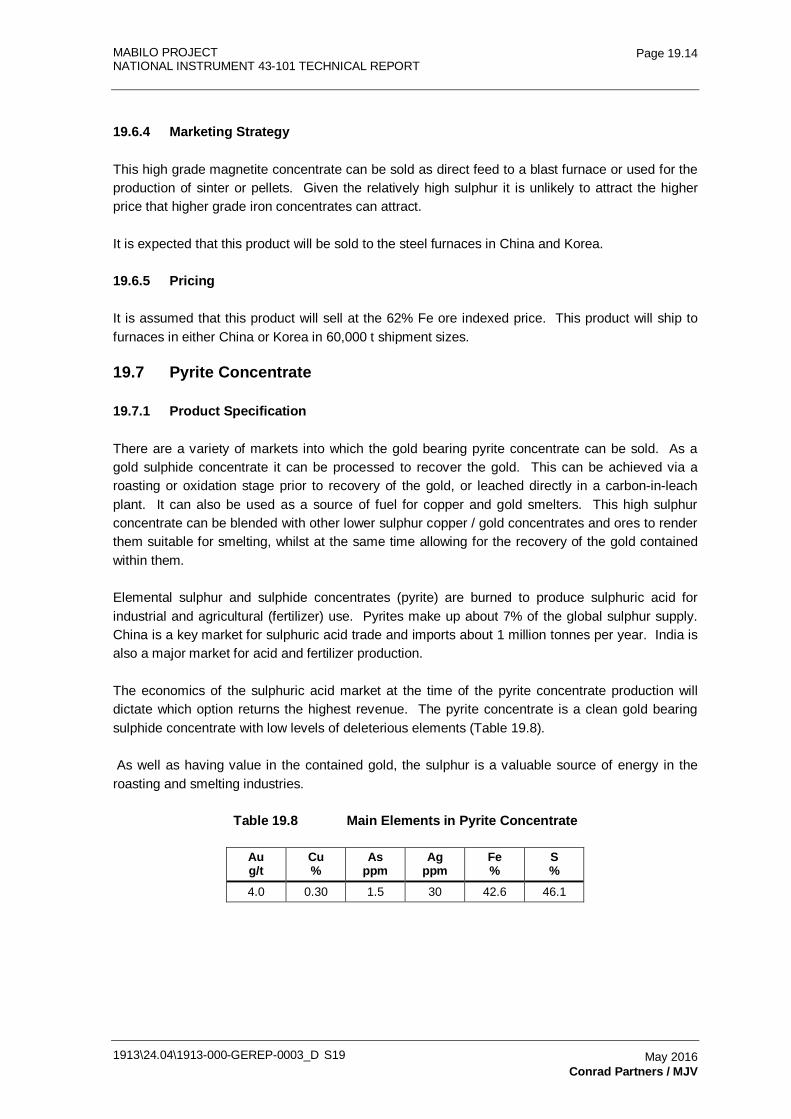
MABILO PROJECT NATIONAL INSTRUMENT 43-101 TECHNICAL REPORT
1913\24.04\1913-000-GEREP-0003_D S19
Page 19.14
May 2016 Conrad Partners / MJV
19.6.4 Marketing Strategy
This high grade magnetite concentrate can be sold as direct feed to a blast furnace or used for the production of sinter or pellets. Given the relatively high sulphur it is unlikely to attract the higher price that higher grade iron concentrates can attract.
It is expected that this product will be sold to the steel furnaces in China and Korea.
19.6.5 Pricing
It is assumed that this product will sell at the 62% Fe ore indexed price. This product will ship to furnaces in either China or Korea in 60,000 t shipment sizes.
19.7 Pyrite Concentrate
19.7.1 Product Specification
There are a variety of markets into which the gold bearing pyrite concentrate can be sold. As a gold sulphide concentrate it can be processed to recover the gold. This can be achieved via a roasting or oxidation stage prior to recovery of the gold, or leached directly in a carbon-in-leach plant. It can also be used as a source of fuel for copper and gold smelters. This high sulphur concentrate can be blended with other lower sulphur copper / gold concentrates and ores to render them suitable for smelting, whilst at the same time allowing for the recovery of the gold contained within them.
Elemental sulphur and sulphide concentrates (pyrite) are burned to produce sulphuric acid for industrial and agricultural (fertilizer) use. Pyrites make up about 7% of the global sulphur supply. China is a key market for sulphuric acid trade and imports about 1 million tonnes per year. India is also a major market for acid and fertilizer production.
The economics of the sulphuric acid market at the time of the pyrite concentrate production will dictate which option returns the highest revenue. The pyrite concentrate is a clean gold bearing sulphide concentrate with low levels of deleterious elements (Table 19.8).
As well as having value in the contained gold, the sulphur is a valuable source of energy in the roasting and smelting industries.
Table 19.8 Main Elements in Pyrite Concentrate
Au g/t
Cu %
As ppm
Ag ppm
Fe %
S %
4.0 0.30 1.5 30 42.6 46.1
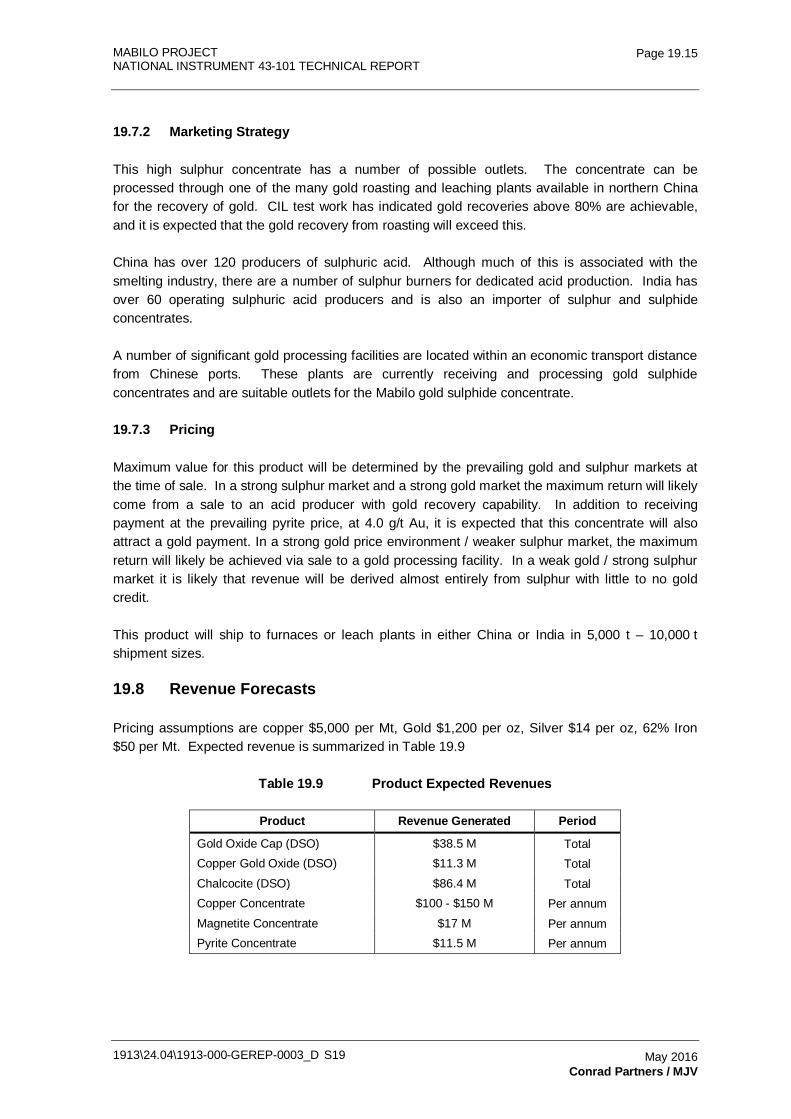
MABILO PROJECT NATIONAL INSTRUMENT 43-101 TECHNICAL REPORT
1913\24.04\1913-000-GEREP-0003_D S19
Page 19.15
May 2016 Conrad Partners / MJV
19.7.2 Marketing Strategy
This high sulphur concentrate has a number of possible outlets. The concentrate can be processed through one of the many gold roasting and leaching plants available in northern China for the recovery of gold. CIL test work has indicated gold recoveries above 80% are achievable, and it is expected that the gold recovery from roasting will exceed this.
China has over 120 producers of sulphuric acid. Although much of this is associated with the smelting industry, there are a number of sulphur burners for dedicated acid production. India has over 60 operating sulphuric acid producers and is also an importer of sulphur and sulphide concentrates.
A number of significant gold processing facilities are located within an economic transport distance from Chinese ports. These plants are currently receiving and processing gold sulphide concentrates and are suitable outlets for the Mabilo gold sulphide concentrate.
19.7.3 Pricing
Maximum value for this product will be determined by the prevailing gold and sulphur markets at the time of sale. In a strong sulphur market and a strong gold market the maximum return will likely come from a sale to an acid producer with gold recovery capability. In addition to receiving payment at the prevailing pyrite price, at 4.0 g/t Au, it is expected that this concentrate will also attract a gold payment. In a strong gold price environment / weaker sulphur market, the maximum return will likely be achieved via sale to a gold processing facility. In a weak gold / strong sulphur market it is likely that revenue will be derived almost entirely from sulphur with little to no gold credit.
This product will ship to furnaces or leach plants in either China or India in 5,000 t – 10,000 t shipment sizes.
19.8 Revenue Forecasts
Pricing assumptions are copper $5,000 per Mt, Gold $1,200 per oz, Silver $14 per oz, 62% Iron $50 per Mt. Expected revenue is summarized in Table 19.9
Table 19.9 Product Expected Revenues
Product Revenue Generated Period
Gold Oxide Cap (DSO) $38.5 M Total Copper Gold Oxide (DSO) $11.3 M Total Chalcocite (DSO) $86.4 M Total Copper Concentrate $100 - $150 M Per annum Magnetite Concentrate $17 M Per annum Pyrite Concentrate $11.5 M Per annum
MABILO PROJECT NATIONAL INSTRUMENT 43-101 TECHNICAL REPORT
1913\24.04\1913-000-GEREP-0003_D S19
Page 19.16
May 2016 Conrad Partners / MJV
19.9 Marketing Resources and Organization
Conrad Partners have been contracted to provide a full suite marketing service to MLEDC and RTG. The marketing service provides for all marketing activities from the load port to customer and receipt of funds into supplier accounts.
Established in 2010, Conrad Partners is a Hong Kong based advisory business, specializing in providing marketing services to the mining and mineral commodities industry.
Conrad Partners services cover the full spectrum of commercial commodity sales and marketing, including marketing strategy and design, contract drafting and negotiation, logistics and shipping, counterparty performance analysis and optimization, hedge design and complete management of traffic and back office services.
Conrad Partners has a working partnership with the highly regarded MINEMAN Systems, a global leader in marketing and logistics software for the mining and smelting industries. Through this relationship Conrad Partners and MINEMAN Systems are able to provide best practice solutions for the management of back office functions.
19.10 Product Shipping, Storage and Distribution
19.10.1 Ocean Freight Market Overview
Current global dry-bulk freight rates are at their lowest levels in more than 20 years. This is due to a combination of vessel oversupply (relative to demand) and low fuel (bunker) prices.
The Baltic Dry Index (BDI) is a measure of the freight cost to move dry bulk materials across 23 significant shipping routes. Specifically, it comprises the daily time-charter rate for Handysize, Supramax, Panamax and Capesize vessels on the 23 routes. Figure 19.4 below shows the BDI from 2002 until today. The index is at all time lows.
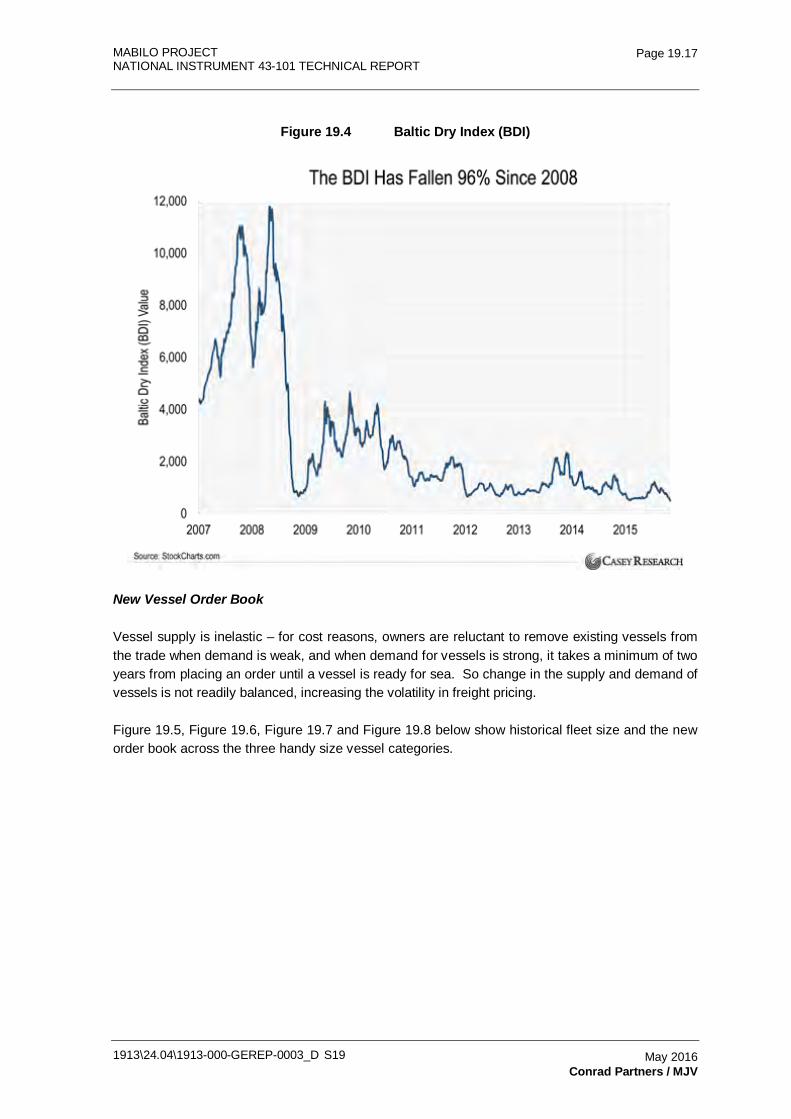
MABILO PROJECT NATIONAL INSTRUMENT 43-101 TECHNICAL REPORT
1913\24.04\1913-000-GEREP-0003_D S19
Page 19.17
May 2016 Conrad Partners / MJV
Figure 19.4 Baltic Dry Index (BDI)
New Vessel Order Book
Vessel supply is inelastic – for cost reasons, owners are reluctant to remove existing vessels from the trade when demand is weak, and when demand for vessels is strong, it takes a minimum of two years from placing an order until a vessel is ready for sea. So change in the supply and demand of vessels is not readily balanced, increasing the volatility in freight pricing.
Figure 19.5, Figure 19.6, Figure 19.7 and Figure 19.8 below show historical fleet size and the new order book across the three handy size vessel categories.
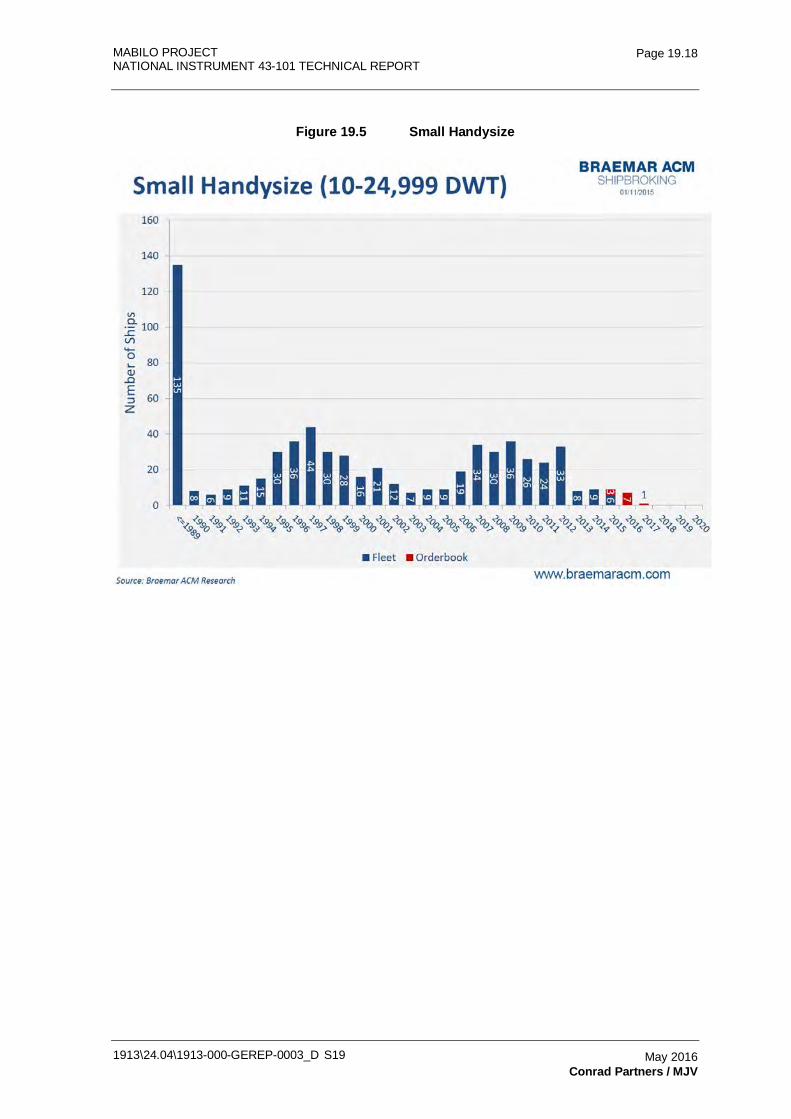
MABILO PROJECT NATIONAL INSTRUMENT 43-101 TECHNICAL REPORT
1913\24.04\1913-000-GEREP-0003_D S19
Page 19.18
May 2016 Conrad Partners / MJV
Figure 19.5 Small Handysize
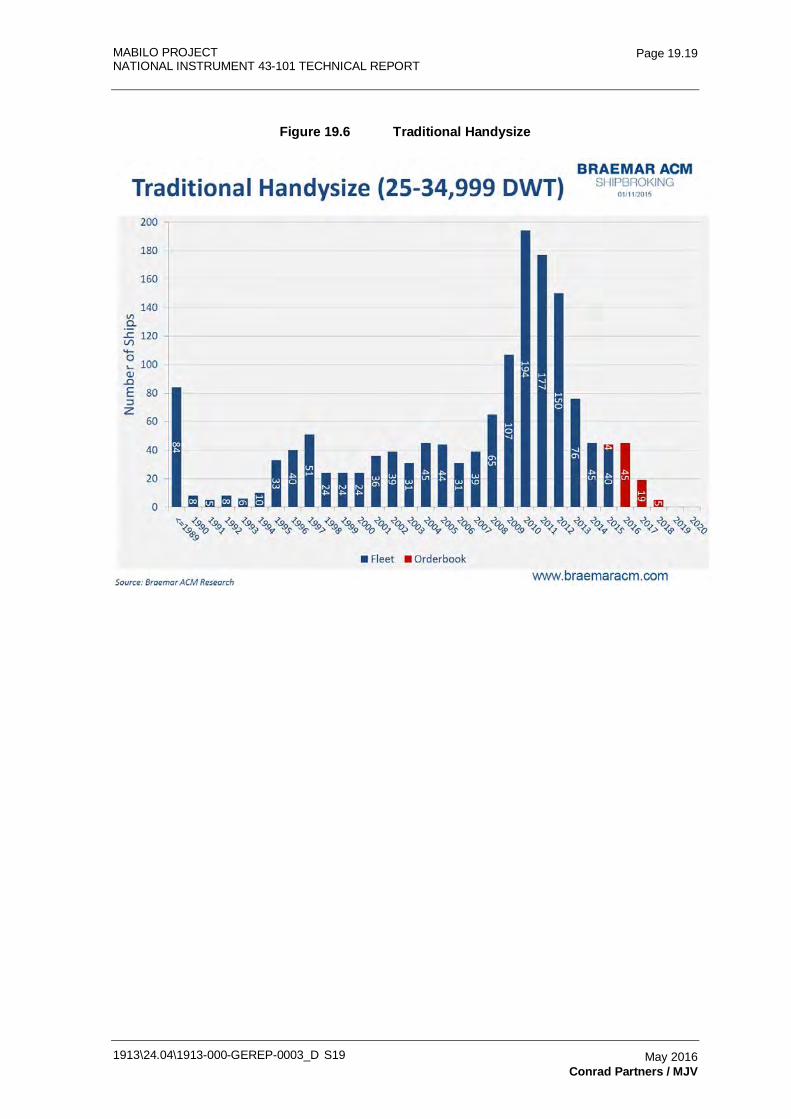
MABILO PROJECT NATIONAL INSTRUMENT 43-101 TECHNICAL REPORT
1913\24.04\1913-000-GEREP-0003_D S19
Page 19.19
May 2016 Conrad Partners / MJV
Figure 19.6 Traditional Handysize
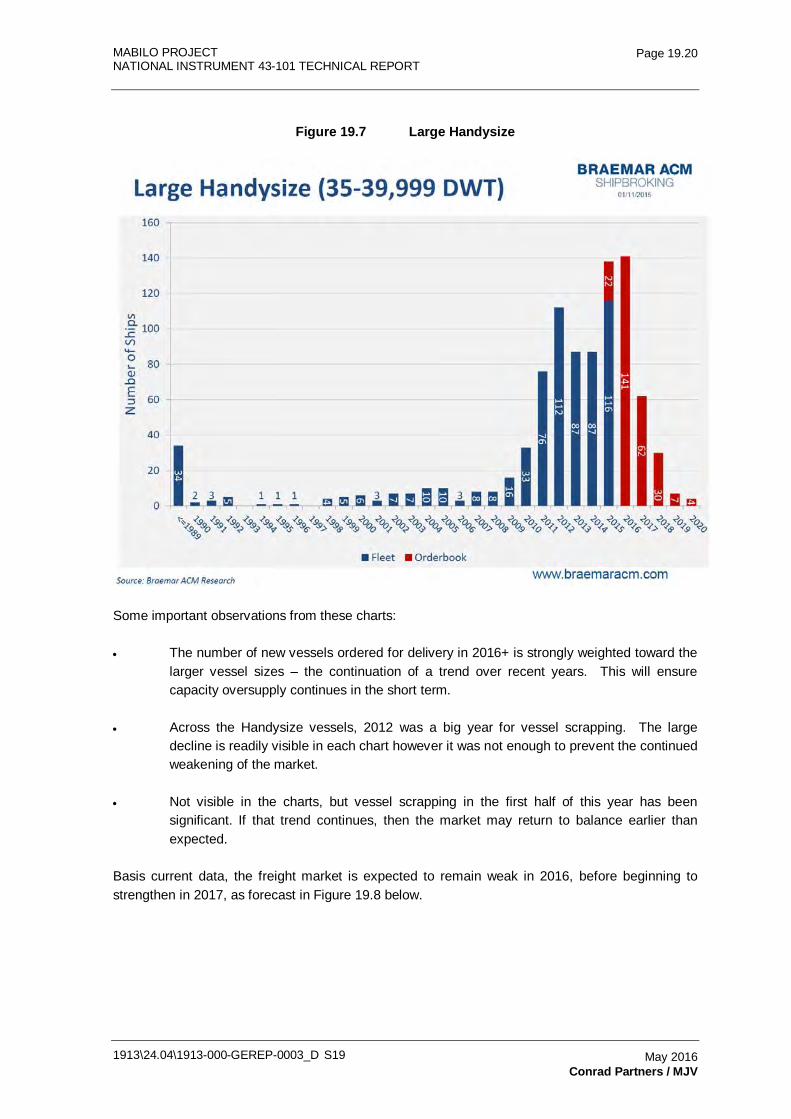
MABILO PROJECT NATIONAL INSTRUMENT 43-101 TECHNICAL REPORT
1913\24.04\1913-000-GEREP-0003_D S19
Page 19.20
May 2016 Conrad Partners / MJV
Figure 19.7 Large Handysize
Some important observations from these charts:
• The number of new vessels ordered for delivery in 2016+ is strongly weighted toward the larger vessel sizes – the continuation of a trend over recent years. This will ensure capacity oversupply continues in the short term.
• Across the Handysize vessels, 2012 was a big year for vessel scrapping. The large decline is readily visible in each chart however it was not enough to prevent the continued weakening of the market.
• Not visible in the charts, but vessel scrapping in the first half of this year has been significant. If that trend continues, then the market may return to balance earlier than expected.
Basis current data, the freight market is expected to remain weak in 2016, before beginning to strengthen in 2017, as forecast in Figure 19.8 below.
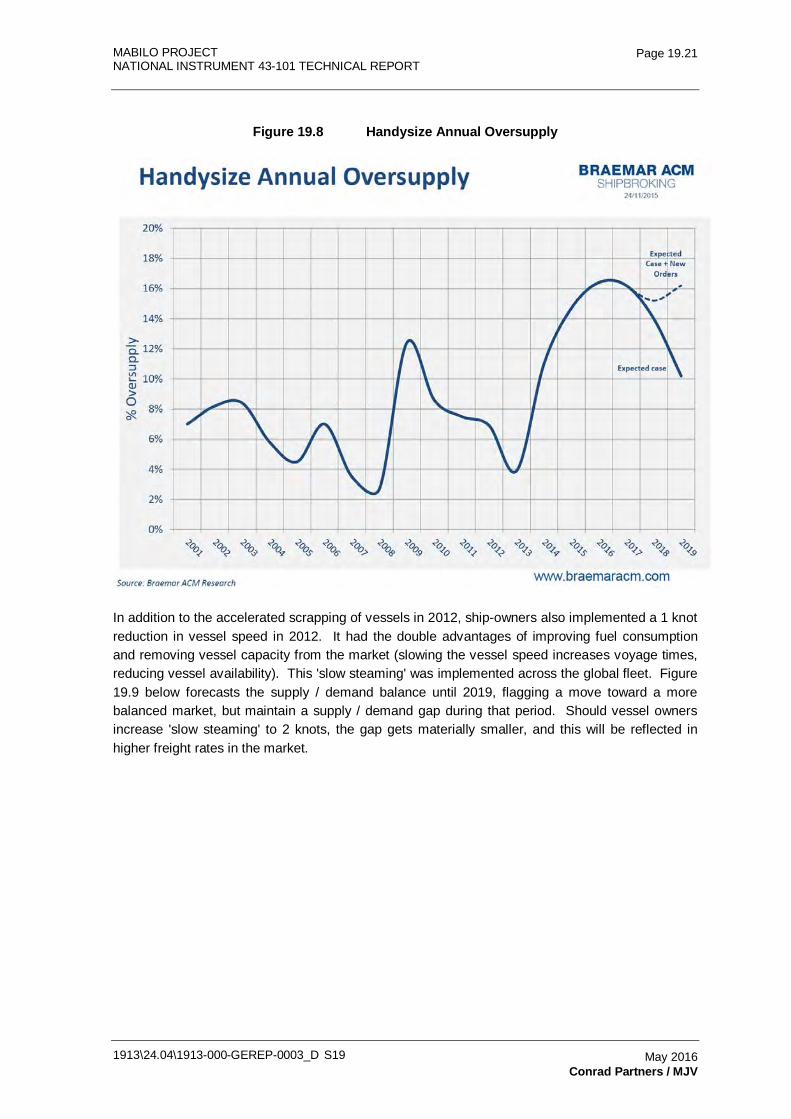
MABILO PROJECT NATIONAL INSTRUMENT 43-101 TECHNICAL REPORT
1913\24.04\1913-000-GEREP-0003_D S19
Page 19.21
May 2016 Conrad Partners / MJV
Figure 19.8 Handysize Annual Oversupply
In addition to the accelerated scrapping of vessels in 2012, ship-owners also implemented a 1 knot reduction in vessel speed in 2012. It had the double advantages of improving fuel consumption and removing vessel capacity from the market (slowing the vessel speed increases voyage times, reducing vessel availability). This 'slow steaming' was implemented across the global fleet. Figure 19.9 below forecasts the supply / demand balance until 2019, flagging a move toward a more balanced market, but maintain a supply / demand gap during that period. Should vessel owners increase 'slow steaming' to 2 knots, the gap gets materially smaller, and this will be reflected in higher freight rates in the market.
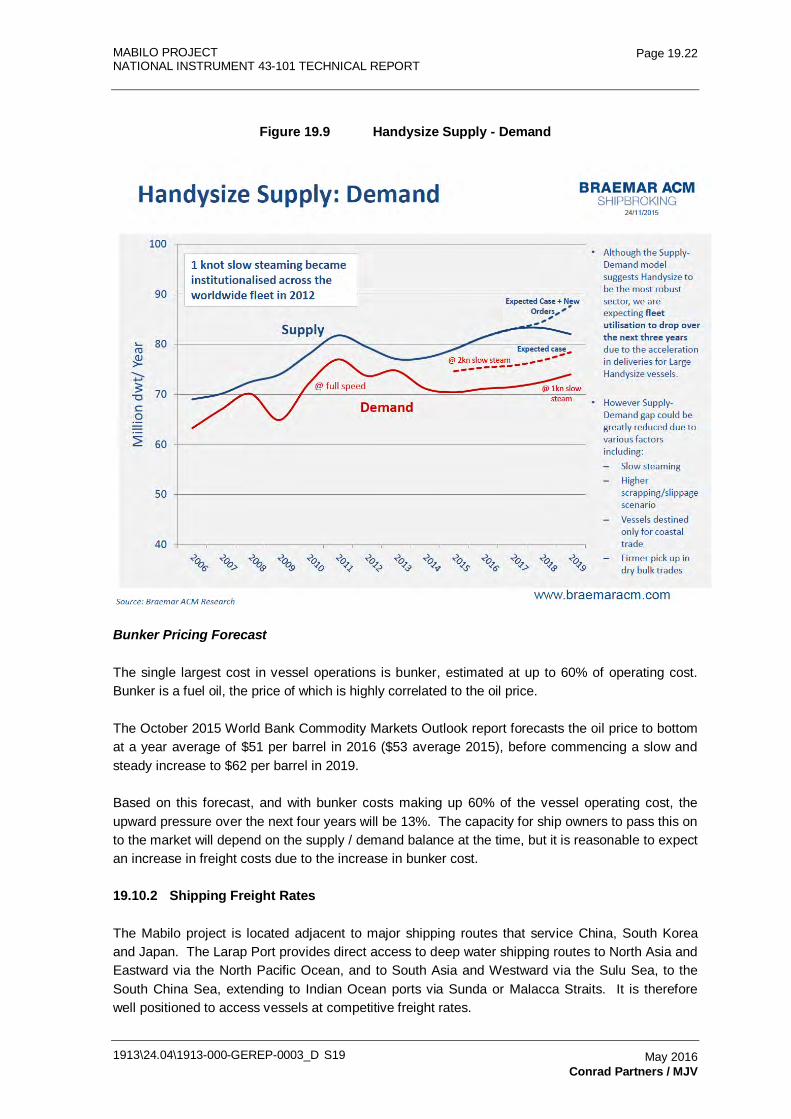
MABILO PROJECT NATIONAL INSTRUMENT 43-101 TECHNICAL REPORT
1913\24.04\1913-000-GEREP-0003_D S19
Page 19.22
May 2016 Conrad Partners / MJV
Figure 19.9 Handysize Supply - Demand
Bunker Pricing Forecast
The single largest cost in vessel operations is bunker, estimated at up to 60% of operating cost. Bunker is a fuel oil, the price of which is highly correlated to the oil price.
The October 2015 World Bank Commodity Markets Outlook report forecasts the oil price to bottom at a year average of $51 per barrel in 2016 ($53 average 2015), before commencing a slow and steady increase to $62 per barrel in 2019.
Based on this forecast, and with bunker costs making up 60% of the vessel operating cost, the upward pressure over the next four years will be 13%. The capacity for ship owners to pass this on to the market will depend on the supply / demand balance at the time, but it is reasonable to expect an increase in freight costs due to the increase in bunker cost.
19.10.2 Shipping Freight Rates
The Mabilo project is located adjacent to major shipping routes that service China, South Korea and Japan. The Larap Port provides direct access to deep water shipping routes to North Asia and Eastward via the North Pacific Ocean, and to South Asia and Westward via the Sulu Sea, to the South China Sea, extending to Indian Ocean ports via Sunda or Malacca Straits. It is therefore well positioned to access vessels at competitive freight rates.
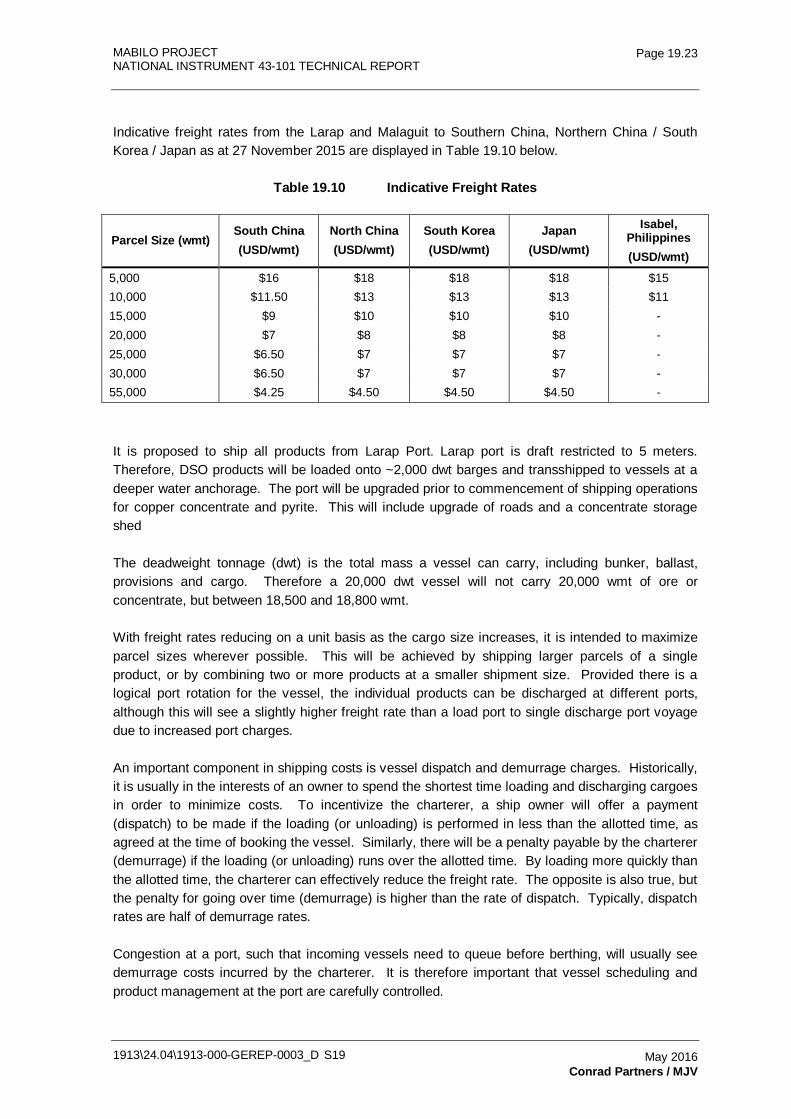
MABILO PROJECT NATIONAL INSTRUMENT 43-101 TECHNICAL REPORT
1913\24.04\1913-000-GEREP-0003_D S19
Page 19.23
May 2016 Conrad Partners / MJV
Indicative freight rates from the Larap and Malaguit to Southern China, Northern China / South Korea / Japan as at 27 November 2015 are displayed in Table 19.10 below.
Table 19.10 Indicative Freight Rates
Parcel Size (wmt) South China (USD/wmt)
North China (USD/wmt)
South Korea (USD/wmt)
Japan (USD/wmt)
Isabel, Philippines (USD/wmt)
5,000 $16 $18 $18 $18 $15 10,000 $11.50 $13 $13 $13 $11 15,000 $9 $10 $10 $10 - 20,000 $7 $8 $8 $8 - 25,000 $6.50 $7 $7 $7 - 30,000 $6.50 $7 $7 $7 - 55,000 $4.25 $4.50 $4.50 $4.50 -
It is proposed to ship all products from Larap Port. Larap port is draft restricted to 5 meters. Therefore, DSO products will be loaded onto ~2,000 dwt barges and transshipped to vessels at a deeper water anchorage. The port will be upgraded prior to commencement of shipping operations for copper concentrate and pyrite. This will include upgrade of roads and a concentrate storage shed
The deadweight tonnage (dwt) is the total mass a vessel can carry, including bunker, ballast, provisions and cargo. Therefore a 20,000 dwt vessel will not carry 20,000 wmt of ore or concentrate, but between 18,500 and 18,800 wmt.
With freight rates reducing on a unit basis as the cargo size increases, it is intended to maximize parcel sizes wherever possible. This will be achieved by shipping larger parcels of a single product, or by combining two or more products at a smaller shipment size. Provided there is a logical port rotation for the vessel, the individual products can be discharged at different ports, although this will see a slightly higher freight rate than a load port to single discharge port voyage due to increased port charges.
An important component in shipping costs is vessel dispatch and demurrage charges. Historically, it is usually in the interests of an owner to spend the shortest time loading and discharging cargoes in order to minimize costs. To incentivize the charterer, a ship owner will offer a payment (dispatch) to be made if the loading (or unloading) is performed in less than the allotted time, as agreed at the time of booking the vessel. Similarly, there will be a penalty payable by the charterer (demurrage) if the loading (or unloading) runs over the allotted time. By loading more quickly than the allotted time, the charterer can effectively reduce the freight rate. The opposite is also true, but the penalty for going over time (demurrage) is higher than the rate of dispatch. Typically, dispatch rates are half of demurrage rates.
Congestion at a port, such that incoming vessels need to queue before berthing, will usually see demurrage costs incurred by the charterer. It is therefore important that vessel scheduling and product management at the port are carefully controlled.
MABILO PROJECT NATIONAL INSTRUMENT 43-101 TECHNICAL REPORT
1913\24.04\1913-000-GEREP-0003_D S19
Page 19.24
May 2016 Conrad Partners / MJV
19.10.3 Vessel Loading
Larap Port
Larap Port has both a public port, operated by a Local Government Unit and a larger private port owned and operated by an incorporated joint venture. Adjacent to the causeway is an open storage yard of sufficient capacity for the storage of DSO products.
There is no loading / unloading infrastructure in place, so barges will be loaded using trucks and a front end loader. Transfer from barge to the vessel will be done using ships gear. Using this method of loading, a load rate of 3,000 tonnes per day can be achieved.
There is no weighing system at Larap, so cargo weights for loading purposes will be determined via draft survey. There is no sampling facility at the Larap berth, so sampling for moisture and quality control purposes will be done manually immediately prior to loading.
19.10.4 Port Storage Optimization
Concentrate will be stored in a shed adjacent to the Larap berth. Care will be needed to keep different products separated, particularly the magnetite concentrate from the copper and pyrite concentrates. The products can be divided by removable concrete 'L-Shape' segments, which when stacked together form a stable wall capable of handling product stacked against it.
19.10.5 Weighing, Sampling, Moisture Determination
Accurate weighing and sampling of the products at the load port is essential for invoicing and for monitoring and reconciling metal balances between load port and discharge port.
Weighing
With no shore based weighing system at Larap Port, weights will be determined using vessel draft survey. This is sufficient for the lower value DSOs pyrite and magnetite. For the high value chalcocite DSO and the copper concentrate a more accurate system is required.
Contractually, it is expected that the majority of Mabilo sales contracts will settle commercially on weights and samples taken at the port of discharge. However, it is important to have an accurate system at load port in order to monitor and mitigate any negative bias at the receiving end.
Sampling and Moisture Determination
The International Organization for Standardization (ISO) has published two standards relevant for the sampling and moisture determination of Mabilo copper concentrate. The principles of both also apply to the sampling and moisture determination of the other Mabilo products.
• ISO 10251:2006 'Copper, lead, zinc and nickel concentrates – Determination of mass loss of bulk material on drying'
MABILO PROJECT NATIONAL INSTRUMENT 43-101 TECHNICAL REPORT
1913\24.04\1913-000-GEREP-0003_D S19
Page 19.25
May 2016 Conrad Partners / MJV
• ISO 12743:2006 'Copper, lead, zinc and nickel concentrates – Sampling procedures for determination of metal and moisture'.
It is possible to attain representative samples from a manual sampling process, but the impracticalities of doing so result in the collection of unrepresentative or biased samples. Amongst other components, the ISO Standard sets out the requirement for sampling size and sampling intervals. These are difficult to maintain on a sustained basis, particularly during night shift or other periods of reduced sampling supervision.
In order to monitor any bias in weighing and sampling between load port and disport it is important to have quality weighing, sampling and moisture determination at both ends. Coupled with assaying methods conducted in line with the relevant ISO Standards for assaying, it enables the calculation of a metal balance. This metal balance compares contained metal units loaded with contained metal units discharged. Ideally this balance will be equal, but in reality that is rarely the case. By having confidence in the quality of load port determinations, it is possible to manage the overall performance more effectively, therefore maximizing payable metals and thereby maximizing sales revenue.
There are several types of commonly used automated sampling systems that comply with ISO 12743, with the most common being cross-belt samplers and falling-stream samplers. Both have advantages and disadvantages, and the most suitable for Mabilo can be determined upon finalization of the intended conveyor system design.
Whichever style is selected, there will be a requirement for different sample cutters (collectors) for the DSO than for the concentrates. As there is no overlap in production between the DSOs and the concentrates, it will be possible to have the optimum cutter installed for each group of products.
19.11 Contracts
There are no contracts in place given that the Project is not operating. The following contracts will be negotiated prior to commencement of operations:
• Electric power.
• Diesel fuel (Local fuel provider).
• General processing consumables.
• Open pit mine and surface mobile equipment leases. Caterpillar (or other selected equipment manufacturer).
• Mining Contract.
• Transport Contracts (consumables and concentrates).
• Smelting and Refining Contracts.
MABILO PROJECT
NATIONAL INSTRUMENT 43-101 TECHNICAL REPORT
1913-000-GEREP-0003
Table of Contents Page
20.0 ENVIRONMENTAL STUDIES, PERMITTING AND COMMUNITY IMPACT 20.1 20.1 Introduction 20.1 20.2 Baseline Monitoring and Data 20.3
20.2.1 Surface Flow Monitoring Stations 20.3 20.2.2 Stream Water Quality 20.3 20.2.3 Ground Water Level Monitoring Stations 20.4 20.2.4 Ground Water Quality 20.4 20.2.5 Potable Water Quality 20.4 20.2.6 Tailings Discharge Quality and Management 20.5 20.2.7 Air Quality 20.6
20.3 Environmental Risk Assessment 20.7 20.3.1 Physical Environment 20.7 20.3.2 Biological Environment 20.8 20.3.3 Environment Management 20.9
20.4 Socio Development Plans 20.10 20.4.1 Methodology 20.10 20.4.2 Overall Findings and Observations 20.11 20.4.3 Socio Conclusions 20.11 20.4.4 Recommendations 20.12
20.5 Relocation 20.13 20.6 Rehabilitation 20.16
20.6.1 Rehabilitation Requirements 20.16 20.6.2 Rehabilitation Programme 20.16 20.6.3 Post Closure Monitoring 20.17
TABLES Table 20.1 Status of Environmental Permits 20.2 Table 20.2 Community Impact by Phase 20.13 Table 20.3 Relocation Budget 20.15 Table 20.4 Projected Final Land Use after Abandonment 20.17 FIGURES Figure 20.2 Example Flooded Open Pit Rehabilitated (Korokan pit, Philippines) 20.16 Figure 20.3 Progressive Waste Dump Rehabilitation, Masbate, Philippines 20.17
1913\24.04\1913-000-GEREP-0003_D S20 May 2016 GAIA South / MJV
MABILO PROJECT NATIONAL INSTRUMENT 43-101 TECHNICAL REPORT
1913\24.04\1913-000-GEREP-0003_D S20
Page 20.1
May 2016 GAIA South / MJV
20.0 ENVIRONMENTAL STUDIES, PERMITTING AND COMMUNITY IMPACT
20.1 Introduction
The Mabilo Project is located in Baraga Napped, Municipality of Labo, the Province of Canaries Norte, Philippines (latitude 14°07' North, longitude 122°46'30'' East).
Labo is a first class municipality with ten barangays (villages) and a population of 92,041. Its land area is 649 square kilometers and is 25% of Canaries Norte's size. The Mabilo project directly impacts two barangays and indirectly an additional four barangays.
The project will affect 144 surface lots and 114 households subject to voluntary resettlement. Eleven of the fifteen lots covering the resource have been acquired and the remaining four are available subject to price.
The Project is sparsely populated and is not subject to any indigenous land owner claims. Vegetation is mostly degraded secondary forest cover or cleared land and the terrain is moderately flat with elevation of ~130 m ASL rising to the inactive Mt. Labo volcano at an elevation of 1,572 m ASL. The elevated areas in the locality are forested, given the high precipitation over the region. The lower lands are agricultural and are mainly planted with rice, coconut, abaca, and other fruit trees.
Water and air sampling completed by Gaia South consultants and MJV personnel shows the project is in environmental compliance except for two contaminated community water bores.
The Mabilo Project is on the foothills of Mt. Labo, a stratovolcanic mound with a peak elevation of over 4,600 meters. The Project has flat to slightly undulating topography that is transected by several north-flowing streams which moderately to deeply incise the soft Quaternary tuffs (pyroclastic rock). Principal drainage meanders for over 10 kilometers through the Labo River which flows out to a delta east of the centre of Daet municipality. This section provides a summary of findings. The status of environmental permits is shown in Table 20.1.
The vast majority of environmental permits will be applied for in the early stages of project approvals and are well understood. The key Environmental Compliance Certificate (ECC) for the Oxide Mining phase is in final stages of approval after having completed the Environmental Impact Assessment, public hearings and technical reviews.
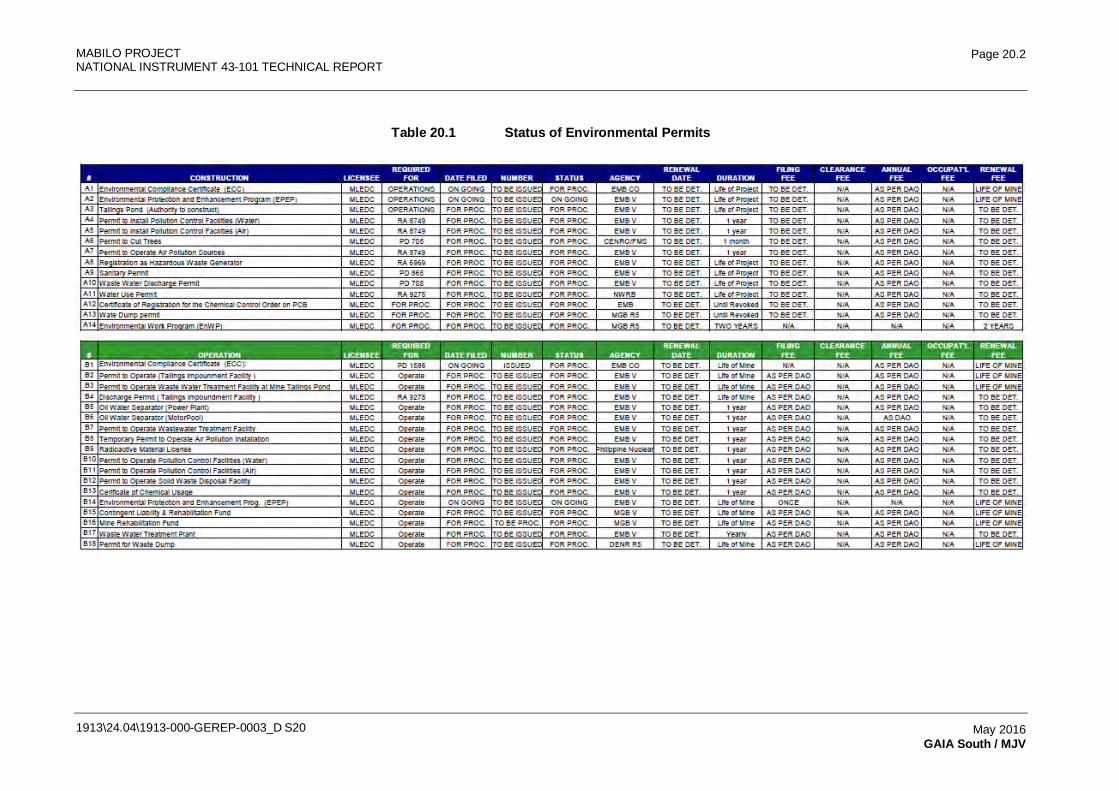
MABILO PROJECT NATIONAL INSTRUMENT 43-101 TECHNICAL REPORT
1913\24.04\1913-000-GEREP-0003_D S20
Page 20.2
May 2016 GAIA South / MJV
Table 20.1 Status of Environmental Permits
MABILO PROJECT NATIONAL INSTRUMENT 43-101 TECHNICAL REPORT
1913\24.04\1913-000-GEREP-0003_D S20
Page 20.3
May 2016 GAIA South / MJV
20.2 Baseline Monitoring and Data
The project monitoring and gauging stations were established by GAIA South environmental consultants in early 2014 and MJV has continued monitoring these stations and others which were added as required. Once the footprint of the project is finalized, the project team will establish permanent stations and expand the monitoring program as proposed in the statutory Environmental Management Plan (EMP).
20.2.1 Surface Flow Monitoring Stations
The surface flow monitoring stations are located across the tenement and surrounding area to monitor in and out flowing systems as they may impact the proposed project. Ten stations in the four streams that flow either through or adjacent to the Mabilo project were established to estimate the flows over four months (March to July), being the drier months. The flow rate at each site is being measured approximately every two weeks.
20.2.2 Stream Water Quality
The sampling for this project was based on the Environmental Management Bureau (EMB) – Water Quality Monitoring Manual (Volume 1), sampling was conducted semestrally at 10 surface water stations established in the study area. In-situ measurements were conducted for dissolved oxygen (DO), temperature, and pH, using portable meters. Results of analysis were compared to the DENR DAO 90-34 Class B Standards
Minalolo Malaki, Minalolo Maliit and Mabilo Tributary can be categorized as Class B (recreational water). The parameters which are used to measure water aesthetics include pH, dissolved oxygen (DO), biological oxygen demand (BOD), chemical oxygen demand (COD), oil and grease, and total suspended solids (TSS). Concentrations of BOD, COD, NO3, and PO4 in all the sampling stations did not exceed the Class B standard.
TSS concentration in most of the sampling stations was below standards limits, ranging only from 2-19 mg/L. Local residents reported that a small scale mining operation in the area flushed effluent water directly into Minalolo Maliit. After the DENR issuance of cease-and-desist order for the illegal operation the water clarity began to improve although sedimentation is still very prevalent in the river bottom.
Dissolved oxygen concentration in all the sampling stations is above the minimum concentration of 5 mg/L.
Hexavalent Chromium, Cadmium, Arsenic, Lead, and Mercury were less than their respective detection limits in all the surface water samples. Cyanide concentration in almost all the stations is also less than the detection limit. Iron concentration, although there is no standard, is very low. Although there is no standard for copper in Class B waters, copper concentration exceeded the permissible limits for Class C downstream in the small scale mining area, which was ordered to cease operation last 2014.
MABILO PROJECT NATIONAL INSTRUMENT 43-101 TECHNICAL REPORT
1913\24.04\1913-000-GEREP-0003_D S20
Page 20.4
May 2016 GAIA South / MJV
20.2.3 Ground Water Level Monitoring Stations
Ground water levels are measured for both ground water level (all nine stations) and quality (Stations of #8 and #9).
The 2015 results show water level in bores is steady except for those bores (i.e. MDH02 and MDH20) that are located proximal to surface streams.
20.2.4 Ground Water Quality
Two exploration wells were sampled in October 2015. The data indicate that the deep sourced groundwater sampled from the exploration wells generally conforms to Philippine Drinking Water Standards with regard to heavy metals. The water may be unpalatable due to total alkalinity (Calcium carbonate). In this regard, the project can anticipate acceptable discharge water quality when de-watering pumping is required for the mining operations.
20.2.5 Potable Water Quality
Community potable water was sampled from springs, manually operated hand pumps and from the source of water supply for the local water district. Temperature and pH levels were determined on site and samples were collected using sterilized sample containers: a wide-mouthed glass for oil and grease, bac-T bottles for bacteriological parameters and two one liter plastic containers for physicochemical parameters. Water sampling was conducted quarterly from March 2014 to June 2015 and is on-going. Three potable water stations were established in the study area.
Physical and chemical quality parameters of health significance including heavy metals, Chromium, Cadmium, Arsenic, Lead and Mercury concentrations in all the ground water samples were less than their respective analytical detection limits or much less than the PNSDW limits. Nitrates (NO3) and Cyanide were also less than their respective PNSDW limits.
The pH values of all the ground water samples were generally neutral. The recommended pH range in the PNSDW however, is based on aesthetic consideration only, and the acceptable pH range may be broader in the absence of a distribution system. Two sampling stations exceeded the permissible limit for turbidity and three samples had slightly elevated TDS but still less than the permissible limits of PNSDW standard. The Baraga will be advised of the data so it can rehabilitate the wells.
Chloride, Copper and Zinc concentration in each sampling station were less than their respective analytical detection limits and much less than the PNSDW limits. Slightly elevated iron concentration in DWQ 401 may be attributed to corrosion of metal pipes of the Jetmatic pump. The concentrations of constituents such as Dissolved Oxygen, Total Settable Solids, Oil and Grease, Biochemical Oxygen Demand and Chemical Oxygen Demand for all the samples are significantly less than their respective analytical detection limits.
Biological Parameters
Water used for drinking must be free from pathogenic organisms responsible for waterborne diseases for the essential protection of public health. BOD in the two sampling stations is below
MABILO PROJECT NATIONAL INSTRUMENT 43-101 TECHNICAL REPORT
1913\24.04\1913-000-GEREP-0003_D S20
Page 20.5
May 2016 GAIA South / MJV
detection limit however Total Coliform count in all stations exceeded the standard value for potable water. E. Coli (Escherichia Coli) and Faecal Coliform in DWQ 402 meets the acceptable limit of the PNSDW while DWQ 401 and DWQ 403 exceeded its maximum limit. The Baraga was advised of the data so it can rehabilitate the wells.
20.2.6 Tailings Discharge Quality and Management
Knight Piésold's analysis of the tailings geochemical characterization indicate the tailings to be produced will have a high geochemical risk profile (if pyrite is included in the tails) which can be mitigated by the inclusion of a water treatment system. There also appears to be limited merit in placing the waste and pyrite tailings streams in different facilities if both streams are to remain as waste. However, the pyrite supernatant and the non-magnetic supernatant should be evaluated further to optimize the management approach. The tailings facilities will include a robust liner system to limit seepage and the adoption of operating procedures to maintain saturation of the tailings solids Figure 20.1. Subsequent to this analysis, MJV has found a market for sales of the pyrite concentrate so no pyrite will report to the TSF. Water treatment of the supernatant may therefore not be required prior to discharge to surface waters provided an appropriate degree of dilution is achieved to meet a suitable TDS concentration. As a result, provision of a water treatment facility is a future item and has not been included in the capital estimate.
Should water treatment of the supernatant be required prior to discharge to surface a schematic is shown in the figure below. This will include a combination of pH amendment to reduce the concentration of the majority of metals in solution, followed by passive treatment through aerated ponds and a gravel rock bed to remove iron and manganese to further improve water quality. The final step would be mixing the treated supernatant flowing out of the gravel rock bed with clean diversion water to further improve water quality and reduce sulphate concentrations to acceptable levels upstream of the compliance point.
On mine closure, a robust cover system will be required to encapsulate the tailings solids and preclude oxygen to reduce ongoing acid generation and limit infiltration to reduce the long term seepage risk. The project will generate large amounts of limestone suitable for this purpose.
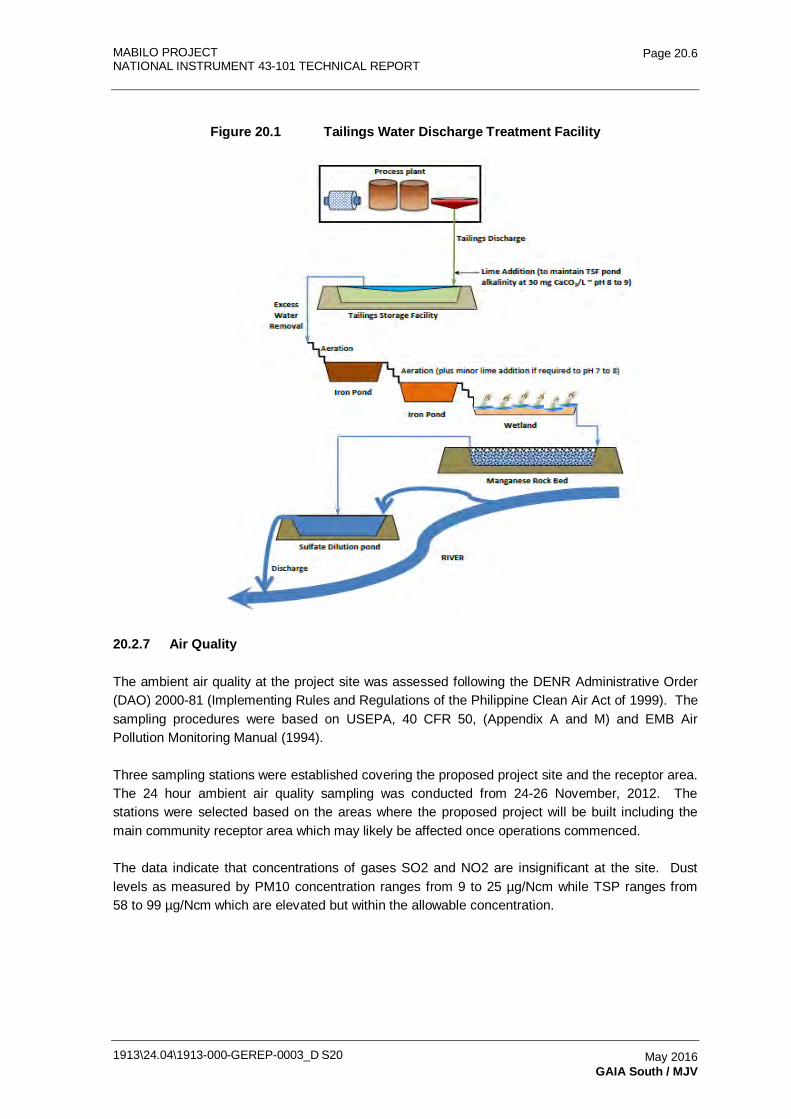
MABILO PROJECT NATIONAL INSTRUMENT 43-101 TECHNICAL REPORT
1913\24.04\1913-000-GEREP-0003_D S20
Page 20.6
May 2016 GAIA South / MJV
Figure 20.1 Tailings Water Discharge Treatment Facility
20.2.7 Air Quality
The ambient air quality at the project site was assessed following the DENR Administrative Order (DAO) 2000-81 (Implementing Rules and Regulations of the Philippine Clean Air Act of 1999). The sampling procedures were based on USEPA, 40 CFR 50, (Appendix A and M) and EMB Air Pollution Monitoring Manual (1994).
Three sampling stations were established covering the proposed project site and the receptor area. The 24 hour ambient air quality sampling was conducted from 24-26 November, 2012. The stations were selected based on the areas where the proposed project will be built including the main community receptor area which may likely be affected once operations commenced.
The data indicate that concentrations of gases SO2 and NO2 are insignificant at the site. Dust levels as measured by PM10 concentration ranges from 9 to 25 µg/Ncm while TSP ranges from 58 to 99 µg/Ncm which are elevated but within the allowable concentration.
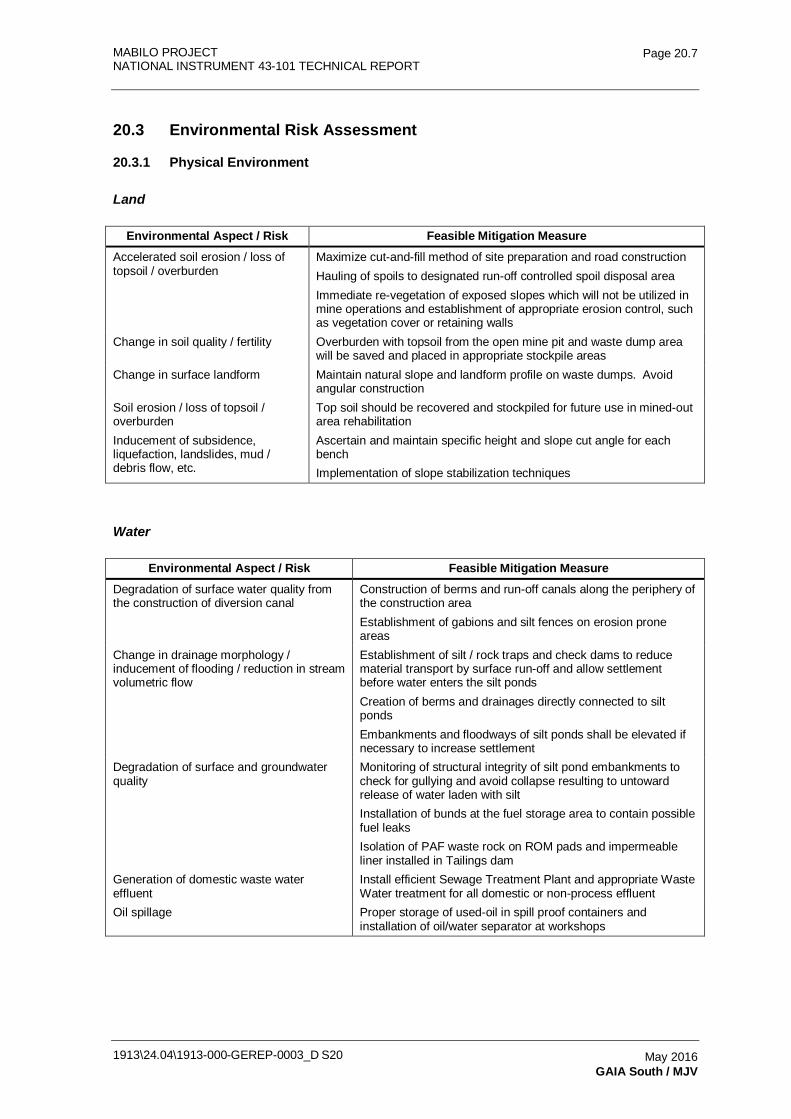
MABILO PROJECT NATIONAL INSTRUMENT 43-101 TECHNICAL REPORT
1913\24.04\1913-000-GEREP-0003_D S20
Page 20.7
May 2016 GAIA South / MJV
20.3 Environmental Risk Assessment
20.3.1 Physical Environment
Land
Environmental Aspect / Risk Feasible Mitigation Measure Accelerated soil erosion / loss of topsoil / overburden
Maximize cut-and-fill method of site preparation and road construction Hauling of spoils to designated run-off controlled spoil disposal area Immediate re-vegetation of exposed slopes which will not be utilized in mine operations and establishment of appropriate erosion control, such as vegetation cover or retaining walls
Change in soil quality / fertility Overburden with topsoil from the open mine pit and waste dump area will be saved and placed in appropriate stockpile areas
Change in surface landform Maintain natural slope and landform profile on waste dumps. Avoid angular construction
Soil erosion / loss of topsoil / overburden
Top soil should be recovered and stockpiled for future use in mined-out area rehabilitation
Inducement of subsidence, liquefaction, landslides, mud / debris flow, etc.
Ascertain and maintain specific height and slope cut angle for each bench Implementation of slope stabilization techniques
Water
Environmental Aspect / Risk Feasible Mitigation Measure Degradation of surface water quality from the construction of diversion canal
Construction of berms and run-off canals along the periphery of the construction area Establishment of gabions and silt fences on erosion prone areas
Change in drainage morphology / inducement of flooding / reduction in stream volumetric flow
Establishment of silt / rock traps and check dams to reduce material transport by surface run-off and allow settlement before water enters the silt ponds Creation of berms and drainages directly connected to silt ponds Embankments and floodways of silt ponds shall be elevated if necessary to increase settlement
Degradation of surface and groundwater quality
Monitoring of structural integrity of silt pond embankments to check for gullying and avoid collapse resulting to untoward release of water laden with silt Installation of bunds at the fuel storage area to contain possible fuel leaks Isolation of PAF waste rock on ROM pads and impermeable liner installed in Tailings dam
Generation of domestic waste water effluent
Install efficient Sewage Treatment Plant and appropriate Waste Water treatment for all domestic or non-process effluent
Oil spillage Proper storage of used-oil in spill proof containers and installation of oil/water separator at workshops
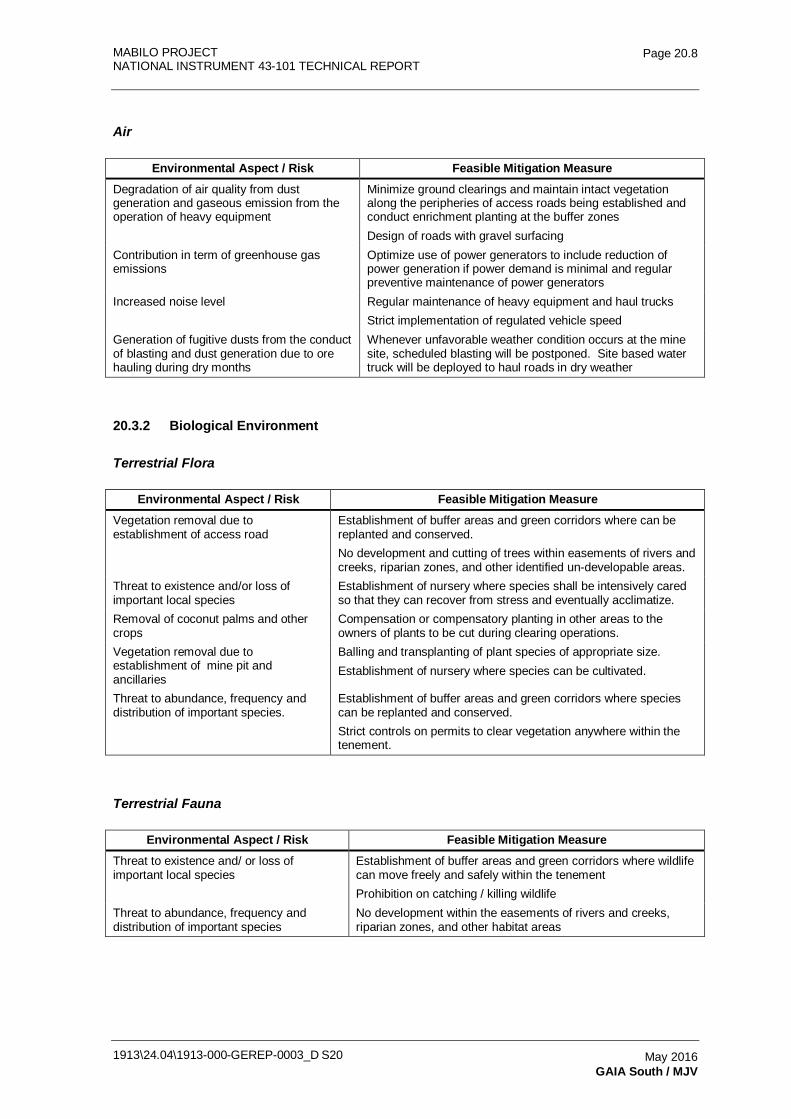
MABILO PROJECT NATIONAL INSTRUMENT 43-101 TECHNICAL REPORT
1913\24.04\1913-000-GEREP-0003_D S20
Page 20.8
May 2016 GAIA South / MJV
Air
Environmental Aspect / Risk Feasible Mitigation Measure Degradation of air quality from dust generation and gaseous emission from the operation of heavy equipment
Minimize ground clearings and maintain intact vegetation along the peripheries of access roads being established and conduct enrichment planting at the buffer zones Design of roads with gravel surfacing
Contribution in term of greenhouse gas emissions
Optimize use of power generators to include reduction of power generation if power demand is minimal and regular preventive maintenance of power generators
Increased noise level Regular maintenance of heavy equipment and haul trucks Strict implementation of regulated vehicle speed
Generation of fugitive dusts from the conduct of blasting and dust generation due to ore hauling during dry months
Whenever unfavorable weather condition occurs at the mine site, scheduled blasting will be postponed. Site based water truck will be deployed to haul roads in dry weather
20.3.2 Biological Environment
Terrestrial Flora
Environmental Aspect / Risk Feasible Mitigation Measure Vegetation removal due to establishment of access road
Establishment of buffer areas and green corridors where can be replanted and conserved. No development and cutting of trees within easements of rivers and creeks, riparian zones, and other identified un-developable areas.
Threat to existence and/or loss of important local species
Establishment of nursery where species shall be intensively cared so that they can recover from stress and eventually acclimatize.
Removal of coconut palms and other crops
Compensation or compensatory planting in other areas to the owners of plants to be cut during clearing operations.
Vegetation removal due to establishment of mine pit and ancillaries
Balling and transplanting of plant species of appropriate size. Establishment of nursery where species can be cultivated.
Threat to abundance, frequency and distribution of important species.
Establishment of buffer areas and green corridors where species can be replanted and conserved. Strict controls on permits to clear vegetation anywhere within the tenement.
Terrestrial Fauna
Environmental Aspect / Risk Feasible Mitigation Measure Threat to existence and/ or loss of important local species
Establishment of buffer areas and green corridors where wildlife can move freely and safely within the tenement Prohibition on catching / killing wildlife
Threat to abundance, frequency and distribution of important species
No development within the easements of rivers and creeks, riparian zones, and other habitat areas
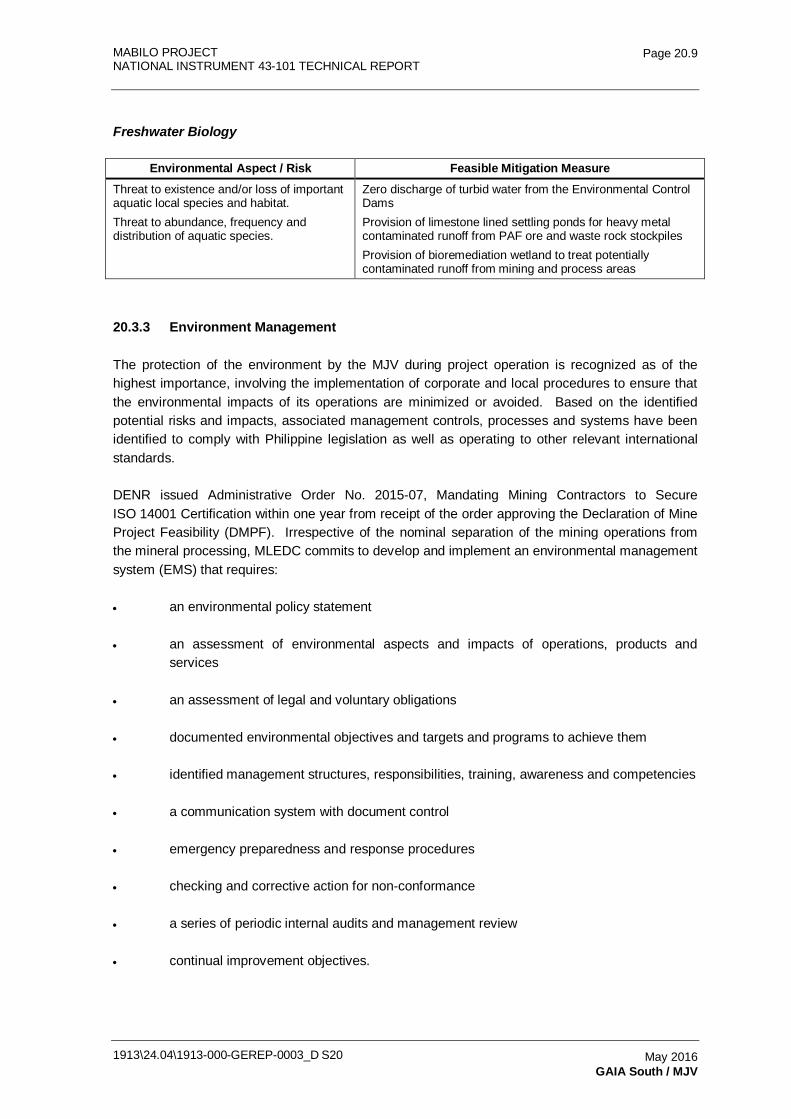
MABILO PROJECT NATIONAL INSTRUMENT 43-101 TECHNICAL REPORT
1913\24.04\1913-000-GEREP-0003_D S20
Page 20.9
May 2016 GAIA South / MJV
Freshwater Biology
Environmental Aspect / Risk Feasible Mitigation Measure Threat to existence and/or loss of important aquatic local species and habitat. Threat to abundance, frequency and distribution of aquatic species.
Zero discharge of turbid water from the Environmental Control Dams Provision of limestone lined settling ponds for heavy metal contaminated runoff from PAF ore and waste rock stockpiles Provision of bioremediation wetland to treat potentially contaminated runoff from mining and process areas
20.3.3 Environment Management
The protection of the environment by the MJV during project operation is recognized as of the highest importance, involving the implementation of corporate and local procedures to ensure that the environmental impacts of its operations are minimized or avoided. Based on the identified potential risks and impacts, associated management controls, processes and systems have been identified to comply with Philippine legislation as well as operating to other relevant international standards.
DENR issued Administrative Order No. 2015-07, Mandating Mining Contractors to Secure ISO 14001 Certification within one year from receipt of the order approving the Declaration of Mine Project Feasibility (DMPF). Irrespective of the nominal separation of the mining operations from the mineral processing, MLEDC commits to develop and implement an environmental management system (EMS) that requires:
• an environmental policy statement
• an assessment of environmental aspects and impacts of operations, products and services
• an assessment of legal and voluntary obligations
• documented environmental objectives and targets and programs to achieve them
• identified management structures, responsibilities, training, awareness and competencies
• a communication system with document control
• emergency preparedness and response procedures
• checking and corrective action for non-conformance
• a series of periodic internal audits and management review
• continual improvement objectives.
MABILO PROJECT NATIONAL INSTRUMENT 43-101 TECHNICAL REPORT
1913\24.04\1913-000-GEREP-0003_D S20
Page 20.10
May 2016 GAIA South / MJV
20.4 Socio Development Plans
All Contractors / Permit Holders / Lessees shall prepare a Social Development Management Plan (SDMP), in consultation and in partnership with the host and neighboring communities. The SDMP shall be actively promoted and shall cover and include all Programs / Projects / Activities (P/P/As) towards enhancing the development of the host and neighboring communities. To meet the changing needs and demands of the communities, the Contractor / Permit Holder / Lessee engaged in mining operations shall submit every five years an SDMP to the Regional Office for approval.
20.4.1 Methodology
Mabilo's five year Social Development and Management Program (SDMP) for mining was prepared through the conduct of the following:
• Surveys were conducted in the host and neighboring barangays, using a four part survey which includes the Social Welfare Indicator (SWI) survey and scoring system being used by the Department of Social Welfare and Development. This is not to serve as statistical data, but more on breaking down or elaborating on a household level, the data provided by other sources such as the Community Based Monitoring System being conducted by the government.
• Review of all available Data from the local government units and its concerned agencies, such as the Community Based Monitoring System (CBMS), Baraga Governance Performance Management System (BGMPS), Socio-Demographic Data, Baraga Investment Plans, Baraga Development Plans, Municipal Development Plans and Accomplishment, and all other similar data and documents from the provincial and municipal government unit.
• Key Informants from the provincial, municipal and barangays, such as barangay captains, councilmen and elders were interviewed to validate various community issues and concerns that needed to be addressed.
• Information displays and face to face meetings with local residents.
• Focus Group Discussions (FGD's) and 'Pulong-Pulong' were also made to validate the issues and concerns of the respective barangays.
• To help in the conceptualization and planning of this program, a multi-stake holder organization; called The Community Technical Working Group (CTWG) was organized. Representatives from the concerned local government units composed this sectorial group, such as women's organization, farmer's organization, and youth organization.
• The CTWG also validated the data gathered by the preparers prior to the community planning session.
MABILO PROJECT NATIONAL INSTRUMENT 43-101 TECHNICAL REPORT
1913\24.04\1913-000-GEREP-0003_D S20
Page 20.11
May 2016 GAIA South / MJV
• The Philippine Millennium Development Goals, the Regional Millennium Development Goals, the Provincial Development Goals, and Municipal Development Goals were also considered in the preparation of this program.
• Review of the physical accomplishment reports of MLEDC.
• The sustainable development principles of the company were also embedded in the preparation of this program.
20.4.2 Overall Findings and Observations
Correlating the primary and secondary data gathered, the following findings and observations were made:
• The average monthly income of the households is far below the poverty line, i.e. from poverty and food threshold. There is difficulty for these households to meet the daily basic needs of the family, whether it is food or non-food requirements.
• The majority of the respondents are either unemployed or underemployed. Most of them are either on / off employment, or employed on a seasonal basis, although they may be working in the agricultural sector, such as copra, their income is still low.
• Most of the respondents have no technical or employable skills. If they have employable skills, they have no certification from the Technical Education and Skills Development Authority (TESDA) or a similar accrediting agency, making them less competitive than others who have the required certification.
• The majority of the respondents are high school and elementary graduates only.
• Most of the respondents are not members of any formal insurance institution or association, such as Philhealth.
• A considerable number of households have no access to safe and portable drinking water.
• The majority of the households interviewed have no access to proper hygiene and sanitation facilities.
20.4.3 Socio Conclusions
It can be observed that the general well-being of households is defined by their current Economic Sufficiency and Social Adequacy. Economic Sufficiency is defined by employment, income and social security membership. Social Adequacy on the other hand is measured by health, nutrition, sanitation, hygiene, housing, and other conditions such as educational status of household members, socio-cultural and role performance of the members of the households.

MABILO PROJECT NATIONAL INSTRUMENT 43-101 TECHNICAL REPORT
1913\24.04\1913-000-GEREP-0003_D S20
Page 20.12
May 2016 GAIA South / MJV
To ultimately improve the general well-being of the households, priority projects such as income generating activities or skills training should be implemented.
• To create an equal opportunity for employment, Skills Training and Scholarship projects are needed by the community.
• To help improve hygiene and sanitation, vital infrastructure projects and improved water systems should be implemented.
• The nearest high school is located in Tulay na Lupa, approximately four kilometers from the barangays. Hence, scholarship and school assistance should be given to both the students and the school.
• Projects, programs and activities to be implemented should be in full partnership with concerned stakeholders, beneficiaries and community people.
• Coordination with the concerned government agencies and organizations need be made prior to, during, and after implementation is made.
20.4.4 Recommendations
Based on the results and findings of the Social Development Study, the following are recommended priority projects. Programs and activities will be included in the Social Development and Management Program of the Mabilo Project.
Baraga Napped
• Skills Training
• Livelihood Projects
• Philhealth Insurance
• Installation of Water System Facility
Baraga Bayan-Bayan
• Water System Facility
• Skills Training
• Philhealth Insurance
• Good Hygiene Practice Training
Baraga Benit
• Philhealth Insurance
• Family Development Session
• Water System Facility
• Skills Training
• Livelihood Programs
Baraga Matanlang
• Water System Facility
• Philhealth Insurance
• Skills Training
• Livelihood Projects
• Scholarship Programs
Baraga Tulay na Lupa
• Philhealth Insurance
• Skills Training
• Livelihood Projects
• Scholarship Programs
Baraga Lugui
• Skills Training
• Livelihood Projects
• Philhealth Insurance
• Scholarship Programs
Over All Conclusion and Recommendation.
• Provision of Skills / Livelihood Training
• Vital Public Infrastructures, i.e. water system
• Health Services
• Education
• Socio- Cultural Preservation
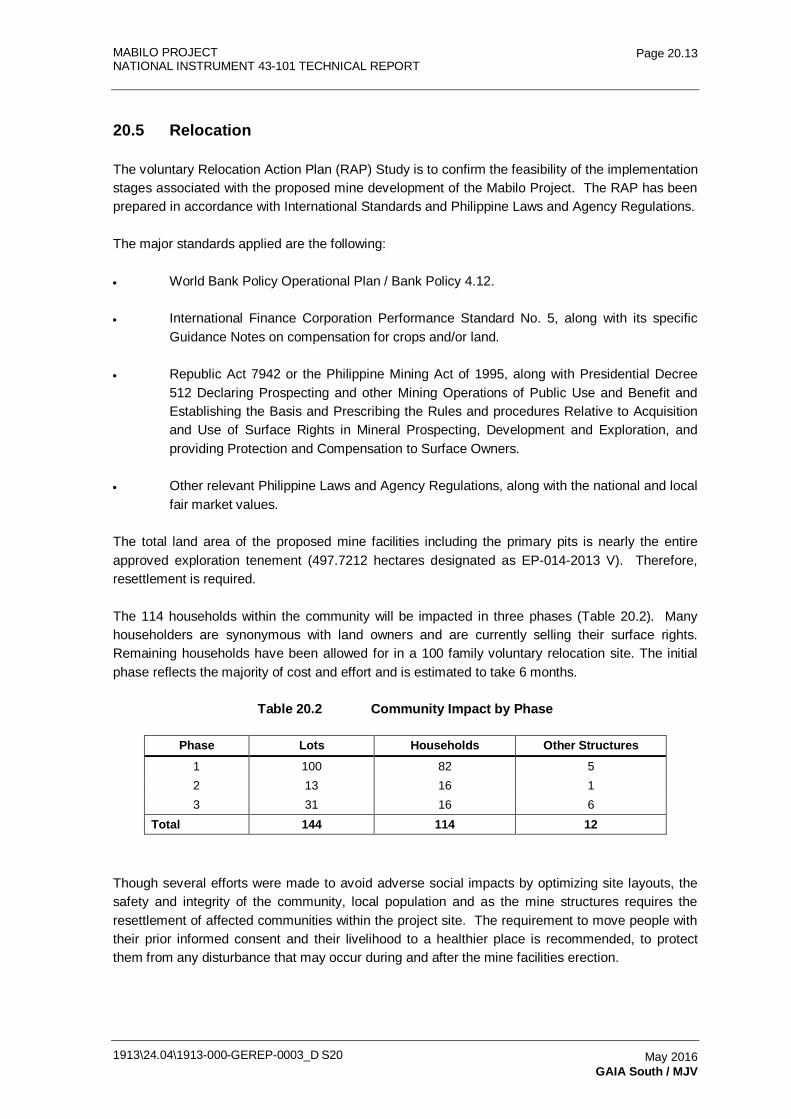
MABILO PROJECT NATIONAL INSTRUMENT 43-101 TECHNICAL REPORT
1913\24.04\1913-000-GEREP-0003_D S20
Page 20.13
May 2016 GAIA South / MJV
20.5 Relocation
The voluntary Relocation Action Plan (RAP) Study is to confirm the feasibility of the implementation stages associated with the proposed mine development of the Mabilo Project. The RAP has been prepared in accordance with International Standards and Philippine Laws and Agency Regulations.
The major standards applied are the following:
• World Bank Policy Operational Plan / Bank Policy 4.12.
• International Finance Corporation Performance Standard No. 5, along with its specific Guidance Notes on compensation for crops and/or land.
• Republic Act 7942 or the Philippine Mining Act of 1995, along with Presidential Decree 512 Declaring Prospecting and other Mining Operations of Public Use and Benefit and Establishing the Basis and Prescribing the Rules and procedures Relative to Acquisition and Use of Surface Rights in Mineral Prospecting, Development and Exploration, and providing Protection and Compensation to Surface Owners.
• Other relevant Philippine Laws and Agency Regulations, along with the national and local fair market values.
The total land area of the proposed mine facilities including the primary pits is nearly the entire approved exploration tenement (497.7212 hectares designated as EP-014-2013 V). Therefore, resettlement is required.
The 114 households within the community will be impacted in three phases (Table 20.2). Many householders are synonymous with land owners and are currently selling their surface rights. Remaining households have been allowed for in a 100 family voluntary relocation site. The initial phase reflects the majority of cost and effort and is estimated to take 6 months.
Table 20.2 Community Impact by Phase
Phase Lots Households Other Structures 1 100 82 5 2 13 16 1 3 31 16 6
Total 144 114 12
Though several efforts were made to avoid adverse social impacts by optimizing site layouts, the safety and integrity of the community, local population and as the mine structures requires the resettlement of affected communities within the project site. The requirement to move people with their prior informed consent and their livelihood to a healthier place is recommended, to protect them from any disturbance that may occur during and after the mine facilities erection.
MABILO PROJECT NATIONAL INSTRUMENT 43-101 TECHNICAL REPORT
1913\24.04\1913-000-GEREP-0003_D S20
Page 20.14
May 2016 GAIA South / MJV
Estimated final RAP assessment values (Table 20.3) were based on the following:
• Socio Economic Data.
• Land and Livelihood Assessment include Crops and Livestock.
• Structure Survey.
• Disturbance Fee.
• Estimated Land Acquisition Values, Taxes and other fees.
• Community Development Study.
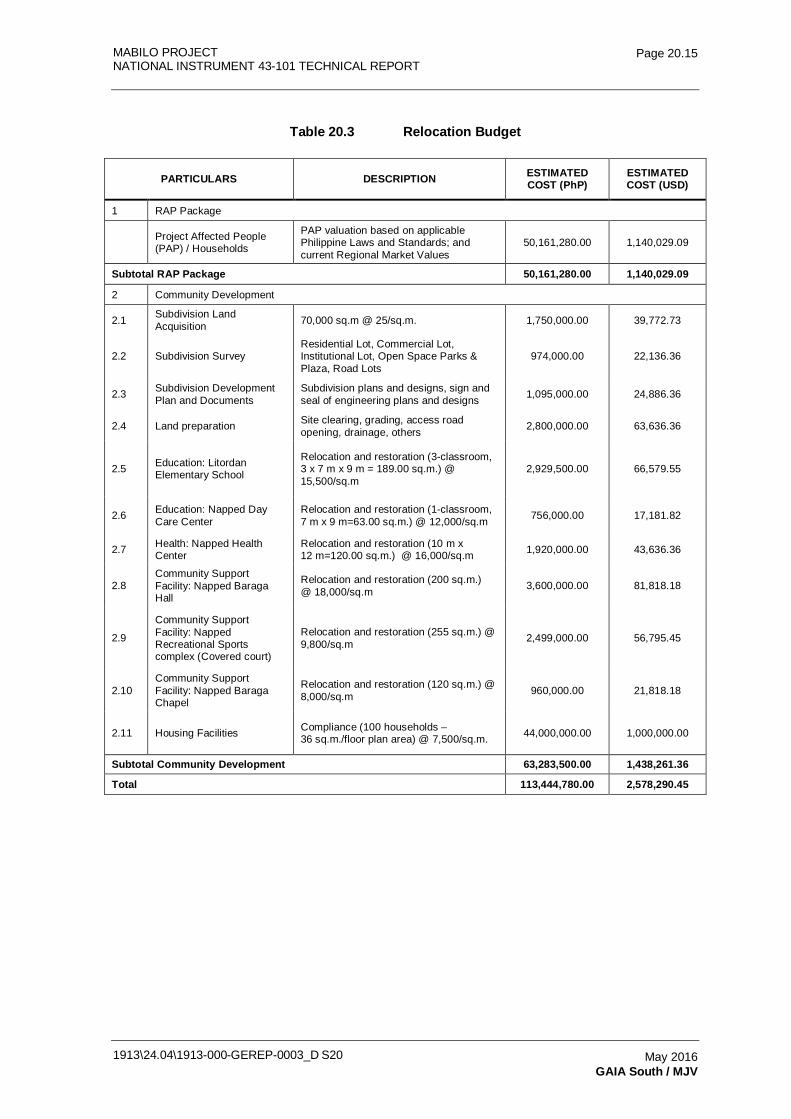
MABILO PROJECT NATIONAL INSTRUMENT 43-101 TECHNICAL REPORT
1913\24.04\1913-000-GEREP-0003_D S20
Page 20.15
May 2016 GAIA South / MJV
Table 20.3 Relocation Budget
PARTICULARS DESCRIPTION ESTIMATED COST (PhP)
ESTIMATED COST (USD)
1 RAP Package
Project Affected People (PAP) / Households
PAP valuation based on applicable Philippine Laws and Standards; and current Regional Market Values
50,161,280.00 1,140,029.09
Subtotal RAP Package 50,161,280.00 1,140,029.09
2 Community Development
2.1 Subdivision Land Acquisition 70,000 sq.m @ 25/sq.m. 1,750,000.00 39,772.73
2.2 Subdivision Survey Residential Lot, Commercial Lot, Institutional Lot, Open Space Parks & Plaza, Road Lots
974,000.00 22,136.36
2.3 Subdivision Development Plan and Documents
Subdivision plans and designs, sign and seal of engineering plans and designs 1,095,000.00 24,886.36
2.4 Land preparation Site clearing, grading, access road opening, drainage, others 2,800,000.00 63,636.36
2.5 Education: Litordan Elementary School
Relocation and restoration (3-classroom, 3 x 7 m x 9 m = 189.00 sq.m.) @ 15,500/sq.m
2,929,500.00 66,579.55
2.6 Education: Napped Day Care Center
Relocation and restoration (1-classroom, 7 m x 9 m=63.00 sq.m.) @ 12,000/sq.m 756,000.00 17,181.82
2.7 Health: Napped Health Center
Relocation and restoration (10 m x 12 m=120.00 sq.m.) @ 16,000/sq.m 1,920,000.00 43,636.36
2.8 Community Support Facility: Napped Baraga Hall
Relocation and restoration (200 sq.m.) @ 18,000/sq.m 3,600,000.00 81,818.18
2.9
Community Support Facility: Napped Recreational Sports complex (Covered court)
Relocation and restoration (255 sq.m.) @ 9,800/sq.m 2,499,000.00 56,795.45
2.10 Community Support Facility: Napped Baraga Chapel
Relocation and restoration (120 sq.m.) @ 8,000/sq.m 960,000.00 21,818.18
2.11 Housing Facilities Compliance (100 households – 36 sq.m./floor plan area) @ 7,500/sq.m. 44,000,000.00 1,000,000.00
Subtotal Community Development 63,283,500.00 1,438,261.36
Total 113,444,780.00 2,578,290.45
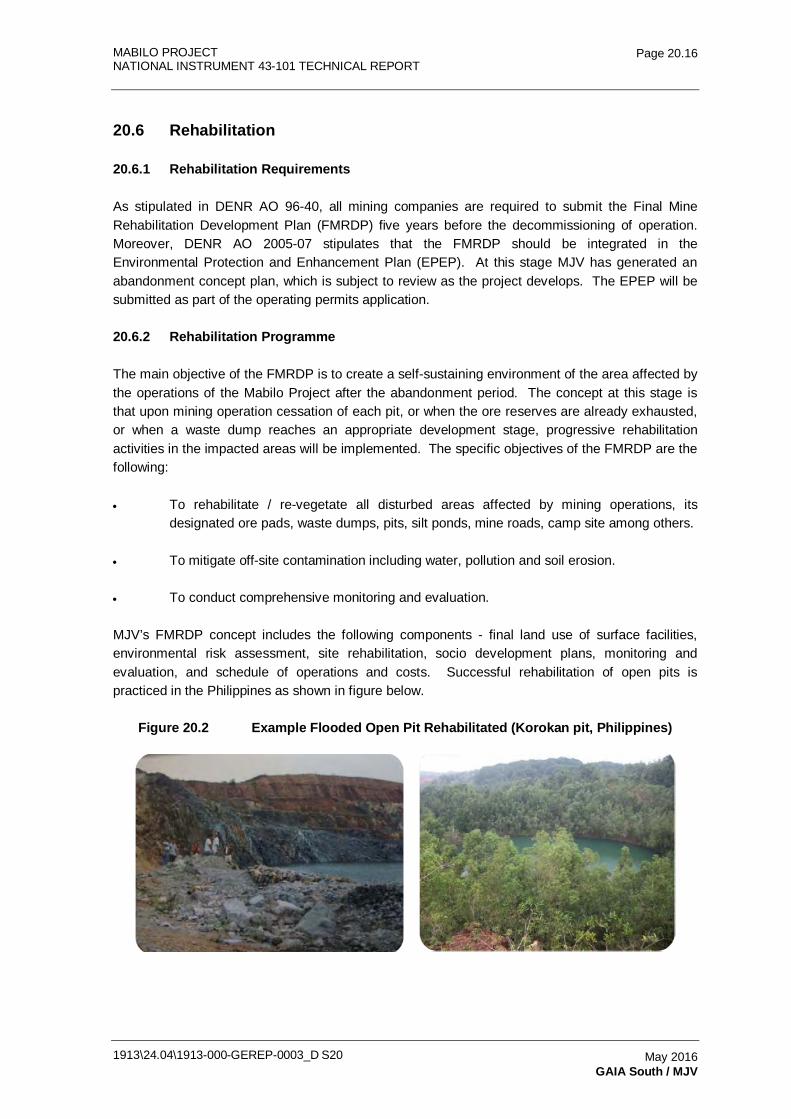
MABILO PROJECT NATIONAL INSTRUMENT 43-101 TECHNICAL REPORT
1913\24.04\1913-000-GEREP-0003_D S20
Page 20.16
May 2016 GAIA South / MJV
20.6 Rehabilitation
20.6.1 Rehabilitation Requirements
As stipulated in DENR AO 96-40, all mining companies are required to submit the Final Mine Rehabilitation Development Plan (FMRDP) five years before the decommissioning of operation. Moreover, DENR AO 2005-07 stipulates that the FMRDP should be integrated in the Environmental Protection and Enhancement Plan (EPEP). At this stage MJV has generated an abandonment concept plan, which is subject to review as the project develops. The EPEP will be submitted as part of the operating permits application.
20.6.2 Rehabilitation Programme
The main objective of the FMRDP is to create a self-sustaining environment of the area affected by the operations of the Mabilo Project after the abandonment period. The concept at this stage is that upon mining operation cessation of each pit, or when the ore reserves are already exhausted, or when a waste dump reaches an appropriate development stage, progressive rehabilitation activities in the impacted areas will be implemented. The specific objectives of the FMRDP are the following:
• To rehabilitate / re-vegetate all disturbed areas affected by mining operations, its designated ore pads, waste dumps, pits, silt ponds, mine roads, camp site among others.
• To mitigate off-site contamination including water, pollution and soil erosion.
• To conduct comprehensive monitoring and evaluation.
MJV’s FMRDP concept includes the following components - final land use of surface facilities, environmental risk assessment, site rehabilitation, socio development plans, monitoring and evaluation, and schedule of operations and costs. Successful rehabilitation of open pits is practiced in the Philippines as shown in figure below.
Figure 20.2 Example Flooded Open Pit Rehabilitated (Korokan pit, Philippines)
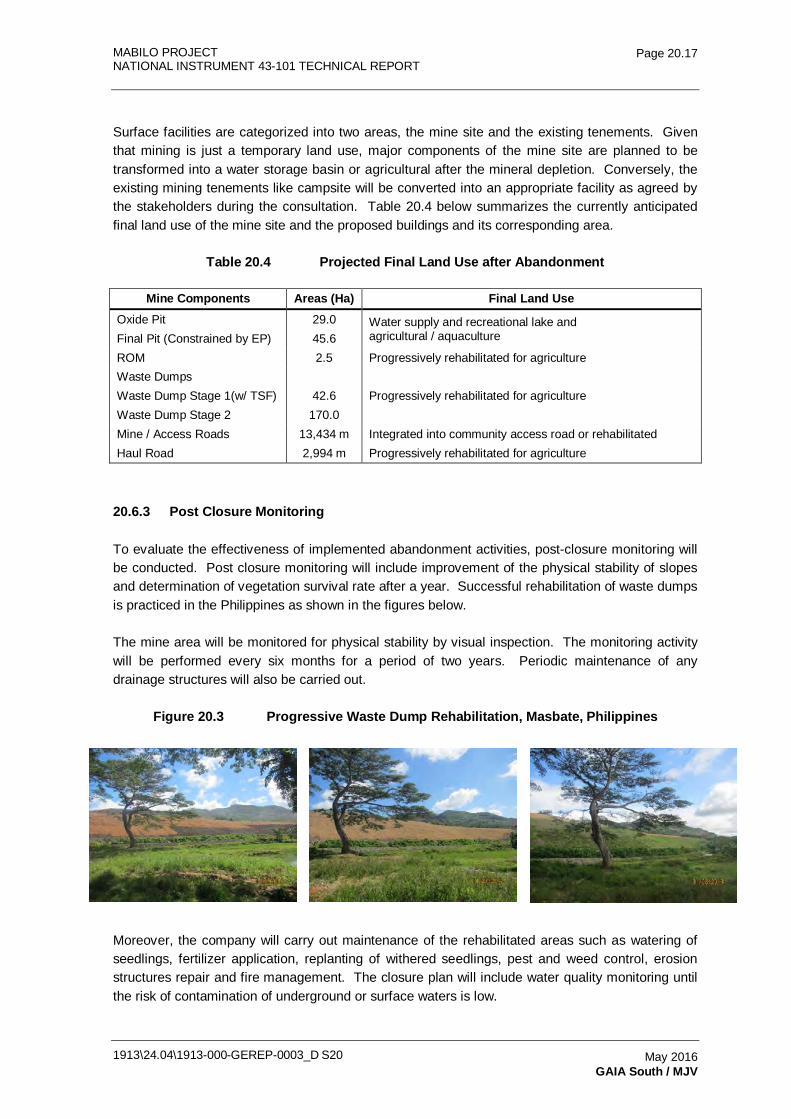
MABILO PROJECT NATIONAL INSTRUMENT 43-101 TECHNICAL REPORT
1913\24.04\1913-000-GEREP-0003_D S20
Page 20.17
May 2016 GAIA South / MJV
Surface facilities are categorized into two areas, the mine site and the existing tenements. Given that mining is just a temporary land use, major components of the mine site are planned to be transformed into a water storage basin or agricultural after the mineral depletion. Conversely, the existing mining tenements like campsite will be converted into an appropriate facility as agreed by the stakeholders during the consultation. Table 20.4 below summarizes the currently anticipated final land use of the mine site and the proposed buildings and its corresponding area.
Table 20.4 Projected Final Land Use after Abandonment
20.6.3 Post Closure Monitoring
To evaluate the effectiveness of implemented abandonment activities, post-closure monitoring will be conducted. Post closure monitoring will include improvement of the physical stability of slopes and determination of vegetation survival rate after a year. Successful rehabilitation of waste dumps is practiced in the Philippines as shown in the figures below.
The mine area will be monitored for physical stability by visual inspection. The monitoring activity will be performed every six months for a period of two years. Periodic maintenance of any drainage structures will also be carried out.
Figure 20.3 Progressive Waste Dump Rehabilitation, Masbate, Philippines
Moreover, the company will carry out maintenance of the rehabilitated areas such as watering of seedlings, fertilizer application, replanting of withered seedlings, pest and weed control, erosion structures repair and fire management. The closure plan will include water quality monitoring until the risk of contamination of underground or surface waters is low.
Mine Components Areas (Ha) Final Land Use Oxide Pit Final Pit (Constrained by EP)
29.0 45.6
Water supply and recreational lake and agricultural / aquaculture
ROM 2.5 Progressively rehabilitated for agriculture Waste Dumps Waste Dump Stage 1(w/ TSF) Waste Dump Stage 2
42.6
170.0 Progressively rehabilitated for agriculture
Mine / Access Roads 13,434 m Integrated into community access road or rehabilitated Haul Road 2,994 m Progressively rehabilitated for agriculture
MABILO PROJECT
NATIONAL INSTRUMENT 43-101 TECHNICAL REPORT
1913-000-GEREP-0003
Table of Contents Page
21.0 CAPITAL AND OPERATING COSTS 21.1 21.1 Capital Cost Estimate 21.1
21.1.1 Overview 21.1 21.1.2 Oxide Mining 21.1 21.1.3 Primary Ore Capital Estimate 21.2 21.1.4 Capital Expenditure (Life of Mine) 21.7
21.2 Operating Cost Estimate 21.7 21.2.1 Overview 21.7 21.2.2 Mining Operating Costs 21.8 21.2.3 Primary Ore Process Operating Costs 21.10 21.2.4 Gold Cap Oxide Ore Operating Costs 21.13 21.2.5 Supergene / Oxide Skarn Operating Costs 21.14
TABLES Table 21.1 Oxide Ore Initial Capital Cost Estimate Summary (US$, 4Q2015,
±15%) 21.1 Table 21.2 Primary Ore Initial Capital Cost Estimate Summary (US$, 4Q2015,
±15%) 21.3 Table 21.3 Capital Cost Estimate Basis 21.5 Table 21.4 Capital Cost Estimate Methodology 21.5 Table 21.5 Life of Mine Capital Cost Estimate 21.7 Table 21.6 Summary of Mabilo Site Operating Cost Estimate (1.0 Mt/y)
(US$, 4Q2015) 21.8 Table 21.7 Summary Mabilo Mining Cost Estimate (1.0 Mt/y) 21.9 Table 21.8 Summary of Mabilo Process Plant Operating Cost Estimate (1.0 Mt/y)
(US$, 4Q2015, +/-15%) 21.11 FIGURES Figure 21.1 Breakdown of Total Mining Costs 21.10 Figure 21.2 Process Plant Operating Cost Breakdown 21.12
1913\24.04\1913-000-GEREP-0003_D S21 May 2016 Lycopodium Minerals Pty Ltd / MJV / Orelogy
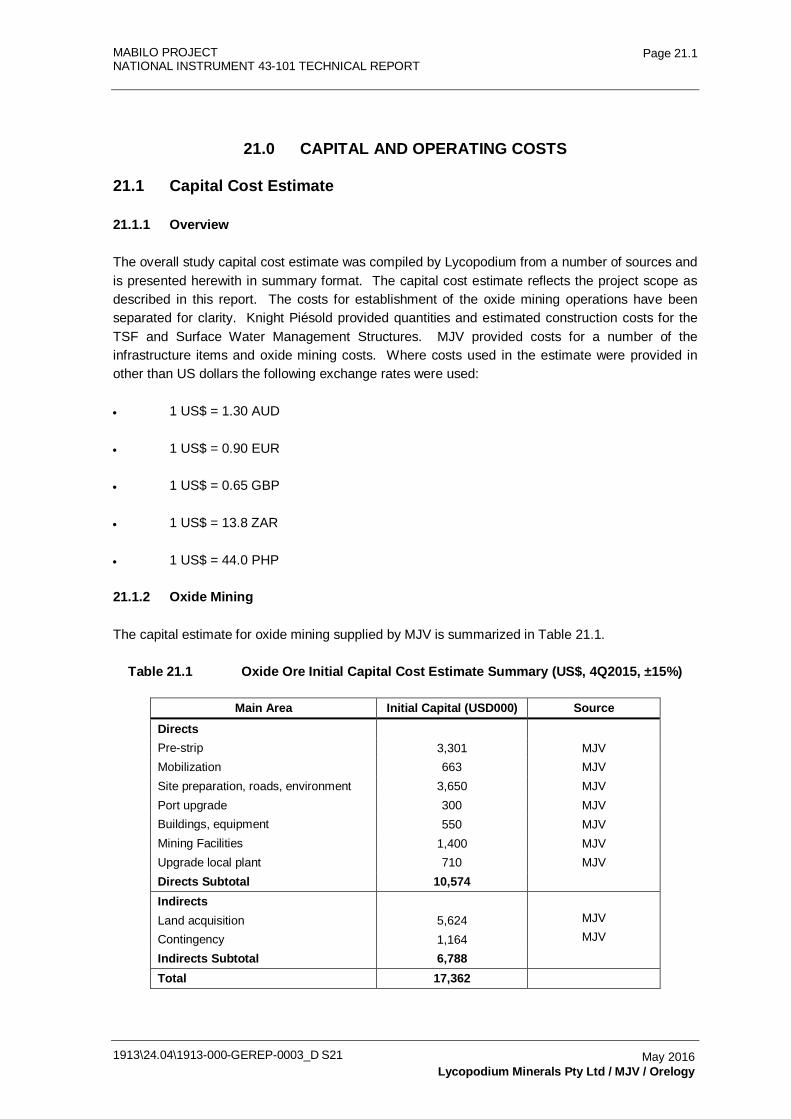
MABILO PROJECT NATIONAL INSTRUMENT 43-101 TECHNICAL REPORT
1913\24.04\1913-000-GEREP-0003_D S21
Page 21.1
May 2016 Lycopodium Minerals Pty Ltd / MJV / Orelogy
21.0 CAPITAL AND OPERATING COSTS
21.1 Capital Cost Estimate
21.1.1 Overview
The overall study capital cost estimate was compiled by Lycopodium from a number of sources and is presented herewith in summary format. The capital cost estimate reflects the project scope as described in this report. The costs for establishment of the oxide mining operations have been separated for clarity. Knight Piésold provided quantities and estimated construction costs for the TSF and Surface Water Management Structures. MJV provided costs for a number of the infrastructure items and oxide mining costs. Where costs used in the estimate were provided in other than US dollars the following exchange rates were used:
• 1 US$ = 1.30 AUD
• 1 US$ = 0.90 EUR
• 1 US$ = 0.65 GBP
• 1 US$ = 13.8 ZAR
• 1 US$ = 44.0 PHP
21.1.2 Oxide Mining
The capital estimate for oxide mining supplied by MJV is summarized in Table 21.1.
Table 21.1 Oxide Ore Initial Capital Cost Estimate Summary (US$, 4Q2015, ±15%)
Main Area Initial Capital (USD000) Source Directs Pre-strip 3,301 MJV Mobilization 663 MJV Site preparation, roads, environment 3,650 MJV Port upgrade 300 MJV Buildings, equipment 550 MJV Mining Facilities 1,400 MJV Upgrade local plant 710 MJV Directs Subtotal 10,574 Indirects Land acquisition 5,624 MJV
Contingency 1,164 MJV
Indirects Subtotal 6,788
Total 17,362
MABILO PROJECT NATIONAL INSTRUMENT 43-101 TECHNICAL REPORT
1913\24.04\1913-000-GEREP-0003_D S21
Page 21.2
May 2016 Lycopodium Minerals Pty Ltd / MJV / Orelogy
Mining costs were prepared by MJV on the basis of contract mining with the contractor establishing some facilities on site which will be serviced by the Project. The costs for establishment of the oxide mining facilities include:
• General mobilization.
• Mobilization, contracts and lands.
• Site preparation, clearing and river diversion.
• Pre-strip.
• Road development and port access.
• Buildings, vehicles, generators, etc.
• LARAP port upgrade.
• Mining facilities.
• Laboratory mobilization.
• Office equipment.
• Security and fencing.
• Environmental structures.
• Contingency, working capital, allowances.
• Upgrade of local plant for processing gold ore.
• Land acquisition.
21.1.3 Primary Ore Capital Estimate
The capital estimate for primary ore processing is summarized in Table 21.2. The initial project capital cost (excluding sustaining and deferred) for this stage (as opposed the Oxide Ore initial capital above) was estimated at US$169.85 million and the total capital cost (including sustained and deferred) was estimated at US$230.23 (see Section 21.1.4)
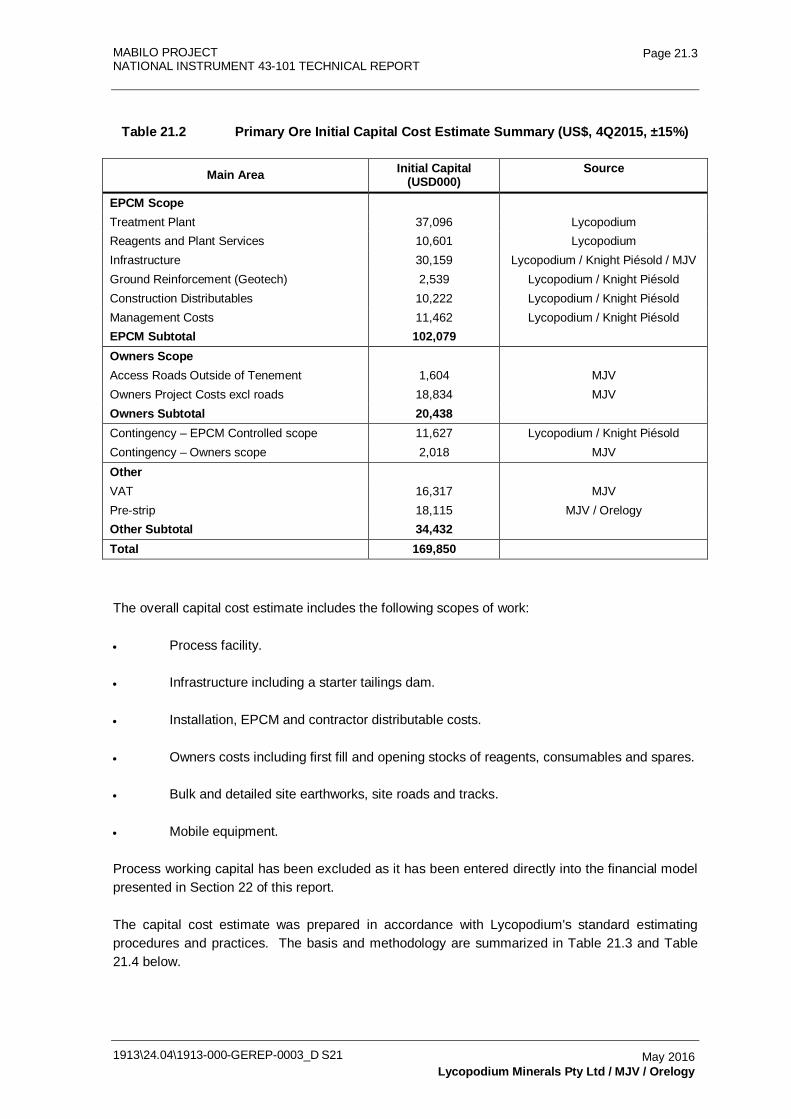
MABILO PROJECT NATIONAL INSTRUMENT 43-101 TECHNICAL REPORT
1913\24.04\1913-000-GEREP-0003_D S21
Page 21.3
May 2016 Lycopodium Minerals Pty Ltd / MJV / Orelogy
Table 21.2 Primary Ore Initial Capital Cost Estimate Summary (US$, 4Q2015, ±15%)
Main Area Initial Capital (USD000)
Source
EPCM Scope Treatment Plant 37,096 Lycopodium Reagents and Plant Services 10,601 Lycopodium Infrastructure 30,159 Lycopodium / Knight Piésold / MJV Ground Reinforcement (Geotech) 2,539 Lycopodium / Knight Piésold Construction Distributables 10,222 Lycopodium / Knight Piésold Management Costs 11,462 Lycopodium / Knight Piésold EPCM Subtotal 102,079 Owners Scope Access Roads Outside of Tenement 1,604 MJV Owners Project Costs excl roads 18,834 MJV Owners Subtotal 20,438 Contingency – EPCM Controlled scope 11,627 Lycopodium / Knight Piésold Contingency – Owners scope 2,018 MJV Other VAT 16,317 MJV Pre-strip 18,115 MJV / Orelogy Other Subtotal 34,432 Total 169,850
The overall capital cost estimate includes the following scopes of work:
• Process facility.
• Infrastructure including a starter tailings dam.
• Installation, EPCM and contractor distributable costs.
• Owners costs including first fill and opening stocks of reagents, consumables and spares.
• Bulk and detailed site earthworks, site roads and tracks.
• Mobile equipment.
Process working capital has been excluded as it has been entered directly into the financial model presented in Section 22 of this report.
The capital cost estimate was prepared in accordance with Lycopodium's standard estimating procedures and practices. The basis and methodology are summarized in Table 21.3 and Table 21.4 below.
MABILO PROJECT NATIONAL INSTRUMENT 43-101 TECHNICAL REPORT
1913\24.04\1913-000-GEREP-0003_D S21
Page 21.4
May 2016 Lycopodium Minerals Pty Ltd / MJV / Orelogy
The process plant was broken down into unit operation areas with quantity take-offs benchmarked against similar facilities from previous projects to provide the additional scope and level of confidence needed to confirm that the accuracy level of the estimate was achieved.
The overall plant layout and equipment sizing was prepared with sufficient detail to permit an assessment of the engineering quantities for the majority of the facilities for earthworks, concrete, steelwork, and mechanical items. The layouts enabled preliminary estimates of quantities to be taken for all areas and for interconnecting items such as piperacks.
Unit rates for labor and materials were derived from responses to Budget Quotation Requests (BQRs) sent to fabricators and contractors experienced in the scale and type of work in the region. Budget pricing for equipment was obtained from reputable suppliers with the exception of low value items which were costed from Lycopodium's database of recent project costs. For the accommodation camp, offices and other architectural buildings, quoted pricing was supplied by MJV from GXD (China).
For the tailings storage facility and surface water management structures bills of quantities and pricing estimates were provided by Knight Piésold based on their preliminary designs. A number of items were costed by outside consultants under the control of MJV. These included the port, external access roads, water transmission and environmental / social costs. MJV provided costs for Owners team and other related expenses.
The purpose of contingency is to make specific provision for uncertain elements of cost within the Project scope. Contingencies do not include allowances for scope changes, escalation or exchange rate fluctuations. Contingency is an integral part of an estimate and has been applied (after careful analysis) to all parts of the estimate, i.e. direct costs, distributable costs, services costs, etc.
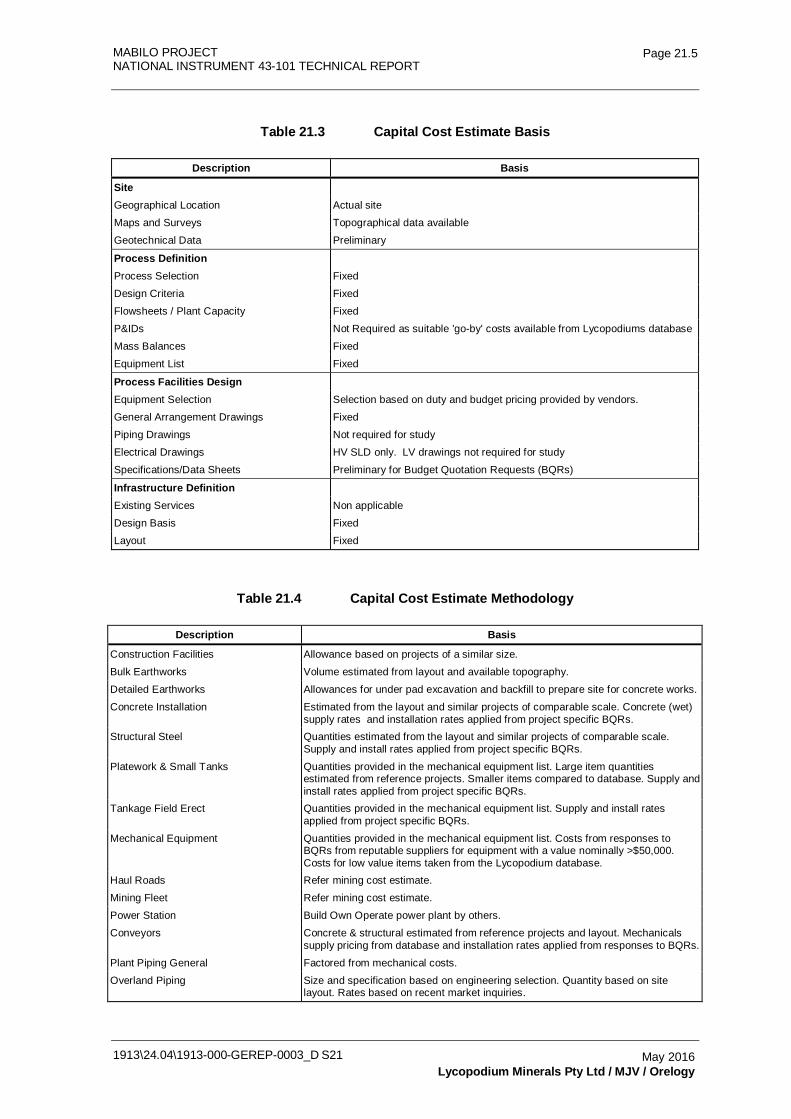
MABILO PROJECT NATIONAL INSTRUMENT 43-101 TECHNICAL REPORT
1913\24.04\1913-000-GEREP-0003_D S21
Page 21.5
May 2016 Lycopodium Minerals Pty Ltd / MJV / Orelogy
Table 21.3 Capital Cost Estimate Basis
Description Basis
Site
Geographical Location Actual site
Maps and Surveys Topographical data available
Geotechnical Data Preliminary
Process Definition
Process Selection Fixed
Design Criteria Fixed
Flowsheets / Plant Capacity Fixed
P&IDs Not Required as suitable 'go-by' costs available from Lycopodiums database
Mass Balances Fixed
Equipment List Fixed
Process Facilities Design
Equipment Selection Selection based on duty and budget pricing provided by vendors.
General Arrangement Drawings Fixed
Piping Drawings Not required for study
Electrical Drawings HV SLD only. LV drawings not required for study
Specifications/Data Sheets Preliminary for Budget Quotation Requests (BQRs)
Infrastructure Definition
Existing Services Non applicable
Design Basis Fixed
Layout Fixed
Table 21.4 Capital Cost Estimate Methodology
Description Basis
Construction Facilities Allowance based on projects of a similar size.
Bulk Earthworks Volume estimated from layout and available topography.
Detailed Earthworks Allowances for under pad excavation and backfill to prepare site for concrete works.
Concrete Installation Estimated from the layout and similar projects of comparable scale. Concrete (wet) supply rates and installation rates applied from project specific BQRs.
Structural Steel Quantities estimated from the layout and similar projects of comparable scale. Supply and install rates applied from project specific BQRs.
Platework & Small Tanks Quantities provided in the mechanical equipment list. Large item quantities estimated from reference projects. Smaller items compared to database. Supply and install rates applied from project specific BQRs.
Tankage Field Erect Quantities provided in the mechanical equipment list. Supply and install rates applied from project specific BQRs.
Mechanical Equipment Quantities provided in the mechanical equipment list. Costs from responses to BQRs from reputable suppliers for equipment with a value nominally >$50,000. Costs for low value items taken from the Lycopodium database.
Haul Roads Refer mining cost estimate.
Mining Fleet Refer mining cost estimate.
Power Station Build Own Operate power plant by others.
Conveyors Concrete & structural estimated from reference projects and layout. Mechanicals supply pricing from database and installation rates applied from responses to BQRs.
Plant Piping General Factored from mechanical costs.
Overland Piping Size and specification based on engineering selection. Quantity based on site layout. Rates based on recent market inquiries.
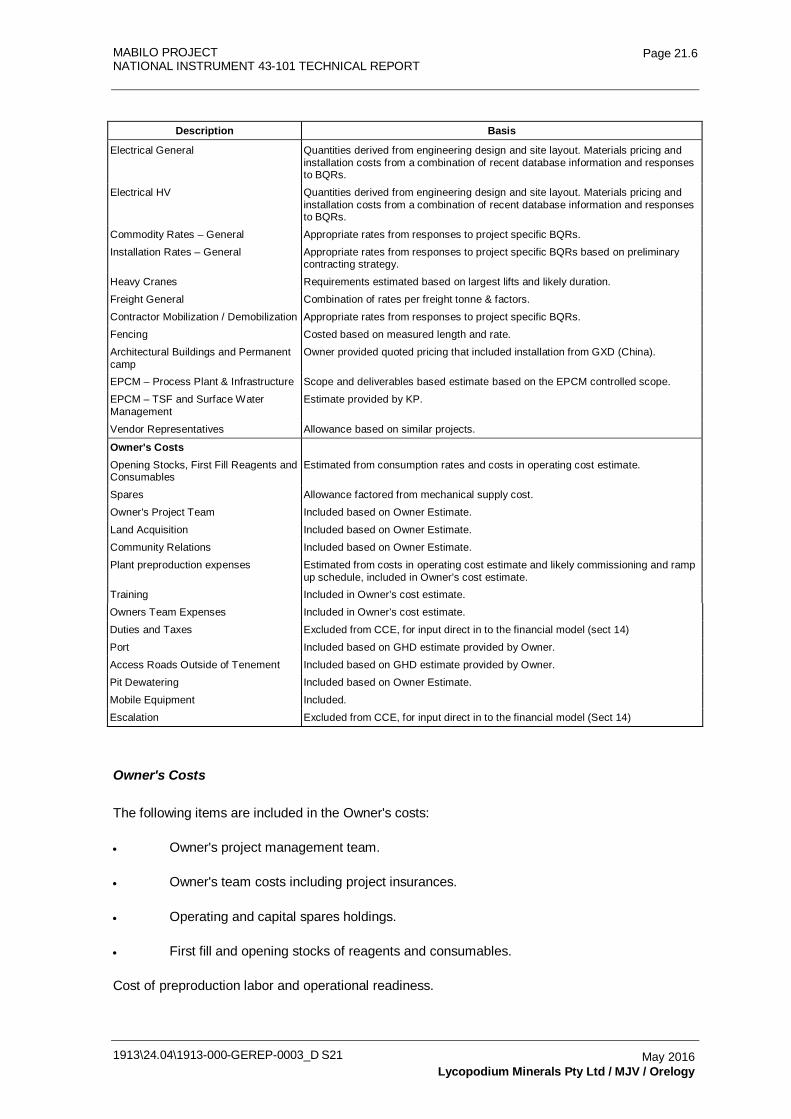
MABILO PROJECT NATIONAL INSTRUMENT 43-101 TECHNICAL REPORT
1913\24.04\1913-000-GEREP-0003_D S21
Page 21.6
May 2016 Lycopodium Minerals Pty Ltd / MJV / Orelogy
Description Basis
Electrical General Quantities derived from engineering design and site layout. Materials pricing and installation costs from a combination of recent database information and responses to BQRs.
Electrical HV Quantities derived from engineering design and site layout. Materials pricing and installation costs from a combination of recent database information and responses to BQRs.
Commodity Rates – General Appropriate rates from responses to project specific BQRs.
Installation Rates – General Appropriate rates from responses to project specific BQRs based on preliminary contracting strategy.
Heavy Cranes Requirements estimated based on largest lifts and likely duration.
Freight General Combination of rates per freight tonne & factors.
Contractor Mobilization / Demobilization Appropriate rates from responses to project specific BQRs.
Fencing Costed based on measured length and rate.
Architectural Buildings and Permanent camp
Owner provided quoted pricing that included installation from GXD (China).
EPCM – Process Plant & Infrastructure Scope and deliverables based estimate based on the EPCM controlled scope.
EPCM – TSF and Surface Water Management
Estimate provided by KP.
Vendor Representatives Allowance based on similar projects.
Owner's Costs
Opening Stocks, First Fill Reagents and Consumables
Estimated from consumption rates and costs in operating cost estimate.
Spares Allowance factored from mechanical supply cost.
Owner's Project Team Included based on Owner Estimate.
Land Acquisition Included based on Owner Estimate.
Community Relations Included based on Owner Estimate.
Plant preproduction expenses Estimated from costs in operating cost estimate and likely commissioning and ramp up schedule, included in Owner’s cost estimate.
Training Included in Owner’s cost estimate.
Owners Team Expenses Included in Owner’s cost estimate.
Duties and Taxes Excluded from CCE, for input direct in to the financial model (sect 14)
Port Included based on GHD estimate provided by Owner.
Access Roads Outside of Tenement Included based on GHD estimate provided by Owner.
Pit Dewatering Included based on Owner Estimate.
Mobile Equipment Included.
Escalation Excluded from CCE, for input direct in to the financial model (Sect 14)
Owner's Costs
The following items are included in the Owner's costs:
• Owner's project management team.
• Owner's team costs including project insurances.
• Operating and capital spares holdings.
• First fill and opening stocks of reagents and consumables.
Cost of preproduction labor and operational readiness.
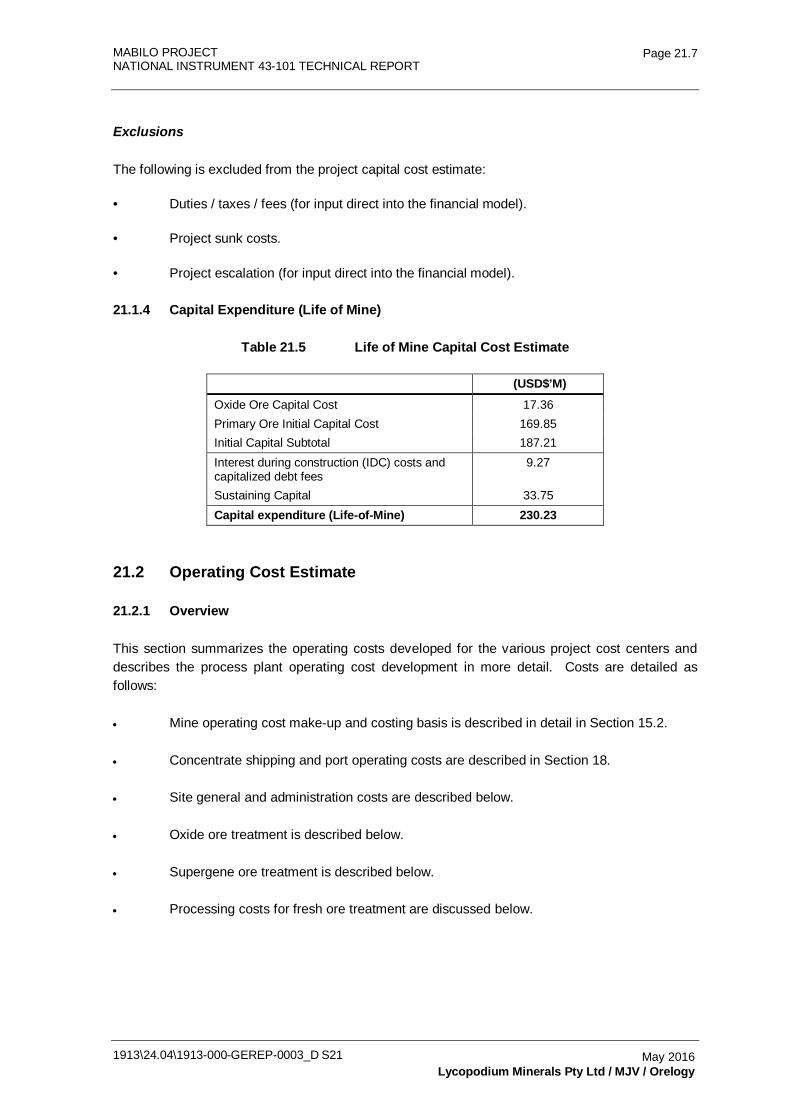
MABILO PROJECT NATIONAL INSTRUMENT 43-101 TECHNICAL REPORT
1913\24.04\1913-000-GEREP-0003_D S21
Page 21.7
May 2016 Lycopodium Minerals Pty Ltd / MJV / Orelogy
Exclusions
The following is excluded from the project capital cost estimate:
• Duties / taxes / fees (for input direct into the financial model).
• Project sunk costs.
• Project escalation (for input direct into the financial model).
21.1.4 Capital Expenditure (Life of Mine)
Table 21.5 Life of Mine Capital Cost Estimate
(USD$’M) Oxide Ore Capital Cost 17.36 Primary Ore Initial Capital Cost 169.85 Initial Capital Subtotal 187.21 Interest during construction (IDC) costs and capitalized debt fees
9.27
Sustaining Capital 33.75 Capital expenditure (Life-of-Mine) 230.23
21.2 Operating Cost Estimate
21.2.1 Overview
This section summarizes the operating costs developed for the various project cost centers and describes the process plant operating cost development in more detail. Costs are detailed as follows:
• Mine operating cost make-up and costing basis is described in detail in Section 15.2.
• Concentrate shipping and port operating costs are described in Section 18.
• Site general and administration costs are described below.
• Oxide ore treatment is described below.
• Supergene ore treatment is described below.
• Processing costs for fresh ore treatment are discussed below.
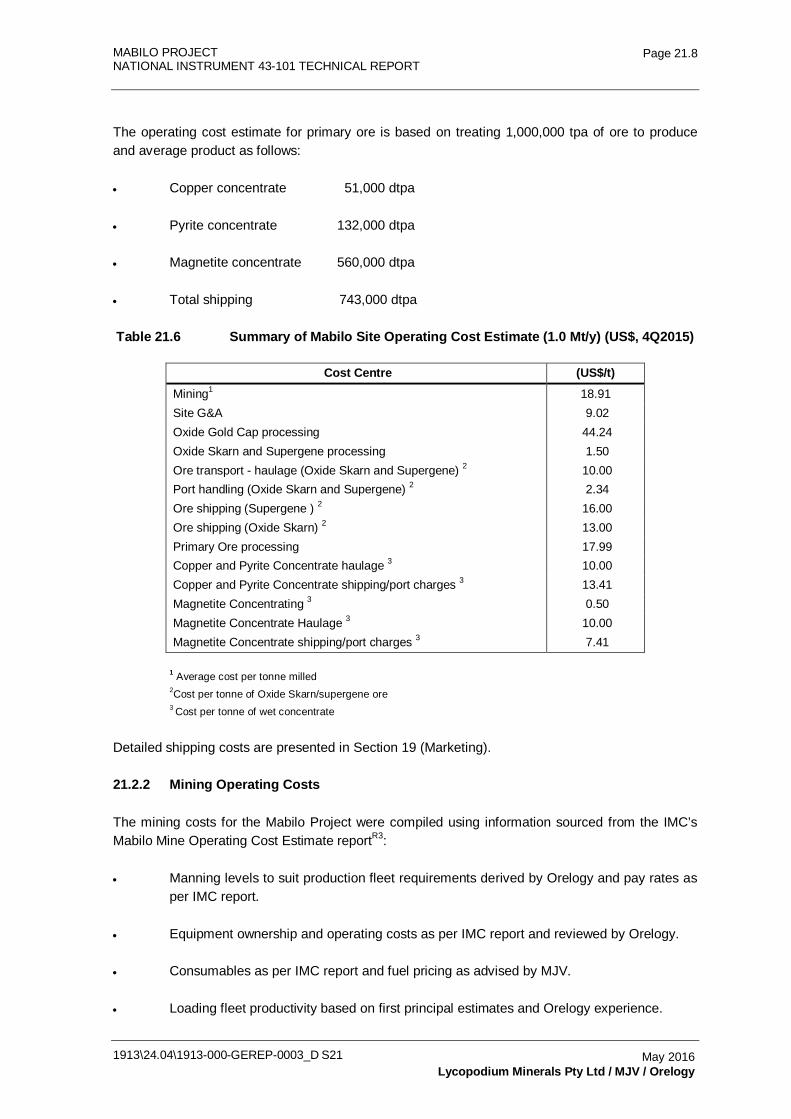
MABILO PROJECT NATIONAL INSTRUMENT 43-101 TECHNICAL REPORT
1913\24.04\1913-000-GEREP-0003_D S21
Page 21.8
May 2016 Lycopodium Minerals Pty Ltd / MJV / Orelogy
The operating cost estimate for primary ore is based on treating 1,000,000 tpa of ore to produce and average product as follows:
• Copper concentrate 51,000 dtpa
• Pyrite concentrate 132,000 dtpa
• Magnetite concentrate 560,000 dtpa
• Total shipping 743,000 dtpa
Table 21.6 Summary of Mabilo Site Operating Cost Estimate (1.0 Mt/y) (US$, 4Q2015)
Cost Centre (US$/t) Mining1 18.91 Site G&A 9.02 Oxide Gold Cap processing 44.24 Oxide Skarn and Supergene processing 1.50 Ore transport - haulage (Oxide Skarn and Supergene) 2 10.00 Port handling (Oxide Skarn and Supergene) 2 2.34 Ore shipping (Supergene ) 2 16.00 Ore shipping (Oxide Skarn) 2 13.00 Primary Ore processing 17.99 Copper and Pyrite Concentrate haulage 3 10.00 Copper and Pyrite Concentrate shipping/port charges 3 13.41 Magnetite Concentrating 3 0.50 Magnetite Concentrate Haulage 3 10.00 Magnetite Concentrate shipping/port charges 3 7.41
1 Average cost per tonne milled 2Cost per tonne of Oxide Skarn/supergene ore 3 Cost per tonne of wet concentrate
Detailed shipping costs are presented in Section 19 (Marketing).
21.2.2 Mining Operating Costs
The mining costs for the Mabilo Project were compiled using information sourced from the IMC’s Mabilo Mine Operating Cost Estimate reportR3:
• Manning levels to suit production fleet requirements derived by Orelogy and pay rates as per IMC report.
• Equipment ownership and operating costs as per IMC report and reviewed by Orelogy.
• Consumables as per IMC report and fuel pricing as advised by MJV.
• Loading fleet productivity based on first principal estimates and Orelogy experience.
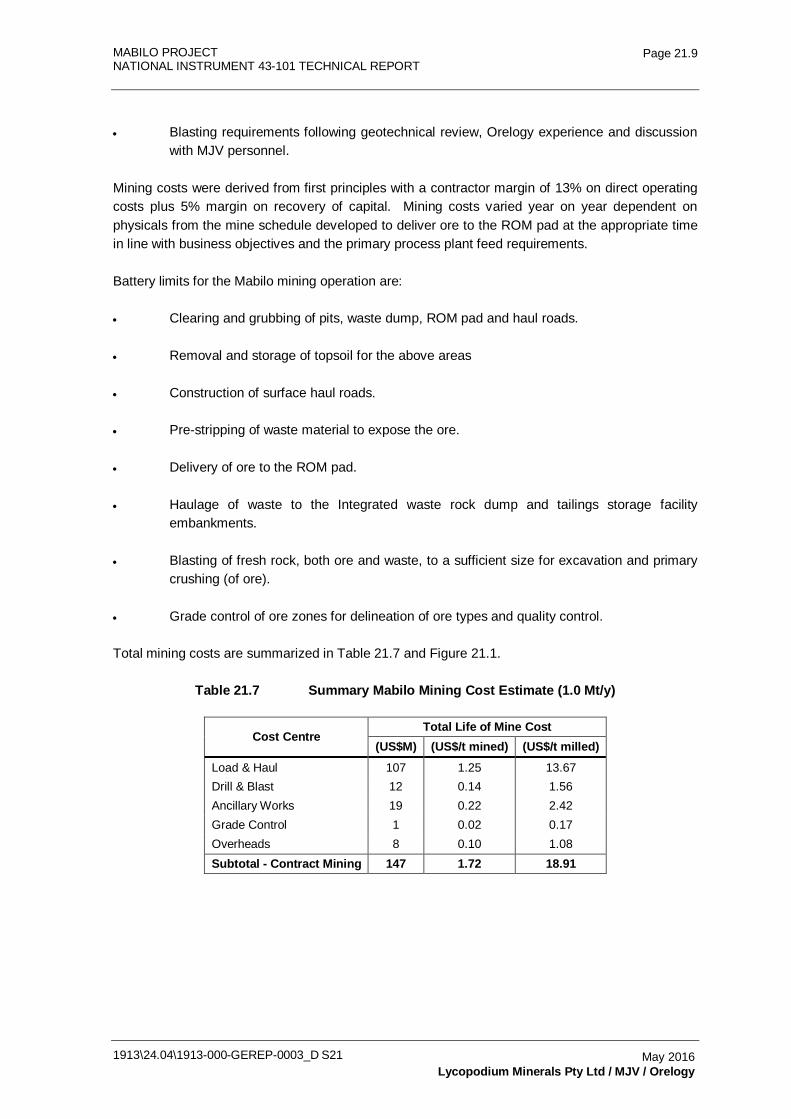
MABILO PROJECT NATIONAL INSTRUMENT 43-101 TECHNICAL REPORT
1913\24.04\1913-000-GEREP-0003_D S21
Page 21.9
May 2016 Lycopodium Minerals Pty Ltd / MJV / Orelogy
• Blasting requirements following geotechnical review, Orelogy experience and discussion with MJV personnel.
Mining costs were derived from first principles with a contractor margin of 13% on direct operating costs plus 5% margin on recovery of capital. Mining costs varied year on year dependent on physicals from the mine schedule developed to deliver ore to the ROM pad at the appropriate time in line with business objectives and the primary process plant feed requirements.
Battery limits for the Mabilo mining operation are:
• Clearing and grubbing of pits, waste dump, ROM pad and haul roads.
• Removal and storage of topsoil for the above areas
• Construction of surface haul roads.
• Pre-stripping of waste material to expose the ore.
• Delivery of ore to the ROM pad.
• Haulage of waste to the Integrated waste rock dump and tailings storage facility embankments.
• Blasting of fresh rock, both ore and waste, to a sufficient size for excavation and primary crushing (of ore).
• Grade control of ore zones for delineation of ore types and quality control.
Total mining costs are summarized in Table 21.7 and Figure 21.1.
Table 21.7 Summary Mabilo Mining Cost Estimate (1.0 Mt/y)
Cost Centre Total Life of Mine Cost
(US$M) (US$/t mined) (US$/t milled) Load & Haul 107 1.25 13.67 Drill & Blast 12 0.14 1.56 Ancillary Works 19 0.22 2.42 Grade Control 1 0.02 0.17 Overheads 8 0.10 1.08 Subtotal - Contract Mining 147 1.72 18.91
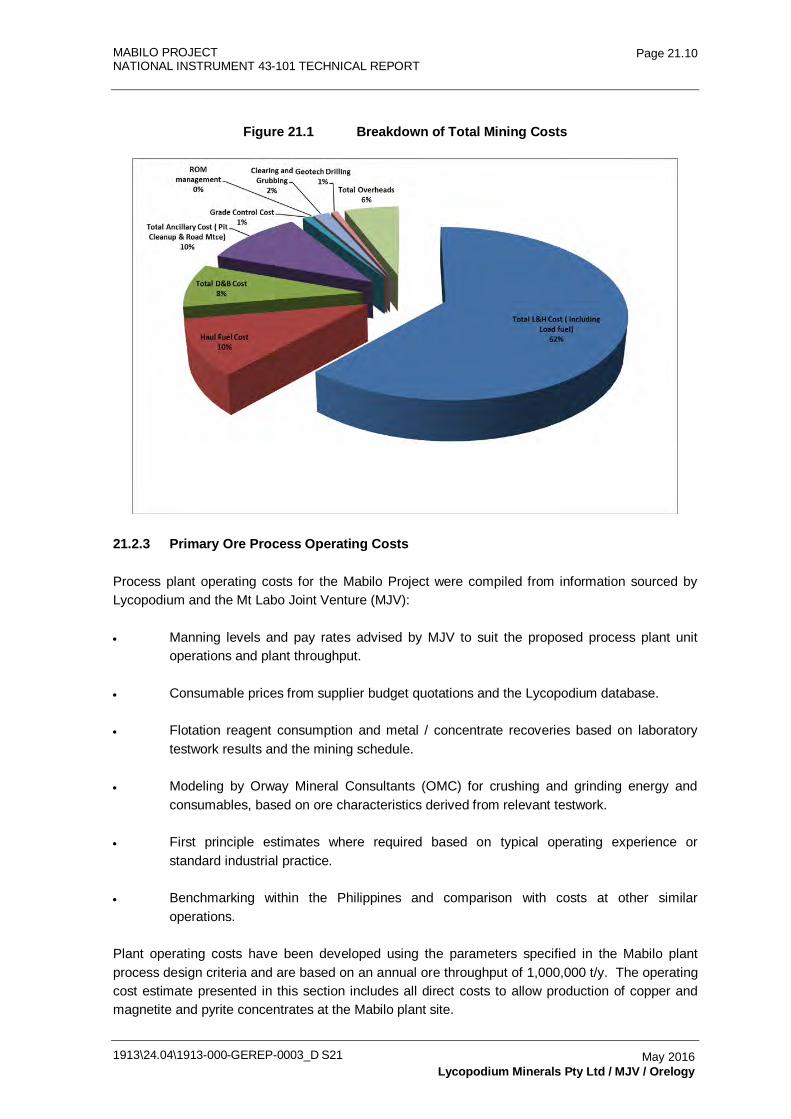
MABILO PROJECT NATIONAL INSTRUMENT 43-101 TECHNICAL REPORT
1913\24.04\1913-000-GEREP-0003_D S21
Page 21.10
May 2016 Lycopodium Minerals Pty Ltd / MJV / Orelogy
Figure 21.1 Breakdown of Total Mining Costs
21.2.3 Primary Ore Process Operating Costs
Process plant operating costs for the Mabilo Project were compiled from information sourced by Lycopodium and the Mt Labo Joint Venture (MJV):
• Manning levels and pay rates advised by MJV to suit the proposed process plant unit operations and plant throughput.
• Consumable prices from supplier budget quotations and the Lycopodium database.
• Flotation reagent consumption and metal / concentrate recoveries based on laboratory testwork results and the mining schedule.
• Modeling by Orway Mineral Consultants (OMC) for crushing and grinding energy and consumables, based on ore characteristics derived from relevant testwork.
• First principle estimates where required based on typical operating experience or standard industrial practice.
• Benchmarking within the Philippines and comparison with costs at other similar operations.
Plant operating costs have been developed using the parameters specified in the Mabilo plant process design criteria and are based on an annual ore throughput of 1,000,000 t/y. The operating cost estimate presented in this section includes all direct costs to allow production of copper and magnetite and pyrite concentrates at the Mabilo plant site.
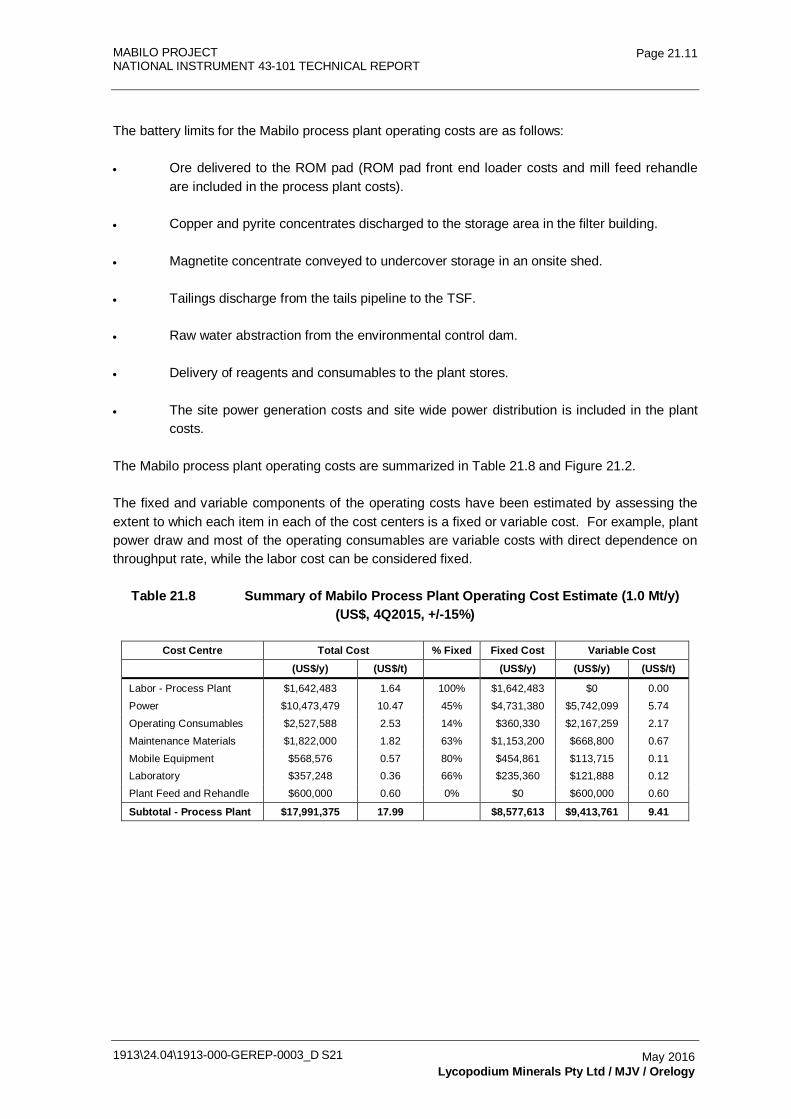
MABILO PROJECT NATIONAL INSTRUMENT 43-101 TECHNICAL REPORT
1913\24.04\1913-000-GEREP-0003_D S21
Page 21.11
May 2016 Lycopodium Minerals Pty Ltd / MJV / Orelogy
The battery limits for the Mabilo process plant operating costs are as follows:
• Ore delivered to the ROM pad (ROM pad front end loader costs and mill feed rehandle are included in the process plant costs).
• Copper and pyrite concentrates discharged to the storage area in the filter building.
• Magnetite concentrate conveyed to undercover storage in an onsite shed.
• Tailings discharge from the tails pipeline to the TSF.
• Raw water abstraction from the environmental control dam.
• Delivery of reagents and consumables to the plant stores.
• The site power generation costs and site wide power distribution is included in the plant costs.
The Mabilo process plant operating costs are summarized in Table 21.8 and Figure 21.2.
The fixed and variable components of the operating costs have been estimated by assessing the extent to which each item in each of the cost centers is a fixed or variable cost. For example, plant power draw and most of the operating consumables are variable costs with direct dependence on throughput rate, while the labor cost can be considered fixed.
Table 21.8 Summary of Mabilo Process Plant Operating Cost Estimate (1.0 Mt/y) (US$, 4Q2015, +/-15%)
Cost Centre Total Cost % Fixed Fixed Cost Variable Cost
(US$/y) (US$/t)
(US$/y) (US$/y) (US$/t)
Labor - Process Plant $1,642,483 1.64 100% $1,642,483 $0 0.00
Power $10,473,479 10.47 45% $4,731,380 $5,742,099 5.74
Operating Consumables $2,527,588 2.53 14% $360,330 $2,167,259 2.17
Maintenance Materials $1,822,000 1.82 63% $1,153,200 $668,800 0.67
Mobile Equipment $568,576 0.57 80% $454,861 $113,715 0.11 Laboratory $357,248 0.36 66% $235,360 $121,888 0.12
Plant Feed and Rehandle $600,000 0.60 0% $0 $600,000 0.60
Subtotal - Process Plant $17,991,375 17.99
$8,577,613 $9,413,761 9.41
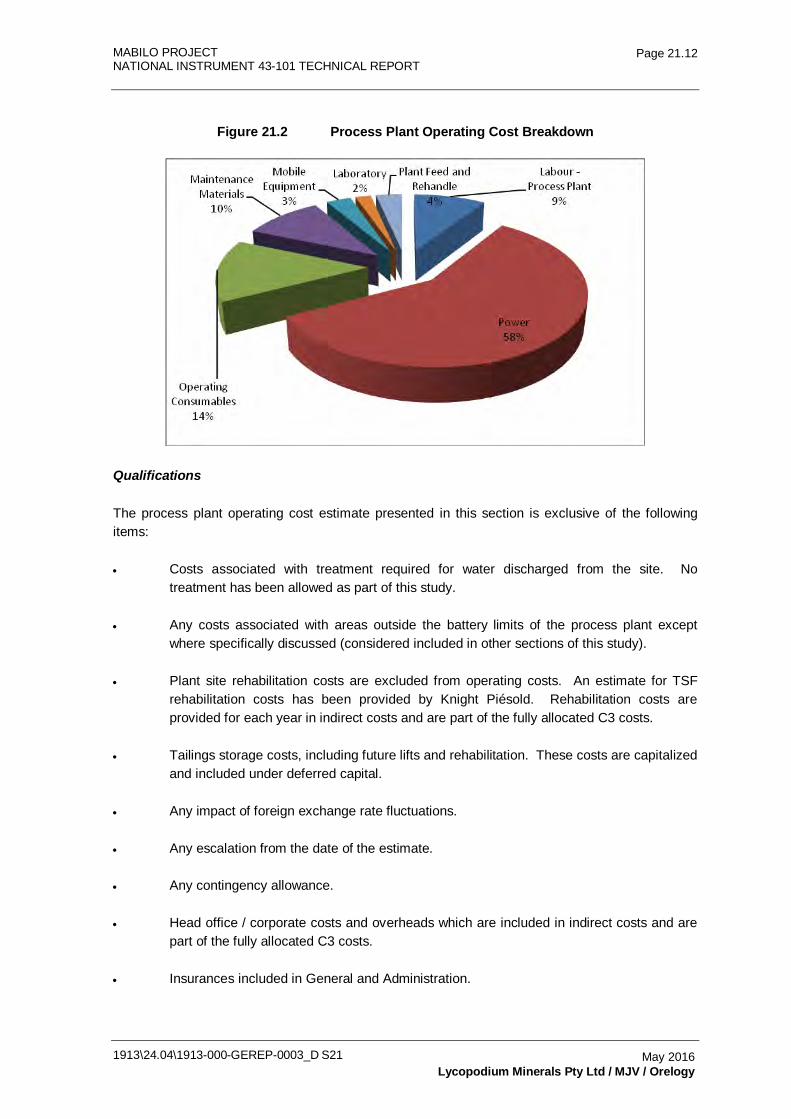
MABILO PROJECT NATIONAL INSTRUMENT 43-101 TECHNICAL REPORT
1913\24.04\1913-000-GEREP-0003_D S21
Page 21.12
May 2016 Lycopodium Minerals Pty Ltd / MJV / Orelogy
Figure 21.2 Process Plant Operating Cost Breakdown
Qualifications
The process plant operating cost estimate presented in this section is exclusive of the following items:
• Costs associated with treatment required for water discharged from the site. No treatment has been allowed as part of this study.
• Any costs associated with areas outside the battery limits of the process plant except where specifically discussed (considered included in other sections of this study).
• Plant site rehabilitation costs are excluded from operating costs. An estimate for TSF rehabilitation costs has been provided by Knight Piésold. Rehabilitation costs are provided for each year in indirect costs and are part of the fully allocated C3 costs.
• Tailings storage costs, including future lifts and rehabilitation. These costs are capitalized and included under deferred capital.
• Any impact of foreign exchange rate fluctuations.
• Any escalation from the date of the estimate.
• Any contingency allowance.
• Head office / corporate costs and overheads which are included in indirect costs and are part of the fully allocated C3 costs.
• Insurances included in General and Administration.
MABILO PROJECT NATIONAL INSTRUMENT 43-101 TECHNICAL REPORT
1913\24.04\1913-000-GEREP-0003_D S21
Page 21.13
May 2016 Lycopodium Minerals Pty Ltd / MJV / Orelogy
• Withholding tax which is included in indirect costs and is part of the fully allocated C3 costs.
• Local / regional government rates and charges which are included in indirect costs and are part of the fully allocated C3 costs..
• Subsidies to local community which are included in indirect costs and are part of the fully allocated C3 costs.
• Ongoing land compensation costs which are included in indirect costs and are part of the fully allocated C3 costs.
• Government monitoring / compliance costs which are included in indirect costs and are part of the Company’s fully allocated C3 costs.
• Concentrate smelting charges are discussed in Section 22 and costs associated with out-loading and transport of the concentrates from site are addressed under concentrate handling and port costs described in Section 19 and allocated against revenue.
• Site laboratory operating costs for grade control samples are described in Section 15 and have been allocated to mining costs.
The process plant operating cost estimate includes the following:
• Import duties on process consumables (in the process consumables cost).
• Power for raw water supply pumps, decant return water pumping, mine dewatering bores, mining services area and accommodation camp.
21.2.4 Gold Cap Oxide Ore Operating Costs
Oxide ore treatment has been developed by MJV. The data has been sourced from the Pit Optimization sign off sheet and MJV advice. The costs allowed for oxide ore are as follows:
• An allowance of $1.50/dt to operate a mobile crushing plant for the oxide ore.
• Transport of ore 40 km at $0.25/km ($10/wmt).
• Processing at Coral Minesite ($35/dt).
MABILO PROJECT NATIONAL INSTRUMENT 43-101 TECHNICAL REPORT
1913\24.04\1913-000-GEREP-0003_D S21
Page 21.14
May 2016 Lycopodium Minerals Pty Ltd / MJV / Orelogy
21.2.5 Supergene / Oxide Skarn Operating Costs
Supergene/oxide skarn ore treatment has been developed by MJV. The data has been sourced from the Pit Optimization sign off sheet and MJV advice. The costs allowed for supergene / oxide skarn ore are as follows:
• Processing cost - $1.50/dt to operate a mobile crushing plant for the supergene ore.
• Transport of ore to port 40 km at $0.25/km ($10/wmt).
• Port charges ($2.34/wmt).
MABILO PROJECT
NATIONAL INSTRUMENT 43-101 TECHNICAL REPORT
1913-000-GEREP-0003
Table of Contents Page
22.0 ECONOMIC ANALYSIS 22.1 22.1 Introduction 22.1 22.2 Assumptions and Qualifications 22.3 22.3 Cash Flow Model 22.5 22.4 Financial Outcomes 22.6 22.5 Sensitivity Analysis 22.8
TABLES Table 22.1 Project Production Summary 22.2 Table 22.2 Tax and Royalty Obligations 22.4 Table 22.3 Project Net Profit After Tax Summary (1.0 Mtpa) 22.6 Table 22.4 Project Financial Measures Summary 22.7 Table 22.5 Key Statistics of the Financial Evaluation (1.0 Mtpa) 22.7 Table 22.6 Project NPVs 22.8 Table 22.7 Sensitivity Analysis 22.9 FIGURES Figure 22.1 Undiscounted Project Cash Flows 22.8 Figure 22.2 Sensitivity of Project IRR to Variation in Key Cost Inputs 22.10 Figure 22.3 Sensitivity of Project Pay-back to Variation in Key Cost Inputs 22.11 Figure 22.4 Sensitivity of Project NPV5 to Variation in Key Cost Inputs 22.12
1913\24.04\1913-000-GEREP-0003_D S22 May 2016 Corality / MJV
MABILO PROJECT NATIONAL INSTRUMENT 43-101 TECHNICAL REPORT
1913\24.04\1913-000-GEREP-0003_D S22
Page 22.1
May 2016 Corality / MJV
22.0 ECONOMIC ANALYSIS
22.1 Introduction
A financial assessment of the Mabilo Project has been conducted using a cash flow model prepared by Corality on behalf of Mt Labo Exploration and Development Corporation (MLEDC) and RTG Mining Inc. The model was structured using an Excel workbook.
Input data came from a variety of sources, including the various consultants contributions to this study, pricing obtained from external suppliers and contractors, and exchange rates and project specific financial data such as the expected project taxation regime received from MJV. The assessment was based upon the following:
• The capital costs are based on the estimates presented in Section 21.
• Capital cost estimates and expenditure schedules prepared by Lycopodium, Knight Piésold (KP) and MJV.
• Owners capital cost estimates prepared by Lycopodium and MJV.
• Sustaining capital cost estimates for the tailings dam calculated using stage development quantities supplied by KP.
• The mining, processing and administration costs are presented in Sections 21.
• Mine schedule and mining operation cost estimates based on the mining operations being contractor-operated, as developed by Orelogy for the study.
• Process operating costs estimates prepared by Lycopodium, with contributions from MJV and other members of the study team.
• Site general and administration costs prepared by MJV.
• Galeo Equipment Corporation's obligation to fund 1.5 Mt of initial pre-strip under its joint venture with RTG (Galeo Prestrip).
• Closure costs estimated by KP (TMF) and MJV. A provision for closure and rehabilitation costs of $8.48M has been allowed.
• Metallurgical performance characterized by testwork conducted for the study (Section 13).
• The metal prices were supplied by MJV based on the spot commodity prices at the time of feasibility completion.
• Offtake terms and pricing for the Project's products were supplied by Conrad Partners. Refining costs, deductions and penalties have been applied against revenue.
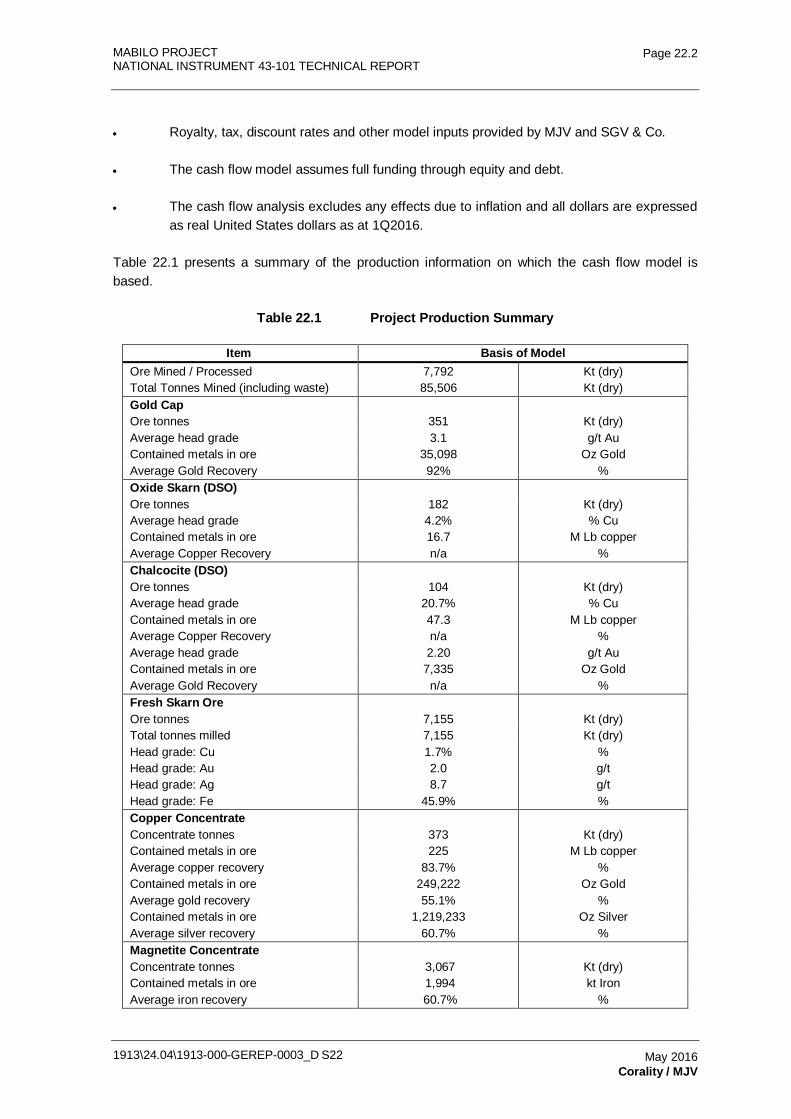
MABILO PROJECT NATIONAL INSTRUMENT 43-101 TECHNICAL REPORT
1913\24.04\1913-000-GEREP-0003_D S22
Page 22.2
May 2016 Corality / MJV
• Royalty, tax, discount rates and other model inputs provided by MJV and SGV & Co.
• The cash flow model assumes full funding through equity and debt.
• The cash flow analysis excludes any effects due to inflation and all dollars are expressed as real United States dollars as at 1Q2016.
Table 22.1 presents a summary of the production information on which the cash flow model is based.
Table 22.1 Project Production Summary
Item Basis of Model Ore Mined / Processed 7,792 Kt (dry) Total Tonnes Mined (including waste) 85,506 Kt (dry) Gold Cap Ore tonnes 351 Kt (dry) Average head grade 3.1 g/t Au Contained metals in ore 35,098 Oz Gold Average Gold Recovery 92% % Oxide Skarn (DSO)
Ore tonnes 182 Kt (dry) Average head grade 4.2% % Cu Contained metals in ore 16.7 M Lb copper Average Copper Recovery n/a % Chalcocite (DSO)
Ore tonnes 104 Kt (dry) Average head grade 20.7% % Cu Contained metals in ore 47.3 M Lb copper Average Copper Recovery n/a % Average head grade 2.20 g/t Au Contained metals in ore 7,335 Oz Gold Average Gold Recovery n/a % Fresh Skarn Ore
Ore tonnes 7,155 Kt (dry) Total tonnes milled 7,155 Kt (dry) Head grade: Cu 1.7% % Head grade: Au 2.0 g/t Head grade: Ag 8.7 g/t Head grade: Fe 45.9% % Copper Concentrate
Concentrate tonnes 373 Kt (dry) Contained metals in ore 225 M Lb copper Average copper recovery 83.7% % Contained metals in ore 249,222 Oz Gold Average gold recovery 55.1% % Contained metals in ore 1,219,233 Oz Silver Average silver recovery 60.7% % Magnetite Concentrate Concentrate tonnes 3,067 Kt (dry) Contained metals in ore 1,994 kt Iron Average iron recovery 60.7% %
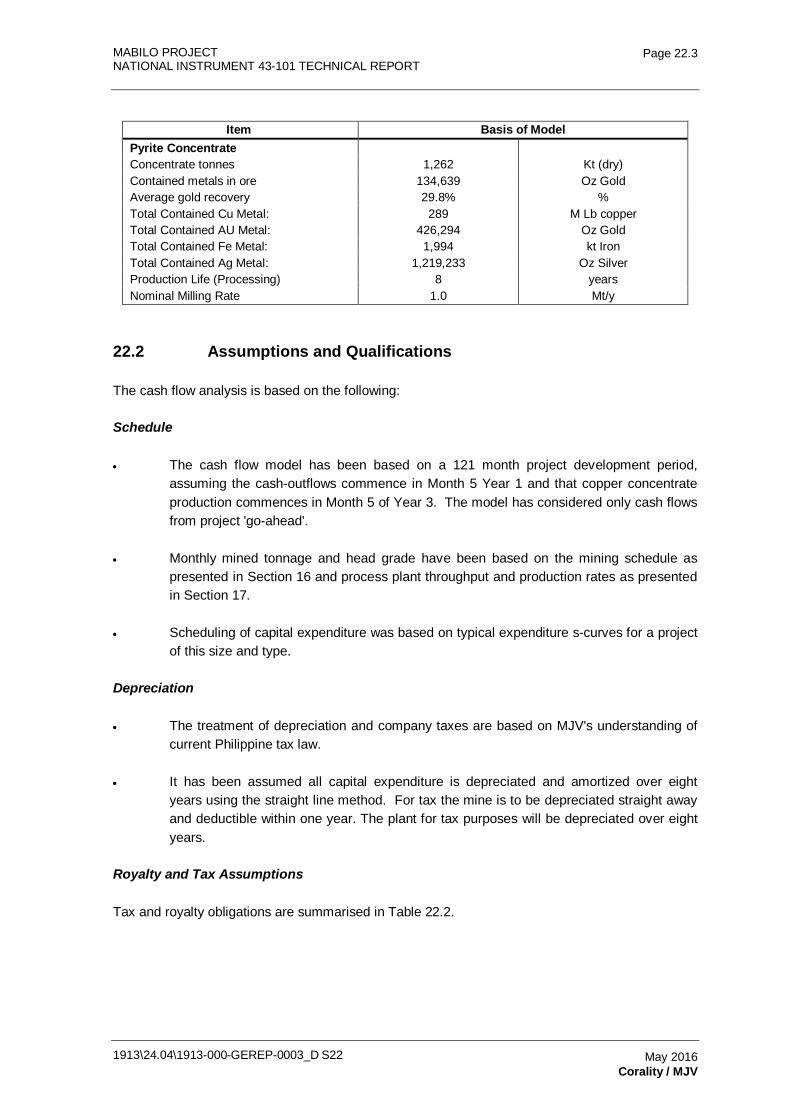
MABILO PROJECT NATIONAL INSTRUMENT 43-101 TECHNICAL REPORT
1913\24.04\1913-000-GEREP-0003_D S22
Page 22.3
May 2016 Corality / MJV
Item Basis of Model Pyrite Concentrate Concentrate tonnes 1,262 Kt (dry) Contained metals in ore 134,639 Oz Gold Average gold recovery 29.8% % Total Contained Cu Metal: 289 M Lb copper Total Contained AU Metal: 426,294 Oz Gold Total Contained Fe Metal: 1,994 kt Iron Total Contained Ag Metal: 1,219,233 Oz Silver Production Life (Processing) 8 years Nominal Milling Rate 1.0 Mt/y
22.2 Assumptions and Qualifications
The cash flow analysis is based on the following:
Schedule
• The cash flow model has been based on a 121 month project development period, assuming the cash-outflows commence in Month 5 Year 1 and that copper concentrate production commences in Month 5 of Year 3. The model has considered only cash flows from project 'go-ahead'.
• Monthly mined tonnage and head grade have been based on the mining schedule as presented in Section 16 and process plant throughput and production rates as presented in Section 17.
• Scheduling of capital expenditure was based on typical expenditure s-curves for a project of this size and type.
Depreciation
• The treatment of depreciation and company taxes are based on MJV's understanding of current Philippine tax law.
• It has been assumed all capital expenditure is depreciated and amortized over eight years using the straight line method. For tax the mine is to be depreciated straight away and deductible within one year. The plant for tax purposes will be depreciated over eight years.
Royalty and Tax Assumptions
Tax and royalty obligations are summarised in Table 22.2.
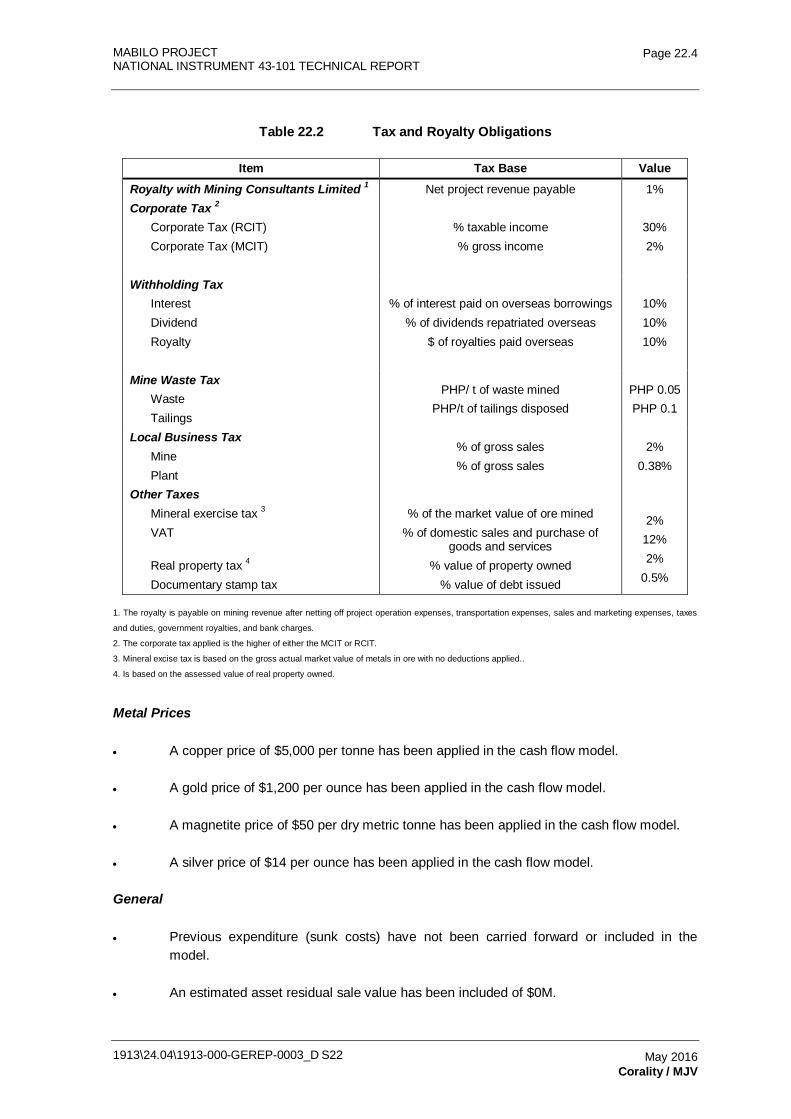
MABILO PROJECT NATIONAL INSTRUMENT 43-101 TECHNICAL REPORT
1913\24.04\1913-000-GEREP-0003_D S22
Page 22.4
May 2016 Corality / MJV
Table 22.2 Tax and Royalty Obligations
Item Tax Base Value Royalty with Mining Consultants Limited 1 Net project revenue payable 1% Corporate Tax 2
Corporate Tax (RCIT) Corporate Tax (MCIT)
% taxable income % gross income
30% 2%
Withholding Tax Interest Dividend Royalty
% of interest paid on overseas borrowings
% of dividends repatriated overseas $ of royalties paid overseas
10% 10% 10%
Mine Waste Tax Waste Tailings
PHP/ t of waste mined PHP/t of tailings disposed
PHP 0.05 PHP 0.1
Local Business Tax Mine Plant
% of gross sales % of gross sales
2% 0.38%
Other Taxes Mineral exercise tax 3 VAT Real property tax 4 Documentary stamp tax
% of the market value of ore mined
% of domestic sales and purchase of goods and services
% value of property owned % value of debt issued
2%
12% 2%
0.5%
1. The royalty is payable on mining revenue after netting off project operation expenses, transportation expenses, sales and marketing expenses, taxes
and duties, government royalties, and bank charges.
2. The corporate tax applied is the higher of either the MCIT or RCIT.
3. Mineral excise tax is based on the gross actual market value of metals in ore with no deductions applied..
4. Is based on the assessed value of real property owned.
Metal Prices
• A copper price of $5,000 per tonne has been applied in the cash flow model.
• A gold price of $1,200 per ounce has been applied in the cash flow model.
• A magnetite price of $50 per dry metric tonne has been applied in the cash flow model.
• A silver price of $14 per ounce has been applied in the cash flow model.
General
• Previous expenditure (sunk costs) have not been carried forward or included in the model.
• An estimated asset residual sale value has been included of $0M.
MABILO PROJECT NATIONAL INSTRUMENT 43-101 TECHNICAL REPORT
1913\24.04\1913-000-GEREP-0003_D S22
Page 22.5
May 2016 Corality / MJV
• Provision has been made for corporate head office costs in Manila during operations.
• No provision has been made for escalation or inflation.
• No provision has been made for Customs import duty, as it has been assumed that MJV will register with the Philippines Board of Investment for exemption from this.
• Provision has been made for additional taxation related to the repatriation of funds from Philippines to debt holders. A withholding tax rate of 10% has been applied.
• The model assumes no distribution of dividends.
• The NPV calculation is based on payments occurring at the end of each month.
22.3 Cash Flow Model
The cash flow model has been based on a 121 month project development period with cash-inflows commencing in Year -2 and gold production commencing in Year 1, Month 1. The model has considered only cash flows from the start of the mining construction period, with all previous expenditure considered losses carried forward to the start of production.
The production schedules, capital cost schedules and mine operating costs have been developed on a monthly basis. The processing and administration costs have been developed on an annual basis and attributed on a monthly basis. The cash flow model has been developed on a monthly basis, with depreciation and tax estimation also performed on a monthly basis.
The cash flow model reports:
• all costs in real US Dollars ($) exclusive of escalation or inflation
• a net present value (NPV) at multiple discount rates
• an internal rate-of-return (IRR) based on after-tax net cash flows.
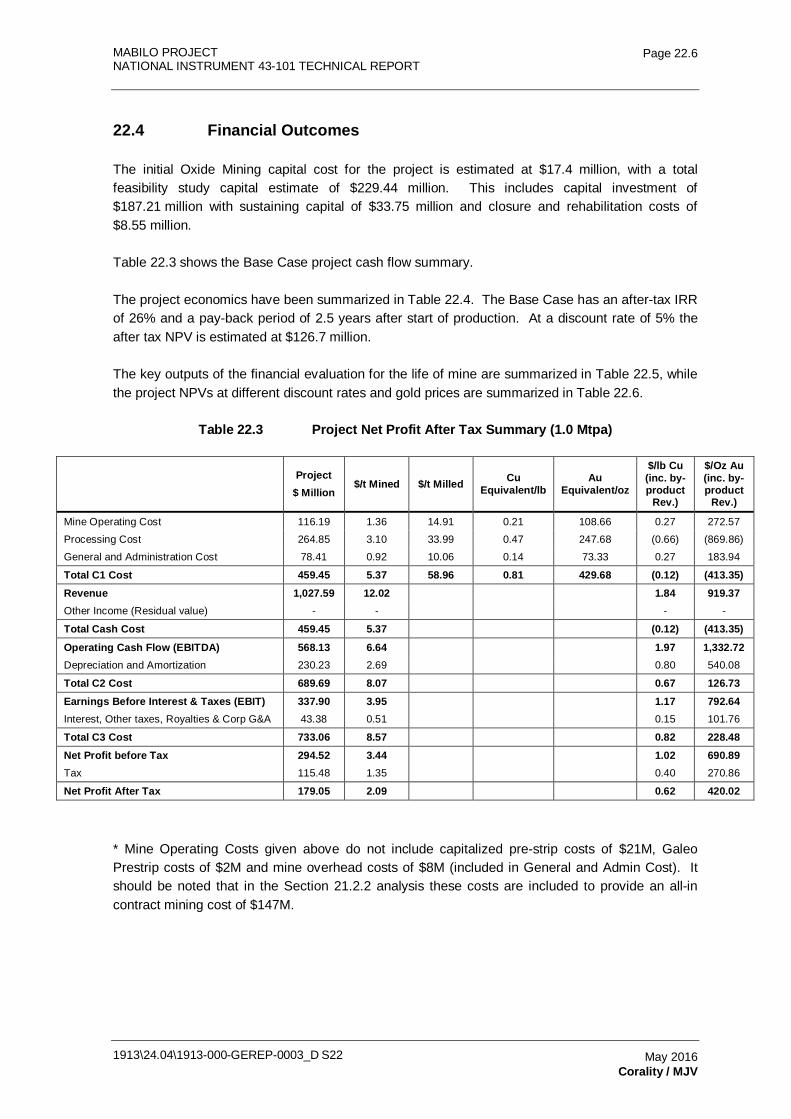
MABILO PROJECT NATIONAL INSTRUMENT 43-101 TECHNICAL REPORT
1913\24.04\1913-000-GEREP-0003_D S22
Page 22.6
May 2016 Corality / MJV
22.4 Financial Outcomes
The initial Oxide Mining capital cost for the project is estimated at $17.4 million, with a total feasibility study capital estimate of $229.44 million. This includes capital investment of $187.21 million with sustaining capital of $33.75 million and closure and rehabilitation costs of $8.55 million.
Table 22.3 shows the Base Case project cash flow summary.
The project economics have been summarized in Table 22.4. The Base Case has an after-tax IRR of 26% and a pay-back period of 2.5 years after start of production. At a discount rate of 5% the after tax NPV is estimated at $126.7 million.
The key outputs of the financial evaluation for the life of mine are summarized in Table 22.5, while the project NPVs at different discount rates and gold prices are summarized in Table 22.6.
Table 22.3 Project Net Profit After Tax Summary (1.0 Mtpa)
Project
$ Million $/t Mined $/t Milled Cu
Equivalent/lb Au
Equivalent/oz
$/lb Cu (inc. by-product
Rev.)
$/Oz Au (inc. by-product
Rev.)
Mine Operating Cost 116.19 1.36 14.91 0.21 108.66 0.27 272.57
Processing Cost 264.85 3.10 33.99 0.47 247.68 (0.66) (869.86)
General and Administration Cost 78.41 0.92 10.06 0.14 73.33 0.27 183.94
Total C1 Cost 459.45 5.37 58.96 0.81 429.68 (0.12) (413.35) Revenue 1,027.59 12.02
1.84 919.37
Other Income (Residual value) - -
- -
Total Cash Cost 459.45 5.37
(0.12) (413.35)
Operating Cash Flow (EBITDA) 568.13 6.64
1.97 1,332.72 Depreciation and Amortization 230.23 2.69
0.80 540.08
Total C2 Cost 689.69 8.07
0.67 126.73 Earnings Before Interest & Taxes (EBIT) 337.90 3.95
1.17 792.64
Interest, Other taxes, Royalties & Corp G&A 43.38 0.51
0.15 101.76
Total C3 Cost 733.06 8.57
0.82 228.48 Net Profit before Tax 294.52 3.44
1.02 690.89
Tax 115.48 1.35
0.40 270.86
Net Profit After Tax 179.05 2.09
0.62 420.02
* Mine Operating Costs given above do not include capitalized pre-strip costs of $21M, Galeo Prestrip costs of $2M and mine overhead costs of $8M (included in General and Admin Cost). It should be noted that in the Section 21.2.2 analysis these costs are included to provide an all-in contract mining cost of $147M.
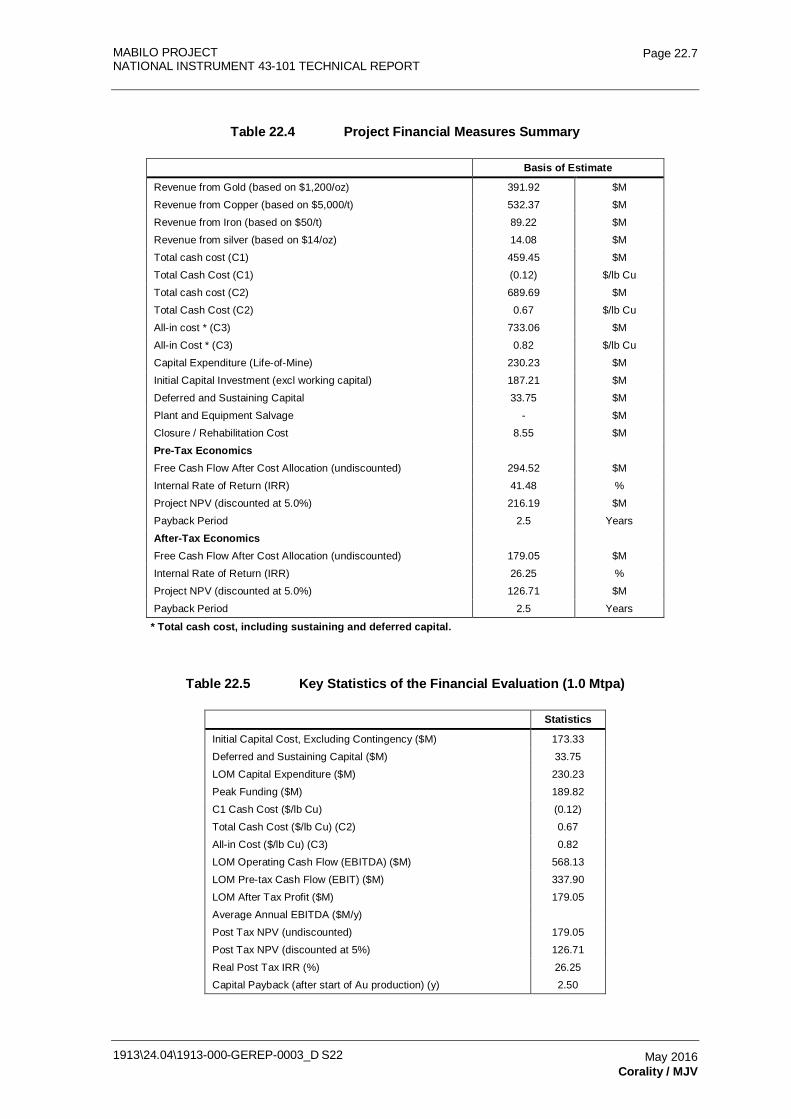
MABILO PROJECT NATIONAL INSTRUMENT 43-101 TECHNICAL REPORT
1913\24.04\1913-000-GEREP-0003_D S22
Page 22.7
May 2016 Corality / MJV
Table 22.4 Project Financial Measures Summary
Basis of Estimate
Revenue from Gold (based on $1,200/oz) 391.92 $M
Revenue from Copper (based on $5,000/t) 532.37 $M
Revenue from Iron (based on $50/t) 89.22 $M
Revenue from silver (based on $14/oz) 14.08 $M
Total cash cost (C1) 459.45 $M
Total Cash Cost (C1) (0.12) $/lb Cu
Total cash cost (C2) 689.69 $M
Total Cash Cost (C2) 0.67 $/lb Cu
All-in cost * (C3) 733.06 $M
All-in Cost * (C3) 0.82 $/lb Cu
Capital Expenditure (Life-of-Mine) 230.23 $M
Initial Capital Investment (excl working capital) 187.21 $M
Deferred and Sustaining Capital 33.75 $M
Plant and Equipment Salvage - $M
Closure / Rehabilitation Cost 8.55 $M
Pre-Tax Economics
Free Cash Flow After Cost Allocation (undiscounted) 294.52 $M
Internal Rate of Return (IRR) 41.48 %
Project NPV (discounted at 5.0%) 216.19 $M
Payback Period 2.5 Years
After-Tax Economics
Free Cash Flow After Cost Allocation (undiscounted) 179.05 $M
Internal Rate of Return (IRR) 26.25 %
Project NPV (discounted at 5.0%) 126.71 $M
Payback Period 2.5 Years
* Total cash cost, including sustaining and deferred capital.
Table 22.5 Key Statistics of the Financial Evaluation (1.0 Mtpa)
Statistics
Initial Capital Cost, Excluding Contingency ($M) 173.33
Deferred and Sustaining Capital ($M) 33.75
LOM Capital Expenditure ($M) 230.23
Peak Funding ($M) 189.82
C1 Cash Cost ($/lb Cu) (0.12)
Total Cash Cost ($/lb Cu) (C2) 0.67
All-in Cost ($/lb Cu) (C3) 0.82
LOM Operating Cash Flow (EBITDA) ($M) 568.13
LOM Pre-tax Cash Flow (EBIT) ($M) 337.90
LOM After Tax Profit ($M) 179.05
Average Annual EBITDA ($M/y)
Post Tax NPV (undiscounted) 179.05
Post Tax NPV (discounted at 5%) 126.71
Real Post Tax IRR (%) 26.25
Capital Payback (after start of Au production) (y) 2.50
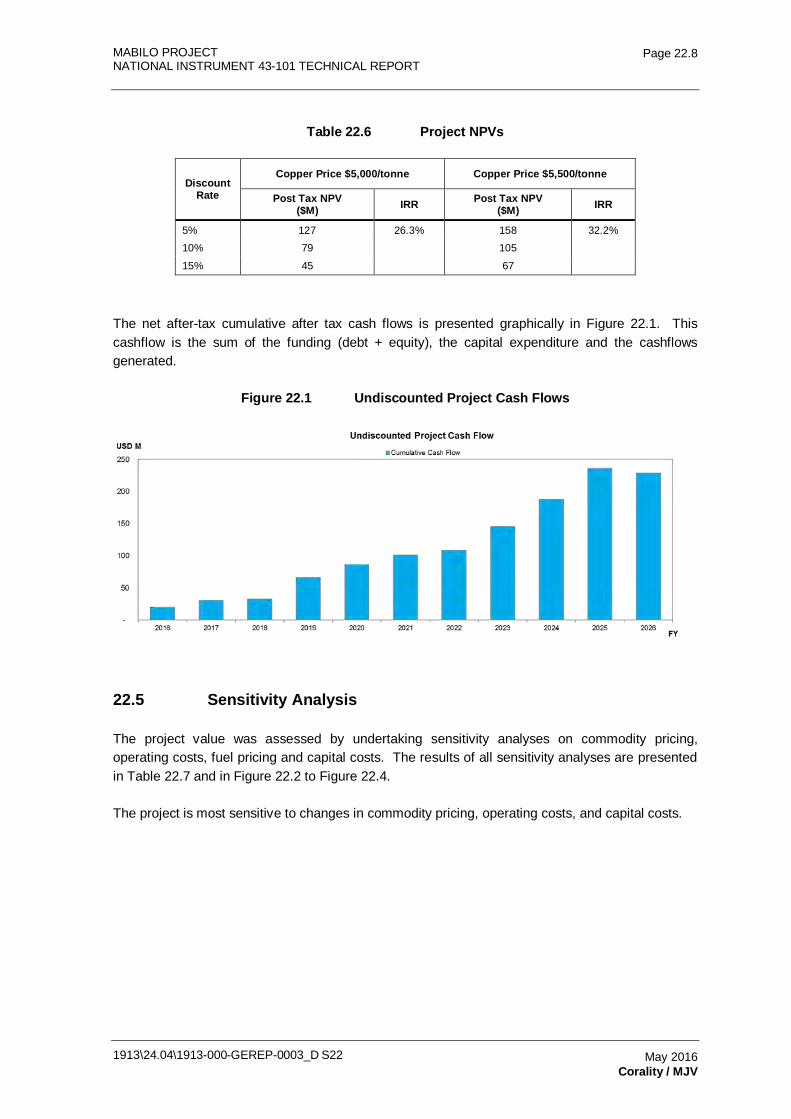
MABILO PROJECT NATIONAL INSTRUMENT 43-101 TECHNICAL REPORT
1913\24.04\1913-000-GEREP-0003_D S22
Page 22.8
May 2016 Corality / MJV
Table 22.6 Project NPVs
Discount Rate
Copper Price $5,000/tonne Copper Price $5,500/tonne
Post Tax NPV ($M) IRR Post Tax NPV
($M) IRR
5% 127 26.3% 158 32.2%
10% 79
105
15% 45
67
The net after-tax cumulative after tax cash flows is presented graphically in Figure 22.1. This cashflow is the sum of the funding (debt + equity), the capital expenditure and the cashflows generated.
Figure 22.1 Undiscounted Project Cash Flows
22.5 Sensitivity Analysis
The project value was assessed by undertaking sensitivity analyses on commodity pricing, operating costs, fuel pricing and capital costs. The results of all sensitivity analyses are presented in Table 22.7 and in Figure 22.2 to Figure 22.4.
The project is most sensitive to changes in commodity pricing, operating costs, and capital costs.
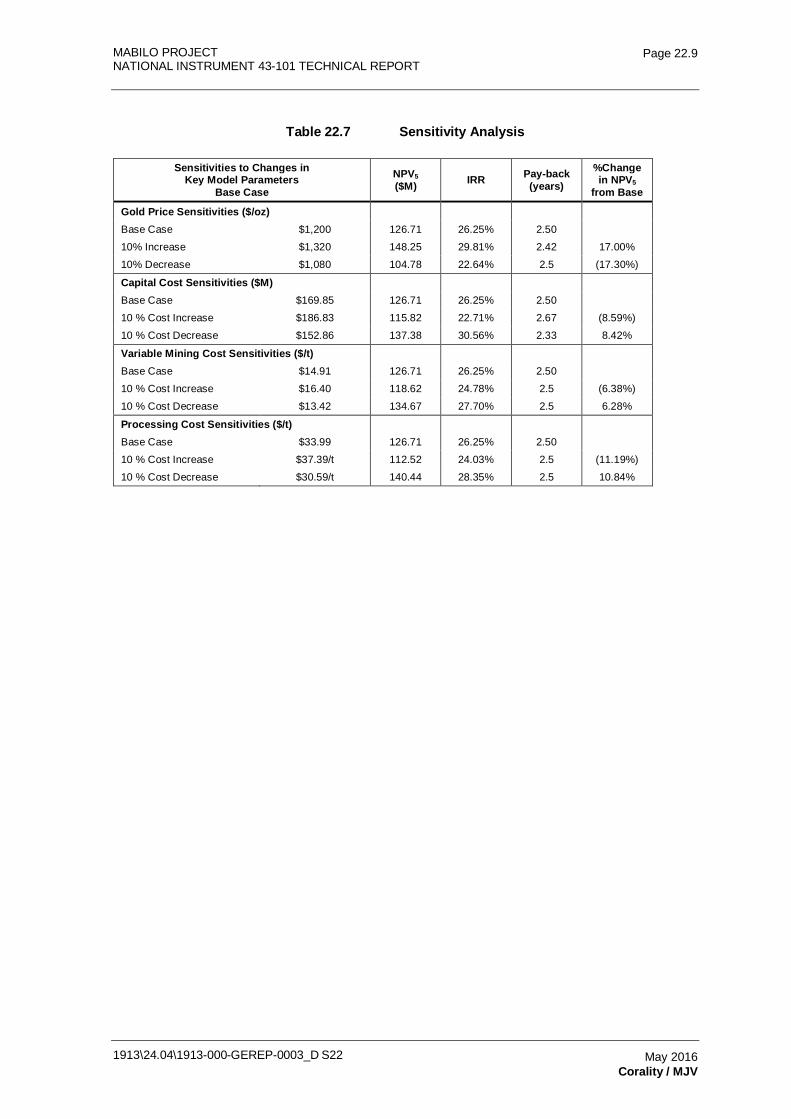
MABILO PROJECT NATIONAL INSTRUMENT 43-101 TECHNICAL REPORT
1913\24.04\1913-000-GEREP-0003_D S22
Page 22.9
May 2016 Corality / MJV
Table 22.7 Sensitivity Analysis
Sensitivities to Changes in Key Model Parameters
Base Case
NPV5 ($M) IRR Pay-back
(years)
%Change in NPV5
from Base
Gold Price Sensitivities ($/oz)
Base Case $1,200 126.71 26.25% 2.50
10% Increase $1,320 148.25 29.81% 2.42 17.00%
10% Decrease $1,080 104.78 22.64% 2.5 (17.30%)
Capital Cost Sensitivities ($M)
Base Case $169.85 126.71 26.25% 2.50
10 % Cost Increase $186.83 115.82 22.71% 2.67 (8.59%)
10 % Cost Decrease $152.86 137.38 30.56% 2.33 8.42%
Variable Mining Cost Sensitivities ($/t)
Base Case $14.91 126.71 26.25% 2.50
10 % Cost Increase $16.40 118.62 24.78% 2.5 (6.38%)
10 % Cost Decrease $13.42 134.67 27.70% 2.5 6.28%
Processing Cost Sensitivities ($/t)
Base Case $33.99 126.71 26.25% 2.50
10 % Cost Increase $37.39/t 112.52 24.03% 2.5 (11.19%)
10 % Cost Decrease $30.59/t 140.44 28.35% 2.5 10.84%
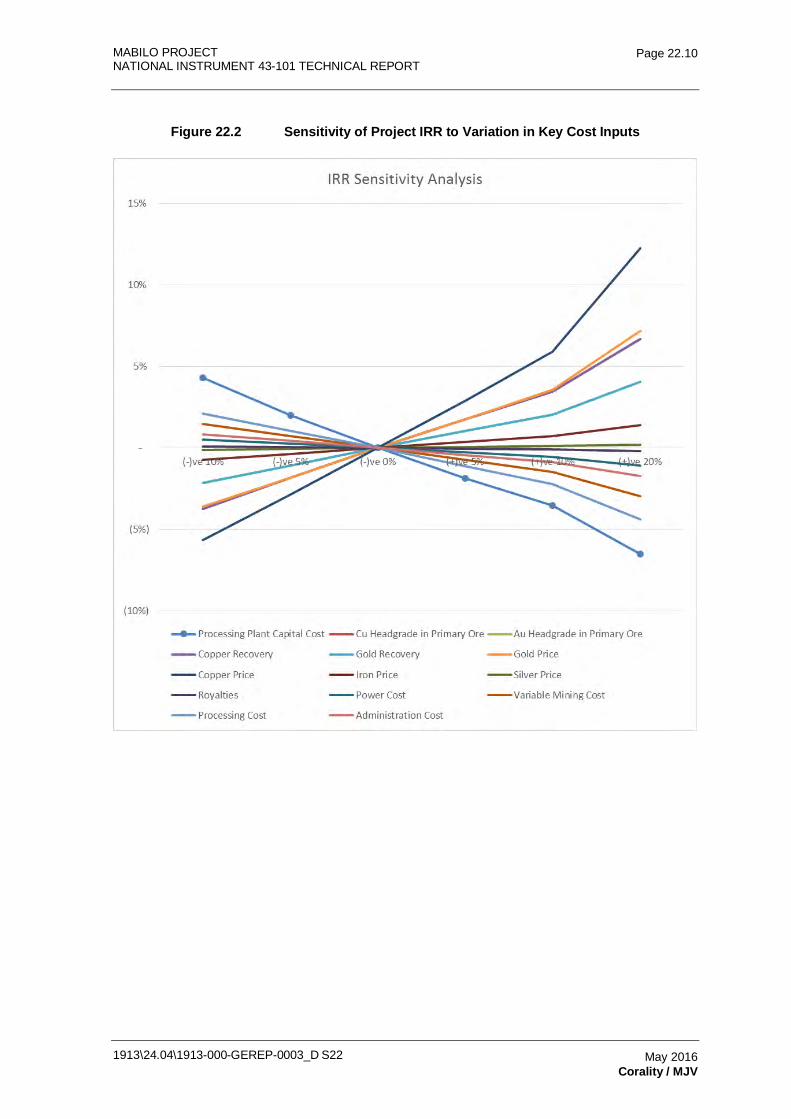
MABILO PROJECT NATIONAL INSTRUMENT 43-101 TECHNICAL REPORT
1913\24.04\1913-000-GEREP-0003_D S22
Page 22.10
May 2016 Corality / MJV
Figure 22.2 Sensitivity of Project IRR to Variation in Key Cost Inputs
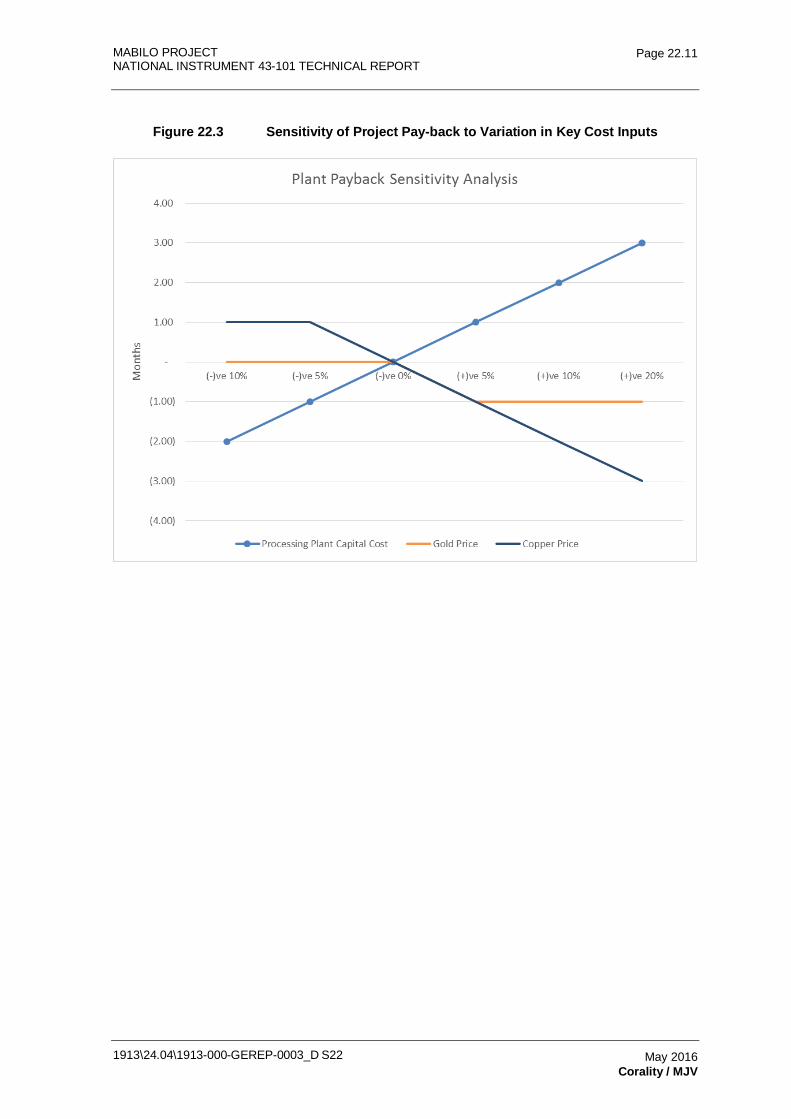
MABILO PROJECT NATIONAL INSTRUMENT 43-101 TECHNICAL REPORT
1913\24.04\1913-000-GEREP-0003_D S22
Page 22.11
May 2016 Corality / MJV
Figure 22.3 Sensitivity of Project Pay-back to Variation in Key Cost Inputs
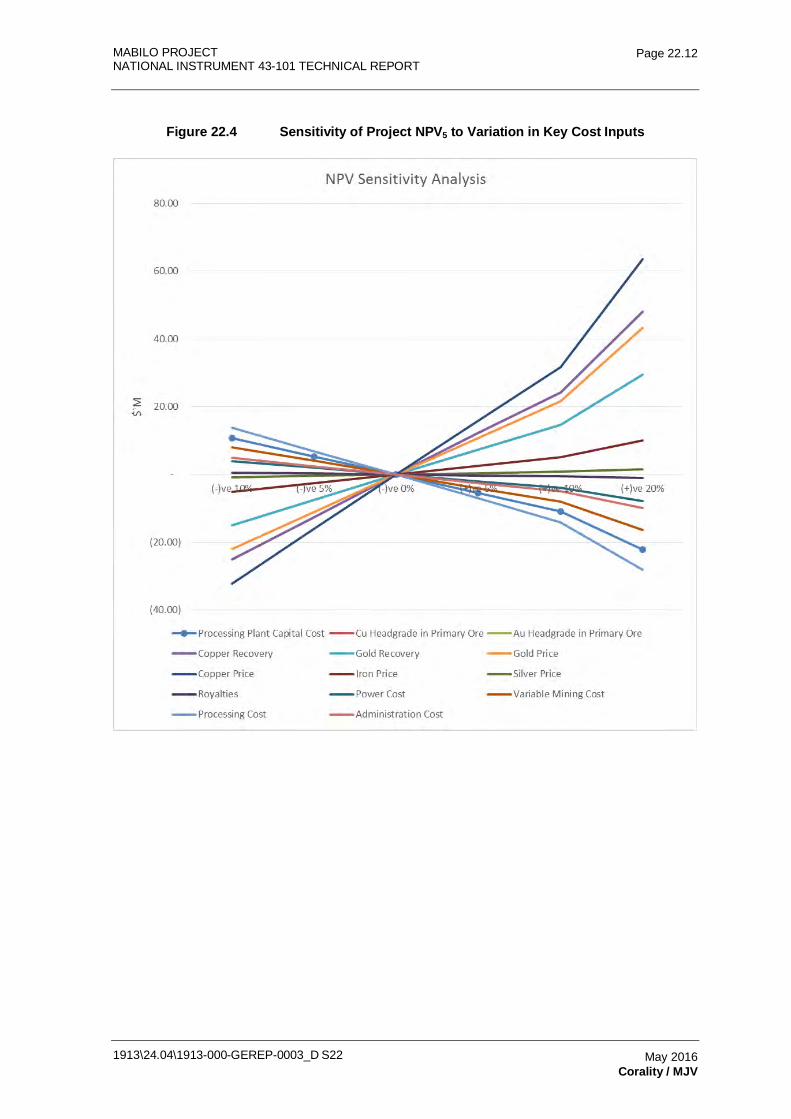
MABILO PROJECT NATIONAL INSTRUMENT 43-101 TECHNICAL REPORT
1913\24.04\1913-000-GEREP-0003_D S22
Page 22.12
May 2016 Corality / MJV
Figure 22.4 Sensitivity of Project NPV5 to Variation in Key Cost Inputs
MABILO PROJECT
NATIONAL INSTRUMENT 43-101 TECHNICAL REPORT
1913-000-GEREP-0003
Table of Contents Page
23.0 ADJACENT PROPERTIES 23.1
1913\24.04\1913-000-GEREP-0003_D S23 May 2016 CSA Global
MABILO PROJECT NATIONAL INSTRUMENT 43-101 TECHNICAL REPORT
1913\24.04\1913-000-GEREP-0003_D S23
Page 23.1
May 2016 CSA Global
23.0 ADJACENT PROPERTIES
The Qualified Person is not aware of any significant active exploration on mining properties in the immediate vicinity of the Mabilo Property. However, small-scale mining for direct shipping oxide ore is variably active at a number of skarn occurrences to the north of Mabilo. These occurrences, Binit, B1, and Mayaman, were described in Section 7. No data is available on production or grade.
MABILO PROJECT
NATIONAL INSTRUMENT 43-101 TECHNICAL REPORT
1913-000-GEREP-0003
Table of Contents Page
24.0 OTHER RELEVANT DATA AND INFORMATION 24.1 24.1 Operating Management Organizational Structure 24.1
24.1.1 General Operating Structure 24.1 24.1.2 Operating Statutory Coverage 24.2 24.1.3 Workplace Occupational Health and Safety 24.3 24.1.4 Roster Arrangements 24.5
24.2 Contractor Supplied Services 24.5 24.2.1 Mining Contractor 24.5 24.2.2 Product Haulage 24.6 24.2.3 Metallurgical, Assay and Environmental Laboratory 24.6 24.2.4 Maintenance Labor 24.6 24.2.5 Catering and Janitorial Services 24.6 24.2.6 Personnel Transport 24.6 24.2.7 Port Operations 24.6 24.2.8 Purchasing Services 24.6 24.2.9 Bulk Freight Movement 24.6
24.3 Project Implementation 24.7 24.3.1 Project Objectives 24.7 24.3.2 Project Execution Strategy 24.7 24.3.3 Schedule 24.7
24.4 Legal Aspects 24.8 24.5 Community Relations 24.8 24.6 Risks and Opportunities 24.8
24.6.1 Risks 24.9 24.6.2 Opportunities 24.10
TABLES Table 24.1 Operating Personnel Numbers 24.2 FIGURES Figure 24.1 Mabilo Project Table of Organization 24.1
1913\24.04\1913-000-GEREP-0003_D S24 May 2016 MJV
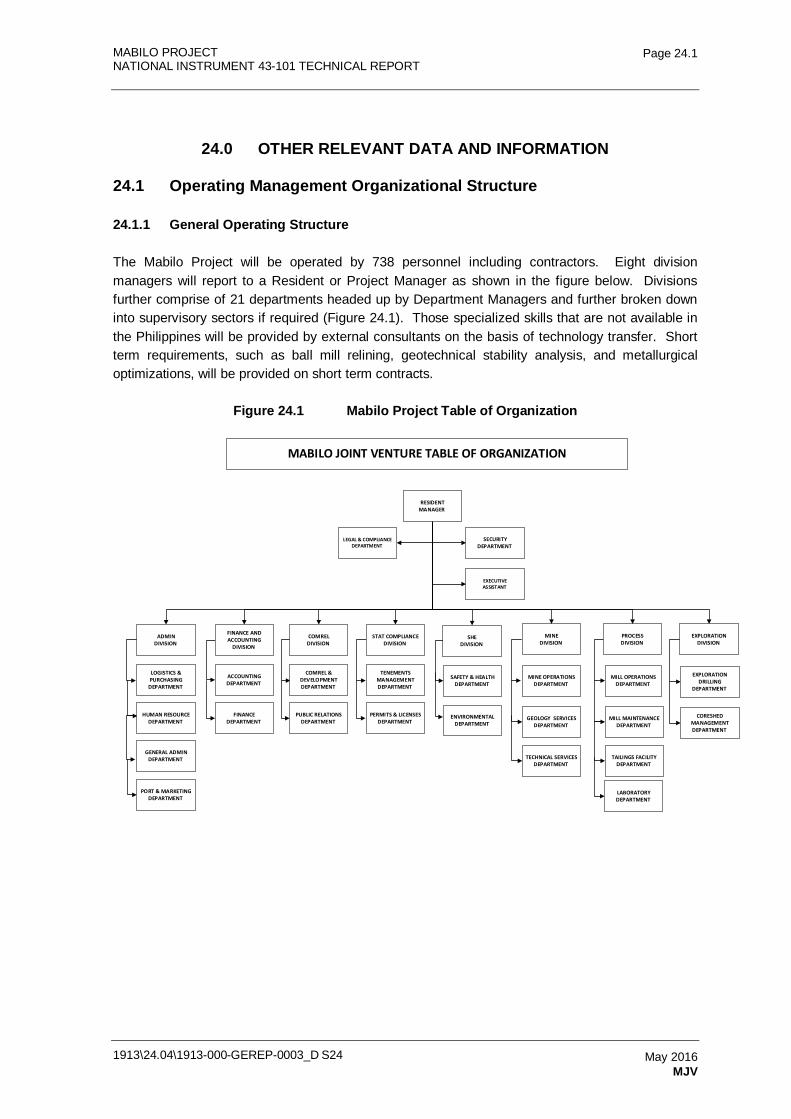
MABILO PROJECT NATIONAL INSTRUMENT 43-101 TECHNICAL REPORT
1913\24.04\1913-000-GEREP-0003_D S24
Page 24.1
May 2016 MJV
24.0 OTHER RELEVANT DATA AND INFORMATION
24.1 Operating Management Organizational Structure
24.1.1 General Operating Structure
The Mabilo Project will be operated by 738 personnel including contractors. Eight division managers will report to a Resident or Project Manager as shown in the figure below. Divisions further comprise of 21 departments headed up by Department Managers and further broken down into supervisory sectors if required (Figure 24.1). Those specialized skills that are not available in the Philippines will be provided by external consultants on the basis of technology transfer. Short term requirements, such as ball mill relining, geotechnical stability analysis, and metallurgical optimizations, will be provided on short term contracts.
Figure 24.1 Mabilo Project Table of Organization
EXECUTIVE ASSISTANT
RESIDENT MANAGER
LEGAL & COMPLIANCE DEPARTMENT
COMREL DIVISION
COMREL & DEVELOPMENT DEPARTMENT
PUBLIC RELATIONSDEPARTMENT
SECURITY DEPARTMENT
SHE DIVISION
SAFETY & HEALTHDEPARTMENT
ENVIRONMENTAL DEPARTMENT
MINE DIVISION
MINE OPERATIONSDEPARTMENT
TECHNICAL SERVICES DEPARTMENT
PROCESS DIVISION
MILL OPERATIONS DEPARTMENT
MILL MAINTENANCEDEPARTMENT
ADMINDIVISION
LOGISTICS & PURCHASING
DEPARTMENT
FINANCE AND ACCOUNTING
DIVISION
HUMAN RESOURCEDEPARTMENT
GENERAL ADMIN DEPARTMENT
PORT & MARKETING DEPARTMENT
TENEMENTS MANAGEMENTDEPARTMENT
TAILINGS FACILITYDEPARTMENT
LABORATORYDEPARTMENT
PERMITS & LICENSESDEPARTMENT
ACCOUNTING DEPARTMENT
MABILO JOINT VENTURE TABLE OF ORGANIZATION
STAT COMPLIANCE DIVISION
EXPLORATIONDIVISION
GEOLOGY SERVICES DEPARTMENT
FINANCEDEPARTMENT
EXPLORATION DRILLING
DEPARTMENT
CORESHED MANAGEMENTDEPARTMENT
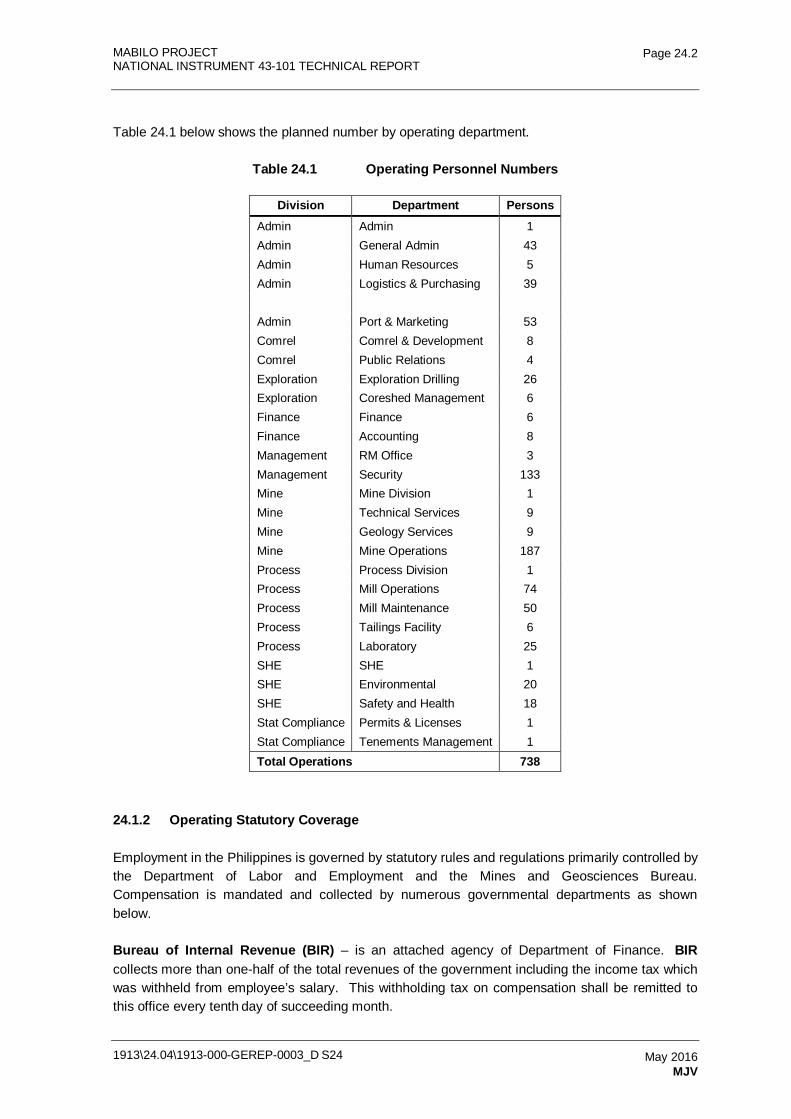
MABILO PROJECT NATIONAL INSTRUMENT 43-101 TECHNICAL REPORT
1913\24.04\1913-000-GEREP-0003_D S24
Page 24.2
May 2016 MJV
Table 24.1 below shows the planned number by operating department.
Table 24.1 Operating Personnel Numbers
Division Department Persons Admin Admin 1 Admin General Admin 43 Admin Human Resources 5 Admin Logistics & Purchasing 39
Admin Port & Marketing 53 Comrel Comrel & Development 8 Comrel Public Relations 4 Exploration Exploration Drilling 26 Exploration Coreshed Management 6 Finance Finance 6 Finance Accounting 8 Management RM Office 3 Management Security 133 Mine Mine Division 1 Mine Technical Services 9 Mine Geology Services 9 Mine Mine Operations 187 Process Process Division 1 Process Mill Operations 74 Process Mill Maintenance 50 Process Tailings Facility 6 Process Laboratory 25 SHE SHE 1 SHE Environmental 20 SHE Safety and Health 18 Stat Compliance Permits & Licenses 1 Stat Compliance Tenements Management 1 Total Operations 738
24.1.2 Operating Statutory Coverage
Employment in the Philippines is governed by statutory rules and regulations primarily controlled by the Department of Labor and Employment and the Mines and Geosciences Bureau. Compensation is mandated and collected by numerous governmental departments as shown below.
Bureau of Internal Revenue (BIR) – is an attached agency of Department of Finance. BIR collects more than one-half of the total revenues of the government including the income tax which was withheld from employee’s salary. This withholding tax on compensation shall be remitted to this office every tenth day of succeeding month.

MABILO PROJECT NATIONAL INSTRUMENT 43-101 TECHNICAL REPORT
1913\24.04\1913-000-GEREP-0003_D S24
Page 24.3
May 2016 MJV
Social Security System (SSS) – a system of federally funded services and payments to help support the needy, the aged, and the temporarily unemployed as well as providing support for needy, dependent, disabled, or neglected children, rehabilitation for the disabled, and a host of other social services. Employers are required to remit the monthly contribution every tenth day of succeeding month (portion of such were deducted from employees salary plus employer’s share).
Philippine Health Insurance Corporation (Philhealth) – was created in 1995 to create a universal health coverage for the Philippines. It is a tax-exempt, government-owned and government controlled corporation (GOCC) of the Philippines, and is attached to the Department of Health. Employers are required to remit the monthly contribution every tenth day of the following month (portion of such were deducted from employees salary and other will be shared of the company)
Home Development Mutual Fund (HDMF) – popularly known as the Pag-ibig Fund, was established to provide a national saving program and affordable shelter financing for the Filipino worker. The Fund offers its members short-term loans and access to housing programs. Employers shall be required to remit the monthly contributions (both employees and employer’s share) depending on the first letter of Company’s name.
Department of Labor and Employment (DOLE) – is the executive department of the Philippine Government mandated to formulate policies, implement programs and services, and serve as the policy-coordinating arm of the Executive Branch in the field of labor and employment. It is tasked with the enforcement of the provisions of the Labor Code.
Alien Employment Permit (AEP) - is a document issued by the Department of Labor and Employment which authorizes a foreign national to work in the Philippines.
Professional Regulation Commission (PRC) - is the Philippine government agency mandated to regulate and supervise the practice of the professionals (except Lawyers), the highly skilled manpower of the country. As the agency-in charge of the professional sector, the PRC plays a strategic role in developing the corps of professionals of industry, commerce, governance, and the economy.
Bureau of Immigration (BOI) - is responsible for the control and regulation of the arrival and stay of foreigners including the admission, registration, exclusion, deportation and repatriation of aliens. It also supervises the immigration into and emigration from the Philippines of aliens. It can be gleaned from these functions that the office is a vital component of government and a potent factor in the development of the nation.
24.1.3 Workplace Occupational Health and Safety
A detailed Project Health and Safety Management Plan has been implemented at the Mabilo project and is available at the Project offices. It must be read in conjunction with all other company policies, including personnel policies.
The Occupational Health & Safety (OH&S) Management Plan has been developed into a full procedure to ensure that all activities of the Mabilo Joint Venture (MJV) conform to the safety regulations, legislation, contract provisions, codes and standards as well as the stringent

MABILO PROJECT NATIONAL INSTRUMENT 43-101 TECHNICAL REPORT
1913\24.04\1913-000-GEREP-0003_D S24
Page 24.4
May 2016 MJV
requirements of the company's policy. The management shall actively seek the support of all operatives, contractors and suppliers engaged with the project to look after their own health and safety as well as that of their colleagues, by working within the context of this plan. The Occupational Health & Safety (OH&S) Management Plan describes the objectives, implementing guidelines, control measures, and the review of performance that shall be utilized in the execution of the operations, construction and civil works that includes but is not limited to:
• OH&S Policy.
• Personnel Protection Program.
• OH&S Organization.
• Accident / Incident Investigation.
• OH&S Training.
• Emergency Preparedness.
• Keep it Safe and Sound Program.
• OH&S Promotion.
• In-house OH&S Rules and Regulations.
• Health Assurance Program.
• Health and Safety Committee.
• Evaluation, Selection and Control of Subcontractor.
• Program for Inspection of Hazardous Operations.
• Process Control Program.
• Hazard Identification, Risk Assessment and Risk Control.
MABILO PROJECT NATIONAL INSTRUMENT 43-101 TECHNICAL REPORT
1913\24.04\1913-000-GEREP-0003_D S24
Page 24.5
May 2016 MJV
24.1.4 Roster Arrangements
The project will employ both locally hired (~70%), non-local personnel, contractors and consultants. All MJV and non-company personnel will be subject to a roster arrangement. MJV will implement a Compressed Work Schedule (CWS) that is in compliance with the Labor Standards set by the Department of Labor and Employment of the Philippines. With the implementation of the CWS Program, the company hereby institutes the Field Break Travel Policy to regulate the rostered schedule and to define the entitlement of travel benefits per position level. The Field Break Policy shall apply to all MJV workers regardless of engagement status and rank and it is planned that non-MJV personnel will follow a similar system. Rosters will be scheduled:
• To ensure that appropriate manpower levels are maintained at all times, a Field Break Schedule prescribed by the MJV, shall be adopted by all support and operations personnel.
• The Field Break Roster (FBR) shall depend on his / her Point of hire declared by the worker upon employment.
• The following FBR shall be applied:
- For managers and above – four weeks on site / one week off site; travel time shall be considered personal time, or included in the one week off.
- Expats will have six weeks on and two weeks off due to long travel to their point of hire.
- For officers and supervisors – six weeks on site / one week off site; travel time shall be considered company time, or not included in the one week off.
- Local hires will have six days work one day off roster.
• Construction rosters will vary and be driven by construction schedules.
24.2 Contractor Supplied Services
It is proposed that the project will operate with key contracts including the following.
24.2.1 Mining Contractor
The mining contractor will be responsible for a complete pre-strip, waste moving and ore stockpiling contract. Battery limits would include environmental management and grade control drilling, if required.
The mining contractor shall provide the following specific items:
• All mining, servicing and auxiliary equipment, facilities, pumps, pipes, tools and spare parts inventory, all in good condition, to meet the mining and ROM quantities required by the Owner’s production schedule.
MABILO PROJECT NATIONAL INSTRUMENT 43-101 TECHNICAL REPORT
1913\24.04\1913-000-GEREP-0003_D S24
Page 24.6
May 2016 MJV
• Sufficient numbers of competent, trained personnel, including qualified operators to operate and maintain the equipment and to supervise and administer the works under the contract.
24.2.2 Product Haulage
A contractor will be retained for the trucking of ore and concentrate products from the ROM to the port facility. Safety, security and self-monitoring systems will be in place.
24.2.3 Metallurgical, Assay and Environmental Laboratory
Licensed laboratory contractors have submitted proposals for operating sampling and analysis services for the project. The details are included in the operating cost section of this report. The successful contractor will equip the project provided building and manage project provided staff. Sampling and analysis include areas of exploration, mine operations, metallurgy, processing, product haulage and shipping, and environmental.
24.2.4 Maintenance Labor
Routine discreet packages of maintenance will be issued to locally qualified contractors.
24.2.5 Catering and Janitorial Services
Catering during construction and operations will contracted to qualified and experienced parties. It is envisioned this will be a combination of capital equipment provision and management of locally hired personnel.
24.2.6 Personnel Transport
This will consist of contract staff movements by certified transporters.
24.2.7 Port Operations
A qualified logistics contractor will contract the shipping logistics and loading.
24.2.8 Purchasing Services
It is envisioned that some long term repeating items, such as PPE and fuel will be contracted out on either a repeat ordering system or consignment.
24.2.9 Bulk Freight Movement
Construction materials will be combined into a single contract of logistics and freight forwarding for both the initial construction phase as well as the operating periods. Fuel, lubricants and explosives will be transported by the vendors.
MABILO PROJECT NATIONAL INSTRUMENT 43-101 TECHNICAL REPORT
1913\24.04\1913-000-GEREP-0003_D S24
Page 24.7
May 2016 MJV
24.3 Project Implementation
24.3.1 Project Objectives
The strategic objectives for the Project can be summarized as follows:
• Zero lost time and medical treatment injuries.
• Zero environmental incidents.
• 100% compliance with all approvals.
• Positive community relations.
• Implementation and delivery of a project which achieves the performance criteria.
• Low cost and fast track approach to delivery.
24.3.2 Project Execution Strategy
The Project execution strategy selected by MJV for the design and construction management of the Project is, in general terms, based on a MJV team self performing the management of all works outside the process plant fence line as well as bulk earthworks for the process plant site itself with an Engineering, Procurement and Construction Management (EPCM) Engineer (the Engineer) providing design, procurement and certain project management services as well as construction management for the greater part of the processing plant and associated infrastructure. MJV believes this will offer a cost effective approach to project delivery and enable it to monitor and control the budget, schedule and quality of the end product through all stages of project development and execution.
The Project capital cost estimate and schedule has been developed in conjunction with MJV on the basis of their preferred execution strategy.
Project implementation is based on contract mining, however, the study assumes that the mine services area will be built and owned by MJV and this is reflected in the capital estimates.
24.3.3 Schedule
The Overall Project schedule has been developed based on the following key dates:
• Early Works Design Award Month 1
• Environmental Permit Issued Month 2
• Mining License Issued Month 2
• Oxide Pre-strip Month 3
MABILO PROJECT NATIONAL INSTRUMENT 43-101 TECHNICAL REPORT
1913\24.04\1913-000-GEREP-0003_D S24
Page 24.8
May 2016 MJV
• Oxide Ore Mining Month 7
• Front End Engineering (FEED) Month 9
• Permitting for Primary Plant Month 11
• Primary Cut back Month 11
• EPCM Award Month 13
• Supergene production commences Month 14
• SAG mill Award Month 14
• Earthworks and Piling Commence Month 16
• SAG mill on site Month 25
• TSF complete Month 29
• Power On Month 29
• Ore through crusher Month 30
• First concentrate Month 31
These activities have been combined into an overall project schedule with total project duration of 31 months from the commencement of early works design to first concentrate production.
24.4 Legal Aspects
This aspect of the project has been addressed in Section 4.0 of this report.
24.5 Community Relations
This aspect of the project has been addressed in Section 20.0 of this report. 24.6 Risks and Opportunities
During the study the participants have identified a number of risks and opportunities. The key items are presented below.
MABILO PROJECT NATIONAL INSTRUMENT 43-101 TECHNICAL REPORT
1913\24.04\1913-000-GEREP-0003_D S24
Page 24.9
May 2016 MJV
24.6.1 Risks
• The domains in the resource model have been developed based on geology and grade distribution, however they do not take into account all the variability in mineralization type that is significant for metallurgical performance. This importantly includes the degree of clay-silica-pyrite overprint and brecciation, as well as hypogene bornite domains. An initial geometallurgical model has been developed using a combination of logging and multi-element analytical data but requires further refinement in tandem with metallurgical optimization.
• Access Risk - Tenement Rights. Approval needs to be obtained via a Mineral Production Sharing Agreement (MPSA), this is the mechanism to secure the Mabilo 'Contract Area' which is a term comparable to a mining lease in other jurisdictions. MPSA approval for the oxide mining phase (no processing) to secure the Mabilo 'Contract Area' has been entered into but not yet granted. During this phase ore and waste are mined and all ore is transported away without onsite treatment.
• The main risk to the project is the assumption that waste mining south of the lease boundary will be permitted. This approval is not necessary for the project to commence mining and processing oxide ores during the first years of the operation. However it will materially impact on the Mineral Reserves if waste mining south of the lease boundary is not granted.
• Geotechnical Conditions – Slightly steeper wall angles have been used in the pit design than those specified in the Geotechnical report. The risks can be managed by:
- ensuring that the slopes are adequately drained
- adopting appropriate mining practices
- utilization of slope monitoring radars for example.
• Transportation – Transportation of significant quantities of ore and concentrate through villages via busy public roads is necessary. A serious incident could interrupt this important activity. This risk can be managed somewhat through:
- developing a road transport protocol and associated training
- additional road upgrades (if required) to those proposed in this study
- maintaining good community relationships in a consultative manner.
• Hydrological Conditions – Hydrological conditions are yet to be tested and modeled. The risks of surface water flooding and pit groundwater inflows can be managed by ensuring that drainage and diversion channels, diversion walls and the borefield are adequately designed to be effective for the duration of the project.
• Cyclonic Rainfall – Cyclonic rainfall events resulting in flooding, damage and delays.
MABILO PROJECT NATIONAL INSTRUMENT 43-101 TECHNICAL REPORT
1913\24.04\1913-000-GEREP-0003_D S24
Page 24.10
May 2016 MJV
• Groundwater Inflow. Groundwater is likely to be encountered as the pit is developed with potential delays from flooding as a result of high water inflows. In accordance with the IMC mining cost assumptions much of this risk is mitigated through the planned dewatering program using a borefield around the pit limit. An in pit dewatering system for pumping excess water out of the pit may be required in conjunction with the sump-loaded water cart solution.
• Sampling of the orebody was limited and the calculation of recoveries was not completed on a geological domain basis as there were insufficient samples in each identified domain. Further definition of domains and subsequent sampling may vary the calculated recoveries.
• Limited piling under the process plant facilities has been allowed. In particular, crushing, milling and flotation. Other facilities such as water storage may be disrupted if an earthquake occurs.
• Geochemical testing of mine waste is currently being undertaken. It is currently assumed that approximately 50% of waste will be potentially acid forming (PAF) or leachable. This value is based on a review of geology database where 42% of material that was not considered ore grade returned sulfur values of less than 0.3% which is generally considered to be the lower limit at which acid generation is likely to occur. In addition, the cover materials are likely to possess lower sulfur values.
• The rainfall at the site is high and sediment loads will naturally be high within the stream courses. The environmental control dams have limited ability to reduce sediment loads and the primary means of sediment control will be to limit sediment runoff at source (from localized areas).
• The site water model currently assumes that in pit dewatering will be treated through a wetland system and perimeter pit dewatering discharged directly to the site streams. The quality and quantity of pit water is to be confirmed.
• Approval for road upgrades is still required.
• No allowances for treatment of pit dewatering water or TSF reclaim water. This may increase reagent costs.
• Lack of qualified process plant operations and maintenance staff may increase usage of reagents.
24.6.2 Opportunities
• The bulk of the resource tonnes are within a very continuous stratabound magnetite skarn body that has been offset along a fault separating the South and North Mineralized Zones. The skarn remains open in the southeast of the South Mineralized Zone and to the North of the North Mineralized Zone.
MABILO PROJECT NATIONAL INSTRUMENT 43-101 TECHNICAL REPORT
1913\24.04\1913-000-GEREP-0003_D S24
Page 24.11
May 2016 MJV
• There is also exploration potential for additional zones of skarn mineralization, including mineralized magnetite skarn and mineralized garnet skarn which has not been identified by magnetic surveys:
- Targets with anomalous magnetic response that have not been fully tested include the Venida pit and the Southeast Anomaly. Limited drilling of the Southeast Anomaly to date has intersected magnetite skarn without significant copper or gold, however additional testing is required.
- Drilling on the South Mineralized Zone has shown that high-grade copper-gold mineralization occurs in garnet skarn without significant magnetite. Exploration and discovery at Mabilo has been driven by testing of modeled magnetic bodies, potential for non-magnetic skarn mineralization remains poorly tested.
- There is additional untested exploration potential for porphyry copper-gold style mineralization at Mabilo. Although, where drilled, the quartz-diorite stock at Mabilo is not significantly altered, strongly altered porphyry dykes have been intersected in the contact zone of the stock and veins similar to D-veins in a porphyry-copper system have been intersected in intrusive rock and altered host metasediments. This suggests that the main stock may not be the causative intrusion for the mineralized skarn and that potential exists for porphyry-style mineralization. The silica-clay-pyrite alteration and hydraulic brecciation are also suggestive of acid steam-driven argillic alteration above or peripheral to mineralizing porphyry.
• Slope Angles. If steeper slope angles can be substantiated through additional geotechnical investigation and also through slope monitoring as the pit is being excavated, there is a potential to reduce the strip ratio and hence mining costs.
• With a strip ratio of 10:1, waste haulage makes up a significant component of the mining cost. Development of an integrated mine production schedule that includes a waste dump construction sequence is recommended to reduce haulage costs over the life of mine.
• The proposed berm / batter configuration proposed consist of 15 m high faces within the fresh material, whereas the proposed blasting bench height is 10 m. Although not impossible, this combination of blasting and face heights will introduce additional complications to the mining activities at Mabilo. It is recommended that 7.5 m blast bench heights are examined.
• A dedicated gold leaching programme on the flotation tails streams is recommended to trial sulphide oxidation processes to improve gold extraction and to investigate specific measures to reduce cyanide consumption. An increase in gold price or leach recoveries would make this step profitable. Retrofitting a gold leach section to the process would be relatively simple with all the infrastructure in place and treating already fine ground tailings.
MABILO PROJECT NATIONAL INSTRUMENT 43-101 TECHNICAL REPORT
1913\24.04\1913-000-GEREP-0003_D S24
Page 24.12
May 2016 MJV
• Staff numbers in the operation are significant (738). Review of the organization chart and simplification of the organization is recommended to improve the operation.
• Explore utilizing in-country supply to a greater extent rather than imported. This will minimize freight costs and may also have tax benefits.
• Consider self perform for portions of the scope such as earthworks and accommodation.
• General and Administration costs are significant and should be reviewed.
• Selection of a Heavy Fuel Oil power station may reduce power unit cost although it will incur additional capital.
• Reagent addition levels in practice are often lower than in laboratory testwork due to recirculation in the process water.
MABILO PROJECT
NATIONAL INSTRUMENT 43-101 TECHNICAL REPORT
1913-000-GEREP-0003
Table of Contents Page
25.0 INTERPRETATION AND CONCLUSIONS 25.1 25.1 Interpretation and Conclusions 25.1 25.2 Mineral Resource Estimate 25.1 25.3 Mineral Reserve 25.3 25.4 Metallurgy and Processing 25.4 25.5 Infrastructure 25.5
TABLES Table 25.1 Financial vs Pit Optimization Comparison 25.4 Table 25.2 Commercial Export Product and Destination 25.6
1913\24.04\1913-000-GEREP-0003_D S25 May 2016 Lycopodium Minerals Pty Ltd / MJV / CSA / Orelogy
MABILO PROJECT NATIONAL INSTRUMENT 43-101 TECHNICAL REPORT
1913\24.04\1913-000-GEREP-0003_D S25
Page 25.1
May 2016 Lycopodium Minerals Pty Ltd / MJV / CSA / Orelogy
25.0 INTERPRETATION AND CONCLUSIONS
25.1 Interpretation and Conclusions
The Mabilo Feasibility Study has identified, defined and costed a conventional open cut mine and flotation / magnetic separation processing facility.
The Mabilo Property occurs in the Paracale district of the Pacific Cordillera magmatic arc belt of the Philippines archipelago. The Paracale district has a long history of gold and iron mining. The Property comprises one granted Exploration Permit (EP-014-2013-V) and two Exploration Permit Applications (EXPA-000188-V and EXPA-209-V). The Property area is relatively flat lying and is accessed by 15 km of all-weather road from the nearby town of Labo.
The Mabilo Project is an economically viable project based on the metal prices used in the evaluation. The project is estimated to have an after tax NPV of $US126.7 million at a 5% discount rate and a payback of 2.5 years.
Residual risks include the granting of mining licenses, finalization of mine geotechnical data and water management and some uncertainty in regard to metallurgical variability.
25.2 Mineral Resource Estimate
The modeled mineralization is a copper–gold–magnetite skarn deposit. This is a relatively common type of skarn deposit, typically associated with mid-level intermediate calc-alkaline intrusions cutting carbonate rocks in magmatic arcs. The two deposit areas modeled, the North Mineralized Zone (NMZ) and South Mineralized Zone (SMZ), are approximately 150 m apart and are interpreted to represent fault offset of a previously continuous skarn body. The mineralized skarn replaces a clean limestone or marble unit within variably calcareous siliciclastic and epiclastic sediments of the Tumbaga Formation, metamorphosed to hornfels in the contact zone of an intrusive quartz-diorite stock. The sedimentary stratigraphy and skarn dip at generally 40 - 60 degrees southwest, while the skarn plunges southeast. The SMZ remains open to the southeast and the NMZ remains open to the north.
The main magnetite skarn horizon varies from 20 to over 80 m thick. The magnetite skarn and the copper-gold mineralization are very continuous, but the down-dip contact of magnetite skarn with limestone (or limestone dissolution breccia) is irregular but sharp. Variably developed late pyrite overprint of skarn and associated brecciation with silica-clay alteration increases local grade variability. As a result of the pyrite overprint, total iron values do not equate to magnetite content, which, based on available metallurgical results, represents about 80% of the total iron.
The skarn occurs in Eocene sediments that are covered by 30 to 50 m of Quaternary volcanics. Palaeo-weathering beneath the volcanics has resulted in development of an oxide zone in the upper 10 to 30 m of the skarn where it underlies the unconformity at the north end of the SMZ and in the NMZ. The oxide zone is characterized by hematite with enhanced gold grade and reduced copper grade. A copper enriched supergene zone is locally developed at the base of the oxide zone.
MABILO PROJECT NATIONAL INSTRUMENT 43-101 TECHNICAL REPORT
1913\24.04\1913-000-GEREP-0003_D S25
Page 25.2
May 2016 Lycopodium Minerals Pty Ltd / MJV / CSA / Orelogy
The quartz-diorite stock at Mabilo is not significantly altered. However, strongly altered porphyry dykes have been intersected in the contact zone of the stock, and veins similar to D-veins in a typical porphyry-copper system have been intersected in intrusive rock and altered host metasediments. This suggests that the main stock may not be the causative intrusion and points to potential for a porphyry-copper deposit at depth. The silica-clay-pyrite alteration and hydraulic brecciation are also suggestive of acid steam-driven argillic alteration above or peripheral to a mineralizing porphyry.
Exploration and discovery at Mabilo has been driven by testing of modeled magnetic bodies. Drilling has shown that high-grade mineralization can also occur in garnet skarn without magnetite, while drilling of the Southeast Anomaly has shown that magnetite skarn can occur without significant copper-gold mineralization. An improved understanding of zonation and mineralization controls in the Mabilo system is needed to support effective future exploration, including understanding of lithostratigraphy, structure, alteration, and intrusive events. Future exploration combining this understanding with additional targeting methods, including IP surveys and base-of-Labo geochemistry, has the potential to drive further discovery success.
The domains in the resource model have been developed based on geology and grade distribution, however they do not take into account all the variability in mineralization type that is significant for metallurgical performance. This most importantly includes the degree of clay-silica-pyrite overprint and brecciation, as well as hypogene bornite domains. An initial geometallurgical model has been developed but a more refined model is a high priority using a combination of logging, multi-element analytical data, and potentially hyperspectral data on sample pulps.
The drill data used as the basis for the MRE are stored in an industry standard relational database. The MRE is based on data obtained from 99 diamond drillholes completed as of the end of September 2015. Of the drillholes used in the modeling, 82 holes have intersected the interpreted mineralization zones with a combined down-hole length of 4,223.61 m. Comprehensive drilling and QAQC protocols have been employed by MJV and the drill data are considered acceptable for use in resource estimation.
Holes are drilled on a nominal 40 m by 40 m drill pattern along strike, with infill to a nominal 20 m by 20 m in parts. About 30% of the holes have been drilled vertically. Roughly 40% of the holes have been drilled at 60° and the remainder drilled at angles between 45° and 80°. The direction of these holes is broadly perpendicular to the mineralization, with a number of holes drilled in directions intended to help with the understanding and interpretation of structures, which appear to be offsetting the mineralization. The drilling density has been sufficient to develop a fairly robust geological model of the Mabilo deposits.
A geological model was provided to CSA Global by MJV, based on implicit modeling of the logged lithology using LeapFrog® software and understanding of deposit geometry developed over time. The model includes lithological solid envelopes, interpreted structures, the boundary contact surface of the overlying Labo volcanic sequence and an oxide weathering boundary surface. This model formed the basis for the interpretation of 30 separate 3-D mineralized lithological envelopes that were constructed using CAE Studio 3 ('Datamine') software.
Modeled magnetite skarn envelopes were interpreted based on drillhole lithological logging, since this unit is high in magnetite content. The unit was limited against interpreted structures. Within the magnetite skarn unit small zones along sections of the edges are not mineralized with Au and
MABILO PROJECT NATIONAL INSTRUMENT 43-101 TECHNICAL REPORT
1913\24.04\1913-000-GEREP-0003_D S25
Page 25.3
May 2016 Lycopodium Minerals Pty Ltd / MJV / CSA / Orelogy
Cu above the selected 0.3 g/t Au or 0.3% Cu grade cut-off. Separate Au / Cu mineralized magnetite skarn envelopes were generated to ensure that the grade continuity can be more accurately represented during grade estimation. Other lithological units modeled in the system are also not necessarily mineralized to potentially economic levels of Au, Cu and Fe throughout their full extent. These envelopes were modeled using lithological logging and nominal lower cutoff grades of 0.3 g/t Au or 0.3% Cu. The 3-D envelopes representing the mineralized zones were grouped into 14 domains based on lithology type and deposit location for estimation and reporting.
A block model constrained by the interpreted mineralized envelopes and boundary surfaces provided by MLEDC and RTG was constructed using Datamine. A parent cell size of 10 m E by 10 m N by 5 m RL was adopted. Composited samples to 1 m were used to interpolate Cu, Au, Ag and Fe grades into the block model. Block grades were validated by means of swath plots, overlapping histograms of sample and block model data and comparison of mean sample and block model grades for each domain. Cross sections showing the block model and drillhole data were also reviewed. The modeled resources are undiluted and therefore appropriate dilution needs to be incorporated in any evaluation of the deposit.
Density was assigned to the model based on linear regression formulas determined for the weathered and unweathered zones. The regression formulas are based on the correlation between specific gravity and Fe which followed statistical analysis. The overall average density of the mineralized weathered zones is 2.96 t/m3 compared to 3.70 t/m3 for the unweathered zones. The average density from measured samples taken outside the interpreted mineralized zones was assigned to waste blocks. A density of 2.2 t/m3 was assigned in the Labo volcanic sequence, 2.33 t/m3 was assigned in the weathered zone and 2.71 t/m3 was assigned in the unweathered zone. As additional density information is collected the density assigned to the model may change and thus affect resource tonnages.
The Mineral Resource is classified as Indicated where in the Qualified Persons opinion, sufficient data exists to assume geological and mineralization continuity. Areas with more limited data density and limited along-strike or down-dip continuity, but with sufficient evidence to imply but not verify geological and grade continuity are classified as Inferred.
25.3 Mineral Reserve
Open pit mining is the method selected for the Mabilo mining operation. The method deploys conventional drilling, blasting, loading and hauling techniques to excavate and transport ore and waste materials.
Mining activities also include clearing of land, stripping and storage of topsoil, ore rehandle, pit dewatering, dust suppression and dump rehabilitation. All activities will be performed by mining contractors except for grade control, mine planning and mine management being undertaken by the mine owners.
Pit optimization, utilizing Whittle-4X™ software, was used to identify the optimum pit shell with modifying factors for slope design, mining dilution, ore loss and processing recoveries. Cost drivers for pit optimization included mining, processing and transport cost estimates, with commodity pricing estimates and royalties used for revenue streams. The discounted cash flow curves indicate that all shells are economic if mined at a breakeven cost. However, the majority of the discounted cash flow is obtained at Shell 18 (revenue factor of 0.64) and any shell after this is
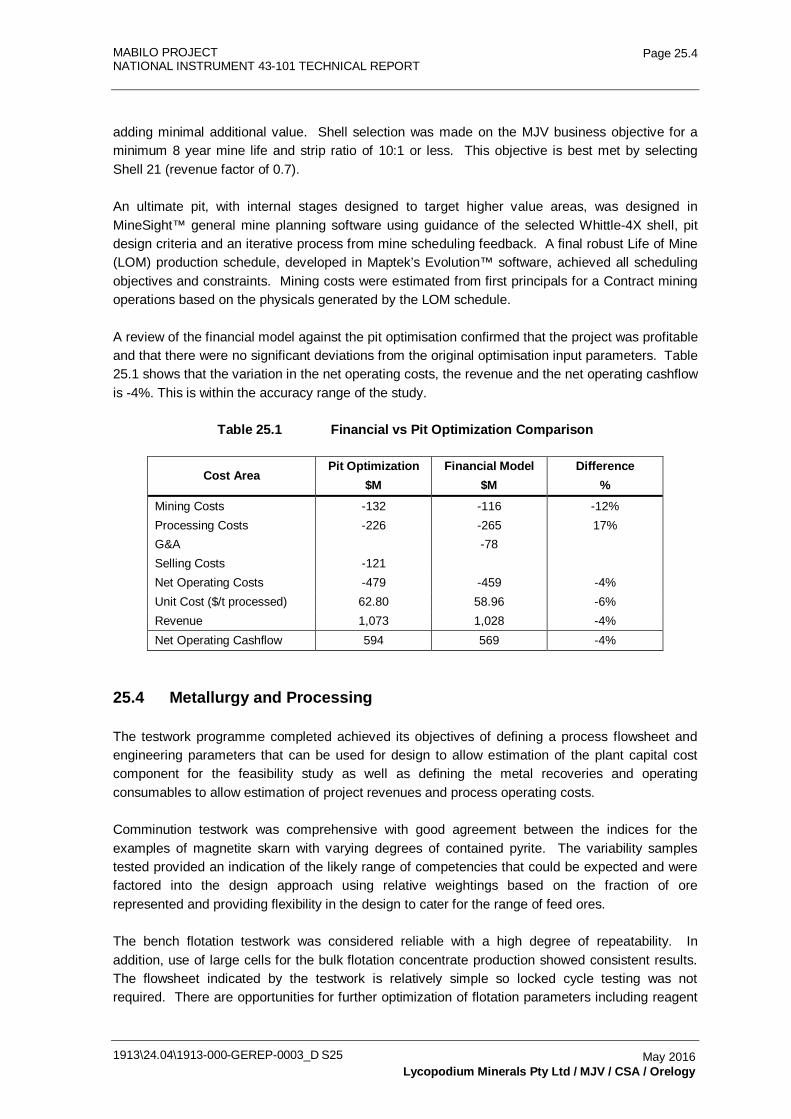
MABILO PROJECT NATIONAL INSTRUMENT 43-101 TECHNICAL REPORT
1913\24.04\1913-000-GEREP-0003_D S25
Page 25.4
May 2016 Lycopodium Minerals Pty Ltd / MJV / CSA / Orelogy
adding minimal additional value. Shell selection was made on the MJV business objective for a minimum 8 year mine life and strip ratio of 10:1 or less. This objective is best met by selecting Shell 21 (revenue factor of 0.7).
An ultimate pit, with internal stages designed to target higher value areas, was designed in MineSight™ general mine planning software using guidance of the selected Whittle-4X shell, pit design criteria and an iterative process from mine scheduling feedback. A final robust Life of Mine (LOM) production schedule, developed in Maptek’s Evolution™ software, achieved all scheduling objectives and constraints. Mining costs were estimated from first principals for a Contract mining operations based on the physicals generated by the LOM schedule.
A review of the financial model against the pit optimisation confirmed that the project was profitable and that there were no significant deviations from the original optimisation input parameters. Table 25.1 shows that the variation in the net operating costs, the revenue and the net operating cashflow is -4%. This is within the accuracy range of the study.
Table 25.1 Financial vs Pit Optimization Comparison
Cost Area Pit Optimization
$M Financial Model
$M Difference
% Mining Costs -132 -116 -12% Processing Costs -226 -265 17% G&A
-78
Selling Costs -121
Net Operating Costs -479 -459 -4% Unit Cost ($/t processed) 62.80 58.96 -6% Revenue 1,073 1,028 -4% Net Operating Cashflow 594 569 -4%
25.4 Metallurgy and Processing
The testwork programme completed achieved its objectives of defining a process flowsheet and engineering parameters that can be used for design to allow estimation of the plant capital cost component for the feasibility study as well as defining the metal recoveries and operating consumables to allow estimation of project revenues and process operating costs.
Comminution testwork was comprehensive with good agreement between the indices for the examples of magnetite skarn with varying degrees of contained pyrite. The variability samples tested provided an indication of the likely range of competencies that could be expected and were factored into the design approach using relative weightings based on the fraction of ore represented and providing flexibility in the design to cater for the range of feed ores.
The bench flotation testwork was considered reliable with a high degree of repeatability. In addition, use of large cells for the bulk flotation concentrate production showed consistent results. The flowsheet indicated by the testwork is relatively simple so locked cycle testing was not required. There are opportunities for further optimization of flotation parameters including reagent
MABILO PROJECT NATIONAL INSTRUMENT 43-101 TECHNICAL REPORT
1913\24.04\1913-000-GEREP-0003_D S25
Page 25.5
May 2016 Lycopodium Minerals Pty Ltd / MJV / CSA / Orelogy
dosing and circuit configuration as well as regrind requirements but this will be best done during operations once the steady state concentrations of reagent in the water circuits have been established.
Testing of additional samples would be beneficial to demonstrate the proposed metal recovery models and also to determine if a scavenger regrind stage would be an economic addition to the proposed flowsheet.
Recovery of the gold in the flotation tails was not considered viable at the study gold price given the high cyanide consumptions experienced, but higher gold prices would indicate that this decision be reviewed and further testing would be required to define the optimum process route and associated recovery processes.
Marketing of the magnetite product may indicate that a higher grade may attract a premium selling price, suggesting that finer grinding of the feed would be warranted to improve liberation and facilitate further magnetic cleaning. No testing has been conducted to this point of magnetite liberation with size, with the grind being dictated by the sulphide mineral liberation requirements.
The ancillary testwork conducted provided all the necessary data to specify the relevant equipment for the process conditions selected.
25.5 Infrastructure
The oxide and chalcocite mining operations will require establishment of limited infrastructure. This will include:
• Phase 1 Surface Water Management structures.
• Port Upgrade.
• Mining Facilities.
• Access and export road development.
• Temporary power and water supplies.
Other issues to be considered include:
• The Philippines is located in a tectonic region known as the 'Ring of Fire' and Mabilo is located approximately 11 km north of the potentially active Mount Labo. The site is located in an area of high seismic activity. Modelling has indicated the potential for soil liquefaction. As a result, piling of key process plant structures has been included.
• Power supply will be from a stand-alone diesel fired power station.
• Surface water management will be critical and will follow the four project development phases:
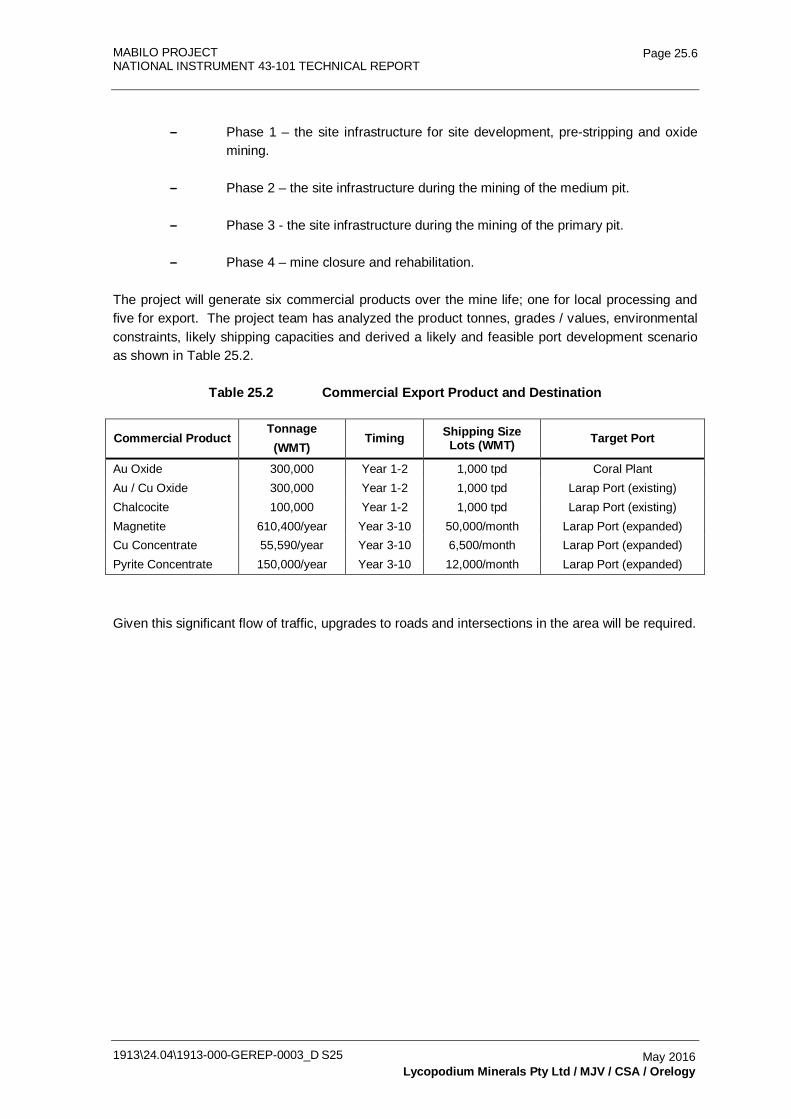
MABILO PROJECT NATIONAL INSTRUMENT 43-101 TECHNICAL REPORT
1913\24.04\1913-000-GEREP-0003_D S25
Page 25.6
May 2016 Lycopodium Minerals Pty Ltd / MJV / CSA / Orelogy
- Phase 1 – the site infrastructure for site development, pre-stripping and oxide mining.
- Phase 2 – the site infrastructure during the mining of the medium pit.
- Phase 3 - the site infrastructure during the mining of the primary pit.
- Phase 4 – mine closure and rehabilitation.
The project will generate six commercial products over the mine life; one for local processing and five for export. The project team has analyzed the product tonnes, grades / values, environmental constraints, likely shipping capacities and derived a likely and feasible port development scenario as shown in Table 25.2.
Table 25.2 Commercial Export Product and Destination
Commercial Product Tonnage (WMT)
Timing Shipping Size Lots (WMT) Target Port
Au Oxide 300,000 Year 1-2 1,000 tpd Coral Plant Au / Cu Oxide 300,000 Year 1-2 1,000 tpd Larap Port (existing) Chalcocite 100,000 Year 1-2 1,000 tpd Larap Port (existing) Magnetite 610,400/year Year 3-10 50,000/month Larap Port (expanded) Cu Concentrate 55,590/year Year 3-10 6,500/month Larap Port (expanded) Pyrite Concentrate 150,000/year Year 3-10 12,000/month Larap Port (expanded)
Given this significant flow of traffic, upgrades to roads and intersections in the area will be required.
MABILO PROJECT
NATIONAL INSTRUMENT 43-101 TECHNICAL REPORT
1913-000-GEREP-0003
Table of Contents Page
26.0 RECOMMENDATIONS 26.1 26.1 Introduction 26.1 26.2 Mineral Resource Estimate 26.1 26.3 Mineral Reserve Estimate 26.2 26.4 Processing 26.2 26.5 Infrastructure 26.2
1913\24.04\1913-000-GEREP-0003_D S26 May 2016 Lycopodium Minerals Pty Ltd
MABILO PROJECT NATIONAL INSTRUMENT 43-101 TECHNICAL REPORT
1913\24.04\1913-000-GEREP-0003_D S26
Page 26.1
May 2016 Lycopodium Minerals Pty Ltd
26.0 RECOMMENDATIONS
26.1 Introduction
It is recommended that the Project proceed to the next stage of development based on the scope and costs described in this report.
26.2 Mineral Resource Estimate
Further drilling is recommended to test the potential for extensions to the current Mineral Resource in the South Mineralized Zone (SMZ) and North Mineralized Zone (NMZ) along strike and at depth.
Additional drilling testing targets outside the NMZ and SMZ, including porphyry targets, should be guided by a lithostratigraphic and structural model for the Property based on existing drilling and geophysical data. The targeting model should also incorporate a systematic lithogeochemical and spectral alteration study, and petrogenetic and chronologic study of intrusive rocks. High-powered 3D IP is recommended as an exploration technique that has the potential to directly detect non-magnetic mineralized skarn and porphyry style mineralization. This should be supported by base of Labo geochemical sampling.
Testing of the Southeast Anomaly is a priority based on better understanding of the temporal and spatial zonation from barren to mineralized magnetite skarn.
A refined geometallurgical model is recommended to take account of the metallurgical variability that is not represented in the current model. A pilot study to assess the contribution of hyperspectral analysis of pulps in modelling clay distribution should be undertaken. Otherwise the geometallurgical model should be based on logging and multi-element geochemistry.
Additional density data should be collected to ensure that density values applied in the model are fully representative of the in situ material to increase confidence in the results of the Mineral Resource Estimate (MRE). These measurements should be directed towards collecting sufficient density data from within each different mineralized lithology type to ensure that more robust estimates of density by lithotype can be completed.
Additional Certified Reference Material (CRM) standards that are matrix matched to the mineralization at Mabilo should be sourced with certification assay method matching intended assay method. These standards should also be selected to match the mean and higher grade range of the mineralization at Mabilo as current matrix matched standards are at the lower end of the grade range.
Additional umpire laboratory analysis of sample pulps should be completed to resolve the uncertainty arising from the existing umpire analysis. This should include assay of the same pulp samples by the three laboratories used for the existing umpire assays.
MABILO PROJECT NATIONAL INSTRUMENT 43-101 TECHNICAL REPORT
1913\24.04\1913-000-GEREP-0003_D S26
Page 26.2
May 2016 Lycopodium Minerals Pty Ltd
26.3 Mineral Reserve Estimate
Further geotechnical drilling investigations are recommended to provide information on ground conditions in areas of the proposed pit walls particularly those required for the final Stage 5, where information is currently absent.
It is recommended that a final decision on choosing appropriate elevations for the 10 m berm (as applicable) and the 30 m wide berm be based on future interpretations made from vertical contoured plots illustrating the range in elevation of the base of the Labo Volcanics within the proposed mining areas.
Blasting optimization is recommended to ensure productivity assumptions can be achieved for excavation of ore and waste and primary crusher feed. This should tie into the assessment of aligning the blast bench to the batter / berm configuration.
With a strip ratio of 10:1, waste haulage makes up a significant component of the mining cost. Development of an integrated mine production schedule that includes a waste dump construction sequence is recommended to reduce haulage costs over the life of mine.
26.4 Processing
Additional metallurgical testwork should be completed as a priority to determine processing options from the oxide zone through transition (with multiple supergene copper species) into fresh magnetite skarn and to determine how this affects copper and gold recoveries. This should also focus on the pyrite-arsenopyrite overprint and determine whether any associated gold is present.
26.5 Infrastructure
Further site geotechnical testing is recommended to determine critical parameters for the waste dump / TSF site.
Further evaluation of groundwater inflow is recommended.
MABILO PROJECT
NATIONAL INSTRUMENT 43-101 TECHNICAL REPORT
1913-000-GEREP-0003
Table of Contents Page
27.0 REFERENCES 27.1 27.1 References 27.1
1913\24.04\1913-000-GEREP-0003_D S27 May 2016 Lycopodium Minerals Pty Ltd
MABILO PROJECT NATIONAL INSTRUMENT 43-101 TECHNICAL REPORT
1913\24.04\1913-000-GEREP-0003_D S27
Page 27.1
May 2016 Lycopodium Minerals Pty Ltd
27.0 REFERENCES
27.1 References
Lycopodium Minerals Pty, Mabilo Project Feasibility Study, 1913-000-GEREP-0002_B, compiled by Lycopodium Minerals Pty Ltd for Mabilo Joint Venture (MJV), March 2016.
RTG Mining Inc. NI 43-101 Technical Report, Mabilo Copper-Gold-Iron Property Mineral Resource Estimate, Green, A., Reynolds, N., Louw, G., November 2015.
Australasian Code for Reporting of Exploration Results, Mineral Resources and Ore Reserves. The JORC Code, 2012 Edition. Prepared by: The Joint Ore Reserves Committee of The Australasian Institute of Mining and Metallurgy, Australian Institute of Geoscientists and Minerals Council of Australia (JORC).
Delfin, D.M. and Tauli, G.A., 1990: Report on the Results of the initial Drilling Program conducted on the Mabilo Prospect, Labo, Camarines Norte. Goldfields Asia Ltd Report No PI 13/1990 (Unpub).
Encom, 2007: Review of Previous Exploration by Goldfields (1989) and 2007 Ground Magnetic Survey and Exploration Recommendations. Unpublished Company Report to Eldore Mining Corporation.
Fernandez, F.C., 1965: Geology of the Labo Iron Deposits, Labo, Camarines Norte, Philippine Bureau of Mines Manila.
Frost, J.E., 1965: Controls of Ore Deposition for the Larap Mineral Deposits, Camarines Norte, Philippines. Unpub PhD Thesis, Stanford University.
Garwin, S., Hall, R., and Watanabe, Y., 2005: Tectonic Setting, Geology, and Gold and Copper Mineralization in Cenozoic Magmatic Arcs of Southeast Asia and the West Pacific, Economic Geology 100th Anniversary Volume.
Green, A., Reynolds, N., and Louw, G., 2014, NI.43-101Technical Report, Mabilo Copper-Gold-Iron Project. CSA Global Report R312.2014 to RTG Mining Inc.
Hedenquist, J. W., Arribas, A., Jr., and Reynolds, T. J., 1998: Evolution of an intrusion-centered hydrothermal system; Far Southeast-Lepanto porphyry and epithermal Cu-Au deposits, Philippines, Economic Geology, V 93.
JICA, 2002: Report on Co-operative Mineral Exploration in the Bicol North Area, The Republic of Philippines, Consolidated Report, Japan International Cooperation Agency, Metal Mining Agency of Japan.
Kirkham, R.V., and Sinclair, W.D., 1995: Porphyry copper, gold, molybdenum, tungsten, tin, silver, in Eckstrand, O.R., Sinclair, W.D., and Thorpe, R.I., eds., Geology of Canadian Mineral Deposit Types: Geological Survey of Canada, Geology of Canada, no. 8, p. 421-446.
MABILO PROJECT NATIONAL INSTRUMENT 43-101 TECHNICAL REPORT
1913\24.04\1913-000-GEREP-0003_D S27
Page 27.2
May 2016 Lycopodium Minerals Pty Ltd
Leach, 2005: Comments on the Results of Drilling in the Millsite-Sinko and Bagong Dose Areas, Nalesbitan Project Area. Report for Nalesbitan Mining by Terry Leach & Co., 37pp.
Maude, G., 2012: Mabilo Ground TMI survey. Southern Geoscience Consultants Pty Ltd Report No. SGC2538 to Sierra Mining Ltd.
Meinert, L.D., Dipple, G. M., and Nicolescu, S., 2005: World Skarn Deposits: in Hedenquist, J.W., Thompson, J.F.H., Goldfarb, R.J., and Richards, J.P., eds., Economic Geology 100th Anniversary Volume, Society of Economic Geologists, Littleton, Colorado, USA, p. 299-336.
MGB, 2013: website accessed 24/01/2014. http://www.mgb.gov.ph
Page, M.L., 2002: Independent Geologists Report for Indophil Resources NL Prospectus.
Pena, R.E., 2008: Lexicon of Philippine Stratigraphy. Geol Soc. Of Philippines.
Quebral, R., Pubellier, M. and Rangin, C., 1996: The onset of movement on the Philippine fault in eastern Mindanao: A transition from a collision to strike slip environment., Tectonics, V15.
Reynolds, N., 2014, R118.2014 NI43-101 Technical Report RTG Mining Inc. Mabilo Copper-Gold-Iron Project.
Samonte, C.S., 1975: Geological Verification of Iron and Copper Mineralisation of the Venida Mine Claim in Labo. Bureau of Mines.
Sajona, F.G., 2013: Philippine Mineralisation in Time, Space and Geology., Presentation to Philippine Mineral Exploration Association.
Sierra Mining Limited, 2013a: 2013 Annual Report. Sierra company report.
Sierra Mining Limited, 2013b: September 2013 Quarterly Report. Announcement to the Australian Securities Exchange: 20 November 2013.
Sierra Mining Limited, 2013c: Announcement to the Australian Securities Exchange: 20 November 2013.
Sierra Mining Limited, 2013d: Announcement to the Australian Securities Exchange: 5 December 2013.
TBM, 2013: Exploratory Metallurgical Testing – Magnetic Separation and Flotation Three (3) Magnetite Samples. TBM Mining Met Services report to Sierra Mining Ltd.
UNDP 1992, The Philippines; A Prospectus for the International Mining Industry, United Nations Development Program, New York.
Orr C (2016). Report entitled “Draft Geotechnical Report Final to Client” containing the slope design criteria, dated 5 January 2016.
MABILO PROJECT NATIONAL INSTRUMENT 43-101 TECHNICAL REPORT
1913\24.04\1913-000-GEREP-0003_D S27
Page 27.3
May 2016 Lycopodium Minerals Pty Ltd
Giddy M (2016). Email entitled “FW: Mabilo Pyrite Recovery” to Ryan Locke with appended subsection outlining recovery calculations for Fresh ore, dated 16th February 2016.
Bazin F (2015). Report entitled “IMC01505_Mabilo_Mine_Operating_Cost_revA”, dated June 2015.
Jupp R (2015). Email entitled “Mabilo – tailings and waste dump dxf” with appended 3D digital files for integrated TSF, dated 30 November 2015
Orr C (2016). Letter entitled “Final Mabilo Pit Letter Report (final)”, dated 6 February 2016
Orway Mineral Consultants, Report 7654 Rev 0 Mabilo Project Comminution Circuit Sizing, July 2015.
Orway Mineral Consultants, Report 7654-01 Rev A Mabilo Project Regrind Mill Sizing, July 2015.
Orway Mineral Consultants, Report 7654-02 Rev A Mabilo Project 1.35 Mtpa Circuit Sizing, March 2016.
ALS (previously AMMTEC Ltd, Perth, Western Australia) testwork reports A16064, A16558, A16958.
Giddy M (2015). Memo entitled “Scouting Testwork Metallurgical Results Summary”, dated 9th January 2015.
EZ-FRISK (2011), “Software for Earthquake Ground Motion Estimation”, Version 7.62, Risk Engineering Inc., Boulder, Colorado, USA.
Philippines Department of Environment and Natural Resources, “DENR Memorandum order No. 99 – 32, Policy Guidelines and Standards for Mine Wastes and Mill Tailings Management”, 24th November 1999.
Australian National Committee on Large Dams (ANCOLD), “Guidelines on Tailings Dams”, May 2012.
International Commission on Large Dams (ICOLD), “Selecting Seismic Parameters for Large Dams. Guidelines, Bulletin 72”, 1989.
International Commission on Large Dams (ICOLD), “Committee on Seismic Aspects of Dam Design”, International Commission on Large Dams, Paris.
International Commission on Large Dams (ICOLD), “Tailings Dams and Seismicity – Review and Recommendations, Bulletin 98”, 1995.
Australian National Committee on Large Dams (ANCOLD), “Guidelines for Design of Dams for Earthquakes”, 1998.
International Building Council, “International Building Code 2012”, June 2011.
MABILO PROJECT NATIONAL INSTRUMENT 43-101 TECHNICAL REPORT
1913\24.04\1913-000-GEREP-0003_D S27
Page 27.4
May 2016 Lycopodium Minerals Pty Ltd
Aqua Dyne, “Hydrogeological Investigation of Areas Around Proposed Mabilo Project, Labo, Camarines Norte”, final report, October 2015
MABILO PROJECT
NATIONAL INSTRUMENT 43-101 TECHNICAL REPORT
1913-000-GEREP-0003
Table of Contents Page
28.0 DATES AND SIGNATURES 28.1
1913\24.04\1913-000-GEREP-0003_D S28 May 2016 Lycopodium Minerals Pty Ltd
MABILO PROJECT NATIONAL INSTRUMENT 43-101 TECHNICAL REPORT
1913\24.04\1913-000-GEREP-0003_D S28
Page 28.1
May 2016 Lycopodium Minerals Pty Ltd
28.0 DATES AND SIGNATURES
This section includes the signed consent forms for the qualified persons.

CONSENT OF QUALIFIED PERSON
2 May, 2016
To: British Columbia Securities Commission Alberta Securities Commission
Ontario Securities Commission Toronto Stock Exchange
Dear Sirs/Mesdames:
Re: Filing of Technical Report by RTG Mining Inc. (the “Issuer”)
I, Richard Frew, am responsible for all or a portion of the technical report entitled “[RTG Mining Inc. NI 43-101 Technical Report Mabilo Copper-Gold-Iron Project Camarines Norte, Philippines]” dated effective 2 May, 2016 (the “Technical Report”).
Pursuant to Section 8.3 of National Instrument 43-101 – Standards of Disclosure for Mineral
Projects, this letter constitutes my consent to the public filing of the Technical Report with each of the British Columbia Securities Commission, the Alberta Securities Commission, the Ontario Securities Commission and the Toronto Stock Exchange and I acknowledge that the Technical Report will become part of the Issuer’s public record.
DATED this 2nd day of May, 2016.
Yours truly,
Richard Frew

CONSENT OF QUALIFIED PERSON
2 May 2016, 2016
To: British Columbia Securities Commission Alberta Securities Commission
Ontario Securities Commission Toronto Stock Exchange
Dear Sirs/Mesdames:
Re: Filing of Technical Report by RTG Mining Inc. (the “Issuer”)
I, Adrian Brett, am responsible for all or a portion of the technical report entitled “[RTG Mining Inc. NI 43-101 Technical Report Mabilo Copper-Gold-Iron Project Camarines Norte, Philippines]” dated effective 2 May, 2016 (the “Technical Report”).
Pursuant to Section 8.3 of National Instrument 43-101 – Standards of Disclosure for Mineral
Projects, this letter constitutes my consent to the public filing of the Technical Report with each of the British Columbia Securities Commission, the Alberta Securities Commission, the Ontario Securities Commission and the Toronto Stock Exchange and I acknowledge that the Technical Report will become part of the Issuer’s public record.
DATED this 2nd day of May, 2016.
Yours truly,
Adrian Brett
CONSENT OF QUALIFIED PERSON
2 May 2016, 2016
To: British Columbia Securities Commission Alberta Securities Commission
Ontario Securities Commission Toronto Stock Exchange
Dear Sirs/Mesdames:
Re: Filing of Technical Report by RTG Mining Inc. (the “Issuer”)
I, Janet Epps, am responsible for all or a portion of the technical report entitled “[RTG Mining Inc. NI 43-101 Technical Report Mabilo Copper-Gold-Iron Project Camarines Norte, Philippines]” dated effective 2 May, 2016 (the “Technical Report”).
Pursuant to Section 8.3 of National Instrument 43-101 – Standards of Disclosure for Mineral
Projects, this letter constitutes my consent to the public filing of the Technical Report with each of the British Columbia Securities Commission, the Alberta Securities Commission, the Ontario Securities Commission and the Toronto Stock Exchange and I acknowledge that the Technical Report will become part of the Issuer’s public record.
DATED this 2nd day of May, 2016.
Yours truly,
Janet Epps

MABILO PROJECT
NATIONAL INSTRUMENT 43-101 TECHNICAL REPORT
1913-000-GEREP-0003
Table of Contents Page
29.0 CERTIFICATE OF AUTHORS 29.1
1913\24.04\1913-000-GEREP-0003_D S29 May 2016 Lycopodium Minerals Pty Ltd
MABILO PROJECT NATIONAL INSTRUMENT 43-101 TECHNICAL REPORT
1913\24.04\1913-000-GEREP-0003_D S29
Page 29.1
May 2016 Lycopodium Minerals Pty Ltd
29.0 CERTIFICATE OF AUTHORS
This section includes the signed certificates for the qualified persons.
ADM-FRM-037_A Lycopodium Minerals Pty Ltd
CERTIFICATE OF QUALIFIED PERSON
I, Dr Neal Reynolds, PhD, FAusIMM, MAIG as an author of this report entitled Mabilo Project,
Philippines NI 43-101 Technical Report (Revision D), prepared for RTG Mining Limited and dated 2
May 2016, do hereby certify that:
1) I am a Principal Geologist with CSA Global Pty Ltd. My office address is Level 2, 3 Ord
Street, West Perth, WA 6005, Australia.
2) I am a professional geologist and a graduate of University College Dublin with a BSc
(Geology) 1982 and a PhD (Geology) 1987.
3) I am a Member of the Australian Institute of Geoscientists (membership number 2334) and a
Fellow of the Australasian Institute of Mining and Metallurgy (membership number 111681).
4) I have practised my profession as a geologist for the past 28 years in areas of gold and
base metals evaluation in a number of countries around the world
5) I have read the definition of 'qualified person' set out in National Instrument 43-101 ('NI 43-
101') and certify that by reason of my education, affiliation with a professional association
(as defined in NI 43-101) and past relevant work experience, I fulfill the requirements to be a
'qualified person' for the purposes of NI 43-101.
6) I have visited the Mabilo Project site from October 28 to November 1 2015, December 18 to
December 20, 2013, February 12 to February 14 2014, and May 13 to May 19 2014.
7) I am responsible for all of preparation of Item Numbers 5, 6, 7, 8, 9, 10, 11, 12, 23, and 24.6
and jointly for 1, 25, 26, and 27 of the Technical Report.
8) I am independent of the Issuer applying the test set out in Section 1.5.(4) of NI 43-101.
9) I have been involved in the 2015 Technical Report on the Mabilo Project.
10) I have read NI 43-101, and the Technical Report has been prepared in compliance with
NI 43-101 and Form 43-101F1.
11) To the best of my knowledge, information, and belief, the Technical Report contains all
scientific and technical information that is required to be disclosed to make the technical
report not misleading.
50989186.2
CERTIFICATE OF QUALIFIED PERSON
I, Richard Frew, [P. Eng.], do hereby certify that:
1) This certificate applies to the technical report entitled “Mabilo Project, Philippines NI 43-101 Technical Report (Revision D)”, prepared for RTG Mining Limited and dated 2 May 2016.
2) I am a Senior Associate of Behre Dolbear Australia Pty Ltd (“BDA”). My office address is Level 9, 80 Mount Street, North Sydney, NSW, Australia.
3) I am a professional civil engineer, having graduated with a BE Civil in 1965 from the University of Melbourne.
4) I am a Member of the Institution of Engineers Australia (“MIE Aust.”), membership number 330624. I have worked as a project and construction engineer for a total of 40 years since my graduation from the University of Melbourne and as a consultant project engineer since 1991. I have been a Senior Associate of BDA since 1997.
5) I have read the definition of “qualified person” set out in National Instrument 43-101 (“NI 43-101”) and certify that by reason of my education, affiliation with a professional association (as defined in NI 43-101) and past relevant work experience, I fulfill the requirements to be a “qualified person” for the purposes of NI 43-101.
6) I have not visited the Mabilo Project site.
7) I am responsible for reviewing Item Numbers 18.4, 18.5, 18.6, 18.7, 18.8, 18.11.1, 18.12, 18.13, 18.14, 18.17 of the Technical Report.
8) I am independent of the Issuer applying the test set out in Section 1.5 of NI 43-101.
9) I have not been involved previously with the Mabilo Project.
10) I have read NI 43-101, and the Technical Report has been prepared in compliance with NI 43-101 and Form 43-101F1.
11) As of the effective date of the Technical Report, to the best of my knowledge, information, and belief, the Technical Report contains all scientific and technical information that is required to be disclosed to make the technical report not misleading.
Dated this 2nd day of May 2016
Richard Frew BE Civil, MIE Aust. Senior Associate Behre Dolbear Australia Pty Ltd.
50989187.2
CERTIFICATE OF QUALIFIED PERSON
I, John McIntyre, [P. Eng.], do hereby certify that:
1) This certificate applies to the technical report entitled “Mabilo Project, Philippines NI 43-101 Technical Report (Revision D)”, prepared for RTG Mining Limited and dated 2 May 2016.
2) I am a Director of Behre Dolbear Australia Pty Ltd (“BDA”). My office address is Level 9, 80 Mount Street, North Sydney, NSW, Australia.
3) I am a professional mining engineer, having graduated with a BE mining (Hon) in 1971 from the University of New South Wales, Kensington, NSW, Australia.
4) I am a Fellow and a Chartered Professional (Mining) of the Australasian Institute of Mining and Metallurgy (“FAusIMM CP”), membership number 103409. I am a Member of the Australasian Institute of Minerals Valuers and Appraisers (“MAIMVA”). I have worked as an underground miner and have been appointed as a Mining Engineer, Senior Mining Engineer, Technical Services Superintendent, Mine Superintendent, General Manager and Chief Executive Officer in mining companies for a total of 23 years since my graduation from the University of NSW and as a mining consultant engineer for 22 years since 1994. I have been the Managing Director of BDA since 1994.
5) I have read the definition of “qualified person” set out in National Instrument 43-101 (“NI 43-101”) and certify that by reason of my education, affiliation with a professional association (as defined in NI 43-101) and past relevant work experience, I fulfill the requirements to be a “qualified person” for the purposes of NI 43-101.
6) I have not visited the Mabilo Project site.
7) I am responsible for reviewing Item Numbers 21.1.2, 21.1.4, 21.2.1, 21.2.4, 21.2.5, 24.1 and 24.2 of the Technical Report.
8) I am independent of the Issuer applying the test set out in Section 1.5 of NI 43-101.
9) I have not been involved previously with the Mabilo Project.
10) I have read NI 43-101, and the Technical Report has been prepared in compliance with NI 43-101 and Form 43-101F1.
11) As of the effective date of the Technical Report, to the best of my knowledge, information, and belief, the Technical Report contains all scientific and technical information that is required to be disclosed to make the technical report not misleading.
Dated this 2nd day of May 2016
John McIntyre BE Mining (Hon), FAusIMM CP (Mining), MAIMVA. Senior Associate Behre Dolbear Australia Pty Ltd.

50989182.2
CERTIFICATE OF QUALIFIED PERSON
I, Adrian Brett, M.Sc., do hereby certify that:
1) This certificate applies to the technical report entitled “Mabilo Project, Philippines NI 43-101 Technical Report (Revision D)”, prepared for RTG Mining Limited and dated 2 May 2016.
2) I am a Senior Associate of Behre Dolbear Australia Pty Ltd (“BDA”). My office address is Level 9, 80 Mount Street, North Sydney, NSW, Australia.
3) I am a scientist, having graduated with a B.Sc. (Hons) in 1972 from the University of New England, Australia. I also graduated with a M.Sc. from Macquarie University in 1980, and graduated with a M. Environmental & Local Government Law from Macquarie University in 1995.
4) I am a Fellow of the Australian Institution of Mining and Metallurgy (“FAusIMM”), membership number 110244. I have worked as a geoscientist for over 40 years since my graduation from the University of New England and as a consultant environmental specialist since 1987. I have been a Senior Associate of BDA since 1996.
5) I have read the definition of “qualified person” set out in National Instrument 43-101 (“NI 43-101”) and certify that by reason of my education, affiliation with a professional association (as defined in NI 43-101) and past relevant work experience, I fulfill the requirements to be a “qualified person” for the purposes of NI 43-101.
6) I have visited the Mabilo Project site on Friday15 April, 2016 for a duration of 1 day.
7) I am responsible for reviewing Item Numbers 20.1, 20.2, 20.3, 20.6 of the Technical Report.
8) I am independent of the Issuer applying the test set out in Section 1.5 of NI 43-101.
9) I have not been involved previously with the Mabilo Project.
10) I have read NI 43-101, and the Technical Report has been prepared in compliance with NI 43-101 and Form 43-101F1.
11) As of the effective date of the Technical Report, to the best of my knowledge, information, and belief, the Technical Report contains all scientific and technical information that is required to be disclosed to make the technical report not misleading.
Dated this 2nd day of May 2016
Adrian Brett B.Sc.(Hons), M.Sc., M.Environmental Law, FAusIMM.
Senior AssociateBehre Dolbear Australia Pty Ltd.
50989184.2
CERTIFICATE OF QUALIFIED PERSON
I, Janet Epps, do hereby certify that:
1) This certificate applies to the technical report entitled “Mabilo Project, Philippines NI 43-101 Technical Report (Revision D)”, prepared for RTG Mining Limited and dated 2 May 2016.
2) I am a Senior Associate of Behre Dolbear Australia Pty Ltd (“BDA”). My office address is Level 9, 80 Mount Street, North Sydney, NSW, Australia.
3) I am a scientist, having graduated with a B.Sc. in 1972 from the University of New England, Australia. I also graduated with a Masters Environmental and Social Studies from Macquarie University in 1980.
4) I am a Fellow of the Australian Institution of Mining and Metallurgy (“FAusIMM”), membership number 101317. I have worked as a geoscientist for over 40 years since my graduation from the University of New England and as a consultant environmental and social specialist since 1982. I have been a Senior Associate of BDA since 2001.
5) I have read the definition of “qualified person” set out in National Instrument 43-101 (“NI 43-101”) and certify that by reason of my education, affiliation with a professional association (as defined in NI 43-101) and past relevant work experience, I fulfill the requirements to be a “qualified person” for the purposes of NI 43-101.
6) I have visited the Mabilo Project site on Friday 15 April, 2016 for a duration of 1 day.
7) I am responsible for reviewing Item Numbers 20.4, 20.5, 24.5 of the Technical Report.
8) I am independent of the Issuer applying the test set out in Section 1.5 of NI 43-101.
9) I have not been involved previously with the Mabilo Project.
10) I have read NI 43-101, and the Technical Report has been prepared in compliance with NI 43-101 and Form 43-101F1.
11) As of the effective date of the Technical Report, to the best of my knowledge, information, and belief, the Technical Report contains all scientific and technical information that is required to be disclosed to make the technical report not misleading.
Dated this 2nd day of May 2016
Janet Epps B.Sc., M. Environmental and Social Studies, FAusIMM. Senior Associate Behre Dolbear Australia Pty Ltd.