ni 43-101 technical report on a mineral resource estimate
TRANSCRIPT
NI 43-101 Technical Report on a Mineral Resource Estimate at the Mato Bula Trend, Adyabo Project
(centred at 38°05’E, 14°33’N), Tigray National Region, Ethiopia
Prepared for
East Africa Metals Inc.
Dr. Sandy M. Archibald, PGeo, Aurum Exploration Services
Christopher Martin, CEng, Blue Coast Research Ltd
David G. Thomas, PGeo, Fladgate Exploration Consulting Corporation
May 29, 2015
AD Y A B O PR O J E C T NI 43-101 RE P O R T
May 2015 ii
TABLE OF CONTENTS
1 SUMMARY .......................................................................................................................................1
2 INTRODUCTION ...............................................................................................................................7
2.1 Terms of Reference, Scope & Purpose of Report ................................................................7
2.2 Sources of Information & Data ............................................................................................8
2.3 Visits to the Property by the Qualified Person ....................................................................9
3 RELIANCE ON OTHER EXPERTS ..................................................................................................... 10
4 PROPERTY DESCRIPTION & LOCATION ........................................................................................ 11
4.1 Size and Location .............................................................................................................. 11
4.2 Mineral Tenure ................................................................................................................. 12
5 ACCESSIBILITY, CLIMATE, LOCAL RESOURCES, INFRASTRUCTURE AND PHYSIOGRAPHY ............ 16
5.1 Accessibility ...................................................................................................................... 16
5.2 Climate .............................................................................................................................. 17
5.3 Local Resources (Tigray Region) ....................................................................................... 17
5.4 Infrastructure.................................................................................................................... 18
5.5 Physiography .................................................................................................................... 20
6 HISTORY ....................................................................................................................................... 21
7 GEOLOGICAL SETTING & MINERALIZATION ................................................................................. 23
7.1 Regional Geology .............................................................................................................. 23
7.2 Property Geology .............................................................................................................. 24
7.3 Prospect Geology .............................................................................................................. 28
Mato Bula ..................................................................................................................................... 28
Mato Bula ..................................................................................................................................... 29
Da Tambuk ................................................................................................................................... 31
Hanbassa ...................................................................................................................................... 32
Adi Gozomo and Adi Gozomo East .............................................................................................. 33
Mugnae Andi ................................................................................................................................ 34
Sentraley ...................................................................................................................................... 35
7.4 Mineralization................................................................................................................... 36
8 DEPOSIT TYPES ............................................................................................................................. 55
8.1 Gold-rich Volcanogenic Massive Sulphide ........................................................................ 55
8.2 Orogenic Gold Deposits .................................................................................................... 57
9 EXPLORATION .............................................................................................................................. 59
9.1 Geological Mapping .......................................................................................................... 59
9.2 Soil Sampling..................................................................................................................... 61
9.3 Stream Sediment Sampling .............................................................................................. 65
9.4 Lithogeochemical Sampling / Trenching .......................................................................... 66
9.5 Airborne Geophysics......................................................................................................... 69
AD Y A B O PR O J E C T NI 43-101 RE P O R T
May 2015 iii
9.6 Petrographic Studies ........................................................................................................ 71
9.7 Remote Sensing ................................................................................................................ 73
9.8 Qualified Person’s Comments on Section 9 ..................................................................... 73
10 DRILLING ...................................................................................................................................... 74
10.1 General ............................................................................................................................. 74
10.2 Diamond Drilling ............................................................................................................... 74
10.3 Mato Bula ......................................................................................................................... 77
10.4 Mato Bula North ............................................................................................................... 81
10.5 Da Tambuk ........................................................................................................................ 83
10.6 Adi Gozomo ...................................................................................................................... 84
10.7 Hanbassa .......................................................................................................................... 85
10.8 Mugnae Andi .................................................................................................................... 86
10.9 Qualified Person’s Comments on Section 10 ................................................................... 87
11 SAMPLE PREPARATION, ANALYZES & SECURITY .......................................................................... 88
11.1 Sampling Method & Approach ......................................................................................... 88
11.2 Laboratory Procedures ..................................................................................................... 93
11.3 Sample Security & Chain of Custody Procedures ............................................................. 94
11.4 Drill Program QA/QC ........................................................................................................ 94
11.5 Qualified Person’s Comments on Section 11 ................................................................. 100
12 DATA VERIFICATION ................................................................................................................... 101
12.1 Electronic Database ........................................................................................................ 101
12.2 Drillhole Collar Checks .................................................................................................... 101
12.3 Fladgate Drillcore Logging Verification ........................................................................... 102
12.4 Downhole Survey Checks ............................................................................................... 102
12.5 Independent Verification of Mineralization ................................................................... 102
12.6 Qualified Person’s Comments on Section 12 ................................................................. 103
13 MINERAL PROCESSING & METALLURGICAL TESTING ................................................................ 104
13.1 Metallurgical Samples .................................................................................................... 104
13.2 Mineralogy ...................................................................................................................... 105
13.3 Gravity Concentration .................................................................................................... 105
13.4 Da Tambuk Leaching and Flotation ................................................................................ 105
13.5 Mato Bula Leaching and Flotation .................................................................................. 106
13.6 Silica Hill Leaching and Flotation .................................................................................... 107
13.7 Concentrate Marketability ............................................................................................. 108
13.8 Qualified Person’s Comments on Section 13 ................................................................. 109
14 MINERAL RESOURCE ESTIMATES ............................................................................................... 110
14.1 Key Assumptions/Basis of Estimate................................................................................ 110
14.2 Da Tambuk Mineral Resource Estimate ......................................................................... 111
14.3 Mato Bula Mineral Resource Estimate ........................................................................... 127
AD Y A B O PR O J E C T NI 43-101 RE P O R T
May 2015 iv
14.4 Mato Bula North Mineral Resource Estimate ................................................................ 144
14.5 Reasonable Prospects of Economic Extraction .............................................................. 157
14.6 QP Comments on Section 14 .......................................................................................... 161
14.7 Conclusions ..................................................................................................................... 161
15 MINERAL RESERVE ESTIMATES .................................................................................................. 163
16 MINING METHODS ..................................................................................................................... 164
17 RECOVERY METHODS ................................................................................................................. 165
18 PROJECT INFRASTRUCTURE ....................................................................................................... 166
19 MARKET STUDIES & CONTRACTS ............................................................................................... 167
20 ENVIRONMENTAL STUDIES, PERMITTING AND SOCIAL OR COMMUNITY IMPACT ................... 168
20.1 Environmental Studies.................................................................................................... 168
20.2 Waste & Tailings Impoundment & Water Management ............................................... 168
20.3 Project Permitting........................................................................................................... 168
20.4 Social & Community Requirements ................................................................................ 168
21 CAPITAL & OPERATING COSTS ................................................................................................... 169
22 ECONOMIC ANALYSIS ................................................................................................................. 170
23 ADJACENT PROPERTIES .............................................................................................................. 171
24 OTHER RELEVANT DATA & INFORMATION ................................................................................ 172
25 INTERPRETATIONS & CONCLUSIONS ......................................................................................... 173
26 RECOMMENDATIONS ................................................................................................................ 176
27 REFERENCES ............................................................................................................................... 178
List of Tables
Table 1-1: Adyabo Project Inferred Mineral Resource Estimate - Effective Date: April 27, 2015 (David
G. Thomas, P. Geo.) ............................................................................................................... 5
Table 2-1: General Areas of Responsibility ............................................................................................. 7
Table 2-2: Qualified Person Site Visits .................................................................................................... 9
Table 4-1: Property Tenure Location .................................................................................................... 14
Table 4-2: Property Tenure Location and Status .................................................................................. 15
Table 7-1: Prospects and Style of Mineralization ................................................................................. 37
Table 8-1: Trench results ...................................................................................................................... 67
Table 10-1: Summary of Drilling on the Adyabo Project ...................................................................... 74
Table 10-2: Mineral Exploration Diamond Drillholes on the Da Tambuk Prospect .............................. 75
Table 10-3: Mineral Exploration Diamond Drillholes on the Mato Bula and Mato Bula North
Prospects ........................................................................................................................... 76
Table 10-4: Mato Bula and Mato Bula North Diamond Drillholes ........................................................ 80
Table 10-5: Mato Bula North Diamond Drillholes ................................................................................ 82
AD Y A B O PR O J E C T NI 43-101 RE P O R T
May 2015 v
Table 10-6: Da Tambuk Diamond Drillholes ......................................................................................... 84
Table 10-7: Adi Gozomo Diamond Drillholes ........................................................................................ 85
Table 10-8: Hanbassa Diamond Drillholes ............................................................................................ 86
Table 10-9: Mugnae Andi Diamond Drillholes ...................................................................................... 87
Table 11-1: Preparation & Assay Methods used during Analysis of Exploration Samples at ACME &
Ultratrace .......................................................................................................................... 93
Table 11-2: Summary of CRMs and ACME Laboratory Results ............................................................. 96
Table 11-3: Duplicate Sample 90th Percentile Precision Values, Gold ................................................ 100
Table 11-4: Duplicate Sample 90th Percentile Precision Values, Copper ............................................ 100
Table 12-1: Fladgate Verification of Drillhole Collars ......................................................................... 102
Table 12-2: Independent Quartered Core Sample Assay Results ....................................................... 103
Table 13-1: Sources of Samples for Metallurgical Composites ........................................................... 104
Table 13-2: Assayed Composite Head Grades ..................................................................................... 104
Table 13-3: Results from Gravity Concentration from each of the Composites ................................. 105
Table 13-4: Summarised Metallurgy from Testing of the Da Tambuk Composite .............................. 106
Table 13-5: Summarised Metallurgy from Testing of the Mato Bula Composite ................................ 107
Table 13-6: Summarised Metallurgy from Testing of the Mato Bula Composite ................................ 108
Table 13-7: Key Assays of Concentrates from Flotation of Adyabo Composites................................. 108
Table 14-1: Adyabo Project Data Types Used to Support Mineral Resource Estimation .................... 110
Table 14-2: Da Tambuk Domain Codes ................................................................................................ 111
Table 14-3: Length Weighted Assay Statistics for Gold Within Each Domain ..................................... 115
Table 14-4: Length Weighted Assay Statistics for Copper Within Each Domain ................................. 115
Table 14-5: Length Weighted Assay Statistics for Silver Within Each Domain .................................... 115
Table 14-6: Length Weighted 2 m Composite Statistics, Gold ............................................................ 116
Table 14-7: Length Weighted 2m Composite Statistics, Copper ......................................................... 116
Table 14-8: Length Weighted 2m Composite Statistics, Silver ............................................................ 116
Table 14-9: Indicator Block Domaining Results, Zone 150 .................................................................. 121
Table 14-10: Composite Subdomaining Results, Zone 150 ................................................................. 121
Table 14-11: Grade Model Interpolation Plan, Pass 1 ......................................................................... 122
Table 14-12: Grade Model Interpolation Plan, Pass 2 ......................................................................... 122
Table 14-13: 2 m Composite, NN and IDW3 Model Statistics Comparison, Gold ............................... 124
Table 14-14: 2 m Composite, NN and IDW3 Model Statistics Comparison, Copper ........................... 124
Table 14-15: 2 m Composite, NN and IDW3 Model Statistics Comparison, Silver .............................. 124
Table 14-16: Adyabo Project Domain Codes ....................................................................................... 127
Table 14-17: Length Weighted Assay Statistics for Gold Within Each Domain ................................... 131
Table 14-18: Length Weighted Assay Statistics for Copper Within Each Domain ............................... 131
Table 14-19: Length Weighted Assay Statistics for Silver Within Each Domain .................................. 131
Table 14-20: Length Weighted 2 m Composite Statistics, Gold .......................................................... 132
Table 14-21: Length Weighted 2m Composite Statistics, Copper ....................................................... 132
Table 14-22: Length Weighted 2m Composite Statistics, Silver .......................................................... 132
Table 14-23: Indicator Grade Thresholds ............................................................................................ 136
Table 14-24: Block Indicator Subdomaining Results, All Zones ........................................................... 137
AD Y A B O PR O J E C T NI 43-101 RE P O R T
May 2015 vi
Table 14-25: Composite Indicator Subdomaining Results, All Zones .................................................. 137
Table 14-26: Grade Model Interpolation Plan, Pass 1 ......................................................................... 138
Table 14-27: Grade Model Interpolation Plan, Pass 2 ......................................................................... 139
Table 14-28: Metal Removed from Models by Capping ...................................................................... 141
Table 14-29: 2 m Composite, NN and IDW3 Model Statistics Comparison, Gold ................................ 141
Table 14-30: 2 m Composite, NN and IDW3 Model Statistics Comparison, Copper ............................ 141
Table 14-31: 2 m Composite, NN and IDW3 Model Statistics Comparison, Silver ............................... 141
Table 14-32: Mato Bula Domain Codes ............................................................................................... 144
Table 14-33: Length Weighted Assay Statistics for Gold Within Each Domain ................................... 148
Table 14-34: Length Weighted Assay Statistics for Copper Within Each Domain ............................... 148
Table 14-35: Length Weighted Assay Statistics for Silver Within Each Domain .................................. 148
Table 14-36: Length Weighted 2 m Composite Statistics, Gold .......................................................... 149
Table 14-37: Length Weighted 2m Composite Statistics, Copper ....................................................... 149
Table 14-38: Length Weighted 2m Composite Statistics, Silver .......................................................... 149
Table 14-39: Grade Model Interpolation Plan, IDW3 ........................................................................... 152
Table 14-40: Grade Model Interpolation Plan, Pass 2 ......................................................................... 152
Table 14-41: 2 m Composite, NN and IDW3 Model Statistics Comparison, Gold ............................... 154
Table 14-42: 2 m Composite, NN and IDW3 Model Statistics Comparison, Copper ........................... 154
Table 14-43: 2 m Composite, NN and IDW3 Model Statistics Comparison, Silver .............................. 154
Table 14-44: Fladgate Long-term Metal Price Assumptions................................................................ 157
Table 14-45: Fladgate Mining Costs and Ore-Based Costs Used for NSR Calculations........................ 158
Table 14-46: Metallurgical Recovery Assumptions for Mineral Resource Constraints ....................... 158
Table 14-47: Adyabo Project Inferred Mineral Resource Estimate David Thomas, P. Geo. (Effective
Date: April 27, 2015) ..................................................................................................... 159
Table 14-48: Open Pit Total Tonnage and Metal Sensitivity to Metal Price ........................................ 160
Table 14-49: Open Pit and Underground Mineable Tonnage and Metal Sensitivity to Metal Price ... 160
Table 25-1: Summary of Optimum Process Route and Respective Recoveries .................................. 175
Table 26-1: Summary of Expenditure ................................................................................................. 177
AD Y A B O PR O J E C T NI 43-101 RE P O R T
May 2015 vii
List of Figures
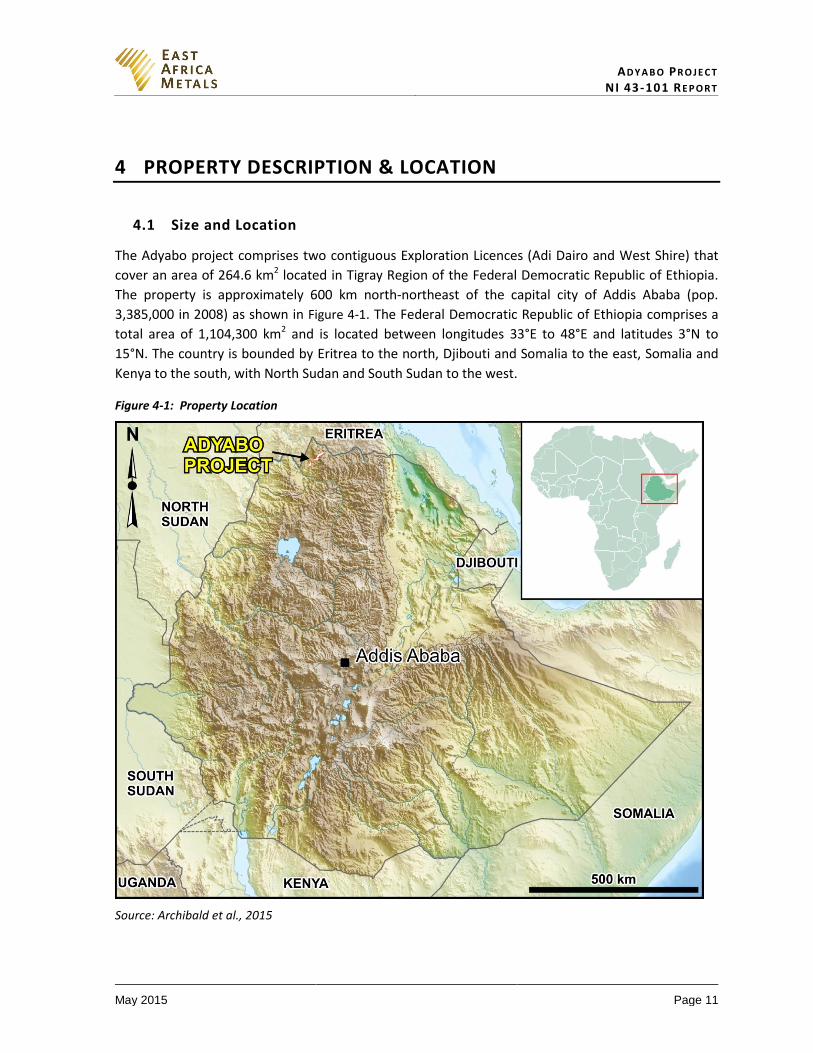
Figure 4-1: Property Location ............................................................................................................... 11
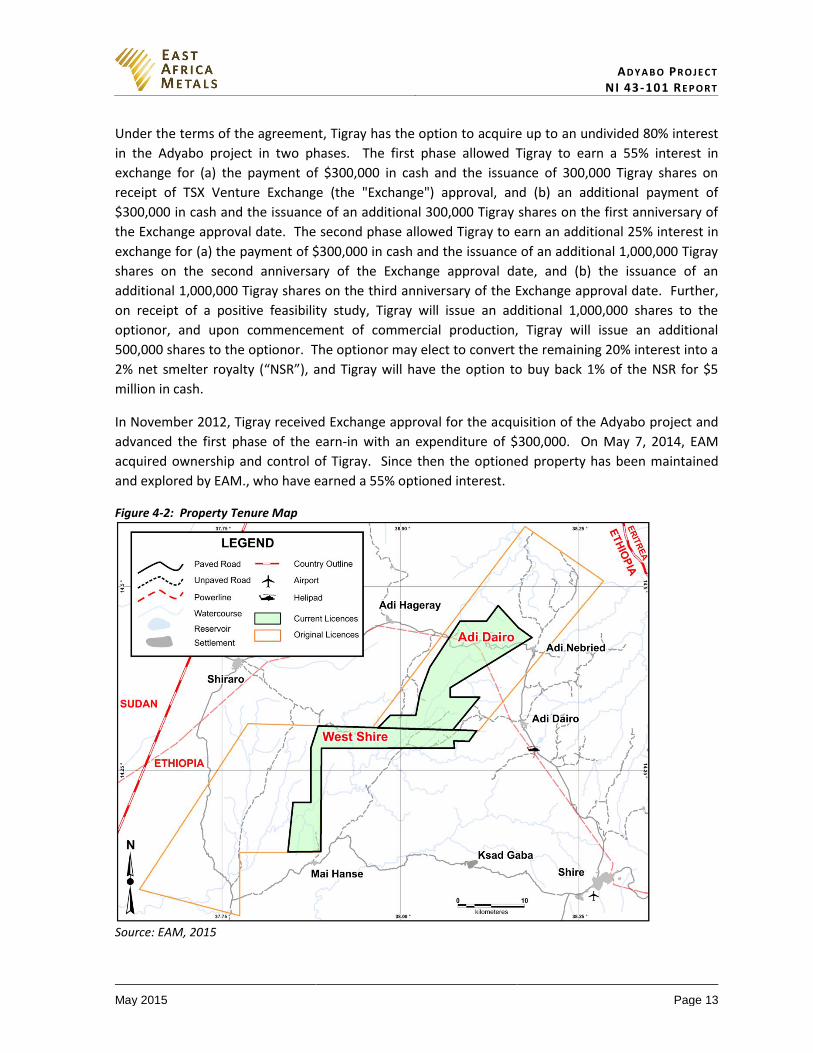
Figure 4-2: Property Tenure Map ......................................................................................................... 13
Figure 5-1: Property Location & Access Routes .................................................................................... 16
Figure 5-2: Climate Chart for Shire, Tigray National Region (2,325 m) ................................................ 17
Figure 5-3: Paved Road and High Tension Power Lines (on left) near the Eastern Boundary of the
Property.............................................................................................................................. 19
Figure 5-4: Reservoir Approximately 3 km southeast of Adi Dairo ...................................................... 19
Figure 5-5: West Shire Concession in the Dry Season (March) ............................................................ 20
Figure 7-1: Geological Setting Map (with relation to Asmara properties and Bisha mine) .................. 23
Figure 7-2: Geology Map of the Adyabo Project ( ................................................................................ 25
Figure 7-3: Typical Rock Types Found Throughout the Adyabo Project ............................................... 26
Figure 7-4: Mato Bula Prospect Geology .............................................................................................. 28
Figure 7-5: Mato Bula Prospect Looking Northwest ............................................................................. 29
Figure 7-6: Mato Bula North Prospect (Looking North) ........................................................................ 30
Figure 7-7: Mato Bula North Prospect Geology .................................................................................... 30
Figure 7-8: Da Tambuk Prospect Geology ............................................................................................ 31
Figure 7-9: Hanbassa Prospect Geology ............................................................................................... 32
Figure 7-10: Adi Gozomo and Ado Gozomo East Prospects Geology ................................................... 33
Figure 7-11: Sentraley Prospect Geology.............................................................................................. 35
Figure 7-12: Prospects Mentioned in the Text ..................................................................................... 36
Figure 7-13: Silica Hill North Mineralization (WMD032) ...................................................................... 38
Figure 7-14: High-Grade Gold Mineralization from Silica Hill (WMD006) ............................................ 39
Figure 7-15 High-Grade Gold Mineralization from Silica Hill (WMD006) ............................................. 39
Figure 7-16: Silica Hill Drill Section 19,880N (looking northeast) ......................................................... 40
Figure 7-17: Mato Bula Upper Lode Long section (looking northwest) ................................................ 41
Figure 7-18: Mato Bula Drill Section 19,560N (looking northeast) ....................................................... 42
Figure 7-19: Mato Bula Main Lode Long section (looking northwest) ................................................. 43
Figure 7-20: Jasper Hill Drill Section 19,560N (looking northeast) ....................................................... 45
Figure 7-21: Jasper Hill Mineralization from the Main Lode (WMD012).............................................. 46
Figure 7-22: Jasper Hill Mineralization from the Upper Lode (WMD006) ............................................ 46
Figure 7-23: Mato Bula North Section 20,760N (looking northeast) .................................................... 48
Figure 7-24: Mato Bula North Long section (looking grid west) ........................................................... 49
Figure 7-25: Low-Grade Gold and Copper Mineralization from Mato Bula North (WMD023) ............ 49
Figure 7-26: High-Grade Copper Mineralization from Mato Bula North (WMD024) ........................... 50
Figure 7-27: Da Tambuk Section 20,760N (looking northeast)............................................................. 51
Figure 7-28: Da Tambuk Long section (looking grid west) .................................................................... 52
Figure 7-29 High-Grade Gold Mineralization from Da Tambuk (ADD006) ............................................ 52
Figure 7-30: Diamond Drilling at the Adi Gozomo Prospect, 2013 ....................................................... 54
Figure 8-1: Au-Rich VMS and Orogenic Gold Deposits of the Arabian-Nubian Shield.......................... 55
AD Y A B O PR O J E C T NI 43-101 RE P O R T
May 2015 viii
Figure 8-2: Schematic Illustration of Geological setting and Hydrothermal Alteration Associated with
Au-rich VMS Systems ........................................................................................................ 57
Figure 8-3: Schematic Representation of Crustal Environments of Orogenic Gold Deposits ............... 58
Figure 9-1: Example of Fact Mapping on the Mato Bula Trend ............................................................ 60
Figure 9-2: Distribution of Gold Shallow Soil Sampling on the Property .............................................. 61
Figure 9-3: Distribution of Gold Shallow Soil Sampling on the Mato Bula Trend ................................. 62
Figure 9-4: XRF Soil Sampling ................................................................................................................ 63
Figure 9-5: XRF Soil Sampling Results for Selenium Distribution over the Mato Bula Trend ............... 64
Figure 9-6: Locations of Stream Sediment Samples ............................................................................. 65
Figure 9-7: Lithogeochemical Sample Locations ................................................................................... 66
Figure 9-8: Location of Trenches (and Artisanal Workings) at Da Tambuk, Looking South ................. 67
Figure 9-9: Location of the 2007 Aeroquest Airborne EM Survey ........................................................ 69
Figure 9-10: Historic Aeroquest Airborne EM Survey Data over the Mato Bula Trend ........................ 70
Figure 9-11: Gold grain (60 x 40 μm) in fine-grained quartz and muscovite, adjacent to 300 μm-wide
pyrite containing chalcopyrite blebs (Da Tambuk, ADD002) ............................................ 72
Figure 10-1: Drilling of an Inclined Diamond Hole at Mato Bula .......................................................... 75
Figure 10-2: Cement Marker Denoting the Location of Drillhole Collars ............................................. 77
Figure 10-3: Mato Bula Drillhole Plan showing Collar Locations .......................................................... 78
Figure 10-4: Mato Bula Upper Lode Long Section (Looking Northwest) .............................................. 79
Figure 10-5: Mato Bula North Drillhole Plan ........................................................................................ 82
Figure 10-6: Da Tambuk Drillhole Plan ................................................................................................. 83
Figure 10-7: Da Tambuk Drillhole Plan ................................................................................................. 85
Figure 11-1: Core Handling & Sampling Photographs .......................................................................... 91
Figure 11-2: Security & Chain of Custody Related Photographs .......................................................... 92
Figure 11-3: Accuracy Plot of ALS against ACME, Gold ......................................................................... 98
Figure 11-4: Accuracy Plot of ALS against ACME, Copper .................................................................... 98
Figure 11-5: Accuracy Plot of ALS against ACME, Silver ....................................................................... 99
Figure 14-1: Horizontal Projection of Mineralization Wireframes, Da Tambuk .................................. 112
Figure 14-2: Zone 150 Histograms and Probability Plots, Assays ........................................................ 113
Figure 14-3: Zone 200 Histograms and Probability Plots, Assays ........................................................ 114
Figure 14-4: Da Tambuk Zone 150 Histograms and Probability Plots, Capped Composites ............... 117
Figure 14-5: Da Tambuk Zone 200 Histograms and Probability Plots, Capped Composites ............... 117
Figure 14-6: Scatter plots of Sulphur Against Gold and SG Against Sulphur, Zone 150 ...................... 118
Figure 14-7: Contact Profile, Zone 150 and Zone 200 ......................................................................... 119
Figure 14-8: Plot of CV against Average Gold Grade, Zone 150 .......................................................... 120
Figure 14-9: East-West Cross Section, 23,680 N .................................................................................. 123
Figure 14-10: Gold Swath Plots by Easting, Northing and Elevation for Zone 150 ............................. 125
Figure 14-11: Gold Swath Plots by Easting, Northing and Elevation for Zone 200 ............................. 126
Figure 14-12: 3-D View of Mineralization Wireframes Looking Northeast, Mato Bula ...................... 128
Figure 14-13: Zone 100 Histograms and Probability Plots, Assays ...................................................... 129
Figure 14-14: Zone 200 Histograms and Probability Plots, Assays ...................................................... 130
Figure 14-15: Mato Bula Zone 100 Histograms and Probability Plots, Capped Composites ............... 133
AD Y A B O PR O J E C T NI 43-101 RE P O R T
May 2015 ix
Figure 14-16: Mato Bula Zone 200 Histograms and Probability Plots, Capped Composites ............... 133
Figure 14-17: Scatter plots of Sulphur Against Gold and Sulphur Against SG, Zone 100 .................... 134
Figure 14-18: Contact Profiles, All Zones ............................................................................................. 134
Figure 14-19: CV Plots, All Zones ......................................................................................................... 135
Figure 14-20: East-West Cross Section, 19,880 N ................................................................................ 140
Figure 14-21: Gold Swath Plots by Easting, Northing and Elevation for Zone 100 ............................. 142
Figure 14-22: Gold Swath Plots by Easting, Northing and Elevation for Zone 150 ............................. 143
Figure 14-23: Gold Swath Plots by Easting, Northing and Elevation for Zone 200 ............................. 143
Figure 14-24: Horizontal Projection of Mineralization Wireframes, Da Tambuk ................................ 145
Figure 14-25: Zone 100 Histograms and Probability Plots, Assays ...................................................... 146
Figure 14-26: Zone 200 Histograms and Probability Plots, Assays ...................................................... 147
Figure 14-27: Mato Bula North Zone 100 Histograms and Probability Plots, Capped Composites .... 149
Figure 14-28: Mato Bula North Zone 200 Histograms and Probability Plots, Capped Composites .... 150
Figure 14-29: Scatter plots of Sulphur Against Copper and SG Against Sulphur, Zone 100 ................ 150
Figure 14-30: Contact Profile, Zone 100 and Zone 200 ....................................................................... 151
Figure 14-31: East-West Cross Section, 20,795 N ................................................................................ 153
Figure 14-32: Copper Swath Plots by Easting, Northing and Elevation for Zone 150 ......................... 155
Figure 14-33: Copper Swath Plots by Easting, Northing and Elevation for Zone 200 ......................... 156
AD Y A B O PR O J E C T NI 43-101 RE P O R T
May 2015 x
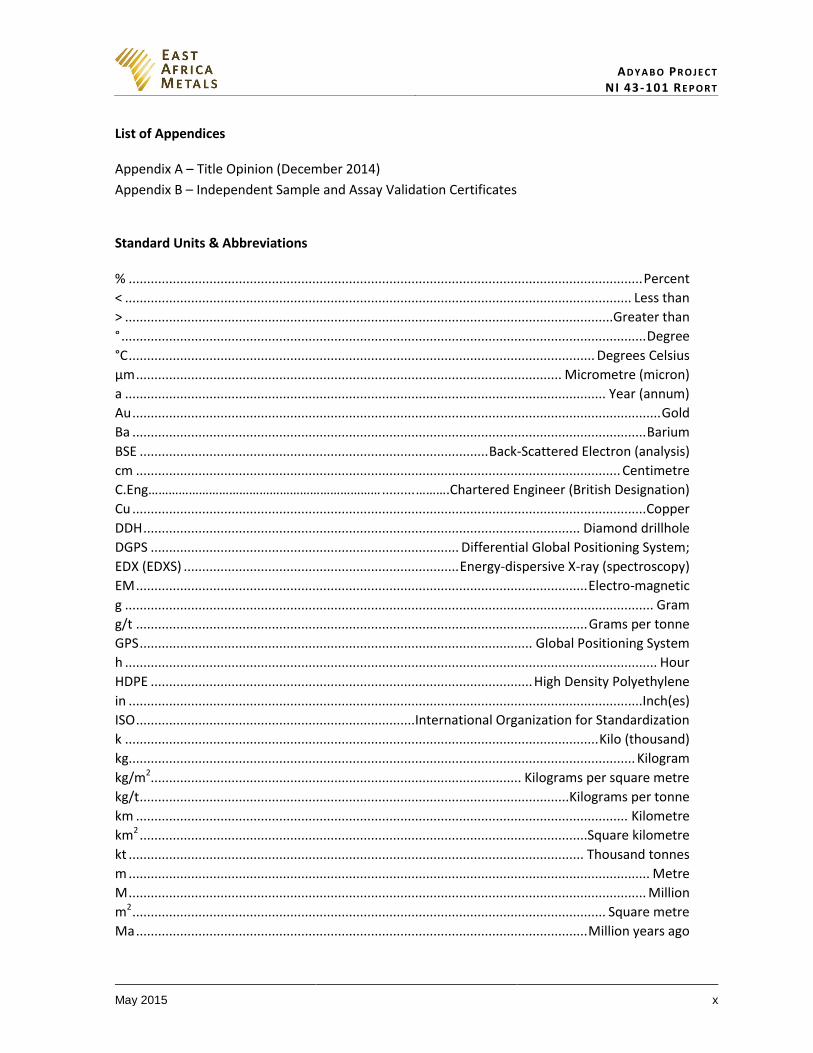
List of Appendices
Appendix A – Title Opinion (December 2014)
Appendix B – Independent Sample and Assay Validation Certificates
Standard Units & Abbreviations
% ............................................................................................................................................ Percent
< .......................................................................................................................................... Less than
> .....................................................................................................................................Greater than
° ............................................................................................................................................... Degree
°C ............................................................................................................................... Degrees Celsius
μm .................................................................................................................... Micrometre (micron)
a ................................................................................................................................... Year (annum)
Au ................................................................................................................................................ Gold
Ba ............................................................................................................................................ Barium
BSE ............................................................................................... Back-Scattered Electron (analysis)
cm .................................................................................................................................... Centimetre
C.Eng…………………………………………………………… ......... ……….Chartered Engineer (British Designation)
Cu ............................................................................................................................................ Copper
DDH ....................................................................................................................... Diamond drillhole
DGPS .................................................................................... Differential Global Positioning System;
EDX (EDXS) ........................................................................... Energy-dispersive X-ray (spectroscopy)
EM ........................................................................................................................... Electro-magnetic
g ................................................................................................................................................ Gram
g/t ........................................................................................................................... Grams per tonne
GPS ........................................................................................................... Global Positioning System
h ................................................................................................................................................. Hour
HDPE ........................................................................................................ High Density Polyethylene
in ............................................................................................................................................Inch(es)
ISO ............................................................................ International Organization for Standardization
k ................................................................................................................................. Kilo (thousand)
kg.......................................................................................................................................... Kilogram
kg/m2..................................................................................................... Kilograms per square metre
kg/t ..................................................................................................................... Kilograms per tonne
km ...................................................................................................................................... Kilometre
km2 ..........................................................................................................................Square kilometre
kt ............................................................................................................................ Thousand tonnes
m .............................................................................................................................................. Metre
M ............................................................................................................................................. Million
m2 ................................................................................................................................. Square metre
Ma ........................................................................................................................... Million years ago
AD Y A B O PR O J E C T NI 43-101 RE P O R T
May 2015 xi
masl ............................................................................................................... Metres above sea level
mm .................................................................................................................................... Millimetre
Mt ............................................................................................................................... Million tonnes
NI 43-101 .............................................................................................. National Instrument 43-101
oz................................................................................................................. Ounce, Troy (31.1035 g)
P.Eng. ........................................................................ Professional Engineer (Canadian Designation)
P.Geo. ....................................................................... Professional Geologist (Canadian Designation)
Pb ................................................................................................................................................ Lead
ppm .......................................................................................................................... Parts per million
QP ............................................................................................................................Qualified Person
SEM .................................................................................................... Scanning Electron Microscope
SG ............................................................................................................................... Specific gravity
t ................................................................................................ Tonne (metric, 1,000 kg = 2,205 lbs)
VMS ................................................................................................. Volcanogenic Massive Sulphide
XRD.............................................................................................................. X-ray powder diffraction
Zn ................................................................................................................................................. Zinc
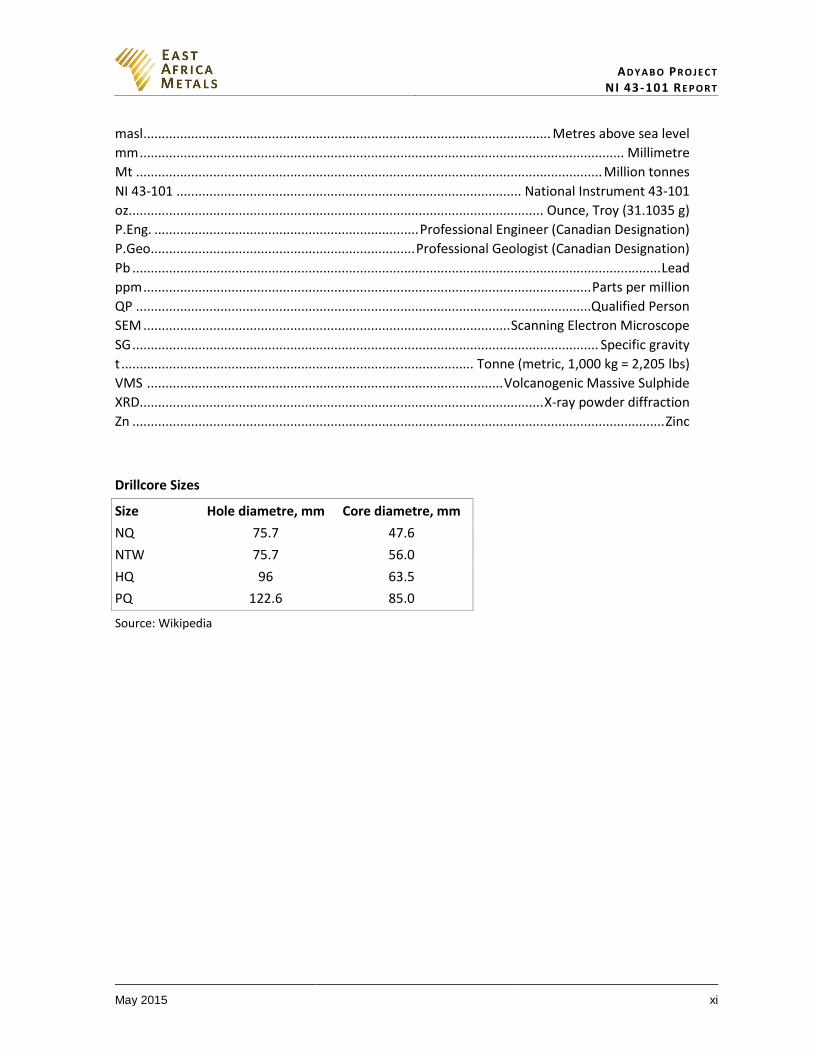
Drillcore Sizes
Size Hole diametre, mm Core diametre, mm
NQ 75.7 47.6
NTW 75.7 56.0
HQ 96 63.5
PQ 122.6 85.0
Source: Wikipedia
AD Y A B O PR O J E C T NI 43-101 RE P O R T
May 2015 Page 1
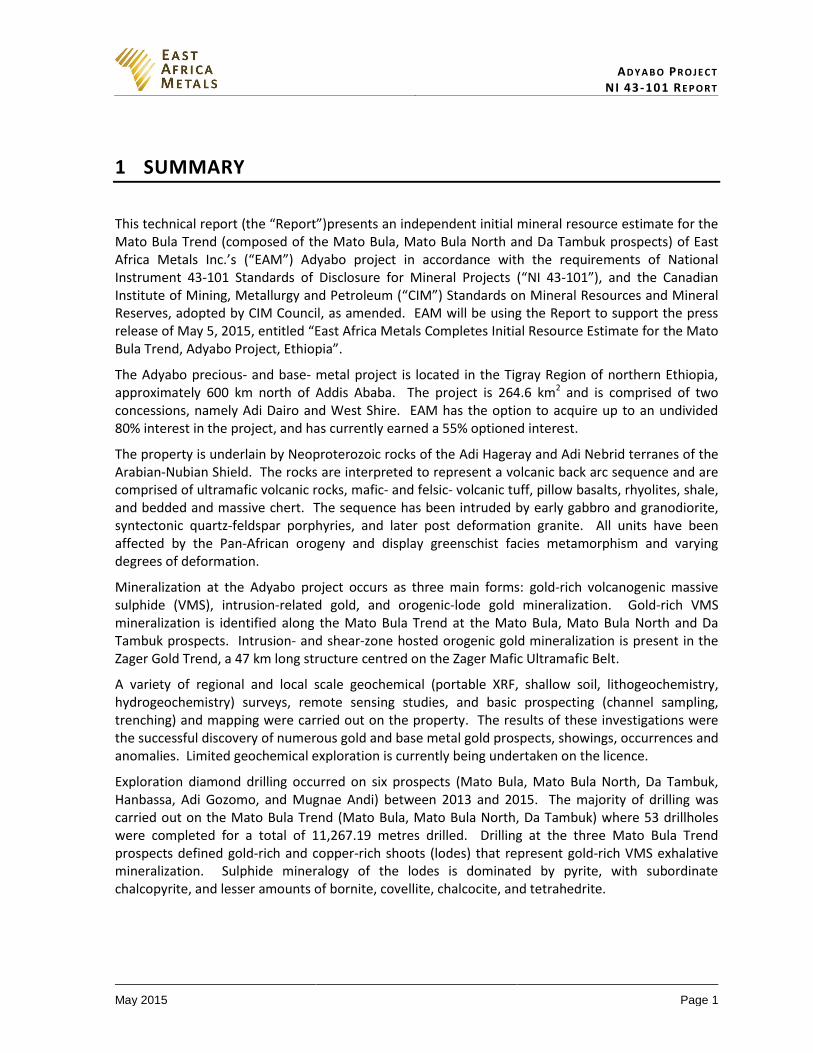
1 SUMMARY
This technical report (the “Report”)presents an independent initial mineral resource estimate for the Mato Bula Trend (composed of the Mato Bula, Mato Bula North and Da Tambuk prospects) of East Africa Metals Inc.’s (“EAM”) Adyabo project in accordance with the requirements of National Instrument 43-101 Standards of Disclosure for Mineral Projects (“NI 43-101”), and the Canadian Institute of Mining, Metallurgy and Petroleum (“CIM”) Standards on Mineral Resources and Mineral Reserves, adopted by CIM Council, as amended. EAM will be using the Report to support the press release of May 5, 2015, entitled “East Africa Metals Completes Initial Resource Estimate for the Mato Bula Trend, Adyabo Project, Ethiopia”.
The Adyabo precious- and base- metal project is located in the Tigray Region of northern Ethiopia, approximately 600 km north of Addis Ababa. The project is 264.6 km2 and is comprised of two concessions, namely Adi Dairo and West Shire. EAM has the option to acquire up to an undivided 80% interest in the project, and has currently earned a 55% optioned interest.
The property is underlain by Neoproterozoic rocks of the Adi Hageray and Adi Nebrid terranes of the Arabian-Nubian Shield. The rocks are interpreted to represent a volcanic back arc sequence and are comprised of ultramafic volcanic rocks, mafic- and felsic- volcanic tuff, pillow basalts, rhyolites, shale, and bedded and massive chert. The sequence has been intruded by early gabbro and granodiorite, syntectonic quartz-feldspar porphyries, and later post deformation granite. All units have been affected by the Pan-African orogeny and display greenschist facies metamorphism and varying degrees of deformation.
Mineralization at the Adyabo project occurs as three main forms: gold-rich volcanogenic massive sulphide (VMS), intrusion-related gold, and orogenic-lode gold mineralization. Gold-rich VMS mineralization is identified along the Mato Bula Trend at the Mato Bula, Mato Bula North and Da Tambuk prospects. Intrusion- and shear-zone hosted orogenic gold mineralization is present in the Zager Gold Trend, a 47 km long structure centred on the Zager Mafic Ultramafic Belt.
A variety of regional and local scale geochemical (portable XRF, shallow soil, lithogeochemistry, hydrogeochemistry) surveys, remote sensing studies, and basic prospecting (channel sampling, trenching) and mapping were carried out on the property. The results of these investigations were the successful discovery of numerous gold and base metal gold prospects, showings, occurrences and anomalies. Limited geochemical exploration is currently being undertaken on the licence.
Exploration diamond drilling occurred on six prospects (Mato Bula, Mato Bula North, Da Tambuk, Hanbassa, Adi Gozomo, and Mugnae Andi) between 2013 and 2015. The majority of drilling was carried out on the Mato Bula Trend (Mato Bula, Mato Bula North, Da Tambuk) where 53 drillholes were completed for a total of 11,267.19 metres drilled. Drilling at the three Mato Bula Trend prospects defined gold-rich and copper-rich shoots (lodes) that represent gold-rich VMS exhalative mineralization. Sulphide mineralogy of the lodes is dominated by pyrite, with subordinate chalcopyrite, and lesser amounts of bornite, covellite, chalcocite, and tetrahedrite.
AD Y A B O PR O J E C T NI 43-101 RE P O R T
May 2015 Page 2
The Mato Bula (sensu lato) prospect comprises four main zones, (from north to south) Silica Hill North, Silica Hill, Mato Bula (sensu stricto) and Jasper Hill. This mineralized zone has been defined for a strike distance of 800 m and includes five separate shoots. At two zones, Mato Bula and Jasper Hill, mineralization is present in a Main and an Upper lode. The Upper Lode exhibits features representative of exhalative mineralization, whereas the Main Lode is more replacive (vent proximal) in nature. The best intercept from the Main Lode at Mato Bula is 17.57 m @ 4.2 g/t Au and 1.05 (from 56.05 m in WMD004), and the best intercept from the Upper Lode 8.2 m @ 4.9 g/t and 0.73% Cu (from 127.10 m in WMD004). The stratiform units vary in thickness, but attain a maximum thickness of 18.5 m (true thickness) at Silica Hill.
The Mato Bula North prospect is located 850 m northeast from the Silica Hill zone at Mato Bula. Drilling has defined a mineralized zone 160 m in length, up to 150 m deep with a true width up to 50 m. Mineralization is present within silica, quartz veins and disseminated sulphides within quartz porphyry intrusions. Drillhole WMD024 intersected three significant mineralized intercepts in the centre of the prospect, which returned values of 20.25 m @1.97 % Cu and 0.17 g/t Au, 4.85 m @ 0.65% Cu and 5.75 g/t Au, and 2.75 m @ 8.76 g/t Au. Mineralization at Mato Bula North is interpreted to be part of the feeder system to a gold-rich VMS.
Da Tambuk is located 4 km northeast along strike from Mato Bula. High-grade gold shoots are present that attain true thicknesses of 13 m, and occur over a surface strike of 135 m, and a height of 150 m. Mineralization is hosted within a highly pyritized sericite schist (containing > 10% pyrite), and is associated with silica alteration, quartz veining, pyrite, weak chalcopyrite and pale sphalerite. The highest grade intercept recorded from Da Tambuk was 12.00 m @ 17.34 g/t Au and 0.32% Cu (from a depth of 52.75 m, ADD002).
In addition to Au-rich VMS mineralization, the Adyabo project also hosts potential orogenic lode gold (intrusion related, and shear-zone hosted) mineralization. Numerous gold-in-soil anomalies are present along the Zager Trend, and abundant artisanal bedrock, eluvial and alluvial gold workings are present over the 47 km strike length of the belt. Limited drilling has taken place at Mugnae Andi, Hanbassa and Adi Gozomo, with encouraging exploration results reported from Sentraley.
Three composites have been subjected to preliminary metallurgical testwork. All three composites
assayed somewhat higher than the resource average grades (so the reader is advised to take care in
interpreting the data).
Limited petrographic work has been conducted on material from the project. Reports from this work
describe materials that are rich in primary copper sulphides and hosted within a siliceous host rock.
The very few gold grains observed (all in Da Tambuk) were associated with sulphides and are mid-
sized (20-60 microns in size).
The copper-poor and gold-rich Da Tambuk composite was subjected to (1) a direct leach of the
composite, (2) flotation and (3) gravity concentration. Direct leaching, conducted at a grind size of 80
microns, yielded 97% gold and while the consumption of cyanide was high, it was not unreasonable
given the copper and gold grades of the sample. Leach optimization and testing of a lower
(especially copper) grade composite should drop the consumption of cyanide. No coarse leach tests
were conducted so no preliminary assessment of the suitability of Da Tambuk to heap leaching can
be made. Flotation yielded a copper concentrate assaying 24% copper and 855 g/t gold, at 72% and
AD Y A B O PR O J E C T NI 43-101 RE P O R T
May 2015 Page 3
57% copper and gold recoveries, respectively. Most of the remaining gold can be concentrated by
flotation and subsequently leached.
The other composites, from Mato Bula and Silica Hill, were both richer in copper, sufficiently so to
respond well to copper flotation. Mato Bula was particularly rich in copper (assaying 1%) and a high
grade (27% copper) copper concentrate was created using a standard copper flotation process. The
copper and gold recoveries to the copper concentrate were 93% and 83%, respectively, the latter
recovery being boosted to 89% by flotation of gold-hosted pyrite from the copper rougher tails and
co-leaching this pyrite concentrate with the copper cleaner circuit tails.
The Silica Hill composite yielded 82% copper recovery to a concentrate assaying 23% copper. Unlike
Mato Bula, the gold in this composite floated quite poorly, with only 38% floating to the final copper
concentrate. The cleaner tails, however, when combined with a pyrite concentrate floated after
copper rougher flotation, boosted the overall gold recovery to 89%.
In summary, the optimum copper and gold recoveries (gold only for Da Tambuk) and the respective
processes were:
Composite Process Recovery (%)
Gold Copper
Da Tambuk Direct cyanidation 97% n/a
Mato Bula Copper flotation, then leaching of the copper cleaner tails and pyrite concentrates 87% 82%
Silica Hill Copper flotation, then leaching of the copper cleaner tails and pyrite concentrates 89% 82% Footnote: As an alternative to direct cyanidation of Da Tambuk material, a flowsheet incorporating flotation and cyanidation can
be expected to achieve 97% total gold recovery and 72% copper recovery.
The Mineral Resource model was prepared by David G. Thomas P. Geo., Associate Mineral Resource with Fladgate Exploration Consulting Corporation (“Fladgate”). This is the first Mineral Resource estimate disclosed by EAM on the Adyabo project.
There are a total of 47 drillholes (for a total of 10,266.2 m) and 22 trenches (for a total of 1,519.8 m) within the Adyabo database used to support mineral resource estimation. Drillholes have intersected mineralization at depths of up to 450 m below surface at Mato Bula, 150 m depth at Mato Bula North and 300 m depth at Da Tambuk.
EAM provided Fladgate with sectional interpretations of the mineralization based on copper and gold grades. Fladgate created wireframe models of the mineralized zones using EAM’s drillhole intercepts with MineSight’s implicit modeller.
Capping was applied to the assays prior to compositing. Assay data were composited to 2 metres in length broken at the contacts of the mineralization wireframes. As a result of evidence of mixed low-grade and higher-grade populations within the mineralization, further sub-domaining of the mineralization was completed using probabilistic models.
Bulk densities were assigned directly from 2,165 SG measurements collected from Mato Bula, Mato Bula North and Da Tambuk.
AD Y A B O PR O J E C T NI 43-101 RE P O R T
May 2015 Page 4
Grade estimation was performed using an inverse-distance-weighted (to the power of three) interpolation method in two passes. In the first pass, Fladgate used MineSight’s dynamic unfolding (DU) module to account for significant changes in the orientation of the mineralization wireframe. In the second estimation pass, Fladgate used conventional grade estimation to estimate grades in blocks which were not estimated in the first pass.
Grade estimation used a composite and block matching scheme based on the domain codes. A minimum of 1 and maximum of 12 composites, with a maximum of 2 composites per drillholes were used to estimate block grades into blocks with dimensions of 5 m (along strike) by 2 m (across strike) by 5 m (vertical).
Block model validation consisted of visual inspection, comparison of global statistics with a reference nearest-neighbour (NN) model and inspection of swath plots for evidence of local biases. Fladgate found the model reflects the input data and shows differences of less than 10% in the average grade relative to the reference NN model. Fladgate considers a difference of less than 10% to be adequate for a preliminary Inferred category Mineral Resource estimate.
Open pit-constrained Mineral Resources are confined within a Lerchs–Grossmann optimized pit shell to assess reasonable prospects of economic extraction. Underground-constrained Mineral Resources are contained within a grade shell above an economic cut-off with consideration of underground mining costs. Isolated blocks were removed as these do not have reasonable prospects of future economic extraction.
Mineral Resources are classified in accordance with the 2014 CIM Definition Standards for Mineral Resources and Mineral Reserves. The Mineral Resources do not include external dilution. The Mineral Resource estimate has an effective date of 27 April, 2015. David Thomas, P.Geo, an associate mineral resource geologist with Fladgate Exploration Consulting Corporation is the Qualified Person (QP) for the estimate.
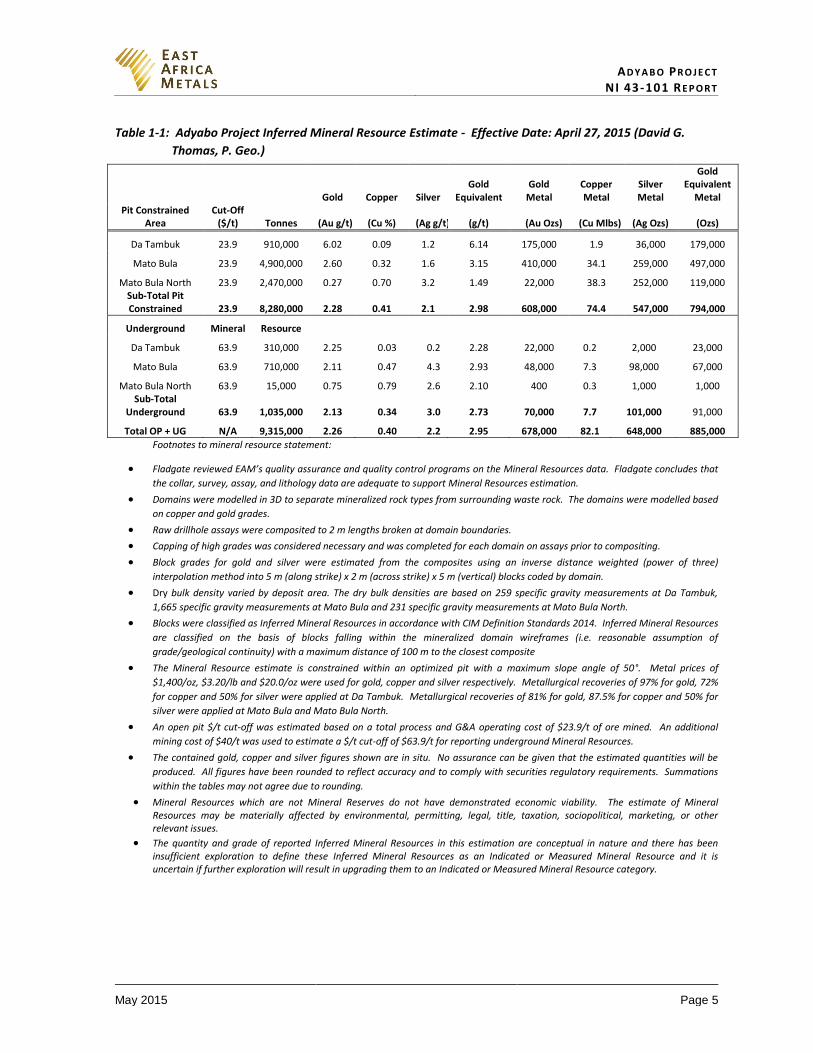
The inferred Mineral Resource estimate is summarized in Table 1-1.
AD Y A B O PR O J E C T NI 43-101 RE P O R T
May 2015 Page 5
Table 1-1: Adyabo Project Inferred Mineral Resource Estimate - Effective Date: April 27, 2015 (David G.
Thomas, P. Geo.)
Gold Copper Silver
Gold Equivalent
Gold Metal
Copper Metal
Silver Metal
Gold Equivalent
Metal Pit Constrained
Area Cut-Off
($/t) Tonnes (Au g/t) (Cu %) (Ag g/t) (g/t) (Au Ozs) (Cu Mlbs) (Ag Ozs) (Ozs)
Da Tambuk 23.9 910,000 6.02 0.09 1.2 6.14 175,000 1.9 36,000 179,000
Mato Bula 23.9 4,900,000 2.60 0.32 1.6 3.15 410,000 34.1 259,000 497,000
Mato Bula North 23.9 2,470,000 0.27 0.70 3.2 1.49 22,000 38.3 252,000 119,000 Sub-Total Pit Constrained 23.9 8,280,000 2.28 0.41 2.1 2.98 608,000 74.4 547,000 794,000
Underground Mineral Resource
Da Tambuk 63.9 310,000 2.25 0.03 0.2 2.28 22,000 0.2 2,000 23,000
Mato Bula 63.9 710,000 2.11 0.47 4.3 2.93 48,000 7.3 98,000 67,000
Mato Bula North 63.9 15,000 0.75 0.79 2.6 2.10 400 0.3 1,000 1,000 Sub-Total
Underground 63.9 1,035,000 2.13 0.34 3.0 2.73 70,000 7.7 101,000 91,000
Total OP + UG N/A 9,315,000 2.26 0.40 2.2 2.95 678,000 82.1 648,000 885,000
Footnotes to mineral resource statement:
Fladgate reviewed EAM’s quality assurance and quality control programs on the Mineral Resources data. Fladgate concludes that
the collar, survey, assay, and lithology data are adequate to support Mineral Resources estimation.
Domains were modelled in 3D to separate mineralized rock types from surrounding waste rock. The domains were modelled based
on copper and gold grades.
Raw drillhole assays were composited to 2 m lengths broken at domain boundaries.
Capping of high grades was considered necessary and was completed for each domain on assays prior to compositing.
Block grades for gold and silver were estimated from the composites using an inverse distance weighted (power of three)
interpolation method into 5 m (along strike) x 2 m (across strike) x 5 m (vertical) blocks coded by domain.
Dry bulk density varied by deposit area. The dry bulk densities are based on 259 specific gravity measurements at Da Tambuk,
1,665 specific gravity measurements at Mato Bula and 231 specific gravity measurements at Mato Bula North.
Blocks were classified as Inferred Mineral Resources in accordance with CIM Definition Standards 2014. Inferred Mineral Resources
are classified on the basis of blocks falling within the mineralized domain wireframes (i.e. reasonable assumption of
grade/geological continuity) with a maximum distance of 100 m to the closest composite
The Mineral Resource estimate is constrained within an optimized pit with a maximum slope angle of 50°. Metal prices of
$1,400/oz, $3.20/lb and $20.0/oz were used for gold, copper and silver respectively. Metallurgical recoveries of 97% for gold, 72%
for copper and 50% for silver were applied at Da Tambuk. Metallurgical recoveries of 81% for gold, 87.5% for copper and 50% for
silver were applied at Mato Bula and Mato Bula North.
An open pit $/t cut-off was estimated based on a total process and G&A operating cost of $23.9/t of ore mined. An additional
mining cost of $40/t was used to estimate a $/t cut-off of $63.9/t for reporting underground Mineral Resources.
The contained gold, copper and silver figures shown are in situ. No assurance can be given that the estimated quantities will be
produced. All figures have been rounded to reflect accuracy and to comply with securities regulatory requirements. Summations
within the tables may not agree due to rounding.
Mineral Resources which are not Mineral Reserves do not have demonstrated economic viability. The estimate of Mineral Resources may be materially affected by environmental, permitting, legal, title, taxation, sociopolitical, marketing, or other relevant issues.
The quantity and grade of reported Inferred Mineral Resources in this estimation are conceptual in nature and there has been insufficient exploration to define these Inferred Mineral Resources as an Indicated or Measured Mineral Resource and it is uncertain if further exploration will result in upgrading them to an Indicated or Measured Mineral Resource category.
AD Y A B O PR O J E C T NI 43-101 RE P O R T
May 2015 Page 6
Several recommendations are suggested regarding the project. These include a contingent two phased work program, with Phase 1 consisting of:
Additional exploration (geochemical and geophysical) programs should be conducted on the area between Mato Bula North and Da Tambuk. Drilling should be performed if encouraging results are encountered.
Exploration should continue at the prospects within the Zager Trend.
Upgrading the resource classification from inferred to indicated by conducting more drilling with a closer spacing.
Closer spaced drilling should be carried out in areas where higher than average grade gold mineralization is encountered.
Additional metallurgical testing should be conducted on a composite with broad spatial and good grade representation of the resource, specifically,
Physical characterization including basic mineralogy and grindability testing
Flotation optimization and confirmation
Pre-optimization of cyanidation of flotation products
Locked Cycle Test (LCT) confirmation and leach of tails
Concentrate complete scans
Bottle roll leaching, including coarse particle bottle roll leaching and cyanide dose optimization for Da Tambuk samples
Testwork to produce a high grade copper concentrate, and leach the copper tails, and also leach the sulphides floated from the copper tails.
Paper trade-off economic studies of the different metallurgical options.
If the results from Phase 1 are encouraging, then a Phase 2 work program should be undertaken to
fully assess the along strike and down-dip potential at Mato Bula, Mato Bula North and Da Tambuk.
A small discretionary drilling budget is also recommended if suitable geochemical targets are
identified along the Mato Bula Trend.
The total cost of this work is estimated to be CDN$1,926,000.
AD Y A B O PR O J E C T NI 43-101 RE P O R T
May 2015 Page 7
2 INTRODUCTION
2.1 Terms of Reference, Scope & Purpose of Report
In February 2015, East Africa Metals Inc. (“EAM”) retained Aurum Exploration Services (“Aurum”) and Fladgate Exploration Consulting Corporation (“Fladgate”) to prepare a mineral resource estimate in accordance with the requirements and standards of National Instrument 43-101 Standards of Disclosure for Mineral Projects (“NI 43-101”), for the Mato Bula, Mato Bula North and Da Tambuk prospects of EAM’s Adyabo gold and base metal exploration project. EAM is a Vancouver-based mineral exploration company focused on exploration of mineral resource projects in Ethiopia and Tanzania. EAM's shares trade on the TSX Venture Exchange under the symbol EAM. Additional information about EAM, including press releases and public documents, can be viewed at the company's website www.eastafricametals.com or at www.sedar.com.
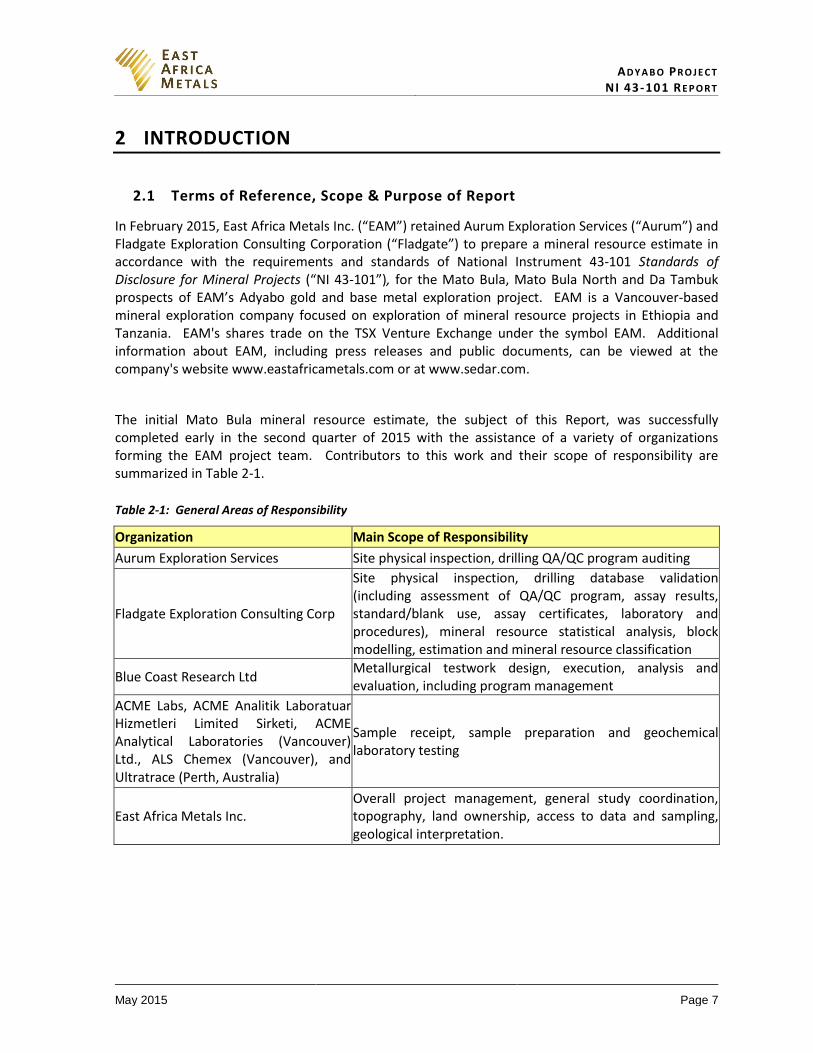
The initial Mato Bula mineral resource estimate, the subject of this Report, was successfully completed early in the second quarter of 2015 with the assistance of a variety of organizations forming the EAM project team. Contributors to this work and their scope of responsibility are summarized in Table 2-1.
Table 2-1: General Areas of Responsibility
Organization Main Scope of Responsibility
Aurum Exploration Services Site physical inspection, drilling QA/QC program auditing
Fladgate Exploration Consulting Corp
Site physical inspection, drilling database validation (including assessment of QA/QC program, assay results, standard/blank use, assay certificates, laboratory and procedures), mineral resource statistical analysis, block modelling, estimation and mineral resource classification
Blue Coast Research Ltd Metallurgical testwork design, execution, analysis and evaluation, including program management
ACME Labs, ACME Analitik Laboratuar Hizmetleri Limited Sirketi, ACME Analytical Laboratories (Vancouver) Ltd., ALS Chemex (Vancouver), and Ultratrace (Perth, Australia)
Sample receipt, sample preparation and geochemical laboratory testing
East Africa Metals Inc. Overall project management, general study coordination, topography, land ownership, access to data and sampling, geological interpretation.
AD Y A B O PR O J E C T NI 43-101 RE P O R T
May 2015 Page 8
The primary objectives of this report are to:
consolidate and review all available past and present work
review all available drilling, sampling and analytical procedures used at site, in the laboratories and in record retention
collect field samples for independent testing and verification
review and validate all drilling data collected for this report, including assessment and validation of associated QA/QC programs and assay results
identify risks and opportunities for the project
make recommendations for a path forward and for further work.
This report was prepared in accordance with the requirements and standards for disclosure of the stock exchanges overseen by the Canadian Securities Administrators, namely, NI 43-101, Companion Policy 43-101CP, Form 43-101F and the Canadian Institute of Mining, Metallurgy and Petroleum (“CIM”) Standards on Mineral Resource and Reserves – Definition and Guidelines.
2.2 Sources of Information & Data
The authors prepared this report using information from the following sources, with further details
of specific sources set out in Section 27 “References”:
drilling and assay data obtained from EAM through a program of field sampling and analytical laboratory processing of field samples
visits to the project site
information from previous technical reports prepared in accordance with NI 43-101 requirements (see references)
site physical inspection, observation and database validation activities, including but not limited to:
Review and observation of drilling, sampling, logging and core retention procedures and practices at site
Sampling, shipping and assaying of independently collected and processed material samples, including use of an independent assay laboratory
Review and examination of drillcore material from selected holes
Drilling database validation, including assessment of QA/QC program, assay certificates, laboratories and procedures
Metallurgical results from industry standard testing
Information supplied by other experts as listed in Section 3 of this report.
AD Y A B O PR O J E C T NI 43-101 RE P O R T
May 2015 Page 9
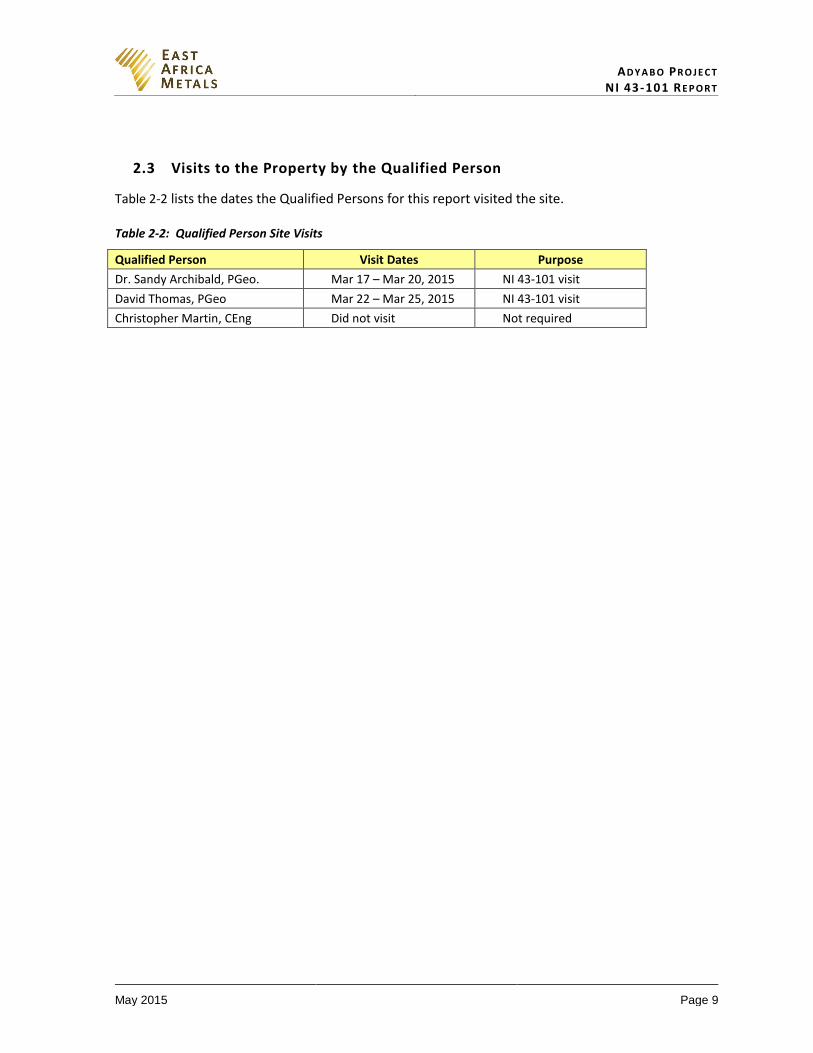
2.3 Visits to the Property by the Qualified Person
Table 2-2 lists the dates the Qualified Persons for this report visited the site.
Table 2-2: Qualified Person Site Visits
Qualified Person Visit Dates Purpose
Dr. Sandy Archibald, PGeo. Mar 17 – Mar 20, 2015 NI 43-101 visit
David Thomas, PGeo Mar 22 – Mar 25, 2015 NI 43-101 visit
Christopher Martin, CEng Did not visit Not required
AD Y A B O PR O J E C T NI 43-101 RE P O R T
May 2015 Page 10
3 RELIANCE ON OTHER EXPERTS
The authors of this report have relied upon the following documents and experts (who are not
qualified persons), and in this regard the authors disclaim responsibility for information provided in
the following:
An opinion with regard to the title, mining concessions, and registration issues provided by
Mr. Sisay Ayalew, Mineral Licensing & Administration Directorate Director in a letter dated
April 7, 2015. This information pertains to Section 4.2.2.
Geological and topographic mapping data and information from Mr. Iain Groves of Insight
Geology PTY carried out during several field campaigns from January 2012 to March 2015.
Geology maps presented in Sections 7.3, 7.4 and 9.1.
Annual exploration reports prepared by Dr. Stephen Gardoll, Mr. Iain Groves, Ms. Helen
Warren and Ms. Sarah Caven. This information is presented Sections 7.2, 7.3, 7.4, and parts
of Section 9 (see references for report titles and dates).
Sample preparation and laboratory assay results provided by Acme Analytical Laboratories,
Vancouver, ALS Chemex Laboratories, Vancouver, and Ultratrace Laboratories, Perth. This
information pertains to assay results quoted in Sections 1, 7.4, 9, 10, 11, 12.5, 13, 14, and 25.
All metallurgical data was generated by Blue Coast Research, including all assay data from
Blue Coast’s own assay laboratory. This lab is not ISO certified, but it participates in
international round-robin programs. QEMSCAN data were obtained from Xstrata Process
Support in Sudbury. This information pertains to Sections 1, 13 and 25.
AD Y A B O PR O J E C T NI 43-101 RE P O R T
May 2015 Page 11
4 PROPERTY DESCRIPTION & LOCATION
4.1 Size and Location
The Adyabo project comprises two contiguous Exploration Licences (Adi Dairo and West Shire) that
cover an area of 264.6 km2 located in Tigray Region of the Federal Democratic Republic of Ethiopia.
The property is approximately 600 km north-northeast of the capital city of Addis Ababa (pop.
3,385,000 in 2008) as shown in Figure 4-1. The Federal Democratic Republic of Ethiopia comprises a
total area of 1,104,300 km2 and is located between longitudes 33°E to 48°E and latitudes 3°N to
15°N. The country is bounded by Eritrea to the north, Djibouti and Somalia to the east, Somalia and
Kenya to the south, with North Sudan and South Sudan to the west.
Figure 4-1: Property Location
Source: Archibald et al., 2015

AD Y A B O PR O J E C T NI 43-101 RE P O R T
May 2015 Page 12
4.2 Mineral Tenure
4.2.1 General Tenure Rights
During the communist regime of 1974 to 1991 mineral exploration and extraction rights of Ethiopia
were not available to the private sector. Only government institutions had the right to explore and
develop the country’s mineral wealth. A new national market-oriented economic policy was
introduced in 1991 and the government made changes to encourage the participation of private
capital in mineral prospecting, exploration and development in the mining sector.
In the early 1990s, the Mining Proclamation 52/1993, Mining Regulations 182/1994 and Income Tax
proclamations 53/1993 were issued to attract private investment. These proclamations gave foreign
investors incentives such as duty-free imports of equipment and repatriation of profits. A new law
(Mining proclamation 678/2010) was issued, and came into effect in August 2010. The current
Mining Proclamation (816/2013) came into effect March 19, 2014.
The new proclamation provides:
Non-exclusive reconnaissance rights (for a maximum period of 18 months);
Initial three-year exclusive exploration licences, with two renewals of one year each (after
each renewal period the licence must be reduced by 25%). The Licensing Authority may
allow further extension of renewals at their discretion; and
Mining licence for 10 or 20 years for small-scale and large-scale operations, respectively, with
unlimited renewal periods (of 5 or 10 years each).
The new proclamation also makes provision for the adequate health and safety of employees,
environmental protection, and for environmental and social impact assessments (depending on the
type and nature of the project). It requires a community development program, guarantees the
licensee’s right to sell the minerals, and provides exemption from customs duties and from taxes on
the equipment, machinery and vehicles necessary for the mineral operations.
Government royalties range from 3% for construction materials to 8% for precious stones and
minerals. This calculation is based on the net value of mineral production.
4.2.2 Adyabo Project Tenure Rights
The property consists of two concessions known collectively as the Adyabo project. These areas are
outlined in Figure 4-2 and Table 4-1. The Adi Dairo concession was originally granted to Aberdeen
International Inc. (“Aberdeen”) on January 25, 2007, and the West Shire concession to the same
company on November 14, 2007. In December 2011 both licences were acquired by Tigray
Resources Inc. (“Tigray”) through an option agreement to acquire up to an 80% interest in the
Adyabo project, in two phases, over a three-year period. The precise details of the agreement were
announced by Tigray on October 16, 2012 set out here.
AD Y A B O PR O J E C T NI 43-101 RE P O R T
May 2015 Page 13
Under the terms of the agreement, Tigray has the option to acquire up to an undivided 80% interest
in the Adyabo project in two phases. The first phase allowed Tigray to earn a 55% interest in
exchange for (a) the payment of $300,000 in cash and the issuance of 300,000 Tigray shares on
receipt of TSX Venture Exchange (the "Exchange") approval, and (b) an additional payment of
$300,000 in cash and the issuance of an additional 300,000 Tigray shares on the first anniversary of
the Exchange approval date. The second phase allowed Tigray to earn an additional 25% interest in
exchange for (a) the payment of $300,000 in cash and the issuance of an additional 1,000,000 Tigray
shares on the second anniversary of the Exchange approval date, and (b) the issuance of an
additional 1,000,000 Tigray shares on the third anniversary of the Exchange approval date. Further,
on receipt of a positive feasibility study, Tigray will issue an additional 1,000,000 shares to the
optionor, and upon commencement of commercial production, Tigray will issue an additional
500,000 shares to the optionor. The optionor may elect to convert the remaining 20% interest into a
2% net smelter royalty (“NSR”), and Tigray will have the option to buy back 1% of the NSR for $5
million in cash.
In November 2012, Tigray received Exchange approval for the acquisition of the Adyabo project and
advanced the first phase of the earn-in with an expenditure of $300,000. On May 7, 2014, EAM
acquired ownership and control of Tigray. Since then the optioned property has been maintained
and explored by EAM., who have earned a 55% optioned interest.
Figure 4-2: Property Tenure Map
Source: EAM, 2015
AD Y A B O PR O J E C T NI 43-101 RE P O R T
May 2015 Page 14
The exploration concession corners (Table 4-1) were established by GIS coordinate points, and have
not been surveyed or marked on the ground.
Copies of title documents were provided by EAM and reviewed by the author. The documentation
supports the information provided in Table 4-2. A letter related to the title opinion from Mr. Sisay
Ayalew, Mineral Licensing & Administration Directorate Director, Addis Ababa, Ethiopia, on April 7,
2015, for both licences (MoM/056-319/99 and MoM/138-182/2000) indicated that they were in
good standing on December 31, 2014. A summary of the current renewal period is present in Table
4-2.
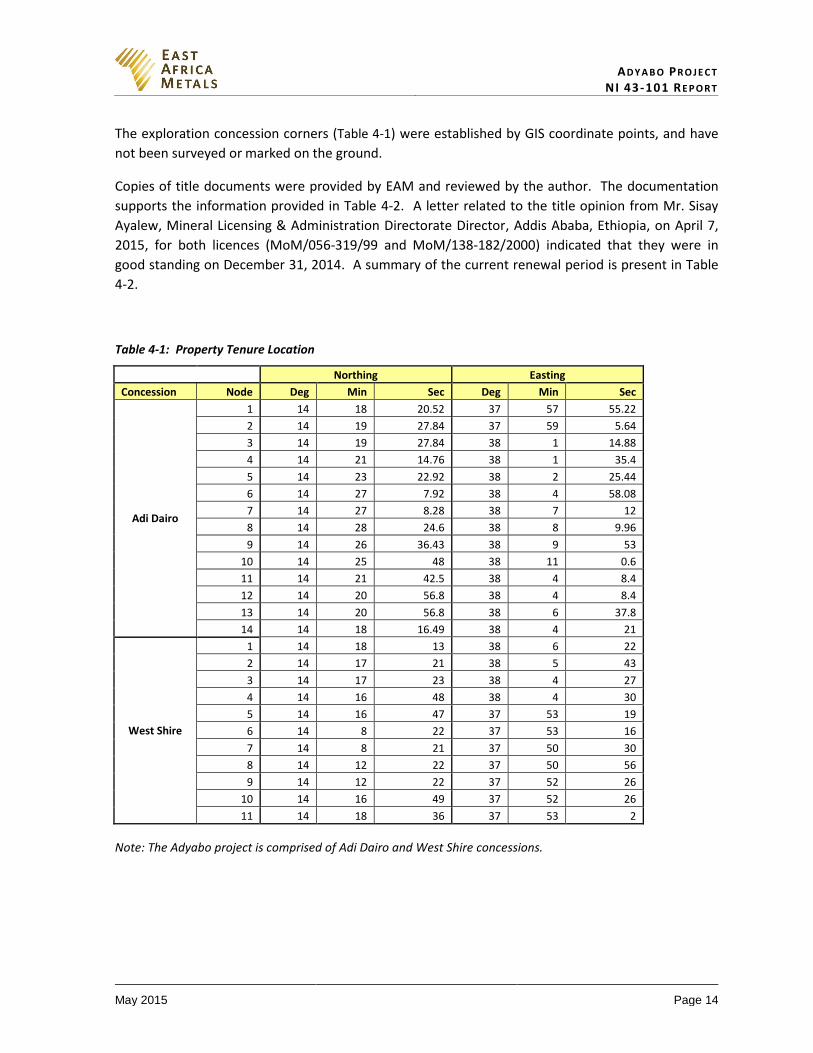
Table 4-1: Property Tenure Location
Northing Easting
Concession Node Deg Min Sec Deg Min Sec
Adi Dairo
1 14 18 20.52 37 57 55.22
2 14 19 27.84 37 59 5.64
3 14 19 27.84 38 1 14.88
4 14 21 14.76 38 1 35.4
5 14 23 22.92 38 2 25.44
6 14 27 7.92 38 4 58.08
7 14 27 8.28 38 7 12
8 14 28 24.6 38 8 9.96
9 14 26 36.43 38 9 53
10 14 25 48 38 11 0.6
11 14 21 42.5 38 4 8.4
12 14 20 56.8 38 4 8.4
13 14 20 56.8 38 6 37.8
14 14 18 16.49 38 4 21
West Shire
1 14 18 13 38 6 22
2 14 17 21 38 5 43
3 14 17 23 38 4 27
4 14 16 48 38 4 30
5 14 16 47 37 53 19
6 14 8 22 37 53 16
7 14 8 21 37 50 30
8 14 12 22 37 50 56
9 14 12 22 37 52 26
10 14 16 49 37 52 26
11 14 18 36 37 53 2
Note: The Adyabo project is comprised of Adi Dairo and West Shire concessions.
AD Y A B O PR O J E C T NI 43-101 RE P O R T
May 2015 Page 15
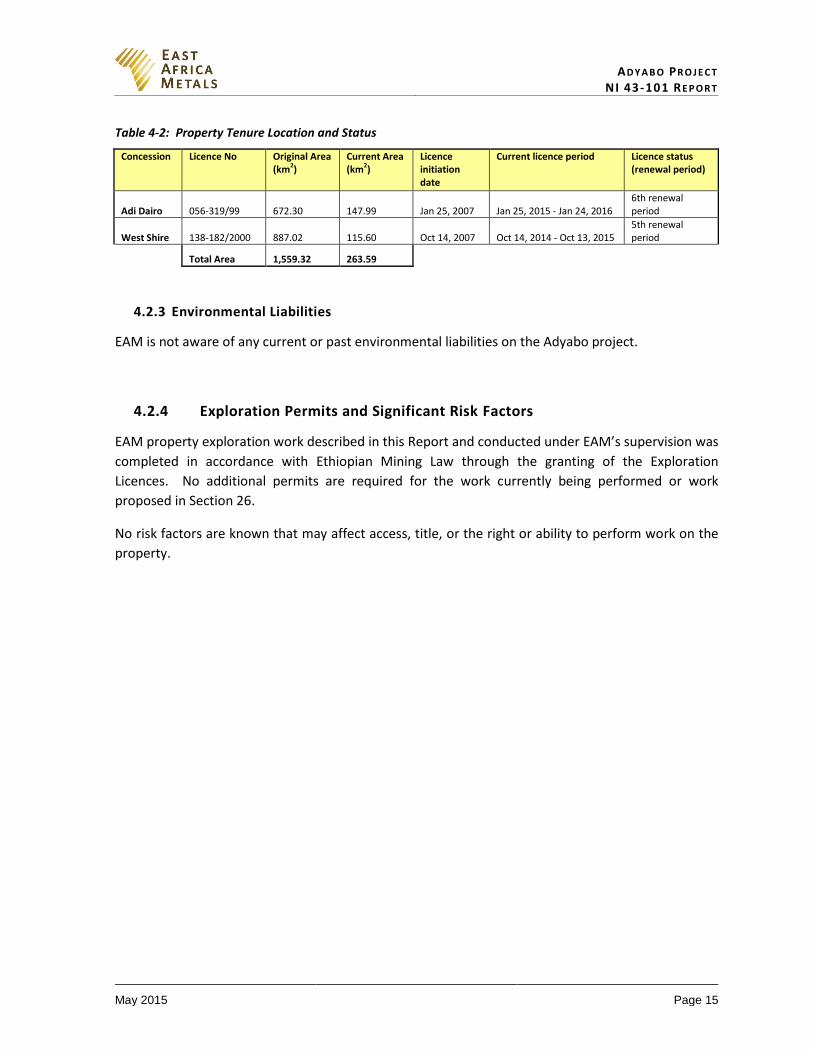
Table 4-2: Property Tenure Location and Status
Concession Licence No Original Area (km2)
Current Area (km2)
Licence initiation date
Current licence period Licence status (renewal period)
Adi Dairo 056-319/99 672.30 147.99 Jan 25, 2007 Jan 25, 2015 - Jan 24, 2016 6th renewal period
West Shire 138-182/2000 887.02 115.60 Oct 14, 2007 Oct 14, 2014 - Oct 13, 2015 5th renewal period
Total Area 1,559.32 263.59
4.2.3 Environmental Liabilities
EAM is not aware of any current or past environmental liabilities on the Adyabo project.
4.2.4 Exploration Permits and Significant Risk Factors
EAM property exploration work described in this Report and conducted under EAM’s supervision was
completed in accordance with Ethiopian Mining Law through the granting of the Exploration
Licences. No additional permits are required for the work currently being performed or work
proposed in Section 26.
No risk factors are known that may affect access, title, or the right or ability to perform work on the
property.
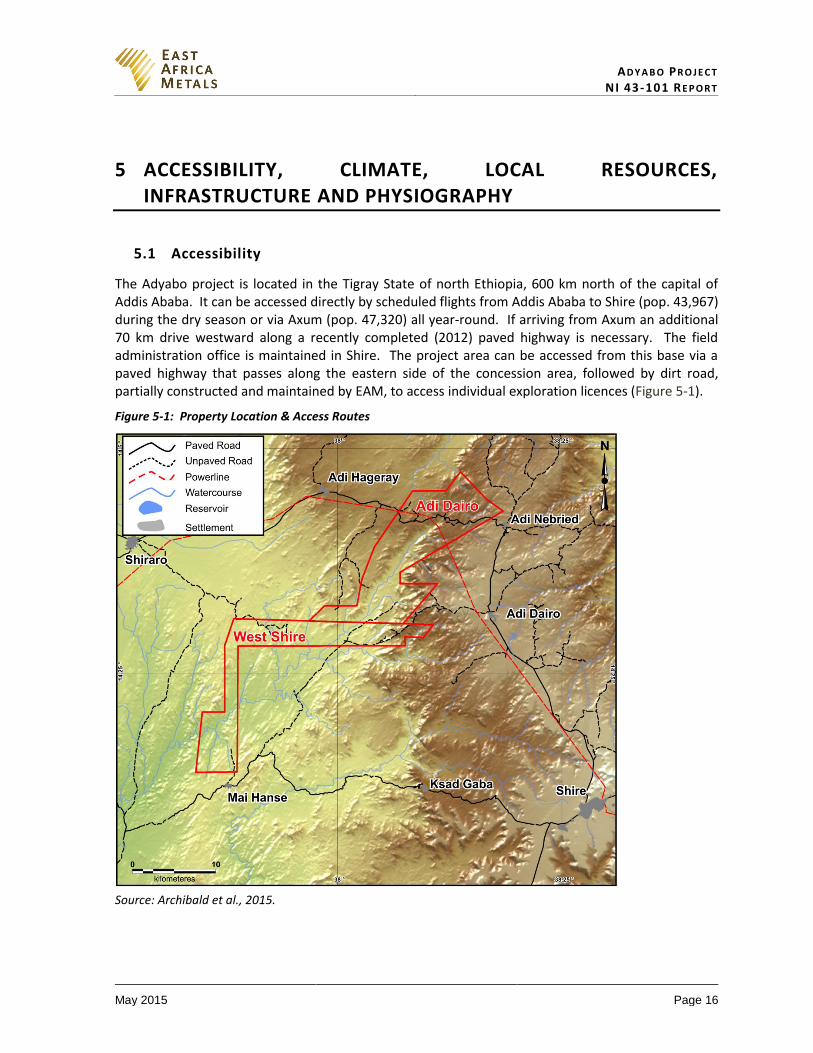
AD Y A B O PR O J E C T NI 43-101 RE P O R T
May 2015 Page 16
5 ACCESSIBILITY, CLIMATE, LOCAL RESOURCES, INFRASTRUCTURE AND PHYSIOGRAPHY
5.1 Accessibility
The Adyabo project is located in the Tigray State of north Ethiopia, 600 km north of the capital of Addis Ababa. It can be accessed directly by scheduled flights from Addis Ababa to Shire (pop. 43,967) during the dry season or via Axum (pop. 47,320) all year-round. If arriving from Axum an additional 70 km drive westward along a recently completed (2012) paved highway is necessary. The field administration office is maintained in Shire. The project area can be accessed from this base via a paved highway that passes along the eastern side of the concession area, followed by dirt road, partially constructed and maintained by EAM, to access individual exploration licences (Figure 5-1).
Figure 5-1: Property Location & Access Routes
Source: Archibald et al., 2015.
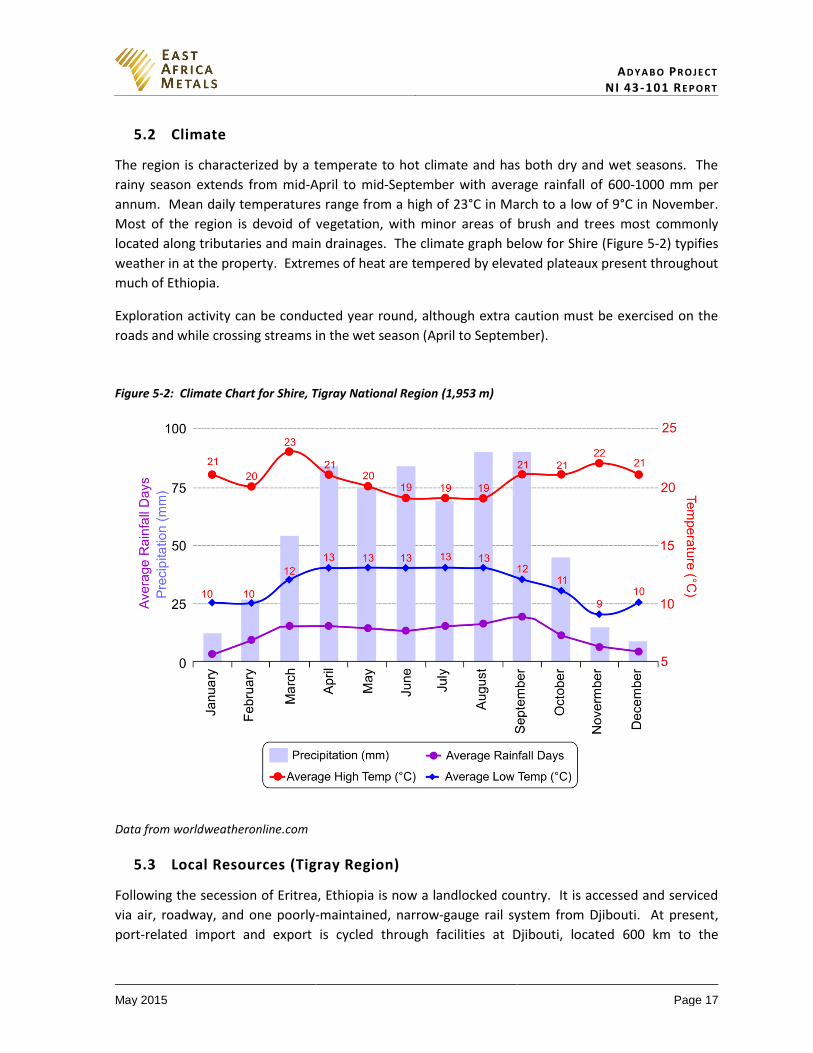
AD Y A B O PR O J E C T NI 43-101 RE P O R T
May 2015 Page 17
5.2 Climate
The region is characterized by a temperate to hot climate and has both dry and wet seasons. The
rainy season extends from mid-April to mid-September with average rainfall of 600-1000 mm per
annum. Mean daily temperatures range from a high of 23°C in March to a low of 9°C in November.
Most of the region is devoid of vegetation, with minor areas of brush and trees most commonly
located along tributaries and main drainages. The climate graph below for Shire (Figure 5-2) typifies
weather in at the property. Extremes of heat are tempered by elevated plateaux present throughout
much of Ethiopia.
Exploration activity can be conducted year round, although extra caution must be exercised on the
roads and while crossing streams in the wet season (April to September).
Figure 5-2: Climate Chart for Shire, Tigray National Region (1,953 m)
Data from worldweatheronline.com
5.3 Local Resources (Tigray Region)
Following the secession of Eritrea, Ethiopia is now a landlocked country. It is accessed and serviced
via air, roadway, and one poorly-maintained, narrow-gauge rail system from Djibouti. At present,
port-related import and export is cycled through facilities at Djibouti, located 600 km to the
AD Y A B O PR O J E C T NI 43-101 RE P O R T
May 2015 Page 18
southeast. Tensions exist between the countries over the monopolized system of port services.
Although numerous rivers drain Ethiopia’s diverse topography, the only navigable waterway is the
Baro River (a tributary of the Nile), located on the border with Sudan. Historically, Gambela has
served as a port.
Roughly 50 civil airports exist in the country, including five in the Tigray Region (viz., Axum, Dansha,
Humera, Mekele, and Shire), along with two major military airports. In January 2010 a contract to
construct 5000 km of new railway for the country, primarily to facilitate the transportation of goods,
was awarded by Ethiopian government to the China Railway Group. In September 2010,
construction began on the project, but no further information is available.
In the general vicinity of the Adyabo Project area, a major infrastructure initiative has recently taken
place. The main highway through the region is now paved between Axum and Shire (and northwards
to Shambuko in Sudan). Shire is a university town with a population of 47,284 (2007 census). Many
districts of the town have modern amenities such as running water, sewerage, and a hospital. A
scheduled air service is operated during the dry season and a variety of commercial premises are
located in the town. A subsistence lifestyle is evident in the villages within and adjacent to the
project area and only limited power and water is available to the villagers. Livestock and agriculture
are emphasized. Water is predominantly sourced through wells, and tributary drainages are mostly
seasonal. The largest river on the concession is the Mai Hanse River, which flows from just south of
the Adi Nebrid and Zagr.
If the Adyabo project proves to be economic there is sufficient space on each of the licences to cover
tailings storage, waste storage and heap leach pads, if required.
5.4 Infrastructure
Significant infrastructure in the area includes 230 kV high voltage power lines installed along the
Shire to Adi Dairo and Adi Nebried to Shiraro roads (Figure 5-3); a large reservoir located 2 km
northwest of Adi Dairo (Figure 5-4), a heliport 1 km south of Adi Dairo and an airport at Shire. The
mobile network and internet are reliable over the majority of the exploration area.
If the Adyabo project proves to be economic, there is sufficient space on each of the licences to cover
mining infrastructure such as mine buildings, offices, mills, tailings storage, and waste storage (Figure 5-
1). There is also adequate water and power in the local area to facilitate extraction and processing.
Skilled local labour is available in the Tigray Region for most aspects of any mining operation, however
highly technical roles would be filled by national and overseas staff.
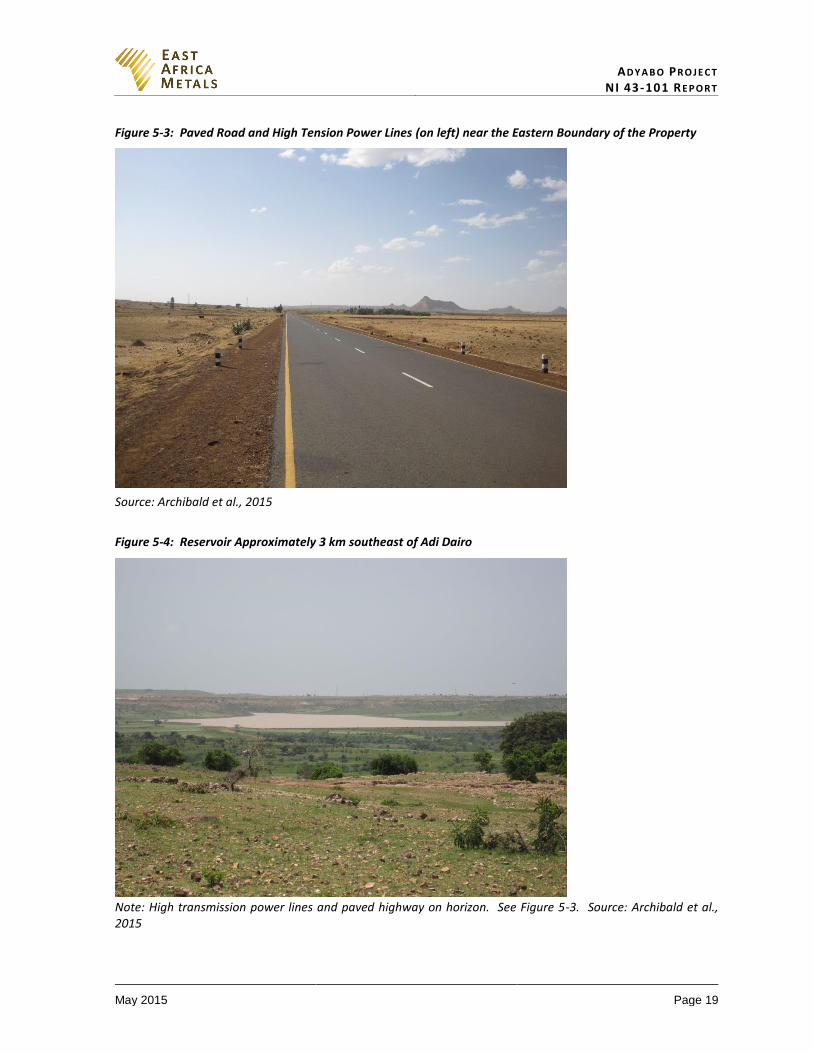
AD Y A B O PR O J E C T NI 43-101 RE P O R T
May 2015 Page 19
Figure 5-3: Paved Road and High Tension Power Lines (on left) near the Eastern Boundary of the Property
Source: Archibald et al., 2015
Figure 5-4: Reservoir Approximately 3 km southeast of Adi Dairo
Note: High transmission power lines and paved highway on horizon. See Figure 5-3. Source: Archibald et al., 2015
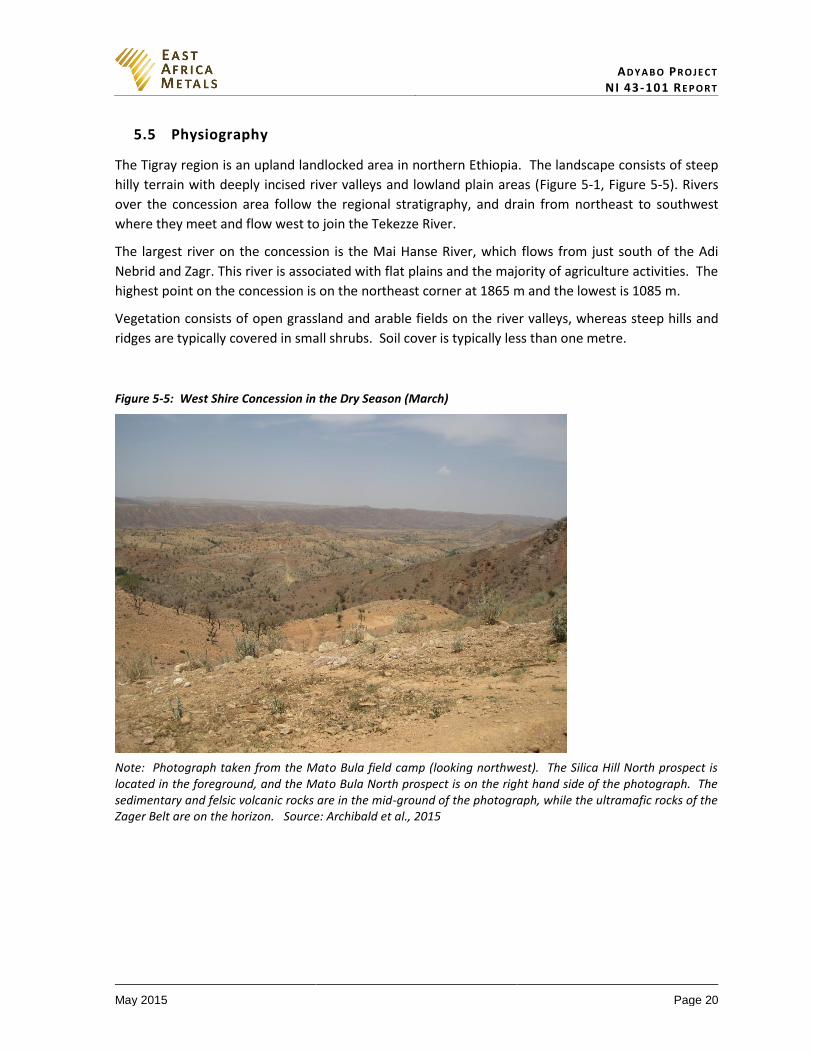
AD Y A B O PR O J E C T NI 43-101 RE P O R T
May 2015 Page 20
5.5 Physiography
The Tigray region is an upland landlocked area in northern Ethiopia. The landscape consists of steep
hilly terrain with deeply incised river valleys and lowland plain areas (Figure 5-1, Figure 5-5). Rivers
over the concession area follow the regional stratigraphy, and drain from northeast to southwest
where they meet and flow west to join the Tekezze River.
The largest river on the concession is the Mai Hanse River, which flows from just south of the Adi
Nebrid and Zagr. This river is associated with flat plains and the majority of agriculture activities. The
highest point on the concession is on the northeast corner at 1865 m and the lowest is 1085 m.
Vegetation consists of open grassland and arable fields on the river valleys, whereas steep hills and
ridges are typically covered in small shrubs. Soil cover is typically less than one metre.
Figure 5-5: West Shire Concession in the Dry Season (March)
Note: Photograph taken from the Mato Bula field camp (looking northwest). The Silica Hill North prospect is located in the foreground, and the Mato Bula North prospect is on the right hand side of the photograph. The sedimentary and felsic volcanic rocks are in the mid-ground of the photograph, while the ultramafic rocks of the Zager Belt are on the horizon. Source: Archibald et al., 2015
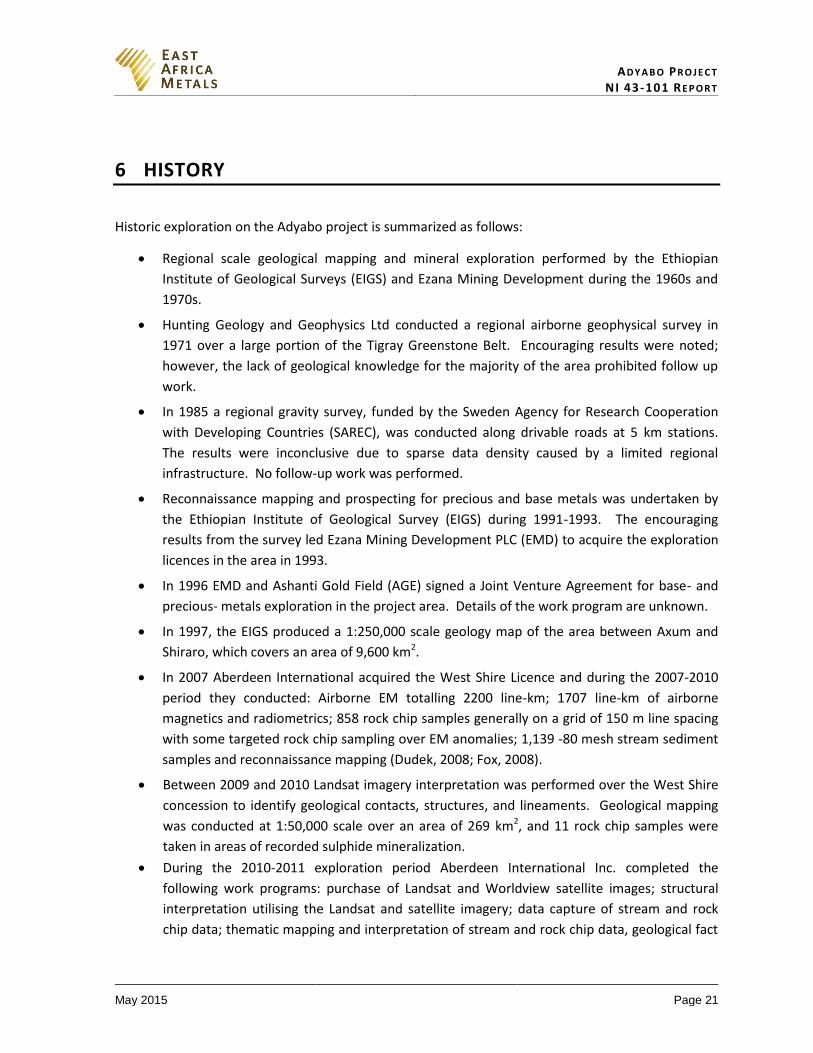
AD Y A B O PR O J E C T NI 43-101 RE P O R T
May 2015 Page 21
6 HISTORY
Historic exploration on the Adyabo project is summarized as follows:
Regional scale geological mapping and mineral exploration performed by the Ethiopian
Institute of Geological Surveys (EIGS) and Ezana Mining Development during the 1960s and
1970s.
Hunting Geology and Geophysics Ltd conducted a regional airborne geophysical survey in
1971 over a large portion of the Tigray Greenstone Belt. Encouraging results were noted;
however, the lack of geological knowledge for the majority of the area prohibited follow up
work.
In 1985 a regional gravity survey, funded by the Sweden Agency for Research Cooperation
with Developing Countries (SAREC), was conducted along drivable roads at 5 km stations.
The results were inconclusive due to sparse data density caused by a limited regional
infrastructure. No follow-up work was performed.
Reconnaissance mapping and prospecting for precious and base metals was undertaken by
the Ethiopian Institute of Geological Survey (EIGS) during 1991-1993. The encouraging
results from the survey led Ezana Mining Development PLC (EMD) to acquire the exploration
licences in the area in 1993.
In 1996 EMD and Ashanti Gold Field (AGE) signed a Joint Venture Agreement for base- and
precious- metals exploration in the project area. Details of the work program are unknown.
In 1997, the EIGS produced a 1:250,000 scale geology map of the area between Axum and
Shiraro, which covers an area of 9,600 km2.
In 2007 Aberdeen International acquired the West Shire Licence and during the 2007-2010
period they conducted: Airborne EM totalling 2200 line-km; 1707 line-km of airborne
magnetics and radiometrics; 858 rock chip samples generally on a grid of 150 m line spacing
with some targeted rock chip sampling over EM anomalies; 1,139 -80 mesh stream sediment
samples and reconnaissance mapping (Dudek, 2008; Fox, 2008).
Between 2009 and 2010 Landsat imagery interpretation was performed over the West Shire
concession to identify geological contacts, structures, and lineaments. Geological mapping
was conducted at 1:50,000 scale over an area of 269 km2, and 11 rock chip samples were
taken in areas of recorded sulphide mineralization.
During the 2010-2011 exploration period Aberdeen International Inc. completed the
following work programs: purchase of Landsat and Worldview satellite images; structural
interpretation utilising the Landsat and satellite imagery; data capture of stream and rock
chip data; thematic mapping and interpretation of stream and rock chip data, geological fact
AD Y A B O PR O J E C T NI 43-101 RE P O R T
May 2015 Page 22
mapping at 1:2,000 scale, soil sampling on a 40 x 40m grid, and channel sampling across
artisanal pits conducted on a selected target area.
In December 2011 Tigray entered into an option agreement to acquire 80% of the Adyabo Project. In November 2012, Tigray received Exchange approval for the acquisition of the Adyabo project and on May 7 2014 EAM acquired ownership of Tigray (see Section 4.2.2 for additional information).
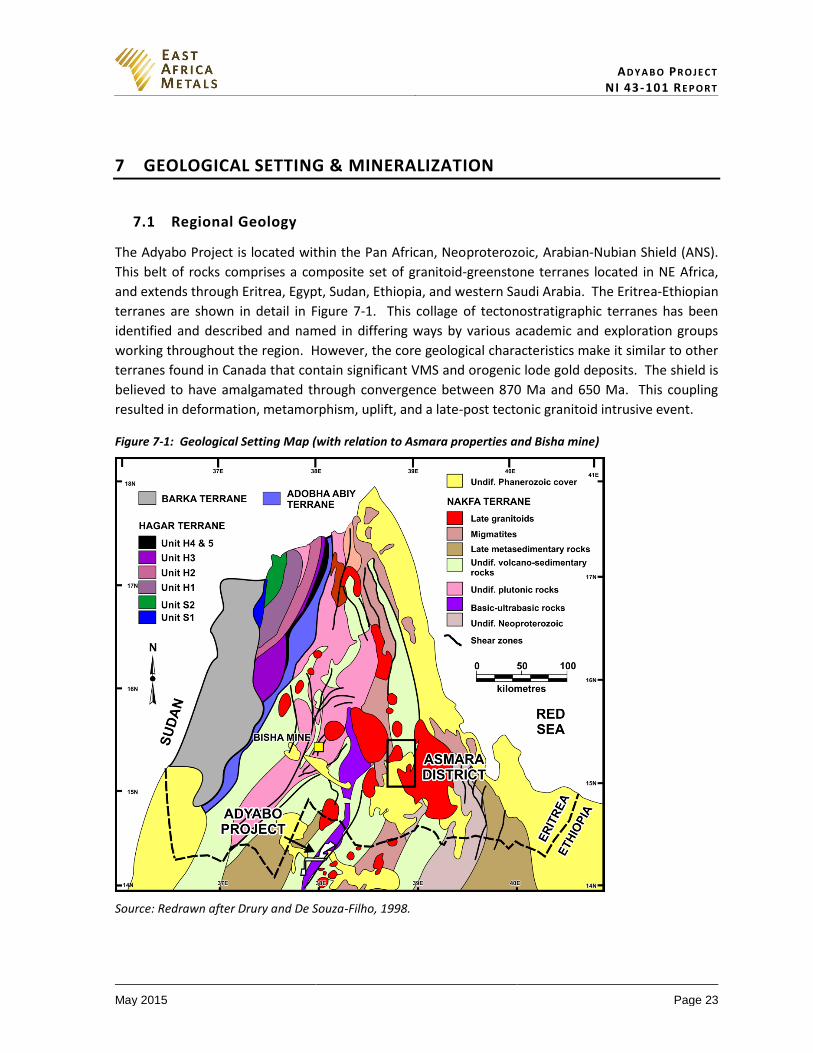
AD Y A B O PR O J E C T NI 43-101 RE P O R T
May 2015 Page 23
7 GEOLOGICAL SETTING & MINERALIZATION
7.1 Regional Geology
The Adyabo Project is located within the Pan African, Neoproterozoic, Arabian-Nubian Shield (ANS).
This belt of rocks comprises a composite set of granitoid-greenstone terranes located in NE Africa,
and extends through Eritrea, Egypt, Sudan, Ethiopia, and western Saudi Arabia. The Eritrea-Ethiopian
terranes are shown in detail in Figure 7-1. This collage of tectonostratigraphic terranes has been
identified and described and named in differing ways by various academic and exploration groups
working throughout the region. However, the core geological characteristics make it similar to other
terranes found in Canada that contain significant VMS and orogenic lode gold deposits. The shield is
believed to have amalgamated through convergence between 870 Ma and 650 Ma. This coupling
resulted in deformation, metamorphism, uplift, and a late-post tectonic granitoid intrusive event.
Figure 7-1: Geological Setting Map (with relation to Asmara properties and Bisha mine)
Source: Redrawn after Drury and De Souza-Filho, 1998.
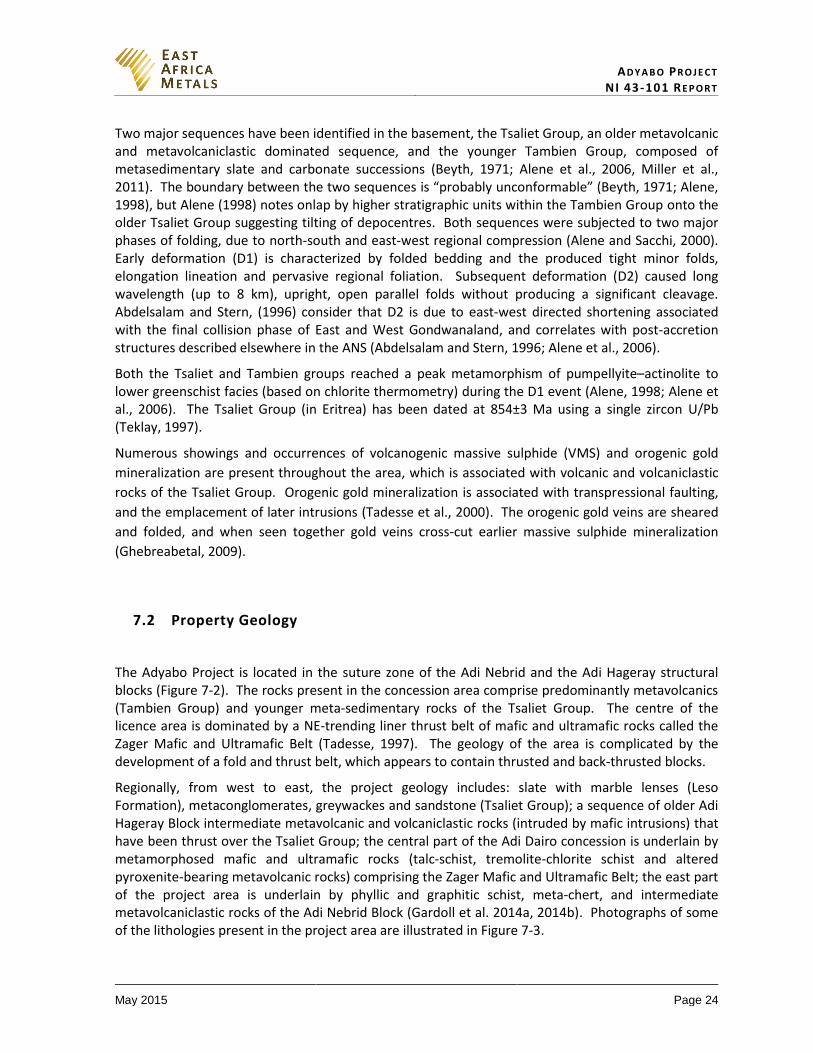
AD Y A B O PR O J E C T NI 43-101 RE P O R T
May 2015 Page 24
Two major sequences have been identified in the basement, the Tsaliet Group, an older metavolcanic and metavolcaniclastic dominated sequence, and the younger Tambien Group, composed of metasedimentary slate and carbonate successions (Beyth, 1971; Alene et al., 2006, Miller et al., 2011). The boundary between the two sequences is “probably unconformable” (Beyth, 1971; Alene, 1998), but Alene (1998) notes onlap by higher stratigraphic units within the Tambien Group onto the older Tsaliet Group suggesting tilting of depocentres. Both sequences were subjected to two major phases of folding, due to north-south and east-west regional compression (Alene and Sacchi, 2000). Early deformation (D1) is characterized by folded bedding and the produced tight minor folds, elongation lineation and pervasive regional foliation. Subsequent deformation (D2) caused long wavelength (up to 8 km), upright, open parallel folds without producing a significant cleavage. Abdelsalam and Stern, (1996) consider that D2 is due to east-west directed shortening associated with the final collision phase of East and West Gondwanaland, and correlates with post-accretion structures described elsewhere in the ANS (Abdelsalam and Stern, 1996; Alene et al., 2006).
Both the Tsaliet and Tambien groups reached a peak metamorphism of pumpellyite–actinolite to lower greenschist facies (based on chlorite thermometry) during the D1 event (Alene, 1998; Alene et al., 2006). The Tsaliet Group (in Eritrea) has been dated at 854±3 Ma using a single zircon U/Pb (Teklay, 1997).
Numerous showings and occurrences of volcanogenic massive sulphide (VMS) and orogenic gold
mineralization are present throughout the area, which is associated with volcanic and volcaniclastic
rocks of the Tsaliet Group. Orogenic gold mineralization is associated with transpressional faulting,
and the emplacement of later intrusions (Tadesse et al., 2000). The orogenic gold veins are sheared
and folded, and when seen together gold veins cross-cut earlier massive sulphide mineralization
(Ghebreabetal, 2009).
7.2 Property Geology
The Adyabo Project is located in the suture zone of the Adi Nebrid and the Adi Hageray structural blocks (Figure 7-2). The rocks present in the concession area comprise predominantly metavolcanics (Tambien Group) and younger meta-sedimentary rocks of the Tsaliet Group. The centre of the licence area is dominated by a NE-trending liner thrust belt of mafic and ultramafic rocks called the Zager Mafic and Ultramafic Belt (Tadesse, 1997). The geology of the area is complicated by the development of a fold and thrust belt, which appears to contain thrusted and back-thrusted blocks.
Regionally, from west to east, the project geology includes: slate with marble lenses (Leso Formation), metaconglomerates, greywackes and sandstone (Tsaliet Group); a sequence of older Adi Hageray Block intermediate metavolcanic and volcaniclastic rocks (intruded by mafic intrusions) that have been thrust over the Tsaliet Group; the central part of the Adi Dairo concession is underlain by metamorphosed mafic and ultramafic rocks (talc-schist, tremolite-chlorite schist and altered pyroxenite-bearing metavolcanic rocks) comprising the Zager Mafic and Ultramafic Belt; the east part of the project area is underlain by phyllic and graphitic schist, meta-chert, and intermediate metavolcaniclastic rocks of the Adi Nebrid Block (Gardoll et al. 2014a, 2014b). Photographs of some of the lithologies present in the project area are illustrated in Figure 7-3.
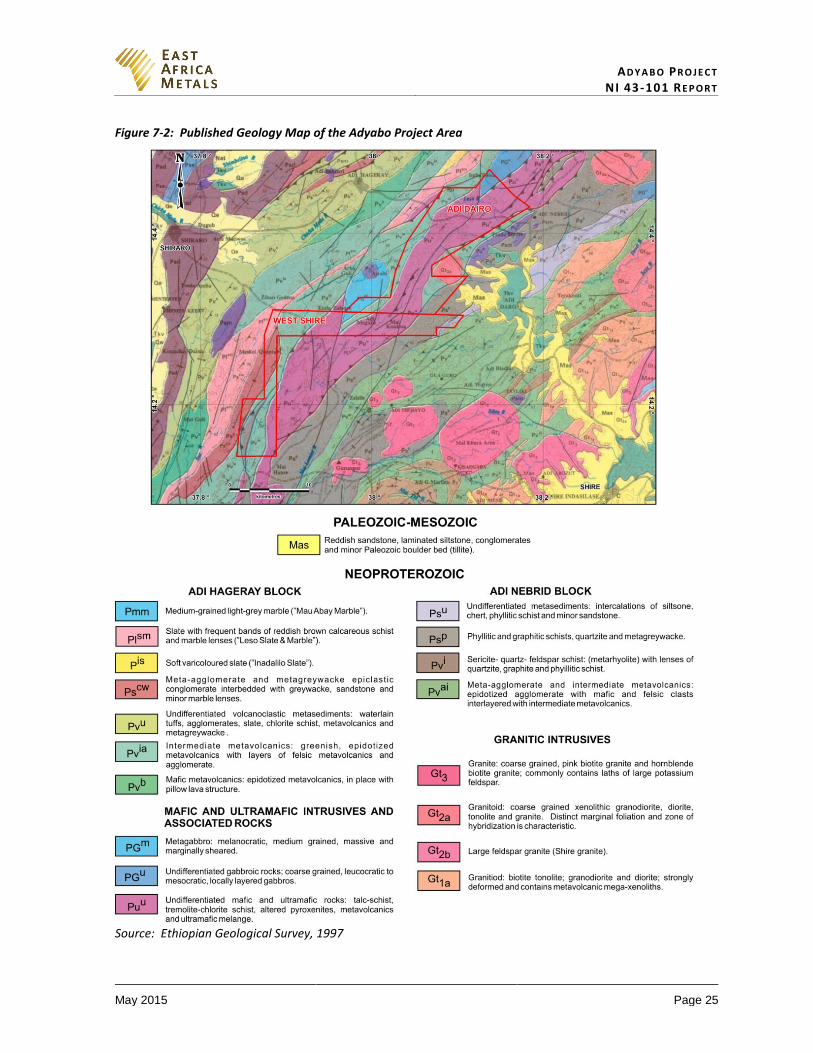
AD Y A B O PR O J E C T NI 43-101 RE P O R T
May 2015 Page 25
Figure 7-2: Published Geology Map of the Adyabo Project Area
Source: Ethiopian Geological Survey, 1997
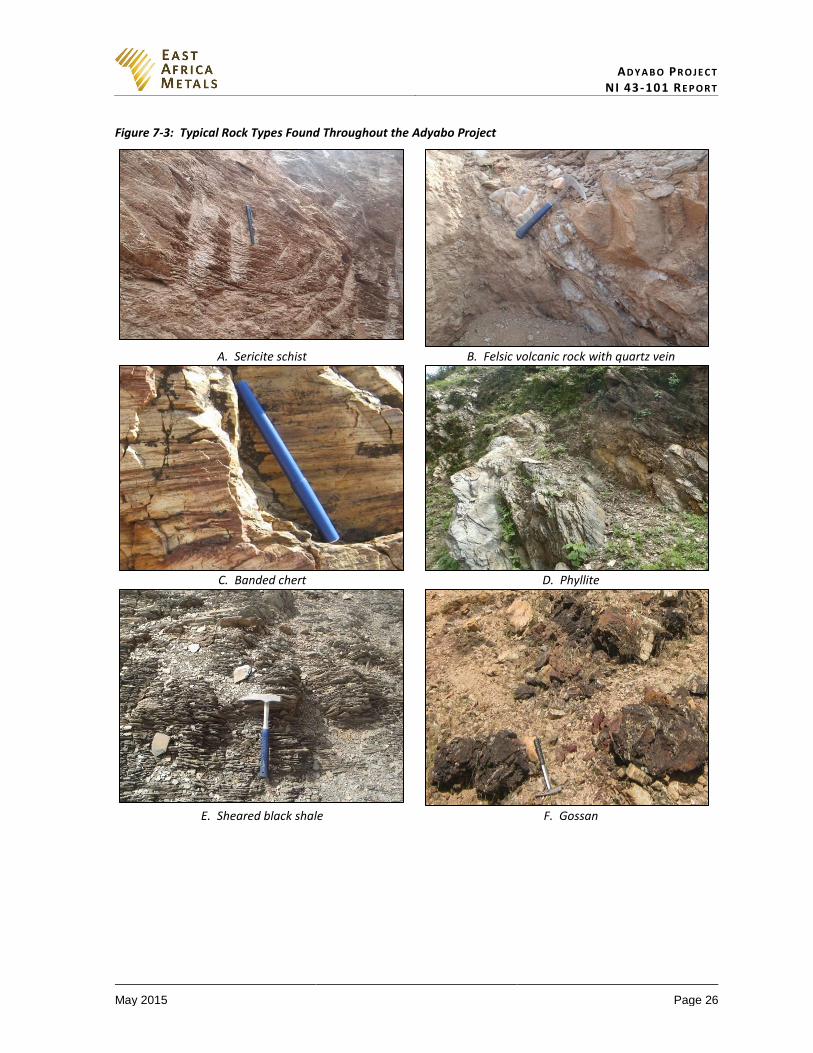
AD Y A B O PR O J E C T NI 43-101 RE P O R T
May 2015 Page 26
Figure 7-3: Typical Rock Types Found Throughout the Adyabo Project
A. Sericite schist B. Felsic volcanic rock with quartz vein
C. Banded chert D. Phyllite
E. Sheared black shale F. Gossan
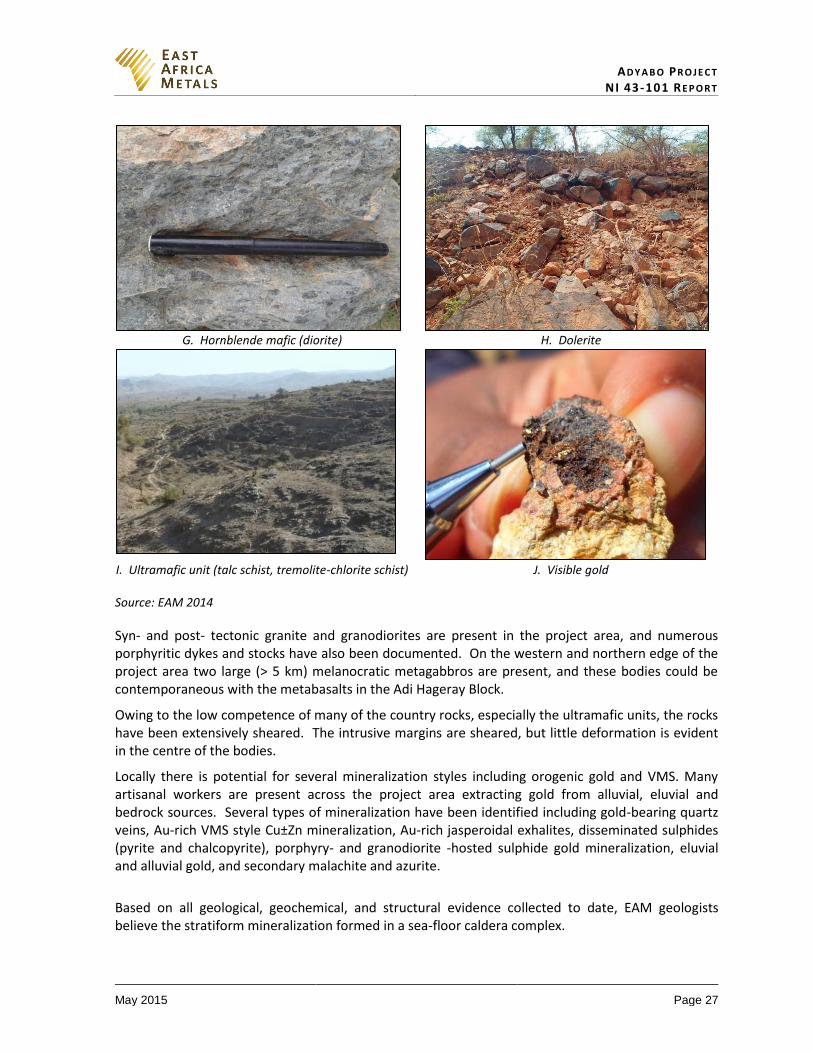
AD Y A B O PR O J E C T NI 43-101 RE P O R T
May 2015 Page 27
G. Hornblende mafic (diorite) H. Dolerite
I. Ultramafic unit (talc schist, tremolite-chlorite schist) J. Visible gold Source: EAM 2014
Syn- and post- tectonic granite and granodiorites are present in the project area, and numerous porphyritic dykes and stocks have also been documented. On the western and northern edge of the project area two large (> 5 km) melanocratic metagabbros are present, and these bodies could be contemporaneous with the metabasalts in the Adi Hageray Block.
Owing to the low competence of many of the country rocks, especially the ultramafic units, the rocks have been extensively sheared. The intrusive margins are sheared, but little deformation is evident in the centre of the bodies.
Locally there is potential for several mineralization styles including orogenic gold and VMS. Many artisanal workers are present across the project area extracting gold from alluvial, eluvial and bedrock sources. Several types of mineralization have been identified including gold-bearing quartz veins, Au-rich VMS style Cu±Zn mineralization, Au-rich jasperoidal exhalites, disseminated sulphides (pyrite and chalcopyrite), porphyry- and granodiorite -hosted sulphide gold mineralization, eluvial and alluvial gold, and secondary malachite and azurite.
Based on all geological, geochemical, and structural evidence collected to date, EAM geologists believe the stratiform mineralization formed in a sea-floor caldera complex.

AD Y A B O PR O J E C T NI 43-101 RE P O R T
May 2015 Page 28
7.3 Prospect Geology
Mato Bula
The Mato Bula (sensu lato) prospect is the main prospect within the Adyabo project, and covers the
Silica Hill North, Silica Hill, Mato Bula (sensu stricto), Jasper Hill and Halima Hill mineralized zones
(Figure 7-4 and Figure 7-5). It is underlain by a variety of rock types, including footwall lithologies of
mafic tuff, sericite-chlorite schist, felsic tuff, and a laterally extensive sericite schist unit that hosts
the mineralization. The gold-copper mineralized horizon, approximately up to 110 m in thickness, is
comprised predominantly of variably mineralized (pyrite and chalcopyrite) sericite schist, bedded
jasper (hematized chert), massive jasper, bedded chert, massive silica flooded zones, and chlorite
schist. This sequence was intruded parallel to the foliation/bedding by a highly altered quartz-eye
porphyry. Hanging wall lithologies are comprised of: mafic tuff (locally with abundant carbonate
alteration); sericite chlorite schist; black shales with mafic tuff; a thick sequence of mafic tuff capped
by baritic chert above the mineralized zone, and overlain in turn by felsic volcanic rocks and black
graphitic shales; and finally, capped by a thick succession of shale containing graphitic horizons. The
whole sequence exhibits shearing, owing to the rheology of the lithologies, and crustal shortening
due to the principal stresses during post depositional tectonics. The general trend of the lithologies
is NE-SW, and dips close to vertical or slightly to the northwest at a high angle.
Figure 7-4: Mato Bula Prospect Geology
Source: EAM 2015
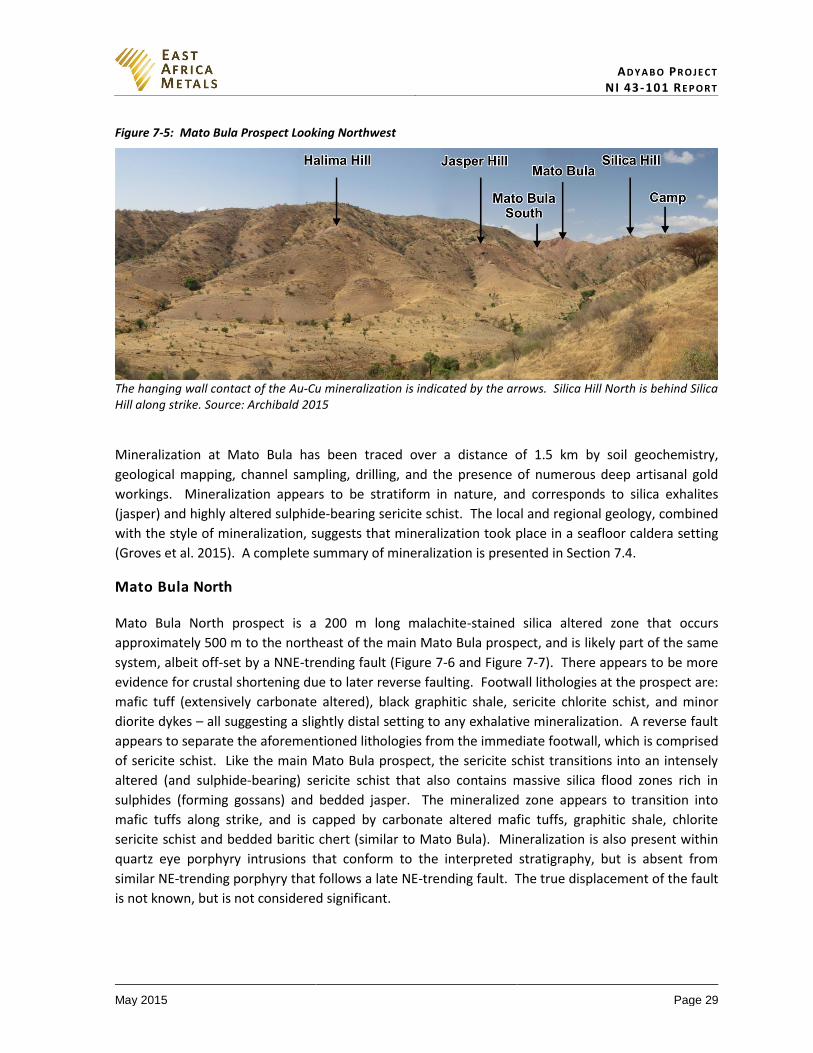
AD Y A B O PR O J E C T NI 43-101 RE P O R T
May 2015 Page 29
Figure 7-5: Mato Bula Prospect Looking Northwest
The hanging wall contact of the Au-Cu mineralization is indicated by the arrows. Silica Hill North is behind Silica Hill along strike. Source: Archibald 2015
Mineralization at Mato Bula has been traced over a distance of 1.5 km by soil geochemistry,
geological mapping, channel sampling, drilling, and the presence of numerous deep artisanal gold
workings. Mineralization appears to be stratiform in nature, and corresponds to silica exhalites
(jasper) and highly altered sulphide-bearing sericite schist. The local and regional geology, combined
with the style of mineralization, suggests that mineralization took place in a seafloor caldera setting
(Groves et al. 2015). A complete summary of mineralization is presented in Section 7.4.
Mato Bula North
Mato Bula North prospect is a 200 m long malachite-stained silica altered zone that occurs
approximately 500 m to the northeast of the main Mato Bula prospect, and is likely part of the same
system, albeit off-set by a NNE-trending fault (Figure 7-6 and Figure 7-7). There appears to be more
evidence for crustal shortening due to later reverse faulting. Footwall lithologies at the prospect are:
mafic tuff (extensively carbonate altered), black graphitic shale, sericite chlorite schist, and minor
diorite dykes – all suggesting a slightly distal setting to any exhalative mineralization. A reverse fault
appears to separate the aforementioned lithologies from the immediate footwall, which is comprised
of sericite schist. Like the main Mato Bula prospect, the sericite schist transitions into an intensely
altered (and sulphide-bearing) sericite schist that also contains massive silica flood zones rich in
sulphides (forming gossans) and bedded jasper. The mineralized zone appears to transition into
mafic tuffs along strike, and is capped by carbonate altered mafic tuffs, graphitic shale, chlorite
sericite schist and bedded baritic chert (similar to Mato Bula). Mineralization is also present within
quartz eye porphyry intrusions that conform to the interpreted stratigraphy, but is absent from
similar NE-trending porphyry that follows a late NE-trending fault. The true displacement of the fault
is not known, but is not considered significant.
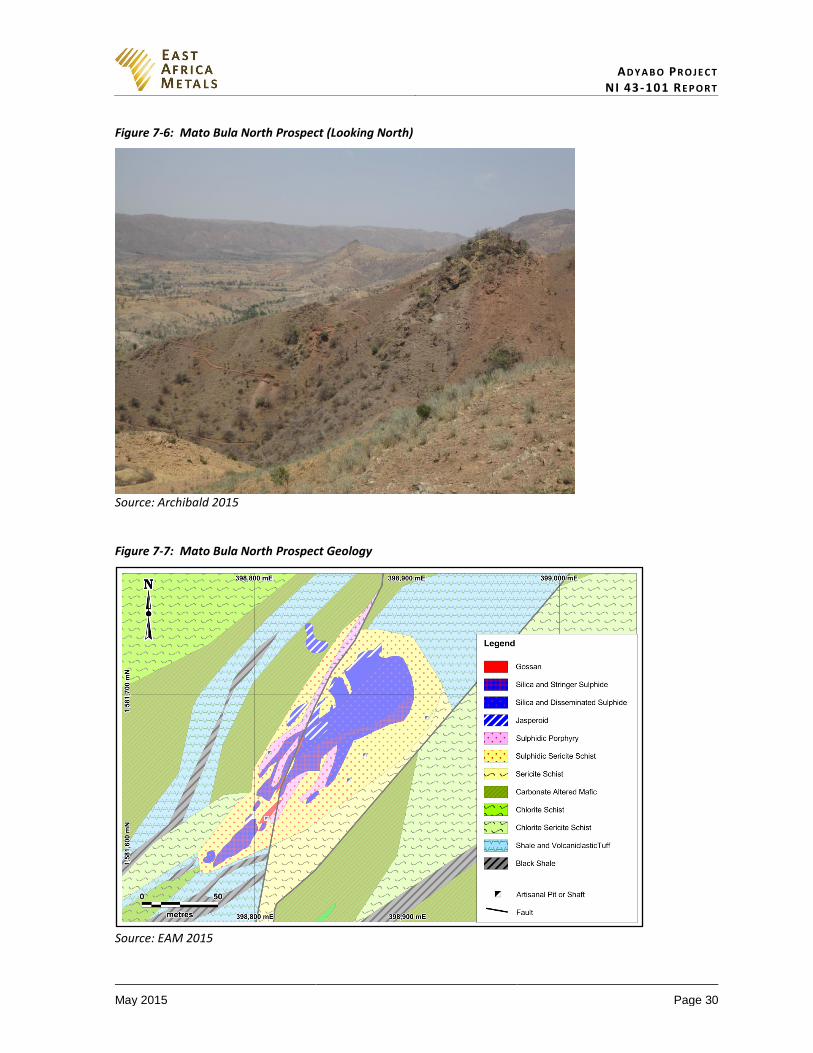
AD Y A B O PR O J E C T NI 43-101 RE P O R T
May 2015 Page 30
Figure 7-6: Mato Bula North Prospect (Looking North)
Source: Archibald 2015 Figure 7-7: Mato Bula North Prospect Geology
Source: EAM 2015
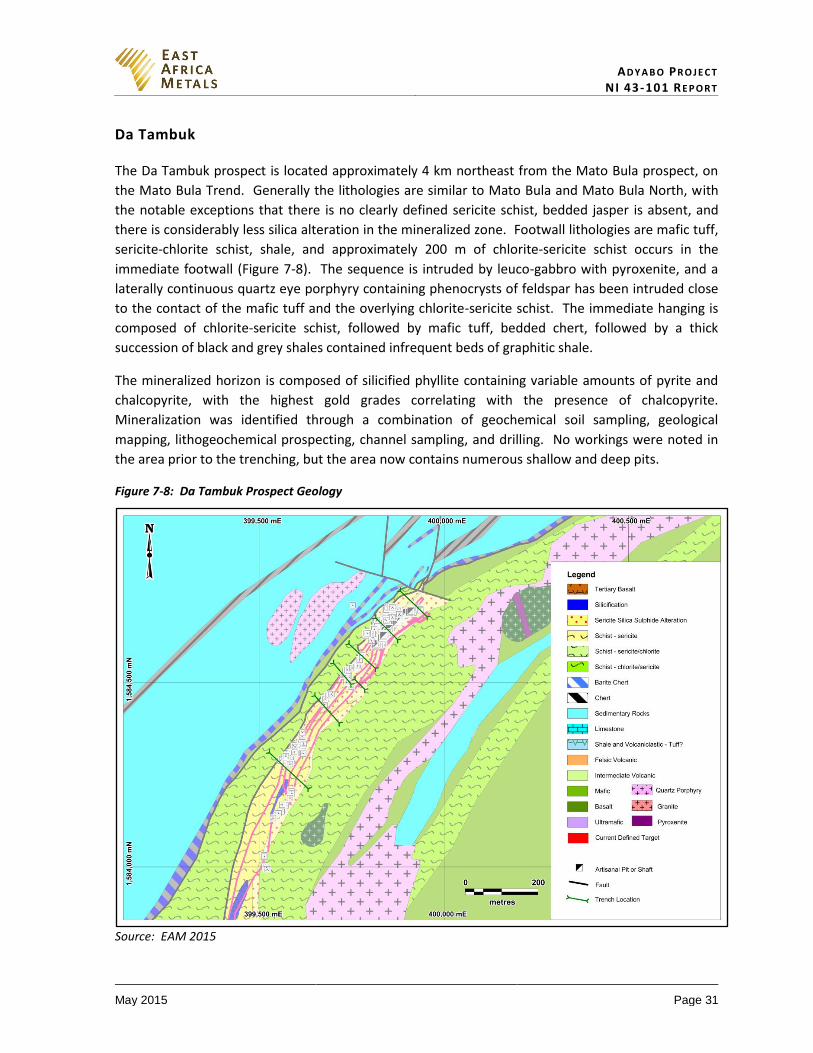
AD Y A B O PR O J E C T NI 43-101 RE P O R T
May 2015 Page 31
Da Tambuk
The Da Tambuk prospect is located approximately 4 km northeast from the Mato Bula prospect, on
the Mato Bula Trend. Generally the lithologies are similar to Mato Bula and Mato Bula North, with
the notable exceptions that there is no clearly defined sericite schist, bedded jasper is absent, and
there is considerably less silica alteration in the mineralized zone. Footwall lithologies are mafic tuff,
sericite-chlorite schist, shale, and approximately 200 m of chlorite-sericite schist occurs in the
immediate footwall (Figure 7-8). The sequence is intruded by leuco-gabbro with pyroxenite, and a
laterally continuous quartz eye porphyry containing phenocrysts of feldspar has been intruded close
to the contact of the mafic tuff and the overlying chlorite-sericite schist. The immediate hanging is
composed of chlorite-sericite schist, followed by mafic tuff, bedded chert, followed by a thick
succession of black and grey shales contained infrequent beds of graphitic shale.
The mineralized horizon is composed of silicified phyllite containing variable amounts of pyrite and
chalcopyrite, with the highest gold grades correlating with the presence of chalcopyrite.
Mineralization was identified through a combination of geochemical soil sampling, geological
mapping, lithogeochemical prospecting, channel sampling, and drilling. No workings were noted in
the area prior to the trenching, but the area now contains numerous shallow and deep pits.
Figure 7-8: Da Tambuk Prospect Geology
Source: EAM 2015
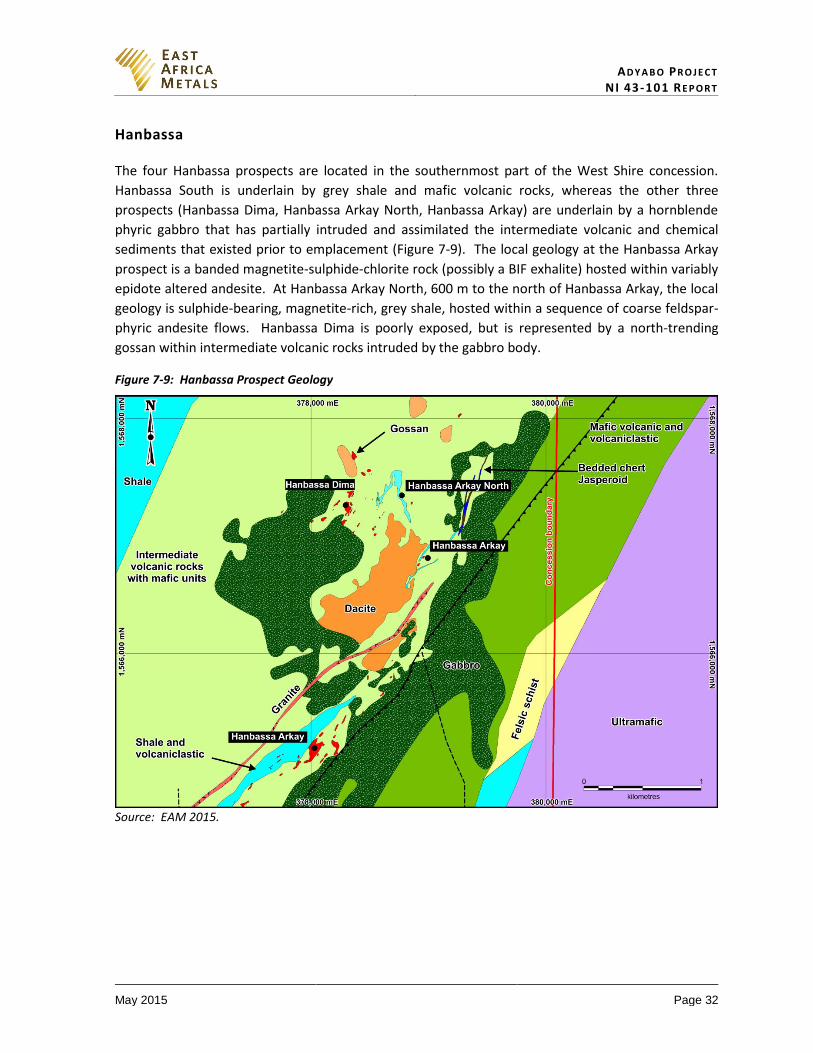
AD Y A B O PR O J E C T NI 43-101 RE P O R T
May 2015 Page 32
Hanbassa
The four Hanbassa prospects are located in the southernmost part of the West Shire concession.
Hanbassa South is underlain by grey shale and mafic volcanic rocks, whereas the other three
prospects (Hanbassa Dima, Hanbassa Arkay North, Hanbassa Arkay) are underlain by a hornblende
phyric gabbro that has partially intruded and assimilated the intermediate volcanic and chemical
sediments that existed prior to emplacement (Figure 7-9). The local geology at the Hanbassa Arkay
prospect is a banded magnetite-sulphide-chlorite rock (possibly a BIF exhalite) hosted within variably
epidote altered andesite. At Hanbassa Arkay North, 600 m to the north of Hanbassa Arkay, the local
geology is sulphide-bearing, magnetite-rich, grey shale, hosted within a sequence of coarse feldspar-
phyric andesite flows. Hanbassa Dima is poorly exposed, but is represented by a north-trending
gossan within intermediate volcanic rocks intruded by the gabbro body.
Figure 7-9: Hanbassa Prospect Geology
Source: EAM 2015.
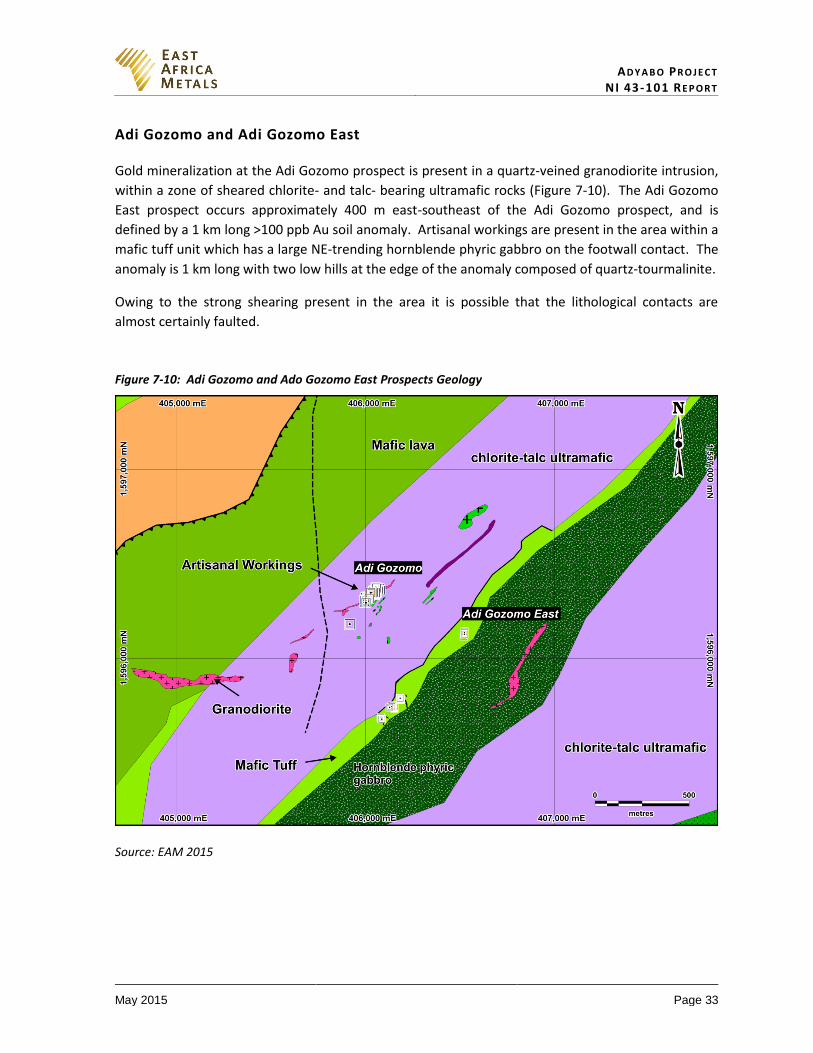
AD Y A B O PR O J E C T NI 43-101 RE P O R T
May 2015 Page 33
Adi Gozomo and Adi Gozomo East
Gold mineralization at the Adi Gozomo prospect is present in a quartz-veined granodiorite intrusion,
within a zone of sheared chlorite- and talc- bearing ultramafic rocks (Figure 7-10). The Adi Gozomo
East prospect occurs approximately 400 m east-southeast of the Adi Gozomo prospect, and is
defined by a 1 km long >100 ppb Au soil anomaly. Artisanal workings are present in the area within a
mafic tuff unit which has a large NE-trending hornblende phyric gabbro on the footwall contact. The
anomaly is 1 km long with two low hills at the edge of the anomaly composed of quartz-tourmalinite.
Owing to the strong shearing present in the area it is possible that the lithological contacts are
almost certainly faulted.
Figure 7-10: Adi Gozomo and Ado Gozomo East Prospects Geology
Source: EAM 2015
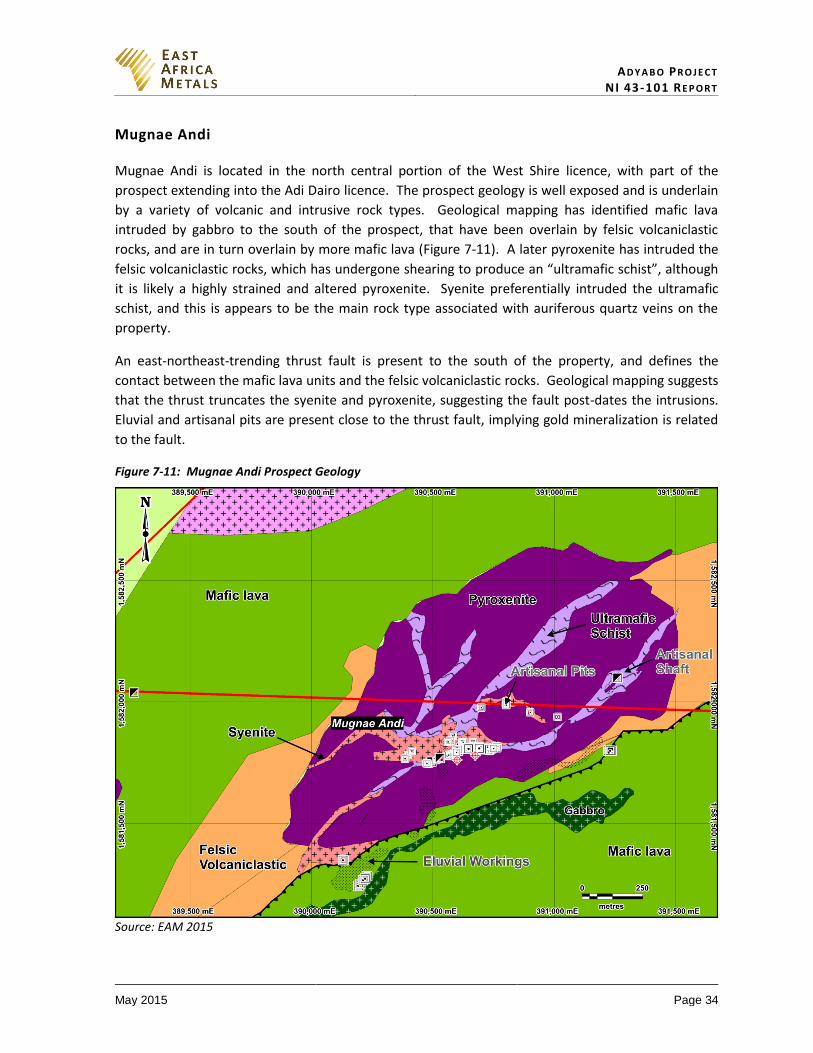
AD Y A B O PR O J E C T NI 43-101 RE P O R T
May 2015 Page 34
Mugnae Andi
Mugnae Andi is located in the north central portion of the West Shire licence, with part of the
prospect extending into the Adi Dairo licence. The prospect geology is well exposed and is underlain
by a variety of volcanic and intrusive rock types. Geological mapping has identified mafic lava
intruded by gabbro to the south of the prospect, that have been overlain by felsic volcaniclastic
rocks, and are in turn overlain by more mafic lava (Figure 7-11). A later pyroxenite has intruded the
felsic volcaniclastic rocks, which has undergone shearing to produce an “ultramafic schist”, although
it is likely a highly strained and altered pyroxenite. Syenite preferentially intruded the ultramafic
schist, and this is appears to be the main rock type associated with auriferous quartz veins on the
property.
An east-northeast-trending thrust fault is present to the south of the property, and defines the
contact between the mafic lava units and the felsic volcaniclastic rocks. Geological mapping suggests
that the thrust truncates the syenite and pyroxenite, suggesting the fault post-dates the intrusions.
Eluvial and artisanal pits are present close to the thrust fault, implying gold mineralization is related
to the fault.
Figure 7-11: Mugnae Andi Prospect Geology
Source: EAM 2015
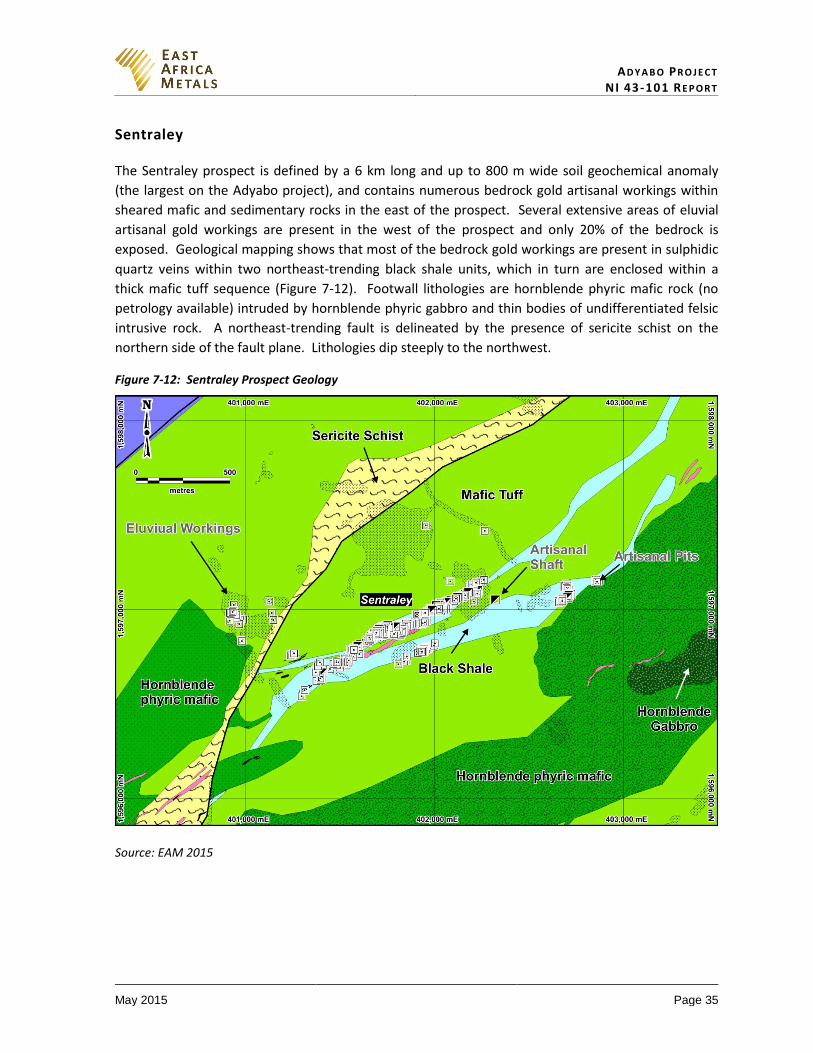
AD Y A B O PR O J E C T NI 43-101 RE P O R T
May 2015 Page 35
Sentraley
The Sentraley prospect is defined by a 6 km long and up to 800 m wide soil geochemical anomaly
(the largest on the Adyabo project), and contains numerous bedrock gold artisanal workings within
sheared mafic and sedimentary rocks in the east of the prospect. Several extensive areas of eluvial
artisanal gold workings are present in the west of the prospect and only 20% of the bedrock is
exposed. Geological mapping shows that most of the bedrock gold workings are present in sulphidic
quartz veins within two northeast-trending black shale units, which in turn are enclosed within a
thick mafic tuff sequence (Figure 7-12). Footwall lithologies are hornblende phyric mafic rock (no
petrology available) intruded by hornblende phyric gabbro and thin bodies of undifferentiated felsic
intrusive rock. A northeast-trending fault is delineated by the presence of sericite schist on the
northern side of the fault plane. Lithologies dip steeply to the northwest.
Figure 7-12: Sentraley Prospect Geology
Source: EAM 2015
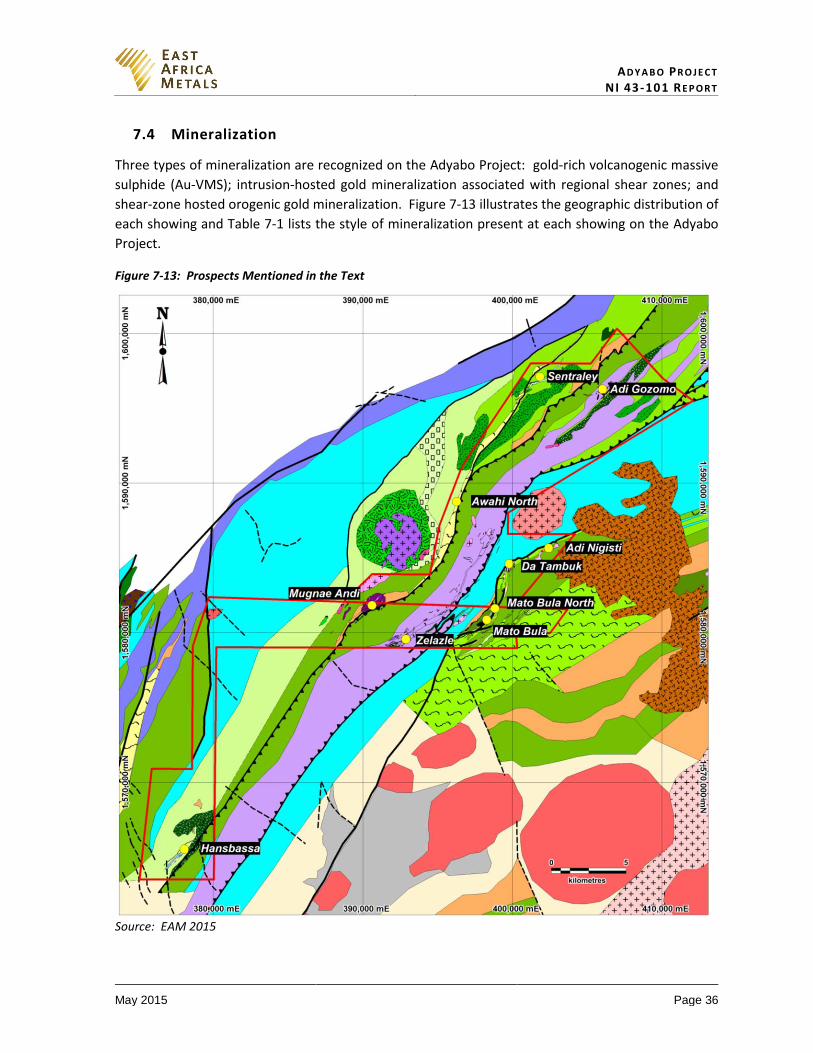
AD Y A B O PR O J E C T NI 43-101 RE P O R T
May 2015 Page 36
7.4 Mineralization
Three types of mineralization are recognized on the Adyabo Project: gold-rich volcanogenic massive
sulphide (Au-VMS); intrusion-hosted gold mineralization associated with regional shear zones; and
shear-zone hosted orogenic gold mineralization. Figure 7-13 illustrates the geographic distribution of
each showing and Table 7-1 lists the style of mineralization present at each showing on the Adyabo
Project.
Figure 7-13: Prospects Mentioned in the Text
Source: EAM 2015
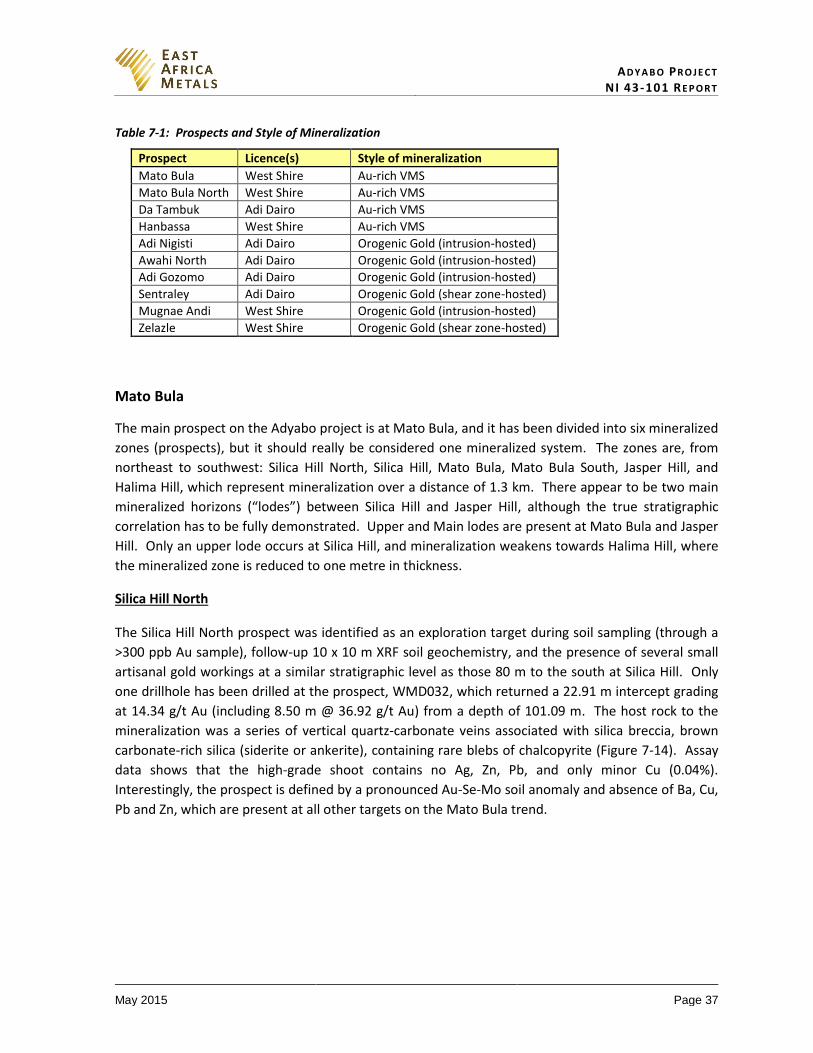
AD Y A B O PR O J E C T NI 43-101 RE P O R T
May 2015 Page 37
Table 7-1: Prospects and Style of Mineralization
Prospect Licence(s) Style of mineralization
Mato Bula West Shire Au-rich VMS
Mato Bula North West Shire Au-rich VMS
Da Tambuk Adi Dairo Au-rich VMS
Hanbassa West Shire Au-rich VMS
Adi Nigisti Adi Dairo Orogenic Gold (intrusion-hosted)
Awahi North Adi Dairo Orogenic Gold (intrusion-hosted)
Adi Gozomo Adi Dairo Orogenic Gold (intrusion-hosted)
Sentraley Adi Dairo Orogenic Gold (shear zone-hosted)
Mugnae Andi West Shire Orogenic Gold (intrusion-hosted)
Zelazle West Shire Orogenic Gold (shear zone-hosted)
Mato Bula
The main prospect on the Adyabo project is at Mato Bula, and it has been divided into six mineralized
zones (prospects), but it should really be considered one mineralized system. The zones are, from
northeast to southwest: Silica Hill North, Silica Hill, Mato Bula, Mato Bula South, Jasper Hill, and
Halima Hill, which represent mineralization over a distance of 1.3 km. There appear to be two main
mineralized horizons (“lodes”) between Silica Hill and Jasper Hill, although the true stratigraphic
correlation has to be fully demonstrated. Upper and Main lodes are present at Mato Bula and Jasper
Hill. Only an upper lode occurs at Silica Hill, and mineralization weakens towards Halima Hill, where
the mineralized zone is reduced to one metre in thickness.
Silica Hill North
The Silica Hill North prospect was identified as an exploration target during soil sampling (through a
>300 ppb Au sample), follow-up 10 x 10 m XRF soil geochemistry, and the presence of several small
artisanal gold workings at a similar stratigraphic level as those 80 m to the south at Silica Hill. Only
one drillhole has been drilled at the prospect, WMD032, which returned a 22.91 m intercept grading
at 14.34 g/t Au (including 8.50 m @ 36.92 g/t Au) from a depth of 101.09 m. The host rock to the
mineralization was a series of vertical quartz-carbonate veins associated with silica breccia, brown
carbonate-rich silica (siderite or ankerite), containing rare blebs of chalcopyrite (Figure 7-14). Assay
data shows that the high-grade shoot contains no Ag, Zn, Pb, and only minor Cu (0.04%).
Interestingly, the prospect is defined by a pronounced Au-Se-Mo soil anomaly and absence of Ba, Cu,
Pb and Zn, which are present at all other targets on the Mato Bula trend.
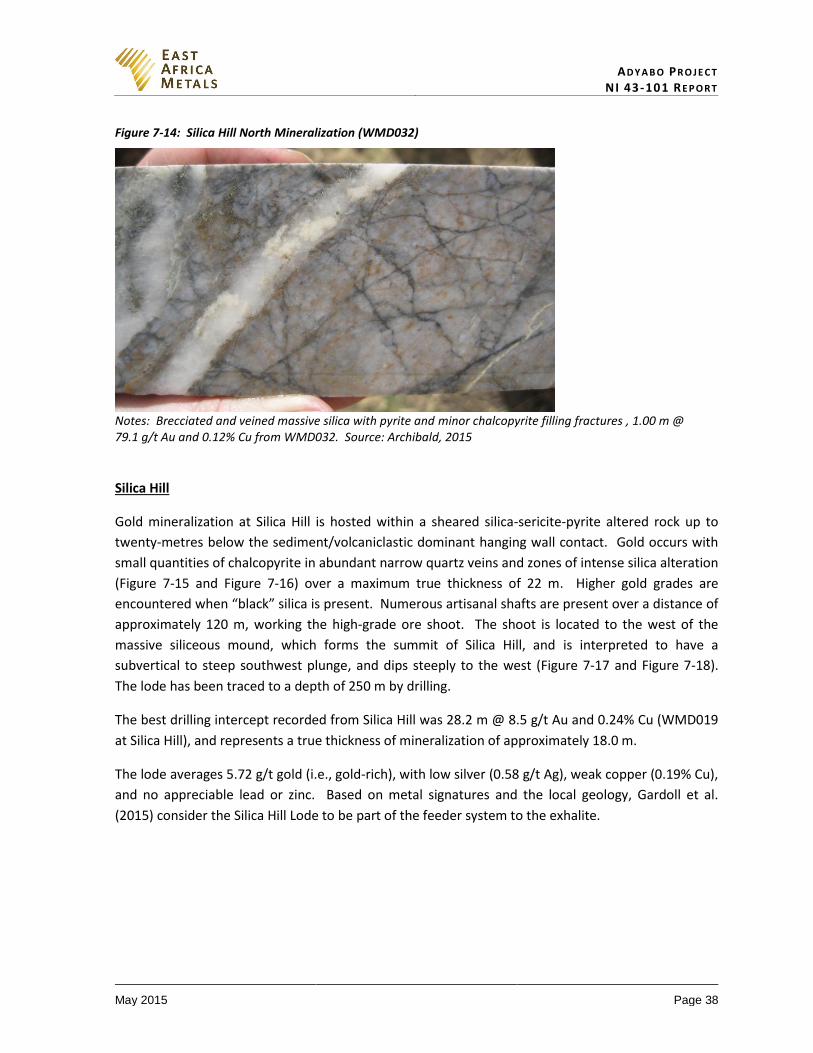
AD Y A B O PR O J E C T NI 43-101 RE P O R T
May 2015 Page 38
Figure 7-14: Silica Hill North Mineralization (WMD032)
Notes: Brecciated and veined massive silica with pyrite and minor chalcopyrite filling fractures , 1.00 m @ 79.1 g/t Au and 0.12% Cu from WMD032. Source: Archibald, 2015
Silica Hill
Gold mineralization at Silica Hill is hosted within a sheared silica-sericite-pyrite altered rock up to
twenty-metres below the sediment/volcaniclastic dominant hanging wall contact. Gold occurs with
small quantities of chalcopyrite in abundant narrow quartz veins and zones of intense silica alteration
(Figure 7-15 and Figure 7-16) over a maximum true thickness of 22 m. Higher gold grades are
encountered when “black” silica is present. Numerous artisanal shafts are present over a distance of
approximately 120 m, working the high-grade ore shoot. The shoot is located to the west of the
massive siliceous mound, which forms the summit of Silica Hill, and is interpreted to have a
subvertical to steep southwest plunge, and dips steeply to the west (Figure 7-17 and Figure 7-18).
The lode has been traced to a depth of 250 m by drilling.
The best drilling intercept recorded from Silica Hill was 28.2 m @ 8.5 g/t Au and 0.24% Cu (WMD019
at Silica Hill), and represents a true thickness of mineralization of approximately 18.0 m.
The lode averages 5.72 g/t gold (i.e., gold-rich), with low silver (0.58 g/t Ag), weak copper (0.19% Cu),
and no appreciable lead or zinc. Based on metal signatures and the local geology, Gardoll et al.
(2015) consider the Silica Hill Lode to be part of the feeder system to the exhalite.
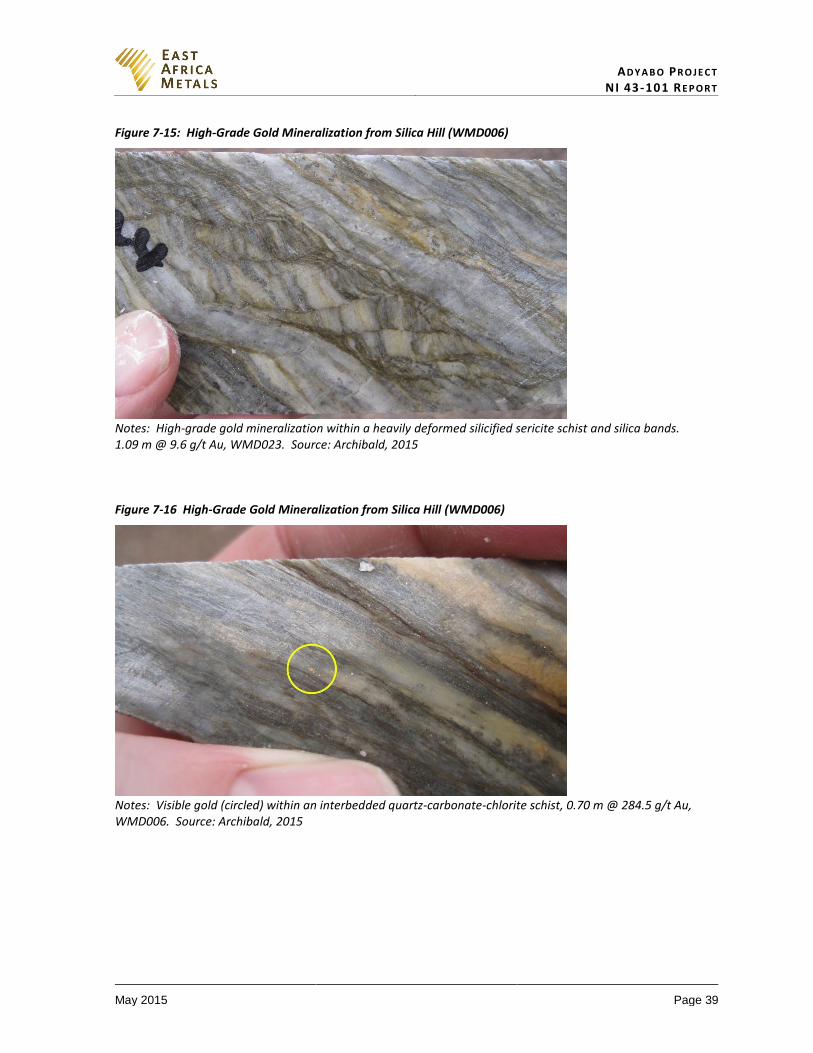
AD Y A B O PR O J E C T NI 43-101 RE P O R T
May 2015 Page 39
Figure 7-15: High-Grade Gold Mineralization from Silica Hill (WMD006)
Notes: High-grade gold mineralization within a heavily deformed silicified sericite schist and silica bands. 1.09 m @ 9.6 g/t Au, WMD023. Source: Archibald, 2015 Figure 7-16 High-Grade Gold Mineralization from Silica Hill (WMD006)
Notes: Visible gold (circled) within an interbedded quartz-carbonate-chlorite schist, 0.70 m @ 284.5 g/t Au, WMD006. Source: Archibald, 2015
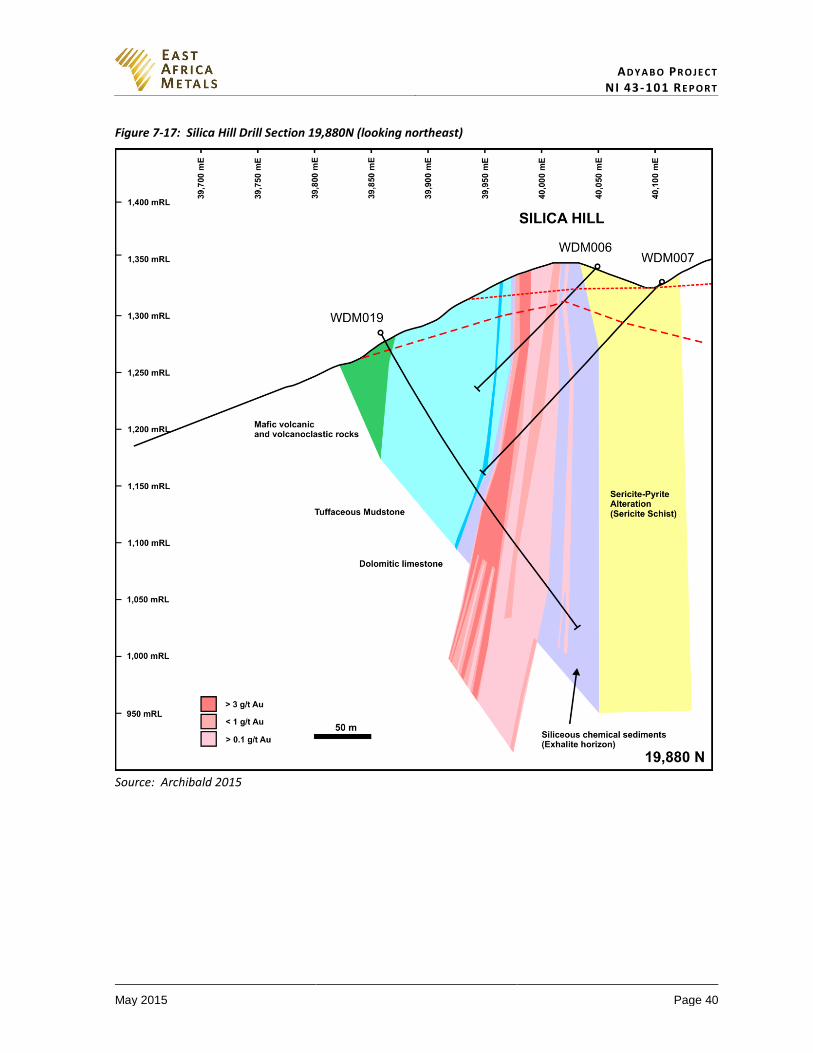
AD Y A B O PR O J E C T NI 43-101 RE P O R T
May 2015 Page 40
Figure 7-17: Silica Hill Drill Section 19,880N (looking northeast)
Source: Archibald 2015
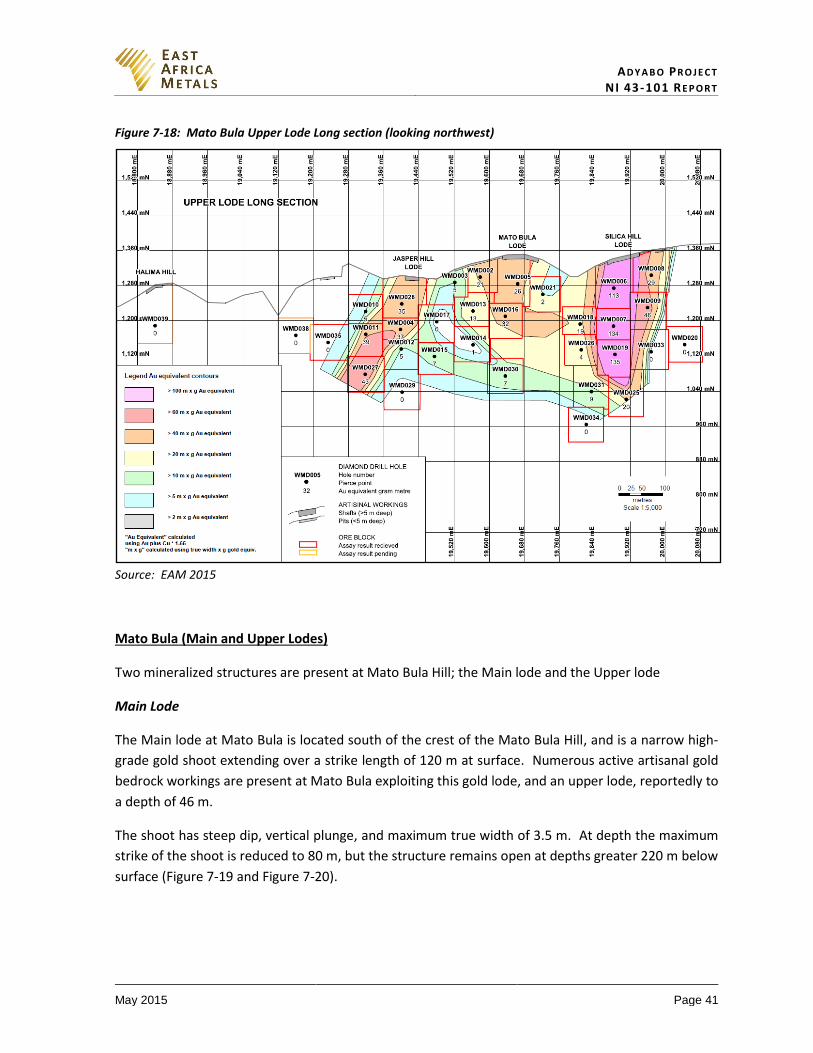
AD Y A B O PR O J E C T NI 43-101 RE P O R T
May 2015 Page 41
Figure 7-18: Mato Bula Upper Lode Long section (looking northwest)
Source: EAM 2015
Mato Bula (Main and Upper Lodes)
Two mineralized structures are present at Mato Bula Hill; the Main lode and the Upper lode
Main Lode
The Main lode at Mato Bula is located south of the crest of the Mato Bula Hill, and is a narrow high-
grade gold shoot extending over a strike length of 120 m at surface. Numerous active artisanal gold
bedrock workings are present at Mato Bula exploiting this gold lode, and an upper lode, reportedly to
a depth of 46 m.
The shoot has steep dip, vertical plunge, and maximum true width of 3.5 m. At depth the maximum
strike of the shoot is reduced to 80 m, but the structure remains open at depths greater 220 m below
surface (Figure 7-19 and Figure 7-20).

AD Y A B O PR O J E C T NI 43-101 RE P O R T
May 2015 Page 42
Silica-pyrite alteration is extensive laterally (750 m strike) and in thickness (159 m wide), and zones of
silica-pyrite are present in the hanging wall and along strike, in a zone up to 150 m wide and 750 m
long.
Mineralization is hosted within a shear zone that contains abundant quartz veining, silicification,
sericitization and carbonate alteration. Gold is associated with chalcopyrite-rich veins in intense
silica alteration, and also the presence of possibly V-rich mica (roscoelite). The Main lode averages
5.5 g/t Au and 0.61% Cu, and has a high Au:Ag ratio of 10.2. Lead and zinc concentrations are
negligible. A full list of drilling results from Mato Bula is presented in Section 10.3 (Drilling).
Figure 7-19: Mato Bula Drill Section 19,560N (looking northeast)
Source: Archibald 2015
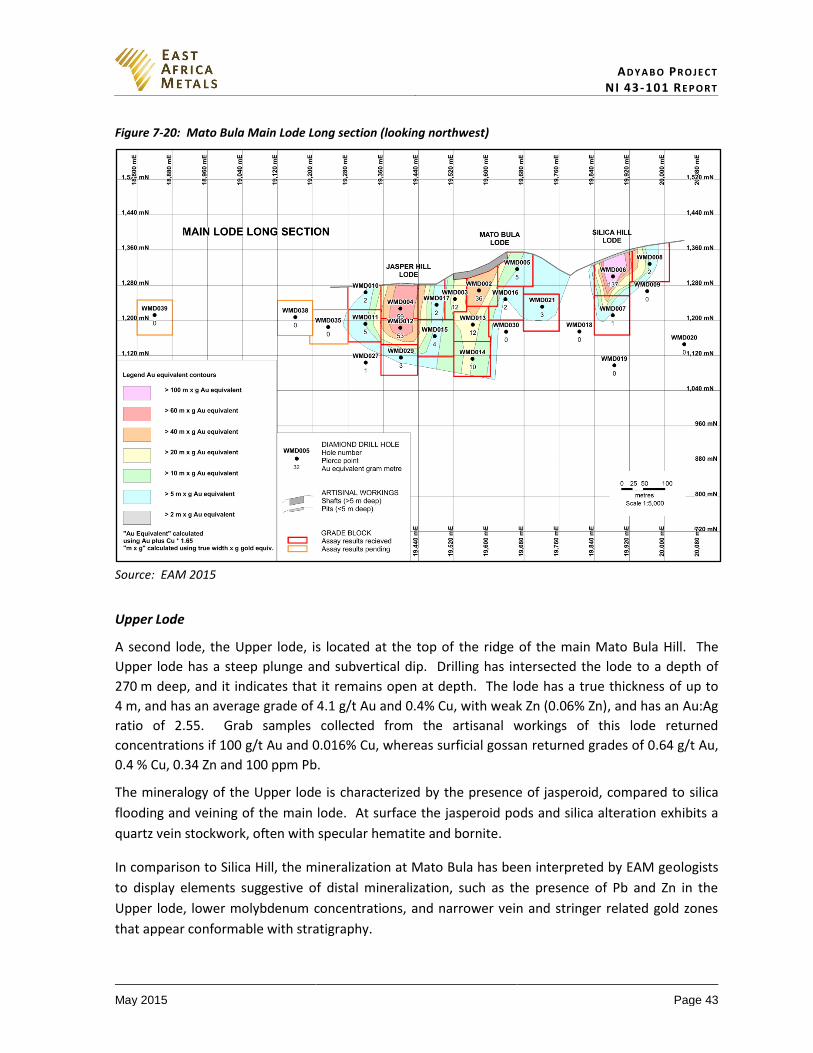
AD Y A B O PR O J E C T NI 43-101 RE P O R T
May 2015 Page 43
Figure 7-20: Mato Bula Main Lode Long section (looking northwest)
Source: EAM 2015
Upper Lode
A second lode, the Upper lode, is located at the top of the ridge of the main Mato Bula Hill. The
Upper lode has a steep plunge and subvertical dip. Drilling has intersected the lode to a depth of
270 m deep, and it indicates that it remains open at depth. The lode has a true thickness of up to
4 m, and has an average grade of 4.1 g/t Au and 0.4% Cu, with weak Zn (0.06% Zn), and has an Au:Ag
ratio of 2.55. Grab samples collected from the artisanal workings of this lode returned
concentrations if 100 g/t Au and 0.016% Cu, whereas surficial gossan returned grades of 0.64 g/t Au,
0.4 % Cu, 0.34 Zn and 100 ppm Pb.
The mineralogy of the Upper lode is characterized by the presence of jasperoid, compared to silica
flooding and veining of the main lode. At surface the jasperoid pods and silica alteration exhibits a
quartz vein stockwork, often with specular hematite and bornite.
In comparison to Silica Hill, the mineralization at Mato Bula has been interpreted by EAM geologists
to display elements suggestive of distal mineralization, such as the presence of Pb and Zn in the
Upper lode, lower molybdenum concentrations, and narrower vein and stringer related gold zones
that appear conformable with stratigraphy.
AD Y A B O PR O J E C T NI 43-101 RE P O R T
May 2015 Page 44
Jasper Hill (Main and Upper Lodes)
The Jasper Hill zone (sometimes known as Mato Bula South) contains structurally controlled gold
lodes (vein/wall rock porphyry hosted), and extend from the Mato Bula zone in the north towards
Halima Hill in the south (Figure 7-4). The upper and main lodes within this zone exhibit more
complex geometry due to possible faulting (or slumping) and wall rock interaction. Mineralization is
lithologically controlled with the gold-bearing zones within a jasperoid alteration zone. Gold
concentration decreases, with increasing zinc concentration, moving away from the jasperoid unit.
Gold-bearing veins have also been identified perpendicular to the long core axis.
The Main lode at Jasper Hill is located 40 m southeast of the Upper lode, south-westwards along
strike from the Mato Bula zone, and outcrops along strike for 80 m. The structure has a maximum
true thickness of 9 m, and an average gold grade of 4.53 g/t and copper grade of 0.85%. It has the
highest Au:Ag ratio in the Mato Bula prospect of 5.3:1, and a low Au:Cu (x10) ratio of 0.56:1. The
average silver concentration is low, 0.85 g/t, and only trace amounts of lead and zinc are present.
The lode plunges at approximately 60-70° to the southwest, and remains open down plunge below
depths of 200 m from surface (Figure 7-21).
The best intercept from the Main lode at Jasper Hill was 10.0 m (approximate true thickness) 4.40 g/t
Au and 0.87% Cu, including 2.4 m (approx. true thickness) of 17.08 g/t Au and 3.05% Cu from
WDM012 (Figure 7-22).
The Upper lode is a thick exhalite horizon comprised of banded to laminated jasperoidal silica,
carbonate (dolomite and minor calcite), with laminated cyclical bands of pyrite, chalcopyrite and
sphalerite (Figure 7-23). The immediate hanging wall to the mineralization is limestone, variably
altered to chloritoid spotted dolomite.
The lode occurs along strike for a distance of 80 to 160 m, and attains a maximum thickness of 16 m.
Interpretation of drilling data suggests that the lode plunges towards the southwest, and appears to
remain open at depths 250 m below surface.

AD Y A B O PR O J E C T NI 43-101 RE P O R T
May 2015 Page 45
Figure 7-21: Jasper Hill Drill Section 19,560N (looking northeast)
Source: Archibald 2015
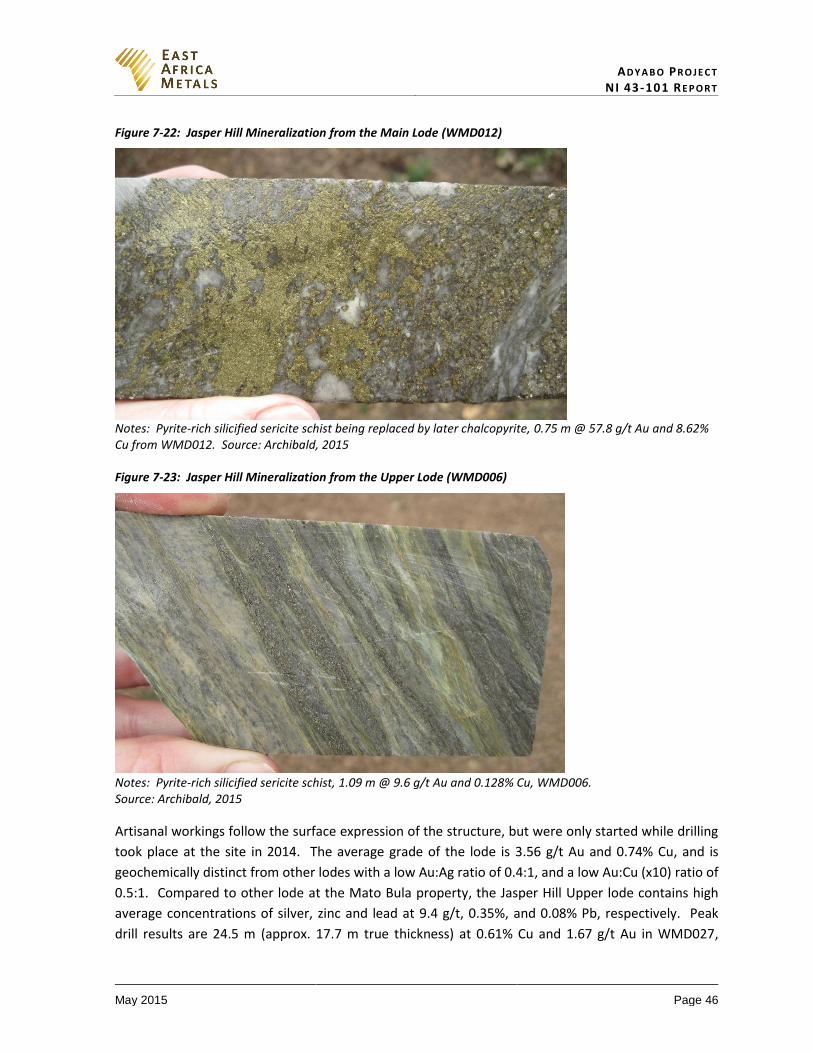
AD Y A B O PR O J E C T NI 43-101 RE P O R T
May 2015 Page 46
Figure 7-22: Jasper Hill Mineralization from the Main Lode (WMD012)
Notes: Pyrite-rich silicified sericite schist being replaced by later chalcopyrite, 0.75 m @ 57.8 g/t Au and 8.62% Cu from WMD012. Source: Archibald, 2015 Figure 7-23: Jasper Hill Mineralization from the Upper Lode (WMD006)
Notes: Pyrite-rich silicified sericite schist, 1.09 m @ 9.6 g/t Au and 0.128% Cu, WMD006. Source: Archibald, 2015
Artisanal workings follow the surface expression of the structure, but were only started while drilling
took place at the site in 2014. The average grade of the lode is 3.56 g/t Au and 0.74% Cu, and is
geochemically distinct from other lodes with a low Au:Ag ratio of 0.4:1, and a low Au:Cu (x10) ratio of
0.5:1. Compared to other lode at the Mato Bula property, the Jasper Hill Upper lode contains high
average concentrations of silver, zinc and lead at 9.4 g/t, 0.35%, and 0.08% Pb, respectively. Peak
drill results are 24.5 m (approx. 17.7 m true thickness) at 0.61% Cu and 1.67 g/t Au in WMD027,
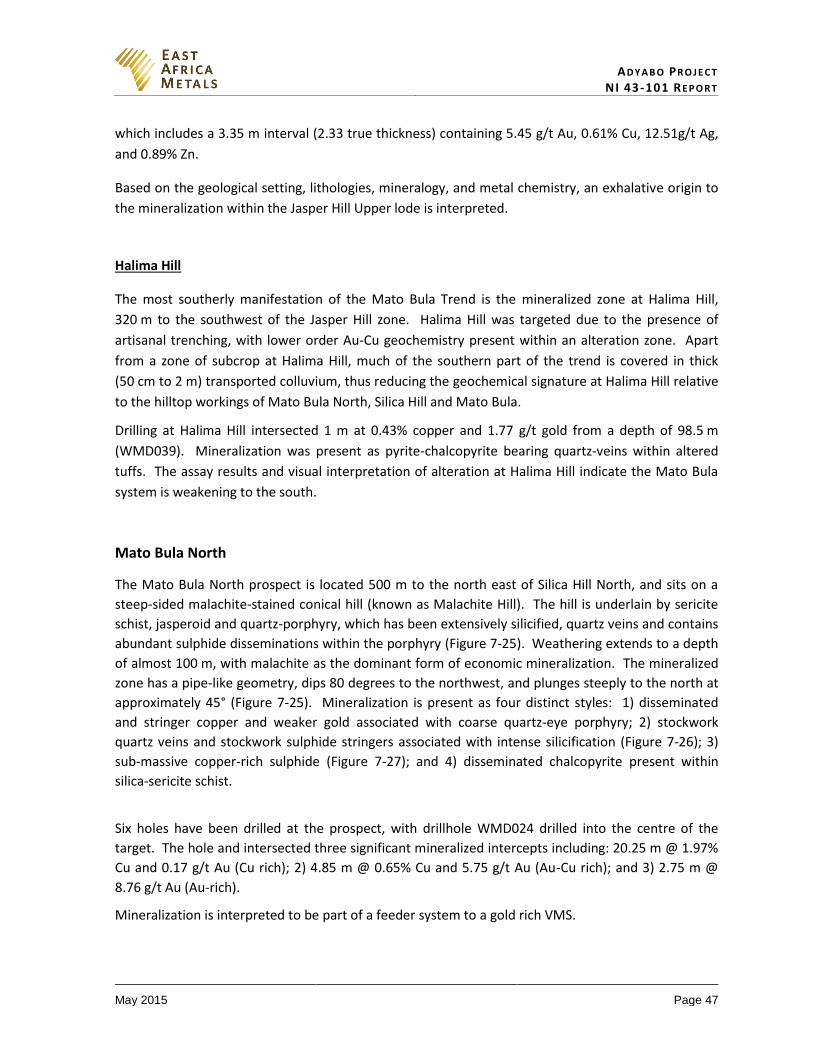
AD Y A B O PR O J E C T NI 43-101 RE P O R T
May 2015 Page 47
which includes a 3.35 m interval (2.33 true thickness) containing 5.45 g/t Au, 0.61% Cu, 12.51g/t Ag,
and 0.89% Zn.
Based on the geological setting, lithologies, mineralogy, and metal chemistry, an exhalative origin to
the mineralization within the Jasper Hill Upper lode is interpreted.
Halima Hill
The most southerly manifestation of the Mato Bula Trend is the mineralized zone at Halima Hill,
320 m to the southwest of the Jasper Hill zone. Halima Hill was targeted due to the presence of
artisanal trenching, with lower order Au-Cu geochemistry present within an alteration zone. Apart
from a zone of subcrop at Halima Hill, much of the southern part of the trend is covered in thick
(50 cm to 2 m) transported colluvium, thus reducing the geochemical signature at Halima Hill relative
to the hilltop workings of Mato Bula North, Silica Hill and Mato Bula.
Drilling at Halima Hill intersected 1 m at 0.43% copper and 1.77 g/t gold from a depth of 98.5 m
(WMD039). Mineralization was present as pyrite-chalcopyrite bearing quartz-veins within altered
tuffs. The assay results and visual interpretation of alteration at Halima Hill indicate the Mato Bula
system is weakening to the south.
Mato Bula North
The Mato Bula North prospect is located 500 m to the north east of Silica Hill North, and sits on a
steep-sided malachite-stained conical hill (known as Malachite Hill). The hill is underlain by sericite
schist, jasperoid and quartz-porphyry, which has been extensively silicified, quartz veins and contains
abundant sulphide disseminations within the porphyry (Figure 7-25). Weathering extends to a depth
of almost 100 m, with malachite as the dominant form of economic mineralization. The mineralized
zone has a pipe-like geometry, dips 80 degrees to the northwest, and plunges steeply to the north at
approximately 45° (Figure 7-25). Mineralization is present as four distinct styles: 1) disseminated
and stringer copper and weaker gold associated with coarse quartz-eye porphyry; 2) stockwork
quartz veins and stockwork sulphide stringers associated with intense silicification (Figure 7-26); 3)
sub-massive copper-rich sulphide (Figure 7-27); and 4) disseminated chalcopyrite present within
silica-sericite schist.
Six holes have been drilled at the prospect, with drillhole WMD024 drilled into the centre of the
target. The hole and intersected three significant mineralized intercepts including: 20.25 m @ 1.97%
Cu and 0.17 g/t Au (Cu rich); 2) 4.85 m @ 0.65% Cu and 5.75 g/t Au (Au-Cu rich); and 3) 2.75 m @
8.76 g/t Au (Au-rich).
Mineralization is interpreted to be part of a feeder system to a gold rich VMS.
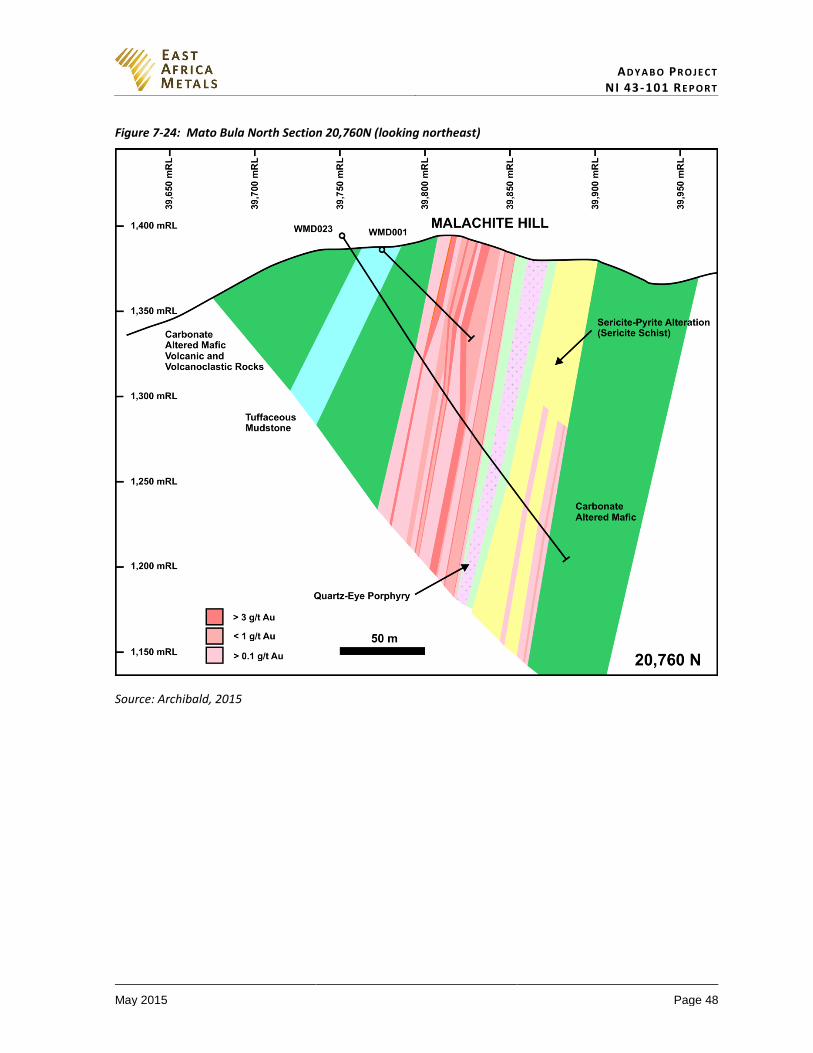
AD Y A B O PR O J E C T NI 43-101 RE P O R T
May 2015 Page 48
Figure 7-24: Mato Bula North Section 20,760N (looking northeast)
Source: Archibald, 2015
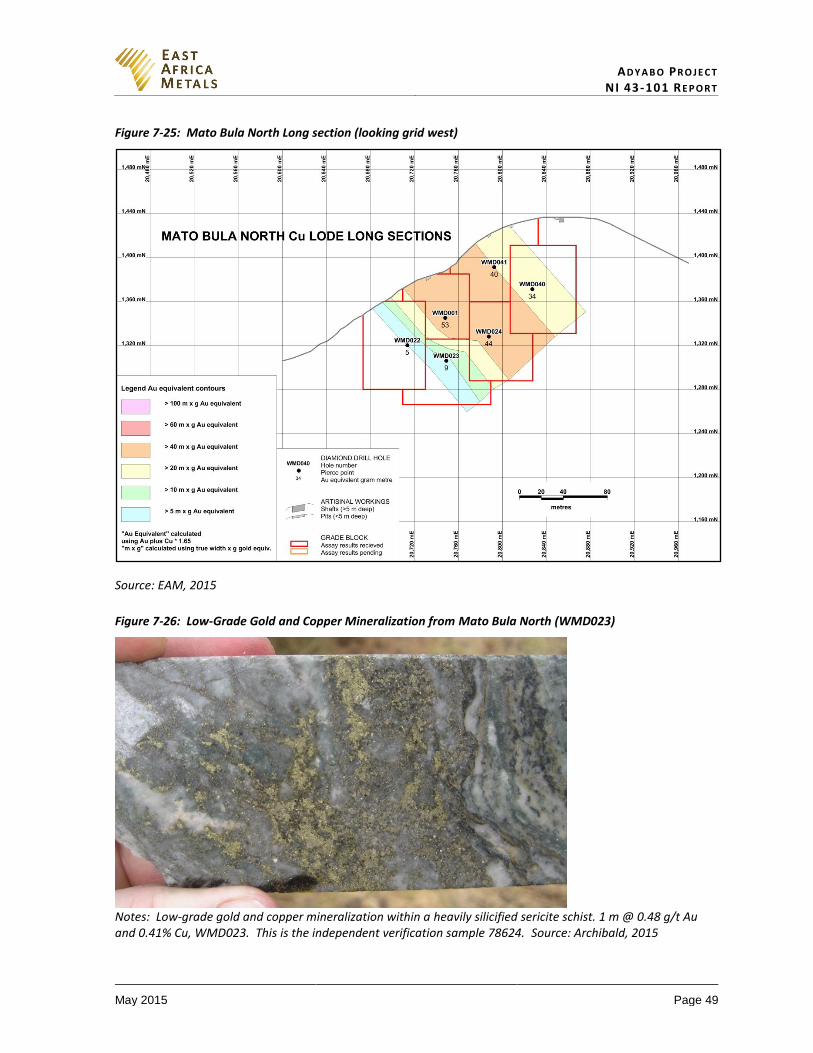
AD Y A B O PR O J E C T NI 43-101 RE P O R T
May 2015 Page 49
Figure 7-25: Mato Bula North Long section (looking grid west)
Source: EAM, 2015
Figure 7-26: Low-Grade Gold and Copper Mineralization from Mato Bula North (WMD023)
Notes: Low-grade gold and copper mineralization within a heavily silicified sericite schist. 1 m @ 0.48 g/t Au and 0.41% Cu, WMD023. This is the independent verification sample 78624. Source: Archibald, 2015
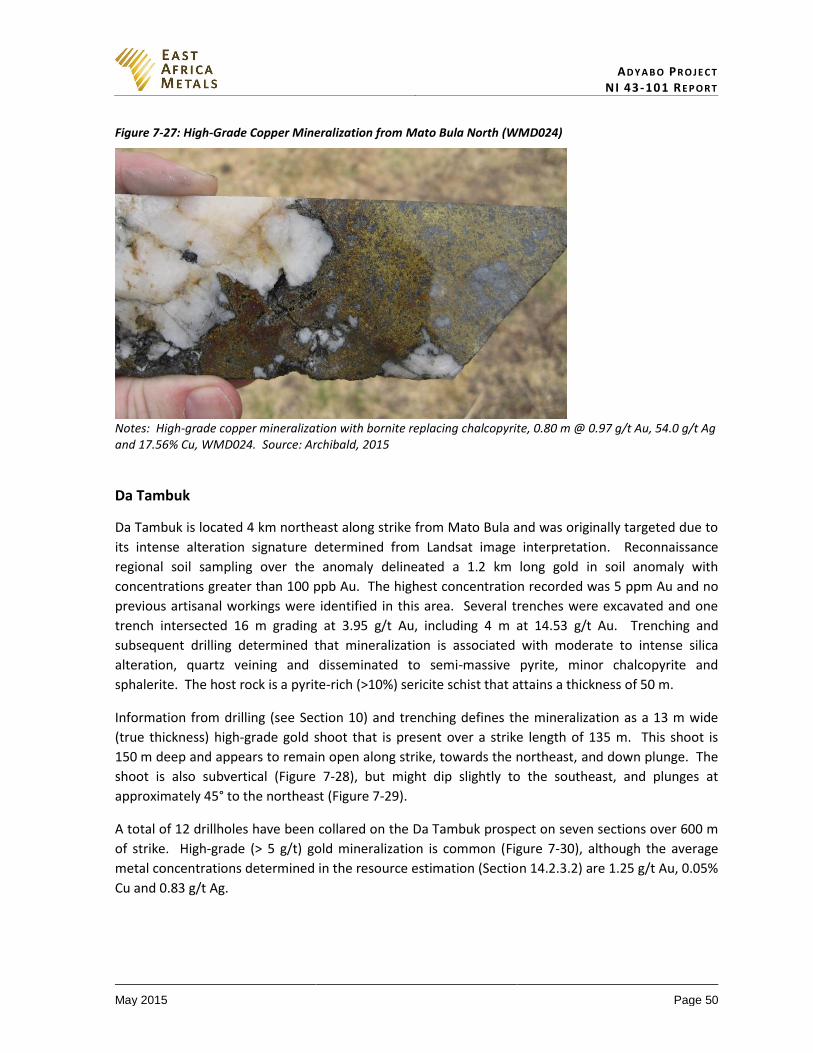
AD Y A B O PR O J E C T NI 43-101 RE P O R T
May 2015 Page 50
Figure 7-27: High-Grade Copper Mineralization from Mato Bula North (WMD024)
Notes: High-grade copper mineralization with bornite replacing chalcopyrite, 0.80 m @ 0.97 g/t Au, 54.0 g/t Ag and 17.56% Cu, WMD024. Source: Archibald, 2015
Da Tambuk
Da Tambuk is located 4 km northeast along strike from Mato Bula and was originally targeted due to
its intense alteration signature determined from Landsat image interpretation. Reconnaissance
regional soil sampling over the anomaly delineated a 1.2 km long gold in soil anomaly with
concentrations greater than 100 ppb Au. The highest concentration recorded was 5 ppm Au and no
previous artisanal workings were identified in this area. Several trenches were excavated and one
trench intersected 16 m grading at 3.95 g/t Au, including 4 m at 14.53 g/t Au. Trenching and
subsequent drilling determined that mineralization is associated with moderate to intense silica
alteration, quartz veining and disseminated to semi-massive pyrite, minor chalcopyrite and
sphalerite. The host rock is a pyrite-rich (>10%) sericite schist that attains a thickness of 50 m.
Information from drilling (see Section 10) and trenching defines the mineralization as a 13 m wide
(true thickness) high-grade gold shoot that is present over a strike length of 135 m. This shoot is
150 m deep and appears to remain open along strike, towards the northeast, and down plunge. The
shoot is also subvertical (Figure 7-28), but might dip slightly to the southeast, and plunges at
approximately 45° to the northeast (Figure 7-29).
A total of 12 drillholes have been collared on the Da Tambuk prospect on seven sections over 600 m
of strike. High-grade (> 5 g/t) gold mineralization is common (Figure 7-30), although the average
metal concentrations determined in the resource estimation (Section 14.2.3.2) are 1.25 g/t Au, 0.05%
Cu and 0.83 g/t Ag.
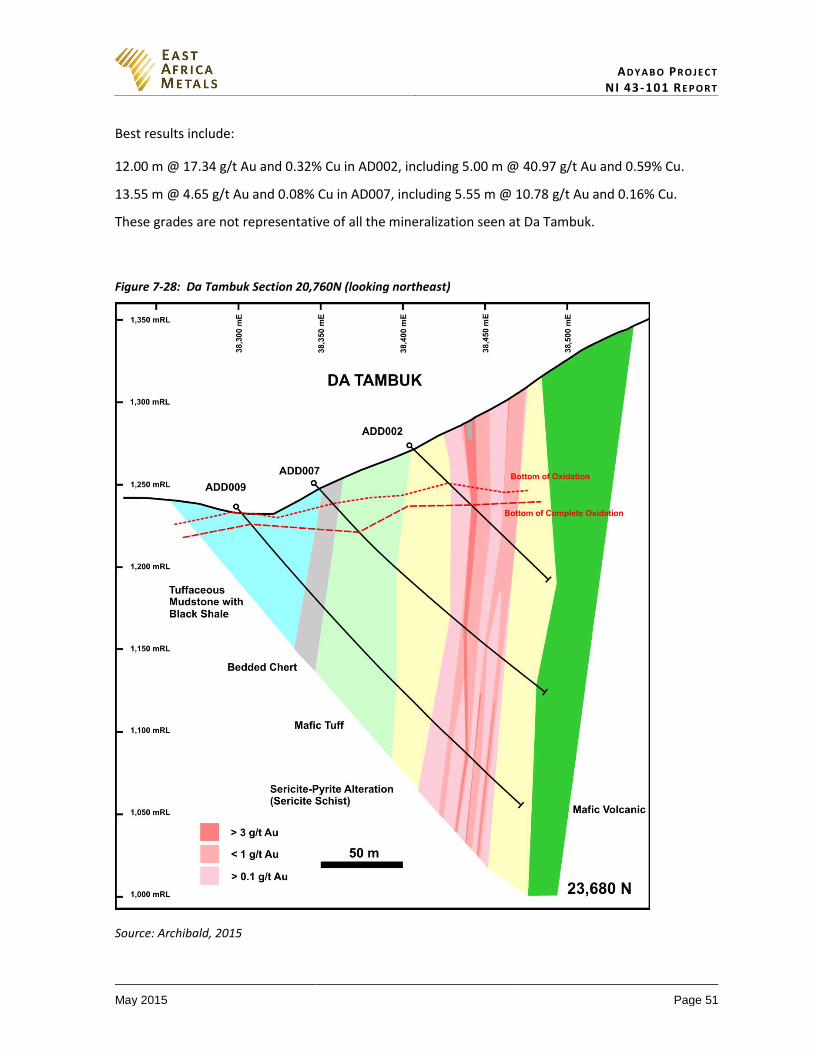
AD Y A B O PR O J E C T NI 43-101 RE P O R T
May 2015 Page 51
Best results include:
12.00 m @ 17.34 g/t Au and 0.32% Cu in AD002, including 5.00 m @ 40.97 g/t Au and 0.59% Cu.
13.55 m @ 4.65 g/t Au and 0.08% Cu in AD007, including 5.55 m @ 10.78 g/t Au and 0.16% Cu.
These grades are not representative of all the mineralization seen at Da Tambuk.
Figure 7-28: Da Tambuk Section 20,760N (looking northeast)
Source: Archibald, 2015
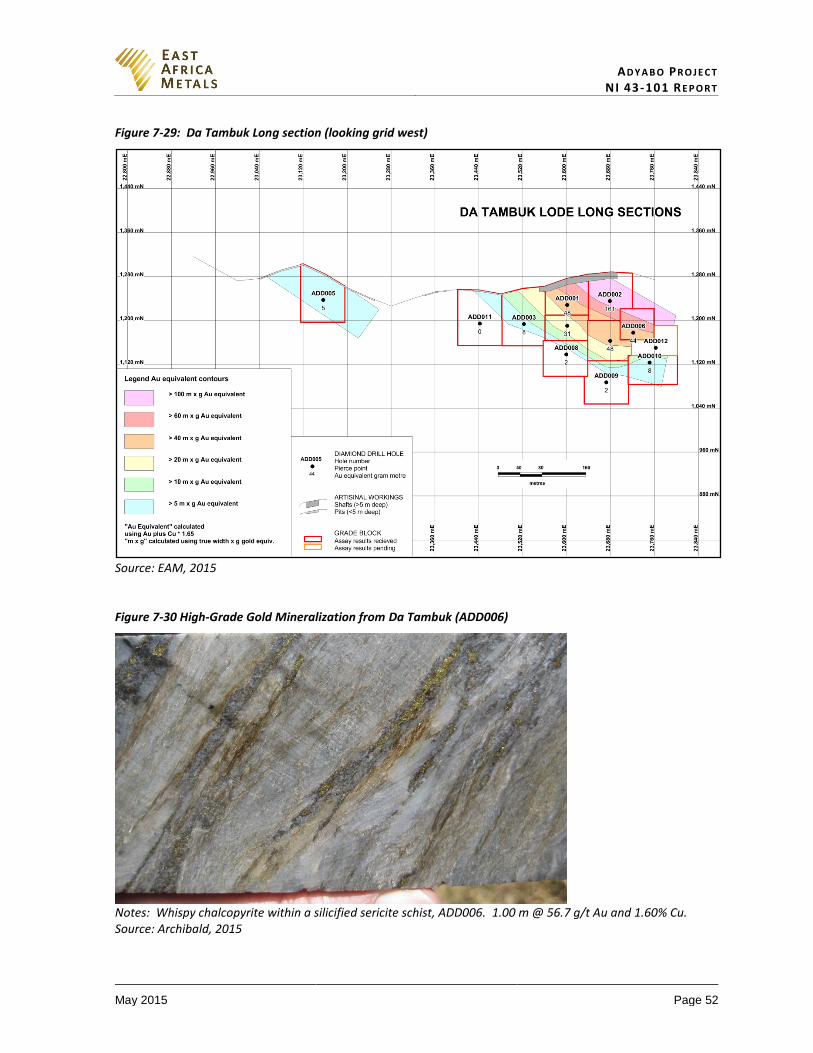
AD Y A B O PR O J E C T NI 43-101 RE P O R T
May 2015 Page 52
Figure 7-29: Da Tambuk Long section (looking grid west)
Source: EAM, 2015
Figure 7-30 High-Grade Gold Mineralization from Da Tambuk (ADD006)
Notes: Whispy chalcopyrite within a silicified sericite schist, ADD006. 1.00 m @ 56.7 g/t Au and 1.60% Cu. Source: Archibald, 2015
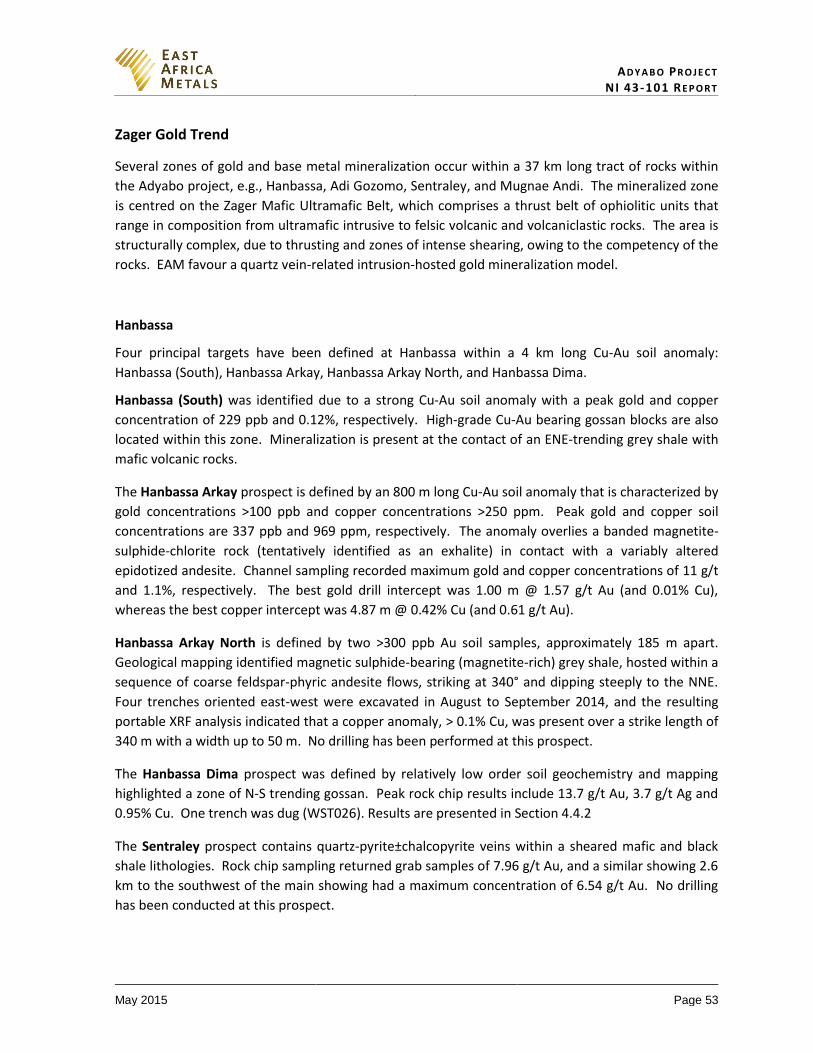
AD Y A B O PR O J E C T NI 43-101 RE P O R T
May 2015 Page 53
Zager Gold Trend
Several zones of gold and base metal mineralization occur within a 37 km long tract of rocks within
the Adyabo project, e.g., Hanbassa, Adi Gozomo, Sentraley, and Mugnae Andi. The mineralized zone
is centred on the Zager Mafic Ultramafic Belt, which comprises a thrust belt of ophiolitic units that
range in composition from ultramafic intrusive to felsic volcanic and volcaniclastic rocks. The area is
structurally complex, due to thrusting and zones of intense shearing, owing to the competency of the
rocks. EAM favour a quartz vein-related intrusion-hosted gold mineralization model.
Hanbassa
Four principal targets have been defined at Hanbassa within a 4 km long Cu-Au soil anomaly:
Hanbassa (South), Hanbassa Arkay, Hanbassa Arkay North, and Hanbassa Dima.
Hanbassa (South) was identified due to a strong Cu-Au soil anomaly with a peak gold and copper
concentration of 229 ppb and 0.12%, respectively. High-grade Cu-Au bearing gossan blocks are also
located within this zone. Mineralization is present at the contact of an ENE-trending grey shale with
mafic volcanic rocks.
The Hanbassa Arkay prospect is defined by an 800 m long Cu-Au soil anomaly that is characterized by
gold concentrations >100 ppb and copper concentrations >250 ppm. Peak gold and copper soil
concentrations are 337 ppb and 969 ppm, respectively. The anomaly overlies a banded magnetite-
sulphide-chlorite rock (tentatively identified as an exhalite) in contact with a variably altered
epidotized andesite. Channel sampling recorded maximum gold and copper concentrations of 11 g/t
and 1.1%, respectively. The best gold drill intercept was 1.00 m @ 1.57 g/t Au (and 0.01% Cu),
whereas the best copper intercept was 4.87 m @ 0.42% Cu (and 0.61 g/t Au).
Hanbassa Arkay North is defined by two >300 ppb Au soil samples, approximately 185 m apart.
Geological mapping identified magnetic sulphide-bearing (magnetite-rich) grey shale, hosted within a
sequence of coarse feldspar-phyric andesite flows, striking at 340° and dipping steeply to the NNE.
Four trenches oriented east-west were excavated in August to September 2014, and the resulting
portable XRF analysis indicated that a copper anomaly, > 0.1% Cu, was present over a strike length of
340 m with a width up to 50 m. No drilling has been performed at this prospect.
The Hanbassa Dima prospect was defined by relatively low order soil geochemistry and mapping
highlighted a zone of N-S trending gossan. Peak rock chip results include 13.7 g/t Au, 3.7 g/t Ag and
0.95% Cu. One trench was dug (WST026). Results are presented in Section 4.4.2
The Sentraley prospect contains quartz-pyrite±chalcopyrite veins within a sheared mafic and black
shale lithologies. Rock chip sampling returned grab samples of 7.96 g/t Au, and a similar showing 2.6
km to the southwest of the main showing had a maximum concentration of 6.54 g/t Au. No drilling
has been conducted at this prospect.
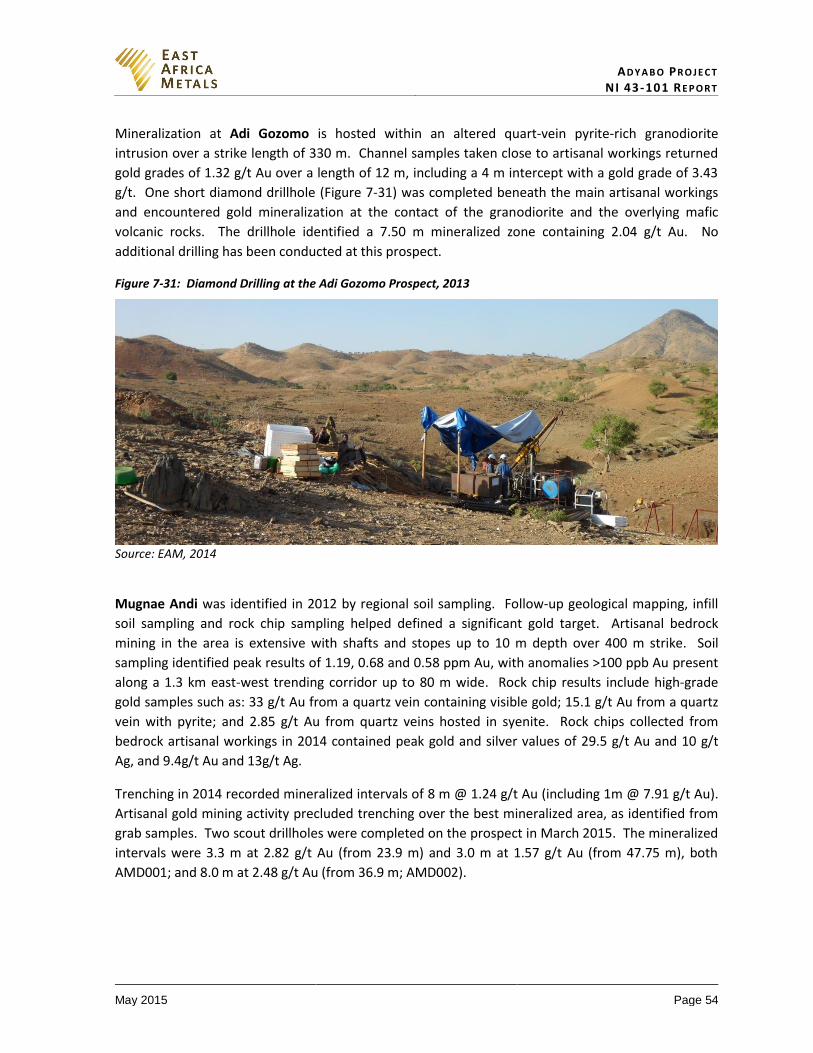
AD Y A B O PR O J E C T NI 43-101 RE P O R T
May 2015 Page 54
Mineralization at Adi Gozomo is hosted within an altered quart-vein pyrite-rich granodiorite
intrusion over a strike length of 330 m. Channel samples taken close to artisanal workings returned
gold grades of 1.32 g/t Au over a length of 12 m, including a 4 m intercept with a gold grade of 3.43
g/t. One short diamond drillhole (Figure 7-31) was completed beneath the main artisanal workings
and encountered gold mineralization at the contact of the granodiorite and the overlying mafic
volcanic rocks. The drillhole identified a 7.50 m mineralized zone containing 2.04 g/t Au. No
additional drilling has been conducted at this prospect.
Figure 7-31: Diamond Drilling at the Adi Gozomo Prospect, 2013
Source: EAM, 2014
Mugnae Andi was identified in 2012 by regional soil sampling. Follow-up geological mapping, infill
soil sampling and rock chip sampling helped defined a significant gold target. Artisanal bedrock
mining in the area is extensive with shafts and stopes up to 10 m depth over 400 m strike. Soil
sampling identified peak results of 1.19, 0.68 and 0.58 ppm Au, with anomalies >100 ppb Au present
along a 1.3 km east-west trending corridor up to 80 m wide. Rock chip results include high-grade
gold samples such as: 33 g/t Au from a quartz vein containing visible gold; 15.1 g/t Au from a quartz
vein with pyrite; and 2.85 g/t Au from quartz veins hosted in syenite. Rock chips collected from
bedrock artisanal workings in 2014 contained peak gold and silver values of 29.5 g/t Au and 10 g/t
Ag, and 9.4g/t Au and 13g/t Ag.
Trenching in 2014 recorded mineralized intervals of 8 m @ 1.24 g/t Au (including 1m @ 7.91 g/t Au).
Artisanal gold mining activity precluded trenching over the best mineralized area, as identified from
grab samples. Two scout drillholes were completed on the prospect in March 2015. The mineralized
intervals were 3.3 m at 2.82 g/t Au (from 23.9 m) and 3.0 m at 1.57 g/t Au (from 47.75 m), both
AMD001; and 8.0 m at 2.48 g/t Au (from 36.9 m; AMD002).
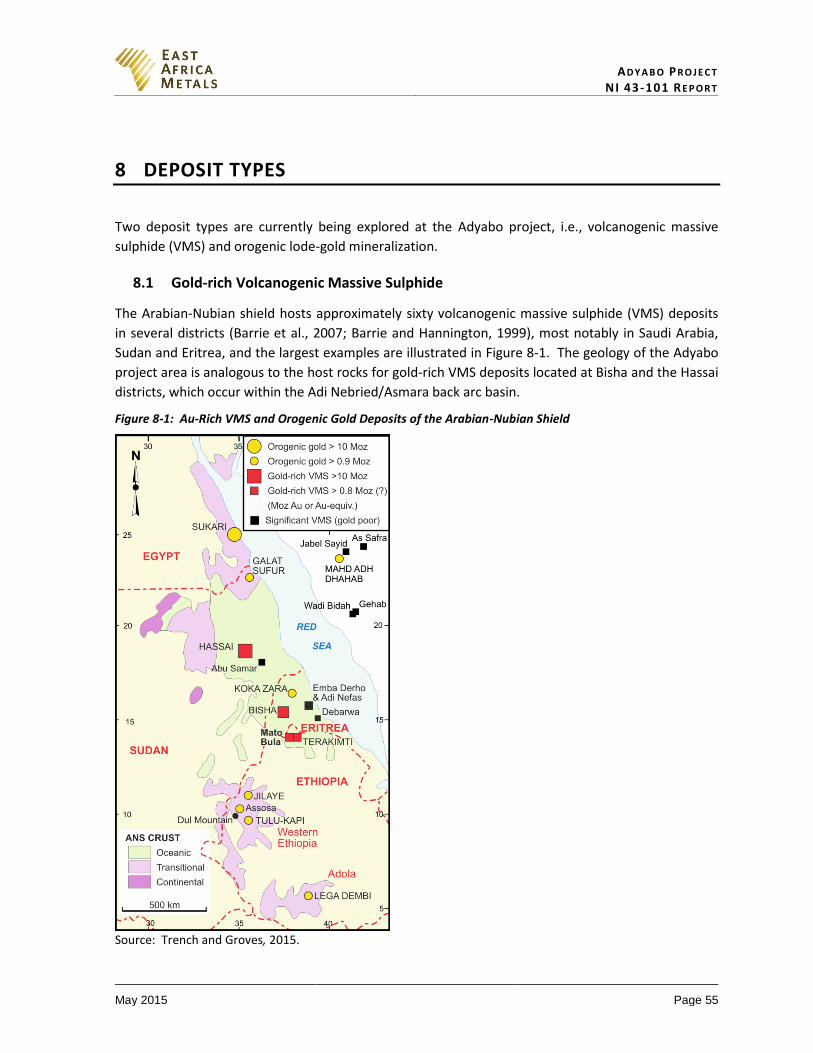
AD Y A B O PR O J E C T NI 43-101 RE P O R T
May 2015 Page 55
8 DEPOSIT TYPES
Two deposit types are currently being explored at the Adyabo project, i.e., volcanogenic massive
sulphide (VMS) and orogenic lode-gold mineralization.
8.1 Gold-rich Volcanogenic Massive Sulphide
The Arabian-Nubian shield hosts approximately sixty volcanogenic massive sulphide (VMS) deposits
in several districts (Barrie et al., 2007; Barrie and Hannington, 1999), most notably in Saudi Arabia,
Sudan and Eritrea, and the largest examples are illustrated in Figure 8-1. The geology of the Adyabo
project area is analogous to the host rocks for gold-rich VMS deposits located at Bisha and the Hassai
districts, which occur within the Adi Nebried/Asmara back arc basin.
Figure 8-1: Au-Rich VMS and Orogenic Gold Deposits of the Arabian-Nubian Shield
Source: Trench and Groves, 2015.

AD Y A B O PR O J E C T NI 43-101 RE P O R T
May 2015 Page 56
The VMS mineralization in the Adi Nebried/Asmara back arc basin have been variably described as
Kuroko-type (Chewaka and DeWit, 1981) and as bi-modal mafic type (Hannington, 2009), with
mineralization hosted within volcanic- and metasedimentary rocks. Generally VMS deposits contain
footwall mineralization consisting of quartz-chalcopyrite stringers (stockwork), overlain by primary
bedded (stratiform) sulphides composed of pyrite, chalcopyrite, ± sphalerite, ± galena, ± barite, ±
tetrahedrite/tennantite. In some deposits the stratiform massive sulphide lens makes up the entire
economic deposit, whereas in other deposits large quantities of ore are also mined from the
stockwork zone. The stratiform sulphides are typical overlain, or grade into, an iron-rich silica facies
that is usually manifested as a banded iron formation (BIF). Surficial weathering results in the
primary sulphides forming secondary, supergene minerals such as chalcocite, covellite, digenite, and
bornite. The surface manifestation of a VMS system is the total leaching of metals with the
exception of silica and iron to produce a hematite-goethite gossan. VMS deposits usually consist of
several mineralized lenses that can attain thicknesses up to 50 m and strike lengths up to 1500 m
(Galley, 2004; Franklin et al., 2005). The schematic model of active VMS formation, alteration and
mineralization is presented in Figure 8-2.
Gold-rich VMS are a sub-type of both volcanogenic massive sulphide (VMS) and lode gold deposits
(Poulsen and Hannington, 1996; Hannington et al., 1999; Huston, 2000; Poulsen et al., 2000; Dubé et
al. 2007a). This sub-type consists of semi-massive to massive sulphide lenses, which are underlain by
discordant stockwork feeder zones. However, gold-rich VMS differ from other types of VMS deposits
by their gold concentration (in g/t Au), which exceeds the associated combined Cu, Pb, and Zn grades
(in weight percent), Dubé et al., 2001.
Host rocks are exclusively felsic to intermediate volcanic or volcaniclastic rocks, with subvolcanic
tonalitic intrusions common at the district scale, e.g., Bousquet 2 - LaRonde 1 and LaRonde Penna
(Dubé et al., 2007b; Dubé et al., 2013). Alteration is advanced argillic at the deposit scale, and when
present in a metamorphosed environment (aluminous alteration with andalusite) may be common at
the deposit scale (Dubé et al., 2007a; Pilote et al., 2014). The sulphide mineralogy of the Au-bearing
ores is commonly more complex than in traditional Au-poor VMS deposits (Hannington et al., 1999).
Sulphide minerals are mainly pyrite, chalcopyrite, sphalerite, pyrrhotite, and galena with a complex
assemblage of minor phases including locally significant amounts of bornite, tennantite, sulphosalts,
arsenopyrite, mawsonite, and tellurides (Hannington et al., 1999; Dubé et al., 2007a; Mercier-
Langevin et al., 2011).

AD Y A B O PR O J E C T NI 43-101 RE P O R T
May 2015 Page 57
Figure 8-2: Schematic Illustration of Geological setting and Hydrothermal Alteration Associated with Au-rich VMS Systems
Source: Dubé et al., 2007
8.2 Orogenic Gold Deposits
Lode-gold deposits are intimately associated with orogeny and other plate collision events within
geologic history. Most lode gold deposits are sourced from metamorphic rocks, because it is thought
that the majority are formed by dehydration of basalt during metamorphism. The gold is
transported up faults by hydrothermal fluids and deposited when the water cools, boils, reacts with
the wall rock, or reacts with another fluid, thus precipitating the gold in solution.
The Arabian-Nubian Shield is also a significant gold producer with numerous gold deposits and
artisanal workings across the whole terrane (Figure 8-3). The host rocks range from graphitic mica
schist and ultramafic rocks (Lega Dembi, Ethiopia), to granite stocks (Sukhaybarat East, Saudi Arabia),
and along granite contact facies (El Sid and Umm Rus, Egypt). Other host rocks from the area include
metamorphosed mafic lavas, volcaniclastic tuff, phyllites and deformed granodiorites. All of the
mineralization is epigenetic, and is present in a variety of forms, e.g., quartz veins, pods, veinlets,
stringers, stockworks, and breccias. Vein mineralogy is dominated by quartz, carbonate (calcite,
dolomite and siderite), pyrite, arsenopyrite and pyrrhotite, and the wallrock alteration is typically
sericite, chlorite, and carbonate.
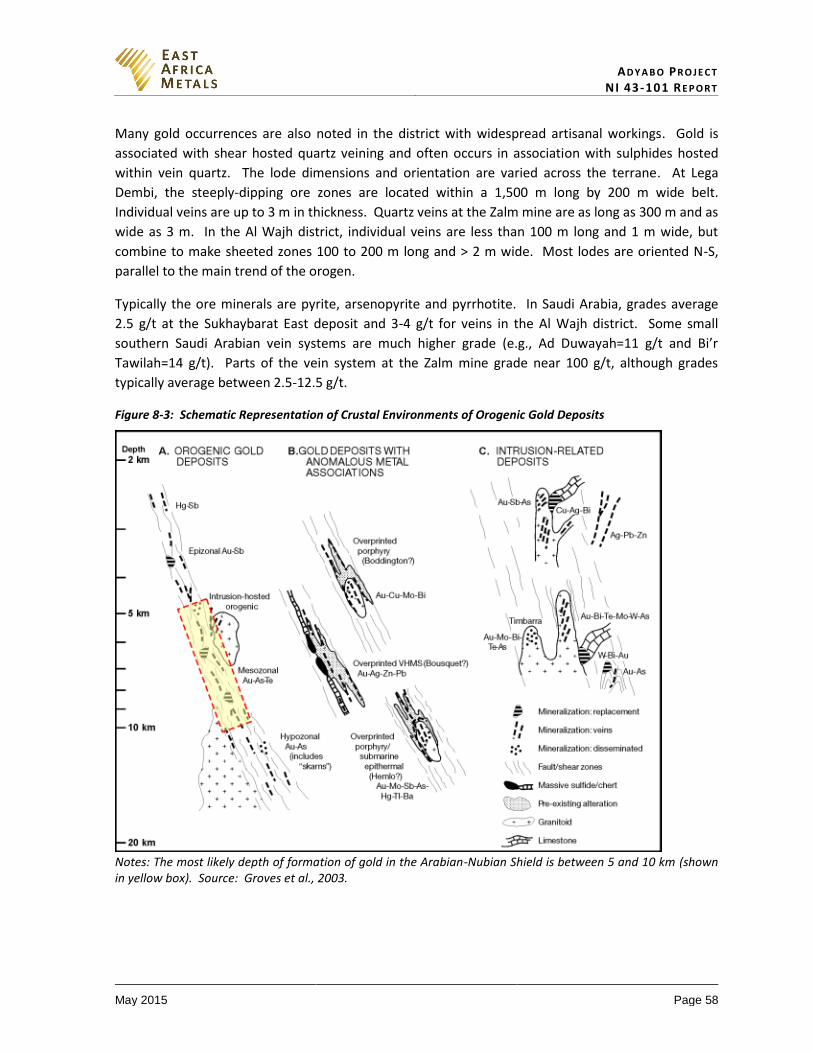
AD Y A B O PR O J E C T NI 43-101 RE P O R T
May 2015 Page 58
Many gold occurrences are also noted in the district with widespread artisanal workings. Gold is
associated with shear hosted quartz veining and often occurs in association with sulphides hosted
within vein quartz. The lode dimensions and orientation are varied across the terrane. At Lega
Dembi, the steeply-dipping ore zones are located within a 1,500 m long by 200 m wide belt.
Individual veins are up to 3 m in thickness. Quartz veins at the Zalm mine are as long as 300 m and as
wide as 3 m. In the Al Wajh district, individual veins are less than 100 m long and 1 m wide, but
combine to make sheeted zones 100 to 200 m long and > 2 m wide. Most lodes are oriented N-S,
parallel to the main trend of the orogen.
Typically the ore minerals are pyrite, arsenopyrite and pyrrhotite. In Saudi Arabia, grades average
2.5 g/t at the Sukhaybarat East deposit and 3-4 g/t for veins in the Al Wajh district. Some small
southern Saudi Arabian vein systems are much higher grade (e.g., Ad Duwayah=11 g/t and Bi’r
Tawilah=14 g/t). Parts of the vein system at the Zalm mine grade near 100 g/t, although grades
typically average between 2.5-12.5 g/t.
Figure 8-3: Schematic Representation of Crustal Environments of Orogenic Gold Deposits
Notes: The most likely depth of formation of gold in the Arabian-Nubian Shield is between 5 and 10 km (shown in yellow box). Source: Groves et al., 2003.
AD Y A B O PR O J E C T NI 43-101 RE P O R T
May 2015 Page 59
9 EXPLORATION
All mineral exploration by EAM to date has been conducted by EAM permanent- and contract- staff,
except for petrographic work conducted by Dr. Gawen Jenkin (Leicester University), Dr. Graham
Wilson (Turnstone Geological Services), and Mallory Dalsin (Hummingbird Geological Services). The
petrographic work was performed under contract in England and Canada.
9.1 Geological Mapping
As noted in Section 6, geological mapping of the Adyabo project was performed by the Ethiopian
Geological Survey and Ezana. However, the first detailed mapping of the property was undertaken
by EAM geologists in March 2012 at a scale of 1:2,000 and covering an area of 1.2 km2 at Mato Bula.
This was followed by the mapping of a 1 km2 area at 1:500 in May 2012, and 3.75 km2 at 1:2,000
scale in August 2012. Additional mapping programs have been carried out since 2012 on other
prospects on the property at scales varying from 1:2000 to 1:250. However, most mapping is
performed at 1:500 scale.
The study involved investigating as many of the outcrops in the mapping area as possible and
accurately describing the geology (lithology, alteration, grain size variations) and taking structural
measurements (bedding, foliation, lineation, etc). Non-orthorectified registered 2012 Worldview
images were employed as a basemap, with geological locations collected using a handheld Garmin 60
CSX GPS unit for accurate location. Over 1,900 outcrops and subcrop areas were recorded and
digitized into MapInfo for the Mato Bula - Da Tambuk area. Additional structural data were collected
to record strike and dip of bedding, lineations and plunge directions associated with folds, and
veining using dip and dip direction. All information was recorded in Microsoft Excel.
An example of the fact geology map is present in Figure 9-1. Once the fact geology map is completed
it is integrated with additional data, such as XRF multi-element soil geochemistry and drilling, to
produce an interpreted geology map (e.g., Figure 7-4).
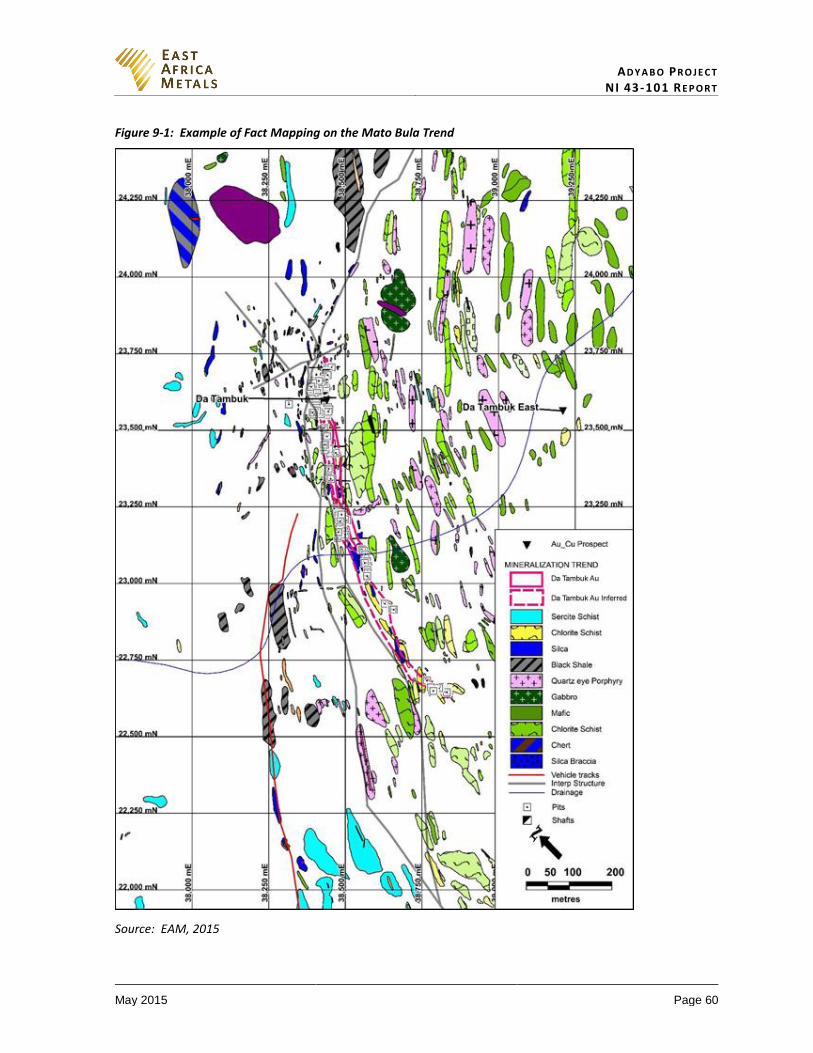
AD Y A B O PR O J E C T NI 43-101 RE P O R T
May 2015 Page 60
Figure 9-1: Example of Fact Mapping on the Mato Bula Trend
Source: EAM, 2015

AD Y A B O PR O J E C T NI 43-101 RE P O R T
May 2015 Page 61
9.2 Soil Sampling
Gold Soil Geochemistry
EAM has carried out regional and detailed soil geochemistry surveys over 85% of the Adyabo project
area. A total of 25,373 soil samples (18,104 in 2012, 6,210 in 2013, and 1,059 in 2014) were collected
throughout the property and analyzed for gold, at the locations shown in Figure 9-2. The initial
measurements were taken with a sample spacing of 80 m on an east-west oriented line, with a line
spacing of 320 m. An infill grid of 40 x 160 m was employed over areas that were considered
anomalous following the initial survey. If anomalism persisted then a grid with a spacing of 40 x 40 m
was employed to resolve the anomaly.
From this work, a number of elongate gold soil anomalies were identified, including the Mato Bula –
Da Tambuk trend (Figure 9-3). The average gold concentration of the soil samples was 32.1 ppb, with
a lower analytical limit of detection of 1 ppb. From the total samples collected 815 (3.2%) had gold
concentrations greater than 100 ppb. The maximum concentration recorded was 145 ppm gold from
the Mato Bula prospect.
Figure 9-2: Distribution of Gold Shallow Soil Sampling on the Property
Source: Archibald et al., 2015

AD Y A B O PR O J E C T NI 43-101 RE P O R T
May 2015 Page 62
Figure 9-3: Distribution of Gold Shallow Soil Sampling on the Mato Bula Trend
Source: EAM, 2015
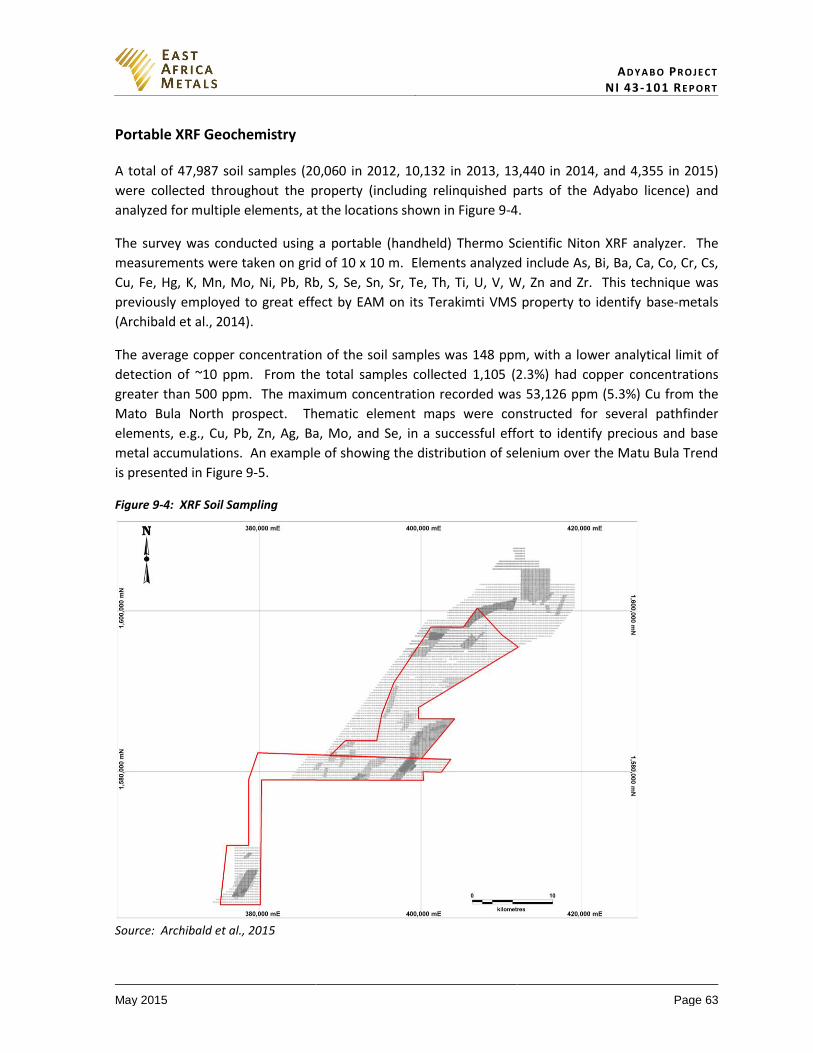
AD Y A B O PR O J E C T NI 43-101 RE P O R T
May 2015 Page 63
Portable XRF Geochemistry
A total of 47,987 soil samples (20,060 in 2012, 10,132 in 2013, 13,440 in 2014, and 4,355 in 2015)
were collected throughout the property (including relinquished parts of the Adyabo licence) and
analyzed for multiple elements, at the locations shown in Figure 9-4.
The survey was conducted using a portable (handheld) Thermo Scientific Niton XRF analyzer. The
measurements were taken on grid of 10 x 10 m. Elements analyzed include As, Bi, Ba, Ca, Co, Cr, Cs,
Cu, Fe, Hg, K, Mn, Mo, Ni, Pb, Rb, S, Se, Sn, Sr, Te, Th, Ti, U, V, W, Zn and Zr. This technique was
previously employed to great effect by EAM on its Terakimti VMS property to identify base-metals
(Archibald et al., 2014).
The average copper concentration of the soil samples was 148 ppm, with a lower analytical limit of
detection of ~10 ppm. From the total samples collected 1,105 (2.3%) had copper concentrations
greater than 500 ppm. The maximum concentration recorded was 53,126 ppm (5.3%) Cu from the
Mato Bula North prospect. Thematic element maps were constructed for several pathfinder
elements, e.g., Cu, Pb, Zn, Ag, Ba, Mo, and Se, in a successful effort to identify precious and base
metal accumulations. An example of showing the distribution of selenium over the Matu Bula Trend
is presented in Figure 9-5.
Figure 9-4: XRF Soil Sampling
Source: Archibald et al., 2015
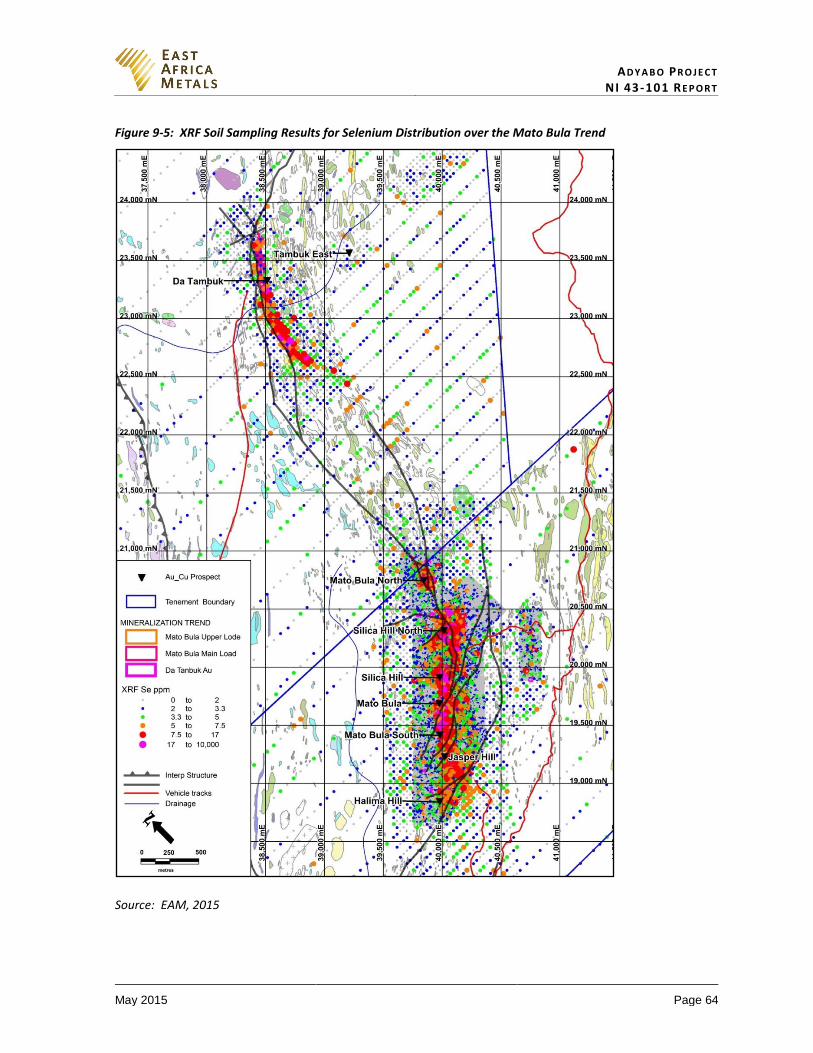
AD Y A B O PR O J E C T NI 43-101 RE P O R T
May 2015 Page 64
Figure 9-5: XRF Soil Sampling Results for Selenium Distribution over the Mato Bula Trend
Source: EAM, 2015

AD Y A B O PR O J E C T NI 43-101 RE P O R T
May 2015 Page 65
9.3 Stream Sediment Sampling
Steam sediment sampling was carried out by EAM over both concessions, but as illustrated in
Figure 9-6, most of the samples are outside the current licence boundaries. Stream sediment
sampling occurred in 2012 with a total of 2,966 samples collected and analyzed, of which 696 are
present within the current Adyabo project. Elements analyzed include Au, Ag, As, Ba, Cu, Pb, and Zn.
This method was utilized to quickly prospect a large area of ground when the concessions were first
acquired.
The average gold concentration of the samples was 33.2 ppb, and the maximum concentration
recorded was 7,340 ppb gold at Mato Bula. A total of 18 highly anomalous gold (>200 ppb gold)
samples collected in the program identified gold mineralization at Mato Bula and Da Tambuk, Adi
Nigisti, and several areas now no longer part of the property.
Figure 9-6: Locations of Stream Sediment Samples
Source: Archibald et al., 2015
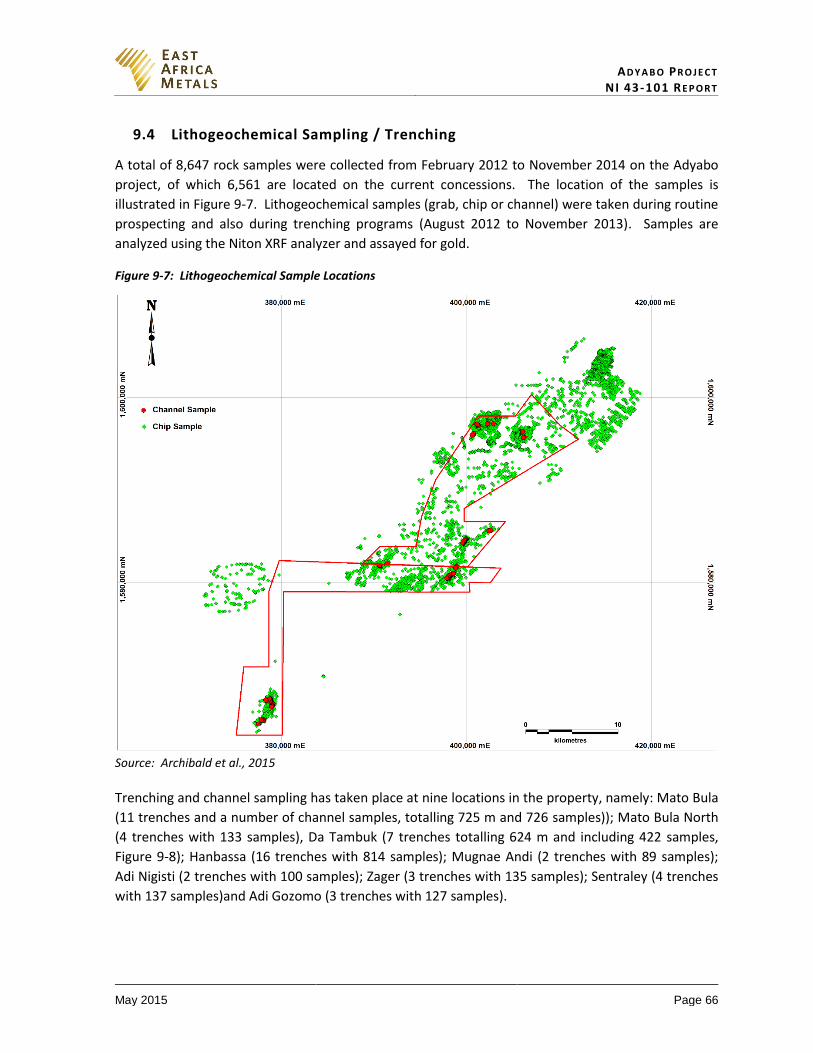
AD Y A B O PR O J E C T NI 43-101 RE P O R T
May 2015 Page 66
9.4 Lithogeochemical Sampling / Trenching
A total of 8,647 rock samples were collected from February 2012 to November 2014 on the Adyabo
project, of which 6,561 are located on the current concessions. The location of the samples is
illustrated in Figure 9-7. Lithogeochemical samples (grab, chip or channel) were taken during routine
prospecting and also during trenching programs (August 2012 to November 2013). Samples are
analyzed using the Niton XRF analyzer and assayed for gold.
Figure 9-7: Lithogeochemical Sample Locations
Source: Archibald et al., 2015
Trenching and channel sampling has taken place at nine locations in the property, namely: Mato Bula
(11 trenches and a number of channel samples, totalling 725 m and 726 samples)); Mato Bula North
(4 trenches with 133 samples), Da Tambuk (7 trenches totalling 624 m and including 422 samples,
Figure 9-8); Hanbassa (16 trenches with 814 samples); Mugnae Andi (2 trenches with 89 samples);
Adi Nigisti (2 trenches with 100 samples); Zager (3 trenches with 135 samples); Sentraley (4 trenches
with 137 samples)and Adi Gozomo (3 trenches with 127 samples).
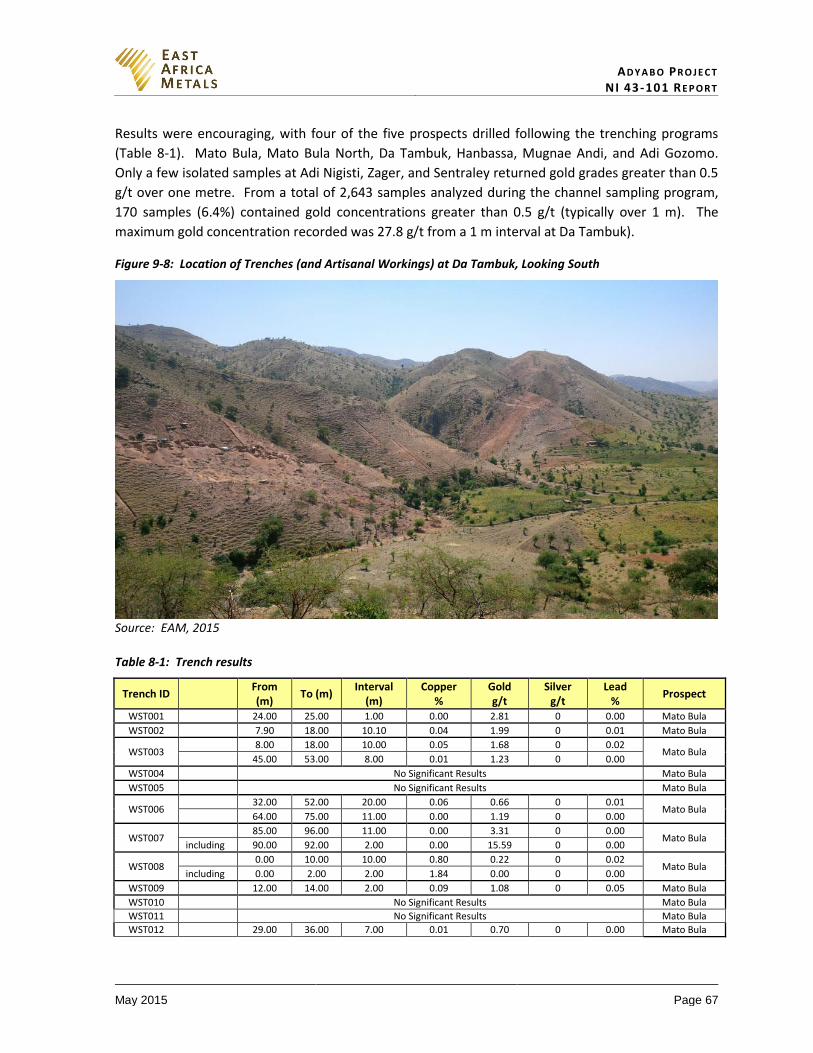
AD Y A B O PR O J E C T NI 43-101 RE P O R T
May 2015 Page 67
Results were encouraging, with four of the five prospects drilled following the trenching programs
(Table 8-1). Mato Bula, Mato Bula North, Da Tambuk, Hanbassa, Mugnae Andi, and Adi Gozomo.
Only a few isolated samples at Adi Nigisti, Zager, and Sentraley returned gold grades greater than 0.5
g/t over one metre. From a total of 2,643 samples analyzed during the channel sampling program,
170 samples (6.4%) contained gold concentrations greater than 0.5 g/t (typically over 1 m). The
maximum gold concentration recorded was 27.8 g/t from a 1 m interval at Da Tambuk).
Figure 9-8: Location of Trenches (and Artisanal Workings) at Da Tambuk, Looking South
Source: EAM, 2015
Table 8-1: Trench results
Trench ID From (m)
To (m) Interval
(m) Copper
% Gold g/t
Silver g/t
Lead %
Prospect
WST001 24.00 25.00 1.00 0.00 2.81 0 0.00 Mato Bula
WST002 7.90 18.00 10.10 0.04 1.99 0 0.01 Mato Bula
WST003 8.00 18.00 10.00 0.05 1.68 0 0.02
Mato Bula 45.00 53.00 8.00 0.01 1.23 0 0.00
WST004 No Significant Results Mato Bula
WST005 No Significant Results Mato Bula
WST006 32.00 52.00 20.00 0.06 0.66 0 0.01
Mato Bula 64.00 75.00 11.00 0.00 1.19 0 0.00
WST007 85.00 96.00 11.00 0.00 3.31 0 0.00
Mato Bula including 90.00 92.00 2.00 0.00 15.59 0 0.00
WST008 0.00 10.00 10.00 0.80 0.22 0 0.02
Mato Bula including 0.00 2.00 2.00 1.84 0.00 0 0.00
WST009 12.00 14.00 2.00 0.09 1.08 0 0.05 Mato Bula
WST010 No Significant Results Mato Bula
WST011 No Significant Results Mato Bula
WST012 29.00 36.00 7.00 0.01 0.70 0 0.00 Mato Bula
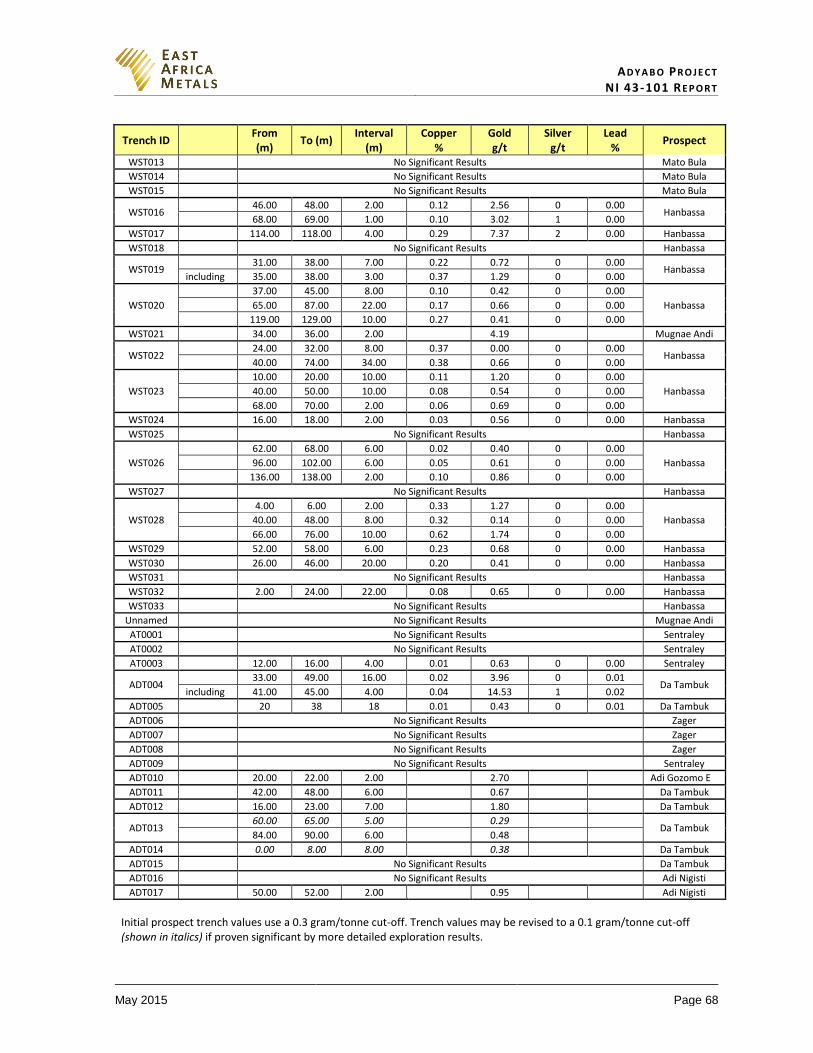
AD Y A B O PR O J E C T NI 43-101 RE P O R T
May 2015 Page 68
Trench ID From (m)
To (m) Interval
(m) Copper
% Gold g/t
Silver g/t
Lead %
Prospect
WST013 No Significant Results Mato Bula
WST014 No Significant Results Mato Bula
WST015 No Significant Results Mato Bula
WST016 46.00 48.00 2.00 0.12 2.56 0 0.00
Hanbassa 68.00 69.00 1.00 0.10 3.02 1 0.00
WST017 114.00 118.00 4.00 0.29 7.37 2 0.00 Hanbassa
WST018 No Significant Results Hanbassa
WST019 31.00 38.00 7.00 0.22 0.72 0 0.00
Hanbassa including 35.00 38.00 3.00 0.37 1.29 0 0.00
WST020
37.00 45.00 8.00 0.10 0.42 0 0.00
Hanbassa 65.00 87.00 22.00 0.17 0.66 0 0.00
119.00 129.00 10.00 0.27 0.41 0 0.00
WST021 34.00 36.00 2.00 4.19 Mugnae Andi
WST022 24.00 32.00 8.00 0.37 0.00 0 0.00
Hanbassa 40.00 74.00 34.00 0.38 0.66 0 0.00
WST023
10.00 20.00 10.00 0.11 1.20 0 0.00
Hanbassa 40.00 50.00 10.00 0.08 0.54 0 0.00
68.00 70.00 2.00 0.06 0.69 0 0.00
WST024 16.00 18.00 2.00 0.03 0.56 0 0.00 Hanbassa
WST025 No Significant Results Hanbassa
WST026
62.00 68.00 6.00 0.02 0.40 0 0.00
Hanbassa 96.00 102.00 6.00 0.05 0.61 0 0.00
136.00 138.00 2.00 0.10 0.86 0 0.00
WST027 No Significant Results Hanbassa
WST028
4.00 6.00 2.00 0.33 1.27 0 0.00
Hanbassa 40.00 48.00 8.00 0.32 0.14 0 0.00
66.00 76.00 10.00 0.62 1.74 0 0.00
WST029 52.00 58.00 6.00 0.23 0.68 0 0.00 Hanbassa
WST030 26.00 46.00 20.00 0.20 0.41 0 0.00 Hanbassa
WST031 No Significant Results Hanbassa
WST032 2.00 24.00 22.00 0.08 0.65 0 0.00 Hanbassa
WST033 No Significant Results Hanbassa
Unnamed No Significant Results Mugnae Andi
AT0001 No Significant Results Sentraley
AT0002 No Significant Results Sentraley
AT0003 12.00 16.00 4.00 0.01 0.63 0 0.00 Sentraley
ADT004 33.00 49.00 16.00 0.02 3.96 0 0.01
Da Tambuk including 41.00 45.00 4.00 0.04 14.53 1 0.02
ADT005 20 38 18 0.01 0.43 0 0.01 Da Tambuk
ADT006 No Significant Results Zager
ADT007 No Significant Results Zager
ADT008 No Significant Results Zager
ADT009 No Significant Results Sentraley
ADT010 20.00 22.00 2.00 2.70 Adi Gozomo E
ADT011 42.00 48.00 6.00 0.67 Da Tambuk
ADT012 16.00 23.00 7.00 1.80 Da Tambuk
ADT013 60.00 65.00 5.00 0.29
Da Tambuk 84.00 90.00 6.00 0.48
ADT014 0.00 8.00 8.00 0.38 Da Tambuk
ADT015 No Significant Results Da Tambuk
ADT016 No Significant Results Adi Nigisti
ADT017 50.00 52.00 2.00 0.95 Adi Nigisti
Initial prospect trench values use a 0.3 gram/tonne cut-off. Trench values may be revised to a 0.1 gram/tonne cut-off (shown in italics) if proven significant by more detailed exploration results.

AD Y A B O PR O J E C T NI 43-101 RE P O R T
May 2015 Page 69
9.5 Airborne Geophysics
A single airborne geophysical survey was performed on the Adyabo project previously by Aberdeen
International in 2007. EAM did not perform their own survey, but reinterpreted some of the data
from the 2007 survey.
Aeroquest Surveys (July 2007)
In July 2007 Aeroquest, on behalf of Aberdeen International conducted a heliborne aeromagnetic,
radiometric, and AeroTEM surveys on their EM 1 Block and EM 2 Block licences (Dudek, 2008). EM 1
Block was the original licence area currently covered by the Adyabo Project.
From August 8 to August 26 in 2007, a 492 km2 AeroTEM III (`Lima’ System) survey was flown over
the Adyabo project concessions (Figure 9-9). The Lima System is a time domain helicopter
electromagnetic system, which is employed in conjunction with a high sensitivity caesium vapour
magnetometre. Survey coverage consisted of approximately 2316.7 line-km, including 210 line-km of
tie lines. The survey was flown with a line spacing of 300 metres, an elevation of 30 m, and in a NW-
SE (125° azimuth) flight direction. The infill area of EM 1 block was flown with a line spacing of 100
metres in a similar direction (125° azimuth) to the main survey. The control (tie) lines were flown
perpendicular to the survey lines with a spacing of 3,000 metres.
Figure 9-9: Location of the 2007 Aeroquest Airborne EM Survey
Source: EAM, 2015
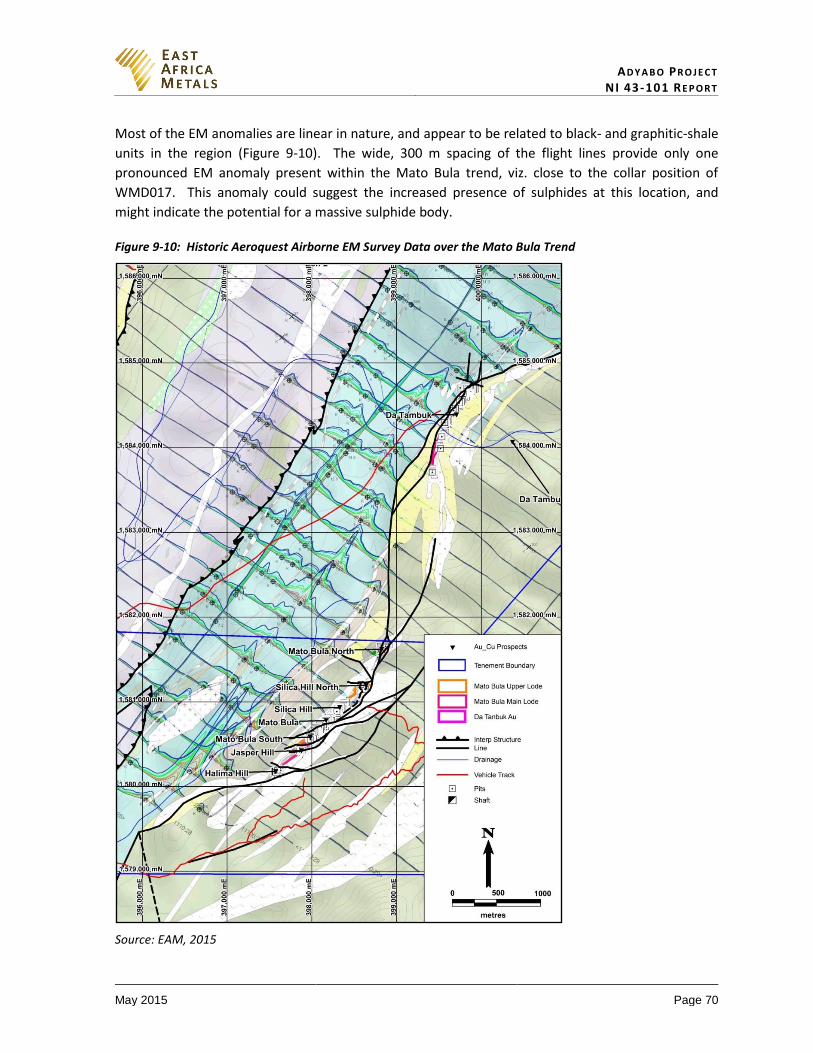
AD Y A B O PR O J E C T NI 43-101 RE P O R T
May 2015 Page 70
Most of the EM anomalies are linear in nature, and appear to be related to black- and graphitic-shale
units in the region (Figure 9-10). The wide, 300 m spacing of the flight lines provide only one
pronounced EM anomaly present within the Mato Bula trend, viz. close to the collar position of
WMD017. This anomaly could suggest the increased presence of sulphides at this location, and
might indicate the potential for a massive sulphide body.
Figure 9-10: Historic Aeroquest Airborne EM Survey Data over the Mato Bula Trend
Source: EAM, 2015

AD Y A B O PR O J E C T NI 43-101 RE P O R T
May 2015 Page 71
9.6 Petrographic Studies
Four petrographic studies have been performed on rocks collected from the Adyabo project. Five
samples were studied by University of Leicester in August 2013; three samples by Hummingbird
Geological Services in August 2014; and twenty-nine samples from Mato Bula and twenty-five
samples from Da Tambuk by Turnstone Geological Services in October and December 2014.
University of Leicester (2013)
Five samples taken from the supergene oxide zone outcrops at the Mato Bula prospect were submitted for petrographic analysis by Dr. Gawen Jenkin and his team, at University of Leicester in 2013 (Mitchinson et al., 2014). The samples were made into polished thin sections and analyzed under transmitted and reflected light. The study showed the samples were originally pyrite±chalcopyrite bearing quartz-rich schists. Sulphides were present as porphyroblasts during deformation as illustrated by quartz fringes around the voids, which are the negative pseudomorphs of these crystals. The quartz-rich nature could relate to early silicification during mineralization prior metamorphism. The presence of a few large feldspar crystals suggests that the original protolith may have been acid volcanic rocks.
Hummingbird Geological Services (2014)
Three samples from Mato Bula drillcore were submitted to Hummingbird Geological Services, in
December 2014 for petrographic analysis of polished thin sections (optical, and SEM using BSE and
EDSX techniques), XRD analysis, and three samples for whole rock geochemistry (Dalsin, 2014). The
main aim of the study was to determine the location of gold within the samples.
The samples comprised of sulphidic-quartz-muscovite schist (WMD006; 88.85 to 89.00 m), and two
samples classified as sulphidic-quartz-muscovite metasomatite (WMD004; 64.44 to 64.52 m, and
132.15 to 132.33 m). Mineralogy was relatively simple, with the sulphides composed of pyrite,
chalcopyrite, sphalerite, covellite and galena. Trace amounts of enargite, rutile, melonite, bornite
and digenite were also observed. From the EDX spectra two unidentified minerals were encountered
containing the following elements; Cu-Ag-Fe-S and Cu-Se-Ag-Te-S. No gold or electrum was observed
during petrographic or SEM analyzes.
X-ray diffraction (XRD) analysis was used as a preliminary survey of the overall mineralogy of the samples. The results showed the presence of quartz, chalcopyrite, pyrite, sphalerite, bornite, muscovite, and dolomite in all of the samples. Chlorite, calcite, enargite, and langite (Cu4(SO4)(OH)6·2H2O) were also identified in some of the other samples.
Ultimately the study failed in its main aim of determining the location of gold, and probably reflects the nuggety distribution of gold in the samples.
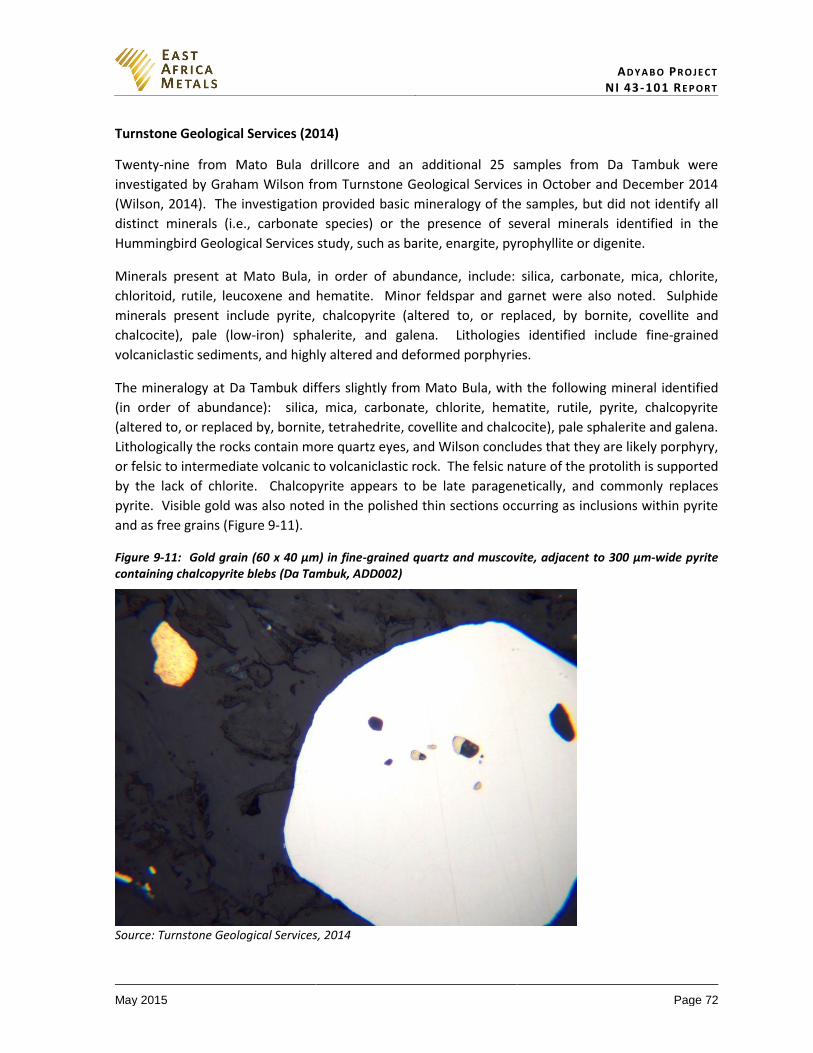
AD Y A B O PR O J E C T NI 43-101 RE P O R T
May 2015 Page 72
Turnstone Geological Services (2014)
Twenty-nine from Mato Bula drillcore and an additional 25 samples from Da Tambuk were
investigated by Graham Wilson from Turnstone Geological Services in October and December 2014
(Wilson, 2014). The investigation provided basic mineralogy of the samples, but did not identify all
distinct minerals (i.e., carbonate species) or the presence of several minerals identified in the
Hummingbird Geological Services study, such as barite, enargite, pyrophyllite or digenite.
Minerals present at Mato Bula, in order of abundance, include: silica, carbonate, mica, chlorite,
chloritoid, rutile, leucoxene and hematite. Minor feldspar and garnet were also noted. Sulphide
minerals present include pyrite, chalcopyrite (altered to, or replaced, by bornite, covellite and
chalcocite), pale (low-iron) sphalerite, and galena. Lithologies identified include fine-grained
volcaniclastic sediments, and highly altered and deformed porphyries.
The mineralogy at Da Tambuk differs slightly from Mato Bula, with the following mineral identified
(in order of abundance): silica, mica, carbonate, chlorite, hematite, rutile, pyrite, chalcopyrite
(altered to, or replaced by, bornite, tetrahedrite, covellite and chalcocite), pale sphalerite and galena.
Lithologically the rocks contain more quartz eyes, and Wilson concludes that they are likely porphyry,
or felsic to intermediate volcanic to volcaniclastic rock. The felsic nature of the protolith is supported
by the lack of chlorite. Chalcopyrite appears to be late paragenetically, and commonly replaces
pyrite. Visible gold was also noted in the polished thin sections occurring as inclusions within pyrite
and as free grains (Figure 9-11).
Figure 9-11: Gold grain (60 x 40 μm) in fine-grained quartz and muscovite, adjacent to 300 μm-wide pyrite containing chalcopyrite blebs (Da Tambuk, ADD002)
Source: Turnstone Geological Services, 2014
AD Y A B O PR O J E C T NI 43-101 RE P O R T
May 2015 Page 73
9.7 Remote Sensing
In 2014 Geoeye colour satellite imagery was purchased from, and interpreted by, East View
Geospatial Inc. The 50 km2 0.46 cm resolution image was used to generate 1 m topographic
contours. The image and contour files are used as base maps during field exploration.
9.8 Qualified Person’s Comments on Section 9
Generally the soil, XRF and stream sediment geochemical samples are collected exactly at the
location on a predetermined sampling grid, thus reducing sampling bias. However, the locations can
be varied slightly at the discretion of the sampler if it is in a dangerous location, or no material (e.g.,
soil) is present at the precise location. Lithogeochemical prospecting “grab” samples are, by their
nature, inherently biased towards higher grades in an effort to locate mineralization that can be
evaluated by more representative sampling, such as trenching or ultimately drilling.
Lithogeochemical channel samples were collected as uniformly as possible, but sampling bias due to
physical properties of the rock (e.g., hardness and competency) might result in assay variation.
Geochemical samples (soil, XRF, stream sediment, and lithogeochemical) collected during exploration
are considered to be representative for the styles of mineralization present on the Adyabo project
area. All exploration techniques utilized are appropriate, and industry best practices have been
followed.
AD Y A B O PR O J E C T NI 43-101 RE P O R T
May 2015 Page 74
10 DRILLING
10.1 General
Drilling commenced on the Adyabo project on April 3, 2013 with the drilling of WMD001 at the Mato
Bula North prospect. Since then a total of 35 diamond drillholes have been completed at Mato Bula,
6 diamond drillholes at Mato Bula North (Malachite Hill), 12 diamond drillholes at Da Tambuk, 3
drillholes at Hanbassa, 2 drillholes at Mugnae Andi, and 1 drillhole at Adi Gozomo. No reverse
circulation (RC) work has been conducted, and no other drilling has been performed on the other
prospects within the Adyabo project area. A summary of the drilling is tabulated in Table 10.1.
Table 10-1: Summary of Drilling on the Adyabo Project
Year Prospect Diamond
Holes Metres
2013
Mato Bula 5 888.64
Mato Bula North 1 74.68
Da Tambuk 4 514.24
Adi Gozomo 1 80.77
2014
Mato Bula 26 6,451.56
Mato Bula North 3 609.60
Da Tambuk 7 1,434.29
Hanbassa 3 463.04
2015
Mato Bula 4 775.20
Mato Bula North 2 293.43
Da Tambuk 1 225.55
Mungae Andi 2 293.43
Total 59 12,104.43
10.2 Diamond Drilling
All diamond drilling at the property was conducted by Kluane Drilling Limited (Yukon, Canada) using a
custom-built, man-portable, KD600 unit (due to the poor accessibility to the drillsite) to drill
HTW/NTW diametre holes. Drilling started on the Mato Bula prospect on April 6th 2013 and
terminated on January 29th 2015 with 35 diamond holes drilled for a length of 8,115.40 m. At Mato
Bula North drilling started on April 3rd 2013 and terminated on February 6th 2015 with 6 diamond
holes drilled for a length of 977.71 m, while at Da Tambuk 12 diamond drillholes were completed for
a length of 2,174.55 m. Da Tambuk drilling was performed in four distinct periods: November-
December in 2013; June 2014; November-December 2014; and March 2015. The three holes,
totalling 463.04 m, drilled at Hanbassa were all drilled in September 2014, and two holes totalling
293.43 m were drilled at Mungae Andi in March 2015. The single 80.77 m long diamond drillhole at
Adi Gozomo was drilled in March 2013. A summary of the collar locations for the drilling at Da
Tambuk is presented in Table 10.2, and Mato Bula and Mato Bula North is presented in Table 10.3.
All drilling collar locations were accurately surveyed in using a Trimble® differential GPS system,
where drilling pads were cleared and built up. All holes were completed with a 80 m or 40 m grid
spacing, and were drilled with azimuths of either 315° or 135° (Mato Bula and Mato Bula North), or
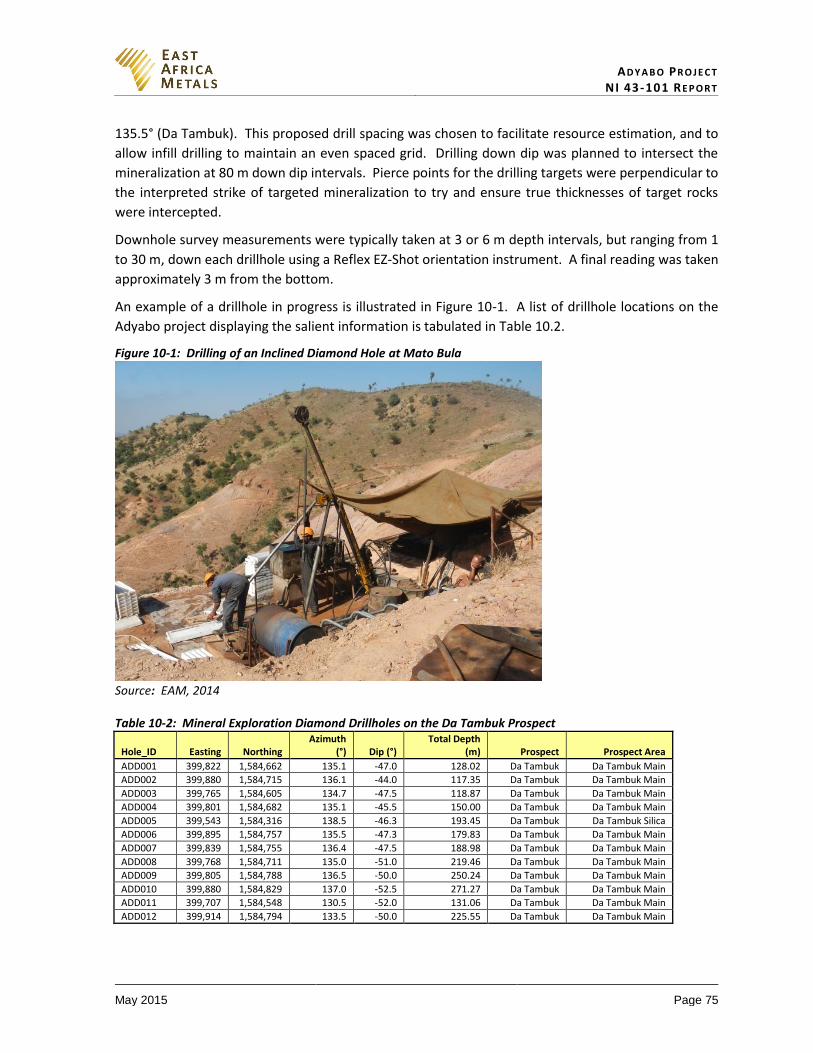
AD Y A B O PR O J E C T NI 43-101 RE P O R T
May 2015 Page 75
135.5° (Da Tambuk). This proposed drill spacing was chosen to facilitate resource estimation, and to
allow infill drilling to maintain an even spaced grid. Drilling down dip was planned to intersect the
mineralization at 80 m down dip intervals. Pierce points for the drilling targets were perpendicular to
the interpreted strike of targeted mineralization to try and ensure true thicknesses of target rocks
were intercepted.
Downhole survey measurements were typically taken at 3 or 6 m depth intervals, but ranging from 1
to 30 m, down each drillhole using a Reflex EZ-Shot orientation instrument. A final reading was taken
approximately 3 m from the bottom.
An example of a drillhole in progress is illustrated in Figure 10-1. A list of drillhole locations on the
Adyabo project displaying the salient information is tabulated in Table 10.2.
Figure 10-1: Drilling of an Inclined Diamond Hole at Mato Bula
Source: EAM, 2014 Table 10-2: Mineral Exploration Diamond Drillholes on the Da Tambuk Prospect
Hole_ID Easting Northing Azimuth
(°) Dip (°) Total Depth
(m) Prospect Prospect Area
ADD001 399,822 1,584,662 135.1 -47.0 128.02 Da Tambuk Da Tambuk Main
ADD002 399,880 1,584,715 136.1 -44.0 117.35 Da Tambuk Da Tambuk Main
ADD003 399,765 1,584,605 134.7 -47.5 118.87 Da Tambuk Da Tambuk Main
ADD004 399,801 1,584,682 135.1 -45.5 150.00 Da Tambuk Da Tambuk Main
ADD005 399,543 1,584,316 138.5 -46.3 193.45 Da Tambuk Da Tambuk Silica
ADD006 399,895 1,584,757 135.5 -47.3 179.83 Da Tambuk Da Tambuk Main
ADD007 399,839 1,584,755 136.4 -47.5 188.98 Da Tambuk Da Tambuk Main
ADD008 399,768 1,584,711 135.0 -51.0 219.46 Da Tambuk Da Tambuk Main
ADD009 399,805 1,584,788 136.5 -50.0 250.24 Da Tambuk Da Tambuk Main
ADD010 399,880 1,584,829 137.0 -52.5 271.27 Da Tambuk Da Tambuk Main
ADD011 399,707 1,584,548 130.5 -52.0 131.06 Da Tambuk Da Tambuk Main
ADD012 399,914 1,584,794 133.5 -50.0 225.55 Da Tambuk Da Tambuk Main
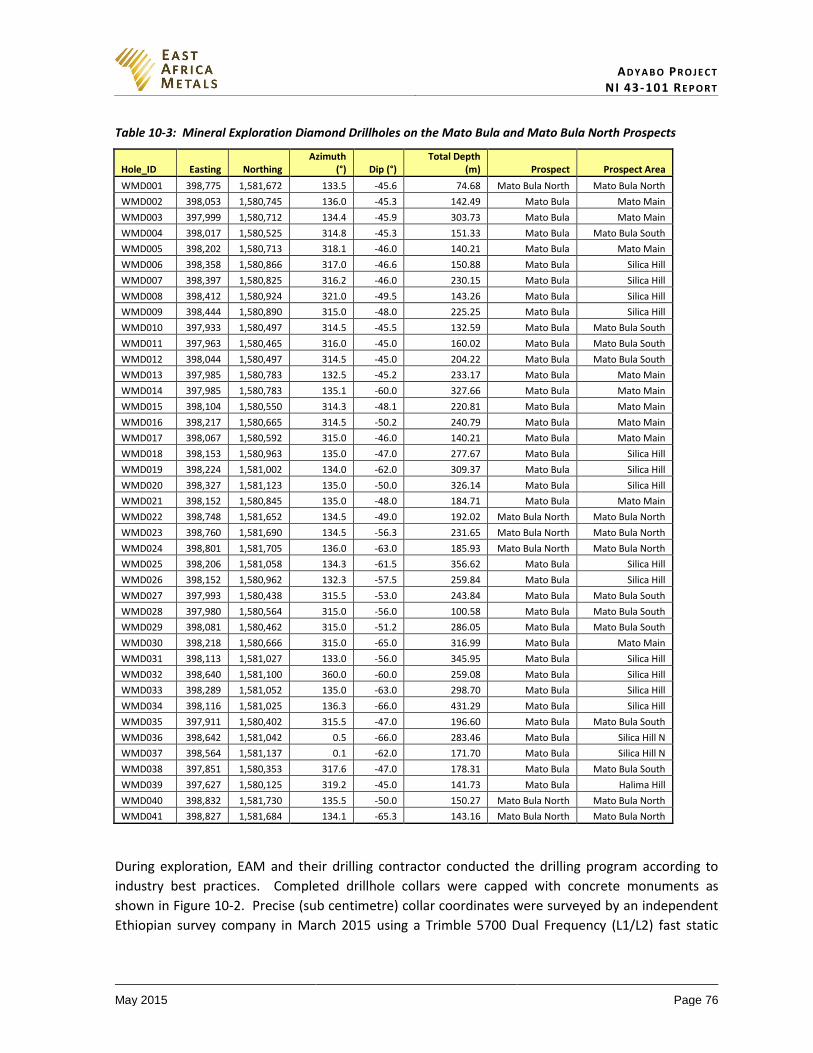
AD Y A B O PR O J E C T NI 43-101 RE P O R T
May 2015 Page 76
Table 10-3: Mineral Exploration Diamond Drillholes on the Mato Bula and Mato Bula North Prospects
Hole_ID Easting Northing Azimuth
(°) Dip (°) Total Depth
(m) Prospect Prospect Area
WMD001 398,775 1,581,672 133.5 -45.6 74.68 Mato Bula North Mato Bula North
WMD002 398,053 1,580,745 136.0 -45.3 142.49 Mato Bula Mato Main
WMD003 397,999 1,580,712 134.4 -45.9 303.73 Mato Bula Mato Main
WMD004 398,017 1,580,525 314.8 -45.3 151.33 Mato Bula Mato Bula South
WMD005 398,202 1,580,713 318.1 -46.0 140.21 Mato Bula Mato Main
WMD006 398,358 1,580,866 317.0 -46.6 150.88 Mato Bula Silica Hill
WMD007 398,397 1,580,825 316.2 -46.0 230.15 Mato Bula Silica Hill
WMD008 398,412 1,580,924 321.0 -49.5 143.26 Mato Bula Silica Hill
WMD009 398,444 1,580,890 315.0 -48.0 225.25 Mato Bula Silica Hill
WMD010 397,933 1,580,497 314.5 -45.5 132.59 Mato Bula Mato Bula South
WMD011 397,963 1,580,465 316.0 -45.0 160.02 Mato Bula Mato Bula South
WMD012 398,044 1,580,497 314.5 -45.0 204.22 Mato Bula Mato Bula South
WMD013 397,985 1,580,783 132.5 -45.2 233.17 Mato Bula Mato Main
WMD014 397,985 1,580,783 135.1 -60.0 327.66 Mato Bula Mato Main
WMD015 398,104 1,580,550 314.3 -48.1 220.81 Mato Bula Mato Main
WMD016 398,217 1,580,665 314.5 -50.2 240.79 Mato Bula Mato Main
WMD017 398,067 1,580,592 315.0 -46.0 140.21 Mato Bula Mato Main
WMD018 398,153 1,580,963 135.0 -47.0 277.67 Mato Bula Silica Hill
WMD019 398,224 1,581,002 134.0 -62.0 309.37 Mato Bula Silica Hill
WMD020 398,327 1,581,123 135.0 -50.0 326.14 Mato Bula Silica Hill
WMD021 398,152 1,580,845 135.0 -48.0 184.71 Mato Bula Mato Main
WMD022 398,748 1,581,652 134.5 -49.0 192.02 Mato Bula North Mato Bula North
WMD023 398,760 1,581,690 134.5 -56.3 231.65 Mato Bula North Mato Bula North
WMD024 398,801 1,581,705 136.0 -63.0 185.93 Mato Bula North Mato Bula North
WMD025 398,206 1,581,058 134.3 -61.5 356.62 Mato Bula Silica Hill
WMD026 398,152 1,580,962 132.3 -57.5 259.84 Mato Bula Silica Hill
WMD027 397,993 1,580,438 315.5 -53.0 243.84 Mato Bula Mato Bula South
WMD028 397,980 1,580,564 315.0 -56.0 100.58 Mato Bula Mato Bula South
WMD029 398,081 1,580,462 315.0 -51.2 286.05 Mato Bula Mato Bula South
WMD030 398,218 1,580,666 315.0 -65.0 316.99 Mato Bula Mato Main
WMD031 398,113 1,581,027 133.0 -56.0 345.95 Mato Bula Silica Hill
WMD032 398,640 1,581,100 360.0 -60.0 259.08 Mato Bula Silica Hill
WMD033 398,289 1,581,052 135.0 -63.0 298.70 Mato Bula Silica Hill
WMD034 398,116 1,581,025 136.3 -66.0 431.29 Mato Bula Silica Hill
WMD035 397,911 1,580,402 315.5 -47.0 196.60 Mato Bula Mato Bula South
WMD036 398,642 1,581,042 0.5 -66.0 283.46 Mato Bula Silica Hill N
WMD037 398,564 1,581,137 0.1 -62.0 171.70 Mato Bula Silica Hill N
WMD038 397,851 1,580,353 317.6 -47.0 178.31 Mato Bula Mato Bula South
WMD039 397,627 1,580,125 319.2 -45.0 141.73 Mato Bula Halima Hill
WMD040 398,832 1,581,730 135.5 -50.0 150.27 Mato Bula North Mato Bula North
WMD041 398,827 1,581,684 134.1 -65.3 143.16 Mato Bula North Mato Bula North
During exploration, EAM and their drilling contractor conducted the drilling program according to
industry best practices. Completed drillhole collars were capped with concrete monuments as
shown in Figure 10-2. Precise (sub centimetre) collar coordinates were surveyed by an independent
Ethiopian survey company in March 2015 using a Trimble 5700 Dual Frequency (L1/L2) fast static
AD Y A B O PR O J E C T NI 43-101 RE P O R T
May 2015 Page 77
DGPS with a base station and rover. A downhole spear was employed to facilitate core orientation
studies. Core orientation information was taken at approximately 6 m intervals to determine the
orientation of mineralization and structures (e.g., foliation) within the rock. All holes were capped
upon completion, with the collar points surveyed and denoted by cement markers. All drill sites
remain generally intact in case additional drilling is necessary from each pad. Once the drilling
program is completed it is anticipated that all pads will be remediated, similar to other projects EAM
has conducted in the area.
Figure 10-2: Cement Marker Denoting the Location of Drillhole Collars
Source: Archibald et al., 2015
Drillcore recoveries for the project were excellent (averaging 96.4% for all 31 resources holes, 86.3%
for the top 30 m, and 97.8% for depths greater than 30 m), and the samples collected were
representative of the observed mineralization. Determining the exact true thickness from individual
drillholes is difficult, but generally drillhole intercepts represent approximately 60% of the true
thickness.
10.3 Mato Bula
At Mato Bula, 35 diamond drillholes on 15 sections were generally drilled with 80 m spacing between
sections, at 40 m spacing in the central part of the prospect. A plan of all of the drillholes on this
prospect is presented in Figure 10-3. Drilling was undertaken to define gold-copper mineralization
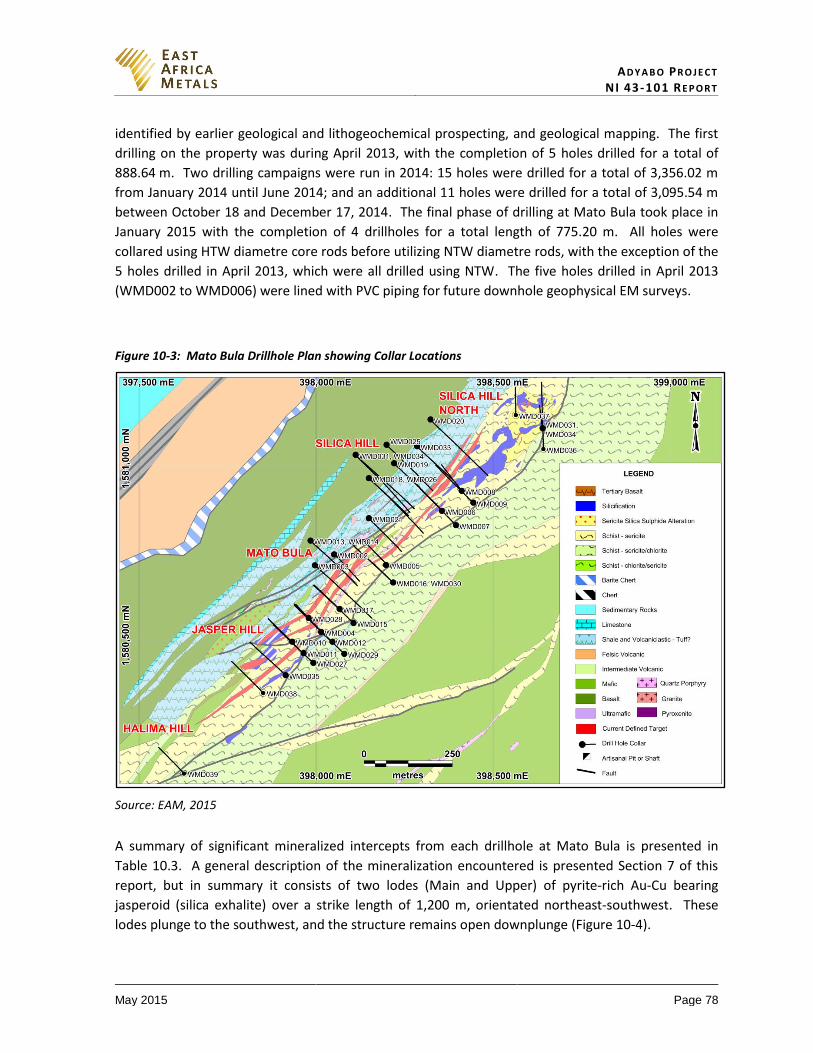
AD Y A B O PR O J E C T NI 43-101 RE P O R T
May 2015 Page 78
identified by earlier geological and lithogeochemical prospecting, and geological mapping. The first
drilling on the property was during April 2013, with the completion of 5 holes drilled for a total of
888.64 m. Two drilling campaigns were run in 2014: 15 holes were drilled for a total of 3,356.02 m
from January 2014 until June 2014; and an additional 11 holes were drilled for a total of 3,095.54 m
between October 18 and December 17, 2014. The final phase of drilling at Mato Bula took place in
January 2015 with the completion of 4 drillholes for a total length of 775.20 m. All holes were
collared using HTW diametre core rods before utilizing NTW diametre rods, with the exception of the
5 holes drilled in April 2013, which were all drilled using NTW. The five holes drilled in April 2013
(WMD002 to WMD006) were lined with PVC piping for future downhole geophysical EM surveys.
Figure 10-3: Mato Bula Drillhole Plan showing Collar Locations
Source: EAM, 2015
A summary of significant mineralized intercepts from each drillhole at Mato Bula is presented in
Table 10.3. A general description of the mineralization encountered is presented Section 7 of this
report, but in summary it consists of two lodes (Main and Upper) of pyrite-rich Au-Cu bearing
jasperoid (silica exhalite) over a strike length of 1,200 m, orientated northeast-southwest. These
lodes plunge to the southwest, and the structure remains open downplunge (Figure 10-4).
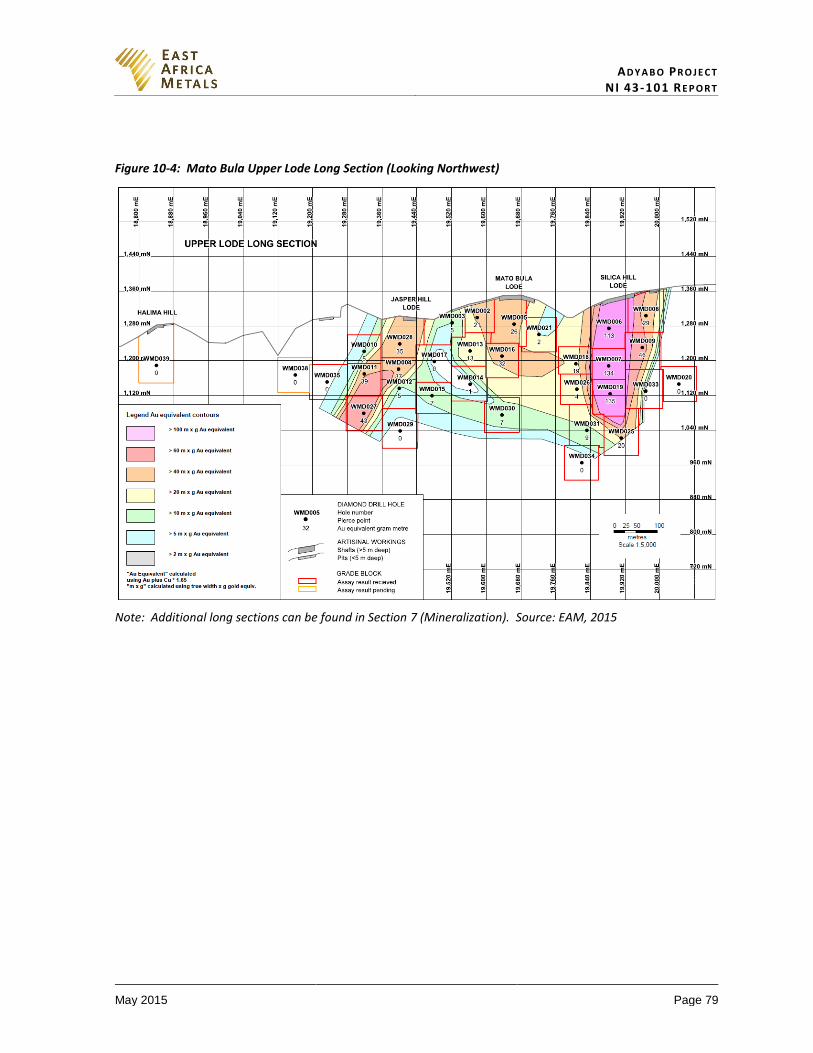
AD Y A B O PR O J E C T NI 43-101 RE P O R T
May 2015 Page 79
Figure 10-4: Mato Bula Upper Lode Long Section (Looking Northwest)
Note: Additional long sections can be found in Section 7 (Mineralization). Source: EAM, 2015
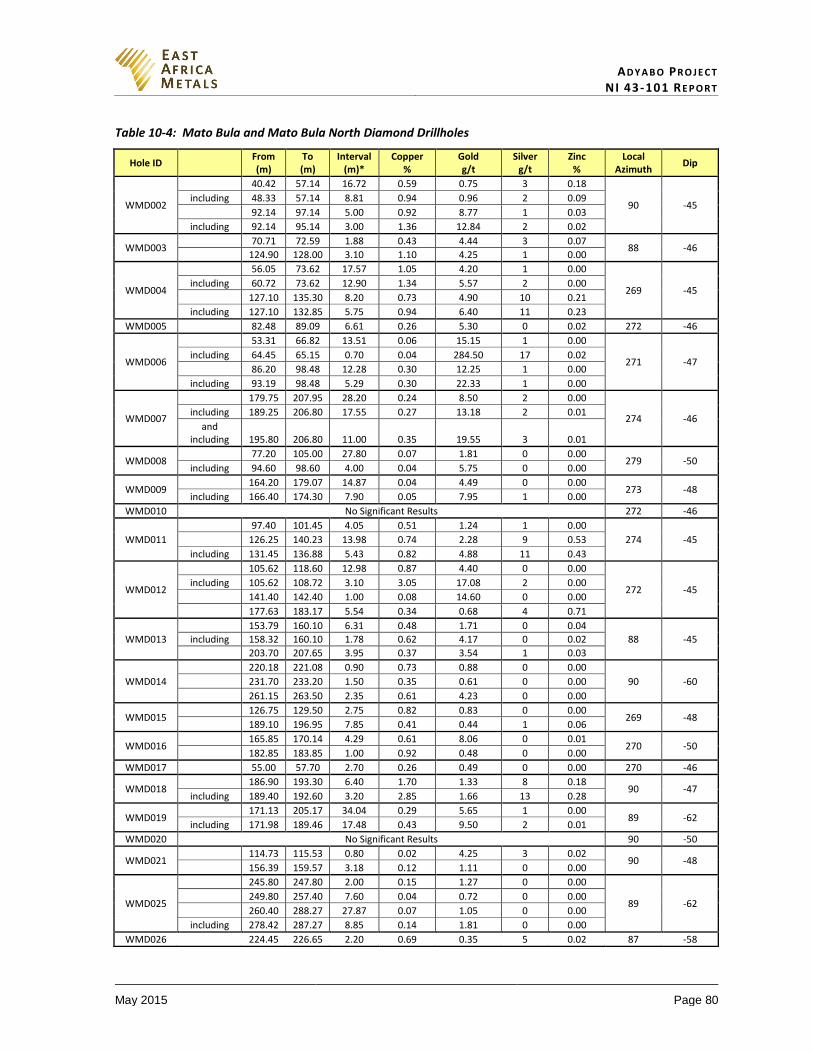
AD Y A B O PR O J E C T NI 43-101 RE P O R T
May 2015 Page 80
Table 10-4: Mato Bula and Mato Bula North Diamond Drillholes
Hole ID From (m)
To (m)
Interval (m)*
Copper %
Gold g/t
Silver g/t
Zinc %
Local Azimuth
Dip
WMD002
40.42 57.14 16.72 0.59 0.75 3 0.18
90 -45 including 48.33 57.14 8.81 0.94 0.96 2 0.09
92.14 97.14 5.00 0.92 8.77 1 0.03
including 92.14 95.14 3.00 1.36 12.84 2 0.02
WMD003 70.71 72.59 1.88 0.43 4.44 3 0.07
88 -46 124.90 128.00 3.10 1.10 4.25 1 0.00
WMD004
56.05 73.62 17.57 1.05 4.20 1 0.00
269 -45 including 60.72 73.62 12.90 1.34 5.57 2 0.00
127.10 135.30 8.20 0.73 4.90 10 0.21
including 127.10 132.85 5.75 0.94 6.40 11 0.23
WMD005 82.48 89.09 6.61 0.26 5.30 0 0.02 272 -46
WMD006
53.31 66.82 13.51 0.06 15.15 1 0.00
271 -47 including 64.45 65.15 0.70 0.04 284.50 17 0.02
86.20 98.48 12.28 0.30 12.25 1 0.00
including 93.19 98.48 5.29 0.30 22.33 1 0.00
WMD007
179.75 207.95 28.20 0.24 8.50 2 0.00
274 -46 including 189.25 206.80 17.55 0.27 13.18 2 0.01
and including 195.80 206.80 11.00 0.35 19.55 3 0.01
WMD008 77.20 105.00 27.80 0.07 1.81 0 0.00
279 -50 including 94.60 98.60 4.00 0.04 5.75 0 0.00
WMD009 164.20 179.07 14.87 0.04 4.49 0 0.00
273 -48 including 166.40 174.30 7.90 0.05 7.95 1 0.00
WMD010 No Significant Results 272 -46
WMD011
97.40 101.45 4.05 0.51 1.24 1 0.00
274 -45 126.25 140.23 13.98 0.74 2.28 9 0.53
including 131.45 136.88 5.43 0.82 4.88 11 0.43
WMD012
105.62 118.60 12.98 0.87 4.40 0 0.00
272 -45 including 105.62 108.72 3.10 3.05 17.08 2 0.00
141.40 142.40 1.00 0.08 14.60 0 0.00
177.63 183.17 5.54 0.34 0.68 4 0.71
WMD013
153.79 160.10 6.31 0.48 1.71 0 0.04
88 -45 including 158.32 160.10 1.78 0.62 4.17 0 0.02
203.70 207.65 3.95 0.37 3.54 1 0.03
WMD014
220.18 221.08 0.90 0.73 0.88 0 0.00
90 -60 231.70 233.20 1.50 0.35 0.61 0 0.00
261.15 263.50 2.35 0.61 4.23 0 0.00
WMD015 126.75 129.50 2.75 0.82 0.83 0 0.00
269 -48 189.10 196.95 7.85 0.41 0.44 1 0.06
WMD016 165.85 170.14 4.29 0.61 8.06 0 0.01
270 -50 182.85 183.85 1.00 0.92 0.48 0 0.00
WMD017 55.00 57.70 2.70 0.26 0.49 0 0.00 270 -46
WMD018 186.90 193.30 6.40 1.70 1.33 8 0.18
90 -47 including 189.40 192.60 3.20 2.85 1.66 13 0.28
WMD019 171.13 205.17 34.04 0.29 5.65 1 0.00
89 -62 including 171.98 189.46 17.48 0.43 9.50 2 0.01
WMD020 No Significant Results 90 -50
WMD021 114.73 115.53 0.80 0.02 4.25 3 0.02
90 -48 156.39 159.57 3.18 0.12 1.11 0 0.00
WMD025
245.80 247.80 2.00 0.15 1.27 0 0.00
89 -62 249.80 257.40 7.60 0.04 0.72 0 0.00
260.40 288.27 27.87 0.07 1.05 0 0.00
including 278.42 287.27 8.85 0.14 1.81 0 0.00
WMD026 224.45 226.65 2.20 0.69 0.35 5 0.02 87 -58
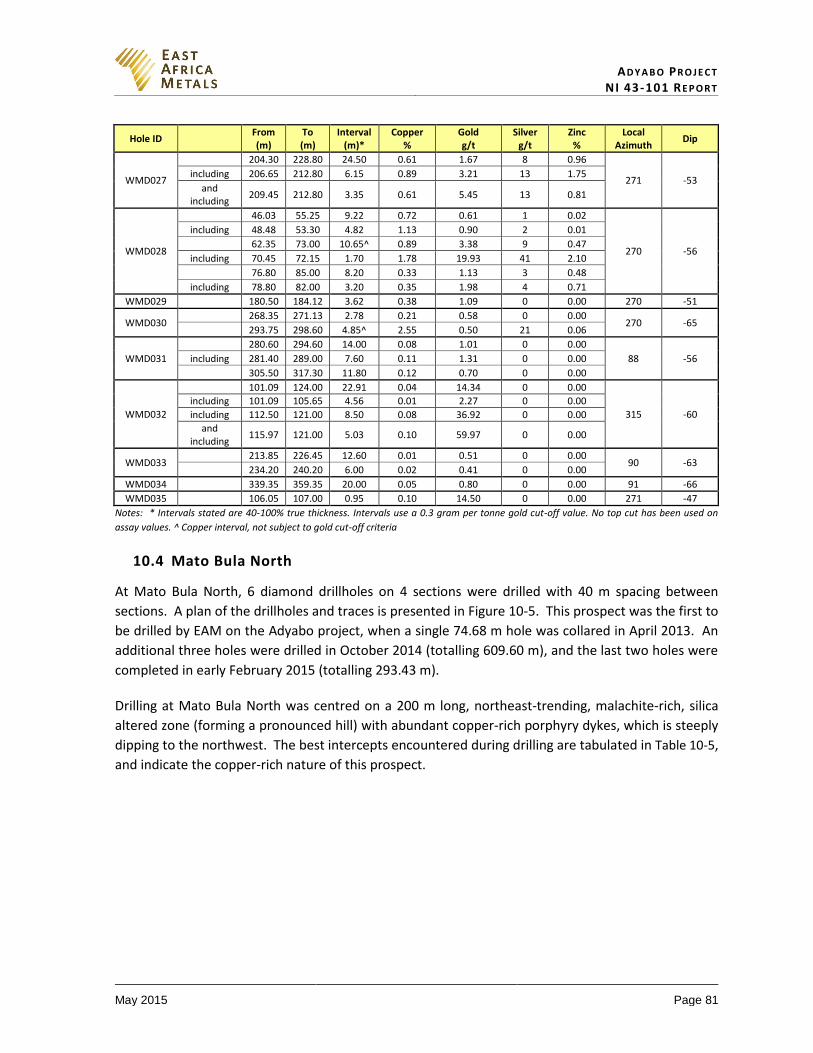
AD Y A B O PR O J E C T NI 43-101 RE P O R T
May 2015 Page 81
Hole ID From (m)
To (m)
Interval (m)*
Copper %
Gold g/t
Silver g/t
Zinc %
Local Azimuth
Dip
WMD027
204.30 228.80 24.50 0.61 1.67 8 0.96
271 -53 including 206.65 212.80 6.15 0.89 3.21 13 1.75
and including
209.45 212.80 3.35 0.61 5.45 13 0.81
WMD028
46.03 55.25 9.22 0.72 0.61 1 0.02
270 -56
including 48.48 53.30 4.82 1.13 0.90 2 0.01
62.35 73.00 10.65^ 0.89 3.38 9 0.47
including 70.45 72.15 1.70 1.78 19.93 41 2.10
76.80 85.00 8.20 0.33 1.13 3 0.48
including 78.80 82.00 3.20 0.35 1.98 4 0.71
WMD029 180.50 184.12 3.62 0.38 1.09 0 0.00 270 -51
WMD030 268.35 271.13 2.78 0.21 0.58 0 0.00
270 -65 293.75 298.60 4.85^ 2.55 0.50 21 0.06
WMD031
280.60 294.60 14.00 0.08 1.01 0 0.00
88 -56 including 281.40 289.00 7.60 0.11 1.31 0 0.00
305.50 317.30 11.80 0.12 0.70 0 0.00
WMD032
101.09 124.00 22.91 0.04 14.34 0 0.00
315 -60
including 101.09 105.65 4.56 0.01 2.27 0 0.00
including 112.50 121.00 8.50 0.08 36.92 0 0.00
and including
115.97 121.00 5.03 0.10 59.97 0 0.00
WMD033 213.85 226.45 12.60 0.01 0.51 0 0.00
90 -63 234.20 240.20 6.00 0.02 0.41 0 0.00
WMD034 339.35 359.35 20.00 0.05 0.80 0 0.00 91 -66
WMD035 106.05 107.00 0.95 0.10 14.50 0 0.00 271 -47
Notes: * Intervals stated are 40-100% true thickness. Intervals use a 0.3 gram per tonne gold cut-off value. No top cut has been used on
assay values. ^ Copper interval, not subject to gold cut-off criteria
10.4 Mato Bula North
At Mato Bula North, 6 diamond drillholes on 4 sections were drilled with 40 m spacing between
sections. A plan of the drillholes and traces is presented in Figure 10-5. This prospect was the first to
be drilled by EAM on the Adyabo project, when a single 74.68 m hole was collared in April 2013. An
additional three holes were drilled in October 2014 (totalling 609.60 m), and the last two holes were
completed in early February 2015 (totalling 293.43 m).
Drilling at Mato Bula North was centred on a 200 m long, northeast-trending, malachite-rich, silica
altered zone (forming a pronounced hill) with abundant copper-rich porphyry dykes, which is steeply
dipping to the northwest. The best intercepts encountered during drilling are tabulated in Table 10-5,
and indicate the copper-rich nature of this prospect.
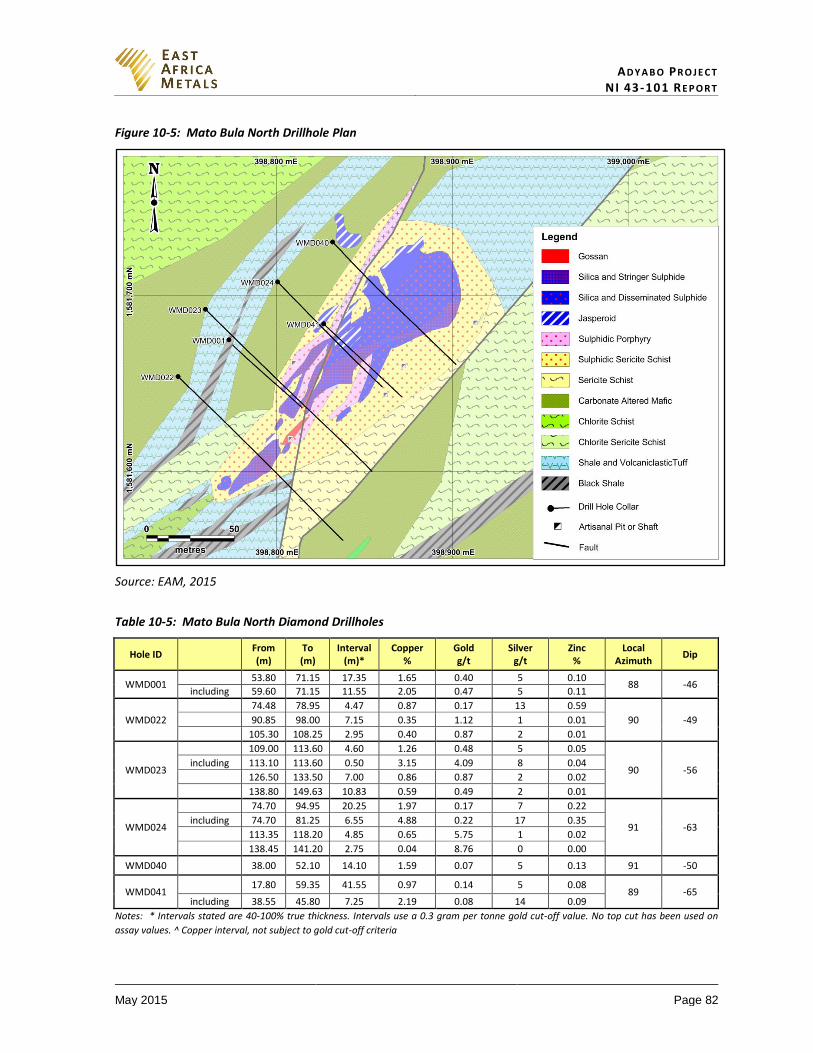
AD Y A B O PR O J E C T NI 43-101 RE P O R T
May 2015 Page 82
Figure 10-5: Mato Bula North Drillhole Plan
Source: EAM, 2015
Table 10-5: Mato Bula North Diamond Drillholes
Hole ID From (m)
To (m)
Interval (m)*
Copper %
Gold g/t
Silver g/t
Zinc %
Local Azimuth
Dip
WMD001 53.80 71.15 17.35 1.65 0.40 5 0.10
88 -46 including 59.60 71.15 11.55 2.05 0.47 5 0.11
WMD022
74.48 78.95 4.47 0.87 0.17 13 0.59
90 -49 90.85 98.00 7.15 0.35 1.12 1 0.01
105.30 108.25 2.95 0.40 0.87 2 0.01
WMD023
109.00 113.60 4.60 1.26 0.48 5 0.05
90 -56 including 113.10 113.60 0.50 3.15 4.09 8 0.04
126.50 133.50 7.00 0.86 0.87 2 0.02
138.80 149.63 10.83 0.59 0.49 2 0.01
WMD024
74.70 94.95 20.25 1.97 0.17 7 0.22
91 -63 including 74.70 81.25 6.55 4.88 0.22 17 0.35
113.35 118.20 4.85 0.65 5.75 1 0.02
138.45 141.20 2.75 0.04 8.76 0 0.00
WMD040 38.00 52.10 14.10 1.59 0.07 5 0.13 91 -50
WMD041 17.80 59.35 41.55 0.97 0.14 5 0.08
89 -65 including 38.55 45.80 7.25 2.19 0.08 14 0.09
Notes: * Intervals stated are 40-100% true thickness. Intervals use a 0.3 gram per tonne gold cut-off value. No top cut has been used on
assay values. ^ Copper interval, not subject to gold cut-off criteria
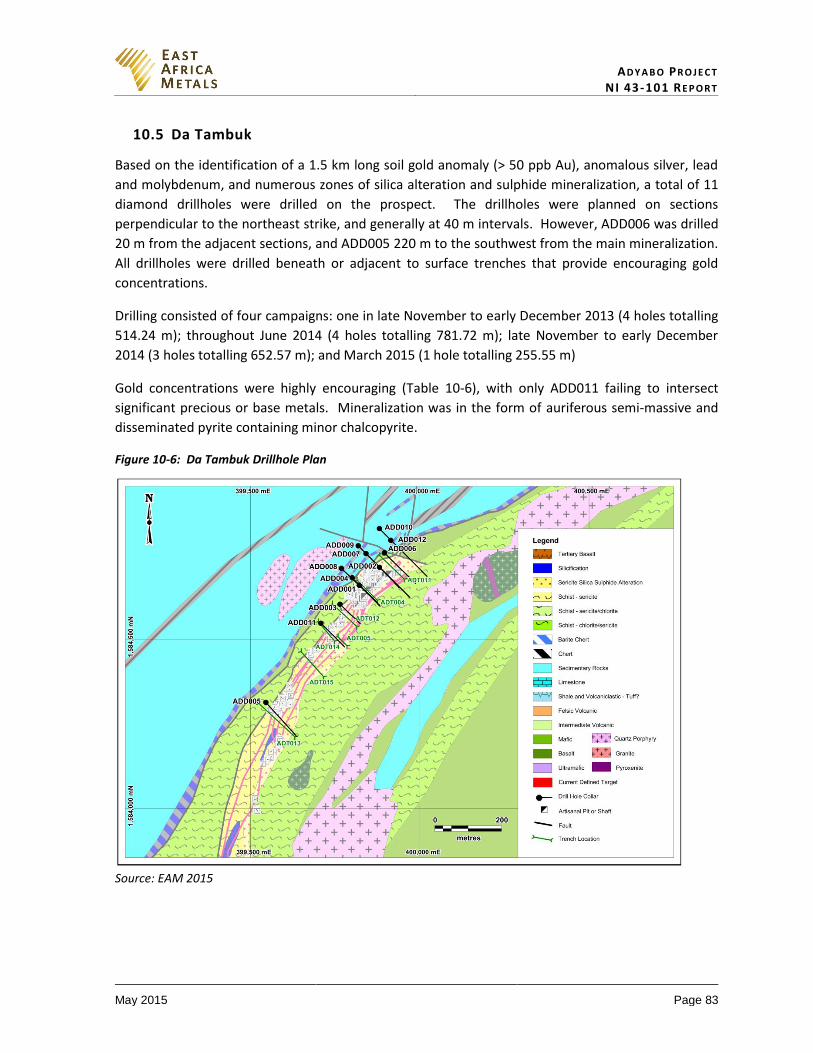
AD Y A B O PR O J E C T NI 43-101 RE P O R T
May 2015 Page 83
10.5 Da Tambuk
Based on the identification of a 1.5 km long soil gold anomaly (> 50 ppb Au), anomalous silver, lead
and molybdenum, and numerous zones of silica alteration and sulphide mineralization, a total of 11
diamond drillholes were drilled on the prospect. The drillholes were planned on sections
perpendicular to the northeast strike, and generally at 40 m intervals. However, ADD006 was drilled
20 m from the adjacent sections, and ADD005 220 m to the southwest from the main mineralization.
All drillholes were drilled beneath or adjacent to surface trenches that provide encouraging gold
concentrations.
Drilling consisted of four campaigns: one in late November to early December 2013 (4 holes totalling
514.24 m); throughout June 2014 (4 holes totalling 781.72 m); late November to early December
2014 (3 holes totalling 652.57 m); and March 2015 (1 hole totalling 255.55 m)
Gold concentrations were highly encouraging (Table 10-6), with only ADD011 failing to intersect
significant precious or base metals. Mineralization was in the form of auriferous semi-massive and
disseminated pyrite containing minor chalcopyrite.
Figure 10-6: Da Tambuk Drillhole Plan
Source: EAM 2015
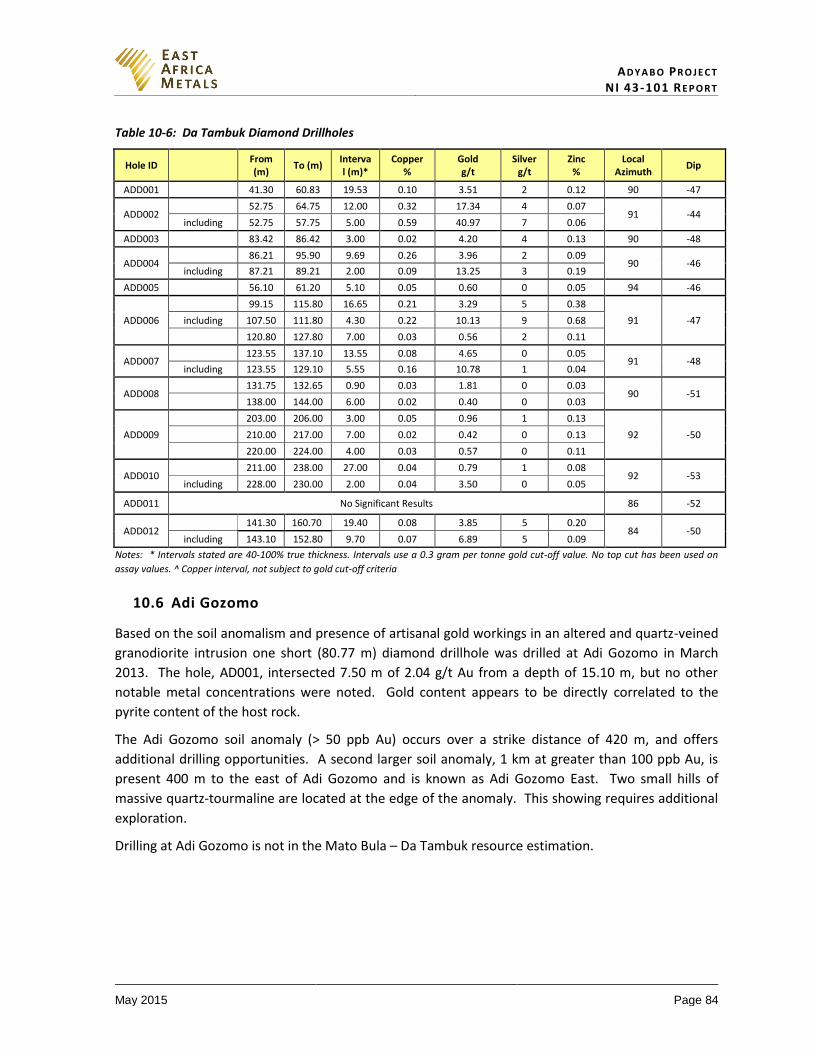
AD Y A B O PR O J E C T NI 43-101 RE P O R T
May 2015 Page 84
Table 10-6: Da Tambuk Diamond Drillholes
Hole ID From (m)
To (m) Interval (m)*
Copper %
Gold g/t
Silver g/t
Zinc %
Local Azimuth
Dip
ADD001
41.30 60.83 19.53 0.10 3.51 2 0.12 90 -47
ADD002 52.75 64.75 12.00 0.32 17.34 4 0.07
91 -44 including 52.75 57.75 5.00 0.59 40.97 7 0.06
ADD003
83.42 86.42 3.00 0.02 4.20 4 0.13 90 -48
ADD004 86.21 95.90 9.69 0.26 3.96 2 0.09
90 -46 including 87.21 89.21 2.00 0.09 13.25 3 0.19
ADD005
56.10 61.20 5.10 0.05 0.60 0 0.05 94 -46
ADD006
99.15 115.80 16.65 0.21 3.29 5 0.38
91 -47 including 107.50 111.80 4.30 0.22 10.13 9 0.68
120.80 127.80 7.00 0.03 0.56 2 0.11
ADD007 123.55 137.10 13.55 0.08 4.65 0 0.05
91 -48 including 123.55 129.10 5.55 0.16 10.78 1 0.04
ADD008 131.75 132.65 0.90 0.03 1.81 0 0.03
90 -51
138.00 144.00 6.00 0.02 0.40 0 0.03
ADD009
203.00 206.00 3.00 0.05 0.96 1 0.13
92 -50
210.00 217.00 7.00 0.02 0.42 0 0.13
220.00 224.00 4.00 0.03 0.57 0 0.11
ADD010 211.00 238.00 27.00 0.04 0.79 1 0.08
92 -53 including 228.00 230.00 2.00 0.04 3.50 0 0.05
ADD011 No Significant Results 86 -52
ADD012 141.30 160.70 19.40 0.08 3.85 5 0.20
84 -50 including 143.10 152.80 9.70 0.07 6.89 5 0.09
Notes: * Intervals stated are 40-100% true thickness. Intervals use a 0.3 gram per tonne gold cut-off value. No top cut has been used on
assay values. ^ Copper interval, not subject to gold cut-off criteria
10.6 Adi Gozomo
Based on the soil anomalism and presence of artisanal gold workings in an altered and quartz-veined
granodiorite intrusion one short (80.77 m) diamond drillhole was drilled at Adi Gozomo in March
2013. The hole, AD001, intersected 7.50 m of 2.04 g/t Au from a depth of 15.10 m, but no other
notable metal concentrations were noted. Gold content appears to be directly correlated to the
pyrite content of the host rock.
The Adi Gozomo soil anomaly (> 50 ppb Au) occurs over a strike distance of 420 m, and offers
additional drilling opportunities. A second larger soil anomaly, 1 km at greater than 100 ppb Au, is
present 400 m to the east of Adi Gozomo and is known as Adi Gozomo East. Two small hills of
massive quartz-tourmaline are located at the edge of the anomaly. This showing requires additional
exploration.
Drilling at Adi Gozomo is not in the Mato Bula – Da Tambuk resource estimation.
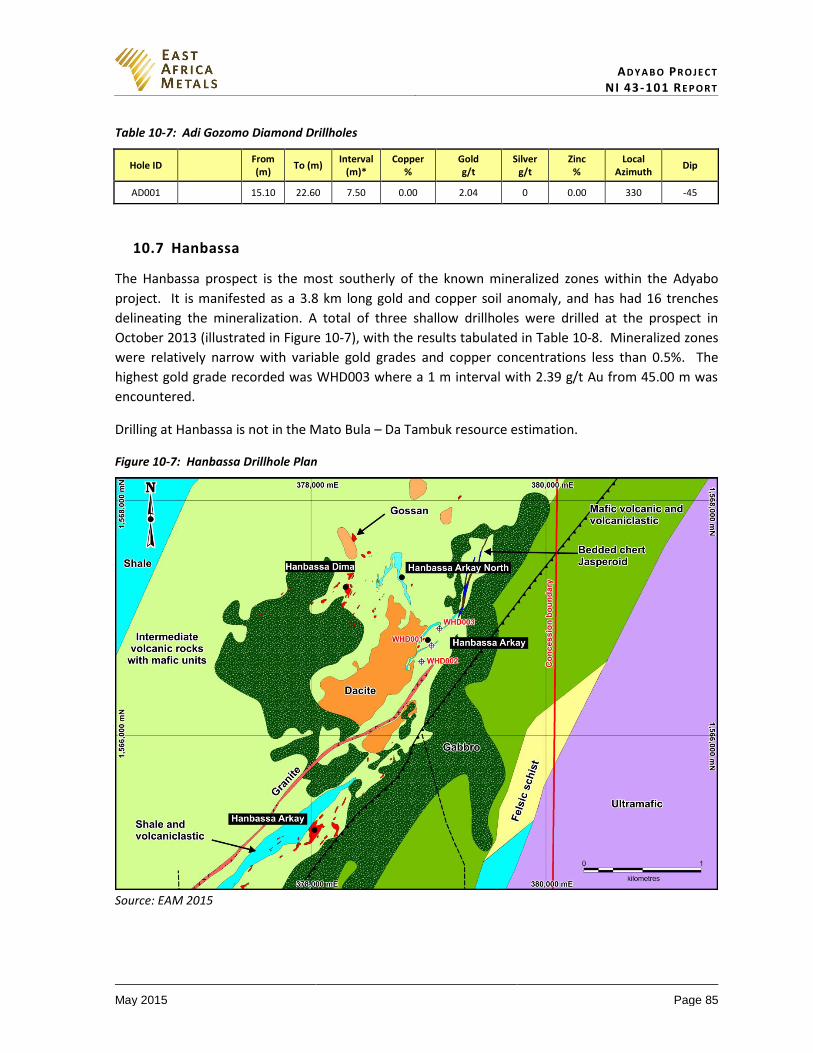
AD Y A B O PR O J E C T NI 43-101 RE P O R T
May 2015 Page 85
Table 10-7: Adi Gozomo Diamond Drillholes
Hole ID From (m)
To (m) Interval
(m)* Copper
% Gold g/t
Silver g/t
Zinc %
Local Azimuth
Dip
AD001 15.10 22.60 7.50 0.00 2.04 0 0.00 330 -45
10.7 Hanbassa
The Hanbassa prospect is the most southerly of the known mineralized zones within the Adyabo
project. It is manifested as a 3.8 km long gold and copper soil anomaly, and has had 16 trenches
delineating the mineralization. A total of three shallow drillholes were drilled at the prospect in
October 2013 (illustrated in Figure 10-7), with the results tabulated in Table 10-8. Mineralized zones
were relatively narrow with variable gold grades and copper concentrations less than 0.5%. The
highest gold grade recorded was WHD003 where a 1 m interval with 2.39 g/t Au from 45.00 m was
encountered.
Drilling at Hanbassa is not in the Mato Bula – Da Tambuk resource estimation.
Figure 10-7: Hanbassa Drillhole Plan
Source: EAM 2015
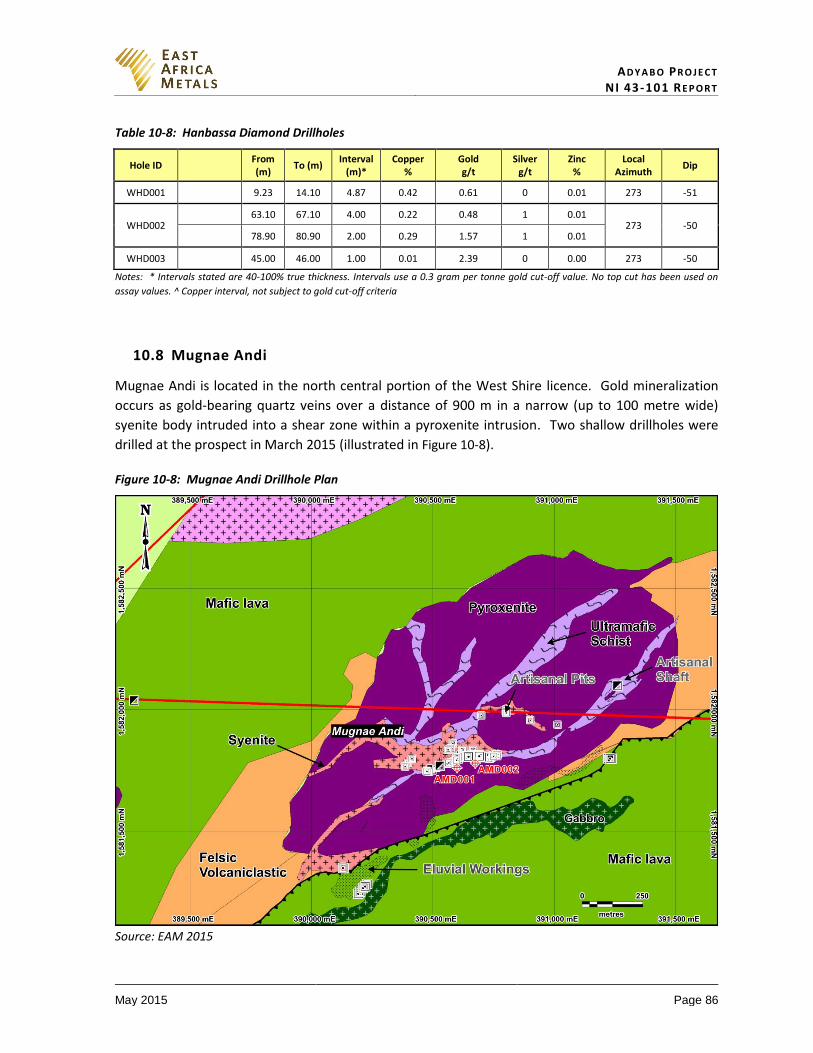
AD Y A B O PR O J E C T NI 43-101 RE P O R T
May 2015 Page 86
Table 10-8: Hanbassa Diamond Drillholes
Hole ID From (m)
To (m) Interval
(m)* Copper
% Gold g/t
Silver g/t
Zinc %
Local Azimuth
Dip
WHD001 9.23 14.10 4.87 0.42 0.61 0 0.01 273 -51
WHD002 63.10 67.10 4.00 0.22 0.48 1 0.01
273 -50
78.90 80.90 2.00 0.29 1.57 1 0.01
WHD003 45.00 46.00 1.00 0.01 2.39 0 0.00 273 -50
Notes: * Intervals stated are 40-100% true thickness. Intervals use a 0.3 gram per tonne gold cut-off value. No top cut has been used on
assay values. ^ Copper interval, not subject to gold cut-off criteria
10.8 Mugnae Andi
Mugnae Andi is located in the north central portion of the West Shire licence. Gold mineralization
occurs as gold-bearing quartz veins over a distance of 900 m in a narrow (up to 100 metre wide)
syenite body intruded into a shear zone within a pyroxenite intrusion. Two shallow drillholes were
drilled at the prospect in March 2015 (illustrated in Figure 10-8).
Figure 10-8: Mugnae Andi Drillhole Plan
Source: EAM 2015
AD Y A B O PR O J E C T NI 43-101 RE P O R T
May 2015 Page 87
Results of the initial drilling on the prospect are tabulated in Table 10-9. Mineralized zones were
relatively narrow (3 to 8 m) with gold grades varying from 1.57 to 5.90 g/t Au. The highest gold grade
recorded was AMD002 where a 2 m interval with 5.90 g/t Au from 42.90 m was encountered.
Drilling at Mugnae Andi is not in the Mato Bula – Da Tambuk resource estimation.
Table 10-9: Mugnae Andi Diamond Drillholes
Hole ID From (m)
To (m) Interval
(m)* Copper
% Gold g/t
Silver g/t
Zinc %
Local Azimuth
Dip
AMD001 23.90 27.20 3.30 2.82
306 -61 47.75 50.75 3.00 1.57
AMD002 36.90 44.90 8.00 2.48
308 -60 including 42.90 44.90 2.00 5.90
Notes: * Intervals stated are 40-100% true thickness. Intervals use a 0.3 gram per tonne gold cut-off value. No top cut has been used on
assay values.
10.9 Qualified Person’s Comments on Section 10
Recoveries for all resource drilling on the project averaged 96.4% (with an average recovery of 97.8%
for core below 30 m), all samples sent to the assay lab were measured for density, and all drillholes
were accurately surveyed upon completion. Large variations in any of these parameters could
materially impact the accuracy and reliability results. Since no large variations were noted the
authors believe the drilling results can be relied upon.
Where any higher grade intervals were present within lower grade zones, these intervals have been
presented in Tables 10-4 to 10-9.
AD Y A B O PR O J E C T NI 43-101 RE P O R T
May 2015 Page 88
11 SAMPLE PREPARATION, ANALYZES & SECURITY
The following sections summarize the extent of the author’s knowledge regarding the sample
preparation, analysis, security and Quality Assurance/Quality Control (“QA/QC”) protocols used in
the drilling programs at the Adyabo project.
11.1 Sampling Method & Approach
Several exploration sampling techniques are employed on the Adyabo project including: sieved soil
samples, stream sediment samples, rock chip samples, channel samples, and diamond drilling. The
emphasis of the collection techniques is to collect geological material using standardised sample
procedures, and insertion of suitable blanks, standards and replicates to monitor the accuracy and
precision of sampling errors and deficiencies in laboratory procedures and results. Although not
stated in the text most lithological samples are 2 kg. The following descriptions of sampling
procedures, with the exception of drilling, are taken from the EAM protocol manual and 2014 Tri PLC
Annual Report (Gardoll et al., 2014).
Stream Sample Procedure
Stream sediment samples are taken on a regional scale to identify anomalous catchment areas for
further follow up work. Samples are taken from the surface of the stream bed and sieved using -60
mesh (250 μm) with a final weight of approximately 250 g. Active river sediment (excluding sand) is
collected in stream samples. All samples are bagged into soil packets or plastic bags to avoid
contamination. Standards and replicates are routinely inserted for quality control and quality
assurance purposes. Pans are cleaned between sample sites to avoid contamination.
The productivity of a stream sample program is routinely maximised with the geologist making notes
on geology, taking grab samples of any mineralized float or outcrop, and recording the location of
alluvial workings as appropriate. This process is delayed in the wet weather when sieving samples is
impossible and streams are flowing.
Soil Sample Procedure
Soil samples are collected on a predetermined soil sample grid at a variety of scales depending on the
stage of exploration (e.g., regional soil programs or detailed infill grids over a prospect).
A sample is taken from a depth of 0.15 m below surface and sieved using -60 mesh (250 μm) to
remove coarse material. The total sample weight aims to be at least 200 g. Standards and replicates
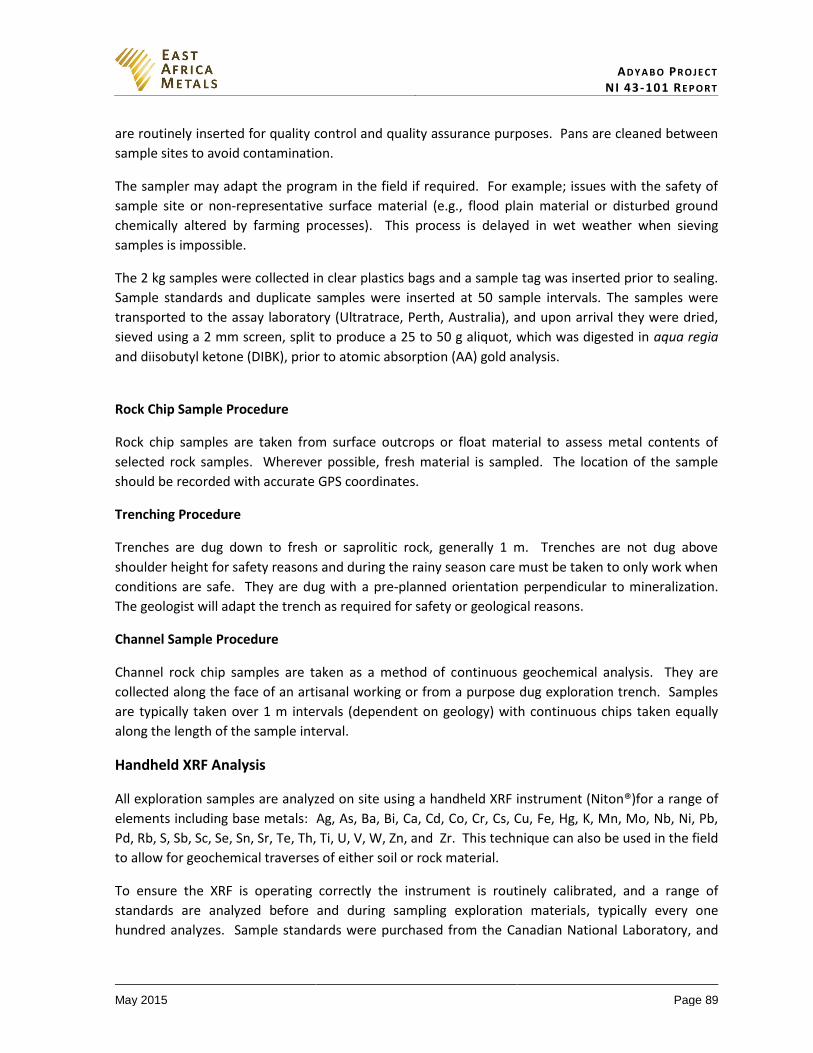
AD Y A B O PR O J E C T NI 43-101 RE P O R T
May 2015 Page 89
are routinely inserted for quality control and quality assurance purposes. Pans are cleaned between
sample sites to avoid contamination.
The sampler may adapt the program in the field if required. For example; issues with the safety of
sample site or non-representative surface material (e.g., flood plain material or disturbed ground
chemically altered by farming processes). This process is delayed in wet weather when sieving
samples is impossible.
The 2 kg samples were collected in clear plastics bags and a sample tag was inserted prior to sealing.
Sample standards and duplicate samples were inserted at 50 sample intervals. The samples were
transported to the assay laboratory (Ultratrace, Perth, Australia), and upon arrival they were dried,
sieved using a 2 mm screen, split to produce a 25 to 50 g aliquot, which was digested in aqua regia
and diisobutyl ketone (DIBK), prior to atomic absorption (AA) gold analysis.
Rock Chip Sample Procedure
Rock chip samples are taken from surface outcrops or float material to assess metal contents of
selected rock samples. Wherever possible, fresh material is sampled. The location of the sample
should be recorded with accurate GPS coordinates.
Trenching Procedure
Trenches are dug down to fresh or saprolitic rock, generally 1 m. Trenches are not dug above
shoulder height for safety reasons and during the rainy season care must be taken to only work when
conditions are safe. They are dug with a pre-planned orientation perpendicular to mineralization.
The geologist will adapt the trench as required for safety or geological reasons.
Channel Sample Procedure
Channel rock chip samples are taken as a method of continuous geochemical analysis. They are
collected along the face of an artisanal working or from a purpose dug exploration trench. Samples
are typically taken over 1 m intervals (dependent on geology) with continuous chips taken equally
along the length of the sample interval.
Handheld XRF Analysis
All exploration samples are analyzed on site using a handheld XRF instrument (Niton®)for a range of
elements including base metals: Ag, As, Ba, Bi, Ca, Cd, Co, Cr, Cs, Cu, Fe, Hg, K, Mn, Mo, Nb, Ni, Pb,
Pd, Rb, S, Sb, Sc, Se, Sn, Sr, Te, Th, Ti, U, V, W, Zn, and Zr. This technique can also be used in the field
to allow for geochemical traverses of either soil or rock material.
To ensure the XRF is operating correctly the instrument is routinely calibrated, and a range of
standards are analyzed before and during sampling exploration materials, typically every one
hundred analyzes. Sample standards were purchased from the Canadian National Laboratory, and
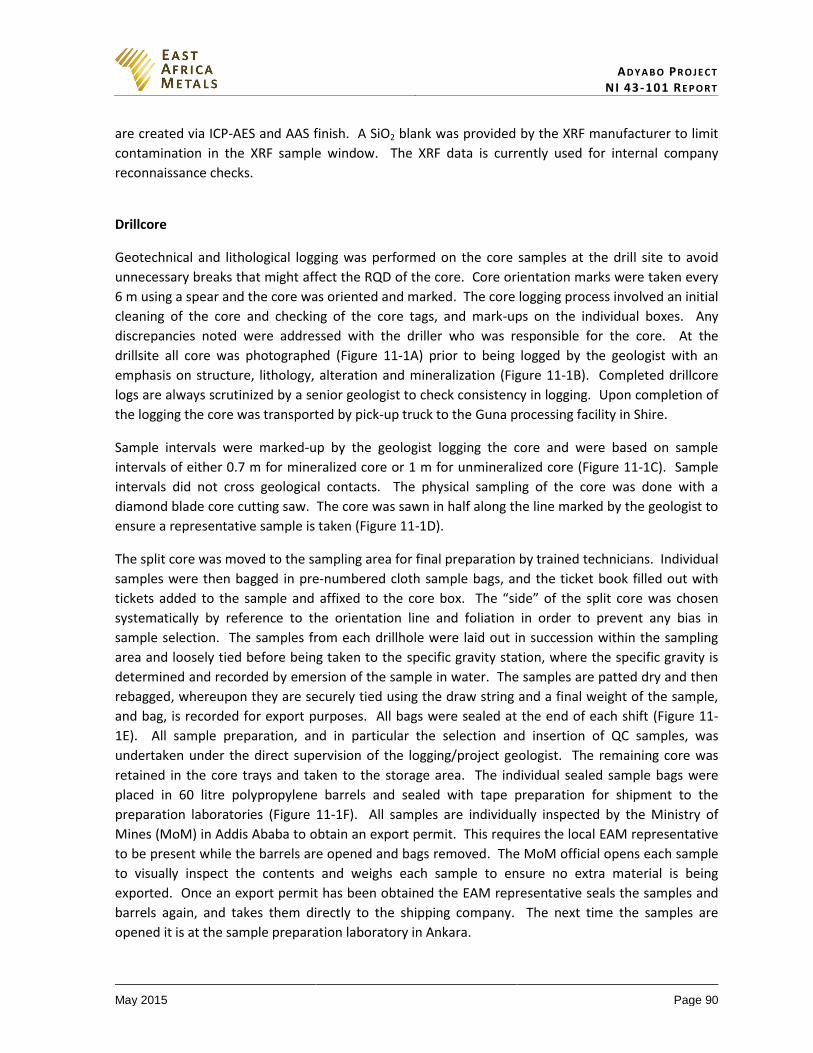
AD Y A B O PR O J E C T NI 43-101 RE P O R T
May 2015 Page 90
are created via ICP-AES and AAS finish. A SiO2 blank was provided by the XRF manufacturer to limit
contamination in the XRF sample window. The XRF data is currently used for internal company
reconnaissance checks.
Drillcore
Geotechnical and lithological logging was performed on the core samples at the drill site to avoid
unnecessary breaks that might affect the RQD of the core. Core orientation marks were taken every
6 m using a spear and the core was oriented and marked. The core logging process involved an initial
cleaning of the core and checking of the core tags, and mark-ups on the individual boxes. Any
discrepancies noted were addressed with the driller who was responsible for the core. At the
drillsite all core was photographed (Figure 11-1A) prior to being logged by the geologist with an
emphasis on structure, lithology, alteration and mineralization (Figure 11-1B). Completed drillcore
logs are always scrutinized by a senior geologist to check consistency in logging. Upon completion of
the logging the core was transported by pick-up truck to the Guna processing facility in Shire.
Sample intervals were marked-up by the geologist logging the core and were based on sample
intervals of either 0.7 m for mineralized core or 1 m for unmineralized core (Figure 11-1C). Sample
intervals did not cross geological contacts. The physical sampling of the core was done with a
diamond blade core cutting saw. The core was sawn in half along the line marked by the geologist to
ensure a representative sample is taken (Figure 11-1D).
The split core was moved to the sampling area for final preparation by trained technicians. Individual
samples were then bagged in pre-numbered cloth sample bags, and the ticket book filled out with
tickets added to the sample and affixed to the core box. The “side” of the split core was chosen
systematically by reference to the orientation line and foliation in order to prevent any bias in
sample selection. The samples from each drillhole were laid out in succession within the sampling
area and loosely tied before being taken to the specific gravity station, where the specific gravity is
determined and recorded by emersion of the sample in water. The samples are patted dry and then
rebagged, whereupon they are securely tied using the draw string and a final weight of the sample,
and bag, is recorded for export purposes. All bags were sealed at the end of each shift (Figure 11-
1E). All sample preparation, and in particular the selection and insertion of QC samples, was
undertaken under the direct supervision of the logging/project geologist. The remaining core was
retained in the core trays and taken to the storage area. The individual sealed sample bags were
placed in 60 litre polypropylene barrels and sealed with tape preparation for shipment to the
preparation laboratories (Figure 11-1F). All samples are individually inspected by the Ministry of
Mines (MoM) in Addis Ababa to obtain an export permit. This requires the local EAM representative
to be present while the barrels are opened and bags removed. The MoM official opens each sample
to visually inspect the contents and weighs each sample to ensure no extra material is being
exported. Once an export permit has been obtained the EAM representative seals the samples and
barrels again, and takes them directly to the shipping company. The next time the samples are
opened it is at the sample preparation laboratory in Ankara.
AD Y A B O PR O J E C T NI 43-101 RE P O R T
May 2015 Page 91
Figure 11-1: Core Handling & Sampling Photographs
Note: See text for a description of the sampling procedures illustrated. Source: Archibald et al., 2014
Certified reference materials are stored in the main office building in clearly marked plastic bags
(Figure 11-2A). The clear plastic bags hold individual 100 g standards in clear plastic bags with
removable identification labels to minimize the insertion of an incorrect standard (Figure 11-2B).
Certified blanks are stored in 100 g sealed plastic bags in the office. Coarse reject pulverized rock
samples and the remainder of the base pulps (the remainder of the initial 1 kg of pulverized sample)
AD Y A B O PR O J E C T NI 43-101 RE P O R T
May 2015 Page 92
are stored at the initial preparation facility in Turkey (Acme Turkey), and analytical pulps are stored
at Acme Vancouver.
Duplicate soil sample paper bags are sorted and placed in cloth calico bags before being catalogued
and stored in the core shed at Guna (Figure 11-2C). Similarly, diamond drillcore is stored inside in
one of two sheds at Guna (Figure 11-2D). The core shed is clean and well organized.
In the author’s opinion, industry best practices have been employed during the sampling of the
drillcore, the storage of the reference materials and storage of returned samples.
Figure 11-2: Security & Chain of Custody Related Photographs
Note: See text for a description of the security of samples, standards, and blanks. Source: Archibald et al., 2014, Archibald 2015
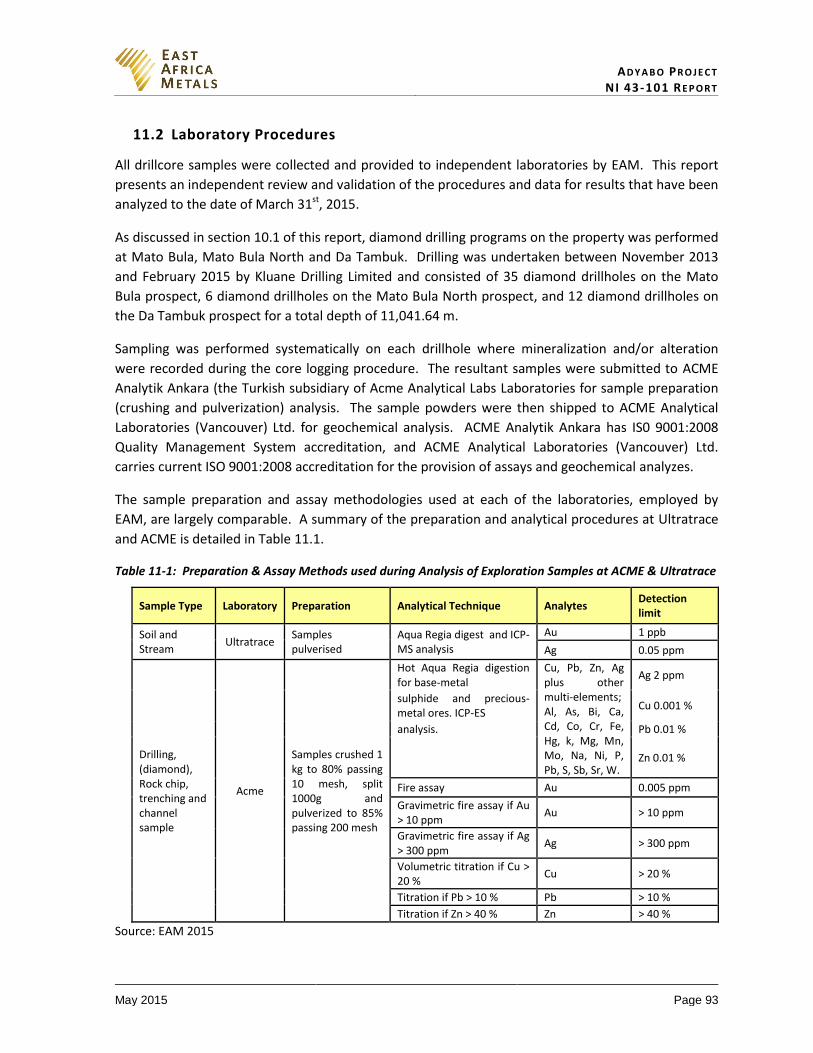
AD Y A B O PR O J E C T NI 43-101 RE P O R T
May 2015 Page 93
11.2 Laboratory Procedures
All drillcore samples were collected and provided to independent laboratories by EAM. This report
presents an independent review and validation of the procedures and data for results that have been
analyzed to the date of March 31st, 2015.
As discussed in section 10.1 of this report, diamond drilling programs on the property was performed
at Mato Bula, Mato Bula North and Da Tambuk. Drilling was undertaken between November 2013
and February 2015 by Kluane Drilling Limited and consisted of 35 diamond drillholes on the Mato
Bula prospect, 6 diamond drillholes on the Mato Bula North prospect, and 12 diamond drillholes on
the Da Tambuk prospect for a total depth of 11,041.64 m.
Sampling was performed systematically on each drillhole where mineralization and/or alteration
were recorded during the core logging procedure. The resultant samples were submitted to ACME
Analytik Ankara (the Turkish subsidiary of Acme Analytical Labs Laboratories for sample preparation
(crushing and pulverization) analysis. The sample powders were then shipped to ACME Analytical
Laboratories (Vancouver) Ltd. for geochemical analysis. ACME Analytik Ankara has IS0 9001:2008
Quality Management System accreditation, and ACME Analytical Laboratories (Vancouver) Ltd.
carries current ISO 9001:2008 accreditation for the provision of assays and geochemical analyzes.
The sample preparation and assay methodologies used at each of the laboratories, employed by
EAM, are largely comparable. A summary of the preparation and analytical procedures at Ultratrace
and ACME is detailed in Table 11.1.
Table 11-1: Preparation & Assay Methods used during Analysis of Exploration Samples at ACME & Ultratrace
Sample Type Laboratory Preparation Analytical Technique Analytes
Detection limit
Soil and Stream
Ultratrace Samples pulverised
Aqua Regia digest and ICP-MS analysis
Au 1 ppb
Ag 0.05 ppm
Drilling, (diamond), Rock chip, trenching and channel sample
Acme
Samples crushed 1 kg to 80% passing 10 mesh, split 1000g and pulverized to 85% passing 200 mesh
Hot Aqua Regia digestion for base-metal
Cu, Pb, Zn, Ag plus other multi-elements; Al, As, Bi, Ca, Cd, Co, Cr, Fe, Hg, k, Mg, Mn, Mo, Na, Ni, P, Pb, S, Sb, Sr, W.
Ag 2 ppm
sulphide and precious-metal ores. ICP-ES
Cu 0.001 %
analysis. Pb 0.01 %
Zn 0.01 %
Fire assay Au 0.005 ppm
Gravimetric fire assay if Au > 10 ppm
Au > 10 ppm
Gravimetric fire assay if Ag > 300 ppm
Ag > 300 ppm
Volumetric titration if Cu > 20 %
Cu > 20 %
Titration if Pb > 10 % Pb > 10 %
Titration if Zn > 40 % Zn > 40 %
Source: EAM 2015

AD Y A B O PR O J E C T NI 43-101 RE P O R T
May 2015 Page 94
In the author’s opinion, all drillcore samples were prepared and assayed using appropriate
techniques at the laboratories.
11.3 Sample Security & Chain of Custody Procedures
The chain of custody procedure from the extraction of the core from the core barrel, through logging
and sampling up to the point of dispatch to the laboratory is described in Section 11.2. Through all of
these stages the responsibility for security lies with EAM and their on-site personnel. Samples are
transported from Shire to the Ministry of Mines in Addis Ababa, then onwards to Bole International
Airport by an Ethiopian haulage company. After this the samples are in the care of airline cargo
companies and international courier companies when shipped to the overseas laboratories. The
security of the sample during transit cannot be guaranteed as tamper proof seals are not used on the
sample bags. Upon receipt at the laboratory, the chain of custody passes to the assayer. Following
assay, the remaining material is stored under secure conditions at the laboratory facilities.
Approximately 1 kg of pulp is created from each drillcore sample, with 100 g sent to Acme’s
Vancouver laboratory for analysis and the remaining 900 g stored in Turkey for potential follow-up
work. The chain of custody reverts to EAM if the samples leave the assay laboratory storage
facilities. This is the case with remaining pulp material following analyzes, which is transferred back
to EAM in Vancouver, who then sent to a secured warehouse location for storage.
In general, industry best practices with respect to chain of custody procedures are followed on site.
However, the weakest point in any chain of custody is during transport. The absence of tamper
proof fastenings on the samples has been noted and their introduction would greatly improve the
chain of custody between the site and laboratory. However, the physical inspection and weighing of
all exported material by the Ministry of Mines in Addis Ababa adds complexity to this solution.
11.4 Drill Program QA/QC
Diamond drilling at Mato Bula and Da Tambuk was supervised at all times by EAM geologists. The
geologists directed and managed the preparation, logging and sampling of core. With several
geologists logging the drillholes variation in lithologies invariably occurs. However, this potential
variation is mitigated by the senior geology staff that reviewed the drillcore and logs, and amended
any discrepancies that arose.
During sampling, quality control standards and blanks were inserted to confidentially monitor
laboratory performance. Refinement of QA/QC procedures during the drill program included the
implementation of field, reject and pulp duplicates, as well as specific programs of re-analysis and
umpire laboratory assaying; all consistent with industry best practice.
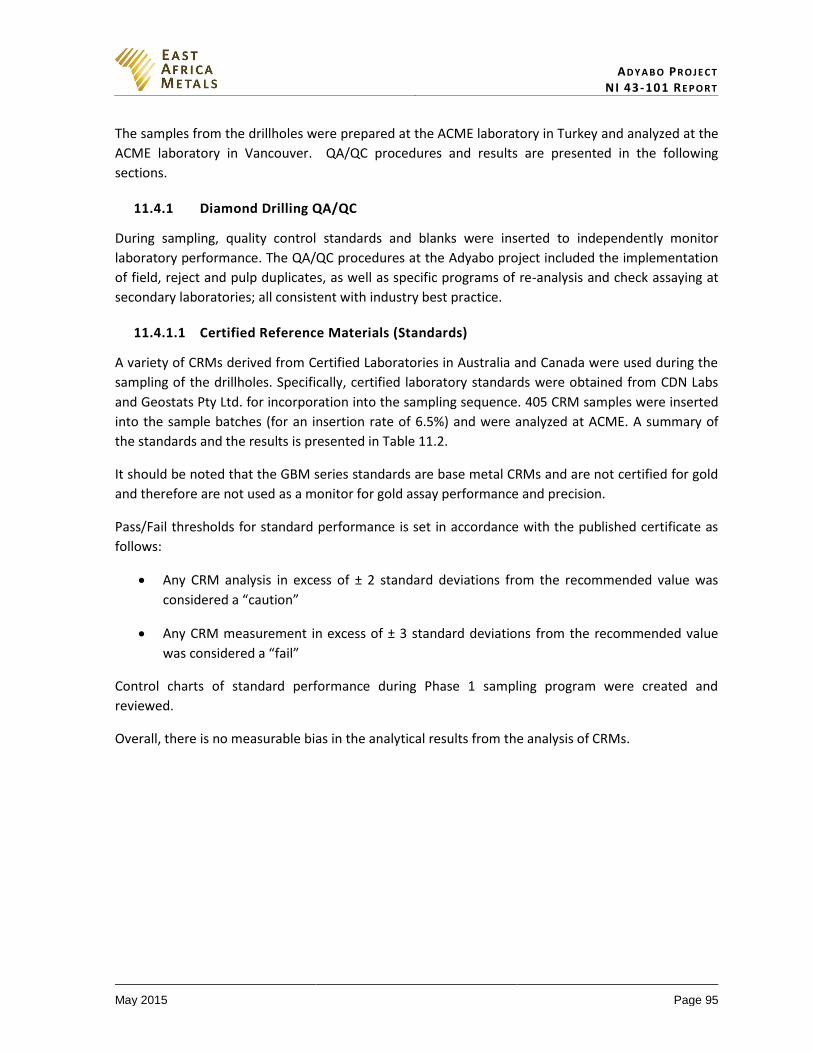
AD Y A B O PR O J E C T NI 43-101 RE P O R T
May 2015 Page 95
The samples from the drillholes were prepared at the ACME laboratory in Turkey and analyzed at the
ACME laboratory in Vancouver. QA/QC procedures and results are presented in the following
sections.
11.4.1 Diamond Drilling QA/QC
During sampling, quality control standards and blanks were inserted to independently monitor
laboratory performance. The QA/QC procedures at the Adyabo project included the implementation
of field, reject and pulp duplicates, as well as specific programs of re-analysis and check assaying at
secondary laboratories; all consistent with industry best practice.
11.4.1.1 Certified Reference Materials (Standards)
A variety of CRMs derived from Certified Laboratories in Australia and Canada were used during the
sampling of the drillholes. Specifically, certified laboratory standards were obtained from CDN Labs
and Geostats Pty Ltd. for incorporation into the sampling sequence. 405 CRM samples were inserted
into the sample batches (for an insertion rate of 6.5%) and were analyzed at ACME. A summary of
the standards and the results is presented in Table 11.2.
It should be noted that the GBM series standards are base metal CRMs and are not certified for gold
and therefore are not used as a monitor for gold assay performance and precision.
Pass/Fail thresholds for standard performance is set in accordance with the published certificate as
follows:
Any CRM analysis in excess of ± 2 standard deviations from the recommended value was
considered a “caution”
Any CRM measurement in excess of ± 3 standard deviations from the recommended value
was considered a “fail”
Control charts of standard performance during Phase 1 sampling program were created and
reviewed.
Overall, there is no measurable bias in the analytical results from the analysis of CRMs.
AD Y A B O PR O J E C T NI 43-101 RE P O R T
May 2015 Page 96
Table 11-2: Summary of CRMs and ACME Laboratory Results
Copper Gold Silver
CRM Number
Expected Value
(%)
ACME Lab
Mean (%)
Bias (%) Number
Expected Value (g/t)
ACME Lab
Mean (g/t)
Bias (%) Number
Expected Value (g/t)
ACME Lab
Mean (g/t)
Bias (%)
CDN-CGS-28 9 2.03 2.04 0% 9 0.73 0.77 -6% 0
CDN-CM-15 23 1.28 1.32 -3% 23 1.25 1.29 -3% 0
CDN-CM-18 7 2.37 2.49 -5% 7 5.28 5.33 -1% 0
CDN-CM-19 5 2.04 2.05 0% 5 2.11 2.14 -2% 0
CDN-CM-22 12 1.00 1.00 0% 12 0.72 0.74 -3% 0
CDN-CM-35 55 0.25 0.25 -1% 55 0.32 0.35 -6% 0
CDN-FCM-7 9 0.53 0.53 0% 9 0.90 0.90 0% 9 64.70 67.33 -4%
CDN-GS-20A 0 8 21.12 22.79 -7% 0
CDN-GS-20B 0 3 20.23 23.23 -13% 0
CDN-GS-2M 0 5 2.21 2.30 -4% 0
CDN-GS-7F 0 12 6.90 6.81 1% 0
CDN-ME-11 5 2.44 2.48 -2% 5 1.38 1.40 -1% 5 79.30 82.80 -4%
CDN-ME-1101 7 0.66 0.71 -7% 7 0.56 0.62 -9% 7 68.20 69.00 -1%
CDN-ME-1204 19 0.52 0.53 -1% 19 0.98 0.96 1% 19 58.00 61.37 -5%
CDN-ME-1205 19 0.22 0.22 0% 19 2.20 2.13 3% 19 25.60 26.26 -3%
CDN-ME-1304 15 0.27 0.27 -1% 15 1.80 1.79 0% 15 34.00 35.33 -4%
CDN-ME-1305 2 0.62 0.63 -2% 2 1.92 1.99 -3% 2 231.00 241.50 -4%
CDN-ME-16 13 0.67 0.68 -1% 13 1.48 1.46 1% 13 30.80 32.23 -4%
G302-10 0 44 0.18 0.18 1% 0
G306-3 0 1 8.66 7.66 13% 0
G398-2 0 39 0.42 0.52 -20% 0
G900-7 0 14 3.19 3.16 1% 0
G901-7 0 18 1.53 1.47 4% 0
G903-10 0 16 0.21 0.20 6% 0
G995-1 0 13 2.64 2.70 -2% 0
G995-4 0 10 8.48 8.89 -5% 0
GBM307-1 5 0.01 0.00 18% 0 5 0.60 0.00 n/a
GBM309-16 1 5.23 4.99 5% 0 1 225.20 226.00 0%
GBM310-2 2 0.69 0.69 1% 0 2 45.50 48.50 -6%
GBM310-3 2 1.44 1.45 0% 0 2 19.40 20.50 -5%
GBM908-10 3 0.36 0.36 1% 0 3 3.00 3.00 0%
GBM908-11 1 17.70 16.84 5% 0 1 11.40 10.00 14%
GBM998-9 8 0.00 0.00 26% 0 8 101.20 99.75 1%
Overall Bias 222 0.03% 383 0.54% 111 0.10%
11.4.1.2 Blanks
Un-mineralized basalt was used as a blank control sample during sampling of the drilling. 386 blank
samples were inserted in the batches of samples (for an insertion rate of 6.2%) analyzed at ACME.
Control charts for all of the metals of interest (Au, Ag and Cu) were created and reviewed. A total of
five blanks failed (using a pass/fail threshold of 10 times the lower detection limit) for a failure rate of
AD Y A B O PR O J E C T NI 43-101 RE P O R T
May 2015 Page 97
1.3%. Charts plotting the grade of the failed blank against the preceding sample (in the sample
sequence) show no correlation, therefore no systematic contamination is suspected.
11.4.1.3 Check Assays
A suite of check samples were collected from ACME Analytical Laboratories (Vancouver) Ltd. and
submitted to ALS Global (Vancouver) for assay. These samples represent pulp duplicates which are
prepared at the primary laboratory and then set aside for later submission to a second laboratory for
re-homogenization and assay. This approach provides a test of sample preparation and splitting
procedure in the laboratory in addition to analytical accuracy. A total of 54 check assays were
selected to cover a range of grades.
The check assay results for gold show an excellent correlation (r2= 0.987) with the ACME assay
results. Similar correlations are observed for copper (r2= 0.9996) and silver (r2= 0.9444).
One outlier value was removed from the gold check assay data. Overall, the ALS biases (using linear
least squares regression) with respect to ACME are:
+6.7% for gold
-0.9% for copper
-8.5% for silver
The positive bias observed in silver check assays can in part be explained by the use of differing
analytical techniques (ACME used an analytical method with a lower detection limit of 2 ppm Ag, ALS
used an analytical method with a lower detection limit of 0.01 ppm Ag).
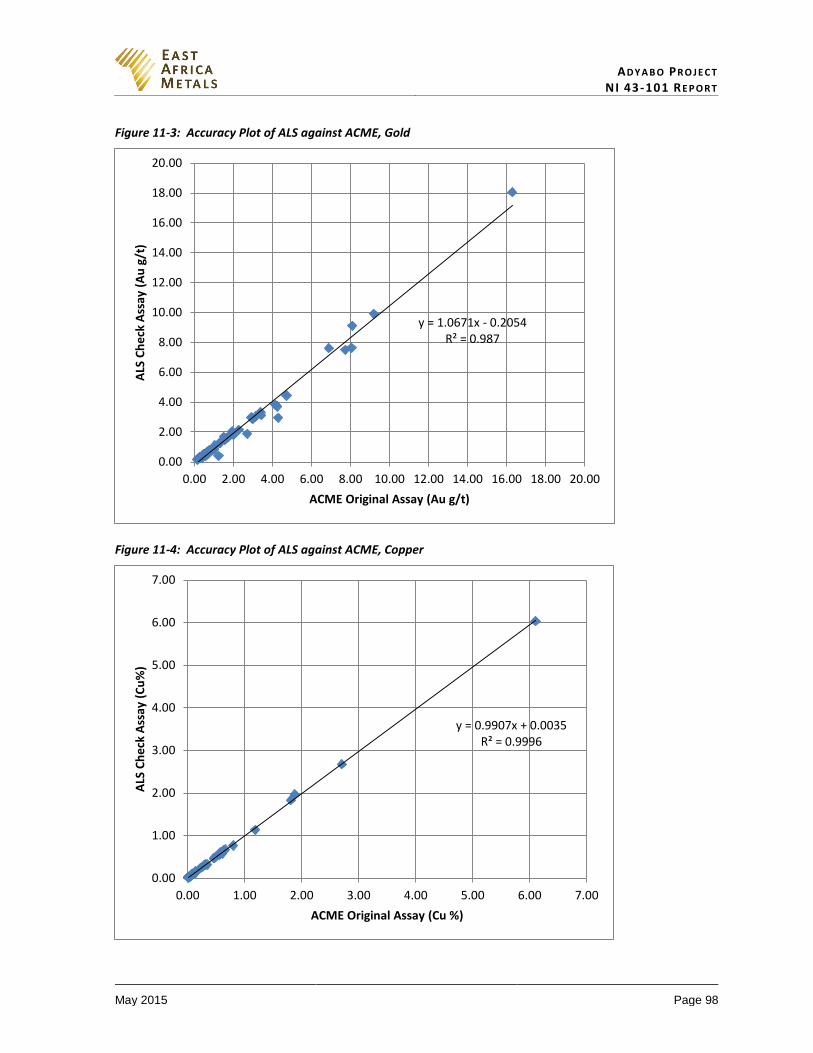
AD Y A B O PR O J E C T NI 43-101 RE P O R T
May 2015 Page 98
Figure 11-3: Accuracy Plot of ALS against ACME, Gold
Figure 11-4: Accuracy Plot of ALS against ACME, Copper
y = 1.0671x - 0.2054 R² = 0.987
0.00
2.00
4.00
6.00
8.00
10.00
12.00
14.00
16.00
18.00
20.00
0.00 2.00 4.00 6.00 8.00 10.00 12.00 14.00 16.00 18.00 20.00
ALS
Ch
eck
Ass
ay (
Au
g/t
)
ACME Original Assay (Au g/t)
y = 0.9907x + 0.0035 R² = 0.9996
0.00
1.00
2.00
3.00
4.00
5.00
6.00
7.00
0.00 1.00 2.00 3.00 4.00 5.00 6.00 7.00
ALS
Ch
eck
Ass
ay (
Cu
%)
ACME Original Assay (Cu %)
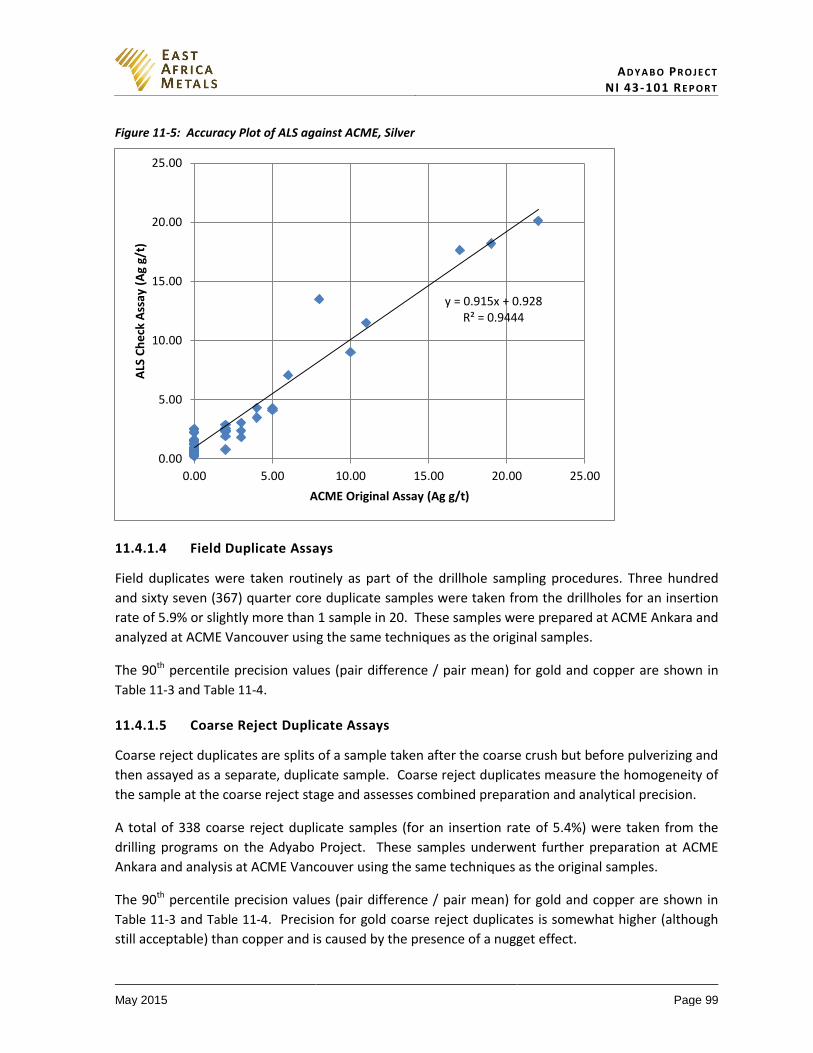
AD Y A B O PR O J E C T NI 43-101 RE P O R T
May 2015 Page 99
Figure 11-5: Accuracy Plot of ALS against ACME, Silver
11.4.1.4 Field Duplicate Assays
Field duplicates were taken routinely as part of the drillhole sampling procedures. Three hundred
and sixty seven (367) quarter core duplicate samples were taken from the drillholes for an insertion
rate of 5.9% or slightly more than 1 sample in 20. These samples were prepared at ACME Ankara and
analyzed at ACME Vancouver using the same techniques as the original samples.
The 90th percentile precision values (pair difference / pair mean) for gold and copper are shown in
Table 11-3 and Table 11-4.
11.4.1.5 Coarse Reject Duplicate Assays
Coarse reject duplicates are splits of a sample taken after the coarse crush but before pulverizing and
then assayed as a separate, duplicate sample. Coarse reject duplicates measure the homogeneity of
the sample at the coarse reject stage and assesses combined preparation and analytical precision.
A total of 338 coarse reject duplicate samples (for an insertion rate of 5.4%) were taken from the
drilling programs on the Adyabo Project. These samples underwent further preparation at ACME
Ankara and analysis at ACME Vancouver using the same techniques as the original samples.
The 90th percentile precision values (pair difference / pair mean) for gold and copper are shown in
Table 11-3 and Table 11-4. Precision for gold coarse reject duplicates is somewhat higher (although
still acceptable) than copper and is caused by the presence of a nugget effect.
y = 0.915x + 0.928 R² = 0.9444
0.00
5.00
10.00
15.00
20.00
25.00
0.00 5.00 10.00 15.00 20.00 25.00
ALS
Ch
eck
Ass
ay (
Ag
g/t)
ACME Original Assay (Ag g/t)
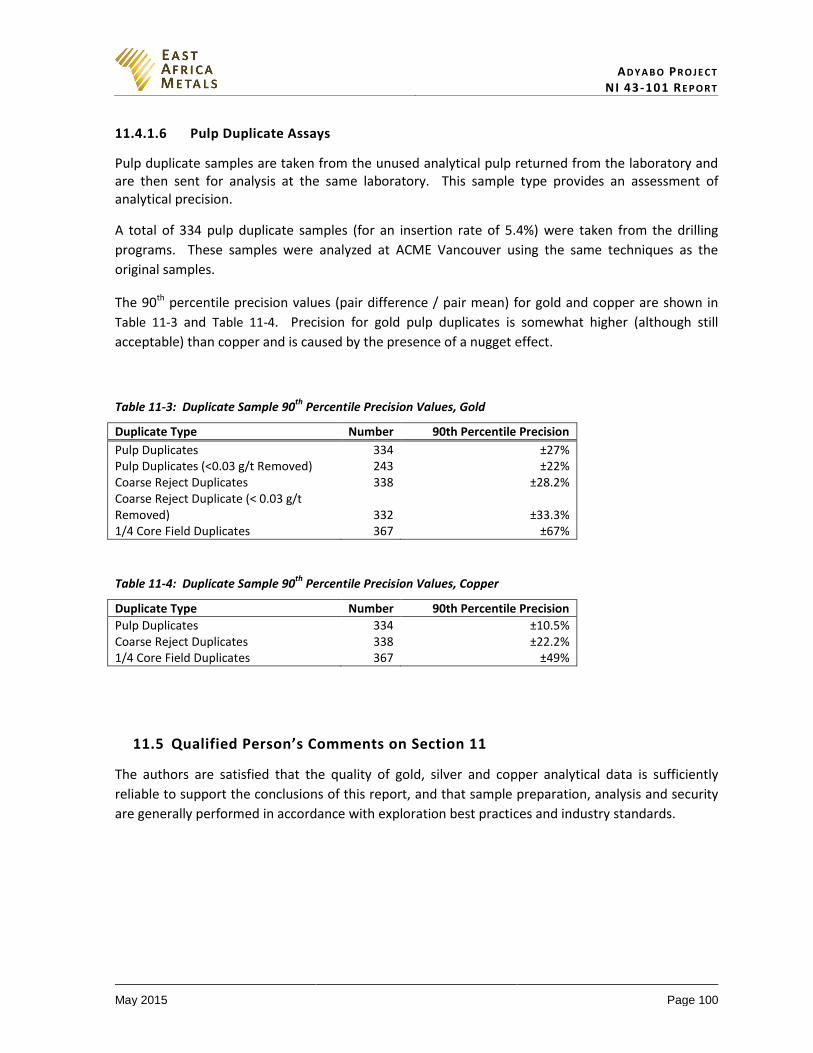
AD Y A B O PR O J E C T NI 43-101 RE P O R T
May 2015 Page 100
11.4.1.6 Pulp Duplicate Assays
Pulp duplicate samples are taken from the unused analytical pulp returned from the laboratory and are then sent for analysis at the same laboratory. This sample type provides an assessment of analytical precision.
A total of 334 pulp duplicate samples (for an insertion rate of 5.4%) were taken from the drilling
programs. These samples were analyzed at ACME Vancouver using the same techniques as the
original samples.
The 90th percentile precision values (pair difference / pair mean) for gold and copper are shown in
Table 11-3 and Table 11-4. Precision for gold pulp duplicates is somewhat higher (although still
acceptable) than copper and is caused by the presence of a nugget effect.
Table 11-3: Duplicate Sample 90th
Percentile Precision Values, Gold
Duplicate Type Number 90th Percentile Precision
Pulp Duplicates 334 ±27% Pulp Duplicates (<0.03 g/t Removed) 243 ±22% Coarse Reject Duplicates 338 ±28.2% Coarse Reject Duplicate (< 0.03 g/t Removed) 332 ±33.3% 1/4 Core Field Duplicates 367 ±67%
Table 11-4: Duplicate Sample 90th
Percentile Precision Values, Copper
Duplicate Type Number 90th Percentile Precision
Pulp Duplicates 334 ±10.5% Coarse Reject Duplicates 338 ±22.2% 1/4 Core Field Duplicates 367 ±49%
11.5 Qualified Person’s Comments on Section 11
The authors are satisfied that the quality of gold, silver and copper analytical data is sufficiently
reliable to support the conclusions of this report, and that sample preparation, analysis and security
are generally performed in accordance with exploration best practices and industry standards.
AD Y A B O PR O J E C T NI 43-101 RE P O R T
May 2015 Page 101
12 DATA VERIFICATION
In consideration of the data summarized below, as well as information provided elsewhere in this report, the author of this section believes the current EAM project data are acceptable for the purposes used in this Report.
12.1 Electronic Database
Initially, an Access database and related Microsoft Excel spreadsheets were provided by EAM to
Aurum as a universal project dataset along with a full set of assay certificates. Additional GIS data
was provided in the form of MapInfo data files.
Information recorded from diamond drillcore logging and assaying was integrated using industry
standard data management software (Maxwell DataShed). The resultant data was reviewed,
including validation of a random selection of data against the source information, and it is considered
acceptable for the purpose of this Report.
12.2 Drillhole Collar Checks
Seventeen drillhole collar checks were undertaken by Aurum during the site visit using a hand held
Garmin GPSmap 62s unit. Thirteen checks were completed at the Mato Bula prospect, and four at Da
Tambuk. At Mato Bula the average deviation was 2.24 m for the easting and 1.77 m for the northing,
with the largest easting deviation recorded being 2.49 m (WMD021), and the largest northing
deviation of 5.42 m (WMD009). At Da Tambuk the average deviation was 1.58 m for the easting and
4.77 m for the northing, with the largest deviation recorded at ADD011 with an easting deviation of
4.05 m and a northing deviation of 9.57 m. The variation at Mato Bula was caused by the steep
slopes encountered on the prospect, whereas the variation at ADD011 was due to restricted satellite
acquisition, caused by the drilling pad being cut into the hillside, and the proximity of overhanging
trees.
One concrete collar location monument (WMD004) was missing during the due diligence check, and
it was probably removed by artisanal miners. In several instances at both Mato Bula and Da Tambuk,
drilling pads were partially covered by spoil from artisanal mining activity. In all probability the
concrete monuments are still intact beneath the spoil. Any missing or defaced drillhole collar slabs
should be replaced for future reference.
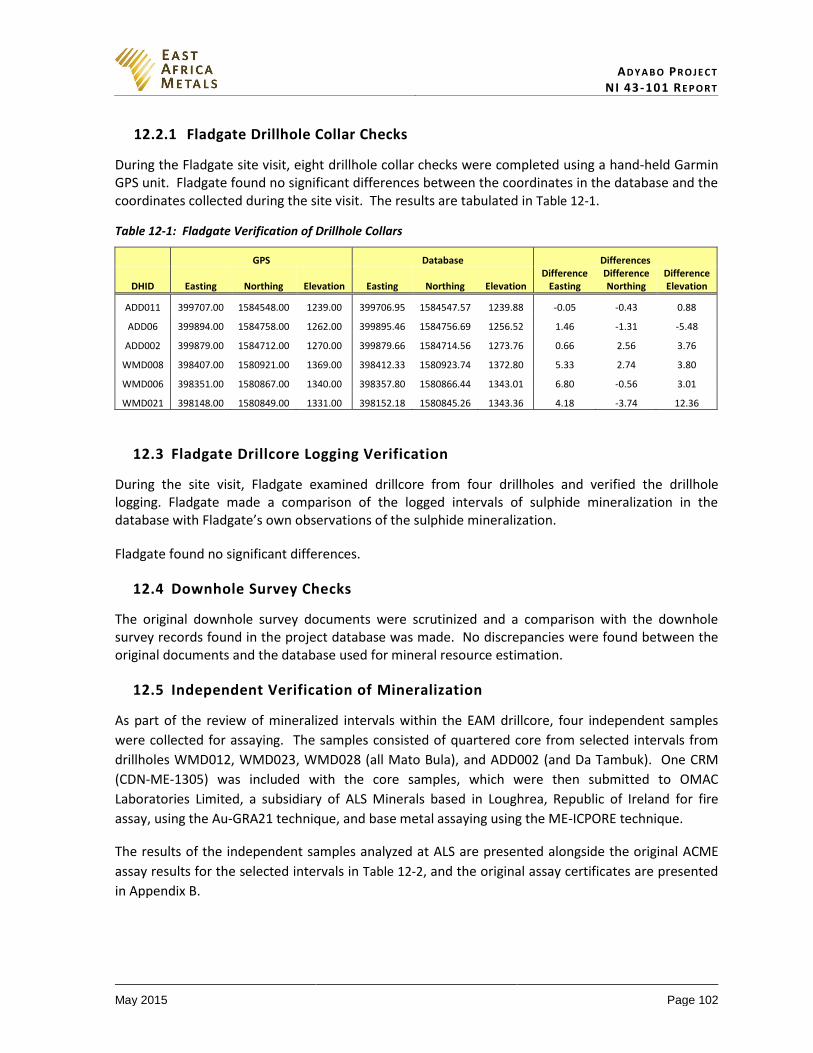
AD Y A B O PR O J E C T NI 43-101 RE P O R T
May 2015 Page 102
12.2.1 Fladgate Drillhole Collar Checks
During the Fladgate site visit, eight drillhole collar checks were completed using a hand-held Garmin GPS unit. Fladgate found no significant differences between the coordinates in the database and the coordinates collected during the site visit. The results are tabulated in Table 12-1.
Table 12-1: Fladgate Verification of Drillhole Collars
GPS Database Differences
DHID Easting Northing Elevation Easting Northing Elevation Difference
Easting Difference Northing
Difference Elevation
ADD011 399707.00 1584548.00 1239.00 399706.95 1584547.57 1239.88 -0.05 -0.43 0.88
ADD06 399894.00 1584758.00 1262.00 399895.46 1584756.69 1256.52 1.46 -1.31 -5.48
ADD002 399879.00 1584712.00 1270.00 399879.66 1584714.56 1273.76 0.66 2.56 3.76
WMD008 398407.00 1580921.00 1369.00 398412.33 1580923.74 1372.80 5.33 2.74 3.80
WMD006 398351.00 1580867.00 1340.00 398357.80 1580866.44 1343.01 6.80 -0.56 3.01
WMD021 398148.00 1580849.00 1331.00 398152.18 1580845.26 1343.36 4.18 -3.74 12.36
12.3 Fladgate Drillcore Logging Verification
During the site visit, Fladgate examined drillcore from four drillholes and verified the drillhole logging. Fladgate made a comparison of the logged intervals of sulphide mineralization in the database with Fladgate’s own observations of the sulphide mineralization.
Fladgate found no significant differences.
12.4 Downhole Survey Checks
The original downhole survey documents were scrutinized and a comparison with the downhole survey records found in the project database was made. No discrepancies were found between the original documents and the database used for mineral resource estimation.
12.5 Independent Verification of Mineralization
As part of the review of mineralized intervals within the EAM drillcore, four independent samples
were collected for assaying. The samples consisted of quartered core from selected intervals from
drillholes WMD012, WMD023, WMD028 (all Mato Bula), and ADD002 (and Da Tambuk). One CRM
(CDN-ME-1305) was included with the core samples, which were then submitted to OMAC
Laboratories Limited, a subsidiary of ALS Minerals based in Loughrea, Republic of Ireland for fire
assay, using the Au-GRA21 technique, and base metal assaying using the ME-ICPORE technique.
The results of the independent samples analyzed at ALS are presented alongside the original ACME
assay results for the selected intervals in Table 12-2, and the original assay certificates are presented
in Appendix B.
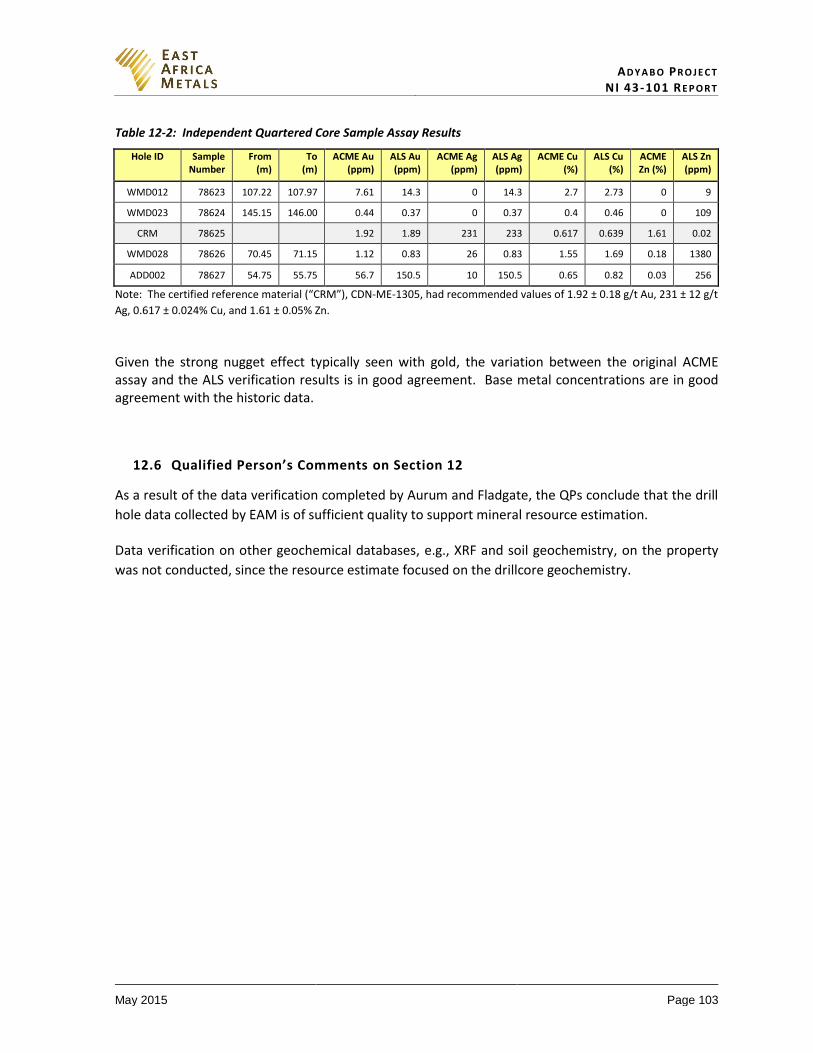
AD Y A B O PR O J E C T NI 43-101 RE P O R T
May 2015 Page 103
Table 12-2: Independent Quartered Core Sample Assay Results
Hole ID Sample Number
From (m)
To (m)
ACME Au (ppm)
ALS Au (ppm)
ACME Ag (ppm)
ALS Ag (ppm)
ACME Cu (%)
ALS Cu (%)
ACME Zn (%)
ALS Zn (ppm)
WMD012 78623 107.22 107.97 7.61 14.3 0 14.3 2.7 2.73 0 9
WMD023 78624 145.15 146.00 0.44 0.37 0 0.37 0.4 0.46 0 109
CRM 78625
1.92 1.89 231 233 0.617 0.639 1.61 0.02
WMD028 78626 70.45 71.15 1.12 0.83 26 0.83 1.55 1.69 0.18 1380
ADD002 78627 54.75 55.75 56.7 150.5 10 150.5 0.65 0.82 0.03 256
Note: The certified reference material (“CRM”), CDN-ME-1305, had recommended values of 1.92 ± 0.18 g/t Au, 231 ± 12 g/t
Ag, 0.617 ± 0.024% Cu, and 1.61 ± 0.05% Zn.
Given the strong nugget effect typically seen with gold, the variation between the original ACME assay and the ALS verification results is in good agreement. Base metal concentrations are in good agreement with the historic data.
12.6 Qualified Person’s Comments on Section 12
As a result of the data verification completed by Aurum and Fladgate, the QPs conclude that the drill
hole data collected by EAM is of sufficient quality to support mineral resource estimation.
Data verification on other geochemical databases, e.g., XRF and soil geochemistry, on the property
was not conducted, since the resource estimate focused on the drillcore geochemistry.
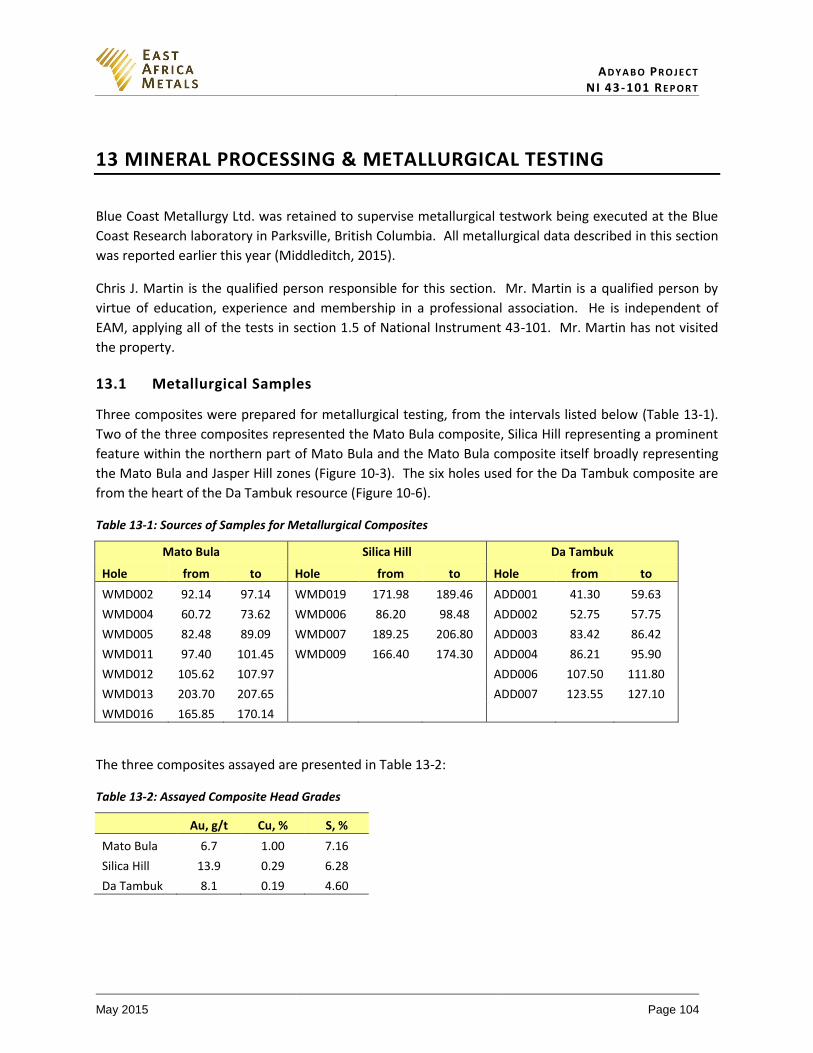
AD Y A B O PR O J E C T NI 43-101 RE P O R T
May 2015 Page 104
13 MINERAL PROCESSING & METALLURGICAL TESTING
Blue Coast Metallurgy Ltd. was retained to supervise metallurgical testwork being executed at the Blue
Coast Research laboratory in Parksville, British Columbia. All metallurgical data described in this section
was reported earlier this year (Middleditch, 2015).
Chris J. Martin is the qualified person responsible for this section. Mr. Martin is a qualified person by
virtue of education, experience and membership in a professional association. He is independent of
EAM, applying all of the tests in section 1.5 of National Instrument 43-101. Mr. Martin has not visited
the property.
13.1 Metallurgical Samples
Three composites were prepared for metallurgical testing, from the intervals listed below (Table 13-1).
Two of the three composites represented the Mato Bula composite, Silica Hill representing a prominent
feature within the northern part of Mato Bula and the Mato Bula composite itself broadly representing
the Mato Bula and Jasper Hill zones (Figure 10-3). The six holes used for the Da Tambuk composite are
from the heart of the Da Tambuk resource (Figure 10-6).
Table 13-1: Sources of Samples for Metallurgical Composites
Mato Bula Silica Hill Da Tambuk
Hole from to Hole from to Hole from to
WMD002 92.14 97.14 WMD019 171.98 189.46 ADD001 41.30 59.63
WMD004 60.72 73.62 WMD006 86.20 98.48 ADD002 52.75 57.75
WMD005 82.48 89.09 WMD007 189.25 206.80 ADD003 83.42 86.42
WMD011 97.40 101.45 WMD009 166.40 174.30 ADD004 86.21 95.90
WMD012 105.62 107.97
ADD006 107.50 111.80
WMD013 203.70 207.65
ADD007 123.55 127.10
WMD016 165.85 170.14
The three composites assayed are presented in Table 13-2:
Table 13-2: Assayed Composite Head Grades
Au, g/t Cu, % S, %
Mato Bula 6.7 1.00 7.16
Silica Hill 13.9 0.29 6.28
Da Tambuk 8.1 0.19 4.60
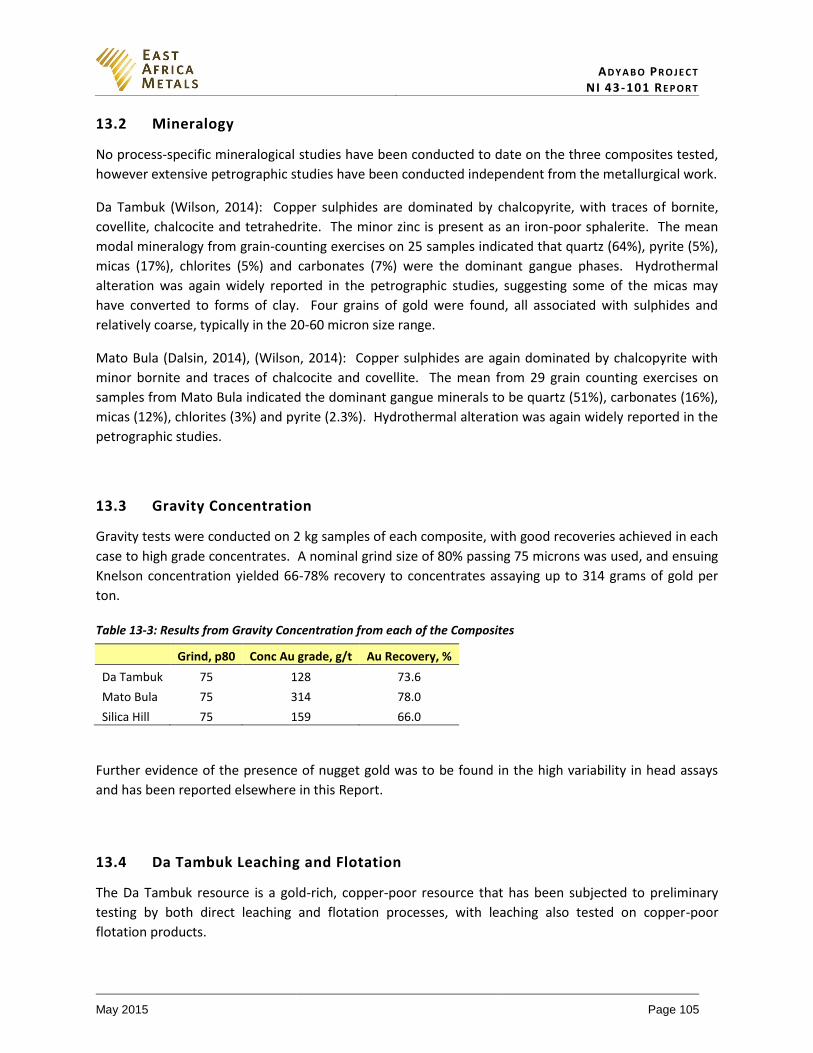
AD Y A B O PR O J E C T NI 43-101 RE P O R T
May 2015 Page 105
13.2 Mineralogy
No process-specific mineralogical studies have been conducted to date on the three composites tested,
however extensive petrographic studies have been conducted independent from the metallurgical work.
Da Tambuk (Wilson, 2014): Copper sulphides are dominated by chalcopyrite, with traces of bornite,
covellite, chalcocite and tetrahedrite. The minor zinc is present as an iron-poor sphalerite. The mean
modal mineralogy from grain-counting exercises on 25 samples indicated that quartz (64%), pyrite (5%),
micas (17%), chlorites (5%) and carbonates (7%) were the dominant gangue phases. Hydrothermal
alteration was again widely reported in the petrographic studies, suggesting some of the micas may
have converted to forms of clay. Four grains of gold were found, all associated with sulphides and
relatively coarse, typically in the 20-60 micron size range.
Mato Bula (Dalsin, 2014), (Wilson, 2014): Copper sulphides are again dominated by chalcopyrite with
minor bornite and traces of chalcocite and covellite. The mean from 29 grain counting exercises on
samples from Mato Bula indicated the dominant gangue minerals to be quartz (51%), carbonates (16%),
micas (12%), chlorites (3%) and pyrite (2.3%). Hydrothermal alteration was again widely reported in the
petrographic studies.
13.3 Gravity Concentration
Gravity tests were conducted on 2 kg samples of each composite, with good recoveries achieved in each
case to high grade concentrates. A nominal grind size of 80% passing 75 microns was used, and ensuing
Knelson concentration yielded 66-78% recovery to concentrates assaying up to 314 grams of gold per
ton.
Table 13-3: Results from Gravity Concentration from each of the Composites
Grind, p80 Conc Au grade, g/t Au Recovery, %
Da Tambuk 75 128 73.6
Mato Bula 75 314 78.0
Silica Hill 75 159 66.0
Further evidence of the presence of nugget gold was to be found in the high variability in head assays
and has been reported elsewhere in this Report.
13.4 Da Tambuk Leaching and Flotation
The Da Tambuk resource is a gold-rich, copper-poor resource that has been subjected to preliminary
testing by both direct leaching and flotation processes, with leaching also tested on copper-poor
flotation products.
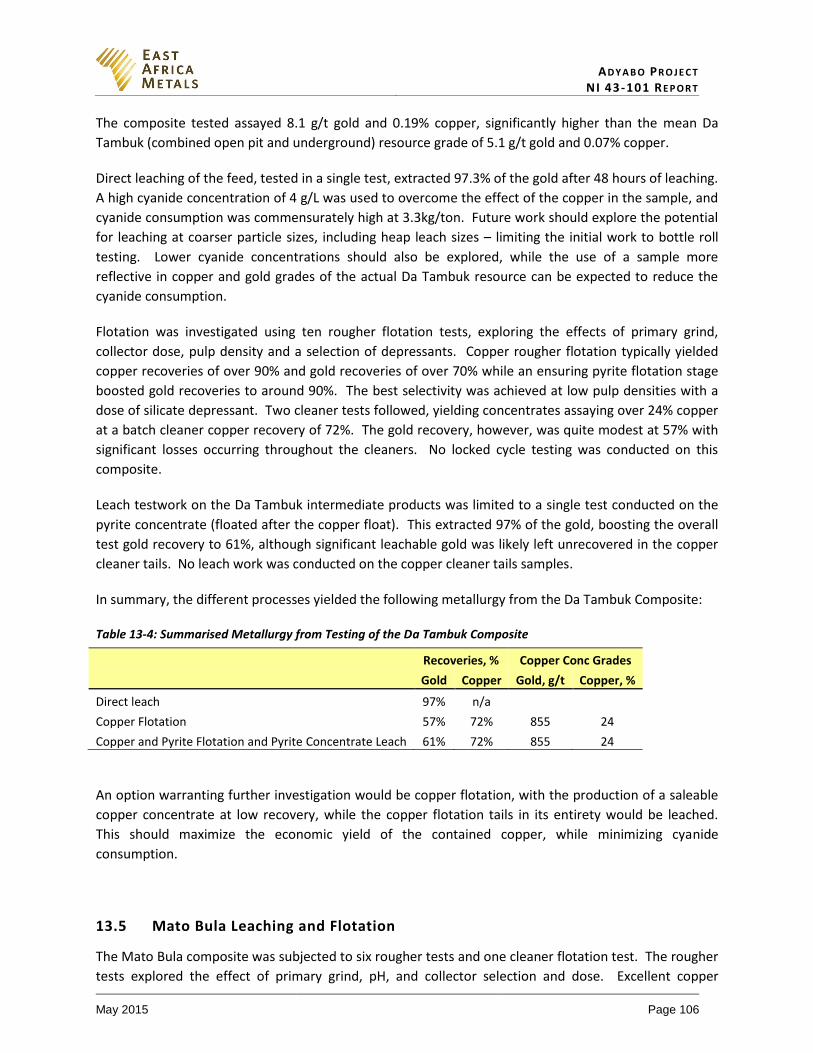
AD Y A B O PR O J E C T NI 43-101 RE P O R T
May 2015 Page 106
The composite tested assayed 8.1 g/t gold and 0.19% copper, significantly higher than the mean Da
Tambuk (combined open pit and underground) resource grade of 5.1 g/t gold and 0.07% copper.
Direct leaching of the feed, tested in a single test, extracted 97.3% of the gold after 48 hours of leaching.
A high cyanide concentration of 4 g/L was used to overcome the effect of the copper in the sample, and
cyanide consumption was commensurately high at 3.3kg/ton. Future work should explore the potential
for leaching at coarser particle sizes, including heap leach sizes – limiting the initial work to bottle roll
testing. Lower cyanide concentrations should also be explored, while the use of a sample more
reflective in copper and gold grades of the actual Da Tambuk resource can be expected to reduce the
cyanide consumption.
Flotation was investigated using ten rougher flotation tests, exploring the effects of primary grind,
collector dose, pulp density and a selection of depressants. Copper rougher flotation typically yielded
copper recoveries of over 90% and gold recoveries of over 70% while an ensuring pyrite flotation stage
boosted gold recoveries to around 90%. The best selectivity was achieved at low pulp densities with a
dose of silicate depressant. Two cleaner tests followed, yielding concentrates assaying over 24% copper
at a batch cleaner copper recovery of 72%. The gold recovery, however, was quite modest at 57% with
significant losses occurring throughout the cleaners. No locked cycle testing was conducted on this
composite.
Leach testwork on the Da Tambuk intermediate products was limited to a single test conducted on the
pyrite concentrate (floated after the copper float). This extracted 97% of the gold, boosting the overall
test gold recovery to 61%, although significant leachable gold was likely left unrecovered in the copper
cleaner tails. No leach work was conducted on the copper cleaner tails samples.
In summary, the different processes yielded the following metallurgy from the Da Tambuk Composite:
Table 13-4: Summarised Metallurgy from Testing of the Da Tambuk Composite
Recoveries, % Copper Conc Grades
Gold Copper Gold, g/t Copper, %
Direct leach 97% n/a Copper Flotation 57% 72% 855 24
Copper and Pyrite Flotation and Pyrite Concentrate Leach 61% 72% 855 24
An option warranting further investigation would be copper flotation, with the production of a saleable
copper concentrate at low recovery, while the copper flotation tails in its entirety would be leached.
This should maximize the economic yield of the contained copper, while minimizing cyanide
consumption.
13.5 Mato Bula Leaching and Flotation
The Mato Bula composite was subjected to six rougher tests and one cleaner flotation test. The rougher
tests explored the effect of primary grind, pH, and collector selection and dose. Excellent copper
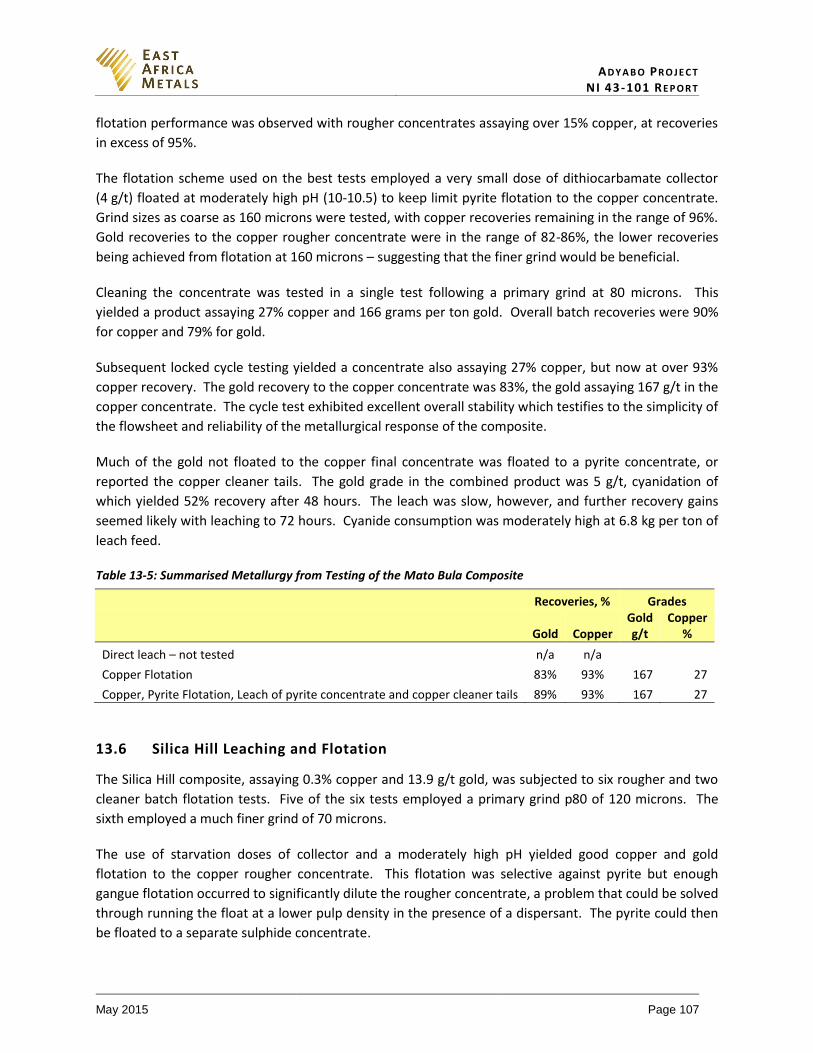
AD Y A B O PR O J E C T NI 43-101 RE P O R T
May 2015 Page 107
flotation performance was observed with rougher concentrates assaying over 15% copper, at recoveries
in excess of 95%.
The flotation scheme used on the best tests employed a very small dose of dithiocarbamate collector
(4 g/t) floated at moderately high pH (10-10.5) to keep limit pyrite flotation to the copper concentrate.
Grind sizes as coarse as 160 microns were tested, with copper recoveries remaining in the range of 96%.
Gold recoveries to the copper rougher concentrate were in the range of 82-86%, the lower recoveries
being achieved from flotation at 160 microns – suggesting that the finer grind would be beneficial.
Cleaning the concentrate was tested in a single test following a primary grind at 80 microns. This
yielded a product assaying 27% copper and 166 grams per ton gold. Overall batch recoveries were 90%
for copper and 79% for gold.
Subsequent locked cycle testing yielded a concentrate also assaying 27% copper, but now at over 93%
copper recovery. The gold recovery to the copper concentrate was 83%, the gold assaying 167 g/t in the
copper concentrate. The cycle test exhibited excellent overall stability which testifies to the simplicity of
the flowsheet and reliability of the metallurgical response of the composite.
Much of the gold not floated to the copper final concentrate was floated to a pyrite concentrate, or
reported the copper cleaner tails. The gold grade in the combined product was 5 g/t, cyanidation of
which yielded 52% recovery after 48 hours. The leach was slow, however, and further recovery gains
seemed likely with leaching to 72 hours. Cyanide consumption was moderately high at 6.8 kg per ton of
leach feed.
Table 13-5: Summarised Metallurgy from Testing of the Mato Bula Composite
Recoveries, % Grades
Gold Copper
Gold g/t
Copper %
Direct leach – not tested n/a n/a Copper Flotation 83% 93% 167 27
Copper, Pyrite Flotation, Leach of pyrite concentrate and copper cleaner tails 89% 93% 167 27
13.6 Silica Hill Leaching and Flotation
The Silica Hill composite, assaying 0.3% copper and 13.9 g/t gold, was subjected to six rougher and two
cleaner batch flotation tests. Five of the six tests employed a primary grind p80 of 120 microns. The
sixth employed a much finer grind of 70 microns.
The use of starvation doses of collector and a moderately high pH yielded good copper and gold
flotation to the copper rougher concentrate. This flotation was selective against pyrite but enough
gangue flotation occurred to significantly dilute the rougher concentrate, a problem that could be solved
through running the float at a lower pulp density in the presence of a dispersant. The pyrite could then
be floated to a separate sulphide concentrate.
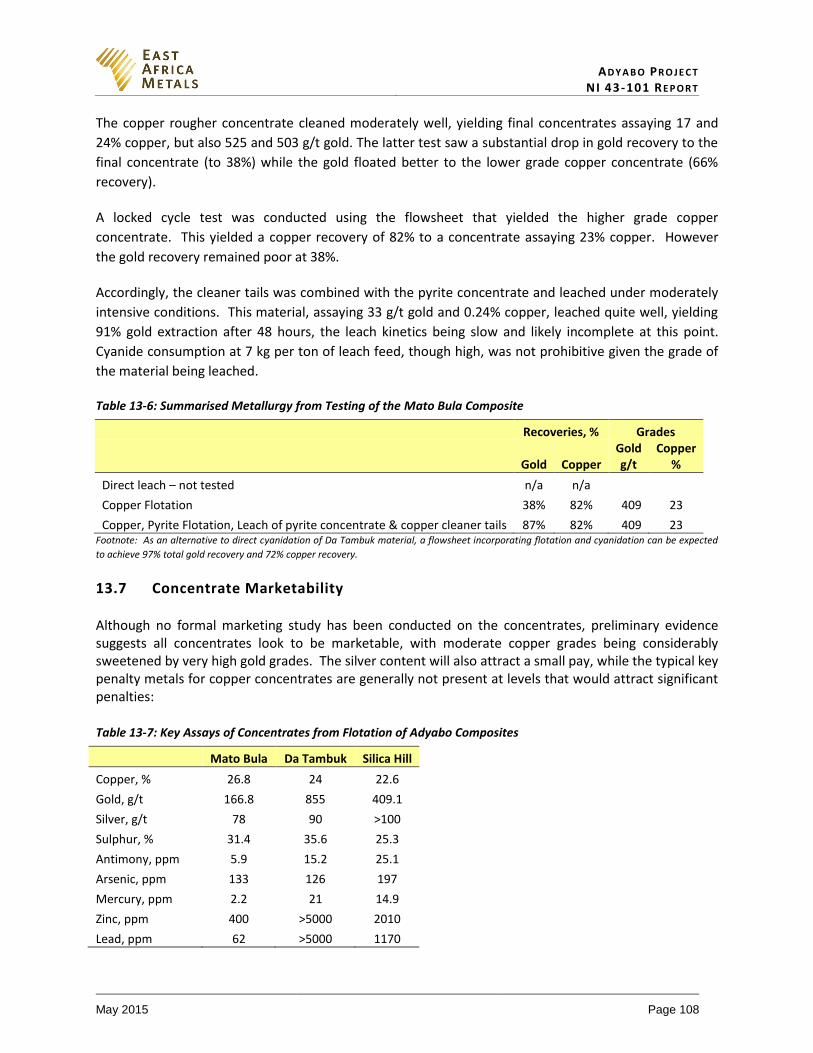
AD Y A B O PR O J E C T NI 43-101 RE P O R T
May 2015 Page 108
The copper rougher concentrate cleaned moderately well, yielding final concentrates assaying 17 and
24% copper, but also 525 and 503 g/t gold. The latter test saw a substantial drop in gold recovery to the
final concentrate (to 38%) while the gold floated better to the lower grade copper concentrate (66%
recovery).
A locked cycle test was conducted using the flowsheet that yielded the higher grade copper
concentrate. This yielded a copper recovery of 82% to a concentrate assaying 23% copper. However
the gold recovery remained poor at 38%.
Accordingly, the cleaner tails was combined with the pyrite concentrate and leached under moderately
intensive conditions. This material, assaying 33 g/t gold and 0.24% copper, leached quite well, yielding
91% gold extraction after 48 hours, the leach kinetics being slow and likely incomplete at this point.
Cyanide consumption at 7 kg per ton of leach feed, though high, was not prohibitive given the grade of
the material being leached.
Table 13-6: Summarised Metallurgy from Testing of the Mato Bula Composite
Recoveries, % Grades
Gold Copper
Gold g/t
Copper %
Direct leach – not tested n/a n/a Copper Flotation 38% 82% 409 23
Copper, Pyrite Flotation, Leach of pyrite concentrate & copper cleaner tails 87% 82% 409 23 Footnote: As an alternative to direct cyanidation of Da Tambuk material, a flowsheet incorporating flotation and cyanidation can be expected
to achieve 97% total gold recovery and 72% copper recovery.
13.7 Concentrate Marketability
Although no formal marketing study has been conducted on the concentrates, preliminary evidence suggests all concentrates look to be marketable, with moderate copper grades being considerably sweetened by very high gold grades. The silver content will also attract a small pay, while the typical key penalty metals for copper concentrates are generally not present at levels that would attract significant penalties:
Table 13-7: Key Assays of Concentrates from Flotation of Adyabo Composites
Mato Bula Da Tambuk Silica Hill
Copper, % 26.8 24 22.6
Gold, g/t 166.8 855 409.1
Silver, g/t 78 90 >100
Sulphur, % 31.4 35.6 25.3
Antimony, ppm 5.9 15.2 25.1
Arsenic, ppm 133 126 197
Mercury, ppm 2.2 21 14.9
Zinc, ppm 400 >5000 2010
Lead, ppm 62 >5000 1170
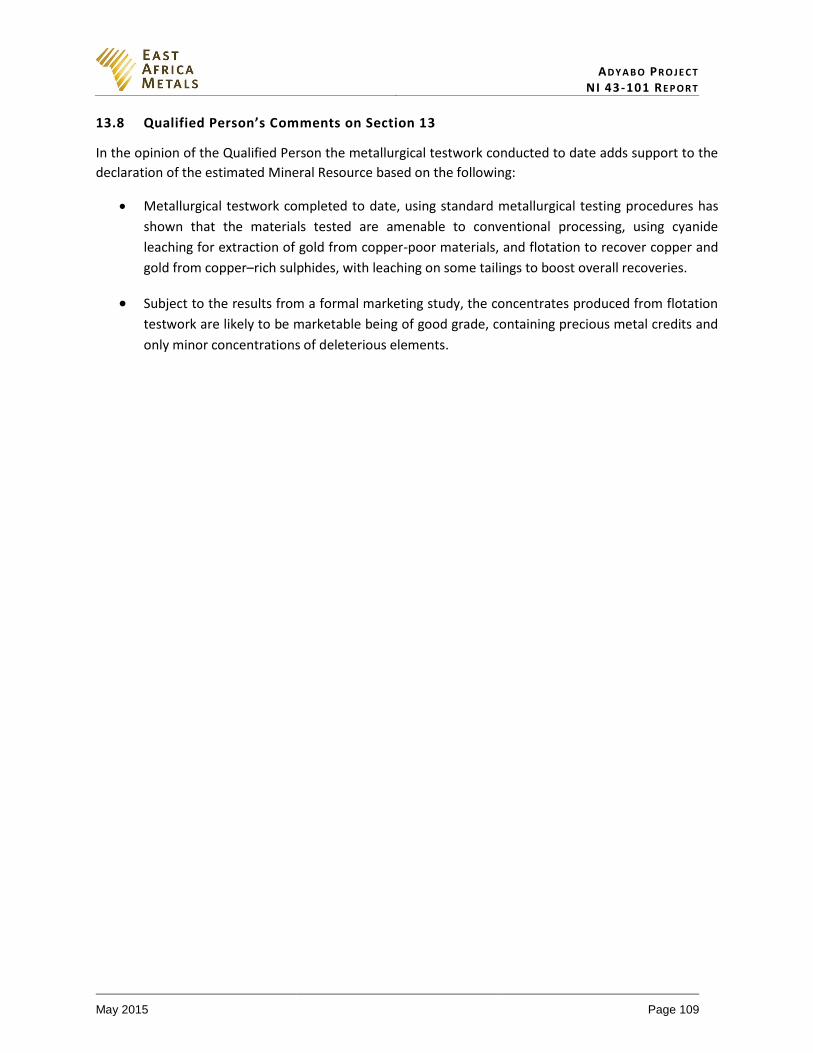
AD Y A B O PR O J E C T NI 43-101 RE P O R T
May 2015 Page 109
13.8 Qualified Person’s Comments on Section 13
In the opinion of the Qualified Person the metallurgical testwork conducted to date adds support to the
declaration of the estimated Mineral Resource based on the following:
Metallurgical testwork completed to date, using standard metallurgical testing procedures has
shown that the materials tested are amenable to conventional processing, using cyanide
leaching for extraction of gold from copper-poor materials, and flotation to recover copper and
gold from copper–rich sulphides, with leaching on some tailings to boost overall recoveries.
Subject to the results from a formal marketing study, the concentrates produced from flotation
testwork are likely to be marketable being of good grade, containing precious metal credits and
only minor concentrations of deleterious elements.
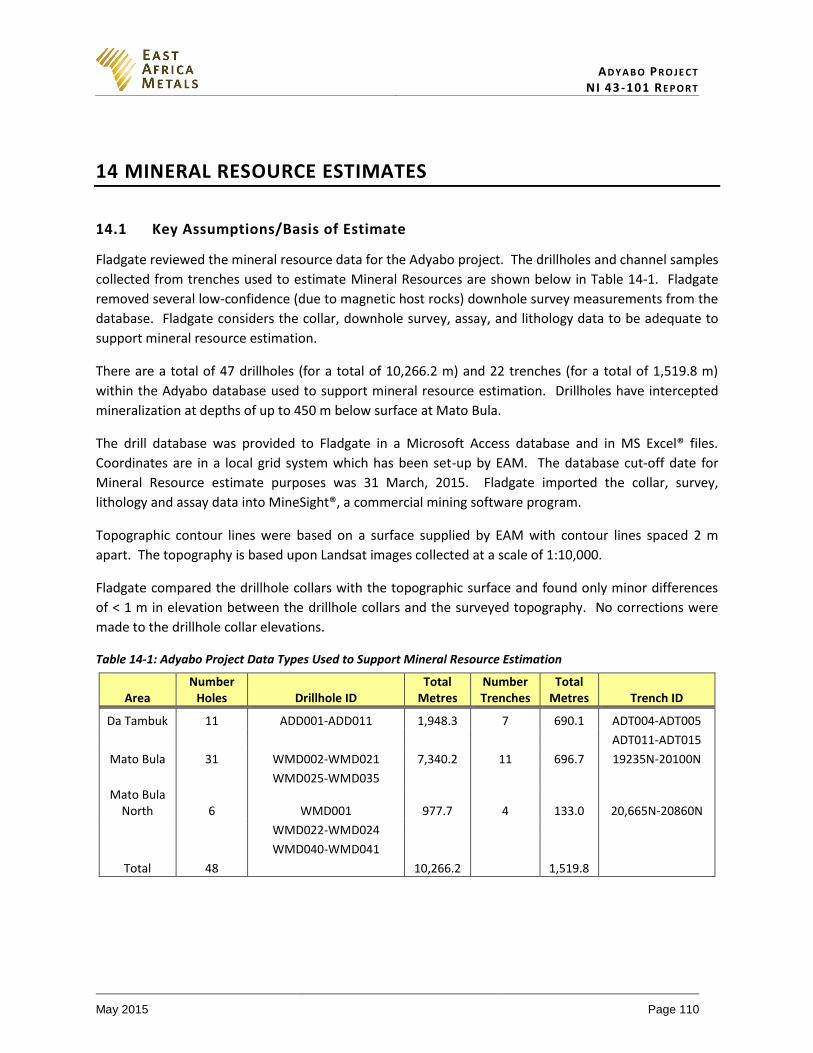
AD Y A B O PR O J E C T NI 43-101 RE P O R T
May 2015 Page 110
14 MINERAL RESOURCE ESTIMATES
14.1 Key Assumptions/Basis of Estimate
Fladgate reviewed the mineral resource data for the Adyabo project. The drillholes and channel samples
collected from trenches used to estimate Mineral Resources are shown below in Table 14-1. Fladgate
removed several low-confidence (due to magnetic host rocks) downhole survey measurements from the
database. Fladgate considers the collar, downhole survey, assay, and lithology data to be adequate to
support mineral resource estimation.
There are a total of 47 drillholes (for a total of 10,266.2 m) and 22 trenches (for a total of 1,519.8 m)
within the Adyabo database used to support mineral resource estimation. Drillholes have intercepted
mineralization at depths of up to 450 m below surface at Mato Bula.
The drill database was provided to Fladgate in a Microsoft Access database and in MS Excel® files.
Coordinates are in a local grid system which has been set-up by EAM. The database cut-off date for
Mineral Resource estimate purposes was 31 March, 2015. Fladgate imported the collar, survey,
lithology and assay data into MineSight®, a commercial mining software program.
Topographic contour lines were based on a surface supplied by EAM with contour lines spaced 2 m
apart. The topography is based upon Landsat images collected at a scale of 1:10,000.
Fladgate compared the drillhole collars with the topographic surface and found only minor differences
of < 1 m in elevation between the drillhole collars and the surveyed topography. No corrections were
made to the drillhole collar elevations.
Table 14-1: Adyabo Project Data Types Used to Support Mineral Resource Estimation
Area Number
Holes Drillhole ID Total
Metres Number Trenches
Total Metres Trench ID
Da Tambuk 11 ADD001-ADD011 1,948.3 7 690.1 ADT004-ADT005
ADT011-ADT015
Mato Bula 31 WMD002-WMD021 7,340.2 11 696.7 19235N-20100N
WMD025-WMD035
Mato Bula North 6 WMD001 977.7 4 133.0 20,665N-20860N
WMD022-WMD024
WMD040-WMD041
Total 48 10,266.2 1,519.8
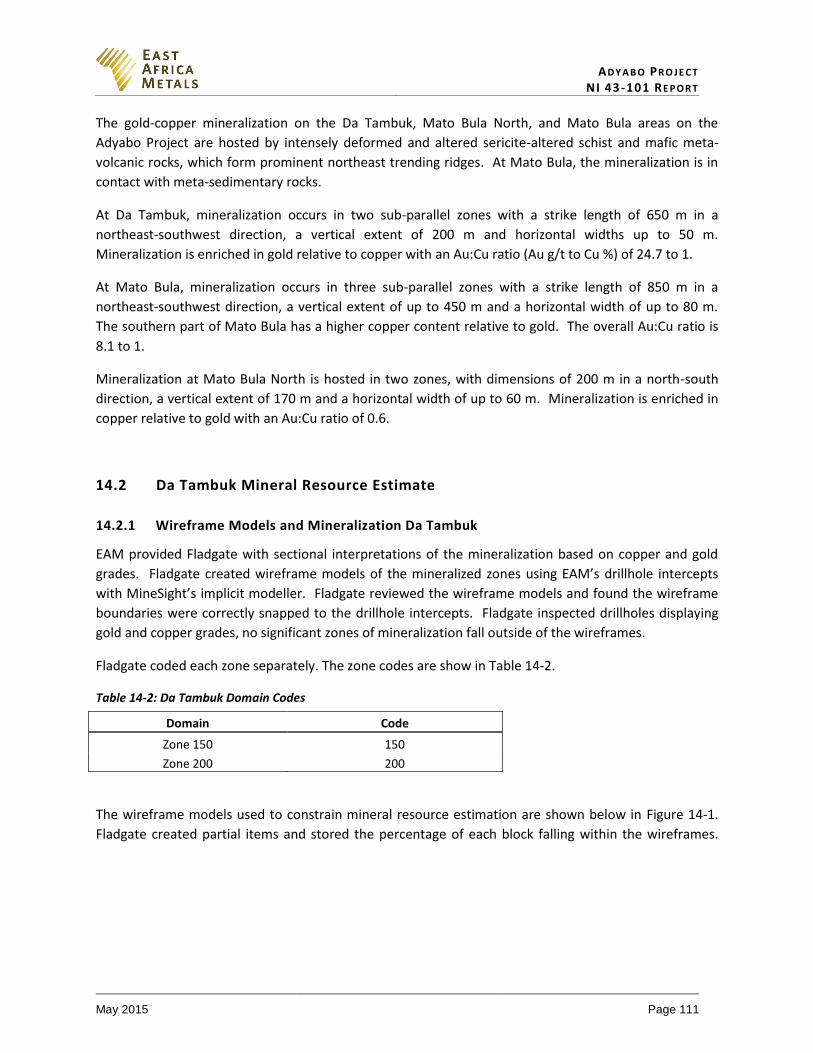
AD Y A B O PR O J E C T NI 43-101 RE P O R T
May 2015 Page 111
The gold-copper mineralization on the Da Tambuk, Mato Bula North, and Mato Bula areas on the
Adyabo Project are hosted by intensely deformed and altered sericite-altered schist and mafic meta-
volcanic rocks, which form prominent northeast trending ridges. At Mato Bula, the mineralization is in
contact with meta-sedimentary rocks.
At Da Tambuk, mineralization occurs in two sub-parallel zones with a strike length of 650 m in a
northeast-southwest direction, a vertical extent of 200 m and horizontal widths up to 50 m.
Mineralization is enriched in gold relative to copper with an Au:Cu ratio (Au g/t to Cu %) of 24.7 to 1.
At Mato Bula, mineralization occurs in three sub-parallel zones with a strike length of 850 m in a
northeast-southwest direction, a vertical extent of up to 450 m and a horizontal width of up to 80 m.
The southern part of Mato Bula has a higher copper content relative to gold. The overall Au:Cu ratio is
8.1 to 1.
Mineralization at Mato Bula North is hosted in two zones, with dimensions of 200 m in a north-south
direction, a vertical extent of 170 m and a horizontal width of up to 60 m. Mineralization is enriched in
copper relative to gold with an Au:Cu ratio of 0.6.
14.2 Da Tambuk Mineral Resource Estimate
14.2.1 Wireframe Models and Mineralization Da Tambuk
EAM provided Fladgate with sectional interpretations of the mineralization based on copper and gold
grades. Fladgate created wireframe models of the mineralized zones using EAM’s drillhole intercepts
with MineSight’s implicit modeller. Fladgate reviewed the wireframe models and found the wireframe
boundaries were correctly snapped to the drillhole intercepts. Fladgate inspected drillholes displaying
gold and copper grades, no significant zones of mineralization fall outside of the wireframes.
Fladgate coded each zone separately. The zone codes are show in Table 14-2.
Table 14-2: Da Tambuk Domain Codes
Domain Code
Zone 150 150
Zone 200 200
The wireframe models used to constrain mineral resource estimation are shown below in Figure 14-1.
Fladgate created partial items and stored the percentage of each block falling within the wireframes.
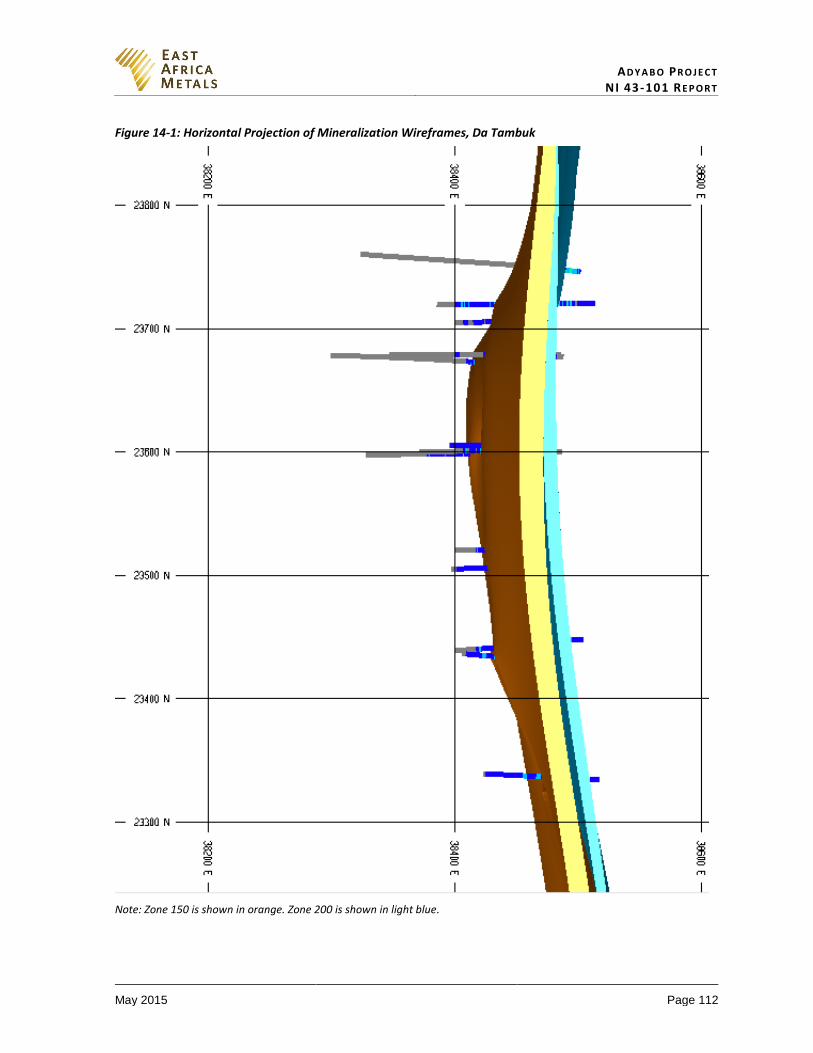
AD Y A B O PR O J E C T NI 43-101 RE P O R T
May 2015 Page 112
Figure 14-1: Horizontal Projection of Mineralization Wireframes, Da Tambuk
Note: Zone 150 is shown in orange. Zone 200 is shown in light blue.
AD Y A B O PR O J E C T NI 43-101 RE P O R T
May 2015 Page 113
14.2.2 Exploratory Data Analysis (EDA)
Exploratory data analysis (EDA) comprised basic statistical evaluation of the assays and composites
for gold, copper, silver and sample length.
14.2.3 Assays
14.2.3.1 Histograms and Probability Plots
Log-scaled histograms and probability plots for copper, gold and silver within the 150 Zone show
evidence for mixed populations. The log-scaled histogram for the 150 zone shows the presence of an
included higher-grade population, comprising 10% of the samples. Fladgate concludes that this
amount of included higher-grade material warrants further domaining. The gold histograms and
probability plots for the 150 and 200 zones are shown below in Figure 14-2 and in Figure 14-3.
Figure 14-2: Zone 150 Histograms and Probability Plots, Assays
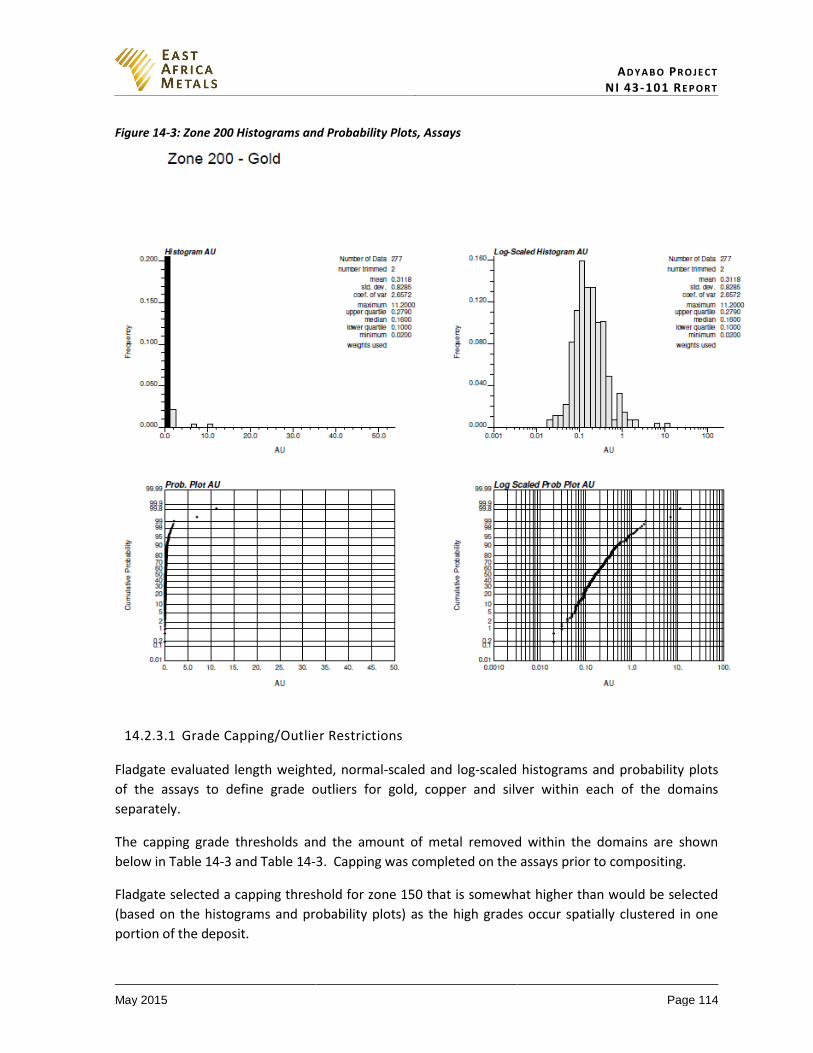
AD Y A B O PR O J E C T NI 43-101 RE P O R T
May 2015 Page 114
Figure 14-3: Zone 200 Histograms and Probability Plots, Assays
14.2.3.1 Grade Capping/Outlier Restrictions
Fladgate evaluated length weighted, normal-scaled and log-scaled histograms and probability plots
of the assays to define grade outliers for gold, copper and silver within each of the domains
separately.
The capping grade thresholds and the amount of metal removed within the domains are shown
below in Table 14-3 and Table 14-3. Capping was completed on the assays prior to compositing.
Fladgate selected a capping threshold for zone 150 that is somewhat higher than would be selected
(based on the histograms and probability plots) as the high grades occur spatially clustered in one
portion of the deposit.
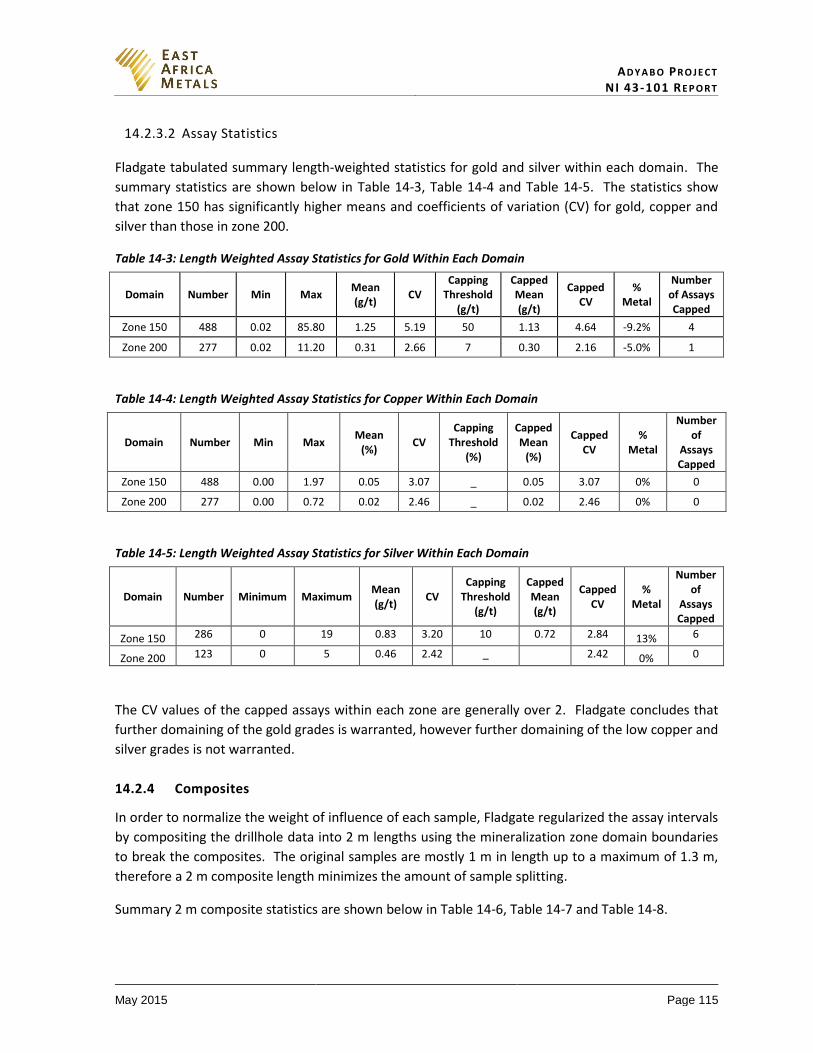
AD Y A B O PR O J E C T NI 43-101 RE P O R T
May 2015 Page 115
14.2.3.2 Assay Statistics
Fladgate tabulated summary length-weighted statistics for gold and silver within each domain. The
summary statistics are shown below in Table 14-3, Table 14-4 and Table 14-5. The statistics show
that zone 150 has significantly higher means and coefficients of variation (CV) for gold, copper and
silver than those in zone 200.
Table 14-3: Length Weighted Assay Statistics for Gold Within Each Domain
Domain Number Min Max Mean (g/t)
CV Capping
Threshold (g/t)
Capped Mean (g/t)
Capped CV
% Metal
Number of Assays Capped
Zone 150 488 0.02 85.80 1.25 5.19 50 1.13 4.64 -9.2% 4
Zone 200 277 0.02 11.20 0.31 2.66 7 0.30 2.16 -5.0% 1
Table 14-4: Length Weighted Assay Statistics for Copper Within Each Domain
Domain Number Min Max Mean
(%) CV
Capping Threshold
(%)
Capped Mean
(%)
Capped CV
% Metal
Number of
Assays Capped
Zone 150 488 0.00 1.97 0.05 3.07 _ 0.05 3.07 0% 0
Zone 200 277 0.00 0.72 0.02 2.46 _ 0.02 2.46 0% 0
Table 14-5: Length Weighted Assay Statistics for Silver Within Each Domain
Domain Number Minimum Maximum Mean (g/t)
CV Capping
Threshold (g/t)
Capped Mean (g/t)
Capped CV
% Metal
Number of
Assays Capped
Zone 150 286 0 19 0.83 3.20 10 0.72 2.84 13% 6
Zone 200 123 0 5 0.46 2.42 _ 2.42 0% 0
The CV values of the capped assays within each zone are generally over 2. Fladgate concludes that
further domaining of the gold grades is warranted, however further domaining of the low copper and
silver grades is not warranted.
14.2.4 Composites
In order to normalize the weight of influence of each sample, Fladgate regularized the assay intervals
by compositing the drillhole data into 2 m lengths using the mineralization zone domain boundaries
to break the composites. The original samples are mostly 1 m in length up to a maximum of 1.3 m,
therefore a 2 m composite length minimizes the amount of sample splitting.
Summary 2 m composite statistics are shown below in Table 14-6, Table 14-7 and Table 14-8.
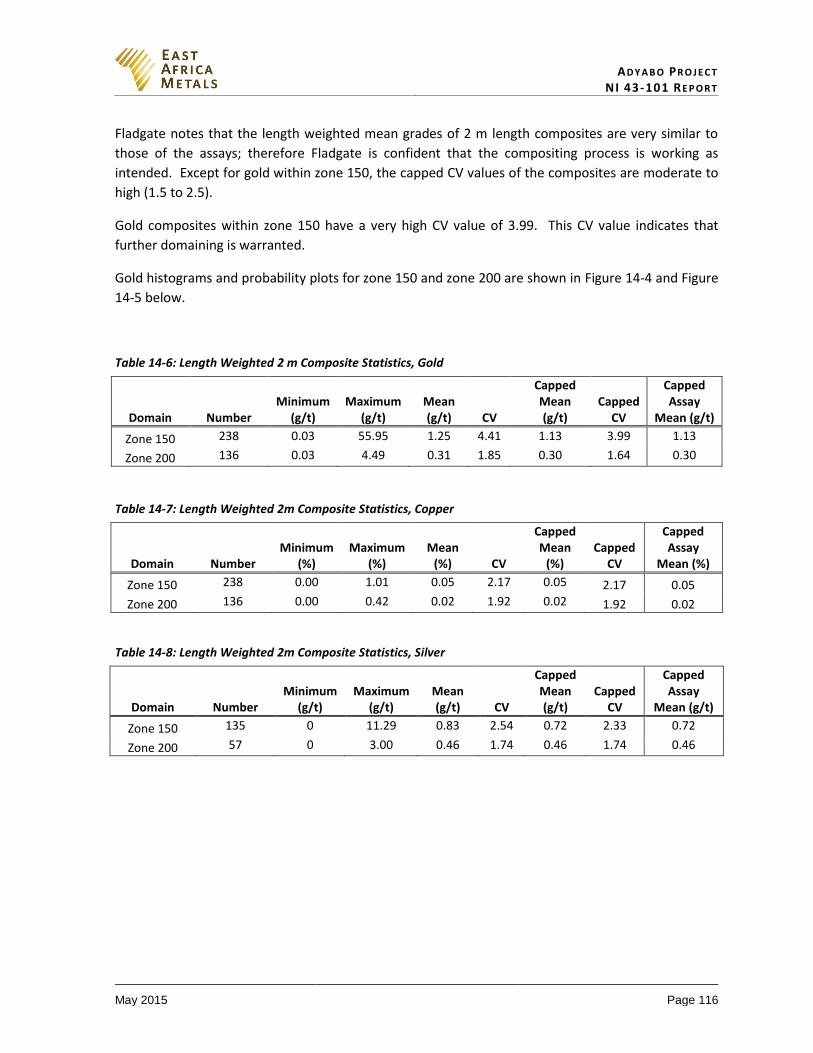
AD Y A B O PR O J E C T NI 43-101 RE P O R T
May 2015 Page 116
Fladgate notes that the length weighted mean grades of 2 m length composites are very similar to
those of the assays; therefore Fladgate is confident that the compositing process is working as
intended. Except for gold within zone 150, the capped CV values of the composites are moderate to
high (1.5 to 2.5).
Gold composites within zone 150 have a very high CV value of 3.99. This CV value indicates that
further domaining is warranted.
Gold histograms and probability plots for zone 150 and zone 200 are shown in Figure 14-4 and Figure
14-5 below.
Table 14-6: Length Weighted 2 m Composite Statistics, Gold
Domain Number Minimum
(g/t) Maximum
(g/t) Mean (g/t) CV
Capped Mean (g/t)
Capped CV
Capped Assay
Mean (g/t)
Zone 150 238 0.03 55.95 1.25 4.41 1.13 3.99 1.13
Zone 200 136 0.03 4.49 0.31 1.85 0.30 1.64 0.30
Table 14-7: Length Weighted 2m Composite Statistics, Copper
Domain Number Minimum
(%) Maximum
(%) Mean
(%) CV
Capped Mean
(%) Capped
CV
Capped Assay
Mean (%)
Zone 150 238 0.00 1.01 0.05 2.17 0.05 2.17 0.05
Zone 200 136 0.00 0.42 0.02 1.92 0.02 1.92 0.02
Table 14-8: Length Weighted 2m Composite Statistics, Silver
Domain Number Minimum
(g/t) Maximum
(g/t) Mean (g/t) CV
Capped Mean (g/t)
Capped CV
Capped Assay
Mean (g/t)
Zone 150 135 0 11.29 0.83 2.54 0.72 2.33 0.72
Zone 200 57 0 3.00 0.46 1.74 0.46 1.74 0.46
AD Y A B O PR O J E C T NI 43-101 RE P O R T
May 2015 Page 117
Figure 14-4: Da Tambuk Zone 150 Histograms and Probability Plots, Capped Composites
Figure 14-5: Da Tambuk Zone 200 Histograms and Probability Plots, Capped Composites
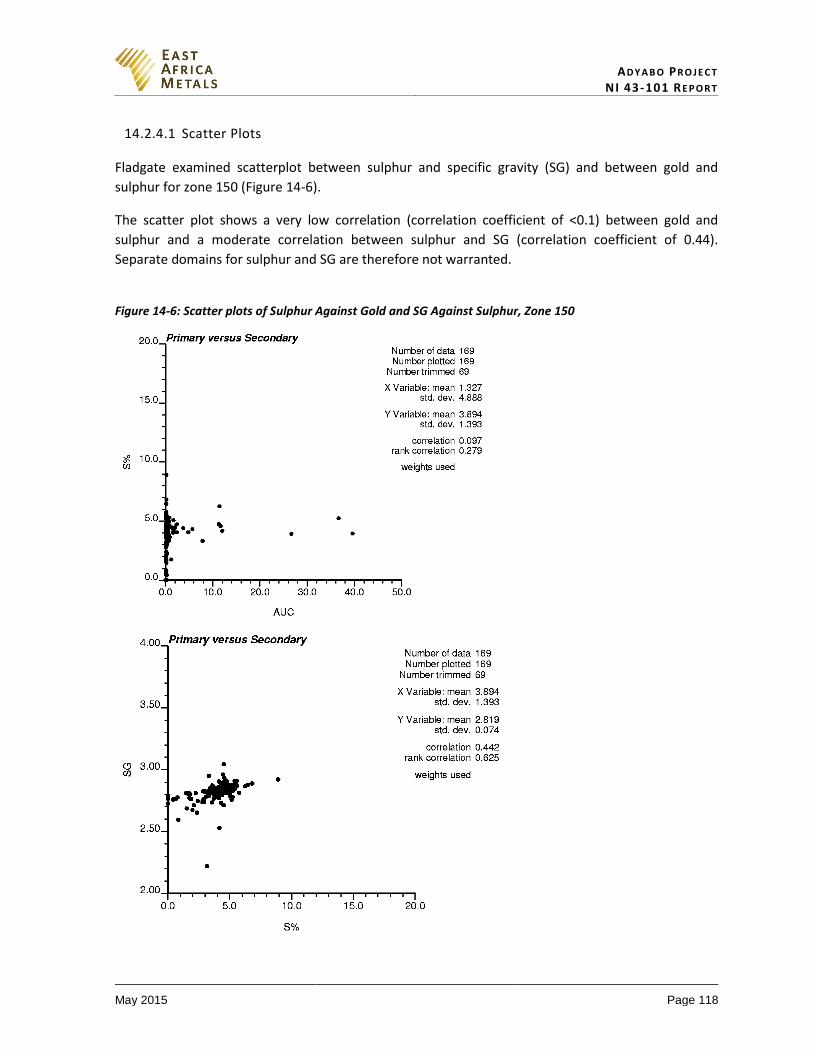
AD Y A B O PR O J E C T NI 43-101 RE P O R T
May 2015 Page 118
14.2.4.1 Scatter Plots
Fladgate examined scatterplot between sulphur and specific gravity (SG) and between gold and
sulphur for zone 150 (Figure 14-6).
The scatter plot shows a very low correlation (correlation coefficient of <0.1) between gold and
sulphur and a moderate correlation between sulphur and SG (correlation coefficient of 0.44).
Separate domains for sulphur and SG are therefore not warranted.
Figure 14-6: Scatter plots of Sulphur Against Gold and SG Against Sulphur, Zone 150
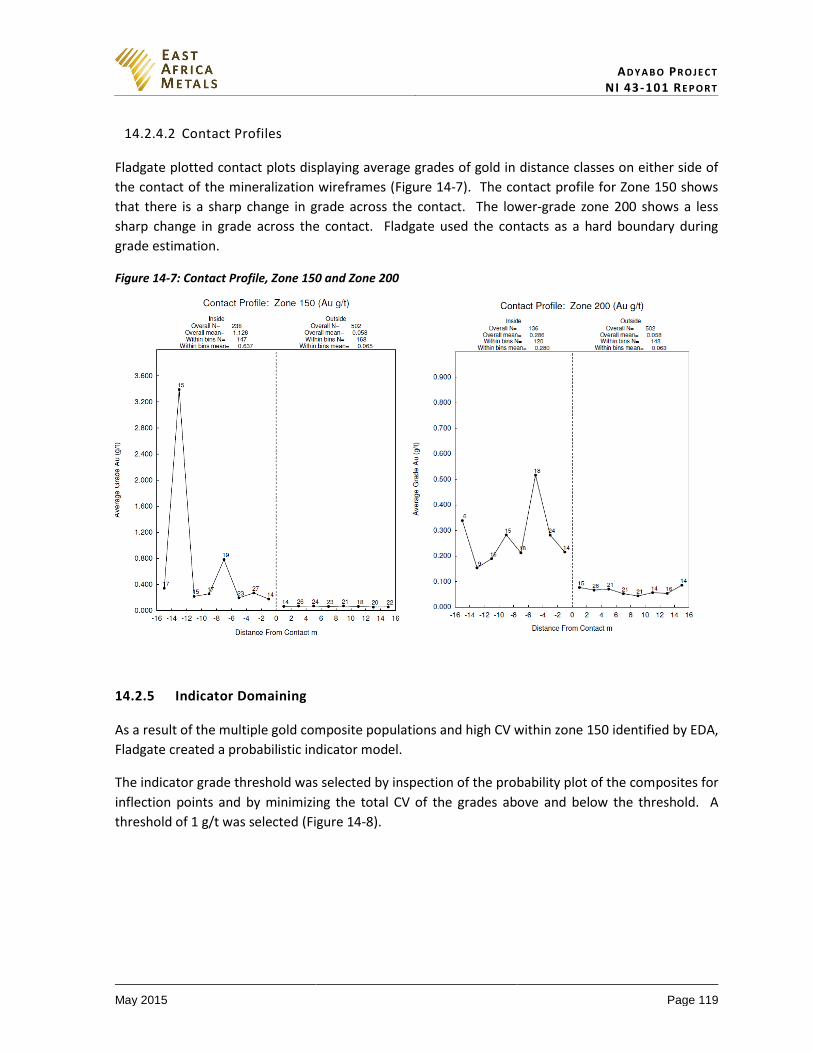
AD Y A B O PR O J E C T NI 43-101 RE P O R T
May 2015 Page 119
14.2.4.2 Contact Profiles
Fladgate plotted contact plots displaying average grades of gold in distance classes on either side of
the contact of the mineralization wireframes (Figure 14-7). The contact profile for Zone 150 shows
that there is a sharp change in grade across the contact. The lower-grade zone 200 shows a less
sharp change in grade across the contact. Fladgate used the contacts as a hard boundary during
grade estimation.
Figure 14-7: Contact Profile, Zone 150 and Zone 200
14.2.5 Indicator Domaining
As a result of the multiple gold composite populations and high CV within zone 150 identified by EDA,
Fladgate created a probabilistic indicator model.
The indicator grade threshold was selected by inspection of the probability plot of the composites for
inflection points and by minimizing the total CV of the grades above and below the threshold. A
threshold of 1 g/t was selected (Figure 14-8).

AD Y A B O PR O J E C T NI 43-101 RE P O R T
May 2015 Page 120
Figure 14-8: Plot of CV against Average Gold Grade, Zone 150
Fladgate coded the composites with a value of 1 if the gold grade was ≥ 1 g/t Au and a code of 0 if
the gold grade was below 1 g/t. The composite indicator values were used to estimate block
indicator values using inverse distance to the power of three (IDW3). A nearest-neighbour model
(NN) was estimated and assumed to represent an unbiased estimate of the proportion of blocks
above the grade threshold.
A threshold indicator value of 0.44 was selected in the IDW3 model such that a close approximation
of the number of blocks with an indicator value of one in the NN model is achieved (shown in Table
14-9). Blocks were coded above and below this indicator threshold. The composites were then back-
tagged with the code from the blocks.
Summary statistics of the coded composites are shown below in Table 14-10. Fladgate notes that the
CV of the low grade composites is highly affected by the misclassification of two high grade
composites. This composite misclassification was not adjusted. Overall the indicator coding is
successful in separating low grade mineralization from higher grade mineralization.
0.00
1.00
2.00
3.00
4.00
5.00
6.00
0.00 2.00 4.00 6.00 8.00 10.00
Co
effi
cien
t o
f V
aria
tio
n (
CV
)
Average Grade (Au g/t)
Low to High CV High to Low CV Total CV
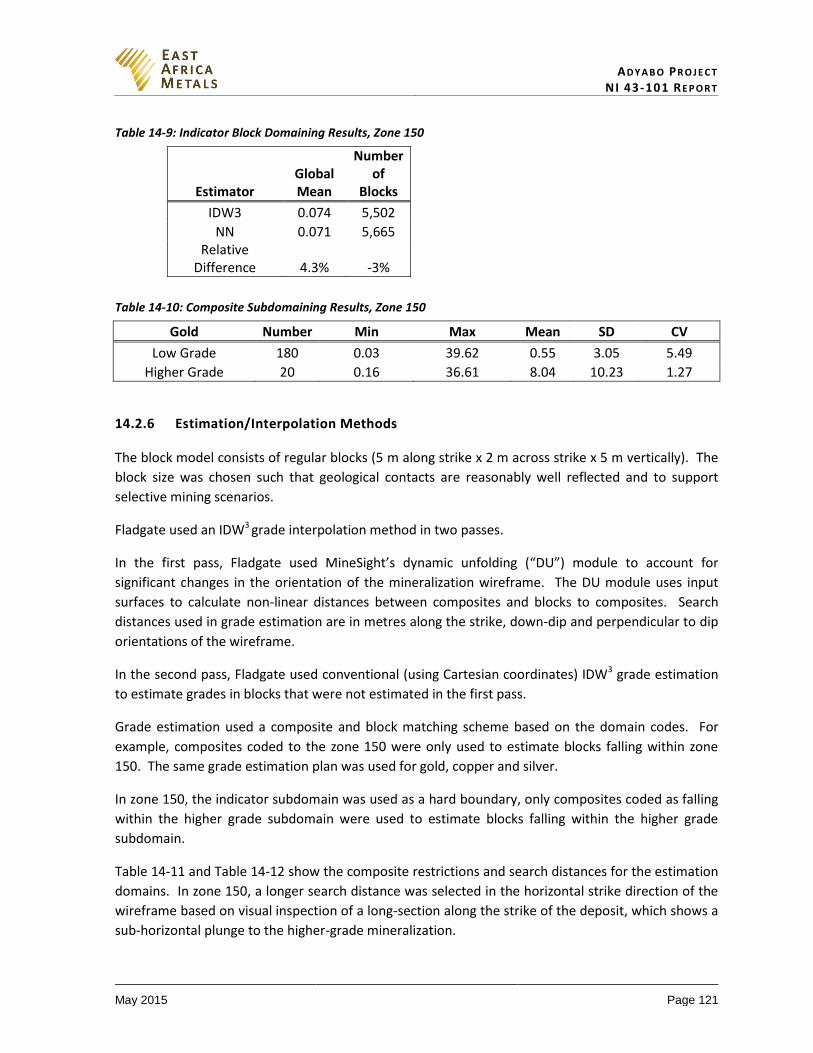
AD Y A B O PR O J E C T NI 43-101 RE P O R T
May 2015 Page 121
Table 14-9: Indicator Block Domaining Results, Zone 150
Estimator Global Mean
Number of
Blocks
IDW3 0.074 5,502
NN 0.071 5,665 Relative
Difference 4.3% -3%
Table 14-10: Composite Subdomaining Results, Zone 150
Gold Number Min Max Mean SD CV
Low Grade 180 0.03 39.62 0.55 3.05 5.49
Higher Grade 20 0.16 36.61 8.04 10.23 1.27
14.2.6 Estimation/Interpolation Methods
The block model consists of regular blocks (5 m along strike x 2 m across strike x 5 m vertically). The
block size was chosen such that geological contacts are reasonably well reflected and to support
selective mining scenarios.
Fladgate used an IDW3 grade interpolation method in two passes.
In the first pass, Fladgate used MineSight’s dynamic unfolding (“DU”) module to account for
significant changes in the orientation of the mineralization wireframe. The DU module uses input
surfaces to calculate non-linear distances between composites and blocks to composites. Search
distances used in grade estimation are in metres along the strike, down-dip and perpendicular to dip
orientations of the wireframe.
In the second pass, Fladgate used conventional (using Cartesian coordinates) IDW3 grade estimation
to estimate grades in blocks that were not estimated in the first pass.
Grade estimation used a composite and block matching scheme based on the domain codes. For
example, composites coded to the zone 150 were only used to estimate blocks falling within zone
150. The same grade estimation plan was used for gold, copper and silver.
In zone 150, the indicator subdomain was used as a hard boundary, only composites coded as falling
within the higher grade subdomain were used to estimate blocks falling within the higher grade
subdomain.
Table 14-11 and Table 14-12 show the composite restrictions and search distances for the estimation
domains. In zone 150, a longer search distance was selected in the horizontal strike direction of the
wireframe based on visual inspection of a long-section along the strike of the deposit, which shows a
sub-horizontal plunge to the higher-grade mineralization.
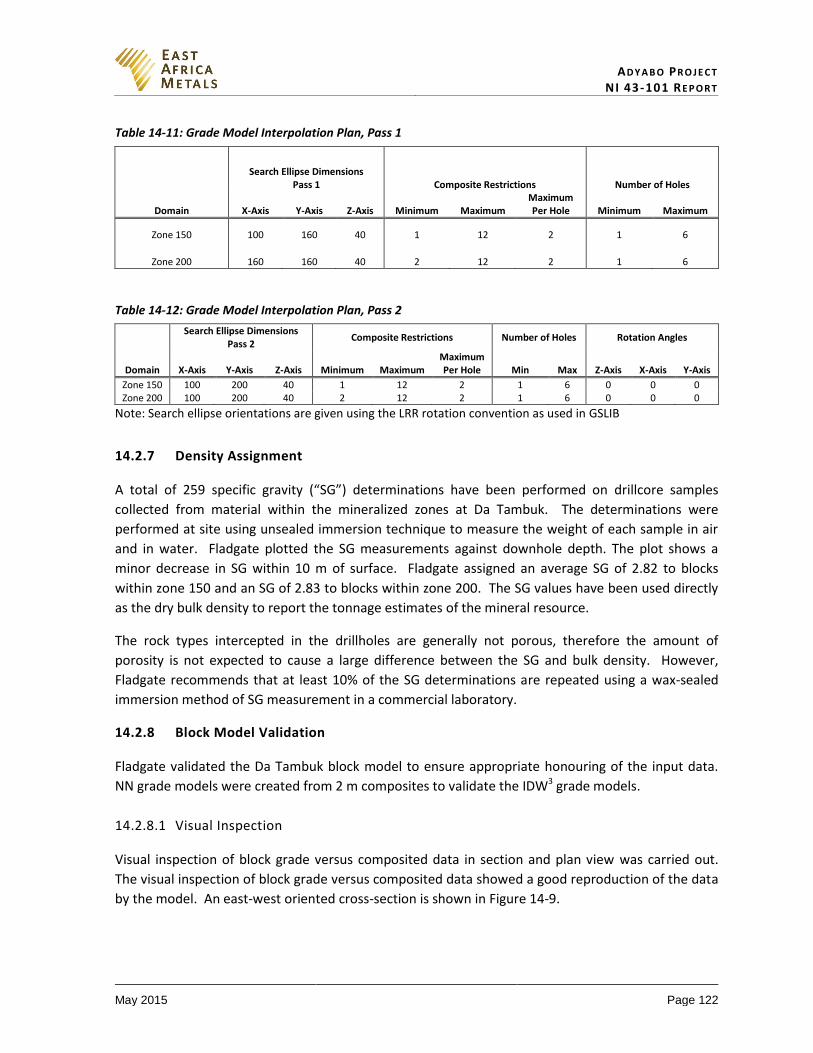
AD Y A B O PR O J E C T NI 43-101 RE P O R T
May 2015 Page 122
Table 14-11: Grade Model Interpolation Plan, Pass 1
Search Ellipse Dimensions Pass 1
Composite Restrictions Number of Holes
Domain X-Axis Y-Axis Z-Axis Minimum Maximum Maximum Per Hole Minimum Maximum
Zone 150 100 160 40 1 12 2 1 6
Zone 200 160 160 40 2 12 2 1 6
Table 14-12: Grade Model Interpolation Plan, Pass 2
Search Ellipse Dimensions Pass 2
Composite Restrictions Number of Holes Rotation Angles
Domain X-Axis Y-Axis Z-Axis Minimum Maximum Maximum Per Hole Min Max
Z-Axis
X-Axis
Y-Axis
Zone 150 100 200 40 1 12 2 1 6 0 0 0 Zone 200 100 200 40 2 12 2 1 6 0 0 0
Note: Search ellipse orientations are given using the LRR rotation convention as used in GSLIB
14.2.7 Density Assignment
A total of 259 specific gravity (“SG”) determinations have been performed on drillcore samples
collected from material within the mineralized zones at Da Tambuk. The determinations were
performed at site using unsealed immersion technique to measure the weight of each sample in air
and in water. Fladgate plotted the SG measurements against downhole depth. The plot shows a
minor decrease in SG within 10 m of surface. Fladgate assigned an average SG of 2.82 to blocks
within zone 150 and an SG of 2.83 to blocks within zone 200. The SG values have been used directly
as the dry bulk density to report the tonnage estimates of the mineral resource.
The rock types intercepted in the drillholes are generally not porous, therefore the amount of
porosity is not expected to cause a large difference between the SG and bulk density. However,
Fladgate recommends that at least 10% of the SG determinations are repeated using a wax-sealed
immersion method of SG measurement in a commercial laboratory.
14.2.8 Block Model Validation
Fladgate validated the Da Tambuk block model to ensure appropriate honouring of the input data.
NN grade models were created from 2 m composites to validate the IDW3 grade models.
14.2.8.1 Visual Inspection
Visual inspection of block grade versus composited data in section and plan view was carried out.
The visual inspection of block grade versus composited data showed a good reproduction of the data
by the model. An east-west oriented cross-section is shown in Figure 14-9.
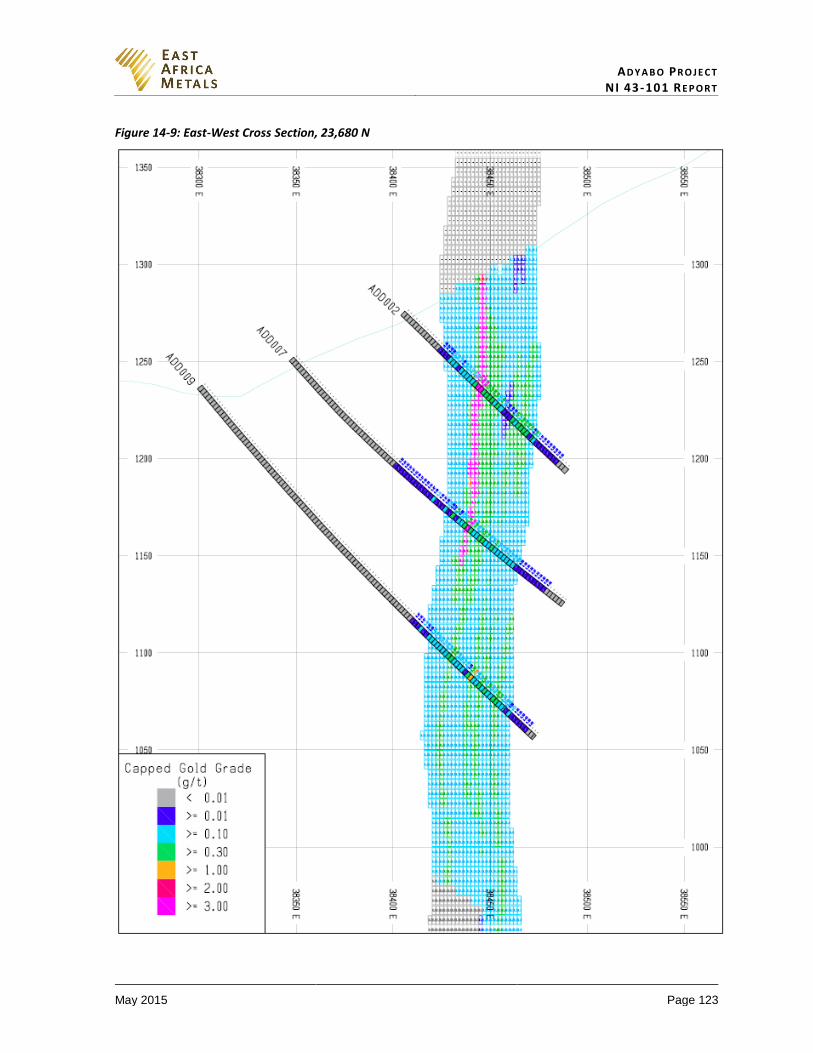
AD Y A B O PR O J E C T NI 43-101 RE P O R T
May 2015 Page 123
Figure 14-9: East-West Cross Section, 23,680 N
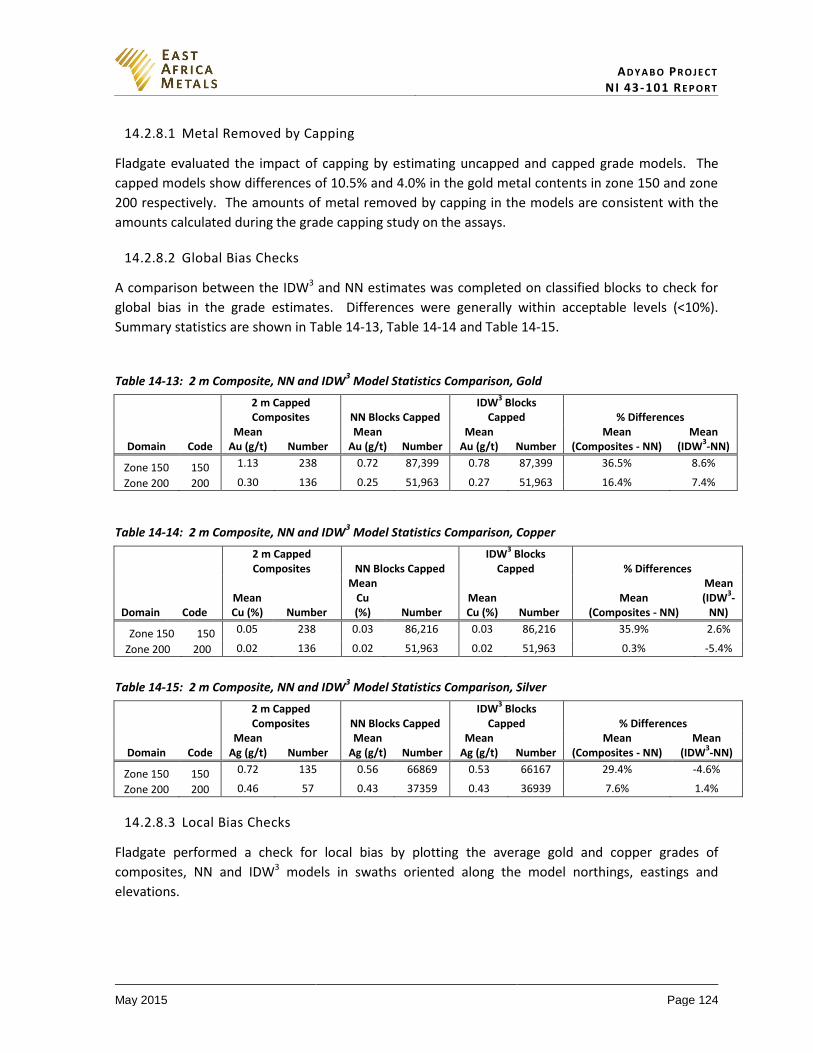
AD Y A B O PR O J E C T NI 43-101 RE P O R T
May 2015 Page 124
14.2.8.1 Metal Removed by Capping
Fladgate evaluated the impact of capping by estimating uncapped and capped grade models. The
capped models show differences of 10.5% and 4.0% in the gold metal contents in zone 150 and zone
200 respectively. The amounts of metal removed by capping in the models are consistent with the
amounts calculated during the grade capping study on the assays.
14.2.8.2 Global Bias Checks
A comparison between the IDW3 and NN estimates was completed on classified blocks to check for
global bias in the grade estimates. Differences were generally within acceptable levels (<10%).
Summary statistics are shown in Table 14-13, Table 14-14 and Table 14-15.
Table 14-13: 2 m Composite, NN and IDW3 Model Statistics Comparison, Gold
2 m Capped Composites NN Blocks Capped
IDW3 Blocks
Capped % Differences
Domain Code Mean
Au (g/t) Number Mean
Au (g/t) Number Mean
Au (g/t) Number Mean
(Composites - NN) Mean
(IDW3-NN)
Zone 150 150 1.13 238 0.72 87,399 0.78 87,399 36.5% 8.6%
Zone 200 200 0.30 136 0.25 51,963 0.27 51,963 16.4% 7.4%
Table 14-14: 2 m Composite, NN and IDW3 Model Statistics Comparison, Copper
2 m Capped Composites NN Blocks Capped
IDW3 Blocks
Capped % Differences
Domain Code Mean Cu (%) Number
Mean Cu (%) Number
Mean Cu (%) Number
Mean (Composites - NN)
Mean (IDW
3-
NN)
Zone 150 150 0.05 238 0.03 86,216 0.03 86,216 35.9% 2.6%
Zone 200 200 0.02 136 0.02 51,963 0.02 51,963 0.3% -5.4%
Table 14-15: 2 m Composite, NN and IDW3 Model Statistics Comparison, Silver
2 m Capped Composites NN Blocks Capped
IDW3 Blocks
Capped % Differences
Domain Code Mean
Ag (g/t) Number Mean
Ag (g/t) Number Mean
Ag (g/t) Number Mean
(Composites - NN) Mean
(IDW3-NN)
Zone 150 150 0.72 135 0.56 66869 0.53 66167 29.4% -4.6%
Zone 200 200 0.46 57 0.43 37359 0.43 36939 7.6% 1.4%
14.2.8.3 Local Bias Checks
Fladgate performed a check for local bias by plotting the average gold and copper grades of
composites, NN and IDW3 models in swaths oriented along the model northings, eastings and
elevations.
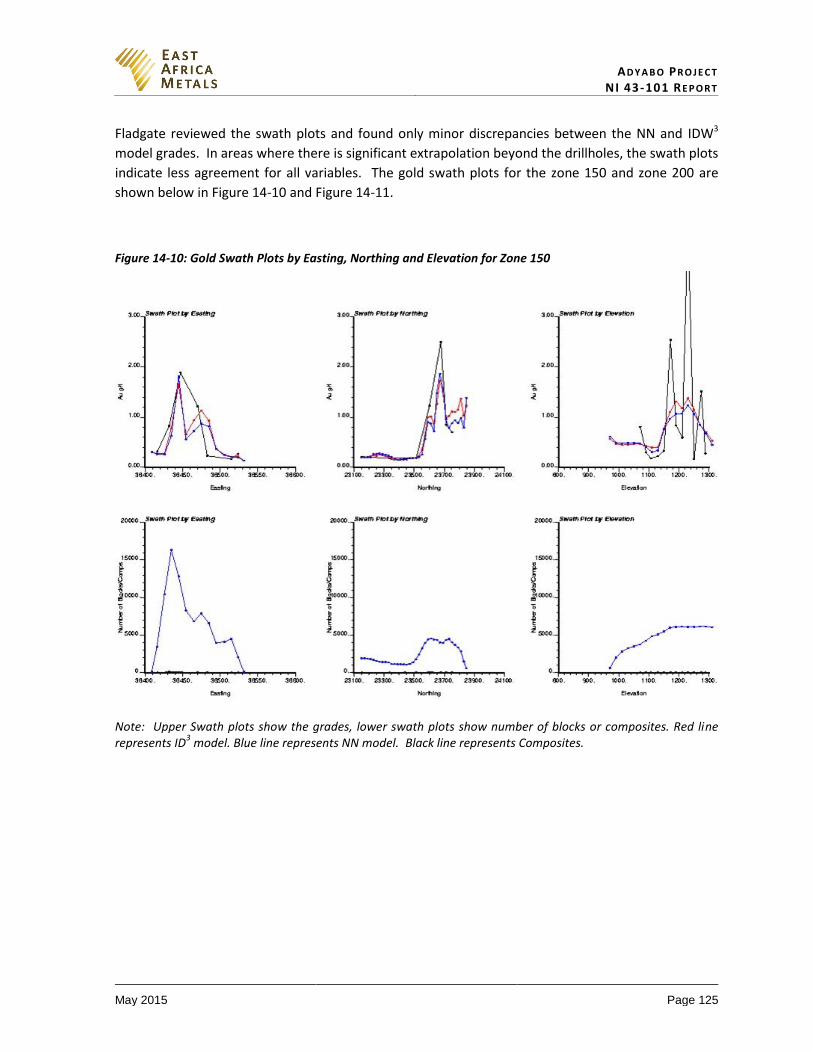
AD Y A B O PR O J E C T NI 43-101 RE P O R T
May 2015 Page 125
Fladgate reviewed the swath plots and found only minor discrepancies between the NN and IDW3
model grades. In areas where there is significant extrapolation beyond the drillholes, the swath plots
indicate less agreement for all variables. The gold swath plots for the zone 150 and zone 200 are
shown below in Figure 14-10 and Figure 14-11.
Figure 14-10: Gold Swath Plots by Easting, Northing and Elevation for Zone 150
Note: Upper Swath plots show the grades, lower swath plots show number of blocks or composites. Red line represents ID
3 model. Blue line represents NN model. Black line represents Composites.
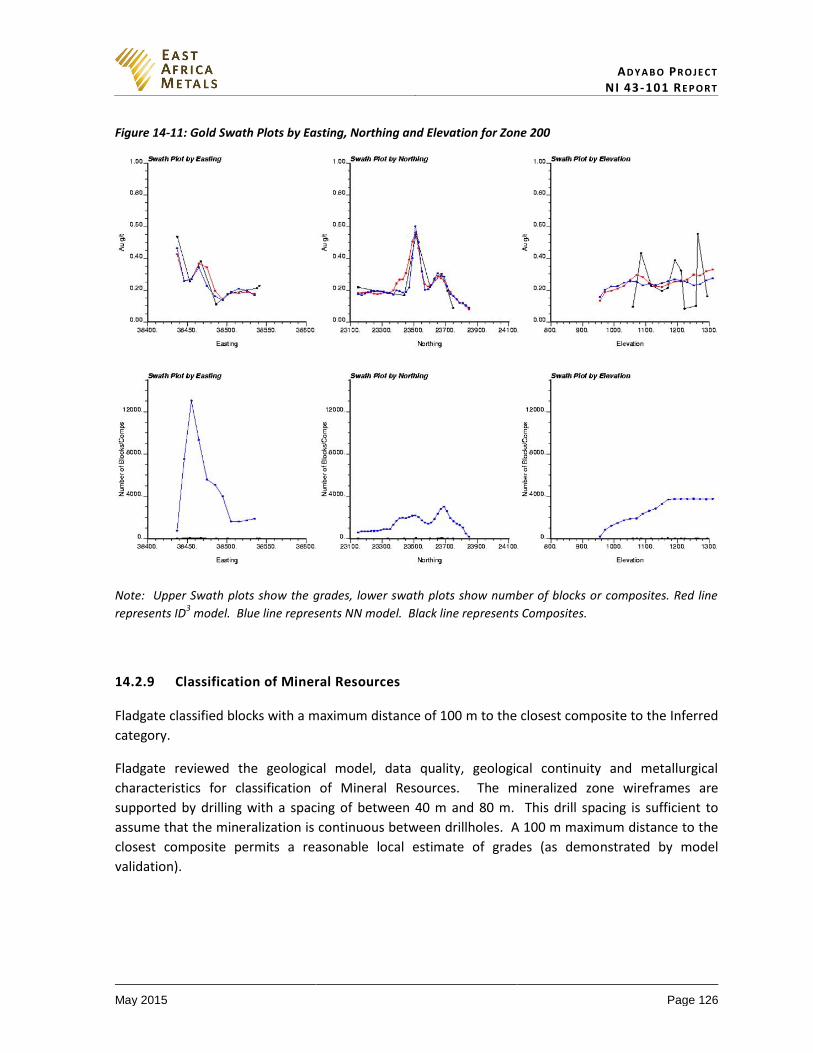
AD Y A B O PR O J E C T NI 43-101 RE P O R T
May 2015 Page 126
Figure 14-11: Gold Swath Plots by Easting, Northing and Elevation for Zone 200
Note: Upper Swath plots show the grades, lower swath plots show number of blocks or composites. Red line
represents ID3 model. Blue line represents NN model. Black line represents Composites.
14.2.9 Classification of Mineral Resources
Fladgate classified blocks with a maximum distance of 100 m to the closest composite to the Inferred
category.
Fladgate reviewed the geological model, data quality, geological continuity and metallurgical
characteristics for classification of Mineral Resources. The mineralized zone wireframes are
supported by drilling with a spacing of between 40 m and 80 m. This drill spacing is sufficient to
assume that the mineralization is continuous between drillholes. A 100 m maximum distance to the
closest composite permits a reasonable local estimate of grades (as demonstrated by model
validation).
AD Y A B O PR O J E C T NI 43-101 RE P O R T
May 2015 Page 127
14.3 Mato Bula Mineral Resource Estimate
14.3.1 Wireframe Models and Mineralization Mato Bula
EAM provided Fladgate with sectional interpretations of the mineralization based on copper and gold
grades. Fladgate created wireframe models of the mineralized zones using EAM’s drillhole intercepts
with MineSight’s implicit modeller. Fladgate reviewed the wireframe models and found the
wireframe boundaries were correctly snapped to the drillhole intercepts. Fladgate inspected
drillholes displaying gold and copper grades, no significant zones of mineralization fall outside of the
wireframes.
Fladgate coded each zone separately. The zone codes are show in Table 14-16.
Table 14-16: Adyabo Project Domain Codes
Domain Code
Zone 100 100
Zone 150 150
Zone 200 200
The wireframe models used to constrain mineral resource estimation are shown below in Figure
14-12. Fladgate created partial items and stored the percentage of each block falling within the
wireframes.
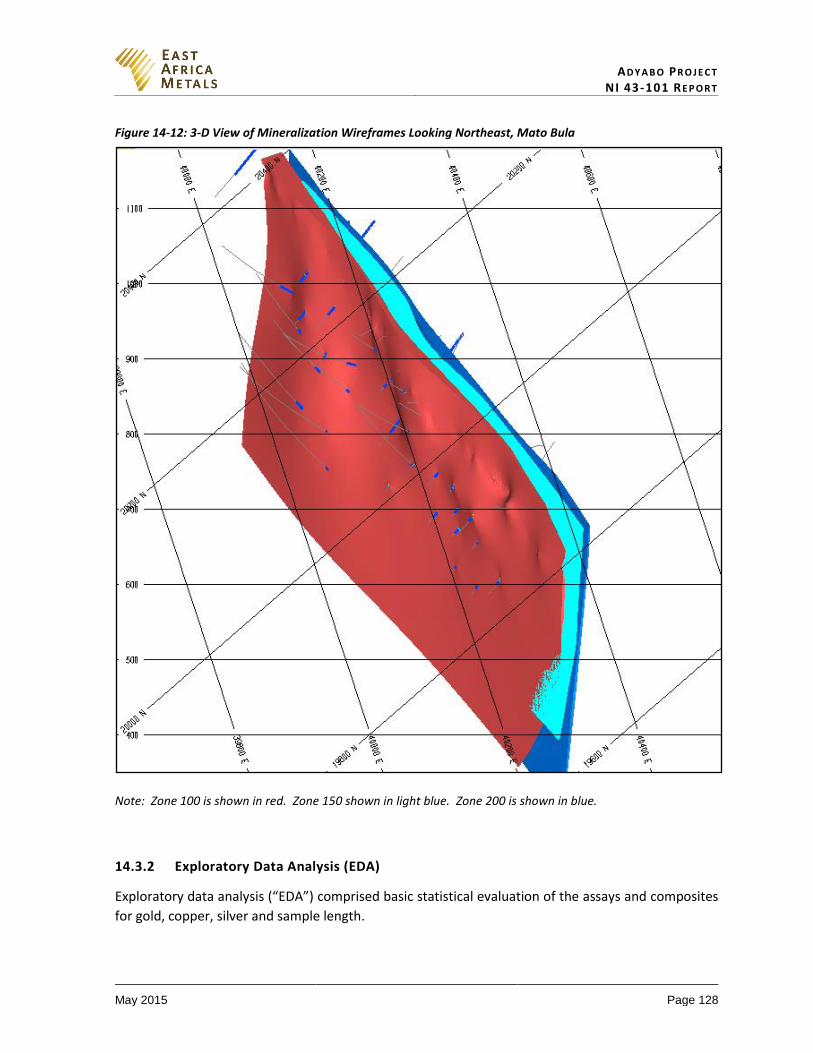
AD Y A B O PR O J E C T NI 43-101 RE P O R T
May 2015 Page 128
Figure 14-12: 3-D View of Mineralization Wireframes Looking Northeast, Mato Bula
Note: Zone 100 is shown in red. Zone 150 shown in light blue. Zone 200 is shown in blue.
14.3.2 Exploratory Data Analysis (EDA)
Exploratory data analysis (“EDA”) comprised basic statistical evaluation of the assays and composites
for gold, copper, silver and sample length.
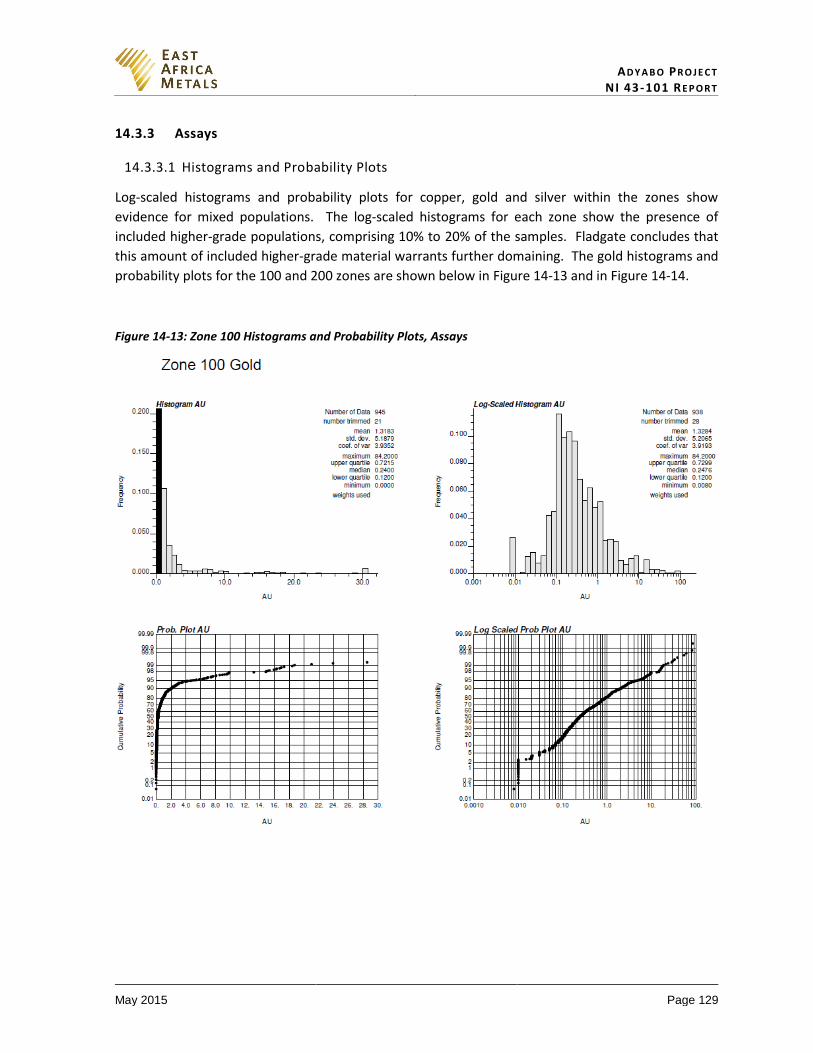
AD Y A B O PR O J E C T NI 43-101 RE P O R T
May 2015 Page 129
14.3.3 Assays
14.3.3.1 Histograms and Probability Plots
Log-scaled histograms and probability plots for copper, gold and silver within the zones show
evidence for mixed populations. The log-scaled histograms for each zone show the presence of
included higher-grade populations, comprising 10% to 20% of the samples. Fladgate concludes that
this amount of included higher-grade material warrants further domaining. The gold histograms and
probability plots for the 100 and 200 zones are shown below in Figure 14-13 and in Figure 14-14.
Figure 14-13: Zone 100 Histograms and Probability Plots, Assays
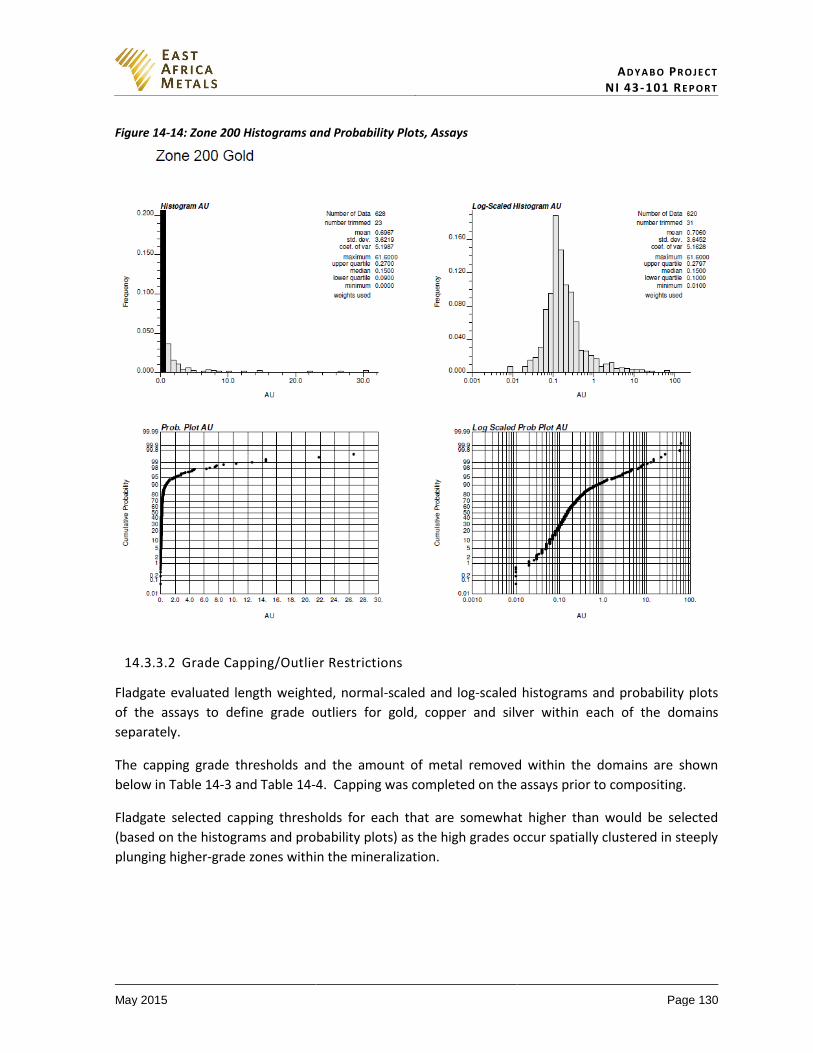
AD Y A B O PR O J E C T NI 43-101 RE P O R T
May 2015 Page 130
Figure 14-14: Zone 200 Histograms and Probability Plots, Assays
14.3.3.2 Grade Capping/Outlier Restrictions
Fladgate evaluated length weighted, normal-scaled and log-scaled histograms and probability plots
of the assays to define grade outliers for gold, copper and silver within each of the domains
separately.
The capping grade thresholds and the amount of metal removed within the domains are shown
below in Table 14-3 and Table 14-4. Capping was completed on the assays prior to compositing.
Fladgate selected capping thresholds for each that are somewhat higher than would be selected
(based on the histograms and probability plots) as the high grades occur spatially clustered in steeply
plunging higher-grade zones within the mineralization.
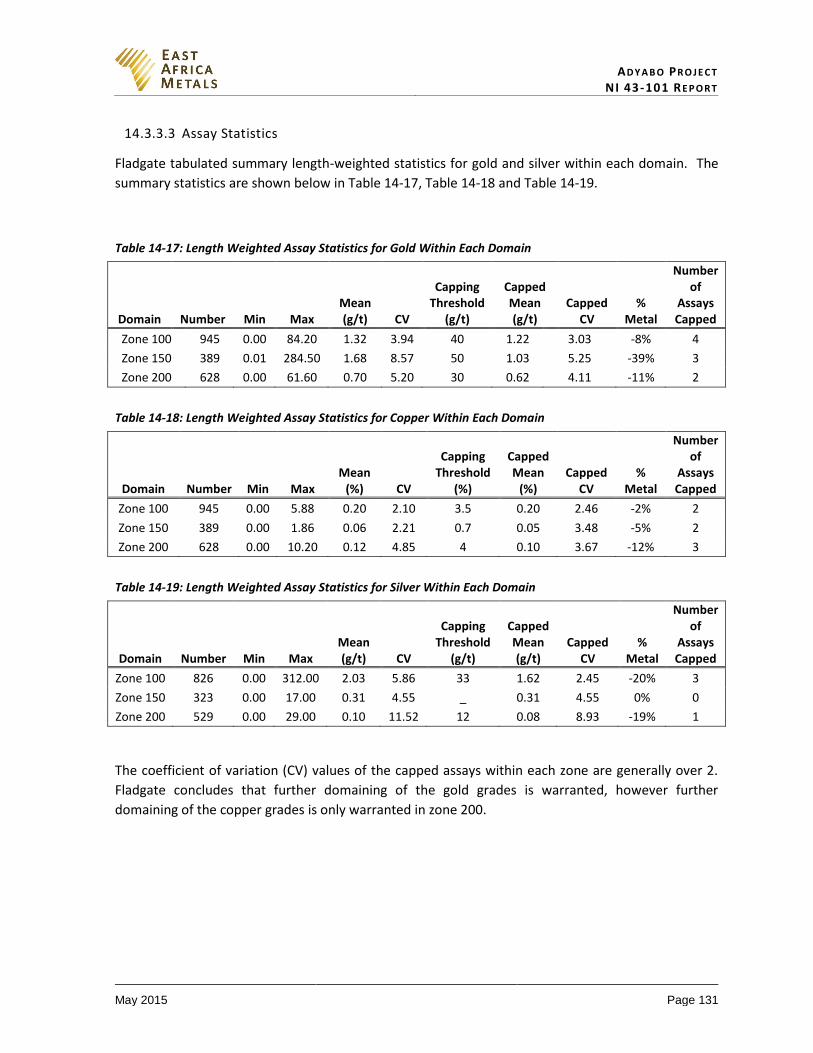
AD Y A B O PR O J E C T NI 43-101 RE P O R T
May 2015 Page 131
14.3.3.3 Assay Statistics
Fladgate tabulated summary length-weighted statistics for gold and silver within each domain. The
summary statistics are shown below in Table 14-17, Table 14-18 and Table 14-19.
Table 14-17: Length Weighted Assay Statistics for Gold Within Each Domain
Domain Number Min Max Mean (g/t) CV
Capping Threshold
(g/t)
Capped Mean (g/t)
Capped CV
% Metal
Number of
Assays Capped
Zone 100 945 0.00 84.20 1.32 3.94 40 1.22 3.03 -8% 4
Zone 150 389 0.01 284.50 1.68 8.57 50 1.03 5.25 -39% 3
Zone 200 628 0.00 61.60 0.70 5.20 30 0.62 4.11 -11% 2
Table 14-18: Length Weighted Assay Statistics for Copper Within Each Domain
Domain Number Min Max Mean
(%) CV
Capping Threshold
(%)
Capped Mean
(%) Capped
CV %
Metal
Number of
Assays Capped
Zone 100 945 0.00 5.88 0.20 2.10 3.5 0.20 2.46 -2% 2
Zone 150 389 0.00 1.86 0.06 2.21 0.7 0.05 3.48 -5% 2
Zone 200 628 0.00 10.20 0.12 4.85 4 0.10 3.67 -12% 3
Table 14-19: Length Weighted Assay Statistics for Silver Within Each Domain
Domain Number Min Max Mean (g/t) CV
Capping Threshold
(g/t)
Capped Mean (g/t)
Capped CV
% Metal
Number of
Assays Capped
Zone 100 826 0.00 312.00 2.03 5.86 33 1.62 2.45 -20% 3
Zone 150 323 0.00 17.00 0.31 4.55 _ 0.31 4.55 0% 0
Zone 200 529 0.00 29.00 0.10 11.52 12 0.08 8.93 -19% 1
The coefficient of variation (CV) values of the capped assays within each zone are generally over 2.
Fladgate concludes that further domaining of the gold grades is warranted, however further
domaining of the copper grades is only warranted in zone 200.
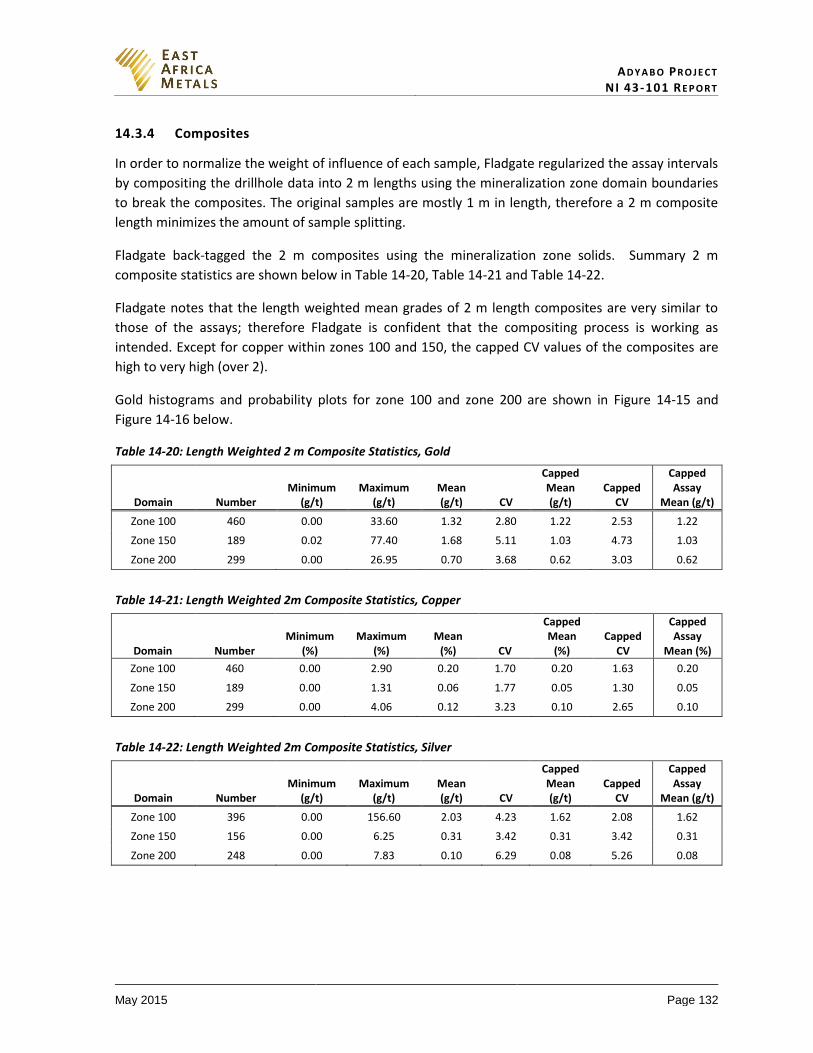
AD Y A B O PR O J E C T NI 43-101 RE P O R T
May 2015 Page 132
14.3.4 Composites
In order to normalize the weight of influence of each sample, Fladgate regularized the assay intervals
by compositing the drillhole data into 2 m lengths using the mineralization zone domain boundaries
to break the composites. The original samples are mostly 1 m in length, therefore a 2 m composite
length minimizes the amount of sample splitting.
Fladgate back-tagged the 2 m composites using the mineralization zone solids. Summary 2 m
composite statistics are shown below in Table 14-20, Table 14-21 and Table 14-22.
Fladgate notes that the length weighted mean grades of 2 m length composites are very similar to
those of the assays; therefore Fladgate is confident that the compositing process is working as
intended. Except for copper within zones 100 and 150, the capped CV values of the composites are
high to very high (over 2).
Gold histograms and probability plots for zone 100 and zone 200 are shown in Figure 14-15 and
Figure 14-16 below.
Table 14-20: Length Weighted 2 m Composite Statistics, Gold
Domain Number Minimum
(g/t) Maximum
(g/t) Mean (g/t) CV
Capped Mean (g/t)
Capped CV
Capped Assay
Mean (g/t)
Zone 100 460 0.00 33.60 1.32 2.80 1.22 2.53 1.22
Zone 150 189 0.02 77.40 1.68 5.11 1.03 4.73 1.03
Zone 200 299 0.00 26.95 0.70 3.68 0.62 3.03 0.62
Table 14-21: Length Weighted 2m Composite Statistics, Copper
Domain Number Minimum
(%) Maximum
(%) Mean
(%) CV
Capped Mean
(%) Capped
CV
Capped Assay
Mean (%)
Zone 100 460 0.00 2.90 0.20 1.70 0.20 1.63 0.20
Zone 150 189 0.00 1.31 0.06 1.77 0.05 1.30 0.05
Zone 200 299 0.00 4.06 0.12 3.23 0.10 2.65 0.10
Table 14-22: Length Weighted 2m Composite Statistics, Silver
Domain Number Minimum
(g/t) Maximum
(g/t) Mean (g/t) CV
Capped Mean (g/t)
Capped CV
Capped Assay
Mean (g/t)
Zone 100 396 0.00 156.60 2.03 4.23 1.62 2.08 1.62
Zone 150 156 0.00 6.25 0.31 3.42 0.31 3.42 0.31
Zone 200 248 0.00 7.83 0.10 6.29 0.08 5.26 0.08

AD Y A B O PR O J E C T NI 43-101 RE P O R T
May 2015 Page 133
Figure 14-15: Mato Bula Zone 100 Histograms and Probability Plots, Capped Composites
Figure 14-16: Mato Bula Zone 200 Histograms and Probability Plots, Capped Composites
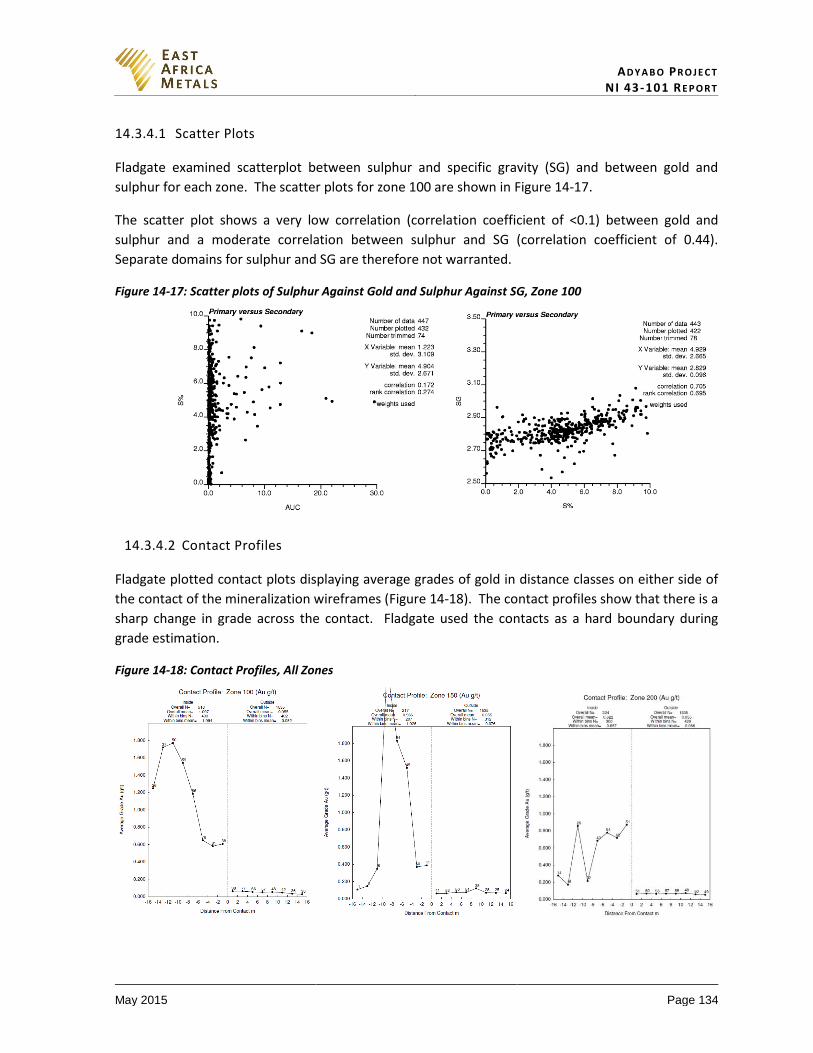
AD Y A B O PR O J E C T NI 43-101 RE P O R T
May 2015 Page 134
14.3.4.1 Scatter Plots
Fladgate examined scatterplot between sulphur and specific gravity (SG) and between gold and
sulphur for each zone. The scatter plots for zone 100 are shown in Figure 14-17.
The scatter plot shows a very low correlation (correlation coefficient of <0.1) between gold and
sulphur and a moderate correlation between sulphur and SG (correlation coefficient of 0.44).
Separate domains for sulphur and SG are therefore not warranted.
Figure 14-17: Scatter plots of Sulphur Against Gold and Sulphur Against SG, Zone 100
14.3.4.2 Contact Profiles
Fladgate plotted contact plots displaying average grades of gold in distance classes on either side of
the contact of the mineralization wireframes (Figure 14-18). The contact profiles show that there is a
sharp change in grade across the contact. Fladgate used the contacts as a hard boundary during
grade estimation.
Figure 14-18: Contact Profiles, All Zones
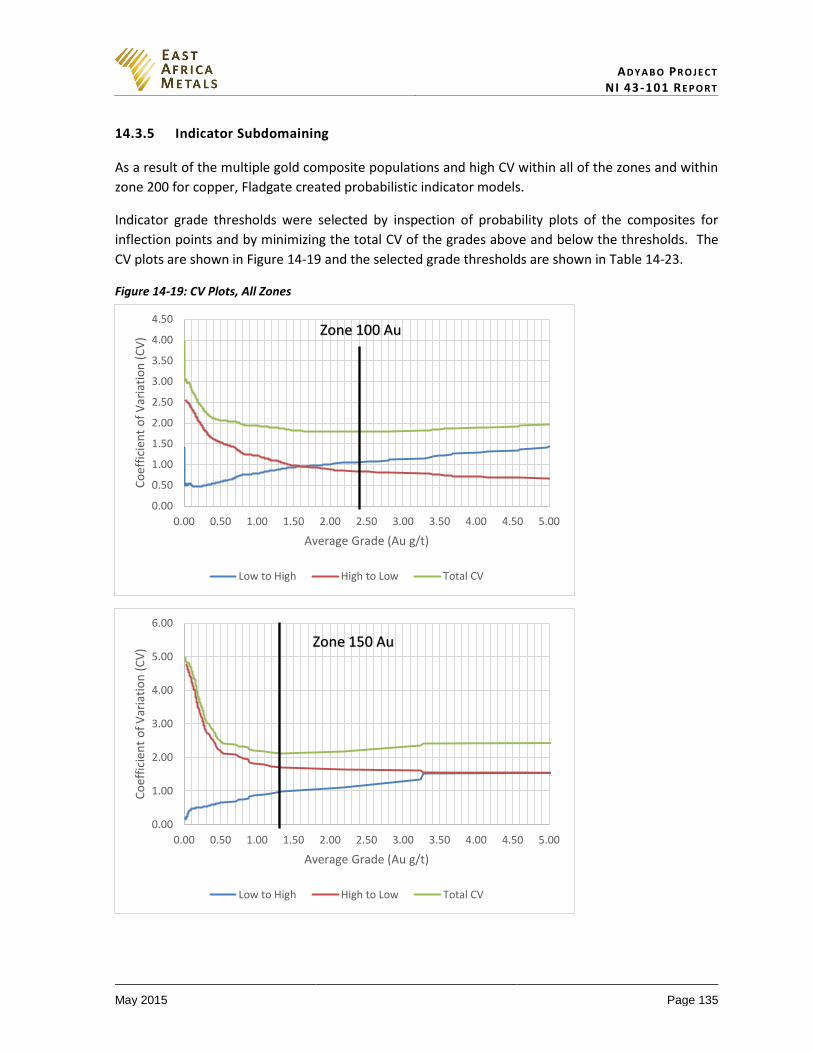
AD Y A B O PR O J E C T NI 43-101 RE P O R T
May 2015 Page 135
14.3.5 Indicator Subdomaining
As a result of the multiple gold composite populations and high CV within all of the zones and within
zone 200 for copper, Fladgate created probabilistic indicator models.
Indicator grade thresholds were selected by inspection of probability plots of the composites for
inflection points and by minimizing the total CV of the grades above and below the thresholds. The
CV plots are shown in Figure 14-19 and the selected grade thresholds are shown in Table 14-23.
Figure 14-19: CV Plots, All Zones
0.00
0.50
1.00
1.50
2.00
2.50
3.00
3.50
4.00
4.50
0.00 0.50 1.00 1.50 2.00 2.50 3.00 3.50 4.00 4.50 5.00
Co
effi
cien
t o
f V
aria
tio
n (
CV
)
Average Grade (Au g/t)
Low to High High to Low Total CV
Zone 100 Au
0.00
1.00
2.00
3.00
4.00
5.00
6.00
0.00 0.50 1.00 1.50 2.00 2.50 3.00 3.50 4.00 4.50 5.00
Co
effi
cien
t o
f V
aria
tio
n (
CV
)
Average Grade (Au g/t)
Low to High High to Low Total CV
Zone 150 Au
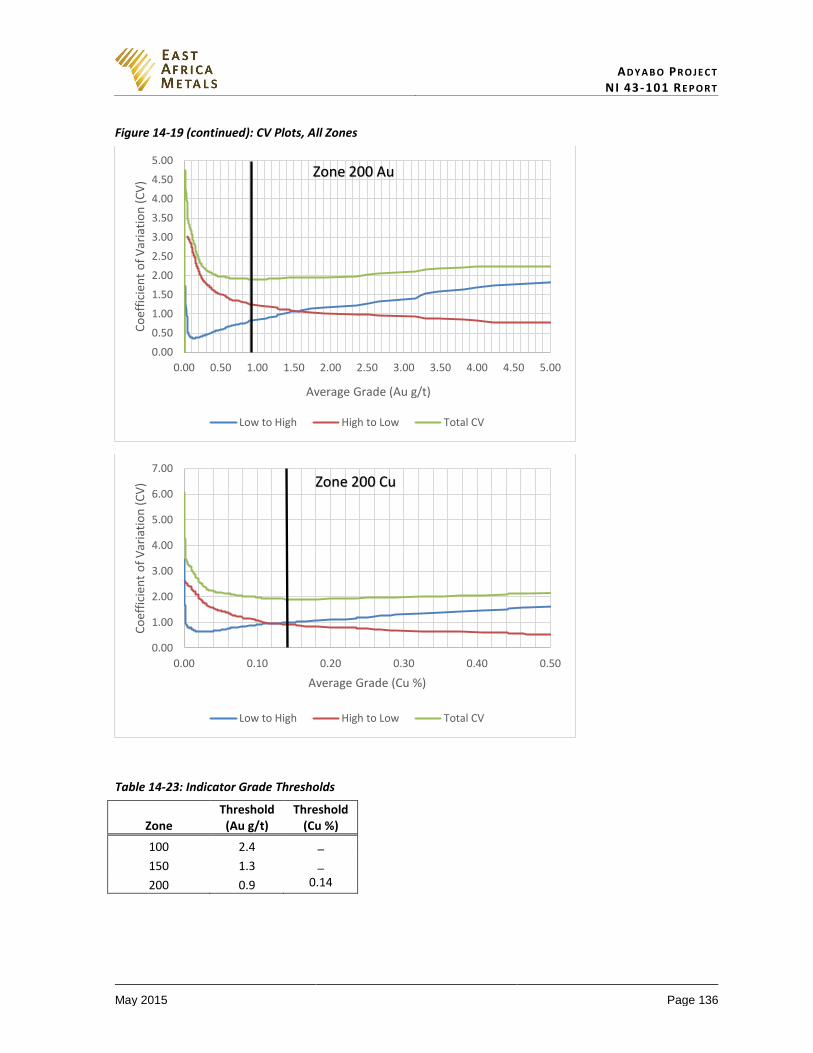
AD Y A B O PR O J E C T NI 43-101 RE P O R T
May 2015 Page 136
Figure 14-19 (continued): CV Plots, All Zones
Table 14-23: Indicator Grade Thresholds
Zone Threshold
(Au g/t) Threshold
(Cu %)
100 2.4 _
150 1.3 _
200 0.9 0.14
0.00
0.50
1.00
1.50
2.00
2.50
3.00
3.50
4.00
4.50
5.00
0.00 0.50 1.00 1.50 2.00 2.50 3.00 3.50 4.00 4.50 5.00
Co
effi
cien
t o
f V
aria
tio
n (
CV
)
Average Grade (Au g/t)
Low to High High to Low Total CV
Zone 200 Au
0.00
1.00
2.00
3.00
4.00
5.00
6.00
7.00
0.00 0.10 0.20 0.30 0.40 0.50
Co
effi
cien
t o
f V
aria
tio
n (
CV
)
Average Grade (Cu %)
Low to High High to Low Total CV
Zone 200 Cu
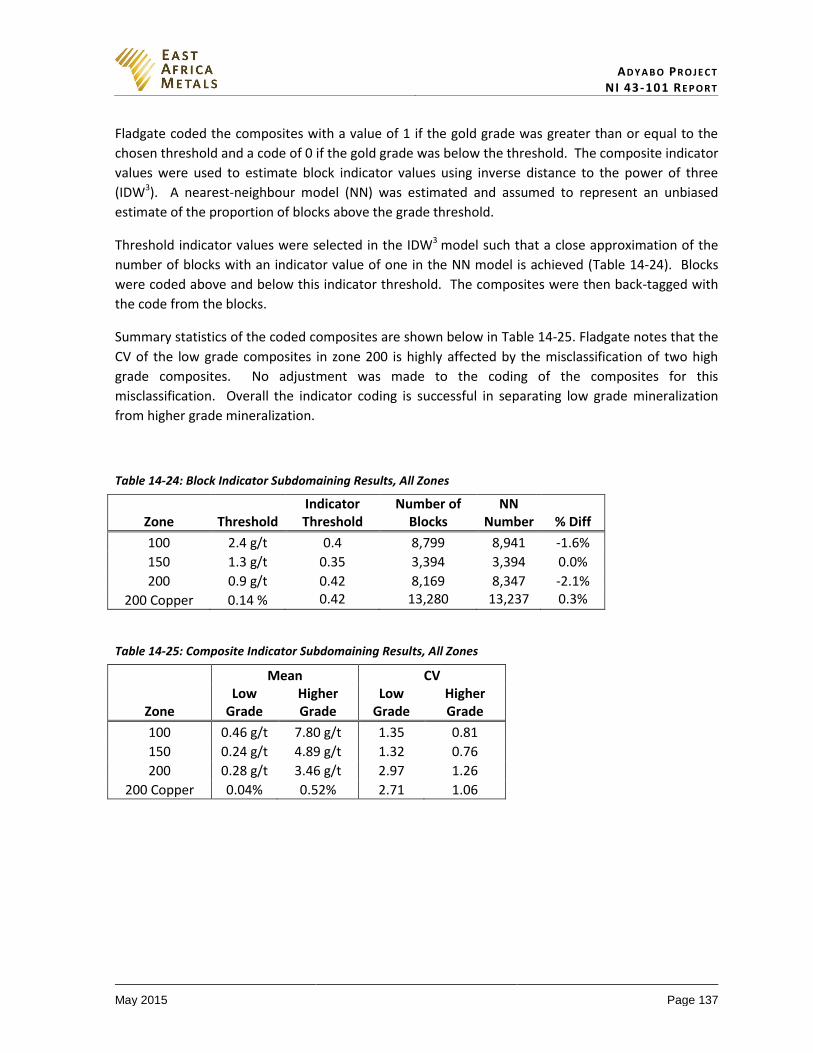
AD Y A B O PR O J E C T NI 43-101 RE P O R T
May 2015 Page 137
Fladgate coded the composites with a value of 1 if the gold grade was greater than or equal to the
chosen threshold and a code of 0 if the gold grade was below the threshold. The composite indicator
values were used to estimate block indicator values using inverse distance to the power of three
(IDW3). A nearest-neighbour model (NN) was estimated and assumed to represent an unbiased
estimate of the proportion of blocks above the grade threshold.
Threshold indicator values were selected in the IDW3 model such that a close approximation of the
number of blocks with an indicator value of one in the NN model is achieved (Table 14-24). Blocks
were coded above and below this indicator threshold. The composites were then back-tagged with
the code from the blocks.
Summary statistics of the coded composites are shown below in Table 14-25. Fladgate notes that the
CV of the low grade composites in zone 200 is highly affected by the misclassification of two high
grade composites. No adjustment was made to the coding of the composites for this
misclassification. Overall the indicator coding is successful in separating low grade mineralization
from higher grade mineralization.
Table 14-24: Block Indicator Subdomaining Results, All Zones
Zone Threshold Indicator Threshold
Number of Blocks
NN Number % Diff
100 2.4 g/t 0.4 8,799 8,941 -1.6%
150 1.3 g/t 0.35 3,394 3,394 0.0%
200 0.9 g/t 0.42 8,169 8,347 -2.1%
200 Copper 0.14 % 0.42 13,280 13,237 0.3%
Table 14-25: Composite Indicator Subdomaining Results, All Zones
Mean CV
Zone Low
Grade Higher Grade
Low Grade
Higher Grade
100 0.46 g/t 7.80 g/t 1.35 0.81
150 0.24 g/t 4.89 g/t 1.32 0.76
200 0.28 g/t 3.46 g/t 2.97 1.26
200 Copper 0.04% 0.52% 2.71 1.06
AD Y A B O PR O J E C T NI 43-101 RE P O R T
May 2015 Page 138
14.3.6 Estimation/Interpolation Methods
The block model consists of regular blocks (5 m along strike x 2 m across strike x 5 m vertically). The
block size was chosen such that geological contacts are reasonably well reflected and to support
selective mining scenarios.
Fladgate used an IDW3 grade interpolation method in a two passes. In the first pass, Fladgate used
MineSight’s DU module to account for significant changes in the orientation of the mineralization
wireframe. The DU module uses input surfaces to calculate non-linear distances between
composites and blocks to composites. Search distances used in grade estimation are in metres along
the strike, down-dip and perpendicular to dip orientations of the wireframe. Fladgate used a second
pass to estimate any blocks not estimated in the first pass with a conventional (using Cartesian
coordinate space) IDW3 grade interpolation method.
Grade estimation used a composite and block matching scheme based on the domain codes. For
example, composites coded to the zone 100 were only used to estimate blocks falling within zone
100. The same grade estimation plan was used for gold, copper and silver.
In zones 100 and zone 200, the indicator subdomain was used as a hard boundary, only composites
coded as falling within the higher grade subdomain were used to estimate blocks falling within the
higher grade subdomain. In zone 150, two composites with extremely high gold grades caused over-
extrapolation of the higher grades in one portion of the deposit. In this local area, Fladgate allowed
block estimates to be informed with both high grade and low grade composites and used a restricted
search of 25 m for composites above 1 g/t Au.
Table 14-26 and Table 14-27 show the composite restrictions and search distances for the
estimation domains. A longer search distance was selected in the vertical direction of the wireframe
based on visual inspection of gold grades on a long-section along the strike of the deposit. The long-
section shows several steeply plunging zones of higher grade mineralization.
Table 14-26: Grade Model Interpolation Plan, Pass 1
Search Ellipse Dimensions Pass 1
Composite Restrictions Number of Holes
Domain X-Axis Y-Axis Z-Axis Minimum Maximum Maximum Per Hole Minimum Maximum
Zone 100 100 200 50 1 12 2 1 6 Zone 150 100 200 50 1 12 2 1 6
Zone 200 100 200 50 1 12 2 1 6

AD Y A B O PR O J E C T NI 43-101 RE P O R T
May 2015 Page 139
Table 14-27: Grade Model Interpolation Plan, Pass 2
Search Ellipse Dimensions
Pass 2 Composite Restrictions
Number of Holes
Rotation Angles
Domain X-Axis Y-Axis Z-Axis Min Max Max Per
Hole Min Max Z-Axis X-Axis Y-Axis
Zone 100 100 200 50 1 12 2 1 6 0 90 90 Zone 150 100 200 50 1 12 2 1 6 0 90 90
Zone 200 100 200 50 1 12 2 1 6 0 90 90
Note: Search ellipse orientations are given using the LRR rotation convention as used in GSLIB.
14.3.7 Density Assignment
A total of 1,665 SG determinations have been performed on drillcore samples collected from
material within the mineralized zones at Mato Bula. The determinations were performed at site
using unsealed immersion technique to measure the weight of each sample in air and in water.
Fladgate assigned an average SG of 2.84 to blocks within zones 100 and 150 and an SG of 2.85 to
blocks within zone 200. The SG values have been used directly as the dry bulk density to report the
tonnage estimates of the mineral resource.
The rock types intercepted in the drillholes are generally not porous, therefore the amount of
porosity is not expected to cause a large difference between the SG and bulk density. However,
Fladgate recommends that at least 10% of the SG determinations are repeated using a wax-sealed
immersion method of SG measurement in a commercial laboratory.
14.3.8 Block Model Validation
Fladgate validated the Mato Bula block model to ensure appropriate honouring of the input data.
NN grade models were created from 2 m composites to validate the IDW3 grade models.
14.3.8.1 Visual Inspection
Visual inspection of block grade versus composited data in section and plan view was carried out.
The visual inspection of block grade versus composited data showed a good reproduction of the data
by the model. An east-west oriented cross-section is shown in Figure 14-20.
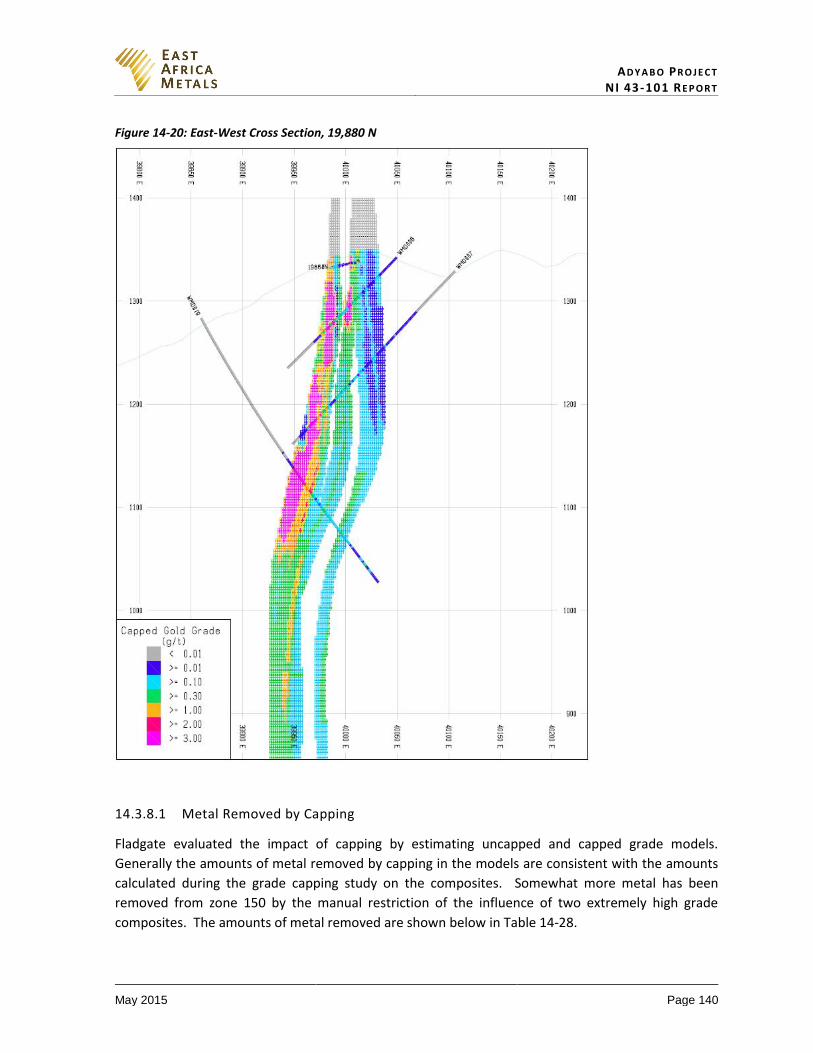
AD Y A B O PR O J E C T NI 43-101 RE P O R T
May 2015 Page 140
Figure 14-20: East-West Cross Section, 19,880 N
14.3.8.1 Metal Removed by Capping
Fladgate evaluated the impact of capping by estimating uncapped and capped grade models.
Generally the amounts of metal removed by capping in the models are consistent with the amounts
calculated during the grade capping study on the composites. Somewhat more metal has been
removed from zone 150 by the manual restriction of the influence of two extremely high grade
composites. The amounts of metal removed are shown below in Table 14-28.
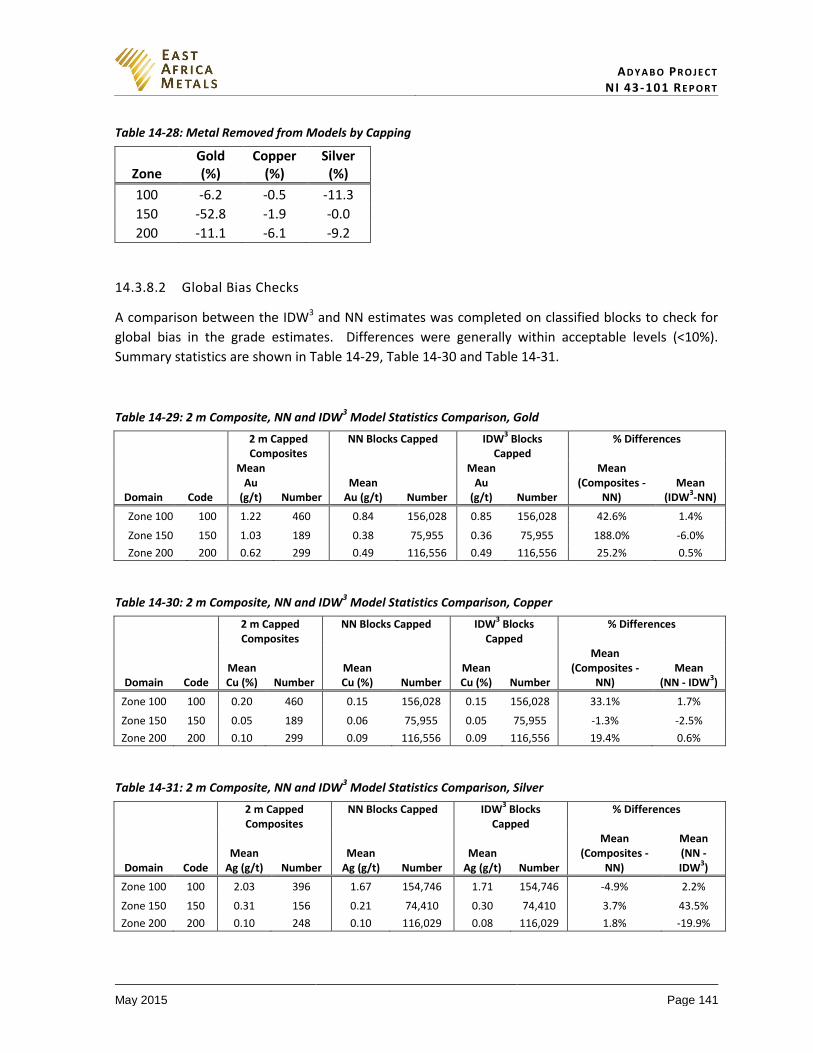
AD Y A B O PR O J E C T NI 43-101 RE P O R T
May 2015 Page 141
Table 14-28: Metal Removed from Models by Capping
Zone Gold (%)
Copper (%)
Silver (%)
100 -6.2 -0.5 -11.3
150 -52.8 -1.9 -0.0
200 -11.1 -6.1 -9.2
14.3.8.2 Global Bias Checks
A comparison between the IDW3 and NN estimates was completed on classified blocks to check for
global bias in the grade estimates. Differences were generally within acceptable levels (<10%).
Summary statistics are shown in Table 14-29, Table 14-30 and Table 14-31.
Table 14-29: 2 m Composite, NN and IDW3 Model Statistics Comparison, Gold
2 m Capped Composites
NN Blocks Capped IDW3 Blocks
Capped % Differences
Domain Code
Mean Au
(g/t) Number Mean
Au (g/t) Number
Mean Au
(g/t) Number
Mean (Composites -
NN) Mean
(IDW3-NN)
Zone 100 100 1.22 460 0.84 156,028 0.85 156,028 42.6% 1.4%
Zone 150 150 1.03 189 0.38 75,955 0.36 75,955 188.0% -6.0%
Zone 200 200 0.62 299 0.49 116,556 0.49 116,556 25.2% 0.5%
Table 14-30: 2 m Composite, NN and IDW3 Model Statistics Comparison, Copper
2 m Capped Composites
NN Blocks Capped IDW3 Blocks
Capped % Differences
Domain Code Mean Cu (%) Number
Mean Cu (%) Number
Mean Cu (%) Number
Mean (Composites -
NN) Mean
(NN - IDW3)
Zone 100 100 0.20 460 0.15 156,028 0.15 156,028 33.1% 1.7%
Zone 150 150 0.05 189 0.06 75,955 0.05 75,955 -1.3% -2.5%
Zone 200 200 0.10 299 0.09 116,556 0.09 116,556 19.4% 0.6%
Table 14-31: 2 m Composite, NN and IDW3 Model Statistics Comparison, Silver
2 m Capped Composites
NN Blocks Capped IDW3 Blocks
Capped % Differences
Domain Code Mean
Ag (g/t) Number Mean
Ag (g/t) Number Mean
Ag (g/t) Number
Mean (Composites -
NN)
Mean (NN - IDW
3)
Zone 100 100 2.03 396 1.67 154,746 1.71 154,746 -4.9% 2.2%
Zone 150 150 0.31 156 0.21 74,410 0.30 74,410 3.7% 43.5%
Zone 200 200 0.10 248 0.10 116,029 0.08 116,029 1.8% -19.9%
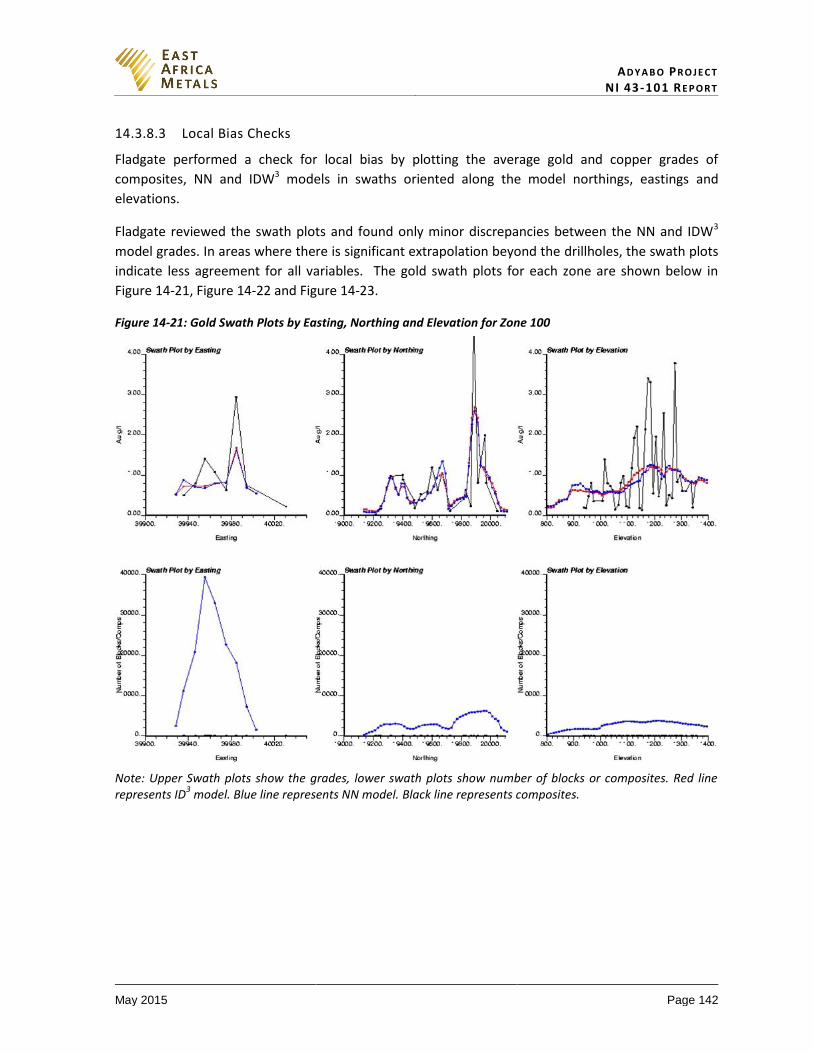
AD Y A B O PR O J E C T NI 43-101 RE P O R T
May 2015 Page 142
14.3.8.3 Local Bias Checks
Fladgate performed a check for local bias by plotting the average gold and copper grades of
composites, NN and IDW3 models in swaths oriented along the model northings, eastings and
elevations.
Fladgate reviewed the swath plots and found only minor discrepancies between the NN and IDW3
model grades. In areas where there is significant extrapolation beyond the drillholes, the swath plots
indicate less agreement for all variables. The gold swath plots for each zone are shown below in
Figure 14-21, Figure 14-22 and Figure 14-23.
Figure 14-21: Gold Swath Plots by Easting, Northing and Elevation for Zone 100
Note: Upper Swath plots show the grades, lower swath plots show number of blocks or composites. Red line represents ID
3 model. Blue line represents NN model. Black line represents composites.
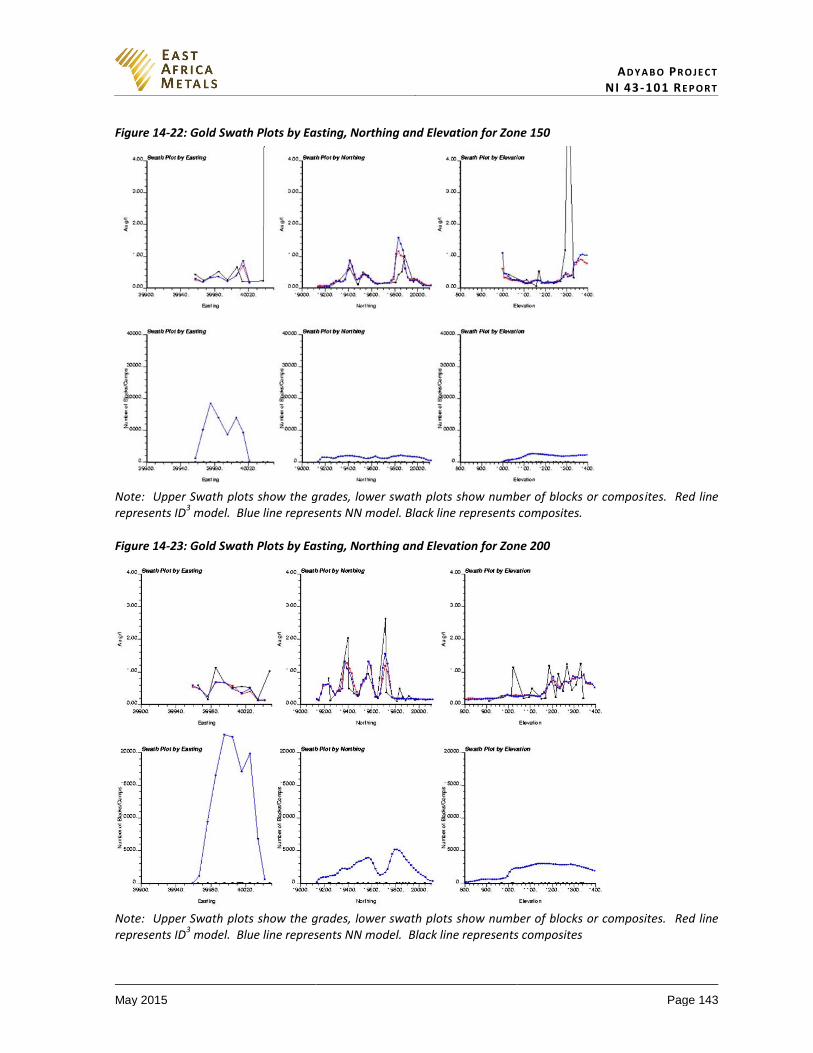
AD Y A B O PR O J E C T NI 43-101 RE P O R T
May 2015 Page 143
Figure 14-22: Gold Swath Plots by Easting, Northing and Elevation for Zone 150
Note: Upper Swath plots show the grades, lower swath plots show number of blocks or composites. Red line represents ID
3 model. Blue line represents NN model. Black line represents composites.
Figure 14-23: Gold Swath Plots by Easting, Northing and Elevation for Zone 200
Note: Upper Swath plots show the grades, lower swath plots show number of blocks or composites. Red line represents ID
3 model. Blue line represents NN model. Black line represents composites
AD Y A B O PR O J E C T NI 43-101 RE P O R T
May 2015 Page 144
14.3.9 Classification of Mineral Resources
Fladgate classified blocks with a maximum distance of 100 m to the closest composite to the Inferred
category.
Fladgate reviewed the geological model, data quality, geological continuity and metallurgical
characteristics for classification of Mineral Resources. The mineralized zone wireframes are
supported by drilling with a spacing of approximately 80 m. This drill spacing is sufficient to assume
that the mineralization is continuous between drillholes. A 100 m maximum distance to the closest
composite permits a reasonable local estimate of grades (as demonstrated by model validation).
14.4 Mato Bula North Mineral Resource Estimate
14.4.1 Wireframe Models and Mineralization Mato Bula North
EAM provided Fladgate with sectional interpretations of the mineralization based on copper and gold
grades. Fladgate created wireframe models of the mineralized zones using EAM’s drillhole intercepts
with MineSight’s implicit modeller. Fladgate reviewed the wireframe models and found the
wireframe boundaries were correctly snapped to the drillhole intercepts. Fladgate inspected
drillholes displaying gold and copper grades, no significant zones of mineralization fall outside of the
wireframes.
Fladgate coded each zone separately. The zone codes are show in Table 14-32.
Table 14-32: Mato Bula Domain Codes
Domain Code
Zone 100 100
Zone 200 200
The wireframe models used to constrain mineral resource estimation are shown below in Figure
14-24. Fladgate created partial items and stored the percentage of each block falling within the
wireframes.
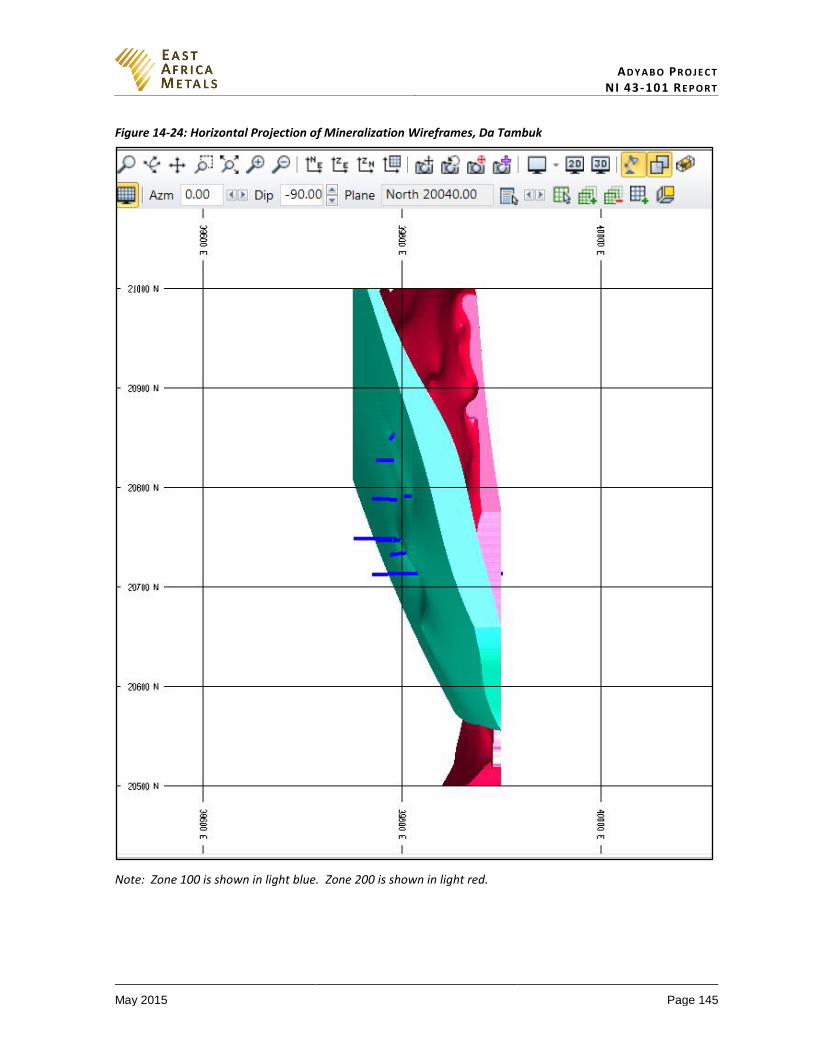
AD Y A B O PR O J E C T NI 43-101 RE P O R T
May 2015 Page 145
Figure 14-24: Horizontal Projection of Mineralization Wireframes, Da Tambuk
Note: Zone 100 is shown in light blue. Zone 200 is shown in light red.
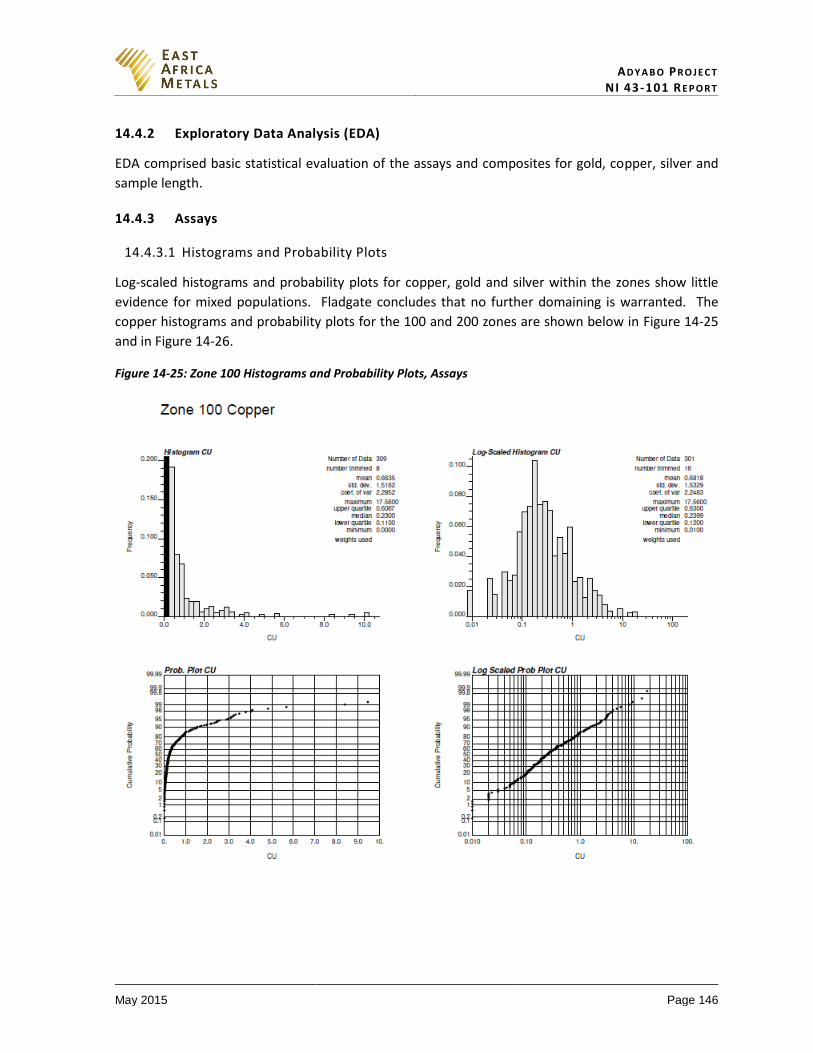
AD Y A B O PR O J E C T NI 43-101 RE P O R T
May 2015 Page 146
14.4.2 Exploratory Data Analysis (EDA)
EDA comprised basic statistical evaluation of the assays and composites for gold, copper, silver and
sample length.
14.4.3 Assays
14.4.3.1 Histograms and Probability Plots
Log-scaled histograms and probability plots for copper, gold and silver within the zones show little
evidence for mixed populations. Fladgate concludes that no further domaining is warranted. The
copper histograms and probability plots for the 100 and 200 zones are shown below in Figure 14-25
and in Figure 14-26.
Figure 14-25: Zone 100 Histograms and Probability Plots, Assays
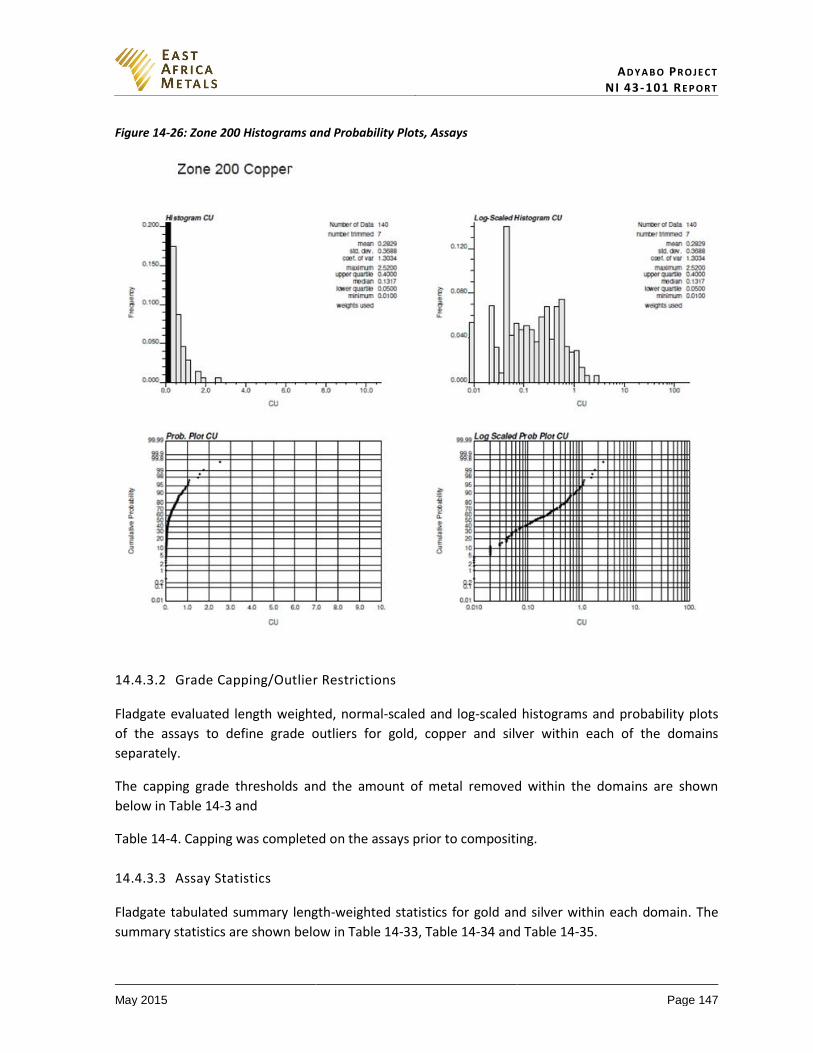
AD Y A B O PR O J E C T NI 43-101 RE P O R T
May 2015 Page 147
Figure 14-26: Zone 200 Histograms and Probability Plots, Assays
14.4.3.2 Grade Capping/Outlier Restrictions
Fladgate evaluated length weighted, normal-scaled and log-scaled histograms and probability plots
of the assays to define grade outliers for gold, copper and silver within each of the domains
separately.
The capping grade thresholds and the amount of metal removed within the domains are shown
below in Table 14-3 and
Table 14-4. Capping was completed on the assays prior to compositing.
14.4.3.3 Assay Statistics
Fladgate tabulated summary length-weighted statistics for gold and silver within each domain. The
summary statistics are shown below in Table 14-33, Table 14-34 and Table 14-35.
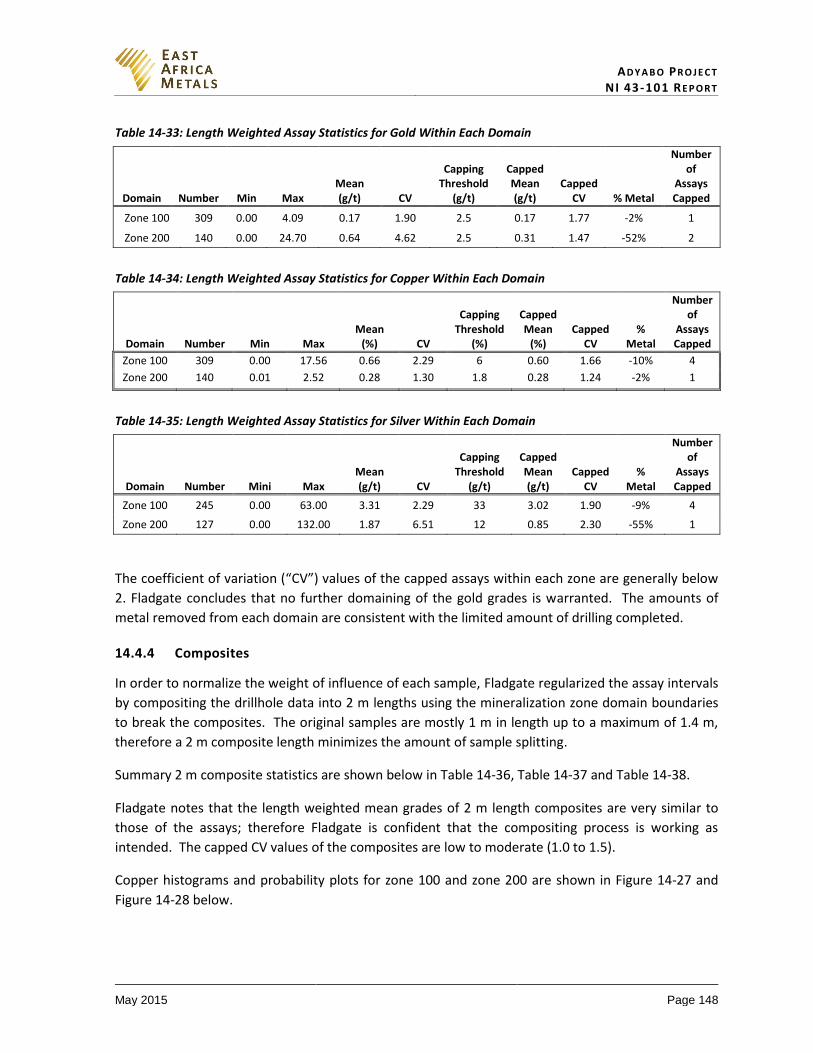
AD Y A B O PR O J E C T NI 43-101 RE P O R T
May 2015 Page 148
Table 14-33: Length Weighted Assay Statistics for Gold Within Each Domain
Domain Number Min Max Mean (g/t) CV
Capping Threshold
(g/t)
Capped Mean (g/t)
Capped CV % Metal
Number of
Assays Capped
Zone 100 309 0.00 4.09 0.17 1.90 2.5 0.17 1.77 -2% 1
Zone 200 140 0.00 24.70 0.64 4.62 2.5 0.31 1.47 -52% 2
Table 14-34: Length Weighted Assay Statistics for Copper Within Each Domain
Domain Number Min Max Mean
(%) CV
Capping Threshold
(%)
Capped Mean
(%) Capped
CV %
Metal
Number of
Assays Capped
Zone 100 309 0.00 17.56 0.66 2.29 6 0.60 1.66 -10% 4
Zone 200 140 0.01 2.52 0.28 1.30 1.8 0.28 1.24 -2% 1
Table 14-35: Length Weighted Assay Statistics for Silver Within Each Domain
Domain Number Mini Max Mean (g/t) CV
Capping Threshold
(g/t)
Capped Mean (g/t)
Capped CV
% Metal
Number of
Assays Capped
Zone 100 245 0.00 63.00 3.31 2.29 33 3.02 1.90 -9% 4
Zone 200 127 0.00 132.00 1.87 6.51 12 0.85 2.30 -55% 1
The coefficient of variation (“CV”) values of the capped assays within each zone are generally below
2. Fladgate concludes that no further domaining of the gold grades is warranted. The amounts of
metal removed from each domain are consistent with the limited amount of drilling completed.
14.4.4 Composites
In order to normalize the weight of influence of each sample, Fladgate regularized the assay intervals
by compositing the drillhole data into 2 m lengths using the mineralization zone domain boundaries
to break the composites. The original samples are mostly 1 m in length up to a maximum of 1.4 m,
therefore a 2 m composite length minimizes the amount of sample splitting.
Summary 2 m composite statistics are shown below in Table 14-36, Table 14-37 and Table 14-38.
Fladgate notes that the length weighted mean grades of 2 m length composites are very similar to
those of the assays; therefore Fladgate is confident that the compositing process is working as
intended. The capped CV values of the composites are low to moderate (1.0 to 1.5).
Copper histograms and probability plots for zone 100 and zone 200 are shown in Figure 14-27 and
Figure 14-28 below.
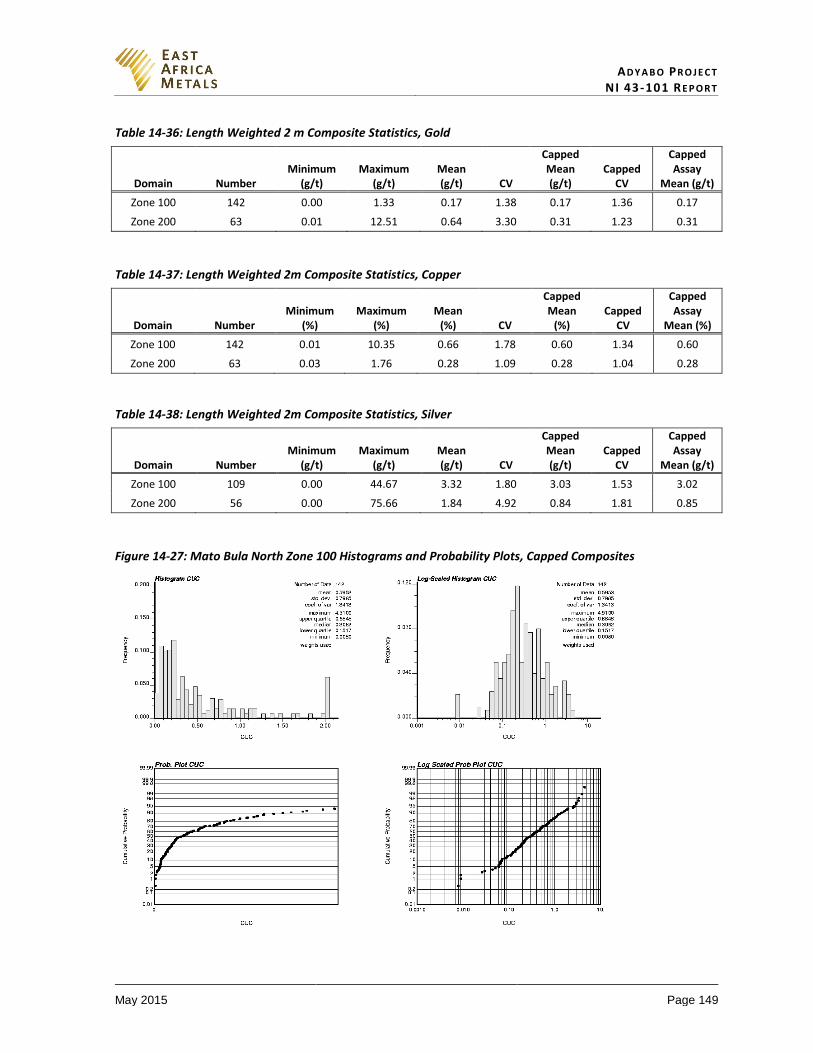
AD Y A B O PR O J E C T NI 43-101 RE P O R T
May 2015 Page 149
Table 14-36: Length Weighted 2 m Composite Statistics, Gold
Domain Number Minimum
(g/t) Maximum
(g/t) Mean (g/t) CV
Capped Mean (g/t)
Capped CV
Capped Assay
Mean (g/t)
Zone 100 142 0.00 1.33 0.17 1.38 0.17 1.36 0.17
Zone 200 63 0.01 12.51 0.64 3.30 0.31 1.23 0.31
Table 14-37: Length Weighted 2m Composite Statistics, Copper
Domain Number Minimum
(%) Maximum
(%) Mean
(%) CV
Capped Mean
(%) Capped
CV
Capped Assay
Mean (%)
Zone 100 142 0.01 10.35 0.66 1.78 0.60 1.34 0.60
Zone 200 63 0.03 1.76 0.28 1.09 0.28 1.04 0.28
Table 14-38: Length Weighted 2m Composite Statistics, Silver
Domain Number Minimum
(g/t) Maximum
(g/t) Mean (g/t) CV
Capped Mean (g/t)
Capped CV
Capped Assay
Mean (g/t)
Zone 100 109 0.00 44.67 3.32 1.80 3.03 1.53 3.02
Zone 200 56 0.00 75.66 1.84 4.92 0.84 1.81 0.85
Figure 14-27: Mato Bula North Zone 100 Histograms and Probability Plots, Capped Composites
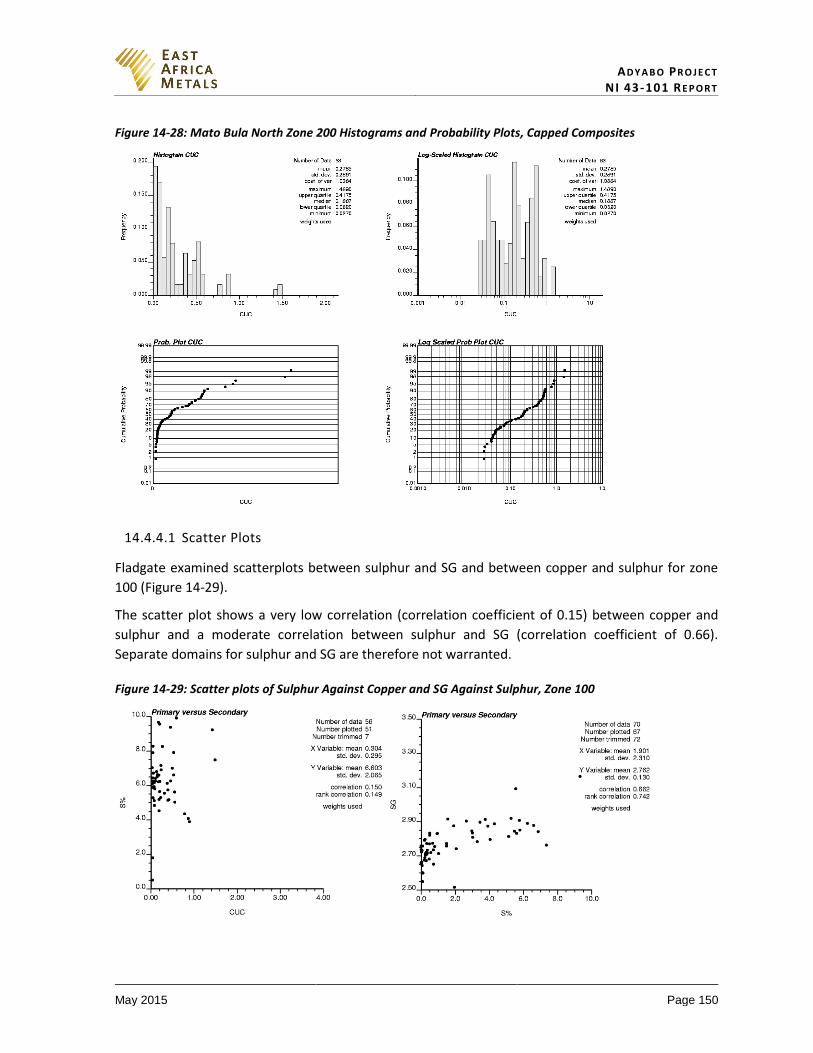
AD Y A B O PR O J E C T NI 43-101 RE P O R T
May 2015 Page 150
Figure 14-28: Mato Bula North Zone 200 Histograms and Probability Plots, Capped Composites
14.4.4.1 Scatter Plots
Fladgate examined scatterplots between sulphur and SG and between copper and sulphur for zone
100 (Figure 14-29).
The scatter plot shows a very low correlation (correlation coefficient of 0.15) between copper and
sulphur and a moderate correlation between sulphur and SG (correlation coefficient of 0.66).
Separate domains for sulphur and SG are therefore not warranted.
Figure 14-29: Scatter plots of Sulphur Against Copper and SG Against Sulphur, Zone 100
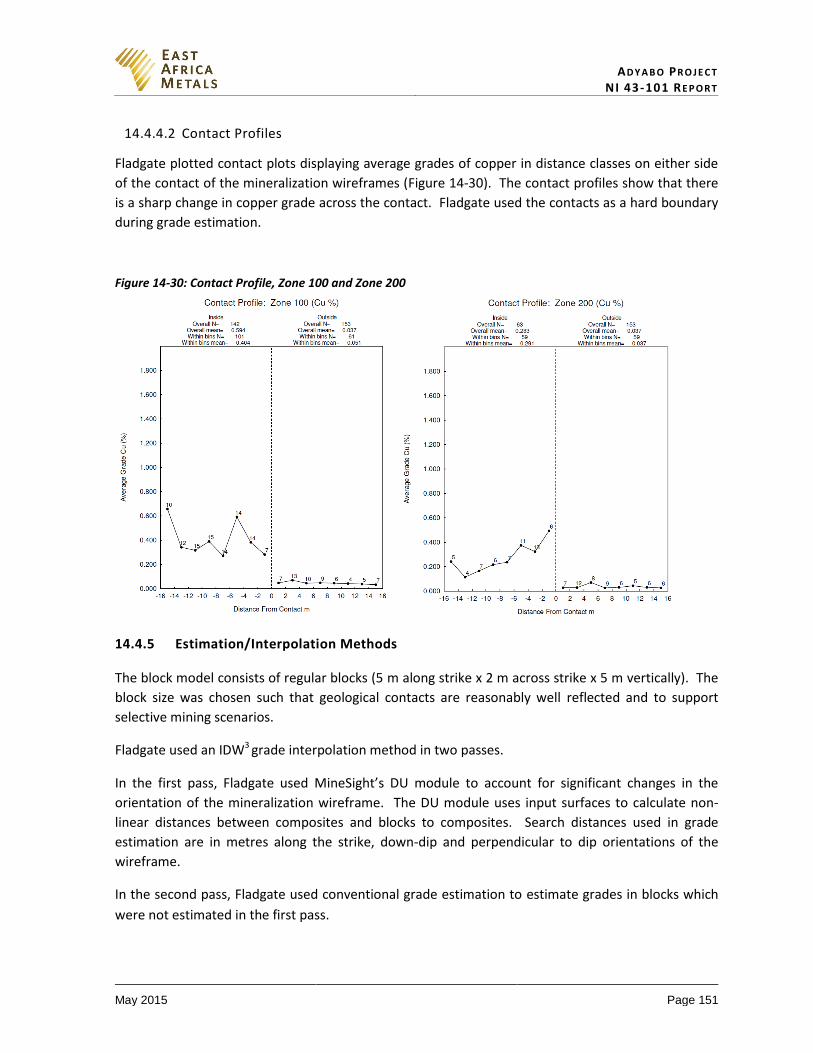
AD Y A B O PR O J E C T NI 43-101 RE P O R T
May 2015 Page 151
14.4.4.2 Contact Profiles
Fladgate plotted contact plots displaying average grades of copper in distance classes on either side
of the contact of the mineralization wireframes (Figure 14-30). The contact profiles show that there
is a sharp change in copper grade across the contact. Fladgate used the contacts as a hard boundary
during grade estimation.
Figure 14-30: Contact Profile, Zone 100 and Zone 200
14.4.5 Estimation/Interpolation Methods
The block model consists of regular blocks (5 m along strike x 2 m across strike x 5 m vertically). The
block size was chosen such that geological contacts are reasonably well reflected and to support
selective mining scenarios.
Fladgate used an IDW3 grade interpolation method in two passes.
In the first pass, Fladgate used MineSight’s DU module to account for significant changes in the
orientation of the mineralization wireframe. The DU module uses input surfaces to calculate non-
linear distances between composites and blocks to composites. Search distances used in grade
estimation are in metres along the strike, down-dip and perpendicular to dip orientations of the
wireframe.
In the second pass, Fladgate used conventional grade estimation to estimate grades in blocks which
were not estimated in the first pass.

AD Y A B O PR O J E C T NI 43-101 RE P O R T
May 2015 Page 152
Table 14-39 and Table 14-40 show the composite restrictions, search ellipse orientations and search
distances for the estimation domains.
Table 14-39: Grade Model Interpolation Plan, IDW3
Search Ellipse Dimensions Pass 1
Search Rotations Composite Restrictions Number of Holes
Domain X-Axis Y-Axis Z-Axis Z-Axis X-Axis Y-Axis Min Max
Maximum Per Hole
Min Max
Zone 100 200 100 50 -20 0 80 1 12 2 1 6 Zone 200 200 100 50 -20 0 80 1 12 2 1 6
Note: Search ellipse orientations are given using the LRR rotation convention as used in GSLIB
Table 14-40: Grade Model Interpolation Plan, Pass 2
Search Ellipse Dimensions Pass 2
Composite Restrictions Number of Holes
Rotation Angles
Domain X-Axis Y-Axis Z-Axis Min Max Maximum Per Hole Min Max Z-Axis X-Axis Y-Axis
Zone 100 100 200 50 1 12 2 1 6 0 90 90 Zone 150 100 200 50 1 12 2 1 6 0 90 90
Zone 200 100 200 50 1 12 2 1 6 0 90 90
Note: Search ellipse orientations are given using the LRR rotation convention as used in GSLIB
14.4.6 Density Assignment
A total of 231 SG determinations have been performed on drillcore samples collected from material
within the mineralized zones at Mato Bula North. The determinations were performed at site using
unsealed immersion technique to measure the weight of each sample in air and in water. Fladgate
assigned an average SG of 2.77 to blocks within zone 100 and an SG of 2.88 to blocks within zone
200. The SG values have been used directly as the dry bulk density to report the tonnage estimates
of the mineral resource.
The rock types intercepted in the drillholes are generally not porous, therefore the amount of
porosity is not expected to cause a large difference between the SG and bulk density. However,
Fladgate recommends that at least 10% of the SG determinations are repeated using a wax-sealed
immersion method of SG measurement in a commercial laboratory.
14.4.7 Block Model Validation
Fladgate validated the Mato Bula North block model to ensure appropriate honouring of the input
data. NN grade models were created from 2 m composites to validate the IDW3 grade models.
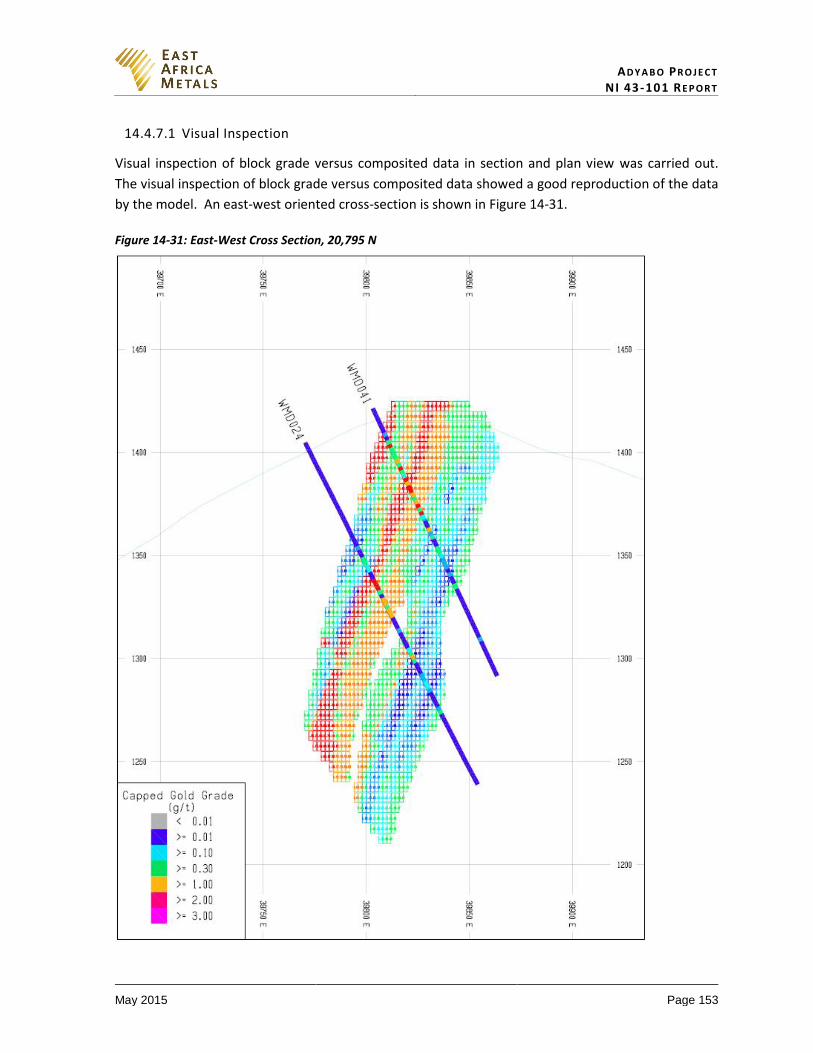
AD Y A B O PR O J E C T NI 43-101 RE P O R T
May 2015 Page 153
14.4.7.1 Visual Inspection
Visual inspection of block grade versus composited data in section and plan view was carried out.
The visual inspection of block grade versus composited data showed a good reproduction of the data
by the model. An east-west oriented cross-section is shown in Figure 14-31.
Figure 14-31: East-West Cross Section, 20,795 N
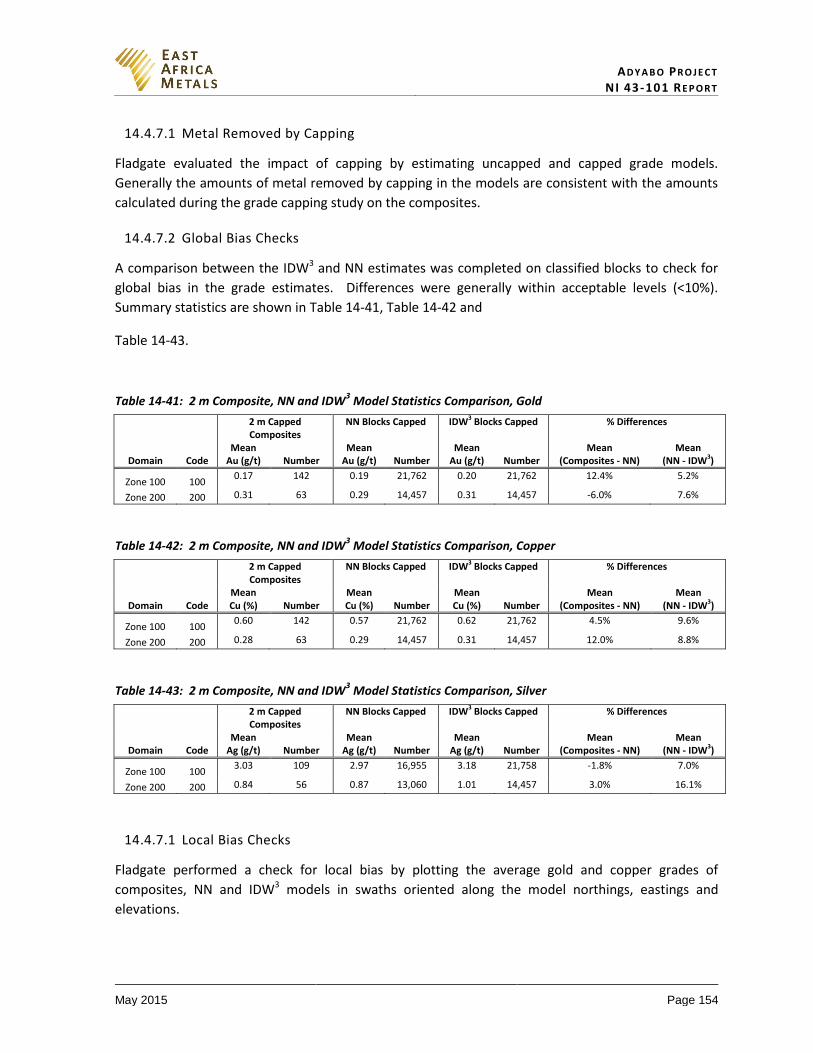
AD Y A B O PR O J E C T NI 43-101 RE P O R T
May 2015 Page 154
14.4.7.1 Metal Removed by Capping
Fladgate evaluated the impact of capping by estimating uncapped and capped grade models.
Generally the amounts of metal removed by capping in the models are consistent with the amounts
calculated during the grade capping study on the composites.
14.4.7.2 Global Bias Checks
A comparison between the IDW3 and NN estimates was completed on classified blocks to check for
global bias in the grade estimates. Differences were generally within acceptable levels (<10%).
Summary statistics are shown in Table 14-41, Table 14-42 and
Table 14-43.
Table 14-41: 2 m Composite, NN and IDW3 Model Statistics Comparison, Gold
2 m Capped Composites
NN Blocks Capped IDW3 Blocks Capped % Differences
Domain Code Mean
Au (g/t) Number Mean
Au (g/t) Number Mean
Au (g/t) Number Mean
(Composites - NN) Mean
(NN - IDW3)
Zone 100 100 0.17 142 0.19 21,762 0.20 21,762 12.4% 5.2%
Zone 200 200 0.31 63 0.29 14,457 0.31 14,457 -6.0% 7.6%
Table 14-42: 2 m Composite, NN and IDW3 Model Statistics Comparison, Copper
2 m Capped Composites
NN Blocks Capped IDW3 Blocks Capped % Differences
Domain Code Mean Cu (%) Number
Mean Cu (%) Number
Mean Cu (%) Number
Mean (Composites - NN)
Mean (NN - IDW3)
Zone 100 100 0.60 142 0.57 21,762 0.62 21,762 4.5% 9.6%
Zone 200 200 0.28 63 0.29 14,457 0.31 14,457 12.0% 8.8%
Table 14-43: 2 m Composite, NN and IDW3 Model Statistics Comparison, Silver
2 m Capped Composites
NN Blocks Capped IDW3 Blocks Capped % Differences
Domain Code Mean
Ag (g/t) Number Mean
Ag (g/t) Number Mean
Ag (g/t) Number Mean
(Composites - NN) Mean
(NN - IDW3)
Zone 100 100 3.03 109 2.97 16,955 3.18 21,758 -1.8% 7.0%
Zone 200 200 0.84 56 0.87 13,060 1.01 14,457 3.0% 16.1%
14.4.7.1 Local Bias Checks
Fladgate performed a check for local bias by plotting the average gold and copper grades of
composites, NN and IDW3 models in swaths oriented along the model northings, eastings and
elevations.
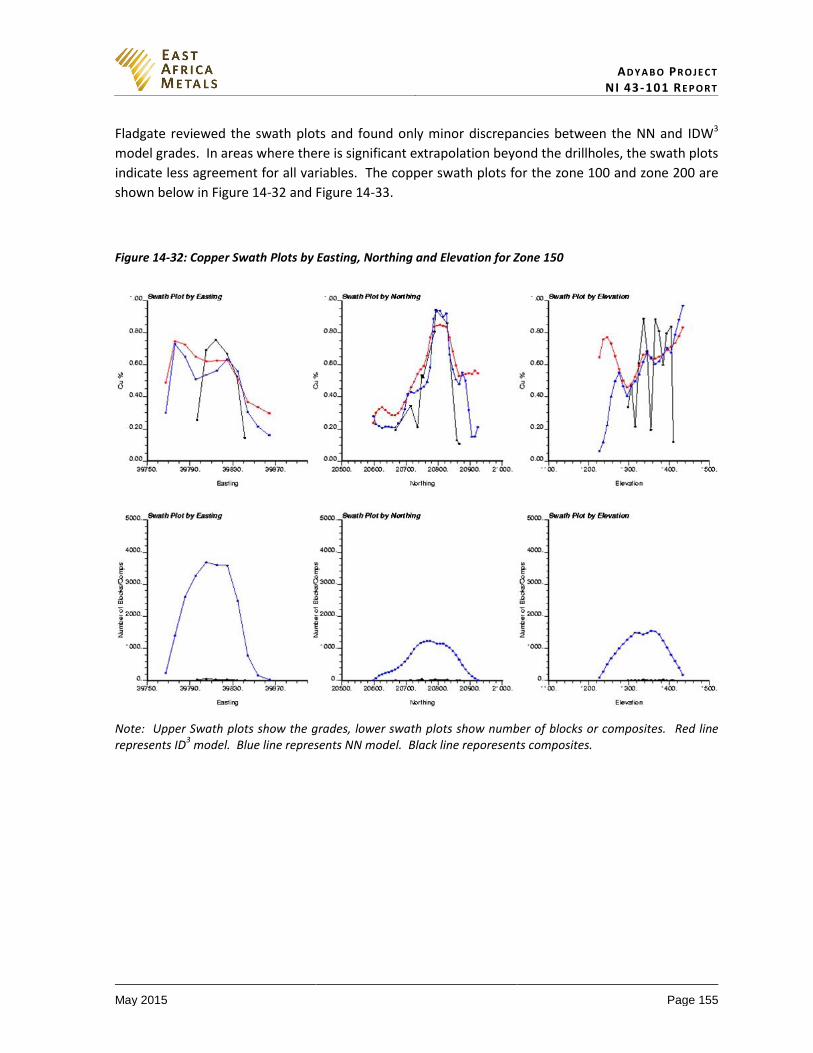
AD Y A B O PR O J E C T NI 43-101 RE P O R T
May 2015 Page 155
Fladgate reviewed the swath plots and found only minor discrepancies between the NN and IDW3
model grades. In areas where there is significant extrapolation beyond the drillholes, the swath plots
indicate less agreement for all variables. The copper swath plots for the zone 100 and zone 200 are
shown below in Figure 14-32 and Figure 14-33.
Figure 14-32: Copper Swath Plots by Easting, Northing and Elevation for Zone 150
Note: Upper Swath plots show the grades, lower swath plots show number of blocks or composites. Red line represents ID
3 model. Blue line represents NN model. Black line reporesents composites.
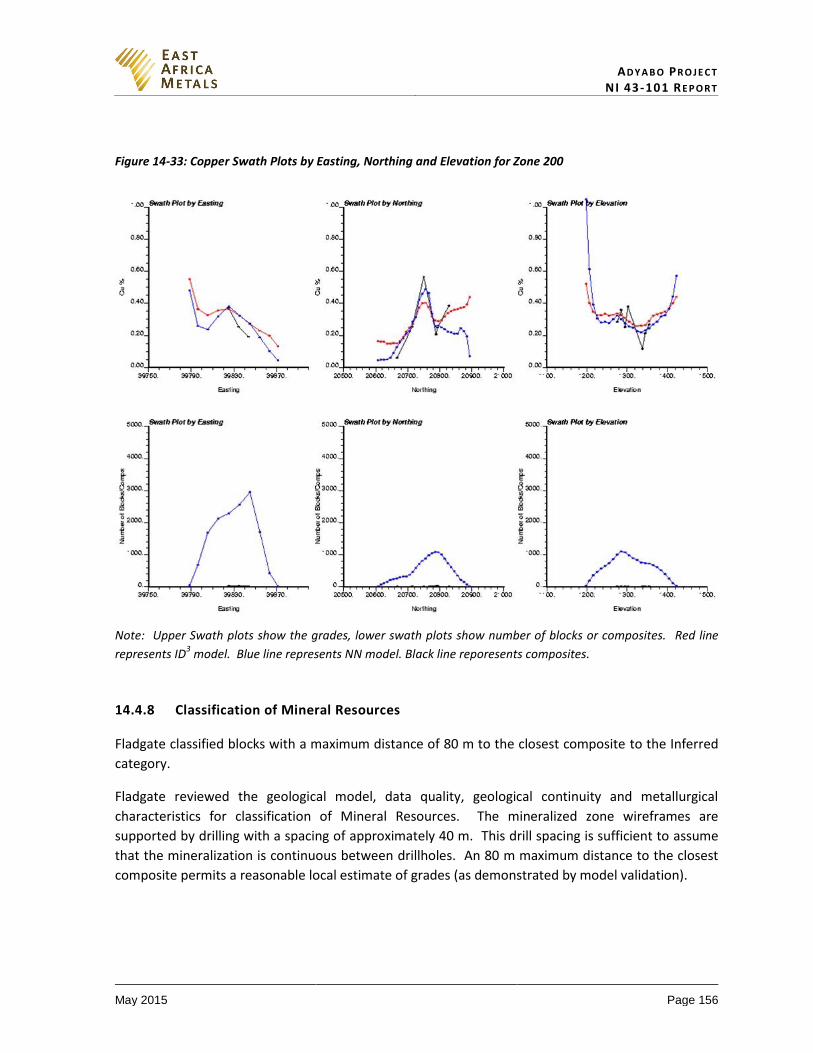
AD Y A B O PR O J E C T NI 43-101 RE P O R T
May 2015 Page 156
Figure 14-33: Copper Swath Plots by Easting, Northing and Elevation for Zone 200
Note: Upper Swath plots show the grades, lower swath plots show number of blocks or composites. Red line
represents ID3 model. Blue line represents NN model. Black line reporesents composites.
14.4.8 Classification of Mineral Resources
Fladgate classified blocks with a maximum distance of 80 m to the closest composite to the Inferred
category.
Fladgate reviewed the geological model, data quality, geological continuity and metallurgical
characteristics for classification of Mineral Resources. The mineralized zone wireframes are
supported by drilling with a spacing of approximately 40 m. This drill spacing is sufficient to assume
that the mineralization is continuous between drillholes. An 80 m maximum distance to the closest
composite permits a reasonable local estimate of grades (as demonstrated by model validation).
AD Y A B O PR O J E C T NI 43-101 RE P O R T
May 2015 Page 157
14.5 Reasonable Prospects of Economic Extraction
Fladgate assessed the classified blocks for reasonable prospects of economic extraction by applying
preliminary economics for potential pit constrained (‘open pit’) mining methods. Metallurgical test-
work has been completed for the mineralization.
For the purpose, Fladgate used input process and operating costs, metal prices, metallurgical
recovery and a 50° slope angle to optimize a pit shell using a Lerchs-Grossman algorithm.
The assessment does not represent an economic analysis of the deposit, but was used to determine
reasonable assumptions for the purpose of determining the mineral resource. The assumed long
term gold and silver prices used by Fladgate for Mineral Resources are shown below in Table 14-44.
The metal prices are similar to metal prices used by other companies to report base metal and gold
Mineral Resources. Fladgate therefore considers these metal prices to be suitable for mineral
resource estimation at the time of reporting.
Table 14-44: Fladgate Long-term Metal Price Assumptions
Metal Prices Price
Gold ($/oz) 1,400
Copper ($/lb) 3.20
Silver ($/oz) 20.0
14.5.1 Marginal Cut-Off Grade Calculation
Fladgate estimated open pit and underground marginal cut-off dollar values of 23.9 $/t and 63.9 $/t
respectively based on the total costs shown in Table 14-45. The marginal cut-off is based on the
generally accepted practice that a decision is made if mined material above the marginal cut-off
grade will lose less money if it is sent to the mill rather than if it is sent to the waste dump. It is
considered for further processing if it contains a value that is greater than the costs to process it. The
assumed metallurgical recoveries are shown in Table 14-46. Subsequent to the mineral resource
estimate, BCM completed a review of the metallurgical recovery data at Mato Bula and Mato Bula
North that resulted in recognition of a potential 5% to 10% increase in gold recoveries.
Fladgate calculated dollar values for the blocks using the metal prices and process recoveries and
used dollar value cut-off grades of 23.9 $/t and 63.9 $/t for reporting Mineral Resources potentially
amenable to open pit or underground mining methods.
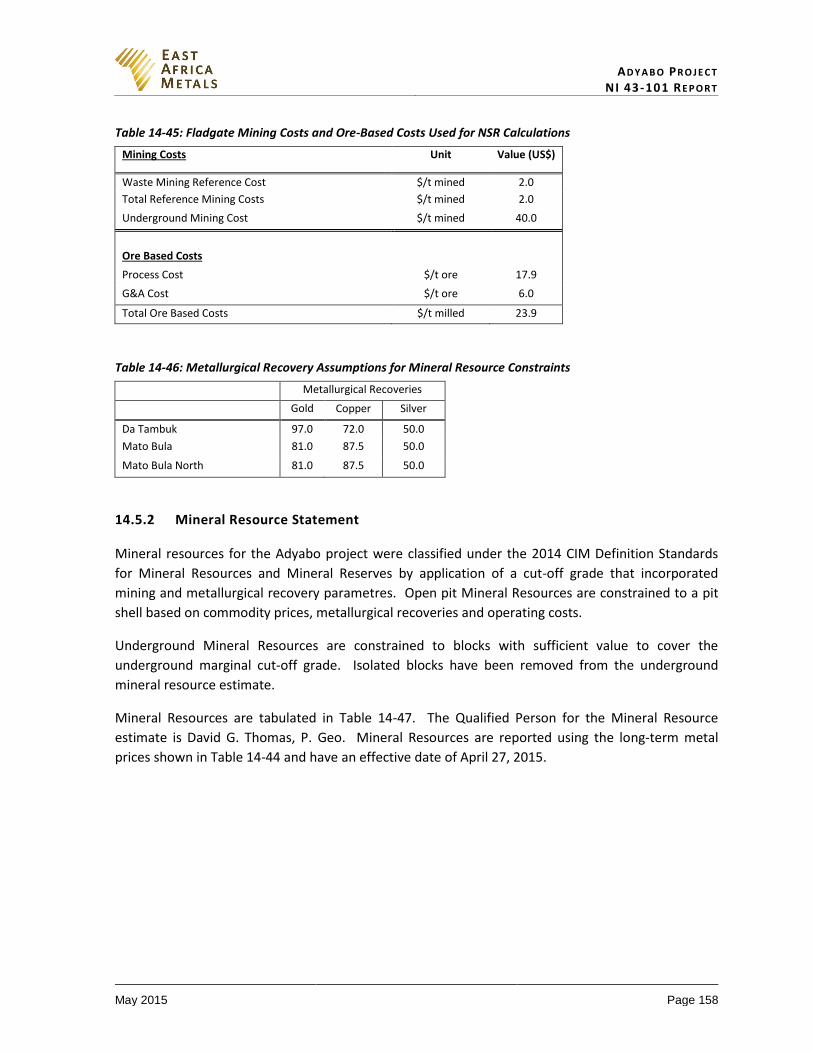
AD Y A B O PR O J E C T NI 43-101 RE P O R T
May 2015 Page 158
Table 14-45: Fladgate Mining Costs and Ore-Based Costs Used for NSR Calculations
Mining Costs Unit Value (US$)
Waste Mining Reference Cost $/t mined 2.0
Total Reference Mining Costs $/t mined 2.0
Underground Mining Cost $/t mined 40.0
Ore Based Costs
Process Cost $/t ore 17.9
G&A Cost $/t ore 6.0
Total Ore Based Costs $/t milled 23.9
Table 14-46: Metallurgical Recovery Assumptions for Mineral Resource Constraints
Metallurgical Recoveries
Gold
(%)
Copper
(%)
Silver
(%) Da Tambuk 97.0 72.0 50.0
Mato Bula 81.0 87.5 50.0
Mato Bula North 81.0 87.5 50.0
14.5.2 Mineral Resource Statement
Mineral resources for the Adyabo project were classified under the 2014 CIM Definition Standards
for Mineral Resources and Mineral Reserves by application of a cut-off grade that incorporated
mining and metallurgical recovery parametres. Open pit Mineral Resources are constrained to a pit
shell based on commodity prices, metallurgical recoveries and operating costs.
Underground Mineral Resources are constrained to blocks with sufficient value to cover the
underground marginal cut-off grade. Isolated blocks have been removed from the underground
mineral resource estimate.
Mineral Resources are tabulated in Table 14-47. The Qualified Person for the Mineral Resource
estimate is David G. Thomas, P. Geo. Mineral Resources are reported using the long-term metal
prices shown in Table 14-44 and have an effective date of April 27, 2015.
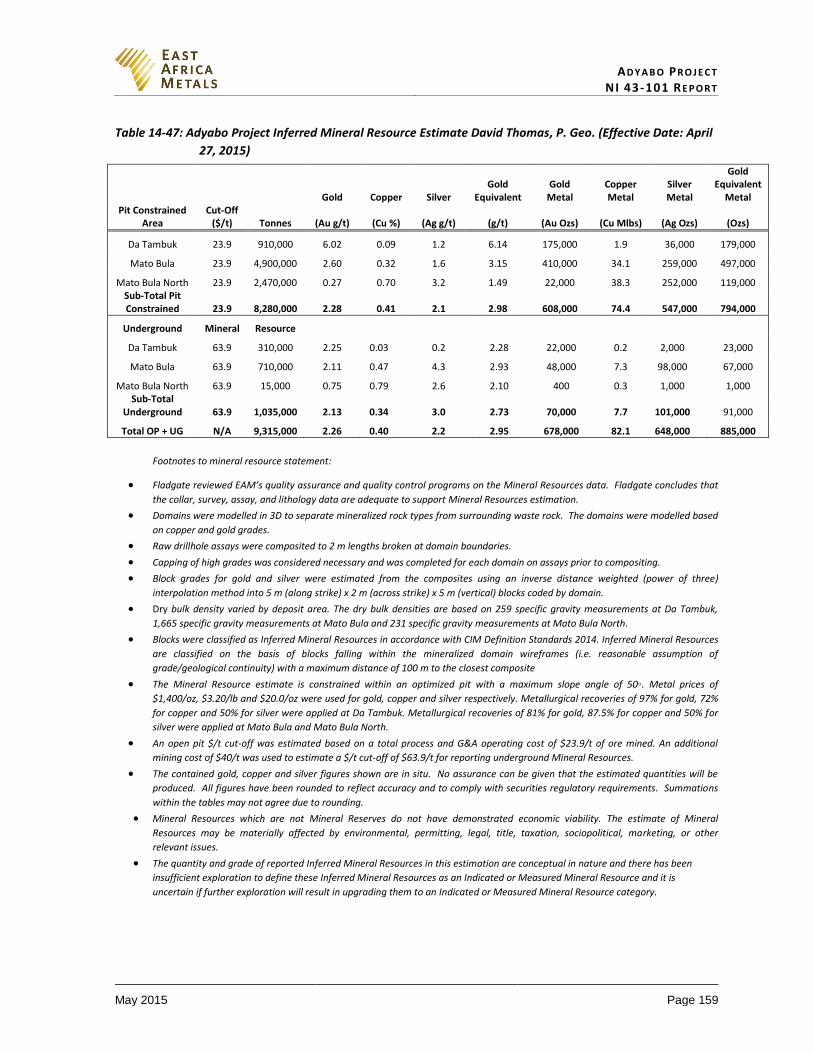
AD Y A B O PR O J E C T NI 43-101 RE P O R T
May 2015 Page 159
Table 14-47: Adyabo Project Inferred Mineral Resource Estimate David Thomas, P. Geo. (Effective Date: April
27, 2015)
Gold Copper Silver
Gold Equivalent
Gold Metal
Copper Metal
Silver Metal
Gold Equivalent
Metal Pit Constrained
Area Cut-Off
($/t) Tonnes (Au g/t) (Cu %) (Ag g/t) (g/t) (Au Ozs) (Cu Mlbs) (Ag Ozs) (Ozs)
Da Tambuk 23.9 910,000 6.02 0.09 1.2 6.14 175,000 1.9 36,000 179,000
Mato Bula 23.9 4,900,000 2.60 0.32 1.6 3.15 410,000 34.1 259,000 497,000
Mato Bula North 23.9 2,470,000 0.27 0.70 3.2 1.49 22,000 38.3 252,000 119,000 Sub-Total Pit Constrained 23.9 8,280,000 2.28 0.41 2.1 2.98 608,000 74.4 547,000 794,000
Underground Mineral Resource
Da Tambuk 63.9 310,000 2.25 0.03 0.2 2.28 22,000 0.2 2,000 23,000
Mato Bula 63.9 710,000 2.11 0.47 4.3 2.93 48,000 7.3 98,000 67,000
Mato Bula North 63.9 15,000 0.75 0.79 2.6 2.10 400 0.3 1,000 1,000 Sub-Total
Underground 63.9 1,035,000 2.13 0.34 3.0 2.73 70,000 7.7 101,000 91,000
Total OP + UG N/A 9,315,000 2.26 0.40 2.2 2.95 678,000 82.1 648,000 885,000
Footnotes to mineral resource statement:
Fladgate reviewed EAM’s quality assurance and quality control programs on the Mineral Resources data. Fladgate concludes that
the collar, survey, assay, and lithology data are adequate to support Mineral Resources estimation.
Domains were modelled in 3D to separate mineralized rock types from surrounding waste rock. The domains were modelled based
on copper and gold grades.
Raw drillhole assays were composited to 2 m lengths broken at domain boundaries.
Capping of high grades was considered necessary and was completed for each domain on assays prior to compositing.
Block grades for gold and silver were estimated from the composites using an inverse distance weighted (power of three)
interpolation method into 5 m (along strike) x 2 m (across strike) x 5 m (vertical) blocks coded by domain.
Dry bulk density varied by deposit area. The dry bulk densities are based on 259 specific gravity measurements at Da Tambuk,
1,665 specific gravity measurements at Mato Bula and 231 specific gravity measurements at Mato Bula North.
Blocks were classified as Inferred Mineral Resources in accordance with CIM Definition Standards 2014. Inferred Mineral Resources
are classified on the basis of blocks falling within the mineralized domain wireframes (i.e. reasonable assumption of
grade/geological continuity) with a maximum distance of 100 m to the closest composite
The Mineral Resource estimate is constrained within an optimized pit with a maximum slope angle of 50◦. Metal prices of
$1,400/oz, $3.20/lb and $20.0/oz were used for gold, copper and silver respectively. Metallurgical recoveries of 97% for gold, 72%
for copper and 50% for silver were applied at Da Tambuk. Metallurgical recoveries of 81% for gold, 87.5% for copper and 50% for
silver were applied at Mato Bula and Mato Bula North.
An open pit $/t cut-off was estimated based on a total process and G&A operating cost of $23.9/t of ore mined. An additional
mining cost of $40/t was used to estimate a $/t cut-off of $63.9/t for reporting underground Mineral Resources.
The contained gold, copper and silver figures shown are in situ. No assurance can be given that the estimated quantities will be
produced. All figures have been rounded to reflect accuracy and to comply with securities regulatory requirements. Summations
within the tables may not agree due to rounding.
Mineral Resources which are not Mineral Reserves do not have demonstrated economic viability. The estimate of Mineral
Resources may be materially affected by environmental, permitting, legal, title, taxation, sociopolitical, marketing, or other
relevant issues.
The quantity and grade of reported Inferred Mineral Resources in this estimation are conceptual in nature and there has been
insufficient exploration to define these Inferred Mineral Resources as an Indicated or Measured Mineral Resource and it is
uncertain if further exploration will result in upgrading them to an Indicated or Measured Mineral Resource category.
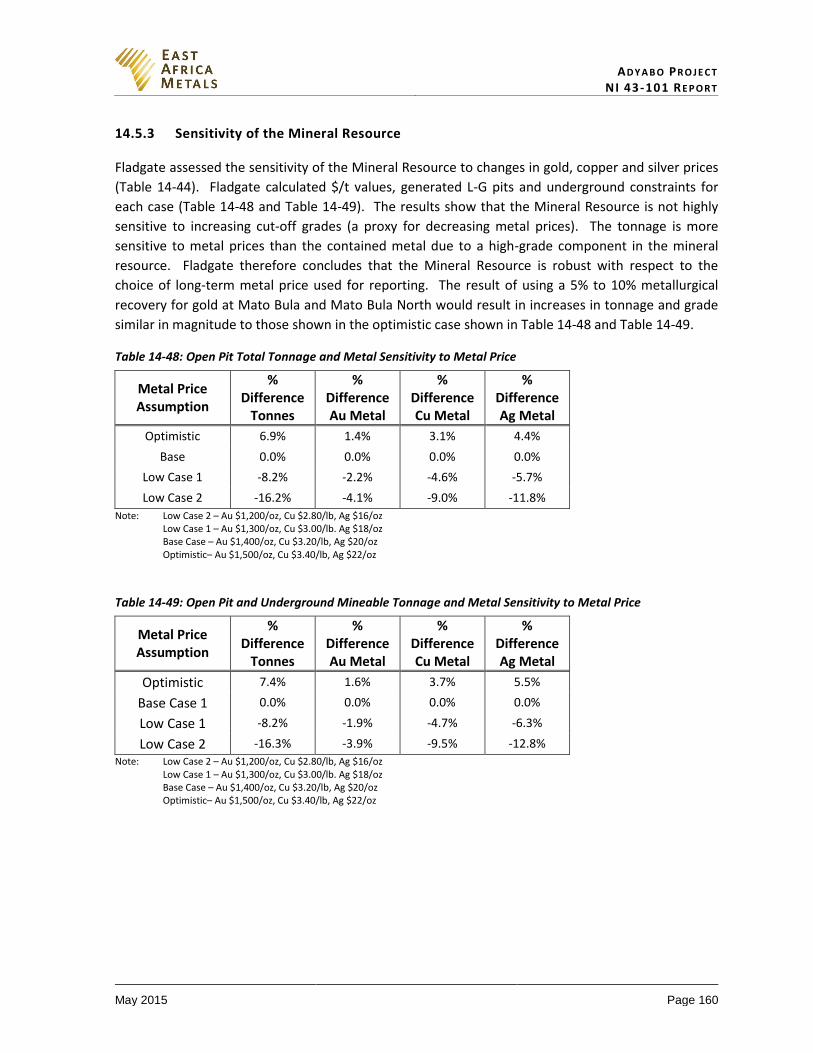
AD Y A B O PR O J E C T NI 43-101 RE P O R T
May 2015 Page 160
14.5.3 Sensitivity of the Mineral Resource
Fladgate assessed the sensitivity of the Mineral Resource to changes in gold, copper and silver prices
(Table 14-44). Fladgate calculated $/t values, generated L-G pits and underground constraints for
each case (Table 14-48 and Table 14-49). The results show that the Mineral Resource is not highly
sensitive to increasing cut-off grades (a proxy for decreasing metal prices). The tonnage is more
sensitive to metal prices than the contained metal due to a high-grade component in the mineral
resource. Fladgate therefore concludes that the Mineral Resource is robust with respect to the
choice of long-term metal price used for reporting. The result of using a 5% to 10% metallurgical
recovery for gold at Mato Bula and Mato Bula North would result in increases in tonnage and grade
similar in magnitude to those shown in the optimistic case shown in Table 14-48 and Table 14-49.
Table 14-48: Open Pit Total Tonnage and Metal Sensitivity to Metal Price
Metal Price Assumption
% Difference
Tonnes
% Difference Au Metal
% Difference Cu Metal
% Difference Ag Metal
Optimistic 6.9% 1.4% 3.1% 4.4%
Base 0.0% 0.0% 0.0% 0.0%
Low Case 1 -8.2% -2.2% -4.6% -5.7%
Low Case 2 -16.2% -4.1% -9.0% -11.8%
Note: Low Case 2 – Au $1,200/oz, Cu $2.80/lb, Ag $16/oz Low Case 1 – Au $1,300/oz, Cu $3.00/lb. Ag $18/oz
Base Case – Au $1,400/oz, Cu $3.20/lb, Ag $20/oz Optimistic– Au $1,500/oz, Cu $3.40/lb, Ag $22/oz
Table 14-49: Open Pit and Underground Mineable Tonnage and Metal Sensitivity to Metal Price
Metal Price Assumption
% Difference
Tonnes
% Difference Au Metal
% Difference Cu Metal
% Difference Ag Metal
Optimistic 7.4% 1.6% 3.7% 5.5%
Base Case 1 0.0% 0.0% 0.0% 0.0%
Low Case 1 -8.2% -1.9% -4.7% -6.3%
Low Case 2 -16.3% -3.9% -9.5% -12.8%
Note: Low Case 2 – Au $1,200/oz, Cu $2.80/lb, Ag $16/oz Low Case 1 – Au $1,300/oz, Cu $3.00/lb. Ag $18/oz
Base Case – Au $1,400/oz, Cu $3.20/lb, Ag $20/oz Optimistic– Au $1,500/oz, Cu $3.40/lb, Ag $22/oz
AD Y A B O PR O J E C T NI 43-101 RE P O R T
May 2015 Page 161
14.5.4 Factors That May Affect the Mineral Resource Estimate
Areas of uncertainty that may materially impact the Mineral Resource estimates include:
Long-term commodity price assumptions
Long-term exchange rate assumptions
Operating cost assumptions used
Metal recovery assumptions used
Changes to the tonnage and grade estimates as a result of new assay and bulk density
information
Future tonnage and grade estimates may vary significantly as more drilling is
completed.
Changes to the metallurgical recovery assumptions as a result of new metallurgical
test-work
Any changes to the slope angle of the pit wall as a result of geotechnical information
would affect the pit shell used to constrain the Mineral Resources.
14.6 QP Comments on Section 14
The QPs are of the opinion that the Mineral Resources for the Adyabo project, which have been
estimated using core drilling, have been performed to industry practices, and conform to the
requirements of CIM Definition Standards (2014).
14.7 Conclusions
Mineral resource estimation is well-constrained by three-dimensional wireframes representing
geologically realistic volumes of mineralization.
Exploratory data analysis conducted on assays and composites shows that the wireframes are
suitable domains for mineral resource estimation.
As a result of validation of the mineral resource block model Fladgate concludes:
Visual inspection of block grade versus composited data shows a good reproduction of
the data by the model
Checks for global bias in the grade estimates show differences generally within
acceptable levels (<10%). Domains with larger differences between the NN model and
OK model have a low number of composites.
AD Y A B O PR O J E C T NI 43-101 RE P O R T
May 2015 Page 162
Checks for local bias (swath plots) indicate good agreement for all variables, except in
areas where there is significant extrapolation beyond the drillholes
Fladgate evaluated the impact of capping by estimating uncapped and capped grade
models. Generally the amounts of metal removed by capping in the models are
consistent with the amounts calculated during the grade capping study on the assays.
Fladgate classified the mineral resource using distances which permit a reasonable assumption of
geological and grade continuity.
Mineral Resources are constrained and reported using economic and technical criteria such that the
mineral resource has reasonable prospects of economic extraction.
The mineral resource is not sensitive to changes in metal price.
Fladgate have estimated Mineral Resources for the Adyabo project which conform to the
requirements of CIM Definition Standards (2014).
AD Y A B O PR O J E C T NI 43-101 RE P O R T
May 2015 Page 163
15 MINERAL RESERVE ESTIMATES
This section is not applicable at this time.
AD Y A B O PR O J E C T NI 43-101 RE P O R T
May 2015 Page 164
16 MINING METHODS
As the Report relates to the description of an initial mineral resource estimate, mining methods have
not been evaluated or established and this section is not applicable at this time.
AD Y A B O PR O J E C T NI 43-101 RE P O R T
May 2015 Page 165
17 RECOVERY METHODS
As the Report relates to description of an initial mineral resource estimate, recovery methods have
not been evaluated and this section is not applicable at this time.
AD Y A B O PR O J E C T NI 43-101 RE P O R T
May 2015 Page 166
18 PROJECT INFRASTRUCTURE
This section is not applicable at this time.
.
AD Y A B O PR O J E C T NI 43-101 RE P O R T
May 2015 Page 167
19 MARKET STUDIES & CONTRACTS
This section is not applicable at this time.
AD Y A B O PR O J E C T NI 43-101 RE P O R T
May 2015 Page 168
20 ENVIRONMENTAL STUDIES, PERMITTING AND SOCIAL OR COMMUNITY IMPACT
20.1 Environmental Studies
EAM has reviewed projected baseline environmental and socio-economic studies with the aim of
initiating an Environmental Impact Assessment (“EIA”) for the Adyabo project if there is an increase
in the resource confidence level, i.e., Inferred classification to Measured and Indicated. If the study
goes ahead it will include initial work to establish field conditions and baseline determination in the
following areas:
meteorology
hydrology
hydrogeology
water quality
vegetation
wildlife
socio-economic conditions
20.2 Waste & Tailings Impoundment & Water Management
As the Report relates to a description of initial exploration, planning, design and other specific factors
related to the impoundment of tailing and waste materials, as well as management of water
resources, have not yet been evaluated. Further development of the Adyabo project should include
early consideration to the environmental and other impacts associated with these important facilities
and aspects of the project.
20.3 Project Permitting
Project permitting activities may be planned if the mineral resource estimation is upgraded from an
Inferred to a Measured and Indicated category.
20.4 Social & Community Requirements
EAM has been working with local communities to establish a relationship based on open
communication and cooperation since 2012. To this end, EAM has engaged local leaders, and has
initiated several community development projects including road building.
AD Y A B O PR O J E C T NI 43-101 RE P O R T
May 2015 Page 169
21 CAPITAL & OPERATING COSTS
This section is not applicable at this time.
AD Y A B O PR O J E C T NI 43-101 RE P O R T
May 2015 Page 170
22 ECONOMIC ANALYSIS
As the Report relates to the description of initial exploration, an economic analysis of the project has
not been undertaken and this section is not applicable at this time.
AD Y A B O PR O J E C T NI 43-101 RE P O R T
May 2015 Page 171
23 ADJACENT PROPERTIES
Additional information is not available to report and this section is not applicable.
AD Y A B O PR O J E C T NI 43-101 RE P O R T
May 2015 Page 172
24 OTHER RELEVANT DATA & INFORMATION
Additional information is not available to report and this section is not applicable.
AD Y A B O PR O J E C T NI 43-101 RE P O R T
May 2015 Page 173
25 INTERPRETATIONS & CONCLUSIONS
The Adyabo project has been comprehensively explored through the use of variety exploration techniques by East Africa Metals Inc. since it was acquired in 2012. Geochemical sampling programs (gold in soil, and portable XRF soil sampling) have been particularly successful in identifying anomalous areas for follow up drilling.
Exploration drilling was carried out at six prospects: Mato Bula, Mato Bula North, Da Tambuk on the Mato Bula Trend, and Mungae Andi, Adi Gozomo and Hanbassa on the Zager Trend. Resource definition drilling was undertaken at Mato Bula, Mato Bula North, and Da Tambuk, which delineated Au-rich VMS style mineralization. Drilling at Mungae Andi, Adi Gozomo and Hanbassa focused on shear-zone and intrusion-related orogenic gold mineralization.
The majority of expenditure at the Adyabo project related to the drilling of 52 diamond drillholes at the Au-rich VMS prospects of Mato Bula (35 holes), Da Tambuk (12 holes), and Mato Bula North (6 holes) for a total of 11,267.19 m. The most substantial gold-copper mineralization on the property is located at Mato Bula, where mineralization is present over a strike distance of 800 m and includes five separate plunging shoots that extend to a known depth of 200 m from surface. Mineralization is hosted with intensely silicified sericite schist, which contain abundant replacement and exhalative silica (jasperoid) in two lodes (Main and Upper). The Main lode is copper-rich and has been interpreted to represent a vent proximal (or feeder) environment, whereas the Upper lode is interpreted to represent an exhalite facies. The sulphide mineralogy of the lodes is dominated by pyrite, with subordinate chalcopyrite, and lesser amounts of bornite, covellite, chalcocite, and tetrahedrite.
The Mato Bula North prospect is located 850 m northeast from the Silica Hill zone at Mato Bula. Drilling has defined a mineralized zone 160 m in length, up to 150 m deep with a true width up to 50 m. Mineralization is present within silica, quartz veins and disseminated sulphides within quartz porphyry intrusions. Mineralization is interpreted to be part of the feeder system to a gold-rich VMS.
The most northerly prospect identified to date on the Mato Bula Trend is at Da Tambuk, which is located 4 km northeast along strike from Mato Bula. High-grade gold shoots are present that attain true thicknesses of 13 m, and occur over a surface strike of 135 m, and a height of 150 m. Mineralization is hosted within a highly pyritized sericite schist (containing > 10% pyrite), and is associated with silica alteration, quartz veining, pyrite, weak chalcopyrite and pale sphalerite.
Recent geological mapping in March 2015 by EAM geologists has identified a zone of phyllic alteration (silica-sericite-pyrite) over 700 m of north-trending strike between the Mato Bula and Da Tambuk prospects. This zone of alteration may prove to be the linking structure between the Mato Bula and Da Tambuk prospects, and if this thesis is correct it could present 700 m of prospective strike. The newly identified zone passes 200 m to the east of Mato Bula North, i.e., into the footwall contact, and appears to be on a separate trend from Mato Bula North. This suggests the new zone could be on the same chronostratigraphic horizon as Mato Bula, Silica Hill and Da Tambuk. Other evidence supporting this hypothesis includes: the different geochemical nature of Mato Bula North
AD Y A B O PR O J E C T NI 43-101 RE P O R T
May 2015 Page 174
(high Cu, low Au) verses Mato Bula, Silica Hill and Da Tambuk (high Au, low Cu); and Mato Bula and Silica Hill are hosted within altered schist, whereas Mato Bula North is hosted higher up in the sequence in the black shale with mafic tuff unit. Additional geological mapping and lithological sampling is required to test this hypothesis.
In addition to Au-rich VMS mineralization, the Adyabo project also holds potential for orogenic lode gold (intrusion related, and shear-zone hosted) mineralization within the Zager Trend. Numerous artisanal gold workings are present, which correspond to geochemical anomalies. Limited drilling has taken place at Mugnae Andi, Hanbassa and Adi Gozomo, with encouraging exploration results reported from Sentraley, but potential exists for additional discoveries.
The geologic understanding of the deposit settings, lithologies, and structural and alteration controls on mineralization is sufficient to support estimation of Mineral Resources. The mineralization style and setting is well understood and is sufficient to support Mineral Resource estimation. The exploration programs completed to date are appropriate to the style of mineralization found in the deposit.
Mineral resource estimation is well-constrained by three-dimensional wireframes representing
geologically realistic volumes of mineralization.
Exploratory data analysis conducted on assays and composites shows that the wireframes are
suitable domains for mineral resource estimation.
As a result of validation of the mineral resource block model Fladgate concludes:
Visual inspection of block grade versus composited data shows a good reproduction of the
data by the model
Checks for global bias in the grade estimates show differences generally within acceptable
levels (<10%). Domains with larger differences between the NN model and OK model have a
low number of composites
Checks for local bias (swath plots) indicate good agreement for all variables except in areas
where there is significant extrapolation beyond the drillholes
Fladgate evaluated the impact of capping by estimating uncapped and capped grade models.
Generally the amounts of metal removed by capping in the models are consistent with the
amounts calculated during the grade capping study on the assays.
Fladgate classified the mineral resource using distances which permit a reasonable assumption of
geological and grade continuity.
Mineral Resources are constrained and reported using economic and technical criteria such that the
mineral resource has reasonable prospects of economic extraction.
The Mineral Resource is not sensitive to changes in metal price.
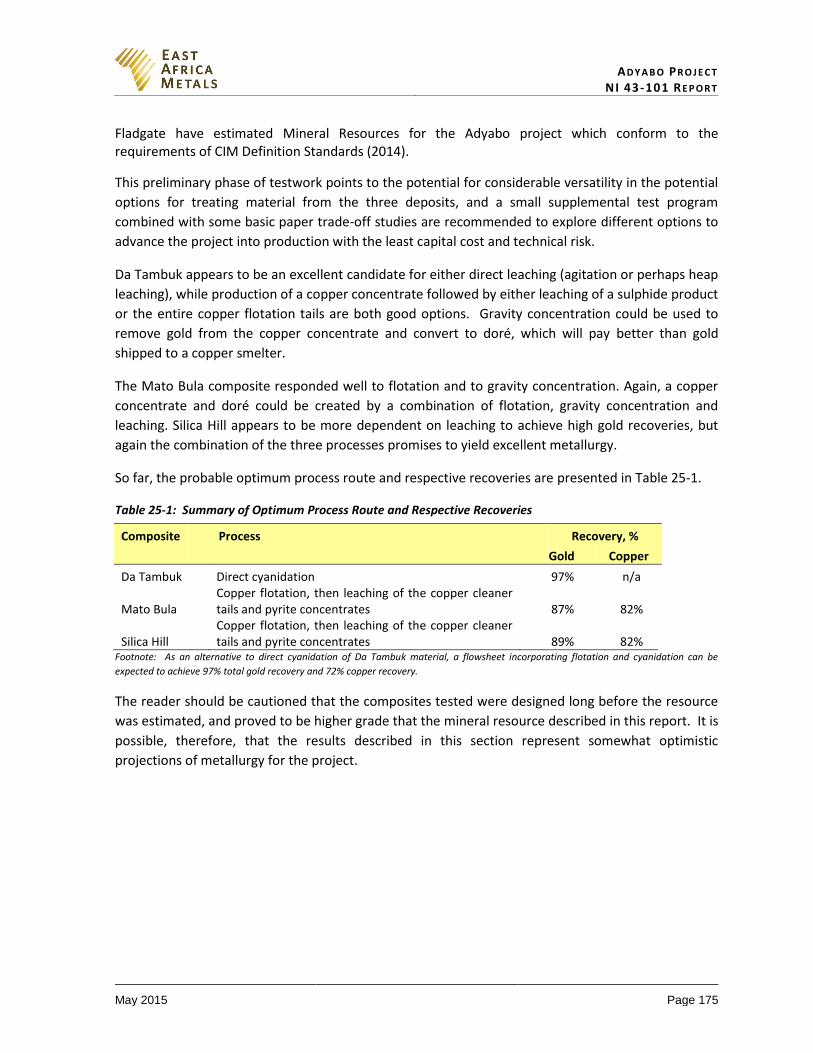
AD Y A B O PR O J E C T NI 43-101 RE P O R T
May 2015 Page 175
Fladgate have estimated Mineral Resources for the Adyabo project which conform to the requirements of CIM Definition Standards (2014).
This preliminary phase of testwork points to the potential for considerable versatility in the potential
options for treating material from the three deposits, and a small supplemental test program
combined with some basic paper trade-off studies are recommended to explore different options to
advance the project into production with the least capital cost and technical risk.
Da Tambuk appears to be an excellent candidate for either direct leaching (agitation or perhaps heap
leaching), while production of a copper concentrate followed by either leaching of a sulphide product
or the entire copper flotation tails are both good options. Gravity concentration could be used to
remove gold from the copper concentrate and convert to doré, which will pay better than gold
shipped to a copper smelter.
The Mato Bula composite responded well to flotation and to gravity concentration. Again, a copper
concentrate and doré could be created by a combination of flotation, gravity concentration and
leaching. Silica Hill appears to be more dependent on leaching to achieve high gold recoveries, but
again the combination of the three processes promises to yield excellent metallurgy.
So far, the probable optimum process route and respective recoveries are presented in Table 25-1.
Table 25-1: Summary of Optimum Process Route and Respective Recoveries
Composite Process Recovery, %
Gold Copper
Da Tambuk Direct cyanidation 97% n/a
Mato Bula Copper flotation, then leaching of the copper cleaner tails and pyrite concentrates 87% 82%
Silica Hill Copper flotation, then leaching of the copper cleaner tails and pyrite concentrates 89% 82%
Footnote: As an alternative to direct cyanidation of Da Tambuk material, a flowsheet incorporating flotation and cyanidation can be
expected to achieve 97% total gold recovery and 72% copper recovery.
The reader should be cautioned that the composites tested were designed long before the resource
was estimated, and proved to be higher grade that the mineral resource described in this report. It is
possible, therefore, that the results described in this section represent somewhat optimistic
projections of metallurgy for the project.
AD Y A B O PR O J E C T NI 43-101 RE P O R T
May 2015 Page 176
26 RECOMMENDATIONS
It is recommended that the path forward for the Adyabo project should include the following contingent
two phase work program:
Phase 1
Parts of the property remain to be fully investigated and exploration work should continue to try and
identify additional Au-rich VMS mineralization and orogenic gold. Supplementary work is required at the
known Au-rich VMS prospects to realize the potential of the existing mineralization, by performing
trenching, targeted diamond drilling, and metallurgical work. Specifically the recommended work
program will include:
Continuation of portable XRF and shallow soil sampling, chip sampling, trenching and
mapping in underexplored parts of the property – particularly between Mato Bula North and
Da Tambuk
Conducting trenching at defined gold zones on the property that require further testing to
warrant additional assessment for drill testing
Performing ground and downhole EM geophysical survey to determine if a base-metal rich
VMS system is present
Fladgate recommends that EAM complete additional drilling on the Adyabo project. Infill drilling of
the Mato Bula deposit should be undertaken in order to determine whether the Mineral Resource
can be upgraded from Inferred to the higher confidence Measured and Indicated categories.
Fladgate recommends that EAM carefully evaluate and identify areas of the deposit with higher risk
(e.g., areas with significantly higher grades than the average grade of the deposit or areas with more
discontinuous grades) and consider strategically located holes in those areas to mitigate the risks.
Additional drilling would mitigate the risk by increasing local confidence in the estimated tonnage
and grade above cut-off.
Blue Coast Metallurgy has several recommendations for the three prospects within the Mato Bula
Trend Resource. Recommendations for Mato Bula, Mato Bula North and Da Tambuk include
testwork on a composite with broad spatial and good grade representation of the resource as
defined in this Report, including:
Physical characterization including basic mineralogy and grindability testing on a single
composite
LCT confirmation and leach of tails
Complete scans of concentrates
Paper trade-off economic studies of the different metallurgical options
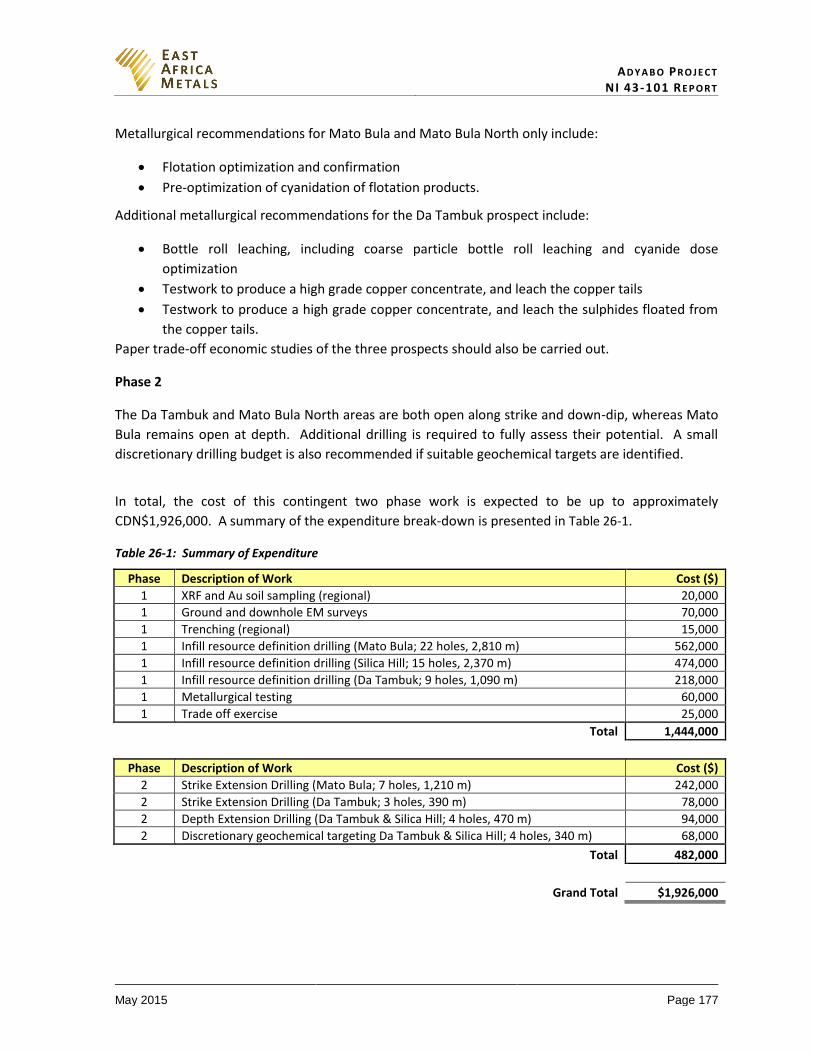
AD Y A B O PR O J E C T NI 43-101 RE P O R T
May 2015 Page 177
Metallurgical recommendations for Mato Bula and Mato Bula North only include:
Flotation optimization and confirmation
Pre-optimization of cyanidation of flotation products.
Additional metallurgical recommendations for the Da Tambuk prospect include:
Bottle roll leaching, including coarse particle bottle roll leaching and cyanide dose
optimization
Testwork to produce a high grade copper concentrate, and leach the copper tails
Testwork to produce a high grade copper concentrate, and leach the sulphides floated from
the copper tails.
Paper trade-off economic studies of the three prospects should also be carried out.
Phase 2
The Da Tambuk and Mato Bula North areas are both open along strike and down-dip, whereas Mato
Bula remains open at depth. Additional drilling is required to fully assess their potential. A small
discretionary drilling budget is also recommended if suitable geochemical targets are identified.
In total, the cost of this contingent two phase work is expected to be up to approximately
CDN$1,926,000. A summary of the expenditure break-down is presented in Table 26-1.
Table 26-1: Summary of Expenditure
Phase Description of Work Cost ($)
1 XRF and Au soil sampling (regional) 20,000
1 Ground and downhole EM surveys 70,000
1 Trenching (regional) 15,000
1 Infill resource definition drilling (Mato Bula; 22 holes, 2,810 m) 562,000
1 Infill resource definition drilling (Silica Hill; 15 holes, 2,370 m) 474,000
1 Infill resource definition drilling (Da Tambuk; 9 holes, 1,090 m) 218,000
1 Metallurgical testing 60,000
1 Trade off exercise 25,000
Total 1,444,000
Phase Description of Work Cost ($)
2 Strike Extension Drilling (Mato Bula; 7 holes, 1,210 m) 242,000
2 Strike Extension Drilling (Da Tambuk; 3 holes, 390 m) 78,000
2 Depth Extension Drilling (Da Tambuk & Silica Hill; 4 holes, 470 m) 94,000
2 Discretionary geochemical targeting Da Tambuk & Silica Hill; 4 holes, 340 m) 68,000
Total 482,000
Grand Total $1,926,000
AD Y A B O PR O J E C T NI 43-101 RE P O R T
May 2015 Page 178
27 REFERENCES
Abdelsalam, M.G., Stern, R.J., 1996. Sutures and shear zones in the Arabian–Nubian Shield. J. Afr. Earth Sci. 23, 289–310.
Alene, M., 1998. Tectonomagmatic evolution of the Neoproterozoic rocks of the Mai Kenetal–Negash area, Tigrai, northern Ethiopia. Unpublished Ph.D. Thesis, University of Turin.
Alene and Sacchi, 2000. The Neoproterozoic low-grade basement of Tigrai, northern Ethiopia. Abstracts: 18th Colloquium of African Geology, Graz. J. Afr. Earth Sci. 30 (4), 5–6.
Alene, M., Jenkin G. R. T., Leng, M. J., and Darbyshire, D. P. F., 2006. The Tambien Group, Ethiopia: An early Cryogenian (ca. 800–735 Ma) Neoproterozoic sequence in the Arabian–Nubian Shield: Precambrian Research, 147, 79-99.
Archibald, S. M., Thomas, D. G., and Martin, C. 2014. NI43-101 Technical Report on the Mineral Resource Estimate at the Terakimti Prospect, Harvest Property (centred at 38°21’E, 14°19’N), Tigray National Region, Ethiopia. Report prepared for Tigray Resources Inc., 204 pp.
Barrie, C. T., Nielsen, F. W., and Aussant, C., 2007. The Bisha volcanic-associated massive sulphide deposit, Western Eritrea: Economic Geology, v. 102, 717-738.
Barrie, C.T., and Hannington, M.D., 1999. Volcanic-associated massive sulphide deposits: Processes and examples in modern and ancient settings, Reviews in Economic Geology, Volume 8, Society of Economic Geology and Geological Association of Canada, 408 pp.
Beyth, M., 1971. The geology of central and western Tigre. Min. Mines, Addis Ababa, unpublished report.
Chewaka, S. and DeWit, M.J., 1981. Plate tectonics and metallogenesis: some guidelines to Ethiopian mineral deposits. EIGS, Addis Ababa, Bulletin No. 2, 129p.
Drury, S.A. and De Souza Filho, C.R., 1998. Neoproterozoic terrane assemblages in Eritrea: review and prospects: Journal of African Earth Sciences, v27, 331-348.
Dubé, B., O’Brien, S., and Dunning, G.R., 2001, Gold deposits in deformed terranes: examples of epithermal and quartz-carbonate shear-zone related gold systems in the Newfoundland Appalachians and their implications for exploration: North Atlantic Mineral Symposium, St. John’s, Newfoundland, Canada, Extended abstracts volume, May 27- 30, 2001, p. 31-35
Dubé, B., Gosselin, P., Mercier-Langevin, P., Hannington, M., and Galley, M., 2007a. Gold-rich volcanogenic massive sulphide deposits, in Goodfellow, W.D., ed., Mineral Deposits of Canada: A Synthesis of Major Deposit-Types, District Metallogeny, the Evolution of Geological Provinces, and Exploration Methods: Geological Association of Canada, Mineral Deposits Division, Special Publication No. 5, p. 75-94.
Dubé, B., Mercier-Langevin, P., Hannington, M., Lafrance, G., Gosselin, G., and Gosselin, P., 2007b, The LaRonde-Penna giant Au-rich volcanogenic massive sulphide deposit, Abitibi, Quebec:
AD Y A B O PR O J E C T NI 43-101 RE P O R T
May 2015 Page 179
Mineralogy and geochemistry of alteration and implications for genesis and exploration: Economic Geology, v. 102, no. 4, p. 633-666.
Dubé, B., Mercier-Langevin, P., Kjarsgaard, I., Hannington, M., Bécu, V., Côté, J., Moorhead., Legault, M., and Bedard, N., 2013. The Bousquet 2-Dumagami world-class Archean Au-rich volcanogenic massive sulfide deposit, Abitibi, Quebec: Special Issue of Economic Geology on the Metallogeny of Archean Greenstone Belts: Economic Geology, v. 109, 1, p. 121-166.
Dudek, D., 2008. Exploration program 2007/2008, Shire Area, Tigray, Northern Ethiopia: Report prepared for Avion Gold Corporation, 30 pp.
Franklin, J. M., Gibson, H. L., Galley, A. G., and Jonasson, I. R., 2005. Volcanogenic Massive Sulfide Deposits, in Hedenquist, J. W., Thompson, J. F. H., Goldfarb, R. J., and Richards, J. P., eds., Economic Geology 100th Anniversary Volume: Littleton, CO, Society of Economic Geologists, p. 523-560.
Fox, D. 2008. Independent Technical Report. Aberdeen International Composite Report for Ethiopian Exploration Properties. Phase 1: March 2007 – December 2007. . Report prepared for Avion Resources Ltd, 52 pp.
Galley, A.G., Hannington, M.D., and Jonasson, I.R., 2007, Volcanogenic massive sulphide deposits, in
Goodfellow, W.D., ed., Mineral Deposits of Canada: A Synthesis of Major Deposit-Types,
District Metallogeny, the Evolution of Geological Provinces, and Exploration Methods:
Geological Association of Canada, Mineral Deposits Division, Special Publication No. 5, p. 141-
161.
Gardoll, S. J., Warren, H. L., Caven, S. K., Warren, H. L., and Groves, I. M., , 2014a. 2013 Annual
Exploration Report for Precious and Base Metals on the Adi Dairo Concession, Tigray National
Region State, Northern Ethiopia. East Africa Metals Inc., Internal company report, 55 pp.
Gardoll, S. J., Warren, H. L., Caven, S. K., Warren, H. L., and Groves, I. M., , 2014b. 2014 Annual
Exploration Report for Precious and Base Metals on the West Shire Concession, Tigray National
Region State, Northern Ethiopia. East Africa Metals Inc., Internal company report, 61 pp.
Gardoll, S. J., Caven, S. K., Warren, H. L., Groves, I. M., and Weston, B., 2015. The Mato Bula – Da
Tambuk Gold-Rich VMS Deposits, Tigray Region, Northern Ethiopia. East Africa Metals Inc,
Internal company report, 72 pp.
Gebremariam, S.G, 2009. Nature and characteristics of metasedimentary rock hosted gold and base
metal mineralization in the Workamba area, central Tigray, northern Ethiopia, Ph.D Thesis,
Ludwig-Maximilians University. p 1-148.
Hannington, M.D., Poulsen, K.H., Thompson, J.F.H., and Sillitoe, R.H., 1999, Volcanogenic gold in massive sulfide environment: Reviews in Economic Geology, v. 8, p. 325-356.
Hannington, M.D., 2009. Modern submarine hydrothermal systems – a global perspective on distribution, size and tectonic settings, in Cousens, B.L. and Piercey, S.J., eds., Submarine Volcanism and Mineralization: Modern Through Ancient: Geological Association of Canada, Mineral Deposits Division, Short Course Volume 19, p 91-146.
AD Y A B O PR O J E C T NI 43-101 RE P O R T
May 2015 Page 180
Huston, D.L., 2000. Gold in volcanic-hosted massive sulfide deposits; distribution, genesis, and
exploration, in Hagemann, S.G. ed., Gold in 2000: Reviews in Economic Geology, v. 13, p. 401-
426.
Middleditch, D. (2015). Da Tambuk and Mato Bula Scoping Study Metallurgical Testwork Report. Blue
Coast Research. Report prepared for East Africa Metals Inc., 36 pp.
Miller, N. R., Avigad, D., Stern, R. J. Beyth, M., 2011. The Tambien Group, Northern Ethiopia (Tigre),
in Arnaud, E., Halverson, G. P., and Shields-Zhou, G. (eds), The Geological Record of
Neoproterozoic Glaciations. Geological Society, London, Memoirs, 36, 263–276.
Mitchinson, A., Hewitson, M., and Jenkin, G. R. T., 2014. Petrographic Update – Mato Bula. Report
prepared for East Africa Metals Inc., 36 pp.
Mercier-Langevin, P., Hannington, M. D., Dubé, B., and Bécu, V., 2011. The Gold Content of
Volcanogenic Massive Sulfide Deposits. Mineralium Deposita, 46, 509-539.
Pilote, J. –L., Piercey, S. J., and Mercier-Langevin, P., 2014. Stratigraphy and hydrothermal alteration
of the Ming Cu-Au volcanogenic massive-sulphide deposit, Baie Vert Peninsula, Newfoundland:
Geological Survey of Canada, Current Research 2014-7, 18 p.
Poulsen, K.H., and Hannington, M.D., 1996. Volcanic-associated massive sulphide gold, in Eckstrand,
O.R., Sinclair, W.D., and Thorpe, R.I., eds., Geology of Canadian Mineral Deposit Types:
Geology of Canada, v. 8, p. 183-196.
Poulsen, K.H., Robert, F., and Dubé, B., 2000, Geological classification of Canadian gold deposits: Geological Survey of Canada, Bulletin 540, 106 pp.
Salsin, M L., 2014. Mato Bula Preliminary Mineralogical Report. Report prepared for East Africa Metals Inc., 69 pp.
Tadesse, T. 1997. The Geology of Axum Area (ND 37-6). Ethiopian Institute of Geological Surveys,
Addis Ababa (Memoir No. 9).
Tadesse, T., Hoshino, M., Suzuki, K., Iisumi, S., 2000. Sm–Nd, Rb–Sr and Th–U–Pb zircon ages of syn-
and post-tectonic granitoids from the Axum area of northern Ethiopia: Journal of African Earth
Sciences, 30, 313–327.
Teklay, M., 1997. Petrology, Geochemistry and Geochronology of Neoproterozoic Magmatic Arc
Rocks from Eritrea: Implications for Crustal Evolution in the Southern Nubian Shield, vol. 1.
Eritrea, Department of Mines Memoir, 125 pp.
Trench A. and Groves, D. I., 2015. The Western Arabian-Nubian Shield: A Rapidly Emerging Gold
Province. SEG Newsletter, 101, 1, 13-16.
Wilson, G. C., 2014. Mineralogy and Petrology of Drill-core Samples from Mato Bula, Northern Ethiopia. Report prepared for East Africa Metals Inc., 80 pp.
AD Y A B O PR O J E C T NI 43-101 RE P O R T
May 2015 Page 181
Appendix A
Title Opinion (31st December 2014)
Confirmed by Mr. Sisay Ayalew, Mineral Licensing & Administration Directorate Director, Ministry of
Mines, Ethiopia (07/04/2015)
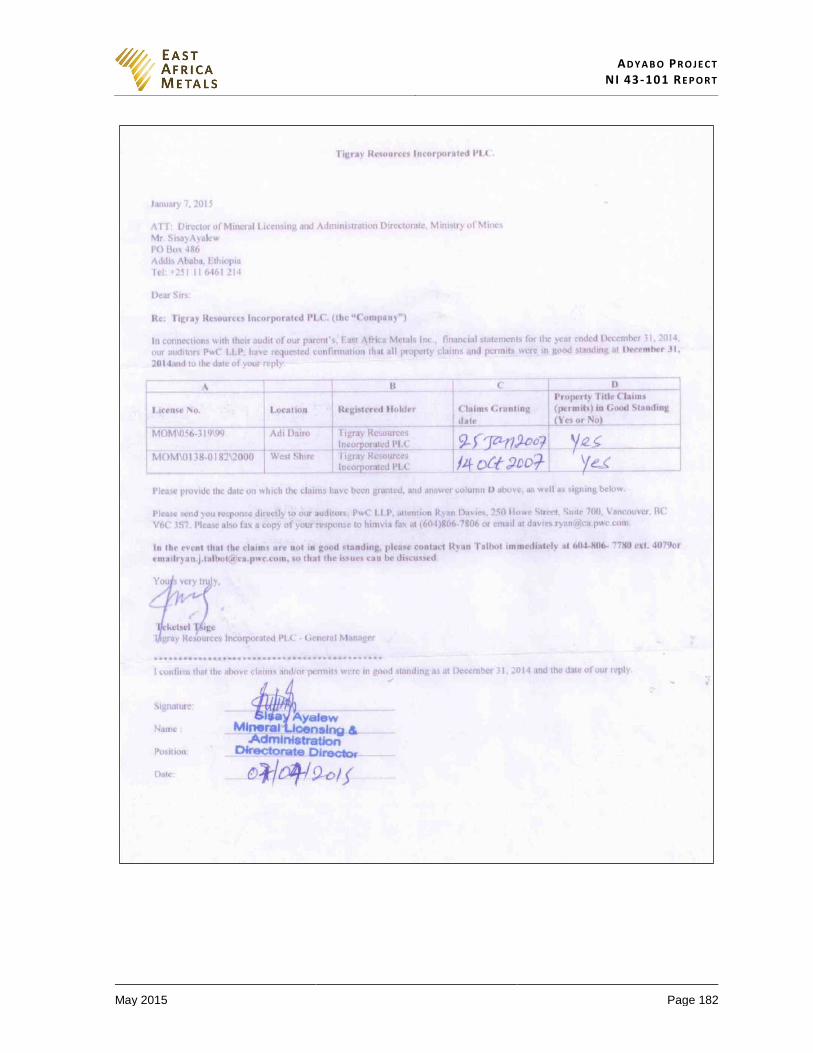
AD Y A B O PR O J E C T NI 43-101 RE P O R T
May 2015 Page 182

AD Y A B O PR O J E C T NI 43-101 RE P O R T
May 2015 Page 183
Appendix B
Independent Sample & Assay Validation Certificates (April 2015)
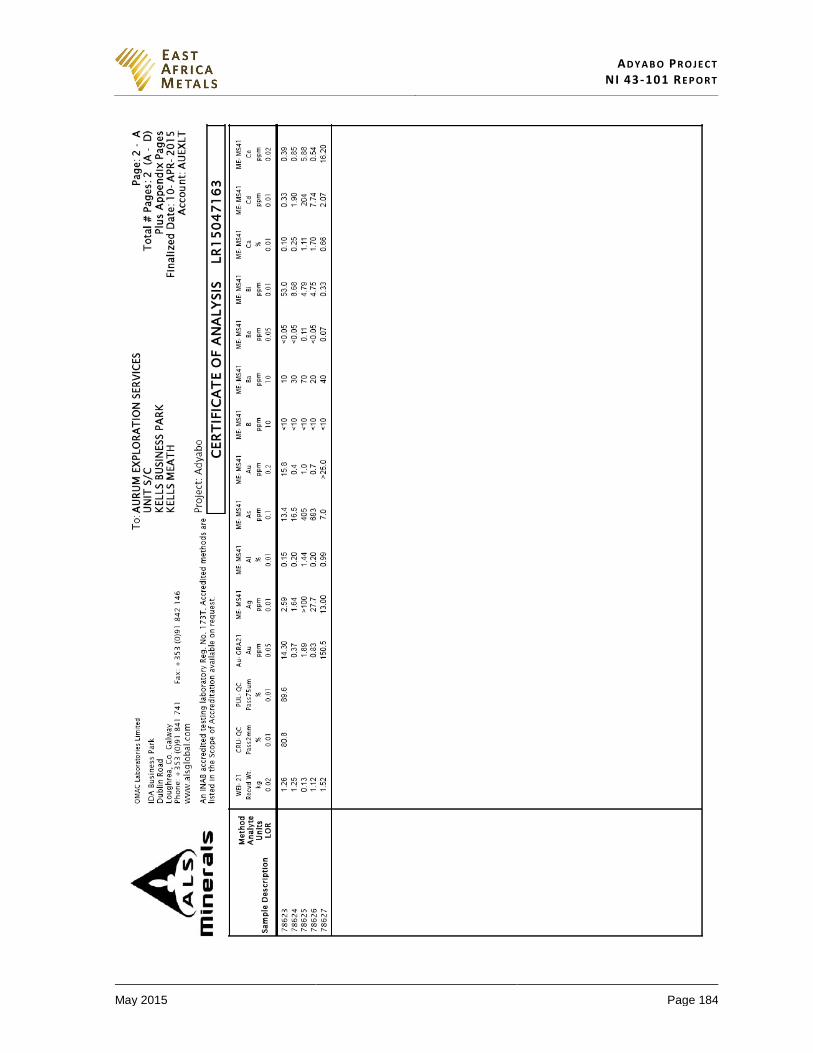
AD Y A B O PR O J E C T NI 43-101 RE P O R T
May 2015 Page 184
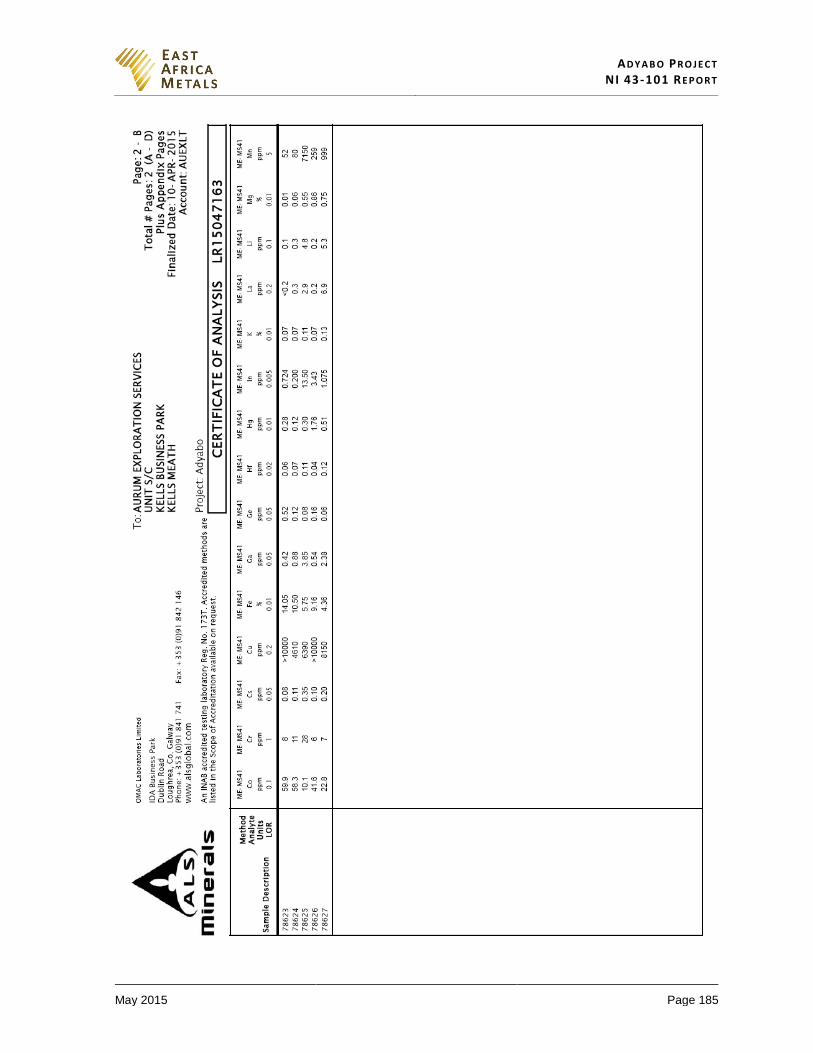
AD Y A B O PR O J E C T NI 43-101 RE P O R T
May 2015 Page 185
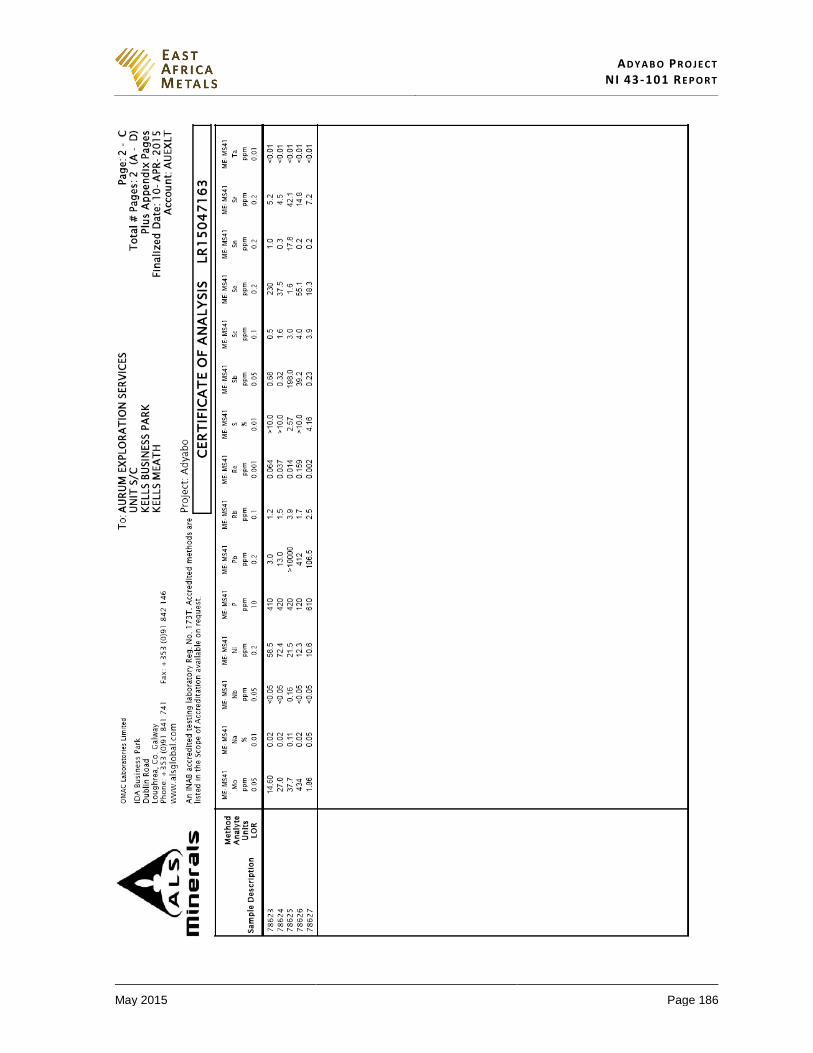
AD Y A B O PR O J E C T NI 43-101 RE P O R T
May 2015 Page 186
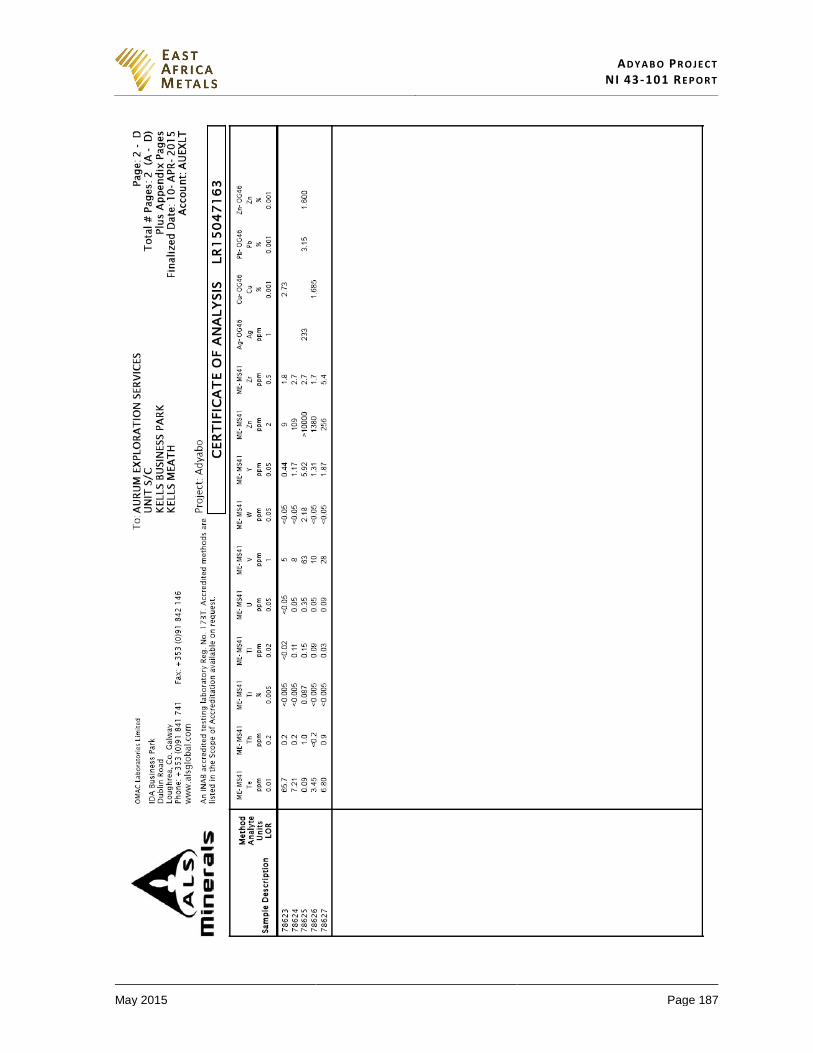
AD Y A B O PR O J E C T NI 43-101 RE P O R T
May 2015 Page 187

AD Y A B O PR O J E C T NI 43-101 RE P O R T
May 2015 Page 188
Qualified Person Certificates

I, Sandy M. Archibald, P. Geo., of 105 Consumers Drive, Whitby, Ontario, Canada, as an author of this report entitled “NI 43-101 Technical Report on a Mineral Resource Estimate at the Mato Bula Trend, Adyabo Project (centred at 38°05’E, 14°33’N), Tigray National Region, Ethiopia” dated May 29, 2015 prepared for East Africa Metals Inc (the “Issuer”), do hereby certify that:
1. I am a Principal Consultant Geologist with Aurum Exploration Services.
2. I graduated with a B.Sc. (Hons) degree in Geology from University of Glasgow in 1992, was awarded an M.Sc. degree in Geology from Memorial University of Newfoundland in 1995, and a Ph.D. in Economic Geology from McGill University, Montreal, Canada in 2002.
3. This certificate applies to the technical report entitled “NI 43-101 Technical Report on a Mineral Resource Estimate at the Mato Bula Trend, Adyabo Project (centred at 38°05’E, 14°33’N), Tigray National Region, Ethiopia” dated May 29, 2015 (“Technical Report”) prepared for the Issuer.
4. I have been employed in my profession by Aurum Exploration Services since completing my final postgraduate degree in 2002. My relevant experience includes designing and implementing mineral exploration programs for a variety of commodities and deposit types, including orogenic lode-gold and volcanogenic massive sulphide exploration (UK, Ireland, Sweden, Ethiopia, Sudan, Tanzania, Mali, Ghana, Mauritania, and Canada).
5. I am a member of the European Federation of Geologists (Title No. 873), and I am a Professional Geologist (Title No. 193) associated with the Institute of Geologists of Ireland. I am also a Fellow of the Society of Economic Geologists and a Council Member of the Society for Geology Applied to Mineral Deposits.
6. I have read the definition of “Qualified Person” set out in National Instrument 43-101 – Standards of Disclosure for Mineral Projects (“NI 43-101”) and certify that by reason of my education, affiliation with a professional association (as defined in NI 43-101) and past relevant work experience, I fulfill the requirements to be a “Qualified Person” for the purposes of NI 43-101.
7. I most recently visited the subject property from March 17 to 20, 2015.
8. I am responsible for preparation of all sections of the Technical Report, except: metallurgical and resource estimation comments in Section 1; subsection 11.4.1.1 to 11.4.1.6; subsection 12.2 to 12.3; Sections 13 and 14; and metallurgical and resource estimation comments in Sections 25 and 26.
9. I am independent of the Issuer applying all the tests in Section 1.5 of NI 43-101.
10. I have had no prior involvement with the property that is the subject of the Technical Report.
11. I have read NI 43-101 and NI 43-101F1 and the Technical Report has been prepared in compliance with that instrument and form.
12. As of the effective date of the Technical Report, to the best of my knowledge, information and belief, the Technical Report contains all scientific and technical information that is required to be disclosed to make the Technical Report not misleading.
“Signed Sandy M. Archibald”
EurGeol Dr. Sandy M. Archibald, P.Geo.
DATED at Whitby, Canada, this 17th day of June, 2015.

I, Christopher John Martin, C.Eng., of 3573 Shelby Lane, Nanoose Bay, British Columbia, Canada, as an author of this report entitled “NI 43-101 Technical Report on a Mineral Resource Estimate at the Mato Bula Trend, Adyabo Project (centred at 38°05’E, 14°33’N), Tigray National Region, Ethiopia” dated May 29, 2015 prepared for East Africa Metals Inc. (the “Issuer”), do hereby certify that:
1. I am President and Principal Metallurgist of both Blue Coast Metallurgy Limited and Blue Coast Research Ltd.
2. I graduated with a B.Sc (Hons) degree in Mineral Processing Technology from the Camborne School of Mines in 1984, and was awarded an M.Eng degree in Metallurgical Engineering from McGill University in 1988.
3. This certificate applies to the technical report entitled “NI 43-101 Technical Report on a Mineral Resource Estimate at the Mato Bula Trend, Adyabo Project (centred at 38°05’E, 14°33’N), Tigray National Region, Ethiopia” dated May 29, 2015 (“Technical Report”) prepared for the Issuer.
4. My relevant experience includes designing and implementing metallurgy test programs for a variety of commodities and deposit types, including twenty volcanogenic massive sulphide deposits (Canada, China, Dominican Republic, Eritrea, Ethiopia, Mexico, Peru, and Sudan) that ranged in age from Archean to Mesozoic.
5. I am a licensed Chartered Engineer in good standing with the IMMM since 1990. I am also a member of the Canadian Institute of Mining, Metallurgy and Petroleum.
6. I have read the definition of “Qualified Person” set out in National Instrument 43-101 – Standards of Disclosure for Mineral Projects (“NI 43-101”) and certify that by reason of my education, affiliation with a professional association (as defined in NI 43-101) and past relevant work experience, I fulfill the requirements to be a “Qualified Person” for the purposes of NI 43-101.
7. I have not visited the subject property.
8. I am responsible for preparation of portions of Section 1 related to mineral processing and metallurgical testing, Section 13, and parts of Sections 25 and 26 of the Technical Report.
9. I am independent of the Issuer applying all the tests in Section 1.5 of NI 43-101.
10. I have had no prior involvement with the property that is the subject of the Technical Report.
11. I have read NI 43-101 and NI 43-101F1 and the Technical Report has been prepared in compliance with that instrument and form.
12. As of the effective date of the Technical Report, to the best of my knowledge, information and belief, the Technical Report contains all scientific and technical information that is required to be disclosed to make the Technical Report not misleading.
“Signed and Sealed”
Christopher J. Martin, C.Eng.
DATED at Parksville, Canada, this 17th day of June, 2015.
I, David G. Thomas, PGeo, of 601 – 1788 West Georgia Street, Vancouver, British Columbia, Canada, as an author of this report entitled “NI 43-101 Technical Report on a Mineral Resource Estimate at the Mato Bula Trend, Adyabo Project (centred at 38°05’E, 14°33’N), Tigray National Region, Ethiopia” dated effective May 29, 2015 prepared for East Africa Metals Inc. (the “Issuer”), do hereby certify that:
1. I am an Associate Geologist with the geological consulting firm of Fladgate Exploration Consulting Corporation.
2. I am a graduate of Durham University, in the United Kingdom with a Bachelor of Science degree in Geology and am a graduate of Imperial College, University of London, in the United Kingdom with a Master of Science degree in Mineral Exploration.
3. This certificate applies to the technical report entitled “NI 43-101 Technical Report on a Mineral Resource Estimate at the Mato Bula Trend, Adyabo Project (centred at 38°05’E, 14°33’N), Tigray National Region, Ethiopia” dated May 29, 2015 (“Technical Report”) prepared for the Issuer.
4. I have practiced my profession for over 18 years. In that time I have been directly involved in review of exploration programs, geological models, exploration data, sampling, sample preparation, quality assurance-quality control, databases, and mineral resource estimates for a variety of mineral deposits, including VMS deposits and orogenic lode-gold mineral deposits (Ghana, Canada, Eritrea and Ethiopia)
5. I am a member in good standing of the Association of Professional Geoscientists of British Columbia (APEGBC NRL # 149114). I am also a member of the Australasian Institute of Mining and Metallurgy (MAusIMM # 225250).
6. I have read the definition of “Qualified Person” set out in National Instrument 43-101 – Standards of Disclosure for Mineral Projects (“NI 43-101”) and certify that by reason of my education, affiliation with a professional association (as defined in NI 43-101) and past relevant work experience, I fulfill the requirements to be a “Qualified Person” for the purposes of NI 43-101.
7. I visited the Adyabo Project from March 22 to March 25, 2015.
8. I am responsible for portions of Section 1 related to Mineral Resource estimation, subsection 11.4.1.1 to 11.4.1.6, subsection 12.2 to 12.3, Section 14 and portions of Section 25 and Section 26 related to Mineral Resource estimation of the Technical Report.
9. I am independent of the Issuer applying all the tests in Section 1.5 of NI 43-101.
10. I have had no prior involvement with the property that is the subject of the Technical Report.
11. I have read NI 43-101 and NI 43-101F1 and the Technical Report has been prepared in compliance with that instrument and form.
12. As of the effective date of the Technical Report, to the best of my knowledge, information and belief, the Technical Report contains all scientific and technical information that is required to be disclosed to make the Technical Report not misleading.
“Signed and Sealed”
David G. Thomas, P.Geo.
DATED at Vancouver, Canada, this 17th day of June, 2015.