31-43 anju kumari.pdf
TRANSCRIPT
Page 31
CASE STUDY Vol.7.Issue.3.2020 July-Sept.
INTERNATIONAL JOURNAL OF BUSINESS, MANAGEMENT
AND ALLIED SCIENCES (IJBMAS)
A Peer Reviewed and refereed Journal
‘UBER’ KILLING THE LARGEST MARKET SHARE HOLDER OF INDIAN
CAB INDUSTRY-A CASE STUDY
ANJU KUMARI
Ad Hoc Faculty, School of Management Studies, NIT Calicut, Kerala, India
E-Mail: [email protected]
DOI: 10.33329/ijbmas.7.3.31
ABSTRACT
Ola, one of the major players of the cab industry in India, is facing dire threat from its
rival Uber. The case describes how Ola started as a front-runner, capturing the
maximum market share, is now struggling in the battle for survival. The case
presents the dilemma and struggle of Ola in maintaining its supremacy and invites
the students to identify the reasons for the losses faced by Ola. The students also
need to identify and analyse its competitive and strategic position depending on
which a strategy can be suggested for the company.
Keywords: Indian Cab aggregators, Ola, Uber, Competition, Strategy.
Introduction
Every third person you meet in India is a youth and by 2020 the median individual age will be
29 years hence making it the youngest country in the world [1]. However, this generation is sinking
and drowning in the pool of educations loans and mortgages and still for few owning a car is a matter
of pride for young generation. There are many who still prefer renting a car. It is much more
economical than owning a car as owning a car attracts expenses like chauffer, maintenance and
sometimes is stressful while driving in crowded metros. So, why go through all these when the cab
aggregators like Ola (the largest market share holder and the first one to come up with rental cars and
cheap rides) and Uber are offering a readymade solution.
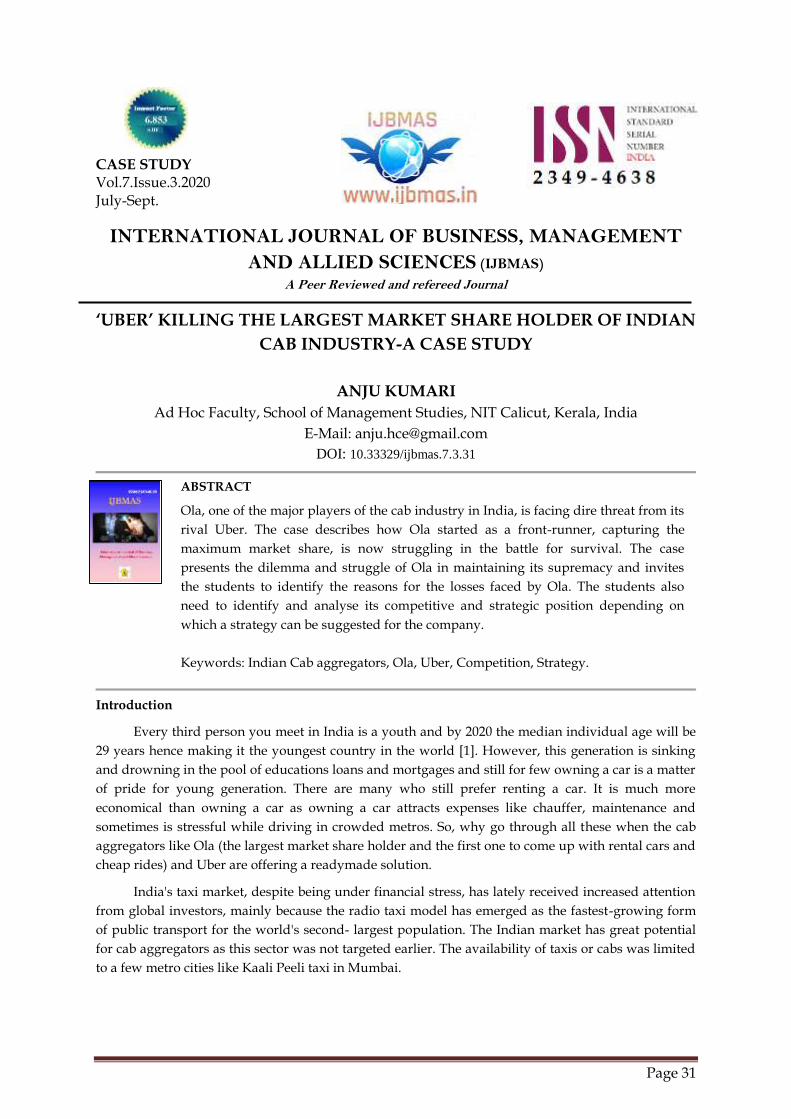
India's taxi market, despite being under financial stress, has lately received increased attention
from global investors, mainly because the radio taxi model has emerged as the fastest-growing form
of public transport for the world's second- largest population. The Indian market has great potential
for cab aggregators as this sector was not targeted earlier. The availability of taxis or cabs was limited
to a few metro cities like Kaali Peeli taxi in Mumbai.
ANJU KUMARI Vol.7. Issue.3.2020 (July-Sept.)
Int.J.Buss.Mang.& Allied.Sci. (ISSN:2349-4638) 32
Case Figure 1: Taxi Business in India
Ola’s Inception
Ola cabs, an Indian taxi service was founded by Bhavish Aggarwal in 2010 after he had a bad
experience with a cab he hired. The driver in the middle of nowhere started to renegotiate the price of
the trip and later left Bhavish in the middle of the journey [2]. Sensing this situation and the plight of
customers who had a bad day due to the taxi they hired, Ola was a solution for all such problems.
Other Players
At present there are 19 radio taxi operators in the country, including Mega Cabs, Easy Cabs,
Meru Cabs, and Tab Cabs, according to the Association of Radio Taxis. These operators run over
25,000 cabs across India. Meru (started in 2007) and Mega (started in 2000) focused principally on the
airport business and got supply initially by buying its own cars. But with Ola coming in, it became
risky for them to change their business models, which worked well for the high ticket size items in the
range of Rs.500-600. Ola was designed for high frequency, multiple short rides with small ticket sizes,
and the others lost out in the process. Ola sped past Meru in the 2015 with revenue of Rs 4.18 billion
against Meru’s revenue of Rs 2.80 billion. The old cab aggregators were slow to respond to the
rapidity with which Indian customers adopted app-based cab-hailing services and continued to focus
on phone bookings.
ANJU KUMARI Vol.7. Issue.3.2020 (July-Sept.)
Int.J.Buss.Mang.& Allied.Sci. (ISSN:2349-4638) 33
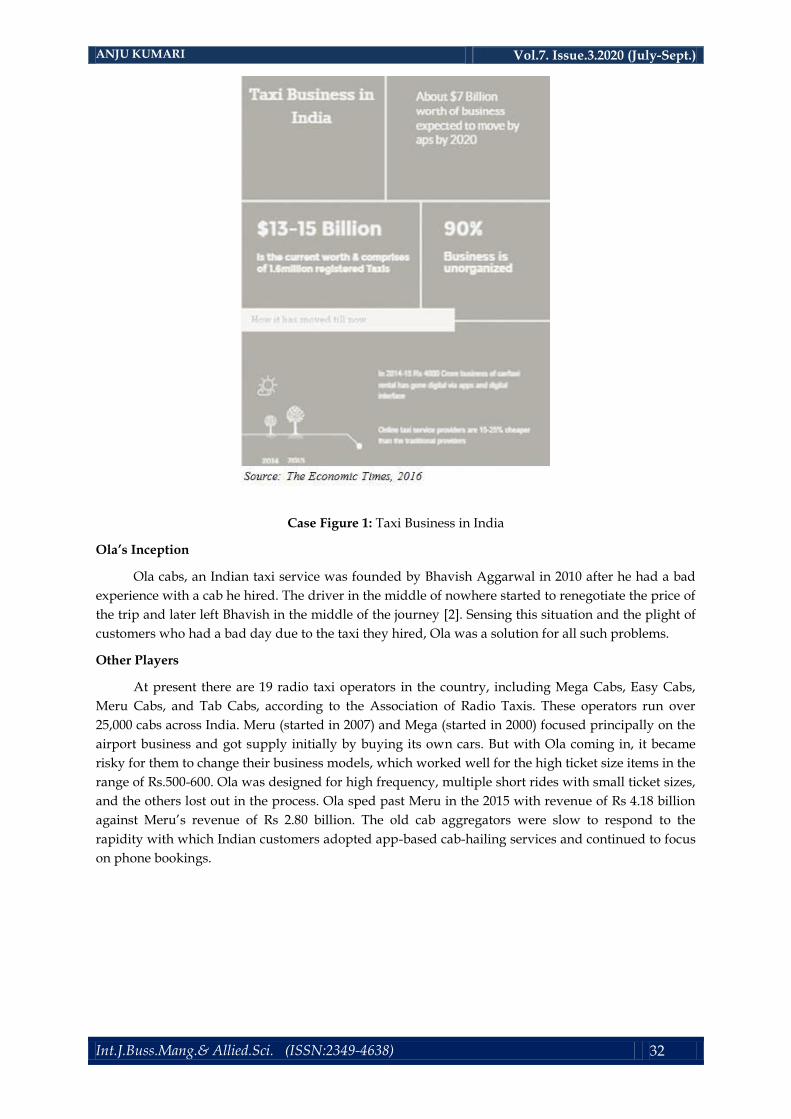
Case Figure 2: Growth of Organized Taxi Market in India
Ola-Uber Rivalry
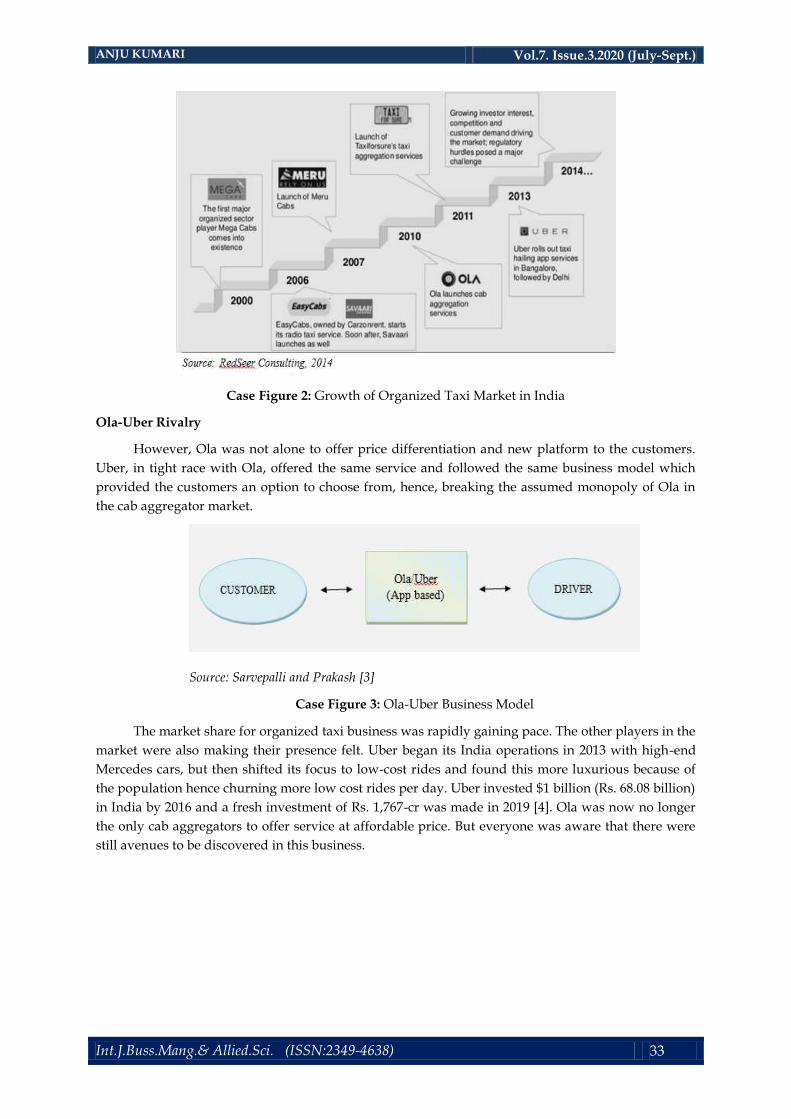
However, Ola was not alone to offer price differentiation and new platform to the customers.
Uber, in tight race with Ola, offered the same service and followed the same business model which
provided the customers an option to choose from, hence, breaking the assumed monopoly of Ola in
the cab aggregator market.
Source: Sarvepalli and Prakash [3]
Case Figure 3: Ola-Uber Business Model
The market share for organized taxi business was rapidly gaining pace. The other players in the
market were also making their presence felt. Uber began its India operations in 2013 with high-end
Mercedes cars, but then shifted its focus to low-cost rides and found this more luxurious because of
the population hence churning more low cost rides per day. Uber invested $1 billion (Rs. 68.08 billion)
in India by 2016 and a fresh investment of Rs. 1,767-cr was made in 2019 [4]. Ola was now no longer
the only cab aggregators to offer service at affordable price. But everyone was aware that there were
still avenues to be discovered in this business.
ANJU KUMARI Vol.7. Issue.3.2020 (July-Sept.)
Int.J.Buss.Mang.& Allied.Sci. (ISSN:2349-4638) 34
Ola Vs Uber – A Comparison
Growth Rate
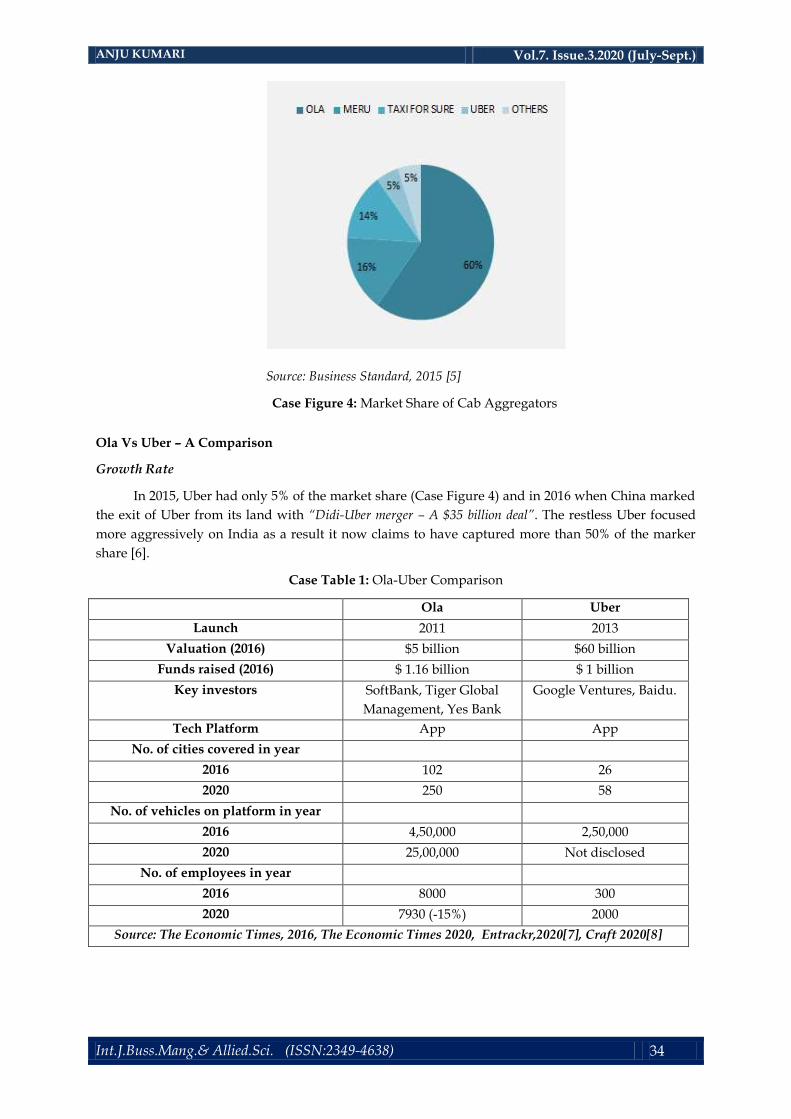
In 2015, Uber had only 5% of the market share (Case Figure 4) and in 2016 when China marked
the exit of Uber from its land with “Didi-Uber merger – A $35 billion deal”. The restless Uber focused
more aggressively on India as a result it now claims to have captured more than 50% of the marker
share [6].
Case Table 1: Ola-Uber Comparison
Ola Uber
Launch 2011 2013
Valuation (2016) $5 billion $60 billion
Funds raised (2016) $ 1.16 billion $ 1 billion
Key investors SoftBank, Tiger Global
Management, Yes Bank
Google Ventures, Baidu.
Tech Platform App App
No. of cities covered in year
2016 102 26
2020 250 58
No. of vehicles on platform in year
2016 4,50,000 2,50,000
2020 25,00,000 Not disclosed
No. of employees in year
2016 8000 300
2020 7930 (-15%) 2000
Source: The Economic Times, 2016, The Economic Times 2020, Entrackr,2020[7], Craft 2020[8]
Source: Business Standard, 2015 [5]
Case Figure 4: Market Share of Cab Aggregators
ANJU KUMARI Vol.7. Issue.3.2020 (July-Sept.)
Int.J.Buss.Mang.& Allied.Sci. (ISSN:2349-4638) 35
Though Uber has grown hastily, Ola has also achieved considerable level of success and
growth (as shown in Case Table 1). The coverage of Ola in terms of presence in different cities and
number of employees is higher than Uber.
Customer Experience
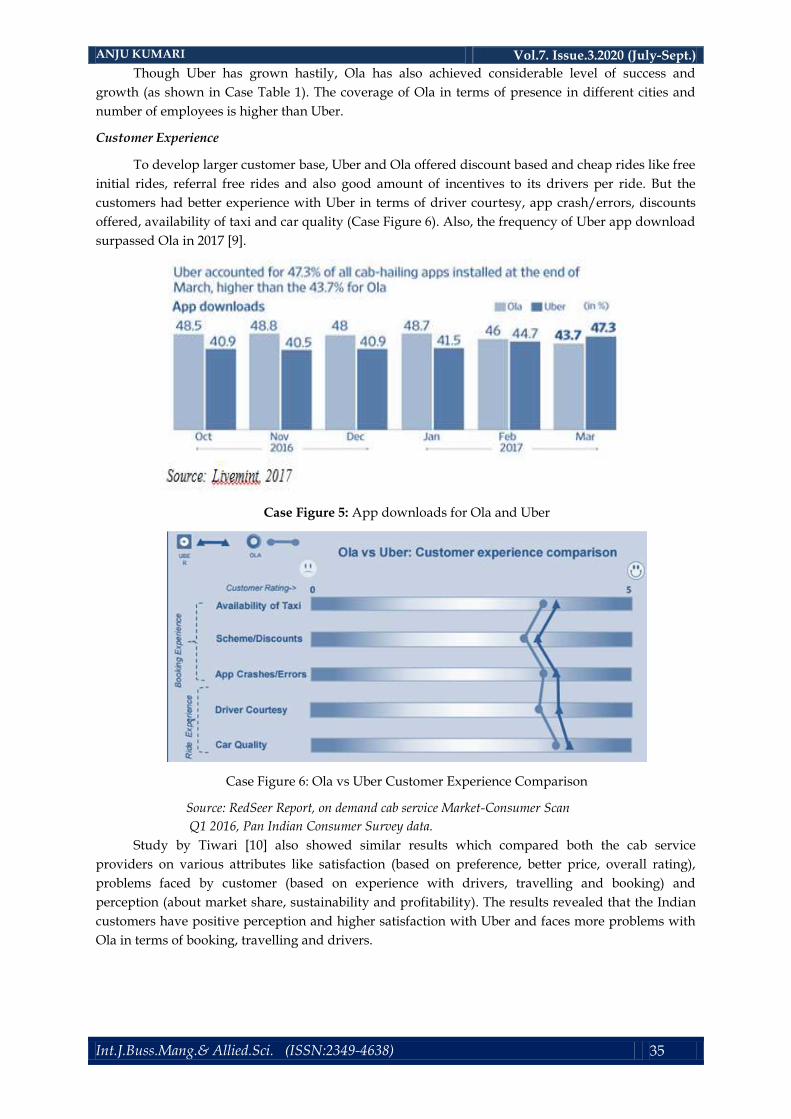
To develop larger customer base, Uber and Ola offered discount based and cheap rides like free
initial rides, referral free rides and also good amount of incentives to its drivers per ride. But the
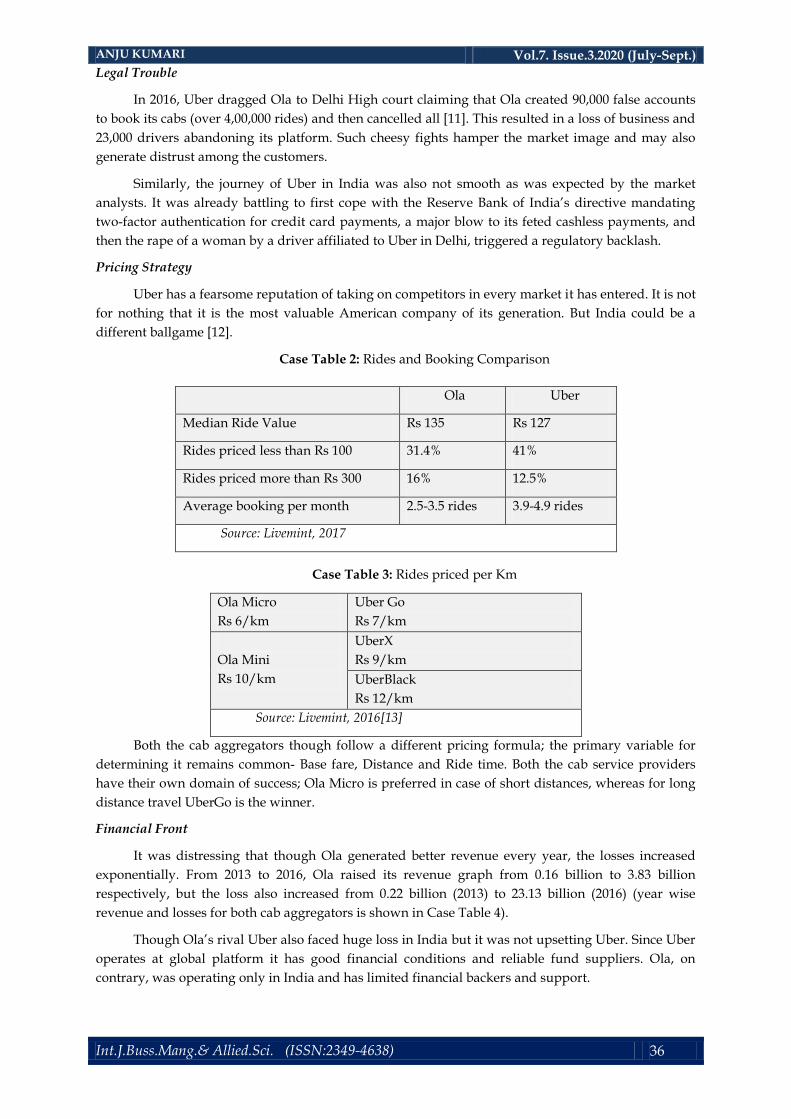
customers had better experience with Uber in terms of driver courtesy, app crash/errors, discounts
offered, availability of taxi and car quality (Case Figure 6). Also, the frequency of Uber app download
surpassed Ola in 2017 [9].
Case Figure 5: App downloads for Ola and Uber
Case Figure 6: Ola vs Uber Customer Experience Comparison
Source: RedSeer Report, on demand cab service Market-Consumer Scan
Q1 2016, Pan Indian Consumer Survey data.
Study by Tiwari [10] also showed similar results which compared both the cab service
providers on various attributes like satisfaction (based on preference, better price, overall rating),
problems faced by customer (based on experience with drivers, travelling and booking) and
perception (about market share, sustainability and profitability). The results revealed that the Indian
customers have positive perception and higher satisfaction with Uber and faces more problems with
Ola in terms of booking, travelling and drivers.
ANJU KUMARI Vol.7. Issue.3.2020 (July-Sept.)
Int.J.Buss.Mang.& Allied.Sci. (ISSN:2349-4638) 36
Legal Trouble
In 2016, Uber dragged Ola to Delhi High court claiming that Ola created 90,000 false accounts
to book its cabs (over 4,00,000 rides) and then cancelled all [11]. This resulted in a loss of business and
23,000 drivers abandoning its platform. Such cheesy fights hamper the market image and may also
generate distrust among the customers.
Similarly, the journey of Uber in India was also not smooth as was expected by the market
analysts. It was already battling to first cope with the Reserve Bank of India’s directive mandating
two-factor authentication for credit card payments, a major blow to its feted cashless payments, and
then the rape of a woman by a driver affiliated to Uber in Delhi, triggered a regulatory backlash.
Pricing Strategy
Uber has a fearsome reputation of taking on competitors in every market it has entered. It is not
for nothing that it is the most valuable American company of its generation. But India could be a
different ballgame [12].
Case Table 2: Rides and Booking Comparison
Case Table 3: Rides priced per Km
Ola Micro
Rs 6/km
Uber Go
Rs 7/km
Ola Mini
Rs 10/km
UberX
Rs 9/km
UberBlack
Rs 12/km
Source: Livemint, 2016[13]
Both the cab aggregators though follow a different pricing formula; the primary variable for
determining it remains common- Base fare, Distance and Ride time. Both the cab service providers
have their own domain of success; Ola Micro is preferred in case of short distances, whereas for long
distance travel UberGo is the winner.
Financial Front
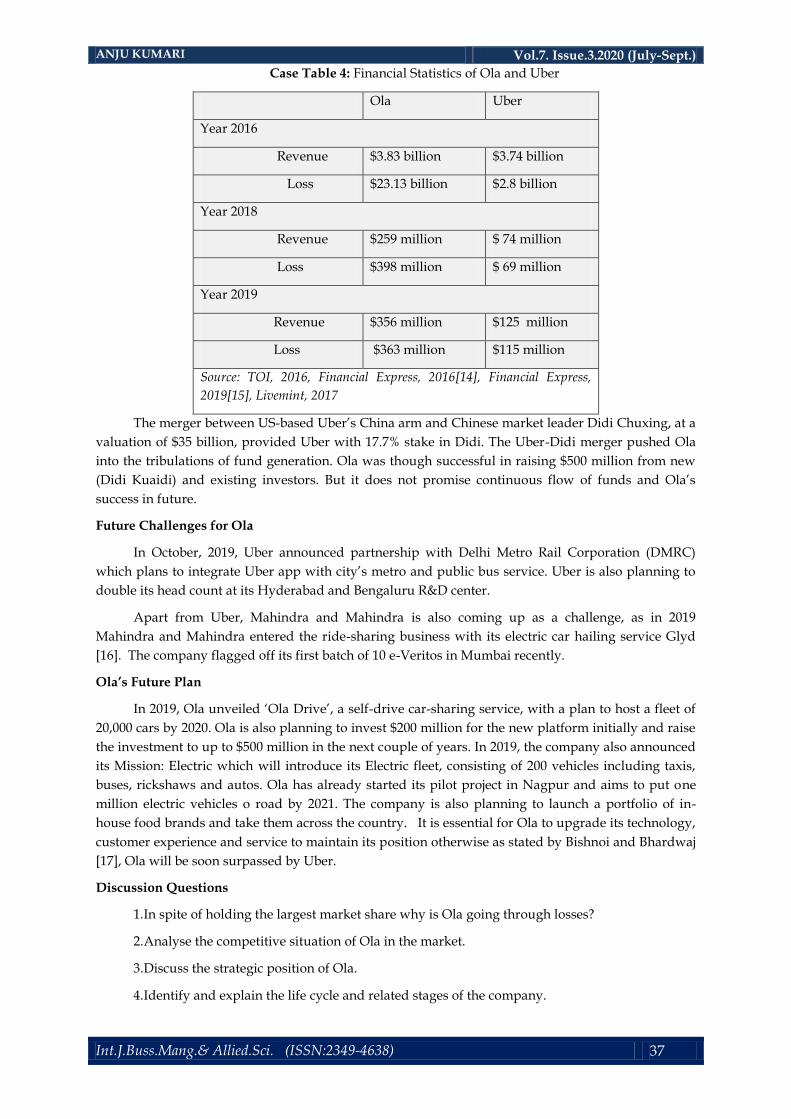
It was distressing that though Ola generated better revenue every year, the losses increased
exponentially. From 2013 to 2016, Ola raised its revenue graph from 0.16 billion to 3.83 billion
respectively, but the loss also increased from 0.22 billion (2013) to 23.13 billion (2016) (year wise
revenue and losses for both cab aggregators is shown in Case Table 4).
Though Ola’s rival Uber also faced huge loss in India but it was not upsetting Uber. Since Uber
operates at global platform it has good financial conditions and reliable fund suppliers. Ola, on
contrary, was operating only in India and has limited financial backers and support.
Ola Uber
Median Ride Value Rs 135 Rs 127
Rides priced less than Rs 100 31.4% 41%
Rides priced more than Rs 300 16% 12.5%
Average booking per month 2.5-3.5 rides 3.9-4.9 rides
Source: Livemint, 2017
ANJU KUMARI Vol.7. Issue.3.2020 (July-Sept.)
Int.J.Buss.Mang.& Allied.Sci. (ISSN:2349-4638) 37
Case Table 4: Financial Statistics of Ola and Uber
Ola Uber
Year 2016
Revenue $3.83 billion $3.74 billion
Loss $23.13 billion $2.8 billion
Year 2018
Revenue $259 million $ 74 million
Loss $398 million $ 69 million
Year 2019
Revenue $356 million $125 million
Loss $363 million $115 million
Source: TOI, 2016, Financial Express, 2016[14], Financial Express,
2019[15], Livemint, 2017
The merger between US-based Uber’s China arm and Chinese market leader Didi Chuxing, at a
valuation of $35 billion, provided Uber with 17.7% stake in Didi. The Uber-Didi merger pushed Ola
into the tribulations of fund generation. Ola was though successful in raising $500 million from new
(Didi Kuaidi) and existing investors. But it does not promise continuous flow of funds and Ola’s
success in future.
Future Challenges for Ola
In October, 2019, Uber announced partnership with Delhi Metro Rail Corporation (DMRC)
which plans to integrate Uber app with city’s metro and public bus service. Uber is also planning to
double its head count at its Hyderabad and Bengaluru R&D center.
Apart from Uber, Mahindra and Mahindra is also coming up as a challenge, as in 2019
Mahindra and Mahindra entered the ride-sharing business with its electric car hailing service Glyd
[16]. The company flagged off its first batch of 10 e-Veritos in Mumbai recently.
Ola’s Future Plan
In 2019, Ola unveiled ‘Ola Drive’, a self-drive car-sharing service, with a plan to host a fleet of
20,000 cars by 2020. Ola is also planning to invest $200 million for the new platform initially and raise
the investment to up to $500 million in the next couple of years. In 2019, the company also announced
its Mission: Electric which will introduce its Electric fleet, consisting of 200 vehicles including taxis,
buses, rickshaws and autos. Ola has already started its pilot project in Nagpur and aims to put one
million electric vehicles o road by 2021. The company is also planning to launch a portfolio of in-
house food brands and take them across the country. It is essential for Ola to upgrade its technology,
customer experience and service to maintain its position otherwise as stated by Bishnoi and Bhardwaj
[17], Ola will be soon surpassed by Uber.
Discussion Questions
1. In spite of holding the largest market share why is Ola going through losses?
2. Analyse the competitive situation of Ola in the market.
3. Discuss the strategic position of Ola.
4. Identify and explain the life cycle and related stages of the company.
ANJU KUMARI Vol.7. Issue.3.2020 (July-Sept.)
Int.J.Buss.Mang.& Allied.Sci. (ISSN:2349-4638) 38
5. What strategy should the company follow to maintain its supremacy over its present and
future rivals like Uber and Mahindra and Mahindra?
CASE SUMMARY:
The Indian taxi market has a witnessed remarkable growth in the past few years. Apparently,
the new players like Ola and Uber are replacing longstanding Kaali Peeli taxis. Though Ola is the
major player (with maximum market share), the growing sales/profit, customer satisfaction and
financial backing of Uber are now becoming a matter of apprehension for the company. The case tries
to offer an insight into the attractiveness of the cab industry and strategic position of the company.
The case also highlights the impact of competition and internal/external factors on company’s
performance.
Teaching Objectives:
The case intends to provide better understanding of the following concepts:
1. Porter’s five forces model to understand level of competition.
2. The Life Cycle Portfolio Analysis (also termed as ADL matrix) to determine the strategic
position of the company and its stage in the life cycle.
3. SPACE Matrix to understand the influence of various factors on company’s performance
4. To offer a solution for the existing problems of the company based on the concepts covered.
Target Audience: Management students at UG and PG level.
Suggested Answers to Discussion Questions:
As the case illustrates the presence of competitors, as shown in Case Figure 2, first of all the
position of Ola and the cab aggregators industry (organized sector) should be understood using
Porter’s five forces model.
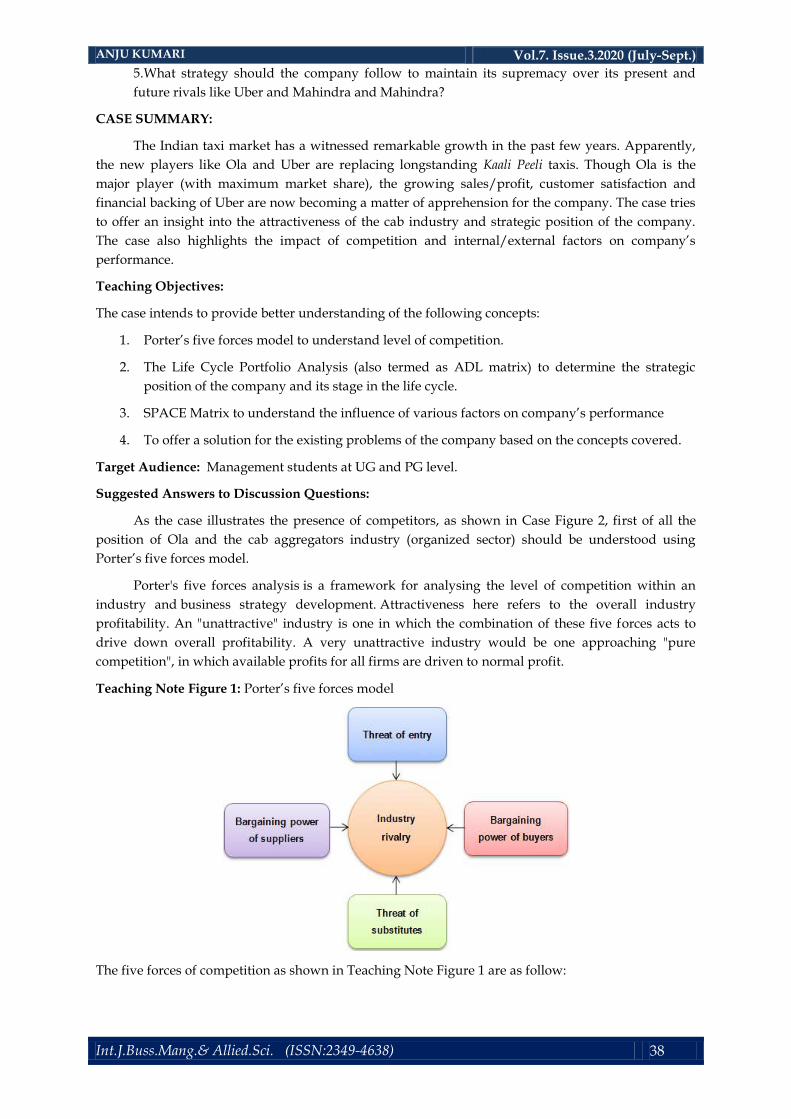
Porter's five forces analysis is a framework for analysing the level of competition within an
industry and business strategy development. Attractiveness here refers to the overall industry
profitability. An "unattractive" industry is one in which the combination of these five forces acts to
drive down overall profitability. A very unattractive industry would be one approaching "pure
competition", in which available profits for all firms are driven to normal profit.
Teaching Note Figure 1: Porter’s five forces model
The five forces of competition as shown in Teaching Note Figure 1 are as follow:
ANJU KUMARI Vol.7. Issue.3.2020 (July-Sept.)
Int.J.Buss.Mang.& Allied.Sci. (ISSN:2349-4638) 39
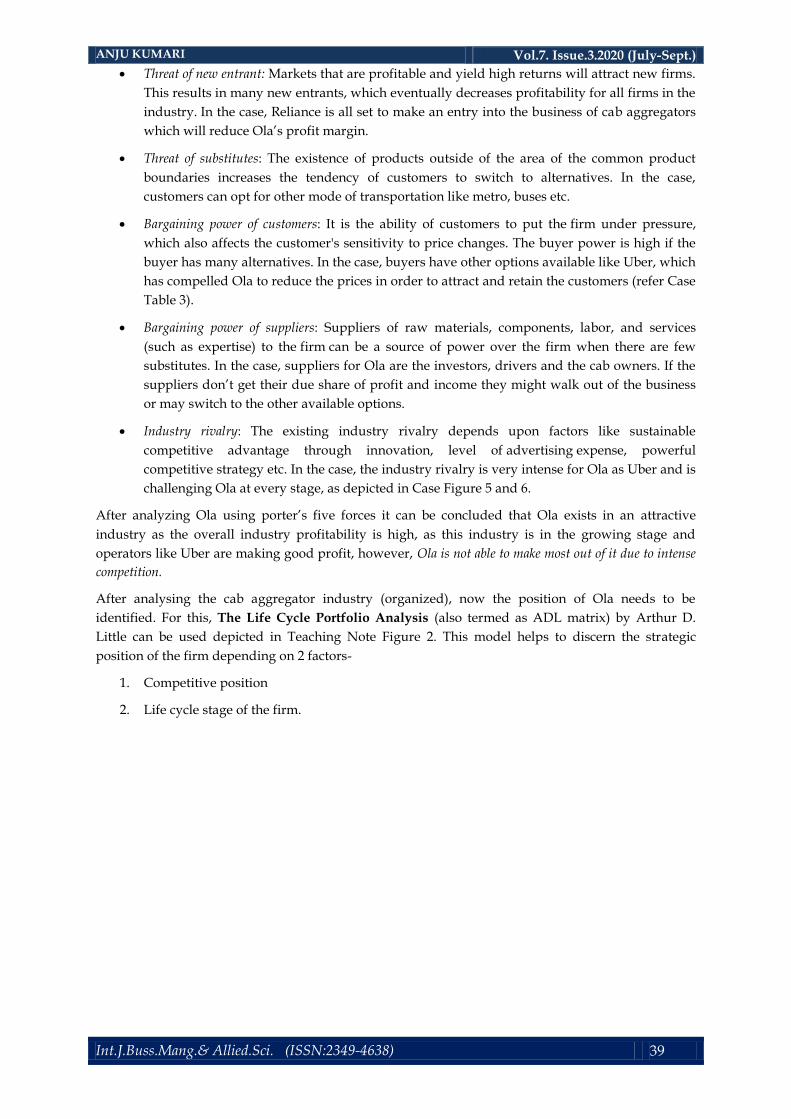
Threat of new entrant: Markets that are profitable and yield high returns will attract new firms.
This results in many new entrants, which eventually decreases profitability for all firms in the
industry. In the case, Reliance is all set to make an entry into the business of cab aggregators
which will reduce Ola’s profit margin.
Threat of substitutes: The existence of products outside of the area of the common product
boundaries increases the tendency of customers to switch to alternatives. In the case,
customers can opt for other mode of transportation like metro, buses etc.
Bargaining power of customers: It is the ability of customers to put the firm under pressure,
which also affects the customer's sensitivity to price changes. The buyer power is high if the
buyer has many alternatives. In the case, buyers have other options available like Uber, which
has compelled Ola to reduce the prices in order to attract and retain the customers (refer Case
Table 3).
Bargaining power of suppliers: Suppliers of raw materials, components, labor, and services
(such as expertise) to the firm can be a source of power over the firm when there are few
substitutes. In the case, suppliers for Ola are the investors, drivers and the cab owners. If the
suppliers don’t get their due share of profit and income they might walk out of the business
or may switch to the other available options.
Industry rivalry: The existing industry rivalry depends upon factors like sustainable
competitive advantage through innovation, level of advertising expense, powerful
competitive strategy etc. In the case, the industry rivalry is very intense for Ola as Uber and is
challenging Ola at every stage, as depicted in Case Figure 5 and 6.
After analyzing Ola using porter’s five forces it can be concluded that Ola exists in an attractive
industry as the overall industry profitability is high, as this industry is in the growing stage and
operators like Uber are making good profit, however, Ola is not able to make most out of it due to intense
competition.
After analysing the cab aggregator industry (organized), now the position of Ola needs to be
identified. For this, The Life Cycle Portfolio Analysis (also termed as ADL matrix) by Arthur D.
Little can be used depicted in Teaching Note Figure 2. This model helps to discern the strategic
position of the firm depending on 2 factors-
1. Competitive position
2. Life cycle stage of the firm.
ANJU KUMARI Vol.7. Issue.3.2020 (July-Sept.)
Int.J.Buss.Mang.& Allied.Sci. (ISSN:2349-4638) 40
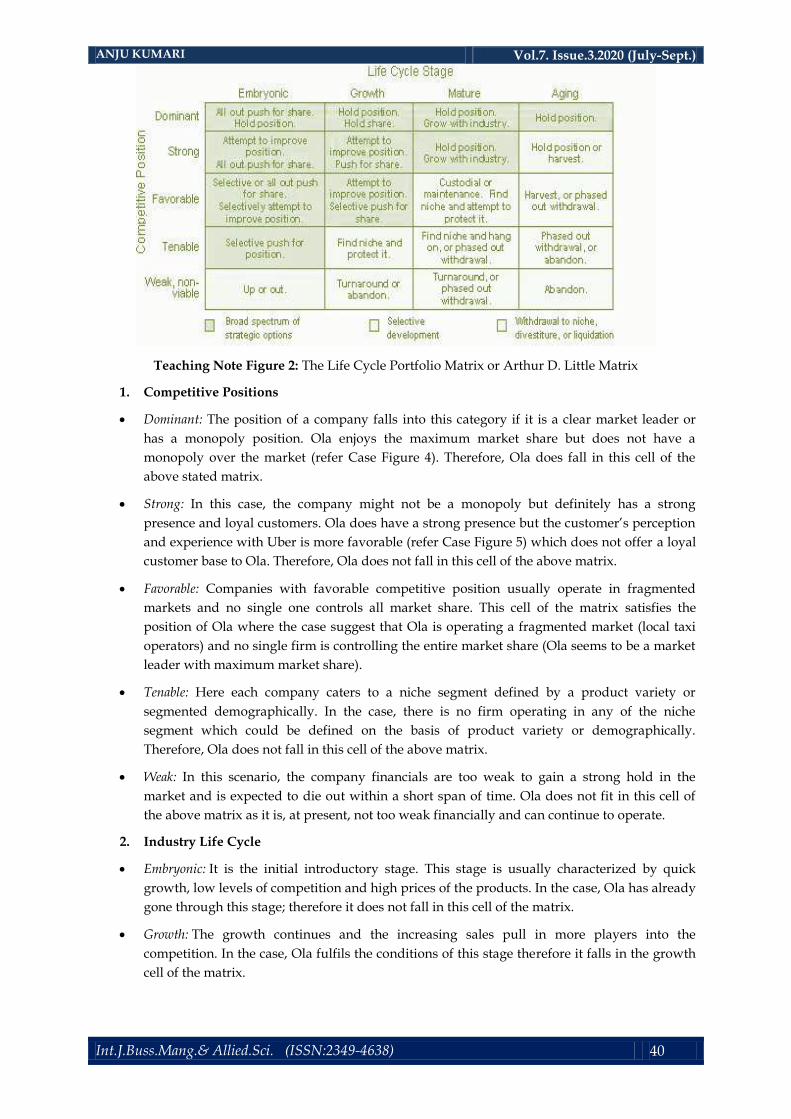
Teaching Note Figure 2: The Life Cycle Portfolio Matrix or Arthur D. Little Matrix
1. Competitive Positions
Dominant: The position of a company falls into this category if it is a clear market leader or
has a monopoly position. Ola enjoys the maximum market share but does not have a
monopoly over the market (refer Case Figure 4). Therefore, Ola does fall in this cell of the
above stated matrix.
Strong: In this case, the company might not be a monopoly but definitely has a strong
presence and loyal customers. Ola does have a strong presence but the customer’s perception
and experience with Uber is more favorable (refer Case Figure 5) which does not offer a loyal
customer base to Ola. Therefore, Ola does not fall in this cell of the above matrix.
Favorable: Companies with favorable competitive position usually operate in fragmented
markets and no single one controls all market share. This cell of the matrix satisfies the
position of Ola where the case suggest that Ola is operating a fragmented market (local taxi
operators) and no single firm is controlling the entire market share (Ola seems to be a market
leader with maximum market share).
Tenable: Here each company caters to a niche segment defined by a product variety or
segmented demographically. In the case, there is no firm operating in any of the niche
segment which could be defined on the basis of product variety or demographically.
Therefore, Ola does not fall in this cell of the above matrix.
Weak: In this scenario, the company financials are too weak to gain a strong hold in the
market and is expected to die out within a short span of time. Ola does not fit in this cell of
the above matrix as it is, at present, not too weak financially and can continue to operate.
2. Industry Life Cycle
Embryonic: It is the initial introductory stage. This stage is usually characterized by quick
growth, low levels of competition and high prices of the products. In the case, Ola has already
gone through this stage; therefore it does not fall in this cell of the matrix.
Growth: The growth continues and the increasing sales pull in more players into the
competition. In the case, Ola fulfils the conditions of this stage therefore it falls in the growth
cell of the matrix.
ANJU KUMARI Vol.7. Issue.3.2020 (July-Sept.)
Int.J.Buss.Mang.& Allied.Sci. (ISSN:2349-4638) 41
Mature: This stage is marked by stagnancy in terms of overall industry’s sales. While the
industry enjoys a well-established customer base, it does not see any further growth. There
are lots of competitors and the competition is fierce. In the case, the market is not stagnant;
the customer base is not well established and the competition has not risen to fierce level,
therefore Ola’s life cycle does not fall in this cell of the matrix.
Ageing: It is characterized by a major fall in the demand. Consolidating or quitting are the
only options left for businesses as the industry begins to die out. In the case, Ola does not fall
under this cell of the matrix.
After analysing Ola’s position according to ADL matrix, it can be concluded that Ola has a favorable
competitive position and is in the growth stage of its life cycle. However, Ola’s situation is dripping,
Case Table 3 clearly depicts that Ola’s price/ride is lower than Uber still the average booking/month
of Uber is higher than Ola (refer Case Table 2). With this rate Ola might not be able to maintain its
position in long run. As the ADL matrix does not clearly state what strategy should be adopted to
improve business and maintain competitive edge over competitors. Another model named SPACE
can be used.
The Strategic Position and Action Evaluation Matrix or SPACE analysis matrix was developed by
strategy academics Alan Rowe, Richard Mason, Karl Dickel, Richard Mann and Robert Mockler.
SPACE Analysis is a systematic appraisal of four key issues that balance the external and internal
factors that should determine the general theme of the strategy:
Internal: Competitive Advantage (CA) and Financial Strength (FS)
External: Industry Attractiveness (IA) and Environmental stability (ES)
Competitive Advantage includes Market share (small to large), Product quality (inferior to
superior), Product life cycle (late to early), Customer loyalty (low to high), Technological
know-how (low to high), Speed of new product introductions (slow to fast). In the case, Ola
satisfies most of the conditions therefore it has a favourable competitive advantage (refer
Case Table 1).
Financial strength includes Return on investment (low to high), Leverage (debt to equity
ratio) (imbalanced to balanced), Liquidity (access to quick money when needed) (imbalanced
to solid), Capital required versus capital available (high to low), Cash flow (low to high), Ease
of exit from market (difficult to easy), Risk involved in the business (much to little), Inventory
turnover (slow to fast), Use of economies of scale and experience (low to high). In the case,
Ola does not satisfies all the conditions of this factor (refer Case Table 4) hence is low on
financial strength.
Industry Attractiveness includes Growth potential (low to high), Profit potential (low to
high), Financial stability (low to high), Technological know-how (simple to complex),
Resource utilization (inefficient to efficient), Ease of entry into the market (easy to difficult),
Productivity; capacity utilization (low to high), Manufacturer’s bargaining power (low to
high). In the case, Porter’s five forces model proves that the industry attractiveness is high.
Environmental stability includes Technological changes, Rate of inflation, Demand
variability, Price range of competing products, Barriers to entry into market, Competitive
pressure/rivalry, Pressure from substitutes. In the case, the factors of environmental stability
are not in favor of Ola, therefore Ola has low environmental stability.
ANJU KUMARI Vol.7. Issue.3.2020 (July-Sept.)
Int.J.Buss.Mang.& Allied.Sci. (ISSN:2349-4638) 42
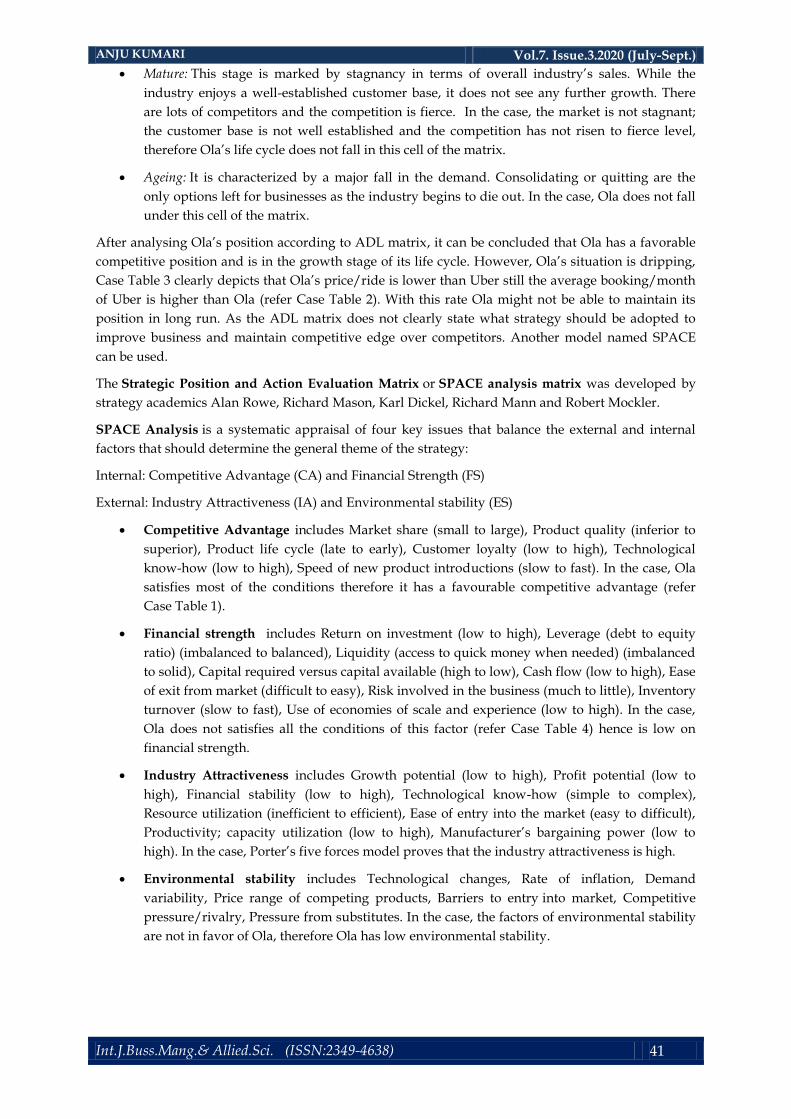
Teaching Note Figure 3: SPACE analysis matrix
Interpretation:
The quadrants of SPACE Matrix as depicted in Teaching Note Figure 3 are explained below:
The Aggressive posture in the SPACE Analysis Matrix occurs when all the dimensions are
positive. The implicit strategy is to aggressively grow the business raising the stakes for all
competitors. The main danger is complacency. In the case, Ola does not have positive
financial strength and environmental stability, hence strategy for Ola cannot be aggressive.
The Competitive posture arises when a firm has strong advantages in an attractive industry
but its financial strength is insufficient to compensate for environmental instability. The
immediate strategy is to improve its financial strength (raising capital, improving
profitability, merging with a cash rich parent) whilst maintaining its competitive position. In
the case, Ola satisfies the condition of competitive posture, hence the strategy suggested for
Ola is competitive according to SPACE matrix.
The Conservative posture arises when the firm is financially strong but is unlikely to make
significant returns from the business. The strategy is to look for diversification opportunities
in more attractive competitive situations. In the case, Ola does not satisfy the conditions of
conservative posture, therefore this strategy cannot be used by Ola.
The Defensive posture in the SPACE matrix occurs when all the dimensions are scored poorly.
Firms in this position are very weak and heading for failure unless the external environment
becomes more favourable. The firm will need to retreat from all but its strongest segments so
that it can concentrate its limited resources on a turnaround. In the case, Ola does not fulfill
the criteria of defensive posture hence this strategy cannot be used for Ola.
According to the SPACE matrix, strategy for Ola is Competitive which suggests that Ola should go
for a merger with a cash rich parent to raise capital, improve profitability and maintain its
competitive position.
References
[1]. Shivakumar G. India is set to become the youngest country by 2020. The Hindu, 2013,
http://www.thehindu.com/news/national/india-is-set-to-become-the youngest- country-by-
2020/article4624347.ece, retrieved on 12 February, 2020.
[2]. Sharma N R G . Ole,Ole,… “Ola…”. Cases in Management, 2015, 4: 219-246.
[3]. Sarvepalli S. K K, Prakash N R M. Cab Aggregation Industry in India – An Overview, Current
Scenario, Issues and Possibilities for Consolidation. IJSDR, 2016, 1(4): 317-324.
ANJU KUMARI Vol.7. Issue.3.2020 (July-Sept.)
Int.J.Buss.Mang.& Allied.Sci. (ISSN:2349-4638) 43
[4]. Abrar P. Uber gives another push to its India plans with Rs. 1,767-cr investment. Business
Standard, 2019, https://www.business-standard.com/article/companies/uber-gives-another-
push-to-its-india-plans-with-rs-1-767-cr-investment-
119111201453_1.html#:~:text=%C2%ABBack-
,Uber%20gives%20another%20push%20to%20its,with%20Rs%201%2C767%2Dcr%20investmen
t&text=Ride%2Dhailing%20major%20Uber%20has,Uber%20India%20Systems%20Private%20Li
mited., retrieved on 20 July, 2020.
[5]. Mitra S, Mishra D. Has Ola set the stage for taxi consolidation? Business Standard, 2015,
http://www.business-standard.com/article/companies/has-ola-set-the-stage-for- taxi-
consolidation-115031101255_1.html), retrieved on 5 June, 2020.
[6]. ET Bureau. Uber vs Ola: Battle for dominance has restarted. The Economic Times, 2020
https://economictimes.indiatimes.com/small-biz/startups/newsbuzz/uber-vs-ola-battle-for-
dominance-has-restarted/articleshow/74055006.cms, retrieved on 15 July, 2020.
[7]. Vardhan J, Bansal V. Exclusive: Uber India plans to lay off over 500 employees soon. Entrackr,
2020,https://entrackr.com/2020/05/exclusive-uber-india-plans-to-lay-off-over-500-
employees-
soon/#:~:text=Uber%20has%20over%202%2C000%20employees%20in%20India%2C%20per%2
0sources, retrieved on 17 July, 2020.
[8]. Craft, 2020, https://craft.co/ola-ani-technologies-pvt, retrieved on 15 July, 2020.
[9]. Chakraborty S. Uber overtakes Ola in number of app downloads for March: Report. Livemint,
2017,http://www.livemint.com/Companies/IU0mdrNwmHbmiGX5dIVOkK/Uber-
overtakes-Ola-in-number-of-app-downloads-for-March Rep.html, retrieved on 12 January,
2020.
[10]. Tiwari S. A Comparative Study on Ola and Uber. Journal of Emerging Technologies and
Innovative Research, 2019, 6(2):171-177.
[11]. Hawkins A J. Uber accuses Indian rival Ola of booking 400,000 fake rides. The Verge, 2016,
https://www.theverge.com/2016/3/23/11292310/uber-ola-lawsuit-india-fake-rides-
lyft#:~:text=According%20to%20Bloomberg%2C%20Uber%20filed,move%20to%20frustrate%2
0its%20drivers, retrieved on 20 July, 2020.
[12]. Singh S. Uber vs Ola: Who will end up dominating the streets? The Economic Times, ,2016,
http://economictimes.indiatimes.com/small-biz/startups/uber-vs-ola-who-will-end- up-
dominating-the-streets/articleshow/51720396.cms, retrieved on 23 April, 2020.
[13]. Chakraborty S. Uber vs Ola: The battle for dominance in India’s taxi market. ,Livemint, 2016,
http://www.livemint.com/Companies/okLbTyf5OtqKnO1roYBAeP/Uber-vs-Ola- the-battle-
for-dominance-in-Indias-cab-market.html, retrieved on 21 April, 2020.
[14]. Bhattacharyya A, Gupta H. Uber India drives to massive success, profit soars 6x to Rs 18.7 cr.
Financial Express, 2016, http://www.financialexpress.com/industry/uber-india-drives-to-
massive-success- profit-soars-6x-to-rs-18-7-cr/470078/, retrieved on 3 June, 2020.
[15]. Soni S. Uber’s profit up 63% in India even as expenses grew higher. Financial Express,
2019,https://www.financialexpress.com/industry/sme/uber-profit-increases-63-expenses-
increases-ola-vs-uber-ola-profit-ride-hailing-cab-booking-cab-drivers-
softbank/1808980/#:~:text=Uber%20India%2C%20which%20competes%20with,to%20the%20c
ompany's%20regulatory%20filing, retrieved on 2 July, 2020.
[16]. Kashyaap S. Mahindra & Mahindra takes on Ola and Uber, enters ride-sharing
businesswithGlyd. Yourstory, 2019, https://yourstory.com/2019/02/mahindra-ola-uber-
glyd-evs-31gedvd4, retrieved on 21 July, 2020.
[17]. Bishnoi B K, Bhardwaj R. Cab Aggregators in India: A Case Study of Ola and Uber.
International Journal of Research in Social Sciences, 2019, 9(4):1029-1040.