productivity analysis and improvement of
TRANSCRIPT

i
PRODUCTIVITY ANALYSIS AND IMPROVEMENT OF
TANNERIES IN KENYA.
A CASE STUDY OF SAGANA TANNERIES.
EVALINE NTAKIRA JAMES
E221-03-0018/2015
EVALINE NTAKIRA JAMES
A Thesis submitted in Partial Fulfilment of the Requirement for the
Award of the Degree of Master of Science in Industrial Engineering
and Management, in the .
School of Engineering,

ii
Dedan Kimathi University of Technology
JANUARYMARCH, 2019
Declaration:
This thesis is my original work and has not been presented in any university/institution for
a degree or for consideration of any certification.
Signature ………………………………… Date……………………………….
Name: Evaline Ntakira James
Reg No: E221-03-0018/2015
APPROVAL
We/I confirm that the work reported in this thesis was carried out by the candidate under
our /my supervision as University Supervisor(s).
Signature ………………………………… Date……………………………….
Name: Prof. Peter. N. Muchiri, PhD
Department of Mechanical, School of Engineering
Institution: Dedan Kimathi University of Technology
Signature ………………………………… Date……………………………….
Name: Dr. Douglas Onyancha, PhD
Department of Chemistry, School of Science
Institution: Dedan Kimathi University of Technology

iii

iv
Dedication:
This work is dedicated to my family for the immerse support during the study. To my
classmates and colleagues, may God bless them for their support and criticism throughout
the study.

v
Acknowledgement:
I thank God for the far he has brought me.
I acknowledge the following for the immerse informative support, guidance and
corrections they gave throughout the study period.
Prof. Peter Muchiri and Dr. Douglas Onyancha for the tireless guidance, support and
corrections.
Sagana tanneries management specifically Mr. Chumo and Mr. Dominic for their ready
information and support together with their staff members.
African Development Bank, for the funding and making it possible for me to join the
programme and accomplish, this has improved and widened my knowledge base.
My classmates for the one on one review sessions which helped each of us to way-find the
directions and informative criticism.
A colleague Mr. Peter Muinde for tireless corrections and guidance.
My Family for the immerse support, prompts and prayers throughout the study.

vi
Table of Contents
Table of Contents
Declaration ......................................................................................................................................... ii
Dedication ......................................................................................................................................... iv
Acknowledgement .............................................................................................................................. v
Table of Contents .............................................................................................................................. vi
List of figures .................................................................................................................................. xiv
List of tables .................................................................................................................................... xvi
Abbreviations: ................................................................................................................................ xvii
ABSTRACT .................................................................................................................................. xviii
Chapter 1 : CHAPTER ONE .............................................................................................................. 1
INTRODUCTION .............................................................................................................................. 1
1.1 Background of study: ............................................................................................................... 1
1.1.1: Tanneries and productivity ............................................................................................... 2
1.1.2 Tanneries in Kenya ............................................................................................................ 4
1.2 Problem Environment .............................................................................................................. 7
1.2.1 Case study ......................................................................................................................... 7
1.2.2 Market ............................................................................................................................... 8
1.2.3 Production capacity and process ....................................................................................... 8
1.3 Problem statement .................................................................................................................. 12
1.4 Objectives ............................................................................................................................... 12
1.5 Justification ............................................................................................................................ 13
Chapter 2 : CHAPTER TWO ........................................................................................................... 14
REVIEW OF RELATED LITERATURE ....................................................................................... 14
2.1. Leather industry introduction ................................................................................................ 14
2.1.1 Leather processing ........................................................................................................... 15
2.1.2 Productivity challenges in leather industries ................................................................... 18
2.2. Productivity concepts ............................................................................................................ 19
2.2.1Types of productivity ....................................................................................................... 20
2.2.2 Productivity measurements ............................................................................................. 21
2.3 Productivity levels Key Performance Indicators .................................................................... 22
2.3.1 Overall Equipment Effectiveness (OEE) ........................................................................ 22
2.3.2: Cycle time Analysis ....................................................................................................... 25

vii
2.3.3 Throughput Process design analysis................................................................................ 27
2.4 Root cause analysis (RCA) .................................................................................................... 28
2.5. Strategy for productivity improvement ................................................................................. 30
2.5.1 Lean manufacturing concept ........................................................................................... 32
2.5.2 Total productive maintenance (TPM) ............................................................................. 33
2.5.3 Layout design .................................................................................................................. 35
2.5.4: Six Sigma ....................................................................................................................... 36
2.6: Case Studies: ......................................................................................................................... 37
2.7: Deductions from Literature ................................................................................................... 38
2.8 Gaps in the literature .............................................................................................................. 39
Chapter 3 : CHAPTER THREE ....................................................................................................... 40
RESEARCH DESIGN AND METHODOLOGY ............................................................................ 40
3.1 Introduction ............................................................................................................................ 40
3.2 Research design ...................................................................................................................... 40
3.3: Data collection and analysis .................................................................................................. 41
3.4: Analysis of the productivity levels in Sagana tanneries ........................................................ 42
3.4.1: Equipment utilization ..................................................................................................... 42
3.4.2: Overall Equipment Effectiveness (OEE) ....................................................................... 43
3.4.3: Cycle time analysis ........................................................................................................ 43
3.4.4: Throughput analysis ....................................................................................................... 44
3.5: Root Cause Analysis for productivity losses in STL ............................................................ 47
3.5.1: Cause and Effect diagram (Cause charting) ................................................................... 47
3.5.2: Pareto chart (Root cause identification) ......................................................................... 48
3.5.3: Five whys (Why-Why analysis) ..................................................................................... 48
3.6. Experimental design .............................................................................................................. 49
3.6.1: Proposed strategies for productivity improvement ........................................................ 49
3.7: Framework of the work carried out ....................................................................................... 53
Chapter 4 : CHAPTER FOUR ......................................................................................................... 54
RESULTS AND DISCUSSION ...................................................................................................... 54
4.1: Introduction ........................................................................................................................... 54
4.2: Analysis of the Productivity levels at STL: .......................................................................... 54
4.2.1: Equipment utilization levels ........................................................................................... 54
4.2.2: Overall Equipment Effectiveness ................................................................................... 56

viii
4.2.3: OEE factors rate for the three-production section .......................................................... 57
4.2.4: Cycle time analysis in Sagana tanneries ........................................................................ 59
4.2.5: Throughput analysis in Sagana tanneries ....................................................................... 61
4.3: Determination of root causes of low productivity in Sagana tanneries ................................. 65
4.3.1: Factors that affect productivity in Sagana tanneries ...................................................... 65
4.3.2: Determination of root causes of low productivity in STL: ............................................ 71
4.3.3: Investigation of Root causes of frequent equipment breakdowns and low operation
speeds in Sagana tanneries ....................................................................................................... 77
4.4: Developing Strategies for productivity improvement ........................................................... 78
4.4.1 Strategy formulation ........................................................................................................ 78
4.4.2 Evaluation of strategies ................................................................................................... 79
4.4.3: Productivity Improvement Strategy Proposal ................................................................ 80
4.4.4 Summary ......................................................................................................................... 80
Chapter 5 : CHAPTER FIVE ........................................................................................................... 81
CONCLUSIONS AND RECOMMENDATIONS ........................................................................... 81
5.1 Review of research objectives ................................................................................................ 81
5.2 Key findings ........................................................................................................................... 81
5.2.1 Analysis of productivity levels in Sagana tanneries ........................................................ 81
5.2.2: Root cause analysis of production losses in STL ........................................................... 83
5.2.3: Proposed strategies for productivity improvement ........................................................ 84
5.4 Recommendations .................................................................................................................. 84
5.5 Research contribution ............................................................................................................. 85
5.5.1 Research contribution to theory ...................................................................................... 85
5.5.2 Research contribution to practice .................................................................................... 85
5.6 Future research ....................................................................................................................... 86
REFERENCES ................................................................................................................................. 86
APPENDIX ...................................................................................................................................... 93
1.Appendix 1: Sales data for a period of one year ....................................................................... 93
2. Appendix 2: Summary of OEE factors rates ............................................................................ 94
3. Appendix 3: Production time data ............................................................................................ 95
4. Appendix 4: Interview schedules guiding questions: ............................................................... 95
5. Appendix 5: Raw company document with data to be extracted ............................................. 96
Declaration: ........................................................................................................................................ ii
Dedication ......................................................................................................................................... iii

ix
Acknowledgement: ........................................................................................................................... iv
Table of Contents ............................................................................................................................... v
List of figures: .................................................................................................................................. vii
List of tables: ..................................................................................................................................... ix
Abbreviations: .................................................................................................................................... x
Abstract ............................................................................................................................................. xi
Chapter 1 : CHAPTER ONE .............................................................................................................. 1
INTRODUCTION .......................................................................................................................... 1
1.1 Background of study: ............................................................................................................... 1
1.1.1: Tanneries and productivity ............................................................................................... 2
1.1.2 Tanneries in Kenya ............................................................................................................ 4
1.2 Problem Environment .............................................................................................................. 7
1.2.1 Case study ......................................................................................................................... 7
1.2.2 Market ............................................................................................................................... 7
1.2.3 Production capacity and process ....................................................................................... 8
1.3 Problem statement .................................................................................................................. 11
1.4 Objectives ............................................................................................................................... 11
1.5 Justification ............................................................................................................................ 12
Chapter 2 : CHAPTER TWO ........................................................................................................... 13
REVIEW OF RELATED LITERATURE ................................................................................... 13
2.1. Leather industry introduction ................................................................................................ 13
2.1.1 Leather processing ........................................................................................................... 14
2.1.2 Productivity challenges in leather industries ................................................................... 17
2.2. Productivity concepts ............................................................................................................ 18
2.2.1Types of productivity ....................................................................................................... 19
2.2.2 Productivity measurements ............................................................................................. 20
2.3 Productivity levels Key Performance Indicators .................................................................... 21
2.3.1 Overall Equipment Effectiveness (OEE) ........................................................................ 21
2.3.2: Cycle time Analysis ....................................................................................................... 24
2.3.3 Throughput Process design analysis................................................................................ 26
2.4 Root cause analysis (RCA) .................................................................................................... 27
2.5. Strategy for productivity improvement ................................................................................. 28
2.5.1 Lean manufacturing concept ........................................................................................... 30
2.5.2 Total productive maintenance (TPM) ............................................................................. 32

x
2.5.3 Layout design .................................................................................................................. 34
2.5.4: Six Sigma ....................................................................................................................... 35
2.6: Case Studies: ......................................................................................................................... 35
2.7: Deductions from Literature ................................................................................................... 37
2.8 Gaps in the literature .............................................................................................................. 37
Chapter 3 : CHAPTER THREE ....................................................................................................... 39
RESEARCH DESIGN AND METHODOLOGY ........................................................................ 39
3.1 Introduction ............................................................................................................................ 39
3.2 Research design ...................................................................................................................... 39
3.3: Data collection and analysis .................................................................................................. 39
3.4: Analysis of the productivity levels in Sagana tanneries ........................................................ 40
3.4.1: Equipment utilization ..................................................................................................... 41
3.4.2: Overall Equipment Effectiveness (OEE) ....................................................................... 41
3.4.3: Cycle time analysis ........................................................................................................ 42
3.4.4: Throughput analysis ....................................................................................................... 43
3.5: Root Cause Analysis for productivity losses in STL ............................................................ 45
3.5.1: Cause and Effect diagram (Cause charting) ................................................................... 45
3.5.2: Pareto chart (Root cause identification) ......................................................................... 46
3.5.3: Five whys (Why-Why analysis) ..................................................................................... 46
3.6. Experimental design .............................................................................................................. 47
3.6.1: Proposed strategies for productivity improvement ........................................................ 47
3.7: Framework of the work carried out ....................................................................................... 51
Chapter 4 : CHAPTER FOUR ......................................................................................................... 52
RESULTS AND DISCUSSION .................................................................................................. 52
4.1: Introduction ........................................................................................................................... 52
4.2: Analysis of the Productivity levels at STL: .......................................................................... 52
4.2.1: Equipment utilization levels ........................................................................................... 52
4.2.2: Overall Equipment Effectiveness ................................................................................... 54
4.2.3: OEE factors rate for the three-production section .......................................................... 55
4.2.4: Cycle time analysis in Sagana tanneries ........................................................................ 57
4.2.5: Throughput analysis in Sagana tanneries ....................................................................... 59
4.3: Determination of root causes of low productivity in Sagana tanneries ................................. 63
4.3.1: Factors that affect productivity in Sagana tanneries ...................................................... 63

xi
4.3.2: Determination of root causes of low productivity in STL: ............................................ 69
4.3.3: Investigation of Root causes of frequent equipment breakdowns and low operation
speeds in Sagana tanneries ....................................................................................................... 74
4.4: Developing Strategies for productivity improvement ........................................................... 76
4.4.1 Strategy formulation ........................................................................................................ 76
4.4.2 Evaluation of strategies ................................................................................................... 76
4.4.3: Productivity Improvement Strategy Proposal ................................................................ 77
4.4.4 Summary ......................................................................................................................... 77
Chapter 5 : CHAPTER FIVE ........................................................................................................... 79
CONCLUSIONS AND RECOMMENDATIONS ....................................................................... 79
5.1 Review of research objectives ................................................................................................ 79
5.2 Key findings ........................................................................................................................... 79
5.2.1 Analysis of productivity levels in Sagana tanneries ........................................................ 79
5.2.2: Root cause analysis of production losses in STL ........................................................... 80
5.2.3: Proposed strategies for productivity improvement ........................................................ 81
5.4 Recommendations .................................................................................................................. 82
5.5 Research contribution ............................................................................................................. 82
5.5.1 Research contribution to theory ...................................................................................... 82
5.5.2 Research contribution to practice .................................................................................... 83
5.6 Future research ....................................................................................................................... 83
REFERENCES ................................................................................................................................. 84
APPENDIX ...................................................................................................................................... 91
1.Appendix 1: Sales data for a period of one year ....................................................................... 91
2. Appendix 2: Summary of OEE factors rates ............................................................................ 92
3. Appendix 3: Production time data ............................................................................................ 92
4. Appendix 4: Interview schedules guiding questions: ............................................................... 93
5. Appendix 5: Raw company document with data to be extracted ............................................. 93
Declaration: .........................................................................................................................................ii
Dedication: ......................................................................................................................................... iii
Acknowledgement: ............................................................................................................................ iv
Table of Contents ................................................................................................................................ v
List of figures: ................................................................................................................................... viii
List of tables: ...................................................................................................................................... ix
Abbreviations: ..................................................................................................................................... x

xii
Abstract: ............................................................................................................................................. xi
Chapter 1 : CHAPTER ONE .................................................................................................................. 1
INTRODUCTION .............................................................................................................................. 1
1.1 Background of study: ............................................................................................................... 1
1.1.1: Tanneries and productivity .............................................................................................. 2
1.1.2 Tanneries in Kenya ............................................................................................................ 4
1.2 Problem Environment .............................................................................................................. 7
1.2.1 Case study ......................................................................................................................... 7
1.2.2 Market ............................................................................................................................... 7
1.2.3 Production capacity and process ...................................................................................... 8
1.3 Problem statement ................................................................................................................ 11
1.4 Objectives ............................................................................................................................... 11
1.5 Justification ............................................................................................................................ 12
Chapter 2 : CHAPTER TWO ............................................................................................................... 13
REVIEW OF RELATED LITERATURE ................................................................................................ 13
2.1. Leather industry introduction ............................................................................................... 13
2.1.1 Leather processing .......................................................................................................... 14
2.1.2 Productivity challenges in leather industries .................................................................. 17
2.2. Productivity concepts ............................................................................................................ 18
2.2.1Types of productivity ........................................................................................................ 19
2.2.2 Productivity measurements ............................................................................................ 20
2.3 Productivity levels Key Performance Indicators..................................................................... 21
2.3.1 Overall Equipment Effectiveness (OEE) ........................................................................... 21
2.3.2: Cycle time Analysis ......................................................................................................... 24
2.3.3 Throughput Process design analysis ............................................................................... 26
2.4 Root cause analysis (RCA) ...................................................................................................... 27
2.5. Strategy for productivity improvement ................................................................................ 28
2.5.1 Lean manufacturing concept........................................................................................... 30
2.5.2 Total productive maintenance (TPM) ............................................................................. 32
2.5.3 Layout design .................................................................................................................. 34
2.5.4: Six Sigma ......................................................................................................................... 35
2.6: Case Studies: ......................................................................................................................... 35
2.7: Deductions from Literature ................................................................................................... 37

xiii
2.8 Gaps in the literature ............................................................................................................. 37
Chapter 3 : CHAPTER THREE ............................................................................................................. 39
RESEARCH DESIGN AND METHODOLOGY .................................................................................... 39
3.1 Introduction............................................................................................................................ 39
3.2 Research design ...................................................................................................................... 39
3.3: Data collection and analysis .................................................................................................. 39
3.4: Analysis of the productivity levels in Sagana tanneries ........................................................ 40
3.4.1: Equipment utilization ..................................................................................................... 41
3.4.2: Overall Equipment Effectiveness (OEE) ......................................................................... 41
3.4.3: Cycle time analysis ......................................................................................................... 42
3.4.4: Throughput analysis ....................................................................................................... 43
3.5: Root Cause Analysis for productivity losses in STL................................................................ 45
3.5.1: Cause and Effect diagram (Cause charting) ................................................................... 45
3.5.2: Pareto chart (Root cause identification) ........................................................................ 46
3.5.3: Five whys (Why-Why analysis) ....................................................................................... 46
3.6. Experimental design .............................................................................................................. 47
3.6.1: Proposed strategies for productivity improvement....................................................... 47
3.7: Framework of the work carried out ...................................................................................... 51
Chapter 4 : CHAPTER FOUR .............................................................................................................. 52
RESULTS AND DISCUSSION ........................................................................................................... 52
4.1: Introduction .......................................................................................................................... 52
4.2: Analysis of the Productivity levels at STL: ............................................................................. 52
4.2.1: Equipment utilization levels ........................................................................................... 52
4.2.2: Overall Equipment Effectiveness ................................................................................... 54
4.2.3: OEE factors rate for the three-production section ........................................................ 55
4.2.4: Cycle time analysis in Sagana tanneries ......................................................................... 57
4.2.5: Throughput analysis in Sagana tanneries....................................................................... 59
4.3: Determination of root causes of low productivity in Sagana tanneries ............................... 63
4.3.1: Factors that affect productivity in Sagana tanneries ..................................................... 63
4.3.2: Determination of root causes of low productivity in STL: ............................................. 69
4.3.3: Investigation of Root causes of frequent equipment breakdowns and low operation
speeds in Sagana tanneries ...................................................................................................... 74
4.4: Developing Strategies for productivity improvement .......................................................... 76
4.4.1 Strategy formulation ....................................................................................................... 76

xiv
4.4.2 Evaluation of strategies ................................................................................................... 76
4.4.3: Productivity Improvement Strategy Proposal ................................................................ 77
4.4.4 Summary ......................................................................................................................... 77
Chapter 5 : CHAPTER FIVE ................................................................................................................ 79
CONCLUSIONS AND RECOMMENDATIONS .................................................................................. 79
5.1 Review of research objectives ................................................................................................ 79
5.2 Key findings ............................................................................................................................ 79
5.2.1 Analysis of productivity levels in Sagana tanneries ........................................................ 79
5.2.2: Root cause analysis of production losses in STL ............................................................ 80
5.2.3: Proposed strategies for productivity improvement....................................................... 81
5.4 Recommendations ................................................................................................................. 82
5.5 Research contribution ............................................................................................................ 82
5.5.1 Research contribution to theory ..................................................................................... 82
5.5.2 Research contribution to practice ................................................................................... 83
5.6 Future research ...................................................................................................................... 83
REFERENCES ..................................................................................................................................... 84
APPENDIX ......................................................................................................................................... 91
1.Appendix 1: Sales data for a period of one year ....................................................................... 91
2. Appendix 2: Summary of OEE factors rates ............................................................................. 92
3. Appendix 3:Production time data ............................................................................................ 92
4. Appendix 4: Interview schedules guiding questions: ............................................................... 93
5. Appendix 5: Raw company document with data to be extracted ........................................... 93
List of figures:
Figure 1.1:Operational numbers of the tanneries, export go-downs and cottage industries showing
the leather sector productivity performance in Kenya (1995-2013) (Mwinyihija M. , 2014) ............ 5
Figure 1.2:Leather value chain (Memedovic & Mattila, 2008).......................................................... 6
Figure 1.3: Raw material grading process. Source: (STL) ................................................................. 8
Figure 1.4: Tanneries operation flow chart. Source: STL ................................................................ 10
Figure 1.5: Sagana tanneries production performance. Source: STL ............................................... 11
Figure 1.6: Broken down boiler unit. Source:STL ........................................................................... 11
Figure 1.7:The broken-down vacuum drying machine.Source:STL ................................................ 11
Figure 1.8: Buffing machine. Source:STL ....................................................................................... 12
Figure 1.9: Splitting machine. Source:STL ...................................................................................... 12
Figure 2.1: Leather processing flow chart(STL) .............................................................................. 16

xv
Figure 2.2:Overall Equipment Effectiveness (OEE) ( (Nigel, Stuart, Robert, & Alan, 2009) ......... 23
Figure 2.3 :Manufacturing cycle time length (Stevenson, Operations Management, 2009) ............ 26
Figure 2.4:Process performance objectives and process design factors (Nigel, Stuart, Robert, &
Alan, 2009) ....................................................................................................................................... 27
Figure 2.5:Example of a fishbone diagram. (Chandrakar & Kumar, 2015 ...................................... 29
Figure 4.1: comparison between average down time and actual production time in a month ......... 56
Figure 4.2: OEE comparison chart ................................................................................................... 58
Figure 4.3: Throughput analysis ....................................................................................................... 63
Figure 4.4: Productivity analysis ...................................................................................................... 64
Figure 4.5: Scatter diagram showing relationship between productivity and availability in STL. .. 67
Figure 4.6: Cause and effect diagram in Sagana tannery ................................................................. 72
Figure 4.7: Chart on Downtime and causal factors in beam house .................................................. 73
Figure 4.8: Pareto Chart on Downtime and causal factors frequency in beam house ...................... 73
Figure 4.9: Downtime causal factors in machining section ............................................................. 74
Figure 4.10: Pareto chart on causal factors in machining section .................................................... 75
Figure 4.11: Down time in finishing section .................................................................................... 76
Figure 4.12: Pareto chart on causal factors in finishing section ....................................................... 77

xvi
List of tables:
Table 1.1:Comparison of major Agro-based commodities value in the international trade
(Mwinyikione, 2014). ......................................................................................................................... 3
Table 1.2: Operational numbers of the tanneries, export go-downs and cottage industries showing
the leather sector productivity performance in Kenya (1995-2013) (Mwinyihija M. , 2014) ............ 4
Table 2.1: OEE major losses (Pomorski, 1997) (Exor & Data, 2017) ............................................. 24
Table 3.1: Sagana tannery monthly production throughput. Source: STL ....................................... 46
Table 3.2: Methodology framework ................................................................................................ 53
Table 4.1: Equipment utilization ...................................................................................................... 55
Table 4.2: Summary of OEE factors rates at the three sections of Sagana tanneries ....................... 57
Table 4.3: OEE factors comparison with the world ideal values ..................................................... 58
Table 4.4: Manufacturing Cycle time analysis ................................................................................. 59
Table 4.5: Sagana tannery monthly throughput ............................................................................... 62
Table 4.6: Variation in availability, performance and productivity in beam house section ............. 66
Table 4.7: Correlation matrix table in the beam house section ........................................................ 67
Table 4.8: Variation in availability, performance and productivity in Machine section .................. 68
Table 4.9: Correlation matrix between variables in the machine section ......................................... 69
Table 4.10: Variation in availability, performance and productivity in the finishing section .......... 70
Table 4.11: Correlation matrix in the finishing section .................................................................... 70
Table 4.12: summary of correlation matrix of Availability, Performance and Productivity of the
three sections .................................................................................................................................... 71
Table 4.13: Causal factors and appropriate solutions ....................................................................... 79
Table 4.14: Evaluation of strategies ................................................................................................. 79

xvii
Abbreviations::
ALLPI African Leather and Leather Product institute
BH Beam House
COMESA Common Market for East and Central Africa
CTE Cycle Time Effectiveness
FS Finishing Section
GDP Gross Domestic Product
KPI Key Performance Indicator
MS Machining Section
OEE Overall Equipment Effectiveness
RCA Root Cause Analysis
SMEs Small and Medium Enterprises
STL Sagana Tanneries Limited
TOC Theory of Constraints
TPM Total Productive Maintenance
UPP Unit Production Process
VSM Value Stream Mapping
WIP Work in Process
xviii
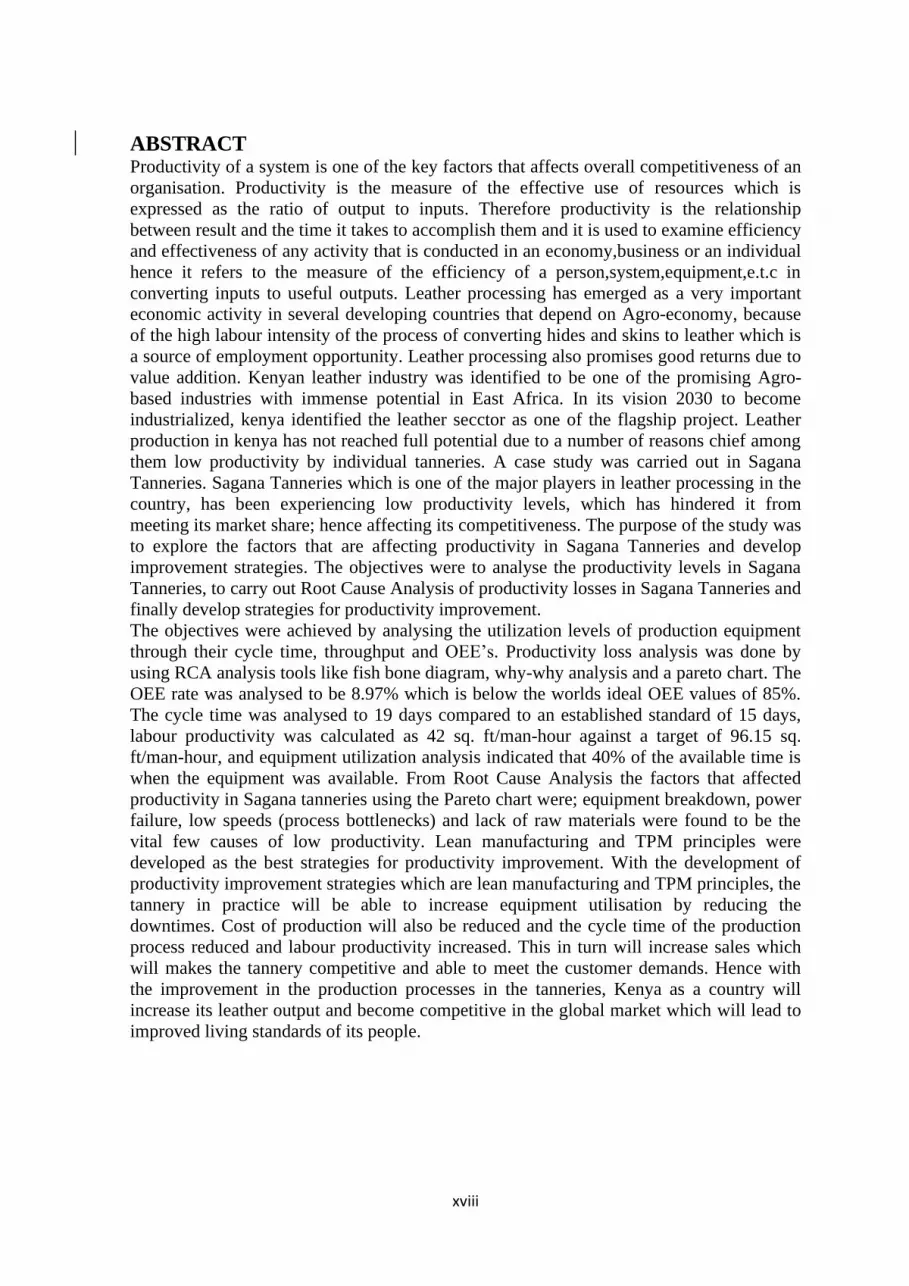
ABSTRACT Productivity of a system is one of the key factors that affects overall competitiveness of an
organisation. Productivity is the measure of the effective use of resources which is
expressed as the ratio of output to inputs. Therefore productivity is the relationship
between result and the time it takes to accomplish them and it is used to examine efficiency
and effectiveness of any activity that is conducted in an economy,business or an individual
hence it refers to the measure of the efficiency of a person,system,equipment,e.t.c in
converting inputs to useful outputs. Leather processing has emerged as a very important
economic activity in several developing countries that depend on Agro-economy, because
of the high labour intensity of the process of converting hides and skins to leather which is
a source of employment opportunity. Leather processing also promises good returns due to
value addition. Kenyan leather industry was identified to be one of the promising Agro-
based industries with immense potential in East Africa. In its vision 2030 to become
industrialized, kenya identified the leather secctor as one of the flagship project. Leather
production in kenya has not reached full potential due to a number of reasons chief among
them low productivity by individual tanneries. A case study was carried out in Sagana
Tanneries. Sagana Tanneries which is one of the major players in leather processing in the
country, has been experiencing low productivity levels, which has hindered it from
meeting its market share; hence affecting its competitiveness. The purpose of the study was
to explore the factors that are affecting productivity in Sagana Tanneries and develop
improvement strategies. The objectives were to analyse the productivity levels in Sagana
Tanneries, to carry out Root Cause Analysis of productivity losses in Sagana Tanneries and
finally develop strategies for productivity improvement.
The objectives were achieved by analysing the utilization levels of production equipment
through their cycle time, throughput and OEE’s. Productivity loss analysis was done by
using RCA analysis tools like fish bone diagram, why-why analysis and a pareto chart. The
OEE rate was analysed to be 8.97% which is below the worlds ideal OEE values of 85%.
The cycle time was analysed to 19 days compared to an established standard of 15 days,
labour productivity was calculated as 42 sq. ft/man-hour against a target of 96.15 sq.
ft/man-hour, and equipment utilization analysis indicated that 40% of the available time is
when the equipment was available. From Root Cause Analysis the factors that affected
productivity in Sagana tanneries using the Pareto chart were; equipment breakdown, power
failure, low speeds (process bottlenecks) and lack of raw materials were found to be the
vital few causes of low productivity. Lean manufacturing and TPM principles were
developed as the best strategies for productivity improvement. With the development of
productivity improvement strategies which are lean manufacturing and TPM principles, the
tannery in practice will be able to increase equipment utilisation by reducing the
downtimes. Cost of production will also be reduced and the cycle time of the production
process reduced and labour productivity increased. This in turn will increase sales which
will makes the tannery competitive and able to meet the customer demands. Hence with
the improvement in the production processes in the tanneries, Kenya as a country will
increase its leather output and become competitive in the global market which will lead to
improved living standards of its people.

1
Chapter 1 : CHAPTER ONE
INTRODUCTION
1.1 Background of study:
Production in an organisation can be characterised by large number of orders, rise in prices
of production resources, continually shortening order times and higher demands for
quality. This translates to pressure to the companies to survive and be successful hence
continual search for methods that can assure its competitiveness. Productivity of a system
is one of the key factors that affects overall competitive of an organisation (Jedrzejewski,
2007). According to (Levary, 1991) and (WebFinance, 2017) productivity is the measure
of the efficiency of a person,system,equipment,e.t.c in converting inputs to useful outputs
hence it is the average measure of the efficiency of a production system. (Stevenson,
Operations Management, 2009)defined productivity as a summary measure of the quantity
and quality of work performance with effective resource utilization considered, which is
expressed as the ratio of output to inputs. (Teklemariam, 2004) also defined productivity as
the relationship between result and the time it takes to accomplish them. (John , 1993)
expressed productivity ratio as in the equation below
In any economy, productivity in the manufacturing sector leads to improved standards of
living and social welfare which translates to an increase in the GDP of the nation.
Productivity being the main determinant of living standards it quantifies how an economy
can use its available resources.Therefore higher productivity leads to improved
competitiveness and trade perfomance,higher profits,low average costs,higher wages and
economic growth (Riley, 2012).For sustainability of a nations economy,manufacturing
industries should be nurtured to be sustained against the global competitive market. In
Manufacturing, productivity helps in:Controlling the business processes, Improving the
processes continously, Understanding the processes of a business, Asssessing the
performance of a business, Determining the business ability to sustain in the long run.
Therefore in the manufucturing sector productivity has a positive and significant
relationship to perfomance measurement for process utilization,process output,product
cost,work in process inventory and on time delivery (Mwinyihija M. , 2014).Productivity is
also used to examine efficiency and effectiveness of any activity that is conducted in an

2
economy, business or an individual. This is because productivity can is used as a measure
of a manufacturing systems efficiency which leads to increased competitive advantage
according to (Levary, 1991).According to (Teklemariam, 2004) productivity is linked with
the utilization of resources in the company.This is the function of achieving the maximum
output with minimum resource input. The resources are manpower, material, equipment,
spares, building, capital and time,where the responsibility of achieving higher productivity
rests on managing these resources efficiently.Productivity growth comes from working
smarter,this means adopting new technonologies or new techniques for production.
One function of productivity is Time and it is a good demonstrator as it is a universal
measure which is beyond human control. The system is deemed productive if it takes less
time to achieve the desired results a key requirement in the manufacturing industry.other
factors affecting Productivity are Quality of inputs and Utilization of resources,i.e
maximum output with minimum resources.
1.1.1: Tanneries and productivity
Tanning is the conversion of raw hides and skins. A tannery is the factory where tanning
takes place. In a Tannery, hides and skins are processed to leather through a series of
processes. The hides and skins trade have gone through phases; witnessing positive impact
on the sector. The sector changed from a purely raw material source to fairly modern
industry adopting the changing technology and market trends (KLDC, 2016). The change
saw the country turn into a tanning hub for the East African region through obtaining hides
and skins and supply of leather in both local and regional markets. In addition, it
experienced exports of semi- processed leather (wet-blue) to the international markets
Most of the tanneries in Kenya are usually small and Medium Enterprises (SMEs) and they
play a very important role in a nation’s economy, in terms of their contributions to the
GDP and employment, and they therefore remain the core engines for productivity and
economic growth of the nation (World, Bank, & Group, 2015).Tanning as a manufacturing
sector, focus on productivity in terms of how to meet the customer requirements, and
where they must inculcate a strong productivity mindset and embrace continuous
productivity improvement. Productivity is considered as a measure of how they meet the
criteria below according to (Teklemariam, 2004):
• Objectives- to what degree do they achieve the organisation objectives

3
• Efficiency –how efficiently are organisation resources used to generate useful
output
• Effectiveness –the achieved throughput compared to what is theoritically possible
In the world today, for any organisation or company to survive in the market, it must be
competitive enough, both nationally and internationally. With the rapid technology growth,
production systems must be enhanced to increase efficiency in every dimension. The
leather industry is very lucrative globally, compared to other Agro-business trades, hence it
has a higher potential of being productive with higher earnings (Mwinyikione, 2014). This
can be seen from Table 1.1 that leather and leather products have a percentage contribution
of 52.8, compared to other Agro-products in the global market. From the Table one can see
that the leather industry is one of the key players in the economic growth of a nation,
compared to the other Agro-commodities in the international market.
Table 0.1:Comparison of major Agro-based commodities value in the international trade
(Mwinyikione, 2014).
Value in USD
(billions)
% contribution of major selected
commodities
Leather and
leather products
52.5 51.8
Meat 12.0 11.0
Rubber 4.0 3.9
Cotton 5.9 5.8
Tea 6.9 6.8
Coffee 7.9 7.8
Rice 2.6 2.6
Sugar 10.4 10.3
Total 53.5 100
Therefore, productivity is a very important factor in enhancing the competitiveness of the
tanneries. Hence productivity should be seen as how well the resources of the organisation

4
are utilized efficiently. This may be through smart working, which means use or adoption
of new techniques for production, or using equipment effectively.
1.1.2 Tanneries in Kenya
From the global context African countries like Kenya remain as marginal players in the
leather industry. Despite Kenya being a leather footwear hub for East Africa two decades
ago has it is only estimated at only US$ 140 million (0.14% of world export in 2013),
making it significantly less competitive than global leaders (Ministry of industrialisation
and enterprise development-kenya, 2015). According to a publication of Kenyan Embassy-
Rome, the leather industry in Kenya mainly depends on the large livestock resource base
which has an estimated population of 17.5 million cattle, 27.7 million goats, 17.1 million
sheep and 3.0 million camels. The sector has a contribution to the economy of Ksh.13.6
billion and creates employment to thousands of people both directly and indirectly through
the existing tanneries and other several leather goods cottages or SMEs in various part of
the country (Mwinyihija M. , 2014). From the Table 1.2 it’s evident that Kenya has had an
improvement in the export of processed leather comparing the exports in the year 1995 and
2013. From the table it’s evident that leather industry has been experiencing an upward
improvement over the years which earned the country about Ksh.13.6 billion in 2013. This
increase in productivity levels in the industry was as a result of the value addition process,
after an imposed tax on raw hides and skins. The increase in other leather cottages led to
the increase in employment levels between the study periods 1995-2013. Hence this shows
there has been tremendous increase in productivity and production levels in the leather
industry in the country.
Table 0.2: Operational numbers of the tanneries, export go-downs and cottage industries
showing the leather sector productivity performance in Kenya (1995-2013) (Mwinyihija M. ,
2014)
1995-2000 2001-2005 2006-2010 2011-2013
Export of leather (trends in
percentage)
Processed 15% Processed 75% Processed 90% Processed 95%
Raw 85% Raw 25% Raw 10% Raw 5%
Prod of Hides and Skins
(in sq. ft)
6.3 million 7.82million 8.25 million 10.6 million
No. Of Tanneries 17 9 13 14
Cottage units 15 17 24 30
Leather goods units 15 12 47 200

5
Direct employment (Nos) 1700 2500 16740 22000
Total Earnings 2.0 billion 2.8 billion 7.86billion 13.6 billion
Source: (Mwinyihija M. , 2014)
At the same time the production of the leather industry of hides/skins has been increasing
in the country in the past few years this means increase in employment opportunity which
leads to improved living standards hence affecting the country’s GDP positively. The
production performance in Kenya as analysed by Mwinyikione,2014, is illustrated in the
graph in Figure 1.1.
Figure 0.1:Operational numbers of the tanneries, export go-downs and cottage industries showing the leather
sector productivity performance in Kenya (1995-2013) (Mwinyihija M. , 2014)
(Mudungwe, 2012) identified the Kenyan leather industry to be one of the promising Agro-
based industries with immense potential where the Kenyan value chain base is very rich
and is ranked third in the COMESA region from Sudan and Ethiopia. Most of the leather
goods producers are the micro and small enterprise that are in the informal sector for
competitiveness. According to (World, Bank, & Group, 2015) report, in Kenya only few
tanneries process finished leather for domestic market as a result of high cost of raw
materials and high cost of chemicals
Key players of the leather industry include the suppliers of raw hides and skins, abattoirs,
tanneries and producers of products (traders).
Leather Value chains
0
2
4
6
8
10
12
1995-2000 2001-2005 2006-2010 2011-2013
Pro
duct
ion p
erfo
man
ce i
n s
q.f
t
(mil
lions)
Period in years
Tanneries leather production perfomance in kenya in sq.ft.

6
A value chain of a product describes all the stages of a process a product undergoes from
inception to the end user. The global leather value chain starts with animal
husbandry/breeding and ends with the manufacture of finished leather goods (Memedovic
& Mattila, 2008)). Bovine/cow hides, sheep and goatskins are the principal hides used and
processed in tanneries before becoming leather footwear, garments and accessories like
bags and belts and for technical products and upholstery. Leather value chain starts with
the breeding of animals, slaughtering hence recovery of the hides and skins from the
slaughtered animals on farms and in slaughter houses. The hides and skins are then
converted to leather in the tanneries, where extensive investment in equipment is required;
the leather is used to manufacture leather products in small labour-intensive workshops
with less investment in equipment’s, or in larger capital-intensive factories.
Value adding in agricultural commodities refers to improving the natural and conventional
form, quality and appeal of a product subsequently increasing the consumer value of the
product starting from the farm level to marketing of finished products. The most important
livestock agro-based commodities are the hides and skins which are a derivative of the
livestock sector (Mwinyikione, 2014). The development of the leather sector, considered as
one of the longest value chains in the agro-based commodities, involves sustaining a
dynamic raw material base, tanning, footwear, leather goods and marketing, with core
stakeholders being the livestock farmers, slaughterhouse owners/butchers, traders, tanners,
and footwear and leather goods strata.
The leather value chain is as shown in figure 1.2 below:
From the (World, Bank, & Group, 2015)report, Kenya’s, leather industry trails behind
global competitors (China and India) and regional competitors (Ethiopia), in terms of
productivity, quality and cost of products. Hence strategies and actions to enhance quality
and standards throughout the leather value chain are vital to Kenya’s ability to compete
both at domestic market and globally. The strategies rest on three pillars where one of the
TANNERIES HERDERS ABATTOIRS
LEATHER
GOODS
PRODUCERS
MARKET CONSUMERS
Figure 0.2:Leather value chain (Memedovic & Mattila, 2008)

7
pillars is aimed at improving the production process, technology and machinery.
Maximizing the performance of machinery prolongs the life of capital equipment which
eventually ensures maximum equipment utilization (Teklemariam, 2004).
1.2 Problem Environment
Leather processing has emerged as an important economic activity in several developing
countries that depend on Agro-economy, because of the high labour intensity of the
process involved in the conversion of the hides and skins to processed leather
(Thanikaivelan, Rao, Nair, & Ramasami, 2005).In most developing economies like Kenya,
leather has presumed an significant role as an opportunity segment for social development,
employment creation and export realization.
Currently tanneries in Kenya have installed capacities standing at 60% for wet-blue, crust
leather at 25% and finished leather taking 15% (KLDC, 2016).With improvement in the
production processes Kenya can increase its leather output revenue from the current
US$140 million to US$500 million. This is only possible if the current tanneries
production level is improved through increasing the output or throughputs of each process
and reducing their processing cycle time by eliminating equipment’s down time.
Generally, tanneries face the following problems:
• Low sales
• High competitiveness
• Low automation levels.
1.2.1 Case study
Sagana Tanneries is one of the tanneries and an SME, which is placed under study by the
COMESA/ALLPI project, whose objective is to improve its Competitiveness through
increased productivity of the tanneries. Sagana Tanneries limited was started in 1975 by
eight directors, who were all Kenyans. The tannery machines were relocated from a
tannery in Norway. In 2003 the management changed to a family company and the
Company has a capacity to employ 50-150 people depending on the production. Currently
there are about fifty employees, who are inclusive of production, security and casual staff,
80% of all employees are in the production line.

8
1.2.2 Market
Sagana tanneries limited performs contract tanning which takes 50% of the company’s
production for individual customers who then sell to Bata shoe industry.
The remaining 50% production is performed up to finishing this is more reliable and
profitable, and in fact the Kenyan government advocates for this. Bata Company do their
own finishing processes. Finished leathers are sold to shoe industries, and small-scale
enterprises (Kariokor traders), for value addition for use in belts, wallets, bags, furniture
(few). The demand is not easy to fulfil due to the different varieties of qualities demanded
and the different challenges the organization faces. The company sells different leather
qualities depending on the product required.
The company obtains raw materials locally especially from regions like Kirinyaga, Mt
Kenya Region, Mombasa, Nakuru. Raw materials order depends on demand for a certain
quality. The cost of a kilogram of skin hides keeps fluctuating with time, but the
companies selling price per sq. ft. remains constant. Previously, the company selectors
would be sent to the suppliers to check the raw materials for grading. Nowadays this is
done on arrival of raw material to the company. The company prefers grades 1,2 and 3
Tannery Runs. This combination forms the best ‘tannery run’. The company also buys
grade 4 at half a price of the ‘tannery run’ and grade 5 at quarter the TR price. Rejects are
never accepted. The grades 4 and 5, are those that have scratches, barbed wire marks,
humps, ticks and identification marks etc. The grading process at Sagana tanneries is
shown in Figure 1.3.
1.2.3 Production capacity and process
The tannery has a capacity to produce 400,000 sq. ft. of leather per month. The Tanning
process begins at soaking where by 3.5 tonnes of skin hides are immersed in the soaking
pit. At the end of finishing processes, the 3.5 tonnes yield 5600 sq. ft. of leather. The
company uses a Conversion factor of 1.7 to convert kilograms to square feet, 1kg=1.7 sq.
ft.
The Tanneries operation can be grouped into:
• Beam house processes
Offloading Physical examination
(grading) Weighing
Raw material
arrival
Figure 0.3: Raw material grading process. Source: (STL)

9
• Machinery processes
• Finishing processes
This is shown in the process flow chart in Figure 1.4

10
production data for Sagana Tanneries over a period of 12 months, was analysed to
CRUST
FINISHING PROCESSES
-Conditioning
-Staking
-Buffing/De-dusting
-Roller coating
-Plating
-Spraying
-Trimming/Selection
-Measuring and Packaging
LEATHER
MACHINERY PROCESSES
-Splitting
-Shaving
-Trimming and Weighing
-Re-tanning
-Neutralizing
-Ageing/Setting
-summing
-Drying
WET SHOP PROCESSES -De-liming
-Bating
-Pickling
-Chrome tanning
-Summing
-Grading/Selection
EXPORT
TO
FIN
ISH
ING
-Soaking
-Liming
-Fleshing
-chrome tanning.
WET BLUE
BEAM HOUSE PROCESSES
-Selection
-Weighing
Trimming
RAW HIDES
Figure 0.4: Tanneries operation flow chart. Source: STL

11
determine the actual capacity of the plant in comparison with the theoretical capacity of the
plant of 400,000 square feet/month. This is further analysed on the chart below. From the
Figure 1.5 below leather production in square feet in the 12 months’ period was highest at
60.9% in the month of July 2017, slightly above the average production and lowest in the
months of September 2016 at 25.5% below the expected factory capacity. From this also
the labour productivity in sq.ft/man hour is determined.
Some of the challenges that the tannery faced that may have contributed to the poor
productivity perfomance i.e below its set capacity throughputs include:
• Mechanical breakdowns of the vacuum drying machine and the boiler
• L
o
n
g
d
r
ying sessions as they are relying on natural
drying of leather. If it rains drying takes too long 3-4 days to dry a required batch of
leather and other processes are also delayed
0
50000
100000
150000
200000
250000
300000
350000
400000
450000
Jul-16 Aug-16 Sep-16 Oct-16 Nov-16 Dec-16 Jan-17 Feb-17 Mar-17 Apr-17 May-17 Jun-17
mo
nth
ly p
rod
uct
ion i
n s
q.f
t
STL Monthly production output versus the rated output capacity
Actual output (sq.ft) Design capacity (sq.ft)
Figure 0.5: Sagana tanneries production performance. Source: STL
Figure 0.7:The broken-down
vacuum drying machine. Source:
STL
Figure 0.6: Broken down boiler
unit. Source: STL

12
• Most of the machines are very old and cannot meet the plant capacity as they are
manual, slow, High power consumers and the end product are of a lower quality as
compared to the new machines. For example, the splitting machine and the buffing
machine cannot give even products.
• Poor quality and low supply of raw materials from the suppliers
• Lack of the right chemicals for tanning,
• Material handling from one processing machine to another is manual
1.3 Problem statement
Though Sagana tanneries limited is one of the major players in leather processing in the
country, the company has been experiencing low productivity levels which hinders it from
meeting its market demands, hence affecting its competitiveness. The tannery operated at
an average production of 43.4 % of its capacity during the period of preliminary study, this
indicated serious problem(s) that required to be identified and solved if the tannery was to
improve its productivity and remain competitive in the market.
1.4 Objectives
The purpose of the research study was to explore the factors that affected productivity in
Sagana Tanneries and propose improvement strategies to be developed.
The specific objectives being:
i. To analyse the productivity levels in Sagana tanneries using OEE,
and cycle time analysis.
Figure 0.8: Buffing machine.
Source: STL
Figure 0.9: Splitting machine.
Source: STL

13
ii. To carry out Root Cause Analysis of productivity losses in Sagana
tanneries
iii. To propose strategies for productivity improvement in Sagana
tanneries.
1.5 Justification
In any manufacturing set up the motivating factor is to be competitive in the market. This
means the use of less input to produce maximum output within the shortest time possible
and to be able to meet the specific customer demands. To remain competitive in a dynamic
market environment, a company should ensure that its production process is up to the task.
This calls for equipment and machineries that can operate in optimum process condition.
This also requires for operators to be able to eliminate any bottle necks in the process
hence ensuring the effective use of the available machine capacity. From the study a
number of factors were analysed and their effect on productivity determined hence
improvements strategies developed depending on the importance of each.
The study findings if implemented will benefit the company and ensure increased sales
growth, reduced cost of production and increased resource utilisation reducing idle time
hence leading to competitiveness in the market. The study findings will therefore help the
company to be competitive in the market if the productivity is enhanced. This is because
productivity can be used as a measure of a manufacturing systems efficiency which leads
to increased competitive advantage.

14
Chapter 2 : CHAPTER TWO
REVIEW OF RELATED LITERATURE
2.1. Leather industry introduction
Tanning is one of the oldest professions for humans; this is because it began with the
creation of humanity being used in making clothing and shelter. The need for better leather
led to the invention of better ways of preservation such as vegetable and chemical tanning
and also supporting equipment and machines to increase the quality and lifespan of the
products (Hussein, 2014). The leather and its related industries is the world’s largest sector
based upon a by-product of the meat industry (Gupta, Gupta, & Tamra, April 2007). Trade
in leather and leather products has progressively increased at the global field, this growth
impacting mostly the developing world as the leather sector main producers move to Asia
and projected to translate to Africa. The leather sectors relevance to the developing world
is becoming conspicuous in relation to the magnitude of trading activity observed in recent
years (Mwinyikione, 2014).In the developing world Asia emerged the most successful,
where China and India were leading, with Brazil in tow. According to (Mwinyikione,
2014) (FAO, 2011), from a global analysis, Asia leads in both consumption of leather
products and the production of footwear with 83% of a total of 13 billion pairs of shoes
produced globally. Comparatively Africa is at the bottom producing only 1.3%, surpassing
only Oceania at 1.2% of the global production. Kenya is at 2.40% of Africa’s share and
0.09% of the global production. On Exports Kenya has a global share of 0.02% valued at
US$ 78 million per annum, hence the leather sector which is a livestock agro-based sector
is very important (Mwinyihija M. , 2014).
The leather industry continues to be the engine of Kenya’s economic growth with an
estimated contribution of over 4% of the Agricultural GDP. According to the economic
survey conducted by the Kenya National Bureau of Statistics (KNBS) there was indication
that the livestock sector which is a major component of the agricultural sector, contributes
12% to the GDP with a share of 40% of the agricultural GDP (KNBS, 2012). The livestock
sector and associated commodity-based industries (including the leather sector) is of great
importance as 80% of the country is arid and semi-arid. The socio-economic dimensions of
the livestock sector in Kenya (including Africa) supports employment, wealth creation,
trade, household food security, nutrition, agro-based commodity development of which to

15
optimize on the benefits of derived commodities appropriate value addition is required
(Mwinyihija M. , 2014)(Sharma, Pathania, & Lal, 2010).
2.1.1 Leather processing
On processing of the hides and skins the transformative material becomes semi-processed
leather (e.g. wet-blue) or finished leather that can be used in the manufacturing of
Footwear and Leather goods (Mwinyihija M. , 2010)The leather industry in Kenya has 19
tanneries with a capital investment worth Kshs. 3.8 billion (equivalent to US$ 47.5million
at 2012/13 exchange rates), employs 4,000 people and operates at an average capacity
utilization of 80%. With the abolishment of the 22% export compensation in 1990 a
significant decline in the leather industry was observed which resulted to 10 tanneries
operating at an average of 30% capacity utilization by 2004/2005. According to the
Economic survey (UNIDO, 2010) report of Kenya, the quantum manufacturing index of
the leather industry continued to indicate a positive trend with a 1.8% economic growth
realized during 2008/09 review period, however, irrespective of the positive growth the
unexplored value addition opportunities are immense with a potential of translating Kenya
to huge trading hub in the East African countries and Africa at large (Mwinyihija M. ,
2010). According to ( (Dandira & Madanhire, 2013) Leather production uses raw material
in the form of cow hides and goat and sheep skins and a number of imported chemicals.
The raw material is locally collected. About 130 different types of chemicals are used in
leather manufacturing which ranges from common salt (sodium chloride) to very
expensive Chrome Sulphate. Leather manufacturing involves the following major steps as
illustrated in process flow chart in Figure 2.1 (Chumba & W, 2017)( the process is similar
to processes at Sagana tanneries):
• Pre-Process
• Pre-Tanning Process
• Tanning Processes
• Wet Finishing Process
• Dry Machining
• Finishing

16
Figure 0.1: Leather processing flow chart (STL)
In Sagana tanneries leather processing is as follows: Pre-processing skins/hides are
received and salt is applied on the flesh side of the skins/hides. Skin trimming is done to
remove unwanted parts. After pre-processing, pre-tanning process starts with the soaking
process in which skin are made flaccid by soaking them in water. After soaking hair is
removed, lime is used to make hair loose. Unwanted flesh is removed using the fleshing
machine after liming is done. Deliming is done using ammonium sulphate and then
washed. Bating is done to purify the hides further, and then they are degreased using
detergents. Tanning involves pickling of skins with acids and salts to stabilize their PH
levels this helps in the preservation of the skin. Chrome Tanning is done to stabilize the
collagen network of skin using tanning agents such as chromium sulphate resulting to “wet
blue”. Sorting is done according to the quality required at this stage or exported as wet
blue. Splitting is done depending on the leather type to give the required thickness.
Shaving is also done on the shaving machine to remove hairs on the skin. Wet finishing
processes are carried out to impart the desired softness, colour, strength and quality. These
include fat liquoring for softness, dyeing gives colour. The processed leather is taken
through some drying process i.e. setting, vacuum dying, stacking/toggling, buffing,
trimming, and pressing and segregation of the leather. The finishing processes are finally

17
carried out to impart beauty and durability to the leather (Chumba & W, 2017) (Dandira &
Madanhire, 2013).
The chemicals used in the leather industry can be divided into three broad categories:
• Pre-tanning Chemicals
• Tanning Chemicals
• Finishing Chemicals
Pre-tanning chemicals are used to clean and prepare skins for the tanning process and they
are mostly washed away with the wastewater. Tanning chemicals react with the collagen
fibres of the skin to convert them into leather. These chemicals are retained in the skin but
a good amount of these is discharged into wastewater. Chrome Sulphate is the basic
tanning chemical. Apart from being expensive, Chrome Sulphate is also a serious pollutant
(Chumba & W, 2017).
Finishing chemicals are used to impart certain properties to the leather like softness,
colour, appearance etc. Like tanning chemicals finishing chemical also get discharged into
wastewater. Only the chemicals that are fully retained are applied as surface coating. A
large amount of water is used in the whole manufacturing process. In tanning process
water is used as carrier to facilitate different chemical reactions and after completion of the
process the water leaves the system as wastewater in the same quantity as added to the
system (Chumba & W, 2017). Ground water is mainly used as processing water.
Equipment’s and machineries
Equipment’s in an industry are usually the largest capital investment that offers
opportunities for continuous improvement throughout the manufacturing operations cycle
(IndustrGroup, 2015). Machines used in tanneries like Sagana tanneries include: soaking
pits, liming drums, chrome tanning drums, fleshers, shavers, toggling, staking machine,
buffers, plating machine, roller coater, measuring, ironing, and spraying, summing and
vacuum and overhead conveyor for drying the skins (Chumba & W, 2017). In Africa, most
tanning is done in tanneries using modern techniques compared to few cases where
traditional techniques are used. However, most of the tanneries were established with
imported reconditioned equipment and there has been little subsequent investment in
modern equipment and technology (UNIDO G. , 2002). Equipment’s are an example of
internal factors that affect productivity and be controlled in a short run. According to

18
(Teklemariam, 2004), equipment productivity can be improved by good maintenance,
operating the equipment in optimum process condition, reducing idle time, eliminating
bottle-necks and effective use of available machines and plant capacity. The author still
argues that, leather industries being a producer of perishable products that degrade unless
continually processed, its productivity is highly dependent on its equipment. Productivity
of equipment is usually affected by the volume, variety and period of operating the fixed
capital. The age of equipment, quality and its degree of sophistication weighs heavily in
any measure of manufacturing plants productivity (Hubert & Bailey, 1980). In most
manufacturing industries machine utilization may be less due to poor planning and
machine breakdowns (Teklemariam, 2004).To ensure equipment effectiveness, quality is
used as a key measurement factor. Improving quality means minimizing waste and
defective products hence increasing productivity. Production equipment begin to
deteriorate as soon as they are commissioned hence leading to downtimes, quality
problems, slower production rate, safety hazards, all these tend to have a negative impact
on profitability, customer satisfaction, productivity among others (Muchiri P. , Pintelon,
Martin, & De Meyer, 2010). (United States Patent No. US 20040148047A1/
PCT/US01/49332, 2001)Identifies productivity analysis at the equipment level to follow a
Unit Production Process (UPP) concept which identifies four performance metrics that
contributes to unit productivity. The metrics are: Overall Equipment Effectiveness (OEE),
output of good product (throughput), Cycle Time Effectiveness (CTE) and equipment level
inventory (work in process) these metrics provide a basis for conducting a root cause
analysis to understand the various manufacturing productivity problems and hence help in
making productivity improvements for equipment’s.
2.1.2 Productivity challenges in leather industries
(Levary, 1991) and (Stevenson, Operations Management, 2009) defined productivity as the
measure of the effective use of resources which gives the average measure of the
efficiency of a production system and it is a key factor for organisations to remain
competitive in the market.
In the leather industry, the effective use of resources may be affected by a number of
factors which may pose challenges to their achieving higher productivity levels. Obsolete
equipment, low levels of training, a badly organised workflow, frequent lack of spares and
tanning chemicals are factors that contribute to low levels of productivity in the leather

19
industry (UNIDO G. , 2002).Lack of appropriate equipment maintenance management
systems as cited in the Ethiopian leather industries by (Teklemariam, 2004), this means the
availability of equipments is not maximized hence affect productivity of the organisation.
Low operational capacity due to high, expensive and intensive capital requirement is a
challenge faced by majority of the Kenyan leather industry as cited by (Mwinyihija M. ,
2014). Effluent treatment facilities, supply of quality raw materials , research and
development of new technologies are factors that pose a challenge in the leather industry
according to a report by (UNIDO, 2010). Other than quality of local raw hides, the size of
the hides have been waning over time especially in the Kenyan industry, where current
average size of a hide is 25 sq.ft from an average of 30 sq.ft in 2005 This affects the
competitivenes of the kenyan leather which in turn affects the productivity of the industry
(World, Bank, & Group, 2015). The Kenyan leather industry lacks equipment, technology,
awareness and knowledge to produce quality hides and skin as well as finished leather
products which as further been curtailed by insufficient funding, investment and incentives
from the industry. Other challenges that affect the leather industry especially in Kenya
include: lack of policy framework to govern the leather industry,little coordination between
key institutions, lack of skills, high costs of production, lack of machinery,high electricity
cost and tarrif on importing inputs and lack of quality enforcemnts (World, Bank, &
Group, 2015) (Botho, 2004).
2.2. Productivity concepts
Productivity refers to the effectiveness of working, not its intensity. Productivity is usually
expressed as a ratio of output to input (Stevenson, Operations Management, 2009).
Productivity is very vital for all business organisations that use a low-cost strategy.
Therefore, productivity ratios are used to plan work force requirements, scheduling
equipment’s and all the important task in a business. Hence for all profit-making
organisations productivity helps determine how competitive the organisation is. Hence to
determine the productivity growth, we evaluate the increase in productivity from one
period to another, relative to the productivity in the preceding period.

20
Productivity growth = (current productivity− previous productivity)
(previous productivity)∗ 100
Hence, productivity of an organisation represents the overall efficiency of the system,
which indicates how well a system is executing against its objectives and goals (Ahuja,
2006)
Generally, productivity growth plays a key factor in a country’s inflation rate and standards
of living of people. For companies, higher productivity relative to their competitors gives
them a competitive advantage in the market place. According to (Gupta & Vardhan, 2016)
productivity is a widely used manufacturing performance measure which is essential in
managing production improvements.
2.2.1Types of productivity
Productivity can be broadly classified in several ways which may include human resource
or capital resource. Capital based productivity includes machinery maintenance
management and technological advancement. Maintenance being a technical field, tries to
maximise the performance of machinery and prolong the life of capital equipment,
enabling maximum utilization of equipment and high rate of return on investment.
Maintenance is related to profitability through equipment output and running cost. Hence
proper maintenance should decrease sudden breakdowns and increase the revenue of the
plant by increasing production output (Teklemariam, 2004)
Productivity can also be the ratio of output value to the input value, which is expressed as
in the equation below (John , 1993)
𝑃𝑟𝑜𝑑𝑢𝑐𝑡𝑖𝑣𝑖𝑡𝑦 = 𝑜𝑢𝑡𝑝𝑢𝑡 𝑣𝑎𝑙𝑢𝑒
𝑖𝑛𝑝𝑢𝑡 𝑣𝑎𝑙𝑢𝑒
From the equation we can see that productivity rises keeping everything else constant
,when the value of output increases ,the quality of output increases and the cost of
resources (input) utilized decreases.
According to (Teklemariam, 2004) productivity is linked with how the resources are
utilized in the company.This is the function of achieving the maximum possible with
minimum resource. The resources are manpower, material, equipment, spares and building,
capital and time.Where the responsibility of achieving higher productivity rests on

21
managing these resources efficiently. Productivity growth comes from working smarter,
this means adopting new technonologies or new techniques for production.
Since one function of productivity is time, we can define productivity as the relationship
between result and the time it takes to accomlpish them. Time is a good demonstrator as it
is a universal measure which is beyond human control. The system is deemed productive if
it takes less time to achieve the desired results.
2.2.2 Productivity measurements
Productivity is a critical issue in the long –term competitiveness and productivity of an
organisation (Spring, 2011).Productivity measurements in any organisations are
cumulative measures, and they serve as a score card of the effective use of resources and is
basically used to judge the performance of the entire industry or track the performance
over time (Stevenson, Operations Management, 2009). Hence productivity measurement is
criterion for productivity improvement (Spring, 2011). According to (Ahuja, 2006)a good
productivity measurement model under systems concept should:
• Reflect how well a system is doing with reference to its performance objectives
• Consider all outputs of the system
• Consider all the resources consumed in the process to achieve output
• Provide information as to deployment and reallocation of resources to obtain
productivity
• Reorganise the relative importance of each objective in case of a multi-performance
objectives
• Make available and comprehensible the data to be used.
To calculate productivity, ( (Mark & White, 2004)), it’s vital to define and measure the
inputs and the outputs of the process. Productivity can also refer to total factor productivity
which is a productivity measure which involves all factors of production (Afriat, 1972).
Productivity measures are based on a single input (partial productivity), on more than one
input (multi factor productivity), or on all inputs (total productivity) (Stevenson W. J.,
2009). The choice of productivity measure depends on primarily the purpose of the
measurement. Partial measures are commonly used in operations management. Types of
productivity measures are:
𝑃𝑎𝑟𝑡𝑖𝑎𝑙 𝑚𝑒𝑎𝑠𝑢𝑟𝑒𝑠 = 𝑜𝑢𝑡𝑝𝑢𝑡
𝑙𝑎𝑏𝑜𝑢𝑟 ,
𝑜𝑢𝑡𝑝𝑢𝑡
𝑚𝑎𝑐ℎ𝑖𝑛𝑒,𝑜𝑢𝑡𝑝𝑢𝑡
𝑐𝑎𝑝𝑖𝑡𝑎𝑙

22
𝑀𝑢𝑙𝑡𝑖𝑓𝑎𝑐𝑡𝑜𝑟 𝑚𝑒𝑎𝑠𝑢𝑟𝑒𝑠
= 𝑜𝑢𝑡𝑝𝑢𝑡
(𝑙𝑎𝑏𝑜𝑢𝑟 + 𝑚𝑎𝑐ℎ𝑖𝑛𝑒),,
𝑜𝑢𝑡𝑝𝑢𝑡
(𝑙𝑎𝑏𝑜𝑢𝑟 + 𝑐𝑎𝑝𝑖𝑡𝑎𝑙 + 𝑒𝑛𝑒𝑟𝑔𝑦)
𝑇𝑜𝑡𝑎𝑙 𝑚𝑒𝑎𝑠𝑢𝑟𝑒 = 𝑡𝑜𝑡𝑎𝑙 𝑔𝑜𝑜𝑑𝑠 𝑝𝑟𝑜𝑑𝑢𝑐𝑒𝑑
𝑎𝑙𝑙 𝑖𝑛𝑝𝑢𝑡𝑠 𝑢𝑠𝑒𝑑 𝑡𝑜 𝑝𝑟𝑜𝑑𝑢𝑐𝑒 𝑡ℎ𝑒𝑚
Partial productivity measures include:
• Labour productivity- units of output per labour hour
• Machine productivity- units of output per machine hour
• Capital productivity –units of output per dollar input
• Energy productivity – units of output per kilowatt-hour
Productivity indicators includes labour productivity and capital productivity and they
measure the effectiveness and efficiency of the production process i.e. input into output
(Spring, 2011). In the leather industry productivity parameters are not exhaustive but may
include (Buljan & Kral, 2012):
• Raw material input tonnes per day, month, week, or year
• Rate of capacity utilization in term of actual work- hours of individual machine vs.
work-hours theoretically possible or target set;𝑡𝑜𝑛𝑛𝑒
𝑤𝑜𝑟𝑘−ℎ𝑜𝑢𝑟,
𝑤𝑜𝑟𝑘−ℎ𝑜𝑢𝑟𝑠
,𝑤𝑜𝑟𝑘−ℎ𝑜𝑢𝑟𝑠∗ 100
• Rate of capacity utilization in term of actual input/output vs. theoretically possible
and or target set;𝑡𝑜𝑛𝑛𝑒
𝑡𝑜𝑛𝑛𝑒∗ 100
• Tan yard output, finished leather output – per day/week/monthly 𝑡𝑜𝑛𝑛𝑒 𝑜𝑟(𝑚2)
𝑤𝑜𝑟𝑘𝑒𝑟 𝑜𝑟 𝑤𝑜𝑟𝑘 ℎ𝑜𝑢𝑟
2.3 Productivity levels Key Performance Indicators
Productivity may be affected by several factors such as methods used, capital, technology
and a management, equipment breakdowns, shortage of materials (raw) etc (Akrani, 2013).
Key performance indicators of productivity in a manufacturing set up may include:
2.3.1 Overall Equipment Effectiveness (OEE)
OEE is a quantitative metric for measuring productivity of individual equipment in a
factory under a total productive maintenance (TPM) a concept by Nakajima (1988)
(Muchiri & Pintelon, 2008). The author’s points out that OEE categorises the major losses
or the reasons for poor performance and provides the basis for setting improvement
priorities and hence the beginning of root cause analysis. OEE measures the percentage of

23
planned production time that is truly productive (Itasca, 2016).The OEE measure is a
popular method of judging the effectiveness of capacity that incorporates concept of
capacity reduction (leakage) (Nigel, Stuart, Robert, & Alan, 2009). It’s based on three
aspects of performance: time (which equipment is available), speed (throughput rate of the
equipment) and quality of the product or services it produces.
𝑂𝐸𝐸 = 𝐴 × 𝑃 × 𝑄 where, A is the availability rate, P is the performance (speed) rate and
Q is the quality rate.
OEE is useful both as a benchmark and a baseline (Itasca, 2016). Where, as a benchmark it
relates the performance of a given production equipment compared to the industry
standards, while as a baseline it is used to track advancement over time in eliminating
waste from the production equipment. (Pomorski, 1997) describes production OEE as a
Available operating time
Availability rate
A= 𝑡𝑜𝑡𝑎𝑙 𝑜𝑝𝑒𝑟𝑎𝑡𝑖𝑛𝑔 𝑡𝑖𝑚𝑒
𝑎𝑣𝑎𝑖𝑙𝑎𝑏𝑙𝑒 𝑜𝑝𝑒𝑟𝑎𝑡𝑖𝑛𝑔 𝑡𝑖𝑚𝑒
Breakdown failure
Planning
/communication
Not worked
unplanned forecast
errors
Total operating time Availability
losses
Performance rate
P = 𝑛𝑒𝑡 𝑜𝑝𝑒𝑟𝑎𝑡𝑖𝑛𝑔 𝑡𝑖𝑚𝑒
𝑡𝑜𝑡𝑎𝑙 𝑜𝑝𝑒𝑟𝑎𝑡𝑖𝑛𝑔 𝑡𝑖𝑚𝑒
Under performing
staff
Learning losses e.g.
new staff
Technology related
delays
Speed losses Net operating
time
valuable operating
time quality losses Quality rate
Q= 𝑣𝑎𝑙𝑢𝑎𝑏𝑙𝑒 𝑜𝑝𝑒𝑟𝑎𝑡𝑖𝑛𝑔 𝑡𝑖𝑚𝑒
𝑛𝑒𝑡 𝑜𝑝𝑒𝑟𝑎𝑡𝑖𝑛𝑔 𝑡𝑖𝑚𝑒 Inspection activities
Complaint handling
Rework losses
Figure 0.2:Overall Equipment Effectiveness (OEE) (Nigel, Stuart, Robert, & Alan, 2009)

24
measurement of equipment effectiveness as long as there is work available for production.
The author also argues that, OEE measurement alone may not provide a tool which can
support an improvement program, but its power is in linking the OEE data to the
identification of the main equipment losses.
OEE has been identified as a safe and correct method of determining the real performance
of equipment (Adriana, 2013) where the indicator of Equipment Productivity OEE is the
setup time. According to (Gupta & Vardhan, 2016) OEE is an influential control tool used
to overcome production insufficiencies and operational performance constraints. The use
of OEE has been found to be gaining importance in computing the performance of
equipment production to optimise productivity (Rohaizan, Ngadiman, Omar, & Yassin,
2015). In a study by (VivekPrabhu, Karthick, & Kumar, 2014), shows that OEE is greatly
improved if the performance rate is improved.
Table 0.1: OEE major losses (Pomorski, 1997) (Exor & Data, 2017)
Major loss category OEE loss category Example of an event
Breakdowns Availability • Equipment failure
• Unplanned maintenance
• Unplanned maintenance
Adjustments and set up Availability • Equipment setup
• Raw material shortage
• Operator shortage
Minor stops/ Idling loss Performance /
Availability
• Equipment failure<10mins
• Obstruction blockages
Speed loss-low speeds
Performance • Machine idling
• Running lower than rated speed
Production rejects/ Rejects on start
up
Quality • Rework
• In process damage
According to (Sohal, Olhager, O'Neill, & Prajogo, 2010) OEE data that is collected on
equipment performance is usually a major initial point for operators to comprehend there
equipment losses and to be able to launch improvement strategies to eradicate them. (The
& Johnston, 2017) highlights the benefits of using OEE as, providing real time target to the

25
operators based on the input and equipment availability at the time. The author also
identifies the ability to comprehend the cause of loss by identifying the type of constraint
and being able to develop the improvement strategies to eliminate the loss as another
benefit of employing OEE. (Sohal, Olhager, O'Neill, & Prajogo, 2010) OEE acts as a tool
used to improve the effectiveness through the identification and elimination of waste in
support of continuous improvement in a production.
2.3.2: Cycle time Analysis
Capacity of an equipment or system is usually measured in terms of its cycle time. Cycle
time it’s the average time that the process takes between completions of units (Nigel Slack,
2009). Cycle time is a vital factor in process design; it’s one of the first things to be
calculated as it can represent the demand placed on a process and the process capacity.
(Marsudi & Shafeek, 2014) defined manufacturing cycle time to be the sum of all the
processing times of every operation a product may go through from the start to the
finishing. (Heizer & Render, 2014) described it as the time between arrival of raw material
and the dispatching of the finished product. Cycle time is therefore the amount of time
required to produce a unit and its measured in mins/pc or sec/pc (Vonderembse & Gregory,
2004) and it sets the drum beat or the pace of a process (Nigel Slack, 2009). Calculated as:
Cycle time for the process = Time available
Number of products to be processed in that time
A cycle time in manufacturing involves both the productive and non-productive time,
where (Jovanovic, Milanovic, & Djukic, 2014) describes productive time to be when a
product changes its shape or properties through a technological operation and non-
productive time is the time covered during control operations and transportation or
movements within the process. Too many non-value adding activities in a manufacturing
process results to a prolonged cycle time, which in addition leads to accumulation of Work
in Process affecting the process throughput capacity (Chen, 2013). Hence a reduction in
the manufacturing cycle time will improve the production process making it lean, will
improve the company’s competitiveness and improve the process throughput (Dossenbach,
2017) (Chen, 2013) (Heizer & Render, 2014).from cycle time analysis the following
benefiting information can be accrued: manufacturing process and capacity of a system can
be identified, cost potentials in terms of input inventories, the manufacturing equipment
technologies applied and causes of cycle losses (Jovanovic, Milanovic, & Djukic, 2014).
Cycle time analysis is accomplished by use of time study in work measurement

26
Cycle time analysis is done using a stopwatch to develop a standard time to accomplish a
given task. Standard time is the time required by a worker, operating at a normal pace to
perform a specified task using a prescribed method, with allowances for personal time,
delays and fatigue (Stevenson, Operations Management, 2009) (Vonderembse & Gregory,
2004).
During observation, the time recorded is known as the Observed time and is the average of
the recorded times and is given by:
𝑂𝑏𝑠𝑒𝑟𝑣𝑒𝑑 𝑡𝑖𝑚𝑒 =𝑆𝑢𝑚 𝑜𝑓 𝑟𝑒𝑐𝑜𝑟𝑑𝑒𝑑 𝑡𝑖𝑚𝑒𝑠(sec)
𝑛𝑢𝑚𝑏𝑒𝑟 𝑜𝑓 𝑜𝑏𝑠𝑒𝑟𝑣𝑎𝑡𝑖𝑜𝑛𝑠
From the Observed Time, Standard time can be computed,
𝑆𝑡𝑎𝑛𝑑𝑎𝑟𝑑 𝑡𝑖𝑚𝑒 = 𝑁𝑜𝑟𝑚𝑎𝑙 𝑡𝑖𝑚𝑒 × 𝐴𝑙𝑙𝑜𝑤𝑎𝑛𝑐𝑒 𝐹𝑎𝑐𝑡𝑜𝑟 , where Normal time is an
adjustment of the observed time based on operator performance, Allowance Factor
comprises of rest breaks and personal delays among others.
𝑁𝑜𝑟𝑚𝑎𝑙 𝑡𝑖𝑚𝑒 = 𝑂𝑏𝑠𝑒𝑟𝑣𝑒𝑑 𝑡𝑖𝑚𝑒 × 𝑃𝑒𝑟𝑓𝑜𝑟𝑚𝑎𝑛𝑐𝑒 𝑟𝑎𝑡𝑖𝑛𝑔
Non-productive time
Change of shape
Change of
properties
Transport
Control
A sequence of technological operations
performance
Machine breakdowns
Material shortages
Quality issues
Inadequate space
Labour losses
Manufacturing cycle time length
Foreseen process cycle time Losses-stoppages
Figure 0.3 :Manufacturing cycle time length (Stevenson, Operations Management, 2009)

27
The procedure for stopwatch time studies as given by (Stevenson W. J., 2009):
• Definition of the task to be studied
• Determination of the number off cycles to be observed
• Actual timing of the job using a stopwatch, and rating the worker’s performance
• Computation of the standard time using the formula above.
2.3.3 Throughput Process design analysis
Process design analysis encompasses calculating the specifics of the process, in particular
its objectives, order of activities, division of tasks and capacity and ability to integrate the
effects of unpredictability (Nigel Slack, 2009). Process design defines the way units flow
through an operation. Four performance objectives that are useful in the design process are:
throughput (flow) rate, throughput time, the number of units in the process (work in
process) and the utilization of process resources.
• Throughput rate (flow rate)- rate at which objects emerge from the process
• Throughput time- average elapsed time taken for inputs to move through the
process and become outputs
• Work in process- the number of units in the process
• Utilization of process resources-proportion of available time for which the sources
within the process are performing useful work.
Variability of
input arrival
Configuration of
resources and
activities
Capacity of
resources
Variability of the
activities within
the process
Throughput rate Arrival rate
Number of units in the process
Utilization of process
resources
Throughput
time
input output
Figure 0.4:Process performance objectives and process design factors (Nigel, Stuart,
Robert, & Alan, 2009)

28
The entire idea of a process design is to make sure that the performance of the process is
suitable for whatsoever it is trying to accomplish. A process performance is adjudicated in
terms of the levels of quality, speed, dependability, flexibility and cost it achieves.
Throughput analysis is crucial for the design, operation and management of a production
system with unreliable machineries (Li, Dennis, Huang, & Jeffrey, 2009).
Bottleneck Analysis: In production, a bottleneck is a resource or operation that limits
output, essentially determining the capacity of the entire process. Even marginal changes in
the capacity of a bottleneck will change the capacity of the process (Ryzin & Garrett,
2008). Bottleneck analysis aims at improving the throughput by strengthening the weakest
point in the production process.
Trend Analysis: It is a technique of looking at the behaviour and frequency of the
performance issue and determining the bottleneck or steps in identifying the bottleneck.
Performance trends can be of different types like consistent, fluctuating, increasing and
even decreasing. Trend analysis can be done on both performance metrics from the end
user (like response time) and also using the server metrics. (performancetestingfun).
Theory of Constraints (TOC): TOC mainly focuses on increasing through put to improve
productivity (Itasca, 2016). It helps in identifying the bottleneck in a process and improves
it till it is no longer the limiting factor on throughput.
2.4 Root cause analysis (RCA)
RCA is used to analyse a problem in order to get to the root cause of the problem. Its use
it’s supposed to eradicate, correct the cause and avert the problem from recurring by
pointing the counteractive measures at the root causes (Chandrakar & Kumar, 2015). RCA
refers to a collective term that describes a wide range of approaches, tools and techniques
which are used to unearth the causes of problems so that the most effective solutions can
be identified and executed (ReliabilityTeam, 2017). Root cause analysis involves three
basic questions:
• What’s the problem?
• Why did it happen?
• What will be done to prevent it from happening again.
These questions are usually answered from a four-step process of RCA which is as follows

29
1. Data collection and analysis
2. Cause charting using Cause and Effect diagram
3. Root cause identification
4. Recommendation is given on the viable corrective measure as per the root cause.
In the use of RCA, the first step involves: establishing the objectives for the root cause
analysis and selecting the necessary analysis tools (Chandrakar & Kumar, 2015).RCA
identifies causal factors using structured approaches with techniques designed to give a
focus for identifying and resolving the problems (Mahto & Kumar, 2008).
RCA ensures that a problem is truly eliminated by applying appropriate corrective action
to the “root cause” of the problem. It involves use of tools such as:
• Cause and Effect diagrams (fishbone diagrams), shows the relationship between a
given outcome and the factors that influence it (Chandrakar & Kumar, 2015),
involves four major categories, Manpower, Methods, Materials and Machinery
(Mahto & Kumar, 2008). This tool identifies possible causes of an effect and sorts
the ideas into major categories hence it is very helpful in brainstorming effects and
solutions (ASQ, 2019)
• Pareto chart which represents individual values by bars, cumulative total by line
highlighting the most important among a set of factors. According to (ASQ, 2019),
pareto charts are very useful when there are many causes and you want to focus on
significant causes or when you need to analyse the frequency of a cause.
• 5 whys (asking why five times- each time you move close to the problem source.)
(Kiran, Cijo, & Kuriakose, 2013,) (Sixsigmagroup, 2017). It’s a very basic and easy to
use
tool.
Work
s hand
in
hand
with
the
cause
and effect diagram.
Productivity
Personnel
Skills
Finance/capital
Equipment
Raw materials
Production factors
Layout
Organizational

30
2.5. Strategy for productivity improvement
To improve productivity, we must consider productivity factors. These can be classified as
internal and external respectively. Internal factors are those within the organisations
control which can include: product, equipment, technology, materials, energy, people,
organisation and management style. While external are those not controllable by the
organisation such as economic, political, and social and other infrastructure factors
(Prokopenko, 1999).
According to (Hubert & Bailey, 1980), Productivity improvement is not just doing things
better; it is doing the right thing better. Hence productivity can be improved by utilising the
resources effectively i.e. Human and Capital resources. Human resource is an important
and potential area of productivity improvement. Here productivity is achieved through high
performance with a sense of satisfaction by the people doing the work. On capital resource,
of most significant productivity improvement usually comes from saving material and
energy. This is because, poor operator practice, bad layout and inadequate storage space
aggravates problems in material handling, leading to excessive movement (Prokopenko,
1999). Improving productivity also depends on optimal choice and utilization of materials,
equipment and energy resources. (Taj & Berro, 2006) demonstrated that lean
manufacturing and constraint management together would improve productivity, efficiency
and quality in a manufacturing plant. Lean principles focused on waste elimination and
process speed while constrained management focused on increasing throughput. (Veronesi,
et al., 2014) highlighted several tactics that can be considered to help improve the
productivity of a plant which are, to reduce movements for efficiency optimization,
reduction of bottlenecks by improving scheduling, improvement of equipment reliability,
inventory levels optimization to reduce shortages and automation of the process. These
tactics were achieved by use of Lean tools such Kanban system, automation, use of
simulation models, TPM, redesigning plant layout.

31
To be competitive in the market an organisation needs to produce quality products.
Therefore, quality is one of the important factors and area of productivity improvement.
Productivity can also be improved through capital resource by maintaining the equipment
properly to make them available whenever needed. Poor planning and lack of preventive
maintenance leads to less equipment utilization, therefore, on a successful productivity
improvement dive, downtime on critical production equipment should reduce considerably.
This means the availability of machines increases and so the productivity (Teklemariam,
2004). A good productivity strategy calls for a system approach, which recognises the
inter-relationship between the elements of the system with their environment to
productivity improvement. Therefore, a productivity strategy is a pattern of decisions in an
organisation that determines the procedure, objectives and principal policies and plans for
achieving long-term productivity improvement goals (Prokopenko, 1999)
A good productivity improvement strategy should include the following according to
(Stevenson, Operations Management, 2009):
• Develop productivity measures for all operations
• Evaluate the whole system to decide which operation are crucial to ensure
effectiveness
• Develop methods for achieving productivity improvements e.g. benchmarking,
team working –develop models for excellence
• Establish reasonable goals for improvement and policies
• Consider incentives to reward workers for contributions- support by management
• Measure improvements and publicize them.
Productivity improvement in an organisation may be influenced by several improvement
criteria or Key Performance Indicators (KPI) such:
• Overall equipment effectiveness
• Flexible manufacturing systems optimization
• Production planning and control
• Operation analysis techniques for decision making
• Improved technology with capital investment (Ahuja, 2006)
Therefore, improvement can be in different forms such as elimination, correction of
ineffective processing, process simplification, system optimization, variation reduction,

32
throughput maximization, cost reduction quality improvement and set-up time
reduction (Naveen & Ramesh, 2000).
2.5.1 Lean manufacturing concept
Lean manufacturing is a management philosophy founded by Toyota Motor Company
where the main principles and practices are based and derived from Toyota Production
System(TPS) (Krishnan & Parveen, 2013).Lean manufacturing refers to a set of techniques
developed for a period of time that help in reducing production cost and increasing
productivity using less effort, lesser space, without any new inventory, better quality and
lesser defects (Dutta & Banerjee, 2014).the overall objective of Lean manufacturing is to
greatly satisfy customer needs, totally eliminate wastes and use less effort with same
production rate. (Taj & Berro, 2006) defined Lean manufacturing as manufacture without
waste. Hence describing waste to be anything other than the minimum amount of
equipment, materials, parts and the working time essential for production processes. Waste
is also defined by (Itasca, 2016) as any activity that does not add value from the customers
perspective. Hence the concept is used to reduce any waste in the production value stream.
Lean manufacturing concept is a Japanese concept where Muda means “waste”. There are
seven major waste covered in Lean manufacturing: they include overproduction waste,
stock (inventory), motion, transporting, correction, waiting (delays), over processing (Taj
& Berro, 2006), (Sanjay & NandKumar, 2007). The concept helps eliminate any redundant
processes, delete non-value-added activities, simplify motions, minimize fatigue and
reduce wait time. (Adriana, 2013) sees Lean as the set of tools that assist in the
identification and steady elimination of waste which in turn improves quality while
reducing production time and cost. Toyota Production System (TPS) identified the
production waste to include: overproduction/push system, inventory (WIP), motion,
waiting and queueing, over processing, correction, conveyance or transportation. There are
practices and parameters used to maintain the Lean manufacturing system for an
organization (Dutta & Banerjee, 2014)which are; Value stream Mapping, Single Minute
Exchange Dies, Single piece Flow, Inventory Control via Card system, 5S concept, TPM,
Production Line Optimization, Kanban (pull system) etc. Lean manufacturing becomes a
success and it’s at is best when executed throughout the organization, where everyone
takes an inventiveness and there is a deep-rooted culture of quality control (Krishnan &
Parveen, 2013). The principles of Lean manufacturing are; Identify the Value for each

33
product with reference to the final customer, Map the Value stream identifying all the
activities and disregarding any loss generating activity, Create the Flow of all the value
adding activities, Establish the Pull of each client type in the system of production flow of
the value set and Seek the Perfection by moving the streamline of the process and
repeating it till you reach an optimal level of the maximum values without loss (Dutta &
Banerjee, 2014) (Adriana, 2013). For the successful implementation employees need to be
trained to hone their latent skills and increase their awareness on latest trends and
technologies. The four main indicators of Lean production are Productivity, quality, Safety
and cost according to (Adriana, 2013). (Dutta & Banerjee, 2014)and (Gupta & Jain, 2013)
identified waste minimization and efficiency improvement as the key objectives(benefits)
of lean manufacturing system implementation, which reduces downtime, lowers lead time
and inventory levels, reduces wastage and non-value adding activities hence making it
possible to increase productivity and reduce cost. Some of the challenges that may be
encountered while implementing Lean manufacturing according to (Gupta & Jain, 2013)
may include; failure to train and educate the employees, poor attitude towards lean, lack of
responsibility and financial inadequacies.
2.5.2 Total productive maintenance (TPM)
TPM is a Japanese philosophy which is unique and has been developed on the basis of
productive maintenance concepts and methodologies. It was first introduced by Nippon
Denso Co. Ltd of Japan, a supplier of Toyota Motor Company Japan in the year 1971.
TPM is one method used to enhance productivity of a system as it maximises equipment
effectiveness (Gupta & Vardhan, 2016).TPM can be described also as an inventive method
that optimizes the effectiveness of equipment, eliminating breakdowns and encouraging
independent maintenance which is done by the operators this is according to Nakajima
(1989) who is a major contributor of TPM (Bhadury, 2000). TPM thus refers to the aspect
of keeping machines in good working condition which is affected by methodical
maintenance of equipment to ensure they fail less and the production process is continuous
(Stevenson, Operations Management, 2009). TPM is one of the very important elements in
lean manufacturing according to (Itasca, 2016) .Effective TPM approaches and programs
can manage with the active needs and support organisations in realising the unexploited
and under-utilized resources such as machine hours, man hours etc. this improves
equipment efficiency and effectiveness which leads to improvements in the production

34
process (Wakjira & Singh, 2012). TPM is based on eight pillars which are founded on 5S
principle as highlighted by (Mendez, Morales, & Rodriguez, 2017) (Gitachu, 2017)
(Venkatesh, 2015) (Wakjira & Singh, 2012) (Akrani, 2013) as follows:
1. The 5S principle foundation disregards the aspect of disorganisation, indiscipline
and inadequacy in an organisation, ensuing to a clean, visually organised workplace
which is self-maintaining (Gitachu, 2017). 5S basic steps are: Sorting (Seiri),
Setting in Order (Seiton), Shining(cleaning)(Seiso), Standardizing (Seiketsu) and
Sustaining (Self-Discipline) (Shitsuke). Hence this sets the pace for TPM
introduction in an organisation.
2. Autonomous Maintenance (Jishu Hozen), this ensures that the obligation of basic
maintenance is on the hands of the operators and the skilled staff can spend time on
more value-added activities. This eradicates unplanned disruption of equipment.
3. Planned maintenance, this refers to scheduling maintenance activities which
progressively decreases breakdowns, increasing capacity for productive activities
and the cost of production is reduced as equipment are fully exploited as the pillar
sets an optimum equipment performance level.
4. Quality maintenance, ensures that equipment is able to spot and avert errors or
defects from moving down the value chain. This pillar also ensures the workers
have the habit of determining the root causes to problems and getting a permanent
solution. Special attention is paid to characteristics that are considered important by
the customer. This is done through 5whys, RCA and Ishikawa diagrams.
5. Focused Improvement (Kobetsu Kaizen), this pillar focuses on small improvements
on continual basis and involves all people in an organization targeting to achieve
and sustain zero losses and manufacturing cost decrease by maximizing equipment
effectiveness. It’s done by interdisciplinary teams that eradicates the most typical
failures of waste in production processes eventually improving productivity by
attaining higher levels of OEE (Mendez, Morales, & Rodriguez, 2017).
6. Training and Education this pillar brings out the initial understanding of the
importance of TPM philosophy to the workers at all levels. This in turn leads to a
workforce with improved knowledge, skills and techniques creating an
environment of self-learning based on needs.

35
7. Office TPM is followed to improve productivity, efficiency and identify and
eliminate losses in the administrative function and have the whole organization
speak from the same page. This pillar leads to involvement of all people focusing
on better plant performance, utilized work areas, reduce repetitive work, inventory
levels, administrative cost, breakdowns of equipment, customer complaints and
increase in productivity of people in the support functions
8. Health Safety and Environment, this pillar focuses on creation of a safe workplace
and a surrounding that is not damaged by procedures and processes and plays an
active role in each of the other pillars on a regular basis. This eliminates any
condition deemed harmful to the well-being of the workers hence targets zero
accidents, zero health damage and zero fires hence a productive workforce.
TPM pillars should be implemented in such a way as to get the full benefit of the entire
system. TPM practices mostly are evidently implemented in the manufacturing industries
as they tend to rely more on machines and equipment that need constant maintenance to
run efficiently and effectively (Krishnan & Parveen, 2013). TPM has a number of benefits
that accrues from its implementation and hence governs its choice as a strategy for
productivity improvement. This benefits as captured by (Okpala & Onyekachi, 2016) and
(Shanmugam, Guru, & Maran, 2015) are, TPM leads to enhanced machine and equipment
efficiency and effectiveness through spot on maintenance by operators, leads to increase in
process throughput, reduction in cost of manufacturing and breakdown occurrences hence
leads to higher customer satisfaction levels resulting to competitiveness in the market.
Other benefits identified by (Shanmugam, Guru, & Maran, 2015) are indirect such as
higher employee morale levels, a neat clean organized work place and positive attitude due
to their involvement in decision making and implementing the approaches of TPM.
(Okpala & Onyekachi, 2016) also noted challenges that impend TPM implementation as
being, lack of support from the administration management, lack of knowledge on TPM,
insufficient trainings of employees, excess inventory and also some cultural orientation in
an organisation.
2.5.3 Layout design
Facility layout is the arrangement of the work space: machines, workstations and logistics
(Mark & White, 2004) (Naqvi, Fahad, Atir, Zubair, & Shehzad, 2016) and it is a compoent
of Lean manufacturing used to eliminate or reduce waste in production. Layout planning is

36
deciding the best physical arrangement of all resources within a facility, by ensuring
efficient utilization of the resources which in turn solves issues on increased product
demand, cost effective manufacturing and improved quality demands. Facility resource
arrangement can significantly affect productivity by assisting in elimination of waste this
leads to economic benefits achieved by reduction of overall material flow and lead time
(Naqvi, Fahad, Atir, Zubair, & Shehzad, 2016). A good layout design aims at minimizing
material handling in a production process, as material handling cost imparts greatly on a
plants operating cost which eventually affects its productivity according to American
Society of Mechanical Engineers. Where material handling is an art and science that deals
with movement, packaging and storing substances in a form (Jiamruangjarus & Naenna,
2016) (Tarkesh, Atighehchian, & Nookabadi, 2009). A good layout redesign of the
production system assists in reduction of transporting time and costs and all other eligible
waste, hence resulting in improvements and better performance of the system (Carlo,
Antonietta, Borgia, & Tucci, 2013). Challenge is coming up with the best layout design
analysis tool as the best is very slow and time consuming (Naqvi, Fahad, Atir, Zubair, &
Shehzad, 2016).
2.5.4: Six Sigma
Six Sigma has been defined as a methodology that improves quality by analysing data with
statistics to determine the root causes of problems in quality and implement controls using
the DMAIC process (define, measure, analysis, improve and control (Fursule, Bansod, &
Fursule, 2012). Six sigma methodologies if well implemented has been identified to reduce
machine downtime, machine setup time, inventory and in-process waste and increase in
workplace safety while upgrading organizations performance and improving quality and
productivity (Albliwi & Antony, 2013) (Hekmatpanah, Sadroddin, Shahbaz, Mokhtari, &
Fadavinia, 2008). Where the fundamental principle of six sigma is to take an organization
to an improved level of sigma capabilities through application of statistical tools and
techniques, to upgrade performance, improve quality and productivity, this applies to
common production problems. Six sigma has been described as a performance
improvement strategy which aims at reducing defects to a low of 3.4 occasions per million
opportunities, as it’s a measure of variation about the average in a process (Desai &
Shrivastava, 2008). The reduction in defects leads to productivity improvement which
translates to improvement of customer satisfaction and hence competitiveness in the

37
market (Mahesh, Ette, Pierce, & Glory Cannon, 2005). According to the author the
challenge Six Sigma faces in its implementation is it does not focus on the management or
movement of the inventories therein but on their processes, requires also active
management and employees and higher resource allocation and extensive training for the
best quality control team. Though six sigma is an improvement methodology it will not be
considered in the methodology as the case study has no major issue with the quality of
product.
2.6: Case Studies:
Productivity growth often is an indicator of expanding output and profits as well as
impending economic recovery. In most cases productivity improvements are driven by
investments in technology which in turn drive economic growth (Mark & White, 2004).
A case study by (Teklemariam, 2004) which sought to improve productivity in Ethiopian,
leather industries through efficient maintenance management by finding an optimum
balance between high maintenance cost and low machinery downtime which would
maximize the profits. This was done through analysing problems that lowered productivity
in the maintenance management system and was to suggest possible solution. The tannery
put under study was Ethiopia Tannery Share Company which was established in 1975 with
a capacity to process 17million square feet of sheep and goat skin annually and 9 million
square feet of cow hide. The tannery processes leather to finished stage with a labour force
of 800 permanent employees and 100 temporary workers. From the study maintenance is
done in two ways, when the machine breaks down (corrective maintenance) and when its
planned (preventive maintenance). It’s evident that corrective maintenance dominated the
preventive activity from the data analysed as breakdowns were more than 85% of the total
maintenance activities. This in turn led to high maintenance cost in terms of wages and
spare parts cost. From the analysis of both the quantitative and qualitative data the
bottleneck machines were identified, and the maintenance cost of those machines was
compared against the company’s profits.
From the case study the conclusion is that the major cause of breakdown is lack of skills
from the operators on maintenance. The target of the maintenance programme was zero
breakdown a strategy where equipment maintenance is key, Hence the TPM strategy was
employed to specifically play a role in equipment availability by employing equipment,
people and workplace changes and improving the equipment availability. From these a

38
maintenance program was proposed to enable efficient maintenance of the system. This
proposed programme ensured that the operators were participating and was included in the
daily equipment maintenance strategies. This is TPM strategies at work.
A study on continuous improvement in safety, quality and productivity of Crystal tannery
S.Co by (Bekele, 2013) showed that low productivity was as a result of wastages, non-
value adding activities, delays, idle times, hence a model on continuous improvement was
implemented to improve the performance based on lean tools, kaizen tools.
A study was done on a switch gear company by (Naqvi, Fahad, Atir, Zubair, & Shehzad,
2016) on productivity improvement of a manufacturing facility using SLP, with an aim of
eliminating waste hence reducing the overall material flow and lead time. A procedural
approach suitable for both quantitative and qualitative data was used for the study. From
this study all, non-value adding activities were identified and a rearrangement of some
machineries was done. With lean tools the overall material efficiency was improved
significantly as with the new model productivity of the facility was increased reducing lead
time and increased value addition. All these was possible since lean manufacturing
principle was being implemented and hence sustain global competition from the company.
From the study plant layout was able to reduce various cost of the company since the
alternatives were evaluated based on an improved accessibility and material flow
efficiency criteria.
2.7: Deductions from Literature
From the literature, productivity can be improved through various ways, but no specific
method is best it all depends with the particular organisation and the specific problem
causes. Productivity strategies cited are through TPM maintenance, layout planning,
overall equipment effectiveness, manpower and raw materials management strategies,
technology enhancement, lean manufacturing, effluent management, work study etc. from
most of the studies productivity improvement in tanneries has not been adequately
covered. On the leather tannery a case of Ethiopian leather industries on improved
maintenance systems (Teklemariam, 2004),efficient production and planning control
system (Hailemariam & Yoseph, 2015) and of Leather Company in Zimbabwe on effluent
waste reduction by using a chiller unit as part of a framework to productivity (Dandira &
Madanhire, 2013). (Singh, Garg, & Deshmukh, 2008) considered TPM to be an important
strategy for equipment productivity improvement. This can be achieved by using personnel
who are adequately trained and appropriate IT controlled process, this lead to an
39
observation that TPM firms have a significantly superior business performance than non-
TPM firms. All other strategies have been applied to other manufacturing industries.
2.8 Gaps in the literature
Most of the research done on the leather industries rotate around waste management
(Dandira & Madanhire, 2013), value addition after tanning (Mwinyihija M. , 2014)
(Hussein, 2014), efficient maintenance management a case of Ethiopian leather industries
(Teklemariam, 2004). From a report by (World, Bank, & Group, 2015) the Kenyan leather
industry faces challenges which affect its competitiveness, these challenges included: lack
of policy framework to govern the leather industry, lack of maintenance systems, little
coordination between key institutions, lack of skills, high costs of production, lack of
machinery, high electricity cost and tariff on importing inputs and lack of quality
enforcements.
From the literature is not evident how productivity in the leather tanneries has been
addressed other than through waste management, and one case on using maintenance
programs to improve an already existing PPC system. Even though there are several tools
and strategies for productivity improvement, there are scanty information on their
utilization in solving the productivity issues in the leather industries such as addressing the
situation of the existing equipment and what is making them not meet their capacity
production.
This research looks into the existing tannery equipment by analysing factors that are
contributing to their low productivity rate, and eventually developing improvement
strategies that can be used to solve the problem. The research will utilize productivity
improvement strategies/tools like Lean manufacturing, TPM strategies, OEE analysis to
address the key problems affecting Sagana tanneries and may be other tanneries on the
same capacity.

40
Chapter 3 : CHAPTER THREE
RESEARCH DESIGN AND METHODOLOGY
3.1 Introduction
This chapter deals with the selection and justification of research design, methods of data
collection and methods of data analysis.
3.2 Research design
The research design is the structure of any scientific work. It gives track and orders
the research (Blakstad, 2008)The approach used for this study was more of quantitative
than qualitative, as it involved more quantitative data generation which is analysed.
A Case study of Sagana tanneries was used to represent tanneries in Kenya. Descriptive
and exploratory research methods were used. According to (Kothari, 1990) descriptive
method is used to explore and describe the factors that affect productivity, while
exploratory method is used to produce a posteriori hypothesis by examining a data set and
identifying any potential relations between variables. In this study both primary and
secondary data sources were used. The primary source contained raw, non-interpreted and
unevaluated information, while secondary data involved annual reports and other
production records documents that could give official information related to the study.

41
A case study research design was used as it was more descriptive and ensured a detailed
study of a specific research problem rather than an all-encompassing statistical survey or
all-inclusive comparative inquiry. It was often used to thin down a very wide field of
research into one or a limited easily researchable example. The case study research design
was useful for testing whether a specific theory and model actually applies to phenomena
in the real world. It is a useful design when not much is known about an issue or
phenomenon (university of southern carolina). The design could also be described as
longitudinal as it covered 12 months period.
3.3: Data collection and analysis
The study targeted Sagana tanneries which comprises of three main section, that is, beam
house section, machining(tan-yard) section and the finishing section. In the beam house
section, the target population is the fleshing machine which was selected on a random
selection for data collection. This reduced biasness as all the elements within the
population were given an equal chance of being selected. On the machining section, the
splitting machine was selected as all the work in that section must pass through the
splitting machine, hence it enabled adequate collection of relevant information and data in
that section. On the finishing section, the plating machine was sampled as all the work in
the section must be plated before going through the various final finishing processes. The
tannery operated only on one eight-hour shift daily. Data collection methods involved
qualitative methods. Qualitative methods involved techniques such as scheduled
interviews, physical observation, discussion techniques and company documents (archival
research).
Daily data recording on equipment’s operating throughput, operating cycle time, design
capacity and design cycle time, number of defects per process and the available operating
time was obtained for the last one year between June 2016 and June 2017. This data was
used to calculate the cycle time, through-put levels and OEE for each section to determine
the eventual equipment utilisation. Daily data recording on equipment availability,
performance and quality was obtained for the past one year from the machine operation
record. In a week only five days had full operation, hence the weekly averages were taken
from the five days data for each variable. To determine the influence of the various
variables on productivity of the tannery, the variables weekly averages were subjected to
regression analysis. Primary data was collected through scheduled interviews and

42
observation which involved following some processes through for five weeks, this was
used to justify the secondary data that was obtained from the company records.
Documentary research(desktop) which involved study of journal papers, articles, reports
and other conference papers on productivity improvement strategies was used. Data
presentation has been done by use of charts and tables through the help of Microsoft excel
and SPSS.
3.4: Analysis of the productivity levels in Sagana tanneries
To analyse the productivity levels in Sagana tanneries, data was obtained for the last
twelve months on all the operation days. The data recorded on the data sheet included,
daily records on the time each operation began, downtime due to machine breakdown,
power failures, blades/knifes adjustments delays, material shortage, process cycle time,
available production time, number of defects, process throughput and process cycle
capacity. This data was collected through observation by following some process for a
period of five weeks to justify the secondary data obtained from processing records,
manufacturers records and from scheduled interview with the company manager and
production supervisor. The following methodologies were used in analysing the
productivity levels in Sagana tanneries.
3.4.1: Equipment utilization
Equipment utilization is usually defined as the percentage of total operating time during
which the equipment is in production (production time) (Hibband, et al., 2011) where
production is not prevented by equipment breakdowns, set up delays or scheduled
downtimes. To determine the equipment utilization, the data recorded included the
production time for each batch per equipment against the total available plant operating
time, the formula below was used;
𝐸𝑞𝑢𝑖𝑝𝑚𝑒𝑛𝑡 𝑢𝑡𝑖𝑙𝑖𝑧𝑎𝑡𝑖𝑜𝑛 =𝑃𝑟𝑜𝑑𝑢𝑐𝑡𝑖𝑜𝑛 𝑡𝑖𝑚𝑒
𝑇𝑜𝑡𝑎𝑙 𝑎𝑣𝑎𝑖𝑙𝑎𝑏𝑙𝑒 𝑡𝑖𝑚𝑒𝑥 100
Equipment utilization rate was analysed against the potential equipment utilization rate as
per the plant capacity which is given as 400000 sq. ft/month. Equipment utilization was
further analysed and determined through calculation of the Overall Equipment
Effectiveness (OEE).

43
3.4.2: Overall Equipment Effectiveness (OEE)
Overall Equipment Effectiveness (OEE) is a key measure of productivity in a
manufacturing/ processing plant and its used for process improvements. To determine the
equipment productivity levels, the OEE of the equipment’s was calculated and compared
with the ideal world standards. To determine the OEE of any machine the OEE factors
were calculated using the formulas:
𝐴𝑣𝑎𝑖𝑙𝑎𝑏𝑖𝑙𝑖𝑡𝑦(𝐴) =(𝑇𝑜𝑡𝑎𝑙 𝐴𝑣𝑎𝑖𝑙𝑎𝑏𝑙𝑒 𝑡𝑖𝑚𝑒 − 𝐷𝑜𝑤𝑛𝑡𝑖𝑚𝑒)
𝑇𝑜𝑡𝑎𝑙 𝐴𝑣𝑎𝑖𝑙𝑎𝑏𝑙𝑒 𝑡𝑖𝑚𝑒 × 100
𝑃𝑒𝑟𝑓𝑜𝑟𝑚𝑎𝑛𝑐𝑒 𝑟𝑎𝑡𝑒(𝑃) =(𝑖𝑑𝑒𝑎𝑙 𝑐𝑦𝑐𝑙𝑒 𝑡𝑖𝑚𝑒 × 𝑜𝑢𝑡𝑝𝑢𝑡)
𝐷𝑒𝑠𝑖𝑔𝑛 𝑝𝑟𝑜𝑑𝑢𝑐𝑡𝑖𝑜𝑛 𝑡𝑖𝑚𝑒 × 100
𝑄𝑢𝑎𝑙𝑖𝑡𝑦 𝑟𝑎𝑡𝑒(𝑄) = (𝑖𝑛𝑝𝑢𝑡 − 𝑅𝑒𝑗𝑒𝑐𝑡𝑠)
𝑖𝑛𝑝𝑢𝑡 × 100
𝑂𝐸𝐸 = 𝐴 𝑥 𝑃 𝑥 𝑄
The data used in the analysis was obtained from company records for 12 months and from
interviews from the company production manager and the production supervisor, and
primary data collected through observation for five weeks. The company’s working days
are 5days in a week, and the operators worked on one shift of 8 hours per day and the data
analysed was for a period of one-year i.e. 12 months.
The OEE analysis was done on the three key sections of the tannery i.e. the beam house,
the machine (tan yard) sections and the finishing section. The key equipment’s on those
section was highlighted as every product in that section must pass through those machines
to their subsequent processes.
3.4.3: Cycle time analysis
Cycle time analysis involved determining the total time taken by a batch of hides to go
through all the processes of production. It included the processing times, waiting times and
material handling times. Cycle time analysis will help get information on the
manufacturing capacity and process of the system, technologies applied and manufacturing
equipment used, volumes of production and causes of cycle losses. Sagana leather tannery
has a combination of long-cycle processes and short-cycle processes. Time studies were
performed for the processes which are highly repetitive and have relatively short cycle
times. A stop watch was used to collect data for process times of each process. The

44
observed time for each process was determined by taking the average of ten observations.
From this, the normal time and standard time was obtained as follows:
𝑂𝑏𝑠𝑒𝑟𝑣𝑒𝑑 𝑡𝑖𝑚𝑒 =𝑆𝑢𝑚 𝑜𝑓 𝑟𝑒𝑐𝑜𝑟𝑑𝑒𝑑 𝑡𝑖𝑚𝑒𝑠(sec)
𝑛𝑢𝑚𝑏𝑒𝑟 𝑜𝑓 𝑜𝑏𝑠𝑒𝑟𝑣𝑎𝑡𝑖𝑜𝑛𝑠
𝑁𝑜𝑟𝑚𝑎𝑙 𝑇𝑖𝑚𝑒 (𝑁𝑇) = 𝑂𝑏𝑠𝑒𝑟𝑣𝑒𝑑 𝑇𝑖𝑚𝑒 × 𝐴𝑣𝑒𝑟𝑎𝑔𝑒 𝑝𝑒𝑟𝑓𝑜𝑟𝑚𝑎𝑛𝑐𝑒 𝑅𝑎𝑡𝑖𝑛𝑔
𝑆𝑡𝑎𝑛𝑑𝑎𝑟𝑑 𝑇𝑖𝑚𝑒 =𝑁𝑜𝑟𝑚𝑎𝑙 𝑇𝑖𝑚𝑒
(1 − 𝑎𝑙𝑙𝑜𝑤𝑎𝑛𝑐𝑒𝑠)
Where allowances included personal needs, unavoidable delays and basic fatigue, all
expressed in percentages.
The process times for long-cycle processes were obtained through interviews. The times
taken for various material handling activities were obtained by timing using stop watch.
The times for any other activity was estimated through observation. All these were
recorded in a precedence diagram and added up to obtain the total manufacturing cycle
time.
3.4.4: Throughput analysis
Throughput analysis established if the company’s actual throughput rate was in line with
the rated throughput rate of 400,000 sq. ft. per month. Below is the procedure that was
followed during throughput analysis:
1. Production records were examined for a period of one year. The data for quantity of
each product produced per month in a period of one year was collected and
recorded.
2. Based on the above data, the total production per month was computed.
3. A graph was drawn to show the deviation of the actual throughput rate from the
targeted capacity.
4. Productivity analysis, specifically for labour productivity was performed to
determine the extent of labour utilization at Sagana tanneries. Labour productivity
was calculated as follows:
𝐿𝑎𝑏𝑜𝑢𝑟 𝑝𝑟𝑜𝑑𝑢𝑐𝑡𝑖𝑣𝑖𝑡𝑦 = 𝐿𝑒𝑎𝑡ℎ𝑒𝑟 𝑝𝑟𝑜𝑑𝑢𝑐𝑒𝑑 (𝑖𝑛 𝑠𝑞. 𝑓𝑡)/𝑚𝑎𝑛ℎ𝑜𝑢𝑟𝑠
The data collected for the 12 months’ period is as tabulated in the Table3.1. From the data
in the table 3.1, Sagana tanneries operated far below the expected capacity of the plant
during the study period of July 2016 to June 2017. The plant operated at an average of
43.4% of the expected capacity of 400,000 sq. ft./month.

45
From Table 3.1, it can be seen that the plant actual production capacity is below the
theoretical expected capacity for the period under study with an average production of
43.4% of the theoretical capacity.

46
Table 0.1: Sagana tannery monthly production throughput. Source: STL
Product Quantity
(sq. ft)
Jul-16 Aug-16 Sep-16 Oct-16 Nov-16 Dec-16 Jan-17 Feb-17 Mar-17 Apr-17 May-17 Jun-17 Total
Wet-blue 166768.3 177743.5 49662.1 113141.8 81780.2 150099.8 156326.9 125613 68601.8 90202 138971.6 203750.1 1492593.2
Pull-up 3774 1338.75 7172.742 9587.507 7167.99 14500.25 5965.99 10158.76 7550.24 628.252 3679.75 3974.75 75498.981
Silka 3758 6099.5 6442.745 2847.99 7246.76 10888.25 8738.26 11467.25 4623.25 2508.5 1354.5 5332.75 71307.755
Linings 1226.5 2740.76 1306.246 2140.25 1855.75 921.5 2947.75 742.75 2702.25 265.51 3240.51 1051.99 21141.766
Hair-on 25.5 532.75 898.501 1548.258 0 540.01 244.75 783.5 941.26 450.5 1812.74 277.75 8055.519
Upholstery 1072.26 116.5 935 2905.99 1199.25 625.24 0 552.76 523.01 215.75 0 659.75 8805.51
Suede 67.51 518.99 586.007 0 585.24 0 112.51 0 54.99 0 0 15.25 1940.497
Kips 24432.5 20392.76 22608.74 33918.76 21514.25 27027.99 23159.25 24577.26 16604 5923 15223.99 21417.25 256799.75
Gloving 6392 3865.8 8690.4 10052.1 9006.6 11391.7 7969.6 5105.1 7480 7228.4 5661 5967 88809.7
Splits 2892.24 274.5 3507.75 2592.5 4222.75 3279.99 1611.01 2550.26 2804.25 1350.5 1264.75 1152.5 27503
Total
production
output
210408.8 213623.8 101810.2 178735.2 134578.8 219274.7 207076 181550.6 111885.1 108772.4 171208.8 243599.1 2052456
Design
capacity 400,000 400000 400000
%
production
capacity
52.6 53.4 25.5 44.7 33.6 54.8 51.8 45.4 27.9 27.2 42.8 60.9 43.4
Productivity
(sq.ft/hr) 50.58 51.35 24.5 42.97 32.35 52.71 49.8 43.64 26.9 26.1 41.16 58.6 41.12

47
3.5: Root Cause Analysis for productivity losses in STL
To determine the factors affecting productivity in Sagana tanneries, the following data was
collected and recorded on the data sheets: OEE factors rate, downtime, throughput, man
hours, Scheduled production attainment, WIP inventory, capacity utilization, production
cycle time, number of rejects and rework. From the analysis of this data it was possible to
determine the impact of equipment availability and performance on productivity or the
relationship that exist between the dependent and independent variables in consideration,
(the degree of variation between the variables). This was done through correlation matrix
and regression analysis using SPSS software. The regression analysis helps in identifying
the type of model fit that exist between the variables. From this the main causes of low
productivity in Sagana tanneries was identified.
From factors such as equipment availability and equipment performance, the Root causes
of equipment unavailability and poor performance were identified and recorded. These
possible causal factors were tested using Cause and Effect diagram, the Pareto chart and
the 5-Ws, and the root causes were finally determined. The cause and effect diagram, the
pareto chart and the 5-Ws are tools in Root-cause analysis to help identify the possible root
causes of a problem. According to (Chandrakar & Kumar, 2015) a root cause analysis
involved: Identification of the objective, Changes to procedure, Changes to operation,
Training of staff, Design modification and Verification that new equipment/solution is free
from defects. There are four main steps involved:
1. Data collection
2. Cause charting
3. Root cause identification
4. Recommendation
3.5.1: Cause and Effect diagram (Cause charting)
It’s a graphical illustration of the relationship between a given outcome and all its
influencing factors (Chandrakar & Kumar, 2015). For Sagana tanneries, from the data
obtained from the company, the causes or factors influencing equipment availability and
performance was summarised and presented in a cause and effect diagram to show the
relationship of the outcome which is low productivity and the factors thought to influence
it.

48
3.5.2: Pareto chart (Root cause identification)
In RCA, after cause charting, the root cause of the given outcome was determined by
constructing a pareto chart showing the frequency of occurrences of each of the causes of
equipment poor performance and unavailability. Pareto chart helped separate the vital few
from the trivial many. This was based on the 80-20 Pareto principle which states that 80%
of the problems come from 20% of the causes, hence one can focus on a few vital factors
in a production process.
3.5.3: Five whys (Why-Why analysis)
This is another RCA tool used mostly when the real cause of a situation is not clear
(Chandrakar & Kumar, 2015). It’s one of the simplest investigation tools which is easily
completed with no statistical analysis, which requires a thorough understanding of what
happened (Mahto & Kumar, 2008) and it’s considered a brainstorming methodology of
asking ‘why’ five times repeatedly to help arrive at root cause of a situation.
In the Sagana tanneries case study, the tool was used to help identify any unanswered
question and information gap that was present and causing poor performance and
unavailability of the equipment. The information gathered for this process was through
interviews with those directly and indirectly involved in the production process and direct
observation of the production process. This involved asking questions to the production
manager, production supervisor, operators and the maintenance staff.
The Why-Why analysis was used to investigate the root cause of frequent equipment
breakdown and low speeds in Sagana tanneries. It involved asking ‘why’ questions
repeatedly till a conclusion was reached as in the following steps:
a) Why frequent equipment breakdown?
• Some parts keep on failing almost every time
b) Why fails every time?
• Because they are only repaired when they stop working or fail
c) Why repair only when they fail?
• Because there is no maintenance program
• No spare parts available
d) Why is there no maintenance programme and no spare parts?
• Only one person is trained to repair and maintain

49
• Most machines are very old
e) Why only one person trained and machines too old?
• Company policies and financial implications.
Why-Why analysis on low speeds causal factors;
a) Why low speeds of performance?
• Slow material transfer between processes
b) Why slow material transfer between processes?
• The material handling transfer method is manual and it takes few pieces at a
time
• Material may delay in one process, holding up other processes
c) Why delay in one process?
• Machine breakdowns and failures which results to process bottlenecks like
in the drying section
d) Why machine breakdowns and failure?
• No maintenance programs and spare parts available
From the analysis it’s evident from the two scenarios that lack of proper maintenance
program, has led to the frequent machine breakdowns, which contributes to low operating
speeds and continuous machine failure.
3.6. Experimental design
3.6.1: Proposed strategies for productivity improvement
To develop productivity strategies which are viable for the productivity improvement in
the tannery context analysis technique was used. Context analysis is a method used to
analyse the environment which an organisation operates in to ensure that any strategy
being implemented is informed by all the contextual factors that might affect its
implementation and sustainability (Vascellari, 2014). From the context analysis principle,
the entire environment that is both external and internal was considered and this helped in
analysing using SWOT analysis on the strengths and benefits of the suggested strategies to
the tannery. The information used to guide on strategy development was obtained from the
company records, observation, interviews with production manager and supervisor,
literature review and journals.

50
A). LEAN
Lean manufacturing as a concept refers to a set of techniques developed for a period of
time that help in reducing production cost and increasing productivity using less effort,
lesser space, without any new inventory, better quality and lesser defects (Dutta &
Banerjee, 2014).the overall objective of Lean manufacturing is to greatly satisfy customer
needs, totally eliminate wastes and use less effort with same production rate. (Taj & Berro,
2006). There are seven major waste covered in Lean manufacturing: they include
overproduction waste, stock (inventory), motion, waiting and queueing, transporting,
correction, waiting (delays), over processing (Taj & Berro, 2006) (Sanjay & NandKumar,
2007).
To implement principles of Lean in manufacturing in STL the process will involve the
following steps (Wright, 2017) (LeanGroup, 2018):
1. Forming a team of dedicated workers
2. Develop an open communication channel for all stakeholders
3. Train all employees on lean objectives, standard operating procedures, and the
waste to be eliminated in system.
4. Analyse the current state of facility and state of lean
5. Sensitize on the foundations of lean which is workplace organization through 5-S
6. Identify and specify the Value for each product with reference to the final
customer,
7. Map the Value stream identifying all the activities of each product and eliminating
any loss generating activity this will involve all the steps required to take a product
from raw materials to delivering the final product- determine the waste across the
entire system
8. Determine the takt /cycle time on all the processes and equipment’s
9. Determine the losses on all processes and equipment’s by OEE
10. Line balance by levelling the load through takt time or OEE
11. Reduce cycle time by pushing set up times down can use SMED (Single minute
exchange of die)
12. Create the Flow of all the value adding activities in an ordered way, without delays
or interruptions.

51
13. Establish the Pull of each client type in the system of production flow – a customer
can pull a product as needed hence no inventory by utilizing Kanban
14. Analyse quality at each source of application
15. Implement error proofing (Poka yoke) by doing it right the first time.
16. Seek the Perfection by moving the streamline of the process and repeating it till you
reach an optimal level of the maximum values without loss after the value was
specified, value creating activities identified, loss eliminated, flow of value set and
introduced- use Kaizen (Dutta & Banerjee, 2014) (Adriana, 2013).
17. All in all, building a culture of stopping to fix problems by introducing TPM
throughout the lean process.
18. For the successful implementation employees need to be trained to hone their latent
skills and increase their awareness on latest trends and technologies.
The four main indicators of Lean production are Productivity, quality, Safety and cost
according to (Adriana, 2013). (Dutta & Banerjee, 2014) identified waste minimization and
efficiency improvement as the key objectives of lean manufacturing system
implementation, which reduces downtime, wastage and non-value adding activities hence
making it possible to increase productivity. With good training and positive attitude from
the workers, financial support and proper communication support from the management,
the lean manufacturing philosophies can be implemented.
B). TPM
TPM as a strategy will be based on its 8 pillars. According to (McKone, Schroeder, & Cua,
1999) if TPM is well established it provides dependable equipment’s, while reducing the
number of production losses and increasing plant capacity by providing effective
maintenance of equipment’s. Based on the data gathered and recorded TPM will involve
the following framework in order to reduce waste and increase equipment availability
hence improving the productivity in STL based on its 8 pillars.
1. Start by announcing intention to start TPM and setting a project team
2. Educate every employee on TPM benefits, activities and importance of their
participation
3. Ensure the right organisation structures are in place to sustain TPM activities
should be linear

52
4. Establish TPM policies and quantifiable goals should be SMART
5. Outline a detailed plan of resources required
6. Classify equipment according to their history and performance analysis by
collecting the necessary historical data on performance rates, breakdowns,
maintenance, replacements
7. Educate the team on what is OEE and how to perform Calculation
8. Measure and asses the six big losses in Equipment’s and set priorities
9. Analyse the condition of each sampled equipment and document
10. Inspect and clean each component of the equipment and record the details for any
disorder
11. Conduct a planned refurbishment for any disorder in step 10 above and introduce
visual devices such as poka yoke and implement any set up time reduction
techniques such as a quick change over through SMED
12. Developing an autonomous maintenance program for operators e.g. daily
inspections, lubrications, simple repairs etc
13. Develops standard operating procedures and routines for each equipment
14. From the measured OEE, we use the 5 whys to create and develop a preventive
maintenance program schedule on each equipment
15. Have smaller groups of employees to work as a team for continuous improvement

53
3.7: Framework of the work carried out
Table 0.2: Methodology framework
Objective Data collected Data collection
tools
Methodology Expected
Results
Productivity
analysis
-design capacity
-operating capacity
-design cycle time
-operating cycle time
-output levels
-number of defects
-observation
-interview
schedules
-company
documents
-Overall
Equipment
Effectiveness
-throughput
-cycle time
-Percentage
capacity level
-equipment
availability
-quality levels
-productivity
levels
Root Cause
Analysis
-downtime time
-throughput
-WIP inventory
-capacity utilization
-OEE
-Scheduled production
attainment
-man hours
-amount of rework
-no. of rejects
-production cycle time
-observation
-company
records
-pareto chart
-Ishikawa
diagram
-Regression/
Correlation
matrix
analysis
-5-Ws
- KPIs rating
-
Strategies for
productivity
improvement.
-Safety,
-inventory level
- quality,
-overall equipment
efficiency (OEE)
- literature
review
-company
records
-interview
schedules
-observation
-interviews
-Lean
Manufacturing
-TPM
-layout re-
design
-Relative
contribution of
strategies to
productivity
improvement

54
Chapter 4 : CHAPTER FOUR
RESULTS AND DISCUSSION
4.1: Introduction
In this chapter analysis was done for both quantitative and qualitative data. Cycle time,
throughput rate and OEE factors has been used to determine the actual equipment
utilisation and compare it with the design capacity. Correlational and regression analysis
have been used to determine the impacts of the independent variables on the dependent
variable to generate a conclusion. RCA tools such as Pareto charts and why-why
techniques have been used to analyse the causes of low productivity and highlight the vital
few causes of the major problems.
4.2: Analysis of the Productivity levels at STL:
To analyse the productivity levels at Sagana Tanneries Limited analysis was done on
Equipment utilization, Production cycle time, OEE and Process throughput. The data used
in the analysis was obtained from company records for 12 months and from interviews
from the company production manager and the production supervisor, and primary data
collected through observation for five weeks.
The company works 5days in a week, and the operators works on one shift of 8 hours per
day and the data analysed is for a period of one-year i.e. 12 months. The analysis was done
on the three key sections of the tannery i.e. the Beam house, the machine (tan yard)
sections and the finishing section. The key equipment’s on those section was highlighted as
every product in that section must pass through those machines to their subsequent
processes.
4.2.1: Equipment utilization levels
To determine the equipment utilization the record on equipment’s production time in a
month and the total available time were taken into consideration using the formula below:
𝐸𝑞𝑢𝑖𝑝𝑚𝑒𝑛𝑡 𝑢𝑡𝑖𝑙𝑖𝑧𝑎𝑡𝑖𝑜𝑛 =𝑃𝑟𝑜𝑑𝑢𝑐𝑡𝑖𝑜𝑛 𝑡𝑖𝑚𝑒
𝑇𝑜𝑡𝑎𝑙 𝑎𝑣𝑎𝑖𝑙𝑎𝑏𝑙𝑒 𝑡𝑖𝑚𝑒𝑥 100
From the data collected the equipment utilization rates for the 12 months was analysed as
on the Table: 4.1. the utilization is analysed based on the factory production benchmark
capacity of 400,000 sq. ft/month. From the table it’s evident that the potential equipment

55
utilization rate(availability) from the factory benchmark is calculated at 99.9% based on
the scheduled operating time and the plant operating time. However, the actual calculated
equipment utilization in the 12 months is seen to average at 27%, 13% and 52% in the
three tannery sections respectively.
Table 0.1: Equipment utilization
BEAM
HOUSE
MACHINE
SECTION:
FINISHING
SECTION:
To
tal
Av
ailable
time (m
in)
Desig
n
pro
ductio
n
time(m
in)
Po
tential
equ
ipm
ent
utilizatio
n
Pro
d
time
cycle(m
in)
Equ
ipm
ent
utilizatio
n
Pro
d
time
cycle(m
in)
Equ
ipm
ent
utilizatio
n
Pro
d
time
cycle(m
in)
Equ
ipm
ent
utilizatio
n
June 016 8820 8880 99.90% 3650.67 41% 1141.3 13% 3593.5 41%
July 016 8820 3218.16 37% 1459.1 17% 7863 89%
Aug 016 9660 2858 30% 242.85 3% 3426 36%
Sept 016 9240 1427.04 15% 921.44 10% 7591 82%
Oct 016 7980 1973.53 25% 699.6 9% 3517.4 44%
Nov 016 9240 2247.74 24% 940.4 10% 5185 56%
Dec 016 8400 2408.3 29% 1659 20% 2849 34%
Jan 017 8820 2404 27% 2342.1 27% 3468 39%
Feb 017 8400 1969.8 24% 1355.2 16% 4698.1 56%
March
017 9660 1503.58 16% 894 9% 4792 50%
April 017
8400 1692.4 20% 970.4 12% 3836.4 46%
May 017 9240 2476.1 27% 1019.4 11% 4771 52%
June 017 8820 3462.4 39% 1233.26 14% 4768 54%
Average 8884.615 8880 99.90% 2407.055 27% 1144.465 13% 4642.954 52%
From the analysis equipment utilization in the machine section rated at 13% which is at
86.9% lower than the potential equipment utilization of 99.90%, while at beam house the
rate was found to be 27% falling 72.9% below the potential equipment utilization.
Compared to an estimate of average capacity utilisation in industry of between 60%- 87%
in major areas of the world in 2003/2004 (Wikipedia, 2018) (James F, 1976), the
calculated average utilization is low. Example a case of Ethiopian tanneries shows that
they have a capacity utilization of 60% (Anon, 2004). From this analysis it is evident the
time the equipment was unavailable for production was high. This is further analysed using
the chart on Figure 4.1 to show the comparison between the actual production cycle time
and the unavailable time of the equipment’s in Sagana Tanneries in a month.

56
Downtime refers to the period the machines are not producing and yet they ought to be
operational. The chart Figure 4.1 below shows the total average downtime(minutes) per
month in comparison to the average actual production time(minutes) for the three sections
in Sagana tanneries to be 60% and 40% respectively. This is based on own business unit
level benchmarking of the design capacity as a best practice, since there are no best
practice KPIs for the downtime in leather industry (Paul, 2009), though in most
manufacturing industries the ideal ratio of planned downtime to unplanned downtime is
19:1 and is considered world class (Hai & Dr.Jay, 2018). From the research observation in
STL all of the downtime that occurred during the study period was unplanned.
Figure 0.1: comparison between average down time and actual production time in a month
4.2.2: Overall Equipment Effectiveness
The OEE analysis was done on the three key sections of the tannery i.e. the beam house,
the machine sections and the finishing section. The key equipment’s on those section was
highlighted as every product in that section must pass through those machines to their
subsequent processes. To calculate the OEE of any machine the OEE factors were
determined using the formula:
𝐴𝑣𝑎𝑖𝑙𝑎𝑏𝑖𝑙𝑖𝑡𝑦(𝐴) =(𝑇𝑜𝑡𝑎𝑙 𝐴𝑣𝑎𝑖𝑙𝑎𝑏𝑙𝑒 𝑡𝑖𝑚𝑒 − 𝐷𝑜𝑤𝑛𝑡𝑖𝑚𝑒)
𝑇𝑜𝑡𝑎𝑙 𝐴𝑣𝑎𝑖𝑙𝑎𝑏𝑙𝑒 𝑡𝑖𝑚𝑒
𝑃𝑒𝑟𝑓𝑜𝑟𝑚𝑎𝑛𝑐𝑒 𝑟𝑎𝑡𝑒 (𝑃) = 𝑖𝑑𝑒𝑎𝑙 𝑐𝑦𝑐𝑙𝑒 𝑡𝑖𝑚𝑒×𝑜𝑢𝑡𝑝𝑢𝑡
𝐷𝑒𝑠𝑖𝑔𝑛 𝑝𝑟𝑜𝑑𝑢𝑐𝑡𝑖𝑜𝑛 𝑡𝑖𝑚𝑒× 100.
𝑄𝑢𝑎𝑙𝑖𝑡𝑦 𝑟𝑎𝑡𝑒(𝑄) =𝐼𝑛𝑝𝑢𝑡 − 𝑅𝑒𝑗𝑒𝑐𝑡𝑠
𝐼𝑛𝑝𝑢𝑡 × 100.
actual production
time40%
downtime
60%
Comparison between average downtime and the
actual production time in a month for the three
sections.

57
Hence, 𝑶𝑬𝑬 = 𝑨 × 𝑷 × 𝑸.
4.2.3: OEE factors rate for the three-production section
From the Table 4.2, the OEE and its factors for the three sections were analysed and
recorded for a period of one year. From table, the machines availability in the beam house
section was found to average at 27.2%, and the machine performance at 43.43%, while at
the machining section the availability and performance factors averaged at 13% and 14%
respectively. The corresponding availability and performance factors for the finishing
section were calculated, and they averaged at 52.1% and 19.4% respectively. The OEE
rates were calculated as 13%, 3% and 11% for the three sections respectively. These
factors were compared to the ideal world OEE rate which are 90%, 95% and 85%
respectively as in Table 4.3.
Table 0.2: Summary of OEE factors rates at the three sections of Sagana tanneries
Av
ailability
Perfo
rman
ce
Qu
ality
OE
E
Av
ailability
Perfo
rman
ce
Qu
ality
OE
E
Av
ailability
Perfo
rman
ce
Qu
ality
OE
E
June
016 41% 66% 100% 27% 13% 14% 100% 2% 41% 15% 100% 6%
July 016 37% 58% 100% 21% 17% 18% 100% 3% 89% 33% 100% 29%
Aug 016 30% 52% 100% 15% 3% 3% 100% 0% 36% 14% 100% 5%
Sept 016 15% 26% 100% 4% 10% 11% 100% 1% 82% 32% 100% 26%
Oct 016 25% 36% 100% 9% 9% 8% 100% 1% 44% 15% 100% 7%
Nov 016 24% 41% 100% 10% 10% 11% 100% 1% 56% 22% 100% 12%
Dec 016 29% 44% 100% 13% 20% 20% 100% 4% 34% 12% 100% 4%
Jan 017 27% 43% 100% 12% 27% 28% 96% 7% 39% 14% 100% 6%
Feb 017 24% 36% 100% 8% 16% 16% 100% 3% 56% 20% 100% 12%
Mar 017 16% 27% 100% 4% 9% 11% 100% 1% 50% 20% 100% 10%
Apri017 20% 31% 100% 6% 12% 12% 100% 1% 46% 16% 100% 7%
May
017 27% 45% 100% 12% 11% 13% 100% 1% 52% 20% 100% 10%
June
017 39% 62% 100% 24% 14% 15% 100% 14% 54% 20% 100% 11%
Average 27% 43% 100% 13% 13% 14% 100% 3% 52% 19% 100% 11%
Beam house Machining section Finishing section
The factors that determine OEE, namely, Availability, Performance and Quality have
values of between 0 and 1, likewise, OEE’s value vary between 0-100 percent. This make
OEE to be a crucial test. Table 4.3, shows comparison between the calculated OEE values
and their corresponding ideal values as reported by Nakajima (1998).

58
Table 0.3: OEE factors comparison with the world ideal values
OEE factor Calculated % Ideal values % Variation
Availability 30.78% 90% 59.22
Performance 25.56% 95% 69.44
Quality 98.86% 99% 0.14
OEE 8.97% 85% 76.03
From the Table 4.3, the percentage variation between the ideal and calculated values of
OEE factors is shown, which shows a great variation in Availability, Performance and
OEE values. The availability and performance rates are very low, which means further
analysis to determine the exact factors causing their low rate. These shows there are
various losses that are contributing to the low availability and the low performance rates of
the machine.
The Figure 4.2 illustrates the comparison between the three sections equipment OEE rate
for the one year in consideration.
Figure 0.2: OEE comparison chart
From the Figure 4.2 it’s seen that the OEE rate of the different sections is very far below
that of the global standards of a manufacturing industry which is 85% as seen in Table 4.3.
0.0%
5.0%
10.0%
15.0%
20.0%
25.0%
30.0%
35.0%
40.0%
45.0%
50.0%
June
016
July
016
Aug
016
Sept
016
Oct 016 Nov
016
Dec
016
Jan 017 Feb 017 March
017
April
017
May
017
June
017
Machines OEE Comparison chart
Fleshing Splitting Plating

59
The tanneries OEE is averaging below 10% which indicates there are a lot of wastes that
need to be eliminated for an improved productivity.
From the equipment OEE analysis, both the performance and the availability are low
compared to the world standards. But the quality rate was found to be satisfactory. Hence
from the analysis the major losses which falls under the three OEE loss categories are to be
identified. These losses are also contributors to the high downtime experienced. Hence
there is need to identify the exact causes of low availability and performance rates of the
equipment’s so that we can improve the productivity of the tannery.
4.2.4: Cycle time analysis in Sagana tanneries
The cycle time analysis was made by taking into consideration the product that must pass
through all the production process in the tannery to the final stage. In STL the product that
has a long processing cycle time is known as Silka. It was selected so as to give an idea of
the longest time a single product can take during processing in this company. The cycle
time analysis was based on processing of a single batch of hides of approximately 3300kg
and containing an average of 250 pieces of hides. The observation period was in the
months of March and April 2017.
Table 0.4: Manufacturing Cycle time analysis
SECTION NO ACTIVITY CYCLE TIME (C.T)
in mins
NVA VA
BEAMHOUSE 1 Transport hides to soak pit 30 30
2 Load hides into the soak pit 40 40
3 Soaking 960 960
4 Offload hides from soak pit 60 60
5 Transport hides to liming drums 15 15
6 Load liming drums 45 45
7 Liming 960 960
8 Offload liming drums 15 15
9 Transport hides to fleshing m/c 90 90
10 Fleshing 90 90
11 Transport hides to chrome tanning drums 50 50
12 Load chrome tanning drums 45 45
13 Chrome tanning 720 720
14 Offload chrome tanning drums 15 15
15 Pile wet blue leather to drain water 40 40
16 Leave wet blue to drain water 2880 2880
TOTAL 6055 3325 2730

60
TANYARD 17 Transport wet blue to sammying m/c 45 45
18 Siding and sammying 135 135
19 Pick, transport to splitting m/c, drop 10+40+10 60
20 Splitting 180 180
21 Pick, transport to shaving m/c, drop 75+50+3 128
22 Shaving 600 600
23 Weighing silka 15 15
24 Pick, transport silka to re-tannage drums, drop 5+70+5 80
25 Load re-tannage drums 30 30
26 Re-tannage 3780 3780
27 Offload re-tannage drums 300 300
28 Transport to setting m/c 6 6
29 Setting 150 150
30 Transport to drying sheds 24 24
31 Hooking leather+ movements 510+120 120 510
32 Drying 4320 4320
33 Unhooking leather+ movements 195+55 250
TOTAL 10733 1058 9675
FINISHING
SECTION
34 Transport to trimming tables, drop 30+30 60
35 Trimming 390 390
36 Pick, transport to staking m/c, drop 25+50+25 100
37 Staking 270 270
38 Pick, transport to buffing m/c, drop 25+50+25 100
39 Buffing 270 270
40 Pick, transport to dusting m/c, drop 30+30+30 90
41 Dusting 240 240
42 Pick, transport to impregnation area, drop 20+100+20 140
43 Impregnation 780 780
44 Pick, transport to buffing m/c, drop 20+100+20 140
45 2nd buffing 270 270
46 Pick, transport to dusting m/c, drop 30+30+30 90
47 Dusting 240 240
48 Pick, transport to colouring area, drop 20+120+20 160
49 Colouring 630 630
50 Pick, transport to plating m/c, drop 30+30+30 90
51 Plating (hair cell) 240 240
52 Pick, transport to spraying area, drop 30+30+30 90
53 Spraying 660 660
54 Pick, transport to plating m/c, drop 30+30+30 90
55 Plating (sandblast) 240 240
56 Pick, transport to measuring m/c, drop 20+100+20 140
57 Measuring 180 180

61
58 Packing 90 90
TOTAL 5730 2370 3360
TOTAL MANUFACTURING CYCLE TIME 22518 6753 15765
The cycle time analysis presented in the Table 4.4 established that the manufacturing cycle
time of an entire single batch of leather of approximately 250pc or 5610 sq.ft at Sagana
tanneries is 22518 minutes, which translates to about 375.3 hours or 19 days. This was
calculated using the sum of total Value adding activities and the non-value adding
activities that were involved in the processing of the entire batch to completion. whereby
as it is explained in section 3.4.3 the activity cycle time were obtained through observation
and timing using a stop watch for short cycles and from records for the long cycles.
According to the production manager under normal conditions with constant material
supply and no equipment breakdowns, and according to general outline of parameters for a
modern tannery (Buljan & Kral, 2012) the cycle time should be between 10 to 15 days.
From BLC leather technology centre a piece of leather meant for upholstery can take 10
working days from salted hide to finishing (BLC Leather Technology, 2007).
From the observation done the process was unusually long because some equipment’s were
too small to accommodate the entire leather batch for one-time processing, hence the
process had to be done in smaller batches like in re-tannage tanks. A process like drying
took longer because it all depended on how the natural weather is like, when cold and
humid it took longer to drain the moisture on the leather and also given the fact that the
drying sheds had limited spaces hence there is usually a waiting duration a time. The other
factor contributing to the exceptionally high cycle time is the fact that product movement
was manually done hence the operators could only carry a few pieces at a time, and
process like spraying, colouring and impregnation were manually done piece by piece.
Sagana tanneries therefore exceeds the upper limit of the standard cycle time by 4 days.
4.2.5: Throughput analysis in Sagana tanneries
To determine the throughput of STL, a summary of production records was taken for a
period of one year from July 2016 to June 2017. Throughput was taken as the total output
produced per month and was compared against the expected production capacity of
400,000 sq. ft/month, as well as labour productivity per month. The summary of the data is
as shown in Table 4.5.

62
Table 0.5: Sagana tannery monthly throughput
Product
Quantity (sq. ft) per month
Jul-16 Aug-16 Sep-16 Oct-16 Nov-16 Dec-16 Jan-17 Feb-17 Mar-17 Apr-17 May-17 Jun-17 Total
Wet blue 166768.3 177743.5 49662.1 113141.8 81780.2 150099.8 156326.9 125613 68601.8 90202 138971.6 203750.1 1492593.2
Pull-up 3774 1338.75 7172.742 9587.507 7167.99 14500.25 5965.99 10158.76 7550.24 628.252 3679.75 3974.75 75498.981
Silka 3758 6099.5 6442.745 2847.99 7246.76 10888.25 8738.26 11467.25 4623.25 2508.5 1354.5 5332.75 71307.755
Linings 1226.5 2740.76 1306.246 2140.25 1855.75 921.5 2947.75 742.75 2702.25 265.51 3240.51 1051.99 21141.766
Hair-on 25.5 532.75 898.501 1548.258 0 540.01 244.75 783.5 941.26 450.5 1812.74 277.75 8055.519
Upholstery 1072.26 116.5 935 2905.99 1199.25 625.24 0 552.76 523.01 215.75 0 659.75 8805.51
Suede 67.51 518.99 586.007 0 585.24 0 112.51 0 54.99 0 0 15.25 1940.497
Kips 24432.5 20392.76 22608.74 33918.76 21514.25 27027.99 23159.25 24577.26 16604 5923 15223.99 21417.25 256799.75
Glovings 6392 3865.8 8690.4 10052.1 9006.6 11391.7 7969.6 5105.1 7480 7228.4 5661 5967 88809.7
Splits 2892.24 274.5 3507.75 2592.5 4222.75 3279.99 1611.01 2550.26 2804.25 1350.5 1264.75 1152.5 27503
Total
output 210408.8 213623.8 101810.2 178735.2 134578.8 219274.7 207076 181550.6 111885.1 108772.4 171208.8 243599.1 2052456
Design
capacity 400,000
Productivity
(sq. ft/hr.) 50.58 51.35 24.5 42.97 32.35 52.71 49.8 43.64 26.9 26.1 41.16 58.6 41.12
Sagana leather tannery has a rated capacity of 400000 sq. ft of leather per month. Figure
4.3 represents a combo chart showing the actual production against the rated capacity at
the tannery:

63
Figure 0.3: Throughput analysis
From the chart in Figure 4.3, it is clear that the company is operating way below its rated
throughput of 400,000 sq. ft per month which acts as an internal benchmarking value. In
most of the months, the company’s’ production is less than half its rated throughput. This
can be seen in the months of Sept 2016, October, November, March, April and May. This
low production capacity was attributed to major equipment’s breakdowns, power outages,
low supply of raw materials and to some extent the humid weather.
From Table 4.5, labour productivity was calculated as:
𝐿𝑎𝑏𝑜𝑢𝑟 𝑝𝑟𝑜𝑑𝑢𝑐𝑡𝑖𝑣𝑖𝑡𝑦 = 𝑜𝑢𝑡𝑝𝑢𝑡𝑠/𝑖𝑛𝑝𝑢𝑡𝑠
Where the Output refers to the amount of leather produced in sq. ft in a particular month
and input is the total man-hours used in production per month, given by:
𝑇𝑜𝑡𝑎𝑙 𝑚𝑎𝑛 ℎ𝑜𝑢𝑟𝑠 𝑝𝑒𝑟 𝑚𝑜𝑛𝑡ℎ = 8ℎ𝑟𝑠 × 5𝑑𝑎𝑦𝑠 × 4𝑤𝑒𝑒𝑘𝑠 × 26𝑚𝑒𝑛 = 4160ℎ𝑟𝑠
The total number of employees directly engaged in production at Sagana leather tanneries
is 26. The targeted/ design labour productivity at STL was calculated as:
𝑇𝑎𝑟𝑔𝑒𝑡𝑒𝑑 𝐿𝑎𝑏𝑜𝑢𝑟 𝑝𝑟𝑜𝑑𝑢𝑐𝑡𝑖𝑣𝑖𝑡𝑦 = 400,000/4160
=96.15sq.fts/man/day
The Figure 4.4 shows the deviation of the actual monthly productivity from the targeted
productivity:
0
50000
100000
150000
200000
250000
300000
350000
400000
450000
Jul-16 Aug-16 Sep-16 Oct-16 Nov-16 Dec-16 Jan-17 Feb-17 Mar-17 Apr-17 May-17 Jun-17
Mo
nth
ly P
rod
uct
ion
STL Monthly output versus the rated output capacity
Actual output (sq.ft) Design capacity (sq.ft)

64
Figure 0.4: Productivity analysis
From the above analysis the actual calculated labour productivity is very low as compared
to the targeted design productivity. On average, the actual labour productivity is given by:
𝐴𝑣𝑒𝑟𝑎𝑔𝑒 𝑎𝑐𝑡𝑢𝑎𝑙 𝑙𝑎𝑏𝑜𝑢𝑟 𝑝𝑟𝑜𝑑𝑢𝑐𝑡𝑖𝑣𝑖𝑡𝑦 = 173543.6/4160
= 41.72 sq. ft/man/day
Comparing the calculated value to the targeted productivity of 96. 15sq.ft/man/day, and the
hypothetical parameters for a model tannery which is 270 sq. ft/day/employee according to
a UNIDO overview (Buljan & Kral, 2012), this means that the employees at Sagana leather
tanneries are underutilized at 41.72 sq. ft/man/day. Other reasons that could be attributed to
the low labour productivity could also be poor plant layout. During the industrial visits it
was noted that some subsequent workstations at the finishing section are far apart thus
increasing the travel distance of workers during material handling this coupled with
manual movement of material within the stations makes the process slow. Hence, there is
so much time wasted by workers moving between work stations as they transport
materials. Such movements are non-value-adding activities that result to underutilized
workmanship. The NVA also include the time wasted in setting up the machine. Some
machines are old as they were reconditioned machines from a Norway tannery that were
used to start -up the tannery in 1975 hence their operating speeds are very low, the waste
0
10
20
30
40
50
60
70
80
90
100
Jul-16 Aug-16 Sep-16 Oct-16 Nov-16 Dec-16 Jan-17 Feb-17 Mar-17 Apr-17 May-17 Jun-17
Pro
duct
ivit
y (
sq.f
t/m
an-h
our
)Monthly Productivity analysis
Actual labour productivity(sq.ft/man- hr) Design productivity capacity (sq.ft/man- hr)

65
management system also contribute to low labour productivity, as the tannery cannot
manage a 24-hour production due to the small effluent management system.
4.3: Determination of root causes of low productivity in Sagana tanneries
4.3.1: Factors that affect productivity in Sagana tanneries
Table 4.6 shows the results of the relationship between availability, performance and
productivity of equipment’s in the beam house section. It shows that the effect of
equipment availability and performance varied substantially. In July 2016, it is seen that a
10% reduction in equipment availability and a 12% decrease in equipment performance led
to productivity reduction of 12%. In the month of October 2016, a 67% increase in
equipment availability together with a 38% increase in equipment performance improved
the productivity by 60%. Between December 2016 and March 2017, there was a notable
drop in equipment availability and performance, with equipment availability dropping
from 21% to -33%, and performance from 7% to -25%, which in effect led to productivity
dropping from 18% to -33%. This significant drop was attributed to lack of raw materials
as a result of the drought that was being experienced in the country at that time, equipment
breaking down and frequent power failures also contributed to the great drop. This trend
follows throughout the months with the indication that any slight change in equipment
availability and performance impacts a greater change in productivity. The equipment
breakdown contributed to low operating speeds, especially on the dying section. This is
because the tannery relies on natural drying, it was found that when the weather conditions
are not favourable especially the wet months, it took long to dry the leather, this meant
holding down or delaying the subsequent process and slowing the preceding process too.

66
Table 0.6: Variation in availability, performance and productivity in beam house
section
Av
aila
bility
Perfo
rma
nce
Pro
du
ctivity
in sq
. ft/ma
n
ho
ur
Ch
an
ge
in
av
aila
bility
Ch
an
ge
in
perfo
rma
nce
Ch
an
ge
in
pro
du
ctivity
June 016 41% 66% 4.27 100
July 016 37% 58% 3.76 -10% -12% -12%
Aug 016 30% 52% 3.05 -19% -10% -19%
Sept 016 15% 26% 1.59 -50% -50% -48%
Oct 016 25% 36% 2.55 67% 38% 60%
Nov 016 24% 41% 2.51 -4% 14% -2%
Dec 016 29% 44% 2.96 21% 7% 18%
Jan 017 27% 43% 2.81 -7% -2% -5%
Feb 017 24% 36% 2.42 -11% -16% -14%
Marc 017 16% 27% 1.61 -33% -25% -33%
April 017 20% 31% 2.08 25% 15% 29%
May 017 27% 45% 2.76 35% 45% 33%
June 017 39% 62% 4.03 44% 38% 46%
At the beam house section, the correlation analysis between availability and performance
of the equipment with their productivity showed different relationship strengths. The
correlation analysis has been done using SPSS software and employed Pearson’s model for
coefficient interpretation. Table 4.7 illustrates that equipment availability is strongly
related to productivity with a correlation of 99.9%, while equipment performance and
productivity correlates at 98.6%. Similarly, the equipment availability and performance
have 98.4% correlation each with a P-value of less than 0.05 i.e. P< 0.05. From the
analysis it’s clear that the effect of availability on the productivity is very significant in the
beam house section with a R2 = 0.998, p<0.001, while that of performance is at R2 =0.998
and P<0.390. this also explain the type of model fit for the beam house section. The model
fit in this section takes this form,
𝑌 = 𝑋1𝑎 + 𝑋2𝑏 + 𝑐, where,
Y=productivity
X1 and X2 =numerical values

67
a, = availability
b, = performance
C = constant
Hence the model equation, 𝑌 = 0.096𝑎 + 0.005𝑏 − 0.009..
From the model, holding all other factors constant, a unit increase in equipment availability
leads to a 0.096-unit increase in productivity, while a unit increase in equipment
performance leads to a 0.005-unit increase in productivity.
Table 0.7: Correlation matrix table in the beam house section
Correlations
Availability Performance Productivity
Availability Pearson
Correlation 1 .984** .999**
Sig. (2-tailed) .000 .000
Performance Pearson
Correlation .984** 1 .986**
Sig. (2-tailed) .000 .000
Productivity Pearson
Correlation .999** .986** 1
Sig. (2-tailed) .000 .000
**. Correlation is significant at the 0.01 level (2-tailed).
Figure 0.5: Scatter diagram showing relationship between productivity and
availability in STL.

68
In the machining section, in July 2016, a 31% increase in equipment availability and a
corresponding 29% increase in equipment performance caused a 28% increase in
productivity this was calculated using the formula
Productivity growth = (current productivity− previous productivity)
(previous productivity)∗ 100
From Table 4.8, in the month of September 2016, there was a tremendous positive change,
where availability increased with 233%, while performance increased with a 270%, and
this led to a 296% increase in productivity. This high positive change was attributed to an
increase in equipment availability down from 3% in august 2016 to 10% in September, has
a result of reduced equipment breakdown and a reduction in power failures during the
month. Similarly, a decrease of -10% and -27% in availability and equipment performance
respectively led to a significant decrease in productivity of -12%, in the month of October
2016, which was attributed to an increase in equipment breakdowns.
Table 0.8: Variation in availability, performance and productivity in Machine section
Availability Performance Productivity in
sq. ft/man hour
Change in
availability
Change in
performance
Change in
productivity
June 016 13% 14% 0.781 100%
July 016 17% 18% 0.998 31% 29% 28%
Aug 016 3% 3% 0.152 -82% -83% -85%
Sept 016 10% 11% 0.602 233% 270% 296%
Oct 016 9% 8% 0.53 -10% -27% -12%
Nov 016 10% 11% 0.615 11% 38% 16%
Dec 016 20% 20% 1.193 100% 82% 94%
Jan 017 27% 28% 1.604 85% 40% 34%
Feb 017 16% 16% 0.974 -41% -43% -39%
Marc 017 9% 11% 0.559 -44% -31% -43%
April 017 12% 12% 0.697 33% 9% 25%
May 017 11% 13% 0.664 -8% 8% -5%
June 017 14% 15% 0.844 27% 15% 27%
This significance trend in variation, explains the degree of association or correlation
between the variables with correlation coefficients of 0.999 and 0.992 between
productivity and availability and performance of equipment’s respectively at the machining
section (splitting machine), with a P-value of less than 0.0001. and R2=0.999 from the
correlation analysis in Table 4.9.
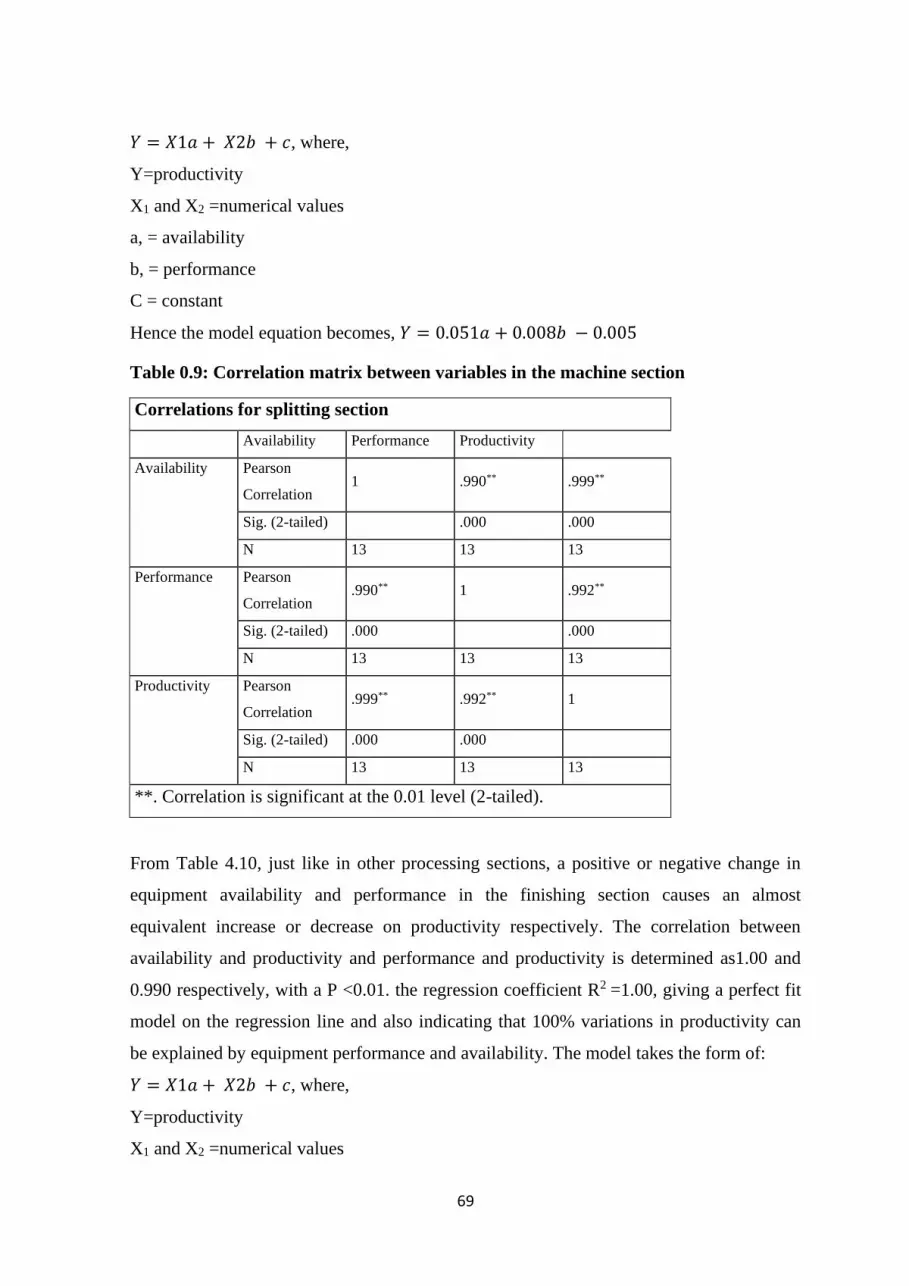
69
𝑌 = 𝑋1𝑎 + 𝑋2𝑏 + 𝑐, where,
Y=productivity
X1 and X2 =numerical values
a, = availability
b, = performance
C = constant
Hence the model equation becomes, 𝑌 = 0.051𝑎 + 0.008𝑏 − 0.005
Table 0.9: Correlation matrix between variables in the machine section
Correlations for splitting section
Availability Performance Productivity
Availability Pearson
Correlation 1 .990** .999**
Sig. (2-tailed) .000 .000
N 13 13 13
Performance Pearson
Correlation .990** 1 .992**
Sig. (2-tailed) .000 .000
N 13 13 13
Productivity Pearson
Correlation .999** .992** 1
Sig. (2-tailed) .000 .000
N 13 13 13
**. Correlation is significant at the 0.01 level (2-tailed).
From Table 4.10, just like in other processing sections, a positive or negative change in
equipment availability and performance in the finishing section causes an almost
equivalent increase or decrease on productivity respectively. The correlation between
availability and productivity and performance and productivity is determined as1.00 and
0.990 respectively, with a P <0.01. the regression coefficient R2 =1.00, giving a perfect fit
model on the regression line and also indicating that 100% variations in productivity can
be explained by equipment performance and availability. The model takes the form of:
𝑌 = 𝑋1𝑎 + 𝑋2𝑏 + 𝑐, where,
Y=productivity
X1 and X2 =numerical values

70
a, = availability
b, = performance
C = constant
𝑌 = 0.016𝑎 − 0.002𝑏 − 0.009
Table 0.10: Variation in availability, performance and productivity in the finishing
section
Availability Performance Productivity in
sq. ft/man hour
Change in
availability
Change in
performance
Change in
productivity
June 16 41% 15% 0.617 100%
July 016 89% 33% 1.351 117% 120% 119%
Aug 016 36% 14% 0.537 -60% -58% -60%
Sept 16 82% 32% 1.245 128% 129% 132%
Oct 016 44% 15% 0.668 -46% -53% -46%
Nov 016 56% 22% 0.849 27% 47% 27%
Dec 016 34% 12% 0.514 -39% -45% -39%
Jan 017 39% 14% 0.596 15% 17% 16%
Feb 017 56% 20% 0.847 44% 44% 42%
Mar 17 50% 20% 0.752 -11% 0% -11%
April 17 46% 16% 0.692 -8% -20% -8%
May 17 52% 20% 0.782 13% 25% 13%
June 17 54% 20% 0.816 4% 0% 4%
Table 0.11: Correlation matrix in the finishing section
Correlations
Availability Performance Productivity
Availability Pearson
Correlation 1 .991** 1.000**
Sig. (2-tailed) .000 .000
N 13 13 13
Performance Pearson
Correlation .991** 1 .990**
Sig. (2-tailed) .000 .000
N 13 13 13
Productivity Pearson
Correlation 1.000** .990** 1
Sig. (2-tailed) .000 .000
N 13 13 13
**. Correlation is significant at the 0.01 level (2-tailed).

71
Table 0.12: summary of correlation matrix of Availability, Performance and
Productivity of the three sections
Pro
du
ctivity
Av
ailability
(BH
)
Perfo
rman
ce
(BH
)
Av
ailability
(MA
)
Perfo
rman
ce
(MA
)
Av
ailability
(FI)
Perfo
rman
ce
(FI)
Productivity 1 0.999** 0.986** 0.999** 0.992** 1.00** 0.990**
Availability (BH) 1 0.984**
Performance
(BH)
1
Availability
(MA)
1 0.990
Performance
(MA)
1
Availability (FI) 1 0.991**
Performance (FI) 1
In determining the factors that affect productivity in STL, the correlation analysis between
availability and productivity and performance and productivity is determined as1.00 and
0.990respectively, with a P <0.01. the regression coefficient R2 =1.00, giving a perfect fit
model on the regression line and also indicating that 100% variations in productivity can
be explained by equipment performance and availability. From this analysis it’s evident
that the cause of low productivity are factors that are associated with equipment
availability and their performance. Hence the need for a Root Cause analysis.
4.3.2: Determination of root causes of low productivity in STL:
From the results in the correlation matrix from the three sections, I.e. beam house section,
machining section and the finishing section in Table 4.12, equipment availability and
performance have a positive significant relationship with productivity where in the three
sections the P value < 0.0001. Hence the results indicate that any improvement in the
equipment’s availability and performance can greatly improve productivity. Therefore, any
slight change in the equipment’s availability and performance have an equal impact on
productivity.

72
From the analysis above its evident that productivity in the tannery was significantly
influenced by the equipment availability and their performance, and of which also rated
below the ideal values. From Root Cause Analysis method several factors that affect the
availability and performance of the equipment’s were identified through secondary data as
discussed in chapter 3 section 3.5. In the beam house section, the factors were: power
failures, machine breakdowns, lack of raw materials, set-up delays, low effluent
management, lack of labour, material handling. These are illustrated in the cause and effect
diagram in Figure 4.6
Manual overloading
Blade setting
Equipment
availability and
performance
Raw materials Power failure
Material
handling
Set up delays
Old machines
Poor
maintenance
Equipment
failure
Equipment
breakdown Effluent
management
No backup
Loading and
offloading
labour
Low Speed
Speed limit
Bottlenecks
Figure 0.6: Cause and effect diagram in Sagana tannery

73
From Figures 4.8 and 4.9, the pareto analysis indicates that equipment breakdowns
contributed to 36.5% of equipment unavailability and performance, power failure
contributed to 32.2% unavailability, raw material and set-up delays contributed to 13.5%
and 10% respectively to equipment unavailability and performance. While material
handling, effluent management and lack of labour had a 5.35%,1.5% and .75%
contribution respectively. From this equipment breakdown, power failure, and lack of raw
materials can be classified as the vital few while the set-up delays, material handling and
lack of labour as the trivial many. From the graph on Figure 4.7, lack of raw materials
contributed greatly to the downtime or equipment’s unavailability especially in the months
Figure 0.8: Pareto Chart on Downtime and causal factors frequency in beam house
0
500
1000
1500
2000
2500
3000
3500
June 016July 016 Aug 016Sept 016 Oct 016 Nov 016 Dec 016 Jan 017 Feb 017 March
017
April
017
May 017June 017
Dow
nti
me
in
min
ute
s
Downtime causal factors in Beam house section
equipment breakdown power failure set up
raw materials labour effluent management
material handling
Figure 0.7: Chart on Downtime and causal factors in beam house

74
of January, February and March, as a result of the drought that had hit the country at that
time which is one of the external factors that the tannery had no control of.
In the machining section, the causal factors that affect equipment availability and
performance included the following; power failures, machine breakdowns, lack of raw
materials, blade setting, low effluent management, lack of labour, material handling, low
speed, speed limit as shown on the cause and effect Figure 4.6
From figure 4.9, the various downtime causal factors are presented in minutes. It’s evident
from the chart that low speeds in operation which were caused by bottlenecks in the
process had the highest number of downtime minutes, specifically in the months that are
deemed to be cold and wet in Kenya central region such as June, July, October, November,
December, March, April and May, which means cumulatively it contributed to 38% of the
downtimes in the section as shown on the pareto chart in figure 4.10. Equipment
0
500
1000
1500
2000
2500
3000
3500
4000
June 016 July 016 Aug 016 Sept 016 Oct 016 Nov 016 Dec 016 Jan 017 Feb 017 March
017
April 017 May 017 June 017
Dow
nti
me
in m
inu
tes
Downtime causal factors in machining section
equipment breakdown powe failure set up raw materials low speeds
material handling labour speed limit effluent management
Figure 0.9: Downtime causal factors in machining section

75
breakdown, power failure contributed to 26% and 16% respectively, while set-up delays,
speed limit had 8% and 5% contribution each, this represented the vital few causes. The
low speeds are as a result of delays caused by bottlenecks in the subsequent processes like
drying. When the weather is not favourable drying takes longer since the drying area
capacity is limited, leads to work in process being held. This of course affects the
utilisation of the equipment hence
affecting equipment availability and performance. Equipment breakdown is also caused by
the fact the main machine which is the splitting machine is old and therefore cannot keep
up with work its subjected to. This affects its performance as the operating speeds are
lower.
Figure 0.10: Pareto chart on causal factors in machining section

76
The graph in figure 4.11, represents the downtime distribution in minutes on the finishing
section. While figure 4.12, represents the pareto chart on the frequency of the causal
factors. From the chart low speeds contributes to 38% of equipment unavailability and low
performance, while equipment breakdown contributed to 27%, power failure 13% and set-
up 11% are considered the vital few causal factors. While the rest of the factors such as
speed limit, raw materials, labour, material handling and effluent management are the
trivial many. The low speeds of processing are as a result of delays in drying unit, which
delays the subsequent finishing process. From the graph figure 4.11, it’s evident the
months that the low speeds downtime is the highest are the months of June, November,
December, January and April, which are deemed to be cold and wet months, hence affects
the drying of the leather. This is because the company relies on the natural drying methods
as their vacuum dryer is no longer operational. Frequent equipment breakdown and power
outages contributes to the equipment unavailability and low performance.
0
500
1000
1500
2000
2500
3000
June
016
July
016
Aug
016
Sept
016
Oct 016 Nov
016
Dec
016
Jan 017 Feb
017
March
017
April
017
May
017
June
017
Dow
nti
me
in m
inu
tes
Causal factors in finishing section
equipment breakdown powe failure set up raw materials low speeds
material handling labour speed limit effluent management
Figure 0.11: Down time in finishing section

77
4.3.3: Investigation of Root causes of frequent equipment breakdowns and low
operation speeds in Sagana tanneries
In the Sagana tanneries case study, the Why- Why analysis tool was used to help identify
any unanswered question and information gap that was present and causing poor
performance and unavailability of the equipment. The information gathered for this process
was through interviews with those directly and indirectly involved in the production
process and direct observation of the production process. This involved asking questions to
the production manager, production supervisor, operators and the maintenance staff.
The Why-Why analysis was used to investigate the root cause of frequent equipment
breakdown and low speeds in Sagana tanneries. It involved asking ‘why’ questions
repeatedly till a conclusion was reached as in the following steps:
f) Why frequent equipment breakdown?
• Machine parts keep on failing almost every time
g) Why fail every time?
• Because they are only repaired when they stop working or fail
h) Why repair only when they fail?
• Because there is no maintenance program
Figure 0.12: Pareto chart on causal factors in finishing section

78
• No spare parts available
i) Why is there no maintenance programme and no spare parts?
• Only one person is trained to repair and maintain
• Most machines models are very old hence no spare parts available
j) Why only one person trained and machines too old?
• Company policies and financial implications.
Why-Why analysis on low speeds causal factors;
e) Why low speeds of performance?
• Slow material transfer between processes
f) Why slow material transfer between processes?
• The material handling transfer method is manual and it takes few pieces at a
time
• Material may delay in one process, holding up other processes
g) Why delay in one process?
• Machine breakdowns and failures which results to process bottlenecks like
in the drying section
h) Why machine breakdowns and failure?
• No maintenance programs and spare parts available
From the analysis it’s evident that lack of proper maintenance program, has led to the
frequent machine breakdowns, which contributes to low operating speeds and continuous
machine failure.
4.4: Developing Strategies for productivity improvement
4.4.1 Strategy formulation
To improve productivity in Sagana tanneries, the strategy to be selected needs to provide a
solution that addresses the root causes of low productivity. Based on the root cause
analysis discussed in Section 4.2, equipment unavailability and low performance which
affects productivity negatively, are caused by equipment breakdown, power failures, low
speeds, raw materials and set-up delays due to inefficiency and bottlenecks in the
production system. From the results it’s evident that equipment availability and
performance can be greatly improved by reducing the breakdowns and other bottlenecks’
in the production process which in turn leads to productivity improvement. Several

79
strategies formulated for productivity improvement in Sagana tanneries include: TPM
techniques, Lean manufacturing, back-up power generator, theory of constraints and
Benchmarking
Table 0.13: Causal factors and appropriate solutions
Problem Causes Root causes effects Viable solutions
Low productivity Equipment
unavailability
-Breakdowns
-Lack of raw material
Unachieved production
and market demand
-TPM
-Benchmarking
Equipment poor
performance
-Low speeds
-Power failure
-Bottlenecks
Unachieved production
and market demand
WIP leading to wastes
-Lean system
-TPM
-Back-up generator
-layout-re-design,
(Theory of constraints)
4.4.2 Evaluation of strategies
From the strategy formulation, it’s evident that several strategies can be developed to solve
the problem of low productivity in Sagana tanneries as in Table 4.13, but in the context
analysis the strategies were evaluated so as to choose the most viable that will solve the
root causes of low productivity. This is because each strategy has its strength and weakness
and may be a solution to a specific situation
Table 0.14: Evaluation of strategies
Strategy Is it cost acceptable? Is it understood? Is it effective? Can it be done
in practice?
TPM Yes Yes Yes Yes Equipment
breakdown
TOC No Yes yes No Layout design
Lean system Yes Yes yes yes Low speed, Raw
materials
Benchmarking Yes No Yes No Enhance continuous
improvement
Back-up generator yes yes yes yes Power failure

80
4.4.3: Productivity Improvement Strategy Proposal
The research only gives a recommendation to the management who can either choose to
implement the proposed improvement strategies or not. To implement the proposed
strategy the overall objective of the tannery has to be considered. This means that the entire
internal and external operations are to be involved. The strategy implementation process
will involve the use of Deming’s model of PDCA(Plan-Do-Check-Act). The model
involves the identification of the formulated best strategy, making a plan about the
strategy, check and test whether the plan works and then act on the plan by fully
implementing it. To sustain the benefits of the best strategy requires formulation of
standard operating procedures. The proposed strategy implementation lies with the
discretion of the management and their goodwill to ensure that its implemented.
4.4.4 Summary
From the research findings, the OEE of the tannery is very low compared to the standard
manufacturing equipment’s OEE, the manufacturing cycle time is very high compared to
the average cycle time given for a product in a model tannery, and the actual throughput of
the tannery is low compared to the target throughput. From this analysis, equipment
availability and performance have a significant positive relationship with productivity in
Sagana tanneries. This means any significant change in either equipment availability or
performance will have an equivalent change in productivity in whatever extreme.
Therefore, this shows that the problem of low productivity in the tanneries is attributed to
low equipment availability and low performance. From the RCA done the causal factors
for low equipment availability and performance were found to be frequent equipment
breakdown, low operation speeds, power failure, lack of raw materials, set-up delays,
labour, material handling, waste management and other bottlenecks in the system. Where
from these causal factors the main root causes that had a higher occurrence frequency
overall, were, equipment breakdown, low operation speed, power failure, raw materials
and set -up delays. From these root causes, an appropriate strategy that can help eliminate
or solve the root cause and improve productivity was developed. The strategies that were
found appropriate to solve the problem are TPM principles and Lean concept for
breakdowns, low speeds and raw material supply, while a back-up power generator was
proposed to sort out the issue of frequent uncontrolled power failures. Benchmarking is
also proposed so that to compare with the best practises to help enhance other strategies.

81
Chapter 5 : CHAPTER FIVE
CONCLUSIONS AND RECOMMENDATIONS
5.1 Review of research objectives
The purpose of the research study was to explore the factors that affected productivity in
Sagana Tanneries and propose improvement strategies. Where the specific objectives were:
to analyse the productivity levels in Sagana tanneries, to carry out Root Cause Analysis of
productivity losses in Sagana tanneries and to develop strategies for productivity
improvement.
5.2 Key findings
The research findings for each objective was summarised as follows.
5.2.1 Analysis of productivity levels in Sagana tanneries
1. Equipment utilization levels
From the analysis, equipment utilization in STL, which was based on the scheduled
operating time and the plant operating time for the three sections rated at 27%, 13% and

82
52% respectively for the 12 months of study though the estimated utilization levels of
equipment’s in different parts of the world range from 60%-87%. Hence it was found that
40% of the total available manufacturing time was when the equipment’s were utilised,
while 60% of the time the equipment’s were unavailable for manufacturing. From this
analysis it is evident the time the equipment was unavailable for production due to various
downtimes was high considering that the ratio of unplanned downtime to planned
downtime is given as 19:1. Hence most of the downtime experienced was unplanned
leading to high rates of unavailability.
2. Overall Equipment Effectiveness (OEE)
At STL, the machines availability in the Beam house section was found to average at
27.2%, and the machine performance at 43.43%, while at the Machining section the
availability and performance factors averaged at 13% and 14% respectively. The
corresponding availability and performance factors for the Finishing section were
calculated, and they averaged at 52.1% and 19.4% respectively. The average OEE factors
rates were calculated as 13%, 3% and 11% for the three sections respectively. These
factors were compared to the ideal world OEE factors rate which are 90%, 95% and 85%
respectively. The average OEE value was calculated as 8.97% compared to 85%. The
availability and performance rates are very low, which means further analysis to determine
the exact factors causing their low rate. From these it was evident there were losses being
experienced that need to be identified and worked on using an appropriate solution.
3. Cycle time analysis
The cycle time analysis was based on processing of a single batch of hides of
approximately 5610 sq ft and containing 250 pieces of hides. The cycle time analysis
established that the manufacturing cycle time of an entire single batch of leather of
approximately 250pc or 5610 sq ft at, Sagana tanneries is 22518 minutes which translates
to about 375.3 hours or 19 days. According to the standards for a model tannery, the cycle
time should be between 10 to 15 days (Buljan & Kral, 2012). Hence from this it is clear
that there are several factors that contributed to the high cycle time for a single batch.
These factors included the equipment’s capacity, unpredictable weather, manual material
handling and movements, setup times, unplanned delays etc. Sagana tanneries therefore

83
exceeds the upper limit of the standard cycle time by 4 days as a result of the many wastes
in the process.
4. Throughput analysis
In STL, throughput was taken as the total actual output produced per month and was
compared against the expected production capacity of 400,000 sq. ft/month. It is clear that
the company is operating way below its rated throughput of 400,000 sq. ft per month In
most of the months, the company’s’ production was less than half its rated throughput.
This low production capacity was attributed to major equipment’s breakdowns, power
outages, low supply of raw materials and to some extent the humid weather.
Labour productivity was at 42 sq. fts/man-hour. and compared against the targeted labour
productivity of 96.15sq.fts/man-hour and productivity of a modern tannery taken to be 270
sq. ft/day/employee. This showed that the labour force at STL was underutilised. This low
throughput and labour productivity could be attributed to several factors such as poor plant
layout, transportation/movement between workstations, machine set-ups delays, low
operating speeds, breakdowns and power failures.
5.2.2: Root cause analysis of production losses in STL
From the analysis results a correlation was done and it was found out that the equipment
availability and performance had a significant relationship to productivity and they
therefore contributed to the low productivity rates. This was evident from the fact that any
slight change in any of the two factors i.e. availability and performance a corresponding
change in productivity was witnessed. This objective was helpful to demonstrate a serious
production problem at Sagana tanneries which has made it difficult for the tannery to
achieve its theoretical production design capacity of 400,000 sq. ft/month. To establish the
exact factors a RCA was carried out on the three sections to determine the vital few against
the trivial many so as to mitigate the problems at the tannery.
From the Root Cause Analysis carried out to determine the root causes of the various
production losses, several causal factors were identified as frequent equipment breakdown,
low operation speeds, power failure, lack of raw materials, set-up delays, labour, material
handling, effluent management and bottlenecks in the system. The main root causes of
equipment un-availability and low performance were found from the Why-Why analysis
and pareto chart to be, equipment breakdown, low operation speed, power failure, raw

84
materials and set -up delays. This are the factors that if worked on and eliminated
equipment availability and performance would increase greatly, hence increasing
productivity levels.
5.2.3: Proposed strategies for productivity improvement
Productivity improvement strategies were proposed after the root causes analysis. The
selection of the improvement strategies was based on Context analysis of the overall
environment which the tannery operated in. This gave insight to what was best suited to
solve the issues at hand, this is because various techniques can be used, hence the most
viable strategy to be recommended was implementation of TPM principles and Lean
strategies, and provision of a power back-up generator. A further recommendation of
benchmarking to enable continuous improvement to be achieved.
5.3 Conclusions
From the research findings, the situation at Sagana tanneries was analysed and the results
explains why the tannery cannot meet its theoretical capacity production through-put of
400,000sq. ft./month. In conclusion to improve the productivity levels at STL the Root
causes of low equipment availability and performance which are frequent breakdowns, low
speeds, set-up losses, power failure, lack of raw material and material handling must be
addressed. To employ both short term and long-term solutions, Lean concept and TPM
principles should be employed to help minimize the waste, to ensure the equipment’s are
available and performing to the optimum productivity level. The frequent power failures, a
cost-effective power back-up generator which can meet the power needs of the tannery its
recommended, to keep the equipment in availability and in performance.
5.4 Recommendations
To solve the problem of low productivity in Sagana tanneries, there is an urgent need to
implement TPM (Total Productive Maintenance) principles and Lean manufacturing
system. The TPM principles should be embraced by all employees starting from the
management level down to the operators and help in establishing an effective maintenance
program, which will eliminate or reduce the equipment breakdowns and makes sure
equipment are available for use. From the TPM principles the management at Sagana
Tanneries should encourage the operators to familiarise with the machines they operate,
and this should be done through trainings. Lean manufacturing will help in solving low

85
speed problems, set-up delays which result in losses(wastes), raw material supply all which
affect equipment performance. A cost-effective power back-up generator is recommended
to curb power failure issues which affect both equipment availability and performance.
Other recommendations based on the study are to semi-automate the plant with new
machines and equipment to facilitate material movement or handling which has an effect
on set-up delays and operation speeds. The layout can also be re-designed to facilitate for
the automation and ease of material flow and provide adequate space for raw material
storage and work in process storage leading to a shorter lead time, hence higher
productivity levels. A study is recommended in other tanneries in Kenya to find out the
scenario they operate in and the applicability of the recommendations to them.
5.5 Research contribution
5.5.1 Research contribution to theory
Productivity has been identified as one of the Key indicators of competitiveness in any
organisations. From the research and literature review, several factors affect productivity in
the manufacturing sector, hence different strategies have been employed to solve those
factors that negatively affect productivity. From the various literature reviewed, little has
been done on productivity improvement in leather industries, other than on waste
management and value addition. Therefore, the research has shown that productivity in
leather industries can be affected by unavailability of equipment and poor performance,
and that TPM principles and Lean manufacturing systems can be employed to improve
productivity in a tannery just like in other manufacturing sectors.
5.5.2 Research contribution to practice
In practice if the proposed improvement strategies are implemented in the tannery, there
will be an increase in productivity levels through increased equipment utilization levels,
reduced lead/cycle time, increased through-put levels, hence improved productivity as the
tannery will meet the customer /market demands. This in turn will lead to increase in the
contribution to national GDP, translating to improved living standards of the community
that is dependent on the tannery, by creation of job opportunities, reduction of poverty and
increase in social welfare. At the same time the implementation of TPM and Lean
principles will ensure a healthy and safe environment for the workers which will positively
motivate the workers and increase their productivity levels.

86
5.6 Future research
Further studies can be done on effects of optimising human resource as a measure of
productivity improvement in STL. Research on other tanneries in Kenya to find out the
applicability of the scenario to them is recommended.
REFERENCES Adriana, F. (2013). Application of Lean Concept in Optimization of Manufacturing Systems.
Advances in Production, Automation and Transportation Systems, 194-197.
Afriat, S. N. (1972). Efficiency Estimation of production Functions. International economic
Review, 13, 568-598.
Ahuja, K. K. (2006). Production management. Delhi: S.K.Jain-CBS Publishers and Distributors.
Akrani, G. (2013, June 3). kalyan-city.blogspot. Retrieved January 25, 2017, from kalyan-
city.blogspot: http://kalyan-city.blogspot.co.ke
Albliwi, S., & Antony, J. (2013). Implementation of a Lean Six Sigma Approach in the
Manufacturing sector: A systematic Literature Review. Proceedings of the 11th
International Conference on Manufacturing Research (ICMR2013). Glasgow -UK: ICMR.
Almeanazel, R., & Osama, T. ( 2010). Total Productive Maintenance Review and Overall
Equipment Effectiveness Measurement. Jordan Journal of Mechanical and Industrial
Engineering, Pages 517 - 522.
Anon. (2004). Special publication for meet in Africa. Ethiopian Leather Journal,1, 1.

87
ASQ. (2019, jan 19). American Society for Quality. Retrieved from ASQ: https://asq.org/quality-
resources/fishbone
Bekele, H. (2013). Continuous Improvement in Safety, Quality and Productivity of Crystal Tannery
S.Co. Addis Ababa.
Bhadury, B. (2000). Management of productivity through TPM. Productivity, Vol. 41, No. 2, 240-
251.
Blakstad, O. (2008, June 17). Research designs. Retrieved march 08, 2017, from Explorable.com:
https://explorable.com/research-designs
BLC Leather Technology, c. (2007). BLC Laether Technology centre. Retrieved from BLC Laether
http://www.all-about-leather.co.uk/index.htmTechnology centre: http://www.all-about-
leather.co.uk/what-is-leather/how-is-leather-made.htm
Botho, l. (2004). Opportunity in Kenyan Manufacturing-Future Trends in the World Leather and
Leather Products Industry and Trade. Nairobi.
Buljan, J., & Kral, I. (2012). Benchmarking in the tanning industry. United Nations Industrial
development organization, 1-83.
Carlo, F. D., Antonietta, M., Borgia, O., & Tucci, M. (2013). Layout Design for a Low Capacity
Manufacturing Line. A Case Study. International Journal of Engineering Business
Management Special Issue on Innovations In Fashion Industry, 35.
Chandrakar, J., & Kumar, R. (2015). Reduction of breakdowns in food processing plants through
Failure Analysis. International Journal of Advanced Engineering Research and Studies,
2249–8974.
Chen, T. (2013). A Systematic Cycle Time Reduction Procedure for Enhancing the
Competitiveness and Sustainability of a Semiconductor Manufacturer. Sustainability,
4637-4652.
Chumba, J., & W, D. (2017, june 29). STL Production manager and Supervisor. (E. Ntakira,
Interviewer)
Dandira, V. S., & Madanhire, I. (2013). Design of a Cleaner Production Framework to Enhance
Productivity: Case Study of Leather Company. International Journal of Science and
Research (IJSR), India Online,February; Vol:2, Issue 2, 2319-7064.
Desai, T. N., & Shrivastava, R. L. (2008). Six Sigma- A new direction to quality and productivity
management. Proceedings of the World Congress on Engineering and Computer Science
(pp. 978-988). San Francisco: WCECS.
Dossenbach, T. (2017, November 16). Management: Woodworking Network. Retrieved from
Woodworking Network Website: http://www.woodworkingnetwork.com
Dutta, A., & Banerjee, S. (2014). Review of Lean manufacturing issues and challenges in
manufacturing Process. Impact: International Journal of Research in Business
Management, 2347-4572.
Exor, & Data, V. (2017). The Complete Guide to Simple OEE”,. Retrieved from www.exor-
rd.com: http://www.exor-
rd.com/docs/vw121/5A55D3F673BC774EC1257481004B6C93/$file/The%20Complete%2
0Guide%20to%20Simple%20OEE.pdf

88
FAO, U. S. (2011). World statistical compendium for raw hides and skins, leather and leather
footwear 1992 – 2011. Viale delle Terme di Caracalla, Rome, Italy.: Commodities and
Trade division,.
Felice, F. D., Petrillo, A., & Monfreda, S. (2015). Improving Operations Performance with World
Class Manufacturing Technique A Case in Automotive Industry. 1-30.
Fursule, N. V., Bansod, S. V., & Fursule, S. N. (2012). Understanding the Benefits and Limitations
of Six Sigma Methodology. International Journal of Scientific and Research Publications,
2250-3153.
Gitachu, D. (2017, May 12). Hub pages Inc. Retrieved from ToughNickel: www.toughnickel.com
Gupta, P., & Vardhan, S. (2016). Optimizing OEE, productivity and production cost for improving
sales volume in an automobile industry through TPM: a case study. International Journal
of Production Research, 2976-2988.
Gupta, S., & Jain, S. K. (2013). A literature review of Lean manufacturing. International Journal
of Management Science and Engineering Management, 241-249.
Gupta, S., Gupta, R., & Tamra, R. (April 2007). Challenges Faced by Leather Industry in Kanpur.
Kanpur , India: Indian Institute of Technology Kanpur.
Hai, Q., & Dr.Jay, L. (2018, 02 8). Reliableplant. Retrieved from Reliableplant.com :
http://www.reliableplant.com/read/6971/downtime_trends
Hailemariam, M., & Yoseph, S. (2015). Improving Production Capacity through Efficient PPC
System: Lesson from Leather Manufacturing. World Academy of Science, Engineering and
Technology: International Journal of Industrial and Manufacturing Engineering, 1307-
6892, Vol: 9, No:2.
Heizer, J., & Render, B. (2014). Operations Management. England: Pearson Education , Inc.
Hekmatpanah, M., Sadroddin, M., Shahbaz, S., Mokhtari, F., & Fadavinia, F. (2008). Six Sigma
Process and its Impacts on the Organisational Productivity. World Academy of Science,
Engineering and Technology;International Journal of Economics and Management
Engineering, vol 2,No:7.
Hibband, S., Harrington, P., Norris, B., Resnick, R., Ronald, C., Sanders, R., . . . Vijayaraghavan,
A. (2011). Production Equipment Availability; A Measurement Guideline. 7901 Westpark
Drive, McLean: The Association for Manufacturing Technology-(AMT); Fourth edition.
Hines, P., & Rich, N. (1997). "The seven value stream mapping tools",. International Journal of
Operations & Production Management,, pp.46-64.
Hubert, & Bailey. (1980). productivity Measurement. Thetford, Norfolk, Great Britain: Lowe &
Brydone printes limited.
Hussein, M. S. (2014). Contributions of Hides /Skins in Sudan Economy: Value Chain analysis for
the sudanese leather sector. Economy and Finance.
Ihigroup. (2017). ihi.org/resourceS. Retrieved 03 10, 2017, from institute of healthcare
improvement:
http://www.ihi.org/resources/Pages/Tools/FailureModesandEffectsAnalysisTool
ILO. (1986). Introduction to Work Study. India: Universal Publishing Corporation.

89
IndustrGroup. (2015, November 2). Manufacturing Optimisation . Retrieved may 2, 2017, from
Industr. web site: http://www.industr.com/en/corporate-channel/rockwell-automation-
1433498/manufacturing-optimisation-695103
Itasca, D. (2016). [email protected]. Retrieved april 25, 2017, from Vorne Industries -
leanproduction: http://www.leanproduction.com
James F, R. (1976). Measuring capacity utilization in manufactring.
Jedrzejewski, J. (2007). Manufacturing Intelligent design and optimization processes. Journal of
Machine Engineering .
Jhamb, L. C. (2006). Production (Operations) Management. In J. L.C., Production (Operations)
Management (pp. 595-708). Pune: Everest Publishing House.
Jiamruangjarus, P., & Naenna, T. (2016). An integrated multicriteria decision-making methodology
for conveyor system selection. Cogent Engineering, Vol 3(1), 1-16.
John , S. R. (1993). Management for productivity, 4th edition. New York: Chichester Brisbane.
John, D., Qi, S., Samuel, H., Mousalam, R., Wang, G., & Ranganath, K. (2001). United States
Patent No. US 20040148047A1/ PCT/US01/49332.
Jovanovic, J. R., Milanovic, D. D., & Djukic, R. D. (2014). Manufacturing Cycle Time Analysis &
Scheduling to Optimize Its Duration. Journal of Mechanical Engineering, 512-514.
Kiran, M., Cijo, M., & Kuriakose, J. (2013,). Root Cause Analysis for Reducing Breakdowns in a
Manufacturing Industry. International Journal of Emerging Technology and Advanced
Engineering; Vol 3, Issue1, 2250-2459.
KLDC. (2016). http://www.leathercouncil.go.ke.
KNBS. (2012). Republic of Kenya economic survey for fiscal year 2012. Kenya National Bureau of
Statistics.
Kothari, C. (1990). Research Methodology Methods and Techniques. Jaipur.
Krishnan, V., & Parveen, M. ( 2013). Comparative Study of Lean Manufacturing Tools Used in
Manufacturing Firms and Service Sector. Proceedings of the World Congress on
Engineering (pp. Vol. 1, 978-988). London, U.K: WCE.
LeanGroup. (2018). What is lean. Retrieved from What is lean: https://www.whatislean.org
Levary, R. R. (1991). Productivity as a Measure of Manufacturing Performance: a Tutorial.
European Journal of Engineering Education, 159-169.
Li, J., Dennis, E., Huang, N., & Jeffrey, M. (2009). Throughput analysis of production systems:
recent advances and future topics. International Journal of Production Research, 3823-
3851.
Mahesh, S. R., Ette, H., Pierce, R., & Glory Cannon, P. D. (2005). "Six Sigma: concepts, tools, and
applications". Industrial Management & Data Systems, 491-505.
Mahto, D., & Kumar, A. (2008). Application of root cause analysis in improvement of product
quality and productivity. Journal of Industrial Engineering and Management, 16-53.

90
Mamo, T. (November 2011). Perfomance measurement and improvement for Ethiopian Tannery
Industries:Case study on Addis Ababa Tannery Share Company. Addis Ababa: Addis
Ababa University-Institute of Technology.
Mark, V., & White, G. (2004). Core concepts of Operations Management. USA: Wiley-leyh
publishing LLC.
Marsudi, M., & Shafeek, H. (2014). Cycle Time Analysis of Tipping Trailer Frame: A Case Study
in a Heavy Equipment Industry. South African Journal of Industrial Engineering, 176-188.
McKone, K. E., Schroeder, R. G., & Cua, K. O. (1999). The impact of total productive
maintenance practices on manufacturing performance. Journal of Operations Management
19, 39-58.
Memedovic, O., & Mattila, H. (2008). The global leather value chain: the industries, the main
actors and prospects for upgrading in LDCs. Int. J. Technological Learning, Innovation
and Development, Vol. 1, No. 4 ,February, pp.482–519.
Mendez, J., Morales, D., & Rodriguez, R. S. (2017). Total productive maintenance (TPM) as a tool
for improving productivity: a case study of application in the bottleneck of an auto-parts
machining line. International Journal of Advanced Manufacturing Technology, 1013-1026.
Moktadir, M., Ahmed, S., Fatema-Tuj-Zohra, & Sultana, R. (2017). Productivity Improvement by
Work Study Technique: A Case on Leather Products Industry of Bangladesh. Industrial
Engineering and Management, Vol:6, issue 1, 207.
Muchiri, P., & Pintelon, L. (2008). Performance measurement using overall equipment
effectiveness (OEE): literature review and practical application discussion. International
Journal of Production Research, 3517-3535.
Muchiri, P., Pintelon, L., Martin, H., & De Meyer, A.-M. (2010). 'Empirical analysis of
maintenance performance measurement in Belgian industries'. International Journal of
Production Research, 48: 20, 5905 — 5924.
Mudungwe, N. (2012). Kenya footwear cluster: Baseline analysis. . Nairobi: Common Market for
Eastern and Southern Africa Leather and Leather Products Institute (COMESA-ALLPI).
Mwinyihija, M. &. (2013). Review of challenges towards value addition of the leather sector in
Africa. Global Advanced Research Journal of Management and Business, 518-528.
Mwinyihija, M. (2010). Ecotoxicological diagnosis in the tanning industry. New York: Springer
Publisher. .
Mwinyihija, M. (2014). A Prognosis of the Leather Sector in Kenya- The upheavals and Antidotes
associated with Value creation. Business Management and Strategy vol 4(1), 21-29.
Mwinyihija, M. (2014). Evaluation of Productivity Responses from the Leather Value Chain Strata
in Kenya. Business Management and Strategy,December, 2157-6068.
Mwinyikione, M. (2014). Analysis of the Trading Regime of the Leather Value Chain Strata in
Kenya. Business Management and Strategy Vol. 5, No. 2, 1-20.
Nakajima, S. (1998). Introduction to Total Productive Maintenance (TPM). Cambridge: MA,
Productivity Press.

91
Naqvi, S. A., Fahad, M., Atir, M., Zubair, M., & Shehzad, M. M. (2016). Productivity
improvement of a manufacturing facility using systematic layout planning. Production and
Manufacturing; Cogent Engineering, issue 3, 1-13.
Naveen, B., & Ramesh, B. (2000). Productivity Improvement in Manufacturing Industry Using
Industrial Engineering Tools. IOSR Journal of Mechanical and Civil Engineering (IOSR-
JMCE), 11-18.
Nigel, S., Stuart, C., Robert, J., & Alan, B. (2009). Operations and Process Management-
principles nad practice for strategic impact. Edinburgh Gate: Pearson Education Limited.
Okpala, C. C., & Onyekachi, M. E. (2016). Benefits and Challenges of Total Productive
Maintenance implementation. International Journal of Advanced Engineering Technology,
196-200.
Organisation, A. P. (2015). Handbook for SME Productivity Measurement and Analysis for NPOs.
Tokyo, Japan: Asian Productivity Organisation.
Paul, C. (2009). Driving Continuous Improvement Through Delay Accounting; A White Paper.
Atlanta.: Schneider Electric.
Pavnaskar, S., Gershenson, J., & Jambekar, A. (2003). Classification scheme for lean
manufacturing tools. International Journal of Production Research, Vol: 41,3075–3090.
Performance. (2017). Performancetestingfun. Retrieved 2017, from
http://www.performancetestingfun.com/bottleneckanalysis/
Pomorski, T. (1997). Managing Overall Equipment Effectiveness [OEE]to Optimize Factory
Performance. JEEE , 2-4.
Prokopenko, J. (1999). Productivity Improvement a Practical Handbook, . New Delhi: Oxford &
Ibh Publishing Co.
ReliabilityTeam. (2017). ThinkReliability. Retrieved 2017, from ThinkReliability.blog:
https://www.thinkreliability.com/root-cause-analysis
Researchteam. (2017, March). university of southern carolina. Retrieved from
libguides.usc.edu/writingguide/researchdesigns:
http://libguides.usc.edu/writingguide/researchdesigns
Riley, G. (2012). Importance of productivity. England: Timetric, 20 may .
Rohaizan, R., Ngadiman, Y., Omar, S. S., & Yassin, A. M. ( 2015). Quantification of Machine
Performance Through Overall Equipment Effectiveness. International Symposium on
Technology Management and Emerging Technologies (ISTMET, 407-411.
Ryzin, V., & Garrett, J. (2008, Spring). columbia business school. Retrieved 03 10, 2017, from
https://www8.gsb.columbia.edu/caseworks
Sanjay, P., & NandKumar, H. (2007). „Industrial Engineering and Production and Operations
Management‟,. ElectroTech Publication, PP. 236.
Shanmugam, V., Guru, M., & Maran, M. (2015). Impact of TPM Implementation: Literature
Review and Direction. International Journal of Innovative Science & Technology, 2348-
7968.

92
Sharma, K., Pathania, M., & Lal, H. (2010). Value chain analysis and financial viability of agro-
processing industries in Himachal Pradesh. Agricultural Economics Research Review,,
515-522.
Singh, B., & Sharma, S. (2009). "Value stream mapping as a versatile tool for lean implementation:
an Indian case study of a manufacturing firm",. Measuring Business Excellence,Vol. 13
Issue: 3, pp.58-68.
Singh, R. K., Garg, S. K., & Deshmukh, S. (2008). Strategy development by SMEs for
competitiveness: a review. Benchmarking: An International Journal, Vol. 15 Issue: 5, 525-
547,.
Sixsigmagroup. (2017). isixsigma.com. Retrieved 03 10, 2017, from isixsigma.com:
https://www.isixsigma.com/tools-templates/cause-effect
Sohal, A., Olhager, J., O'Neill, P., & Prajogo, D. (2010). Implementation of OEE- Issues and
challenges. ResearchGate Publications.
Spring. (2011). A Guide to Productivity Measurement. Singapore: SPRING singapore.
Stevenson, W. J. (2009). Operations Management. Boston: McGraw-Hill Irwin.
Taj, S., & Berro, L. (2006). "Application of constrained management and lean manufacturing in
developing best practices for productivity improvement in an auto‐assembly plant.
International Journal of Productivity and Performance Management, Vol. 55 Issue: 3/4,,
pp.332-345.
Tarkesh, H., Atighehchian, A., & Nookabadi, S. A. (2009). Facility layout design using virtual
multi-agent system. Journal of Intelligent Manufacturing,vol:20, 347–357.
Teklemariam, M. (2004). Productivityy improvement in Ethiopian Leather industry through
Efficient Maintenance Management. Thesis .
Thanikaivelan, P., Rao, J. R., Nair, B. U., & Ramasami, T. (2005). Recent Trends in Leather
Making: Processes, Problems, and Pathways, Critical Reviews in Environmental Science
and Technology,. 35:1,, 37-79, .
The, Y., & Johnston, S. (2017). Benefits of Overall Equipment Effectiveness(OEE) Techniques in
Metal Mining Environment. NSW Australia: Schneider Electric(Australia) Pty Ltd.
UNIDO. (2010). Future Trends in the World Leather and Leather Products Industry and Trade.
Vienna: United Nations Industrial development Organization.
UNIDO, G. (2002). A Blueprint for the African leather industry: A development, investment and
trade guide for the leather industry in Africa. UNIDO GROUP.
Vascellari, A. (2014). AndreaVascellari.com. Retrieved from AndreaVascellari.com:
www.andreavascellari.com
Venkatesh, J. (2015, October 08). The Plant Maintenance Resource Center. Retrieved from EADT:
www.amazon.com
Veronesi, L., Kuban, M., Manenti, P., Parker, R., Holmes, C., & Doorly, J. (2014, January). IDC
Manufacturing insights Summit. Retrieved from IDC Manufacturing insights Summit:
www.infor.com

93
VivekPrabhu, M., Karthick, R., & Kumar, S. G. ( 2014). Optimization of Overall Equipment
Effectiveness in A Manufacturing System. International Journal of Innovative Research in
Science, Engineering and Technology, 1192-1196.
Vonderembse, M. A., & Gregory, P. (2004). Core Concepts of Operations Management. Hoboken:
John Wiley & Sons.
Wakjira, M. W., & Singh, A. P. (2012). Total Productive Maintenance: A Case study in
Manufacturing Industry. Global Journal of Researchers in Engineering Industrial
Engineering, 2249-4596.
WebFinance. (2017, may 24). WebFinance Inc. Retrieved may 2017
White, T., & Tanchoco, B. (2010). Facilities planning. USA: John Wiley and Sons.Inc.
Wikipedia. (2018, 8 2). Wikipedia.org. Retrieved from Wikimedia Foundation.Inc:
https://en.wikipedia.org/wiki/Capacity_utilization
World, Bank, & Group. (2015). Kenya Leather IndustryY -DIaGNosIs, sTraTEGy aND acTIoN
PlaN,June. Washington, DC 20433, USA,: World Bank Group, Economic and
Transformation Group -DFID and the Netherlands.
Wright, C. (2017). Reliableplant. Retrieved from Reliableplant: http://www.reliableplant.com
APPENDIX
1.Appendix 1: Sales data for a period of one year:
produ
ct
June
016
July
016
Aug
016
Sept
016
Oct
016
Nov
016
Dec
016
Jan
017
Feb
017
Mar
017
Apr
017
May
017
June
017
Fin
ish
ed
leat
her
sq
.
ft
92487.7
6
50790 25829.08 24823.85 14750 24309.5 20382 25518 25318.27 0 14163.22 23036 15944
Cru
st
leat
her
sq
.
ft
24.50 48.25 19.75 0 367 19.75 8.55 7.5 46.25 0 146.25 0 0
Nat
ura
l
glo
vin
g k
g 1671.1 4991.2 4474.4 2709.8 3865.8 6689.5 889.1 2500.7 1806.76 0 447.1 1091.4 2988.6

94
Off
cuts
kg 24642.3
5
13856.7 76.5 66.3 45.9 56.1 1798.6 97.92 125.46 0 37.06 76.67 55.25 W
et b
lue
kg
178914.
8
24323.6 403196.99 0 86810.5 117986.8 1660765.
57
0 0 0 0 143155.3 27949.7
To
tal
SQ
.
FT
297740.
51
94009.7
5
433596.72 27599.95 105839.
2
149061.6
5
189154.8
2
28124.12 27296.74 0 14793.63 167359.3
7
46937.55
Bat
ch i
npu
t
sq.
ft
263512.
5
232293.
1
206291.6 103006.4 142453.
2
162246.3 173838.6 173525.8 142181.2 10853
1.4
122158.6 178729.5 249092.5
Dif
f in
in
pu
t
and
ou
tpu
t
-
34228.0
1
138283.
35
-
227305.12
100246.4
5
36614 13184.65 -15316.22 145401.6
8
114884.4
6
107364.9
7
11370.13 202154.9
5
% o
f th
e ex
pec
ted
capac
ity
(400000) 74.44% 23.5% 108.4% 6.9% 26.5% 37.3% 421% 7.03% 6.8% 0% 3.7% 42% 11.7%
CO
ST
IN
K.S
HS
353074
9.01
317472
2.42
6606265.5
0
1337782 236228
2.00
2935371.
85
3584067.
6
2390591 2351633 0 1305905.
15
3552610.
00
1871746
2. Appendix 2: Summary of OEE factors rates
Availability Performance Quality OEE Availability Performance Quality OEE Availability Performance Quality OEE
June 016 41% 66% 100% 27% 13% 14% 100% 2% 41% 15% 100% 6%
July 016 37% 58% 100% 21% 17% 18% 100% 3% 89% 33% 100% 29%
Aug 016 30% 52% 100% 15% 3% 3% 100% 0% 36% 14% 100% 5%
Sept 016 15% 26% 100% 4% 10% 11% 100% 1% 82% 32% 100% 26%
Oct 016 25% 36% 100% 9% 9% 8% 100% 1% 44% 15% 100% 7%
Nov 016 24% 41% 100% 10% 10% 11% 100% 1% 56% 22% 100% 12%
Dec 016 29% 44% 100% 13% 20% 20% 100% 4% 34% 12% 100% 4%
Jan 017 27% 43% 100% 12% 27% 28% 96% 7% 39% 14% 100% 6%
Feb 017 24% 36% 100% 8% 16% 16% 100% 3% 56% 20% 100% 12%

95
Mar 017 16% 27% 100% 4% 9% 11% 100% 1% 50% 20% 100% 10%
Apri017 20% 31% 100% 6% 12% 12% 100% 1% 46% 16% 100% 7%
May 017 27% 45% 100% 12% 11% 13% 100% 1% 52% 20% 100% 10%
3. Appendix 3: Production time data
BEAM HOUSE
MACHINE
SECTION:
FINISHING
SECTION: Total A
vailab
le
time (m
in)
Desig
n
pro
ductio
n
time(m
in)
Desig
n
availab
ility
Pro
d tim
e
cycle(m
in)
Availab
ility
Pro
d tim
e
cycle(m
in)
Availab
ility
Pro
d tim
e
cycle(m
in)
Availab
ility
June 016 8820 8880 99.90% 3650.67 41% 1141.3 13% 3593.5 41%
July 016 8820 3218.16 37% 1459.1 17% 7863 89%
Aug 016 9660 2858 30% 242.85 3% 3426 36%
Sept 016 9240 1427.04 15% 921.44 10% 7591 82%
Oct 016 7980 1973.53 25% 699.6 9% 3517.4 44%
Nov 016 9240 2247.74 24% 940.4 10% 5185 56%
Dec 016 8400 2408.3 29% 1659 20% 2849 34%
Jan 017 8820 2404 27% 2342.1 27% 3468 39%
Feb 017 8400 1969.8 24% 1355.2 16% 4698.1 56%
March
017 9660 1503.58 16% 894 9% 4792 50%
April 017 8400 1692.4 20% 970.4 12% 3836.4 46%
May 017 9240 2476.1 27% 1019.4 11% 4771 52%
June 017 8820 3462.4 39% 1233.26 14% 4768 54%
Average 8884.615 8880 99.90% 2407.055 27% 1144.465 13% 4642.954 52%
4. Appendix 4: Interview schedules guiding questions:
Why-why analysis on frequency of breakdowns
i. Why frequent equipment breakdown?
ii. Why fails every time?
iii. Why repair only when they fail?
iv. Why is there no maintenance programme and no spare parts?
v. Why only one person trained and machines too old?
Why-Why analysis on low speeds causal factors;
i. Why low speeds of performance?
ii. Why slow material transfer between processes?
iii. Why delay in one process?
iv. Why machine breakdowns and failure?

96
5. Appendix 5: Raw company document with data to be extracted
a) Raw material records sample
b) Machining operations cycle time entry sample data
c) Beam house processing data

97
d) Raw data finishing section data entry