feasibility analysis for implementing gpr scanning system in sawmills for productivity improvement
TRANSCRIPT
International Journal of Advances in Management Science, Vol. 4 No. 1, July 2015 1
2169‐7558/15/01 001‐15, © 2015 DEStech Publications, Inc.
doi: 10.12783/ijams.2015.0401.01
Feasibility Analysis for Implementing GPR
Scanning System in Sawmills for Productivity
Improvement Dayakar Devaru1, Nishit Banuri2, Bhaskaran Gopalakrishnan3, Udaya Halabe4, Hasan H Latif*5
1,2,3,5 Department of Industrial Management & Systems Engineering, West Virginia University, WV, USA
4Department of Civil & Environmental Engineering, West Virginia University, WV, USA
[email protected]; [email protected]; [email protected]; [email protected], *[email protected]
Abstract
Non‐destructive scanning technologies have been applied to detect internal defects of logs to optimize log scanning. Research
has been done using many non‐destructive scanning technologies with limited success for real‐time implementation. The main
objective of this research is to identify the issues related to implementation of the Ground Penetrating Radar (GPR) scanning
system in sawmills for purposes of yield improvement.
The paper discusses the logistics on integration of the scanning system into the existing sawmill environment. The durability of
a scanning system in continuously operating sawmills and integrating the scanning system into existing sawmill operations
were identified as major research aspects. The paper also evaluates the economic feasibility of implementing the GPR scanning
system for three different size sawmill classes. Based on conservative estimates of revenue and initial costs, results indicate that
the investment would be feasible for all the three sawmill sizes.
Keywords
Sawmills, Wooden Logs, Cants, Ground Penetrating Radar (GPR), Productivity Improvement, Quality Improvement, Feasibility Study,
Sawmill Economics, Lumber value yield, Scanning, Lumber Grades, Non‐Destructive Testing
Introduction
Productivity is often defined as the ratio of output to input where output means the amount produced or the
number of items produced and input consists of various resources employed such as labor, material, capital and
services. For industries where the cost of raw material constitutes larger part of the cost of finished goods, higher
productivity can be achieved through efficient use of raw material [Khanna 2004]. The process of lumber
manufacturing has not changed over the years; a cylindrical log (raw material) goes in at one end of the mill and
gets transformed into lumber. The sawmill industry includes facilities engaged producing dimension lumber,
boards, timber, ties and woodchips from logs. The purpose of the research is to set boundary conditions for the
design of the commercialized GPR technology for identifying defects in logs for improving manufacturing yield
and to use sensitivity to analyze its economic feasibility. The objective of every organization is to maximize profits
and to continuously improve productivity.
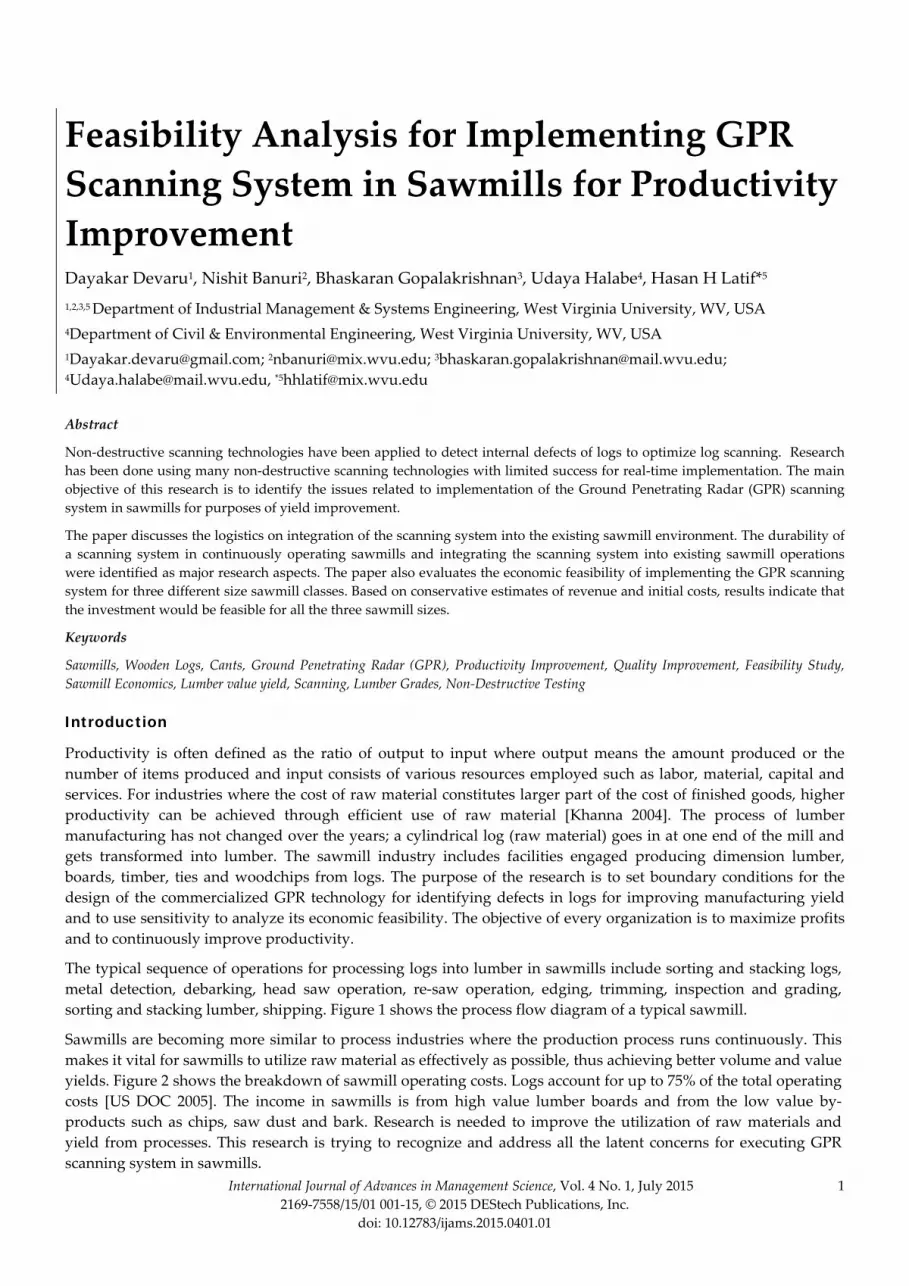
The typical sequence of operations for processing logs into lumber in sawmills include sorting and stacking logs,
metal detection, debarking, head saw operation, re‐saw operation, edging, trimming, inspection and grading,
sorting and stacking lumber, shipping. Figure 1 shows the process flow diagram of a typical sawmill.
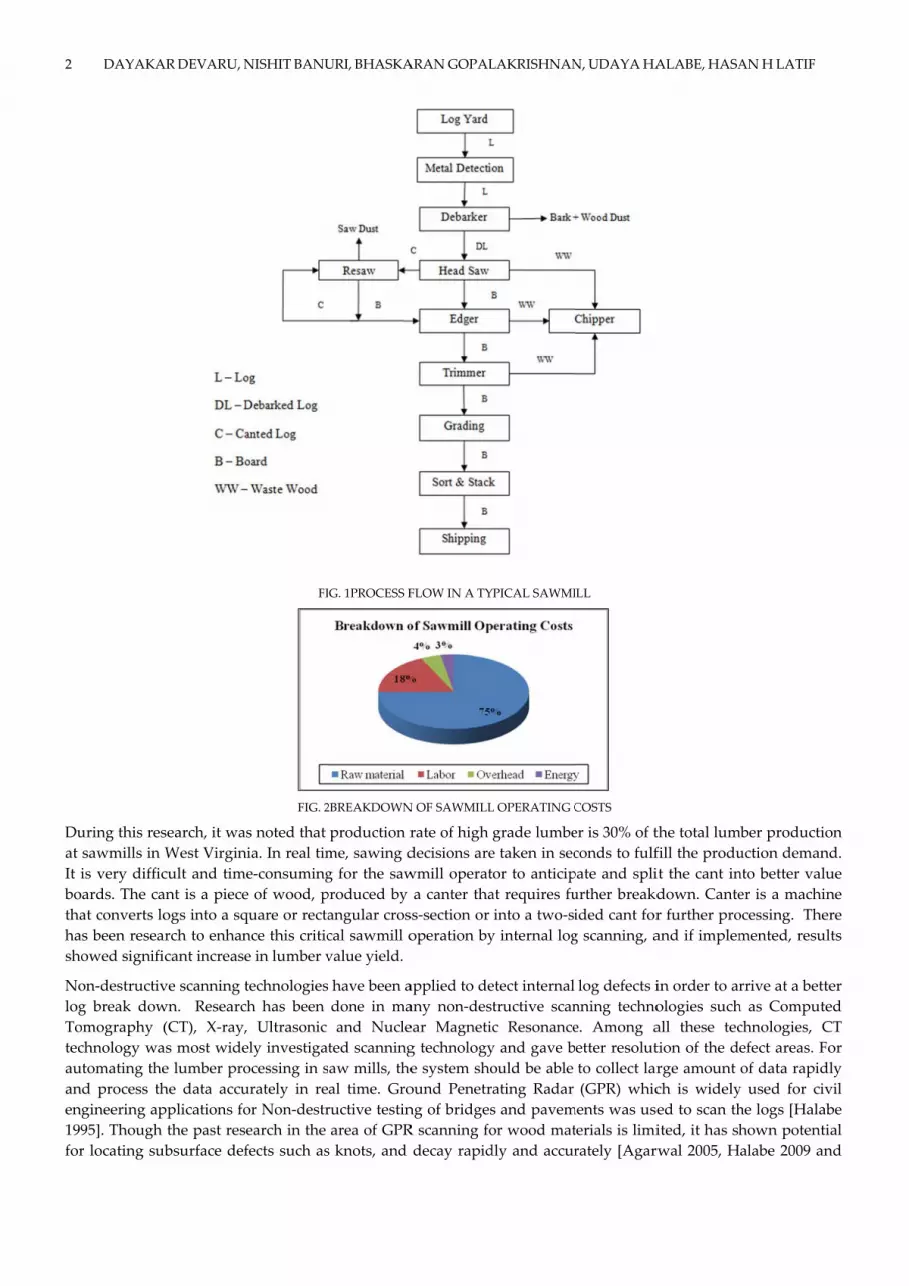
Sawmills are becoming more similar to process industries where the production process runs continuously. This
makes it vital for sawmills to utilize raw material as effectively as possible, thus achieving better volume and value
yields. Figure 2 shows the breakdown of sawmill operating costs. Logs account for up to 75% of the total operating
costs [US DOC 2005]. The income in sawmills is from high value lumber boards and from the low value by‐
products such as chips, saw dust and bark. Research is needed to improve the utilization of raw materials and
yield from processes. This research is trying to recognize and address all the latent concerns for executing GPR
scanning system in sawmills.
2
Du
at
It i
bo
tha
ha
sho
No
log
To
tec
au
an
eng
199
for
DAYAKA
uring this res
sawmills in
is very diffic
ards. The ca
at converts lo
s been resea
owed signifi
on‐destructiv
g break dow
mography (
chnology wa
tomating the
d process th
gineering ap
95]. Though
r locating su
AR DEVARU, N
search, it was
West Virgin
cult and time
ant is a piece
ogs into a sq
rch to enhan
cant increase
ve scanning t
wn. Researc
(CT), X‐ray,
as most wide
e lumber pro
he data accu
pplications fo
the past rese
ubsurface def
NISHIT BANU
FI
FIG. 2
s noted that
ia. In real tim
e‐consuming
e of wood, p
quare or recta
nce this critic
e in lumber v
technologies
h has been
, Ultrasonic
ely investigat
ocessing in s
urately in re
or Non‐destr
earch in the
fects such as
URI, BHASKA
G. 1PROCESS F
2BREAKDOWN
production r
me, sawing d
g for the saw
produced by
angular cros
cal sawmill o
value yield.
have been a
done in ma
and Nucle
ted scanning
aw mills, the
al time. Gro
ructive testin
area of GPR
s knots, and
ARAN GOPAL
FLOW IN A TY
N OF SAWMILL
rate of high
decisions are
wmill operat
a canter tha
ss‐section or
operation by
applied to de
any non‐dest
ear Magnetic
g technology
e system sho
ound Penetra
ng of bridges
R scanning fo
decay rapid
LAKRISHNAN
PICAL SAWMI
L OPERATING C
grade lumbe
e taken in sec
or to anticip
at requires fu
into a two‐si
y internal log
etect internal
tructive scan
c Resonance
y and gave b
ould be able
ating Radar
s and pavem
or wood mat
dly and accur
N, UDAYA HA
ILL
COSTS
er is 30% of t
conds to fulf
pate and spli
urther breakd
ided cant for
g scanning, a
log defects i
nning techno
e. Among a
etter resolut
to collect lar
(GPR) whic
ments was use
terials is limi
rately [Agarw
ALABE, HASA
the total lum
fill the produ
it the cant in
down. Cante
r further pro
and if implem
in order to ar
ologies such
all these tec
tion of the d
rge amount
ch is widely
ed to scan th
ited, it has sh
rwal 2005, H
AN H LATIF
mber producti
uction deman
nto better va
er is a mach
ocessing. Th
mented, resu
rrive at a bet
h as Comput
chnologies,
efect areas. F
of data rapid
y used for ci
he logs [Hala
hown potent
alabe 2009 a
ion
nd.
lue
ine
ere
ults
tter
ted
CT
For
dly
ivil
abe
tial
and

Feasibility Analysis for Implementing GPR Scanning System in Sawmills for Productivity Improvement 3
Pyakurel 2009].
Sarigul et al. [2006] presented a paper describing the importance of detecting internal hardwood defects in order to
improve the lumber grade. CT images were analyzed to locate several internal defects on different hardwood
species. The paper also considers defect dependent post‐processing methods, based on mathematical morphology.
Schad et al. [1996] investigated three non‐destructive techniques such as Sound wave transmission, x‐ray
computed tomography, and impulse radar for locating internal wood defects. The paper discusses the
implementation of each of these techniques and difficulties in interpreting radar scanned data. All three techniques
were able to detect the presence of knots but were not able to detect small areas which are of decay. Of these
techniques, Computed Tomography provided highest resolution for voids, knots and high moisture contents.
Muller [2002] performed tests on timber girders of diameter varying between 0.35m to 0.40m from an existing and
demolished bridge using various non‐destructive techniques such as GPR, gamma ray transmission, and
ultrasound techniques. Of these techniques, GPR was found to be the most reliable method for locating internal
defects. Kabir and Araman [2002] successfully conducted ultrasonic scanning experiments for detecting defects in
wood pallet parts using rolling transducers. The paper describes the importance of characterization of defects for
grading pallet parts. Decay has the greatest effect on the amplitude of the ultrasound signals. Bhandarkar et al.
[1998] presented a paper describing the design and implementation of computer vision based system for lumber
production planning. This paper discusses about identification and classification of internal log defects from
analyzing computer axial tomography images. The mathematical algorithm was capable of providing cutting
pattern that improved yield and grade of resulting lumber significantly. Bhandarkar et al. [2002] described a
prototype computer vision system for identification and localization of defects. The tests performed on CT images
of hardwood logs from White Ash, Hard Maple, Red Oak, and Black Walnut showed 23‐63% gain in value yield
recovery when compared to sawing strategy that did not use internal log defect information. In a related research,
Bhandarkar et al. [2008] described the design and implementation of an automated system for planning and
optimization of lumber production using Machine Vision and Computed Tomography. Optimal log sawing
algorithms were designed and implemented for live sawing, grade sawing and cant sawing. The algorithms
showed significant increase in value yield recovery but the execution times were not suitable for real time
implementation.
Agrawal [2005] of Department of Civil and Environmental Engineering at West Virginia University successfully
performed tests on wooden logs using Ground Penetrating Radar (GPR), to detect the internal defects such as rots,
knots, and metals in logs. Subsurface Interface Radar (SIR)‐20 GPR system manufactured by Geophysical Survey
Systems, Inc. (GSSI) and a ground coupled dipole antenna with central frequency of 900 MHz was used for data
acquisition. The scanned data was processed using RADAN 5.0® software. The study was successful in detecting
the defects with a depth resolution of within 4 cm and a length resolution of within 2 cm. Pyakurel [2009] of
Department of Civil and Environmental Engineering at West Virginia University successfully performed tests on
wooden logs and cants using GPR and explored different interpretation methods (2‐D and 3‐D imaging) to
identify defects accurately. Automated Scanning System was developed to automate the movement of scanning
system with respect to canted logs and study the effects of motor vibrations on GPR scanned data. Devaru [2006,
2008] of Department of Industrial and Management Systems Engineering at West Virginia University developed a
MATLAB® algorithm to process the GPR scanned data. The study was successful in detecting the defects such as
rot, knots and embedded metals and was also able to represent the defect location in X‐Y (distance–depth)
coordinates. Jadeja [2007] of Department of Industrial and Management Systems Engineering at West Virginia
University used defect detection algorithm from previous study [Devaru 2006] to develop a process plan that
generated a cutting sequence for sawing cant at re‐saw machine. The generated process plan was represented as
series of numbers that corresponded to the different faces of the cant. This process plan algorithm showed an
increase of 13 to 21 % in lumber value yield compared to conventional sawing sequence.
Schmoldt et al. [2000] in their paper discussed about the six design and operational constraints for industrial CT
scanners to become a viable reality. Schmoldt et al. discussed about important constraints such as scanning speed,
scanner duty cycle, harsh environment and effective application software which needed to be satisfied before
being implemented in sawmill environment. They also discussed the value gain realized from prototype testing of
CT scanner at medium sized facility in Austria.

4 DAYAKAR DEVARU, NISHIT BANURI, BHASKARAN GOPALAKRISHNAN, UDAYA HALABE, HASAN H LATIF
Occena [1991] stated that the advent of non‐invasive technological developments without integrating the
information involved would result in data overload for the human saw mill operator. This paper discusses about
the issues related to computer integration for various technologies such as scanning, edging, trimming and
grading available to hardwood sawmills. Occena described a model for computer integrated hardwood sawmill to
resolve issues related to the integration of hardware and software such as scanning, edging, trimming and
grading. Bowe et al. [2000] found that nearly 73% of the hardwood sawmills did not have any type of scanning and
optimization technology. They stated the reason for reluctance to adopt new technology might be the low available
capital in the sawmill industry. In a related research, Bowe and Smith [2006] analyzed the data collected through
personal interviews with two hardwood sawmill groups including one that had adopted scanning and
optimization technology and the other had not. They examined decision factors for adopting scanning and
optimization technology such as production improvements, maintenance issues and barriers in hardwood
sawmills. The components such as improved raw material recovery, increased production levels, increased lumber
revenues, improved lumber quality and improved lumber consistency were classified into “production
improvements” factor. The components such as initial cost, new mill installation and existing mill layout
restriction were classified into “barriers” factor. The adopters of scanning technology rated production
improvements as the most important decision factor whereas the non‐adopters rated barriers as the most
important decision factor. Schmoldt [1992] presented a paper describing the importance of Computer Integrated
Manufacturing (CIM) software that can exercise processing decisions with the information provided by the
scanning systems. He stated that the difficult aspect to automate sawmill operations would be the natural
variability and complexity of wood such as different species and defect types such as visual surface defects (e.g.
knots, holes, and splits), board geometry defects (e.g. warp, crook, thickness variation),and internal defects (e.g.
honeycomb splits). He also attributed the high capital investment and poor payback on investment as primary
reasons for reluctance to automation improvements.
The above literature review indicates that significant effort has been devoted to developing various nondestructive
technologies for use with wood based products. Non‐destructive scanning technologies such as Computed
Tomography (CT), X‐ray, ultrasonic, nuclear magnetic resonance, sound wave transmission, gamma ray
transmission and GPR were able to detect the defects. Among these scanning technologies CT was found to be
most widely investigated technology and give better resolution of defects. The execution speeds of various data
processing algorithms and cost involved were the major drawbacks for the CT scanning technology. The literature
review also discusses about the concerns of hardwood sawmill industries such as high initial cost, production and
maintenance issues to implement the scanning systems. Significant research has been done on using GPR scanning
systems to identify the defect location and to generate cutting sequence to obtain better grade lumber. GPR
scanning system also provided better resolution of defects and was found to be less expensive compared to CT
scanners. There is the scope for research to evaluate the technical requirements and economic feasibility for
implementing GPR scanning system in sawmills.
GPR Scanning System
The laboratory setup for GPR scanning was assembled by Agrawal [2005] (Figure 3a) who utilized the Subsurface
Interface Radar (SIR)‐20 system manufactured by Geophysical Survey System, Inc. (GSSI). The GPR system
consisted of a mainframe unit connected to a portable laptop computer. The laptop controls the GPR data
acquisition. The mainframe unit was connected to the antennas for transmitting and receiving the signals. GPR
scans were acquired using survey wheel mode. The survey wheel includes an optical encoder which transmits
distance information to the GPR data acquisition system using a connecting cable. The data collection parameters
such as scans/second and scans/meter were user‐specified inputs that respectively affected how many scans of
GPR data are collected in a second and how many scans are collected based on distance traveled. Other user
defined parameters include time range (ns), samples/scan and bits/sample that affected the sample depth and
resolution of the data, and the signal quality as well. The header file that contains input values must be entered by
the user every time before performing the scanning process.
Ground Coupled Antennas
The ground coupled antennas were used as they had the deeper penetrating ability. The antennas were mono‐

sta
in
bei
un
po
da
F
F
atic (both tran
a bi‐static m
ing debarked
nevenness of
ssible to the
mage to the
FIG. 3A GPR S
FIG. 4A RADAN
FIG. 5A DEFE
Feasibility Anal
nsmitter and
mode where
d) were used
bark on logs
e scanning su
antennas bu
SCANNING SY
N PROCESSED
CT DETECTION
lysis for Implem
d receiver on
one antenna
d for scannin
s is not suitab
urface for be
ut it is not fea
YSTEM [AGRAW
GPR DATA [A
N ALGORIGHT
menting GPR S
n one electron
a transmitted
ng during th
ble for groun
etter scan. M
asible to repla
WAL 2005]
GRAWAL 2005
TM [DEVARU 2
Scanning System
nic plug‐in i
d the signal
he research p
nd coupled a
Moreover the
ace antennas
FIG. 3B AUTO
5] F
2006]
m in Sawmills f
in a single an
and the oth
performed by
antennas bec
e uneven su
s frequently a
OMATED SCAN
FIG. 4B GPR DA
FIG. 5B PROC
for Productivity
ntenna housi
her one recei
y Agrawal [2
ause the ante
rface of the
as they are v
NNING SYSTEM
ATA PROCESSE
ESS PLAN ALG
ty Improvement
ing) but cou
ived it. Circ
2005] & Dev
ennas need t
bark on log
very expensiv
M ASSEMBLED
ED [DEVARU 2
GORITHM [JAD
t
ld also be us
ular logs (af
aru [2006]. T
to be as close
gs would cau
ve.
[PYAKUREL 2
2006]
DEJA 2007]
5
sed
fter
The
e as
use
2009]

6
Au
A
ant
eff
saw
or
of
GP
To
bac
att
rel
com
sho
act
coo
Pro
Th
op
wh
seq
can
ant
“sy
tw
det
dif
seq
inc
Ne
Int
the
DAYAKA
FIG. 5C C
utomated Sca
new scannin
tennas with
fects of moto
wmills, the a
the canted lo
motor vibrat
PR Data Pro
enhance the
ckground re
tenuation wi
liable as the
mpensates fo
own in Figur
tually implem
ordinates (Fi
ocess Plan A
hough the loc
erator to int
hich used th
quence in ter
nted logs w
tennas on ad
ynthesize da
wo antennas a
termined by
fference to a
quence (Figu
crease of 13 t
eed for Res
ternal defect
e ultimate va
AR DEVARU, N
CANT WITH M
anning Syste
ng setup (Fi
respect to ca
or vibration
antennas can
og can be sta
tions on acqu
ocessing
e features in
emoval and
th increasing
data near t
or amplitude
re 4a) which
ment it in s
igure 4b), MA
Algorithm
cations of de
terpret the d
he coordinate
rms of face n
were used fo
djacent faces
ata module” o
and find the
y subtracting
a standard d
ure 5d) in ter
to 21 % in lum
search
s such as kn
alue of the l
NISHIT BANU
MAPPED INTER
em Setup
igure 3b) wa
ants in order
on the acqu
n remain stat
ationary. The
uired GPR d
n the GPR sc
noise filter
g depth. Bec
the surface
e reduction
h needs an ex
sawmills. To
ATLAB® alg
efects by MA
defects and c
e matrices g
numbers. Th
r scanning.
of the canted
of the proces
e defect dime
g each X coo
delta value o
rms of face n
mber value y
nots, decays a
lumber. The
URI, BHASKA
RNAL DEFECTS
as developed
r to better si
uired GPR d
tionary and t
e research pe
ata quality.
can data, cer
ring were d
ause of atten
of the anten
with depth.
xpert to inter
process and
gorithm was
ATLAB® alg
cut the cant
generated by
his process p
The defect
d log to obtai
ss plan algor
ensions. The
ordinate of th
of 3 cm (Figu
numbers to g
yield compar
and rots in h
process of s
ARAN GOPAL
S FIG. 5D
d by Pyaku
imulate the s
data by Auto
the canted lo
erformed by
rtain post pr
done using
nuation, the
nna. RADAN
RADAN® p
rpret the def
d analyze th
developed b
gorithm were
into boards.
y defect dete
plan algorith
detection al
in coordinat
rithm was de
e defect clust
the matrix fr
ure 5c).Then
get the maxim
red to conven
hardwood lo
selling lumb
LAKRISHNAN
D CROSS SECTI
rel [2009] to
scanning ope
omated Scan
og can move
Pyakurel sh
rocessing ste
RADAN® s
information
N® software
processed da
fects; and mo
he data and
by Devaru [2
e in X‐Y coo
. Jadeja [200
ection algorit
hm was desig
lgorithm wa
e matrices (d
eveloped to p
ters were ma
rom its imm
n the process
mum yield. T
ntional sawin
ogs are of ma
er according
N, UDAYA HA
ION OF CANT
o automate t
eration in a r
nning System
e with respec
howed that th
ps such as r
software. Ra
at greater d
e allows dep
ata will be in
oreover it wo
to present t
006] in his re
rdinates, it w
7] developed
thm [Devaru
gned based o
as used to p
defects locati
process the c
apped into a
ediate prede
s plan algori
This process
ng sequence
ajor concern
g to grades i
ALABE, HASA
SHOWING SA
the moveme
real sawmill
m. In real tim
ct to antenna
here wouldn
range gain, z
adar signals
depths was n
pth depende
n the form o
would be time
the defects l
esearch (Figu
would take t
d an algorith
u 2006] to g
on re‐saw o
process the
ion in X‐Y co
coordinate m
a 3 dimensio
ecessor and
ithm genera
plan algorit
[Halabe et. a
as they actu
is intensifyin
AN H LATIF
WING SEQUEN
ent of the G
l and study t
me scanning
as on convey
n’t be any eff
zero correctio
s are prone
not as clear a
ent gain wh
of an image
e‐consuming
location in X
ure 5a).
time for re‐s
hm (Figure 5
give the cutti
peration as t
data from tw
oordinates). T
matrix data fro
onal model a
comparing t
ted the cutti
thm showed
al. 2011].
ually determ
ng the need
NCE
GPR
the
g in
yor,
fect
on,
to
and
hich
(as
g to
X‐Y
aw
5b)
ing
the
wo
The
om
and
the
ing
an
ine
for

Feasibility Analysis for Implementing GPR Scanning System in Sawmills for Productivity Improvement 7
sawmills to introduce new sawing techniques so that they will get best possible grades from the logs. Table 1
shows the average lumber prices by species, grade and thickness acquired from one of sawmills during this
research.
TABLE 1 LUMBERPRICES (USD) BYGRADE ANDTHICKNESS ($/1000 BOARDFT)
Lumber Grade Cherry Hard Maple Red Oak White Oak
4/4ʺ thickness boards
FAS / FAS – 1F / Selects $2,200 $2,000 $1,450 $1,400
No. 1 Common $1,380 $1,020 $960 $800
No. 2 Common $845 $620 $630 $550
6/4ʺ thickness boards
FAS / FAS – 1F / Selects $3,100 $2,950 $2,400 $2,300
No. 1 Common $1,850 $1,580 $1,700 $1,550
The fact that the raw material costs up to 75% of the total operating costs in sawmills makes it an economic
necessity to implement some type of NDT to improve lumber value yield. Based on a survey conducted [Smith
2004] in couple of mills in West Virginia and Pennsylvania which were two major hardwood lumber producers,
the production rate of high grade lumber (FAS/Selects) was less than 50%. This is due to the fact that the wood
processors are not able to identify the location of defects before actually sawing. And as the steps in sawing
process are irreversible, the loss involved in producing low grade lumber is also irrevocable. As a consequence
many mills are operating less than optimal profits. According to various surveys conducted to determine
hardwood research technology priorities [Milauskas 2005], one of the primary priorities was introduction of
automated defect detection and grading systems in sawmills.
Significant research has already been performed to address the scanning, processing, and analysis of the data and
generating the process plan for break‐down of cants. All this research was performed in a lab environment but the
critical issue was to integrate this scanning system technology into existing sawmill environment. Concerning such
as data acquisition, processing speeds, locating the scanner into existing sawmill layout and operations, and
impact on production parameters have to be addressed before implementing the scanning system.
To implement the GPR scanning system in sawmills, it is important to do feasibility studies. This research focuses
on determining and analyzing the potential issues for implementing GPR scanning system in sawmills. Technical
issues are often seen as primary focus of a feasibility study, but it is also important to analyze whether the project
is economically viable. This analysis will help to determine whether it is feasible or not to develop GPR scanning
system prototype and implement it in sawmills.
Feasibility Analysis
The GPR scanning system in sawmills must be able to operate up to 3 shifts, 5 days per week continuously. For
bridge deck and concrete evaluations, GPR was used only for certain periods of time, but sawmills would saw
hundreds and thousands of cants every day and they should be scanned in nearly a continuously manner. The
environmental noise which may be from nearby power lines, interference from any electromagnetic devices or
conductive materials such as conveyor system may contribute to errors in recorded scan data. Though the GPR
scanning systems which are used for surveying have the ability to collect data continuously, the reliability and
durability of the system in harsh sawmill environment would be a major concern. Further, the design of non‐
conductive conveyor system at the GPR scanning location would add to the cost and complexity of the scanning
system installed at sawmills.
The defect detection algorithm does not specify the type of defect, but identify the type of defect is important
because lumber grades depend on the type and length of the defect. Further research needs to be done to
differentiate the defect types based on the signal intensities by scanning logs of various species in each of the three
different log grades (FAS, Select, and Common). A better cutting sequence could be obtained by improved
estimation of third dimension of the defect which would require scanning cant from four faces [Jadeja 2007]. The
GPR data processing software could be developed by integrating enhanced defect detection and process plan
algorithms. GPR scan data is processed by applying the following major steps to generate cutting sequence that

8 DAYAKAR DEVARU, NISHIT BANURI, BHASKARAN GOPALAKRISHNAN, UDAYA HALABE, HASAN H LATIF
yield higher value lumber.
Converting radar data and processing individual antenna scan data by applying steps such as linear gain,
zero correction, signal clipping and filtering by using the defect detection algorithm.
Detection of internal defects in individual processed antenna scan data by applying threshold value concept
used by Devaru [2006]. Generating two‐dimensional coordinates for identified defects by using the defect
detection algorithm.
Integrating the coordinate matrix data obtained from processing scan data of individual antennas to
determine the defect dimensions. Boxing the defects using synthesize data module of process plan
algorithm.
Generating sawing sequence in terms of face numbers and thickness by integrating “compare face module”,
“grading module” developed by Jadeja [2007] with the cost module. A “cost module” should be used which
has the cost details of the lumber based on species, grade, and dimensions. This would allow the program
to generate the sequence based on the lumber value and not just only on the grade.
For real time implementation of a GPR scanning system, the processing time of algorithms would play an
important role. Therefore, the algorithm should have the capability to process the radar data from multiple
antennas simultaneously. This could be achieved by using Parallel Computing Toolbox™ in MATLAB® software.
The algorithm should take the data from sensors about the length, width and height of the cant to generate defect
location coordinates. Further research needs to be done to verify if the data acquisition toolbox can send the data
from GPR antennas directly into the algorithm. Figure 6shows the overview of the data acquisition system
components.
FIG.6 OVERVIEW OF DATA ACQUISITION SYSTEM COMPONENTS
The cants produced at the head saw will be conveyed to a buffer region before entering re‐saw conveyor loop. The
buffer region holds around 7 to 8 cants before they enter re‐saw conveyor system. These cants stay in the buffer
region while the cants which are already on the conveyor system are processed into boards. The re‐saw operator
flips the cants to the desired side every time when they arrive for re‐sawing. Therefore, the appropriate location
for the GPR scanning system would be the place before the cant enters the re‐saw conveyor system (Figure 7).
After scanning and processing, the process plan (or cutting sequence) would be generated for the cant, but it may
become difficult to track the cant and indicate the process plan to the re‐saw operator. It is proposed to have
equipment to tag the cant with barcode on one end and mark it with face numbers on the other end at this
location.
Advantages of having scanning system at this location:
Scanning process could be completed during the time that cants wait in the buffer region and would have
less impact on production output.
Sensor Signal
Conditioning
Acquisition
Hardware
Computer
Drivers
Physical Phenomena
MATLAB Data Acquisition System

On
the
sys
C+
bar
an
to
ter
a w
au
saw
ha
As
F
The sca
moving
cant. Th
acquisit
ne of the maj
e re‐saw and
stem which
++ and could
rcode could
d the other o
mark the fac
rms of face n
way similar t
tomatic cant
wing operati
s to interfere
s a part of thi
A cant o
It takes
saw con
For a ca
Ca
Feasibility Anal
anning proce
g the automa
his would a
tion process.
FIG. 7 TYPICA
jor concerns
d indicating t
tags each ca
d store the c
be tagged to
option is to u
ce numbers o
numbers. Figu
to the one sh
t flipping me
ion can be do
e every time t
is research, ti
of 10 feet tak
approximat
nveyor loop.
ant of size 8’
Cant Flippe
ant from head s
Buffer
Region
Cant
lysis for Implem
ess could be
ated setup w
also elimina
AL RE‐SAW LA
for real time
the process p
ant with a ba
cutting seque
o the cant in
use laser cod
on one end o
ure 8 shows
own in Figur
echanism ba
one easily wi
to locate the
ime study w
kes around 4
ely 60 second
’’ x 8’’ x 10’,
er
Boarsaw
Scanning Op
GPR Scanni
menting GPR S
e done as if
with multiple
ate synchron
AYOUT WITH A
FIG. 8 CAN
e implement
plan informa
arcode. The b
ence informa
n two ways: o
ders for print
f the cant wh
the sample c
re 8since the
ased on the p
ithout much
correct side
was performed
seconds for
ds for the can
, and board
Board
Ca
perator Cabin
ng System Loca
Scanning System
it is done a
e antennas (a
nizing the sc
APPROPRIATE
NT WITH FACE
tation of GPR
ation to the o
barcode can
ation for the
one is to use
ting the barc
hile scanning
cant with fac
e cant should
process plan
h interference
of the cant f
d on re‐saw
one cut.
nt to return b
thickness of
Board +
Re
ard Separator
ant Return
ation
m in Sawmills f
at a laborato
as the one de
canning syst
LOCATION FO
E NUMBERS
R scanning s
operator. So,
n be generate
e cant with
e automated
code on cant
g as the proc
ce numbers.
d have at leas
n stored in th
e of re‐saw op
or re‐sawing
operation at
back to re‐sa
1 inch, it w
+ Cant
e‐saw Operator
Cabin
Re‐saw
Barco
for Productivity
ory setting k
eveloped by
tem or conv
OR GPR SCANN
system would
it is necessa
ed using soft
generated b
barcode pri
directly. A s
ess plan (or c
The face num
st one face nu
he barcode c
perator. Oth
g based on pr
sawmill. Th
w head whe
ould take ar
Ba
ode and Process
Cant Flippin
ty Improvement
keeping the
y Pyakurel [2
veyor speed
NING SYSTEM
d be identify
ary to design
tware such a
barcode in a
inting and la
system shou
cutting sequ
mbers shoul
umber left til
can be deve
herwise, the r
rocess plan.
he findings ar
en there are 7
round 512 se
arcode Reader
s Plan Tagger
ng Mechanism
t
cant fixed a
2009]) along
d for GPR d
ying the cant
n and develop
as Visual Bas
database. T
abeling syste
uld be design
uence) will be
d be marked
ll the last cut
loped, then
re‐saw opera
re:
7 cants in the
econds to saw
9
and
the
data
t at
p a
sic,
This
ems
ned
e in
d in
t. If
re‐
ator
e re‐
w 8

10 DAYAKAR DEVARU, NISHIT BANURI, BHASKARAN GOPALAKRISHNAN, UDAYA HALABE, HASAN H LATIF
boards through re‐saw. Assuming the dimensions of all the 7 cants are same, it takes around 10 minutes to
complete the sawing process for a cycle.
During this time, another set of 7 to 8 cants would be waiting in the buffer region to enter re‐saw conveyor loop.
The GPR scanning and data processing of 7 to 8 cants should be completed within these 10 minutes or between 75
to 85 seconds for one cant to have no impact on the production output. The total time taken by the existing SIR‐20
GPR scanning system and the execution time of the algorithms is approximately around 175 seconds for each cant.
The distribution of 175 seconds for scanning a log and processing the data as per the tasks performed are shown
below.
1. Data Entry = 15 seconds
2. Scanning = 20 seconds
3. Data Conversion = 50 seconds (25 seconds x 2 scanned data files)
4. Defect Detection Algorithm = 60 seconds (30 seconds x 2 data files)
5. Process Plan Algorithm = 30 seconds
Assuming data entry and scanning are done in main frame computer and data conversion, defect detection and
process plan algorithm are run in individual personal computers, the cycle time will be around 60 seconds since
the defect detection algorithm takes the maximum time out of all the tasks. Programs can be written to transfer the
data from one computer to another and process it automatically. Programs can also be written to do parallel
processing of last 3 tasks in the same computer, but the computer might get overloaded due to parallel data
processing. While this cycle time of processing programs is going on, log scanning can be done with the log
sawing time and save some time. Also, currently data conversion and defect detection algorithms are processing
two files each and if this can be done in parallel, then cycle time can be further reduced. The GPR scanning speed
can further be increased by using new SIR‐30 control system.
Sensitivity Analysis
In this study, the feasibility of implementing GPR scanning system is evaluated for three different sawmill
capacities. Sawmill capacity of 4.5 Million Board Feet (MMBF) of lumber per year was the lowest among all the re‐
saw operation. Therefore, sawmills producing lumber of 5, 10 and 20 MMBF/yr are considered for this analysis.
In this research, GPR scanning system and process plan (cutting sequence) were based on scanning cants. Hence,
sawmill revenues generated through re‐saw operation is considered for analysis. For sawmills producing 5, 10 and
20 MMBF of lumber per year, approximately 3 MMBF/yr (60%), 5 MMBF/yr (50%) and 8 MMBF/yr (40%)
respectively were produced through re‐saw operation. The gross annual income through lumber produced at re‐
saw can be estimated by using the following equation.
Annual Income = 1 1 1
p q r
S T G GS T G
PL PL PL P TL
Where,
PLS = Percent of lumber species ‘S’
PLT = Percent of lumber thickness ‘T’ of species ‘S’
PLG = Percent of lumber grade ‘G’ of lumber thickness ‘T’ of species ‘S’
PG = Price of lumber grade ‘G’ of lumber thickness ‘T’ of species ‘S’
TL =Total Lumber produced at re‐saw
A sensitivity analysis was performed to study the potential impact of uncertainty in the initial assumptions. The
sensitivity of Net Present Value (NPV)was evaluated with respect to the changes in key factors such as initial
investments, lumber value yield, revenue, operating costs and scanner downtime for different sawmill
configurations. This was done by varying values of one assumption at a time while holding all the other
Feasibility Analysis for Implementing GPR Scanning System in Sawmills for Productivity Improvement 11
assumptions constant. Table 2 shows the initial assumptions made for different sawmill configurations. The
important assumption of implementation of GPR scanning system in sawmill will have 0% impact on production
output and will increase the lumber value yield by 10%. The initial investment for scanning system was estimated
as $300,000 for 5 MMBF size sawmill using estimated values for GSSI SIR‐30 control unit with four 1,600 MHz
antennas as $60,000 [GSSI 2011], installation of non‐conductive conveyor system, scanning set up, tagging and
tracking system and any additional modifications as $150,000, data processing software as $50,000and $40,000 for
any other additional equipment and training. For the sawmills producing 10 and 20 MMBF lumber, it was
assumed that they would need additional SIR control unit and antennas as the reliability of these systems is not
known in continuous operation sawmills. Hence, for these larger sized sawmills, initial cost was estimated to be
$400,000.
Fixed costs include management and administrative costs, maintenance expenses and insurance costs and these
costs are categorized as overhead expenses and it accounted for only 4% of total operating costs in a typical
sawmill in 2005 [US DOC 2005]. For this analysis, it was estimated that overhead expenses were 10% of the
installed GPR scanning equipment cost in sawmill producing 5 MMBF of lumber per year and 15% for sawmills
producing more than 5 MMBF/yr. Variable costs include the labor cost for GPR scanning operator and the
electrical costs for operating equipment related to the scanning process. The average hourly wage for production
worker was $15.74 in 2008 [US DOL 2010]. The scanning operator is considered to be skilled labor and the hourly
wage is assumed to be $30 including fringe benefits. The labor cost is estimated to be around $60,000 (8‐hr shift for
scanning operator for 250 working days a year) for a sawmill producing 5 MMBF of lumber per year. The electrical
costs are estimated to be no more than $1,500 per month, which translates to $18,000 per annum. The operating
cost of barcode tagging and process plan marking on the cant was estimated to be $2,500. Therefore, the total
operating costs are estimated to be around $110,500 for sawmill producing 5 MMBF of lumber per year. Similarly,
the variable operating costs for sawmills producing more than 5 MMBF of lumber (operating more than 1 shift) are
calculated and shown in Table 2.
TABLE 2 ASSUMPTIONSMADE FORDIFFERENTSAWMILLSIZES
Sawmill Size
(MMBF/yr)
Re‐saw Output
(MMBF/yr)
Revenue through Re‐saw
($)*
Initial Investment
($)*
Operating Costs
($)*
Increase in Annual
Income ($/yr)*
5 3 2,652,450 300,000 110,500 265,245
10 5 4,420,750 400,000 208,500 442,075
20 8 7,073,200 400,000 251,500 707,320
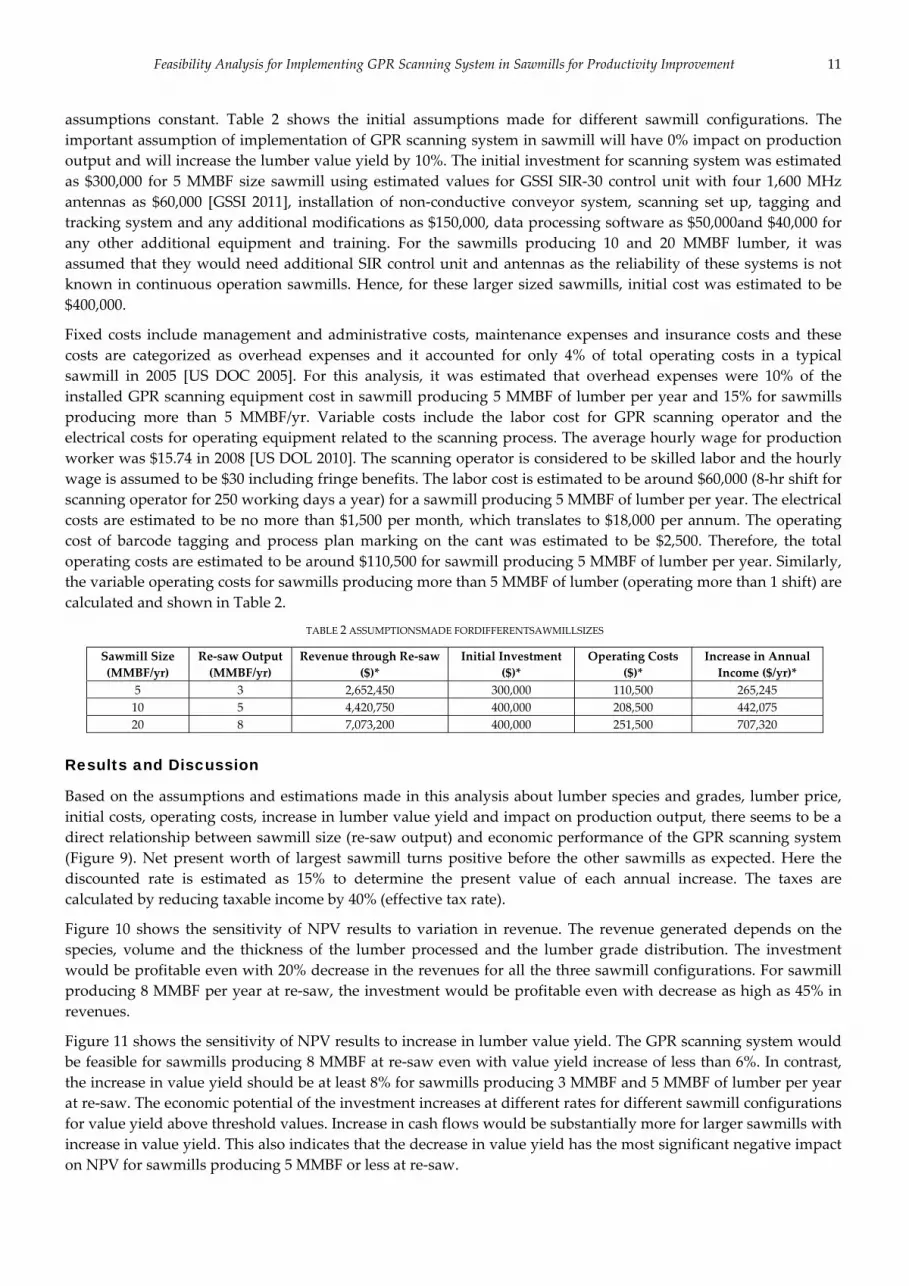
Results and Discussion
Based on the assumptions and estimations made in this analysis about lumber species and grades, lumber price,
initial costs, operating costs, increase in lumber value yield and impact on production output, there seems to be a
direct relationship between sawmill size (re‐saw output) and economic performance of the GPR scanning system
(Figure 9). Net present worth of largest sawmill turns positive before the other sawmills as expected. Here the
discounted rate is estimated as 15% to determine the present value of each annual increase. The taxes are
calculated by reducing taxable income by 40% (effective tax rate).
Figure 10 shows the sensitivity of NPV results to variation in revenue. The revenue generated depends on the
species, volume and the thickness of the lumber processed and the lumber grade distribution. The investment
would be profitable even with 20% decrease in the revenues for all the three sawmill configurations. For sawmill
producing 8 MMBF per year at re‐saw, the investment would be profitable even with decrease as high as 45% in
revenues.
Figure 11 shows the sensitivity of NPV results to increase in lumber value yield. The GPR scanning system would
be feasible for sawmills producing 8 MMBF at re‐saw even with value yield increase of less than 6%. In contrast,
the increase in value yield should be at least 8% for sawmills producing 3 MMBF and 5 MMBF of lumber per year
at re‐saw. The economic potential of the investment increases at different rates for different sawmill configurations
for value yield above threshold values. Increase in cash flows would be substantially more for larger sawmills with
increase in value yield. This also indicates that the decrease in value yield has the most significant negative impact
on NPV for sawmills producing 5 MMBF or less at re‐saw.
12
Fig
do
of
Th
MM
Fig
20%
pro
op
Fig
do
$15
Am
im
DAYAKA
FIG. 9 D
FIG. 11 NP
FIG
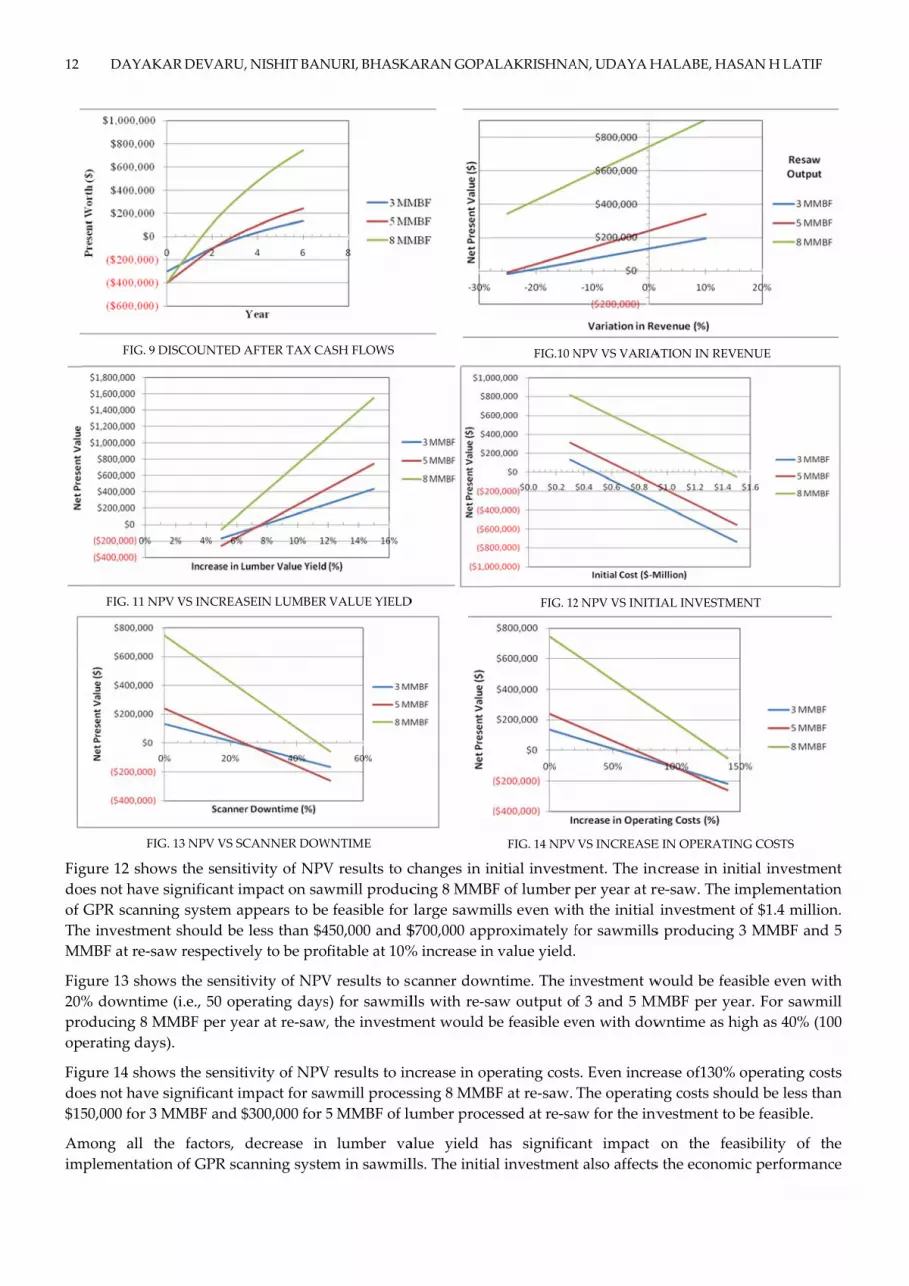
gure 12 show
es not have s
GPR scannin
he investmen
MBF at re‐sa
gure 13 show
% downtime
oducing 8 M
erating days
gure 14 show
es not have s
50,000 for 3 M
mong all th
mplementation
AR DEVARU,
DISCOUNTED A
PV VS INCREAS
G. 13 NPV VS SC
ws the sensit
significant im
ng system ap
nt should be
aw respective
ws the sensiti
e (i.e., 50 ope
MMBF per ye
s).
ws the sensiti
significant im
MMBF and $
he factors, d
n of GPR sca
, NISHIT BAN
AFTER TAX CA
SEIN LUMBER
CANNER DOW
tivity of NPV
mpact on saw
ppears to be
less than $4
ely to be prof
ivity of NPV
erating days
ar at re‐saw,
ivity of NPV
mpact for saw
$300,000 for 5
decrease in
anning system
NURI, BHASKA
ASH FLOWS
VALUE YIELD
WNTIME
V results to c
wmill produc
feasible for
50,000 and $
fitable at 10%
V results to s
) for sawmil
, the investm
V results to in
wmill proces
5 MMBF of lu
lumber va
m in sawmil
ARAN GOPA
D
changes in in
cing 8 MMBF
large sawm
$700,000 app
% increase in
canner down
lls with re‐sa
ment would b
ncrease in op
ssing 8 MMB
umber proce
alue yield h
lls. The initia
ALAKRISHNA
FIG.10 N
FIG. 12
FIG. 14 NPV
nitial investm
F of lumber
ills even wit
proximately f
n value yield.
ntime. The in
aw output o
be feasible ev
perating costs
BF at re‐saw.
essed at re‐sa
has significa
al investment
AN, UDAYA H
NPV VS VARIA
2 NPV VS INITI
VS INCREASE
ment. The in
per year at re
th the initial
for sawmills
nvestment w
f 3 and 5 MM
ven with dow
s. Even incre
The operatin
aw for the inv
ant impact
t also affects
HALABE, HAS
ATION IN REVE
IAL INVESTME
E IN OPERATIN
ncrease in ini
re‐saw. The im
investment
s producing
would be fea
MBF per yea
wntime as hi
ease of130%
ng costs shou
vestment to
on the fea
s the econom
SAN H LATIF
ENUE
ENT
NG COSTS
itial investme
mplementati
of $1.4 millio
3 MMBF and
sible even w
ar. For sawm
igh as 40% (1
operating co
uld be less th
be feasible.
asibility of t
mic performan
F
ent
ion
on.
d 5
with
mill
100
osts
han
the
nce

Feasibility Analysis for Implementing GPR Scanning System in Sawmills for Productivity Improvement 13
of the scanning system for sawmills producing 3 MMBF and 5 MMBF of lumber per year at re‐saw. The results
indicate that sawmills produce 8 MMBF or more at re‐saw would have least amount of risk and highest possible
return on investment (ROI) from installation of GPR scanning system.
Conclusions
This study investigated the feasibility of implementing GPR scanning system in sawmills. The technical
requirements for GPR scanning system and the data processing software were analyzed. The durability of
scanning system in continuously operating sawmills, and integrating scanning system into existing sawmill
operations were identified as major technical concerns for implementing GPR scanning system. GSSI SIR‐30
control unit has the ability to collect radar data from four channels at higher speeds compared to SIR‐20 control
unit. The scan data from four antennas would enhance the internal defect information but processing time of the
algorithms might increase. The introduction of quad‐core processors which has the 8‐way multi‐tasking
capabilities and the parallel computing techniques in MATLAB® software would help in processing the data from
four antennas simultaneously which would significantly reduce the execution times of processing algorithms.
The location for GPR scanning setup has been identified to be the place just before the cants entering re‐saw
conveyor loop. A method to track the cants after scanning and indicate the process plan to re‐saw operator has
been proposed. The automated flipping of cant without the intervention of re‐saw operator has been investigated,
but it is not possible with the current barcode technologies and the major concern would be cants following one
another in quick succession at re‐saw. Time study with the proposed scanning location indicated that the scanning
and data processing time should be kept to approximately less than 75 seconds. The log scanning time and the
processing times of algorithms developed by Devaru [2006] and Jadeja [2007] were less than 75 seconds and hence
GPR scanning could be easily integrated into sawmill operation to improve lumber value yield. But identifying
defect types (i.e., rot, knot) would be crucial to obtain a better cutting sequence as these defects effect the grades
and value of the lumber produced.
This study also investigated the economic feasibility of implementing GPR scanning system for three different size
based sawmill configurations. Based on the conservative estimates of revenues and costs, the GPR scanning system
seems feasible for all the sawmill configurations. Sensitivity analysis indicates that the decrease in lumber value
yield has the greatest impact on economic potential. The initial cost is also a major factor for small and medium
sized sawmills. Scanning cants using GPR technology appears to be promising and warrants further research to
make it a viable reality.
Future work for this research would be to actually simulate the GPR scanning operation under sawmills
conditions such as continuous data collection on cants to test its durability. Further research needs to be done on
barcode readers to integrate it with flipping mechanism and re‐saw operation. Research should be done to test the
signal quality at different sampling rate and at higher data acquisition speeds using SIR‐30 control unit. Scanning
should be performed on cants of different species and grades to know how it increases in value yield vary by
species and log grades.
REFERENCES
[1] Agrawal, S., “Nondestructive Evaluation of Wooden Logs Using Ground Penetrating Radar” M.S. Thesis, Department of
Civil and Environmental Engineering, West Virginia University, Morgantown, WV, 2005.
[2] Bhandarkar, S.M., Faust, T.D., Tang, M., “Design and Prototype Development of a Computer Vision Based Lumber
Production Planning System”, Image and Vision Computing 20, Elsevier Science, pp. 167‐189, 2002.
[3] Bhandarkar, S.M., Faust, T.D., Tang, M., “A Computer Vision System for Lumber Production Planning”, 4th IEEE Workshop
on Applications of Computer Vision (WACVʹ98), pp 134‐139, 1998.
[4] Bhandarkar, S.M., Luo, X., Daniels, R.F., Tollner, E.W., “Automated Planning and Optimization of Lumber Production
Using Machine Vision and Computed Tomography”, IEEE Transactions on Automation Science and Engineering, 5(4), pp 677‐
695, 2008.

14 DAYAKAR DEVARU, NISHIT BANURI, BHASKARAN GOPALAKRISHNAN, UDAYA HALABE, HASAN H LATIF
[5] Bowe, S., Smith, R., Araman, P., Kline, E.D., “Use of Advanced Sawmill Equipment, and Desired Features for Next‐
Generation Systems”, Proceedings of the Twenty‐Eighth Annual Hardwood Symposium, pp 131‐140, 2000.
[6] Bowe, S.A., Smith, R.L., “Modeling Technology Adoption in the Hardwood Sawmill”, Wood and Fiber Science, 38(3), pp 484‐
496, 2006.
[7] Devaru, D., “Ground Penetrating RADAR (GPR) based System for Nondestructive Detection of Interior Defects in
Wooden Logs”, M.S. Thesis, Department of Industrial and Management Systems Engineering, West Virginia University,
Morgantown, WV, 2006.
[8] Devaru D, Halabe UB, Gopalakrishnan B, Agrawal S (2008) “Ground penetrating radar (GPR) based system for
nondestructive detection of interior defects in wooden logs”. Int. J. of Manufacturing Research, 2008 Vol.3, No.4, pp.425 ‐ 451
[9] Geophysical Survey Systems, Inc. website as on 2011, http://www.geophysical.com/
[10] Halabe, U.B., Petro, S.H., GangaRao, H.V., “Nondestructive Evaluation Methods for Highway Bridges Superstructures”,
CFC 95‐215, Constructed Facilities Center, Department of Civil and Environment Engineering, West Virginia University,
Morgantown, WV, 1995.
[11] Halabe UB, Agrawal S, Gopalakrishnan B (2009) “Nondestructive evaluation of wooden logs using ground penetrating
radar”. Nondestructive Testing and Evaluation, 24(4):329–346
[12] Halabe UB&GopalakrishnanB &Jadeja J, “Advanced lumber manufacturing model for increasing yield in sawmills using
GPR‐based defect detection system”, Int J AdvManufTechnol (2011) 56:649–661
[13] Jadeja, J., “A model for increasing yield in sawmills based on the detection of subsurface defects in canted logs using
Ground Penetrating Radar (GPR) system”, M.S. Thesis, Department of Industrial and Management Systems Engineering,
West Virginia University, Morgantown, WV, 2007.
[14] Kabir, M.F., Araman, P.A., “Nondestructive Evaluation of Defects in Wooden Pallet Parts by Ultrasonic Scanning”,
Proceedings of 13th International Symposium on Nondestructive Testing of Wood, August 19‐21, 2002.
[15] Khanna, O.P., “Industrial Engineering and Management”, Chapter 2, Production and Productivity, pp 2.1‐2.11, Revised
Edition, Dhanpat Rai Publications (P) Ltd., 2004.
[16] Kline, E.D., Araman, P.A., Chris, S., “Evaluation of an Automated Hardwood Lumber Grading System”, Proceedings of
ScanTech, 2001 International Conference, Seattle, Washington, USA.
[17] Milauskas, S.J., Anderson, R.B., McNeel, J.F., “Hardwood industry research priorities in West Virginia”, Forest Products
Journal, 55(1), pp 28‐32, 2005.
[18] Muller, W., “Trial of Ground Penetrating Radar to Locate Defects in Timber M Bridge Girders”, Queensland Department
of Main Roads, Brisbane, Australia, 2002.
[19] Occena, L.G., “Computer Integrated Manufacturing Issues Related to the Hardwood Log Sawmill”, Journal of Forest
Engineering, 3(1), pp 39‐45, 1991
[20] Pyakurel, S., “2D and 3D GPR Imaging of Wood and Fiber Reinforced Polymer Composites”Ph.D. Dissertation, Department
of Civil and Environmental Engineering, West Virginia University, Morgantown, WV, 2009
[21] Sarigul, E., Abbott, A.L., Schmoldt, D.L., Araman, P.A., “An Interactive Machine‐Learning Approach for Defect Detection
in Computed Tomography (CT) Images of Hardwood Logs”, Proceedings of ScanTech 2005, The Eleventh International
Conference on Scanning Technology and Process Optimization in the Wood Industry, pp 15‐26, 2006
[22] Schad, K.C., Schmoldt, D.L., Ross, R.J., “Nondestructive Methods for Detecting Defects in Softwood Logs”, Research Paper
FPL‐RP‐546, Forest Products Laboratory, US Department of Agriculture, Madison, WI, 1996.
[23] Schmoldt, D.L., “Automation for Primary Processing of Hardwoods”, Statistical Methods, Mathematics and Computers,
Proceedings of the Meeting of IUFRO, pp 103‐112, 1992.
[24] Schmoldt, D.L., Scheinman, E., Rinnhofer, A., Occena, L.G., “Internal Log Scanning: Research to Reality”, Proceedings of the
Twenty‐Eighth Annual Hardwood Symposium, pp 103‐114, 2000.

Feasibility Analysis for Implementing GPR Scanning System in Sawmills for Productivity Improvement 15
[25] Smith, P.M., Dasmohapatra, S., Luppold, W.G., “A Profile of Pennsylvania’s Hardwood Sawmill Industry”, Forest Products
Journal, 54(5), pp 43‐49, 2004.
[26] US Census Bureau, Department of Commerce, “Statistics for Industry Groups and Industries‐2005”, M05 (AS)‐1, Issued
November 2006.
[27] US Census Bureau, Department of Labor, “Productivity and Costs”, Website as on February 2010. http://www.bls.gov/lpc/
DayakarDevaruis a Ph.D candidate at Industrial and Management Systems Engineering department ofWest Virginia
University. He received his Bachelor’s in Mechanical Engineering from University of Mysore in 1998 and Master’s in Industrial
Engineering from West Virginia University in 2006. He is a ‘Certified Energy Manager’ from ‘Association of Energy Engineers’
and a qualified specialist of ‘Process Heating Assessment and Survey Tool’ from US Department of Energy. He has received
‘Outstanding Industrial Assessment Center Engineering Student’ award for the year 2014 from US Department of Energy. He
worked on developing an Algorithm to detect defects in wooden logs using ground penetrating radar for his Master’s thesis
and currently working on Predicting Energy Intensity in Wood Processing Sawmills based on Analysis of Product, Process and
System parameters for his Ph.D dissertation. He is also an ‘Engineering Intern’ from ‘West Virginia Board of Registration for
Professional Engineers’.
NishitBanuri is working as a project engineer at Casco, USA. He was a graduate student from the Department of Industrial and
Management Systems Engineering (IMSE) at West Virginia University (WVU). During his Master’s program, he was also a part
of the research assistant team at WVU’s Industrial Assessment Center (IAC) funded by the US DOE. Mr. Banuri obtained his
M.S. degree in Industrial Engineering from the IMSE department at West Virginia University.
BhaskaranGopalakrishnan is a Professor of Industrial and Management Systems Engineering (IMSE) at West Virginia
University (WVU) and Director of the Industrial Assessment Center (IAC) funded by the US DOE. Through the IAC and as a
private consultant, he has conducted numerous industrial and energy assessments as well as plant wide energy assessments for
manufacturing facilities and has published widely in this field. Dr. Gopalakrishnan obtained his B.E. (Hons) degree in
Production Engineering from the College of Engineering at Guindy, University of Madras, India, M.S. degree in Operations
Research from Southern Methodist University, and Ph.D degree in Industrial Engineering and Operations Research from
Virginia Tech. He is a Certified Energy Manager (CEM) certified by the Association of Energy Engineers, Atlanta, Certified
Practitioner in Energy Management Systems (CPEnMS), and a US DOE Qualified AirMaster+ Specialist, SSAT Qualified
Specialist, FSAT Qualified Specialist, PSAT Qualified Specialist, and a PHAST Qualified Specialist. He is a registered
Professional Engineer (PE) in the State of West Virginia. His areas of research interest are industrial energy conservation, waste
reduction, and productivity improvement.
Udaya B. Halabe is a Professor of Civil and Environmental Engineering at West Virginia University, Morgantown, WV. He
received his B.E. degree in Civil Engineering from University of Roorkee, India in 1984, and M. Tech. degree in Civil/Structural
Engineering from the Indian Institute of Technology (IIT) Kanpur, India in 1985. He received M.S. and Ph.D. degrees in
Civil/Structural Engineering from the Massachusetts Institute of Technology (MIT) in 1988 and 1990, respectively. He also
received M.S. degree in Management from MIT in 1990. He is a Fellow of the American Society of Civil Engineers (ASCE), the
Structural Engineering Institute (SEI) and the American Society for Nondestructive Testing (ASNT), and member of the
American Concrete Institute (ACI) and the American Society for Engineering Education (ASEE). He has received the Statler
College Outstanding Teacher Award for 2009‐2010 and numerous teaching awards from the CEE Department. In 2012, he
received the James M. Robbins National Excellence in Teaching Award presented by Chi Epsilon, the National Civil
Engineering Honor Society. He is a member of two honorary societies, Chi Epsilon and Tau Beta Pi. Dr. Halabe has over
twenty‐five years of research and field testing experience in the area of nondestructive testing and evaluation of civil
infrastructure. He has published over 100 technical papers and over 40 research reports in the area of nondestructive evaluation
of timber, steel, concrete, and composite structural components. His expertise includes the use of several nondestructive testing
techniques such as ground penetrating radar, infrared thermography, ultrasonics, and vibration based technologies.
Hasan H. Latifis a graduate student in Industrial and Management Systems Engineering Department (IMSE) of West Virginia
University (WVU). He is playing a significant role as a research assistant in the Industrial Assessment Center (IAC) funded by
US DOE. His research interest includes energy efficiency, sustainable manufacturing, and operations management. He achieved
BSc. in Industrial and Production Engineering (IPE) from Bangladesh University of Engineering and Technology (BUET) where
he served as a lecturer also. He is a certified six sigma green belt holder from American Society of Quality (ASQ). He is affiliated
with Institute of Industrial Engineers (IIE), Society of Manufacturing Engineer (SME), Alpha Pi Mu, Project Management
Institute (PMI), and American Society of Quality (ASQ).