scanning calorimetry - ncbi
TRANSCRIPT
Theoretical analysis of Lumry-Eyring models in differentialscanning calorimetry
Jose M. Sanchez-RuizDepartamento de Quimica Fisica (Facultad de Ciencias) e Instituto de Biotecnologia, Universidad de Granada,18071 Granada, Spain
ABSTRACT A theoretical analysis of several protein denaturation models (Lumry-Eyring models) that include a rate-limited stepleading to an irreversibly denatured state of the protein (the final state) has been carried out. The differential scanning calorimetrytransitions predicted for these models can be broadly classified into four groups: situations A, B, C, and C'. (A) The transition iscalorimetrically irreversible but the rate-limited, irreversible step takes place with significant rate only at temperatures slightly abovethose corresponding to the transition. Equilibrium thermodynamics analysis is permissible. (B) The transition is distorted by theoccurrence of the rate-limited step; nevertheless, it contains thermodynamic information about the reversible unfolding of theprotein, which could be obtained upon the appropriate data treatment. (C) The heat absorption is entirely determined by thekinetics of formation of the final state and no thermodynamic information can be extracted from the calorimetric transition; therate-determining step is the irreversible process itself. (C') same as C, but, in this case, the rate-determining step is a previous stepin the unfolding pathway. It is shown that ligand and protein concentration effects on transitions corresponding to situation C(strongly rate-limited transitions) are similar to those predicted by equilibrium thermodynamics for simple reversible unfoldingmodels. It has been widely held in recent literature that experimentally observed ligand and protein concentration effects supportthe applicability of equilibrium thermodynamics to irreversible protein denaturation. The theoretical analysis reported here disfavorsthis claim.
INTRODUCTION
Equilibrium thermodynamics analysis of differential scan-ning calorimetry (DSC)1 thermograms corresponding toreversible denaturation of proteins, provides detailedinformation about the energetics and mechanism of thereversible unfolding (Privalov, 1979, 1982, and 1989).Thus, it is possible to check the two-state character ofthe process and, in the case of non-two-state unfolding,to determine the number and to develop a thermody-namic characterization of the intermediate states signif-icantly populated during unfolding (Freire and Bil-tonen, 1978). In addition, complex DSC thermogramscan also be interpreted in terms of the more or lessindependent unfolding of protein domains (Privalov,1982 and 1989); it has been recently shown (Brandts etal., 1989; Ramsay and Freire, 1990) that thermodynamicinformation on domain-domain interactions can beobtained from the thermograms.The above types of analysis are based on equilibrium
thermodynamics and require that the experimental heatcapacity data accurately reflect the equilibrium proteinunfolding (Freire and Biltonen, 1978). In principle,several factors may distort the DSC transitions andmake unreliable the equilibrium thermodynamics analy-
'Abbreviations: DSC, differential scanning calorimetry; IPTG, isopro-pyl ,B-D-thiogalactoside; ONPF, o-nitrophenyl ,-D-fucoside; Tris, tr-is(hydroxymethyl)aminomethane.
sis. The distortions caused by the calorimeter response
time and the folding-unfolding kinetics appear to berelatively minor (at least, at moderate scanning rates),and, in any case, Lopez-Mayorga and Freire (1987) haveshown how they can be corrected for. It must berecognized, nevertheless, that, in many cases, the overallprocess that takes place during the DSC scan is theirreversible denaturation of the protein (as shown by thelack of thermal effect in the thermogram correspondingto the second heating); in this work we will consider thedistortion of the DSC transitions caused by the existenceof irreversibility.
Irreversible protein denaturation is thought to in-volve, at least, two steps: (a) reversible unfolding of thenative protein (N); (b) irreversible alteration of theunfolded protein (U) to yield a final state (F) that isunable to fold back to the native one. For a recent reviewon the several processes responsible for the irreversiblestep (aggregation, autolysis, chemical alteration of resi-dues etc.), see Klibanov and Ahern (1987).The two-step nature of irreversible denaturation is
depicted in the following simplified scheme:
N =U F,
which is usually known as the Lumry and Eyring model(Lumry and Eyring, 1954). According to a point of view
Biophys. J. c Biophysical SocietyVolume 61 April 1992 921-935
0006-3495/92/04/921/15 $2.00 9210006-3495/92/04/921/15 $2.00 921
widely held in the last 10 yr, the irreversible step (U -*
F) does not take place significantly during the short timethe protein spends in the temperature range of the DSCtransition, but occurs (with little thermal effect) atsomewhat higher temperatures; it is usually assumed(see, for instance, Privalov, 1982; Privalov and Medved,1982; Manly et al., 1985; Edge et al., 1985; Hu andSturtevant, 1987 and 1989; Brandts et al., 1989; Bertaz-zon et al., 1990), therefore, that irreversible DSC transi-tions are due, in fact, to the reversible unfolding and are
amenable to equilibrium thermodynamics analysis. Al-though this may be the case in some instances (see, forexample, Goins and Freire, 1988), recent work hasshown that, often, the irreversible step takes place, infact, during the time the protein spends in the transitionregion and, therefore, the DSC transition is strongly ratelimited (Sanchez-Ruiz et al., 1988a and 1988b; Guzman-Casado et al., 1990; Lepock et al., 1990; Morin et al.,1990; Freire et al., 1990; Galisteo et al., 1991; Conejero-Lara et al., 1991).The theoretical basis of the equilibrium thermodynam-
ics analysis of reversible DSC transitions is well estab-lished. However, theoretical studies on irreversible dena-turation models (models that include rate-limited stepsleading to a final state) are not available in the litera-ture. This work is intended to fill (in part) this gap.
It must be noted that the fact that many irreversibleDSC transitions are strongly rate limited has becomeknown very recently (see the above references) and,therefore, it does not appear feasible at this time to givegeneral recipes for the analysis of this kind of DSCtransitions. The purpose of this theoretical analysis is todemonstrate (in the simplest possible manner) twoimportant points:
(a) Irreversible denaturation models lead to differentsituations depending on the rate of the irreversible step;if this step is fast enough, the DSC transition is entirelydetermined by the kinetics of formation of the final stateand equilibrium thermodynamics analysis is not permis-sible.
(b) Even in the case of strongly rate-limited denatur-ation, ligand and protein concentration effects on theDSC transitions may be observed if ligand release andprotein dissociation into monomers take place beforethe rate-determining step; these will be shown to benonsaturating effects, similar to those predicted byequilibrium thermodynamics for reversible unfoldingtransitions.The above ideas will be demonstrated by the theoreti-
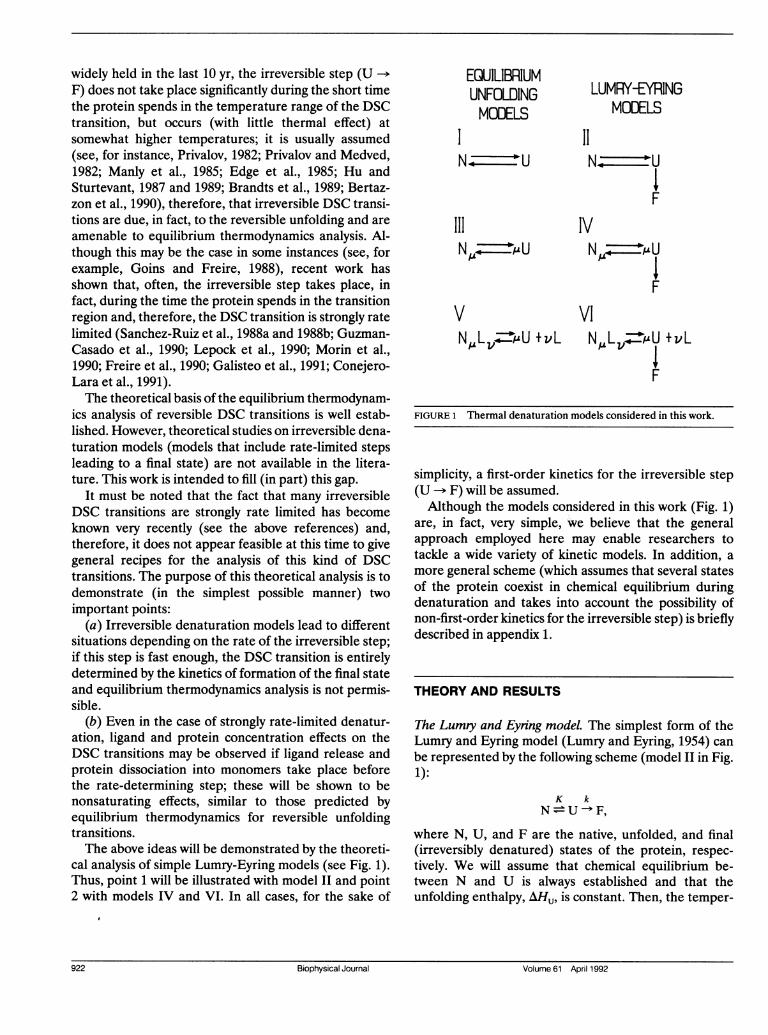
cal analysis of simple Lumry-Eyring models (see Fig. 1).Thus, point 1 will be illustrated with model II and point2 with models IV and VI. In all cases, for the sake of
EQUILIBRIUMUNFOLDINGMODELS
N.* *U
III
N *U
V
N,LLv=Z-/U +vL
LUMRY-EYRINGMODELS
11
IV~~~~~~~IIV
FVI
NI LV~u +vL
F
FIGURE 1 Thermal denaturation models considered in this work.
simplicity, a first-order kinetics for the irreversible step(U -- F) will be assumed.
Although the models considered in this work (Fig. 1)are, in fact, very simple, we believe that the generalapproach employed here may enable researchers totackle a wide variety of kinetic models. In addition, a
more general scheme (which assumes that several statesof the protein coexist in chemical equilibrium duringdenaturation and takes into account the possibility ofnon-first-order kinetics for the irreversible step) is brieflydescribed in appendix 1.
THEORY AND RESULTS
The Lumry and Eyring model. The simplest form of theLumry and Eyring model (Lumry and Eyring, 1954) canbe represented by the following scheme (model II in Fig.1):
K kN U F.
where N, U, and F are the native, unfolded, and final(irreversibly denatured) states of the protein, respec-tively. We will assume that chemical equilibrium be-tween N and U is always established and that theunfolding enthalpy, AHu, is constant. Then, the temper-
92 Bipyia ora Arl19
922 Biophysical Journal Volume 61 April 1992
ature dependence ofK can be expressed as,
K= [U] X = exp - RHu [11T- 1/T11211,[N] XNR(1)
wherexu andxN stand for the molar fractions of unfoldedand native states and T1,2 is the temperature at whichK= 1.We will also assume that the irreversible step (U -* F)
is first-order and that the rate constant, k, changes withtemperature according to the Arrhenius equation, whichwill be used in the form:
k(min-') = exp l- [lT - 1IT*4, (2)
where E is the activation energy and T* is the tempera-ture at which k = 1 min-' [the frequency factor is equalto exp (EIRT*)].The rate equation for the irreversible formation ofF
is:
d[F]dt
or
dJxFdtF = k * xu, (4)
where XF is the molar fraction of final state. From K =XUIXN andXN + xU + XF = 1, it can be easily deduced thatXU = (1 - XF)K/(l + K). Eq. 4 can, then, be rewritten as,
dXF kKdt K+1 (l-XF), (5)
which shows that, at constant temperature, XF changeswith time after a first-order kinetics with an apparentrate constant equal to kK/(K + 1). In a DSC experiment,however, temperature changes with time according to aconstant scanning rate (v = dT/dt) and the relevantdifferential equation is:
dXF 1 kKdT - (1-XF).dTvK+l
K 1 T kKx K expvJ K + 1
1 1 T kKx K +expJv K + 1
The apparent excess enthalpy, (AH), is given by,
(AH) = xUAHU + XFAH,
(8)
(9)
(10)
where AHu and AH are, respectively, the enthalpies ofthe states U and F (taking N as the reference state).Note that the enthalpy of the final state (AH) is equal tothe calorimetric enthalpy of the DSC transition, becauseeventually all protein molecules will be found in the finalstate.Authors who have previously supported the applicabil-
ity of the equilibrium thermodynamics analysis to irre-versible DSC transitions (see, for instance, Privalov,1982; Privalov and Medved', 1982; Manly et al., 1985)have made the (reasonable) assumption that the pro-cesses responsible for the irreversible step have muchlower enthalpy than the cooperative unfolding. Clearly,if the enthalpy change for the irreversible step was large,there is no doubt that the DSC thermograms would behighly distorted. The following analysis of model II isintended to show that the DSC transitions may bedistorted, even if the irreversible step has a negligiblethermal effect. Accordingly, we will assume that theenthalpy of the U -* F transition is zero and that,therefore, AHu = AH. It must be noted, nevertheless,that other treatments reported in this work (ligand andprotein concentration effects on irreversible DSC transi-tions, as well as the general scheme of Appendix 1) donot depend on this assumption.
If AHu = AH, Eq. 10 can be written as,
(AM) AH (XU + XF) = AH(1 XN), (11)
and the apparent, excess heat capacity, Cex is given by,
CCpx = _AH dXNcx= dT'(6)
Separation of variables in Eq. 6, followed by integra-tion from a low temperature, To (at which the reactionrate is negligible and XF = 0), to a temperature T, yieldsthe temperature dependence of XF for a DSC experi-ment. Then, taking into account that K = XU/XN and XN +XU + XF = 1, the temperature dependencies of XN and xucan also be obtained:
(12)
as AH has been assumed to be constant. Finally, dx,N/dTis obtained from Eq. 9 and substituted in Eq. 12 to yield:
KAH k AH 1 T kKccx= J- IVJToK+ljT (13)(K + 1) v RT2 x v JTK + 1 .(3
It is interesting that the equation corresponding to atwo-state reversible unfolding (model I in Fig. 1):
X1 T kK~~~~XF=1-exp -- J dTAH2 K
cex =R +1RT2(K+ 1)2(7)
J.M. Sanchez-Ruiz Lumry-Eyring Models in DSC 923
(14)
J.M. Sanchez-Ruiz Lumry-Eyring Models in DSC 923
,aE-I
x0.au
T/°c
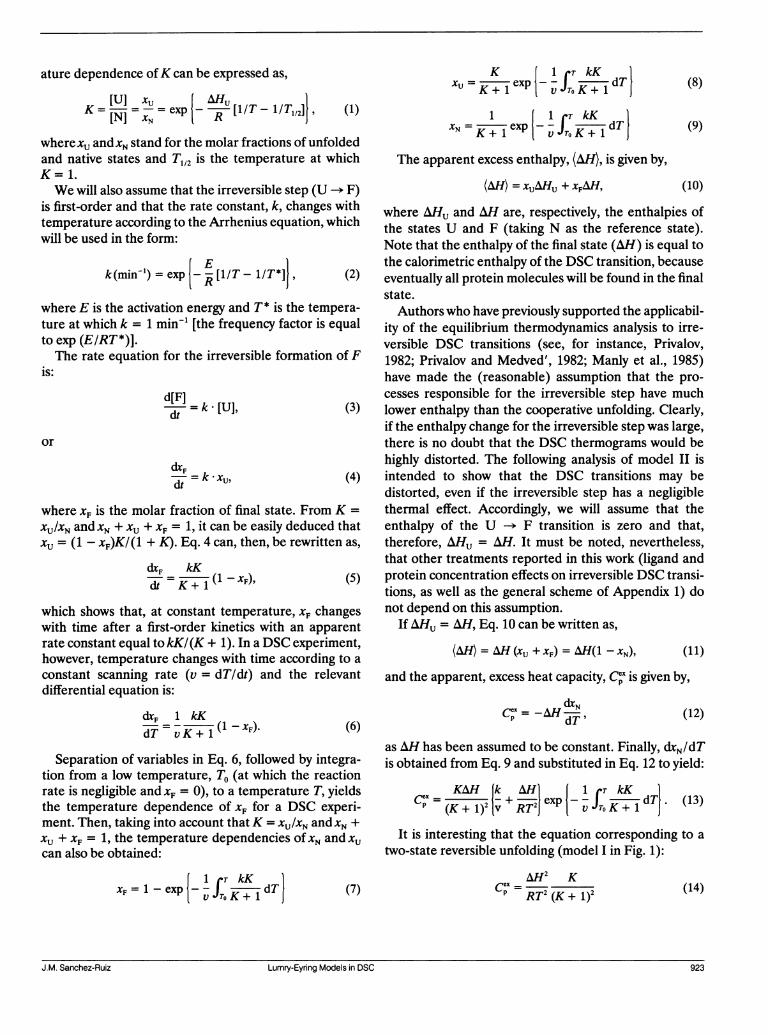
FIGURE 2 DSC transitions predicted by Eq. 13 (model II) and thefollowing parameters: AH = 400 kJ/mol; T1,2 = 55°C; E = 100 kJ/mol;v = 2 K/min. (A) T* = 75°C; (B) T* = 55°C; (C) T* = 25°C. In allcases, the dashed transition corresponds to the reversible unfolding(Eq. 14).
can be derived from Eq. 13 either by setting k = 0 at anytemperature (the irreversible process does not takeplace) or by setting 1/v = 0 (infinite scanning rate).The DSC transitions predicted by Eq. 13 can be
broadly classified into three groups, that will be referredto as situations A, B, and C. These are illustrated by thetraces shown in Fig. 2, which correspond to the samevalues of AH (400 kJ/mol), T,12 (55°C), E (100 kJ/mol),and v (2 K/min), and different values of T* (thecorresponding population of states versus temperatureprofiles are given in Fig. 3). The values chosen for AHand T112 are within the ranges found for small globularproteins (Privalov, 1979), while the one for the energy ofactivation, E, is close to that determined by Goins andFreire (1988) for the irreversible step in the thermaldenaturation of the B subunit of cholera toxin.2
2Recent DSC studies on the irreversible thermal denaturation ofseveral proteins (Sanchez-Ruiz et al., 1988a and 1988b; Guzman-Casado et al., 1990, Lepock et al., 1990; Morin et al., 1990; Conejero-Lara et al., 1991) report energies of activation within the range- 150- 600 kJ/mol. In these studies, however, the DSC transitionswere found to conform to two-state irreversible models and, therefore,they correspond to what we call situations C/C'; the theoreticalanalysis reported in this work shows that, in these situations, theenergy of activation is an apparent value (Eapp), which is not equal tothe energy of activation for the irreversible step (E). On the otherhand, Goins and Freire (1988) have shown that the irreversible step in
c0
0
be..
45 55 65
T/ °C
FIGURE 3 (A, B, and C) Fraction of states versus temperature profilescorresponding to the DSC transitions of Fig. 2 (model II). The profileswere calculated by using Eqs. 7, 8, and 9 and the parameters given inthe legend of Fig. 2. (EQ) Fraction of states versus temperature profilecorresponding to the reversible equilibrium unfolding.
SituationA (Figs. 2A and 3A). In this case T* = 75°C,the irreversible step proceeds at significant rate only attemperatures above T112 (55°C) and, in fact, the calorimet-ric trace differs little from that corresponding to thereversible unfolding (model I in Fig. 1). At T = Tl,2, XF isvery low; however, at T = 70°C (a few degrees above theend of the transition), most of the protein is in the finalstate, F (Fig. 3 A). Therefore, if the DSC scan isterminated at 70°C, no significant heat effect will be
the thermal denaturation of the B subunit of cholera toxin takes place(with negligible thermal effect) at temperatures somewhat above thanthose corresponding to the DSC transition (this case is referred to inthis work as situation A); therefore, they were able to study theirreversible step separately and the energy of activation reported bythese authors (- 100 kJ/mol) does correspond to the irreversible stepitself. In this work, E = 100 kJ/mol is employed as demonstrationvalue for the simulations of model II; it must be noted, nevertheless,that situations A, B, and C are also obtained with values for E muchlower (and much higher) than 100 kJ/mol. In fact, the specific values ofthe parameters (AH, T,,2, and E, for model II) are not critical for thegeneral result of the simulation. This remark also applies to all othersimulations described in this work.
924 Biophysical Journal Volume 61 April1992924 Biophysical Journal Volume61 April 1992
observed in the reheating run and the transition will beconsidered as calorimetrically irreversible. In spite ofthat, it is clear that direct application of equilibriumthermodynamics to the irreversible transition in Fig. 2Awould not lead to large errors.
Situation B (Figs. 2B and 3B). Here, T* = 55°C andthe irreversible step is fast in the temperature range ofthe reversible unfolding. The DSC transition deviatesclearly from that corresponding to the equilibriumunfolding (Fig. 2 B) and direct application of equilib-rium thermodynamics would lead to significant errors.
There exist, however, a significant amount of unfoldedstate in equilibrium with the native one during thetemperature-induced denaturation (Fig. 3 B); that is,the calorimetric transition contains thermodynamic in-formation about the reversible unfolding, which couldbe obtained upon the appropriate data treatment (seeAppendix 1).
Situation C (Figs. 2 C and 3 C). In this case, T* =
25°C, the irreversible step being fast at temperatureswell below T1,2 (55°C). The Tm value (temperaturecorresponding to the maximum heat capacity) is severaldegrees lower than the one for the reversible unfolding(Fig. 2 C) and only the states N and F are significantlypopulated (Fig. 3 C). Thus, the irreversible transition inFig. 2 C can be described by the so-called two-stateirreversible model (Sanchez-Ruiz et al., 1988a):
kK
N 3 F,
where the apparent first-order rate constant for theprocess is equal to kK, given that, within the tempera-ture range of this transition, K << 1 and K + 1 = 1 (seeEq. 5). Equilibrium thermodynamic analysis of thistransition would lead to gross errors. In addition, thesmall amount of U, together with the experimentaluncertainties (noise, baseline tracing, etc.) found in a
real DSC experiment, would preclude the determinationof any thermodynamic information about the reversibleunfolding step.The three situations (A, B, and C) have been simu-
lated in Figs. 2 and 3 by using different values of theparameter T*. These situations, however, can also beachieved (Fig. 4) by changing the scanning rate whilekeeping constant AH, T1,2, and T*. For the transitions ofFig. 4, AH = 400 kJ/mol, T1,2 = 55°C, T* = 55°C, andthe scanning rate has been changed from 102 K/min to10-4 K/min. The transition corresponding to the highestscanning rate does not differ significantly from that forthe reversible unfolding, while those obtained within thescanning rate range 102-10-4 K/min correspond tosituation C and are described by the two-state irrevers-ible model. (The transitions of Fig. 4 are shown forillustration purposes: it must be noted that the total
I
*.1I
x0
-u
T/°C
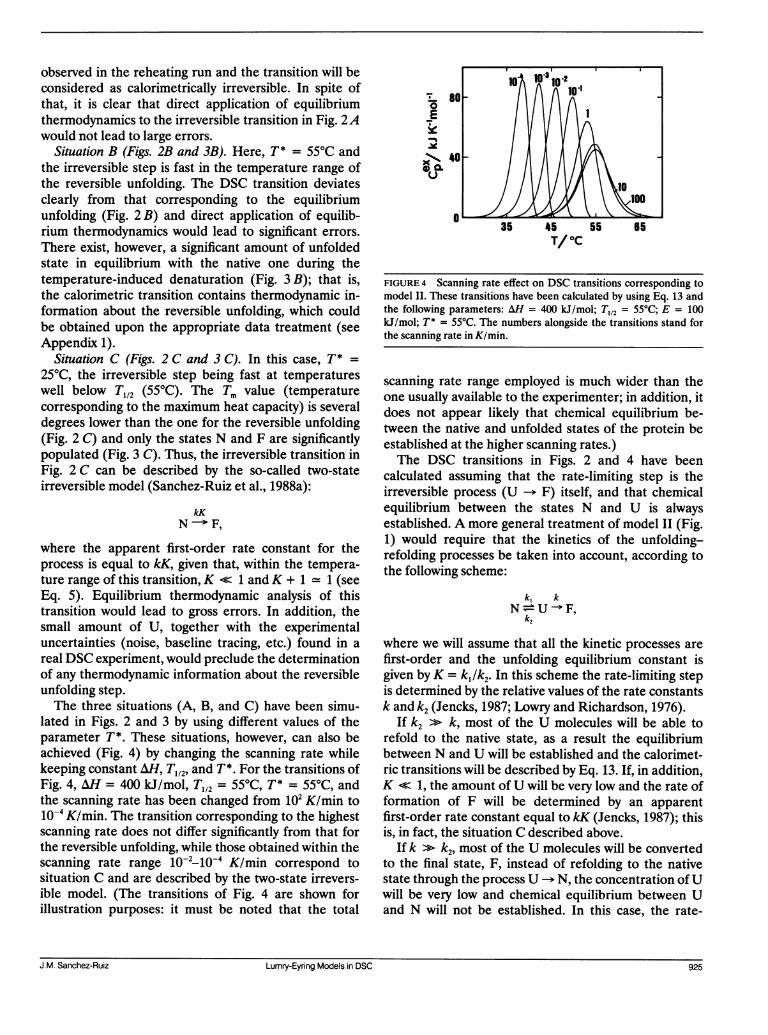
FIGURE 4 Scanning rate effect on DSC transitions corresponding tomodel II. These transitions have been calculated by using Eq. 13 andthe following parameters: AH = 400 kJ/mol; T1,2 = 55°C; E = 100kJ/mol; T* = 55°C. The numbers alongside the transitions stand forthe scanning rate in K/min.
scanning rate range employed is much wider than theone usually available to the experimenter; in addition, itdoes not appear likely that chemical equilibrium be-tween the native and unfolded states of the protein beestablished at the higher scanning rates.)The DSC transitions in Figs. 2 and 4 have been
calculated assuming that the rate-limiting step is theirreversible process (U -- F) itself, and that chemical
equilibrium between the states N and U is alwaysestablished. A more general treatment of model II (Fig.1) would require that the kinetics of the unfolding-refolding processes be taken into account, according tothe following scheme:
k, k= U F,k2
where we will assume that all the kinetic processes arefirst-order and the unfolding equilibrium constant isgiven byK = k,/k2. In this scheme the rate-limiting stepis determined by the relative values of the rate constantsk and k2 (Jencks, 1987; Lowry and Richardson, 1976).
If k2 >» k, most of the U molecules will be able torefold to the native state, as a result the equilibriumbetween N and U will be established and the calorimet-ric transitions will be described by Eq. 13. If, in addition,K << 1, the amount of U will be very low and the rate offormation of F will be determined by an apparentfirst-order rate constant equal to kK (Jencks, 1987); thisis, in fact, the situation C described above.
If k >> k2, most of the U molecules will be convertedto the final state, F, instead of refolding to the nativestate through the process U -- N, the concentration ofU
will be very low and chemical equilibrium between Uand N will not be established. In this case, the rate-
J.M. Sanchez-Ruiz Lumry-Eyring Models in DSC 925J.M. Sanchez-Ruiz Lumry-Eyring Models in DSC 925
limiting step is the unfolding (N -- U) and the formationof F is determined by a first-order rate constant equal tok, (Jencks, 1987; see, also, Sanchez-Ruiz et al., 1988a):
k,N > F.
This case will be referred to as Situation C'. At least formodel II with first order kinetics, both situations, C andC', are described by the two-state irreversible model andcannot be distinguished on the basis of the DSC transitions,the only difference being the rate-determining step.
Concentration effects on DSC transitions correspondingto irreversible protein denaturation. Equilibrium thermody-namics predicts that, for the simple equilibrium model(model III in Fig. 1):
K
in which a multimeric protein undergoes two-statereversible unfolding with simultaneous dissociation intomonomers, the temperature of the maximum of the DSCtransitions, Tm, increases with the total protein concen-tration according to (Takahashi and Sturtevant, 1981):
AHIH/RTm + (,. - 1) ln Ct = constant, (15)
where AHVH is the so-called van't Hoff enthalpy3 and C, isthe total protein concentration. It must be noted that theAHvH value can be independently calculated from theshape of the transitions according to the well knownequation:
AfH = ART,Cpm/AH, (16)
where Cem and AH are the excess heat capacity at themaximum and the denaturation enthalpy (values of theconstantA for several values of pu are given by Manly etal., 1985; see also Table 1).The Lumry and Eyring model corresponding to model
III is:
KN U
F
which is model IV in Fig. 1. Depending on the rate of theirreversible step, this model will lead to different situa-tions; here, however, we will be interested in situation C.Therefore, we will assume that the equilibrium between
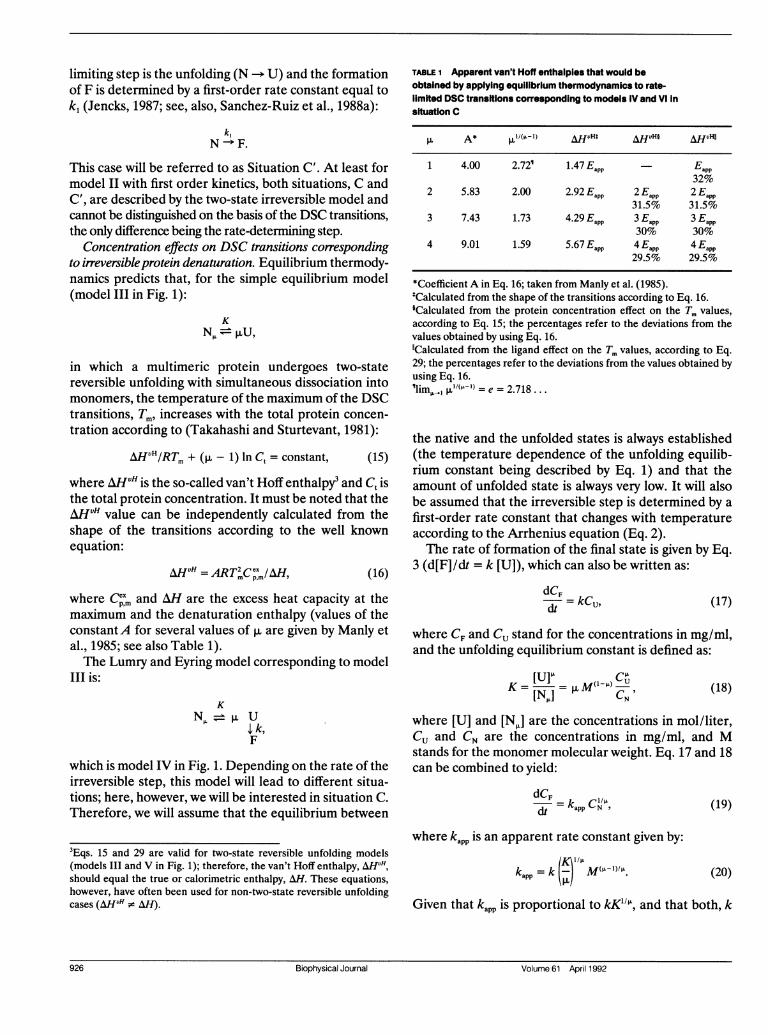
TABLE 1 Apparent van't Hoff enthalpies that would beobtained by applying equilibrium thermodynamics to rate-limited DSC transitions corresponding to models IV and VI insituation C
SL A* p,I(p 1) AHvHt AHRvH§ MHuHII
1 4.00 2.72' 1.47 Eapp Eapp32%
2 5.83 2.00 2.92 Eapp 2 Eapp 2 Eapp31.5% 31.5%
3 7.43 1.73 4.29 Eapp 3 Eapp 3 Eapp30% 30%
4 9.01 1.59 5.67 Eapp 4 Eapp 4 Eapp29.5% 29.5%
*Coefficient A in Eq. 16; taken from Manly et al. (1985).tCalculated from the shape of the transitions according to Eq. 16.'Calculated from the protein concentration effect on the Tm values,according to Eq. 15; the percentages refer to the deviations from thevalues obtained by using Eq. 16.I1Calculated from the ligand effect on the Tm values, according to Eq.29; the percentages refer to the deviations from the values obtained byusing Eq. 16.'lim,,>L-(>L e = 2.718 .. .
the native and the unfolded states is always established(the temperature dependence of the unfolding equilib-rium constant being described by Eq. 1) and that theamount of unfolded state is always very low. It will alsobe assumed that the irreversible step is determined by afirst-order rate constant that changes with temperatureaccording to the Arrhenius equation (Eq. 2).The rate of formation of the final state is given by Eq.
3 (d[F]/dt = k [U]), which can also be written as:
dCF - kCu,dt (17)
where CF and Cu stand for the concentrations in mg/ml,and the unfolding equilibrium constant is defined as:
[Nl] = (18)
where [U] and [N,j] are the concentrations in mol/liter,Cu and CN are the concentrations in mg/ml, and Mstands for the monomer molecular weight. Eq. 17 and 18can be combined to yield:
dCFdtj7 app N
(
3Eqs. 15 and 29 are valid for two-state reversible unfolding models(models III and V in Fig. 1); therefore, the van't Hoff enthalpy, AHUH,should equal the true or calorimetric enthalpy, AH. These equations,however, have often been used for non-two-state reversible unfoldingcases (AHvUH . AM).
where kapp is an apparent rate constant given by:
kapp = k M(P- )/P.
Given that kapp is proportional to kKW'I, and that both, k
92B-pyialJunlVoue6-Arl19
(20)
(18)
(19)
926 Biophysical Journal Volume 61 April 1992
and K, are assumed to show exponential dependencewith 1IT, it is clear that the temperature dependence ofkapp can be expressed by an Arrhenius equation:
kapp exp(E + AH /uIi± 1 1kapp =ep R T T*
= exp (EappIRT*) exp (-EappIRT)Eapp = E + (AHu/I),
E
-i
,MN(21)
where T* is the temperature at which kapp = 1 (in units ofmin-' (mg/ml)(1`)''L), E is the energy of activation of theirreversible step (U -* F), and AHu is the unfoldingenthalpy. Note, however, that the temperature depen-dence of kapp is determined by the value ofE + AHu/p.;that is, E + AlHu/p plays the role of an apparent energyof activation: Eapp*For situation C, the total protein concentration can be
expressed as Ct = CN + CF. Accordingly, dCN/dt =
- dCF/dt and Eq. 19 becomes:
dt - kappCN/IL (22)
and for a DSC experiment the relevant differentialequation is:
dCN=T _(1Iv) kapp(T)C?/P, (23)
where v is the scanning rate (dTldt) and kapp(T) is thetemperature-dependent value of kapp given by Eq. 21.DSC traces corresponding to model IV in situation C
were calculated by using the following procedure: Eq. 23was integrated numerically (using the fourth-orderRunge-Kutta algorithm with an integration interval of0.02°C) from a low temperature To (at which the rate isnegligible and CN = Ct) to a temperature T. This integra-tion leads to the temperature dependence of CN anddCN/dT (Eq. 23). Finally, the excess heat capacity wasobtained according to,
d(CN/C_) dCNCP = -AHI =(AHI Ct)- (24)
as the denaturation enthalpy, AH, is assumed to beconstant. These CeX/T profiles depend on the valueschosen for the following parameters: p., v, Ct, AH, T*,and Eapp. In the simulations described below Eapp = 300kJ/mol is always employed (see footnote 2); of course,this value may be obtained from different sets of AHuand E values (for instance, for p. = 2, it is obtained fromAHu = 400 kJ/mol and E = 100 kJ/mol, or from AHu =
500 kJ/mol and E = 50 kJ/mol, or ... .); note, however,that the DSC transitions do not depend on the values ofAHu and E, but only on (E + AlHu/p.), which is theapparent energy of activation: Eapp (see Eq. 21).
40 45 50 55 60T/oC
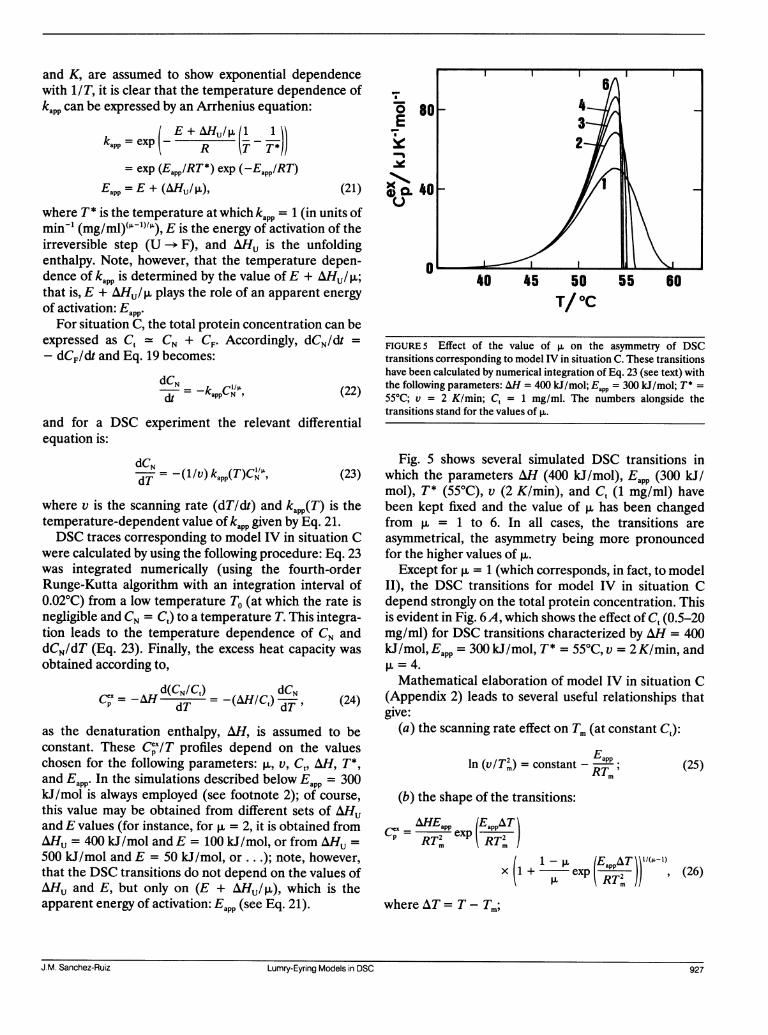
FIGURE 5 Effect of the value of > on the asymmetry of DSCtransitions corresponding to model IV in situation C. These transitionshave been calculated by numerical integration of Eq. 23 (see text) withthe following parameters: AH = 400 kJ/mol; Eapp = 300 kJ/mol; T* =55°C; v = 2 K/min; C, = 1 mg/ml. The numbers alongside thetransitions stand for the values of p.
Fig. 5 shows several simulated DSC transitions inwhich the parameters AH (400 kJ/mol), Eapp (300 kJ/mol), T* (55°C), v (2 K/min), and C, (1 mg/ml) havebeen kept fixed and the value of p, has been changedfrom p, = 1 to 6. In all cases, the transitions areasymmetrical, the asymmetry being more pronouncedfor the higher values of p.
Except for p. = 1 (which corresponds, in fact, to modelII), the DSC transitions for model IV in situation Cdepend strongly on the total protein concentration. Thisis evident in Fig. 6A, which shows the effect of Ct (0.5-20mg/ml) for DSC transitions characterized by AH = 400kJ/mol, Eapp = 300 kJ/mol, T* = 55°C, v = 2 K/min, andp. =4.Mathematical elaboration of model IV in situation C
(Appendix 2) leads to several useful relationships thatgive:
(a) the scanning rate effect on Tm (at constant CQ):
In (vIT') = constant -RT; (25)
(b) the shape of the transitions:
AHEapp (appAT= RT2 exp RT(
m m
ATx 1+ exp app
) (26)
where AT = T- Tm;
J.M. Sanchez-Ruiz Lumry-Eyring Models in DSC 927
-
a'p-
0
J.M. Sanchez-Ruiz Lumry-Eyring Models in DSC 927
(c) the apparent energy of activation in terms of theparameters corresponding to the maximum of the transi-tion:
Eapp = X(A-")RT C"'mIAH; (27)
(d) the effect of the total protein concentration on thetemperature corresponding to the maximum heat capac-ity (at constant scanning rate):
RTm 21n Tm + lnC, = cte. (28)RTm
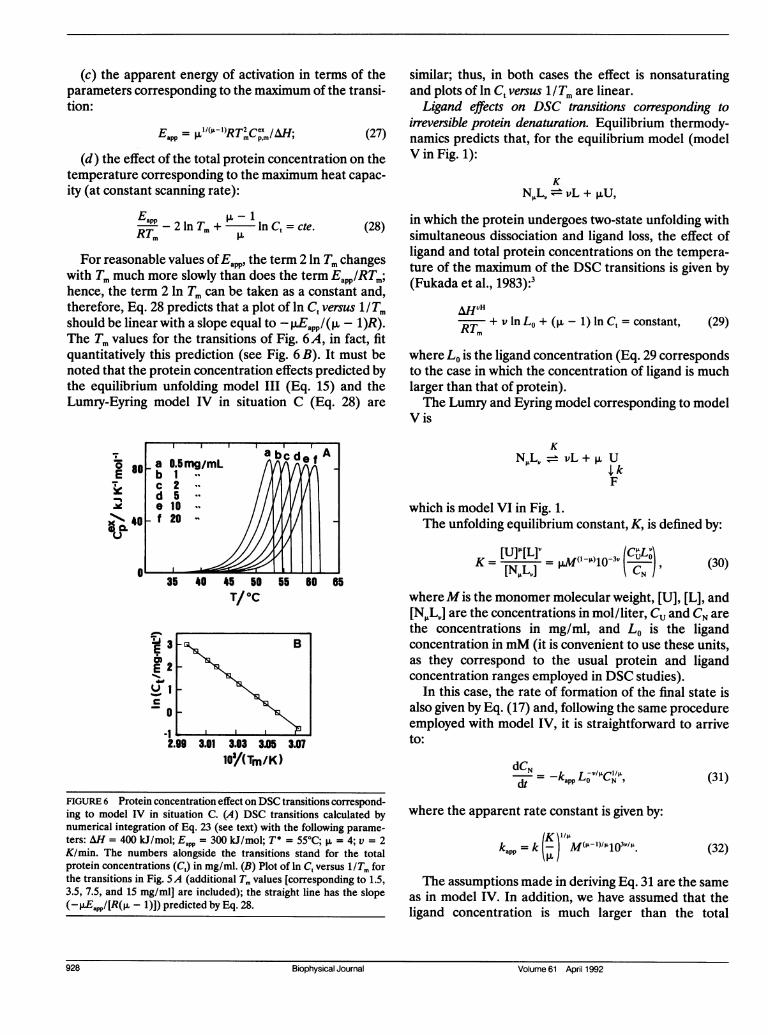
For reasonable values of Eapp, the term 2 ln Tm changeswith Tm much more slowly than does the term Eapp/RTm;hence, the term 2 In Tm can be taken as a constant and,therefore, Eq. 28 predicts that a plot of ln Ct versus 1/Tmshould be linear with a slope equal to - jEapp/(p. - 1)R).The Tm values for the transitions of Fig. 6A, in fact, fitquantitatively this prediction (see Fig. 6 B). It must benoted that the protein concentration effects predicted bythe equilibrium unfolding model III (Eq. 15) and theLumry-Eyring model IV in situation C (Eq. 28) are
a 0.5 mglmL abcd*fE b YY,V
e0 .I4o f 20
_~~~~~IL 3 BE2E 2-X
-1
u 1 X
2.99 3.01 3.03 3.05 3.07IOZ(Tm/K)
FIGURE 6 Protein concentration effect on DSC transitions correspond-ing to model IV in situation C. (A) DSC transitions calculated bynumerical integration of Eq. 23 (see text) with the following parame-ters: AH = 400 kJ/mol; Eapp =300 kJ/mol; T* = 55°C; ,u = 4; v = 2K/min. The numbers alongside the transitions stand for the totalprotein concentrations (C,) in mg/ml. (B) Plot of In C, versus 1/Tm forthe transitions in Fig. 5A (additional Tm values [corresponding to 1.5,3.5, 7.5, and 15 mg/ml] are included); the straight line has the slope(_ JEappI[R(PL - 1)]) predicted by Eq. 28.
similar; thus, in both cases the effect is nonsaturatingand plots of ln Ct versus 1/Tm are linear.Ligand effects on DSC transitions corresponding to
irreversible protein denaturation. Equilibrium thermody-namics predicts that, for the equilibrium model (modelVin Fig. 1):
KN,LL = vL + ,LU,
in which the protein undergoes two-state unfolding withsimultaneous dissociation and ligand loss, the effect ofligand and total protein concentrations on the tempera-ture of the maximum of the DSC transitions is given by(Fukada et al., 1983):3
AHuH
RT + v ln Lo + (,u - 1) ln C, = constant, (29)
where Lo is the ligand concentration (Eq. 29 correspondsto the case in which the concentration of ligand is muchlarger than that of protein).The Lumry and Eyring model corresponding to model
Vis
KN,L=vL +p U
F
which is model VI in Fig. 1.The unfolding equilibrium constant, K, is defined by:
K= [UHILI = pm(I-Ol(CoI.4) (30)
whereM is the monomer molecular weight, [U], [L], and[N.,LV] are the concentrations in mol/liter, Cu and CN arethe concentrations in mg/ml, and Lo is the ligandconcentration in mM (it is convenient to use these units,as they correspond to the usual protein and ligandconcentration ranges employed in DSC studies).
In this case, the rate of formation of the final state isalso given by Eq. (17) and, following the same procedureemployed with model IV, it is straightforward to arriveto:
---k -vl,=C'I,,dt kappLO N L
where the apparent rate constant is given by:
kapp = k MO-lwV/1L
(31)
(32)
The assumptions made in deriving Eq. 31 are the sameas in model IV. In addition, we have assumed that theligand concentration is much larger than the total
92 ipyiclJunl928 Biophysical Journal Volume61 April 1992
protein concentration and, therefore, the former can betaken as a constant in a given DSC experiment. It is alsoimportant to note that Eq. 31 is valid exclusively forsituation C (the concentration of U is very low and onlythe states NFL,, and F are significantly populated).As was the case for model IV, kapp is proportional to
kKW11 and, therefore, its temperature dependence can bedescribed by Eq. 21 with an apparent energy of activa-tion, Eapp, and a temperature, T*, at which kapp = 1 (inunits of min-' (mg/ml)("`)'/ mMv/L). Thus, for a DSCexperiment,
dC -(/lv) kapp(T)LOv/ C`N, (33)
where kapp(T) is the temperature dependent value of kappgiven by Eq. 21. Eq. 33 can be written as,
dC _-(1IV) k'pp(T, LO)C"IL, (34)
where k' = kap -V/0 For a given DSC experiment,however, Lo is constant and Eq. (34) is equivalent to Eq.(23). Therefore, Eqs. 25 (scanning rate effect), 26 (shapeof the transitions), and 27 (energy of activation in termsof the parameters of the maximum) hold true for modelVI in situation C (see Appendix 2).Of course, in this case there is ligand concentration
effect on the transitions. This effect (together with thetotal protein concentration effect) is given by (Appendix2):
lnT. + In C + -In Lo = constant. (35)RTm
Thus, the effect of C, on Tm (at constant Lo andscanning rate) is the same as that described for model IVin situation C (Eq. 28). In addition, the Tm valueincreases with the ligand concentration (at constant C,and scanning rate) and a plot of ln Lo versus 1 /Tm will belinear with a slope equal to - IJEapp/(vR) (given that theterm 2 ln Tm can, in fact, be taken as a constant).
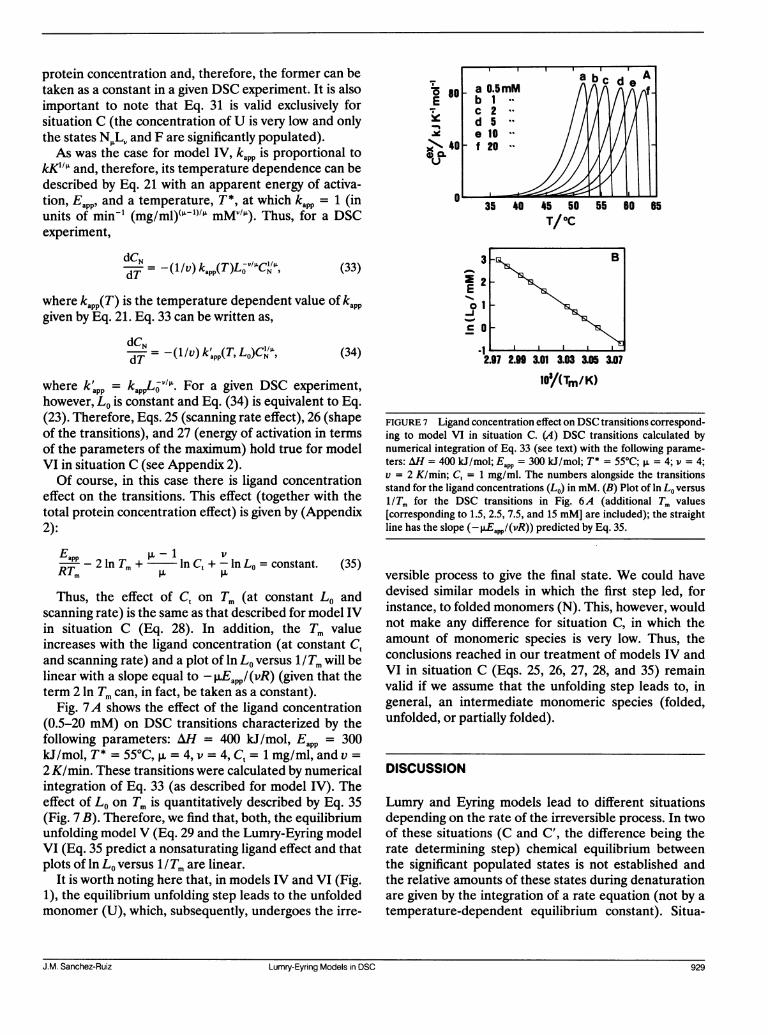
Fig. 7A shows the effect of the ligand concentration(0.5-20 mM) on DSC transitions characterized by thefollowing parameters: AH = 400 kJ/mol, Eapp = 300kJ/mol, T* = 55°C, = 4, v = 4, Ct = 1 mg/ml, and v =2 K/min. These transitions were calculated by numericalintegration of Eq. 33 (as described for model IV). Theeffect of Lo on Tm is quantitatively described by Eq. 35(Fig. 7 B). Therefore, we find that, both, the equilibriumunfolding model V (Eq. 29 and the Lumry-Eyring modelVI (Eq. 35 predict a nonsaturating ligand effect and thatplots of ln Lo versus 1/Tm are linear.
It is worth noting here that, in models IV and VI (Fig.1), the equilibrium unfolding step leads to the unfoldedmonomer (U), which, subsequently, undergoes the irre-
1 rn/(T /K)
FIGURE 7 Ligand concentration effect on DSC transitions correspond-ing to model VI in situation C. (A) DSC transitions calculated bynumerical integration of Eq. 33 (see text) with the following parame-ters: AH = 400 kJ/mol; Eapp = 300 kJ/mol; T* = 55°C; p. = 4; v = 4;v = 2 K/min; C, = 1 mg/ml. The numbers alongside the transitionsstand for the ligand concentrations (Lo) in mM. (B) Plot of In Lo versus1/Tm for the DSC transitions in Fig. 6A (additional Tm values[corresponding to 1.5, 2.5, 7.5, and 15 mM] are included); the straightline has the slope (-IEapp/(vR)) predicted by Eq. 35.
versible process to give the final state. We could havedevised similar models in which the first step led, forinstance, to folded monomers (N). This, however, wouldnot make any difference for situation C, in which theamount of monomeric species is very low. Thus, theconclusions reached in our treatment of models IV andVI in situation C (Eqs. 25, 26, 27, 28, and 35) remainvalid if we assume that the unfolding step leads to, ingeneral, an intermediate monomeric species (folded,unfolded, or partially folded).
DISCUSSION
Lumry and Eyring models lead to different situationsdepending on the rate of the irreversible process. In twoof these situations (C and C', the difference being therate determining step) chemical equilibrium betweenthe significant populated states is not established andthe relative amounts of these states during denaturationare given by the integration of a rate equation (not by atemperature-dependent equilibrium constant). Situa-
J.M. Sanchez-Ruiz Lumry-Eyring Models in DSC 929
I
-6E
T/OC65
J.M. Sanchez-Ruiz Lumry-Eyring Models in DSC 929
tions C/C' are not just theoretical possibilities; in fact,they correspond to the so-called two-state irreversiblemodel, which has been recently demonstrated for thethermal denaturation of several proteins (Sanchez-Ruizet al., 1988a and 1988b; Guzman-Casado et al, 1990;Lepock et al., 1990; Morin et al., 1990; Conejero-Lara etal., 1991).
Equilibrium thermodynamics analysis of DSC transi-tions in situation C/C' is not permissible. This statementmeans that: (a) the denaturation entropy change (and,hence, the denaturation Gibbs energy change) cannotbe determined from the transitions, given that entropycalculations from experimental heat capacity data are
based upon the Clausius equality, which does not holdfor an irreversible, rate-limited process; (b) analysis ofthe transition shapes based on the assumption that twoor more protein states coexist in equilibrium during thescan are obviously incorrect. (It must be noted, neverthe-less, that, according to the first law, the total heatabsorbed equals the denaturation enthalpy change, even
if the denaturation process is irreversible. Of course, thisdenaturation enthalpy will be the enthalpy differencebetween the final and native states.)The main experimental evidence supporting equilib-
rium thermodynamics analysis of irreversible DSC tran-sitions comes from the fact that, in several cases (seeManly et al., 1985; Edge et al., 1985; Hu and Sturtevant,1987), ligand and protein concentration effects on thetransitions conform to Eqs. 15 and 29, which are derivedfrom equilibrium unfolding models (models III and V inFig. 1); that is, plots of ln C, and ln Lo versus 1/Tm are
often found to be linear (within the scatter of theexperimental data), and the AH H values obtained fromthe slope of these plots show a "rough" agreement withthose calculated from the shape of the transitions (Eq.16).The analysis of models IV and VI reported here
shows, however, that the Tm values may increase withligand and protein concentrations and that plots of ln Loand ln Ct versus 1/Tm may be linear, even in cases ofstrongly rate-limited denaturation. In addition, it is notat all clear whether a "rough" agreement between theAHlV values derived from the plots of ln Lo and ln C,versus 1/Tm and those calculated from Eq. 16 proves
conclusively that the denaturation follows equilibriumthermodynamics. For instance (see Table 1), if Eq. 16 isapplied to a DSC transition corresponding to models IVor VI in situation C, the apparent AH H value obtainedwould, in fact, be equal to AEapp/ W1(IL-1) (compare Eqs.16 and 27); the values derived from the ligand andprotein concentration effects (compare Eqs. 29 and 35)would be equal to IuEapp. In Table 1 we show theapparent AH vH values that would be obtained for severalvalues of p, (1-4); the percentage deviation between the
AlHlL values is 30%; that is, there is a rough agree-
ment. It must be noted that the Lumry-Eyring models wehave analyzed (as well as the reversible unfoldingmodels: I, III, and V) are very simple ones; even if a
good agreement between the several AHlH values isexperimentally found, the possibility that more complexkinetic models could also explain the data must beconsidered.
It appears, therefore, that ligand and protein concen-
tration effects are not reliable equilibrium criteria inDSC of proteins. This statement can be illustrated with a
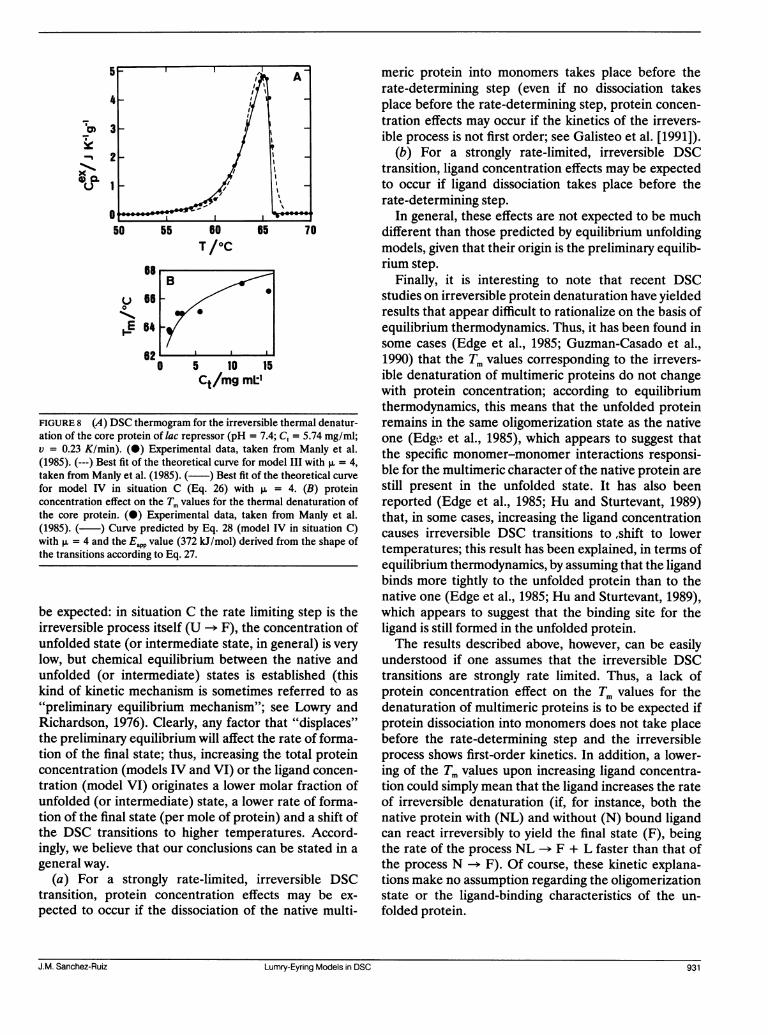
specific example; Manly et al. (1985) carried out a DSCstudy on the irreversible thermal denaturation of thetetrameric (,u = 4) core protein of lac repressor inphosphate buffer 0.048 M, pH 7.4, 15% glycerol, 0.1 mMdithiothreitol. They found that, in the absence of ligands,the shape of the DSC transitions and the total proteinconcentration effect on the Tm values could be inter-preted on the basis of the reversible unfolding model IIIwith p, = 4. However, the shape of the transitions can
also be explained by model IV in situation C, as shown inFig. 8 A; in addition, the plot of Tm versus Ct of Fig. 8 B,in which the data reported by Manly et al. are comparedwith the theoretical curve predicted by Eq. 28 with theEapp value (372 kJ/mol) calculated from the shape of thetransitions (Eq. 27), shows that the observed proteinconcentration effect is also consistent with model IV insituation C. Manly et al. also found an effect of theligands IPTG and ONPF on the DSC transitions, whichwas explained (qualitatively) on the basis of the equilib-rium model V with v = 4; thus, plots of ln Lo versus 1/Tmwere linear, but the AH vH values derived from the slopes(3,025 kJ/mol for IPTG and 4489 kJ/mol for ONPF)were in poor agreement with those calculated from theshape of the transitions by using Eq. 16 (1766 kJ/mol forIPTG and 1715 kJ/mol for ONPF). If the plots of ln Loversus 1/Tm are interpreted according to Eq. 35 (modelVI in situation C), values of Eapp = 756 kJ/mol for IPTGand Eapp = 1122 kJ/mol for ONPF are obtained. Again,these values are in very poor agreement with the ones
calculated from the shape of transitions (Eq. 27): Eapp =311 kJ/mol for IPTG and Eapp = 303 kJ/mol for ONPF.It appears, therefore, that neither model V nor modelVI in situation C are able to account (in a quantitativemanner) for the observed ligand effects. Of course, bothmodels can be "improved"; for instance, Manly et al.pointed out that the discrepancy between the AH '
values could be removed if only three or less moleculesof ligand were bound to the native protein at denatur-ational temperatures (v < 3). Obviously, this procedurewould also work for model VI in situation C.The fact that the ligand and protein concentration
effects for models VI and IV in situation C are similar tothose predicted by equilibrium unfolding models was to
930 Biophysical Journal Volume 61 April 1992930 Biophysical Journal Volume 61 April 1992
I
-I3§
T/OC
U0
5 10 ICt/mg mlt
FIGURE 8 (A) DSC thermogram for the irreversible thermal denatur-ation of the core protein of lac repressor (pH = 7.4; C, = 5.74 mg/ml;v = 0.23 K/min). (0) Experimental data, taken from Manly et al.(1985). (---) Best fit of the theoretical curve for model III with ,u = 4,taken from Manly et al. (1985). ( ) Best fit of the theoretical curvefor model IV in situation C (Eq. 26) with p. = 4. (B) proteinconcentration effect on the Tm values for the thermal denaturation ofthe core protein. (0) Experimental data, taken from Manly et al.(1985). ( ) Curve predicted by Eq. 28 (model IV in situation C)with p. = 4 and the Ea.p value (372 kJ/mol) derived from the shape ofthe transitions according to Eq. 27.
be expected: in situation C the rate limiting step is theirreversible process itself (U -+ F), the concentration of
unfolded state (or intermediate state, in general) is verylow, but chemical equilibrium between the native andunfolded (or intermediate) states is established (thiskind of kinetic mechanism is sometimes referred to as
"preliminary equilibrium mechanism"; see Lowry andRichardson, 1976). Clearly, any factor that "displaces"the preliminary equilibrium will affect the rate of forma-tion of the final state; thus, increasing the total proteinconcentration (models IV and VI) or the ligand concen-tration (model VI) originates a lower molar fraction ofunfolded (or intermediate) state, a lower rate of forma-tion of the final state (per mole of protein) and a shift ofthe DSC transitions to higher temperatures. Accord-ingly, we believe that our conclusions can be stated in a
general way.(a) For a strongly rate-limited, irreversible DSC
transition, protein concentration effects may be ex-
pected to occur if the dissociation of the native multi-
meric protein into monomers takes place before therate-determining step (even if no dissociation takesplace before the rate-determining step, protein concen-tration effects may occur if the kinetics of the irrevers-ible process is not first order; see Galisteo et al. [1991]).
(b) For a strongly rate-limited, irreversible DSCtransition, ligand concentration effects may be expectedto occur if ligand dissociation takes place before therate-determining step.
In general, these effects are not expected to be muchdifferent than those predicted by equilibrium unfoldingmodels, given that their origin is the preliminary equilib-rium step.
Finally, it is interesting to note that recent DSCstudies on irreversible protein denaturation have yieldedresults that appear difficult to rationalize on the basis ofequilibrium thermodynamics. Thus, it has been found insome cases (Edge et al., 1985; Guzman-Casado et al.,1990) that the Tm values corresponding to the irrevers-ible denaturation of multimeric proteins do not changewith protein concentration; according to equilibriumthermodynamics, this means that the unfolded proteinremains in the same oligomerization state as the nativeone (Edge et al., 1985), which appears to suggest thatthe specific monomer-monomer interactions responsi-ble for the multimeric character of the native protein arestill present in the unfolded state. It has also beenreported (Edge et al., 1985; Hu and Sturtevant, 1989)that, in some cases, increasing the ligand concentrationcauses irreversible DSC transitions to shift to lowertemperatures; this result has been explained, in terms ofequilibrium thermodynamics, by assuming that the ligandbinds more tightly to the unfolded protein than to thenative one (Edge et al., 1985; Hu and Sturtevant, 1989),which appears to suggest that the binding site for theligand is still formed in the unfolded protein.The results described above, however, can be easily
understood if one assumes that the irreversible DSCtransitions are strongly rate limited. Thus, a lack ofprotein concentration effect on the Tm values for thedenaturation of multimeric proteins is to be expected ifprotein dissociation into monomers does not take placebefore the rate-determining step and the irreversibleprocess shows first-order kinetics. In addition, a lower-ing of the Tm values upon increasing ligand concentra-tion could simply mean that the ligand increases the rateof irreversible denaturation (if, for instance, both thenative protein with (NL) and without (N) bound ligandcan react irreversibly to yield the final state (F), beingthe rate of the process NL -* F + L faster than that of
the process N -+ F). Of course, these kinetic explana-
tions make no assumption regarding the oligomerizationstate or the ligand-binding characteristics of the un-
folded protein.
J.M. Sanchez-Ruiz Lumry-Eyring Models in OSO 931J.M. Sanchez-Ruiz Lumry-Eyring Models in DSC 931
rium:CONCLUDING REMARKS
It has been widely held in the literature that irreversiblealterations of the unfolded state do not distort signifi-cantly the DSC transitions, but take place at somewhathigher temperatures; this is equivalent to assume thatprotein thermal stability is determined by equilibriumfactors (the unfolding Gibbs energy versus temperatureprofile), even when denaturation is overall irreversible.The fact that, in some cases, ligand and protein concen-tration effects on irreversible DSC transitions appear toconform to the dictates of equilibrium thermodynamicshas been claimed to support the above point of view.However, the theoretical analysis reported in this workhighly disfavors this claim; in addition, recent experimen-tal studies have shown that, often, irreversible DSCtransitions are strongly rate limited. It appears verylikely, therefore, that, in many cases of irreversibledenaturation, operational thermal stability (as mea-sured by the denaturation temperature under givenconditions) is subject to kinetic constraints. This factought to have influence, not only on DSC data analysis,but also on the approaches employed to obtain modifiedproteins with enhanced thermal stability; thus, equilib-rium approaches (such as introducing mutations that arethought to increase the unfolding Gibbs energy) mightnot be adequate in some cases of irreversible denatur-ation, while changes (in the protein or in the solventconditions) that decrease the rate of irreversible denatur-ation might be found to be more successful.
(A1.3)Yj = CjICeq.
The two sets of fractions are related by,
xi
1 -XF(A1.4)
The apparent excess enthalpy, (AH), is an average over all theprotein states:
() = XF AH + EXi AHj, (A1.5)
where AHi is the enthalpy difference between the state Ii and thereference state Io (i.e., the native state). Note that the enthalpydifference between the state F and the state 10 is equal to the totalenthalpy change of the transition, AH, as eventually all the proteinmolecules will be found in the state F.
Again, we define another excess enthalpy, (A, for the states I,exclusively:
(AH)M = I yj AlHl. (A1.6)
The relationship between both excess enthalpies can be easilyderived by combining Eqs. A1.4-6:
(AH) = (1 -XF) (H, + XF AH. (A1.7)
(AM) versus temperature profiles can be obtained from the experimen-tal excess heat capacity data by integration. However, the thermody-namic information associated with the DSC transitions is contained inthe (A-),/T profile (note that (Al), is an average over the states Ii inequilibrium only). If the (AH),/T profile can be extracted from theexperimental data, then it can be analyzed using the equilibriumthermodynamic procedure.Assume that the rate of formation of the final state is given by4:
APPENDIX 1
Multistate denaturation mechanismincluding irreversibilityAssume that several, significantly populated states of the protein (Is, II,12, 13 ... In) coexist in chemical equilibrium during the thermally-induced denaturation and that any (or, in general, all) of the Ii statesundergo an irreversible, rate-controlled conversion to a final state F.The concentrations of states are related by:
Ceq = XCi Ct = Ceq + CF, (A1.1)
where C, is the total protein concentration, CF is the concentration offinal state, C, is the concentration of a state I, and C,q the totalconcentration of states Ii in equilibrium. The fractions of states aregiven by,
X = Cj/C, = C +CF XF = CF/Ct + CF'Ceq + CF Ceq + CF 9(A1.2)
where xi and XF are, respectively, the fractions of states Ii and F. Wedefine a second set of fractions (y;), only for those states in equilib-
d CF_ dCcqCCdt dt app eq'
or for a DSC experiment at constant scanning rate (v),
dT -(1Ilv) kappCq,
(A1.8)
(A1.9)
where n is the reaction order and kapp is an apparent n-order rateconstant. k.PP may, in general, be a complicated expression includingindividual rate constants (corresponding to irreversible steps: Ii -> F)and equilibrium constants (corresponding to reversible steps: IiI*+,); it is assumed, however, to depend only on temperature. Forinstance, in model II only two states of the protein coexist inequilibrium (Io = N and I, = U), the reaction order is unity and theapparent rate constant is given byk,pp = kK/(K + 1) (Eq. 5).
Separation of variables in Eq. A1.9 followed by integration from alow temperature, To, at which the reaction rate is negligible and
4Eq. A1.8 assumes that the collection of states Ii in equilibrium behavesas a single species from the kinetic point ofview, as is to be expected ongeneral grounds.
93 ipyiclJunl932 Biophysical Journal Volume61 April 1992
essentially all the protein is in the native state, leads to:
c(I-n) = (n 1)
where F(T) is the following integral:
F(T) = Jf kappdT.
From Eq. Al.10 the following can be easily obtained,
XF = 1 -(1 + (n ) F(T)
which, substituted in Eq. A1.7, yields:
AH (AH) = (AH (AH)e)
(n- 11(-nX 1 +-'C(n- 1) F(T)
kapp = exp (EappIRT*) exp (EappIRT),(A1.10)
(A2.2)
which is Eq. 21 in the text. Note that, for a given DSC experiment, thescanning rate (v) and the ligand concentration (Lo) are taken as
constants.
(A1. 1 1) Condition ofthe maximum ofthe DSC transitions. For T = Tm we have
(A1.11) that dCPX/dT = 0 and, therefore, (d2CNIdT2)m = 0. Applying thiscondition to Eq. A2.1 we obtain:
dpp Cl + k1
C(1- dCN
\ dT CNm app,m 11 N,m dT 1m(A1.12) (A2.3)
or
1
(d In kapp/dT)m = (d In CNIdT)m,
(A1.13)
or
(A2.4)
where CNm, kappm, (d In ka.pp/dT)in, and (d In CNIdT)m are the values ofCN, kapp, (d In kappldT), and (d In CNIdT) at T = Tm. Finally, taking intoaccount Eqs. A2.1 and A2.2, the following is easily arrived at,
(AH - (AH))1'n = (AM - (AM) )1 n
(n (A )'+ (A-(A)e)"n CI"n-1 F(T). (A1.14)
Thus, at constant T and C,, a plot of (AH - (AH))'-n versus 1/v
should result in a straight line; (AH)e and F(T) could then be obtainedfrom the intercept and slope of that line (of course, a nonlinear leastsquares analysis based on Eq. (A1.13) would also be possible). Thisprocedure should be applied to several temperatures (within thedenaturational range) to produce the (Al)i/ T profile (thermodynamicinformation associated with the DSC transitions) and the F(T)ITprofile (kinetic information about the irreversible formation of F).Note that, if this procedure is applied to DSC transitions in situationc, (AH) values close to zero will be obtained, indicating that no
information about the equilibrium unfolding is associated with thetransitions.
Eq. A1.13 is valid for n 1. The equation corresponding to n = 1can be easily shown to be:
(AH- (AM)) = (AH - < AH)) e F(T)(A1.15)
, E-PP exp (-EappIRT*)
=- exp (-EappIRTm) LovlR C('-m)IA. (A2.5)
Temperature dependence ofthe concentration ofnativeprotein. Separa-tion of variables in Eq. A2.1, followed by integration from a tempera-ture, To, low enough to make the reaction rate negligible, leads to:
CNP-I)IA = Ct(-1)/p' + (1 ) LO "F(T), (A2.6)
where C, is the total protein concentration (for T = TO, CN = C,) andF(T) is the following integral:
rTF(T) = fT kap dT
T= exp (Eapp/RT*) fT exp (-EappIRT) dT. (A2.7)
Eq. A2.6 can also be written as:
APPENDIX 2
Transitions shape and effects ofligand concentration, proteinconcentration, and scanning rate formodels IV and VI in situation CWe will carry out the derivations specifically for model VI (model IVcan be considered a particular case of model VI for the case in whichv = 0). The differential equation corresponding to a DSC experiment(Eq. 33 in the text) is:
dCN 1d
_-
1,k L-V/& Cl/LdT -v app 0 N (A2.1)
(1 C/('-)1)XN = 1 + -L LV/l C('-P')/P F(T) (A2.8)
wherexN (= Cs/C,) is the fraction of protein that remains in the nativestate at the temperature T.The integral in Eq. (A2.7) does not have an exact closed form
solution. An approximate expression for F(T), valid within therelatively narrow temperature range of a DSC transition, can beobtained, however, by taking into account that, within that tempera-ture range, 1 /T can be approximated by (Sanchez-Ruiz et al., 1988a):
1T = 1/Tm - AT/Tm,2 (A2.9)
where AT = T - Tm. Substituting A2.9 into A2.7 and integrating from
J.M. Sanchez-Ruiz Lumry-Eyrng Models in DSC 933
where k.PP depends on temperature according to,
J.M. Sanchez-Ruiz Lumry-Eyring Models in DSC 933
ATo (AT = T - Tm) to AT, we arrive at,
1 Eapp(1 1'F(T) = Wexp R (T* i')J
{exp (WAT) - exp (WATO)}, (A2.10)where W = Eapp /RTM. If To is low enough, and for the temperaturerange of the calorimetric transition, exp (WATO) << exp (WAT).Therefore, and taking into account Eq. A2.5, F(T) can be expressedas:
F(T) = pLv Lo'/ C(ml)/ exp (EappATIRT2) (A2. 11)Substituting Eq. A2.11 into A2.8, we obtain,
XN = (1 + (1 - pL)X(R)/! exp (EappAT/RT2)) 'l (A212)
where XNm (= CNm/IC) is the fraction of protein that remains in thenative state at the temperature Tm. For T = Tm, AT = 0 and XN = XNm;therefore.
XNm = (1 + (1 - ) XN m -) (A2.13)from whence,
XNm IL (A2.14)
Finally, substituting Eq. A2.14 into A2.12 the following is arrived at:
wcCN (= + (1 I exp (EappAT/RTM)) , (A2.15)
which gives the temperature dependence of the concentration ofnative protein.
Scanning rate, ligand concentration, and protein concentration effectson the DSC transitions. Substituting Eq. A2.14 into A2.5 yields:
Eap exp (-E IRT*)R Eapp!R*
T2=-exp (Eapp/RTi) Lj-'' C (A2.16)
Therefore, at constant Lo and C, the scanning rate effect on theDSC transitions is described by,
In (v/T2) = constant - RTEp (A2.17)
and, at constant scanning rate, the ligand and protein concentrationeffects on the transitions are given by:
constalt = Tpp - 2 In TmRTM(p.-1) v
+ In Ct +-1n LO. (A2.18)
Temperature dependence of the apparent excess heat capacity. Theapparent excess heat capacity if given by,
p" (Al/C) d = AH d , (A2.19)p ~~dT dT'
dXN/dT can be obtained from Eq. A2.15 and substituted into Eq. A2.19to yield5,
cex =AH
Eap exp (CRApTp RT~ ex RT 2
1 + ( T It)exp / TT2 (A2.20)
Taking the ,u-- 1 limit in Eq. A2.20 the following is obtained:
cex = HEapp jappA
CP RT 2 exp RT2
(Eapp AT \x exp |-expk RT2)J2 (A2.21)
which corresponds to ,u = 1, that is, to the two-state irreversible modelwith first-order kinetics (Sanchez-Ruiz et al., 1988a).
Setting T = Tm (AT = 0) in Fig. A2.20 leads to,
Eapp = 1(')RT2 Cem/AH. (A2.22)
Given that limr,1 L,u/(G-l) = e, the equation corresponding to thetwo-state irreversible model with first-order kinetics is:
Eapp =eRTm Cp,/AH, (A2.23)
which was obtained by Sanchez-Ruiz et al. (1988a) using a differentprocedure (Eq. (A2.23) can also be arrived at by setting AT = 0 in Eq.A2.21.
This research was supported by grants PB87-0871 from the DireccionGeneral de Investigacion Cientifica y Tecnica and 0460.E from theBiotechnology Action Programme of the European Communities.
Received for publication 20 December 1990 and in final forn 6November 1991.
REFERENCES
Bertazzon, A., G. H. Tian, A. Lamblin, and T.Y. Tsong. 1990.Enthalpic and entropic contributions to actin stability: calorimetry,
'Eq. A2.20 must be applied within the temperature range 0 < T < T',where T' is equal to Tm + (RT2lEapp) ln (p./([. - 1)); note that, forT = T', Cex = 0, and that, for T > T', it is not possible to calculate Cpxpvalues, as the last bracket in Eq. A2.20 yields a negative number (forfitting purposes, Cpx has been set equal to zero for any temperatureabove T'). This is a consequence of the fact that Eq. A2.1 is anapproximation based on the assumption that CQ <« CN (situation C);obviously, this assumption will break down at a given temperatureduring the scan given that, as the temperature increases, the concentra-tion of native plus unfolded protein becomes lower and the prelimi-nary equilibrium is displaced towards the monomeric unfolded spe-cies. Thus, a DSC transition will be described by models IV or VI insituation C, if essentially all the protein is already in the final state atthe temperatures in which Eq. A2.1 (and, hence, Eq. A2.20) no longerholds true.
934 Biophysical Journal Volume 61 April 1992
circular dichroism, and fluorescence study and effects of calcium.Biochemistry. 29:291-298.
Brandts, J. F., C. Q. Hu, L.-N. Lin, and M. T. Mas. 1989. A simplemodel for proteins with interacting domains. Applications to scan-ning calorimetry data. Biochemistry. 28:8588-8596.
Conejero-Lara, F., P. L. Mateo, F. X. Aviles, and J. M. Sanchez-Ruiz.1991. The effect of Zn2+ on the thermal denaturation of carboxypep-tidase B. Biochemistry. 30:2067-2072.
Edge, V., N. M. Allewell, and J. M. Sturtevant. 1985. High-resolutiondifferential scanning calorimetric analysis of the subunits of Escheri-chia coli aspartate transcarbamoylase. Biochemistry. 24:5899-5906.
Freire, E., and R. L. Biltonen. 1978. Statistical mechanical deconvolu-tion of thermal transitions in macromolecules. I. Theory andapplications to homogeneous systems. Biopolymers. 17:463-479.
Freire, E., W. W. van Osdol, 0. L. Mayorga, and J. M. Sanchez-Ruiz.1990. Calorimetrically determined dynamics of complex unfoldingtransitions in proteins. Annu. Rev. Biophys. Biophys. Chem. 19:159-188.
Fukada, H., J. M. Sturtevant, and F. A. Quiocho. 1983. Thermodynam-ics of the binding of L-arabinose and of D-galactose to the L-arabinose-binding protein of Eschenichia coli. J. Bio. Chem. 258:13193-13198.
Galisteo, M. L., P. L. Mateo, and J. M. Sanchez-Ruiz. 1991. A kineticstudy on the irreversible thermal denaturation of yeast phosphoglyc-erate kinase. Biochemistry. 30:2061-2066.
Goins, B., and E. Freire. 1988. Thermal stability and intersubunitinteractions of cholera toxin in solution and in association with itscell-surface receptor ganglioside GM,. Biochemistry. 27:2046-2052.
Guzman-Casado, M., A. Parody-Morreale, P. L. Mateo, and J. M.Sanchez-Ruiz. 1990. Differential scanning calorimetry of lobsterhaemocyanin. EurJ. Biochem. 188:181-185.
Hu, C. Q., and J. M. Sturtevant. 1987. Thermodynamic study of yeastphosphoglycerate kinase. Biochemistry. 26:178-182.
Hu, C. Q., and J. M. Sturtevant. 1989. A differential scanningcalorimetric study on the binding of sulfate ion and of Cibacron blueF3GA to yeast phosphoglycerate kinase. Biochemistry. 28:813-818.
Jencks, W. P. 1987. Catalysis in Chemistry and Enzymology. DoverPublications Inc., New York. 836 pp.
Klibanov, A. M., and T. J. Ahern. 1987. Thermal stability of proteins.In Protein Engineering. D. L. Oxender and C. F. Fox, editors. AlanR. Liss, New York. 213-218.
Lepock, J. R., A. M. Rodahl, C. Zhang, M. L. Heynen, B. Waters, andK.-H. Cheng. 1990. Thermal denaturation of the Ca2+-ATPase ofsarcoplasmic reticulum reveals two thermodynamically independentdomains. Biochemistry. 29:681-689.
Lowry, T. H., and K. S. Richardson. 1976. Mechanism and theory inorganic chemistry. Harper and Row, New York. 748 pp.
Lumry, R., and H. Eyring. 1954. Conformation changes of proteins. J.Phys. Chem. 58:110-120.
Manly, S. P., K. S. Matthews, and J. M. Sturtevant. 1985. Thermaldenaturation of the core protein of lac repressor. Biochemistry.24:3842-3846.
Morin, P. E., D. Diggs, and E. Freire. 1990. Thermal stability ofmembrane-reconstituted yeast cytochrome c oxidase. Biochemistry.29:781-788.
Privalov, P. L. 1979. Stability of proteins. Small globular proteins. Adv.Protein Chem. 33:167-241.
Privalov, P. L. 1982. Stability of proteins. Proteins which do notpresent a single cooperative system. Adv. Protein Chem. 35:1-104.
Privalov, P. L. 1989. Thermodynamic problems of protein structure.Annu. Rev. Biophys. Biophys. Chem. 18:47-69.
Privalov, P. L., and L. V. Medved'. 1982. Domains in the fibrinogenmolecule. J. Mol. Bio. 159:665-683.
Ramsay, G., and E. Freire. 1990. Linked thermal and solute perturba-tion analysis of cooperative domain interactions in proteins. Struc-tural stability of diphtheria toxin. Biochemistry. 29:8677-8683.
Sanchez-Ruiz, J. M., J. L. Lopez-Lacomba, M. Cortijo, and P. L.Mateo. 1988a. Differential scanning calorimetry of the irreversiblethermal denaturation of thermolysin. Biochemistry. 27:1648-1652.
Sanchez-Ruiz, J. M., J. L. Lopez-Lacomba, P. L. Mateo, M. Vilanova,M. A. Serra, and F. X. Aviles. 1988b. Analysis of the thermalunfolding of procine procarboxypeptidase A and its functionalpieces by differential scanning calorimetry. Eur. J. Biochem. 176:225-230.
Sturtevant, J. M. 1987. Biochemical applications of differential scan-ning calorimetry. Annu. Rev. Phys. Chem. 38:463-488.
Takahashi, K., and J. M. Sturtevant. 1981. Thermal denaturation ofStreptomyces subtilisin inhibitor, subtilisin BPN', and the inhibitor-subtilisin complex. Biochemistry. 20:6185-6190.
J.M. Sanchez-Ruiz Lumry-Eyring Models in DSC 935