thermodynamic characterization of conformational states of biological macromolecules using...
TRANSCRIPT
November 1978 85
ERMODYNAMIC CHARACTERIZATION OF CONFORMATIONAL STATES OF BIOLOGICAL MACROMOLECULES USING DIFFERENTIAL SCANNING
CALORIMETRY
Authors: Rodney L. Biltonen Ernest0 Freire Departments of Pharmacology and Biochemistry University of Virginia School of Medicine Charlottesville, Virginia
Referee: John F. Brandts Department of Chemistry University of Massachusetts Amherst, Massachusetts
INTRODUCTION
Conformational changes of biological mac- romolecules play a major role in discussions about the functioning of complex biochemical systems. Abrupt- changes in the catalytic activ- ity of enzymes with temperature have been as- cribed to reversible, “all-or-none” transitions in the structural state of the macromolecule. Allosteric regulation has been rationalized in terms of ligand-induced conformational changes in proteins. More recently, it has been demonstrated that transfer ribonucleic acids undergo a sequence of conformational changes as a function of temperature and magnesium
salt concentration; these variations in structure may play a role at the various stages of protein synthesis in which tRNA is involved. It has also been suggested that gel-to-liquid crystalline transitions of the phospholipid ma- trix of biological membranes may play an im- portant role in the functioning of these complex systems.
In order to develop a complete understanding
of biological phenomena in molecular terms, it is necessary to identify the structural and ther- modynamic characteristics of the accessible states of the system of interest. This review will consider experimental and analytical methods by which identification of the number of acces- sible states and their thermodynamic character- istics can be made. First, the problems involved in developing a detailed thermodynamic de- scription of conformational transitions of ma- cromolecular systems will be briefly stated. There will follow a description of the basic principles involved in using differential scan- ning calorimetry to obtain heat-capacity data and a review of the thermodynamic informa- tion which has been obtained for a number of systems. It appears, however, that heat-capac- ity data contain substantially more information relating to the statistical thermodynamic de- scriptions of complex macromolecular systems than has been normally extracted. Therefore, the last part of this review will consist of a dis- cussion of analytical protocols to obtain such information, as recently developed in the au- thors’ laboratory.
Cri
tical
Rev
iew
s in
Bio
chem
istr
y an
d M
olec
ular
Bio
logy
Dow
nloa
ded
from
info
rmah
ealth
care
.com
by
222.
222.
251.
129
on 0
5/20
/14
For
pers
onal
use
onl
y.

86 CRC Critical Reviews in Biochemistry
GENERAL CONSIDERATIONS OF
~ O N ~ Q R ~ A ~ ~ O N ~ ~ TRANSITIONS
THREE STATE (To)
J/
The major problem in defining the thermo- dynamic details of a con formational transition of a macromolecule in solution is that the tran- sition may proceed through a series of distinct states, and identification of the number of ac- cessible states and their related thermodynamic parameters is difficult at best. Consider the se- quential reaction scheme
( 1 )
where a macromolecule undergoes a transition from some initial state, lo, to some final state, I,. The equilibrium situation can be defined by the set of equilibrium constants,
- -1 _ _ _ - I -1 l o - 4 d 2 n-1- n
I..
K , = [‘il I
[ I i-1 1
with which a as
Q = 1 + K , +
FIVE STATE
(TO)
I , I I , . I
(2)
partition function can be defined
(i = l , 2 , 3 . . . n )
K , K , + K, K , K, + - - - - +
l a . I I ) . I
K , K, - - - K n (3)
This partition function is defined in terms of the probabilities of each state relative to that of state lo being equal to one at all temperatures.
Before proceeding, it may be useful to make some fundamental definitions. By “state” is meant a macroscopic distribution summed over a number of microstates whose average energy quantities are defined by GO,, W o j , SO,, C”,,,, etc. These macrostates are not necessarily static, structurally well-defined entities; they may rep- resent dynamic, fluctuating molecular distribu- tions (e.g., the “native” state of a protein). The transitions between states are reversible in a thermodynamic sense and, from an experimen- tal point of view, are in equilibrium. The enu- meration of states makes no implication regard- ing the kinetic path for transformation. The designation of a state simply means that at some point in the transition it is significantly populated. It should also be noted that this re- action scheme, as well as the derived partition function, is general. The individual states are separated in a sequential sense in terms of in- creasing enthalpy values. A special case of this representation is a reaction scheme of inde- pendent two-state transitions.
The discreteness of the states depends, from an experimental point of view, upon their sep- aration in terms of A , and AS,. As will be seen in the case of proteins and transfer ribonucleic acids, AH, and AH,,, may differ by 30 kcallmol or more. In other cases, adjacent states will thermodynamically differ very little and will tend to merge so as to form a continuum. This is the case for helix-coil transitions of polypep- tides and synthetic ribonucleic acids. A picto- rial representation of these differences as they manifest themselves in the energy distribution function is given in Figure 1.
of each macrostale is given by The probability or fractional occupancy, F,,
e - AGi/RT
Q F. =
(4)
where AGj = GDi - GD,. If we assign the value a: to any general property of state, the average value (measured value) is given by
(5) Q
Experimentally, however, one is primarily con- cerned with changes in an observable relative to that found in some reference state which we will
1 CONTINUOUS DISTRIBUTION (To) I
NON-SYMMETRICAL TWO STATE (To)
I I I I I I I I f I 1
0 10 20 30 40 50 60 70 60 90 IC ENERGY (KCAL )
FIGURE 1. Distribution functions for the three-state five-state, uniform-continuous, and nonsymmetrical two state cases at the transition temperature. (From Lumry, R. Biltonen, R., and Brandts, J . , Biopolymers, 4, 917, 1966 With permission.)
Cri
tical
Rev
iew
s in
Bio
chem
istr
y an
d M
olec
ular
Bio
logy
Dow
nloa
ded
from
info
rmah
ealth
care
.com
by
222.
222.
251.
129
on 0
5/20
/14
For
pers
onal
use
onl
y.

November 1978 87
ginning a discussion of the analysis of experi- mental results.
The traditional differential scanning calori- meter consists of a sample and a reference ca- lorimetric cell which, ideally, are thermally iso- lated from one another and from the environment. If the cells (including contents) are identical, constant and identical power in- put into each will produce a constant tempera- ture rise with time in the two cells. This is usu- ally accomplished by placing two identical resistance heaters in series in each of the cells. The rate of temperature rise, y, is given by4
y = PIC = 12RR/C (9)
where I is the constant current applied to each heater of resistance, R, and C is the heat capac- ity of each cell in joules per degree.
If the heat capacity of, for example, the sam- ple cell is greater than that of the reference cell, the temperature of the former will tend to lag behind the latter. In order to maintain y con- stant in both cells, a temperature-sensing device monitors the temperature difference between the two cells, and, via a feedback circuit, suffi- cient additional power is applied to an auxiliary heater in the cell which is lagging to null this temperature difference. Thus,
take to be I,. Thus, we shall define Aa, = ai - a, and
XAei ,-AGi/RT < A e > =
Q (6 1
If the enthalpy of the system is considered to be the observable, then the excess enthalpy is defined as
(7)
Usually, a general observable is monitored to characterize a transition. This function con- tains 3 (n-1) parameters ( A a i , AHj, and ASt for each step). An advantage of the use of AH as the observable is that it is contained as both a coefficient and a parameter in the exponential terms. Thus, only 2 (n - 1) parameters are re- quired to exactly define the transition.
Another advantage of using AH as the ob- servable is that its temperature derivative can be directly measured, adding greater sensitivity to the analysis. This derivative is, by definition, equal to the excess heat capacity, <AC,>, and related to the variance of the enthalpy distribu- tion function:
a < A H > <AH2 > -- <AH 1' < A C P > = (-) = aT RT*
P
(8)
These facts form the basis of the use of differ- ential scanning calorimetry in monitoring ma- cromolecular conformational transitions and the basis for the method of analysis described in this review.
DIFFERENTIAL SCANNING CALORIMETRY
In this review, the applications of the tech- nique of differential scanning calorimetry in the study of conformational changes of biological macromolecules will be considered. The opera- tional details of the technique, however, will not be examined; a number of recent reviews dealing with this aspect of the problem are rec- ommended to the reader instead. 1-3 Neverthe- less, it will be useful to briefly consider the basic principles of the measurement before be-
P y = - - P + A P c - - C + AC
and AC = AP/y. AP is the instantaneous power input via the auxiliary heater in the cell with the greater heat capacity (C + AC). Measurement of the absolute temperature (as a function of time) and of AP provides the basic information which can be converted to an excess heat capac- ity vs. temperature function.
The calorimeters designed by Ackermann,' Gill,' Privalov,' and co-workers op-
erate in this manner. Sturtevant's calorimeter9 measures the integrated power input as a func- tion of temperature, which, upon differentia- tion, yields the excess heat capacity. More re-
oss and Goldberg', designed a calorimeter in which the primary signal is the temperature difference between cells (feedback control is not utilized). This type of calorimeter does not directly yield AC, but appropriate computer analysis of the data, as developed by Suurkuusk and co-workers," provides esti- mates of AC as a function of temperature.
Cri
tical
Rev
iew
s in
Bio
chem
istr
y an
d M
olec
ular
Bio
logy
Dow
nloa
ded
from
info
rmah
ealth
care
.com
by
222.
222.
251.
129
on 0
5/20
/14
For
pers
onal
use
onl
y.
88 CRC Critical Reviews in Biochemistry
In this latter type of calorimeter, based on the heat-leak principle, the two cells are con- tained within a heat sink. The heat sink, whose heat capacity is much greater than the sample or reference cell, is heated a t a constant rate, ideally. Because of thermal barriers between the cells and the sink, the cell temperature, T,, lags behind that of the sink, T,. Under steady-state conditions, the rate of heat flow into both cells is proportional to this temperature difference:
- dQ dt
= K (T, -Tc) (1 1)
where K is a constant of the calorimeter which can be experimentally determined, and
(under steady-state conditions, y = dT,/dt = dTJdt). If the heat capacity of both cells is identical, no temperature difference between the two cells exists, but if the heat capacity of one is greater by an amount AC, then a temper- ature difference
6T = A C Y K
between the two cells is developed. Thus, mon- itoring dT and the temperature as a function of time and knowing K , one can determine the ex- cess heat capacity. It is to be noted, however, that because of thermal impedance in the meas- uring devices which form the thermal barriers, a time-response correction must be made. This correction is straightforward, and its applica- tion to yield AC as a function of temperature has been discussed by Suurkuusk et al. l 1
The design, construction, and use of calorim- eters of the type described above are not im- plied to be simple. Calorimeters of the neces- sary sensitivity and precision require rather sophisticated control, monitoring, and data ac- quisition equipment. For example, the thermal characteristics of cells can never be made iden- tical; cells cannot be isolated from the environ- ment at adiabatic conditions; and, in the case of the heat-leak type calorimeter, extensive computer calculation is required to transform the basic data into a heat-capacity curve.
It should be noted that this discussion will be very concerned about the exact shape of heat- capacity curves obtained with quite small
amounts of biological material. For the most part, the only calorimeters capable of generat- ing the required data are those which have been produced in research laboratories throughout the world. The only commercially available cal- orimeter which meets the necessary require- ments is one based on the design of Privalov.8
EXCESS HEAT CAPACITIES
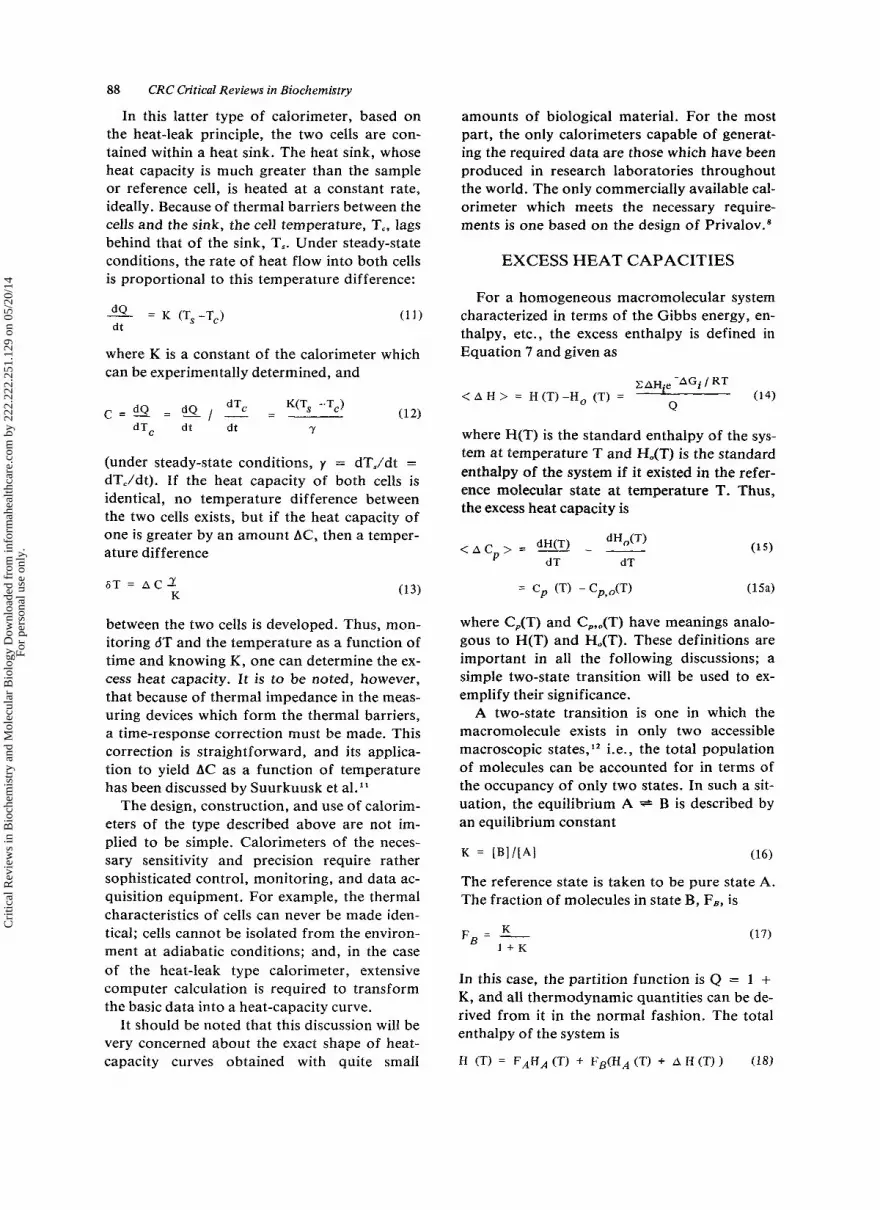
For a homogeneous macromolecular system characterized in terms of the Gibbs energy, en- thalpy, etc., the excess enthalpy is defined in Equation 7 and given as
-AGi t RT < A H > = H (T) -Ho (T) = 0 4 )
Q
where H(T) is the standard enthalpy of the sys- tem at temperature T and H,(T) is the standard enthalpy of the system if it existed in the refer- ence molecular state a t temperature T. Thus, the excess heat capacity is
(1 5 )
= C p (TI - C p , o ( T ) (15a)
where C,(T) and C,,,(T) have meanings analo- gous to H(T) and H,(T). These definitions are important in all the following discussions; a simple two-state transition will be used to ex- emplify their significance.
A two-state transition is one in which the macromolecule exists in only two accessible macroscopic states, ** i.e., the total population of molecules can be accounted for in terms of the occupancy of only two states. In such a sit- uation, the equilibrium A * B is described by an equilibrium constant
K = [BII [Al (16)
The reference state is taken to be pure state A. The fraction of molecules in state B, Fe, is
dHJ-0 < A C p > = dm - __
dT dT
K F B = - 1 + K
In this case, the partition function is Q = 1 + K, and all thermodynamic quantities can be de- rived from it in the normal fashion. The total enthalpy of the system is
H (TI = FAHA (T) i- FB(HA (T) i- A H (TI ) (18)
Cri
tical
Rev
iew
s in
Bio
chem
istr
y an
d M
olec
ular
Bio
logy
Dow
nloa
ded
from
info
rmah
ealth
care
.com
by
222.
222.
251.
129
on 0
5/20
/14
For
pers
onal
use
onl
y.

November 1978 89
the integral provides the enthalpy difference be- tween state B and state A at temperature T,. If, however, the heat-capacity curve is integrated using the temperature-independent line (solid) shown in Figure 2A, the estimate of AH refers to the enthalpy difference between state B at temperature T, and state A at temperature To. This is not particularly important if the transi- tion occurs over an interval of a few degrees but is a serious problem if the transition is broad. Examples of this problem will be viewed later.
FIGURE 2. Computer-simulated heat capacity function, C,, and excess heat capacity function, <AC,>, for a two- state transition characterized by the following parameters: AH = 100 kcal/mol; T, = 50°C; AC, = 3 kcal/K/mol; <AC,> is obtained from C, after subtraction of C,,, (dotted line), the heat capacity of the initial state.
where AH(T) = H,(T) - HA(T). Noting that Fa + F, = 1 , it follows that
The latter term in Equation 21 is referred to as a “between states” heat capacity (arising from a change in the relative population of macro- scopic states with temperature), whereas C,,A(T) or C,,,(T) is a “within states” heat ca- pacity (an intrinsic property of a particular macroscopic state), and AC, = C,,, - C,,A.
In an ideal differential scanning calorimeter, the measured quantity is C,(T), as shown in Figure 2A, for a hypothetical two-state transi- tion. In order to obtain <AC,>, it is necessary to estimate the temperature dependence of C,JT), as indicated by the broken line. Sub- traction of C,,,(T) will yield <AC,>, as shown in Figure 2B. This calculated result can then yield estimates of the transition temperature; where Fa = F, = 9’2 in the present case, AH(T)
T, = I <AC,> dT and AC,, as indicated in the
figure. This method of estimating the enthalpy
change for the transition is extremely impor- tant. If one uses the <AC,> curve as defined,
A REVIEW OF PREVIOUS CALORIMETRIC STUDIES
The most obvious advantage of scanning ca- lorimetry is that it provides a direct estimate of the overall enthalpy change of a transition with- out requiring knowledge of the thermodynamic mechanism. Other methods which monitor the transition can provide reasonable estimates of the transition temperature (ACP-O), but, unless the reaction is of the two-state type, thermody- namic quantities can only be approximated, at best. In this section, the literature through about 1977 on scanning calorimeter results will be reviewed. These works report the enthalpy changes associated with the double-single strand transition of DNA and some synthetic polynucleotide systems, the gel-liquid crystal- line transitions of phospholipid bilayers, and the thermal unfolding of transfer ribonucleic acids; the evaluation of theoretical parameters associated with transitions in homopolymers; and the testing of the two-state hypothesis of the thermal unfolding of globular proteins. It has only been rather recently that analysis of the detailed shape of <AC,> curves for biologi- cal macromolecules has been attempted. This recapitulation of past work should provide the background for the discussion to be presented in later sections.
Deoxyribonucleic Acids (DNA) The double-strand single-strand transition of
naturally occurring DNA has been particularly interesting to the calorimetrist. Not only is the system biologically important, but the transi- tion is extremely abrupt and occurs with a large enthalpy change. Thus, it is relatively easy to monitor the transition with most differential
Cri
tical
Rev
iew
s in
Bio
chem
istr
y an
d M
olec
ular
Bio
logy
Dow
nloa
ded
from
info
rmah
ealth
care
.com
by
222.
222.
251.
129
on 0
5/20
/14
For
pers
onal
use
onl
y.
90 CRC Critical Reviews in Biochemistry
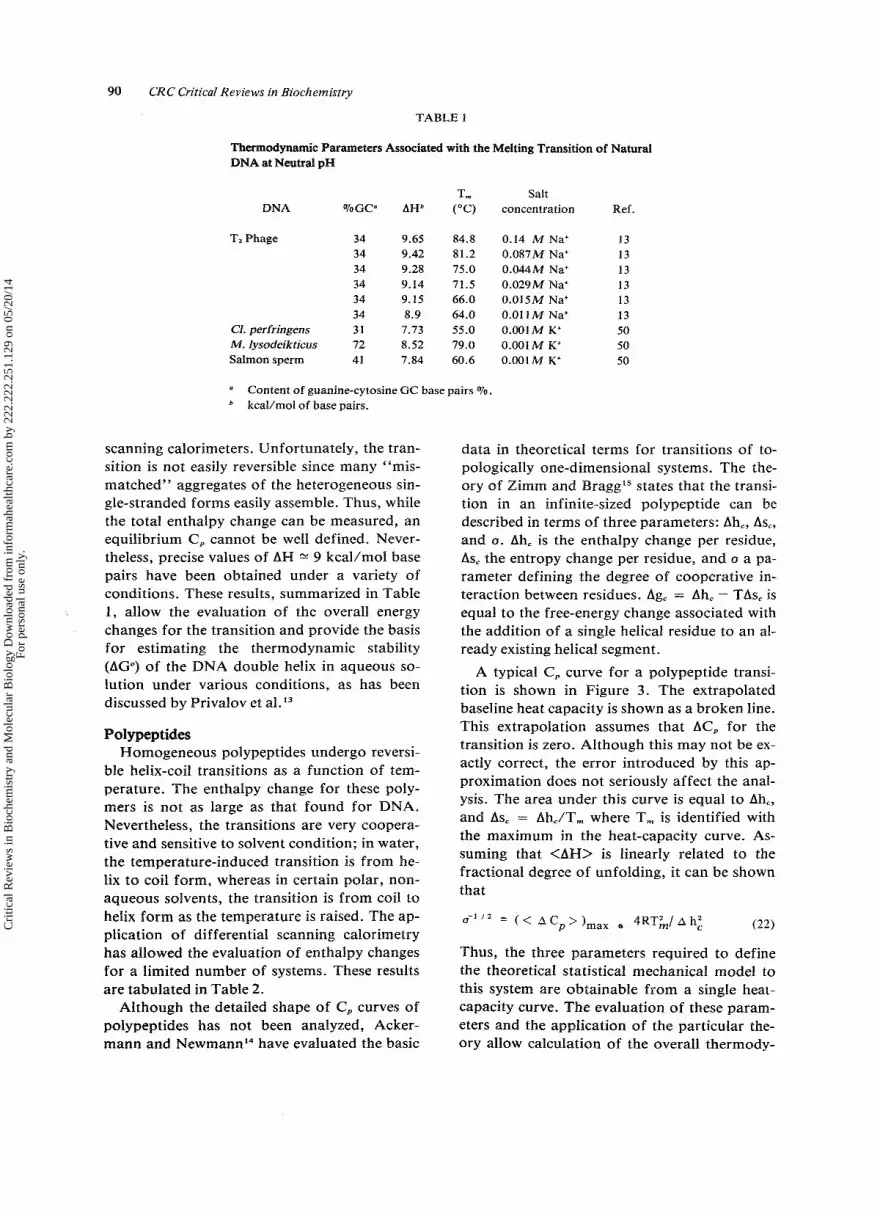
TABLE 1
Thermodynamic Parameters Associated with the Melting Transition of Natural DNA at Neutral pH
T, Salt DNA ToGC" AHb ("C) concentration Ref.
T2 Phage 34 9.65 84.8 34 9.42 81.2 34 9.28 75.0 34 9.14 71.5 34 9.15 66.0 34 8.9 64.0
Cl. perfringens 31 7.73 55.0 M. Iysodeikticus 72 8.52 79.0 Salmon sperm 41 7.84 60.6
0.14 M Na' 0.087M Na' 0.044M Na' 0.029M Na' 0.015M Na+ 0.01 1 M Na' 0.001 M K' 0.001 M K' 0.001 M K'
13 13 13 13 13 13 50 50 50
Content of guanine-cytosine GC base pairs To. kcaVmo1 of base pairs.
scanning calorimeters. Unfortunately, the tran- sition is not easily reversible since many "mis- matched" aggregates of the heterogeneous sin- gle-stranded forms easily assemble. Thus, while the total enthalpy change can be measured, an equilibrium C, cannot be well defined. Never- theless, precise values of AH % 9 kcal/mol base pairs have been obtained under a variety of conditions. These results, summarized in Table 1, allow the evaluation of the overall energy changes for the transition and provide the basis for estimating the thermodynamic stability @Go) of the DNA double helix in aqueous so- lution under various conditions, as has been discussed by Privalov et al. l3
Polypeptides Homogeneous polypeptides undergo reversi-
ble helix-coil transitions as a function of tem- perature. The enthalpy change for these poly- mers is not as large as that found for DNA. Nevertheless, the transitions are very coopera- tive and sensitive to solvent condition; in water, the temperature-induced transition is from he- lix to coil form, whereas in certain polar, non- aqueous solvents, the transition is from coil to helix form as the temperature is raised. The ap- plication of differential scanning calorimetry has allowed the evaluation of enthalpy changes for a limited number of systems. These results are tabulated in Table 2.
Although the detailed shape of C, curves of polypeptides has not been analyzed, Acker- mann and NewmannI4 have evaluated the basic
data in theoretical terms for transitions of to- pologically one-dimensional systems. The the- ory of Zimm and Braggls states that the transi- tion in an infinite-sized polypeptide can be described in terms of three parameters: Ah,, As,, and 0. Ah, is the enthalpy change per residue, Asc the entropy change per residue, and o a pa- rameter defining the degree of cooperative in- teraction between residues. Ag, = Ah, - TAs, is equal to the free-energy change associated with the addition of a single helical residue to an al- ready existing helical segment.
A typical C, curve for a polypeptide transi- tion is shown in Figure 3 . The extrapolated baseline heat capacity is shown as a broken line. This extrapolation assumes that AC, for the transition is zero. Although this may not be ex- actly correct, the error introduced by this ap- proximation does not seriously affect the anal- ysis. The area under this curve is equal to Ah,, and Asc = Ah,/T, where T, is identified with the maximum in the heat-capacity curve. As- suming that <AH> is linearly related to the fractional degree of unfolding, it can be shown that
Thus, the three parameters required to define the theoretical statistical mechanical model to this system are obtainable from a single heat- capacity curve. The evaluation of these param- eters and the application of the particular the- ory allow calculation of the overall thermody-
Cri
tical
Rev
iew
s in
Bio
chem
istr
y an
d M
olec
ular
Bio
logy
Dow
nloa
ded
from
info
rmah
ealth
care
.com
by
222.
222.
251.
129
on 0
5/20
/14
For
pers
onal
use
onl
y.

November 1978 91
TABLE 2
Thermodynamic Parameters Associated with the Helix-coil Transition of Polypeptides
T, Polypeptide AHo ("C) ob Solvent Reference
Poly (y-benzyl 950 +. 20" 55 1 . 2 8 ~ 1 0 - ~ 85wtVo DCA-EDC 14
42 0.98x10⁻⁴ 82wtVn DCA-EDC 14 L-gluta-mate)
a cal/mol of amino acid residue. Cooperativity parameter. See text for details. Extrapolated value to infinite dilution. DCA: dichloracetic acid; EDC: I ,2-dichloroethane.
*
namic functions, including helical distribution functions, for the transition. It has been shown that the assumption of a specific model is not required, however, to obtain this information if the entire C, curve is used in the analysis.32 This point will be discussed in a later section.
A ~ k e r m a n n ' ~ has shown that Ah,, Asc, and u, as calculated by the above procedure, are de- pendent upon the polypeptide and upon the ex- act solvent conditions. A summary of his re- sults is given in Table 2 .
Polynucleotides
poly (A). P O ~ Y (A), P O ~ Y (A) poly (U), and Complimentary polynucleotides, such as
poly (dAT) . poly (dAT), form well-defined double-stranded and, occasionally, triple- stranded structures in aqueous solution. Dis- ruption of these helical structures occurs upon increasing the temperature, giving rise to anom- alous heat- capacity curves such as that shown in Figure 4. The broken line is the excess en- thalpy function, <AH>, calculated by direct in- tegration of <AC,> = C,(T) - Cp,o(T). The area under <AC,> provides an estimate of the en- thalpy change for the transition from the dou- ble-stranded to the single-stranded form.
The strand-separation reaction occurs ab- ruptly near the maximum in <AC,>. The grad- ual increase in <AC,> prior to strand separation is due to the partial unraveling at the ends of the double strand and the formation of non- base-paired loops within the helical duplex. An apparent ACp between the double- and single- stranded forms is to be noted. This ACp is pri- marily the result of temperature-dependent changes in the degree of base stacking in the single-stranded
Neumann and Ackermann16 have calculated
I 1 ,/'
D
FIGURE 3. Heat capacity as a function of temperature of two poly(y-benzyl L-glutamate) solutions of equal con- centration (0.25 M) and of different dichloroacetic acetic acid content (A: 81 wt% DCA; B: 85 wt% DCA). Under these solvent conditions, the transition is from coil to helix upon increasing the temperature. (Adapted from Acker- mann, T. and Neumann, E., Biopolyrners, 5, 649, 1967. With permission.)
cooperative interaction parameters and average helical lengths at the transition temperature us- ing specific theoretical models. These parame- ters are useful in comparing theoretical results 38.s2 with experimental data, but, as with poly- peptide systems, such information can be ex- tracted from <AC,> curves without explicit as- sumptions of a particular The
Cri
tical
Rev
iew
s in
Bio
chem
istr
y an
d M
olec
ular
Bio
logy
Dow
nloa
ded
from
info
rmah
ealth
care
.com
by
222.
222.
251.
129
on 0
5/20
/14
For
pers
onal
use
onl
y.

92 CRC Critical Reviews in Biochemistry
_..._..... -.. 10 20 30 (0 M
TEMP OC
A P I
Y
x 0
Fr -.
FIGURE 4. C, vs. temperature (solid line) for the helix- coil transition of poly(A) ' poly(U) at neutral pH and "a'] = 0.016 M. The dashed line (<AH>) is the average excess enthalpy calculated by direct integration of C, after sub- traction of C,,,. (From Suurkuusk, J . , Alvarez, J . , Freire, E., and Biltonen, R., Biopolymers, 16, 2641, 1977. With permission.)
thermodynamic results for a number of poly- nucleotide systems are summarized in Table 3 .
Proteins The broadest application of the differential
scanning calorimetric technique has been the study of the reversible thermal unfolding of globular proteins in aqueous solution. A typical heat-capacity profile for a globular protein is shown in Figure 5. The salient features are the pronounced temperature dependence of C, prior to the occurrence of the maximum in C, and the large difference between C, before and after the transition. This type of data has been interpreted to indicate a large d C p 7 ° for the
folded low-temperature form and a large AC, for the transition.
The temperature dependence of C,,, for the folded state is estimated by the broken line in Figure 5, which upon subtraction yields the ex- cess heat-capacity function, <AC,>. Integration of <AC,> over the entire transition interval yields a AH value which is extremely ternpera- ture dependent. This temperature dependence in AH, resulting from a nonzero ACp, has been interpreted to be the result of a positive increase in AC, upon unfolding, due to the exposure of previously buried hydrophobic groups to the aqueous medium. 12.53-s5
Lumry et al.l2 have previously shown that the van't Hoff heat for such a transition, AH,,, will be less than or equal to the calorimetrically determined enthalpy change:
AHVH 5 AH (23)
dT
-
TABLE 3
Thermodynamic Parameters Associated with the Double-strand Single-strand Transition of Polynucleotides
System AHa
Poly(A) ' Poly(U) 6.8 7.8 8.6 7 .4 7.95 8.2
Poly(A) ' Poly(A) 1.4
Poly(dAT) 8.1 Poly(dAT)
T, ("C) ACPb
42.2 80 58.2 100 62.5 95 44.5 - 51.3 - 58.2 - 52.5 174
39. I 23
Salt concentration
0.016M Na' 0.16 M Na' 0.26 M Na' 0.018M Na' 0.043 M Na' 0.103M Na' 0.1 MAcetate, 0.1 MNaCI, pH 5.4
0.005 MNaC104, 0.001 M Cacodylate- citrate
Reference
48 48 48 49 49 49 48
51
a kcal/mol of base pair. cal/K.mol of base pair.
Cri
tical
Rev
iew
s in
Bio
chem
istr
y an
d M
olec
ular
Bio
logy
Dow
nloa
ded
from
info
rmah
ealth
care
.com
by
222.
222.
251.
129
on 0
5/20
/14
For
pers
onal
use
onl
y.

November 1978 93
The equality will hold only in the case of two- state transitions. Assuming a two-state transi- tion, one can calculate AHv, from the <AC,> curve, according to
where (<AC,>),,,ax is the excess heat capacity at the transition temperature. Jackson and Brandts6 have shown that AHvH = AH for the unfolding of chymotrypsinogen, and Privalov and Khechinashvili18 have shown that AH/AHVH = 1.05 +- 0.03 for a number of proteins. These results clearly demonstrate that, to a good ap- proximation, the unfolding of many low molec- ular weight globular proteins is a two-state pro- cess.
It is presently clear that globular proteins un- fold via approximate two-state processes, that the heat capacity of the folded form is very tem- perature dependent, and that a substantial in- crease in C, occurs upon unfolding. The results of the analysis of several protein systems de- scribed above are summarized in Table 4.
Transfer Ribonucleic Acids The study of the thermal unfolding of trans-
fer ribonucleic acids using differential scanning calorimetric techniques has been rather limited; only four reports currently exist in the litera- ture. Nevertheless, the results of these studies have been of substantial value. Brandts et a1.l' unequivocally demonstrated that since AH/ AH,, >> 1 , the unfolding of tRNA was not a two-state process. Their results also indicated
c , I
O t l . ~ ~ ~ - ~ . ! - - L u : I I I I 20 30 40 50 60 70 80 90
TEMP OC
FIGURE 5. Temperature dependence of partial heat ca- pacity of lysozyme at pH values 2.0, 2.5, and 4.5. (From Privalov, P. and Khechinashvili, N., J . Mol. Biol., 86, 665, 1974. With permission.)
that AH 200 kcal/mol and that AC, = 1 to 7 kcal/K.mol. These values are much larger than those found for proteins of the same molecular weight.
Privalov and co-workers20.21 arrived at simi- lar conclusions, except that they asserted that C, of the folded state is very temperature de- pendent and that AC, is not particularly large. They suggested that the large ACp values which were obtained in the presence of MgZ+, under which conditions tRNA tends to be hydrolyzed, were the result of the transition not being re- versible.
A typical <AC,> profile for tRNA is shown in Figure 6. The salient feature of this transition is that it occurs over a very broad temperature range. Privalov and co-workers20.2' have at- tempted to define this complex transition in terms of a number of independent two-state
TABLE 4
Thermodynamic Parameters Associated with the Thermal Unfolding of Globular Proteins
AH (kcall
Protein mol)
Ribonuclease 88 90'
95 f 5 Chymotry- 102
psinogen 135
a-Chymotrypsin 95' Lysozyme 90' Cytochrome c 7OS
T, ("C)
40.6 43 .O" 43.0 42.0
54.2 44.0' 53.0- 59.0"
ACP (kcal/
K . mol)
2.1 1.3-
1.8kO.5 3.3
2.8 3.2 1.6" 1.7"
Solvent
0.2 MGlycine, pH 2.8 0.04 MGlycine, pH 2.8 0.2 MGlycine, pH 2.8 HCI, pH 2.03
0.05 MGlycine, pH 3.02 0.04 MGlycine, pH 2.6 0.04 MGlycine, pH 2 0.04 MGlycine, pH 3
Reference
47 18 27 6
6 18 18 18
Values estimated from figures in the original reference.
Cri
tical
Rev
iew
s in
Bio
chem
istr
y an
d M
olec
ular
Bio
logy
Dow
nloa
ded
from
info
rmah
ealth
care
.com
by
222.
222.
251.
129
on 0
5/20
/14
For
pers
onal
use
onl
y.

94 CRC Critical Reviews in Biochemistry
15
..--- oI-L: 20 30 40 - 50 60 70 80 90 100
TEMP OC
FIGURE 6 . Decomposition of the excess heat capacity function of tRNAPh' (yeast) in terms of five independent two-state transitions. Dotted line: experimental curve; solid line: summation of the functions 1 to 5. Solvent: 5 m M sodium phosphate, 1 m M E D T A , 150 mMNaCI , p H 7.0. (From Him, H., Filiminov, V . , and Privalov, P., Eur. J . Biochem., 72, 79, 1977. With permission.)
transitions, as depicted by the solid lines in Fig- ure 6. In such a case and assuming AC,,, = 0,
AH;
i (1 + Kj)* 4RT2 (25) L_
Ki < A C p > = t:
where K j and AH, are the equilibrium constants and enthalpy changes of the independent tran- sitions. The results of one such analysis are tab- ulated in Table 5.
The type of analysis suggested by Privalov and co-workersZo.Z1 is correct in special cases but is not valid for all situations. In any case, it is now clear that the thermal transitions of tRNA are multistate and exhibit enthalpy changes of about 300 kcal/mol for the overall transition. In subsequent sections of this re- view, appropriate procedures for obtaining a detailed description of their thermal behavior will be discussed.
Gel-liquid Crystalline Transition in Phospho-
Pure phosphatidylcholine and other phos- pholipids can form either single lamellar or multilamellar vesicles in an aqueous disper- sion." These dispersions undergo thermally in- duced transitions in state which can be moni- t o r e d wi th a d i f f e r e n t i a l s c a n n i n g calorimeter. 11 .23 -25 A typical C, curve for mul- tilamcllar dipalmitoylphosphatidylcholine (DPPC) liposomes is shown in Figure 7 . Two transitions are observed. The first at about 35°C presumably involves reorientation of the
charged head groups. However, this change in state is slow, and the apparent C , function does not represent an equilibrium situation. 11.56,57
The second transition at 41 "C is rapid, and the C , function in this region represents a change from a state in which the aliphatic side chains are relatively rigid and in close van der Waal's contact with its neighbors to a state in which essentially free rotation about the carbon-car- bon bonds is allowed.
This main transition, with an associated AH = 8.7 kcal/mol, is definitely not a two-state transition. The typical information derived from this transition curve includes AH, the melting temperature, T,, and an apparent co- operative unit calculated from
n = (26 )
It has been found that changes in the average size of the vesicle, the size of the phospholipid, and the presence of small molecules such as an- esthetics and cholesterol alter the characteristics of the main transition. The results obtained for several such systems are summarized in Table 6.
Although no attempt at a detailed analysis of the statistical thermodynamic description of the gel-liquid crystalline transition of phospho- lipids has been published, the basic analytical protocol to do so will be described in the fol- lowing section. It will be demonstrated that the distribution of cluster sizes and changes therein can be obtained from appropriate analysis of the C, data.
(< AC,>),,, - 4 R T k
AH^
A GENERAL STATISTICAL THERMODYNAMIC DESCRIPTION
In the preceding section, the results of the analysis of C , for several different systems were presented. For the most part, these analyses have focused upon the evaluation of AH for the transition and, in a few cases, evaluation of cer- tain model-based quantities. The most signifi- cant conclusion of these studies has been the validation of the two-state approximation for proteins. Except in the case of the analysis of tRNA data, the detailed shape of the C , curve has been ignored. In the following discussion, procedures proposed by Fre i re a n d
Cri
tical
Rev
iew
s in
Bio
chem
istr
y an
d M
olec
ular
Bio
logy
Dow
nloa
ded
from
info
rmah
ealth
care
.com
by
222.
222.
251.
129
on 0
5/20
/14
For
pers
onal
use
onl
y.

TA
BL
E 5
The
rmod
ynam
ic Pa
ram
eter
s fro
m D
ecom
posi
tion
of tR
NA
'h'
(Yea
st) H
eats
apac
ity
Cur
ves A
ssum
ing a
Mod
el o
f In
depe
nden
t Tra
nsiti
ons
Solv
ent
AH
, T
,,r
AH2
T,,,
AH
3 T
,,,
AH1
T-3,
AHs
Tm,,
(kca
l/mol
) ("
C)
(kca
l/mol
) ("
C)
(kca
l/mol
) ("
C)
(kca
l/mol
) ("
C)
(kca
l/mol
) ("
C)
10 m
MSo
dium
caco
dyla
te, 2
0 m
MN
aC1,
l mM
45
26
52
41
.3
69
50.5
57
62
76
41
5 m
MSo
dium
pho
spha
te, 1
50 m
MN
aC1,
1 m
M
45
43
60
50
82
56.3
58
78
68
65
E
DT
A, p
H 6
.8
ED
TA
, pH
7.0
Take
n fr
om H
inz,
H.,
Fili
min
ov, V
., a
nd P
riva
lov,
P.,
Eur
. J. B
iocb
em.,
72, 7
9, 1
977.
With
per
mis
sion
.
Cri
tical
Rev
iew
s in
Bio
chem
istr
y an
d M
olec
ular
Bio
logy
Dow
nloa
ded
from
info
rmah
ealth
care
.com
by
222.
222.
251.
129
on 0
5/20
/14
For
pers
onal
use
onl
y.

CRC Critical Reviews in Biochemistry 96
10.0
m Q
0 - E \ 5 0
Y - 0
0 U
0
25 3 0 3 5 40 45 50
TEMPERATURE (“C)
FIGURE 7. Excess heat capacity function of a fresh dis- persion of multilamellar liposomes prepared from DPPC in 0.05 M KCI. (Reprinted with permission from Suurk- uusk, J . , Lentz, B., Barenholz, Y . , Biltonen, R . , and Thompson, T. , Biochemistry, 15 , 1393, 1976. Copyright by the American Chemical Society.)
B i l t ~ n e n ~ ’ . ~ ~ . ~ ~ by which statistical thermody- namic descriptions of thermally induced pro- cesses of macromolecular systems can be ob- tained from C , data will be reviewed. Let us begin by considering the general statistical ther- modynamic properties of such systems.
The Configurational Partition Function From the point of view of statistical thermo-
dynamics, definition of a function, gcalled the
“configurational” or “molecular partition function,” is sufficient to specify the system in terms of molecular distributions and its average thermodynamic properties. This function is ob- tained by summing the statistical weights, W, of all accessible configurations or conforma- tional states of the molecule,
z =p(= (27)
The statistical weight, W,, is the absolute prob- ability of the macromolecule existing in the conformational state, c, which can be expressed in terms of the Maxwell-Boltzmann term,
, where 6, is the Gibbs energy of the con- formation c, R the universal gas constant, and T the absolute temperature. It follows that con- formations with the same Gibbs energy have ex- actly the same probability of occurrence.
The sum over conformations included in the partition function can be transformed into a sum over energies by grouping together all con- formations sharing the same Gibbs energy, Gi ,
wie -Gi/RT (28)
where w i is the number of distinct states of en- ergy G;.
In the study of conformational transitions, relative energy changes are of more interest
e-G I R T
n = x 1
TABLE 6
Thermodynamic Parameters Associated with the Gel-liquid Crystalline Transi- tion of Multilamellar Phospholipid Vesicles
Pretransition Tmb
Phospholipid AH” (“C) nc
DPPC 2.3 34.0 70 DPPC 1.6 35.4 DPPC 1.8 35.3 290 DMPCd 1 . 1 13.5 200 DMPC 1.0 14.2 280 DSPC‘ 1.4 49.1 230 DSPC 1.8 51.5 160 DLPC’
Main transition
AH-
9.69 8.2 8.7 6.26 5.4
10.84 10.6
1.7
Tmb (“C)
41.75 41.2 41.4 23.7 23.9 58.24 54.9 -1.8
nc Reference
70 23 1 1
260 24 200 23 330 24 80 23
I30 24 980 24
kcal/mol of phospholipid molecule. Temperature of the maximum in Cp.
Dimyristoylphosphatidyicholine. Distearoylphosphatidylcholine. Dilauroylphosphatidylcholine.
L. Cooperative unit (molecules).
Cri
tical
Rev
iew
s in
Bio
chem
istr
y an
d M
olec
ular
Bio
logy
Dow
nloa
ded
from
info
rmah
ealth
care
.com
by
222.
222.
251.
129
on 0
5/20
/14
For
pers
onal
use
onl
y.

November 1978 97
than absolute energy values. Therefore, it is im- portant to introduce reference states to which the thermodynamic quantities associated with the transitions can be referred. It is convenient to use some well-defined macromolecular states such as the folded (native) state or the com- pletely unfolded state of the molecule as a ref- erence state. Hence, we will introduce the “par- tition functions” Q and Z, defined as follows: Q is the ratio between Z and the statistical weight of the state of lowest enthalpy; Z is the ratio between Zand the statistical weight of the final or highest enthalpy state. Thus, Z and Q differ only in the choice of the reference state; therefore,
where AG = G, - Go is the Gibbs energy differ- ence between the final, high-temperature state and the low-temperature state. It will be shown later that Q and Z contain all the information required for a complete thermodynamic de- scription of the conformational equilibria of a homogeneous system and, furthermore, that both quantities can be experimentally evaluated from the heat-capacity function.
Macroscopic Averages and the Partition Func- tion
Consider a solution of N, molecules (NT being of the order of Avogadro’s number, though not necessarily identical). Let Yk be the mole fraction of molecules of type k
(30)
where #k is the total number of molecules of type k in the solution. Assume that the solution is sufficiently dilute so that the molecules do not interact with one another. Let X be any property of the system dependent upon its en- ergy. The average value of X, x, is an average over all the species in solution and can be rep- resented as - x = x y, < X k >
k
where <X,> is the average value of X per mole of species k. In this notation, is an average
over different species, while <Xk> is an average over all configurations of the same species;
where Fk,l is the relative fraction of molecules of type k populating the it” Gibbs energy state accessible to this species. The distribution of molecules of the same species among its acces- sible energy states is a Maxwell-Boltzmann dis- tribution, so that F,,j can be written as
Fk,i = (33)
where Wk,; is the degeneracy of the irk energy state accessible to species k. In terms of the par- tition function Qk, Fk,, is written as
-AGk, j /RT -k , i F,, = -
Q k
where AGk,, = (Gk,; - Gk,J . enthalpy <AH,> is defined and, by virtue of Equations to
a In Q , < A H k > = RT’ -
a ‘r
(34)
The average excess as in Equation 32 33 and 34, is equal
(35)
The average excess enthalpy of the whole sys- tem, A?, is then
Equation 36 is the fundamental linkage relation between experimental thermodynamic quan- tities and the microscopic molecular parameters contained in the partition function of the sys- tem.
Integral Representation of the Partition Func- tion
Equation 36 can be rewritten in an integral form as
(37) ‘0 RTZ
and numerically solved for at any tempera-
Cri
tical
Rev
iew
s in
Bio
chem
istr
y an
d M
olec
ular
Bio
logy
Dow
nloa
ded
from
info
rmah
ealth
care
.com
by
222.
222.
251.
129
on 0
5/20
/14
For
pers
onal
use
onl
y.

98 CRC Critical Reviews in Biochemistry
ture, T, if AH is known as a function of tem- perature. T, is defined as the temperature at which all the molecules exist in their lowest en- ergy state.
FreireZ6 has demonstrated that the integrand of Equation 37 satisfies a Lipschitz condition with reference to q ~ , so that Equation 36 has one and only one solution. In addition, the in- tegral solution is numerically stable with respect to the initial conditions, i.e., if the initial con- ditions at To are altered by a very small amount, then the solution is altered very little for all T > To.
Equation 37 is an integral representation of the logarithm of the partition function of the internal degrees of freedom of the molecules in solution. As a partition function, e" is con- structed from contributions of all the confor- mational states of all the molecules in solution. However, since all the quantities have been de- fined in terms of thermodynamic excess func- tions, e' is not exactly the partition function of the solution as a whole but only of the confor- mational properties of the molecules in solu- tion. In studying conformational transitions in macromolecules, this is precisely the quantity of interest.
In the derivation of Equation 37, no explicit reference to the nature of yk was made. Ac- tually, yk, as a distribution function, is arbi- trary and may or may not follow any specified law. Since yk measures the relative population of species k in the solution, it will always de- pend on the particular conditions of the exper- iment. Accordingly, the simplest case is that of a homogeneous, one-component system in which the solution is composed of a single ma- cromolecular species; in this instance, yt = I , AH = <AH>, and ew is equal to the partition function, Q.
Equation 37 thus offers the unique opportu- nity of evaluating the partition function of a system from the average excess enthalpy func- tion which is obtainable from calorimetric data. It should be emphasized that the derivation of Equation 37 involved only thermodynamic con- siderations. Therefore, its solution is general and independent of any particular model or mechanism of the transition. Furthermore, it is also valid for a heterogeneous multicomponent system. This is an advantage if one considers that only a few simple systems have a mathe-
matically analytical partition function. Having numerically defined the partition function, one can calculate the molecular averages and molec- ular distribution functions, as will be discussed in the next sections.
MULTISTATE TRANSITIONS
A considerable body of calorimetric data has shown that the thermal unfolding of globular proteins is well approximated as a two-state process. This fact allows one to obtain reliable thermodynamic information for these confor- mational transitions by monitoring the temper- ature-induced change of any appropriate ob- servable. Such is not the case for fibrous proteins, nucleic acids, synthetic polypeptides, synthetic polynucleotides, and biomembranes. In such systems, deviations from the two-state process are of such magnitude that thermody- namic information is not directly available from a single melting profile.
Multistate transitions have usually been ana- lyzed by comparison of the experimental melt- ing profile to one derived from a theoretical model for the reaction. In doing this, several approximations for the partition function have been developed, and the thermodynamic infor- mation has been indirectly obtained by fitting the experimental data to theoretical equations derived from the model. For this reason, relia- ble thermodynamic information has generally been restricted to molecules in which the contri- bution of each residue to the actual value of the observable is known or can be assumed to be the same for each. For a multistate transition, melting profiles obtained with different physi- cal observables are not necessarily identical. Recently, Freire and Biltonen" demonstrated that all relevant thermodynamic information for a sequential multistate transition can be ob- tained by proper analysis of the excess heat-ca- pacity function of the system. Their develop- ment will be reviewed here.
A generalized multistate transition is de- scribed by Equation 1 in terms of a sequential mechanism in which a macromolecule in its folded state (Io) undergoes a melting transition to an unfolded state (In) through (n-1) inter- mediate states. The partition function of such systems (Equation 3) can be written as
Cri
tical
Rev
iew
s in
Bio
chem
istr
y an
d M
olec
ular
Bio
logy
Dow
nloa
ded
from
info
rmah
ealth
care
.com
by
222.
222.
251.
129
on 0
5/20
/14
For
pers
onal
use
onl
y.
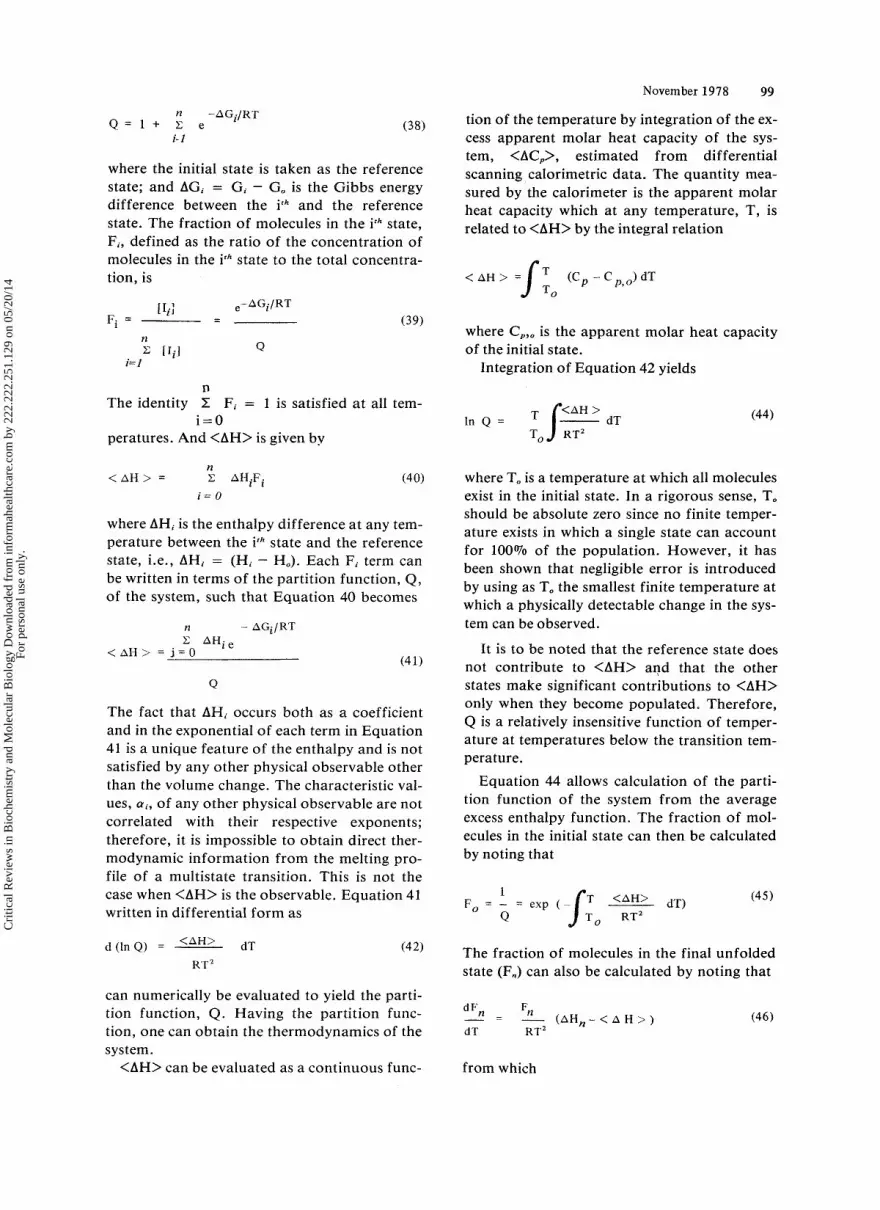
where the initial state is taken as the reference state; and AG, = G, - Go is the Gibbs energy difference between the irk and the reference state. The fraction of molecules in the irk state, F,, defined as the ratio of the concentration of molecules in the irk state to the total concentra- tion, is
F. =
n 2: I I j l
i=l Q
(39)
n The identity 2 F, = 1 is satisfied a t all tem-
peratures. And <AH> is given by i=O
n
i = 0 < A H > = C AHiFi (40)
where AH, is the enthalpy difference a t any tem- perature between the ith state and the reference state, i.e., AH, = (H, - Ho). Each F, term can be written in terms of the partition function, Qs of the system, such that Equation 40 becomes
n - AGi/RT X A H i e
< A H > = j = O (41)
Q
The fact that AHi occurs both as a coefficient and in the exponential of each term in Equation 41 is a unique feature of the enthalpy and is not satisfied by any other physical observable other than the volume change. The characteristic val- ues, a,, of any other physical observable are not correlated with their respective exponents; therefore, it is impossible to obtain direct ther- modynamic information from the melting pro- file of a multistate transition. This is not the case when <AH> is the observable. Equation 41 written in differential form as
<AH> dT d (in Q ) = - K'r
can numerically be evaluated to yield the parti- tion function, Q. Having the partition func- tion, one can obtain the thermodynamics of the system.
<AH> can be evaluated as a continuous func-
November 1978 99
tion of the temperature by integration of the ex- cess apparent molar heat capacity of the sys- tem, <AC,>, estimated from differential scanning calorimetric data. The quantity mea- sured by the calorimeter is the apparent molar heat capacity which at any temperature, T, is related to <AH> by the integral relation
where C,,, is the apparent molar heat capacity of the initial state.
Integration of Equation 42 yields
in Q = T O
(44)
where To is a temperature at which all molecules exist in the initial state. In a rigorous sense, To should be absolute zero since no finite temper- ature exists in which a single state can account for 100% of the population. However, it has been shown that negligible error is introduced by using as T, the smallest finite temperature at which a physically detectable change in the sys- tem can be observed.
It is to be noted that the reference state does not contribute to <AH> and that the other states make significant contributions to <AH> only when they become populated. Therefore, Q is a relatively insensitive function of temper- ature at temperatures below the transition tem- perature.
Equation 44 allows calculation of the parti- tion function of the system from the average excess enthalpy function. The fraction of mol- ecules in the initial state can then be calculated by noting that
The fraction of molecules in the final unfolded state (F,) can also be calculated by noting that
from which
Cri
tical
Rev
iew
s in
Bio
chem
istr
y an
d M
olec
ular
Bio
logy
Dow
nloa
ded
from
info
rmah
ealth
care
.com
by
222.
222.
251.
129
on 0
5/20
/14
For
pers
onal
use
onl
y.

100
F n = - =
CRC Critical Reviews in Biochemistry
1
Z
1
RTZ (AH, - < A H > ) - dT) exp ( -
(47)
can be evaluated. T, is defined in analogous form to To (all molecules exist in the final state at TJ, and AH,, is the enthalpy change associ- ated with the complete transition, I. - I,.
The fraction of molecules populating all in- termediate states, F,, is
FI = 1 - F,-F, (48)
For a transition of the two-state type, F,, is identically zero at all temperatures, and F,, de- fined by Equation 47, is equal to the apparent fraction of unfolded molecules, F,,,, defined in the conventional form as the fractional degree of change of the observable with which the transition is being measured. Equation 48 al- lows not only testing of the two-state hypothe- sis but quantitative estimation of the overall population of intermediate states existing dur- ing the transition. A further test can be per- formed by noting that the quantity, <AH>/(l - FJ, defined as
n z AH^^ FAGi/RT
n -AG;/RT <AH> = i=l 1 - Fo
z e
i= 1
(49)
is, at all temperatures, identically equal to the total enthalpy change for the transition if and only if the transition is of the two-state type. As we shall see later, Equation 49 also provides the basis for the entire deconvolution of the melting profile of a multistate transition into population fractions.
DECONVOLUTION ANALYSIS OF THE THERMAL UNFOLDING OF
RIBONUGLEASE A
Freire and Biltonen*' have applied this anal- ysis to test the two-state hypothesis for the ther- mal unfolding of ribonuclease A, as described below. In Figure 8, the apparent molar heat-ca- pacity function (C,) and the average excess en- thalpy (<AH>) of ribonuclease A at pH 2.8 are
shown. Under the conditions of this experi- ment, ribonuclease A undergoes a reversible thermal unfolding characterized by the ther- modynamic parameters previously summarized in Table 4. <AH> was calculated according to Equation 43, assuming that C,,, is given by the linear extrapolation of the low-temperature C , curve. Ah, = <AH>/(l-F,) is shown as the bro- ken line in Figure 8. The nonconstant value of Ahl is consistent with an average AC," = 2 kcall mol for the transition over the given tempera- ture interval.
The results of the deconvolution analysis of this experiment are presented in Figure 9. In this figure, the fraction of molecules populating the initial and final states is plotted as a func- tion of temperature; F, and F, were calculated with Equations 45 and 47, respectively. The fraction of molecules populating intermediate
20 30 40 50 60 TEMP OC
FIGURE 8. Experimental C , and <AH> vs. temperature profiles of Ribonuclease A. The upper dotted line is the experimental <AH>/(l - F.) function which for a two-state transition is equal to the overall enthalpy change for the transition. The nonconstant value for AH reflects the dif- ference in C, between the initial and final states. C,,, (bot- tom dotted line) was calculated by a least-squares fit of the heat capacity function up to 25OC. The experimental con- ditions were as follows: 0.2 Mglycine buffer, 1 mMEDTA at pH 2.8, 9 mg/ml RNAse concentration in the calorime- tric cell. (From Freire, E. and Biltonen, R . , Biopolymers, 17,463,1978. With permission.)
Cri
tical
Rev
iew
s in
Bio
chem
istr
y an
d M
olec
ular
Bio
logy
Dow
nloa
ded
from
info
rmah
ealth
care
.com
by
222.
222.
251.
129
on 0
5/20
/14
For
pers
onal
use
onl
y.

November 1978 101
1
.5.
0-
states (F, = 1 - F, - F,) is also shown. At no temperature is the fraction of intermediates greater than 5% of the total population, i.e., the fraction of molecules in the initial and final states always accounts for at least 950/0 of the total population. This conclusion supports the two-state model as a first approximation to this transition.
This procedure for testing the two-state hy- pothesis for a thermal transition should be more sensitive than a simple comparison of the integrated enthalpy change with the van't Hoff heat obtained from a slope at the T,. The small deviation from exact two-state behavior ap- pears to be real and agrees with Privalov's ob- servation'8 of an average AH/AH,,, ratio of 1.05 for several proteins. Thus, this apparent deviation from two-state behavior is probably not an experimental or analytical artifact but a characteristic of the transition.
DECONVOLUTJON OF A MULTISTATE TRANSITION
For a multistate transition, the quantity <AH>/(l-F,), defined by Equation 49, is an S- shaped curve whose lower limit is equal to the enthalpy difference, Ahl, between the first in- termediate and the initial state. In this case, Equation 49 can be rewritten as
= A h , + < A H , > (50a)
The function <AH1> defines a new average ex- cess enthalpy, but one which is averaged over all energy states except the first. Similarly, Q1 as a partition function is obtained by summing the statistical weights of all energy states except the first. Q, and <HI> are related by the inte- gral equation
< A H , >
R T Z Q , = exp (JF ~ dT)
0
and can be experimentally obtained after eval- uation of Ahl, as previously described. Ql can then be used to define a subfraction (F'] = Q-IJ of molecules in the first intermediate state. It must be noted that F'] is not an average over all the accessible energy states of the sys- tem but only over those states included in Q1.
.... .. ....... - .....
Fo '.. ... F"
..
. . . .
I 1 I
30 44 50 TEMP O C
FIGURE 9. The experimentally calculated relative popu- lation of states associated with the thermal unfolding of Ribonuclease A. F, and F. are the fraction of molecules populating the initial and final states, respectively. F, is the summed population of all intermediates. This result clearly demonstrates that this transition is well approximated as a two-state transition; at no temperature is F, greater than 5% of the total population. (From Freire, E. and Biltonen, R., Biopolyrners, in press. With permission.)
The above mathematical procedure is equiva- lent to eliminating the contributions of the ini- tial state to the thermodynamic parameters de- scribing the transition. From a mathematical standpoint, we have reduced the number of en- ergy states by one, and all remaining functions are analogous to those that one would find if the first intermediate state were the lowest en- thalpy state and the initial state did not exist.
This procedure can be successively repeated to yield a set of recursion relationsz7 from which all the Ahi AHi - AHi-,, Fi', and Qi can be estimated. In general,
<AH;>
( 5 3 )
from which all the thermodynamic parameters describing each transition of the unfolding re- action can be evaluated. In particular, each T,,; is equal to the temperature at which Fi-] = F i ,
Cri
tical
Rev
iew
s in
Bio
chem
istr
y an
d M
olec
ular
Bio
logy
Dow
nloa
ded
from
info
rmah
ealth
care
.com
by
222.
222.
251.
129
on 0
5/20
/14
For
pers
onal
use
onl
y.

102 CRC Critical Reviews in Biochemistry
TABLE 7
Thermodynamic Parameters Associated with the Melting Transition of Figure 10
Ah,- (kcal/ Ah,h (kcal/ T,,,,,e Tm,,d Transition mol) mol) ("C) ("C)
1 60 60.7 30 29.89 2 60 60.01 40 39.97 3 100 101.2 50 49.99 4 100 99.6 60 59.99
Actual value. Obtained from deconvolution analysis. Actual value. Obtained from deconvolution analysis.
TLMP 06
FIGURE 10. Computer-simulated C, (-) and <AH> (---) VS. temperature for the multistate transition de- scribed in Table 7. (From Freire, E. and Biltonen, R . , Bio- polymers, 17,463, 1968.
SO that Asi = AhJT,,,,i. Each of the equilibrium constants, Ki, defined in Equation 5 can be cal- culated by
Ahi Asi K i = exp ( - - +-)
or by use of the relation:
RT R (54)
(55)
Absolute fractions of molecules in each partic- ular state i, defined by Equation 39, can be ex- pressed in a recursive form as
from which the relative population of each state as a continuous function of the temperature is obtained.
GENERAL APPLICATION TO MUETISTATE TRANSITIONS
In principle, the deconvolution analysis de- scribed makes possible the dissection of the melting profile of a multistate transition with- out any a priori assumptions relating to the thermodynamic mechanism of the reaction. This capability of the method has been demon- strated by Freire and B i l t~nen ,~ ' who first ap- plied the procedure to a hypothetical multistate transition whose thermodynamic parameters are summarized in Table 7. In Figure 10, the computer-simulated apparent molar heat-ca- pacity function (<AC,>) and the average excess enthalpy (<AH>) associated with this complex transition have been plotted as a function of the temperature.
Having <AC,> and <AH>, the typical se- quence of calculations in the deconvolution analysis is as follows. First, the partition fUnC- tion of the system, Q, is calculated by numeri- cal integration of Equation 44. Ah, is estimated by determining the lower limit of <AH>/ (l-FJ. By subtraction of Ah,, <AH>/(l-F,) is then transformed into the excess function <AH,> from which Q, is obtained in an analo- gous way to 0. Successive applications of re- cursion relations given in Equations 52 and 53 allow calculation of the various Ah,, Q,, and <Hi> from which the complete set of thermo- dynamic parameters describing the transition is obtained. This procedure is graphically illus- trated in Figure 11, in which the various <H,> have been plotted on the temperature scale.
The accuracy of the method was found to be very high; all the thermodynamic parameters were reproduced with a relative error smaller than 1 To. Figure 12 shows the relative popula- tion of each state as a function of the tempera- ture; the deviation from the theoretical curves is negligible over the entire temperature range.
The resolving potential of the method was
Cri
tical
Rev
iew
s in
Bio
chem
istr
y an
d M
olec
ular
Bio
logy
Dow
nloa
ded
from
info
rmah
ealth
care
.com
by
222.
222.
251.
129
on 0
5/20
/14
For
pers
onal
use
onl
y.

November 1978 103
TEMP OC
FIGURE 11. Graphic illustration of deconvolution of the rnultistate transition of Figure 10. The <H,> functions were calculated as described in the text. (From Freire, E. and Biltonen, R. , Biopolyrners, 17, 463, 1978. With permis- sion.)
also examined by decreasing the temperature spacing between the hypothetical transitions. When the temperature spacing between transi- tions was reduced to 3"C, the heat-capacity curve did not reveal any detail of the nature of the transition or the number of states present. Deconvolution analysis, however, not only identified the number of intermediate states but allowed determination of the thermodynamic parameters for the entire transition with a high degree of accuracy. The comparison between the results of the analysis and the hypothetic parameters is given in Table 7. Computer sim- ulations have also shown that the deconvolu- tion analysis is capable of accurately determin- ing the thermodynamic parameters associated with two transitions having exactly the same melting temperature.
Freire and Biltonen" also investigated sources of various errors in this deconvohtion analysis. They found that selection of To, the initial temperature at which integration is initi- ated, was not critical. They also discovered that random experimental noise has negligible influ- ence on the results of the analysis, presumably because of the double integration procedure. The major sources of uncertainty were found to be propagation of error due to incorrect es- timation of the heat capacity of the reference
1 -
.5 -
0 - I 1 I I I
10 20 30 40 50 60 70 TEMP QC
FIGURE 12. Relative population vs. temperature of the five thermodynamic states associated with the multistate transition described in Table 7. (---), theoretical popu- lations; (. . . .), as obtained from the deconvolution analy- sis. (From Freire, E. and Biltonen, R. , Biopolymers, 17, 463,1978. With permission.)
state and a systematic error due to mistakes in the determination of the concentration of the macromolecule in solution. The former type of error produces a distortion in the <AC,> curve, and the latter type produces a constant percent- age error in its magnitude. The effect of these errors is best demonstrated with actual experi- mental data, as will be given for tRNA in the next section.
THE THERMAL UNFOLDING OF TRANSFER RIBONUCLEIC ACIDS
Brandts,Ig Privalov et a1.,20 Hinz et a1.,21 and Ackermann and co-workers28 have previously demonstrated that the thermally induced un- folding of tRNA is not a simple two-state pro- cess but rather a sequence of transitions. Pri- valov and co-workersZo.21 have attempted to resolve the overall transition into a sum of in- dependent two-state processes, as discussed in the section on previous calorimetric studies. In certain cases, this procedure will produce a cor- rect description of the system, but, in general, it is inadequate. In this section, the application of the deconvolution procedure to the analysis of the unfolding of tRNA will be described.
The apparent heat-capacity function, C,, of a tRNA sample containing 0.52 MNa+ and no Mg2+ is shown in Figure 13. It is characterized by a melting temperature, T,, (defined as the position of the maximum in C,) of 63.4"C and a calorimetric AH (the area under the heat-ca-
Cri
tical
Rev
iew
s in
Bio
chem
istr
y an
d M
olec
ular
Bio
logy
Dow
nloa
ded
from
info
rmah
ealth
care
.com
by
222.
222.
251.
129
on 0
5/20
/14
For
pers
onal
use
onl
y.
104 CRC Critical Reviews in Biochemistry
I--------- I
- 10 m 30 db 50 Bb-iij--& L-
TEMP OC
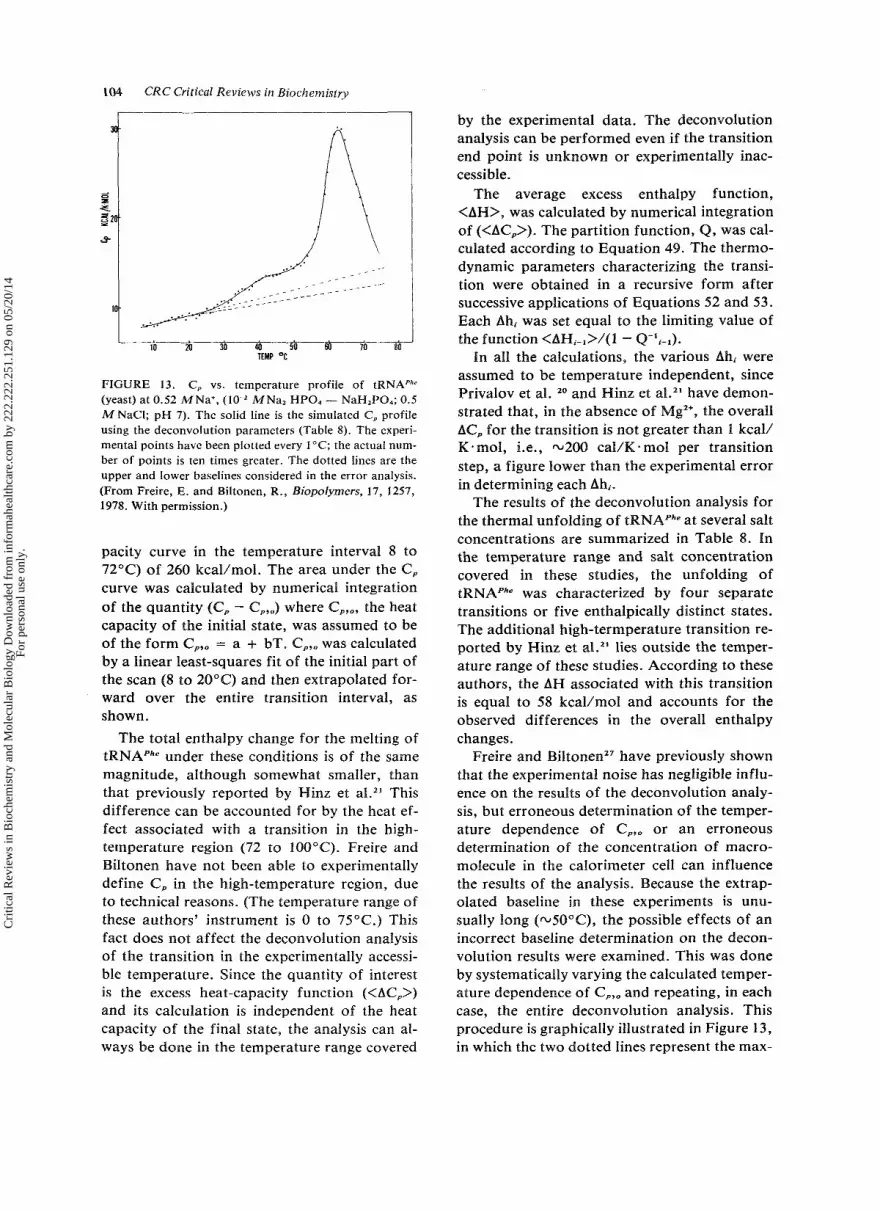
FIGURE 13. C , vs. temperature profile of tRNAPh* (yeast) at 0.52 MNa’, (lo-z MNa2 HPO, - NaN2PO4; 0 .5 M NaCI; pH 7). The solid line is the simulated C, profile using the deconvolution parameters (Table 8). The experi- mental points have been plotted every 1°C; the actual num- ber of points is ten times greater. The dotted lines are the upper and lower baselines considered in the error analysis. (From Freire, E. and Biltonen, R., Biopolyrners, 17, 1257, 1978. With permission.)
pacity curve in the temperature interval 8 to 72°C) of 260 kcal/mol. The area under the C , curve was calculated by numerical integration of the quantity (C, - C,,,) where C,,,, the heat capacity of the initial state, was assumed to be of the form C,,, = a + bT. C,,, was calculated by a linear least-squares fit of the initial part of the scan (8 to 20°C) and then extrapolated for- ward over the entire transition interval, as shown.
The total enthalpy change for the melting of tRNAPhe under these conditions is of the same magnitude, although somewhat smaller, than that previously reported by Hinz et at.*’ This difference can be accounted for by the heat ef- fect associated with a transition in the high- temperature region (72 to 100°C). Freire and Biltonen have not been able to experimentally define C, in the high-temperature region, due to technical reasons. (The temperature range of these authors’ instrument is 0 to 75°C. ) This fact does not affect the deconvolution analysis of the transition in the experimentally accessi- ble temperature. Since the quantity of interest is the excess heat-capacity function (<AC,>) and its calculation is independent of the heat capacity of the final state, the analysis can al- ways be done in the temperature range covered
by the experimental data. The deconvolution analysis can be performed even if the transition end point is unknown or experimentally inac- cessible.
The average excess enthalpy function, <AH>, was calculated by numerical integration of (<AC,>). The partition function, Q, was cal- culated according to Equation 49. The thermo- dynamic parameters characterizing the transi- tion were obtained in a recursive form after successive applications of Equations 52 and 53. Each Ah, was set equal to the limiting value of the function <AH,-$>/(l - Q-*,-l).
In all the calculations, the various Ah, were assumed to be temperature independent, since Privalov et al. 2o and Hinz et ak2I have demon- strated that, in the absence of Mg”, the overall AC, for the transition is not greater than 1 kcall Ksmol, i.e., -200 cal/K.mol per transition step, a figure lower than the experimental error in determining each Ah,.
The results of the deconvolution analysis for the thermal unfolding of tRNAPhe at several salt concentrations are summarized in Table 8. In the temperature range and salt concentration covered in these studies, the unfolding of tRNAPhe was characterized by four separate transitions or five enthalpically distinct states. The additional high-termperature transition re- ported by Hinz et a1.21 lies outside the temper- ature range of these studies. According to these authors, the AH associated with this transition is equal to 58 kcal/mol and accounts for the observed differences in the overall enthalpy changes.
Freire and Biltonen” have previously shown that the experimental noise has negligible influ- ence on the results of the deconvolution analy- sis, but erroneous determination of the temper- ature dependence of C,,, or an erroneous determination of the concentration of macro- molecule in the calorimeter cell can influence the results of the analysis. Because the extrap- olated baseline in these experiments is unu- sually long (-5O0C), the possible effects of an incorrect baseline determination on the decon- volution results were examined. This was done by systematically varying the calculated temper- ature dependence of C,,, and repeating, in each case, the entire deconvolution analysis. This procedure is graphically illustrated in Figure 13, in which the two dotted lines represent the max-
Cri
tical
Rev
iew
s in
Bio
chem
istr
y an
d M
olec
ular
Bio
logy
Dow
nloa
ded
from
info
rmah
ealth
care
.com
by
222.
222.
251.
129
on 0
5/20
/14
For
pers
onal
use
onl
y.

November 1978 105
TABLE 8
Deconvolution Analysis of the Thermal Unfolding of tRNAPh' (Yeast)
"a'] = 0.067 M "a'] = 0.17 M "a'] = 0.52 M A P As' As' As'
(kcal/ (cal/ (cal/K. (cal/K Transition mol) T,* ("C) K.mol) Tmb ("c) mol) T,* ("C) mol)
1 44 -t- 2 33.4 144 37.0 142 41.4 140 2 6 1 & 5 42.1 194 45.3 192 57.1 185 3 8 9 k 10 48.5 277 54.0 272 62.1 266 4 73 k 8 59.0 220 65.2 216 67.9 214
From deconvolution analysis at three salt concentrations. (See text for details.) The values quoted are averages over three salt concentrations. From deconvolution analysis. T,,i is defined as the temperature at which F,-, = F.. AS, = AhJT,,,.
Taken from Freire, E. and Biltonen, R., Biopolyrners, 17, 1257, 1978. With permission.
imal and the minimal slopes considered. The difference between these slopes is 30 call K2-mol and exceeds the experimental error with which the slope can be determined. The error in the calculated Ah was never greater than 10'70, and the melting temperatures only slightly changed. In all cases, it was concluded that four transitions occurred over the experi- mental temperature interval. The influence of concentration errors up to 10% on the decon- volution results was also examined. A 10% er- ror in the concentration introduces larger errors in the thermodynamic parameters than those introduced by the uncertainty in the extrapo- lated slope. However, these errors are still small and in no way affect the deduced therrnody- namic characteristics of the transition.
Figure 14 shows the relative population of states, Fi, as a function of temperature for three different salt concentrations. As defined by Equation 39, the various F i represent the aver- age fraction of tRNA molecules populating a particular macroscopic energy state; in this sense, the population vs. temperature diagrams of intermediate states are characterized by bell- shaped functions which achieve a maximum and then decrease to zero as the next state be- comes populated. For a sequential transition, the relative populations of the initial and final states are the only ones characterized by S- shaped curves. Since the excess heat-capacity function (C, - Cp,o) is equal to the temperature derivative of the excess enthalpy function, <AH>, it follows that
FIGURE 14. Relative populations vs. temperature of the five thermodynamic states associated with the thermal un- folding of tRNAPh' (yeast) in the temperature interval 0 to 72°C. (a: 0.067 M Na'; b: 0.17 M Na+; c: 0.52 M Na+). (From Freire, E. and Biltonen, R., Biopolyrners, 17, 1257, 1978. With permission.)
Cri
tical
Rev
iew
s in
Bio
chem
istr
y an
d M
olec
ular
Bio
logy
Dow
nloa
ded
from
info
rmah
ealth
care
.com
by
222.
222.
251.
129
on 0
5/20
/14
For
pers
onal
use
onl
y.

106 CRC Critical Reviews in Biochemistry
a Fi n
(C - C P , J = C AHi - + F i ~ C p , i (57) a T P
i = 1
i.e., the contribution of each transition step to the overall C, function is proportional to the derivatives a F,/ a T. This is illustrated in Figure 15 for the experiment at 0.067 M Na' and should be contrasted with the usual practice of approximating the overall heat capacity func- tion by a collection of bell-shaped curves.
The Model of Independent Transitions as an Approximation to a Sequential Transition
Privalov et a1.*O and Hinz et al.*' have ana- lyzed the heat-capacity function of tRNA by fitting the experimental data to a theoretical curve which assumes that the sequential unfold- ing of tRNA can be approximated by a collec- tion of independent noninteracting two-state processes in which each elementary process cor- responds to the melting of a particular struc- tural region of the molecule. There are several problems regarding this approximation which are circumvented by the deconvolution analy- sis. It is doubtful that the fitting of the heat- capacity function of tRNA to ten or more highly correlated variables can yield a unique solution, particularly since the estimation of the number of transitions to which the experimen- tal curve is fit is arbitrary. The deconvolution analysis involves no fitting of the experimental data; the thermodynamic parameters of a se- quential transition are obtained in a recursive form from the actual data, as has been shown. The deconvolution analysis yields directly the thermodynamic parameters of the transition and the number of macroscopic macromolecu- lar energy states, Thus, the deconvolution re- sults serve as a test for assessing the range of validity of a model of independent transitions as an approximation to a sequential transition.
The model of independent two-state transi- tions can provide reasonable estimates for the thermodynamic parameters of a sequential transition only when at any particular region of the independent variable, two consecutive ma- cromolecular energy states are the only ones significantly populated and together account for ~ ~ 1 0 0 % of the total population of mole- cules. This situation is only realized when the individual transition steps are well separated on the temperature scale. Under these circumstan-
I
0 30 40 50 60 70 TEMP OC
FIGURE 15. Apparent excess heat-capacity function of tRNAph' (yeast) at 0.067 MNa'. The solid line is the simu- lated curve by the deconvolution parameters. The experi- mental points have been plotted every 1 "C. The dotted lines are the calculated contributions of each transition step to the overall heat capacity curve. The deviation between the calculated and experimental heat capacity curves at high temperature is real and is most likely associated with the beginning of the high-temperature transition reported by Hinz et a1.*' (From Freire, E. and Biltonen, R., Biopoly- men, 17, 1257, 1978. With permission.)
ces, the melting profiles of the sequential tran- sition and the model of independent two-state transitions are identical and, therefore, ther- modynamically indistinguishable.
As shown in Figure 14, this situation is never absolutely met in the transition region, partic- ularly at high salt concentrations, in which transitions two, three, and four strongly over- lap. Only at intermediate salt concentrations, where transitions two, three, and four are sep- arated by 7 to 10"C, does the model of inde- pendent transitions provide reasonably good es- timates for the thermodynamic parameters. It is in this salt concentration range that the en- thalpies and melting temperatures calculated by Hinz et a1." qualitatively and quantitatively agree with the results of the deconvolution analysis.
Cri
tical
Rev
iew
s in
Bio
chem
istr
y an
d M
olec
ular
Bio
logy
Dow
nloa
ded
from
info
rmah
ealth
care
.com
by
222.
222.
251.
129
on 0
5/20
/14
For
pers
onal
use
onl
y.
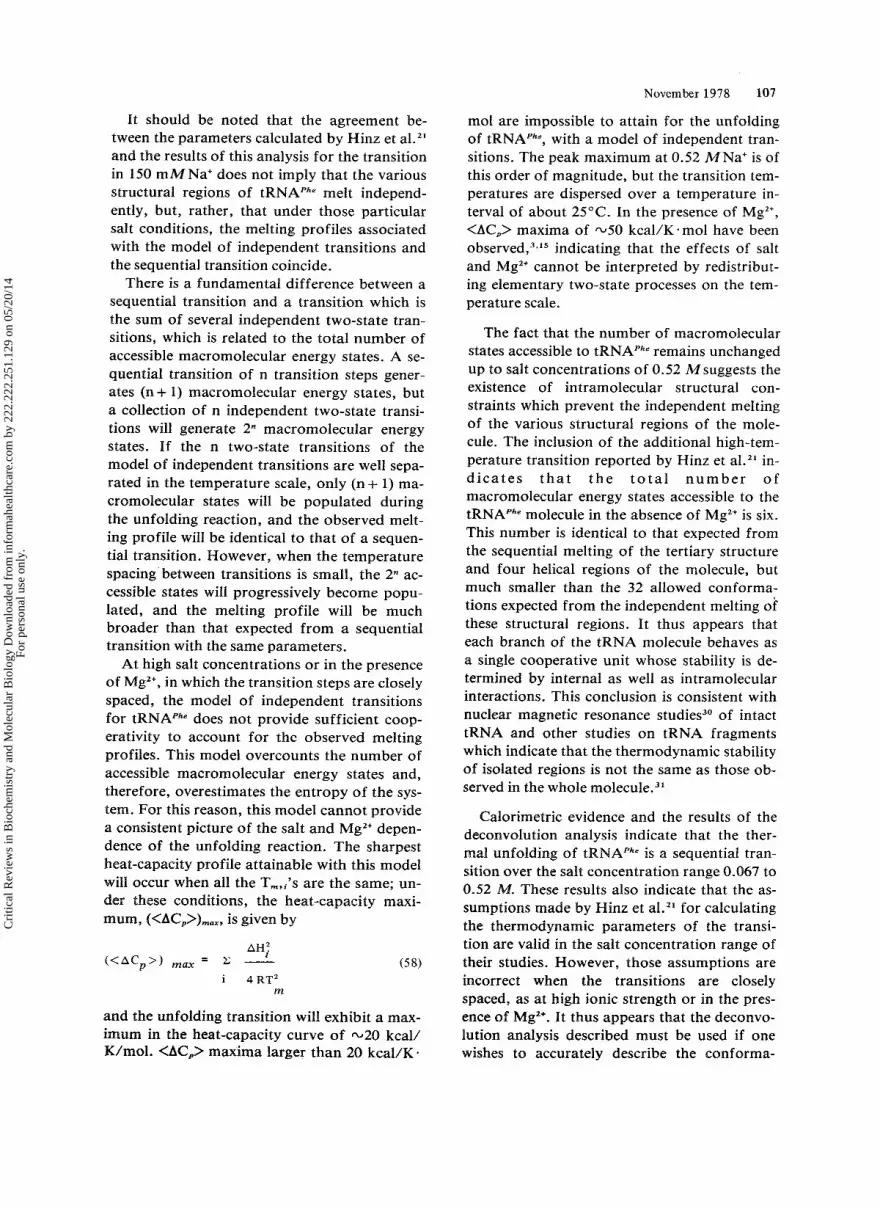
November 1978 107
mol are impossible to attain for the unfolding of tRNAPhe, with a model of independent tran- sitions. The peak maximum at 0.52 MNa' is of this order of magnitude, but the transition tem- peratures are dispersed over a temperature in- terval of about 25°C. In the presence of Mg2+, <AC,> maxima of ~ 5 0 kcal/K.mol have been o b ~ e r v e d , ~ . ' ~ indicating that the effects of salt and Mg2+ cannot be interpreted by redistribut- ing elementary two-state processes on the tem- perature scale.
The fact that the number of macromolecular states accessible to tRNAPke remains unchanged up to salt concentrations of 0.52 Msuggests the existence of intramolecular structural con- straints which prevent the independent melting of the various structural regions of the mole- cule. The inclusion of the additional high-tem- perature transition reported by Hinz et a1.2' in- d i ca t e s t h a t t h e t o t a l n u m b e r of macromolecular energy states accessible to the tRNAPhe molecule in the absence of Mgz+ is six. This number is identical to that expected from the sequential melting of the tertiary structure and four helical regions of the molecule, but much smaller than the 32 allowed conforma- tions expected from the independent melting of these structural regions. It thus appears that each branch of the tRNA molecule behaves as a single cooperative unit whose stability is de- termined by internal as well as intramolecular interactions. This conclusion is consistent with nuclear magnetic resonance studies30 of intact tRNA and other studies on tRNA fragments which indicate that the thermodynamic stability of isolated regions is not the same as those ob- served in the whole m01ecule.~~
Calorimetric evidence and the results of the deconvolution analysis indicate that the ther- mal unfolding of tRNAPke is a sequential tran- sition over the salt concentration range 0.067 to 0.52 M. These results also indicate that the as- sumptions made by Hinz et al.*' for calculating the thermodynamic parameters of the transi- tion are valid in the salt concentration range of their studies. However, those assumptions are incorrect when the transitions are closely spaced, as at high ionic strength or in the pres- ence of Mg2+. It thus appears that the deconvo- lution analysis described must be used if one wishes to accurately describe the conforma-
It should be noted that the agreement be- tween the parameters calculated by Hinz et a1." and the results of this analysis for the transition in 150 mMNa+ does not imply that the various structural regions of tRNAPke melt independ- ently, but, rather, that under those particular salt conditions, the melting profiles associated with the model of independent transitions and the sequential transition coincide.
There is a fundamental difference between a sequential transition and a transition which is the sum of several independent two-state tran- sitions, which is related to the total number of accessible macromolecular energy states. A se- quential transition of n transition steps gener- ates (n + 1) macromolecular energy states, but a collection of n independent two-state transi- tions will generate 2" macromolecular energy states. If the n two-state transitions of the model of independent transitions are well sepa- rated in the temperature scale, only (n+ l) ma- cromolecular states will be populated during the unfolding reaction, and the observed melt- ing profile will be identical to that of a sequen- tial transition. However, when the temperature spacing between transitions is small, the 2" ac- cessible states will progressively become popu- lated, and the melting profile will be much broader than that expected from a sequential transition with the same parameters.
At high salt concentrations or in the presence of MgZ+, in which the transition steps are closely spaced, the model of independent transitions for tRNAPke does not provide sufficient coop- erativity to account for the observed melting profiles. This model overcounts the number of accessible macromolecular energy states and, therefore, overestimates the entropy of the sys- tem. For this reason, this model cannot provide a consistent picture of the salt and Mgz+ depen- dence of the unfolding reaction. The sharpest heat-capacity profile attainable with this model will occur when all the T,,i's are the same; un- der these conditions, the heat-capacity maxi- mum, (<AC,>),,,, is given by
i 4 R T ' m
and the unfolding transition will exhibit a max- imum in the heat-capacity curve of -20 kcal/ K/mol. <AC,> maxima larger than 20 kcal/K.
Cri
tical
Rev
iew
s in
Bio
chem
istr
y an
d M
olec
ular
Bio
logy
Dow
nloa
ded
from
info
rmah
ealth
care
.com
by
222.
222.
251.
129
on 0
5/20
/14
For
pers
onal
use
onl
y.

108
tional transitions of tRNA over a broad range of conditions.
CRC Critical Reviews in Biochemistry
GENERAL COOPERATIVE TRANSITIONS
In the preceding sections, the procedures were reviewed by which the partition function of a system could be calculated from the excess heat-capacity function, as well as how, in the case of the existence of distinct transitions, this information could be used to deduce the ther- modynamic quantities associated with each transition. In many systems of biological inter- est (e.g., polypeptides, polyribonucleotides, DNA, and phospholipid bilayers), the individ- ual macromolecular states differ only slightly in energy so that the discrete steps tend to merge into a near continuum of states. In such cases, it is not possible to deconvolute the transition curve into distinct transitions, but, having the partition function, it is possible to describe the overall thermodynamic changes and calculate molecular distribution functions. In these types of systems, the individual macromolecular states are not uniquely defined, and therefore a better description is obtained by considering the energy states accessible to a single residue (e.g., helix, coil, etc.). Macromolecular states are then defined in terms of statistical averages and distribution functions. Cooperative transitions are generally described by specifying the rela- tive population of residues populating a partic- ular energy state and the statistical distribution of such residues within the macromolecular moiety. This distribution of residues is not ran- dom but is constrained by the extent and mag- nitude of the cooperative interactions existing within the system. The greater the cooperativ- ity, the greater the tendency of residues in the same state to group together, and, therefore, the smaller the probability of finding a pair of neighboring residues in different states. A highly cooperative transition is then character- ized by the presence of large clusters or do- mains of residues in the same state. Conversely, in a poorly cooperative system, the size of these clusters tends to a minimum. A two-state tran- sition as defined in previous sections is, within this context, a limiting case of a highly cooper- ative transition, i.e., one in which the probabil- ity of finding unlike neighbors is always zero.
Helix-coil transitions in polypeptide and po- lynucleotide systems, as well as the gel-liquid transition in phospholipid bilayers, are exam- ples of these types of cooperative transitions. In these transitions, one is primarily interested in a precise evaluation of the fractional degree of melting, the relative population of residues in the various accessible energy states, and the statistical distribution of residues within the molecular array. The knowledge of this statis- tical distribution will provide information re- garding the size of the clusters and the equilib- rium fluctuations of the statistical averages.
This section will briefly summarize the basic theoretical background for the deconvolution analysis of cooperative transitions. The general theory for cooperative transitions in biopoly- mers has been continuously developed since the late 1 9 5 0 ’ ~ ~ and excellent reviews e x i ~ t . ~ ~ ~ ~ ~ The reader not familiar with this topic is referred to these references and the original references quoted in the text for a thorough discussion of the statistical mechanical concepts summarized here.
Recently, Freire and B i l t ~ n e n ~ ~ have shown that the statistical thermodynamic functions of cooperative systems can be directly deduced from excess heat-capacity data without requir- ing that the form of Q be specified by a precise model. This result thus opened the possibility of obtaining a statistical thermodynamic de- scription of complex systems which heretofore has been extremely difficult.
This method is based upon the general result of statistical mechanics that in the thermody- namic limit canonical and grand canonical en- semble averages are identical.33 For a system in which the macromolecule is composed of N identical units or residues (e.g., the amino acid residue comprising a polypeptide chain), a “residue partition function” can be defined as
( 5 9)
where <Ah> <AH[>/N is the excess enthalpy per mole of residues. As defined, the molecular partition function, Q, will always be recovered by raising q(N) to the N‘” power. It is also true that as N becomes large, q(N) approaches a limit, q , in which it is independent of N. This situation defines the thermodynamic limit in
Cri
tical
Rev
iew
s in
Bio
chem
istr
y an
d M
olec
ular
Bio
logy
Dow
nloa
ded
from
info
rmah
ealth
care
.com
by
222.
222.
251.
129
on 0
5/20
/14
For
pers
onal
use
onl
y.

November 1978 109
the canonical ensemble. It should be noted that Equation 59 provides a method for experimen- tally testing whether or not this limit has been reached.
The use of the grand canonical ensemble in relation with conformational transitions in macromolecules was introduced by Eifson and Zimm34 for the helix-coil transition of DNA. Sture and N ~ r d h o l m ~ ~ provided a theoretical justification of its use and showed that if the thermodynamic limit exists in the grand canon- ical ensemble, then the molecular averages cal- culated from the canonical and grand cononical ensemble are identical for all the properties of the system that are bounded functions of N. The existence of the thermodynamic limit in the grand canonical ensemble is assured by the di- vergence condition of the grand partition func- tion.
Making use of the formalism of the grand canonical ensemble, Freire and Biltonen3* have shown that the molecular averages and distri- bution functions can be formulated in terms of experimental residue partition functions, which can be obtained from integration of the heat- capacity function. Thus, the molecular aver- ages and distribution functions can be directly evaluated from experimental data, making pos- sible the statistical thermodynamic analysis of transitions occurring in systems which are to- pologically of any dimension.
Clusters Consider a molecular array of N units or res-
idues, each of which can exist in two different states, A and B. A microscopic configuration of the system is specified by the fractional num- ber of residues in states A and B and by the particular way in which these residues are dis- tributed within the molecular lattice. This dis- tribution of A and B residues will give rise to dusters of residues in state A and clusters of residues in state B. These clusters can be further specified by their average number and their av- erage size as well as the relative fluctuations of these quantities around their mean value.
The total number of clusters, n,, is
nt = n A + n B (60)
where nA and n, are the number of A and B clusters, respectively. If the number of A and B clusters having j residues is designated by
PA(j) and P,(j), respectively, then the total number of residues in states A and B can be written as
N B = C jP,(i) j = I
and NA + N, = N. The fraction of residues in states A and B is
defined as
N
N B F g = - N
and the average size of clusters A and B by
< B A > = - N A
" A
The average properties of this system can be de- rived from the canonical partition function, i? (N), defined in Equation 27. By convention, state A is designated as stable at low tempera- tures and state B as stable above the transition temperature.
Next, the partition functions Q(N) and Z(N) are introduced. Q(N) is defined as the ratio be- tween Z(N) and the statistical weight of the con- figuration in which F, = 0. Z(N), on the other hand, is defined as the ratio between q N ) and the statistical weight of the configuration in which F A = 0. Z(N) and Q(N) differ only in the choice of the reference state; thus,
(64)
where A@ = GA - G, is the free-energy differ- ence between configurations A and B. The av- erage thermodynamic properties of the system can be derived either from Z(N) or Q(N). The purpose of introducing Q(N) and Z(N) is that both functions can be experimentally evalu- ated; Q(N) by means of Equation 44 and Z(N) in an analogous form but performing the inte- gration from the high- to the low-temperature end of the transition (Equation 47). Having
Cri
tical
Rev
iew
s in
Bio
chem
istr
y an
d M
olec
ular
Bio
logy
Dow
nloa
ded
from
info
rmah
ealth
care
.com
by
222.
222.
251.
129
on 0
5/20
/14
For
pers
onal
use
onl
y.

110
both quantities, one can evaluate AG“ for the transition as a function of temperature.
CRC Critical Reviews in Biochemistry
Evaluation of the Partition Function The canonical partition function, Z(N), can
be evaluated by considering the grand partition f u n ~ t i o n ~ ~ . ~ ~ , ~ ~
=(a) = x e - a N z ( ~ ) (65) N
where a is the variable conjugate to the number of residues per macromolecule. a determines the average number of residues per macromol- ecule, <N>, and is specified by the condition
a 1 n X
a a < N > = - -
Considered as a power series, Equation 65 pro- vides the basis for the sequence-generating function method originally proposed by Lif-
Representing Equation 65 as
Lifson3’ has shown that Z(x) converges for x > xl, x, being defined as x1 [Z(N)]””, and di- verges in the limit x - xl. Thus, xl, and, there- fore, Z(N), is the largest root of the equation =(x)-l = 0. This divergence condition also de- fines the thermodynamic limit of the grand can- onical ensemble, i.e., the limit in which canon- ical and grand canonical averages coincide.
-
The Residue Partition Functions q and z The experimental residue partition function
q (Equation 59) is defined by the definite inte- gral in which the integration is performed from the low- to the high-temperature end of the transition. For convenience, a second experi- mental residue partition function, z, (z = [Z(N)l”J) obtained in an exactly analogous way to q but performing the integrations from the high- to the low-temperature end of the transi- tion will be introduced. z is related to q by
(6 8) 2 - = , - A g / R T s 4
where Ag = (gA - gB) is the free-energy differ- ence per mole of residues in states A and B. It should be recognized that in the case of one-di- mensional helix-coil transitions, the ratio z/q I s is identical to the helix-stability constant.
Since the canonical partition function Z(N) is, by definition, equal to zN, it follows that in the thermodynamic limit
z = x, = eOiO (69)
Grand Partition Function Assuming that the clusters do not interact
with one another or that the interactions are sufficiently weak such that the clusters can be considered as independent subsystems, the grand partition function Z can be written as a product of cluster grand partition functions3 RA and RB:
where the summation runs over all numbers of clusters. The cluster grand partition functions RA and Re are defined by the equations
m
f i g = x g, ( i )e - ia j = I
where gA(j) and gB(j) are, respectively, the sta- tistical weights or relative probabilities of find- ing A and B clusters containing j residues.
In the case of one-dimensional polymer chains, the grand partition function, E , can be expressed in closed form due to the fact that the number of sequences nA is always equal to n,. Thus, Equation 70 becomes
= (1 - nAnB)-l (73)
and diverges when RARB = 1. This condition defines the thermodynamic limit in the grand canonical ensemble. In the case of two- and three-dimensional systems, however, no simple relation exists between nA and n,, and f cannot be expressed in closed form.
Average Cluster Size
of clusters A and B are defined by: In the thermodynamic limit, the average sizes
Cri
tical
Rev
iew
s in
Bio
chem
istr
y an
d M
olec
ular
Bio
logy
Dow
nloa
ded
from
info
rmah
ealth
care
.com
by
222.
222.
251.
129
on 0
5/20
/14
For
pers
onal
use
onl
y.

November 1978 111
g
(78)
and can be directly calculated from the experi- mental results.
Since the number of A(he1ix) and B(coi1) se- quences is the same, application of Equations 6% and 63 yields
< Y A > = __ g - 1
m
m
where z is the exper~menta~ly determined resi- due partition function. A similar expression holds for <I,>. At this point, a general closed expression for the average cluster sizes cannot be obtained because the statistical weights gA (j) are still undefined.
elk-coil transitions in polypeptide and nu- cid systems are topologically one-dimen-
sional transitions in which the molecular con- figurations of the polymer are specified in terms of alternating sequences of helix and coil residues. In the case of nucleic acid systems, coil sequences at internal positions of the poly- mer chain form matched or mismatched loops, depending on whether or not the number of coil
ues in each strand of the loop is the same.38 hereas the partition function for polypep-
tide models can be solved in closed form, this is not so for nucleic acid models. Difficulties arising from the mathematical form of the sta- tistical weights of loops make impossible an ex- act solution for the partition f ~ n c t i o n . ~ This fact is, however, immaterial from the point of view of the deconvolution analysis.
The statistical weight of a cluster (sequence) containing j residues in state A (helix) is simply sj for both polypeptide and polynucleotide sys- tems. In this case, R, can be expressed in closed form as RA = (q - and the average length of helical sequences, <IA>, can be immediately expressed as
so that only one statistical weight, gA (j) or ge (j), need be specified to experimentally obtain the average sequence lengths <Ie> and < I A > . This is a completely general result from transi- tions occurring in topologically one-dimen- sional spaces. Furthermore, the statistical weight, s, can be experimentally obtained using Equation 68. In what follows we will assume that gA (j) = sj; however, the formalism will remain the same for any other functional form of &A (j).
The fraction of residues in states A or B is directly related to the average excess enthalpy <Ah>:
FA = ?!! = l - F B N
where <Ah> and Ah are expressed in energy units per mole of residue. Having FA and Fe and <PA> and <Ie>, one can calculate the average number of A and
~ ~ ~ ~ b ~ t ~ ~ n tion§ on§ and ~ ~ ~ ~ t ~ ~ t ~ ~ ~ § Up to this point, we have been primarily con-
cerned with the derivation of the appropriate expressions for the thermodynamic molecular averages. A detailed molecular picture of the system requires the knowledge of the distribu- tion functions leading to the macroscopic aver- ages. This information is also contained in the partition function.
Consider first the probability functions asso- ciated with the residues in state A (an analogous
Cri
tical
Rev
iew
s in
Bio
chem
istr
y an
d M
olec
ular
Bio
logy
Dow
nloa
ded
from
info
rmah
ealth
care
.com
by
222.
222.
251.
129
on 0
5/20
/14
For
pers
onal
use
onl
y.

112
treatment will lead to the functions associated with the residues in state B.) The probability, PA (I), of finding a cluster of residues in state A containing P residues among all A clusters is
CRC Critical Reviews in Biochemistry
and can be expressed in terms of the experimen- tal residue partition function, q, as
q - 1 PA (1) = - e 9
(84)
The moment-generating function of the distri- bution is
m
(85) k < e A > = j k P ~ ( 1 )
, t = l
and can be expressed in terms of q as co <a," > = ( 9 -
thus allowing us to express all the moments of the distribution in closed form. The first mo- ment is equal to the average cluster size, <Pa>. The second moment, <PZa>, equal to
(87)
provides a measure of the breadth of the distri- bution. The dispersion, A', can be expressed in terms of the first and second moments as
and indicates a relatively broad distribution with a root mean square deviation approxi- mately equal to the average cluster size. The magnitude of the equilibrium fluctuations in cluster size is give by A.
Another quantity of interest is the probabil- ity, @a"), that an A residue picked at random is in a cluster of j residues:
j p ~ ( j ) j ( 9 - 1 )' (89) P A ( j ) = ___ = ___
j + I z. ' P A ( j ) 9
The generality of the above treatment can be
verified by replacing q by the appropriate expression corresponding to one of the differ- ent models existing in the literature. For exam- ple, if the value q = 1 + a"*, corresponding to the nearest-neighbor king model at s = 1, is replaced in Equation 89, it reduces to the expression derived by Poland and Scheraga3' by a rather different approach. An extensive dis- cussion of this quantity as well as some approx- ximate treatments are given in the same refer- ence.
The residue partition functions, q and z, are in the context of the deconvolution theory, thermodynamically defined so that their calcu- lation from experimental data does not require any special assumptions regarding the nature or mechanism of the transition other than that the system can be approximated as being infinite in size. q or z can be used for experimentally test- ing whether or not the infinite size limit has been reached a t some large, but still finite, de- gree of polymerization, N. In this limit which defines the thermodynamic limit in the canoni- cal ensemble, the residue partition functions, q and z, are independent of N. As the degree of polymerization, N, becomes very large, q and z should asymptotically approach a limiting value.
ANALYSIS QF HELIX-COIL TRANSITIONS IN HOMOPQLYMERS
In the preceding section, the formalism for statistical mechanical analysis of conforma- tional transitions of highly cooperative homo- geneous polymers was reviewed. The simplest system to which to apply this procedure is the helix-coil transition of polypeptides. Evalua- tion of q and z as described will yield s, the helix stability constant, and complete distribution functions of helical lengths, etc., as functions of temperature. However, the results of such an analysis of polypeptides will not be presented; instead, the behavior of double-strand to sin- gle-strand transitions of polynucleotides will be immediately considered. This system is more complex because strand separation occurs and because both unraveling at the ends and for- mation of internal loops can occur. The decon- volution theory for this class of systems has been developed in Reference 40. In this section, those results will be reviewed.
A double-strand to single-strand transition can be represented as
Cri
tical
Rev
iew
s in
Bio
chem
istr
y an
d M
olec
ular
Bio
logy
Dow
nloa
ded
from
info
rmah
ealth
care
.com
by
222.
222.
251.
129
on 0
5/20
/14
For
pers
onal
use
onl
y.

November 1978 113
At any temperature, the fraction of single- stranded molecules (%in) can be calculated by means of the relation
F ~ ~ = exp ( - JT ( A H, - <AH> - 1
RT2 dT
Tn
(96)
where the enthalpy terms are given in calories per mole of double-stranded molecules. The av- erage excess enthalpy of the system <AH> is
I, . . . . . . . . . . n - 2 1
where all species up to A, inclusive are double- stranded forms characterized by different de- grees of base pairing and J, representing all the possible forms of the single-stranded confor- mation. Here =I, refers to a species of x strands with y broken base pairs. The partition func- tion, Q, of this system is represented by
n
i = 1 Q = 1 + 1: wi - 4 G i / R T (91)
the concentration dependence for double- strand formation being included in the last term of the summation. The residue partition func- tion per base pair, q. defined as q = Q"" (where N is the average degree of polymerization of the double-stranded molecule) is the quantity di- rectly obtained from the experiment since the polymer concentration is always determined in moles of nucleotides; additional knowledge of the polymer molecular weight allows calcula- tion of Q. The fraction of molecules in the itfi state, defined as
- 4Gjj RT
Q F. = (93)
and together with the partition function can be calculated with the deconvolution equations given in the section on multistate transitions.
The overall fraction, (Q, of base pairs is as- sumed to be
and the fraction & of base pairs among the double-stranded molecules
(95)
n - 1
i=O <AH> = 2: FjAHi+ FnAHn (97)
from which the average excess enthalpy func- tion associated with the double-stranded mole- cules (<AH>*) can be calculated,
n - 1 - AGi /RT X AHie
(98) < A H > * = i = o Q*
<AH > - F,AH - - (99)
Q is the partition function for double strands only, which is numerically obtained from the equation
1 - F,
(100) T
Q*= e x p ( j <aH>* dT) To RT2
The strand separation step in the general re- action mechanism is analytically isolated from the whole transition, according to the equilib- rium
n - i ' zIj-2iIn __*
i = 0
with equilibrium constant, K, defined as
n - 1 ($1
i = 0
where C , is the total concentration of polymeric molecule expressed in moles of single-stranded forms. The apparent enthalpy change for the strand separation, defined in terms of the clas- sical van't Hoff equation, is
Cri
tical
Rev
iew
s in
Bio
chem
istr
y an
d M
olec
ular
Bio
logy
Dow
nloa
ded
from
info
rmah
ealth
care
.com
by
222.
222.
251.
129
on 0
5/20
/14
For
pers
onal
use
onl
y.

I14 CRC Critical Reviews in Biochemistry
where AH, is the total heat for the transition * the average excess enthalpy per uble-stranded form at the point in
which the strand separation occurs. If the usual assumpt~on that the main contribution to the total enthalpy change is the disruption of base pairs is made, it follows that
AHvh = Ah (N - <n>*) (104)
where Ah is the enthalpy change associated with breaking one base pair, N the total number of base pairs per polymer chain, and <n>* the av- erage number of broken base pairs in the dou-
n ~ ~ m e ~ ~ a t e l y before the In other words, (N - <n>*)
is a measure of the size of the cooperative unit formation of the double-
is shown in Figure 4. average excess en-
gration of the quantity (C, - C,,,) as described. The heat capacity of the initial state, C,,,., was calculated by a linear least-squares fit of the in- itial part of the apparent heat-capacity curve (generally between 10 and 20°C) and extsapo- lated over the entire transitional interval. With this procedure, an average AC, difference of 911 k 8 ca%/K/mol base pairs between the final and initial state was obtained. For this particular ex- periment, AH was calculated to be 6.8 kcal/mol base pair.
>, the partition function, Q3 was calculated as described, assuming 450 base pairs per polymer complex. The partition func- tion Z = zN was calculated in an analogous way tQ Q but performing the integrations from the high- to the low-temperature ends of the tran- sition. In Figure 16, the fraction of broken base pairs and the fraction of single-stranded mole- cules, F,, are plotted as a function of tempera- ture. In calculating F,, a total average n ~ m b e r of 450 base pairs per double-stranded molecule was assumed; the effect of increasing or de- creasing this num er plus or minus 100 nucleo- tides was only to shift the F, curve -+0. 1 "C on the temperature scale.
In Figure 17, the temperature dependence of
TEMP 'C
FIGURE 16. Experimental fraction of broken base pairs, ( I - 6,) [solid line], and fraction of single stranded mole- cules, F., vs. temperature, for the helix-coil transition of poIy(A) . poly(U) at [Na'] = 0.016 M. (From Freire, E.
iltonen, R., Biopolymers, 17, 497, 1978. With per- mission.)
1- t t
-21
'i -i
\
FIGURE 17. Van't Hoff representation of the strand sep- aration equilibrium constant, K , at "a'] = 0.0116 M and "a'] = 0.16 M. The results of a linear least-squares anal- ysis are summarized in Table 9. (From Freke, E. and E l - tonen, R., Biopolymers, 17,497, 1978. With permission.)
the strand separation e q u ~ ~ ~ ~ r ~ u m constants is shown. The e q u i ~ i ~ r ~ u ~ constants were calcu- lated by means of Equation 103 and the corre- sponding van't off enthalpy change callcu- lated by a linear east-s~uares fit. are summarized in Table 9. The line van't Hoff plots indicates a basic h o ~ o g e n e ~ t y in the size of the cooperative unit, suggesting that the ~ ~ p e r ~ m e n t a ~ data are affected by the slight length the p o ~ y ~ e r sample.
Cri
tical
Rev
iew
s in
Bio
chem
istr
y an
d M
olec
ular
Bio
logy
Dow
nloa
ded
from
info
rmah
ealth
care
.com
by
222.
222.
251.
129
on 0
5/20
/14
For
pers
onal
use
onl
y.
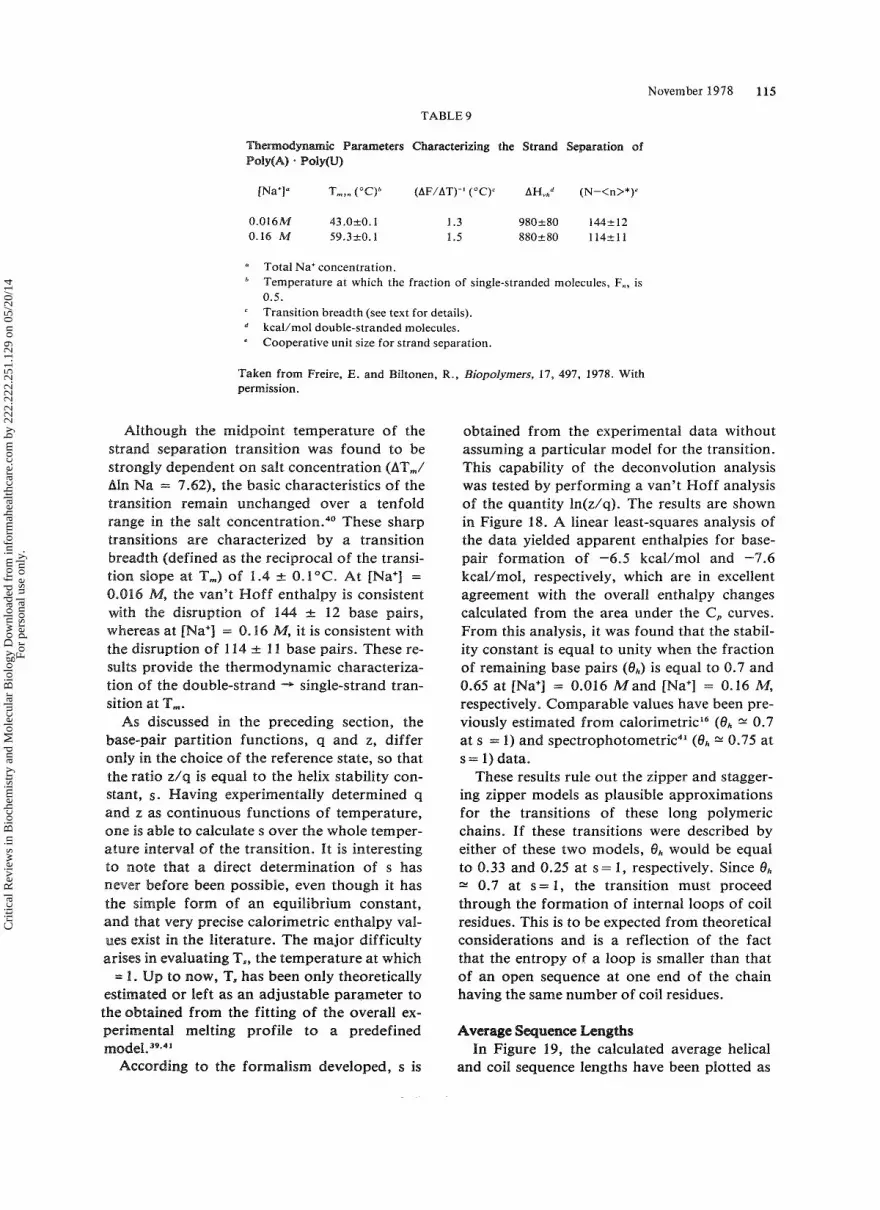
November 1978 115
TABLE 9
ic Parameters ~ h ~ r a c t e r ~ ~ n g the Strand Separation of (er)
[Na']" Tm," (°C)b (AF/AT)-' ("C). AH,,d (N-<n>*)'
0.016M 43.0-tO. 1 1.3 980k80 144k12 0.16 M 59.320.1 1.5 880+80 11421 1
Total Na' concentration. Temperature at which the fraction of single-stranded molecules, F., is 0.5. Transition breadth (see text for details). kcal/mol double-stranded molecules. Cooperative unit size for strand separation.
'
*
Taken from Freire, E. and Biltonen, R., Biopolymers, 17, 497, 1978. With permission.
though the m ~ ~ ~ o i n t temperature of the separation ~ r a n s ~ t ~ o n was found to be
ent on salt concentration (AT,/ a = 7-62) , the basic characteristics of the tion remain unchanged over a tenfold
range in the salt c ~ n c e n t r a t i o n . ~ ~ These sharp
tion of the double-stra~d + single-strand tran- sition at T,.
AS discussed in the preceding section, the base-pair partition funct~ons, q and z, differ only in the choice of the reference state, so that the ratio z/q is equal to the helix stability con-
aving exper~menta~~y determined q and z as continuo~s funct~ons of temperature, one is able to calculate s over the whole temper- ature interval of the t~ans~t ion . It is interesting
very precise calorimetric enthalpy val-
or left as an adjustable parameter to the ~ ~ t a ~ n e d from the fitting of the overall ex-
melting profile to a predefined
alism developed, s is
obtained from the ex~erimenta~ data without assuming a particular model for the transition. This capability of the deconvolution analysis was tested by performing a van't Hoff analysis of the quantity In(z/q). The results are shown in Figure 18. A linear least-squares analysis of the data yielded apparent enthalpies for base- pair formation of -6.5 kcal/mol and -4.6 kcal/mol, respectively, which are in excellent agreement with the overall enthalpy changes ca ic~~ated from the area under the C, curves. From this analysis, it was found that the stabil- ity constant is equal to unity when the fraction of remaining base pairs (6,) is equal to 0.7 and 0.45 at [Na'] = 0.016 Mand "a+] = 0.16 M, respectively. Comparable values have been pre- viousPy estimated from (6, N 0.7 at s = 1) and spectroph~tometric~~ (6, N 0.95 at s = 1) data.
These results rule out the zipper and stagger- ing zipper models as plausible approximations for the transitions of these long polymeric chains. If these transitions were described by either of these two models, @k would be equal
.33 and 0.25 at s = 1, respectively. Since 6 k
2 0.7 at s = 1 , the transition must proceed through the formation of internal loops of coil residues. This is to be expected from theoretical considerations and is a reflection of the fact that the entropy of a loop is smaller than that of an open sequence at one end of the chain having the same number of coil residues.
VW8
In Figure 19, the calculated average helical and coil sequence lengths have been plotted as
Cri
tical
Rev
iew
s in
Bio
chem
istr
y an
d M
olec
ular
Bio
logy
Dow
nloa
ded
from
info
rmah
ealth
care
.com
by
222.
222.
251.
129
on 0
5/20
/14
For
pers
onal
use
onl
y.
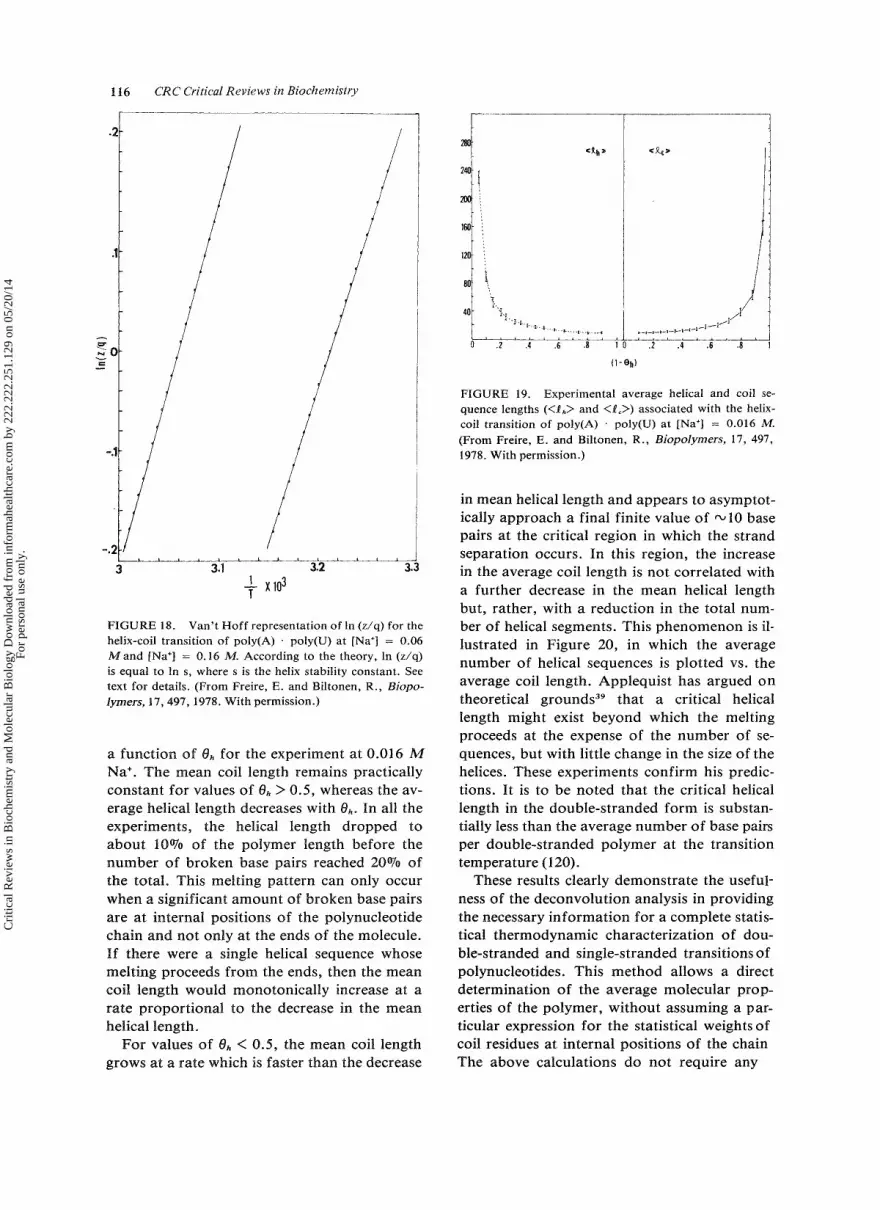
116 CRC Critical Reviews in Biochemistry
FIGURE 18. Van’t Hoff representation of In (z/q) for the helix-coil transition of poly(A) . poly(U) at “a’] = 0.06 M and “a’] = 0.16 M. According to the theory, In (z/q) is equal to In s, where s is the helix stability constant. See text for details. (From Freire, E. and Biltonen, R. , Biopo- lymers, 17,497, 1978. With permission.)
a function of & for the experiment a t 0.016 A4 Na’. The mean coil length remains practically constant for values of 6,, > 0.5, whereas the av- erage helical length decreases with t j h . In all the experiments, the helical length dropped to about 10% of the polymer length before the number of broken base pairs reached 20% of the total. This melting pattern can only occur when a significant amount of broken base pairs are a t internal positions of the polynucleotide chain and not only at the ends of the molecule. If there were a single helical sequence whose melting proceeds from the ends, then the mean coil length would monotonically increase at a rate proportional to the decrease in the mean helical length.
For values of o h < 0.5, the mean coil length grows at a rate which is faster than the decrease
c?+ a
FIGURE 19. Experimental average helical and coil se- quence lengths (<P,> and <P,>) associated with the helix- coil transition of poly(A) . poly(U) at “a’] = 0.016 M. (From Freire, E. and Biltonen, R . , Biopolymers, 17, 497, 1978. With permission.)
in mean helical length and appears to asymptot- ically approach a final finite value of - 10 base pairs at the critical region in which the strand separation occurs. In this region, the increase in the average coil length is not correlated with a further decrease in the mean helical length but, rather, with a reduction in the total num- ber of helical segments. This phenomenon is il- lustrated in Figure 20, in which the average number of helical sequences is plotted vs. the average coil length. Applequist has argued on theoretical that a critical helical length might exist beyond which the melting proceeds at the expense of the number of se- quences, but with little change in the size of the helices. These experiments confirm his predic- tions. It is to be noted that the critical helical length in the double-stranded form is substan- tially less than the average number of base pairs per double-stranded polymer at the transition temperature (120).
These results clearly demonstrate the useful- ness of the deconvolution analysis in providing the necessary information for a complete statis- tical thermodynamic characterization of dou- ble-stranded and single-stranded transitions of polynucleotides. This method allows a direct determination of the average molecular prop- erties of the polymer, without assuming a par- ticular expression for the statistical weights of coil residues at internal positions of the chain The above calculations do not require any
Cri
tical
Rev
iew
s in
Bio
chem
istr
y an
d M
olec
ular
Bio
logy
Dow
nloa
ded
from
info
rmah
ealth
care
.com
by
222.
222.
251.
129
on 0
5/20
/14
For
pers
onal
use
onl
y.

priori estimation of the base-stacking parame- ter and the loop closure exponent. This should be an advantage in dealing with samples of het- erogeneous base composition.
ORDER-DISORDER TRANSITIONS IN PHOSPHOLIPID BILAYERS
The excess heat-capacity function of multila- mellar DPPC liposome was shown in Figure 7. The nature of the smaller, low-temperature transition is not yet well understood, and the <AC,> curve for this transition very likely does not represent an equilibrium situation." The main transition at 41.3"C is known to involve loss of regular order of the hydrocarbon chains and is often referred to as a "gel-liquid crystal- line" phase transition. It is this transition upon which the current discussion will focus.
These gel-crystalline phase transitions have been studied with several experimental tech- niques, including scanning calorimetry, 1,23-25
fluorescence probes," NMR,42 X-ray scatter- ing,43 and density r n e a s ~ r e m e n t s . ~ ~ These works have shown that the thermodynamic character- istics of this transition are greatly altered by changing the phospholipid chain length, in- creasing the radius of curvature of the vesicle, and adding compounds with a small molecular weight, such as anesthetics, to the system. Sev- eral workers have considered various statistical mechanical models to describe this transition in phospholipid bilayers. However, the work has been primarily directed towards formulating plausible expressions for the possible configu- rational states of the hydrocarbon chains of the phospholipids and not for the conformational states of the bilayer as a whole.
Although it is recognized that the properties of the bilayer have their ultimate origin in the configurational state of the phospholipid mol- ecules, there does not appear to be a simple one-to-one correspondence between the prop- erties of the bilayer and their isolated constitu- ents. For example, there is strong experimental evidence which indicates that transport proper- ties across the membrane do not directly de- pend on the degree of fluidity of the phospho- lipids. This and similar phenomena do not appear to be simply correlated to the degree of fluidity of the bilayer or the average confor- mational state of the phospholipids. It thus ap-
November 1978 117
I 1 141 h
i ! 12 '
2= E
I
0 L
FIGURE 20. Experimentally determined average number of helical sequences vs. average coil length. This figure clearly demonstrates that the last step in the helix-coil tran- sition is made at the expense of reducing the total number of helical sequences, but with little change in the size of the helical segments. (From Freire, E. and Biltonen, R . , Bio- polymers, 17,497, 1978. With permission.)
pears that important properties of the bilayer depend not only on the average degree of flu- idity but on the organization and distribution of the phospholipids within the bilayer. There- fore, in studying the properties of the bilayer, one should not only be concerned with the physical state of the phospholipids but with the rules by which the average properties of the bi- layer are defined.
In analogy to the situation for synthetic poly- peptides and polynucleotides which are topol- ogically one dimensional, the bilayer can be thought of as being formed of clusters of phos- pholipids in the gel state and clusters of phos- pholipids in the liquid crystal state. At temper- atures well below the transition temperature, T,, all the phospholipids are in the gel state. At temperatures well above T,, the entire bilayer can be considered as being a single liquid crystal cluster. In the transition region, the state of the bilayer can be described by a particular distri- bution of clusters of phospholipids in the gel state and clusters of phospholipids in the liquid crystal state.
Cri
tical
Rev
iew
s in
Bio
chem
istr
y an
d M
olec
ular
Bio
logy
Dow
nloa
ded
from
info
rmah
ealth
care
.com
by
222.
222.
251.
129
on 0
5/20
/14
For
pers
onal
use
onl
y.

118 CRC Critical Reviews in Biochemistry
ltonen3* have developed the the- work for the statistical thermo-
dynamic description of a cooperative transition in terms of cluster distribution functions and some operational relations which allow calcu- lation of those functions from scanning calori-
egarding a hypothetical bilayer at the transition midpoint (i.e., when half of its phospholipids are in the gel state and half in the liquid crystal state), it is significant to ask what is the configurational state of the whole bilayer a t that point. The sole specification of the frac- tion of p ~ o s p h o ~ i ~ i d s melted does not provide much information on the state of the bilayer; there are a very large number of co~f~gurat ions which satisfy the restriction that the fraction of phospho~ip~ds melted is one half. A more de- tailed description of the bilayer would be ob- tained if the cluster distr~bution functions were known. Then, the relative fluctuation of the av- erages and the probability of finding a cluster of any particular size could be defined.
Each p h ~ ~ p h ~ ~ ~ p ~ d molecule which melts during the transition can create a new liquid crystal cluster of unit size, increase the size of a preexisting cluster by one, or join two (or more) already existing clusters. The relative probability of occurrence of any of these events will depend on the magnitude of the coopera- tive interactions existing within the bilayer and the fractional degree of melting.
The gel-liquid crystal transition is highly co- operative; cooperativity is defined simply as the tendency of the residues in the same state to group together. The actual nature of the tran- sition (which lies somewhere between the non- cooperative and infinitely cooperative cases) will depend on the ultimate balance between two forces, the combinatorial entropy which tends to ~ a x i m ~ z e the number of clusters, min- imizing their size, and the cooperative forces which tend to maximize the cluster size, mini- mizing their number. The former has its origin in the combinatorial degeneracy and is entropic in nature. The latter, on the other hand, could arise from different kinds of interactions, whose origin, within the bilayer, is S t i l l un- known. For example, the model of Jackson45 for the conformation of the hydrocarbon chains assumes that a source of cooperativity is the energy difference between what he refers to as a "forcing kink" and a "falling kink." In
any case, cooperative i ~ ~ e ~ a c ~ i o n s cause gel-gel OK liquid-liquid neighbors to be e n e ~ g e ~ ~ ~ a ~ ~ y more favorable than gel-liquid neighbors.
The shape of a gel-hqeaid crystalhe transi- tion curve will be efined by the enthal melting of the p h o s p h o ~ ~ p ~ d molecules and the magn~~ude of cooperative ~ n ~ e r ~ c t ~ o n s . Several variables or perturbations to t fect one or both of these basic types of interas- tions. For example, Suurkuusk et ale'* have demonstrated that changes in the radius of cur- vature of DPPC lip thalpy change, and
ple will be used as the basis for c o n s i ~ e r i ~ g the analysis of <dG,> data to obtain statistical me- chanical information r e ~ a r ~ ~ n ~ the t r ~ n s ~ t ~ ~ n ~
In Figure 21, the excess ~ e a t - c a ~ ~ ~ ~ t y func- tion, <A@,>, of an a q ~ e o u s d i s ~ e r s ~ o n of mul- t ~ l a m e ~ ~ a ~ liposomes prepared from the absence and in the presence of 4.4 the anesthetic halothane is plstte sence of the anesthetic, the main t rans~t~on of DPPG is characterized by a melting tempera- ture, T,, of 4B.%"C and a calorimetric 8.6 kcal/mol of p h o s p h ~ ~ i ~ i d s . In the presence of the anesthetic, T, is lowered to 39.5"C and
of the transition is only 0.5"6 , whereas, presence of the anesthetic, it is broade 2°C. These two expe r~me~t s were chosen for the purpose of this discussion because the an- esthetic predom~nantly affects the cooperat~vi~e of the transition, leaving unchange~ other properties of the bilayer.
The quantities directly accessible from scan- ning calorimetry are the residue p a r t ~ t ~ o n func- tions, q and 2, defined as before. In calculating q, the state that is sta le below the transition temperature (gel) is taken as reference states whereas in calculating z, the state that is stable
i s the reference state. The ratio z/q is equal to
Cri
tical
Rev
iew
s in
Bio
chem
istr
y an
d M
olec
ular
Bio
logy
Dow
nloa
ded
from
info
rmah
ealth
care
.com
by
222.
222.
251.
129
on 0
5/20
/14
For
pers
onal
use
onl
y.

November 1978 119
1
FIGURE 21. Heat capacity function associated with the main transition of a fresh dispersion of: (1) multilamellar lipos mes prepared from pure DPPC and (2) multilamellar liposomes prepared from DPPC in the presence of 4.7 atm of the gaseous anesthetic, halothane.
where Ag is the free energy difference between the gel and liquid crystal states (Ag = ggel - g,) per mole of phospholipid. This relation allows cakulation of Ag as a continuous function of t e ~ p e r a t u r e without making any assumption about the mechanism of the transition.
The van’t Hoff representation of the quan- tity s z/q is shown in Figure 22 for these two experiments. The results of a linear least- squares analysis are summarized in Table 10. The agreement between the Ah values obtained in this form and those calculated from the area under the C , curve is very good. lit should be noted that the temperature at which Ag is zero is not equal to the temperature of the maximum in<A.C,>. This is particularly noticeable for the transition in the presence of halothane. This ef- fect is not due to experimental error in the de-
FIGURE 22. Van’t Hoff representation of In (z/q) for the gel-liquid crystalline transition of multilamellar DPPC li- posomes in the absence (1) and in the presence (2) of 4.7 atm of halothane. The results of a least-squares analysis are shown in Table 10.
termination of Ag but merely reflects the fact that the transitions are not perfectly symmetri- cal. For an assymetrical transition, T, (defined as the position of the maximum in <A\e,>) is not equal to the temperature at which Ag = 0, and, in general, no simple relation exists be- tween the position of the maximum and the value of Ag at that point. The deconvolution method thus provides a unique opportunity of having a direct experimental access to Ag, with- out a priori assuming a model for the transi- tion.
Freire and Biltonen assumed that this system is sufficiently large so that the residue partition functions, q and z, are independent of N, the average number of residues per liposome. This assumption appears justified in the case of mul- tilamellar liposomes. The above assumption does not impose any restriction on the depen- dence of q and z on the length of the hydrocar- bon chains. In this treatment, q and z are ob- tained from the experimental data, and, thus, no assumptions about their internal structure are required. This is to be contrasted with the so-called ab initio models in which the hydro- carbon partition functions need to be solved. The residue partition functions, q and z, as ef- fective partition functions, contain contribu- tions from the configurational state of the phospholipids as well as contributions from the interactions arising from the particular way in which the phospholipids are organized within the bilayer.
If the reference state is defined as that state
Cri
tical
Rev
iew
s in
Bio
chem
istr
y an
d M
olec
ular
Bio
logy
Dow
nloa
ded
from
info
rmah
ealth
care
.com
by
222.
222.
251.
129
on 0
5/20
/14
For
pers
onal
use
onl
y.

120 CRC Critical Reviews in Biochemistry
TABLE 10
Thermodynamic Parameters Associated with the Gel-liquid Crystal Transition of DPPC'
System Ah (kcal/mol)b T, ("'2). Ahuh (kcal/mol)d (T,) A~ = o ("c).
DPPC 8.6 41.3 8.59 41.25 DPPC + 4.7% 7.8 39.5 1.92 39.0 halothane
Multilamellar liposomes prepared from DPPC. Calorimetric Ah: area under the <AC,> curve. Temperature of the maximum value in <Ace> . From van't Hoff analysis of In Temperature at which Ag = 0.
= In s. See text for details.
of the bilayer which is stable above the transi- tion temperature (i.e., the state in which all the phospholipids are in the liquid crystal state), the statistical weight of a phospholipid in the gel state relative to a phospholipid in the liquid crystal state is s, the equilibrium constant for the conversion of a phospholipid from the liq- uid state to the gel state. Note that s, defined as z/q, is not the equilibrium constant for the conversion of an isolated phospholipid but, rather, the effective equilibrium constant per phospholipid when this process occurs within the bilayer; therefore, s already includes the in- teraction energies existing in the bilayer, and no further specifications are required to define the statistical weight gger (j). The gel cluster grand
b .2 .4 d a 1 fi
. .. GEL
__ 110 cRIs1.41 T.
FIGURE 23. Cluster averages associated with the gel-liq- uid crystalline transition of pure multilamellar DPPC lipo- somes: (A) experimental average gel and liquid cluster size (<la> and <I,>) as a function of the fraction of phospho- lipids in the liquid state, F,; and (B) experimental gel and liquid cluster densities (n,/N and n,/N) as a function of F,.
partition function, R,,,, is given by Equation 71, and the average size of gel clusters, <Q,,,>, is given by Equation 78. In Figures 23 and 24, the <Qge1> calculated from the <AC,> functions of Figure 21 has been plotted as a function of the degree of melting. The cluster densities ngel/ N are also shown.
In writing the statistical weight of a liquid crystal cluster, one needs to consider two kinds of phospholipids, those surrounded by other molecules in the liquid state and those existing at the boundaries of the cluster, which are also in contact with phospholipids in the gel state.
FIGURE 24. Cluster averages associated with the gel-liq- uid crystalline transition of multilamellar DPPC liposome in the presence of 4.7 atm halothane: (A) experimental av- erage gel and liquid cluster size (<!,> and <!,,>) as a func- tion of F, and (B) experimental gel and liquid cluster dens- ities (n,/N and n,/N) as a function of F,.
Cri
tical
Rev
iew
s in
Bio
chem
istr
y an
d M
olec
ular
Bio
logy
Dow
nloa
ded
from
info
rmah
ealth
care
.com
by
222.
222.
251.
129
on 0
5/20
/14
For
pers
onal
use
onl
y.
November 1978 121
mechanism of multilamellar DPPC liposomes in the absence and in the presence of halothane can be drawn from the results summarized in Figures 23 and 24. First, the transition is less cooperative in the presence of halothane. Over the entire transition interval, the average size of gel and liquid clusters is greater in the absence of the anesthetic. At the transition midpoint, the average cluster size is about 250 residues, whereas, in the presence of halothane, it is only 80 residues. This decrease in cluster size after addition of the anesthetic is accompanied by an increase in the number of clusters.
The total number of clusters is always maxi- mal at the transition midpoint. At comparable degrees of melting, there are more clusters in the DPPC-halothane system than in the pure DPPC. This increase in the number of clusters is accompanied by an increase in the number of gel-liquid neighbors and, therefore, in the amount of lipids at interfacial regions. This quantity, the number of residues at the gel-liq- uid boundaries, is proportional to the quantity <Ifg> of Equation 110 and can be estimated from our experimental knowledge of <If,>. FreireZ6 has calculated the fraction of phospho- lipids at the interface region, assuming a circu- lar geometric shape of the liquid crystalline clusters. Although this assumption with regard to shape is approximate, changes in geometry do not affect the results of the calculation sub- stantially.
The results of FreireZ6 constitute the first ap- plication of this theory to the study of phospho- lipid bilayer membranes. It has been demon- strated that scanning calorimetry can, in principle, provide not only the magnitude of the thermodynamic parameters associated with the transition but also a complete statistical thermodynamic description of the system, from which the configurational state of the bilayer could be inferred at any degree of melting. It is anticipated that further studies of this nature relating the various statistical mechanical pa- rameters and changes therein to specific func- tions and perturbations of model membranes will enhance our overall understanding of such systems.
As mentioned before, cooperative interactions cause the molecules at the interphase region to be energetically less stable than those sur- rounded by molecules in the same state. This interfacial region is considered to be the outer layer of a liquid crystal cluster; analogous re- sults would be obtained if this convention were inverted. The liquid crystal cluster grand parti- tion function, R,, is, then,
where A is the statistical weight of a phospho- lipid in the interfacial region and m(j) the num- ber of phospholipids in the interfacial region of a liquid cluster of j residues. Equation 106 can- not be directly evaluated since the dependence of m(j) on j is unknown: therefore, an alterna- tive procedure was developed.
The previous equation can be rewritten as
where is a phenomenological parameter de- fined in such a way that Equations 107 and 108 are identical. a(T) can be considered as an effec- tive, temperature-dependent, cooperative-inter- action parameter. The average size of liquid crystal clusters, <I,>, is, then,
a ~n fir
In this expression, the first term on the right- hand side is equal to the average size of liquid crystal clusters without including the interfacial region, and the second term represents the av- erage number of phospholipids a t the inter- phase region per cluster. Therefore,
Z
where < I f g > is the number of phospholipids surrounding a liquid cluster of z/(z-1) mole- cules; for convenience, this latter quantity will be called < I f f > . This is the term directly ob- tained from the experimental data and is the one plotted in Figures 23 and 24.
Several conclusions regarding the transition
CQNCLUDING REMARKS
Until recently, the use of scanning calorime- try for the study of macromolecular systems
Cri
tical
Rev
iew
s in
Bio
chem
istr
y an
d M
olec
ular
Bio
logy
Dow
nloa
ded
from
info
rmah
ealth
care
.com
by
222.
222.
251.
129
on 0
5/20
/14
For
pers
onal
use
onl
y.

122
has been limited, as has been pointed out. The goal of such studies has been mainly to provide estimates of the overall enthalpy change for a transition. One exception to this statement is the work of Privalov and co-workers, who have attempted to decompose, in an operational way, the distinct sequential transitions of trans- fer ribonucleic acids. It now appears that the excess heat capacity function can provide a great deal more information of the thermody- namic nature of complex transitions if the data are properly analyzed. An outline of the appro- priate procedures, as applied to a few specific systems, has been provided in this study.
The general application of the described an- alytical techniques depends upon the attain- ment of precise and accurate excess heat-capac- ity data. The mathematical procedures involved in this analysis appear to be sound and should not produce artifacts in the computed results. The resolving power of the technique for cases of discrete, sequential transitions will be deter- mined by the magnitude of the thermodynamic changes at each step and the precision of the data. In fact, it is the latter which is most im- portant.
In the case of cooperative transitions of large, homogeneous systems, the ability to eval- uate the partition function of the system allows the calculations of distribution functions as de- scribed. While such calculations are independ- ent of assumed models, the interpretation of q in molecular terms must still be done within the context of specific models. The analysis has not, as yet, been extended to finite systems or systems containing more than one chemical component. However, the potential for the analysis of such systems exists, and applications in this area in the not too distant future are to be anticipated.
It is obvious that the excess enthalpy function obtained from precise calorimetric data is the appropriate one to use for this analysis. Wow- ever, in many cases, it may be possible to ana-
CRC Critical Reviews in Biochemistry
lyze systems in which the overall transition is monitored by noncalorimetric techniques (e.g., changes in absorption). This can be done if the monitoring parameter is directly proportional to the excess enthalpy change. Knowing the to- tal enthalpy change, one could, then, transform the “degree of progress” curve into the excess enthalpy function. This does not, of course, ob- viate the need to have the calorimetrically deter- mined enthalpy change but reduces the require- ment of the need for a heat-capacity calorimeter which can precisely define the ex- cess heat capacity as a function of temperature.
The biological or biochemical usefulness of the technique described will become most ob- vious when functional correlations wiih changes in thermodynamic parameters of these complex transition curves can be made. For ex- ample, if changes in specific functions of tRNA can be correlated with specific transitions or if changes in membrane functions can be corre- lated with changes in the degree of cooperative interaction, then one will understand in more detail the thermodynamic control of some spe- cific biochemical functions. Until that time, the procedures described herein should provide a better understanding of the statistical thermo- dynamic behavior of interacting biological ma- cromolecular systems.
We wish to thank several colleagues, includ- ing Dr. Donald B. Mountcastle, Dr. Maurice Eftink, Vincent Chau, and Guillermo Romerc for their many helpful comments during the course of this work. Research from this Pabo. ratory described herein was supported by grants from the National Institutes of Health (GM. 20637-05, PI7 AM-17042-03), the National Sci. ence Foundation (PCM75-23245-A01), and thc American Cancer Society (BC-240-01). Thc skillful help of Cynthia Annunziata during thc preparation of this manuscript is appreciated
TICEES REVIEWED
Freke. E. and ~ ~ t ~ n e n , R., Statistical mechanical deconvolution of thermal transitions in macromolecules. 1. Theory an1 application to homogeneous systems, Biopolyrners, 17,463, 1978.
iltonen, R., Statistical mechanical deconvolution of thermal transitions in macromolecules. I I . General treat ment of cooperative phenomena, Biopolymers, 17,481, 1978.
Cri
tical
Rev
iew
s in
Bio
chem
istr
y an
d M
olec
ular
Bio
logy
Dow
nloa
ded
from
info
rmah
ealth
care
.com
by
222.
222.
251.
129
on 0
5/20
/14
For
pers
onal
use
onl
y.

November 1978 123
n, R., Statistical mechanical deconvolution of thermal transitions in macromolecules. 111. Application gle-stranded transitions of nucleic acids, Biopolymers, 17,497, 1978. V., and Privalov. P., Calorimetric studies on melting of tRNAP"' (yeast), Eur. J . Biochern., 72, 79,
, N. and ~ ~ ~ ~ e v a n ~ , J., Calorimetric studies of dilute aqueous suspensions of bilayers formed from synthetic L-a-leci- thins, J. Biol. Chem., 247,6071, 1972. Neumann, E. and Ackermann, T., Thermodynamic investigation of the helix-coil transition of a polyribonucleotide system, J . Phys. Chem.,73,2170, 1969. Privalov, P., ~ i ~ i m i ~ o v ~ V., Venkstern, T., and Bayev, T., A calorimetric investigation of tRN*' melting, J . Mol. Biol., 97,279, 1975.
EFERENCES
1. P~valov, P., P ~ o t n ~ ~ o v , V., and Filiminov, V., Precision scanning microcalorimeter for the study of liquids, J. Chem.
2. Sturtevant. J., Some applications of calorimetry in biochemistry and biology, in Annual Review of Biophysics and
3. ~ c N a u g h ~ o n , J. and Mortimer, C.. Differential scanning calorimetry, in Physical Chemistry Series Two, Vol. 10,
4. Calvet, E. and Prat, H., Recent Progress in Microcalorimetry, Pergamon Press, New York, 1963. 5. Ackermann, T., The calorimeters: adiabatic calorimeters, in Biochemical Microcalorimetry, Brown, H. D., Ed., Aca-
demic Press, New York, 1969, 235. 6. Jackson, W. and Brandts, J., Thermodynamics of protein denaturation. A calorimetric study of the reversible dena-
turation of chymotrypsinogen and conclusions regarding the accuracy of the two-state approximation, Biochemistry, 9, 2294, 1970.
7. Gill, S. and Beck, K., Differential heat capacity calorimeter for polymer transition studies, Rev. Sci. Instrum., 36, 274, 1965.
8. Privalov, P. L., Thermal investigations of biopolymers solutions and scanning microcalorirnetry, FEBS Lett., 40, 5140, 1974.
9. Danforth, R., Krakauer, H., and Sturtevant, J., Differential calorimetry of thermally induced processes in solution, Rev. Sci. Instrum., 38, 484, 1967.
10. Ross, P. and Goldberg, R., A scanning microcalorimeter for thermally induced transitions in solution, Thermochim. Acta, 10, 143, 1974.
11. Suurkuusk, J., Lentz, B., Barenholz, Y.. Biltonen, R., and Thompson, T., A calorimetric and fluorescent probe study of the gel-liquid crystalline phase transition in small single-lamellar dipalmitoylphosphatidylcholine vesicles, Biochem- istry, 15, 1393, 1976.
12. Lumry. R., Biltonen, R., and Brandts, J., Validity of the "two-state" hypothesis for conformational transitions of proteins, Biopolymers, 4, 917, 1966.
13. Privalov, P., Ptitsyn, 0.. and Birshtein, T., Determination of stability of the DNA double helix in an aqueous medium, Biopolymers, 8, 559, 1969.
14. Ackermann, T. and Neumann, E., Experimental thermodynamics of the helix-random coil transition. I. Influence of polymer concentration and solvent composition in the PBG-DCA-EDC system, Biopolymers, 5,649, 1967.
~ and Bragg, 9.. Theory of the phase transition between helix and random coil in polypeptide chains, J . Chem. Phys., 31, 526, 1959.
16. Neumann, E. and Ackermann, T., Thermodynamic investigation of the helix-coil transition of a polyribonucleotide system, J . Phys. Chem., 73,2170, 1969.
17. A ~ ~ e r m a n n , T., Physical states of biomolecules: calorimetric study of helix-random coil transitions in solution, in BiochemicalMicrocalorimetry, Brown, H. D., Ed., Academic Press, New York, 1969, 121.
18. Priva~Qv, P. and Khechinashvil~, N., A thermodynamic approach to the problem of stabilization of globular protein ructure: a calorimetric study, J . Mol. Biol., 86, 665, 1974. randts, J., Jackson, W., and Yao-Chung Ting, T., A calorimetric study of the thermal transitions of three specific
20. Privalov, P., Filiminov, V., Venkstern, T., and Bayev, A., A calorimetric investigation of tRNA,'"' melting, J. Mol.
21. Ninz, H., Filiminov, V., and Privalov, P., Calorimetric studies on melting of tRNApha (yeast), Eur. J . Biochem., 72,
22. Huang, C., Studies of phosphatidylcholine vesicles. Formation and physical characteristics, Biochemistry, 8, 344,
23. Him, H. and Sturtevant, J., Calorimetric studies of dilute aqueous suspensions of bilayers formed from synthetic L-
Thermodyn., 7,41, 1975.
Bioengineering, Vol. 3, Mullins, E., Ed., Annual Reviews, Inc., Palto Alto, California, 1974, 35.
Skinner, H., Ed., Butterworths, London, 1975, 1.
transfer ribonucleic acids, Biochemistry, 13, 3595, 1974.
Biol.,97, 279, 1975.
79, 1977.
1969.
a-Lecithins, J . Biol. Chem., 274, 6071, 1972.
Cri
tical
Rev
iew
s in
Bio
chem
istr
y an
d M
olec
ular
Bio
logy
Dow
nloa
ded
from
info
rmah
ealth
care
.com
by
222.
222.
251.
129
on 0
5/20
/14
For
pers
onal
use
onl
y.

124
24. Mabrey, S. and Sturtevant. J., Investigation of phase transitions of lipids and lipid mixtures by high sensitivity differ-
25. Barenholz, Y., Suurkuusk. J., Mountcastle, D., Thompson, T., and Biltonen, R., A calorimetric study of the ther-
26. Freire, E., Statistical Thermodynamics of Conformational Transitions in Macromolecules, Ph.D. dissertation, Univer-
27. Freire, E. and Biltonen, R., Statistical mechanical deconvolution of thermal transitions in macromolecules. I . Theory
28. Bode, D., Schernau. V., and Ackermann, T., Calorimetric investigation of the helix-coil conversion of phenylalanine-
29. Freire, E. and Biltonen, R., Thermodynamics of transfer ribonucleic acids: the effect of sodium on the thermal un-
30. Crothers, D., Cole, P., Hilbers, C., and Shulman, R., The molecular mechanism of thermal unfolding of Escherichia
31. Riesner, D., Maas, G., Thiebe, R., Philippsen, P., and Zachau, H., The conformational transitions in yeast tRNAPh'
32. Freire. E. and Biltonen, R., Statistical mechanical deconvolution of thermal transitions in macromolecules. 11. General
33. Thompson, C. J., Mathematical Statistical Mechanics, The Macmillan Company, New York, 1972, chap. 3. 34. Lifson, S. and Zimm, B., Simplified theory of the helix-coil transition in DNA based on a grand partition function,
35. Sture, K. and Nordholm, J., A new analytic solution for the Zwanzig-Lauritzen model of polymer chain folding, J .
36. Sture, K., Nordholm, J., and Rice, S. , Phase transitions and end effects in models of biopolymers, J . Chem. Phys.,
37. Lifson, S., Partition function of linear-chain molecules, J . Chem. Phys., 40, 3705, 1964. 38. Poland, D. and Scheraga, H., Theory of Helix-coil Transitions in Biopolymers, Academic Press, New York, 1970,
39. Applequist, J., Higher-order phase transitions in two-stranded macromolecules, J . Chem. Phys., 50, 600, 1969. 40. Freire, E. and Biltonen, R., Statistical mechanical deconvolution of thermal transitions in macromolecules. 111. Appli-
41. Blake, R., Helix-coil equilibria of Poly(rA) . Poly(rU), Biophys. Chem., 1,24, 1973. 42. Vibina, J. and Waugh, J., Proton-enhanced 13C nuclear magnetic resonance of lipids and biomembranes, Proc. Natl.
43. Levine, Y. and Wilkins, M., Structure of oriented lipid bilayers, Nature(London) New Biol., 230,69, 1971. 44. Nagle, J., Lipid bilayer phase transition: density measurements and theory, Proc. Natl. Acad. Sci. U.S.A., 70, 3443,
45. Jackson, M., A /3-coupled gauch-kink description of the lipid bilayer phase transition, Biochemistry, 15, 2555, 1976. 46. Mountcastle, D., Halsey, M., and Biltonen, R., The effects of anesthetics and pressure on the thermotropic behavior
of multilamellar dipalmitoylphosphatidylcholine liposomes, Proc. Natl. Acad. Sci. U.S.A., in press. 47. Tsong, T., Hearn, R., Wrathall, D., and Sturtevant, J., A calorimetric study of thermally induced conformational
transitions of Ribonuclease A and certain of its derivatives, Biochemistry, 1,2666, 1970. 48. Suurkuusk, J., Alvarez, J., Freire, E., and Biltonen, R., Calorimetric determination of the heat capacity changes
associated with the conformational transitions of polyriboadenylic acid and polyribouridylic acid, Biopolymers, 16, 2641, 1977.
49. Krakauer, H. and Sturtevant, J., Heats of the helix-coil transitions of the Poly A-Poly U complexes, Biopolymers, 6, 491, 1968.
50. Klump, H. and Ackermann, T., Experimental thermodynamics of the helix-random coil transition. IV. Influence of the basecomposition of DNA on the transition enthalpy, Biopolymers, 10, 513, 1971.
51. Scheffler, I. and Sturtevant, J., Thermodynamics of the helix-coil transition of the alternating copolymer of deoxy- adenylic acid and deoxythymidylic acid, J . Mol. Biol., 42, 577, 1969.
52. Bloomfield, V., Crothers, D., and Tinoco, I., Physical Chemistry of Nucleic Acids, Harper and Row, New York, 1974.
53. Kauzmann, W., Some factors in the interpretation of protein denaturation, in Advances in Protein Chemistry. Vol. 14, Academic Press, New York, 1959, 1.
54. Lumry, R. and Biltonen, R., Thermodynamic and kinetic aspects of protein conformations in relation to physiological function, in Structure and Stability of Biological Macromolecules, Timasheff, S. N. and Fasman, G . D., Eds., Marcel Dekker, New York, 1969,65.
55. Brandts, J . F., Conformational transitions of proteins in water and aqueous mixtures, in Structure and Stability of Biological Macromolecules, Timasheff, S. N. and Fasman, G. D., Marcel Dekker, New York, 1969, 213.
56. Tsong, T. Y. and Kanehisa. M. I . , Relaxation phenomena in aqueous dispersions of synthetic lecithins, Biochemistry, 16,2674, 1977.
57. Lentz, B., Freire, E., and Biltonen, R., Fluorescence and calorimetric studies of phase transitions in phosphatidylcho- line multilayers: kinetics of the pretransition, Biochemistry, in press.
58. Applequist, J., Macromolecular cooperative phenomena, in Conformation of Biopolymers, Vol. 1 , Ramachandran, G . N., Ed., Academic Press, New York, 1967,403.
CRC Critical Reviews in Biochemistry
ential scanning calorimetry, Proc. Natl. Acad. Sci. U.S.A., 73, 3862, 1976.
motropic behavior of aqueous dispersions of natural and synthetic sphyngomyelins, Biochemistry, 15,2441, 1976.
sity of Virginia, 1977.
and applications to homogeneous systems, Biopolymers, 17,463, 1978.
specific transfer ribonucleic acid, Biophys. Chem., 1, 214, 1974.
folding of yeast tRNAPh', Biopolymers, 17, 1257, 1978.
coliformylmethionine transfer RNA, J . Mol. Biol., 87, 63, 1974.
as studied with tRNA"* fragments, Eur. J . Biochem., 36, 76, 1973.
treatment of cooperative phenomena, Biopolymers, 17,481, 1978.
Biopolymers, 1, 15 , 1963.
Stat Phys., 9,235, 1973.
59, 5605, 1973.
chap. 7.
cation to double-stranded single-stranded transitions of nucleic acids, Biopolymers, 17,497, 1978.
Acad. Sci. U.S.A.,71, 5062, 1974.
1973.
Cri
tical
Rev
iew
s in
Bio
chem
istr
y an
d M
olec
ular
Bio
logy
Dow
nloa
ded
from
info
rmah
ealth
care
.com
by
222.
222.
251.
129
on 0
5/20
/14
For
pers
onal
use
onl
y.