changes in litter properties during decomposition: a study by differential thermogravimetry and...
TRANSCRIPT
This article was published in an Elsevier journal. The attached copyis furnished to the author for non-commercial research and
education use, including for instruction at the author’s institution,sharing with colleagues and providing to institution administration.
Other uses, including reproduction and distribution, or selling orlicensing copies, or posting to personal, institutional or third party
websites are prohibited.
In most cases authors are permitted to post their version of thearticle (e.g. in Word or Tex form) to their personal website orinstitutional repository. Authors requiring further information
regarding Elsevier’s archiving and manuscript policies areencouraged to visit:
http://www.elsevier.com/copyright
Author's personal copy
Soil Biology & Biochemistry 40 (2008) 172–185
Changes in litter properties during decomposition: A study bydifferential thermogravimetry and scanning calorimetry
Pere Roviraa,�, Cathy Kurz-Bessonb,1, Marie-Madeleine Couteauxb, V. Ramon Vallejoc
aUnitat de Fisiologia Vegetal, Facultat de Biologia, Universitat de Barcelona, Diagonal 645, 08028 Barcelona, SpainbCentre d’Ecologie Fonctionnelle et Evolutive, CNRS, 1919 Route de Mende, F-34293 Montpellier Cedex 05, France
cCEAM, Ch Darwin 14, 46980 Paterna, Valencia, Spain
Received 13 February 2007; received in revised form 6 June 2007; accepted 25 July 2007
Available online 29 August 2007
Abstract
To verify the paradigm that organic matter (OM) quality (q) decreases with decomposition it is necessary to define q in strictly
chemical, operational terms. We suggest defining q as the result of a balance between the energy stored in OM and the external supply of
energy needed to release it. We apply this concept to the study of litter decomposition in four European pine forests: boreal, cool
Atlantic, Mediterranean and warm Atlantic. Intact litter cores were taken and transported to the laboratory, where needles were sorted
into six classes that summarize the main facts of the decomposition: melanisation, fragmentation and perforation by mesofauna. Each
class was analyzed by both differential thermogravimetry and differential scanning calorimetry to obtain its spectra of weight loss and
energy release.
In the non-decomposed needles, two peaks of weight loss and energy release appear: a labile peak at about 350 1C, and a recalcitrant
peak at about 450 1C. During decomposition, both peaks (but especially the recalcitrant one) move to lower temperatures, and their
shapes change from well defined to flattened. In Mediterranean litters, a third peak appears at about 500 1C, due probably to refractory
products of neoformation. There is a continuous increase in the energy stored in the remaining litter (in Joules per unit OM): this increase
is concentrated in both the most thermolabile fractions (lost at temperatures o350 1C) and the most thermostable ones (4450 1C). With
decomposition OM becomes more recalcitrant (i.e., it is lost at higher temperatures), but its stored energy becomes more available (i.e., it
is released at lower temperatures). Overall, the energetic benefit/cost ratio increases. Thus, our results to date do not agree with the
current paradigm that q decreases with decomposition; rather, they suggest that, at least in the first phases we studied, q is maintained or
even increases.
r 2007 Elsevier Ltd. All rights reserved.
Keywords: Thermal analysis methods; Differential thermogravimetry; Differential scanning calorimetry; Litter quality; Forest soils
1. Introduction
‘Quality’ (henceforth, q), a term widely used in soilorganic matter (SOM) studies, can be defined as aquantitative measure of how difficult it is for SOM to bebiodegraded by soil microflora: q is assumed to be theresult of both the SOM chemical composition (proteins,
polyphenolics, carbohydrates, lipids, etc.) and its physicalstructure (the remaining tissular structure). According tothe current paradigm, q decreases with decomposition dueto several facts. The labile components are degraded first,while the recalcitrant ones (waxes, polyphenolics, lignin)remain, as has been known for many years (e.g., Minder-man, 1968). Microbial by-products of the decomposition,often refractory in structure (humic substances or similar),accumulate in the decomposing SOM, which tends toacquire a blackish tint as a result.This paradigm can be verified indirectly, through the
study of decomposition curves. Decomposition rates oftendecrease with time. This has been interpreted as the result
ARTICLE IN PRESS
www.elsevier.com/locate/soilbio
0038-0717/$ - see front matter r 2007 Elsevier Ltd. All rights reserved.
doi:10.1016/j.soilbio.2007.07.021
�Corresponding author. Current address: SRSN, UMR CNRS 6514, 40
Avenue du Recteur Pineau, 86022 Poitiers, France. Tel.: +34 93 402 1462;
fax: +3493 411 2842.
E-mail address: [email protected] (P. Rovira).1Current address: Instituto Superior de Agronomıa, DBEB, Tapada de
Ajuda, 1349-017 Lisboa, Portugal.
Author's personal copy
of the existence of two pools of SOM: one labile and theother recalcitrant. As the second becomes more relevant inthe remaining SOM the overall decomposition ratesdecrease. In agreement with this, SOM decompositiondata are often fitted to double-exponential curves (e.g.,Gillon et al., 1993). Nevertheless, the decrease in thedecomposition rates does not imply a decrease in q,because other processes can yield the same result, e.g.,changes in the physical position of an SOM pool within thesoil matrix (physical protection by fine silt and clays:Baldock and Skjemstad, 2000), or its position within thesoil profile, which results in changes in the pedoclimate andthus in the decomposition rate (Rovira and Vallejo, 1997).Changes in the microbial community can also result inchanges in the overall decomposition rate, for the enzy-matic systems needed to degrade some substrates may belacking in some microbial taxa. To include all theseconstraints within the q concept implies that the q of agiven substrate varies depending on site, climate, horizonor position within the soil matrix, which is unfair. For aproper analysis of the decomposition process, q should bedefined strictly in terms of the chemical features of thedecomposing material, leaving aside other properties that,in fact, refer to different characteristics.
Attempts have been made to define q in chemical terms.For litters, the C/N ratio is the most classic indicator(Vallejo, 1981) and is still useful for predictive purposes(Nicolardot et al., 2001). Approaches involving thequantification of both N and lignin are assumed to bebetter (Meentemeyer, 1978; Aber and Melillo, 1982). Theholocellulose-to-lignin ratio has also been suggested(McClaugherty and Berg, 1987). Some authors proposeindices based on litter toughness (as a function of thedevelopment of cuticles), which seem to predict decom-position quite well (Gallardo and Merino, 1993; Perez-Harguindeguy et al., 2000). For mineral soil horizons, acidhydrolysis has been applied to isolate a refractory fractionresistant to acid attack, more stable and often much olderthan the overall SOM (Paul et al., 2006).
Thermal analysis methods have also been applied.Thermal analysis techniques detect several peaks in lossof matter (differential thermogravimetry: DTG), increasesor decreases in temperature with respect to a givenstandard (differential thermal analysis: DTA), and/or therelease of energy in the form of heat (differential scanningcalorimetry: DSC). Both the DTG and the DSC spectra(henceforth: thermograms) show two main peaks: a labileone at low or medium temperatures, and a recalcitrant oneat high temperatures. The labile peak is due both to theoxidation of carbohydrates and proteins and to the loss ofcarboxyl groups, whereas the recalcitrant peak is attributedto polyphenolic and other condensed structures, includinglignin (Flaig et al., 1975). The quantification of these peakshas been used to obtain insight into the biochemicalstabilization of organic substrates, both in humic sub-stances (see Schnitzer and Hoffman, 1965; Flaig et al.,1975, for pioneer work; recent examples can be found in
Provenzano and Senesi, 1998; Peuravuori et al., 1999;Dell’Abate et al., 2002), and in unfractionated organicsubstrates, including litter (Angehrn-Bettinazzi et al., 1988;Kristensen, 1990; Beyer et al., 1998; Rovira and Vallejo,2000), fecal pellets (Jocteur Monrozier and Robin, 1988) orcomposts (Schnitzer and Hoffman, 1966; Dell’Abate et al.,1998). To date, most of the research in this topic has beenfocused on the quantification of these peaks, theiridentification with a given set of compounds, and thestudy of their changes with time.However, thermal methods have potential applications
that are less widely taken into account, such as evaluatingthe amount of energy stored in the SOM, thus placingSOM into a whole-ecosystem theoretical scheme of energystorage and dissipation (Margalef, 1974). Ecologists fromthe USA studied SOM from this point of view (Malone andSwartout, 1969; Van Cleve, 1971; De la Cruz and Gabriel,1974); similar issues have been explored by Polishresearchers (Dziadowiec and Kwiatkowska, 1980; Bien-kowski, 1981). Combining this approach with the study ofthe changes in the DTG or DSC thermograms with timecould open new ways of studying the behavior of q indecomposing SOM.The aim of this paper is to apply thermal analysis
methods to the study of changes in organic matter (OM)quality during decomposition. Our previous work (Roviraand Vallejo, 2000) showed that the presence of a mineralmatrix greatly distorts the DTG and DSC thermograms,thus complicating their interpretation in terms of q. Mostof the research in this area has been carried out on organichorizons, where mineral matter has little relevance.Consistent with these observations, in this paper we focusour work on the study of the litter horizons (L and F),leaving aside the mineral layers, which should be the matterof future studies.
2. Material and methods
2.1. Concept
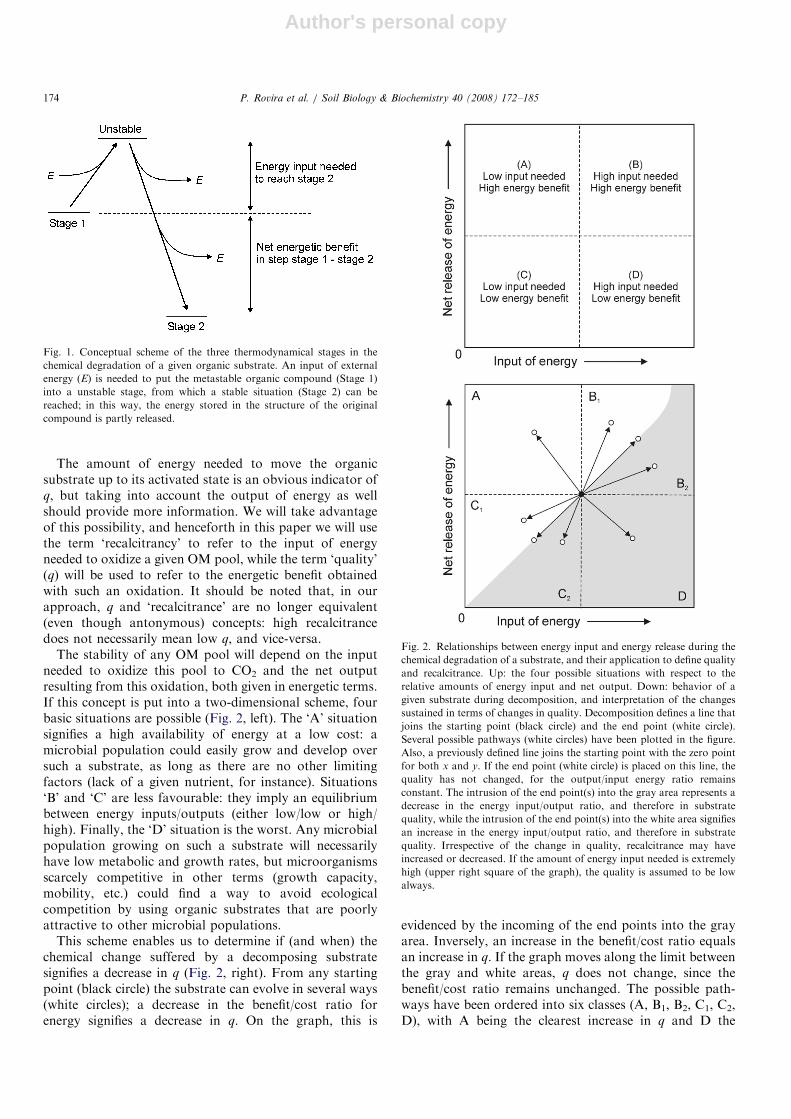
Autotrophic organisms capture energy from an abioticsource and store it as chemical bonds between C atoms.OM is a form of energy storage. The stored energy can befurther released if the organic compounds are broken intosmaller fragments. Most compounds need an external inputof energy to release their own stored energy (Fig. 1). Thisexternal input moves the compound to an activatedconfiguration that enables the organic structure to releaseits stored energy (either totally or partly), thus reaching anew, thermodynamically more stable, state. The end pointis CO2 or, under anaerobiosis, CH4 or an organiccompound simpler than the original one (fermentation).The difference between the input needed and the energyreleased represents a net output of energy, which can beused by the organisms if properly translated to ATP,NADH or NADPH.
ARTICLE IN PRESSP. Rovira et al. / Soil Biology & Biochemistry 40 (2008) 172–185 173
Author's personal copy
The amount of energy needed to move the organicsubstrate up to its activated state is an obvious indicator ofq, but taking into account the output of energy as wellshould provide more information. We will take advantageof this possibility, and henceforth in this paper we will usethe term ‘recalcitrancy’ to refer to the input of energyneeded to oxidize a given OM pool, while the term ‘quality’(q) will be used to refer to the energetic benefit obtainedwith such an oxidation. It should be noted that, in ourapproach, q and ‘recalcitrance’ are no longer equivalent(even though antonymous) concepts: high recalcitrancedoes not necessarily mean low q, and vice-versa.
The stability of any OM pool will depend on the inputneeded to oxidize this pool to CO2 and the net outputresulting from this oxidation, both given in energetic terms.If this concept is put into a two-dimensional scheme, fourbasic situations are possible (Fig. 2, left). The ‘A’ situationsignifies a high availability of energy at a low cost: amicrobial population could easily grow and develop oversuch a substrate, as long as there are no other limitingfactors (lack of a given nutrient, for instance). Situations‘B’ and ‘C’ are less favourable: they imply an equilibriumbetween energy inputs/outputs (either low/low or high/high). Finally, the ‘D’ situation is the worst. Any microbialpopulation growing on such a substrate will necessarilyhave low metabolic and growth rates, but microorganismsscarcely competitive in other terms (growth capacity,mobility, etc.) could find a way to avoid ecologicalcompetition by using organic substrates that are poorlyattractive to other microbial populations.
This scheme enables us to determine if (and when) thechemical change suffered by a decomposing substratesignifies a decrease in q (Fig. 2, right). From any startingpoint (black circle) the substrate can evolve in several ways(white circles); a decrease in the benefit/cost ratio forenergy signifies a decrease in q. On the graph, this is
evidenced by the incoming of the end points into the grayarea. Inversely, an increase in the benefit/cost ratio equalsan increase in q. If the graph moves along the limit betweenthe gray and white areas, q does not change, since thebenefit/cost ratio remains unchanged. The possible path-ways have been ordered into six classes (A, B1, B2, C1, C2,D), with A being the clearest increase in q and D the
ARTICLE IN PRESS
Fig. 1. Conceptual scheme of the three thermodynamical stages in the
chemical degradation of a given organic substrate. An input of external
energy (E) is needed to put the metastable organic compound (Stage 1)
into a unstable stage, from which a stable situation (Stage 2) can be
reached; in this way, the energy stored in the structure of the original
compound is partly released.
Fig. 2. Relationships between energy input and energy release during the
chemical degradation of a substrate, and their application to define quality
and recalcitrance. Up: the four possible situations with respect to the
relative amounts of energy input and net output. Down: behavior of a
given substrate during decomposition, and interpretation of the changes
sustained in terms of changes in quality. Decomposition defines a line that
joins the starting point (black circle) and the end point (white circle).
Several possible pathways (white circles) have been plotted in the figure.
Also, a previously defined line joins the starting point with the zero point
for both x and y. If the end point (white circle) is placed on this line, the
quality has not changed, for the output/input energy ratio remains
constant. The intrusion of the end point(s) into the gray area represents a
decrease in the energy input/output ratio, and therefore in substrate
quality, while the intrusion of the end point(s) into the white area signifies
an increase in the energy input/output ratio, and therefore in substrate
quality. Irrespective of the change in quality, recalcitrance may have
increased or decreased. If the amount of energy input needed is extremely
high (upper right square of the graph), the quality is assumed to be low
always.
P. Rovira et al. / Soil Biology & Biochemistry 40 (2008) 172–185174
Author's personal copy
clearest decrease. Both B1 and C1 represent an increase inq, the first at the price of an increase in the energy inputneeded, and the second at the price of a decrease in the netbenefit. As for B2 and C2, q decreases in both: in the first,owing to an excessive increase in the input needed, and inthe second, due to an excessive decrease in the energyoutput. Finally, if the energy input needed to break up anorganic structure is excessive, the substrate will have a verylow q: the energetic benefit may be very high, but theenergetic input needed may be beyond the possibilities ofmost microbial populations. Condensed C structures(black carbon) are examples of such substrates. This iswhy in Fig. 2 right, the B2 area is superimposed on the B1
area at the highest abscissa values.This concept will be applied to the studied litters, as
shown below.
2.2. Sites
The organic horizons of four coniferous forests werestudied: a boreal site (Sweden), a cool Atlantic site(Belgium), a dry Mediterranean site (Catalonia, NE Spain)and a warm Atlantic site (Portugal). Details of the sites aregiven in Table 1. All sites were Pinus stands; due to climatevariation, it was not possible to use the same Pinus speciesthroughout.
2.3. Litter collection and fractionation
The direct observation method has been describedpreviously (Kurz et al., 2000; Kurz-Besson et al., 2005,
2006). At each site, several undisturbed forest floor blocks(30� 40 cm), including the whole organic horizons, wererandomly taken: of these, only three blocks per site wereincluded in our study. The blocks were transported to thelaboratory and dried at 45 1C. Litter components otherthan needles were not considered. Needles were sorted intosix categories (Table 2), according to morphologicalcriteria (Gourbiere, 1981; Kurz et al., 2000). The initialstage (called 0) was the newly shed litter collected in littertraps. The remaining categories (I–V) were all in the L andF horizons. The Oa horizon, without structured needles,was discarded.Each needle category in each soil block constituted a
sample, yielding n ¼ 3. The samples were ground in aCyclotec grinder, for further chemical and thermalanalyses.
2.4. Remaining mass and age
The measurement of remaining mass and decompositiontime has been extensively described elsewhere (Kurz et al.,2000). Briefly, the mass loss was determined using thelinear mass density method: one meter of dry single needleswas placed end to end and weighed to determine the linearmass density of each category. The linear needle mass ofdecomposing needles from each category was expressed asa percentage of the linear needle mass of the newly shedlitter. The mean residence time of a needle in eachmorphological category was calculated as the ratio betweenthe mass of this category (in t ha�1) and the flux of matterto this category from the previous (younger) category(in t ha�1 year�1). The age of a category was theaccumulated age of the previous (younger) categories.The mathematical explanation of these calculations,supposing a stationary cascade system, was detailed inKurz et al. (2000).
2.5. Chemical analyses
C and N concentrations in litter samples were measuredby dry combustion in a CARLO ERBA analyzer, and ashcontent was obtained by calcination in a muffle furnace at650 1C for 6 h.Litter samples were analyzed for a set of biochemical
fractions: hemicelluloses, cellulose, lignin, and lignin-associated N. All fractions were determined using Near
ARTICLE IN PRESS
Table 1
Sites where litter horizons were sampled
Jadraas La Gileppe Maials Montemor
Country Sweden Belgium Spain Portugal
Latitude 601490N 501340N 411220N 401170N
Longitude 161010E 051590E 001300E 081420W
Altitude (m) 185 370 30 70
Precipitation (mm) 764 1425 396 914
Temperature (1C) 3.9 6.8 15.2 14.8
Climate type Boreal Atlantic Mediterranean Warm Atlantic
Tree species P. sylvestris P. sylvestris P. halepensis P. pinaster
Stand age (year) 140 30 30 70
Bedrock Sand Silt Marl Sand
Table 2
Definition of the stages of decomposition, from the morphology of leaves (Kurz et al., 2000), reproduced with permission of Elsevier
Stage Origin Color Aspect Needle integrity Surface
0 Litterfall traps Light-brown Shiny Unbroken Intact
I Soil Light-brown Shiny Unbroken Intact
II Soil Dark-brown Matt Unbroken Intact
III Soil Blackish Matt Unbroken Intact
IV Soil Black Matt Broken, gross fragments Intact
V Soil Black Matt Broken, small fragments Perforated by fauna
P. Rovira et al. / Soil Biology & Biochemistry 40 (2008) 172–185 175
Author's personal copy
Infrared Reflectance Spectroscopy (NIRSystems 6500,Perstorp Analytical) (Couteaux et al., 1998). A set ofsamples was analyzed by NDF (neutral detergent fibers),ADF (acid detergent fibers) and ADL (acid detergentlignin) by the van Soest method using filter bags (Ankom220 filter analyzer, USA) (Van Soest and Robertson, 1985).These samples were used for calibrating NIRS data.Calibrations and predictions were performed with theWINISI II (Version 1.02A) software, using modifiedpartial least-square regressions between the measuredvalues and the wavelengths of the spectra. The modelsused for predicting all the data set fulfilled the criteriarequired to evaluate the goodness-of-fit of a model (Changet al., 2001).
2.6. Thermogravimetry and calorimetry
In DTG, the sample is placed in a small crucible,introduced in a furnace and connected to a precisionelectronic balance. The temperature is raised and theweight of the sample is recorded continuously, whichpermits the monitoring of weight losses with time. Theprocedure is similar in DSC, but the furnace is connectedto a calorimetric device, which continuously measures theheat released by the sample.
DTG curves were obtained in a Mettler-Toledo TGA-851e thermobalance, and DSC curves in a Mettler-ToledoDSC-822e calorimeter. Both were calibrated with standardindium of 99.99% purity. The following temperatureprogram was applied: (a) samples (about 10mg) wereheated at a rate of 10 1Cmin�1, up to 105 1C; (b) thistemperature was maintained for 15min, to eliminate water;then (c) the temperature was raised at a rate of 3 1Cmin�1,up to 600 1C. This rate is slower than that applied by otherauthors (Angehrn-Bettinazzi et al., 1988; Reh et al., 1990;Kristensen, 1990; Beyer et al., 1998), but it yields the bestpeak resolution. From our trials, increasing the heatingrate up to 5 1Cmin�1 (Peuravuori et al., 1999; Schnitzerand Hoffman, 1966) strongly decreased peak resolution,whereas slowing the heating rate down to 2 1Cmin�1 didnot improve it. Experiments were done under air flux(50 cm3min�1).
The primary result of DTG is a graph of the remainingweight (y-axis) vs. time or temperature (x-axis). The totalOM loss was measured as the weight loss between 105 1C(after the 15min period and just before starting thetemperature raising) and 550 1C. No weight losses wereobserved at temperatures above 550 1C, in any case. Thefinal remaining weight was taken as ash. From the graph,the T50 value (temperature at which 50% OM is lost) isobtained directly. Thereafter, the first derivative isobtained, i.e., the mass loss per unit time; in our casemgmin�1. The graph of the first derivate shows the peaksof mass loss; the exact position of each peak (temperatureat which it occurs) was recorded.
In the DSC technique, the original data output is a plotof energy flux (in Watts) vs. time or temperature. The exact
position of peaks is recorded. These data are furtherintegrated by the technique into Joules (1 J ¼ 1W� 1 s);hence the original result is the total energy released by thesample (J g�1) and its distribution in time. From thisdistribution we calculate T50, the temperature at which thesample has released half of its total stored energy.By combining both thermograms, we calculated the
energetic net output, as Jmg�1 OM. It is possible tocalculate this parameter for the whole sample, or for theOM lost within a range of temperatures, as shown below.
2.7. Statistical analysis
The data from different sites were compared by two-wayANOVA, taking the decomposition stage as the first factor(six levels) and the site as the second (four levels). When thedata to be compared were percentages, they werepreviously transformed by arc sine of squared root.Otherwise, they were previously log-transformed. Inaddition, standard regression analysis was performed.ANOVAs were carried out with SPSS v. 12.0, whereasregression analyses were done using SigmaPlot v. 7.0routines (Jandel Scientific).Since the various sites do not have the same pine species,
it is not always possible to say whether the differencesbetween sites are due to climatic constraints or to a specieseffect. In the text we merely report these differences whenfound, without trying to relate them to any defined reason.
3. Results
3.1. Litter decomposition data
Litter decomposition at the sites has been describedbefore (Kurz et al., 2000; Kurz-Besson et al., 2005, 2006);only the data relevant for our purposes will be shown here.For each decomposition stage of each profile of each site, aweight loss and an age in years can be calculated. Weightlosses are remarkably similar among sites, but the agesdiffer greatly (Table 3). The last stage (V) is reached afterneedles have lost about 60–65% of their initial mass, at allsites. While 3 years are enough to reach this stage forMontemor, about 19 years are needed for Maials. OnMediterranean sites drought is an obvious limiting factor,while at Jadraas and La Gileppe, low temperatures are themost likely limiting factor.
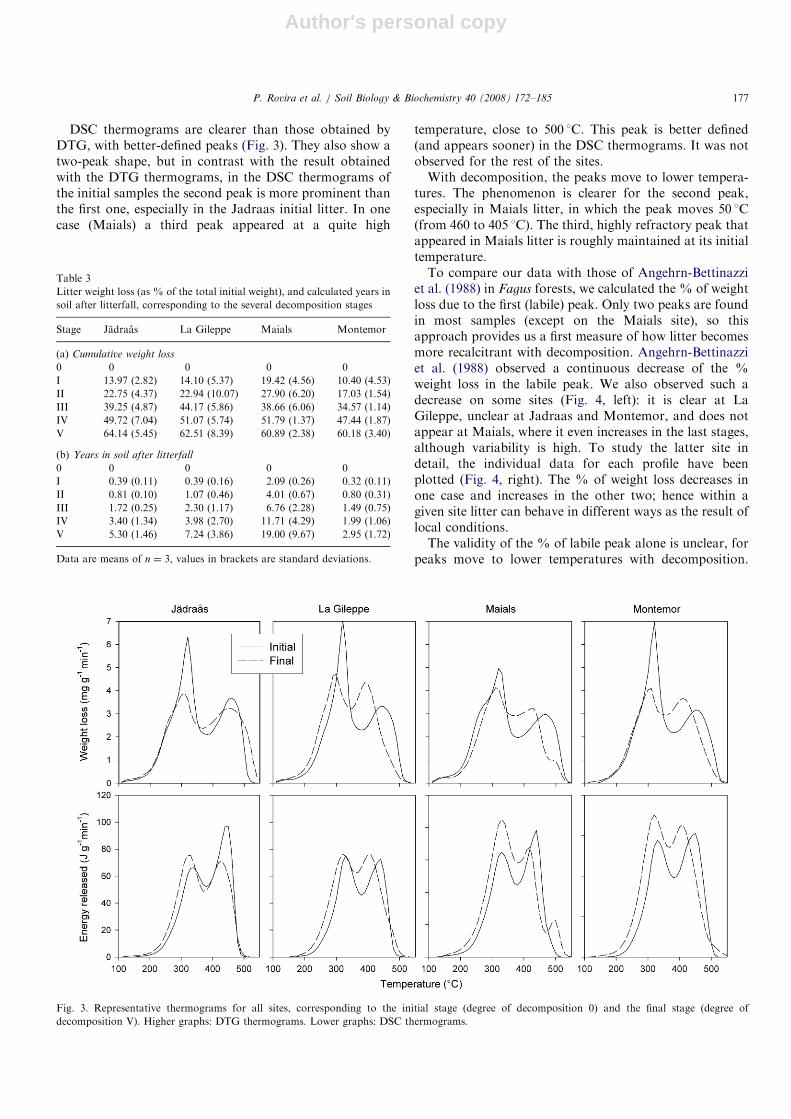
3.2. Main features of thermograms
Fig. 3 shows representative thermograms obtained frominitial (0) and final (V) stages, for all sites. DTGthermograms show a typical two-peak shape, with a first,prominent peak at 300–350 1C, and a second, lessprominent peak at about 450 1C. With decomposition,both peaks are maintained, but the first one becomes flatterand less prominent.
ARTICLE IN PRESSP. Rovira et al. / Soil Biology & Biochemistry 40 (2008) 172–185176
Author's personal copy
DSC thermograms are clearer than those obtained byDTG, with better-defined peaks (Fig. 3). They also show atwo-peak shape, but in contrast with the result obtainedwith the DTG thermograms, in the DSC thermograms ofthe initial samples the second peak is more prominent thanthe first one, especially in the Jadraas initial litter. In onecase (Maials) a third peak appeared at a quite high
temperature, close to 500 1C. This peak is better defined(and appears sooner) in the DSC thermograms. It was notobserved for the rest of the sites.With decomposition, the peaks move to lower tempera-
tures. The phenomenon is clearer for the second peak,especially in Maials litter, in which the peak moves 50 1C(from 460 to 405 1C). The third, highly refractory peak thatappeared in Maials litter is roughly maintained at its initialtemperature.To compare our data with those of Angehrn-Bettinazzi
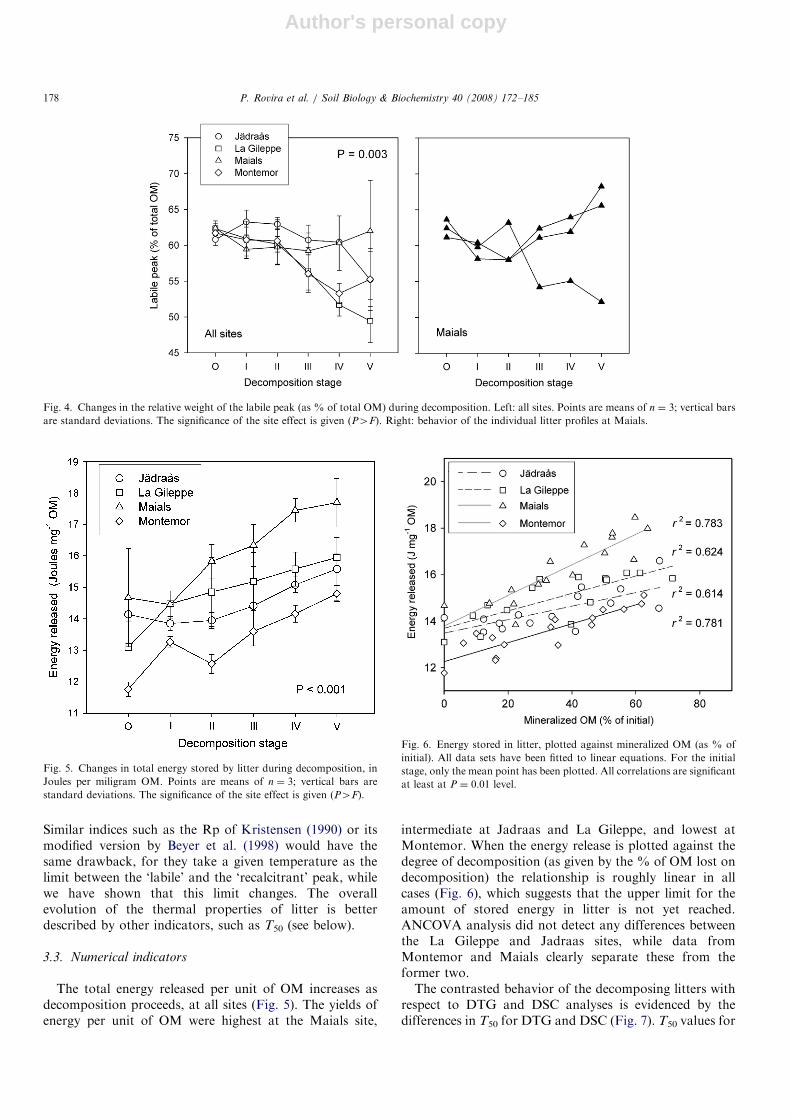
et al. (1988) in Fagus forests, we calculated the % of weightloss due to the first (labile) peak. Only two peaks are foundin most samples (except on the Maials site), so thisapproach provides us a first measure of how litter becomesmore recalcitrant with decomposition. Angehrn-Bettinazziet al. (1988) observed a continuous decrease of the %weight loss in the labile peak. We also observed such adecrease on some sites (Fig. 4, left): it is clear at LaGileppe, unclear at Jadraas and Montemor, and does notappear at Maials, where it even increases in the last stages,although variability is high. To study the latter site indetail, the individual data for each profile have beenplotted (Fig. 4, right). The % of weight loss decreases inone case and increases in the other two; hence within agiven site litter can behave in different ways as the result oflocal conditions.The validity of the % of labile peak alone is unclear, for
peaks move to lower temperatures with decomposition.
ARTICLE IN PRESS
Table 3
Litter weight loss (as % of the total initial weight), and calculated years in
soil after litterfall, corresponding to the several decomposition stages
Stage Jadraas La Gileppe Maials Montemor
(a) Cumulative weight loss
0 0 0 0 0
I 13.97 (2.82) 14.10 (5.37) 19.42 (4.56) 10.40 (4.53)
II 22.75 (4.37) 22.94 (10.07) 27.90 (6.20) 17.03 (1.54)
III 39.25 (4.87) 44.17 (5.86) 38.66 (6.06) 34.57 (1.14)
IV 49.72 (7.04) 51.07 (5.74) 51.79 (1.37) 47.44 (1.87)
V 64.14 (5.45) 62.51 (8.39) 60.89 (2.38) 60.18 (3.40)
(b) Years in soil after litterfall
0 0 0 0 0
I 0.39 (0.11) 0.39 (0.16) 2.09 (0.26) 0.32 (0.11)
II 0.81 (0.10) 1.07 (0.46) 4.01 (0.67) 0.80 (0.31)
III 1.72 (0.25) 2.30 (1.17) 6.76 (2.28) 1.49 (0.75)
IV 3.40 (1.34) 3.98 (2.70) 11.71 (4.29) 1.99 (1.06)
V 5.30 (1.46) 7.24 (3.86) 19.00 (9.67) 2.95 (1.72)
Data are means of n ¼ 3, values in brackets are standard deviations.
Fig. 3. Representative thermograms for all sites, corresponding to the initial stage (degree of decomposition 0) and the final stage (degree of
decomposition V). Higher graphs: DTG thermograms. Lower graphs: DSC thermograms.
P. Rovira et al. / Soil Biology & Biochemistry 40 (2008) 172–185 177
Author's personal copy
Similar indices such as the Rp of Kristensen (1990) or itsmodified version by Beyer et al. (1998) would have thesame drawback, for they take a given temperature as thelimit between the ‘labile’ and the ‘recalcitrant’ peak, whilewe have shown that this limit changes. The overallevolution of the thermal properties of litter is betterdescribed by other indicators, such as T50 (see below).
3.3. Numerical indicators
The total energy released per unit of OM increases asdecomposition proceeds, at all sites (Fig. 5). The yields ofenergy per unit of OM were highest at the Maials site,
intermediate at Jadraas and La Gileppe, and lowest atMontemor. When the energy release is plotted against thedegree of decomposition (as given by the % of OM lost ondecomposition) the relationship is roughly linear in allcases (Fig. 6), which suggests that the upper limit for theamount of stored energy in litter is not yet reached.ANCOVA analysis did not detect any differences betweenthe La Gileppe and Jadraas sites, while data fromMontemor and Maials clearly separate these from theformer two.The contrasted behavior of the decomposing litters with
respect to DTG and DSC analyses is evidenced by thedifferences in T50 for DTG and DSC (Fig. 7). T50 values for
ARTICLE IN PRESS
Fig. 4. Changes in the relative weight of the labile peak (as % of total OM) during decomposition. Left: all sites. Points are means of n ¼ 3; vertical bars
are standard deviations. The significance of the site effect is given (P4F). Right: behavior of the individual litter profiles at Maials.
Fig. 5. Changes in total energy stored by litter during decomposition, in
Joules per miligram OM. Points are means of n ¼ 3; vertical bars are
standard deviations. The significance of the site effect is given (P4F).
Fig. 6. Energy stored in litter, plotted against mineralized OM (as % of
initial). All data sets have been fitted to linear equations. For the initial
stage, only the mean point has been plotted. All correlations are significant
at least at P ¼ 0.01 level.
P. Rovira et al. / Soil Biology & Biochemistry 40 (2008) 172–185178
Author's personal copy
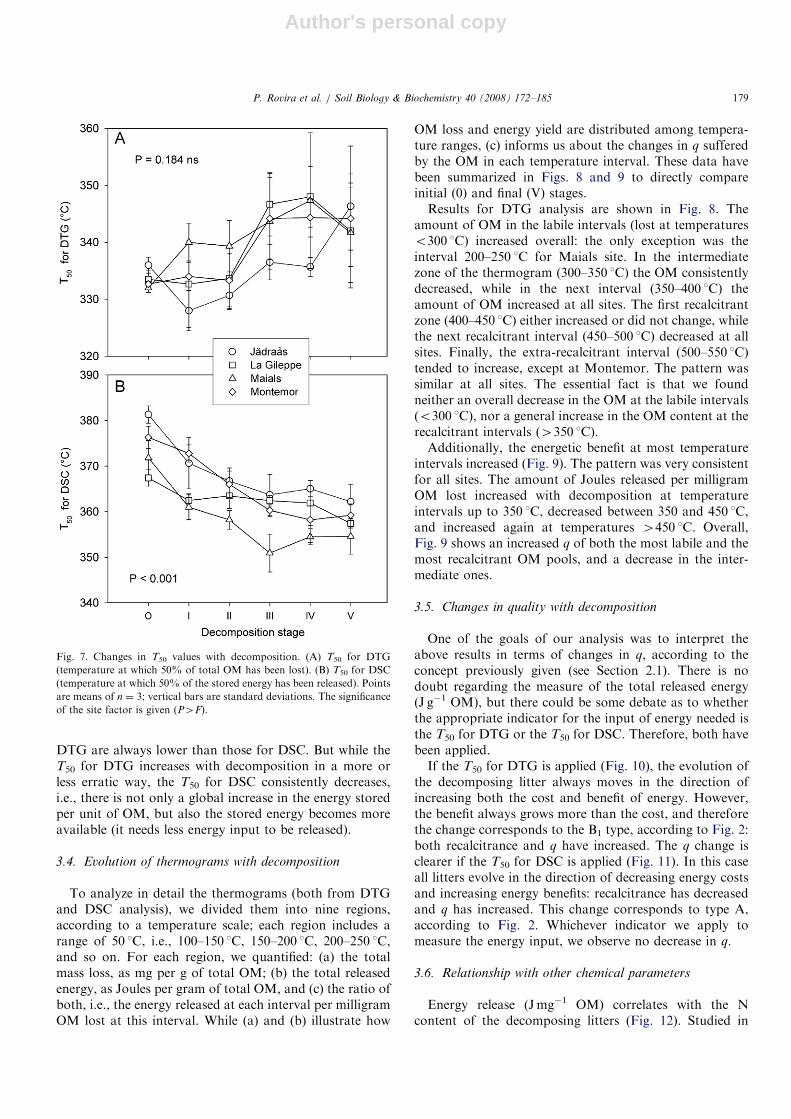
DTG are always lower than those for DSC. But while theT50 for DTG increases with decomposition in a more orless erratic way, the T50 for DSC consistently decreases,i.e., there is not only a global increase in the energy storedper unit of OM, but also the stored energy becomes moreavailable (it needs less energy input to be released).
3.4. Evolution of thermograms with decomposition
To analyze in detail the thermograms (both from DTGand DSC analysis), we divided them into nine regions,according to a temperature scale; each region includes arange of 50 1C, i.e., 100–150 1C, 150–200 1C, 200–250 1C,and so on. For each region, we quantified: (a) the totalmass loss, as mg per g of total OM; (b) the total releasedenergy, as Joules per gram of total OM, and (c) the ratio ofboth, i.e., the energy released at each interval per milligramOM lost at this interval. While (a) and (b) illustrate how
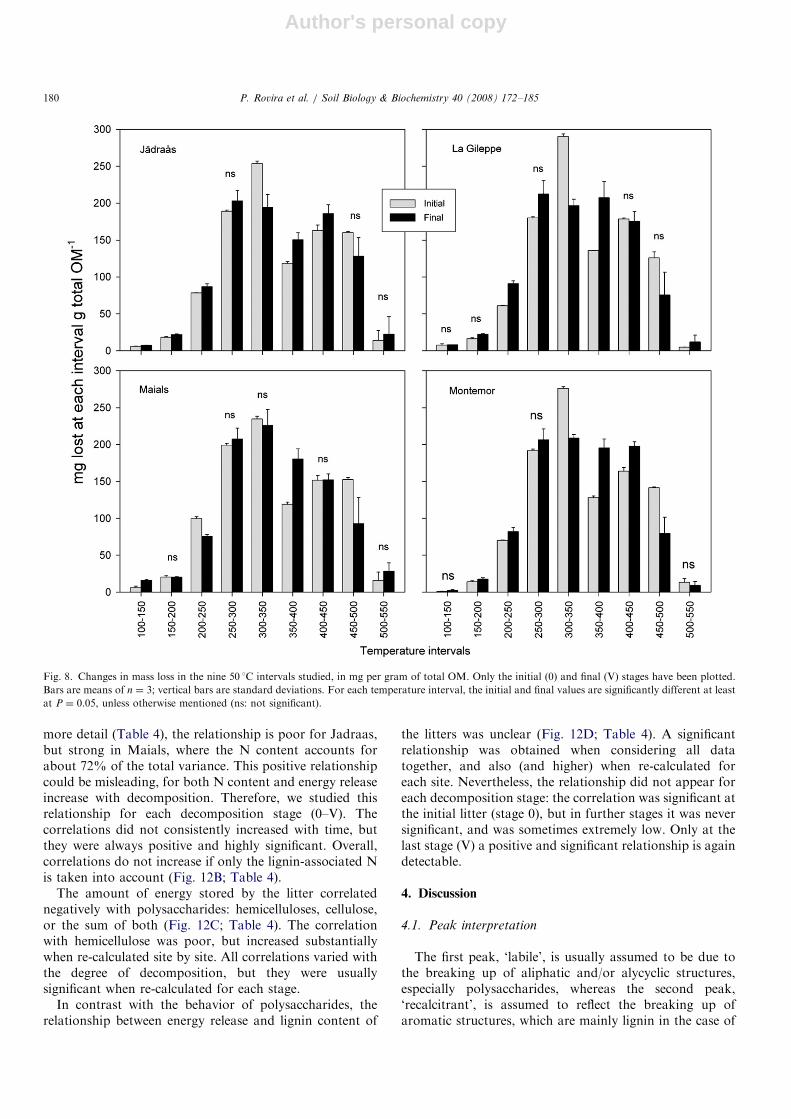
OM loss and energy yield are distributed among tempera-ture ranges, (c) informs us about the changes in q sufferedby the OM in each temperature interval. These data havebeen summarized in Figs. 8 and 9 to directly compareinitial (0) and final (V) stages.Results for DTG analysis are shown in Fig. 8. The
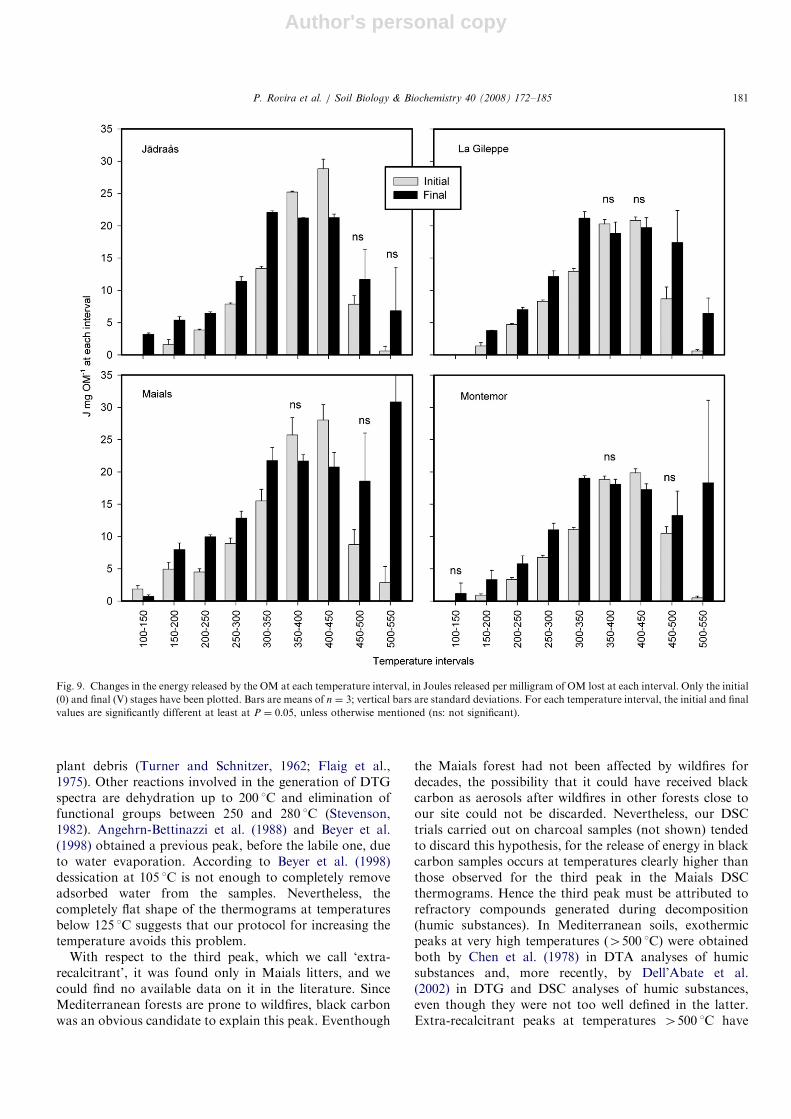
amount of OM in the labile intervals (lost at temperatureso300 1C) increased overall: the only exception was theinterval 200–250 1C for Maials site. In the intermediatezone of the thermogram (300–350 1C) the OM consistentlydecreased, while in the next interval (350–400 1C) theamount of OM increased at all sites. The first recalcitrantzone (400–450 1C) either increased or did not change, whilethe next recalcitrant interval (450–500 1C) decreased at allsites. Finally, the extra-recalcitrant interval (500–550 1C)tended to increase, except at Montemor. The pattern wassimilar at all sites. The essential fact is that we foundneither an overall decrease in the OM at the labile intervals(o300 1C), nor a general increase in the OM content at therecalcitrant intervals (4350 1C).Additionally, the energetic benefit at most temperature
intervals increased (Fig. 9). The pattern was very consistentfor all sites. The amount of Joules released per milligramOM lost increased with decomposition at temperatureintervals up to 350 1C, decreased between 350 and 450 1C,and increased again at temperatures 4450 1C. Overall,Fig. 9 shows an increased q of both the most labile and themost recalcitrant OM pools, and a decrease in the inter-mediate ones.
3.5. Changes in quality with decomposition
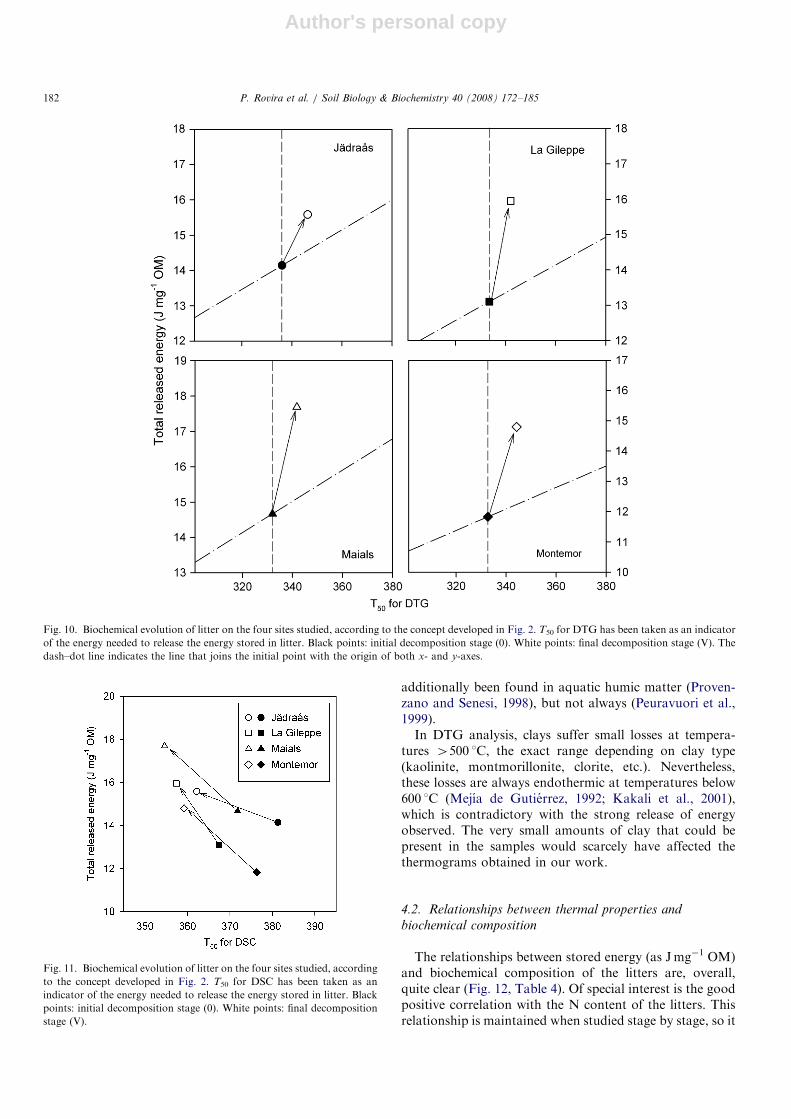
One of the goals of our analysis was to interpret theabove results in terms of changes in q, according to theconcept previously given (see Section 2.1). There is nodoubt regarding the measure of the total released energy(J g�1 OM), but there could be some debate as to whetherthe appropriate indicator for the input of energy needed isthe T50 for DTG or the T50 for DSC. Therefore, both havebeen applied.If the T50 for DTG is applied (Fig. 10), the evolution of
the decomposing litter always moves in the direction ofincreasing both the cost and benefit of energy. However,the benefit always grows more than the cost, and thereforethe change corresponds to the B1 type, according to Fig. 2:both recalcitrance and q have increased. The q change isclearer if the T50 for DSC is applied (Fig. 11). In this caseall litters evolve in the direction of decreasing energy costsand increasing energy benefits: recalcitrance has decreasedand q has increased. This change corresponds to type A,according to Fig. 2. Whichever indicator we apply tomeasure the energy input, we observe no decrease in q.
3.6. Relationship with other chemical parameters
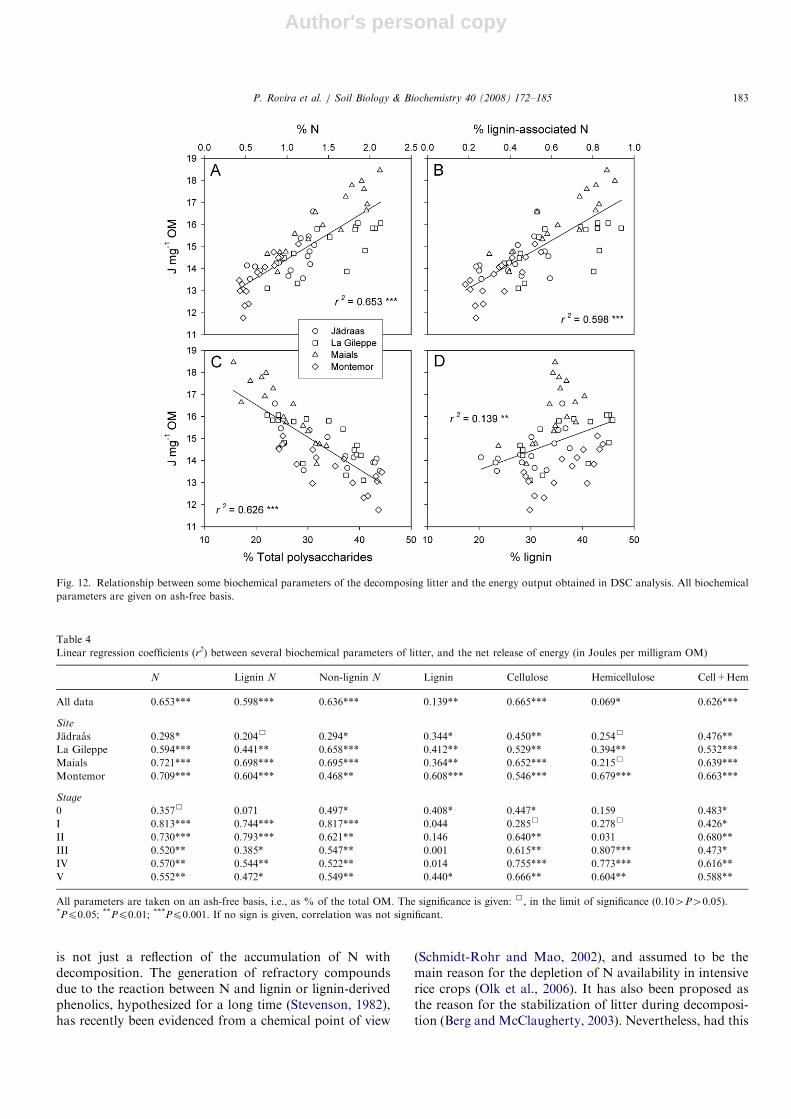
Energy release (Jmg�1 OM) correlates with the Ncontent of the decomposing litters (Fig. 12). Studied in
ARTICLE IN PRESS
Fig. 7. Changes in T50 values with decomposition. (A) T50 for DTG
(temperature at which 50% of total OM has been lost). (B) T50 for DSC
(temperature at which 50% of the stored energy has been released). Points
are means of n ¼ 3; vertical bars are standard deviations. The significance
of the site factor is given (P4F).
P. Rovira et al. / Soil Biology & Biochemistry 40 (2008) 172–185 179
Author's personal copy
more detail (Table 4), the relationship is poor for Jadraas,but strong in Maials, where the N content accounts forabout 72% of the total variance. This positive relationshipcould be misleading, for both N content and energy releaseincrease with decomposition. Therefore, we studied thisrelationship for each decomposition stage (0–V). Thecorrelations did not consistently increased with time, butthey were always positive and highly significant. Overall,correlations do not increase if only the lignin-associated Nis taken into account (Fig. 12B; Table 4).
The amount of energy stored by the litter correlatednegatively with polysaccharides: hemicelluloses, cellulose,or the sum of both (Fig. 12C; Table 4). The correlationwith hemicellulose was poor, but increased substantiallywhen re-calculated site by site. All correlations varied withthe degree of decomposition, but they were usuallysignificant when re-calculated for each stage.
In contrast with the behavior of polysaccharides, therelationship between energy release and lignin content of
the litters was unclear (Fig. 12D; Table 4). A significantrelationship was obtained when considering all datatogether, and also (and higher) when re-calculated foreach site. Nevertheless, the relationship did not appear foreach decomposition stage: the correlation was significant atthe initial litter (stage 0), but in further stages it was neversignificant, and was sometimes extremely low. Only at thelast stage (V) a positive and significant relationship is againdetectable.
4. Discussion
4.1. Peak interpretation
The first peak, ‘labile’, is usually assumed to be due tothe breaking up of aliphatic and/or alycyclic structures,especially polysaccharides, whereas the second peak,‘recalcitrant’, is assumed to reflect the breaking up ofaromatic structures, which are mainly lignin in the case of
ARTICLE IN PRESS
Fig. 8. Changes in mass loss in the nine 50 1C intervals studied, in mg per gram of total OM. Only the initial (0) and final (V) stages have been plotted.
Bars are means of n ¼ 3; vertical bars are standard deviations. For each temperature interval, the initial and final values are significantly different at least
at P ¼ 0.05, unless otherwise mentioned (ns: not significant).
P. Rovira et al. / Soil Biology & Biochemistry 40 (2008) 172–185180
Author's personal copy
plant debris (Turner and Schnitzer, 1962; Flaig et al.,1975). Other reactions involved in the generation of DTGspectra are dehydration up to 200 1C and elimination offunctional groups between 250 and 280 1C (Stevenson,1982). Angehrn-Bettinazzi et al. (1988) and Beyer et al.(1998) obtained a previous peak, before the labile one, dueto water evaporation. According to Beyer et al. (1998)dessication at 105 1C is not enough to completely removeadsorbed water from the samples. Nevertheless, thecompletely flat shape of the thermograms at temperaturesbelow 125 1C suggests that our protocol for increasing thetemperature avoids this problem.
With respect to the third peak, which we call ‘extra-recalcitrant’, it was found only in Maials litters, and wecould find no available data on it in the literature. SinceMediterranean forests are prone to wildfires, black carbonwas an obvious candidate to explain this peak. Eventhough
the Maials forest had not been affected by wildfires fordecades, the possibility that it could have received blackcarbon as aerosols after wildfires in other forests close toour site could not be discarded. Nevertheless, our DSCtrials carried out on charcoal samples (not shown) tendedto discard this hypothesis, for the release of energy in blackcarbon samples occurs at temperatures clearly higher thanthose observed for the third peak in the Maials DSCthermograms. Hence the third peak must be attributed torefractory compounds generated during decomposition(humic substances). In Mediterranean soils, exothermicpeaks at very high temperatures (4500 1C) were obtainedboth by Chen et al. (1978) in DTA analyses of humicsubstances and, more recently, by Dell’Abate et al.(2002) in DTG and DSC analyses of humic substances,even though they were not too well defined in the latter.Extra-recalcitrant peaks at temperatures 4500 1C have
ARTICLE IN PRESS
Fig. 9. Changes in the energy released by the OM at each temperature interval, in Joules released per milligram of OM lost at each interval. Only the initial
(0) and final (V) stages have been plotted. Bars are means of n ¼ 3; vertical bars are standard deviations. For each temperature interval, the initial and final
values are significantly different at least at P ¼ 0.05, unless otherwise mentioned (ns: not significant).
P. Rovira et al. / Soil Biology & Biochemistry 40 (2008) 172–185 181
Author's personal copy
additionally been found in aquatic humic matter (Proven-zano and Senesi, 1998), but not always (Peuravuori et al.,1999).In DTG analysis, clays suffer small losses at tempera-
tures 4500 1C, the exact range depending on clay type(kaolinite, montmorillonite, clorite, etc.). Nevertheless,these losses are always endothermic at temperatures below600 1C (Mejıa de Gutierrez, 1992; Kakali et al., 2001),which is contradictory with the strong release of energyobserved. The very small amounts of clay that could bepresent in the samples would scarcely have affected thethermograms obtained in our work.
4.2. Relationships between thermal properties and
biochemical composition
The relationships between stored energy (as Jmg�1 OM)and biochemical composition of the litters are, overall,quite clear (Fig. 12, Table 4). Of special interest is the goodpositive correlation with the N content of the litters. Thisrelationship is maintained when studied stage by stage, so it
ARTICLE IN PRESS
Fig. 10. Biochemical evolution of litter on the four sites studied, according to the concept developed in Fig. 2. T50 for DTG has been taken as an indicator
of the energy needed to release the energy stored in litter. Black points: initial decomposition stage (0). White points: final decomposition stage (V). The
dash–dot line indicates the line that joins the initial point with the origin of both x- and y-axes.
Fig. 11. Biochemical evolution of litter on the four sites studied, according
to the concept developed in Fig. 2. T50 for DSC has been taken as an
indicator of the energy needed to release the energy stored in litter. Black
points: initial decomposition stage (0). White points: final decomposition
stage (V).
P. Rovira et al. / Soil Biology & Biochemistry 40 (2008) 172–185182
Author's personal copy
is not just a reflection of the accumulation of N withdecomposition. The generation of refractory compoundsdue to the reaction between N and lignin or lignin-derivedphenolics, hypothesized for a long time (Stevenson, 1982),has recently been evidenced from a chemical point of view
(Schmidt-Rohr and Mao, 2002), and assumed to be themain reason for the depletion of N availability in intensiverice crops (Olk et al., 2006). It has also been proposed asthe reason for the stabilization of litter during decomposi-tion (Berg and McClaugherty, 2003). Nevertheless, had this
ARTICLE IN PRESS
Fig. 12. Relationship between some biochemical parameters of the decomposing litter and the energy output obtained in DSC analysis. All biochemical
parameters are given on ash-free basis.
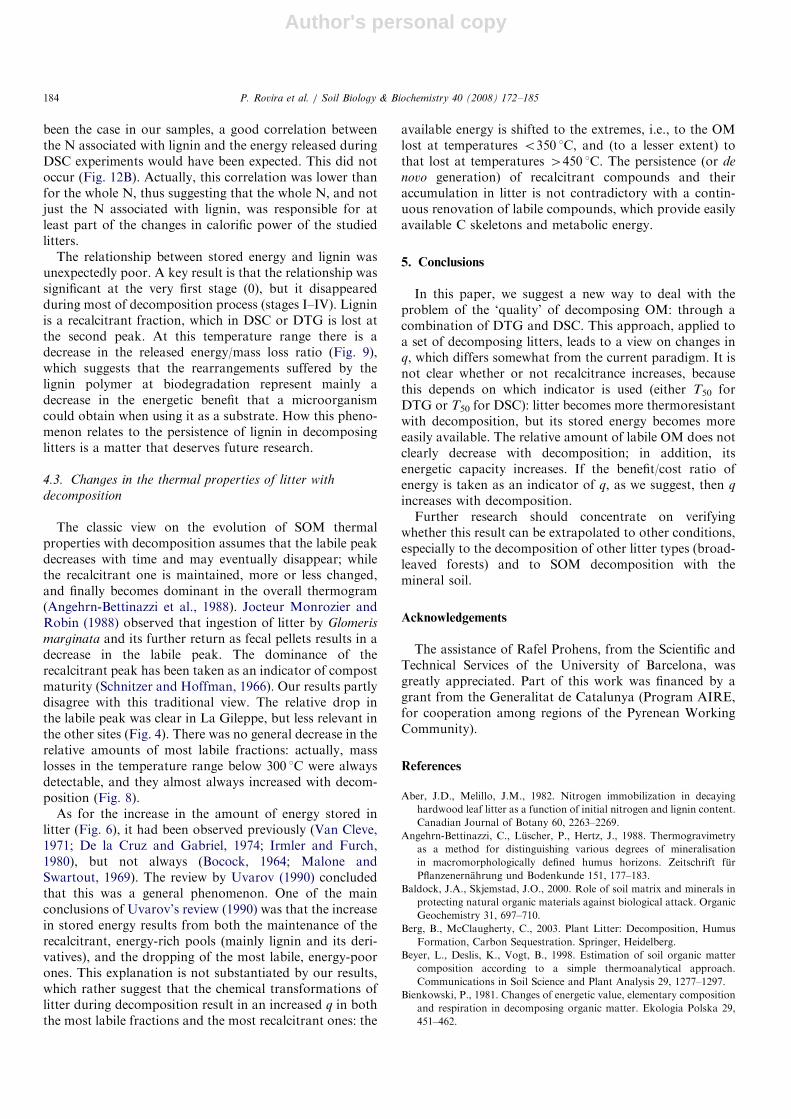
Table 4
Linear regression coefficients (r2) between several biochemical parameters of litter, and the net release of energy (in Joules per milligram OM)
N Lignin N Non-lignin N Lignin Cellulose Hemicellulose Cell+Hem
All data 0.653*** 0.598*** 0.636*** 0.139** 0.665*** 0.069* 0.626***
Site
Jadraas 0.298* 0.204& 0.294* 0.344* 0.450** 0.254& 0.476**
La Gileppe 0.594*** 0.441** 0.658*** 0.412** 0.529** 0.394** 0.532***
Maials 0.721*** 0.698*** 0.695*** 0.364** 0.652*** 0.215& 0.639***
Montemor 0.709*** 0.604*** 0.468** 0.608*** 0.546*** 0.679*** 0.663***
Stage
0 0.357& 0.071 0.497* 0.408* 0.447* 0.159 0.483*
I 0.813*** 0.744*** 0.817*** 0.044 0.285& 0.278& 0.426*
II 0.730*** 0.793*** 0.621** 0.146 0.640** 0.031 0.680**
III 0.520** 0.385* 0.547** 0.001 0.615** 0.807*** 0.473*
IV 0.570** 0.544** 0.522** 0.014 0.755*** 0.773*** 0.616**
V 0.552** 0.472* 0.549** 0.440* 0.666** 0.604** 0.588**
All parameters are taken on an ash-free basis, i.e., as % of the total OM. The significance is given: &, in the limit of significance (0.104P40.05).*Pp0.05; **Pp0.01; ***Pp0.001. If no sign is given, correlation was not significant.
P. Rovira et al. / Soil Biology & Biochemistry 40 (2008) 172–185 183
Author's personal copy
been the case in our samples, a good correlation betweenthe N associated with lignin and the energy released duringDSC experiments would have been expected. This did notoccur (Fig. 12B). Actually, this correlation was lower thanfor the whole N, thus suggesting that the whole N, and notjust the N associated with lignin, was responsible for atleast part of the changes in calorific power of the studiedlitters.
The relationship between stored energy and lignin wasunexpectedly poor. A key result is that the relationship wassignificant at the very first stage (0), but it disappearedduring most of decomposition process (stages I–IV). Ligninis a recalcitrant fraction, which in DSC or DTG is lost atthe second peak. At this temperature range there is adecrease in the released energy/mass loss ratio (Fig. 9),which suggests that the rearrangements suffered by thelignin polymer at biodegradation represent mainly adecrease in the energetic benefit that a microorganismcould obtain when using it as a substrate. How this pheno-menon relates to the persistence of lignin in decomposinglitters is a matter that deserves future research.
4.3. Changes in the thermal properties of litter with
decomposition
The classic view on the evolution of SOM thermalproperties with decomposition assumes that the labile peakdecreases with time and may eventually disappear; whilethe recalcitrant one is maintained, more or less changed,and finally becomes dominant in the overall thermogram(Angehrn-Bettinazzi et al., 1988). Jocteur Monrozier andRobin (1988) observed that ingestion of litter by Glomeris
marginata and its further return as fecal pellets results in adecrease in the labile peak. The dominance of therecalcitrant peak has been taken as an indicator of compostmaturity (Schnitzer and Hoffman, 1966). Our results partlydisagree with this traditional view. The relative drop inthe labile peak was clear in La Gileppe, but less relevant inthe other sites (Fig. 4). There was no general decrease in therelative amounts of most labile fractions: actually, masslosses in the temperature range below 300 1C were alwaysdetectable, and they almost always increased with decom-position (Fig. 8).
As for the increase in the amount of energy stored inlitter (Fig. 6), it had been observed previously (Van Cleve,1971; De la Cruz and Gabriel, 1974; Irmler and Furch,1980), but not always (Bocock, 1964; Malone andSwartout, 1969). The review by Uvarov (1990) concludedthat this was a general phenomenon. One of the mainconclusions of Uvarov’s review (1990) was that the increasein stored energy results from both the maintenance of therecalcitrant, energy-rich pools (mainly lignin and its deri-vatives), and the dropping of the most labile, energy-poorones. This explanation is not substantiated by our results,which rather suggest that the chemical transformations oflitter during decomposition result in an increased q in boththe most labile fractions and the most recalcitrant ones: the
available energy is shifted to the extremes, i.e., to the OMlost at temperatures o350 1C, and (to a lesser extent) tothat lost at temperatures 4450 1C. The persistence (or de
novo generation) of recalcitrant compounds and theiraccumulation in litter is not contradictory with a contin-uous renovation of labile compounds, which provide easilyavailable C skeletons and metabolic energy.
5. Conclusions
In this paper, we suggest a new way to deal with theproblem of the ‘quality’ of decomposing OM: through acombination of DTG and DSC. This approach, applied toa set of decomposing litters, leads to a view on changes inq, which differs somewhat from the current paradigm. It isnot clear whether or not recalcitrance increases, becausethis depends on which indicator is used (either T50 forDTG or T50 for DSC): litter becomes more thermoresistantwith decomposition, but its stored energy becomes moreeasily available. The relative amount of labile OM does notclearly decrease with decomposition; in addition, itsenergetic capacity increases. If the benefit/cost ratio ofenergy is taken as an indicator of q, as we suggest, then q
increases with decomposition.Further research should concentrate on verifying
whether this result can be extrapolated to other conditions,especially to the decomposition of other litter types (broad-leaved forests) and to SOM decomposition with themineral soil.
Acknowledgements
The assistance of Rafel Prohens, from the Scientific andTechnical Services of the University of Barcelona, wasgreatly appreciated. Part of this work was financed by agrant from the Generalitat de Catalunya (Program AIRE,for cooperation among regions of the Pyrenean WorkingCommunity).
References
Aber, J.D., Melillo, J.M., 1982. Nitrogen immobilization in decaying
hardwood leaf litter as a function of initial nitrogen and lignin content.
Canadian Journal of Botany 60, 2263–2269.
Angehrn-Bettinazzi, C., Luscher, P., Hertz, J., 1988. Thermogravimetry
as a method for distinguishing various degrees of mineralisation
in macromorphologically defined humus horizons. Zeitschrift fur
Pflanzenernahrung und Bodenkunde 151, 177–183.
Baldock, J.A., Skjemstad, J.O., 2000. Role of soil matrix and minerals in
protecting natural organic materials against biological attack. Organic
Geochemistry 31, 697–710.
Berg, B., McClaugherty, C., 2003. Plant Litter: Decomposition, Humus
Formation, Carbon Sequestration. Springer, Heidelberg.
Beyer, L., Deslis, K., Vogt, B., 1998. Estimation of soil organic matter
composition according to a simple thermoanalytical approach.
Communications in Soil Science and Plant Analysis 29, 1277–1297.
Bienkowski, P., 1981. Changes of energetic value, elementary composition
and respiration in decomposing organic matter. Ekologia Polska 29,
451–462.
ARTICLE IN PRESSP. Rovira et al. / Soil Biology & Biochemistry 40 (2008) 172–185184
Author's personal copy
Bocock, K.L., 1964. Changes in the amounts of dry matter, nitro-
gen, carbon and energy in decomposing woodland leaf litter in
relation to the activities of the soil fauna. Journal of Ecology 52,
273–284.
Chang, C.W., Laird, D.A., Mausbach, M.J., Hurburgh, C.R., 2001. Near-
infrared reflectance spectroscopy—principal components regression
analyses of soil properties. Soil Science Society of America Journal 65,
480–490.
Chen, Y., Senesi, N., Schnitzer, M., 1978. Chemical and physical
characteristics of humic and fulvic acids extracted from soils of the
Mediterranean region. Geoderma 20, 87–104.
Couteaux, M.M., McTiernan, K.B., Berg, B., Szuberla, D., Dardenne, P.,
Bottner, P., 1998. Chemical composition and carbon mineralisation
potential of Scots pine needles at different stages of decomposition.
Soil Biology & Biochemistry 30, 583–595.
De la Cruz, A.A., Gabriel, B.C., 1974. Caloric, elemental, and nutritive
changes in decomposing Juncus romerianus leaves. Ecology 55,
882–886.
Dell’Abate, M.T., Canali, S., Trinchera, A., Benedetti, A., Sequi, P., 1998.
Thermal analysis in the evaluation of compost stability: a comparison
with humification parameters. Nutrient Cycling in Agroecosystems 51,
217–224.
Dell’Abate, M.T., Benedetti, A., Trinchera, A., Dazzi, C., 2002. Humic
substances along the profile of two Typic Haploxerert. Geoderma 107,
281–296.
Dziadowiec, H., Kwiatkowska, A., 1980. Mineralization and humification
of plant fall in mixed forest stand of the reserve ‘Las Piwnicki’ near
Torun. Ekologia Polska 28, 111–128.
Flaig, W., Beutelspacher, H., Rietz, E., 1975. Chemical composition and
physical properties of humic substances. In: Gieseking, J.E. (Ed.),
Soil Components, Vol. 1: Organic Components. Springer, Berlin,
pp. 1–211.
Gallardo, A., Merino, J., 1993. Leaf decomposition in two Mediterranean
ecosystems of southwest Spain: influence of substrate quality. Ecology
74, 152–161.
Gillon, D., Joffre, R., Ibrahima, A., 1993. Initial litter properties and
decay rate: a microcosm experiment on Mediterranean species.
Canadian Journal of Botany 72, 946–954.
Gourbiere, F., 1981. Vie, senescence et decomposition des aiguilles de
sapin (Abies alba Mill.). I. Methodologie et premiers resultats. Acta
Oecologica—Oecologia Plantarum 2, 223–232.
Irmler, U., Furch, K., 1980. Weight, energy, and nutrient changes during
the decomposition of leaves in the emersion phase of Central-
Amazonian inundation forest. Pedobiologia 20, 118–130.
Jocteur Monrozier, L., Robin, A.M., 1988. Action de la faune du sol sur
une litiere de feuillu: application de techniques pyrolytiques a l’etude
des modifications subies par les feuilles de charme (Carpinus betulus)
ingerees par Glomeris marginata. Revue d’Ecologie et de Biologie du
Sol 25, 203–214.
Kakali, G., Perraki, T., Tsivilis, S., Badogiannis, E., 2001. Thermal
treatment of kaolin: the effect of mineralogy on the pozzolanic activity.
Applied Clay Science 20, 73–80.
Kristensen, E., 1990. Characterization of biogenic organic matter by
stepwise thermogravimetry (STG). Biogeochemistry 9, 135–159.
Kurz, C., Couteaux, M.M., Thiery, J.M., 2000. Residence time and
decomposition rate of Pinus pinaster needles in the forest floor from
direct field measurements under a Mediterranean climate. Soil Biology
& Biochemistry 32, 1197–1206.
Kurz-Besson, C., Couteaux, M.M., Thiery, J.M., Berg, B., Remacle, J.,
2005. A comparison of litterbag and direct observation methods of
Scots pine needle decomposition measurement. Soil Biology &
Biochemistry 37, 2315–2318.
Kurz-Besson, C., Couteaux, M.M., Berg, B., Remacle, J., Ribeiro, C.,
Romanya, J., Thiery, J.M., 2006. A climate response function
explaining most of the variation of the forest floor needle mass and
the needle decomposition in pine forests across Europe. Plant and Soil
285, 97–114.
Malone, C.R., Swartout, H.B., 1969. Size, mass and caloric content of
particulate organic matter in old field and forest soils. Ecology 50,
720–724.
Margalef, R., 1974. Ecologıa. Omega, Barcelona, Spain.
McClaugherty, C., Berg, B., 1987. Cellulose, lignin and nitrogen
concentrations as rate regulating factors in late stages of forest litter
decomposition. Pedobiologia 30, 101–112.
Meentemeyer, B., 1978. Macroclimate and lignin control of litter
decomposition rates. Ecology 59, 465–472.
Mejıa de Gutierrez, R., 1992. Tecnicas y Rutinas para la Caracterizacion
de las Arcillas. Cuaderno no 1. Programa de Ceramicos y Vıtreos.
Medellın, Colombia.
Minderman, G., 1968. Addition, decomposition and accumulation of
organic matter in forests. Journal of Ecology 56, 355–362.
Nicolardot, B., Recous, S., Mary, B., 2001. Simulation of C and N
mineralisation during crop residue decomposition: a simple dynamic
model based on the C:N ratio of the residues. Plant and Soil 228, 83–103.
Olk, D.C., Cassman, K.G., Schmidt-Rohr, K., Anders, M.M., Mao, J.D.,
Deenik, J.L., 2006. Chemical stabilization of soil organic nitrogen by
phenolic lignin residues in anaerobic agroecosystems. Soil Biology &
Biochemistry 38, 3303–3312.
Paul, E.A., Morris, S.J., Conant, R.T., Plante, A.F., 2006. Does the acid
hydrolysis-incubation method measure meaningful soil organic carbon
pools? Soil Science Society of America Journal 70, 1023–1035.
Perez-Harguindeguy, N., Dıaz, S., Cornelissen, J.H.C., Vendramini, F.,
Cabido, M., Castellanos, A., 2000. Chemistry and toughness predict
leaf litter decomposition rates over a wide spectrum of functional types
and taxa in central Argentina. Plant and Soil 218, 21–30.
Peuravuori, J., Paaso, N., Pihlaja, K., 1999. Kinetic study of the thermal
degradation of lake aquatic humic matter by thermogravimetric
analysis. Thermochimica Acta 325, 181–193.
Provenzano, M.R., Senesi, N., 1998. Differential scanning calorimetry of
river aquatic fulvic acids and their metal complexes. Fresenius
Environmental Bulletin 7, 423–428.
Reh, U., Kratz, W., Kraepelin, G., Angehrn-Bettinazzi, C., 1990. Analysis
of leaf and needle litter decomposition by differential scanning
calorimetry and differential thermogravimetry. Biology and Fertility
of Soils 9, 188–191.
Rovira, P., Vallejo, V.R., 1997. Organic carbon and nitrogen mineraliza-
tion under mediterranean climatic conditions: the effects of incubation
depth. Soil Biology & Biochemistry 29, 1509–1520.
Rovira, P., Vallejo, V.R., 2000. Evaluating thermal and acid hydrolysis
methods as indicators of soil organic matter quality. Communications
in Soil Science and Plant Analysis 31, 81–100.
Schmidt-Rohr, K., Mao, J.D., 2002. Selective observation of nitrogen-
bonded carbons in solid-state NMR by saturation-pulse induced dipolar
exchange with recoupling. Chemical Physics Letters 359, 403–411.
Schnitzer, M., Hoffman, I., 1965. Thermogravimetry of soil humic
compounds. Geochimica et Cosmochimica Acta 29, 859–870.
Schnitzer, M., Hoffman, I., 1966. A thermogravimetric approach to the
classification of organic soils. Soil Science Society of America
Proceedings 30, 63–66.
Stevenson, F.J., 1982. Humus Chemistry. Wiley, New York.
Turner, R.C., Schnitzer, M., 1962. Thermogravimetry of the organic
matter of a podzol. Soil Science 93, 225–232.
Uvarov, A.V., 1990. Dynamics of the specific energy content of organic
matter in the course of the decomposition of plant remains. I. Data in
general. Polish Ecological Studies 16, 259–296.
Vallejo, V.R., 1981. Evaluation of C:N ratio as a parameter of N
mineralization. Mitteilungen des Osterreichischen Bodenkundlichen
Gesellschaft 47, 71–78.
Van Cleve, K., 1971. Energy- and weight-loss function for decomposing
foliage in birch and aspen forests in Interior Alaska. Ecology 52,
720–723.
Van Soest, P.J., Robertson, J.B., 1985. Analysis of Forage and Fibrous
Foods: A Laboratory Manual for Animal Science. Cornell University
Publisher.
ARTICLE IN PRESSP. Rovira et al. / Soil Biology & Biochemistry 40 (2008) 172–185 185