proceedings of the scientific meeting on radon in natural waters
TRANSCRIPT
KURRI-KR--6___________ ISSN 1342-0852
KURRI-KR-6
JP9709040
# ^ #
MB : 1996^121312 B-13 B
* «s * ^ m * fpn m m
Research Reactor Institute, Kyoto University
5*86*36 Hi^tFSIS&P/r KUR Report (KURRI-KR)KUR Report#, f tP'£S$P/r#.fc; tt & tMWim-f Z> i)<VX’&Z>o
#$-#..................................................................19%-kurri-kr- iy 3 y y #%# ........................................................19%-kurri-kr- 2
&VtiuitfliJtiU 19%-KURRI-KR- 3K r- 6D jig? ^ ffl V ^ 1 ;u X #Uf n 9f 3: £ $ £ »...................................................................................... 19%-KURRI-KR- \
; van^'tt-.........................................................................19%-kurri-kr- 5K > J ........................................................................................................... 1997-KURRI-KR- 6
Proceedings of the Scientific Meeting on
’’Radon in Natural Waters”
Held on December 12-13, 1996
Edited by M. FUKUI and K. HORIUCHI
Research Reactor Institute, Kyoto University
February, 1997
1996^12/3 12-130 mm
r^m7K^7K>j 1996^12^12 i30t:M#^#mf^m0rTim#
Ztifco ¥ > izMt 'iX & 'O > 2(7)#(7)#%#^%d6
9 K>(D^>yv %7K^^#2K^7 V >/, ^#^(7)
KLWS#l:Z67K>(7)##. mTzK^^K
>(7) h i%—4—#m2: rxov%-& O
1997^-1014 0
Proceedings of the Scientific Meeting on
"Radon in Natural Waters"
Preface
Scientific meeting on "Radon in Natural Waters" was held at the Research Reactor Institute, Kyoto University on December 1 2-13, 1996. There has been an increasing interest in radon in the environment. This prompted to host the first-of-its-kind meeting which focused on the following topics: sampling and analysis of radon in natural waters; monitoring radon from hydrogeologic sources and drinking water; mining impacts on the occurrence of radon in natural waters; feasibility study for predicting earthquake; hydrological aspect of radon as a tracer in ground water; radon daughters in precipitation, and the uncertainty for risk assessment of radon.
The meeting provided an opportunity for interested professionals to learn more about these topics. It is then hoped that scientists doing research in the laboratory and the field could lead to a better cooperation and exchange of opinion among scientists who usually belong to different governmental and public agencies, universities and laboratories.
We thank the chairpersons, the presenters at the meeting and the authors in the proceedings for their invaluable discussion and timely submittals. We also thank the members of the Research Reactor Institute, Kyoto University for being supportive of this activity.
January 14, 1997Kumatori-cho, Sennan-gun, Osaka
Masami FUKUI and Kimiko HORIUCHI
V-III-
un : ¥E8^12B 12El (A) - 13 B (#)
#^r:(T 590 - 04)
12H12B (A)
13:30 13:35 ## ##1E#
1 3:35-14:55 Eg #m&f
#A
(2) ##E% #B^7^vE-y
14:55-15:50 Eg g^lll@0
(3) mm## tg##m
H) am # ^
15:50-16:05
16:05 17:30 Eg Mm %
(5)#A%^ HSll#####-tr > ? -
A#^AA
E S
mTAA(7)7
zKm-7<7)yiSA
tt & am Am (?)
, y 7,^^ h cm EV K£&7k^7 V'y
mTAA(T)7
Amw5a(7)#mK. miiAA^^Rni&m
i&^AA<7)7
- IV-
12fll3B (±)
09:30 11:20 $5 M
(8) /MtfnX MiA
(9) i£IWlA #pT#X
no) me m mumm-M
11:20-11:35 AS
11:35 12:50 $5
(11) #
(12)
12:50 12:55
■& I'-55 A
(13) mt m
(14)
(15) SiStEA
do) r mm
(17)
(18) AfB*A
(19) m
(20) mm mm.
(21) ##1E#
mmm
ffiizmR$B@A
AKWA
SEX A
15 A
mA
,kmnTWW2fLA7
liov^T
9
LT<7)7 K>
mT7K#:(D7
7
l#7KC
AE^-7 k>esLT-
A^ma<oA^2K(D7 K>%m[
Cd' T
K>#%
mx^KE 9 r ^ o x x #Fm<7)
B #
(1) MT&rpn? KyzgJt<7)M;e&(#A)
(2) 7 K>#tilm?JD£ftHCOE;ti;#miE% (#g^7v h -
mm##, z+m#-
j2;m#mt:j3Lt6#7K, %T*m(07K>z&^Mi i# (jg;A)
(5) Am^m^^A-mnAm^Rn#^
^m%B8
(7) &&7k*<D7 yymm#em^f (A#^f±)
(8) mm'hmMikzmmltz^mm^-mntmu -cmztitz
? K> #mtmn #, m#em% (<&iRA)
^aie# (#p#A)
(10) K>1IA# m
(11) 7 K >MMiJ£u X Z> AfeTAh ?0rJI|*(7)^j#(7)S^!ABB #, ##%# (mA)
- vi-
i
1
5
15
21
31
37
43
47
57
61
65
71(12) fc-XMtitfaMt LX <7)7 K>/Mm#
(13) MT ^<7)7 y> 77m# m
(14) ss
(15) 89##m:A
(16) 7k^x>7 L>m&-^MJj(DmjLW.7LtP'LtLX- 97T mm
(17) AMaoA&bW^ 99, jii9my\ #m## (A^#A)
(Am$A)
(18) K>iS)ttzov>r ................ 103AiB#i\ ^#AA
d9) ^mm%Km(7)^a7K4:(D7K>m% mmn m&m# (^mzA)
($^:m#A)
(20) Hffli&m^&rt2>7kty7 115###m, , mmmft (^A)
(A iamA)
(21) ............... 125WHE# OKA)
(22) #E #7 ............... 133m#z# (^A)
\ #tio * 136
Contents
Preface i
(1) Measurement Methods of Radon Concentration in Groundwater, ............. 1K. Hasegawa
(2) Calculation of Radon Concentration in Water by Toluene ExtractionMethod, 5M, Saito
(3) Radon Concentrations in Drinking Water in Wakasa Area, FukuiPrefecture, 15H. Tokuyama, S. Igarashi
(4) Measurement of Radon Concentration in Water by mean of a „ y Spectrometry:Radon Concentration in Ground and Spring Water in Hiroshima Prefecture, ■■■■ 21 K. Shizuma
(5) 222Rn Concentrations in Private Well Water and in River Water Around ............. 31
Ningyo Toge Area,A. Yunoki
(6) Radon in Water Samples Around Ningyo Toge Area, 37S. Furuta
(7) Radon Concentration in the Thermal Springs, 43K. Horiuchi
(8) Ogoya Old Copper Mine as a Monitoring Station for Various Fields ofEarth Sciences and Radon Anomaly Observred at Tatsunokuchi ............. 47K. Komura, T. Wataguchi, S. Yamazaki
(9) Distribution of Rn 222 Concentration in Natural Waters in Kobe, ............. 57Y. Yasuoka, M. Shinogi
(10) Radon Monitoring for Earthquake Prediction, ............. 61M. Takahashi
-viii-
(11) Estimating the Relation between Groundwater and River Water byMeasuring the Concentration of 222Rn, 65M. Yoneda, S. Morisawa
(12) Radon as a Hydrological Indicator, 71T. Komae
(13) Behavior of Rn Contents in Undergroundwater Related to RadioactiveDisequilibrium, 77S. Nishimura
(14) Phenomena Associated with Rain Deposition of Radon Daughters, ............. 83K. Fuji taka
(15) Scavenging of Radon Daughters by Precipitation from the Atmosphere, ............... 89N. Fujinami
(16) Radon Concentration in Water —On the Values Measured in Central Japan— , • • ■ 97M. Shi mo
(17) Radon Concentrations in Natural Water in and around Osaka District, ............. 99S. Shibata, E. Kawano, R. I to, H. Masuda, M. Tsurumaki
(18) Radon Concentrations of Ground Waters in Aichi Prefecture, ............. 103S. Ohnuma, N. Kawamura
(19) Concentration of Radon-222 in the Cold Mineral Water of Futamata Spa,............. IllS'. Mochizuki, T. Tanji, K. Nishimura
(20) Radon Concentrations in the Water of Misasa Area (Tottori Pref.), ............. 115H. Morishima, T. Koga, M. Inagaki, M. Mifune
(21) Radon Contents in Groundwater and Uncertainties Related to the RiskAssessment, 125M. Fukui
(22) Summary 133M. Fukui
Participant, Contributor and Affiliation Index 136
-ix-
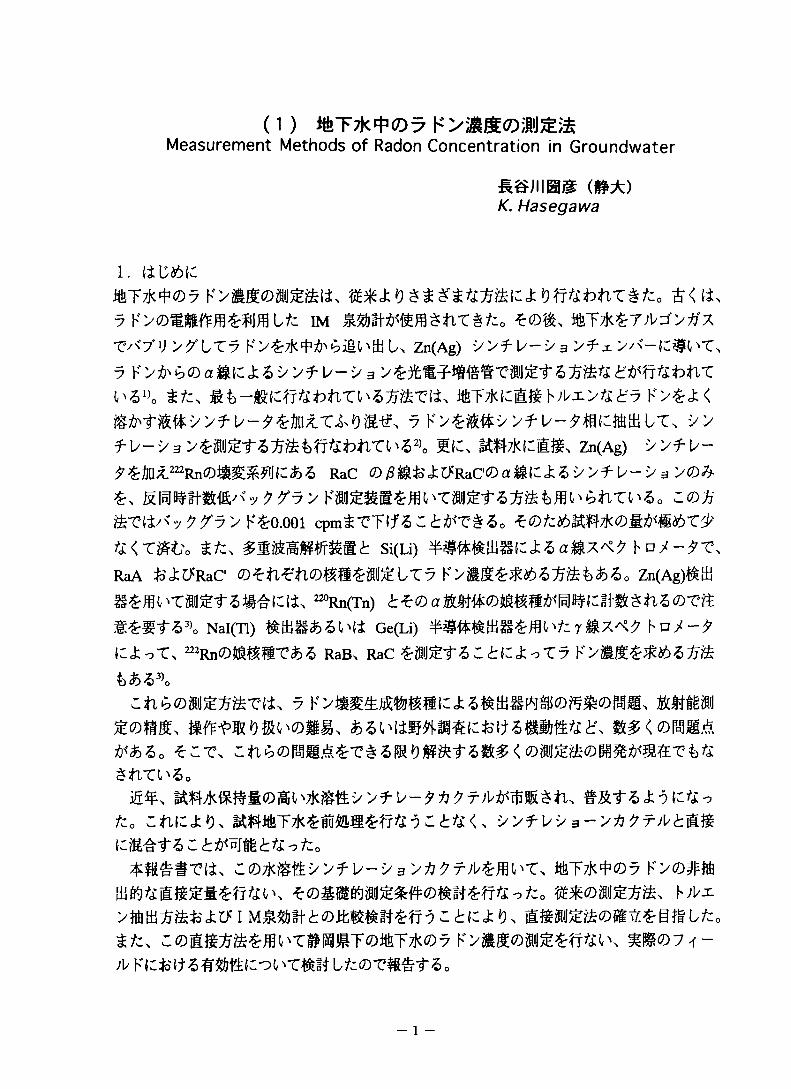
(i) *rF7kMeasurement Methods of Radon Concentration in Groundwater
(»*)K. Hasegawa
1. iiCfeiCmMoy $ZKmK<£'ombtiT%tz0 t;<&,7 vyoMmmmRUz im mmmmtix&tz0 z®'&, ^ttk
T/<7'U >^'LT7 K^TkWbiil'ftU Zn(Ag) '> >f-l/-'> a >f-x
^z>»0 ttz, k>£J;<
?is-^ame, m?kKm, zn(Ag) v>f i/-
^^6nx.222Rn©E^^IJt:*5 RaC (DB&&£VRaC(Da^£6is>?-ls-iS3><D%-
K&0.001 cpm^TT(f5:6^T#&0&<xm0 ttz, si(u) ho^-^r\RaA fccttfRaC 0^WW#@m^LT7 Zn(Ag)$tfl
^Rn(Tn) tz<Dammmmmmcm$M<Dv&Nal(Tl) Ge(Li) 'tz 7 F U / - ?
K«fcoT\ 222Rn(Dm%mV&Z RaB, RaC C <i:C«t 0T7 K
fci)'53)o
ft&Zo *ct> cnbcd^e5eh<mm&mmm&T:t>^^nr^-So
tzo BuM^fr/C7 :6:^l/ys->*^fyL/6mmCM^f6 : o /Co
$#e#TU\ : W#%y l/-y g >/7^f HT;W®7F>®a1^/:, f^
i c6i:a9,ttz, %mu-
-1 -
2. mm7 K>©^7jC^ LT> ($2 200 m) ©Szk^C'^o
its ## 100 ml ©f7D>#/W7vW:, W:##7k 50 ml ti/'sf-U-ttltf-JU(Packard tt : ULTIMA-FLO M) 50 ml £iif&S£ lVZ<Dt £M£ U L/:o
7 b*> tzmmt<Dmzm¥'0miLifr<Dt>s m
fro
3. ##<!:#$E^ij^irioT, ^©#^#^3.7586^0, 5 k
>(^Rn)©f%#.82B 6(3l^-&L/:o 7^7A©#$mmi\ X otKjft1B©l3l£lOO %m\MT dr^EML^o3. 1$^y>7L/-y3 y^CJ:5SJST1i, zKimi^xyf ff-»«tt
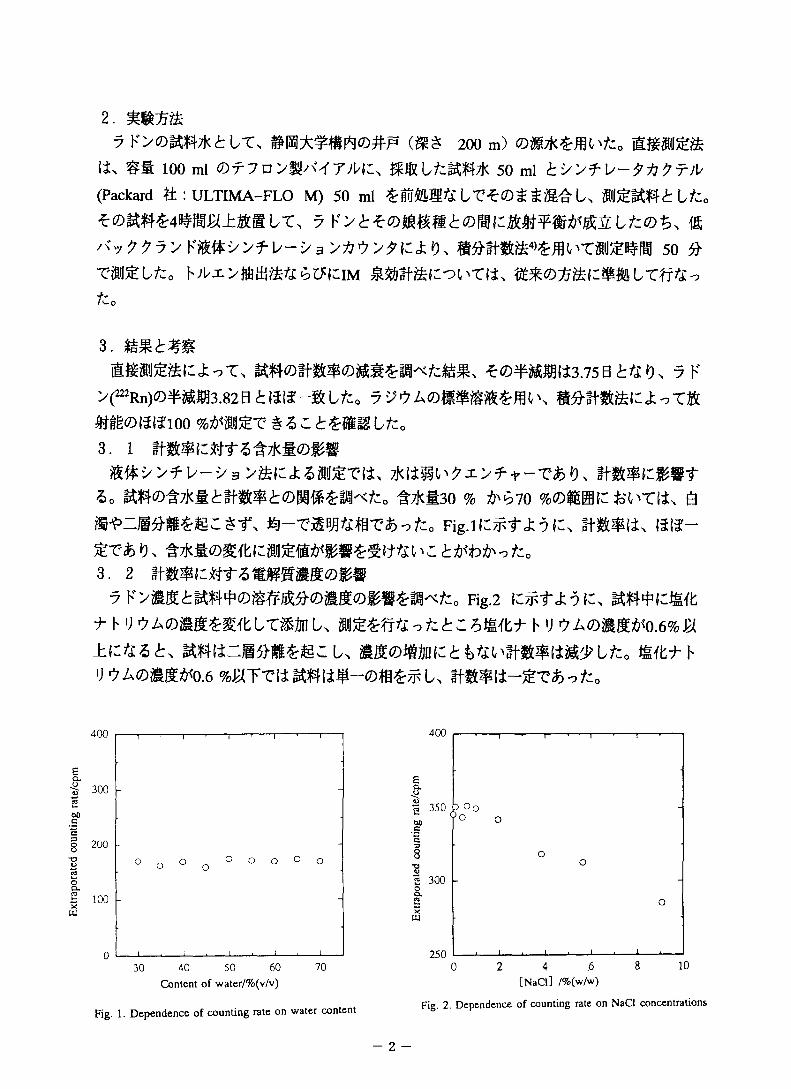
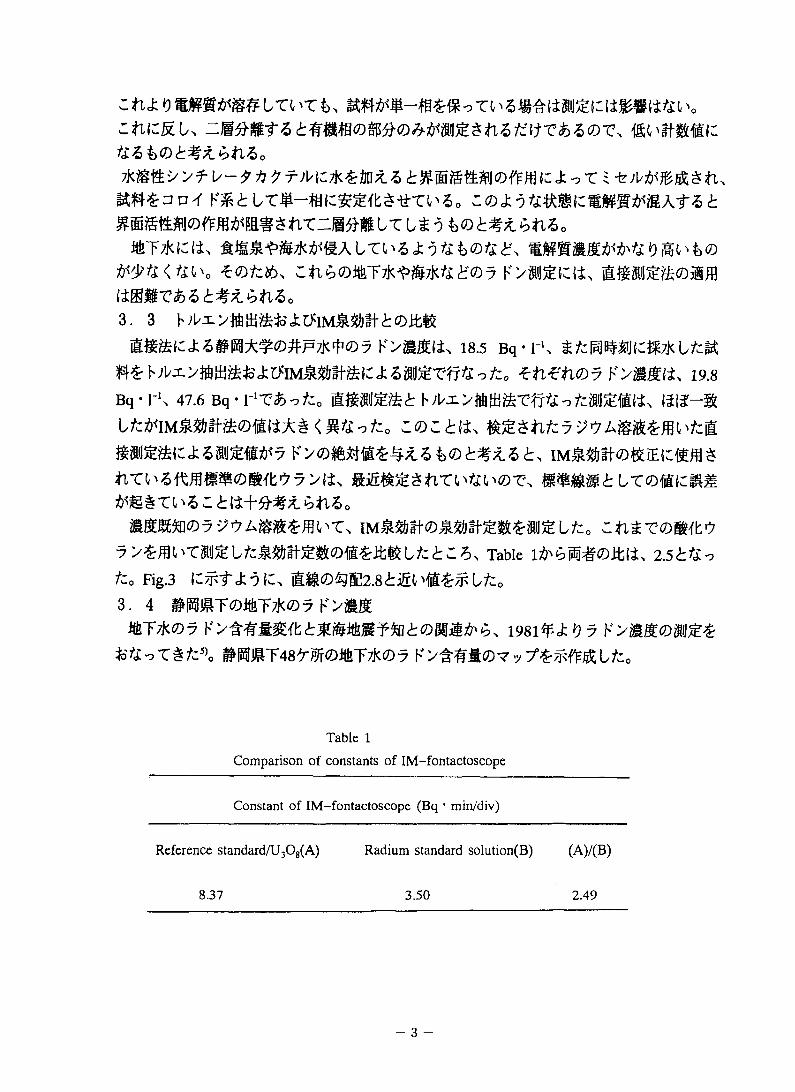
£= ^#©^zK#6##$6^tKM30 % &&70 %©fBBC^^Tii, 6
^-TM&m:£>o/,:0 Fig.i(:^f«t7(:, iflf-£t* %, fro
3. 2y YyWi^.tm^ommom.mmm^fro Rg.2 jioc, ^#fcm
f h V 7A®M£ErtLTSSU h V 7A©#&^o.6%JWU #m©WCd:$)%U#f»$(i^L/:o mtfr b
U7A©SS^0.6 %J^TTIt U
400
Es-
g,E38-o
UJ
30 40 50 60 70Content of water/%(v/v)
400
0 2 4 .6[NaCl] /%(w/w)
Fig. 2. Dependence of counting rate on NaCl concentrations
- 2 -
Fig. 1. Dependence of counting rate on water content
cftj:oltiztuz&u #c#m#c
LTi'& j; 9 % w%^ft'PU fcti, £ti6®mT7K^#X%^®7itmv&s<t%z.t>ti6o3. 3 h 7Ujl > % &&& x mu&m t mmz±z>mx¥®#P7W(Dy K>smt> is.5 Bq• i-\
m h7^>^l±}^joJ:o to ZtlZtKD? F>Mm, 19.8 Bq • l-\ 47.6 Bq • hvl/J: ^
< #%O/:o £©££&>
rs<Dmm$7i6$><Dt%z.6t, m&mv&iEizmz tiT^z>K%m®m4t'y7>\z, m&%i$tiT^tz^<DT\ mmmtiTCDmzmm
rnffirnywmmm'x, iM%m<D&m%.mmmuz0 7>%m'Tmfeitz%m%.m®mmuctzs, Table 2.5ttz^fco Fig.3 K/ft <£ 0 K' fi$cD^E22.8£i5(< MB^tF Lfco
3. 4 #M#T®%T*07MT7k<D7 k>twrnmtmmm1981
toK-iT%tz% #MST48>r^©i6T7jc©7 K>^W*©v7
Table 1
Comparison of constants of IM-fontactoscope
Constant of IM-fontactoscope (Bq • min/div)
Reference standard/U308(A) Radium standard solution(B) (A)/(B)
8.37 3.50 2.49
- 3 -
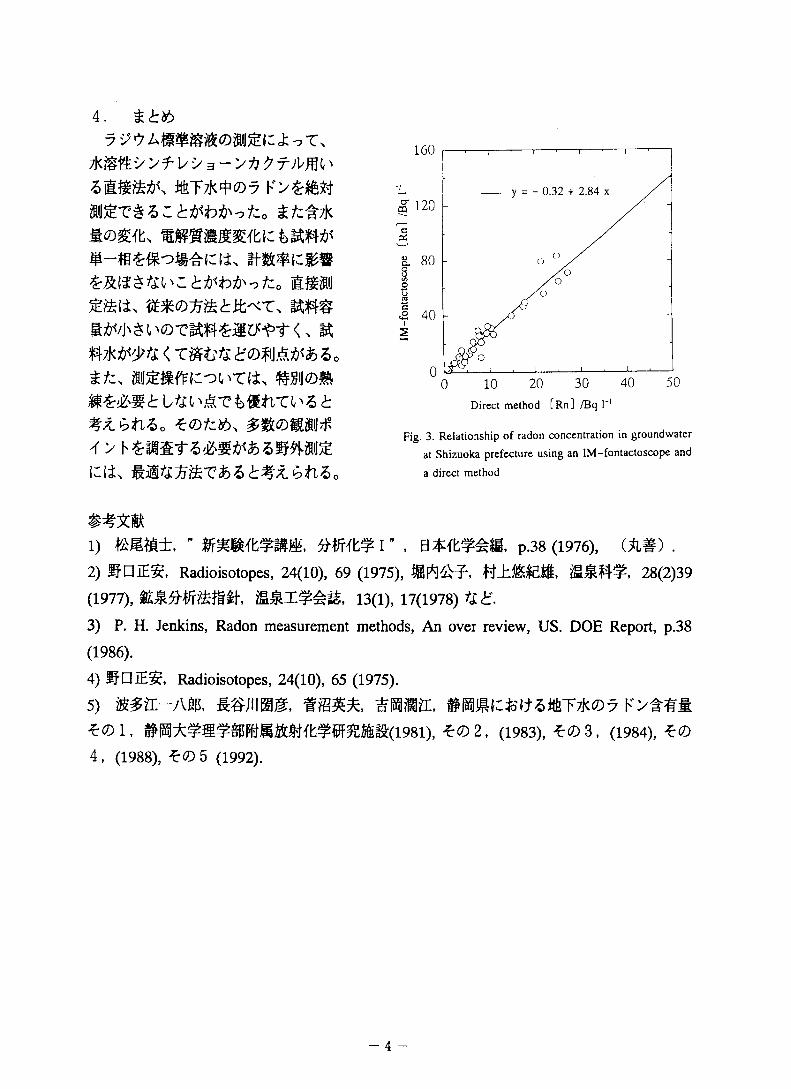
4. ttib
*smk m^coy$J5lT£3 C tftt>fy-?tc0 £ /i^zKi©eil
EMfemt, t,1W£C >cDTMI4^aWt <, §s WMityti < T^t'/j:
ZOtzti. £B©B« d' > h£«t£^#<fc£SM£ i:ii>
- 0.32 + 2.84 x
£ 40
Direct method [Rn] /Bq 1 1
Fig. 3. Relationship of radon concentration in groundwater at Shizuoka prefecture using an IM-fontactoscope and
a direct method
1) %m#±, - P.38 (1976), aim .2) SPIES, Radioisotopes, 24(10), 69 (1975), tt±&iEil, 28(2)39
(1977), 13(1), 17(1978) U £.3) P. H. Jenkins, Radon measurement methods, An over review, US. DOE Report, p.38 (1986).
4) SPIES, Radioisotopes, 24(10), 65 (1975).
5) mm-Afip, mm##, t*©i. #M±#@^mmm#b##%m#(i98i), *©2, (1983), *©3, (1984), *© 4, (1988), t©5 (1992).
- 4 -
(2) 7^7K>#iti;1JEIcfclf5iS6lt-#<oaSj5Calculation of Radon Concentration in Water by
Toluene Extraction Method
mmiEM ($317-TV I—ZfB£W9lPJi)M. Saito
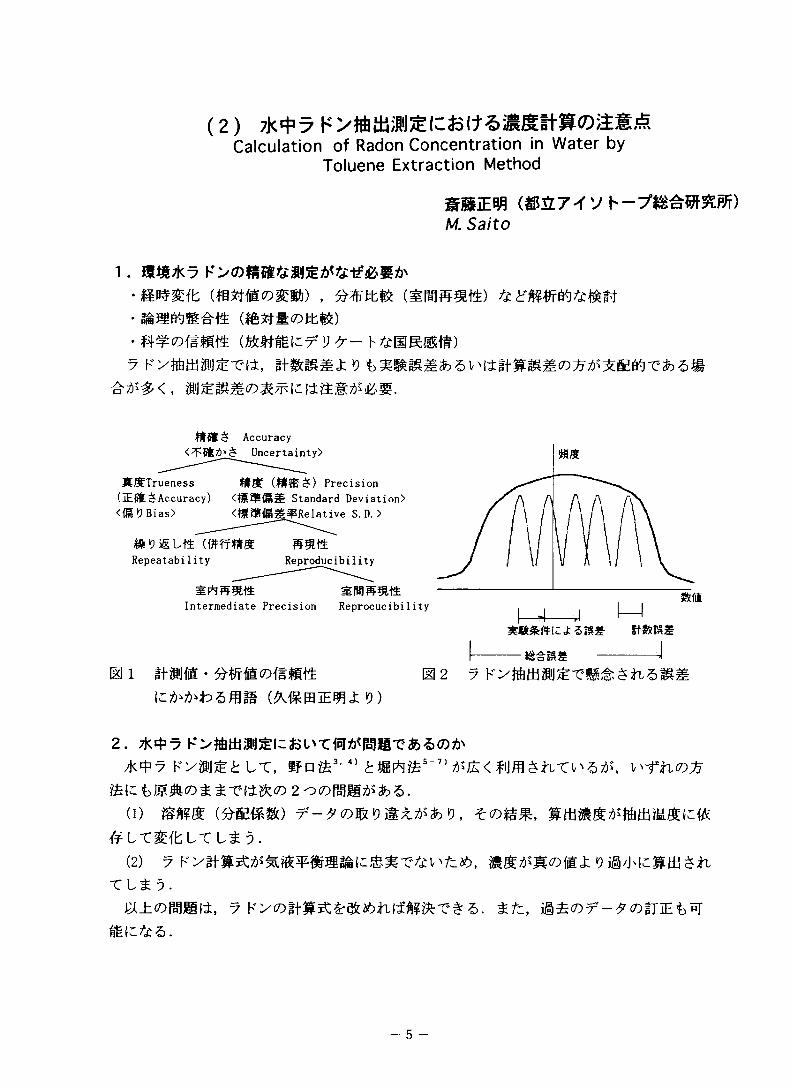
fit $65 Accuracy<-T'$6*>5 Uncertainty)
(til® 5) Precision (IE$65Accuracy) Standard Deviation)<(10 Bias) <£USffiS^Relative S. D. >
mmstRepeatability
R9H4Reproducibility
Intermediate Precision Reprocucibility
mi itzB'jffi• ftmutDitim m2 7icwbamm 0)
2. *4=7My Ky$iJ^<b LT, 8fn&3'41 £igFW~7) ^'J£< ^-ftuDU
(1) mmm y-?omv, ^<d^,#LTEfbLTLt 5.
(2) 7 KyStg^^^WSS^&^r&i'/cib, ^S^Scoffij: «9ig/Jx|cStti$iL
XU).7 tilt, ii£(D7-^<7)|TEt)W
- 5 -
2 1:
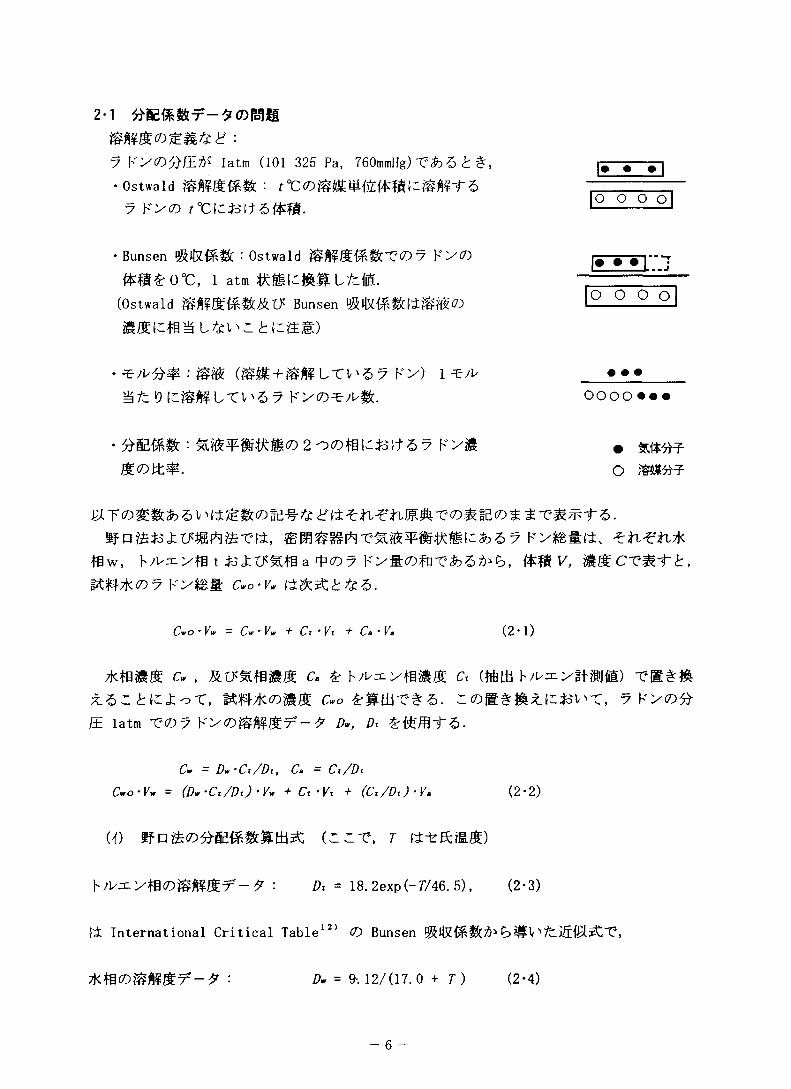
7 KycO^E^" latm (101 325 Pa, 760mmHg) Xfc> 5 £ #,
• Ostwald : t°C (D ##C67 rncjopfa##.
• Bunsen »&U&M : Ostwald feM&fa$CX<Dy Y's(D
mn&0°C, 1 atm Lt#.
(Ostwald Bunsen
if/kLX\'Z>y Y'S'O**#.
- Ky#
fgw, Wwnyfc t *3«fctf$alB a ^7 K^fiWfBT'fcS^b, (*f* y, M& cxm-ft, ^#*607 K^# C.o-p.
Cv,o-Vw = Cw-Vw + CfVt + C,-V, (2-1)
Tktass c,, c. & c* (ttm wv^^ttM) -em##X.ZZk ICiot, Cwo Z(Dg#%xJCjoV\-C, 7 V'SfDft
E latm X(Dy YXDmmy1-? Dw, D<
• • e
oooo •••
# 5U$E"F- O
CV — Dur'Ct/Di, C* — Ci/DtCwo-Vw = (Dw-Ct/Dx)-Vw + CfV t + (tVflrJ -pa (2-2)
u) c:-e, r
h/^y^cD^SSx-^ : 0t = 18. 2exp (- T/46. 5), (2-3)
[i International Critical Table121 CO Bunsen (b#V
7k#(Di8#&T-f : /), = 9-. 12/(17.0 + T) (2-4)
— 6 —
Radioactivity Applied to Chemistry13) CD Ostwald
(«0 SMB”
^EJlBtiTk 1000 ml, YlV^'s 25 ml, 75 ml t V' D &{$TT*<D
’ **7 KyBSZhy^y^^ KyBi:’ left5£$rC'£>5. #E^B#mci^LT, Ostwald hA^^ti Bunsen a <D%%
tfMfaV, MAT-Effl LTV'S&iUtfijtiz:Lfai\
B = 7 + K./K,-6/a + K./K,-7/a (2-5)
-hefiCD (/) ( n) CDfnlJi^iX)^ C/cffiA tt, j^#<t t> International CriticalTable121 (DYfV^'y Bunsen Ostwald f&fl? i %L V it X.XMM
Ltztziht&t>M (&*U) •
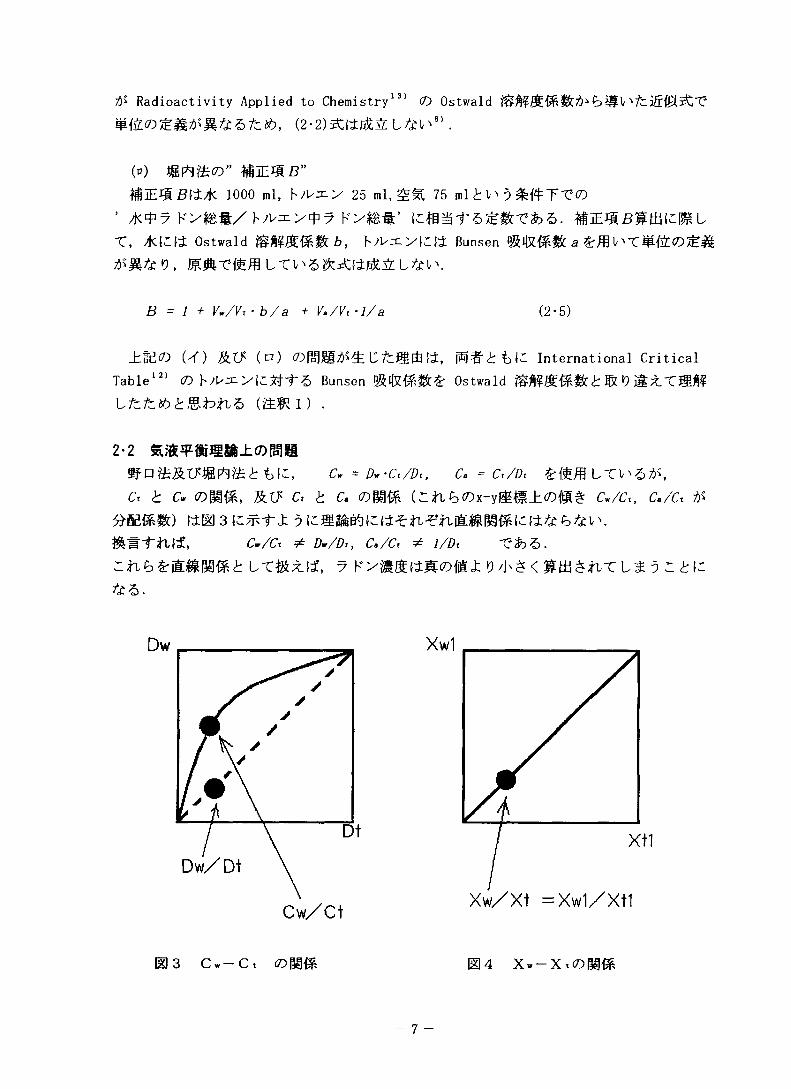
2-2 St;6¥96@86±(DFa1@klz, c* = Dw-Ct/Dt, Cs = Ct/Dt LTl'5^,
Ct t C* <vm&, RXf Cx t Cs (nm& (Ca^(Dx-yA#±(D## Cw/Ct, Cs/Cx ifi
egm&) nia3{^-f j;tem-fM, Cw/Ct * d~/Dx, Cs/Cx / i/o, -e&s.
fa 5.
Dw/Dt
Xw/Xt =Xw1/Xt1
123 Cw-Ct (Dgg# 124 X.-X.©|i
7
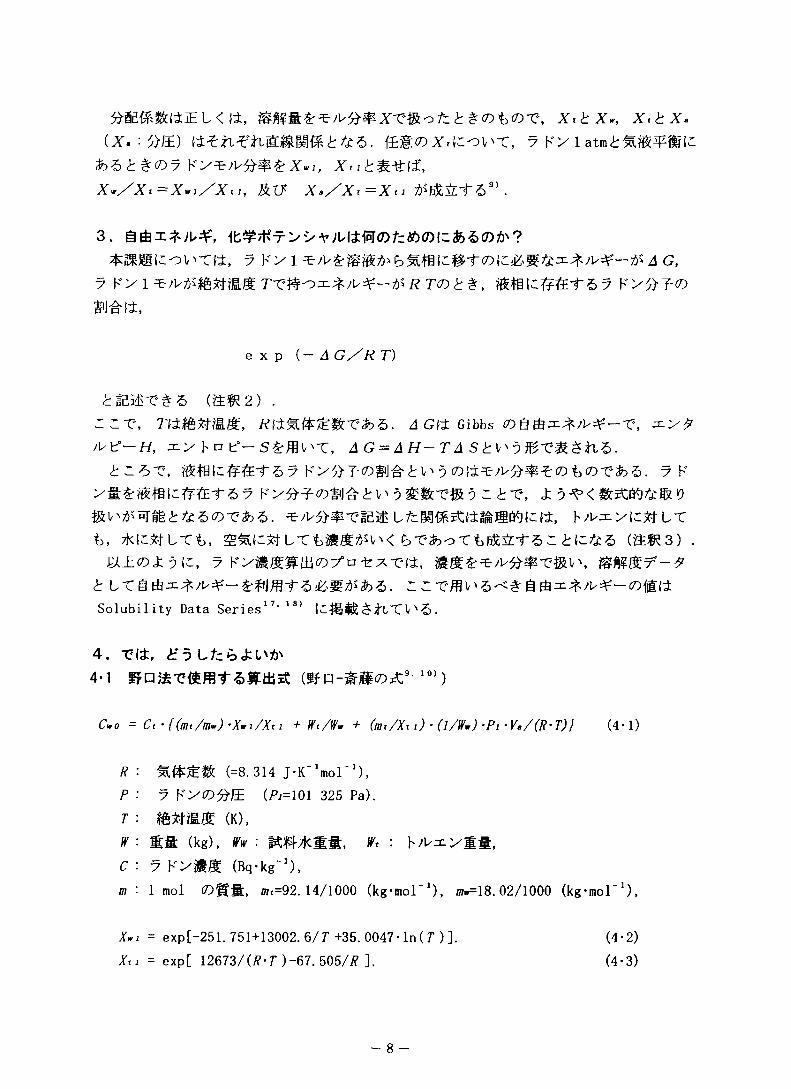
L < (1, X<tX*, X<bX*
(x.:ftl£) H^n-enEiUggOF^ &5. ffi&^X^oV'T, 7 Ky latm<h^E¥Wl-
3. a6x*;U4r, ib#^T>v-v;UI±iqr(D/=A(7)lZ&'5(7)A'?*E®lC-OV^rti, 7 Kyi A G,
7 F> l i? T© ^, %#lcWEf 57
exp (- A G/R T)
<b^T#5 (&^2) .::t, Tfttett&g, RteMft£&vfrz. a Git Gibbs ^y^
yvtf- H, xyhDt-S^ffll'T, AG = AH-TA St\*'i&V&&1nZ>.^ ' 5T, %fm:#%i-57 Ky^-f 9 7 K
ya&#mu:WE-f 57 Kyef(D#j^&^9^%-c%? Z6T, z &V'^BTiBi:*5^)'C*>5. ^yu^-CfBiE LfcK^sfcttSfeJSiftlcW:, K/^y[c*LT
fc, 7k(-*fLTt, ^mtLTtai«^V'< 5)-efcotfc)S4t5: £(-&5 (&ms) .^±(7) j; 9 (c, 7 KylSf til<7)/Dtxt1i,
<b Lt £#Jffl-r5&gj5S*>5. r ; -efflV'S^#Solubility Data Series17, 1 81 c^ixT V'5 .
4. -eii, if 5 Lfcfcja'jb'4-1 5»ffixt (ifp-Mw^;9,10))
C»o = Cf{(mt/mw)-Xwi/Xti + Wt/W* + (mt/X*i) • (1/W.)-Pi-V./(R-T)} (4-1)
/? : (=8.314 J-K",mol'1),
P : 7 Ky(f,=101 325 Pa).
T : (K),
y : mm (kg), Fwr : K#*##, Wt : h^yfiS,C : 7 Ky«$ (Bq-kg-1),
m : 1 mol (Dlfm, mi=92. 14/1000 (kg-mol_1), /mr= 18.02/1000 (kg-mol1),
AVj = exp[-251. 751+13002. 6/7 +35. 0047-ln(7)].
Xu = exp[ 12673/(R-T )-67. 505/7? ].
- 8 -
(4-2)(4-3)
%###( Vs t#ii,
Is-Ko-Kw-Kt (4-4)
p w(T ) (4-5)
Vt=Wt/pt{T) (4-6)
Vo: ftmv-bPV&m (m3)
(kg-m3),
p w (T)= 999. 8/[1-6. 427 X 10'5 ( 7-273. 15)
+8. 505 X Iff6 (7’-273. 15) 2 -6. 79 X 10"8 (7-273. 15) 3 (4-7)
p x (T> 866. 6/[l+l. 028X10"3 (7-291. 15)
+1. 779 X 10 s (T-291. 15)2] (4-8)
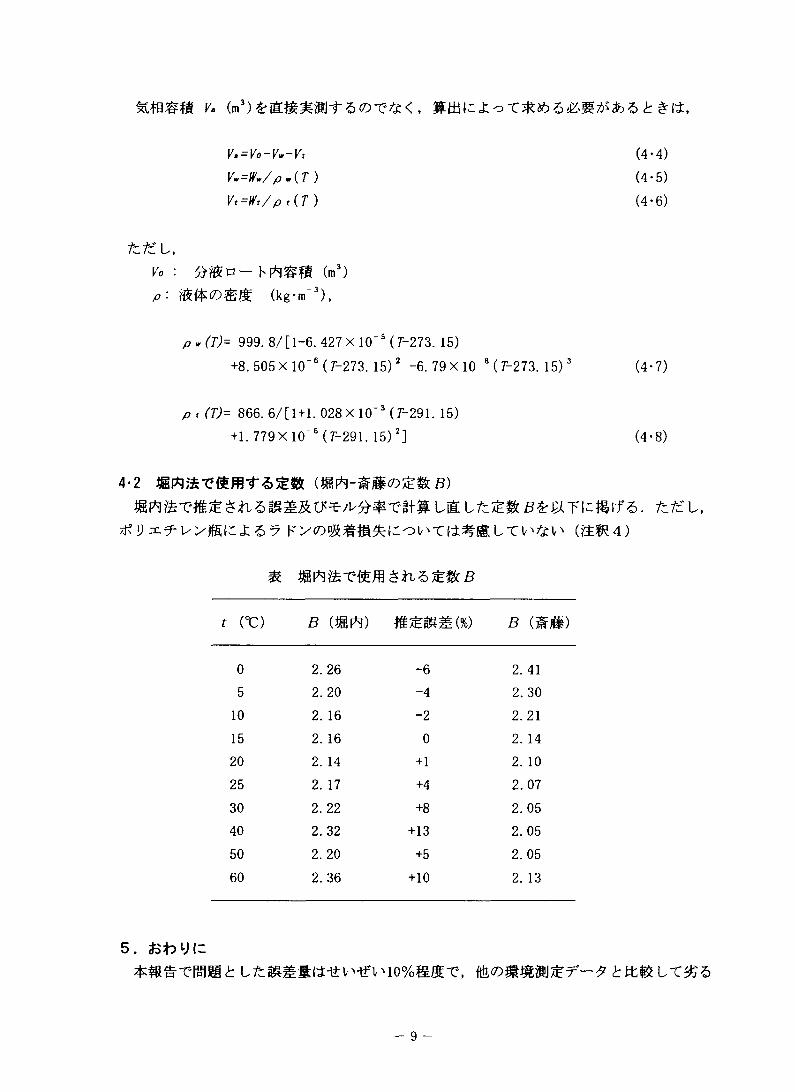
4-2 (®F*H?S<Da£$(S). ittzt,
f rc) B (#gF*9) B (am
0 2. 26 -6 2. 415 2. 20 -4 2. 30
10 2. 16 -2 2. 21
15 2. 16 0 2. 1420 2. 14 +1 2. 10
25 2. 17 +4 2.07
30 2. 22 +8 2.0540 2. 32 +13 2. 05
50 2. 20 +5 2.05
60 2. 36 +10 2. 13
5. VIZ^■craii Lfc&M*l*£iHfi'iO%&£-C, mnmVLWfeT-fi kt£&LX£5
- 9 -
rcD&i^&v'T,7 K y SS$(7) y /Ut2-- ^ (7) ($ ^ A/ <tf ft 1910¥ft t^ ij^ $ iiyt Bunsen %###
tar?, z9^i979#(cE^Lmc^^^t<DXhZ>. t-^^oTV'dSSll
##-ek5.
nm^y K^aj^ov'xt, lt^h^ltv'<±t% mztm'o Mt£(D^'mmr'-tvgm'^kvfoztmi-n-fz.
(B*R 1)
Ifp^-cti, 5i/z?« = l/exp{Ki/t + k*) - i (DBXhtUt, Ki, ^ LA^L,(4) (D^(Dm<D£ £ -et^CW±<7)j£V 'MOT ClOVvxllll^t CX t $. 0 .mfe-eii, 9(c", sor&mo
ac<Dttmtfro-4o°c (Dm tttm lx TFmmteB^te^x^'z.(D40, 50, &m0°C(D7k(C*i-6 Bunsen
Pp^^o-cv^. **3, -%S8"10,^5lfflLfcXto17' 18> LT, S6^^/i/^-$E^5fclT$iLTVN5.
(B^2)MfB tdjo it 5 ^ ^ /l/, n = n* + A71n(xg)
## I: jo It 6 ^ ^ -V /!/, M = Mi + A71n(xi)^Mtit'Sf(J?U^b, xt = 1 (f1 , ftj£ 1 atm) <Ok%,7 xi = exp(-A n /kT ) <W<£5.
(af?3)riitt, iM-ec^ststc-e, La»L,
XCDm&Z^m m?Ut, V'VX/l'&M, Van der waalsiC . ) -fntf,5t^5).
(&$3 4)• Bfn&T^tfrm$^|6]±^-ti:5fc»<7)Sm^±(7)WS^ : #$n-]>*0WWr.
jf L±ifm<Dm&k lx, Tk^'oitmom^^y^ vx- hu^-tv>9).
• iti^$7 K^* (50 Bq/kg a±) &5L'#7 Kh^xy©Aof;MD“ h^(-aC^iil^±co@E^ : 7 K
-10-
K^IASrKCfcftl^ttiK^TtcSr^KTSfcl'&£-f.
• LT^y^^-i/yE^Mt-5^, 7 Kytt^v^yyf^#lt^ltu$9. #viL5^in, 9Km#uyc#e^^< p>v'^dS4i:5^ttfeip>nTV'/<cv'
SlfflXitt• 7 Kyro|«£
1) If PIES :S(^'>yf Radon <Z) %##&#]#[" ,
Radioisotopes, 13, 362-366(1964)
2) IfPlE^ :” Ifryyf^ya ytf-»ftflr (x) , ,Radioisotopes, 24, 741-744(1975).
• (if pE)3) lfP3E£ :
" ^yy^y-yay^»Km= (x) , 7 Ky(D#j^" ,Radioisotopes, 24, 745-748 (1975).
4) SB %, IfSSfS, f##%, IfPlEgc:
” H>8$©tr ,i&£, 29, 71-81(1976)
• WV3Ly$m*fc (%F^Ws) =
" Km^7 Kyw^yy^y-y3 y*col^fT ,
28, 39-52(1977)
6) =" &%tp7 Kycottm-^^yy^y-ya y*!)y^“ia5»fia(COV'T”
13,95-103(1978)
7) ” (^-yyfy->a y# ^y^-{;:j;5£S;) ” :
&$%###, 13, 17-19(1978)
• (IfP£&# Lfc t(D)
8) Saito,M. and Takata,S.:
"Improvements for Measurement of 222Rn in Water",
Radioisotopes, 41, 391-396(1992)
-11-
• (Bf □&£: g b<0)9) Saito,M., Takata,S. and Masuda,Y.:
"Improved Calculation for Measurement of 222Rn in Water",
Radioisotopes, 42, 330-334 (1993)
10) WSE99,
” 7Kcf3222R n<D ,Radioisotopes, 43, 515-522(1994)
- zkf 7 Kywtf!) ^yyJS'M11) Saito, M. :
"Correction for Loss of Radon-222 in Water Sample Caused by the Use of
a Polyethylene Bottle",
Radioisotopes, 32, 109-112 (1983)
•7Ky©*f-^ (Bunsen####, Ostwald#####)12) Loomis, A. G. :
"International Critical Table 3," ed. by Washburn, E. W.,
pp. 257-263, McGraw-Hill Book Co.,Inc. New York(1928)
13) Bonner, N. A. and Kahn, M. :"Radioactivity Applied to Chemistry," ed. by Wahl,A. C. and Bonner, N. A. ,
p. 157, John-Wiley and Sons Inc. , New York(1951)14) "Solubilities 2," ed. by Linke, W. F. , pp. 1382-1384, American Chemical Society,
Washington D. C. (1965)
15) pp. 668-685, %#, £m(1975)
16) "S4JKS6Mfc¥!*ffil5##f", ®, PP. 134-135, ^L#, ££(1991)
•7hyo^Sf-^ (66^-^vv^-,17) Battino.R., Solubility Data Ser. , 2, 227-234(1979).
18) Gerrard,'ll. , Solubility Data Ser., 2, 264-269 (1979).
19) pp. 156-157, %W, ££(1993)
Saito Masaaki, E-mail: dej891540pcvan.or.jpsaito. masaaki@tokyo-itc. metro, tokyo.jp
-12-
mm*#? (^#M)
-Tkf 7 znx1) Saito, M. :
"Correction for Loss of Radon-222 in Water Sample Caused by the Use of a Polyethylene Bottle",Radioisotopes, 32, 109-112 (1983)
2) Saito, M. and Takata, S. :"Improvements for Measurement of 222Rn in Water",Radioisotopes, 41,391-396(1992)
3) Saito, M. , Takata, S. and Masuda, Y. :"Improved Calculation for Measurement of 222Rn in Water",Radioisotopes, 42, 330-334 (1993)
4) %BiEW, :” *^222R n (7) ,Radioisotopes, 43, 515-522 (1994)
5) %BiEW :
PP.21-24(1980)e) mm m, :
Y'svmfefe,Sgfn63¥S B-e-9f%0f¥W, pp. 74-76(1989)
7) mm m, ^#E^ =3H, 1 4C, 2 2 ZRn^Wfyyfk-yayMyflcZa
SJiV$imn-7' No. 8, 87-99(1991)8) wse^, mm m ■■
7 Yy-222(DWfci£<Wfe±L,No. 11, 15-20(1994)
• 79) MEBS, mm m, /j#am, ^khi,
IB :*^ia(7)mT7k^7 Radioisotopes, 42, 273-278(1993)
10) ilEI, iUffl m :
Radioisotopes, 43, 507-514(1994)11) »E^ :
67 RyMS,B 1992, 375-382(1992)
-13-
(A&mm&nrrm12) fiBiEW, /]##%, SUM, SB m, H :
mr^yBgfp59« ###3myH" PP. 43-45(1935)
13) %miEw, suEs], SB %, ^#B 0 ■
BgfP61*FS ###£747 H‘ B^flF^/WW, PP. 62-63(1987)14) %MiEW :
BSfn62¥S ###3£7>fyH’ PP. 43-45(1988)15) SB %, ^B IS, 1595f^^, Wh], /J##^ :
%T7Kf 7Bgf058#m ###&7^ W PP. 22-24 (1984)
16) |5|lfS$, %, MEB^, SUEs], *B 0, /J#*% :m#T%K0/c#f)7 Ky#m#j#(:g@-f63@%#%,BgfP61^$ ###^7^7" PP. 59-61 (1987)
17) ¥m 0, |69IfSB m, %miEW, SUES], /J#m% : %#T&(0t&(97 KyM^JStcKhrsMfiBE,Bgf063¥S ###&7/f7|-7' pp. 94-97(1989)
is) ®, sb m, i69if^%, tin, suEsj, /]##% =titiSESa<T)fc*(7)7 Ky#&#J#lcKlf-63@##%,
###>7747^7" pp. 72-76 (1990)19) 0, fM, SB %, SUES], I59TOS, /]##fe:
ME^0(7)7c67)CD7###^7H7" PP. 70-78(1991)
20) ^B 0, ##E%, SB m, SUES], 0lf$^, /]##% :
¥rK3¥$ ###&747H7' pp. 85-93(1992)(^*%##fr#)
21) /]##%, #B 0, SB m, SUES], ME^ :" 7 k m-t 6 (Bg%5o#-ng#57#m) %Myzutnm-r pp. 1-219, ###(1984)
22) 7 Ky$SSJ^Mi-5P£9F%(^(7)i),"Bgfn50¥$ i6SESqlc^-t5ilS9F%",###K%#%$@, pp. 2-164, ###(1976)
23) -37) |5]± (^02) Bgfn5WS(l977)~ {^(D 15) #1&E¥S(1990)
E«cWl»&
38) 7 6),"^2^$
pp. 2-80, ###(1991)
-14-
(3) k >aaRadon Concentrations in Drinking Water in
Wakasa Area, Fukui Prefecture
H. Tokuyama, S. Igarashi
1. liU&K:m&xiz, mm^ 6 sm s n a*©@su mtt> p vrv/**®
£$MLT£-a'5Uo #h t>mml>
#m&fiao*"c&ao *©*£3X u-c#K> C A & <1:L'6o
iz, $km*fp<D7 FymmzmgLtzo zzxu, A c ^ j 6m&aam^#£TZo
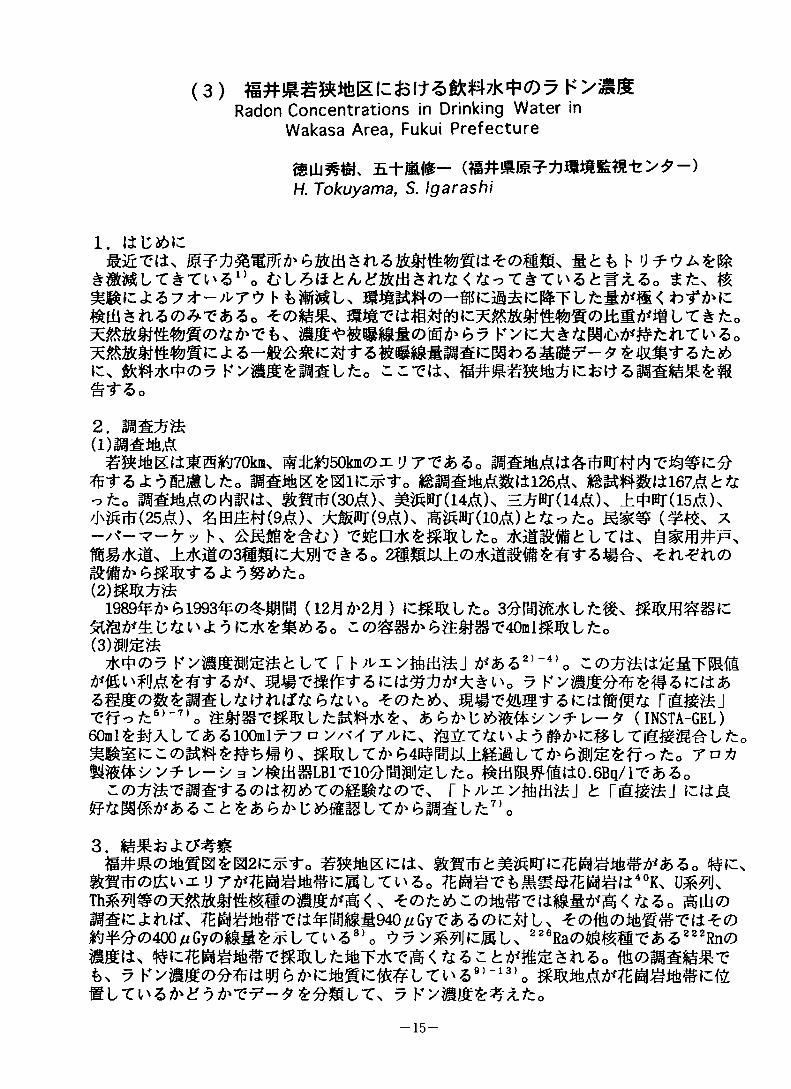
2. am##d)mg%A
Sdb^50krn©x VTX&Zo Mgtibtili&rfiNTttftX^lZfr^pf 5 j:^esl/co mm&mAmi±i26^,ofco sa$tiL&©rtsms isc^moo^o. ##mr(i4A)\ hawhh^k ±fwumx /J\#m(25A), Ammr(9A)\ i^#RT(10A)a^^/:o (#^ X-/^-v-^r^ k xmnx*m%.itz0 ^mmmtbxit,
±*m©3@mc±m^#6o znztiommfr bwfct^&^&fzo mw&jjm
1989^^61993^©^%% {12H^2H) C#%L^o 3#%m*L©^§§^6&##§"C40ml^%Ltz0
(m\%.m**©7 yymmmfemtLx r i>^xy«j 7)*&52,-4,0 :omkithi
6z5X 6 L'o 9*(Dtztb, mmxmm-tz\zimmti mmmj
t?fT-D/c6,-7,o L/-^ (INSTA-GEL)60ml£S'JALT£5100ml7u:7 o y/x'-f y;w:A <£ oW>fr\Z&bXM&U&btz0
cc©^#&#%#%. m&Lxfrt>4 wm-hE;®bx^^mfezn^tzo m* mm-yy+v-y 3 v^mmBi-eio^imm&Lto t&toRmihto.GBq/i-efcSo
z<DjjmxM&-t2><nitfij#>x<Dmmte<Dx^ r h^xy#m&j t hm&u izhm &temm-i&z>zt*&t>fr\:#>mmLxfre>M&Ltz7)o
3.s#s©m@e$rmnz&'to mta„ #c,
g(gm©jKvxvT^7E®me^MLTo^o mm,Th^J#©A^%###@©#m^<, i:©]t36C©%^^(±mm^<^6o ^OJ©
it$%m^x&^rBmm4otiGyx&z<D\ztti, ^©^©^^i**© M>¥#©400uGy©M$r^L TV' 5 8) o y^iJtcSU 226Ra©&m@T-£3 222Rn©
fes 7 Ky»K©^±W635'^®f3fe#Lri'«B,"13,o mLXl'ZfrZvfrXT-fZfrMLX, y FyMHifco
-15-
|_Natasho ) Obama vZ— Q__ §__19^
Wakasa area
Fig.l. Study area in Fukui Prefecture D
Him Unconsolidated sediment or alluviumConsolidated sediment
Igneous rock
Granite
Fig.2. Geologic map of Fukui Prefecture
-16-
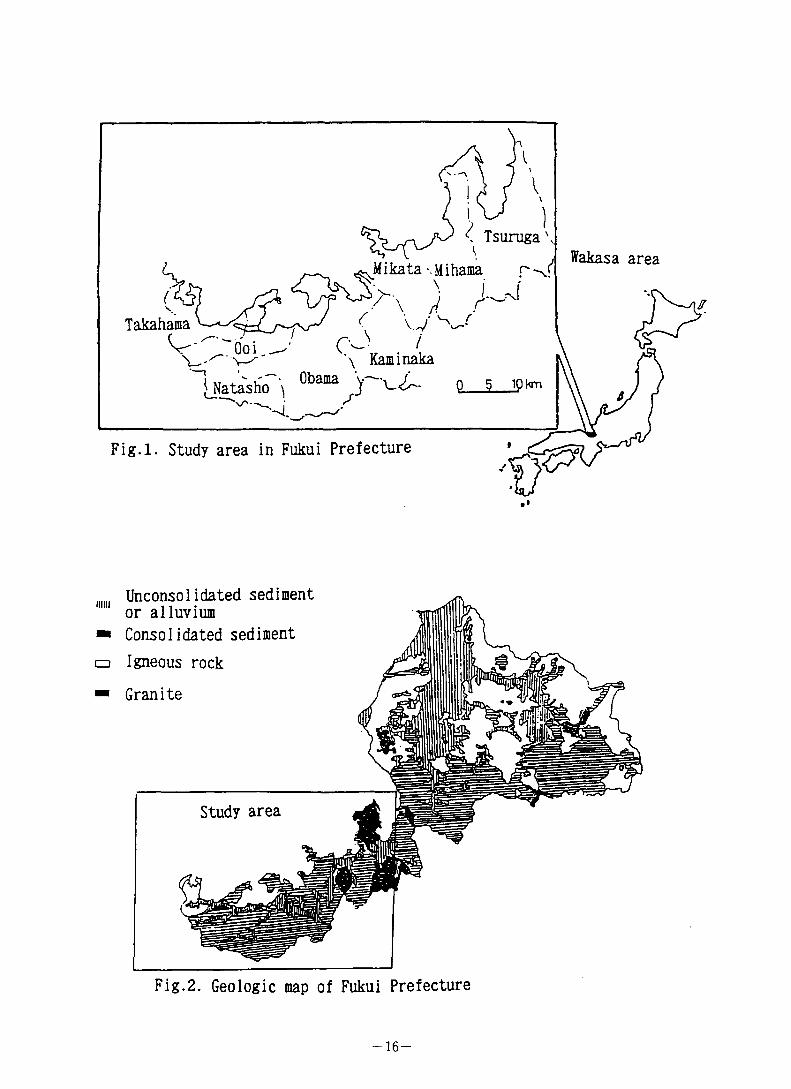
Table 1 Summary of Radon concentrations in water samples collected in Wakasa Area, Fukui Prefecture(Bq/1)
Water service Water source 1Number of samples 222Rn concentration
Private well Ground water 67 Median=28.5Range=0.7~943
Small public water supply
Surfaceflow water Underflow water
24 Median=5.0Range=l. 2~59
Large public water supply
Surfaceflow water Underflow water Groundwater
39 Median=11.2Range=1.2~104
ti*)s u^tzo t)&Lv v>mm<Dc(D&MizBimlx^z0 $mme>i<n9*>377-*wittiEimT-e*otz0
it&mx&kiss-mm£ n& ^ofco ^ o(Dtimk
#SEJE^e fc t,' T g §Effl*°yxxm*L/cf&Tzk£HI$Ltzo C3i6omTzKei0m^B,20mO9E$7i^S*sn^^#xe.n5o ±T'^fecfc9ic,
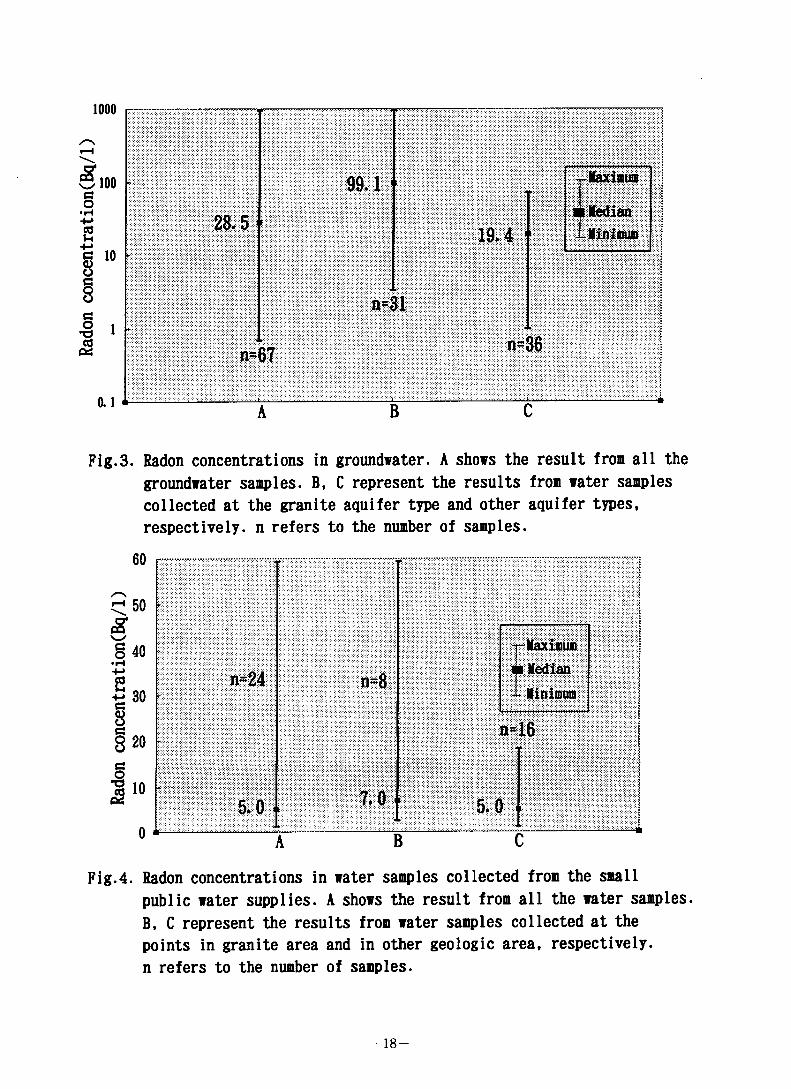
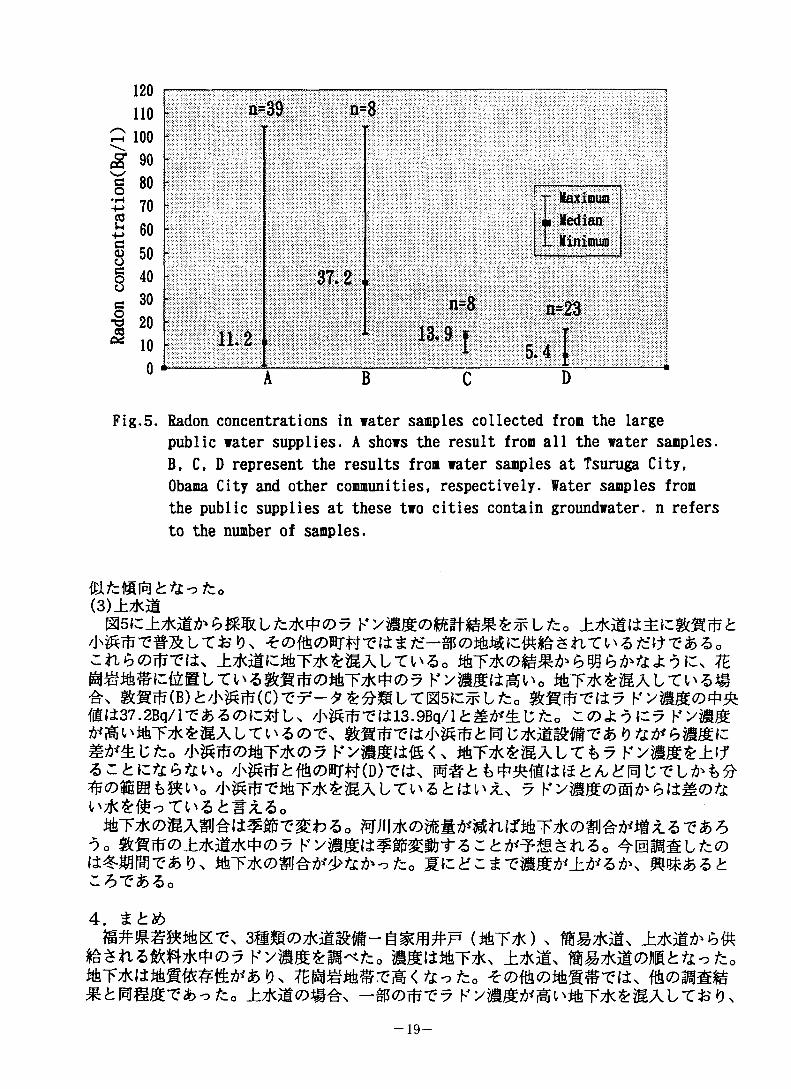
TBIs^MKB)<!: *<£>{ti<Dfi!ig^(C)T-r-* $r^El/co seim mtLtzm$kx&z0 Kyss©^#13:99.IBq/l<h% *K ^B>7W::{ft<D*tk®^T'$g&LfcJS&HU; (9fco iW^fS^StS!
mTzk^Oy Ky#meirfiffiacT#m-de6a6 ^v't&o mm^eTE^MT28Bq/l76^57Bq/l13,N SMI^ei30Bq/l©{S7H#B>nTl,'3101 o # *&mmm\umt%%im<Dr$<Dmm*x<Ltz0 * ©ttiio&gs •? e ^fsM9.4Bq/11 tl'itzo UtLZsmsTESL/h% AS©8±llBq/112 \ ±E<Z)4Bq/l^B)7Bq/l(0#14) ttz, momaemm?%x ^i^ifmi^nfmBq/i^B>16Bq/l10\ 1.2^e>8.4Bq/l<D#13> £SLTl'3o 7EN^S<Dl&T*e*fcM^&5
e*# ^ v \otzfc^O^ Ky#me, *0*9^3075' 6200Bq/10SQEe
^tfco 943Bq/l11'9L^ U 9#A?#t%^ ^ t o CO# A-eeumkri*£(D#mc^j:9ei$u^^9thieta&&, ftiosST*t>E^fc0
69^B,785Bq/l<h#'te)£V'|affl©Tf-^^t#enfcoMy#m^±&<m^&o ITF^iftKicko Ty Ky#m^±
§ < mwzgvz z£fr'%z_c,ti. mA(Z)R##& M j: 9 C#6^ ttmk^y K'ySa&<D#L&^L%i'6o(2)m#zkm
meEM*ii75> l/c*tf©7 k ymmomn&M**l/t „ m-ce,#(B)t*<D®kmmmoxftvtz^WL&„ ^n^n<D^\mti$rac®#a^
?et*(D^wmomzit? Kymmcmaw'o mjii©yvmmiz
emgcj:6mL\em&5B,wuo M;n*^<Dy KysmesTftkT^om/3o-e*ofii6,o mmme&6&^m<
-17-
Rad
on co
ncen
trat
ion(
Bq/l)
1000
100
10
i *
0.1
28.5
99.1
19,4
8=31
n=67 n=36
B
Fig.3. Radon concentrations in groundwater. A shows the result from all the groundwater samples. B, C represent the results from water samples collected at the granite aquifer type and other aquifer types, respectively, n refers to the number of samples.
60
50£§6 40
i”8 20
I10
n=24 n=8
5.0 .Y-................ —--- ----
7.0t
MaximumMedian
Minimum
8=16
5.0
B
Fig.4. Radon concentrations in water samples collected from the smallpublic water supplies. A shows the result from all the water samples. B, C represent the results from water samples collected at the points in granite area and in other geologic area, respectively, n refers to the number of samples.
—18 —
120110 a=39 n=8
Q 100S 90 - g 80 -£ 70 -
CO£ 60 -
- Maximum ii Median 1 Minimum
p 40 37.2c 30 - o n=8 n=23
10 11.2 13.9 f T1 5.4 |
A B C D
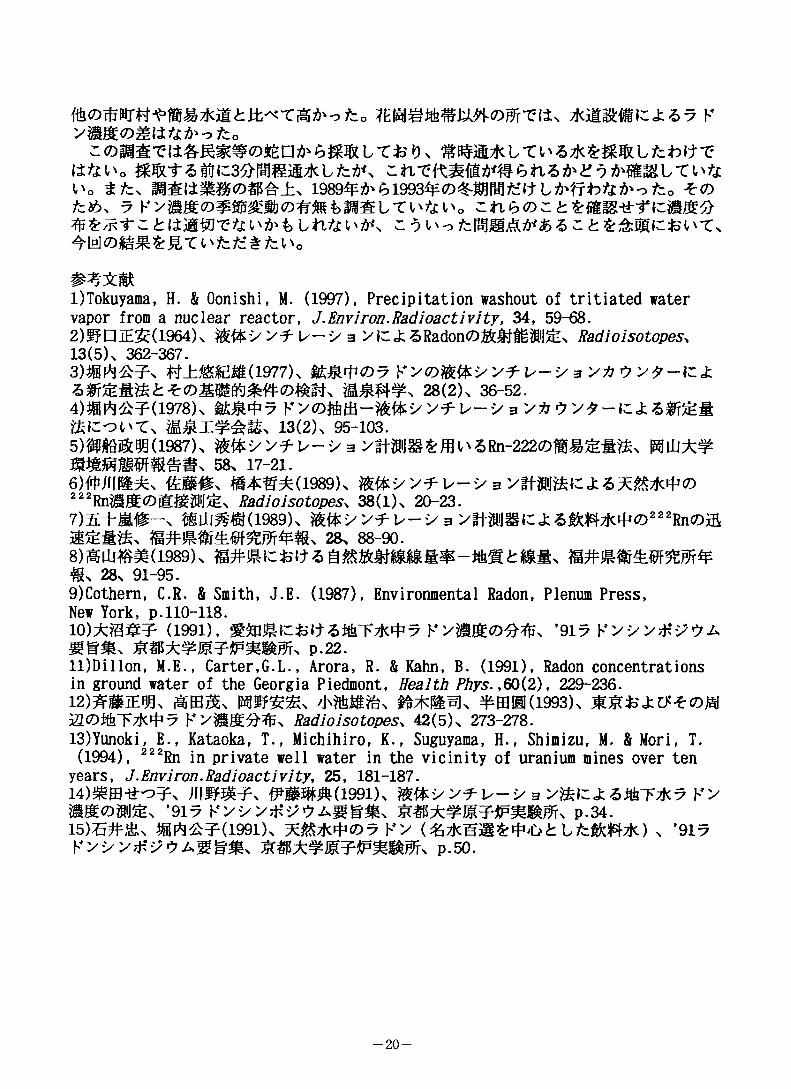
Fig.5. Radon concentrations in water samples collected from the largepublic water supplies. A shows the result from all the water samples. B, C, D represent the results from water samples at Tsuruga City, Obama City and other communities, respectively. Water samples from the public supplies at these two cities contain groundwater. n refers to the number of samples.
(3)_bkBKLtzoXlti tz—ffi<D%Li$.ZftX\,'Z>tzWX$>Z>0
cfiGOrfr?#, A L T i' 5 0 ftKymsiaiW^o ^ky^UALx^^m
S(gm(B) t/J^W(C)T-r-* L T05^L tz0#(±37.2Bq/l-e&a%)IC#L, /H$Wmi3.9Bq/l tm*$i\Ztzo Kyzi^
m^ttzo /M6rf?<DtrF*<Z>y ST*$rSALTt)7 Ky#m^±lf
/j^r##A L T u & <b (i u ;U 7
ao w\\y<D'famr&ft\t&y&<Dn\'&i>m7L%x&b ■9o sts:m(D±*ii*4i©7 k s ft 5 <> stains l/cco
to %\zzzt.m<%&5£Z-hX&Zo
4.
teztizmyy®? b'vmmzm^tzo ssii^TTKx ±.*m, m^jmm&tti^tzo
^.m^^xM<ti^tz0 zai&vn&n&xti, ftk<owm&^tnU&.Xb'itzo ±7k'M©*§£\ —afiCDrfiX? Ky#aWiSumTzk&#ALT&tK
-19-
tzo
mnrhtu ltz.tK rnx'Rmmtmbtizfrzo tMsslx^kt'o ttz, E&li##0$PA±x 1989¥^ 6l993¥<D^rBl/ce tz0 *<Dtz#>, 9 znz&zt*mm-&-rizmmfr
bli'MtyX'tH'frbLtitH'frs - 9 i'o -1 £±figi:::fct'Tx
##&i§K1) Tokuyama, H. & Oonishi, M. (1997), Precipitation washout of tritiated water vapor from a nuclear reactor, J.Environ.Radioactivity, 34 , 59-68.2) I?P 1E$(1964)s ##yy^lx-y a yfCck^Radon<Z)###W^x 13(5)x 362-367.3) #^t&?\ #±f&E#(1977)s W07 !/-'> a 7 >^-i: J;&#ea#airo&#w#<DmN sm 28(2), 36-52.4) #ma?(i978K yy^mm-m^yy^y-yBy^^y^-iz^^^mj&CoUTx 13(2)N 95-103.5) OTj&99(1987)n I/-y a ymBm&m'&Rn-222(Dm#ma#\ m\hX¥
s& 17-21.6) #;ma, £ESx #*#^(1989), !/-«> 3 yffE^tc222RniEJ$(DB^$iJ^x Radioisotopes. 38(1). 20-23.7) Z+m#-x ^LU^#(1989). %*yy^lx-i/a y#m§§Cj:6(k#*4)0'^Rn0a
28.88-90.8) i$Lu%#(i989)x c ^ e 6 @ - mm ^ m#x n#m®$LW%m*#x 28x 91-95.9) Cothern, C.R. & Smith, J.E. (1987), Environmental Radon, Plenum Press,New York, p.110-118.10) ±^B#? (1991), ft*? yymmnftft, ’917 yyyytfWJ*swSx p.22.11) Dillon, M E., Carter,G.L., Arora, R. & Kahn, B. (1991), Radon concentrations in ground water of the Georgia Piedmont, Health Phys. ,60(2), 229-236.12) mmE%x iWfflj&x /j#m%x ¥m@(i993)x20^+7 K ySJS^x Radioisotopes. 42(5)x 273-278.13) Yunoki, E., Kataoka, T., Michihiro, K., Suguyama, H., Shimizu, M. & Mori, T. (1994), 222Rn in private well water in the vicinity of uranium mines over ten
years, J.Environ.Radioactivity, 25, 181-187.14) ^b-£o?n m###d99i)x rnfayy^y-y aymzxztikrfr? yymmom^x '917 yyyyxw^mwm, p.34.15) 5#&x (1991)x ^£$**©7 b"y (^zKgm$r^5aL^#k#zk) x '917yyyytfi;vj»mwM. p.so.
tzo *ilES^J:5 7 K
-20-
(4) a, hn> hU(Cck<57k*^K>;ito<D;l$ :
Measurement of Radon Concentration in Water by means of a, r Spectrometry: Radon Concentration in Ground and Spring Water in
Hiroshima Prefecture
ffiH m (£*)K. Shizuma
1. (iCabC:
3^7 LT-^^L^tLTV^0^{d«7 KvSr^tpTKW^WW^ixrv'Sis, LT<D&& l) tt
fcot^7 KySr^irTkS^tfrhtfcS: |9ffbtLTv>/cev\7Kcp7 Ky^iiJ^te:—j&buMH
ya j: z^^
yv^wmk-zhZo Ky^$$lt£* 5tLdms<7)7^ boy 7
Si£, 7 h*y<DaM*m&&ft’fZ)Jj&kLTm'y>aX'<? boy b U(CoV^T##L,7 1^7 bny b U ^#mLTV\6o Z.thb<Djjm<Dfcmt Kyis
(Dtzib.
2. r&X^ boy b'Jlc«k^>**7 h#>S6<7)Si|$
2.1 mmo>mm7 Ky (^Rn, Ti/2=3.8235±0.0003d) tta017IIJ^^tS
^ttrtS^tiTf&VX, LA»L&dS&, 214Pb T1/2=26.8 min)*5 £15 2,4Bi(Ti/2=19.9 min) ^7 S^tti*td(7)-e Ge 5= 7 Ky
£o0 KycDBttmiS^WBLfco PimSTTK^y K'y
214pb bp*a wast'd * -eoBer^ -ttut*1 . a,a2
tma A,-A, -ln-(Ax - A0)A(
= 3.5 (A) (1)
btezo crr% Ao,A,,A;l±^^,f^ ™Rn, 218Po, 214Pb 214Pb#7 W3§4><7) 2,4Pb (D%## A(214Pb)ht 222Rnig A(222Rn){C^L< &5 (A(214Pb)=A(222Rn)) 0 214Pb A(214Pb)H&^(l £
4(2,4P6) = - (Bq) e
(2)
-21-
r ZLT\ « « 214Pb 352keV y&(D^rT\ teU ^ U
fl:£ V(ml) t -tfttiBTk^<Dy K>#gl±A=i(^).m (Bq/L)
e-v. F(3)
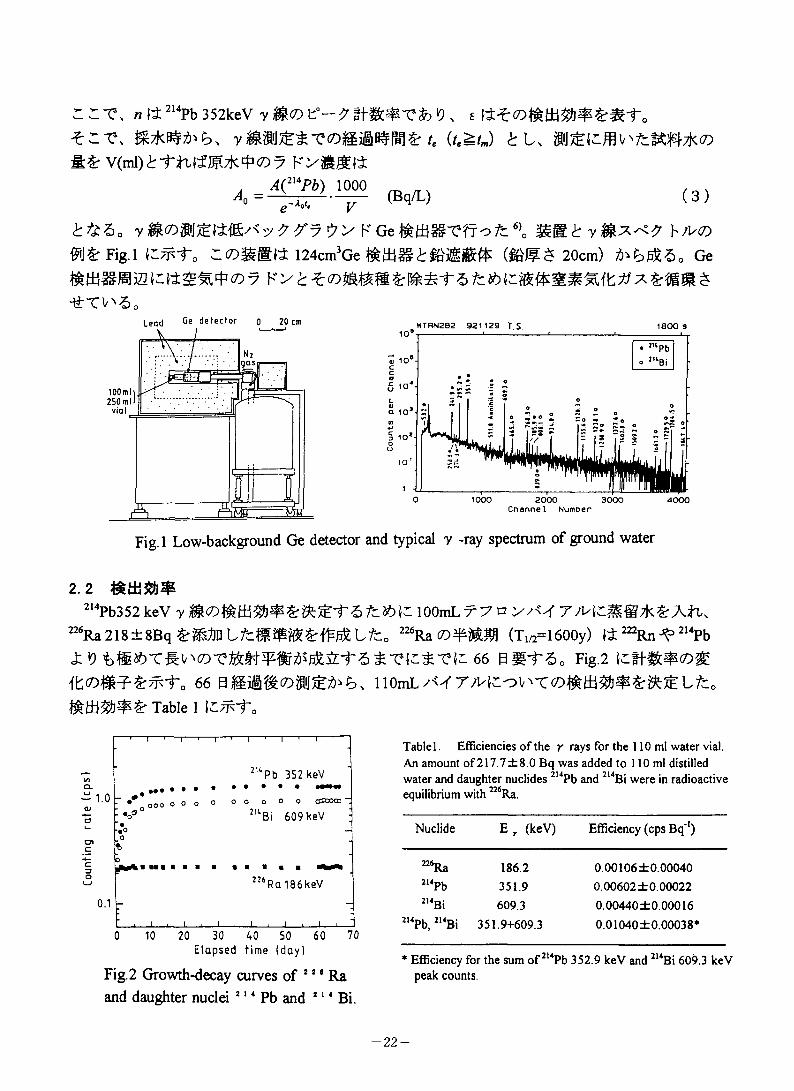
£*5„ y&Vffl&Z1&'<'y? ?*7?y FGemtB^vn^fc6)0 h/l/tf)fi»JS:Fig.l l^fo r^SEBti 124cm3Ge$tti^£ai&B& (&M¥£ 20cm) a>b$30 Ge
-ti:TV>;50■ . f»a rfa fortnr A "$A » —
HTRN202 921129 T.S.Lead Ge defector o 20 cm 1600 s
1000 2000 3000Channel Numoer
Fig.l Low-background Ge detector and typical y -ray spectrum of ground water
2.2 ###!$
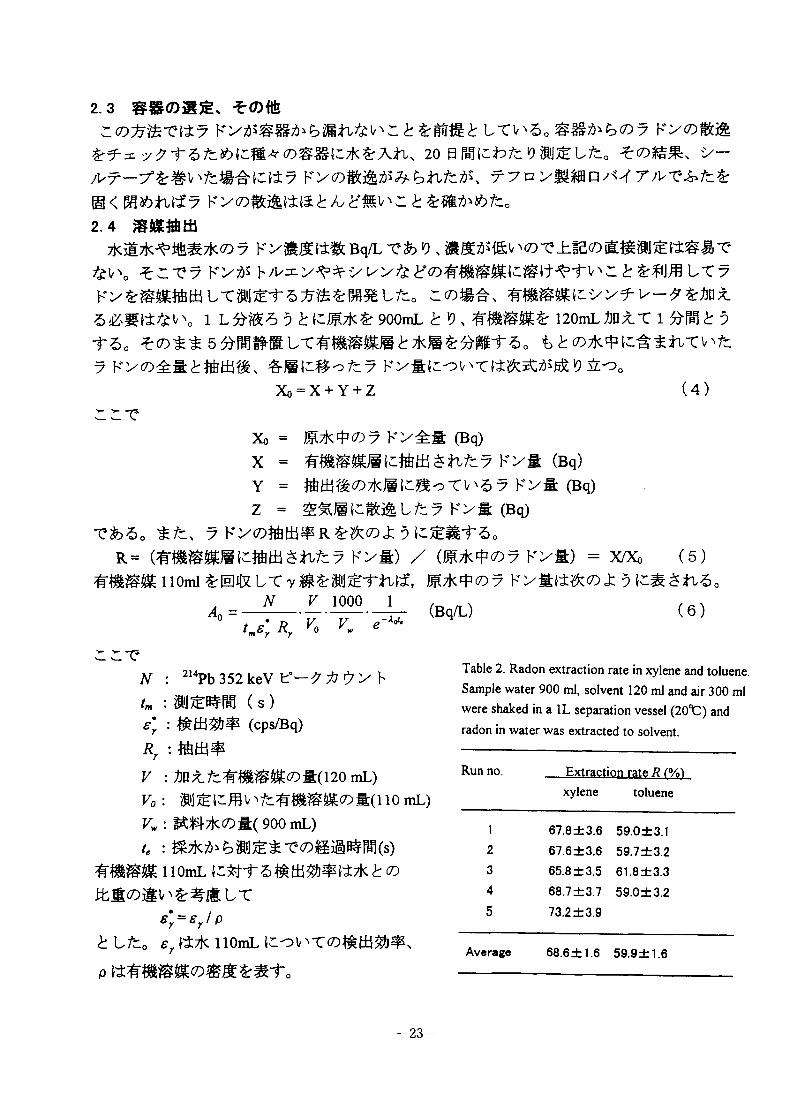
214Pb352 keV 7 lOOmLX 7 n >sU T/H^@7k£226Ra218±8Bq LfcS lfc0 226Ra <D^WM (Ti/r=1600y) It 222Rn ^ 214PbX 9 tM^>XM^^(DVMcM¥M^^xLi~6tV(^V^ 66 BSt~5o Fig.2
66 1 lOmL /W T/MCoVL/L,Table 1
Pb 352keV•♦••••000 o o o
Bi 609keV
10 20 30 40 50 60 70Elapsed time (day)
Fig.2 Growth-decay curves of *2 ’ Ra and daughter nuclei 214 Pb and 214 Bi.
Tablel. Efficiencies of the r rays for the 110 ml water vial. An amount of217.7±8.0 Bq was added to 110 ml distilled water and daughter nuclides 214Pb and 214Bi were in radioactive equilibrium with 226Ra.
Nuclide E r (keV) Efficiency (cps Bq'1)
“Ra 186.2 0.00106±0.000402,4Pb 351.9 0.00602± 0.000222,4Bi 609.3 0.00440 ± 0.00016
214Pb, 214Bi 351.9+609.3 0.01040±0.00038*
* Efficiency for the sum of 214Pb 352.9 keV and 214Bi 609.3 keV peak counts.
-22-
2.3 ^016z.(D^m-?\±7 tzmmt Lx^'Zo^m'bny fxdwl'm
^^3: 2̂0 B^i-bTt ^$iJ^Ufc0 y-
/>f—y&r#v\yb#^^H7 Fyz)mW^6^^\ f7nylKlP^77WWc^Ky1$£ Ay h*mx'X t
2.4 %mam
7km7k^m*7k(D7 KyMiilcBq/L xh 'o, #m^#v^-e±^7)K#m^(i##-e *V'„ ZXXy Ky^ h/F^y^^y yy^^7)#"a#E^tt^i-v^ ^ $r$ijm LT7 Ky$:SEtotoLTaijsi-5^&=S:MLrco C7)#e, wasEzyy^y-? £Sx. 5&ma#V\ 1 LM5 9 ir(^7K^ 900mL £ V , WaSESr 120mLAPX."Cl^^ 51-So 5^#mLT##i#E@2:7K@^emi-5. t^7)7K^^$jT,-CV^7 Kyo^tittws, &m\x®'itz.7 Ky#(^y-n^^^«9
Xo = X + Y + Z (4)rrt
Xo = ^4^7)7 Ky£* (Bq)X = WSSSl^tttoSiLfcy Kyft (Bq)Y = tttfjf£7)7kJf (-Bco TV ^ 7 Kyi (Bq) Z = £SUIR:|ti&Lfc7 K'ye (Bq)
XhZo i:/t, 7 Ky7)#m#R^%7)Zr= (WaSEltytetiti£;hZ:7 P'yfl:) Z (M7k^7>7 K'yft) = x/x<>
WSSS lioml £@4X LT mAf 7)7 Kyfifcm7>«fc5te# F l000 l
4 =/_Z /?„ F., -^Vf (Bq/L)
(5)
(6)
mvr
CCTA : 214Pb 352 keV t°— ? # £ y bL : ( S )
£"* : #(ij^l# (cps/Bq)4 : #m#
F : AnZ7cWSSE7)S:(l20 mL)VQ : $ijSi-ffiV>fcWBSE7)fl[(110 mL) Fw : ##7K7)a( 900 mL)4 : E7k^^$'JS^T‘7)BiSB#^(s)
WaSE llOmL (C#i-6#m##^7k^7)
itBT) jgiy£;%BLT e'r = er!p
t Lfc0 fy«7k llOmL (CoV^T7)^|±J^,
P ttWaSE7)^S^Wt"o
Table 2. Radon extraction rate in xylene and toluene. Sample water 900 ml, solvent 120 ml and air 300 ml were shaked in a 1L separation vessel (20%:) and
radon in water was extracted to solvent.
Run no. Extraction rate R f%)xylene toluene
1 67.8±3.6 59.0±3.12 67.6±3.6 59.7±3.23 65.8 ±3.5 61.8±3.34 68.7±3.7 59.0±3.25 73.2±3.9
Average 68.6± 1.6 59.9±1.6
-23-
3. hn>3.1 sisss. si$/<>tt;u
7 Ky^rr^yv^-E a=5.489MeV (7) a3.824d T^Si"50 7 K>® $St^=£: 218Po 3.1minT*a$BL, 214Pb, 214Bi — t 0 ^i"^0 214Bi
214Po 163 fi s-CaMt, 214Pb2 ~ 3 9
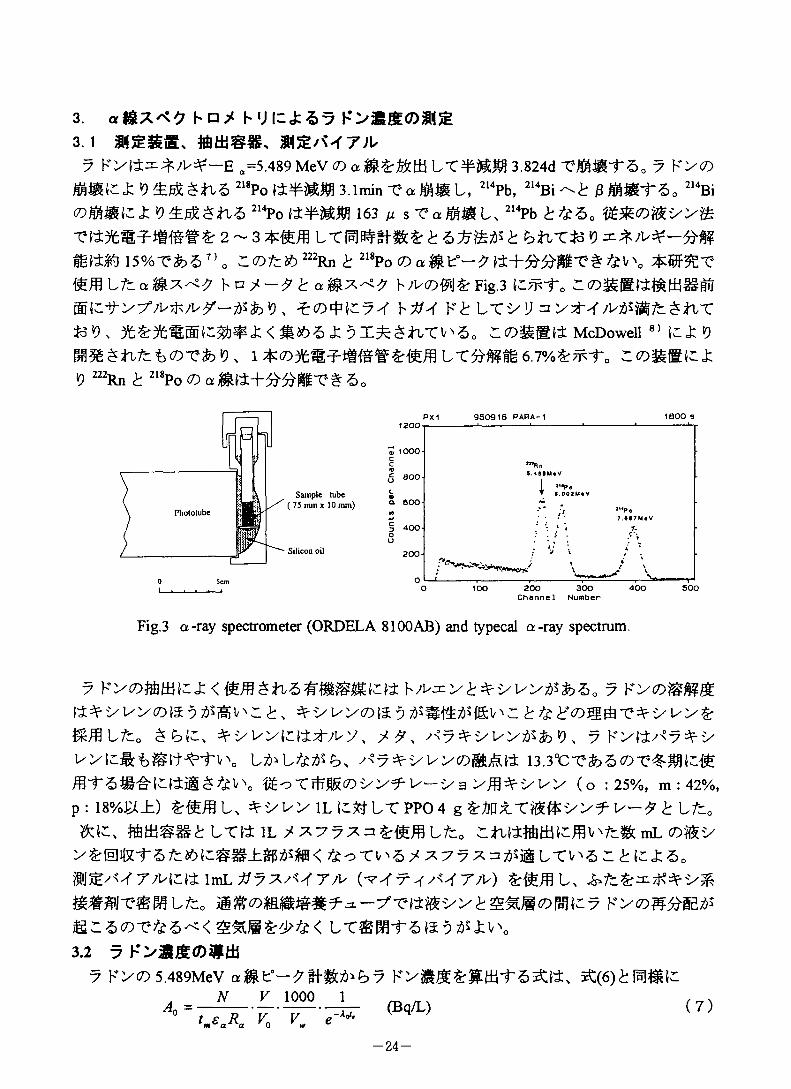
SEM 15%Xfc57)0 ZL<Z)*:£> 222Rn £ 218Po OaSt:0-^ti+5>^‘FiT#^V\b/V(7)#ij£ Fig.3 :: o3£Bhi1&^titg^f^^
@tc:1by70/Vz}vvy-;i5fc 19 x b#-f K<!: LTy U n y ;*-y/v#Wc5tiX*3 9. < #&& j: 5 McDowell 8) izZ'OG83S$tUbt2)X&9, 1 LX^-##6.7%^^^ Zco^gtcZ9 222Rn £ 2I8Po (Damt+ftftMVZ 50
PX1 950916 PARA-1 1800 31200
a 600
200-
200 300Channel Number
Fig.3 a-ray spectrometer (ORDELA 8100AB) and typecal a-ray spectrum.
7 Ky(7)%mcz <b;>^y^4ryyy^$)6. 7 Ky#m#$ te^yyytfm^i^v'r ^yyyoi$ 9> z: ^ yy y £
^yyyKH^y, /f, /<7^yyy^$>9, 7Ky(±/<7^y yy(-#t^it^i'v\ /<7=3ryyy<c#A#
^oTrtTlS(Dyy^y-y 3 yl^yyy (o : 25%, m : 42%,p : is%y±) ^yyy iu-*fLXPP0 4 geDixiffyyfy-^ tfe0
LTfi 1L 77^=3 Srffiffltfeo ZLfttettfflfcfflV'fci&mL <E>i£y ySrHiR-rs^fei^SSiSP^SK *oTl'5 * *77*=*tfSjS LXl'5 r. £ «t5„ tgiJ^WT/Wdte lmL^7 7/^7/V -SHfcffl U
-y-e^%yy^^@6DM(c7 Ky^s^-E^
$fi z: 5 <Z)X& 5 /< < S^JI£y>& < LT®P0-t'SI5 5^<tv\3.2 7 K>££<D#tti
7 Kyro 5.489MeV a$tWft*)^7 Ky#&&£tti*r55£ra\ K(6)^im#(C
Ao =F 1000 1
tmCaK V0 K e -^o». (Bq/L) (7)
-24-
>- *>- -r$ o '— V
N : ^Rn <D 5.5MeV a tm : S'J/Et™ (S) fa : (cps/Bq)Ra : (tK F,mL : %yy FmL)
F : tin X./"::*&'> y CO S:(mL) (3mL)F0 : #J^(cmv^#yytDm (lml)
Vw : V ^7K(D#:(mL) (lOOOmL)U : (s)
####&##&(c##yy lmi tpizgE&mcD? b*yr^'§LfttcM'mmfc‘&g-chz0
Ky^Sti£1\ EtK 900mL ^%yy 120mL£|gi 5U 7 Ky $r%yy(c#mi-S. ^oi'>y^^ imL££ tK aSSrW^-t^o -^\ a«9^#yy
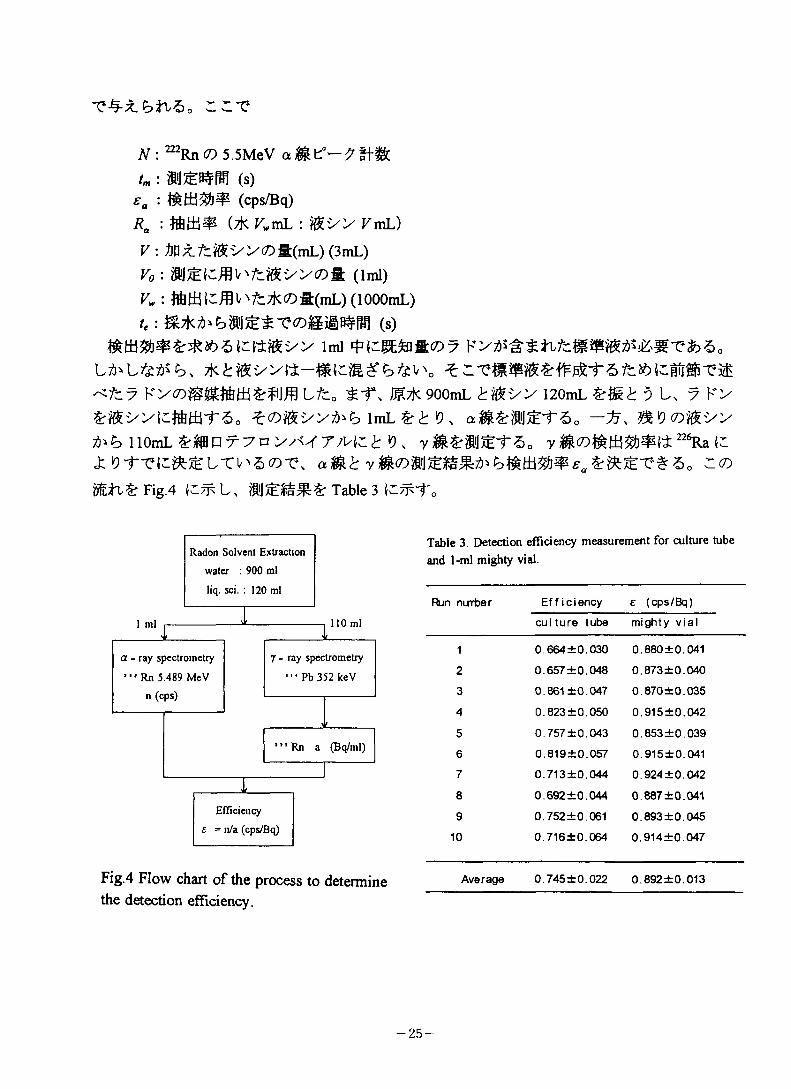
110mL&#OT7oy/WT/Hc^ D, y S^SJ^-f"d0 y 226Ra (C£ 9f-ei;L#:£LTiy5<Z)T\ aBt yB<Dfflffl&£zi)'b&to%}&ea%Zo ~<D
Fig.4 {Ctf U Table 3 (C^Tc
110 ml
Efficiency
e = n/a (cps/Bq)
7 - ray spectrometry
■“ Pb 352 keV
a - ray spectrometry
•" Rn 5.489 MeV
Radon Solvent Extraction water : 900 ml
liq. sci. : 120 ml
Fig.4 Flow chart of the process to determine the detection efficiency.
Table 3. Detection efficiency measurement for culture tube and 1-ml mighty vial.
Run nurrber Efficiency £ (cps/Bq)
culture tube mighty vial
1 0.664 ±0.030 0.880±0.041
2 0.657 + 0.048 0.873 ±0.040
3 0.861 ±0.047 0.870±0.035
4 0.823±0.050 0.915±0.042
5 0.757±0.043 0.853±0.039
6 0.819±0.057 0.915±0.041
7 0.713±0.044 0.924 ±0.042
8 0.692 ±0.044 0.887 ±0.041
9 0.752 ±0.061 0.893 ±0.045
10 0.716±0.064 0.914±0.047
Average 0.745 + 0.022 0.892 ±0.013
-25-
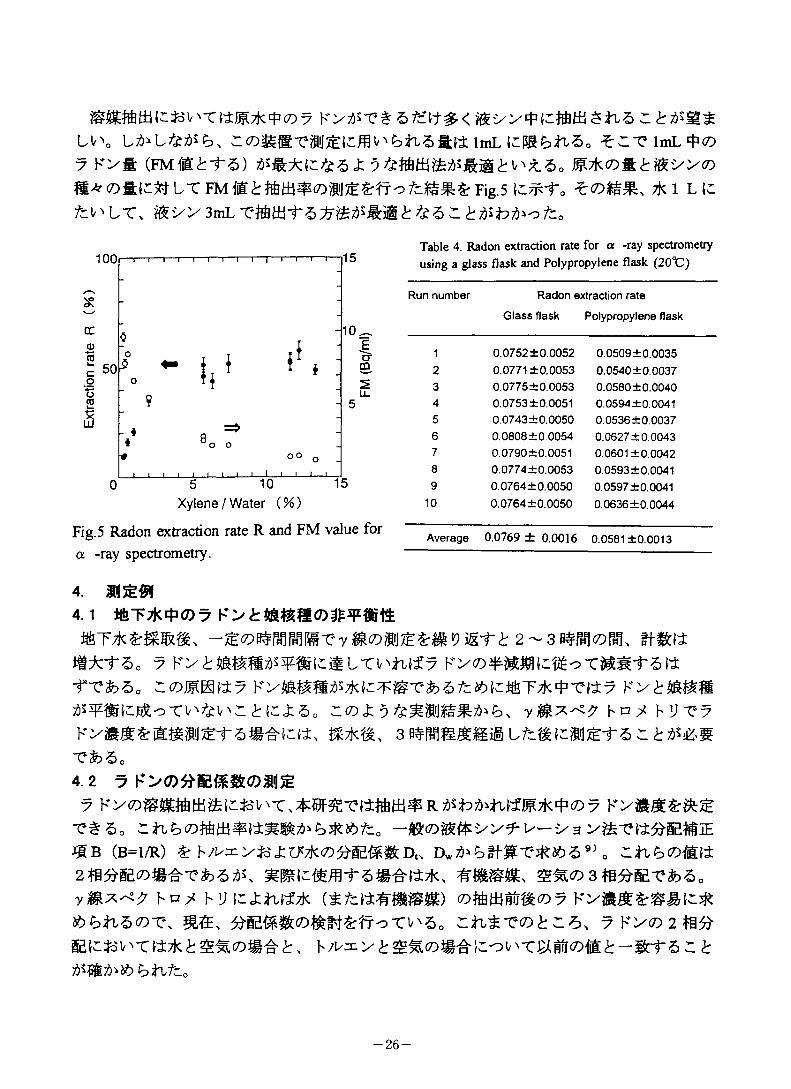
LV\ LfaLftfrb, C(D=^@-C#^(cmv^fT,6## ImL (dP^^^^o ^2T ImL ^(7)
■7 K>i: (FM#:«>i-6) ^#^(c^6z9^#m&^#m(kv^5o j^tk<Dmtm'»<D (Dmc^ LT FM #^ Fig.5 \Z.7jk-ro ^<7)*^ Tkl Lid
fcV' LT\ WL'S's 3mL Tumi'S # 3
Xylene / Water
Fig.5 Radon extraction rate R and FM value for a -ray spectrometry.
Table 4. Radon extraction rate for a -ray spectrometry using a glass flask and Polypropylene flask (20tC)
Run number Radon extraction rate
Glass flask Polypropylene flask
1 0.0752+0.0052 0.0509 ±0.00352 0.0771 ±0.0053 0.0540±0.00373 0.0775±0.0053 0.0580±0.00404 0.0753+0.0051 0.0594 ±0.00415 0.0743+0.0050 0.0536±0.00376 0.0808+0.0054 0.0627±0.00437 0.0790+0.0051 0.0601 ±0.00428 0.0774+0.0053 0.0593± 0.00419 0.0764+0.0050 0.0597±0.0041
10 0.0764+0.0050 0.0636 ±0.0044
Average 0.0769 ± 0.0016 0.0581 ±0.0013
4. mmm4.1 iftT7k4=(7)7
y<9 ei-^ 2 ~ 3 mmvm, m-mn
7 Ky^mmwsqmid#LT^:wf7 K>^id% cT5# TTfcSo e-mail7 kidtfst & 3/t*idi&T*■£ -m 7 2S5FffildfiJcoTV'&V'2£|d<fc30 2(7) J: 9 hnpt hy-C7
K £r mg$!l £1" 5 Id te. 3 BSBa&g&iS Lfc^ldfciJ^-TS 2 £2S&gT$)6.
4.2 ^ K>®*He«»a>JW5E
7 K>-(7)^m#m&(dj3v\T^#%Ti±#m^R^t)^ifm7k^(7)7 t$5o 2jT,^)(7)#m#ll#»^6#t»^. — «<*)$£#'>3 JgB (B=l/R) §r h/I/aiy&Jzmk-T^ES^Dt, D* 9) 0 2il6^)#[ll2WME<D»^-cfcS^, ^mid#mi-6#ei±7K. ##8#, S^(7)3fB^E-efc50
h i; id^iLif* (£/ti;*m$sm (7)#m##(7)7 K^#m&#aid^ £ib*L5<7)T\ ^Em<7)mSrtroTV>5= 2littoi:25, 7 Ky<7)2fB# El^*5V^Tlt7k^SMc7)S'^^:, F/^>^^(D#eid'3V^TJ^#(7)#^-#[i-6 2^
bti/fd0
— 26 —
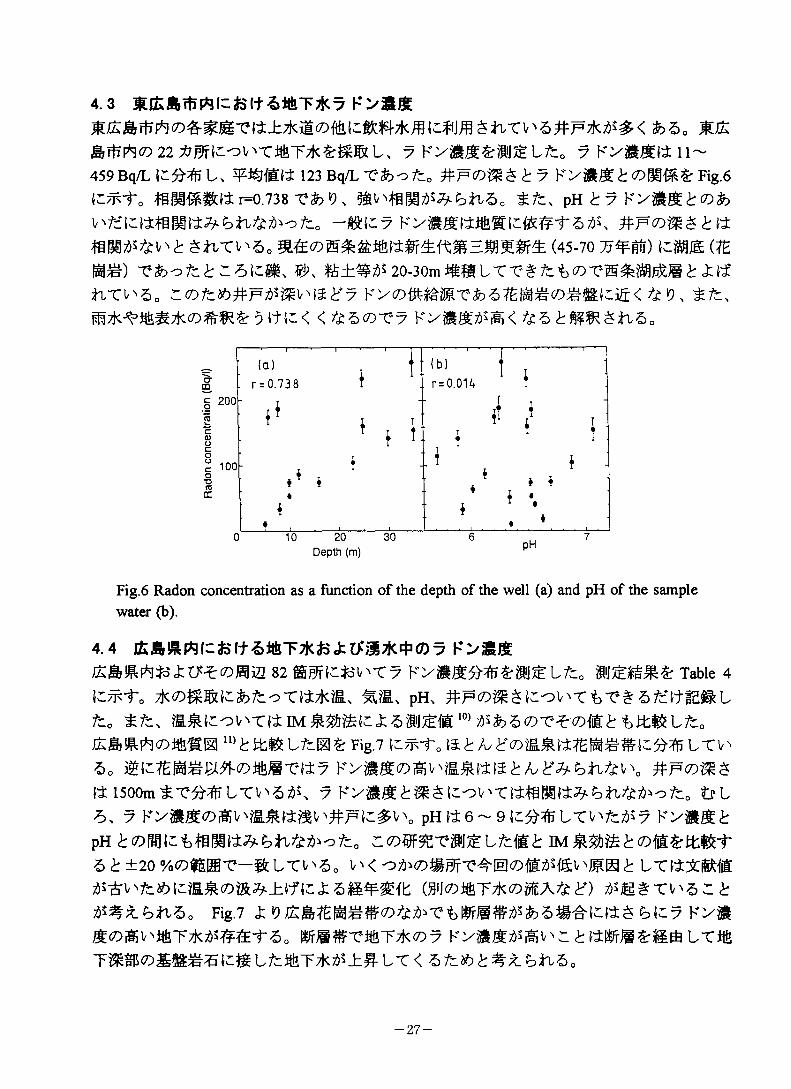
4.3 mjAS.rfrAicfcitstrFTfo
£>50 Mfc
22 *Bffi-^V>-CitiT7k5rEERL, 7 Ky#^£$iJ£Lfc0 7Ky#£tell~ 459Bq/L 123 Bq/L T'foo fc0 ± 7 Ky#$ t <D§!#£: Fig.6
ffiM^»ttr=0.738-C*>«9, ifc/c, pH £ 7 Ky#££tf)fcv^£(cttflig||^?jti*^oyho -«{i7
£*vcv^0 (45-70 WS) fciME (#mm) ^o/-:K6i;i, e, 2o-30mmffiLTvztz'bvvm&Mf&mt xitfb-cv^o
mk^WDk(D##&5#K:< < ^6<7)-C7 Ky#^i%< ^5
s§ 200
i8Co■§tr
—. .—.(a)
t *:(b) rrn’ r = 0.738 r = 0.014
: t* i t* { K I
i11 l:
- t t -.« *«
*$ ♦ •
i •k * 1 •
« , , , .«. , *............. '10 20 30
Depth (m) pH
Fig.6 Radon concentration as a function of the depth of the well (a) and pH of the sample water (b).
4.4 &aR#(c&(fa*T*&J:tfm7K4](D7 KZ/SR#
jEAmmeiwema 82 Ky$$^£$j£Lfc0 m^m^sr Table 47KcoE®i-^7toTti7K^ pH,
fto £fc,j£Sm^(Diti«El U)bttmLfdllSr Fig.7 \z^-ro \ZbhVTV>5, mt1£M%£Xft(DMmx*\t7 Ky#$<Z)^WMy±l$^^ibii&i\ t± 1500m £LTV'57 Ky#*i?ll$l:ol/'TliffiS«:^biX)fe^ofco tf L 5, 7 Ky#S<7)iEv^g.Slt?Sv^Flc:^v\ pHf±6~9i:5)flT^fc^7 KyfcSfc pH Ct7)9F%-ezgiJ^:L/MEb IMb<Dm%Vc®?t5 £ ±20 %<DS£I3T—g:LTV'5o v' < 'EB b LTitzScBIE
'fcV)5E¥^b (BiJo&TTkcDSftAfc^) ^$a#T^6 " ± is#^.bti5o Fig.7 Ky#S^Sv>t6T7k^#6-t-^0 WfSffir-CiST*^7 Ky^S/dW^ b htEJI^Eti LTi& T^coS^m^(^L/c%T7K^±#LT< Sfcfci:#* bftfco
-27-
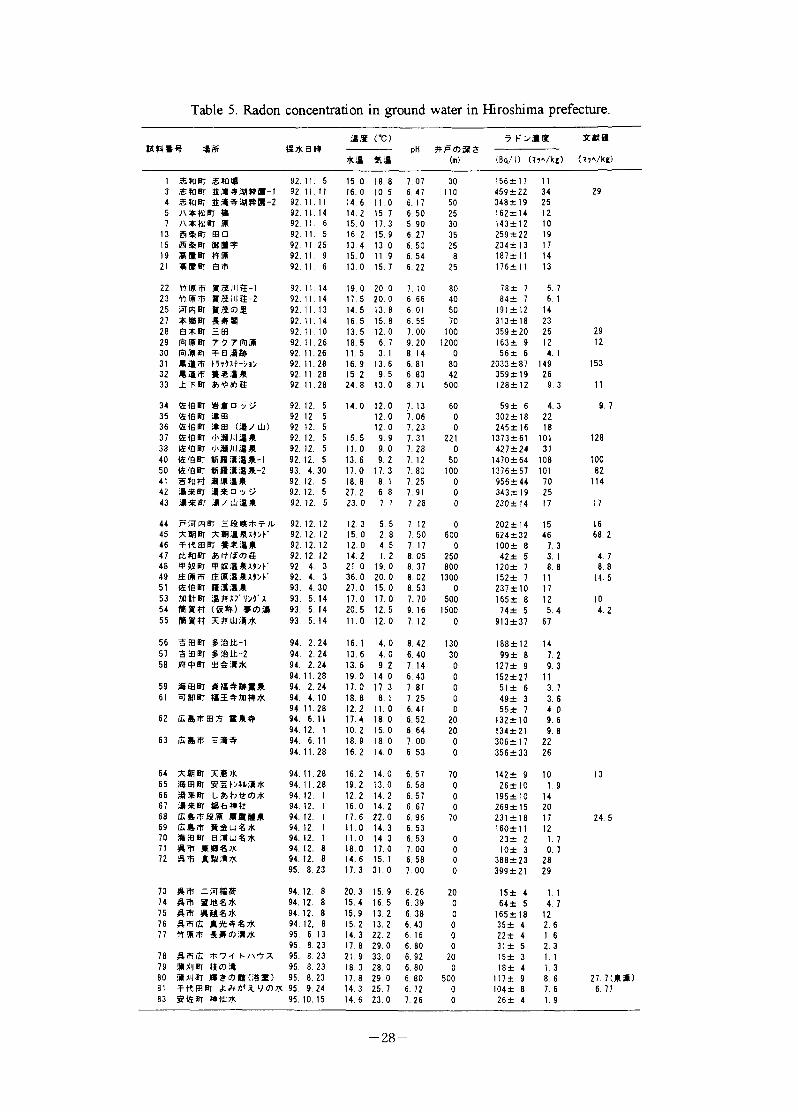
Table 5. Radon concentration in ground water in Hiroshima prefecture.
S*BI#as rn
pHCm)
7 K>a$ XKffl
(7Wke)*a at a (Bg/I) (7Wk{)
1 .SHUT $tt(B 92. 11. 5 15. 0 18.8 7.07 30 15 6 ± 1 7 113 .$«bt 92. 11.11 16.0 10. 5 6. 47 110 459± 22 34 294 $toer &*#a#a-2 92. 11.11 14. 6 11.0 6. 17 50 348± 19 255 A*toBT a 92. 11. 14 14. 2 15. 7 6. 50 25 162± 14 127 A*#!ET dk 92. 11. 6 15.0 17. 3 5. 90 30 143 ± 12 10
13 B&BT fflP 92.11. 5 16. 2 15. 9 6. 27 35 259 ± 22 1915 b$8t 92. 11 25 13.4 13. 0 6. 50 25 234± 13 1719 #BBr 92. 11. 9 15. 0 11. 9 6.54 8 187 + 11 1421 «®BT S* 92.11. 6 13.0 15. 7 6.22 25 176+11 13
22 nwm 92. 11. 14 19. 0 20. 0 7. 10 80 78± 7 5 723 wsm *am3-2 92. 11. 14 17. 5 20. 0 6. 66 40 84+ 7 6. 125 iSlFtjBT 92. 11. 13 14.5 13. 8 6.01 50 191 ±12 1427 *0Br 92. 11. 14 16. 5 15. 8 6. 55 70 313 + 18 2328 S*Bf Zffl 92. 11. 10 13.5 12.0 7.00 100 359±20 26 2929 iBlfltBr 77 7$>m 92. 11.26 18.5 6. 7 9.20 1200 163± 9 12 12
30 isi«bt msam 92. 11. 26 11.5 3. 1 8. 14 0 56± 6 4. 131 J69|rf) lii'Jif-vi 'J 92. 11. 28 16. 9 13. 6 6. 81 80 2033 ±87 149 15332 aim ®$aa 92. 11. 28 15.2 9. 5 6. 83 42 359+ 19 2633 ±tbt ibv-tts 92. 11.28 24.8 13. 0 8. 71 500 I28± 12 9. 3 11
34 tiElSBi *}*D ~j v 92. 12. 5 14.0 12.0 7. 13 60 59± 6 4. 3 9. 735 &10BI *ffl 92.12. 5 12. 0 7.06 0 302 ± 18 2236 ttiesr tay cl)) 92. 12. 5 12. 0 7.23 0 245 ± 16 1837 KI0BJ '1'34JII;8M 92. 12. 5 15.5 9. 9 7.31 221 1373±61 101 12838 161BBT mama* 92. 12. 5 II. 0 9. 0 7.28 0 427 ±24 3140 iti0Br waaaa-i 92. 12. 5 13.6 9. 2 7. 12 50 147Q±64 108 100
50 i0bt tfaaam-2 93. 4.30 17.0 17. 3 7.80 100 1376 + 57 101 8241 s*tm a a a* 92 12. 5 18. 8 8. 1 7. 25 0 956 + 44 70 11442 a$Br a$a ~j > 92. 12. 5 27. 2 6 8 7. 91 0 343+ 19 2543 a*Br a/aia* 92. 12. 5 23. 0 7. 1 7. 28 0 230±14 17 17
44 92. 12. 12 12. 3 5. 5 7. 12 0 202 + 1 4 15 1645 X«Bt ?;KISJ)>r 92. 12. 12 15. 0 2. 8 7. 50 600 624+ 32 46 68. 246 mi-tsar #*a* 92. 12. 12 12.0 4. 5 7. 17 0 100+ 8 7.347 tttoBr »iti£®S 92. 12. 12 14.2 1. 2 8. 05 250 42± 5 3. 1 4. 748 m fisar fisa*i)>K 92. 4. 3 21.0 19. 0 8. 37 800 120 ± 7 8. 8 8.849 Earn E«a*3)>7" 92. 4. 3 36. 0 20.0 8.02 1300 152 ± 7 11 14. 551 &i0Bi aaa* 93. 4.30 27.0 15.0 8.53 0 237+ 10 1753 Miter nmr'M'x 93. 5. 14 17.0 17.0 7.70 500 165+ 8 12 1054 M**t asm aroa 93. 5. 14 20.5 12. 5 9. 16 1500 74+ 5 5.4 4.255 ®x# %*ma* 93. 5.14 11.0 12. 0 7. 12 0 913 ± 37 67
56 sbbj ^;att-i 94. 2.24 16. 1 4. 0 8.42 130 !88± 12 1457 SfflBj #,=fitk-2 94. 2.24 13.6 4.0 6. 40 30 99± 8 7.258 ffffflBr a#** 94. 2.24 13.6 9. 2 7. 14 0 127± 9 9. 3
94. 11.28 19 0 14.0 6.43 0 152+27 1159 SfflBr *«#»** 94. 2.24 17.0 17. 3 7 81 0 51 ± 6 3. 761 ■sjftiBi aE#mt#7k 94. 4. 10 18. 8 8. 1 7.25 0 49± 3 3. 6
94. 11.28 12.2 11. 0 6. 41 0 55± 7 4. 062 ElffflS «*# 94. 6. II 17.4 18. 0 6.52 20 132+10 9. 6
94.12. 1 10.2 15. 0 6. 64 20 134 ± 21 9. 863 earn za* 94. 6. 11 18.9 18. 0 7.00 0 306+ 17 22
94. 11.28 16.2 14. 0 6. 53 0 356 + 33 26
64 XtoBr 35** 94. 11.28 16.2 14. 0 6.57 70 142+ 9 10 1365 SfflBj $si>Ha* 94. 11.28 19. 2 13. 0 6.58 0 26± 10 1. 966 a*Br uAhti-m* 94. 12. 1 12.2 14. 2 6.57 0 195+10 1467 assBr 94.12. 1 16.0 14. 2 6. 67 0 269+ 15 2068 esmsi »s»* 94. 12. 1 17. 6 22. 0 6. 96 70 231 + 18 17 24. 569 e»s **uj$* 94. 12. 1 11.0 14. 3 6.53 160± 11 1270 smBr asms* 94. 12. 1 11.0 14. 3 6. 53 0 23± 2 1. 771 am *»«* 94. 12. 8 18.0 17. 0 7.00 0 10± 3 0. 772 am *m;w* 94. 12. 8 14. 6 15. 1 6. 58 0 388 + 23 28
95. 8.23 17.3 31. 0 7.00 0 399 ±21 29
73 am 94.12. 8 20.3 15. 9 6.26 20 15± 4 1. 174 am ante* 94.12. 8 15.4 16. 5 6.39 0 64± 5 4. 775 am aa«* 94.12. 8 15. 9 13. 2 6 38 0 165+18 1276 amE **3«* 94.12. 8 15.2 13. 2 6. 43 0 35± 4 2. 677 tt*m *»ma* 95. 6. 13 14.3 22. 2 6. 16 0 22+ 4 1. 6
95. 8. 23 17. a 29.0 6. 80 0 31+ 5 2. 378 amE mrM- 95. 8.23 21. 9 33. 0 6. 92 20 15± 3 1.179 mWBr urn a 95. 8.23 18. 3 28.0 6. 80 0 18± 4 1.380 #MBr atmttosx) 95. 8.23 17. 8 29.0 6. 80 500 117± 9 8 6 27. 7(SS)81 mttfflBr iftH'iijro* 95. 9.24 14. 3 25. 7 6. 72 0 104+ 8 7. 6 6. 7783 eiSBr aiiu* 95. 10. 15 14. 6 23.0 7. 26 0 26± 4 1. 9
-28-
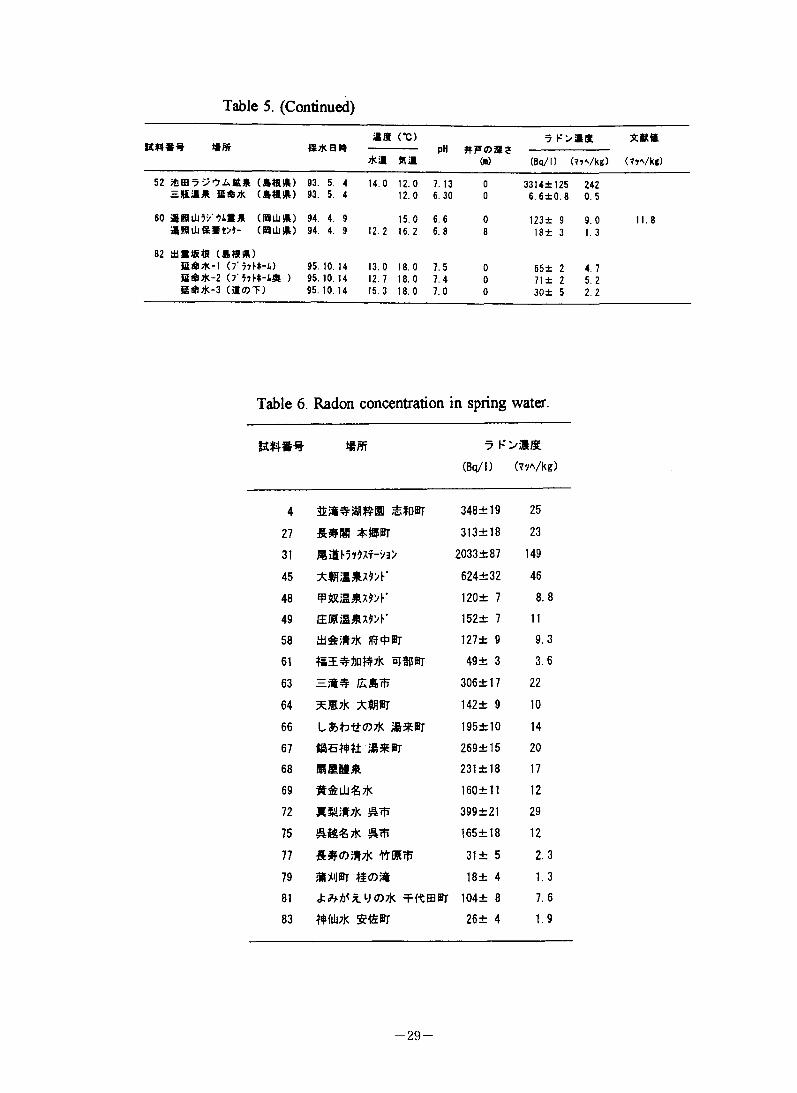
Table 5. (Continued)
ttti## mm S*awas (°C)
pHCm)
7 k>*$*a si a (Bq/I) (7?Vkg)
52 ,16697 (»«!*) 93. 5. 4 14.0 12.0 7.13 0 3314+125 242= Bft* (»#*) 93. 5. 4 12.0 6. 30 0 6. 6±0.8 0.5
60 ftJBiiJr/OA** (Hill I*) 94. 4. 9 15.0 6.6 0 123+ 9 9.0 11. 8(hlu*) 94. 4. 9 12. 2 16. 2 6.8 8 18+ 3 1. 3
82 (»«*)B67k-1 O'iin-L) 95. 10. 14 13.0 18.0 7.5 0 65± 2 4. 7B»*-2 (rsnt-A# ) 95. 10.14 12.7 18.0 7.4 0 71 ± 2 5. 2B**-3 (B(OT) 95. 10.14 15.3 18.0 7.0 0 30± 5 2.2
Table 6. Radon concentration in spring water.
BBSS tftefT 7 K>;!S(Bq/I) (vyVkg)
4 348+19 25
27 313±18 23
31 2033 ±87 149
45 624+32 46
48 120± 7 8.8
49 152± 7 11
58 ttiS;*7k 127± 9 9.3
61 1*i#flat#7k pJSPBt 49+ 3 3.6
63 Eft# EArfj 306±17 22
64 ^.i7k 142+ 9 10
66 Lfct7ti-(7)7K 195±10 1467 269+15 2068 E5S8I& 231 ±18 1769 #&iii€7k 160±11 1272 *$ift7k 399 ±21 2975 #^7k 165 ±18 12
77 31 ± 5 2.3
79 ftkW t$<Dft 18± 4 1.381 ?)7k EitBBr 104± 8 7. 683 ##7k $6»r 26+ 4 1.9
-29-
Hiroshima prefecture
Granite
Rhyolite
Older rocks
Clastic rocks53 Silt, Clay
o 60
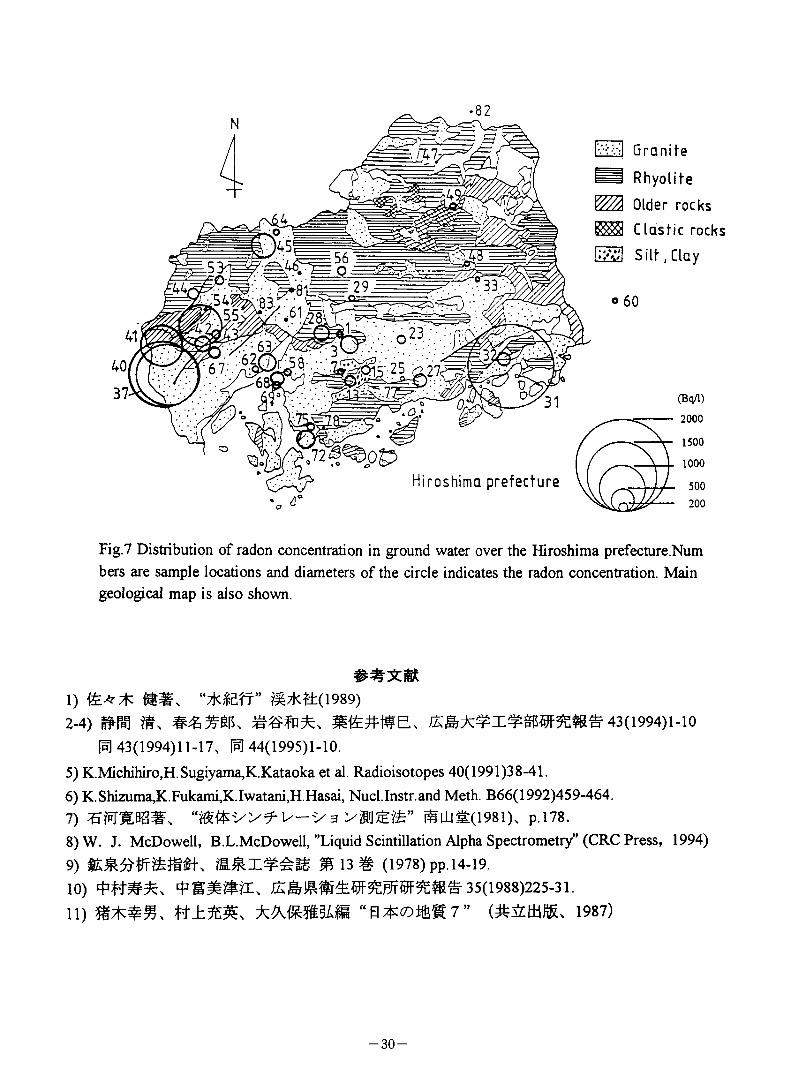
Fig.7 Distribution of radon concentration in ground water over the Hiroshima prefecture.Num bers are sample locations and diameters of the circle indicates the radon concentration. Main geological map is also shown.
I) mm. “TklSfT” 7H7k*±(1989)
2-4) 43(1994)1-10
1^43(1994)11-17, 44(1995)1-10.5) K.Michihiro,H.Sugiyama,K.Kataoka et al. Radioisotopes 40(1991)38-41.6) K.Shizuma,K.Fukami,K.Iwatani,H Hasai, Nucl.Instr.and Meth. B66( 1992)459-464.7) SUJ^(1981), P,178.8) W. J. McDowell, B.L.McDowell, "Liquid Scintillation Alpha Spectrometry" (CRC Press, 1994)9) # u# (1978)PP.i4-i9.
10) 35(1988)225-31.II) wb ?n 1937)
-30-
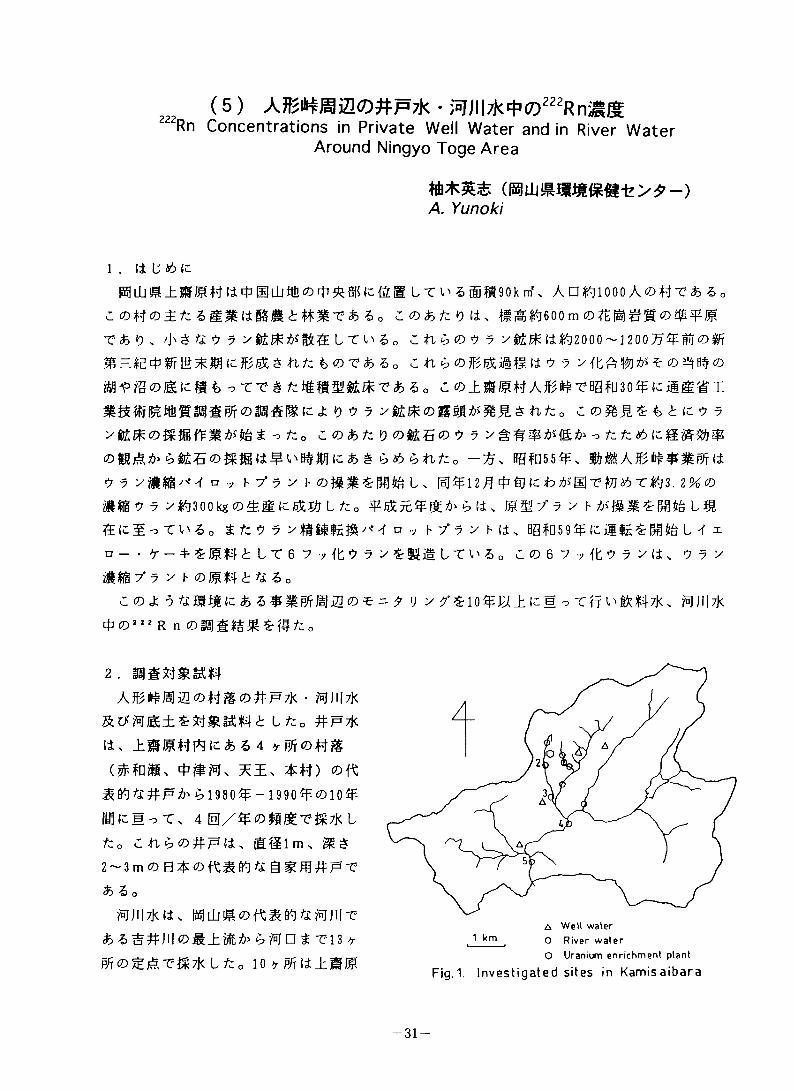
(5) • *JJIl7k^<Z)222Rn;aUt:222Rn Concentrations in Private Well Water and in River Water
Around Ningyo Toge Area
(miliA. Yunoki
1 . (i U 46 (c
Ad^lOOOA©#? $, 6o
:©^0l/;4iilig§giWiTi5o C © & A 9 It > #^^600rn©^^^m©$^m
?& 9 . /J\ ^ A 9 7 y Sievin'Lti'So zti£<D9 y yS£EFli^2000~i2007?^iN©#r
mHE*STti5k^<cBE$nA tons, cn^©BEiSflii 9 7 yfbA#*^©^8#©
8B<F>?S©& *> rtti feUStMteflc-riio c ©±*mWAB^?Bgf030^(cag#i
SSEI^iti2Ka@S^©i@SEA J: 9 9? y ^©SSHtffiSji * ft A0 c ©%H£ f> t ic 9 7
y*£fl5©«#8f^H**tei yfto c ©*A 9 ©A&5© 9 7 o AA©icg^r%$
©#gA^6#6S©$g@(j:#i^mic*# 6 *6 ft A, -#N BBfOSS^. »«SA^^**Bfr(i
9 y yWUfa'■<'< n .y h y 7 y h L. *t)ft ft*>'@Tftj-s6T^3.2%©
#*@9 7 y^300 kg©i$S(c^ejL Ao b 7 y h L#
SKSotl'So JA9 5 y milled D .y h 7" 7 y H±, B8m59%icig$z^^% Ui
n - • A - 4- A L T 6 7 y it 9 7 y £S¥i£ t T l' 4 0 C 0 6 7 7 ft9 7 y IA 9 7 y
#my 7 y r ©m#6^6o
c ©ck 9 ttJSUifc* -5**0^220* - 9 V y 9'^10^J^±aM ^ t^JUtK
*©'" R n ©M$$%£^fto
2. astt&smAB##^a©#%©#^;X • #ejjl|7k
la, np7k
tts 4 »m©#%(jfcfDiBU A3E. $#) ©ft
#M/I#F^yl980^-1990^©10^
FbUcM^T, 4 lEl/$©^%TK*L
A0 Cftb©#F(ix EEl m x % £
2~3m© B$©ft#m% @M#F-C
i 5 O•MJI|7M(4x MLLm©ftmM^^MlT
*5SftJH©S±oSA^MntT137 R/r©MTi*7|< L Ao 10 7 PfT(*±EE
A Well water O River water0 Uranium enrichment plant
Fig. 1. Investigated sites in Kamisaibara
-31-
KB
208
00
4 fri
34 Jtft 3" E- 8= dlE H8 $51 r q d y& H E rt aiE° p
>HFH94-%38ffllfi
# T'nl dRg -H
S 51 PB S i£ S
Or
>H h-w m94-
s 2t 4 8 ^ B a y
dlE m I (4
E# m
mdlE
-&#a94-
fl9114o
#2
d*
51 K
Q XHI dtE scr til o(V ds cte cmC- °d 4 8 0 CM0 Hv 94-
coX)
4V4
v44
r<3vP4^ M-51
' 0 s #
0 HIs 0
ntt m(V $i#a SB @ r S
=3
d&O
to I
o d (4 S at- 81 ait j c <M- rt Ft 3 ° rv d 1 r< c m CM(M 0 ^
0 Stt m : # 0 , % E
0 # s «^ FH# mn ^ 9-r *
(4m m #ft} ~
n91i 4
m?HI #
HI
n0
dFHmts©&
9c-&0
933g#:
» m(4 5$
© fT Xn
91i 4•a/\
o4<ii$>
at?
(V
Frequency Frequency
Pi HI^ —# 9^
z ©
%xX
a
X
?o3s
29c(V
&nK0
©4F&d$
3K
w-
HiWtH-*©
HifH}m
HiE494-
32#%2?
94-Zt>OX*&>
Itree
E(4m
594-
E
&<•
H
$mw
Ffi?(4a
c
rv
%to
sg&
(XOr
#4\y-3-(X0d
$eafnAJ
933
0E
(4
81o
%#VV 4
T I
K-m
V
\T' V
© 4 8t Im 4
® i r4 d
or m^ n4 %
<r4 Ftx_ 0fX ^V
n a
^ I
(T n° 98S cE 2f
^ $ S 52
d rv
l l94- ,
^ _
41
n
vH
V
4
94-
51CMJd■a■aoOq
rv■ao•ao■ao
SQ
(4
%35
fT
TH
V4
V4
T
co
93
9VM
ffimX|
#ddt-CMrt»
"TT-B-ti-
5'
%
m
%
-ft4
*
%(4
cd
4CMo
(4>3>9
HI
0Mi
9r
Fr 3 IE rv r4 51 S3 iH} 21 1 Hr E © rv ©Sr ^ 3 rt
H M :
<= 11 EV \ #
4 9ft I4 0 Z^ & 5
v m hif d © 4 hr 53
ML '
91i4
51 *•
2t H3 \© -m ^ © * %51 » 0 d M 5S Hr 99 d <~ S Ft 2 °4 Him ms 4r n Ft 0
d94Hi
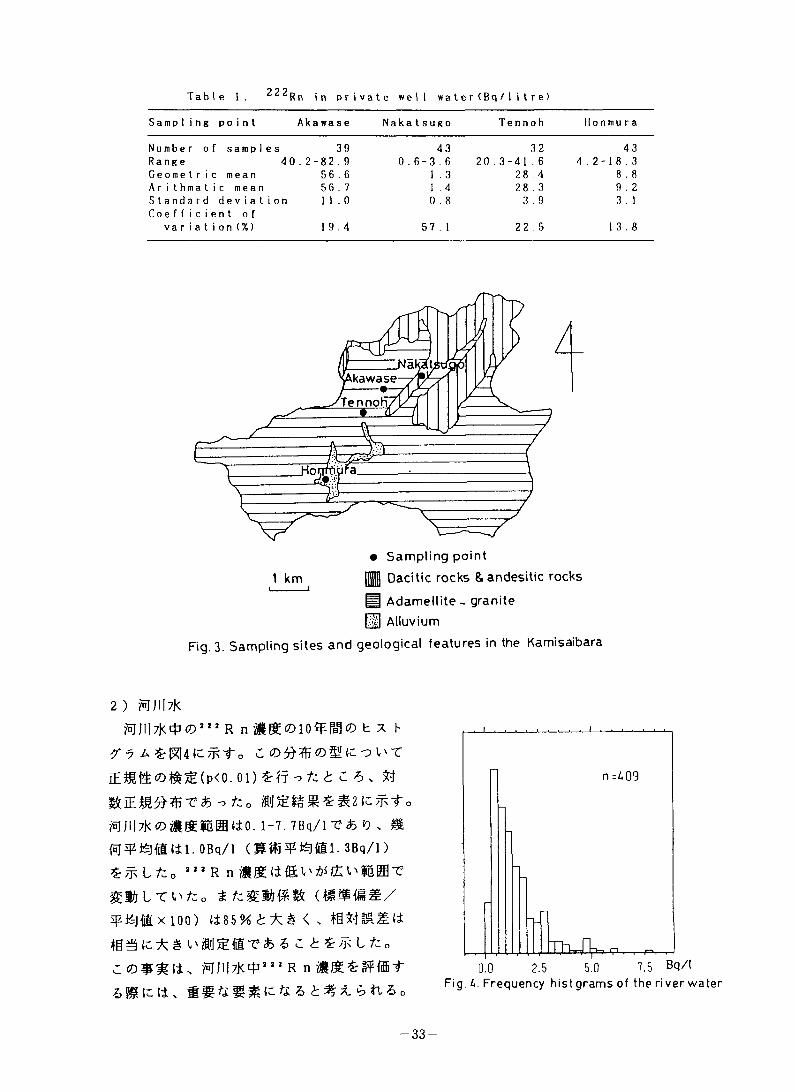
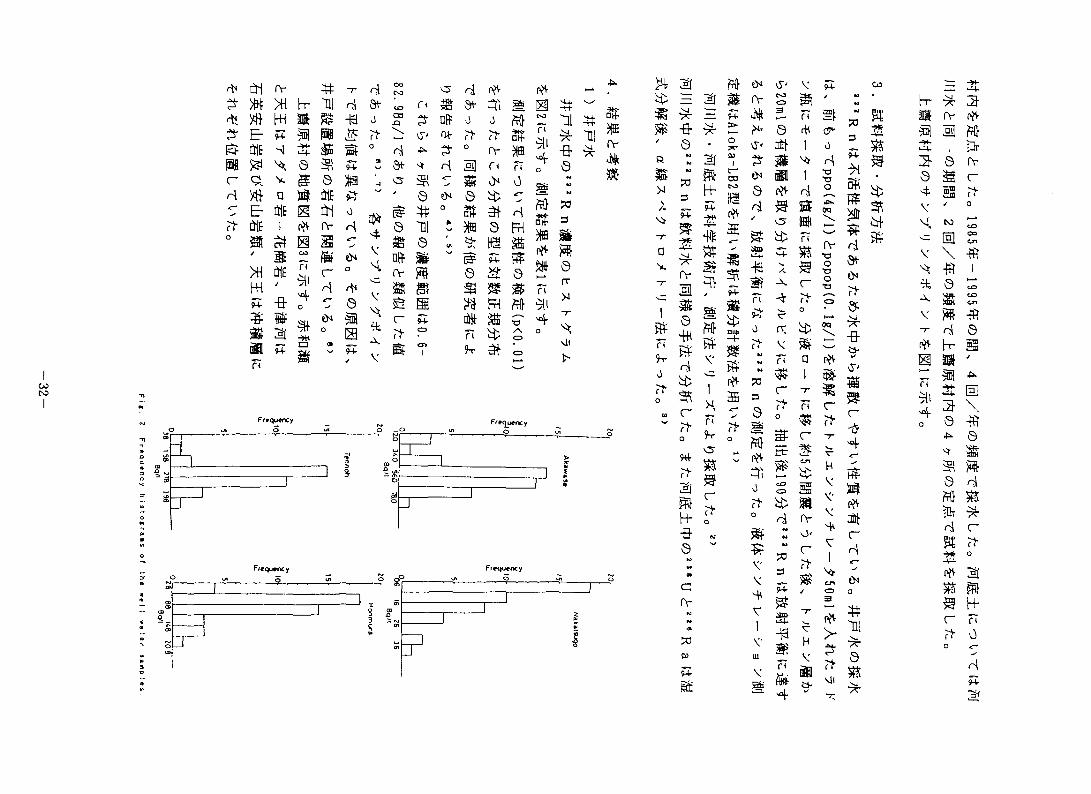
Table 1 . Rn in private well water(Bq/litre)222
Sampling point Akawase Nakatsugo Tennoh Honmura
Number o f samples 39 43 32 43Range 40 . 2-82 . 9 0.6-3 . 6 20 .3-41 . 6 4.2-18 . 3Geome t r i c mean 56 . 6 1 . 3 28 . 4 8 . 8A r i t hma t i c mean 5 6 . 7 1 . 4 28 . 3 9 . 2Standard deviation 1 1 . 0 0 . 8 3 . 9 3 . 1Coe f fici e n t of
va ria t ion(%) 1 9 . 4 57 . 1 22 . 5 1 3 . 8
.kawase
Tennoh
• Sampling pointHI Dad tic rocks 8. andesitic rocks
j§ Adamellite - granite HI Alluvium
Fig. 3. Sampling sites and geological features in the Kamisaibara
2 ) jBJJII*•/5]JI|7K*cd2,z r n aiKoio^K© t X h
CCDfiftCD UKol'T
IE$tt©tftJ£(p<0.01)£fto*:<!: <1 6. ft
ffiJIbkcD&SiBffltiO. 1-7. 7Bq/lT£> 9 > #
OBq/l 3Bq/l)
ZjjkLfco 1,1 R n
tiLTb/co i (mmmm/
100) (±85% ^ < x ig*fl£^l±
tg 3 tc * S v ME T * 5 C <!: £ /Is L /c 0
c ©$#(±x mm wz R n 6 m 1C (± > £ t%*. iti6o Fig. 4. Frequency hist grams of the river water
-33-
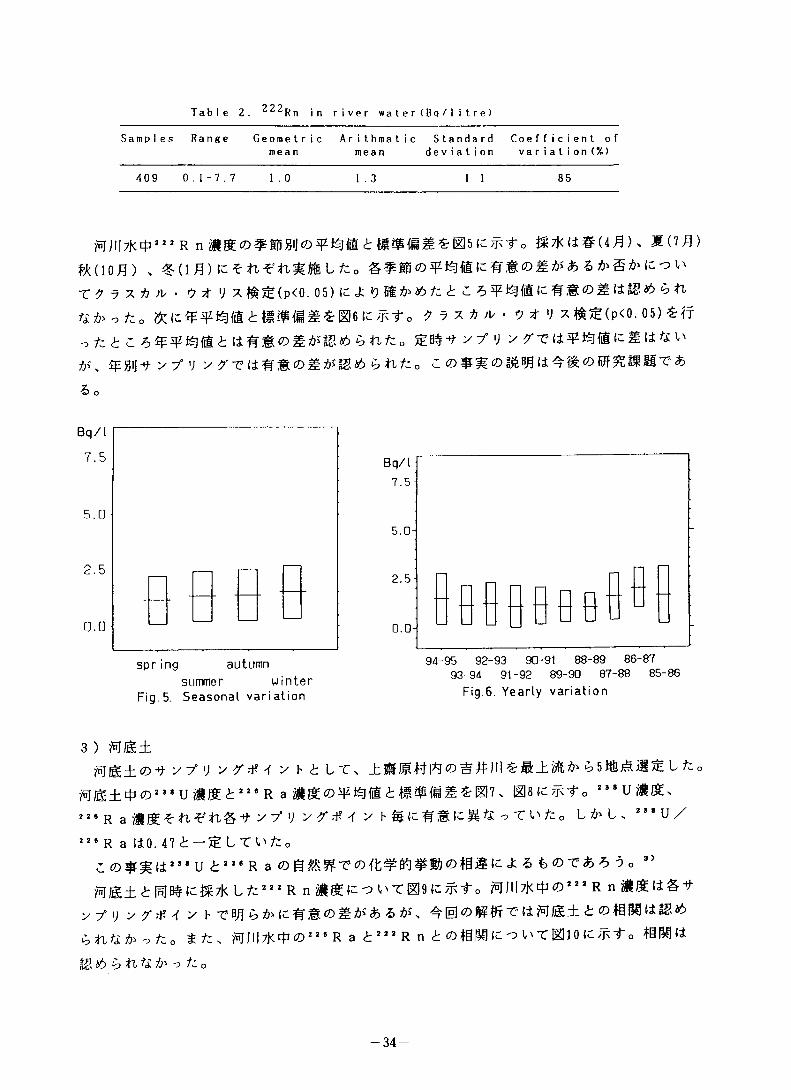
Table 2 . ^ 2 2pn j n river water (Bq/I itre)
Samp 1es Range Geometr i cmean
A r i thmatmean
i c Standard deviation
Coefficient of va ria tion(%)
409 0 . 1 -7 . 7 1 . 0 1 . 3 1 . 1 85
#biji[7Jc4i|** r n o i$7j<ti#(4M) > M(lB)
gtdo^) . ^.(i^){c-en^nw%L/co &¥®s®5Ffc3fifcWSt®^a<* &T 7 7 x * w • 7 * V x#^(p<0.0 5) fc J; 7 t C 6¥i6){filcWS©illi55* ^>n
tit^tzo ^ x x * vu • 9 zt V x &£(p<0. 05) iff
,fci c (iW&o^E* bti/co Ie^H y 7° V y 7"e li £M6ti t£ v
*>\ ^gijtb y 7” V y 7'T(iWS©SAUgA ^n/co c
6 o
autumnspr ingwintersummer
86-8788-8990-9192-9394-9585-8687-8889-9091-9293-94
DUIHINCI W M I L I . ...
Fig. 5. Seasonal variation F,9-6- Yearly variation
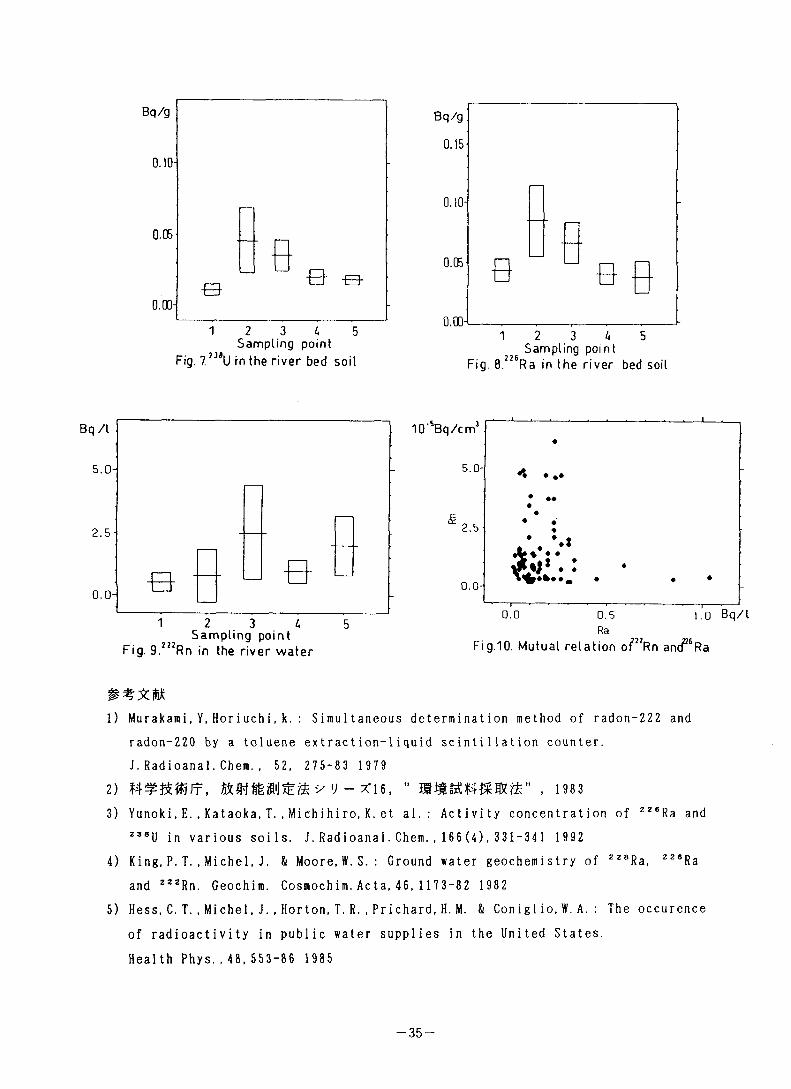
3 ) ME±MIS ±Of y 7’ 'J y 7' -iW y lilts L/:o
ME±*© 2 8 8 U SIS <h 2 2 8 R a 'IS©¥^<6 £ ff,iP^^£IE]7s « 2 8 8 US$>
2 2 8 R a 7*J^^n^n&T- y 7° v y/tM y h SicWSi-Ste -? t v/c0 U>U 2 8 8 uZ
2 2 6 R a fio. 47 i— ^ Itl'fco(ICD^Hjj>>«Ui228R a 0 3>
ME±i:|BlB#lc%7j< L/c 2 2 2 R n o yBJJU7K*© 2 2 2 R ny 7" v y 7* * 4 y h T-Bfl e>(c WS©^*$& 5 #s> ^[HlOlWtlTtrliMEZ i ©HH liIS46
Z, ftc $ t: s MJIItK# ©2 2 6 R a t 22 2 R n t ©fflUfl (c "7 t' T HP 10 ic ^t° tBM
aS 4^> tl Tji A1 -7 /c o
-34-
Sampling point Fig. 7.”*U in the river bed soil
Sampling pointFig. 8.226Ra in the river bed soil
1.0 Bq/l
Fig.10. Mutual relation of22Rn and°6Ra
1) Murakami, Y, Horiuchi, k. : Simultaneous determination method of radon-222 and radon-220 by a toluene extraction-liquid scintillation counter.J.Radioana1.Chem., 52, 275-83 1979
2) -y v - xi6, ” , 1983
3) Yunoki,E.,Kataoka,T.,Michihiro,K.et al.: Activity concentration of ZZ6Ra and
Z38U in various soils. J.Radioanal.Chem.,166(4), 331-341 19924) King, P. T. , Michel, J. & Moore, W. S. : Ground water geochemistry of ZZ8Ra, ZZ8Ra
and zzzRn. Geochim. Cosmochim.Acta,46,1173-82 19825) Hess, C. T. , Michel, J. , Horton, T. R. , Prichard, H. M. & Conigl io.W.A. : The occurence
of radioactivity in public water supplies in the United States.
Health Phys., 48,553-86 1985
-35-
6) Schonhofer, F. : Determination of radon-222 and radium-2 26 in mineral water and drinking water— a survey in Austria .Analyst,114,1345-7 1989
7) Murakami,Y..Noguchi,M. & Ohashi.S. : Activity concentration of water around Toki city. J. Atom. Energy Jap.,7, 49-5 3 1 965
8) Andrews, J. N. & Wood. D. F. : Mechanism of radon release in rock matrices and entry into ground waters. Inst.Mining Metallurg. Bui 1., 8 1,1 98-20 9 1 972
-36-
Radon in Water Samples Around Ningyo Toge Area(6)
£B£B8 (StJ$SS@)S. Furuta
1 • W
As^ss0fT($, mm 30 ^mzfttDntcmmmmiz£z>$ziUBMmfr<bmtiti$n^^L7jC> M2(Di5JJll7j<^F7jCC9^ FZSS£$J5tLT&iZ
$#Bfc^^57x^9 Hz#
2.5j-En- HcI^FtKS 450m/ #754Cth>yj ZZL, S&tCEffcZZ^Z-Z^:
30m/ tOAa. 5^ed-Yfrt>mvtis>?-v-*? 20m/ TMsi-itAf sc 3.5mmmz
v^tSMLtv^0
Rn = N • a . 1000 . 15x60 20 exp(- A -t)
N = —g- (8Ni + 2N: -4Nj)
(1)
(2)
_ 1 . Vair i Vt . Dwa Dt Vw Vw Dt (3)
Dt — 18.2exp(- 4g 5 ) (4)
Dw 9.1217.0+T
273+T273 (5)
Rn : ?K^y H ZBS(Bq Z /)N :Ni : Z Z51 U— Z a Z# *5 Z^<D#^ > F 0 i (7)#f#[#(cpm) A : v F 2.1 X iff* s')
t : -9-zzu zz^e»iiiJS$T(7)EiiBerBi(s)T : 7K#("C)
Vair : ^Ii©^i(m/)Vw : #^##(m/)Vt : SitFtCtiQxfcZZ^Z-^ (= hJHZ) #(m/)Dw : Rn (D7KK:#TDt : Rn £> h;|/XZI:^Tf 6^@E#^C
-37-
CCT, N (*#:'> a >t) V$>0,S;(2)(cj:oTSmdn^os^^(ctt'>>^iz-'>3 yfivy^o) ioo~°oCh,200 -oo ch, 300 -oo Ch %)###%#& 5 #7M ^L#-o (7) Rn-222, Po-218, Po-210 ^ b O 3&(D7 )V7 rUt
Bi-214, Pb-214 ".^(4)^(5)^ 5
- 40 o, 2^gnmmcj:
ff«(J«7P* lb-2rnfayy^u-ya
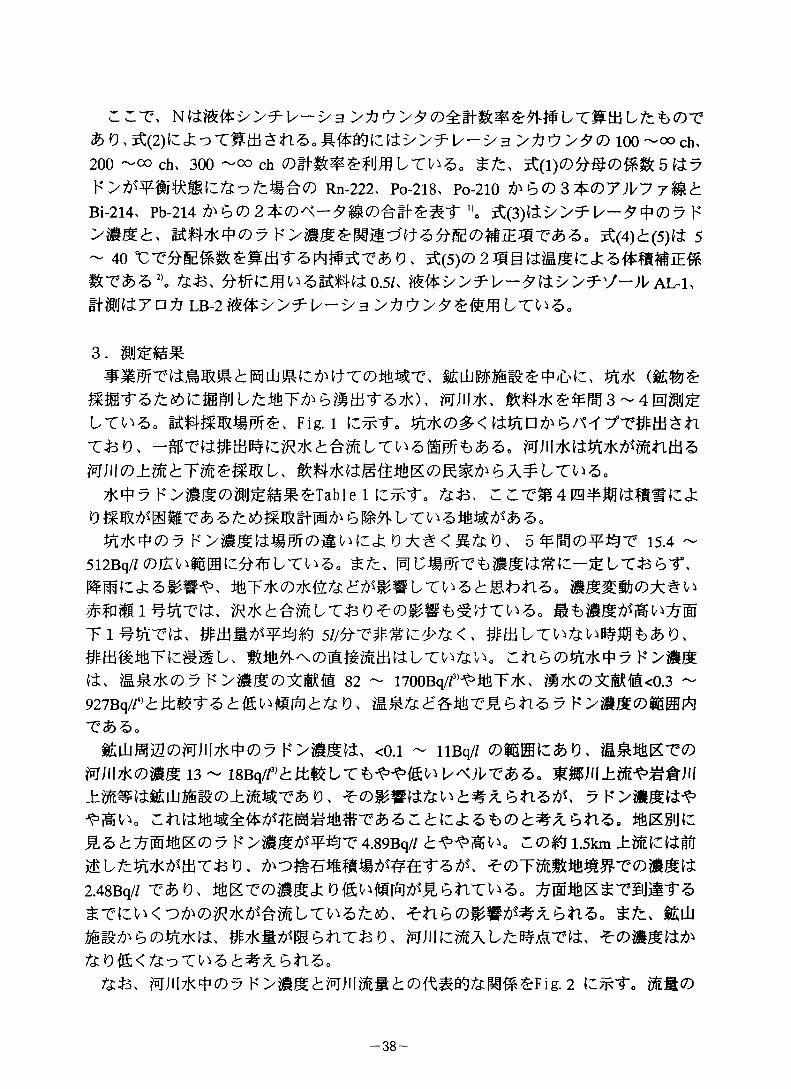
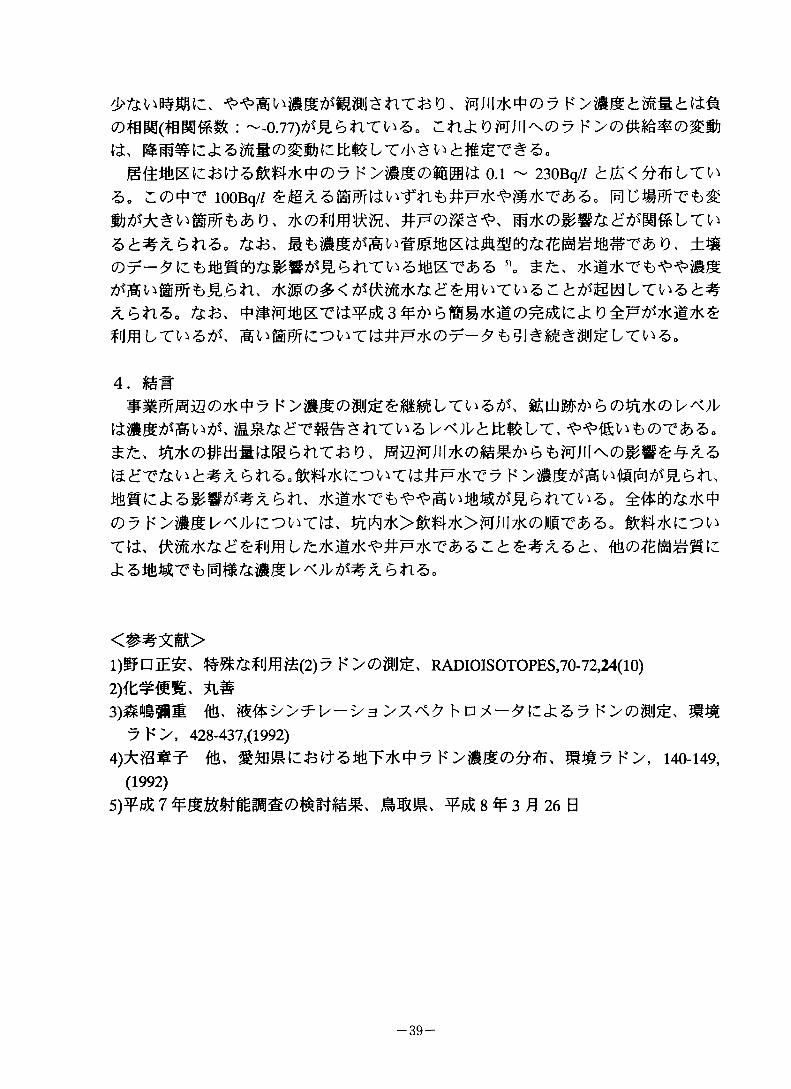
3. aij®*gmEUUBSSESr^kt^ £ltK (E#&
^ffl-rsfefeuMjL-fe^T^^siaj-rsTK), MJH7j<, »47k^¥^3-4®^ UTV^o Fig. l tc^r= %7K(T)#< #%O/W YT#m$flt&o> MJibm^Tk^wim^M/ll©±»ft£Tfl?i££'®U A^tTt^o
7K^7 F>S$<7)zSJ£*S^£Tablel i^t"= &£,
%zK^(D9 15.4-512Bq// <Dfc^ffim\Zft1$LX^Z>a IpJCSmTLT* 6T,PWCcka##^ mT7K(T)7K^6:^#L/T^6(hm^^%.
ctubcDiA^^^ymm\t, ^S7X(T)7 h*>SS(MEE 82 - 1700Bq//3,^itiT7K, #7K(D^##<0.3 - 927Bq//4)titgi-tZ t fal'Mfatte <9 , M&tuZ&MT&ZftZ 7 F>M^0f6fflf*J T&6.
EOj^a^MJiiTK^cD^ h>ss^> <o.i - nBqn (Dmmiz&K),M/ll7jC(7)SS 13 - lSBq//3^ m lT lx 5. MMJH±ffi-P%£JH±m^^mmmm(D±mmT$> o > f 7F>iiii^-^iSV^o i&MJtC
F >*i^'W? 4.89Bq// «h^iW^0 1.5kmj7FL^^L7K^titiT43D,2.48Bq//T&9, ^KT(0SS=k D i£V^[6]^B 6nT V^„ ;5@ifcE$T$ltiiT5 ^TCVX3^(D^7K^mLTW%^l6, EUUSE^6to^i7K«> #*#a#SiTTj3 9,
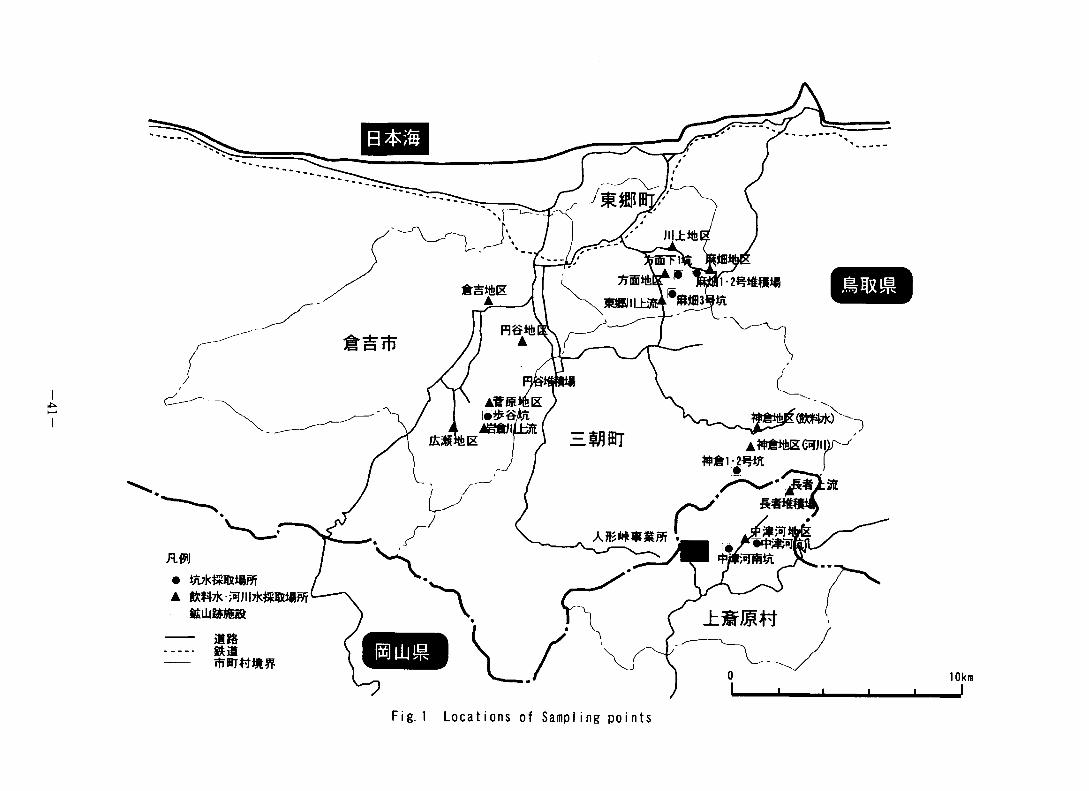
M;ii7K4:<z)7 F>#maM;iim#<h(D^M^R#&Fig. 2 m#o
-38-
: ~-0.77)AVES,flTWa. cn«fcf3M/M7 V ><D{kffim<D&m
m&M&.\Z&\tZ>&n*^<Dy F>^©f5Bte 0.1 ~ 230Bq// TtAS. lOOBq// ^Ex^EF/fttV^rnt)#F7jc^?l7KT$)^o
7K(D#m^ #F©%ezi\zt^piztizo K&, o, ±m
?io &tz, TKmzKTt^mm
A6n^)0 ft*5, 3 0iWl>®mt20im£AF7j<©^-^t)§l£sES-$JvtLT^5o
tea$^iSv^\ iga& af T|g^ £ n w 5 w;v £ m b T,
(Dy \i>m%.l"<)l\Z’D^T\t, ^L^zK>^7K>MiH7K©JlllT^##7K(:Ob Ttt, ftdE7K&££f iJFLA7j<®7K^#F7j<T& 5Z.t^^t, M(Dltm%m\z
<##^cm>l)^PIE£, &W£%l\J%fe(2)y F>©$J>t> RADIOISOTOPES,70-72,24(10)lymmL, as
3) m#am m, %#=y>^i%-s/3 Eo/-^t:j;69mmy H>, 428-437,(1992)
4) ±m$f m, %%\mz.&rtz>MT**y F>a$©#s> ##9 F>, 140-149,(1992)
5) ¥^ 7 mmm, ¥/& 8 f 3 ^ 26 b
-39-
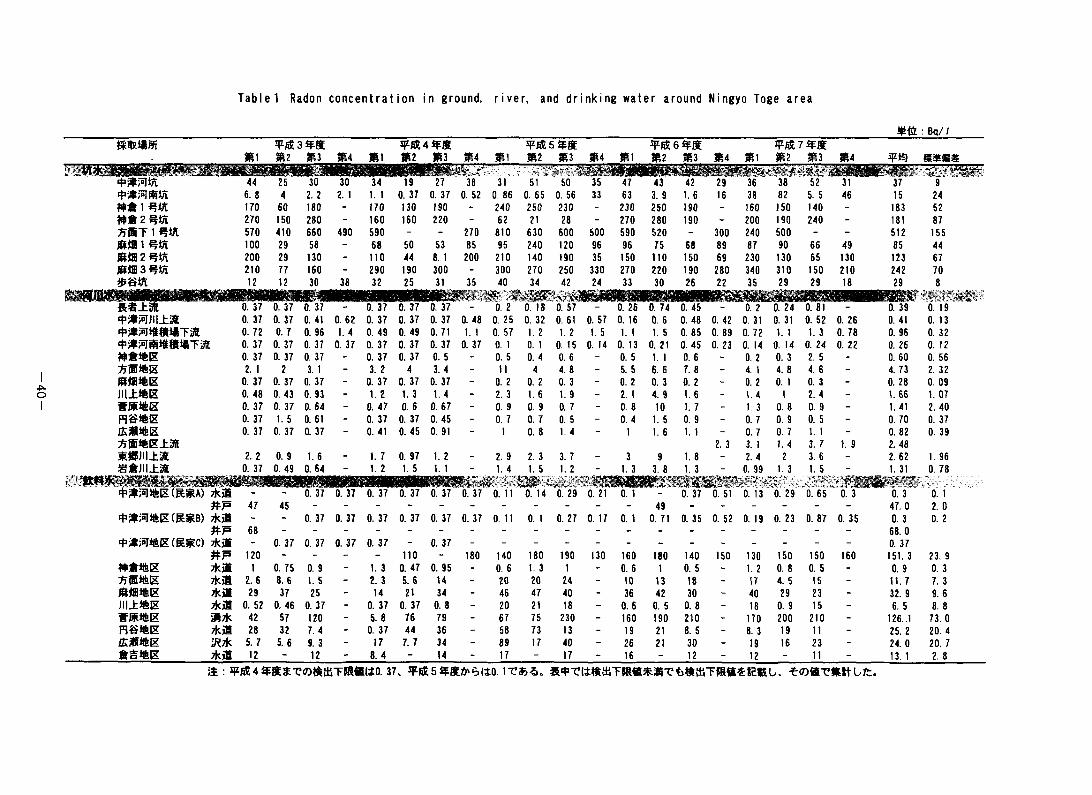
Table 1 Radon concentration in ground, river, and drinking water around Ningyo Toge area
: Bq/ /
mi
¥<$3 58
$2 m3 m4 mi
¥<$4 58
mz ms 954 951
¥<$5 58
m2 m3 954 mi
¥<$6 56
m2 m3 954 mi
¥<$7 58
m2 m3 954 ¥«0
mmLisme***’**:!#HU BrvC
44 25 30 30 34 19 27 38 31 51 50 35 47 43 42 29 36 38 52 31 37 96. 8 4 2. 2 2. 1 1. 1 0. 37 0. 37 0. 52 0. 86 0. 65 0. 56 33 63 3. 9 1. 6 16 38 82 5. 5 46 15 24170 60 180 - 170 130 190 - 240 250 230 - 230 250 190 - 160 150 140 - 183 52
#62#% 270 150 280 - 160 160 220 - 62 21 28 " 270 280 190 - 200 190 240 - 181 87fi@T1#% 570 410 660 490 590 " - 270 810 630 600 500 590 520 - 300 240 500 - - 512 155*mi #% 100 29 58 " 68 50 53 85 95 240 120 96 96 75 68 89 87 90 66 49 85 44jsaa 2 #% 200 29 130 " 110 44 8. 1 200 210 140 190 35 150 110 150 69 230 130 65 130 123 67JS«B3#% 210 77 160 - 290 190 300 - 300 270 250 330 270 220 190 280 340 310 150 210 242 70$e% 12 12 30 38 32 25 31 35 40 34 42 24 33 30 26 22 35 29 29 18 29 8
0. 37 0. 37 0. 37 0. 37 0. 37 0. 37 0. 2 0. 18 0. 57 0. 26 0. 74 0. 45 0. 2 0. 24 0. 81 0. 39 0.19**;"5im±3l[ 0. 37 0. 37 0.41 0. 62 0. 37 0. 37 0. 37 0. 48 0. 25 0. 32 0. 61 0. 57 0. 16 0. 6 0. 48 0. 42 0. 31 0. 31 0. 52 0. 26 0. 41 0. 13*i*i5Iie«iiT3S 0. 72 0. 7 0. 96 1. 4 0. 49 0. 49 0. 71 1. 1 0. 57 1. 2 1. 2 1. 5 1. 1 1. 5 0. 85 0. 89 0. 72 1. 1 1. 3 0. 78 0. 96 0. 32
0. 37 0. 37 0. 37 0. 37 0. 37 0. 37 0. 37 0. 37 0. 1 0. 1 0. 15 0. 14 0. 13 0. 21 0. 45 0. 23 0. 14 0. 14 0. 24 0. 22 0. 26 0. 12#6%E 0. 37 0. 37 0. 37 - 0. 37 0. 37 0. 5 - 0. 5 0. 4 0. 6 - 0. 5 1. 1 0. 6 - 0. 2 0. 3 2. 5 - 0. 60 0. 56
2. 1 2 3. 1 - 3. 2 4 3. 4 - 11 4 4. 8 - 5. 5 6. 6 7. 8 - 4. 1 4. 8 4. 6 - 4. 73 2. 32««B16E 0. 37 0. 37 0. 37 " 0. 37 0. 37 0. 37 - 0. 2 0. 2 0. 3 - 0. 2 0. 3 0. 2 - 0. 2 0. 1 0. 3 - 0. 28 0. 09Jll±tftE 0. 48 0. 43 0. 93 - 1. 2 1. 3 1.4 - 2. 3 1. 6 1. 9 - 2. 1 4. 9 1.6 - 1. 4 1 2. 4 - 1. 66 1. 076«#E 0. 37 0. 37 0. 64 - 0. 47 0. 6 0.67 - 0. 9 0. 9 0. 7 - 0. 8 10 1. 7 - 1. 3 0. 8 0. 9 - 1. 41 2. 40RSifctZ 0. 37 1. 5 0. 61 - 0. 37 0. 37 0. 45 - 0. 7 0. 7 0. 5 - 0. 4 1. 5 0. 9 - 0. 7 0. 9 0. 5 - 0. 70 0. 37ZK6HfeE 0. 37 0. 37 0. 37 - 0. 41 0. 45 0. 91 - 1 0. 8 1. 4 - 1 1. 6 1. 1 - 0. 7 0. 7 1. 1 - 0. 82 0. 39
2. 3 3. 1 1. 4 3. 7 1. 9 2. 48$@m±3it 2. 2 0. 9 1. 6 - 1. 7 0. 97 1. 2 - 2. 9 2. 3 3. 7 - 3 9 1. 8 - 2. 4 2 3. 6 - 2. 62 1. 96@6Jii±m 0. 37 0. 49 0. 64 - 1. 2 1. 5 1. 1 - 1. 4 1. 5 1. 2 - 1. 3 3. 8 1. 3 - 0. 99 1. 3 1. 5 - 1. 31 0. 78
: '■ ' "AS
~ ' 0. 37 0. 37 0. 37 0. 37 0. 37 0. 37 0. 11 0. 14 0. 29 0. 21 0. 1 - 0. 37 0. 51 0. 13 0. 29 0. 65 0. 3 0. 3 0. 1#F 47 45 - - - - " - - - - - - 49 - - - - - - 47. 0 2. 0
- - 0. 37 0. 37 0. 37 0. 37 0. 37 0. 37 0. 11 0. 1 0. 27 0. 17 0. 1 0. 71 0. 35 0. 52 0. 19 0. 23 0. 87 0. 35 0. 3 0. 2## 68 - - " - - - - - - - - - - - - - - - - 68.0
4>*;'5J#E(S6C) - 0. 37 0. 37 0. 37 0. 37 - 0. 37 - - " - - - - - - - - - " 0. 37#p 120 - - - - 110 - 180 140 180 190 130 160 180 140 150 130 150 150 160 151. 3 23. 9
#6%E 7k« 1 0. 75 0. 9 - 1. 3 0. 47 0. 95 - 0. 6 1. 3 1 - 0. 6 1 0. 5 - 1. 2 0. 8 0. 5 - 0. 9 0. 3*@16E Tkifi 2. 6 8.6 1. 5 - 2. 3 5.6 14 - 20 20 24 " 10 13 18 - 17 4. 5 15 - 11. 7 7. 3
7k« 29 37 25 - 14 21 34 - 46 47 40 - 36 42 30 - 40 29 23 - 32. 9 9. 6Jl|±H6E *m 0. 52 0. 46 0. 37 - 0. 37 0. 37 0. 8 - 20 21 18 - 0. 6 0. 5 0. 8 - 18 0. 9 15 - 6. 5 8. 8
#m%g 317k 42 57 120 - 5. 8 76 79 - 67 75 230 - 160 190 210 - 170 200 210 - 126. 1 73. 0m@#E 7km 28 32 7. 4 - 0. 37 44 36 - 58 73 13 - 19 21 8. 5 - 8. 3 19 11 - 25. 2 20. 4ZK616E i^Tk 5. 7 5.6 9. 3 " 17 7. 7 34 " 89 17 40 " 26 21 30 - 19 16 23 - 24. 0 20. 76A%E 7km 12 ~ 12 - 8. 4 - 14 - 17 " 17 - 16 - 12 - 12 - 11 - 13. 1 2. 8
a : ¥<$4 58$T<D#iirF»II(iO. 37, ¥<$558^13:0. ITfcS. XEKL. -t:<OttTSttUfc.
• tJtTkSDUgSr ▲ to^Tk^JilTkSatlSSr
S£UjBH6e8
ing points
rado
n con
cent
ratio
n^//)
ra
don c
once
ntra
tion^
//)
♦
♦
♦
#
$
0 10 20 30 40 50river flow rate (m3/min.)
1
f 0.8mI 0.61I 0 4
| 02
0
JH±$
«r♦♦♦
j# ♦♦—♦»
! ______ L
♦
20 40 60 80river flow rate (m3/min.)
100
♦
;
il£«16E
♦ 1
♦
♦ ♦ X
—W------
-♦ - -
%♦
0 20 40 60river flow rate (m3/min.) river flow rate (m3/min.)
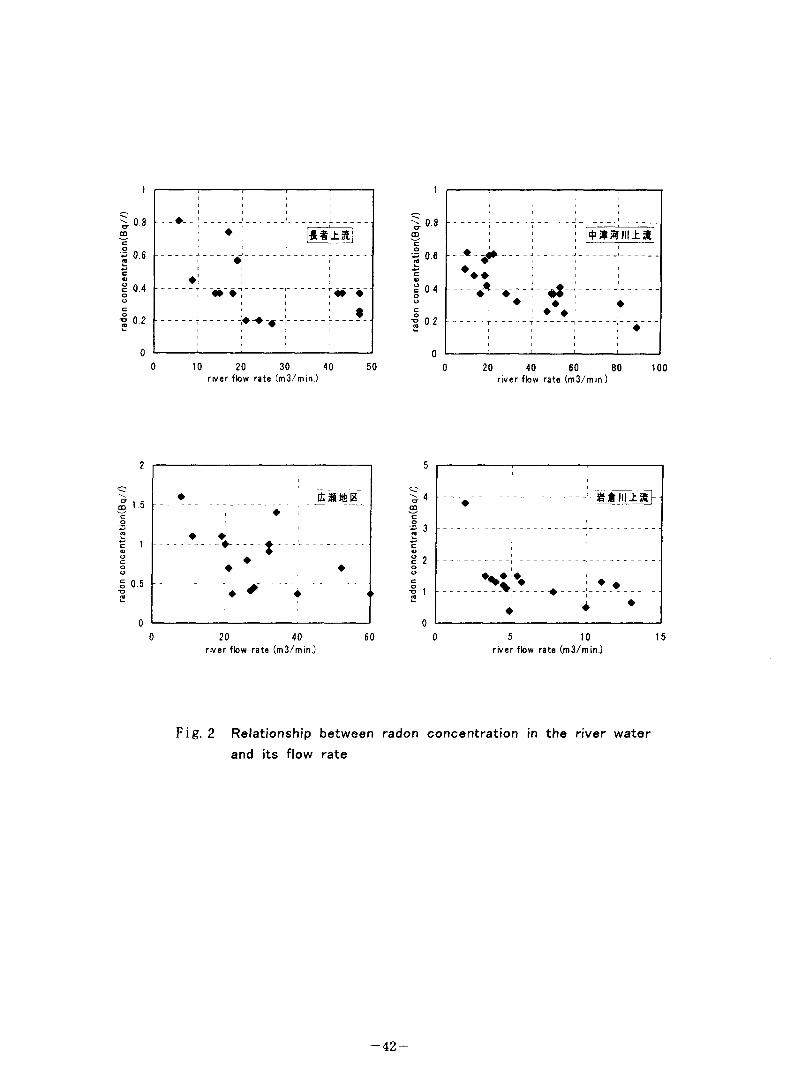
Fig. 2 Relationship between radon concentration in the river water and its flow rate
-42-
(7)Radon Concentration in the Thermal Springs
K. Horiuchi
1. liCfcl:
100 ¥itfr, 1896 A. H. Becquerel tioT P 7
P :/#### 1903 # H S. Allen (£t oT Bath CO Kings Spring btl, F>ir 1904 #H. Mache Wot BadGestein ^^5 & <P, #%!?# • &&7kto7 F^(DM^ •#%^lt Ft o t'. "7 (Mache) It H. Mache HJ:ot7 £LT^tf) bti, FA
i909¥i2^^^§g¥toi^ir^ttr^ems,s^s-6^^toTBS-^a:uj •
m^mmmotz. t tot bmm-m&v\ m&, iUFyitfiS<7)^tif3lg(Z)^-oTfci9, M py
7 ffu, ###<%
LT^s. %cT,Sftpj^ 10tmibtiz. ^er-e$astT(Z)Swms:WA@^S5W
2. 7 Fx#g|ct6^.$(D^m
7 F^(Rn) 20X10"10Ci U±, 1g7kk<Dmi, I(1)7 F7(Rn) 30X10-10Ci £X±., (%##$) (2)
C (D#|t Bq ^ , Arn^n 74Bq/l, 111 Bq/1 <>&5.m ur^-my FFS^Tfi^n^st©, gpT,(i)^%##$#Li:mi^.
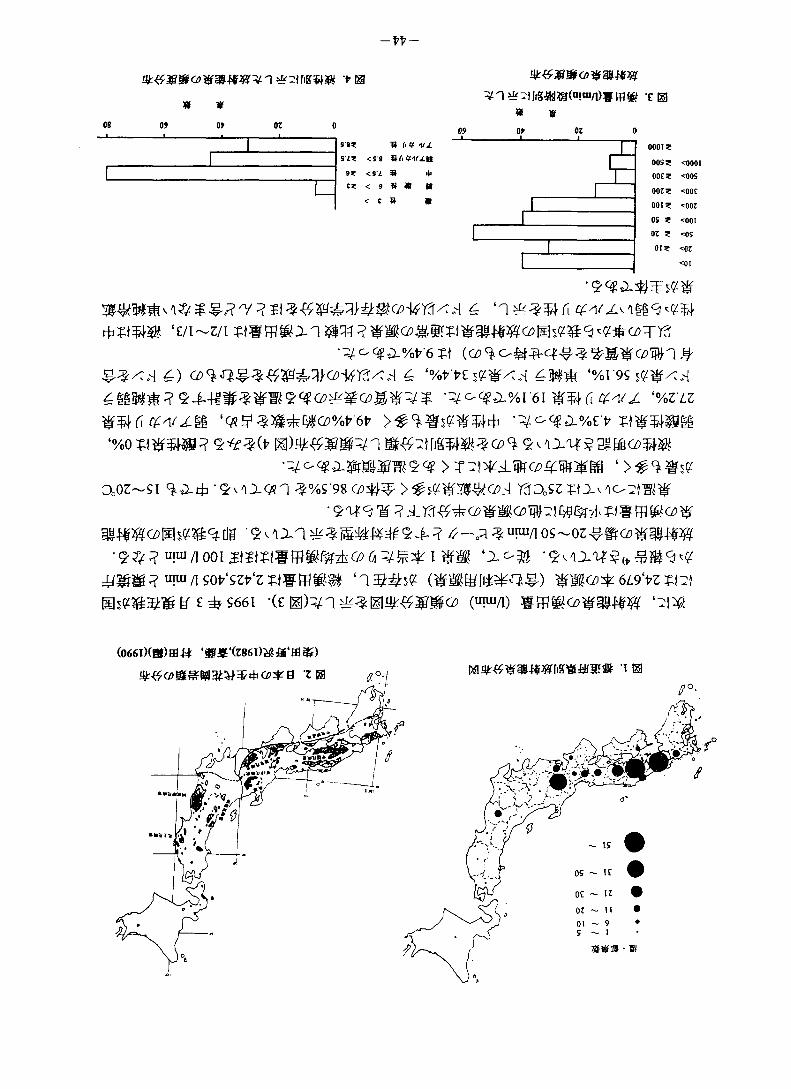
3. s-am#s@2) icxz,5fc¥£ i #) bfitcM. • 2)F: £ 5 £, 7.73%(SH
(Z)^E^tLTV>5^<D : m# 3,659)(^fcfci9,
L-cv\6 z t as*q btix^'Ztf, @ 1 2
-43
-n-
# w08 09
iOf oz
TZ
se%s \t?
9?
C?
3 fi<y ml<S8
<sz a *< 9 a « «< c a a
^i ^*)rigad®(nira/owm# cia# sr
0001?OOS? <0001
ooc? <oos OOZ? <ooc ooi? <oorOS ? <001
oz ? <os01? <0Z
<01
‘e/Nz/i mu ?-+ oc$a%t7'6 ?i (a) ^ 9?MW^Wn #
-^C.($a%r6i "%ZAZ
-9if9W? A-K^CD^mcAW^W&TkzmWWO)^
/I soKgzyz a#### (W#g^^Q#) WMCD^6L9^zmz^s66i ■(£ ED^/n^^ia^Wto (uwi)
(066i)(@f)ffl4=* ‘«fJf‘(mt)^da‘ffl^)
or ~ iz #
4.
wm»#, %^^6V\5(7)^eTj[I<fT^ir^64-1
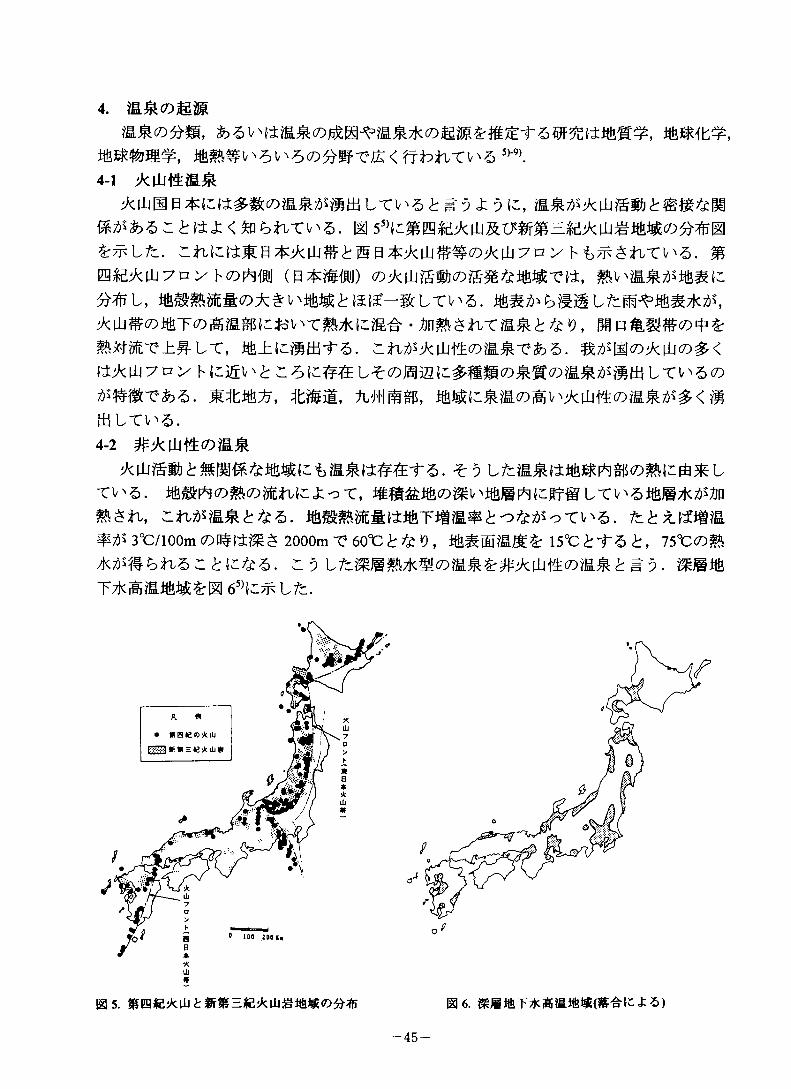
!kiuma*taz£&(DummmLx\,'z tm o £ 51-,##&&- t tt«fc < So6*iTV'5. m 55)(^EESBjkUjS:WS=e^m^W^^S@
tz. ~n\a'£MB*!kih%ttma*ikihftm<DAih7vy b-b^£tiT^Z. mmm^iuyuy b(Dftm (B*##) ^jkuuBSb^^^weti, mwawsmmc
v>i6jS^I${$'-$fi:LTV>5. ifcS^tbEBLfciW^ito7k;$\
AHi^(D%T(D^M#(cjo^Tm7K^me • an&£*iTJ&&£ & V,#Wm-f±#LT, 6. z:n^jkUUt£ <DES Th5. %tdm<Dikiti(D£<teikihyv> tAmwL-ehz. MitMJj, 4b#m, A#ii#gp, mwc$m(%m'Am#(Z)fa$dS0< #titiLTV-5.
4-2
Ti'5. mStPKDfkvffifoiziot,nmTmM#k ^ ^ ^ o -c v ^. /tkxLtfw
W 3t:/100m (Z)B#tiS $ 2000m X* 60°C £ ft 9 , l5°Cft^>t, 75°C (D%fctmbtizzkiz.tt:z>. zi9 mm®
65)\Z7jk t fc.
05. 0 6. 8ISST*il5ia^«(S'S-ti:J:5)
45-
(0661) 6M-0M UKA 4#m„ : ms$Y (n
(0661) 3£l-£3I ‘FZ £3>SW : Y^WW '#$#% (ZI(K6i) 6-i ‘iz-on • j&w • jesw
W5/: —Wm^^WilW— '$#%# (n(3861) 6Z-SZ ‘91 : Y
‘snn ‘asffl- (oi(8861) ‘Z01-88 ‘E'ON ‘63 : M83a>3r ? —(6
(I860 ‘9S-Z.fr
‘£-on ‘IT : Ms|cz»gW"EPY^^^m7i}[B|SS^T^S^ '9m## («(6961) ‘3H-0M ‘W£'ON ‘0! '-$#¥ (3(€i6i) >9-59 ‘3-on *fz ‘#mw^ : 2£m<24-m?mm o
(£660 — n = si9»&3% (;(9661) ¥1-01 ‘I'°M ‘F9 ‘W"@*: EE
mmmwm+iMM my et e im £0k m^9^±) (f
(£661) ^sra&¥£¥ ‘BW*g = '#¥& '###¥ (e(366i)m$mm# • w^*g: [aw^ (2
(8361) SL-l ‘ (II#) : (I9
'Mwm '##m# - 6
mcom%m •(£,<«(„ 9^xnc^B^~"9%>!m##/:3 4 %% 0(3^1^
333 C ‘ <4 ?/ > ^£1 Hd CD^XWTO 9?/ > (wm@# ?
#G9g|^# ‘Q(^(2)ir^a94-^^-im^-y ^va ^wwmmy# mug'5<I*I$P®BI?9‘S0OT: -TO/TOBS %$!#% ‘K» ‘Yin
‘ 6, #%i G T^iTO i-s
(8) iBJi/jxEEOj^fijfflSPT«38$nfc^K>H»
Ogoya Old Copper Mine as a Monitoring Station for Various Fields of Earth Sciences and Radon Anomaly Observred at Tatsunokuchi
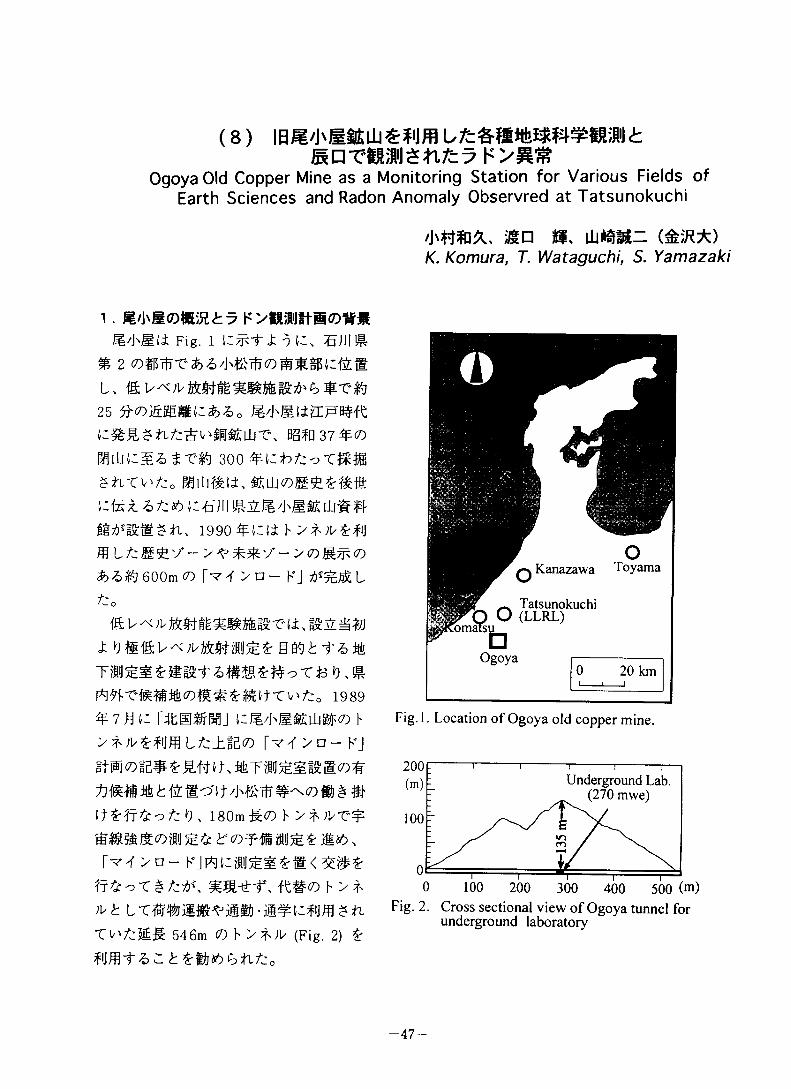
1 . M/JnMcDmut^Jt/J'Eli Fig. l i C. 5111#
25 frvi&mmz&Zo m'b&mrFmslZ%%tZtLtz-&b'm&lliX\ 37#(7)
T*#5j 300 ^-IZhtz'jXUM
$tiTWjo fflihfeli, §£ih<nM'£.%'&-\&
6g7)5i£S£tu 1990 ¥t:ii b ffl LZ:@£v'- >co®^<7)
600m (7) f v >f > □ - KJ
tZ0
t?!5eS *• mmt1989
uji/hjiEajis<7) h> * L fc±!5W Tv ^ > o - KJ
^3## # ^ {Z f /J\^$ ^ #It^fT&oZ: <9 , 180m &<7) F
jt<7)?flij TE&^wfusiis^msx[W >n- KJ!*J U$IJSS£ S <
ff 7k -3 T # Z:Z,\ , ft#?) F >
TV>Z-@6 546m <DY>^)V (Fig. 2) £#Rf
*mmx. igp *K Uj*SM- (£}RX)K. Komura, T. Wataguchi, S. Yamazaki
*nm
0 100 200 300 400 500 (m)Fig. 2. Cross sectional view of Ogoya tunnel for
underground laboratory
Fig.l. Location of Ogoya old copper mine.
-47-
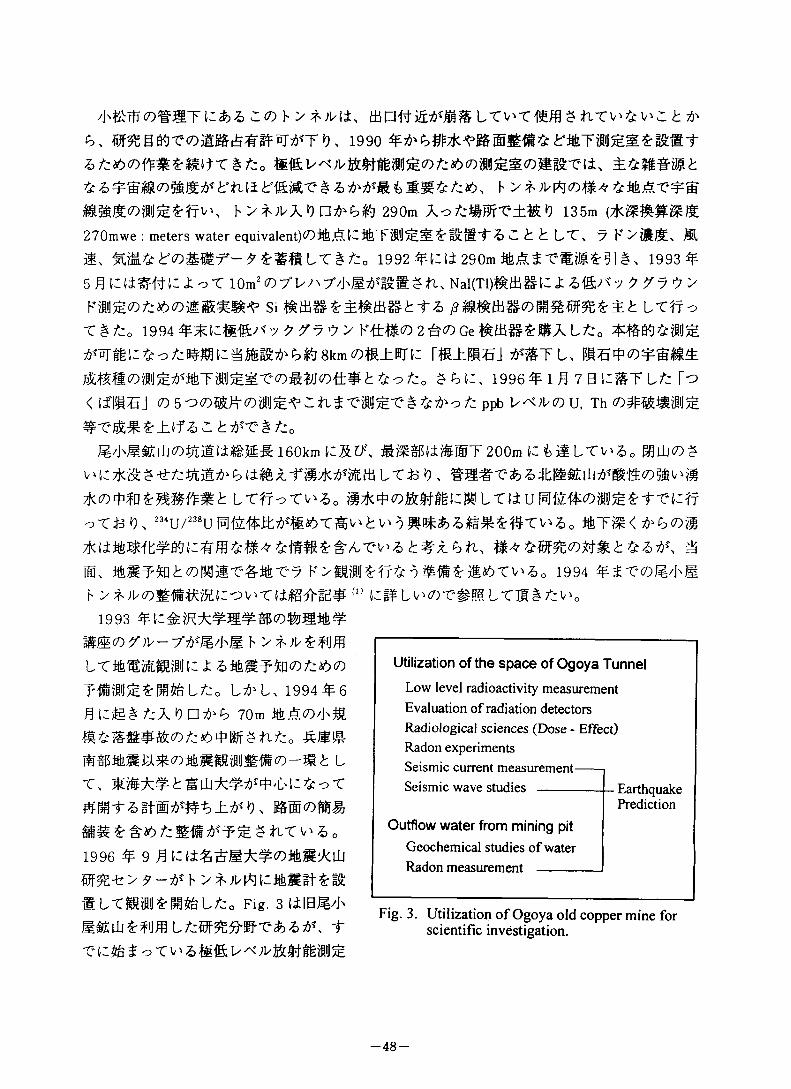
/M&Ttr<d##Tiz&z z<7) b mo####m nrv^^ i^zkfrb, ffift§to-eojEB<o, 1990 & tz*b(Dftm£^fr § fz0&Z>4=WiB<7#M7^tUi§ a frtfM&SS& b >*;V|*1<7)#* &itL5T-T®E^$<7)SIJS^#V\ b y*)VX V)Hfrb & 290m A o£J#BfrT±&>) 135m (*S&gSE 270mwe : meters water equivalent)<7)%An%T#J@^'&'^#Ti>Z.kk Lt, y K 7 lift ST M, a, ^WMf“^IILt^:0 1992 TUI± 290m 1993 ¥5moiW#OJ:oT 10m2<7)7T^7'TJl^I£fi$ti, NaI(Tl)#m#HZa@;s'v ? T7-7 7
si #m#&±#m#ftta uffo■C^o 1994 #^4:@#;s'7 K##(7)2^^Ge#mK#AL/:oM#n^c 8km <o#±im: rm±mejMS(7)yia^T?lS^-e(7)ft^^ttV k & o fco £^T 1996 ¥l£ 7B HIST Lfc fo< (fH5J (0 5O(7)%M#^2;K$-C#!l&-C#&d'cZ: ppb U^-iwdu, Th
#r&^^±#a ^JlTSEL0<7)^il#ESS 160km HS.ZT S«t±yS@T 200m CtlLTV'So ffllhCDZ
V'U*&TMtK«m LT# <9 > #m#Th6:jhB££lWM<7#£v>#LT#oTV^0 in*TOMititHM LT# U fc|&fc<DPJ£ £ t T n #
cT&IX %Tm<^^(7)#
m. 1994 ^^-etDmTmb 7?.;i'(D###%ncv'T#i@^'%$ (" H#Lv^r#BBLTm#^v^
1993 T n Aas?)##* # n&(D7)U-7T1/M b 7$Ltiifllii: i ai&STftKD^tfxD Tfilii05c«rSteL*o Lri'U 1994 T6 fth|b£ tzX'onfrb 70m m*w/M
t, ^mm;*##T'W:^c-C
e ^ $ ftT w &,1996 ¥ 9 ft H#%t7^-^b 7*;w*ni:iteOT-£l£SLTM£H&L£o Fig. 3 til BUT JiEiliMffl ktzm^^hh-hK T
Utilization of the space of Ogoya Tunnel
Low level radioactivity measurement Evaluation of radiation detectors Radiological sciences (Dose - Effect)Radon experimentsSeismic current measurement------Seismic wave studies------------------ Earthquake
Prediction
Outflow water from mining pit
Geochemical studies of water Radon measurement ---------------
Fig. 3. Utilization of Ogoya old copper mine for scientific investigation.
-48-
vn&tmm ltv'*0*lft£'Cli, fe'bm&ihmv V >^;i/S'fiJfflLTffcT^*7 K^Mii^iBI^ MltE*
0 7 96 #9 H(:lnt|liB$^7 K>fMW(:o^T$8^i-6o
2. Ji/JxSh>*;Ufi<05 K>Mh 's+frpw? k> (222Rn) mm it, %tkmx'&z> b>^)vm<o^fp<D u mm, z&wm
tl (#%) > %E, PS*& tlZ&fttZo Efi546m <Dfe/\'M h
si, A<9P^*tJ290m pyroni±mCO PRD-1 g#m wm## 272ml) £fflV'T 30Mv> L 1 6 6 ^ t S:
CanomaxttlScO Anemomaster 6623 h^,?mC0|5]B$|SrfllJ$'fi:oZrQ Fig. 4 IZy F>
mmvmmi(23)1000
100
10
0.1
0.01Mar. 31, 1993 24 25 26 Date
1 1 !Ogoya Rn (Bq/m3) Rn-9303 23-26
Wx^A.W ind Velocity (m/s)
yi AAtV"1 Ay | w 1 h V "_____
Mr T
1000
100
10
1
0.1
0.01May 28, 1993 29 30 31 June 1 2 Date
1000
100
10
1
0.1
0.01June 7,1993 8 9 10 11 12 13 Date
Fig. 4. Variation of radon activity and wind velocity in Ogoya tunnel and radon activity in the outside air at Tatsunokuchi.
Ogoya Rn (Bq/m1
3) R i-9306( 17-13
K1 v V'h/i,
3RL Rn (Bq/m-vf\r
3) yw[\rVv/Wa rV^A ,<r\^/\
WiI Vnd Velocity (n______ i______
i/s)L_
lV
Ogoya Rn (Bq/m3)Rn-930528 -602
r*[Oky ^Vv^V)VA. \X rv— \Ai)
___ LI RL Ri
\H(Bq/m
\j^
V vV VXrv “A/A/Vk/vi/A/
WV
ind Vel ______
ocity (i ______
n/s)______
u nr \r hi/-r v
—49 —
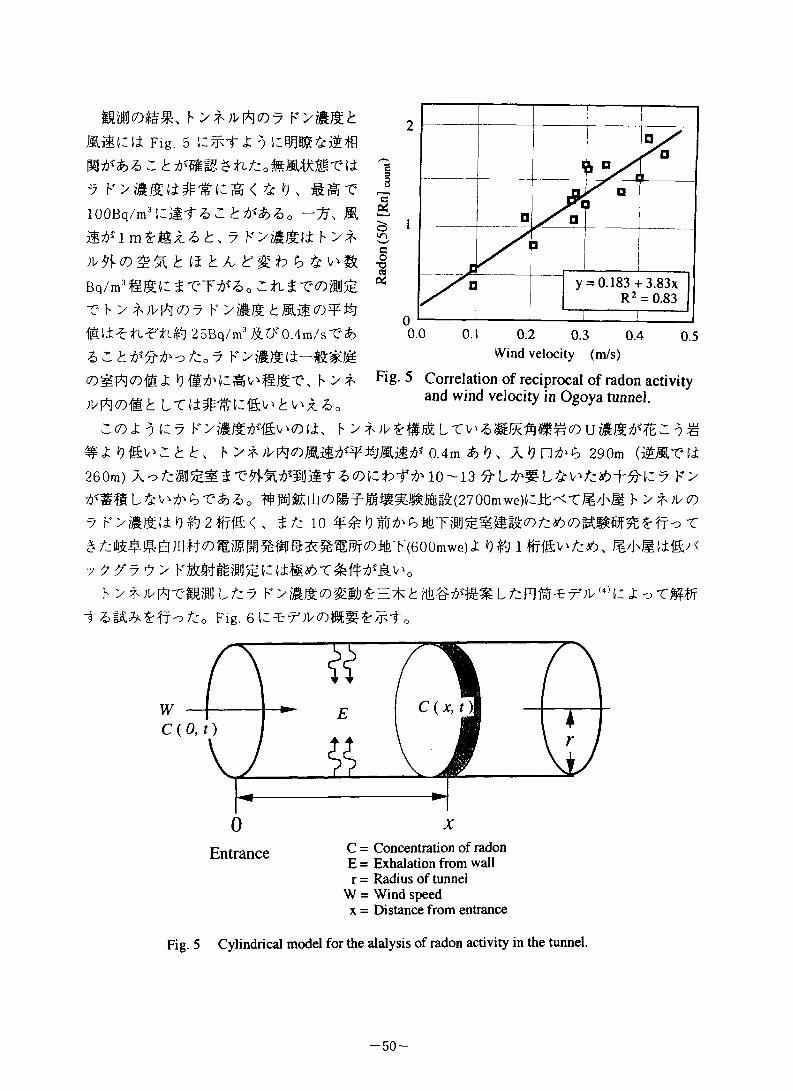
mi?)##. ^Ki:ii Fig. 5 «t o HBM&Mm*$>z>zt wmw ztitio -e t±7 < f£ >9, #AT100Bq/m3 lzmi~Z ^ M
Mlt A, ^Bq/m3g]£KS T*Tri*So r i' > K >#%
25Bq/m3 %0?0.4m/sT&6 ^ ^ 7^0 7 K(7)^FW@l ^H^nn;v4iST\ h y*
%?£ *)i&^Z.t t, h > *Jls 1*3 <nM&7bs¥%fM.&7&* 0.4 m $>*), X*)nfrt> 290m (MMVti 260m) 10-13 ^L^#gL^V^*+^:7 K>
#MKllJ(D|#f^##m#^(2700mwe)m:"<T#/^m Y'y^)V(D7 K>#%(±o$^2eig:<. io #^%$!#8;ii#<7)m?m^%#e&%m^T^%T(6oomwe)j:V ^ ^7 C; >
^ ;i/ m -cm# L ^ 7 r > #% ^ ^ u 7t mm t ^ ;i/ ^ i: z c -c ##Fig.
0 xEntrance g = Concentration of radon
E = Exhalation from wall r = Radius of tunnel
W = Wind speed x = Distance from entrance
Fig. 5 Cylindrical model for the alalysis of radon activity in the tunnel.
y = 0.183+ 3.83xR2 = 0.83
Wind velocity (m/s)Fig- 5 Correlation of reciprocal of radon activity
and wind velocity in Ogoya tunnel.
-50-
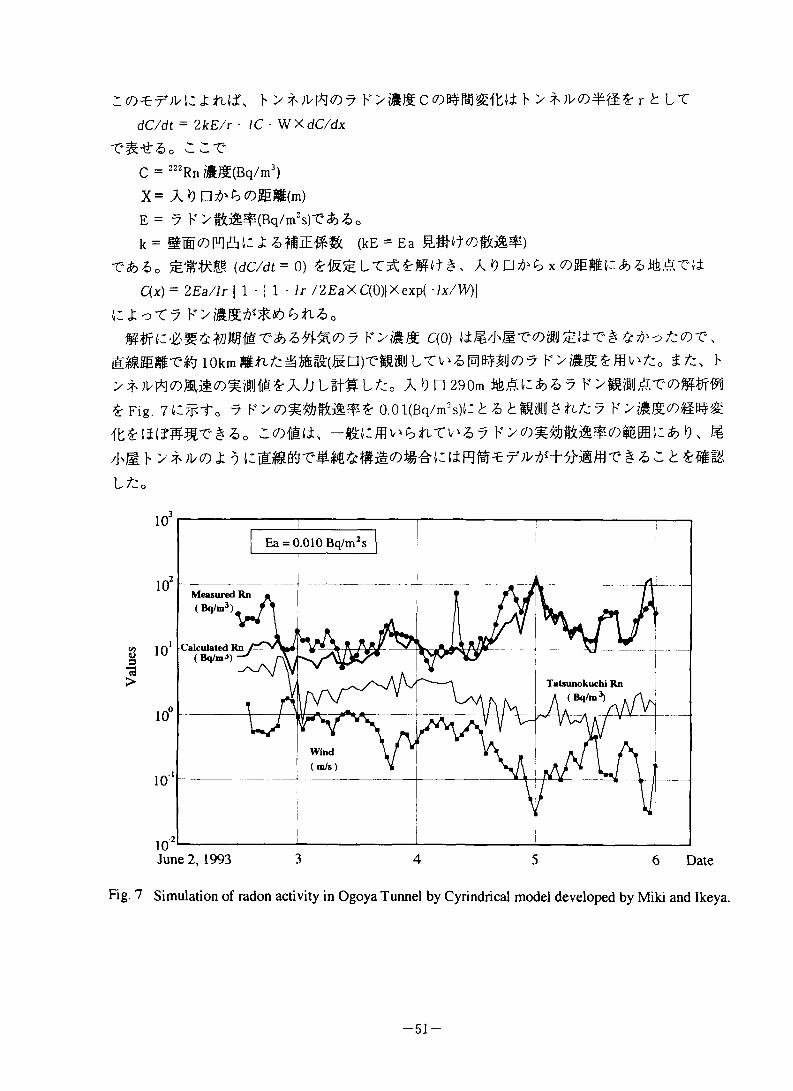
ZfLlf, F b >T-;W7)4M$£ r t LT
dC/dt = 2kE/r - 1C ■ W XdC/dx
TM&o CZTC = 222Rn #S(Bq/m3)
X= A *9 P^^WSgSi(m)
E = 7 K>#m$(Bq/rn2s)T&6o
k = (kE = EaT&'So (dC/dt = 0) *{&7ELX£.£Mlf£, A *9 x (7)3&Mlz&Z>m&Xl±
C(x) = 2Ea/lr | 1 -| 1 - Ir /2EaXC(0)|Xexp( lx/W)|
iokmmtifz^mmmo)xmmLx^^mmc)y K>s®£fflv>A0 ttz, v Lit# tAon290mmAn$>67 k>ii?ie,a(7)W^j
£ Fig. 7t:^to 7 0.0l(Bq/m2sH:i: Z> t&WZtitz?
z<7)#u\ -%t:mv^^Tv^7KxD#%m^$<T)$BBn*o, m
/j# h 9 & 2 ^L tz0
Measured Rn (Bq/m3)
Calculated Rn ( Bq/m-1) —
Tatsunokuchi Rn A ( Bq/m ■*) ,
Wind(m/s)
Fig. 7 Simulation of radon activity in Ogoya Tunnel by Cylindrical model developed by Miki and Ikeya.
-51
intO
ti; 3 d g 3 '# ^ to to to of i '
hr i-* 0 dm3M »4 rEf
0 n-
V 8^ id 3 ^ rv
<iCT)s*r5:
(V.I
Xj-null
B B A d d A8^ d-CP ~r
d id V ^ X w
Oonull
5Vti-vPsto
cn ip« 4% ^
»-rO'pc
<(V
#S3mo:3mill
#•S
S'
ti- [1
B5-d
<r
3d
eti4-o
d*r<3
r i
# s
< d W
oh c* x d
s> 3n> 94-< Xs x3 d4 d,<$ xi
4oildV
>4
>.Xj-
V Or to
03m>4>.
Xl--7“
V
# »- B 0 E d ^ °^ *& w
1#
I *
5?
B ^E M% b3 M-), r x d x- B
d 3
3 x m d^ 0*- ^ 3B id!■>
P' x ^ m<Zs ^2 ^/" MB *& ^d 4# €n @k r# d rv
a* E ^ vP $ ^n 3 B
ag E % 3 % ^ Si 9 O1 ow ^ 4 3 H^ n H to B x ^ d.
JS*i ?@ 3 ^
# fE 4 x9# fd B
H Os'S X X xX Xj- Xf X% 94- S Y' d w Vd l
ss 3m4
x3 X-fd g
a#94-4d<r
Or Xd3 oB 9*
S dti- -
I*A ^^ 5as dm# H^ 4 ^r
4 3
11
[4 h d4 d X w X xX)- d3 ^sa 4at ^5 IS f
9-r O' n
0 %9» m' xOJf d X on>1 « dH"
r- » d y tAr 4?
e>44.
b4rvu-
d
vjir3Efr□i+5-
xX-Dllll
eP
P&
3V
>x
E$3^jmn> 114
BE%3Hv
-w -* x
1 4~r ^
af a^ XAt S% H W4 m). x x 3XT 4^ md a
id
m 3 a told d
y h- 4 d rv # d®Vy-. SB co
X3 3 3 d # 4 X B3 B B 4 X & 4 i® XJ- B W ~t\
3 Ml W d d 3 eP 4 » V tira> B H» IE 94- X hr d V Xl d X4 i»i* d % E yx O' 5- 4' X- ir(- V i#6
d 3 # 4 n M 3 4 V 93S X ►—1 d d M » 3 X d 3f oid 3 Sb 94- <r <r B M mill & mv <pa •x s
6 4 M B!3
CP S Bant-cvcv m V iS 4 i® 0 Mi M o W Kd X0 w a- d -r <r X g X d SIS
1° 3 3 3 94- V A d 94# ti- 94- 3Xr ^t“
V✓* Mt d d' 3§ o 4 r
x.y. .
4 ti n> <3 <r <r V ro Xl X0* ll n
6 0 3 4 B X l H Xl-/X
AM H- 4 X 3 eP E V * tt.4 9-4 Xl ti- Xi ° sfa X M d Xlep X 4 W r 3 4 to 4 S3-hr P' d V A y V y-. 3 4 l VO' ?p Or x ti-*"# 4 * X Sra 4 XM 9-r £g d to B} * Xj- 3# W B} nip
m O' ss >. 4 S 3 4 s 3 % *% TT Xj- 3 3 4 Xl 3 #i a nid 9^ d -r 2f JO to x> % n> 4 $ygo ep X V i—* w ®F V # r i 3 toe d 3 to 1
494- X id 4 # 4
fv r< 4 Woo 2F null-4- H& 4 Xi
X 7* m to V to zx id Xd 2t d m d to Dd M r< 4 VSV 4 4 4 ti X 3 % rvep CM d ti- d 4 94# ti- Xi 4 &o to 4 »—• eP B d 4 W X CPm cd r» 4 4 Xi m V d is
# # #' a sti- X d 4 3- 3i® f# 4 to X ' V * to ts
d 4<1o XJ- 1 3 CP ti- 4 «
4 eP /X 3 # % 2* o BM * to d eS d 3 4it r< <- 4frl} 94-
topa O' m W m X r < 3 Htt
m > D 3 3 4 d d 3n X 4 » to X X 3 94- #
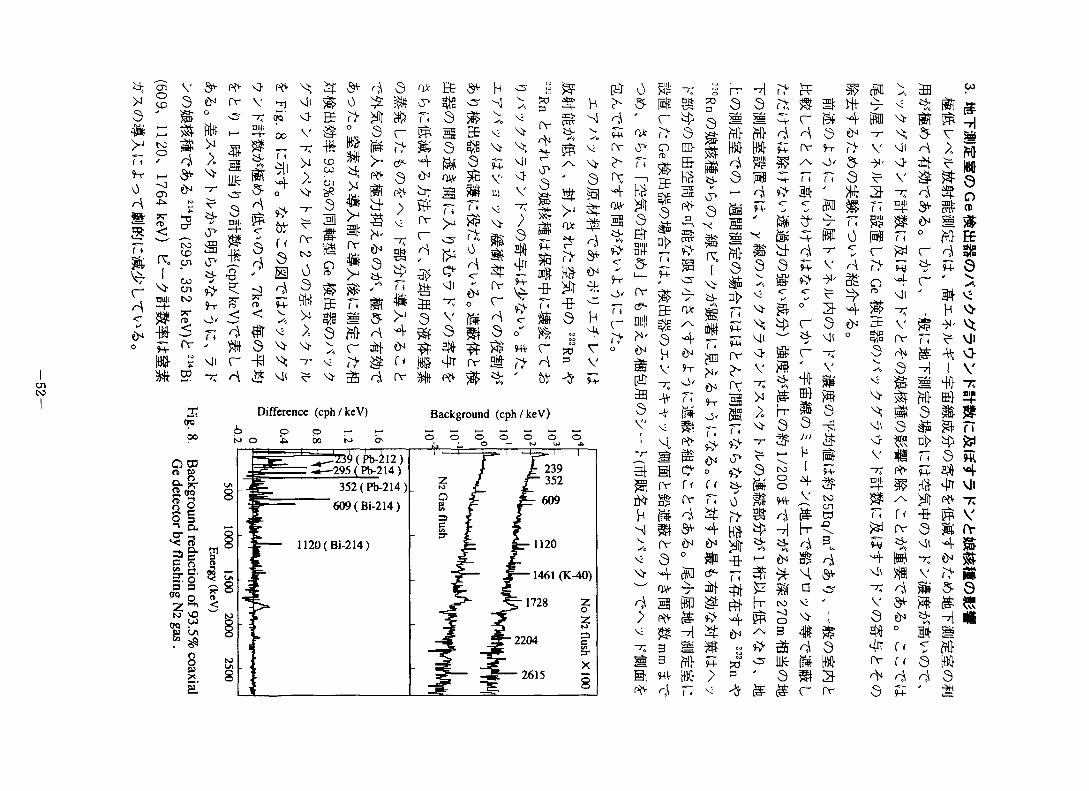
SSSA^ J: 01 222Rn<7)MS<7)lF5-t±^ 1 /5 t: 220Rn <7)WS<7)W4M 1/3 t:frM
L./t0 x.ft-&^<7)£i/'2I4Pb5&'P>£> 352keV b°- ^ 0.003 - 0.004cpm(2-3cpd)
iWo-CV^,3l0 2(7)1 9 &7 K>WHloTW%b^93.5%<7))k:iy Ge^to§|(7)/<7 ^
KfH&ti 0.1-2.8MeV#mr#LT 1.26 cpm tU#) T© < , fiLt-CiSE L&
<7)% 1/20000, m±-emE^^-3^#^(7)^ 1/30 2<7)i^#$:^
Sr lOOg <?)#&#& 1 U O.Sppb, Th T# 1.5ppb
6:^cTv^o
7 $V4:7 irify^y Vtf0.1-0.2cpmfM±i*a-t^ 2 t '*y 9 KStM^SOcpm Wik
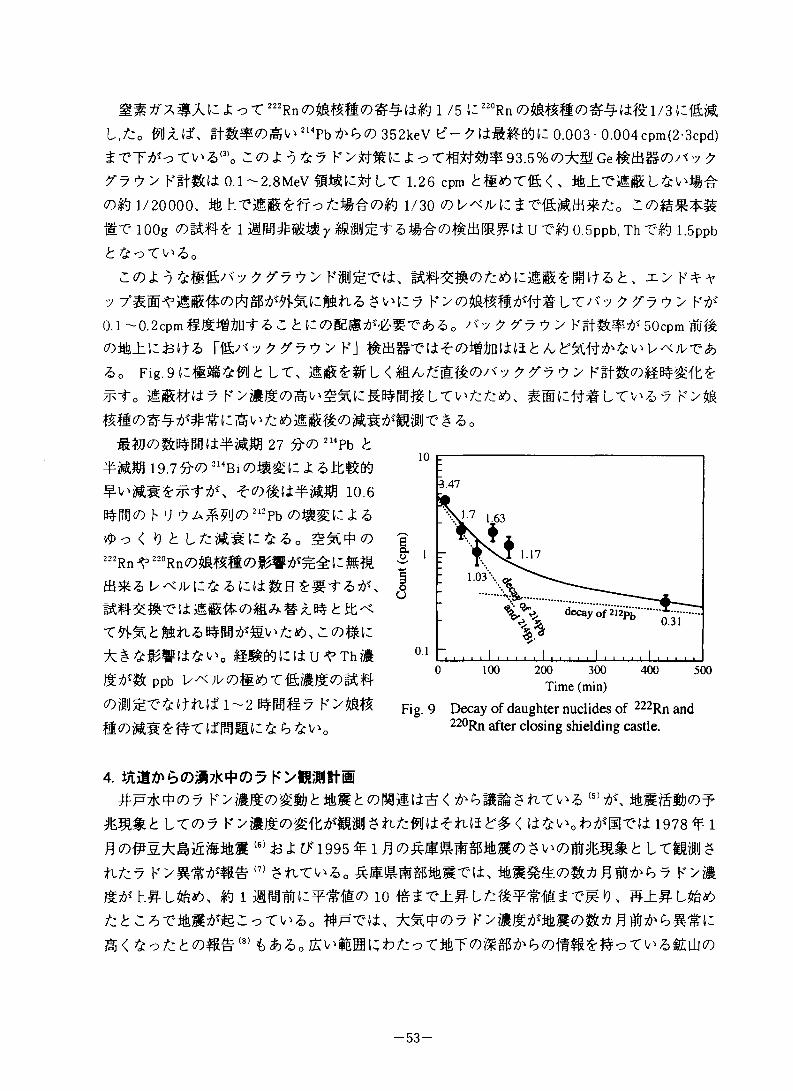
(7)%±l:j3l)& RSKJ t&tti t?T:i±^<f)m\it±Hb Az & v >1/ p T $>&o Fig.gcmm^^aLT, mE$-#L<mA,^g#<7)^v^^7^>K:m(7)##gEit:^ ^-fo mE#(i7K>#jg(7)Av^%C^#M#LTV^/:*,
##(7)^4^,##nitsv*^AmE#(7)m%^m#-c § * 0#%(7)%#fm(i^«m 27 ^<7) "^Pb ^
#Wt% 19.7 ft<r> 214Bi(7)^ni^JtKW f10.6
#^(7) I' v ?A#?IJ(7):"Pb (7)j»^t: 1^,< t? t Lfzti&MlZZ&o -£%^<D
222Rn^ 220Rn(Dl&&m<7)BWtf%^zm%
m$/5 u^ouizZ; zizii&B
##^#T(±mE#:(7)m^#x.# a
xw-% t mtiz> www&\'tz#>, 2 <Dmz
ppb lx^;i/(7)@&!)T@#m<7)Bt#
p)m^-c&R-Nfi~2ii#m7 r>%#muffin* ft'cmwizKb-b^o
4. tumfrbQMyWQ? K>K;IiJlt@#p*4^7)7 (5)^\ ife*#g»(7)^
h lt(7)7 k> ttjt <» mttfMm £ ^ w±*■ *ui t"# < t± * v >0 ^ -c n 1978 ^ 1
3(6)^1^1995^1^(7)^$##%m#(7)$^vmmn11 ltesij$fitzy K'yBWM (7) $tL-Cv^0 ftlis^lltli, ym&OLfO&Lii n%Why K>«
S^'±#Lte*. ft l 10 #±#
f:i27)We2oo^0 ttptit *^^<7)7 Rm'bmhz
i#5< ^cX:&<7)#^^ t*6o!AV'#at;t)^cTmT(7)mgB^^(7)m#^#cTv^$tLli(7)
decay of 212p5
Time (min)Fig. 9 Decay of daughter nuclides of 222Rn and
220Rn after closing shielding castle.
-53-
gift^b<om^(0 7
m'l'Mi&ilKnMft'PV? K >«S!UcMLTJi, 1994
tfrv\ M#t^(7)#7Kri8mf6coz tV&'i/Zo L^L> 7-WJEHiDx.T, Fig. 10 Z 9 1:
y F><i&<nmtKlZ‘&gZmm*Wtl2>%ffitfMfrnfrC,%l400m
1995 ¥ l ^J; oTilf ^^t\ &##
/jA41 ELTvVc^mEErSiJ(7)S^<?) Hii L<h, 1996 # 9
iW%-t>?- (/)#%^;u- 7d*±iR;t# <h *[s]-c* h > * ;n*i UifeHtf &Efi LTlIfl u^ca, i99o#^^mnr^oTv^^:%4:(7)7 1996^8^$^^
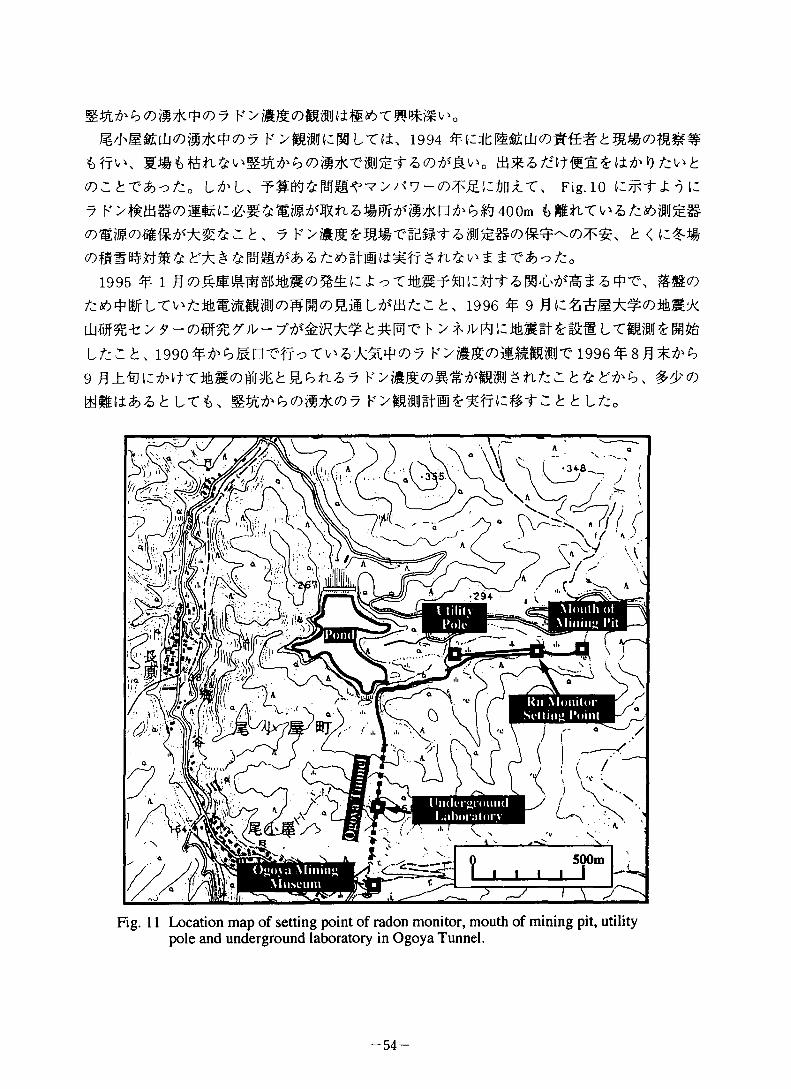
Fig. 11 Location map of setting point of radon monitor, mouth of mining pit, utility pole and underground laboratory in Ogoya Tunnel.
—54—
, 7 >ta>xn mmmfc,
? k *) z>o K>ims#@uy<yTV
-r 1 X fmmt&Zt. <toTM#£igSgSf£3: Xfcz.Z>X ttfvjmt 2
tfrb, z<7)##?)#ArzcTZK%(7)im@&d'&o#m"o#a7 k>&i
or lkm SIEftA h 7 AA<7)M 1/^;v£5tlW!iJ£S^ y t v n yT-SMEEi"6£0 i£v>Mi±EIS[H]S£*iJffl LT,
&#x.Tv^o
5. ^ KX %m%L Hb»(0 3 7t|5imiJ$(7)t6<!: UT<Z)J1/]\E
v^ B^ VkmStLTjo D>10km i^±^tlTk^0 t: 1 TSffl*<7)
i), ?K>,
££7y-textmgLTUy o, -#'bE&*4§-e&1"Ci£< ^T-MW^bfi^(7)Ty A§ *KgKJifc b £v>«h#x.T^£0 f -ck i Lxmfcmmvwfetf&m* ce
m^^g#LTjoO. 4-#&3-#Ty K>(7)mm!l^li+^W#^#ATv^o ftiS, K 3 ? 7xvshMMM
I«t:MLtv^o XtDtzsb. 7 Ky^^ESJ5ti^e^i±JtK^il5< > 3 7t®mw\
6. JSPT«;!i]£n7t*m*0^ K>«S©g$mm-mwmk t&bnz> 7F>iiomi:oi >tmeti $ ntzm z mfrt a«,
T 1990^11 Rfrb0km±%*<D7 K >M(7)ilEEilffo T V> & 0 1m <7)%<0 Atinfrb¥--)i?-j--7*xm±.<v'<y v7,A\\zwtWLtz7 Ky#m#t:m^K6o
6 Mfrbmzfri, tx& < %-frb%lzfrtfx 7 K>8M< %Z>t ^
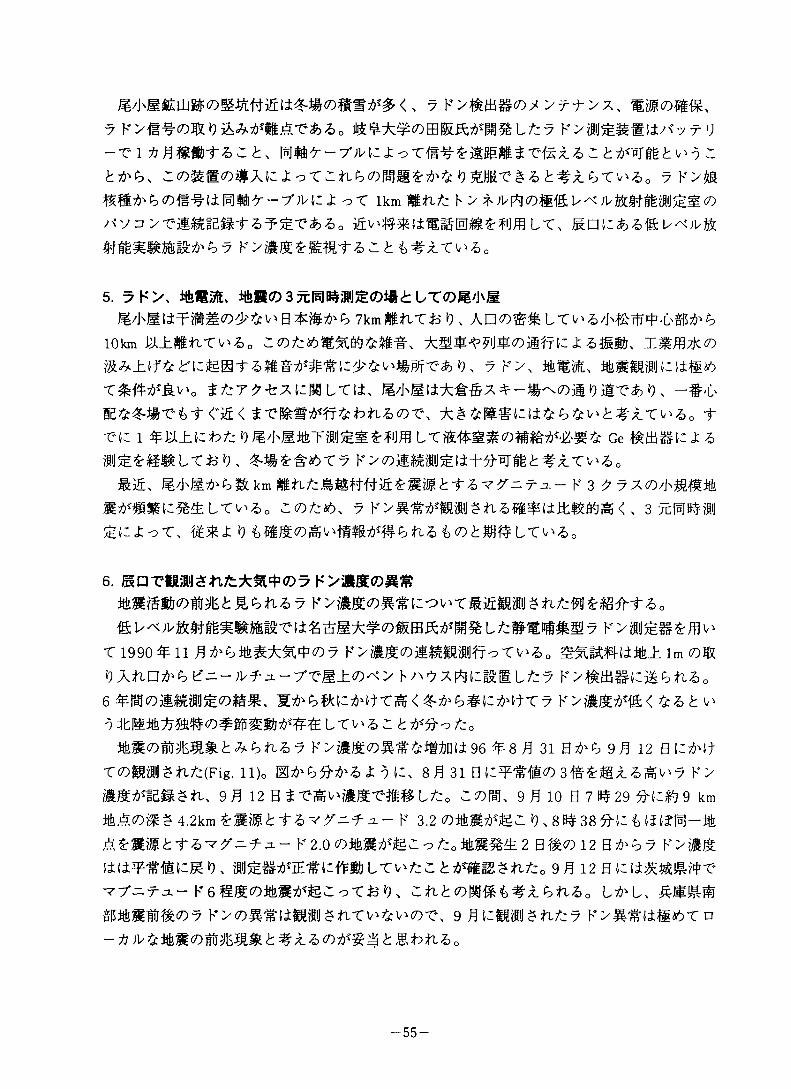
n tz0MM(DMym%.t&bti&7 K>?&K<7)M1£&iM± 96 ^8 /! 31 B frb 9£ 12 BlzfrU
x(DMmztifz(Fig. ii)o mfrbfrfr&id 8^ 31 ac¥ti«3i&^ii^^'7 k>
mmmmzti, 9B 12 uzx^M&ximitzo x<n®. 9n 10 s 7^29km M&vmz4.2kmjl- k 3.2(ornrn^^£ £ S W h "t S v y* - -7.3. - K2.0«iM;o/:0ilM2 B#<% 12 B^f?y K/iM lilMi:I>), iliJStr^ESt:^Sb LTv^A^ 9E 12 H7^fa-K6gMS^;ott3^ Ztit(Dm%i>%z.CitiZ>0 Lri'U &$SW
MSM07 K><7)S's-(±E?SiJ$tLTv^v^(7)-t\ 9 £ rEilll$ fitz7 K>If(iifeTn -ij )v% Mcossm
—55—
Fig. 11 Radon anomaly observed at Tatsunokuchi during Aug. 31 to Sep. 12. Time of earthquake is shown by an arrow.
7. fc*) U 1CIBm&fWL2:7 K $ fifz7
9 k>, mmm,S£l^-ife£'C*?T;5 C t t#x., l 1 m±T-?£$SU
fufT- ^ c «b ^^ LX®m*Vatbtz^t&no IBM/hEEUjt±ciiib(7)($^t:i> & s#f»j ^ f ij ffl t- §= £ ^ !Eti £ $ * t v' & 0 %.A%frmfrbm4'mzmm-tz>ffl9zzffi^LTSifc^o Jr<DBnt 2ftj-j3#fcv^L2:v^#l-Cv^0
(1) 3 7(8). 283 - 286 (1994). IWs 3 7(10). 3 62 - 366 (1994).
(2) #0 #, (1994).(3) (1996).(4) mf tl##m21(4), 57 (1979).
(5) J&EB^, 31(2). 215 - 222 (1996)
(6) H. Wakita, Y. Nakamura, K. Notsu, M. Noguchi and T. Asada. Science, 207, 882 (1980).
(7) G. Igarashi, S. Saeki, Y. Sasaki, M. Takahashi and Y. Sano, Science, 269, 60-61 (1995).
(8) “±%^(D9 vymtwmmm ir, (B$i^m, mMM) pp. 204 - 206 (1996).
— 56 —
Distribution of Rn-222 Concentration in Natural Waters at Kobe(9)
$159611. JtBKiEW Y. Yasuoka, M. Shinogi
1 . & b g> t;:
1993- 94# (3, 7\9UU^(DA(3$:M(3@m^^TW&mTzk6(:'am
n?>7h">s®^aij^u tzo am mm1995# la i?g %^ )#, ^ n ^ ©tfeTTk a (3^ % n % 7h">a® & ao^ uitifcBm b tzo
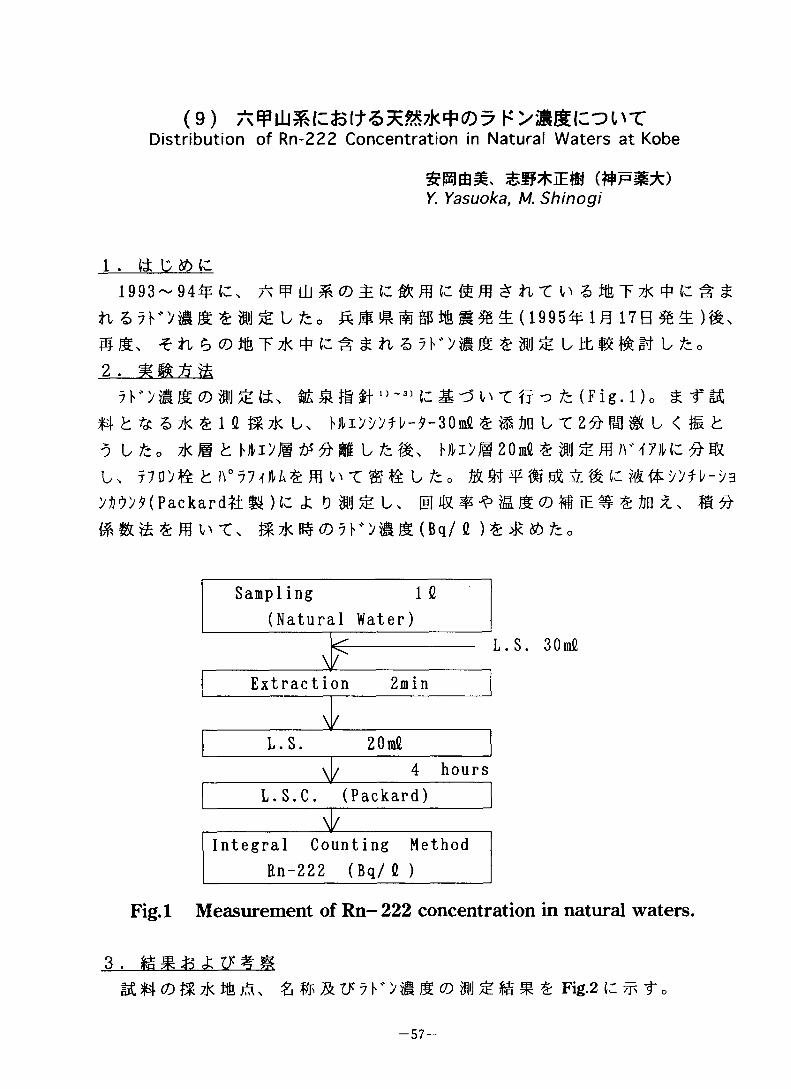
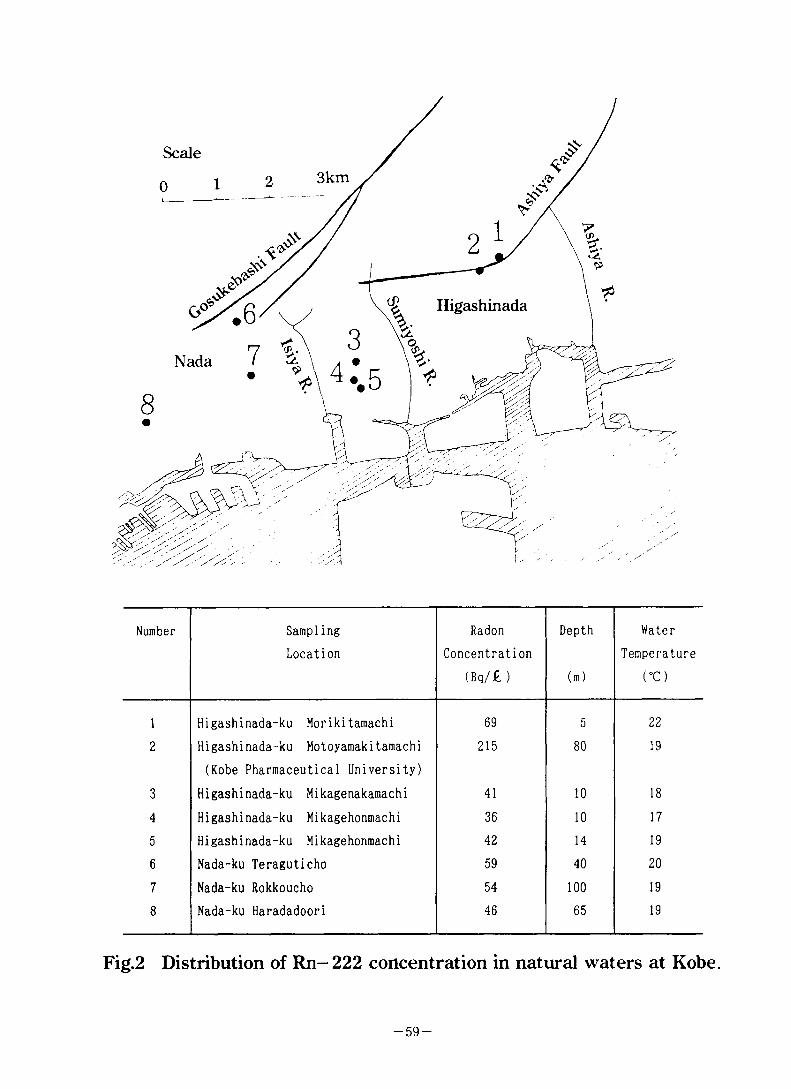
2.7b*>as©«o^ti, (3m^v\Tffc/= (Fig.i)c mf^
*4 b * a * & i a m* u Huv'»fi/-^-30m£ LTze^mu < mao Ltzo 7km £ MU>1 tffrM b tz'&, MU>E 20mfi £ $J £ # AM7)W3 ^ ^
b, T7D)#kn°77^A%m^T%#b^o>iW( Packard# ti ) (3 & 0 $J £ U [1] JR & ^ U JS © W IE ^ £ in &,
m%k^®7r>#m(Bq/G)&mA^o
4 hours
Extraction
(Packard)
Integral Counting Method
Rn-222 (Bq/G)
Sampling
(Natural Water)
Fig.l Measurement of Rn-222 concentration in natural waters.
3 .A. &###7r>iemc>#j^*am& Fig.2t3#-r0
-57-
*feSllu&©JfcT;d<*©7K >«&©£!& f ggB ^ LUm@P"C^
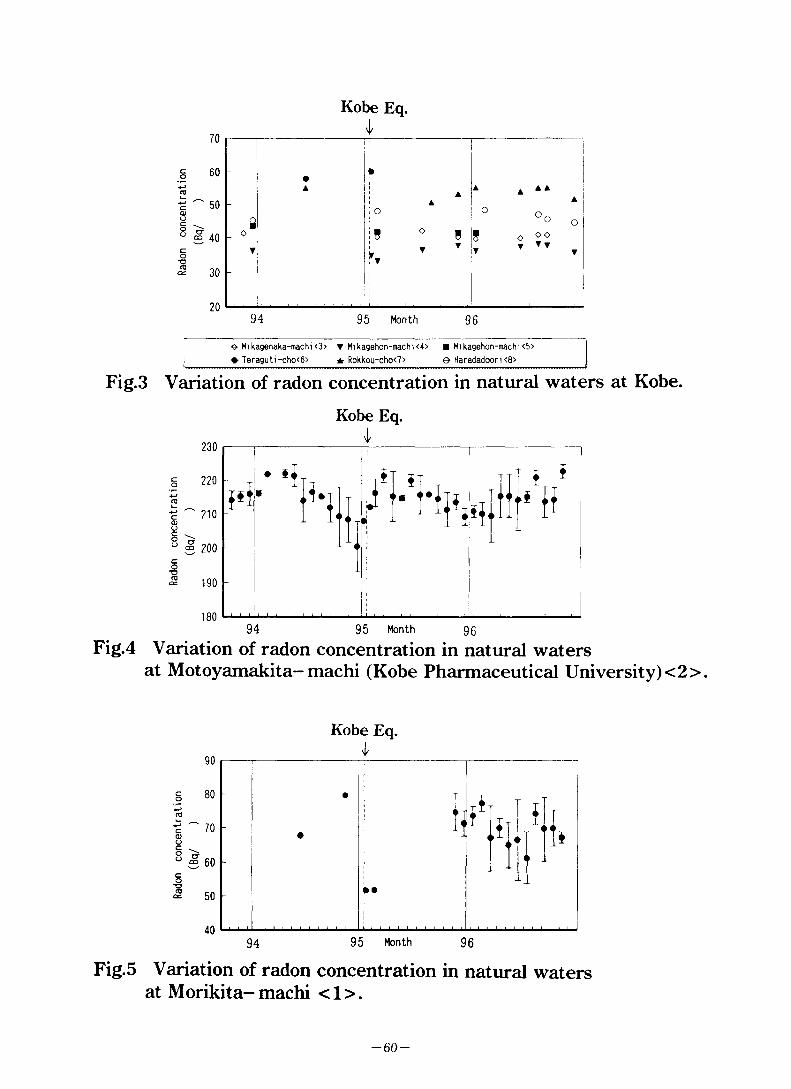
£1\ ¥1?$(3~8)£ Sim: tiu Fig.3 tmt £o MmmtMM \k-eit ($Eim o#-c& o fee
m z=, Mmtisfi%\tt®B%fre>ftt)pmmm<D'£<fctiLWLz\,'&ii}* ^ ( 2 ) & S 4b BJ (l) © 2 >r Fir £ o U T
ItSSu© 1994^12 F§ (;: ti: 7 K ># S © ¥ ±§ 16 U^o X, ttSiiilu© 1995¥U48B h, It # m # © 1H
31 B (C U X & 0 s 1/4 31B IZ tel2&MM<Dligfc.m o tz (Fig.4)0 - Ji, W 4b bj © it T tK ¥ © 7 r >?i Jt &, lt##(zfm^#^¥U^o ^ © f£ ¥ S iCMo tz (Fig.5)o
*#©%¥*#: ©7r>#m &, m4bBT©7i'>mm©^%^#^^Tj3 D , ^©ifibbt, ifeMitu©Jte68©^&fc<fcoTig£fc3a£T?&!K
mmm,aw#^T$>6m4bBT(Z)mT7k(±s m##, mmE©Ltma;
©$! 17k©7kS*siiSo b tz tz®, ci ©^Hf4‘3£©7ki©±iXjo c- £ !)> 7h$#©%T7k(±x 80m^^l\#
p^&^tztztb, mmm©m@##©7k#©#an©#2##^#&&-3&
m/=, *m#©7rx#m (¥¥ )4> ©sttk ¥ ©7K:/SJt (s^ )5> &s mmvmzBm x *) mm\stz o %<>
# % % m
1) S? □ 1E£ ; M 1£'»?!/-'> 3 £ Z> Radon ©%## #J /&Radioisotopes, 13(5), 362-367 (1964) .2) #m&¥, ; m##:©7l''>©##:)/>fl/-)/3>*^>^-C J: &#r
©&#%#%{#:©#mis mm##, 28(2), 35-52 (1977).3) ##a? ; £££ ¥7K>0fl& ffi - iSf ^SSCo^Ts
13(2), 95-103 ( 1978).4) %ma#s ^#^E# ; ^Smm^ltiS©lu^(ct5^5XMtk©7b">ss©ss, j (b^se*#^),
204-206 (1995).5 ) G.Igarashi,T.Saeki,N.Takahata,K.Sumikawa,S.Tasaka,Y.Sasaki and Y.Sano;Groundw ater radon anomaly before the Kobe earthquake in Japan, science,269, 60-61 (1995).
-58-
Scale
Number SamplingLocation
RadonConcentration
(Bq/JG. )
Depth
(m)
WaterTemperature
ro
1 Higashinada-ku Morikitamachi 69 5 22
2 Higashinada-ku Hotoyamakitamachi 215 80 19(Kobe Pharmaceutical University)
3 Higashinada-ku Mikagenakamachi 41 10 18
4 Higashinada-ku Mikagehonmachi 36 10 17
5 Higashinada-ku Mikagehonmachi 42 14 19
6 Nada-ku Teraguticho 59 40 20
7 Nada-ku Rokkoucho 54 100 198 Nada-ku Haradadoori 46 65 19
Fig.2 Distribution of Rn- 222 concentration in natural waters at Kobe.
-59-
Kobe Eq.
co 40 -
95 Month
■e- Mikagenaka-machi<3> ▼ Mikagehon-machi<4> ■ Mikagehon-machi<5>» Teraguti-cho<6>* Rokkou-cho<7>O Haradadoori <8>j
Fig.3 Variation of radon concentration in natural waters at Kobe.
Kobe Eq.
95 Month
Fig.4 Variation of radon concentration in natural watersat Motoyamakita— machi (Kobe Pharmaceutical University)<2>.
Kobe Eq.
Fig. 5 Variation of radon concentration in natural waters at Morikita-machi <1>.
-60-
(10) tfeE^SQOfctiXD^ K>mnRadon Monitoring for Earthquake Prediction
«# K (WWmr)M. Takahashi
l.ltZtbtz.
^I^L, S^Bf^^-CyKy
mwoBEmLtmsm, znsyyf-
#7kdfyy(cZ'9TL#m^mT'7k^&L^^L, #*#^{ktCj;oT%7K@d'6Wm(C#A&:h,6$
n* 44- /r\ 7, -r*4EH vBil ^ „ -r
jgvmtttWLmztitefrj:u(,7 py#
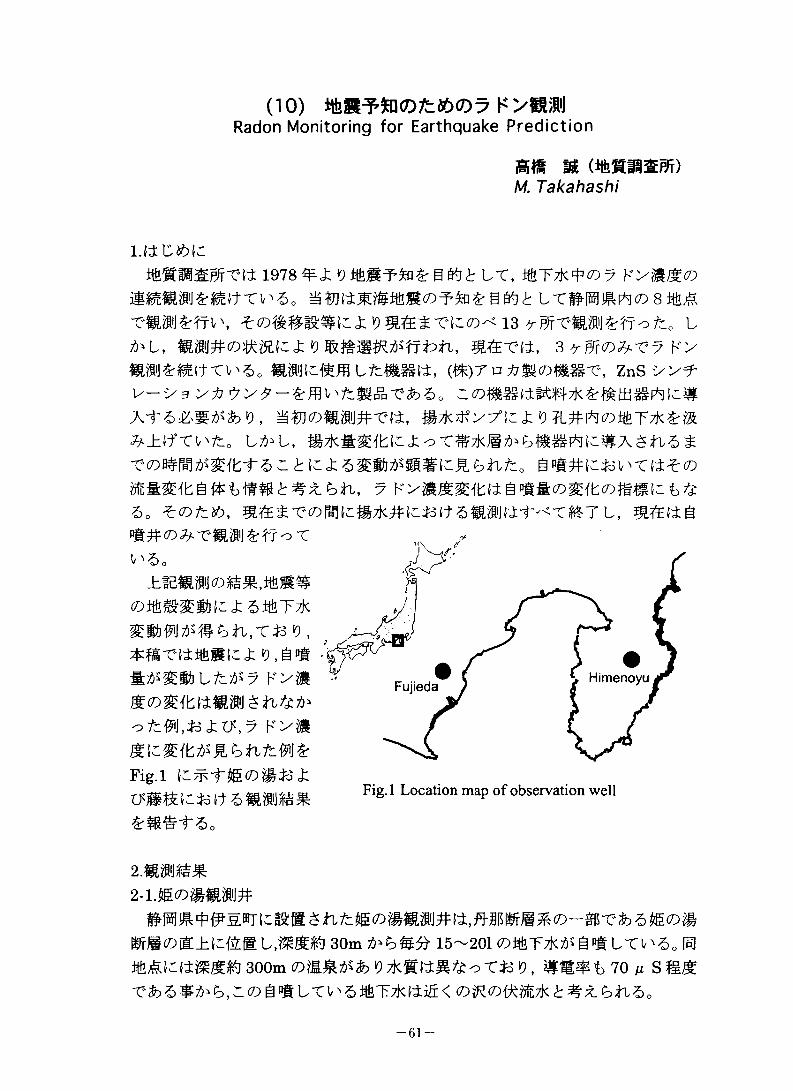
Fig.l lz.^i-&(Dmib'«fcmmmc# #&%#]##
cr"t" do
Fig.l Location map of observation well
2-iM(Dmmm#
^fr®cDE±i^SB 30m frbWti 15~20lOlteT7k^S[tLT^dof5]300m (D^S^fc <0 TkWteMtioXte <0 , 70 // SM&
-e$)6$:^P),Z^gi#LT^dmiT7K^ia< <D^(D^m;K^#x.6jT,do
-61-
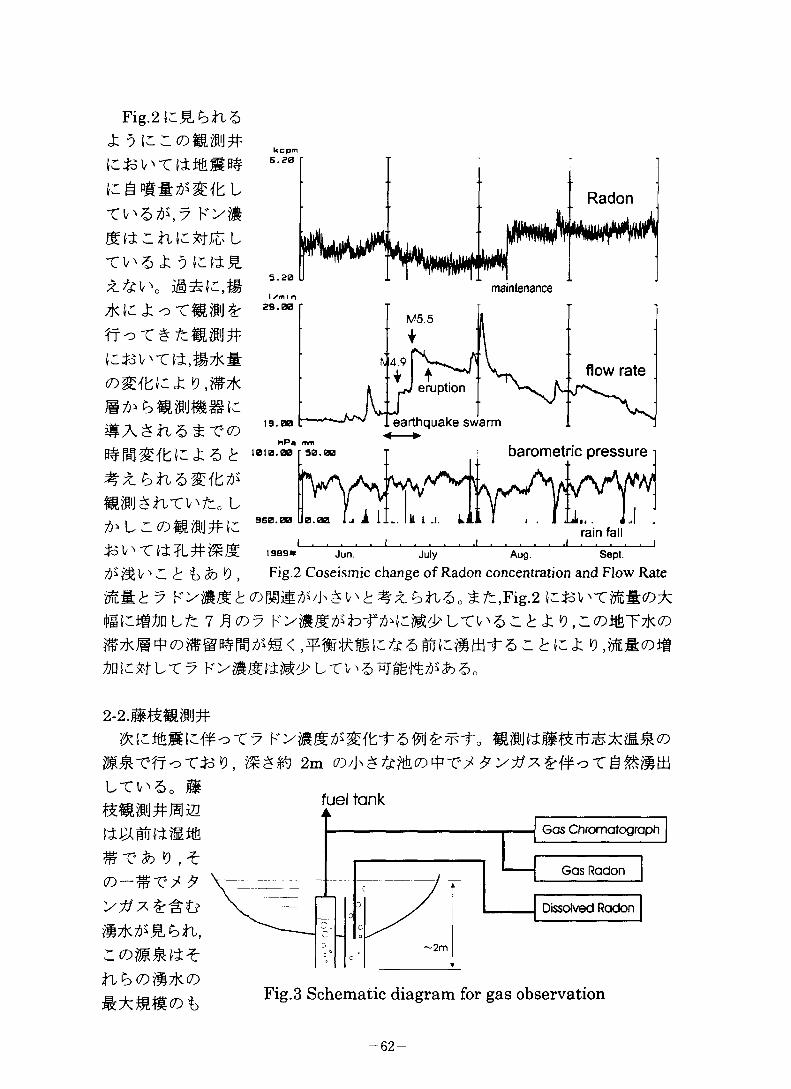
Fig.2(cm%fl,5
kcpm
Cjol'TItf&SB#
Radon
Tt'6 =k 9
maintenance
zKK J:cT:WJ&
flow rate2)^h(c J: <9,#A eruption
..earthquake swarmSA 1:
1
toJSiLTWCo L
barometric pressure
19B9* Jun. July Aug. Sept.
:$z V ^ 2L t b $0 *9 , Fig.2 Coseismic change of Radon concentration and Flow Rate
mm <1:7 (cjov^mmtDAWici#A0L/k 7 ,9 2)7 j; «P,C2)mTA2)
mHc#rni-6 c (b tc j; 19 ,m#2)m^DiC#L-C7
2-2.#^m#j*
#A-efT^Tjoi9, 2m 2)/J\^^#2)^T^ffa^o S
9 , f
2)—^
Z2)m&#f
ti/b2)rlA2)
fuel tank
Gas Radon
Dissolved Radon
Gas Chromatograph
Fig.3 Schematic diagram for gas observation
-62-
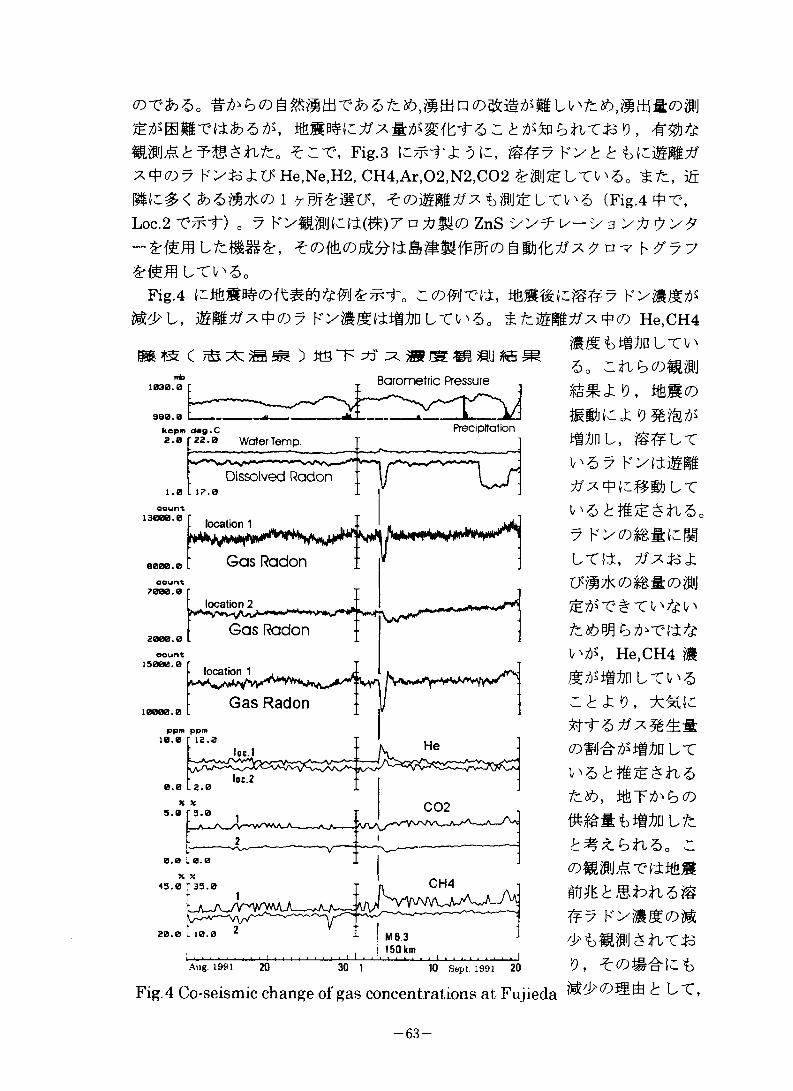
blfitobtixte*) , &$hte
^CT, Fig.3^t®7 K^*3<fct/He,Ne,H2,CH4,Ar,02,N2>C02^aiJ^LTl'5o ifi #(C#<$)6#7K<Dl/rBT^#U(, (Fig.4fT,Loc.2T^f-) . 7K>WJ(C(l#)Tn^7#(DZnSC/yf-l/-^3y^9>^
Ztiim LT#£0
Fig.4 zco#ij-m,
(Z>L, Ii^^©7 K^M^fiti^OLT^^o mzmmtfX'Pn He,CH4
® c ) tts ~f ^ a* ® ipi mj #s:Tr t Barometric Pressure
13000.0
ppm ppm10.0 r i2.0
lec.2
x x45.0 "35.0
1
20.0 L 10.0
LJW\_y\r''v/WVL^
2
^VWVVVArVvUV-V^V
1 1MB 3
1 150 kmAug 1991 20 30 1 10 Sept. 1991 20
Fig. 4 Co-seismic change of gas concentrations at Fujieda
6o Cfbt)###
l£IU: <9, %##
mnL,v^7 Kximm
LTlt, #7*3 j:
He,CH4 M
C t ct <9 ,
it
MTfrb(D
^#^t)a6o c
#7 K7#g#M
d/twj^a-cjo
»9,
EZ>#S6 t LX,
-63-
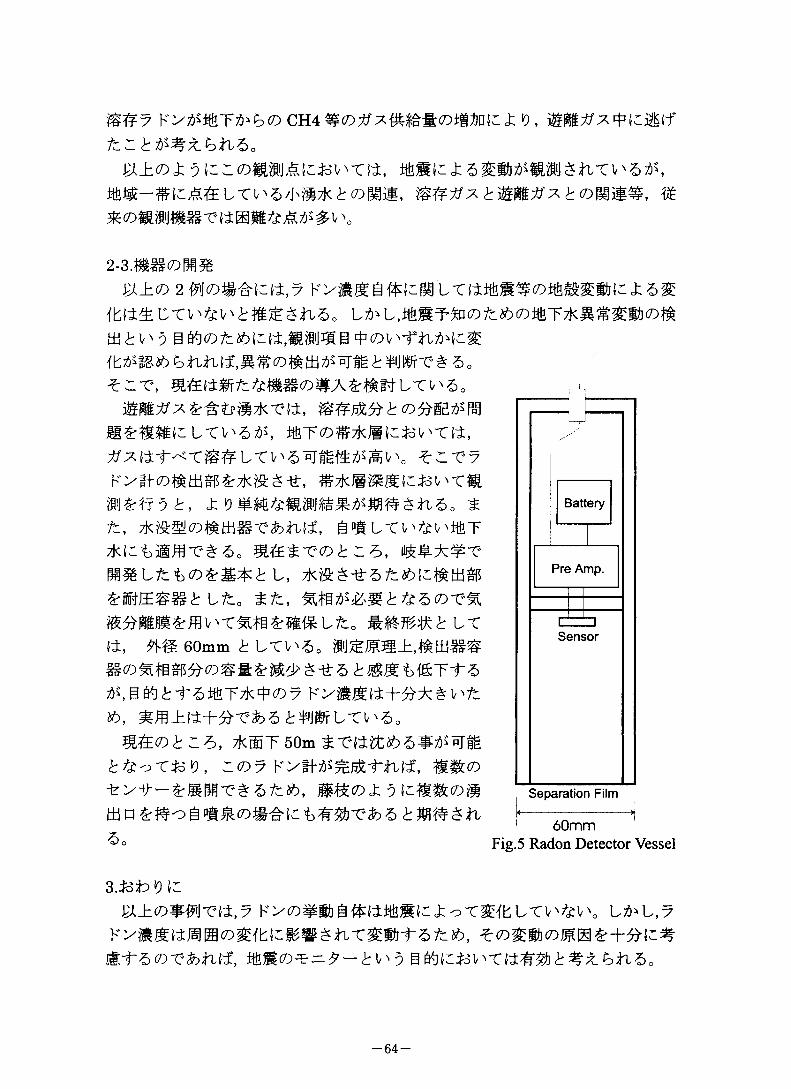
mtfy CH4 m(Dl3'yWf£J§L(D^Mz-£v),1tz bfi'^x.bln&o
2-3.#^§(D^%
tti£V'5 (DV\-fW4c^
^r-e,
E^m^LTV^^, i&Tto^TKJll-jb'V^Tti,
it, 7k&SM(D#HW#gT&)i%(f, @#LTV^v^%T
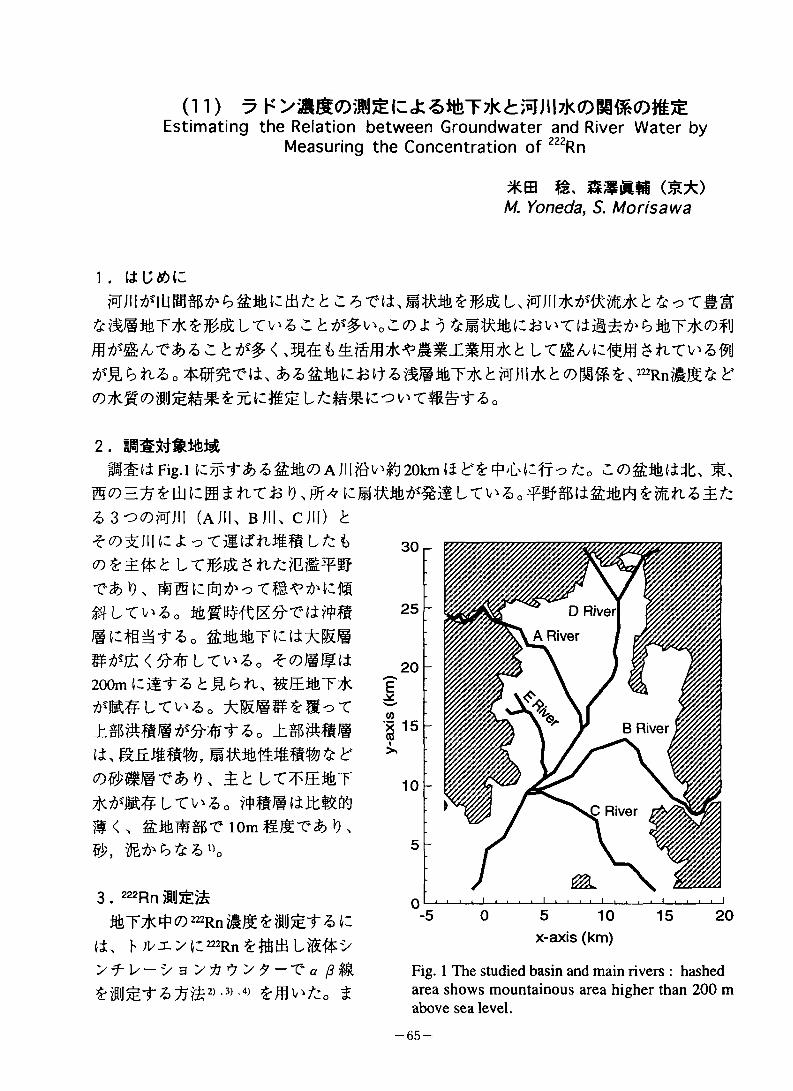
zkictmm-ee^o m&$-e<D(bc5,
at, Mws&#,k%5(0-cm
ti, ^ 60mm £ LTl'5c S'JSSS±,^titi^S&<Dis.n&&<Dmm%wj>&j£z
^,g^^i-6%Tzk4:(D7A, mm±(i+e-r^6 6$ij»fLi:^6o
mt<Dbbh, *®T 50m oTIEir&oT&i0, Z.(Dy K’y|+^^-f"tUf, ##(D
th p g m.$k<DWs^\t b ^r^b-efc 5 <h $ ti
^3 o
LSeparation Film
! 60mmFig.5 Radon Detector Vessel
S.toiD'O ^a±(D^mvn,y j;o-cmfkLTi^v\ u^u,
ti£tZ<DVhtiit, MM(D^=.? — t\;'o g^]^joV^TttW$t)^:#x^nd =
-64-
# Ml
(11) 7 K>**03ll3£lc<fcSifeT7Ki:}»nil7kOH«a>«l^Estimating the Relation between Groundwater and River Water by
Measuring the Concentration of 222Rn
*b ummm o&*)M. Yoneda, S. Morisawa
1.
2.Mli Fig.l tZTfit&Z &&<D A Jll 20km ti ^L'Mt o tz0 3L
3 3-o60mil (AJIU Bilk Cill) t *<D3UWK J: O T3ifnS«LZ: *> <7)£±$:£ LTSEStLZryBE^ X& h >
i*fJo#7)% < ^LTv^3o ^(DlgMlt200m tMhti, $.f±MT7k«Ltv^0 Z:Iiff^Sot l®i»8Wt5o ±^##@ it, E-Esew, ^
3£^ LT^E^T2K^m#LTV^o B <, iom ,
3 . 222Rn rnu^mMTfc*<D222RnM£Mfct £ t:
ti, h )VS.'y lZ2nRn $rWth Lf&'ffcv
D River
A River
x 15 B River
C River
x-axis (km)
'y ^V—'y a 'y tl ^ 'y 9 ~X a /? # Fig. 1 The studied basin and main rivers : hashed£igljjg-f ^,^f-^2) ,3) .4) £^]vV::o $ area shows mountainous area higher than 200 m
above sea level.
-65-
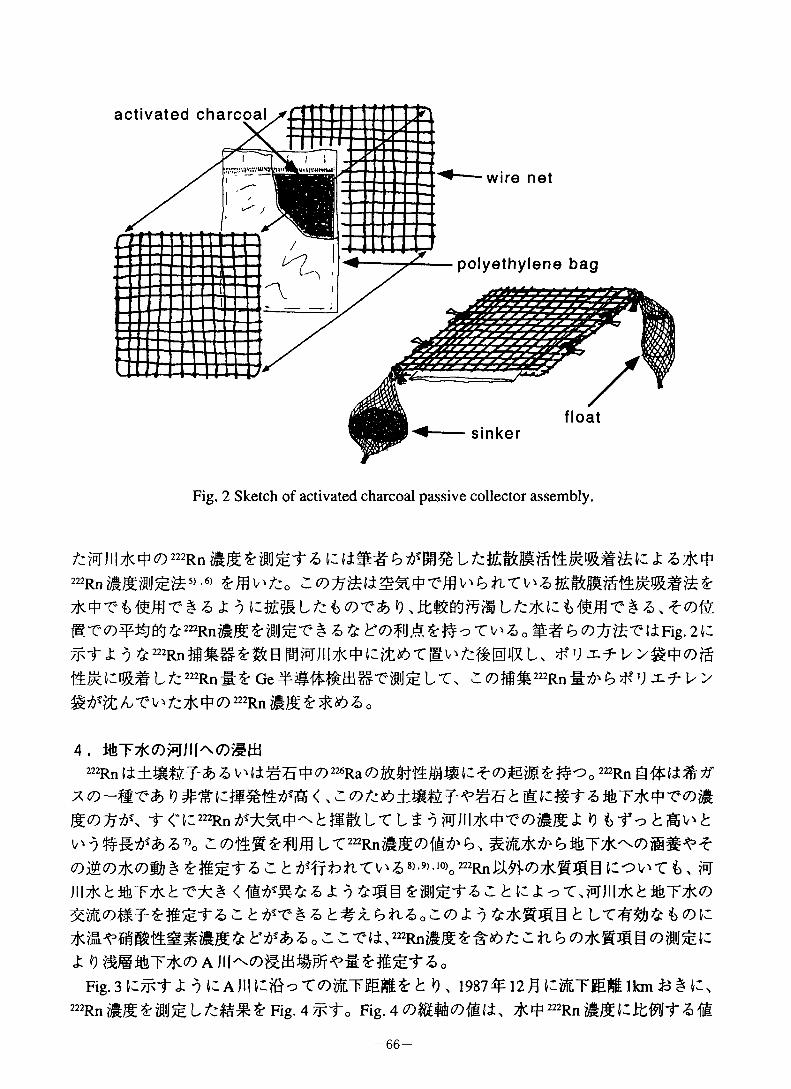
Fig. 2 Sketch of activated charcoal passive collector assembly.
tzW il**e> 222Rn £ iist £ tc im% b L iz>7k*222RnEj$M5e&5)'6) SrfflvVsio CfiT $:
T # 6 j: 9 tcEE L/C&<7)T% 'O , L fzfrK & #M T#6, f (7)@:222Rn$SE Fig. 21:
TFtii^ 222Rn####^mB^M;iizK4:(:i±^Tmw:m[maL, ^uxfu^gw1:## L222RnB£GeteLT, ■!(7)##222Rn t^?)^'Jxfl/ >
4. i-6T*<7)^I/l|^(7)^tjd222Rn 6V'(igS4:<7) 226Ra <£> 1^(7)^ £#00 222Rn
x(7)-st* •? <, <rJt<7)W\ f <l:222Rn^^[#^^m#LTL^ 9mil2K^T<7)#jgZ «9 tfo v^#stf?&£7)o LT222Rn#m(D#^6, ^m7K^6mT2K^m#^f(7)jSC02K(7)i6 # h ^fbtLTV^8).9).i0)o 222Rn ICOV'Tk, fflhl7K^mT7KhT±# 9 32 ^ l:ZcT.mil7K^mT7K(0
t^x.htiZoZ(7)J: 7 t LT#%&tot:& o c: - -Cfi >222RnilJt i $#> tz i ft <7)tK®^ g (O mfe K
«t o #@mT7K# A 6oFig. 3 KTFt <t -9 iw AJII 1CBoT<7)ET®$£1 *), 1987^12 £ MTJZEE lkm ft 11C,
222Rn iM £Bl;6 L £ Fig. 4 Fig.4<7)^#60#(i, *42222Rn#J^l:jtMf
— 66 —
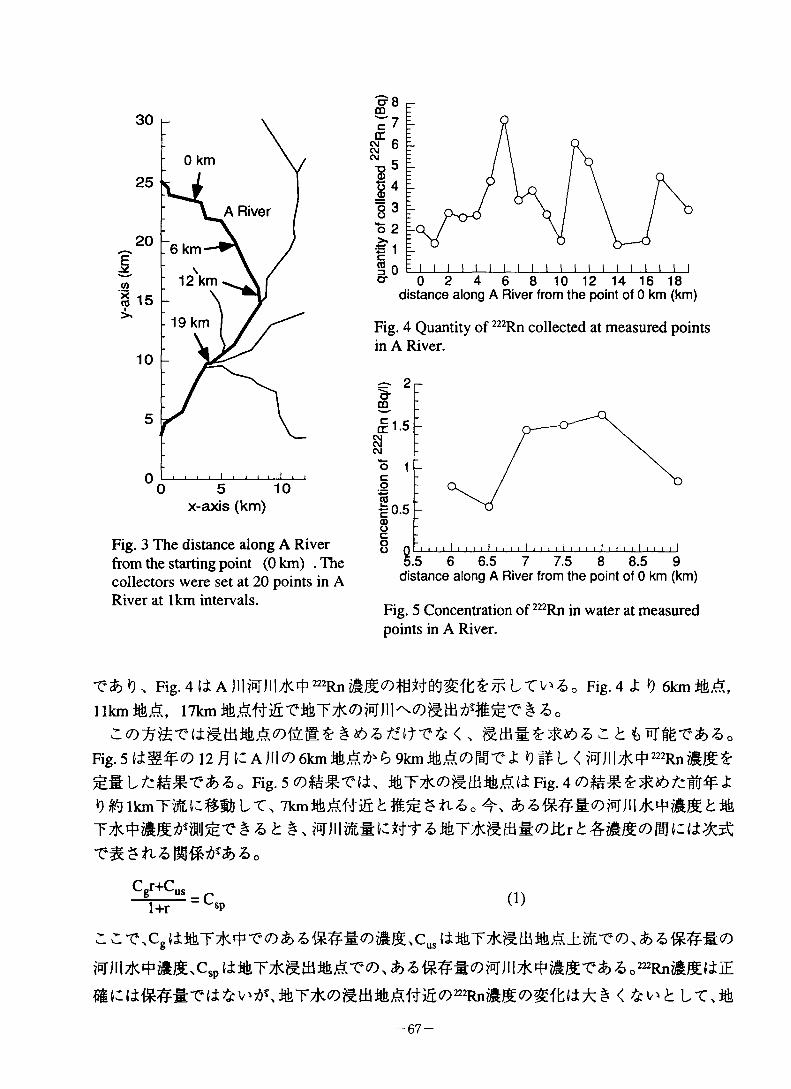
A River
20 -. 6 km
-19 km
10 -
x-axis (km)
Fig. 3 The distance along A River from the starting point (Okm) . The collectors were set at 20 points in A River at 1km intervals.
0 2 4 6 8 10 12 14 16 18distance along A River from the point of 0 km (km)
Fig. 4 Quantity of 222Rn collected at measured points in A River.
o 1 -
i i i i i
distance along A River from the point of 0 km (km)
Fig. 5 Concentration of 222Rn in water at measured points in A River.
T&IX Fig.4l±AJII?BrJII*tf, 222RnzftE<0ffl^69E<k:$r^LTV^o Fig. 4 X >0 6km Mj£,11km M17km & £ o
Fig. 5 f i <D 12 M 1C A) 11 <D 6km fr b 9km * <T) K'"C X *) # L < Mil I 1$ 222Rn £Fig.S^M^T^i, %T7K<7)EttiM*(iFig.4(7)^5-^^Zcmi¥«t:
0#nkrnTim:##)LT\ 7krnmA#^h#^^fL6o 6k%
^^•C%Cg{i^T7K4|T<7D^^^e<7)ilS>cusiii&T7KEmSti±E'e(7)>ab^^fi(7)
mil7K^#m,C,p(d:mT7KEmmA-C(7)^3i%##(7)mil7K4:i#mT^6o222Rn^(j:iE
# c mT7K<7)EmmA#m(7)222Rn#m(7)^f
-67-
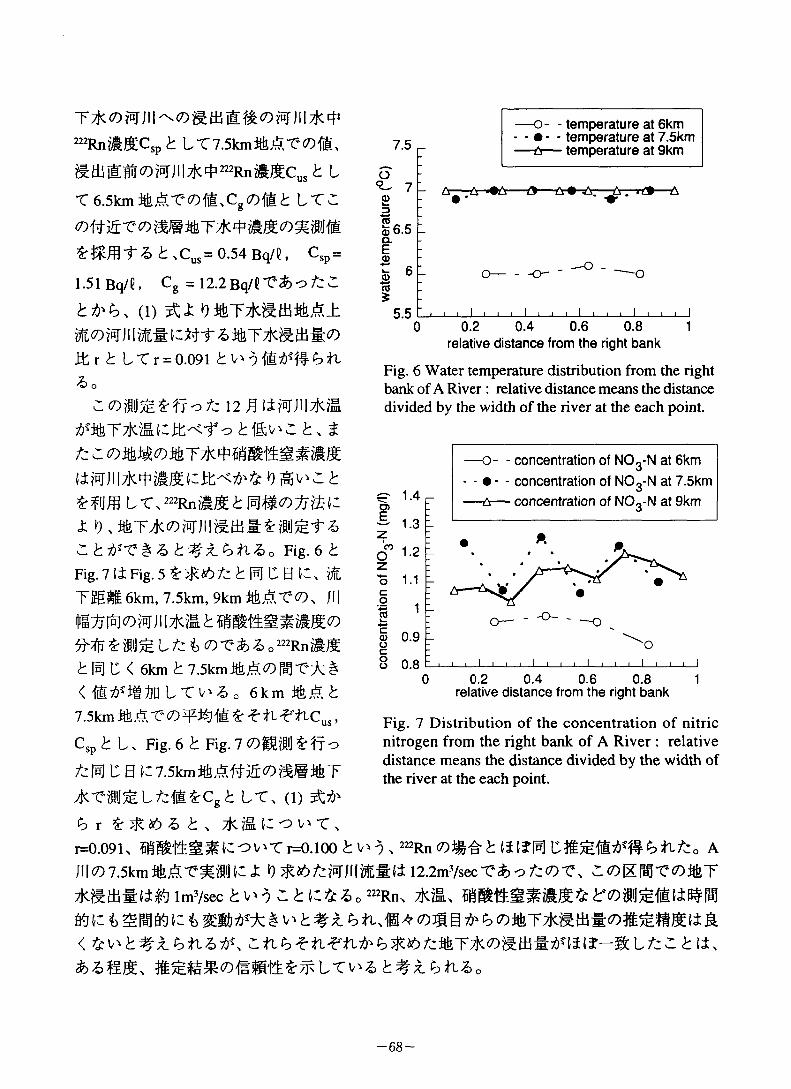
222RnflSJtCsp t LT7.5krnmAT^#,
BdiWS^milTK^RniMc^ t l
X 6.5km i&&T<7)W,Cg<vm t IX ^
tDit&xcommMkTdopmmtomm& t >CUS = 0.54 Bq/t, Csp =
1.51 Bq/6, Cg =12.2Bq/rt^o7^^
(i) *£<£ ^i#T7KE^#A± m^Mji i m# ic#t 6 mT7Kmm#<7)Jt r ^ LTr = 0.091 k b ft•?> O
of: 12 ^ Jll2K?m
tiTsrJilTK^iftJKlcJt^* *) t
C t tfX £ Z> t b ft£ o Fig. 6 £Fig. 712 Fig. 5 *6 At fsj C B 1C, iE Tgg# 6km, 7.5km, 9km i&AT<7X Jl| ls^i6]co-/5lJil7K^hiiSt4SSilJt^55"^ £ SU/E L A £> <7) "trab -& o 222RnESh M C < 6km h 7.5km%A<7)^ft±&< til t5? iM L TV'S o 6km i&A h 7.5km M A ”C (D£ * ft-T ftCus,
Csp £ U Fig. 6 h Fig. 7 <7)B$J Irlfo
AMDS tc 7.5km i&AttSO-a/S&T 7K"ef5ij^L/-zii*cgh it, (i)
tbr & 6 ^ , 7K?m (r -o T ,r=0.09K #@g###lCC V'T r=0.100 h , ^Rn ^ ##19 &#$&### % fit, A Jl|<7) 7.5km % A T^#j 1CJ: D^^ZrfBrill’Mtil 2.2m3/sec X&^fzVX.
lmVsec h V'? CL h 1C & S o 222Rn,% ic t ic t oi# g ^ ^ omT7KEmm<o#3&m%#&< ^#x_^ft32ft ^-ftf ft^ ^ tf-m L ^ 2 ^ (i,
7.5 r-
o°~ 7 2
16.5Q.
!•5.5
— A—7A «#A----- A-— A # Ar—A . r£9 A
-o- - temperature at 6km • - - temperature at 7.5km
-A— temperature at 9km
i i i i i
o-
J
—O -
I ■ , : I J0.2 0.4 0.6 0.8 1
relative distance from the right bank
Fig. 6 Water temperature distribution from the right bank of A River : relative distance means the distance divided by the width of the river at the each point.
Fig. 7 Distribution of the concentration of nitric nitrogen from the right bank of A River: relative distance means the distance divided by the width of the river at the each point.
—68 —
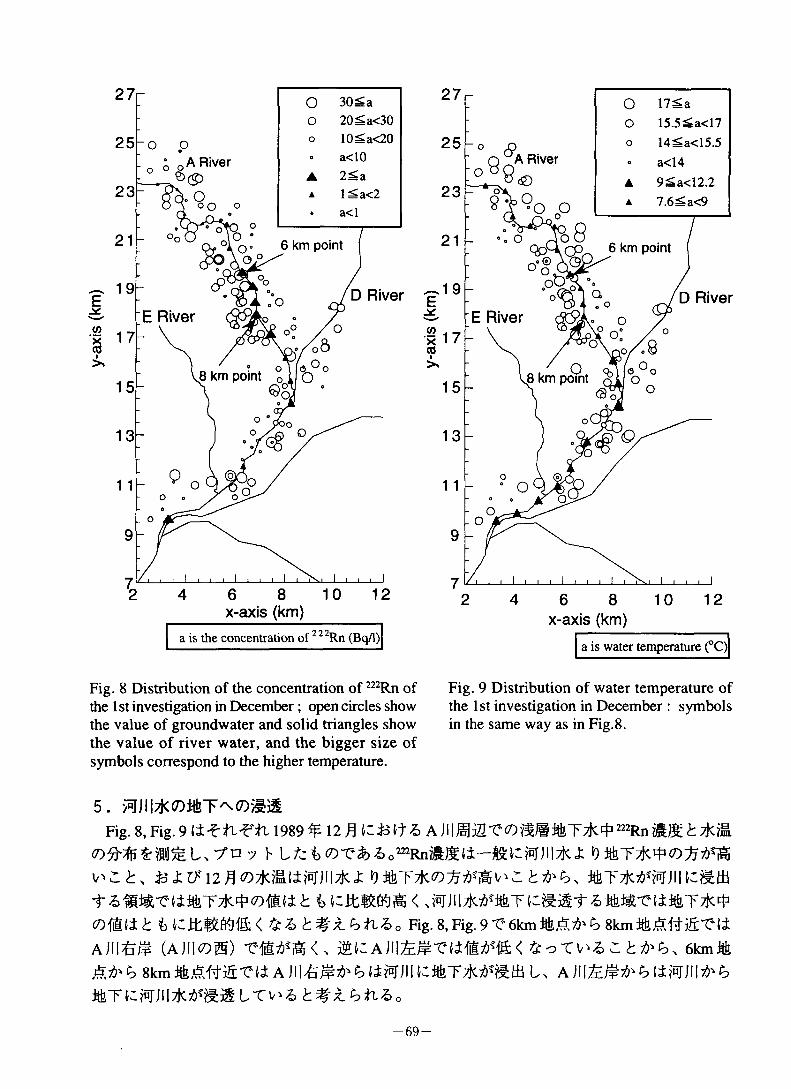
A River
6 km point
D RiverE River <&}
8 km point
x-axis (km)a is the concentration of 222Rn (Bqfl)
A River
O (3
6 km point
D River"E River
8 km point
x-axis (km)
a is water temperature (°C)
Fig. 8 Distribution of the concentration of 222Rn of Fig. 9 Distribution of water temperature ofthe 1st investigation in December; open circles show the 1st investigation in December : symbolsthe value of groundwater and solid triangles show in the same way as in Fig.8. the value of river water, and the bigger size of symbols correspond to the higher temperature.
5. *JJI|7kC7)*rp\0);lSFig. 8, Fig. 9 1989 12 R It & A Jll® 2“?^® ifeT** 222Rn t tKS.
V'li, is XVs'12 M t)
(Di&tet & Fig. 8, Fig. 9 T 6km%Ad' ^ 8kmAJIl££ (AJIIOE) T#d^ < , m H A ±#d# <^cTV^2^d^, 6km %A&%8kmA%amiiu, A)ii^#d^umnd^
-69-
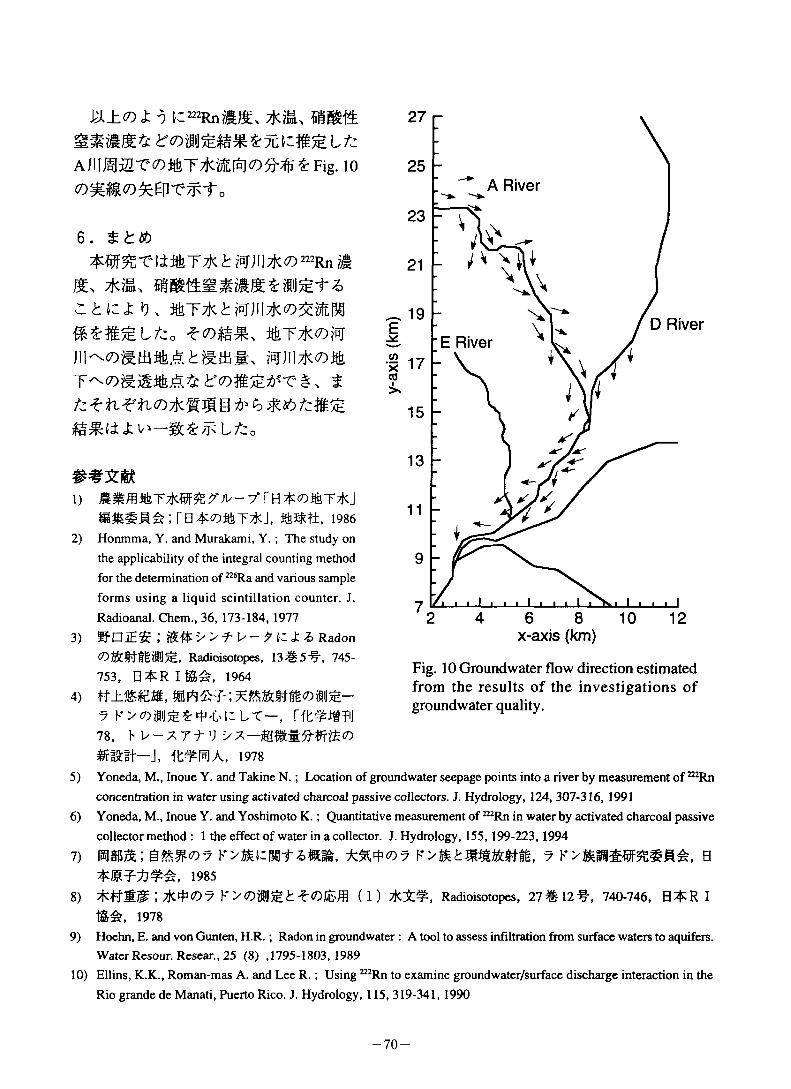
AJIl^iS^ifeTvfaM^^SrFig. 10
6.
WF^T'iiifcT* £ ?fJI|*(7) 222Rn #m. 7Kz&, 3c ^ Z 0 , rnTzK^MPlTK^a^ &*fefeLtzo fi&TTKW JII^^EttiitehEttiiL ?BjJll7K<7)S
* & h"<7)S^^T §, £7t f tL^'il<7)7KE^ g ^ b 7^#^
1) y r E *tfDit!iT*J####&;[B*(7)AfcT*J, 1986
2) Honmma, Y. and Murakami, Y. ; The study on the applicability of the integral counting method for the determination of 226Ra and various sample forms using a liquid scintillation counter. J. Radioanal. Chem., 36, 173-184, 1977
3) SfdJE^ ', fStfc'y yf-U—& Radon ^StStflsilM/E, Radioisotopes, 13#5#, 745- 753, H^RII^, 1964
7 K >costed U LT-, Hfc^JUTU 78, M/“7Tt’JyX-OTM^
ik#RA, 1978
A River
D River■ E River
■ ill
x-axis (km)
Fig. 10 Groundwater flow direction estimated from the results of the investigations of groundwater quality.
5) Yoneda, M., Inoue Y. and Takine N.; Location of groundwater seepage points into a river by measurement of 222Rn concentration in water using activated charcoal passive collectors. J. Hydrology, 124, 307-316, 1991
6) Yoneda, M., Inoue Y. and Yoshimoto K.; Quantitative measurement of 222Rn in water by activated charcoal passive collector method : 1 the effect of water in a collector. J. Hydrology, 155,199-223,1994
7) mm; -k%*<D7 v>mtmtWL%m, 7 M£, b1985
8) l Tfc^p<07 (1) *%#, Radioisotopes, 27 #12^-, 740-746, B*R I1978
9) Hoehn, E. and von Gunten, H R.; Radon in groundwater : A tool to assess infiltration from surface waters to aquifers. Water Resour. Resear., 25 (8) ,1795-1803, 1989
10) Ellins, K.K., Roman-mas A. and Lee R.; Using 222Rn to examine groundwater/surface discharge interaction in the Rio grande de Manati, Puerto Rico. J. Hydrology, 115, 319-341, 1990
70-
(12)Radon as a Hydrological Indicator
/MimnT. Komae
1.
5I< 6, ^2,200#m^^3". #^zKOOOflcin3 ££t,\> #(CttiT7j<SElCo^T<i, ^tc&200^m3©*ij
u62% c©oi:7k©8#M##@&TamUTi^c$6c, m&c&w
rt^m^wru 7K#^m@(6UTt>sm£ft6j; i\ztir>izo <-©#m,
itiTzKtrol, >T t)i&@©BUtScb L/cfcfEBfrWS©fES
-e^^©^@©#mc(±#^i/: h i/-f-©#ma ^ 6 ax©r i ©eB#m67 K>£ h L/—tf66-/cTA7K####ei&©
^t^t^\ ccm, ^©m#^##f 6.
2. 7 K>©BfflSS2:$iJ^CCCU97 KXX 0 7 >m\7tm<D 2 2 2RnT& 6 o ^©&#m^m^C 6^<L#
%cxsB^##%^#T^6c6, a#m#mT##amarmu^T#zzttitftu -vt LT#n/c#B^%6o $bir, f
67 K>©^(d;i6@'f© 2 3 8UT^>6o mg©l»m2 2 6RaT&6o Mjgt(r*>2 2 6Ra©mBBETM U fc 7 K >©-£&{*, EfB/^iSjSH LTJi&©7K
am^tk©s^icj:-?Tmm^m^T^Zo 7F>^mi ©%f^ 6##(:o^-ni, 22 "Ra###f 6l#©MmJ:4;7l/^-T#f
Um#7K#^CA6##^, 6#f(:^AL/c#,Mmfr3Lfo'chz>t%z.t>tit^64)'5)o l/c^ot, mm©22=Ra#m*<mi43^, s ###©#f%2fm~#m3fi,37 K>a(i#Af 6o £A, mm7 K>*^Af6c6«^, mmirckoTmm^ K>*^i#A-r6ci7) i, itm me©i#A#m6 u-cmmcmm^ ^ 6 o m@©^m^m#X6mTA©7F>iiii, mm®22'Ra^#m,67 D, $s©isi> ir ^xmmztK@w©ag£jtocii:/,i5o m@(:@MU/:mT7K©7 7 K y©^MS8*^3. 8B 2:0
itzmmn/citj2E7jc©7 K>smt/c^ ^*>i6Tt-60 %T7i(©7 6
6C6(:^^, c©c6X,\ 7 F>^#A$t3ia^©m##%©1##^#
-71-
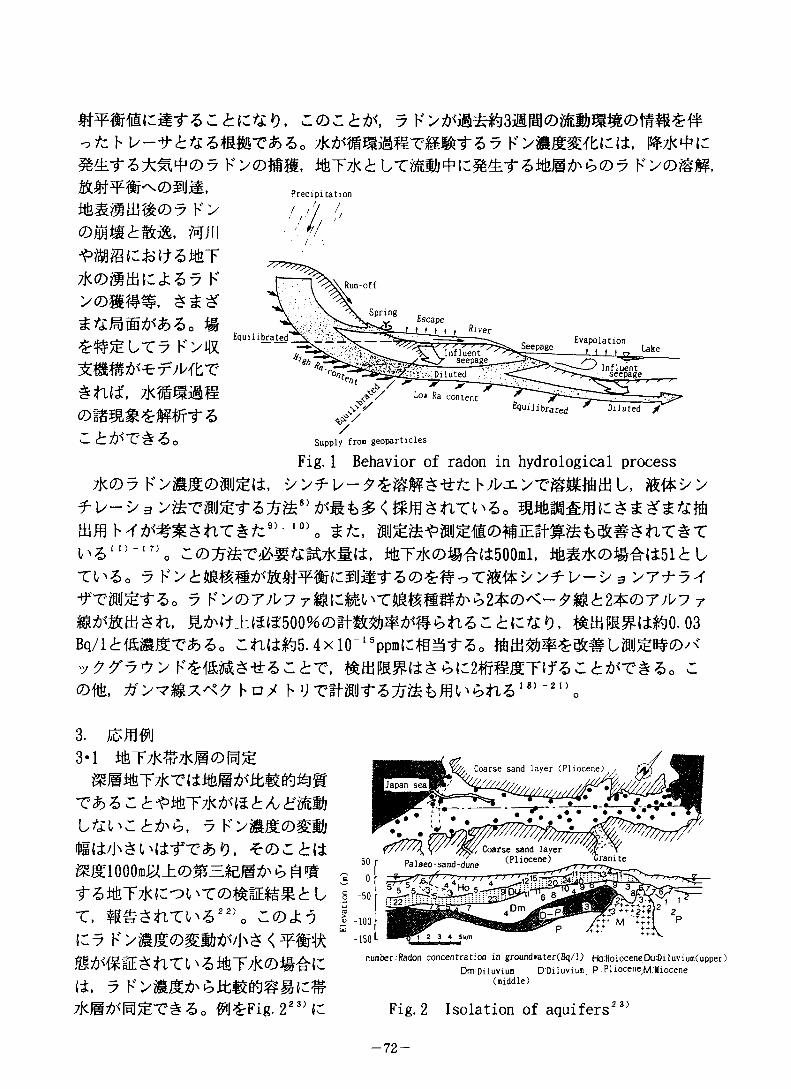
o/chu-ti^wT&&0;kfrmmim-vm&rtz? \?>m&$t<kMt, %zk^i:KxdSE, %TzK6K >©*§»?,
mm#aj#©7 k>fflil^fi Mill
Precipication/ /7 /./ / ./
H
7jc©^aitrJ:57 K>©##%
®lt7 K>iR
sn(df, 7j<sm®
Run-off
X Spring
Equilibrated EvaporationSeepage i-1 t t.Influent ■ seepage
InfluentDiluted seepage
contentDiluted y
Supply from geoparticles
Fig. 1 Behavior of radon in hydrological process 7k©5 K>»£©««£{*, v >7 l/-f L, Wti/'s
ttz, #%m^$iJ%#©#iEg+#)&^ 4lT # Tl^in-‘7,o C©^T^%#7Ka(i, mT*©#^(±500ml, SS7K©^(i51<h U
-fTiKf 60 5 K >0771/7 7#(:#^T##@S#^62$©/<-7#62^:©77l/7 7m'Vtmmmmmzhmmztizz.tictzio, 03
Bq/16i&#mT&3o Churns. 4xl0 "ppm(:%^76o ####&##U#i%#0/< 7 77 7^>K^«$^Cit, i^ 6(:2mmT(faC6#6o c©fife, hoy h VTMJ75^^ffl^bn518,"2l,=
3.3*l mT;X^*@©im%
Thz>z.t 1 /L zwmu%uc6&&, 7F>mE©mB
^rOZtitmmmom±(Dm=&Mfr f 6%T7i((:"3^T©#mE^m6U T, C(DXoI: 7 K < ¥Wt^SrtWE mT7K©#^(:ti, 5tKS^'^T^^o ^J^Fig.223)(C
number:Radon concentration in ground«,ater(Bq/l) HoHoloceneDuDiluvium(upper) DmDiluvium DDiluvium, p:PlioceneM.Miocene
(middle)
Fig. 2 Isolation of aquifers23)
-72-
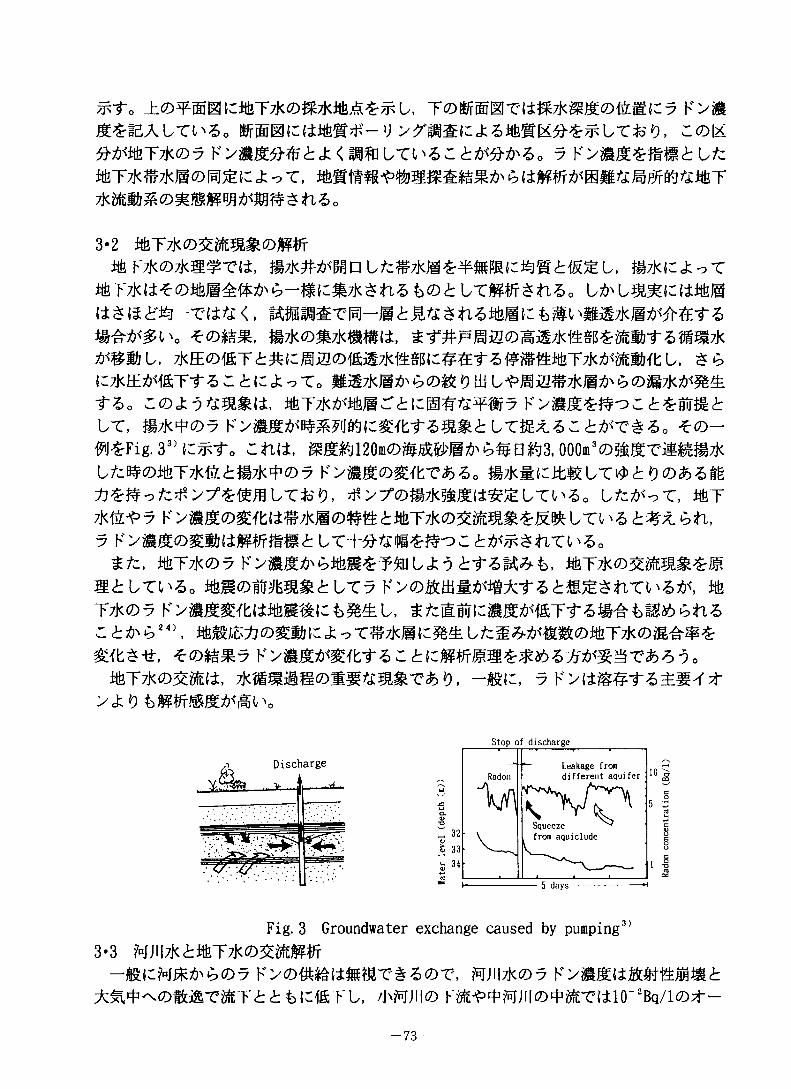
&?<> ±©¥@Etri&T7j<cDS7jci&*^^ u k>s
MEAltl^o Wfffi0{r|±Hb©^-y >?mmcj:ZMn&fr£<ldt), C©g ^#T7k©5 K t£<mmLT^6Z. tfrftti'Zo 5±&T7K^7K@cDiwi^(rctot,
3-2 mT7k©2m#&©#*fmT7k©7k##T(3, S7M^nL^7k@^¥teEiri6iE<h{S^U, m/Kc^^T
urm/f^nso u^um^c^ma ii$i3£t*4'<, umm&vm-mtmztizmmizb#i'iis^atw&tz
*©#m, m&<D&kmmit,fr&ML, 7l<EcD16T2:*(rMlS©16^7KM(r^1-5MSST7j<^WbU, $6 (C7j<E^1ST1-5C6(:ck^To BiE7ka^b©&0titiU^aa#7km&<3©E7k/^£ -fz>o z.<b&otmm±, tifeTTK^ar^irBw^w^ ktzmmt vt, #7k^©5 6#m6 UTK^ac 6^r#6o *©-#J£Fig.33)iC/^fo Cfl#, ^m^l20rn©#^#®^^#8^3, 000rn3©^mTmm#7k U/:^©mT7KiA6#7k^©7 K>^©^bT££0 #7k#CE#LT^^0©^6#
yutjo ^^ >y©#7K3&ma^ u-rua. st7k^5 r >#m©^fb(3^7k®©##6mT7k©^mmm^MBit LTi ^5 k >#m©m#(3##m# ^ lt-b^s^o c t tin ^ „
ttz, %T7k©7 mT7k©^mm&^mliitt^o ss©sma<hUT7 K>©&ai»^i#^:-r^<bss5nT^5M mT7k©5 ku $-£^£>24), «SA?©E$;(rj:^T^7katc%^U/c$wmi$c©tifeT7jc©Eir2p^
*©*£315 ^C±ttiT7k©^(3, 7k##m@©mg^#&T& 9, -j&K, 5 KX3##f 6^#^^-
>ck<9 fem/rSE^'iWlv
______Stop of discharge_______________
Fig. 3 Groundwater exchange caused by pumping3’3-3 MJIl7k6mT*©3mWf
—fi£trm:^b©5 F> ©#^(3#%T# 6©T, MJH7k©5^^-©tk^T^Tiir^tr^TU, /kMJII©T^fflJII©4^T{*l(T2Bq/l©;t-
-73-
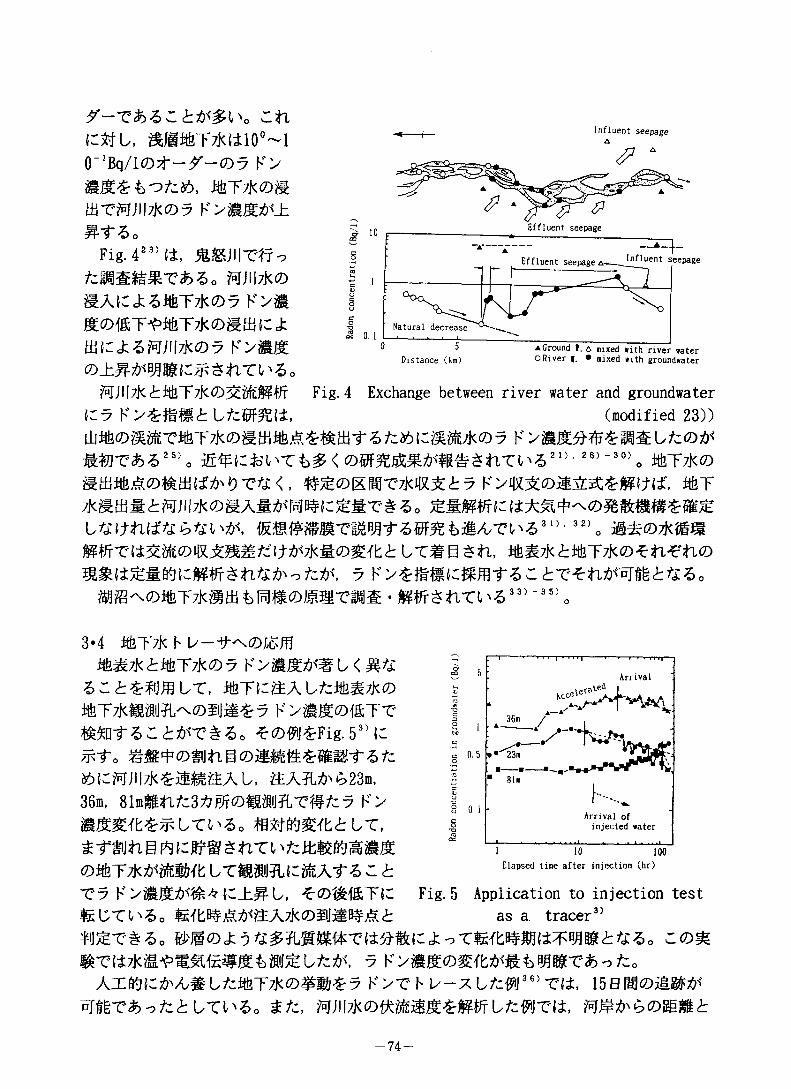
o Cti^@ST7jc(ilO°~l
0_1Bq/l©*-^-©5 K> mTzk©#
anmni7k©5 k >m&&±#t5o
Fig. 423) (£, *&JI|TfTo /cSmSHT&So MJUtK© EAtrck^ST7j<©7 K># E©mT^±tfeT7k©Eai C «fc to(rj:5M;il7K©5 K>#1£
MiH7k6%T7X©3c^#e(:7
Influent seepageA
Effluent seepage
Influent seepageEffluent seepage a-
Natural decrease
▲ Ground I. a mixed with river water ORiver |. • mixed with groundwaterDistance (km)
Fig. 4 Exchange between river water and groundwater(modified 23))
3/:Acm%7k©7 r ut©#im^25,o 26)~30>o timk©
vyw.moM±^?mnz, sr7kEtti*^MJil7k©EAe^l^mrS«T^5oLWntfKMl'M 32)o ii*©7kSSI
#^T(i3^m©iR^mm/:ij'^7Ka©Kfl:(hVTSBdti, ti^K^timco^fteh©
m@^©mT7Kmmt)im#©m#Tmg ■ wt/r$nT^533)_35)o
3*4 iteTzk h U—!f^Ofcm f«7k iffeTTk© 5 K U < #%
JTFtr&AU/dtiSTk© ti2T7kE9iJ?L^©$m^ 5 K>S£©Ifi;TT
^©m^Fig.53'(:^■to m*©sm g ©iSEB^Bsgt-3 /c ACMjllTK^-mm&Al/, EA?l>5>23m,36m, 81mg|n/c3^P)r©WJ?LTt#^5 K>B^EYb£SlT©30 fW%mb6L/T, t-rmtiuft\tff% $ tiTi ©mTA^mmfb LT#mij?u:mAf6 c at7 K (C±#U, ^©##T(: Fig. 5 Application to injection test9ECTU&. b#A^mA7k©mm#A6 as a tracer3'mfer&Zo #@©j:oj:^T(h%^o com irai7jts^€MeeEM£L/cM 5 v'ym&omtftWLwmxh^fzo
A%%C^A#U/C%T7K©##^7 K>T h U-X L^J 3 65 Tit, 15B^©m#^ ^mvh^tztLti^o miii7K©^mmm^#^u/:^jT(j:, ##^6©mm6
Arrival
36m y
• • 23m
Arrival of injected eater
Elapsed time after injection (hr)
-74-
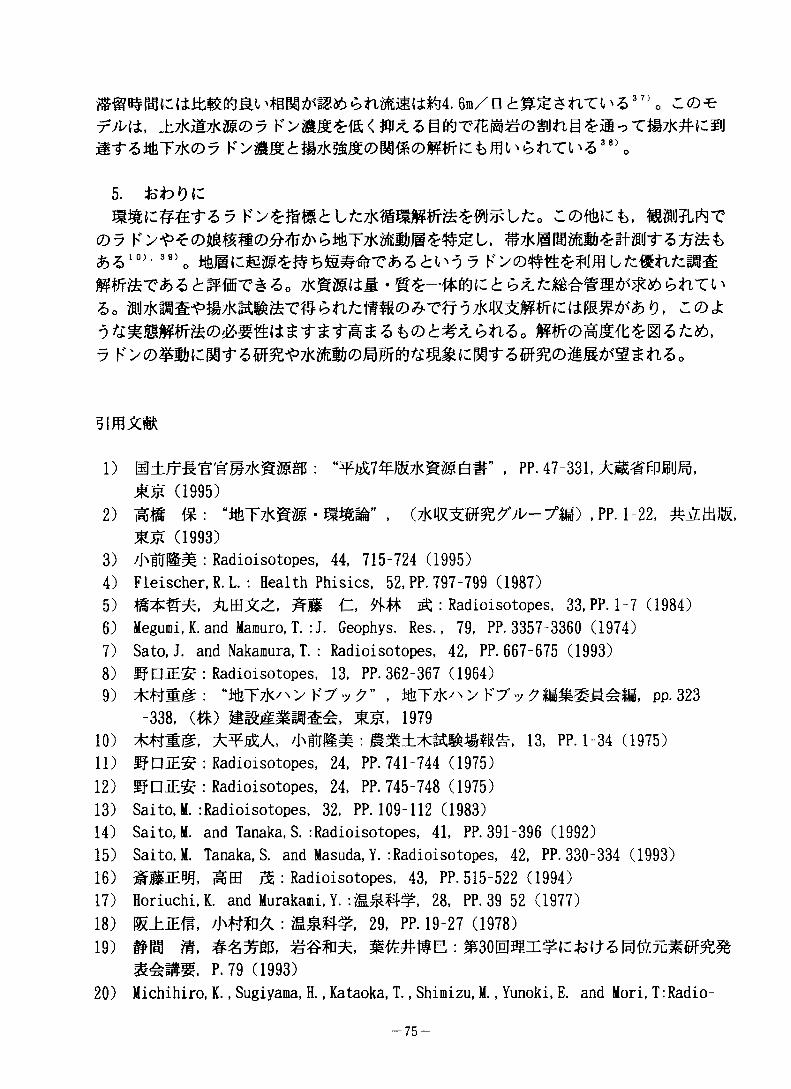
mmimemtat66m/ 0 £$nx 1 > *3710 c©t 5sMt, ±7j<ii7»©5 r3 g%T7:w#©#j#g-oTmmem mi~z>MT7K(D7 F>mm<tM7mm<DM%(DWffi{zt>im'<btiTi'Z38)o
5.mmzft&tz7 Ltz7mmMVr&£M*btco comet, ii?L^t
©5 k^mT7K«jg^#sl, ^7K@:+##&#&t $>zi0)' 39>0 m@t6<h/-57 ku/c®n/cps
tmm-zzzo tkg®ti* • E^-tme^ ^nT/60 m7Kmm^m7xm#&T#6a/c##©^TiT37m^##e(±pg#^^^, c©j:
5 F>©#meMf6#%^7m#©#Rff%^mme^fa#%©mm^m$^5o
1) a±/rsw,tE7j<s^^: . ??Ai-m,±mmmm,Hr (1995)
2) mm %-. “tizT7]cWE • mm? , omHmuy^-zrm) ,pp. 1-22, &£ejk,SS (1993)
3) AhlulBiS! : Radioisotopes, 44, 715-724 (1995)4) Fleischer, R.L. : Health Phisics, 52, PP. 797-799 (1987)5) AmXZ, C, 9W S : Radioisotopes, 33, PP. 1-7 (1984)6) Megumi, K. and Mamuro, T. :J. Geophys. Res., 79, PP. 3357-3360 (1974)7) Sato, J. and Nakamura, T. : Radioisotopes, 42, PP. 667-675 (1993)8) SniES : Radioisotopes, 13, PP. 362-367 (1964)9) 7t#mm: “tin/jv\> k/, mr7^\> py<y ?pp. 323
-338, (#) hr, 197910) ttmm, izmsa, /tmim#: 13, pp. 1-34 (1975)11) mUiE^ : Radioisotopes, 24, PP. 741-744 (1975)12) EDIE£ : Radioisotopes, 24, PP. 745-748 (1975)13) Saito, M. :Radioisotopes, 32, PP.109 112 (1983)14) Saito, M. and Tanaka, S. :Radioisotopes, 41, PP. 391-396 (1992)15) Saito, M. Tanaka, S. and Masuda, Y. :Radioisotopes, 42, PP. 330 334 (1993)16) ^BM, iBE m : Radioisotopes, 43, PP. 515-522 (1994)17) Horiuchi, K. and Murakami, Y. -.aS##, 28, PP. 39-52 (1977)
is) e±jhs, /mmx: am##, 29, pp. 19-27 am)19) #m m, utmiE :
P.79 (1993)20) Michihiro, K., Sugiyama, H., Kataoka, T., Shimizu, M., Yunoki, E. and Mori, T: Radio-
-75-
isotopes, 40, PP. 38 41 (1991)21) Yoneda, M., Inoue. Y. and Takine, N. : J. Hydrology, 124, PP. 307-316 (1991)22) mnm&w, sm#-,
U, 19, PP. 87-103 (1977)23) XttSB : Radioisotopes, 27, 740-746 (1978)24) /Mm—, mm m ■. 34, pp. 253-262 (1992)25) Rogers, A. S. :U. S. Geol. Surv. Bull., 1052 E, PP. 187-210 (1958)26) Lee, R. W. and Hollyday, E. F. : “RADON IN GROUND WATER" , (Graves, B. ed. ),
pp. 241-249, LEWIS PUBLISHERS, INC., Chelsea, U. S. A. (1987)27) Jacobs, L. A., von Gunten, H. R., Keil, R. and Kuslys, M. :Geochim. Cosmochim. Acta,
52, PP. 2693-2706 (1988)28) El liras, K. K., Roman-mas, A. and Lee, R. : J. Hydrology, 115, PP. 319 341 (1990)29) Genereux, d. p. and Hemond, H. F. :Water Resour. Res., 26, PP. 3065 3075 (1990)30) EES1E, AfjCK SESS, /MuISSI : 35, PP. 165-
183 (1993)31) Haraada, H. and Koraae, T. : “Water Down Under ’94” , pp. 115120, Adelaid,
Australia (1994)32) MB-/&JE, /MUHSI: Radioisotopes, 43, PP. 770-775 (1984)
33) .- “tmmmmmt Lxomyymmm (uss) ”,# rmwj pp. 91-106 (1986)
34) Weiss, W., Zapf, T., Baitter, N., Kroner, B., Fischer, K. H. Schlosser, P., Roether and Munnich, K. 0.: “Isotope Hydrology 1983” (IAEA), PP. 43-66 (1984)
35) Rank, D., Rajner, V., Nussbaumer, W., Paresch, W., Dreher, J. and Reitinger, J. : ibid., pp. 67-81
36) Hoehn, E., Willrae, U., Hollerung, R., Shulte-Ebbert, S. and von Gunten, H. R. : “Isotope Techiniques in Water Resources Development 1991" , (IAEA), pp. 712- 714 (1991)
37) Hoehn, E. and von Gunten, H. R. : Water Resourc. Res., 25, pp. 1795 1803 (1989)38) Chia-Shyun Chen and Wilson, J. L. : “RADON IN GROUND WATER” , (Graves, B. ed. ),
pp. 423-436, LEWIS PUBLISHERS, INC., Chelsea, U. S. A. (1987)39) Nelson, P. H., Rachiele, R. and Smith, A. : J. Geophis. Res., 88, pp. 2395-2405
(1983)
-76-
(i3)Behavior of Rn Contents in Undergroundwater Related to
Radioactive Disequilibrium
S. Nishimura
88^30^frbmtetvizi&mcDmtern'orn-cRnt< n^Rn
4-®«%T7K4i^^tsW’e222Rn^^t'Cv^^^<, t <0®fJi^f&oTm-c< z&t)MJ±t&Tfr'p(D222Rnmmz&<-&ztix^z>mz7j:;i. *
U.Th.AcUtg^&ESFig. UljfVf, (1) 1t¥& (2)(3)±SB^y b;l/(7)SI$^Etr-7^^m*^>h v^u, Th,
<DSttfii/J>t£l'm(Table 1.) .
u,Th^Mu-nT< (Fig.2)
^otzsbttmm^omw.m^m SIK jfi v>m^UTh(DzgE**<&ft & MSI3J: 0^:^u^DTfgf±-C$6(D"C^8BL:^
-cmm-t. bu&tit-cv>&„ m j i bm* bt>-c & &^34u/B8U^lt^^= £&. mizi7< bUCDm
Tzmmhut <m&±wmTz> (Table 2.) .
#$ft6 (Table 3.) „ pH*) W>-C16V> t £ IZWfrtikmz iX'bfzb$nZ> (^E?SM,mmEm) -cRa##,< u^u&crt*RnL^#tTV^V). Rn^SO j£TrSBt^'Cmf^-efmbWbft^(DX*1fo±frhftX
stmtuwa- ^r$nrv^0Yymm'p-th.
RnUT0)4:(:2"B, 214Pb& £f b «9 7 9. Cftd*Rn
O^c^jioTV^oyE-t>RnST'U(7)^S^tit|^^Vx
-77-
####'1. @tm, #@#B#-Mmm, p295-306. min
mm, mtP, 1991.
2. mm, #® • A^yy^y^^m-xm, 1-10,1991.
B65:1. mm, 19.
63-68, 1957.
2. mm, #$wrom ±###,25.66-77,1973.
3 @fm, 7K4'C>5 h'XDMEh-eOBffl (II) ##f%. Radioisotopes, 27. 747-752, 1978.
4. mmoa, mm, 9 kxdem (1) ^bee. 22,29-33,1979.
5. mm. ^^1^7 h*>(7)S$lStE. Radioisotopes. 28,27-30, 1979.
6. mium-, a*#-b, mm.tiES^, mrsmMEW^w&mTKci? k>###. 32. 31-41, 1981.
7. n&xm, mm, (1) -%m###-. ##2,38,571-576, 1985.
8. MSfw^.mm. m -A*%^c • =wJitM-. ## 2,38,577-585, 1985.
9. -asm. mm, mm*, mmis, mmmimttMLmmmm. (1) -mw. ## 2,38,57-66,1985
10. mm, »H¥B±ErM'±E?&£-e(7)5 h yommm. ## 2,38,537-596,1935.
11. mm, (2) -ebwsb
-e<7)®i^?5S|-. ##2,38,57-66,1985.
12. mm, n^m. emosse (d
#$8,28,91-97, 1985.
13. mm, mm, mfcxm, mm*, #%#####%yms&m
E®~ -r;V Af- + >## 2,39, 267-275, 1986.
-78-
14.979, 1986.
#m#m.mm. tsitaRn-momm 28.972
15. mmm.mm, r^>40K2,4Bi6^(7)y umi mSI 2.40, 117-119, 1987.
16. #mm mm. e.m.Arsadi, (5) -a
*®tji • wbbtot)**!*t '&mm%<T)-7u v ?mm~. mm 2,40,561-573,1937.
17. mm, mmttttfttmmtm. rincws. 35,4-5,1991.
is. am. xawfcmjKURRI-TR-393, 11-23, 1994.
19. am. 5 H > t ESI-NEWS, 13, No. 5,205-209, 1995.
20. mm. mnmm. t $£1^,34,398-409,1995.
» • is# •1 S. Nishimura and I. Katsura, Radon is soil gas: Applications in Exploration and Earthquake
Predication In Geochemistry of Gaseous elements and compounds, In E. A. Durrance, et al., eds., pp. 497-533, Theophrastus Publish, 1990.
tSiX1 S. Nishimura, Radium and Uranium contents of standard Rocks, Chem. Geol., 5, 139-141,
1969.
2 S. Nishimura, Disequilibrium of the 238U series in recent volcanic rocks, Earth Planet. Sci. Lett., 8, 293-300, 1970.
3 S. Nishimura, Partition of uranium between Peridotite nodules and host Basalt, Chem. Geol., 10, 211-221, 1972.
4 T. Mogi, I. Katsura and S. Nishimura, Magnetotelluric survey of an active fault system in the northern part of Kinki District, Southwest Japan, Journal of Structural Geology, 13,235-240, 1991.
-79-
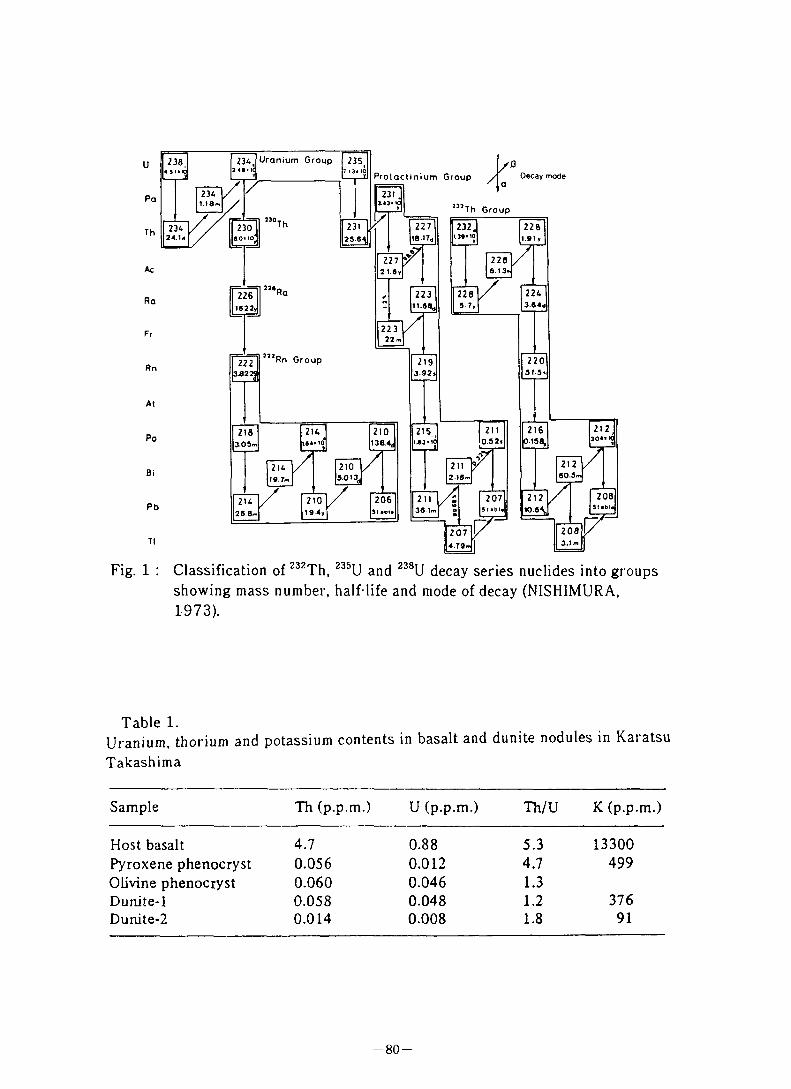
u
Pa
Th
Ac
Ra
Fr
Rn
At
Po
Bi
Pb
Tl
Uranium Group
Protactinium Group y Decay mode
Th Group
Rn Group
S.013„
Fig. 1 : Classification of 232Th, 235U and 238U decay series nuclides into groups showing mass number, half life and mode of decay (NISHIMURA,1973).
Table 1.Uranium, thorium and potassium contents in basalt and dunite nodules in Karatsu Takashima
Sample Th (p.p.m.) U (p.p.m.) Th/U K (p.p.m.)
Host basalt 4.7 0.88 5.3 13300Pyroxene phenocryst 0.056 0.012 4.7 499Olivine phenocryst 0.060 0.046 1.3Dunite-1 0.058 0.048 1.2 376Dunite-2 0.014 0.008 1.8 91
-80-
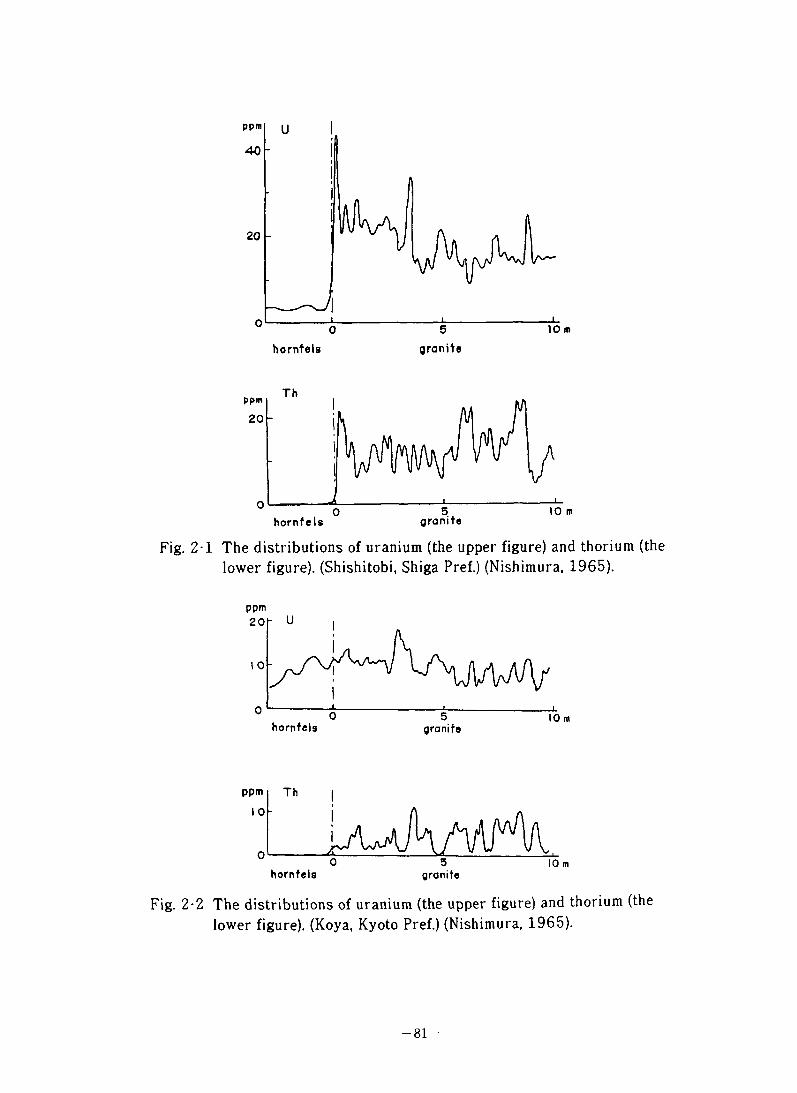
granitehorntels
granitehornfels
Fig. 2-1 The distributions of uranium (the upper figure) and thorium (the lower figure). (Shishitobi, Shiga Pref.) (Nishimura, 1965).
ppm
hornfels granite
hornfels granite
Fig. 2-2 The distributions of uranium (the upper figure) and thorium (the lower figure). (Koya, Kyoto Pref.) (Nishimura, 1965).
-81-
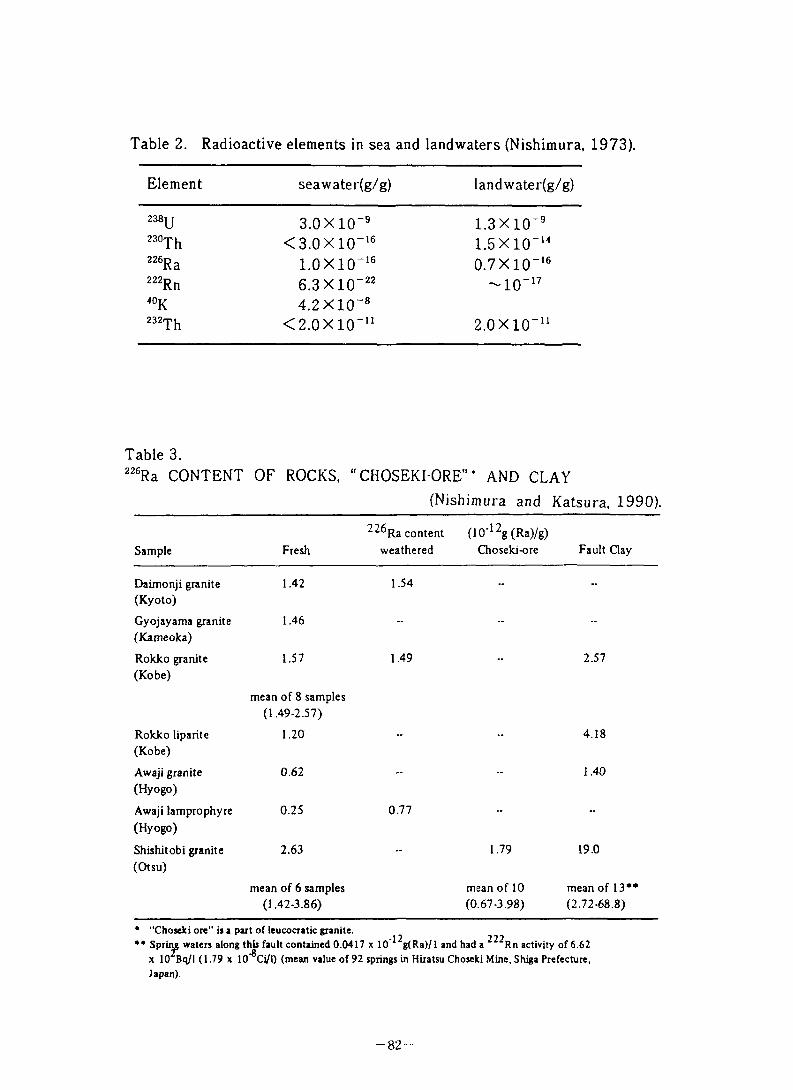
Table 2. Radioactive elements in sea and landwaters (Nishimura, 1973).
Element seawater(g/g) landwater(g/g)
3.0X10"9 1.3X10-9230Th < 3.0 X10⁻¹⁶ 1.5X10""22«Ra 1.0X10⁻¹⁶ 0.7X10"16222Rn 6.3 X10"22 -10""40K 4.2X10™8232Th <2.0X10"" 2.0X10""
Table 3.226Ra CONTENT OF ROCKS, " CHOSEKIORE"' AND CLAY
(Nishimura and Katsura, 1990).
Sample Fresh
22<^Ra content
weathered
(10"12g (Ra)/g)
Choseki-ore Fault Clay
Daimonji granite
(Kyoto)
1.42 1.54 ■* —
Gyojayama granite
(Kameoka)
1.46 ” — "
Rokko granite
(Kobe)
1.57 1.49 — 2.57
mean of 8 samples
(1.49-2.57)
Rokko liparite
(Kobe)
1.20 — 4.18
Awaji granite
(Hyogo)
0.62 — — 1.40
Awaji lamprophyre
(Hyogo)
0.25 0.77 — —
Shishitobi granite
(Otsu)
2.63 1.79 19.0
mean of 6 samples
(1.42-3.86)
mean of 10
(0.67-3.98)
mean of 13**
(2.72-68.8)
* “Choseki ore" is a part of leucocratic granite.*• Spring waters along this fault contained 0.0417 x 10 "g(Ra)/l and had a 222Rn activity of 6.62
x 10 Bq/1 (1.79 x 10"®Ci/l) (mean value of 92 springs in Hiiatsu Choseki Mine, Shiga Prefecture, Japan).
-82-
(i4) ?Phenomena Associated with Rain Deposition of Radon Daughters
K. Fujit aka
1. teDfcte
n^fn%0Wta&D, nmkn^©-mztz-DfzvTz. #3^6^Mu.
c<b#m<mw5= z.(D^mtkMmu^jv±mt-mm^s ® mmmcm&eLc mm7E
#8am*T&5#, mw&Mstxfv>^-s^ss/=tfecoT^-So {6j6^(Dss^^aj®
fU3&o
#%##!$##&&
TRTMS^tim^BaLfco
2.
i985^\zj&mwft<DmmtmmzmmEttQffittfti&:£~5'$:m3mMLTmw
zmzffbttizn, i-07Kmm^i/-'tf'-T*9>hT6^(:75:oi:w5. mm^z 5mam:i±^T100{ea±#m^m < , &m0043mm(0.2556mm/h) 1^±®W £ t& titiTS, ^nTttE4-H#V^cSM$T^xTL$5^Sd, ^titiTE®2fg^±®x-
MS«2"cfrx2"NaI(Tl)(7)->>^ V-'>3 >5t:EX^T$. D > *fe±#U.5m®ifh $ ictgg L
3. x—Fig.m^u,^zx^mMMm^)V(D±^m(D3fM(Di±^^ta ccT±#$
^-X97> - Fig.2m%at%mL/:&(7y> . 2). 3). 4)
T, 1985^^ 619894^Tt:m#J$ flf:298#J®^fm%MS l/^Adi#£# 5l$M< /<> Fig.3te£t^-Dfcw^s-mmcsozsn
-83-
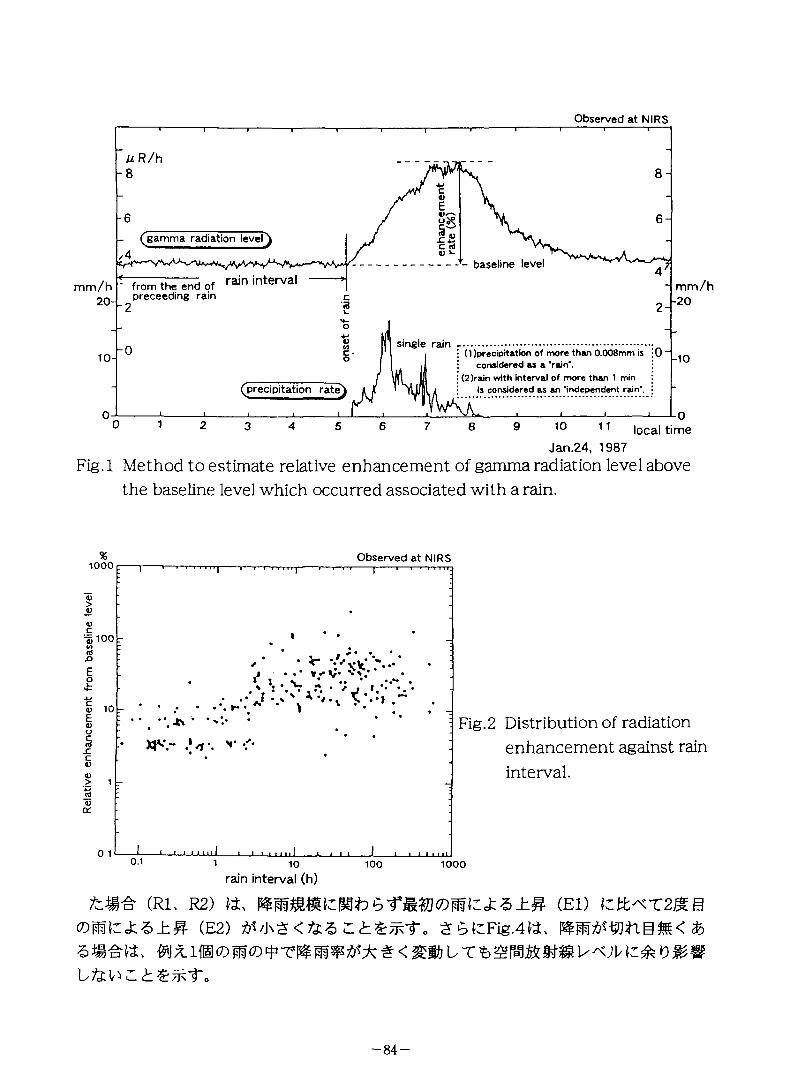
Observed at NIRS
U R/h
(gamma radiation level ^
baseline levelrain interval ■ mm/h
-20mm/h
20-
from the end of proceeding rain
single rain -(1 )precipitation of more than 0.008mm is
considered as a "rain".(2 Vain with Interval of more than 1 min
is considered as an ‘independent rain".^precipitation rate}
local timeJan.24, 1987
Fig.l Method to estimate relative enhancement of gamma radiation level above the baseline level which occurred associated with a rain.
Observed at NIRS1000
^100
Fig.2 Distribution of radiation enhancement against rain interval.
1000rain interval (h)
(rl R2) (ed iztt^T2ms(DmizJ:Z±g- (E2) $6(:Fig.4^. PlimSKSfe
— 84 —
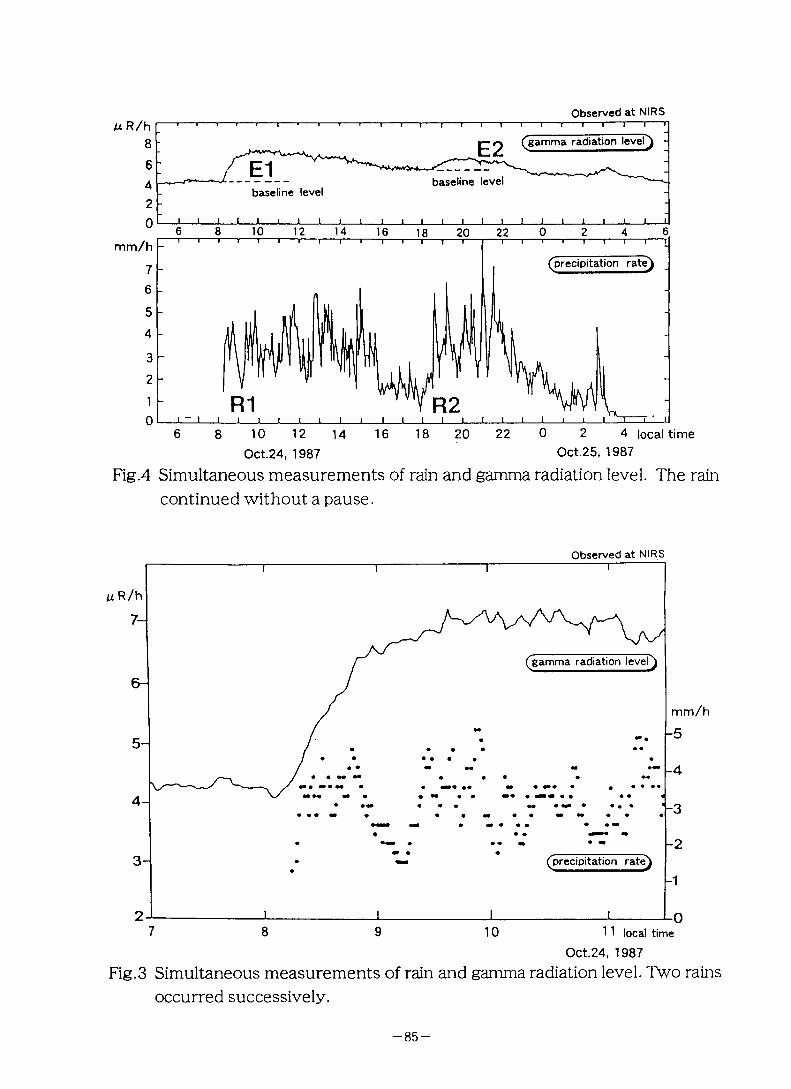
Observed at NIRS
(gamma radiation level) -
baseline levelbaseline level
mm/h(precipitation rate)
4 local time
Fig.4 Simultaneous measurements of rain and gamma radiation level. The rain continued without a pause.
Observed at NIRS
(gamma radiation level ^
mm/h
(precipitation rate)
11 local time
Oct.24, 1987Fig.3 Simultaneous measurements of rain and gamma radiation level. Two rains
occurred successively.
-85-
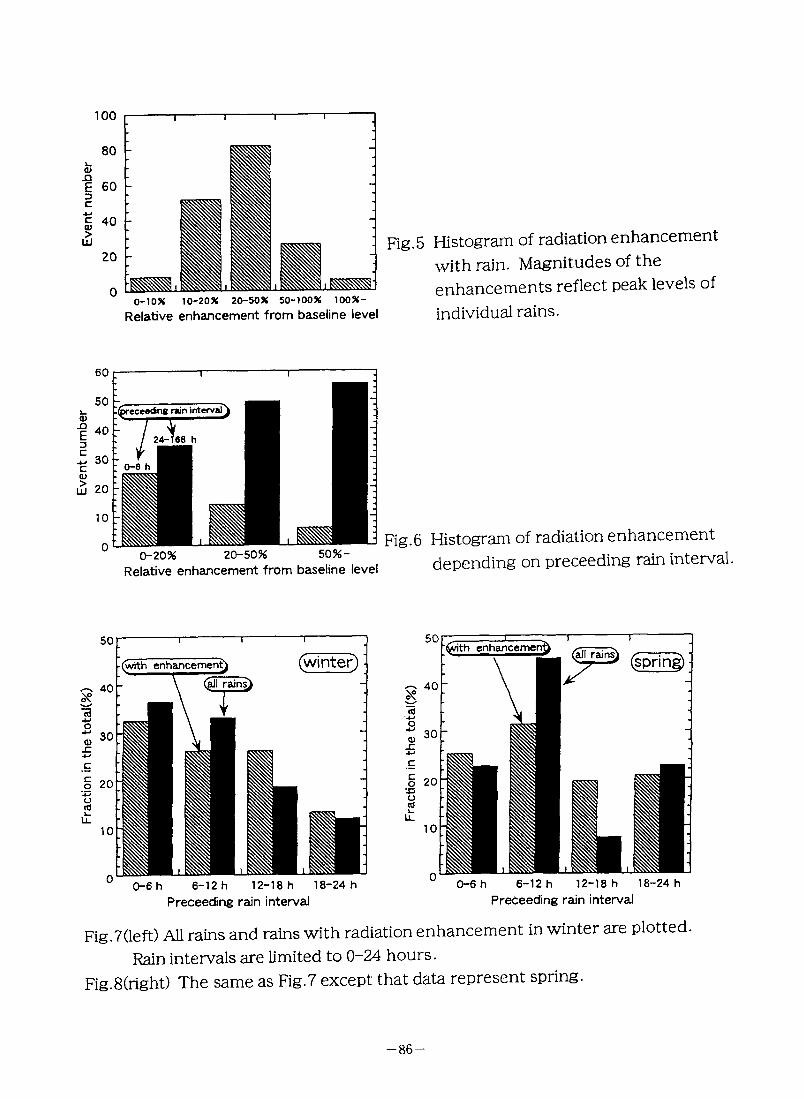
Frac
tion i
n the
tota
l(%)
Eve
nt nu
mbe
r E
vent
num
ber
0-10* 10-20% 20-50% 50-100% 100%-Relative enhancement from baseline level
Histogram of radiation enhancement with rain. Magnitudes of the enhancements reflect peak levels of individual rains.
eo------------------- 1-------------------- r
Relative enhancement from baseline level
Fig.6 Histogram of radiation enhancement depending on proceeding rain interval.
50
Proceeding rain interval Proceeding rain interval
Fig.7(left) All rains and rains with radiation enhancement in winter are plotted.Rain intervals are limited to 0-24 hours.
Fig.S(right) The same as Fig.7 except that data represent spring.
-86-
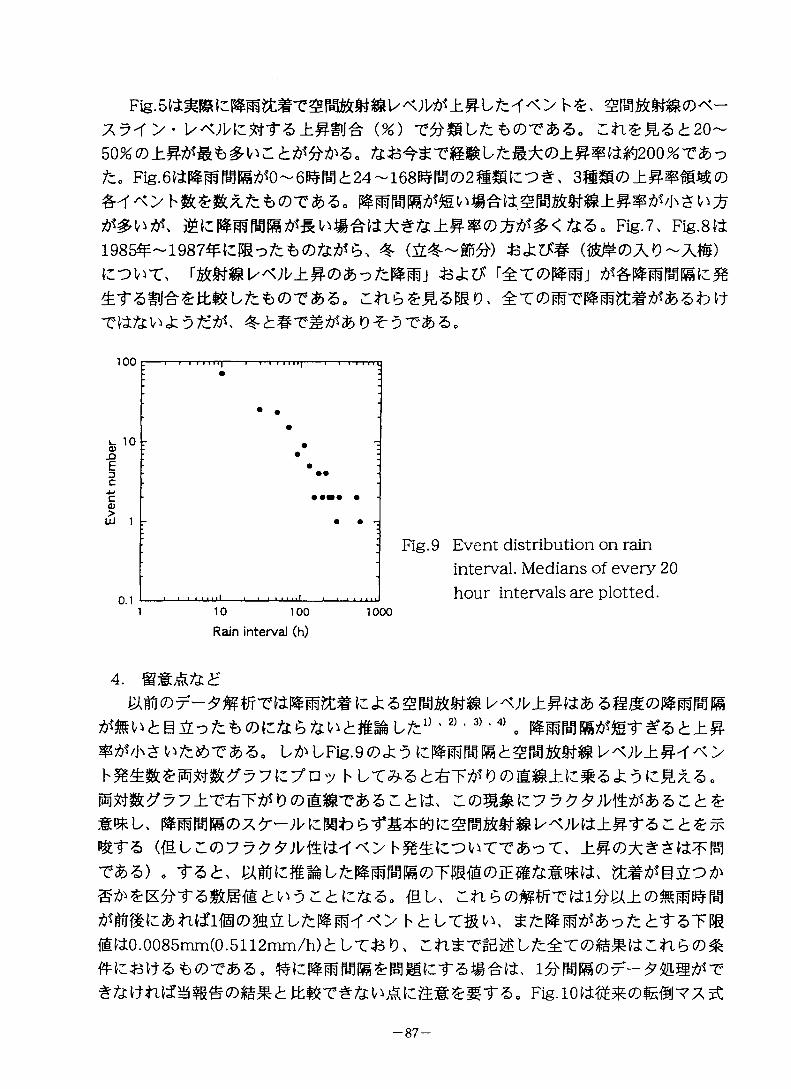
Zy'f > - l"<Jl'lZttT5±&fiJ^ (%) TftmLfzbcDT&Zo Ztl&RZt 20~
fzo Fig.6^mm^^0-6#^(h24-168^^(D2@m[:O#. 3@E®±#W^(D #</<>
Fig.7, Fig.8#1985^-1987^CPgo^t(7)^^6, 4 (5b§-~Sn#) ^=k^# (%#(DAO-A#)COWT, r±T0|$mj ^epmfwmk:^
dnb£.FI5ED,
Fig. 9 Event distribution on raininterval. Medians of every 20 hour intervals are plotted.
1 10 100 ioooRain interval (h)
4. m8c,a%<H
fim^tBiLz)tzb(D\Ztet>t^tmmLtz1} ' 2K 3)'4) .
#Wb£ ^ T & 5. bbFig.9 (D*k 5 tcPi £b^;i/±#H ^ >
h LTfrZtfiTtfKXDig.i&Mzmz&ZfiZ&ZZ.
wm?yy±T£T^V(Dm%n?$>zzttt,
S9fcU 6fCcb^a;({abd<z)77^^;H±tt-r^>h^fcoviTT*^T,
t*§) o rst,gfr&iKfrTzmmmt^vztizfez. mb, bnbtoSt/fTtii^b(±cDMMBe^ a## 1: & mil# # 3&& b % I# m< < > hchbrmvx tf-STI®mi0.0085mm(0.5112mm/h)cb bT45 D, CinSTlB^bfc^T©^«C:n^C0^ #fc43tt3fc©T&50 iftltiim(DT-?MM&T
-87-
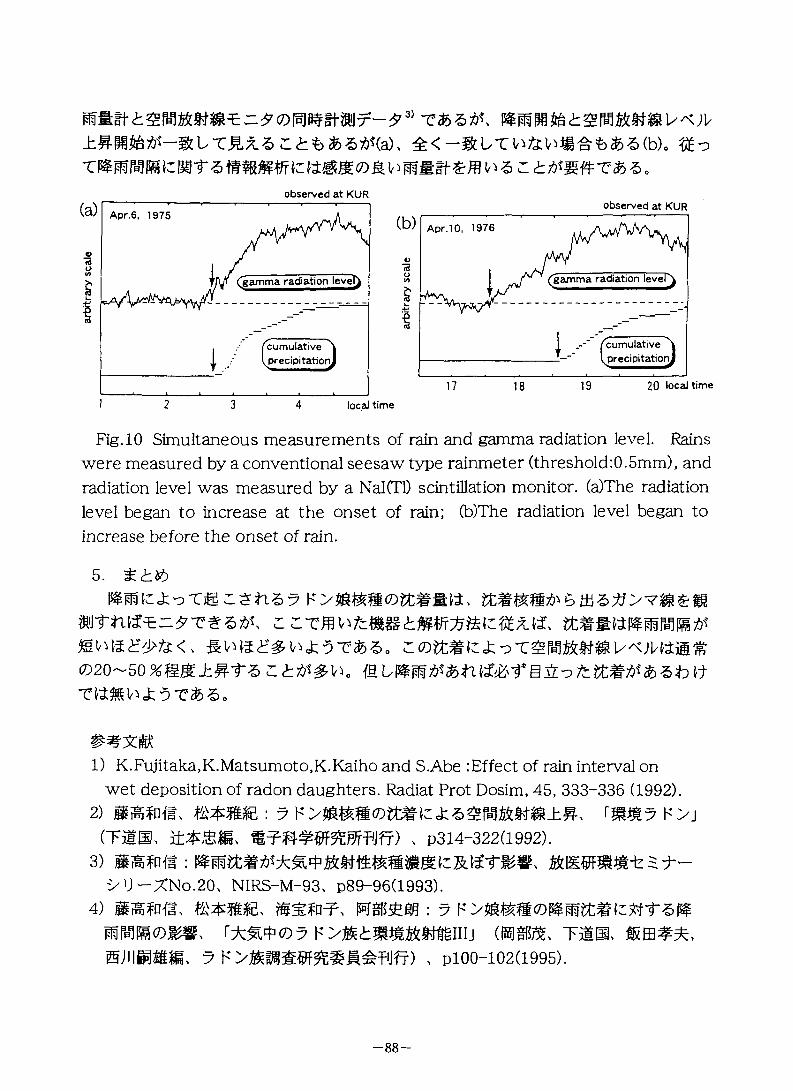
±#M% Ai-m L T^a. a C <b t & a #(aX ±<-<U75:W#^t)&a(b). %o
observed at KUR
Apr.6, 1975
(gamma radiation levels
local time
observed at KUR
17 18 19 20 local time
Fig. 10 Simultaneous measurements of rain and gamma radiation level. Rains were measured by a conventional seesaw type rainmeter (threshold:0.5mm), and radiation level was measured by a NaKTl) scintillation monitor. (a)The radiation level began to increase at the onset of rain; (b)The radiation level began to increase before the onset of rain.
5. $ (hidbym&mvizmmiz. ##s, m a # >7$# & m
^ouobitm'M(D2o-5o%@m±#Tac^^^w.
1) K.Fujitaka,K.Matsumoto,K.Kaiho and S.Abe :Effect of rain interval on wet deposition of radon daughters. Radiat Prot Dosim, 45, 333-336 (1992).
2) mmm, ####: ? mm? f>j
(Tits, i> p3i4-322(i992).
vU-XNo.20, NIRS-M-93, p89-96(1993).4) siisfDft, mmn^,
r±^(D? Timmilrn#K y F ) > pl00-102(1995).
-88-
(15)Scavenging of Radon Daughters by Precipitation from the Atmosphere
N. Fujinami
1. ttb&tc7 b, l%7k^^%7kS(c
oTAt <£mLm%t%Z.ibtl%tz&)s Beck and Miller "kt,7 h* >£IM©P$TS©k > immmfe&u ^mmiznoxt^^xxu^o
z(Dtz&s ^
o 2'8"12)A$$) h\ Rangarajan and Eapen13)©#^^®^—77 £> XCD^Bh'&m'QgtUT^-So Fujitakaet al.^&iWk*©^ H >$SOTSStC^f Nishikawaet al.^&iWSTk^hS^©^(#@*4:07
^zt\ n7kmRw$&mm<Dmmm**®? k y^mm^nt^mo^xo^,
b5A^(rainout)tfOTT-0tb&<fr(washout)© £ FFE A £0 E#©#4-&#BU# ELT:fc< zbtiz %7k(c AaA^i#©? K>m##©|#At A;i/^#^A6±T#AT m^x&Zo
%*(:ck^»7 P>%##©%b3&^C^Aa#^(d:w< ofp& b, Jacobi164±^ lfcfc«fc b rainout ^ washout © W4 £ EE L TT l > £ »k #Sib&oTV^^o BhandariandRama^ttl^Tk^ct^AM^©^ M>##@©#A$^ Itv^AatC&fcoT. rainout ©#&#gUT^&„ Makhon’ko18>&A^0xTD'J))/ lt£t LX rainout lz£ oT|5&*£tia 7 K L <%b&c%V\%t\o XXX, B&ktcAaAm#©? K>%##©%b&^©/*-XA©#%&a(^%o Z©;< A:z%A&%|6&(:Aazhlix #^%^M?A#gS©#&k: AcTAM^C%tB^fi,t%#^#@(c^A^|%7k©
2.
(1) EStIcA©:? K >*6OTSJt
m$#±#AaoE-^S©cM:#& ASi; tl© tt Pb-214(RaB)t Bi-214(RaC)T& b. Mz.lt, ^i#T'OT^ilZd$$7k|ji:^*©SSly^;V(d:5xi02 - 4X 10³ Bq/LT&a 15>0 &
-89-
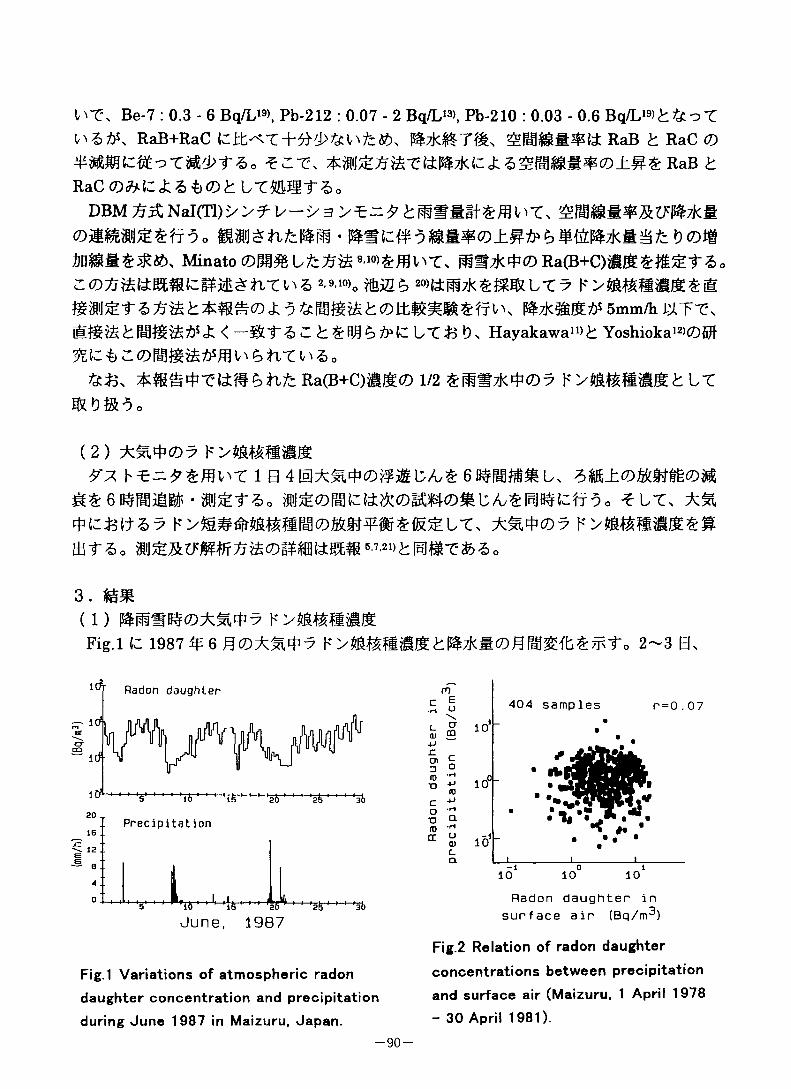
Be-7 : 0.3 - 6 Bq/L19>, Pb-212 : 0.07 - 2 Bq/L13>, Pb-210 : 0.03 - 0.6 Bq/L^&oT RaB+RaC ^7kH7^ ^HaSMMsfcfc RaB RaC ©
RaC©&C«t&t©^LT4&gf So DBM NaI(Tl)'>>^V-^3 >^E-* ^iSSSSf
o $#m$©±#^ ^ $w**^ ^ D ©mMinato (DfflftLtzfim 910>£ffil't7 HS7k4© Ra(B+C)tE&£jt£t 5o
z©^^(±%#tc#xE^fi-cv\% z.s.10),2°)tiiW7k^®3iLT7 h->immmm%ml$7k&J6#5mm/hWTT>
tmmm*£<-%LTZ>Zt%Wt>MZLZ&*), Hayakawa”)h Yoshioka'2)©^
Ra(B+C)#m© 1/2 &m#7kP#©7 K>$MSJthLT
(2) ^m*©7y* i 5m±vmmoM
mfe(Dr3M±$:(Ds&m(Dmt/u%mmiz'i7 0o fit, x%h*>i#^ilPI©M¥i^i^lt, *^4©7 K>$mmJ6£H
titiff)o s'7'21)£:|5}#tr&5o
(i) h >mmm&Fig.i tc i987^6^©^m4'^ \t>t&mm&&£.&7km<DRm£{b%mto 2-3 b.
Radon daughter
" Id
Precipitation
June, 1987
Fig.i Variations of atmospheric radon
daughter concentration and precipitation
during June 1987 in Maizuru, Japan.
cn
c_Q __ 1_____________ I_____________ L-1 0 1
10 10 10
Radon daughter in surface air (Bq/m3)
Fig.2 Relation of radon daughter
concentrations between precipitation
and surface air (Maizuru, 1 April 1978
- 30 April 1981).
-90-
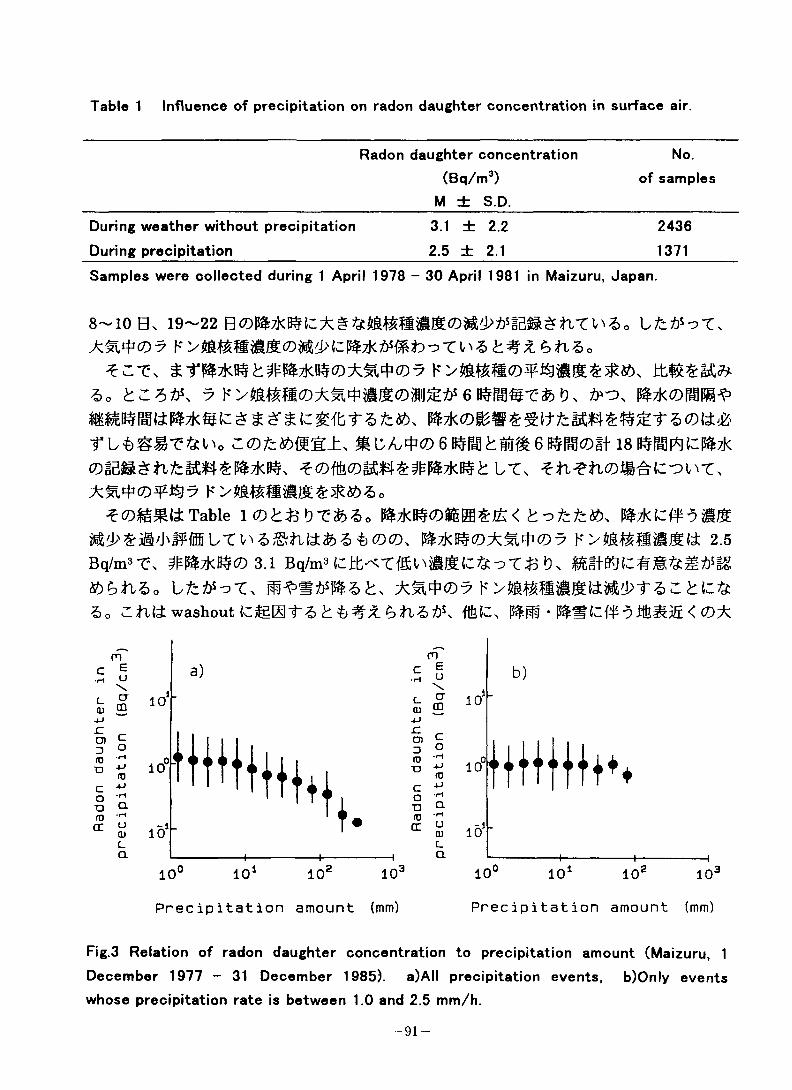
Table 1 Influence of precipitation on radon daughter concentration in surface air.
Radon daughter concentration No.
(Bq/m3) of samples
M ± S.D.
During weather without precipitation 3.1 ± 2.2 2436
During precipitation 2.5 ± 2.1 1371
Samples were collected during 1 April 1978 - 30 April 1981 in Maizuru, Japan.
8~10Bx 19-22 BOB&WKI*eW ao
a„ ^ k6nenae-cfcd>mmmmit£ £ $ i* $ tc ^ r a ^ #x f SC A,*© 6B$ftgCSuf£6B$Hg©§t 18
<DSB&£iifcl£*4:£l$7.kB3x f0#Da&#&#P&7kB3^ LTx
Table 1 (Dt&*)X$>%o Wm(Dffim*fc< t-3tztz&),
Bq/m3 TTx #%7k^(D 3.1 Bq/m3 (Cj:b^<T{SV>SStC^ oT jo tl x %sirao L/=^-3%x m^m^i^a^xa. ^ n& washout tc&Bfa h na #x e$® • P£Sic#assijE<cD*
m "
Precipitation amount (mm) Precipitation amount (mm)
Fig.3 Relation of radon daughter concentration to precipitation amount (Maizuru, 1
December 1977 - 31 December 1985). a)AII precipitation events, b)0nly events
whose precipitation rate is between 1.0 and 2.5 mm/h.
-91-
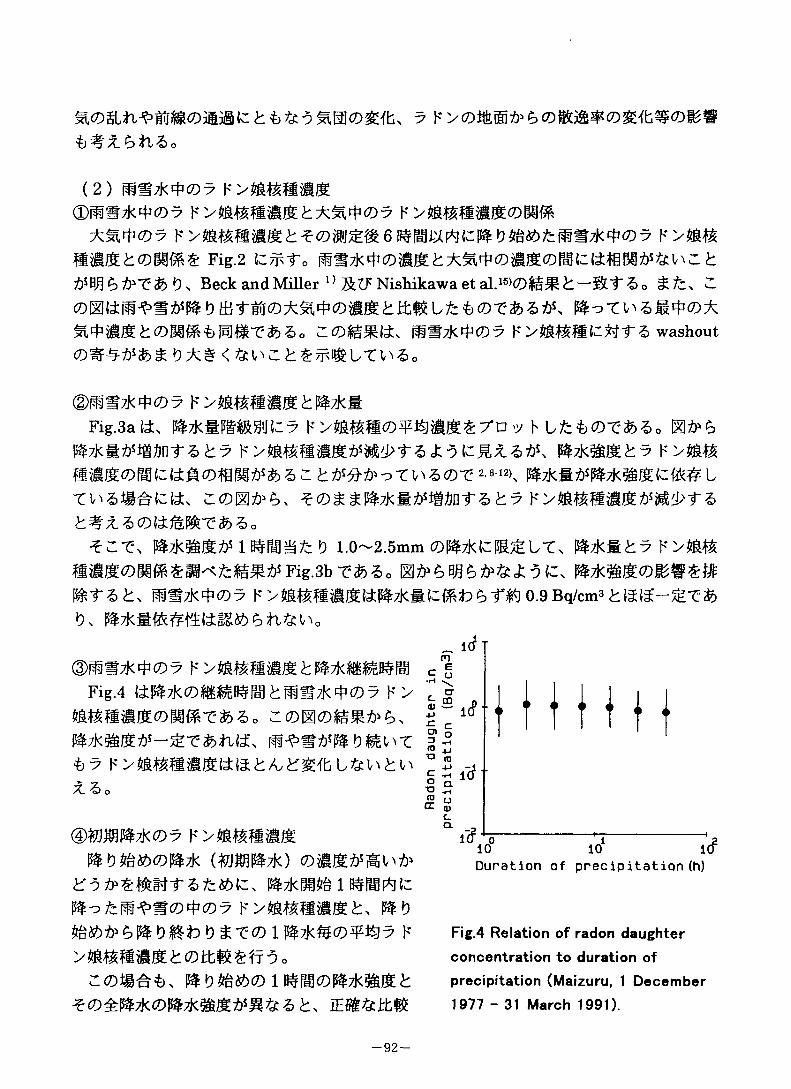
(2) mszk^o^ k >mmmi%.
(DMM7k*pcD? h* >tmmmi£t*Mcp(D7 f ytmMmmvmm
Fig.2 izfjktob b x Beck and Miller 1} j&tk Nishikawa et al.1S)(D|a^ t. —5&T Z> o C
©EKim^SA^bm-riuCD^^OMhirbEV/r^OT^^A^ M*S®hCD^^>|0]ST'S>5o HSzk^CD^ MSMEt^iTS washout
©mm**®?Fig.3a (is ^TkMPfWJt^ K>^M©¥^l?iJt^7*D'y h tfc^©T'fe^)o El^6
i^Tksftmwtzb? hytmMmmm'ptz£oiz%z_z>&s mm&t? mm&cDffiiz&Mvfflmtf&zz. *■ »-i2k %7k#A#7k^mc##ur^zm&iztes z®mfrt>s t^ZZOlZM P&r'&Zo
?ZX\ ^7k^s>b$ m^l^cb 1.0~2.5mm©|^7k^PS^tTs P$zk
mtzt, msTk^cD^ h*>nmmmmm7mizfct)e,tm0.9Bq/on3 ^ bs %7k###%(±m% 6 ;h%^o
Fig.4 imykvmfaffiffitmnyk^cD^ k> mmm&cDmmz&Zo z.omo^t^,l^7k^S7b$-St:$>n(^ |#^#A#bmv\?
B$b##xD#7k (#mi$7k)^zk^m^l^Kc
%b%A^6i^b#bb 1 p$7k@®#%7 k >mmmm&t<Dtm*'nz)o
zornst), ^b^©i»i^7j<Mb
z(D±&7k(Dm7k&m&m-&zts lEmtatm
Duration of precipitation (h)
Fig.4 Relation of radon daughter
concentration to duration of
precipitation (Maizuru, 1 December
1977 - 31 March 1991).
-92-
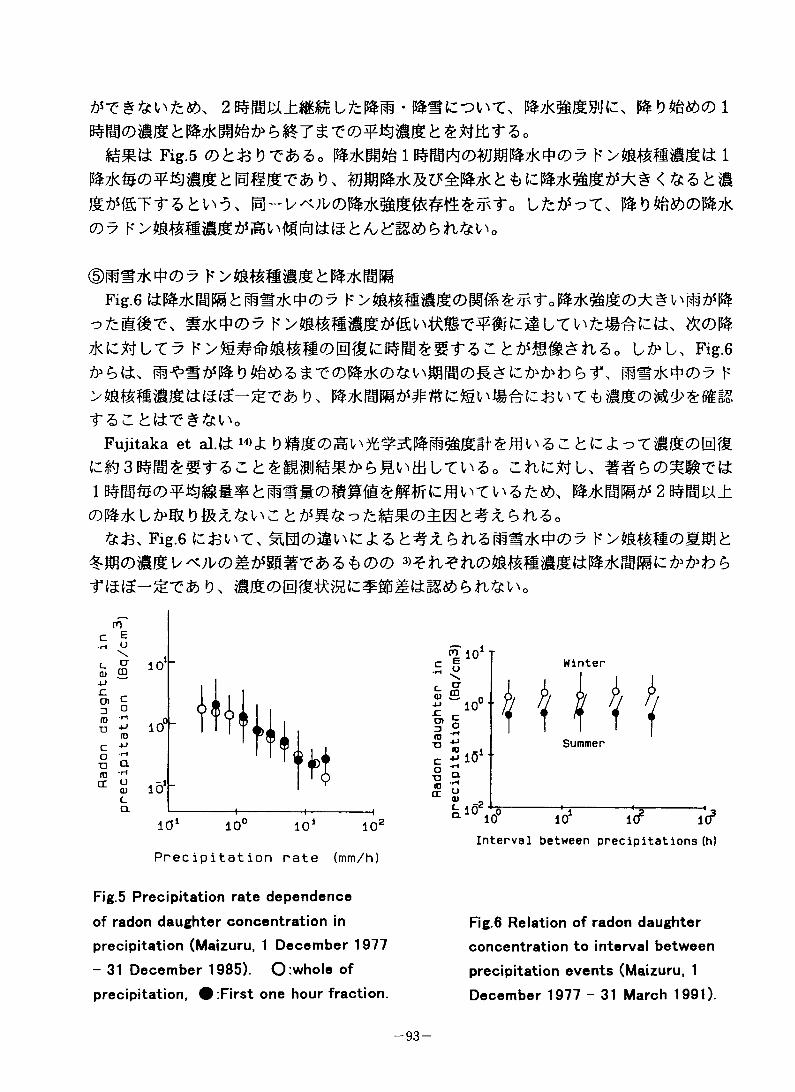
pwstfxD 1
Fig.5 <Dt&b?$)Zo &7km%ikymmmmmt 1 i%zke#fg##tmutr-&dx ®m&&jm±foik1
|Bl-v^;vcDl^7k^Ste#t4^^to Ifetfot, #%%&%#*
©mszk^cD^Fig.6 (±%zk^m^m@zk^(D7 h* ypmmmmomm z fkto
-itzm'&'Cs #**@7 fromTkfctttx? Fig.6&6kL Fi^Sim b £T<m7k<D&^mflE<7):E£ ^ 1\ UStK^ct)^ h*
tz>z kf±T'#&^oFujitaka et al.fi C k C ioT#%(D[mm
5^^^EWM/b^BV>mLTV>^.o utiC^tL, ##<b©HirC'fiimrm<D^mm.^hmnm<Dmnm*Mmm^-z^z>tz®, ^7K^h*s2b#^j^±
&*> Fig.6 (c^^Tx ^a©av>(zj;^,^#x.^n^ES7jc*^7 *rffl(Dmfey^)\s(DmmmT:foz>&(D(D 3^ri^tuDmmmmmm7kmm^^^tD^
c_Q.
10 10 10 lcf id3Interval between precipitations (h)
Precipitation rate (mm/h)
Fig.5 Precipitation rate dependence
of radon daughter concentration in Fig.6 Relation of radon daughter
concentration to interval between
precipitation events (Maizuru, 1
December 1977 - 31 March 1991).
precipitation (Maizuru, 1 December 1977
- 31 December 1985). O whole of
precipitation, # first one hour fraction.
-93-
4.(#@*##5 K > EM SS6 k <D 5 H
(D m^SWbEtoS $T<m7k£>&^M<7)S££*>*>£)e>1* > M>EMfSii$ti:ra-5£T $> S o
© ns7k*(D7 k >imMmfeizm7k&mzikftr%bK t#7Kmc^##L^Wo
(D mS7k*©7 h* >EMESJtcD^(cttffilEA$
%v^o P£Pi • IWS(c<koT^:S*07 h-yEMSm^fr&DM'-kirs&tf)
Ox UStK^O^ h'yEMSBMM'-kL&i'o
© W±0$g#^^,x m@7k#07 F>EM@#Ak:^f ^#OTTO%D^^(washout)0^(±/J^ <x ^^^S*TO$lD^(rainout)^6*r5^SS^n^,o
CO^#(d:x Jacobi^)^t^7l/##^6f#X:$&# rwashout C Si#^<%)5 F >EMS BJttiU @m07 F >EM##^x f^ht»x rainout l^SSS© 10-2~~HH£T'ifc So j k«t<-&Lx Makhon'ko18)O^Erox F>EM#C#a#&
S tfefcot washout CD W4F £: L Bhandari andRama17) CD 53-91£5#$TSoZOckoCx ESTk^O^ F>EMfI£*f1"S rainout OW-^A^S(C^$VAOttx ## 05 F >Om#T^g)cL^^^ D O rj:TD Po-218(RaA)j % Ufc>#>S r7 V —O RaAj <#%(C%0&^^S^%k#^^^,So
dktdttU h D>(Rn-220)EMMO^^ttx iteS@/^l£BLT < S hn>k^Oit #^6R#0 Po-216(ThA)0^m^##(:mw^Ax SO^^tt^TD V;VtCf4SL^: Pb-212(ThB)##X#&f Sk#t%h,SZk&%x l^zkC ZSmD&^(:j3t\T h □ >
EMfIk5 zk^fm^^is ^o ^n^oB^ofctoOES/b$^Oi$ET-^)So 1 2 3 4
1. Beck, H. L., Miller, K. M., Temporal variations of the natural radiation field. Vohra, K. G., Pillai, K. C., Mishra, U. C., Sadasivan, S., eds. Proc. 2nd special symp. on the natural radiation environment, Bombay, India, Wiley Eastern Limited Publishers, 163-172 (1981).
2. Fujinami, N., Esaka, S., Minato, S., Influence of the precipitation rate on the seasonal variation in the specific radioactivity of short-lived Rn-222 daughters in precipitation, J. Radioanal. Nucl. Chem., Letters, 95(2), 111-118 (1985).
3. Fujinami, N., Esaka, S., Minato, S., Estimation of cloud parameters from shortlived Rn daughter activity of rainwater. Nucl. Geophys. 7, 359-366 (1993)..
4. Fujinami, N., Observational study of the scavenging of radon daughters by
-94-
precipitation from the atmosphere, Environment International, 22, Suppl.l, S181- S185 (1996).
5. Fujinami, N., Esaka, S., Variations in radon-222 daughter concentrations in surface air with atmospheric stability. J. Geophys. Res., 92(D1), 1041-1043 (1987).
6. Fujinami, N. , Esaka, S., Influence of solar radiation and heat emission on radon- 222 daughter concentrations in surface air, J. Geophys. Res., 93(D10), 12627-12629 (1988).
7. Fujinami, N., Esaka, S. A simple model for estimating the mixing depth from the diurnal variation of atmospheric Rn-222 concentration, Radiation Protection Dosimetry, 24(1/4), 89-91 (1988).
8. Damon, P. E., Kuroda, P. K., On the natural radioactivity of rainfall, Trans. Amer. Geophys. Union, 35, 208-216 (1954)
9. Minato, S., Some observations of the variations in natural gamma radiation due to rainfall, "Natural Radiation Environment III", CONF-780422, pp.370-382 (1980)
10. Minato, S., Estimate of radon-222 concentrations in rain-clouds from radioactivity of rainwater observed at ground level. J. Radioanal. Chem., 78, 199-207 (1983).
11. Hayakawa, H., Radon-concentration-in-cloud and rainfall rate dependency of short-lived radon daughters in rainwater, J. Nucl. Sci. Technol., 22, 292-300 (1985)
12. Yoshioka, K., The seasonal variation of rainout activity of short-lived radon daughters, Radiation Protection Dosimetry, 45(1/4), 395-398 (1992)
13. Rangarajan, C., Eapen, C. D., Some observations on the concentrations of shortlived decay products of radon and thoron in the monsoon rains of Bombay, India. J. Geophys. Res., 90(D5), 8155-8159 (1985).
14. Fujitaka, K., Matsumoto, M., Kaiho K., Abe, S., Effect of rain interval on wet deposition of radon daughters, Radiation Protection Dosimetry, 45(1/4), 333-336 (1992)
15. Nishikawa, T., Aoki, M., Okabe, S., Time variation of Rn-222 progeny concentration in rainwater, Health Phys., 49, 1284-1289 (1985).
16. Jacobi, W., Die Anlagerung von naturlichen Radionukliden an Aerosolpartikel und Niederschlagselemente in der Atmosphare, Geofisica Pura e Apphcata, 50, 260-277 (1961).
17. Bhandari, N., Rama., Study of atmospheric washout processes by means of radon decay products, J. Geophys. Res., 68, 3823-3826 (1963).
18. Makhon'ko, K. P., Simplified theoretical notion of contaminant removal by precipitation from the atmosphere, Tellus, 19, 467- 476 (1967).
19. Gaffney, J. S., Orlandini, K. A., Marley N. A., Measurements of Be-7 and Pb-210 in Rain, Snow, and Hail, J. Appl. Meteorol., 33, 869-873 (1994).
20. b«->
— 95 —
pp.203-210(msma) ”,0*JE^*^(1985)
m, 29#, 110-116(1984)
22. sssAxEE^, 35 #,132-137(1990)
-96-
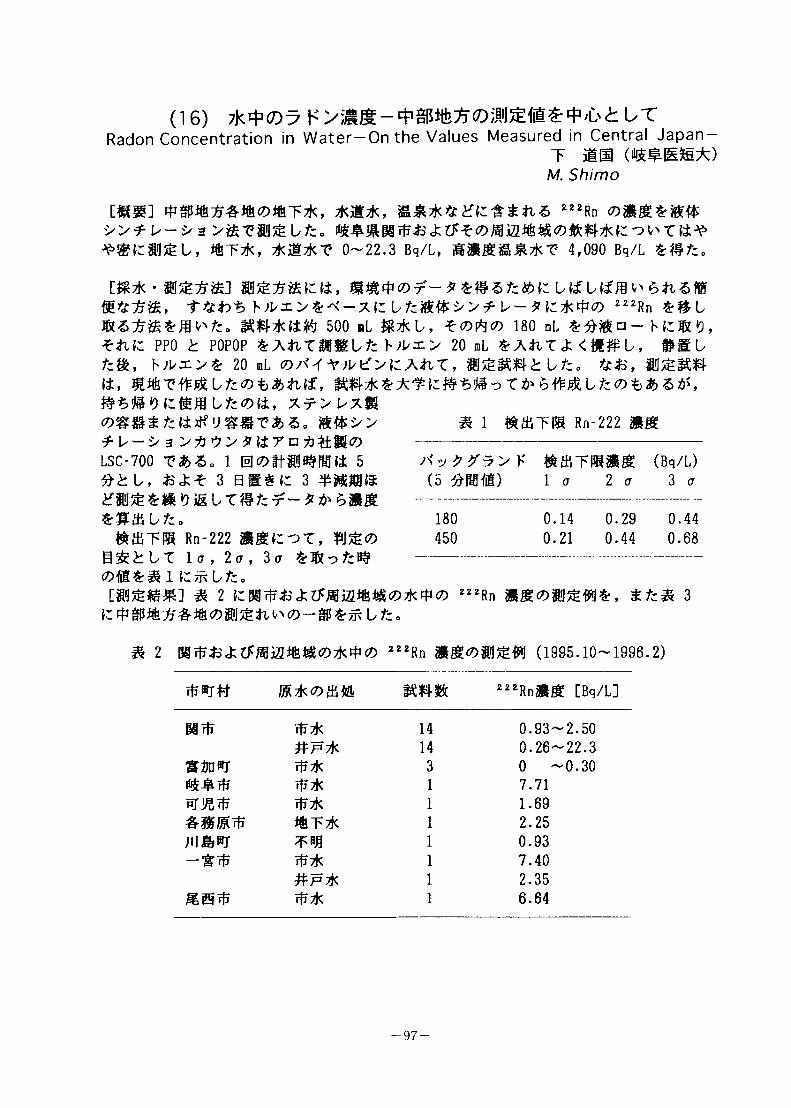
(1 6) 7k43<D^ K > iiiJt - 41 SIWj <Z):M3£.m£ * /i> <h UT Radon Concentration in Water-On the Values Measured in Central Japan-
t iliaM. Shimo
[«£] *£*, 222Rn &&&*&&'>>*ls-'>3>mVMfebrza
IfeT*, **1*? 0-22.3 Bq/L, 4,090 Bq/L
[$R* - UfEV'6*i<5fBf"f&£>*> 1/ - * £**</> 222Rn
SS***^ 500 mL $g*U, f 180 ml n- H:%0,PPO £ P0P0P *A*lTS®HU*: 20 mL £ A*iT £ < S# L, ##0h;PX>^ 20 mL O/'W Y;l/tf>tlAilT, jHSimfc Lfc. *43,
9 CfStii LtzMZ, X-r > I/X@
^P-'> a n*ti:g(£>LSC-700 1 igc7)ffE^K(i 5fit u, aat 3 3
Z&tibtzo&&rm Rn-222 ssiroT,
BSh UT la, 2a, 3a SrlRo?:# comZ3klfcmVtz<,
m 2 CMMjlMia##®**® 222Rn »g<9$!l%frj*, £££ 3
m 2 Hi^a«fcMaift«07k^© 222Rn (1995.10-1996.2)
TfilW SW» 222Rn#g [Bq/L]
Mr? ip* 14 0.93-2.50#f* 14 0.26-22.3
Sim*: rp* 3 0 -0.30HffcJUrfr rp* 1 7.71rT rf? Tf? tK 1 1.69
%T* 1 2.25iu&»r *»J§ 1 0.93-sn? rp* 1 7.40
#P* 1 2.35iS$ ip* 1 6.64
m 1 taaiTis Rn-222 mmXv ^ K tfc&TSiag (Bq/L)(5 #|HHfi) la 2 a 3 a
180 0.14 0.29 0.44450 0.21 0.44 0.68
-97-
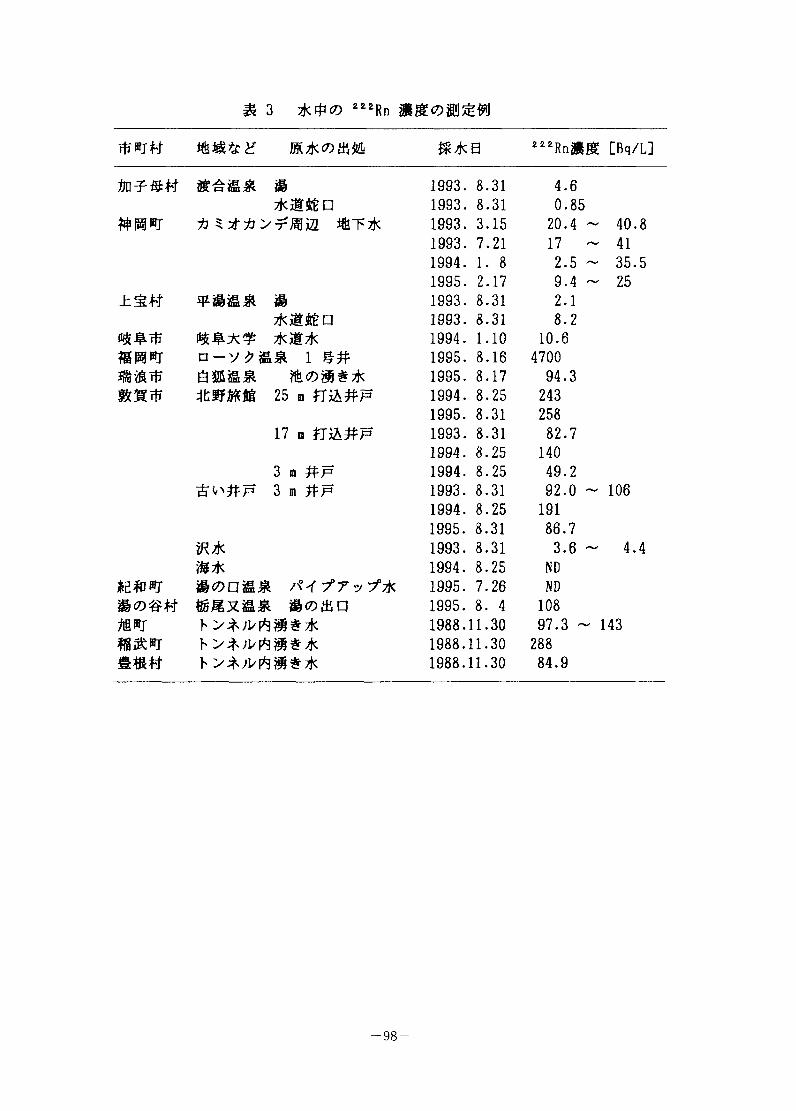
m 3 **<9 222Rn
Tim# &*g 222Rn&£ CBq/L]
Anf ## m 1993. 8.31 4.6*iE4£n 1993. 8.31 0.85
;*> Srfjbi'-rMia #T* 1993. 3.15 20.4 ~ 40.81993. 7.21 17 ~ 411994. 1. 8 2.5 ~ 35.51995. 2.17 9.4 — 25
±%tt B 1993. 8.31 2.1*it46n 1993. 8.31 8.2*&* 1994. 1.10 10.6
?SisgwT n-V*B£ 1## 1995. 8.16 4700SSBH? 6EBS 1995. 8.17 94.3gfcgrff ttTOflt 25 m #&#p 1994. 8.25 243
1995. 8.31 25817 m JT&#f 1993. 8.31 82.7
1994. 8.25 1403 n #f 1994. 8.25 49.2
#^#F 3 m #p 1993. 8.31 92.0 ~ 1061994. 8.25 1911995. 8.31 86.7
iR* 1993. 8.31 3.6 ~ 4.4S* 1994. 8.25 ND
1995. 7.26 NDBoe# 1995. 8. 4 108MBtr h 1988.11.30 97.3 ~ 143
h 1988.11.30 288®«# 1988.11.30 84.9
-98-
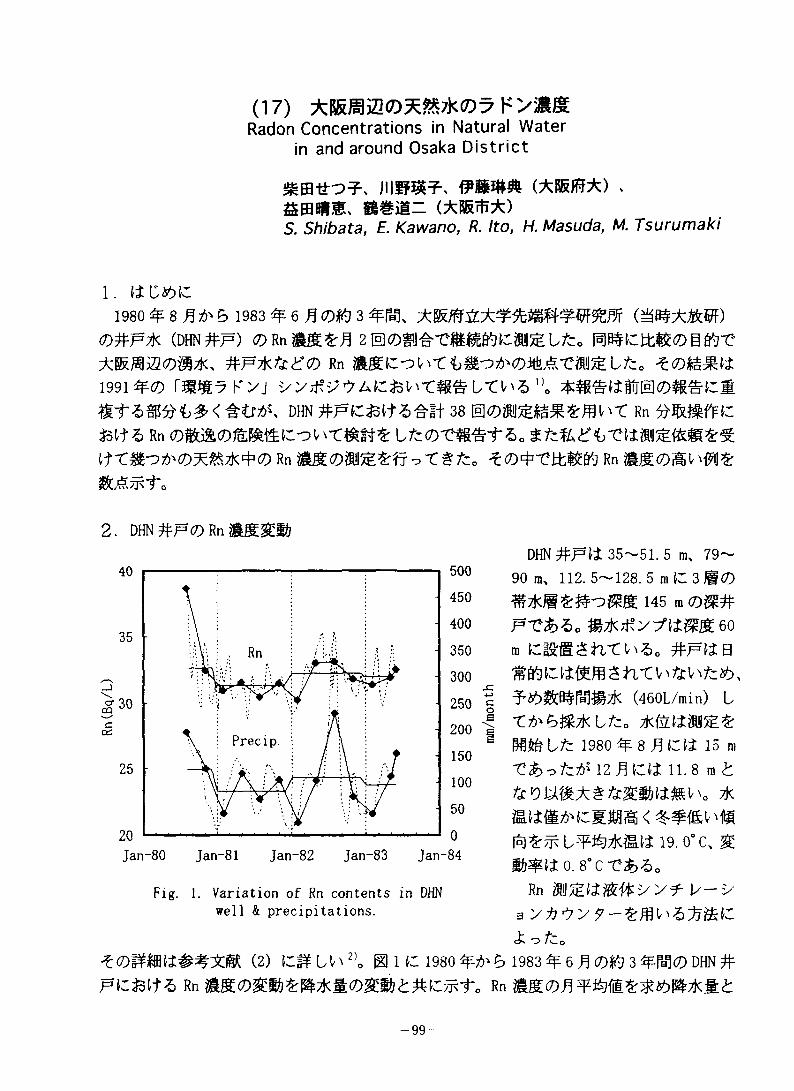
(17)Radon Concentrations in Natural Water
in and around Osaka District
to^-s imm=Fs ckBSfli*) »SfflUE, @#il- (^Rsm^:)S. Shibata, E. Kawano, R. Ito, H. Masuda, M. Tsurumaki
1. #1980 F8 1983 ^6 E(D^ 3 Ffal
off* (dhnff)
1991F© r#%5Fyj yy^^^ACjs^"C#eu-cw^
DHN 38 Rn
m% Rn Lto-cmefa. ^refA^^-c^ay^E^sIFCSoFO^BTkFCD Rn Rn
2. DHN#F#Rn#m3E%
Precip.
Jan-83 Jan-84Jan-80 Jan-81 Jan-82
Fig. 1. Variation of Rn contents in DHN well & precipitations.
DHN PP\t 35-51. 5 nu 79- 90 m. 112. 5—128. 5 mC3l®
145 mCD^F F'C^b-So eom £is:e2ft-o^„ #f«b
(460L/rain) LTFBE*L/c=
1980 F 8 jj£fi 15 m 1?$>o/c;F 12 AM 11.8 m a
A^^UTOTkm 19. 0° c% %mmt o. 8°c-cab^o
Rn y-y3 y*^y f-$rmw6F&C
O fco
(2) C#UVF^ g| 1 c 1980 6 1983 % 6 JJ 0^1 3 DHN *
F^its Rnmt
-99-
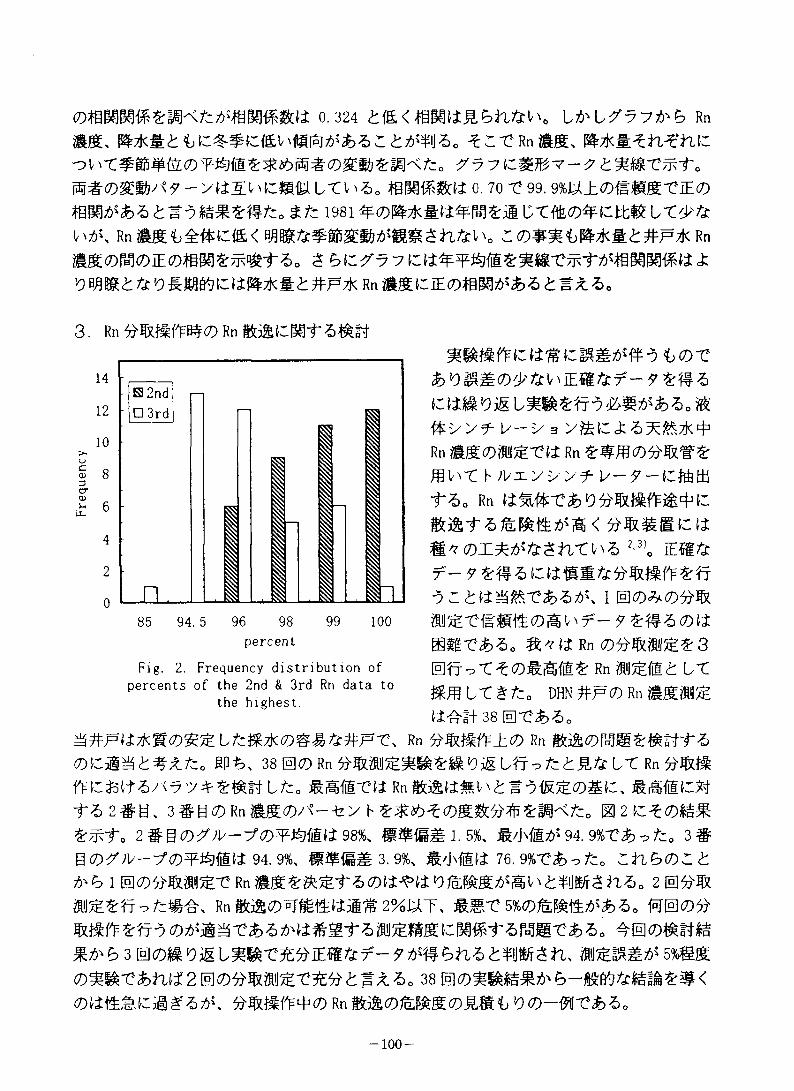
0.324 Lt-LXyy^b Rn
ss, &fomti>\z%rmz.fc^mfatf-Sbz>z.tm\\z0 ^r-cRnss, ^s^n^ntrf 777tm%x^-t0
y^swcmmltv^0 0.70 -e99. 9%u±x>mm^x^o1981 C-Cf60^^j±# U"Cf ^
V^\ Rn ag*;£&«< h,ftK r ©^^^tKS^^PtK Rn
ssc^cDE^m^'tf a. s 6 c f 7 7 cz*0 %ma &96mtcm*Sf#F7k Rn *£CE<Z)tBK)>&*£>a tmZZo
3. Rn^%#fF^0Rnmm^^f6^#
S 2nd□ 3rd
6
percent
Fig. 2. Frequency distribution of percents of the 2nd & 3rd Rn data to
the highest.
t0"C
&wEm&f-?&#a
fo'y'si- V—'y a 7&CZa^Bff Rn m&<D:mj£X\t Rn ZlfRKDttWgZ
b ^l7yyf 1/ — 9 —
fa. Rn k
ftfcf afe&&j&SiS< tfJ&gSKili
f - f ^#a
itu^-cfgictt (d £ ^ t - 9 *n a (d a@m-c&a. a^^Rn0^%#^^3
Rn m%#2: LX SfflLttt. DHN #p® Rn mmw^:^i^i+38 ®-c£>a0
Rn ^%#fF±6D Rn afiPS. 38 @<7) Rn L&Lfir>tzt%ti:LXRn
Ltz0 #^#TU Rn m *5{££©&£,fa2#g^ gi2ct<DMm
£ffo 2&B®XJU-X<?)¥tyim 98%, #$#mi.5%, Syjvfl;^ 94. 9%X& -? tz0 3#
g<Z)f Az-fCDWEte 94. 9%, #$#m 3. 9%, ^/Jvfifte 76. 9%'C&o £.
i @<7)5>imre RnS6£&^f amw^mg^v^wsna. 2®^
Rn iti&OTEtttiiis 2%ut, mm-c 5%0^m^aba.
apnm-c&a.
E) 3 ® u^-c^EC^f - f A# sfia <b##ra s%@m
2 ® osm&m-ca# ^ 38 gomaMmd' <o«i4,mcigt'a^, Rn L(D-Mxhz>0
-100-
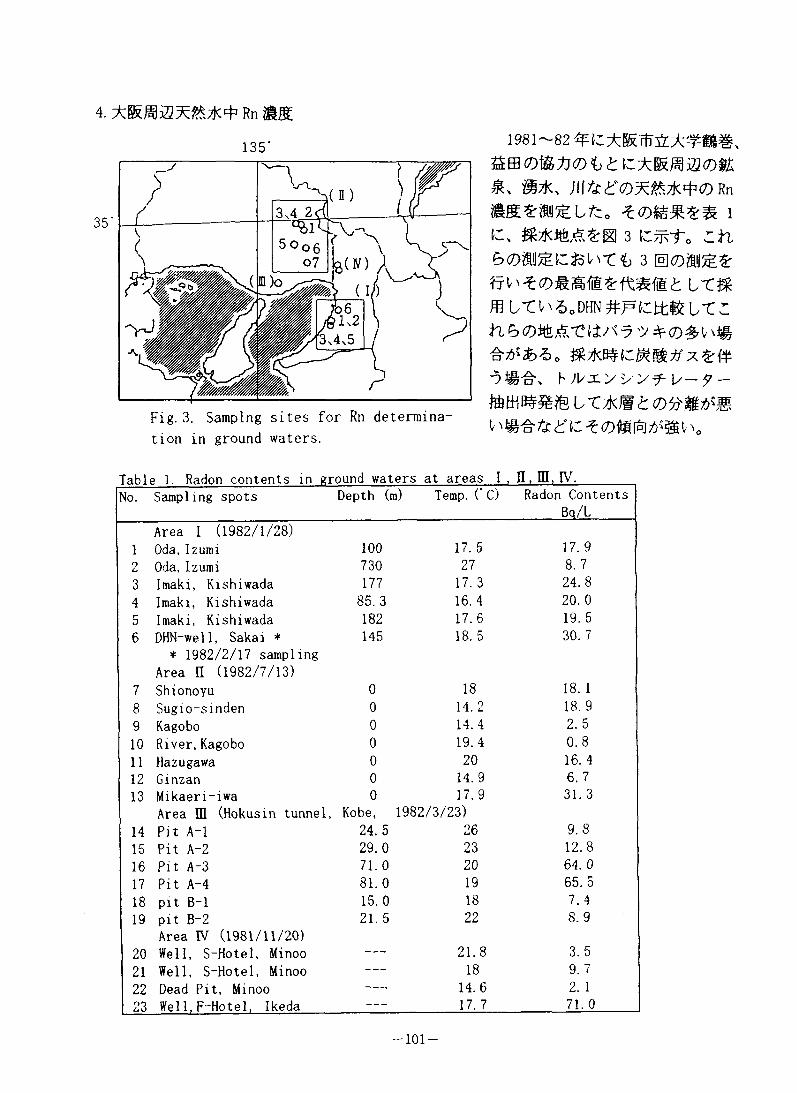
4. Rn SS
35'
&mo)W,tj(D<L£iz-±&m$i(D$t7%, #7k, jlf&£'©^*7k^(7)Rn
mg.zmfeLtz0 ic, tRiKMt&zm 3 rn
LXMfflurvx^oDHN^F^murrn60%^'r^/<7 9^(D^v\#
3#To, h )\7jLy'yy^~ u—9 —
LTfrJ9£®ttMX>m
Table 1. Radon contents in ground waters at areas I, II, HI, IV.No. Sampling spots Depth (m) Temp. (" C) Radon Contents
Bq/L
1Area I (1982/1/28)Oda,Izumi 100 17. 5 17. 9
2 Oda, Izumi 730 27 8. 73 Imaki, Kishiwada 177 17. 3 24.84 Imaki, Kishiwada 85.3 16. 4 20. 05 Imaki, Kishiwada 182 17.6 19. 56 DHN-well, Sakai * 145 18. 5 30. 7
7
* 1982/2/17 sampling Area II (1982/7/13) Shionoyu 0 18 18. 1
8 Sugio-sinden 0 14. 2 18.99 Kagobo 0 14. 4 2. 510 River, Kagobo 0 19. 4 0.811 Hazugawa 0 20 16. 412 Ginzan 0 14.9 6. 713 Mikaeri-iwa 0 17. 9 31. 3
14Area IH (Hokusin tunnel, Pit A-l
Kobe, 1982/3/23)24.5 26 9.8
15 Pit A-2 29.0 23 12. 816 Pit A-3 71. 0 20 64.017 Pit A-4 81.0 19 65. 518 pit B-l 15.0 18 7. 419 pit B_2 21. 5 22 8.9
20Area IV (1981/11/20) Well, S-Hotel, Minoo — -—- 21.8 3. 5
21 Well, S-Hotel, Minoo — 18 9. 722 Dead Pit, Minoo ------------- 14.6 2. 123 Well,F-Hotel, Ikeda — 17. 7 71. 0
135
Fig. 3. Samplng sites for Rn determination in ground waters.
-101-
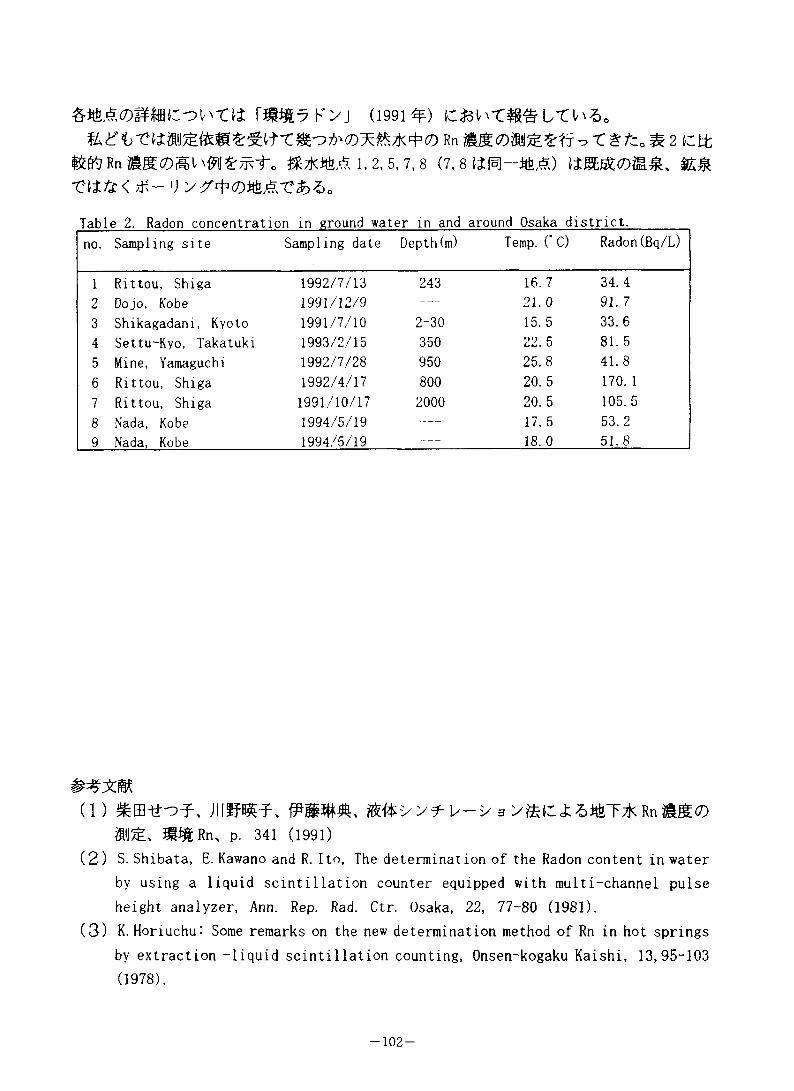
(1991^)
Rn #mo#imefT T, -c e 2 ctt
^t"= 1,2,5,7, g (7, g tm-mA) am-cn%c< v yy^ojGA-c&ao 1 2 3
Table 2. Radon concentration in ground water in and around Osaka district.no. Sampling site Sampling date Depth(m) Temp. (* C) Radon(Bq/L)
1 Rittou, Shiga 1992/7/13 243 16. 7 34. 42 Dojo, Kobe 1991/12/9 — 21. 0 92. 73 Shikagadam, Kyoto 1991/7/10 2-30 15. 5 33.64 Settu-Kyo, Takatuki 1993/2/15 350 22. 5 81. 55 Mine, Yamaguchi 1992/7/28 950 25.8 41.86 Rittou, Shiga 1992/4/17 800 20.5 170. 17 Rittou, Shiga 1991/10/17 2000 20.5 105. 58 Nada, Kobe 1994/5/19 — 17. 5 53.29 Nada, Kobe 1994/5/19 — 18.0 51. 8
(1) ^EBth^ JllfM-tP, ####, iy-'> 3 yteir^ittmkRnS6o
m'J%. n%L Rn, p. 341 (1991)(2) S. Shibata, E. Kawano and R. I to, The determination of the Radon content in water
by using a liquid scintillation counter equipped with multi-channel pulse height analyzer, Ann. Rep. Rad. Ctr. Osaka, 22, 77-80 (1981).
(3) K. Horiuchu: Some remarks on the new determination method of Rn in hot springs
by extraction -liquid scintillation counting, Onsen-kogaku Kaishi, 13,95-103 (1978).
-102-
Radon Concentrations of Ground Waters in Aichi Prefecture
S. Ohnuma, N. Kawamura
(18)
1. u: i; A c
Bq/lfc WHOtrtmsmc&iWTK
xj >2)£aa r-^H©Ak#*0^*To. i msvj X'hz>o ^nii, $ntziij >(Dtk®mmgiCoUTi^a<lEtrO. 1 Bq/U *&#%##"?! Bq/l"C$)6. r © IS £ if 7X it © 0 ft <D
w^MTkMfo. 1 msvi:m^t6&#%#m#rnif 22^RaTii
i Bq/i?&a. 9 Kxif ^&r* & 5 £ a £ 7k;i £ ® <^_t tf £tzif
+ L-ert?(7)7 K > 1/^ 11/£ _h If 5 0 % c T, tK it* + <D y K > <Da%mc7Kit©is^±if\z&^i&Aif<mvitmtfxgZ>o 'ft£b%, #k#7K^f 1 mSv/ylCttt$LT, 7 K > l:oU
T©%A*SB(fl982¥©UNSCEAR$8Sk:*}t,'-Cm mSv/y& <0 ? ViZ Ufii^ ^ t ft Ml
. -H, £ -5 I'o + (ERA) litfc*47K + 07 K >©«
Ar53fe U ^ )V (maximum contam i nat level) £-11 Bq/1 (C L ^ U ^ L Tl'1 <E>3> „
S0TCW: %T7jcroia^^f/f t t t>\Zy K >m%trfr ? Tfc <0 , #$0#©%T7K^©7 Kiti^. -f-cm991^3/f gxv?-?
(c^vrii$g^Lf:4) <DT\ f &iaanLT#<&. ttz^'ik,LTfffl $nTV'S%T7k*MJIl7k$?I£*a&3St£7k 4>(7)7 K > « g 80 £ © fc A £, Zti£x&m lx^tzify x^(Dmxidmu- b (utge) 5>x\t& < mmicx<f *>%
l/>8H0}iai#S (UTPE)
2. S*]ftfc::J3ttS*lT*+9 K>*«2. 1 ai£&
1978^5^K&rr£fu 7 K>©m^i:M u-cif iM$%:+&cjmA-c
mftisyi-is-i/ a yii+ty v-mbmmztLtzo i974%km^TiM$%:t&^m
ztm'&ii%k®s>iz£6&#'>>*U"y syfi^y^-^m^tz. y h*>tv >? >fy^y ^rnfayy+y-y a yti^y
*-LB-01£«k oTf+80L«#l+&&K'C2ltB ltz0 ttz. 1991#48UPWAL0KA&!@X73 >'> Ax ALSC-LBiniCck ?T:t80 K
(ETM) Ctmilfc.
^jb\ i:ifi^# c -caio^ Lfc„
-103-
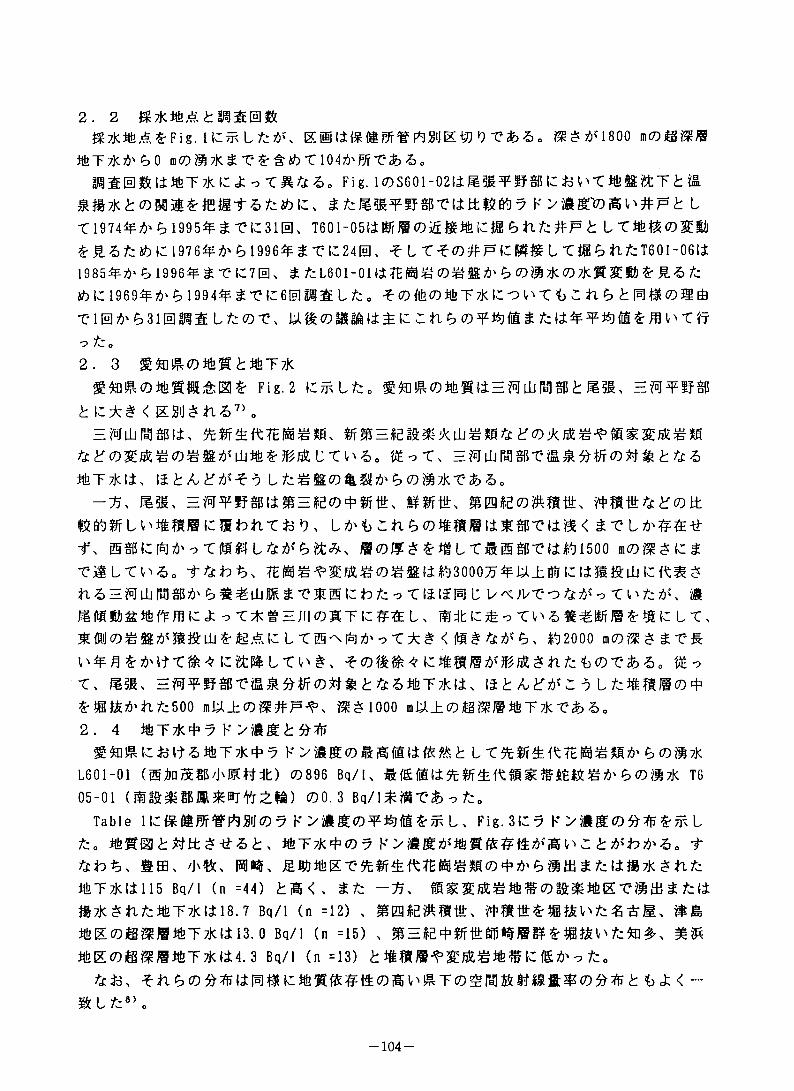
2. 2 i$7kite£
#7kife7&£Fig. lKiSLfcj&'x $£/>J1800 m(DBUMJfeT7jc*'?>0 nKD#7K^T$"^A-C104A^-C&6.
WlEBfttiifeTTKK «fc oTM44. Fig. lOSeOl-OZti^SBT^SSK iJV'TJfettitTt fia&mse^BaG-fwtt##? k >#a%)Au#r6: l
X 1974^/)' b 1995^ £T*K 31 T601-051* Wr JlOj£i$Jl!!CJHS> ft fc#F t LTtfc^0$Sti
£ H £fc * K 1976^^' t, 1996^ £ T'(C240, * L X ^ (D#P \Z |»& L XW, b ft £1601-061*
19854PA' 6 1996¥$TMC7@, £ tz L601-01ti7E M £ 0^SI />' £ 0?H 7k 0 Zk® 3CS& £ £ 6 £
* H 1969^^5) 1994^ i-CK:6BMjiELfco * 0 te0*feT 7k £ o ^ X i> :k b tfflffi<Dm& •ci®*'e>3iiH]waEitz<Dx\ mk<nmm\£3L\z.z.titb<D¥%)fa£tz\£^$)m*m\'X'ii•o tZo2. 3 7k
g $0!R (%%%#:& BI& Fig.2 K*L£o J13I, EM?5SG
t\z±g < Ejgij£ft£7> „
te¥(D&J&m<D%m'iUn>ZMJ&\:X\<'Z>0 ftoTx EMiljMgB"C&m^#r0^#^£^
%T7kti> \ZtL££*E048(*'£08&7kt?&*o
-U, H$Mx EM^lfgBtimEE^ + Srlttx #%r#x W>*»it ft ¥0 tt
■r, mffilzfafr'ixm® l %(D&£ £f#LTSMT(*^1500
tlLTt'io TE^^-^^fiK^co^S^liltjSOOO^^UEIu tc liMili I::-R3E £
n^EMajr^SB^^si^ajE^Tt$ifiB] i; Tir'fc*^ mJil«»£%ffFffiK:«fc o -C*gEJl|0KTIc#£ L, Tir'**€»rW££K: Lt,
LT@^f^A'oT±# <memooo m0$£
■c, ms, EM?5a;Tsm##(%#$&%T7kw\ L£#m@0^
£ffl&j&'ft£500 mkU:0$#F-^x $£ 1000 ■ U_h<&fi$»ifeT7kT?&S«
2. 4 ifeTTk+7
g*n&(:tma#T7k4:7 K >-$S(7)Sil5Mti^^^ LT%#T±ft7EW^M^6(D#7k
L601-01 (SinM'MiifcMk) £7)896 Bq/U &f£M(*?c ff £ ft «£#*£&£ />' £ <7) $ 7k T6
05-01 00.3 W\*ffiX&-0tzo
Table lKftttBrtf rt»J09 K i/*®©3^!® Lx Fig. Z\Zy K L
£= mt?k*<d7 -tt£b%. affix /J\%x M^x J&Jft«!Et?$fcfff£ft?EW£»04'a'£>iBffl££ti:»7lc£ft£
%T7kiiii5 Bq/i (n =44) tm <, £tz -#x com^^xmta&tzit»7k£ft£itfeT7kttl8.7 Bq/l (n =12) , SegE^mtttx «> I* t£ £ «! tfc l' £ «*Mx SB
%E0@$@%Tzkl*13. 0 Bq/l (n =15) x &Ete + iFrMt$fi#£-iBft!r'£fc]£’x ##
%E0@$@%T7kij:4.3 Bq/i (n =13) t\Ztz0 &&x f ji6 0^^mmi#^ *; < -
&L£'\
-104-
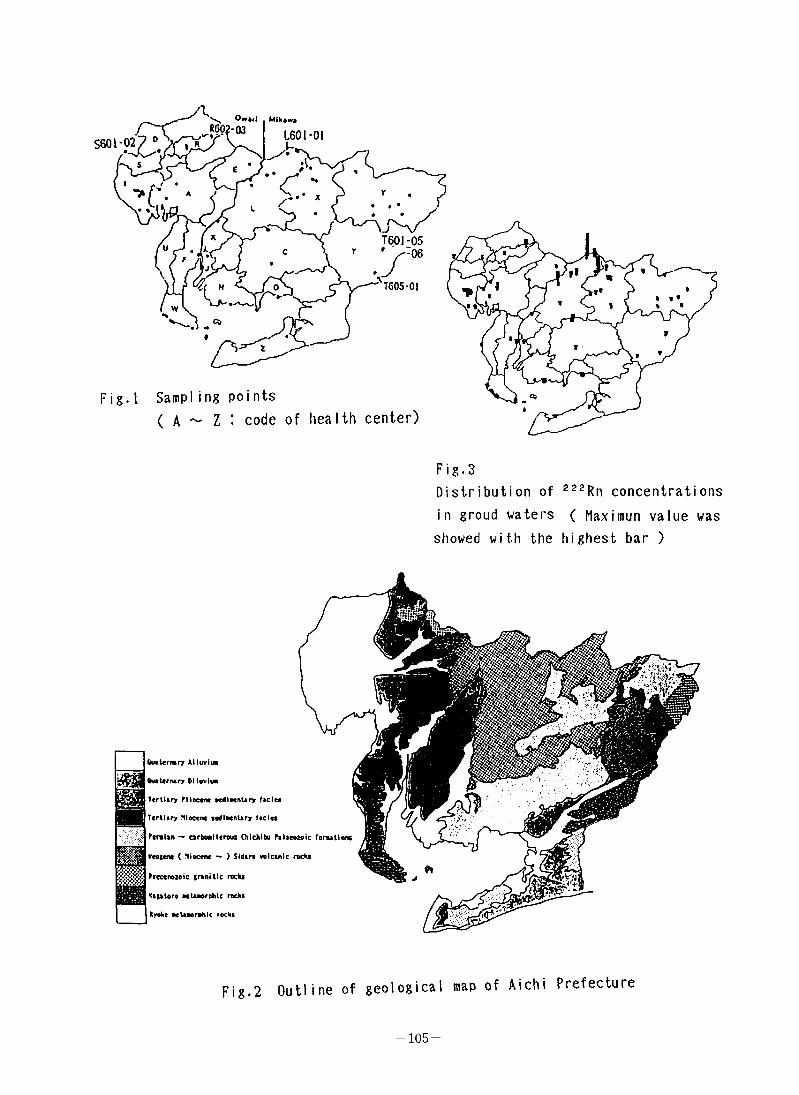
Own! Mlktni*602-03 L60I-01S601-02
T60I-05
TG05-01
Samp Iing points( A ~ Z : code of health center)
Rn concentrationsDistribution ofin groud waters ( Maxi mun value was
showed with the highest bar )
Outternsry Alluvium
Quaternary Diluvium
Tertiary Miocene sedimentary facies
Tertiary Miocene sedimentary facies
Permian — carboniferous Otlchibu Palaeozoic formations
Neosene ( Miocene — ) Sldara volcanic rocks
Pricenozeic sramlic rocks
I ^as&tero me tamer oh l c rocks
I lyoke metamorohic rocks
Fig.2 Outline of geological map of Aichi Prefecture
-105-
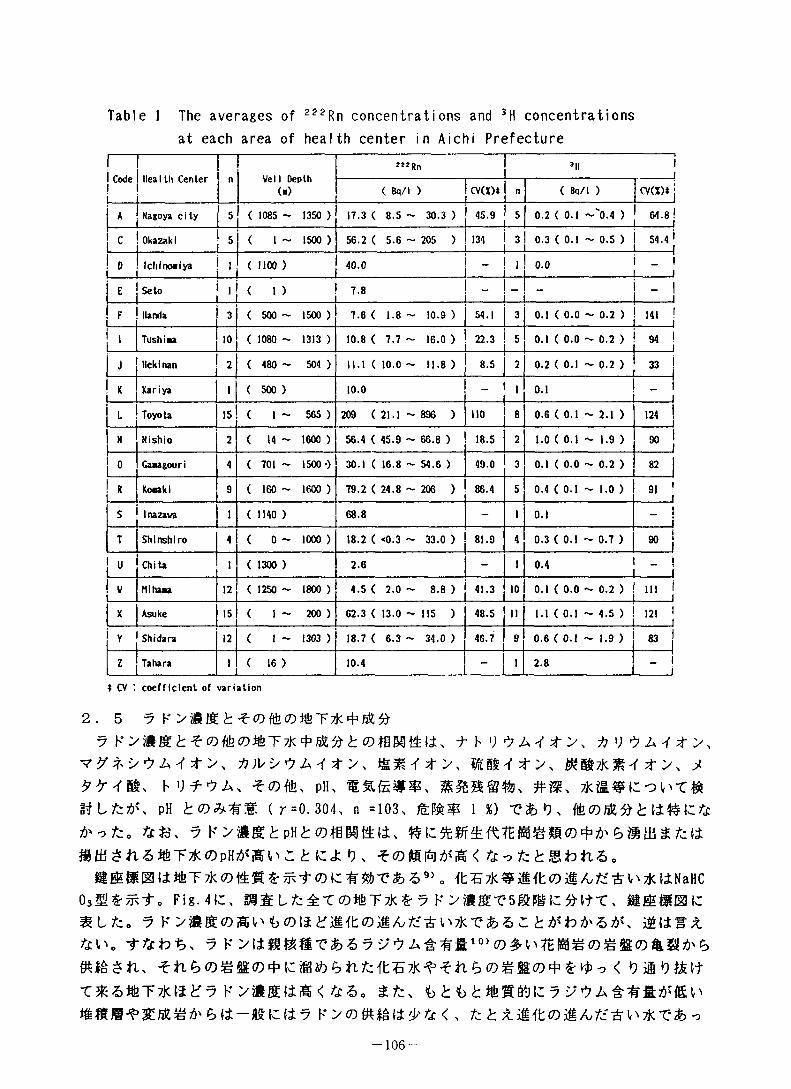
Table 1 The averages of 22 2Rn concentrations and 3H concentrationsat each area of health center in Aichi Prefecture
11 Code Health Center n
I
Veil Depth (■)
*”*n r 'll
( Bq/I ) CV(X)»j n ( Bq/I ) CV(X)t
A Nagoya city 5 ( 1085 ~ 1350 ) 17.3 ( 8.5 ~ 30.3 ) l±L 5___
0.2 ( 0.1 ~'0.4 ) 64.8______ 1
C Okazaki 5 ( 1 ~ 1500 ) 56.2 ( 5.6 ~ 205 ) 134 3 0.3 (0.1 ~ 0.5 ) 54.4 ' |
'• Ichinoeiya ' ( 1100 ) 40.0 ~ ' 0.0 _______ 1
E Seto ' ( o 7.8 _ - - i
F llanda 3 ( 500 ~ 1500 ) 7.6 ( 1.8 ~ 10.9 ) 54.1 3 0.1 ( 0.0 ~ 0.2 ) 141
1 Tushiea 10 ( 1080 ~ 1313 ) 10.8 ( 7.7 ~ 16.0 ) 22.3 5 0.1 ( 0.0 ~ 0.2 ) 94
J llekinan 2 ( 480 ~ 504 ) II.1 ( 10.0 ~ 11.8 ) 8.5 2 0.2 ( 0.1 ~ 0.2 ) 33
K Kariya 1 ( 500 ) 10.0 _ I -- 1
1l Toyota 15 ( 1 ~ 565 ) 209 ( 21.1 ~ 896 ) no 8 0.6 ( 0.1 ~ 2.1 ) 124 1
1N Nishio 2 ( 14 ~ 1600 ) 56.4 ( 45.9 ~ 66.8 ) 18.5 2 1.0 ( 0.1 - 1.9 ) - 10 Gaugour i 4 ( 701 ~ 1500 ) 30.1 ( 16.8 ~ 54.6 ) 49.0 3 0.1 ( 0.0 - 0.2 ) 82
ft Koeakl 9 ( 160 ~ 1600 ) 79.2 ( 24.8 ~ 206 ) 86.4 5 0.4 ( 0.1 - 1.0 ) 91 !
S Inazava 1 ( 1140 ) 68.8 - 1 0.1 - !
T Shinshiro 4 ( 0 ~ 1000 ) 18.2 ( <0.3 ~ 33.0 ) 81.9 4 0.3 ( 0.1 ~ 0.7 ) 90 !
U Chita 1 ( 1300 ) 2.6 - 1 0.4 - ji
V Mihaaa 12 ( 1250 - 1800 ) 4.5 ( 2.0 ~ 8.8 ) 41.3 10 0.1 ( 0.0 ~ 0.2 ) in ii
X Asuke 15 ( 1 ~ 200 ) 62.3 ( 13.0 ~ 115 ) 48.5 " 1.1 ( 0.1 ~ 4.5 ) 121 11
Y Shidara 12 ( 1 ~ 1303 ) 18.7 ( 6.3 ~ 34.0 ) 46.7 9 0.6 < 0.1 ~ 1.9 ) 83 j
Z Tahara 1 ( 16 ) 10.4 1 2.8 _ 1 ______ 1
t CV : coefficient of variation
2. 5 7 K>##kf(Df|fe(D*feT7k + ;&#
7 h*11' * v ^ A*;i/y>)Aft>, Amur's, *y, timikim *y, *
H V f ^ A, f Oflfe, pH, ##, 7k&3MCo^T&Wlfci«, pH ( r=0. 304, n =103, 1 X) "C&O, fife (D1$. % t ti ft \Z &
&&, 7 K ^Sg^pH^OfBMttli, ft + £?l§ai£fcli& (C«k 0 , *<DmW&< U'ltzt&frtlZo
E&$0 ti*feT7k <Dt£K£^<7) 5 9> „ ikS7k#mfk(Dm/l,^:*^7K[lNaHC03S£^-to Fig. 41C, M$L^^TO%T*^7 K>#gT5K%(:^lfT, H&jgEIKWLZco 7 K >®S(Dil5V^i7)l$^iiifb©liAZc*^7XT'fc5 ^fclr'. 7 K >li$&ST*&5 7 A£WS10><7)^7EI8£<7)55S$<7)&Stri't>
< oao&itK>*«IJK<&*. ttz, i) t b tn>ntfi\zy ¥ *y
-106-
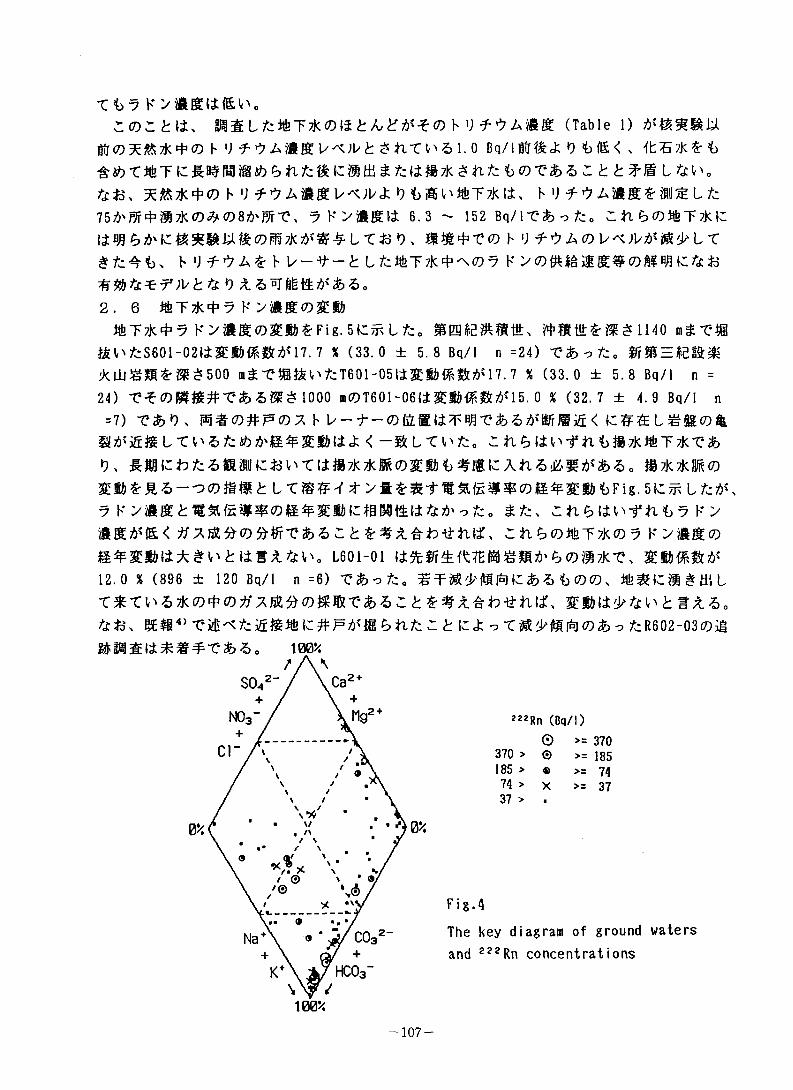
M*Lfc«!T7lcOli b/uZtf*(D V U ** (Table 1)Hil© A&7X + © h V $ tit l>* 1.0 Bq/lltr&«k 0 k(£< * <b57X$- fc£fcT%Tfcgl$rafflA&ftfcfcfc85ffl £fcliJ8*3hfc (iCtiS £ 11L fclr'«
ft*>\ A&7X + © h U f”t7 ASgl/^^J: •) h V ^ A$g £ zBti£ L75^9r4’9l7X(7)^c7)87ii'mT> 7 K >#gl± 6.3 ~ 152 Bq/l-Cfc -? £<, £ h £>® ttsT2X K «W£j&'C&*l*Wt*0it9;Ms$4LT:i3»K a#t-CO h U f
h V f ^ A& h Lt%T7Xt"\^7 K*) x.£*T&&fcfe^&£o
2. 6 *T*+5K>i«C*ft
^T7X*7 K>ieg<Z)$I&£Fig. 5K25xLfc0 WmWZ & $ 1140 m£ T*10
ttV'fcS601-02ttXEfrffiftdM7. 7 X (33.0 ±5.8 Bq/I n =24) Xh^tz. ^fEEEIS:^
Alll£E£}$3500 ma-omm'%T601-05!±%#mmA<17.7 % (33.0 ± 5.8 Bq/l n =
24) "Cf (DM##*='r$,60K$ 1000 ■OT601-06(i3C*ftffitt^{15. 0 % (32.7 ± 4.9 Bq/l n
=7) ?&*X m%<D#F(DZ h L/-±-(D(6Sli^B^T*db^^®r@i5< (c#&L£S£<D&
a3&<£#L’rv'Sfc**'ft^xiftttj: < -ai-o'fc, rh^^xtfn^x-cfc
0, gmc b 5 T I*&7X7XEMi& <b ^18 £ Ah -5-ti H/>>'£> 5 = &7XtXM©$fi>£ t *>ft&£’*Mfi2i5p©ft4F8:*&<>Fig.5£^ Lfc/>'\
5 *fc> Ch^ti^f ht? K>#gA<(&< # AR%^(D^#T^6 ^ h Sr#*.£b-£htf, i h £ ©ifeTTX© ? K ft*PXim*£lf'fcH:*;%.fclr'o L601-01 W%9f&{t7m8#A'6(0#7kT\12.0 X (896 ± 120 Bq/l n =6) T&o t. 1- * 3 i> CDCD, till W tC ii # £H Lr%X^Z7k<D#(DtfZl£ft(D%®T$>ZZt £#A£b-£htf,**h @E$84> ?i6^fcJfi&«!K:#pa<ffl£hfc:: t IZJ; o T«iH@|B|©* o fcR602-030ia
100%
Fig.4The key diagram of ground waters and 222Rn concentrations
370 > © >= 185185 > e >=7474 > x >= 3737 > .
*“Rn (Bq/l)© >= 370
-107-
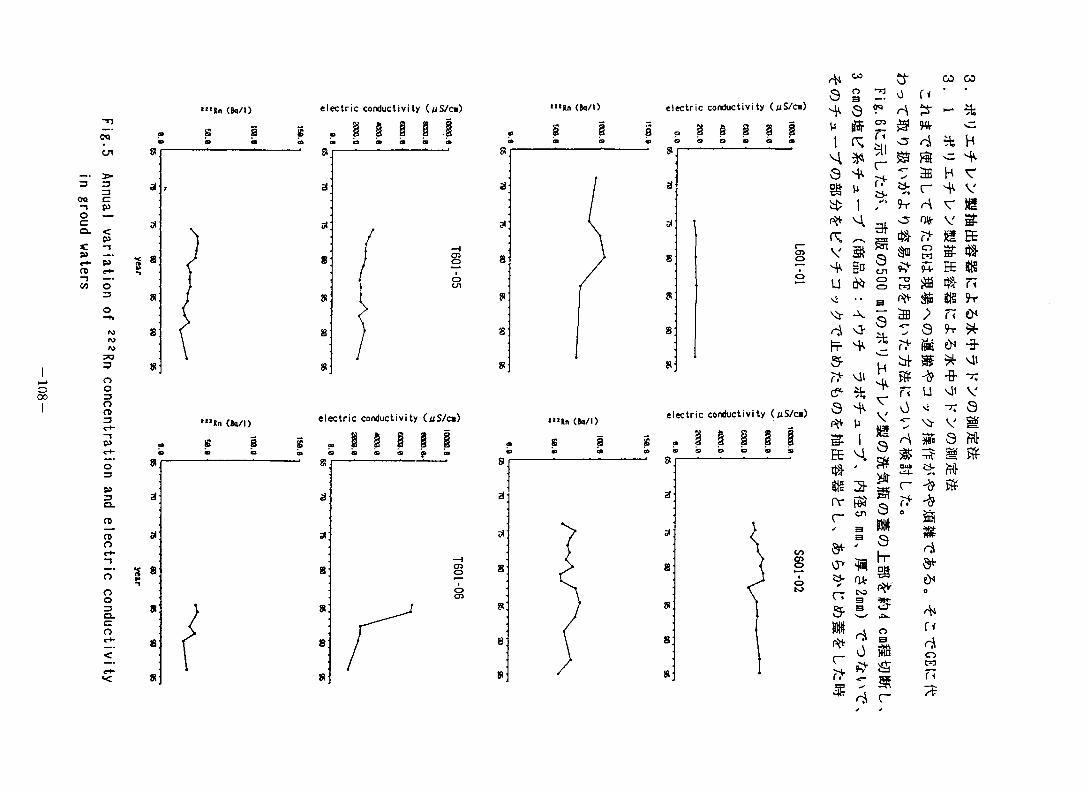
Fig.5 A
nnual variation of 222 R
r> concentration and electric conductivity in groud w
aters
•”Rn (Be/I) electric conductivity ( yS/cm)
a I 1 P 8 § § I Ie ca s o o o o o a----------- ----------- - » —■—■—'—■—’
/ a
ut
8
9
8
»
s
»“ln (Be/I)
s 1
electric conductivity (yS/ci)
Q
wI
^4Qgg
n;v
U<;Vj-dFr&rd(^a
S:E#dsrvc~
&
ti
er&
oo
O ~T3
Q
M.
igo
3fsacnd>o
vllrh
uI<
3
ovCO
H
rvmaa*viir
amahrartvCJ-
f*e~idS
d0
d
SBSsc~
0(2(%
D~M
W'4
r<$n
VM$i
4 r- Ce
JrW
KQ
)N^»
lE?i
ao^ $
X 1
BfU
a ?i
f -
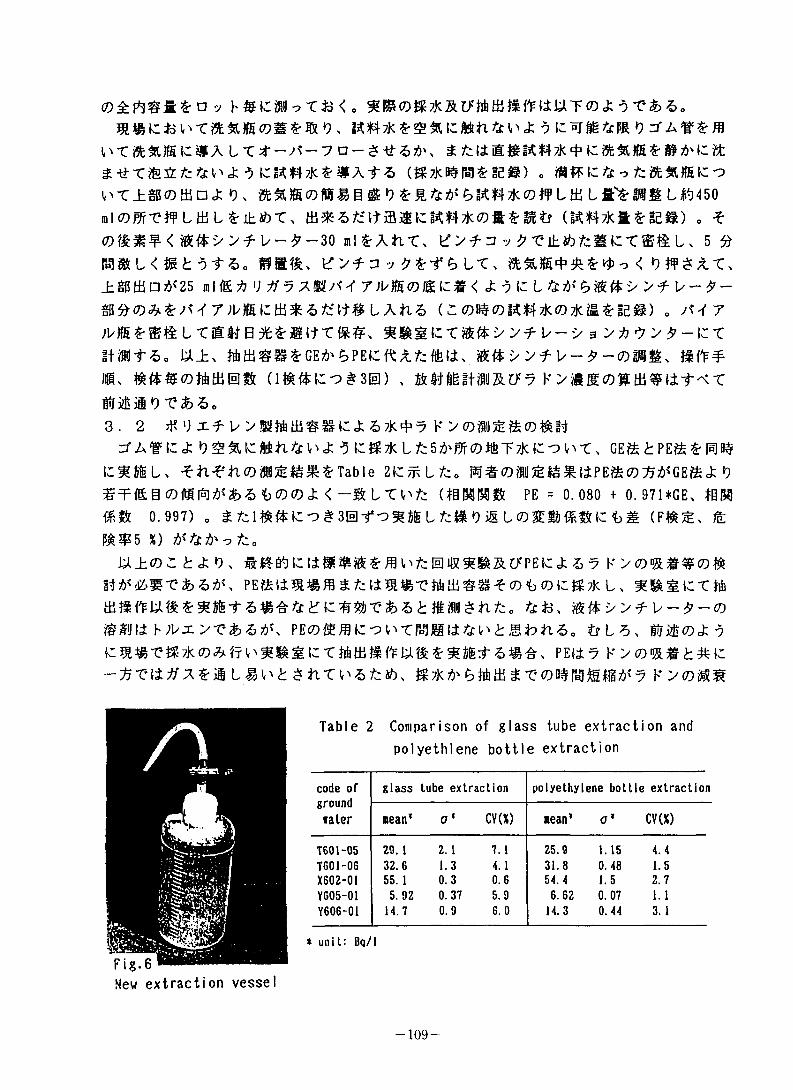
7 < , 9EI^(7)S7XSt>16tijf##tiUT(Dcfc o*e$)6„
v\Tm%m:#A L-Cd--x-7n--z#&Ax £ ik:W:m#;<#7K^lc%%E^#^l:i± £-£Xm*Ltzti:\<'£*) trlM:)F47X$-SA-t^ ($ 7* B$ IK) £ tt®) , ffifr \Z & o tz ft&EK o VT±g&<DttiD<k 0, "MEtDffiSB&t £)lti:^6!*iW7X<Dff Ltti LS>|ilgLto450mmrr-cff LtitiL^itAT. ta*z>tiitjb & k t**4 ?x <d I:*•sitf mmxa&ge#) o f
l/-^-30 ml^AtlT, \sy?=i y £ T'lhibfcH K T®&L , 5 %KS(L< mt 0-tZo SfB&, tf > f- 3 v Lt, ft^E***^± gutting 25 ml®* ')tfy*m;U 7)UM<Df&lzM < ct * IZ L >f- L-£-
gg^(D*^7W 7X/EI:m$6tflt# L A^6 (C<D#(DK#*(D7kB&2ee) o ;W7 IVEfrEtl LTil&B te£igltT&#, $KmCT%#v>f l/-v a>**>^-l:T gtmuta. u±x #m#§§^GE^6PEi:RA/cAbij:, mrp#I®, GGeommiE]#
3. 2 ^ V %flz >##&###t:«X&7X4]9 K >(7)#^&(7)^Mrf A<f K«k *)^lcMft&^ct 9 IC^TX LtSA'BfomTTXCcU-C, GE&^PEm^lB]#
USE SSL, f a-f jl(Dm!l^0m^Table 2l:^Lt:. MS<7)ifliJSi^^lj;PE?£(7)^^GEft ck 9 %=F&%<nmM'&Z>i>V)V>&< -mix\'tz PE = 0. 080 + 0. 971*GE, tin&tn o.997) „ omssL^m»)mL(Dmm#mi: t)m (r»m,K$5 X) fco
W±<D£ h =k 9, #^^l:li##%$-mi^@em#&[XPEl:ck 6 7 h'>0)'&M&<Dtfi titf&mx&zfr, PEmii%#m^kzii%#-rmai##5^(7)<L(Di:m7XL, gE^stcttiti \&&ft&ik*nm-tz>m&u¥\z^%xhz>tmm£tLtz0 %&, %*v>f L-^-(D Mfi S;i/X>T*^^^', PEO^ffllco^TPn^JSii^^^s^n^o tr L5, ffl&vJ; 9 c%#?^7X(D*eu#m^i:-c^mm^Limemss^6#^, psit^
$n-c^-6X:y), ^7X^e>totiti^-C(7)Bep^^ii®^7 k >®$g
New extraction vessel
Table 2 Comparison of glass tube extraction and polyethlene bottle extraction
code of ground water
glass tube extraction polyethylene bottle extraction
mean' o' CV(X) mean' o' CV(X)
TSOI-05 29. 1 2. 1 7.1 25.9 1.15 4.4
T601-06 32.6 1.3 4.1 31.8 0.48 1.5
X602-01 55. 1 0.3 0.6 54.4 1.5 2.7
YG05-0I 5. 92 0. 37 5.9 6. 62 0. 07 1.1Y606-01 H.7 0.9 6.0 14.3 0.44 3.1
* unit: Bq/I
-109-
4. tttb-3-ceo'C3K^. 1952^^6
1996#i-C0iffl3£te^^5>#:Oi ttfnZ-Zo(1) k >m&(Dm&mtt9tm±ftitm%mfrt>(D®7k (mtamu^
umt) (D896 Bq/L
(7)0. 3 Bq/I$#-C& 7 fc„
(2) &T7X + 7 K >S»gli«!*te#14j&<R^. ,
*0(3) %T7X4»7 (7)f6(D%T7km^^(7)fBMa(j:pH^(7)*&0 ,
RTEHSffl%*©flfeT2K-PS5^ofc.
(4) «!T3k + 5 K>*£0H^£SM±, &&Jfe»C|i3fcKIB£ftfc#F<Dm«££ttfc«
litfXimfcj&'ofco%&, ^&fifc*4zk«fc LTfiJffl£ft*^T7K*MJIl7lc#J£l5fc8£7X + <7>^ K>*giM
ff L < V %f K>OiM3£filtLT#tt'7^^(7)#&^%a- b £<t: & b<D t J: <-&L,
1) : Bg#23^7^ 10B$lJ^ (&#gSl25^-) , Bg*a58^12/! 10B QfcIE (&##83 ^)
2) EffiSS, : WH0&*47X7X®tf4 K7 4 > (SS2)$) -mi# «ft£
(B*SJK) -. 105-111, (&) B*7Xil$£, 3K&, 1995
3) Michael E. Kitto, Michael K. Kuhland, Robert Dansereau : Direct comparison
of three methods for the determination of radon in well water, Health
Physics, 70(3), 358-362, 1996
4) ±?g$f, &#%#, %##B : a*T7X*7 K
7F>, 140-149, (Bt) m-®¥W3Zm. *R. 1992
5) ±mmi-, mnm&w, #*a#, %'sn%, v-y 3
«X6g%mT(T)%T7X^7 K >$$<7)£gi::ot>T,
32, 63-67, 1982
6) (%m , u - 21, **,1978
7) muj^6l$. &T A. &&)!!#% : 4*56%^ BfcfTKS. 127 -
369. $&#./£, 3K«(1975)
8) SB{¥-, Will #. BBEE. tUB%±, ###% :lZh'ltZ£RI®S&, 35, 43 (1985)
9) : JfcT*^. 365 - 372, ^£§0, *$, (1965)
10) M. Eisenbud (R±E(il£IR) :#%%##-3B%###m-.130 (1979)
-110
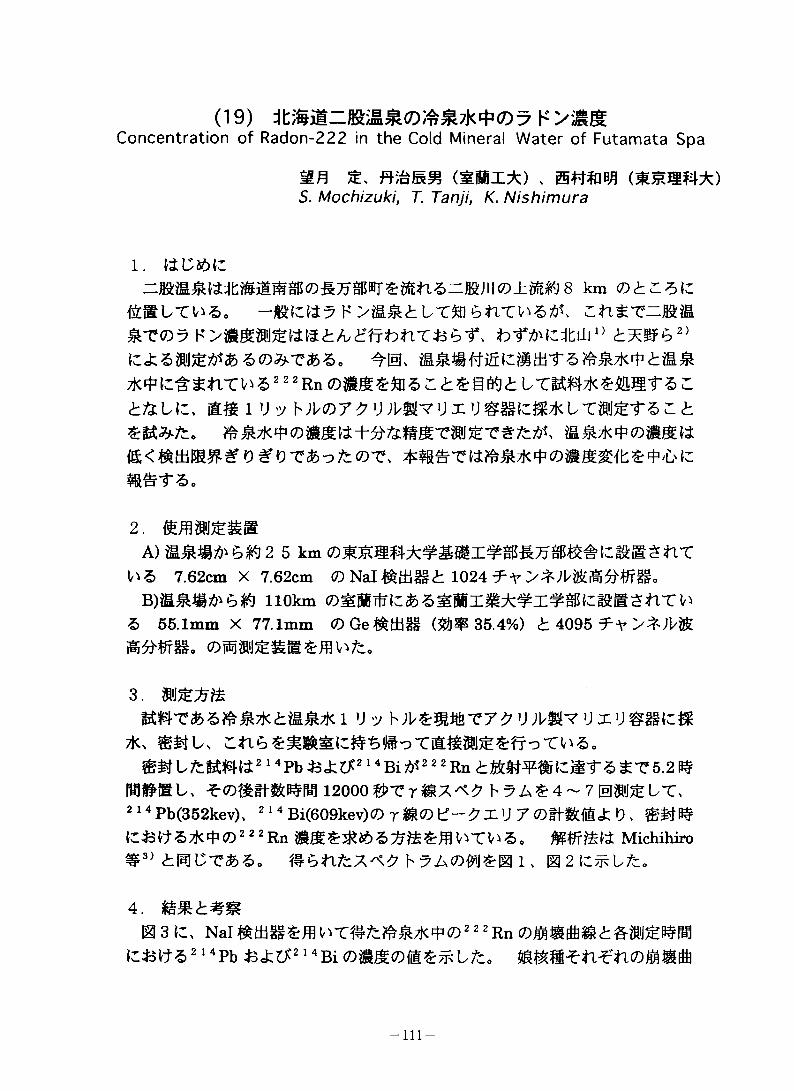
d9) tt»ia-«sA<7)£A7k*<0^ k
Concentration of Radon-222 in the Cold Mineral Water of Futamata Spa
ME mi®f! (MI*) ,S. Mochizuki, T. Tanji, K. Nishimura
1.-MSMSiEWSBcDST?OTSr^n5.-J}S:Jll8 km (Dt^Zlz
mT(D^ t^62)iz£5m%tf&z<D&T$>5o
m# 1 V y h;V(D7^7 U ;|/g{7 >J X V ^IzMtKLT$iJ£T5 d t zu&fzo ftM7k'p<Dmmm-ft&&mTW%T&%:&. *&&**©*&«
2.a) ma#^6$t2 5 km
WS 7.62cm X 7.62cm (D Nal 1024
5 55.1mm X 77.1mm <7)Ge^tti§§ ($)¥ 35.4%) t 4095iS#WB. (DMS'J^g^fflWc,
3.
7k> WStU ;in5£M&Ki#^!li&oTMailJ££fToW5.afiJbfctt^tt214Pb^ck^214Bi^2 2 2 Rn^lt¥«icBT‘5ST5.2l^
MBI1U f 12000 50>TrSX^^ h7A^4~7[U$iJSUT>214 Pb(352kev), 21 4 Bi(609kev)(D r H(D tf-^X U 7 ©fHM«fc 0 , tC:fcrt5*tp<D2 2 2 Rn BS£;£tf>5*?££ffllvCV>5. flptfr&tt Michihiro 3#") 6MCT&&. fSStlfcX^ h^AWJ£0 1, |g2 (C#L/c.
4. ^#6#^® 3 ic, Nai&tidg§£ffl<D 2 2 2 Rn o^mmutm^nm
\z&rtz>214Pb &£zs214Bi(Dmmomz^vtzo m^m^ti^n^m^
-in-
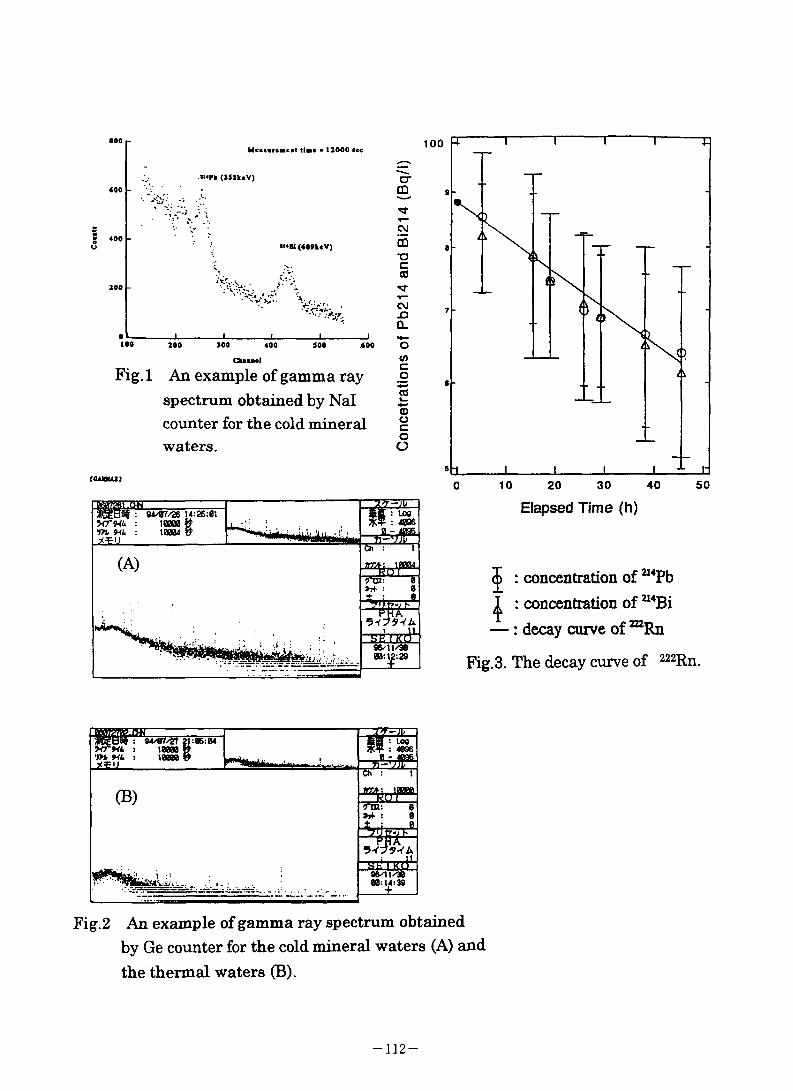
•00 MeMereeeet time - 13000 eec 100
<00«<rb (352keV)
g <60o (<09k«V)
• ■---------------- 1 I I I I100 200 200 400 500 <00Cfceasel
Fig. 1 An example of gamma ray spectrum obtained by Nal counter for the cold mineralwaters.
crCO
OvJ
in"OcCO
CMXI0-
inco<00)ocoo
taueuij
94/07/26 14:26:8118080 g10084 6
J-+ :
Elapsed Time (h)
<j) : concentration of a4Pb
^ : concentration of U4Bi
—: decay curve of 222Rn
Fig.3. The decay curve of 222Rn.
*4^7/27 21:06:0410000
I :>
Fig.2 An example of gamma ray spectrum obtainedby Ge counter for the cold mineral waters (A) and the thermal waters (B).
-112-
0 2 2 2 Rn 5 % <Z>BT & 5 <DT\ 7UX'J§§§l^mSt¥S^S^^n2 2 2 Rn X <h#x. 6 n^» = £ fc,£©0, ff3M«fc9, ^7K^22.0tC(D^SM:^7K4](D 2 2 2 RnSSti 88.1 + 11.5 (Bq/l)£^6>ftfc.
WT, 1994 ^ 7 ^ 26 Bfrb 29 B 1$/tlW<Z) 11 ^ 24 B^6 28 BlC^^T#^Mm%#2 l:*b^. S
im imisc4 t 1 imicoe 5tHioaijs, gg*«$B9i$, *a# 25.01cT&o^c S2TH OT-& 10BT 1 2 dJtDSJ^ StKMB 9S^F~10 P^i; 14l$~15l$©2|IIfToTfcO, &S*P#*am^nfc 20.0‘CT&^tzo ^ 1 > 2 icn<=>ns<k-5 c*aa2 2 2Rn mmzum 6^WdbK>, ^60 22.O"C(D#^(b^t)#0 4 (:*b^. @*S*lT*bfc 133 Bq/1 (Dfilte 1993 ^IfllC^gf^Kck 9fiiJ5£Snfcfc0T* 0 , #%STC *bfc0 K>;»t*tC&<^WT5 *a<b7Ktp(D? h* >/£&*© 7 H>(DitT^(D^SS^E(cLfc$nTV^4) o brt'U
0, >&<&CWAb
W)LT^Z>Zt\Zn$t&%Ztt&t>tl%0 £tz, &&IWtcE*bfc&m*<ham*<b£$ 100km EtlTV^SEXS
<£S*tcOV^TtiNal MtitiS§TOMM^t5^|lIbil5r#TV^0 b^U am*(:3
Q€K)<D 0.5~2.5 Bq/l«blf&m* : 0.40 bqzl am* rose
Bq/1 ^rtl^tl 0.17, 0.19 Bq/1 T&^fZo Z.(D$ij^« i K#(7)^cowT(7)^mT&%^ am*^c#&^i6 2 2 2 Rnomm
uifc&7k\zitLmsbTm'<D\tmfr<D&?T$)2>o
5. &t> 0 IZ4#zGc commas
m*\Z®mbT 2 2 2 Rn*UVtb*:<Dttl(Dm&mmb&t>^. ftl60il
$r996^t’bTV^^V^
SNIXE1) M.Kitayama, Y.Sato, K.Inoue : Report of the Hokkaido Institute of Public
Heath, 30,19802) -%m m mmm
-113-
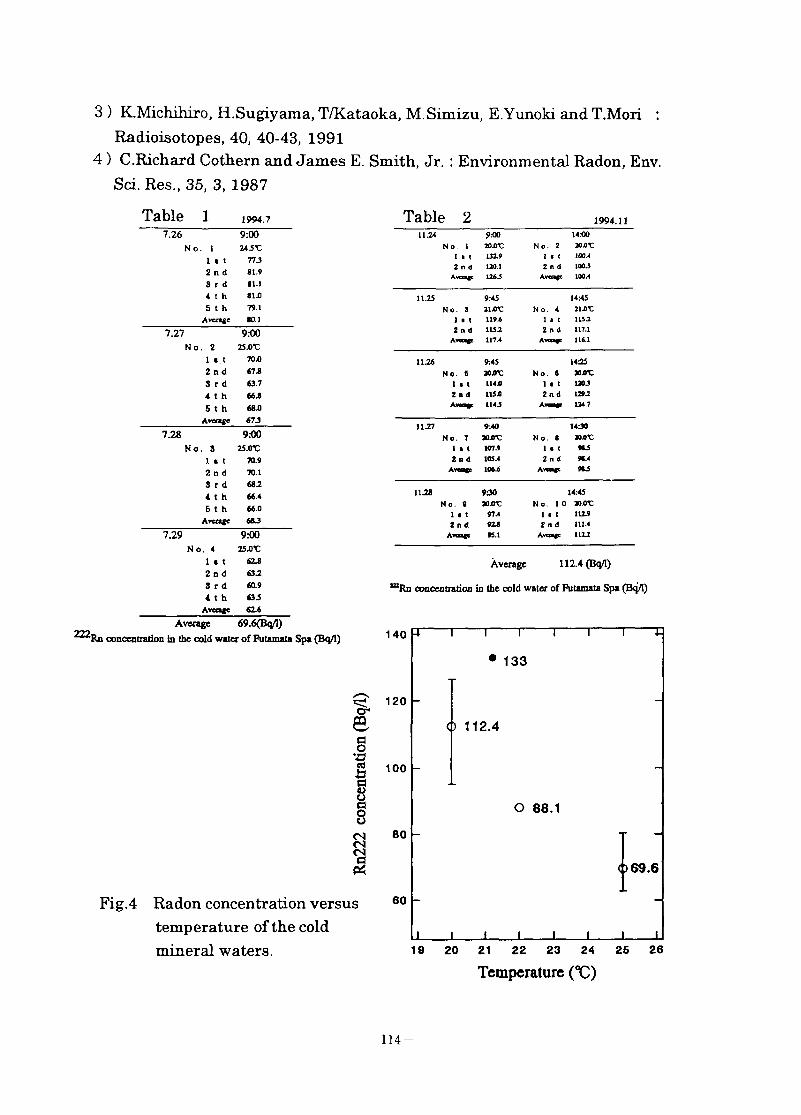
3 ) K.Michihiro, H.Sugiyama, T/Kataoka, M.Simizu, E.Yunoki and T.Mori : Radioisotopes, 40, 40-43, 1991
4) C.Richard Cothern and James E. Smith, Jr. : Environmental Radon, Env. Sci. Res., 35, 3, 1987
Table 1 1994.7
7.26 9:00No. 1
1 s t 77J2nd 81.93rd 81.14 t h 81U5 t h 79.1
Average 80.1
7.27 9:00No. 2 25 .or
1 « t 70X12nd 6733 r d 63.74 t h 6635 t h 683
Anoje 673
7.28 9:00No. 3 2SjOT
1 s t 70.92nd 70.13rd 68.24 t h 66.46 t h 66.0
Avenge 683
7.29 9:00No. 4 2sxr
1 « t 6232nd 6333rd 60.94 t h 633
Avenge 62.6
Average 69.6(Bq/l)concentration in the cold water of Futamata Spa (Bq/1)
I
I
1
Fig.4 Radon concentration versus temperature of the cold mineral waters.
Table 211.24
No. II • t2nd
Avenge
9KMtojox:132.9
120.11263
No. 2l * t2nd
Avenge
14:00203X100.41003100.4
11.25 9:45 14:45No. 3 213T No. 4 21XIX
1 • t 1193 1 e t 11522nd 1153 2nd 117.1
Avene 117.4 Avenge 116.1
11.26 9:45 14:25
No. 6 aojn: No. 6 XJPC1 e t 1143 1 • t 120J2nd 115 jo 2nd 1292
Avenge 1145 Avenge 124.7
11.27 9:40 1430
No. 7 No. 8 mjox:
1 • t 107.9 1 • t «52nd 105.4 2nd 96.4
Avenge 106-6 Avenge 915
11.28 9-30 14:45No. 8 20 SVC No. 10 203T
1 • t 97 A 1 a t 112-9
2nd 923 2nd 111.4Avenge 95.1 Avenge 1113
Average 112.4 (Bq/1)
mRn concentration in the cold water of Futamata Spa (Bq/1)
• 133
<) 112.4
O 88.1
0 69.6
Temperature (Xl)
—114 —
(20)Radon Concentrations in the Water of
Misasa Area (Tottori Pref.)
mt&mn. mmmrt gsa) ,amattw (tc mas*)H. Morishima, T. Koga, M. Inagaki, M. Mifune
1.UNSCEAR 1988,1993^S@######^#(C j:6 i, gB6
o~?hZ>7 Ky (Rn-222) i j: 6 ##(1, g6^it6<mm2.4msv
7 y^7 ^ LT $3 (9 , Z.tlb&7 Ky<Z)%£Mi LT«*<o^fl!t?A©£«a#fcM4U
irCT, Ky*& <D&l$£#i:i3«tt5fJ:11
SfflU **<07 Ky*®{JioV'Ttt, 7 Ky^ h/v^y(Cj:<ciLTA#(D7kK#Z 9 7 Ry£#fliU %#yy^y-ya y*^ (ftiti&O 7 Ry#m
?L{byyf-y-fLTaams tfT&ftTV'57 KyfiS®ll®^, Packard %# Pico-
RAD'^T^ib'ctU'ift^yf l/-7ay^ (Tri-carb2250CA) (CZ %frv\ g*T%^(7)7 KyfiST%5S$iS=WlMi. Z<DjmnM®<D7 KysSto$ij$^fToT^/c ,̂3~i5), Ry#mo#mcMLT#ei-5.
2.iiiiii, smcdwsb^ 30km to,
zitm-$-zxnn\<D3iffi<D=m\<vwi&<D=m, mmmm-emm Am A 5. hsjum
mg, /j#jnm#(D/j\mmg^j:u(Amii$^i'(D, 7 1
t^Lfco Tkf7 Ky#g<Dm^(ai, rnrntcTiomo #7%/</T^(OPTI - FLUOR) SrlOmGAtl, ^(C#%L ^# A$r 10m G WO
U $30#ffflEi 5 U /<7^7- Kth#(Z)PICO-RADy7AA^m^-C##:yyf y- '>ay^ hn^—^-C^^rffofCo
-115-
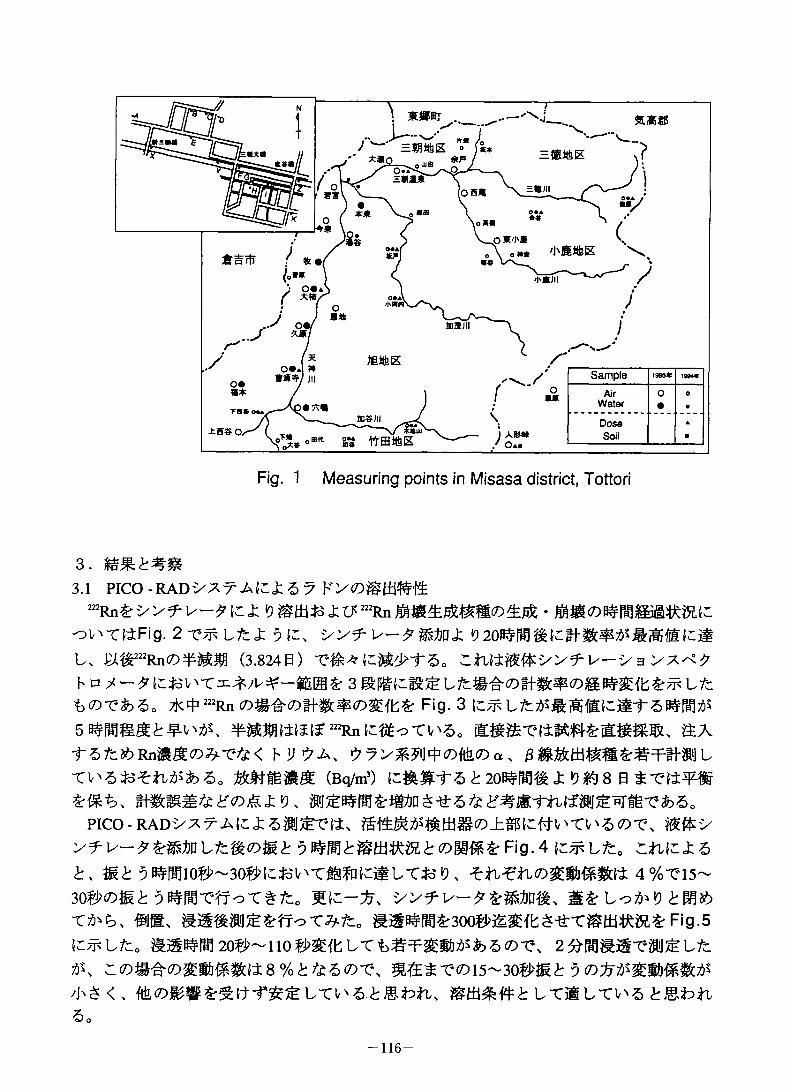
----'Nj.X—
" E9i6K o
e«i* \
p K'J'«
AirWater
Fig. 1 Measuring points in Misasa district, Tottori
3.3.1 PICO - RAD'>* TAMS? Ky^>Stti#-l4
oV'-mFig. 25 yy^y— *8fc&D«J:U y^222Rn(D^SE (3.8240) 6o r. tlttMfo's's?- y— '> a y*^
t)<7)T'fcdo zKf 222Rn Fig. 3 5^^5^mnnms 222Rntc&ori^0 ax
hi m-#j u(Bq/m3) ^ 20^^ ± >98 0
emt). ###%#%MAJ:9, E^^5rOTS-ti:5^^SttU»SWEr»fc6o
PICO-RAD'>^X-MCXZmfeVlt. ##:y1/-^&##Lfc^<DiE£ 5 6coM#^Fig.4tc^Lfc, CfU:i6
5^10#~30#'(c4b'V'TlSfP^LTfe>9, Ztl^tKD^Wl&m't 4%TM5~ 3O#0^^ 9i$FlttTotf fc0 ;b\ yy^y—
-c^, ejg, miffjs^roT^fe. Fig.5l^Lfco S5SB5H9 20#~110 LT <7)T\ 2^^E^-e$iJSLfc
/h£<, fetH&Wb LTilLTl'560
-116-
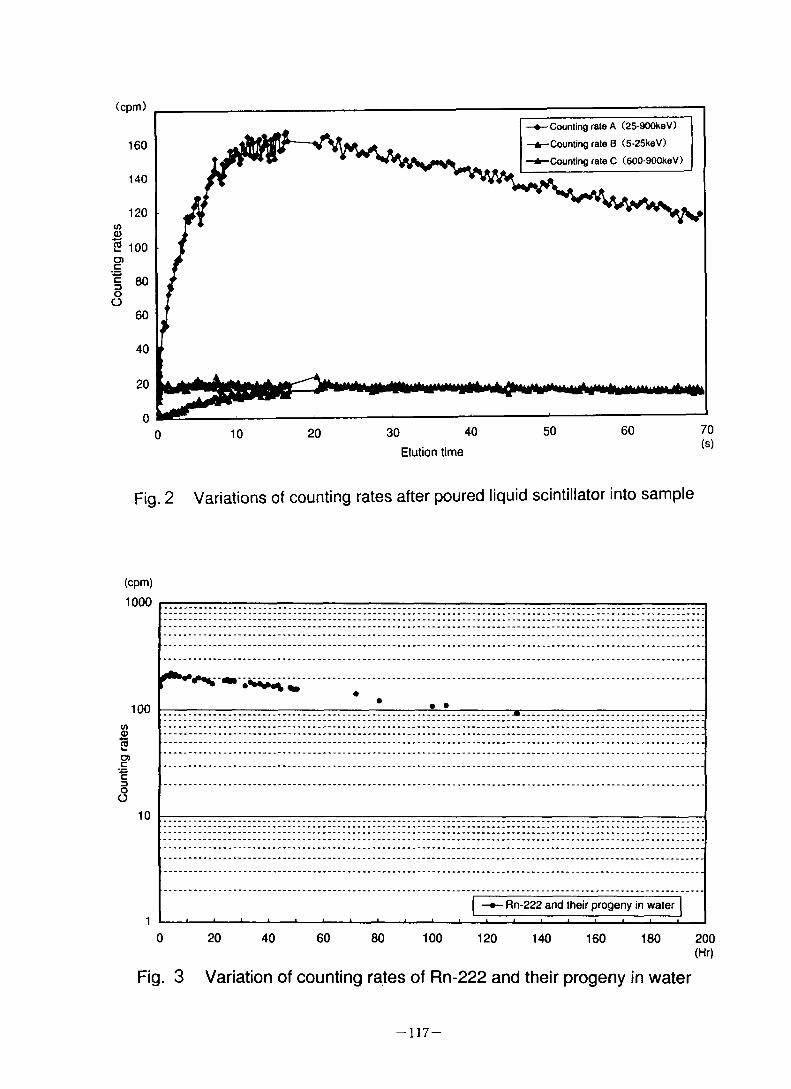
Counting rate A (25-900keV) Counting rate B (5-25keV) Counting rate C (600-900keV)
5 100
10 20 30 40 50 60 70(s)
Elution time
Fig. 2 Variations of counting rates after poured liquid scintillator into sample
Rn-222 and their progeny in water
0 20 40 60 80 100 120 140 160 180 200(Hr)
Fig. 3 Variation of counting rates of Rn-222 and their progeny in water
-117-
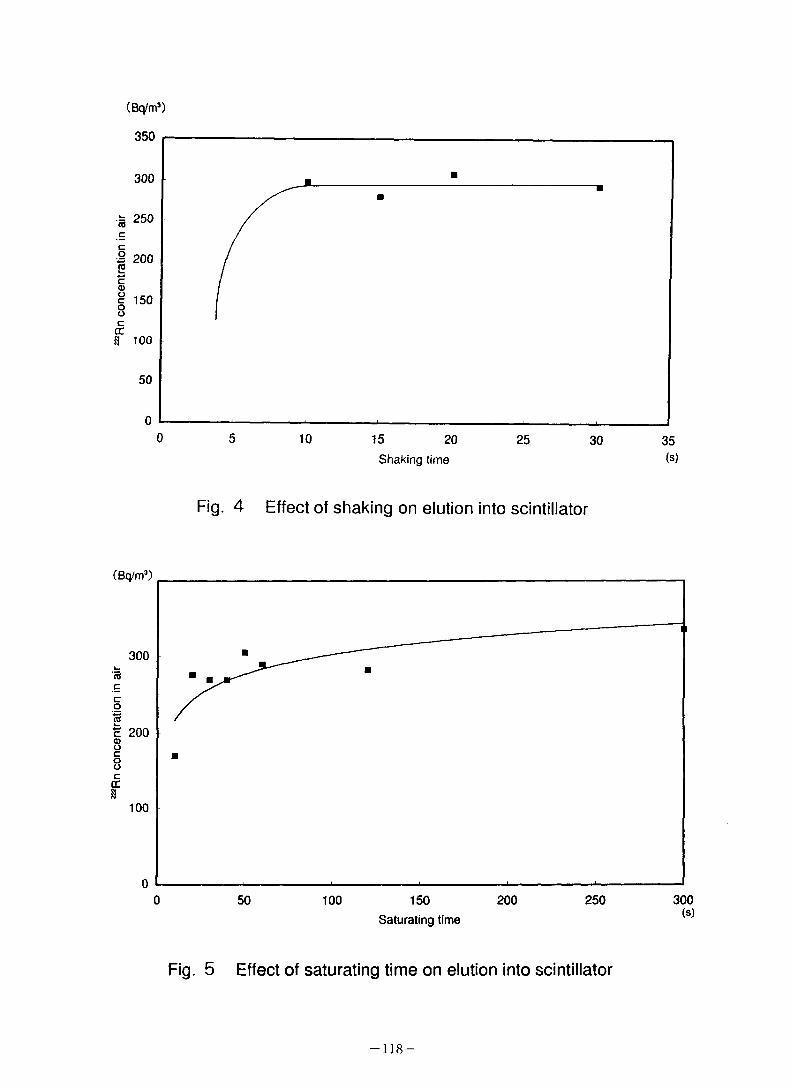
“Rn c
once
ntra
tion
in ai
r S
^Rn
conc
entra
tion i
n air
(Bq/m3)
350
300
250
200
150
100
50
0 -0 5 10 15 20 25 30 35
Shaking time (s)
Fig. 4 Effect of shaking on elution into scintillator
Saturating time
Fig. 5 Effect of saturating time on elution into scintillator
-118-
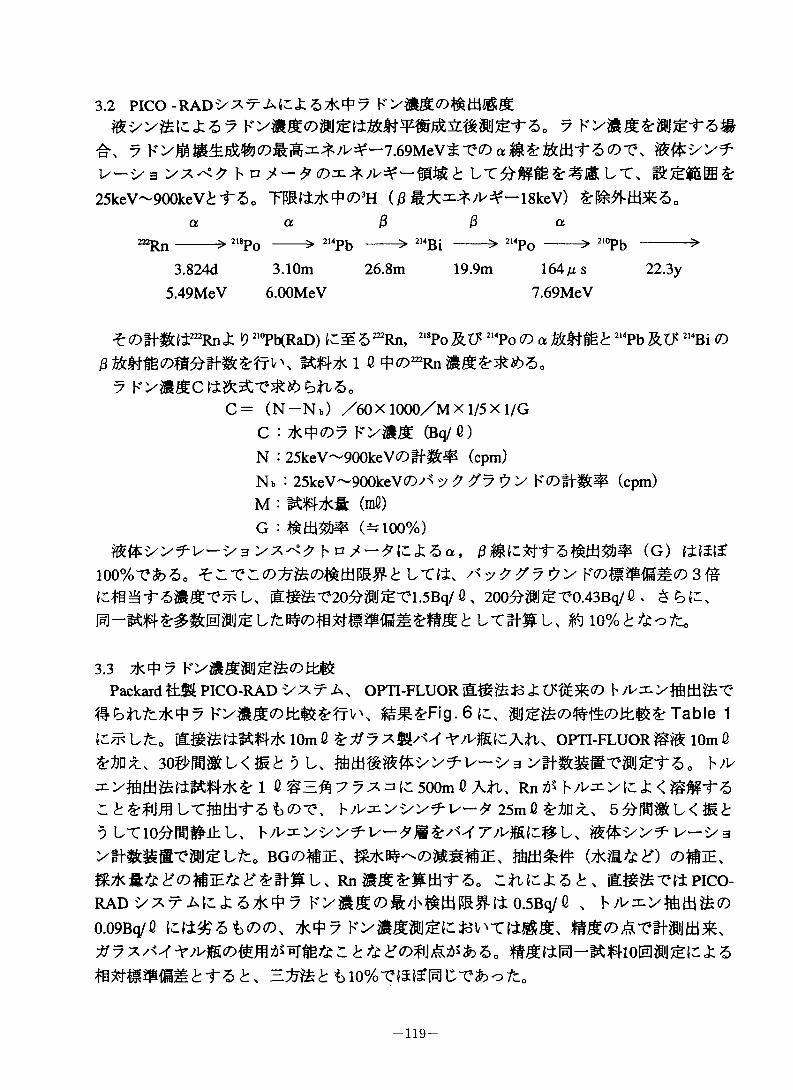
3.2 PICO-RAD^X^A^i^TK^^
£\ 7 K>^#^#(D#i@53:$/^^-7.69MeV$-e(Da#$r%mi-5(D-e, Eft'>y^y-y 3 yx^ b n LT#JWlB£#Jt LT,25keV~900keV£-f 60 TEdzK'f'^'H (0 ^C^/V=¥-18keV) Srl&^btti&So
a a j3 j3 a
222^--------> 2l8p0 ------> 2,4Pb ------> 214Bi ------ > 214Po -------> 210Pb --------- >3.824d 3.10m 26.8m 19.9m 164n s 22.3y
5.49MeV 6.00MeV 7.69MeV
^(D##[|l222RnZ <9 2,0Pb(RaD) (Cg 6^Rn, 218PoRTf 214Po <D a Mcft&b 2l4Pb RTfi 2,4Bi <D^Tki e f<D2=Rn#a&*&a.
7 Ky#Sc btiz>0C = (N-Nb) Z60x lOOOZM X1/5 X l/G
C : *4^7 Ky#m (Bq/6)N : 25keV~900keV<D (cpm)Nb : 25keV~900keV(D/< y# #7 *7's K(D#b## (cpm)M : ##*#: (mO)
G : #am# (if 100%)(g) ttM
100%-efcd, lxix /^z/^yKosifiic 3^ttM&-C20^$lJST»1.5Bq/ a , 200^$lJST0.43Bq/6 . ^ 6 by
vrtbSFu ^
3.3 7k^7 KyS$$IJS&(DmPackard PICO-RAD VXfA, OPTI-FLUORZll'&$k<D h ;Ux y#^&T
%bfttc7k*7 KySStoifcij&SrtTVX ^m&Fig.6(c, Table 1{C^LfCo 10m 0 OPTI-FLUOR10m0
30&!«mv<mb5u #m#m#:yy^y-y3 y#mm@Tmij^i-6o b/yG 7 7 7. =% |C 500m 0 Afk Rn ft b/l^yb: J: <
r t &mm LTtttid-f-5 'bco-e, b;^yi/yfi/-^ 25m<2 &MtL,5 LTl0#fl9#-ihU b;vxyj/yfw^il:/W7^«iliiL, ^i/yfu-j/a yth^g-cso^u^o bg^sie, mm# wm^^) ©we,
Rn#^$r#mi-6. rtuasi, pico-RADZ7TAK j:67kf 7 Ky#^(D#/j\#mm#ll0.5Bq/G , b/V3iy%tti&C)0.09Bq/e \a*£6b<D(D. Tk-^7 Ky&mU^&VmMS,
ttebnm&ft&Zo #m(iRi-m#io[amn^(cj:6 #####&5 b, t>10%'CISl£PC‘?&o7i:0
-119-
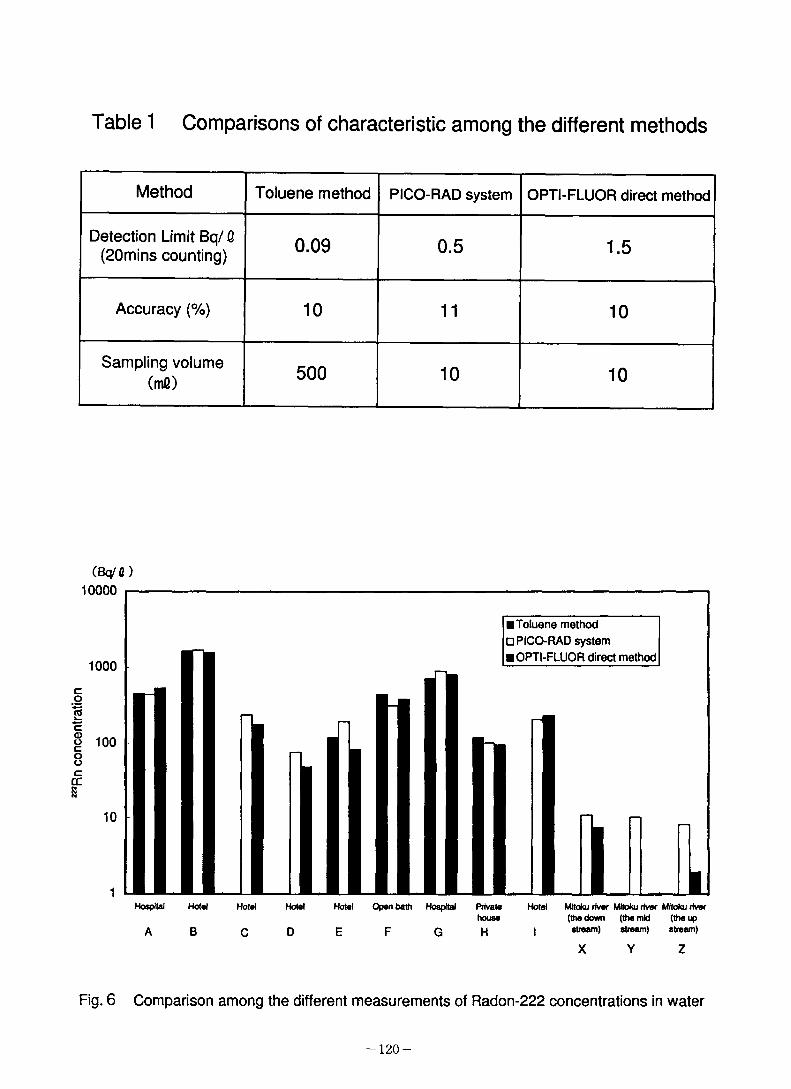
Rn c
once
ntra
tion
Table 1 Comparisons of characteristic among the different methods
Method Toluene method PICO-RAD system OPTI-FLUOR direct method
Detection Limit Bq/ Q (20mins counting) 0.09 0.5 1.5
Accuracy (%) 10 11 10
Sampling volume (mfi) 500 10 10
(Bq/6) 10000 r-
1000
■Toluene method □ PICO-RAD system ■OPTI-FLUOR direct method
100
10
Hotel Open bath Hospital
E F G
Mitoku fiver MHoku river Mitoku river (the down (the mid (the upstream) stream) stream)
X Y Z
Fig. 6 Comparison among the different measurements of Radon-222 concentrations in water
-120-
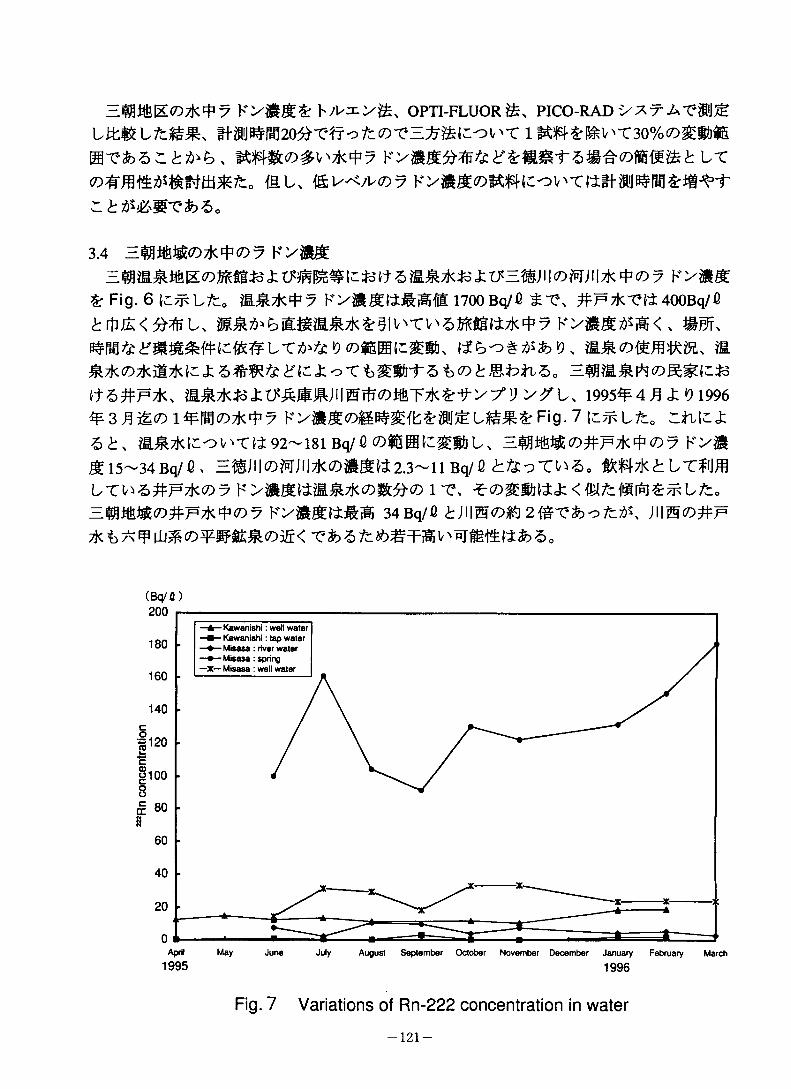
Ky$S5r OPTI-FLUORPICO-RAD ^7 A-C*!IJ£
3.4 =fflM®<D7k$<D7 KyjftSj;m#m#^^ttazt/nm;iiowjii*^?- ky#&
&- Fig. 6 t^Lfc, 7 Ky&mt^iEfiE 1700 Bq/G t.~C, #F*-m 4OOBq/0trtu£<#^u mm^6KgEmm*^gi^TV'6mm^7K4:7 Ky#m^m<. mm,
yvmwizg®, #«ms*^^d^^afiCcto-ct)3E%i-
jaSTkjb^^SSJUBTfTtoitiTTK^^yy V y^U 1995¥4^^*9 1996 ^3^m(Dl^<7)7k^7 KyM<DB^^5r$iJSL^m5rFig.7 (^Lfco Cibtcj: 6^v &m*(CcV\Tfl92-181Bq/0(D$6@(:^miL, H%%%(D^p7k^<D7 py# £ 15-34 Bq/C* H^Jl|(Z)MJll7K©Smi2.3-11 Bq/fi <h&-3TU£0 im*<hl/T*IJffl LTV^#FtKcD7 ^©^»j«ct<^fcMrS]^^bfcoH%gm#(D#r7Kf (D7 Ky#md#m 34Bq/o ^jiim^ze-c&^ybK jhb^f
(Bq/C)
—A— Kawanishi: well water —#— Kawanishi: tap water
♦ Misasa : river water —•—Misasa : spring —X— Misasa : well water
■5120 ■
August September October November December January February
1996March
Fig. 7 Variations of Ftn-222 concentration in water
-121-
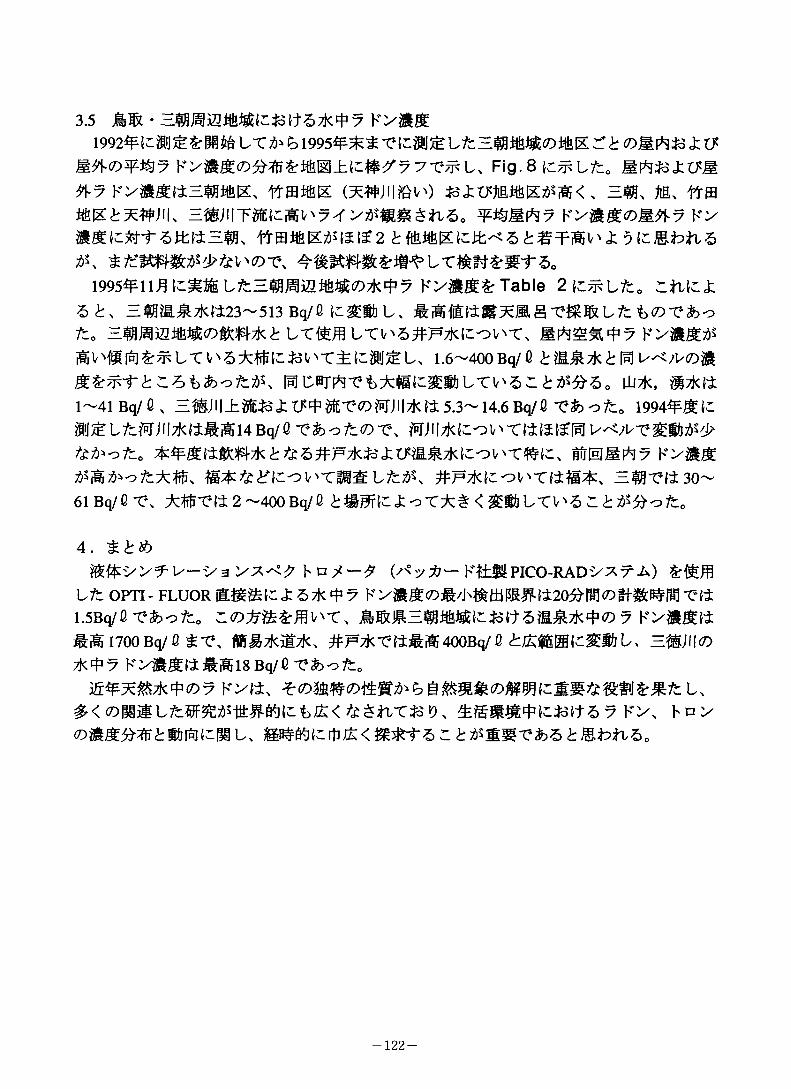
3.5 j&# •
Mo^7 Kyig0M^i@±i^^77t^L, Fig.8 (^Lfc0^7 KyMftHiiE, YtmMK (^#jii%v^) &£xjmmmm<, nm
¥^mf^Kyisoi^Ky
*k tLt&mmtf&to'ox\ Lxmnzm-r?>01995^11^ t^SS LfcElHJiMW)**? Ky&££ Table 2 i^Lfc0 r*Uc£
6 HfM&7Kte23-513 Bq/6 M^Sb U ST^^Lfc ̂ ^-Cfco
i^V'MlR]£^LTl'5;k:St-:ioV'T±1.6—400Bq/G IrJ l^7H£>j|m^-rt^.^hh'otz^K i^curr^TLT^sc&##&. m*, stkh
1-41 Bq/6> H^JIIi^foJ; U^^WWJIlTktt 5.3-14.6 Bq/<3-Cfcofc0 1994¥^(- SJSLyhMJll7KtiSEl4Bq/6-efco^(Dr\
^&(±^7k ^ 6*jazu(&m7K(cc^-c#^, mmmft? Ky&s^FtK^oV'T^Is^ H^T*«30~
61 Bq/6 T\ Affirm 2 -400 Bq/6 j:cT±#<$%LTV'5C
4. ££#>ifr>yfl/-'>3y7^hD^-^ (/-?y * — Kf±$tPICO-RAD'>xtA)
L/t OPTI- FLUOR ^ Z 6 7k ^ 7 K y&$ ti E# tt20#M <DTtit1.5Bq/G-?fcofc0 7 KyjSStiSiSl700Bq/e E^TkilTk, #F7kT»MiE400Bq/6 £j£^ffltC^SbUtK4>9 k >mm nmmsBq/Qvhot^o
&¥?:®7ktp<D7 z<Dm®cDi§im'ib&mm&<DMwizm^j:'&m$:mtiu # < (D M3 7 K>, hny(D^S^-S^SbiRH-ML,
-122-
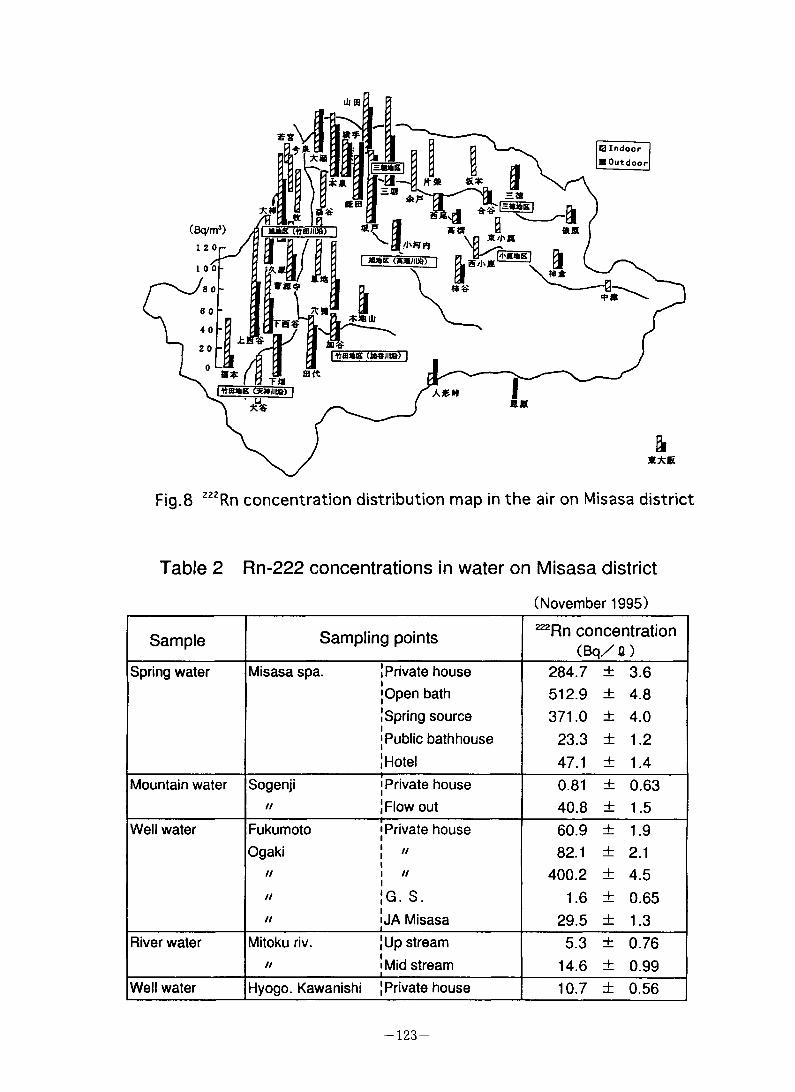
0 Indoor ■ Outdoor
4 0-
treog
Rn concentration distribution map in the air on Misasa district
Table 2 Rn-222 concentrations in water on Misasa district
(November 1995)
Sample Sampling points 222Ftn concentration
(Bq/fl)Spring water Misasa spa. Private house
Open bathSpring sourcePublic bathhouseHotel
284.7 ± 3.6
512.9 ± 4.8
371.0 ± 4.0
23.3 ± 1.2
47.1 ± 1.4
Mountain water Sogenji//
Private houseFlow out
0.81 ± 0.63
40.8 ± 1.5
Well water FukumotoOgaki
//////
Private house////
G. S.JA Misasa
60.9 ± 1.9
82.1 ± 2.1
400.2 ± 4.5
1.6 ± 0.65
29.5 ± 1.3
River water Mitoku riv.//
Up streamMid stream
5.3 ± 0.76
14.6 ± 0.99
Well water Hyogo. Kawanishi Private house 10.7 ± 0.56
-123-
1) United Nations Scientific Committee on the Effect of Atomic Radiation
(UNSCEAR) 1988,1993 Reports, “Sources, effect and risks of ionizing radiation” ,
United Nations, New York (1988,1993 )
2) e, Efflux r EBx ; mtb? Ky##@#
m, 149-154(1995)
3) ium e> mm#Ex t EBx bv>mm
Radioisotopesx 44x 251 - 255 (1995)
4) ME Ax EE & ; H'y^SESbx ###mx 26, 127-128
(1991)
5) T EBx hny^^(7)^@-SJE&<7)^^E@-x
JCACx No.l8x 12-29(1990)
6) Ex Ky#E@i^mmie#(DK]E
Ex KXm&#W##Bx 53 -63(1990)
7) t EBx ; y mx^<oy b*ymt
##E##x 113-118(1990)
8) 7 y*»7y^-EJ:5SfS:
ifeiloUT, 13 (2)x 95 - 103 (1978)
9) : #$##x 28(2)x 39(1977)
10) E* Sx : B^b#^#x (l)x 116(1981)
11) ; Radioisotopesx 2Sx 20(1989)
12) S+ES-m ; 28x 88 (1989)
13) &mS3Mx ^I^fx M'B'Ex @M»;Sfr>yf^'>3y
bn^-^ias7 Kyoa^x m#7 Ky, 429-437(1991)
14) T. Koga, H. Morishima, et al. > Radon measurement Using a Liquid Scintillation
Spectrometer, Annual Report of Kinki University Atomic Energy Research Institute, 29.
17 - 24(1992)
15) mittx
y-y3 yfH£EE=t5Sifc • Ky&£<D$iJS (3) N i5
22x (1995)
-124-
(21) K>aJS<hUXd7M(D^$iSERadon Contents in Groundwater and
the Uncertainty Related to Risk Assessment
(»*)
M. Fukui
1 . (iDAlC'Clift#** 976#KThe National Interim Primary
Drinking Water Regulations (NIPDWR)J: 1986#C^^#7K&#^A^
tzffi* %%x (Maximum Contaminant Levels: MCLs) t LT11 Bq/L (300pCi/L)
- #c#/K#7^ IWD SEMICO V'TSnt" So
2. F><DVZ'7tffiM&
#%lx^;Ph (BEIR#^)o
X S#S* t ^.ifc^co fMx tft-fLiiWbh'bzz fix I'tai'Xt Z7j<
:Ptx&<x /&7Km7K^^##kf&7 #%m755lit^h^lH'6IiLtx USDOE7)^#A[#&##^ & 11 Bq/L HfSSLTV^6Cthx t'^g|(D6tm^$f&m$+'r7K>a^^74Bq/H2Jl±^mmx 111 Bq/L ^±
L-cmoTLTv^^ ^t:^-#LTv^o euAif^7KMm(Di"3-e*6jg;mmm^m#(D#7K(D'7 K>#^i±i83 Bq/L-e^hx atmrn^iwm^&cM'&vx um%Sx ^^i:^<^m7crv^fLT v'6^0
^m-r(±x ^#7 (0.15 Bq/L)#i&(D%&^ (0.03-0.2 Bq/L)£7ktSl*J39,OOOSMroTS29,OOOSflff<7)T-? (1950-1969#) ^'^x BEIR(?l)t
(#<D#
-125-
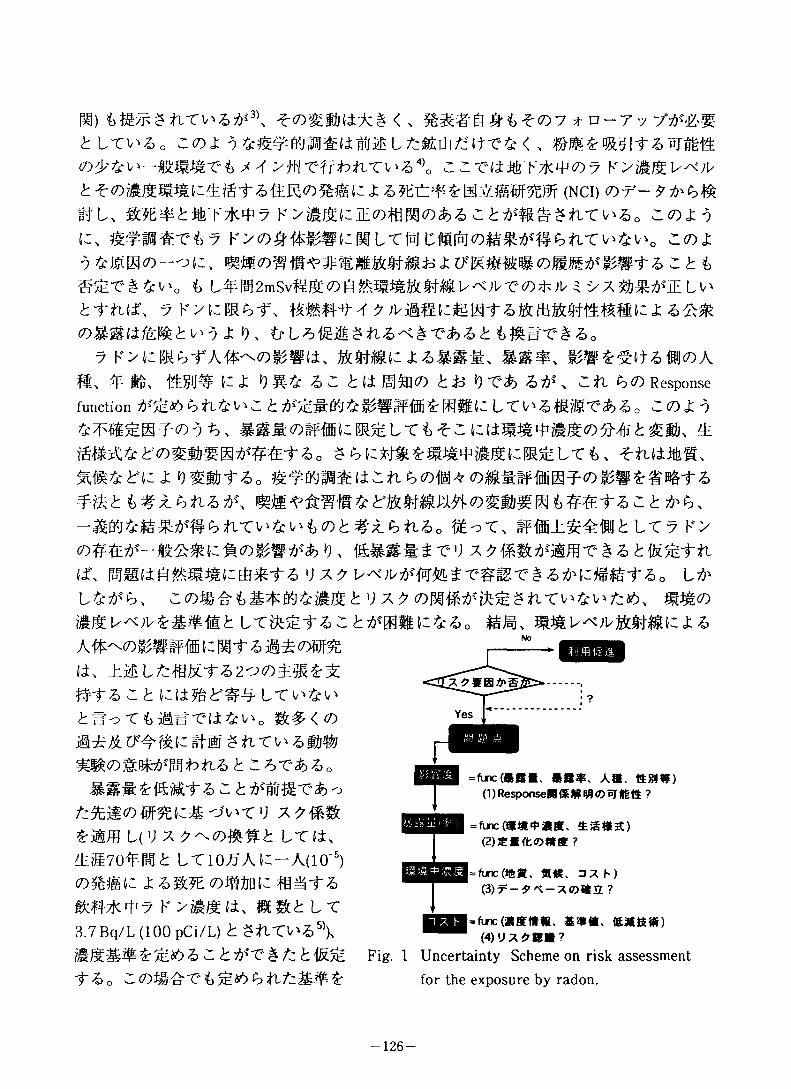
tLTV'&o mm&g&gitaor##
6: f ae^<7)%#(:Z a#C^^@]%m#%mf (NCI) <7)-r- ?#Lx ^E$6:mT^4:7K>#^(:lH(7)^^|(7)^&2t^#e$fLTv^o Z<7)Z9 C, 2<7)Z
v^9 j: *K j: t#g"C#^o###. B@&#tta#<7)A
fix ¥ Bx %glj# t: Z 0#^ 6C bti t& *) T% 6^x -tl b<D Responsefunction ^dO L"CV^6%#"("*60 2<^)Z 9
ffummx
#&^t#x.A,fi6^x w# ^ <7)at#^fa^2:^^x%-3-Cx #Fm±^#^LT7 K>
(7)#%^- -AS%&#U:# <7)^@0 x ###:#2 "C V % ^ & a t fL(fx a aoLtr^^x ^(7)#^t&3#:%^#J^^V%^(7)MW^^$fLTV^V^A, ##<%
A#:^(7)^#eF# I: im-f a mA(7)#%Ux ±^L/:f8&ta2^<7)±#^^#ta 2 ^ LTV^V'^w^TtAM-Cli^v^ &#<<7)
#^#(7)^^^tifia ^ ca-r*6o
%7&m(7)#%t:&cfv^-cv 77 m&L(V^ ^^<7)##2: LTUx
&@70¥M^ LT10^AIC-A(10'5)(7)m#c a am# (7)i#tnc fg^-^a
K>#^(ix mmt LT3.7 Bq/L (100 pCi/L) t ZtlTl'Z5\0&^m# a z ^ ^ ^¥ao 2(7)#^"C6^d6^fL^:&#^
= func(#se. »B$. A». S8IJW)(1) Response* * # W (O ^ K @ ?
= funcO«9l^aflE. £;$«5t)(2) &m<t<omm?
= func(ifeK. fl[«. 3X h)
&)t-■$"<■-XOtlttL ?
= fine (* SUMS. *#a.(4)'JA4>B*?
Fig. 1 Uncertainty Scheme on risk assessmentfor the exposure by radon.
-126-
#(±f(7)vx^^m^L^v^^3%u, mmu/j^L-ctlO'^10h^^t»fL6^E(±^v^ Fig.l (:(±2<^± 9 &7
#wc#7 k><vm&£^Mt&ztKit
3. #H(7)ifeT7k • fikS4**7 K>»6mTK(i#mt:j3tt6mT7k@m^^#7K #mmm7K) t u < (±#c#7t& L
T#m$^6nT#%^*6mT7k, $ t(:##^^*>(:###(:tmv^KTv^6i&m -
7K#M^mnLTV^^ 14#$20#7f(COV^T#12L<7)M#7k£7.6 cmX7.6 cm (7)NaI(TI)"e#:##J^ 30«I&a#S - MmmMT&tp(Dy K>?S/S:i±1.7-161 Bq/L <7)$eBX\ ^#^(±11 Bq/Lm
o(2) 41 SKHIT'(i94r ti95-ffr<7)MM#P7)EBvk75^±t:$ij£ ±i (h
>-^l/-'> 3 W£7) ), ##(±1.1-16.7 Bq/L. ##(±0.93-11.7 Bq/LCO2(09 til Bq/L^@X.6i-^r b(±4^^T^^%(:#^(±#
V^o
?IJJ^?1980#ft^Mf;b±LTV'£0 ±^34rR)f<7)S tc & (± & i o 7 M <7) ^ 198 2^F4^ 1985^9^ ^T<7)#j^#$M(±87-30,480 Bq/L&^ ZfLt (7)7&jK/K^)7 K>#^(D#^T(±1 L<T)M#7K^7.6cmX7.6cm (7)NaI(Tl)-Cg#iK2fLTV'6o ^
mm#c(±7A^±#t6&o V^ffLCLTt 2(7)±9 ^##7&m/K(7)7 K>^%(±^#7K&$^#At±LTV^ #± % t l-3#m±i@#\
(4) 36mm<^7 (0.6 L 3 (±0.19-63 Bq/L<7)%H^ Tto/io f(D9t29/36##^19Bq/L^lT, 5/36^19-37Bq/L, 2/36^'37 Bq/L &±T& V , V C2-T(7)#^(±m^(:iS:v^
(5) 7V *y7V7>#ft^^^ftC^(±T(7)%#^gem#^t#^$±LTV^f >"7 ^ h7#C&&Bornholm#T\ %A#(0*T7K54gt#^##i/ >f 3>& (10 mL7KBt#& h ^J:>^10 mLC#^ : 30^#j^E<7)^mRR##@(±1 Bq/L) TfSS^n/jo f (7) 9 t26#^#(±10 Bq/L mT, 10-100 Bq/L(±23M#T* *9 , lEfejfi
-127
#<7)mT*2#(#li550j3 Z LFl.070 Bq/L£M'o£rt{,Bq/Li^T'C*o*") o ::t(i7 K>#%140 Bq/L(7)xK^^Wl
n, x(D&(DmmK£ k>iis^/kiiit c> io±c&&Bq/m^^O, Cl <DWlXK £ & W^^ft^siiO.S mSvfcigP
#%KZ6 W^(7)##z 0 &5f^A< &&^W:#%#$fLTV'6o
(6) y 4 >y> K(i^^Mlb?lJt(7)Sv^iSh Ltt^tJbS^ 1980#m#mT#k#7K#(7)4#J^^mT7K^T*6 o 1974-19773Ml7WtT±
Wtb^'ES$it (2 L M#tK> 5X4 >r <±. Nal(Tl) : 40^#^<D^mT ®?lS(i3.7 Bq/L), #H, AfaT7K^W$tLTV^vWt'e<7)#P7KES<)ii*n$tL^o !,247<7)7KiE7KK#(7)f j4)#(i25 Bq/LT'<£> o ±tf?, *^#(7)#W#P'7K^#7K690K# ?>TOzlJtfi59 Bq/L (#±1,600 Bq/L), 570§£#<7);E±#<MT;±(;iTO7l6630 Bq/L (#±44,400 Bq/L)
(7) ^;i/b*'A/T(d:^#7K^LT$m$fLTv^<A7;i/7K, ±$7Kj3Zr/#yK^^(0±x^^%^(- 15"C)(:##$4±±#, Ge(Li)t:iIIJ^$tl± #mi## : 1 Bq/L)0 f <7)^i ^(i#MTO#^ LT17 Bq/L (<1-814 Bq/L) t flX V^^'14) , lOT/K^H/S
-f LT^mTTK, #)^7K#(07 ^#7K(i0.8L(D'7V AV####mTim#^2 Bq/L(OGe#m^-em:##%$fL±o as^umMTO, #
STO®i)^tl^'fl 1 0± £/381 Bq/L (#±#^: 31 kBq/L) X'h *9 , 45%^'MCL£Ei® L x^tio 5±, # y yyyy K$MiB:M£Btt(;if, l^#/K * <7)222Rn £ 226Rail
(9) 77 -7 h y > K«7^fl->TfrtiftS<7)±&WEr«j^/i--h^£> 9 , HSV'g^ac#< (?)^m^mT7K^#7K^#mLTv^o
70mmt:j8V^T130 mL<D#mk#m&f)(7)#x &ZnS(Ag)y >±L/-i/ a
L±M*, 40-76 Bq/L (TO 61 ±13 Bq/L), SS^iMT't±3-35Bq/L (TO 23 ±11 Bq/L)-e*o±0 X<Dfc(DW% K «t £iEF*J y
< ^v^^-eio-15%, z o7 F>zSJt iil-5%fIJt^tiiD L±o f (D^, tfrb. y KX7)^#(:E@±6#^5%#a^#(DTO<b LT(i0.3±0.06 mSvU±^^V^h"M$ti
o(10) y*yy(Db)l * rWAtim £$S tt& K&n-t %> t)< ^^JfeT200 m
$-e<7)46m^#P7K417 K>M^'lu5ELZ:±&7) -eiij^£ii±0 #±#(i11.3 Bq/L, 58%±1'2.4 Bq/LF1T t 0
(11) £>AmUz33lf&7k'P<7)7 K 1909h)U(E)Sv IWn $ =M,1980#%d6^Tm#<#^$fLTW6^ o ±2:±(f^z&ME6: LT5^amT(i^m
-128-
*<0 9 K>iftJgj&*5.2-2,541 Bq/L (TO4 37± 1 32 Bq/L), 118.8 Bq/L (¥#J54.0±29.1 Bq/L), ^<Oitfe[X <O?0TJI|*^1.5- 11.8 Bq/L (W4.9 + 2.4 Bq/L) <bE£i$ tlTV^^'19) , #Rlf%KlX 10" Bq/L<OA#^Z&^ fLTV'6^ oEHh LTW^^±#Sco^S6.8Xio3Bq/L2n X 2Z:, =*«7K>t:U
a###a#(±8.5-21.5 mSv/y22) b M£ flTl^o
titz<Diti97o¥fm^-e&ao h ix-ww2"-^ w9 > 9-^901/tiX-d'< :te®*to<07^<0iyi<mS<0?ro26) t^o/:0
Z>kUM&CDMT7kty<7)7 KX?1E^\ irm20015 Bq/L@^T^ 0 (H*<OZ:i/>(OX h V ~:H250-170m), 4-10 m6?^#
H-H&a 2 £ 27) , tilE@Tl-2 rnK&ms&Z>imMT7kX~l±KmZ 0 &##(:%&%&#, m*#t:#-3Tm@mT*9 K>#^±
#L, mig(7)#%r?#m%(15Bq/L@mKgjmf6 2«L^^ mSW'KZfLTwao m##^mv^7K4:(7)7
%^^(0*EmT*(7)9 VA#^m^amT*^±#^%<0##^t: j: 0, M*mm:#9a#mT*<0 9 K>
%#<o9 ^ ctmv^fL-cv^.-$<o&t** M*&^£fijffi-fas@<o')z?k>
*/g W±###199lWmT*(0?:#J9 K> #^^2.6-2 28 Bq/L (<0.3-929 Bq/L) <0|&@ \Z-hh 2 t £ LTl'634) 0 2 2 Till 2X^T11 Bq/L^@ALT^6o LTm^$fLTV^#7K35^mr(7)7&%KL, ¥#113 Bq/L (0.24-99 Bq/L) £ IdS LT va 35)0 ¥<0 9 ^ #Jl/3fil 1 Bq/L &@ALTV'&o %ffl ^36) tc Z *) J^SBWUCTO g2$il* (79"# : 0.8-31.3 Bq/L) ¥ *KJi$F<Oit!lT* (69*/W : 8.7-30.7 Bq/L) (7)9
#*¥9 K>i#a^fWf$&;k$fLTV'&#n'C(7)9 K>#^^(0^#T(i, ^1,000 m3 / B #* L T$&* L T w a ##<0#^:^ (±$&*KD T(0 9 K > (7)1/5 62 0M#t:9 K>#m(0#Tf 62wa23' o 2(7) j: 9 K#7K$fL^mT7K^(7)9 om*h u-cdS7K$Kam:#maWff &<, 2<o/:AKm#<o^:#v^*9XTAz ^P ^/Jx^tlSfelx^ a (7)^*^ (7) 9 K > zISt)5^ v \Zhh 37) o
9 9>EULj(7)MLZ:|t9UUB±S®mSE(7)SE#P*4](7)EM4zMJ9 K>#%(0# ffliil.3-56.6 Bq/L (§*82.9 Bq/L)38) t 01MSi§iHiJt'e<£) 6 >(¥629Plf(7)MT7Kl1J9 K>M<7)$IJ$eM:^: (K# : 100 mL, Ge(Li)^ti^) TNi, ^r*a!#@sgt:##^A#mmE(#)ki,47o sq/wm*a 21 lt^6 39) 0 $ tz. #^Hl(^W#m^)t:*ai39-^r(7)mT7K4:9 KX#%t7-176 Bq/L-C*l)*" ,
-129-
12f MfTll Bq/L£Ej$LTl'B>0 ^*^##^1981-1983^t:^4j"C#% 8#30f Rf(7)#:m:#$fLTV'amT7t, #^(^#^^1.2-92 Bq/L (EM?% 10.7 Bq/L) -C^oTtlo - 0 , NUjS±^^SE^#MA(82.3Bq/Lr> ^/:, @k#7KT(±^v^\607 v (2.1X10³Bq/L)o
(12) ^H-e(i#< (OW-ei970¥^WSHASTA, WJ#^, mTA^M(0Am ^(07 K>#&mW^2fL,2 ft 6 Ctll AT USEPA^^'L'E & 0 m& LfzXi ftjfcMfbillt$^t" B £^,#k#7K^U. ^Ra. ^=Ra.2fLito 2<o##TU,TA^(o#me^#mLT-7vym^$fL^o 4i#i(0MmEm#:m#Kz^(f,r'E (OEM1.24-65.6 Bq/L (0#B C&9,#(0to r E (OAn An#MMZ###1.8~ll Bq/L<0$affl (¥^5.2 Bq/L) E $tlTV^0 ^gT(iAn<049.5%^#<)7 K7#^(0#V^gfu7K, 18.3%U#t^^V'^*M, ^^32.2%(i[#M#m^^fmT7K^m(o^*m7K^^mLTv^o mtzrE-niwe#F(0EM¥1W36 Bq/L, ifcTA^^W9At25.2 Bq/L, Sz/fAiiO.3 Bq/Lt%^/j0 C (0^m^E(0^mt:j:&mi*l ^^(7)7K7#^(0^ ^(±fK^fL2 4, 1.3, 0.1 Bq/m3 EM$ilTV^52) o L^^^K#7K<OEMf^#(iNew Hampshire (32.1 Bq/L), Maine (37.4 Bq/L), Rhode Island (65.6 Bq/L)(0Z 9 C , 4lfflWHl0^1t* USEPAHJ: l9tSS$iLTV^MCL(ll Bq/L)£E1® LT^B-o L/:^t,7)^, ET#^$fL-B E V x
6 3% h-^?,7/f vh^^(0Tyo-f
m±(i#a(0#%(0-@G&a E#/: &(0T&&d?, (U.s. Dept, of Commerce) Tli±##7 t #AT%#mE ^B#^7 V 7P ^L /j"3\ ^ @ ^ B ^ *b t: 6 ^^#-e* 6 o
4. ist> U 1Cm±, ^mT(imT7K^±^^m^t6##7K4:7K7t:NLT, t(0V7^^f!jmr
7K7m^<o^mE^B >en^<o6k^Ah L-c(omM#m%(o#m#(AM#m)^#-iE
#^^77 > -K7SS(i^iL($E"iW< Sv'EBS^fiB t<0(0, m#E
mu $ -ti:^ ^m&jft mmr~<D mta* (o^^^smA e lt<o itf
E'^%@f B^^^B o m##,^6f, $:#2K4:(0-^#-##mi:ZB V 7 7#E(0jt$g- #M-K#mE^B^tr^ Bt ~ «t -BBS5® (Public perception) n"%^56r^4&# •
-130-
55)*####&% raimt^ r>j r#k#7K^7An#-#EL^t(D-e*6o
1) F.W. Pointius. ! An update of the federal drinking water rcgs. AWWA (Feb.), 48(1995).
2) 6, p.226,(1994).3) Cohen, B.L.: In Radon, Radium, and Uranium in Drinking Water. (Eds. by Cothern
C.R., Rebers, P.A.), Chelsea, MI: Lewis Publisher Inc., 69 (1990).4) Hess, C. T., et al. ! Radon-222 in portable water supplies in Maine: The geology,
hydrology, physics and health effects. Land and Water Resource Center, University of Maine at Orono. p.l 19 (1979).
5) Cothern, C.R. ! In: Radon in Ground Water, (Ed. by B. Gravas), Chelsea,MI: Lewis Publisher Inc., 1 (1987).
6) Farai, I.P., et al. ! Health Phys., 62, 96 (1992)..7) toiES : Radioisotopes, 13, 362 (1964).8) Lin, Yu-Min, et al. : {%###., 18, 23 (1983).9) DaniliCotsaki, S., et al. ! Health Phys., 64, 605 (1994).
10) Kobal, I., et al. I Health Phys., 37, 239 (1979).11) Ulbak, K., et al. ! Radiat. Prot. Dosim., 7(1-4) 87 (1984).12) UNSCEAR ! United Nations. Ionizing Radiation: Sources and Biological Effects.
New York, (1982).13) Asikainen, M., et al. ! Health Phys., 39, 77 (1980)..14) Bettencourt, A.O., et al. ! Radiat. Protect. Dosim., 24 (1/4), 139 (1988).15) Soto, J„ Fernandez et al. ! Health Phys. 69, 961 (1995)16) Al Doorie, F.N., et al. ! J. Environ. Radioactivity, 18, 163 (1993).17) Olguin, M. T., et al. I Sci. of Tatal Envir., 130/131, 43 (1993).18) %:##7K>(T mm, #:#*), 553 (1992).19) : 0 45, 37(1982).20) # : faWm##, 9, 37 (1953).21) Kimura, K. ! Pacific Sci. Assoc., 7th Congr., Proc., 2, 485 (1949).22) 71, 80(1981).23) 28, 39 (1977).24) WA3%\ 1 (1975).25) # : KURRI TR 155, 5-2 (1977).
-131-
26) mm #29#. 71 (1976).
27) Fukui, M., et al. : J. Hydrol., 60, 197 (1983).28) Fukui, M. : J. Hydro!., 79, 83 (1985).29) Noguchi, M„ et al. ! J. Geophys. Res., 82, 1353 (1977).30) J# : Radioisotopes, 27, 747 (1978).31) Jtii : #32#, #3%\ 151(1981).32) Fukui, M. : Health Phys., 53, 181 (1987).33) Fukui, M. : J. Hydrol., 82, 371 (1985).34) mm, #:#$), %?###%#, 140 (1992).35) ffe : 160 (1992).36) # ; [6]±, 341 (1992).37) Milvy, P., et al. ! In: Radon, Radium, and Uranium in Drinking Water. (Eds. by
Cothern C.R., et al.), Chelsea, MI: Lewis Publisher Inc., 1 (1 990).38) Yunoki, E., et al. J. Environ. Radioactivity, 25, 181 (1994).39) #43#, 1-^(1994).40) p.69(i994).41) Fukui, M. ! Unpublished data.42) Arndt, R. H., et al. ! Econ. Geology, 48, 551 (1953).43) Kuroda, P.K., et al. ! Am, Jour. Sci., 252, 76 (1954).44) Burnett, B., et al. ! Eos, Am. Geophys. Union Trans., 70: 500 (1989).45) Parsa, B„ et al. : Health Phys., 58, 209 (1990).46) Sasser, H. K„ et al. ! Health Phys., 34, 667 (1978).47) Senior, L., et al. ! Geol. Soc. America, Abstracts with Programs, 21, A145. (1989).48) Wanty, R. B., et al. ! In: Geologic Causes of Natural Radionuclide Anomalies
(Marikos, M. A., et al., eds.), Proceedings of the GEORAD Conf., St. Louis, Mo., April 21-22 (1987).
49) Rogers, A. S. ! Geol. Soc. America Bull, 67, 1781 (1956).50) Mose, D. M„ et al. ! Eos, Am. Geophys. Union Trans., 70, 500 (1989).51) Hess, C.T., et al. ! Health Phys., 48, 553 (1985).52) Nazaroff, W.W., et al. ! Health Phys., 52, 281 (1987).53) USDOC ! National Inst, of Standards and Technology, NISTIR 5399, Apr., (1994).54) Vol.37, No.ll, 1017-1025 (1995).55) B19, p.84 (1996).
-132-
(22) m aSummary
M. Fukui
f 2T-4S:(7)#%*nR#f
^62 bwmuT#2:o 2(7)2
i^aoTV'&o20M%m^^&#)m7K4:(7)^7 Kk^T(±mi'/K
'C(±2fL^<7)#j^e!l^#7KaL'C(7)#mW%t:^f6##t^+^'r*6c 9K
k'(7)^r^^m$fL-CV'6o ^2T, 2fL^(7)#^^#%^(7)1##^t))^a*)62 h(i, Wtt • M<oeS£®U\ $ W4:f amAd'% &, ^(DMMli
2(7)Zo^i##(i#*, %##, m9-A*(7)-###%mez6v %(7)jt!R - #m:#m&tr6-r^<, mf
6 , &%L\Z. X & #2#Public Perception) jb* X • M#(7)#&2fb6o m±(7)Z9^@(i#:S(7)#%#^ L /: o
^<T)7ny7A&# 1 m#(7)m^$:^lTK^6omwa, 2fL^^2
2ZT<0|*#*(a#F7K(200 m)X~& D > -f <0 Bit Lt 18.5 Bq/LT#57^vh-y#)-e(a, %*mv^fLTv^7K*-7K><7)M/j:>
^#%f-^<7)#^(omv4:Zi), m%C(i
(g#u8#mK. ±Am, #^Am)^g#&CZ OlJJJ^U ^*^^2(0)111^28.5, 11.2, 5.0 Bq/L T&6 2 t h frK t, ^mtr#AbT7K*%&(7)^^2at#mL^ (max. 943 Bq/L) o %m4(#l%,?K*7 Hw:a o L<
-133-
####<%#HCIa^TO# p*?l/t(il 1-459 Bq/UI^WL (TO 123 Bq/L) , £SBl*]SA<7)i&T2K • 711*7#)$ (i2 X 1 o3Bq/LK & R&Z t ?):% bfrlZ £tlfz0
> * -, m5)(i, ^?>mu<Dm£Ltzm\hm±mmm\K4 mmcomm%#p7k<7)h )\'^>m-Mfa's'y?-i'-'>3 y&c #iBJTO$Effl7)51.3-56 Bq/LT*6 2h,*f:TO #^#^(i82.9(iBq/LT*62(h^^&^L^o AB8(##, %m6)(±A#^
mu*. #k#*^m^L. #A7#^^*TO*4:7#)$(7)5^f ^#m5.4-5l2Bq/L#%-e*i). L<(iffLWTO&&::,!x§&\hm2i<nviI)\\$WiB.t$lM;M±n<nttmi!)*Uibbti2>Zt%¥*WbfrKLtzo Wl4
A, #*#.M^Alll t (O^^K-DV'T i t tbtzo
±<b LT#^*[#g07/^o 2BB(mm8-12)(±, pmmt&fcm&jfflftfim&ztifzo
mm8(*#. &%RA)TkL
m&vibm-M&px&ztzMTELtzoXtp<7)7 yy 7#J$ HF> P^\(D if X (He, Ne, H2 & h") t * &:## L > H&M&K g #*^<7)
mil*^**^}#^^ t f±&< %\b tiX^Z>i)K
mn)o #mi2)(±. 7K>&mTOhi/--TO,LLT#mfama
£n&^fflv^ii&itimKTO K Ltzo(TO (##^####(7)##/^ ^ : KURRI-KR-1, April 1996)
mfw#gg^5a#x mT*^9
-134-
#L/:o%Ei5(SE, mwfrtpn? F>m&mwkmm*)&itf>KftKM\<'
<D*r>V%WiK£ 'O^^fltz. washout <£ «) r ainoutC Z 6 % 0 &*##ULfZo
3§E16(T\ ESjSS@E)-ei±^M^ltiiT7k, tKStK, aSjUc^ K >?!MJ5e$I
fflvVj h )Vx.yW\^-Wi^yy^\y~'y a >&lzioi^T,
mT7K#m[<!:P$mm<DJE^)mKH:#%LTv^o %El8)^(i, #%]!#
a" L/Co
{2Q-2b°C)t%(D)®m<DjbZ> Z.t*7TsLX^Z>0 Sll|S(£E> %E20)^(i, EL$mtKK&tf &&a7k mr*. ffiffL#i^#^^L"ci.7xio'Bq/L.4X102 Bq/L, 1.8X10' Bq/L T&& 2 t £$Kcf LTV&0
%E21)(i.H, ###g|(DmT7K,
mm, ##, m##m^^@^(o^e-c#wc^7Ky
7-K n L -̂ mm ^m 9 r* 6 o
-135-
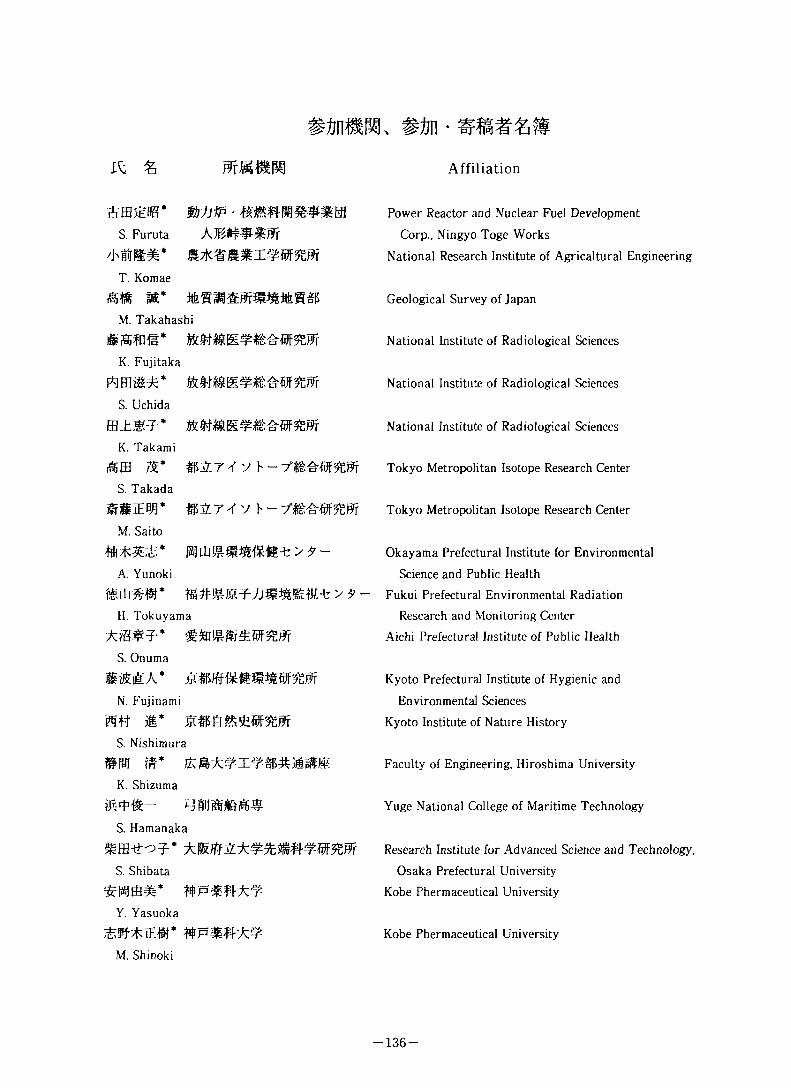
ft % Affiliation
SBB5E0S* mtrp ■S. Furuta A®WS9f
T. Komae
A# m*M. Takahashi
®mhs*K. Fujitaka
ABis-A* -S. Uchida
K. Takami
mm ?&* iisiTfvh-S. Takada
mmiEW* nar^vh-M. Saito
#A%^*A. Yunoki
ebsw* > ? -H. Tokuyama
S. Onuma
s?ma*N. Fujinami
@# B* anm#56#%&rS. Nishimura
it*K. Shizuma
THOMASS. Hamanaka
sm-d-of *S. Shibata
$nm#* #^m#A#Y. Yasuoka
SifAJEW* #P-S#A¥
Power Reactor and Nuclear Fuel Development
Corp., Ningyo Toge Works
National Research Institute of Agricultural Engineering
Tokyo Metropolitan Isotope Research Center
Tokyo Metropolitan Isotope Research Center
Okayama Prefectural Institute for Environmental
Science and Public Health
Fukui Prefectural Environmental Radiation
Research and Monitoring Center
Aichi Prefectural Institute of Public Health
Faculty of Engineering, Hiroshima University
Yuge National College of Maritime Technology
Research Institute for Advanced Science and Technology,
Osaka Prefectural University
Kobe Phermaceutical University
Kobe Phermaceutical University
Geological Survey of Japan
National Institute of Radiological Sciences
National Institute of Radiological Sciences
National Institute of Radiological Sciences
Kyoto Prefectural Institute of Hygienic and
Environmental Sciences
Kyoto Institute of Nature History
M. Shinoki
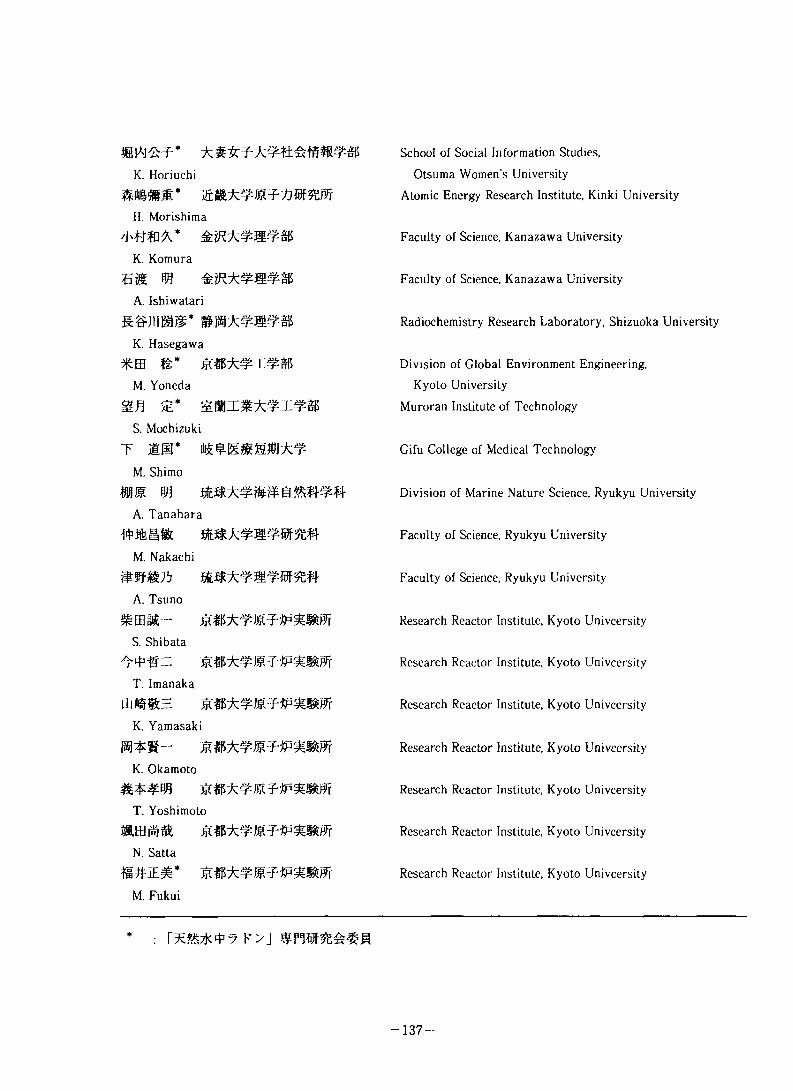
K. Horiuchi
mmm* &t&k¥mkkmmH. Morishima
K. Komura
5z$ % &#*###*A. Ishiwatari
Szmmm*K. Hasegawa
ft*
M. Yoneda
mnS. Mochizuki
t mm*M. Shi mo
mm mA. Tanahara
mmmM. Nakachi
tmmnA. Tsuno
%be-S. Shibata
T. Imanaka
K. Yamasaki
K. Okamoto
T. Yoshimoto
N. Satta
M. Fukui
r^*B7 K> J
School of Social Information Studies,
Otsuma Women’s University
Atomic Energy Research Institute, Kinki University
Faculty of Science, Kanazawa University
Faculty of Science, Kanazawa University
Radiochemistry Research Laboratory, Shizuoka University
Division of Global Environment Engineering,
Kyoto University
Muroran Institute of Technology
Gifu College of Medical Technology
Division of Marine Nature Science, Ryukyu University
Faculty of Science, Ryukyu University
Faculty of Science, Ryukyu University
Research Reactor Institute, Kyoto Univcersity
Research Reactor Institute, Kyoto Univcersity
Research Reactor Institute, Kyoto Univcersity
Research Reactor Institute, Kyoto Univcersity
Research Reactor Institute, Kyoto Univcersity
Research Reactor Institute, Kyoto Univcersity
Research Reactor Institute, Kyoto Univcersity
-137-
KUR REPORT OF THE RESEARCH REACTOR INSTITUTE
OF KYOTO UNIVERSITYmmmiB ¥l5;9$2/f it m
SIS ft# (0724) 51-2300mmft Pff #$$#±181460-33