proceedings template
TRANSCRIPT

Canadian Science Advisory Secretariat (CSAS)
Proceedings Series 2017/044 Newfoundland and Labrador Region
November 2017
Proceedings of the Newfoundland and Labrador Regional Peer Review of the Assessment of Sea Cucumber in NAFO Subdivision 3Ps, and the Newfoundland and Labrador Snow Crab Assessment
February 21-23, 2017 St. John’s, NL
Chairperson – Mark Simpson Rapporteur – Jane Tucker
Fisheries and Oceans Canada Science Branch PO Box 5667 St. John’s, NL A1C 5X1
Foreword The purpose of these Proceedings is to document the activities and key discussions of the meeting. The Proceedings may include research recommendations, uncertainties, and the rationale for decisions made during the meeting. Proceedings may also document when data, analyses or interpretations were reviewed and rejected on scientific grounds, including the reason(s) for rejection. As such, interpretations and opinions presented in this report individually may be factually incorrect or misleading, but are included to record as faithfully as possible what was considered at the meeting. No statements are to be taken as reflecting the conclusions of the meeting unless they are clearly identified as such. Moreover, further review may result in a change of conclusions where additional information was identified as relevant to the topics being considered, but not available in the timeframe of the meeting. In the rare case when there are formal dissenting views, these are also archived as Annexes to the Proceedings.
Published by: Fisheries and Oceans Canada
Canadian Science Advisory Secretariat 200 Kent Street
Ottawa ON K1A 0E6
http://www.dfo-mpo.gc.ca/csas-sccs/ [email protected]
© Her Majesty the Queen in Right of Canada, 2017 ISSN 1701-1280
Correct citation for this publication: DFO. 2017. Proceedings of the Newfoundland and Labrador Regional Peer Review of the
Assessment of Sea Cucumber in NAFO Subdivision 3Ps, and the Newfoundland and Labrador Snow Crab Assessment; February 21-23, 2017. DFO Can. Sci. Advis. Sec. Proceed. Ser. 2017/044.
iii
TABLE OF CONTENTS SUMMARY ................................................................................................................................ V
SOMMAIRE .............................................................................................................................. VI
INTRODUCTION ....................................................................................................................... 1
PRESENTATIONS ..................................................................................................................... 1
ENVIRONMENTAL/ OCEANOGRAPHIC UPDATE ................................................................ 1 Abstract .............................................................................................................................. 1 Discussion .......................................................................................................................... 2
NEWFOUNDLAND AND LABRADOR BIOREGION: ECOSYSTEM UPDATE ....................... 2
Abstract .............................................................................................................................. 2Discussion .......................................................................................................................... 3
ASSESSMENT OF SUBDIVISION 3PS SEA CUCUMBER .................................................... 4Abstract .............................................................................................................................. 4Discussion .......................................................................................................................... 4
CHANGES TO SURVEYS AND DATA ANALYSIS IN THE SNOW CRAB MONITORING PROGRAM AND ASSESSMENT ........................................................................................... 7
Abstract .............................................................................................................................. 7Discussion .......................................................................................................................... 7
NAFO DIVISIONS 2HJ3KLNOP4R SNOW CRAB .................................................................. 8Abstract .............................................................................................................................. 8Discussion .......................................................................................................................... 8
NAFO SUBDIVISION 3PS SNOW CRAB ............................................................................... 9Abstract .............................................................................................................................. 9
Discussion .......................................................................................................................... 9TORNGAT JOINT FISHERIES BOARD – DFO COLLABORATIVE POST SEASON TRAP SURVEY IN NAFO DIVISIONS 2H AND 2J NORTH .............................................................10
Abstract .............................................................................................................................10Discussion .........................................................................................................................10
NAFO DIVISIONS 2HJ SNOW CRAB ...................................................................................10Abstract .............................................................................................................................10Discussion .........................................................................................................................10
NAFO DIVISION 3K SNOW CRAB .......................................................................................11Abstract .............................................................................................................................11Discussion .........................................................................................................................11
NAFO DIVISIONS 3LNO OFFSHORE SNOW CRAB............................................................12Abstract .............................................................................................................................12Discussion .........................................................................................................................12
NAFO DIVISION 3L INSHORE SNOW CRAB .......................................................................14Abstract .............................................................................................................................14Discussion .........................................................................................................................15
NAFO DIVISIONS 4R3PN SNOW CRAB ..............................................................................16Abstract .............................................................................................................................16

iv
Discussion .........................................................................................................................16
PROGRESS ON PRECAUTIONARY APPROACH REFERENCE POINTS AND HARVEST CONTROL RULES ................................................................................................................16
Abstract .............................................................................................................................16Discussion .........................................................................................................................16
2017 RESEARCH RECOMMENDATIONS ............................................................................18
APPENDIX I: TERMS OF REFERENCE – SEA CUCUMBER ..................................................19
APPENDIX II: TERMS OF REFERENCE – SNOW CRAB ........................................................20
APPENDIX III: AGENDA ...........................................................................................................21
APPENDIX IV: LIST OF PARTICIPANTS .................................................................................23

v
SUMMARY A meeting of the Newfoundland and Labrador Regional Peer Review Process was held February 21-23, 2017, in St. John’s, Newfoundland and Labrador (NL), to assess the stock status of Sea Cucumber (Cucumaria frondosa) in Northwest Atlantic Fisheries Organization (NAFO) Subdivision 3Ps, and Snow Crab (Chionoecetes opilio) in NAFO Divisions 2HJ3KLNOP4. This proceedings report includes an abstract and summary of discussion for each presentation. The meeting terms of reference, agenda, and list of attendees are appended.
The meeting included participation from DFO Science, Fisheries and Aquaculture Management, Newfoundland and Labrador Department of Fisheries, Forestry and Agrifoods, the Fish Food and Allied Workers Union, the fishing industry, and academia.
In addition to these proceedings, publications to be produced from the meeting include a Science Advisory Report and a comprehensive Research Document for each species, all to be available online on the Canadian Science Advisory Secretariat website.
vi
Compte rendu du processus régional d’examen par les pairs de Terre-Neuve-et-Labrador sur l’évaluation du concombre de mer sur le banc de Saint-Pierre et sur
l’évaluation du crabe des neiges de Terre-Neuve-et-Labrador
SOMMAIRE Une réunion du processus régional d’examen par les pairs de Terre-Neuve-et-Labrador a eu lieu du 21 au 23 février 2017, à St. John’s (Terre-Neuve-et-Labrador) afin d’évaluer l’état du stock de concombre de mer (Cucumaria frondosa) dans la sous-division 3Ps de l’Organisation des pêches de l’Atlantique Nord-Ouest (OPANO) et du stock de crabes des neiges (Chionoecetes opilio) dans les divisions 2HJ3KLNOP4 de l’OPANO. Le présent compte rendu comprend un résumé et un sommaire des discussions liées à chaque présentation. Le cadre de référence, l’ordre du jour et la liste des participants de la réunion sont joints.
Les participants à la réunion comprenaient des représentants du Secteur des sciences et du Secteur de la gestion des pêches et de l'aquaculture de Pêches et Océans Canada (MPO), du ministère des Pêches, des Forêts et de l'Agroalimentaire de Terre-Neuve-et-Labrador, de la Fish Food and Allied Workers Union, de l'industrie de la pêche, et du milieu universitaire.
En plus du présent compte rendu, les publications à produire émanant de la réunion incluent un avis scientifique et un document de recherche exhaustif pour chaque espèce, qui seront tous disponibles en ligne sur le site Web du Secrétariat canadien de consultation scientifique de Pêches et Océans Canada.
1
INTRODUCTION The status of Northwest Atlantic Fisheries Organization (NAFO) Subdivision (Subdiv.) 3Ps Sea Cucumber was last assessed in 2009. The status of Snow Crab in NAFO Divisions (Divs.) 2HJ3KLNOP4R was last assessed February 22-24, 2016. The main objectives of these assessments were to evaluate the status of the stocks and to provide scientific advice concerning conservation outcomes related to various fishery management options.
The current assessments were used to reach consensus on main points (summary bullets) to inform management options for the upcoming 2016 fishing season. The summary bullets are included in the Science Advisory Report (SAR) for each of Sea Cucumber and Snow Crab.
The proceedings include an abstract and summary of discussion for each presentation. Additional information can be found in the SAR and research documents or from references cited therein.
PRESENTATIONS
ENVIRONMENTAL/ OCEANOGRAPHIC UPDATE Presenter: E. Colbourne
Abstract The North Atlantic Oscillation (NAO) Index, a key indicator of the direction and intensity of the winter wind field patterns over the Northwest Atlantic, remained in a positive phase during 2016; however, it was lower than in 2015. In addition, the spatial patterns of the associated atmospheric pressure fields resulted in a reduced arctic air outflow in the northwest Atlantic during the winter months. This resulted in higher than normal winter air temperatures in many areas. Sea ice extent, although above normal during March and April, was below normal overall during 2016.
Annual sea-surface temperature (SST based on infrared satellite imagery) trends on the northeast Newfoundland Shelf while showing an increase of about 1oC since the early 1980s were mostly below normal during 2016. A standardized composite climate index for the Northwest Atlantic derived from meteorological, ice and ocean temperature and salinity time series since 1950 reached a record low value in 1991. Since then it shows an increasing trend with mostly above normal values except for 2014 and 2015, the latter being the 7th lowest in 67 years and the lowest value since 1993. Data from 2016 show a return to above normal conditions.
The spatially averaged bottom temperature during the spring in Subdiv. 3Ps was above normal by about 1.2°C (1 SD) and about normal on the Grand Banks in Divs. 3LNO. The spatially averaged bottom temperature in Divs. 2J and 3K show an increasing trend since the early 1990s of about 1°C, reaching a peak of > 2 SD above normal in 2011 and remaining above normal in 2016, by about 0.5°C in Div. 2J. As a result, the area of bottom habitat covered by water < 2oC increased to near-normal values in recent years compared to the record low observed in 2011. The only exception was in Div. 2J where it decreased over 2015.
2
Discussion A comment was made that although Snow Crab is a cold-water species, there is a lower limit to its temperature tolerance, which is thought to be about -0.75°C. Additionally, the habitat index (HI; area where bottom temperature < 2°C) represents optimum temperatures for survival at young stages, while warmer water is beneficial at older stages. A good situation is to have a large number of crabs born in cold conditions, with warmer conditions later in the life cycle, supporting increased growth.
NEWFOUNDLAND AND LABRADOR BIOREGION: ECOSYSTEM UPDATE Mariano Koen-Alonso, Nadine Wells, Denise Holloway, and Jennifer Mercer
Presenter: M. Koen-Alonso
Abstract The ecosystem structure of the Newfoundland and Labrador (NL) bioregion can be described in terms of four Ecosystem Production Units (EPUs): the Labrador Shelf (Divs. 2GH), the Newfoundland Shelf (Divs. 2J3K), the Grand Bank (Divs. 3LNO), and southern Newfoundland (Subdiv. 3Ps). Changes in the fish community and trends in the Newfoundland Shelf, the Grand Bank, and southern Newfoundland EPUs were analyzed on the basis of DFO Research Vessel (RV) surveys during fall and spring. Trends were summarized in terms of fish functional groups defined in terms of general fish size and feeding habits: small, medium, and large benthivores, piscivores, plank-piscivores, planktivores, and shellfish (only commercial species, recorded since 1995).
In the early 1990s, this large marine ecosystem underwent important changes associated with a history of overfishing and a regime shift. The collapse in the 1990s involved the entire fish community. After the collapse, the system was highly dominated by shellfish. The changes observed have a coherent internal structure; increases in small fish and shellfish are associated with declines in forage and large fishes.
Consistent signals of rebuilding of the groundfish community appeared in the mid-late 2000s. During this period, shellfish declined and moderate improvements in a key forage species like capelin were also observed. Despite the observed increases in finfish, overall biomass is still significantly below pre-collapse levels.
Although these general patterns are observed across all EPUs, the collapse was more severe in the northern area (2J3K) and less severe in Southern Newfoundland (3Ps). These ecosystem units also show differences in their internal structure. The Newfoundland Shelf (2J3K) is characterized by a high dominance of shellfish after the collapse, and with piscivores being the dominant functional group among finfishes. On the Grand Bank (3LNO) EPU, although experiencing an increase in shellfish after the collapse, this functional group never reached the high dominance observed in the northern area, and medium and large benthivores are the dominant functional groups among finfishes. The southern Newfoundland (3Ps) EPU showed the lowest levels of shellfish after the collapse and its finfish community has a more even distribution of biomass among functional groups; it is this ecosystem unit that is showing important increases in warm water species like the piscivore Silver Hake.
Finfish biomass has been relatively stable in the early to mid-2010s, but recent surveys are indicating downward trends. This is most evident on the Grand Bank (3LNO), where total biomass in the RV Fall Survey has dropped nearly 40% from the 2010-13 average. This may be linked to the simultaneous reductions in availability of important forage species like capelin and shrimp, as well as other changes in ecosystem conditions (e.g. late onset of the spring
3
phytoplankton bloom, low zooplankton levels). Overall, it appears that the conditions that led to the start of finfish rebuilding have declined.
In this general context of poor capelin and shrimp availability, consumption of alternative prey by groundfishes has increased. Estimated consumption of Snow Crab has increased since the late 2000s and early 2010s in most EPUs. Since 2013-14 consumption of Snow Crab by predators is showing declining signals in the Grand Bank (3LNO) and Southern Newfoundland (3Ps) EPUs, and an important increase in the Newfoundland Shelf (2J3K). However, despite these recent declining trends in consumption in some areas, given the faster decreasing levels of Snow Crab, the predation mortality has actually increased in recent years. Although current results are still preliminary, this increase in predation mortality appears to be very rapid in the Newfoundland Shelf (2J3K).
Predation mortality shows important differences in magnitude across EPUs. Southern Newfoundland (3Ps) has predation levels an order of magnitude higher than the other areas. Still, predation mortality in the Grand Bank (3LNO) and Newfoundland Shelf (2J3K) EPUs has coarsely increased five-fold over the last 4-5 years. These trends suggest that predation may already be an important driver for Snow Crab in Southern Newfoundland (3Ps), and it can become one in the other areas in the years to come.
Discussion There was a question of clarification regarding the “leveling off” of the biomass of Atlantic Cod in the most recent fall survey in Divs. 2J3K. Clarification was made that this refers to the piscivore functional group. It was noted that, in Divs. 3LNO, there was a spike in biomass of piscivores and benthivores in 2013, which then returned to similar levels as in previous years. Meanwhile, the data presented showed a marked increase in crab consumption in these divisions in the years following 2013, which does not correspond with the piscivore and benthivore biomasses. The response was that this represents an increase in the fraction of crab in the diets of these functional groups. It was noted that in each of the last four years, Snow Crab have been found in cod stomachs in Subdiv. 3Ps. It was then asked if Snow Crab are actually suitable prey for cod? The response was that the most energetically beneficial food (capelin) is the best for the predator and that Snow Crab is “junk” food. It is eaten because there are no alternatives and it is not a signal of healthy eating for cod. Clarification was requested to confirm that dietary requirements were estimated using biomass.
After the presentation, the presenter agreed to write summary bullets to capture changes in the ecosystem, to be reviewed later in the meeting. There was some discussion on whether or not to include the second bullet, describing current finfish biomass trends, as it does not deal directly with Snow Crab. The bullet was retained, based on the argument that it follows from the first bullet, which describes the finfish collapse (1980-90s) and rebuilding (mid – late 2000s), in relation to Snow Crab trends. A participant (who had not seen the presentation) expressed concerns about both using the multi-species survey to describe trends in capelin biomass, and presenting capelin data at all during the Snow Crab Assessment. Regarding the third bullet on predation mortality, a participant asked what is preying on Snow Crab on the Grand Bank and the answer was that it is large benthivores. Regarding the last bullet, which suggests predation mortality may be important in Subdiv. 3Ps, a participant noted there are no cod in Subdiv. 3Ps. The response was that other species also consume crab, such as Silver Hake.
4
ASSESSMENT OF SUBDIVISION 3PS SEA CUCUMBER Presenter: E. Coughlan
Abstract The Sea Cucumber (Cucumaria frondosa) has been reported almost circumpolar in the northern hemisphere. Populations off Newfoundland and Labrador are normally found in waters down to 100 meters, usually on hard bottom with a cobble-shell-boulder substrate composition.
In 2003 a Sea Cucumber drag fishery, under the umbrella of the New Emerging Fisheries Policy, was established on the St. Pierre Bank with eight participants sharing a total allocation of 454 t. As part of the emerging fisheries policy, the same 8 fishers entered into a five year Joint Project Agreement (JPA) with DFO to conduct a resource assessment survey which took place from 2004 to 2008. The allocation gradually increased to 2242 t in 2013, where it has remained.
There are two main Sea Cucumber concentrations on the Canadian portion of the St. Pierre Bank (NAFO Subdivision 3Ps) - one northwest and one southeast of the French Economic Zone. In 2010 the southeastern area was closed to fishing as a conservation measure to preserve the resource in this area until the effects of fishing could be evaluated. The fishery has focused primarily on the northwestern portion of the resource distribution.
The status of Subdivision 3Ps Sea Cucumber was last assessed in 2009. A Canadian research survey on St. Pierre Bank was carried out in September 2016, which covered all of the southeast area but only covered 23% of the northwest area and forms the basis for this Peer Review Process.
Landings averaged approximately 1200 t since 2010 with the highest catch in 2015 at 2,297 t. The catch per unit effort (CPUE) increased in the beginning of the fishery from 2003 to 2008 and has remained stable since 2009 with a mean CPUE of 597 kg/tow. The biomass index based on the emerging Sea Cucumber fishery survey from 2004 to 2008 (excluding 2005) averaged 89 kt in the northwest area and 210 kt in the southeast area. The 2005 estimate was not considered reliable due to gear configuration issues. In 2016 the Sea Cucumber survey biomass index was 187 kt in the southeast area, and the survey in the northwest area was incomplete in 2016. The abundance in 2016 in the southeast area was above the 2004-08 average. Sustainable exploitation rates are unknown and given the uncertainties with this species on the St. Pierre Bank, there is no scientific basis for assessing the risk of any increase in harvest level
Discussion A participant asked how to determine the age of Sea Cucumber and the response was that this is unknown. When asked when they reproduce, the response was from March to May, based on a study from the St. Pierre Bank stock. A participant asked if there is sharing of fishery information between France and Canada. The response was that this does not take place but there has been interest in the past. Sharing of information between France and Canada has been done for Sea Scallop in the past. It was then asked if it is known how France sets their quotas, and the response was that this is unknown. A participant asked if there is a minimum harvest size. The response was that 15 cm is considered commercial size, but the quota is set by wet weight and the current quota is 260,000 lb wet weight. The minimum size and weight are determined by the processor.
Regarding biology of the species, it was asked how it was determined that it takes 25 years for a Sea Cucumber to reach market size. The response was that this is based on a study from the St. Pierre Bank, data from DFO surveys, and laboratory studies from the Ocean Sciences
.
5
Centre, Memorial University. It was noted that there were variations in biomass observed in the southeast, where there is no fishing. It was then asked what accounts for changes in biomass in the absence of fishing, is it natural mortality or predators? The response was that the key predator is starfish (Solaster spp.). It was stated that results from the last survey showed a low percentage of wet weight of the catch but that the multispecies survey is not the best method for sampling this resource. It was explained that available data were pulled together to fill in the gaps between 2008 and present. It was then noted that the 2016 biomass estimate excludes a large portion of the eastern area and it was asked if data presented in the figure showing biomass by grid could be extrapolated to give estimates for the area not surveyed. The response was that this could be done, but it would not give a true biomass estimate. A participant commented that somewhere in the presentation, total biomass must be estimated. The response was that this is a problem in the survey (i.e. missing locations where fishing is taking place). There is no information available on how the fishery is impacting the resource. It was asked what time of year the Sea Cucumber survey took place, and the response was that it took place in September but was incomplete due to issues with the research vessel. It was then asked if there was any attempt to get help from fishers to complete the survey, and the reply was that there was not. Some points were reiterated questioning the validity of the survey, as much of the survey was not conducted in the area where the majority of harvesting takes place. In addition, concern was expressed that there is no information on fishing in the French Zone. It was noted that fishers conducted and paid for a survey in 2004 and that licenses increased in 2008, even though there was no survey in that year.
During review of the summary bullets, it was asked if landings in 2015 should be captured. Clarification that landings were presented in wet weight was given. A participant asked what are landings based on, and the response was that they are based on purchase slips from buyers. It was asked if French landings were available to DFO and the response was that they are not, as they are not fished in Canadian waters (later it was clarified that French purchase slips are submitted to DFO, but the data have not been used). A participant noted that they had preliminary data from DFO, obtained a week before the meeting showing there was a discrepancy in the landings data. The response was that this is preliminary data which is updated as purchase slips are submitted. Regarding the bullet on biomass index estimates based on the fishery survey, it was noted that the fact that the 2016 survey was incomplete should be captured. It was then asked if the biomass estimate of 187,000 t in the southeast area is realistic. There was some discussion regarding the validity of this biomass estimate, given that the entire fish community biomass in all of Subdiv. 3Ps is estimated at just over 200,000 t. It was stated that the analysis was conducted based on methods from the last assessment and that the Sea Cucumber surveys give good data. It was then asked how different are Sea Cucumber surveys compared with shrimp. The response was that shrimp are more catchable in the multispecies survey and unlike shrimp, Sea Cucumbers are attached to the bottom.
Estimating Sea Cucumber biomass was then compared with estimating coral biomass, by sampling one small area and extrapolating to a wider area. It was noted that the survey methods are generally good, other than the northern area not being covered in 2016. There were five years with ten sets taken in each grid randomly and some years yeilded large catches. The survey conducted by the fishers reflects what is in the ocean and, compared with shrimp methods, they are similar. It was noted that one should not state biomass is skewed to the east when there was no survey in the west and that little is known about Sea Cucumber biology. It was also asked how much of the reported catch is water and how does that impact the landings? The response was that this is unknown but it would be beneficial to report trend analyses rather than numbers, and that a 1% exploitation rate from 2009 is very low.
6
It was noted that the numbers are different from the 2009 Science Advisory Report (SAR). The presenter noticed this as well but stated the trends are the same. It was requested that the bullet on biomass index estimate based on fishery survey mention the fraction of the area that was not surveyed in 2016. It was noted that biomass has decreased by 23,000 t in the southeast even though there was no fishing in that area. The response was that biomass decreased with an increase in abundance, which suggests there are smaller Sea Cucumbers. It was asked why the Sea Cucumbers have gotten smaller and if abundance should be mentioned in the bullet. It was asked if there was fishing in grids 13, 16, and 17. The answer was that there was fishing in grid 16 in one year. It was again mentioned that there is no information on the impact that the French Zone has on biomass.
Regarding the biomass index estimate based on the Sea Scallop survey, it was asked if this bullet should be included since it is not based on the Sea Cucumber survey. It was noted that the data from the Sea Scallop surveys cover years during which the Sea Cucumber survey was not completed. A participant noted that the during the Sea Scallop assessment in 2016 there were problems with that survey (Sea Scallop) as well. The response was that there was trouble with the gear, but the area was generally well-covered. It was noted that multispecies surveys occur every year and give indirect but crude information on Sea Cucumber estimates, which could be useful given that there is no way of comparing the catchability of Sea Scallop and Sea Cucumber surveys. It was then asked if this should be treated as an index for the bullets or just included in the SAR. It was stated that more work has to be done to use the multispecies survey data. There was a comment that some work has been done comparing the catchability of the three surveys. The Sea Scallop survey bullet was deleted as catchability for Sea Cucumber is unknown.
Regarding the bullet stating “Sustainable exploitation rates are unknown”, it was noted that some experimental work has been done in the St. Lawrence area and that it is known that global biomass is decreasing. It was asked if Sea Cucumbers moved and the answer was that yes, they have feet. They respond to predators but they probably do not migrate. Regarding the bullet on “… assessing the risk of any increase in harvest level…” it was noted that a “cautious approach” is not defined and therefore it is unknown how to manage for a cautious approach. Response from industry was that they would like to see a cautious approach. DFO Resource Management noted that there will be industry consultations in March. It was noted that Sea Cucumber may take up to 25 years to grow to commercial size, although two or three publications that suggest it could take 10 to 15 years. As this is still unknown for Sea Cucumber on the St. Pierre Bank, it should be investigated.
A comment from industry noted that French harvesters fish the east area just as much as the northern area. It was stated that risks are different on either side of the French zone since one side is fished and the other is not. A participant suggested that as the effects of increasing the quota on the stock are unknown, any decision to increase the number of licences should be deferred until until the science is known. The response was that this is a management issue to be discussed at the consultation meetings.
It was noted that the goal of the September 2016 Sea Cucumber survey was to provide data on exploitation rates and biomass, but unfortunately the survey was incomplete. Further, there was a recommendation in the 2009 assessment to survey the stock annually, but this has occurred.
7
CHANGES TO SURVEYS AND DATA ANALYSIS IN THE SNOW CRAB MONITORING PROGRAM AND ASSESSMENT Presenter: D. Mullowney
Abstract Three major changes occurring in the methodology of the Snow Crab assessment for 2017 were detailed for discussion: the implementation of a standardization model for logbook catch per unit effort (CPUE); conversion factors for trawl-survey biomass estimates; and a new spatial expansion platform for trap-survey biomass estimation. An overview of changes occurring to the DFO-Industry Collaborative Post-Season (CPS) trap survey in 2016 as well as changes planned for forthcoming years, was also provided. For standardization of logbook CPUE, a generalized linear model incorporating time (week) as a continuous covariate alongside year was introduced to account for changes in fishery timing over the past decade, with the fishery having transitioned from late summer-early fall to spring-early summer in recent years. Delury-depletion regression models on CPUE were used to re-scale trawl survey biomass estimates. Trawl survey biomass indices have long been recognized to under-estimate true biomass. The conversions, based on biomass estimation from logbook CPUE re-scale biomass estimates to closer to absolute levels. A new stratification scheme conforming to Crab Management Areas was developed for spatial expansion of trap survey biomass estimates, and a modified version of OGMAP (OGive MAPping), the platform used to derive trawl survey biomass estimates, was introduced as the method to estimate biomass from traps. Finally, regarding changes to the CPS survey, the presentation discussed the introduction of expanded survey grounds in Divs. 2J and 3N, the increased use of small-mesh traps in the survey, and a plan to transition the survey from a patch fixed station design to a more spatially all-encompassing random stratified survey design over the next 3-4 years.
Discussion During the presentation it was asked how to get fishers to participate in the CPS trap survey in Subdiv. 3Ps if no fishers want to fish in that area. The response was that this is unknown and will likely be a concern for other areas as well in coming years. The presenter asked why soak times have been increasing since the time series began in 1995. An increase in sea lice became a problem in the mid-1990s and since then squid (bait) have been in bottles. The soak times can be longer because the squid are lasting longer in the bottles. It was also noted that the fishery in Div. 3L inshore was exploratory in 1995 and fishers were only fishing for one or two days at that time.
During post-presentation discussion, there were some comments regarding the regression analysis. It was noted that in a figure showing the regression of the raw OgMap biomass on the DeLury biomass, the line was not constrained through the origin, thus with a DeLury biomass of zero, there is still a positive OgMap estimate. It was asked if the line should be constrained through the origin to analyze catchability. The response was that this may not be necessary but is still under consideration. A participant suggested the regression line should go through the origin and it was noted the model could change shape when run through the origin. Further, it was stated that the origin is the only point that is really known. It was asked why use the DeLury method and the response was that this gives a ballpark biomass estimate and it brings OgMap biomass estimates to something closer to the truth.
8
NAFO DIVISIONS 2HJ3KLNOP4R SNOW CRAB Presenter: D. Mullowney
Abstract Resource status is evaluated based on trends in fishery catch per unit of effort (CPUE), exploitable biomass indices, recruitment prospects, and mortality indices. Data are derived from multi-species bottom trawl surveys in Divs. 2HJ3KLNOP, DFO inshore trap surveys in Divs. 3KLPs, fishery data from logbooks, observer catch-effort data, industry-DFO collaborative trap survey data, as well as biological sampling from multiple sources.
Data availability varied among divisions and between inshore and offshore areas within divisions. Trap and trawl surveys indicate that the overall exploitable biomass index has declined by 80% since 2013. All divisions are at or near their lowest observed levels of biomass, with an overall decline of 40% in 2016. Overall recruitment was at its lowest observed level in 2016, and no improvement or further reductions in recruitment are expected in the next 3-4 years. Although a small pulse of young crabs (i.e. < 30 mm carapace width [CW]) has emerged in some divisions in recent years (i.e. Divs. 2HJ and 3K), overall, virtually all population components are at low levels relative to historical levels in all divisions. Trends in indices are described in detail for each division and conclusions are presented with respect to the anticipated effects of short-term changes in removal levels on fishery-induced mortality.
Discussion During the presentation, it was asked why DFO does not conduct a trap survey in crab management areas (CMAs) 8A and 6C? The response was that the Placentia Bay population extends well offshore and is captured in the trawl survey. It was noted that regarding fishery logbook catch rate data, CMAs MS and MSex look good (high catch rates). It was also noted that there should be more small mesh pots to provide a better overview of abundance of small crabs, representing recruitment to the fishery. It was noted that the CPS survey was initially requested by the fishers and there have been problems with it. The low numbers of small mesh pots in the survey have resulted in requests for more small mesh pots to understand recruitment. Now previous surveys (with few small mesh pots) are being dismissed, which is unfortunate as fishers requested the survey to do good science. For example, in Subdiv. 3Ps, fishers do not want to participate in the survey because the fishing is poor and only four blocks were surveyed in the inner part of Placentia Bay. Last year a stabilization fund was put in place to enable more survey participation in Subdiv. 3Ps, but many fishers did not know the fund existed. A question was asked if the number of females have decreased? It was noted that in 1995-96, there were more females but the index is highly variable among years.
Post-presentation, there was some discussion regarding the analysis of shell composition of adult male crab. A participant challenged the argument that the fraction of legal size crabs that would survive (i.e. not be harvested) to get old would be notably smaller due to the effect of fishing. It was noted that with all survey years combined (since 1995), Divs. 2HJ3K do not show a decrease in old shell at legal size, and in fact in Div. 3K there is an increase. It was noted that in a figure showing the percentage of old-shelled adult males grouped by 5 mm CW bins, there is a decrease in percentage of above legal size (95 mm CW) males in Divs. 3LNO, but not in Div. 3K. It was noted that the effect appears more obvious in a figure showing similar data, but using data from all years combined. It was countered that in Div. 3K there is no obvious effect in either figure. The response was that there are no old crabs observed above legal size and there must be something going on in the fishery to contribute to mortality. An explanation followed that highlighted the presence of soft shell crabs at large sizes in recent years. It was stated that this

9
affects the numbers but not the fractions and the response was that the numbers are used to calculate the fractions.
There was a point of clarification that the figure showing bottom ocean temperatures on 1 May and 1 October 2016 was constructed using a model that is available on DFO’s Ocean Navigator Site. There was some discussion regarding the utility of comparing HI and population at seven year lags. It was noted that a low HI could kill crabs but a sudden increase in HI will not resurrect them, and the relationship is not apparent. It was asked if crabs are easier to catch in cold water? The response was that the relationship is auto-correlated and the utility of the plot is diminishing. For example, in Subdiv. 3Ps the relationship does not work anymore and it is thought that bottom-up temperature forcing is decreasing compared to other factors. It was asked if it is possible to track down when this relationship started breaking down in Subdiv. 3Ps, as it is believed predation could be a factor.
During the review of the summary bullets, a participant asked how the statement “no further reductions in recruitment are expected…” was derived (bullet four). The response was that this is based on the pre-recruit index having flat-lined and that, in theory, it could decrease. A participant also asked how the exploitation rate index (ERI; bullet six) is calculated and it was explained and then noted that this information would be described in the SAR.
NAFO SUBDIVISION 3PS SNOW CRAB Presenter: D. Mullowney
Abstract Landings declined from a recent peak of 6,700 t in 2011 to a time series low of 1,200 t in 2016. Effort reached a historic high in 2014 and has since decreased by half, with only 40-60% of the TAC taken in the past two years. CPUE has steadily declined since 2009 to a record low in 2016, reflecting precipitous declines throughout most of the Subdivision in recent years. The trawl survey exploitable biomass index declined by 88% since 2010, to a time series low in 2016. Overall recruitment has declined since 2009 to its lowest observed level and is expected to remain low in the short term (2-3 years) as the pre-recruit biomass index has remained at its lowest level for four consecutive years. Concern is expressed that discards comprised half the catch in 2016. The four highest levels in the pre-recruit fishing mortality index have occurred during the past four years. Continuing to fish under elevated mortality levels on sub-legal-sized crabs could potentially impair reproductive capacity.
Discussion During the review of the summary bullets it was asked if the potential importance of predation in Subdiv. 3Ps should be included in a bullet. The response was that perhaps this could be included in the overview bullets for all divisions. For the recruitment bullet, there was some discussion on whether the statement “near zero” pre-recruit biomass index has meaning, and it was ultimately removed. A note was made that total mortality was included in a bullet for the first time as it appears to be driven by fishing mortality. Regarding pre-recruit fishing mortality index, it was noted that discards last year in Subdiv. 3Ps reached 50% of the catch and that the strength of the fishery has been that no females and a portion of adult males are not caught. Now adult males are starting to be discarded. Clarification was asked for regarding percent female clutch, and it was noted that it is still high. It was also noted that in previous years there had been a response in egg clutch size. It was then discussed whether this is just an anomaly of one year with very high discards.

10
TORNGAT JOINT FISHERIES BOARD – DFO COLLABORATIVE POST SEASON TRAP SURVEY IN NAFO DIVISIONS 2H AND 2J NORTH Victoria Neville and Jamie Snook
Presenter: V. Neville
Abstract This presentation highlighted the Torngat Joint Fisheries Board Post Season Trap Survey (TJFB-DFO PSTS) in NAFO Divisions 2H and 2J North. Through the work of Nunatsiavut Fisheries Workshops, which brought together government, academia, fishers and processors, the need for a northern extension of the PSTS survey was identified. Before the establishment of the TJFB-DFO PSTS, trawl surveys could provide a relative index for Snow Crab abundance in NAFO Divs. 2H and 2JN. Trap surveys (utilizing commercial and small-meshed pots) are an effective sampling method for Snow Crab and generate a more accurate assessment of the resource. Since 2013, the Torngat Joint Fisheries Board has led the TJFB-DFO PSTS on the Nunatsiavut fishing grounds. The survey has created an extensive database of the demography of the Snow Crab population enabling the detection of pulses of recruitment and larval production. The survey has also begun a mark-recapture program that tracks the movements of adult Snow Crab and in time will produce an independent population assessment. This survey has generated a four year timeseries of data which is reviewed and discussed annually at the Nunatsiavut Fisheries Workshop and is now included in the DFO stock assessment. This has resulted in a more robust biomass index, as well as increased collaboration through the co-management process in Nunatsiavut.
Discussion No discussion
NAFO DIVISIONS 2HJ SNOW CRAB Presenter: D. Mullowney
Abstract Landings have remained relatively low at less than 2,000 t since 2011. Meanwhile, effort has been substantially reduced and remained at or near its lowest level in the past four years, and while CPUE increased steadily from 2011-15, it decreased throughout the division in 2016 to a relatively low level. The trawl and CPS trap survey-based exploitable biomass indices both increased sharply in 2014 and since declined by about half to relatively low levels. Recruitment spiked to a recent high in 2014 but subsequently decreased to more typical levels in both the trap and trawl surveys in the past two years and short-term recruitment prospects appear poor as the pre-recruit biomass index was at or near its lowest level in the past two years. The pre-recruit fishing mortality index has been increasing since 2005 and was at its highest level in a decade in 2016. While below historic peaks, the exploitation rate index doubled to 60% in 2016. Exploitation rates above 50% are associated with high levels of soft-shell discards. Status quo removals in 2017 would increase the exploitation rate index to 67%.
Discussion During the review of the summary bullets, it was noted that the statement that no improvements in catch per unit effort (CPUE) are anticipated in 2017 is based on the trawl survey, which is believed to have good predictability. It was noted that in the fourth bullet (recruitment), the
11
statement “typical levels” refers to low levels throughout the 2000s. Regarding pre-recruit fishing mortality, it was noted that it has been increasing since 2005, but 2003-04 values were extraordinarily high. Regarding total mortality, it was suggested that “recent high” is more like an average value, having doubled from a very low value. It was asked: what is the take home message of this bullet? The response was that fishing in this division has been “very hard” and the ERI is going to approach 75%, which is higher than in other regions. Further, Divs. 2HJ are the home of the soft shell (along with Div. 3K) and the take home message is a warning. It was asked if the level of mortality is too high. The data may show a better situation than the past, but it is still not a good situation. It was then stated that regardless of method, ERI in 2003 was terrible and the average since then is still bad. A comment was made that the link between ERI and discards is important. It was asked if there could be a statement to note that there are improved methods of calculating ERI, and the response was that this will be included in the research document. It was suggested that there can be a summary bullet about the precautionary approach and the new methods of calculating ERI.
NAFO DIVISION 3K SNOW CRAB
Presenter: D. Mullowney
Abstract Landings declined by 63% since 2009 to 5,600 t in 2016, a time series’ low. Meanwhile effort has remained near its lowest level for the past five years. CPUE has been low for the past six years reflecting recent lows in most management areas. The post-season trawl and trap survey exploitable biomass indices both declined since 2008 to their lowest observed level in the past two years. Recruitment is at or near time series’ lows throughout most of the division and is expected to remain low in the short term with trawl and trap pre-recruit indices near time series’ lows throughout the division. Maintaining current removals would leave the overall exploitation rate index unchanged in 2017, reflecting slight changes throughout most of the division. However, White Bay (CMA 3B) would double, to a historical high.
Discussion During the presentation, a participant asked about the water depth during sampling in the inner bay. The reply was that sampling occurred at depths greater than about 200 m. It was then stated that there were landings between 70 to 80 fathom (128 to 146 m) and fishers averaged a box a pot at those depths. It was noted that during the survey there were a lot of capelin observed and that in the 1980s, when there were a lot of capelin, the fishery would be shut down. It was elaborated that the DFO trap survey took place during late August into early September and capelin were observed in the CPS survey around 20 September.
After the presentation, it was noted that there was a high incidence of soft shell at the beginning of the 2016 season, which was also one of the highest seasons on record for soft shell closures. It was suggested that cold water entering the western side of the basin (Funk Island Deep) and on the level bottom (where younger crab live) resulted in this very high incidence of soft shell. A harvester noted that on a trip on 10 June, he observed young males (~ 2 inch CW) when he encountered soft shell, while normally he observes large males during high soft shell incidents. He noted that 2006 was a high year for soft shell as well, and benefits were seen in 2008, thus the stock could be replenished in years to come based on this. The response was that the magnitude is not quite high enough to be optimistic and that observers are sent out to look for soft shell once it is detected, which could conflate the data. It was noted that not all data presented represent grids that were closed due to soft shell. It was suggested that fishers have
12
not seen as much soft shell over the past few years and that could create the perception that there was much more than is true. Industry responded that they believe it is an anomaly and that soft shell was widespread from the beginning of the season.
During the review of the summary bullets, a participant asked why recruitment (fourth bullet) was said to be decreasing in most divisions, while it was showing an increase in CMA 3C. It was noted that the trawl estimate showed a small increase in CMAs 3C and 3D, but not large enough to change the bullet. Clarification was requested regarding the ERI in Div. 3K. It was stressed that ERI is an index (not an absolute value) and was calculated to be 50% using both surveys. It was asked if a 50% ERI amounts to 50% removals of the exploitable biomass. The answer was yes and the example was given that a 50% increase from 50 would be 75.
NAFO DIVISIONS 3LNO OFFSHORE SNOW CRAB Presenter: D. Mullowney
Abstract Landings have remained at 22,000-29,000 t since 1999. Effort has gradually increased over this period, to a historic high in 2016. CPUE declined by a third from near a time series’ high in 2013 to a two decade low in 2016. Both the trawl and trap surveys show considerable spatial contraction in high catch rates of exploitable crabs in recent years. The trawl survey exploitable biomass index, which covers the entire division, has precipitously declined since 2013 to a historic low. Both indices declined by about 50% in 2016, with the CPS trap survey index declining between 27-74% in the various management areas. Overall recruitment was at a historic low in 2016, reflecting low levels throughout most of the division and recruitment prospects are very poor. The pre-recruit biomass index has been at its lowest level for the past three years. The pre-recruit fishing mortality index has been at or near the time series’ high in the past two years. The exploitation rate index doubled to 60%, a historic high, in 2016. Status quo removals would double the index again in 2017, with increases occurring in all management areas.
Discussion A participant asked why an increase in catch rates occurs sometimes near the end of the season. A response from a harvester was that fishers have seen it in numerous years; they may think the crab are gone but they are surprised with good fishing (e.g. a box per pot). The harvester has been carrying a bottom temperature probe for a number of years and has noticed that when the temperature is around -1°C, catches are lower (~half a box per pot) and when the temperature increases to around 1°C, 1 box per pot is typically the catch. This has been observed several times in the same location and he stated that when the tide comes over the bank rather than from the north or northwest, as is common on the slope, the temperature decreases and the catch rates decrease. When the temperatures increase to about 1°C, the fishing improves again. The harvester was asked if fishers might be getting into next year’s crop toward the end of the season; is it new shell crab? The response was that they are not new shell, they are all similar crabs. It was noted this could be a behavioural process. It was asked if DFO measures temperature on their surveys and the answer was yes.
A harvester mentioned he noticed “dirty water” early in the season in the Nearshore (NS) CMA, and that fishing improved there toward the end of the season in 2016. Further, even in 3Lex, fishers saw no crab earlier in the season and thus expected to have poor fishing throughout the season and were surprised by good fishing later. It was noted that in some cases pots were hauled with bait (squid) still on the skiver (or in the bottle), which means nothing was moving on
13
the bottom, not even sea lice. It was mentioned that sometimes crab movement can be substantial.
There was some discussion regarding recruitment in the Whale Deep and the trap survey results. A harvester expressed concern with the recruitment data, specifically the lack of small mesh traps in the trap survey, and indicated that the trawl does not capture recruitment-sized crabs. He noted that when he conducted the CPS trap survey, his small mesh traps showed a lot of small crab, which were not found in large mesh traps. He stated he has completed three surveys in MS and MSex and not once had a small mesh trap, and is concerned that the trawl survey is missing all signs of recruitment in the Whale Deep. The response was that these are valid concerns that are shared by DFO Science, however the RV surveys have proven to have good predictability. Thus, the lack of pre-recruits in the trawl survey should not be dismissed and is a reliable index. There was some reiteration that small mesh pots can show a substantial number (500-700) of small crabs per trap.
It was mentioned several times that fishers were told at an assessment meeting 12 years ago that recruitment was low, but catch rates have remained high. Some remarks were made from industry that they would be comfortable keeping current quotas based on catch rates they have experienced. Further, if most crabs are 12 to 14 years old, they are toward the end of their lifespan, and they would like to catch what is available while it is available. The response was that catch rates are, in fact, down substantially. Catch rates are at or near low levels, except in MSex and maybe MS. Regarding the reliability of the trawl survey, biomass estimates collapsed to predict these low catch rates. Thus, this is well-timed with the loss of pre-recruits in the trawl survey. This was met with further disagreement and notes that fishers are still catching ≥ 10 kg per pot in CMAs MS, MSex and 3L200. Among harvesters, there was agreement that aside from Div. 3N, they experienced good catches. It was countered that logbook data clearly demonstrates decreased catch rates in this area. A harvester responded that all fishers have a different style of fishing. Some fishers do not change their bait throughout the season (which will result in decreased catch rates). The harvester reiterated that his fastest time catching his quota was 2016. It was stated that there is always variability in fishing due to water, wind, and other environmental conditions. For the purpose of stock assessment, one must zoom out and look at broad scale patterns. A harvester countered that 150 boxes per 80 pots does not seem like a decline and that they are seeing good catch rates everywhere except in Div. 3N. Discussion returned again to the previous science (12 years ago) that there would be no crab in 4-5 years yet record catches have been observed since then. It was stressed that this should be discussed thoroughly before any quota cuts are made because cuts in the Snow Crab quota would be especially dire, as harvesters have already experienced huge declines in their shrimp fishery.
While concerned about a lack of recruits, harvesters reported good catches in last year’s fishery. It was reiterated that in 2012, Subdiv. 3Ps fishers were telling DFO Science the same thing and now that fishery has observed a large and rapid decline, so “if the trawl survey is not reliable, how does it do such a decent job of predicting the fishery?” It was suggested that since fishers are making observations based on CPUE, differing views could be due to the differing perception when contrasting fishery performance with stock biomass indices. For example, in MS, the decrease in CPUE was from 20 to 15 kg per trap over the past two years, with no change in MSex and it there is agreement that there is a change in Div. 3N. A difference in 5 kg per trap may not be a big change for fishers on the water but, DFO Science is using all the surveys that fishers are not privy to throughout the year. In Div. 3L, catch rates vs. survey indices has always been an issue in the assessments. A harvester responded that it is understood how pulses were observed coming though in the early 1990s, where pre-recruit indices were quite high and were followed by a good fishery in the mid-1990s. He would like to
14
see what happened pre-2004-05 (when there was no CPS survey) for DFO to tell harvesters the fishery was going to fail in a few years from that time. It was suggested that the only reason the fishery expanded out 40 – 50 nM from shore and eventually outside the 200 nM limit, was to make room for everybody who wanted to fish. The response was that it is understood that the fishery has improved from a bad situation in the past, however the data show a dip in CPUE after the pre-recruit index in 2004, and the pre-recruit index is even lower now.
There was disagreement that Div. 3L is declining the way Subdiv. 3Ps did. A harvester asked for clarification regarding the difference in climate in Divs. 3LNO, which has remained relatively cold, compared with Div. 3K and Subdiv. 3Ps, which have warmed. The response was that Divs. 3LNO are colder and do not have high levels of finfish, and are theoretically more resilient to ecosystem trends. It was then asked if it is true that the ecosystem in Div. 3L is more healthy and it was pointed out that there have been general ebbs and flows in the fishery over the last 20 years. The response was that ebbs and flows are apparent over time, but crabs now are more like 15 years old rather than 12, and the ebbs and flows are not as they were previously. A harvester noted seeing less females in the last number of years. He mentioned that he discussed it with DFO Science in the past and was told the females could be at a different depth and it was likely not cause for concern. It was also noted that there is increased seismic testing in their fishing area over the past 10 years, and he would like to know what the effect is on females and crab reproduction. The response was that work is currently being done at DFO to investigate the effects of seismic activities on Snow Crab.
During review of the summary bullets, there was some discussion regarding the projected doubling of ERI in the coming season. Some participants from industry did not believe the index could double (from ERI of 60% to 120%) based on their experience on the water. Some fishers reiterated the statement that if the crab are old and could be dead by the time they set their gear, there is no point in cutting quotas. A participant asked the ages when Snow Crab begin and end their reproductive cycle. The response was that adolescent crabs as small as 50 mm, and sometimes smaller, are sexually mature. The exact age of sexual maturity is unknown, but it is known that in Divs. 3LNO, the water is colder and maturation is slower. In Divs. 3LNO, crabs are about 10 years old when they enter the exploitable biomass and at 16 years old natural mortality takes hold. It could be crabs are reproducing at about five years old, but they are likely not very active at that age. Senescent crabs move to warmer water. A comment was made that the females that are not caught in the fishery must be the same age as the males and the reply was that females generally do not live as long as males. Females terminally moult at smaller sizes and younger ages. Finally, the comment was made that, as there is no recruitment pulse coming in the next two to three years, either the fishery or natural mortality is going to take the remaining old crabs.
NAFO DIVISION 3L INSHORE SNOW CRAB Presenter: D. Mullowney
Abstract Landings increased throughout the 2000s and remained at about 8,000 t since 2013 while effort had oscillated without trend from 2005-2016 but increased by 40% to a time series’ high in 2016. Overall CPUE was near its highest observed level during 2014-2015 but abruptly declined by about 40% in 2016 to its lowest level in a decade. The post season trap survey exploitable biomass index changed little from 2004-2015 but declined by a third in 2016. This reflected decreases ranging from 12-46% in the various management areas. Overall recruitment has steadily declined since 2010 to a time series low and is expected to remain low in most management areas in the short-term as inferred from pre-recruit indices from DFO and CPS
15
trap surveys. However, improvements appear likely for Bonavista Bay (CMA 5A). The overall trap survey-based exploitation rate index increased gradually from 2006-2016 to a time series’ high. Maintaining status quo removals would increase the exploitation rate by 52% in 2017.
Discussion During the review of the summary bullets, there was some discussion on the differences in fishery and survey trends among CMAs. It was stressed that when it comes to management decisions, data for each CMA will have to be discussed. It was noted that this comes up every year, and if there is something particularly alarming in a certain CMA, it will be included in a bullet. Otherwise, any differences among CMAs will be described in the SAR. To better capture the differences among CMAs, ranges were added to most bullets.
Regarding CPUE, a participant asked what is the margin of error of the new model. It was stated that in past meetings, margins of error were always mentioned, and it was questioned if the new model, which describes a 40% decline in CPUE between the 2015-16 seasons, can be trusted. The response was that the figures presented show 95% confidence intervals, and that the 2016 data point is preliminary. A participant noted that the CPS began in 2003, after which it took three or four years to use the CPS data to see a trend and describe it in an assessment. It was asked if it will take another three or four years to determine if the new model is correct. It was noted that the new CPUE model has changed absolute values of numbers presented last year. The response was that the science needs to be allowed to change, and the ultimate goal is to evaluate trends rather than absolute numbers.
It was again discussed that fishers had not seen evidence of a declining fishery during last season. The point was made that there are many variables regulating the fishery, such as change in timing (from fall to spring) and soak time, and thus DFO Science must have the freedom to change analytical methods in response to changes in the fishery. Harvesters stated they do not understand the new model and they need to be able to explain to other fishers what they learn at the meeting. They want to know what the catch rate was in previous years. There was some discussion regarding what predictors were used in the new model. It was asked if CMA was included as a predictor. The response was that it was tried, and was sometimes significant, but it affected the fit of the divisional model. It was stated that the model predictors were “year” and the interaction of “year” with a two week time bin. The model was explained as producing a line, which is the difference between observed and model values. It was noted that the new model accounts for the skew in the data distribution. It was stated that evaluating CPUE at the (Regional) peer review (RPR) meeting is problematic as the most recent data point is preliminary (i.e. DFO is still waiting on return of logbooks). A comment was made that it would be good to have the RPR earlier in the year. The response was that DFO surveys begin in September (finishing in December or early January), the logbook data begin to arrive the first week of February, and the survey data arrive just before that. This allows only a short time frame to do the science and makes it unlikely the RPR could take place earlier in the year. Management informed participants that the consultation meetings will take place two weeks after the RPR. The comment was made that the purpose of the RPR is to assess the status of the stock, which is operating at an ecological and biological scale that is much larger than what is measured. Relative indices are used to understand a signal of the stock in the big picture, and to inform management, as absolute values of biomass or abundance are not obtainable.
16
NAFO DIVISIONS 4R3PN SNOW CRAB Presenter: D. Mullowney
Abstract Landings increased from a historic low of 190 t in 2010 to between 700-900 t since 2012. Effort has been relatively unchanged since 2012. Overall CPUE has been low throughout the time series relative to most other divisions, but there is considerable variability among management areas. The exploitable biomass index most recently peaked in 2011 and has since gradually declined, reflecting patterns in most surveyed areas. Overall recruitment most recently peaked in 2012 but has since declined to low levels in all surveyed areas. Prospects appear relatively weak for the next two to three years, as pre-recruit indices have been low in most surveyed areas following relatively high levels within the 2008-13 period. The overall exploitation rate index has increased since 2013 in all surveyed areas. Maintaining the current level of fishery removals would elevate the exploitation rate index to a new high.
Discussion A comment was made that there were charges laid for fishers from 12H who were fishing in the incorrect area, thus fishers may have abandoned 12H. These investigations are ongoing. During review of the summary bullets, some comments were made that the exploitable biomass index is starting to show a downward trend over the past three years. It was also noted that the term “surveyed areas” is different from “management areas” as not all management areas (CMAs) are surveyed. Regarding pre-recruit abundance indices, it was noted that a high value in CMA 12C is likely not representative, and is likely due to the presence of a few larger crabs, increasing the kg per trap. Regarding the ERI, there was some discussion on the role of the Bay of Islands (CMAs 12EF) in driving the overall data. It was noted that ERI is expected to increase greatly in the Bay of Islands, due to a decrease in biomass, but that Bay of Islands is a lesser player in terms of the weight of the data; not a “driver” of the data.
PROGRESS ON PRECAUTIONARY APPROACH REFERENCE POINTS AND HARVEST CONTROL RULES Presenter: D. Mullowney
Abstract Progress has been elusive on development and implementation of a precautionary approach framework for NL Snow Crab was detailed and discussed. The presentation reviewed several approaches that have been tried based on climate indices and fishery discards. It also compared how the NL Snow Crab resource would fit with conventional exploitation and biomass-based PA frameworks. Science continues to find no long-term relation or scientifically defendable method for establishing a PA framework for NL Snow Crab, and collectively industry, management, and science have not accepted any of the numerous previous attempts as a suitable basis for a PA framework. The presentation served as an overview of efforts and progress to date and sought discussion on possible ways to move forward to meet forthcoming deadlines for implementation of the PA framework into the NL Snow Crab assessment and management.
Discussion Prior to the presentation, it was suggested that DFO Science needs a clear question from the Marine Stewardship Council (MSC) to be able to meet their conditions. An update was provided
17
that the adoption of reference points and harvest control rules have been delayed until the next certificate (currently in fourth of five - year certificate). It was noted that in this fourth year of certification, a full assessment of the certification process must be completed. It was asked, giving consideration to lack or robust PA relationships, if a request can be made to exclude reference points from the upcoming certificate. The reply was that as reference points have already been delayed until the second certificate, and the assessment is taking place while certification is still valid, this was not necessary. The comment was made that the fishery has been sustainable since before receiving MSC certification, but there are now steep declines in Snow Crab biomass, so what is the way forward? The importance of MSC certification was stressed in terms of democracy of the market place, i.e. consumers exercise their prerogative to buy from fisheries for which they have assurance of sustainability through labels such as MSC. A comment was made that other fisheries that are intrinsically more harmful to the stock than the Snow Crab fishery have MSC certification. An idea for a reference point using female biomass was suggested, such that if female biomass is ten times less than the largest biomass ever measured, fishing will stop.
During the presentation, it was asked if the biomass index would increase if all mature males, rather than just the exploitable biomass index, were represented. The response was that the figures would still show decreasing biomass. Regarding the relationship between ERI and percent discarded, it was asked if this is meant to be a potential in-season management tool (harvest control rule), as management cannot predict percent discarded prior to the season and use it to manage the upcoming fishery. A comment was made that rather than attempting to manage for percent discards, it would be more suitable to attempt to manage for ERI. One can manage for ERI and predict a particular percent discard, but cannot manage for percent discard. It was countered that ERI can be calculated as a function of another indicator, but it cannot be calculated using ERI itself. The response was that there is a relationship between ERI and percent discard; if the objective is to minimize percent discard, the TAC can be set using a projected ERI, which is calculated using values from the survey. It was also noted that over time, validation can take place. The counter was that this is essentially a discussion of yield per recruit, which must be predicted from more than just percent discarded (i.e. natural mortality, etc.).
It was noted that the southern Gulf of St. Lawrence fishery is managed using contemporary data and no models. A participant asked if it is assumed all discards are killed and the response was no, soft shell crabs die immediately, but hard shell crabs do not. It was asked if the season should be changed to avoid catches of any soft shell crabs and the response was that management can work with industry to do this. A harvester mentioned that once management detects its limit of soft shell crab in a certain grid, a lot of damage has already been done. He stated that to prevent this, the season will have to be shortened, which is bad for fishers. Moreover, the season is often extended and shortening the season in Div. 3K would be especially detrimental to harvesters there as they often do not begin fishing until May or June due to sea ice. It was also noted that some areas, such as the Whale Deep, see a lot of discards, but in areas with good catches, this is not an issue.
During post-presentation discussion, the yield per recruit concept was discussed further. It was noted that yield per recruit is calculated based on the most efficient exploitation of a certain cohort, and that the exploitation curve can be modified depending on the relative strength of certain cohorts. For example, if a large cohort is about to enter the exploitable biomass, exploitation can decrease to allow the cohort to survive to exploitable size. It was suggested that the idea of minimizing discards relates to the concept of balancing wastage by discarding with loss due to natural mortality of legal-sized crabs but that a calculation must be developed to use the concept quantitatively. The discussion was pulled back into the context of MSC certification,
18
and it was stated that the milestone for this fourth year of certification is that a reference point should be tested and used.
For the harvest control rule, there must be evidence that it has been proposed and discussed, but it does not have to be in place. It was asked if the presentation has shown a reference point having been tested and used and the answer was that no, it has not. The concept of using a fecundity limit for females, was again brought up and it was stated that this concept had been previously proposed and abandoned. It was also noted that a limit on females is not quantitative for setting a TAC, which is the requirement of MSC. It was countered that this could be a harvest control rule for females, which are representative of the stock. It was noted that management has advised MSC, and they have recognized, that the fishery is already managed cautiously. The relationship of percent discard as a function of ERI was again brought up, and it was stated that deviations from the curve can take place if a particularly strong or weak cohort is coming through. In the context of harvest control rules, this was described as being a strategy which depends upon the age structure of the population, rather than on total biomass indices. This could be a good method, but the quantitative details must be worked out. It was asked what kind of work is involved to test what is being proposed and the response was that this is ultimately a yield per recruit model and testing will take time.
The effectiveness of establishing potential reference points in terms of impact on stock was questioned. It was noted that one must make measurements to know if they are effective. It was stated that there is a problem with verifying models if it requires increased exploitation in the fishery. It was asked if a rationale could be constructed based on consequences rather than conducting a real-life experiment. The response was that the ultimate measure is females and exploitation has never been high enough to detect a problem; it is like trying to model a flat line. It was countered that dips do occur within the flat line and have been related to discard effects on soft shell, which is a fishing activity, and asked if predictions can be made based on this. A comment was made by a harvester that the collapses in Subdiv. 3Ps and Div. 3K were blamed on soft shell, and it is not known on what to blame the decline in Div. 3L. He suggested that in two years, the decline in Div. 3L may be blamed on soft shell, but he suggests there are no female crabs or reproduction. The response was that this has been predicted in Div. 3L for a long time, based on a warming ocean driving an unproductive phase. The comment was made that there is a good survey in the Gulf of St. Lawrence and it was asked if they ever experienced a cautious biomass zone. The response was that they only recently developed harvest control rules, and have remained in the healthy zone since that time; though there is a mechanism (lower harvest rate) for reduction in the cautious zone. A participant reiterated that Div. 3L is a colder, and thus healthier, ecosystem. The response was that it is warming and it theoretically may be more resilient than the other divisions. However, it still responds to temperature changes, only more slowly than other divisions.
2017 RESEARCH RECOMMENDATIONS • Continue to investigate new ageing methodology (gastric mill).
• Examine Campelen survey behaviour on different substrates. This may occur by testing whether Snow Crabs in trap surveys have a catchability independent of bottom type. Follow this with nearest neighbor analysis of trap versus Campelen trawl and how it is affected by bottom type. (Compare NL Campelen and Gulf Nephrops trawls).
• Continue investigations of comparison of existing CPS survey gear with weighted pots equipped with bait protectors in areas of strong currents.
19
• Continue to explore MMB (Mature Male Biomass) as an indicator of mating success and larval production. Also, investigate the relationship of percent full clutches and co-occurrence of mature males.
• Continue work on a yield per recruit model.
• Continue seismic study on biological aspects of crab.
APPENDIX I: TERMS OF REFERENCE – SEA CUCUMBER Regional Peer Review Process - Newfoundland and Labrador Region
February 21, 2017 St. John’s, NL
Chairperson: Mark Simpson
Context The status of NAFO Subdivision 3Ps Sea Cucumber was last assessed in 2009. The current assessment is requested by Fisheries Management to provide the Minister with advice on the status of the stock in order to inform management decisions, and to provide the data that will be used to assist in the development of an Integrated Fisheries Management Plan (IFMP).
Objectives Assess the status of the Sea Cucumber resource in NAFO Division 3Ps.
Expected Publications
• Science Advisory Report
• Proceedings1
• Research Document
Participation
• Fisheries and Oceans Canada (DFO) Science and Fisheries Management
• Province of Newfoundland and Labrador Department of Fisheries Forestry and Agrifoods
• Academia
• Aboriginal Groups
• Fishing Industry
• Other invited experts
1 Joint Proceedings with the February 21-24, 2017 Newfoundland and Labrador Snow Crab Assessment
20
APPENDIX II: TERMS OF REFERENCE – SNOW CRAB Regional Peer Review Process - Newfoundland and Labrador Region
February 21-24, 2017 St. John’s, NL
Chairperson: Mark Simpson
Context The status of Divs. 2HJ3KLNO, Subdiv. 3Ps and Div. 4R Snow Crab was assessed in 2016. The current assessment of the stock components was requested by Fisheries Management to provide current information on the status of the resource and to provide the data that will be used in the 2017 Snow Crab Management Plan.
Objectives
• To assess the status of Snow Crab resource: Divisions 2HJ3KLNOP4R;
• To determine the impact of maintaining the current harvest levels; and
• To provide status updates on the Precautionary Approach (PA) framework reference points and harvest control rules.
Expected Publications
• Science Advisory Report
• Proceedings2
• Research Document
Participation
• Fisheries and Oceans Canada (DFO) Science and Fisheries Management
• Province of Newfoundland and Labrador Department of Fisheries Forestry and Agrifoods
• Academia
• Aboriginal Groups
• Fishing Industry
• Other invited experts
2 Joint Proceedings with the February 21, 2017 Assessment of 3Ps Sea Cucumber
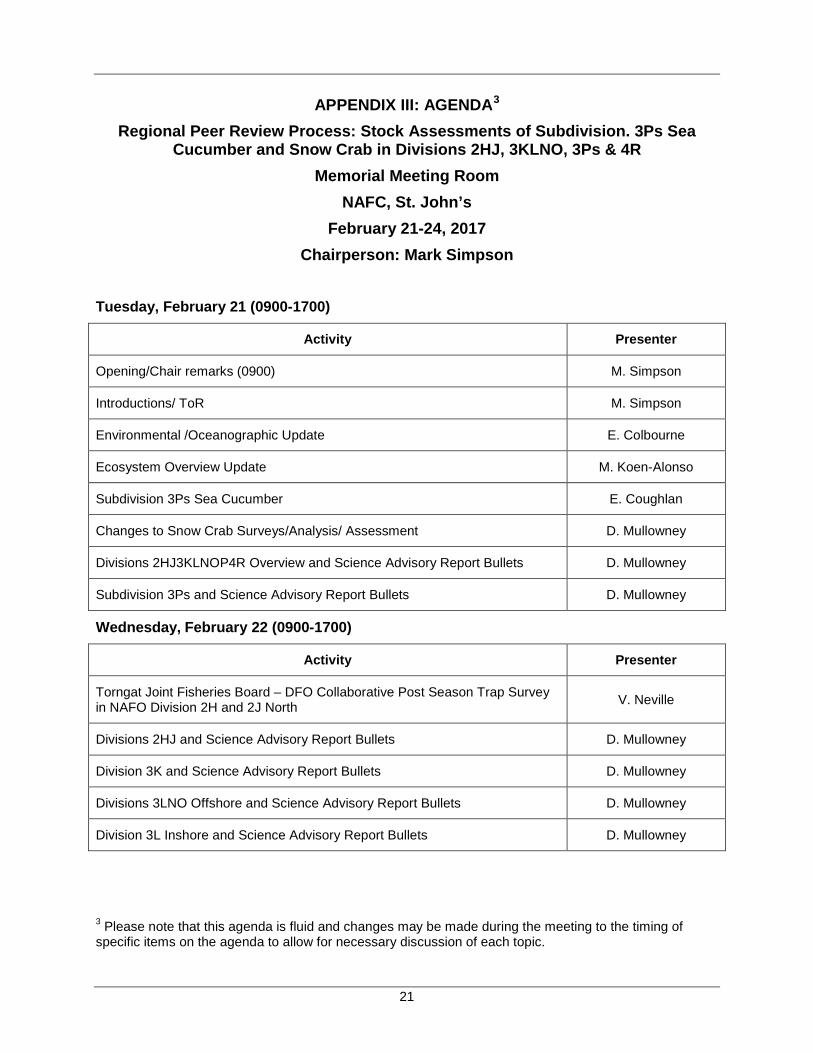
21
APPENDIX III: AGENDA3
Regional Peer Review Process: Stock Assessments of Subdivision. 3Ps Sea Cucumber and Snow Crab in Divisions 2HJ, 3KLNO, 3Ps & 4R
Memorial Meeting Room NAFC, St. John’s
February 21-24, 2017 Chairperson: Mark Simpson
Tuesday, February 21 (0900-1700)
Activity Presenter
Opening/Chair remarks (0900) M. Simpson
Introductions/ ToR M. Simpson
Environmental /Oceanographic Update E. Colbourne
Ecosystem Overview Update M. Koen-Alonso
Subdivision 3Ps Sea Cucumber E. Coughlan
Changes to Snow Crab Surveys/Analysis/ Assessment D. Mullowney
Divisions 2HJ3KLNOP4R Overview and Science Advisory Report Bullets D. Mullowney
Subdivision 3Ps and Science Advisory Report Bullets D. Mullowney
Wednesday, February 22 (0900-1700)
Activity Presenter
Torngat Joint Fisheries Board – DFO Collaborative Post Season Trap Survey in NAFO Division 2H and 2J North V. Neville
Divisions 2HJ and Science Advisory Report Bullets D. Mullowney
Division 3K and Science Advisory Report Bullets D. Mullowney
Divisions 3LNO Offshore and Science Advisory Report Bullets D. Mullowney
Division 3L Inshore and Science Advisory Report Bullets D. Mullowney
3 Please note that this agenda is fluid and changes may be made during the meeting to the timing of specific items on the agenda to allow for necessary discussion of each topic.

22
Thursday, February 23 (0900-1700)
Activity Presenter
Division 4R and Science Advisory Report Bullets D. Mullowney
Progress on Precautionary rules
Approach reference points and harvest control D. Mullowney
Research Recommendations ALL
ADJOURN M. Simpson
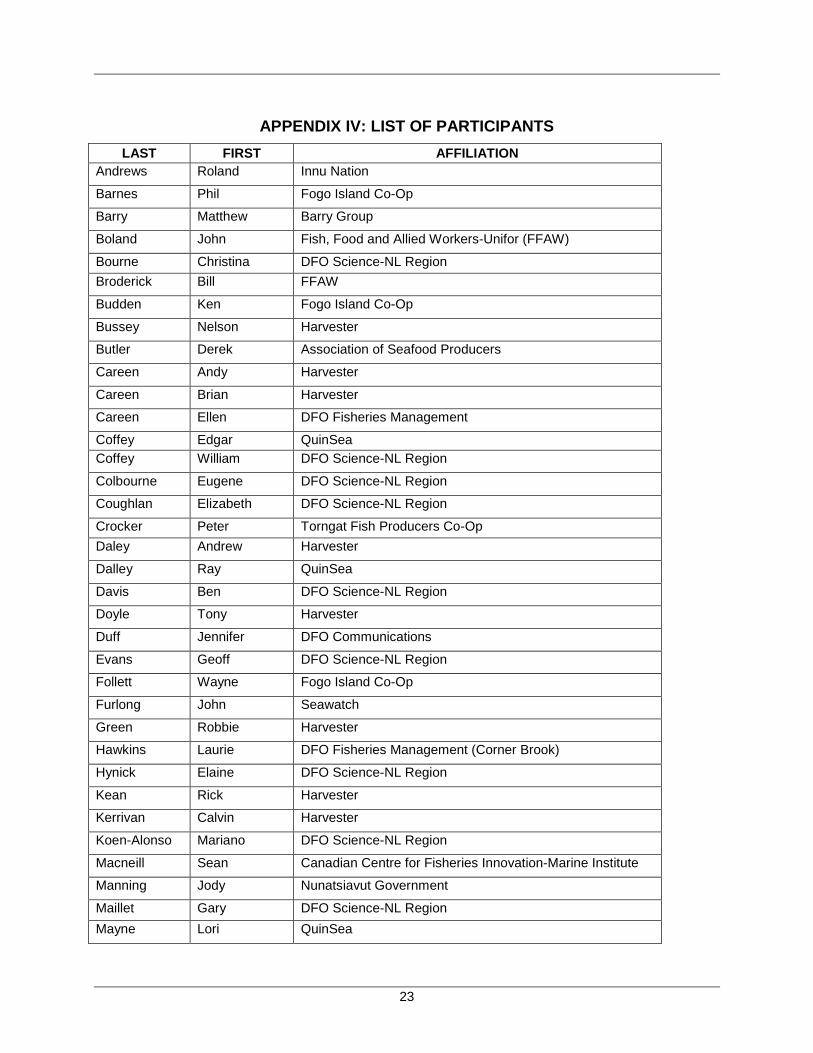
23
APPENDIX IV: LIST OF PARTICIPANTS LAST FIRST AFFILIATION
Andrews Roland Innu Nation
Barnes Phil Fogo Island Co-Op
Barry Matthew Barry Group
Boland John Fish, Food and Allied Workers-Unifor (FFAW)
Bourne Christina DFO Science-NL Region Broderick Bill FFAW
Budden Ken Fogo Island Co-Op
Bussey Nelson Harvester
Butler Derek Association of Seafood Producers
Careen Andy Harvester
Careen Brian Harvester
Careen Ellen DFO Fisheries Management
Coffey Edgar QuinSea Coffey William DFO Science-NL Region
Colbourne Eugene DFO Science-NL Region
Coughlan Elizabeth DFO Science-NL Region
Crocker Peter Torngat Fish Producers Co-Op Daley Andrew Harvester
Dalley Ray QuinSea
Davis Ben DFO Science-NL Region
Doyle Tony Harvester
Duff Jennifer DFO Communications
Evans Geoff DFO Science-NL Region
Follett Wayne Fogo Island Co-Op
Furlong John Seawatch
Green Robbie Harvester
Hawkins Laurie DFO Fisheries Management (Corner Brook)
Hynick Elaine DFO Science-NL Region
Kean Rick Harvester
Kerrivan Calvin Harvester
Koen-Alonso Mariano DFO Science-NL Region
Macneill Sean Canadian Centre for Fisheries Innovation-Marine Institute
Manning Jody Nunatsiavut Government
Maillet Gary DFO Science-NL Region Mayne Lori QuinSea
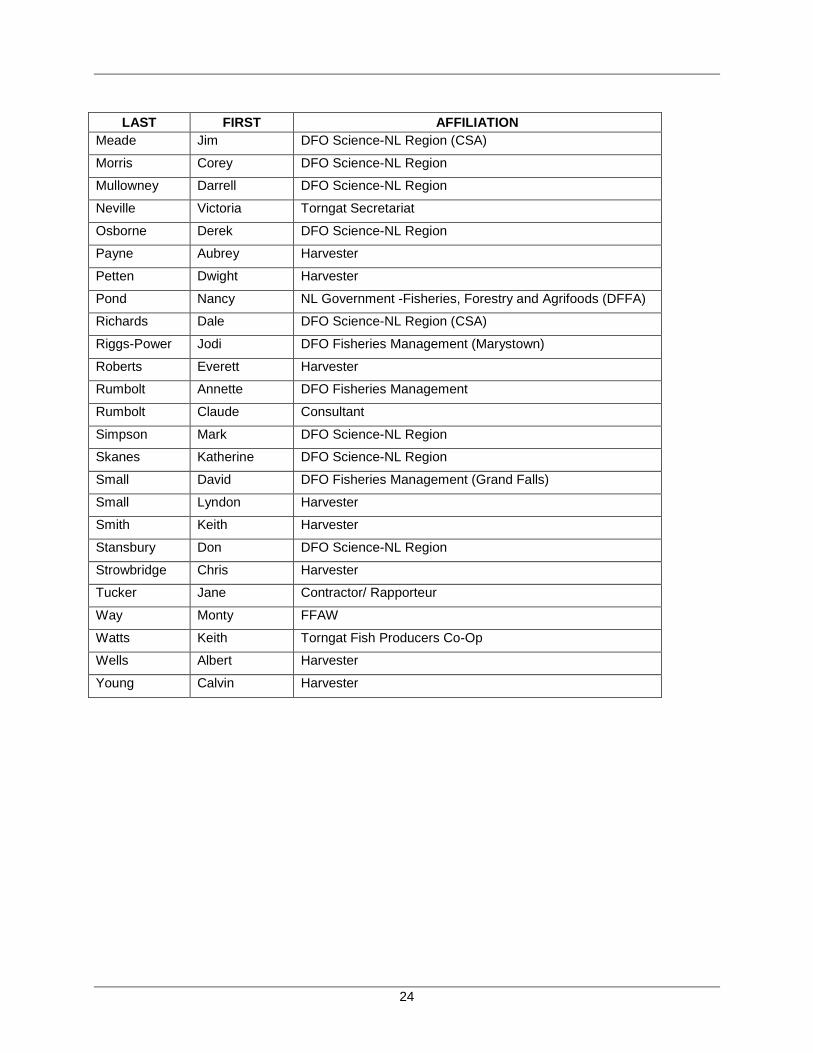
24
LAST FIRST AFFILIATION
Meade Jim DFO Science-NL Region (CSA)
Morris Corey DFO Science-NL Region
Mullowney Darrell DFO Science-NL Region
Neville Victoria Torngat Secretariat
Osborne Derek DFO Science-NL Region
Payne Aubrey Harvester
Petten Dwight Harvester
Pond Nancy NL Government -Fisheries, Forestry and Agrifoods (DFFA)
Richards Dale DFO Science-NL Region (CSA)
Riggs-Power Jodi DFO Fisheries Management (Marystown)
Roberts Everett Harvester
Rumbolt Annette DFO Fisheries Management
Rumbolt Claude Consultant
Simpson Mark DFO Science-NL Region
Skanes Katherine DFO Science-NL Region
Small David DFO Fisheries Management (Grand Falls)
Small Lyndon Harvester
Smith Keith Harvester
Stansbury Don DFO Science-NL Region
Strowbridge Chris Harvester
Tucker Jane Contractor/ Rapporteur
Way Monty FFAW
Watts Keith Torngat Fish Producers Co-Op
Wells Albert Harvester
Young Calvin Harvester