probabilistic evaluation of traffic flux and bridges safety
TRANSCRIPT

Revista Ingeniería de Construcción RIC Vol 33 Nº2 2018 www.ricuc.cl
ENGLISH VERSION.....................................................................................................................................................................................................................................................
Revista Ingeniería de Construcción Vol 33 Nº2 Abril de 2018 www.ricuc.cl 147
Probabilistic Evaluation of Traffic Flux and Bridges Safety La evaluación probabilística de Flujo del Tráfico y Seguridad del Puentes
A. Bouhaloufa *1, K. Zellat *, T. Kadri1*
* Abdelhamid Ibn Badis University, Mostaganem, ALGERIA
Fecha de Recepción: 28/11/2017 Fecha de Aceptación: 03/03/2018
PAG 147-154 Abstract The traffic flux is a complex phenomenon that occurs in existing bridges, what makes their dynamic behavior difficult to understand and badly defined. Indeed, all laws and models reflect from idealizations and empirical approximations. For this reason, the present work proposes a methodological approach for a macroscopic modeling of the traffic based on the probabilistic aspect of the phenomenon. The whole system is described using a probabilistic model where all the factors influencing the highway traffic and the safety of bridges are considered. The basic traffic data and results get using this approach lead to describe the crucial phenomena caused by traffic flux which serves to identify the vehicles speeds limits, the appropriate density and the minimum distance between two moving objects on bridges roadways. Keywords: Flux, Highway traffic, Probabilistic model, Statistic model, Structure safety, Safe distance Resumen El flujo de tráfico es un fenómeno complejo que ocurre en los puentes existentes, lo que hace que su comportamiento dinámico sea difícil de entender y esté mal definido. De hecho, todas las leyes y modelos se reflejan a partir de idealizaciones y aproximaciones empíricas. Por esta razón, el presente trabajo propone un enfoque metodológico para una modelización macroscópica del tráfico basada en el aspecto probabilístico del fenómeno. Todo el sistema se describe utilizando un modelo probabilístico donde se consideran todos los factores que influyen en el tráfico de la carretera y la seguridad de los puentes. Los datos y resultados del tráfico básico utilizan este enfoque para describir los fenómenos cruciales causados por el flujo de tráfico que sirve para identificar los límites de velocidad de los vehículos, la densidad adecuada y la distancia mínima entre dos objetos en movimiento en las carreteras de los puentes. Palabras clave: Flujo, Tráfico de la carretera, Modelo probabilístico, la Estadística de modelos, Estructura de seguridad, Distancia segura
1. Introduction
The daily traffic on bridges increases over time and all over the world, that’s why it is vital to find a way to preserve such structures from failure and damages. This can be realized by either enhancing the capacity of the bridge to match the traffic flux or modify authorities’ lows regarding the circulation as vehicles running speeds limitation and safe distance increasing (Tuny, 1979).. In both cases a good estimation of traffic flux and traffic effect must be conducted.
In the traffic process, the flux is continually changing as a result of the contribution of different dynamic properties in this phenomenon in addition to the transport tools and the road obstacles influence (barriers, convoys, climatic conditions, etc…). All of the aforementioned conditions make difficult to create an adequate mathematical model that represents the traffic flux. Thus, many research works have been carried out in the field of traffic flux estimation and evaluation in bridges. Some works regarding the traffic flux characteristics were based on sensors collected data. (Zhao et al., 2009) analyzed the traffic flux characteristics including vehicles speeds and density relationship in Beijing using remote traffic microwave
sensor data. (Lu et al., 2012) proposed a method to estimate traffic speed with single inductive loop event data. Although such site-based sensors are the most common tools to obtain the basic data for the traffic flow characteristic analysis, the obtained results can be affected by the installation position of the traffic sensor which can cause the difference on traffic flows and speeds between the adjacent upstream and downstream sections. Moreover, the installation and maintenance of sensors take a lot of human and financial resources. Further, the conditions of vehicles circulation on bridges were studied by (Enright, 2010) where a data model was established using a normal distribution considering the speeds and the intervals between vehicles. The work presented herein is an analytical approach for traffic flux estimation based on the probabilistic aspect of the phenomenon. The main purpose is on one hand the prediction of traffic and more generally the completion of traffic measurements over time (prediction) and space (distribution), and on the other hand the study of the structure loading and the determination of the traffic conditions (boundary conditions). That is why statistical methods were used in order to propose adequate and automated solutions that can be modular and adapted to technical and climate conditions that represent the case of the present study .
.
1 Corresponding author:
PhD Student, Materials and Construction Process Laboratory (LMPC), Department of Civil Engineering and Architecture Abdelhamid Ibn Badis University, Mostaganem, ALGERIA E-mail: [email protected]

148 Revista Ingeniería de Construcción Vol 33 Nº2 Abril de 2018 www.ricuc.cl
2. Static Model of Transport Flux
As the circulation regime is changing in time (during a day), the law of its variation cannot be described. That is why obtained results using static approaches are mostly unsuitable for stability calculation to estimate the probability of failure and bridges life time. For this reason, IP (Image Processing) data collected and generalized by (Enright, B., 2010) using special programs serve in this work to calculate serious
unpredictable changes in the UBM (Universal Background Model).
In the present work, the statistical model of vehicles in motion flux proposed below is established and an analytical study of probability of circulation regime changes in time is elaborated. The distribution function of vehicles number of one circulation lane as shown in Fig.1 on a given interval is given based on the following assumptions:
• The velocity v (m/s) and the intensity i (1/h) of vehicles movement are considered constant in the time interval τ. They can vary when they are discretized at each time interval, exemple: 1 hour; • Overtaking in the bridge is excluded; • The distance between vehicles (in meters) located in an
interval, is considered as the minimum safety distance Lmin ; • The influence of cars on each others on the same or opposite lane is not taken into account; • The situation change in the interval l occurs (discretized) in
a time interval equal tovl
The probability
)(ljp of the number of vehicles j on the
interval l is subjected to the Poisson law (Garber N.J. and Lester, A.H., 2014) (Equation 1 and 2):
mjlj ejcmp −−= 1)(
)!( (1)
mn
j
jn
j
lj ejmpC
1
0
1
0
)(!/−
=
−
=⎥⎦
⎤⎢⎣
⎡=⎥
⎦
⎤⎢⎣
⎡= ∑∑
(2)
Where C is a constant determined from the maximum number of vehicles probabilities min/ Ll which may be found
at the same time in the interval l. The minimum safety distance authorized between the
gravity centers of nearby vehicles depends on the speed and intensity of traffic. According to Table 1, where a comparative illustration between safety distance authorized between vehicles running on bridges in the site of Algeria and Russia in the period 2008-2009 is established, we can observe a quite difference in the safe distance related to the traffic conditions difference of Russian and Algerian roads. Moreover, the distance values calculated by the elementary formula provides good results for most speeds between 7-20 m/s as compared to the get values derived from Algerian and Russian roads recorded data in the period 2008-2009.
Figure 1. Minimum safe distance on highway bridges (Alessandro Lipari, 2016)
Table 1: Comparison on safe distance between Algerian and Russian roads according to vehicles running speeds (m)
( Get from Guebchman, 1990)
Speeds (m/s) 5 10 15 20 25
Authorized distance between vehicles (m) Values found in the site of Algeria 15 20 28 36 54
Values found in the site of Russia 17 23 35 44 66
Theoretical values 15 30 48 76 100
Revista Ingeniería de Construcción RIC Vol 33 Nº2 2018 www.ricuc.cl
ENGLISH VERSION.....................................................................................................................................................................................................................................................
Revista Ingeniería de Construcción Vol 33 Nº2 Abril de 2018 www.ricuc.cl 149
Speeds intervals shown in Table 1 are provided in some conditioned measure, they increase with the increasing of loading vehicles size. The intensity is related to the speed by correlation equations obtained using the sample data processing by the least squares method, for a mixed flux we have(Equation 3):
uv 3102,44,16 −∗−= (3)
And for trucks flux we have:
uv 3104,315 −∗−= (3.a)
Where u is the flux intensity it is represented by the number of vehicles per hour.
Theoretically, the maximum intensity for a single band does not exceed 1000 l/τ (Ouleski. B.E. and Bacilev. A.I., 1969). Practically, the daily limit intensity does not exceed 5000 vehicles / day, and the probable speed of loaded trucks traffic varies between 10 to 20 m / s.
The likelihood of the Poisson hypothesis is verified by the samples of traffic on a single band (lane A) of Algerian road section at different times by day in the present section as detailed below:
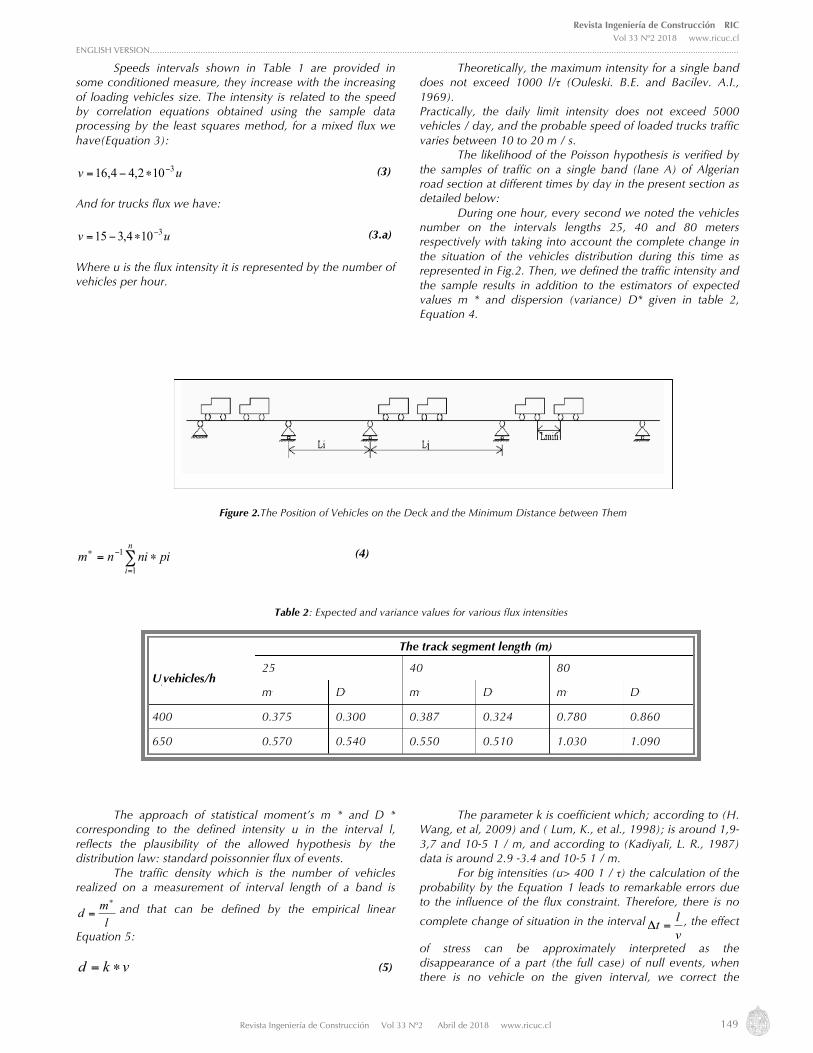
During one hour, every second we noted the vehicles number on the intervals lengths 25, 40 and 80 meters respectively with taking into account the complete change in the situation of the vehicles distribution during this time as represented in Fig.2. Then, we defined the traffic intensity and the sample results in addition to the estimators of expected values m * and dispersion (variance) D* given in table 2, Equation 4.
∑=
−∗ ∗=n
ipininm
1
1
(4)
The approach of statistical moment’s m * and D * corresponding to the defined intensity u in the interval l, reflects the plausibility of the allowed hypothesis by the distribution law: standard poissonnier flux of events.
The traffic density which is the number of vehicles realized on a measurement of interval length of a band is
lmd∗
= and that can be defined by the empirical linear
Equation 5:
vkd ∗= (5)
The parameter k is coefficient which; according to (H. Wang, et al, 2009) and ( Lum, K., et al., 1998); is around 1,9-3,7 and 10-5 1 / m, and according to (Kadiyali, L. R., 1987) data is around 2.9 -3.4 and 10-5 1 / m.
For big intensities (u> 400 1 / τ) the calculation of the probability by the Equation 1 leads to remarkable errors due to the influence of the flux constraint. Therefore, there is no
complete change of situation in the intervalvlt =Δ , the effect
of stress can be approximately interpreted as the disappearance of a part (the full case) of null events, when there is no vehicle on the given interval, we correct the
Figure 2.The Position of Vehicles on the Deck and the Minimum Distance between Them
Table 2: Expected and variance values for various flux intensities
U
j vehicles/h
The track segment length (m)
25 40 80
m* D* m* D* m* D*
400 0.375 0.300 0.387 0.324 0.780 0.860
650 0.570 0.540 0.550 0.510 1.030 1.090

150 Revista Ingeniería de Construcción Vol 33 Nº2 Abril de 2018 www.ricuc.cl
allowed law (Equation 1) excluding a part of null event (j =
0), by proportionate distribution with the probability)(ejp for
which j ≠ 0. For this, we define first the number M of vehicles
subjected to constraint during an hour as given in the following Equation 6.
lvpjUM
ej
n
j3600)(
1∑=
−=
(6)
So, the number of complementary vehicles, located on
the sample, under the same stress (Equation 7):
∑=
==n
j
ej
ej PjPMjMj
1
)()( (7)
The probability)(ejp for j vehicles (j ≠ 0) to 'fall' on
the interval l that takes into account the correction of stress is defined by the Equation 8:
⎥⎦
⎤⎢⎣
⎡⎥⎦
⎤⎢⎣
⎡−+= ∑∑
==
n
j
lj
n
j
lj
lj
lj
lj Pjv
lv
lPjUPPP
1
)(
1
)()()()( 3600:3600
(8)
The probability of appearance of a null event P
0 will be
smaller and is defined by Equation 9:
⎥⎦
⎤⎢⎣
⎡⎥⎦
⎤⎢⎣
⎡−−= ∑∑∑
===
n
j
lj
n
j
lj
N
j
llj Pjv
lv
lPjUPP
1
)(
1
)(
1
)(0
)( 3600:3600 (9)
3. Estimate of Bridge Loading
The number of events λj, for j vehicles at the same time over a length l, for a period τ = 1h is equal to Equation 10:
lvP
ljj 3600)(
=λ (10)
Similarly, we can estimate the number of such events
for the bridge employment duration T using a discrete variable of the intensity and the speed of transport movement that vary in time. For such calculation, we can use the cyclograms proposed in (Bando, M. et al. 1998).
The prospect of changes in traffic flux during series of years can be defined mainly on the basis of the extensive evolution particularity of the production of an economic real region (Leurent.F., 1996).. For bridges calculations, only the contribution of heaviest trucks is taken into account, for which thresholds of given reinforcement are achieved in construction.
After the observation of the traffic movement on the considered roadway, it was found that the distribution probability for an infinite column of a particular vehicles type follows a geometric distribution given by the Equation 11:
)1( PPP lj −= (11)
And the probability of the appearance of vehicles j having the same; type the one after the other; can be defined from the multiplication of probabilities theorem as Equation 12:
jj PP = (12)
With:
P: frequency of appearance of a particular type of vehicle in the column. In a column, the distribution probability following different types of trucks can be defined by Equation 13:
∏=
=j
rjP
1Pr (13)
With:
Pr: probability of appearance of the truck type r in the uniform column.
Distribution, at the same time, of different types of vehicles in the column is defined by Equation 13 and assumed arbitrary. The coefficient µ of vehicle loading represents the relationship between transported change and the total transport column of the vehicle, according to data (Birouli, A.K. and Mikhovitch, C.I., 1978) and (Federov. I.P., 1980), can be equal to 0.4-0.8.
We assume that for all the service period of the bridge, the appearance of a heavy and different loading set is possible and that is on a single band of the road. The number of event Nq, for q = 1, 2, ..., Q, for the qth loading calculation during the period T (in years) is estimated by the Equation 14 (taking into account a variation of the intensity and speed).
( ) nT
t i S Kv
ltiskPqNq η=∑∑∑∑
= = = =
3600,,,1
12
1
30
1
24
1
(14)
With:
( ) ( ) )()( ,,,,,, qn
ln PtiskPtiskPq =
N: number of cars on the bridge at the same time
Pq (k, s, i, t): Probability of appearance on the bridge for the qth loading calculation, this probability of a complex event is defined as the product of probabilities of unfavorable loading combination and calculated using the formula Equation 12 or 13, and the probabilities ( )tiskP l
n ,,,)( are calculated by the
Equation 8. k, s, i, t: are values in terms (k = 1, 2, 3, ..., 12), in
days (s = 1, 2, 3, .... 30), in months (i = 1, 2, 3, .... 12), in years (t = 1, 2, 3, T). The average value of the probability of qth loading calculation for the whole period T is calculated by the Equation 15:
∑∑∑ ∑= = = =
=T
t i s Kqq tiskPP
1
12
1
30
1
24
1),,,(
(15)
Here, the numbers 12, 30, 24, correspond
respectively to the number of months in the year, days in the month and hours in a day.

Revista Ingeniería de Construcción RIC Vol 33 Nº2 2018 www.ricuc.cl
ENGLISH VERSION.....................................................................................................................................................................................................................................................
Revista Ingeniería de Construcción Vol 33 Nº2 Abril de 2018 www.ricuc.cl 151
In the case when (Pu) and the intensity of movement are given by statistical series, the number of loading calculations Nq is defined by the Equation 16:
)(,
11 )()(3600243012 e
un
m
nn
q PUvPqPvl
TN ∗∗∗µ∗∗∗∗∗∗= ∑=ν
(16)
For the crossing movement the probability of
intersection of two trucks at a given section of the bridge should theoretically be null. It would be different from 0 if the location of such crossing is given by a certain interval, this probability depends on the relationship that links the length of this interval and the average distances between heavy vehicles of each column. Such situation can be observed in the case of more complex events, for example the intersection of a column of trucks.
The number of events Nq for a movement in both directions will be defined approximately, with an additional element (corrective) by the Equation 17:
( ) ( )∑∑∑ ∑= = = =
η=T
t i S K
nq v
ltiskPqtiskPqN
1
12
1
24
1
30
1212
3600,,,,,,
(17)
In which the probabilities PQ1 (k, s, i, t) and P
Q2 (k, s, i, t)
correspond to the different directions of transport movement. Thus, the appearance of loading calculations for
bridges with medium and long spans under normal conditions for mixed movements is studied as a very rare event.
The intensity of the movement on roads for one day is distributed unevenly, according to (Birouli, A.K., 1984) data, it is close to 0 for 1/3 of the day, and can vary from 1.5 to 4 times in the 2/3 of the time remaining. For a high intensity (u ≥ 400 1 / h), the passage to a motion with multiple columns is necessary in order to reduce accident situations.
Multiple observations of the circulation (movement) realized by the service operating on different highways in Algeria show a significant decrease in the intensity over time. Table 3 presents an example get from the daily average intensities data (in both directions of motion) for 2 years (2007 and 2008) recorded in economic regions (zones I, II and III). We can observe that the proportion of vehicles over 5T.C in a mixed circulation (movement) is from 18-27% of the total number of vehicles. The proportion of heaviest vehicles (30T.c and more), as reported by (Barrenkov. A.C. and Maltsev. P.I., 1971), is taken equal to 2% of all vehicles.
Further, the viaducts and flyover bridges with special prescription (economic, career) are exploited only by heavy vehicles where the probability and the number of calculations of change can be highly significant.
The transverse distribution of vehicles for roads and bridges with a multi column circulation (movement), according to research, is characterized by the flux division into two parts: heavy vehicles (outside the band) and light (inside the band) (IAURIF, 1997)., holding that the circulation (movement) of light and heavy vehicles is carried out in accordance with the speeds 50-70km / h and 80-110 km / h.
The distribution densities of vehicles constructed according to the crossing widths of bridges have a double modal form for each traffic direction. The important mode corresponds primarily to heavy vehicles (trucks) in a transportation network. The distances between the modes are
between the limits 3m-4m and their distances in edges do not exceed 4m. These data are not practically the distances limits of recommended densities.
Moreover, the transport band on light bridges has almost the same conditions as on bridges having special requirement, which means that the empirical frequency of loading calculations, for them, can be significant. In complex multi-way bridges, the probability Pq and the predictable number of loading calculations Nq are defined as for complex events of k spans loading using the possible number of vehicles nj and simultaneously with the total absence of loading on the other spans (s-k).
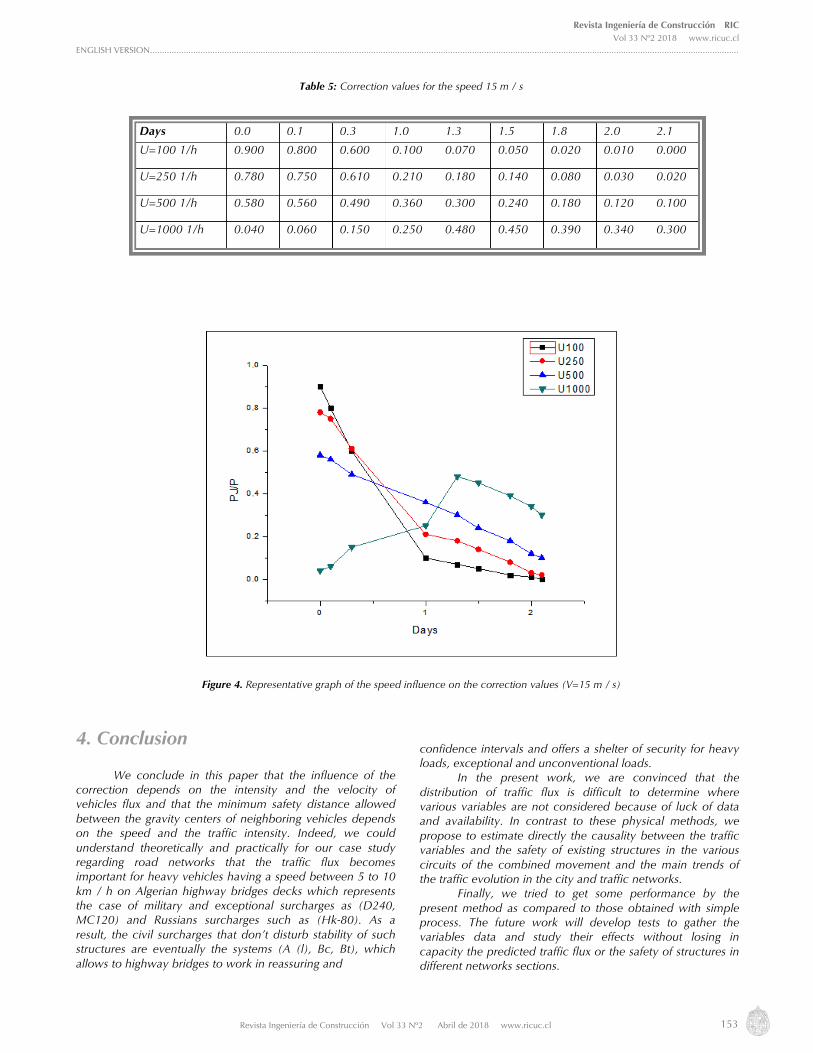
From the results obtained through the graphs of Figures 3 and 4, we note that the results are convincing and the influence of the obtained results on the correction depends highly on the speed of traffic and travel time realized. In this context, we note that for a time t less than 0.5
Table 3: Vehicles percentage in economic zones in the years 2007 and 2008
Convoys of vehicles
Stations of traffic data recording I II III
2007 2008 2007 2008 2007 2008
light % 16.700 30.800 8.800 8.600 17.300 18.400
Heavy up 2,5 tf % 20.000 10.700 20.000 21.000 26.300 27.600
Heavy up 4,5tf % 31.200 34.900 36.100 32.200 28.500 29.800
Buses % 14.000 4.200 7.900 12.700 6.700 6.000
Heavy vehicles> 5 tf % 18.100 20.400 27.200 25.500 21.200 18.200
Total % 100.000 100.000 100.000 100.000 100.000 100.000
Number of vehicles in 24 h 19500 32700 1200 1550 6150 6800

152 Revista Ingeniería de Construcción Vol 33 Nº2 Abril de 2018 www.ricuc.cl
days, the influence of the correction is very important generally for all densities and in particular the densities between 100 and 250 vehicles per hour, but this influence over this period varies in the opposite direction which means that the correction value decreases for the lowest densities mentioned above and even null values (see Figures 3 and 4) and increases for other cases especially for the speed 15 km / h. For this reason, we always try to maintain the traffic flux in urban areas with certain fluidity and a uniform distribution on all circulation roads, as we arrive to guarantee or ensure an adequate velocity according to our traffic plan. In fact, it is a dilemma for our technicians to find an equilibrium between a relatively low speed and a moderate traffic density that are
appropriate to our traffic conditions in the different road networks generally and arches roads networks particularly. Moreover, we are interesting a lot of in rush hours for the traffic organization in order to offer comfort and safety to passengers. Finally, our goal of this modest study is to improve significantly our calculation models and to manage the traffic for the horizons lower than 0.5 days, as we can dare to go further than that like the case of lower horizons where the record time is less than 15.00 minutes (less than 0.25 hours). These results are confirmed when predicting travel time of a traffic flux for two types of bridges and bridges in urban environment where a large crowded city and heavy traffic are preferred.
Figure 3. Representative graph of speed influence on the correction values (V=10 m / s)
Days 0.0 0.1 0.3 1.0 1.3 2.0 2.3 2.6 3.2
U=100 1/h 0.900 0.690 0.650 0.100 0.070 0.010 0.010 0.005 0.000
U=250 1/h 0.680 0.650 0.440 0.250 0.180 0.030 0.020 0.010 0.004
U=500 1/h 0.380 0.380 0.380 0.380 0.350 0.150 0.120 0.090 0.044
U=1000 1/h 0.380 0.380 0.380 0.380 0.370 0.330 0.300 0.270 0.200
Table 4: Correction values for the speed 10m / s
Revista Ingeniería de Construcción RIC Vol 33 Nº2 2018 www.ricuc.cl
ENGLISH VERSION.....................................................................................................................................................................................................................................................
Revista Ingeniería de Construcción Vol 33 Nº2 Abril de 2018 www.ricuc.cl 153
4. Conclusion
We conclude in this paper that the influence of the correction depends on the intensity and the velocity of vehicles flux and that the minimum safety distance allowed between the gravity centers of neighboring vehicles depends on the speed and the traffic intensity. Indeed, we could understand theoretically and practically for our case study regarding road networks that the traffic flux becomes important for heavy vehicles having a speed between 5 to 10 km / h on Algerian highway bridges decks which represents the case of military and exceptional surcharges as (D240, MC120) and Russians surcharges such as (Hk-80). As a result, the civil surcharges that don’t disturb stability of such structures are eventually the systems (A (l), Bc, Bt), which allows to highway bridges to work in reassuring and
confidence intervals and offers a shelter of security for heavy loads, exceptional and unconventional loads.
In the present work, we are convinced that the distribution of traffic flux is difficult to determine where various variables are not considered because of luck of data and availability. In contrast to these physical methods, we propose to estimate directly the causality between the traffic variables and the safety of existing structures in the various circuits of the combined movement and the main trends of the traffic evolution in the city and traffic networks.
Finally, we tried to get some performance by the present method as compared to those obtained with simple process. The future work will develop tests to gather the variables data and study their effects without losing in capacity the predicted traffic flux or the safety of structures in different networks sections.
Days 0.0 0.1 0.3 1.0 1.3 1.5 1.8 2.0 2.1
U=100 1/h 0.900 0.800 0.600 0.100 0.070 0.050 0.020 0.010 0.000
U=250 1/h 0.780 0.750 0.610 0.210 0.180 0.140 0.080 0.030 0.020
U=500 1/h 0.580 0.560 0.490 0.360 0.300 0.240 0.180 0.120 0.100
U=1000 1/h 0.040 0.060 0.150 0.250 0.480 0.450 0.390 0.340 0.300
Table 5: Correction values for the speed 15 m / s
Figure 4. Representative graph of the speed influence on the correction values (V=15 m / s)
154 Revista Ingeniería de Construcción Vol 33 Nº2 Abril de 2018 www.ricuc.cl
5. References Alessandro Lipari, Colin C. Caprani, Eugene J. OBrien (2016), A Methodology for Calculating Congested Traffic Characteristic Loading
on Long-Span Bridges Using Site-Specific Data, Computers & Structures, Vol 190, pp 1-12 Bando M., Hasebe K., Nakanishi K., and Nakayama A. (1998), Analysis of Optimal Velocity Model with Explicit Delay. Phys. Rev. E, vol. 58,
pp. 5429-5435 Barrenkov A.C. and Maltsev P.I. (1971), Méthode Probabiliste dans le Calcul Dynamique des Ponts. Journal de l’Université de Varonege, pp 48-
77.Varonege Birouli A.K. (1984), Aide-mémoire de l’Ingénierie des Routes. Edition Transport, Mouscou Birouli A.K. and Mikhovitch,C.I. (1978), Etude des Courbes de Roulements. Edition Transport, Mouscou Enright B. (2010), Simulation of Traffic Loading on Highway Bridges, PhD Thesis, School of Architecture, Landscape Federov I.P. (1980), Travaux de Recherche des Ponts Routiers. Thèse de Ph.D. Mouscou Guebchman E.E. (1990), La Sécurité de la Circulation sur les Ponts. Edition transports, Mouscou IAURIF (1997), Le Modèle de Trafic de l’IAURIF. Division Transports et Infrastructure, Paris Kadiyali L. R. (1987), Traffic Engineering and Transportation Planning. Khanna Publishers, New Delhi Leurent F. (1996), Indicateur Infra Economique des Conditions de Circulation sur un Réseau Routier. France Lu X. Y., Varaiya P., Horowitz R., Guo, Z. M. & Palen J. (2012), Estimating Traffic Speed with Single Inductive Loop Event Data in
Transportation Research Record, Journal of the Transportation Research Board, No. 2308, Transportation Research Board of the National Academies, Washington, D.C., 157 - 166
Lum K., Fan H., Lam S., Olszewski P. (1998), Speed-Flow Modeling of Arterial Roads in Singapore. Journal of Transportation Engineering 124(3), 213-222
Ouleski B.E. and Bacilev A.I. (1969), Normes et Surcharges Roulantes Verticales pour les Ponts Routiers. Construction des Infrastructures Routières, Transport N°8, pp27-30 Moscou
Garber N. J., Hoel L. A. (2010), Traffic and Highway Engineering, SI Edition Tuny C.C. (1979), Answer of Highway Bridges to Renewal Traffic Loads. Souvnal of the Eng.Mech. Zurich In Transportation Research Record:
Journal of the Transportation Research Board, No. 2124, Transportation Research Board of the National Academies, Washington, D.C.,178 - 185
Wang H., Li J., Chen Q.Y. and NI D. (2009), Speed Density Relationship: Deterministic to Stochastic, TRB 88th Annual Meeting, Washington Zhao N. L., Yu L., Zhao H., Guo J. F. & Wen H. M. (2009), Analysis of Traffic Flow Characteristics on Ring-Road Expressways in Beijing Using
Floating-Car Data and Remote Traffic Microwave Sensor Data. Journal of the Transportation Research Board. Vol 2124, pp 31-41