preqin-and-first-republic-update-us-venture-capital-in-q1
TRANSCRIPT

PREQIN AND FIRST REPUBLIC UPDATE:US VENTURE CAPITAL IN Q1 2020
PREQIN AND FIRST REPUBLIC UPDATE: US VENTURE CAPITAL IN Q1 2020
© Preqin Ltd. www.preqin.com 2
Contents
Preqin partnered with First Republic Bank to prepare this information regarding US Venture Capital. This report is for information purposes only and is not intended as an offer, solicitation, advice (investment, legal, tax, or otherwise), or as the basis for any contract. First Republic Bank has not independently verified the information contained herein and shall not have liability to any third party in any respect for this report or any actions taken or decisions made based upon anything contained herein. This information is valid only as of April 2020 and neither Preqin nor First Republic Bank will undertake to update this report with regard to changes in market conditions, information, laws, or regulations after the date of this report. This report may not be further reproduced or circulated without the written permission of Preqin and First Republic Bank.
All rights reserved. The entire contents of Preqin and First Republic Update: US Venture Capital in Q1 2020 are the Copyright of Preqin Ltd. No part of this publication or any information contained in it may be copied, transmitted by any electronic means, or stored in any electronic or other data storage medium, or printed or published in any document, report or publication, without the express prior written approval of Preqin Ltd. The information presented in Preqin and First Republic Update: US Venture Capital in Q1 2020 is for information purposes only and does not constitute and should not be construed as a solicitation or other offer, or recommendation to acquire or dispose of any investment or to engage in any other transaction, or as advice of any nature whatsoever. If the reader seeks advice rather than information then he should seek an independent financial advisor and hereby agrees that he will not hold Preqin Ltd. responsible in law or equity for any decisions of whatever nature the reader makes or refrains from making following its use of Preqin and First Republic Update: US Venture Capital in Q1 2020. While reasonable efforts have been made to obtain information from sources that are believed to be accurate, and to confirm the accuracy of such information wherever possible, Preqin Ltd. does not make any representation or warranty that the information or opinions contained in Preqin and First Republic Update: US Venture Capital in Q1 2020 are accurate, reliable, up to date or complete. Although every reasonable effort has been made to ensure the accuracy of this publication Preqin Ltd. does not accept any responsibility for any errors or omissions within Preqin and First Republic Update: US Venture Capital in Q1 2020 or for any expense or other loss alleged to have arisen in any way with a reader’s use of this publication.
3 Foreword
4 Deals & Exits
7 Fundraising
10 Funds in Market
12 Micro Venture Capital
15 Performance
17 Fund Managers
19 Investors
Data PackThe data behind all of the charts featured in this report is available to download for free. Ready-made charts are also included that can be used for presentations, marketing materials, and company reports.
To download the data pack, please visit: www.preqin.com/FRUSVCQ120
PREQIN AND FIRST REPUBLIC UPDATE: US VENTURE CAPITAL IN Q1 2020
© Preqin Ltd. www.preqin.com 3
Following a robust 2019, US venture capital activity slowed considerably in Q1 2020. A total of 963 deals were completed in the US for an aggregate $27bn, a 19% decline from 1,191 deals in Q1 2019. Other key statistics from the quarter include:
• Exit activity increased compared with the prior year, with 147 venture capital-backed exits valued at an aggregate $26bn, in contrast to 142 exits at $14bn in Q1 2019.
• In the fundraising market, 83 US-based venture capital funds held a final close, down from 109 in Q1 2019. That said, those funds that closed raised $27bn, a substantial total representing over half of the capital raised in 2019 ($50bn). Mega funds drove this number as seven funds closed at over $1bn, compared to just six in all of 2019.
• At the other end of the market, funds that raised $50mn or less accounted for only 42% of all funds closed, the lowest quarterly level in 10 years. The trend is likely the result of many large managers coming back to market and closing in Q1, along with the delay many smaller managers are facing due to COVID-19.
• The fundraising pipeline has grown to record heights, with 1,085 funds seeking $99bn in commitments. Of those funds, 486 early-stage funds seeking $30bn in capital represent 45% of all funds on the road and 31% of targeted capital. Four of the 10 largest US-based funds in market
focus on healthcare, reflecting investor interest in the sector which is even more pronounced due to COVID-19.
• Following 2019’s record totals, micro venture capital fundraising momentum slowed significantly in Q1 2020. Micro venture capital funds (sized at $100mn or less) secured just $1.1bn in aggregate, with only 47 funds reaching a final close. The funds that did close, however, did so with success, spending an average of only 15 months on the road.
Foreword
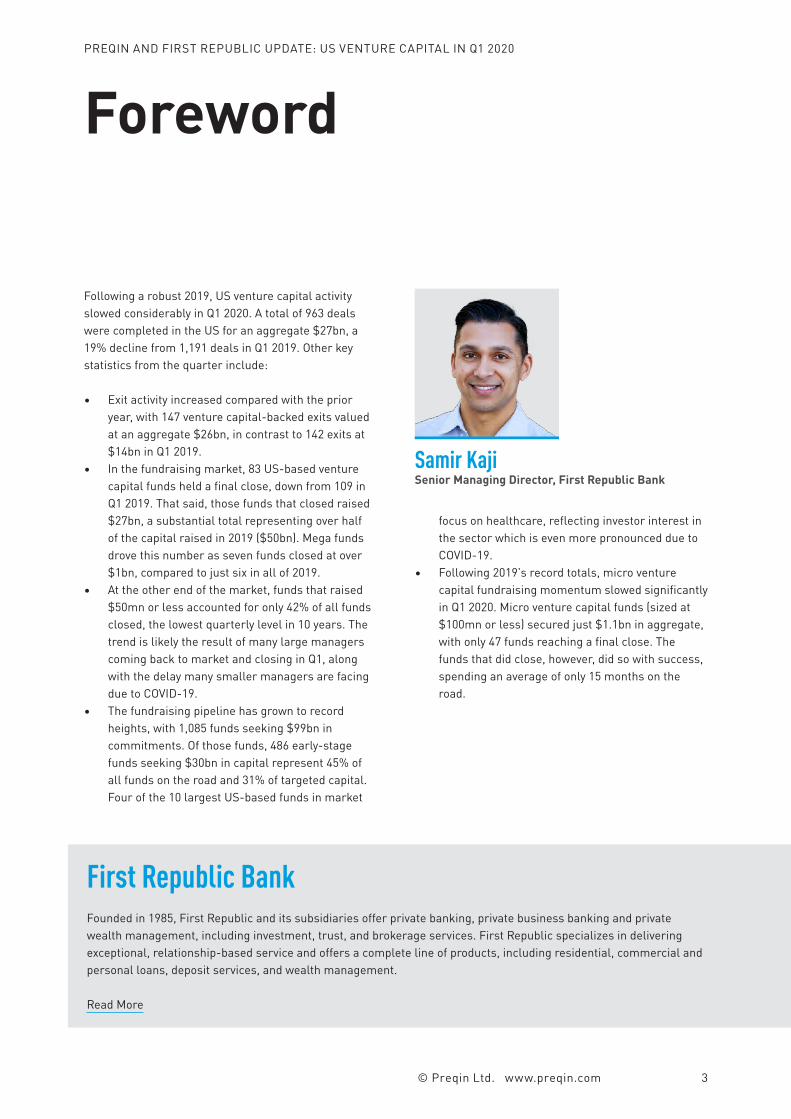
Samir KajiSenior Managing Director, First Republic Bank
First Republic BankFounded in 1985, First Republic and its subsidiaries offer private banking, private business banking and private wealth management, including investment, trust, and brokerage services. First Republic specializes in delivering exceptional, relationship-based service and offers a complete line of products, including residential, commercial and personal loans, deposit services, and wealth management.
Read More
PREQIN AND FIRST REPUBLIC UPDATE: US VENTURE CAPITAL IN Q1 2020
© Preqin Ltd. www.preqin.com 4
Deals &Exits
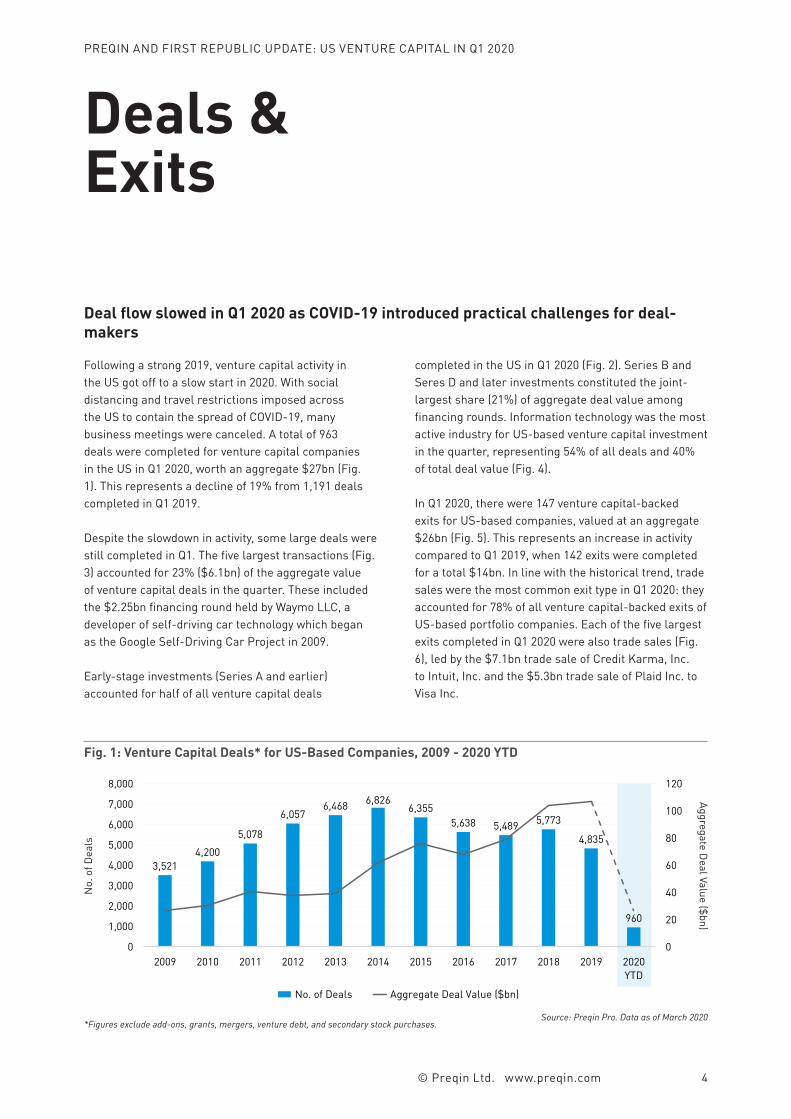
Following a strong 2019, venture capital activity in the US got off to a slow start in 2020. With social distancing and travel restrictions imposed across the US to contain the spread of COVID-19, many business meetings were canceled. A total of 963 deals were completed for venture capital companies in the US in Q1 2020, worth an aggregate $27bn (Fig. 1). This represents a decline of 19% from 1,191 deals completed in Q1 2019.
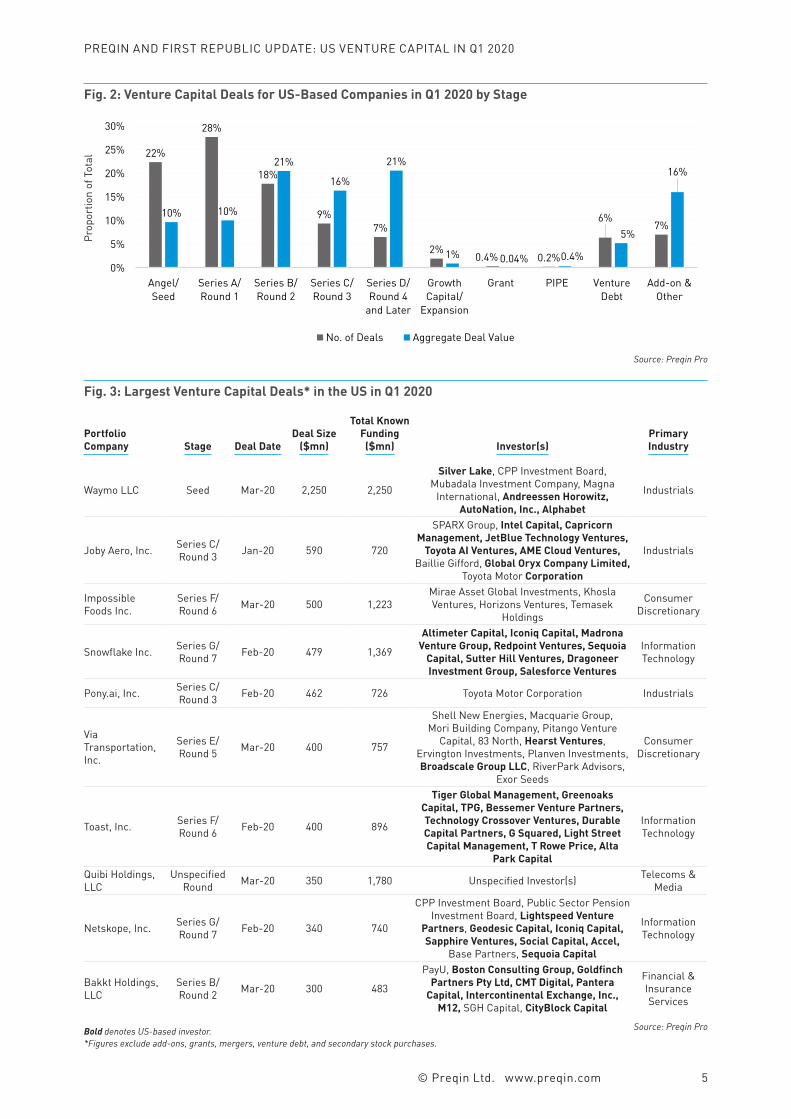
Despite the slowdown in activity, some large deals were still completed in Q1. The five largest transactions (Fig. 3) accounted for 23% ($6.1bn) of the aggregate value of venture capital deals in the quarter. These included the $2.25bn financing round held by Waymo LLC, a developer of self-driving car technology which began as the Google Self-Driving Car Project in 2009.
Early-stage investments (Series A and earlier) accounted for half of all venture capital deals
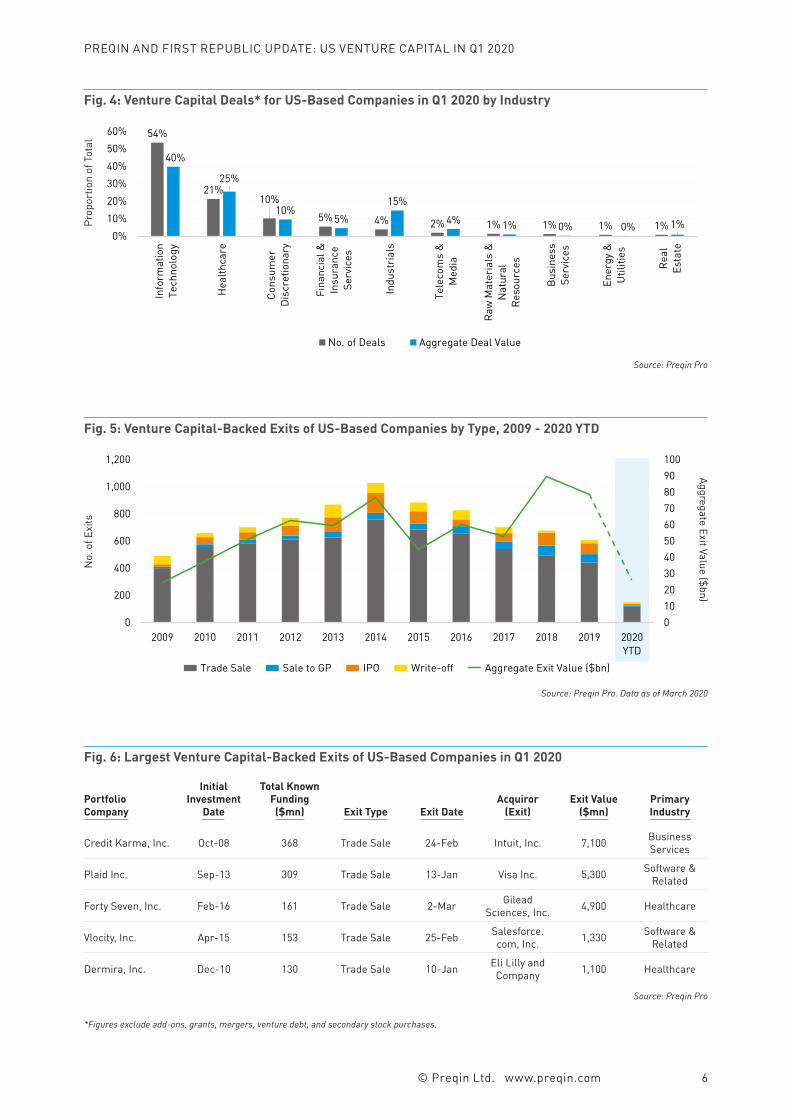
completed in the US in Q1 2020 (Fig. 2). Series B and Seres D and later investments constituted the joint-largest share (21%) of aggregate deal value among financing rounds. Information technology was the most active industry for US-based venture capital investment in the quarter, representing 54% of all deals and 40% of total deal value (Fig. 4).
In Q1 2020, there were 147 venture capital-backed exits for US-based companies, valued at an aggregate $26bn (Fig. 5). This represents an increase in activity compared to Q1 2019, when 142 exits were completed for a total $14bn. In line with the historical trend, trade sales were the most common exit type in Q1 2020: they accounted for 78% of all venture capital-backed exits of US-based portfolio companies. Each of the five largest exits completed in Q1 2020 were also trade sales (Fig. 6), led by the $7.1bn trade sale of Credit Karma, Inc. to Intuit, Inc. and the $5.3bn trade sale of Plaid Inc. to Visa Inc.
Deal flow slowed in Q1 2020 as COVID-19 introduced practical challenges for deal-makers
Fig. 1: Venture Capital Deals* for US-Based Companies, 2009 - 2020 YTD
Source: Preqin Pro. Data as of March 2020
3,5214,200
5,078
6,0576,468 6,826
6,3555,638 5,489 5,773
4,835
960
0
20
40
60
80
100
120
0
1,000
2,000
3,000
4,000
5,000
6,000
7,000
8,000
2009 2010 2011 2012 2013 2014 2015 2016 2017 2018 2019 2020YTD
No. of Deals Aggregate Deal Value ($bn)
*Figures exclude add-ons, grants, mergers, venture debt, and secondary stock purchases.
No.
of D
eals
Aggregate Deal Value ($bn)
PREQIN AND FIRST REPUBLIC UPDATE: US VENTURE CAPITAL IN Q1 2020
© Preqin Ltd. www.preqin.com 5
Fig. 2: Venture Capital Deals for US-Based Companies in Q1 2020 by Stage
Source: Preqin Pro
22%
28%
18%
9%7%
2%0.4% 0.2%
6%7%
10% 10%
21%
16%
21%
1% 0.04% 0.4%
5%
16%
0%
5%
10%
15%
20%
25%
30%
Angel/Seed
Series A/Round 1
Series B/Round 2
Series C/Round 3
Series D/Round 4
and Later
GrowthCapital/
Expansion
Grant PIPE VentureDebt
Add-on &Other
No. of Deals Aggregate Deal Value
Bold denotes US-based investor.*Figures exclude add-ons, grants, mergers, venture debt, and secondary stock purchases.
Portfolio Company Stage Deal Date
Deal Size ($mn)
Total Known Funding
($mn) Investor(s)Primary Industry
Waymo LLC Seed Mar-20 2,250 2,250
Silver Lake, CPP Investment Board, Mubadala Investment Company, Magna
International, Andreessen Horowitz, AutoNation, Inc., Alphabet
Industrials
Joby Aero, Inc. Series C/Round 3 Jan-20 590 720
SPARX Group, Intel Capital, Capricorn Management, JetBlue Technology Ventures,
Toyota AI Ventures, AME Cloud Ventures, Baillie Gifford, Global Oryx Company Limited,
Toyota Motor Corporation
Industrials
Impossible Foods Inc.
Series F/Round 6 Mar-20 500 1,223
Mirae Asset Global Investments, Khosla Ventures, Horizons Ventures, Temasek
Holdings
Consumer Discretionary
Snowflake Inc. Series G/Round 7 Feb-20 479 1,369
Altimeter Capital, Iconiq Capital, Madrona Venture Group, Redpoint Ventures, Sequoia
Capital, Sutter Hill Ventures, Dragoneer Investment Group, Salesforce Ventures
Information Technology
Pony.ai, Inc. Series C/Round 3 Feb-20 462 726 Toyota Motor Corporation Industrials
Via Transportation, Inc.
Series E/Round 5 Mar-20 400 757
Shell New Energies, Macquarie Group, Mori Building Company, Pitango Venture
Capital, 83 North, Hearst Ventures, Ervington Investments, Planven Investments, Broadscale Group LLC, RiverPark Advisors,
Exor Seeds
Consumer Discretionary
Toast, Inc. Series F/Round 6 Feb-20 400 896
Tiger Global Management, Greenoaks Capital, TPG, Bessemer Venture Partners, Technology Crossover Ventures, Durable Capital Partners, G Squared, Light Street Capital Management, T Rowe Price, Alta
Park Capital
Information Technology
Quibi Holdings, LLC
Unspecified Round Mar-20 350 1,780 Unspecified Investor(s) Telecoms &
Media
Netskope, Inc. Series G/Round 7 Feb-20 340 740
CPP Investment Board, Public Sector Pension Investment Board, Lightspeed Venture
Partners, Geodesic Capital, Iconiq Capital, Sapphire Ventures, Social Capital, Accel,
Base Partners, Sequoia Capital
Information Technology
Bakkt Holdings, LLC
Series B/Round 2 Mar-20 300 483
PayU, Boston Consulting Group, Goldfinch Partners Pty Ltd, CMT Digital, Pantera
Capital, Intercontinental Exchange, Inc., M12, SGH Capital, CityBlock Capital
Financial & Insurance Services
Source: Preqin Pro
Fig. 3: Largest Venture Capital Deals* in the US in Q1 2020
Prop
ortio
n of
Tot
al
PREQIN AND FIRST REPUBLIC UPDATE: US VENTURE CAPITAL IN Q1 2020
© Preqin Ltd. www.preqin.com 6
Fig. 4: Venture Capital Deals* for US-Based Companies in Q1 2020 by Industry
Source: Preqin Pro
54%
21%10%
5% 4% 2% 1% 1% 1% 1%
40%
25%
10%5%
15%
4% 1% 0% 0% 1%0%
10%20%30%40%50%60%
Info
rmat
ion
Tech
nolo
gy
Hea
lthca
re
Cons
umer
Disc
retio
nary
Fina
ncia
l &In
sura
nce
Serv
ices
Indu
stria
ls
Tele
com
s &
Med
ia
Raw
Mat
eria
ls &
Nat
ural
Reso
urce
s
Busi
ness
Serv
ices
Ener
gy &
Util
ities
Real
Esta
te
No. of Deals Aggregate Deal Value
Prop
ortio
n of
Tot
al
Fig. 5: Venture Capital-Backed Exits of US-Based Companies by Type, 2009 - 2020 YTD
Source: Preqin Pro. Data as of March 2020
0102030405060708090100
0
200
400
600
800
1,000
1,200
2009 2010 2011 2012 2013 2014 2015 2016 2017 2018 2019 2020YTD
Trade Sale Sale to GP IPO Write-off Aggregate Exit Value ($bn)
No.
of E
xits
Aggregate Exit Value ($bn)
*Figures exclude add-ons, grants, mergers, venture debt, and secondary stock purchases.
Portfolio Company
Initial Investment
Date
Total Known Funding
($mn) Exit Type Exit DateAcquiror
(Exit)Exit Value
($mn)Primary Industry
Credit Karma, Inc. Oct-08 368 Trade Sale 24-Feb Intuit, Inc. 7,100 Business Services
Plaid Inc. Sep-13 309 Trade Sale 13-Jan Visa Inc. 5,300 Software & Related
Forty Seven, Inc. Feb-16 161 Trade Sale 2-Mar Gilead Sciences, Inc. 4,900 Healthcare
Vlocity, Inc. Apr-15 153 Trade Sale 25-Feb Salesforce.com, Inc. 1,330 Software &
Related
Dermira, Inc. Dec-10 130 Trade Sale 10-Jan Eli Lilly and Company 1,100 Healthcare
Source: Preqin Pro
Fig. 6: Largest Venture Capital-Backed Exits of US-Based Companies in Q1 2020
PREQIN AND FIRST REPUBLIC UPDATE: US VENTURE CAPITAL IN Q1 2020
© Preqin Ltd. www.preqin.com 7
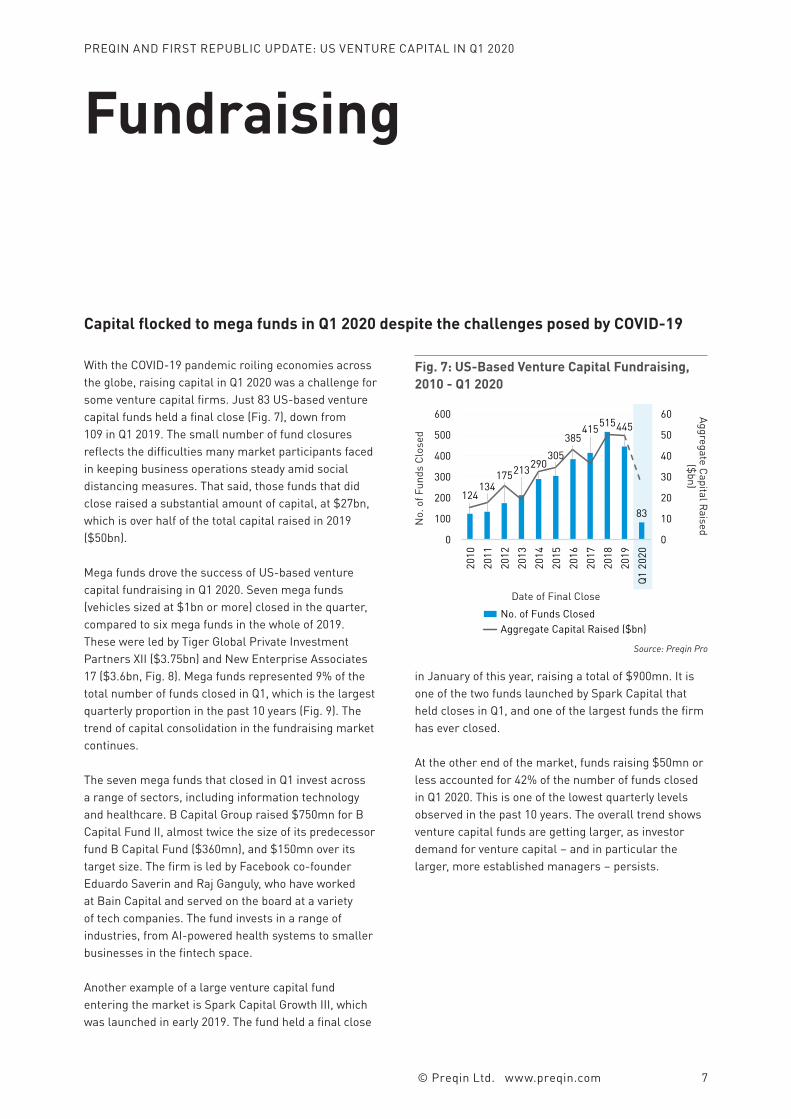
Fundraising
With the COVID-19 pandemic roiling economies across the globe, raising capital in Q1 2020 was a challenge for some venture capital firms. Just 83 US-based venture capital funds held a final close (Fig. 7), down from 109 in Q1 2019. The small number of fund closures reflects the difficulties many market participants faced in keeping business operations steady amid social distancing measures. That said, those funds that did close raised a substantial amount of capital, at $27bn, which is over half of the total capital raised in 2019 ($50bn).
Mega funds drove the success of US-based venture capital fundraising in Q1 2020. Seven mega funds (vehicles sized at $1bn or more) closed in the quarter, compared to six mega funds in the whole of 2019. These were led by Tiger Global Private Investment Partners XII ($3.75bn) and New Enterprise Associates 17 ($3.6bn, Fig. 8). Mega funds represented 9% of the total number of funds closed in Q1, which is the largest quarterly proportion in the past 10 years (Fig. 9). The trend of capital consolidation in the fundraising market continues.
The seven mega funds that closed in Q1 invest across a range of sectors, including information technology and healthcare. B Capital Group raised $750mn for B Capital Fund II, almost twice the size of its predecessor fund B Capital Fund ($360mn), and $150mn over its target size. The firm is led by Facebook co-founder Eduardo Saverin and Raj Ganguly, who have worked at Bain Capital and served on the board at a variety of tech companies. The fund invests in a range of industries, from AI-powered health systems to smaller businesses in the fintech space.
Another example of a large venture capital fund entering the market is Spark Capital Growth III, which was launched in early 2019. The fund held a final close
in January of this year, raising a total of $900mn. It is one of the two funds launched by Spark Capital that held closes in Q1, and one of the largest funds the firm has ever closed.
At the other end of the market, funds raising $50mn or less accounted for 42% of the number of funds closed in Q1 2020. This is one of the lowest quarterly levels observed in the past 10 years. The overall trend shows venture capital funds are getting larger, as investor demand for venture capital – and in particular the larger, more established managers – persists.
Capital flocked to mega funds in Q1 2020 despite the challenges posed by COVID-19
124134
175213290305
385415515445
83
0
10
20
30
40
50
60
0
100
200
300
400
500
600
2010
2011
2012
2013
2014
2015
2016
2017
2018
2019
Q1 2
020
No. of Funds Closed Aggregate Capital Raised ($bn)
Fig. 7: US-Based Venture Capital Fundraising, 2010 - Q1 2020
Source: Preqin Pro
No.
of F
unds
Clo
sed
Aggregate Capital Raised ($bn)
Date of Final Close
PREQIN AND FIRST REPUBLIC UPDATE: US VENTURE CAPITAL IN Q1 2020
© Preqin Ltd. www.preqin.com 8
Fund FirmFund Size
($mn) Fund Type Geographic Focus
Tiger Global Private Investment Partners XII
Tiger Global Management 3,750 Venture Capital (General) China, India, US
New Enterprise Associates 17 New Enterprise Associates 3,600 Early Stage US
Healthcare Royalty Partners IV Healthcare Royalty Partners 1,830 Venture Capital (General) Europe, Asia, US
Founders Fund Growth Founders Fund 1,500 Expansion/Late Stage US
Battery Ventures XIII Battery Ventures 1,200 Venture Capital (General) North America, Asia
Founders Fund VII Founders Fund 1,200 Early Stage US
General Catalyst Group X General Catalyst Partners 1,000 Venture Capital (General) US
Spark Capital Growth Fund III Spark Capital 900 Expansion/Late Stage US
Andreessen Horowitz Bio Fund III Andreessen Horowitz 750 Early Stage US
B Capital Fund II B Capital Group 750 Venture Capital (General) North America, Asia
Source: Preqin Pro
Fig. 8: Largest US-Based Venture Capital Funds Closed in Q1 2020
Fig. 10: US-Based Venture Capital Fundraising Success, 2010 - Q1 2020
Source: Preqin Pro
21.6
14.1 15.2
18.616.5
18.3
21.7
17.6 18.315.9 14.8
80%
85%
90%
95%
100%
105%
0
5
10
15
20
25
2010 2011 2012 2013 2014 2015 2016 2017 2018 2019 Q1 2020
Average Time Spent in Market (Months) Average Proportion of Target Size Achieved
Fig. 9: US-Based Venture Capital Funds Closed by Fund Size, 2010 - Q1 2020
Source: Preqin Pro
43%53% 55% 53% 54% 47% 47% 56% 52% 48% 42%
18% 7% 6% 17% 16%13% 18%
14% 14% 18%10%
16% 22% 21%17% 12% 25% 17%
19% 17% 20%
14%
14% 11% 8%9% 12% 9% 10%
7% 10% 8%
13%
7% 3% 4% 3% 4% 4% 6% 4% 5% 5%12%
1% 5% 4% 1% 3% 2% 2% 1% 2% 1%9%
0%10%20%30%40%50%60%70%80%90%
100%
2010 2011 2012 2013 2014 2015 2016 2017 2018 2019 Q1 2020
Less than $50mn $50-99mn $100-249mn $250-499mn $500-999mn $1bn or MoreDate of Final Close
Prop
ortio
n of
Fun
ds C
lose
dTi
me
Spen
t in
Mar
ket (
Mon
ths)
Proportion of Target Size Achieved
Date of Final Close

PREQIN AND FIRST REPUBLIC UPDATE: US VENTURE CAPITAL IN Q1 2020
© Preqin Ltd. www.preqin.com 9
Fig. 12: US-Based Venture Capital Funds Closed in Q1 2020 by Primary Geographic Focus
North America
Latin America
EuropeAsia
1%
1%
94%
Source: Preqin Pro
Proportion of Funds Closed
2%
Fig. 11: US-Based Venture Capital Fundraising in Q1 2020 by Strategy
Source: Preqin Pro
6
35
4
38
0.2
10.6
2.8
13.0
0
2
4
6
8
10
12
14
0
5
10
15
20
25
30
35
40
Seed Early Stage Expansion/Late Stage
Venture Capital(General)
No. of Funds Closed Aggregate Capital Raised ($bn)
No.
of F
unds
Clo
sed
Aggregate Capital Raised ($bn)
DiversifiedMulti-Regional
1%
PREQIN AND FIRST REPUBLIC UPDATE: US VENTURE CAPITAL IN Q1 2020
© Preqin Ltd. www.preqin.com 10
Funds inMarket
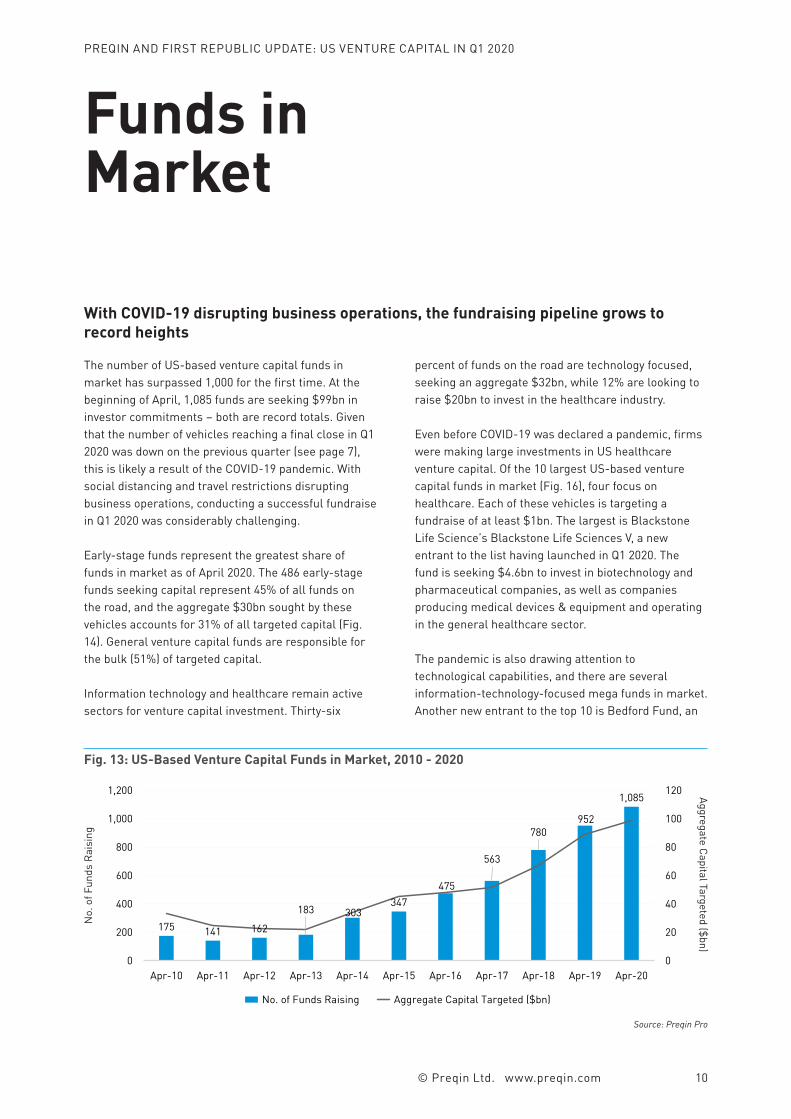
The number of US-based venture capital funds in market has surpassed 1,000 for the first time. At the beginning of April, 1,085 funds are seeking $99bn in investor commitments – both are record totals. Given that the number of vehicles reaching a final close in Q1 2020 was down on the previous quarter (see page 7), this is likely a result of the COVID-19 pandemic. With social distancing and travel restrictions disrupting business operations, conducting a successful fundraise in Q1 2020 was considerably challenging.
Early-stage funds represent the greatest share of funds in market as of April 2020. The 486 early-stage funds seeking capital represent 45% of all funds on the road, and the aggregate $30bn sought by these vehicles accounts for 31% of all targeted capital (Fig. 14). General venture capital funds are responsible for the bulk (51%) of targeted capital.
Information technology and healthcare remain active sectors for venture capital investment. Thirty-six
percent of funds on the road are technology focused, seeking an aggregate $32bn, while 12% are looking to raise $20bn to invest in the healthcare industry.
Even before COVID-19 was declared a pandemic, firms were making large investments in US healthcare venture capital. Of the 10 largest US-based venture capital funds in market (Fig. 16), four focus on healthcare. Each of these vehicles is targeting a fundraise of at least $1bn. The largest is Blackstone Life Science’s Blackstone Life Sciences V, a new entrant to the list having launched in Q1 2020. The fund is seeking $4.6bn to invest in biotechnology and pharmaceutical companies, as well as companies producing medical devices & equipment and operating in the general healthcare sector.
The pandemic is also drawing attention to technological capabilities, and there are several information-technology-focused mega funds in market. Another new entrant to the top 10 is Bedford Fund, an
With COVID-19 disrupting business operations, the fundraising pipeline grows to record heights
Fig. 13: US-Based Venture Capital Funds in Market, 2010 - 2020
Source: Preqin Pro
175 141 162
183 303347
475
563
780952
1,085
0
20
40
60
80
100
120
0
200
400
600
800
1,000
1,200
Apr-10 Apr-11 Apr-12 Apr-13 Apr-14 Apr-15 Apr-16 Apr-17 Apr-18 Apr-19 Apr-20
No. of Funds Raising Aggregate Capital Targeted ($bn)
No.
of F
unds
Rai
sing
Aggregate Capital Targeted ($bn)

PREQIN AND FIRST REPUBLIC UPDATE: US VENTURE CAPITAL IN Q1 2020
© Preqin Ltd. www.preqin.com 11
116
486
66
417
5.3
30.3
12.7
50.8
0
10
20
30
40
50
60
0
100
200
300
400
500
600
Seed EarlyStage
Expansion/Late Stage
VentureCapital
(General)
No. of Funds Raising Aggregate Capital Targeted ($bn)
Fig. 14: US-Based Venture Capital Funds in Market by Strategy
Source: Preqin Pro. Data as of April 2020
No.
of F
unds
Rai
sing
Aggregate Capital Targeted ($bn)
1,015
10 31 29
85.3
0.7 4.0 9.1
0102030405060708090
0
200
400
600
800
1,000
1,200
NorthAmerica
Europe Asia Rest ofWorld
No. of Funds Raising Aggregate Capital Targeted ($bn)
Fig. 15: US-Based Venture Capital Funds in Market by Primary Geographic Focus
Source: Preqin Pro. Data as of April 2020
No.
of F
unds
Rai
sing
Aggregate Capital Targeted ($bn)
Fund FirmTarget Size
($mn) Fund Type Geographic Focus
SoftBank Innovation Fund Softbank Latin America Ventures 5,000 Venture Capital (General)
Argentina, Brazil, Central America, Chile,
Colombia, Mexico, South America
Blackstone Life Sciences V Blackstone Life Sciences 4,580 Venture Capital (General) US
The Rise Fund II TPG 2,500 Venture Capital (General) Emerging Markets, North Africa, South Asia
Bedford Fund Bedford Funds 2,000 Venture Capital (General) US
NovaQuest Pharma Opportunities Fund V
NovaQuest Capital Management 1,500 Expansion/Late Stage Europe, US
Deerfield Healthcare Innovations Fund II Deerfield Management 1,000 Venture Capital (General) US
Khosla Ventures VI Khosla Ventures 1,000 Venture Capital (General) US
OrbiMed Private Investments VII OrbiMed Advisors 1,000 Venture Capital (General) Europe, North America,
US, West Europe
Y Combinator Continuity Affiliates Fund I Y Combinator 1,000 Venture Capital (General) US
DCM IX DCM 750 Venture Capital (General) China, Japan, US
Source: Preqin Pro. Data as of April 2020
Fig. 16: Largest US-Based Venture Capital Funds in Market
opportunity zone fund run by Bedford Funds, a first-time fund manager based in Pennsylvania. As with 94% of US-based funds currently in market, Bedford Fund invests across the US. The fund is targeting $2bn and focuses primarily on Pittsburgh and the Tri-state area, investing in companies operating in areas of power
generation, micro-grid, smart city, smart building, energy technology, AI, cybersecurity, and workforce development. Two other mega funds in market are focused on the information technology sector: Khosla Ventures VI and Y Combinator Continuity Affiliates Fund I, both of which are seeking $1bn.
PREQIN AND FIRST REPUBLIC UPDATE: US VENTURE CAPITAL IN Q1 2020
© Preqin Ltd. www.preqin.com 12
Micro VentureCapital
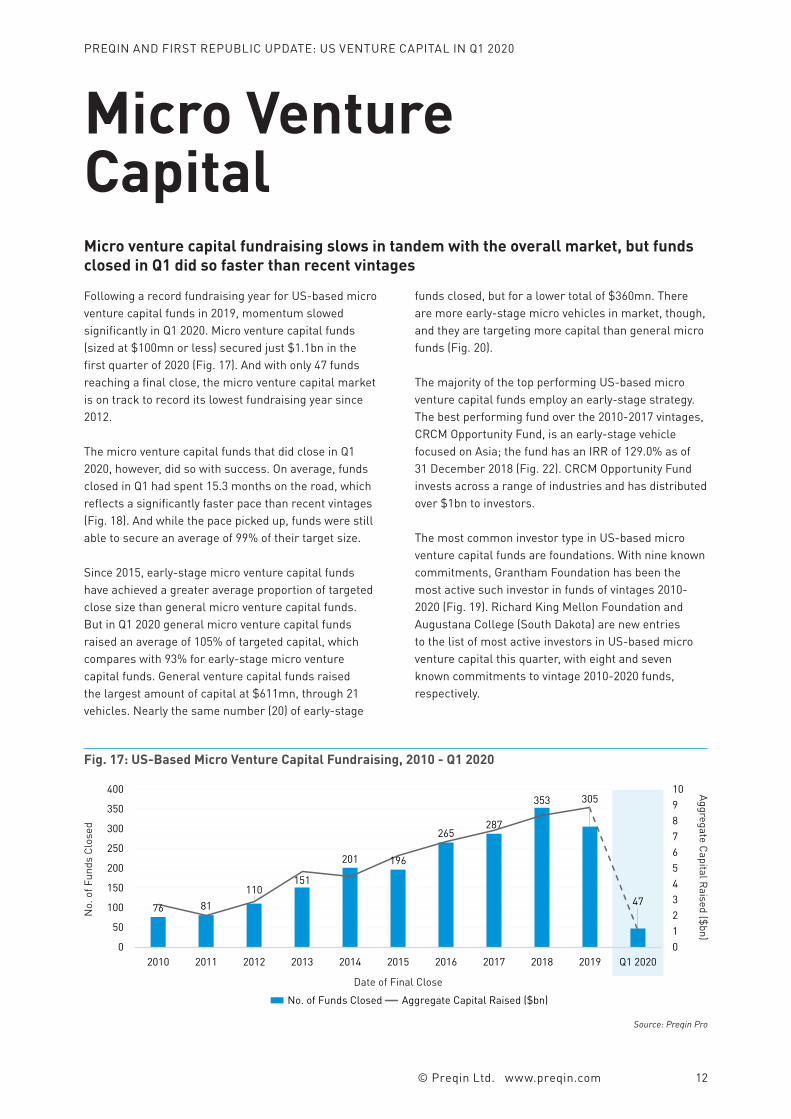
Following a record fundraising year for US-based micro venture capital funds in 2019, momentum slowed significantly in Q1 2020. Micro venture capital funds (sized at $100mn or less) secured just $1.1bn in the first quarter of 2020 (Fig. 17). And with only 47 funds reaching a final close, the micro venture capital market is on track to record its lowest fundraising year since 2012.
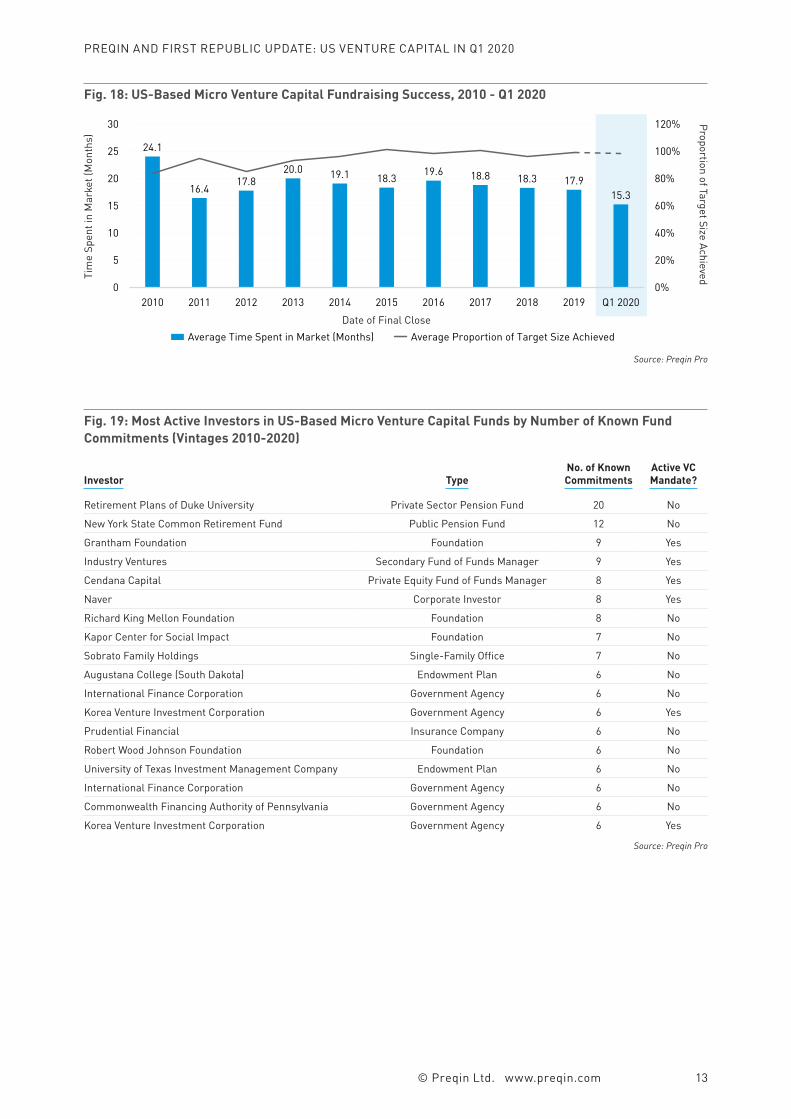
The micro venture capital funds that did close in Q1 2020, however, did so with success. On average, funds closed in Q1 had spent 15.3 months on the road, which reflects a significantly faster pace than recent vintages (Fig. 18). And while the pace picked up, funds were still able to secure an average of 99% of their target size.
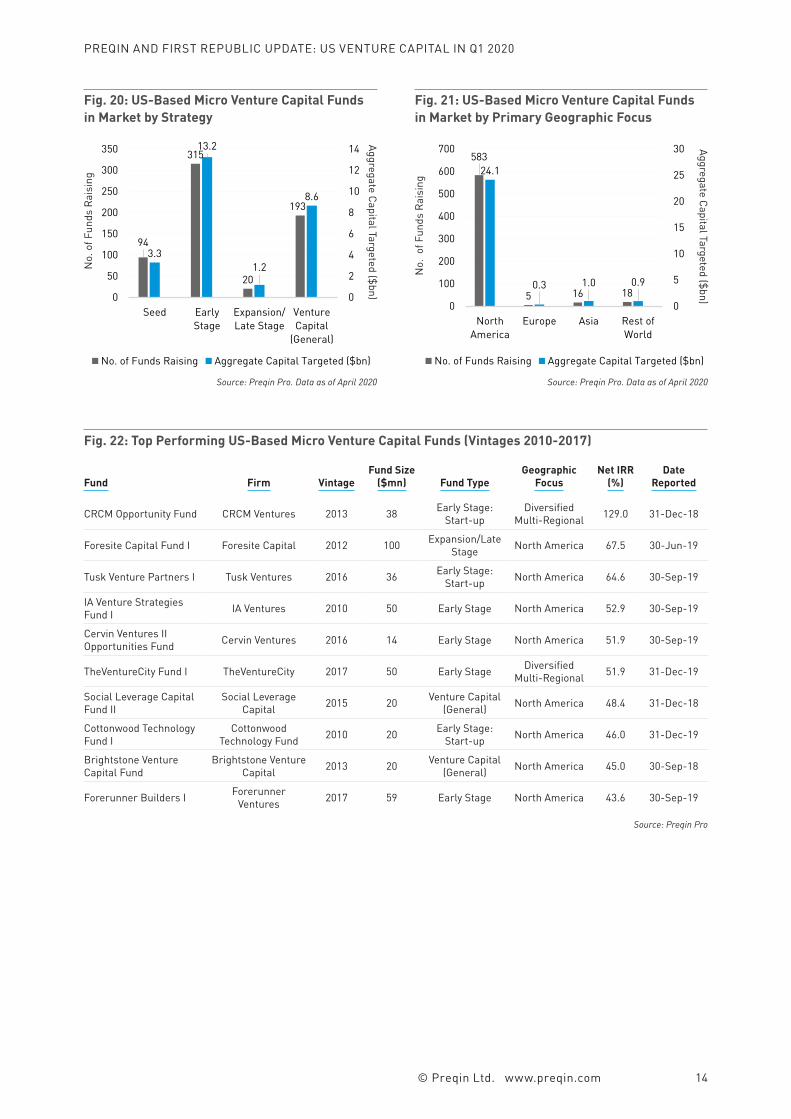
Since 2015, early-stage micro venture capital funds have achieved a greater average proportion of targeted close size than general micro venture capital funds. But in Q1 2020 general micro venture capital funds raised an average of 105% of targeted capital, which compares with 93% for early-stage micro venture capital funds. General venture capital funds raised the largest amount of capital at $611mn, through 21 vehicles. Nearly the same number (20) of early-stage
funds closed, but for a lower total of $360mn. There are more early-stage micro vehicles in market, though, and they are targeting more capital than general micro funds (Fig. 20).
The majority of the top performing US-based micro venture capital funds employ an early-stage strategy. The best performing fund over the 2010-2017 vintages, CRCM Opportunity Fund, is an early-stage vehicle focused on Asia; the fund has an IRR of 129.0% as of 31 December 2018 (Fig. 22). CRCM Opportunity Fund invests across a range of industries and has distributed over $1bn to investors.
The most common investor type in US-based micro venture capital funds are foundations. With nine known commitments, Grantham Foundation has been the most active such investor in funds of vintages 2010-2020 (Fig. 19). Richard King Mellon Foundation and Augustana College (South Dakota) are new entries to the list of most active investors in US-based micro venture capital this quarter, with eight and seven known commitments to vintage 2010-2020 funds, respectively.
Micro venture capital fundraising slows in tandem with the overall market, but funds closed in Q1 did so faster than recent vintages
Fig. 17: US-Based Micro Venture Capital Fundraising, 2010 - Q1 2020
Source: Preqin Pro
76 81110
151
201 196
265287
353 305
47
012345678910
0
50
100
150
200
250
300
350
400
2010 2011 2012 2013 2014 2015 2016 2017 2018 2019 Q1 2020
No. of Funds Closed Aggregate Capital Raised ($bn)
No.
of F
unds
Clo
sed
Aggregate Capital Raised ($bn)
Date of Final Close
PREQIN AND FIRST REPUBLIC UPDATE: US VENTURE CAPITAL IN Q1 2020
© Preqin Ltd. www.preqin.com 13
Investor TypeNo. of Known Commitments
Active VC Mandate?
Retirement Plans of Duke University Private Sector Pension Fund 20 No
New York State Common Retirement Fund Public Pension Fund 12 No
Grantham Foundation Foundation 9 Yes
Industry Ventures Secondary Fund of Funds Manager 9 Yes
Cendana Capital Private Equity Fund of Funds Manager 8 Yes
Naver Corporate Investor 8 Yes
Richard King Mellon Foundation Foundation 8 No
Kapor Center for Social Impact Foundation 7 No
Sobrato Family Holdings Single-Family Office 7 No
Augustana College (South Dakota) Endowment Plan 6 No
International Finance Corporation Government Agency 6 No
Korea Venture Investment Corporation Government Agency 6 Yes
Prudential Financial Insurance Company 6 No
Robert Wood Johnson Foundation Foundation 6 No
University of Texas Investment Management Company Endowment Plan 6 No
International Finance Corporation Government Agency 6 No
Commonwealth Financing Authority of Pennsylvania Government Agency 6 No
Korea Venture Investment Corporation Government Agency 6 Yes
Source: Preqin Pro
Fig. 19: Most Active Investors in US-Based Micro Venture Capital Funds by Number of Known Fund Commitments (Vintages 2010-2020)
Fig. 18: US-Based Micro Venture Capital Fundraising Success, 2010 - Q1 2020
Source: Preqin Pro
24.1
16.417.8
20.0 19.1 18.3 19.6 18.8 18.3 17.915.3
0%
20%
40%
60%
80%
100%
120%
0
5
10
15
20
25
30
2010 2011 2012 2013 2014 2015 2016 2017 2018 2019 Q1 2020
Average Time Spent in Market (Months) Average Proportion of Target Size Achieved
Tim
e Sp
ent i
n M
arke
t (M
onth
s)Proportion of Target Size Achieved
Date of Final Close
PREQIN AND FIRST REPUBLIC UPDATE: US VENTURE CAPITAL IN Q1 2020
© Preqin Ltd. www.preqin.com 14
Fund Firm VintageFund Size
($mn) Fund TypeGeographic
FocusNet IRR
(%)Date
Reported
CRCM Opportunity Fund CRCM Ventures 2013 38 Early Stage: Start-up
Diversified Multi-Regional 129.0 31-Dec-18
Foresite Capital Fund I Foresite Capital 2012 100 Expansion/Late Stage North America 67.5 30-Jun-19
Tusk Venture Partners I Tusk Ventures 2016 36 Early Stage: Start-up North America 64.6 30-Sep-19
IA Venture Strategies Fund I IA Ventures 2010 50 Early Stage North America 52.9 30-Sep-19
Cervin Ventures II Opportunities Fund Cervin Ventures 2016 14 Early Stage North America 51.9 30-Sep-19
TheVentureCity Fund I TheVentureCity 2017 50 Early Stage Diversified Multi-Regional 51.9 31-Dec-19
Social Leverage Capital Fund II
Social Leverage Capital 2015 20 Venture Capital
(General) North America 48.4 31-Dec-18
Cottonwood Technology Fund I
Cottonwood Technology Fund 2010 20 Early Stage:
Start-up North America 46.0 31-Dec-19
Brightstone Venture Capital Fund
Brightstone Venture Capital 2013 20 Venture Capital
(General) North America 45.0 30-Sep-18
Forerunner Builders I Forerunner Ventures 2017 59 Early Stage North America 43.6 30-Sep-19
Source: Preqin Pro
Fig. 22: Top Performing US-Based Micro Venture Capital Funds (Vintages 2010-2017)
94
315
20
193
3.3
13.2
1.2
8.6
0
2
4
6
8
10
12
14
0
50
100
150
200
250
300
350
Seed EarlyStage
Expansion/Late Stage
VentureCapital
(General)
No. of Funds Raising Aggregate Capital Targeted ($bn)
Fig. 20: US-Based Micro Venture Capital Funds in Market by Strategy
Source: Preqin Pro. Data as of April 2020
No.
of F
unds
Rai
sing
Aggregate Capital Targeted ($bn)
583
5 16 18
24.1
0.3 1.0 0.9
0
5
10
15
20
25
30
0
100
200
300
400
500
600
700
NorthAmerica
Europe Asia Rest ofWorld
No. of Funds Raising Aggregate Capital Targeted ($bn)
Fig. 21: US-Based Micro Venture Capital Funds in Market by Primary Geographic Focus
Source: Preqin Pro. Data as of April 2020
No.
of F
unds
Rai
sing
Aggregate Capital Targeted ($bn)
PREQIN AND FIRST REPUBLIC UPDATE: US VENTURE CAPITAL IN Q1 2020
© Preqin Ltd. www.preqin.com 15
Performance
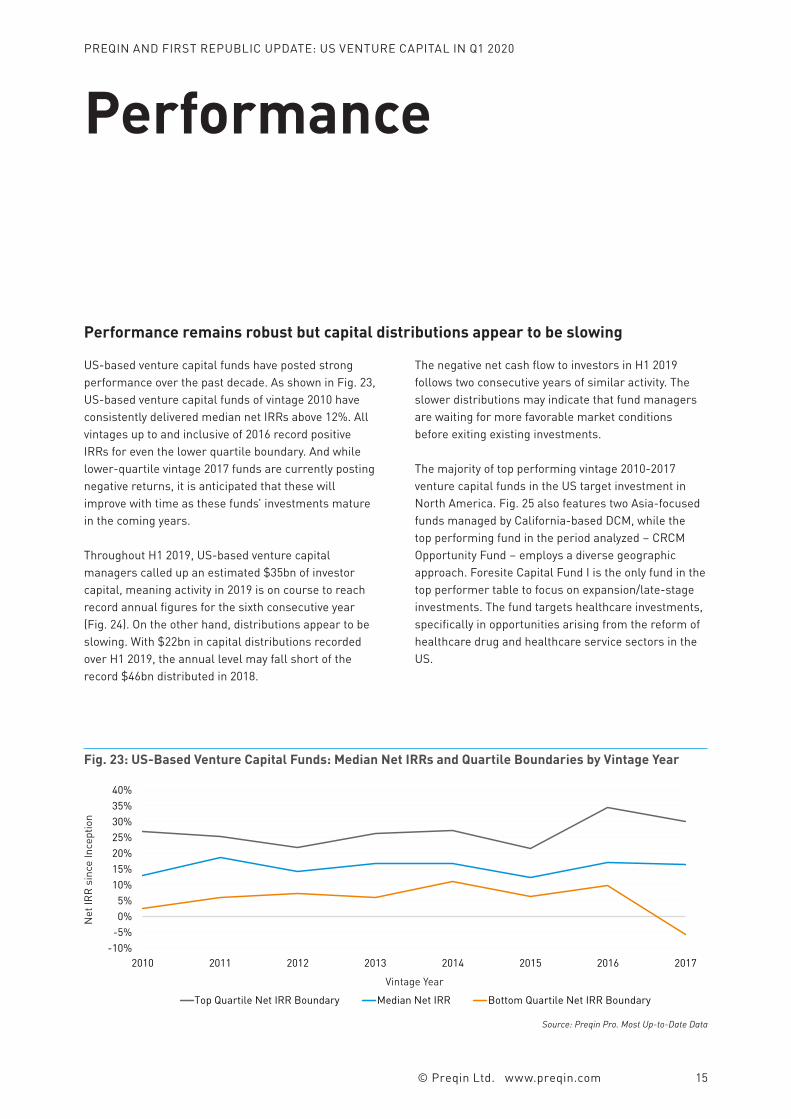
US-based venture capital funds have posted strong performance over the past decade. As shown in Fig. 23, US-based venture capital funds of vintage 2010 have consistently delivered median net IRRs above 12%. All vintages up to and inclusive of 2016 record positive IRRs for even the lower quartile boundary. And while lower-quartile vintage 2017 funds are currently posting negative returns, it is anticipated that these will improve with time as these funds’ investments mature in the coming years.
Throughout H1 2019, US-based venture capital managers called up an estimated $35bn of investor capital, meaning activity in 2019 is on course to reach record annual figures for the sixth consecutive year (Fig. 24). On the other hand, distributions appear to be slowing. With $22bn in capital distributions recorded over H1 2019, the annual level may fall short of the record $46bn distributed in 2018.
The negative net cash flow to investors in H1 2019 follows two consecutive years of similar activity. The slower distributions may indicate that fund managers are waiting for more favorable market conditions before exiting existing investments.
The majority of top performing vintage 2010-2017 venture capital funds in the US target investment in North America. Fig. 25 also features two Asia-focused funds managed by California-based DCM, while the top performing fund in the period analyzed – CRCM Opportunity Fund – employs a diverse geographic approach. Foresite Capital Fund I is the only fund in the top performer table to focus on expansion/late-stage investments. The fund targets healthcare investments, specifically in opportunities arising from the reform of healthcare drug and healthcare service sectors in the US.
Performance remains robust but capital distributions appear to be slowing
Fig. 23: US-Based Venture Capital Funds: Median Net IRRs and Quartile Boundaries by Vintage Year
Source: Preqin Pro. Most Up-to-Date Data
-10%-5%0%5%
10%15%20%25%30%35%40%
2010 2011 2012 2013 2014 2015 2016 2017
Top Quartile Net IRR Boundary Median Net IRR Bottom Quartile Net IRR Boundary
Net
IRR
sinc
e In
cept
ion
Vintage Year

PREQIN AND FIRST REPUBLIC UPDATE: US VENTURE CAPITAL IN Q1 2020
© Preqin Ltd. www.preqin.com 16
Fig. 24: US-Based Venture Capital Funds: Annual Amount Called up, Distributed, and Net Cash Flow, 2010 - H1 2019
Source: Preqin Pro
25.5 28.0 29.223.8
37.5 37.6 39.546.1
61.6
35.034.3
21.6
33.226.1
39.4
31.2
58.8
34.7
46.3
21.9
-20
-10
0
10
20
30
40
50
60
70
2010 2011 2012 2013 2014 2015 2016 2017 2018 H1 2019
Capital Called up ($bn) Capital Distributed ($bn) Net Cash Flow ($bn)
Fund Firm VintageFund Size
($mn) Fund TypeGeographic
FocusNet IRR
(%) Date Reported
CRCM Opportunity Fund
ChinaRock Capital Management 2013 38 Early Stage:
Start-upDiversified
Multi-Regional 129.0 31-Dec-18
Alta Partners NextGen Fund I Alta Partners 2017 130 Venture Capital
(General) North America 79.7 30-Sep-19
Foresite Capital Fund I Foresite Capital 2012 100 Expansion/Late
Stage North America 67.5 30-Jun-19
DCM Hybrid RMB Fund DCM 2011 150 Venture Capital
(General) Asia 65.4 30-Jun-18
Tusk Venture Partners I Tusk Ventures 2016 36 Early Stage:
Start-up North America 64.6 30-Sep-19
DCM Ventures China Fund (DCM VII) DCM 2014 330 Venture Capital
(General) Asia 62.6 30-Jun-18
Forerunner Partners III
Forerunner Ventures 2017 122 Early Stage North America 54.6 30-Sep-19
IA Venture Strategies Fund I IA Ventures 2010 50 Early Stage North America 52.9 30-Sep-19
Cervin Ventures II Opportunities Fund Cervin Ventures 2016 14 Early Stage North America 51.9 30-Sep-19
Flagship Ventures Fund IV Flagship Pioneering 2010 269 Venture Capital
(General) North America 51.9 31-Dec-18
Source: Preqin Pro
Fig. 25: Top Performing US-Based Venture Capital Funds (Vintages 2010-2017)
PREQIN AND FIRST REPUBLIC UPDATE: US VENTURE CAPITAL IN Q1 2020
© Preqin Ltd. www.preqin.com 17
FundManagers
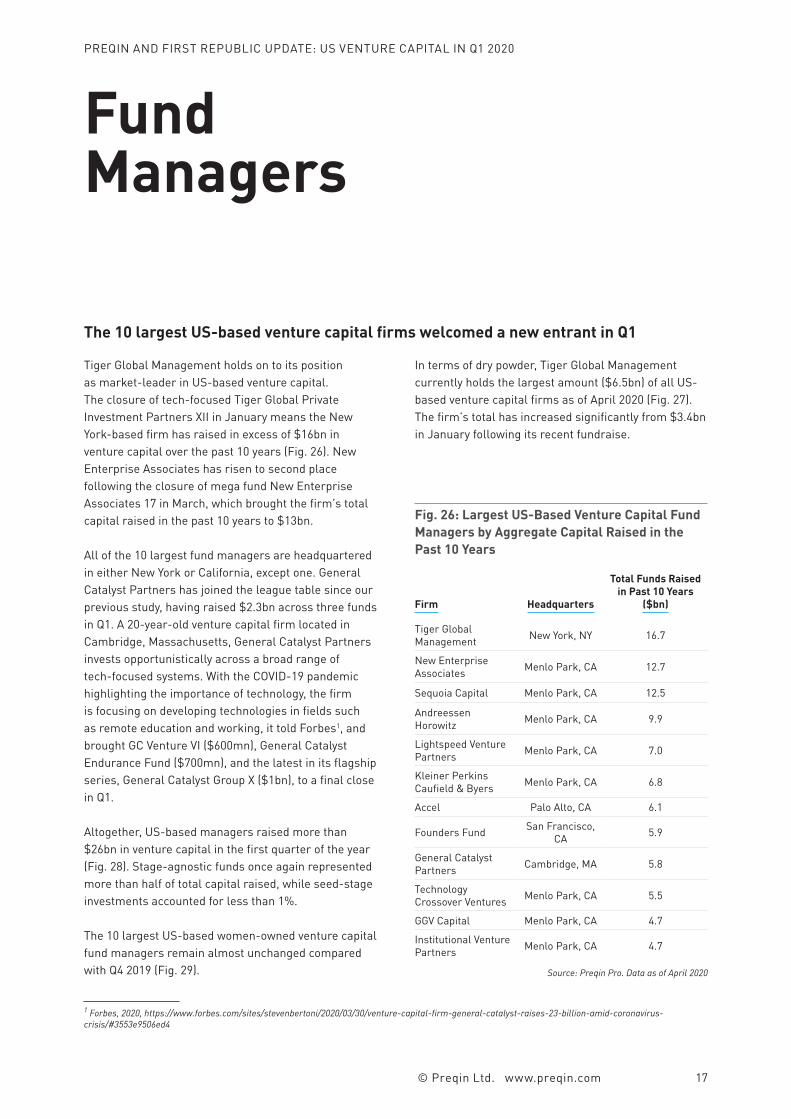
Tiger Global Management holds on to its position as market-leader in US-based venture capital. The closure of tech-focused Tiger Global Private Investment Partners XII in January means the New York-based firm has raised in excess of $16bn in venture capital over the past 10 years (Fig. 26). New Enterprise Associates has risen to second place following the closure of mega fund New Enterprise Associates 17 in March, which brought the firm’s total capital raised in the past 10 years to $13bn.
All of the 10 largest fund managers are headquartered in either New York or California, except one. General Catalyst Partners has joined the league table since our previous study, having raised $2.3bn across three funds in Q1. A 20-year-old venture capital firm located in Cambridge, Massachusetts, General Catalyst Partners invests opportunistically across a broad range of tech-focused systems. With the COVID-19 pandemic highlighting the importance of technology, the firm is focusing on developing technologies in fields such as remote education and working, it told Forbes1, and brought GC Venture VI ($600mn), General Catalyst Endurance Fund ($700mn), and the latest in its flagship series, General Catalyst Group X ($1bn), to a final close in Q1.
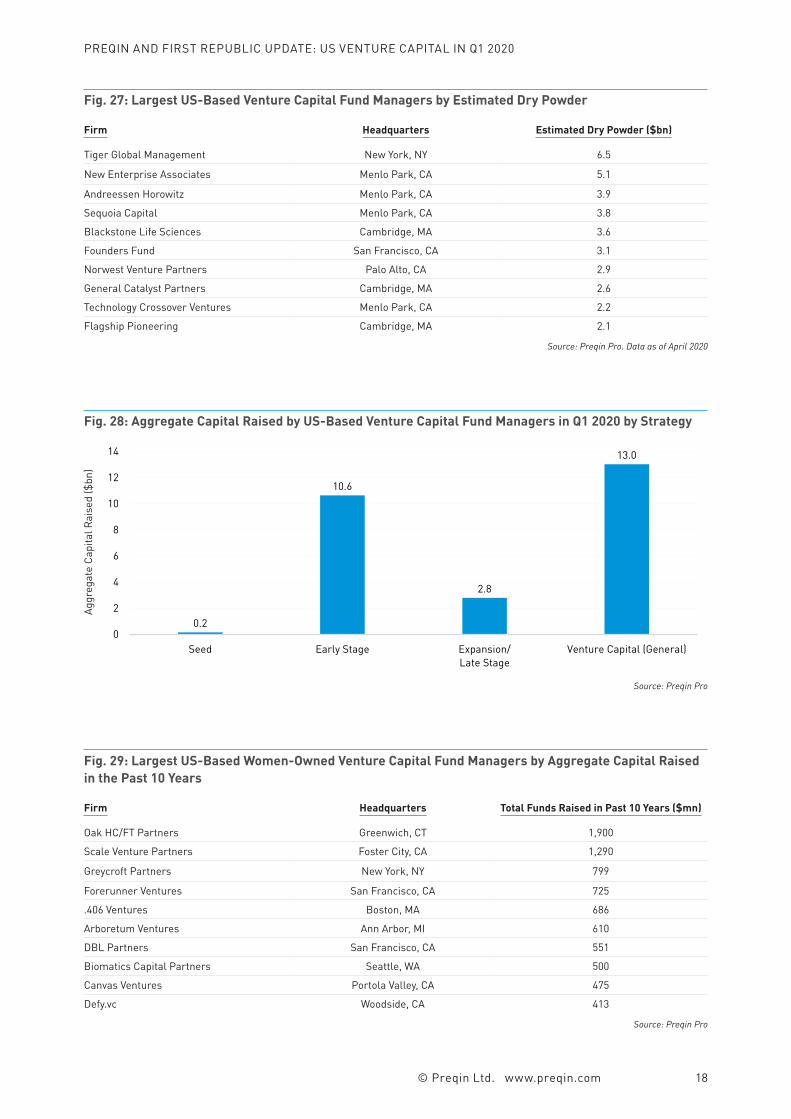
Altogether, US-based managers raised more than $26bn in venture capital in the first quarter of the year (Fig. 28). Stage-agnostic funds once again represented more than half of total capital raised, while seed-stage investments accounted for less than 1%.
The 10 largest US-based women-owned venture capital fund managers remain almost unchanged compared with Q4 2019 (Fig. 29).
1 Forbes, 2020, https://www.forbes.com/sites/stevenbertoni/2020/03/30/venture-capital-firm-general-catalyst-raises-23-billion-amid-coronavirus-crisis/#3553e9506ed4
In terms of dry powder, Tiger Global Management currently holds the largest amount ($6.5bn) of all US-based venture capital firms as of April 2020 (Fig. 27). The firm’s total has increased significantly from $3.4bn in January following its recent fundraise.
The 10 largest US-based venture capital firms welcomed a new entrant in Q1
Firm Headquarters
Total Funds Raised in Past 10 Years
($bn)
Tiger Global Management New York, NY 16.7
New Enterprise Associates Menlo Park, CA 12.7
Sequoia Capital Menlo Park, CA 12.5
Andreessen Horowitz Menlo Park, CA 9.9
Lightspeed Venture Partners Menlo Park, CA 7.0
Kleiner Perkins Caufield & Byers Menlo Park, CA 6.8
Accel Palo Alto, CA 6.1
Founders Fund San Francisco, CA 5.9
General Catalyst Partners Cambridge, MA 5.8
Technology Crossover Ventures Menlo Park, CA 5.5
GGV Capital Menlo Park, CA 4.7
Institutional Venture Partners Menlo Park, CA 4.7
Source: Preqin Pro. Data as of April 2020
Fig. 26: Largest US-Based Venture Capital Fund Managers by Aggregate Capital Raised in the Past 10 Years
PREQIN AND FIRST REPUBLIC UPDATE: US VENTURE CAPITAL IN Q1 2020
© Preqin Ltd. www.preqin.com 18
Firm Headquarters Estimated Dry Powder ($bn)
Tiger Global Management New York, NY 6.5
New Enterprise Associates Menlo Park, CA 5.1
Andreessen Horowitz Menlo Park, CA 3.9
Sequoia Capital Menlo Park, CA 3.8
Blackstone Life Sciences Cambridge, MA 3.6
Founders Fund San Francisco, CA 3.1
Norwest Venture Partners Palo Alto, CA 2.9
General Catalyst Partners Cambridge, MA 2.6
Technology Crossover Ventures Menlo Park, CA 2.2
Flagship Pioneering Cambridge, MA 2.1
Source: Preqin Pro. Data as of April 2020
Fig. 27: Largest US-Based Venture Capital Fund Managers by Estimated Dry Powder
Firm Headquarters Total Funds Raised in Past 10 Years ($mn)
Oak HC/FT Partners Greenwich, CT 1,900
Scale Venture Partners Foster City, CA 1,290
Greycroft Partners New York, NY 799
Forerunner Ventures San Francisco, CA 725
.406 Ventures Boston, MA 686
Arboretum Ventures Ann Arbor, MI 610
DBL Partners San Francisco, CA 551
Biomatics Capital Partners Seattle, WA 500
Canvas Ventures Portola Valley, CA 475
Defy.vc Woodside, CA 413
Source: Preqin Pro
Fig. 29: Largest US-Based Women-Owned Venture Capital Fund Managers by Aggregate Capital Raised in the Past 10 Years
Fig. 28: Aggregate Capital Raised by US-Based Venture Capital Fund Managers in Q1 2020 by Strategy
Source: Preqin Pro
0.2
10.6
2.8
13.0
0
2
4
6
8
10
12
14
Seed Early Stage Expansion/Late Stage
Venture Capital (General)
Aggr
egat
e Ca
pita
l Rai
sed
($bn
)

PREQIN AND FIRST REPUBLIC UPDATE: US VENTURE CAPITAL IN Q1 2020
© Preqin Ltd. www.preqin.com 19
Investors
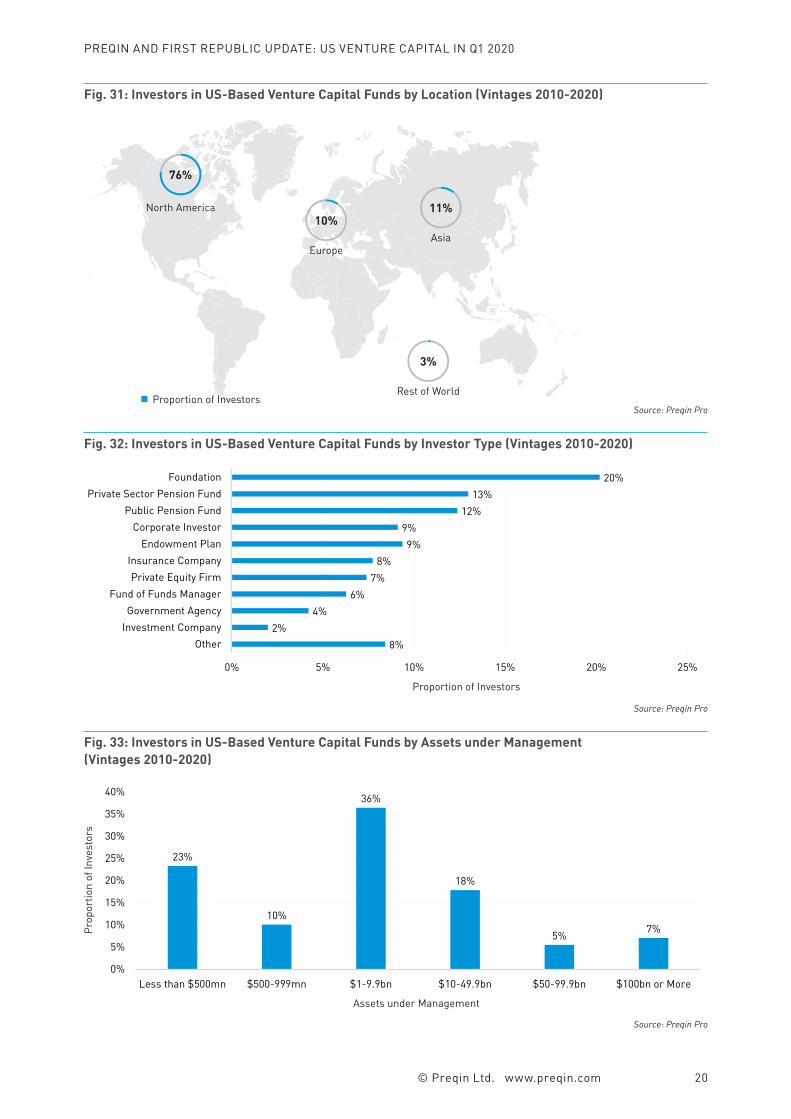
The five most active investors in US venture capital are pension funds. San Francisco Employees’ Retirement System and Retirement Plans of Duke University sit atop the table, each with 69 known commitments to vintage 2010-2019 US-based venture capital funds (Fig. 30). Of the investors in Fig. 30, Texas County & District Retirement System is the only institution with an active mandate. The pension fund is planning to commit $1.8bn across private equity & venture capital funds in the next 12 months.
US-based venture capital funds attract capital from a range of investors globally. Foundations account for the largest proportion (20%) of investors active in US-based venture capital funds, followed by private sector (13%) and public (12%) pension funds (Fig. 32). North America-based institutions represent 76% of
all investors active in US-based venture capital funds (Fig. 31). That said, with 24% of investors based outside of North America, the demand for US venture capital vehicles extends across the globe.
US-based venture capital funds are targeted by investors of all sizes. The majority (67%) of active investors manage at least $1bn in assets, including 12% that manage at least $50bn (Fig. 33). But smaller investors still take up a sizable portion of the space, with one-third managing less than $1bn, indicating there is room to profit regardless of portfolio size.
US venture capital attracts a range of investors, and almost a quarter are located outside of North America
Investor TypeNo. of Known Commitments
Active VC Mandate?
Retirement Plans of Duke University Private Sector Pension Fund 69 No
San Francisco Employees' Retirement System Public Pension Fund 69 No
Royal Borough of Kensington and Chelsea Superannuation Fund Public Pension Fund 64 No
Texas County & District Retirement System Public Pension Fund 56 Yes
Los Angeles Fire and Police Pension System Public Pension Fund 53 No
University of Texas Investment Management Company Endowment Plan 50 No
MetLife Insurance Company Insurance Company 48 No
Penn Mutual Life Insurance Company Insurance Company 48 No
Sherman Fairchild Foundation Foundation 47 No
University of Michigan Endowment Endowment Plan 47 No
Source: Preqin Pro
Fig. 30: Most Active Investors in US-Based Venture Capital Funds by Number of Known Fund Commitments (Vintages 2010-2020)
PREQIN AND FIRST REPUBLIC UPDATE: US VENTURE CAPITAL IN Q1 2020
© Preqin Ltd. www.preqin.com 20
Fig. 31: Investors in US-Based Venture Capital Funds by Location (Vintages 2010-2020)
North America
EuropeAsia
10%11%
76%
3%
Rest of World
Source: Preqin Pro
Fig. 33: Investors in US-Based Venture Capital Funds by Assets under Management (Vintages 2010-2020)
Source: Preqin Pro
23%
10%
36%
18%
5% 7%
0%
5%
10%
15%
20%
25%
30%
35%
40%
Less than $500mn $500-999mn $1-9.9bn $10-49.9bn $50-99.9bn $100bn or More
Prop
ortio
n of
Inve
stor
s
Fig. 32: Investors in US-Based Venture Capital Funds by Investor Type (Vintages 2010-2020)
Source: Preqin Pro
8%2%
4%6%
7%8%
9%9%
12%13%
20%
0% 5% 10% 15% 20% 25%
OtherInvestment CompanyGovernment Agency
Fund of Funds ManagerPrivate Equity Firm
Insurance CompanyEndowment Plan
Corporate InvestorPublic Pension Fund
Private Sector Pension FundFoundation
Proportion of Investors
Assets under Management
Proportion of Investors

PREQIN AND FIRST REPUBLIC UPDATE: US VENTURE CAPITAL IN Q1 2020
© Preqin Ltd. www.preqin.com 21
The Homeof Alternatives®