predicting the risk of extinction through hybridization
TRANSCRIPT

1039
Conservation Biology, Pages 1039–1053Volume 15, No. 4, August 2001
Predicting the Risk of Extinction through Hybridization
DIANA E. WOLF,* NAOKI TAKEBAYASHI, AND LOREN H. RIESEBERG
Department of Biology, Indiana University, 1001 East Third Street, Bloomington, IN 47405, U.S.A.
Abstract:
Natural hybridization threatens a substantial number of plant and animal species with extinction,but extinction risk has been difficult to evaluate in the absence of a quantitative assessment of risk factors.We investigated a number of ecological parameters likely to affect extinction risk, through an individual-based model simulating the life cycle of two hybridizing annual plant species. All parameters tested, rangingfrom population size to variance in pollen-tube growth rates, affected extinction risk. The sensitivity of eachparameter varied dramatically across parameter sets, but, overall, the competitive ability, initial frequency,and selfing rate of the native taxon had the strongest effect on extinction. In addition, prezygotic reproductivebarriers had a stronger influence on extinction rates than did postzygotic barriers. A stable hybrid zone waspossible only when habitat differentiation was included in the model. When there was no habitat differentia-tion, either one of the parental species or the hybrids eventually displaced the other two taxa. The simulationsdemonstrated that hybridization is perhaps the most rapidly acting genetic threat to endangered species, withextinction often taking place in less than five generations. The simulation model was also applied to natu-rally hybridizing species pairs for which considerable genetic and ecological information is available. Thepredictions from these “worked examples” are in close agreement with observed outcomes and further sug-gest that an endemic cordgrass species is threatened by hybridization. These simulations provide guidanceconcerning the kinds of data required to evaluate extinction risk and possible conservation strategies.
Predicción del Riesgo de Extinción por Hibridación
Resumen:
La hibridación natural amenaza de extinción a numerosas especies de plantas y animales. Sinembargo, el riesgo de extinción es difícil de determinar en ausencia de una evaluación cuantitativa de losfactores de riesgo. Investigamos un conjunto de parámetros ecológicos que afectan el riesgo de extinción, pormedio de un modelo basado en individuos que simula el ciclo de vida de dos especies de plantas anualeshibridizantes. Todos los parámetros muestreados, desde el tamaño de la población hasta la varianza en latasa de crecimiento de los tubos de polen, afectaron el riesgo de extinción. La sensibilidad de cada parámetrovarió dramáticamente en los conjuntos de parámetros, pero en general, la habilidad competitiva, la frecuen-cia inicial y la tasa de autogamia del taxón nativo tuvieron el mayor efecto sobre la extinción. Adicional-mente, las barreras reproductivas precigóticas tuvieron una influencia mayor en las tasas de extinción quelas barreras postcigóticas. Una zona híbrida estable solo fue posible cuando se incluyó la diferenciación delhábitat en el modelo. Donde no hubo diferenciación de hábitat, alguna de las especies parentales o los híbri-dos eventualmente desplazaban a los otros dos taxones. Las simulaciones demostraron que la hibridación esquizás la amenaza genética que más rápidamente actúa sobre las especies en peligro de extinción, alcan-zando la extinción en menos de cinco generaciones. El modelo de simulación también fue aplicado a paresde especies que hibridizan naturalmente para las que existe considerable información genética y ecológica.Las predicciones de estos “ejemplos trabajados” concuerdan con los resultados observados y sugieren queuna especie nativa de pasto está amenazada por hibridación. Estas simulaciones proporcionan una guía enrelación con los tipos de datos requeridos para evaluar el riesgo de extinción y las posibles estrategias de con-
servación.
*
Current address: Department of Biology, Box 90338, Duke University, Durham, NC 27708-0338, email [email protected] submitted March 13, 2000; revised manuscript accepted November 8, 2000.

1040
Risk of Extinction through Hybridization Wolf et al.
Conservation BiologyVolume 15, No. 4, August 2001
Introduction
The spread of humans throughout the world has beenaccompanied by a wave of invasions by exotic plants,animals, and microorganisms (Wilson 1992). In some in-stances, exotic species have been introduced throughpurposeful or unknowing transportation by humans,whereas in other cases, colonizing plants and animalshave exploited corridors created to facilitate humantransportation and communication, including roads, rail-road tracks, and power and gas line right-of-ways. As aresult of this unprecedented scale of organismal dis-persal, previously allopatric species are coming into con-tact at an alarming rate (Pysek et al. 1995).
The biogeography of contact between species is chang-ing as well. In the past, range expansions were morelikely to produce parapatric distributions, with contactlimited to the periphery of species’ ranges. Now the na-tive ranges of many species are honeycombed with cor-ridors, increasing the surface area of contact and accel-erating the ultimate outcome of this contact (Levin etal. 1996). In addition, widespread cultivation of domesti-cated plants has led to contact between wild and culti-vated species, resulting in a variety of unforeseen conse-quences, including the potential escape of geneticallyengineered genes through hybridization (Hancock et al.1996; Snow & Morán-Palma 1997). This is not an iso-lated problem. Crop-wild hybridization has been docu-mented in 12 of the world’s 13 most important foodcrops (Ellstrand et al. 1999). Finally, contact is increas-ingly likely to take place in disturbed habitats, possiblyaltering competitive relationships and increasing thelikelihood of hybridization if the species are closely re-lated (Anderson 1948).
Given the increasing size and vagility of human popu-lations, it seems likely that organismal movement willcontinue to accelerate, leading to more frequent and ex-tensive contact between previously allopatric taxa. Thus,a major task for conservation biologists is the develop-ment of methods to predict likely outcomes of interac-tions between species that have only recently come intocontact.
We used computer simulation to examine the likelyoutcome of contact between closely related, hybridizingplant species. The impetus for our work came from nu-merous recent reports that implicate hybridization inthe decline of a wide array of rare and endemic plantand animal species (reviewed by Rieseberg 1991; Ell-strand & Elam 1993; Levin et al. 1996; Rhymer & Simber-loff 1996; Ellstrand et al. 1999). A noteworthy exampleis
Argyranthemum coronopifolium
, a rare plant spe-cies known from only seven populations on Tenerife Is-land in the Canaries. All seven populations were appar-ently healthy until roads were built across the lava flowthat isolated
A. coronopifolium
from other members ofthe genus. A weedy congener has now expanded into
the
A. coronopifolium
habitat, and three of the sevenpopulations now contain only hybrids and pure individ-uals of the invading congener (Brochmann 1984; Levinet al. 1996). This scenario is likely to be repeated withincreasing frequency among both plants and animals.For example, 38% of freshwater fish in North Americaare considered threatened by hybridization (Wilson1992); Ellstrand and Elam (1993) estimate that at least19% of California’s sensitive flora are likely to hybridize;and 10% of protected species in the British Isles areknown to hybridize with more common relatives (Stace1975).
Hybridization appears to contribute to a species’ de-cline in two general ways (Ellstrand & Elam 1993; Levinet al. 1996; Ellstrand et al. 1999). If the hybrids exhibitreduced fitness relative to that of either parental species(i.e., outbreeding depression), the growth rate of the nu-merically inferior taxon may decline below that requiredfor replacement (i.e., demographic swamping). Alterna-tively, if hybrids are fertile and exhibit little or no reduc-tion in fitness, they may displace pure conspecifics ofone or both hybridizing taxa (i.e., genetic assimilation).Often the decline of hybridizing species can be attrib-uted to the synergistic action of demographic swampingand genetic assimilation, and it may be difficult to distin-guish between them.
A variety of ecological and genetic parameters mayinfluence the risk of extinction through hybridization(Rieseberg 1991; Ellstrand & Elam 1993; Levin et al.1996; Rhymer & Simberloff 1996; Ellstrand et al. 1999;Carney et al. 2000), including the strength of the repro-ductive barriers that isolate the hybridizing taxa, thevigor and fertility of the hybrids, the relative and abso-lute sizes of the hybridizing populations, demographicstochasticity, population subdivision, habitat require-ments, population growth rates, the diversity of self-incompatibility alleles, and changes in herbivore andpathogen pressure. To date there have been no quantita-tive assessments of the relative importance of these riskfactors, although several noteworthy results from thepresent simulation study were summarized by Carney etal. (2000). Further, no predictive framework exists inwhich to assess the likelihood that hybridization willlead to extinction or the speed with which it may occur(but see Huxel 1999). We used a sensitivity analysis toevaluate the relative importance of many of the aboveecological and genetic parameters. In addition, we em-ployed simulations to predict the likely outcome of hy-bridization between species pairs for which consider-able genetic and ecological information is available. Theexamples we chose varied significantly in strength of re-productive isolation, degree of habitat differentiation,and life history, allowing us to investigate a wide rangeof ecological scenarios. The predictions from our simula-tions accord well with the observed outcomes of hybrid-ization.

Conservation BiologyVolume 15, No. 4, August 2001
Wolf et al. Risk of Extinction through Hybridization
1041
Methods
Basic Model
We modeled the life cycle of two hybridizing annualplant species in an individual-based stochastic simula-tion (Fig. 1), implemented with the C programming lan-guage. Source code and executables are available byrequest from D.E.W. Simulations were initiated as a sym-patric population containing members of two speciesand no hybrids, representing the initial stage of contact.Hybridization began in the first generation, and the num-ber of individuals from each class (native species, invad-ing species, and hybrid) in subsequent generations wasdetermined by interactions among the selfing rate, pol-len production, pollen competition, seed production,and seedling competitive ability of each class of plants.We assumed that the habitat consisted of
K
patches andthat each patch could be occupied by only one flower-
ing adult. In most simulations, the number of patcheswas constant, representing the habitat’s carrying capac-ity or the maximum number of individuals that could besupported. When demographic stochasticity was intro-duced, however,
K
was variable across generations.Each generation of the life cycle was implemented as
follows. To simulate mating, the following procedurewas used for each plant (
i
, where
i
�
1, 2, . . . ,
N
). Theclass of the plant was ascertained, and the number ofovules (
O
i
) produced by the plant was acquired from aPoisson distribution with parameter
�
�
O
c
, where
c
de-notes genotypic class (threatened native species [
T
], for-eign invading species [
F
], and hybrids [
H
]). Of the
O
i
ovules,
S
i
ovules were designated for self-fertilization.The
S
i
was chosen as a random deviate from a binomialdistribution with
O
i
trials and the probability
�
c
(themean selfing rate of the parent’s class). All selfed seedswere assigned to the same class as their parent.
Figure 1. Representation of the sim-ulation that models the life cycle of two hybridizing plant species (solid and spotted petals). The plants are annual hermaphrodites with one ovule per stigma. In each genera-tion, self-fertilization occurs first, then pollen is randomly distributed to stigmas of non-selfed ovules. The sire of each seed is determined through pollen competition within stigmas, and because conspecific pollen generally grows faster than foreign pollen, pollen competition provides prezygotic reproductive isolation between species. Post-zygotic isolation can be introduced by assigning lower fertility values to hybrids than to the parental species or by assigning a reduced competi-tive ability to hybrid seedlings. Seeds are randomly distributed to patches, and seedlings within each patch compete such that only the most competitive plant in each patch flowers. In the basic model, all patches are identical, representing a single habitat, but in some cases, there are two habitats in which each class has a different competi-tive ability (solid and spotted patches). The life cycle is repeated until the entire population consists of a single class of plants or for 500 generations.

1042
Risk of Extinction through Hybridization Wolf et al.
Conservation BiologyVolume 15, No. 4, August 2001
Remaining ovules (
O
i
�
S
i
) were randomly outcrossedas follows. First, the amount of pollen produced by eachplant (
P
i
) was selected from a Poisson distribution (
�
�
P
c
), and the frequency of each class in the pollen poolwas determined from total pollen production. The num-ber of pollen grains to land on each (
j
th) stigma (
L
j
,where
j
�
1, 2, . . . ,
O
i
�
S
i
) was determined by choos-ing a Poisson deviate with mean
L
, where
The maximum value of
L
was limited to reduce compu-tation time and to account for factors other than pollenabundance that influence the amount of pollen reachingstigmas (e.g., pollinator availability). Assuming pollina-tors did not discriminate among genotypic classes, allthree classes had the same mean number of pollengrains per stigma (pollen load). Each pollen grain thatreached a stigma was assigned a class from a multinomi-nal distribution, where the probability of choosing eachclass was equal to its frequency in the pollen pool.
The next step in the mating procedure was pollen-tube competition. The growth rate of each pollen tube(
G
i
, where
l
�
1, 2, . . . ,
L
i
) was determined by choosinga normal deviate. The mean (
G
D,R
) and variance (
g
2
D,R
)in pollen tube growth rate were dependent on theclasses of both the pollen donor (
D
) and the recipient(
R
). On average, conspecific pollen grew more quicklythan heterospecific pollen (
G
i,i
�
G
j,i
, where
i
�
j
and
i
�
T,F).
The fastest-growing pollen grain on eachstigma fertilized the ovule, and the resulting seed was as-signed to a genotypic class based on its parentage. Anovule fertilized by conspecific pollen was classed withits parents. All other seeds were classified as hybrids, in-cluding late-generation backcross individuals.
Self-fertilization occurred prior to outcrossing and didnot influence the amount of pollen exported to the out-cross pollen pool (no pollen discounting). In addition,there was no inbreeding depression. The inclusion of in-breeding depression would reduce the effective selfingrate, but the qualitative results should not be altered bythis assumption as long as the degree of inbreeding de-pression does not differ among the three classes. Finally,it was possible for some stigmas to receive no pollen, soactual seed production could be lower than ovule pro-duction.
After mating, the frequency of each genotypic class inthe seed pool was determined and used for the seed-dis-persal stage of the simulation. This process was essen-tially the same as that for pollen dispersal. First, thenumber of seeds to land in each patch (
E
k
, where
k
�
1,2, . . . ,
K
) was chosen from a Poisson distribution, withparameter
�
�
E
(
E
is the lesser of
E
MAX
, or the totalnumber of seeds/
K
). A class was then randomly se-lected for each seed in the patch, through a multinomial
L Pi
i 1=
N
∑= Oi
i 1=
N
∑ if Pi
i 1=
N
∑ Oi
i 1=
N
∑ LMAX≤ else L LMAX= .⁄⁄
distribution, with probabilities equalling the frequency ofeach class in the seed pool.
The implementation of seedling competition was com-parable to that of pollen-tube competition. The competi-tive ability of each seedling (
A
i
) depended on its classand the type of patch (
z
) in which it landed and was cho-sen from a normal distribution with mean
A
c,z
and vari-ance
a
2
c,z
. The one seedling in each patch with the high-est competitive ability was allowed to flower and contributeto the next generation. Thus, the frequency of adults in thenext generation was determined both by the mating pro-cess and by seedling competition.
The major simplifying assumptions of our model in-clude (1) categorizing all individuals as native, invading,or hybrid, with hybrid as an absorbing state; (2) discretegenerations; (3) no explicit spatial structure; and (4) seed-ling competition enacted within discrete patches in whichonly one individual flowered. All simulations were repli-cated 500 times, during which we evaluated the numberof generations to extinction of the native species and ex-tinction probabilities. Extinction probabilities were cal-culated as the number of replicates in which the nativespecies became extinct over the total number of repli-cates.
Case Studies
To assess the performance of our model when appliedto natural systems, we estimated parameter values fromnaturally hybridizing taxa and, when possible, comparedthe simulation results to those observed in nature. Weselected three examples for which relevant data wereavailable which would allow us to examine differentconsequences of hybridization: crop-weed hybridizationand long-term introgression, a stable hybrid zone, andthe potential replacement of a native species by hybrids.We examined two well-characterized pairs of hybridiz-ing sunflower taxa (cultivated
�
wild
Helianthus an-nuus
and
H. annuus � H. petiolaris) and a recent caseof natural hybridization involving two species of cordgrass(Spartina alterniflora � S. foliosa). Most parameter val-ues for these hybridizing pairs were obtained from theliterature. For the few parameters without estimated val-ues, we examined a range of values (Table 1).
CULTIVATED � WILD HELIANTHUS ANNUUS
Recently, crop-weed hybridization has come under in-creased scrutiny because of the possibility that transgeneswill be released into natural populations (Ellstrand et al.1999). Particular attention has been given to sunflowersbecause of widespread hybridization between cultivatedand wild H. annuus. The cultivated sunflower was de-rived from the wild form about 4000 years B.P. (Crites1993). The two taxa presently co-occur across much ofthe central United States, overlap in flowering time, and
Conservation BiologyVolume 15, No. 4, August 2001
Wolf et al. Risk of Extinction through Hybridization 1043
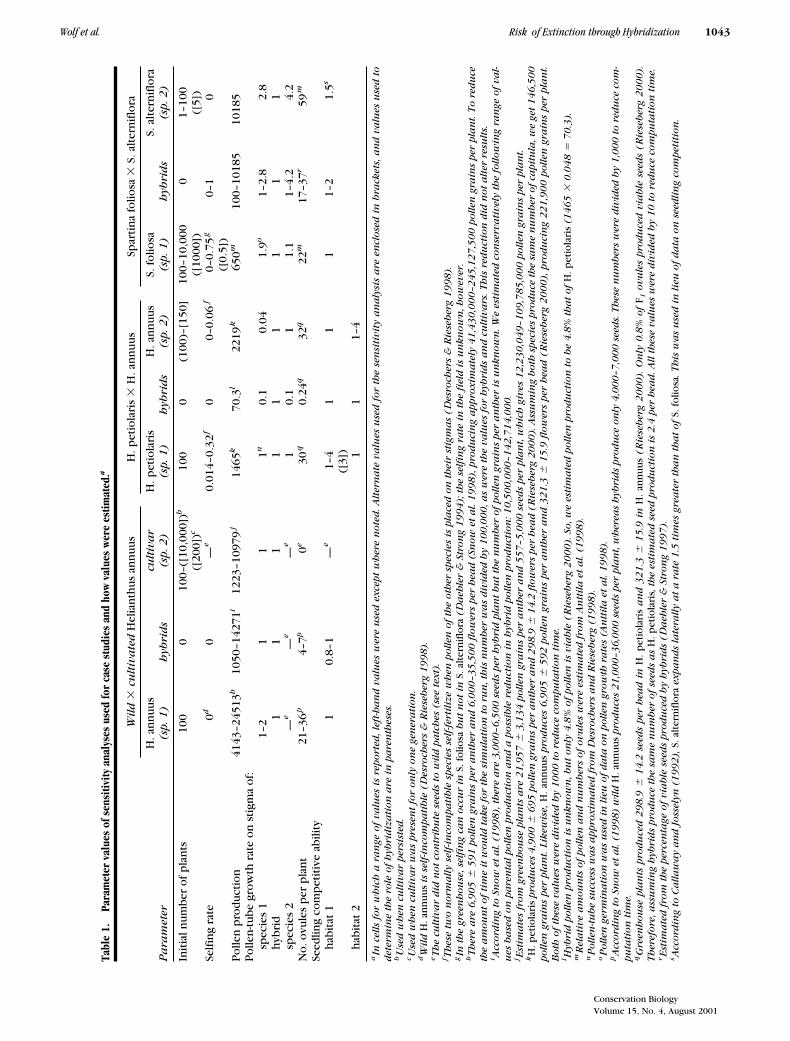
Tabl
e 1.
Para
met
er v
alue
s of
sen
sitiv
ity a
naly
ses
used
for
case
stu
dies
and
how
val
ues
wer
e es
timat
ed.a
Wil
d �
cu
ltiv
ate
d H
elia
nth
us
ann
uu
sH
. pet
iola
ris
� H
. an
nu
us
Spar
tin
a fo
liosa
� S
. alt
ern
iflo
ra
Pa
ram
eter
H. a
nn
uu
s(s
p. 1
)h
ybri
ds
cult
iva
r(s
p. 2
)H
. pet
iola
ris
(sp. 1
)h
ybri
ds
H. a
nn
uu
s(s
p. 2
)S.
fo
liosa
(sp. 1
)h
ybri
ds
S. a
lter
nif
lora
(sp. 2
)
Init
ial n
um
ber
of
pla
nts
100
010
0–([
10,0
00])
b
([20
0])c
100
0(1
00)–
[150
]10
0–10
,000
([10
00])
01–
100
([5]
)Se
lfin
g ra
te0d
0—
e0.
014–
0.32
f0
0–0.
06 f
0–0.
75g
([0.
5])
0–1
0
Po
llen
pro
du
ctio
n41
43–2
4513
h10
50–1
4271
i12
23–1
0979
j14
65k
70.3
l22
19k
650m
100–
1018
510
185
Po
llen
-tu
be
gro
wth
rat
e o
n s
tigm
a o
f:sp
ecie
s 1
1–2
11
1n0.
10.
041.
9o1–
2.8
2.8
hyb
rid
11
11
11
11
1sp
ecie
s 2
—e
—e
—e
10.
11
1.1
1–4.
24.
2N
o. o
vule
s p
er p
lan
t21
–36
p4–
7p0e
30q
0.24
q32
q22
m17
–37r
59m
Seed
ling
com
pet
itiv
e ab
ility
hab
itat
11
0.8–
1—
e1–
4([
3])
11
11–
21.
5s
hab
itat
21
11–
4aIn
cel
ls f
or
wh
ich
a r
an
ge o
f va
lues
is
report
ed, l
eft-h
an
d v
alu
es w
ere
use
d e
xcep
t w
her
e n
ote
d. A
lter
na
te v
alu
es u
sed f
or
the
sen
siti
vity
an
aly
sis
are
en
close
d i
n b
rack
ets,
an
d v
alu
es u
sed t
odet
erm
ine
the
role
of
hyb
ridiz
ati
on
are
in
pa
ren
thes
es.
bU
sed w
hen
cu
ltiv
ar
per
sist
ed.
cU
sed w
hen
cu
ltiv
ar
wa
s pre
sen
t fo
r on
ly o
ne
gen
era
tion
.dW
ild H
. an
nu
us
is s
elf-in
com
pa
tible
(D
esro
cher
s &
Rie
seber
g 1
99
8).
eTh
e cu
ltiv
ar
did
not
con
trib
ute
see
ds
to w
ild p
atc
hes
(se
e te
xt).
f Th
ese
two n
orm
ally
self
-in
com
pa
tible
spec
ies
self
-fer
tili
ze w
hen
pollen
of
the
oth
er s
pec
ies
is p
lace
d o
n t
hei
r st
igm
as
(Des
roch
ers
& R
iese
ber
g 1
99
8).
gIn
th
e gr
een
hou
se, s
elfi
ng
can
occ
ur
in S
. fo
liosa
bu
t n
ot
in S
. alt
ern
iflo
ra (
Da
ehle
r &
Str
on
g 1
99
4);
th
e se
lfin
g ra
te i
n t
he
fiel
d i
s u
nkn
ow
n, h
ow
ever
.hTh
ere
are
6,9
05
5
91
pollen
gra
ins
per
an
ther
an
d 6
,00
0–3
5,5
00
flo
wer
s per
hea
d (
Snow
et
al.
19
98
), p
rodu
cin
g a
ppro
xim
ate
ly 4
1,4
30
,00
0–2
45
,12
7,5
00
pollen
gra
ins
per
pla
nt. T
o r
edu
ceth
e a
mou
nt
of
tim
e it
wou
ld t
ake
for
the
sim
ula
tion
to r
un
, th
is n
um
ber
wa
s div
ided
by
10
0,0
00
, as
wer
e th
e va
lues
for
hyb
rids
an
d c
ult
iva
rs. T
his
red
uct
ion
did
not
alt
er r
esu
lts.
i Acc
ord
ing
to S
now
et
al.
(19
98
), t
her
e a
re 3
,00
0–6
,50
0 s
eeds
per
hyb
rid p
lan
t bu
t th
e n
um
ber
of
pollen
gra
ins
per
an
ther
is
un
kn
ow
n. W
e es
tim
ate
d c
on
serv
ati
vely
th
e fo
llow
ing
ran
ge o
f va
l-u
es b
ase
d o
n p
are
nta
l pollen
pro
du
ctio
n a
nd a
poss
ible
red
uct
ion
in
hyb
rid p
ollen
pro
du
ctio
n: 1
0,5
00
,00
0–1
42
,71
4,0
00
.j E
stim
ate
s fr
om
gre
enh
ou
se p
lan
ts a
re 2
1,9
57
3
,13
4 p
ollen
gra
ins
per
an
ther
an
d 5
57
–5,0
00
see
ds
per
pla
nt, w
hic
h g
ives
12
,23
0,0
49
–10
9,7
85
,00
0 p
ollen
gra
ins
per
pla
nt.
kH
. pet
iola
ris
pro
du
ces
4,9
00
6
95
pollen
gra
ins
per
an
ther
an
d 2
98
.9
14
.2 f
low
ers
per
hea
d (
Rie
seber
g 2
00
0).
Ass
um
ing
both
spec
ies
pro
du
ce t
he
sam
e n
um
ber
of
capit
ula
, we
get
14
6,5
00
pollen
gra
ins
per
pla
nt. L
ikew
ise,
H.
ann
uu
s pro
du
ces
6,9
05
5
92
pollen
gra
ins
per
an
ther
an
d 3
21
.3
15
.9 f
low
ers
per
hea
d (
Rie
seber
g 2
00
0),
pro
du
cin
g 2
21
,90
0 p
ollen
gra
ins
per
pla
nt.
Both
of
thes
e va
lues
wer
e div
ided
by
10
00
to r
edu
ce c
om
pu
tati
on
tim
e.l H
ybri
d p
ollen
pro
du
ctio
n i
s u
nkn
ow
n, b
ut
on
ly 4
.8%
of
pollen
is
via
ble
(R
iese
ber
g 2
00
0).
So, w
e es
tim
ate
d p
ollen
pro
du
ctio
n t
o b
e 4
.8%
th
at
of
H. p
etio
lari
s (1
46
5 �
0.0
48
� 7
0.3
).m
Rel
ati
ve a
mou
nts
of
pollen
an
d n
um
ber
s of
ovu
les
wer
e es
tim
ate
d f
rom
An
ttil
a e
t a
l. (1
99
8).
nP
ollen
-tu
be
succ
ess
wa
s a
ppro
xim
ate
d f
rom
Des
roch
ers
an
d R
iese
ber
g (1
99
8).
oP
ollen
ger
min
ati
on
wa
s u
sed i
n lie
u o
f da
ta o
n p
ollen
gro
wth
ra
tes
(An
ttil
a e
t a
l. 1
99
8).
pA
ccord
ing
to S
now
et
al.
(1998)
wil
d H
. an
nu
us
produ
ces
21,0
00–3
6,0
00 s
eeds
per
pla
nt,
wh
erea
s h
ybri
ds
produ
ce o
nly
4,0
00–7
,000 s
eeds.
Th
ese
nu
mber
s w
ere
div
ided
by
1,0
00 t
o r
edu
ce c
om
-pu
tati
on
tim
e.qG
reen
hou
se p
lan
ts p
rodu
ced 2
98
.9
14
.2 s
eeds
per
hea
d i
n H
. p
etio
lari
s a
nd 3
21
.3
15
.9 i
n H
. an
nu
us
(Rie
seber
g 2
00
0).
On
ly 0
.8%
of
F 1 o
vule
s pro
du
ced v
iable
see
ds
(Rie
seber
g 2
00
0).
Th
eref
ore
, ass
um
ing
hyb
rids
pro
du
ce t
he
sam
e n
um
ber
of
seed
s a
s H
. pet
iola
ris,
th
e es
tim
ate
d s
eed p
rodu
ctio
n i
s 2
.4 p
er h
ead. A
ll t
hes
e va
lues
wer
e div
ided
by
10
to r
edu
ce c
om
pu
tati
on
tim
e.r E
stim
ate
d f
rom
th
e per
cen
tage
of
via
ble
see
ds
pro
du
ced b
y h
ybri
ds
(Da
ehle
r &
Str
on
g 1
99
7).
s Acc
ord
ing
to C
alla
wa
y a
nd J
oss
elyn
(1
99
2),
S. a
lter
nif
lora
exp
an
ds
late
rally
at
a r
ate
1.5
tim
es g
rea
ter
tha
n t
ha
t of
S. f
olio
sa. T
his
wa
s u
sed i
n lie
u o
f da
ta o
n s
eedli
ng
com
pet
itio
n.

1044 Risk of Extinction through Hybridization Wolf et al.
Conservation BiologyVolume 15, No. 4, August 2001
share pollinators (Heiser 1951). First-generation hybridsare fully fertile (Heiser 1951), but F1 generations producesignificantly fewer flowering heads and seeds than thewild form, leading to a modest fitness reduction (Snow etal. 1998). In general, it appears that the population sizesof the cultivar far exceed those of the wild plants: wildplants tend to be found along the periphery of cultivatedsunflower fields, in ditches and on roadsides. The major-ity of gene flow appears to arise from cultivar pollenrather than ovules ( Whitton et al. 1997 ).
To take into account the characteristics of this hybridzone, we modified the model such that the cultivar pop-ulation size remained constant and contributed pollenbut not seeds to the population under study. To imple-ment this change, cultivar ovule production was set tozero, and the number of cultivated adults was made toalways equal the initial number of cultivar individuals(NF). The number of hybrid and wild plants present eachgeneration, however, was controlled by reproductionand by competition, as in the other simulations, and thenumber of wild patches was equal to the initial numberof wild plants. In additional simulations, a second modifi-cation was made so that the cultivated plants were presentfor only one breeding season. Again, the number of wildpatches was equal to the initial number of wild plants, asif the cultivated field was planted with sunflowers in thefirst generation and with a different crop thereafter.
Hybridization between these two sunflowers results inthe long-term introgression of cultivar alleles. Molecularmarker studies of three wild populations that have beenadjacent to cultivar fields for 20–40 years revealed thatall individuals had a hybrid ancestry, although most hadthe typical wild-type phenotype (Linder et al. 1998).Even when the wild population was exposed to the cul-tivated sunflowers for only a single generation, many hy-brids were produced. Also, the frequency of cultivarmarkers did not significantly decrease in the 5 years af-ter hybridization (Whitton et al. 1997). This suggeststhat many cultivar alleles are not selected against in wildpopulations (Whitton et al. 1997), even though F1 gen-erations have lower fitness than wild plants (Snow et al.1998).
HELIANTHUS ANNUUS � H. PETIOLARIS
Most of the parameter sets we explored resulted in theextinction of one or both species. To recognize situa-tions in which a species is at risk, however, it is also nec-essary to investigate situations in which hybridization isnot a threat. The case of H. annuus � H. petiolaris al-lows us to explore situations in which two hybridizingspecies can coexist for long periods of time.
Both of these widespread sunflower species are abun-dant in the central and western United States, with nar-row, stable hybrid zones forming where they come into
contact (Heiser 1947). For example, all three classes ofplants have been found in three western Nebraska hy-brid zones that are thought to date from the turn of thecentury (Rieseberg et al. 1999b). Similarly, H. petiolarispopulations that have been in contact with cultivated H.annuus fields for as long as 40 years still contain a ma-jority of genetically pure H. petiolaris individuals (Riese-berg et al. 1999a).
The barriers to gene flow are substantial, includingstrong prezygotic, postzygotic, and ecological barriers.Pollen competition is a major prezygotic barrier and isasymmetric, such that H. petiolaris has a stronger bar-rier against H. annuus pollen than the reverse (Riese-berg et al. 1995). Also, although both species are self-incompatible (Desrochers & Rieseberg 1998), pollenloads including interspecific pollen may induce bothspecies to self-fertilize (mentor effect), with H. petiolarisgenerally having the higher selfing rate (Rieseberg et al.1995; Desrochers & Rieseberg 1998). Hybrid pollen andseed sterility create a strong postzygotic barrier: F1 gen-erations average 4.8% pollen viability and 0.8% seed set(Rieseberg 2000). Finally, where the two species meet,H. annuus seems to be restricted to heavy soils and H.petiolaris to sandy soils (Heiser 1947).
We explored this system using both the standard one-habitat model and a two-habitat model. In the two-habi-tat simulations, each species had higher seedling com-petitive ability in its own habitat than did the otherclasses ( � , for i � j), and the number of patchesrepresenting each habitat was equal to the initial popula-tion size of each species (Kr � Nr, KF � NF).
SPARTINA ALTERNIFLORA � S. FOLIOSA
Smooth cordgrass (S. alterniflora) is a clonally repro-ducing perennial grass that is currently invading the saltmarshes of the San Francisco Bay (Daehler & Strong1994), home of the common native California cordgrass(S. foliosa). Hybridization has been documented be-tween the two taxa, and hybrids are vigorous and fertile(Daehler & Strong 1997). S. foliosa is more abundantthan the invader but produces smaller quantities of infe-rior pollen (Anttila et al. 1998).
In this species pair, the invader can occupy the entirehabitat range occupied by the native species (Callaway &Josselyn 1992), so only one patch type was included inthese simulations. S. alterniflora and likely the hybridshave higher clonal growth rates than S. foliosa (Calla-way & Josselyn 1992). We considered this a measure ofcompetitive ability. We also used measurements of pol-len-tube germination in place of pollen-tube competi-tion, which was not measured (Table 1). Although thedata do not correspond exactly to the parameters usedin the simulation, the values we used reflect the underly-ing biology. Consequently, we believe that our simula-
Ci,i Cj,i

Conservation BiologyVolume 15, No. 4, August 2001
Wolf et al. Risk of Extinction through Hybridization 1045
tions should have some predictive power in ascertainingthe eventual fate of the native S. foliosa.
Sensitivity Analysis
In addition to determining whether each parameter hadan influence on extinction, we conducted a sensitivityanalysis to assess the relative importance of each parame-ter. For each sensitivity analysis, every parameter was in-creased or decreased by 10% of its “standard value” (e.g.,parameter set 1; Table 2), whereas all other parameterswere held at their standard values. The parameters werethen ranked according to their influence on the numberof generations to extinction of the native species or ac-cording to extinction probabilities in cases where extinc-tion was not inevitable. Thirteen different sensitivity anal-yses were carried out, each based on a different set ofparameter values. Four analyses employed parameter val-ues from the case studies (Table 1), whereas the othernine analyses used the values in Table 2, except for thefollowing modifications listed for each parameter set: (1)all parameter values are identical to those of Table 2, thedefault parameter set; (2) hybrid fertility is half that ofthe parents (OT � OF � 20, OH � 10, PT � PF � 1000,and PF � 500); (3) the native species is a minority in theinitial population (NT � 75, NF � 100); (4) no reproduc-tive isolation occurs via pollen-tube growth (Gi,j � 1 forall i,j � {T,F,H}); (5) reproductive isolation via pollen-tubegrowth doubled, such that conspecific pollen grew fourtimes faster than heterospecific pollen (GT,T � GF,F � 4,GH,H � Gi,j � 1, where i � j ); (6) the competitive abilityof hybrids is reduced to half that of the parents (CT,CF � 1, CH � 0.5); (7) the native species is less competi-tive than the other classes (CT � 0.9, CF � CH � 1); (8)no hybridization occurs because both species are obli-gate selfers with no inbreeding depression (�T � �F ��H � 1); and (9) between two habitats, each species has
the highest competitive ability in its own habitat (Ci,i �2, Ci,j � 1 , for i � j), and frequency of the native specieswas reduced (NT � 80, NF � 120) so that extinction rateswere high enough to measure. We estimated the averagerank of each parameter using the rank order from analy-ses on parameter sets 1–9 and from analyses on the case-study parameter sets.
Role of Hybridization
Our final goal was to determine whether hybridizationhad an effect on the probability and rapidity of extinctionor whether extinction would occur just as quickly throughcompetition alone. Hybridization was prevented by mak-ing both species obligate selfers with no inbreeding de-pression. Using parameter sets from the case studies andfrom the above parameter sets, we compared native ex-tinction rates with and without hybridization.
Results
Basic Model
All analyzed parameters interacted to influence time toextinction and the extinction probability of the nativespecies (Fig. 2). Working through the life cycle depictedin Fig. 1, we found that an increase in the selfing rate ofthe native species extended the time to extinction. Like-wise, faster native pollen-tube growth rates, greater na-tive pollen and seed production, and enhanced nativeseedling competitive ability all increased time to extinc-tion. The effects of pollen load and number of seeds perpatch (intensity of competition) were not independentof other parameters. If native pollen grew fastest, then alarger pollen load increased time to extinction. In con-trast, if invader or hybrid pollen was fastest, a larger pol-
Table 2. Standard values (parameter set 1) for sensitivity analysis.a
Parameterb Mean Possible range Distribution Variance
Number of patches (K ) 200 �0 normal 0Initial frequency of native plants (NT/K ) 0.5 0–1 none noneSelfing rate (�c)
b 0.5 0–1 binomial —Amount of pollen produced per plant (Pc )b 1000 �0 Poisson —Number of pollen grains per stigma (LMAX) 10 �0 Poisson —Conspecific pollen-tube growth rate
(GT,T, GF,F) 2 infinite normal 1Foreign pollen-tube growth rate
(GH,H, Gi,j for i � j ) 1 infinite normal 1Number of ovules per plant (Oc )b 20 �0 Poisson —Number of seeds per patch (EMAX) 10 �0 Poisson —Seedling competitive ability (Cc)
b 1 infinite normal 1aThe three genotypic classes have equal values for all parameters, except pollen-tube competition, which provided prezygotic isolation. Param-eter set 1 was used as the default because it is intermediate to the various possibilities. In some hybridizing pairs, the native species will havethe highest seed production, whereas in other cases the invader or hybrids will have an advantage. Likewise, the invader will be locally rare insome hybridizing pairs, whereas in others it will be more abundant than the native species, such as in cases where the invader was intention-ally introduced by humans. bc � T (threatened native species), F ( foreign invading species), and H (hybrids).

1046 Risk of Extinction through Hybridization Wolf et al.
Conservation BiologyVolume 15, No. 4, August 2001
len load slightly reduced time to extinction. A similar sce-nario held for the number of seeds per patch. If nativeseeds were the most competitive, then the native speciesbenefited from more seeds per patch. If the native com-petitive ability was low, increased seeds per patchslightly favored the invaders or hybrids. Both an in-creased number of patches (carrying capacity) and an in-creased frequency of natives in the initial population en-
hanced the persistence of the native species. But carryingcapacity had an effect only when the population wasvery small (i.e., 30 patches under parameter set 1).
The variance of parameters with normal distributionsalso had an effect on time to extinction (Fig. 3). Demo-graphic stochasticity (i.e., among-generation variance inthe number of patches) reduced time to extinction. Incontrast, increased variance in the competitive ability of
Figure 2. The effect of each parame-ter on time to extinction of the na-tive species (local extirpation). In each graph, the parameter on the x-axis was varied to determine its effect on the number of generations to the extinction of the native spe-cies. All other parameters were the same as in parameter set 1 (Table 1) except where noted. Error bars repre-sent one standard deviation. (A) Number of patches that determined the maximum population size. (B) Frequency of the native species in the first generation ( frequency ranges from 0.01 to 0.99 so that the initial population never consists of only a single species). (C) Average proportion of native ovules self-fertil-ized prior to random mating. (D) Average number of pollen grains produced by each native individual. (E) Mean number of pollen grains on each stigma at two different lev-els of reproductive isolation (high, GT,T � 4; low, GT,T � 1). Pollen grains per stigma represents the intensity of pollen tube competition. (F) Mean growth rate of native pollen on con-specific stigmas. (G) Mean growth rate of foreign pollen on native stig-mas. (H) Average number of ovules produced by each native individual. The native species never went extinct if it made more than 25 ovules per plant. (I) Number of seeds per patch, representing the intensity of seedling competition in two different native competitive abilities ( high, CT� 1.2; low, CT� 0.5). ( J) Mean competi-tive ability of native seedlings. Na-tive species never went extinct when its competitive ability ( CT) was � 1.1 ( CF � CH� 1).

Conservation BiologyVolume 15, No. 4, August 2001
Wolf et al. Risk of Extinction through Hybridization 1047
pollen or seeds of the native species was favorable andincreased time to extinction.
Case Studies
CULTIVATED � WILD HELIANTHUS ANNUUS
When the cultivar was sown for only a single generation,the fate of wild H. annuus depended on the initial fre-quencies of wild and cultivated plants. If the initial popu-lation had equal numbers of each parental type (N1 �N2 � 100), the wild type persisted and hybrids were elim-inated within a few generations (mean SD � 4.6 1.1).But when the wild population was much smaller than thenumber of cultivated plants (N1 � 100, N2 � 10,000), asis likely to be the case in nature, the wild plants werecompletely replaced by hybrids 75% of the time, with amean time to extinction of 4.0 2.1 generations.
When the cultivar was present every generation, wildplants were replaced by hybrids under much less stringentconditions, including equal initial population sizes. For ex-ample, when the competitive abilities of hybrids and wildplants were equal, hybrids replaced wild plants in 18.1 4.5 generations. Even when hybrids had a slight competi-tive disadvantage (C1 � 1, Ch � 0.8), they were able to re-place wild plants in 11.5 2.1 generations if the cultivarsinitially had a numerical advantage (N1 � 100, N2 � 200).
The rapid replacement of pure wild plants by hybridsin the simulations accords well with the observed persis-tence of cultivar alleles in natural H. annuus popula-tions (Whitton et al. 1997; Linder et al. 1998). In addi-tion, both the simulation and empirical results demonstratethe ease with which favorable, neutral, and even delete-rious cultivar genes are likely to move into parapatricwild sunflower populations.
HELIANTHUS ANNUUS � H. PETIOLARIS
In simulations with no habitat differentiation, one paren-tal species always displaced the other two genotypicclasses. In general, H. petiolaris was more likely to over-take the population, causing the extinction of H. an-nuus (Table 3). This was surprising because H. annuushad higher pollen and ovule output than H. petiolaris(Table 1). The advantage of H. petiolaris appears to bedue to its asymmetrical reproductive barrier, which makesit is easier for H. petiolaris pollen to fertilize H. annuusovules than the reverse. This was modeled by providingH. petiolaris pollen a higher mean pollen-tube growthrate on H. annuus stigmas than the reverse and by al-lowing a very small amount of selfing in H. petiolaris(Table 1). Thus, when measuring a species’ risk of ex-tinction through hybridization, it is important to mea-sure hybrid seed production by each species.
Under the model with two patch types (habitats), theresults were the same as with one patch type if habitatdifferentiation was weak. But when both species wereat least three times as competitive in their own habitatas in the foreign habitat, a hybrid zone developed thatwas stable for at least 500 generations (Table 3). Eachspecies remained primarily in its own habitat, and asmall number of hybrids was produced each generation.Because the overall fitness of the two species was madeless equitable, more habitat differentiation was requiredto maintain a stable hybrid zone. For example, when theinitial population size of H. annuus was greater thanthat of H. petiolaris, more habitat divergence was re-quired to maintain a stable hybrid zone than when popu-lation sizes were equal. If the already favored H. peti-olaris was initially more numerous than H. annuus, therequirement for habitat differentiation was even greater(Table 3). Selfing rate had a similar effect. When selfing
Figure 3. The effect of coefficient of variance (CV ) of each normally dis-tributed parameter on native time to extinction. Error bars represent stan-dard deviations. (A) Demographic sto-chasticity or among-generation CV in the number of patches. (B) Coefficient of variance in the growth rate of native pollen on conspecific stigmas (intensity of pollen competition: high, LMAX � 10; low, LMAX � 3). (C) Coefficient of vari-ance in the growth rate of foreign pol-len on native stigmas, another part of prezygotic isolation (high, LMAX � 10; low, LMAX � 3). (D) Coefficient of vari-ance in native competitive ability (high, EMAX � 10; low, EMAX � 3). With 10 seeds per patch, the native species never went extinct if the CV in CT was �100.

1048 Risk of Extinction through Hybridization Wolf et al.
Conservation BiologyVolume 15, No. 4, August 2001
rates increased the similarity in fitness of the two spe-cies, habitat requirements were reduced (e.g., �T � 0, �F �0.06; Table 3), and vice versa. Although mentor effectshave not received a great deal of attention in the litera-ture, these results suggest that they may play an impor-tant role in hybrid-zone dynamics. Finally, the observa-tion that stable hybrid zones never formed in the single-habitat simulations, but did form in the two-habitat simu-lations, suggests that the habitat differences betweenthese two species are crucial in determining the out-come of hybridization.
SPARTINA ALTERNIFLORA � A. FOLIOSA
Spartina foliosa, the native species, went extinct in all sim-ulations and almost always went extinct within 3–20 gener-ations. This was apparently due to its low fertility and com-petitive ability relative to the invading species (Table 1).
In some cases, S. foliosa was replaced by S. alterni-flora, whereas in others it was replaced by hybrids, de-pending on the initial number of invaders, the fertility ofhybrids, and their competitive abilities. When initial fre-quencies of the two species were equal, S. alternifloranearly always took over the population. When the hy-brid had very high fertility and competitive ability (Ta-ble 1, right-hand values), hybrids were able to take overthe population. Hybrids also were more likely to replaceboth parental species when the initial frequency of theinvader was low. For instance, when hybrid fertility andcompetitive ability were low (Table 1, left-hand values),S. alterniflora usually dominated the population, but ifonly one invader was introduced into a population of1000 S. foliosa, hybrids had an 83% chance of replacingboth parental species. This is likely due to the low pol-len output of S. foliosa, which allowed S. alterniflora tosire most of its seeds, generating more F1 seeds thanseeds of either parental species.
Nonetheless, our simulations suggest that populationsof S. foliosa that have been invaded by S. alternifloraare likely to be extirpated. In fact, our simulations pre-dict that the native species will go extinct even if hybridfitness is low or if there is no hybridization, because ofthe high clonal growth rate of the invader. But genera-tion times are likely to be very long in this clonallyspreading grass, substantially increasing the number ofyears before extinction is likely to occur.
The simulations also show that S. alterniflora or hy-brids can invade a population even when S. alterniflorais introduced in fairly low numbers. This risk is likely tobe amplified by the rapid clonal growth, longevity, andgreater ecological amplitude of the invader and the hy-brids. Hence, our results support the implementation ofmeasures to eliminate the invaders and hybrids in orderto prevent the likely extinction of S. foliosa within theSan Francisco Bay area.
Sensitivity Analysis
The sensitivity analyses allowed us to rank the parame-ters according to their influence on extinction of the na-tive species (Tables 4 & 5). Overall, the competitive abil-ity, initial frequency, selfing rate, and ovule productionof natives had the strongest influence on time to extinc-tion. Thus, these parameters are likely to have the stron-gest effects on the accuracy of risk prediction and maybe the most important to measure accurately. Althoughthe initial population size of the native species relativeto that of the invader was important, the total popula-tion size (carrying capacity) had a low rank. This is prob-ably because carrying capacity influenced extinctionrates only when it was small (i.e., 30 individuals; Fig.2). At the population sizes we used for the sensitivityanalyses, a change of only 10% in the parameter value (K )had little effect on extinction.
Table 3. Effect of initial population size and self-fertilization rate on the stability of H. petiolaris � H. annuus hybrid zones.
Initial population size Selfing rate
Competitive abilitya (CT,T , CF,F )
Frequency of extinction
Frequency of stablehybrid zone
H. petiolaris( NT)
H. annuus( NF )
H. petiolaris(sT)
H. annuus(sF ) H. petiolaris H. annuus
100 100 0.014 0 1b 0.10 0.90 0.00100 100 0.014 0 3b 0.00 0.16 0.84100 100 0.014 0 4b 0.00 0.00 1.00100 150b 0.014 0 3b 1.00 0.00 0.00100 150b 0.014 0 4b 0.10 0.00 0.90100 150b 0.014 0 5b 0.00 0.00 1.00150b 100 0.014 0 3.5b 0.00 1.00 0.00150b 100 0.014 0 4b 0.00 0.01 0.99150b 100 0.014 0 4.5b 0.00 0.00 1.00100 100 0b 0b 3b 0.00 0.16 0.84100 100 0b 0.06b 3b 0.00 0.00 1.00100 100 0.32b 0b 3b 0.00 0.83 0.17
aHabitat differentiation; a value of one indicates no differentiation.bParameters that are different from the standard (Table 1).

Conservation BiologyVolume 15, No. 4, August 2001
Wolf et al. Risk of Extinction through Hybridization 1049
Changing a native species’ parameter always had astronger effect than did a change in the same parameterfor hybrids. For instance, native competitive ability wasalways ranked higher than hybrid competitive ability.This is probably because the native species could beforced to extinction by the invading species, the hy-brids, and the synergistic effects of both groups. Oneconsequence of this was that prezygotic barriers to hy-bridization (i.e., GT,T and �T) GH,T CH had a larger effecton extinction than postzygotic barriers (i.e., OH, PH,GH,T and CH). It was especially surprising that hybridfertility was not among the top factors (OH, PH, and pos-sibly GH,T may be considered components of hybrid fer-tility). Although this result may seem counterintuitive, itdoes not necessarily mean that hybrid fertility is unim-portant; it is just not as important as other parameters.Part of the explanation may lie in the fact hybrid fertilityis divided into several parameters, which likely reducesthe effect of each parameter. Also, because the hybridclass is an absorbing class, hybrids can replace the nativespecies even if their fertility is low. Finally, if nativeovules are frequently pollinated by invader pollen, andvice versa, hybrid seeds may be generated at such a highrate that the native species cannot replace itself.
Although we were able to make a number of generali-zations about the sensitivity of each parameter, analysesbased on different parameter sets did not rank the pa-rameters in the same order, and the sensitivity of eachparameter often differed dramatically among parametersets. For instance, when there was no reproductive iso-lation through pollen-tube growth (parameter set 4), na-tive selfing rate was highly ranked (1.5); the same pa-rameter was ranked eighth when reproductive isolation
was strong (parameter set 5). This demonstrates how allparameters interacted to influence the probability andspeed of extinction under at least some conditions.
Role of Hybridization
In all cases studied, hybridization increased either theprobability of extinction or the rapidity of extinctionfor one or both species (Table 6). In the case of H. peti-olaris � H. annuus, both species were able to persistindefinitely with or without hybridization when theirhabitat was sufficiently isolated. When habitat differenti-ation was low, however, hybridization determined whichspecies would persist. When there was no hybridization,H. annuus drove H. petiolaris to extinction because ofhigher seed production by H. annuus. But when thetwo species hybridized, this fecundity advantage wascounterbalanced by the asymmetry of the reproductivebarrier: H. petiolaris was less likely to be the seed par-ent of hybrids than was H. annuus. As a result, the rela-tive fitnesses of the two species was reversed.
Discussion
General Findings
Our results confirm earlier predictions (Ellstrand & Elam1993; Levin et al. 1996; Huxel 1999) that hybridizationmay lead to the extinction of populations or species,particularly if the native taxon lacks a competitive ad-vantage, is rare, and reproductive barriers are weak. Thisis not a surprising result in itself, but the breadth of pa-
Table 4. Effect of various parameters on extinction risk based on a sensitivity analysis.a
Time to extinction (generations)
Parameter modified Parameter value mean SD
Native competitive ability (CT) 1.1 29.60 13.35 Native ovule production (OT) 22 19.91 5.83Hybrid competitive ability (CH) 0.9 19.73 6.65Native selfing rate (�T) 0.6 17.60 3.84Initial frequency of native (NT /K) 120/200 16.77 2.97Hybrid ovule production (OH) 18 16.29 3.80Native pollen growth rate (GT,T) 2.2 15.90 3.01Native pollen production (PT) 1100 14.76 3.08Initial population size of native (NT) 110 14.75 3.01Hybrid pollen growth rate (GH,T) 0.9 14.5 2.69Pollen grains per stigma (LMAX) 11 14.46 2.93Hybrid pollen production (PH) 900 14.44 2.82Hybrid selfing rate (�H) 0.4 14.16 2.76Seeds per patch (EMAX) 11 14.04 2.69Number of patches (K ) 220 14.04 2.88Standard valuesb — 13.95 2.82aIndividually, each native species parameter was increased by 10% of its value, and each hybrid parameter was decreased by 10% of its value.In this case, deviations were made from parameter set 1 (Table 2). Parameters are ordered according to the amount by which changes increasethe time to extinction of the native species.bStandard values represent the results from parameter set 1, no altered values.

1050 Risk of Extinction through Hybridization Wolf et al.
Conservation BiologyVolume 15, No. 4, August 2001
rameter space under which extinction is likely was un-expected, as was the observation that all of the parame-ters tested and the variance of those parameters had asignificant effect on rates of extinction.
A second important conclusion concerns the rapiditywith which hybridization may cause extinction. In fact,our simulation results indicate that extinction may occurin five or fewer generations (Fig. 2). Thus, hybridizationcan be viewed as perhaps the most rapidly acting geneticthreat to endangered species. In contrast, extinctionthrough mutational meltdown is likely to occur on a time-scale of 100 generations or more (Lynch et al. 1995).
Assumptions and Comparisons to Previous Work
Huxel (1999) demonstrated that hybridization increasesa species’ risk of extinction beyond the risks presentedby competition alone. Our results were concordant withthis finding, whether there were one or two habitats.
But we did find a surprising exception to this generalrule: hybridization actually reversed the outcome of theinteraction between H. annuus and H. petiolaris (Table6), demonstrating how studies that ignore the possibilityof hybridization or make casual analyses of hybridizationcould lead to erroneous conclusions concerning extinc-tion risk.
There are two main differences between our modeland Huxel’s (1999) model. First, Huxel’s model was gen-eralized, whereas we explicitly modeled a plant’s life cy-cle. Our simulation thus allows evaluation of the impor-tance of each life-cycle stage and provides a tool for riskprediction in natural populations. Second, Huxel mod-eled a one-locus system, whereas our model was not ex-plicitly genetic but assigned individuals to three classesbased on their parentage. A potential drawback of theone-locus model is that when F1 individuals (heterozy-gotes) mate, 50% of their gametes will be hybrids and50% will be parental. Likewise, only 50% of the F2 gener-ation will be classified as hybrids. Our model avoids thisdrawback, but it introduces the problem that even late-generation hybrids are classified as hybrids and are as-signed the same low fertility as F1 individuals. In actual-ity, backcross individuals are likely to have higher fertil-ity than F1s and may completely regain fertility in laterbackcross generations (Rieseberg 2000). Therefore ourmodel may underestimate the risk of hybrid takeover.
On the other hand, hybridization may lead to the intro-gression of only neutral alleles, leaving intact the parts ofthe genome that are under selection and define speciesidentity (Buerkle et al. 2000). This is probably what oc-curs when cultivated and wild sunflowers hybridize: themajority of wild plants show evidence of hybrid ancestrybut retain the wild phenotype (Linder et al. 1998). A mul-tilocus simulation clearly is needed to take into accountdifferent coefficients of selection at individual loci andto estimate levels of genomic infiltration. If only a smallnumber of neutral genes from the invading species aremaintained in hybrids, these hybrids are essentiallymembers of the native taxon and are unlikely to repre-sent a threat to species diversity. But if the hybrid ge-nome consists primarily of the invading species’ genomeand hybrids encroach on the native species’ habitat,there is cause for concern. Despite the lack of an ex-plicit genetic model, our approach does effectively mon-itor the persistence of “pure” species, which is likely tobe the focus of many conservation efforts.
Conservation Implications
Our data demonstrate that hybridization can be a power-ful and rapidly acting force toward extinction. Thus, itshould be one of the important factors considered inmanagement plans, and our model can provide guidanceregarding the kinds of data required to evaluate extinc-tion risk.
Table 5. Mean rank of each parameter’s effect on extinction risk.a
Parametera Mean rank SD
Case studiesb
Initial frequency of native (NT/K ) 1.20 0.45Native selfing rate (�T) 2.20 1.10Native competitive ability (CT) 2.25 0.71Native pollen growth rate (GT,T) 4.88 3.14Native pollen production (PT) 5.50 1.51Native ovule production (OT) 5.88 2.47Initial population size of native (NT) 5.88 2.23Hybrid competitive ability (CH) 7.5 3.59Seeds per patch (EMAX) 9.13 2.17Hybrid pollen growth rate (GH,T) 10.75 3.99Number of patches (K ) 10.88 3.87Pollen load per stigma (LMAX) 10.88 2.47Hybrid ovule production (OH ) 11.13 3.31Hybrid pollen production (PH) 11.25 3.45Hybrid selfing rate (�H) 13.50 0.58Standard values 13.57 2.1
Standards 1–9c
Native competitive ability (CT) 1.22 0.43Native ovule production (OT) 2.44 0.92Initial frequency of native (NT/K ) 3.83 1.54Native selfing rate (�T) 4.24 1.92Hybrid competitive ability (CH) 5.63 3.05Native pollen growth rate (GT,T) 6.22 1.56Initial population size of native (NT) 7.39 1.88Native pollen production (PT) 8.17 1.72Hybrid ovule production (OH) 8.31 3.79Hybrid pollen growth rate (GH,T ) 10.88 2.22Pollen load per stigma (LMAX) 11.33 3.24Number of patches (K ) 12.11 3.29Hybrid pollen production (PH) 12.25 1.91Seeds per patch (EMAX) 13.00 2.95Hybrid selfing rate (�H) 13.88 2.13Standard values 14.14 2.69
aParameters ordered from largest to smallest influence on time toextinction of native species.bRanks averaged over sensitivity analyses of the case studies.cMean ranks are for parameter sets 1–9.

Conservation BiologyVolume 15, No. 4, August 2001
Wolf et al. Risk of Extinction through Hybridization 1051
The first step is to determine whether hybridization isoccurring and to estimate the frequency of parental andhybrid groups. First generation hybrids tend to be a mo-saic of parental and intermediate characters (Rieseberg &Ellstrand 1993) and can be easily diagnosed based onmorphological criteria. Because of selection against re-combinant phenotypes, however, morphological mea-surements may consistently underestimate the true pro-portion of hybrids in natural populations (Rieseberg et al.1999a, 1999b; Carney et al. 2000). Thus, when time andresources are available, it may be best to use molecularmarkers to determine actual frequencies of the hybridand parental groups. Even if the number of markers istoo small to assure detection of all hybrids, maximum-likelihood methods can be employed to estimate the fre-quencies of different hybrid classes (Nason & Ellstrand1993).
If hybrids are present, then steps should be takenquickly to determine whether hybridization is likely tobe a threat. In an ideal world, managers would measureall of the parameters in the model. This is likely to betime-consuming and infeasible when a rapid assessmentis needed. One quick approach is to estimate the frequencyof native species, invader species, and hybrids acrossmultiple generations. If the frequency of the native spe-cies is decreasing, it may be at risk. This approach hasthe advantage of requiring the measurement of only asingle parameter. It also represents a more direct esti-mate of extinction risk through hybridization. One pos-sible drawback, however, is the nonlinear nature of theextinction curve. Typically, the decline of the threat-ened taxon starts slowly but accelerates due to a feed-back effect. Decreasing numbers of the threatened formlead to a decreased chance of finding a conspecific mate,
Table 6. Probability of extinction and number of generations (mean SD) to extinction in the presence or absence of hybridization.a
Native speciesb Invading speciesb
Case probability generations probability generations
Wild cultivated � H. annuushybridization 1.00 11.4 2.1 0.00 —no hybridization 0.00 — 0.00 —
H. petiolaris � H. annuus, 1 habitathybridization 0.09 9.2 1.9 0.91 7.0 1.7no hybridization 1.00 59.6 22.1 0.00 —
H. petiolaris � H. annuus, 2 habitatshybridization 0.00 — 0.20 262.3 133.7no hybridization 0.00 — 0.00 —
S. foliosa � S. alterniflorahybridization 1.00 6.7 0.7 0.00 —no hybridization 1.00 7.7 0.7 0.00 —
Parameter set 1hybridization 1.00 14.0 2.9 1.00 14.0 2.7no hybridization 0.46 217.2 105.5 0.43 212.4 123.0
Parameter set 2hybridization 0.49 21.6 6.4 0.51 21.5 6.5no hybridization 0.49 209.4 113.9 0.40 203.7 106.4
Parameter set 3hybridization 1.00 12.3 2.6 1.00 15.6 3.2no hybridization 0.55 179.6 109.4 0.39 211.0 119.9
Parameter set 4hybridization 1.00 9.1 1.9 1.00 9.2 1.9no hybridization 0.48 206.8 115.2 0.41 202.4 111.6
Parameter set 5hybridization 0.88 66.3 54.0 0.87 65.6 52.6no hybridization 0.46 217.1 120.5 0.47 194.8 103.2
Parameter set 6hybridization 0.49 21.9 6.6 0.51 21.7 6.6no hybridization 0.45 205.6 113.6 0.45 201.6 112.2
Parameter set 7hybridization 1.00 10.2 1.9 1.00 16.0 3.1no hybridization 1.00 29.9 9.0 0.00 —
Parameter set 9hybridization 1.00 23.1 6.1 0.00 —no hybridization 0.00 — 0.00 —
aParameter set 8 is identical to parameter set 1, no hybridization, so parameter set 8 is not presented.bCase studies are listed as native � invader.

1052 Risk of Extinction through Hybridization Wolf et al.
Conservation BiologyVolume 15, No. 4, August 2001
which in turn decreases the number of conspecific indi-viduals in the next generation, and so forth. Thus, calcu-lations of extinction risk may vary with position alongthe extinction curve when the population is sampled.
Some additional measures that can be taken quicklyshould increase the accuracy of risk assessment. In gen-eral, if the frequency of the invading species is low andhybrids are at a selective disadvantage, the native spe-cies will probably purge most of the foreign genome,keeping only beneficial alleles. But if the native speciesis in the minority, extinction through genetic assimila-tion and/or outbreeding depression becomes increas-ingly likely, regardless of the fitness of hybrids. Likewise,species with short generation times are in greater imme-diate danger of extinction through hybridization thanare long-lived taxa and thus are more likely to requireprompt action. Like long-generation time, clonal growthis likely to slow the production of hybrids, but clonalgrowth may increase the tempo of extinction if the in-vading species or the hybrids grow more vigorously(e.g., Callaway & Josselyn 1992). Finally, the mating sys-tem is critical. If the threatened taxon primarily self-fer-tilizes, hybridization is unlikely to be a threat, althoughcompetition may still be a hazard. Mating system is mostaccurately measured by molecular marker assays of ma-ternal families, but floral morphology can be predictiveof mating system as well (Richards 1986).
Given additional time and resources, estimates of seedand pollen production in both species and in hybridswill improve estimates of extinction risk. If the taxon ofconcern has lower fertility than either the hybrids or theinvading species, extinction is likely. Competitive abilityshould also be measured because it has the strongestinfluence on the sensitivity analysis. Risk assessment willimprove with each additional parameter measured. None-theless, our case studies indicate that even an incompletedata set, along with educated guesses for the other param-eters, can have predictive power, and that use of the sim-ulation to explore a range of parameter values can revealthe importance of measuring additional parameters.
If hybridization is shown to be a threat, several man-agement strategies are possible (Rieseberg & Gerber 1995).First, the invading species and the hybrids may be elimi-nated from the range of the threatened species. Thismay not be practical, however, if the range of the nativespecies is large and the invading species is numerous. Asecond strategy is to transplant the threatened popula-tion (or propagules) to a more isolated locale. But thetranslocated populations may not survive, and greaterisolation provided by the new location may be transi-tory. A third option, habitat improvement, may repre-sent the best long-term solution. Hybridization has longbeen associated with habitat disturbance, and habitatdisturbance facilitates the breakdown of premating re-productive barriers, increasing hybridization frequency.In addition, competition is generally reduced in disturbed
habitats, facilitating the survival of hybrid genotypes,even if they have low fitness.
Conclusions
The simulation approach we employed represents a use-ful tool for assessing the risk of extinction throughhybridization. Our results suggest that not only is hybrid-ization a significant threat to both rare and abundant spe-cies, but also that it can lead to extinction in a surprisinglyshort period of time, often less than five generations. Al-though we have focused on the potentially destructiveconsequences of hybridization between previously allo-patric taxa, extinction represents only one of many po-tential outcomes of hybridization. In fact, several recentreviews emphasize the creative role that hybridizationmay play in adaptive evolution and speciation (e.g., Ab-bott 1992; Arnold 1997; Rieseberg 1997; Grant & Grant1998; Ramsey & Schemske 1998). In addition, it has beensuggested that plant hybrid zones may serve as focalpoints of biodiversity and may represent centers of abun-dance for normally rare species (Martinsen & Whitham1994; Whitham et al. 1994). Our study not only serves asa counterbalance to these more favorable assessments ofhybridization’s role, but also raises a critical unansweredquestion concerning the relative frequency of thesemany different outcomes of hybridization.
Acknowledgments
We thank N. C. Ellstrand and S. P. Otto for useful discus-sions. We are also grateful to J. M. Burke, N. C. Ellstrand,K. D. Livingstone, and three anonymous reviewers foruseful comments on the manuscript. C. A. Buerkle andR. R. Repasky provided invaluable technical assistance.D.E.W. was supported by a Floyd Botany Fellowshipwhile completing this work.
Literature Cited
Abbott, R. J. 1992. Plant invasions, interspecific hybridization and theevolution of new plant taxa. Trends in Ecology and Evolution 7:401–404.
Anderson, E. 1948. Hybridization of the habitat. Evolution 2:1–9.Anttila, C. K., C. C. Daehler, E. N. Rank, and D. R. Strong. 1998.
Greater male fitness of a rare invader (Spartina alterniflora,Poaceae) threatens a common native (Spartina foliosa) with hy-bridization. American Journal of Botany 85:1597–1601.
Arnold, M. L. 1997. Natural hybridization and evolution. Oxford Uni-versity Press, Oxford, United Kingdom.
Brochmann, C. 1984. Hybridization and distribution of Argyranthe-mum coronopifolium (Asteraceae-Anthemideae) in the Canary Is-lands. Nordic Journal of Botany 4:729–736.
Buerkle C. A., R. J. Morris, M. A. Asmussen, and L. H. Rieseberg. 2000.The likelihood of homoploid hybrid speciation. Heredity 84:441–451.
Callaway, J. C., and M. N. Josselyn. 1992. The introduction and spreadof smooth cordgrass (Spartina alterniflora) in South San FranciscoBay. Estuaries 15:219–226.

Conservation BiologyVolume 15, No. 4, August 2001
Wolf et al. Risk of Extinction through Hybridization 1053
Carney, S., D. Wolf, and L. H. Rieseberg. 2000. Hybridization and for-est conservation. Pages 167–182 in T. J. B. Boyle, A. Young, andD. Boshier, editors. Forest conservation genetics: principles and prac-tice. CSIRO Publishing, Collingwood, Victoria, Australia.
Crites, G. D. 1993. Domesticated sunflower in fifth millennium b.p.temporal context: new evidence from middle Tennessee. Ameri-can Antiquities 58:146–148.
Daehler, C. C., and D. R. Strong. 1994. Variable reproductive outputamong clones of Spartina alterniflora (Poaceae) invading SanFrancisco Bay, California: the influence of herbivory, pollination,and establishment site. American Journal of Botany 81:307–313.
Daehler, C. C., and D. R. Strong. 1997. Hybridization between intro-duced smooth cordgrass (Spartina alterniflora; Poaceae) and na-tive California cordgrass (S. foliosa) in San Francisco Bay, Califor-nia, USA. American Journal of Botany 84:607–611.
Desrochers, A. M., and L. H. Rieseberg. 1998. Mentor effects in wildspecies of Helianthus (Asteraceae). American Journal of Botany85:770–775.
Ellstrand, N. C., and D. R. Elam. 1993. Population genetic conse-quences of small population size: implications for plant conserva-tion. Annual Review of Ecology and Systematics 24:217–242.
Ellstrand, N. C., H. C. Prentice, and J. F. Hancock. 1999. Gene flow andintrogression from domesticated plants into their wild relatives.Annual Review of Ecology and Systematics 30:539–563.
Grant, B. R., and P. R. Grant. 1998. Hybridization and speciation inDarwin’s Finches: the role of sexual imprinting on a culturallytransmitted trait. Pages 404–423 in D. J. Howard and S. H. Ber-locher, editors. Endless forms: species and speciation. Oxford Uni-versity Press, New York.
Hancock, J. F., R. Grumet, and S. C. Hokanson. 1996. The opportunityfor escape of engineered genes from transgenic crops. HortScience31:1080–1085.
Heiser, C. B. 1947. Hybridization between the sunflower species He-lianthus annuus and H. petiolaris. Evolution 1:249–262.
Heiser, C. B. 1951. The sunflower among the North American Indians.Proceedings of the American Philosophical Society 95:432–448.
Huxel, G. R. 1999. Rapid displacement of native species by invasivespecies: effects of hybridization. Biological Conservation 89:143–152.
Levin, D. A., J. K. Francisco-Ortega, and R. K. Jansen. 1996. Hybridiza-tion and the extinction of rare plant species. Conservation Biology10:10–16.
Linder, C. R., I. Taha, G. J. Seiler, A. A. Snow, and L. H. Rieseberg.1998. Long-term introgression of crop genes into wild sunflowerpopulations. Theoretical and Applied Genetics 96:339–347.
Lynch, M., J. Conery, and R. Burger. 1995. Mutation accumulation and theextinction of small populations. The American Naturalist 146:489–518.
Martinsen, G. D., and T. G. Whitham. 1994. More birds nest in hybridcottonwood trees. Wilson Bulletin 106:474–481.
Nason, J. D., and N. C. Ellstrand. 1993. Estimating the frequencies ofgenetically distinct classes of individuals in hybridized populations.Journal of Heredity 84:1–12.
Pysek, P., K. Prach, M. Rejmanek, and M. Wade. 1995. Plant invasions:general aspects and special problems. SPB Academic Publishing,Amsterdam.
Ramsey, J., and D. Schemske. 1998. Pathways, mechanisms and ratesof polyploid formation in flowering plants. Annual Review of Ecol-ogy and Systematics 29:467–501.
Rhymer, J. M., and D. Simberloff. 1996. Extinction by hybridization andintrogression. Annual Review of Ecology and Systematics 27:83–109.
Richards, A. J. 1986. Plant breeding systems. Allen & Unwin, HempelHemstead, United Kingdom.
Rieseberg, L. H. 1991. Hybridization in rare plants: insights from casestudies in Cercocarpus and Helianthus. Pages 171–181 in D. A.Falk and K. E. Holsinger, editors. Genetics and conservation of rareplants. Oxford University Press, New York.
Rieseberg, L. H. 1997. Hybrid origins of plant species. Annual Reviewof Ecology and Systematics 28:359–389.
Rieseberg, L. H. 2000. Crossing relationships among ancient and ex-perimental sunflower hybrid lineages. Evolution 54:859–865.
Rieseberg, L. H., and N. C. Ellstrand. 1993. What can morphologicaland molecular markers tell us about plant hybridization? CriticalReviews in Plant Sciences 12:213–241.
Rieseberg, L. H., and D. Gerber. 1995. Hybridization in the Catalinamahogany: RAPD evidence. Conservation Biology 9:199–203.
Rieseberg, L. H., A. Desrochers, and S. J. Youn. 1995. Interspecific pol-len competition as a reproductive barrier between sympatric spe-cies of Helianthus (Asteraceae). American Journal of Botany 82:515–519.
Rieseberg, L. H., M. J. Kim, and G. J. Seiler. 1999a. Introgression be-tween cultivated sunflowers and a sympatric wild relative, Helian-thus petiolaris (Asteraceae). International Journal of Plant Sciences160:102–108.
Rieseberg, L. H., J. Whitton, and K. Gardner. 1999b. Hybrid zones andthe genetic architecture of a barrier to gene flow between twowild sunflower species. Genetics 152:713–727.
Snow, A. A., and P. Morán-Palma. 1997. Commercialization of trans-genic plants: potential ecological risks. BioScience 47:86–96.
Snow, A. A., P. Morán-Palma, L. H. Rieseberg, A. Wszelaki, and G.Seiler. 1998. Fecundity, phenology, and seed dormancy of F1 wild-crop hybrids in sunflower (Helianthus annuus, Asteraceae).American Journal of Botany 85:794–801.
Stace, C. A. 1975. Hybridization and the flora of the British Isles. Cam-bridge University Press, Cambridge, United Kingdom.
Whitham, T. G., P. A. Morrow, and B. M. Potts. 1994. Plant hybridzones as centers of biodiversity: the herbivore community of twoendemic Tasmanian eucalypts. Oecologia 97:481–490.
Whitton, J., D. E. Wolf, D. M. Arias, A. A. Snow, and L. H. Rieseberg.1997. The persistence of cultivar alleles in wild populations of sun-flowers five generations after hybridization. Theoretical and Ap-plied Genetics 95:33–40.
Wilson, E. O. 1992. The diversity of life. Harvard University Press,Cambridge, Massachusetts.