politics, policies, and productivity: an international dataset
TRANSCRIPT
1
Politics, Policies, and Productivity: An International Dataset
Codebook
Ariel Mecikovsky* Carlos Scartascini*
Mariano Tommasi**
*Inter-American Development Bank **Universidad de San Andrés
Download the dataset at: http://www.iadb.org/research/pub_desc.cfm?pub_id=DBA-013&lang=en Citation of the dataset: Mecikovsky, Ariel, Scartascini, Carlos and Tommasi, Mariano. 2010. “Politics, Policies, and Productivity: An International Dataset”. Washington, DC, United States: Research Department, Inter-American Development Bank Contact info: [email protected] The views and interpretations in this document are those of the authors and should not be attributed to the Inter-American Development Bank, or to any individual acting on its behalf.
2
I. Introduction Latin American countries have fared relatively poorly in terms of fostering productivity.
Latin America’s productivity has been falling compared to other benchmark countries
such as the United States, and the countries of the region have not even performed well in
absolute terms. Had they performed at the same level as the world’s average country,
countries like Argentina would be among the world’s richest. Yet most Latin American
countries have fallen behind.
IDB (2010) presents a thorough analysis of the reasons behind this decline.
Basically, productivity in Latin America is hindered by the lack of credit, macroeconomic
volatility, high transport costs, distorted labor market incentives, fragmented social
policy, discriminatory tax enforcement, and a dearth of adequate productive development
policies. Identifying the key obstacles for productivity growth in a given country is easier
than implementing a coherent set of policies to address them. Even recognizing
productivity as a policy priority requires some nontrivial policymaking capabilities. The
policy changes necessary to unlock productivity are sometimes difficult to sell to the
public, as they entail short-term sacrifices and require substantial resources.
Implementing such policies demands articulation in a number of different policy
domains, as well as broad public-private cooperation. Unfortunately, most Latin
American polities lack precisely the capabilities required to implement such complex
policy objectives. Not all countries face the same policy challenges, and not all countries
share the same institutional configurations: ones that may facilitate or impede
productivity enhancement. Scartascini and Tommasi (2010) shows these connections
3
empirically using the data described in this document and available in the companion
dataset.
This dataset compiles data publicly available that proxies for the quality of the
public policies that affect productivity at the national level, alongside with proxies for the
articulation and characteristics of interest groups. It complements another dataset by the
authors and colleagues (Berkman et al. (2008)) on the features of public policies. The
main sources of data are the World Economic Forum’s Global Competitiveness Report
(GCR) and the World Bank’s World Development Indicators (WDI). The set of variables
presented here are available for 200 countries around the world.
The project leading to the compilation of this dataset builds upon previous work
conducted by the authors and colleagues. Those projects have focused on various
institutional features of political institutions, including the different branches of
government, bureaucracy, and electoral variables, to analyze their effects on the
policymaking process and the resulting public policy outcomes.1 Therefore, this study
includes new measures of public policies and characteristics/articulations of real actors.
This document is organized as follows. The next three sections introduce the
public policy and real actors’ variables. These sections are followed by a description of
the method employed to construct the variables and some robustness checks that were
carried out to assess the reliability of the data.
1 See IDB (2005), Spiller & Tommasi (2007), Stein & Tommasi (2007), Stein et al. (2008), Berkman et al. (2008).

4
2. Public Policies
There is an extensive literature that analyzes the determinants of productivity.2 In
most cases, we could identify that the literature associates productivity variations at firm,
industry or country level, to the type of tax policy (Arnold & Schwellnus, 2008; Vartia,
2008), regulations and subsidies (Bridgman et al., 2007; Scarpetta & Tressel, 2002;
Crafts, 2006), innovation (Griffith et al. 2006; Parisi et al. 2006, Boris et al. 2008),
infrastructure (Pineda & Rodriguez, 2005; Mamatzakis, 2007), competitivity (Gardiner,
Martin & Tyler, 2004; O’Mahony & Van Ark, 2003), credit (Gatti & Love, 2008; Butler
& Cornaggia, 2008) and informal sector (Farrel, 2004; Fajnzylber et al. 2006; Levy,
2007).
The sources that we use to measure the public policies variables are perception-
based indicators derived from responses to the World Economic Forum executive opinion
survey. Surveys of this type provide valuable information on a broad range of variables
for which hard data is typically scarce. They have the advantage of permitting the
construction of indicators with a relatively high degree of conceptual precision. The
homogeneity of the sample group allows the use of fairly well-specified concepts, and
also the use of a large set of questions permits the unbundling of broad concepts. This
type of indicators can be considered as a useful tool to spot specific problems and to
provide some guidance in identifying potential areas for policy intervention.
2.1. Administrative Easiness Startups
burdenstartprom: Administrative Burden for Startups (GCR, 2001, 2003, 2004).
2 See Isaksson (2006), Iverson (2006) and Sveikauskas (2007). More recently, IDB (2010) surveys this literature in the context of Latin America.
5
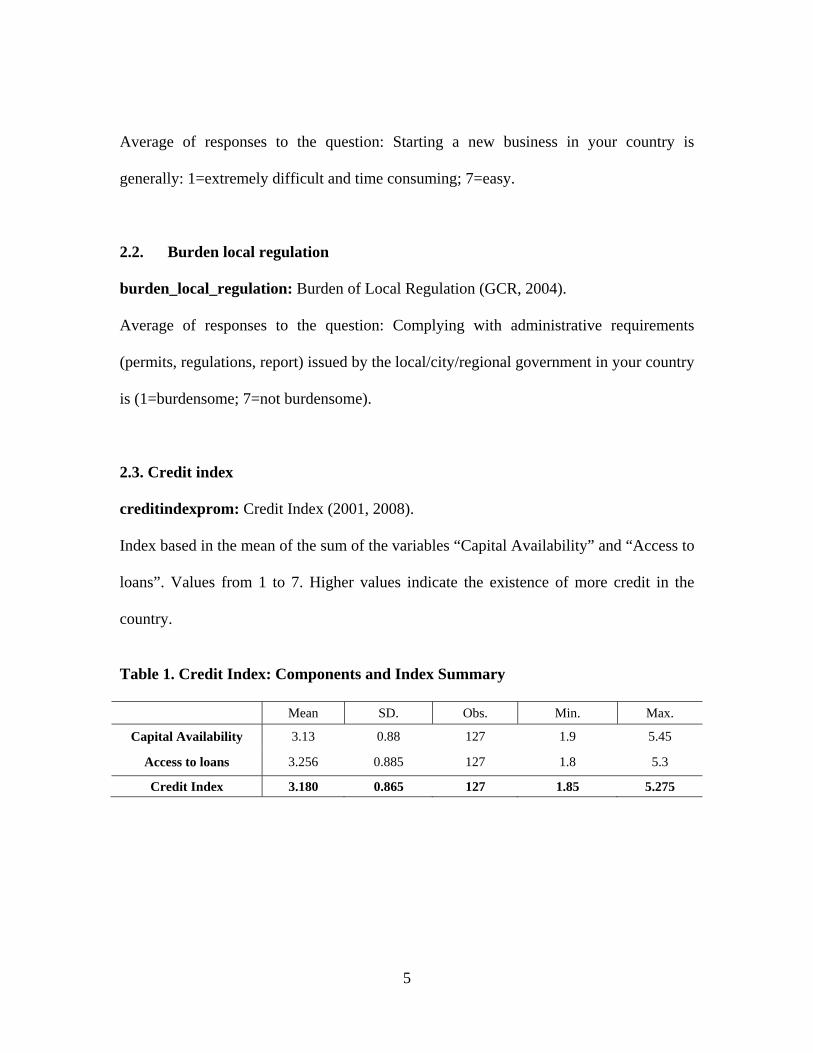
Average of responses to the question: Starting a new business in your country is
generally: 1=extremely difficult and time consuming; 7=easy.
2.2. Burden local regulation
burden_local_regulation: Burden of Local Regulation (GCR, 2004).
Average of responses to the question: Complying with administrative requirements
(permits, regulations, report) issued by the local/city/regional government in your country
is (1=burdensome; 7=not burdensome).
2.3. Credit index
creditindexprom: Credit Index (2001, 2008).
Index based in the mean of the sum of the variables “Capital Availability” and “Access to
loans”. Values from 1 to 7. Higher values indicate the existence of more credit in the
country.
Table 1. Credit Index: Components and Index Summary
Mean SD. Obs. Min. Max.
Capital Availability 3.13 0.88 127 1.9 5.45
Access to loans 3.256 0.885 127 1.8 5.3
Credit Index 3.180 0.865 127 1.85 5.275
6
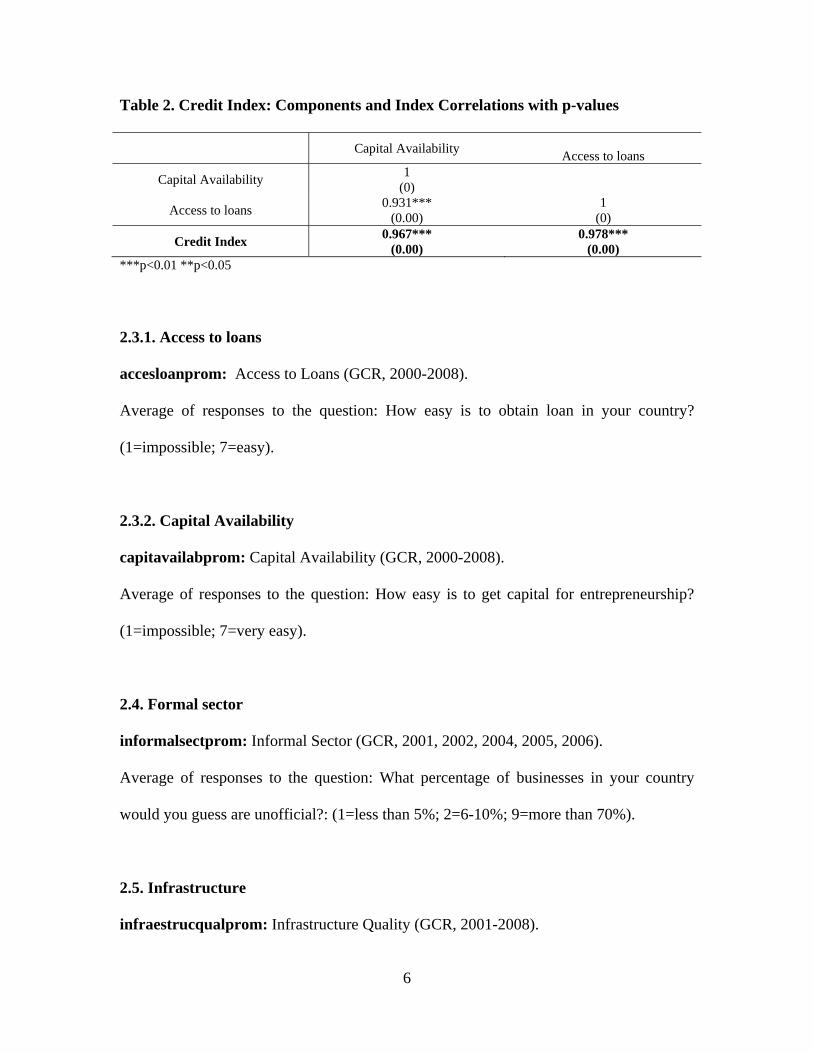
Table 2. Credit Index: Components and Index Correlations with p-values
Capital Availability Access to loans
Capital Availability 1 (0)
Access to loans 0.931*** (0.00)
1 (0)
Credit Index 0.967*** (0.00)
0.978*** (0.00)
***p<0.01 **p<0.05
2.3.1. Access to loans
accesloanprom: Access to Loans (GCR, 2000-2008).
Average of responses to the question: How easy is to obtain loan in your country?
(1=impossible; 7=easy).
2.3.2. Capital Availability
capitavailabprom: Capital Availability (GCR, 2000-2008).
Average of responses to the question: How easy is to get capital for entrepreneurship?
(1=impossible; 7=very easy).
2.4. Formal sector
informalsectprom: Informal Sector (GCR, 2001, 2002, 2004, 2005, 2006).
Average of responses to the question: What percentage of businesses in your country
would you guess are unofficial?: (1=less than 5%; 2=6-10%; 9=more than 70%).
2.5. Infrastructure
infraestrucqualprom: Infrastructure Quality (GCR, 2001-2008).
7
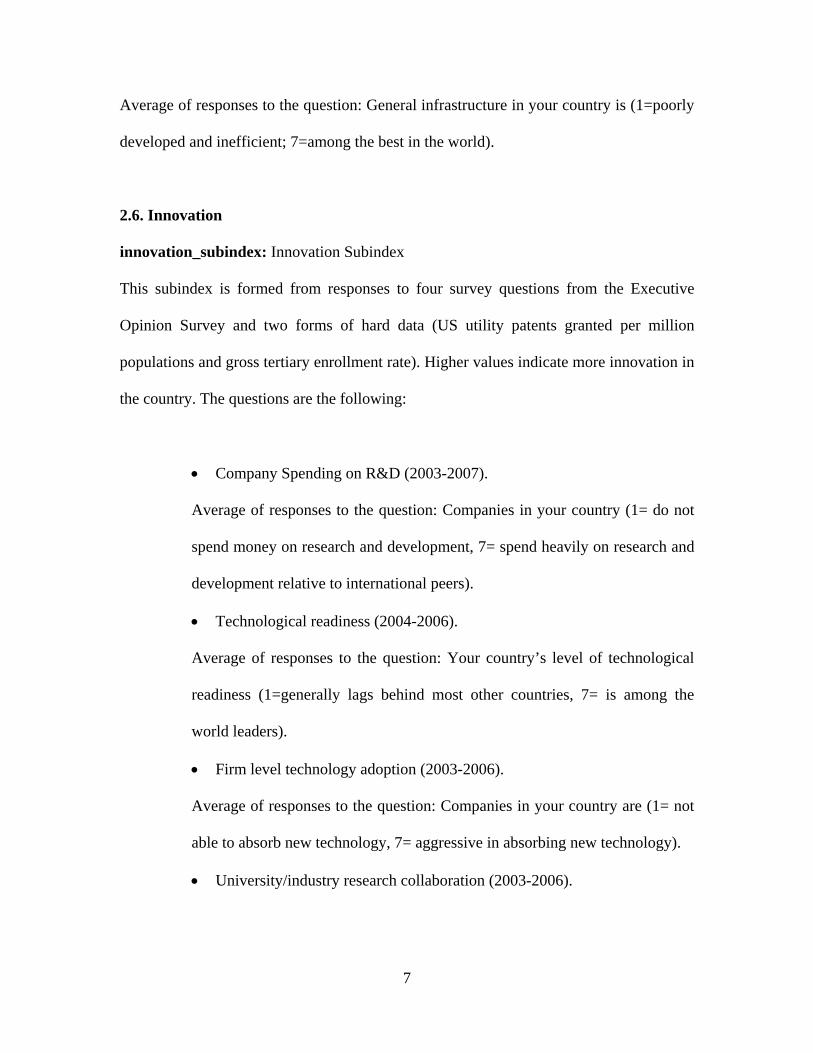
Average of responses to the question: General infrastructure in your country is (1=poorly
developed and inefficient; 7=among the best in the world).
2.6. Innovation
innovation_subindex: Innovation Subindex
This subindex is formed from responses to four survey questions from the Executive
Opinion Survey and two forms of hard data (US utility patents granted per million
populations and gross tertiary enrollment rate). Higher values indicate more innovation in
the country. The questions are the following:
• Company Spending on R&D (2003-2007).
Average of responses to the question: Companies in your country (1= do not
spend money on research and development, 7= spend heavily on research and
development relative to international peers).
• Technological readiness (2004-2006).
Average of responses to the question: Your country’s level of technological
readiness (1=generally lags behind most other countries, 7= is among the
world leaders).
• Firm level technology adoption (2003-2006).
Average of responses to the question: Companies in your country are (1= not
able to absorb new technology, 7= aggressive in absorbing new technology).
• University/industry research collaboration (2003-2006).
8
Average of responses to the question: In its R&D activity, business
collaboration with local universities is (1=minimal or nonexistent, 7=
intensive and ongoing).
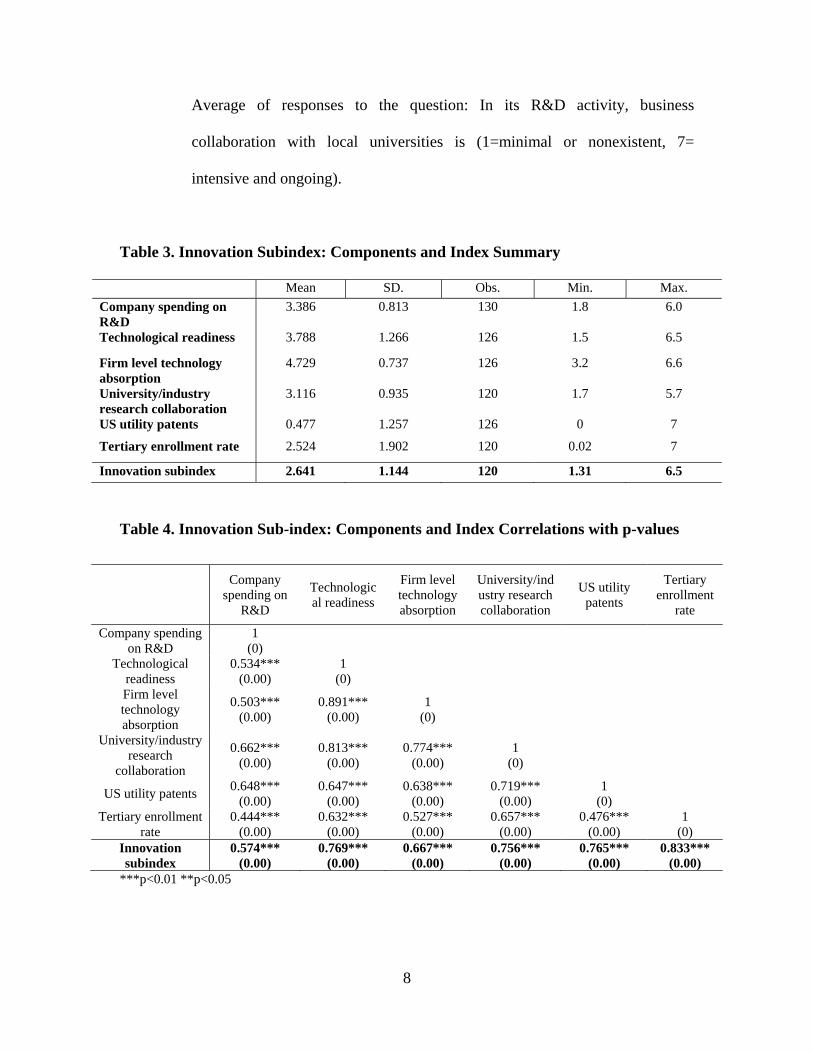
Table 3. Innovation Subindex: Components and Index Summary
Mean SD. Obs. Min. Max. Company spending on R&D
3.386 0.813 130 1.8 6.0
Technological readiness 3.788 1.266 126 1.5 6.5
Firm level technology absorption
4.729 0.737 126 3.2 6.6
University/industry research collaboration
3.116 0.935 120 1.7 5.7
US utility patents 0.477 1.257 126 0 7
Tertiary enrollment rate 2.524 1.902 120 0.02 7
Innovation subindex 2.641 1.144 120 1.31 6.5
Table 4. Innovation Sub-index: Components and Index Correlations with p-values
***p<0.01 **p<0.05
Company spending on
R&D
Technological readiness
Firm level technology absorption
University/industry research collaboration
US utility patents
Tertiary enrollment
rate
Company spending on R&D
1 (0)
Technological readiness
0.534*** (0.00)
1 (0)
Firm level technology absorption
0.503*** (0.00)
0.891*** (0.00)
1 (0)
University/industry research
collaboration
0.662*** (0.00)
0.813*** (0.00)
0.774*** (0.00)
1 (0)
US utility patents 0.648*** (0.00)
0.647*** (0.00)
0.638*** (0.00)
0.719*** (0.00)
1 (0)
Tertiary enrollment rate
0.444*** (0.00)
0.632*** (0.00)
0.527*** (0.00)
0.657*** (0.00)
0.476*** (0.00)
1 (0)
Innovation subindex
0.574*** (0.00)
0.769*** (0.00)
0.667*** (0.00)
0.756*** (0.00)
0.765*** (0.00)
0.833*** (0.00)
9
2.6.1. FDI and technology transfer
fditecnotransfprom: FDI and Technology Transfer (GCR, 2002, 2004, 2005, 2006,
2008).
Average of responses to the question: Foreign direct investment in your country: (1 =
brings little new technology; 7 = is an important source of new technology).
2.6.2. Firm absorption of technology
firmabsortprom: Firm Absorption of Technology (GCR, 2003-2006).
Average of responses to the question: Companies in your country are: (1 = not able to
absorb new technology; 7 = aggressive in absorbing new technology).
2.6.3. Impact of rules on FDI
impactrulesfdiprom: Impacts of Rules on FDI (GCR, 2004, 2007).
Average of responses to the question: What is the impact of your country’s rules
governing foreign direct investment on your business? (1=damaging; 7=beneficial).
2.7. Neutrality of government subsidies:
extentdisortgovsubsprom: Extent Disortative Government Subsidies (GCR, 2000-
2002).
Average of responses to the question: Government subsidies to business in your country
(1=keep uncompetitive industries alive artificially; 7=improve the productivity of
industries).
10
2.8. Neutrality of tax system:
extenttaxprom: Extent Distortive Tax System(GCR, 2004-2007)
Average of responses to the question: The level of taxes in your country: (1=limits
incentives to work and invest; 7=has limit impact of those incentives).
2.9. Organized efforts to improve competitiveness
effortcompetitivprom: Organized Efforts to Improve Competitiveness (GCR, 2004).
Average of responses to the question: Organized efforts to improve competitiveness in
your country are: (1= nonexistent; 7= widespread and well coordinated).
2.10. Unions contribution to productivity
unioncontribproductprom: Union Contribution to Productivity (GCR, 2001).
Average of responses to the question: "Labor unions in your country (1=prevent
productivity improvements, 7=contribute to productivity improvements)"
2.11. Policy index
gcr_policyindex: GCR Policy Index
The index is based in the average of values for the variables infrastructure quality, credit
index, extent and effect of taxation, extent of distortive government subsidies, burden of
government regulation, efforts to improve competitiveness and informal sector.3
3 Note: The variable informal sector was rescaled so as to vary from 1 to 7 instead of from 1 to 9.
11
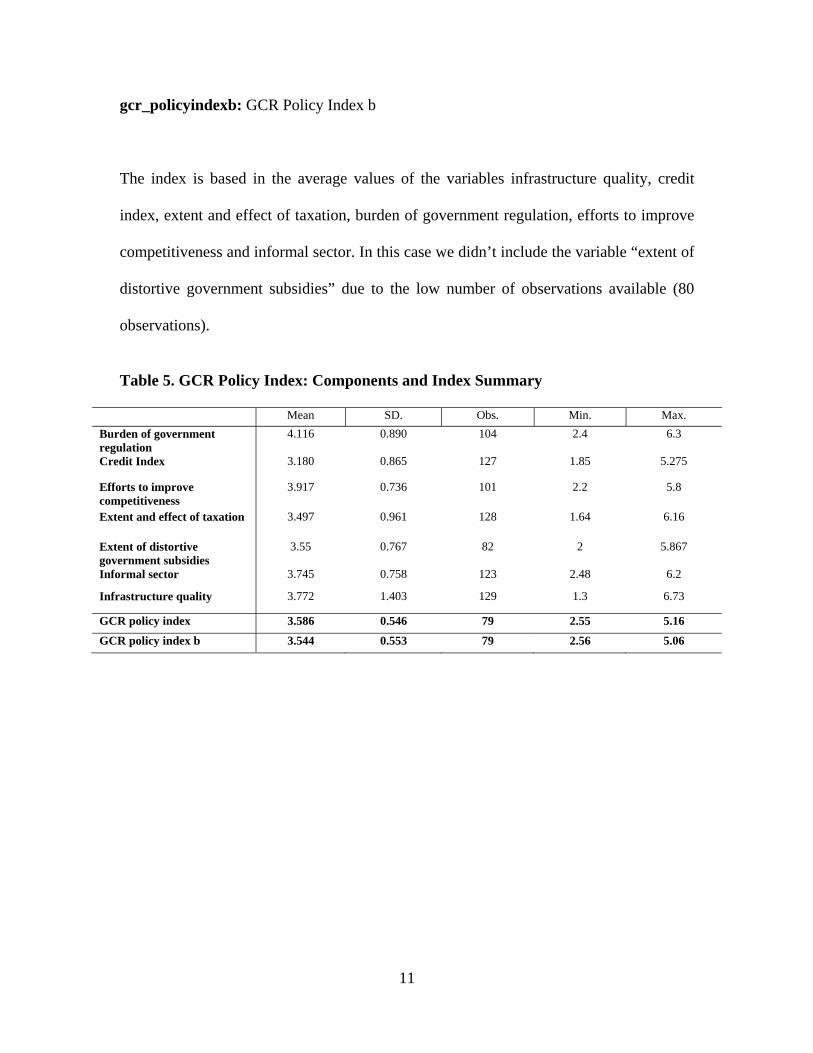
gcr_policyindexb: GCR Policy Index b
The index is based in the average values of the variables infrastructure quality, credit
index, extent and effect of taxation, burden of government regulation, efforts to improve
competitiveness and informal sector. In this case we didn’t include the variable “extent of
distortive government subsidies” due to the low number of observations available (80
observations).
Table 5. GCR Policy Index: Components and Index Summary
Mean SD. Obs. Min. Max. Burden of government regulation
4.116 0.890 104 2.4 6.3
Credit Index 3.180 0.865 127 1.85 5.275
Efforts to improve competitiveness
3.917 0.736 101 2.2 5.8
Extent and effect of taxation 3.497 0.961 128 1.64 6.16
Extent of distortive government subsidies
3.55 0.767 82 2 5.867
Informal sector 3.745 0.758 123 2.48 6.2
Infrastructure quality 3.772 1.403 129 1.3 6.73
GCR policy index 3.586 0.546 79 2.55 5.16
GCR policy index b 3.544 0.553 79 2.56 5.06
12
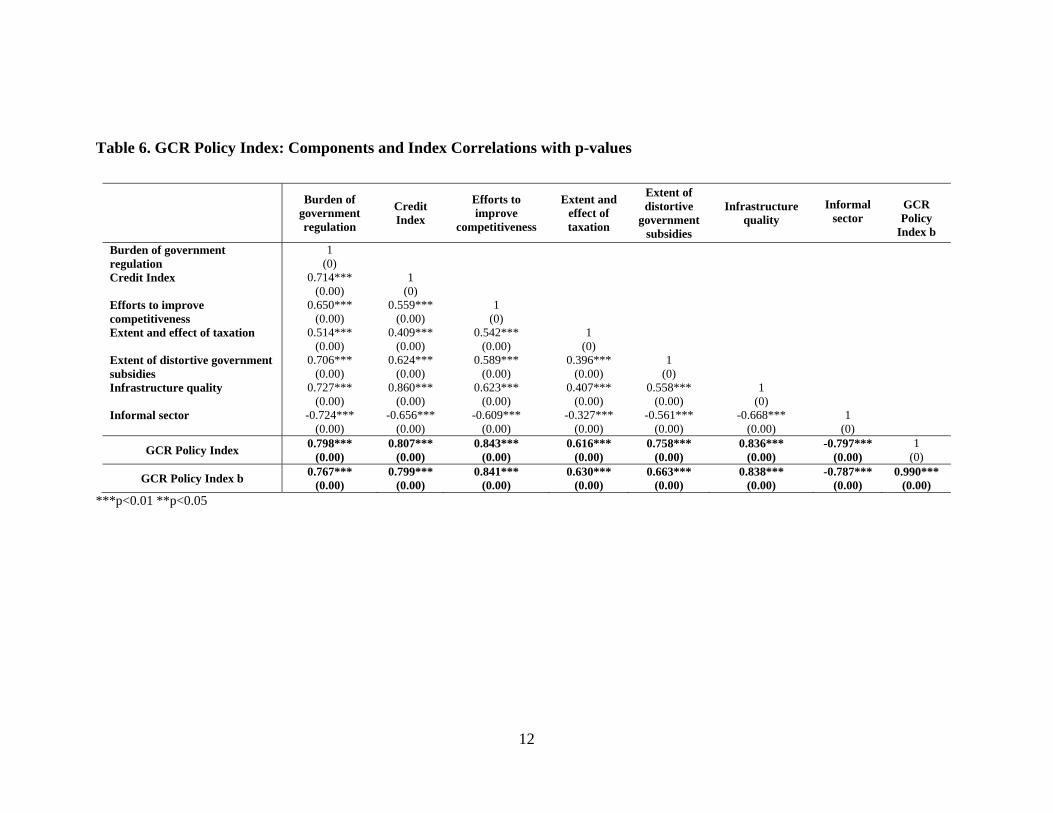
Table 6. GCR Policy Index: Components and Index Correlations with p-values
***p<0.01 **p<0.05
Burden of
government regulation
Credit Index
Efforts to improve
competitiveness
Extent and effect of taxation
Extent of distortive
government subsidies
Infrastructure quality
Informal
sector
GCR Policy
Index b Burden of government regulation
1 (0)
Credit Index 0.714*** (0.00)
1 (0)
Efforts to improve competitiveness
0.650*** (0.00)
0.559*** (0.00)
1 (0)
Extent and effect of taxation 0.514*** (0.00)
0.409*** (0.00)
0.542*** (0.00)
1 (0)
Extent of distortive government subsidies
0.706*** (0.00)
0.624*** (0.00)
0.589*** (0.00)
0.396*** (0.00)
1 (0)
Infrastructure quality 0.727*** (0.00)
0.860*** (0.00)
0.623*** (0.00)
0.407*** (0.00)
0.558*** (0.00)
1 (0)
Informal sector -0.724*** (0.00)
-0.656*** (0.00)
-0.609*** (0.00)
-0.327*** (0.00)
-0.561*** (0.00)
-0.668*** (0.00)
1 (0)
GCR Policy Index 0.798*** (0.00)
0.807*** (0.00)
0.843*** (0.00)
0.616*** (0.00)
0.758*** (0.00)
0.836*** (0.00)
-0.797*** (0.00)
1 (0)
GCR Policy Index b 0.767*** (0.00)
0.799*** (0.00)
0.841*** (0.00)
0.630*** (0.00)
0.663*** (0.00)
0.838*** (0.00)
-0.787*** (0.00)
0.990*** (0.00)

13
3. Articulation of the private sector
The PMP can be understood as a process of bargains and exchanges among political
actors. Some of these exchanges are consummated instantly, but in many other cases
current actions or resources are exchanged for promises of future actions or resources
(they are intertemporal transactions). The type of transaction that political actors are able
to engage in will depend on the possibilities provided by the institutional environment.
Issues of credibility and the capacity to enforce political and policy agreements are
crucial for political actors to be able to engage in intertemporal transactions.
The variables that we include in this section are the following:
3.1. Bribes for influencing policies
bribespoliciesprom: Bribes for Influencing Policies (GCR, 2003-2007).
Average of responses to the question: In your industry, how commonly would you
estimate that firms make undocumented extra payments or bribes connected with
influencing laws and policies, regulations, or decrees to favor selected business interests?
(1=common; 7=never occurs).
3.2. Centralization of economic policymaking
centralizpmpprom: Centralization of Policy-Making (GCR, 2004-2007).
Average of responses to the question: Economic policymaking in your country is:
(1=centralized at the national level; 7=decentralized at the state and city level).
14
3.3. Diversion of public funds
publicdiversprom: Diversion of Public Funds (GCR, 2002-2006).
Average of responses to the question: In your country, diversion of public funds to
companies, individuals, or groups due to corruption: (1=is common; 7=never occurs).
3.4. Efficiency of legal framework
eficlegalfwkprom: Efficiency of legal framework (GCR, 2002-2007).
Average of responses to the question: The legal framework in your country for private
business to settle disputes and challenge the legality of government actions or regulation
is: (1=inefficient and subject to manipulation, 7=efficient).
3.5. Extent bureaucratic red tape
extentbureaucratprom: Extent Bureaucratic Red Tape (GCR, 2002-2008).
Average of responses to the question: How much time your firm spend dealing with
government official? (1=0%; 2=1-10%; 8=81-100%).
3.6. Favoritism in government decisions
favoritismprom: Favoritism Government Officials (GCR, 2001-2008).
Average of responses to the question: When deciding upon policies, government
officials: (1=usually favor well connected firms; 7=are neutral).
15
3.7. Illegal donations to political parties
illegaldonatpartyprom: Illegal Donations to Political Parties (GCR, 2002, 2003, 2004,
2006).
Average of responses to the question: How common are illegal donations to political
parties in your country?” (1=common; 7=rare).
3.8. Index of irregular payments
indexirregpaym: Index of Irregular Payments
Higher values indicate the existence of less irregular payments in the country. The index
or irregular payments (indexirregpaym) was created based in the following sources:
• Irregular payments in exports and imports (2003-2006).
Average of responses to the question: In your industry, how commonly would
you estimate that firms make undocumented extra payments or bribes
connected with export and import permits? (1= common; 7= never occurs).
• Irregular payments in judicial decisions (2003-2006).
Average of responses to the question: In your industry, how commonly would
you estimate that firms make undocumented extra payments or bribes
connected with getting favorable judicial decisions? 1= common; 7= never
occurs.
• Irregular payments in loan applications (2002 and 2004).
16
Average of responses to the question: In your industry, how commonly would
you estimate that firms make undocumented extra payments or bribes
connected with loan applications? 1 = common; 7 = never occurs.
• Irregular payments in public contracts (2003-2006).
Average of responses to the question: In your industry, how commonly would
you estimate that firms make undocumented extra payments or bribes
connected with public contracts (investment projects) 1= common; 7= never
occur.
• Irregular payments in public utilities (2003-2006).
Average of responses to the question: In your industry, how commonly would
you estimate that firms make undocumented extra payments or bribes when
getting connected to public utilities e.g. telephone or electricity? 1= common;
7= never occurs.
• Irregular payments in tax collections (2003-2006).
Average of responses to the question: In your industry, how commonly would
you estimate that firms make undocumented extra payments or bribes
connected with annual tax payments? 1 = common; 7 = never occurs.
17
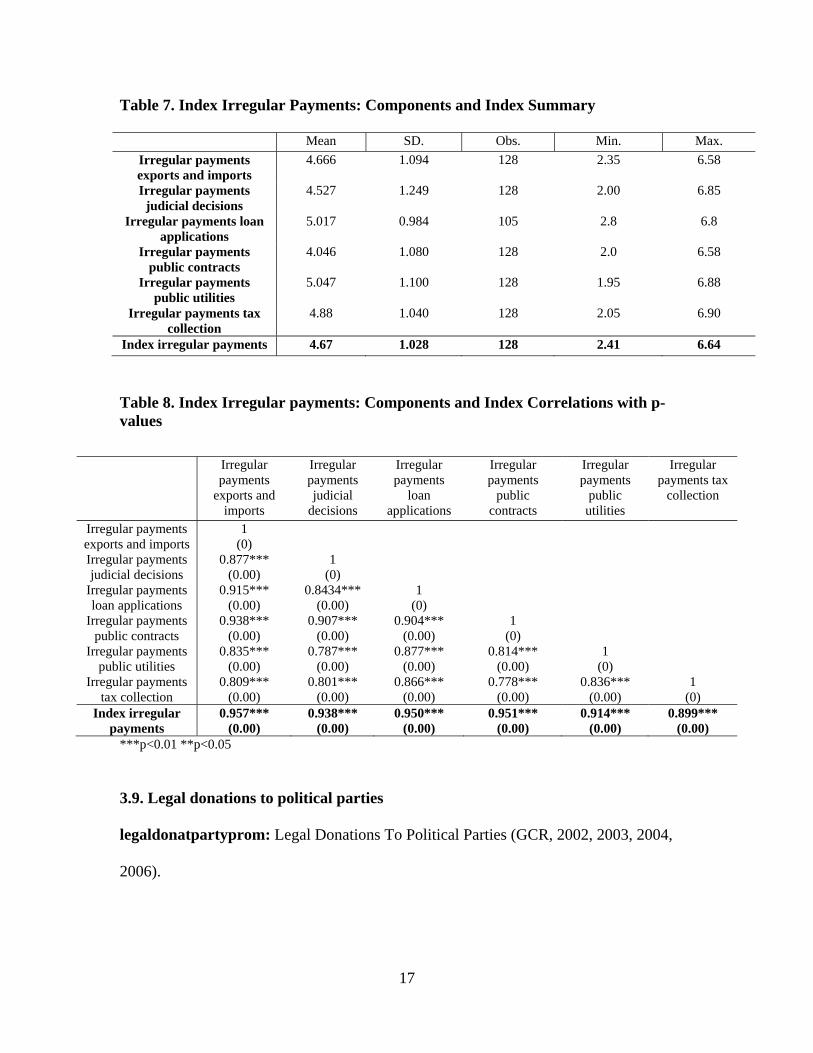
Table 7. Index Irregular Payments: Components and Index Summary
Mean SD. Obs. Min. Max. Irregular payments exports and imports
4.666 1.094 128 2.35 6.58
Irregular payments judicial decisions
4.527 1.249 128 2.00 6.85
Irregular payments loan applications
5.017 0.984 105 2.8 6.8
Irregular payments public contracts
4.046 1.080 128 2.0 6.58
Irregular payments public utilities
5.047 1.100 128 1.95 6.88
Irregular payments tax collection
4.88 1.040 128 2.05 6.90
Index irregular payments 4.67 1.028 128 2.41 6.64
Table 8. Index Irregular payments: Components and Index Correlations with p-values
***p<0.01 **p<0.05
3.9. Legal donations to political parties
legaldonatpartyprom: Legal Donations To Political Parties (GCR, 2002, 2003, 2004,
2006).
Irregular payments
exports and imports
Irregular payments judicial
decisions
Irregular payments
loan applications
Irregular payments
public contracts
Irregular payments
public utilities
Irregular payments tax
collection
Irregular payments exports and imports
1 (0)
Irregular payments judicial decisions
0.877*** (0.00)
1 (0)
Irregular payments loan applications
0.915*** (0.00)
0.8434*** (0.00)
1 (0)
Irregular payments public contracts
0.938*** (0.00)
0.907*** (0.00)
0.904*** (0.00)
1 (0)
Irregular payments public utilities
0.835*** (0.00)
0.787*** (0.00)
0.877*** (0.00)
0.814*** (0.00)
1 (0)
Irregular payments tax collection
0.809*** (0.00)
0.801*** (0.00)
0.866*** (0.00)
0.778*** (0.00)
0.836*** (0.00)
1 (0)
Index irregular payments
0.957*** (0.00)
0.938*** (0.00)
0.950*** (0.00)
0.951*** (0.00)
0.914*** (0.00)
0.899*** (0.00)
18
Average of responses to the question: To what extent the legal donations to political
parties have a direct influence on the public policies? (1=there is a direct relation between
donations and policies; 7=there isn’t a direct impact on the influence on policies).
4. Characteristics of economic actors
The behavior of various actors in the PMP will depend on their basic incentives (e.g.,
electoral, power building, job security in the case of state managers, and economic
benefits in the case of social actors) as well as on the exchange possibilities provided by
institutions and real actors’ characteristics.
Murillo et al. (2008) analyzed the formation process of real actors’ interests and
emphasized the importance of considering these principal factors when studying the real
actors’ influence in the policy formation: economic structure, group size, sectoral
division, aggregation level, and political and market incorporation.
These factors affect the behavior of the actors, influencing the way they organize,
their ability to coordinate, and the articulation with the public sector. This is relevant
because it determines their demands. For example, large infrastructure works require the
coordinated demand of multiple actors in order to be implemented. If those potentially
interested are spread out, the probability of it would be lower. Similarly occurs regarding
the way they can articulate with the public sector and the type of influence they gain.
Those that have access to the local government may be able to exert different pressures
than those that have access to the national level agencies. Here, only some distant proxies
are provided and further work is encouraged.
19
4.1. Extent of Market Dominance
extentmarketdominprom: Extent of Market Dominance (GCR, 2006-2007).
Average of responses to the question: Corporate activity in your country is: (1 =
dominated by a few business groups; 7 = spread among many firms).
4.2. Intensity of Local Competition
localcompetprom: Intensity of Local Competition (GCR, 2004, 2005, 2008).
Average of responses to the question: In most industries, competition in the local market
is: (1=limited and price-cutting is rare, 7=intense and market leadership changes over
time).
4.3. Prevalence of Foreign Own
prevalencforeignownprom: Prevalence of Foreign Own (GCR, 2008).
Average of responses to the question: Foreign ownership of companies in your country
is: (1 = rare and limited; 7 = prevalent and encouraged).
5. Additional variables
The database is complemented with economic variables that are useful for running the
empirical exercises.
5.1. Productivity variables (Daude & Fernández-Arias, 2008)
5.1.1. TFP level
tfplevel: Level of TFP (2000-2005).
20
5.1.2. TFP growth
growthtfp: Growth of TFP (2000-2005).
5.2. WDI (World Development Indicator) variables
5.2.1. Central government debt (% GDP)
cgdtpgdprom: Central Government Debt (%GDP) (WDI, 2000-2005).
5.2.2. Central government debt (current LCU)
cgdtculcuprom: Central Government Debt (current LCU) (WDI, 2000-
2005).
5.2.3. Domestic credit to private sector (% GDP)
dcpspgdprom: Domestic credit to private sector (%GDP) (WDI, 2000-
2007).
5.2.4. Exports plus Imports (% GDP)
tpgdpprom: Exports plus Imports (% GDP) (WDI, 2000-2007).
5.2.5. GDP per capita 1990
lngdppc90: GDP per capita 1990 (in logs)
5.2.6. GDP per capita 1980
lngdppc80: GDP per capita 1980 (in logs)
5.2.7. Surface of the country
lnsurfaceprom: Surface of the country (thousand of km)
5.2.8. Public spending on education
publicspendeducprom: Public Spending on Education (%GDP) (WDI,
2000-2002).
21
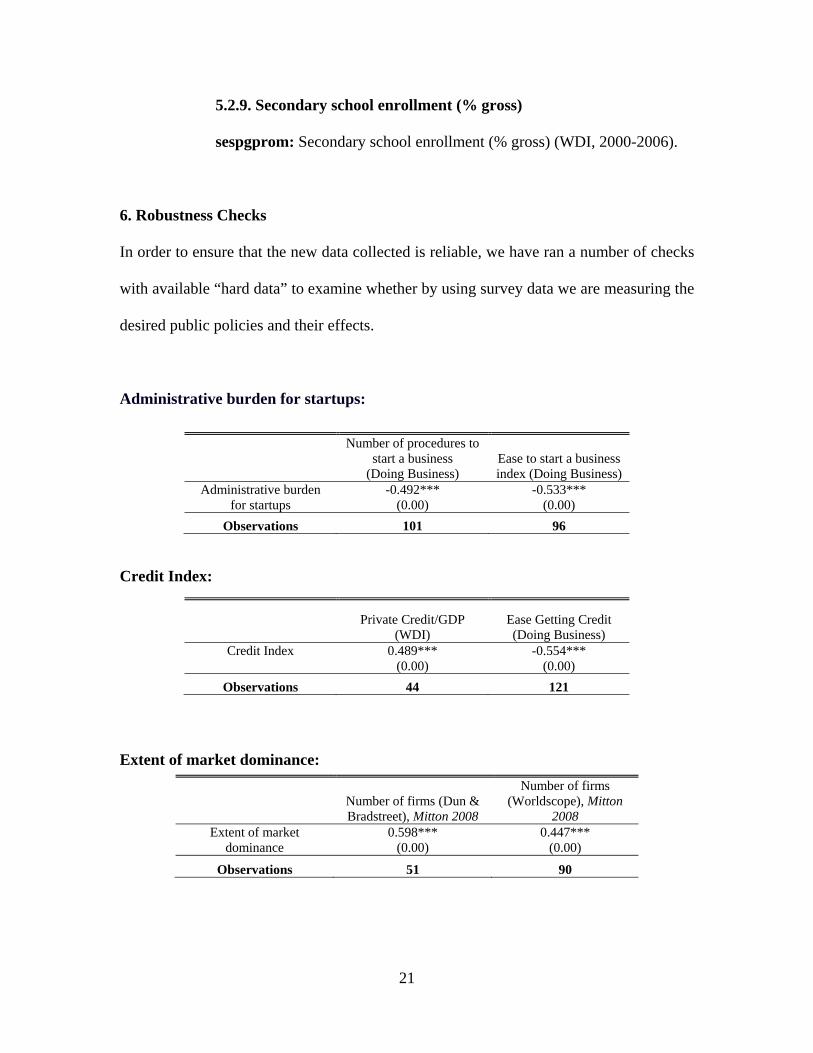
5.2.9. Secondary school enrollment (% gross)
sespgprom: Secondary school enrollment (% gross) (WDI, 2000-2006).
6. Robustness Checks
In order to ensure that the new data collected is reliable, we have ran a number of checks
with available “hard data” to examine whether by using survey data we are measuring the
desired public policies and their effects.
Administrative burden for startups:
Credit Index: Extent of market dominance:
Number of procedures to start a business
(Doing Business) Ease to start a business index (Doing Business)
Administrative burden for startups
-0.492*** (0.00)
-0.533*** (0.00)
Observations 101 96
Private Credit/GDP
(WDI) Ease Getting Credit (Doing Business)
Credit Index
0.489*** (0.00)
-0.554*** (0.00)
Observations 44 121
Number of firms (Dun & Bradstreet), Mitton 2008
Number of firms (Worldscope), Mitton
2008 Extent of market
dominance 0.598***
(0.00) 0.447***
(0.00)
Observations 51 90
22
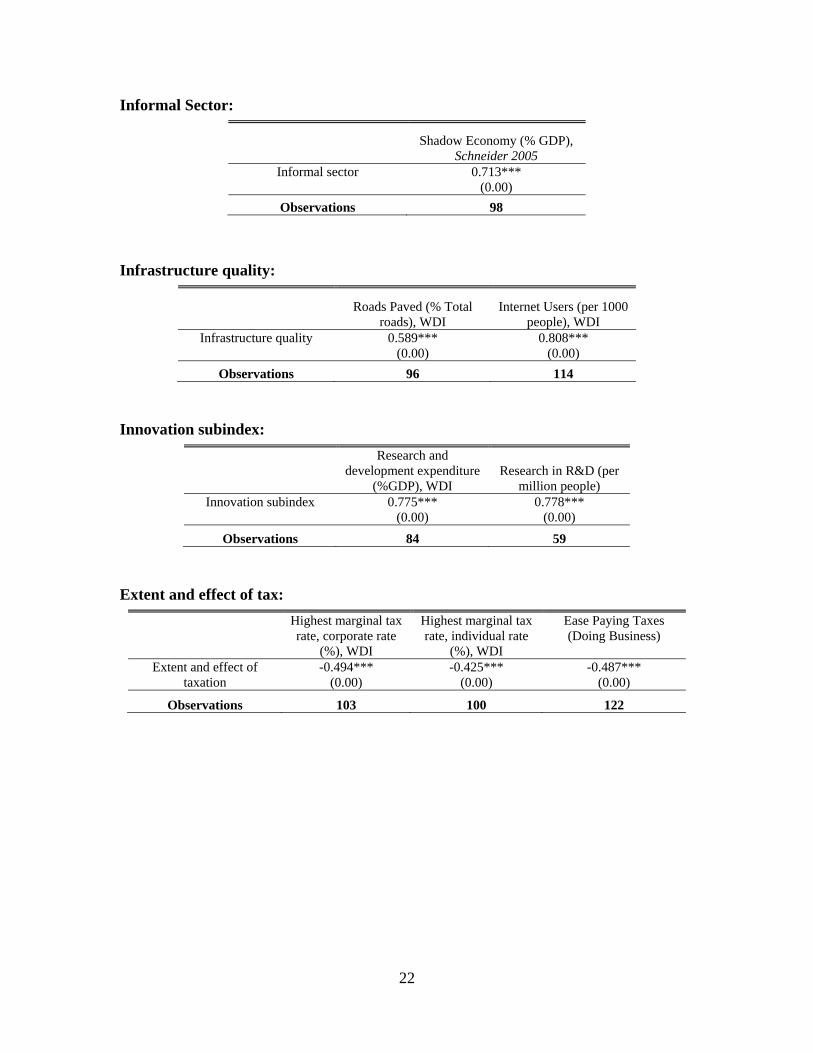
Informal Sector: Infrastructure quality: Innovation subindex: Extent and effect of tax:
Shadow Economy (% GDP),
Schneider 2005 Informal sector
0.713***
(0.00) Observations 98
Roads Paved (% Total
roads), WDI Internet Users (per 1000
people), WDI Infrastructure quality
0.589***
(0.00) 0.808***
(0.00) Observations 96 114
Research and development expenditure
(%GDP), WDI Research in R&D (per
million people) Innovation subindex
0.775***
(0.00) 0.778***
(0.00) Observations 84 59
Highest marginal tax rate, corporate rate
(%), WDI
Highest marginal tax rate, individual rate
(%), WDI
Ease Paying Taxes (Doing Business)
Extent and effect of taxation
-0.494*** (0.00)
-0.425*** (0.00)
-0.487*** (0.00)
Observations 103 100 122
23
Bibliography Acemoglu, D., Johnson, S. & Robinson, J. (2001). “The Colonial Origins of Comparative
Development: An Empirical Investigation.” American Economic Review 91(5):
1369-1401.
Acemoglu, D., Johnson, S. & Robinson, J. (2002). “Reversal of Fortune: Geography and
Institutions in the Making of the World Income Distribution.” Quarterly Journal
of Economics 117(4): 1231-1294.
Acemoglu, D., Johnson, S., Mitton, T. (2007). “Determinants of vertical integration:
Financial development and contracting costs”. MIT Working Paper.
Arnold, J. & Schwellnus, C. (2008). "Do Corporate Taxes Reduce Productivity and
Investment at the Firm Level? Cross-Country Evidence from the Amadeus
Dataset". Working Papers 2008-19, CEPII research center.
Beck, T., Levine, R. & Loayza, N. (2000). “Finance and the sources of growth.” Journal
of Financial Economics 58, 261–300.
Becker, G.S. (1983). “A Theory of Competition Among Pressure Groups for Political
Influence.” Quarterly Journal of Economics 97(3): 371-400.
Berkman, H.; Scartascini, C.; Stein, E. & Tommasi, M. (2008). “Political Institutions,
State Capabilities, and Public Policy: An International Dataset”. Washington, DC,
United States: Inter-American Development Bank.
Bridgman, B.; Qi S. & Schmitz, J. (2007). "Does regulation reduce productivity?
Evidence from regulation of the U.S. beet-sugar manufacturing industry during
the Sugar Acts, 1934-74". Staff Report 389, Federal Reserve Bank of
Minneapolis.
24
Butler, A. W. & Cornaggia, J. (2008). ‘Does Access to Finance Improve Productivity?
Evidence from a Natural Experiment’, Dallas School of Management, University
of Texas.
Calmfors, L., & Driffill, J. (1988). “Bargaining Structure, Corporatism and
Macroeconomic Performance.” Economic Policy 6: 12-61.
Crafts, N. (2006). “Regulation and Productivity Performance”. Oxford Review of
Economic Policy, Vol. 22, Issue 2, pp. 186-202.
Lokshin, B., Belderbos, R. & Carree, M. (2008). “The Productivity Effects of Internal
and External R&D: Evidence from a Dynamic Panel Data Model”. Oxford
Bulletin of Economics and Statistics, Vol. 70, Issue 3, pp. 399-413.
Daude, C., & Fernández-Arias, E. (2008). “Notes on Productivity and Investment in Latin
America and the Caribbean.” Washington, DC, United States: Inter-American
Development Bank. Mimeographed document.
Djankov, S., La Porta, R., Lopez-de-Silanes, F. & Shleifer, A. (2002). "The Regulation of
Entry." Quarterly Journal of Economics 117(1):1-37.
Fajnzylber, P., Maloney, W. & Rojas, G. (2006). “Does formality improve micro-firm
performance? Quasi-Experimental Evidence from the Brazilian SIMPLES
program.”
Farrell, D. (2004). “The hidden dangers of the informal economy.” The McKinsey
Quarterly (Number 3).
Frieden, J. (1991). Debt, Development and Democracy. Princeton, United States:
Princeton University Press.
25
Gatti, R. & Love, I. (2008). "Does access to credit improve productivity? Evidence from
Bulgarian firms," CEPR Discussion Papers 6676, C.E.P.R. Discussion Papers.
Glaeser, E., & Shleifer, A. (2002). “Legal Origins.” The Quarterly Journal of Economics
117(4): 1193-1229.
Griffith, R., Huergo, E., Mairesse, J. & Peters, B. (2006). “Innovation and productivity
across four European countries.” Oxford Review of Economic Policy, 22, 483-498.
Hayek, F. (1960). The Constitution of Liberty. Chicago, United States: University of
Chicago Press.
Henisz, W., & Zelner, B. (2003). “Legitimacy, Interest Group Pressures and Change in
Emergent Institutions: The Case of Foreign Investors and Host Country
Governments.” Ann Arbor, United States: University of Michigan Business
School.
Isaksson, A. (2006), “Determinants of Total Factor Productivity: A literature review”,
mimeo, Viena: UNIDO.
Inter-American Development Bank (2005), The Politics of Policies. Economic and Social
Progress in Latin America and the Caribbean 2006 Report. Washington, DC.
Available online at:
http://www.iadb.org/res/ipes/2006/index.cfm?language=english
Inter-American Development Bank (2010), The Age of Productivity. Washington, DC:
Inter-American Development Bank and Palgrave
Itzigsohn, J. 2000. Developing Poverty: The State, Labor Market Deregulation, and the
Informal Economy in Costa Rica and the Dominican Republic. University Park,
Pennsylvania, United States: Pennsylvania State University Press.
26
Iverson, C. (2006). “A literature review of research on Productivity and Growth”.
Australian APEC Study Centre. Monash University, Melbourne.
Keefer, P. (2005). “Clientelism, Credibility and the Policy Choices of Young
Democracies.” Washington, DC, United States: World Bank. Unpublished Paper.
Kuenzi, M., & Lambright, G. (2001). “Party System Institutionalization in 30 African
Countries.” Party Politics 7(4): 437-468.
La Porta, R., López-de-Silanes, F. & Shleifer, A. (2008). “The Economic Consequences
of Legal Origins.” Journal of Economic Literature 46(2): 285-332.
La Porta, R., Lopez-de-Silanes, F., Shleifer, A. & Vishny, R. W.. (1999). “The Quality of
Government.” Journal of Law, Economics and Organization 15(1): 222-79.
Levy, S. (2007), “Can Social Programs Reduce Productivity and Growth? A Hypothesis
for Mexico”, paper written for the 8th Global Development Network Meeting in
Beijing, 12–19 January.
Mainwaring, S., & Zoco, E. (2007). “Political Sequences and the Stabilization of
Interparty Competitions: Electoral Volatility in Old and New Democracies.”
Party Politics 13(2): 155-178.
Mamatzakis, E. (2007). “An Analysis of the Impact of Public Infrastructure on
Productivity Performance of Mexican Industry”. CESifo Working Paper No.
2099.
Murillo, M..; Scartascini, C. & Tommasi, M. (2008). “The Political Economy of
Productivity: Actors, Arenas, and Policies. A Framework of Analysis.”
Washington, DC, United States: Inter-American Development Bank. WP 640.
27
Mitton, T. (2008). “Institutions and Concentration.” Journal of Development Economics
Volume 86, Issue 2, June 2008, Pages 367-394
North, D., & Weingast, B. (1989). “Constitutions and Commitment: Evolution of
Institutions Governing Public Choice in 17th Century England.” Journal of
Economic History 49(4): 803-832.
Olson, M.. (1982). The Rise and Decline of Nations: Economic Growth, Stagflation, and
Social Rigidities. New Haven, United States: Yale University Press.
O’Mahony, M. & Van Ark, B. eds. (2003). EU Productivity and Competitiveness: An
Industry Perspective: Can Europe Resume the Catching-up Process?
Luxembourg: Office for Official Publications of the European Communities
Parisi M.L, Schiantarelli F. & Sembenelli A. (2006). “Productivity, innovation creation
and absorption, and R&D: micro evidence for Italy.” European Economic Review,
Volume 50, Issue 8, pp. 2037-2061.
Pineda, J. & Rodríguez F. (2005). “Public investment in infrastructure and productivity
growth: Evidence from the Venezuelan manufacturing sector.” Wesleyan
University, WP. 2006-010
Posner, R.A. 1973. Economic Analysis of the Law. Boston, United States: Little-Brown.
Scarpetta, S. & Tressel, T. (2002). "Productivity and Convergence in a Panel of OECD
Industries: Do Regulations and Institutions Matter?" OECD Economics
Department Working Papers 342, OECD, Economics Department.
Scartascini, C & Tommasi, M. (2010). “The Political Economy of Productivity”. In Inter-
American Development Bank (2010), The Age of Productivity. Washington, DC:
Inter-American Development Bank and Palgrave

28
Schneider, F. (2005), “Shadow Economies around the world: What do we really know?”
European Journal of Political Economy 21, 3, 598-642.
Schneider, B.R..(2005b). “Business Politics and Policy Making in Contemporary Latin
America.” Background paper for Inter-American Development Bank Annual
Report 2005, The Politics of Policies. Washington, DC, United States: Inter-
American Development Bank.
Spiller, P. and Tommasi, M. (2007). The Institutional Foundations of Public Policy in
Argentina. Cambridge, UK: Cambridge University Press.
Stein, E. and Tommasi, M. (2007) “The Institutional Determinants of State Capability in
Latin America” in Bourgignon and Pleskovic (eds), Beyond Transition (Annual
World Bank Conference on Development Economics. Washington DC: World
Bank.
Stein, E., Tommasi M., Spiller P. and Scartascini, C. (2008) Policymaking in Latin
America: How Politics Shapes Policies, Cambridge, MA and Washington, DC:
Harvard University Press and Inter-American Development Bank.
Sveikauskas, L. (2007). “R&D and Productivity Growth: A Review of the Literature”.
U.S. Bureau of Labor Statistics, Working Paper 208.
Vartia, L. (2008). "How do Taxes Affect Investment and Productivity?: An Industry-
Level Analysis of OECD Countries." OECD Economics Department Working
Papers, No. 656, OECD publishing.