identifying patient–ventilator asynchrony on a small dataset
TRANSCRIPT
sensors
Article
Identifying Patient–Ventilator Asynchrony on a Small DatasetUsing Image-Based Transfer Learning
Qing Pan 1 , Mengzhe Jia 1, Qijie Liu 1, Lingwei Zhang 1, Jie Pan 1, Fei Lu 1, Zhongheng Zhang 2 ,Luping Fang 1,* and Huiqing Ge 3,*
�����������������
Citation: Pan, Q.; Jia, M.; Liu, Q.;
Zhang, L.; Pan, J.; Lu, F.; Zhang, Z.;
Fang, L.; Ge, H. Identifying
Patient–Ventilator Asynchrony on a
Small Dataset Using Image-Based
Transfer Learning. Sensors 2021, 21,
4149. https://doi.org/10.3390/
s21124149
Academic Editor: Domenico Formica
Received: 22 April 2021
Accepted: 9 June 2021
Published: 17 June 2021
Publisher’s Note: MDPI stays neutral
with regard to jurisdictional claims in
published maps and institutional affil-
iations.
Copyright: © 2021 by the authors.
Licensee MDPI, Basel, Switzerland.
This article is an open access article
distributed under the terms and
conditions of the Creative Commons
Attribution (CC BY) license (https://
creativecommons.org/licenses/by/
4.0/).
1 College of Information Engineering, Zhejiang University of Technology, Liuhe Rd. 288,Hangzhou 310023, China; [email protected] (Q.P.); [email protected] (M.J.);[email protected] (Q.L.); [email protected] (L.Z.); [email protected] (J.P.);[email protected] (F.L.)
2 Department of Emergency Medicine, Sir Run Run Shaw Hospital, School of Medicine, Zhejiang University,Qingchun East Rd. 3, Hangzhou 310016, China; [email protected]
3 Department of Respiratory Care, Regional Medical Center for National Institute of Respiratory Diseases,Sir Run Run Shaw Hospital, School of Medicine, Zhejiang University, Qingchun East Rd. 3,Hangzhou 310016, China
* Correspondence: [email protected] (L.F.); [email protected] (H.G.); Tel.: +86-571-85290595 (L.F.);+86-571-86006855 (H.G.)
Abstract: Mechanical ventilation is an essential life-support treatment for patients who cannotbreathe independently. Patient–ventilator asynchrony (PVA) occurs when ventilatory support doesnot match the needs of the patient and is associated with a series of adverse clinical outcomes. Deeplearning methods have shown a strong discriminative ability for PVA detection, but they requirea large number of annotated data for model training, which hampers their application to this task.We developed a transfer learning architecture based on pretrained convolutional neural networks(CNN) and used it for PVA recognition based on small datasets. The one-dimensional signal wasconverted to a two-dimensional image, and features were extracted by the CNN using pretrainedweights for classification. A partial dropping cross-validation technique was developed to evaluatemodel performance on small datasets. When using large datasets, the performance of the proposedmethod was similar to that of non-transfer learning methods. However, when the amount of datawas reduced to 1%, the accuracy of transfer learning was approximately 90%, whereas the accuracyof the non-transfer learning was less than 80%. The findings suggest that the proposed transferlearning method can obtain satisfactory accuracies for PVA detection when using small datasets.Such a method can promote the application of deep learning to detect more types of PVA undervarious ventilation modes.
Keywords: mechanical ventilation; transfer learning; deep learning; patient–ventilator asynchrony;convolutional neural network
1. Introduction
Mechanical ventilation (MV) is one of the most important life-support treatmentsfor patients who are unable to breathe on their own. It is used to assist patients duringrest and recovery from their primary diseases [1]. Patient–ventilator asynchrony (PVA)occurs when the phases of the breath delivered by the ventilator do not match that of thepatient’s respiratory center output or when there is a mismatch between the demands ofthe patient and the assistance offered by the ventilator [2,3]. This phenomenon is associatedwith a series of adverse clinical outcomes, such as the failed liberation of patients fromventilators [4,5], extended stays in intensive care units (ICU), increased likelihood ofrespiratory-muscle and diaphragmatic injuries, and increased consumption of sedativesand paralytics [6]. Studies have demonstrated that PVA can be detected by analyzingairway pressure, flow velocity, and tidal volume sequences [3,7]. Traditional PVA detection
Sensors 2021, 21, 4149. https://doi.org/10.3390/s21124149 https://www.mdpi.com/journal/sensors
Sensors 2021, 21, 4149 2 of 14
methods involve observing and evaluating the respiratory sequences at the bedside [8].However, because many clinicians have insufficient recognition ability [9] and cannotremain at the bedside long-term, this detection method still has clinical limitations.
Some computerized algorithms have been developed for PVA detection over the pastdecade [10]. Early efforts include rule-based algorithms that computed features from therespiratory sequences and set thresholds to identify PVA cycles [1,11]. In recent years,machine learning has been used for the detection of PVA. By manually selecting valuablefeatures and inputting them into machine learning models, such as random forest andsupport vector machine (SVM) models, a high classification accuracy can be achieved [12].However, the accurate extraction of features from respiratory sequences is challenging,especially when dealing with highly noisy signals [13]. Deep learning (DL) models haveexhibited superior performance over conventional rule-based algorithms and machinelearning models in medical applications, such as arrhythmia detection and diagnosisof retinal diseases from electrocardiogram and retinal images, respectively [14,15]. Wepreviously developed deep learning models to recognize four main types of PVA: doubletriggering (DT), ineffective inspiratory efforts during expiration (IEE), delayed cycling,and premature cycling under pressure-controlled MV [16,17]. These methods achievedsuperior classification accuracies compared with conventional methods. However, themodel had to be trained with a large amount of labeled data to guarantee its performance,limiting its application to the detection of other types of PVA under different modes of MV.Therefore, developing a high-performance DL model based on a small amount of labeleddata remains a challenging task.
Transfer learning, which borrows knowledge from a source domain to facilitate thelearning problem in a target domain, provides an effective framework for DL small datasets.In particular, most studies have made use of models pretrained from the large-scaleImageNet database [18], containing 1.2 million images. These models trained from theImageNet have a strong capability for feature extraction. Thus, they are suitable to betransferred to other fields having small number of image data. Transfer learning hasbeen widely applied to computer vision. However, only a few studies have applied thesemethods to time series problems in the medical field [19]. These studies require complextime–frequency transformations to convert the one-dimensional (1D) time series to two-dimensional (2D) images, which hampers the application of the algorithm in real time andlacks interpretability [20]. Additionally, such methods have never before been applied toPVA detection.
To develop a DL model for PVA detection based on a small, labeled dataset, weproposed a transfer learning approach. The approach identified PVA from the 1D respi-ratory sequences using the 2D–CNN. The 1D breathing cycles were first converted intoimages. Then, features were extracted from the converted images using pretrained CNNarchitectures to feed to an SVM for PVA classification.
2. Methods2.1. Overview of the Method
The formal definition of transfer learning involves the concepts of domains and tasks.A domain D consists of a feature space X and an edge probability distribution P(X)denoted by D = {X, P(X)}, where {x1, . . . ., xn}∈ X. The target domain T consists of a labelspace Y and an objective predictive function f (·), denoted by T = {Y, f (·)}, which can beregarded as a conditional probability function P(y|x) . It can be learned from the trainingdata, which consist of pairs {xi, yi|xi ∈ X, yi ∈ Y}. Given a source domain Ds, a learningtask Ts, a target domain Dt, and a learning task Tt, transfer learning aims to help improvethe learning of the target predictive function f (·) in Dt using the knowledge in Ds. In mostcases, the size of Ds is significantly larger than that of Dt. In this work, Ds represents theImageNet dataset and Dt represents the respiratory sequence dataset.
We proposed a transfer learning approach for PVA classification. Figure 1 shows theschematic of the transfer learning framework. First, the airway pressure, flow velocity, and
Sensors 2021, 21, 4149 3 of 14
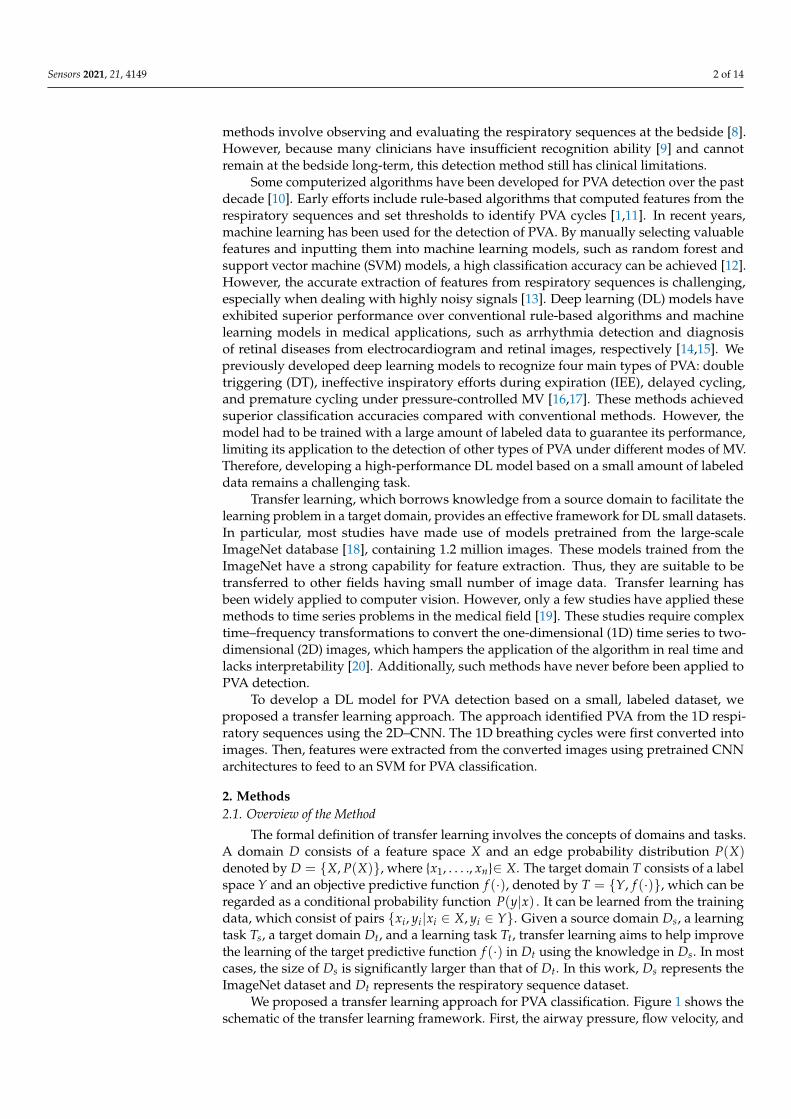
tidal volume recording were cut into segments, and each data instance was transformedinto a red–green–blue (RGB) image via preprocessing. Then, the images were fed intothe pretrained deep CNN to extract the features. The features were processed by a globalaveraging pooling (GAP) layer to generate class activation maps for visual interpretationof the results and fed to an SVM or a dense layer classifier for classification.
Sensors 2021, 21, x FOR PEER REVIEW 3 of 13
We proposed a transfer learning approach for PVA classification. Figure 1 shows the schematic of the transfer learning framework. First, the airway pressure, flow velocity, and tidal volume recording were cut into segments, and each data instance was trans-formed into a red–green–blue (RGB) image via preprocessing. Then, the images were fed into the pretrained deep CNN to extract the features. The features were processed by a global averaging pooling (GAP) layer to generate class activation maps for visual inter-pretation of the results and fed to an SVM or a dense layer classifier for classification.
Figure 1. Schematic of PVA identification based on the transfer learning method. The input se-quence is handled in the preprocessing section. GAP: global average pooling. SVM: support vector machine.
2.2. Data Collection and Annotation Data collection and annotation were performed as described in our previous study
[17]. Briefly, adult patients who were admitted to the ICUs of Sir Run Run Shaw Hospital of Zhejiang University and accepted invasive MV were included. Raw respiratory wave-form data, including airway pressure sequence and flow velocity sequence, were collected using a ventilator information system (RespCare™, ZhiRuiSi Co. Ltd., Hangzhou, China). The data sampling frequency was 50 Hz. The tidal volume sequence was computed by integrating the flow velocity over time for each breath. All patients were ventilated with PB840 (PB840, Covidien, U.S.) ventilator under assist/control ventilation mode and pres-sure control type. The study was approved by the ethics committee of Sir Run Run Shaw Hospital of Zhejiang University (No. 20190916-16).
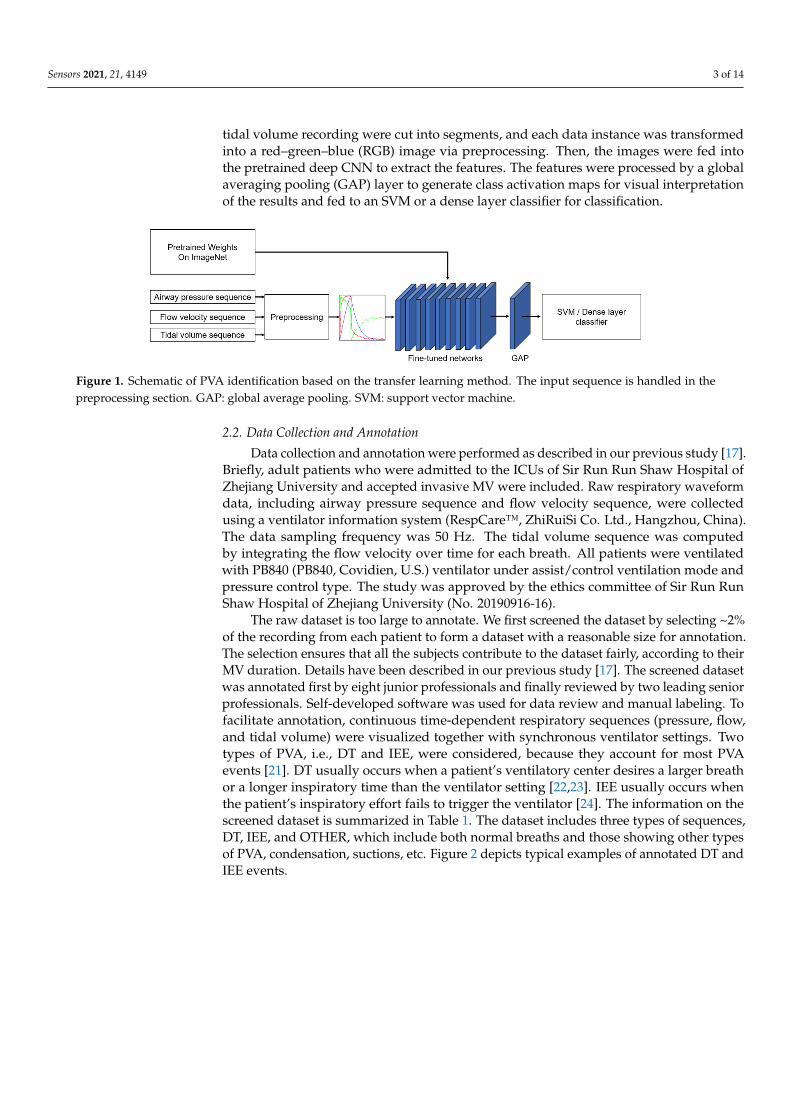
The raw dataset is too large to annotate. We first screened the dataset by selecting ~2% of the recording from each patient to form a dataset with a reasonable size for anno-tation. The selection ensures that all the subjects contribute to the dataset fairly, according to their MV duration. Details have been described in our previous study [17]. The screened dataset was annotated first by eight junior professionals and finally reviewed by two lead-ing senior professionals. Self-developed software was used for data review and manual labeling. To facilitate annotation, continuous time-dependent respiratory sequences (pres-sure, flow, and tidal volume) were visualized together with synchronous ventilator set-tings. Two types of PVA, i.e., DT and IEE, were considered, because they account for most PVA events [21]. DT usually occurs when a patient’s ventilatory center desires a larger breath or a longer inspiratory time than the ventilator setting [22,23]. IEE usually occurs when the patient’s inspiratory effort fails to trigger the ventilator [24]. The information on the screened dataset is summarized in Table 1. The dataset includes three types of se-quences, DT, IEE, and OTHER, which include both normal breaths and those showing other types of PVA, condensation, suctions, etc. Figure 2 depicts typical examples of an-notated DT and IEE events.
Figure 1. Schematic of PVA identification based on the transfer learning method. The input sequence is handled in thepreprocessing section. GAP: global average pooling. SVM: support vector machine.
2.2. Data Collection and Annotation
Data collection and annotation were performed as described in our previous study [17].Briefly, adult patients who were admitted to the ICUs of Sir Run Run Shaw Hospital ofZhejiang University and accepted invasive MV were included. Raw respiratory waveformdata, including airway pressure sequence and flow velocity sequence, were collectedusing a ventilator information system (RespCare™, ZhiRuiSi Co. Ltd., Hangzhou, China).The data sampling frequency was 50 Hz. The tidal volume sequence was computedby integrating the flow velocity over time for each breath. All patients were ventilatedwith PB840 (PB840, Covidien, U.S.) ventilator under assist/control ventilation mode andpressure control type. The study was approved by the ethics committee of Sir Run RunShaw Hospital of Zhejiang University (No. 20190916-16).
The raw dataset is too large to annotate. We first screened the dataset by selecting ~2%of the recording from each patient to form a dataset with a reasonable size for annotation.The selection ensures that all the subjects contribute to the dataset fairly, according to theirMV duration. Details have been described in our previous study [17]. The screened datasetwas annotated first by eight junior professionals and finally reviewed by two leading seniorprofessionals. Self-developed software was used for data review and manual labeling. Tofacilitate annotation, continuous time-dependent respiratory sequences (pressure, flow,and tidal volume) were visualized together with synchronous ventilator settings. Twotypes of PVA, i.e., DT and IEE, were considered, because they account for most PVAevents [21]. DT usually occurs when a patient’s ventilatory center desires a larger breathor a longer inspiratory time than the ventilator setting [22,23]. IEE usually occurs whenthe patient’s inspiratory effort fails to trigger the ventilator [24]. The information on thescreened dataset is summarized in Table 1. The dataset includes three types of sequences,DT, IEE, and OTHER, which include both normal breaths and those showing other typesof PVA, condensation, suctions, etc. Figure 2 depicts typical examples of annotated DT andIEE events.
Sensors 2021, 21, 4149 4 of 14
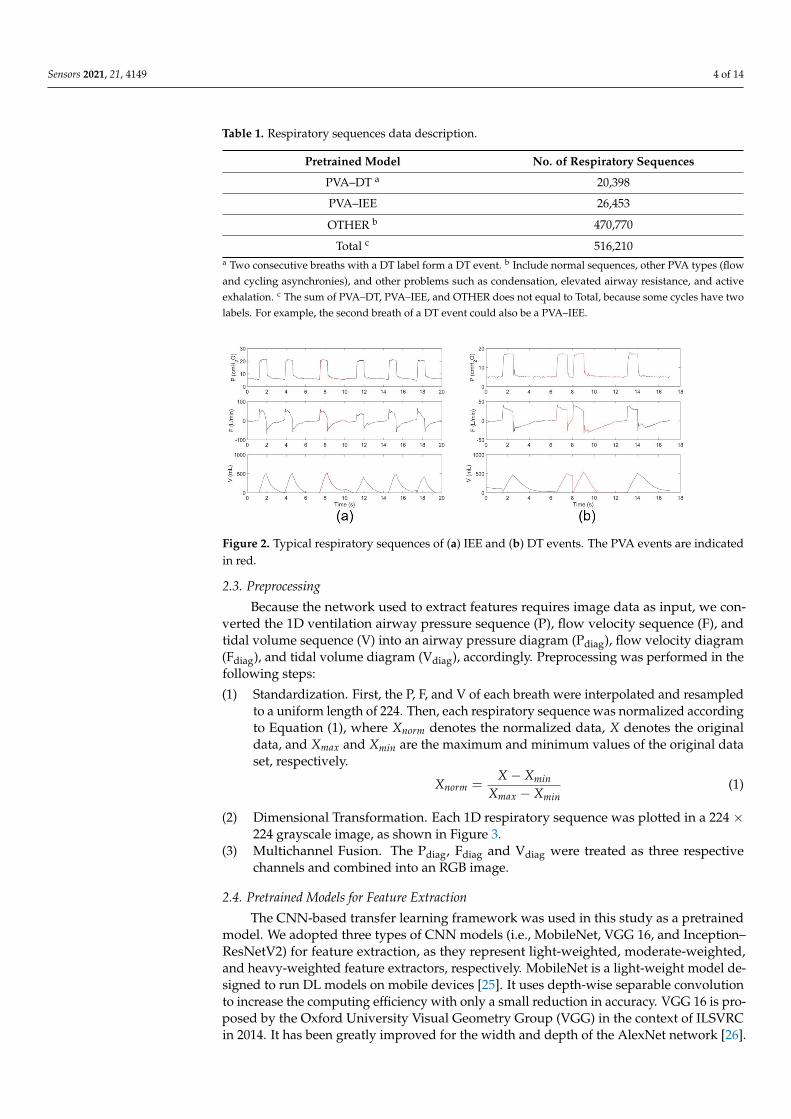
Table 1. Respiratory sequences data description.
Pretrained Model No. of Respiratory Sequences
PVA–DT a 20,398
PVA–IEE 26,453
OTHER b 470,770
Total c 516,210a Two consecutive breaths with a DT label form a DT event. b Include normal sequences, other PVA types (flowand cycling asynchronies), and other problems such as condensation, elevated airway resistance, and activeexhalation. c The sum of PVA–DT, PVA–IEE, and OTHER does not equal to Total, because some cycles have twolabels. For example, the second breath of a DT event could also be a PVA–IEE.
Sensors 2021, 21, x FOR PEER REVIEW 4 of 13
Table 1. Respiratory sequences data description.
Pretrained Model No. of Respiratory Sequences PVA–DT a 20,398 PVA–IEE 26,453 OTHER b 470,770
Total c 516,210 a Two consecutive breaths with a DT label form a DT event. b Include normal sequences, other PVA types (flow and cycling asynchronies), and other problems such as condensation, elevated airway resistance, and active exhalation. c The sum of PVA–DT, PVA–IEE, and OTHER does not equal to Total, because some cycles have two labels. For example, the second breath of a DT event could also be a PVA–IEE.
Figure 2. Typical respiratory sequences of (a) IEE and (b) DT events. The PVA events are indicated in red.
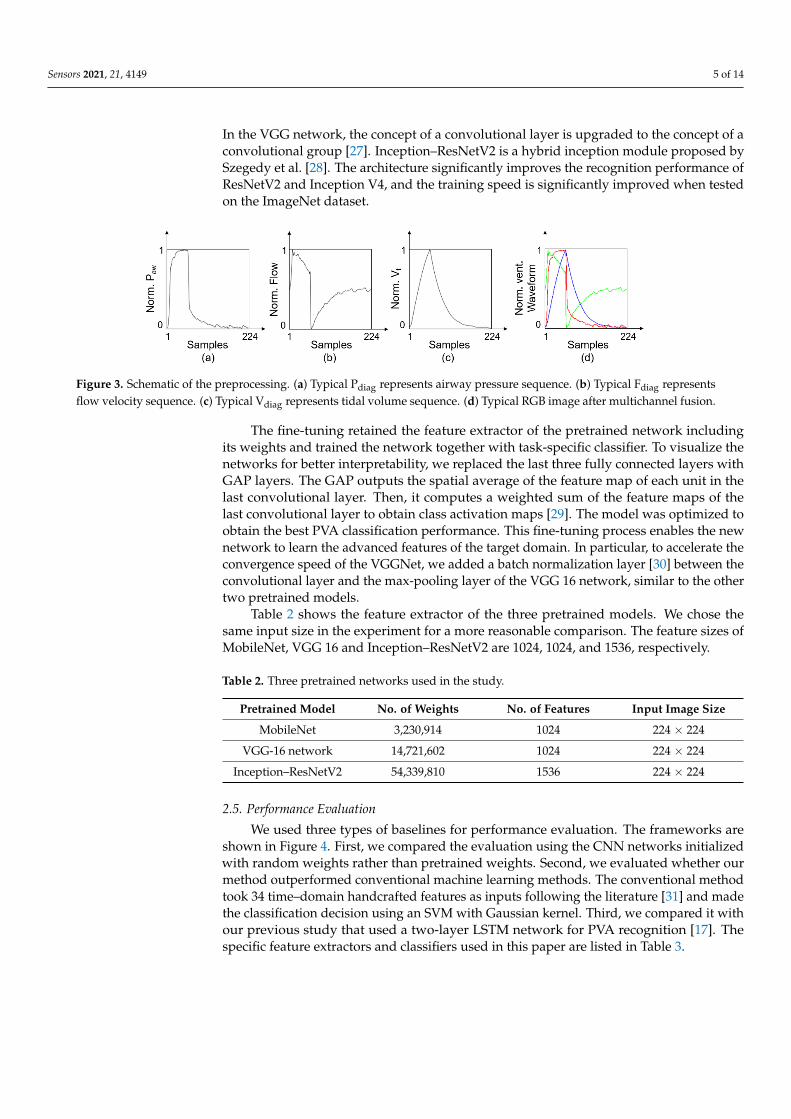
2.3. Preprocessing Because the network used to extract features requires image data as input, we con-
verted the 1D ventilation airway pressure sequence (P), flow velocity sequence (F), and tidal volume sequence (V) into an airway pressure diagram (Pdiag), flow velocity diagram (Fdiag), and tidal volume diagram (Vdiag), accordingly. Preprocessing was performed in the following steps:
(1) Standardization. First, the P, F, and V of each breath were interpolated and resampled to a uniform length of 224. Then, each respiratory sequence was normalized according to Equation (1), where 𝑋𝑋𝑛𝑛𝑛𝑛𝑛𝑛𝑛𝑛 denotes the normalized data, 𝑋𝑋 denotes the orig-inal data, and 𝑋𝑋𝑛𝑛𝑚𝑚𝑚𝑚 and 𝑋𝑋𝑛𝑛𝑖𝑖𝑛𝑛 are the maximum and minimum values of the original data set, respectively.
𝑋𝑋𝑛𝑛𝑛𝑛𝑛𝑛𝑛𝑛 =𝑋𝑋 − 𝑋𝑋𝑛𝑛𝑖𝑖𝑛𝑛
𝑋𝑋𝑛𝑛𝑚𝑚𝑚𝑚 − 𝑋𝑋𝑛𝑛𝑖𝑖𝑛𝑛 (1)
(2) Dimensional Transformation. Each 1D respiratory sequence was plotted in a 224 × 224 grayscale image, as shown in Figure 3.
(3) Multichannel Fusion. The Pdiag, Fdiag and Vdiag were treated as three respective channels and combined into an RGB image.
Figure 2. Typical respiratory sequences of (a) IEE and (b) DT events. The PVA events are indicatedin red.
2.3. Preprocessing
Because the network used to extract features requires image data as input, we con-verted the 1D ventilation airway pressure sequence (P), flow velocity sequence (F), andtidal volume sequence (V) into an airway pressure diagram (Pdiag), flow velocity diagram(Fdiag), and tidal volume diagram (Vdiag), accordingly. Preprocessing was performed in thefollowing steps:
(1) Standardization. First, the P, F, and V of each breath were interpolated and resampledto a uniform length of 224. Then, each respiratory sequence was normalized accordingto Equation (1), where Xnorm denotes the normalized data, X denotes the originaldata, and Xmax and Xmin are the maximum and minimum values of the original dataset, respectively.
Xnorm =X− Xmin
Xmax − Xmin(1)
(2) Dimensional Transformation. Each 1D respiratory sequence was plotted in a 224 ×224 grayscale image, as shown in Figure 3.
(3) Multichannel Fusion. The Pdiag, Fdiag and Vdiag were treated as three respectivechannels and combined into an RGB image.
2.4. Pretrained Models for Feature Extraction
The CNN-based transfer learning framework was used in this study as a pretrainedmodel. We adopted three types of CNN models (i.e., MobileNet, VGG 16, and Inception–ResNetV2) for feature extraction, as they represent light-weighted, moderate-weighted,and heavy-weighted feature extractors, respectively. MobileNet is a light-weight model de-signed to run DL models on mobile devices [25]. It uses depth-wise separable convolutionto increase the computing efficiency with only a small reduction in accuracy. VGG 16 is pro-posed by the Oxford University Visual Geometry Group (VGG) in the context of ILSVRCin 2014. It has been greatly improved for the width and depth of the AlexNet network [26].
Sensors 2021, 21, 4149 5 of 14
In the VGG network, the concept of a convolutional layer is upgraded to the concept of aconvolutional group [27]. Inception–ResNetV2 is a hybrid inception module proposed bySzegedy et al. [28]. The architecture significantly improves the recognition performance ofResNetV2 and Inception V4, and the training speed is significantly improved when testedon the ImageNet dataset.
Sensors 2021, 21, x FOR PEER REVIEW 5 of 13
Figure 3. Schematic of the preprocessing. (a) Typical Pdiag represents airway pressure sequence. (b) Typical Fdiag represents flow velocity sequence. (c) Typical Vdiag represents tidal volume sequence. (d) Typical RGB image after multichannel fusion.
2.4. Pretrained Models for Feature Extraction The CNN-based transfer learning framework was used in this study as a pretrained
model. We adopted three types of CNN models (i.e., MobileNet, VGG 16, and Inception–ResNetV2) for feature extraction, as they represent light-weighted, moderate-weighted, and heavy-weighted feature extractors, respectively. MobileNet is a light-weight model designed to run DL models on mobile devices [25]. It uses depth-wise separable convolu-tion to increase the computing efficiency with only a small reduction in accuracy. VGG 16 is proposed by the Oxford University Visual Geometry Group (VGG) in the context of ILSVRC in 2014. It has been greatly improved for the width and depth of the AlexNet network [26]. In the VGG network, the concept of a convolutional layer is upgraded to the concept of a convolutional group [27]. Inception–ResNetV2 is a hybrid inception module proposed by Szegedy et al. [28]. The architecture significantly improves the recognition performance of ResNetV2 and Inception V4, and the training speed is significantly im-proved when tested on the ImageNet dataset.
The fine-tuning retained the feature extractor of the pretrained network including its weights and trained the network together with task-specific classifier. To visualize the networks for better interpretability, we replaced the last three fully connected layers with GAP layers. The GAP outputs the spatial average of the feature map of each unit in the last convolutional layer. Then, it computes a weighted sum of the feature maps of the last convolutional layer to obtain class activation maps [29]. The model was optimized to ob-tain the best PVA classification performance. This fine-tuning process enables the new network to learn the advanced features of the target domain. In particular, to accelerate the convergence speed of the VGGNet, we added a batch normalization layer [30] between the convolutional layer and the max-pooling layer of the VGG 16 network, similar to the other two pretrained models.
Table 2 shows the feature extractor of the three pretrained models. We chose the same input size in the experiment for a more reasonable comparison. The feature sizes of Mo-bileNet, VGG 16 and Inception–ResNetV2 are 1024, 1024, and 1536, respectively.
Table 2. Three pretrained networks used in the study.
Pretrained Model No. of Weights No. of Features Input Image Size MobileNet 3,230,914 1024 224 × 224
VGG-16 network 14,721,602 1024 224 × 224 Inception–ResNetV2 54,339,810 1536 224 × 224
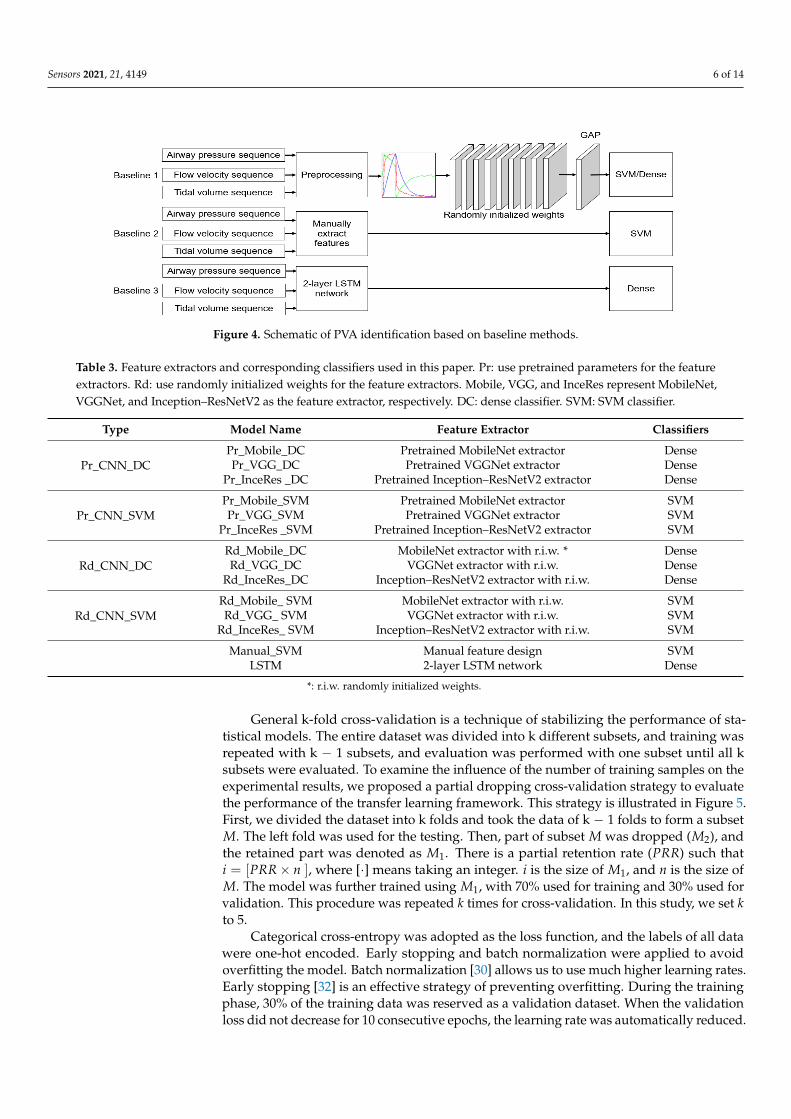
2.5. Performance Evaluation We used three types of baselines for performance evaluation. The frameworks are
shown in Figure 4. First, we compared the evaluation using the CNN networks initialized with random weights rather than pretrained weights. Second, we evaluated whether our method outperformed conventional machine learning methods. The conventional method took 34 time–domain handcrafted features as inputs following the literature [31] and
Figure 3. Schematic of the preprocessing. (a) Typical Pdiag represents airway pressure sequence. (b) Typical Fdiag representsflow velocity sequence. (c) Typical Vdiag represents tidal volume sequence. (d) Typical RGB image after multichannel fusion.
The fine-tuning retained the feature extractor of the pretrained network includingits weights and trained the network together with task-specific classifier. To visualize thenetworks for better interpretability, we replaced the last three fully connected layers withGAP layers. The GAP outputs the spatial average of the feature map of each unit in thelast convolutional layer. Then, it computes a weighted sum of the feature maps of thelast convolutional layer to obtain class activation maps [29]. The model was optimized toobtain the best PVA classification performance. This fine-tuning process enables the newnetwork to learn the advanced features of the target domain. In particular, to accelerate theconvergence speed of the VGGNet, we added a batch normalization layer [30] between theconvolutional layer and the max-pooling layer of the VGG 16 network, similar to the othertwo pretrained models.
Table 2 shows the feature extractor of the three pretrained models. We chose thesame input size in the experiment for a more reasonable comparison. The feature sizes ofMobileNet, VGG 16 and Inception–ResNetV2 are 1024, 1024, and 1536, respectively.
Table 2. Three pretrained networks used in the study.
Pretrained Model No. of Weights No. of Features Input Image Size
MobileNet 3,230,914 1024 224 × 224
VGG-16 network 14,721,602 1024 224 × 224
Inception–ResNetV2 54,339,810 1536 224 × 224
2.5. Performance Evaluation
We used three types of baselines for performance evaluation. The frameworks areshown in Figure 4. First, we compared the evaluation using the CNN networks initializedwith random weights rather than pretrained weights. Second, we evaluated whether ourmethod outperformed conventional machine learning methods. The conventional methodtook 34 time–domain handcrafted features as inputs following the literature [31] and madethe classification decision using an SVM with Gaussian kernel. Third, we compared it withour previous study that used a two-layer LSTM network for PVA recognition [17]. Thespecific feature extractors and classifiers used in this paper are listed in Table 3.
Sensors 2021, 21, 4149 6 of 14
Sensors 2021, 21, x FOR PEER REVIEW 6 of 13
made the classification decision using an SVM with Gaussian kernel. Third, we compared it with our previous study that used a two-layer LSTM network for PVA recognition [17]. The specific feature extractors and classifiers used in this paper are listed in Table 3.
Figure 4. Schematic of PVA identification based on baseline methods.
Table 3. Feature extractors and corresponding classifiers used in this paper. Pr: use pretrained parameters for the feature extractors. Rd: use randomly initialized weights for the feature extrac-tors. Mobile, VGG, and InceRes represent MobileNet, VGGNet, and Inception–ResNetV2 as the feature extractor, respectively. DC: dense classifier. SVM: SVM classifier.
Type Model Name Feature Extractor Classifiers
Pr_CNN_DC Pr_Mobile_DC Pretrained MobileNet extractor Dense Pr_VGG_DC Pretrained VGGNet extractor Dense
Pr_InceRes _DC Pretrained Inception–ResNetV2 extractor Dense
Pr_CNN_SVM Pr_Mobile_SVM Pretrained MobileNet extractor SVM Pr_VGG_SVM Pretrained VGGNet extractor SVM
Pr_InceRes _SVM Pretrained Inception–ResNetV2 extractor SVM
Rd_CNN_DC Rd_Mobile_DC MobileNet extractor with r.i.w.* Dense Rd_VGG_DC VGGNet extractor with r.i.w. Dense
Rd_InceRes_DC Inception–ResNetV2 extractor with r.i.w. Dense
Rd_CNN_SVM Rd_Mobile_ SVM MobileNet extractor with r.i.w. SVM Rd_VGG_ SVM VGGNet extractor with r.i.w. SVM
Rd_InceRes_ SVM Inception–ResNetV2 extractor with r.i.w. SVM Manual_SVM Manual feature design SVM LSTM 2-layer LSTM network Dense
*: r.i.w. randomly initialized weights.
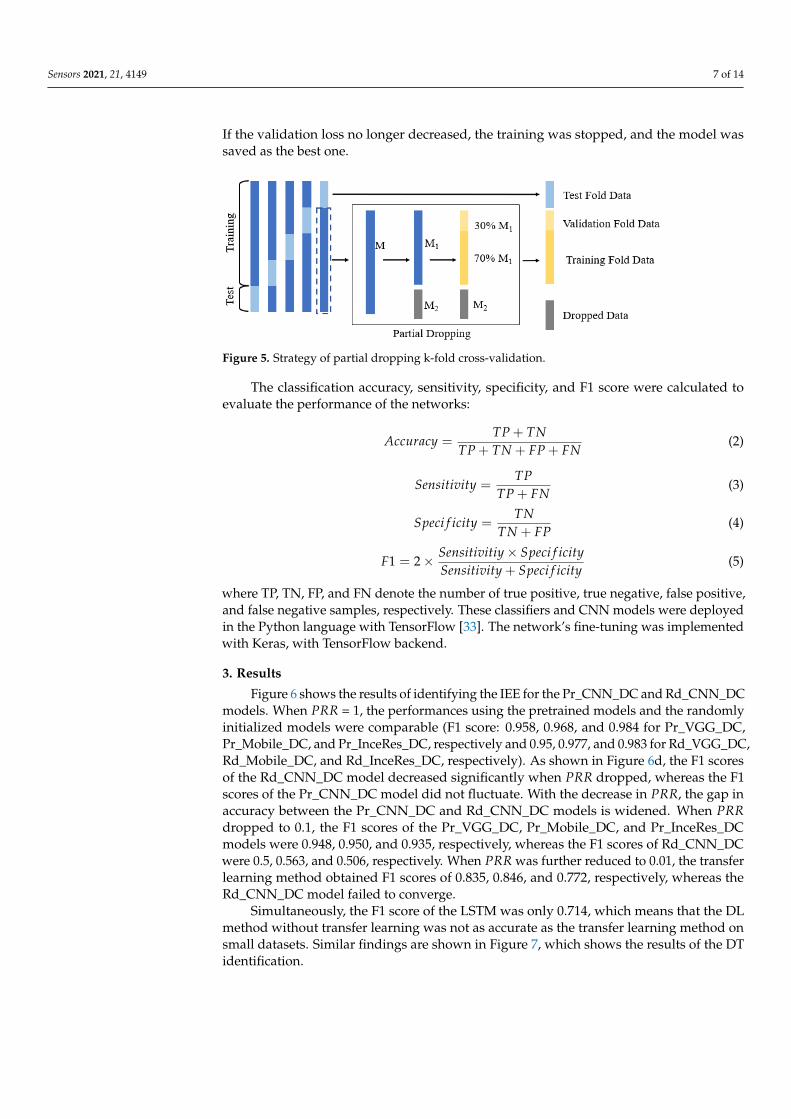
General k-fold cross-validation is a technique of stabilizing the performance of sta-tistical models. The entire dataset was divided into k different subsets, and training was repeated with k-1 subsets, and evaluation was performed with one subset until all k sub-sets were evaluated. To examine the influence of the number of training samples on the experimental results, we proposed a partial dropping cross-validation strategy to evaluate the performance of the transfer learning framework. This strategy is illustrated in Figure 5. First, we divided the dataset into k folds and took the data of k-1 folds to form a subset 𝑀𝑀. The left fold was used for the testing. Then, part of subset 𝑀𝑀 was dropped (𝑀𝑀2), and the retained part was denoted as 𝑀𝑀1. There is a partial retention rate (𝑃𝑃𝑃𝑃𝑃𝑃) such that 𝑖𝑖 =[𝑃𝑃𝑃𝑃𝑃𝑃 × 𝑛𝑛 ], where [ ] means taking an integer. 𝑖𝑖 is the size of 𝑀𝑀1, and 𝑛𝑛 is the size of 𝑀𝑀. The model was further trained using 𝑀𝑀1, with 70% used for training and 30% used for validation. This procedure was repeated 𝑘𝑘 times for cross-validation. In this study, we set 𝑘𝑘 to 5.
Figure 4. Schematic of PVA identification based on baseline methods.
Table 3. Feature extractors and corresponding classifiers used in this paper. Pr: use pretrained parameters for the featureextractors. Rd: use randomly initialized weights for the feature extractors. Mobile, VGG, and InceRes represent MobileNet,VGGNet, and Inception–ResNetV2 as the feature extractor, respectively. DC: dense classifier. SVM: SVM classifier.
Type Model Name Feature Extractor Classifiers
Pr_CNN_DCPr_Mobile_DC Pretrained MobileNet extractor DensePr_VGG_DC Pretrained VGGNet extractor Dense
Pr_InceRes _DC Pretrained Inception–ResNetV2 extractor Dense
Pr_CNN_SVMPr_Mobile_SVM Pretrained MobileNet extractor SVMPr_VGG_SVM Pretrained VGGNet extractor SVM
Pr_InceRes _SVM Pretrained Inception–ResNetV2 extractor SVM
Rd_CNN_DCRd_Mobile_DC MobileNet extractor with r.i.w. * DenseRd_VGG_DC VGGNet extractor with r.i.w. Dense
Rd_InceRes_DC Inception–ResNetV2 extractor with r.i.w. Dense
Rd_CNN_SVMRd_Mobile_ SVM MobileNet extractor with r.i.w. SVMRd_VGG_ SVM VGGNet extractor with r.i.w. SVM
Rd_InceRes_ SVM Inception–ResNetV2 extractor with r.i.w. SVM
Manual_SVM Manual feature design SVMLSTM 2-layer LSTM network Dense
*: r.i.w. randomly initialized weights.
General k-fold cross-validation is a technique of stabilizing the performance of sta-tistical models. The entire dataset was divided into k different subsets, and training wasrepeated with k − 1 subsets, and evaluation was performed with one subset until all ksubsets were evaluated. To examine the influence of the number of training samples on theexperimental results, we proposed a partial dropping cross-validation strategy to evaluatethe performance of the transfer learning framework. This strategy is illustrated in Figure 5.First, we divided the dataset into k folds and took the data of k − 1 folds to form a subsetM. The left fold was used for the testing. Then, part of subset M was dropped (M2), andthe retained part was denoted as M1. There is a partial retention rate (PRR) such thati = [PRR× n ], where [·] means taking an integer. i is the size of M1, and n is the size ofM. The model was further trained using M1, with 70% used for training and 30% used forvalidation. This procedure was repeated k times for cross-validation. In this study, we set kto 5.
Categorical cross-entropy was adopted as the loss function, and the labels of all datawere one-hot encoded. Early stopping and batch normalization were applied to avoidoverfitting the model. Batch normalization [30] allows us to use much higher learning rates.Early stopping [32] is an effective strategy of preventing overfitting. During the trainingphase, 30% of the training data was reserved as a validation dataset. When the validationloss did not decrease for 10 consecutive epochs, the learning rate was automatically reduced.
Sensors 2021, 21, 4149 7 of 14
If the validation loss no longer decreased, the training was stopped, and the model wassaved as the best one.
Sensors 2021, 21, x FOR PEER REVIEW 7 of 13
Figure 5. Strategy of partial dropping k-fold cross-validation.
Categorical cross-entropy was adopted as the loss function, and the labels of all data were one-hot encoded. Early stopping and batch normalization were applied to avoid overfitting the model. Batch normalization [30] allows us to use much higher learning rates. Early stopping [32] is an effective strategy of preventing overfitting. During the training phase, 30% of the training data was reserved as a validation dataset. When the validation loss did not decrease for 10 consecutive epochs, the learning rate was automat-ically reduced. If the validation loss no longer decreased, the training was stopped, and the model was saved as the best one.
The classification accuracy, sensitivity, specificity, and F1 score were calculated to evaluate the performance of the networks:
𝐴𝐴𝐴𝐴𝐴𝐴𝐴𝐴𝐴𝐴𝐴𝐴𝐴𝐴𝑦𝑦 =𝑇𝑇𝑃𝑃 + 𝑇𝑇𝑇𝑇
𝑇𝑇𝑃𝑃 + 𝑇𝑇𝑇𝑇 + 𝐹𝐹𝑃𝑃 + 𝐹𝐹𝑇𝑇 (2)
𝑆𝑆𝑆𝑆𝑛𝑛𝑆𝑆𝑖𝑖𝑆𝑆𝑖𝑖𝑆𝑆𝑖𝑖𝑆𝑆𝑦𝑦 =𝑇𝑇𝑃𝑃
𝑇𝑇𝑃𝑃 + 𝐹𝐹𝑇𝑇 (3)
𝑆𝑆𝑆𝑆𝑆𝑆𝐴𝐴𝑖𝑖𝑓𝑓𝑖𝑖𝐴𝐴𝑖𝑖𝑆𝑆𝑦𝑦 =𝑇𝑇𝑇𝑇
𝑇𝑇𝑇𝑇 + 𝐹𝐹𝑃𝑃 (4)
𝐹𝐹1 = 2 ×𝑆𝑆𝑆𝑆𝑛𝑛𝑆𝑆𝑖𝑖𝑆𝑆𝑖𝑖𝑆𝑆𝑖𝑖𝑆𝑆𝑖𝑖𝑦𝑦 × 𝑆𝑆𝑆𝑆𝑆𝑆𝐴𝐴𝑖𝑖𝑓𝑓𝑖𝑖𝐴𝐴𝑖𝑖𝑆𝑆𝑦𝑦𝑆𝑆𝑆𝑆𝑛𝑛𝑆𝑆𝑖𝑖𝑆𝑆𝑖𝑖𝑆𝑆𝑖𝑖𝑆𝑆𝑦𝑦 + 𝑆𝑆𝑆𝑆𝑆𝑆𝐴𝐴𝑖𝑖𝑓𝑓𝑖𝑖𝐴𝐴𝑖𝑖𝑆𝑆𝑦𝑦
(5)
where TP, TN, FP, and FN denote the number of true positive, true negative, false positive, and false negative samples, respectively. These classifiers and CNN models were de-ployed in the Python language with TensorFlow [33]. The network’s fine-tuning was im-plemented with Keras, with TensorFlow backend.
3. Results Figure 6 shows the results of identifying the IEE for the Pr_CNN_DC and
Rd_CNN_DC models. When 𝑃𝑃𝑃𝑃𝑃𝑃=1, the performances using the pretrained models and the randomly initialized models were comparable (F1 score: 0.958, 0.968, and 0.984 for Pr_VGG_DC, Pr_Mobile_DC, and Pr_InceRes_DC, respectively and 0.95, 0.977, and 0.983 for Rd_VGG_DC, Rd_Mobile_DC, and Rd_InceRes_DC, respectively). As shown in Fig-ure 6d, the F1 scores of the Rd_CNN_DC model decreased significantly when 𝑃𝑃𝑃𝑃𝑃𝑃 dropped, whereas the F1 scores of the Pr_CNN_DC model did not fluctuate. With the decrease in 𝑃𝑃𝑃𝑃𝑃𝑃, the gap in accuracy between the Pr_CNN_DC and Rd_CNN_DC models is widened. When 𝑃𝑃𝑃𝑃𝑃𝑃 dropped to 0.1, the F1 scores of the Pr_VGG_DC, Pr_Mobile_DC, and Pr_InceRes_DC models were 0.948, 0.950, and 0.935, respectively, whereas the F1 scores of Rd_CNN_DC were 0.5, 0.563, and 0.506, respectively. When 𝑃𝑃𝑃𝑃𝑃𝑃 was further reduced to 0.01, the transfer learning method obtained F1 scores of 0.835, 0.846, and 0.772, respectively, whereas the Rd_CNN_DC model failed to converge.
Figure 5. Strategy of partial dropping k-fold cross-validation.
The classification accuracy, sensitivity, specificity, and F1 score were calculated toevaluate the performance of the networks:
Accuracy =TP + TN
TP + TN + FP + FN(2)
Sensitivity =TP
TP + FN(3)
Speci f icity =TN
TN + FP(4)
F1 = 2× Sensitivitiy× Speci f icitySensitivity + Speci f icity
(5)
where TP, TN, FP, and FN denote the number of true positive, true negative, false positive,and false negative samples, respectively. These classifiers and CNN models were deployedin the Python language with TensorFlow [33]. The network’s fine-tuning was implementedwith Keras, with TensorFlow backend.
3. Results
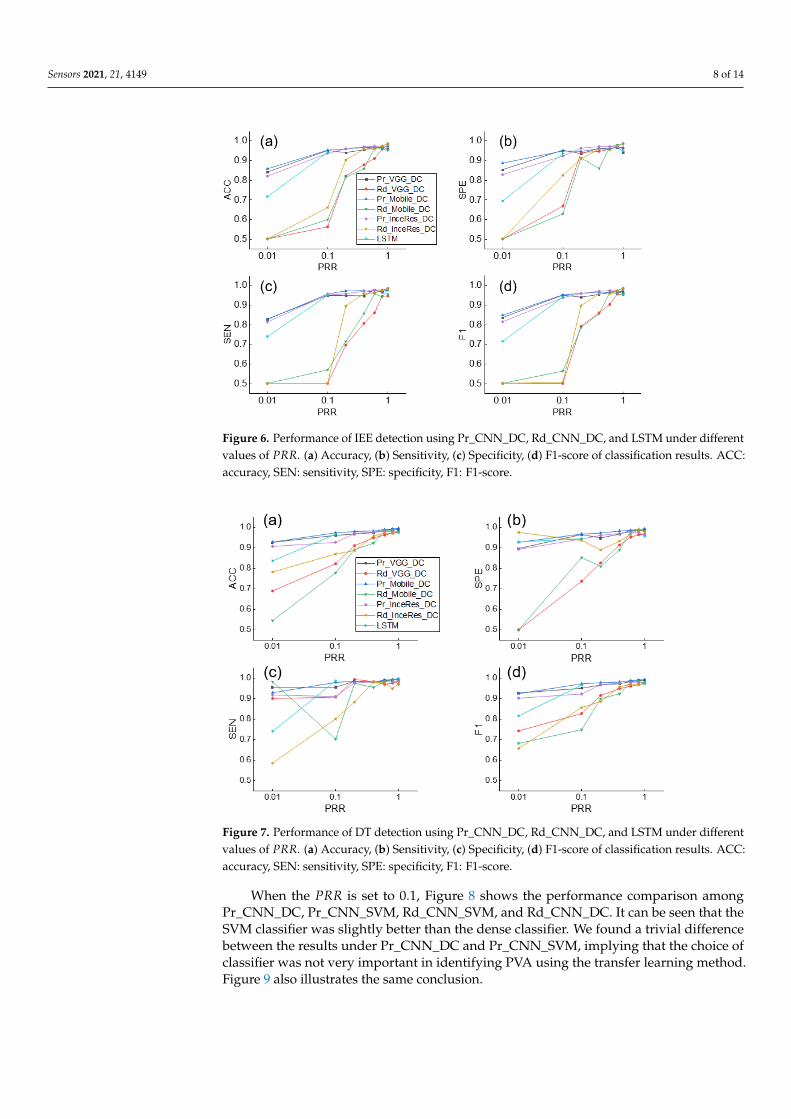
Figure 6 shows the results of identifying the IEE for the Pr_CNN_DC and Rd_CNN_DCmodels. When PRR = 1, the performances using the pretrained models and the randomlyinitialized models were comparable (F1 score: 0.958, 0.968, and 0.984 for Pr_VGG_DC,Pr_Mobile_DC, and Pr_InceRes_DC, respectively and 0.95, 0.977, and 0.983 for Rd_VGG_DC,Rd_Mobile_DC, and Rd_InceRes_DC, respectively). As shown in Figure 6d, the F1 scoresof the Rd_CNN_DC model decreased significantly when PRR dropped, whereas the F1scores of the Pr_CNN_DC model did not fluctuate. With the decrease in PRR, the gap inaccuracy between the Pr_CNN_DC and Rd_CNN_DC models is widened. When PRRdropped to 0.1, the F1 scores of the Pr_VGG_DC, Pr_Mobile_DC, and Pr_InceRes_DCmodels were 0.948, 0.950, and 0.935, respectively, whereas the F1 scores of Rd_CNN_DCwere 0.5, 0.563, and 0.506, respectively. When PRR was further reduced to 0.01, the transferlearning method obtained F1 scores of 0.835, 0.846, and 0.772, respectively, whereas theRd_CNN_DC model failed to converge.
Simultaneously, the F1 score of the LSTM was only 0.714, which means that the DLmethod without transfer learning was not as accurate as the transfer learning method onsmall datasets. Similar findings are shown in Figure 7, which shows the results of the DTidentification.
Sensors 2021, 21, 4149 8 of 14Sensors 2021, 21, x FOR PEER REVIEW 8 of 13
Figure 6. Performance of IEE detection using Pr_CNN_DC, Rd_CNN_DC, and LSTM under differ-ent values of 𝑃𝑃𝑃𝑃𝑃𝑃. (a) Accuracy, (b) Sensitivity, (c) Specificity, (d) F1-score of classification results. ACC : accuracy, SEN: sensitivity, SPE : specificity, F1: F1-score.
Simultaneously, the F1 score of the LSTM was only 0.714, which means that the DL method without transfer learning was not as accurate as the transfer learning method on small datasets. Similar findings are shown in Figure 7, which shows the results of the DT identification.
Figure 7. Performance of DT detection using Pr_CNN_DC, Rd_CNN_DC, and LSTM under differ-ent values of 𝑃𝑃𝑃𝑃𝑃𝑃. (a) Accuracy, (b) Sensitivity, (c) Specificity, (d) F1-score of classification results. ACC: accuracy, SEN: sensitivity, SPE: specificity, F1: F1-score.
When the 𝑃𝑃𝑃𝑃𝑃𝑃 is set to 0.1, Figure 8 shows the performance comparison among Pr_CNN_DC, Pr_CNN_SVM, Rd_CNN_SVM, and Rd_CNN_DC. It can be seen that the SVM classifier was slightly better than the dense classifier. We found a trivial difference between the results under Pr_CNN_DC and Pr_CNN_SVM, implying that the choice of
Figure 6. Performance of IEE detection using Pr_CNN_DC, Rd_CNN_DC, and LSTM under differentvalues of PRR. (a) Accuracy, (b) Sensitivity, (c) Specificity, (d) F1-score of classification results. ACC:accuracy, SEN: sensitivity, SPE: specificity, F1: F1-score.
Sensors 2021, 21, x FOR PEER REVIEW 8 of 13
Figure 6. Performance of IEE detection using Pr_CNN_DC, Rd_CNN_DC, and LSTM under differ-ent values of 𝑃𝑃𝑃𝑃𝑃𝑃. (a) Accuracy, (b) Sensitivity, (c) Specificity, (d) F1-score of classification results. ACC : accuracy, SEN: sensitivity, SPE : specificity, F1: F1-score.
Simultaneously, the F1 score of the LSTM was only 0.714, which means that the DL method without transfer learning was not as accurate as the transfer learning method on small datasets. Similar findings are shown in Figure 7, which shows the results of the DT identification.
Figure 7. Performance of DT detection using Pr_CNN_DC, Rd_CNN_DC, and LSTM under differ-ent values of 𝑃𝑃𝑃𝑃𝑃𝑃. (a) Accuracy, (b) Sensitivity, (c) Specificity, (d) F1-score of classification results. ACC: accuracy, SEN: sensitivity, SPE: specificity, F1: F1-score.
When the 𝑃𝑃𝑃𝑃𝑃𝑃 is set to 0.1, Figure 8 shows the performance comparison among Pr_CNN_DC, Pr_CNN_SVM, Rd_CNN_SVM, and Rd_CNN_DC. It can be seen that the SVM classifier was slightly better than the dense classifier. We found a trivial difference between the results under Pr_CNN_DC and Pr_CNN_SVM, implying that the choice of
Figure 7. Performance of DT detection using Pr_CNN_DC, Rd_CNN_DC, and LSTM under differentvalues of PRR. (a) Accuracy, (b) Sensitivity, (c) Specificity, (d) F1-score of classification results. ACC:accuracy, SEN: sensitivity, SPE: specificity, F1: F1-score.
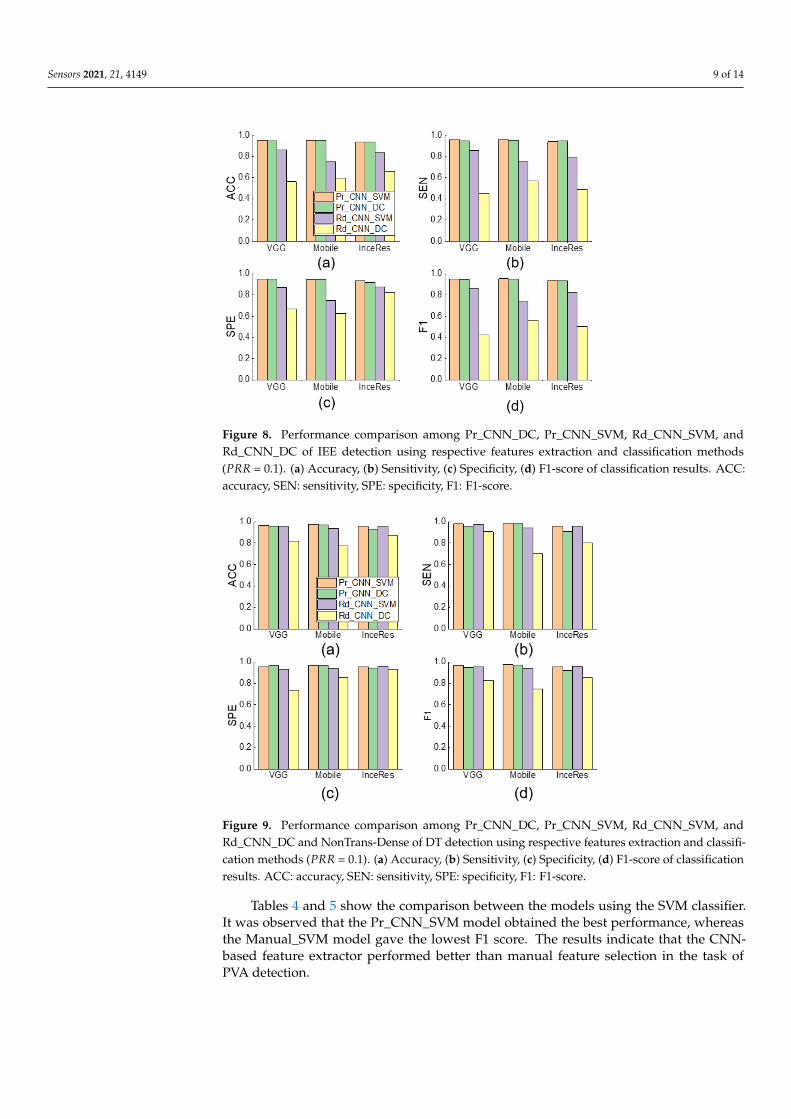
When the PRR is set to 0.1, Figure 8 shows the performance comparison amongPr_CNN_DC, Pr_CNN_SVM, Rd_CNN_SVM, and Rd_CNN_DC. It can be seen that theSVM classifier was slightly better than the dense classifier. We found a trivial differencebetween the results under Pr_CNN_DC and Pr_CNN_SVM, implying that the choice ofclassifier was not very important in identifying PVA using the transfer learning method.Figure 9 also illustrates the same conclusion.
Sensors 2021, 21, 4149 9 of 14
Sensors 2021, 21, x FOR PEER REVIEW 9 of 13
classifier was not very important in identifying PVA using the transfer learning method. Figure 9 also illustrates the same conclusion.
Figure 8. Performance comparison among Pr_CNN_DC, Pr_CNN_SVM, Rd_CNN_SVM, and Rd_CNN_DC of IEE detection using respective features extraction and classification methods (𝑃𝑃𝑃𝑃𝑃𝑃=0.1). (a) Accuracy, (b) Sensitivity, (c) Specificity, (d) F1-score of classification results. ACC: accuracy, SEN: sensitivity, SPE: specificity, F1: F1-score.
Figure 9. Performance comparison among Pr_CNN_DC, Pr_CNN_SVM, Rd_CNN_SVM, and Rd_CNN_DC and NonTrans-Dense of DT detection using respective features extraction and clas-sification methods (𝑃𝑃𝑃𝑃𝑃𝑃=0.1). (a) Accuracy, (b) Sensitivity, (c) Specificity, (d) F1-score of classifica-tion results. ACC: accuracy, SEN: sensitivity, SPE: specificity, F1: F1-score.
Tables 4 and 5 show the comparison between the models using the SVM classifier. It was observed that the Pr_CNN_SVM model obtained the best performance, whereas the Manual_SVM model gave the lowest F1 score. The results indicate that the CNN-based feature extractor performed better than manual feature selection in the task of PVA detec-tion.
Figure 8. Performance comparison among Pr_CNN_DC, Pr_CNN_SVM, Rd_CNN_SVM, andRd_CNN_DC of IEE detection using respective features extraction and classification methods(PRR = 0.1). (a) Accuracy, (b) Sensitivity, (c) Specificity, (d) F1-score of classification results. ACC:accuracy, SEN: sensitivity, SPE: specificity, F1: F1-score.
Sensors 2021, 21, x FOR PEER REVIEW 9 of 13
classifier was not very important in identifying PVA using the transfer learning method. Figure 9 also illustrates the same conclusion.
Figure 8. Performance comparison among Pr_CNN_DC, Pr_CNN_SVM, Rd_CNN_SVM, and Rd_CNN_DC of IEE detection using respective features extraction and classification methods (𝑃𝑃𝑃𝑃𝑃𝑃=0.1). (a) Accuracy, (b) Sensitivity, (c) Specificity, (d) F1-score of classification results. ACC: accuracy, SEN: sensitivity, SPE: specificity, F1: F1-score.
Figure 9. Performance comparison among Pr_CNN_DC, Pr_CNN_SVM, Rd_CNN_SVM, and Rd_CNN_DC and NonTrans-Dense of DT detection using respective features extraction and clas-sification methods (𝑃𝑃𝑃𝑃𝑃𝑃=0.1). (a) Accuracy, (b) Sensitivity, (c) Specificity, (d) F1-score of classifica-tion results. ACC: accuracy, SEN: sensitivity, SPE: specificity, F1: F1-score.
Tables 4 and 5 show the comparison between the models using the SVM classifier. It was observed that the Pr_CNN_SVM model obtained the best performance, whereas the Manual_SVM model gave the lowest F1 score. The results indicate that the CNN-based feature extractor performed better than manual feature selection in the task of PVA detec-tion.
Figure 9. Performance comparison among Pr_CNN_DC, Pr_CNN_SVM, Rd_CNN_SVM, andRd_CNN_DC and NonTrans-Dense of DT detection using respective features extraction and classifi-cation methods (PRR = 0.1). (a) Accuracy, (b) Sensitivity, (c) Specificity, (d) F1-score of classificationresults. ACC: accuracy, SEN: sensitivity, SPE: specificity, F1: F1-score.
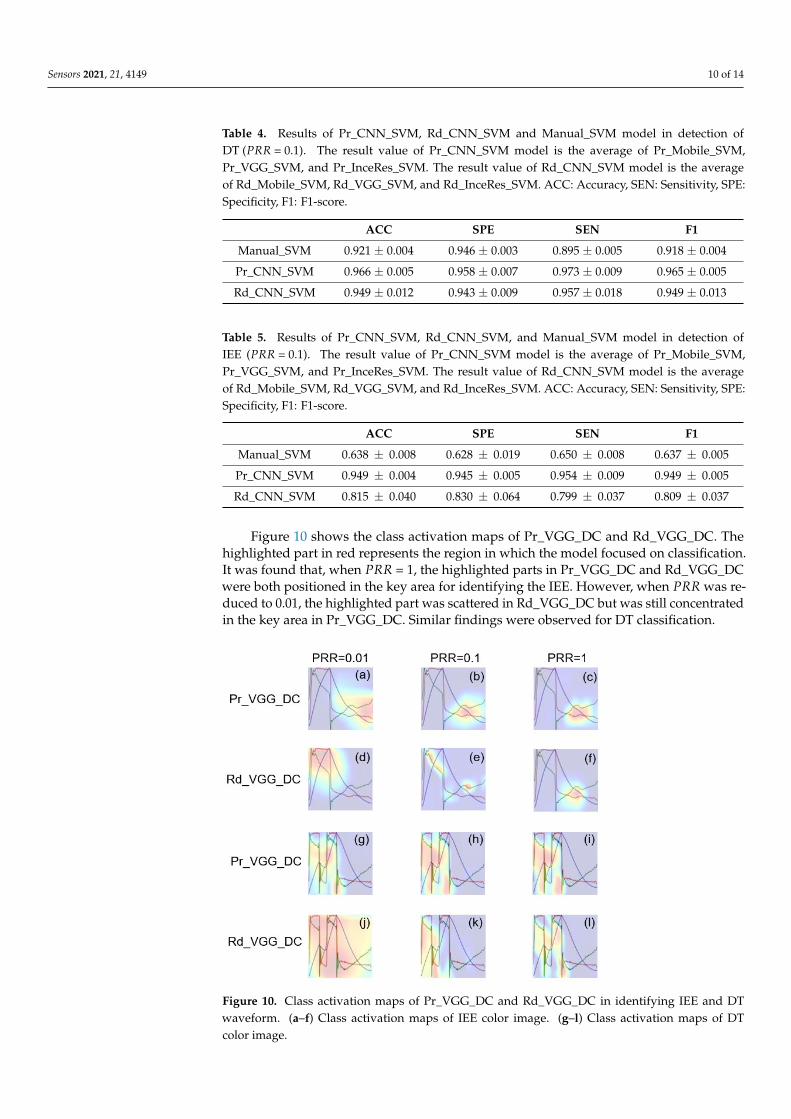
Tables 4 and 5 show the comparison between the models using the SVM classifier.It was observed that the Pr_CNN_SVM model obtained the best performance, whereasthe Manual_SVM model gave the lowest F1 score. The results indicate that the CNN-based feature extractor performed better than manual feature selection in the task ofPVA detection.
Sensors 2021, 21, 4149 10 of 14
Table 4. Results of Pr_CNN_SVM, Rd_CNN_SVM and Manual_SVM model in detection ofDT (PRR = 0.1). The result value of Pr_CNN_SVM model is the average of Pr_Mobile_SVM,Pr_VGG_SVM, and Pr_InceRes_SVM. The result value of Rd_CNN_SVM model is the averageof Rd_Mobile_SVM, Rd_VGG_SVM, and Rd_InceRes_SVM. ACC: Accuracy, SEN: Sensitivity, SPE:Specificity, F1: F1-score.
ACC SPE SEN F1
Manual_SVM 0.921 ± 0.004 0.946 ± 0.003 0.895 ± 0.005 0.918 ± 0.004
Pr_CNN_SVM 0.966 ± 0.005 0.958 ± 0.007 0.973 ± 0.009 0.965 ± 0.005
Rd_CNN_SVM 0.949 ± 0.012 0.943 ± 0.009 0.957 ± 0.018 0.949 ± 0.013
Table 5. Results of Pr_CNN_SVM, Rd_CNN_SVM, and Manual_SVM model in detection ofIEE (PRR = 0.1). The result value of Pr_CNN_SVM model is the average of Pr_Mobile_SVM,Pr_VGG_SVM, and Pr_InceRes_SVM. The result value of Rd_CNN_SVM model is the averageof Rd_Mobile_SVM, Rd_VGG_SVM, and Rd_InceRes_SVM. ACC: Accuracy, SEN: Sensitivity, SPE:Specificity, F1: F1-score.
ACC SPE SEN F1
Manual_SVM 0.638 ± 0.008 0.628 ± 0.019 0.650 ± 0.008 0.637 ± 0.005
Pr_CNN_SVM 0.949 ± 0.004 0.945 ± 0.005 0.954 ± 0.009 0.949 ± 0.005
Rd_CNN_SVM 0.815 ± 0.040 0.830 ± 0.064 0.799 ± 0.037 0.809 ± 0.037
Figure 10 shows the class activation maps of Pr_VGG_DC and Rd_VGG_DC. Thehighlighted part in red represents the region in which the model focused on classification.It was found that, when PRR = 1, the highlighted parts in Pr_VGG_DC and Rd_VGG_DCwere both positioned in the key area for identifying the IEE. However, when PRR was re-duced to 0.01, the highlighted part was scattered in Rd_VGG_DC but was still concentratedin the key area in Pr_VGG_DC. Similar findings were observed for DT classification.
Sensors 2021, 21, x FOR PEER REVIEW 10 of 13
Figure 10 shows the class activation maps of Pr_VGG_DC and Rd_VGG_DC. The highlighted part in red represents the region in which the model focused on classification. It was found that, when 𝑃𝑃𝑃𝑃𝑃𝑃 = 1, the highlighted parts in Pr_VGG_DC and Rd_VGG_DC were both positioned in the key area for identifying the IEE. However, when 𝑃𝑃𝑃𝑃𝑃𝑃 was reduced to 0.01, the highlighted part was scattered in Rd_VGG_DC but was still concen-trated in the key area in Pr_VGG_DC. Similar findings were observed for DT classifica-tion.
Table 4. Results of Pr_CNN_SVM, Rd_CNN_SVM and Manual_SVM model in detection of DT (𝑃𝑃𝑃𝑃𝑃𝑃 = 0.1). The result value of Pr_CNN_SVM model is the average of Pr_Mobile_SVM, Pr_VGG_SVM, and Pr_InceRes_SVM. The result value of Rd_CNN_SVM model is the average of Rd_Mobile_SVM, Rd_VGG_SVM, and Rd_InceRes_SVM. ACC: Accuracy, SEN: Sensitivity, SPE: Specificity, F1: F1-score.
ACC SPE SEN F1 Manual_SVM 0.921 ± 0.004 0.946 ± 0.003 0.895 ± 0.005 0.918 ± 0.004 Pr_CNN_SVM 0.966 ± 0.005 0.958 ± 0.007 0.973 ± 0.009 0.965 ± 0.005 Rd_CNN_SVM 0.949 ± 0.012 0.943 ± 0.009 0.957 ± 0.018 0.949 ± 0.013
Table 5. Results of Pr_CNN_SVM, Rd_CNN_SVM, and Manual_SVM model in detection of IEE (𝑃𝑃𝑃𝑃𝑃𝑃 = 0.1). The result value of Pr_CNN_SVM model is the average of Pr_Mobile_SVM, Pr_VGG_SVM, and Pr_InceRes_SVM. The result value of Rd_CNN_SVM model is the average of Rd_Mobile_SVM, Rd_VGG_SVM, and Rd_InceRes_SVM. ACC: Accuracy, SEN: Sensitivity, SPE: Specificity, F1: F1-score.
ACC SPE SEN F1 Manual_SVM 0.638 ± 0.008 0.628 ± 0.019 0.650 ± 0.008 0.637 ± 0.005 Pr_CNN_SVM 0.949 ± 0.004 0.945 ± 0.005 0.954 ± 0.009 0.949 ± 0.005 Rd_CNN_SVM 0.815 ± 0.040 0.830 ± 0.064 0.799 ± 0.037 0.809 ± 0.037
Figure 10. Class activation maps of Pr_VGG_DC and Rd_VGG_DC in identifying IEE and DT waveform. (a–f) Class activation maps of IEE color image. (g–l) Class activation maps of DT color image.
Figure 10. Class activation maps of Pr_VGG_DC and Rd_VGG_DC in identifying IEE and DTwaveform. (a–f) Class activation maps of IEE color image. (g–l) Class activation maps of DTcolor image.
Sensors 2021, 21, 4149 11 of 14
4. Discussion
There is an urgent requirement for the study of ventilatory support techniques duringthe coronavirus disease 2019 (COVID-19) pandemic, and automatic detection of PVA is oneof the challenges faced by clinics worldwide [34]. Using DL approaches to detect PVA ispromising, but it is hampered by the limited number of annotated data [26]. We proposedand evaluated a method that applies transfer learning to identify PVA. We transferredthree CNN models, which were pretrained based on the large-scale ImageNet database, toextract features from the 1D respiratory sequences. We then adopted different classifiers torecognize two types of PVA, i.e., DT and IEE. Using a partial dropping cross-validation,we found that, with a reduction in the size of the training dataset, the accuracy of PVAclassification dropped significantly when using non-transfer learning. In contrast, thetransfer learning method achieved a high classification accuracy, even when only 1% ofthe samples in the original training dataset were involved in training. This indicates thefeasibility of transfer learning for identifying PVA cycles having small, annotated datasets.
In developing computerized algorithms for PVA detection, feature extraction andclassifier selection are key steps. Sottile et al. proposed using 34 features to classify DT, IEE,flow-limited, premature ventilator-terminated, and synchronous breaths [31]. We adoptedtheir respective extracted features and fed them to the SVM model. The performance wasweaker than that of the DL method, probably because the extraction of handcrafted featuresis vulnerable to noise. We set up three pretrained CNN having different levels of weightto extract the features. The difference in the performance of the three models was lessthan 5%, which means that even the light-weighted MobileNet could effectively extract thecrucial features for PVA analysis. Its strength in feature extraction mainly benefits from thecomplex image classification problem on the ImageNet dataset. The results also imply thatthe feature extraction model can be further simplified to achieve satisfactory performance.
Figures 6 and 7 indicate that the complexity of the model structure was more impor-tant than the number of parameters. The structures of extractor in both MobileNet andInception–ResNetV2 contained more regularization and other methods to enhance thegeneralization ability of the model. In contrast, although we added the batch normalizationlayer to the VGG 16 extractor, the generalization ability of the model was weaker than thatof the MobileNet and Inception–ResNetV2 extractors. The classifier plays only an auxiliaryrole in identifying PVA. Figure 8 shows that the models using SVM or dense classifiersobtained similar results.
The proposed preprocessing method was easy to implement and was reasonable forour research. There are some methods that converted 1D time series to 2D images forCNN processing over the past decade. Some of them transformed the 1D time seriesinto spectrograms using wavelet transforms, Fourier transforms, etc. [19,35], whereasothers obtained time–domain characteristics by plotting the waveforms directly onto acanvas [36,37]. The former strategy aimed to highlight the time–frequency characteristics,whereas the latter focused on the original time–domain information. We adopted thelatter type of preprocessing, because PVA occurs because of the asynchronous process ofhuman–machine interaction and may not reflect specific frequency properties. However, ithas to be pointed out that the resampling procedure is likely to down-sample the waveformsignal and may lose the detailed features in the ventilator waveform, particularly for longbreathing cycles. Moreover, conversion of the 1D waveform into 2D image may distortthe amplitude of the ventilator waveform. Despite of the satisfactory performance of theproposed approach, the influence of the preprocessing method on the results needs to beinvestigated further.
The transfer learning shows superior performance over the compared machine learn-ing and standard DL models in PVA detection. By embedding the algorithm into a ven-tilator information system, which collects real-time ventilator waveforms, the algorithmis promising to detect the occurrence of PVA in real-time under specific ventilation modeto alert the clinicians to deal with it. However, more efforts are required to apply theproposed approach in real clinical settings. First, it remains to be investigated whether the
Sensors 2021, 21, 4149 12 of 14
approach can be extrapolated to more ventilator vendors, more ventilation modes, andmore PVA types. The method is expected to be applicable to these conditions, because thefeature extraction is automatic and thus suitable for detecting other types of PVA undervarious ventilation modes. Second, we converted the 1D time series into images havinga unique size as required by the CNN models. This led to distortion of waveforms atdifferent lengths. Although most breaths last for 4–6 s and 224 samples were sufficientto represent the characteristics of the normal and PVA cycles (longer than previouslyreported 150 samples for CNN [37]), the influence of the resampling processing shouldbe investigated in the future. Future studies are required to apply this approach in realclinical settings.
5. Conclusions
We presented a PVA detection and classification method based on MV sequences.This method exploited CNN-based learning features through transfer learning to fine-tunethe pretrained CNN and then classify the features. The results suggest that transferringpretrained 2D–CNN to solve the 1D problem is capable of acquiring a high accuracy inPVA detection with a small dataset. Future application of the transfer learning technologycould assist the detection of other types of PVA cycles under various ventilation modes,and therefore, rendering better patient–ventilator interaction, which probably benefits theintubated patients in the ICU, including the COVID-19 patients.
Author Contributions: Conceptualization, Q.P. and H.G.; Data curation, H.G.; Formal analysis, F.L.and Z.Z.; Funding acquisition, Q.P., L.F. and H.G.; Investigation, Q.L. and J.P.; Methodology, Q.P.,M.J., Q.L. and L.Z.; Visualization, M.J. and L.Z.; Writing—original draft, Q.P. and M.J.; Writing—review & editing, Q.P., L.F. and H.G. All authors have read and agreed to the published version ofthe manuscript.
Funding: This study is supported by Zhejiang Province Key Research and Development Program(2020C03073), National Natural Science Foundation of China (Grant nos. 31870938, 82070087), andZhejiang Provincial Key Laboratory of Communication Networks and Applications.
Institutional Review Board Statement: The study was conducted according to the guidelines of theDeclaration of Helsinki, and approved by the Institutional Ethics Committee of Sir Run Run ShawHospital of Zhejiang University (protocol code 20190916-16 and date of approval 16 September 2019).
Informed Consent Statement: Patient consent was waived due to retrospective design of the studybased on our local ethics committee protocols.
Data Availability Statement: The data presented in this study are available on reasonable requestfrom the corresponding authors.
Conflicts of Interest: The authors have no conflict of interest to disclose.
References1. Blanch, L.; Villagra, A.; Sales, B.; Montanya, J.; Lucangelo, U.; Lujan, M.; Garcia-Esquirol, O.; Chacon, E.; Estruga, A.;
Oliva, J.C.; et al. Asynchronies during mechanical ventilation are associated with mortality. Intensive Care Med. 2015, 41, 633–641.[CrossRef]
2. De Haro, C.; Sarlabous, L.; Esperanza, J.A.; Magrans, R.; Blanch, L. Monitoring Patient–Ventilator Interaction; ERS PracticalHandbook of Invasive Mechanical Ventilation; European Respiratory Society: Sheffield, UK, 2019; p. 159.
3. Sassoon, C.S.H.; Foster, G.T. Patient-Ventilator asynchrony. Curr. Opin. Crit. Care 2001, 7, 28–33. [CrossRef]4. Chao, D.C.; Scheinhorn, D.J.; Stearn-Hassenpflug, M. Patient-Ventilator trigger asynchrony in prolonged mechanical ventilation.
Chest 1997, 112, 1592–1599. [CrossRef]5. De Wit, M.; Miller, K.B.; Green, D.A.; Ostman, H.E.; Gennings, C.; Epstein, S.K. Ineffective triggering predicts increased duration
of mechanical ventilation. Crit. Care Med. 2009, 37, 2740–2745.6. Tobin, M.J.; Jubran, A.; Laghi, F. Patient-Ventilator interaction. Am. J. Respir. Crit. Care Med. 2001, 163, 1059–1063. [CrossRef]7. Sassoon, C.S. Triggering of the ventilator in patient-ventilator interactions. Respir. Care 2011, 56, 39–51. [CrossRef] [PubMed]8. Ramirez, I.I.; Arellano, D.H.; Adasme, R.S.; Landeros, J.M.; Salinas, F.A.; Vargas, A.G.; Vasquez, F.J.; Lobos, I.A.; Oyarzun, M.L.;
Restrepo, R.D. Ability of ICU health-care professionals to identify patient-ventilator asynchrony using waveform analysis. Respir.Care 2017, 62, 144–149. [CrossRef] [PubMed]
Sensors 2021, 21, 4149 13 of 14
9. Mulqueeny, Q.; Ceriana, P.; Carlucci, A.; Fanfulla, F.; Delmastro, M.; Nava, S. Automatic detection of ineffective triggering anddouble triggering during mechanical ventilation. Intensive Care Med. 2007, 33, 2014–2018. [CrossRef] [PubMed]
10. De Haro, C.; Ochagavia, A.; López-Aguilar, J.; Fernandez-Gonzalo, S.; Navarra-Ventura, G.; Magrans, R.; Montanyà, J.; Blanch, L.;de Haro, C.; López-Aguilar, J.; et al. Patient-Ventilator asynchronies during mechanical ventilation: Current knowledge andresearch priorities. Intensive Care Med. Exp. 2019, 7, 43. [CrossRef] [PubMed]
11. Georgopoulos, D. Ineffective efforts during mechanical ventilation: The brain wants, the machine declines. Intensive Care Med.2012, 38, 738–740. [CrossRef]
12. Taniguchi, H.; Sato, H.; Shirakawa, T. A machine learning model with human cognitive biases capable of learning from small andbiased datasets. Sci. Rep. 2018, 8, 7397. [CrossRef]
13. Gholami, B.; Phan, T.S.; Haddad, W.M.; Cason, A.; Mullis, J.; Price, L.; Bailey, J.M. Replicating human expertise of mechanicalventilation waveform analysis in detecting patient-ventilator cycling asynchrony using machine learning. Comput. Biol. Med.2018, 97, 137–144. [CrossRef]
14. De Fauw, J.; Ledsam, J.R.; Romera-Paredes, B.; Nikolov, S.; Tomasev, N.; Blackwell, S.; Askham, H.; Glorot, X.; O’Donoghue,B.; Visentin, D. Clinically applicable deep learning for diagnosis and referral in retinal disease. Nat. Med. 2018, 24, 1342–1350.[CrossRef]
15. Hannun, A.Y.; Rajpurkar, P.; Haghpanahi, M.; Tison, G.H.; Bourn, C.; Turakhia, M.P.; Ng, A.Y. Cardiologist-Level arrhythmiadetection and classification in ambulatory electrocardiograms using a deep neural network. Nat. Med. 2019, 25, 65. [CrossRef]
16. Pan, Q.; Zhang, L.; Jia, M.; Pan, J.; Gong, Q.; Lu, Y.; Zhang, Z.; Ge, H.; Fang, L. An interpretable 1D convolutional neural networkfor detecting patient-ventilator asynchrony in mechanical ventilation. Comput. Methods Programs Biomed. 2021, 204, 106057.[CrossRef] [PubMed]
17. Zhang, L.; Mao, K.; Duan, K.; Fang, S.; Lu, Y.; Gong, Q.; Lu, F.; Jiang, Y.; Jiang, L.; Fang, W. Detection of patient-ventilatorasynchrony from mechanical ventilation waveforms using a two-layer long short-term memory neural network. Comput. Biol.Med. 2020, 120, 103721. [CrossRef] [PubMed]
18. Tan, C.; Sun, F.; Kong, T.; Zhang, W.; Yang, C.; Liu, C. A survey on deep transfer learning. In Proceedings of the InternationalConference on Artificial Neural Networks, Rhodes, Greece, 4–7 October 2018.
19. Raghu, S.; Sriraam, N.; Temel, Y.; Rao, S.V.; Kubben, P.L. EEG based multi-class seizure type classification using convolutionalneural network and transfer learning. Neural Netw. 2020, 124, 202–212. [CrossRef] [PubMed]
20. Salem, M.; Taheri, S.; Yuan, J.S. ECG arrhythmia classification using transfer learning from 2-dimensional deep CNN features. InProceedings of the IEEE Biomedical Circuits and Systems Conference (BioCAS), Cleveland, OH, USA, 17–19 October 2018.
21. Kacmarek, R.; Stoller, J.; Heuer, A. Fundamentals of Respiratory Care; Elsevier: St. Louis, MI, USA, 2017; p. 1059.22. Parthasarathy, S.; Jubran, A.; Tobin, M.J. Cycling of inspiratory and expiratory muscle groups with the ventilator in airflow
limitation. Am. J. Respir. Crit. Care Med. 1998, 158, 1471–1478. [CrossRef] [PubMed]23. Tokioka, H.; Tanaka, T.; Ishizu, T.; Fukushima, T.; Iwaki, T.; Nakamura, Y.; Kosogabe, Y. The effect of breath termination criterion
on breathing patterns and the work of breathing during pressure support ventilation. Anesth. Analg. 2001, 92, 161–165. [CrossRef][PubMed]
24. Casagrande, A.; Quintavalle, F.; Fernandez, R.; Blanch, L.; Ferluga, M.; Lena, E.; Fabris, F.; Lucangelo, U. An effective pressure-flow characterization of respiratory asynchronies in mechanical ventilation. J. Clin. Monit. Comput. 2021, 35, 289–296. [CrossRef][PubMed]
25. Srinivasu, P.N.; SivaSai, J.G.; Ijaz, M.F.; Bhoi, A.K.; Kim, W.; Kang, J.J. Classification of skin disease using deep learning neuralnetworks with MobileNet V2 and LSTM. Sensors 2021, 21, 2852. [CrossRef]
26. Krizhevsky, A.; Sutskever, I.; Hinton, G.E. ImageNet classification with deep convolutional neural networks. Commun. ACM 2017,60, 84–90. [CrossRef]
27. Xu, X.; Xie, M.; Miao, P.; Qu, W.; Xiao, W.; Zhang, H.; Liu, X.; Wong, T.-T. Perceptual-aware sketch simplification based onintegrated VGG layers. IEEE Trans. Vis. Comput. Graph. 2019, 27, 178–189. [CrossRef]
28. Szegedy, C.; Ioffe, S.; Vanhoucke, V.; Alemi, A.A. Inception-v4, inception-resnet and the impact of residual connections onlearning. In Proceedings of the 31st AAAI Conference on Artificial Intelligence, San Francisco, CA, USA, 4–9 February 2017.
29. Li, Z.; Wang, S.H.; Fan, R.R.; Cao, G.; Zhang, Y.D.; Guo, T. Teeth category classification via seven-layer deep convolutional neuralnetwork with max pooling and global average pooling. Int. J. Imaging Syst. Technol. 2019, 29, 577–583. [CrossRef]
30. Wang, S.-H.; Hong, J.; Yang, M. Sensorineural hearing loss identification via nine-layer convolutional neural network with batchnormalization and dropout. Multimed. Tools Appl. 2020, 79, 15135–15150. [CrossRef]
31. Sottile, P.D.; Albers, D.; Higgins, C.; Mckeehan, J.; Moss, M. The Association Between Ventilator Dyssynchrony, Delivered TidalVolume, and Sedation Using a Novel Automated Ventilator Dyssynchrony Detection Algorithm. Crit. Care Med. 2018, 46, e151.[CrossRef] [PubMed]
32. Yao, Y.; Rosasco, L.; Caponnetto, A. On early stopping in gradient descent learning. Constr. Approx. 2007, 26, 289–315. [CrossRef]33. Lee, S.; Huh, J.-H.; Kim, Y.J.E. Python TensorFlow Big Data Analysis for the Security of Korean Nuclear Power Plants. Electronics
2020, 9, 1467. [CrossRef]34. Wang, C.; Horby, P.W.; Hayden, F.G.; Gao, G.F. A novel coronavirus outbreak of global health concern. Lancet 2020, 395, 470–473.
[CrossRef]

Sensors 2021, 21, 4149 14 of 14
35. Wang, Y.; Wu, Q.; Dey, N.; Fong, S.; Ashour, A.S. Deep back propagation-long short-term memory network based upper-limbsEMG signal classification for automated rehabilitation. Biocybern. Biomed. Eng. 2020, 40, 987–1001. [CrossRef]
36. Rohmantri, R.; Surantha, N. Arrhythmia Classification using 2D Convolutional Neural Network. Int. J. Adv. Comput. Sci. Appl.2020, 11, 201–208. [CrossRef]
37. Loo, N.; Chiew, Y.; Tan, C.; Arunachalam, G.; Ralib, A.; Mat-Nor, M.-B. A machine learning model for real-time asynchronousberathing monitoring. IFAC Pap. Online 2018, 51, 378–383. [CrossRef]