plasticity requirements of aggregates used in pavement
TRANSCRIPT
CIVIL ENGINEERING STUDIES Illinois Center for Transportation Series No. 18-018
UILU-ENG-2018-2018 ISSN: 0197-9191
PLASTICITY REQUIREMENTS OF
AGGREGATES USED IN PAVEMENT
BASE AND SUBBASE COURSES
Prepared By
Abdolreza Osouli
Associate Professor Southern Illinois University Edwardsville
Erol Tutumluer
Professor University of Illinois at Urbana-Champaign
Brent Vaughn
Laboratory Specialist/Lecturer Southern Illinois University Edwardsville
Research Report No. FHWA-ICT-18-015
A report of the findings of
ICT PROJECT R27-157 Plasticity Requirements of the Aggregates as Subbase, Base,
Surface, and Shoulder Courses
https://doi.org/10.36501/0197-9191/18-018
Illinois Center for Transportation
October 2018

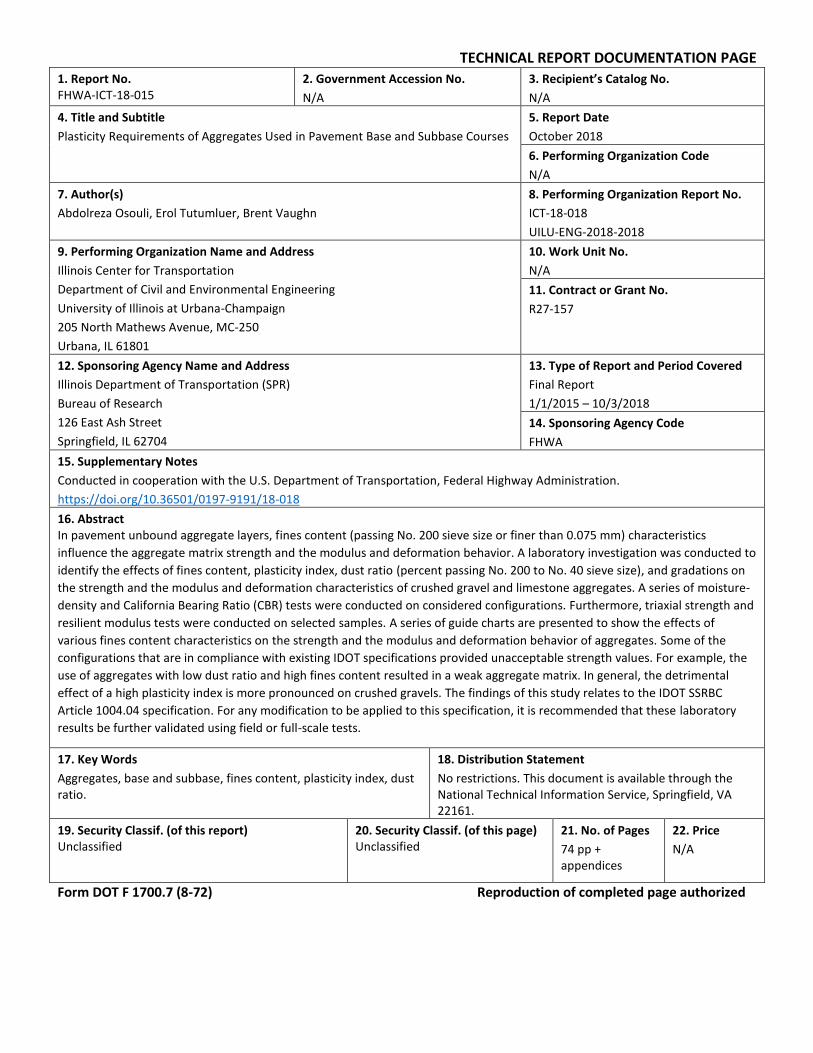
TECHNICAL REPORT DOCUMENTATION PAGE
1. Report No. FHWA-ICT-18-015
2. Government Accession No.
N/A
3. Recipient’s Catalog No.
N/A
4. Title and Subtitle
Plasticity Requirements of Aggregates Used in Pavement Base and Subbase Courses
5. Report Date
October 2018
6. Performing Organization Code
N/A
7. Author(s)
Abdolreza Osouli, Erol Tutumluer, Brent Vaughn
8. Performing Organization Report No.
ICT-18-018
UILU-ENG-2018-2018
9. Performing Organization Name and Address
Illinois Center for Transportation
Department of Civil and Environmental Engineering
University of Illinois at Urbana-Champaign
205 North Mathews Avenue, MC-250
Urbana, IL 61801
10. Work Unit No.
N/A
11. Contract or Grant No.
R27-157
12. Sponsoring Agency Name and Address
Illinois Department of Transportation (SPR)
Bureau of Research
126 East Ash Street
Springfield, IL 62704
13. Type of Report and Period Covered
Final Report
1/1/2015 – 10/3/2018
14. Sponsoring Agency Code
FHWA
15. Supplementary Notes
Conducted in cooperation with the U.S. Department of Transportation, Federal Highway Administration.
https://doi.org/10.36501/0197-9191/18-018
16. Abstract In pavement unbound aggregate layers, fines content (passing No. 200 sieve size or finer than 0.075 mm) characteristics
influence the aggregate matrix strength and the modulus and deformation behavior. A laboratory investigation was conducted to
identify the effects of fines content, plasticity index, dust ratio (percent passing No. 200 to No. 40 sieve size), and gradations on
the strength and the modulus and deformation characteristics of crushed gravel and limestone aggregates. A series of moisture-
density and California Bearing Ratio (CBR) tests were conducted on considered configurations. Furthermore, triaxial strength and
resilient modulus tests were conducted on selected samples. A series of guide charts are presented to show the effects of
various fines content characteristics on the strength and the modulus and deformation behavior of aggregates. Some of the
configurations that are in compliance with existing IDOT specifications provided unacceptable strength values. For example, the
use of aggregates with low dust ratio and high fines content resulted in a weak aggregate matrix. In general, the detrimental
effect of a high plasticity index is more pronounced on crushed gravels. The findings of this study relates to the IDOT SSRBC
Article 1004.04 specification. For any modification to be applied to this specification, it is recommended that these laboratory
results be further validated using field or full-scale tests.
17. Key Words
Aggregates, base and subbase, fines content, plasticity index, dust ratio.
18. Distribution Statement
No restrictions. This document is available through the National Technical Information Service, Springfield, VA 22161.
19. Security Classif. (of this report) Unclassified
20. Security Classif. (of this page) Unclassified
21. No. of Pages
74 pp + appendices
22. Price
N/A
Form DOT F 1700.7 (8-72) Reproduction of completed page authorized

i
ACKNOWLEDGMENT, DISCLAIMER, MANUFACTURERS’ NAMES
This publication is based on the results of ICT-R27-157, Plasticity Requirements of the Aggregates as Subbase, Base, Surface, and Shoulder Courses. ICT-R27-157 was conducted in cooperation with the Illinois Center for Transportation, the Illinois Department of Transportation, and the U.S. Department of Transportation, Federal Highway Administration.
Members of the Technical Review panel were the following:
Heather Shoup (chair), Illinois Department of Transportation
Sheila Beshears (chair) , Illinois Department of Transportation
Chad Arkenberg, Illinois Department of Transportation
Dennis Bachman, Federal Highway Administration
Ryan Culton, Illinois Department of Transportation
Dean Mentjes, Federal Highway Administration
Gary Millhoff, Illinois Department of Transportation
Edward Bartholomew, Lehigh-Hanson
Dell Revees, Illinois Department of Transportation
James Stewart, Illinois Department of Transportation
Sean Stutler, Illinois Department of Transportation
Tom Weck, Illinois Department of Transportation
The contents of this report reflect the view of the author(s), who is (are) responsible for the facts and the accuracy of the data presented herein. The contents do not necessarily reflect the official views or policies of the Illinois Center for Transportation, the Illinois Department of Transportation, or the Federal Highway Administration. This report does not constitute a standard, specification, or regulation.
Trademark or manufacturers’ names appear in this report only because they are considered essential to the object of this document and do not constitute an endorsement of product by the Federal Highway Administration, the Illinois Department of Transportation, or the Illinois Center for Transportation.
The authors would like to acknowledge the Technical Review Panel in this project and especially the chairs, Heather Shoup and Sheila Beshears, for their support, comments, and guidance. The authors would like to thank the Illinois Department of Transportation and Illinois Center for Transportation for facilitating this study. The authors would like to thank many individuals who helped as consultants or provided data to make this study possible. Special thanks go to many students who participated in various aspects of this project. The authors sincerely thank graduate students Sajjad Salam, Goran Othmanawny, and Rabindra Chaulagai for conducting compaction and soaked and unsoaked California Bearing Ratio (CBR), and triaxial tests. The authors would also to thank graduate student Pradip Adhikari for conducting resilient modulus tests and assisting in report preparation. The authors would also like to thank other graduate students (Sudesh Thapa, Andrew Burckhardt) and
ii
undergraduate students (Stefan Flynn, Amanda Fisher, Jacob Lewis, Mathew Eck, Mathew Bay, Raphael Heinzmann, Erich Kopp, Christian Randel) who helped the team in this project with material handling.
iii
EXECUTIVE SUMMARY
The objective of this project was to update the requirements of crushed aggregates in terms of the percentage passing amount and the properties of aggregate fines (i.e. passing the No. 200 sieve size or finer than 0.075 mm) in pavement unbound base and subbase applications. The R27-157 project focused on laboratory tests to determine the effects of fines content, plasticity index, dust ratio (percent passing No. 200 to 40 sieve size), gradations, and the material type on moisture-density relationships. Laboratory tests were also used to determine the strength and the modulus and deformation characteristics of aggregates.
Two commonly used Coarse Aggregate (CA) 2 and CA 6 gradations of crushed limestone as well as a CA 6 gradation of crushed gravel were utilized. Then, for each material, samples with three different fines content (FC) (i.e., 5%, 8%, and 12%), three plasticity indices (PI) (i.e., 5%, 9%, and 13%), and three dust ratios (DR) (i.e., 0.4, 0.6, and 1) were considered. This resulted in 27 configurations for each of CA 6 crushed limestone, CA 2 crushed limestone, and CA 6 crushed gravel materials. For each configuration, four to five samples were prepared to identify moisture-density relations and compaction curves. Soaked and unsoaked CBR tests were conducted on the compacted samples. On selected samples, staged triaxial tests and resilient modulus tests were also performed.
The soaked CBR tests on CA 6 crushed limestone showed that among all examined index properties, fines content has the most dominant effect on aggregate strength characteristics. For PIs of 5% and 9%, an increase in fines content decreases the strength. Increases of PI to 13% and Liquid Limit (LL) to above 30% have limited effects on the strength of aggregates. The significance of dust ratio depends on the fines content. For example, samples engineered with DR of 1.0 had somewhat lower CBRs than those for other DR values, when fines content was 5%. Samples engineered with DR of 0.4 and 1.0 resulted in the lowest and highest average soaked CBR values, respectively, when fines content was 12%. The effect of the higher PI was minor at all fines contents.
The soaked CBR tests on CA 2 crushed limestone showed that among all examined index properties, fines content and dust ratio have the most dominant effect on the strength characteristics of aggregates. For PIs of 5% and 9%, an increase in fines content increases the strength. For the PI of 13%, the increase of fines content does not show any effect on strength. The appropriate dust ratio depends on the fines content. For example, samples engineered with a DR of 1.0 had somewhat lower CBRs than other DR values, when fines content was 5%. Samples engineered with a DR of 1.0 resulted in high average soaked CBR, when fines content was 12%. The effect of higher PI was trivial at fines content of 5% and 8% while it was significant in samples with 12% fines content.
The soaked CBR tests on CA 6 crushed gravel showed that fines content is the dominant index property influencing the strength of crushed gravel. For PIs of 5% and 9%, an increase in fines content decreases the strength. An increase of PI to 13% and LL to above 30% have limited effects on the strength of aggregates. The effect of dust ratio depends on the fines content. For example, at 5% FC, an increase in the dust ratio to 1.0 has almost negligible effect on the strength. However, at 8% and 12% FC, soaked CBR increases with the increase in the dust ratio. The effect of a higher PI was trivial at fines content 5% and 8% while it was significant in samples with 12% fines content.
iv
A series of guide charts were provided to help IDOT to identify the effect of using any other configurations that were not used in this study on strength. It is concluded from these charts that the use of a DR of 0.4 with an FC of 12% show weak strength performance. The comparison of soaked and unsoaked CBRs show that the unsoaked CBR for both materials were higher than their soaked CBR values, it is particularly more pronounced for samples with a 12% FC. A prediction model was provided to convert the commonly conducted unsoaked CBR test values to soaked CBR.
The resilient modulus tests showed that permanent deformation increased and the resilient modulus decreased when the DR increased from 0.4 to 0.6 to 1.0 at a PI of 5%. The negative effect of the PI on the resilient modulus results is low in CA 6 and CA 2 crushed limestone, but excessively high in CA 6 crushed gravel. In general, samples with an FC of 8% have higher resilient moduli and lower permanent deformations compared to an FC 5%. Resilient modulus values were found to decrease and the permanent deformation value was found to increase when FC increased from 5% to 12%. It was also concluded that a sample with a DR of 1.0 will have a higher resilient modulus and a lower permanent deformation at the end of sequence 15 compared to other DRs. With the use of the test results, prediction models for determining the resilient modulus and the permanent deformation are proposed.
Finally, the results of this study may influence the Article 1004.04 IDOT SSRBC specification on aggregates for base and subbase applications. It is important to note that the results of this report are primarily based on laboratory tests and were not tested in the field. It is highly recommended that the findings of this research are validated in the field through full-scale accelerated pavement testing before making revisions to this IDOT specification.
v
CONTENTS
CHAPTER 1: INTRODUCTION ................................................................................................ 1
1.1 OVERVIEW AND PROBLEM STATEMENT ..........................................................................1
1.2 RESEARCH OBJECTIVES ..................................................................................................2
1.3 RESEARCH METHODOLOGY ............................................................................................2
1.4 REPORT ORGANIZATION ................................................................................................3
CHAPTER 2: LITERATURE REVIEW ......................................................................................... 4
2.1 INFLUENCING FACTORS IN STRENGTH OF UNBOUND AGGREGATES .................................4
2.2 CRITERIA OF INDEX PROPERTIES BY DIFFERENT DOTS AND STANDARDS ..........................5
CHAPTER 3: MATERIAL AND TEST PLAN ................................................................................ 7
3.1 MATERIAL ......................................................................................................................7
3.2 TEST MATRIX ..................................................................................................................9
3.3 LABORATORY TESTS ..................................................................................................... 11
3.3.1 Atterberg Tests ………………………………………………………………………………………………………….11
3.3.2 Soaked and Unsoaked CBR..…………………………………………………………………………………………11
3.3.3 Undrained Unconsolidated Triaxial Test..………………………………………………………………………12
3.3.4 Resilient Modulus Tests………………………………………………………………………………………………12
CHAPTER 4: MOISTURE DENSITY RELATIONSHIPS ............................................................... 13
CHAPTER 5: SOAKED CBR TEST RESULTS ............................................................................. 17
5.1 SOAKED STRENGTH OF CA 6 LIMESTONE ....................................................................... 17
5.2 SOAKED STRENGTH OF CA 6 GRAVEL ............................................................................ 19
5.3 SOAKED STRENGTH OF CA 2 LIMESTONE ....................................................................... 21
5.4 SOAKED STRENGTH OF CA 6 AND CA 2 CRUSHED LIMESTONE ........................................ 23
5.5 SOAKED STRENGTH OF CA 6 CRUSHED GRAVEL AND CA 6 CRUSHED LIMESTONE ........... 28
5.6 PROPOSED STRENGTH ZONES FOR CA 6 CRUSHED GRAVEL, CA 6 CRUSHED LIMESTONE
AND CA 2 CRUSHED LIMESTONE ................................................................................... 32
CHAPTER 6: UNSOAKED CBR TEST RESULTS ........................................................................ 37
6.1 UNSOAKED CBR ............................................................................................................ 37
vi
6.2 SOAKED AND UNSOAKED CBR RESULTS (CA 6 CRUSHED LIMESTONE AND CA 6 CRUSHED
GRAVEL) ....................................................................................................................... 37
6.3 SOAKED CBR PREDICTION MODEL FOR CRUSHED LIMESTONE AND GRAVEL .................. 41
6.4 STRENGTH ZONES BASED ON SOAKED AND UNSOAKED CBR ......................................... 42
CHAPTER 7: ANALYSIS OF TRIAXIAL TEST DATA .................................................................. 44
7.1 STRENGTH ZONES BASED ON SOAKED AND UNSOAKED CBR ......................................... 44
7.2 STAGED TRIAXIAL TEST ON CA 6 CRUSHED GRAVEL ....................................................... 46
7.3 STAGED TRIAXIAL TEST ON CA 2 CRUSHED LIMESTONE ................................................. 48
CHAPTER 8: RESILIENT MODULUS TEST RESULTS ................................................................ 50
8.1 PERMANENT DEFORMATION AND RESILIENT MODULUS ............................................... 50
8.1.1 Crushed Limestone CA 6 …………………………………………………………………………………………….50
8.1.2 Crushed Gravel CA 6 ………………………………………………………………………………………………….53
8.1.3 Crushed Limestone CA 2 …………………………………………………………………………………………….55
8.1.4 Permanent Deformation and Resilient Modulus of Crushed Limestone CA 6 and Crushed
Gravel CA 6………………………………………………………………………………………………………………..58
8.1.5 Permanent Deformation and Resilient Modulus of Crushed Limestone CA 6 and Crushed
Limestone CA 2…………………………………………………………………………………………………………..59
8.2 COMPARISON OF RESILIENT MODULUS AND PERMANENT DEFORMATION TEST RESULTS
..................................................................................................................................... 60
8.3 PREDICTION OF PERMANENT DEFORMATION AND RESILIENT MODULUS ...................... 63
CHAPTER 9: CONCLUSION AND RECOMMENDATION .......................................................... 68
REFERENCES ...................................................................................................................... 70
APPENDIX ......................................................................................................................... 75
A-1 AGGREGATE FINES CONTENT REQUIREMENTS OF VARIOUS STATES AND STANDARDS . 75
A-2 ILLINOIS AGGREGATE STRENGTH QC METHOD IN REGARDS TO FINES CONTENT .......... 76
A-3 ATTERBERG LIMITS DETERMINATIONS ......................................................................... 78
A-4 MOISTURE-DENSITY AND CBR FOR SOAKED AND UNSOAKED AGGREGATE SAMPLES … 81
vii
A-5 TRIAXIAL TESTS RESULTS .............................................................................................. 86
A-6 PERMANENT DEFORMATION AND RESILIENT MODULUS PLOTS IN US UNITS ............... 88

1
CHAPTER 1: INTRODUCTION
1.1 OVERVIEW AND PROBLEM STATEMENT
Coarse aggregates are essential geomaterials used in the construction of flexible and rigid pavements. They are primarily used as a subgrade replacement over soft soils. They are also used as dense-graded and open-graded granular subbase and aggregate base layers in highway applications. The well-compacted and stable subgrade, subbase, and base layers are vital to help ensure the longevity and performance of the pavement.
Typical coarse aggregates used in Illinois are gravel obtained from either gravel pits (or dredged from riverbeds) or crushed stone that are quarried from limestone, dolomite and massive metamorphic quartzite rocks. Per Section 1004 of IDOT Standard Specifications for Road and Bridge Construction (SSRBC) (IDOT SSRBC [1]), there are other coarse aggregate types that can be used for IDOT applications such as crushed concrete, crushed slag, and crushed sandstone. According to this standard, the coarse aggregates shall be Class D Quality or better; and if the material lacks required fines content, a fine aggregate of Class C quality or better shall be used. All IDOT SSRBC specified coarse aggregate materials should comply with the plasticity index requirements shown in Appendix A-2. Based on this specification, the plasticity requirement for crushed gravel, crushed stone, and crushed slag may be waived if the ratio of the percent passing the No. 200 (75 μm) sieve to that passing the No. 40 (425 μm) sieve (i.e. dust ratio) is 0.6 or less. Current IDOT specification does not state any requirement related to Liquid Limit (LL) and the sand equivalent index. It is noteworthy that the percent passing the No. 200 sieve size is referred to as fines content throughout this report.
AASHTO and ASTM standards have both set different requirements for the subgrade, subbase and base coarse aggregates (ASTM D2940/D2940M-09, AASHTO M147). Some states have followed the requirements determined by AASHTO, ASTM, or established different criteria to control the plasticity indices of coarse aggregate materials (See Appendix A-1).
The stability of coarse aggregate mixtures depends on the particle size distribution, the moisture content, the particle characterization (such as shape, angularity, and texture), the relative density, the strength properties of coarse aggregates, and particularly, the proportion of fines to the coarse fraction and their plasticity. Therefore, limiting the fines content percentages alone would not be sufficient to ensure quality performance.
For developing specifications, Hogtentogler and Wills (1936) were the first to suggest upper limits to be established for the plasticity index and liquid limit for a base course material. Their study was the basis for AASHTO to adopt the specifications related to the plasticity of coarse aggregates. Consequently, most departments of transportation (DOTs) widely enforced that the plasticity index and the liquid limits of the minus No. 40 sieve fraction of the mix had to be less than 6% and 25%, respectively.
The specified plasticity requirements in most specifications are not often supported by published results and are possibly addressing the performance aspects of coarse aggregates in frost susceptible
2
areas (Faiz 1971). Consequently, these limits are often restrictive in nature. In general, the minus No. 200 sieve affects all of the dry density, strength, and permeability characteristics of the granular base whereas the plasticity of the fines primarily influences the strength characteristics.
There are multiple reports and guidelines on the plasticity requirements on aggregates in various states. However, the need for research stems from the lack of knowledge in determining which specification would best satisfy IDOT’s performance requirements.
1.2 RESEARCH OBJECTIVES
This research aims to identify the effects of fines content, dust ratio, and plasticity index on the moisture-density relationship and the strength of crushed limestone and crushed gravel aggregates used for base and subbase layers by the evaluation of soaked California Bearing Ratio (CBR) and limited triaxial test results. In addition, this research aims to develop the required knowledge for IDOT so that the related sections of IDOT SSRBC can be properly modified.
1.3 RESEARCH METHODOLOGY
The original work plan for this research project involved four different tasks. However, modifications were made later in the research process to add resilient modulus tests and unsoaked CBR strength evaluations. The report presents the findings from laboratory tests on two different aggregate materials (i.e., crushed limestone and crushed gravel) selected for this research. Brief descriptions on the scopes of individual tasks are presented below according to the modified work plan.
I. Task 1: Literature review on the plasticity requirements of coarse aggregates. Comprehensive literature for current plasticity requirements of aggregates by various states were reviewed. In addition, the material specification manuals of various counties and states were evaluated. The basis for standard specification of the percentages and Atterberg limits of the fines content was studied.
II. Task 2: Investigate the effect of index properties on aggregate behavior using lab testing.
For laboratory testing purposes, Illinois coarse aggregate material was collected and characterized. A series of Standard Proctor compaction, soaked and unsoaked CBR tests was conducted to evaluate the effect of the dust ratio (i.e. percent passing No. 200 sieve to percent passing No. 40 sieve), the plasticity index and the liquid limit of the fines. The tests also analyzed the amount of fines content, the gradation of aggregates, and the type of aggregates on the performance of coarse aggregates as granular subbase, stabilized subbase, and aggregate base, surface, and shoulder courses. In addition, a series of staged triaxial tests and resilient modulus tests were conducted.
III. Task 3: Develop a summary of findings and recommendation on the index properties of aggregates.
3
The recommendations were developed based on the test results conducted in Task 2, input from a Technical Review Panel (TRP), and external reviews. The test results were summarized to help with potential modification of Section 1004 of IDOT SSRBC. It is worth noting that the recommendations for all tests except the resilient modulus tests provide insight on the performance of aggregates as base/subbase material under static loading. Further field validations of outcomes under traffic loads are recommended.
IV. Task 4: Final Report Development
Based on the work in previous tasks a final report was prepared which included all research findings. According to test results, recommendations were made in terms of combination effects of plasticity indices, dust ratio, and fines content for two aggregate gradations.
1.4 REPORT ORGANIZATION
Chapter 2 contains a literature review on major aggregate properties affecting the strength and deformation behavior. The scientific research plan of this study as well as detailed information about aggregate particle size distribution (Gradation) are presented in Chapter 3. Compaction test results on the studied aggregates are presented in Chapter 4. Soaked CBR test results and the effects of aggregate index properties on unbound aggregate strength is discussed in Chapter 5. Chapter 6 summarizes the unsoaked CBR test results and their correlations with the soaked CBR test results. The analyses of staged triaxial tests together with the interpretation of the significant trends identified in the aggregate strength and deformation behavior are described in Chapter 7. The resilient modulus tests results and the influence of repeated loading is discussed in Chapter 8. Finally, the major findings of the research study are provided in Chapter 9. Based on the laboratory test results, some guides regarding plasticity index, fines content and dust ratio are recommended in base and subbase applications.
4
CHAPTER 2: LITERATURE REVIEW
2.1 INFLUENCING FACTORS IN STRENGTH OF UNBOUND AGGREGATES
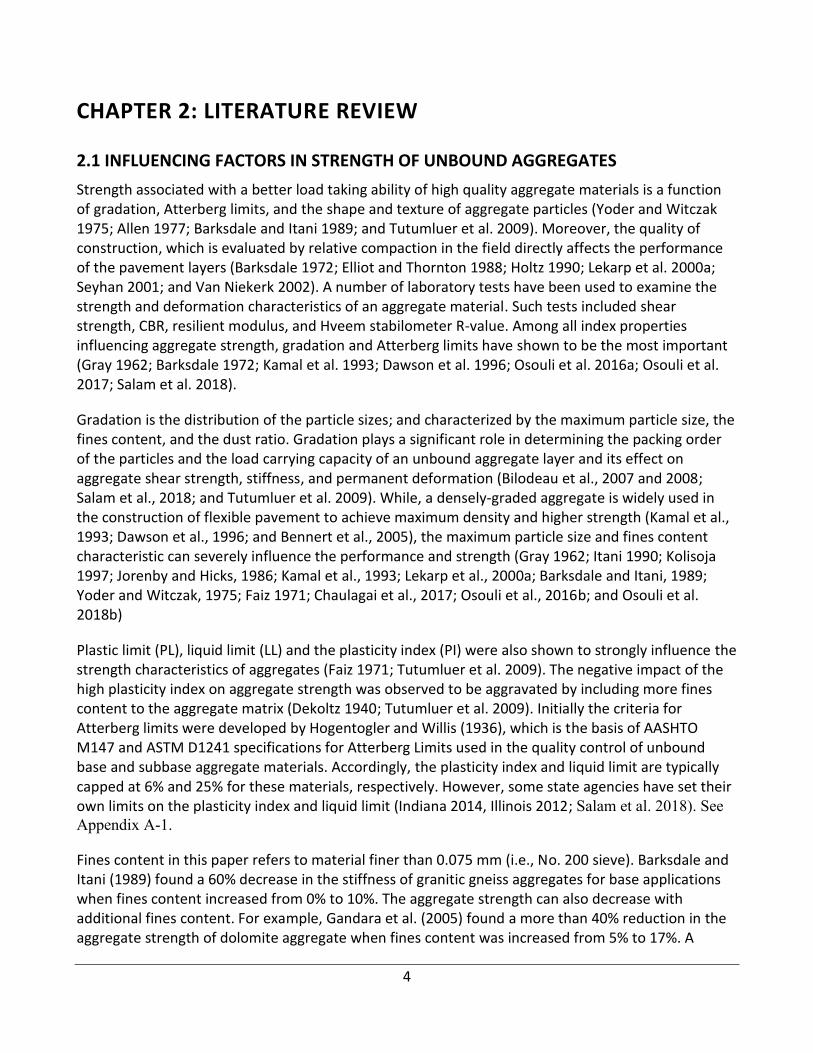
Strength associated with a better load taking ability of high quality aggregate materials is a function of gradation, Atterberg limits, and the shape and texture of aggregate particles (Yoder and Witczak 1975; Allen 1977; Barksdale and Itani 1989; and Tutumluer et al. 2009). Moreover, the quality of construction, which is evaluated by relative compaction in the field directly affects the performance of the pavement layers (Barksdale 1972; Elliot and Thornton 1988; Holtz 1990; Lekarp et al. 2000a; Seyhan 2001; and Van Niekerk 2002). A number of laboratory tests have been used to examine the strength and deformation characteristics of an aggregate material. Such tests included shear strength, CBR, resilient modulus, and Hveem stabilometer R-value. Among all index properties influencing aggregate strength, gradation and Atterberg limits have shown to be the most important (Gray 1962; Barksdale 1972; Kamal et al. 1993; Dawson et al. 1996; Osouli et al. 2016a; Osouli et al. 2017; Salam et al. 2018).
Gradation is the distribution of the particle sizes; and characterized by the maximum particle size, the fines content, and the dust ratio. Gradation plays a significant role in determining the packing order of the particles and the load carrying capacity of an unbound aggregate layer and its effect on aggregate shear strength, stiffness, and permanent deformation (Bilodeau et al., 2007 and 2008; Salam et al., 2018; and Tutumluer et al. 2009). While, a densely-graded aggregate is widely used in the construction of flexible pavement to achieve maximum density and higher strength (Kamal et al., 1993; Dawson et al., 1996; and Bennert et al., 2005), the maximum particle size and fines content characteristic can severely influence the performance and strength (Gray 1962; Itani 1990; Kolisoja 1997; Jorenby and Hicks, 1986; Kamal et al., 1993; Lekarp et al., 2000a; Barksdale and Itani, 1989; Yoder and Witczak, 1975; Faiz 1971; Chaulagai et al., 2017; Osouli et al., 2016b; and Osouli et al. 2018b)
Plastic limit (PL), liquid limit (LL) and the plasticity index (PI) were also shown to strongly influence the strength characteristics of aggregates (Faiz 1971; Tutumluer et al. 2009). The negative impact of the high plasticity index on aggregate strength was observed to be aggravated by including more fines content to the aggregate matrix (Dekoltz 1940; Tutumluer et al. 2009). Initially the criteria for Atterberg limits were developed by Hogentogler and Willis (1936), which is the basis of AASHTO M147 and ASTM D1241 specifications for Atterberg Limits used in the quality control of unbound base and subbase aggregate materials. Accordingly, the plasticity index and liquid limit are typically capped at 6% and 25% for these materials, respectively. However, some state agencies have set their own limits on the plasticity index and liquid limit (Indiana 2014, Illinois 2012; Salam et al. 2018). See
Appendix A-1.
Fines content in this paper refers to material finer than 0.075 mm (i.e., No. 200 sieve). Barksdale and Itani (1989) found a 60% decrease in the stiffness of granitic gneiss aggregates for base applications when fines content increased from 0% to 10%. The aggregate strength can also decrease with additional fines content. For example, Gandara et al. (2005) found a more than 40% reduction in the aggregate strength of dolomite aggregate when fines content was increased from 5% to 17%. A
5
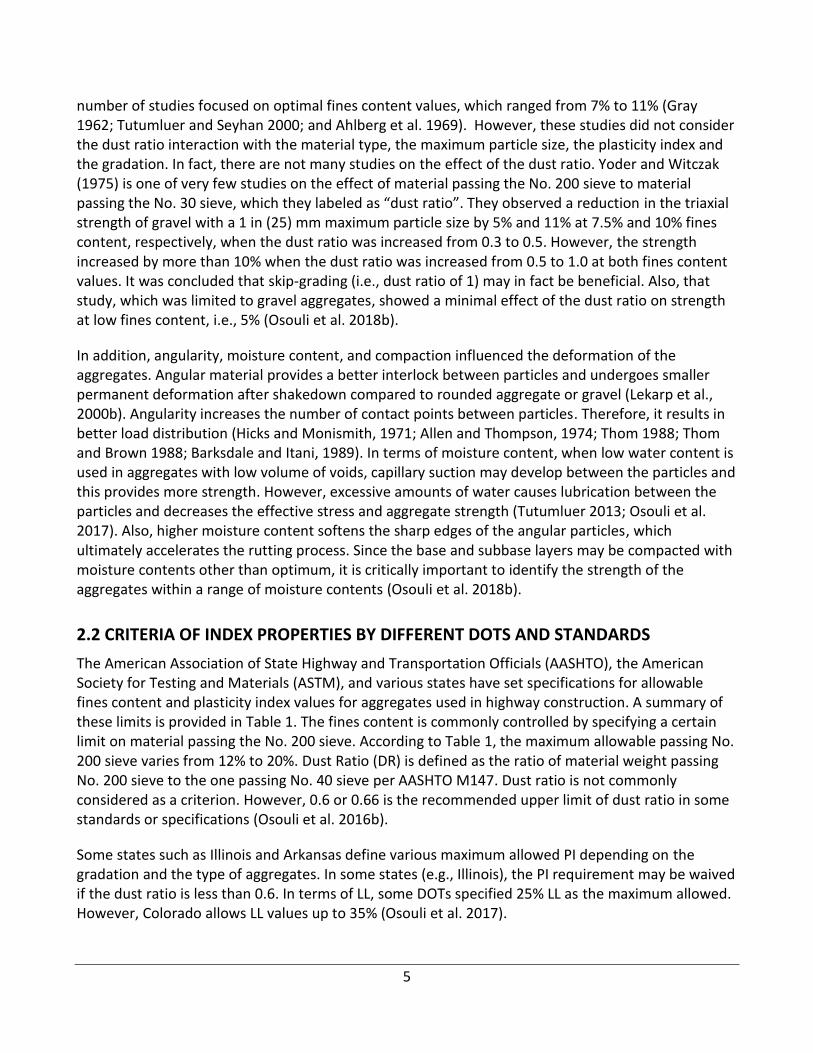
number of studies focused on optimal fines content values, which ranged from 7% to 11% (Gray 1962; Tutumluer and Seyhan 2000; and Ahlberg et al. 1969). However, these studies did not consider the dust ratio interaction with the material type, the maximum particle size, the plasticity index and the gradation. In fact, there are not many studies on the effect of the dust ratio. Yoder and Witczak (1975) is one of very few studies on the effect of material passing the No. 200 sieve to material passing the No. 30 sieve, which they labeled as “dust ratio”. They observed a reduction in the triaxial strength of gravel with a 1 in (25) mm maximum particle size by 5% and 11% at 7.5% and 10% fines content, respectively, when the dust ratio was increased from 0.3 to 0.5. However, the strength increased by more than 10% when the dust ratio was increased from 0.5 to 1.0 at both fines content values. It was concluded that skip-grading (i.e., dust ratio of 1) may in fact be beneficial. Also, that study, which was limited to gravel aggregates, showed a minimal effect of the dust ratio on strength at low fines content, i.e., 5% (Osouli et al. 2018b).
In addition, angularity, moisture content, and compaction influenced the deformation of the aggregates. Angular material provides a better interlock between particles and undergoes smaller permanent deformation after shakedown compared to rounded aggregate or gravel (Lekarp et al., 2000b). Angularity increases the number of contact points between particles. Therefore, it results in better load distribution (Hicks and Monismith, 1971; Allen and Thompson, 1974; Thom 1988; Thom and Brown 1988; Barksdale and Itani, 1989). In terms of moisture content, when low water content is used in aggregates with low volume of voids, capillary suction may develop between the particles and this provides more strength. However, excessive amounts of water causes lubrication between the particles and decreases the effective stress and aggregate strength (Tutumluer 2013; Osouli et al. 2017). Also, higher moisture content softens the sharp edges of the angular particles, which ultimately accelerates the rutting process. Since the base and subbase layers may be compacted with moisture contents other than optimum, it is critically important to identify the strength of the aggregates within a range of moisture contents (Osouli et al. 2018b).
2.2 CRITERIA OF INDEX PROPERTIES BY DIFFERENT DOTS AND STANDARDS
The American Association of State Highway and Transportation Officials (AASHTO), the American Society for Testing and Materials (ASTM), and various states have set specifications for allowable fines content and plasticity index values for aggregates used in highway construction. A summary of these limits is provided in Table 1. The fines content is commonly controlled by specifying a certain limit on material passing the No. 200 sieve. According to Table 1, the maximum allowable passing No. 200 sieve varies from 12% to 20%. Dust Ratio (DR) is defined as the ratio of material weight passing No. 200 sieve to the one passing No. 40 sieve per AASHTO M147. Dust ratio is not commonly considered as a criterion. However, 0.6 or 0.66 is the recommended upper limit of dust ratio in some standards or specifications (Osouli et al. 2016b).
Some states such as Illinois and Arkansas define various maximum allowed PI depending on the gradation and the type of aggregates. In some states (e.g., Illinois), the PI requirement may be waived if the dust ratio is less than 0.6. In terms of LL, some DOTs specified 25% LL as the maximum allowed. However, Colorado allows LL values up to 35% (Osouli et al. 2017).
6
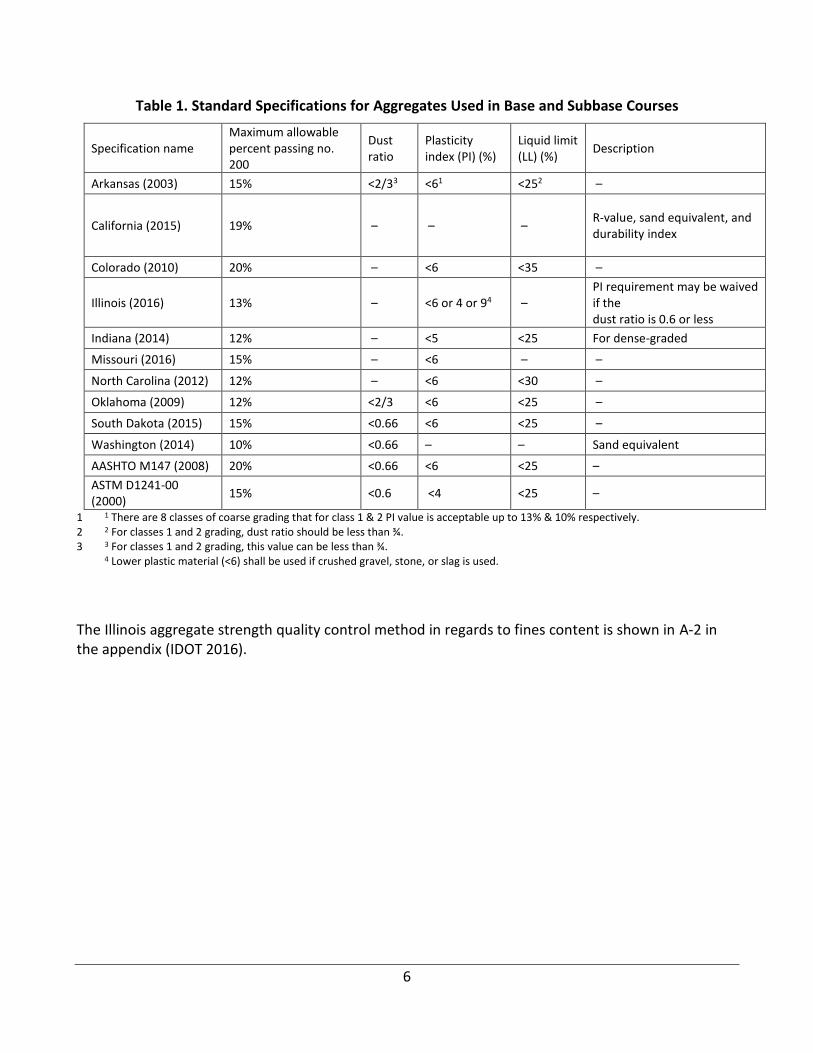
Table 1. Standard Specifications for Aggregates Used in Base and Subbase Courses
Specification name Maximum allowable percent passing no. 200
Dust ratio
Plasticity index (PI) (%)
Liquid limit (LL) (%)
Description
Arkansas (2003) 15% <2/33 <61 <252 –
California (2015) 19% – – – R-value, sand equivalent, and durability index
Colorado (2010) 20% – <6 <35 –
Illinois (2016) 13% – <6 or 4 or 94 – PI requirement may be waived if the dust ratio is 0.6 or less
Indiana (2014) 12% – <5 <25 For dense-graded
Missouri (2016) 15% – <6 – –
North Carolina (2012) 12% – <6 <30 –
Oklahoma (2009) 12% <2/3 <6 <25 –
South Dakota (2015) 15% <0.66 <6 <25 –
Washington (2014) 10% <0.66 – – Sand equivalent
AASHTO M147 (2008) 20% <0.66 <6 <25 –
ASTM D1241-00 (2000)
15% <0.6 <4 <25 –
1 1 There are 8 classes of coarse grading that for class 1 & 2 PI value is acceptable up to 13% & 10% respectively. 2 2 For classes 1 and 2 grading, dust ratio should be less than ¾. 3 3 For classes 1 and 2 grading, this value can be less than ¾.
4 Lower plastic material (<6) shall be used if crushed gravel, stone, or slag is used.
The Illinois aggregate strength quality control method in regards to fines content is shown in A-2 in the appendix (IDOT 2016).
7
CHAPTER 3: MATERIAL AND TEST PLAN
This chapter discusses the test matrix that was developed based on the different index properties (i.e., fines content, dust ratios and plasticity index). The limit of index properties were capped in accordance with national standards such as ASTM, AASHTO and U.S. Department of Transportation (USDOT).
3.1 MATERIAL
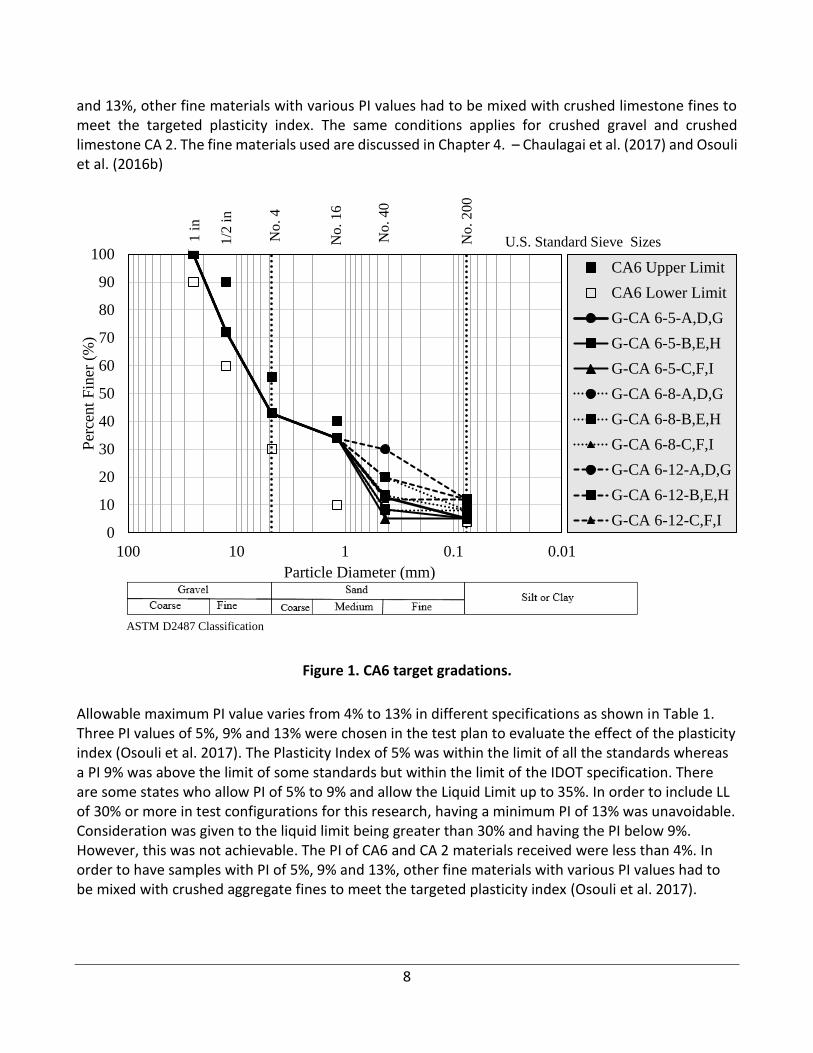
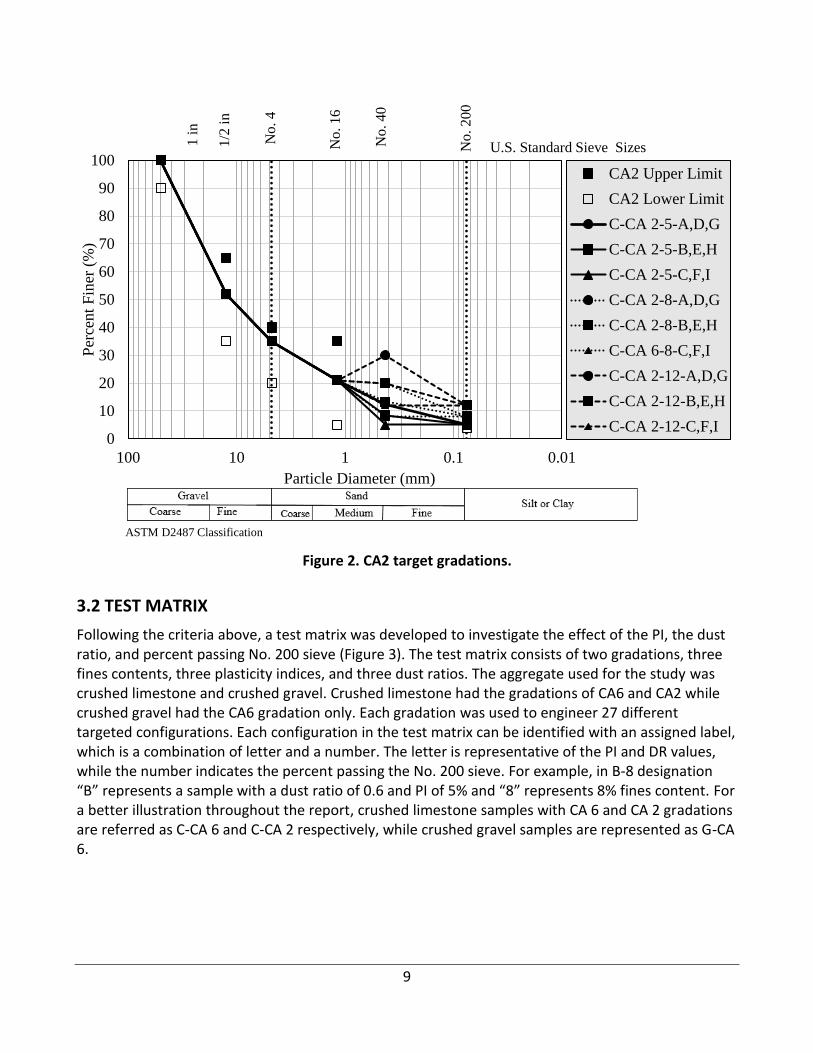
The gradations commonly used for base and subbase layer construction in Illinois are referred to as CA 6 and CA 2 gradations. CA 6 and CA 2 are densely-graded gradations with a maximum particle size of 1 in (25.4 mm) and 2 in (50.8 mm) respectively. The CA 6 and CA 2 gradations allows 4% and 12% passing No. 200 sieve respectively. The upper and lower limits of the two aggregate gradations are shown in Figure 1 and Figure 2. The plasticity index of received material was less than 4%. In the study, fines content of 5% was considered the lower limit and 12% was considered the upper limit. Fines content of 8% was picked as intermediate fines content.
The dust ratio is the proportion of material passing No. 200 and 40 sieves. Dust ratio values of 0.4, 0.6 and 1.0 were targeted so that a broad range of possible dust ratios for unbound aggregate materials would be covered. A dust ratio of 1.0, which exceeds the maximum allowed in many standards and specifications, was included to study the worst case scenario and skip-grading effect.
For both gradations, three different fines contents (i.e., 5%, 8%, 12%) and three different dust ratios (i.e., 0.4, 0.6, 1.0) were considered when engineering the samples. For the CA2 gradation, the combination of a fines content of 12% and a dust ratio of 0.4 was logically impossible. The reason was that the percentage passing the No. 40 sieve had to be greater than percentage passing the No. 16 sieve if the intended gradation was to be within CA 2 gradation limits. Therefore, samples with FC of 12% and DR of 0.4 were not prepared for CA 2 gradations. –Chaulagai et al. (2017)
To prepare samples with various dust ratios and percent passing No. 200 sieve values, different gradations of CA 6 had to be engineered for the material passing No. 40 sieve. However, in all samples, the same gradation for sizes larger than No. 40 sieve was targeted using Talbot’s equation (Talbot and Richart 1923) (Eq. 1):
Percent passing (P) = (dD⁄ )n ∗ 100 (1)
Where ‘d’ is the opening size of sieve and ‘D’ is the maximum particle size, while n is the constant value. The n value can be considered 0.45 to 0.5 to achieve a high density. An n value of 0.5 and 0.45 were adopted for CA 6 and CA 2, respectively. Due to the differences in dust ratios, percent passing the No. 40 sieve was different even for the sample with the same amount of fines content. The percent passing No. 40 sieve is determined by multiplying the targeted dust ratio to targeted percent passing the No. 200 sieve. The crushed aggregate material received from each supplier was washed and then sieved. The target gradations were engineered for each gradation shown in Figure 1 and Figure 2. For example, the crushed limestone material had a PI of less than 4%. In order to have samples with PI of 5%, 9%
8
and 13%, other fine materials with various PI values had to be mixed with crushed limestone fines to meet the targeted plasticity index. The same conditions applies for crushed gravel and crushed limestone CA 2. The fine materials used are discussed in Chapter 4. – Chaulagai et al. (2017) and Osouli et al. (2016b)
Figure 1. CA6 target gradations.
Allowable maximum PI value varies from 4% to 13% in different specifications as shown in Table 1. Three PI values of 5%, 9% and 13% were chosen in the test plan to evaluate the effect of the plasticity index (Osouli et al. 2017). The Plasticity Index of 5% was within the limit of all the standards whereas a PI 9% was above the limit of some standards but within the limit of the IDOT specification. There are some states who allow PI of 5% to 9% and allow the Liquid Limit up to 35%. In order to include LL of 30% or more in test configurations for this research, having a minimum PI of 13% was unavoidable. Consideration was given to the liquid limit being greater than 30% and having the PI below 9%. However, this was not achievable. The PI of CA6 and CA 2 materials received were less than 4%. In order to have samples with PI of 5%, 9% and 13%, other fine materials with various PI values had to be mixed with crushed aggregate fines to meet the targeted plasticity index (Osouli et al. 2017).
0
10
20
30
40
50
60
70
80
90
100
0.010.1110100
Per
cent
Fin
er (
%)
Particle Diameter (mm)
CA6 Upper Limit
CA6 Lower Limit
G-CA 6-5-A,D,G
G-CA 6-5-B,E,H
G-CA 6-5-C,F,I
G-CA 6-8-A,D,G
G-CA 6-8-B,E,H
G-CA 6-8-C,F,I
G-CA 6-12-A,D,G
G-CA 6-12-B,E,H
G-CA 6-12-C,F,I
1in
1/2
in
No
. 4
No
. 1
6
No
. 4
0
No
. 2
00
U.S. Standard Sieve Sizes
ASTM D2487 Classification
9
Figure 2. CA2 target gradations.
3.2 TEST MATRIX
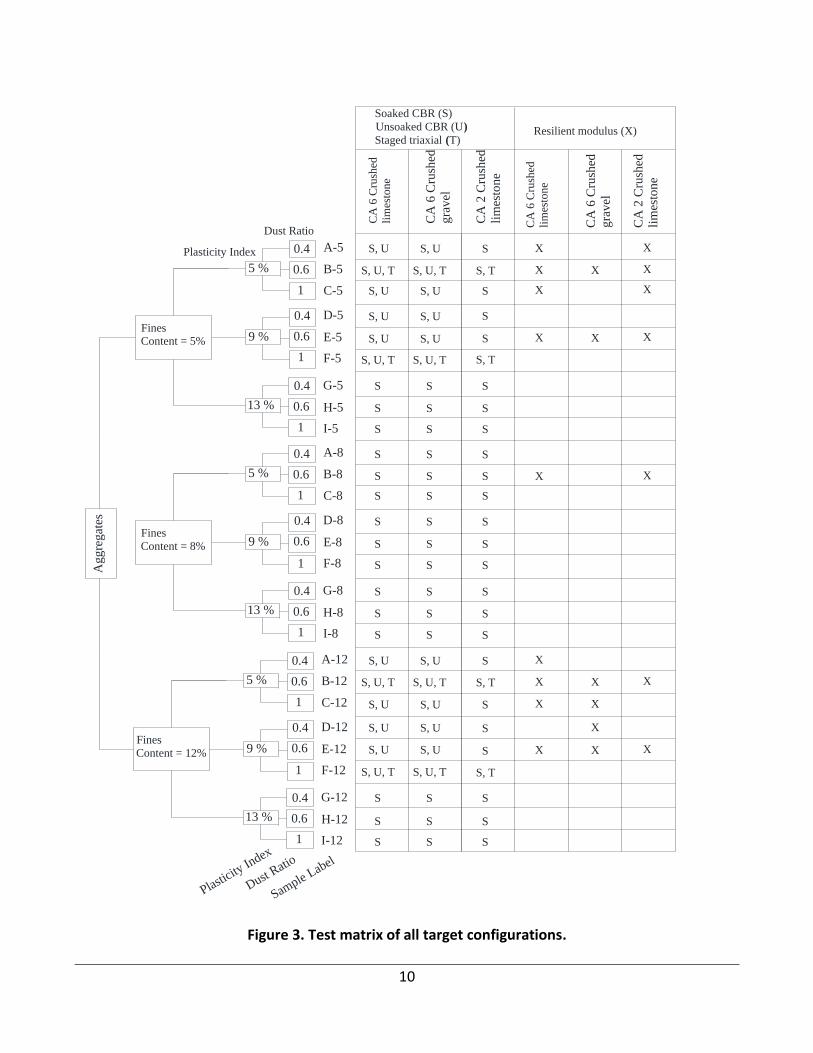
Following the criteria above, a test matrix was developed to investigate the effect of the PI, the dust ratio, and percent passing No. 200 sieve (Figure 3). The test matrix consists of two gradations, three fines contents, three plasticity indices, and three dust ratios. The aggregate used for the study was crushed limestone and crushed gravel. Crushed limestone had the gradations of CA6 and CA2 while crushed gravel had the CA6 gradation only. Each gradation was used to engineer 27 different targeted configurations. Each configuration in the test matrix can be identified with an assigned label, which is a combination of letter and a number. The letter is representative of the PI and DR values, while the number indicates the percent passing the No. 200 sieve. For example, in B-8 designation “B” represents a sample with a dust ratio of 0.6 and PI of 5% and “8” represents 8% fines content. For a better illustration throughout the report, crushed limestone samples with CA 6 and CA 2 gradations are referred as C-CA 6 and C-CA 2 respectively, while crushed gravel samples are represented as G-CA 6.
0
10
20
30
40
50
60
70
80
90
100
0.010.1110100
Per
cent
Fin
er (
%)
Particle Diameter (mm)
CA2 Upper Limit
CA2 Lower Limit
C-CA 2-5-A,D,G
C-CA 2-5-B,E,H
C-CA 2-5-C,F,I
C-CA 2-8-A,D,G
C-CA 2-8-B,E,H
C-CA 6-8-C,F,I
C-CA 2-12-A,D,G
C-CA 2-12-B,E,H
C-CA 2-12-C,F,I
1in
1/2
in
No
. 4
No. 16
No
. 4
0
No
. 2
00
U.S. Standard Sieve Sizes
ASTM D2487 Classification
10
Figure 3. Test matrix of all target configurations.
5 %
I-5
H-5
G-5
F-5
E-5
D-5
C-5
B-5
A-5
0.6
1
0.4
0.6
1
0.4
0.6
1
0.4
9 %
13 %
FinesContent = 5%
5 %
I-8
H-8
G-8
F-8
E-8
D-8
C-8
B-8
A-8
0.6
1
0.4
0.6
0.4
0.6
0.4
9 %
13 %
Fines
Content = 8%
1
5 %
I-12
H-12
G-12
F-12
E-12
D-12
C-12
B-12
A-12
0.6
1
0.4
0.6
0.4
0.6
0.4
9 %
13 %
Fines
Content = 12%
1
1
1
Ag
gre
gat
es
Plasticity
Index
Dust Ratio
Sample Label
Plasticity Index
Dust Ratio
Soaked CBR (S)
Unsoaked CBR (U)
Staged triaxial (T)Resilient modulus (X)
CA
6 C
rush
ed
lim
esto
ne
CA
6 C
rush
ed
gra
vel
CA
2 C
rush
ed
lim
esto
ne
CA
6 C
rush
ed
lim
esto
ne
CA
6 C
rush
ed
gra
vel
CA
2 C
rush
ed
lim
esto
ne
S, U
S, U, T
S, U
S
S
S
S
S
S
S
S
S
S
S
S
S, U
S, U, T
S, U
S
S
S
S, U
S, U
S, U, T
S, U
S, U
S, U, T
S, U
S, U, T
S, U
S
S
S
S
S
S
S
S
S
S
S
S
S, U
S, U, T
S, U
S
S
S
S, U
S, U
S, U, T
S, U
S, U
S, U, T
S
S, T
S
S
S
S, T
S
S
S
S
S
S
S
S
S
S
S
S
S
S, T
S
S
S
S, T
S
S
S
X
X
X
X
X
X
X
X
X
X
X
X
X
X
X
X
X
X
X
X
X
X
11
3.3 LABORATORY TESTS
3.3.1 Atterberg Tests
The Atterberg limit test includes liquid limit (LL) and plastic limit (PL) tests, which are conducted in general accordance with AASHTO T89 and AASHTO T90 standard methods, respectively. Atterberg limit tests were run three times and averaged for each sample to ensure its accuracy. Atterberg limit tests were conducted on a mix of aggregate fines and more plastic fines materials from other resources to obtain the targeted PI.
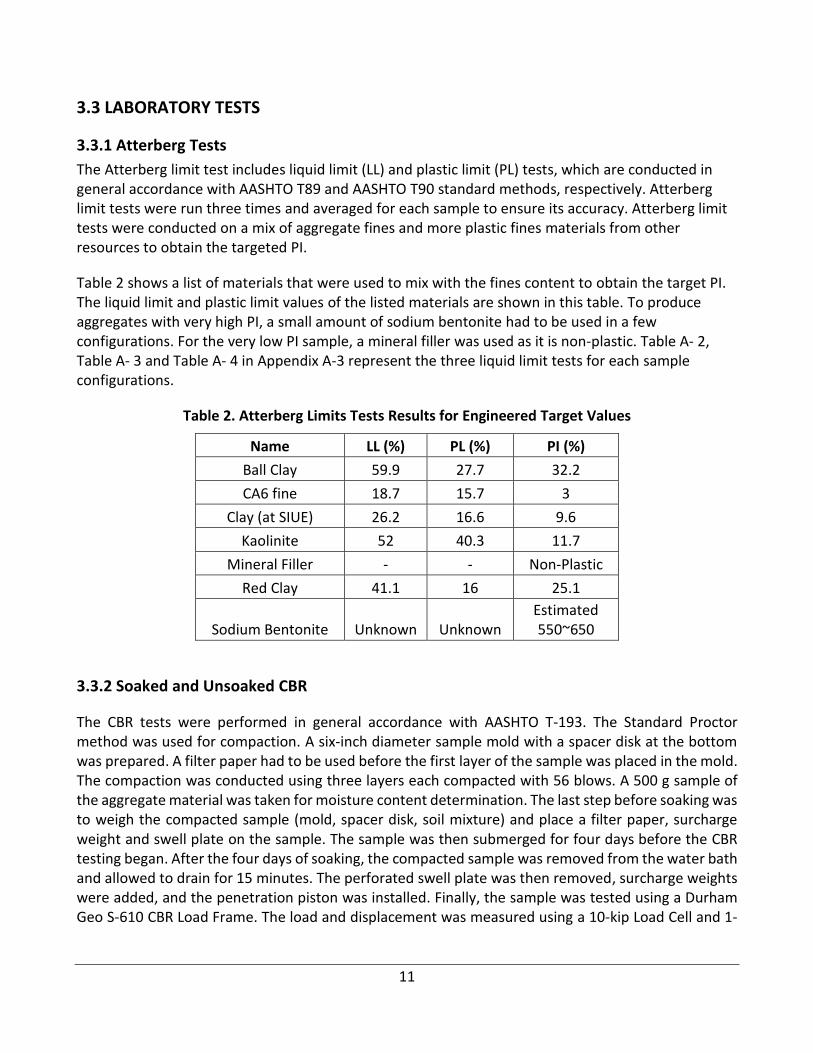
Table 2 shows a list of materials that were used to mix with the fines content to obtain the target PI. The liquid limit and plastic limit values of the listed materials are shown in this table. To produce aggregates with very high PI, a small amount of sodium bentonite had to be used in a few configurations. For the very low PI sample, a mineral filler was used as it is non-plastic. Table A- 2, Table A- 3 and Table A- 4 in Appendix A-3 represent the three liquid limit tests for each sample configurations.
Table 2. Atterberg Limits Tests Results for Engineered Target Values
Name LL (%) PL (%) PI (%)
Ball Clay 59.9 27.7 32.2
CA6 fine 18.7 15.7 3
Clay (at SIUE) 26.2 16.6 9.6
Kaolinite 52 40.3 11.7
Mineral Filler - - Non-Plastic
Red Clay 41.1 16 25.1
Sodium Bentonite Unknown Unknown Estimated 550~650
3.3.2 Soaked and Unsoaked CBR
The CBR tests were performed in general accordance with AASHTO T-193. The Standard Proctor method was used for compaction. A six-inch diameter sample mold with a spacer disk at the bottom was prepared. A filter paper had to be used before the first layer of the sample was placed in the mold. The compaction was conducted using three layers each compacted with 56 blows. A 500 g sample of the aggregate material was taken for moisture content determination. The last step before soaking was to weigh the compacted sample (mold, spacer disk, soil mixture) and place a filter paper, surcharge weight and swell plate on the sample. The sample was then submerged for four days before the CBR testing began. After the four days of soaking, the compacted sample was removed from the water bath and allowed to drain for 15 minutes. The perforated swell plate was then removed, surcharge weights were added, and the penetration piston was installed. Finally, the sample was tested using a Durham Geo S-610 CBR Load Frame. The load and displacement was measured using a 10-kip Load Cell and 1-
12
inch capacity Linear Displacement Transducer (LDT), respectively. For the unsoaked CBR tests, the samples were not submerged in water.
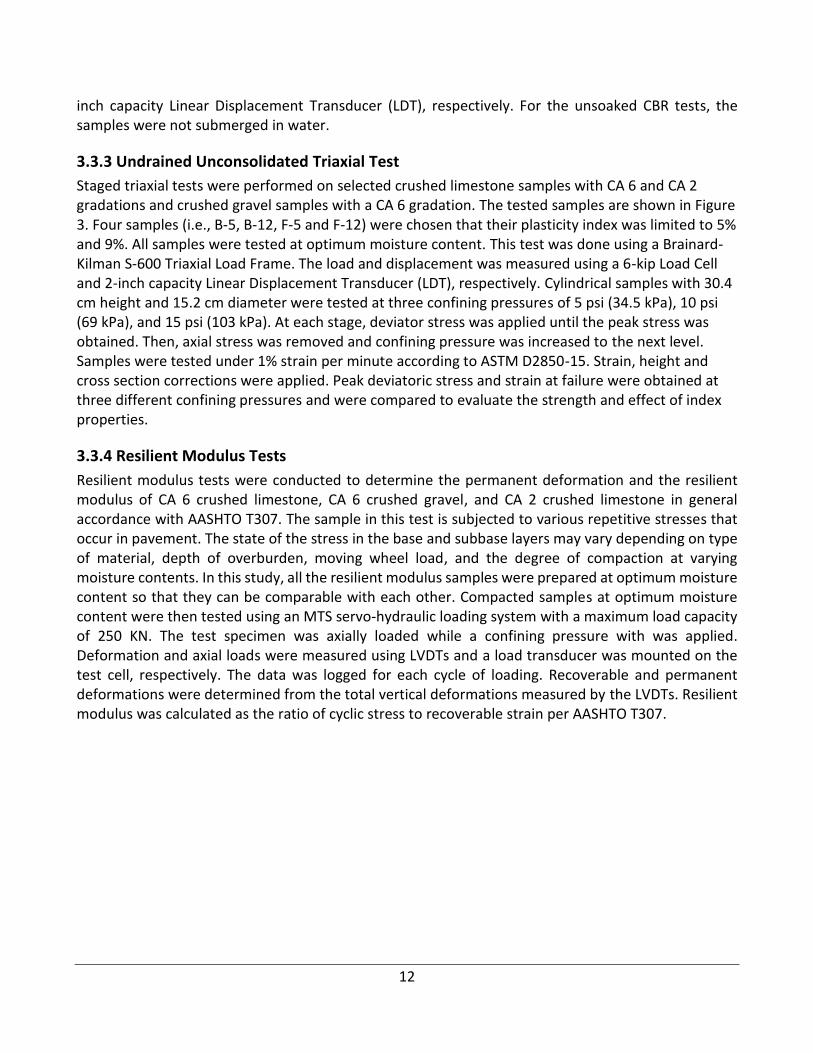
3.3.3 Undrained Unconsolidated Triaxial Test
Staged triaxial tests were performed on selected crushed limestone samples with CA 6 and CA 2 gradations and crushed gravel samples with a CA 6 gradation. The tested samples are shown in Figure 3. Four samples (i.e., B-5, B-12, F-5 and F-12) were chosen that their plasticity index was limited to 5% and 9%. All samples were tested at optimum moisture content. This test was done using a Brainard-Kilman S-600 Triaxial Load Frame. The load and displacement was measured using a 6-kip Load Cell and 2-inch capacity Linear Displacement Transducer (LDT), respectively. Cylindrical samples with 30.4 cm height and 15.2 cm diameter were tested at three confining pressures of 5 psi (34.5 kPa), 10 psi (69 kPa), and 15 psi (103 kPa). At each stage, deviator stress was applied until the peak stress was obtained. Then, axial stress was removed and confining pressure was increased to the next level. Samples were tested under 1% strain per minute according to ASTM D2850-15. Strain, height and cross section corrections were applied. Peak deviatoric stress and strain at failure were obtained at three different confining pressures and were compared to evaluate the strength and effect of index properties.
3.3.4 Resilient Modulus Tests
Resilient modulus tests were conducted to determine the permanent deformation and the resilient modulus of CA 6 crushed limestone, CA 6 crushed gravel, and CA 2 crushed limestone in general accordance with AASHTO T307. The sample in this test is subjected to various repetitive stresses that occur in pavement. The state of the stress in the base and subbase layers may vary depending on type of material, depth of overburden, moving wheel load, and the degree of compaction at varying moisture contents. In this study, all the resilient modulus samples were prepared at optimum moisture content so that they can be comparable with each other. Compacted samples at optimum moisture content were then tested using an MTS servo-hydraulic loading system with a maximum load capacity of 250 KN. The test specimen was axially loaded while a confining pressure with was applied. Deformation and axial loads were measured using LVDTs and a load transducer was mounted on the test cell, respectively. The data was logged for each cycle of loading. Recoverable and permanent deformations were determined from the total vertical deformations measured by the LVDTs. Resilient modulus was calculated as the ratio of cyclic stress to recoverable strain per AASHTO T307.
13
CHAPTER 4: MOISTURE-DENSITY RELATIONSHIP
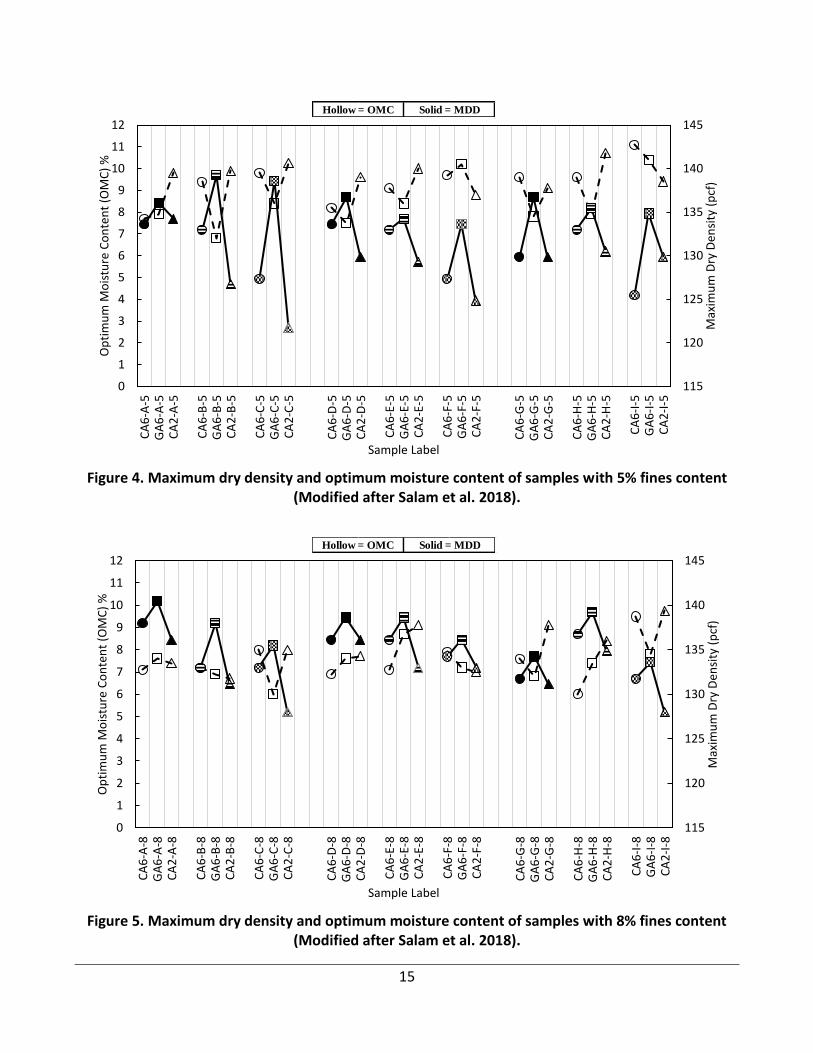
Standard Proctor (AASHTO T99) maximum dry density (MDD) and optimum moisture content (OMC) were obtained within the range of OMC-1.5% to OMC+1.5%. There are a number of properties affecting the MDD and OMC of each tested configuration, among which the effect of fines content has been more pronounced. However, the roles of other index properties such as the maximum particle size, the dust ratio, and the plasticity index for each fines content (i.e. 5%, 8%, and 12%) are also analyzed. Figure 4, Figure 5, and Figure 6 show the moisture-density characteristics of samples with 5%, 8%, and 12% fines, for CA 6 crushed limestone, CA 6 crushed gravel, and CA 2 crushed limestone, respectively. The primary vertical axis shows the optimum moisture content, while the secondary vertical axis indicates maximum dry density. Solid markers were used to present the maximum dry density results, and hollow markers were used to show the optimum moisture content values. Moreover, circles, squares and triangles are symbols used for C-CA 6 and G-CA 6 and C-CA 2, respectively (Salam et al. 2018).
An increase in fines content results in a higher maximum dry density and a reduction in optimum moisture content. The above trend can be observed in Figure 4, Figure 5, and Figure 6. Figure 4 shows the effects of the maximum particle size, the dust ratio, and the plasticity index on moisture-density characteristics of samples with 5% fines content. The most pronounced is the effect of the maximum particle size, which is detectable upon comparing the MDD and OMC of different configurations. Generally, the MDD for CA 6 gradation is higher than that of CA 2 gradation, while the OMC of CA 6 gradation is less than that of CA 2 gradation when PI is 5% and 9%. The MDD of CA 6 gravel was found to be the highest of all three when the fines content is 5%. The MDD becomes less as the dust ratio increases from 0.4 to 1.0 regardless of gradation (i.e. CA 6 and CA 2) when fines content is 5%. It can be concluded that the higher dust ratio results in more voids, and subsequently, lower maximum dry density and higher optimum moisture content.
According to the test results, the samples with PI of 13% (i.e., G, H, I) did not show any significant sensitivity of the MDD to dust ratio. Due to limited fines content in these samples, the PI effect on the MDD was minimal. The maximum dry density of CA 6 limestone configurations with 5% fines content ranges from 124.9 pcf (2 gr/cm3) to 134.2 pcf (2.15 gr/cm3), and CA 6 gravel configurations ranges from 133.6 pcf (2.14 gr/cm3) to 139.2 pcf (2.23 gr/cm3). On the other hand, the range for CA 2 gradation is from 121.7 pcf (1.95 gr/cm3) to 131.1 pcf (2.1 gr/cm3). Furthermore, the optimum moisture content varies from 7.5% to 11.5% for CA 6 limestone, 6.8% to 10.4% for crushed gravel CA 6, and 8.5% to 11% for CA 2 gradations, respectively.
Figure 5 presents the compaction test results for samples with 8% fines. Similar conclusions to the ones for 5% fines content can be derived regarding the maximum particle size and plasticity index. However, the difference in MDD values for CA 2 and CA 6 gradations were less significant compared to aggregates with 5% fines content (see Figure 4). Also, similar to fines content of 5%, the MDD of CA 6 gravel was the highest of all. Therefore, the highest and lowest MDD values are 140.5 pcf (2.25 gr/cm3) and 134.2 pcf (2.15 gr/cm3) respectively for GA 6 group samples, 138.6 pcf (2.22 gr/cm3) and 132.4 pcf (2.12 gr/cm3) for CA 6 limestone group samples, and 136.1 pcf (2.18 gr/cm3) to 128.0 pcf (2.05 gr/cm3) for CA 2 group samples.
14
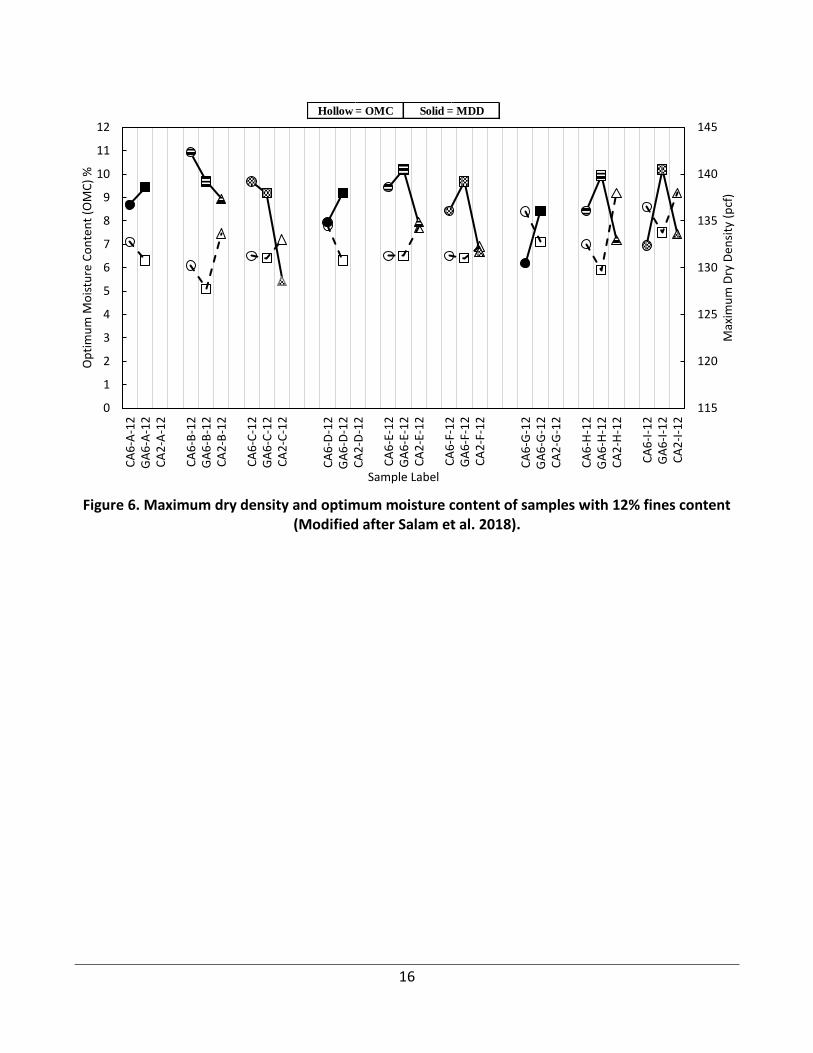
The moisture-density characteristics of samples with 12% fines content are presented in Figure 6. As noted earlier, since samples with a dust ratio of 0.4 and 12% fines content in CA 2 group samples were impossible to create, they were removed from the test matrix and are not shown in Figure 5. The CA 6 gravel has the highest MDD among three materials when PI is 9% and 13%. It appears that same trend from previous figures is observed. However, the difference between the MDD of CA 6 gradations and the CA 2 gradation is more pronounced when the PI is 9% and 13%, compared to what was observed for gradations with 8% fine content (see Figure 5). The range of the OMC decreased for all samples compared to the samples prepared at 5% and 8% fines content. The MDD ranged from 136.1 pcf (2.18 gr/cm3) to 140.5 pcf (2.25 gr/cm3) for G-CA 6 group samples, 130.5 pcf (2.09 gr/cm3) to 142.3 pcf (2.28 gr/cm3) for C-CA 6 group samples, and 128.6 pcf (2.06 gr/cm3) to 137.3 pcf (2.2 gr/cm3) for C-CA 2 group samples. The OMC ranged from 5.1% to 7.5% for G-CA 6, 6.1% to 8.6% for C-CA 6 and 6.9% to 9.2% for C-CA 2 samples.
The CA 2 and CA 6 gradations have less diverse moisture-density characteristics when fines content is 8%. In the case of 5% and 12% fines content, the CA 6 gradations have higher MDD and lower OMC compared to the CA 2 gradation for samples with PIs of 5% and 9%. Mixed results were observed for samples with a PI of 13%, i.e., G, H, and I. The comparison of Figure 4, Figure 5, and Figure 6 shows that the effect of the dust ratio on the moisture-density of samples is a function of fines content. A lower dust ratio (i.e. DR=0.4) leads to a denser sample when fines content is 5%, while a higher dust ratio (i.e. DR=1.0) results in a denser sample when fines content is 12%. Therefore, CA 6 samples with dust ratio of 0.4 have the lowest and highest MDD, when fines content is 12% and 5%, respectively. While variation in the plasticity index resulted in some differences in aggregate moisture-density relationships, its effect was not as pronounced as other factors based on these lab tests.
15
Figure 4. Maximum dry density and optimum moisture content of samples with 5% fines content (Modified after Salam et al. 2018).
Figure 5. Maximum dry density and optimum moisture content of samples with 8% fines content (Modified after Salam et al. 2018).
115
120
125
130
135
140
145
0
1
2
3
4
5
6
7
8
9
10
11
12
CA
6-A
-5G
A6
-A-5
CA
2-A
-5
CA
6-B
-5G
A6
-B-5
CA
2-B
-5
CA
6-C
-5G
A6
-C-5
CA
2-C
-5
CA
6-D
-5G
A6
-D-5
CA
2-D
-5
CA
6-E
-5G
A6
-E-5
CA
2-E
-5
CA
6-F
-5G
A6
-F-5
CA
2-F
-5
CA
6-G
-5G
A6
-G-5
CA
2-G
-5
CA
6-H
-5G
A6
-H-5
CA
2-H
-5
CA
6-I
-5G
A6
-I-5
CA
2-I
-5
Max
imu
m D
ry D
ensi
ty (
pcf
)
Op
tim
um
Mo
istu
re C
on
ten
t (O
MC
) %
Sample Label
Hollow = OMC Solid = MDD
115
120
125
130
135
140
145
0
1
2
3
4
5
6
7
8
9
10
11
12
CA
6-A
-8G
A6
-A-8
CA
2-A
-8
CA
6-B
-8G
A6
-B-8
CA
2-B
-8
CA
6-C
-8G
A6
-C-8
CA
2-C
-8
CA
6-D
-8G
A6
-D-8
CA
2-D
-8
CA
6-E
-8G
A6
-E-8
CA
2-E
-8
CA
6-F
-8G
A6
-F-8
CA
2-F
-8
CA
6-G
-8G
A6
-G-8
CA
2-G
-8
CA
6-H
-8G
A6
-H-8
CA
2-H
-8
CA
6-I
-8G
A6
-I-8
CA
2-I
-8
Max
imu
m D
ry D
ensi
ty (
pcf
)
Op
tim
um
Mo
istu
re C
on
ten
t (O
MC
) %
Sample Label
Hollow = OMC Solid = MDD
16
Figure 6. Maximum dry density and optimum moisture content of samples with 12% fines content (Modified after Salam et al. 2018).
115
120
125
130
135
140
145
0
1
2
3
4
5
6
7
8
9
10
11
12C
A6
-A-1
2G
A6
-A-1
2C
A2
-A-1
2
CA
6-B
-12
GA
6-B
-12
CA
2-B
-12
CA
6-C
-12
GA
6-C
-12
CA
2-C
-12
CA
6-D
-12
GA
6-D
-12
CA
2-D
-12
CA
6-E
-12
GA
6-E
-12
CA
2-E
-12
CA
6-F
-12
GA
6-F
-12
CA
2-F
-12
CA
6-G
-12
GA
6-G
-12
CA
2-G
-12
CA
6-H
-12
GA
6-H
-12
CA
2-H
-12
CA
6-I
-12
GA
6-I
-12
CA
2-I
-12
Max
imu
m D
ry D
ensi
ty (
pcf
)
Op
tim
um
Mo
istu
re C
on
ten
t (O
MC
) %
Sample Label
Hollow = OMC Solid = MDD
17
CHAPTER 5: SOAKED CBR TEST RESULTS
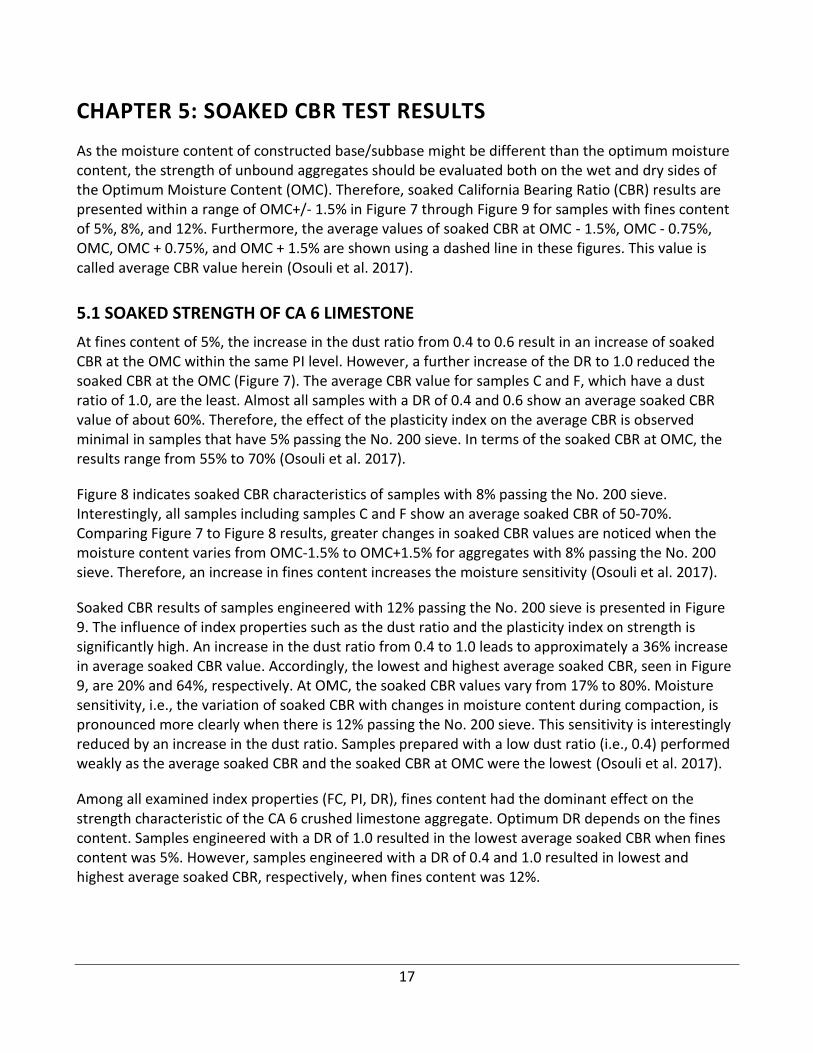
As the moisture content of constructed base/subbase might be different than the optimum moisture content, the strength of unbound aggregates should be evaluated both on the wet and dry sides of the Optimum Moisture Content (OMC). Therefore, soaked California Bearing Ratio (CBR) results are presented within a range of OMC+/- 1.5% in Figure 7 through Figure 9 for samples with fines content of 5%, 8%, and 12%. Furthermore, the average values of soaked CBR at OMC - 1.5%, OMC - 0.75%, OMC, OMC + 0.75%, and OMC + 1.5% are shown using a dashed line in these figures. This value is called average CBR value herein (Osouli et al. 2017).
5.1 SOAKED STRENGTH OF CA 6 LIMESTONE
At fines content of 5%, the increase in the dust ratio from 0.4 to 0.6 result in an increase of soaked CBR at the OMC within the same PI level. However, a further increase of the DR to 1.0 reduced the soaked CBR at the OMC (Figure 7). The average CBR value for samples C and F, which have a dust ratio of 1.0, are the least. Almost all samples with a DR of 0.4 and 0.6 show an average soaked CBR value of about 60%. Therefore, the effect of the plasticity index on the average CBR is observed minimal in samples that have 5% passing the No. 200 sieve. In terms of the soaked CBR at OMC, the results range from 55% to 70% (Osouli et al. 2017).
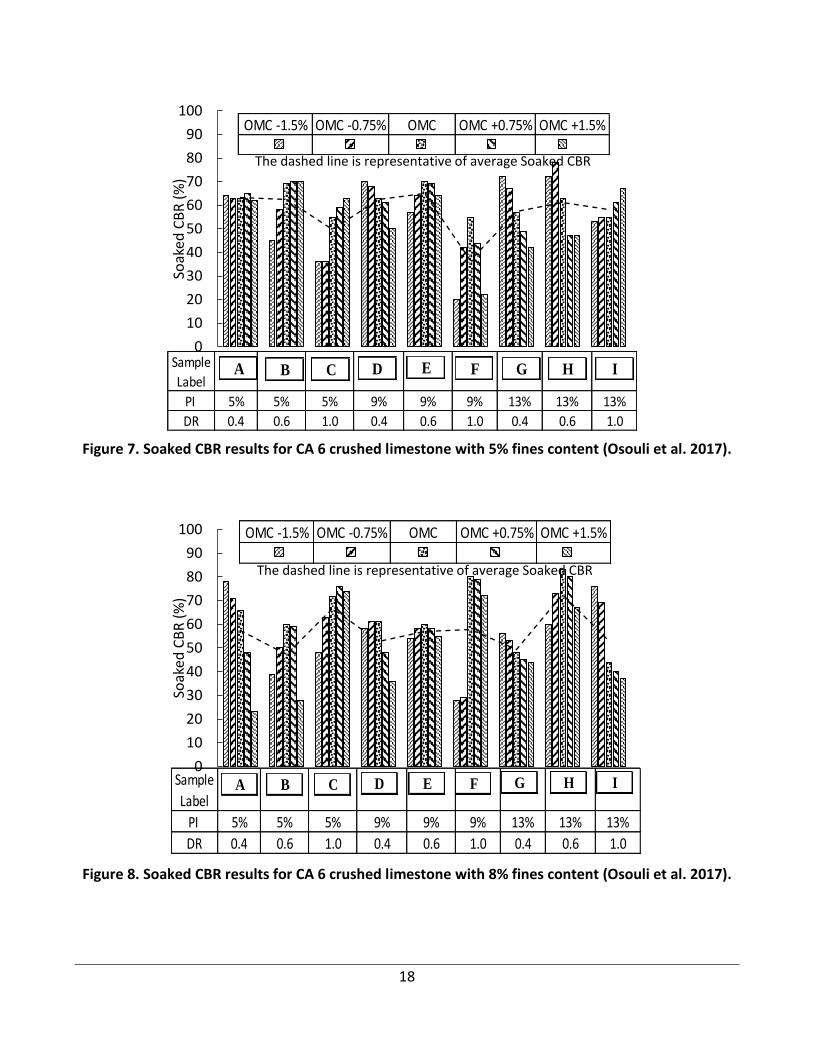
Figure 8 indicates soaked CBR characteristics of samples with 8% passing the No. 200 sieve. Interestingly, all samples including samples C and F show an average soaked CBR of 50-70%. Comparing Figure 7 to Figure 8 results, greater changes in soaked CBR values are noticed when the moisture content varies from OMC-1.5% to OMC+1.5% for aggregates with 8% passing the No. 200 sieve. Therefore, an increase in fines content increases the moisture sensitivity (Osouli et al. 2017).
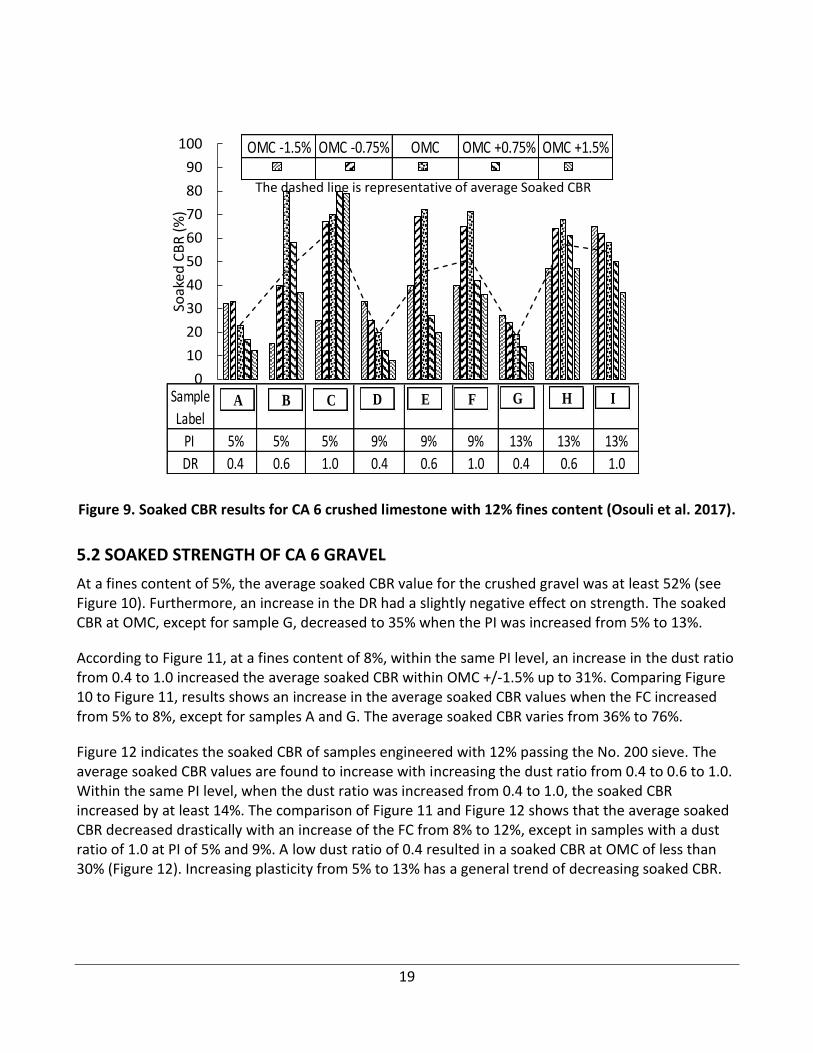
Soaked CBR results of samples engineered with 12% passing the No. 200 sieve is presented in Figure 9. The influence of index properties such as the dust ratio and the plasticity index on strength is significantly high. An increase in the dust ratio from 0.4 to 1.0 leads to approximately a 36% increase in average soaked CBR value. Accordingly, the lowest and highest average soaked CBR, seen in Figure 9, are 20% and 64%, respectively. At OMC, the soaked CBR values vary from 17% to 80%. Moisture sensitivity, i.e., the variation of soaked CBR with changes in moisture content during compaction, is pronounced more clearly when there is 12% passing the No. 200 sieve. This sensitivity is interestingly reduced by an increase in the dust ratio. Samples prepared with a low dust ratio (i.e., 0.4) performed weakly as the average soaked CBR and the soaked CBR at OMC were the lowest (Osouli et al. 2017).
Among all examined index properties (FC, PI, DR), fines content had the dominant effect on the strength characteristic of the CA 6 crushed limestone aggregate. Optimum DR depends on the fines content. Samples engineered with a DR of 1.0 resulted in the lowest average soaked CBR when fines content was 5%. However, samples engineered with a DR of 0.4 and 1.0 resulted in lowest and highest average soaked CBR, respectively, when fines content was 12%.
18
Figure 7. Soaked CBR results for CA 6 crushed limestone with 5% fines content (Osouli et al. 2017).
Figure 8. Soaked CBR results for CA 6 crushed limestone with 8% fines content (Osouli et al. 2017).
0
10
20
30
40
50
60
70
80
90
100
Soak
ed C
BR
(%
)
A B C D E F G H I
The dashed line is representative of average Soaked CBR
OMC -1.5% OMC -0.75% OMC OMC +0.75% OMC +1.5%
Sample
Label
PI 5% 5% 5% 9% 9% 9% 13% 13% 13%
DR 0.4 0.6 1.0 0.4 0.6 1.0 0.4 0.6 1.0
0
10
20
30
40
50
60
70
80
90
100
Soak
ed C
BR
(%
)
A B C D E F G H I
The dashed line is representative of average Soaked CBR
OMC -1.5% OMC -0.75% OMC OMC +0.75% OMC +1.5%
Sample
Label
PI 5% 5% 5% 9% 9% 9% 13% 13% 13%
DR 0.4 0.6 1.0 0.4 0.6 1.0 0.4 0.6 1.0
19
Figure 9. Soaked CBR results for CA 6 crushed limestone with 12% fines content (Osouli et al. 2017).
5.2 SOAKED STRENGTH OF CA 6 GRAVEL
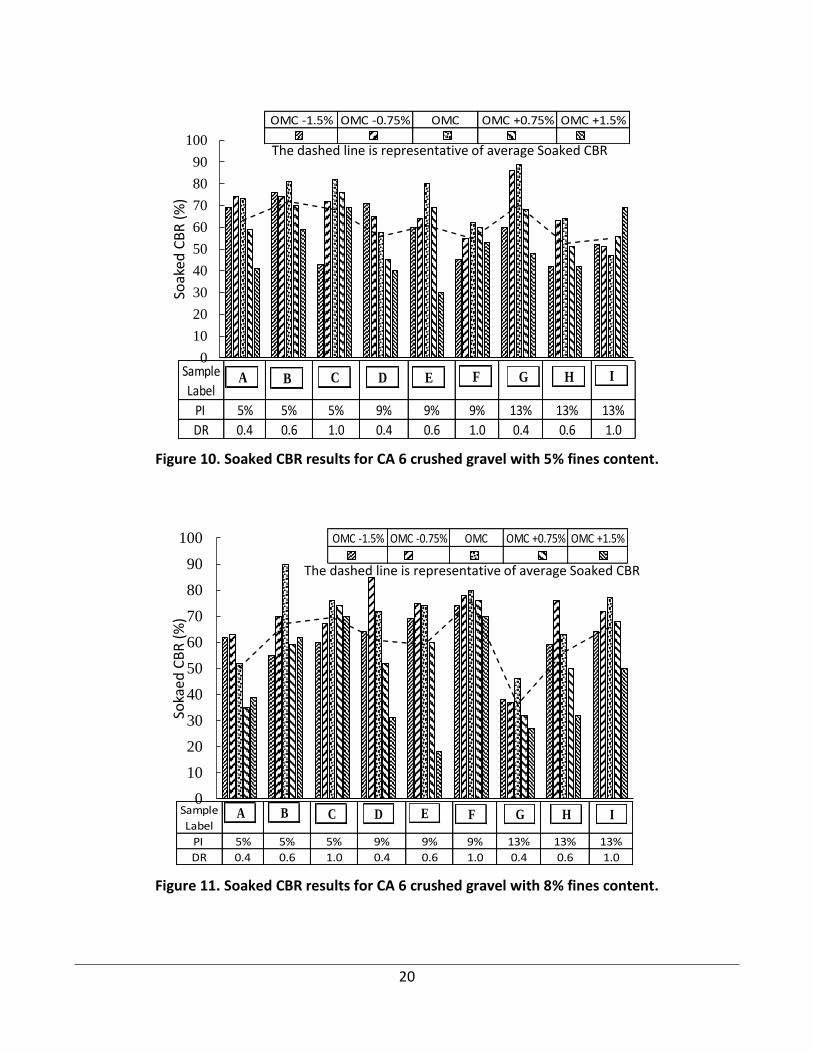
At a fines content of 5%, the average soaked CBR value for the crushed gravel was at least 52% (see Figure 10). Furthermore, an increase in the DR had a slightly negative effect on strength. The soaked CBR at OMC, except for sample G, decreased to 35% when the PI was increased from 5% to 13%.
According to Figure 11, at a fines content of 8%, within the same PI level, an increase in the dust ratio from 0.4 to 1.0 increased the average soaked CBR within OMC +/-1.5% up to 31%. Comparing Figure 10 to Figure 11, results shows an increase in the average soaked CBR values when the FC increased from 5% to 8%, except for samples A and G. The average soaked CBR varies from 36% to 76%.
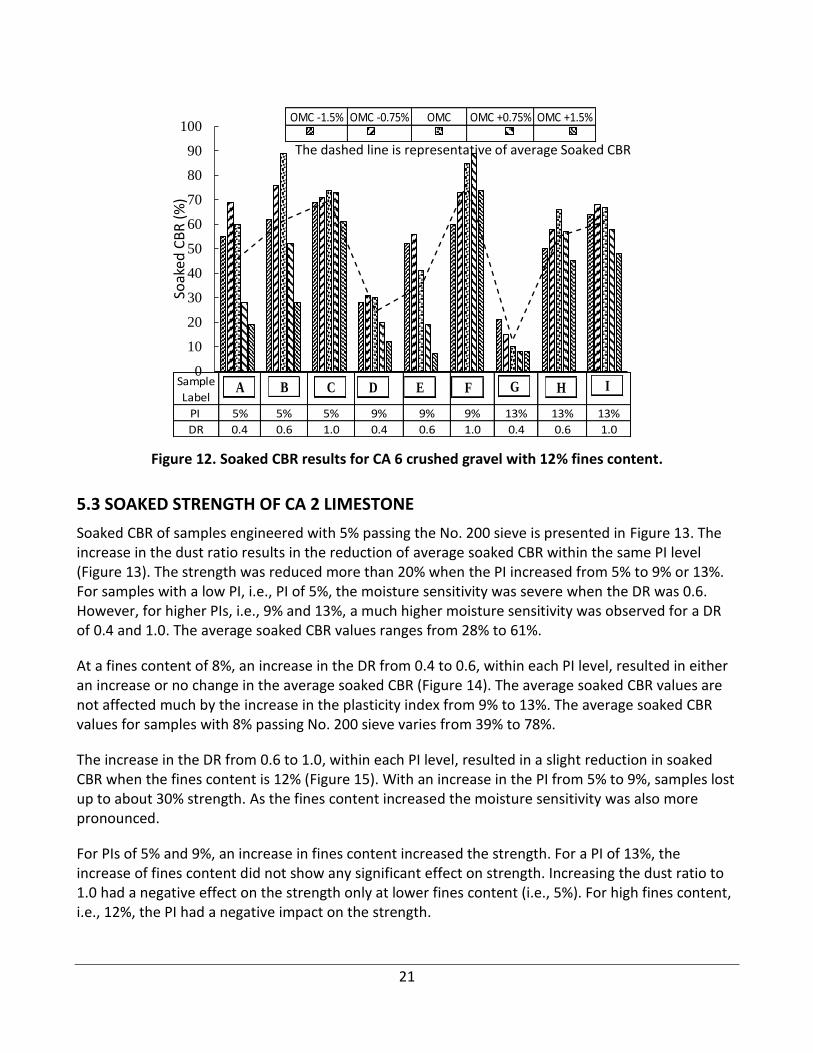
Figure 12 indicates the soaked CBR of samples engineered with 12% passing the No. 200 sieve. The average soaked CBR values are found to increase with increasing the dust ratio from 0.4 to 0.6 to 1.0. Within the same PI level, when the dust ratio was increased from 0.4 to 1.0, the soaked CBR increased by at least 14%. The comparison of Figure 11 and Figure 12 shows that the average soaked CBR decreased drastically with an increase of the FC from 8% to 12%, except in samples with a dust ratio of 1.0 at PI of 5% and 9%. A low dust ratio of 0.4 resulted in a soaked CBR at OMC of less than 30% (Figure 12). Increasing plasticity from 5% to 13% has a general trend of decreasing soaked CBR.
0
10
20
30
40
50
60
70
80
90
100
Soak
ed C
BR
(%
)
A B C D E F G H I
The dashed line is representative of average Soaked CBR
OMC -1.5% OMC -0.75% OMC OMC +0.75% OMC +1.5%
Sample
Label
PI 5% 5% 5% 9% 9% 9% 13% 13% 13%
DR 0.4 0.6 1.0 0.4 0.6 1.0 0.4 0.6 1.0
20
Figure 10. Soaked CBR results for CA 6 crushed gravel with 5% fines content.
Figure 11. Soaked CBR results for CA 6 crushed gravel with 8% fines content.
0
10
20
30
40
50
60
70
80
90
100
Soak
ed C
BR
(%
)
The dashed line is representative of average Soaked CBR
A B C D E F G H I
OMC -1.5% OMC -0.75% OMC OMC +0.75% OMC +1.5%
Sample
Label
PI 5% 5% 5% 9% 9% 9% 13% 13% 13%
DR 0.4 0.6 1.0 0.4 0.6 1.0 0.4 0.6 1.0
0
10
20
30
40
50
60
70
80
90
100
Soka
ed C
BR
(%
)
A B C D E F G H I
The dashed line is representative of average Soaked CBR
OMC -1.5% OMC -0.75% OMC OMC +0.75% OMC +1.5%
Sample
Label
PI 5% 5% 5% 9% 9% 9% 13% 13% 13%
DR 0.4 0.6 1.0 0.4 0.6 1.0 0.4 0.6 1.0
21
Figure 12. Soaked CBR results for CA 6 crushed gravel with 12% fines content.
5.3 SOAKED STRENGTH OF CA 2 LIMESTONE
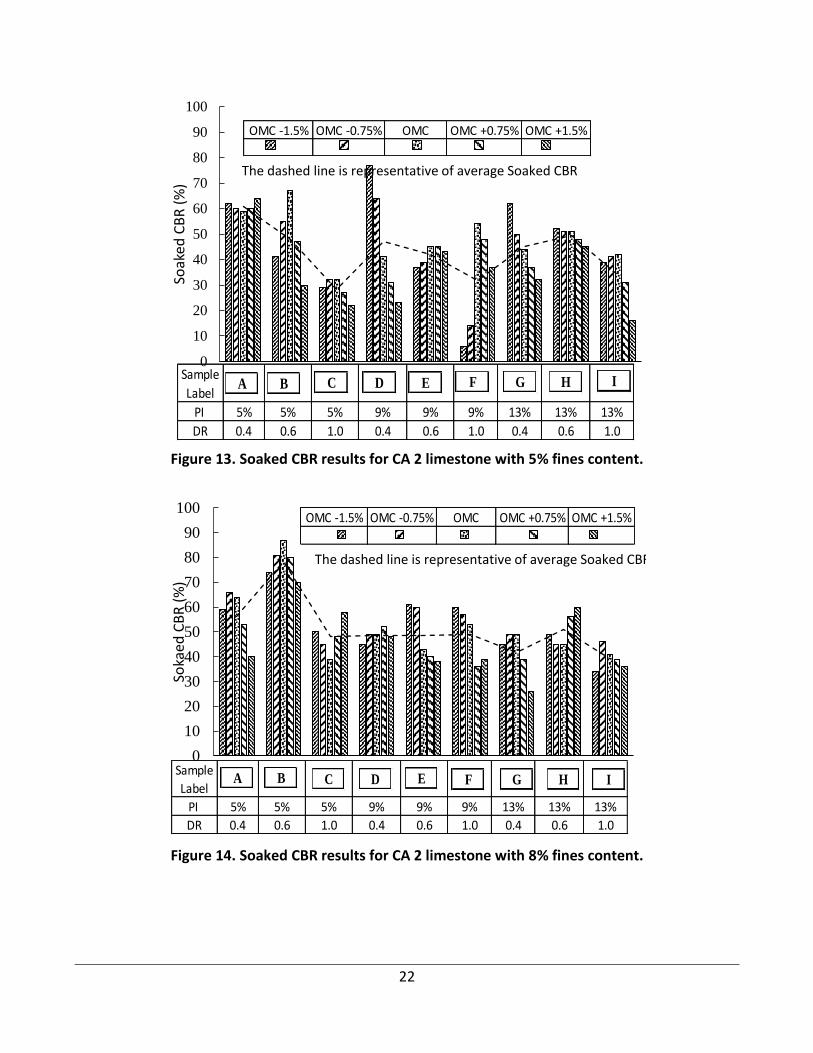
Soaked CBR of samples engineered with 5% passing the No. 200 sieve is presented in Figure 13. The increase in the dust ratio results in the reduction of average soaked CBR within the same PI level (Figure 13). The strength was reduced more than 20% when the PI increased from 5% to 9% or 13%. For samples with a low PI, i.e., PI of 5%, the moisture sensitivity was severe when the DR was 0.6. However, for higher PIs, i.e., 9% and 13%, a much higher moisture sensitivity was observed for a DR of 0.4 and 1.0. The average soaked CBR values ranges from 28% to 61%.
At a fines content of 8%, an increase in the DR from 0.4 to 0.6, within each PI level, resulted in either an increase or no change in the average soaked CBR (Figure 14). The average soaked CBR values are not affected much by the increase in the plasticity index from 9% to 13%. The average soaked CBR values for samples with 8% passing No. 200 sieve varies from 39% to 78%.
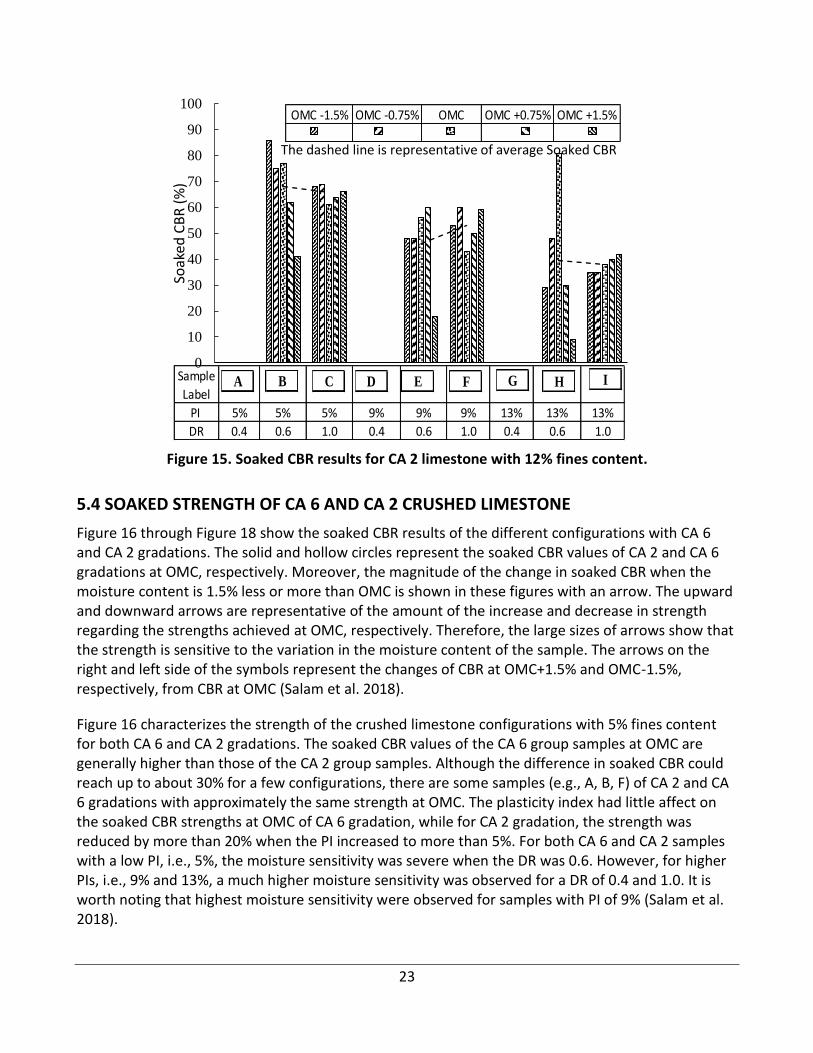
The increase in the DR from 0.6 to 1.0, within each PI level, resulted in a slight reduction in soaked CBR when the fines content is 12% (Figure 15). With an increase in the PI from 5% to 9%, samples lost up to about 30% strength. As the fines content increased the moisture sensitivity was also more pronounced.
For PIs of 5% and 9%, an increase in fines content increased the strength. For a PI of 13%, the increase of fines content did not show any significant effect on strength. Increasing the dust ratio to 1.0 had a negative effect on the strength only at lower fines content (i.e., 5%). For high fines content, i.e., 12%, the PI had a negative impact on the strength.
0
10
20
30
40
50
60
70
80
90
100
Soak
ed C
BR
(%
)
The dashed line is representative of average Soaked CBR
A B C D E F G H I
OMC -1.5% OMC -0.75% OMC OMC +0.75% OMC +1.5%
Sample
Label
PI 5% 5% 5% 9% 9% 9% 13% 13% 13%
DR 0.4 0.6 1.0 0.4 0.6 1.0 0.4 0.6 1.0
22
Figure 13. Soaked CBR results for CA 2 limestone with 5% fines content.
Figure 14. Soaked CBR results for CA 2 limestone with 8% fines content.
0
10
20
30
40
50
60
70
80
90
100
Soak
ed C
BR
(%
)The dashed line is representative of average Soaked CBR
A B C D E F G H I
OMC -1.5% OMC -0.75% OMC OMC +0.75% OMC +1.5%
Sample
Label
PI 5% 5% 5% 9% 9% 9% 13% 13% 13%
DR 0.4 0.6 1.0 0.4 0.6 1.0 0.4 0.6 1.0
0
10
20
30
40
50
60
70
80
90
100
Soka
ed C
BR
(%
)
A B C D E F G H I
The dashed line is representative of average Soaked CBR
OMC -1.5% OMC -0.75% OMC OMC +0.75% OMC +1.5%
Sample
Label
PI 5% 5% 5% 9% 9% 9% 13% 13% 13%
DR 0.4 0.6 1.0 0.4 0.6 1.0 0.4 0.6 1.0
23
Figure 15. Soaked CBR results for CA 2 limestone with 12% fines content.
5.4 SOAKED STRENGTH OF CA 6 AND CA 2 CRUSHED LIMESTONE
Figure 16 through Figure 18 show the soaked CBR results of the different configurations with CA 6 and CA 2 gradations. The solid and hollow circles represent the soaked CBR values of CA 2 and CA 6 gradations at OMC, respectively. Moreover, the magnitude of the change in soaked CBR when the moisture content is 1.5% less or more than OMC is shown in these figures with an arrow. The upward and downward arrows are representative of the amount of the increase and decrease in strength regarding the strengths achieved at OMC, respectively. Therefore, the large sizes of arrows show that the strength is sensitive to the variation in the moisture content of the sample. The arrows on the right and left side of the symbols represent the changes of CBR at OMC+1.5% and OMC-1.5%, respectively, from CBR at OMC (Salam et al. 2018).
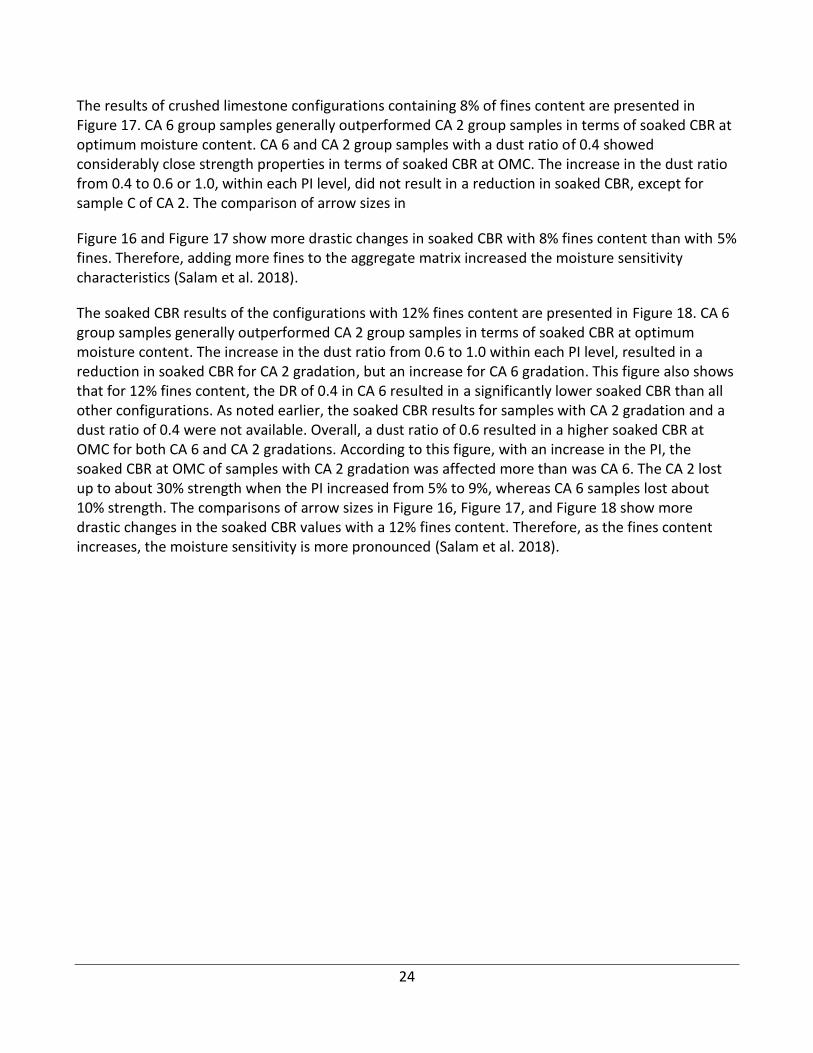
Figure 16 characterizes the strength of the crushed limestone configurations with 5% fines content for both CA 6 and CA 2 gradations. The soaked CBR values of the CA 6 group samples at OMC are generally higher than those of the CA 2 group samples. Although the difference in soaked CBR could reach up to about 30% for a few configurations, there are some samples (e.g., A, B, F) of CA 2 and CA 6 gradations with approximately the same strength at OMC. The plasticity index had little affect on the soaked CBR strengths at OMC of CA 6 gradation, while for CA 2 gradation, the strength was reduced by more than 20% when the PI increased to more than 5%. For both CA 6 and CA 2 samples with a low PI, i.e., 5%, the moisture sensitivity was severe when the DR was 0.6. However, for higher PIs, i.e., 9% and 13%, a much higher moisture sensitivity was observed for a DR of 0.4 and 1.0. It is worth noting that highest moisture sensitivity were observed for samples with PI of 9% (Salam et al. 2018).
0
10
20
30
40
50
60
70
80
90
100
Soak
ed C
BR
(%
)
The dashed line is representative of average Soaked CBR
A B C D E F G H I
OMC -1.5% OMC -0.75% OMC OMC +0.75% OMC +1.5%
Sample
Label
PI 5% 5% 5% 9% 9% 9% 13% 13% 13%
DR 0.4 0.6 1.0 0.4 0.6 1.0 0.4 0.6 1.0
24
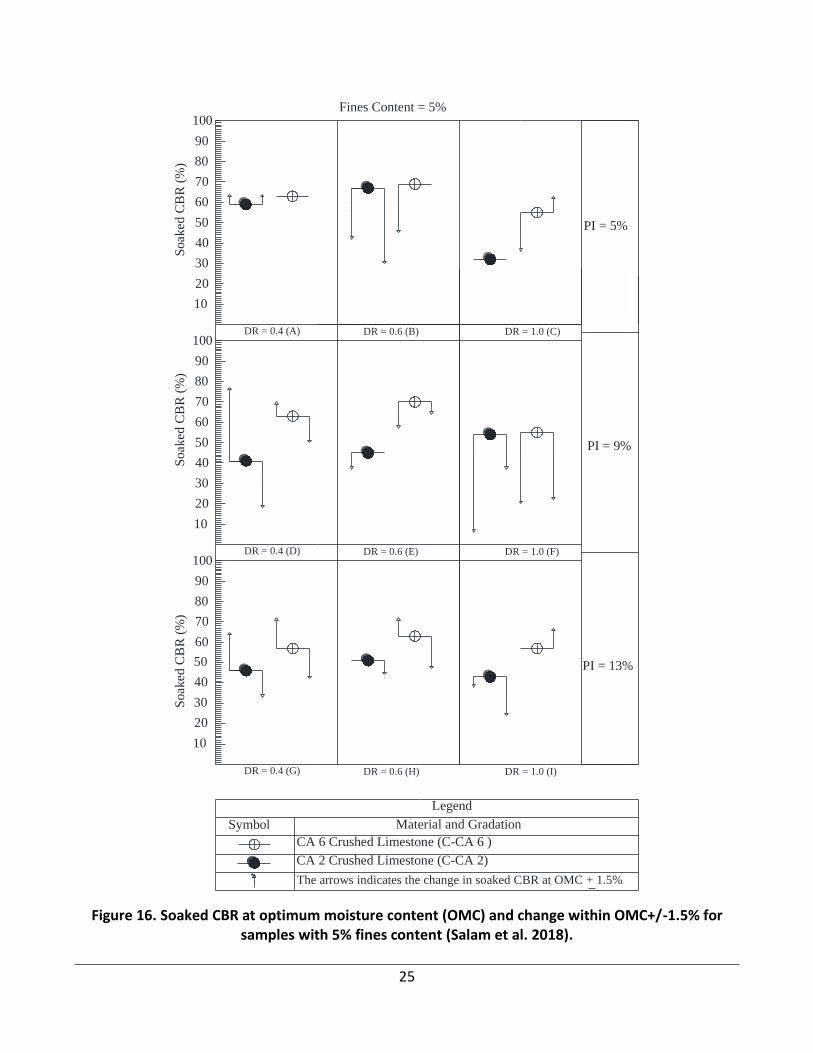
The results of crushed limestone configurations containing 8% of fines content are presented in Figure 17. CA 6 group samples generally outperformed CA 2 group samples in terms of soaked CBR at optimum moisture content. CA 6 and CA 2 group samples with a dust ratio of 0.4 showed considerably close strength properties in terms of soaked CBR at OMC. The increase in the dust ratio from 0.4 to 0.6 or 1.0, within each PI level, did not result in a reduction in soaked CBR, except for sample C of CA 2. The comparison of arrow sizes in
Figure 16 and Figure 17 show more drastic changes in soaked CBR with 8% fines content than with 5% fines. Therefore, adding more fines to the aggregate matrix increased the moisture sensitivity characteristics (Salam et al. 2018).
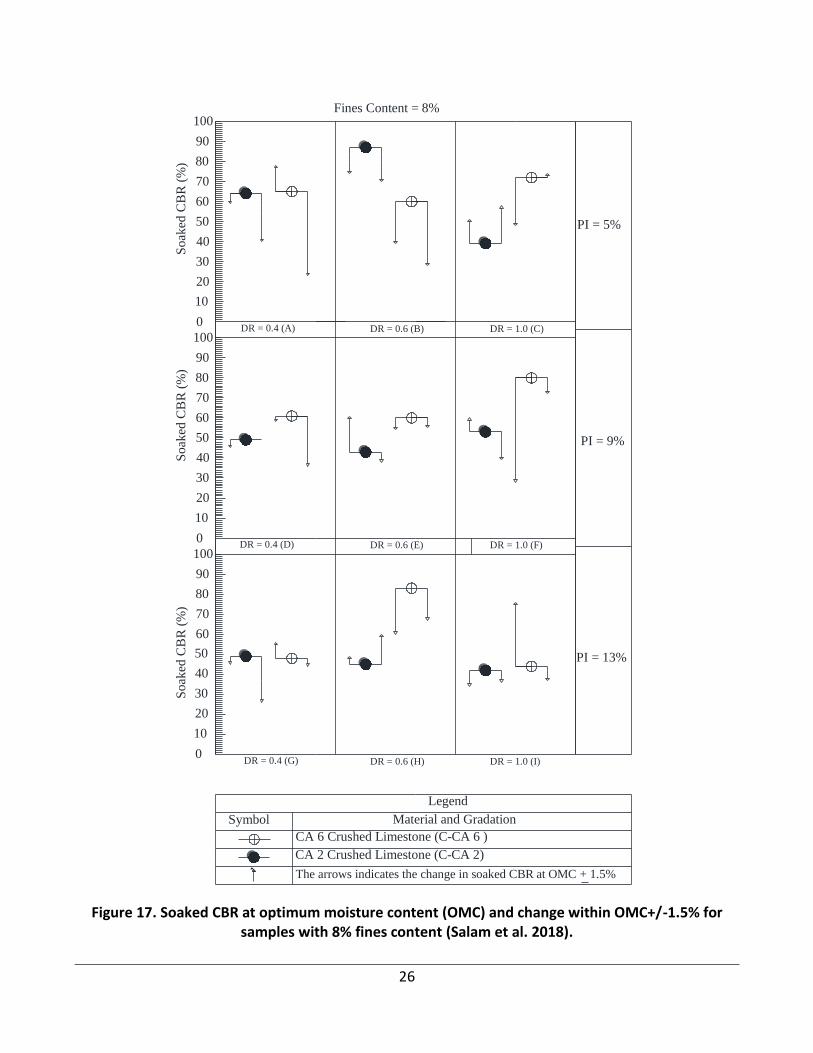
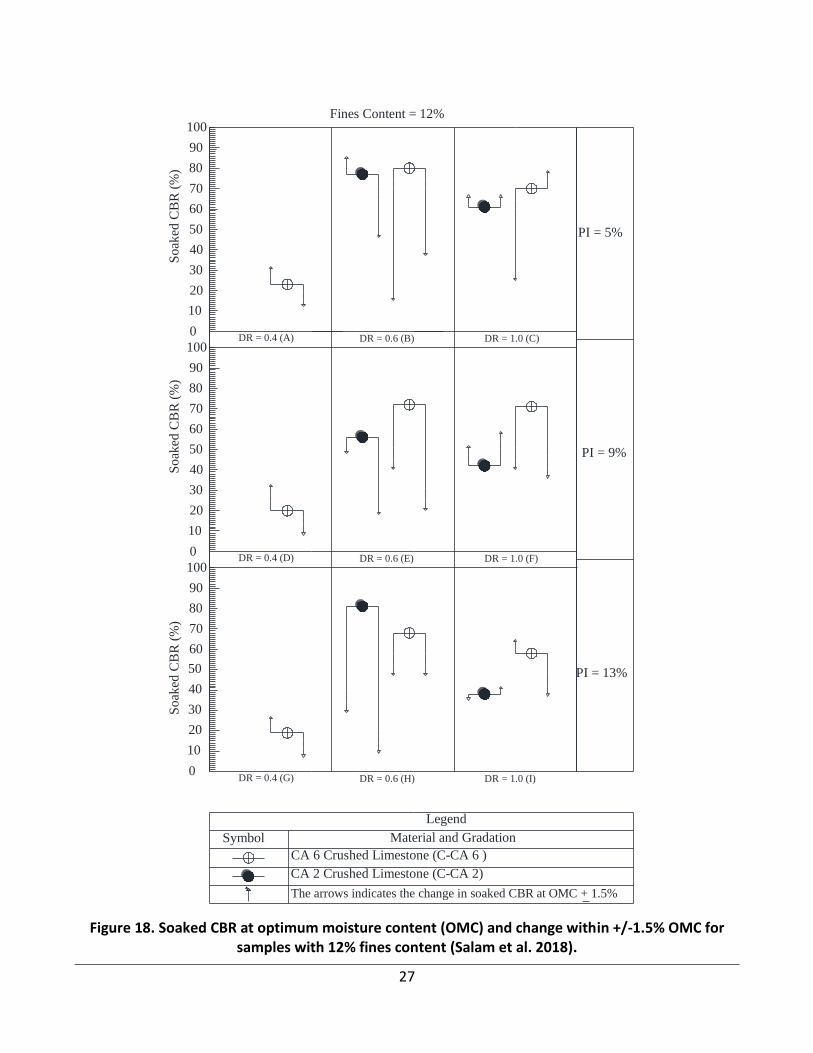
The soaked CBR results of the configurations with 12% fines content are presented in Figure 18. CA 6 group samples generally outperformed CA 2 group samples in terms of soaked CBR at optimum moisture content. The increase in the dust ratio from 0.6 to 1.0 within each PI level, resulted in a reduction in soaked CBR for CA 2 gradation, but an increase for CA 6 gradation. This figure also shows that for 12% fines content, the DR of 0.4 in CA 6 resulted in a significantly lower soaked CBR than all other configurations. As noted earlier, the soaked CBR results for samples with CA 2 gradation and a dust ratio of 0.4 were not available. Overall, a dust ratio of 0.6 resulted in a higher soaked CBR at OMC for both CA 6 and CA 2 gradations. According to this figure, with an increase in the PI, the soaked CBR at OMC of samples with CA 2 gradation was affected more than was CA 6. The CA 2 lost up to about 30% strength when the PI increased from 5% to 9%, whereas CA 6 samples lost about 10% strength. The comparisons of arrow sizes in Figure 16, Figure 17, and Figure 18 show more drastic changes in the soaked CBR values with a 12% fines content. Therefore, as the fines content increases, the moisture sensitivity is more pronounced (Salam et al. 2018).
25
Figure 16. Soaked CBR at optimum moisture content (OMC) and change within OMC+/-1.5% for samples with 5% fines content (Salam et al. 2018).
DR = 0.4 (D) DR = 0.6 (E) DR = 1.0 (F)
DR = 0.4 (G) DR = 0.6 (H) DR = 1.0 (I)
PI = 9%
PI = 13%
PI = 5%
20
30
40
50
60
70
80
90
100
10
20
30
40
50
60
70
80
90
100
10
20
30
40
50
60
70
80
90
100
10
Soak
ed C
BR
(%
)S
oak
ed C
BR
(%
)S
oak
ed C
BR
(%
)
Fines Content = 5%
Material and GradationSymbol
Legend
The arrows indicates the change in soaked CBR at OMC + 1.5%
CA 2 Crushed Limestone (C-CA 2)
CA 6 Crushed Limestone (C-CA 6 )
DR = 0.4 (A) DR = 0.6 (B) DR = 1.0 (C)
26
Figure 17. Soaked CBR at optimum moisture content (OMC) and change within OMC+/-1.5% for samples with 8% fines content (Salam et al. 2018).
DR = 0.4 (A) DR = 0.6 (B) DR = 1.0 (C)
DR = 0.4 (D) DR = 0.6 (E) DR = 1.0 (F)
DR = 0.4 (G) DR = 0.6 (H) DR = 1.0 (I)
PI = 9%
PI = 13%
PI = 5%
20
30
40
50
60
70
80
90
100
10
0
20
30
40
50
60
70
80
90
100
10
0
20
30
40
50
60
70
80
90
100
10
0
So
aked
CB
R (
%)
So
aked
CB
R (
%)
So
aked
CB
R (
%)
Fines Content = 8%
Material and GradationSymbol
Legend
The arrows indicates the change in soaked CBR at OMC + 1.5%
CA 2 Crushed Limestone (C-CA 2)
CA 6 Crushed Limestone (C-CA 6 )
27
Figure 18. Soaked CBR at optimum moisture content (OMC) and change within +/-1.5% OMC for samples with 12% fines content (Salam et al. 2018).
Symbol
Legend
The arrows indicates the change in soaked CBR at OMC + 1.5%
CA 2 Crushed Limestone (C-CA 2)
CA 6 Crushed Limestone (C-CA 6 )
DR = 0.4 (A) DR = 0.6 (B) DR = 1.0 (C)
DR = 0.4 (D) DR = 0.6 (E) DR = 1.0 (F)
DR = 0.4 (G) DR = 0.6 (H) DR = 1.0 (I)
PI = 9%
PI = 13%
PI = 5%
20
30
40
50
60
70
80
90
100
10
0
20
30
40
50
60
70
80
90
100
10
0
20
30
40
50
60
70
80
90
100
10
0
So
aked
CB
R (
%)
So
aked
CB
R (
%)
So
aked
CB
R (
%)
Fines Content = 12%
Material and Gradation
28
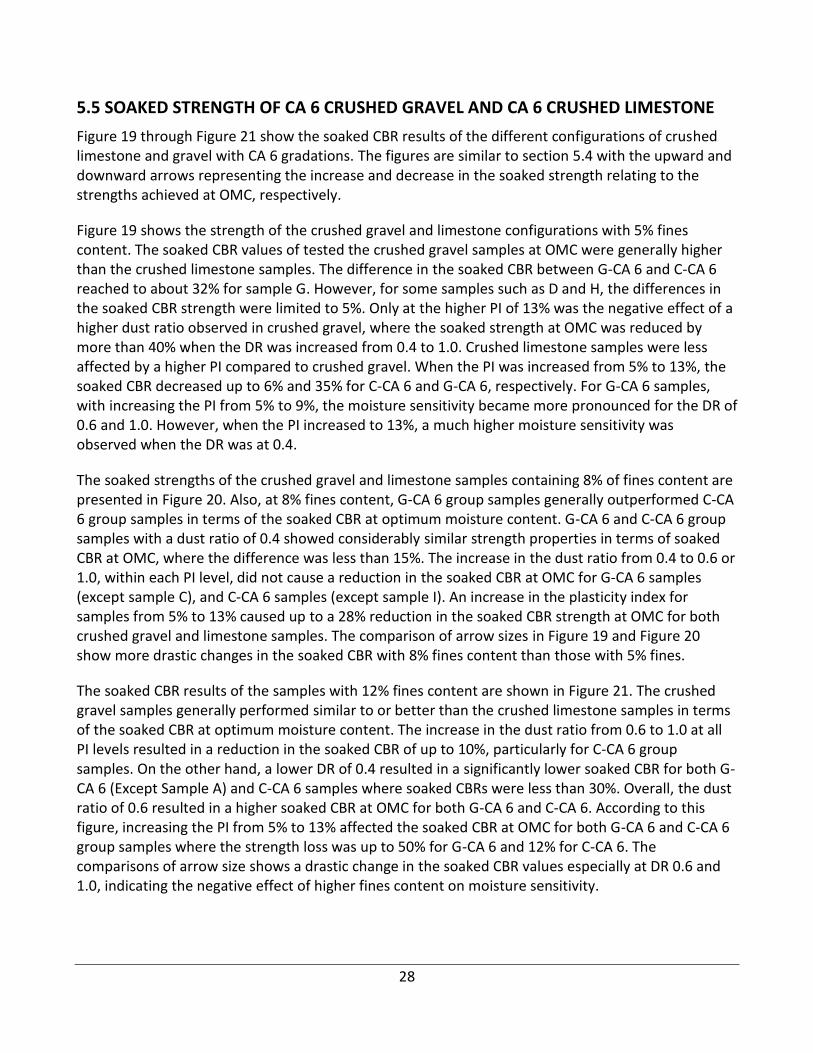
5.5 SOAKED STRENGTH OF CA 6 CRUSHED GRAVEL AND CA 6 CRUSHED LIMESTONE
Figure 19 through Figure 21 show the soaked CBR results of the different configurations of crushed limestone and gravel with CA 6 gradations. The figures are similar to section 5.4 with the upward and downward arrows representing the increase and decrease in the soaked strength relating to the strengths achieved at OMC, respectively.
Figure 19 shows the strength of the crushed gravel and limestone configurations with 5% fines content. The soaked CBR values of tested the crushed gravel samples at OMC were generally higher than the crushed limestone samples. The difference in the soaked CBR between G-CA 6 and C-CA 6 reached to about 32% for sample G. However, for some samples such as D and H, the differences in the soaked CBR strength were limited to 5%. Only at the higher PI of 13% was the negative effect of a higher dust ratio observed in crushed gravel, where the soaked strength at OMC was reduced by more than 40% when the DR was increased from 0.4 to 1.0. Crushed limestone samples were less affected by a higher PI compared to crushed gravel. When the PI was increased from 5% to 13%, the soaked CBR decreased up to 6% and 35% for C-CA 6 and G-CA 6, respectively. For G-CA 6 samples, with increasing the PI from 5% to 9%, the moisture sensitivity became more pronounced for the DR of 0.6 and 1.0. However, when the PI increased to 13%, a much higher moisture sensitivity was observed when the DR was at 0.4.
The soaked strengths of the crushed gravel and limestone samples containing 8% of fines content are presented in Figure 20. Also, at 8% fines content, G-CA 6 group samples generally outperformed C-CA 6 group samples in terms of the soaked CBR at optimum moisture content. G-CA 6 and C-CA 6 group samples with a dust ratio of 0.4 showed considerably similar strength properties in terms of soaked CBR at OMC, where the difference was less than 15%. The increase in the dust ratio from 0.4 to 0.6 or 1.0, within each PI level, did not cause a reduction in the soaked CBR at OMC for G-CA 6 samples (except sample C), and C-CA 6 samples (except sample I). An increase in the plasticity index for samples from 5% to 13% caused up to a 28% reduction in the soaked CBR strength at OMC for both crushed gravel and limestone samples. The comparison of arrow sizes in Figure 19 and Figure 20 show more drastic changes in the soaked CBR with 8% fines content than those with 5% fines.
The soaked CBR results of the samples with 12% fines content are shown in Figure 21. The crushed gravel samples generally performed similar to or better than the crushed limestone samples in terms of the soaked CBR at optimum moisture content. The increase in the dust ratio from 0.6 to 1.0 at all PI levels resulted in a reduction in the soaked CBR of up to 10%, particularly for C-CA 6 group samples. On the other hand, a lower DR of 0.4 resulted in a significantly lower soaked CBR for both G-CA 6 (Except Sample A) and C-CA 6 samples where soaked CBRs were less than 30%. Overall, the dust ratio of 0.6 resulted in a higher soaked CBR at OMC for both G-CA 6 and C-CA 6. According to this figure, increasing the PI from 5% to 13% affected the soaked CBR at OMC for both G-CA 6 and C-CA 6 group samples where the strength loss was up to 50% for G-CA 6 and 12% for C-CA 6. The comparisons of arrow size shows a drastic change in the soaked CBR values especially at DR 0.6 and 1.0, indicating the negative effect of higher fines content on moisture sensitivity.
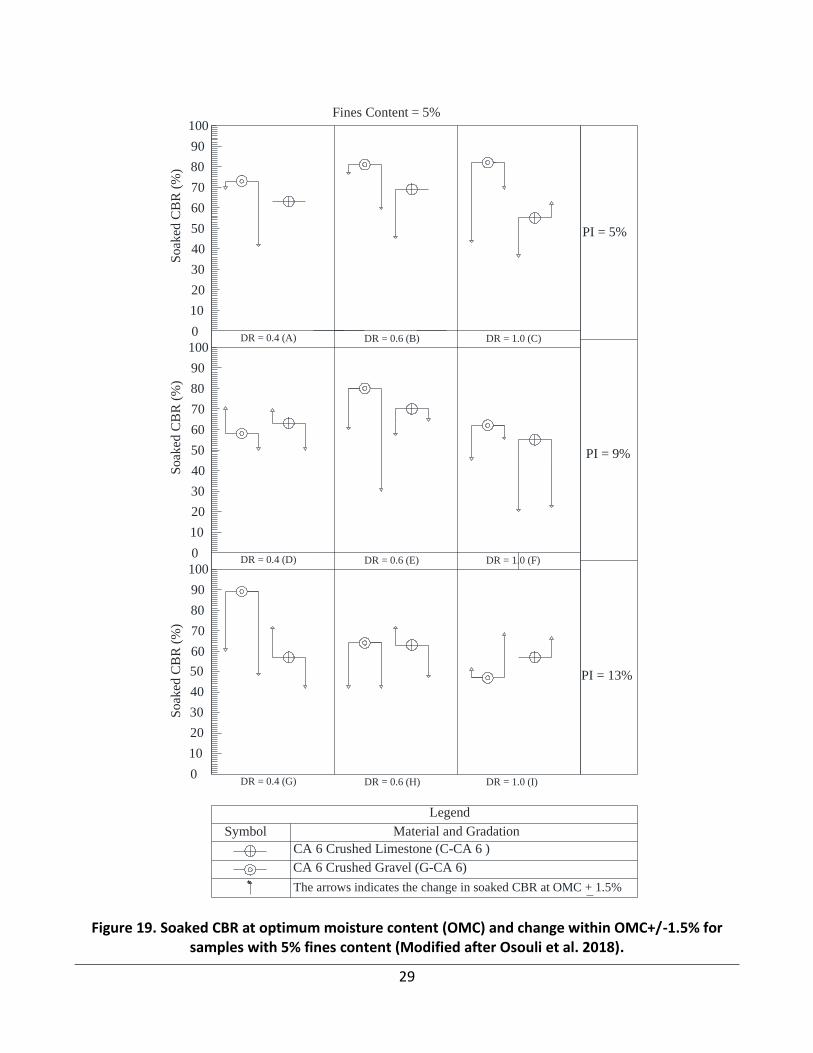
29
Figure 19. Soaked CBR at optimum moisture content (OMC) and change within OMC+/-1.5% for samples with 5% fines content (Modified after Osouli et al. 2018).
DR = 0.4 (A) DR = 0.6 (B) DR = 1.0 (C)
DR = 0.4 (D) DR = 0.6 (E) DR = 1.0 (F)
DR = 0.4 (G) DR = 0.6 (H) DR = 1.0 (I)
PI = 9%
PI = 13%
PI = 5%
20
30
40
50
60
70
80
90
100
10
0
20
30
40
50
60
70
80
90
100
10
0
20
30
40
50
60
70
80
90
100
10
0
Soak
ed C
BR
(%
)S
oak
ed C
BR
(%
)S
oak
ed C
BR
(%
)
Fines Content = 5%
Material and GradationSymbol
Legend
The arrows indicates the change in soaked CBR at OMC + 1.5%
CA 6 Crushed Gravel (G-CA 6)
CA 6 Crushed Limestone (C-CA 6 )
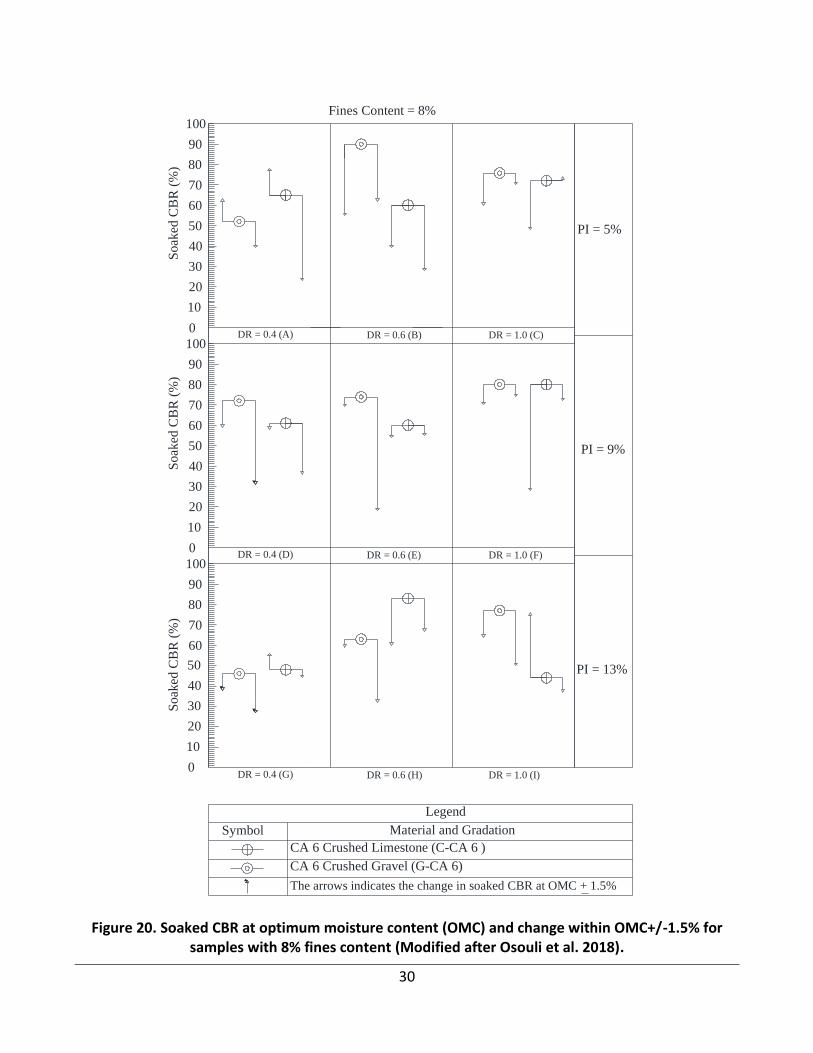
30
Figure 20. Soaked CBR at optimum moisture content (OMC) and change within OMC+/-1.5% for samples with 8% fines content (Modified after Osouli et al. 2018).
DR = 0.4 (A) DR = 0.6 (B) DR = 1.0 (C)
DR = 0.4 (D) DR = 0.6 (E) DR = 1.0 (F)
DR = 0.4 (G) DR = 0.6 (H) DR = 1.0 (I)
PI = 9%
PI = 13%
PI = 5%
20
30
40
50
60
70
80
90
100
10
0
20
30
40
50
60
70
80
90
100
10
0
20
30
40
50
60
70
80
90
100
10
0
Soak
ed C
BR
(%
)S
oak
ed C
BR
(%
)S
oak
ed C
BR
(%
)
Fines Content = 8%
Material and GradationSymbol
Legend
The arrows indicates the change in soaked CBR at OMC + 1.5%
CA 6 Crushed Gravel (G-CA 6)
CA 6 Crushed Limestone (C-CA 6 )
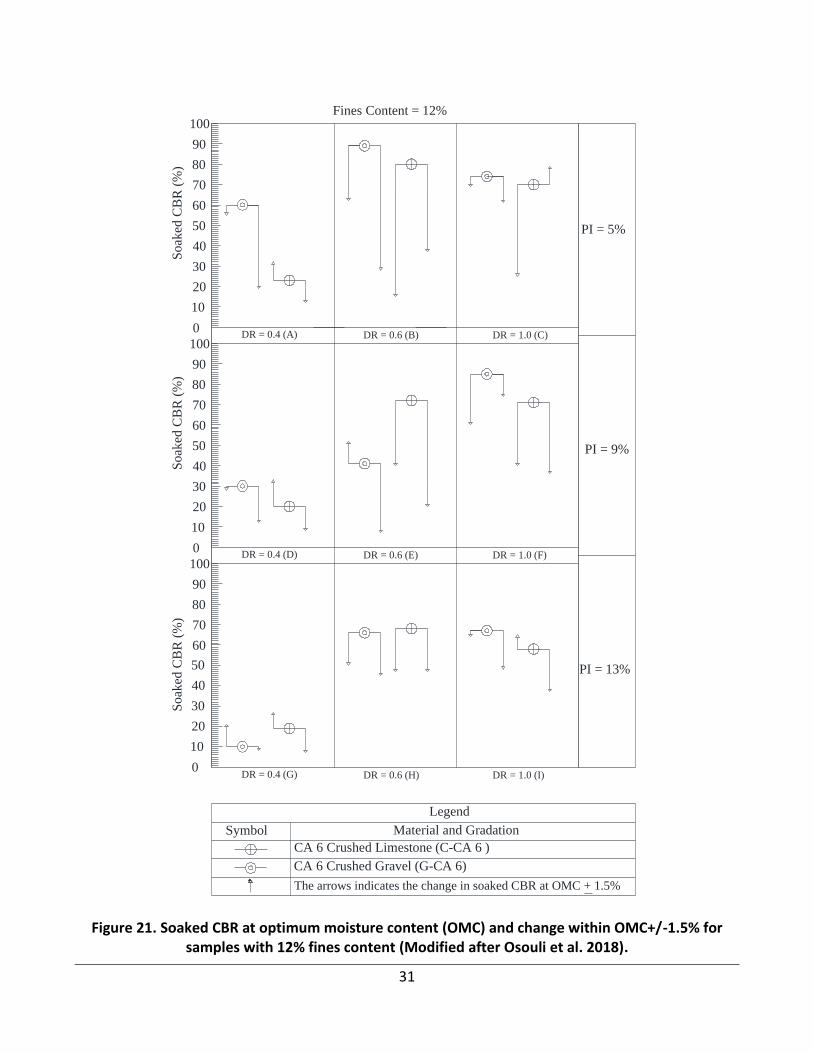
31
Figure 21. Soaked CBR at optimum moisture content (OMC) and change within OMC+/-1.5% for samples with 12% fines content (Modified after Osouli et al. 2018).
DR = 0.4 (A) DR = 0.6 (B) DR = 1.0 (C)
DR = 0.4 (D) DR = 0.6 (E) DR = 1.0 (F)
DR = 0.4 (G) DR = 0.6 (H) DR = 1.0 (I)
PI = 9%
PI = 13%
PI = 5%
20
30
40
50
60
70
80
90
100
10
0
20
30
40
50
60
70
80
90
100
10
0
20
30
40
50
60
70
80
90
100
10
0
So
aked
CB
R (
%)
So
aked
CB
R (
%)
So
aked
CB
R (
%)
Fines Content = 12%
Material and GradationSymbol
Legend
The arrows indicates the change in soaked CBR at OMC + 1.5%
CA 6 Crushed Gravel (G-CA 6)
CA 6 Crushed Limestone (C-CA 6 )
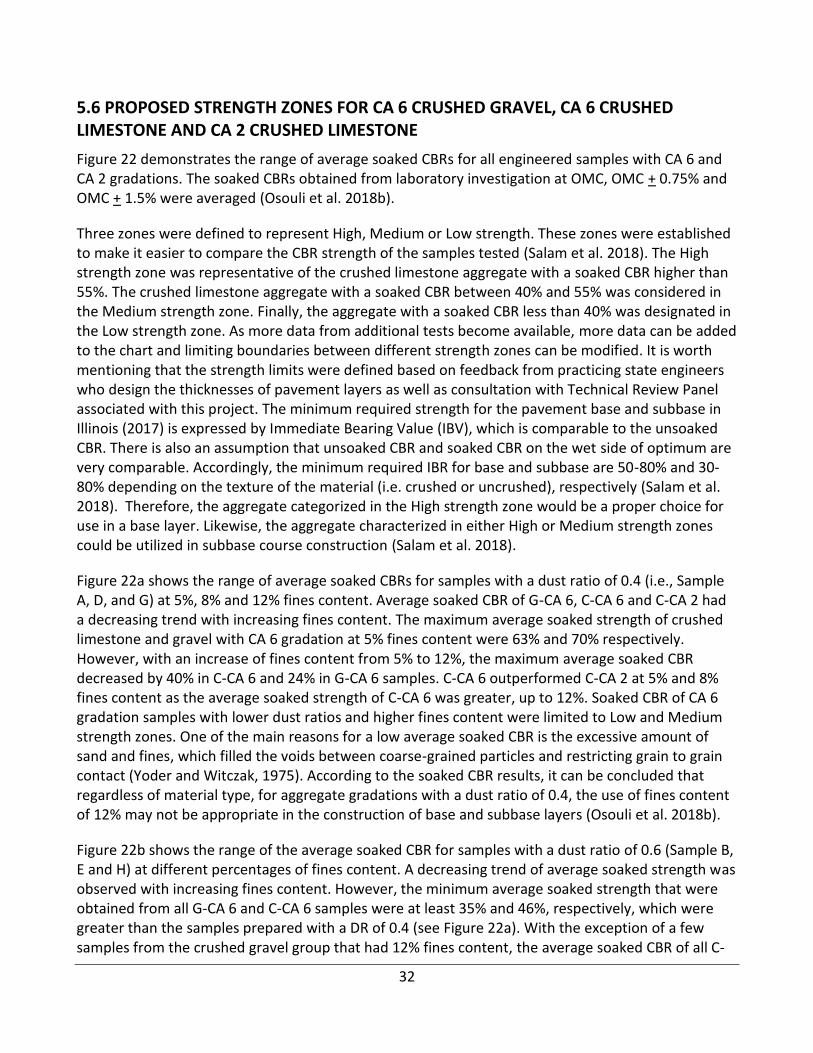
32
5.6 PROPOSED STRENGTH ZONES FOR CA 6 CRUSHED GRAVEL, CA 6 CRUSHED LIMESTONE AND CA 2 CRUSHED LIMESTONE
Figure 22 demonstrates the range of average soaked CBRs for all engineered samples with CA 6 and CA 2 gradations. The soaked CBRs obtained from laboratory investigation at OMC, OMC + 0.75% and OMC + 1.5% were averaged (Osouli et al. 2018b).
Three zones were defined to represent High, Medium or Low strength. These zones were established to make it easier to compare the CBR strength of the samples tested (Salam et al. 2018). The High strength zone was representative of the crushed limestone aggregate with a soaked CBR higher than 55%. The crushed limestone aggregate with a soaked CBR between 40% and 55% was considered in the Medium strength zone. Finally, the aggregate with a soaked CBR less than 40% was designated in the Low strength zone. As more data from additional tests become available, more data can be added to the chart and limiting boundaries between different strength zones can be modified. It is worth mentioning that the strength limits were defined based on feedback from practicing state engineers who design the thicknesses of pavement layers as well as consultation with Technical Review Panel associated with this project. The minimum required strength for the pavement base and subbase in Illinois (2017) is expressed by Immediate Bearing Value (IBV), which is comparable to the unsoaked CBR. There is also an assumption that unsoaked CBR and soaked CBR on the wet side of optimum are very comparable. Accordingly, the minimum required IBR for base and subbase are 50-80% and 30-80% depending on the texture of the material (i.e. crushed or uncrushed), respectively (Salam et al. 2018). Therefore, the aggregate categorized in the High strength zone would be a proper choice for use in a base layer. Likewise, the aggregate characterized in either High or Medium strength zones could be utilized in subbase course construction (Salam et al. 2018).
Figure 22a shows the range of average soaked CBRs for samples with a dust ratio of 0.4 (i.e., Sample A, D, and G) at 5%, 8% and 12% fines content. Average soaked CBR of G-CA 6, C-CA 6 and C-CA 2 had a decreasing trend with increasing fines content. The maximum average soaked strength of crushed limestone and gravel with CA 6 gradation at 5% fines content were 63% and 70% respectively. However, with an increase of fines content from 5% to 12%, the maximum average soaked CBR decreased by 40% in C-CA 6 and 24% in G-CA 6 samples. C-CA 6 outperformed C-CA 2 at 5% and 8% fines content as the average soaked strength of C-CA 6 was greater, up to 12%. Soaked CBR of CA 6 gradation samples with lower dust ratios and higher fines content were limited to Low and Medium strength zones. One of the main reasons for a low average soaked CBR is the excessive amount of sand and fines, which filled the voids between coarse-grained particles and restricting grain to grain contact (Yoder and Witczak, 1975). According to the soaked CBR results, it can be concluded that regardless of material type, for aggregate gradations with a dust ratio of 0.4, the use of fines content of 12% may not be appropriate in the construction of base and subbase layers (Osouli et al. 2018b).
Figure 22b shows the range of the average soaked CBR for samples with a dust ratio of 0.6 (Sample B, E and H) at different percentages of fines content. A decreasing trend of average soaked strength was observed with increasing fines content. However, the minimum average soaked strength that were obtained from all G-CA 6 and C-CA 6 samples were at least 35% and 46%, respectively, which were greater than the samples prepared with a DR of 0.4 (see Figure 22a). With the exception of a few samples from the crushed gravel group that had 12% fines content, the average soaked CBR of all C-
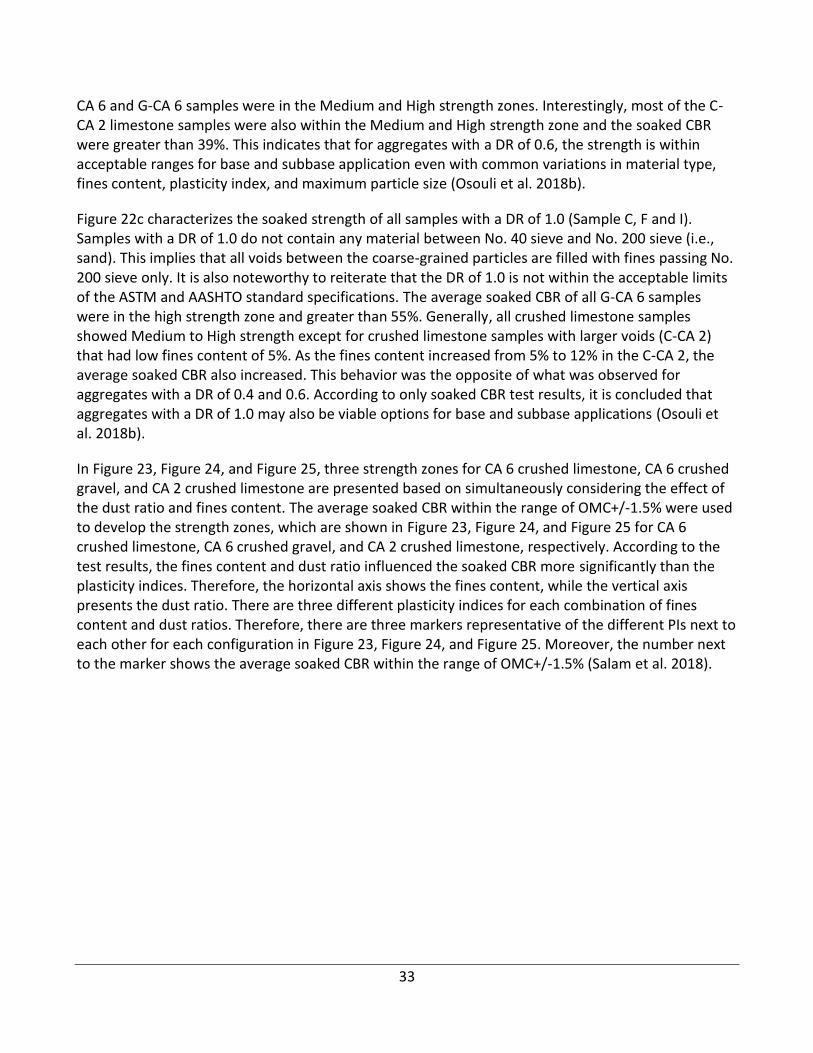
33
CA 6 and G-CA 6 samples were in the Medium and High strength zones. Interestingly, most of the C-CA 2 limestone samples were also within the Medium and High strength zone and the soaked CBR were greater than 39%. This indicates that for aggregates with a DR of 0.6, the strength is within acceptable ranges for base and subbase application even with common variations in material type, fines content, plasticity index, and maximum particle size (Osouli et al. 2018b).
Figure 22c characterizes the soaked strength of all samples with a DR of 1.0 (Sample C, F and I). Samples with a DR of 1.0 do not contain any material between No. 40 sieve and No. 200 sieve (i.e., sand). This implies that all voids between the coarse-grained particles are filled with fines passing No. 200 sieve only. It is also noteworthy to reiterate that the DR of 1.0 is not within the acceptable limits of the ASTM and AASHTO standard specifications. The average soaked CBR of all G-CA 6 samples were in the high strength zone and greater than 55%. Generally, all crushed limestone samples showed Medium to High strength except for crushed limestone samples with larger voids (C-CA 2) that had low fines content of 5%. As the fines content increased from 5% to 12% in the C-CA 2, the average soaked CBR also increased. This behavior was the opposite of what was observed for aggregates with a DR of 0.4 and 0.6. According to only soaked CBR test results, it is concluded that aggregates with a DR of 1.0 may also be viable options for base and subbase applications (Osouli et al. 2018b).
In Figure 23, Figure 24, and Figure 25, three strength zones for CA 6 crushed limestone, CA 6 crushed gravel, and CA 2 crushed limestone are presented based on simultaneously considering the effect of the dust ratio and fines content. The average soaked CBR within the range of OMC+/-1.5% were used to develop the strength zones, which are shown in Figure 23, Figure 24, and Figure 25 for CA 6 crushed limestone, CA 6 crushed gravel, and CA 2 crushed limestone, respectively. According to the test results, the fines content and dust ratio influenced the soaked CBR more significantly than the plasticity indices. Therefore, the horizontal axis shows the fines content, while the vertical axis presents the dust ratio. There are three different plasticity indices for each combination of fines content and dust ratios. Therefore, there are three markers representative of the different PIs next to each other for each configuration in Figure 23, Figure 24, and Figure 25. Moreover, the number next to the marker shows the average soaked CBR within the range of OMC+/-1.5% (Salam et al. 2018).
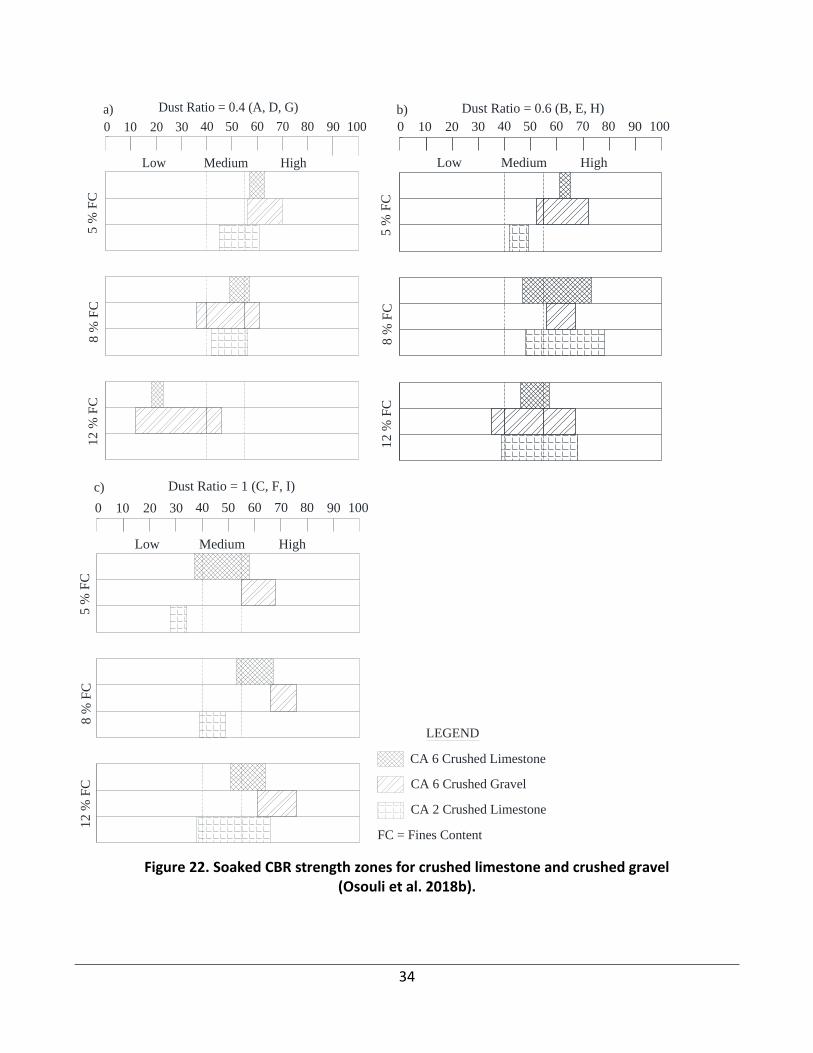
34
Figure 22. Soaked CBR strength zones for crushed limestone and crushed gravel (Osouli et al. 2018b).
0 10 20 30 40 50 60 70 80 90 100
Low Medium High
5 %
FC
8 %
FC
12
% F
CDust Ratio = 0.4 (A, D, G)a)
0 10 20 30 40 50 60 70 80 90 100
Low Medium High
5 %
FC
8 %
FC
12
% F
C
Dust Ratio = 0.6 (B, E, H)b)
0 10 20 30 40 50 60 70 80 90 100
Low Medium High
5 %
FC
8 %
FC
12
% F
C
Dust Ratio = 1 (C, F, I)c)
CA 6 Crushed Limestone
CA 6 Crushed Gravel
CA 2 Crushed Limestone
LEGEND
FC = Fines Content
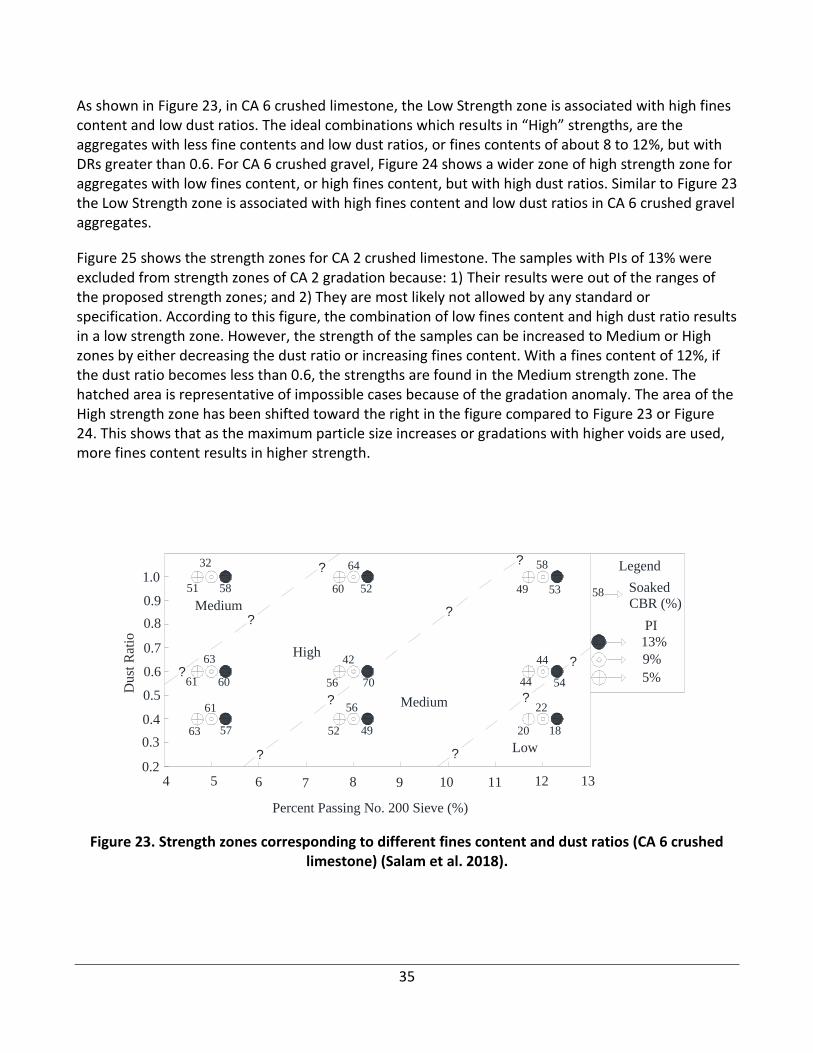
35
As shown in Figure 23, in CA 6 crushed limestone, the Low Strength zone is associated with high fines content and low dust ratios. The ideal combinations which results in “High” strengths, are the aggregates with less fine contents and low dust ratios, or fines contents of about 8 to 12%, but with DRs greater than 0.6. For CA 6 crushed gravel, Figure 24 shows a wider zone of high strength zone for aggregates with low fines content, or high fines content, but with high dust ratios. Similar to Figure 23 the Low Strength zone is associated with high fines content and low dust ratios in CA 6 crushed gravel aggregates.
Figure 25 shows the strength zones for CA 2 crushed limestone. The samples with PIs of 13% were excluded from strength zones of CA 2 gradation because: 1) Their results were out of the ranges of the proposed strength zones; and 2) They are most likely not allowed by any standard or specification. According to this figure, the combination of low fines content and high dust ratio results in a low strength zone. However, the strength of the samples can be increased to Medium or High zones by either decreasing the dust ratio or increasing fines content. With a fines content of 12%, if the dust ratio becomes less than 0.6, the strengths are found in the Medium strength zone. The hatched area is representative of impossible cases because of the gradation anomaly. The area of the High strength zone has been shifted toward the right in the figure compared to Figure 23 or Figure 24. This shows that as the maximum particle size increases or gradations with higher voids are used, more fines content results in higher strength.
Figure 23. Strength zones corresponding to different fines content and dust ratios (CA 6 crushed limestone) (Salam et al. 2018).
High
Medium
Low
Medium
5 6 7 8 9 10 11 12
Percent Passing No. 200 Sieve (%)
0.2
0.3
0.4
0.5
0.6
0.7
0.8
0.9
1.0
4
63
61
57
61
63
60
32
51 58 60
64
52
56
42
70
52
56
49
49
58
53
44
44
54
13
5%
9%
13%
Du
st R
atio
Legend
58 Soaked
CBR (%)
PI
?
?
?
?
?
?
20
22
18
??
? ?
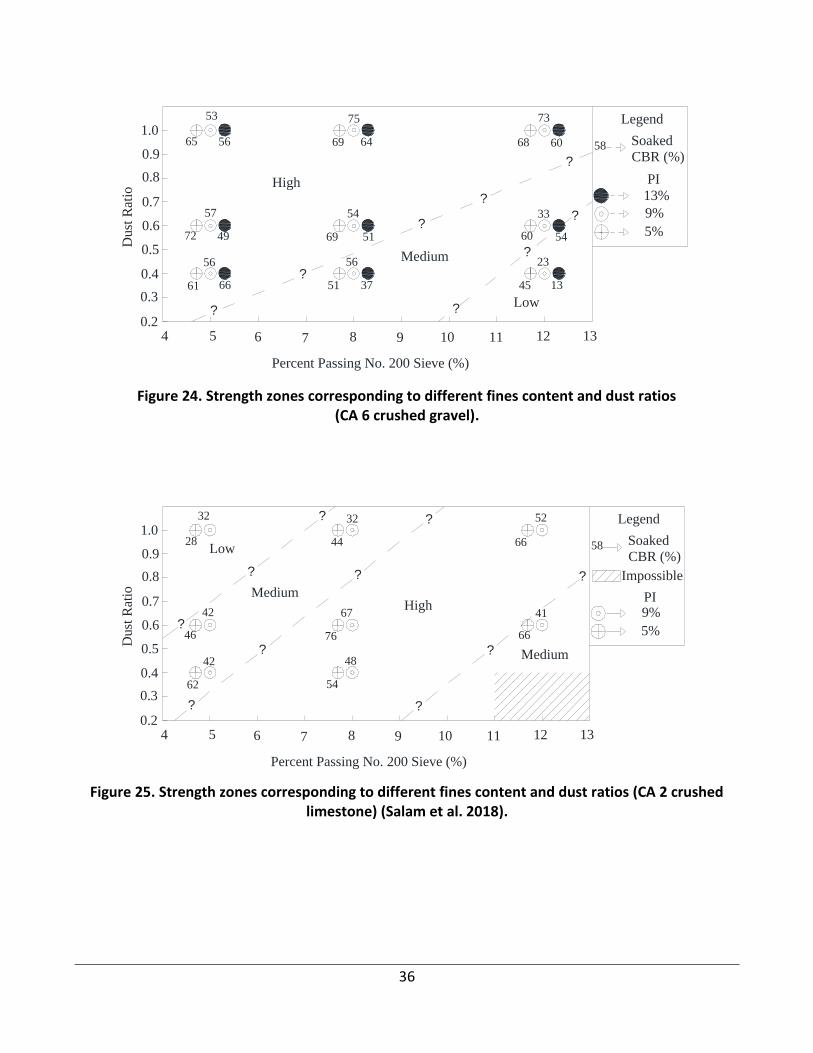
36
Figure 24. Strength zones corresponding to different fines content and dust ratios (CA 6 crushed gravel).
Figure 25. Strength zones corresponding to different fines content and dust ratios (CA 2 crushed limestone) (Salam et al. 2018).
High
Medium
Low
5 6 7 8 9 10 11 12
Percent Passing No. 200 Sieve (%)
0.2
0.3
0.4
0.5
0.6
0.7
0.8
0.9
1.0
4
61
56
66
72
57
49
53
65 56 69
75
64
69
54
51
51
56
37
68
73
60
60
33
54
13
5%
9%
13%
Dust
Rat
ioLegend
58 Soaked
CBR (%)
PI
?
?
45
23
13
?
?
?
?
?
?
High
Low
Medium
5 6 7 8 9 10 11 12
Percent Passing No. 200 Sieve (%)
0.2
0.3
0.4
0.5
0.6
0.7
0.8
0.9
1.0
4
62
42
46
42
32
28 44
32
76
67
54
48
66
52
66
41
13
5%
9%
Dust
Rat
io
Legend
58 Soaked
CBR (%)
PI
?
?
?
?
?
?
Medium
Impossible?
?
?
?
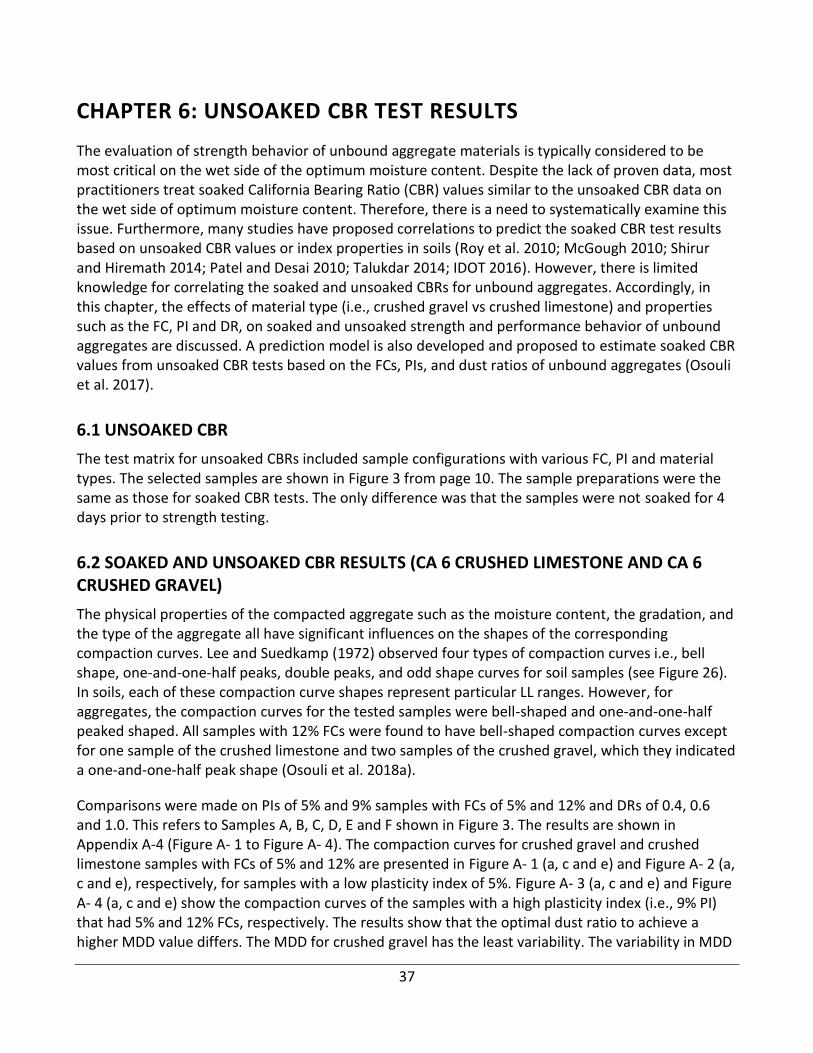
37
CHAPTER 6: UNSOAKED CBR TEST RESULTS
The evaluation of strength behavior of unbound aggregate materials is typically considered to be most critical on the wet side of the optimum moisture content. Despite the lack of proven data, most practitioners treat soaked California Bearing Ratio (CBR) values similar to the unsoaked CBR data on the wet side of optimum moisture content. Therefore, there is a need to systematically examine this issue. Furthermore, many studies have proposed correlations to predict the soaked CBR test results based on unsoaked CBR values or index properties in soils (Roy et al. 2010; McGough 2010; Shirur and Hiremath 2014; Patel and Desai 2010; Talukdar 2014; IDOT 2016). However, there is limited knowledge for correlating the soaked and unsoaked CBRs for unbound aggregates. Accordingly, in this chapter, the effects of material type (i.e., crushed gravel vs crushed limestone) and properties such as the FC, PI and DR, on soaked and unsoaked strength and performance behavior of unbound aggregates are discussed. A prediction model is also developed and proposed to estimate soaked CBR values from unsoaked CBR tests based on the FCs, PIs, and dust ratios of unbound aggregates (Osouli et al. 2017).
6.1 UNSOAKED CBR
The test matrix for unsoaked CBRs included sample configurations with various FC, PI and material types. The selected samples are shown in Figure 3 from page 10. The sample preparations were the same as those for soaked CBR tests. The only difference was that the samples were not soaked for 4 days prior to strength testing.
6.2 SOAKED AND UNSOAKED CBR RESULTS (CA 6 CRUSHED LIMESTONE AND CA 6 CRUSHED GRAVEL)
The physical properties of the compacted aggregate such as the moisture content, the gradation, and the type of the aggregate all have significant influences on the shapes of the corresponding compaction curves. Lee and Suedkamp (1972) observed four types of compaction curves i.e., bell shape, one-and-one-half peaks, double peaks, and odd shape curves for soil samples (see Figure 26). In soils, each of these compaction curve shapes represent particular LL ranges. However, for aggregates, the compaction curves for the tested samples were bell-shaped and one-and-one-half peaked shaped. All samples with 12% FCs were found to have bell-shaped compaction curves except for one sample of the crushed limestone and two samples of the crushed gravel, which they indicated a one-and-one-half peak shape (Osouli et al. 2018a).
Comparisons were made on PIs of 5% and 9% samples with FCs of 5% and 12% and DRs of 0.4, 0.6 and 1.0. This refers to Samples A, B, C, D, E and F shown in Figure 3. The results are shown in Appendix A-4 (Figure A- 1 to Figure A- 4). The compaction curves for crushed gravel and crushed limestone samples with FCs of 5% and 12% are presented in Figure A- 1 (a, c and e) and Figure A- 2 (a, c and e), respectively, for samples with a low plasticity index of 5%. Figure A- 3 (a, c and e) and Figure A- 4 (a, c and e) show the compaction curves of the samples with a high plasticity index (i.e., 9% PI) that had 5% and 12% FCs, respectively. The results show that the optimal dust ratio to achieve a higher MDD value differs. The MDD for crushed gravel has the least variability. The variability in MDD
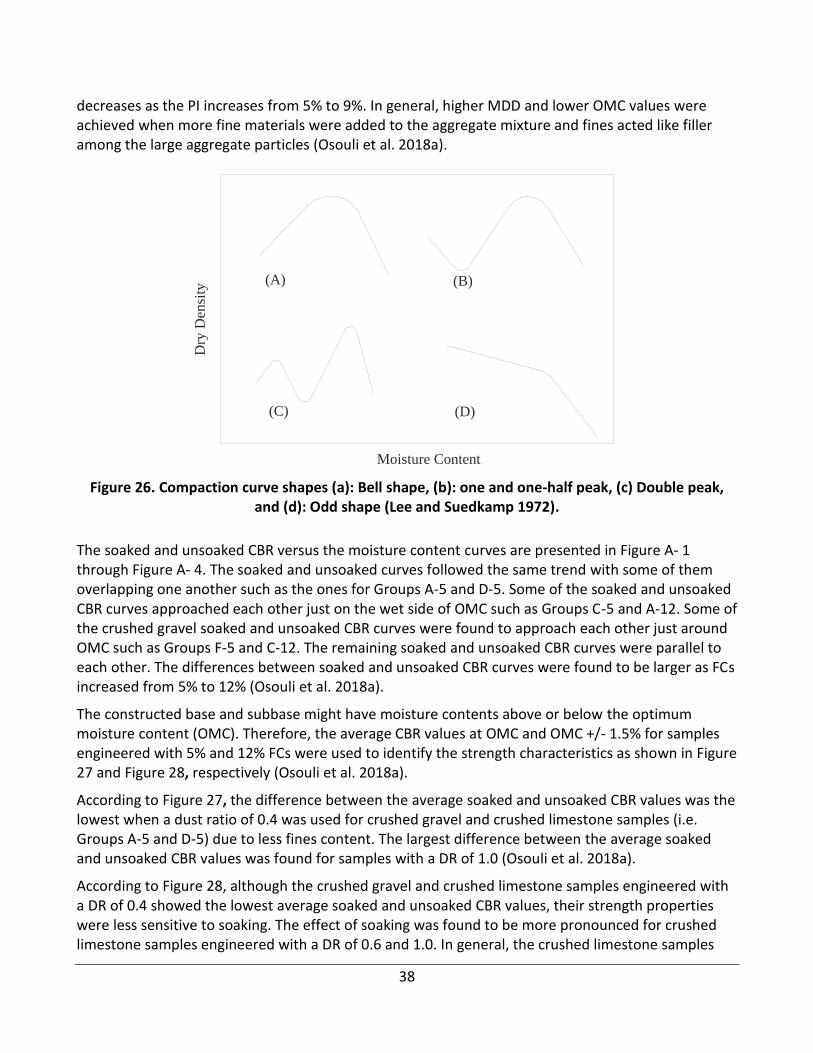
38
decreases as the PI increases from 5% to 9%. In general, higher MDD and lower OMC values were achieved when more fine materials were added to the aggregate mixture and fines acted like filler among the large aggregate particles (Osouli et al. 2018a).
Figure 26. Compaction curve shapes (a): Bell shape, (b): one and one-half peak, (c) Double peak, and (d): Odd shape (Lee and Suedkamp 1972).
The soaked and unsoaked CBR versus the moisture content curves are presented in Figure A- 1 through Figure A- 4. The soaked and unsoaked curves followed the same trend with some of them overlapping one another such as the ones for Groups A-5 and D-5. Some of the soaked and unsoaked CBR curves approached each other just on the wet side of OMC such as Groups C-5 and A-12. Some of the crushed gravel soaked and unsoaked CBR curves were found to approach each other just around OMC such as Groups F-5 and C-12. The remaining soaked and unsoaked CBR curves were parallel to each other. The differences between soaked and unsoaked CBR curves were found to be larger as FCs increased from 5% to 12% (Osouli et al. 2018a).
The constructed base and subbase might have moisture contents above or below the optimum moisture content (OMC). Therefore, the average CBR values at OMC and OMC +/- 1.5% for samples engineered with 5% and 12% FCs were used to identify the strength characteristics as shown in Figure 27 and Figure 28, respectively (Osouli et al. 2018a).
According to Figure 27, the difference between the average soaked and unsoaked CBR values was the lowest when a dust ratio of 0.4 was used for crushed gravel and crushed limestone samples (i.e. Groups A-5 and D-5) due to less fines content. The largest difference between the average soaked and unsoaked CBR values was found for samples with a DR of 1.0 (Osouli et al. 2018a).
According to Figure 28, although the crushed gravel and crushed limestone samples engineered with a DR of 0.4 showed the lowest average soaked and unsoaked CBR values, their strength properties were less sensitive to soaking. The effect of soaking was found to be more pronounced for crushed limestone samples engineered with a DR of 0.6 and 1.0. In general, the crushed limestone samples
(A) (B)
(C) (D)
Dry
Den
sity
Moisture Content
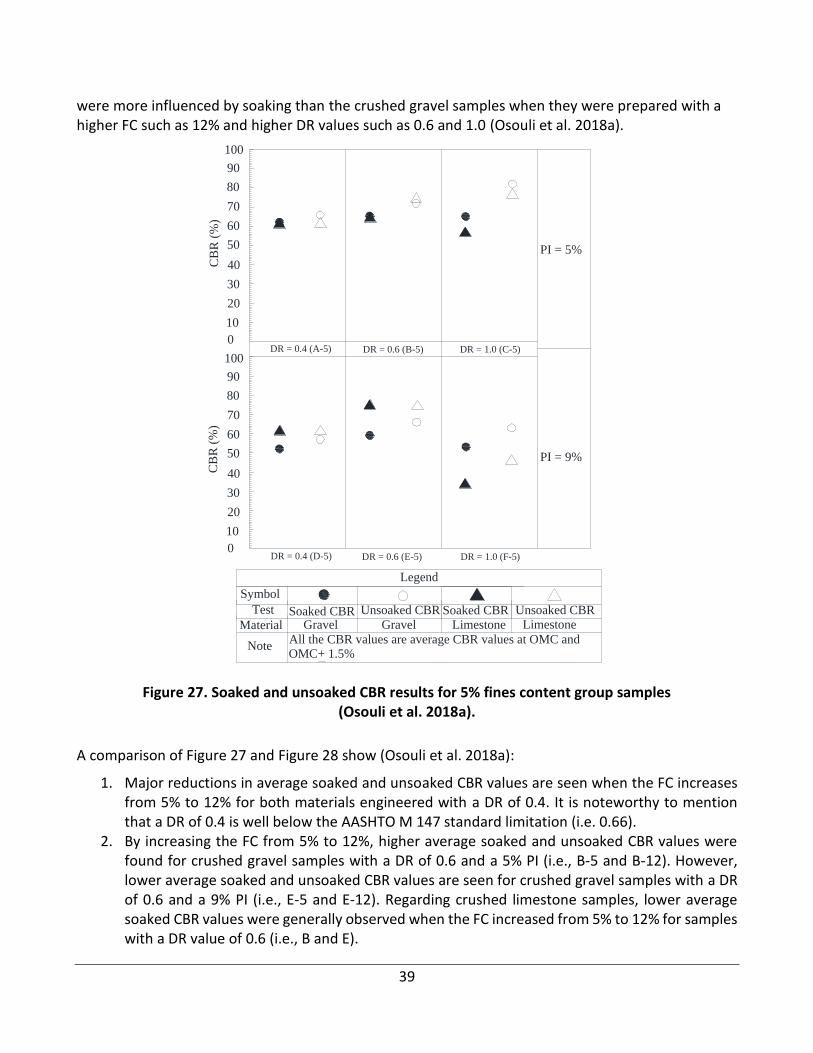
39
were more influenced by soaking than the crushed gravel samples when they were prepared with a higher FC such as 12% and higher DR values such as 0.6 and 1.0 (Osouli et al. 2018a).
Figure 27. Soaked and unsoaked CBR results for 5% fines content group samples (Osouli et al. 2018a).
A comparison of Figure 27 and Figure 28 show (Osouli et al. 2018a):
1. Major reductions in average soaked and unsoaked CBR values are seen when the FC increases from 5% to 12% for both materials engineered with a DR of 0.4. It is noteworthy to mention that a DR of 0.4 is well below the AASHTO M 147 standard limitation (i.e. 0.66).
2. By increasing the FC from 5% to 12%, higher average soaked and unsoaked CBR values were found for crushed gravel samples with a DR of 0.6 and a 5% PI (i.e., B-5 and B-12). However, lower average soaked and unsoaked CBR values are seen for crushed gravel samples with a DR of 0.6 and a 9% PI (i.e., E-5 and E-12). Regarding crushed limestone samples, lower average soaked CBR values were generally observed when the FC increased from 5% to 12% for samples with a DR value of 0.6 (i.e., B and E).
CB
R (
%)
CB
R (
%)
DR = 0.4 (A-5) DR = 0.6 (B-5) DR = 1.0 (C-5)
DR = 0.4 (D-5) DR = 0.6 (E-5) DR = 1.0 (F-5)
PI = 9%
PI = 5%
20
30
40
50
60
70
80
90
100
10
0
20
30
40
50
60
70
80
90
100
10
0
Legend
Symbol
Test Soaked CBR Unsoaked CBR Soaked CBR Unsoaked CBR
Material Gravel Gravel Limestone Limestone
NoteAll the CBR values are average CBR values at OMC andOMC+ 1.5%
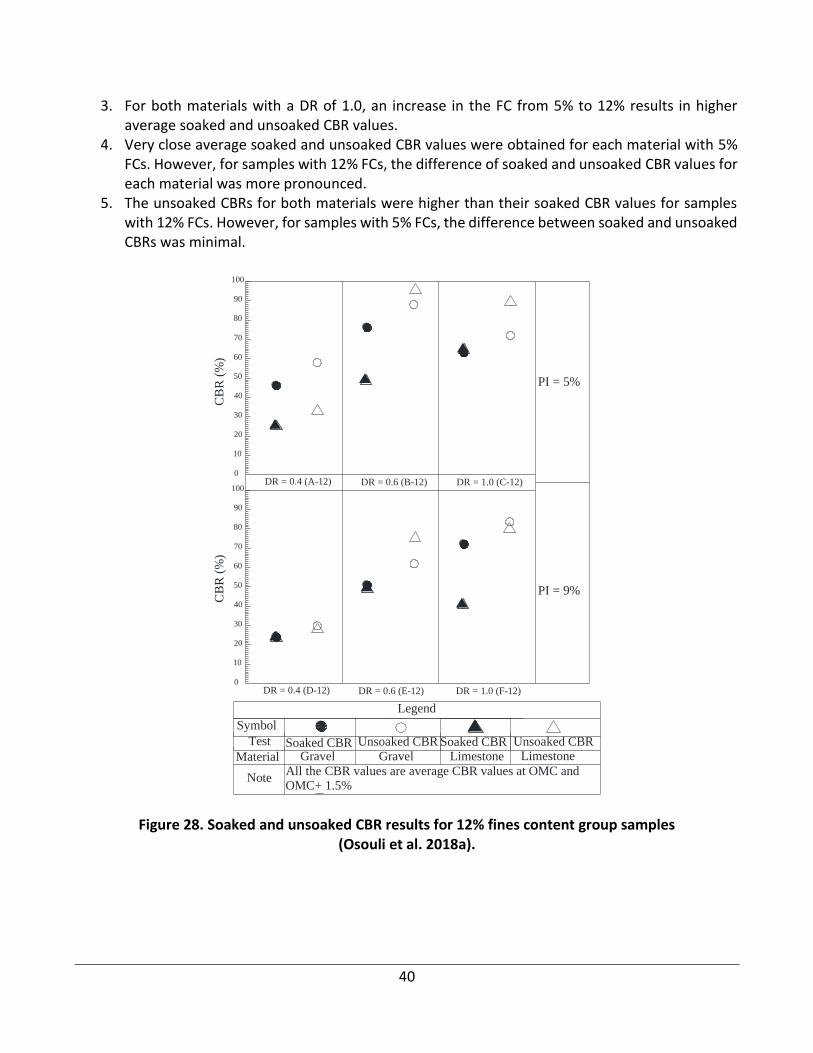
40
3. For both materials with a DR of 1.0, an increase in the FC from 5% to 12% results in higher average soaked and unsoaked CBR values.
4. Very close average soaked and unsoaked CBR values were obtained for each material with 5% FCs. However, for samples with 12% FCs, the difference of soaked and unsoaked CBR values for each material was more pronounced.
5. The unsoaked CBRs for both materials were higher than their soaked CBR values for samples with 12% FCs. However, for samples with 5% FCs, the difference between soaked and unsoaked CBRs was minimal.
Figure 28. Soaked and unsoaked CBR results for 12% fines content group samples (Osouli et al. 2018a).
DR = 0.4 (A-12) DR = 0.6 (B-12) DR = 1.0 (C-12)
DR = 0.4 (D-12) DR = 0.6 (E-12) DR = 1.0 (F-12)
PI = 9%
PI = 5%
20
30
40
50
60
70
80
90
100
10
0
20
30
40
50
60
70
80
90
100
10
0
CB
R (
%)
CB
R (
%)
Legend
Symbol
Test Soaked CBR Unsoaked CBR Soaked CBR Unsoaked CBR
Material Gravel Gravel Limestone Limestone
NoteAll the CBR values are average CBR values at OMC andOMC+ 1.5%
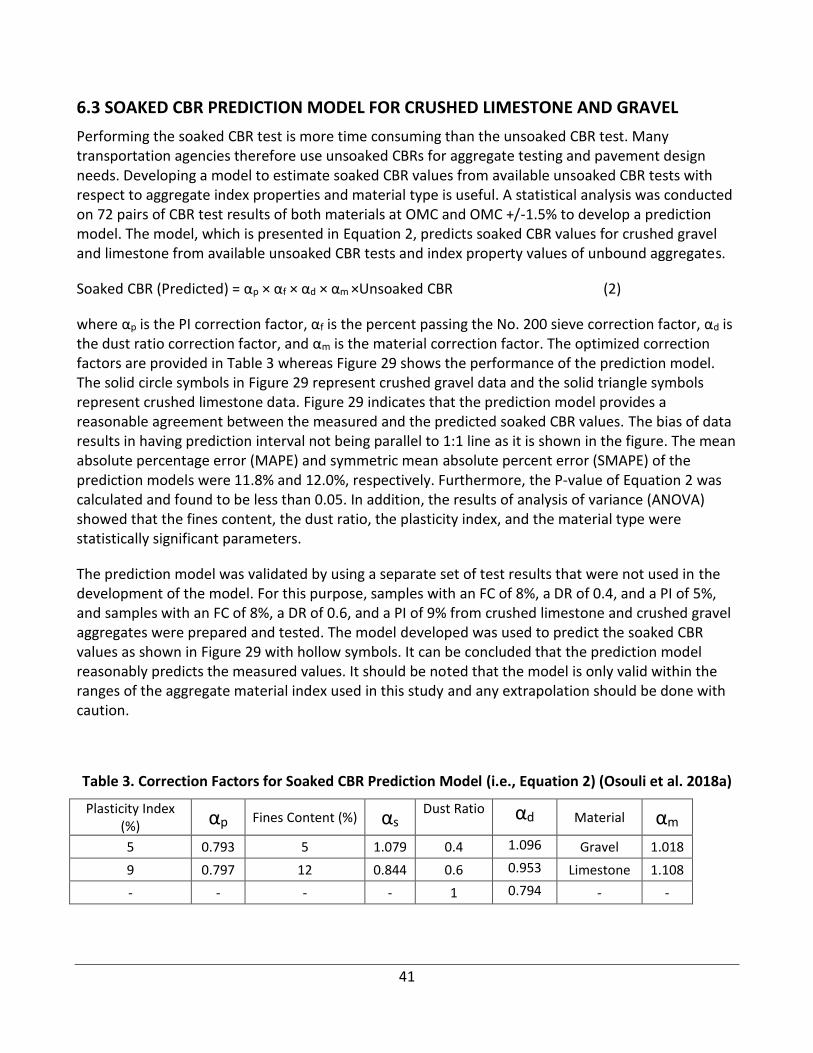
41
6.3 SOAKED CBR PREDICTION MODEL FOR CRUSHED LIMESTONE AND GRAVEL
Performing the soaked CBR test is more time consuming than the unsoaked CBR test. Many transportation agencies therefore use unsoaked CBRs for aggregate testing and pavement design needs. Developing a model to estimate soaked CBR values from available unsoaked CBR tests with respect to aggregate index properties and material type is useful. A statistical analysis was conducted on 72 pairs of CBR test results of both materials at OMC and OMC +/-1.5% to develop a prediction model. The model, which is presented in Equation 2, predicts soaked CBR values for crushed gravel and limestone from available unsoaked CBR tests and index property values of unbound aggregates.
Soaked CBR (Predicted) = αp × αf × αd × αm ×Unsoaked CBR (2)
where αp is the PI correction factor, αf is the percent passing the No. 200 sieve correction factor, αd is the dust ratio correction factor, and αm is the material correction factor. The optimized correction factors are provided in Table 3 whereas Figure 29 shows the performance of the prediction model. The solid circle symbols in Figure 29 represent crushed gravel data and the solid triangle symbols represent crushed limestone data. Figure 29 indicates that the prediction model provides a reasonable agreement between the measured and the predicted soaked CBR values. The bias of data results in having prediction interval not being parallel to 1:1 line as it is shown in the figure. The mean absolute percentage error (MAPE) and symmetric mean absolute percent error (SMAPE) of the prediction models were 11.8% and 12.0%, respectively. Furthermore, the P-value of Equation 2 was calculated and found to be less than 0.05. In addition, the results of analysis of variance (ANOVA) showed that the fines content, the dust ratio, the plasticity index, and the material type were statistically significant parameters.
The prediction model was validated by using a separate set of test results that were not used in the development of the model. For this purpose, samples with an FC of 8%, a DR of 0.4, and a PI of 5%, and samples with an FC of 8%, a DR of 0.6, and a PI of 9% from crushed limestone and crushed gravel aggregates were prepared and tested. The model developed was used to predict the soaked CBR values as shown in Figure 29 with hollow symbols. It can be concluded that the prediction model reasonably predicts the measured values. It should be noted that the model is only valid within the ranges of the aggregate material index used in this study and any extrapolation should be done with caution.
Table 3. Correction Factors for Soaked CBR Prediction Model (i.e., Equation 2) (Osouli et al. 2018a)
Plasticity Index (%) αp Fines Content (%) αs
Dust Ratio αd Material αm
5 0.793 5 1.079 0.4 1.096 Gravel 1.018
9 0.797 12 0.844 0.6 0.953 Limestone 1.108
- - - - 1 0.794 - -
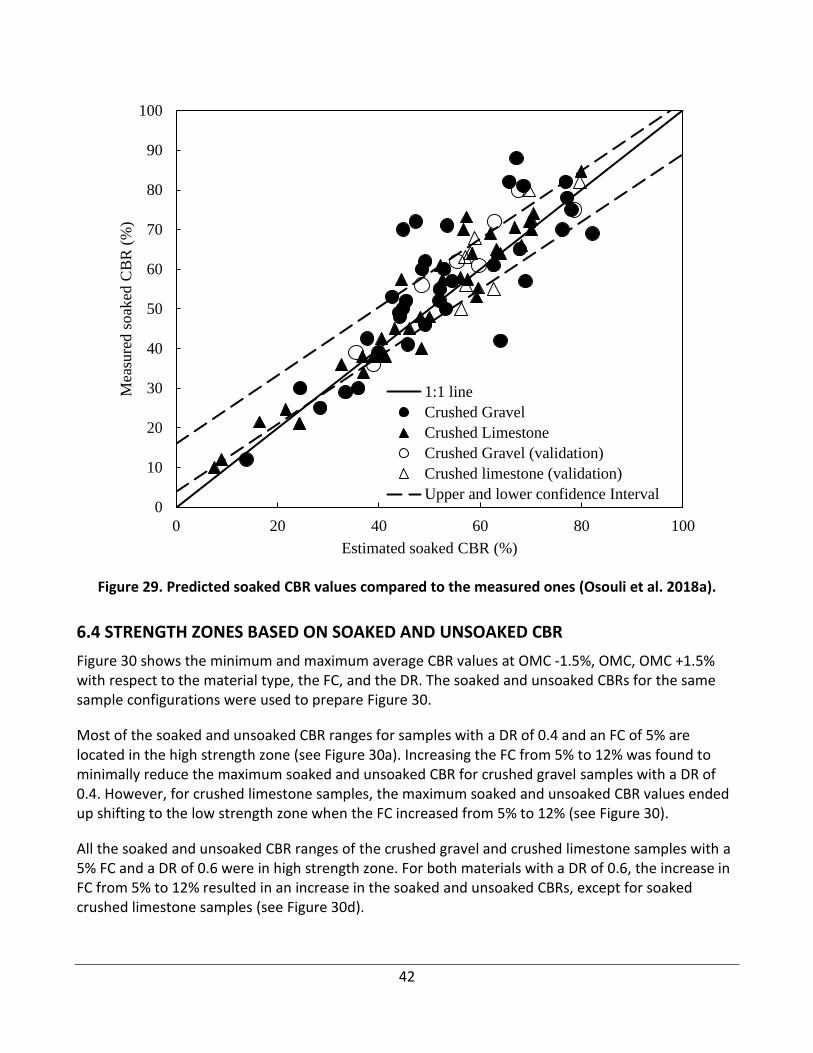
42
Figure 29. Predicted soaked CBR values compared to the measured ones (Osouli et al. 2018a).
6.4 STRENGTH ZONES BASED ON SOAKED AND UNSOAKED CBR
Figure 30 shows the minimum and maximum average CBR values at OMC -1.5%, OMC, OMC +1.5% with respect to the material type, the FC, and the DR. The soaked and unsoaked CBRs for the same sample configurations were used to prepare Figure 30.
Most of the soaked and unsoaked CBR ranges for samples with a DR of 0.4 and an FC of 5% are located in the high strength zone (see Figure 30a). Increasing the FC from 5% to 12% was found to minimally reduce the maximum soaked and unsoaked CBR for crushed gravel samples with a DR of 0.4. However, for crushed limestone samples, the maximum soaked and unsoaked CBR values ended up shifting to the low strength zone when the FC increased from 5% to 12% (see Figure 30).
All the soaked and unsoaked CBR ranges of the crushed gravel and crushed limestone samples with a 5% FC and a DR of 0.6 were in high strength zone. For both materials with a DR of 0.6, the increase in FC from 5% to 12% resulted in an increase in the soaked and unsoaked CBRs, except for soaked crushed limestone samples (see Figure 30d).
0
10
20
30
40
50
60
70
80
90
100
0 20 40 60 80 100
Mea
sure
d s
oak
ed C
BR
(%
)
Estimated soaked CBR (%)
1:1 line
Crushed Gravel
Crushed Limestone
Crushed Gravel (validation)
Crushed limestone (validation)
Upper and lower confidence Interval
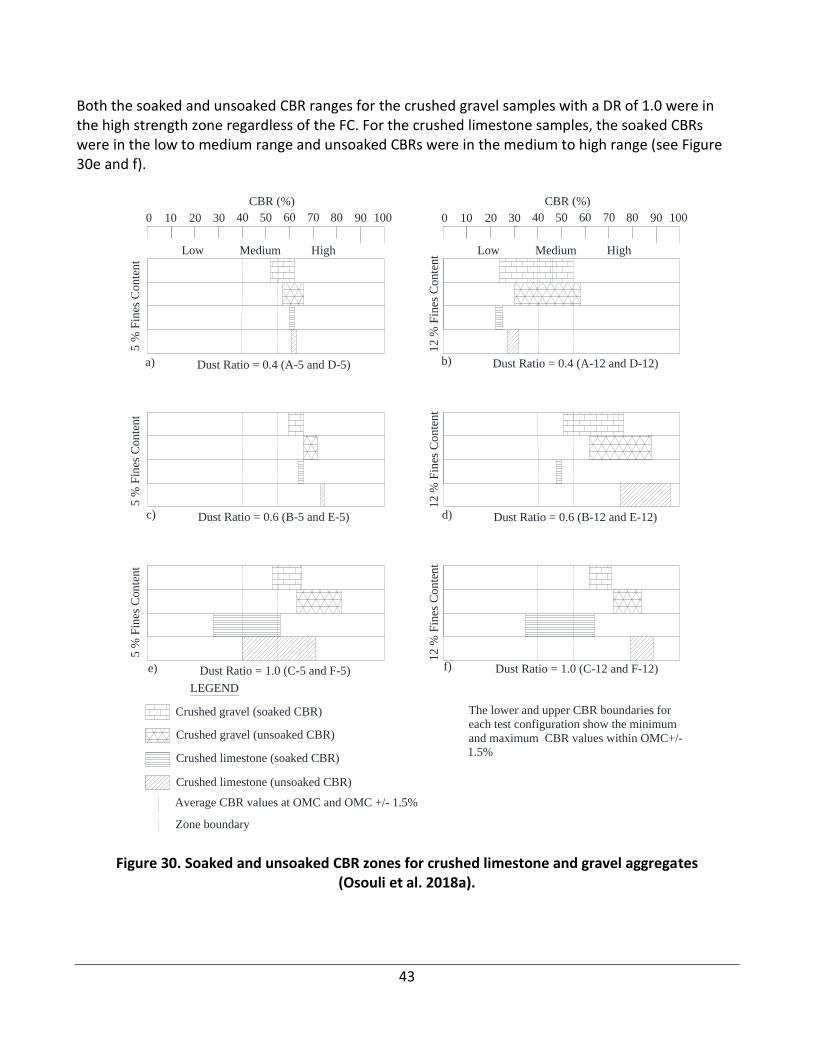
43
Both the soaked and unsoaked CBR ranges for the crushed gravel samples with a DR of 1.0 were in the high strength zone regardless of the FC. For the crushed limestone samples, the soaked CBRs were in the low to medium range and unsoaked CBRs were in the medium to high range (see Figure 30e and f).
Figure 30. Soaked and unsoaked CBR zones for crushed limestone and gravel aggregates (Osouli et al. 2018a).
0 10 20 30 40 50 60 70 80 90 100
Low Medium High
Dust Ratio = 0.4 (A-5 and D-5)
Crushed gravel (soaked CBR)
Crushed gravel (unsoaked CBR)
Crushed limestone (soaked CBR)
a)
LEGEND
CBR (%)
Dust Ratio = 0.4 (A-12 and D-12)b)
Crushed limestone (unsoaked CBR)
0 10 20 30 40 50 60 70 80 90 100
Low Medium High
CBR (%)
5 %
Fin
es C
on
ten
t
Dust Ratio = 0.6 (B-5 and E-5)c) Dust Ratio = 0.6 (B-12 and E-12)d)
Dust Ratio = 1.0 (C-5 and F-5)e) Dust Ratio = 1.0 (C-12 and F-12)f)
5 %
Fin
es C
on
ten
t5
% F
ines
Con
ten
t
12
% F
ines
Co
nte
nt
12
% F
ines
Co
nte
nt
12
% F
ines
Co
nte
nt
Zone boundary
Average CBR values at OMC and OMC +/- 1.5%
The lower and upper CBR boundaries for
each test configuration show the minimum
and maximum CBR values within OMC+/-1.5%
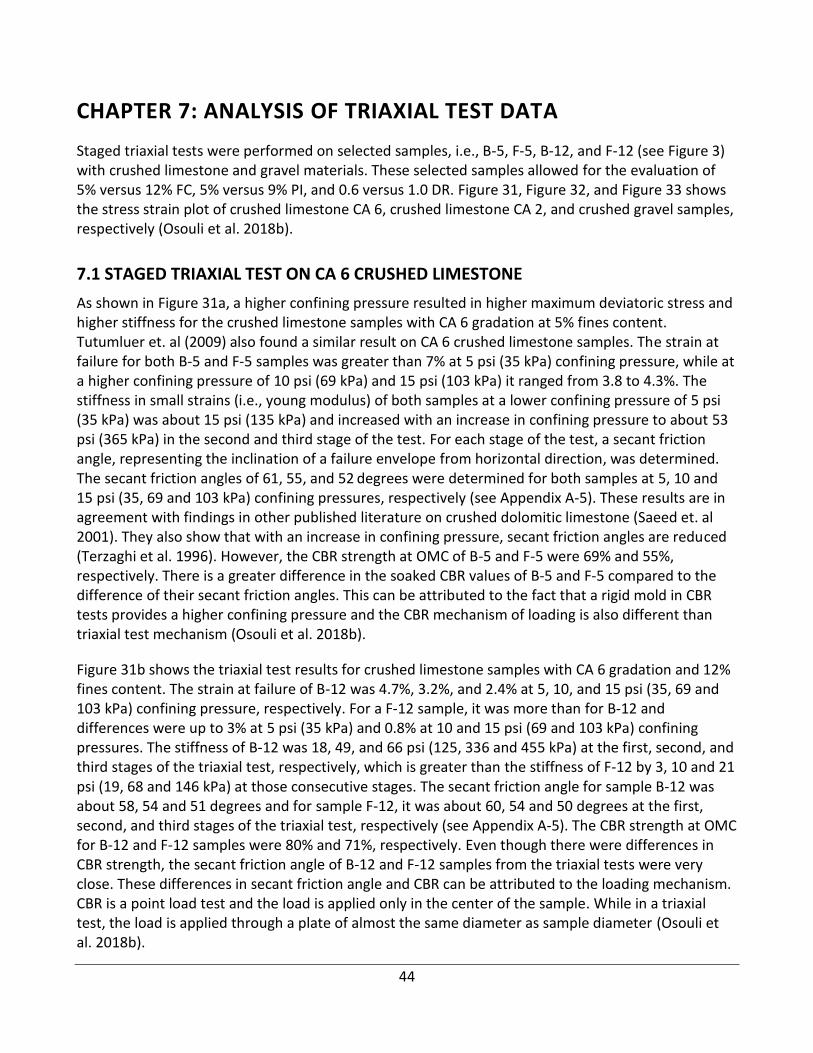
44
CHAPTER 7: ANALYSIS OF TRIAXIAL TEST DATA
Staged triaxial tests were performed on selected samples, i.e., B-5, F-5, B-12, and F-12 (see Figure 3) with crushed limestone and gravel materials. These selected samples allowed for the evaluation of 5% versus 12% FC, 5% versus 9% PI, and 0.6 versus 1.0 DR. Figure 31, Figure 32, and Figure 33 shows the stress strain plot of crushed limestone CA 6, crushed limestone CA 2, and crushed gravel samples, respectively (Osouli et al. 2018b).
7.1 STAGED TRIAXIAL TEST ON CA 6 CRUSHED LIMESTONE
As shown in Figure 31a, a higher confining pressure resulted in higher maximum deviatoric stress and higher stiffness for the crushed limestone samples with CA 6 gradation at 5% fines content. Tutumluer et. al (2009) also found a similar result on CA 6 crushed limestone samples. The strain at failure for both B-5 and F-5 samples was greater than 7% at 5 psi (35 kPa) confining pressure, while at a higher confining pressure of 10 psi (69 kPa) and 15 psi (103 kPa) it ranged from 3.8 to 4.3%. The stiffness in small strains (i.e., young modulus) of both samples at a lower confining pressure of 5 psi (35 kPa) was about 15 psi (135 kPa) and increased with an increase in confining pressure to about 53 psi (365 kPa) in the second and third stage of the test. For each stage of the test, a secant friction angle, representing the inclination of a failure envelope from horizontal direction, was determined. The secant friction angles of 61, 55, and 52 degrees were determined for both samples at 5, 10 and 15 psi (35, 69 and 103 kPa) confining pressures, respectively (see Appendix A-5). These results are in agreement with findings in other published literature on crushed dolomitic limestone (Saeed et. al 2001). They also show that with an increase in confining pressure, secant friction angles are reduced (Terzaghi et al. 1996). However, the CBR strength at OMC of B-5 and F-5 were 69% and 55%, respectively. There is a greater difference in the soaked CBR values of B-5 and F-5 compared to the difference of their secant friction angles. This can be attributed to the fact that a rigid mold in CBR tests provides a higher confining pressure and the CBR mechanism of loading is also different than triaxial test mechanism (Osouli et al. 2018b).
Figure 31b shows the triaxial test results for crushed limestone samples with CA 6 gradation and 12% fines content. The strain at failure of B-12 was 4.7%, 3.2%, and 2.4% at 5, 10, and 15 psi (35, 69 and 103 kPa) confining pressure, respectively. For a F-12 sample, it was more than for B-12 and differences were up to 3% at 5 psi (35 kPa) and 0.8% at 10 and 15 psi (69 and 103 kPa) confining pressures. The stiffness of B-12 was 18, 49, and 66 psi (125, 336 and 455 kPa) at the first, second, and third stages of the triaxial test, respectively, which is greater than the stiffness of F-12 by 3, 10 and 21 psi (19, 68 and 146 kPa) at those consecutive stages. The secant friction angle for sample B-12 was about 58, 54 and 51 degrees and for sample F-12, it was about 60, 54 and 50 degrees at the first, second, and third stages of the triaxial test, respectively (see Appendix A-5). The CBR strength at OMC for B-12 and F-12 samples were 80% and 71%, respectively. Even though there were differences in CBR strength, the secant friction angle of B-12 and F-12 samples from the triaxial tests were very close. These differences in secant friction angle and CBR can be attributed to the loading mechanism. CBR is a point load test and the load is applied only in the center of the sample. While in a triaxial test, the load is applied through a plate of almost the same diameter as sample diameter (Osouli et al. 2018b).
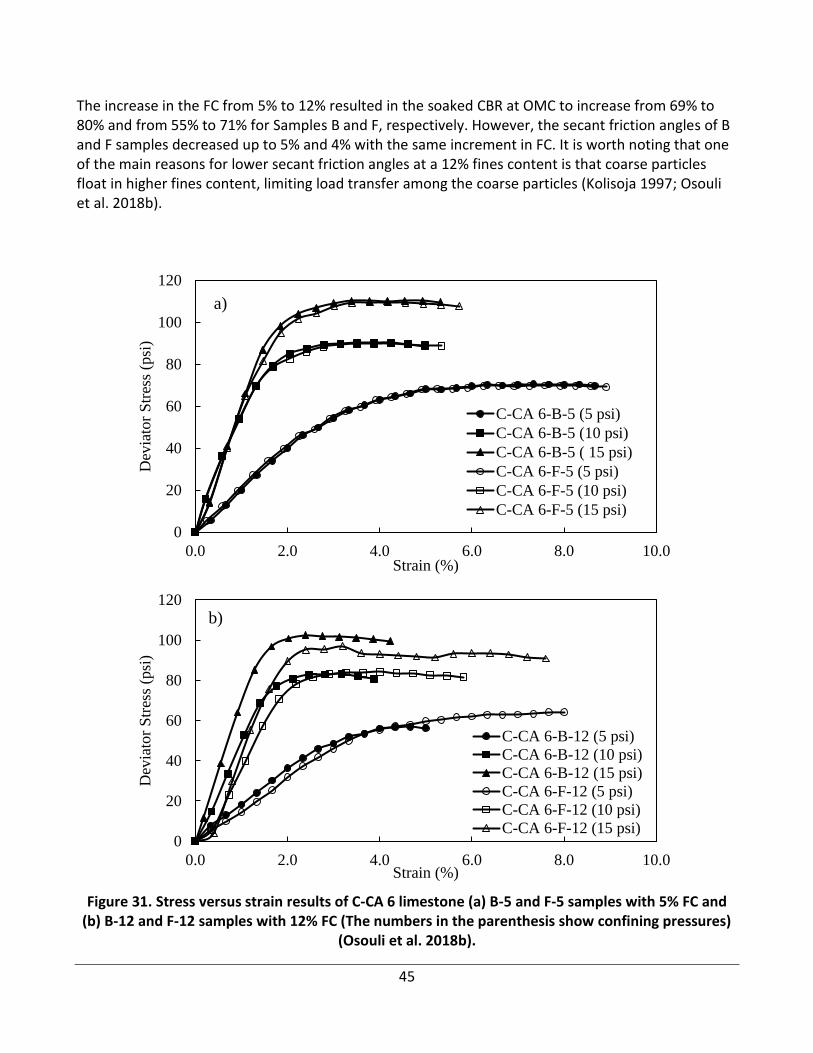
45
The increase in the FC from 5% to 12% resulted in the soaked CBR at OMC to increase from 69% to 80% and from 55% to 71% for Samples B and F, respectively. However, the secant friction angles of B and F samples decreased up to 5% and 4% with the same increment in FC. It is worth noting that one of the main reasons for lower secant friction angles at a 12% fines content is that coarse particles float in higher fines content, limiting load transfer among the coarse particles (Kolisoja 1997; Osouli et al. 2018b).
Figure 31. Stress versus strain results of C-CA 6 limestone (a) B-5 and F-5 samples with 5% FC and (b) B-12 and F-12 samples with 12% FC (The numbers in the parenthesis show confining pressures)
(Osouli et al. 2018b).
0
20
40
60
80
100
120
0.0 2.0 4.0 6.0 8.0 10.0
Dev
iato
r S
tres
s (p
si)
Strain (%)
C-CA 6-B-5 (5 psi)
C-CA 6-B-5 (10 psi)
C-CA 6-B-5 ( 15 psi)
C-CA 6-F-5 (5 psi)
C-CA 6-F-5 (10 psi)
C-CA 6-F-5 (15 psi)
a)
0
20
40
60
80
100
120
0.0 2.0 4.0 6.0 8.0 10.0
Dev
iato
r S
tres
s (p
si)
Strain (%)
C-CA 6-B-12 (5 psi)
C-CA 6-B-12 (10 psi)
C-CA 6-B-12 (15 psi)
C-CA 6-F-12 (5 psi)
C-CA 6-F-12 (10 psi)
C-CA 6-F-12 (15 psi)
b)
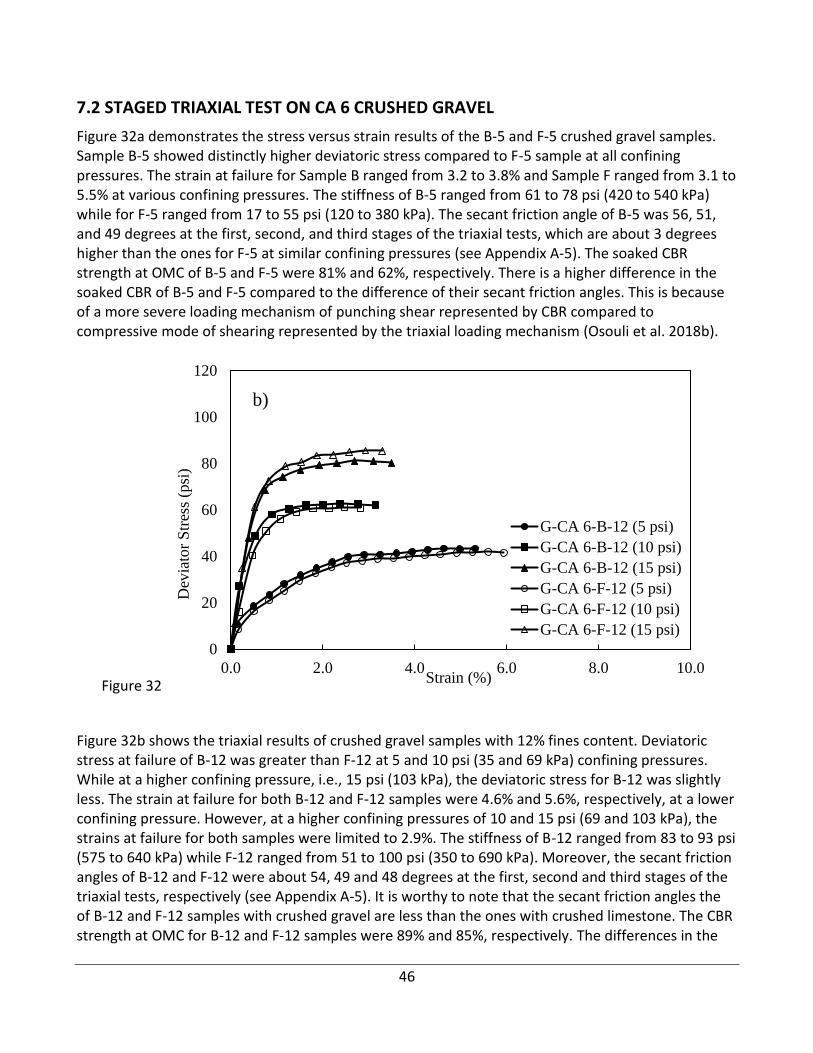
46
7.2 STAGED TRIAXIAL TEST ON CA 6 CRUSHED GRAVEL
Figure 32a demonstrates the stress versus strain results of the B-5 and F-5 crushed gravel samples. Sample B-5 showed distinctly higher deviatoric stress compared to F-5 sample at all confining pressures. The strain at failure for Sample B ranged from 3.2 to 3.8% and Sample F ranged from 3.1 to 5.5% at various confining pressures. The stiffness of B-5 ranged from 61 to 78 psi (420 to 540 kPa) while for F-5 ranged from 17 to 55 psi (120 to 380 kPa). The secant friction angle of B-5 was 56, 51, and 49 degrees at the first, second, and third stages of the triaxial tests, which are about 3 degrees higher than the ones for F-5 at similar confining pressures (see Appendix A-5). The soaked CBR strength at OMC of B-5 and F-5 were 81% and 62%, respectively. There is a higher difference in the soaked CBR of B-5 and F-5 compared to the difference of their secant friction angles. This is because of a more severe loading mechanism of punching shear represented by CBR compared to compressive mode of shearing represented by the triaxial loading mechanism (Osouli et al. 2018b).
Figure 32
Figure 32b shows the triaxial results of crushed gravel samples with 12% fines content. Deviatoric stress at failure of B-12 was greater than F-12 at 5 and 10 psi (35 and 69 kPa) confining pressures. While at a higher confining pressure, i.e., 15 psi (103 kPa), the deviatoric stress for B-12 was slightly less. The strain at failure for both B-12 and F-12 samples were 4.6% and 5.6%, respectively, at a lower confining pressure. However, at a higher confining pressures of 10 and 15 psi (69 and 103 kPa), the strains at failure for both samples were limited to 2.9%. The stiffness of B-12 ranged from 83 to 93 psi (575 to 640 kPa) while F-12 ranged from 51 to 100 psi (350 to 690 kPa). Moreover, the secant friction angles of B-12 and F-12 were about 54, 49 and 48 degrees at the first, second and third stages of the triaxial tests, respectively (see Appendix A-5). It is worthy to note that the secant friction angles the of B-12 and F-12 samples with crushed gravel are less than the ones with crushed limestone. The CBR strength at OMC for B-12 and F-12 samples were 89% and 85%, respectively. The differences in the
0
20
40
60
80
100
120
0.0 2.0 4.0 6.0 8.0 10.0
Dev
iato
r S
tres
s (p
si)
Strain (%)
b)
G-CA 6-B-12 (5 psi)
G-CA 6-B-12 (10 psi)
G-CA 6-B-12 (15 psi)
G-CA 6-F-12 (5 psi)
G-CA 6-F-12 (10 psi)
G-CA 6-F-12 (15 psi)
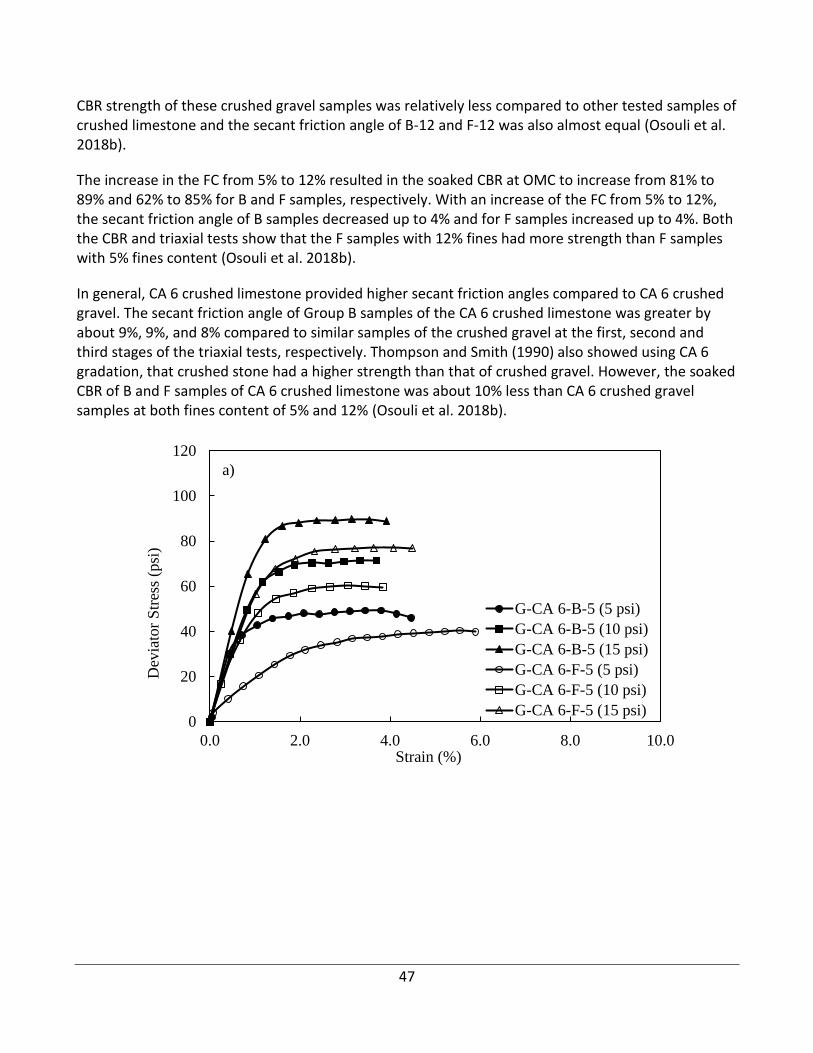
47
CBR strength of these crushed gravel samples was relatively less compared to other tested samples of crushed limestone and the secant friction angle of B-12 and F-12 was also almost equal (Osouli et al. 2018b).
The increase in the FC from 5% to 12% resulted in the soaked CBR at OMC to increase from 81% to 89% and 62% to 85% for B and F samples, respectively. With an increase of the FC from 5% to 12%, the secant friction angle of B samples decreased up to 4% and for F samples increased up to 4%. Both the CBR and triaxial tests show that the F samples with 12% fines had more strength than F samples with 5% fines content (Osouli et al. 2018b).
In general, CA 6 crushed limestone provided higher secant friction angles compared to CA 6 crushed gravel. The secant friction angle of Group B samples of the CA 6 crushed limestone was greater by about 9%, 9%, and 8% compared to similar samples of the crushed gravel at the first, second and third stages of the triaxial tests, respectively. Thompson and Smith (1990) also showed using CA 6 gradation, that crushed stone had a higher strength than that of crushed gravel. However, the soaked CBR of B and F samples of CA 6 crushed limestone was about 10% less than CA 6 crushed gravel samples at both fines content of 5% and 12% (Osouli et al. 2018b).
0
20
40
60
80
100
120
0.0 2.0 4.0 6.0 8.0 10.0
Dev
iato
r S
tres
s (p
si)
Strain (%)
a)
G-CA 6-B-5 (5 psi)
G-CA 6-B-5 (10 psi)
G-CA 6-B-5 (15 psi)
G-CA 6-F-5 (5 psi)
G-CA 6-F-5 (10 psi)
G-CA 6-F-5 (15 psi)
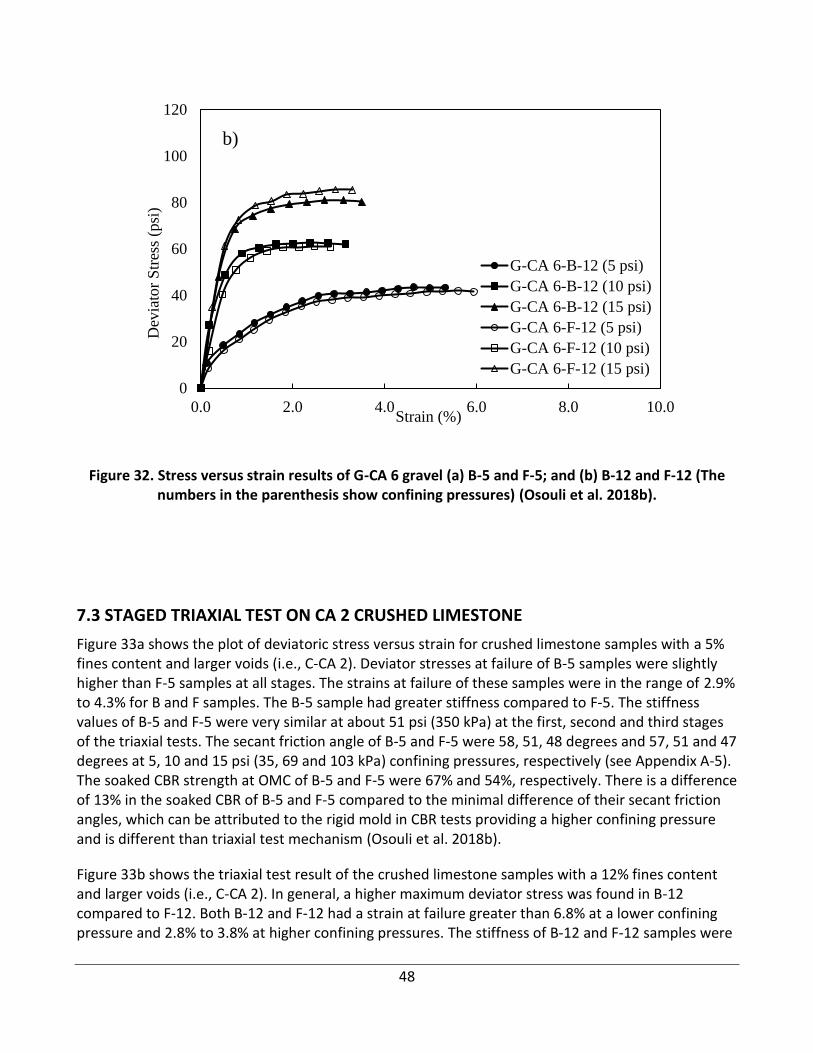
48
Figure 32. Stress versus strain results of G-CA 6 gravel (a) B-5 and F-5; and (b) B-12 and F-12 (The numbers in the parenthesis show confining pressures) (Osouli et al. 2018b).
7.3 STAGED TRIAXIAL TEST ON CA 2 CRUSHED LIMESTONE
Figure 33a shows the plot of deviatoric stress versus strain for crushed limestone samples with a 5% fines content and larger voids (i.e., C-CA 2). Deviator stresses at failure of B-5 samples were slightly higher than F-5 samples at all stages. The strains at failure of these samples were in the range of 2.9% to 4.3% for B and F samples. The B-5 sample had greater stiffness compared to F-5. The stiffness values of B-5 and F-5 were very similar at about 51 psi (350 kPa) at the first, second and third stages of the triaxial tests. The secant friction angle of B-5 and F-5 were 58, 51, 48 degrees and 57, 51 and 47 degrees at 5, 10 and 15 psi (35, 69 and 103 kPa) confining pressures, respectively (see Appendix A-5). The soaked CBR strength at OMC of B-5 and F-5 were 67% and 54%, respectively. There is a difference of 13% in the soaked CBR of B-5 and F-5 compared to the minimal difference of their secant friction angles, which can be attributed to the rigid mold in CBR tests providing a higher confining pressure and is different than triaxial test mechanism (Osouli et al. 2018b).
Figure 33b shows the triaxial test result of the crushed limestone samples with a 12% fines content and larger voids (i.e., C-CA 2). In general, a higher maximum deviator stress was found in B-12 compared to F-12. Both B-12 and F-12 had a strain at failure greater than 6.8% at a lower confining pressure and 2.8% to 3.8% at higher confining pressures. The stiffness of B-12 and F-12 samples were
0
20
40
60
80
100
120
0.0 2.0 4.0 6.0 8.0 10.0
Dev
iato
r S
tres
s (p
si)
Strain (%)
b)
G-CA 6-B-12 (5 psi)
G-CA 6-B-12 (10 psi)
G-CA 6-B-12 (15 psi)
G-CA 6-F-12 (5 psi)
G-CA 6-F-12 (10 psi)
G-CA 6-F-12 (15 psi)
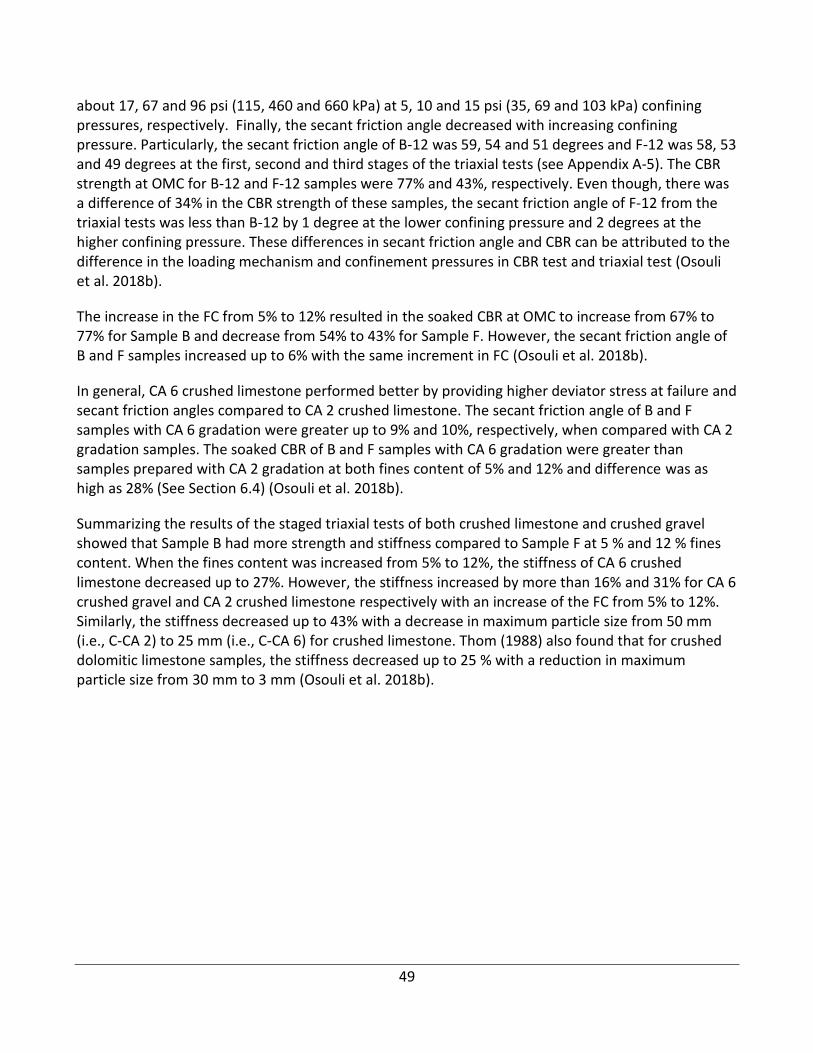
49
about 17, 67 and 96 psi (115, 460 and 660 kPa) at 5, 10 and 15 psi (35, 69 and 103 kPa) confining pressures, respectively. Finally, the secant friction angle decreased with increasing confining pressure. Particularly, the secant friction angle of B-12 was 59, 54 and 51 degrees and F-12 was 58, 53 and 49 degrees at the first, second and third stages of the triaxial tests (see Appendix A-5). The CBR strength at OMC for B-12 and F-12 samples were 77% and 43%, respectively. Even though, there was a difference of 34% in the CBR strength of these samples, the secant friction angle of F-12 from the triaxial tests was less than B-12 by 1 degree at the lower confining pressure and 2 degrees at the higher confining pressure. These differences in secant friction angle and CBR can be attributed to the difference in the loading mechanism and confinement pressures in CBR test and triaxial test (Osouli et al. 2018b).
The increase in the FC from 5% to 12% resulted in the soaked CBR at OMC to increase from 67% to 77% for Sample B and decrease from 54% to 43% for Sample F. However, the secant friction angle of B and F samples increased up to 6% with the same increment in FC (Osouli et al. 2018b).
In general, CA 6 crushed limestone performed better by providing higher deviator stress at failure and secant friction angles compared to CA 2 crushed limestone. The secant friction angle of B and F samples with CA 6 gradation were greater up to 9% and 10%, respectively, when compared with CA 2 gradation samples. The soaked CBR of B and F samples with CA 6 gradation were greater than samples prepared with CA 2 gradation at both fines content of 5% and 12% and difference was as high as 28% (See Section 6.4) (Osouli et al. 2018b).
Summarizing the results of the staged triaxial tests of both crushed limestone and crushed gravel showed that Sample B had more strength and stiffness compared to Sample F at 5 % and 12 % fines content. When the fines content was increased from 5% to 12%, the stiffness of CA 6 crushed limestone decreased up to 27%. However, the stiffness increased by more than 16% and 31% for CA 6 crushed gravel and CA 2 crushed limestone respectively with an increase of the FC from 5% to 12%. Similarly, the stiffness decreased up to 43% with a decrease in maximum particle size from 50 mm (i.e., C-CA 2) to 25 mm (i.e., C-CA 6) for crushed limestone. Thom (1988) also found that for crushed dolomitic limestone samples, the stiffness decreased up to 25 % with a reduction in maximum particle size from 30 mm to 3 mm (Osouli et al. 2018b).
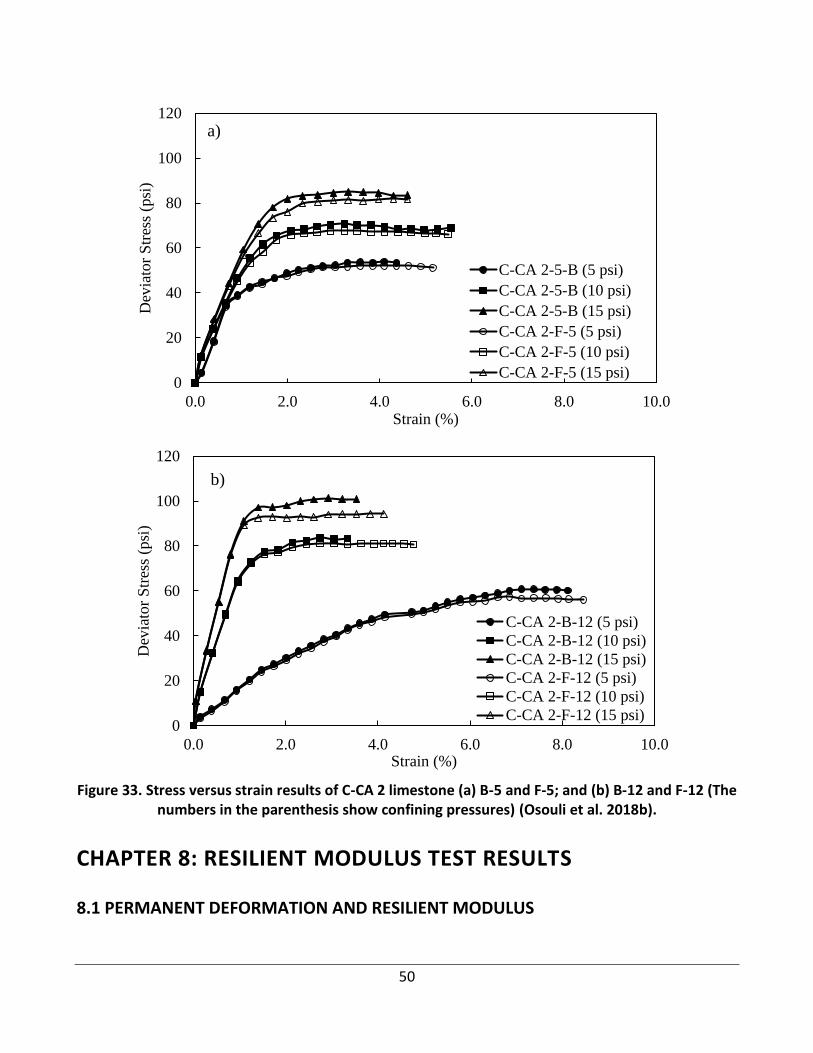
50
Figure 33. Stress versus strain results of C-CA 2 limestone (a) B-5 and F-5; and (b) B-12 and F-12 (The numbers in the parenthesis show confining pressures) (Osouli et al. 2018b).
CHAPTER 8: RESILIENT MODULUS TEST RESULTS
8.1 PERMANENT DEFORMATION AND RESILIENT MODULUS
0
20
40
60
80
100
120
0.0 2.0 4.0 6.0 8.0 10.0
Dev
iato
r S
tres
s (p
si)
Strain (%)
C-CA 2-5-B (5 psi)
C-CA 2-5-B (10 psi)
C-CA 2-5-B (15 psi)
C-CA 2-F-5 (5 psi)
C-CA 2-F-5 (10 psi)
C-CA 2-F-5 (15 psi)
a)
0
20
40
60
80
100
120
0.0 2.0 4.0 6.0 8.0 10.0
Dev
iato
r S
tres
s (p
si)
Strain (%)
C-CA 2-B-12 (5 psi)
C-CA 2-B-12 (10 psi)
C-CA 2-B-12 (15 psi)
C-CA 2-F-12 (5 psi)
C-CA 2-F-12 (10 psi)
C-CA 2-F-12 (15 psi)
b)
51
It should be mentioned that the figures plotted in SI units in this chapter were also plotted in US units and are presented in Appendix A-6.
8.1.1 Crushed Limestone CA 6
Figure 34 and Figure 35 show the permanent deformation and resilient modulus variation of CA 6 crushed limestone, respectively. In these plots, hollow, solid gray, and solid black symbols represent the material with 5%, 8%, and 12% fines content, respectively. For samples with an FC of 5% and a DR of 0.6, with an increase in the PI from 5% to 9% (i.e., C- CA 6- B- 5 to C- CA 6- E- 5), the ultimate permanent deformation increased by 56%, and resilient modulus decreased by 15% to 30% depending on the level of confining pressures. The reductions of the resilient modulus in the tests were larger for lower confining pressures. A very similar observation was made for samples with an FC of 12% (i.e., C- CA 6- B- 12 to C- CA 6- E- 12) (Osouli et al. 2018c).
For samples with a DR of 0.6 and a PI of 5%, with an increase of the FC from 5% to 8% (i.e., C- CA 6- B- 5 to C- CA 6- B- 8), the ultimate permanent deformation was reduced by 33%, and the resilient modulus was increased by 13 to 50% depending on confining pressures. With an increase of the FC from 5% to 12% (i.e., C- CA 6- B- 5 to C- CA 6- B- 12), the ultimate permanent deformation increased by more than four times and the resilient modulus decreased by 18 to 44%. Larger reductions in resilient moduli occurred when the samples were subjected to low confining pressures. The lower permanent deformation of aggregate sample with an FC of 8% is different than other FCs because of optimum combination of fines content and coarse particles resulting in better interlocking. When the fines content is low (i.e., 5%), there is more void space in the aggregate matrix and hence permanent deformation increases due to the instability of coarser particles and their potential rearrangements. This is similar to findings by Tutumluer et al. (2009). On the other hand, at a high FC (i.e., 12%), the state of coarse particles are transitioning from being in contact with each other to floating in fines. Therefore, permanent deformation is increased due to less direct contact between coarser grains and a corresponding increase in instability. For samples with a DR of 0.6, but higher PIs (i.e., 9%) similar observations were made. The increase in the FC from 5% to 12% (i.e., C- CA 6- E- 5 to C- CA 6- E- 12) results in about four times higher permanent deformation and 16% to 40% lower resilient modulus depending on confining pressures (Osouli et al. 2018c).
For samples with a DR of 0.4 and a PI of 5%, an increase in the FC from 5% to 12% (i.e., C- CA 6- A- 5 to C- CA 6- A-12) results in excessive permanent deformation causing premature failure of the sample. However, for samples with a DR of 1.0 and a PI of 5%, with the increase of the FC from 5% to 12% (i.e., C- CA 6- C- 5 to C- CA 6- C- 12), the permanent deformation was reduced by 82% and the resilient modulus was increased by 6 to 46%. The possible reason is that at a higher DR and a lower FC, gradation consists of coarser material and deformation due to the increased rearrangement of coarser particles. On the other hand, at a higher DR and a higher FC, there would be enough fines content to provide better interlocking among the coarse grains causing less permanent deformation and recoverable deformation (Osouli et al. 2018c).
In samples with an FC of 5% and a PI of 5%, the change of the DR from 0.4 to 0.6 (i.e., C- CA 6- A- 5 to C- CA 6- B- 5) resulted in very similar permanent deformation and a slight decrease (i.e., less than 8%) in the resilient modulus values. However, with the increase of the DR from 0.6 to 1.0 (i.e., C- CA 6- B-
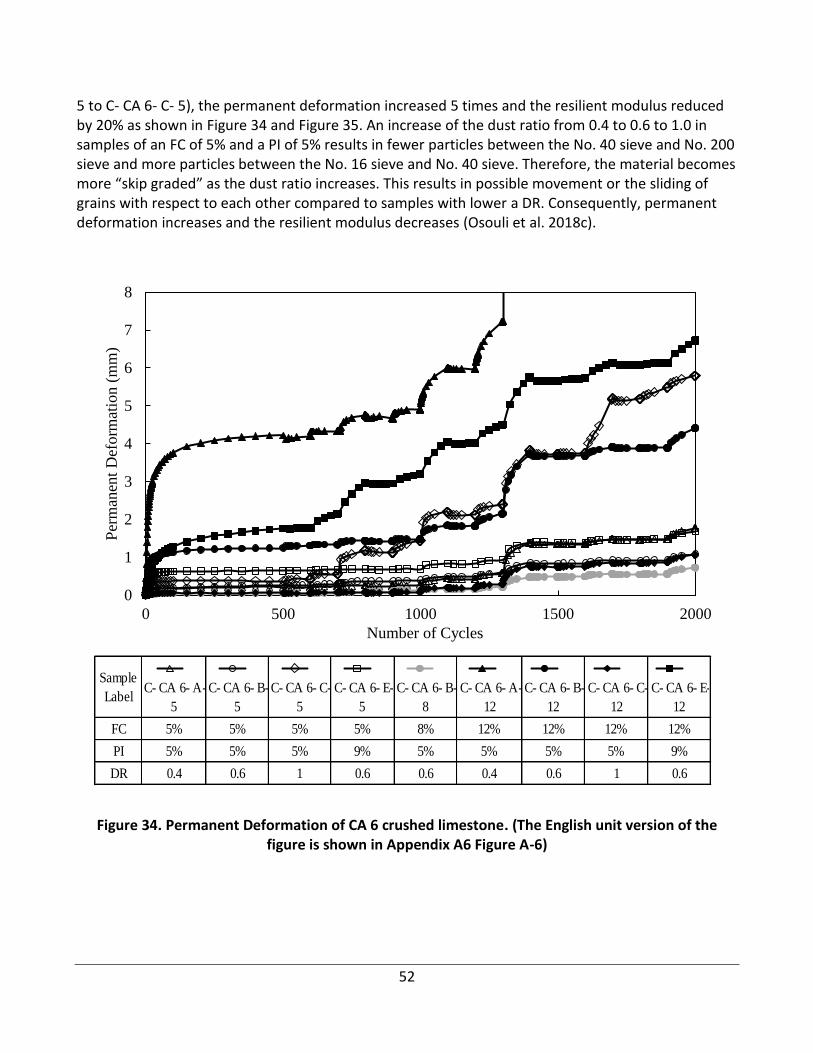
52
5 to C- CA 6- C- 5), the permanent deformation increased 5 times and the resilient modulus reduced by 20% as shown in Figure 34 and Figure 35. An increase of the dust ratio from 0.4 to 0.6 to 1.0 in samples of an FC of 5% and a PI of 5% results in fewer particles between the No. 40 sieve and No. 200 sieve and more particles between the No. 16 sieve and No. 40 sieve. Therefore, the material becomes more “skip graded” as the dust ratio increases. This results in possible movement or the sliding of grains with respect to each other compared to samples with lower a DR. Consequently, permanent deformation increases and the resilient modulus decreases (Osouli et al. 2018c).
Figure 34. Permanent Deformation of CA 6 crushed limestone. (The English unit version of the figure is shown in Appendix A6 Figure A-6)
0
1
2
3
4
5
6
7
8
0 500 1000 1500 2000
Per
man
ent
Def
orm
atio
n (
mm
)
Number of Cycles
Sample
LabelC- CA 6- A-
5
C- CA 6- B-
5
C- CA 6- C-
5
C- CA 6- E-
5
C- CA 6- B-
8
C- CA 6- A-
12
C- CA 6- B-
12
C- CA 6- C-
12
C- CA 6- E-
12
FC 5% 5% 5% 5% 8% 12% 12% 12% 12%
PI 5% 5% 5% 9% 5% 5% 5% 5% 9%
DR 0.4 0.6 1 0.6 0.6 0.4 0.6 1 0.6
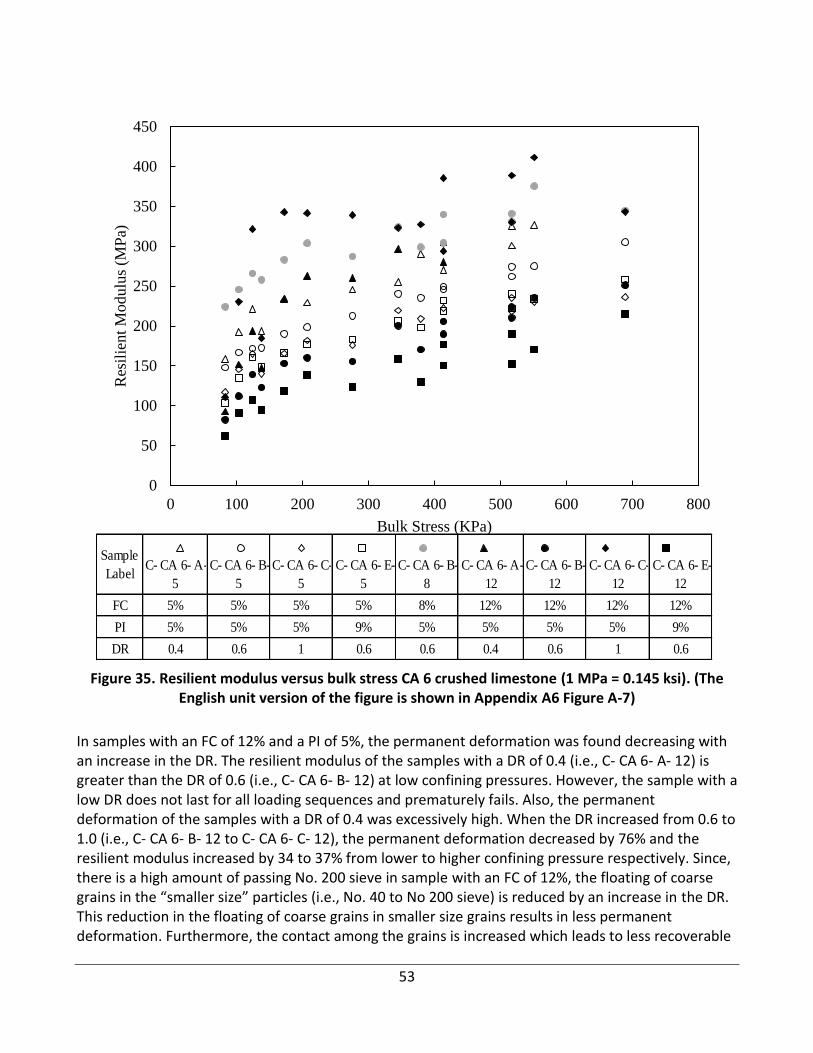
53
Figure 35. Resilient modulus versus bulk stress CA 6 crushed limestone (1 MPa = 0.145 ksi). (The English unit version of the figure is shown in Appendix A6 Figure A-7)
In samples with an FC of 12% and a PI of 5%, the permanent deformation was found decreasing with an increase in the DR. The resilient modulus of the samples with a DR of 0.4 (i.e., C- CA 6- A- 12) is greater than the DR of 0.6 (i.e., C- CA 6- B- 12) at low confining pressures. However, the sample with a low DR does not last for all loading sequences and prematurely fails. Also, the permanent deformation of the samples with a DR of 0.4 was excessively high. When the DR increased from 0.6 to 1.0 (i.e., C- CA 6- B- 12 to C- CA 6- C- 12), the permanent deformation decreased by 76% and the resilient modulus increased by 34 to 37% from lower to higher confining pressure respectively. Since, there is a high amount of passing No. 200 sieve in sample with an FC of 12%, the floating of coarse grains in the “smaller size” particles (i.e., No. 40 to No 200 sieve) is reduced by an increase in the DR. This reduction in the floating of coarse grains in smaller size grains results in less permanent deformation. Furthermore, the contact among the grains is increased which leads to less recoverable
0
50
100
150
200
250
300
350
400
450
0 100 200 300 400 500 600 700 800
Res
ilie
nt
Modulu
s (M
Pa)
Bulk Stress (KPa)
Sample
LabelC- CA 6- A-
5
C- CA 6- B-
5
C- CA 6- C-
5
C- CA 6- E-
5
C- CA 6- B-
8
C- CA 6- A-
12
C- CA 6- B-
12
C- CA 6- C-
12
C- CA 6- E-
12
FC 5% 5% 5% 5% 8% 12% 12% 12% 12%
PI 5% 5% 5% 9% 5% 5% 5% 5% 9%
DR 0.4 0.6 1 0.6 0.6 0.4 0.6 1 0.6
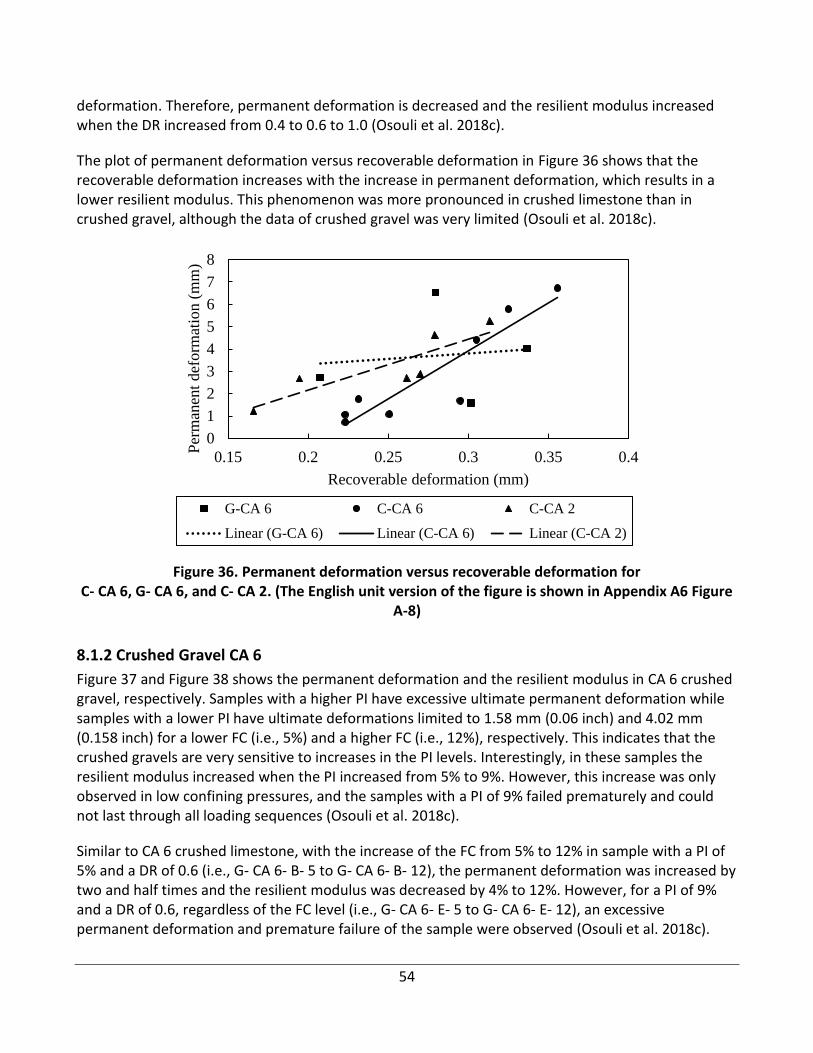
54
deformation. Therefore, permanent deformation is decreased and the resilient modulus increased when the DR increased from 0.4 to 0.6 to 1.0 (Osouli et al. 2018c).
The plot of permanent deformation versus recoverable deformation in Figure 36 shows that the recoverable deformation increases with the increase in permanent deformation, which results in a lower resilient modulus. This phenomenon was more pronounced in crushed limestone than in crushed gravel, although the data of crushed gravel was very limited (Osouli et al. 2018c).
Figure 36. Permanent deformation versus recoverable deformation for C- CA 6, G- CA 6, and C- CA 2. (The English unit version of the figure is shown in Appendix A6 Figure
A-8)
8.1.2 Crushed Gravel CA 6
Figure 37 and Figure 38 shows the permanent deformation and the resilient modulus in CA 6 crushed gravel, respectively. Samples with a higher PI have excessive ultimate permanent deformation while samples with a lower PI have ultimate deformations limited to 1.58 mm (0.06 inch) and 4.02 mm (0.158 inch) for a lower FC (i.e., 5%) and a higher FC (i.e., 12%), respectively. This indicates that the crushed gravels are very sensitive to increases in the PI levels. Interestingly, in these samples the resilient modulus increased when the PI increased from 5% to 9%. However, this increase was only observed in low confining pressures, and the samples with a PI of 9% failed prematurely and could not last through all loading sequences (Osouli et al. 2018c).
Similar to CA 6 crushed limestone, with the increase of the FC from 5% to 12% in sample with a PI of 5% and a DR of 0.6 (i.e., G- CA 6- B- 5 to G- CA 6- B- 12), the permanent deformation was increased by two and half times and the resilient modulus was decreased by 4% to 12%. However, for a PI of 9% and a DR of 0.6, regardless of the FC level (i.e., G- CA 6- E- 5 to G- CA 6- E- 12), an excessive permanent deformation and premature failure of the sample were observed (Osouli et al. 2018c).
0
1
2
3
4
5
6
7
8
0.15 0.2 0.25 0.3 0.35 0.4
Per
man
ent
def
orm
atio
n (
mm
)
Recoverable deformation (mm)
G-CA 6 C-CA 6 C-CA 2
Linear (G-CA 6) Linear (C-CA 6) Linear (C-CA 2)
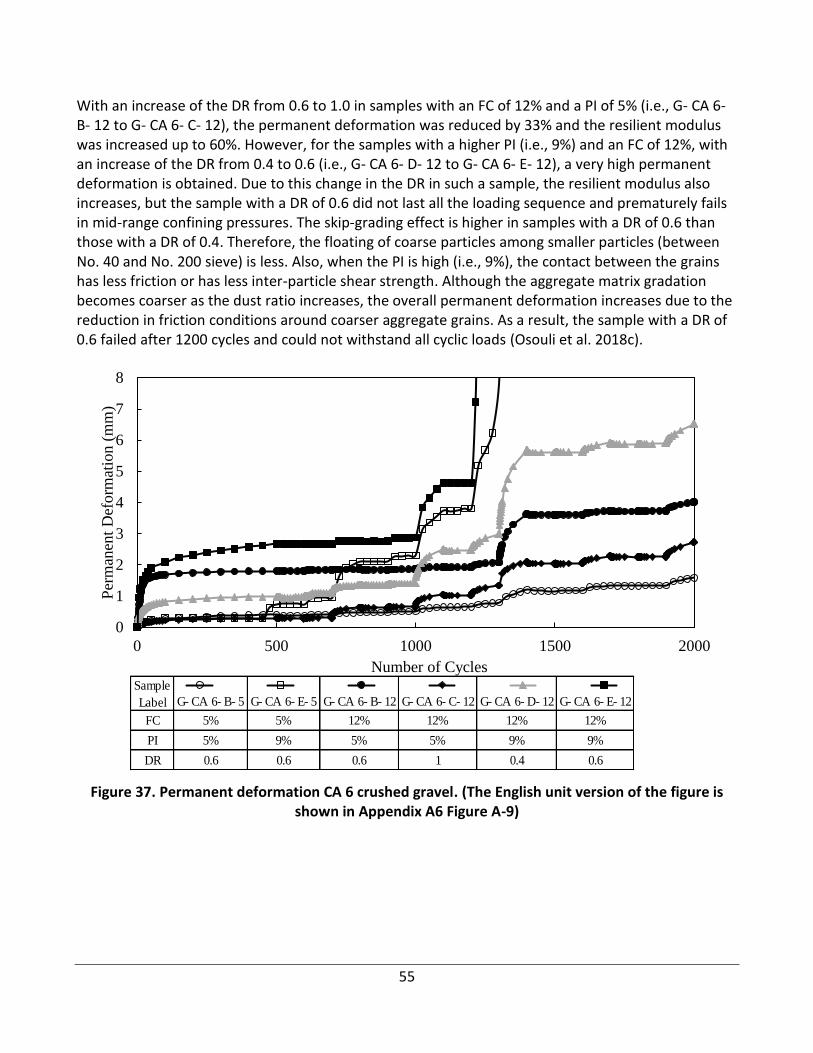
55
With an increase of the DR from 0.6 to 1.0 in samples with an FC of 12% and a PI of 5% (i.e., G- CA 6- B- 12 to G- CA 6- C- 12), the permanent deformation was reduced by 33% and the resilient modulus was increased up to 60%. However, for the samples with a higher PI (i.e., 9%) and an FC of 12%, with an increase of the DR from 0.4 to 0.6 (i.e., G- CA 6- D- 12 to G- CA 6- E- 12), a very high permanent deformation is obtained. Due to this change in the DR in such a sample, the resilient modulus also increases, but the sample with a DR of 0.6 did not last all the loading sequence and prematurely fails in mid-range confining pressures. The skip-grading effect is higher in samples with a DR of 0.6 than those with a DR of 0.4. Therefore, the floating of coarse particles among smaller particles (between No. 40 and No. 200 sieve) is less. Also, when the PI is high (i.e., 9%), the contact between the grains has less friction or has less inter-particle shear strength. Although the aggregate matrix gradation becomes coarser as the dust ratio increases, the overall permanent deformation increases due to the reduction in friction conditions around coarser aggregate grains. As a result, the sample with a DR of 0.6 failed after 1200 cycles and could not withstand all cyclic loads (Osouli et al. 2018c).
Figure 37. Permanent deformation CA 6 crushed gravel. (The English unit version of the figure is shown in Appendix A6 Figure A-9)
0
1
2
3
4
5
6
7
8
0 500 1000 1500 2000
Per
man
ent
Def
orm
atio
n (
mm
)
Number of CyclesSample
Label G- CA 6- B- 5 G- CA 6- E- 5 G- CA 6- B- 12 G- CA 6- C- 12 G- CA 6- D- 12 G- CA 6- E- 12
FC 5% 5% 12% 12% 12% 12%
PI 5% 9% 5% 5% 9% 9%
DR 0.6 0.6 0.6 1 0.4 0.6
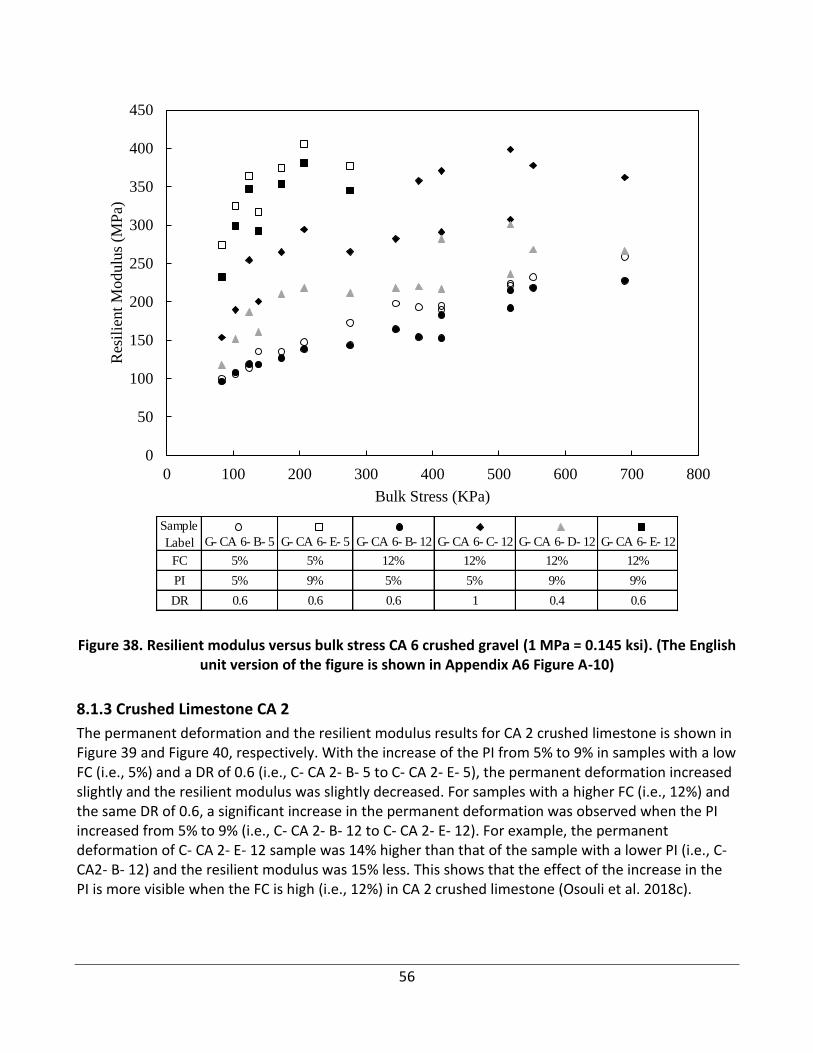
56
Figure 38. Resilient modulus versus bulk stress CA 6 crushed gravel (1 MPa = 0.145 ksi). (The English unit version of the figure is shown in Appendix A6 Figure A-10)
8.1.3 Crushed Limestone CA 2
The permanent deformation and the resilient modulus results for CA 2 crushed limestone is shown in Figure 39 and Figure 40, respectively. With the increase of the PI from 5% to 9% in samples with a low FC (i.e., 5%) and a DR of 0.6 (i.e., C- CA 2- B- 5 to C- CA 2- E- 5), the permanent deformation increased slightly and the resilient modulus was slightly decreased. For samples with a higher FC (i.e., 12%) and the same DR of 0.6, a significant increase in the permanent deformation was observed when the PI increased from 5% to 9% (i.e., C- CA 2- B- 12 to C- CA 2- E- 12). For example, the permanent deformation of C- CA 2- E- 12 sample was 14% higher than that of the sample with a lower PI (i.e., C- CA2- B- 12) and the resilient modulus was 15% less. This shows that the effect of the increase in the PI is more visible when the FC is high (i.e., 12%) in CA 2 crushed limestone (Osouli et al. 2018c).
0
50
100
150
200
250
300
350
400
450
0 100 200 300 400 500 600 700 800
Res
ilie
nt
Mo
dulu
s (M
Pa)
Bulk Stress (KPa)
Sample
Label G- CA 6- B- 5 G- CA 6- E- 5 G- CA 6- B- 12 G- CA 6- C- 12 G- CA 6- D- 12 G- CA 6- E- 12
FC 5% 5% 12% 12% 12% 12%
PI 5% 9% 5% 5% 9% 9%
DR 0.6 0.6 0.6 1 0.4 0.6
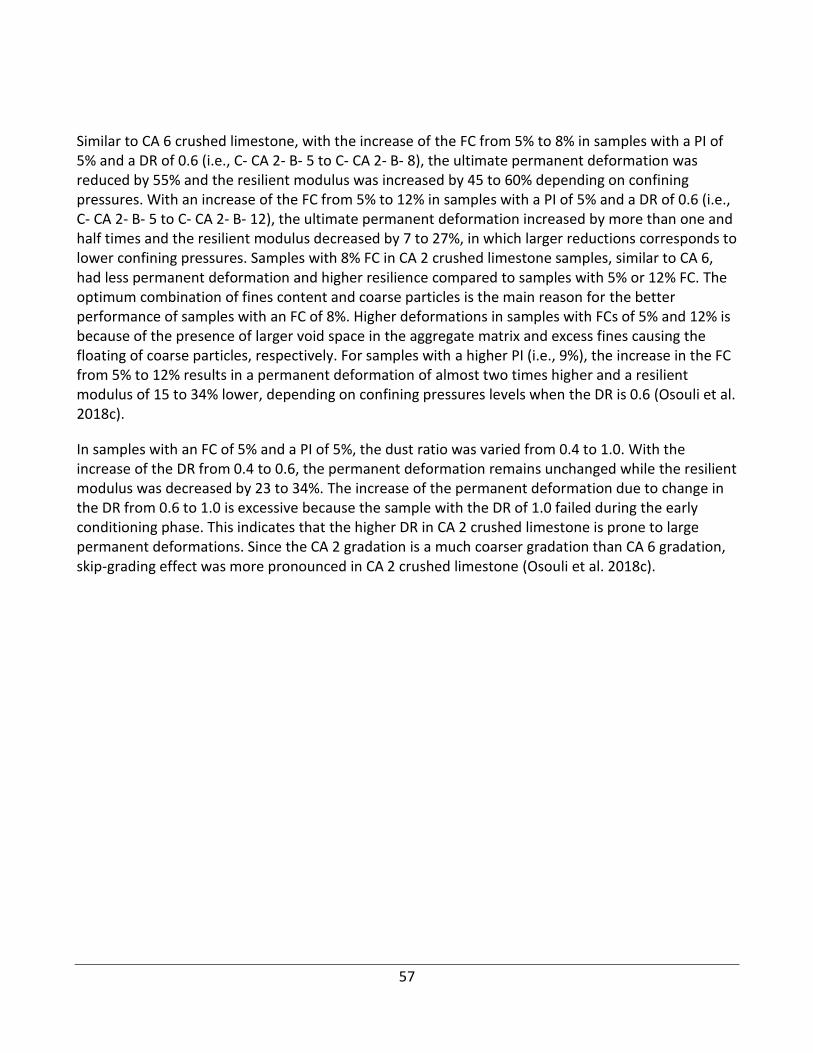
57
Similar to CA 6 crushed limestone, with the increase of the FC from 5% to 8% in samples with a PI of 5% and a DR of 0.6 (i.e., C- CA 2- B- 5 to C- CA 2- B- 8), the ultimate permanent deformation was reduced by 55% and the resilient modulus was increased by 45 to 60% depending on confining pressures. With an increase of the FC from 5% to 12% in samples with a PI of 5% and a DR of 0.6 (i.e., C- CA 2- B- 5 to C- CA 2- B- 12), the ultimate permanent deformation increased by more than one and half times and the resilient modulus decreased by 7 to 27%, in which larger reductions corresponds to lower confining pressures. Samples with 8% FC in CA 2 crushed limestone samples, similar to CA 6, had less permanent deformation and higher resilience compared to samples with 5% or 12% FC. The optimum combination of fines content and coarse particles is the main reason for the better performance of samples with an FC of 8%. Higher deformations in samples with FCs of 5% and 12% is because of the presence of larger void space in the aggregate matrix and excess fines causing the floating of coarse particles, respectively. For samples with a higher PI (i.e., 9%), the increase in the FC from 5% to 12% results in a permanent deformation of almost two times higher and a resilient modulus of 15 to 34% lower, depending on confining pressures levels when the DR is 0.6 (Osouli et al. 2018c).
In samples with an FC of 5% and a PI of 5%, the dust ratio was varied from 0.4 to 1.0. With the increase of the DR from 0.4 to 0.6, the permanent deformation remains unchanged while the resilient modulus was decreased by 23 to 34%. The increase of the permanent deformation due to change in the DR from 0.6 to 1.0 is excessive because the sample with the DR of 1.0 failed during the early conditioning phase. This indicates that the higher DR in CA 2 crushed limestone is prone to large permanent deformations. Since the CA 2 gradation is a much coarser gradation than CA 6 gradation, skip-grading effect was more pronounced in CA 2 crushed limestone (Osouli et al. 2018c).
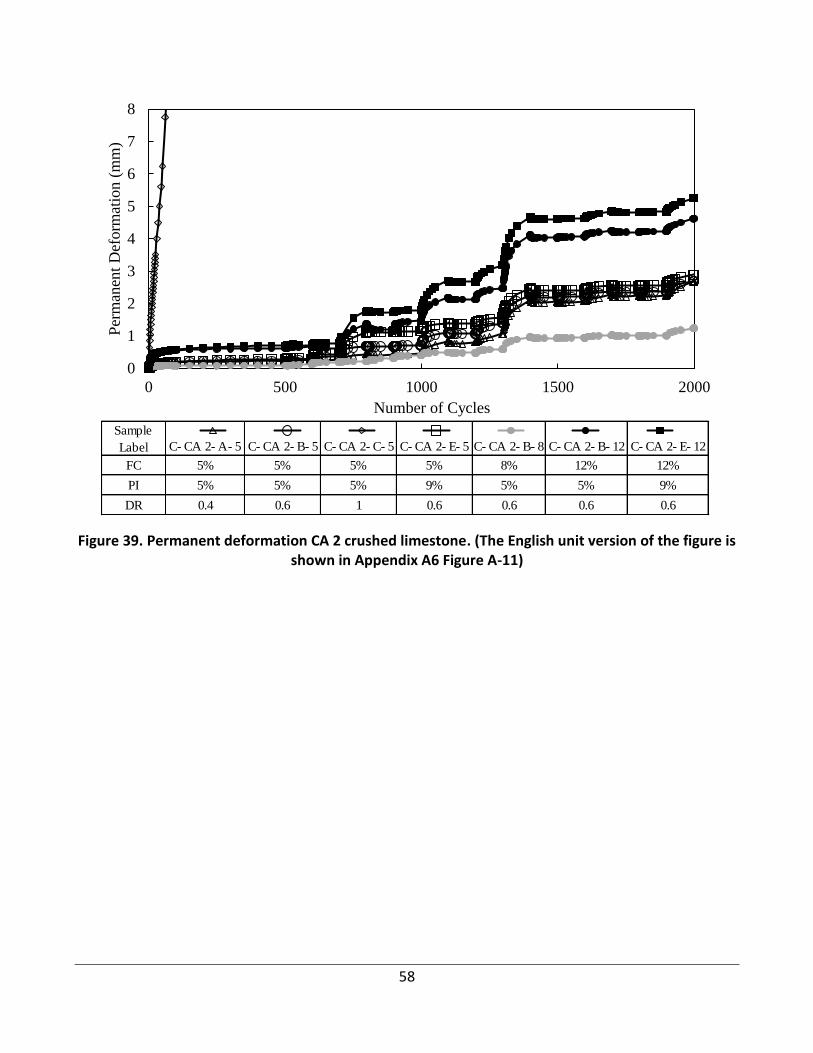
58
Figure 39. Permanent deformation CA 2 crushed limestone. (The English unit version of the figure is shown in Appendix A6 Figure A-11)
0
1
2
3
4
5
6
7
8
0 500 1000 1500 2000
Per
man
ent
Def
orm
atio
n (
mm
)
Number of Cycles
Sample
Label C- CA 2- A- 5 C- CA 2- B- 5 C- CA 2- C- 5 C- CA 2- E- 5 C- CA 2- B- 8 C- CA 2- B- 12 C- CA 2- E- 12
FC 5% 5% 5% 5% 8% 12% 12%
PI 5% 5% 5% 9% 5% 5% 9%
DR 0.4 0.6 1 0.6 0.6 0.6 0.6
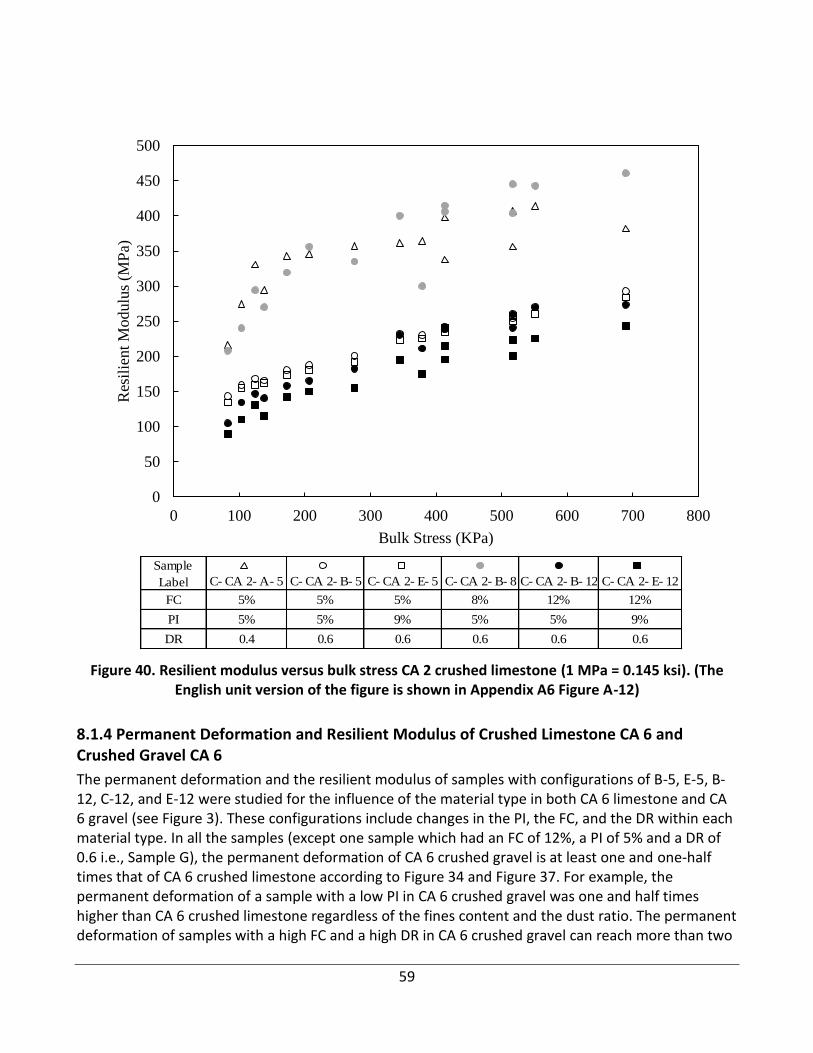
59
Figure 40. Resilient modulus versus bulk stress CA 2 crushed limestone (1 MPa = 0.145 ksi). (The English unit version of the figure is shown in Appendix A6 Figure A-12)
8.1.4 Permanent Deformation and Resilient Modulus of Crushed Limestone CA 6 and Crushed Gravel CA 6
The permanent deformation and the resilient modulus of samples with configurations of B-5, E-5, B-12, C-12, and E-12 were studied for the influence of the material type in both CA 6 limestone and CA 6 gravel (see Figure 3). These configurations include changes in the PI, the FC, and the DR within each material type. In all the samples (except one sample which had an FC of 12%, a PI of 5% and a DR of 0.6 i.e., Sample G), the permanent deformation of CA 6 crushed gravel is at least one and one-half times that of CA 6 crushed limestone according to Figure 34 and Figure 37. For example, the permanent deformation of a sample with a low PI in CA 6 crushed gravel was one and half times higher than CA 6 crushed limestone regardless of the fines content and the dust ratio. The permanent deformation of samples with a high FC and a high DR in CA 6 crushed gravel can reach more than two
0
50
100
150
200
250
300
350
400
450
500
0 100 200 300 400 500 600 700 800
Res
ilie
nt
Mod
ulu
s (M
Pa)
Bulk Stress (KPa)
Sample
Label C- CA 2- A- 5 C- CA 2- B- 5 C- CA 2- E- 5 C- CA 2- B- 8 C- CA 2- B- 12 C- CA 2- E- 12
FC 5% 5% 5% 8% 12% 12%
PI 5% 5% 9% 5% 5% 9%
DR 0.4 0.6 0.6 0.6 0.6 0.6
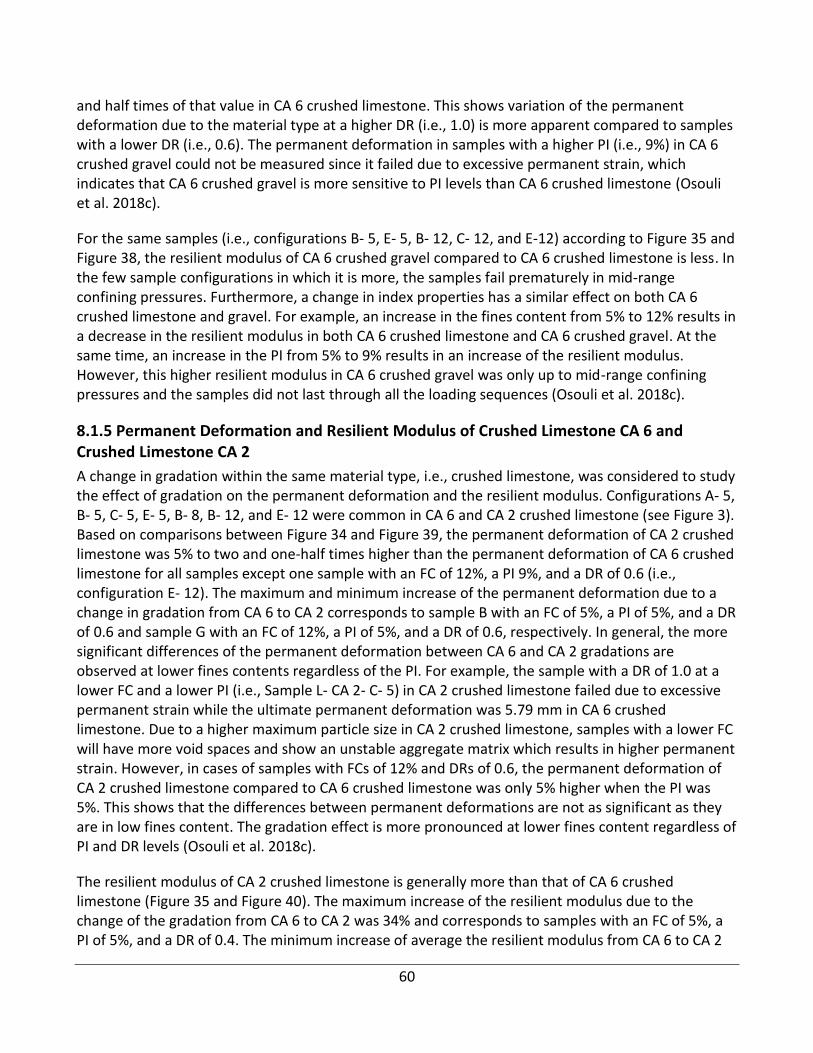
60
and half times of that value in CA 6 crushed limestone. This shows variation of the permanent deformation due to the material type at a higher DR (i.e., 1.0) is more apparent compared to samples with a lower DR (i.e., 0.6). The permanent deformation in samples with a higher PI (i.e., 9%) in CA 6 crushed gravel could not be measured since it failed due to excessive permanent strain, which indicates that CA 6 crushed gravel is more sensitive to PI levels than CA 6 crushed limestone (Osouli et al. 2018c).
For the same samples (i.e., configurations B- 5, E- 5, B- 12, C- 12, and E-12) according to Figure 35 and Figure 38, the resilient modulus of CA 6 crushed gravel compared to CA 6 crushed limestone is less. In the few sample configurations in which it is more, the samples fail prematurely in mid-range confining pressures. Furthermore, a change in index properties has a similar effect on both CA 6 crushed limestone and gravel. For example, an increase in the fines content from 5% to 12% results in a decrease in the resilient modulus in both CA 6 crushed limestone and CA 6 crushed gravel. At the same time, an increase in the PI from 5% to 9% results in an increase of the resilient modulus. However, this higher resilient modulus in CA 6 crushed gravel was only up to mid-range confining pressures and the samples did not last through all the loading sequences (Osouli et al. 2018c).
8.1.5 Permanent Deformation and Resilient Modulus of Crushed Limestone CA 6 and Crushed Limestone CA 2
A change in gradation within the same material type, i.e., crushed limestone, was considered to study the effect of gradation on the permanent deformation and the resilient modulus. Configurations A- 5, B- 5, C- 5, E- 5, B- 8, B- 12, and E- 12 were common in CA 6 and CA 2 crushed limestone (see Figure 3). Based on comparisons between Figure 34 and Figure 39, the permanent deformation of CA 2 crushed limestone was 5% to two and one-half times higher than the permanent deformation of CA 6 crushed limestone for all samples except one sample with an FC of 12%, a PI 9%, and a DR of 0.6 (i.e., configuration E- 12). The maximum and minimum increase of the permanent deformation due to a change in gradation from CA 6 to CA 2 corresponds to sample B with an FC of 5%, a PI of 5%, and a DR of 0.6 and sample G with an FC of 12%, a PI of 5%, and a DR of 0.6, respectively. In general, the more significant differences of the permanent deformation between CA 6 and CA 2 gradations are observed at lower fines contents regardless of the PI. For example, the sample with a DR of 1.0 at a lower FC and a lower PI (i.e., Sample L- CA 2- C- 5) in CA 2 crushed limestone failed due to excessive permanent strain while the ultimate permanent deformation was 5.79 mm in CA 6 crushed limestone. Due to a higher maximum particle size in CA 2 crushed limestone, samples with a lower FC will have more void spaces and show an unstable aggregate matrix which results in higher permanent strain. However, in cases of samples with FCs of 12% and DRs of 0.6, the permanent deformation of CA 2 crushed limestone compared to CA 6 crushed limestone was only 5% higher when the PI was 5%. This shows that the differences between permanent deformations are not as significant as they are in low fines content. The gradation effect is more pronounced at lower fines content regardless of PI and DR levels (Osouli et al. 2018c).
The resilient modulus of CA 2 crushed limestone is generally more than that of CA 6 crushed limestone (Figure 35 and Figure 40). The maximum increase of the resilient modulus due to the change of the gradation from CA 6 to CA 2 was 34% and corresponds to samples with an FC of 5%, a PI of 5%, and a DR of 0.4. The minimum increase of average the resilient modulus from CA 6 to CA 2
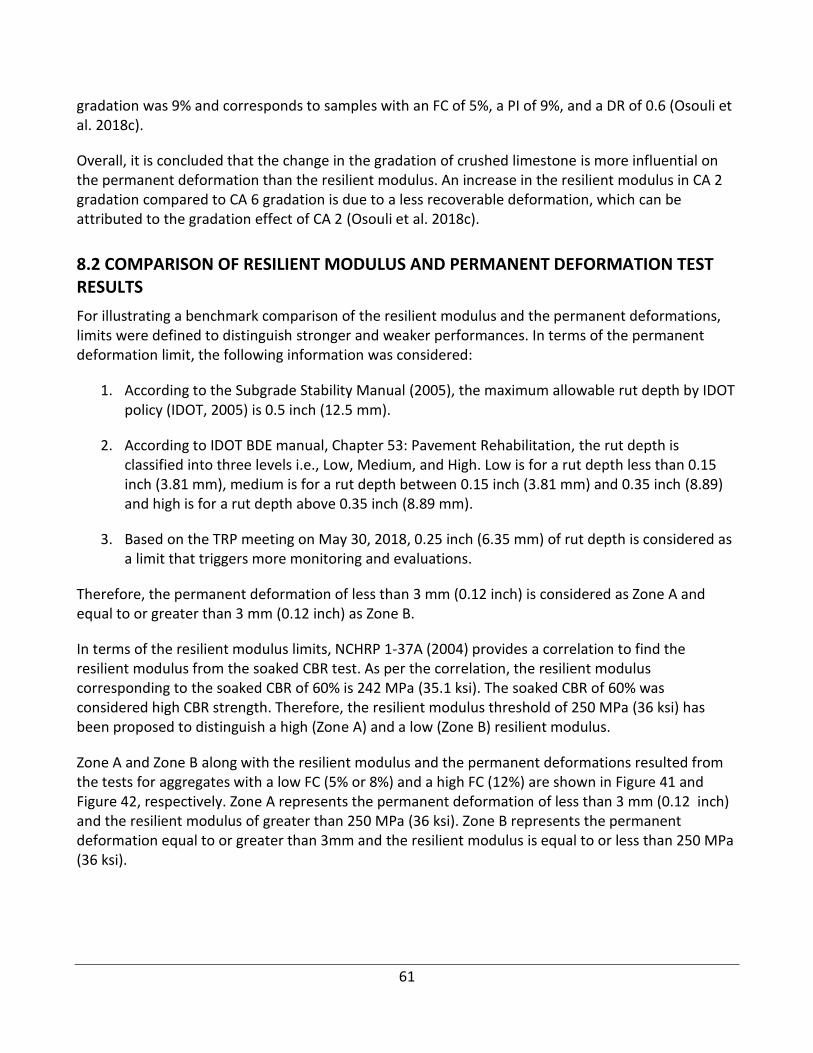
61
gradation was 9% and corresponds to samples with an FC of 5%, a PI of 9%, and a DR of 0.6 (Osouli et al. 2018c).
Overall, it is concluded that the change in the gradation of crushed limestone is more influential on the permanent deformation than the resilient modulus. An increase in the resilient modulus in CA 2 gradation compared to CA 6 gradation is due to a less recoverable deformation, which can be attributed to the gradation effect of CA 2 (Osouli et al. 2018c).
8.2 COMPARISON OF RESILIENT MODULUS AND PERMANENT DEFORMATION TEST RESULTS
For illustrating a benchmark comparison of the resilient modulus and the permanent deformations, limits were defined to distinguish stronger and weaker performances. In terms of the permanent deformation limit, the following information was considered:
1. According to the Subgrade Stability Manual (2005), the maximum allowable rut depth by IDOT policy (IDOT, 2005) is 0.5 inch (12.5 mm).
2. According to IDOT BDE manual, Chapter 53: Pavement Rehabilitation, the rut depth is classified into three levels i.e., Low, Medium, and High. Low is for a rut depth less than 0.15 inch (3.81 mm), medium is for a rut depth between 0.15 inch (3.81 mm) and 0.35 inch (8.89) and high is for a rut depth above 0.35 inch (8.89 mm).
3. Based on the TRP meeting on May 30, 2018, 0.25 inch (6.35 mm) of rut depth is considered as a limit that triggers more monitoring and evaluations.
Therefore, the permanent deformation of less than 3 mm (0.12 inch) is considered as Zone A and equal to or greater than 3 mm (0.12 inch) as Zone B.
In terms of the resilient modulus limits, NCHRP 1-37A (2004) provides a correlation to find the resilient modulus from the soaked CBR test. As per the correlation, the resilient modulus corresponding to the soaked CBR of 60% is 242 MPa (35.1 ksi). The soaked CBR of 60% was considered high CBR strength. Therefore, the resilient modulus threshold of 250 MPa (36 ksi) has been proposed to distinguish a high (Zone A) and a low (Zone B) resilient modulus.
Zone A and Zone B along with the resilient modulus and the permanent deformations resulted from the tests for aggregates with a low FC (5% or 8%) and a high FC (12%) are shown in Figure 41 and Figure 42, respectively. Zone A represents the permanent deformation of less than 3 mm (0.12 inch) and the resilient modulus of greater than 250 MPa (36 ksi). Zone B represents the permanent deformation equal to or greater than 3mm and the resilient modulus is equal to or less than 250 MPa (36 ksi).
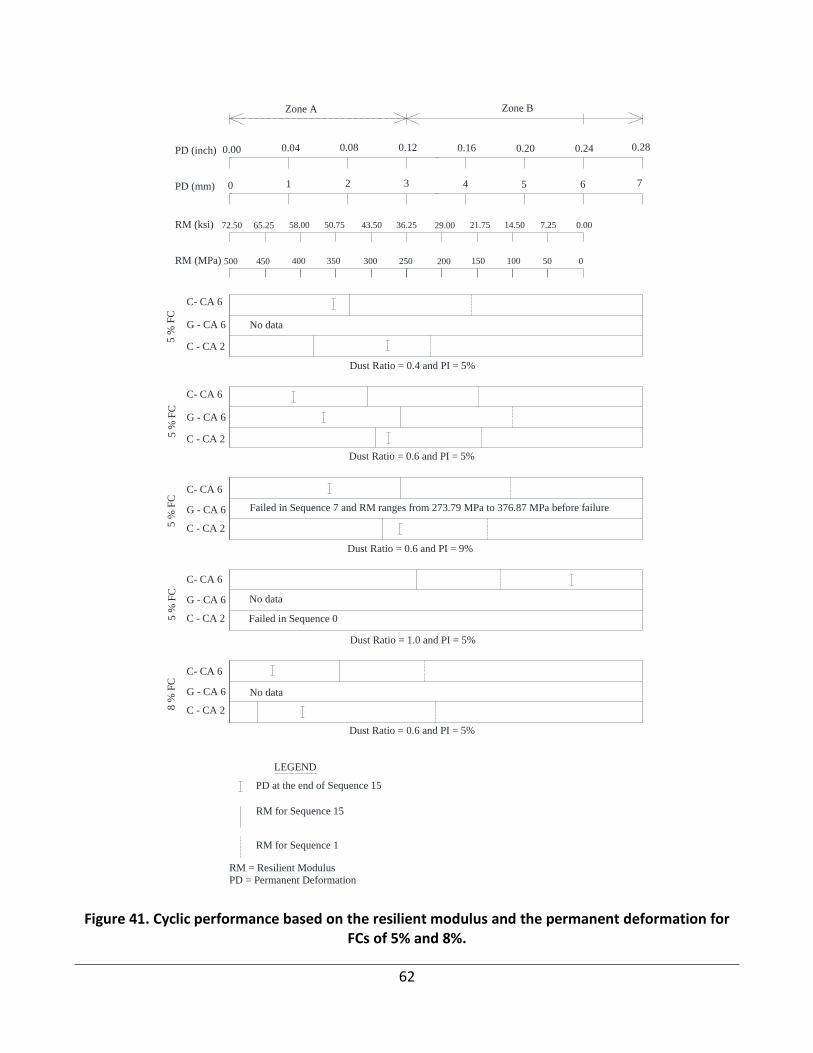
62
Figure 41. Cyclic performance based on the resilient modulus and the permanent deformation for FCs of 5% and 8%.
5 %
FC
5 %
FC
5 %
FC
Dust Ratio = 0.4 and PI = 5%
PD at the end of Sequence 15
LEGEND
RM = Resilient Modulus
PD = Permanent Deformation
RM for Sequence 15
RM for Sequence 1
5 %
FC
8 %
FC
0 1 2 3 4 5 6 7
No data
No data
No data
Failed in Sequence 7 and RM ranges from 273.79 MPa to 376.87 MPa before failure
Failed in Sequence 0
Dust Ratio = 0.6 and PI = 5%
Dust Ratio = 0.6 and PI = 9%
Dust Ratio = 1.0 and PI = 5%
Dust Ratio = 0.6 and PI = 5%
G - CA 6
C- CA 6
C - CA 2
G - CA 6
C- CA 6
C - CA 2
G - CA 6
C- CA 6
C - CA 2
G - CA 6
C- CA 6
C - CA 2
G - CA 6
C- CA 6
C - CA 2
RM (MPa)
PD (mm)
Zone A Zone B
500 450 400 350 300 250 200 150 100 50 0
0.00 0.04 0.08 0.12 0.16 0.20 0.24 0.28
RM (ksi)
PD (inch)
72.50 65.25 58.00 50.75 43.50 36.25 29.00 21.75 14.50 7.25 0.00
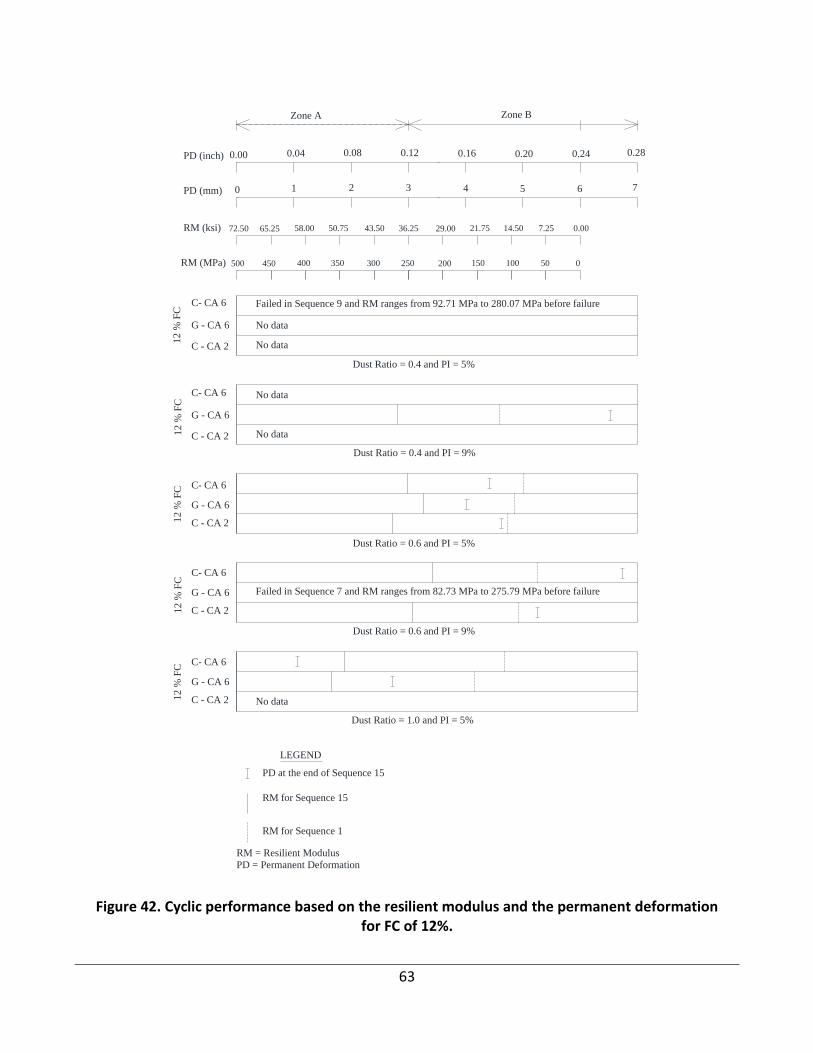
63
Figure 42. Cyclic performance based on the resilient modulus and the permanent deformation for FC of 12%.
12 %
FC
12 %
FC
12 %
FC
12 %
FC
12 %
FC
Dust Ratio = 0.4 and PI = 5%
Dust Ratio = 0.4 and PI = 9%
Dust Ratio = 0.6 and PI = 5%
Dust Ratio = 0.6 and PI = 9%
Dust Ratio = 1.0 and PI = 5%
No data
Failed in Sequence 9 and RM ranges from 92.71 MPa to 280.07 MPa before failure
No data
No data
No data
No data
Failed in Sequence 7 and RM ranges from 82.73 MPa to 275.79 MPa before failure
G - CA 6
C- CA 6
C - CA 2
G - CA 6
C- CA 6
C - CA 2
G - CA 6
C- CA 6
C - CA 2
G - CA 6
C- CA 6
C - CA 2
G - CA 6
C- CA 6
C - CA 2
RM (MPa)
PD at the end of Sequence 15
LEGEND
RM = Resilient Modulus
PD = Permanent Deformation
RM for Sequence 15
RM for Sequence 1
500 450 400 350 300 250 200 150 100 50 0
0 1 2 3 4 5 6 7PD (mm)
Zone A Zone B
0.00 0.04 0.08 0.12 0.16 0.20 0.24 0.28
RM (ksi)
PD (inch)
72.50 65.25 58.00 50.75 43.50 36.25 29.00 21.75 14.50 7.25 0.00
64
According to Figure 41, for low FC aggregates, the permanent deformation increased and the resilient modulus decreased when the DR increased from 0.4 to 0.6 to 1.0 at a PI of 5%. However, according to Figure 42, for high FC aggregates, the permanent deformation decreased and the resilient modulus increased when the DR increased from 0.4 to 0.6 to 1.0 at same PI. The samples with a DR of 1.0 were found to have a higher value of the resilient modulus and a lower value of the permanent deformation at the end of sequence 15 compared to other DRs when the FC is 12% (Figure 42). It is noteworthy to mention that an FC of 8% has a higher range of the resilient modulus and a lower range permanent deformation compared to an FC of 5%. The resilient modulus value was found to decrease and the permanent deformation value to increase when the FC increased from 5% to 12%. Furthermore, the PI effect on the resilient modulus results is low in CA 6 and CA 2 crushed limestone and excessively high in CA 6 crushed gravel (Figure 41 and Figure 42).
Based on the represented data, Zone A is achieved by the combinations of aggregates with a low FC (i.e., 5%) and low DRs (i.e., 0.4 and 0.6) or FCs of about 8 to 12% but with DRs greater than 0.6. However, Zone B is associated with a high FC (i.e., 12%) and low DRs (i.e., 0.4 and 0.6) and with a low FC (i.e., 5%) and a high DR (i.e., 1.0). The cyclic performance of high plastic samples (i.e., 9%) at an FC of 5% and a DR of 0.6 are in Zone A for crushed limestone, whereas for crushed gravels, they are represented by Zone B limits.
8.3 PREDICTION OF PERMANENT DEFORMATION AND RESILIENT MODULUS
There are several studies which present correlations for estimating permanent deformation (Monismith et al. 1975; Gidel et al. 2001; Tseng and Lytton 1989; Sweere 1990; Barksdale 1972; Paute et al. 1996; Uzan 2004; and Lentz and Baladi 1981) and resilient modulus (Hicks and Monismith 1971 MEPDG 2004; Uzan 1985; Lytton 1996; Karasahin 1993) of aggregate matrix. All these formulations were developed based on granular materials. However, in this study, the permanent deformation model developed by Monismith et al. (1975) and the resilient modulus model implemented by MEPDG were used for the characterization of base and subbase materials. Since in this study, a detailed response of aggregates with specific fines content characteristics through resilient modulus tests were obtained, it was intended to develop a prediction model for the permanent deformation and the resilient modulus of aggregates with a focus on fines content (Osouli et al. 2018c).
Permanent Deformation
Permanent deformation was characterized by using Eq. 3 proposed by Monismith et al. (1975).
𝜀𝑝 = 𝐴𝑁𝑏 (3)
where, 𝜀𝑝 is the permanent strain, 𝑁 is the number of cycles, 𝐴 and b are the input coefficients.
Input coefficients were determined through a linear regression analysis of the logarithmic relationship of number cycles and the permanent strain for each tested sample. The coefficient of determination (R2) of this regression analyses for different tested samples ranged from 0.73 to 0.97
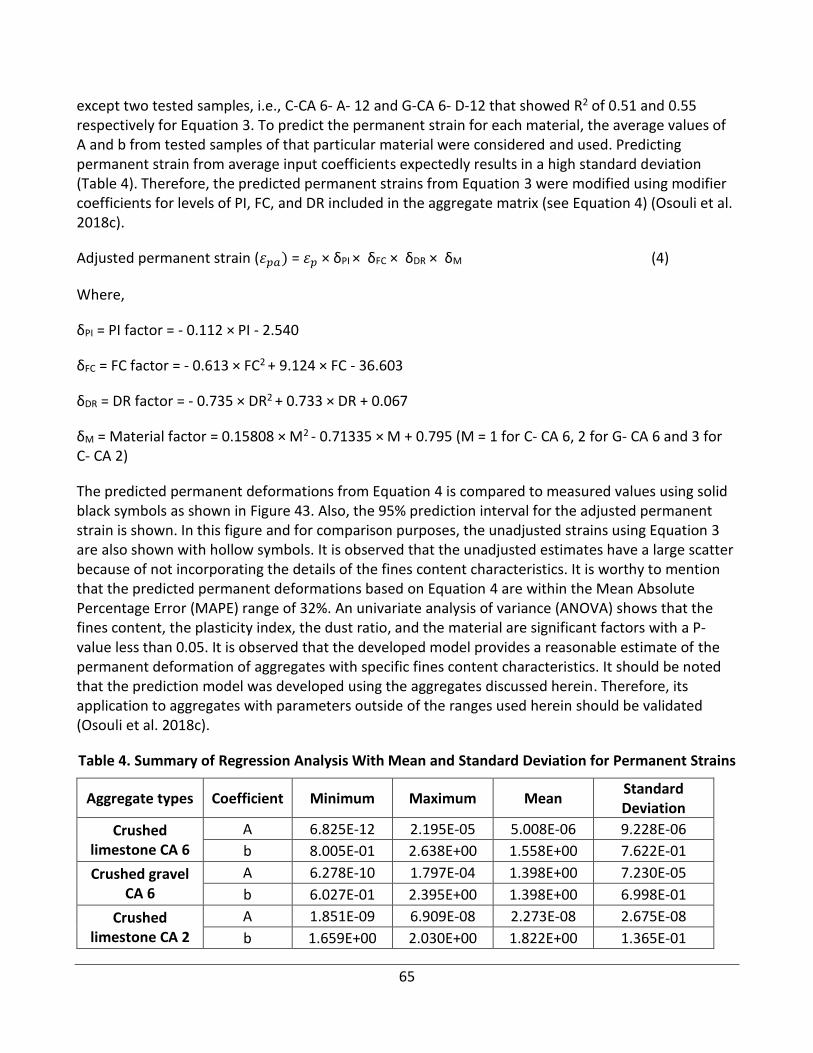
65
except two tested samples, i.e., C-CA 6- A- 12 and G-CA 6- D-12 that showed R2 of 0.51 and 0.55 respectively for Equation 3. To predict the permanent strain for each material, the average values of A and b from tested samples of that particular material were considered and used. Predicting permanent strain from average input coefficients expectedly results in a high standard deviation (Table 4). Therefore, the predicted permanent strains from Equation 3 were modified using modifier coefficients for levels of PI, FC, and DR included in the aggregate matrix (see Equation 4) (Osouli et al. 2018c).
Adjusted permanent strain (𝜀𝑝𝑎) = 𝜀𝑝 × δPI × δFC × δDR × δM (4)
Where,
δPI = PI factor = - 0.112 × PI - 2.540
δFC = FC factor = - 0.613 × FC2 + 9.124 × FC - 36.603
δDR = DR factor = - 0.735 × DR2 + 0.733 × DR + 0.067
δM = Material factor = 0.15808 × M2 - 0.71335 × M + 0.795 (M = 1 for C- CA 6, 2 for G- CA 6 and 3 for C- CA 2)
The predicted permanent deformations from Equation 4 is compared to measured values using solid black symbols as shown in Figure 43. Also, the 95% prediction interval for the adjusted permanent strain is shown. In this figure and for comparison purposes, the unadjusted strains using Equation 3 are also shown with hollow symbols. It is observed that the unadjusted estimates have a large scatter because of not incorporating the details of the fines content characteristics. It is worthy to mention that the predicted permanent deformations based on Equation 4 are within the Mean Absolute Percentage Error (MAPE) range of 32%. An univariate analysis of variance (ANOVA) shows that the fines content, the plasticity index, the dust ratio, and the material are significant factors with a P-value less than 0.05. It is observed that the developed model provides a reasonable estimate of the permanent deformation of aggregates with specific fines content characteristics. It should be noted that the prediction model was developed using the aggregates discussed herein. Therefore, its application to aggregates with parameters outside of the ranges used herein should be validated (Osouli et al. 2018c).
Table 4. Summary of Regression Analysis With Mean and Standard Deviation for Permanent Strains
Aggregate types Coefficient Minimum Maximum Mean Standard Deviation
Crushed limestone CA 6
A 6.825E-12 2.195E-05 5.008E-06 9.228E-06
b 8.005E-01 2.638E+00 1.558E+00 7.622E-01
Crushed gravel CA 6
A 6.278E-10 1.797E-04 1.398E+00 7.230E-05
b 6.027E-01 2.395E+00 1.398E+00 6.998E-01
Crushed limestone CA 2
A 1.851E-09 6.909E-08 2.273E-08 2.675E-08
b 1.659E+00 2.030E+00 1.822E+00 1.365E-01
66
Resilient modulus
The general format of the resilient modulus formula per National Cooperative Highway Research Program (NCHRP) 1-37A MEPDG is shown in Equation 5 (MEPDG 2004), which is unit sensitive.
𝑀𝑟 = 𝑘1𝑃𝑎 (Ɵ
𝑃𝑎)
𝑘2
(𝜏𝑜𝑐𝑡
𝑃𝑎+ 1)
𝑘3
(5)
where, τoct = √2/3 × σd
Where, Mr is resilient modulus in MPa. Pa is atmospheric pressure (i.e., 101.3 kPa), Ɵ is the bulk stress in kPa, τoct is octahedral shear stress in kPa, σd is deviator stress in kPa and k1, k2 and k3 are regression parameters. k1 is first stress invariant in kPa, k2 is function of bulk stress and k3 is function of shear. Multiple linear regressions of logarithmic functions of bulk stress, shear stress and resilient modulus were carried out to determine coefficients of k1, k2 and k3 for MEPDG resilient modulus model shown in Equation 5 (MEPDG 2004). The R2 for this regression analyses for different tested samples ranged from 0.74 to 1.0 except for one sample, i.e., C- CA 6- H that has R2 of 0.52. To predict the resilient modulus for each material type, the average values of k1, k2 and k3 from tested samples of that particular material were initially used. Input coefficients k1, k2 and k3 along with the mean and standard deviations from the multiple linear regression are presented in Table 5. With the use of mean coefficients of k1, k2 and k3, one can predict the resilient modulus. However, the predicted resilient modulus will expectedly have a high percentage of error due to not accounting for the effect of the FC, the DR, and the PI. Therefore, to provide a more representative value for the resilient modulus of aggregates, a set of modifier coefficients are identified using nonlinear regression analyses and the results of this study as expressed by Equation 6 (Osouli et al. 2018c).
Adjusted resilient modulus (Mr ) = Mr × δPI × δFC × δDR × δM (6)
δPI =PI factor = - 0.151 × PI + 8
δFC =FC factor = - 0.844 × FC2 + 13.995 × FC - 31.462
δDR =DR factor = 0.095 × DR2 - 0.123 × DR + 0.053
δM =Material factor = 0.097 × M2 - 0.372 × M + 0.763 (M = 1 for C- CA 6, 2 for G- CA 6 and 3 for C- CA 2)
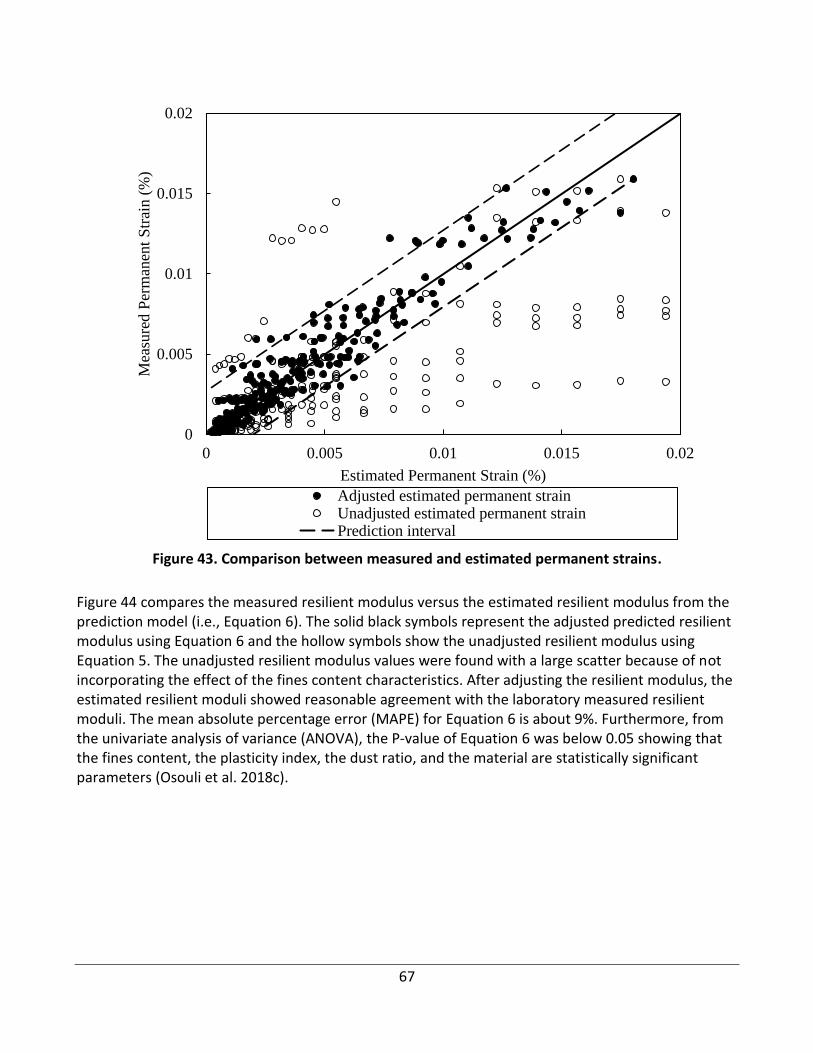
67
Figure 43. Comparison between measured and estimated permanent strains.
Figure 44 compares the measured resilient modulus versus the estimated resilient modulus from the prediction model (i.e., Equation 6). The solid black symbols represent the adjusted predicted resilient modulus using Equation 6 and the hollow symbols show the unadjusted resilient modulus using Equation 5. The unadjusted resilient modulus values were found with a large scatter because of not incorporating the effect of the fines content characteristics. After adjusting the resilient modulus, the estimated resilient moduli showed reasonable agreement with the laboratory measured resilient moduli. The mean absolute percentage error (MAPE) for Equation 6 is about 9%. Furthermore, from the univariate analysis of variance (ANOVA), the P-value of Equation 6 was below 0.05 showing that the fines content, the plasticity index, the dust ratio, and the material are statistically significant parameters (Osouli et al. 2018c).
0
0.005
0.01
0.015
0.02
0 0.005 0.01 0.015 0.02
Mea
sure
d P
erm
anen
t S
trai
n (
%)
Estimated Permanent Strain (%)
Adjusted estimated permanent strainUnadjusted estimated permanent strainPrediction interval
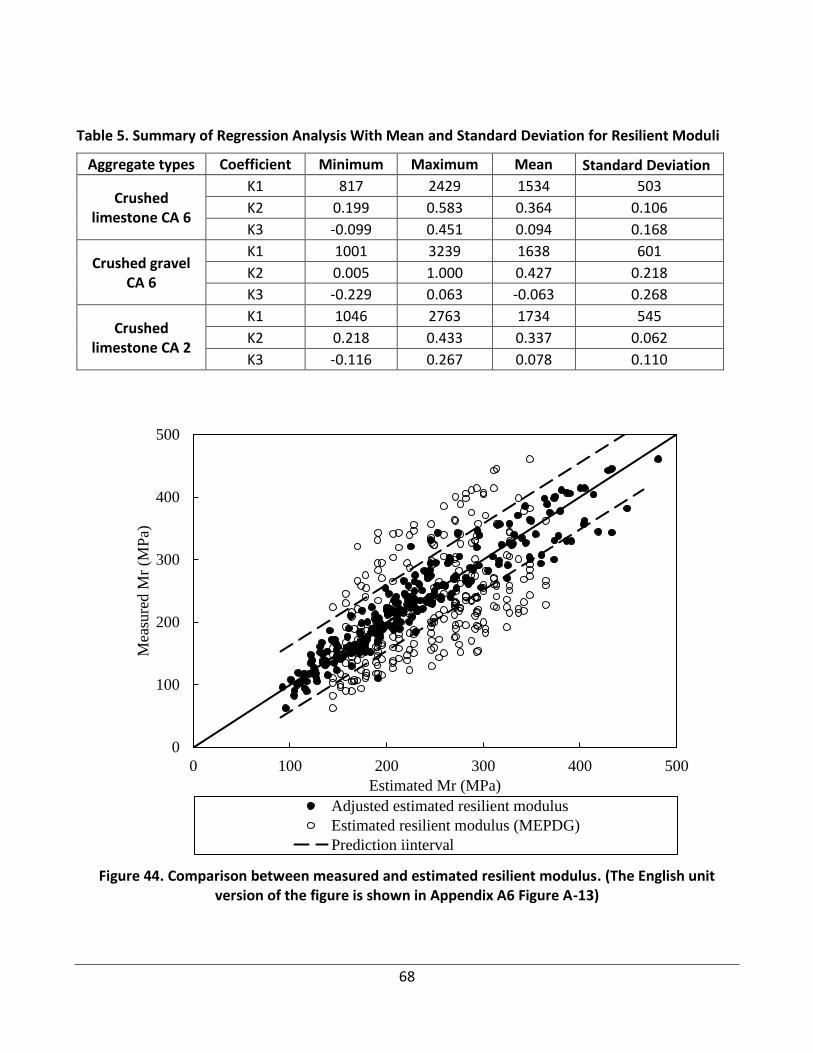
68
Table 5. Summary of Regression Analysis With Mean and Standard Deviation for Resilient Moduli
Aggregate types Coefficient Minimum Maximum Mean Standard Deviation
Crushed limestone CA 6
K1 817 2429 1534 503
K2 0.199 0.583 0.364 0.106
K3 -0.099 0.451 0.094 0.168
Crushed gravel CA 6
K1 1001 3239 1638 601
K2 0.005 1.000 0.427 0.218
K3 -0.229 0.063 -0.063 0.268
Crushed limestone CA 2
K1 1046 2763 1734 545
K2 0.218 0.433 0.337 0.062
K3 -0.116 0.267 0.078 0.110
Figure 44. Comparison between measured and estimated resilient modulus. (The English unit version of the figure is shown in Appendix A6 Figure A-13)
0
100
200
300
400
500
0 100 200 300 400 500
Mea
sure
d M
r (M
Pa)
Estimated Mr (MPa)
Adjusted estimated resilient modulus
Estimated resilient modulus (MEPDG)
Prediction iinterval
69
CHAPTER 9: CONCLUSIONS AND RECOMMENDATIONS
CBRs greater than 40%, resilient moduli greater than 250 MPa (36 ksi), and permanent deformations less than 3 mm (0.12 inch), were considered per discussions provided in previous chapters. In CA 6 crushed lime configurations, samples with high and medium CBR strength zones generally showed acceptable performance under repeated loading. At a low FC (i.e., 5%) and a DR of 1, the CBRs also show acceptable performance. However, the repeated loading behavior shows poor performance. High fines contents (i.e., 12%) and low DRs (i.e., 0.4) show poor performance both in CBR and under repeated loading. Both CBR and repeated load tests show weak results when the FC increased from 5% to 12% at a DR of 0.4. Samples with an 8% FC at a DR of 0.6 or an FC of 12% and a DR of 1.0 showed acceptable performance both in CBR and under repeated loading. Samples with FCs of 12% and DRs of 0.6 showed medium to high CBR strength while they performed poorly under repeated loading.
In CA 6 crushed gravel, samples with a high fines content (i.e., 12%) and a high DR (i.e., 1) show high CBR and good performance under repeated loading test. However, samples with a high fines content (12%) and a low DR (0.4) show weak performance in CBR and under repeated loading. Samples with low FCs (5%) and DRs of 0.6 show a good CBR performance when the PI is high (i.e., 9%). However, the repeated loading performance is poor. With lower PIs of 5%, both CBR and the resilient modulus show good performance for such samples. Samples with high FCs (i.e., 12%) and DRs of 0.6, show medium to high CBR values. However, their repeated loading performance is poor.
In CA 2 crushed limestone, samples that are in the high and medium strength zones in CBR also show good performance under repeated loading. At low FCs (i.e., 5%) and DRs of 1, the samples showed poor performance both in CBR and under repeated loading even at a low PI of 5%. Samples with an 8% FC and a DR of 0.6 showed acceptable performance both in CBR and under repeated loading. On the other hand, samples with FCs of 12% and DRs of 0.6 showed medium to high strength in CBR while they showed poor performance under repeated loading.
The relevant section of Article 1004.04 of IDOT SSRBC is shown in Appendix A-2. The following items are noted for IDOT considerations:
Gradation
The tested gradations in this research were CA 2 and CA 6. The gradation and coefficient of curvature and uniformity of all IDOT listed allowable gradation for base and subbase course aggregates (i.e., CA 4, CA 6, CA 7, CA 10, CA 11, CA 12, and CA 19) were compared. It was identified that the gradations CA 4, CA 10, CA 12, and CA 19 are more closely matched with the CA 6 gradation in terms of void space between grains and maximum particle size, and CA 4, CA 7, and CA 11 gradations are more closely matched with the CA 2 gradation. Therefore, the conclusions of CA 2 and CA 6 gradations should be cautiously applied within these two different groups.
70
Based on the soaked CBR performance and the repeated loading performance, a DR of 1.0 can be considered in CA 6 gradation when the PI is lower than 5% and the FC is 8% to 12%. However, in the case of CA 2 gradation, a DR of 1.0 can be considered at PIs of lower than 5% and high FCs (i.e., 12%). Therefore, consideration of these gradations should be made when thresholds for FC, DR, and PI is defined.
Plasticity Index and Dust Ratio
According to the IDOT SSRBC, aggregate base course should have PIs of less than 4% for crushed gravel and crushed stone, and for crushed granular subbase Type A and B, there is no limitation. In addition, the plasticity index requirement for crushed gravel and stones is allowed to be waived if the DR is 0.6 or less.
The results of this laboratory study showed that:
1. Aggregates with PIs of 5% show generally reasonable test performance. However, when FC is 12%, samples with DRs less than 0.6 and PIs of 5% have low performance in CBR as well as repeated loading.Aggregates with PIs of 9% show good performance when the FC is 5% and the DR is 0.6 or less. It should be noted that use of material with PIs up to 9% are allowed per IDOT SSRBC. This is applicable only for crushed limestone, not for crushed gravel.
2. Using DRs of 0.6 or less in materials with high FCs (i.e. about 12%) and PIs of greater than 5% (i.e., 9%) does not show good performance for CA 2 as well as CA 6 gradations.
3. Some of the samples having DRs 0.6 or less show low performance with the CBR and repeated loading. Based on the CBR and the cyclic tests, the PI requirement should not be waived for CA 2 and CA 6 or similar gradations with high FCs (i.e., 12%) if the DR is 0.6 or less.
Finally, it is important to mention that the authors realize that the findings of this research are primarily based on laboratory testing. Therefore, before making any modifications to pertinent IDOT specifications, the outcomes of this research should be validated via field full-scale pavement tests. One of the common methods that have been used in Illinois for the validation of laboratory findings is the use of Accelerated Transportation Loading System (ATLAS). This equipment can test for the rutting performance of constructed pavement layers under repetitive loading cycles of tires simulating truck or vehicle loads. This verification effort can also be supplemented by a trial run in an IDOT contracted work.
71
REFERENCES
AASHTO M 147 (2008). Standard Specification for Materials for Aggregate and Soil- Aggregate Subbase, Base, and Surface Courses. American Association of State Highway and Transportation Officials, Washington D.C.
Ahlberg, H.L., Barenberg, E.J., and Bartholomew, C.L. (1966). Physical Properties of Illinois Aggregates Affecting Load Bearing Strength and Performance, A & H Engineering & Testing Corporation, Champaign, Illinois.
Allen, J. J. (1977). The effect of non-constant lateral pressures on the resilient response of granular materials. Ph.D. thesis, Univ. of Illinois at Urbana-Champaign, Urbana, IL.
Allen, J.J. and Thompson, M.R. (1974). Resilient Response of Granular Materials Subjected to Time Dependent Lateral Stresses. Transportation Research Record, 1-13.
Arkansas Department of Transportation (ARDOT), (2003), Standard Specifications for Highway construction.
ASTM Standard D 1241 – 00. (2000). Standard Specification for Materials for Soil- Aggregate Subbase, Base, and Surface Courses, ASTM International, West Conshohocken, Pennsylvania
ASTM Standard D 2850 – 15. (2015). Standard Test Method for Unconsolidated-Undrained Triaxial Compression Test on Cohesive Soils, ASTM International, West Conshohocken, Pennsylvania
ASTM, D 2940. (2009). Standard Specification for Graded Aggregate Material for Bases or Subbases for Highway or Airports.
Barksdale (1972). Laboratory evaluation of rutting in base course materials. Proceeding of the 3rd International Conference on Structural Design of Asphalt Pavements. P. 161-74
Barksdale, R.D. and Itani S.Y. (1989). Influence of Aggregate Shape on Base Behavior. Transportation Research Record, 173–182.
Bennert, T., & Maher, A. (2005). The Development of a Performance Specification for Granular Base and Subbase Material, Trenton, (No. FHWA-NJ-2005-003).
Bilodeau, J. P., Doré, G., & Pierre, P. (2007). Erosion susceptibility of granular pavement materials. International Journal of Pavement Engineering, 8(1), 55-66.
Bilodeau, J. P., Dore, G., & Pierre, P. (2008). Gradation influence on frost susceptibility of base granular materials. International Journal of Pavement Engineering, 9(6), 397-411.
California Department of Transportation (Caltrans), (2015). Standard Specifications State of California. Department of Transportation Publication Distribution, Unit 1900 Royal Oaks Drive, Sacramento, California 95815-3800.
Chaulagai, R., Osouli, A., Salam, S., Tutumluer, E., Beshears, S., Shoup, H., & Bay, M. (2017). Maximum Particle Size, Fines Content and Dust Ratio Influencing Behavior of Base and Subbase Coarse Aggregates. Transportation Research Record, 2655, 20-26
Colorado Department of Transportation (CDOT), (2010). Standard Specifications for Road and Bridge
72
Construction.
Dawson, A.R., Thom, N.H., and Paute, J.L. (1996). Mechanical Characteristics of Unbound Granular Materials as a Function of Condition. European Symposium Euroflex. A.G. Correia, ed., Balkema, Rotterdam, the Netherlands, pp. 35-44.
Dekoltz, L. A. (1940). Effect of Varying the Quantity and Quality of the Soil Portion of Highway Aggregate on Their Stability. Highway Research Board. Vol 20.
Elliot and Thornton (1988). Resilient Modulus and AASHTO pavement design, transportation research record 1196. Washington DC: Transportation Research Board; 1988. Pp. 116-124
Faiz, A. (1971). The Effect of Skip-Grading on Stability of Soil-Aggregate Mixtures. Publication FHWA/IN/JHRP-71/10
Gandara, J. A., Kancherla, A., Alvarado, G., Nazarian , S., & Scullion, T. (2005). Materials, Specifications, and Construction Techniques for High Performance Flexible Bases. Center for Transportation Infrastructure System, El Paso.
Gidel, G., Hornych, P., Breysse, D., & Denis, A. (2001). A new approach for investigating the permanent deformation behaviour of unbound granular material using the repeated loading triaxial apparatus. Bulletin des laboratoires des Ponts et Chaussées, (233).
Gray, J.E. (1962). Characteristics of Graded Base Course Aggregates Determined by Triaxial Tests. Engineering Research Bulletin No. 12, National Crushed Stone Association
Hogentogler, C. A., & Willis, E. A. (1936). Stabilized soil roads. Public Roads, 17(3), 45-65.
Hicks, R.G. and Monismith, C.L. (1971). Factors Influencing the Resilient Response of Granular Materials. Highway Research Record, 15-31.
Holtz, R. D. Compaction Concepts. Chapter 3. (1990). Guide to Earthwork Compaction. In State of the Art Report 8. Transportation Research Board, pp. 9–23.
Illinois Department of Transportation (IDOT), (2012). Standard Specifications for Road and Bridge Construction, Springfield, Illinois.
Illinois Department of Transportation (IDOT), (2016). Standard Specifications for Road and Bridge Construction, Springfield, Illinois.
Illinois Department of Transportation (IDOT). (2017) “Chapter 54, Pavement Design.” IDOT Bureau of Design and Environmental Manual, Springfield, Illinois.
Indiana Department of Transportation (INDOT), (2014). Standard Specifications
Itani, Samir Youssef (1990). Behavior of Base Materials Containing Large Sized Particles. Ph.D, Georgia Institute of Technology
Jorenby, B.N. and Hicks R.G. (1986). Base Course Contamination Limits, Transportation Research Record, 86–101.
Kamal, M.A., Dawson, A.R., Farouki, O.T., Hughes, D. A. B., and Sha‘at, A.A. (1993). Field and Laboratory Evaluation of the Mechanical Behavior of Unbound Granular Materials in Pavements. Transportation Research Record 1406, pp. 88-97.
73
Karasahin, M. (1993). Resilient behaviour of granular materials for analysis of highway pavements (Doctoral dissertation, University of Nottingham).
Kolisoja, P., (1997). Resilient Deformation Characteristics of Granular Materials. Ph.D, Tampere University of Technology, Tampere, Publication 223
Lee, P. Y., & Suedkamp, R. J. (1972). Characteristics of irregularly shaped compaction curves of soils. Highway Research Record, 381, 1-9.
Lekarp, F., Isacsson, U., and Dawson, A. (2000a). State of the Art. I: Resilient response of unbound aggregates. J. Transp. Eng., 126(1), 66–75.
Lekarp, F, Isacsson U. and Dawson A. (2000b). Permanent Strain Response of Unbound Aggregates. Journal of Transportation and Engineering, 76-83.
Lentz, R. W., & Baladi, G. Y. (1981). Constitutive equation for permanent strain of sand subjected to cyclic loading. Transportation Research Record, 810, 50-54.
Lytton, R. L. (1996). Foundations and pavements on unsaturated soils. In PROCEEDINGS OF THE FIRST INTERNATIONAL CONFERENCE ON UNSATURATED SOILS/UNSAT'95/PARIS/FRANCE/6-8 SEPTEMBER 1995. VOLUME 3.
Manual, S. S. (2005). Bureau of Bridges and Structures. Illinois Department of Transportation, Springfield.
McGough, P. G. (2010). A method for the prediction of soaked CBR of remoulded samples from standard classification tests. Australian Geomechanics, 45(4), 75.
Mechanistic-Empirical Pavement Design Guide (MEPDG). (2004). “Guide for mechanistic empirical design of new and rehabilitated pavement structures.” NCHRP Rep. 1-37A, Final Rep., National Cooperative Highway Research Program, Transportation Research Board, National Research Council, Washington, DC.
Missouri Department of Transportation (MODOT), (2016). Missouri Standard Specification for Highway Construction.
Monismith, C. L., Ogawa, N., & Freeme, C. R. (1975). Permanent deformation characteristics of subgrade soils due to repeated loading. Transportation Research Record, (537).
NCHRP 1-37A. (2004). Mechanistic-empirical design of new and rehabilitated pavement structures, Final Report, NCHRP Project 1-37A.
North Carolina Department of Transportation (NCDOT), (2012). Standard specifications for roads and structures.
Oklahoma Department of Transportation (OKDOT), (2009). Standard Specifications for Highway Construction.
Osouli, A., Salam, S., Tutumluer, E., Beshears, S., & Flynn, S. (2016a). Effect of Dust Ratios on the Strength of Aggregates with Low Plasticity Fines. In Geo-Chicago 2016, pp. 253-265
Osouli, A., Salam, S., & Tutumluer, E. (2016b). Effect of plasticity index and dust ratio on moisture-density and strength characteristics of aggregates. Transportation Geotechnics, 9, 69-79.
74
Osouli, A., Salam, S., Othmanawny, G., Tutumluer, E., Beshears, S., Shoup, H., & Eck, M. (2017). Results of Soaked and Unsoaked CBR Test Results on Unbound Aggregates with Varying Amounts of Fines and Dust Ratios. In Transportation Research Board 96th Annual Meeting, No. 17-04666.
Osouli, A., Othmanawny, G., Tutumluer, E., Beshears, S., & Shoup, H. (2018a). Soaking Effects on Strength Characteristics of Crushed Gravel and Limestone Unbound Aggregates. Transportation Research Record, 0361198118756886.
Osouli, A., Chaulagai, R., Tutumluer, E. (2018b). Strength Comparison of Crushed gravel and limestone aggregates with up to 12% FC . Transportation Geotechnics, Under Review.
Osouli, A., Adhikari, P., Tutumluer, E. (2018c). Fines Content Characteristics Influence on Permanent Deformation and Resilient Modulus of Unbound Crushed Gravel and Limestone Aggregates, Transportation Research Board, Submitted and Under Review.
Patel, R. S., & Desai, M. D. (2010, December). CBR predicted by index properties for alluvial soils of South Gujarat. In Proceedings of the Indian Geotechnical conference, Mumbai (pp. 79-82).
Paute, J. L., Hornych, P., & Benaben, J. P. (1996). Repeated load triaxial testing of granular materials in the French Network of Laboratories des Ponts et Chaussées. In FLEXIBLE PAVEMENTS. PROCEEDINGS OF THE EUROPEAN SYMPOSIUM EUROFLEX 1993 HELD IN LISBON, PORTUGAL, 20-22 SEPTEMBER 1993.
Roy, T. K., Chattopadhyay, B. C., & Roy, S. K. (2010, December). California Bearing Ratio, Evaluation and Estimation: A Study of Comparison. In Proceedings of the Indian Geotechnical conference, Geotrendz, Mumbai (pp. 19-22).
Saeed, A., J.W. Hall, Jr., and W. Barker, (2001) NCHRP Report 453: Performance-Related Tests of Aggregates for Use in Unbound Pavement Layers, Transportation Research Board, National Research Council, Washington, D.C.
Salam, S., Osouli, A., & Tutumluer, E. (2018). Crushed Limestone Aggregate Strength Influenced by Gradation, Fines Content, and Dust Ratio. Journal of Transportation Engineering, Part B: Pavements, 144(1), 04018002.
Seyhan, U. (2001). Characterization of anisotropic granular layer behavior in flexible pavements. (Doctoral dissertation, University of Illinois at Urbana-Champaign).
Shirur, N. B., & Hiremath, S. G. (2014). Establishing relationship between CBR value and physical properties of soil. IOSR journal of mechanical and civil engineering, 11(5), 26-30.
South Dakota Department of Transportation (SDDOT), (2015). Standard Specifications for Road and Bridge Construction.
Sweere, G. T. (1990). Unbound granular bases for roads.
Talbot, A. N., & Richart, F. E. (1923). The strength of concrete, its relation to the cement aggregates and water. University of Illinois at Urbana Champaign, College of Engineering. Engineering Experiment Station.
Talukdar, D. K. (2014). A Study of correlation between California Bearing Ratio (CBR) value with other properties of soil. International Journal of Emerging Technology and Advanced Engineering, 4(1),
75
559-562.
Tennessee State Department of Transportation (TDOT), (2006). Standard Specifications for Road and Bridge Construction.
Terzaghi K., Peck R.B., Mesri G. (1996). Soil Mechanics in Engineering Practice, John Wiley & Sons, Inc.
Texas State Department of Transportation TxDOT, (2004). Standard Specifications for Construction and Maintenance of Highways, Streets, and Bridges.
Thom, N. H., & Brown, S. F. (1988). The effect of grading and density on the mechanical properties of a crushed dolomitic limestone. Australian Road Research Board (ARRB) Conference, 14th, Australian Road Research Board (ARRB), Canberra, 94-100
Thom, N.H. (1988). Design of Road Foundations. Ph.D, University of Nottingham
Thompson M.R., Smith K.L, (1990). Repeated Triaxial Characterization of Granular Bases. Transportation Research Record, 7-17
Tseng, K. H., & Lytton, R. L. (1989). Prediction of permanent deformation in flexible pavement materials. In Implication of aggregates in the design, construction, and performance of flexible pavements. ASTM International.
Tutumluer, E., Mishra, D., and Butt, A. A. (2009). Characterization of Illinois aggregates for subgrade replacement and subbase. Technical Rep. R27-1, Illinois Center for Transportation, Univ. of Illinois at Urbana-Champaign, IL.
Tutumluer, E., & Seyhan, U. (2000, June). Effects of fines content on the anisotropic response and characterization of unbound aggregate bases. In Proceeding of the 5th Symposium of Unbound Aggregates in Roads (UNBAR5), A.A. Balkema, Rotterdam, 153-160
Tutumluer, E. (2013). Practices for Unbound Aggregate Pavement Layers. NCHRP Synthesis 445, Transportation Research Board, Washington, DC
Uzan, J. (2004). Permanent deformation in flexible pavements. Journal of Transportation Engineering, 130(1), 6-13.
Uzan, J. (1985). Characterization of granular material. Transportation research record, 1022(1), 52-59.
Van Niekerk, A. A., A. A. A. Molenaar, and L. J. M. Houben. (2002). Effect of material quality and compaction on the mechanical behavior of base course materials and pavement performance. 6th International Conference Bearing Capacity of Roads, Railways and Airfields.
Washington State Department of Transportation (WSDOT), (2014). Standard Specifications for Road, Bridge and Municipal Construction.
Yoder, E. J. and Witczak M.W. (1975). Principles of Pavement Design, John Wiley & Sons, Inc.
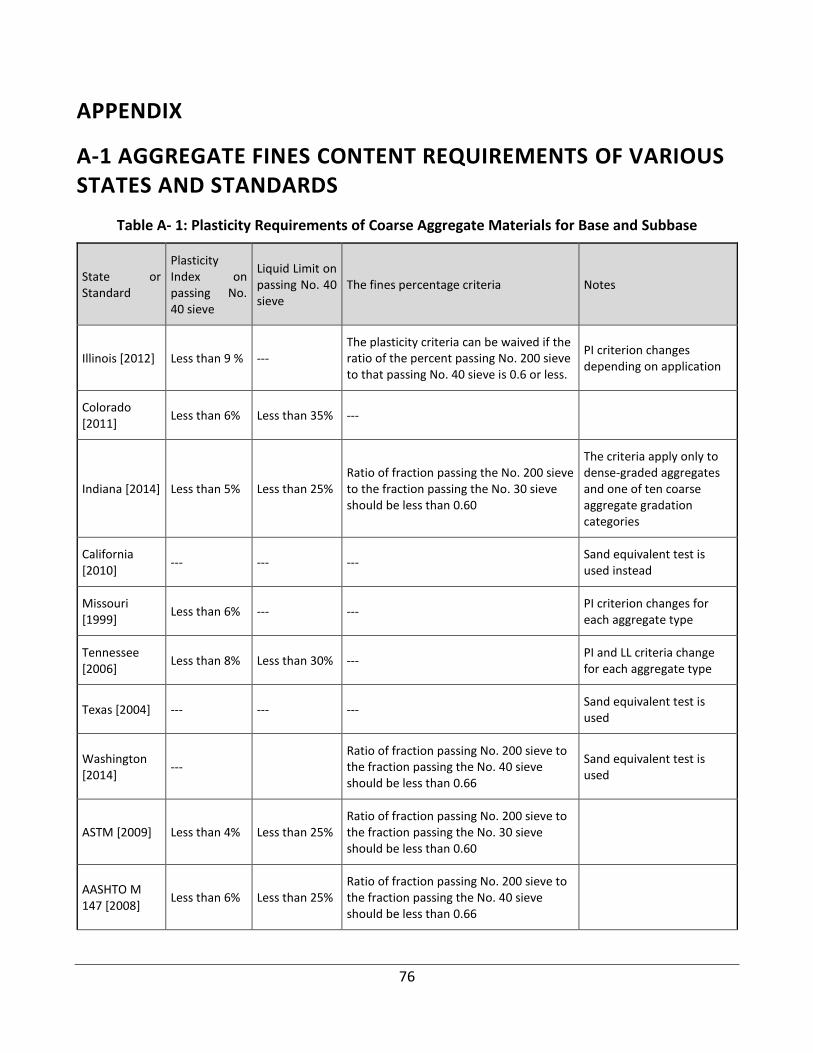
76
APPENDIX
A-1 AGGREGATE FINES CONTENT REQUIREMENTS OF VARIOUS STATES AND STANDARDS
Table A- 1: Plasticity Requirements of Coarse Aggregate Materials for Base and Subbase
State or Standard
Plasticity Index on passing No. 40 sieve
Liquid Limit on passing No. 40 sieve
The fines percentage criteria Notes
Illinois [2012] Less than 9 % --- The plasticity criteria can be waived if the ratio of the percent passing No. 200 sieve to that passing No. 40 sieve is 0.6 or less.
PI criterion changes depending on application
Colorado [2011]
Less than 6% Less than 35% ---
Indiana [2014] Less than 5% Less than 25% Ratio of fraction passing the No. 200 sieve to the fraction passing the No. 30 sieve should be less than 0.60
The criteria apply only to dense-graded aggregates and one of ten coarse aggregate gradation categories
California [2010]
--- --- --- Sand equivalent test is used instead
Missouri [1999]
Less than 6% --- --- PI criterion changes for each aggregate type
Tennessee [2006]
Less than 8% Less than 30% --- PI and LL criteria change for each aggregate type
Texas [2004] --- --- --- Sand equivalent test is used
Washington [2014]
--- Ratio of fraction passing No. 200 sieve to the fraction passing the No. 40 sieve should be less than 0.66
Sand equivalent test is used
ASTM [2009] Less than 4% Less than 25% Ratio of fraction passing No. 200 sieve to the fraction passing the No. 30 sieve should be less than 0.60
AASHTO M 147 [2008]
Less than 6% Less than 25% Ratio of fraction passing No. 200 sieve to the fraction passing the No. 40 sieve should be less than 0.66
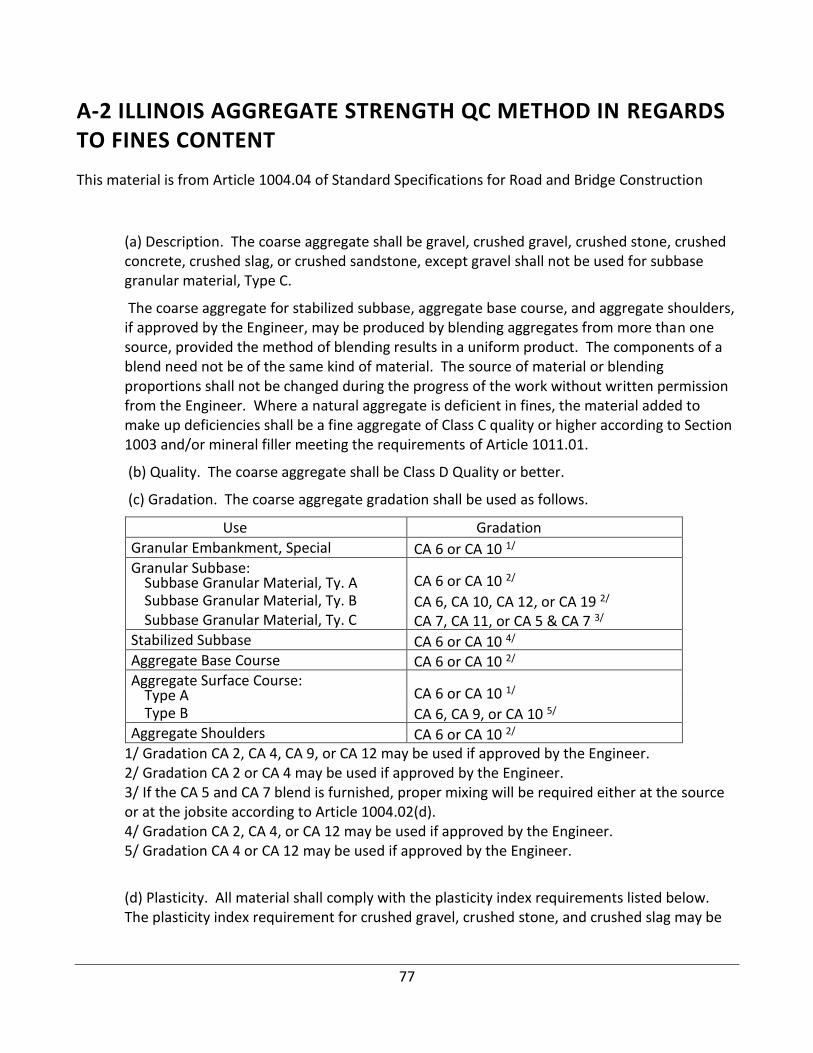
77
A-2 ILLINOIS AGGREGATE STRENGTH QC METHOD IN REGARDS TO FINES CONTENT
This material is from Article 1004.04 of Standard Specifications for Road and Bridge Construction
(a) Description. The coarse aggregate shall be gravel, crushed gravel, crushed stone, crushed concrete, crushed slag, or crushed sandstone, except gravel shall not be used for subbase granular material, Type C.
The coarse aggregate for stabilized subbase, aggregate base course, and aggregate shoulders, if approved by the Engineer, may be produced by blending aggregates from more than one source, provided the method of blending results in a uniform product. The components of a blend need not be of the same kind of material. The source of material or blending proportions shall not be changed during the progress of the work without written permission from the Engineer. Where a natural aggregate is deficient in fines, the material added to make up deficiencies shall be a fine aggregate of Class C quality or higher according to Section 1003 and/or mineral filler meeting the requirements of Article 1011.01.
(b) Quality. The coarse aggregate shall be Class D Quality or better.
(c) Gradation. The coarse aggregate gradation shall be used as follows.
Use Gradation
Granular Embankment, Special CA 6 or CA 10 1/
Granular Subbase: CA 6 or CA 10 2/ Subbase Granular Material, Ty. A
Subbase Granular Material, Ty. B CA 6, CA 10, CA 12, or CA 19 2/
Subbase Granular Material, Ty. C CA 7, CA 11, or CA 5 & CA 7 3/
Stabilized Subbase CA 6 or CA 10 4/
Aggregate Base Course CA 6 or CA 10 2/
Aggregate Surface Course: CA 6 or CA 10 1/ Type A
Type B CA 6, CA 9, or CA 10 5/
Aggregate Shoulders CA 6 or CA 10 2/
1/ Gradation CA 2, CA 4, CA 9, or CA 12 may be used if approved by the Engineer. 2/ Gradation CA 2 or CA 4 may be used if approved by the Engineer. 3/ If the CA 5 and CA 7 blend is furnished, proper mixing will be required either at the source or at the jobsite according to Article 1004.02(d). 4/ Gradation CA 2, CA 4, or CA 12 may be used if approved by the Engineer. 5/ Gradation CA 4 or CA 12 may be used if approved by the Engineer.
(d) Plasticity. All material shall comply with the plasticity index requirements listed below. The plasticity index requirement for crushed gravel, crushed stone, and crushed slag may be
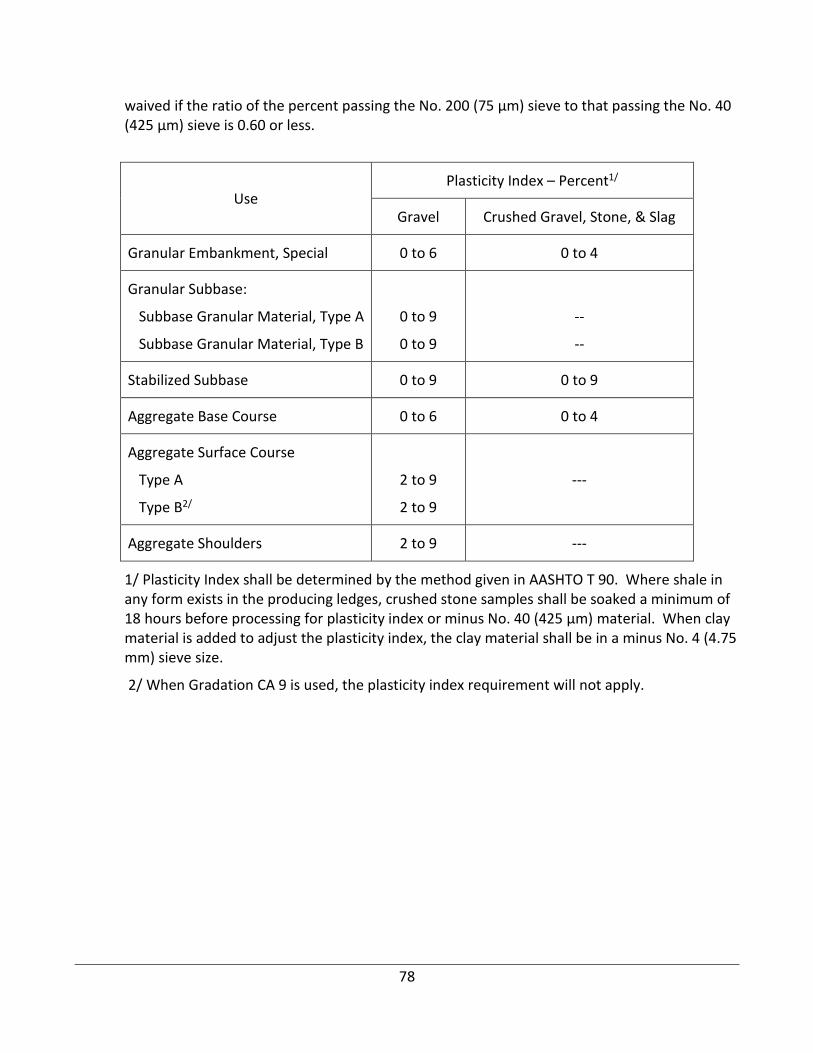
78
waived if the ratio of the percent passing the No. 200 (75 µm) sieve to that passing the No. 40 (425 µm) sieve is 0.60 or less.
Use Plasticity Index – Percent1/
Gravel Crushed Gravel, Stone, & Slag
Granular Embankment, Special 0 to 6 0 to 4
Granular Subbase:
Subbase Granular Material, Type A
Subbase Granular Material, Type B
0 to 9
0 to 9
--
--
Stabilized Subbase 0 to 9 0 to 9
Aggregate Base Course 0 to 6 0 to 4
Aggregate Surface Course
Type A
Type B2/
2 to 9
2 to 9
---
Aggregate Shoulders 2 to 9 ---
1/ Plasticity Index shall be determined by the method given in AASHTO T 90. Where shale in any form exists in the producing ledges, crushed stone samples shall be soaked a minimum of 18 hours before processing for plasticity index or minus No. 40 (425 µm) material. When clay material is added to adjust the plasticity index, the clay material shall be in a minus No. 4 (4.75 mm) sieve size.
2/ When Gradation CA 9 is used, the plasticity index requirement will not apply.
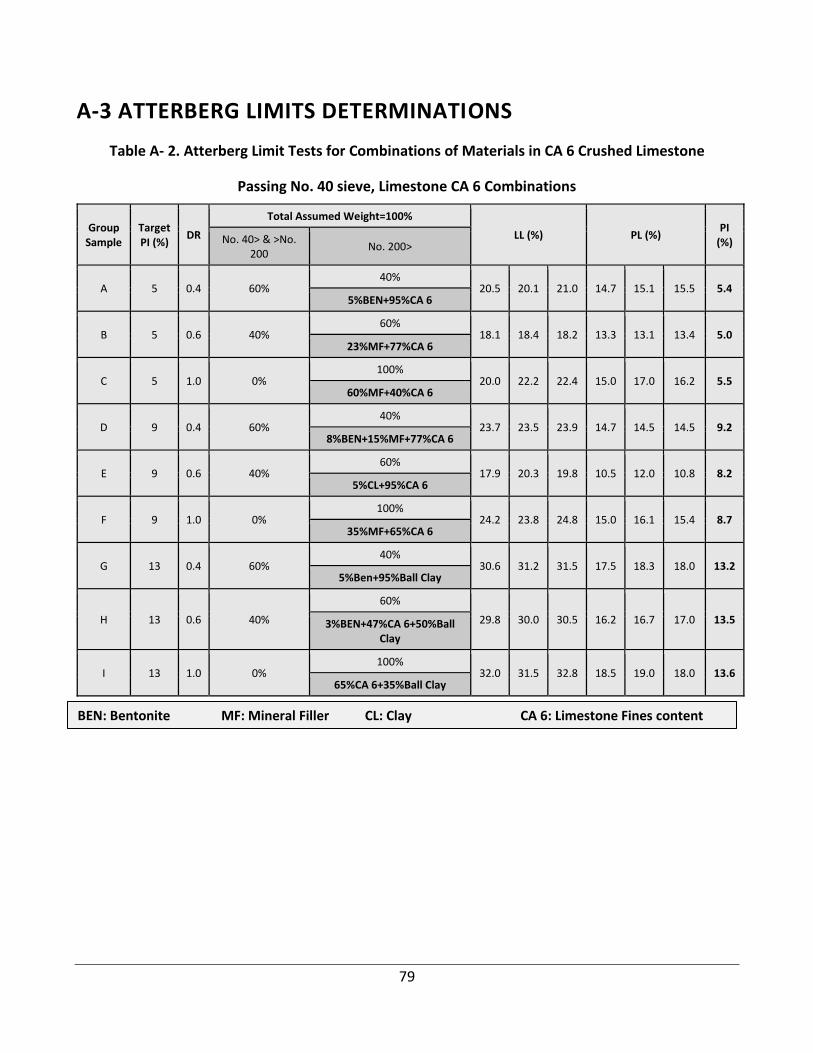
79
A-3 ATTERBERG LIMITS DETERMINATIONS
Table A- 2. Atterberg Limit Tests for Combinations of Materials in CA 6 Crushed Limestone
Passing No. 40 sieve, Limestone CA 6 Combinations
Group Sample
Target PI (%)
DR
Total Assumed Weight=100%
LL (%) PL (%) PI
(%) No. 40> & >No. 200
No. 200>
A 5 0.4 60% 40%
20.5 20.1 21.0 14.7 15.1 15.5 5.4 5%BEN+95%CA 6
B 5 0.6 40% 60%
18.1 18.4 18.2 13.3 13.1 13.4 5.0 23%MF+77%CA 6
C 5 1.0 0% 100%
20.0 22.2 22.4 15.0 17.0 16.2 5.5 60%MF+40%CA 6
D 9 0.4 60% 40%
23.7 23.5 23.9 14.7 14.5 14.5 9.2 8%BEN+15%MF+77%CA 6
E 9 0.6 40% 60%
17.9 20.3 19.8 10.5 12.0 10.8 8.2 5%CL+95%CA 6
F 9 1.0 0% 100%
24.2 23.8 24.8 15.0 16.1 15.4 8.7 35%MF+65%CA 6
G 13 0.4 60% 40%
30.6 31.2 31.5 17.5 18.3 18.0 13.2 5%Ben+95%Ball Clay
H 13 0.6 40%
60%
29.8 30.0 30.5 16.2 16.7 17.0 13.5 3%BEN+47%CA 6+50%Ball Clay
I 13 1.0 0% 100%
32.0 31.5 32.8 18.5 19.0 18.0 13.6 65%CA 6+35%Ball Clay
BEN: Bentonite MF: Mineral Filler CL: Clay CA 6: Limestone Fines content
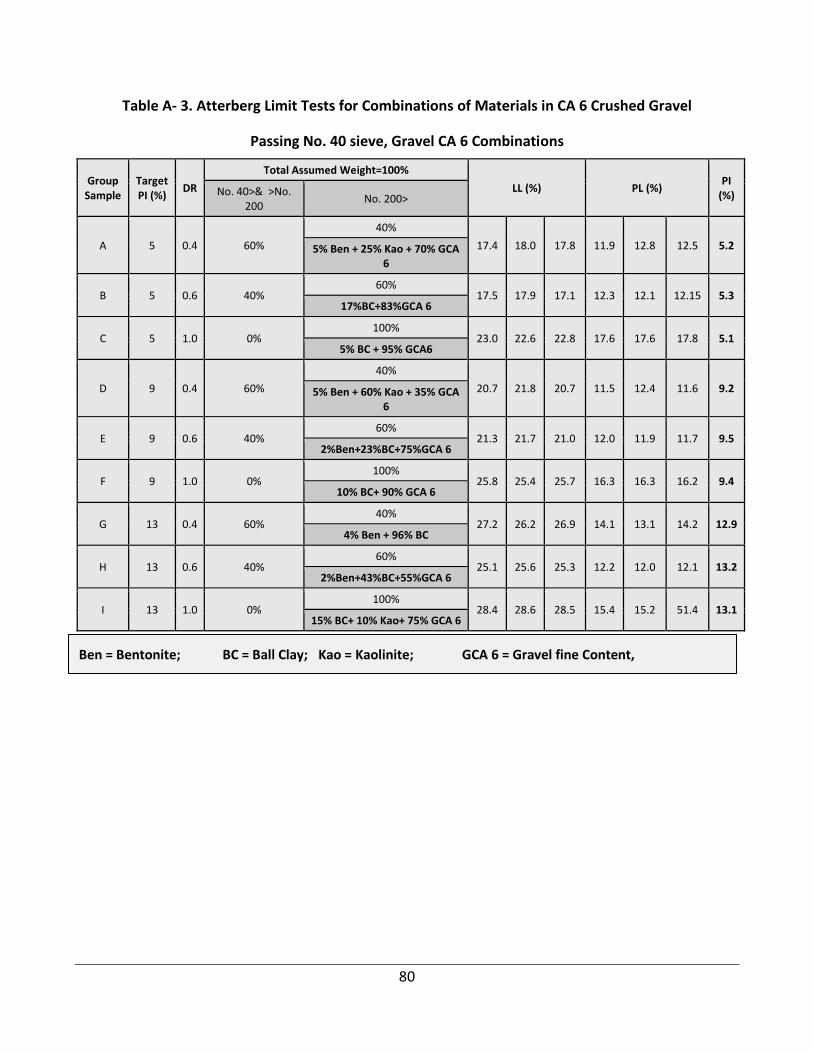
80
Table A- 3. Atterberg Limit Tests for Combinations of Materials in CA 6 Crushed Gravel
Passing No. 40 sieve, Gravel CA 6 Combinations
Group Sample
Target PI (%)
DR
Total Assumed Weight=100%
LL (%) PL (%) PI
(%) No. 40>& >No. 200
No. 200>
A 5 0.4 60%
40%
17.4 18.0 17.8 11.9 12.8 12.5 5.2 5% Ben + 25% Kao + 70% GCA 6
B 5 0.6 40% 60%
17.5 17.9 17.1 12.3 12.1 12.15 5.3 17%BC+83%GCA 6
C 5 1.0 0% 100%
23.0 22.6 22.8 17.6 17.6 17.8 5.1 5% BC + 95% GCA6
D 9 0.4 60%
40%
20.7 21.8 20.7 11.5 12.4 11.6 9.2 5% Ben + 60% Kao + 35% GCA 6
E 9 0.6 40% 60%
21.3 21.7 21.0 12.0 11.9 11.7 9.5 2%Ben+23%BC+75%GCA 6
F 9 1.0 0% 100%
25.8 25.4 25.7 16.3 16.3 16.2 9.4 10% BC+ 90% GCA 6
G 13 0.4 60% 40%
27.2 26.2 26.9 14.1 13.1 14.2 12.9 4% Ben + 96% BC
H 13 0.6 40% 60%
25.1 25.6 25.3 12.2 12.0 12.1 13.2 2%Ben+43%BC+55%GCA 6
I 13 1.0 0% 100%
28.4 28.6 28.5 15.4 15.2 51.4 13.1 15% BC+ 10% Kao+ 75% GCA 6
Ben = Bentonite; BC = Ball Clay; Kao = Kaolinite; GCA 6 = Gravel fine Content,
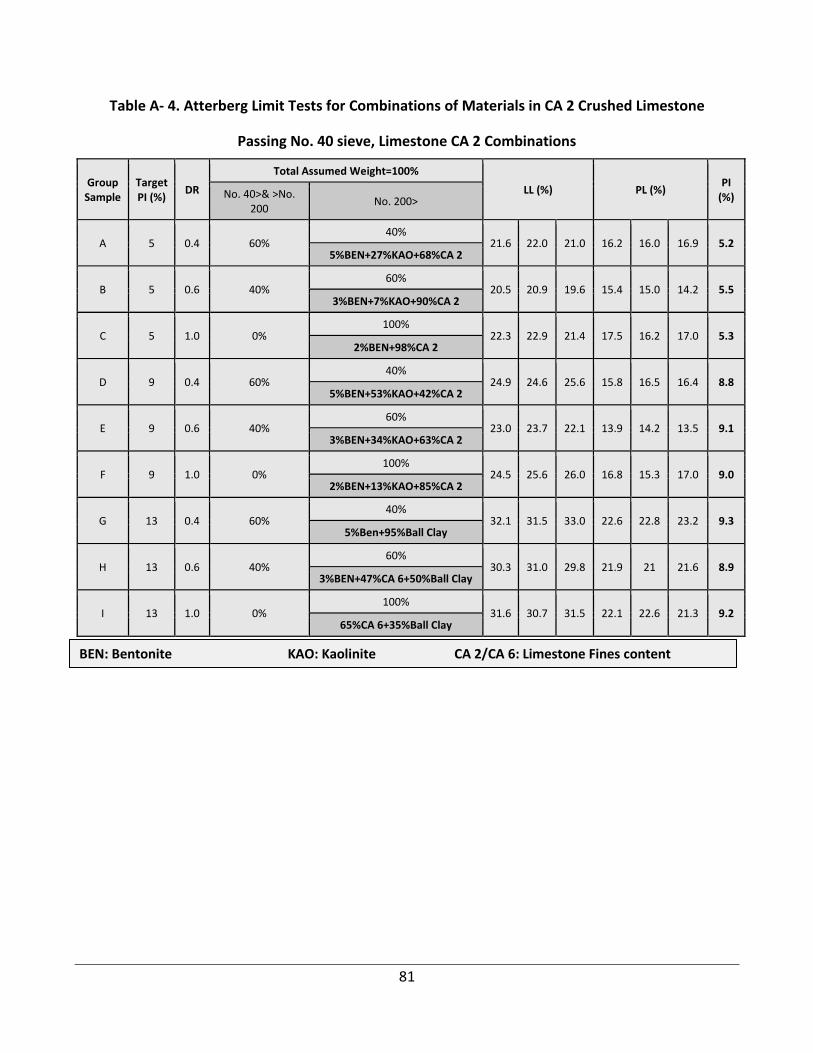
81
Table A- 4. Atterberg Limit Tests for Combinations of Materials in CA 2 Crushed Limestone
Passing No. 40 sieve, Limestone CA 2 Combinations
Group Sample
Target PI (%)
DR
Total Assumed Weight=100%
LL (%) PL (%) PI
(%) No. 40>& >No. 200
No. 200>
A 5 0.4 60% 40%
21.6 22.0 21.0 16.2 16.0 16.9 5.2 5%BEN+27%KAO+68%CA 2
B 5 0.6 40% 60%
20.5 20.9 19.6 15.4 15.0 14.2 5.5 3%BEN+7%KAO+90%CA 2
C 5 1.0 0% 100%
22.3 22.9 21.4 17.5 16.2 17.0 5.3 2%BEN+98%CA 2
D 9 0.4 60% 40%
24.9 24.6 25.6 15.8 16.5 16.4 8.8 5%BEN+53%KAO+42%CA 2
E 9 0.6 40% 60%
23.0 23.7 22.1 13.9 14.2 13.5 9.1 3%BEN+34%KAO+63%CA 2
F 9 1.0 0% 100%
24.5 25.6 26.0 16.8 15.3 17.0 9.0 2%BEN+13%KAO+85%CA 2
G 13 0.4 60% 40%
32.1 31.5 33.0 22.6 22.8 23.2 9.3 5%Ben+95%Ball Clay
H 13 0.6 40% 60%
30.3 31.0 29.8 21.9 21 21.6 8.9 3%BEN+47%CA 6+50%Ball Clay
I 13 1.0 0% 100%
31.6 30.7 31.5 22.1 22.6 21.3 9.2 65%CA 6+35%Ball Clay
BEN: Bentonite KAO: Kaolinite CA 2/CA 6: Limestone Fines content
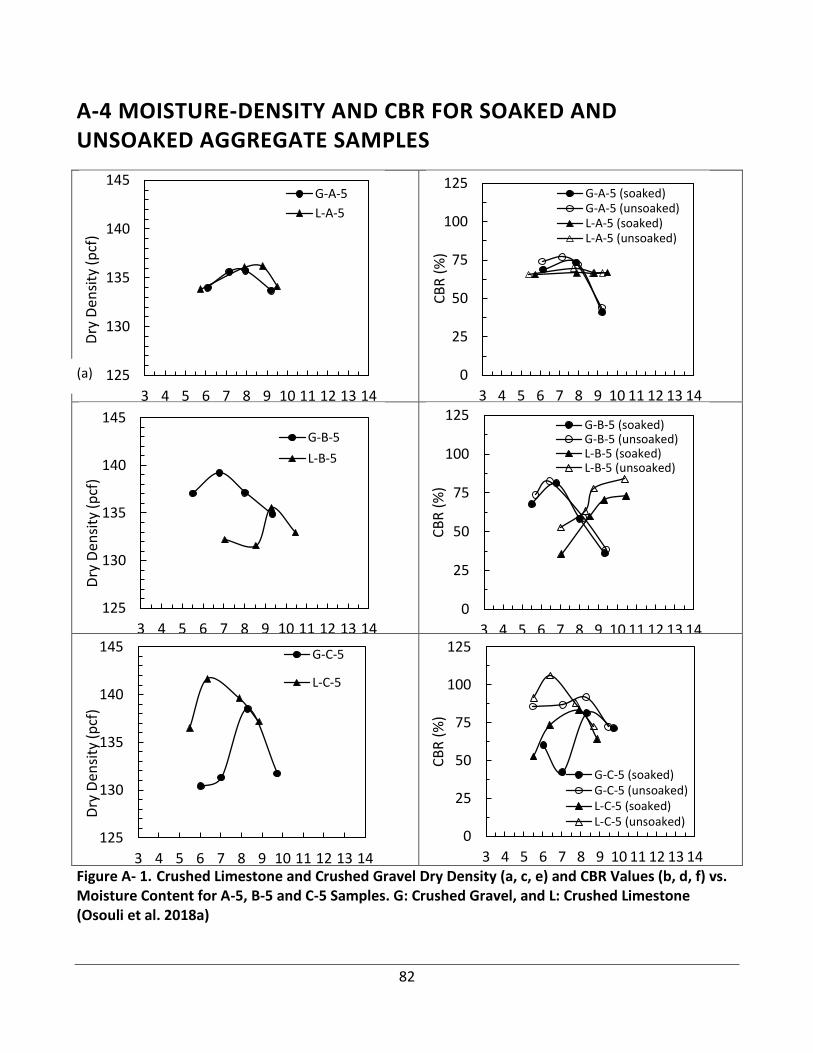
82
A-4 MOISTURE-DENSITY AND CBR FOR SOAKED AND UNSOAKED AGGREGATE SAMPLES
Figure A- 1. Crushed Limestone and Crushed Gravel Dry Density (a, c, e) and CBR Values (b, d, f) vs. Moisture Content for A-5, B-5 and C-5 Samples. G: Crushed Gravel, and L: Crushed Limestone (Osouli et al. 2018a)
125
130
135
140
145
3 4 5 6 7 8 9 10 11 12 13 14
Dry
Den
sity
(p
cf)
Moisture Content (%)
G-A-5
L-A-5
0
25
50
75
100
125
3 4 5 6 7 8 9 10 11 12 13 14
CB
R (
%)
Moisture Content (%)
G-A-5 (soaked)G-A-5 (unsoaked)L-A-5 (soaked)L-A-5 (unsoaked)
(b)
125
130
135
140
145
3 4 5 6 7 8 9 10 11 12 13 14
Dry
Den
sity
(p
cf)
Moisture Content (%)
G-B-5
L-B-5
0
25
50
75
100
125
3 4 5 6 7 8 9 10 11 12 13 14
CB
R (
%)
Moisture Content (%)
G-B-5 (soaked)G-B-5 (unsoaked)L-B-5 (soaked)L-B-5 (unsoaked)
(d)
125
130
135
140
145
3 4 5 6 7 8 9 10 11 12 13 14
Dry
Den
sity
(p
cf)
Moisture Content (%)
G-C-5
L-C-5
0
25
50
75
100
125
3 4 5 6 7 8 9 10 11 12 13 14
CB
R (
%)
Moisture Content (%)
G-C-5 (soaked)G-C-5 (unsoaked)L-C-5 (soaked)L-C-5 (unsoaked)
(f)
(a)
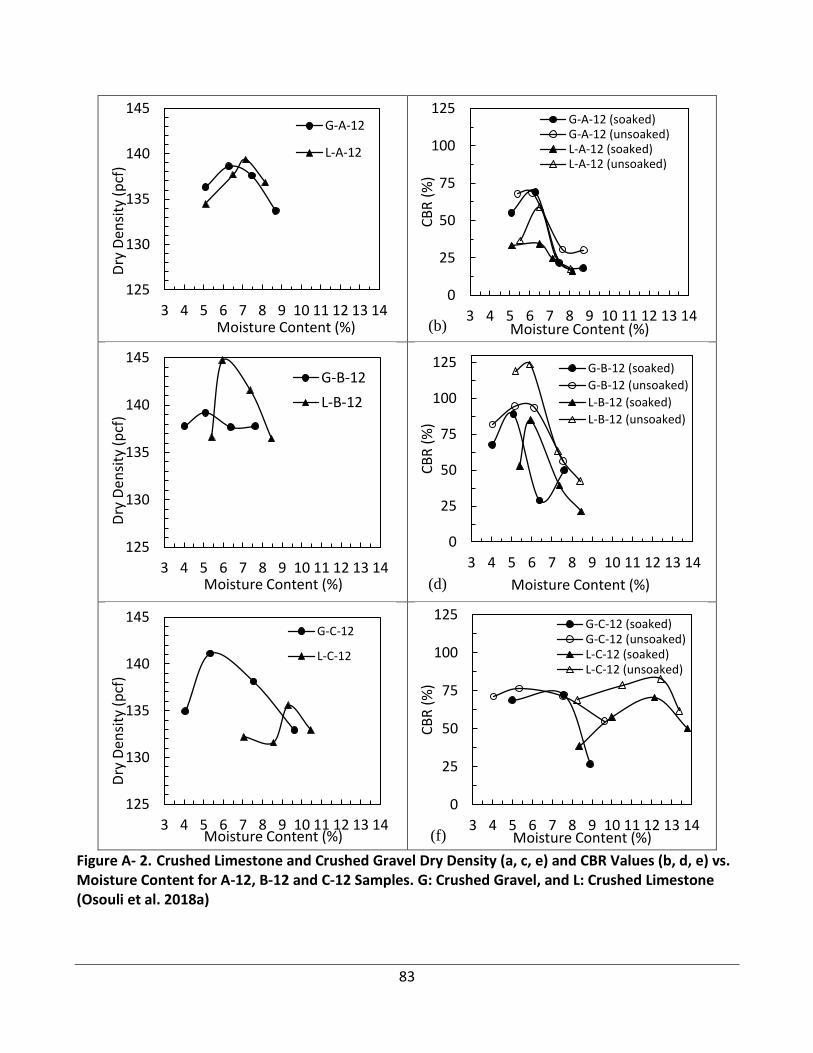
83
Figure A- 2. Crushed Limestone and Crushed Gravel Dry Density (a, c, e) and CBR Values (b, d, e) vs. Moisture Content for A-12, B-12 and C-12 Samples. G: Crushed Gravel, and L: Crushed Limestone (Osouli et al. 2018a)
125
130
135
140
145
3 4 5 6 7 8 9 10 11 12 13 14
Dry
Den
sity
(p
cf)
Moisture Content (%)
G-A-12
L-A-12
0
25
50
75
100
125
3 4 5 6 7 8 9 10 11 12 13 14
CB
R (
%)
Moisture Content (%)
G-A-12 (soaked)G-A-12 (unsoaked)L-A-12 (soaked)L-A-12 (unsoaked)
(b)
125
130
135
140
145
3 4 5 6 7 8 9 10 11 12 13 14
Dry
De
nsi
ty (
pcf
)
Moisture Content (%)
G-B-12
L-B-12
0
25
50
75
100
125
3 4 5 6 7 8 9 10 11 12 13 14
CB
R (
%)
Moisture Content (%)
G-B-12 (soaked)
G-B-12 (unsoaked)
L-B-12 (soaked)
L-B-12 (unsoaked)
(d)
125
130
135
140
145
3 4 5 6 7 8 9 10 11 12 13 14
Dry
Den
sity
(p
cf)
Moisture Content (%)
G-C-12
L-C-12
0
25
50
75
100
125
3 4 5 6 7 8 9 10 11 12 13 14
CB
R (
%)
Moisture Content (%)
G-C-12 (soaked)G-C-12 (unsoaked)L-C-12 (soaked)L-C-12 (unsoaked)
(f)
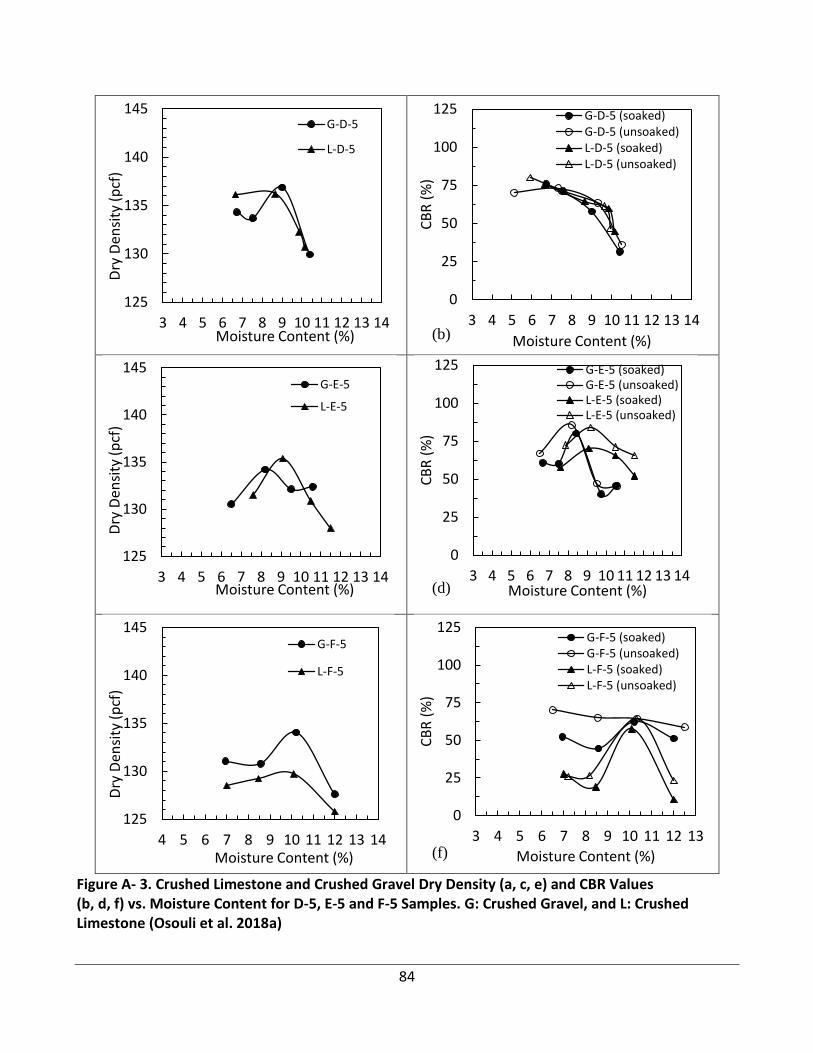
84
Figure A- 3. Crushed Limestone and Crushed Gravel Dry Density (a, c, e) and CBR Values (b, d, f) vs. Moisture Content for D-5, E-5 and F-5 Samples. G: Crushed Gravel, and L: Crushed Limestone (Osouli et al. 2018a)
125
130
135
140
145
3 4 5 6 7 8 9 10 11 12 13 14
Dry
Den
sity
(p
cf)
Moisture Content (%)
G-D-5
L-D-5
0
25
50
75
100
125
3 4 5 6 7 8 9 10 11 12 13 14
CB
R (
%)
Moisture Content (%)
G-D-5 (soaked)G-D-5 (unsoaked)L-D-5 (soaked)L-D-5 (unsoaked)
(b)
125
130
135
140
145
3 4 5 6 7 8 9 10 11 12 13 14
Dry
Den
sity
(p
cf)
Moisture Content (%)
G-E-5
L-E-5
0
25
50
75
100
125
3 4 5 6 7 8 9 10 11 12 13 14
CB
R (
%)
Moisture Content (%)
G-E-5 (soaked)G-E-5 (unsoaked)L-E-5 (soaked)L-E-5 (unsoaked)
(d)
125
130
135
140
145
4 5 6 7 8 9 10 11 12 13 14
Dry
Den
sity
(p
cf)
Moisture Content (%)
G-F-5
L-F-5
0
25
50
75
100
125
3 4 5 6 7 8 9 10 11 12 13
CB
R (
%)
Moisture Content (%)
G-F-5 (soaked)G-F-5 (unsoaked)L-F-5 (soaked)L-F-5 (unsoaked)
(f)
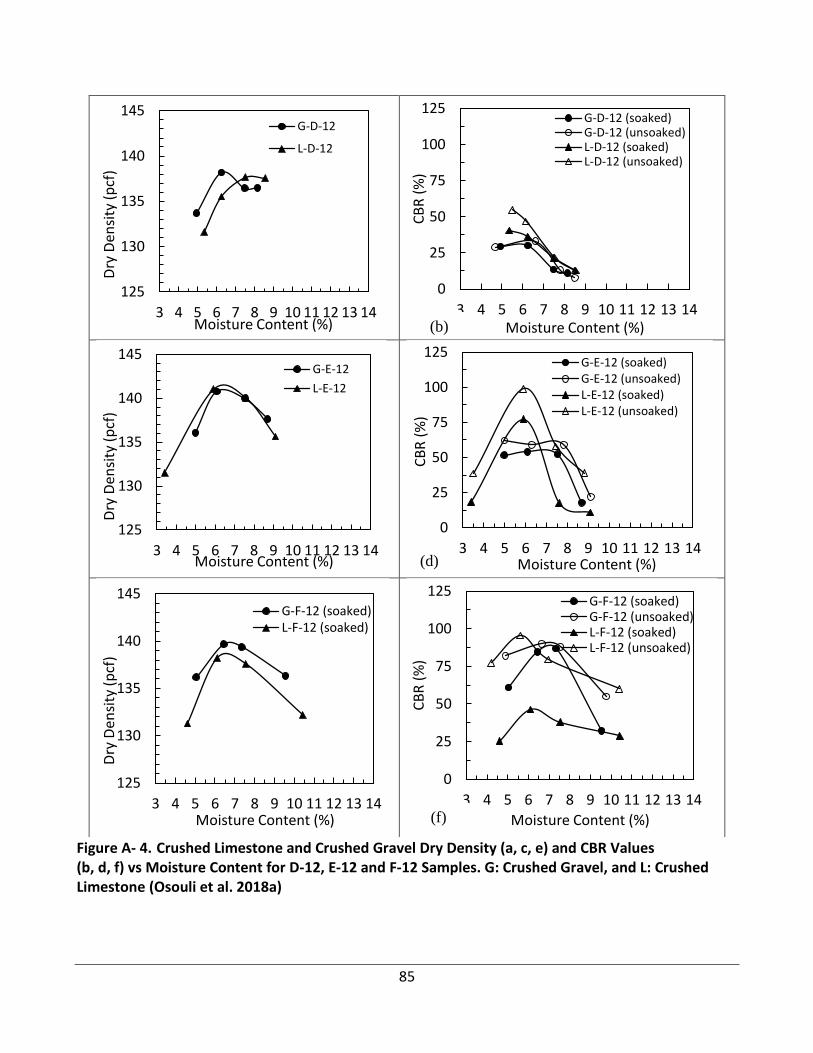
85
Figure A- 4. Crushed Limestone and Crushed Gravel Dry Density (a, c, e) and CBR Values (b, d, f) vs Moisture Content for D-12, E-12 and F-12 Samples. G: Crushed Gravel, and L: Crushed Limestone (Osouli et al. 2018a)
125
130
135
140
145
3 4 5 6 7 8 9 10 11 12 13 14
Dry
Den
sity
(p
cf)
Moisture Content (%)
G-D-12
L-D-12
0
25
50
75
100
125
3 4 5 6 7 8 9 10 11 12 13 14
CB
R (
%)
Moisture Content (%)
G-D-12 (soaked)G-D-12 (unsoaked)L-D-12 (soaked)L-D-12 (unsoaked)
(b)
125
130
135
140
145
3 4 5 6 7 8 9 10 11 12 13 14
Dry
Den
sity
(p
cf)
Moisture Content (%)
G-E-12
L-E-12
0
25
50
75
100
125
3 4 5 6 7 8 9 10 11 12 13 14
CB
R (
%)
Moisture Content (%)
G-E-12 (soaked)G-E-12 (unsoaked)L-E-12 (soaked)L-E-12 (unsoaked)
(d)
125
130
135
140
145
3 4 5 6 7 8 9 10 11 12 13 14
Dry
Den
sity
(p
cf)
Moisture Content (%)
G-F-12 (soaked)L-F-12 (soaked)
0
25
50
75
100
125
3 4 5 6 7 8 9 10 11 12 13 14
CB
R (
%)
Moisture Content (%)
G-F-12 (soaked)G-F-12 (unsoaked)L-F-12 (soaked)L-F-12 (unsoaked)
(f)
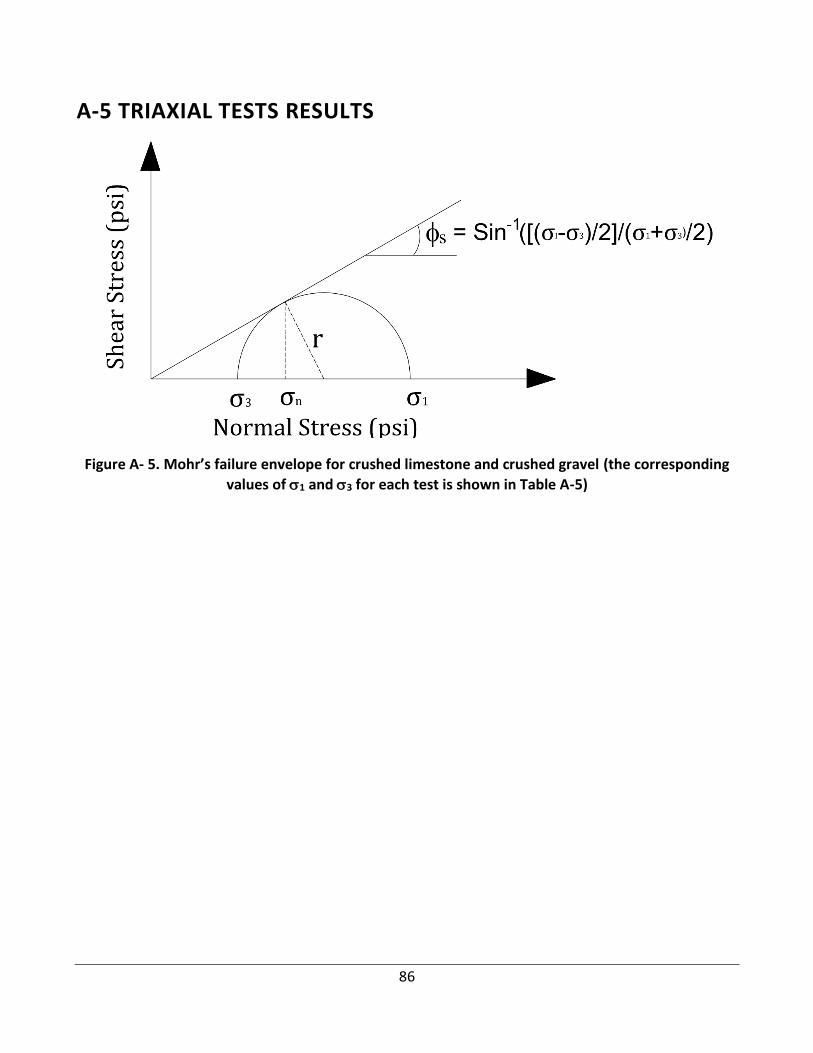
86
A-5 TRIAXIAL TESTS RESULTS
Figure A- 5. Mohr’s failure envelope for crushed limestone and crushed gravel (the corresponding
values of 1 and 3 for each test is shown in Table A-5)
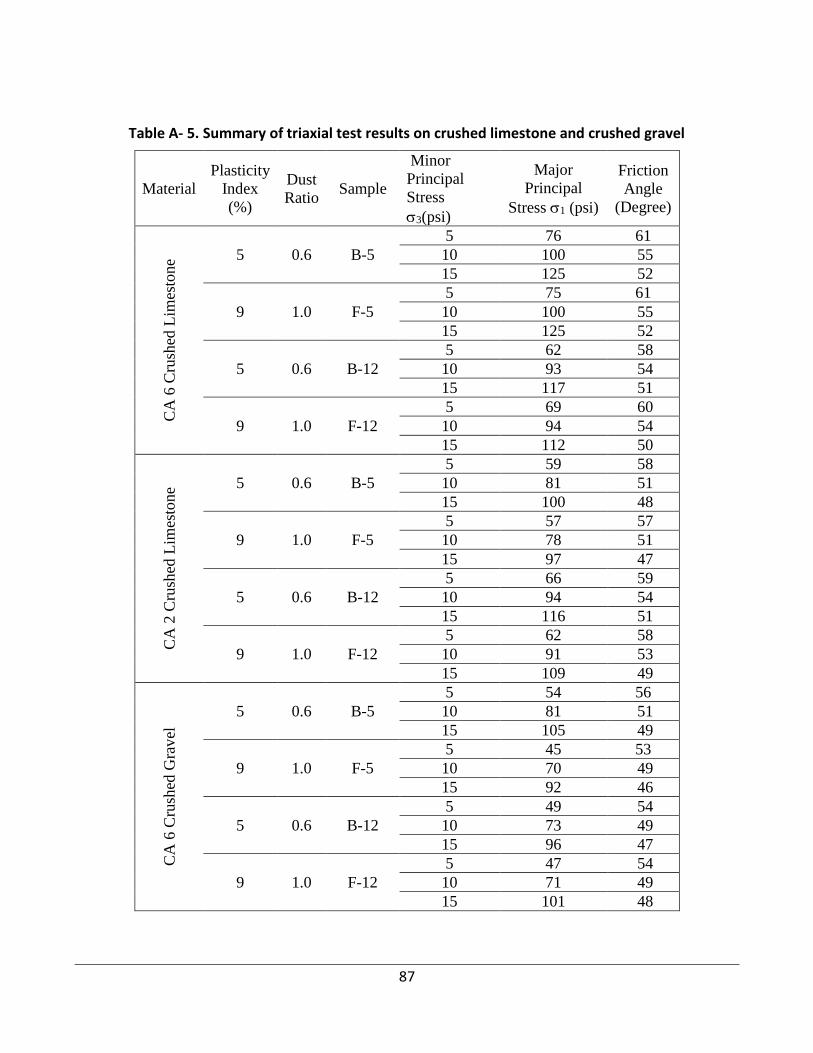
87
Table A- 5. Summary of triaxial test results on crushed limestone and crushed gravel
Material
Plasticity
Index
(%)
Dust
Ratio Sample
Minor
Principal
Stress
3(psi)
Major
Principal
Stress 1 (psi)
Friction
Angle
(Degree)
CA
6 C
rush
ed L
imes
tone
5 0.6 B-5
5 76 61
10 100 55
15 125 52
9 1.0 F-5
5 75 61
10 100 55
15 125 52
5 0.6 B-12
5 62 58
10 93 54
15 117 51
9 1.0 F-12
5 69 60
10 94 54
15 112 50
CA
2 C
rush
ed L
imes
tone 5 0.6 B-5
5 59 58
10 81 51
15 100 48
9 1.0 F-5
5 57 57
10 78 51
15 97 47
5 0.6 B-12
5 66 59
10 94 54
15 116 51
9 1.0 F-12
5 62 58
10 91 53
15 109 49
CA
6 C
rush
ed G
rav
el
5 0.6 B-5
5 54 56
10 81 51
15 105 49
9 1.0 F-5
5 45 53
10 70 49
15 92 46
5 0.6 B-12
5 49 54
10 73 49
15 96 47
9 1.0 F-12
5 47 54
10 71 49
15 101 48
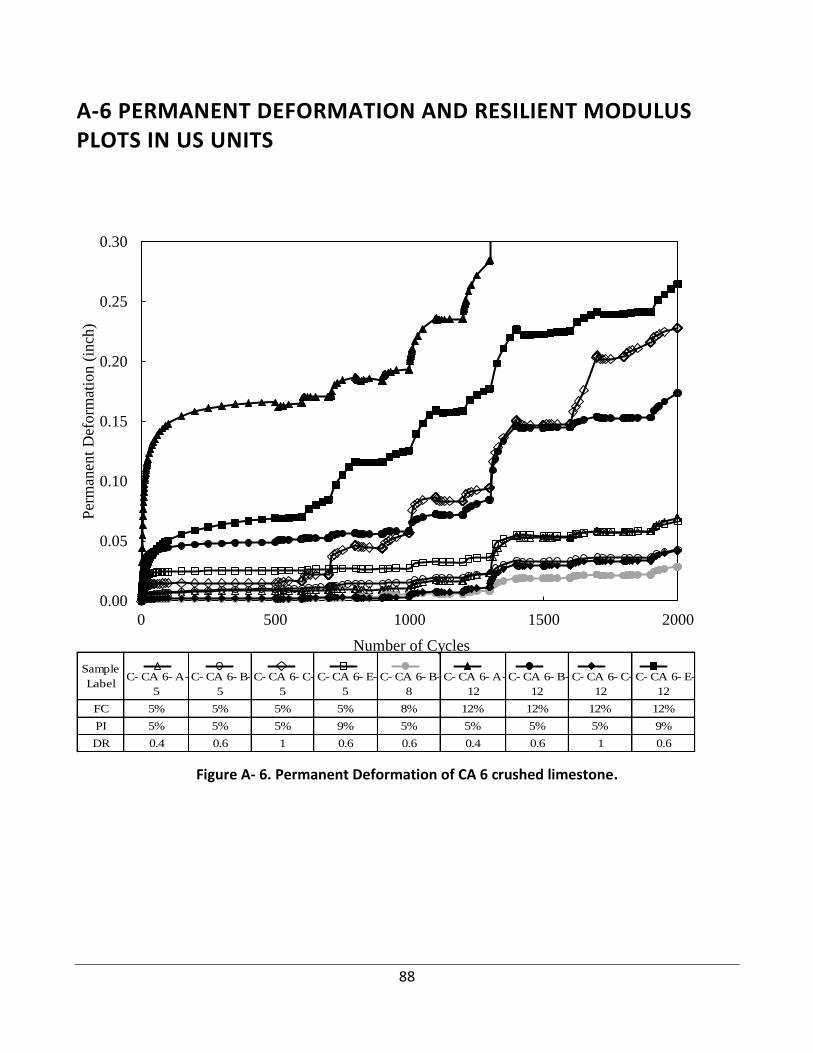
88
A-6 PERMANENT DEFORMATION AND RESILIENT MODULUS PLOTS IN US UNITS
Figure A- 6. Permanent Deformation of CA 6 crushed limestone.
0.00
0.05
0.10
0.15
0.20
0.25
0.30
0 500 1000 1500 2000
Per
man
ent
Def
orm
atio
n (
inch
)
Number of Cycles
Sample
LabelC- CA 6- A-
5
C- CA 6- B-
5
C- CA 6- C-
5
C- CA 6- E-
5
C- CA 6- B-
8
C- CA 6- A-
12
C- CA 6- B-
12
C- CA 6- C-
12
C- CA 6- E-
12
FC 5% 5% 5% 5% 8% 12% 12% 12% 12%
PI 5% 5% 5% 9% 5% 5% 5% 5% 9%
DR 0.4 0.6 1 0.6 0.6 0.4 0.6 1 0.6
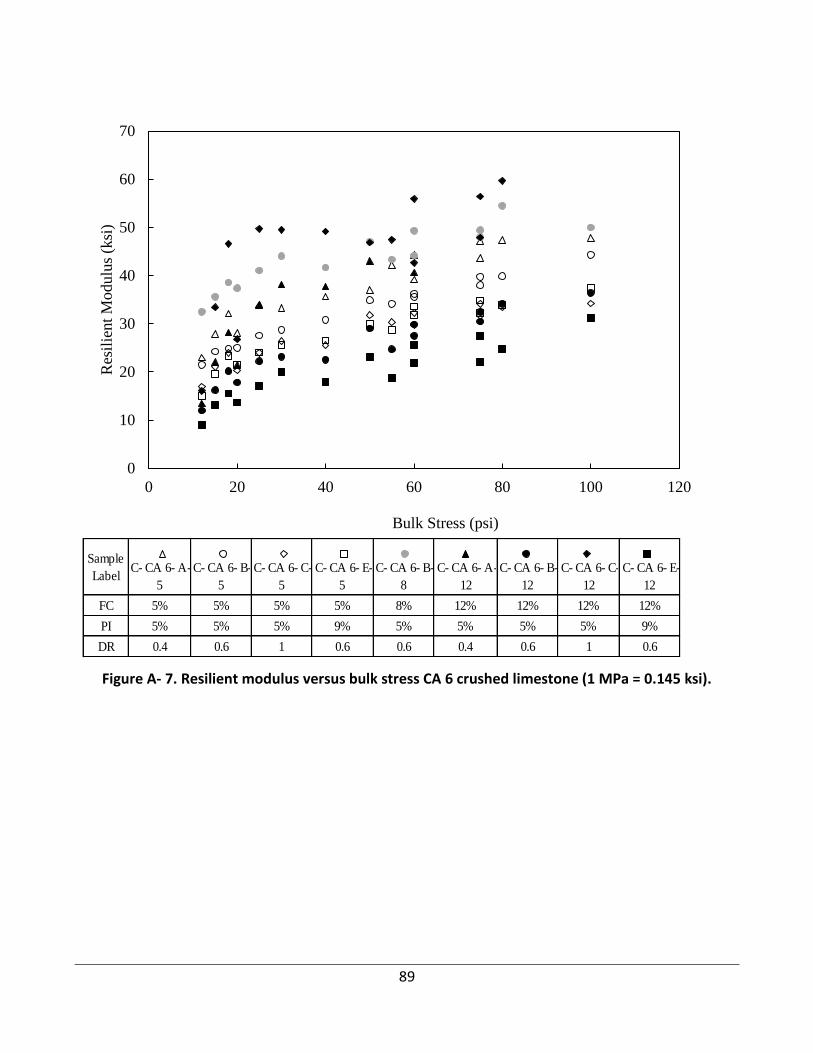
89
Figure A- 7. Resilient modulus versus bulk stress CA 6 crushed limestone (1 MPa = 0.145 ksi).
0
10
20
30
40
50
60
70
0 20 40 60 80 100 120
Res
ilie
nt
Modulu
s (k
si)
Bulk Stress (psi)
Sample
LabelC- CA 6- A-
5
C- CA 6- B-
5
C- CA 6- C-
5
C- CA 6- E-
5
C- CA 6- B-
8
C- CA 6- A-
12
C- CA 6- B-
12
C- CA 6- C-
12
C- CA 6- E-
12
FC 5% 5% 5% 5% 8% 12% 12% 12% 12%
PI 5% 5% 5% 9% 5% 5% 5% 5% 9%
DR 0.4 0.6 1 0.6 0.6 0.4 0.6 1 0.6
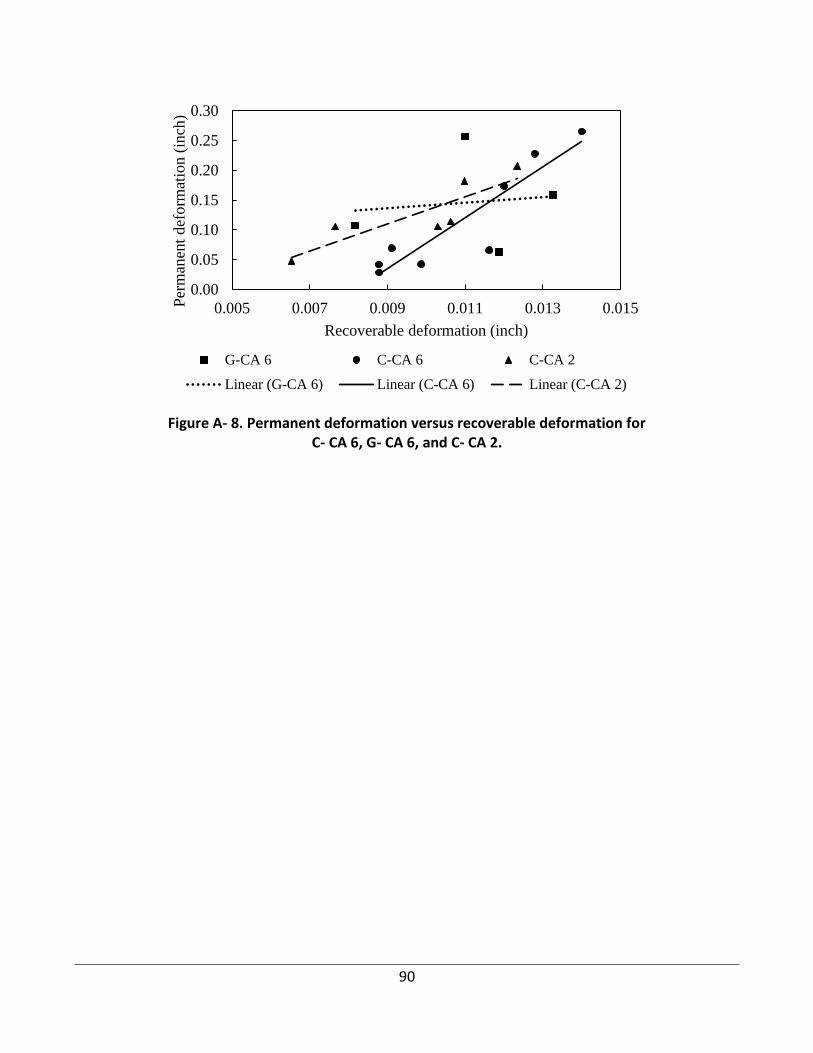
90
Figure A- 8. Permanent deformation versus recoverable deformation for C- CA 6, G- CA 6, and C- CA 2.
0.00
0.05
0.10
0.15
0.20
0.25
0.30
0.005 0.007 0.009 0.011 0.013 0.015Per
man
ent
def
orm
atio
n (
inch
)
Recoverable deformation (inch)
G-CA 6 C-CA 6 C-CA 2
Linear (G-CA 6) Linear (C-CA 6) Linear (C-CA 2)
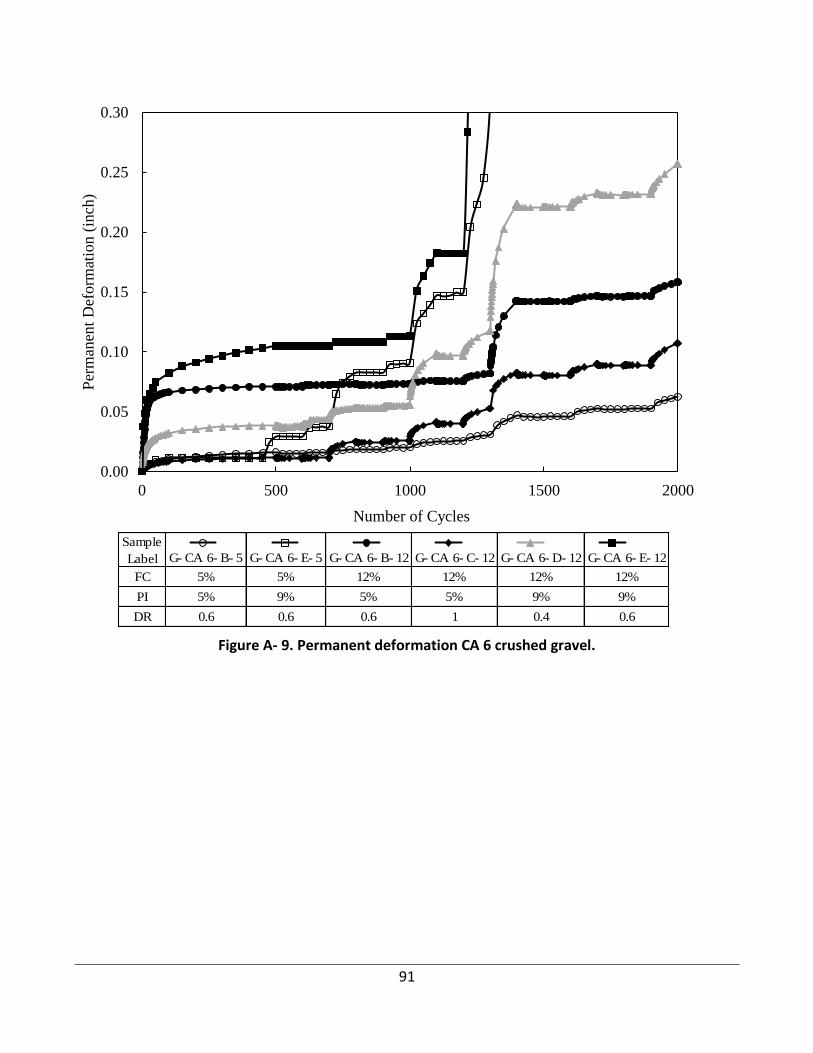
91
Figure A- 9. Permanent deformation CA 6 crushed gravel.
0.00
0.05
0.10
0.15
0.20
0.25
0.30
0 500 1000 1500 2000
Per
man
ent
Def
orm
atio
n (
inch
)
Number of Cycles
Sample
Label G- CA 6- B- 5 G- CA 6- E- 5 G- CA 6- B- 12 G- CA 6- C- 12 G- CA 6- D- 12 G- CA 6- E- 12
FC 5% 5% 12% 12% 12% 12%
PI 5% 9% 5% 5% 9% 9%
DR 0.6 0.6 0.6 1 0.4 0.6
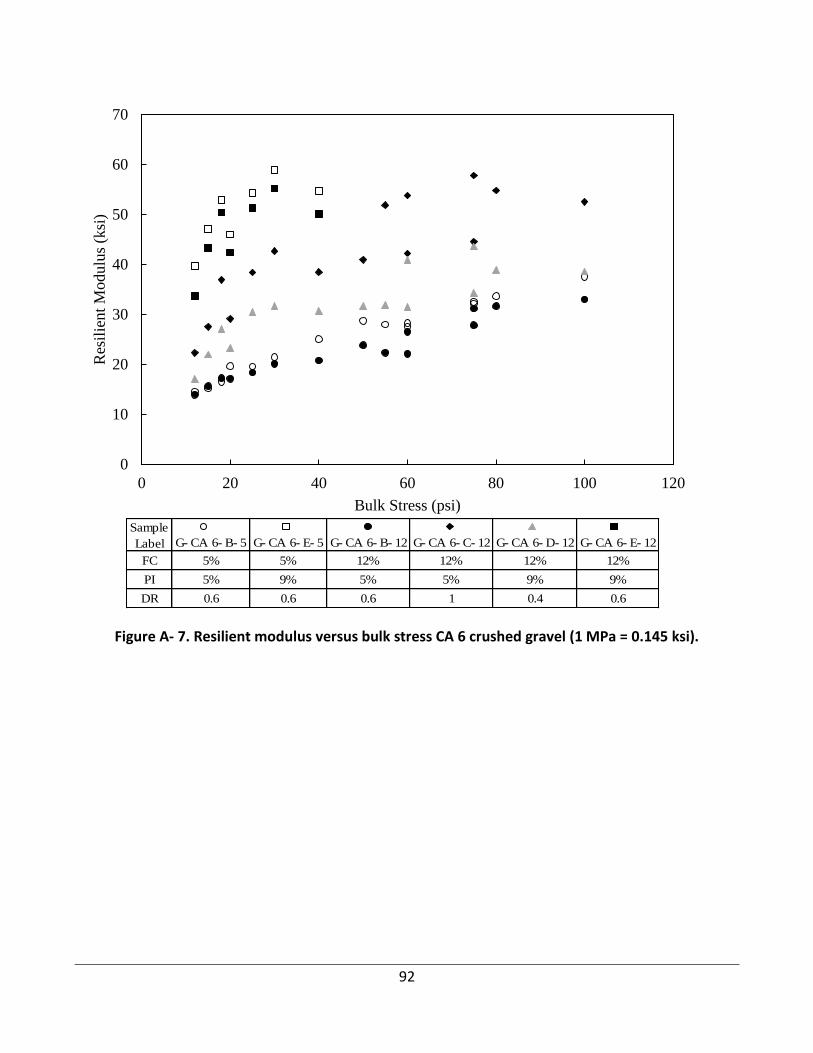
92
Figure A- 7. Resilient modulus versus bulk stress CA 6 crushed gravel (1 MPa = 0.145 ksi).
0
10
20
30
40
50
60
70
0 20 40 60 80 100 120
Res
ilie
nt
Modulu
s (k
si)
Bulk Stress (psi)
Sample
Label G- CA 6- B- 5 G- CA 6- E- 5 G- CA 6- B- 12 G- CA 6- C- 12 G- CA 6- D- 12 G- CA 6- E- 12
FC 5% 5% 12% 12% 12% 12%
PI 5% 9% 5% 5% 9% 9%
DR 0.6 0.6 0.6 1 0.4 0.6
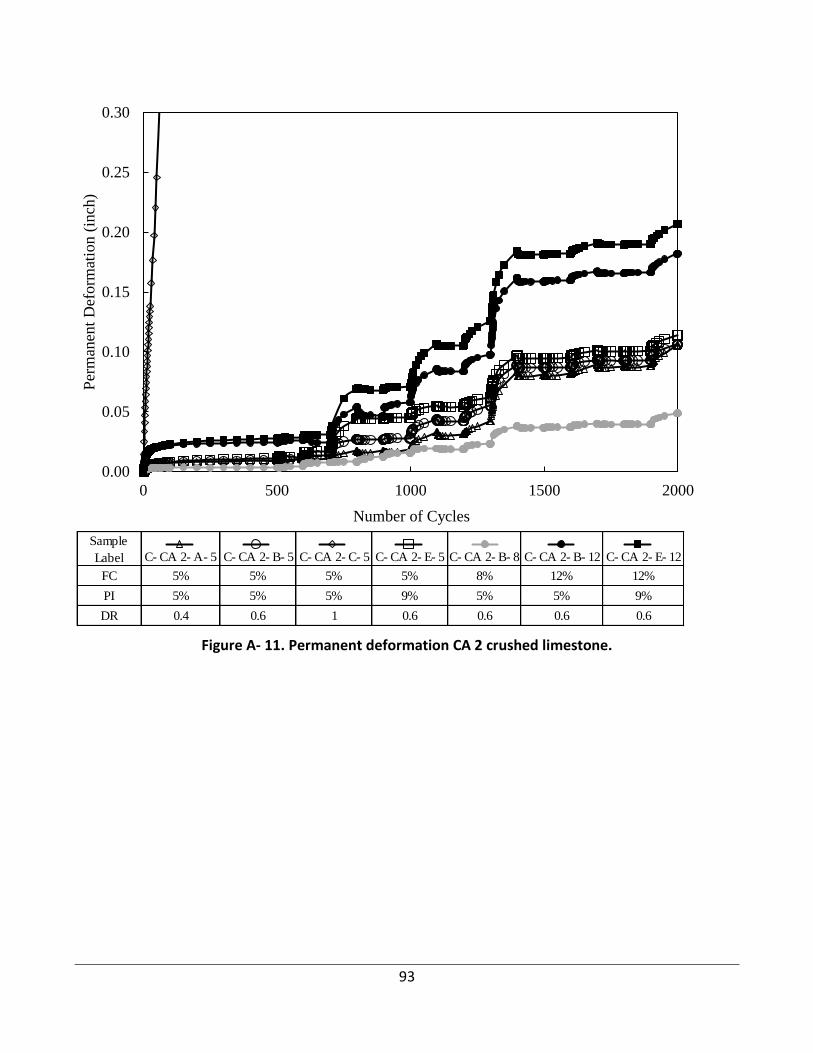
93
Figure A- 11. Permanent deformation CA 2 crushed limestone.
0.00
0.05
0.10
0.15
0.20
0.25
0.30
0 500 1000 1500 2000
Per
man
ent
Def
orm
atio
n (
inch
)
Number of Cycles
Sample
Label C- CA 2- A- 5 C- CA 2- B- 5 C- CA 2- C- 5 C- CA 2- E- 5 C- CA 2- B- 8 C- CA 2- B- 12 C- CA 2- E- 12
FC 5% 5% 5% 5% 8% 12% 12%
PI 5% 5% 5% 9% 5% 5% 9%
DR 0.4 0.6 1 0.6 0.6 0.6 0.6
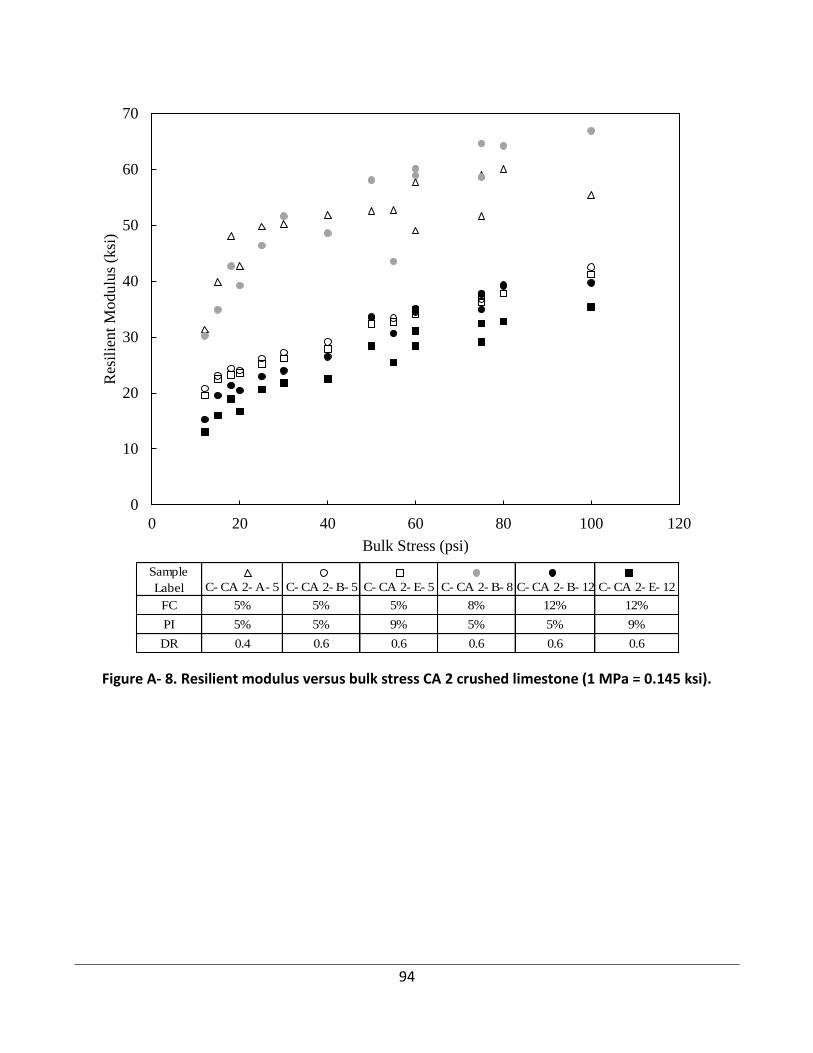
94
Figure A- 8. Resilient modulus versus bulk stress CA 2 crushed limestone (1 MPa = 0.145 ksi).
0
10
20
30
40
50
60
70
0 20 40 60 80 100 120
Res
ilie
nt
Modulu
s (k
si)
Bulk Stress (psi)
Sample
Label C- CA 2- A- 5 C- CA 2- B- 5 C- CA 2- E- 5 C- CA 2- B- 8 C- CA 2- B- 12 C- CA 2- E- 12
FC 5% 5% 5% 8% 12% 12%
PI 5% 5% 9% 5% 5% 9%
DR 0.4 0.6 0.6 0.6 0.6 0.6
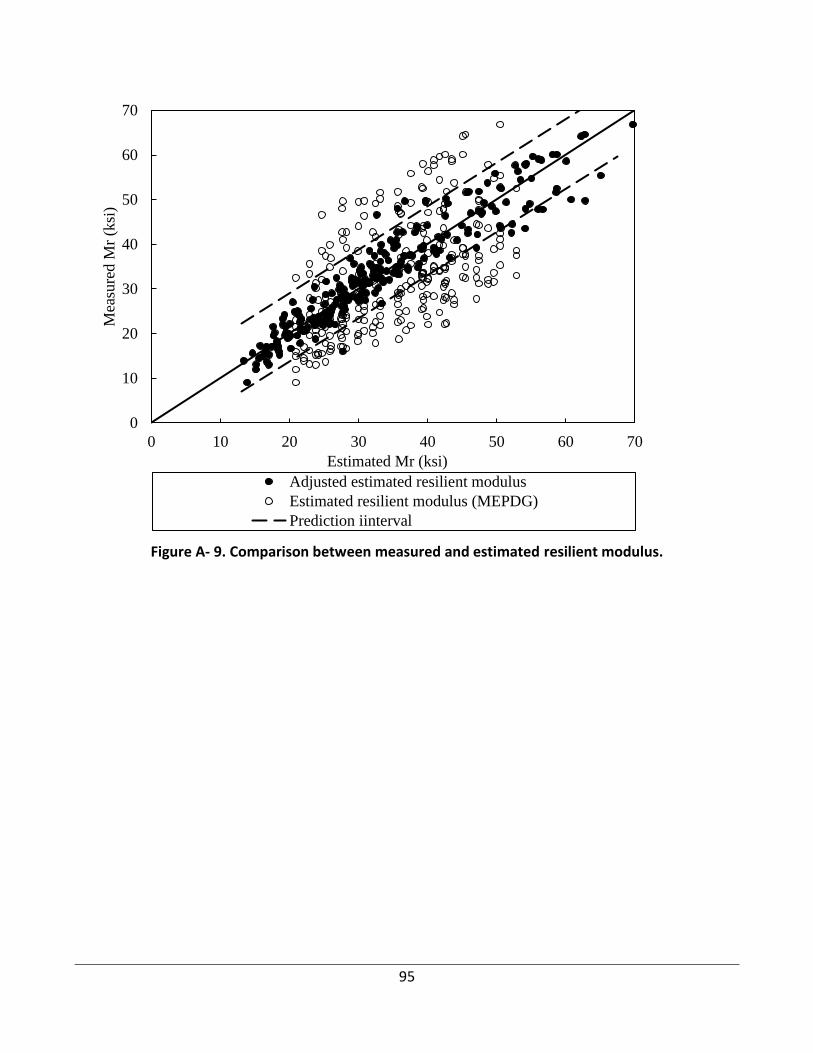
95
Figure A- 9. Comparison between measured and estimated resilient modulus.
0
10
20
30
40
50
60
70
0 10 20 30 40 50 60 70
Mea
sure
d M
r (k
si)
Estimated Mr (ksi)
Adjusted estimated resilient modulus
Estimated resilient modulus (MEPDG)
Prediction iinterval