layered pavement design method for massachusetts
TRANSCRIPT
Layered Pavement Design Method for Massachusetts EGONS TONS, RICHARD E. CHAMBERS, and MICHAEL A. KAMIN
Respectively, Assistant Professor of Civil Engineering, Senior Research Engineer, Principal Civil Engineer, Massachusetts Department of Public Works
A method for the design of flexible pavements has been developed for Massachusetts. The method is simple, rational and practical, and can be applied immediately on a routine basis in the design office, yet is flexible enough to permit modification as indicated by future research. Data and analyses that evolved from the AASHO Road Test experiments were used as a guide in the development of the design method.
Straightforward conventional procedures have been selected to provide a value for soil support. Preliminary soils data are obtained from geological and soil maps, and borings and samples for test are taken as needed. Laboratory Bearing Ratio and other tests are performed. Test results and boring data are then used as a basis for a Design Bearing Ratio. Traffic factors are computed from anticipated traffic conditions and existing traffic and Loadometer data. The 18-K Daily Equivalent Axle Load is used directly as defined in AASHO procedures.
The Regional Factor as recommended by the AASHO guide was not adopted in its present form. This approach was deemed too specifically related to materials, soils and environment of the test site. To account for possible moisture, frost, traffic, time (aging) and other effects, a blanket increase of 15 percent in Structural Number was introduced. This increase probably approximates a reasonable Regional Factor. More study is needed in this area.
There are an infinite variety of layered pavement systems that will satisfy the strength requirements as dictated by a given soil and traffic. AASHO coefficients of relative strength of various materials for surface, base and subbasewere adopted where possible. A new coefficient was derived for the penetrated base. The general design chart correlating DBR values with traffic and structural number permits the use of any type and thickness of surface, base, and subbase, provided the strength coefficient for each material is known. The pavement thicknesses obtained by using the derived design chart are reasonable when compared to past experiences in Massachusetts and other states.
•FIELD EXPERIENCE has formed the basis for proportioning of flexible pavements in Massachusetts as well as in many other states. In an attempt to place pavement design in Massachusetts on a more quantitative basis, a committee was formed of members of the Massachusetts Department of Public Works and of the Department of Civil Engineering of the Massachusetts Institute of Technology; their mission was to review and evaluate available approaches and recommend a practical design method that could
Paper sponsored by Committee on Flexible Pavement Des ign and presented at the 44th Annual Meeting.
193
194
be used immediately in the design office. It was , of course, recognized that any approach adopted would have to be augmented with subsequent research, the direction of which would also be recommended by the committee. This paper covers the first phase of the study, i.e., the background and development of the design method.
There are a variety of sources that can be used as a basis for the design of flexible pavements. There are empirical methods that become so modified with time that the reasons for their existence are vague and often not documented. At the other extreme are theoretical approaches that are oversimplified in assumptions but complicated in application, demanding development of data and techniques not now available. Therefore, it was decided that a new approach, that offered by the AASHO guide, would be a desirable path to follow. Although the AASHO concept is controversial and certainly not conclusive in many respects, it does offer an extensive, well-documented, and well-controlled fund of data as its background. There is also the hope that more information will be developed to strengthen further the AASHO approach.
In essence, the AASHO approach considers: (a) soil supporting capacity, (b) traffic factors, (c) regional variables, and (d) structural capabilities of pavement materials. These factors form the basis for proportioning a pavement section that will serve the riding public for a predictable period of ti me. Certainly the critical parameters are recognized and the criterion for performance is realistic. A design method based on the AASHO approach should, therefore, be reasonable.
DEFINITIONS OF TERMS
Axle Load.-Load transmitted by a single axle having two single- or dual-tired wheels.
Base Course. -Layer of specified material of designed thickness placed on a subbase or subgradc to support a surface course.
Bearing Ratio (BR). -stress required to produce a certain penetration, using a standard piston, in a given soil relative to a standard reference stress.
Black Base. -A plant-mixed graded bituminous mixture used under the surface layer. Design Bearing Ratio (DBR). -That bearing ratio selected as being typical for design
purposes of the section under consideration. 18-Kip Equivalence Factor. -Number of applications of an 18, 000-lb single-axle load
that will have the same effect on the serviceability of a pavement as a single application of a given load.
Equivalent Daily 18-Kip Load. -Average number of equivalent 18-kip load applications that will be applied to the pavement structure in one day.
Freezing Index (FI). -An index of the severity of a winter which takes into account the temperature drop below freezing and the number of days in which this occurs.
Frost Heave. -Increase in elevation of the pavement surface due to ice lens formation in the underlying soils or materials.
Frost Susceptible Material. -A soil in which significant detrimental ice segregation can occur if conditions of moisture and temperature are favorable.
Future Average Daily Traffic (Future ADT). -Estimated average daily traffic at the time that the Terminal Serviceability Index is reached.
Initial Serviceability Index (ISI) . -Serviceability index of a newly constructed road before the commencement of traffic.
Layered (Flexible) Pavement.-A pavement structure which maintains intimate contact with and distributes loads to the subgrade and depends on aggregate interlock, particle friction, and cohesion for stability.
Longitudinal Profile. - Contour of the surface grade in the direction of traffic. Pavement Structure. -Combination of subbase, base course, and surface course placed
on a subgrade to support the traffic load and distribute it to the subgrade. Penetrated Base. -An open-graded crushed rock layer penetrated in the field with
asphalt, used under the surface layer. Present Average Daily Traffic (Present ADT). -Average daily traffic expected to occur
immediately after the highway is opened to traffic . Present Serviceability Index (PSI). -Serviceability index at time of observation.
195
Regional Factor. -A factor used to adjust the structural number for climatic and environmental conditions.
Serviceability. -Ability of a pavement to serve traffic that it was meant to serve. Serviceability Index (SI). -A number that estimates ability of a pavement to serve traf
fic that it was meant to serve. A measure of the roughness, rutting and degree of cracking and patching found in a pavement.
Soil Support Value (S). -An index of the relative ability of a subgrade material to support traffic loads imposed on it by the pavement structure.
Strength Coefficient. -A number indicating relative effectiveness of pavement materials as they contribute to the performance of the pavement structure.
Structural Number. -Product of thickness and strength coefficient of a given layer of the pavement structure. Sum of the structural numbers for all layers is the structural number of the pavement and is an index of the performance of the section.
Subbase. -Layer or layers of specified or selected material of design thickness placed on a subgrade to support a base course.
Subgrade Line. -Level above which the pavement structure and shoulders are constructed.
Subgrade Material. -Material below subgrade line in cuts and embankments and in embankment foundations, extending to such depth as affects the support of the pavement structure .
Subgrade Weakening. -Loss in supporting capacity of subgrade soils due to increase in water content.
Surface (Wearing) Course. -Top layer(s) of the pavement structure that resists the direct stress applied by traffic loads. It provides a smooth riding surface, resists skidding, abrasion and climatic effects, and protects the underlying layers from moisture.
Terminal Serviceability Index (TSI). -Serviceability index at which the pavement is deemed unable to serve the traffic that it was meant to serve; the point at which major resurfacing of the pavement is necessary.
Traffic Analysis (Design) Period. -Number of years that the highway will be in service before the Terminal Serviceability Index is reached.
Transverse Profile. -Contour of surface grade across the roadway. Truck Weight (Loadometer) study. -A field survey made for the purpose of obtaining
information on trends in weight dimensions, axle spacings, types, loads, etc., of freight vehicles actually using the road.
FACTORS IN PAVEMENT DESIGN
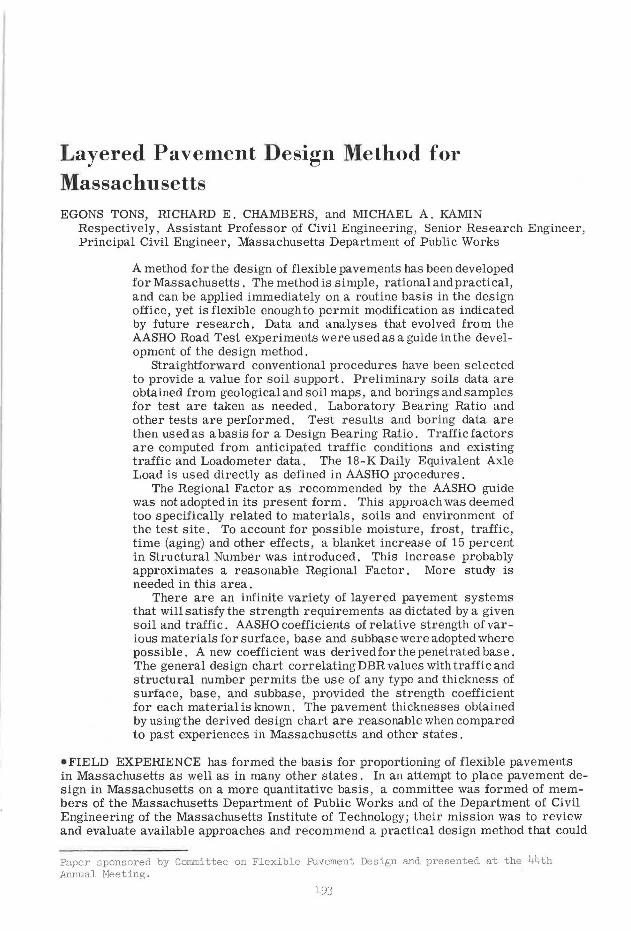
The purpose of a pavement is to provide a smooth riding support for various loaded vehicles. This is achieved by designing and constructing a layered densified composite consisting of various sizes of rock particles, often bound together by some organic or inorganic cementing agent. The function of each layer is as follows (Fig. 1):
1. Surface Layer. -This must resist the high vertical stresses applied under the tire. As it acts as a plate under dynamic conditions, it develops substantial bending and shear stresses as well. The surface must also act as a protective layer to shield the layers beneath from water, provide a smooth wearing surface to afford a satisfactory ride to the user, and reduce stresses on the layers below it.
2. Base Layer. -This must resist high stresses. Although the surface layer acts to reduce them to some degree, the stresses within the base are still high. This is particularly true for bases which underlie thin surface layers. The base must also serve to reduce stresses on the weaker layers below it, and provide a smooth support on which the surface can be laid.
3. Subbase. -This must provide drainage for water that may penetrate the surface layers and also must allow drainage for the water that percolates from sclow. The drainage function is particularly critical because of the frost conditions found in Massachusetts. The subbase must also resist stress applied from above, and reduce stresses on the underlying soil layer.
196
0
Function
l. Resists high stresses
Surface 2 . Reduces stress on support
3. Protects against moisture 4. Provides riding surface
1. Resists high stresses
Bose 2. Reduces stress on subgrode
3. Provides smooth support
Subbose l. Provides drainage
2 . Reduces stress on subgrode
Subgrode
Figure 1 . Primary functions of pavement layers .
Static vs Moving Load
The load applied to the layered vaverne11l curnvu::;ile ca11 ue ::;lalic, ::;uc!t ai:; al i:;lup lights, or moving, as encountered in rural and many urban highways. In the methods of design developed in the past, the static load was considered the most critical; therefore, static test values were often used in design. Most of the mileage of the interstate highways and expressways is subjected exclusively to moving loads during its service. Furthermore, the data developed at the AASHO Road Test are based on performance under moving loads(l).
There are materlils, such as crushed rock or gravel, which may not have properties influenced by time of load duration. On the other hand, materials like bituminous concrete and some soils can be greatly affected by the speed of load application and by temperature. Therefore, it is necessary for the purposes of design to decide what kind of loading the designed pavement will predominantly serve.
The speed of traffic used in the AASHO Road Test was about 30 mph. On primary highways and most secondary roads, 30 mph and above are frequently encountered, although it is possible that trucks on grades may slow down to below the 30-mph speed.
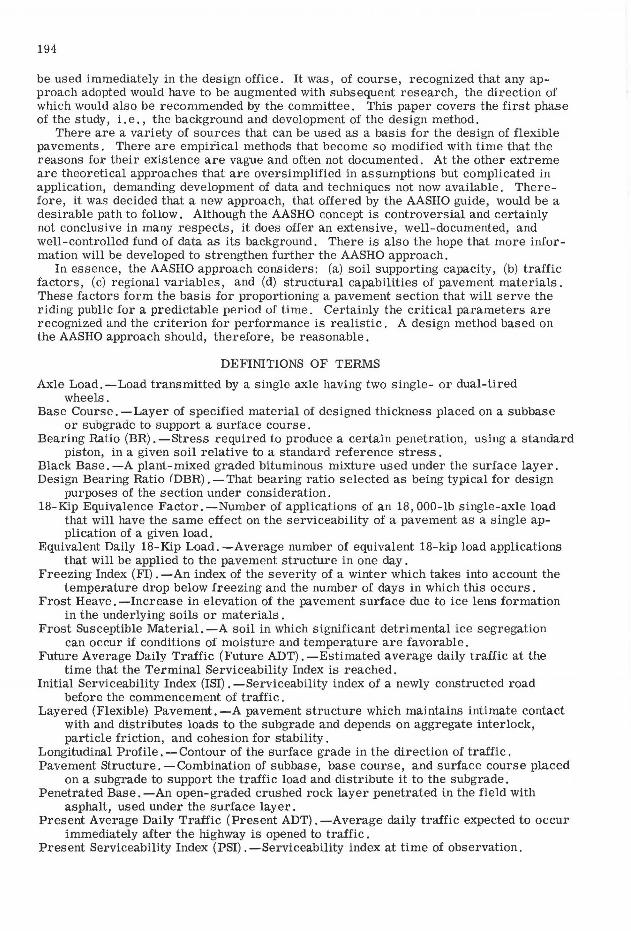
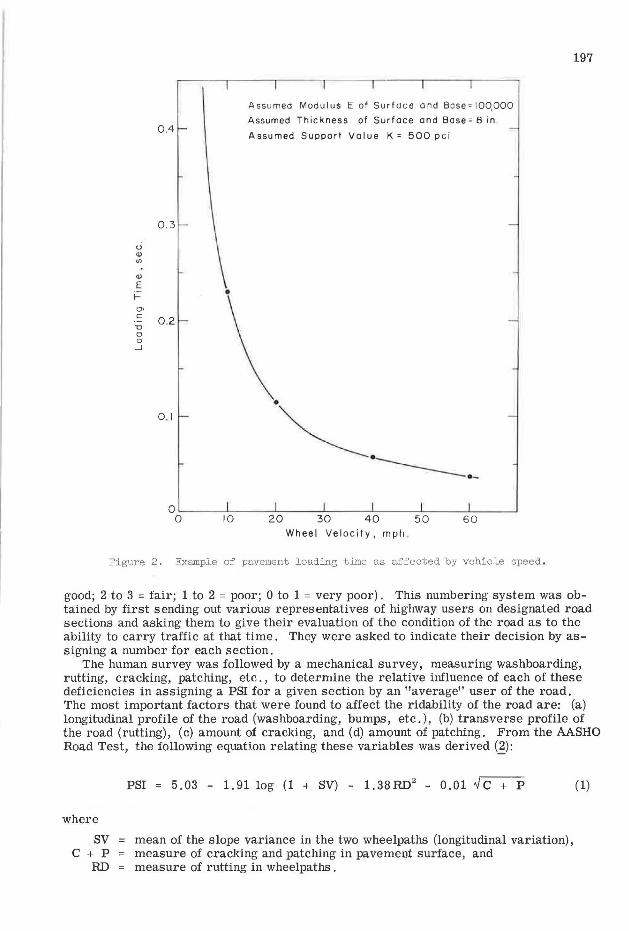
In this design approach, using the AASHO Road Test findings as background, it was assumed that a moving load would be applied to a given point on the wheelpath for very short durations, usually lasting much less than one second. Figure 2 shows the relationship between speed of given vehicle and the approximate time of load duration at a point the wheel is traversing.
Present Serviceability Index
One of the major contributions towards quantitative measurement of ridability of the pavement is the Present Serviceability Index (PSI) developed during the AASHO Road Test experiments (~ . The index can vary between 0 and 5 ( 4 to 5 = very good; 3 to 4 =
u Q)
Vl
Q)
E I-
O> c: ·-"O CJ 0 _J
0.4
0.3
•
0 .2
0 . 1
As sumed Modulus E of Surface and Base = 100,000
Assumed Thickness of Surface and Bose= 8 in
Assumed Support Value K = 500 pc i
·~. -----------·-
Wheel Velocity, mph .
197
Figure 2. Example of pavement loading time as affected by vehicle speed .
good; 2 to 3 = fair; 1 to 2 = poor; 0 to 1 = very poor). This numbering system was obtained by first sending out various representatives of highway users on designated road sections and asking them to give their evaluation of the condition of the road as to the ability to carry traffic at that time. They were asked to indicate their decision by assigning a number for each section.
The human survey was followed by a mechanical survey, measuring washboarding, rutting, cracking, patching, etc., to determine the relative influence of each of these deficiencies in assigning a PSI for a given section by an "average" user of the road. The most important factors that were found to affect the ridability of the road are: (a) longitudinal profile of the road (washboarding, bumps, etc.), (b) transverse profile of the road (rutting), (c) amount of cracking, and (d) amount of patching. From the AASHO Road Test, the following equation relating these variables was derived ~):
where
sv c + p
RD
PSI = 5.03 - 1.91 log (1 + SV) - l.38RD2 - 0.01 ~c + p (1)
mean of the slope variance in the two wheelpaths (longitudinal variation), measure of cracking and patching in pavement surface, and measure of rutting in wheelpaths .
198
H (/)
a...
)( Q)
'O c >- Q)
-~ 0 (.J
.n (/) 0 Q) O> (.J 0 > _J ~ ~
Q)
(/)
c Q) CJ)
~ a..._
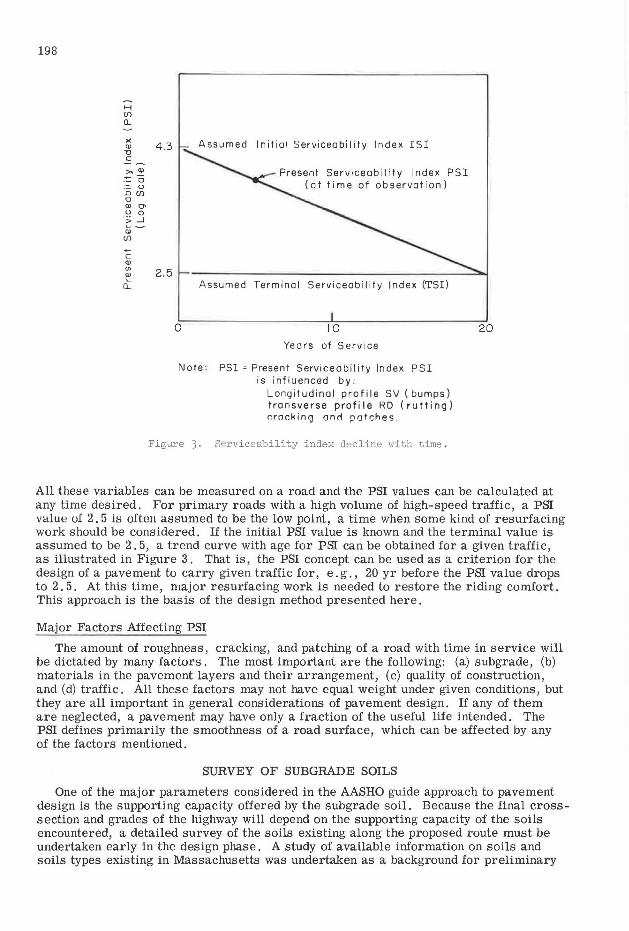
4.3
2.5
0
Initial Serviceability Index !SI
Present Serviceability Index PSI (at time of observation)
Assumed Terminal Serviceability Index (TSil
10
Years of Service
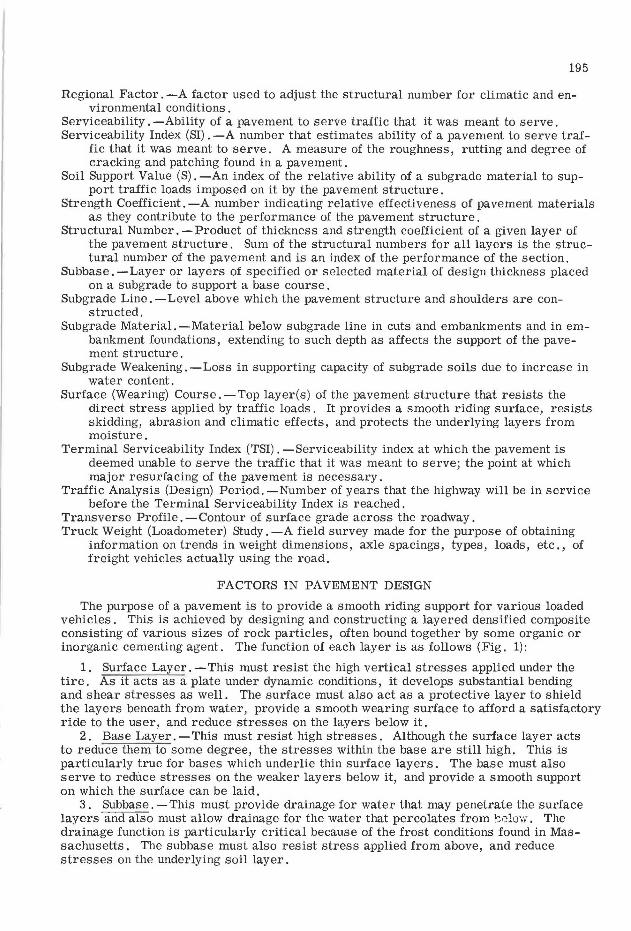
Note : PSI= Present Serviceability Index PSI is influenced by:
Longitudinal profile SV (bumps) transverse profile RD (rutting) r.ror.king nnrl patche5 ,
Figure 3. Serviceability index decline with time.
20
All these variables can be measured on a road and the PSI values can be calculated at any time desired. For primary roads with a high volume of high-speed traffic, a PSI value uI 2. 5 is often assumed to be the low point, a time when some kind of resurfacing work should be considered. If the initial PSI value is known and the terminal value is assumed to be 2. 5, a trend curve with age for PSI can be obtained for a given traffic, as illustrated in Figure 3. That is, the PSI concept can be used as a criterion for the design of a pavement to carry given traffic for, e.g., 20 yr before the PSI value drops to 2. 5. At this time, major resurfacing work is needed to restore the riding comfort. This approach is the basis of the design method presented here.
Major Factors Affecting PSI
The amount of roughness, cracking, and patching of a road with time in service will be dictated by many factors. The most important are the following: (a) subgrade, (b) materials in the pavement layers and their arrangement, (c) quality of construction, and (d) traffic. All these factors may not have equal weight under given conditions, but they are all important in general considerations of pavement design. If any of them are neglected, a pavement may have only a fraction of the useful life intended. The PSI defines primarily the smoothness of a road surface, which can be affected by any of the factors mentioned.
SURVEY OF SUBGRADE SOILS
One of the major parameters considered in the AASHO guide approach to pavement design is the supporting capacity offered by the subgrade soil. Because the final crosssection and grades of the highway will depend on the supporting capacity of the soils encountered, a detailed survey of the soils existing along the proposed route must be undertaken early in the design phase. A study of available information on soils and soils types existing in Massachusetts was undertaken as a background for preliminary
<I> Ql
Cl. E 40 ,___ 0 Ul
-0
~ 20 -~ Ql
CL
0 .__ __ _ - - - -A- I A-2 A-3 A-4 A-5 A-6 A-7 A-8
AASHO Soil Classification
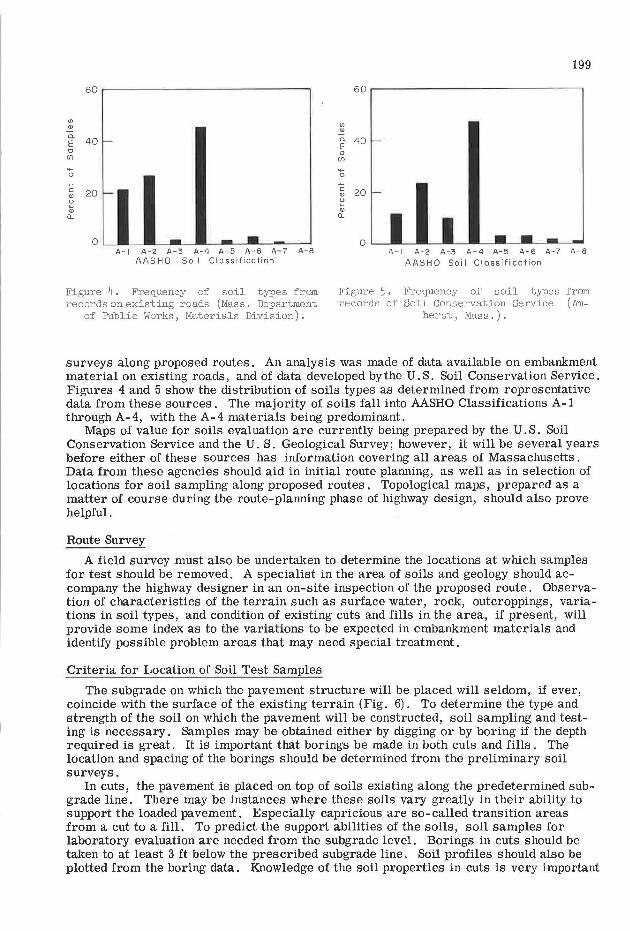
Figure 4. Frequency of soil tYJles from records on existing roads (Mass. Department
of Public Works, Materials Division).
<I>
~ Cl.
E 0 Ul -0
"2 Ql u
Ql CL
40
20
199
A-I A-2 A-3 A-4 A-5 A-6 A-7 A-8
AASHO Soil Classification
Figure 5. Frequency of soil tYJles from records of Soil Conservation Service (Am
herst, Mass.).
surveys along proposed routes. An analysis was made of data available on embankment material on existing roads, and of data developed by the U.S. Soil Conservation Service. Figures 4 and 5 show the distribution of soils types as determined from representative data from these sources. The majority of soils fall into AASHO Classifications A-1 through A-4, with the A-4 materials being predominant.
Maps of value for soils evaluation are currently being prepared by the U.S. Soil Conservation Service and the U.S. Geological Survey; however, it will be several years before either of these sources has information covering all areas of Massachusetts. Data from these agencies should aid in initial route planning, as well as in selection of locations for soil sampling along proposed routes. Topological maps, prepared as a matter of course during the route-planning phase of highway design, should also prove helpful.
Route Survey
A field survey must also be undertaken to determine the locations at which samples for test should be removed. A specialist in the area of soils and geology should accompany the highway designer in an on-site inspection of the proposed route. Observation of characteristics of the terrain such as surface water, rock, outcroppings, variations in soil types, and condition of existing cuts and fills in the area, if present, will provide some index as to the variations to be expected in embankment materials and identify possible problem areas that may need special treatment.
Criteria for Location of Soil Test Samples
The subgrade on which the pavement structure will be placed will seldom, if ever, coincide with the surface of the existing terrain (Fig. 6). To determine the type and strength of the soil on which the pavement will be constructed, soil sampling and testing is necessary . Samples may be obtained either by digging or by boring if the depth required is great. It is important that borings be made in both cuts and fills . The location and spacing of the borings should be determined from the preliminary soil surveys.
In cuts, the pavement is placed on top of soils existing along the predetermined subgrade line. There may be instances where these soils vary greatly in their ability to support the loaded pavement. Especially capricious are so-called transition areas from a cut to a fill. To predict the support abilities of the soils, soil samples for laboratory evaluation are needed from the subgrade level. Borings in cuts should be taken to at least 3 ft below the prescribed subgrade line. Soil profiles should also be plotted from the boring data. Knowledge of the soil properties in cuts is very important
200
Subgrode Line
Sampling Hole
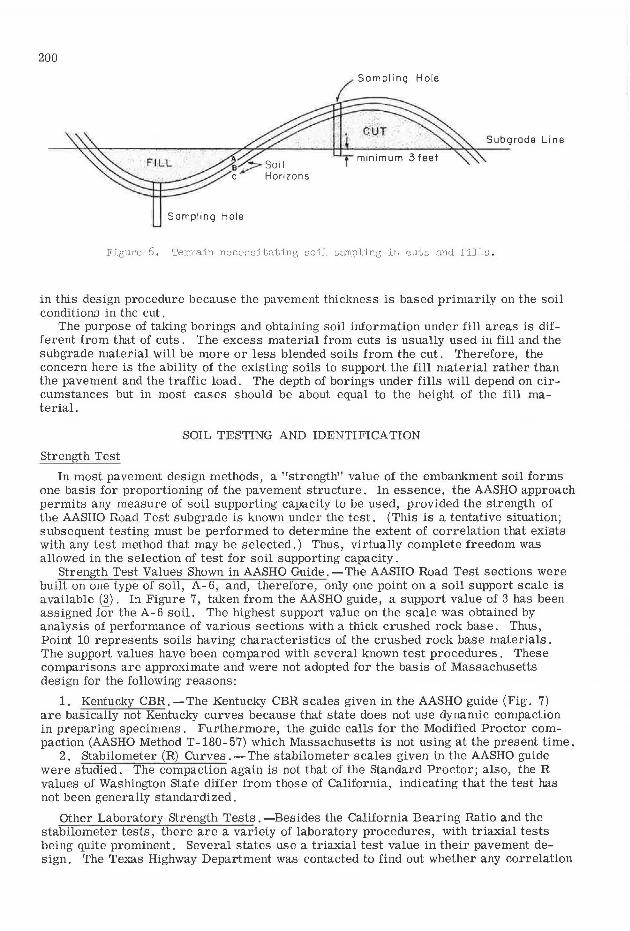
Figure 6. Terrain necessitating soil sampling in cuts and fills .
in this design procedure because the pavement thickness is based primarily on the soil conditions in the cut.
The purpose of taking borings and obtaining soil information under fill areas is different from that of cuts. The excess material from cuts is usually used in fill and the subgrade material will be more or less blended soils from the cut. Therefore, the concern here is the ability of the existing soils to support the fill material rather than the pavement and the traffic load. The depth of borings under fills will depend on circumstances but in most cases should be about equal to the height of the fill material.
SOIL TESTING AND IDENTIFICATION
Strength Test
In most pavement design methods, a "strength" value of the embankment soil forms one basis for proportioning of the pavement structure. In essence, the AASHO approach permits any measure of soil supporting capacity to be used, provided the strength of the AASIIO Road Test subgrade is known under the test. (This is a tentative situation; subsequent testing must be performed to determine the extent of correlation that exists with any test method that may be selected.) Thus, virtually complete freedom was allowed in the selection of test for soil supporting capacity.
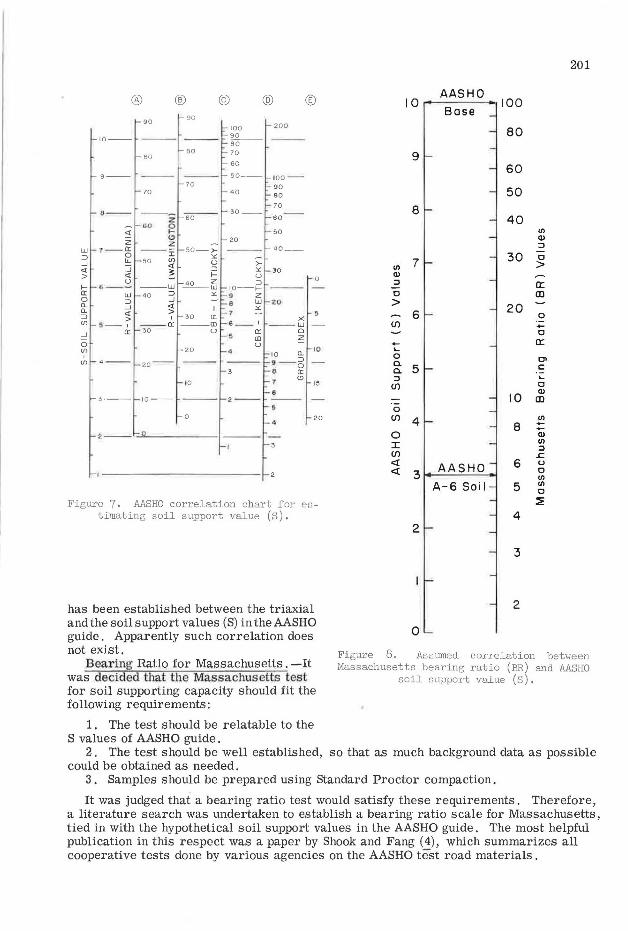
Strength Test Values Shown in AASHO Guide. -The AASHO Road Test sections were built on one type of soil, A-6, and, therefore, only one point on a soil support scale is available (3). In Figure 7, taken from the AASHO guide, a support value of 3 has been assigned for the A- 6 soil. The highest support value on the scale was obtained by analysis of performance of various sections with a thick crushed rock base. Thus, Point 10 represents soils having characteristics of the crushed rock base materials. The support values have been compared with several known test procedures. These comparisons are approximate and were not adopted for the basis of Massachusetts design for the following reasons:
1. Kentucky CBR. -The Kentucky CBR scales given in the AASHO guide (Fig. 7) are basically not Kentucky curves because that state does not use dynamic compaction in preparing specimens. Furthermore, the guide calls for the Modified Proctor compaction (AASHO Method T-180-57) which Massachusetts is not using at the present time.
2. Stabilometer (R) Curves. -The stabilometer scales given in the AASHO guide were studied. The compaction again is not that of the standard Proctor; also, the R values of Washington State differ from those of California, indicating that the test has not been generally standardized.
Other Laboratory strength Tests. -Besides the California Bearing Ratio and the stabilometer tests, there are a variety of laboratory procedures, with triaxial tests being quite prominent. Several states use a triaxial test value in their pavement design. The Texas Highway Department was contacted to find out whether any correlation
® ®
10--
9--
9 - -
z w 7-Cl:
90
80
70
60
90
BO
70
z -60--
f:? l'.l z I 50- >-
::J 0 _J LI... 50 <[ ::::;
Cfl "' <[ u > <[
I.) I- 6--a: w 0 ::J (l_ _J (l_ <[ ::J > Cf) 5 - 1
0 Cf)
I
a:
~ i= - - W
llO 3 <[ >
~rE "'
I 30 ll: --Cl'. - - CD 30 u
20
(f) 4 -- 20
10
3 - - 10 - -
0
© @
100 90 8- 0--
70
60
200
50-- 100 -
40
30_
2 0
>-
90 80
70
60--
50
40_
"' 30 u ::J
10-1--9 z a W <O
7 "' 6_1
a: CD
x -- W
0 z
®
0
u 10 Q. 10
9- 6 8 a: 1 l'.l 15
2--
20
2--'-"------1
Figure 7. AASHO correlation chart for e s timating soil support val ue (S) .
has been established between the triaxial and the soil support values (S) in the AASHO guide. Apparently such correlation does not exist.
Bearing Ratio for Massachusetts. -It was decided that t he Massach\lsetts test for soil supporting capacity should fit the following requirements:
1 . The test should be relatable to the S values of AASHO guide.
AAS HO 10 ------~ 100
Bose
9
8
rn 7 Q)
:I
0
> (/)
+..... 0
6
:i 5 :I
(/)
0
(/) 4 0 :r: (/)
<l: <l: AAS HO 3 ...... ---"---
A-6 Soi I
2
0
80
60
50
40
30
20
10
8
6
5
4
3
2
rn Q)
:I
0 > a:: ID
0 +-0 a:: O'I c: ..... 0 Q)
ID
rn ++-Q) rn :I .c. 0 0 rn (/)
0
:!!
201
Figure 8 . As swned correlation between Massachusetts bearing ratio (BR) and AASHO
soil support value (s).
2. The test should be well established, so that as much background data as possible could be obtained as needed.
3 . Samples should be prepared using Standard Proctor compaction.
It was judged that a bearing ratio test would satisfy these requirements. Therefore, a literature search was undertaken to establish a bearing ratio scale for Massachusetts, tied in with the hypothetical soil support values in the AASHO guide. The most helpful publication in this respect was a paper by Shook and Fang (4) , which summarizes all cooperative tests done by various agencies on the AASHO test road materials.

202
The Massachusetts scale was established by averaging appropriate CBR values for the AASHO test road soil compacted by the Standard Proctor (5,5-lb hammer, 12-in. drop). This bearing ratio value was approximately 5. 5 and was assumed to be equal to the soil support value, S = 3. Also, the appropriate bearing ratio values for the crushed rock base material, compacted according to the Standard Proctor method, were averaged. This value was about 100 and it was assumed to be equal to 10 on the soil support scale. Then a logarithmic relationship was assumed between the two established points which resulted in a bearing ratio scale for Massachusetts as shown in Figure 8. Further research and improvement of this scale may be necessary. At the same time, the scale is reasonable if compared to the other attempts made along the same lines. The test basically calls for AASHO T-99-57 compaction, and a 4-day soaking before test. Detailed procedure is given in ASTM D1883-61 T.
Classification Tests
Standard soil classification tests should be performed on the subgrade materials . These include: (a) sieve analysis (AASHO Designation T-88- 57), (b) hydrometer analysis (AASHO Designation T-88-57), (c) liquid limit (AASHO Designation T-89- 60), and (d) plastic limit (AASHO Des ignation T - 90- 56) . Although these tests are not directly involved in structural design calculations, they should be performed for purposes of identification and determination of the degree of frost susceptibility of the soil.
Desirable Additional Tests
In addition to tests needed for design purposes, three other tests are suggested: (a) volume change, (b) permeability, and (c) unconfined compression. The first two tests a:re fu1,darnc;;-,ta.1 in des c:1' ibii1g 8f1giueeriug )Jehaviur u£ soih:i, A serious thought should be given to incorporating these two tests in design considerations. To achieve this, accumulation of measurements and research is needed. The unconfined compression test can be used only with clays . This simple test, in comparison to the bearing ratio values, should add to the understanding of the strength behavior of cohesive soils in subgrades.
SUDGn.ADE SUPPORT FOR DESIGN
Selection of Design Bearing Ratio
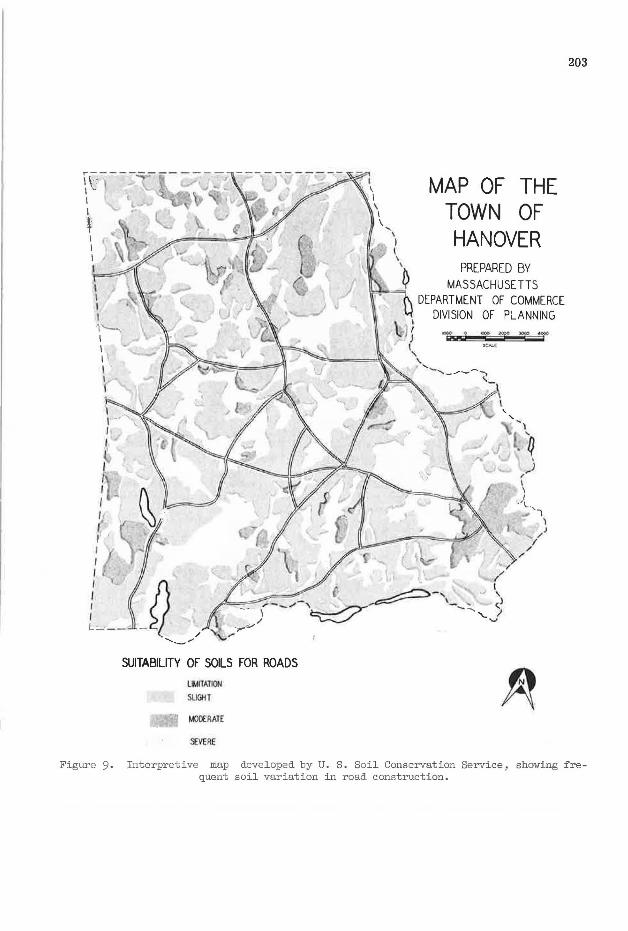
One of the problems facing the design engineer is the selection of a Design Bearing Ratio value (DBR) for a given section of a roadway. The soils vary widely from place to place, as is illustrated in Figure 9. If the design is based on different bearing ratio values, the cross-section of the pavement may have to be changed every 500 to 1, 000 ft. If the lowest bearing ratio value is used, overdesign in most sections will result. The economics of the project and minimum pavement thickness requirements should be the guiding factors for a decision to change a cross-section.
A practical criterion for the selection of the DBR results if normal construction practice is considered. Usually in cut areas practice is to utilize the soils in situ as the subgrade for the pavement. Fill areas, however, are built up from either cut or borrow soils. It is reasonable to expect that the fill, if made up from the cut material, will be at least as strong as the weakest material in the cut. In cases where fill is built up from borrow, the borrow material can be specified as having a given strength. It is clear that the governing factor in the choice of a DBR is the strength of the soil in the cuts; the properties of the soils in fill areas will usually exceed those in the cut area either by nature or by control.
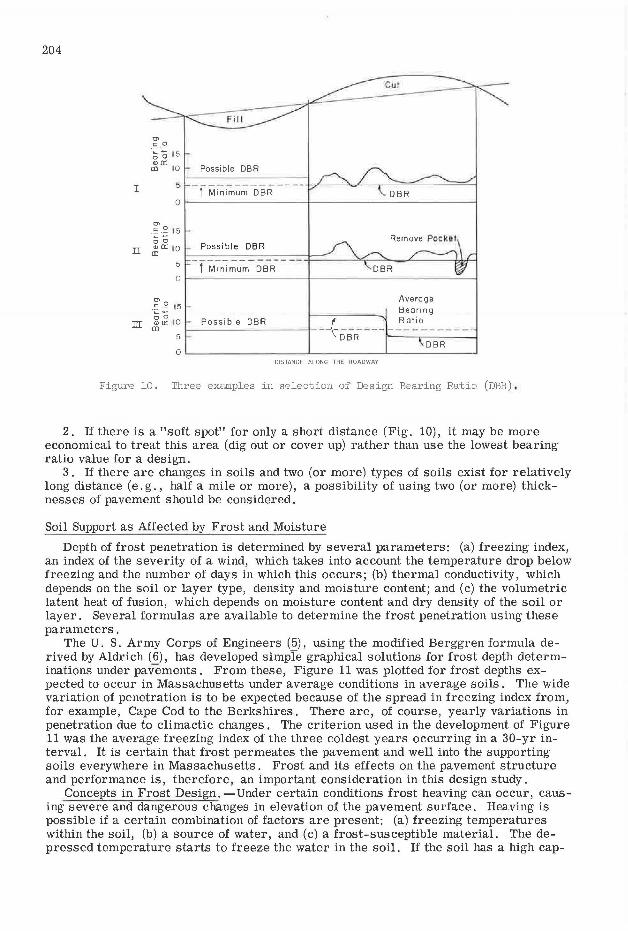
The choice of the DBR within the cut will depend on the variations of strength of the soils. Figure 10 shows three examples of cases that may arise:
1. If the bearing ratio values in the cut do not vary greatly, the DBR should be close to the minimum bearing ratio found. If fill is to be borrow, the borrow must be specified to have a bearing ratio equal to the DBR.
\(: ________ ----.I
I I I
~ I I I j
I I I
' 1'--. I '
h I I {
{ I I I
'· ,. ;
I I I r I I I L'-"--
SUITABILITY OF SOILS FOR ROADS
LIMITAllON
SUOHT
MOOCRATE
SEVERE
MAP OF THE TOWN OF HANOVER
PREPARED BY MASSACHUSETTS
.(\ DEPARTMENT OF COMMERCE ~ DIVISION OF PLANNING
l)j il' • - T 'T ~ ( :KAL(
' ' . ... _ '-----., '-,
203
Figure 9. Interpretive map developed by U. S. Soil Conservation Service, showing frequent soil variation in road construction.
204
I
C> c.~ ·~c 15 <1>0::
CD 10
Cu t
Fi l l
Possible DBR
g'.<:' 15
Average ·~ - Bearing
m ~~ 10 1--P_o_s_si_b_1e_ o_B_R ___ -+---~DBR ______ R_'.1~°_ ___ _ _
DBR
DISTANCE ALONG THE ROADWAY
Figure 10. Three examples in selection of Design Bearing Ratio (DBR) .
2. If there is a "soft spot" for only a short distance (Fig. 10), it may be more economical to treat this area (dig out or cover up) rather than use the lowest bearing ratio value for a design.
3. If there are changes in soils and two (or more) types of soils exist for relatively long distance (e.g., half a mile or more), a possibility of using two (or more) thicknesses of pavement should be considered.
Soil Support as Affected by Frost and Moisture
Depth of frost penetration is determined by several parameters: (a) freezing index, an index of the severity of a wind, which takes into account the temperature drop below freezing and the number of days in which this occurs; (b) thermal conductivity, which depends on the soil or layer type, density and moisture content; and (c) the volumetric latent heat of fusion, which depends on moisture content and dry density of the soil or layer. Several formulas are available to determine the frost penetration using these parameters .
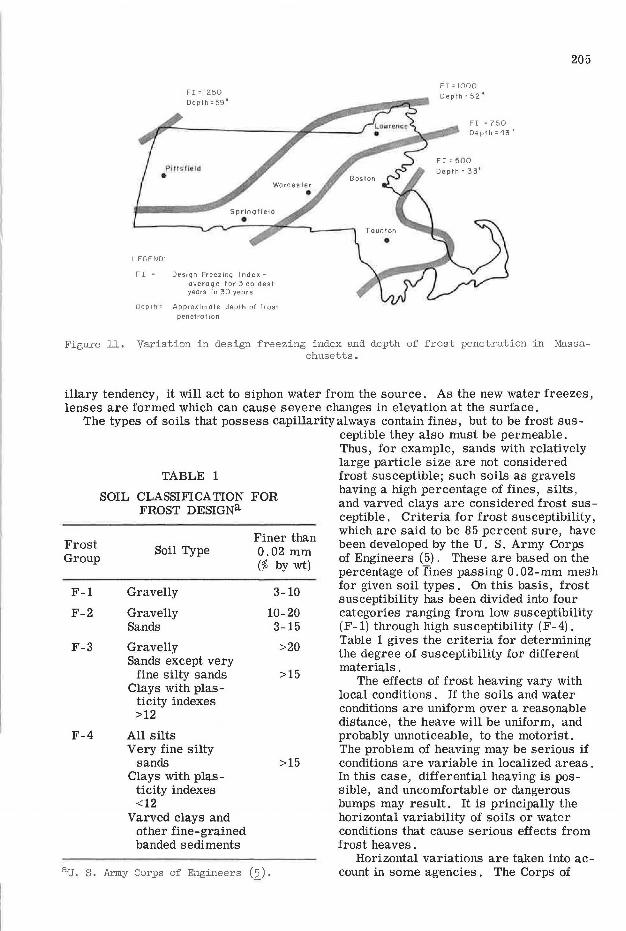
The U. S. Army Corps of Engineers ( 5), using the modified Berggren formula derived by Aldrich (6), has developed simple graphical solutions for frost depth determinations under pavements. From these, Figure 11 was plotted for frost depths expected to occur in Massachusetts under average conditions in average soils. The wide variation of penetration is to be expected because of the spread in freezing index from, for example, Cape Cod to the Berkshires. There are, of course, yearly variations in penetration due to climactic changes . The criterion used in the development of Figure 11 was the average freezing index of the three coldest years occurring in a 30-yr interval. It is certain that frost permeates the pavement and well into the supporting soils everywhere in Massachusetts. Frost and its effects on the pavement structure and performance is, therefore, an important consideration in this design study.
Concepts in Frost Design. - Under certain conditions frost heaving can occur, causing severe and dangerous changes in elevation of the pavement surface. Heaving is possible if a certain combination of factors are present: (a) freezing temperatures within the soil, (b) a source of water, and (c) a frost-susceptible material. The depressed temperature starts to freeze the water in the soil. If the soil has a high cap-
FI 0 1250 Depth=59 11
Pim Hol d •
LEGEND:
FI= Design Freezing lndex-overoge for 3 coldest years in 30 years
Depth = Approximate depth of frost
penetration
FI 0 1000 Depth= 52 11
FI o 750 Depth=43 11
205
Figure ll. Variation in design freezing index and depth of frost penetration in Massachusetts.
illary tendency, it will act to siphon water from the source. As the new water freezes, lenses are formed which can cause severe changes in elevation at the surface.
The types of soils that possess capillarity always contain fines, but to be frost susceptible they also must be permeable. Thus, for example, sands with relatively
Frost Group
F-1
F-2
F-3
F-4
TABLE 1
SOIL CLASSIFlCA TION FOR FROST DESIGNa
Soil Type
Gravelly
Gravelly Sands
Gravelly Sands except very
fine silty sands Clays with plas
ticity indexes >12
All silts Very fine silty
sands Clays with plas
ticity indexes <12
Varved clays and other fine-grained banded sediments
Finer than 0.02 mm (% by wt)
3-10
10-20 3-15
>20
>15
>15
au. S. Army Corps of Engineers (2).
large particle size are not considered frost susceptible; such soils as gravels having a high percentage of fines, silts, and varved clays are considered frost susceptible. Criteria for frost susceptibility, which are said to be 85 percent sure, have been developed by the U. S. Army Corps of Engineers (5). These are based on the percentage of Tines passing 0. 02-mm mesh for given soil types. On this basis, frost susceptibility has been divided into four categories ranging from low susceptibility ( F -1) through high susceptibility ( F - 4) . Table 1 gives the criteria for determining the degree of susceptibility for different materials.
The effects of frost heaving vary with local conditions. If the soils and water conditions are uniform over a reasonable distance, the heave will be uniform, and probably unnoticeable, to the motorist. The problem of heaving may be serious if conditions are variable in localized areas . In this case, differential heaving is possible, and uncomfortable or dangerous bumps may result. It is principally the horizontal variability of soils or water conditions that cause serious effects from frost heaves.
Horizontal variations are taken into account in some agencies . The Corps of
206
Engineers, for example, uses these as the basic consideration that determines the ap·· proach to frost effects in airfields, where maintenance of uniform grade is critical. If variations are high, removal of most or all of the susceptible material is recommended. Such a step is not deemed economically feasible for highway pavements except in unusual circumstances. Michigan, too, considers horizontal variations to be serious. In their study of the problem (7), they found that 98 percent of all heaves occurred in cuts where the soil pattern is variable. In fills, few heaves were observed because, by nature, sharp variations are minimized. Blending of the top 12 in. of the subgrade may be a helpful step in minimizing horizontal variations, and hence frost heave.
Once the soil and select materials of a pavement are frozen, beneficial effects occur. Freezing essentially stabilizes the particulate materials and increases their resistance to deflection. At the AASHO test road a marked decrease in loss of serviceability was observed in the winter months, indicating improved performance.
When frost leaves, significant weakening of the soil and select pavement materials can result. If there are frozen lenses within the soil, thawing essentially leaves a pocket of liquid. This liquid then saturates the surrounding soil. Because the material below remains frozen, the path of escape for the water is upwards. According to the AASHO test results, this weakens the subbase as well as the subgrade soil. Thus, while the gravel acts as a draining layer, it is also weakened in strength.
The Corps of Engineers recommends designing highways for the reduced subgrade strength encountered during spring breakup. They recommend increasing the design traffic number in their design method as an adjustment to, in effect, arrive at a stronger pavement section than would normally be used. The size of the increase depends on the degree of frost susceptibility of the soil under consideration. The Corps of Engineers' approach cannot be applied directly to the AASHO data because the criteria used for mea.::;urlug perfonna.nce i.Jy lhe lwu meli1ud::; difie.r.
Massachusetts' Experience with Frost Problems . -A survey was taken of all the district offices of the Massachusetts Department of Public Works regarding their experience with frost problems on major roadways . There were a few isolated cases where serious heaving was reported, for example, in places where springs were found close to the surface. But problems were considered the exception rather than the rule. The Design Committee on its several survey trips made special note of the frequency of heaves. None were apparent, although one area had been marked as such on Iloute 128.
On the basis of experience, frost heaves do not appear to be a major problem in Massachusetts, although certainly conditions are favorable for them to develop. There are apparently several reasons for this. Massachusetts has been particularly careful to provide good surface and subsurface drainage in their pavements. For example, practice has been to keep the road surface at least 5 ft above free water to allow for drainage. Also, a gravel subbase layer extending to 20 in. below the pavement surface has been provided on major highways. These precautions have, in most cases, probably reduced the amount of free water available to create frost heaving.
The effects of subgrade weakening during spring breakup have not been documented. But these effects, although damaging, are more subtle and would probably not be noticed unless specific study were given to the problem.
AASHO Approach-Regional Factor. -At the AASHO test road, the rate of decay of serviceability was found to vary significantly with season. Indeed, a major conclusion of the research effort was that 80 percent of the sections failed during spring breakup. To account for these variations in performance, deflection data were analyzed. Deflections found in plate bearing tests on many of the test sections were found to vary with season. They were low in the winter, high in spring, and intermediate in summer. By statistical manipulation a weighting function was derived that related serviceability loss and deflection variations (Fig. 12) .
The approach recommended by the AASHO guide regarding seasonal variations is to use a regional factor. Although no quantitative means of determining the regional factor is given, consideration is recommended of such factors as finished grade elevation above water, drainage, depth of frost penetration and number of freeze-thaw cycles. Furthermore, other considerations are lumped in with this factor, such as steepness of grade and areas of concentrated stopping or turning. The regional factor, which can

.._ 0 -u 0
LL
0 c 0
O' Q)
a: -0 Q) -0
E -CJ)
w
4
3
2
1958
I I
207
Note : Regional Factor is function of deflection
Actual
\-- Approximate
1959 1960 Time of Year
Figure 12. Monthly variations in estimated regional factor for the AASHO test road .
vary from 0. 5 to 5. 0, can then be applied to adjust the structural proportions of the pavement to account for these effects.
The regional factor should also account for the relative weakening that can occur in soils and materials, depending on their frost susceptibility. Further study of this area should be undertaken to account for seasonal variations in properties of soils and materials.
Recommendations. -Soils and materials should be checked for frost susceptibility according to the Corps of Engineers criteria (Table 1). The F-4 soils, as designated by the Corps of Engineers are highly susceptible and, therefore, offer the possibility of creating significant differential heaves and weakening. Special attention should be given to surface drainage and water table when these materials are encountered. If good drainage is impossible to achieve or if ground or surface water conditions exist near F-4 soils, they should be removed and replaced with less susceptible materials, preferably of the same type as is adjacent to the problem area. The depth of removal should be at least 80 percent of the depth of frost penetration in the area (Fig. 11). Economics and practicality of the specific situation should govern the exact quantity of material to be removed.
Variations in soils cause differential frost heaves and weakening effects. In fills, where the material is randomly deposited and intermixed in the grading operation, the chances of local variations in soils are small. In cuts, soils will be of a more variable nature; therefore, consideration should be given to blending at least the top 12 in. of subgrade in cut areas. To reduce the potential hazards of frost heave and weakening, the present practice of holding surface grade at least 5 ft above free or groundwater should be continued.
Non-frost-susceptible materials should be used in the select materials of all pavement. In all cases, a minimum depth below pavement surface of 20 in. of non-frost-
208
susceptible material should be provided. Presently, insufficient data are available to determine quantitatively the regional factor. If the regional factor is ignored, the resulting design may not be adequate. Thus, a factor should be introduced to account for: {a) frost weakening effects, {b) Massachusetts construction practice differing from the super-controlled procedures used at the AASHO Road Test, {c) unknown differences in materials properties from those used at the AASHO Road Test, {d) effects of mixed traffic, (e) effects of traffic application over longer periods of time than was possible at the AASHO Road Test, and {f) other unknown factors. It is recommended that a blanket increase of 15 percent be applied to the structural requirements of the pavement. In fact, this is equivalent to a regional factor of 3.
PAVEMENT AS A STRUCTURE
Structural Approach
The design method evolved here is, in essence, a structural design. It differs significantly in its approach from those normally used by the civil engineer in designing bridges, buildings or other structures. Designers of the latter structures usually can estimate the loadings, the stresses within the structure, and the behavior of the materials that they will use. The immensity of the variables that accompany a flexible pavement design have precluded a full rational design treatment, and so the AASHO Road Test and resulting design guide depend heavily on empirical results. Although the state of the art in design theory and materials understanding cannot yet replace empirical methods, it can supplement the AASHO approach and contribute to an understanding of the behavior of the layered pavement as a structural system.
Applicable Theories
There are several theoretical solutions for the stresses and deflections existing in a pavement section when subjected to wheel loads. One simplified solution is that developed by Boussinesq (8) using the theory of elasticity. As it is applied to pavement sections, it must be assumed that the materials in the section have the same elastic properties, i.e., modulus of elasticity and Poisson's ratio. It also must be assumed that the material is elastic. Whereas neither of the acsumptions are true for particulate layered systems, the Boussinesq solution provides a first approximation of pavement stresses.
A solution that is more refined than the Boussinesq solution has been offered by Burmister (9). The Burmister solution theoretically is more applicable to the pavement system because it can account for the differing properties in each layer. The solution still assumes that the materials are elastic and, therefore, it suffers some of the weaknesses of the Boussinesq solution.
A third solution extended from the Westergaard {10) theory by our Materials Research Laboratory {11) makes significantly different assumptions than were made by either Boussinesq orBurmister. This theory assumes that an elastic plate rests on a dense liquid foundation. It maintains that the surface layer, the plate, behaves elastically and that the foundation is made up of a bed of independent springs. Thus far, this theory has been developed to consider stresses in the asphalt-bound layer only and the vertical stress applied to the layer below.
Stresses in Pavement Layers
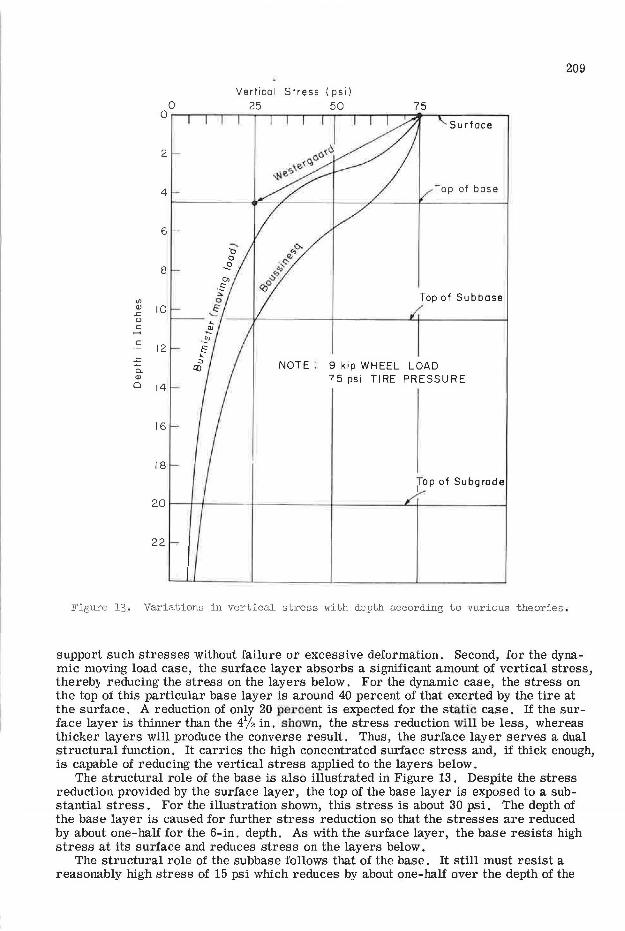
Vertical Stress. -These three theories involve different stiffness parameters and, therefore, it is difficult to compare rigorously values obtained with them. By using some approximations, the plots of variations in vertical stress with depth were obtained {Fig. 13). The Boussinesq theory yields results that are reasonably valid for the static case only, whereas the Burmister and Westergaard theories can be applied to the dynamic or moving load case because they can account for differing properties of the pavement layers.
The plots in Figure 13 clearly illustrate the important structural functions of the surface layer. First, it must support a high stress at the surface; most soils cannot
Vertical Stress (psi) 0 25 50 75 o..-~~~~~--..-~~~~..---~~~--...-~..-..-..-~
2
4
6
8
"' ~ 10 u c
c
.r::. -CL Q)
12
0 14
16 -
18
22 -
Surface
Top of Subbase
NOTE : 9 kip WHEEL LOAD 75 psi TIRE PRESSURE
( op of Subgrade
209
Figure 13 . Variations in vertical stress with depth according to various theories .
support such stresses without failure or excessive deformation. Second, for the dynamic moving load case, the surface layer absorbs a significant amount of vertical stress, thereby reducing the stress on the layers below. For the dynamic case, the stress on the top of this particular base layer is around 40 percent of that exerted by the tire at the surface. A reduction of only 20 percent is expected for the static case. If the surface layer is thinner than the 4% in. shown, the stress reduction will be less, whereas thicker layers will produce the converse result. Thus, the surface layer serves a dual structural function. It carries the high concentrated surface stress and, if thick enough, is capable of reducing the vertical stress applied to the layers below.
The structural role of the base is also illustrated in Figure 13 . Despite the stress reduction provided by the surface layer, the top of the base layer is exposed to a substantial stress. For the illustration shown, this stress is about 30 psi. The depth of the base layer is caused for further stress reduction so that the stresses are reduced by about one-half for the 6-in. depth. As with the surface layer, the base resists high stress at its surface and reduces stress on the layers below.
The structural role of the subbase follows that of the base. It still must resist a reasonably high stress of 15 psi which reduces by about one-half over the depth of the
210
400
300
200
100
80
60 en 0.
40 -!: "' c: Q) ~
(/) 20
2 0
E - 10 -;:)
8
6 a 4 IN / IN / MIN .
0 0 . 4 IN/IN/MIN . 4
x 0 .04 IN/IN /MIN .
.. 0 004 iN/iN/iviiN
2
Temperature, Degrees Fahrenheit
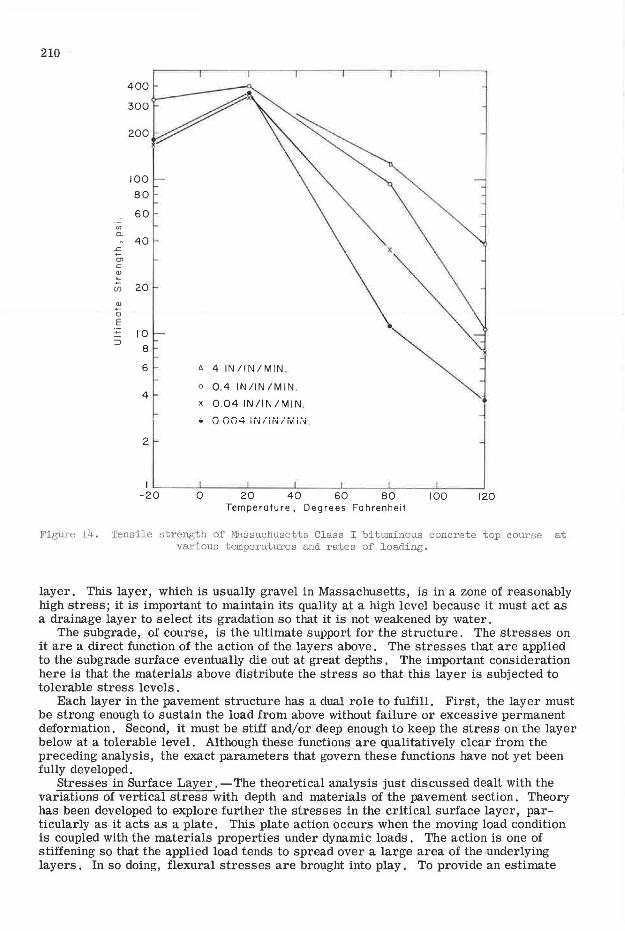
Figure l4. Tensile strength of Massachusetts Class I bituminous concrete top course at various temperatures and rates of loading.
layer. This layer, which is usually gravel in Massachusetts, is in a zone of reasonably high stress; it is important to maintain its quality at a high level because it must act as a drainage layer to select its gradation so that it is not weakened by water.
The subgrade, of course, is the ultimate support for the structure. The stresses on it are a direct function of the action of the layers above. The stresses that are applied to the subgrade surface eventually die out at great depths. The important consideration here is that the materials above distribute the stress so that this layer is subjected to tolerable stress levels .
Each layer in the pavement structure has a dual role to fulfill. First, the layer must be strong enough to sustain the load from above without failure or excessive permanent deformation. Second, it must be stiff and/or deep enough to keep the stress on the layer below at a tolerable level. Although these functions are qualitatively clear from the preceding analysis, the exact parameters that govern these functions have not yet been fully developed.
Stresses in Surface Layer. -The theoretical analysis just discussed dealt with the variations of vertical stress with depth and materials of the pavement section. Theory has been developed to explore further the stresses in the critical surface layer, particularly as it acts as a plate. This plate action occurs when the moving load condition is coupled with the materials properties under dynamic loads . The action is one of stiffening so that the applied load tends to spread over a large area of the underlying layers. In so doing, flexural stresses are brought into play. To provide an estimate
500
"" 0 400 ><
·;;; a . -~ ., -e~ iii .3 300
c :§ 'Q i9 5
Cll
200
100
0
E= 20 ,000 ,,..,,---...., '
' E=I0,000 '- ...._
Support modulus, K= 500 pci Poisson's ratio= 0.5 Radius of loaded area =6. 74 in E-Young's modulus, psi.
Key· - ·- E/K ?: 100
--- E/K < 100
--- ......... ,~ .............. ........"" ........ "...__ __ ..._ ---===------2 3 4 5 6 7 8 9 10 11
Thickness, H ( in.l 12
211
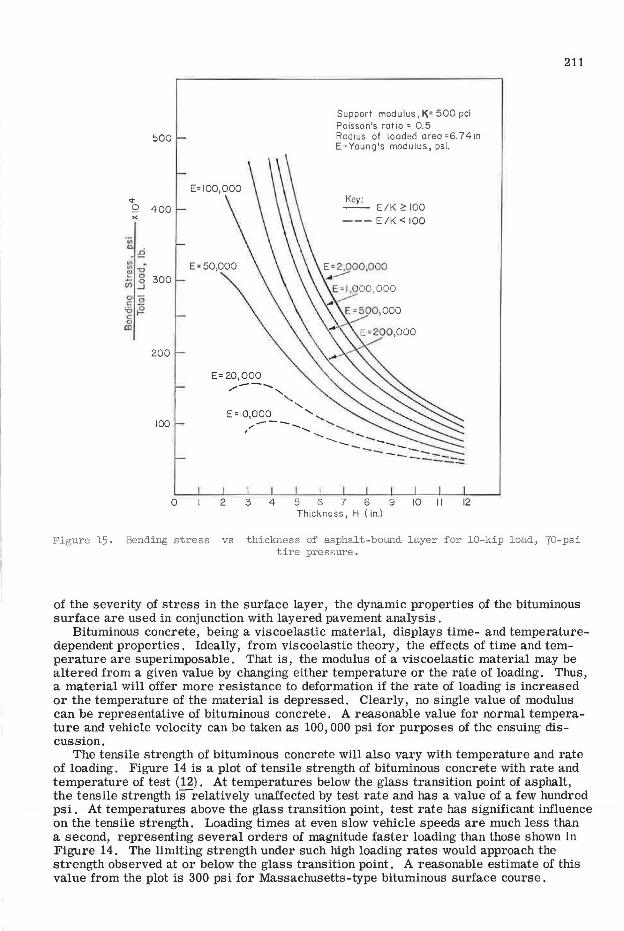
Figure 15. Bending stress vs thickness of asphalt-bound layer for 10-kip load, 70-psi tire pressure.
of the severity of stress in the surface layer , the dynamic properties of the bituminous surface are used in conjunction with layered pavement analysis.
Bitllminous concrete, being a viscoelastic material, displays time- and temperaturedependent properties. Ideally, from viscoelastic theory, the effects of time and temperature are superimposable. That is , the modulus of a viscoelastic material may be altered from a given value by changing either temperature or the rate of loading. Thus, a material will offer more resistance to deformation if the rate of loading is increased or the temperature of the material is depressed. Clearly, no single value of modulus can be representative of bituminous concrete. A reasonable value for normal temperature and vehicle velocity can be taken as 100, 000 psi for purposes of the ensuing discussion.
The tensile strength of bituminous concrete will also vary with temperature and rate of loading . Figure 14 is a plot of tensile strength of bituminous concrete with rate and temperature of test (12) , At temperatures below the glass transition point of asphalt, the tensile strength isrelatively unaffected by test rate and has a value of a few hundred psi. At temperatures above the glass transition point, test rate has significant influence on the tensile strength, Loading times at even slow vehicle speeds are much less than a second, representing several orders of magnitude faster loading than those shown in Figure 14. The limiting strength under such high loading rates would approach the strength observed at or below the glass transition point. A reasonable estimate of this value from the plot is 300 psi for Massachusetts-type bituminous surface course.
212
120
100
v Q )(
:i 80 ~ ~ (/) -0 ... 0 0 0 ~ _J
(/) 0 E o 60 :J IE
>< ~I
E=2,000,000
Support modulus, K= 500 pci Poission's ratio •0.5 Radius of loaded area • 6. 74 in. E-Young's modulus, psi.
Key : -- E/K 2: 100 ---E/K < 100
40 E=50,000 ----
E=20,000_..........-
2.0 ~-·--- ... ___ _
E=I0,000 / --
0 2 3 4 5 6 7 8 9 10 I I 12 Thickness, H (in)
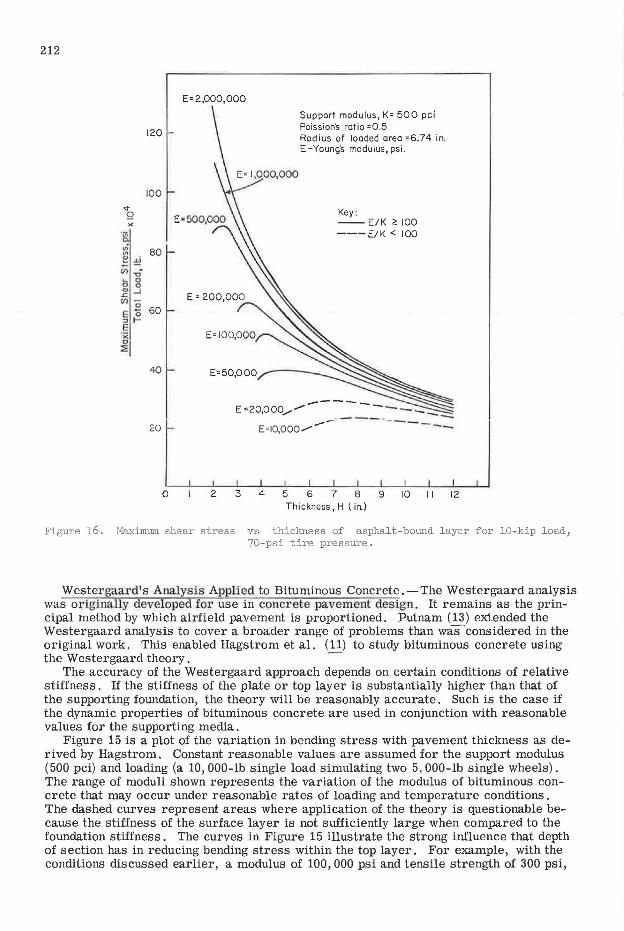
Figure 16. Maximum shear stress vs thickness of asphalt-bound layer for 10-kip load, 70-psi tire pressure.
Westergaard's Analysis Applied to Bituminous Concrete. -The Westergaard analysis was origina lly developed for use in concrete pavement design. It remains as the principal method by which airfield pavement is proportioned. Putnam (13) extended the Westergaard analysis to cover a broader range of problems than was considered in the original work. This enabled Hagstrom et al. ( 11) to study bituminous concrete using the Westergaard theory . -
The accuracy of the Westergaard approach depends on certain conditions of relative stiffness. If the stiffness of the plate or top layer is substantially higher than that of the supporting foundation, the theory will be reasonably accurate. Such is the case if the dynamic properties of bituminous concrete are used in conjunction with reasonable values for the supporting media.
Figure 15 is a plot of the variation in bending stress with pavement thickness as derived by Hagstrom. Constant reasonable values are assumed for the support modulus (500 pci) and loading (a 10, 000-lb single load simulating two 5, 000-lb single wheels). The range of moduli shown represents the variation of the modulus of bituminous concrete that may occur under reasonable rates of loading and temperature conditions. The dashed curves represent areas where application of the theory is questionable because the stiffness of the surface layer is not sufficiently large when compared to the foundation stiffness. The curves in Figure 15 illustrate the strong influence that depth of section has in reducing bending stress within the top layer. For example, with the conditions discussed earlier, a modulus of 100, 000 psi and tensile strength of 300 psi,
213
the depth required so that the section would just fail under the loading is 31/2 in. If fatigue effects are considered, the allowable working stress might be about one-half of the test value, or 150 psi. Thus, to sustain repeated loadings, a depth of 7 in. would be required. Of course, tensile failure of the flexural section implies cracking on the under surface that will eventually reflect through to the surface. Clearly, to reduce cracking, the bituminous layers should be as thick as economically possible.
The previous analysis probably relates directly to the studies of black bases at the AASHO Road Test. It was found that black bases offered significant improvement in pavement performance. The well-graded cohesive base layers served to add depth and, hence, flexural capacity to the surface layer. This would then reflect itself in retention of serviceability.
There are a number of assumptions necessary to develop the preceding discussion. But changing the modulus of the bituminous layer by a factor of two alters the stress by perhaps 10 percent. Varying the foundation modulus by a factor of two changes the bending stress by a maximum of 10 percent at reasonable depths . More recent work by Hagstrom shows that a more exact analysis for dual wheels yields results about 20 percent lower than assumed. On the other hand, wheel loads may in practice exceed those assumed here. Significant latitude in assumptions is possible without altering the general conclusion regarding the analysis.
Hagstrom also obtained values for shear stress existing in the bituminous layer. Figure 16 shows the variation in shear stress with pavement thickness for the same conditions assumed in the bending analysis . For the practical range of moduli and thickness of the bituminous layer, the shear stress is usually less than 100 psi. Although dynamic values of the shear strength of bituminous concrete are not available, it would be expected that the shear strength is of the same order as the tensile strength. Thus, shear strength does not appear to be a criterion governing the top layer of pavement.
COEFFICIENTS OF RELATIVE STRENGTH FOR SUBBASE, BASE AND SURFACE
The preceding theoretical discussion indicated that conventional theory and test values could be applied to the surface layer to provide a reasonable estimate of failure conditions. However, as subsequent layers are treated, the analysis becomes more complex and the important parameters remain unknown. At present, there are severe limits to theory as it applies to the complex action of these non-cohesive layers.
In the absence of theoretical treatment of the layered pavement system, empirical methods were used at the AASHO Road Test. A statistical factorial experiment was designed in which several thicknesses and combinations of materials were placed in a number of test sections. By monitoring the traffic and serviceability, the relative contribution of each material to performance could be obtained. This relative contribution to performance can be assigned to the pavement materials in the form of coefficients.
Coefficients of Various Layers
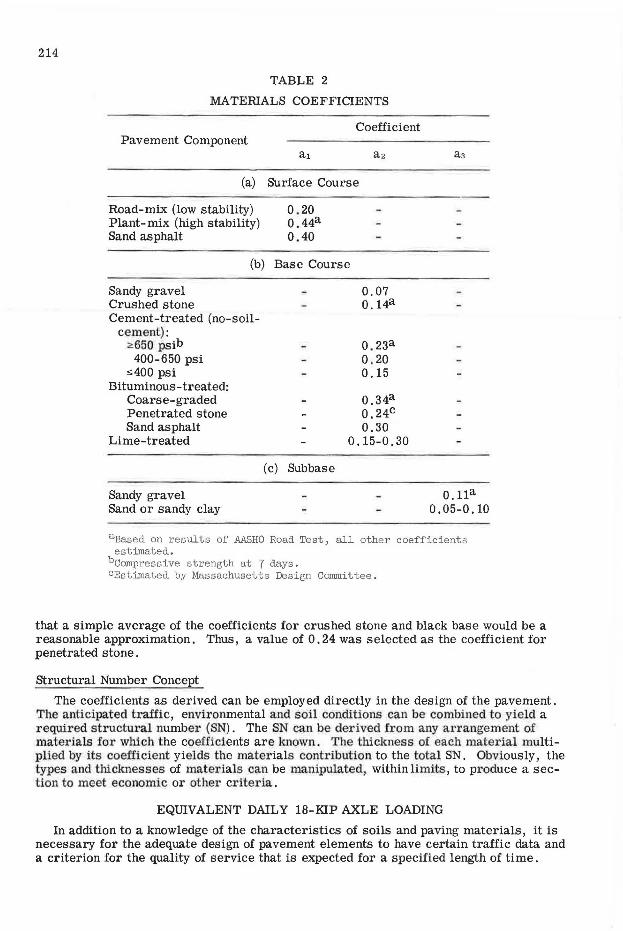
Table 2 gives the coefficients for various materials as provided by the AASHO guide. Of interest is the relative contribution that each material makes to the performance of a section. For example, 1-in. plant-mixed bituminous concrete (coefficient:= 0.44) is equivalent to 3 in. of crushed stone (coefficient = 0 . 14) or 4 in. of gravel (coefficient= O .11). This is the first time that quantitative relative values for the performance of materials have been made available to the designer. Although there is as yet no theoretical grasp or means of measuring the coefficients of materials that differ from the AASHO materials, a valuable incentive has been established.
Current Massachusetts practice is to use a penetrated crushed stone base. Because the AASHO guide did not give coefficients for this material, a value had to be estimated for design purposes. The coefficient for crushed stone in the base layer is 0 .14, and the coefficient for a black base is 0. 34. The strength of a penetrated base should be greater than crushed stone because it is bound by asphalt. Yet the penetrated base cannot be as effective as a well-graded black base because of its open gradation and incomplete penetration of the asphalt. It was decided on the basis of these considerations
214
TABLE 2
MA TERJALS COEFFICIENTS
Coefficient Pavement Component
(a) Surface Course
Road-mix (low stability) Plant-mix (high stability) Sand asphalt
0.20 0.44a 0.40
(b) Base Course
Sandy gravel Crushed stone Cement-treated (no-soil-
cement): :::..650 psib
400-650 psi ,;:400 psi
Bituminous-treated: Coarse-graded Penetrated stone Sand asphalt
Lime-treated
Sandy gravel Sand or sandy clay
(c) Subbase
0.07 0.14a
o.23a 0.20 0.15
0.34a 0.24c 0.30
0.15-0.30
o.11a 0.05-0.10
aBased on results of AJ\SHO Road Test, all other coefficients estimated.
bcompressive strength at 7 days. CEstimated by Massachusetts Design Committee.
that a simple average of the coefficients for crushed stone and black base would be a reasonable approximation. Thus, a value of 0. 24 was selected as the coefficient for penetrated stone.
Structural Number Concept
The coefficients as derived can be employed directly in the design of the pavement. The anticipated traffic, environmental and soil conditions can be combiJ1ed to yield a required structural number (SN). The SN can be derived from any arrangement of mate1·ials for which the coefficients are k11own. The thickness of each material multiplied by its coefficient yields the materials contribution to the total SN. Obviously, the types and thicknesses of materials can be manipulated, within limits, to produce a section to meet economic or other criteria.
EQUIVALENT DAILY 18-KIP AXLE LOADING
In addition to a knowledge of the characteristics of soils and paving materials, it is necessary for the adequate design of pavement elements to have certain traffic data and a criterion for the quality of service that is expected for a specified length of time.
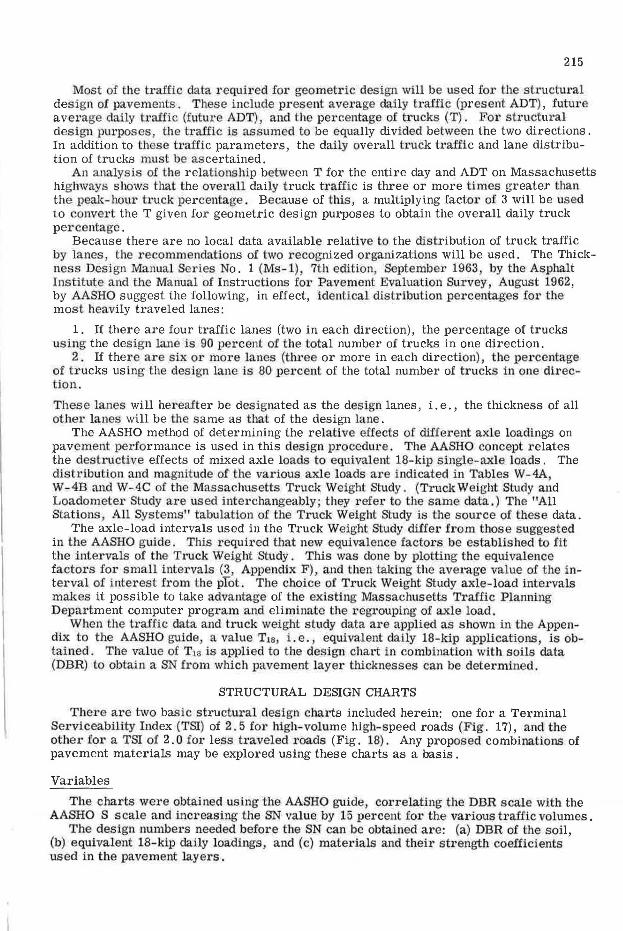
215
Most of the traffic data required for geometric design. will be used for the structural design of pavements. These include present average daily traffic (present ADT), future average daily traffic (future ADT), and the percentage of trucks (T) . For stru·ctural design purposes, the ti·affic is assumed to be equally divided between the two directions. In addition to these traffic parameters, the daily overall truck traffic and lane distribution of trucks must be ascertained.
An analysis oI the relationship between T for the entire day and ADT on Massachusetts highways shows that the overall daily truck traffic is three or more times greater than the peak-hour h·uck percentage. Because of this, a multiplying factor of 3 will be used to convert the T given for geometric design purposes to obtain the overall daily truck percentage.
Because there are no local data available relative to the distribution of truck traffic by lanes , the recommendations of two recognized organizations will be used. The Thickness Design Manual Series No. 1 (Ms-1), 7th edition, September 1963 by the Asphalt Institute and the Manual of Instructions for Pavement Evaluation Survey, August 1962, by AASHO suggest the following, in effect, identical distribution percentages for the most heavily traveled lanes:
1. If there are four traffic lanes (two in each direction), the percentage of trucks using the design lane is 90 percent of the total number of trucks in one direction.
2. If there are six or more lanes (three or more in each direction), the percentage of trucks using the design lane is 80 percent of the total number of trucks in one direction .
These lanes will hereafter be designated as the design lanes, i.e., the thickness of all other lanes will be the same as that of the design lane.
The AASHO method of determining the relative effects of different axle loadings on pavement performance is used in this design procedure. The AASHO concept relates the destructive effects of mixed axle loads to equivalent 18-kip single-axle loads. The distribution and magnitude of the various axle loads are indicated in Tables W-4A W-4B and W-4C of the Massachusetts Truck Weight Study. (Truck Weight Study and Loadomete1· Study are used interchangeably; they refer to the same data.) The "All Stations All Systems" tabulation of the Truck Weight study is the source of these data.
The axle-load intervals used in the Truck Weight study differ from those suggested in the AASHO guide. This required that new equivalence factors be established to fit the intervals of the Truck Weight Study. This was done by plottil1g the equivalence factors for small intervals (3, Appendix F), and then taking the average value of the interval of interest from the plot. The choice of Truck Weight Study axle-load intervals makes it possible to take advantage of the existing Massachusetts T1•affic Plarming Depa.rtment computer program and eliminate the regrouping of axle load.
When the traffic data and truck weight study data ai-e applied as shown in the Appendix to the AASHO guide a value TlB, i.e., equivaler1t daily 18-kip applications, is obtained. The value of T1a is applied to the design chart in combination with soils data (DBR) to obtain a SN from which pavement layer thicknesses can be determined.
STRUCTURAL DESIGN CHARTS
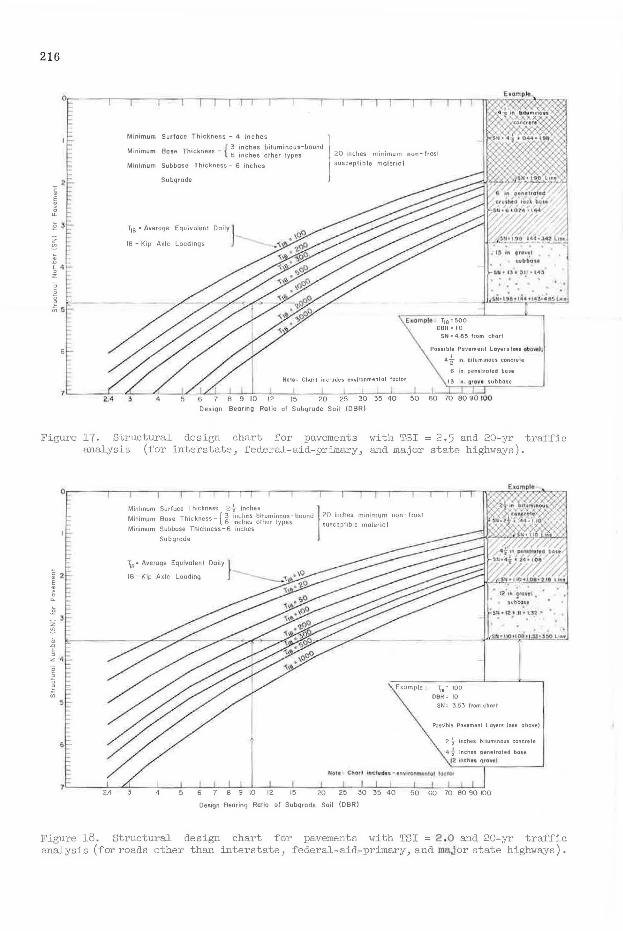
There are two basic structural design charts included herein: one for a Terminal Serviceability Index (TSI) of 2. 5 for high-volume high-speed roads (Fig. 17), and the 0th.er for a TSI of 2. 0 for less traveled roads (Fig. 18). Any proposed combinations of pavement materials may be explored using these charts as a basis.
Variables
The charts were obtained using the AASHO guide, correlating the DBR scale with the AASHO S scale and increasing the SN value by 15 percent for the various traffic volumes.
The design numbers needed before the SN can be obtained are: (a) DBR of the soil, (b) equivalent 18-kip daily loadings, and (c) materials and their strength coefficients used in the pavement layers.
216
6
Minimum Surface Thickness - 4 inches
Minimum e e Thickness { 3 inches bituminous-bound os - 6 inches other lypes 20 mches minimum non- ffosl
Minimum Subbose Thickness- 6 inches susceplible moleriol
Subgrode
T18 =Average Equivolenl Daily} _
18 - Kip A)(le Loodrngs
I• . .
7 8 9 10 12
~T19=SOO OBR • 10
'"fl 0
&11~4• i4'l•.;tt.;L,i,.
SN:: 4 85 fcom chorl
Pouible Pavemenl Layers (see obon). I 4z in blruminous concre1e
6 in penetraled base
Nole: Chart in clu des environmenlol factor 13 in 111tow1 subbase
15 20 25 30 35 40 50 60 70 80 90 100
Design Bearing Rolio of Subgrode Soil (DBR)
Figure 17. Structural design chart for pavements with TS! = 2. 5 and 20-yr traffic analysis (for interstate, federal-aid-primary, and major state highways).
2.4
Mini.mum Bose Thickness-{ 3 im..l1t'- bituminou~ - bound ?O inr:hr.s minimum non - fros1 Minimum Sur race Thickness - 2-f inches 1
. · . 6 inches other types susceptible material Minimum Subbase Th1ckness-6 inches
Subgrode
~8 = Average Equivalent
IB- Kip Axle Loading
Example ; T10
= IOO
DBR = 10
SN= J 53 from chart
Possible Pavement Layers (see above)
2t inches biluminous concrete
4f inches penelrated base
fl! iftthe• gtO~t'
8 9 10 12 15 20 25 30 35 40 50 60 70 80 90 100
Design Bearing Ratio of Subgrade Soil (DBR)
Figure 18. Structural design chart for pavements with TSI = 2 . 0 and 20-yr traffic analysis (for roads other than interstate, federal-aid-primary, and major state highways).
217
Design Using Various Materials
The two basic design charts (Figs. 17 and 18) can be used to design with various types of materials provided their structural coefficients are known or can be estimated . An example for the design is given on the charts. It must be emphasized that the charts give a required SN and not pavement thickness for a given design DBR and traffic combination. Because each material in the layered system has a different strength coefficient, the total thickness of a pavement will vary for a given DBR and trafiic number (DBR and Ti a) .
The charts can be used for any road. One can assume certain thickness of asphaltic concrete for the surface , multiply the strength coefficient of this layer by the thickness, and add necessary rock or gravel layers for a foundation to meet the required SN.
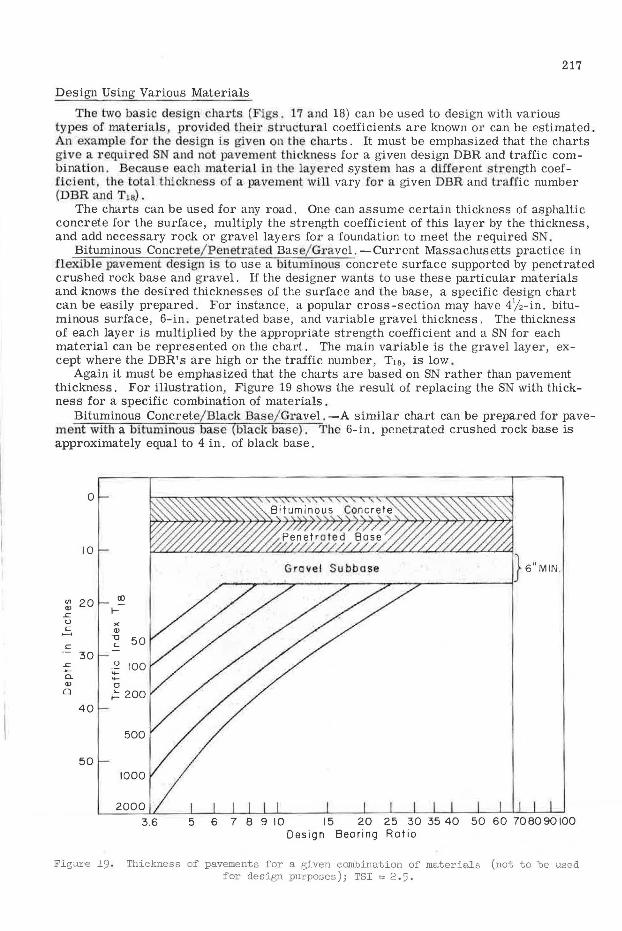
Bituminous Concrete/Penet~·ated Base/Gravel. -Current Massachusetts practice in flexible pavement design is to use a bituminous concrete surface supported by penetrated crushed rock base and gravel. If the designer wants to use these particular materials and knows the desired thicknesses of the surface and the base, a specific design chart can be easily prepared. For instance, a popular cross-section may have 4%-in. bituminous surface, 6-in. penetrated base, and variable gravel thickness. The thickness of each layer is multiplied by the appropriate strength coefficient and a SN for each material can be represented on the chart. The main variable is the gravel layer, except where the DBR' s are high or the traffic number, T18 , is low.
Again it must be emphasized that the charts are based on SN rather than pavement thickness. For illustration, Figure 19 shows the result of replacing the SN with thickness for a specific combination of materials.
Bituminous Concrete/ Black Base/ Gravel.-A similar chart can be prepared for pavement with a bituminous base (black base). The 6-in. penetrated crushed rock base is approximately equal to 4 in. of black base.
0
10
(/) 20 tO -
"' I-.c u )( c:: Q)
-c 50 c:: c::
30 .c u 100 ~
0.. ..... "' 0 0 .: 200
40
500
50 1000
2000
3.6 5 6 7 8 9 10 15 20 25 30 35 40 50 60 70BO90100 Design Bearing Ratio
Figure 19. Thickness of pavements for a given combination of materials (not to be used for design purposes); TSI = 2.5.
218
CONCLUDING REMARKS
The layered pavement design method developed for Massachusetts recognizes characteristics of soils, b:affic, and materials as the parameters of major influence in the retention of serviceability of a pa.vement. Where possible, the results of the AASHO Road Test were used to assess quantitatively the influence of the major parameters. In addition, the special problems related to frost penetration into pavements, frost heaving and spring breakup have been analyzed and recommendations have been made concerning detection, control and treatment of frost-susceptible materials. The pavement structure was analyzed using layered theory to demonstrate the critical action of each layer. The importance of using deep surface layers to reduce cracking was particularly evident from this analysis. The procedure has been developed in such a way that it can be integrated into the sequence of present Massachusetts practice in highway plannfog, design, and construction.
It was recognized at the outset of this study that alth0t1gh the design method to be developed should represent an improvement over existing constant section design, there would be a necessity for further research in areas where lmowledge was found to be particularly deficient. Futu1·e research should be directed toward the evaluation of the structural support offered by soils and pavement materials and variations in tl1is support with environmental conditions. Results of this work should provide a better means for assessment ai1d control of the structural capacity of the pavement components than is currently available.
ACKNOWLEDGMENTS
The work described he1•ein was carried out under the sponsorship of the U. S. Bureau of Puulic Roads and the Massachusetts Department of Public- Works . In the course of this work, the authors called on members of many state highway and federal agencies and drew on the special talents of many in the Massachusetts Department of Public Works and at the Massachusetts Institute of Technology. The number of contributors is so great that it is not possible to give individual credits; the help of all has been invaluable.
REFERENCES
1. The AASHO Road Test, Report 3: Traffic Operations and Pavement Maintenance. Highway Research Board Spec. Rept. 61C, 1962.
2. Carey, W. N., Jr., and Irick, P. E. The Pavement Serviceability-Performance Concept. Highway Research Board Bull. 250, pp. 40- 58, 1960.
3. AASHO Interim Guide for the Design of Flexible Pavement Structures. Oct. 12, 1962.
4. Shook, J. F., and Fang, H. Y. Cooperative Materials Testing Program at the AASHO Road Test. Highway Research Board Spec. Rept. 66, 1961,
5. Engineering and Design, Pavement Design for Frost Conditions. U. S. Army, Corps of Engineers, Rept. EM 1110-1-306, May 1962.
6. Aldrich, H. P. Frost Penetration Below Highway and Airfield Pavements. Highway Research Board Bull. 135, pp. 124-149, 1956.
7. Stokstad, 0. L. Frost Action in Michigan. Symposium on Frost Heave and Frost Action on Soils. Highway Research Board Spec. Publ. , 1951.
8. Boussinesq, J. Application of Potential Theory in a Study of Equilibrium and Motion of Elastic Solids. Paris, 188 5.
9. Burmister, D. M. The General Theory of stresses and Displacements in Layered Soil Systems. Jour. of Applied Physics, Vol. 16, 1945.
10. Westergaard, H. M. Theory of Concrete Pavement Design. Highway Research Board Proc., Vol. 7, Pt . 1, pp. 175-181, 1927.
11. Hagstx:om, .,_CJlamQ..ex.li R E. and Tons, E. Low Modulus Pavement on Elastic Foundation. MIT, Dept. of Civil Engineering, Res. Rept. R64-ll, April 1964.
12. Tons, E., and Krokosky, E. M. Tensile Properties of Dense Bituminous Concrete. Proc. 38th Annual Meeting AAPT.
219
13. Putnam, J . 0. Theoretical Analysis of the Behavior of Rigid Airfield Pavements for the Case of lnte1·ior Loading . Unpublished Doctoral Thesis, MIT, 1963.
14. Helmer, R. A . Nuclear Moisture-Density Research Project. Oklahoma Highway Dept., 1963.
15 . The AASHO Road Test. Highway Research Board Spec. Repts. 61A-G, 1962. 16. Proc. Int. Conf. on the Structural Design of Asphalt Pavements, Univ. of Michigan,
Aug. 1962. 17. The AASHO Road Test. Highway Research Board Spec. Rept. 73, 1962.