plasticity of behaviours modulated by alcohol
TRANSCRIPT
PLASTICITY OF BEHAVIOURS MODULATED BY ALCOHOL
by
Conny Hsin-Cheng Lin
B.Sc., The University of British Columbia, 2005 M.Sc., The University of British Columbia, 2008
A DISSERTATION SUBMITTED IN PARTIAL FULFILLMENT OF THE REQUIREMENTS FOR THE DEGREE OF
DOCTOR OF PHILOSOPHY
in
THE FACULTY OF GRADUATE AND POSTDOCTORAL STUDIES
(Neuroscience)
THE UNIVERSITY OF BRITISH COLUMBIA (Vancouver)
July 2017
© Conny Hsin-Cheng Lin, 2017
ii
ABSTRACT
In this dissertation, I investigated the ways that alcohol modulates plasticity of
behaviours through studying effects of alcohol on body posture, locomotion, and a simple
form of behavioral plasticity, habituation, in the genetic model organism Caenorhabditis
elegans. I found that the effects of alcohol on body posture and locomotion are
temporally dynamic especially for the first 30 min. Some earlier studies found alcohol
facilitated habituation but others found alcohol inhibited habitation. I found that alcohol
can both facilitate or inhibit habituation of the reversal response to repeated stimuli (taps)
depending on the component of the reversal response assessed. Furthermore, I discovered
that alcohol altered the predominant response to tap from a backward reversal to a
forward acceleration. With this understanding, I examined the role of 27 genes on the
alcohol induced behavioural changes characterized in Chapter 2. I found different alcohol
modulated behaviors involved different sets of genes. For example, I observed that 2
genes modulated only body posture, 3 genes modulated only reversals, 1 gene modulated
posture and acceleration but not reversal. I also discovered a gene not previously
implicated in alcohol’s effect on behaviour: tomosyn, a negative regulator of SNARE
complex. In the final study I investigated another alcohol modulated behavioural
plasticity: tolerance. In C. elegans acute tolerance has been studied, however, chronic
tolerance has not. I developed a chronic alcohol exposure paradigm and tested several
candidate genes to determine whether they play a role in chronic tolerance to alcohol. I
found that worms with a mutation in the Neuropeptide Y receptor, a gene that is involved
in acute tolerance, had better chronic tolerance than wild-type worms. I then showed that
mutations in genes that encode histone methyltransferases impaired chronic tolerance,

iii
which provided the first evidence relating histone methyltransferases with functional
outcomes of alcohol exposure in adult animals. Together, the results from my dissertation
contribute to our understanding of how alcohol alters behaviour.
iv
LAY SUMMARY
This dissertation characterizes and identified genes involved in behavioral
changes modulated by alcohol. I found that habituation, a simple form of behavioural
plasticity defined as reduced response level to repeated stimuli, can be facilitated or
inhibited by alcohol. In addition, alcohol alters the predominant response direction from
backward reversal responses to forward acceleration. These alcohol modulated behavioral
changes involve different sets of genes. For example, some genes modulate only body
posture, but some modulate only reversals. I also discovered that tomosyn, an inhibitor of
neuronal communication, and a gene that has not been implicated in alcohol’s effect
before, is important for alcohol modulated behaviour. Finally, I found that alcohol
tolerance involves histone methyltransferases, enzymes that contribute to the control of
gene expression levels. Together, the results from my dissertation contribute to our
understanding of how alcohol alters behaviour.
v
PREFACE
The initial research direction in Chapter 2 was based on Michael Butterfield’s
Master’s thesis, and I further expanded the research design to explore additional ethanol
doses, and sub-components of the habituation responses. The data collection was
completed by more than 20 undergraduate assistants under my supervision, and by
myself. I designed and wrote the data analysis codes from scratch in Matlab based on the
conceptual framework of Andrew Gile’s java code. The acceleration response analysis
was entirely designed and written by me and later confirmed with Andrea McEwan’s
conceptual framework. I wrote the entire Chapter with input from my supervisor.
The research direction for Chapter 3 initiated from Michael Butterfield’s pilot
work on SLO-1, which I later expanded into a candidate gene screen. I designed the
genetic screen candidates with input from my supervisor. Data were collected by
undergraduate assistants that I supervised as well as me. I performed all the data analysis
and interpretation, and wrote the entire Chapter with input from my supervisor.
The research question in Chapter 4 was first identified by Dr. Igor Ponomarev
who suggested a set of human histone methylation and acetylation genes he hypothesized
to be involved in epigenetic changes found in chronic alcoholic brains. I conducted the C.
elegans ortholog search, directed the development of the assay paradigm in conjunction
with inputs from my undergraduate assistants, Ankie Huang and James Shih, and
designed/conducted all the data analysis under my supervision. The data presented in this
Chapter were collected by Ankie Huang and James Shih, and were included in James
Shih’s undergraduate honour thesis at the University of British Columbia. I am

vi
responsible for designing and writing the data analysis Matlab codes, performing the
analysis, and interpreting of the data included in James’ thesis and Chapter 4.
vii
TABLE OF CONTENTS
Abstract..........................................................................................................................................................ii
Laysummary..............................................................................................................................................iv
Preface.............................................................................................................................................................v
TableofContents.....................................................................................................................................vii
ListofTables.............................................................................................................................................viii
ListofFigures.............................................................................................................................................ix
ListofAbbreviations...............................................................................................................................xi
Acknowledgements.................................................................................................................................xii
1 Introduction.......................................................................................................................................11.1 Alcoholusedisorderandbehavioralplasticity.......................................................21.2 Tolerance...............................................................................................................................231.3 Objectivesofthisthesis...................................................................................................26
2 Ethanol’seffectsonwild-typelocomotion,bodycurveandhabituation..............292.1 Introduction..........................................................................................................................292.2 Materialsandmethods.....................................................................................................322.3 Results.....................................................................................................................................402.4 Discussion..............................................................................................................................67
3 Genesmediatingethanol’seffectsonbodycurveandhabituationphenotypes753.1 Introduction..........................................................................................................................753.2 Materialsandmethods.....................................................................................................863.3 Results.....................................................................................................................................893.4 Discussion...........................................................................................................................111
4 Tolerance........................................................................................................................................1254.1 Introduction.......................................................................................................................1254.2 Materials&methods......................................................................................................1314.3 Results..................................................................................................................................1354.4 Discussion...........................................................................................................................146
5 GeneralDiscussion.....................................................................................................................1585.1 Summary.............................................................................................................................1585.2 Majorcontributions........................................................................................................1605.3 Caveats.................................................................................................................................1735.4 Futuredirection...............................................................................................................1815.5 Significance/Conclusions.............................................................................................184
References...............................................................................................................................................187
Appendix...................................................................................................................................................206
viii
LIST OF TABLES
Table 2-1. List of Multi-Worm Tracker/choreography standard behavioral measures .... 37Table 2-2. Response type criteria ...................................................................................... 40Table 3-1. Candidate gene screen strain information ....................................................... 87Table 3-2. Summary of ethanol’s effects on body curve, reversal and acceleration
probabilities in strains tested in the candidate gene screen ............................ 90Table 4-1. List of strains tested in the 24-hour pre-exposure paradigm ......................... 131Table 4-2. Pre-exposure paradigm experimental groups and names .............................. 137
ix
LIST OF FIGURES
Figure 1-1. Tap response circuit ....................................................................................... 17Figure 2-1. Ethanol gradually decreases body curve of 3, 4, and 5 day old worms ......... 42Figure 2-2. Speed of 3, 4 and 5 day old worms on ethanol show different temporal
dynamics ........................................................................................................ 44Figure 2-3. Ethanol has concentration-dependent effects on wild-type speed and body
curve ............................................................................................................... 47Figure 2-4. Speeds of wild-type worms on ethanol fail to increase in the absence of food
........................................................................................................................ 48Figure 2-5. Visualization of speeds of individual wild-type worms confirm that worms on
ethanol fail to increase in speed in response to the absence of food .............. 49Figure 2-6. Food does not alter the inhibitory effect of ethanol on wild-type body curve 50Figure 2-7. Effects of ethanol on responses to repeated taps depend on ethanol
concentrations ranging from 100-600mM) .................................................... 52Figure 2-8. Effects of 400mM ethanol on tap withdrawal responses of wild-type worms
differ for different components of the response ............................................. 57Figure 2-9. Worms on ethanol recovered more rapidly following habituation at a 10sISI
than to a 60sISI .............................................................................................. 61Figure 2-10. Raster plot revealed ethanol altered response direction ............................... 63Figure 2-11. Ethanol altered response type probability .................................................... 64Figure 2-12. Effects of ethanol on probability to accelerate are dependent on
concentration .................................................................................................. 67Figure 3-1. BK channel ..................................................................................................... 78Figure 3-2. BK channel mutation locations ...................................................................... 81Figure 3-3. tom-1 isoforms gene structure and mutation location .................................... 85Figure 3-4. A mutation in slo-1(eg142) reduces the effect of ethanol on body curve, and
lost the effects on reversal and acceleration probability ................................ 92Figure 3-5. A mutation in slo-1(js379) reduces the effect of ethanol on body curve, and
lost the effects on reversal and acceleration probability ................................ 94Figure 3-6. A mutation in slo-1(js118) reduces the effect of ethanol on body curve and
reversal probability, and lost the effect on acceleration probability .............. 95Figure 3-7. A mutation in slo-1(gk60229) JPS429 reduces the effect of ethanol on body
curve, but retains the effect on reversal and acceleration probability ............ 97Figure 3-8. A mutation in npr-1(ad609) retains the effect of ethanol on body curve, but
lost the effect on reversal and acceleration probability .................................. 99Figure 3-9. A mutation in npr-1(g320) retains the effect of ethanol on body curve, but
reduces the effect on reversal and acceleration probability ......................... 100Figure 3-10. A mutation in flp-18(gk3063) retains the effect of ethanol on body curve,
lost the effect on reversal, but retains the effect on acceleration probability102Figure 3-11. A mutation in dgk-1(nu62) reduces the effect of ethanol on body curve,
attenuates the effect on reversal and acceleration probability ..................... 104Figure 3-12. A mutation in pkc-1(ok563) retains the effect of ethanol on body curve, lost
the effect on reversal, and retains the effect on acceleration probability ..... 106Figure 3-13. A mutation in cnb-1(jh103) reduced the effect of ethanol on body curve and
reversal probability, but lost the effect on acceleration probability ............. 107

x
Figure 3-14. A mutation in tom-1(tm4724) reduces the effect of ethanol on body curve and reversal probability, but lost the effect on acceleration probability ...... 109
Figure 3-15. A mutation in tom-1(ok285) reduces the effect of ethanol on body curve and severly attenuates the effect on reversal probability, and lost the effect on acceleration probability ................................................................................ 110
Figure 3-16. Different genes can affect one, two or all three of the effects of ethanol on behavioral plasticity ..................................................................................... 112
Figure 4-1. Diagrammatic representation of the 24-hour pre-exposure paradigm ......... 133Figure 4-2. Speed for wild-type worms shows tolerance after 24hr ethanol exposure ... 138Figure 4-3. Neuropeptide Y receptor orthology npr-1(ad609) mutant shows tolerance 140Figure 4-4. Gene model of set-11 ................................................................................... 142Figure 4-5. A mutation in the H3K9 methyltransferase set-11(n4488) attenuates tolerance
...................................................................................................................... 143Figure 4-6. Gene model of set-2 ..................................................................................... 144Figure 4-7. A mutation in H3K4 methyltransferase set-2(ok952) attenuates tolerance . 145Figure 4-8. A mutation in the 3’ region of H3K9 methyltransferase set-2(ok1493) shows
tolerance ....................................................................................................... 146Figure 4-9. Tolerance Indices with confidence intervals shows npr-1(ad609) and set-
2(ok952) have altered tolerance compared to wild-type .............................. 150

xi
LIST OF ABBREVIATIONS
ADH Alcohol dehydrogenase ADHD Attention-Deficit/Hyperactivity Disorder ALDH Aldehyde dehydrogenase ISI Inter-stimulus-interval NPY Neuropeptide Y PET Positron emission tomography PKA Protein kinase A
xii
ACKNOWLEDGEMENTS
My Ph.D. education has been quite a journey. Without the support of many people
along the way, I would not have learned so much about life in general nor could I have
completed the dissertation.
The positive impact my supervisor Dr. Catharine Rankin has made to my life is
beyond what I can describe here. Metaphorically, she took me home as a stray dog, and
transformed me into a show dog with her patience and love. She took a risk taking me in
her lab when my grades weren’t all that impressive. She mentored me through countless
life challenges I experienced thorough the past decade. She supported me trying different
leadership and industry opportunities, even when that meant I would have much less time
working in the lab. Her support for my career development was over and beyond any
graduate student could hope for from a supervisor. Today, because of her mentoring, I am
a candidate running for provincial election as a Member of the Legislative Assembly, a
career path and achievement far beyond my imagination when we first found each other.
Every member of the Rankin Lab helped me and my students in so many ways,
especially when I became busy with extracurricular activities. I am forever grateful to
their support. Evan Ardiel and I started graduate school together and became friends who
truly understand each other. Andrew Giles was the best desk mate I could ever hope for,
and a mentor. Lee Lau, Ricardo Bortolon, and Andrea McEwan, Tiffany Timbers, Troy
McDiarmid, Aram Bernardos, Alex Yu were such delightful and intelligent lab mates that
made my life in the lab filled with fun and laughter.
My dissertation and research exploration would not have happened without my
30+ undergraduate students, whom I care for dearly and many became close friends. I

xiii
will try to name a few here that made major contributions to my work: Sasha Sa, Sonja
Soo, Ankie Hung, James Shih, Sabrina Khan, Shideh, Daniel Hsaio, Danica Chiam,
Denny Seo, Sharfiyet, Ken Huang, and Jeeniece Chand. I will always cheer for you and
be there for you when you need a hand.
My family and my boyfriend, Craig Stark, were integral support during my
writing process. Craig was always there for me when I felt down and anxious. My mother
encouraged, listened, and made sure my life wasn’t a complete chaos while I wrote. My
father continued to support me even after so many twists and turns in my life, for which I
am very grateful. My grandfather, who passed away on the same day I finished my
Master’s thesis, is still my role model and inspiration to always strive for better with the
utmost integrity.
This was a long journey from being a heavy-metal vocalist and artist to becoming
a Ph.D. in Neuroscience. All my families, friends, mentors, and colleagues, who cared,
asked and heard me say “I am graduating soon” for the past many years. Thank you for
tolerating my absence. Thank you for caring. Thank you for never giving up on me. I did
it! Thank you!
1
1 INTRODUCTION
Alcohol is the most widely abused drug in the world (WHO, 2014). In Canada,
18.1% of Canadians meet the clinical criteria for alcohol abuse or dependence (Pearson et
al., 2013). That translates to about 1 in 5 Canadians or 6 million Canadians who abuse
alcohol. Compared to other drugs of abuse, 6.8% Canadians abused cannabis and 4.0%
abused drugs other than cannabis or alcohol, alcohol is by far the most commonly abused
drug. The cost of alcohol abuse is significant. In Canada, the cost of alcohol abuse has
been estimated to be $14.6 billion dollars per year (Rehm et al., 2006). This represents
more than a third of the total cost of all substance abuse combined in Canada.
Harmful alcohol consumption is associated with more than 200 health conditions
(WHO, 2014). This includes cancers, hepatocellular carcinoma, cardiomyopathy,
hypertension, coronary artery disease, stroke, and liver diseases (Lieber, 1995; Hill et al.,
2004). Knowing the range of diseases associated with alcohol abuse and the prevalence
of the disorder, it is not surprising to find more than 5% of global burden of disease can
be attributed to harmful alcohol consumption (WHO, 2014). The death and disability
attributable to alcohol are more than those attributed to tobacco and hypertension
combined.
Alcohol is a complex drug that has many different negative and positive effects.
The negative consequences of harmful alcohol consumption go beyond harm done to the
physical health of the drinker. Alcohol intoxication alters many behavioral and cognitive
functions including physical coordination, attention, learning and memory, decision-
making, problem solving, and social interactions (Leckliter and Matarazzo, 1989; Selby
and Azrin, 1998). Alcohol can increase violence and/or impair driving ability, which can
2
lead to intentional or accidental injuries or deaths. In terms of positive effects, alcohol
can reduce anxiety and facilitate social interactions.
1.1 ALCOHOL USE DISORDER AND BEHAVIORAL PLASTICITY
Ironically, the effects of alcohol on behavioral and cognitive function can be
rewarding and can perpetuate the development of harmful alcohol use. As in all
problematic drug use, an individual’s experiences with a drug determine the propensity
for future drug use or abuse. Much research on alcohol and other drugs of abuse has
concluded that individuals who report experiencing more positive effects from a drug are
more likely to use the drug again (de Wit and Griffiths, 1991; Fischman and Foltin, 1991;
de Wit and Phillips, 2012). Therefore, the current hypothesis to explain initiation and
regulation of drinking behavior suggests that an individual’s propensity to drink at a
given time reflects a balance between alcohol’s rewarding effects and the drug’s aversive
effects. The rewarding effects can include euphoria and reduction of anxiety. The
aversive effects can include hangover or withdrawal symptoms. A longitudinal study
found that individuals that experienced greater sensitivity to the stimulating and
rewarding effects of alcohol, and lower sensitivity to the sedative effects of alcohol had a
greater number of alcohol abuse symptoms through 6 years of follow-up (King et al.,
2014). These data illustrate the importance of an individual’s experience with alcohol on
the person’s future likelihood in engaging in problematic drinking behavior (Grant and
Harford, 1995; Samson and Hodge, 1996; Weiss; Becker, 2008; Vengeliene et al., 2008).
To understand why some people develop alcohol abuse disorder but some do not, we
need to first understand what makes individuals experience alcohol differently. For
3
example, why do some people perceive alcohol’s effects as more rewarding than
aversive?
1.1.1 Twins studies indicate a strong genetic factor in the development of alcohol
abuse
Aside from the intertwined environmental and social factors, we know that
genetics play a strong role in the development of alcohol abuse. Decades ago, Hrubec and
Omenn (1981) found that monozygotic twins had twice the concordance rate for
alcoholism than dizygotic twins, suggesting a strong genetic component for the
development of alcoholism. Adoption studies in Denmark, Sweden, and the United States
reported the adopted sons of alcoholics were 3-5 times more likely to develop alcoholism
compared to adopted sons without an alcoholic biological parent (Goodwin, 1974;
Goodwin et al., 1977; Bohman, 1978; Cadoret and Gath, 1978; Cadoret et al., 1980).
Although genetics does not explain the entire picture, it is indisputable that genetic
background plays a role in the susceptibility to problematic alcohol use (Hawkins et al.,
1992; Rodriguez et al., 1993; Schuckit and Smith, 1996; Prescott et al., 1999). Knowing
this, much research to date has focused on understanding how genetic variation
contributes to the development of alcohol use disorder.
1.1.2 Initial response to alcohol can determine the vulnerability for future use
The best described mechanism for how genetic variation can lead to higher or
lower risk in alcohol abuse is the alcohol metabolic pathway. Alcohol metabolism
consists of two steps. The first step involves alcohol dehydrogenase (ADH) converting
ethanol into acetaldehyde, and the second step involves aldehyde dehydrogenase (ALDH)
4
converting acetaldehyde to acetic acid and acetyl-CoA (Crabb et al., 1987). Therefore,
ADH and ALDH are the two liver enzymes responsible for most of the alcohol
metabolism in humans (Edenberg, 2007). Certain individuals, more commonly those of
East Asian descent, experience an aversive facial flushing, nausea, discomfort, and
tachycardia after consuming alcohol. This symptom is associated with a specific genetic
polymorphism in the ADH2 gene. ADH2 encodes the beta subunit of the dimeric ADH
enzyme, and has three polymorphic forms: ADH2*1, ADH2*2, and ADH2*3, each with
different metabolic efficiencies. The less efficient ADH2*2 polymorphic form is
associated with the flushing response and was found in 73% of the non-alcoholic
population, but only found in 48% of the alcoholics, indicating a link between higher
alcohol metabolic rate with alcoholism (Whitfield, 2002; Edenberg, 2007; de Wit and
Phillips, 2012). This suggests that having less efficient ADH, and presumably the
associated aversive responses to alcohol, is linked to a reduced rate of alcoholism.
Furthermore, a polymorphism in the ALDH gene was also linked to alcoholism. Asians
with a less effective ALDH enzyme drink less and have lower rates of alcoholism than
those with a more effective ALDH polymorphic form (Harada et al., 1983; Suwaki and
Ohara, 1985; Schuckit, 1987; Hawkins et al., 1992). From the polymorphism studies of
the alcohol metabolic genes, it seems that people who have less efficient alcohol
metabolism experience more negative effects from alcohol consumption in comparison to
positive effects, thus, making the drinking experience less rewarding. These data indicate
that genetic variations can be linked to experience with alcohol, which can contribute to
the different propensities to abuse alcohol (de Wit and Phillips, 2012).

5
1.1.3 Beyond Metabolism
Having a less efficient alcohol metabolism does not completely protect a person
against alcoholism. Although the least efficient ADH2*2 polymorphic form is more
prevalent in non-alcoholic than alcoholic populations, still nearly half of the alcoholics
carry the ADH2*2 form (Whitfield, 2002; Edenberg, 2007; de Wit and Phillips, 2012).
These numbers indicate that the innate alcohol metabolic inefficiency is not enough to
deter harmful alcohol consumption. For individuals carrying the ADH2*2 allele, drinking
causes embarrassing flushing and more uncomfortable sedative effects, and yet many of
these individuals disregard these aversive effects and continue drinking. The rewarding
effects of alcohol must be strong enough to overpower the aversive effects these
individual experiences.
1.1.4 Range of genes implicated in behavioural effects of ethanol
Interestingly, most genes associated with increased risk for alcoholism are not
directly related to alcohol metabolism. By 2015, alcohol has been associated with more
than 700 genes in human genes (Crabbe et al., 2006b). Except for a few genes such as
ADH, ALDH, and cytochrome P450 that are related to alcohol metabolism, most genes
are not. From a review of 93 alcohol-related genes studied in mice, most of the genes
play roles in alcohol self-administration, reward, sedative effects, locomotor stimulation,
anxiolytic effects, and neuroadaptations such as tolerance, sensitization, withdrawal
(Crabbe et al., 2006b). Clearly, most of the genes modulate behavioral plasticity. In fact,
effects of alcohol can be moderated by all major neurotransmitter systems used in the
brain, including GABA, glutamate, dopamine, acetylcholine, glycine, and serotonin, and
6
many other signaling systems such as neuropeptides, ion channels, G proteins [for more
comprehensive reviews see (Crabbe et al., 2006a; Ron and Messing, 2011; Lovinger and
Roberto, 2013)]. Instead of attempting to summarize alcohol’s effect on every major
classes of molecules below, I describe two examples that illustrate two interesting
behavioral phenotypes that may contribute to higher risk of alcohol use disorder.
1.1.5 Examples of two genes underlying behavioral differences in stress and
impulsivity, and their relationship with alcohol
1.1.5.1 Neuropeptide Y: an explanation for anxiety/stress related alcohol consumption
Neuropeptide Y (NPY) and NPY receptors, well known for their roles in stress,
depression, and anxiety (Heilig et al., 1993; Morales-Medina et al., 2010), also have well-
documented roles in the neurobiological response to ethanol in mammals, including
humans, and in invertebrates (Thiele et al., 1998; Pandey, 2003; Thiele and Badia-Elder,
2003; Davies et al., 2004; Eva et al., 2006). In humans, altered NPY levels resulting from
Neuropeptide Y polymorphisms was associated with different alcohol consumption
levels, risk of alcoholism, and the probability of experiencing seizures during ethanol
withdrawal (Karvonen et al., 1998; Kauhanen et al., 2000; Ilveskoski et al., 2001; Okubo
and Harada, 2001; Lappalainen et al., 2002; Thiele and Badia-Elder, 2003; Zhu et al.,
2003). In rodents, neuropeptide Y has well-documented roles in the resistance to ethanol
intoxication and voluntary alcohol consumption (Thiele and Badia-Elder, 2003; Eva et
al., 2006). For example, NPY-null mutant mice consumed more ethanol than wild-type
mice, whereas transgenic mice overexpressing NPY consumed less ethanol than wild-
type mice (Thiele et al., 1998; Eva et al., 2006). In addition, NPY-null mice recovered
7
from the sedative effects of ethanol sooner than wild-type mice, and this effect was
unrelated to their ethanol metabolic rate (Thiele et al., 1998). In the mouse, Neuropeptide
Y has at least five receptor subtypes, the Neuropeptide Y1, Y2, Y4, Y5 and Y6 receptors
(Thiele and Badia-Elder, 2003). Amongst the 5 Neuropeptide Y receptors, Y1, and Y2
receptors modulated voluntary alcohol consumption, and Y1 and possibly Y5 modulated
ethanol-induced sedation (Thiele and Badia-Elder, 2003). In particular, the Y1-null mice
recovered faster from the sedative effect of ethanol than wild-type mice and the effect
was unrelated to altered ethanol metabolic rate (Thiele et al., 2002). In C. elegans, a
single amino acid polymorphism in the Neuropeptide Y receptor gene, npr-1, was
responsible for a better acute tolerance to ethanol (de Bono and Bargmann, 1998; Davies
et al., 2004). Because of neuropeptides’ well-documented roles in stress, anxiety, and
depression (Morales-Medina et al., 2010), differences in NPY and NPY receptor
functions are a plausible contributors to stress- and/or depression-driven drinking
behaviors.
1.1.5.2 Dopamine: a link between impulsivity and alcohol consumption
Genes in the dopaminergic system are known to mediate drug reward, alcohol
withdrawal, as well as impulsivity, a trait associated with risk of initiating and
maintaining abuse of most drugs (Kreek et al., 2005; Perry and Carroll, 2008). Human
studies have linked dopamine with impulsivity and risk of alcoholism. In a study of
French alcoholics, a polymorphism in the dopamine D2 receptor gene correlated with a
higher score of impulsiveness (Limosin et al., 2003). Animal studies provided further
evidence. A positron emission tomography (PET) study of impulsive rats showed reduced
dopamine D2/D3 receptors in the nucleus accumbens, which is a key brain area involved
8
in drug-seeking behavior (Ikemoto and Panksepp, 1999; Dalley et al., 2007). Mice
lacking the dopamine D2 receptor had marked aversion to ethanol compared to control
mice (Phillips et al., 1998), decreased ethanol intake (Phillips et al., 1998; Palmer et al.,
2003; Thanos et al., 2005), decreased self-administration of ethanol (Risinger et al.,
2000), and lack of place preference to ethanol (Cunningham et al., 2000). This evidence
links the dopamine system with a complex trait such as impulsivity, which is associated
with risk of developing alcohol use disorder. In fact, an FDA-approved drug for treating
alcohol use disorder targets the dopamine system, and more drugs targeting the dopamine
receptors are being explored for alleviating not only alcohol withdrawal symptoms but
also prevention of alcohol consumption (Koob, 2010).
1.1.6 Ethanol’s effects on behaviour are mediated by many genes, some as yet
unknown
Current research efforts on alcohol-related genes suggest that no single gene is
fully responsible for the development of alcoholism. Even for genes with strong evidence
such as neuropeptide Y, ADH, and the D2-type dopamine receptors, none of them fully
explain alcohol abuse behaviours. Like any other complex disorders, the manifestation of
alcohol use disorder involves the interaction of many genes and many traits, which are
expressed through interactions with an individual’s unique environment. As with any
other drug of abuse, treatments are most successful when tailored to an individual’s
unique profile. As Crabbe et al. (2006b) suggested, to develop an appropriate
individualized treatment for individuals, we need to fully understand the disorder and the
genes that play a role in it. With hundreds of genes and numerous complex behavioral
9
traits currently linked to alcohol, we need a high throughput approach to fast track our
efforts to identify genes that are involved in alcohol’s effects on the nervous system.
1.1.7 Using C. elegans as a model, 50 ethanol genes were uncovered
A recent review by Grotewiel and Bettinger (2015) highlighted the success of
using an invertebrate system, the roundworm Caenorhabditis elegans, to identify genes
associated with ethanol’s effect on behavior and the nervous system. The range of
ethanol-induced behaviors studied in the worm include acute inhibition in locomotor
activities, tolerance, withdrawal, and ethanol preference. Thus far, 50 genes in worms
with orthologs in humans can influence behavioral responses to alcohol. These include
some conserved genes such as genes encoding alcohol metabolic enzymes, dopamine
receptors, and the NPY receptor. Other genes have furthered our understanding of
ethanol’s effects on the nervous system, such as calcium and voltage-gated potassium
channels, cation channels, and histone deacetylation. In addition, studies have identified
genes that encode proteins with incompletely understood functions. Since most vertebrate
proteins in the nervous system have orthologs in C. elegans (Bargmann, 1998; Brownlee
and Fairweather, 1999), C. elegans can serve as a platform to quickly screen for alcohol-
related genes that have behavioral relevance.
1.1.8 Why C. elegans is a good model for ethanol genetic and behavioral
C. elegans is especially suited for high throughput genetic screens for acute and
short-term behavioral effects of ethanol. C. elegans has a short generation time, a large
brood size, and self-fertilization, all of which are ideal for growing and breeding a large
number of genetically identical animals (Brenner, 1974). Genetic and nervous system

10
resources are readily available with the completely mapped genome, mapped nervous
system connectome, and a knockout library with over 60% coverage (Sulston and
Horvitz, 1977; Kimble and Hirsh, 1979; Sulston et al., 1983; White et al., 1986; Fire et
al., 1998; Ahringer, 2005). In addition, technology is available to simultaneously track
behavior from 50-100 animals, allowing high throughput behavioral study from an
isogenic animal population on the same ethanol exposure environment (Swierczek et al.,
2011).
1.1.9 The first C. elegans study
Ethanol’s effects on C. elegans have been studied for over 2 decades. Morgan &
Sedensky (1995) first made the observation that worms exposed to ethanol initially
become “excited” and then became progressively “anesthetized”. In their study worm
locomotor movement first increased, then became progressively more uncoordinated, and
finally worms became immobilized and unresponsive to stimuli to the head. These effects
were quickly reversible when worms were removed from ethanol. Worms transferred to
ethanol-free medium had a normal lifespan, fertility, movement, feeding, and mating
behaviors. These data showed that worms recovered from short-term exposure to ethanol.
1.1.10 Ethanol Tissue concentrations of C. elegans
The common ethanol exposure method for C. elegans is infusing ethanol into the
agar medium on which the worms were cultivated. A volume of ethanol appropriate to
produce the desired molar concentration based on the weight of the agar medium is
pipetted onto the surface of the agar. After all ethanol is fully absorbed by the agar,
worms are placed on the agar plate for exposure. Using this method, tissue alcohol
11
concentrations of the worms on a 400-mM ethanol plate reached around 0.3% blood
alcohol concentration (BAC) [estimated from internal concentration reported in (Alaimo
et al., 2012)], which is four times the driving limit in Canada. This concentration would
be produced by consuming 6-8 drinks of alcohol, and would cause severe physical and
sensory impairment in humans. There has been some controversy about the internal
concentration in C. elegans (Davies et al., 2003; Mitchell et al., 2007; Alaimo et al.,
2012). The first report on C. elegans internal alcohol concentration indicated 400mM
ethanol produced an equivalent of 0.1% BAC (Davies et al., 2003). This method used the
standard blood alcohol assay used in humans and rodents. However, a subsequent study
reported that the buffer used to rinse worms off from alcohol plates also diluted the
amount of alcohol in the assay, and proposed that ethanol could readily pass C. elegans
cuticle thus the internal concentration should be equivalent to external environment
(Mitchell et al., 2007). If that were true, 400mM alcohol could potentially produce 1.8%
BAC, which is more than 4 times the amount that would lead to death in humans. To
settle this dispute Alaimo et al. (2012) picked worms with a platinum pick instead of
washing them off the agar plate, and calculated the amount of alcohol detected by the
alcohol assay according to the volume of the worms. This method avoided diluting
ethanol in the worms or including ethanol trapped between worms, and yielded a value
comparable with the original readings from gas chromatography (Alaimo et al., 2012).
Thus Alaimo et al. (2012) argued that the method used in Mitchell et al. (2007) included
volumes of ethanol trapped between the worms, thus contributing to a much higher
internal concentration measurement. Based on this the common dosages used in
published studies range from an equivalent of 0.04-0.4% BAC in humans. At this range
12
of alcohol concentration, worms show increasingly flat body posture, slower egg laying
rate, and slower locomotion compared to their sober counterparts (Morgan and Sedensky,
1995; Davies et al., 2003).
1.1.11 Behavioral effects of C. elegans on ethanol
To date, a variety of alcohol-related behaviors have been studied in worms. Most
of the studies have focused on the effects of ethanol on locomotor activities (Morgan and
Sedensky, 1995; Davies et al., 2003; Speca et al., 2010; Alaimo et al., 2012). Ethanol can
increase or decrease locomotor activities depending on the dose of ethanol exposure
(Morgan and Sedensky, 1995; Davies et al., 2003). Worms can develop acute tolerance to
ethanol within 30 min of exposure (Davies et al., 2004). This was measured as decreasing
sedative effects of ethanol in conjunction with increasing internal tissue alcohol
concentrations (Davies et al., 2004; Jee et al., 2013; Raabe et al., 2014; Mathies et al.,
2015). Worms can also show withdrawal to alcohol observed as increased clumping
behavior, tremors, increased turning behavior or a decreased capability to reach a food
source depending on the specific treatment paradigm (Davies et al., 2004; Mitchell et al.,
2010; Jee et al., 2013; Scott et al., 2016). Other behaviors affected by ethanol include
inhibitory effects on egg-laying and increased muscle contraction when worms are given
food (Davies et al., 2003; Hawkins et al., 2015). More complex alcohol-related behaviors
include state-dependent learning (Bettinger and McIntire, 2004) and developing a
preference for ethanol if it is associated with food (Lee et al., 2009).
13
1.1.12 Habituation, a foundation of higher order cognitive function
Habituation is defined as a decremented response to repeated stimuli that is not
due to fatigue or sensory adaptation (Thompson and Spencer, 1966). It is one of the
simplest forms of learning, where animals modify their behavior based on their
experiences with repeating stimuli that have no consequences. Habituation is highly
conserved across the animal kingdom. It is thought to be a foundation of selective
attention that allows animals to free up attention for stimuli that have biological
consequences.
Interestingly, problems in habituation can be found in association with complex
psychiatric disorders. For example, schizophrenia patients have long been known to have
slower habituation to sensory stimuli, which is hypothesized to be an underlying reason
for their over-reactivity to stimuli (Venables, 1966; Depue and Fowles, 1973; Gruzelier et
al., 1981; Geyer and Braff, 1982; Braff et al., 1992; Hollister et al., 1994; Akdag et al.,
2003). Another example is the faster habituation found in Attention-Deficit/Hyperactivity
Disorder (ADHD) (Lloyd et al., 2015). ADHD is characterized by an inappropriate levels
of inattention, hyperactivity and/or impulsivity (American Psychiatric Association. et al.,
2013). Children with ADHD had faster habituation of heart rate responses to rewards
than children without ADHD (Iaboni et al., 1997). This faster habituation to rewards is
thought to be the underlying reason for the faster loss of ability to regulate their attention
(Lloyd et al., 2015). These two examples demonstrate the importance of a well-regulated
habituation equilibrium: slower or faster habituation can both lead to problems in more
complex cognitive functions.
14
1.1.13 Psychiatric disorders that include altered habituation are comorbid with
alcoholism
The same psychiatric disorders associated with problems in habituation have been
associated with a higher risk of alcoholism. Both ADHD and schizophrenia are linked to
higher rates of alcohol abuse (Drake et al., 1990; Braff et al., 1992; Biederman et al.,
1995; Herpertz et al., 2001). In a nationwide survey in the United States that used DSM-
IV criteria to determine the prevalence of psychiatric disorders in the general population
and among people in treatment for alcohol abuse, 34% of individuals diagnosed with
schizophrenia also meet the diagnostic criteria for alcohol use disorder (Drake and
Mueser, 2002). The prevalence of ADHD is 5-10 times greater in adult alcoholics than in
non-alcoholics. Other examples include individuals with eating disorders, who are also
thought to have impaired habituation (Faunce, 2002; Epstein et al., 2009), are 5 times
more likely to suffer from alcohol or substance use disorders (Bulik et al., 2004).
Although habituation defects in alcohol use disorder have not received the same attention
as other psychiatric disorders, more recent reviews suggest abnormal habituation may
play a role in many cognitive process dysfunctions found in different stages of drug
addiction (De Luca, 2015).
1.1.14 Previous study of habituation on ethanol produced conflicting results
Despite a possible role of habituation in alcoholism, studies on the relationship
between alcohol intoxication and habituation was limited and contradictory. The first
report on acute alcohol intoxication and habituation studied habituation of post-rotatory
nystagmus (rapid involuntary movement of the eyes) from a small group of fighter pilots,
15
ballet dancers, and figure skaters (Aschan, 1967). Aschan (1967) found these subjects,
known to have exceptional post-rotatory nystagmus habituation, showed no habituation
when intoxicated. However, subsequent studies in humans and various animal models
showed conflicting results. Some studies found alcohol inhibited habituation (Ingle,
1973; Peeke et al., 1975; Rinaldi et al., 1983; Lister, 1987), similar to the impaired
habituation of post-rotary nystagmus (Aschan, 1967; Berthoz et al., 1977), but others
found alcohol facilitated habituation (Peeke et al., 1975; Glanzman and Epperlein, 1981;
Dinges and Kribbs, 1990). These conflicting results suggest that alcohol may not globally
inhibit or facilitate habituation (for more details on these studies see Chapter 2
Introduction).
1.1.15 Habituation in C. elegans
Our lab was the first to demonstrate that C. elegans can display habituation
(Rankin et al., 1990). In the lab, worms are cultured on agar in a Petri dish. When a tap is
given to the side of the Petri dish, worms typically respond to the tap stimulus by
crawling backward (reversal or reverse movement). When a series of taps were given at a
fixed interval (i.e. 10s or 60s), worms responded less and less to the tap stimuli. This
decremented response was not due to fatigue. This was demonstrated by delivering a mild
electric shock to the agar, and observing that the response decrement returned to near
baseline levels, a process called dishabituation. In addition, if the decremented responses
were due to fatigue, worms showing a greater decrement to stimuli delivered at a 10s
Inter-stimulus-interval (ISI) than taps delivered at a 60s ISI should be more fatigued.
However, that is not the case. Worms showed more rapid recovery from habituation after

16
training with a 10s ISI than a 60s ISI. Together these results demonstrated that worms can
habituate to taps and can learn from their experience.
1.1.16 Tap response circuit
The neuronal circuits for the touch and tap withdrawal responses were mapped
out using laser ablation studies (Chalfie et al., 1985; Wicks et al., 1996). The sensory
neurons and interneurons required for behavioral responses to either a head or a tail touch
(the touch circuit) includes sensory neurons ALML/R, PLML/R, and AVM, the
interneurons AVAL/R, AVBL/R, AVDL/R, and possibly PVC and/or RIM (Chalfie et al.,
1985) (Figure 1-1). The bilateral interneurons AVA, AVB and AVD are responsible for
transmitting sensory information to motor neurons are called “premotor interneurons”.
The AVD/AVA innervate VA/DA motoneurons that drive the reversal movement. The
PVC/AVB innervate VB/DB motoneurons that drive the forward movement.

17
Figure 1-1. Tap response circuit Tap stimuli are sensed by mechanosensory neurons ALM, AVM, PLM, and PVD sensory neurons (blue), and a proprioception neuron DVA. These neurons connect to each other and to premotor interneurons AVD, PVC, AVA, AVB (pink) through chemical or electrical connections. The premotor interneurons integrate the inputs and drive activation of motoneurons (yellow), which innervates the muscles (not shown). The VA/DA motoneurons drive reverse movement and the VB/DB drive the forward movement. The CEP neuron was involved in food sensing and has a role in TWR habituation (Kindt et al., 2007). The RIM interneurons receive inputs from the AIB chemical sensory neurons (not shown) and innervate AVA/AVB and so could have effects on TWR.
sensory neurons motoneuronsinterneurons
ForwardReverse
PVD
ALM PLMAVMCEP
VB
RIM
DVA
Anterior Posterior
VA DBDA
AVD PVC
AVA AVB
chemical connection (excitatory)
chemical connection (inhibitory) electrical connection (gap junction)
chemical connection (?)
18
Based on the touch circuits and the completed neuronal circuitry map (Chalfie et
al., 1985; White et al., 1986), our laboratory mapped the tap withdrawal circuit by
systematically ablating candidate sensory neurons and interneurons either singly or in
combination and examined the resulting behavioral responses to tap (Wicks and Rankin,
1995). The results showed that the tap withdrawal circuit is composed of 5 sensory
neurons (ALML/R, PLML/R and AVM), 4 pairs of premotor interneurons (AVAL/R,
AVBL/R, AVDL/R, PVCL/R), a pair of harsh touch neuron PVDL/R, and a single
proprioception neuron DVA (Figure 1-1). This study confirmed that the anterior touch
cells promote reversal responses whereas the posterior touch cells promote forward
responses. Anterior touch cells, when ablated, resulted in reduced reversal frequency and
increased forward accelerations. In contrast, posterior touch cells, when ablated, resulted
in increased reversal frequency. This suggested the tap withdrawal responses were a
result of the integration of input from two antagonistic sub-circuits: one that promotes
forward accelerations and another that promotes backward locomotion, termed
“reversals”. In addition, in larval animals when there are only 2 anterior sensory neurons
and 2 posterior sensory neurons, worms are equally likely to reverse or accelerate to tap
(Chiba and Rankin, 1990). In adults worms the “default” initial response to taps is
reversal, probably because the anterior circuit now has 3 sensory neurons (drives reversal;
mechanosensory neuron AVM is added to the circuit late in L4; Chalfie et al., 1985) and
is hypothesized to have stronger input to the locomotor interneurons than the posterior
circuit with 2 sensory neurons.
More recently, another sub-circuit showed a probable involvement in the tap
response (Piggott et al., 2011). Combining laser ablation and imaging techniques, a
19
second sub-circuit that governs reversal behavior, including a pair of RIM neurons and an
interneuron AIB, was identified (Piggott et al., 2011). AIB neurons are part of the amphid
interneurons that receive information from the chemosensory neurons. The RIM
interneurons are also connected with AVA and AVD, the premotor interneurons of the
tap circuit (Figure 1-1). Synapsing onto RIM interneurons, AIB inhibits RIM, which
triggers reversal movement. This finding suggests the possibility that the tap response
could also include the RIM neuron. Together with our group’s study, the data suggests
that the tap response circuit consists of three sub-circuits: a circuit driving forward
movement and two redundant circuits driving reversal movements. Therefore, members
of the tap withdrawal response circuit are currently known to consist of 8 sensory neurons
(ALML, ALMR, AVM, PLML, PLMR, PVDL, PVDR, and DVA), and 5 pairs of
premotor interneurons (AVA, AVB, AVD, PVC, RIM).
1.1.17 Modulating relative strengths of forward/backward circuits mediates
habituation
Knowing that the forward and backward neural circuits determine the responses to
taps, habituation might involve changing the relative strengths of the forward and
backward circuits. How might C. elegans do that? Based on previous findings, Wicks et
al. (1996) hypothesized that the gap junctions within the tap circuit were excitatory and
the synaptic connections were mostly inhibitory (Chalfie et al., 1985; Wicks et al., 1996).
According to this model, the role of gap junctions between premotor interneurons and
motor neurons is to drive forward or backward movement and the role of chemical
synapses between sensory neurons and interneurons is to modulate the strength of the
forward/backward circuits through inhibitory signals. Based on existing cell ablation
20
findings from C. elegans and electrophysiology data from a related nematode species
Ascaris, Wicks et al. (1996) further hypothesized that sensory neurons ALM, AVM and
PLM are inhibitory while the synapses between AVD and AVA are like excitatory
(Wicks et al., 1996). If this model were true, a way the tap circuit could change itself in
response to repeated taps is to modulate the strength of the chemical transmission.
Chemical transmission between synapses is mediated by neurotransmitters and
neuropeptides. C. elegans expresses many different neurotransmitter types including
dopamine, glutamate, GABA, acetylcholine and serotonin (Horvitz et al., 1982; Loera
and Meichenbaum, 1993; Hart et al., 1995). For the chemical synapses between the touch
cells (ALM/AVM/PLM/PVD) to the premotor interneurons (AVA/AVD/AVB/PVC),
evidence suggests that the transmission is glutamatergic (Serrano-Saiz et al., 2013). The
touch cells express eat-4, an ortholog of mammalian VGlut1, a vesicular glutamate
transporter (Lee et al., 1999; Serrano-Saiz et al., 2013). The premotor interneurons
express AMPA-type glutamate receptor subunits glr-1 and glr-2 (Hart et al., 1995;
Maricq et al., 1995), NMDA-type glutamate receptor subunits, nmr-1 and nmr-2 (Brockie
et al., 2001), and may also express glutamate gated chloride channels avr-14 and/or avr-
15.
The first line of evidence suggesting that habituation in C. elegans can be
modulated by chemical transmission came from studying worms with a mutation in a
gene encoding a mammalian vesicular glutamate transporter ortholog, eat-4 (Lee et al.,
1999; Rankin and Wicks, 2000). eat-4 is expressed in the touch cells ALM, AVM and
PLM of the tap circuit (Lee et al., 1999). If the chemical synapses between the touch cells
and premotor interneurons are glutamatergic, and habituation to taps is modulated by

21
glutamate, the eat-4 mutation should produce some deficit in habituation (Rankin and
Wicks, 2000). Indeed, eat-4 mutants had dramatically faster habituation than wild-type
animals, and restoring wild-type eat-4 in the mutant background restored habituation to
wild-type levels. This supported the hypothesis that habituation to taps in C. elegans is in
part modulated by glutamate neurotransmission.
In addition to glutamate, genes involved in dopamine neurotransmission also
modulate habituation to taps in C. elegans. The C. elegans homologue for tyrosine
hydroxylase is cat-2; worms with a mutation in cat-2 show faster habituation to taps than
wild-type worms (Sanyal et al., 2004). Interestingly, this faster habituation was only
observed in the probability of reversals but not in the distance of reversals. This
suggested that dopamine was specifically affecting habituation of one but not all
components of the reversal response (i.e. probability vs distance). This raised the
hypothesis that habituation of different components of a response might be modulated by
different mechanisms.
The D1 type dopamine receptor dop-1 is expressed in the touch cells ALM and
PLM (Suo et al., 2002). If this dopamine receptor is involved in habituation and the
plasticity occurs at the synapses between the touch cells and the premotor interneurons, it
is likely that the dopamine receptor’s downstream signaling pathway is also involved in
the process. DOP-1 encodes a Gq-protein-coupled receptor. The signaling pathway of a
Gq-protein-coupled receptor involves the G protein Gq, which activates phospholipase C
beta (PLC-β), which then hydrolyzes PIP2 into DAG and IP3. DAG can then activate
protein kinase C (PKC). Mutations in C. elegans orthologs of the Gq/egl-30, PLC-β/egl-
8, and PKC/pkc-1 all showed the faster habituation phenotype similar to the dop-1 mutant
22
(Kindt et al., 2007). Conversely, an inhibitor of DAG, DGK/dgk-1, showed slower
habituation opposite to that seen in the dop-1 downstream signaling mutants. These data
demonstrated that cellular signaling pathways within the touch cells can have important
roles in shaping the kinetics of habituation.
1.1.18 High-throughput behavioral screens uncovered habituation genes
The realization that learning as “simple” as habituation is not mechanistically
simple prompted a large-scale candidate gene screen in our laboratory to search for genes
in the C. elegans nervous system involved in habituation (Giles, 2012). This screen was
not previously possible because the habituation assay protocol was done manually and
was thus highly labour-intensive. To automate the habituation assay, our lab collaborated
with Dr. Rex Kerr to develop a high throughput Multi-Worm Tracker (Swierczek et al.,
2011) that could automatically deliver taps at specified intervals while recording
behaviors from a plate of worms (typically 50-100 worms). The camera of the Tracker
records the behavior of the worms at a rate faster than 0.2s per frame, and the Multi-
Worm Tracker software skeletonizes each worm from the images in real time, thereby
efficiently storing worms’ behavioral data, which can be later extracted and analyzed
(Swierczek et al., 2011). With this technology advancement, worms’ responses to taps
could be analyzed in much greater detail. Previously habituation data scored manually
could extract reversal distance and probability from one experiment in one day or two.
However, with the Multi-Worm Tracker, the behavioral data in one experiment could be
analyzed for multiple components of reversal response such as distance, duration,
probability, speed within 10 min using pre-written analysis program code.

23
Using this new technology, Giles (2012) characterized habituation from over 500
C. elegans strains with mutations in nervous system genes. The screen uncovered
hundreds of mutations affecting one or more aspect of habituation. From this data, Giles
(2012) hypothesized that different features of the habituation (i.e. rate and asymptotic
level), and components of the reversal response (i.e. probability and distance), have
genetically independent mechanisms. Adding to the previous finding that dop-1 and
Gq/egl-30 pathway modulates the rate of habituation of reversal probability, we now have
evidence supporting the hypothesis that different aspects and components of habituation
are modulated by different genetic mechanisms.
The complex genetic mechanisms for habituation to taps in C. elegans provides a
platform to study the genetic interaction of ethanol intoxication on learning. In this
dissertation, I investigate the role of some candidate genes in ethanol’s effect on
probability, duration and speed of responses to repeated taps.
1.2 TOLERANCE
1.2.1 Tolerance: a key component of alcohol abuse
The development of alcohol abuse involves not only the initial experience with
alcohol but also transforming the experience into neurobiological changes that gradually
lead to a chronic condition. Some of these changes include tolerance, withdrawal, and
drug-seeking behavior that are part of the clinical definition of Alcohol Use Disorder
(American Psychiatric Association. et al., 2013). Tolerance is a key component of drug
addiction. It is as a decreased response to repeated drug exposures (Kalant, 1998), and is
a form of behavioral plasticity (Pietrzykowski and Treistman, 2008). Tolerance can occur
at different levels of complexity (molecular, cellular, or behavioral level). Behavioral
24
tolerance can be characterized temporally into acute, rapid, or chronic tolerance (LeBlanc
et al., 1975b; Crabbe et al., 1979; Kalant, 1998; Pietrzykowski and Treistman, 2008).
1.2.2 Differences between acute, rapid and chronic tolerance
Behavioral tolerance is measured by some output of the entire animal. For
example, ethanol inhibits the crawling speed in worms within minutes. However, after 30
min of continuous exposure to the same ethanol concentration, worms crawling speed
increased despite the maintenance of the same internal ethanol concentration (Bettinger et
al., 2012). This type of tolerance occurring within minutes of a single ethanol exposure
episode is called “acute tolerance” (Pietrzykowski and Treistman, 2008). Rapid tolerance
develops after exposures that lasts typically 8-24 hours, and does not involve protein
synthesis. Chronic tolerance typically happens after continuous or intermittent alcohol
exposure for 24 hours or longer, and involves protein synthesis.
1.2.3 Molecular tolerance contributes to behavioral tolerance
Most of our understanding of tolerance is at the molecular level which focuses on
the adaptation process of individual molecules such as ion channels. Many ion channels,
including BK channels, GABA, and Glutamate receptors, have been well characterized
for their temporal adaptation to the presence of alcohol. For example, we know that the
BK channel begins to potentiate within seconds of ethanol exposure, but this potentiation
subsides within several minutes, demonstrating acute tolerance (Dopico et al., 1998;
Dopico et al., 1999; Pietrzykowski et al., 2004; Pietrzykowski and Treistman, 2008). This
acute tolerance can be modulated by posttranslational mechanisms such as
phosphorylation of the BK channel by protein kinase A (PKA) (Pietrzykowski and
25
Treistman, 2008). Other mechanisms that are known to mediate tolerance include
interactions with the lipid microenvironments, interaction with auxiliary proteins, protein
trafficking, cytoskeleton reorganization, epigenetic cytoplasmic mechanisms (i.e.
microRNA regulation), and epigenetic nuclear mechanisms (i.e. chromatin remodeling).
1.2.4 Behavioral tolerance involves epigenetic modifications
One of the molecular mechanisms implicated in tolerance is epigenetics.
Epigenetics refers to a set of molecular mechanisms that regulate long-term activation or
repression of genes without alterations in the DNA sequence (Choudhuri, 2011).
Epigenetic regulation of gene expression can take place in the cytoplasm (i.e. mRNA
processing) or in the nucleus (DNA methylation, posttranscriptional modifications of
histones, chromatin remodeling). Epigenetic modification in the nucleus has the
capability to persistently alter the expression level of a large number of genes. A grossly
altered transcriptome (gene expression profile), and altered epigenome (epigenetic marks
profile) has been observed in post-mortem alcoholic brains (Ponomarev et al., 2012).
These alterations can lead to changes in neuronal functioning, which in turn manifest as
behavioral tolerance to ethanol (Nestler, 2014). Therefore, epigenetic mechanisms may
offer a plausible explanation for long-term changes produced by continuous alcohol
consumption (Hutchison et al., 2008; Nestler, 2014).
Nuclear epigenetic mechanisms are of particular interest because of their ability to
translate experience with alcohol into future behavioral changes. Cowmeadow et al.,
(2006) showed that the Drosophila BK channel gene Slo expression levels were increased
6 hours after only a brief 15min alcohol exposure. This increase was coupled with
increased histone acetylation in the Slo gene promoter region, exposing the promoter

26
region to the cAMP response element-binding protein (CREB) which enhances
transcription of the Slo gene. In flies this mechanism is believed to contribute to the
development of behavioral tolerance to alcohol (Wang et al., 2007). To date, many
epigenetic mechanisms such as DNA methylation and histone acetylation have received a
great deal of attention in their role in liver damage and brain plasticity (Ponomarev, 2013;
Shukla and Lim, 2013). However, less is understood about how histone methylation
contributes to the development of tolerance. Here, I will explore the role of histone
methylation in a new model of chronic tolerance in C. elegans.
1.3 OBJECTIVES OF THIS THESIS
In this dissertation, I asked three main questions. First, how does ethanol affect
different aspects of responses to repeated taps in C. elegans? Second, if it affects different
components differently, does each affected component have an independent genetic
mechanism? Third, do either acute or chronic tolerance in C. elegans involve histone
methylation?
Objective 1. Characterize ethanol’s effect on responses to repeated taps in C. elegans
Because there is no consensus on how ethanol affects habituation, I first
investigated whether ethanol has effects on the habituation of reversal responses to
repeated taps in C. elegans, and if so, whether ethanol differentially affects different
measures (i.e. probability, duration speed) of the reversal response. I found that the
probability of reversal responses in the presence of ethanol habituated faster than
unexposed controls, however, ethanol had an opposite effect on habituation of reversal
speed. In addition, when I investigated another type of response to taps, an acceleration
forward, I found that in the absence of ethanol, worms slightly increased the probability
27
of accelerating to taps as the probability of reversals decreased; however, throughout the
habituation series accelerations never became the dominant response type (the reversal
response was dominant). In contrast, in the presence of ethanol worms' accelerations
became the dominant response type within 2-3 taps.
Objective 2. Investigate roles of candidate genes on the effect of ethanol on
responses to repeated taps
Once I characterized the effects of ethanol on habituation in wild-type worms, I
carried out a screen of candidate genes to examine the effects of ethanol on tap
habituation for 40 strains of worms expressing mutations in 27 candidate genes on the
two main behavioral plasticity phenotypes: habituation of reversal probability and the
shift of dominant response to acceleration. In addition to these two behavioral plasticity
phenotypes, I also used ethanol’s depressive effect on body posture to examine whether
the candidate gene has a general effect on the worm or a specific effect on the response
plasticity to taps. More than half of the genes tested had some effect on one or more of
the phenotypes. Seven of the candidate genes tested were chosen for more detailed
discussion in this Chapter. This screen confirmed the role of a well-known ethanol
response gene, the BK channel, in all three behavioral measures. Interestingly, the stress-
related gene, the neuropeptide Y receptor, has a role specific to ethanol’s effects on
response plasticity but not body posture. One of the putative neuropeptide Y ligands was
found to only affect reversals but not accelerations, supporting my hypothesis that ethanol
modulates the two response types via distinct mechanisms. This screen also identified a
new gene that plays a role in ethanol’s effects on behaviour, tom-1, a C. elegans
28
homologue of the mammalian tomosyn gene that encodes a synaptic vesicle release
modulator that has not previously been related to ethanol.
Objective 3. Investigate genes involved in epigenetic histone modification on
tolerance in C. elegans
For objective 3, I developed a new C. elegans model for chronic tolerance. I
found that with 24 hours of ethanol exposure worms developed tolerance to the excitatory
effects of ethanol on locomotion when they were exposed to the same dose of ethanol
again. I found that mutations in genes encoding histone methyltransferases, enzymes
catalyzing the addition of methyl group on histones, have defective chronic ethanol
tolerance. This experiment suggests histone methylation plays a role in tolerance to
ethanol in C. elegans.
29
2 ETHANOL’S EFFECTS ON WILD-TYPE LOCOMOTION, BODY CURVE AND HABITUATION
2.1 INTRODUCTION
Despite a possible role of habituation in alcoholism, studies of the relationship
between alcohol intoxication and habituation have been very limited. The first report on
acute alcohol intoxication and habituation was a study on habituation of rotary stimuli
from a small group of fighter pilots, ballet dancers and figure skaters (Aschan, 1967).
These professionals were known to have better habituation to rotatory stimuli because
their jobs involved rotatory spinning. The rotatory stimuli produce post-rotatory
nystagmus, or rapid involuntary movement of the eyes. The duration of the nystagmus
was reduced as the number of rotatory stimuli increased, demonstrating habituation to the
rotatory stimuli. Eight out of ten fighter pilots, two dancers and two figure skaters
showed no habituation when intoxicated. Similar results were replicated in cats (Berthoz
et al., 1977). Cats given repeated rotatory stimuli after an alcohol injection had less
habituation of nystagmus. This demonstrated that alcohol affects habituation in mammals
including humans and cats.
However, studies using different responses showed conflicting results. A study in
1973 described that frogs had less pronounced habituation if intoxicated (Ingle, 1973),
similar to the impaired habituation of nystagmus to rotatory stimuli found in humans and
cats (Aschan, 1967; Berthoz et al., 1977). However, a later study found that intoxicated
frogs had more pronounced habituation (Glanzman and Epperlein, 1981). These two
studies had contradictory results: one suggested that alcohol inhibited habituation but the
other suggested facilitation of habituation. Although both studies used frogs as the model,
30
they studied different stimuli and responses. The Ingle (1973) study measured the
habituation of a prey catching response to dummy preys. The Glanzman and Epperlein
(1981) study measured habituation of spinal cord dorsal to ventral root reflex responses to
electrical dorsal root stimulation. This suggests the effect of alcohol on habituation of one
response may not be generalized to another response.
Alcohol’s contradictory effects on habituation were not just found between
different stimuli. When the habituation of aggressive displays to conspecific male cichlid
fish was measured in terms of display frequency and duration, alcohol had opposite
effects (Peeke et al., 1975). Alcohol-exposed fish showed faster habituation of response
frequency but slower habituation of response duration. This shows that alcohol can have
opposite effects on different components of the same response.
These reports were published near the time when the notion of the biphasic action
of alcohol was first introduced (Pohorecky, 1978) and the issue was still under heated
debate. The biphasic action of alcohol came from the observation that alcohol’s effect on
a physiological, behavioural or biochemical measure can be inhibitory or stimulatory
dependent on the dose or the time of observation (Pohorecky, 1978), which disputed the
then popular “alcohol disinhibition” hypothesis (Ingle, 1973). As a result, the report by
Glanzman and Epperlein (1981), who supported the idea of biphasic effect, was under
scrutiny. Rinaldi et al. (1983) questioned the experimental procedure of the Glanzman
and Epperlein (1981) report because Rinaldi et al.’s study using the same dorsal to ventral
root reflex response model found habituation was, in contrast to Glanzman and Epperlein,
less pronounced if measured 40 min into exposure. Rinaldi et al. (1983) also found
habituation was more pronounced if measured 90 min into exposure, however, the
31
alcohol group also did not respond to a recovery stimulus, suggesting the stronger
decrement in responses was likely due to severe sedation. Therefore, Rinaldi et al. (1983)
concluded that alcohol in fact generally impaired habituation. Following these studies
only two more reports investigated habituation and acute alcohol exposure. Lister (1987)
showed that intoxicated mice had less habituation of exploration to a new holeboard than
control sober mice. (Dinges and Kribbs, 1990) suggested greater habituation of human
reaction time to audio stimuli when under the influence of alcohol.
Alcohol’s effects on habituation can also depend on the dose or exposure history
of the animal. For example, a lower alcohol dose facilitated and a higher dose inhibited
habituation of aggressive display probability in cichlid fish (Peeke et al., 1975). In
contrast, when the duration of the aggressive display was compared, the effect was
reversed: a higher alcohol concentration facilitated habituation but a lower concentration
inhibited habituation (Peeke et al., 1975). Furthermore, studies on the frog spinal cord
model also reported contradictory results for different exposure durations of the same
alcohol concentration (Glanzman and Epperlein, 1981; Rinaldi et al., 1983). Alcohol
exposure for 90 min facilitated habituation, while shorter exposure inhibited habituation
(Rinaldi et al., 1983). This phenomenon does not only occur in laboratory animals: in
humans, alcohol facilitated the habituation of somatic, autonomic and EEG response
magnitude and frequency to an auditory stimulus; however, the extent of the facilitation
was dependent on the amount and duration of alcohol consumption (Rogozea and Florea-
Ciocoiu, 1988). These data suggest that the effect of alcohol on habituation can be
dependent on dose and exposure history.
32
In fact, alcohol’s influence on behavior does not remain constant over time. For
instance, often the longer animals are exposed to alcohol, the less alcohol affects
behavior, a phenomenon known as acute tolerance (LeBlanc et al., 1975a; Radlow, 1994).
For example, worms can develop acute tolerance to alcohol within 30 min of exposure
(Davies et al., 2012; Mathies et al., 2015). This is demonstrated by the observation that
the inhibitory effect of alcohol on locomotor speed was significantly reduced within 30
min of exposure. These findings offer a reminder that behavioral assays conducted at
different times of exposure may very well produce different findings. Therefore, in any
experiment the temporal dynamics of alcohol’s influences on behavior should be taken
into consideration, especially when locomotion measures such as the probability, duration
and speed response to repeated stimuli are used.
Since the early work, very little has been done to investigate how alcohol affects
habituation. The discrepancies amongst previous research suggest that alcohol is not an
universal inhibitor or facilitator of habituation. Therefore, I hypothesized that alcohol
may have different effects on habituation depending on alcohol dose and the components
of responses. To investigate this, I used our well-characterized and high throughput
Multi-Worm Tracker (Swierczek et al., 2011) to carry out behavioral analyses of C.
elegans tap withdrawal response habituation in order to further our understanding in how
ethanol affects habituation,
2.2 MATERIALS AND METHODS
2.2.1 Worm Culture
C. elegans stocks were grown and maintained as per standard methods on NGM
(Nematode Growth Medium) plates, with the Escherichia coli OP50 strain as a food

33
source (Brenner, 1974). N2 Bristol was used as the reference wild-type strain. To obtain
age-synchronized colonies for testing, a 12.5µl of bleach reagent composed of 1:1
Bleach, 5% solution of sodium hypochlorite and 1M NaOH, as described in (Stiernagle,
2006), was pipetted onto a OP50 free area of a 5 cm NGM plate seeded with OP50. An
appropriate number (often 15) of gravid adult worms were placed in the bleach dot.
Bleach lysed the adults and the eggs in the gonads were released (Stiernagle, 2006). By
the time larvae hatched from the eggs, the bleach solution was absorbed by agar. After
hatching, larvae crawled towards the food, moving away from the bleach dot. The
resulting colony, using this synchronization method, was age matched with a range of
350 min or 5-6 hours (Altun and Hall, 2009). Age of worms was calculated as hours or
days from hatch time.
2.2.2 Adding ethanol to NGM plates
Ethanol-treatment plates were prepared as described in (Davies et al., 2003). Prior
to adding ethanol, NGM plates were seeded with E. coli; plates with the lids on were then
placed in a 25oC incubator in front of the incubator fan for 4 days to dry. Ethanol was
then infused into the dried agar by pipetting 4oC cold 100% onto NGM plates to the
desired concentrations. The volume of ethanol required to achieve the desired molar
concentration was calculated based on the weight of NGM agar in each plate according to
the following formula:
𝑉𝑜𝑙𝑢𝑚𝑒𝐸𝑡𝑂𝐻(µ𝑙) =𝑎𝑔𝑎𝑟𝑚𝑎𝑠𝑠 𝑔 ∗ 𝑑𝑒𝑠𝑖𝑟𝑒𝑑𝑒𝑡𝑜ℎ𝑐𝑜𝑛𝑐𝑒𝑛𝑡𝑟𝑎𝑡𝑖𝑜𝑛(𝑚𝑀)
17.12
where the 17.12 constant value was derived from the formula below, where agar
was assumed to have a density of 1:
34
17.12𝐿 ∙ 𝑚𝐿𝑚𝑜𝑙 ∙ 𝑔 =
46.07𝑒𝑡𝑜ℎ𝑀𝑊 𝑔𝑚𝑜𝑙
0.789𝑒𝑡𝑜ℎ𝑑𝑒𝑛𝑠𝑖𝑡𝑦 𝑔𝑚𝑙 ×1000 𝑚𝑙𝐿 ×1𝑎𝑔𝑎𝑟𝑑𝑒𝑛𝑠𝑖𝑡𝑦( 𝑔𝑚𝑙)
The calculated volume was then divided into two volumes. The first volume was
pipetted continuously onto the center of the plate (on the E. coli lawn), and the second
volume was pipetted drop by drop around the periphery of the plate (outside of the E. coli
lawn). Immediately following the addition of ethanol, plates were sealed by wrapping a
piece of 5cm x 10cm parafilm tightly around the side of the plate twice, taking care to
keep the plate parallel to the floor to avoid spilling ethanol. The sealed plate was
incubated at 20oC to dry for at least 2 hours or until the ethanol was absorbed and the
surface of the agar was visibly dry.
2.2.3 Transferring worms onto ethanol infused plates
To transfer worms to ethanol plates, 1 mL dH2O was pipetted onto a 5cm plate;
this liquid now containing the worms was subsequently transferred to a 1.5 mL
microcentrifuge tube and worms were allowed to sediment by gravity for about 30s. The
supernatant was removed and the worm pellet was transferred to an ethanol infused plate,
and sealed with parafilm.
2.2.4 Multi-Worm Tracker recording
Tracking was done using the Multi-Worm Tracker apparatus and program version
1.2.0.2 (Swierczek et al., 2011). Plates containing worms were placed onto the Multi-
Worm Tracker holder on a platform, and were visualized using a Falcon 4M30 camera
(Dalsa) and a 60mm f-number 4.0 Rodagon (Rodenstock) lens. The distance between
35
tracking platform and the camera was 40cm. Images was processed using a capture card
PCIe-1427 CameraLink (National Instruments). An elliptical region of interest excluding
the outer 5mm of the tracked plate was denoted on the Multi-Worm Tracker program.
2.2.5 Behavioral testing
2.2.5.1 Basal response to ethanol 0-60min after exposure
Age-synchronized colonies were grown at 20oC for 72 hours (3 days), 96 hours (4
days; worms are young adult at 3 days and full egg-laying adults at 4 and 5 days) or 108
hours (5 days) in 5cm NGM plates seeded with OP50. At the specified hour of age worms
were transferred onto ethanol-infused plates. Because the recording period was long,
plates were sealed water-tight using parafilm to limit ethanol evaporation (the seal was
tight enough to not let water into the plates if immersed in a water bath). Plates were
immediately placed on the Multi-Worm Tracker and recorded for 60min (delay between
initial exposure and beginning recording was less than 1min).
2.2.5.2 Responses to repeated taps and habituation
Age-synchronized colonies were grown at 20oC for 96 hours (4 days) in 5cm
NGM plates seeded with OP50. For habituation assays involving ethanol, 4 day old
worms were transferred onto an ethanol-infused plate for 30min before being placed onto
the Multi-Worm Tracker. Once a plate was placed on the Multi-Worm Tracker, the
recording started 100s before the first tap stimulus. This 100s pre-plate period was
included to allow worms to settle from the agitation caused by placing the plate on the
Multi-Worm Tracker. After the 100s pre-plate taps were produced by a solenoid tapper
36
that drives a plunger into the side of the plate at a 10s inter-stimulus-interval (ISI;
(Swierczek et al., 2011). After 30 taps at 10s ISI were delivered to the plate, worm
behavior was recorded for 10s more to capture the response to the last stimulus before the
plate was removed from the Multi-Worm Tracker.
Because characterizing the phenotypes produced by ethanol on habituation of
wild-type worms tap withdrawal was crucial to the subsequent genetic analyses, stringent
criteria were used to include only plates with correct experimental procedures and
reliable ethanol exposure effects. Experiments included had to satisfy two criteria. First,
because a low number of tracked-worms results in unreliable response probability
calculations plates were required to contain a mean of >20 worms that were tracked for
the period between 100-395s. Second, body curve was validated through blinded visual
inspection of every plate (data not shown) as the most reliable measure of the
effectiveness of ethanol treatment. To be included in the analysis the 400mM treatment
must have resulted in a mean body curve smaller than 23.51, which was the minimum
mean curvature detected from all 0mM plates (see Figure 2-3). Using these criteria, the
final sample included 77 experiments containing 230 control plates of 0mM ethanol
exposure and 207 plates of 400mM ethanol exposure.
2.2.5.3 Recovery from habituation
Spontaneous recovery from habituation training was tested by giving a tap 5 min
after the 30th tap (last tap) at 10s or 60s ISI, and behaviour continued to be recorded for
10s after the tap before the plate was removed from the Multi-Worm Tracker. The %
recovery was calculated as the percent change in response measure between the mean of
last 3 taps of the habituation series and the 5 min recovery tap.
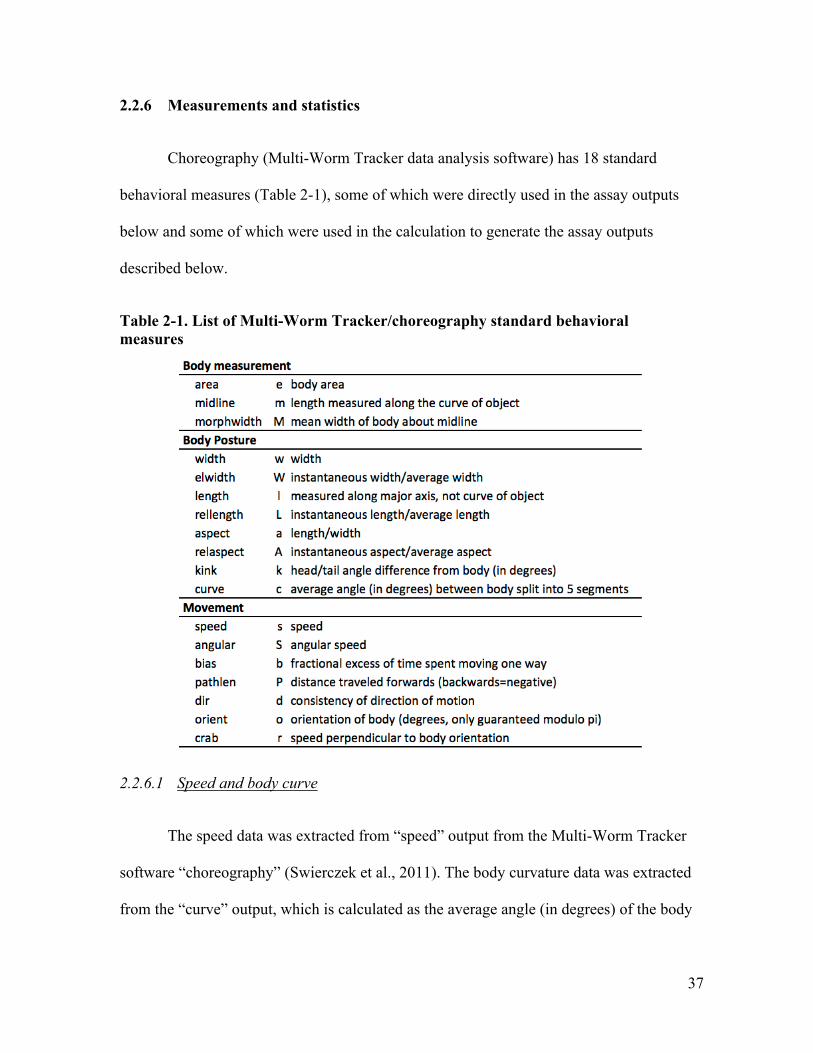
37
2.2.6 Measurements and statistics
Choreography (Multi-Worm Tracker data analysis software) has 18 standard
behavioral measures (Table 2-1), some of which were directly used in the assay outputs
below and some of which were used in the calculation to generate the assay outputs
described below.
Table 2-1. List of Multi-Worm Tracker/choreography standard behavioral measures
2.2.6.1 Speed and body curve
The speed data was extracted from “speed” output from the Multi-Worm Tracker
software “choreography” (Swierczek et al., 2011). The body curvature data was extracted
from the “curve” output, which is calculated as the average angle (in degrees) of the body
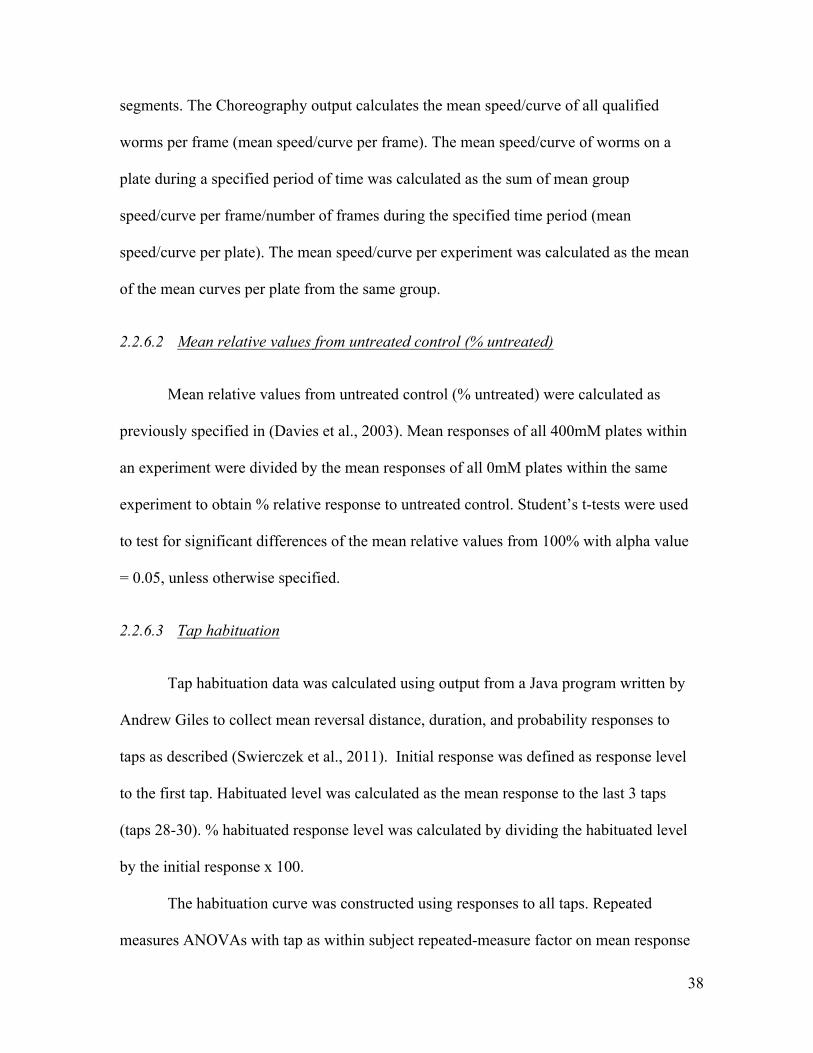
38
segments. The Choreography output calculates the mean speed/curve of all qualified
worms per frame (mean speed/curve per frame). The mean speed/curve of worms on a
plate during a specified period of time was calculated as the sum of mean group
speed/curve per frame/number of frames during the specified time period (mean
speed/curve per plate). The mean speed/curve per experiment was calculated as the mean
of the mean curves per plate from the same group.
2.2.6.2 Mean relative values from untreated control (% untreated)
Mean relative values from untreated control (% untreated) were calculated as
previously specified in (Davies et al., 2003). Mean responses of all 400mM plates within
an experiment were divided by the mean responses of all 0mM plates within the same
experiment to obtain % relative response to untreated control. Student’s t-tests were used
to test for significant differences of the mean relative values from 100% with alpha value
= 0.05, unless otherwise specified.
2.2.6.3 Tap habituation
Tap habituation data was calculated using output from a Java program written by
Andrew Giles to collect mean reversal distance, duration, and probability responses to
taps as described (Swierczek et al., 2011). Initial response was defined as response level
to the first tap. Habituated level was calculated as the mean response to the last 3 taps
(taps 28-30). % habituated response level was calculated by dividing the habituated level
by the initial response x 100.
The habituation curve was constructed using responses to all taps. Repeated
measures ANOVAs with tap as within subject repeated-measure factor on mean response
39
per plate were used to evaluate the effect of dependent variables on tap habituation using
Matlab® R2016a fitrm function. If more than one dependent variable (i.e. strain and
dose) was evaluated, then the main effects and the interactions between variables were
evaluated. Tukey-Kramer posthoc tests were used to compare habituation curves between
groups and to compare responses to individual taps between groups. Each sample (a
plate) represents the mean value from a plate of ~20-80 worms, unless otherwise
specified. Habituation was defined as a significant decrease in response level to the 30th
tap compared to the initial response level, evaluated by Tukey-Kramer posthoc tests
between the 1st and 30th responses.
2.2.6.4 Response types
Initial categories of responses were pause, reversal, accelerate-forward, accelerate
reverse, decelerate forward, decelerate reverse, and no response after a tap. The
categories were defined by comparing a worm’s velocity after a tap with its own baseline
velocity and baseline movement direction. Velocity was defined as speed x bias. Bias
indicates average movement direction within a given time frame, where a positive value
indicates forward movement, a negative value indicates reverse movement direction, a
zero indicates no direction (pause) or the worm moves equally forward and reverses
during a given time frame, and no data indicates the Multi-Worm Tracker failed to
determine the direction of a worm. The baseline velocity of a worm was defined as the
range of velocity between -0.3 to -0.1s before the tap because responses to the first tap
could take longer than 0.5s to finish, thus baseline velocity was taken 0.7s after the
previous tap (or 0.3s before the next tap). Three velocity data points were taken from 0.1-
0.3s before the tap at the 0.1s interval. The maximum and minimum velocity and the
40
direction of movement 0.1s before a tap were used to compare to velocities after a tap as
described in Table 2-2.
Table 2-2. Response type criteria
The acceleration forward response probability was calculated as the number of
worms within a plate that accelerated forward to a tap divided by the total number of
worms that responded to the tap (excluding no response or worms with missing data) for
every 0.1s from 0.1-0.5s after a tap. Plates containing fewer than 10 worms responding to
any tap were excluded from the calculation. Mean acceleration response probability was
calculated as the mean of probability for each plate within a given experimental group.
Standard error was calculated as standard deviation divided by square root of the number
of plates minus 1.
Multifactorial repeated measures ANOVAs were used to determine significant
effects of time, dose and on acceleration response probability. Tukey’s posthoc was used
to compare probabilities of each given time point between groups.
2.3 RESULTS
2.3.1 Ethanol’s effects on unstimulated behavior
To further our understanding in how ethanol affects habituation, I used our well-
characterized and high throughput Multi-Worm Tracker to carry out behavioral analyses
of C. elegans tap withdrawal response habituation (Swierczek et al., 2011). I began by
Responsetypes baselinemovementdirection responsevelocityaccelerate forward >baselinemaximumreversals pauseorforward <0noresponse forwardorreverse withinbaselinerangepause forwardorreverse 0

41
establishing a duration of exposure that produced stable behavioural effects that would
then be used as the exposure protocol in the rest of the experiments. To do this, I first
examined the effect of exposure dose, exposure age, and the presence/absence of food on
unstimulated behavior.
2.3.1.1 Temporal response to 60 min ethanol exposure of 3, 4 and 5 day old worms
In C. elegans, at 20 degrees Celsius, worms become sexually mature at 2.5 days
of age and so at 3 days of age are early adult and 4 and 5 day old worms are middle aged
egg-laying adults. Ages older than 5 day old were not examined because worms begin to
show some effects of senescence around 6 or 7 days of age. To characterize the temporal
effects of ethanol exposure on worms of different ages, the curve and speed of 3, 4, or 5
day old wild-type worms from the onset of exposure to 200mM or 400mM ethanol
(200mM data was not collected for 5 day old worms) were analyzed.
2.3.1.1.1 Effects of 60 min exposure to ethanol on body curve
Ethanol decreased the depth of the worm’s body curve over 60 min of ethanol
exposure (Figure 2-1). Regardless of age, worm body curves were progressively
depressed by both 200mM and 400mM ethanol. Although 200mM ethanol appeared to
produce less of an effect than 400mM ethanol, the difference was not statistically
significant.
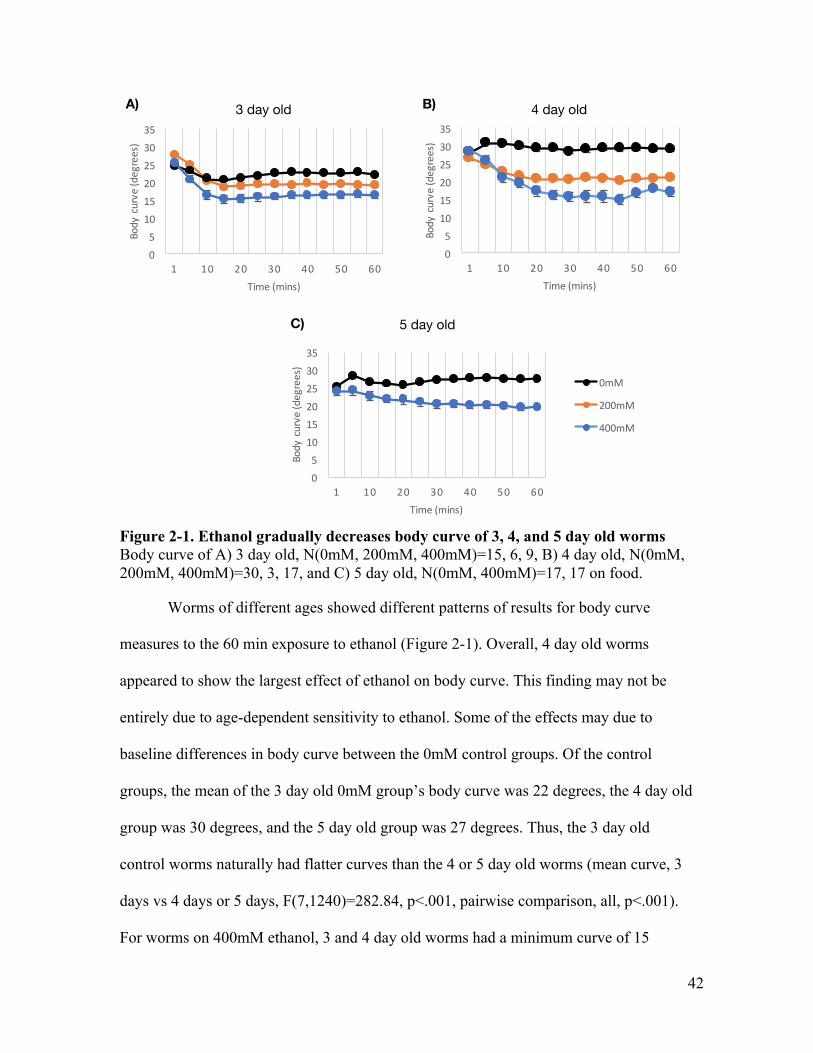
42
Figure 2-1. Ethanol gradually decreases body curve of 3, 4, and 5 day old worms Body curve of A) 3 day old, N(0mM, 200mM, 400mM)=15, 6, 9, B) 4 day old, N(0mM, 200mM, 400mM)=30, 3, 17, and C) 5 day old, N(0mM, 400mM)=17, 17 on food.
Worms of different ages showed different patterns of results for body curve
measures to the 60 min exposure to ethanol (Figure 2-1). Overall, 4 day old worms
appeared to show the largest effect of ethanol on body curve. This finding may not be
entirely due to age-dependent sensitivity to ethanol. Some of the effects may due to
baseline differences in body curve between the 0mM control groups. Of the control
groups, the mean of the 3 day old 0mM group’s body curve was 22 degrees, the 4 day old
group was 30 degrees, and the 5 day old group was 27 degrees. Thus, the 3 day old
control worms naturally had flatter curves than the 4 or 5 day old worms (mean curve, 3
days vs 4 days or 5 days, F(7,1240)=282.84, p<.001, pairwise comparison, all, p<.001).
For worms on 400mM ethanol, 3 and 4 day old worms had a minimum curve of 15
05101520253035
1 10 20 30 40 50 60
Bodycurve(degrees)
Time(mins)
4DAY OLDS
0mM4d
200mM4d
400mM4d
05101520253035
1 10 20 30 40 50 60
Bodycurve(degrees)
Time(mins)
3DAY OLDS
200mM3d
0mM3d
400mM3d
05101520253035
1 10 20 30 40 50 60
Bodycurve(degrees)
Time(mins)
4DAY OLDS
0mM4d
200mM4d
400mM4d
05101520253035
1 10 20 30 40 50 60
Bodycurve(degrees)
Time(mins)
5DAY OLDS
0mM5d
400mM5d
A) B)
C)
3 day old 4 day old
5 day old
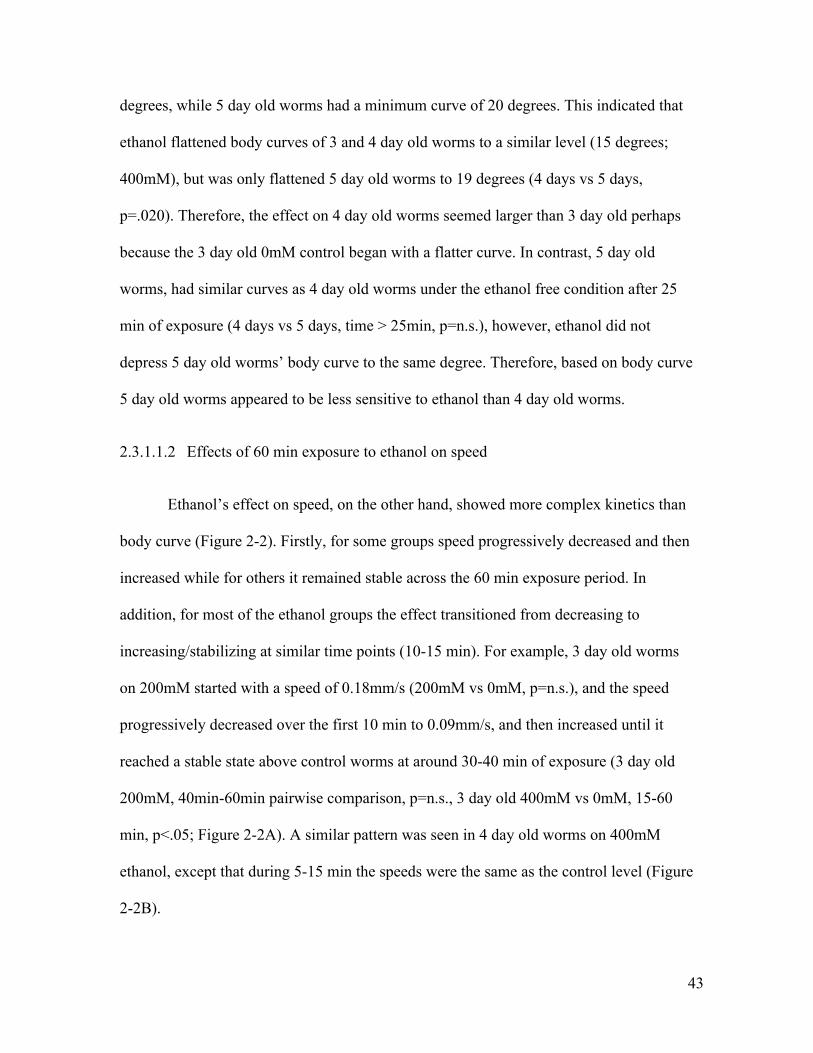
43
degrees, while 5 day old worms had a minimum curve of 20 degrees. This indicated that
ethanol flattened body curves of 3 and 4 day old worms to a similar level (15 degrees;
400mM), but was only flattened 5 day old worms to 19 degrees (4 days vs 5 days,
p=.020). Therefore, the effect on 4 day old worms seemed larger than 3 day old perhaps
because the 3 day old 0mM control began with a flatter curve. In contrast, 5 day old
worms, had similar curves as 4 day old worms under the ethanol free condition after 25
min of exposure (4 days vs 5 days, time > 25min, p=n.s.), however, ethanol did not
depress 5 day old worms’ body curve to the same degree. Therefore, based on body curve
5 day old worms appeared to be less sensitive to ethanol than 4 day old worms.
2.3.1.1.2 Effects of 60 min exposure to ethanol on speed
Ethanol’s effect on speed, on the other hand, showed more complex kinetics than
body curve (Figure 2-2). Firstly, for some groups speed progressively decreased and then
increased while for others it remained stable across the 60 min exposure period. In
addition, for most of the ethanol groups the effect transitioned from decreasing to
increasing/stabilizing at similar time points (10-15 min). For example, 3 day old worms
on 200mM started with a speed of 0.18mm/s (200mM vs 0mM, p=n.s.), and the speed
progressively decreased over the first 10 min to 0.09mm/s, and then increased until it
reached a stable state above control worms at around 30-40 min of exposure (3 day old
200mM, 40min-60min pairwise comparison, p=n.s., 3 day old 400mM vs 0mM, 15-60
min, p<.05; Figure 2-2A). A similar pattern was seen in 4 day old worms on 400mM
ethanol, except that during 5-15 min the speeds were the same as the control level (Figure
2-2B).
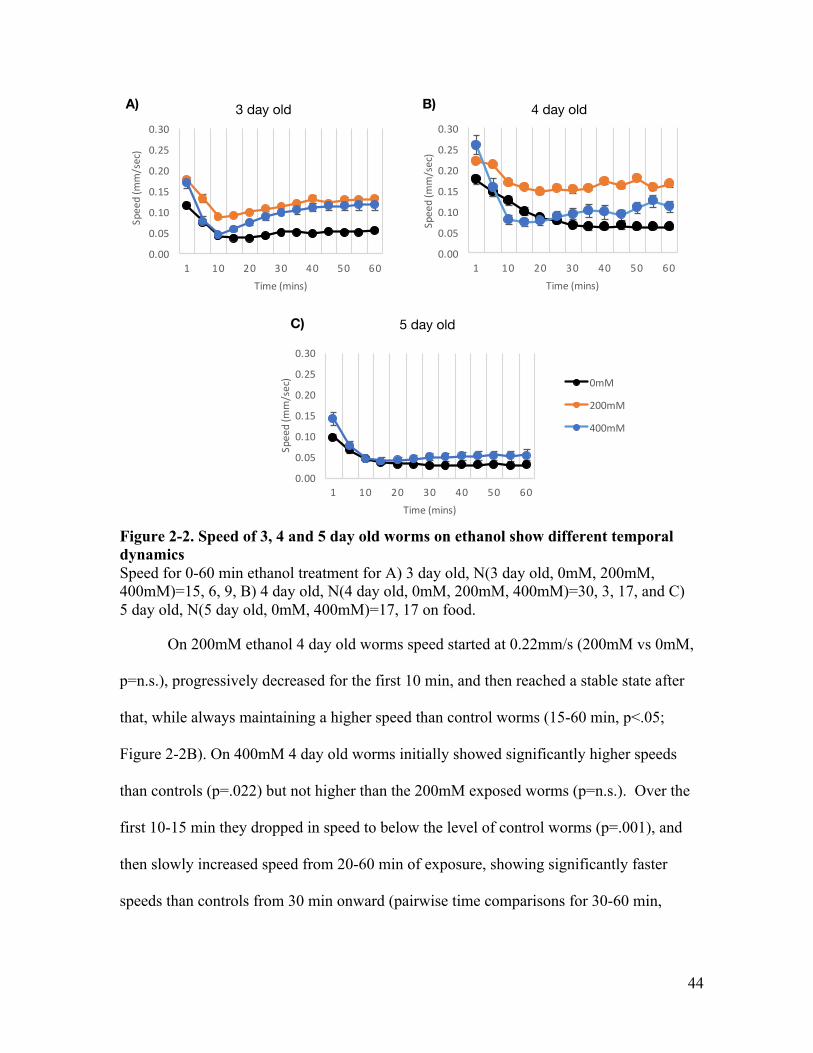
44
Figure 2-2. Speed of 3, 4 and 5 day old worms on ethanol show different temporal dynamics Speed for 0-60 min ethanol treatment for A) 3 day old, N(3 day old, 0mM, 200mM, 400mM)=15, 6, 9, B) 4 day old, N(4 day old, 0mM, 200mM, 400mM)=30, 3, 17, and C) 5 day old, N(5 day old, 0mM, 400mM)=17, 17 on food.
On 200mM ethanol 4 day old worms speed started at 0.22mm/s (200mM vs 0mM,
p=n.s.), progressively decreased for the first 10 min, and then reached a stable state after
that, while always maintaining a higher speed than control worms (15-60 min, p<.05;
Figure 2-2B). On 400mM 4 day old worms initially showed significantly higher speeds
than controls (p=.022) but not higher than the 200mM exposed worms (p=n.s.). Over the
first 10-15 min they dropped in speed to below the level of control worms (p=.001), and
then slowly increased speed from 20-60 min of exposure, showing significantly faster
speeds than controls from 30 min onward (pairwise time comparisons for 30-60 min,
0.00
0.05
0.10
0.15
0.20
0.25
0.30
1 10 20 30 40 50 60
Speed(m
m/sec)
Time(mins)
3DO
200mM3d
0mM3d
400mM3d
0.00
0.05
0.10
0.15
0.20
0.25
0.30
1 10 20 30 40 50 60
Speed(m
m/sec)
Time(mins)
4DO
0mM4d
200mM4d
400mM4d
0.00
0.05
0.10
0.15
0.20
0.25
0.30
1 10 20 30 40 50 60
Speed(m
m/sec)
Time(mins)
5DO
0mM5d
400mM5d05101520253035
1 10 20 30 40 50 60
Bodycurve(degrees)
Time(mins)
4DAY OLDS
0mM4d
200mM4d
400mM4d
A) B)
C)
3 day old 4 day old
5 day old

45
p<.05). The change in speed stabilized between 30-50 min, and increased again at 50 min
(30 min vs 50-55min, p<.05).
Five day worms were only tested on 400mM; for them speed started similar as the
0mM control (p=n.s.; Figure 2-2C), progressively decreased for the first 10 min until it
matched control worms, and then remained at a stable state slightly higher than controls
after that (pairwise comparison, time 10-60 min, p=n.s.).
Interestingly, speed of the 4 day old worms on 400mM appeared to show a
“biphasic action” of ethanol, a phenomenon in which ethanol can have both stimulatory
and inhibitory effects dependent on the dose or the time of observation on a biological
measure (Pohorecky, 1978). Compared to the 0mM group, initially the 4 day old 400mM
group had faster speeds (p=.022; Figure 2-2B). However, 10 min into the exposure, the
speed of the 4 day old 400mM group became slower than the 0mM control group
(p=.021). By 30min into the exposure 4 day old worms on 400mM recovered to faster
speed compared to the 0mM control (p=.021). Qualitatively speaking, 4 day old worms
on ethanol initially were “excited”, then become “sedated”, and finally recovered to an
“excited” state. This observation is not unexpected because biphasic actions of ethanol
have been well documented in human, mammals, and even at the molecular level
(Pohorecky, 1978; Martin et al., 1993; Moghaddam and Bolinao, 1994). Molecularly,
depending on the duration of the exposure, glutamate levels in rat hippocampus were
higher or lower than the control level (Moghaddam and Bolinao, 1994). The first C.
elegans ethanol paper indicated that worm locomotion first became “excited” before
becoming sedated (Morgan and Sedensky, 1995). Other C. elegans studies also showed
that the speed of worms 30 min into 400mM ethanol exposure was higher than speed 10
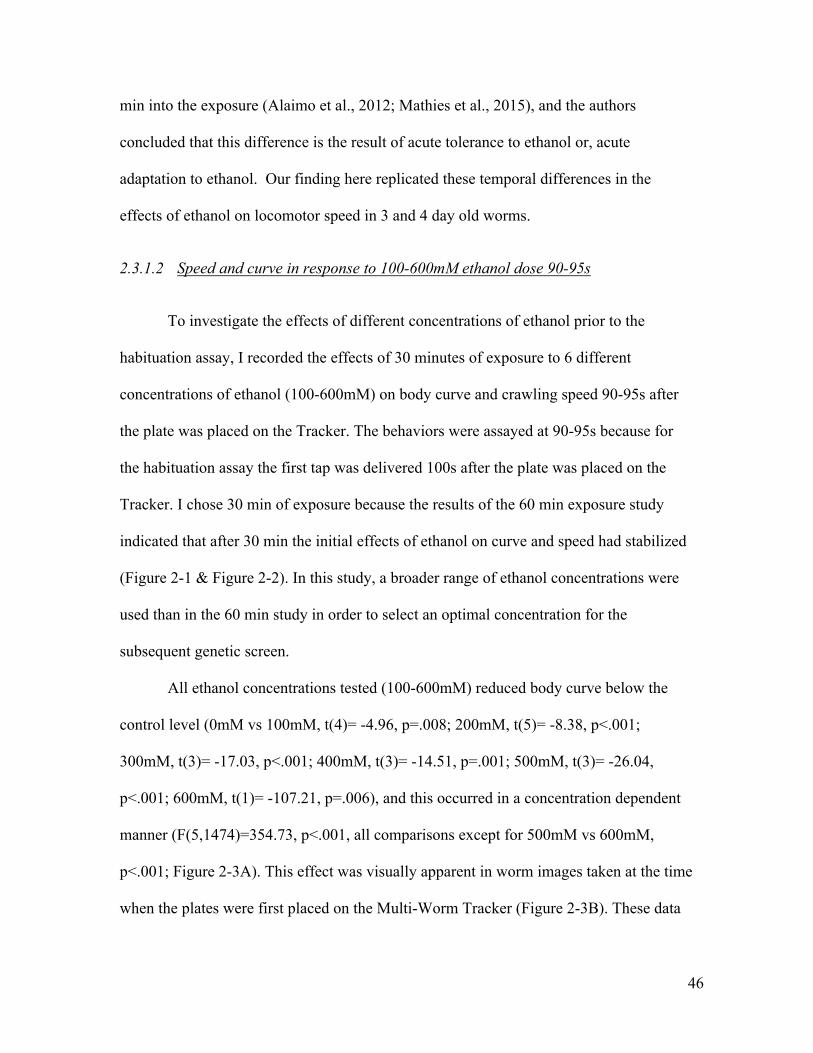
46
min into the exposure (Alaimo et al., 2012; Mathies et al., 2015), and the authors
concluded that this difference is the result of acute tolerance to ethanol or, acute
adaptation to ethanol. Our finding here replicated these temporal differences in the
effects of ethanol on locomotor speed in 3 and 4 day old worms.
2.3.1.2 Speed and curve in response to 100-600mM ethanol dose 90-95s
To investigate the effects of different concentrations of ethanol prior to the
habituation assay, I recorded the effects of 30 minutes of exposure to 6 different
concentrations of ethanol (100-600mM) on body curve and crawling speed 90-95s after
the plate was placed on the Tracker. The behaviors were assayed at 90-95s because for
the habituation assay the first tap was delivered 100s after the plate was placed on the
Tracker. I chose 30 min of exposure because the results of the 60 min exposure study
indicated that after 30 min the initial effects of ethanol on curve and speed had stabilized
(Figure 2-1 & Figure 2-2). In this study, a broader range of ethanol concentrations were
used than in the 60 min study in order to select an optimal concentration for the
subsequent genetic screen.
All ethanol concentrations tested (100-600mM) reduced body curve below the
control level (0mM vs 100mM, t(4)= -4.96, p=.008; 200mM, t(5)= -8.38, p<.001;
300mM, t(3)= -17.03, p<.001; 400mM, t(3)= -14.51, p=.001; 500mM, t(3)= -26.04,
p<.001; 600mM, t(1)= -107.21, p=.006), and this occurred in a concentration dependent
manner (F(5,1474)=354.73, p<.001, all comparisons except for 500mM vs 600mM,
p<.001; Figure 2-3A). This effect was visually apparent in worm images taken at the time
when the plates were first placed on the Multi-Worm Tracker (Figure 2-3B). These data
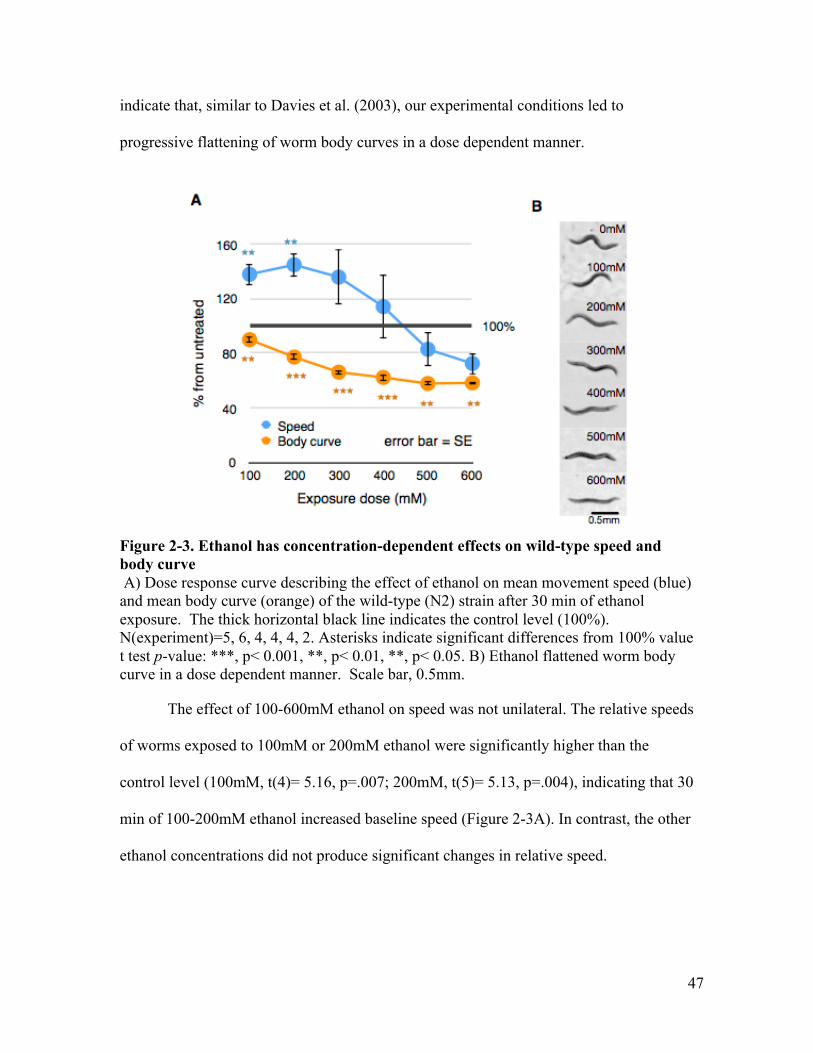
47
indicate that, similar to Davies et al. (2003), our experimental conditions led to
progressive flattening of worm body curves in a dose dependent manner.
Figure 2-3. Ethanol has concentration-dependent effects on wild-type speed and body curve A) Dose response curve describing the effect of ethanol on mean movement speed (blue) and mean body curve (orange) of the wild-type (N2) strain after 30 min of ethanol exposure. The thick horizontal black line indicates the control level (100%). N(experiment)=5, 6, 4, 4, 4, 2. Asterisks indicate significant differences from 100% value t test p-value: ***, p< 0.001, **, p< 0.01, **, p< 0.05. B) Ethanol flattened worm body curve in a dose dependent manner. Scale bar, 0.5mm.
The effect of 100-600mM ethanol on speed was not unilateral. The relative speeds
of worms exposed to 100mM or 200mM ethanol were significantly higher than the
control level (100mM, t(4)= 5.16, p=.007; 200mM, t(5)= 5.13, p=.004), indicating that 30
min of 100-200mM ethanol increased baseline speed (Figure 2-3A). In contrast, the other
ethanol concentrations did not produce significant changes in relative speed.

48
2.3.1.3 Speed and curve in the presence or absence of food
The presence or absence of food (the bacteria E. coli) is known to have a large
influence on worm behavior. To see if the presence or absence of food altered worm
behavior on ethanol, worm speed and body curve were measured after worms were
exposed to 0mM or 400mM ethanol for 30 min in the presence or absence of food.
Figure 2-4. Speeds of wild-type worms on ethanol fail to increase in the absence of food Speed of wild-type worms on 0mM or 400mM ethanol in the presence (+) or absence (-) of food. N(plates)=8,8,6,9. ***, p<.001.
An ANOVA evaluating the effects of ethanol and food on crawling speed reveled
significant effects of ethanol, F(1,27)=20.28, p<.001, food, F(1,27)=8.04, p=.009, and an
interaction between ethanol and food, F(1,27)=11.18, p=.002 (Figure 2-4). Worms in the
absence of food crawled faster than worms in the presence of food (0mM+Food vs 0mM-
Food, p<.001). As expected, in the presence of food, worms on or off ethanol crawled at
similar speeds. However, a comparison of groups in the absence of food showed that
worms on ethanol moved more slowly than worms on ethanol-free plates (0mM-Food vs
400mM-Food, p<.001). The speed of worms on ethanol in the absence of food was
approximately 40% the speed of worms on ethanol-free plate in the absence of food. In
0.00
0.05
0.10
0.15
0.20
0.25
0.30
0mM+Food
0mM-Food
400mM+Food
400mM-Food
Speed(m
m/sec)
0mM
Food
400mM+ - + -
*********

49
fact, among the 4 conditions, worms in the no food and no ethanol condition moved faster
than the other three groups (all pairwise comparisons, p<.001). This food effect was
particularly astonishing when individual worm speeds were visualized in raster plots
(Figure 2-5). In the raster plots, the horizontal lines represent an individual worm’s speed
for 85-95s after being placed onto the Tracker. The hotter the color, the faster the forward
speed. The colder the color, the faster the reversal speed. Yellow represents the worms
that were “pausing” or “remaining still”. Worms in the no food and no ethanol condition
mostly moved forward at fast speed and rarely reversed. In contrast, worms on food or on
ethanol mostly stayed still or moved forward at a slower speed, punctuated by short
reversals. Compared with worms in the no food, no ethanol condition, the other three
groups moved at much slower speeds.
Figure 2-5. Visualization of speeds of individual wild-type worms confirm that worms on ethanol fail to increase in speed in response to the absence of food Speeds of locomotor movement of individual worms on 0mM or 400mM ethanol in the presence or absence of food 90-95s after placement on the Multi-Worm Tracker. Within each box, the speeds of individual worms (y-axis) across time (x-axis) are represented by color. The hotter the color, the faster the forward movement (orange to red); the colder the color, the faster the reversal movement (light to dark blue); and pauses are represented by bright yellow. N(worms)=194,208,134,142.
Interestingly, the effects of ethanol on body curve were not dependent on food.
An ANOVA evaluating the effects of ethanol and food reveled a significant effect of
Indi
vidu
alw
orm
s
0mM 400mMfood
5 10 15 20 25 30 35 40 45 50
20
40
60
80
100
120
no food
5 10 15 20 25 30 35 40 45 50
20
40
60
80
100
120
140
food
5 10 15 20 25 30 35 40 45 50
20
40
60
80
100
120
140
160
180
no food
5 10 15 20 25 30 35 40 45 50
20
40
60
80
100
120
140
160
180
200
pause
reversal
forwardSpeed
Time (sec)90s 95s
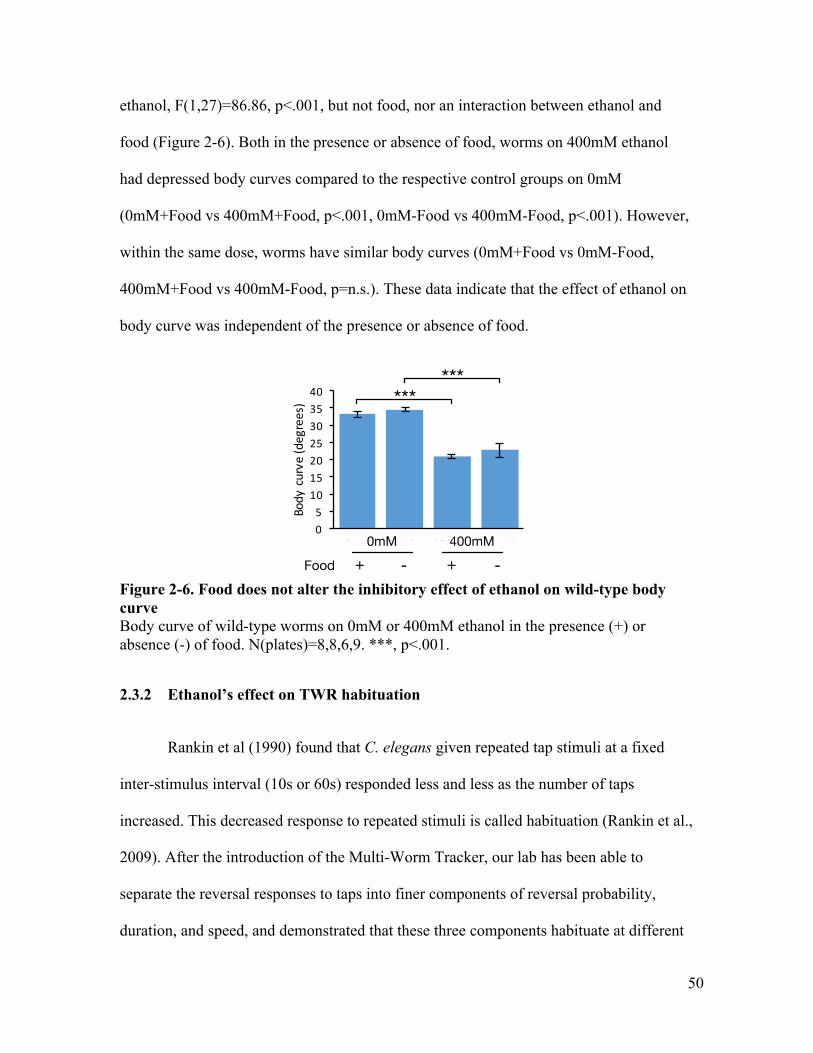
50
ethanol, F(1,27)=86.86, p<.001, but not food, nor an interaction between ethanol and
food (Figure 2-6). Both in the presence or absence of food, worms on 400mM ethanol
had depressed body curves compared to the respective control groups on 0mM
(0mM+Food vs 400mM+Food, p<.001, 0mM-Food vs 400mM-Food, p<.001). However,
within the same dose, worms have similar body curves (0mM+Food vs 0mM-Food,
400mM+Food vs 400mM-Food, p=n.s.). These data indicate that the effect of ethanol on
body curve was independent of the presence or absence of food.
Figure 2-6. Food does not alter the inhibitory effect of ethanol on wild-type body curve Body curve of wild-type worms on 0mM or 400mM ethanol in the presence (+) or absence (-) of food. N(plates)=8,8,6,9. ***, p<.001.
2.3.2 Ethanol’s effect on TWR habituation
Rankin et al (1990) found that C. elegans given repeated tap stimuli at a fixed
inter-stimulus interval (10s or 60s) responded less and less as the number of taps
increased. This decreased response to repeated stimuli is called habituation (Rankin et al.,
2009). After the introduction of the Multi-Worm Tracker, our lab has been able to
separate the reversal responses to taps into finer components of reversal probability,
duration, and speed, and demonstrated that these three components habituate at different
0510152025303540
0mM+Food
0mM-Food
400mM+Food
400mM-Food
Bodycurve(degrees)
0mM
Food
400mM+ - + -
******

51
rates and to different depths (Giles, 2012). To understand how ethanol affects habituation
in wild-type animals, we characterized final level of habituation of reversal probability,
duration and speed to tap stimuli delivered at 10sISI.
2.3.2.1 Effect of different doses of ethanol on habituation at a 10sISI
The first question I asked was whether different doses of ethanol dose
differentially affected habituation to taps given at 10sISI using the Multi-Worm Tracker.
To do this, worms were moved onto agar plates containing 100mM, 200mM, 300mM,
400mM, 500mM, or 600mM ethanol concentrations for 30 min before being placed onto
the Multi-Worm Tracker for behavioral testing. After a plate was placed onto the Tracker,
a 100s resting period was given before the first tap was delivered. A total of 30 taps were
given at 10sISI, and the reversal probability, duration and speed were analyzed.

52
Figure 2-7. Effects of ethanol on responses to repeated taps depend on ethanol concentrations ranging from 100-600mM) Reversal response probability (A) duration (B) and speed (C) to the first tap stimulus on 100, 200, 300, 400, 500 and 600mM ethanol. Habituation curve (D-F) for reversal probability (D), duration (E), and speed (F) in response to 30 tap stimuli given at 10s inter-stimulus-interval (ISI). Habituation levels (mean of responses to the last 3 taps) for reversal probability (G), duration (H), and speed (I). Comparison to 0mM control: *, p<.05. **, p<.01. ***, p<.001. N(plate) = 16, 15, 20, 15, 15, 16, 8
2.3.2.1.1 Initial response
Because different ethanol doses affect basal locomotor activity differently (Figure
2-3A), it is likely that different ethanol doses will also affect responses to tap stimuli
differently. To see this, reversal response probability, duration and speed to the first tap
53
(initial response) were compared between worms exposed to different doses (Figure
2-7A-C). For response probability, an ethanol dose of 300mM or more depressed the
initial response probability (F(6,98)=9.73, p<.001, 0mM vs. 300mM, p=.002, 0mM vs
400mM-600mM, p<.001). Although the effects of ethanol on initial response probability
appeared to show a dose-dependent decrease, the reversal probability levels of 300-
600mM group were not statistically different (all comparisons, p=n.s.). All ethanol doses
depressed the initial response durations (F(6,98)=22.46, p<.001, 0mM vs 100-600mM,
p<.001); again, the effect appeared to be dose-dependent, but only the response of the
600mM group was significantly different than the 100mM group (0mM vs 600mM curve,
p=.003). Interestingly, the direction of the effect on initial response speed was opposite to
that of reversal probability and duration: ethanol doses 100-400mM or higher
significantly increased the initial response speed compared to controls (F(6,97)=7.18,
p<.001, 0mM vs. 100mM, p=.003, 200mM, p<.001, 300mM, p=.036, 400mM, p=.002).
In addition, doses higher than 500mM produced similar response speed as the unexposed
controls. These data suggest that ethanol’s effect on initial response levels is different
depending on the component of the reversal response being studied. Overall, ethanol
depressed initial reversal probability and duration responses to tap at a dose higher than
300mM or 100mM dose, respectively. At the same time, ethanol doses between 100-
400mM increased initial reversal response speed.
2.3.2.1.2 Habituation curves
The kinetics of the habituation curves represent how fast and how much a
response decrements in response to repeated stimuli. Our lab’s unpublished data indicate
that different components of the reversal response habituate with different kinetics (Giles,
54
2012). For example, reversal probability habituates faster and deeper than reversal
duration to taps given at 10sISI, however reversal speed barely habituates. If ethanol
affects initial response probability, duration, and speed differently, its effects could also
differ for habituation of different components of the reversal response. The data showed
that indeed was the case. For reversal probability, worms given 100m-200mM ethanol
had similar habituation curves compared to the 0mM control, but those given 300-
600mM had habituation curves significantly lower than control (F(174,2842)=1.38,
p<.001, 0mM vs 300-600mM, p<.001), indicating doses higher than 300mM altered
habituation of reversal probability (Figure 2-7D). For reversal duration, worms given
more than 200mM ethanol had significantly lower habituation curves compared to the
0mM control (F(174,2842)=1.51, p<.001, 0mM vs 200-600mM, p<.001), indicating
doses higher than 200mM altered habituation of reversal duration (Figure 2-7E). In
contrast to the reversal probability and duration results, although pair-wise comparison
showed that worms given 100mM-300mM ethanol had higher habituation curves for
reversal speed compared to the 0mM control (0mM vs 100-200mM, p<.001, 300mM,
p=.003), but because an ANOVA did not reveal a significant effect of ethanol doses on
habituation curves for reversal speed (F(174,2842)=.86, p=n.s.) the results indicated that
100-600mM ethanol did not have significant effect on habituation curves for reversal
speed (Figure 2-7F). These results showed that the effects of ethanol on habituation
depends on dose and the specific component of the responses.
2.3.2.1.3 Habituated level
The final habituated levels, represented by the mean of the last 3 responses for
each group, were compared to determine whether different ethanol doses had different
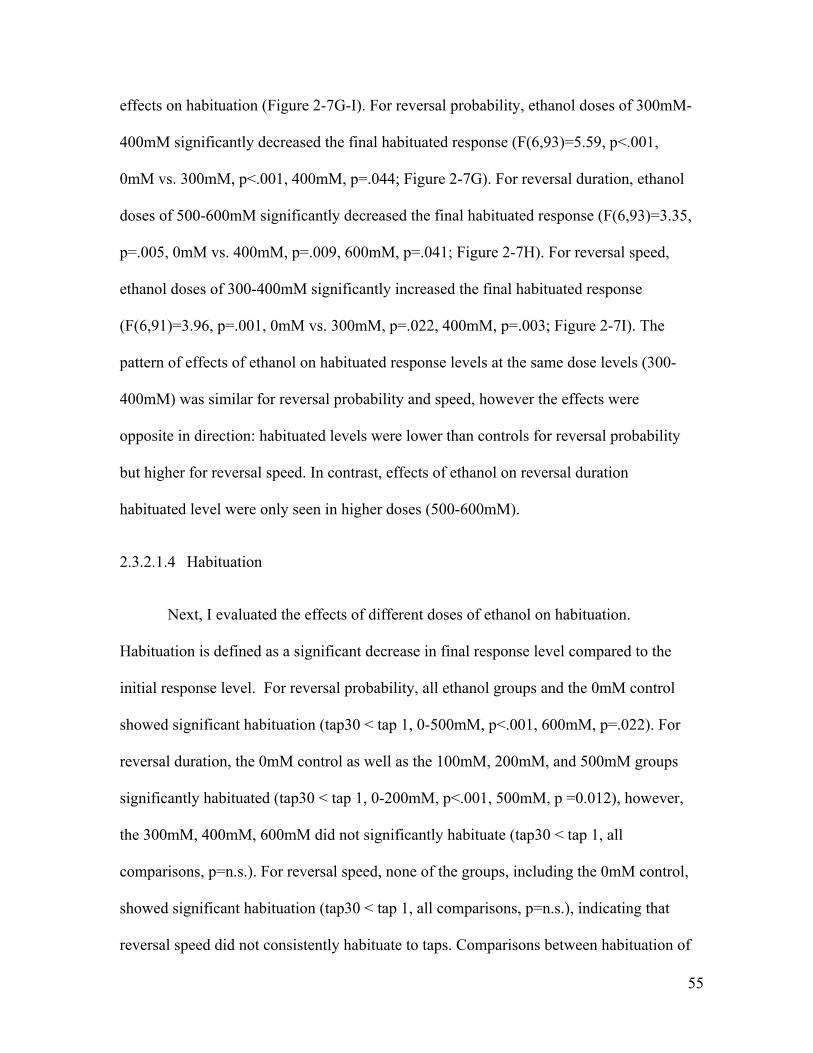
55
effects on habituation (Figure 2-7G-I). For reversal probability, ethanol doses of 300mM-
400mM significantly decreased the final habituated response (F(6,93)=5.59, p<.001,
0mM vs. 300mM, p<.001, 400mM, p=.044; Figure 2-7G). For reversal duration, ethanol
doses of 500-600mM significantly decreased the final habituated response (F(6,93)=3.35,
p=.005, 0mM vs. 400mM, p=.009, 600mM, p=.041; Figure 2-7H). For reversal speed,
ethanol doses of 300-400mM significantly increased the final habituated response
(F(6,91)=3.96, p=.001, 0mM vs. 300mM, p=.022, 400mM, p=.003; Figure 2-7I). The
pattern of effects of ethanol on habituated response levels at the same dose levels (300-
400mM) was similar for reversal probability and speed, however the effects were
opposite in direction: habituated levels were lower than controls for reversal probability
but higher for reversal speed. In contrast, effects of ethanol on reversal duration
habituated level were only seen in higher doses (500-600mM).
2.3.2.1.4 Habituation
Next, I evaluated the effects of different doses of ethanol on habituation.
Habituation is defined as a significant decrease in final response level compared to the
initial response level. For reversal probability, all ethanol groups and the 0mM control
showed significant habituation (tap30 < tap 1, 0-500mM, p<.001, 600mM, p=.022). For
reversal duration, the 0mM control as well as the 100mM, 200mM, and 500mM groups
significantly habituated (tap30 < tap 1, 0-200mM, p<.001, 500mM, p =0.012), however,
the 300mM, 400mM, 600mM did not significantly habituate (tap30 < tap 1, all
comparisons, p=n.s.). For reversal speed, none of the groups, including the 0mM control,
showed significant habituation (tap30 < tap 1, all comparisons, p=n.s.), indicating that
reversal speed did not consistently habituate to taps. Comparisons between habituation of
56
all groups for all three response components showed no significant differences, indicating
different ethanol doses did not drastically alter the extent of habituation.
Together, these data showed that ethanol can have different effects on different
aspects of the same behavior. For initial responses, higher doses of ethanol (>300mM)
depressed reversal probability, lower doses of ethanol (<400mM) increased reversal
speed, and all doses shortened reversal duration. This has some similarities with the
observations from cichlid fish studies showing that ethanol facilitated habituation of the
aggressive display probability but inhibited habituation of the aggressive display duration
(Peeke et al., 1975). In our study, we found ethanol facilitated the habituation of reversal
probability (steeper curve), but inhibited the habituation of reversal duration (flatter
curve), and might enhance the reversal speed overall (faster mean response to all taps).
These data indicate that ethanol does not have an universal effect on habituation. In
general, our results indicate that the effects of ethanol are dependent on the aspect of
behavioral responses being measured.
For studies following up on these initial findings the 400mM dose was chosen for
further analysis for several reasons. First, most C. elegans studies in the past have used a
400mM ethanol dose (Davies et al., 2004; Alaimo et al., 2012; Grotewiel and Bettinger,
2015). Secondly, for reversal probability, doses higher than 400mM did not produce more
severe results (Figure 2-7). In addition, for reversal duration, although the 600mM dose
produced more extreme results, worms on 600mM were often too immobilized to respond
to taps. Therefore, in the next experiment I carried out a more detailed analysis of
ethanol’s effect on habituation using the 400mM dose.
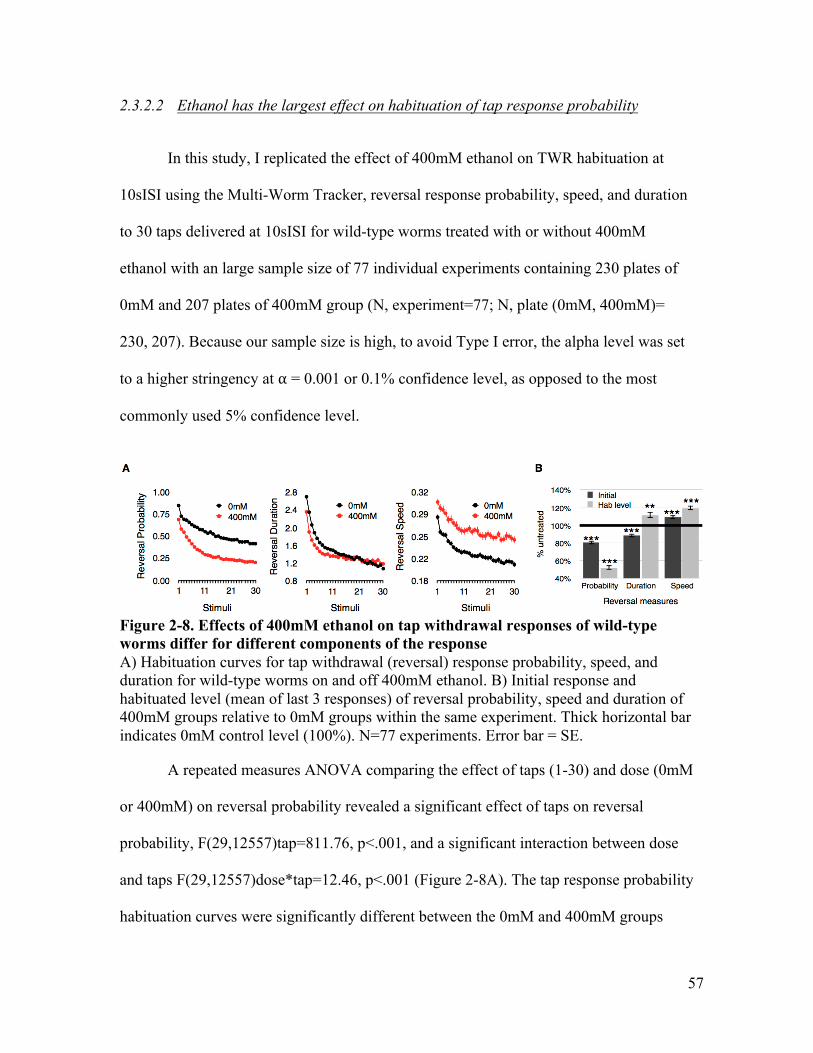
57
2.3.2.2 Ethanol has the largest effect on habituation of tap response probability
In this study, I replicated the effect of 400mM ethanol on TWR habituation at
10sISI using the Multi-Worm Tracker, reversal response probability, speed, and duration
to 30 taps delivered at 10sISI for wild-type worms treated with or without 400mM
ethanol with an large sample size of 77 individual experiments containing 230 plates of
0mM and 207 plates of 400mM group (N, experiment=77; N, plate (0mM, 400mM)=
230, 207). Because our sample size is high, to avoid Type I error, the alpha level was set
to a higher stringency at α = 0.001 or 0.1% confidence level, as opposed to the most
commonly used 5% confidence level.
Figure 2-8. Effects of 400mM ethanol on tap withdrawal responses of wild-type worms differ for different components of the response A) Habituation curves for tap withdrawal (reversal) response probability, speed, and duration for wild-type worms on and off 400mM ethanol. B) Initial response and habituated level (mean of last 3 responses) of reversal probability, speed and duration of 400mM groups relative to 0mM groups within the same experiment. Thick horizontal bar indicates 0mM control level (100%). N=77 experiments. Error bar = SE.
A repeated measures ANOVA comparing the effect of taps (1-30) and dose (0mM
or 400mM) on reversal probability revealed a significant effect of taps on reversal
probability, F(29,12557)tap=811.76, p<.001, and a significant interaction between dose
and taps F(29,12557)dose*tap=12.46, p<.001 (Figure 2-8A). The tap response probability
habituation curves were significantly different between the 0mM and 400mM groups

58
(p<.001), and the responses to all taps were significantly different (p<.001), suggesting
that ethanol altered habituation of reversal probability. For reversal duration, both taps
and dose had significant effects on responses, F(29,12557)tap=280.81, p<.001,
F(29,12557)dose*tap=19.91, p<.001. However, the 0mM and 400mM curves were not
significantly different (p=.041, α=0.001), and only responses to tap 1-8, and 30 were
significantly different (tap1-8, 30, p<.001), suggesting ethanol did not have a large effect
on habituation of tap response duration. For reversal speed, both taps and dose had
significant effect on responses, F(29,12557)tap=105.99, p<.001,
F(29,12557)dose*tap=2.20, p<.001, the 0mM and 400mM curves were significantly
different (p<.001), and responses to all taps were significantly different (tap1, p<.001,
tap2-30, p<.001), suggesting that ethanol altered habituation of tap response speed. Thus,
ethanol significantly altered habituation curves of tap response probability and speed, but
not duration.
To evaluate whether ethanol altered basal response levels, the initial response
levels (responses to the first tap) from the 400mM groups were compared to the untreated
(0mM) groups within the same experiment. To do this the mean initial responses of all
400mM plates within an experiment were divided by the mean initial responses of all
0mM plates within the same experiment to obtain “% untreated initial response” (Figure
2-8B). The results showed that ethanol reduced initial reversal response probability
(t(74)= -10.70, p<.001) and duration (t(74)= -5.49, p<.001), but increased initial response
speed (t(74)=4.38, p < 0.001). These data suggest that worms on ethanol were less likely
to respond to taps, but when they did, they did so faster and for a shorter duration
compared to worms on ethanol-free condition.
59
To evaluate whether ethanol altered the final habituated response level (mean
response to the last 3 taps), the % habituated response level was compared between the
0mM and 400mM groups. The 400mM group had significantly deeper final habituated
level for response probability (t(75)= -17.12, p<.001), shallower habituated level for
response speed (t(75)=7.66, p<.001) but the same level for duration.
Finally, to determine whether ethanol changed the extent of habituation (%
habituation), the percent change of the final habituated response level from the initial
level was calculated per plate of worms on or off ethanol (N=229, 204). From this
calculation, the higher the percentage, the deeper the habituated level compared to the
initial response. For reversal probability ethanol increased the % habituation by 20%
(mean, 0mM, 400mM=51.3%, 71.3%, F(1,431)=144.04, p<.001), indicating that ethanol
facilitated habituation for reversal probability. For reversal duration, ethanol decreased
the % habituation by 18% (mean, 0mM, 400mM=58.0%, 39.9%, F(1,431)=12.89,
p<.001), indicating ethanol inhibited habituation for reversal duration. For reversal speed,
ethanol decreased the % habituation by 9% (mean, 0mM, 400mM=26.0%, 17.2%,
F(1,430)=41.81, p<.001), indicating ethanol inhibited habituation for reversal duration.
Together, these findings suggest that ethanol altered the depth of habituation and that the
effect for reversal probability was the largest (20% facilitation), and opposite to its effects
on reversal duration (18% inhibition) and speed (9% inhibition).
Wary of the possibility of Type I error due to high number of samples, and
conscious of the importance of defining a robust phenotype for the subsequent genetic
analysis, the data were explored in deeper detail. Although both TWR probability and
speed habituation curves were significantly affected by ethanol, according to statistical
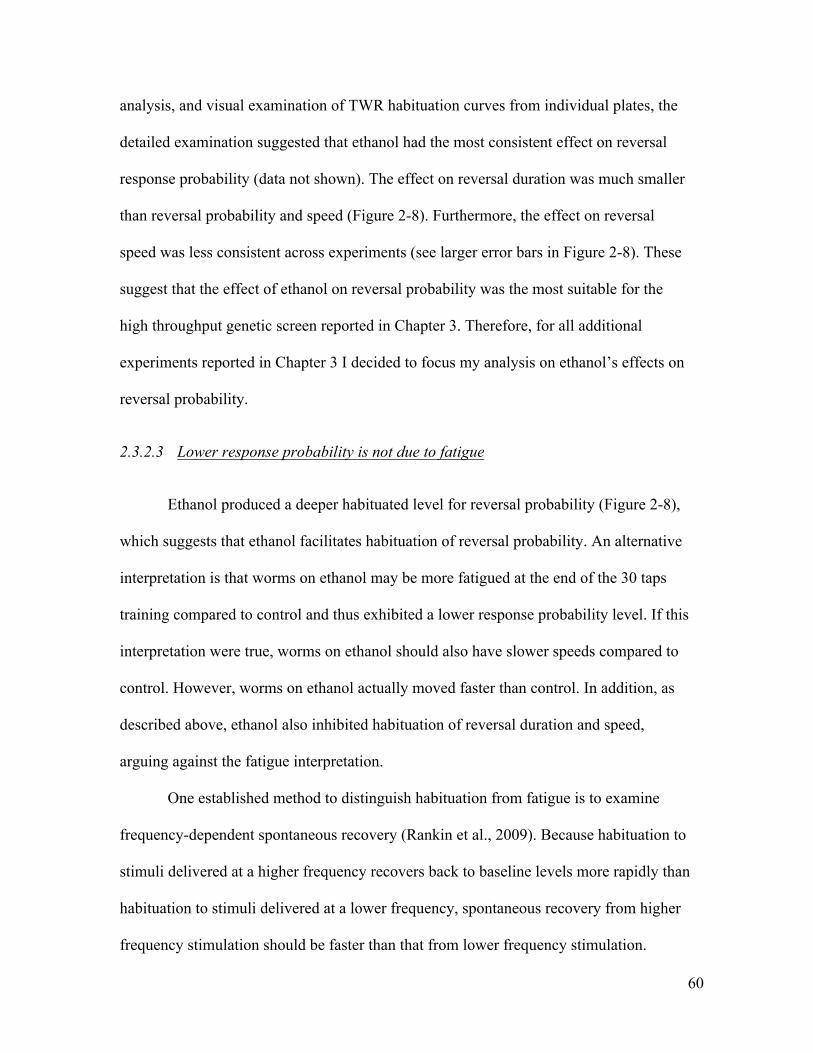
60
analysis, and visual examination of TWR habituation curves from individual plates, the
detailed examination suggested that ethanol had the most consistent effect on reversal
response probability (data not shown). The effect on reversal duration was much smaller
than reversal probability and speed (Figure 2-8). Furthermore, the effect on reversal
speed was less consistent across experiments (see larger error bars in Figure 2-8). These
suggest that the effect of ethanol on reversal probability was the most suitable for the
high throughput genetic screen reported in Chapter 3. Therefore, for all additional
experiments reported in Chapter 3 I decided to focus my analysis on ethanol’s effects on
reversal probability.
2.3.2.3 Lower response probability is not due to fatigue
Ethanol produced a deeper habituated level for reversal probability (Figure 2-8),
which suggests that ethanol facilitates habituation of reversal probability. An alternative
interpretation is that worms on ethanol may be more fatigued at the end of the 30 taps
training compared to control and thus exhibited a lower response probability level. If this
interpretation were true, worms on ethanol should also have slower speeds compared to
control. However, worms on ethanol actually moved faster than control. In addition, as
described above, ethanol also inhibited habituation of reversal duration and speed,
arguing against the fatigue interpretation.
One established method to distinguish habituation from fatigue is to examine
frequency-dependent spontaneous recovery (Rankin et al., 2009). Because habituation to
stimuli delivered at a higher frequency recovers back to baseline levels more rapidly than
habituation to stimuli delivered at a lower frequency, spontaneous recovery from higher
frequency stimulation should be faster than that from lower frequency stimulation.
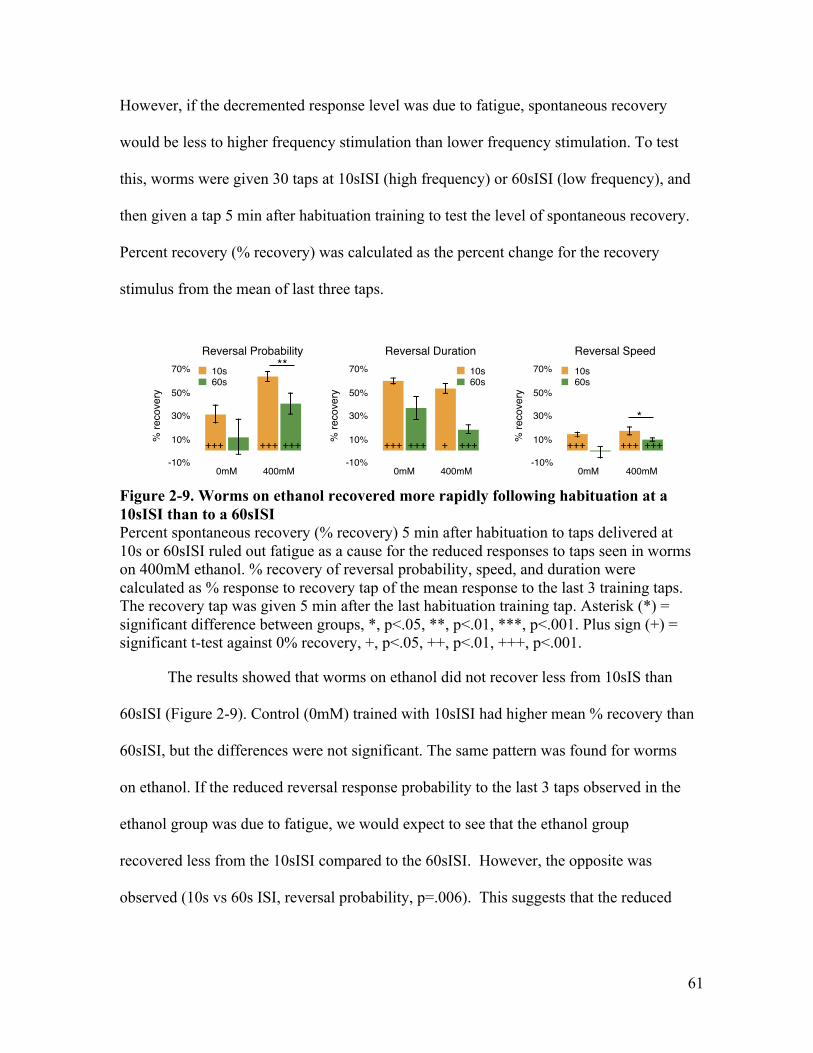
61
However, if the decremented response level was due to fatigue, spontaneous recovery
would be less to higher frequency stimulation than lower frequency stimulation. To test
this, worms were given 30 taps at 10sISI (high frequency) or 60sISI (low frequency), and
then given a tap 5 min after habituation training to test the level of spontaneous recovery.
Percent recovery (% recovery) was calculated as the percent change for the recovery
stimulus from the mean of last three taps.
Figure 2-9. Worms on ethanol recovered more rapidly following habituation at a 10sISI than to a 60sISI Percent spontaneous recovery (% recovery) 5 min after habituation to taps delivered at 10s or 60sISI ruled out fatigue as a cause for the reduced responses to taps seen in worms on 400mM ethanol. % recovery of reversal probability, speed, and duration were calculated as % response to recovery tap of the mean response to the last 3 training taps. The recovery tap was given 5 min after the last habituation training tap. Asterisk (*) = significant difference between groups, *, p<.05, **, p<.01, ***, p<.001. Plus sign (+) = significant t-test against 0% recovery, +, p<.05, ++, p<.01, +++, p<.001.
The results showed that worms on ethanol did not recover less from 10sIS than
60sISI (Figure 2-9). Control (0mM) trained with 10sISI had higher mean % recovery than
60sISI, but the differences were not significant. The same pattern was found for worms
on ethanol. If the reduced reversal response probability to the last 3 taps observed in the
ethanol group was due to fatigue, we would expect to see that the ethanol group
recovered less from the 10sISI compared to the 60sISI. However, the opposite was
observed (10s vs 60s ISI, reversal probability, p=.006). This suggests that the reduced
RevDur -----------------------MANOVA ISI x dose (nested)ISI: F(1,46) = 29.925, p < 0.0001dose(ISI): F(2,46) = 4.599, p = 0.0151
t test for recovery > zero10ISI(N2): < 0.000110ISI(N2_400mM): < 0.000160ISI(N2): = 0.010860ISI(N2_400mM): = 0.0003
posthoc tukey-kramer (dose)10ISI: N2 v.s. N2_400mM <0.0560ISI: N2 v.s. N2_400mM <0.05
posthoc tukey-kramer (ISI)N2: ISI10 v.s. ISI60 <0.05N2_400mM: ISI10 v.s. ISI60 <0.05
Reversal Probability
% re
cove
ry
-10%
10%
30%
50%
70%
0mM 400mM
10s60s
Reversal Speed
% re
cove
ry
-10%
10%
30%
50%
70%
0mM 400mM
10s60s
Reversal Duration%
reco
very
-10%
10%
30%
50%
70%
0mM 400mM
10s60s
RevFreq -----------------------MANOVA ISI x dose (nested)ISI: F(1,46) = 5.198, p = 0.0273dose(ISI): F(2,46) = 5.786, p = 0.0057
t test for recovery > zero10ISI(N2): = 0.000910ISI(N2_400mM): < 0.000160ISI(N2): = 0.441260ISI(N2_400mM): = 0.0006
posthoc tukey-kramer (dose)10ISI: N2 v.s. N2_400mM <0.0560ISI: N2 v.s. N2_400mM n.s.
posthoc tukey-kramer (ISI)N2: ISI10 v.s. ISI60 n.s.N2_400mM: ISI10 v.s. ISI60 n.s.
RevSpeed -----------------------MANOVA ISI x dose (nested)ISI: F(1,46) = 15.564, p = 0.0003dose(ISI): F(2,46) = 3.162, p = 0.0517
t test for recovery > zero10ISI(N2): < 0.000110ISI(N2_400mM): = 0.000160ISI(N2): = 0.852160ISI(N2_400mM): = 0.0005
posthoc tukey-kramer (dose)10ISI: N2 v.s. N2_400mM n.s.60ISI: N2 v.s. N2_400mM <0.05
posthoc tukey-kramer (ISI)N2: ISI10 v.s. ISI60 <0.05N2_400mM: ISI10 v.s. ISI60 <0.05
RL201512111243_MANOVAnestedRec-- RevSpeed --MANOVAisi: F(1,50) = 23.121, p < 0.000dose: F(1,50) = 1.944, p = 0.169isi*dose: F(1,50) = 4.514, p = 0.039posthoc(tukey)N2 10 x N2_400mM 10, p=n.s.N2 10 x N2 60, p=n.s.N2 10 x N2_400mM 60, p<0.001N2_400mM 10 x N2 60, p=n.s.N2_400mM 10 x N2_400mM 60, p=0.024N2 60 x N2_400mM 60, p<0.001
-- RevDur --MANOVAisi: F(1,50) = 0.230, p = 0.634dose: F(1,50) = 0.082, p = 0.776isi*dose: F(1,50) = 1.103, p = 0.299posthoc(tukey)N2 10 x N2_400mM 10, p=n.s.N2 10 x N2 60, p=n.s.N2 10 x N2_400mM 60, p=n.s.N2_400mM 10 x N2 60, p=n.s.N2_400mM 10 x N2_400mM 60, p=n.s.N2 60 x N2_400mM 60, p=n.s.
-- RevFreq --MANOVAisi: F(1,50) = 3.458, p = 0.069dose: F(1,50) = 9.799, p = 0.003isi*dose: F(1,50) = 0.905, p = 0.346posthoc(tukey)N2 10 x N2_400mM 10, p=n.s.N2 10 x N2 60, p=n.s.N2 10 x N2_400mM 60, p<0.001N2_400mM 10 x N2 60, p=n.s.N2_400mM 10 x N2_400mM 60, p=0.006N2 60 x N2_400mM 60, p=n.s.
**
*
+++ +++ +++ +++ +++ ++++++ +++ ++++
�2
62
reversal probability in 400mM group was less likely a result of fatigue and more likely a
result of altered habituation.
2.3.3 Effects of ethanol on the probability of reversal and acceleration responses
2.3.3.1 Ethanol switched dominant response type from reversal to acceleration
Although a reversal is C. elegans’ dominant response to taps, it is not the only
way worms respond to taps (Wicks and Rankin, 1996; McEwan, 2013). Worms can
respond to taps by reversing, pausing, accelerating, or decelerating (McEwan, 2013). In
fact, as worms experience more tap stimuli in a habituation series, the probability of
reversal responses decrements, while at the same time, the probability of pauses,
decelerations and accelerations forward increases (McEwan, 2013).
One way to visualize this complex response dynamic to taps is to use Raster plots
showing changes in speed and direction of movement over time (Figure 2-10). For the
first tap (tap1), most of the worms reversed (blue) for nearly 3s in response to tap, hence
the cluster of blue lines in the middle of the raster plot (Figure 2-10). In both 0mM and
400mM groups many worms reversed to the tap. The differences were that in the 400mM
group fewer worms reversed (i.e. reduced initial reversal probability), reversal duration
was shorter, and the reversal speed was faster (darker color blue). These were previously
characterized in the reversal line plots (Figure 2-8).
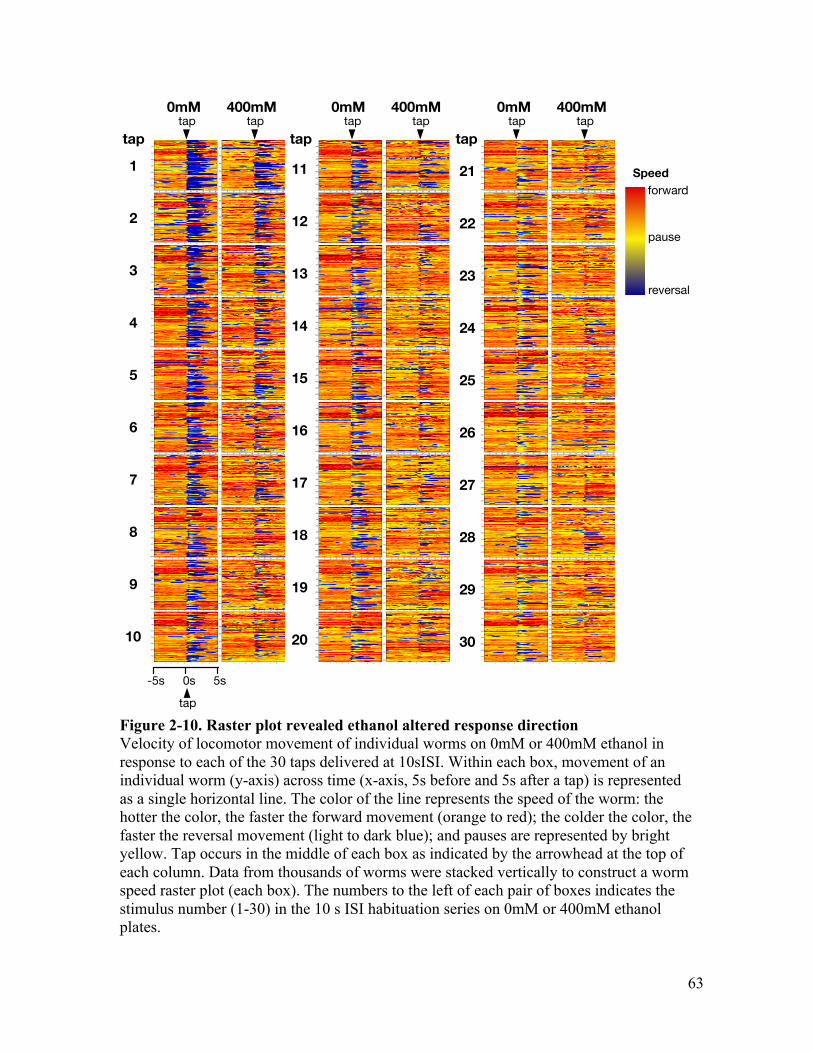
63
Figure 2-10. Raster plot revealed ethanol altered response direction Velocity of locomotor movement of individual worms on 0mM or 400mM ethanol in response to each of the 30 taps delivered at 10sISI. Within each box, movement of an individual worm (y-axis) across time (x-axis, 5s before and 5s after a tap) is represented as a single horizontal line. The color of the line represents the speed of the worm: the hotter the color, the faster the forward movement (orange to red); the colder the color, the faster the reversal movement (light to dark blue); and pauses are represented by bright yellow. Tap occurs in the middle of each box as indicated by the arrowhead at the top of each column. Data from thousands of worms were stacked vertically to construct a worm speed raster plot (each box). The numbers to the left of each pair of boxes indicates the stimulus number (1-30) in the 10 s ISI habituation series on 0mM or 400mM ethanol plates.
tap1
2
3
4
5
6
7
8
9
10
11
12
13
14
15
16
17
18
19
20
21
22
23
24
25
26
27
28
29
30
tap tap
pause
reversal
forwardSpeed
tap
-5s 0s 5s
tap tap tap tap tap tap0mM
5 10 15 20 25 30 35 40 45 50
200
400
600
800
1000
1200
1400
5 10 15 20 25 30 35 40 45 50
200
400
600
800
1000
1200
1400
5 10 15 20 25 30 35 40 45 50
200
400
600
800
1000
1200
5 10 15 20 25 30 35 40 45 50
200
400
600
800
1000
1200
1400
5 10 15 20 25 30 35 40 45 50
200
400
600
800
1000
1200
1400
5 10 15 20 25 30 35 40 45 50
200
400
600
800
1000
1200
1400
5 10 15 20 25 30 35 40 45 50
200
400
600
800
1000
1200
1400
1600
5 10 15 20 25 30 35 40 45 50
200
400
600
800
1000
1200
1400
1600
5 10 15 20 25 30 35 40 45 50
200
400
600
800
1000
1200
1400
1600
5 10 15 20 25 30 35 40 45 50
200
400
600
800
1000
1200
1400
5 10 15 20 25 30 35 40 45 50
200
400
600
800
1000
1200
5 10 15 20 25 30 35 40 45 50
200
400
600
800
1000
1200
5 10 15 20 25 30 35 40 45 50
100
200
300
400
500
600
700
800
900
1000
1100
5 10 15 20 25 30 35 40 45 50
100
200
300
400
500
600
700
800
900
1000
1100
5 10 15 20 25 30 35 40 45 50
200
400
600
800
1000
1200
5 10 15 20 25 30 35 40 45 50
200
400
600
800
1000
1200
5 10 15 20 25 30 35 40 45 50
200
400
600
800
1000
1200
5 10 15 20 25 30 35 40 45 50
200
400
600
800
1000
1200
5 10 15 20 25 30 35 40 45 50
200
400
600
800
1000
1200
5 10 15 20 25 30 35 40 45 50
200
400
600
800
1000
1200
400mM
5 10 15 20 25 30 35 40 45 50
200
400
600
800
1000
1200
1400
5 10 15 20 25 30 35 40 45 50
200
400
600
800
1000
1200
1400
1600
5 10 15 20 25 30 35 40 45 50
200
400
600
800
1000
1200
1400
5 10 15 20 25 30 35 40 45 50
200
400
600
800
1000
1200
1400
5 10 15 20 25 30 35 40 45 50
200
400
600
800
1000
1200
1400
5 10 15 20 25 30 35 40 45 50
200
400
600
800
1000
1200
1400
1600
5 10 15 20 25 30 35 40 45 50
200
400
600
800
1000
1200
1400
1600
5 10 15 20 25 30 35 40 45 50
200
400
600
800
1000
1200
1400
1600
5 10 15 20 25 30 35 40 45 50
200
400
600
800
1000
1200
1400
5 10 15 20 25 30 35 40 45 50
200
400
600
800
1000
1200
1400
0mM
5 10 15 20 25 30 35 40 45 50
200
400
600
800
1000
1200
5 10 15 20 25 30 35 40 45 50
200
400
600
800
1000
1200
5 10 15 20 25 30 35 40 45 50
200
400
600
800
1000
1200
5 10 15 20 25 30 35 40 45 50
200
400
600
800
1000
1200
5 10 15 20 25 30 35 40 45 50
200
400
600
800
1000
1200
5 10 15 20 25 30 35 40 45 50
200
400
600
800
1000
1200
5 10 15 20 25 30 35 40 45 50
200
400
600
800
1000
1200
5 10 15 20 25 30 35 40 45 50
200
400
600
800
1000
1200
5 10 15 20 25 30 35 40 45 50
200
400
600
800
1000
1200
5 10 15 20 25 30 35 40 45 50
200
400
600
800
1000
1200
400mM
5 10 15 20 25 30 35 40 45 50
200
400
600
800
1000
1200
1400
1600
5 10 15 20 25 30 35 40 45 50
200
400
600
800
1000
1200
1400
5 10 15 20 25 30 35 40 45 50
200
400
600
800
1000
1200
1400
5 10 15 20 25 30 35 40 45 50
200
400
600
800
1000
1200
1400
5 10 15 20 25 30 35 40 45 50
200
400
600
800
1000
1200
1400
5 10 15 20 25 30 35 40 45 50
200
400
600
800
1000
1200
1400
5 10 15 20 25 30 35 40 45 50
200
400
600
800
1000
1200
1400
5 10 15 20 25 30 35 40 45 50
200
400
600
800
1000
1200
1400
5 10 15 20 25 30 35 40 45 50
200
400
600
800
1000
1200
1400
5 10 15 20 25 30 35 40 45 50
200
400
600
800
1000
1200
1400
0mM
5 10 15 20 25 30 35 40 45 50
200
400
600
800
1000
1200
5 10 15 20 25 30 35 40 45 50
200
400
600
800
1000
1200
5 10 15 20 25 30 35 40 45 50
200
400
600
800
1000
1200
5 10 15 20 25 30 35 40 45 50
200
400
600
800
1000
1200
5 10 15 20 25 30 35 40 45 50
200
400
600
800
1000
1200
5 10 15 20 25 30 35 40 45 50
200
400
600
800
1000
1200
5 10 15 20 25 30 35 40 45 50
200
400
600
800
1000
1200
5 10 15 20 25 30 35 40 45 50
200
400
600
800
1000
1200
5 10 15 20 25 30 35 40 45 50
100
200
300
400
500
600
700
800
900
1000
1100
5 10 15 20 25 30 35 40 45 50
100
200
300
400
500
600
700
800
900
1000
1100
400mM
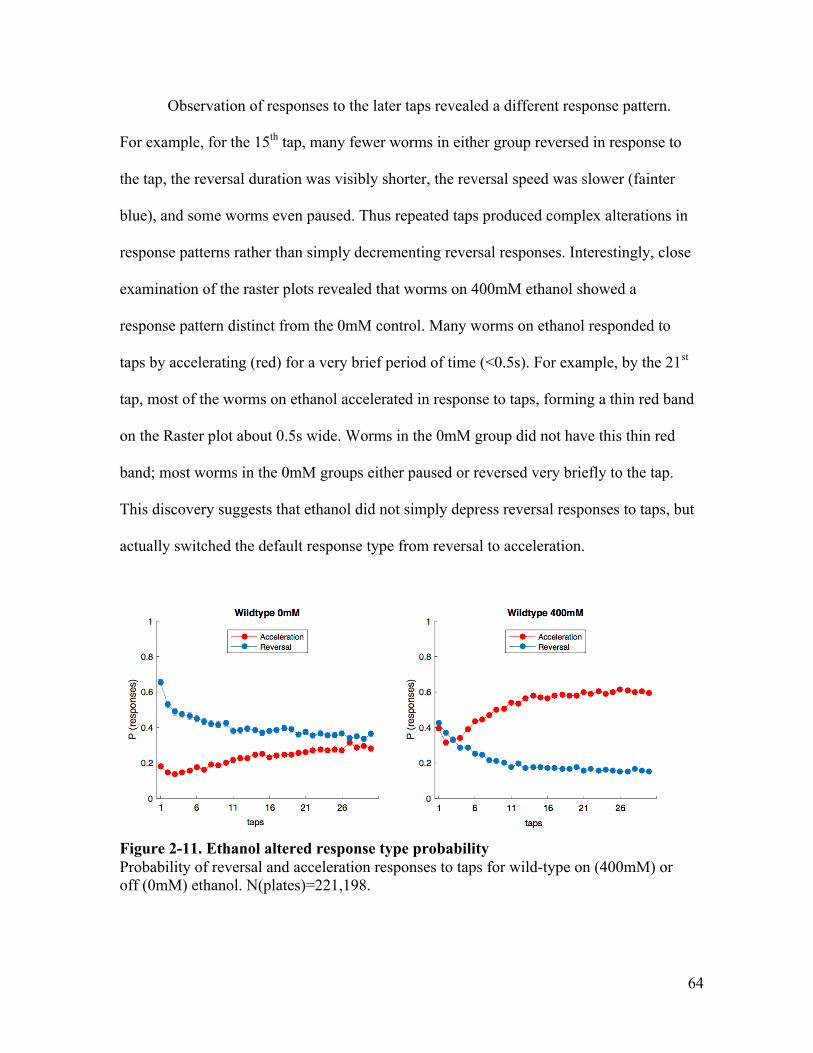
64
Observation of responses to the later taps revealed a different response pattern.
For example, for the 15th tap, many fewer worms in either group reversed in response to
the tap, the reversal duration was visibly shorter, the reversal speed was slower (fainter
blue), and some worms even paused. Thus repeated taps produced complex alterations in
response patterns rather than simply decrementing reversal responses. Interestingly, close
examination of the raster plots revealed that worms on 400mM ethanol showed a
response pattern distinct from the 0mM control. Many worms on ethanol responded to
taps by accelerating (red) for a very brief period of time (<0.5s). For example, by the 21st
tap, most of the worms on ethanol accelerated in response to taps, forming a thin red band
on the Raster plot about 0.5s wide. Worms in the 0mM group did not have this thin red
band; most worms in the 0mM groups either paused or reversed very briefly to the tap.
This discovery suggests that ethanol did not simply depress reversal responses to taps, but
actually switched the default response type from reversal to acceleration.
Figure 2-11. Ethanol altered response type probability Probability of reversal and acceleration responses to taps for wild-type on (400mM) or off (0mM) ethanol. N(plates)=221,198.
65
To quantify this switch of dominant response types, the proportion of reversal or
acceleration responses to each tap were plotted in Figure 2-11. The probability of no
response, pause, and deceleration were excluded from the plot because the probability of
those response types was low and not significantly different between the two groups. For
both groups, the curves of the probability of reversal response which decreased as the
number of taps increased were parallel to the classic tap response habituation curve as
described in Figure 2-8A. On the other hand, the probability of the tap-induced
acceleration response gradually increased as the number of taps increased.
For worms in the ethanol free condition, the reversal response was dominant over
the acceleration response from the first tap to the last tap. Although the probability of
reversal and acceleration response to the last few taps became similar to each other, at no
point did the acceleration responses outnumber reversal responses. Therefore, for wild-
type worms, in the absence of ethanol, reversals remained the dominant response from
the first to the 30th taps.
In contrast, ethanol induced a switch in the dominant response type from reversal
to acceleration. Worms on ethanol had similar probability to reverse or accelerate in
response to the first 3 taps which reflected a decrease in reversal probability and an
increase in acceleration probability compared to off of ethanol. From this altered baseline
the acceleration responses continued to increase as the tap number increases. By the 30th
tap, approximately 60% of the responses were accelerations and only ~18% were
reversals, representing ~78% of all response types. From observing movies of worm
movement reconstructed from the Multi-Worm Tracker data, worms on ethanol tend to
respond to taps with a sudden jerky forward movement. It appeared as if they were
66
suddenly aroused by a tap and then reflexively moved forward. Interestingly, the
response type analysis also suggests that ethanol did not suppress initial response
probability to the extent as previously determined from the reversal probability curve. If
only reversal responses were considered, worms on ethanol had a response probability of
~40%, which is ~25% lower than worms on ethanol free condition. However, if the
reversal and acceleration response probabilities were combined, worms on ethanol had a
total of ~80% probability of responding to tap while worms in the ethanol free condition
had a total of ~85% probability of responding to tap, indicating only a ~5% difference in
responding probability. The same is true for responses to the last tap: the combined
response probability is approximately 80% for both 0mM and 400mM groups. This led
me to conclude that the key effect of ethanol on the tap response and on habituation was
not suppressing responses, but rather shifting the predominant response type from
reversal to acceleration.
2.3.3.2 Acceleration effect is dose dependent
To determine whether different doses of ethanol produce different effects on
acceleration response plasticity, data from the 10sISI 100-600mM study described earlier
were analyzed for acceleration response probability. A repeated measures ANOVA
evaluating the effect of ethanol dose and tap on acceleration probability reveled
significant effect of dose, F(29,2842)tap=15.19, p<.001, but not an interaction between
dose and tap. Except for 100mM ethanol, the probability of accelerations for groups on
200mM-600mM were all significantly different from the 0mM control (all, p<.001). The
effect increased from 200mM, plateaued at 300-500mM, and decreased at 600mM. In

67
addition, ethanol’s effect on elevating acceleration responses was independent of the
presence of food (data not shown).
Figure 2-12. Effects of ethanol on probability to accelerate are dependent on concentration Probability of acceleration responses to taps for wild-type on 0mM-600mM ethanol. N(plates)=13,12,16,11,11,13,6.
2.4 DISCUSSION
This chapter characterized the effects of ethanol on C. elegans behavior under
unstimulated and stimulated conditions. During a period of 60 min ethanol exposure, the
locomotor speed first decreased and then increased or reached a steady state after 10-30
min. For reversal responses to repeated taps, ethanol significantly facilitated the
habituation of reversal probability, and to a lesser extent facilitated habituation of reversal
duration and inhibited habituation of reversal speed (Figure 2-8). Interestingly, ethanol
not only facilitated the decrement of reversal response probability (Figure 2-8A) but also
facilitated the increase of acceleration response probability (Figure 2-11). In fact, worms
on ethanol had equal probability to reverse or accelerate in response to the first tap, but
68
worms on ethanol-free conditions were highly biased to reverse than to accelerate. After
only a few taps, the dominant response type for worms on ethanol became an
acceleration. In contrast, the dominant response for worms in the ethanol free condition
remained a reversal. Thus, ethanol switched the dominant response type from reversal to
acceleration.
2.4.1 Ethanol’s effect on worm behaviour is temporally dynamic
The study examining the temporal response to 60 min ethanol exposure yielded 3
main findings (Figure 2-1 and Figure 2-2). First, ethanol exposure to both 200mM and
400mM initially produced excitation in speed regardless of age. Secondly, 4 day old
worms on 400mM ethanol showed a true biphasic action of ethanol, where they started
out more “excited” than control, transitioned to more “sedated” than control, and then
recovered to became more “excited” than control again. The excited behavior could
reflect worms trying to escape from ethanol, which is an aversive olfactory stimulus (Lee
et al., 2009). The sedated behavior could reflect ethanol’s inhibition on locomotion.
Finally, the effects of ethanol differed depending on the age of the worms: 400mM
ethanol seemed to have less of an effect on 5 day old worms than on 3 and 4 day old
worms. Overall, this study described dynamic temporal kinetics of ethanol’s effect on
speed and body curve.
2.4.2 The effect of food on ethanol related behaviour
I observed that 100-200mM ethanol increased the speed of worms, and that 300-
600mM ethanol had no significant effect on speed 30 min into exposure (Figure 2-3).
However, this finding is not consistent with the previous report (Davies et al., 2003).
69
Davies et al. (2003) reported that doses ranging from 100mM-500mM ethanol caused a
dose-dependent decrease in speed. A comparison of their methods and ours indicated four
obvious differences between our experimental set up and theirs. 1) We tested adult
worms one day older than theirs. 2) Immediately prior to recording, and 30 min after
ethanol exposure, our plates were moved onto the Multi-Worm Tracker (this was done to
minimize the time plates occupied the Tracker thus increasing the availability of Trackers
for testing). In contrast, Davies et al. (2003), placed the plates onto the recording
apparatus immediately following the exposure and left them undisturbed for 30 min and
then the measurements were taken for 5 min. 3) Davies et al. (2003) used a copper ring
(an aversive stimulus for C. elegans) to restrict worm movement within the camera view
range, while we allowed worms full access to the plate. 4) Our standard behavioral
testing was done in the presence of food (E. coli) while theirs was done in the absence of
food. Out of these four experimental differences, age and food most likely play a key role
in the differences observed between data from Davies et al. (2003) and this dissertation.
In our baseline experiment I showed differences in the effects of ethanol depending on
age of the worms that may account for the some of the differences in findings (Figure 2-1
& Figure 2-2). The presence or absence of food, on the other hand, arguably contributes
to most of the differences, and is discussed further below.
The presence or absence of food is known to have a large influence on locomotor
behavior. When worms are moved to a food-free condition, they move at a faster speed in
search of food, a behavior called “local search” (Albrecht and Bargmann, 2011), while in
the presence of food worms move more slowly. Since our assay plates contains food, one
explanation is that the control group moved at a slower speed, therefore, in comparison to
70
the control group on food, ethanol groups moved faster rather than slower. This
hypothesis was supported by data shown in Figure 2-4 and Figure 2-5, which showed that
the speed of worms on ethanol in the absence of food was approximately 40% the speed
of worms on ethanol-free plate in the absence of food (Figure 2-5), which closely
resembled the finding reported by Davies et al. (2003). In addition, compared with worms
in the no-food-no-ethanol condition, the other three groups moved at much slower speeds
(Figure 2-5). These results suggest that the presence or absence of food is the key
experimental condition that may have differentiated our speed results from Davies et al.
(2003)’s results.
This finding raised questions on the interaction between ethanol and C. elegans’
food source, E. coli. Ethanol is known to kill bacteria (Block, 2001). We used 99.9%
ethanol to make the appropriate ethanol plate concentration, and the plates were sealed to
let the agar absorb the ethanol for 2 hours. There was enough time for ethanol to kill
bacteria on the plates. Perhaps the behavioral effects we see in our ethanol group were a
combination of response to ethanol and an absence of “live” food. If that was the case, we
should see worms in the absence of food move faster than worms in the presence of food,
regardless of the ethanol condition, however this was not the case.
In summary, we hypothesize that Davies et al. (2003) reported that 400mM
ethanol depressed speed because they were looking at worm behavior in the absence of
food. We reported that worms on 400mM ethanol showed little change of speed because
we were comparing behavior on food. We made the choice to carry out our experiments
with E. coli on the plate because our standard habituation assays are done on food, and
the absence of food can change habituation kinetics to taps (Kindt et al., 2007).
71
Interestingly, I also showed here that food does not influence all of the effects of ethanol
as the effect on body curve was independent of food (Figure 2-6).
2.4.3 Ethanol’s effect on TWR habituation is specific to response probability
In this study the behavioural analyses using data collected by the Multi-Worm
Tracker I demonstrated that ethanol can have opposite effects on habituation measured by
different sub-components of responses to repeated taps. Previous studies on ethanol’s
effect on habituation in other organisms produced mixed results, which led to a debate
about whether ethanol is an inhibitor or facilitator of habituation (Ingle, 1973; Peeke et
al., 1975; Rinaldi et al., 1983; Rogozea and Florea-Ciocoiu, 1988). However, opposite
effects within the same organism were reported in cichlids, where a high dose of ethanol
facilitated habituation of aggressive response probability to conspecific male intruder, but
inhibited habituation of response magnitude. Our data showed similar findings: ethanol
facilitated habituation of reversal response probability to taps, but inhibited habituation of
reversal speed and duration (Figure 2-8). These suggest the effect of ethanol is specific to
the type of stimuli and individual response measures. Perhaps these differences are a
readout of ethanol’s effect on selective molecules expressed in a subset of neural
circuitry. Thus, the outcomes may be dependent on how ethanol interacts with the
molecular and cellular mechanisms responsible for modulating habituation to a specific
stimulus.
For habituation, ethanol has the most pronounced effect on the habituation of
reversal response probability, and the effect contains two main features. First, ethanol
decreased initial reversal response probability. In other words, ethanol-treated worms
were less likely to reverse to the first tap. Second, ethanol facilitated habituation of

72
reversal probability. Without ethanol, habituation of responses to repeated stimuli (taps)
constitutes the gradually decreasing habituation curve that eventually reaches an
asymptotic level that is lower than the initial response level (Rankin et al., 2009). For
intoxicated worms, this habituation was faster and deeper for reversal probability,
reaching a lower asymptotic habituated response level than worms without ethanol
treatment (Figure 2-8A).
The decreased response probability was unlikely to be due to fatigue for several
reasons. Most obviously, wild-type reversal response speeds were higher across all taps
(Figure 2-8A). If the decreased response level was due to fatigue, the response speed
should also be lower. Alternatively, fatigue and habituation can be differentiated through
comparing recovery from habituating stimuli delivered at short and long ISIs (Rankin et
al., 2009). If the reduced response level to repeated stimuli was due to fatigue, responding
to stimuli delivered at short ISIs should be more tiring than long ISIs. Therefore,
responses to the same stimulus delivered at a time point after the repeated stimuli should
be less for short ISIs. If the reduced responding was due to habituation, responses to
stimuli delivered at long ISIs should recover more slowly than at short ISIs. From an
analysis of responses to a tap delivered 5 min after the end of 30 taps at 10 or 60sISI,
worms with ethanol and without ethanol recovered significantly better from habituation at
a 10sISI than 60sISI. In fact, worms on ethanol recovered to a greater extent than worms
trained without ethanol (Figure 2-9). These data supported the hypothesis that the lower
responding level characterized in the ethanol’s effect on habituation of reversal
probability was more likely an alteration of habituation learning, rather than simply a
generalized locomotor inhibition by ethanol.
73
2.4.4 In the presence of ethanol the dominant tap response switched from reversals
to accelerations
The technological advance of the Multi-Worm Tracker allowed us to measure
behavior in much more depth than ever before. Previously the measurement of behaviors
was done by laboriously tracing worm’s movement replayed on a video monitor onto an
acetate transparency. With the Multi-Worm Tracker once the worm behaviors have been
recorded by the Tracker, the data can be re-analyzed many times to investigates for
different aspects of behavior using analysis programs for a wide range of measures. As a
result our lab has begun to study response types other than our classic tap withdrawal
response (McEwan, 2013). My large dataset (thousands of worms per group) also enabled
a more advanced visualization method such as a raster plot (Figure 2-10), which helped
me to carry out more detailed analyses of behavioral responses than ever before.
The most interesting and robust effect of ethanol on response plasticity identified
in this study was that exposure to ethanol led to a switch in the dominant tap response
from reversals to accelerations. Considering the hypothesis that the direction of a worm’s
tap response is determined by the balance of strength between the forward and backward
circuit (Chalfie et al., 1985; Wicks and Rankin, 1995), one explanation for this is that
ethanol might selectively inhibit the backward circuit and/or enhance the forward circuit.
Ablation of neurons in the forward circuit increased the probability of reversal (Wicks et
al., 1996), thus enhancing the drive of the forward circuit could possibly increase the
probability of forward movement. Conversely, ablation of neurons in the backward
circuit increased the probability of an acceleration and decreased the probability of a
reversal (Wicks et al., 1996). A similar observation can be found in Figure 2-11 in which
74
worms on ethanol showed an enhanced probability to accelerate-forward, and a decreased
probability to reverse, while maintained a similar total response probability as the control.
With this understanding of the effects of ethanol on habituation in wild-type
worms in the next chapter, I will describe a candidate gene screen to identify genes that
modulate these interesting effects of ethanol intoxication on this simple form of
behavioral plasticity.

75
3 GENES MEDIATING ETHANOL’S EFFECTS ON BODY CURVE AND HABITUATION PHENOTYPES
3.1 INTRODUCTION
In Chapter 2 I characterized the effect of acute ethanol exposure on wild-type
worms first by studying the effects of 60 min ethanol exposure on body curve and
locomotion across a range of doses. I confirmed effects of ethanol on body curve
reported by Davies et al. (2003), and found that both dose of ethanol and age of worms
played roles in the ways locomotion was altered. Based on the 60 min exposure study I
examined the effects of ethanol on tap habituation 30 min after initial exposure to
ethanol. Ethanol altered habituation in a dose dependent fashion in several key ways: it
decreased the initial reversal probability to tap, which then habituated more rapidly to
repeated taps than off of ethanol. In addition, I observed that within habituation training
the predominant response of ethanol-treated worms shifted from reversal to acceleration.
In this chapter I use a candidate gene approach to identify genes that play a role in the
ethanol induced habituation phenotypes described in Chapter 2.
The select candidate genes, I used 3 main approaches: look for candidates with 1)
pre-existing evidence on the gene’s role in ethanol’s effects or 2) similar response
probability phenotypes as those elicited by ethanol, or 3) known or predicted genetic
interactions with candidates identified in 1) and 2). Firstly, the most obvious targets were
genes already implicated in ethanol’s effect in C. elegans. For example, mutations in the
following 3 genes are known to reduce the inhibitory effect of ethanol on locomotion:
slo-1, an ortholog of the Big conductance calcium modulated voltage gated Potassium
channel (BK channel), dgk-1, an ortholog of diacylglycerol kinase, and npr-1, an ortholog

76
of neuropeptide Y receptor (Davies et al., 2003; Davies et al., 2004). In addition, a
mutation in PTCHD3/ptr-6, an ortholog of patched-related protein, increased sensitivity
to paralysis caused by exposure to ethanol (Choi et al., 2016). Furthermore, our lab
showed that 2 additional genes, altered the effects of ethanol on habituation: nlg-1,
neuroligin, and nrx-1 neurexin (Butterfield, 2007). These 6 genes with pre-existing
evidence on the gene’s role in the effects of ethanol on habituation ideal candidates to
begin my screen.
From reviewing results from previous studies in our lab, I found that mutations in
several genes produced similar habituation phenotypes in the absence of ethanol as that
shown by wild-type worms on ethanol. These genes were the Gaq ortholog egl-30, the
phospholipase C ortholog, egl-8, GaI ortholog, goa-1, a D1-like dopamine receptor dop-
1, and an AMPA-type glutamate receptor glr-1 (Kindt et al., 2007; McEwan, 2013).
Strains of worms with mutations in these genes had similar reversal response probability
curves as wild-type on ethanol showed in Figure 2-8A. If these genes are involved in
ethanol’s effects on behaviour then ethanol should not produce further effects on worms
with mutations in these genes.
To further understand the genetic mechanism underlying ethanol’s effects on
response plasticity, genes known to interact with some of the candidates mentioned above
were included in the screen. For example, if neuropeptide Y receptor npr-1 is involved in
the inhibitory effect of ethanol on locomotion, perhaps the two known npr-1 ligands, flp-
18 and flp-21 (Li and Kim, 2008), could also be involved. In addition, several genes
within the same G protein pathway as egl-30 and goa-1 were tested: a regulator of G-
protein signaling (RGS), eat-16, a guanine nucleotide exchange factor (GEF), ric-8, a
77
Gas, gsa-1, and adenylyl cyclase, acy-1. Other candidates include tyrosine hydroxylase, a
rate limiting enzymes for dopamine production encoded by cat-2 (Kindt et al., 2007), and
miR1, a micro RNA known to mediate retrograde communication between neuroligin and
neurexin encoded by mir-1 (Hu et al., 2012). To expand the genetic screen beyond the
genes currently known to play a role in ethanol’s effects or in habituation, genetic
pathway analysis based on the genes described above was carried out using a
bioinformatics tool “Gene Mania” (Warde-Farley et al., 2010). Based on the results of the
bioinformatics analysis I selected 9 additional genes for further investigation. These were
two voltage gated potassium channel genes, egl-2 and unc-103, two synaptic vesicle
release regulators, UNC-13/unc-13 and tomosyn/tom-1, one neuropeptide, flp-20,
calcineurin B, cnb-1, protein kinase C, pkc-1, phosphodieasterase, pde-4, and a regulator
of protein kinase A, kin-2.
From genes identified by the above 3 approaches, a total of 27 candidates were
tested in the screen for ethanol’s effects on habituation of tap response probability and on
body curve. For some of the genes I tested, multiple strains carrying different alleles of
the same gene. This served two main purposes. First, studying alleles carrying mutations
affecting different parts of a gene can reveal the functional role of a protein region or
specific amino acid of the protein. Secondly, standard mutagenesis methods in C. elegans
can cause multiple mutations in the genome. If two alleles of a gene produced similar
results, we can be more confident that the effect comes from dysfunction of the gene of
interest, and not from background mutations in other genes. Thus, a total of 39 different
strains were tested, each carrying a mutation in one of the 27 candidate genes. More
background information for the genes and strains tested is presented below.

78
3.1.1 Big conductance voltage gated potassium calcium mediated channel (BK
channel)
The first candidate gene I will describe in detail is the BK channel, or the Big
conductance calcium modulated voltage gated Potassium(K+) channel, which is a well
characterized target of ethanol in mammals and in C. elegans (Davies et al., 2003;
Martin, 2010; Dopico et al., 2014). The BK channel is a subtype of potassium channel
unique for its large potassium conductance and its capacity to be activated synergistically
by membrane potential and intracellular calcium ions. Aside from alcohol metabolic
enzymes, the BK channel was the first protein whose physiological response to ethanol
was linked to the behavioral effects of ethanol in the same animal (Davies et al., 2003).
Figure 3-1. BK channel BK channel, also known as Slo, slo-1, MaxiK or KCNMA1, has the largest unitary potassium conductance (~250pS) of all of the potassium channels. The pore forming a subunit consists of 7 transmembrane domains (S0-S6). The voltage sensor (S1-4) detects membrane potential changes, and the pore-forming domain (S5-6) allows passage of potassium ions. Long intracellular hydrophobic segments (S7-10) contain two main calcium sensors: RCK1 and RCK2/calcium bowl.
The BK channel is composed of 4 pore-forming a subunits (Figure 3-1). Each a
subunit consists of 7 transmembrane domains (S0-S6) and long intracellular hydrophobic

79
segments (S7-10). Within the transmembrane domains, the voltage sensor (S1-4) detects
membrane potential changes and the pore-forming domain (S5-6) allows passage of
potassium ions. In comparison to other voltage gated ion channels, the BK channel has an
unusually large potassium conductance (Latorre and Miller, 1983; Pallotta, 1985), which
allows the BK channel to disproportionally influence cellular excitability (Martin, 2010).
The long intracellular hydrophobic segments (S7-10) contain two main calcium sensors,
the RCK1 and RCK2/calcium bowls, allowing calcium-coupled channel activation. The
BK channel can be co-localized with voltage-gated calcium channels (VGCCs) whose
calcium influx increases the BK channel’s opening probability (Loane et al., 2007).
Physiologically, BK channels contribute to action potential after-hyperpolarization and
repolarization (van Huizen et al., 1999; Goldberg and Wilson, 2005). Functionally, BK
channels modulate neuronal excitability, firing rate and neurotransmitter release
(Raffaelli et al., 2004; Petrik et al., 2011; Zhang et al., 2013).
Ethanol has well documented effects on BK channels in a variety of organisms
ranging from mammals to worms (Dopico et al., 1998; Bukiya et al., 2013; Bukiya et al.,
2014; Davis et al., 2015). Acute ethanol increases BK channel activity by increasing the
time spent in the open confirmation (Yuan et al., 2008). The two calcium sensor regions,
RCK1 and RCK2, are particularly important in BK channel’s interaction with ethanol.
Amino acid substitutions in the RCK1 and RCK2 domain that made the two calcium
sensor sites non-functional resulted in ethanol-resistant BK channels (Liu et al., 2008;
Dopico et al., 2014). In C. elegans, the BK channel ortholog slo-1 is important in ethanol
sensitivity (Davies et al., 2003; Hong et al., 2008; Bettinger et al., 2012; Dillon et al.,
2013; Davis et al., 2014). slo-1 was first isolated as an ethanol target in worms from a
80
forward genetic screen where worms were mutagenized and screen for resistance to the
inhibitory effect of ethanol on crawling speed (Davies et al., 2003). Genomic mapping of
the strains with strong resistance to ethanol found that several of the strains carried
mutations in the slo-1 gene. This resistance to ethanol was eliminated when wild-type
copies of slo-1 were restored in neurons but not in muscles (Davies et al., 2003). This
indicates that slo-1 in neurons contributed to ethanol’s inhibitory effect on crawling
speed. Furthermore, electrophysiology studies from whole cell patch clamp of C. elegans
neurons confirmed that 20mM ethanol increased SLO-1 current in wild-type animals, but
failed to do so in slo-1 null mutants or a slo-1(js118) mutant missing the RCK2 region
(Davies et al., 2003). In addition, gain of function slo-1 mutants showed a crawling speed
phenotype comparable to wild-type on ethanol, providing further support that
hyperactivity of SLO-1 is responsible for ethanol’s inhibitory effect on crawling speed.
Following that, a study of 32 slo-1 strains identified a SLO-1 T381I substitution mutation
that resulted in strong resistance to ethanol’s effect on crawling speed and egg laying
frequency (Davis et al., 2014). This T381 amino acid residue is located 10-15 residues
away from the SLO-1 RCK1 calcium sensor domain and is conserved in humans,
mammals and flies (Davis et al., 2014). When a human wild-type version of the BK
channel gene was expressed in worms, the ethanol sensitivity was restored; but when a
human version with mutation equivalent to the T381I mutation, the ethanol sensitivity
remained lost (Davis et al., 2014). These data suggest that BK channels in C. elegans and
humans have strong functional similarities, and that the SLO-1 calcium sensor domain is
involved in ethanol’s effect on behavior.

81
Figure 3-2. BK channel mutation locations The locations of 4 alleles tested are indicated by red arrows. The slo-1(eg142) contains a nonsense mutation at the first transmembrane motif S0 (Wang et al., 2001). slo-1(js379) contains a nonsense mutation at the ion pore voltage sensing region. slo-1(js118) contains a nonsense mutation before the intracellular calcium sensing domain. slo-1(gk60229) contains a T381I point mutation 10-15 residues away from the RCK1 domain.
To see if the BK channel is involved in the ethanol induced changes in tap
response plasticity, we tested 4 alleles of the C. elegans BK channel ortholog, slo-1
(Figure 3-2). Two alleles, eg142 and js379, are putative null (Davies et al., 2003;
Wormbase., 2016). The first null allele slo-1(eg142) contains a nonsense mutation at the
first transmembrane motif S0 (Wang et al., 2001). The second null allele slo-1(js379)
contains a nonsense mutation at the ion pore voltage sensing region. The other two alleles
each have a mutation in one of the two calcium sensing domains, RCK1 and RCK2.
Because ethanol has been reported to enhance BK channel function through amplifying
calcium dependent activation of the channel (Liu et al., 2008), we hypothesized that
ethanol would have less of an effect on behaviour for mutants lacking the calcium
sensors. slo-1(js118) contains a nonsense mutation before the calcium sensing domain
RCK2. slo-1(gk60229) contains a point mutation resulting a threonine to isoleucine
mutation at position 381 of the SLO-1 channel (T381I) near the RCK1 domain, and was
82
predicted to disrupt RCK1 function (Davis et al., 2014). Worms carrying the slo-
1(gk60229) mutation have strong resistance to ethanol’s inhibition on locomotor activity
similar to that of null mutant slo-1(js379) but otherwise undisrupted SLO-1 function
(Davis et al., 2014).
3.1.2 Neuropeptide Y
Ethanol’s actions on the nervous system are known to involve numerous
neurotransmitter receptors including the Neuropeptide Y receptor, dopamine receptors,
and glutamate receptors (Crews et al., 1995; Harris et al., 2008). The neuropeptide Y
receptor (NPY) is a Gai-protein coupled receptor that is involved in a diverse array of
behavioral processes in mammals including appetite, anxiety, alcohol consumption and
resistance (Thiele et al., 1998; Thorsell, 2007). In addition, the C. elegans neuropeptide Y
receptor ortholog npr-1 modulates ethanol related behaviors (Davies et al., 2004).
In this study I tested two alleles of npr-1. npr-1(ad609) had a null mutation and
npr-1(g320) carried a point mutation that had previously been demonstrated to play a role
in ethanol tolerance (Davies et al., 2004). C. elegans carrying the npr-1(ad609) null
mutation have been reported to show resistance to the depressive effect of ethanol on
movement speed (Davies et al., 2004). The next npr-1 mutant I assayed was npr-1(g320)
which carries a point mutation converting npr-1 amino acid V215F (Gloria-Soria and
Azevedo, 2008).
NPR-1 has two known ligands in C. elegans, the FMRFamide-related peptide
orthologs FLP-18 and FLP-21 (Li and Kim, 2008). FLP-18 activates only NPR-1 with the
215F amino acid form, while FLP-21 activates both the 215F form and 215V forms
(Wormbase., 2016). The flp-18(gk3063) allele tested is a putative null mutation,
83
containing a deletion overlapping the entire flp-18 coding region (Wormbase., 2016). The
flp-21(ok889) allele tested is also a putative null, containing a deletion mutation
overlapping the complete coding region (Wormbase., 2016).
3.1.3 Diacylglycerol kinase (DGK)
Another mutant that has previously been shown to moderate resistance to
ethanol’s effects on behavior is dgk-1 (Davies et al., 2003). dgk-1 encodes an ortholog of
diacylglycerol kinase (DGK), which is a family of enzymes that catalyzes the conversion
of diacylglycerol (DAG) to phosphatidic acid (PA). The conversion of DAG to PA stops
the downstream signaling pathway of DAG, whose targets include kinases such as protein
kinase C. dgk-1 was one of the genes isolated from the ethanol resistance forward genetic
screen (Davies et al., 2003). In comparison to the strong ethanol resistant of the slo-1
mutant, dgk-1(nu62) was only mildly resistant to the effect of ethanol on crawling speed
(Davies et al., 2003), thus dgk-1 did not receive attention after that report. However, our
lab’s data suggest dgk-1 is an important modulator of tap reversal probability in the
absence of ethanol (Andrea; McEwan, 2013), therefore, the gene was added to my screen.
The mutant tested carried a dgk-1(nu62) allele, containing a nonsense substitution at
R167 exon 5 of dgk-1.
3.1.4 Protein kinase A, protein kinase C, and calcineurin B
DAG is part of the G protein signaling pathway that modulates the availability of
2nd messengers (i.e. cAMP, PIP2) which then regulates the activities of effector proteins
such as protein kinase A (kin-1), protein kinase C (pkc-1), and calcineurin B (cnb-1).
Because loss of function mutations in the protein kinase A ortholog kin-1 are lethal, we
84
tested a point mutation in the PKA regulator kin-2, which results in constitutively active
PKA activity (Schade et al., 2005). On the other hand, the activity of the protein kinase C
ortholog, pkc-1, is inhibited by activation of dgk-1/DGK (Bastiani and Mendel, 2006).
The pkc-1(ok563) allele tested contains a 1.3kb deletion removing the C2-like domain
near the N-terminus (Okochi et al., 2005; Sieburth et al., 2007; Hyde et al., 2011).
cnb-1, an ortholog of a calcineurin subunit calcineurin B, was identified from my
gene network analysis to find additional candidate genes that interact with slo-1, npr-1,
and genes in the G-protein pathway. Calcineurin is a highly conserved Ca+ and
calmodulin-dependent protein phosphatase. It has numerous downstream effectors
including AMPA and NMDA glutamate receptors, thus is thought to be an important
regulator of synaptic plasticity and memory (Baumgärtel and Mansuy, 2012). Aside from
its link with learning and memory, there is some evidence suggesting an interaction of
calcineurin with ethanol. In yeast, calcineurin dephosphorylates a transcription factor,
Crz1, which is involved in the adaptation of ethanol stress (Araki et al., 2009). In fetal
alcohol spectrum disorder research, the negative effect of ethanol on neuronal migration
is thought to involve calcineurin (Kumada et al., 2007). The cnb-1(jh103) allele tested
here carries a large deletion resulting a null mutation confirmed by Western blot using an
anti-calcineurin B antibody, and was outcrossed 6 times to reduce background mutations
caused by the standard mutagenesis method (Bandyopadhyay et al., 2002).
3.1.5 Tomosyn
Tomosyn is an interactor with the SNARE complex, and functions to inhibit the
SNARE complex which then leads to inhibition of synaptic vesicle release (Gracheva et
al., 2006). As a result, tom-1 mutants accumulate an abnormally high number of neuronal

85
vesicles next to the presynaptic membrane (Gracheva et al., 2006). The tom-1 gene has 7
isoforms (Wormbase., 2016). Six of the isoforms are long isoforms and have similar
structure as the TOM-1A and TOM-1C isoforms shown in Figure 3-3. The long isoforms
differ in their alternative splicing sites for exon 13 and 16. One isoform is much shorter,
named TOM-1B, and lacks the WD40 repeats domain. All isoforms contain the R-
SNARE domain, which interacts with the SNARE protein. The TM4724 strain contains
the tm4724 allele that carries a complex substitution mutation overlapping exon 4-7 of the
gene, and the WD40 repeats. A second tom-1 allele I tested contains the ok285 allele,
which carries a deletion overlapping the tom-1 exon 9-12 region.
Figure 3-3. tom-1 isoforms gene structure and mutation location Three reported tom-1 isoforms TOM-1A, TOM-1B, and TOM-1C all contain a highly conserved R-SNARE motif. TOM-1A/C also contains WD40 repeats. The tm4724 allele carries a complex substitution mutation overlapping exon 4-7, and the WD40 repeats. The ok285 allele deleted exon 9-12. Both alleles affect isoform A/C but not isoform B.
3.1.6 Objective
The purpose of this candidate gene screen is to expand our knowledge about
mechanisms involved in ethanol’s effect on behavioral plasticity. I hypothesize that
ethanol alters different behavioural components through different sets of genes. If this
prediction is correct, my results will show that genes that are involved in one of ethanol’s
behavioral effects but not others. For example, mutations in some genes may only
eliminate ethanol’s effect on body curve, but not the effect on reversal responses. In
addition, since a genetic screen for ethanol’s effect on habituation has never been done
TOM-1ATOM-1CTOM-1B
WD40 repeats R-SNARE5/3’ untranslated regionexon
ok285, deletiontm4724, complex substitution
86
before, this study may uncover new genes that play a role on ethanol’s effects on
behaviour.
3.2 MATERIALS AND METHODS
3.2.1 Worm culture maintenance and strains
All strains used in this Chapter were obtained from C. elegans Genetic Center,
except for JPS429 and JPS428, which were courtesy of Jon Pierce-Shimomura’s
laboratory. For full list of strains see Table 3-1. The two strains, JPS428 and JPS429, had
been independently outcrossed 6 times in the Pierce-Shimomura lab with wild-type and
selected for the slo-1(gk60229) T381I point mutation (Davis et al., 2014) by the Pierce-
Shimomura lab. The outcrossing technique is a standard method to reduce background
mutations induced by the genome-wide mutagenesis method used to generate the mutant
strains (Kutscher and Shaham, 2014).

87
Table 3-1. Candidate gene screen strain information For each gene ortholog, the genotype, mutation type, strain name, and the number of times the strain was backcrossed with wildtype background are listed. Mutation(s) were designated as loss-of-function (LOF), reduction-of-function (ROF) or gain-of-function (GOF) according to the references listed.
Ortholog Genotype Mutation Strain Backcross(x) Referenceslo-1(eg142) LOF BZ142 2 Wangetal.,2001slo-1(js379) LOF NM1968 5 Wangetal.,2001slo-1(js118) ROF NM1630 4 Wangetal.,2001slo-1(gk60229)#1 ROF JPS429 6 Daviesetal.,2014slo-1(gk60229)#2 ROF JPS428 6 Daviesetal.,2014
egl-2(rg4) ROF CG197 2 LeBouefetal.,2007
unc-103(n500n1211) ROF MT2633 1Hodgkin,1983;ParkandHorvitz,1986;Reineretal.,1995;Petersenetal.,2004;Reineretal.,2006
npr-1(ad609) LOF DA609 2 Wormbase,2016npr-1(g320) ROF DA650 1 Gloria-SoriaandAzevedo,2008
flp-18(gk3063) LOF VC2016 0 Wormbase,2016flp-20(ok1596) LOF NY1184 ? Wormbase,2016flp-21(ok889) LOF RB982 0 Wormbase,2016
tom-1(ok285) LOF VC223 0 Burdinaetal.,2007tom-1(tm4724) LOF TM4724 0 Wormbase,2016
UNC-13 unc-13(e312) LOF CB312 1 Maruyamaetal.,2001
RGS eat-16(ce71) LOF KG571 6 Reynoldsetal.,2005
GEF ric-8(md1909) LOF RM2209 11 Millereta.,2000
goa-1(n1134) LOF MT2426 1 Wormbase,2016goa-1(n3055) LOF MT8626 2 Sawinetal.,2000
DGK dgk-1(nu62) LOF KP1097 2 Daviesetal.,2003
egl-30(ad806) LOF DA1084 1Mumbyetal.,1994;Brundageetal.,1996;Lambrightetal.,1996
egl-30(js126) GOF NM1380 8 XuandChisholm,2011
PLC egl-8(ok934) LOF RB1012 0 Dempseyetal.,2005
cnb-1(jh103) LOF KJ300 6 Bandyopadhyayetal.,2002cnb-1(ok276) LOF VC990 1 Bandyopadhyayetal.,2002
PKC pkc-1(ok563) LOF RB781 0Okochietal.,2005;Sieburthetal.,2007;Hydeetal.,2011
Gas gsa-1(ce81) GOF KG421 5VanDopetal.,1984;Landisetal.,1989;Lyonsetal.,1990;Shenkeretal.,1993;Sondeketal.,1994;Schadeetal.,2005
Adenylylcyclase acy-1(ce2) GOF KG518 5 Schadeetal.,2005
PDE pde-4(ok1290) LOF RB1231 0Jacobitzetal.,1996;Kovalaetal.,1997;Owensetal.,1997;Charlieetal.,2006;Yuetal.,2016
PKAregulator kin-2(ce179) LOF KG532 5 Schadeetal.,2005
Dopaminereceptor dop-1(ok398) LOF RB665 0 Wormbase,2016
Tyrosinehydroxylase cat-2(e1112) LOF CB1112 1 LintsandEmmons,1999
glr-1(ky176) LOF VM3109 ? Maricqetal.,1995glr-1(n2461) LOF KP4 4 Hartetal.,1995
Neuroligin nlg-1(ok259) LOF VC228 0 Hunteretal.,2010
nrx-1(ds1) LOF SG1 3 Maroetal.,2015nrx-1(ok1649) LOF VC1416 1 Wormbase,2016
miR1 mir-1(gk276) LOF VC576 0 Wormbase,2016
PTCHD3 ptr-6(ok2988) LOF VC2301 0 Choietal.,2016
Gaq
CalcineurinB
AMPA-typeglutamatereceptor
Neurexin
BKchannel
Voltagegatedpotassiumchannel
NeuropeptideYreceptor
NeuropeptideY
Tomosyn
Gai

88
3.2.2 Behavioral assay and statistics
Protocols for ethanol treatment and behavioral assays of responses to repeated
taps are described in the previous Chapter. Ethanol sensitivity was measured by ethanol’s
depressive effects on body curve. Recall that wild-type worms exposed to increasing
doses of ethanol showed progressively flatter body posture and that this can be used as a
reliable indicator of intoxication. Body curve measured 5 s before the first tap was used
to assess the intoxication state of the worms on that plate before the onset of behavioral
testing. Mean body curves per group were generated by calculating a mean of the mean
body curve per plate (a mean of body curves of all worms on the same plate) for all of the
plates in the experiment. Percent body curve (% body curve) was calculated by dividing
the mean body curve of a 400mM plate by the mean of body curve of all 0mM plates
within the same experiment. Measured in this way, wild-type worms consistently showed
a ~30-50% flatter body curve on 400mM ethanol than the 0mM control worms.
ANOVAs were used to compare % body curve between wild-type and mutant worms.
For responses to taps, multifactorial repeated measures ANOVAs were used to determine
significant effects of time, strain, and dose and on reversal or acceleration response
probability. Tukey’s posthoc test was used to compare between groups, between each
time point within or between groups. An ethanol group was determined to show
significant ethanol effects on increasing acceleration response probability if Tukey’s
posthoc test showed a significant difference between the 400mM and 0mM control group
within a strain.
89
3.3 RESULTS
The results for all experiments are summarized in Table 3-2. More comprehensive
statistical results are listed in Table A- 1 (body curve), Table A- 2 (reversal probability),
and Table A- 3 (acceleration probability). I found 19 genes that played a role in ethanol’s
effects on body curve, habituation of reversal response probability, or acceleration
responses (slo-1, eg-2, npr-1, flp-18, dgk-1, cnb-1, pkc-1, tom-1, unc-13, glr-1, ric-8, egl-
30, goa-1, gsa-1 acy-1, pde-4, nlg-1, nrx-1, and ptr-6), and 9 genes did not (unc-103, flp-
20, flp-21, dop-1, cat-2, eat-16, egl-8, kin-2, and mir-1; Table 3-2). Of the genes tested a
few stood out as having particularly large effects on how ethanol altered behavior, or a
unique pattern of effects on one of more of these phenotypes. These are slo-1, npr-1, flp-
18, dgk-1, pkc-1, cnb-1, and tom-1.
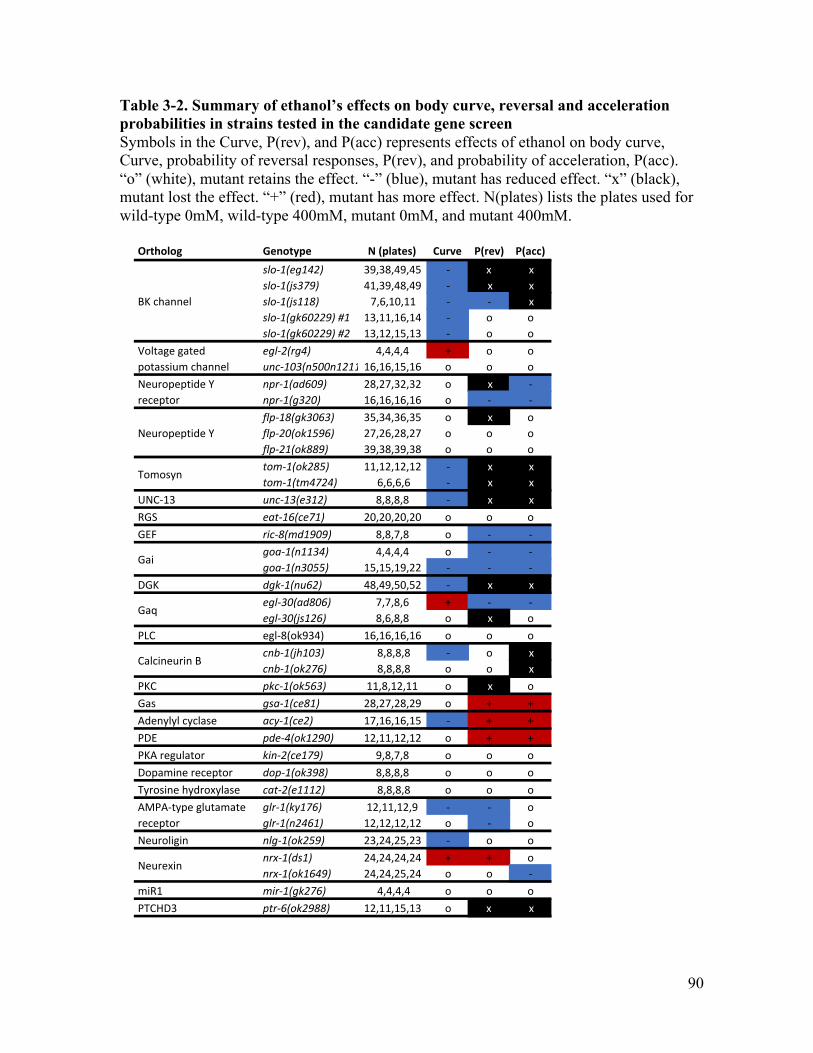
90
Table 3-2. Summary of ethanol’s effects on body curve, reversal and acceleration probabilities in strains tested in the candidate gene screen Symbols in the Curve, P(rev), and P(acc) represents effects of ethanol on body curve, Curve, probability of reversal responses, P(rev), and probability of acceleration, P(acc). “o” (white), mutant retains the effect. “-” (blue), mutant has reduced effect. “x” (black), mutant lost the effect. “+” (red), mutant has more effect. N(plates) lists the plates used for wild-type 0mM, wild-type 400mM, mutant 0mM, and mutant 400mM.
Ortholog Genotype N(plates) Curve P(rev) P(acc)slo-1(eg142) 39,38,49,45 - x x
slo-1(js379) 41,39,48,49 - x x
slo-1(js118) 7,6,10,11 - - x
slo-1(gk60229)#1 13,11,16,14 - o o
slo-1(gk60229)#2 13,12,15,13 - o o
egl-2(rg4) 4,4,4,4 + o o
unc-103(n500n1211)16,16,15,16 o o o
npr-1(ad609) 28,27,32,32 o x -
npr-1(g320) 16,16,16,16 o - -
flp-18(gk3063) 35,34,36,35 o x o
flp-20(ok1596) 27,26,28,27 o o o
flp-21(ok889) 39,38,39,38 o o o
tom-1(ok285) 11,12,12,12 - x x
tom-1(tm4724) 6,6,6,6 - x x
UNC-13 unc-13(e312) 8,8,8,8 - x x
RGS eat-16(ce71) 20,20,20,20 o o o
GEF ric-8(md1909) 8,8,7,8 o - -
goa-1(n1134) 4,4,4,4 o - -
goa-1(n3055) 15,15,19,22 - - -
DGK dgk-1(nu62) 48,49,50,52 - x x
egl-30(ad806) 7,7,8,6 + - -
egl-30(js126) 8,6,8,8 o x o
PLC egl-8(ok934) 16,16,16,16 o o o
cnb-1(jh103) 8,8,8,8 - o x
cnb-1(ok276) 8,8,8,8 o o x
PKC pkc-1(ok563) 11,8,12,11 o x o
Gas gsa-1(ce81) 28,27,28,29 o + +
Adenylylcyclase acy-1(ce2) 17,16,16,15 - + +
PDE pde-4(ok1290) 12,11,12,12 o + +
PKAregulator kin-2(ce179) 9,8,7,8 o o o
Dopaminereceptor dop-1(ok398) 8,8,8,8 o o o
Tyrosinehydroxylase cat-2(e1112) 8,8,8,8 o o o
glr-1(ky176) 12,11,12,9 - - o
glr-1(n2461) 12,12,12,12 o - o
Neuroligin nlg-1(ok259) 23,24,25,23 - o o
nrx-1(ds1) 24,24,24,24 + + o
nrx-1(ok1649) 24,24,25,24 o o -
miR1 mir-1(gk276) 4,4,4,4 o o o
PTCHD3 ptr-6(ok2988) 12,11,15,13 o x x
AMPA-typeglutamate
receptor
Neurexin
Tomosyn
Gai
Gaq
CalcineurinB
BKchannel
Voltagegated
potassiumchannel
NeuropeptideY
receptor
NeuropeptideY

91
In this Results section I will discuss in detail the 7 genes that showed the strongest
or most unique effects in my ethanol habituation assays (slo-1, npr-1, flp-18, dgk-1, tom-
1, pkc-1, and cnb-1). I first investigated 4 alleles of slo-1, which is the most well
characterized ethanol target out of our 27 candidates and found that slo-1 is involved in
ethanol’s effects on both reversal and acceleration responses. Another gene known to
play a role in ethanol’s effects on behaviour, the Neuropeptide Y receptor, npr-1, also
altered ethanol’s effects on both reversals and accelerations, however one putative
neuropeptide Y ligand, flp-18, only affected reversals and the other, flp-21 played no role
in ethanol’s effects on habituation. The diacylglycerol kinase, dgk-1, previously reported
to have a weak role in ethanol’s effects on C. elegans’ locomotion, showed a strong
involvement in ethanol’s effects on reversal and acceleration responses. Two genes, pkc-1
and cnb-1, predicted downstream effectors of dgk-1, showed a role in only reversals or
accelerations, respectively. All the genes described thus far were implicated in ethanol’s
effects on behaviour. The last gene I will describe in detail is tomosyn, tom-1, which has
not previously been implicated in ethanol’s effects on behavior in any organism.
3.3.1 Big conductance voltage gated potassium calcium mediated channel (BK
channel)
To see whether the BK channel is involved in the ethanol induced changes in tap
response plasticity, we tested 4 alleles of the C. elegans BK channel ortholog, slo-1
(Figure 3-2).
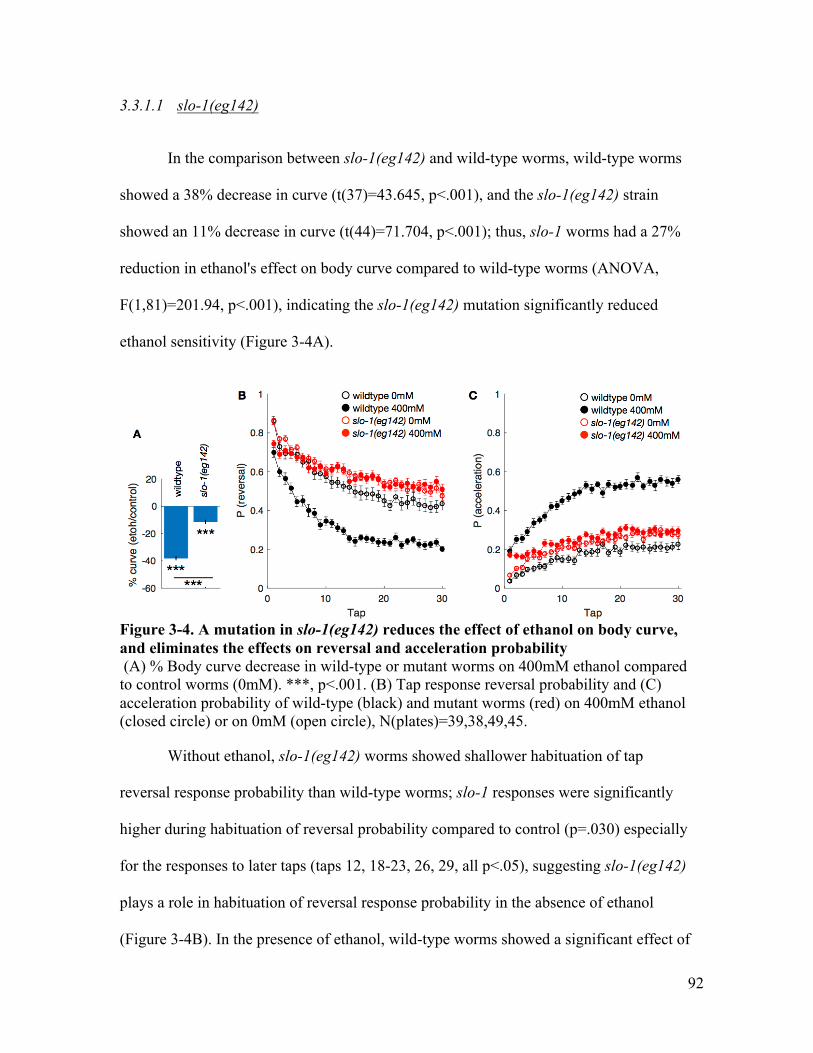
92
3.3.1.1 slo-1(eg142)
In the comparison between slo-1(eg142) and wild-type worms, wild-type worms
showed a 38% decrease in curve (t(37)=43.645, p<.001), and the slo-1(eg142) strain
showed an 11% decrease in curve (t(44)=71.704, p<.001); thus, slo-1 worms had a 27%
reduction in ethanol's effect on body curve compared to wild-type worms (ANOVA,
F(1,81)=201.94, p<.001), indicating the slo-1(eg142) mutation significantly reduced
ethanol sensitivity (Figure 3-4A).
Figure 3-4. A mutation in slo-1(eg142) reduces the effect of ethanol on body curve, and eliminates the effects on reversal and acceleration probability (A) % Body curve decrease in wild-type or mutant worms on 400mM ethanol compared to control worms (0mM). ***, p<.001. (B) Tap response reversal probability and (C) acceleration probability of wild-type (black) and mutant worms (red) on 400mM ethanol (closed circle) or on 0mM (open circle), N(plates)=39,38,49,45.
Without ethanol, slo-1(eg142) worms showed shallower habituation of tap
reversal response probability than wild-type worms; slo-1 responses were significantly
higher during habituation of reversal probability compared to control (p=.030) especially
for the responses to later taps (taps 12, 18-23, 26, 29, all p<.05), suggesting slo-1(eg142)
plays a role in habituation of reversal response probability in the absence of ethanol
(Figure 3-4B). In the presence of ethanol, wild-type worms showed a significant effect of
93
ethanol on habituation of response probability (p<.001), but slo-1(eg142) did not. This
indicates that the slo-1(eg142) mutation completely eliminated ethanol’s effect on
habituation of reversal probability.
Ethanol’s effect on enhancing acceleration response probability to taps was
examined in the slo-1(eg142) mutant (Figure 3-4C). In the absence of ethanol, slo-
1(eg142) had slight but significantly higher acceleration response probability compared
to the wild-type 0mM group (p=.009). In the presence of ethanol, wild-type worms
showed the expected elevation of acceleration response probability (p<.001), while slo-
1(eg142) mutants did not. This suggested that the slo-1(eg142) mutation attenuated
ethanol’s effect on acceleration response.
3.3.1.2 slo-1(js379)
To confirm slo-1’s role in ethanol’s effects on responses to taps, mutants carrying
a second putatively null mutation, slo-1(js379) (Wang et al., 2001) were assayed for
ethanol sensitivity and ethanol’s effect on tap response plasticity. For ethanol sensitivity
measured by the percentage of body curve depressed by ethanol, wild-type worms
showed a 40% decrease (t(38)=32.526, p<.001), and the slo-1(js379) strain showed a
25% decrease (t(48)=36.328, p<.001), representing a 15% reduction in ethanol's effect on
body curve compared to wild-type (ANOVA, F(1,86)=27.04, p<.001; Figure 3-5A).
The analyses of ethanol’s effects on reversal probability showed that the slo-
1(js379) mutation eliminated the effect (Figure 3-5B). While wild-type worms showed
the expected effect of ethanol on reversal probability (p<.001), slo-1(js379) mutants
showed a minor, significant, but opposite effect (p=.030): the effects were restricted to
increasing rather than decreasing responses to later taps (taps 11-12, 14, 17-18, 21-26, 29-

94
30, p<.05). The data suggests that the slo1(js379) mutation eliminated ethanol’s
facilitative effect on habituation of tap reversal response probability.
Figure 3-5. A mutation in slo-1(js379) reduces the effect of ethanol on body curve, and eliminates the effects on reversal and acceleration probability (A) % Body curve decrease in wild-type or mutant worms on 400mM ethanol compared to control (0mM). ***, p<.001. (B) Tap response reversal probability and (C) acceleration probability of wild-type (black) and mutant worms (red) on 400mM (closed circle) or on 0mM (open circle), N(plates)=41,39,48,49.
The results showed that the slo-1(js379) mutation also eliminated ethanol’s effect
on acceleration probability (Figure 3-5C). While wild-type worms showed the expected
elevation of acceleration response probability (p<.001), comparison between the slo-
1(js379) 0mM and 400mM groups showed that ethanol did not alter acceleration response
probability. This result suggests that the slo-1(js379) mutation eliminated ethanol’s effect
on acceleration probability.
Overall, the slo-1(js379) mutation resulted in reduced ethanol sensitivity and
eliminated ethanol’s effect on tap response plasticity. These findings are very similar to
the findings from the other null mutation slo-1(eg142), confirming the hypothesis that
slo-1 plays an important role in all three phenotypes under investigation.
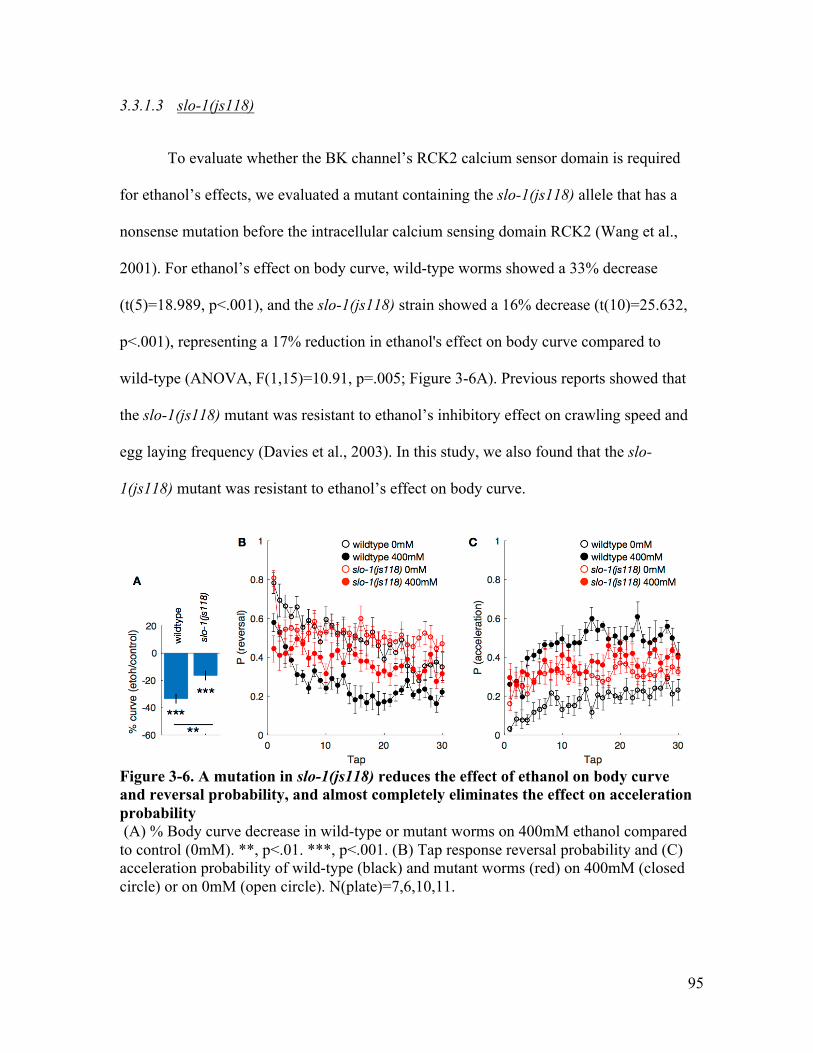
95
3.3.1.3 slo-1(js118)
To evaluate whether the BK channel’s RCK2 calcium sensor domain is required
for ethanol’s effects, we evaluated a mutant containing the slo-1(js118) allele that has a
nonsense mutation before the intracellular calcium sensing domain RCK2 (Wang et al.,
2001). For ethanol’s effect on body curve, wild-type worms showed a 33% decrease
(t(5)=18.989, p<.001), and the slo-1(js118) strain showed a 16% decrease (t(10)=25.632,
p<.001), representing a 17% reduction in ethanol's effect on body curve compared to
wild-type (ANOVA, F(1,15)=10.91, p=.005; Figure 3-6A). Previous reports showed that
the slo-1(js118) mutant was resistant to ethanol’s inhibitory effect on crawling speed and
egg laying frequency (Davies et al., 2003). In this study, we also found that the slo-
1(js118) mutant was resistant to ethanol’s effect on body curve.
Figure 3-6. A mutation in slo-1(js118) reduces the effect of ethanol on body curve and reversal probability, and almost completely eliminates the effect on acceleration probability (A) % Body curve decrease in wild-type or mutant worms on 400mM ethanol compared to control (0mM). **, p<.01. ***, p<.001. (B) Tap response reversal probability and (C) acceleration probability of wild-type (black) and mutant worms (red) on 400mM (closed circle) or on 0mM (open circle). N(plate)=7,6,10,11.
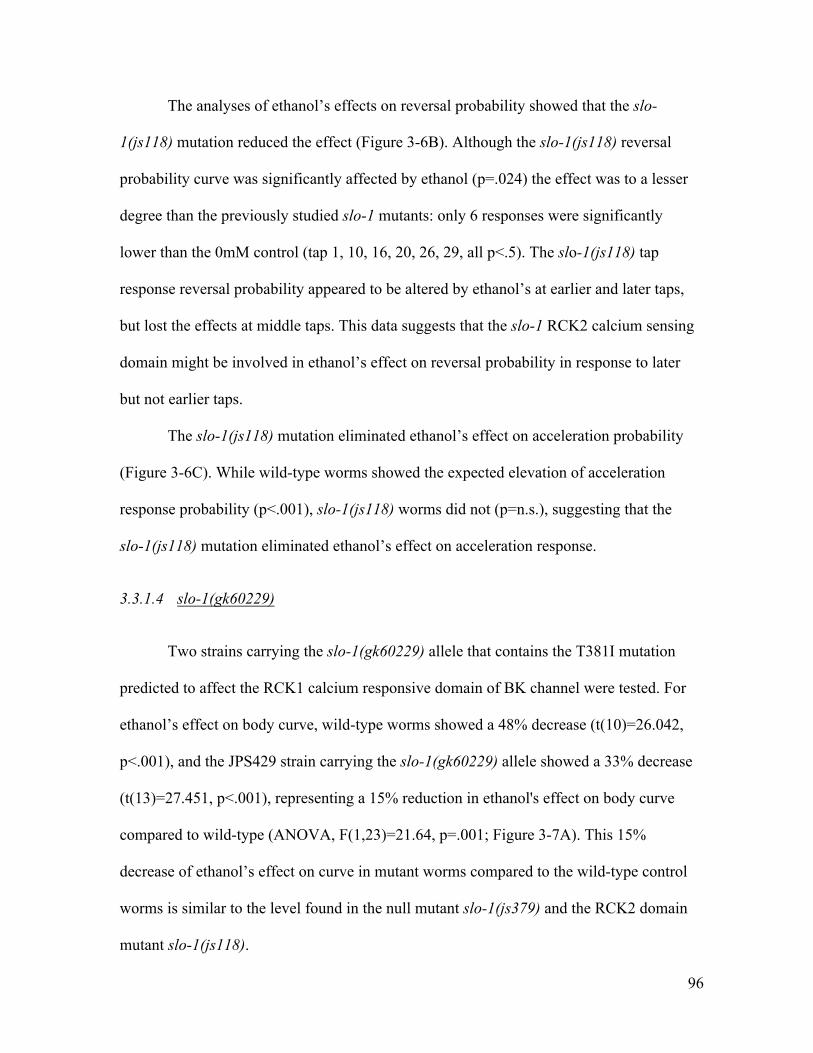
96
The analyses of ethanol’s effects on reversal probability showed that the slo-
1(js118) mutation reduced the effect (Figure 3-6B). Although the slo-1(js118) reversal
probability curve was significantly affected by ethanol (p=.024) the effect was to a lesser
degree than the previously studied slo-1 mutants: only 6 responses were significantly
lower than the 0mM control (tap 1, 10, 16, 20, 26, 29, all p<.5). The slo-1(js118) tap
response reversal probability appeared to be altered by ethanol’s at earlier and later taps,
but lost the effects at middle taps. This data suggests that the slo-1 RCK2 calcium sensing
domain might be involved in ethanol’s effect on reversal probability in response to later
but not earlier taps.
The slo-1(js118) mutation eliminated ethanol’s effect on acceleration probability
(Figure 3-6C). While wild-type worms showed the expected elevation of acceleration
response probability (p<.001), slo-1(js118) worms did not (p=n.s.), suggesting that the
slo-1(js118) mutation eliminated ethanol’s effect on acceleration response.
3.3.1.4 slo-1(gk60229)
Two strains carrying the slo-1(gk60229) allele that contains the T381I mutation
predicted to affect the RCK1 calcium responsive domain of BK channel were tested. For
ethanol’s effect on body curve, wild-type worms showed a 48% decrease (t(10)=26.042,
p<.001), and the JPS429 strain carrying the slo-1(gk60229) allele showed a 33% decrease
(t(13)=27.451, p<.001), representing a 15% reduction in ethanol's effect on body curve
compared to wild-type (ANOVA, F(1,23)=21.64, p=.001; Figure 3-7A). This 15%
decrease of ethanol’s effect on curve in mutant worms compared to the wild-type control
worms is similar to the level found in the null mutant slo-1(js379) and the RCK2 domain
mutant slo-1(js118).
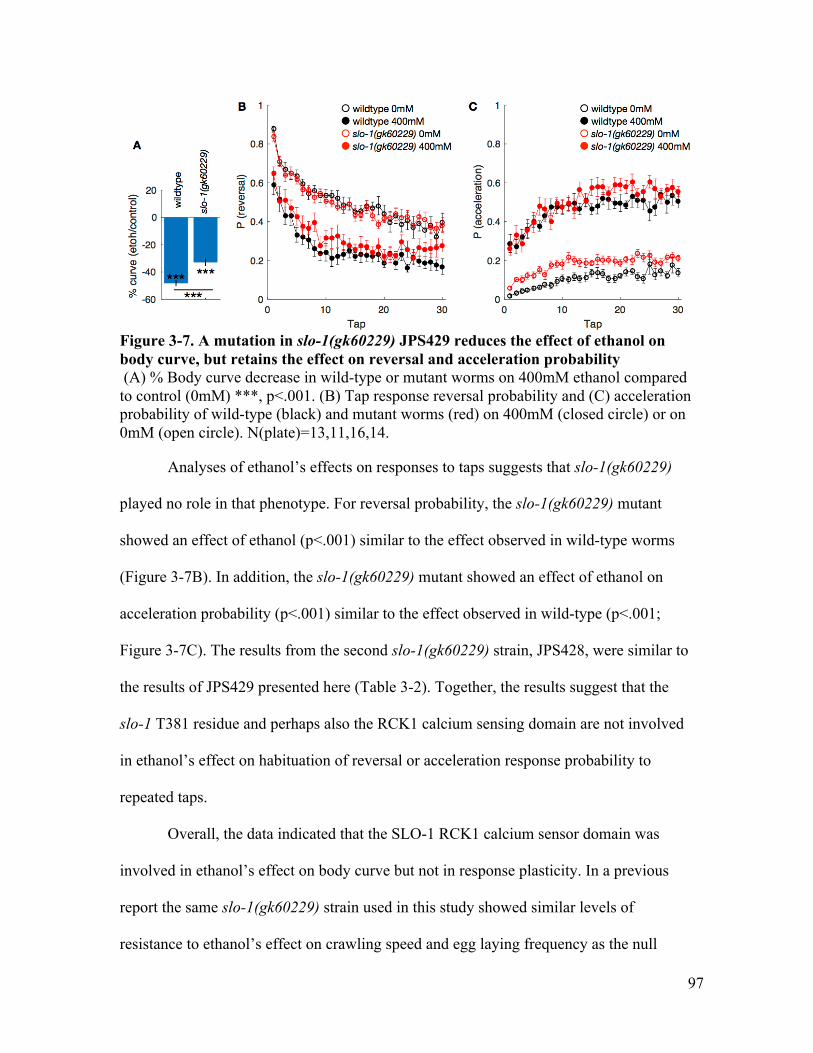
97
Figure 3-7. A mutation in slo-1(gk60229) JPS429 reduces the effect of ethanol on body curve, but retains the effect on reversal and acceleration probability (A) % Body curve decrease in wild-type or mutant worms on 400mM ethanol compared to control (0mM) ***, p<.001. (B) Tap response reversal probability and (C) acceleration probability of wild-type (black) and mutant worms (red) on 400mM (closed circle) or on 0mM (open circle). N(plate)=13,11,16,14.
Analyses of ethanol’s effects on responses to taps suggests that slo-1(gk60229)
played no role in that phenotype. For reversal probability, the slo-1(gk60229) mutant
showed an effect of ethanol (p<.001) similar to the effect observed in wild-type worms
(Figure 3-7B). In addition, the slo-1(gk60229) mutant showed an effect of ethanol on
acceleration probability (p<.001) similar to the effect observed in wild-type (p<.001;
Figure 3-7C). The results from the second slo-1(gk60229) strain, JPS428, were similar to
the results of JPS429 presented here (Table 3-2). Together, the results suggest that the
slo-1 T381 residue and perhaps also the RCK1 calcium sensing domain are not involved
in ethanol’s effect on habituation of reversal or acceleration response probability to
repeated taps.
Overall, the data indicated that the SLO-1 RCK1 calcium sensor domain was
involved in ethanol’s effect on body curve but not in response plasticity. In a previous
report the same slo-1(gk60229) strain used in this study showed similar levels of
resistance to ethanol’s effect on crawling speed and egg laying frequency as the null

98
mutant slo-1(js379) strain (Davis et al., 2014). I reported the same for ethanol’s effect on
body curve. The two slo-1(gk60229) strains showed 12% reduction in ethanol’s effect on
body curve, while slo-1(js379) showed a 14% reduction. However, the slo-1(gk60229)
mutants had little resistance to ethanol’s effects on the plasticity of responses to repeated
taps. Both slo-1(gk60229) strains (JPS428 and JPS429) showed significant effects of
ethanol on the habituation of tap reversal probability and the acceleration probability.
These data suggest that the T381 amino acid near the RCK1 domain is important for
some but not all ethanol’s effects on behaviours.
3.3.2 NPY receptor plays a critical role in ethanol’s effect on reversal and
acceleration response to repeated taps, but not on body curve
To determine whether the NPY receptor ortholog, npr-1, is involved in ethanol’s
effect on responses to repeated taps, I tested two alleles of npr-1, npr-1(ad609) and npr-
1(g320).
3.3.2.1 npr-1(ad609)
When I tested the null mutation, npr-1(ad609), for ethanol sensitivity as measured
by the percentage of body curve depressed by ethanol, wild-type worms showed a 42%
decrease (t(27)=26.932, p<.001), and the npr-1(ad609) worms showed a 43% decrease
(t(31)=40.376, p<.001), representing the same ethanol effect on body curve compared to
wild-type (ANOVA, F(1,58)=.36, p=.550; Figure 3-8). Thus, the npr-1(ad609) mutation
did not alter ethanol’s effect on body curve. This is different from the previous reports
showing that npr-1 had strong resistance to ethanol’s effect as measured by crawling
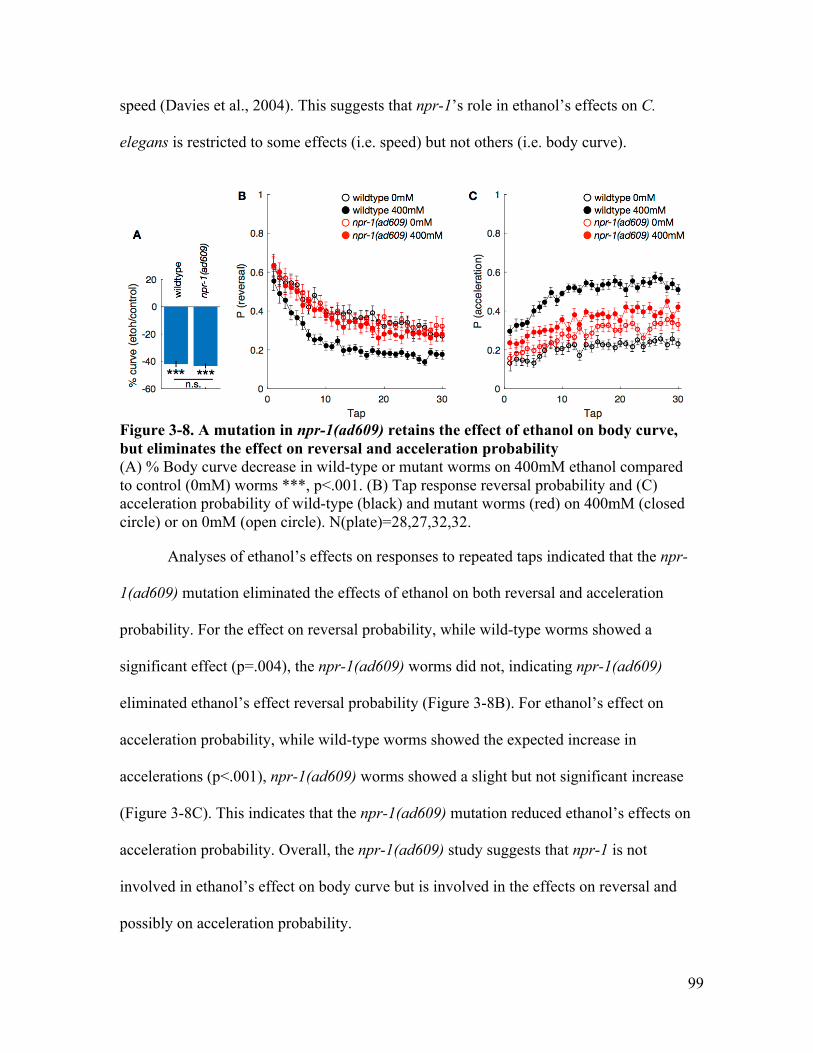
99
speed (Davies et al., 2004). This suggests that npr-1’s role in ethanol’s effects on C.
elegans is restricted to some effects (i.e. speed) but not others (i.e. body curve).
Figure 3-8. A mutation in npr-1(ad609) retains the effect of ethanol on body curve, but eliminates the effect on reversal and acceleration probability (A) % Body curve decrease in wild-type or mutant worms on 400mM ethanol compared to control (0mM) worms ***, p<.001. (B) Tap response reversal probability and (C) acceleration probability of wild-type (black) and mutant worms (red) on 400mM (closed circle) or on 0mM (open circle). N(plate)=28,27,32,32.
Analyses of ethanol’s effects on responses to repeated taps indicated that the npr-
1(ad609) mutation eliminated the effects of ethanol on both reversal and acceleration
probability. For the effect on reversal probability, while wild-type worms showed a
significant effect (p=.004), the npr-1(ad609) worms did not, indicating npr-1(ad609)
eliminated ethanol’s effect reversal probability (Figure 3-8B). For ethanol’s effect on
acceleration probability, while wild-type worms showed the expected increase in
accelerations (p<.001), npr-1(ad609) worms showed a slight but not significant increase
(Figure 3-8C). This indicates that the npr-1(ad609) mutation reduced ethanol’s effects on
acceleration probability. Overall, the npr-1(ad609) study suggests that npr-1 is not
involved in ethanol’s effect on body curve but is involved in the effects on reversal and
possibly on acceleration probability.
100
3.3.2.2 npr-1(g320)
The next npr-1 mutant I assayed was npr-1(g320) which carries a point mutation
converting npr-1 amino acid V215F (Gloria-Soria and Azevedo, 2008). For ethanol
sensitivity measured by the percentage of body curve depressed by ethanol, wild-type
showed a 49% decrease (t(15)=48.212, p<.001), and the npr-1(g320) strain showed a
50% decrease (t(15)=38.228, p<.001), indicating that there was no difference in ethanol’s
effect on body curve compared to wild-type worms (ANOVA, F(1,30)=.36, p=n.s.;
Figure 3-9A). Similar to the finding in the npr-1(ad609) study, the results indicated that
the npr-1(g320) mutation also did not alter ethanol’s effect on body curve.
Figure 3-9. A mutation in npr-1(g320) retains the effect of ethanol on body curve, but reduces the effect on reversal and acceleration probability (A) % Body curve decreased in wild-type or mutant worms on 400mM ethanol compared to control (0mM). ***, p<.001. (B) Tap response reversal probability and (C) acceleration probability of wild-type (black) and mutant worms (red) on 400mM (closed circle) or on 0mM (open circle). N(plate)=16,16,16,16.
Analyses of ethanol’s effects on responses to taps indicated that npr-1(g320)
mutation reduced the effect on reversal and acceleration probability. While wild-type
worms showed the expected ethanol effect on reversal probability (p<.001), npr-1(g320)
mutant worms also showed a significant effect (p=.003), however, the effect was
101
restricted to the 15th taps or later (taps 14-15, 17, 19-23, 25, 28-30, p<.05; Figure 3-9B).
In contrast to npr-1(ad609) which showed no significant effect of ethanol for responses to
all taps, the npr-1(g320) mutant showed significant effects on responses to later taps. This
indicated npr-1(g320) resulted an intermediate phenotype for ethanol’s effect on reversal
probability.
For the effect on acceleration probability, both wild-type and npr-1(g320) showed
elevation of acceleration response probability (both, p<.001), however the npr-1(g320)
mutant showed less of an effect than wild-type (p<.001; Figure 3-9C). Compared to the
npr-1(ad609) worms, npr-1(g320) worms showed an intermediate effect of ethanol on
acceleration probability.
Overall, the npr-1(g320) study indicated that the 215V mutation has a minor role
in ethanol’s effect on response plasticity, and no role in the effect on body curve. Neither
the npr-1 null mutant npr-1(ad609) or the V215F substitution mutant npr-1(g320)
showed an effect of ethanol on body curve, indicating that ethanol’s effect on body curve
does not involve npr-1 (Figure 3-9A). The mutant strain with the point mutation retained
much but not all effects of ethanol on tap responses. For reversal probability, npr-1(g320)
lost ethanol’s effect on responses to first half of the taps, but retained the effects on the
second half (Figure 3-9B). For acceleration probability npr-1(g320) mutant worms
showed an intermediate effect while npr-1(ad609) showed a very small effect (Figure
3-8C and Figure 3-9C). Together, the npr-1 studies demonstrated a role of npr-1 in
ethanol’s effect on reversal and acceleration responses to repeated taps, and suggest that
the npr-1 215 amino acid might be modulating part but not all the observed effects.
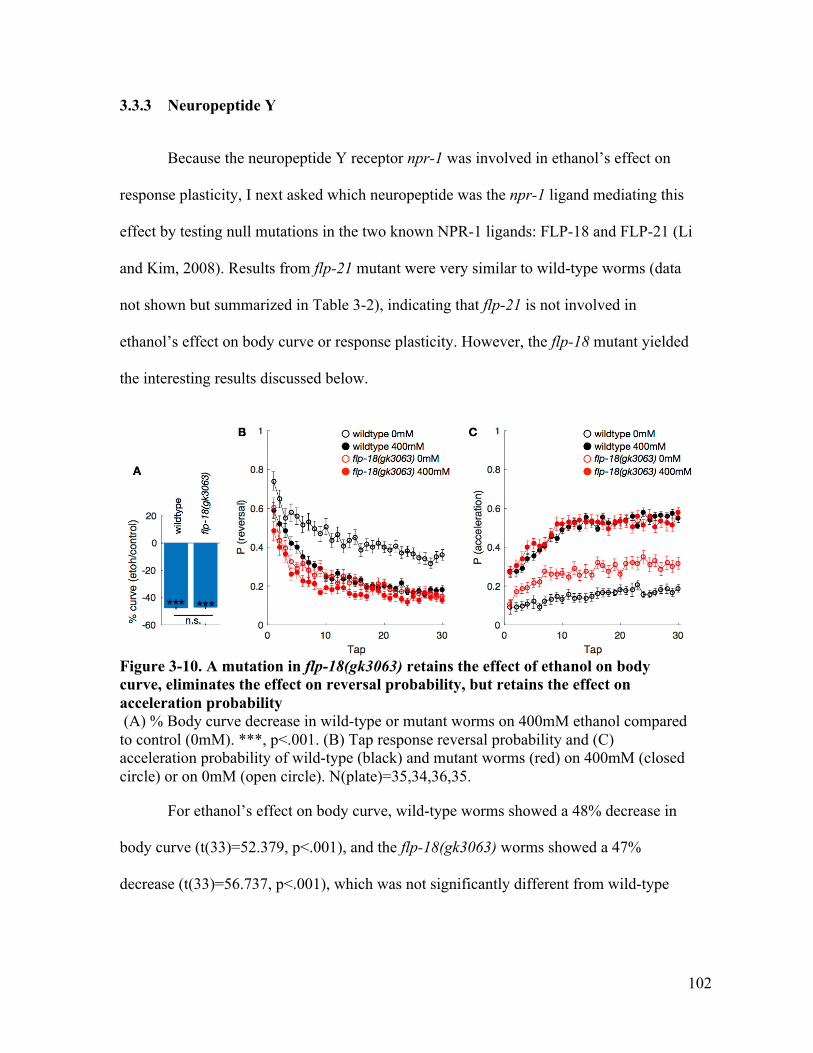
102
3.3.3 Neuropeptide Y
Because the neuropeptide Y receptor npr-1 was involved in ethanol’s effect on
response plasticity, I next asked which neuropeptide was the npr-1 ligand mediating this
effect by testing null mutations in the two known NPR-1 ligands: FLP-18 and FLP-21 (Li
and Kim, 2008). Results from flp-21 mutant were very similar to wild-type worms (data
not shown but summarized in Table 3-2), indicating that flp-21 is not involved in
ethanol’s effect on body curve or response plasticity. However, the flp-18 mutant yielded
the interesting results discussed below.
Figure 3-10. A mutation in flp-18(gk3063) retains the effect of ethanol on body curve, eliminates the effect on reversal probability, but retains the effect on acceleration probability (A) % Body curve decrease in wild-type or mutant worms on 400mM ethanol compared to control (0mM). ***, p<.001. (B) Tap response reversal probability and (C) acceleration probability of wild-type (black) and mutant worms (red) on 400mM (closed circle) or on 0mM (open circle). N(plate)=35,34,36,35.
For ethanol’s effect on body curve, wild-type worms showed a 48% decrease in
body curve (t(33)=52.379, p<.001), and the flp-18(gk3063) worms showed a 47%
decrease (t(33)=56.737, p<.001), which was not significantly different from wild-type

103
worms (Figure 3-10A). Similar to its receptor npr-1, a mutation in flp-18(gk3063) did not
affect ethanol's effect on body curve.
Analyses of ethanol’s effects on responses to taps indicated that the flp-
18(gk3063) mutation eliminated the effect on reversal probability but retained the effect
on acceleration probability. For the effect on reversal probability, wild-type worms
showed the expected effect (p<.001), but the flp-18(gk3063) mutant worms did not
(Figure 3-10B). In fact, the reversal probability curve of the flp-18(gk3063) 400mM
group was nearly identical to the wild-type 400mM group differing in only 3 responses
(taps 4, 5, 23, p<.05). This lack of an ethanol effect was unlikely to be due to a floor
effect because ethanol depressed reversal probability to nearly zero in other mutants with
a phenotype similar to flp-18 off of ethanol (i.e. tom-1, data shown in later section).
Therefore, the data suggests that the flp-18 mutation eliminated ethanol’s effect on
reversal probability.
For ethanol’s effect on acceleration probability, wild-type worms showed the
expected effect (p<.001) as did flp-18(gk3063) (p<.001; Figure 3-10C). Even though flp-
18(gk3063) without ethanol had a higher acceleration curve compared to wild-type
worms(p<.001), flp-18(gk3063) on ethanol had similar acceleration curves to wild-type
on ethanol (p=n.s.). Because the flp-18(gk3063) mutant showed an effect of ethanol
comparable to wild-type worms, the data suggests that flp-18 is not important for
ethanol's effect on acceleration response probability.
Overall, the results indicated that although flp-18 is involved in ethanol’s effects
on response plasticity, it is only critically involved in ethanol’s effect on reversal
probability, but not in the effects on acceleration. Similar to its putative ligand, npr-1, flp-
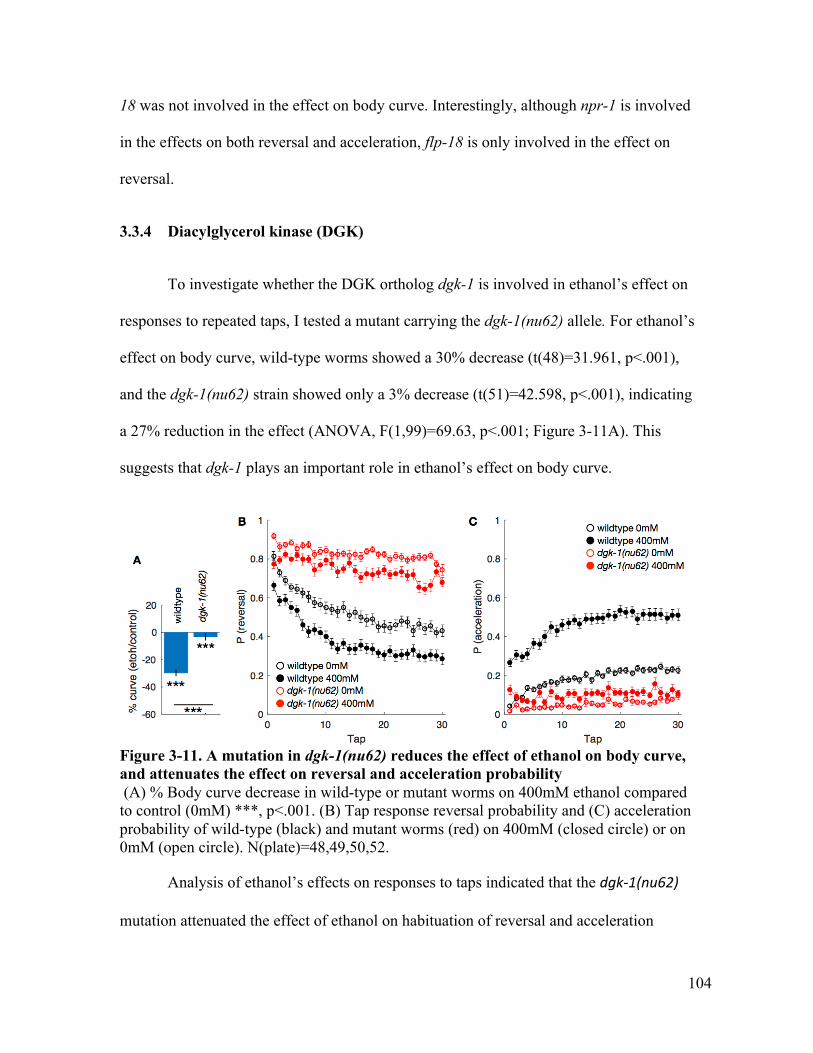
104
18 was not involved in the effect on body curve. Interestingly, although npr-1 is involved
in the effects on both reversal and acceleration, flp-18 is only involved in the effect on
reversal.
3.3.4 Diacylglycerol kinase (DGK)
To investigate whether the DGK ortholog dgk-1 is involved in ethanol’s effect on
responses to repeated taps, I tested a mutant carrying the dgk-1(nu62) allele. For ethanol’s
effect on body curve, wild-type worms showed a 30% decrease (t(48)=31.961, p<.001),
and the dgk-1(nu62) strain showed only a 3% decrease (t(51)=42.598, p<.001), indicating
a 27% reduction in the effect (ANOVA, F(1,99)=69.63, p<.001; Figure 3-11A). This
suggests that dgk-1 plays an important role in ethanol’s effect on body curve.
Figure 3-11. A mutation in dgk-1(nu62) reduces the effect of ethanol on body curve, and attenuates the effect on reversal and acceleration probability (A) % Body curve decrease in wild-type or mutant worms on 400mM ethanol compared to control (0mM) ***, p<.001. (B) Tap response reversal probability and (C) acceleration probability of wild-type (black) and mutant worms (red) on 400mM (closed circle) or on 0mM (open circle). N(plate)=48,49,50,52.
Analysis of ethanol’s effects on responses to taps indicated that the dgk-1(nu62)
mutation attenuated the effect of ethanol on habituation of reversal and acceleration
105
probability. For the effect on reversal probability, both wild-type and dgk-1(nu62)
mutants showed the effects (p<.001; p=.005), though for dgk-1(nu62) mutant worms the
effects were much smaller than for wild-type worms, and were limited to fewer than half
of the responses (taps 1, 2, 4, 12, 16-19, 26-28, p<.05), suggesting that the dgk-1(nu62)
mutation attenuated ethanol’s effect on reversal probability (Figure 3-11B). For the effect
on acceleration, although dgk-1(nu62) worms showed an effect of ethanol (p=.038) as did
wild-type (p<.001), the effect for dgk-1 was again much smaller than wild-type, and was
limited to responses to 4 taps (pairwise, t1, p=.001, t6, p=.045, t8, p=.025, t16, p=.037;
Figure 3-11C). These data suggested that the dgk-1(nu62) mutation attenuated ethanol’s
effect on habituation of the acceleration response. However, it is important to note that
the dgk-1 mutation also altered habituation to taps in the absence of ethanol. Overall, the
dgk-1 mutant had strong resistance to ethanol’s effect on body curve, and response
plasticity.
3.3.5 Protein kinase C
Mutations in genes encoding orthologs of protein kinase A (kin-1), protein kinase
C (pkc-1), and calcineurin B (cnb-1) were tested to determine whether the activity of
effector proteins of the G protein signaling pathway are involved in ethanol’s effects.
Because loss of function mutations in the protein kinase A ortholog kin-1 are lethal, we
tested a point mutation in the PKA regulator kin-2, which results in constitutively active
PKA activity (Schade et al., 2005). My results indicated that kin-2 mutant had normal
ethanol effects (Table 3-2). However, results from pkc-1 and cnb-1 yielded interesting
results: mutation in pkc-1 attenuated ethanol’s effect on reversal response, while
mutations in cnb-1 attenuated the effects on acceleration response.
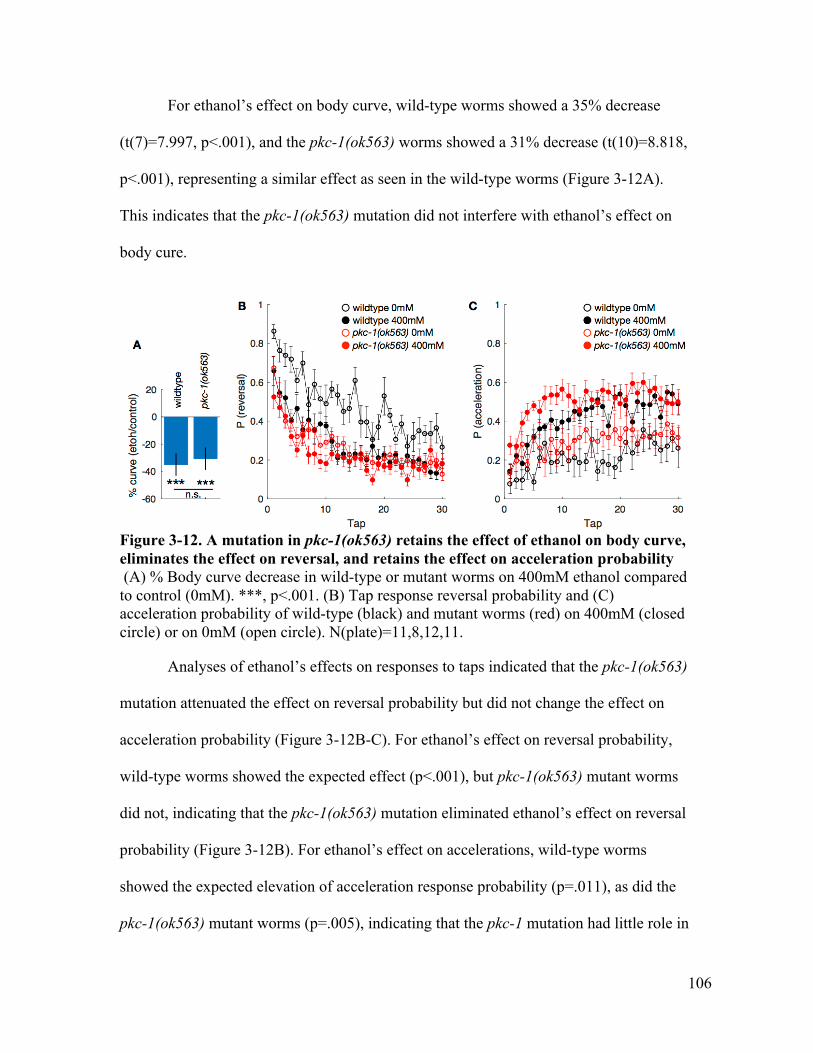
106
For ethanol’s effect on body curve, wild-type worms showed a 35% decrease
(t(7)=7.997, p<.001), and the pkc-1(ok563) worms showed a 31% decrease (t(10)=8.818,
p<.001), representing a similar effect as seen in the wild-type worms (Figure 3-12A).
This indicates that the pkc-1(ok563) mutation did not interfere with ethanol’s effect on
body cure.
Figure 3-12. A mutation in pkc-1(ok563) retains the effect of ethanol on body curve, eliminates the effect on reversal, and retains the effect on acceleration probability (A) % Body curve decrease in wild-type or mutant worms on 400mM ethanol compared to control (0mM). ***, p<.001. (B) Tap response reversal probability and (C) acceleration probability of wild-type (black) and mutant worms (red) on 400mM (closed circle) or on 0mM (open circle). N(plate)=11,8,12,11.
Analyses of ethanol’s effects on responses to taps indicated that the pkc-1(ok563)
mutation attenuated the effect on reversal probability but did not change the effect on
acceleration probability (Figure 3-12B-C). For ethanol’s effect on reversal probability,
wild-type worms showed the expected effect (p<.001), but pkc-1(ok563) mutant worms
did not, indicating that the pkc-1(ok563) mutation eliminated ethanol’s effect on reversal
probability (Figure 3-12B). For ethanol’s effect on accelerations, wild-type worms
showed the expected elevation of acceleration response probability (p=.011), as did the
pkc-1(ok563) mutant worms (p=.005), indicating that the pkc-1 mutation had little role in
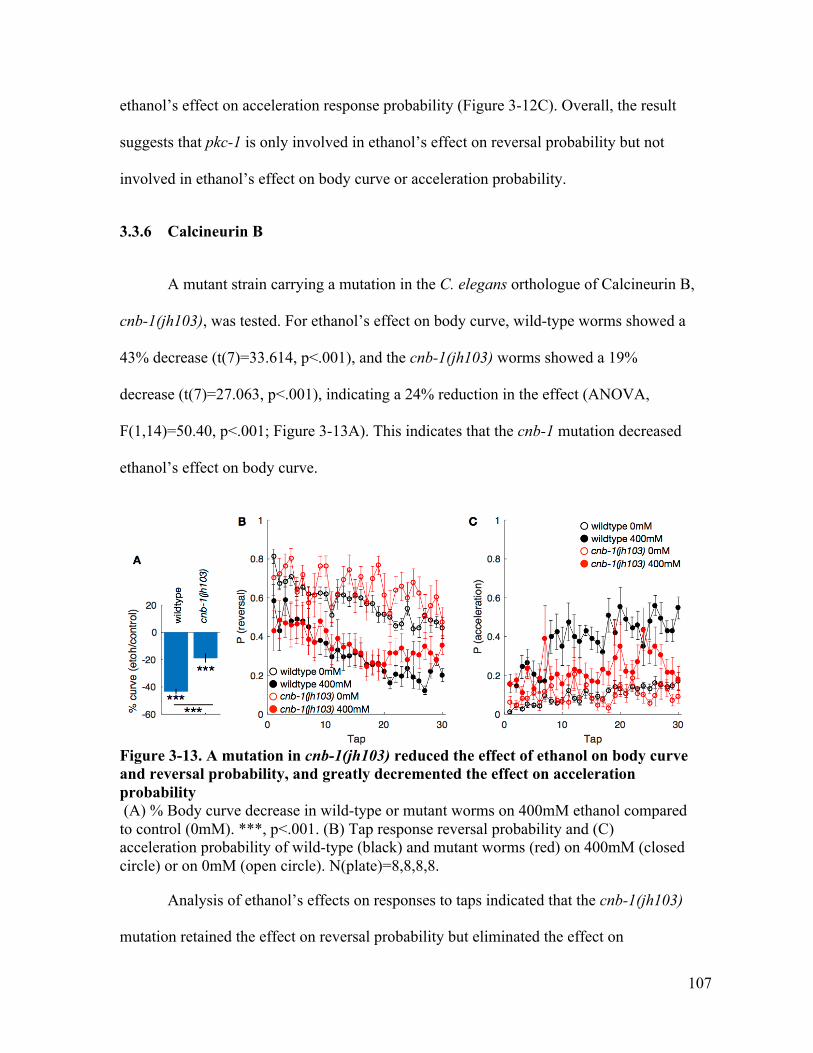
107
ethanol’s effect on acceleration response probability (Figure 3-12C). Overall, the result
suggests that pkc-1 is only involved in ethanol’s effect on reversal probability but not
involved in ethanol’s effect on body curve or acceleration probability.
3.3.6 Calcineurin B
A mutant strain carrying a mutation in the C. elegans orthologue of Calcineurin B,
cnb-1(jh103), was tested. For ethanol’s effect on body curve, wild-type worms showed a
43% decrease (t(7)=33.614, p<.001), and the cnb-1(jh103) worms showed a 19%
decrease (t(7)=27.063, p<.001), indicating a 24% reduction in the effect (ANOVA,
F(1,14)=50.40, p<.001; Figure 3-13A). This indicates that the cnb-1 mutation decreased
ethanol’s effect on body curve.
Figure 3-13. A mutation in cnb-1(jh103) reduced the effect of ethanol on body curve and reversal probability, and greatly decremented the effect on acceleration probability (A) % Body curve decrease in wild-type or mutant worms on 400mM ethanol compared to control (0mM). ***, p<.001. (B) Tap response reversal probability and (C) acceleration probability of wild-type (black) and mutant worms (red) on 400mM (closed circle) or on 0mM (open circle). N(plate)=8,8,8,8.
Analysis of ethanol’s effects on responses to taps indicated that the cnb-1(jh103)
mutation retained the effect on reversal probability but eliminated the effect on
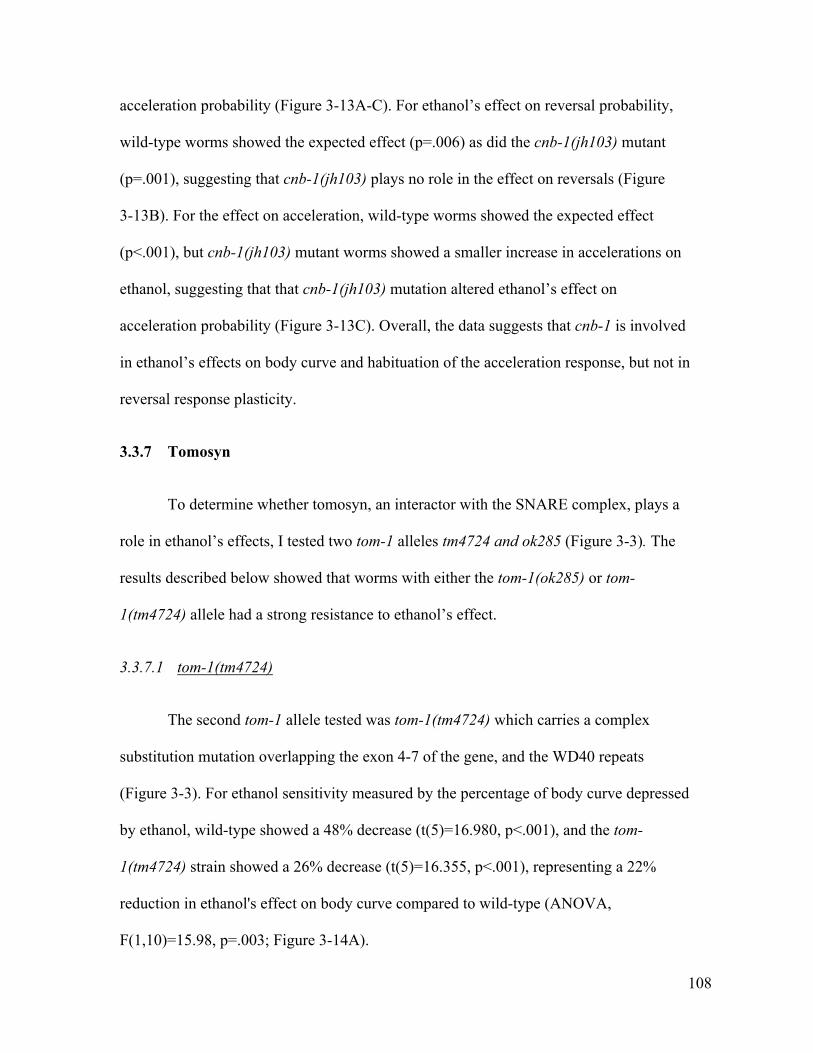
108
acceleration probability (Figure 3-13A-C). For ethanol’s effect on reversal probability,
wild-type worms showed the expected effect (p=.006) as did the cnb-1(jh103) mutant
(p=.001), suggesting that cnb-1(jh103) plays no role in the effect on reversals (Figure
3-13B). For the effect on acceleration, wild-type worms showed the expected effect
(p<.001), but cnb-1(jh103) mutant worms showed a smaller increase in accelerations on
ethanol, suggesting that that cnb-1(jh103) mutation altered ethanol’s effect on
acceleration probability (Figure 3-13C). Overall, the data suggests that cnb-1 is involved
in ethanol’s effects on body curve and habituation of the acceleration response, but not in
reversal response plasticity.
3.3.7 Tomosyn
To determine whether tomosyn, an interactor with the SNARE complex, plays a
role in ethanol’s effects, I tested two tom-1 alleles tm4724 and ok285 (Figure 3-3). The
results described below showed that worms with either the tom-1(ok285) or tom-
1(tm4724) allele had a strong resistance to ethanol’s effect.
3.3.7.1 tom-1(tm4724)
The second tom-1 allele tested was tom-1(tm4724) which carries a complex
substitution mutation overlapping the exon 4-7 of the gene, and the WD40 repeats
(Figure 3-3). For ethanol sensitivity measured by the percentage of body curve depressed
by ethanol, wild-type showed a 48% decrease (t(5)=16.980, p<.001), and the tom-
1(tm4724) strain showed a 26% decrease (t(5)=16.355, p<.001), representing a 22%
reduction in ethanol's effect on body curve compared to wild-type (ANOVA,
F(1,10)=15.98, p=.003; Figure 3-14A).
109
Figure 3-14. A mutation in tom-1(tm4724) reduces the effect of ethanol on body curve and reversal probability, and eliminated the effect on acceleration probability (A) % Body curve decreased in wild-type or mutant worms on 400mM ethanol compared to control (0mM). ***, p<.001. (B) Tap response reversal probability and (C) acceleration probability of wild-type (black) and mutant worms (red) on 400mM (closed circle) or on 0mM (open circle). N(plate)= 6,6,6,6.
For ethanol’s effect on reversal probability, while ethanol facilitated the
habituation of reversal probability in wild-type worms (p<.001), ethanol had no effect on
reversal probability in tom-1(tm4724) worms (Figure 3-14B). This indicated that tom-
1(tm4724) eliminated ethanol’s effect on reversal probability. Ethanol increased
acceleration probability in wild-type worms (p<.001), but had no effect in tom-1(tm4724)
worms (Figure 3-14C). This indicates that the tom-1(tm4724) mutation eliminated
ethanol’s effect on acceleration responses. The analysis of the tom-1(tm4724) worms
suggests that tom-1 is required for all three of ethanol’s effects under investigation.
3.3.7.2 tom-1(ok285)
The tom-1(ok285) allele with a deletion overlapping the exon 9-12 region,
attenuated ethanol’s effect on body curve, and eliminated the effect on response plasticity
(Figure 3-15). For the effect on body curve, wild-type worms showed a 41% decrease
+ --60
-40
-20
0
20
% c
urve
(eto
h/co
ntro
l)
0 10 20 30Tap
0
0.2
0.4
0.6
0.8
1
P (re
vers
al)
+ 0mM+ 400mM(-) 0mM(-) 400mM
0 10 20 30Tap
0
0.2
0.4
0.6
0.8
1
P (a
ccel
erat
ion)
tom-1(tm4724)I
wild
type
tom
-1(tm
4724
)
******
wildtype 0mMwildtype 400mMtom-1(tm4724) 0mMtom-1(tm4724) 400mM
**

110
(t(11)=40.245, p<.001), and the tom-1(ok285) strain showed a 33% decrease
(t(11)=54.265, p<.001), representing a significant 9% reduction in ethanol's effect on
body curve compared to wild-type (ANOVA, F(1,22)=19.86, p<.001; Figure 3-15A).
Compared to mutants with strong resistance to ethanol’s effect on body curve (i.e. slo-1),
a 9% reduction in the effect was relatively minor. This suggests that tom-1 may play a
minor role in the effect on body curve.
Figure 3-15. A mutation in tom-1(ok285) reduces the effect of ethanol on body curve severely attenuates the effect on reversal probability, and eliminates the effect on acceleration probability % Body curve decrease in wild-type or mutant worms on 400mM ethanol compared to control (0mM). ***, p<.001. (B) Tap response reversal probability and (C) acceleration probability of wild-type (black) and mutant worms (red) on 400mM (closed circle) or on 0mM (open circle). N(plate)=11,12,12,12.
For ethanol’s effect on reversal probability, while ethanol facilitated the
habituation of reversal probability in wild-type worms (p<.001), ethanol had no effect on
reversal probability in tom-1(ok285) worms (Figure 3-15B). This indicated that tom-
1(ok285) eliminated ethanol’s effect on reversal probability. Ethanol drastically increased
acceleration probability in wild-type worms (p<.001), but had no effect in tom-1(ok285)
worms (Figure 3-15C). This indicates that the tom-1(ok285) mutation eliminated
111
ethanol’s effect on acceleration responses. The analysis of the tom-1(ok285) worms
suggests that tom-1 is required for all three of ethanol’s effects under investigation.
3.4 DISCUSSION
To the best of my knowledge this is the first genetic screen for genes involved in
ethanol’s effect on habituation in any organism. A total of 27 genes and 39 strains were
tested. This screen found that genes involved in ethanol resistance phenotypes in C.
elegans (slo-1, npr-1, and dgk-1) are also involved in ethanol’s effects on body curve and
response plasticity. In addition, this candidate screen identified a gene (tom-1) that has
not previously been implicated in ethanol’s effects on behaviour before.
3.4.1 Effects of ethanol on body curve, reversal and acceleration can be genetically
dissociated
This study also suggests that the effects of ethanol on body curve, habituation of
reversal responses and acceleration responses can be genetically dissociated. I identified
genes that affected all three ethanol phenotypes as well as genes that affected only
specific ethanol phenotypes, suggesting mechanisms modulating the effect of the three
phenotypes overlap but are not entirely identical (Figure 3-16). I discussed three genes
that affected all three ethanol phenotypes: slo-1, dgk-1, and tom-1. Interestingly, these 3
genes are all important in the regulation of synaptic transmission (Lackner et al., 1999;
Wang, 2008; Ashery et al., 2009). Some of the genes I tested were only involved in
ethanol’s’ effects on components of response plasticity. For example, the neuropeptide Y
receptor npr-1 was involved in ethanol’s effect on response plasticity, but not in body
curve (Figure 3-8 and Figure 3-9). In addition, npr-1’s putative ligand neuropeptide Y

112
flp-18 and protein kinase C pkc-1 were only involved in ethanol’s effect on habituation of
reversal probability but not acceleration probability (Figure 3-10 and Figure 3-12).
Furthermore, a calcineurin subunit calcineurin B ortholog cnb-1 was only involved in
ethanol’s effect on the probability of the acceleration response and on body curve (Figure
3-13). Interestingly, pkc-1 and cnb-1 are both downstream of the PIP2/IP3/DAG
signaling pathway so it may be possible that the same upstream signals diverge to
produce more specific downstream effects: pkc-1 for reversals and cnb-1 for acceleration.
Overall, this genetic screen identified genes important in ethanol’s effects on response
plasticity in tap habituation and identified a new gene that interacts with ethanol’s effect
on behavior.
Figure 3-16. Different genes can affect one, two or all three of the effects of ethanol on behavioral plasticity Summary of candidate genes involved in the effects of ethanol’s on three behavioral phenotypes: Posture (body curve), Habituation of Reversals (reversal probability), and Acceleration (acceleration probability).
Posture
Acceleration
Reversal
egl-2
slo-1
npr-1
flp-18
dgk-1
cnb-1
tom-1
pkc-1
unc-13
glr-1
ric-8
egl-30goa-1
gsa-1
acy-1
pde-4
nlg-1
nrx-1
ptr-6

113
3.4.2 BK channel’s role in response plasticity may involve BK channel regulation
other than calcium concentration
This screen found that genes involved in strong ethanol resistance phenotypes in
C. elegans (slo-1, npr-1, and dgk-1) (Davies et al., 2003; Davies et al., 2004) are also
involved in ethanol’s effects on response plasticity in tap habituation. Amongst these, the
SLO-1/BK channel has the most well established evidence as a direct ethanol target. C.
elegans provided the first evidence linking the physiological effect of ethanol on ion
channels with its effects on behavior (Davies et al., 2003). Following that, an ethanol
binding site on BK channel was identified based on point amino acid substitution,
electrophysiology, and crystallography data (Liu et al., 2008; Yuan et al., 2010; Bukiya et
al., 2014). The BK channel’s role in ethanol modulated behavior in C. elegans has been
well characterized, including inhibition of locomotor speed, egg laying (Davies et al.,
2003), inhibition of pharyngeal activities (Dillon et al., 2013), and a role in acute ethanol
tolerance (Bettinger et al., 2012). Thus my finding that BK channel was has a role in
ethanol’s effect on body curve (Figure 3-4 to Figure 3-7) was not surprising. However,
the BK channel’s role in learning under ethanol intoxication had not been explored prior
to this work.
The data presented in this chapter for the effects of ethanol on body curve and tap
habituation for the four different mutations in slo-1 support the hypothesis that the BK
channel is required for all three effects of ethanol under investigation. All slo-1 mutants
tested were resistant to ethanol’s effect on body curve, suggesting that intact slo-1
function including the RCK1 and RCK2 regions are important in ethanol’s effect on body
curve. For ethanol’s effects on habituation to tap, the two null slo-1 mutants lost the
114
effects, the mutant lacking the RCK2 region lost effects on later responses, while the
mutants carrying a different amino acid near the RCK1 region retained the effects. These
data suggest that the RCK2 region may only become important when animals were given
repeated stimuli, and that the RCK1 domain was perhaps not involved in the effect of
ethanol on tap habituation. In addition, only the null and RCK2 mutants lost the effect on
acceleration probability, while the RCK1 mutants retained the effect. This suggests that
SLO-1 and its RCK2 region play an important role in ethanol’s increase in acceleration
response probability, but the RCK1 region was not important for this effect. Overall, the
results suggest that the BK channel plays an important role in all three ethanol effects
under study, however different parts of the protein play roles in different phenotypes: the
RCK2 calcium sensing domain is important for the effects on acceleration but only
played a partial role in the effects on reversal probability. The RCK1 calcium sensing
domain only plays a role in the effects of ethanol on body curve, but not in its effects on
responses to repeated taps.
In this report I demonstrated that slo-1 also plays a crucial role in ethanol-altered
plasticity of responses to repeated stimuli. In the absence of ethanol, slo-1 has very little
role in response plasticity to repeated taps. However, slo-1 is essential for ethanol’s
modulation on responses to repeated taps. This was not simply due to the potassium
current conducted by SLO-1. Lost-of-function mutants of two of the close relatives of
SLO-1, the EAG voltage gated potassium channel, EGL-2, and the ERG voltage gated
potassium channel, UNC-103, both retained ethanol’s effect on response plasticity (Table
3-2).

115
In addition, my results suggest that the RCK2 but not the RCK1 calcium sensing
domain of SLO-1 is involved in ethanol’s action on response plasticity. This is different
from ethanol’s effects on crawling speed, egg laying and body curve, which all require
the T381 amino acid near the RCK1 domain (Davis et al., 2014). Furthermore, my data
suggests that although the RCK2 domain may be fully responsible for ethanol’s effect on
acceleration response plasticity, the RCK2 domain is only partly responsible for the effect
on reversal response plasticity. This suggests that other types of BK channel regulation
may be involved in the effect on reversal. Since BK channel activities can be regulated by
numerous other mechanisms, including alpha subunit alternative splicing, modulation by
kinases, and regulation by auxiliary beta subunits, (Salkoff et al., 2006; Dopico et al.,
2014), further investigation into which regulatory mechanism is involved in ethanol’s
effects on reversal response plasticity may provide useful insights.
3.4.3 Tomosyn, a gene newly implicated in moderating ethanol’s effects on
behaviour
This study identified a new gene that hasn’t previously been implicated with
ethanol’s action: tomosyn. Tomosyn is a soluble protein expressed in the mammalian
brain and colocalized in synaptic regions with syntaxin (Yizhar et al., 2007). Tomosyn
has an established role in inhibiting synaptic transmission (Fujita et al., 1998; Ashery et
al., 2009). In C. elegans, tom-1 is expressed in ventral nerve cord and head neurons
(McEwen et al., 2006). The C. elegans tomosyn ortholog (tom-1) contains the highly-
conserved N-terminal WD40 repeats domain and a C-terminal R-SNARE domain found
in all 7 mammalian tomosyn isoforms (Masuda et al., 1998; Yokoyama et al., 1999;
Hatsuzawa et al., 2003; Groffen et al., 2005). The tomosyn R-SNARE domain has a high
116
homology with the synaptobrevin R-SNARE domain, which interacts with syntaxin and
SNAP-25 to form a SNARE complex. A SNARE complex containing synaptobrevins
brings the synaptic vesicle close to the plasma membrane, a mechanism known as the
synaptic vesicle priming. The “primed” vesicle is then ready for calcium activated
exocytosis (Haucke et al., 2011). The tomosyn R-SNARE domain can replace
synaptobrevin, and interacts with syntaxin and SNAP-25 to form a tomosyn-SNARE
complex, which has a high structural similarity with the synaptobrevin-containing
SNARE complex (Fujita et al., 1998; Pobbati et al., 2004). The tomosyn-SNARE
complex, unlike the synaptobrevin-SNARE complex, has primarily been reported as
inhibitory to exocytosis in a wide variety of cells (Fujita et al., 1998; Hatsuzawa et al.,
2003; Widberg et al., 2003; Yizhar et al., 2004; Zhang et al., 2006). Consistent with this,
C. elegans mutants carrying the tom-1(ok285) loss of function allele had abnormally high
accumulation of neuronal vesicles next to the presynaptic membrane (Gracheva et al.,
2006). In addition, electrophysiological recordings from the C. elegans neuromuscular
junction of a tom-1(ok285) mutant showed a pronounced increase in the duration of
calcium evoked responses (Gracheva et al., 2006), supporting an inhibitory role for tom-1
in synaptic vesicle release.
There is growing evidence that tomosyn may be important in behavioural
plasticity. Previous work from our lab showed that habituation at a 10s ISI is disrupted in
worms with a mutation in the C. elegans homolog of tomosyn, tom-1 (Swierczek et al.,
2011). Recently, tomosyn was suggested to play a role in modulating learning in rodents.
In a study on LTP in rodent hippocampal CA3 neurons tomosyn knock-down led to
drastic reduction in EPSC facilitation from repeated optogenetic activations, indicating
117
that a low tomosyn level impaired short term plasticity (Ben-Simon et al., 2015). This
observation suggested that tomosyn may modulate learning measured at the physiological
level, therefore, might also contribute to learning measured at the behavioral level.
.Consistent with this, I found that tom-1(ok285) mutants in the absence of ethanol had
slower reversal response habituation compared to wildtype, indicative of an impaired
reversal response decrease induced by repetitive stimuli (Figure 3-15B). This data
supports the hypothesis that tomosyn dependent inhibition of synaptic transmission is
important for the habituation of reversal probability. Interestingly, another tom-1 mutant
tom-1(tm4724) deficient in the tail end of the WD40 repeats domain had wild-type
habituation of reversal probability. In rodents, the WD40 repeats are involved in
tomosyn’s Ca+ dependent modulating of exocytosis, but not in tomosyn’s Ca+
independent modulation (Yamamoto et al., 2010). Perhaps the WD40 repeats domain and
the region encoded by exons 9-12 have different functional roles in response plasticity.
Tomosyn has not been studied as a direct or indirect target of ethanol previously.
However, since ethanol is well known to alter synaptic transmission (Harris et al., 2008),
and given tomosyn’s role in regulating synaptic transmission, tomosyn seems like a
plausible interactor of ethanol. Both tom-1 mutants tested, tom-1(ok285) and tom-
1(tm4724) lost the effects of ethanol on reversal and acceleration responses, as well as
body curve. This suggests that the two regions deleted by the two alleles might be
important for ethanol’s effect. However, in this study I was not able to test a tom-1
mutant lacking the SNARE-binding motif because the available mutant strain with a
mutation in this region, RB1887 tom-1(ok2437), was too unhealthy to test. It will be
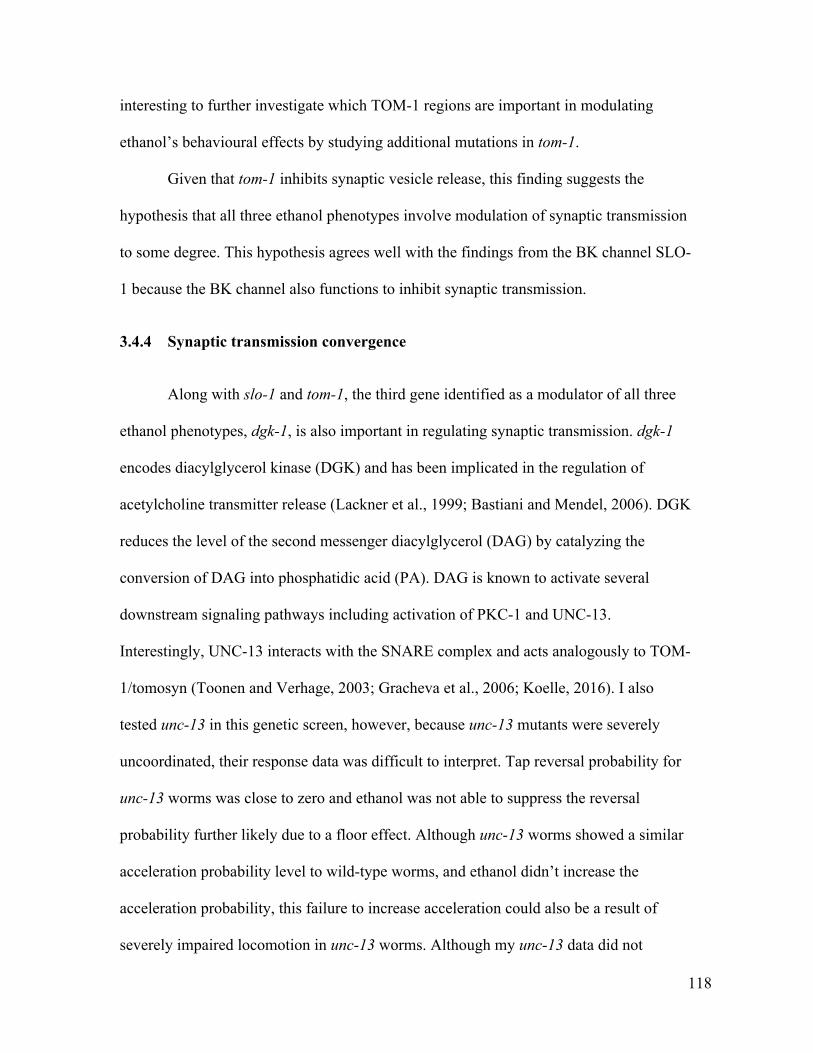
118
interesting to further investigate which TOM-1 regions are important in modulating
ethanol’s behavioural effects by studying additional mutations in tom-1.
Given that tom-1 inhibits synaptic vesicle release, this finding suggests the
hypothesis that all three ethanol phenotypes involve modulation of synaptic transmission
to some degree. This hypothesis agrees well with the findings from the BK channel SLO-
1 because the BK channel also functions to inhibit synaptic transmission.
3.4.4 Synaptic transmission convergence
Along with slo-1 and tom-1, the third gene identified as a modulator of all three
ethanol phenotypes, dgk-1, is also important in regulating synaptic transmission. dgk-1
encodes diacylglycerol kinase (DGK) and has been implicated in the regulation of
acetylcholine transmitter release (Lackner et al., 1999; Bastiani and Mendel, 2006). DGK
reduces the level of the second messenger diacylglycerol (DAG) by catalyzing the
conversion of DAG into phosphatidic acid (PA). DAG is known to activate several
downstream signaling pathways including activation of PKC-1 and UNC-13.
Interestingly, UNC-13 interacts with the SNARE complex and acts analogously to TOM-
1/tomosyn (Toonen and Verhage, 2003; Gracheva et al., 2006; Koelle, 2016). I also
tested unc-13 in this genetic screen, however, because unc-13 mutants were severely
uncoordinated, their response data was difficult to interpret. Tap reversal probability for
unc-13 worms was close to zero and ethanol was not able to suppress the reversal
probability further likely due to a floor effect. Although unc-13 worms showed a similar
acceleration probability level to wild-type worms, and ethanol didn’t increase the
acceleration probability, this failure to increase acceleration could also be a result of
severely impaired locomotion in unc-13 worms. Although my unc-13 data did not
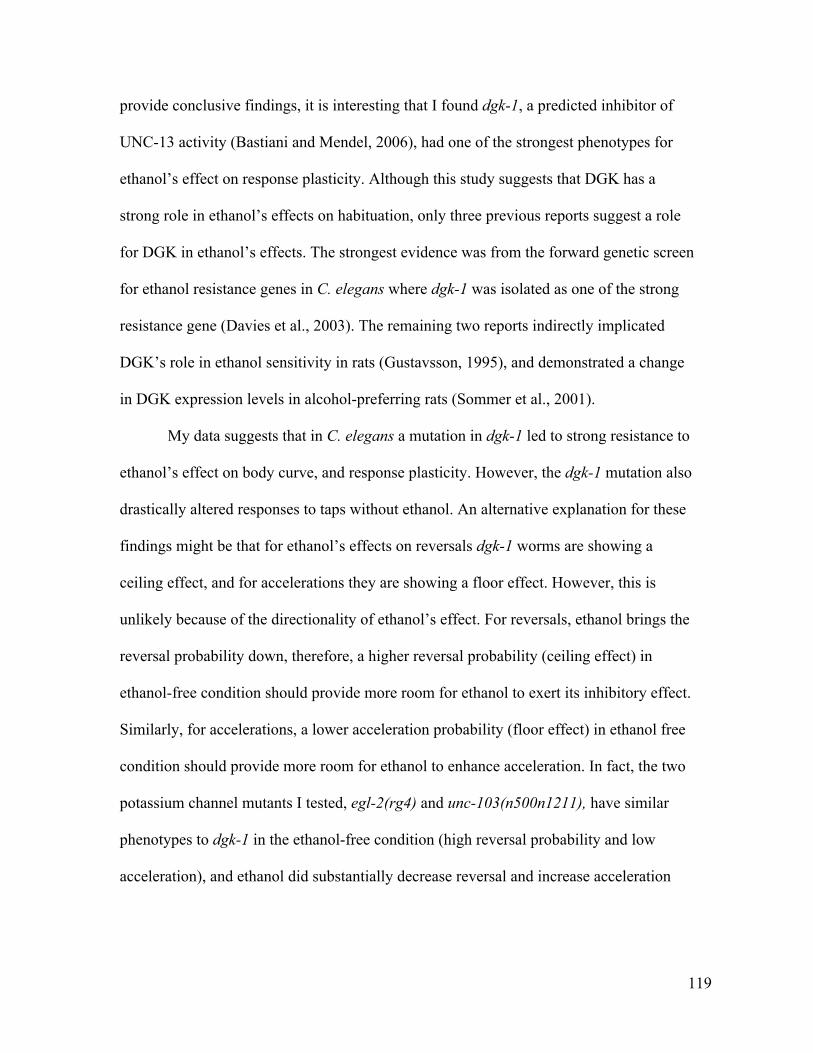
119
provide conclusive findings, it is interesting that I found dgk-1, a predicted inhibitor of
UNC-13 activity (Bastiani and Mendel, 2006), had one of the strongest phenotypes for
ethanol’s effect on response plasticity. Although this study suggests that DGK has a
strong role in ethanol’s effects on habituation, only three previous reports suggest a role
for DGK in ethanol’s effects. The strongest evidence was from the forward genetic screen
for ethanol resistance genes in C. elegans where dgk-1 was isolated as one of the strong
resistance gene (Davies et al., 2003). The remaining two reports indirectly implicated
DGK’s role in ethanol sensitivity in rats (Gustavsson, 1995), and demonstrated a change
in DGK expression levels in alcohol-preferring rats (Sommer et al., 2001).
My data suggests that in C. elegans a mutation in dgk-1 led to strong resistance to
ethanol’s effect on body curve, and response plasticity. However, the dgk-1 mutation also
drastically altered responses to taps without ethanol. An alternative explanation for these
findings might be that for ethanol’s effects on reversals dgk-1 worms are showing a
ceiling effect, and for accelerations they are showing a floor effect. However, this is
unlikely because of the directionality of ethanol’s effect. For reversals, ethanol brings the
reversal probability down, therefore, a higher reversal probability (ceiling effect) in
ethanol-free condition should provide more room for ethanol to exert its inhibitory effect.
Similarly, for accelerations, a lower acceleration probability (floor effect) in ethanol free
condition should provide more room for ethanol to enhance acceleration. In fact, the two
potassium channel mutants I tested, egl-2(rg4) and unc-103(n500n1211), have similar
phenotypes to dgk-1 in the ethanol-free condition (high reversal probability and low
acceleration), and ethanol did substantially decrease reversal and increase acceleration
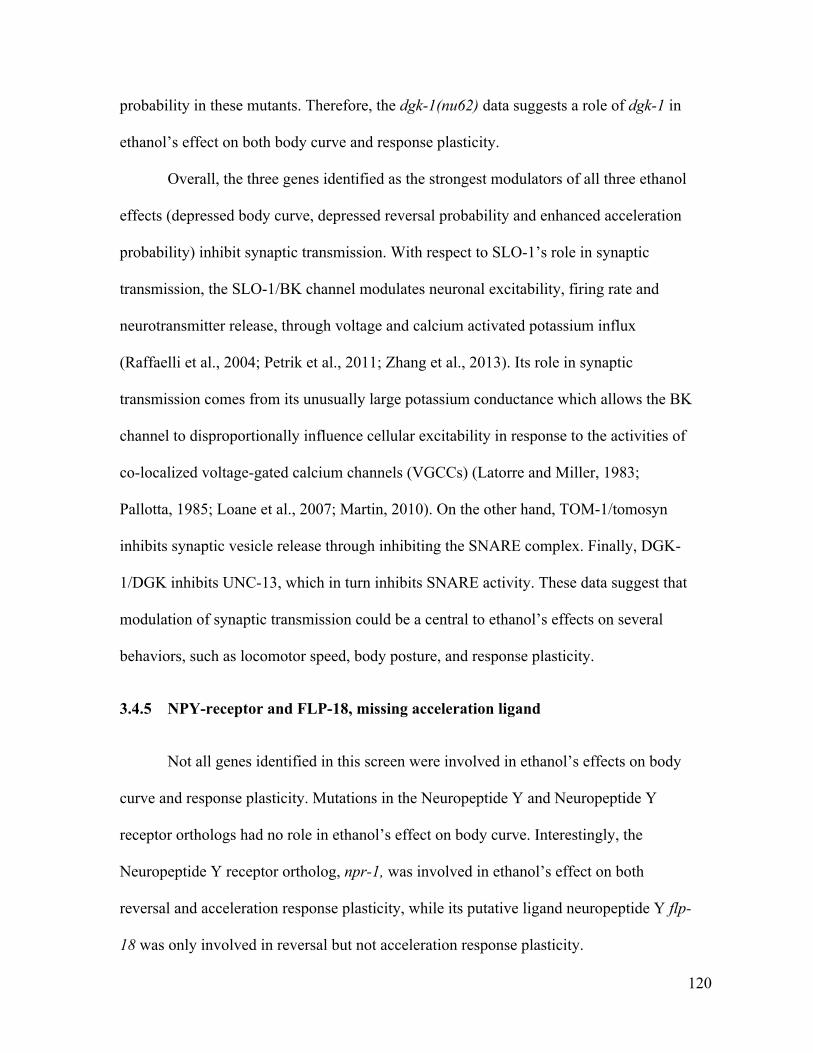
120
probability in these mutants. Therefore, the dgk-1(nu62) data suggests a role of dgk-1 in
ethanol’s effect on both body curve and response plasticity.
Overall, the three genes identified as the strongest modulators of all three ethanol
effects (depressed body curve, depressed reversal probability and enhanced acceleration
probability) inhibit synaptic transmission. With respect to SLO-1’s role in synaptic
transmission, the SLO-1/BK channel modulates neuronal excitability, firing rate and
neurotransmitter release, through voltage and calcium activated potassium influx
(Raffaelli et al., 2004; Petrik et al., 2011; Zhang et al., 2013). Its role in synaptic
transmission comes from its unusually large potassium conductance which allows the BK
channel to disproportionally influence cellular excitability in response to the activities of
co-localized voltage-gated calcium channels (VGCCs) (Latorre and Miller, 1983;
Pallotta, 1985; Loane et al., 2007; Martin, 2010). On the other hand, TOM-1/tomosyn
inhibits synaptic vesicle release through inhibiting the SNARE complex. Finally, DGK-
1/DGK inhibits UNC-13, which in turn inhibits SNARE activity. These data suggest that
modulation of synaptic transmission could be a central to ethanol’s effects on several
behaviors, such as locomotor speed, body posture, and response plasticity.
3.4.5 NPY-receptor and FLP-18, missing acceleration ligand
Not all genes identified in this screen were involved in ethanol’s effects on body
curve and response plasticity. Mutations in the Neuropeptide Y and Neuropeptide Y
receptor orthologs had no role in ethanol’s effect on body curve. Interestingly, the
Neuropeptide Y receptor ortholog, npr-1, was involved in ethanol’s effect on both
reversal and acceleration response plasticity, while its putative ligand neuropeptide Y flp-
18 was only involved in reversal but not acceleration response plasticity.
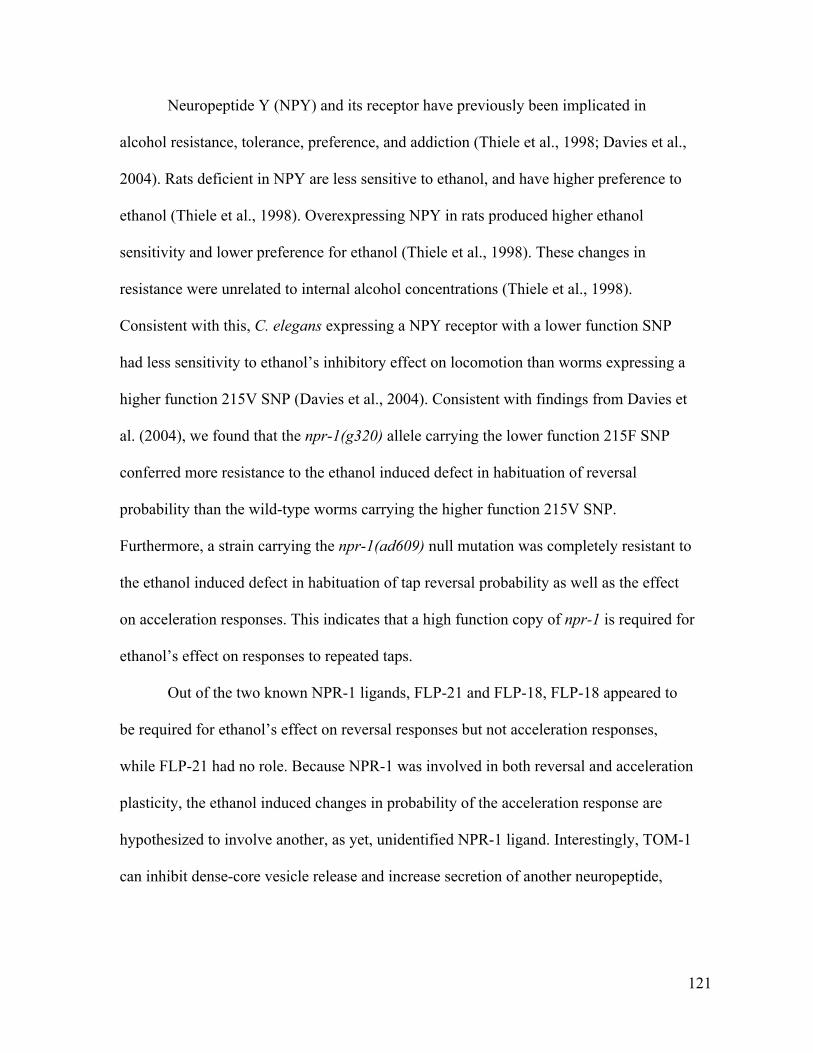
121
Neuropeptide Y (NPY) and its receptor have previously been implicated in
alcohol resistance, tolerance, preference, and addiction (Thiele et al., 1998; Davies et al.,
2004). Rats deficient in NPY are less sensitive to ethanol, and have higher preference to
ethanol (Thiele et al., 1998). Overexpressing NPY in rats produced higher ethanol
sensitivity and lower preference for ethanol (Thiele et al., 1998). These changes in
resistance were unrelated to internal alcohol concentrations (Thiele et al., 1998).
Consistent with this, C. elegans expressing a NPY receptor with a lower function SNP
had less sensitivity to ethanol’s inhibitory effect on locomotion than worms expressing a
higher function 215V SNP (Davies et al., 2004). Consistent with findings from Davies et
al. (2004), we found that the npr-1(g320) allele carrying the lower function 215F SNP
conferred more resistance to the ethanol induced defect in habituation of reversal
probability than the wild-type worms carrying the higher function 215V SNP.
Furthermore, a strain carrying the npr-1(ad609) null mutation was completely resistant to
the ethanol induced defect in habituation of tap reversal probability as well as the effect
on acceleration responses. This indicates that a high function copy of npr-1 is required for
ethanol’s effect on responses to repeated taps.
Out of the two known NPR-1 ligands, FLP-21 and FLP-18, FLP-18 appeared to
be required for ethanol’s effect on reversal responses but not acceleration responses,
while FLP-21 had no role. Because NPR-1 was involved in both reversal and acceleration
plasticity, the ethanol induced changes in probability of the acceleration response are
hypothesized to involve another, as yet, unidentified NPR-1 ligand. Interestingly, TOM-1
can inhibit dense-core vesicle release and increase secretion of another neuropeptide,
122
NLP-21 (Gracheva et al., 2007). It may be that TOM-1 mediates secretion FLP-18. This
should be investigated more thoroughly.
3.4.6 Calcineurin B and Protein Kinase C
The last two genes I found to be strong modulators of ethanol’s effect on response
plasticity are the calcineurin B ortholog, cnb-1, and the protein kinase C ortholog, pkc-1.
Ethanol’s effect on calcineurin B and protein kinase C have been previously reported in
other systems. Ethanol can stimulate calcineurin B activity in yeast (Araki et al., 2009).
Protein kinase C activity has reported to be increased by chronic ethanol exposure in
cultured neuronal cells (Messing et al., 1991). In this study I found that, while both cnb-1
and pkc-1 mediate ethanol’s effect on body curve, cnb-1 only mediated ethanol’s effect
on the probability of acceleration response, while the protein kinase C ortholog pkc-1
mediated only the effect on the probability of reversal response. Interestingly, these two
proteins are second messengers in the same phospholipid phosphatidylinositol 4,5-
biphosphate (PIP2) pathway. Catalyzed by phospholipase C (PLC), PIP2 dissociates into
diacylglycerol and inositol triphosphate (IP3). IP3 then activates the IP3 receptor on the
endoplasmic reticulum, which then releases Ca+ into the cytosol. pkc-1 is a downstream
effector of diacylglycerol and cnb-1 is activated by intracellular Ca+ released by the IP3
receptor (Bastiani and Mendel, 2006). The C. elegans ortholog of protein lipase C,
responsible for catalyzing PIP2 into DAG/IP3, is EGL-8. My screen originally included 3
alleles of egl-8, however, unfortunately, the wild-type control in these experiments did
not show consistent ethanol effects and so I could not confidently draw conclusions from
the data. More replications of the egl-8 mutants will help to determine whether ethanol
also requires protein lipase C to exert effects on response plasticity.
123
3.4.7 Caveats
When interpreting results from C. elegans mutant studies, one needs to be aware
that the effects seen may be the result of background mutations in locations outside of the
gene of interest. The standard mutagenesis method used to create C. elegans mutants
produces multiple mutations in the genome that might not be on record in the C. elegans
genome database. One way to address this issue is to “backcross” the mutant strain with
the wild-type strain multiple times to reduce the background mutations. For example, all
the slo-1, npr-1, dgk-1, and cnb-1 strains tested were backcrossed 1-11 times. However,
the neuropeptide Y mutants, tom-1 mutants, and pkc-1 mutant were not backcrossed.
Another way to address this issue is to test multiple alleles of the same gene. If mutations
created independently result in the same phenotype, then the effects are more likely to
come from the gene of interest rather than background mutations. Finally, the most
definitive method is to rescue the gene. If the effects of ethanol were restored to wild-
type level after expressing a wild-type copy of the gene in the mutant background, then
the gene should be the cause for the loss of effects. Rescue experiments can be used to
confirm the role of genes presented in this dissertation.
Lastly, it is possible the strains used in this dissertation might have undergone
genetic drift or be mistaken with another strain during repeated handling. If those
occurred, the mutations contained in the strains we tested may not be the same as
reported in the literature. These possibilities can be checked by genotyping the strains
used for the experiments to confirm the mutations were still the same as expected.

124
3.4.8 Conclusion
Overall, this candidate gene screen identified several genes involved in synaptic
transmission that were central to ethanol’s action on behavior, and demonstrated that
ethanol’s action on habituation learning involve complex molecular pathways. Four genes
were identified that alter ethanol’s effects on both the probability of reversal and
acceleration responses across habituation training. Two genes were identified that alter
ethanol’s effects on only probability of reversal or acceleration responses. Finally, we
identified a new gene, tom-1, that had not previously been associated with ethanol. This
study provides a foundation from which we can further investigate the mechanism
underlying ethanol’s effect on response plasticity in more detail.

125
4 TOLERANCE
4.1 INTRODUCTION
Thus far this research has focused on the effects of the first exposure to ethanol on
the behaviour of C. elegans. The research described in this Chapter reports experiments
designed to determine whether exposure to ethanol leads to alterations in behaviour to a
subsequent exposure, i.e. tolerance to the behavioural effects of ethanol.
4.1.1 Tolerance as a hallmark for development of alcoholism
People with problematic drinking behavior exhibit a set of behavioural and
biological changes induced by repeated consumption of alcohol, collectively termed
Alcohol Use Disorder (American Psychiatric Association. et al., 2013). As with most
substance abuse disorders, people with AUD exhibit tolerance, withdrawal, and chronic
drug-seeking behavior. Tolerance is known as a hallmark for drug addiction and refers to
a markedly diminished behavioural response to the same concentration of a given drug
(American Psychiatric Association. et al., 2013). Tolerance is a result of physiological
adaptation to a drug; the molecular changes underlying the adaptation differ depending
on the length of drug exposure. These changes can be observed as changes in the
behavioural effects of alcohol. Although a long list of molecules has been associated
with ethanol’s action at the molecular level (Valenzuela, 1997; Harris et al., 2008), much
remains unclear about how molecular mechanisms translate to behavioural changes
associated with alcohol tolerance.
126
4.1.2 Epigenetics as an mechanism for tolerance
A current theory proposes that epigenetic mechanisms are key contributors to long
term addiction-related changes in the brain. Epigenetics refers to a set of biochemical
mechanisms that regulate long-term activation or repression of genes (Choudhuri, 2011).
Epigenetic modification has the capability to persistently alter the expression level of a
large number of genes, as observed as an “altered transcriptome” in post-mortem
alcoholic brains (Ponomarev et al., 2012). This broad and persistent alteration in the gene
expression pattern changes neuronal functioning, which in turn manifests as behavioural
tolerance to ethanol (Nestler, 2014). The persistent nature of epigenetic regulation
provides a plausible molecular mechanism to explain the persistent nature of addiction
behaviours (Hutchison et al., 2008; Nestler, 2014).
4.1.3 Histone modifications
Histone modification is a type of epigenetic mechanism. In the cell, DNA is
packaged into chromosomes, which are made up of repeating units of nucleosomes (Ito,
2007). Nucleosomes are made up of DNA tightly wrapped around a histone complex
consists of 4 histone subunits. Modifications to specific residues of histone subunits can
change the interaction between DNA and histones. These modifications can result in
chromatin condensation or decondensation, leading to repression and activation of gene
expression, respectively (Choudhuri, 2011).
127
4.1.4 Acetylation and methylation of H3K9
Rapid and chronic ethanol tolerance can involve a specific histone modification,
acetylation at lysine residue 9 of histone subunit 3 (H3K9ace) (Renthal and Nestler,
2008). Histone acetylation at histone lysine residues neutralizes lysine residue’s positive
charge, resulting in a decreased affinity of histone proteins to DNA, thus detaching DNA
from the acetylated histone proteins. As a result, the detached DNA segments become
available for transcription. Therefore, histone acetylation is generally considered to be a
transcription activator (Choudhuri, 2011). In rats, a single ethanol exposure episode
increased histone acetylation of the neuropeptide Y (Npy) promoter in the amygdala,
resulting in rapid tolerance (Sakharkar et al., 2012). In cultured neuronal cells, chronic
intermittent ethanol treatment increased H3K9 acetylation at the subunit 2B of the N-
methyl D-aspartate receptor (NR2B) gene (Qiang et al., 2011). Given the established role
of Npy in social behaviour (de Bono and Bargmann, 1998) and stress resilience (Heilig,
2004), as well as the role of the NR2B receptor subunits in mediating experience-
dependent synaptic plasticity (Suo et al., 1999), acetylation at H3K9 seems to be involved
in the altered cellular processes underlying ethanol tolerance. However, the roles of other
types of histone modifications, such as histone methylation, are less well understood.
Little is known about how histone methylation is involved in ethanol tolerance
(Heintzman et al., 2007). To my knowledge, although histone methylation have been
associated with outcomes of developmental ethanol exposure (Bekdash et al., 2013;
Subbanna et al., 2013; Subbanna et al., 2014; Basavarajappa and Subbanna, 2016), only a
handful of studies have related histone methylation with ethanol tolerance (Pal-Bhadra et
al., 2007; Esfandiari et al., 2010; Zhou et al., 2011b; Ponomarev et al., 2012).
128
Interestingly, the addition of acetyl or methyl groups at the H3K9 residue
competes antagonistically. For example, if a H3K9 reside is already methylated,
acetylation cannot occur without first evicting the existing methyl group with an enzyme
called demethylase. Conversely, if a H3K9 reside is already acetylated, methylation
requires the eviction of the existing acetyl group with a deacetylase (Schotta et al., 2004;
Stewart et al., 2005). Given the known role of H3K9 acetylation in ethanol tolerance,
ethanol tolerance likely also involves H3K9 methylation.
H3K9 methylation was implicated in drug addiction. Chronic cocaine exposure
decreased the level of H3K9 dimethylation (H3K9me2) in the Nucleus Accumbens, the
structure in the mesolimbic dopamine pathway critical for motivating drug seeking
behaviour (Maze et al., 2010; Maze et al., 2011). The same study also showed that the
down-regulation of G9a/EHMT2, a histone methyltransferase (HMT) that deposits
dimethyl groups on the H3K9 residue, was sufficient to enhance preference for cocaine
(Maze et al., 2010). Furthermore, a gene co-expression analysis of post-mortem brains
from chronic alcoholics revealed an upregulation of G9a/EHMT2 in the basolateral
amygdala region (Ponomarev et al., 2012). Taken together, G9a/EHMT2 mediated H3K9
methylation is a potential candidate mechanism underlying ethanol tolerance.
4.1.4.1 H3K4
A second histone lysine residue, H3K4, has also been also associated with
alcoholism (Ponomarev et al., 2012). In particular, globally altered gene expression
patterns commonly found in alcoholic brains is associated with trimethylation patterns on
H3K4 residue (H3K4me3) (Ponomarev et al., 2012). Similar changes in H3K4me3
patterns were found in post-mortem ChIP-Seq studies of the hippocampi in alcoholic

129
patients (Zhou et al., 2011b). Since H3K4me is known as a hallmark of chromatin
decondensation and gene activation (Heintzman et al., 2007), regulation of H3K4me3
patterns would be important for addiction disorders. Indeed, Ponomarev et al. (2012) also
found an increase in the expression of SETD1A, a H3K4 methyltransferase, in the frontal
cortex and amygdala of post-mortem brains from chronic alcoholics, suggesting that
chronic alcohol consumption is associated with greater H3K4 methyltransferase activity.
Although post-mortem studies established correlations between alcoholism and
altered G9a/EHMT2 and SETD1A expression (Zhou et al., 2011b; Ponomarev et al.,
2012), whether altered HMT expressions were a cause or consequences of chronic
alcoholism remains to be elucidated. Furthermore, given that the studies were conducted
on post-mortem samples, behavioural correlations to changes in HMT expressions and
histone modifications remain unknown. To address these questions, this Chapter aims to
investigate whether G9a/EHMT2 and SETD1A are functionally required for the
behavioural tolerance to ethanol in C. elegans.
4.1.5 Tolerance in C. elegans
C. elegans is an important invertebrate model system used to study alcohol use
disorder (Grotewiel and Bettinger, 2015). Aside from the studies of acute ethanol
intoxication mentioned in previous chapters, C. elegans has also been used to study
ethanol tolerance (Bettinger et al., 2012; Jee et al., 2013). A C. elegans ortholog of
Neuropeptide Receptor Y (npr-1), a gene implicated in ethanol tolerance in humans and
fruit flies, is a key negative regulator of acute ethanol tolerance in C. elegans (Davies et
al., 2004). This suggests that at least some mechanisms underlying ethanol tolerance are
conserved in C. elegans.

130
A model in C. elegans that tested acute tolerance that developed with 10-30 min,
exposure showed that components of the chromatin remodeling complex were required
(Mathies et al., 2015). This suggests that acute alcohol tolerance in C. elegans might
involve epigenetic mechanisms. However, compared to acute ethanol tolerance, the
genetic mechanisms underlying rapid and chronic tolerance during adulthood have not
been well explored in C. elegans.
Mitchell et al., (2010) investigated withdrawal (not tolerance) from chronic
ethanol exposure in C. elegans. In that study worms were exposed to 250mM ethanol for
24 hours starting from larval stage 4 (~2.5 day old), and then recovered for longer than 2
hours before being challenged with a locomotor assay. The percentage of worms that
successfully moved to a food patch at the opposite edge of the Petri dish were counted
over a 3-hour period. Worms exposed to ethanol performed worse in the assay compared
to unexposed worms, but if exposed worms were given a low dose of ethanol (50mM),
they performed better than the exposed worms without ethanol. In other words, worms
can show withdrawal from ethanol, which can be relieved by a low concentration of
ethanol. Unexpectedly, npr-1 mutants performed similarly to wild-type, indicating that
ethanol had the same effect on npr-1 mutants as it did to wild-type worms, and
suggesting that npr-1 mutants showed withdrawal similar to wild-type worms
Mitchell et al., (2010)’s experimental design is unsuitable to answer the tolerance
question posed in this chapter for 3 main reasons. First, the design did not test tolerance,
which is defined as reduced response to the same amount of alcohol. Second, in this
series of experiments I wish to study chronic tolerance in adults, however the treatment in
the Mitchell et al (2010) started at larval stage 4, when the nervous system was still
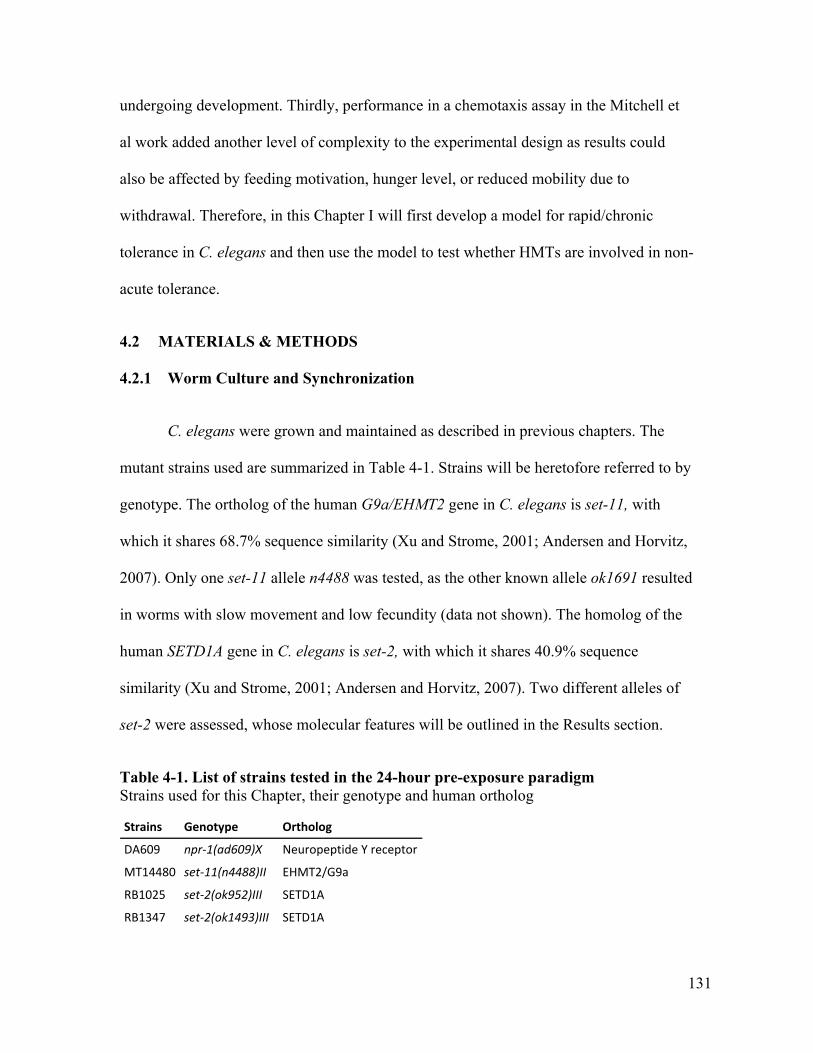
131
undergoing development. Thirdly, performance in a chemotaxis assay in the Mitchell et
al work added another level of complexity to the experimental design as results could
also be affected by feeding motivation, hunger level, or reduced mobility due to
withdrawal. Therefore, in this Chapter I will first develop a model for rapid/chronic
tolerance in C. elegans and then use the model to test whether HMTs are involved in non-
acute tolerance.
4.2 MATERIALS & METHODS
4.2.1 Worm Culture and Synchronization
C. elegans were grown and maintained as described in previous chapters. The
mutant strains used are summarized in Table 4-1. Strains will be heretofore referred to by
genotype. The ortholog of the human G9a/EHMT2 gene in C. elegans is set-11, with
which it shares 68.7% sequence similarity (Xu and Strome, 2001; Andersen and Horvitz,
2007). Only one set-11 allele n4488 was tested, as the other known allele ok1691 resulted
in worms with slow movement and low fecundity (data not shown). The homolog of the
human SETD1A gene in C. elegans is set-2, with which it shares 40.9% sequence
similarity (Xu and Strome, 2001; Andersen and Horvitz, 2007). Two different alleles of
set-2 were assessed, whose molecular features will be outlined in the Results section.
Table 4-1. List of strains tested in the 24-hour pre-exposure paradigm Strains used for this Chapter, their genotype and human ortholog
Strains Genotype Ortholog
DA609 npr-1(ad609)X NeuropeptideYreceptor
MT14480 set-11(n4488)II EHMT2/G9a
RB1025 set-2(ok952)III SETD1A
RB1347 set-2(ok1493)III SETD1A
132
4.2.2 Ethanol Exposure Paradigm
Originally both 200mM and 40mM ethanol were tested using this paradigm.
Because 200mM produced only excitation effects on speed for 3 and 4 day old worms
(Figure 2-2) and the 400mM dose produced a biphasic action (both excitation and
sedation, depending on the assay timing), and a smaller excitation effect than the 200mM
dose, the 200mM dose was used in this study.
Worms were age-synchronized as described in previous chapters, and grown at
20oC for 72 hours in 5cm NGM plates seeded with OP50. At 72 hours, worms were
transferred onto ethanol-infused plates prepared as described in previous chapters. To
transfer worms to ethanol plates, 1 mL dH2O was pipetted onto a 5cm plate; this liquid
was subsequently transferred to a 1.5 mL microcentrifuge tube and worms were allowed
to sediment by gravity for about 30s. The supernatant was removed and the worm pellet
was transferred to the new ethanol plates (either 0 or 200mM), and sealed with parafilm.
Animals were kept undisturbed on these ethanol plates for 24 hours (i.e. from 72
to 96 hours of age). Following this 24-hour exposure, the animals from each plate were
washed once with 1mL dH2O, and then transferred (as described above) onto untreated
(i.e. no ethanol) 5-cm NGM-OP50 plates. These worms were allowed to recover on the
ethanol free plates for 2 hours (Personal communication, Dr. Jon Pierce-Shimomura)
after which they were transferred again onto new NGM-OP50 plates containing either 0
or 200mM ethanol (Figure 4-1). The animals were left undisturbed for 30 min on these
new plates with or without ethanol in 20C (i.e. on foam pads, not placed onto the tracking
platform); then these plates were placed onto the tracking platform for behavioral
analysis.
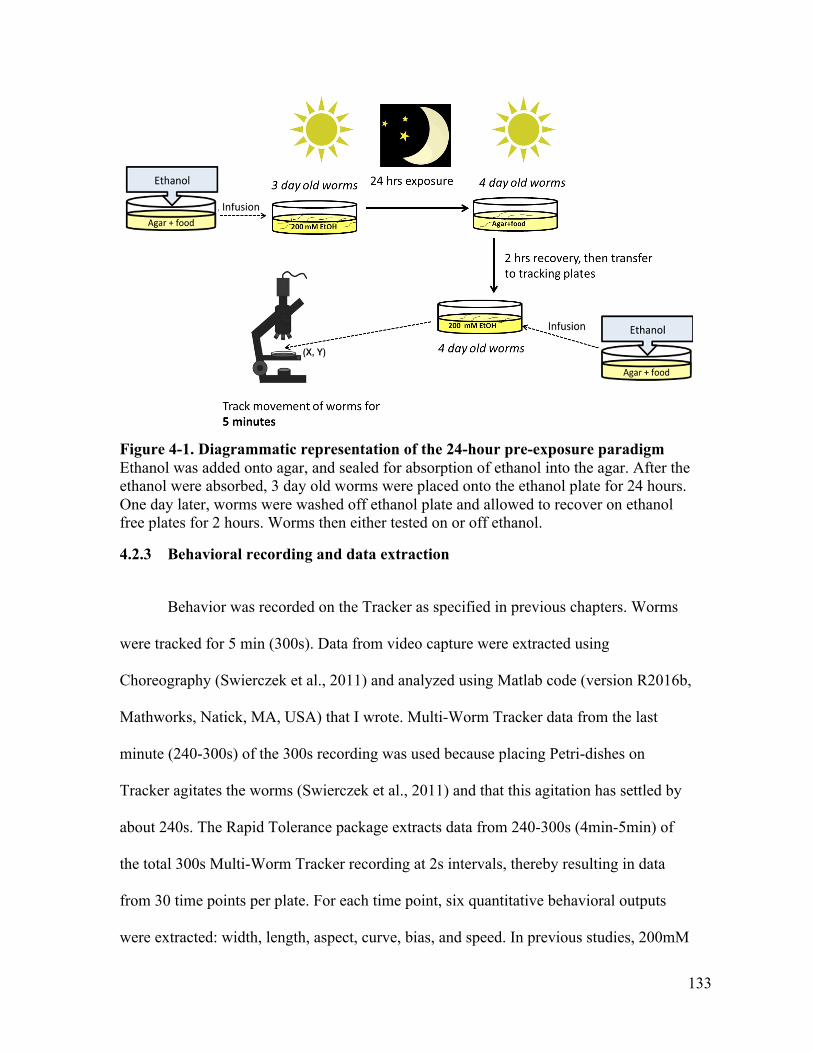
133
Figure 4-1. Diagrammatic representation of the 24-hour pre-exposure paradigm Ethanol was added onto agar, and sealed for absorption of ethanol into the agar. After the ethanol were absorbed, 3 day old worms were placed onto the ethanol plate for 24 hours. One day later, worms were washed off ethanol plate and allowed to recover on ethanol free plates for 2 hours. Worms then either tested on or off ethanol.
4.2.3 Behavioral recording and data extraction
Behavior was recorded on the Tracker as specified in previous chapters. Worms
were tracked for 5 min (300s). Data from video capture were extracted using
Choreography (Swierczek et al., 2011) and analyzed using Matlab code (version R2016b,
Mathworks, Natick, MA, USA) that I wrote. Multi-Worm Tracker data from the last
minute (240-300s) of the 300s recording was used because placing Petri-dishes on
Tracker agitates the worms (Swierczek et al., 2011) and that this agitation has settled by
about 240s. The Rapid Tolerance package extracts data from 240-300s (4min-5min) of
the total 300s Multi-Worm Tracker recording at 2s intervals, thereby resulting in data
from 30 time points per plate. For each time point, six quantitative behavioral outputs
were extracted: width, length, aspect, curve, bias, and speed. In previous studies, 200mM
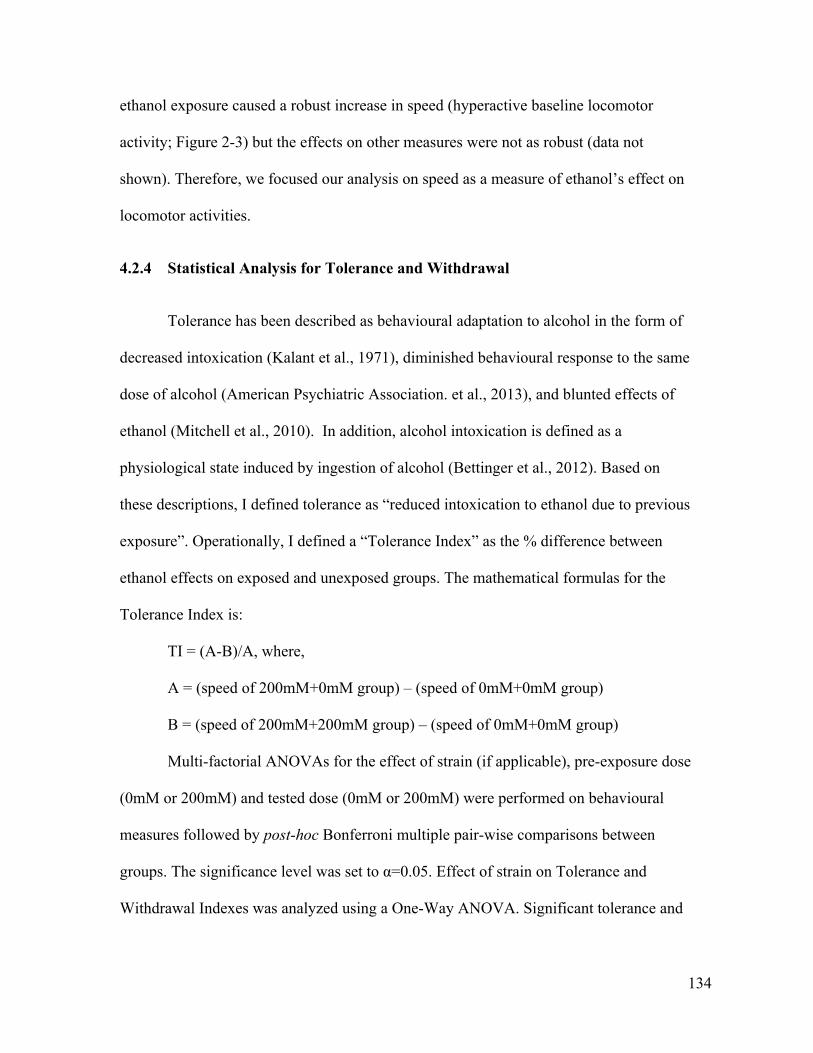
134
ethanol exposure caused a robust increase in speed (hyperactive baseline locomotor
activity; Figure 2-3) but the effects on other measures were not as robust (data not
shown). Therefore, we focused our analysis on speed as a measure of ethanol’s effect on
locomotor activities.
4.2.4 Statistical Analysis for Tolerance and Withdrawal
Tolerance has been described as behavioural adaptation to alcohol in the form of
decreased intoxication (Kalant et al., 1971), diminished behavioural response to the same
dose of alcohol (American Psychiatric Association. et al., 2013), and blunted effects of
ethanol (Mitchell et al., 2010). In addition, alcohol intoxication is defined as a
physiological state induced by ingestion of alcohol (Bettinger et al., 2012). Based on
these descriptions, I defined tolerance as “reduced intoxication to ethanol due to previous
exposure”. Operationally, I defined a “Tolerance Index” as the % difference between
ethanol effects on exposed and unexposed groups. The mathematical formulas for the
Tolerance Index is:
TI = (A-B)/A, where,
A = (speed of 200mM+0mM group) – (speed of 0mM+0mM group)
B = (speed of 200mM+200mM group) – (speed of 0mM+0mM group)
Multi-factorial ANOVAs for the effect of strain (if applicable), pre-exposure dose
(0mM or 200mM) and tested dose (0mM or 200mM) were performed on behavioural
measures followed by post-hoc Bonferroni multiple pair-wise comparisons between
groups. The significance level was set to α=0.05. Effect of strain on Tolerance and
Withdrawal Indexes was analyzed using a One-Way ANOVA. Significant tolerance and
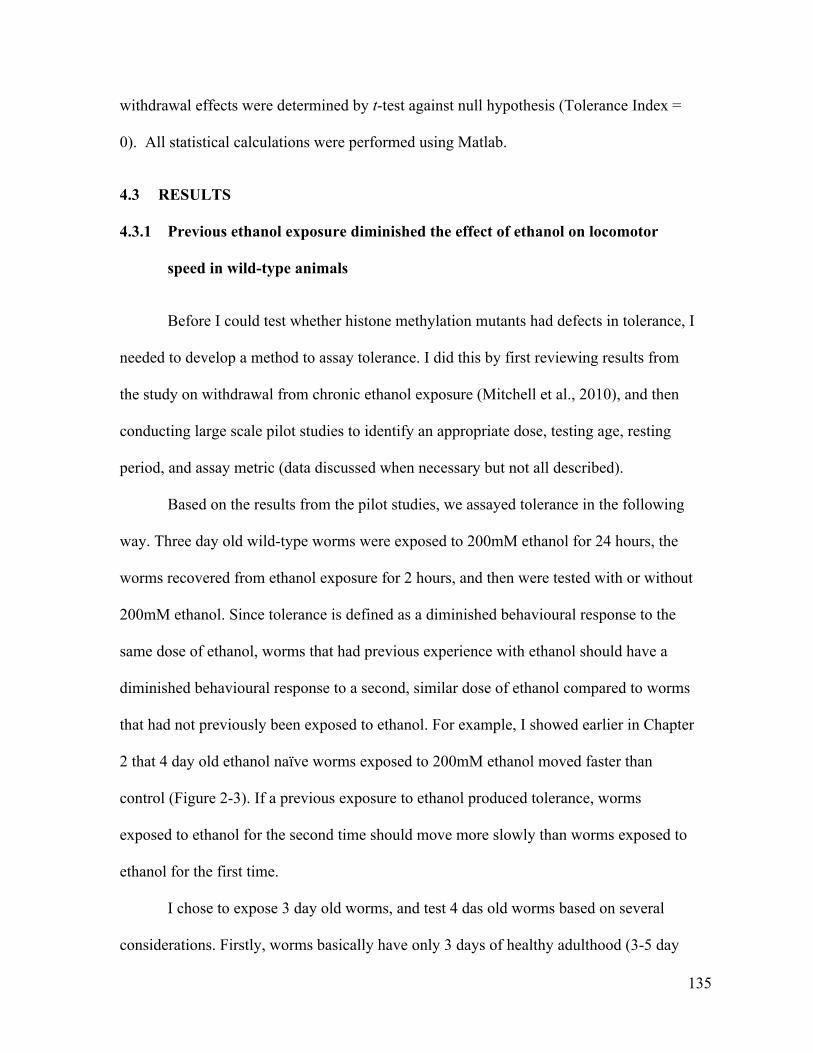
135
withdrawal effects were determined by t-test against null hypothesis (Tolerance Index =
0). All statistical calculations were performed using Matlab.
4.3 RESULTS
4.3.1 Previous ethanol exposure diminished the effect of ethanol on locomotor
speed in wild-type animals
Before I could test whether histone methylation mutants had defects in tolerance, I
needed to develop a method to assay tolerance. I did this by first reviewing results from
the study on withdrawal from chronic ethanol exposure (Mitchell et al., 2010), and then
conducting large scale pilot studies to identify an appropriate dose, testing age, resting
period, and assay metric (data discussed when necessary but not all described).
Based on the results from the pilot studies, we assayed tolerance in the following
way. Three day old wild-type worms were exposed to 200mM ethanol for 24 hours, the
worms recovered from ethanol exposure for 2 hours, and then were tested with or without
200mM ethanol. Since tolerance is defined as a diminished behavioural response to the
same dose of ethanol, worms that had previous experience with ethanol should have a
diminished behavioural response to a second, similar dose of ethanol compared to worms
that had not previously been exposed to ethanol. For example, I showed earlier in Chapter
2 that 4 day old ethanol naïve worms exposed to 200mM ethanol moved faster than
control (Figure 2-3). If a previous exposure to ethanol produced tolerance, worms
exposed to ethanol for the second time should move more slowly than worms exposed to
ethanol for the first time.
I chose to expose 3 day old worms, and test 4 das old worms based on several
considerations. Firstly, worms basically have only 3 days of healthy adulthood (3-5 day
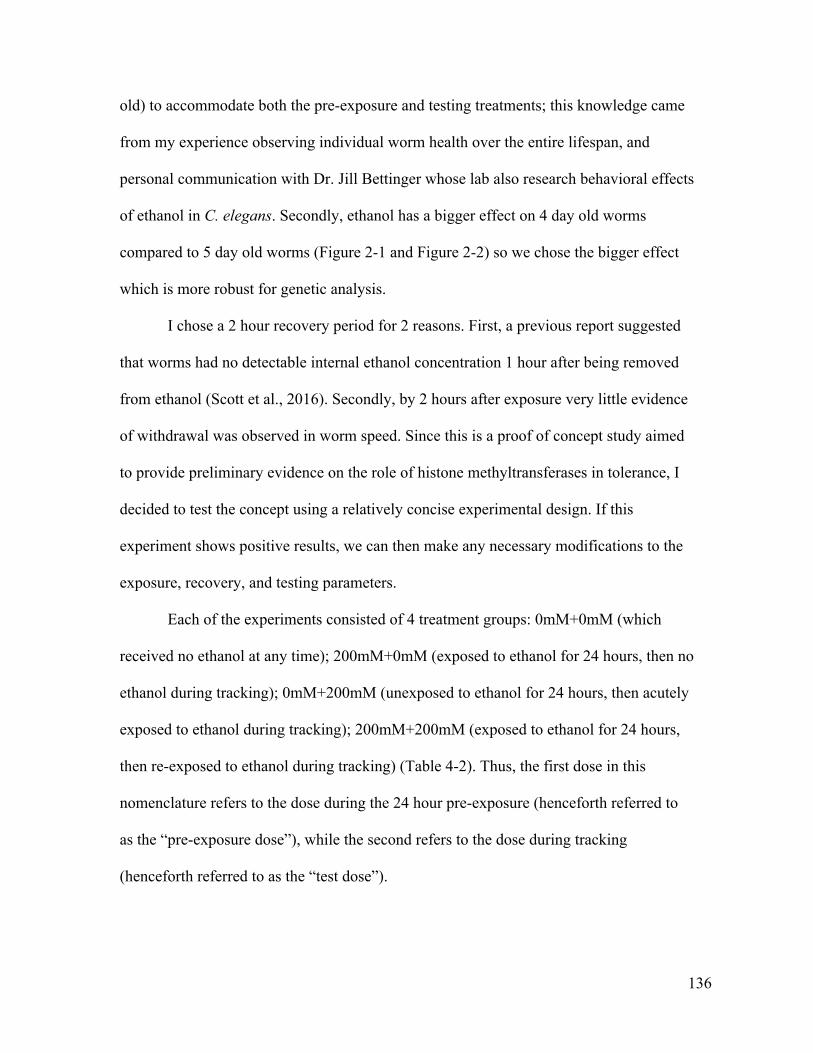
136
old) to accommodate both the pre-exposure and testing treatments; this knowledge came
from my experience observing individual worm health over the entire lifespan, and
personal communication with Dr. Jill Bettinger whose lab also research behavioral effects
of ethanol in C. elegans. Secondly, ethanol has a bigger effect on 4 day old worms
compared to 5 day old worms (Figure 2-1 and Figure 2-2) so we chose the bigger effect
which is more robust for genetic analysis.
I chose a 2 hour recovery period for 2 reasons. First, a previous report suggested
that worms had no detectable internal ethanol concentration 1 hour after being removed
from ethanol (Scott et al., 2016). Secondly, by 2 hours after exposure very little evidence
of withdrawal was observed in worm speed. Since this is a proof of concept study aimed
to provide preliminary evidence on the role of histone methyltransferases in tolerance, I
decided to test the concept using a relatively concise experimental design. If this
experiment shows positive results, we can then make any necessary modifications to the
exposure, recovery, and testing parameters.
Each of the experiments consisted of 4 treatment groups: 0mM+0mM (which
received no ethanol at any time); 200mM+0mM (exposed to ethanol for 24 hours, then no
ethanol during tracking); 0mM+200mM (unexposed to ethanol for 24 hours, then acutely
exposed to ethanol during tracking); 200mM+200mM (exposed to ethanol for 24 hours,
then re-exposed to ethanol during tracking) (Table 4-2). Thus, the first dose in this
nomenclature refers to the dose during the 24 hour pre-exposure (henceforth referred to
as the “pre-exposure dose”), while the second refers to the dose during tracking
(henceforth referred to as the “test dose”).

137
Table 4-2. Pre-exposure paradigm experimental groups and names List of experimental groups and their pre-exposure dose and test dose concentrations. Listed abbreviated name and nick name was used for easier reference to each group.
Before I examined tolerance, I confirmed the effect of 200mM ethanol exposure
on crawling speed (Figure 4-2). As expected, the first-time group (0mM+200mM) had
faster speeds compared to the naïve group control (0mM+0mM; p<.001), indicating
200mM ethanol increased worm speed. Similarity, the double exposed group
(200mM+200mM) had faster speeds compared to the recovered group (200mM+ 0mM; p
< 0.001), indicating that worms previously exposed to ethanol still became hyperactive
when exposed the second time. To determine whether the previous ethanol exposure had
a residual effect on speed, I compared the speed of the recovered group with the naïve
group, and found the two groups had comparable speeds (0mM+0mM vs. 200mM+0mM,
p=n.s.), indicating that the effects of the previous exposure did not significantly affect
speed 2 hours after removal from ethanol.
Pre-exposureDose(mMEtOH)
TestDose(mMEtOH)
AbbreviatedName
GroupName
0 0 0mM+0mM Naïve0 200 0mM+200mM First-time200 0 200mM+0mM Recovered200 200 200mM+200mM Double
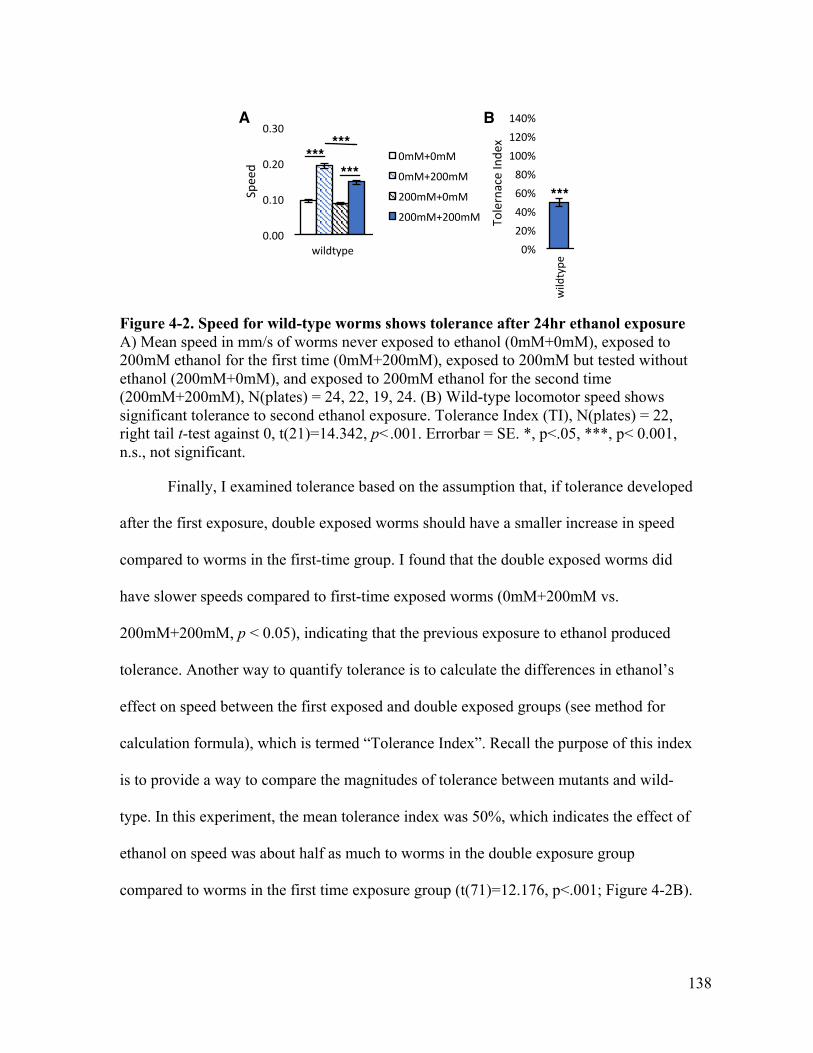
138
Figure 4-2. Speed for wild-type worms shows tolerance after 24hr ethanol exposure A) Mean speed in mm/s of worms never exposed to ethanol (0mM+0mM), exposed to 200mM ethanol for the first time (0mM+200mM), exposed to 200mM but tested without ethanol (200mM+0mM), and exposed to 200mM ethanol for the second time (200mM+200mM), N(plates) = 24, 22, 19, 24. (B) Wild-type locomotor speed shows significant tolerance to second ethanol exposure. Tolerance Index (TI), N(plates) = 22, right tail t-test against 0, t(21)=14.342, p<.001. Errorbar = SE. *, p<.05, ***, p< 0.001, n.s., not significant.
Finally, I examined tolerance based on the assumption that, if tolerance developed
after the first exposure, double exposed worms should have a smaller increase in speed
compared to worms in the first-time group. I found that the double exposed worms did
have slower speeds compared to first-time exposed worms (0mM+200mM vs.
200mM+200mM, p < 0.05), indicating that the previous exposure to ethanol produced
tolerance. Another way to quantify tolerance is to calculate the differences in ethanol’s
effect on speed between the first exposed and double exposed groups (see method for
calculation formula), which is termed “Tolerance Index”. Recall the purpose of this index
is to provide a way to compare the magnitudes of tolerance between mutants and wild-
type. In this experiment, the mean tolerance index was 50%, which indicates the effect of
ethanol on speed was about half as much to worms in the double exposure group
compared to worms in the first time exposure group (t(71)=12.176, p<.001; Figure 4-2B).
0.00
0.10
0.20
0.30
wildtypeSpeed
0mM+0mM
0mM+200mM
200mM+0mM
200mM+200mM
0%20%40%60%80%100%120%140%
wildtype
TolernaceInde
x
-30%
-10%
10%
30%
50%
wildtype
With
draw
alInde
x
0.00
0.10
0.20
0.30
wildtype
Speed
0mM+0mM
0mM+200mM
200mM+0mM
200mM+200mM
0%20%40%60%80%100%120%140%
wildtype
TolernaceInde
x
-30%
-10%
10%
30%
50%
wildtype
With
draw
alInde
x
0.00
0.10
0.20
0.30
wildtype
Speed
0mM+0mM
0mM+200mM
200mM+0mM
200mM+200mM
0%20%40%60%80%100%120%140%
wildtype
TolernaceInde
x
-30%
-10%
10%
30%
50%
wildtype
With
draw
alInde
x
0.00
0.10
0.20
0.30
wildtype
Speed
0mM+0mM
0mM+200mM
200mM+0mM
200mM+200mM
0%20%40%60%80%100%120%140%
wildtype
TolernaceInde
x
-30%
-10%
10%
30%
50%
wildtype
With
draw
alInde
x
A B
***
******
***
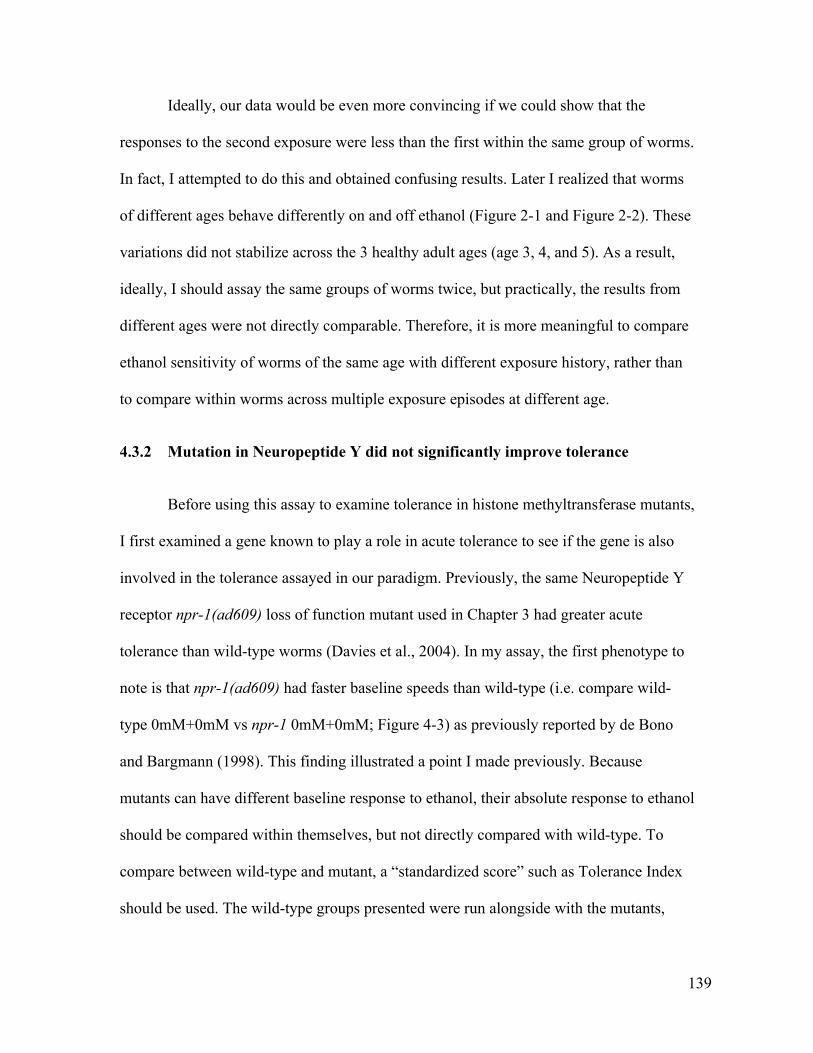
139
Ideally, our data would be even more convincing if we could show that the
responses to the second exposure were less than the first within the same group of worms.
In fact, I attempted to do this and obtained confusing results. Later I realized that worms
of different ages behave differently on and off ethanol (Figure 2-1 and Figure 2-2). These
variations did not stabilize across the 3 healthy adult ages (age 3, 4, and 5). As a result,
ideally, I should assay the same groups of worms twice, but practically, the results from
different ages were not directly comparable. Therefore, it is more meaningful to compare
ethanol sensitivity of worms of the same age with different exposure history, rather than
to compare within worms across multiple exposure episodes at different age.
4.3.2 Mutation in Neuropeptide Y did not significantly improve tolerance
Before using this assay to examine tolerance in histone methyltransferase mutants,
I first examined a gene known to play a role in acute tolerance to see if the gene is also
involved in the tolerance assayed in our paradigm. Previously, the same Neuropeptide Y
receptor npr-1(ad609) loss of function mutant used in Chapter 3 had greater acute
tolerance than wild-type worms (Davies et al., 2004). In my assay, the first phenotype to
note is that npr-1(ad609) had faster baseline speeds than wild-type (i.e. compare wild-
type 0mM+0mM vs npr-1 0mM+0mM; Figure 4-3) as previously reported by de Bono
and Bargmann (1998). This finding illustrated a point I made previously. Because
mutants can have different baseline response to ethanol, their absolute response to ethanol
should be compared within themselves, but not directly compared with wild-type. To
compare between wild-type and mutant, a “standardized score” such as Tolerance Index
should be used. The wild-type groups presented were run alongside with the mutants,

140
thus serve as a control for the effects of ethanol during the experimental conditions
shared with the mutants.
Figure 4-3. Neuropeptide Y receptor ortholog npr-1(ad609) mutant shows tolerance A) Mean speed of wild-type worms and npr-1(ad609) mutant worms that were never exposed to ethanol (0mM+0mM), exposed to 200mM ethanol for the first time (0mM+200mM), exposed to 200mM but tested without ethanol (200mM+0mM), and exposed to 200mM ethanol for the second time (200mM+200mM). N(plates, wild-type)=8, 8, 9, 9, N(plates, npr-1)=11, 12, 12, 12. (B) Tolerance Index (TI) of wild-type, N(plates)=9, and npr-1, N(plates)=12. Errorbar = SE. *, p<.05, **, p<.01, ***, p< 0.001, n.s., not significant.
Results indicated that wild-type worms in this experiment showed tolerance to
ethanol. Wild-type worms in the first-time exposed group had higher speeds than their
corresponding naïve control groups (0mM+0mM vs. 0mM+200mM, p=.002; Figure
4-3A), indicating that ethanol increased speed. However, double exposed wild-type
worms did not have higher speeds than the recovered group or the naïve groups,
suggesting ethanol failed to significantly increase speeds. Although mean speed of the
double exposed wild-type group was not different from the first time exposed group, the
Tolerance Index was higher than 0% (t(8)=2.768, p=.012; Figure 4-3B), indicating wild-
type worms showed significant tolerance. The Tolerance Index is arguably a more
accurate measure because the differences between speeds were compared within the same
0.00
0.10
0.20
0.30
wildtype npr-1(ad609)
Speed
0mM+0mM0mM+200mM200mM+0mM200mM+200mM
0%20%40%60%80%100%120%140%
wildtype
npr-1
(ad6
09)
TolernaceInde
x
-30%
-10%
10%
30%
50%
wildtype
npr-1
(ad6
09)
With
draw
alInde
x
A BA BA
A B
**
****
***
****

141
experiments. From observation of the raw data, speeds could vary slightly between
experiments thus the Tolerance Index took the variations between experiments into
account.
For npr-1 mutants, results indicated significant tolerance, however the tolerance
level was not significantly higher than for wild-type worms. First time exposed npr-1
worms had higher speeds than their corresponding naïve control groups (0mM+0mM vs.
0mM+200mM, wild-type, p=.002, npr-1, p<.001; Figure 4-3A), indicating that ethanol
increased speed. The speed of the double exposed group was significantly higher than the
recovered group (p=.041), was comparable to the naïve group, and significantly lower
than the first-time exposed group (0mM+200mM vs 200mM+200mM, p<.001),
suggesting that ethanol had less effect on the double exposed group. In addition, the
Tolerance Index of npr-1 was significantly higher than 0% (t(11)=6.501, p<.001; Figure
4-3B), indicating npr-1 showed tolerance.
To test whether npr-1 worms showed stronger tolerance that wild-type, tolerance
indices between the wild-type and npr-1 were compared. Although npr-1 worms
appeared to have stronger tolerance compared to wild-type, the two Tolerance Indices
were not significantly different (ANOVA, F(1,19)strain=2.74, p=0.114). Overall, in
contrast to published results on acute tolerance my results did not show significantly
better chronic tolerance in npr-1(ad609) mutants, and suggested that the npr-1 mutation
may prolong withdrawal.
4.3.3 H3K9 methyltransferase mutation attenuated tolerance
To investigate the role of the H3K9 methyltransferase in tolerance, I tested the MT14480
strain carrying a deletion in putative transmembrane regions of set-11, a C. elegans
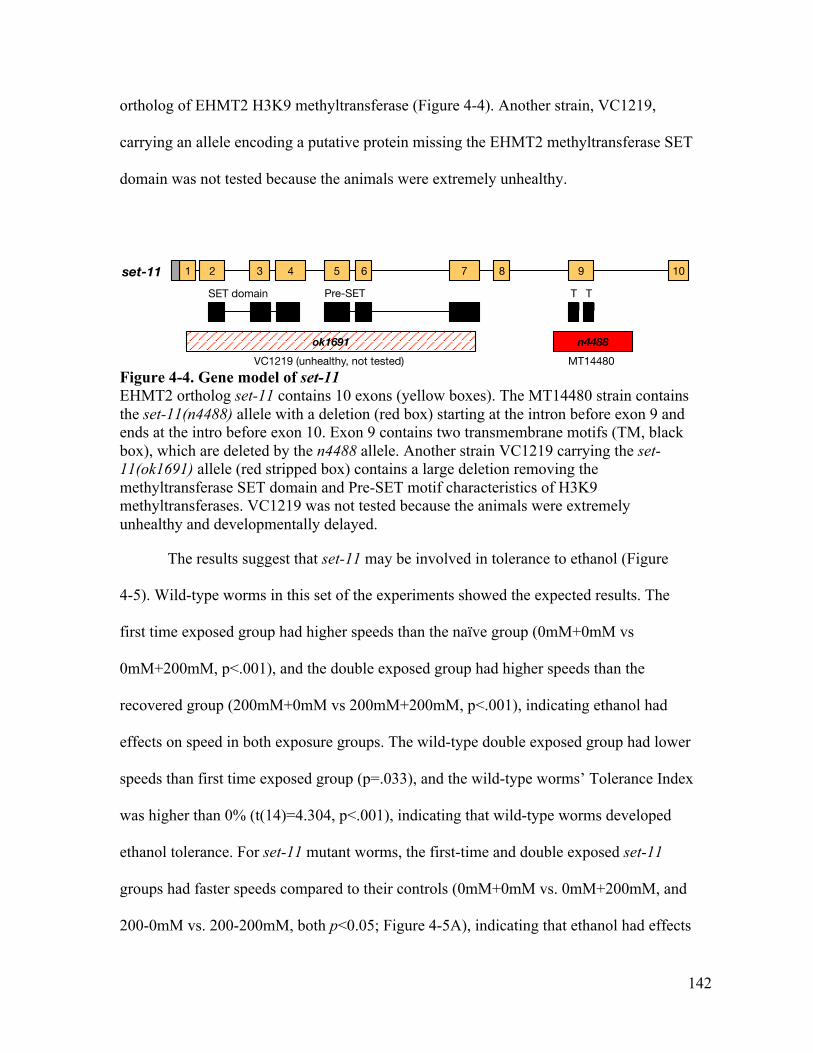
142
ortholog of EHMT2 H3K9 methyltransferase (Figure 4-4). Another strain, VC1219,
carrying an allele encoding a putative protein missing the EHMT2 methyltransferase SET
domain was not tested because the animals were extremely unhealthy.
Figure 4-4. Gene model of set-11 EHMT2 ortholog set-11 contains 10 exons (yellow boxes). The MT14480 strain contains the set-11(n4488) allele with a deletion (red box) starting at the intron before exon 9 and ends at the intro before exon 10. Exon 9 contains two transmembrane motifs (TM, black box), which are deleted by the n4488 allele. Another strain VC1219 carrying the set-11(ok1691) allele (red stripped box) contains a large deletion removing the methyltransferase SET domain and Pre-SET motif characteristics of H3K9 methyltransferases. VC1219 was not tested because the animals were extremely unhealthy and developmentally delayed.
The results suggest that set-11 may be involved in tolerance to ethanol (Figure
4-5). Wild-type worms in this set of the experiments showed the expected results. The
first time exposed group had higher speeds than the naïve group (0mM+0mM vs
0mM+200mM, p<.001), and the double exposed group had higher speeds than the
recovered group (200mM+0mM vs 200mM+200mM, p<.001), indicating ethanol had
effects on speed in both exposure groups. The wild-type double exposed group had lower
speeds than first time exposed group (p=.033), and the wild-type worms’ Tolerance Index
was higher than 0% (t(14)=4.304, p<.001), indicating that wild-type worms developed
ethanol tolerance. For set-11 mutant worms, the first-time and double exposed set-11
groups had faster speeds compared to their controls (0mM+0mM vs. 0mM+200mM, and
200-0mM vs. 200-200mM, both p<0.05; Figure 4-5A), indicating that ethanol had effects
2 3 4 5 6 7 8 9 101
n4488ok1691
SET domain Pre-SET motif
TM
TM
set-11
VC1219 (unhealthy, not tested) MT14480

143
on speed in both exposure groups. However, the set-11 double exposed group had
comparable speed to the first time exposed group, but the Tolerance Index was not
significantly higher than 0%, suggesting that the set-11 mutant failed to develop tolerance
to ethanol. I am reluctant to conclude a major role of set-11 in tolerance because the
difference between the set-11 double and first time exposed groups as not significant
(Figure 4-5A). Therefore, I conclude that the data suggests only a possible minor role of
set-11 in tolerance.
Figure 4-5. A mutation in the H3K9 methyltransferase set-11(n4488) attenuates tolerance A) Mean speed for wild-type and set-11(n4488) mutant worms that never exposed to ethanol (0mM+0mM), exposed to 200mM ethanol for the first time (0mM+200mM), exposed to 200mM but tested without ethanol (200mM+0mM), and exposed to 200mM ethanol for the second time (200mM+200mM). N(plates, wild-type)=15, 14, 15, 15, N(plates, set-11)=20, 20, 20, 20. (B) Tolerance Index (TI) of wild-type, N(plates)=15, and set-11, N(plates)=20. Errorbar = SE. *, p<.05, **, p<.01, ***, p< 0.001, n.s., not significant.
4.3.4 H3K4 methyltransferase mutation set-2(ok952) but not set-2(ok1493)
attenuated tolerance
To investigate the role of H3K4 methyltransferase plays a role in tolerance, I
tested two strains carrying mutations in set-2, the H3K4 methyltransferase SETD1A
ortholog in C. elegans (Figure 4-6). The RB1025 strain contains the set-2(ok952) allele
0.00
0.10
0.20
0.30
wildtype set-11(n4488)
Speed
0mM+0mM0mM+200mM200mM+0mM200mM+200mM
0%20%40%60%80%100%120%140%
wildtype
set-1
1(n4
488)
TolernaceInde
x-30%
-10%
10%
30%
50%
wildtype
set-1
1(n4
488)
With
draw
alInde
x
***
A B
***
****
******
n.s.

144
with a complex substitution overlapping a phosphorylation site at exon 6 disrupted all 3
set-2 isoforms. RB1347 contains the set-2(ok1493) allele with a deletion at the 5’UTR
region present in two of the set-2 isoforms.
Figure 4-6. Gene model of set-2 SETD1A ortholog set-2 gene encode 3 transcriptional isoforms. The first isoform contains 8 exons while the other two contains 16 (yellow boxes). The RB1025 strain contains the set-2(ok952) allele with a complex substitution (blue box) overlaps with a putative phosphorylation site at the 6th exon for all three isoforms. The RB1347 strain contains the set-2(ok1493) allele with a deletion overlapping the 5’UTR of the first two isoforms but not the last isoform. Both strains have wild-type locomotion and developmental rate.
Results from the set-2(ok952) experiment suggest that set-2 is involved in
tolerance to ethanol. Wild-type control worms showed the expected effect of ethanol
(Figure 4-7A). Both the first time and double exposed groups had faster speeds than their
corresponding controls (0mM+0mM vs 0mM+200mM, p<.001, 200mM+0mM vs
200mM+200mM, p=.005), the double exposed groups had less of an effect than the first
time exposed groups (0mM+200mM vs 200mM+200mM, p<.001), and the Tolerance
Index was significantly larger than 0% (t(8)=4.657, p<.001; Figure 4-7B), suggesting the
double exposed group established tolerance. For set-2(ok952) worms, both first-time and
double exposed worms had faster speeds than their corresponding control groups
(0mM+0mM vs 0mM+200mM, p<.001, 200mM+0mM vs 200mM+200mM, p<.001),
indicating ethanol increased speeds for both groups tested on ethanol. However, the set-
set-2
RB1347
ok1493
RB1025
ok952
2 3 4 5 6 7 8 9 10 11 12 13 14 15
2 3 4 5 6 7 8 9 10 11 12 13 14 15
2 3 4 5 6 7 8
SET domain phosphorylation site
16
16
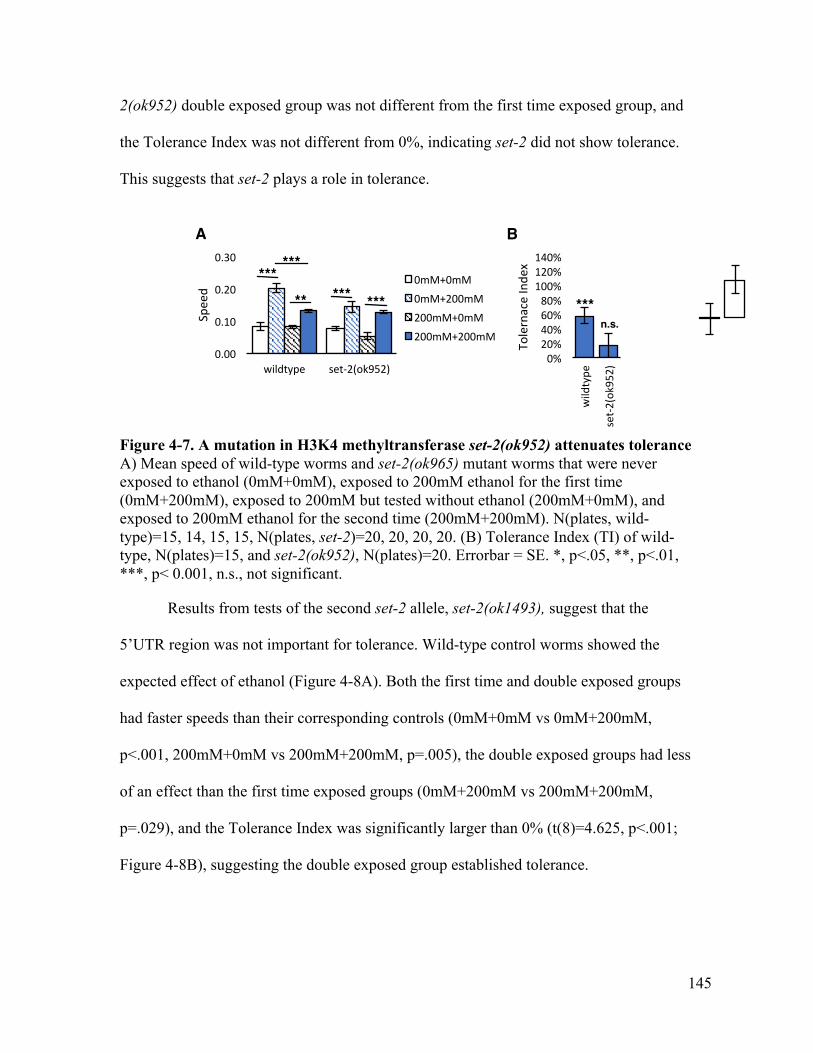
145
2(ok952) double exposed group was not different from the first time exposed group, and
the Tolerance Index was not different from 0%, indicating set-2 did not show tolerance.
This suggests that set-2 plays a role in tolerance.
Figure 4-7. A mutation in H3K4 methyltransferase set-2(ok952) attenuates tolerance A) Mean speed of wild-type worms and set-2(ok965) mutant worms that were never exposed to ethanol (0mM+0mM), exposed to 200mM ethanol for the first time (0mM+200mM), exposed to 200mM but tested without ethanol (200mM+0mM), and exposed to 200mM ethanol for the second time (200mM+200mM). N(plates, wild-type)=15, 14, 15, 15, N(plates, set-2)=20, 20, 20, 20. (B) Tolerance Index (TI) of wild-type, N(plates)=15, and set-2(ok952), N(plates)=20. Errorbar = SE. *, p<.05, **, p<.01, ***, p< 0.001, n.s., not significant.
Results from tests of the second set-2 allele, set-2(ok1493), suggest that the
5’UTR region was not important for tolerance. Wild-type control worms showed the
expected effect of ethanol (Figure 4-8A). Both the first time and double exposed groups
had faster speeds than their corresponding controls (0mM+0mM vs 0mM+200mM,
p<.001, 200mM+0mM vs 200mM+200mM, p=.005), the double exposed groups had less
of an effect than the first time exposed groups (0mM+200mM vs 200mM+200mM,
p=.029), and the Tolerance Index was significantly larger than 0% (t(8)=4.625, p<.001;
Figure 4-8B), suggesting the double exposed group established tolerance.
0.00
0.10
0.20
0.30
wildtype set-2(ok952)
Speed
0mM+0mM0mM+200mM200mM+0mM200mM+200mM
0%20%40%60%80%100%120%140%
wildtype
set-2
(ok952)
TolernaceInde
x
-30%
-10%
10%
30%
50%
wildtype
set-2
(ok952)
With
draw
alInde
x
A B
*****
***
*** *** ***n.s.
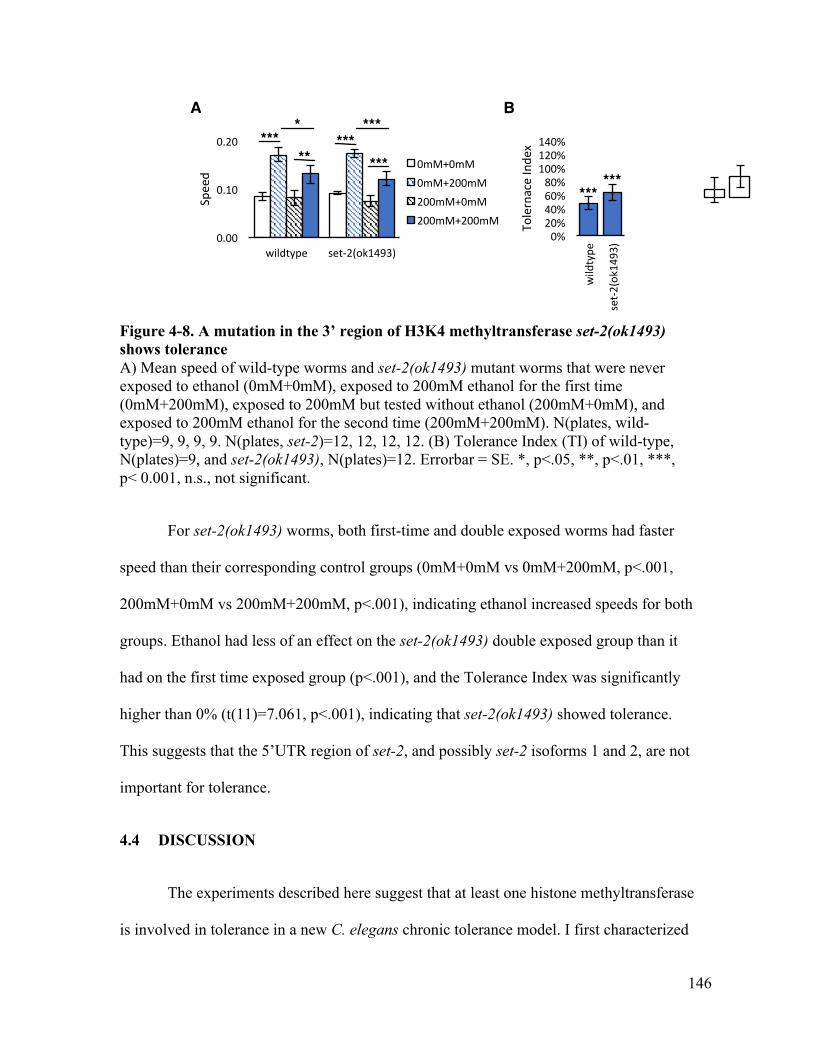
146
Figure 4-8. A mutation in the 3’ region of H3K4 methyltransferase set-2(ok1493) shows tolerance A) Mean speed of wild-type worms and set-2(ok1493) mutant worms that were never exposed to ethanol (0mM+0mM), exposed to 200mM ethanol for the first time (0mM+200mM), exposed to 200mM but tested without ethanol (200mM+0mM), and exposed to 200mM ethanol for the second time (200mM+200mM). N(plates, wild-type)=9, 9, 9, 9. N(plates, set-2)=12, 12, 12, 12. (B) Tolerance Index (TI) of wild-type, N(plates)=9, and set-2(ok1493), N(plates)=12. Errorbar = SE. *, p<.05, **, p<.01, ***, p< 0.001, n.s., not significant.
For set-2(ok1493) worms, both first-time and double exposed worms had faster
speed than their corresponding control groups (0mM+0mM vs 0mM+200mM, p<.001,
200mM+0mM vs 200mM+200mM, p<.001), indicating ethanol increased speeds for both
groups. Ethanol had less of an effect on the set-2(ok1493) double exposed group than it
had on the first time exposed group (p<.001), and the Tolerance Index was significantly
higher than 0% (t(11)=7.061, p<.001), indicating that set-2(ok1493) showed tolerance.
This suggests that the 5’UTR region of set-2, and possibly set-2 isoforms 1 and 2, are not
important for tolerance.
4.4 DISCUSSION
The experiments described here suggest that at least one histone methyltransferase
is involved in tolerance in a new C. elegans chronic tolerance model. I first characterized
0.00
0.10
0.20
wildtype set-2(ok1493)
Speed
0mM+0mM0mM+200mM200mM+0mM200mM+200mM
0%20%40%60%80%100%120%140%
wildtype
set-2
(ok1493)
TolernaceInde
x
-30%
-10%
10%
30%
50%
wildtype
set-2
(ok1493)
With
draw
alInde
x
A B
*****
****
***
***
******
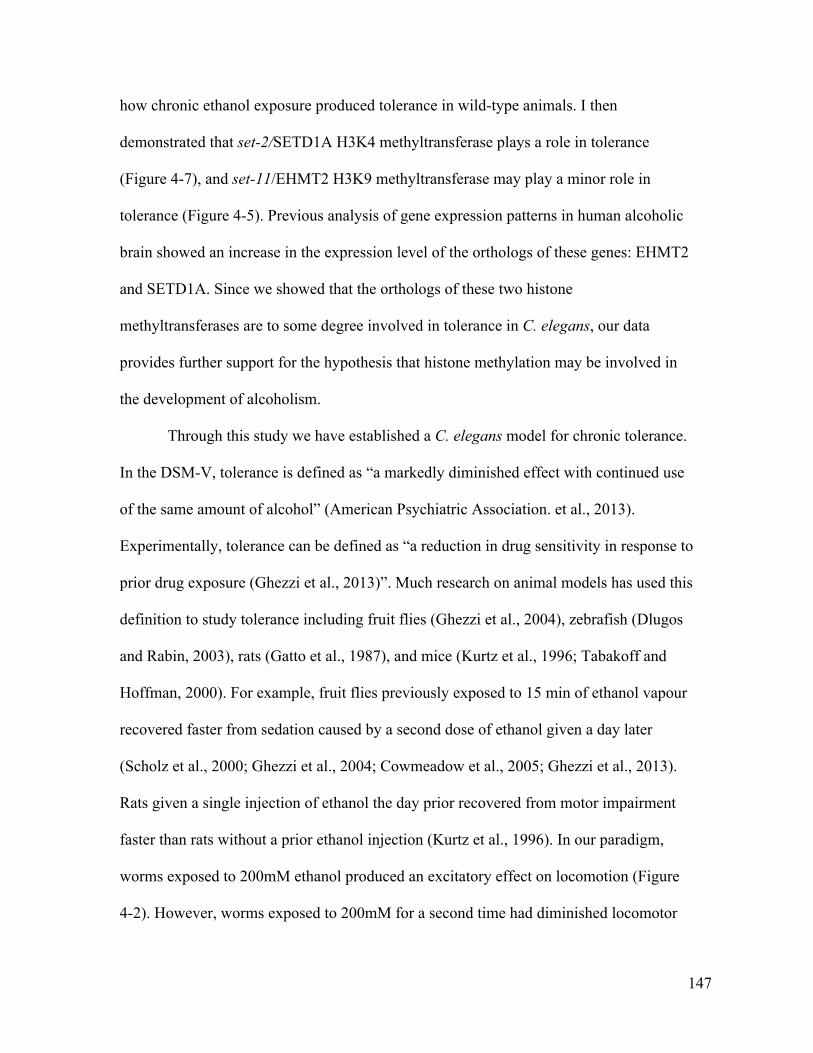
147
how chronic ethanol exposure produced tolerance in wild-type animals. I then
demonstrated that set-2/SETD1A H3K4 methyltransferase plays a role in tolerance
(Figure 4-7), and set-11/EHMT2 H3K9 methyltransferase may play a minor role in
tolerance (Figure 4-5). Previous analysis of gene expression patterns in human alcoholic
brain showed an increase in the expression level of the orthologs of these genes: EHMT2
and SETD1A. Since we showed that the orthologs of these two histone
methyltransferases are to some degree involved in tolerance in C. elegans, our data
provides further support for the hypothesis that histone methylation may be involved in
the development of alcoholism.
Through this study we have established a C. elegans model for chronic tolerance.
In the DSM-V, tolerance is defined as “a markedly diminished effect with continued use
of the same amount of alcohol” (American Psychiatric Association. et al., 2013).
Experimentally, tolerance can be defined as “a reduction in drug sensitivity in response to
prior drug exposure (Ghezzi et al., 2013)”. Much research on animal models has used this
definition to study tolerance including fruit flies (Ghezzi et al., 2004), zebrafish (Dlugos
and Rabin, 2003), rats (Gatto et al., 1987), and mice (Kurtz et al., 1996; Tabakoff and
Hoffman, 2000). For example, fruit flies previously exposed to 15 min of ethanol vapour
recovered faster from sedation caused by a second dose of ethanol given a day later
(Scholz et al., 2000; Ghezzi et al., 2004; Cowmeadow et al., 2005; Ghezzi et al., 2013).
Rats given a single injection of ethanol the day prior recovered from motor impairment
faster than rats without a prior ethanol injection (Kurtz et al., 1996). In our paradigm,
worms exposed to 200mM ethanol produced an excitatory effect on locomotion (Figure
4-2). However, worms exposed to 200mM for a second time had diminished locomotor
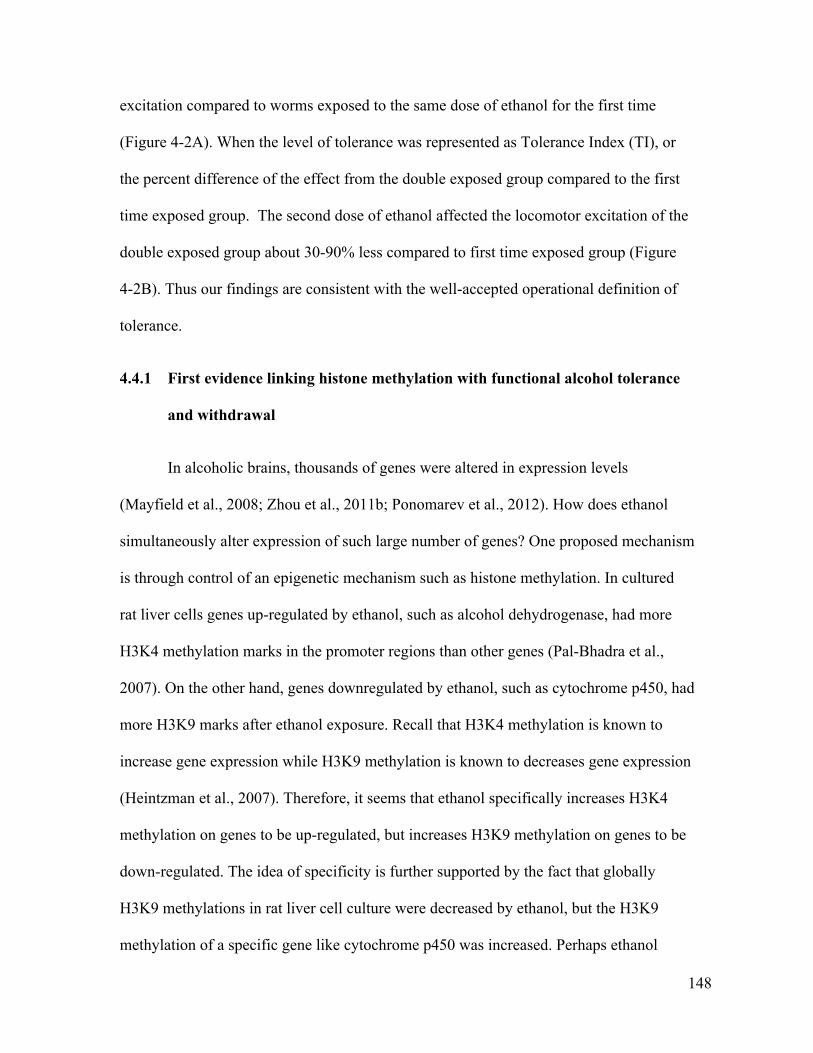
148
excitation compared to worms exposed to the same dose of ethanol for the first time
(Figure 4-2A). When the level of tolerance was represented as Tolerance Index (TI), or
the percent difference of the effect from the double exposed group compared to the first
time exposed group. The second dose of ethanol affected the locomotor excitation of the
double exposed group about 30-90% less compared to first time exposed group (Figure
4-2B). Thus our findings are consistent with the well-accepted operational definition of
tolerance.
4.4.1 First evidence linking histone methylation with functional alcohol tolerance
and withdrawal
In alcoholic brains, thousands of genes were altered in expression levels
(Mayfield et al., 2008; Zhou et al., 2011b; Ponomarev et al., 2012). How does ethanol
simultaneously alter expression of such large number of genes? One proposed mechanism
is through control of an epigenetic mechanism such as histone methylation. In cultured
rat liver cells genes up-regulated by ethanol, such as alcohol dehydrogenase, had more
H3K4 methylation marks in the promoter regions than other genes (Pal-Bhadra et al.,
2007). On the other hand, genes downregulated by ethanol, such as cytochrome p450, had
more H3K9 marks after ethanol exposure. Recall that H3K4 methylation is known to
increase gene expression while H3K9 methylation is known to decreases gene expression
(Heintzman et al., 2007). Therefore, it seems that ethanol specifically increases H3K4
methylation on genes to be up-regulated, but increases H3K9 methylation on genes to be
down-regulated. The idea of specificity is further supported by the fact that globally
H3K9 methylations in rat liver cell culture were decreased by ethanol, but the H3K9
methylation of a specific gene like cytochrome p450 was increased. Perhaps ethanol
149
accomplishes this through some mechanisms that target histone methyltransferases to
specific genes. In fact, a siRNA mechanism can direct H3K9 histone methyltransferase to
specific sites of the genome (Zilberman et al., 2003), and alcohol specifically upregulate
microRNA 9 (Pietrzykowski and Treistman, 2008). Therefore, it is not unreasonable to
speculate that alcohol might specifically alter gene expression through some interactions
with histone methyltransferases.
Our results provide evidence that functional alcohol tolerance involves histone
methylation modification proteins, SETD1A H3K9 methyltransferases, and possibly also
involves EHMT2 H3K4 methyltransferases. We tested mutant carrying a EHMT2/set-11
allele missing the gene’s transmembrane domains, a SETD1A/set-2 allele missing a
phosphorylation site, and a SETD1A/set-2 allele missing the 5’UTR region. Because
histone methylation is critical for development, mutants carrying defects in catalytic
domains of histone methyltransferases have severe defects such as sterility, lethality,
developmental defects, and/or locomotor defects. These severe phenotypes make null
knockout mutants unsuitable for behavioral analysis. Considering the relatively mild
nature of the mutations we tested, the results were quite astonishing. Even with such
relatively minor mutations, we found that, while wild-type worms showed significant
functional tolerance, mutant worms missing the transmembrane domains of EHMT2/set-
11 or a SETD1A/set-2 phosphorylation site did not show significant tolerance (Figure
4-7B & Figure 4-5B). It may be that ethanol needs these two regions to produce tolerance
to ethanol.

150
Figure 4-9. Tolerance Indices with confidence intervals shows npr-1(ad609) and set-2(ok952) have altered tolerance compared to wild-type Tolerance Index (TI) confidence interval (mean +/- SE) of mutant strains (red bars, allele name listed on the y-axis) and wild-type control worms run with the mutants (gray bars). A TI of 0% indicates no tolerance occurred. The TI confidence interval for wild-type controls varied between experiments, and the overall range was between 33%-73%. The TI confidence interval of npr-1(ad609) is higher than its wild-type control, suggesting better tolerance. TI confidence interval of set-2(ok952) is lower than its wild-type control, suggesting impaired tolerance.
Currently, very little is understood about the role of EHMT2 and alcohol tolerance
in adults. Aside from a report that found EHMT2 mRNA level was decreased in ethanol-
fed mice (Esfandiari et al., 2010), other studies linking functional outcome of alcohol and
EHMT2 came from studies of developmental ethanol exposure (Subbanna et al., 2013;
Subbanna and Basavarajappa, 2014; Basavarajappa and Subbanna, 2016). In this study
we showed that worms carrying an EHMT2/set-11 ortholog without the transmembrane
motifs did not show significant tolerance (Figure 4-9), which suggests that the
localization of this protein may play a minor role in alcohol tolerance. However, because
the effects of the set-11 mutation on tolerance was small, I concluded my data support a
possible role of EHMT2/set-11 on tolerance, and examination of additional mutations are
needed to confirm the involvement of EHMT2/set-11 on tolerance.
Other than the evidence provided here, no previous publication has linked
EHMT2 with functional effects of alcohol. However, EHMT2 has been elegantly linked
0% 20% 40% 60% 80% 100% 120%
npr-1(ad609)
set-11(n4488)
set-2(ok952)
set-2(ok1493)
ToleranceIndex(Speed) Tolerance Index confidence interval (+/- SE)
wildtype
mutant
151
with functional effects in another drug of abuse: cocaine (Maze et al., 2010; Maze et al.,
2011). Chronic cocaine administration in rats decreased H3K9me2 levels, which was
associated with decreased G9a/EHMT2 mRNA and protein levels. Overexpression of
EHMT2 prevented the cocaine induced decrease in H3K9me2 levels, and reduced
subsequent cocaine preference. Both genetic and pharmacological knockdown of EHMT2
activities mimic the effect of chronic cocaine administration. If the EHMT2-dependent
mechanism works similarly across both cocaine and alcohol and is conserved across
animal species, we might speculate that the reduced tolerance seen in the set-11(n4488)
mutant would be a result of enhanced activity of set-11/EHMT2. However, we should not
jump to this conclusion for the following reasons: first, chronic alcohol exposure
conditions have been associated with a decrease in H3K9me2 levels as well as an
increase or no change in H3K9me2 levels (Pal-Bhadra et al., 2007; Shukla et al., 2008;
Wang et al., 2014). Second, a global decrease in H3K9me2 levels coincides with increase
in H3K9me2 levels for specific genes (Pal-Bhadra et al., 2007). Third, drug preference
and drug tolerance could be medicated by very different mechanisms. Therefore, the way
that EHMT2/set-11 mediates alcohol tolerance in our model remains to be elucidated.
Unfortunately, at this point very little, if at all, is known about the functional role of the
EHMT2/set-11 transmembrane motif. Important next steps will be to investigate further
how EHMT2 functions are altered by ethanol exposure.
This study also provided the first evidence that SETD1A is critical for functional
alcohol tolerance. Although increased H3K4me and increased SETD1A have been
identified in alcoholic conditions (Zhou et al., 2011a; Ponomarev et al., 2012), no studies
have provided functional relevance of SETD1A to alcohol related behaviors. I have
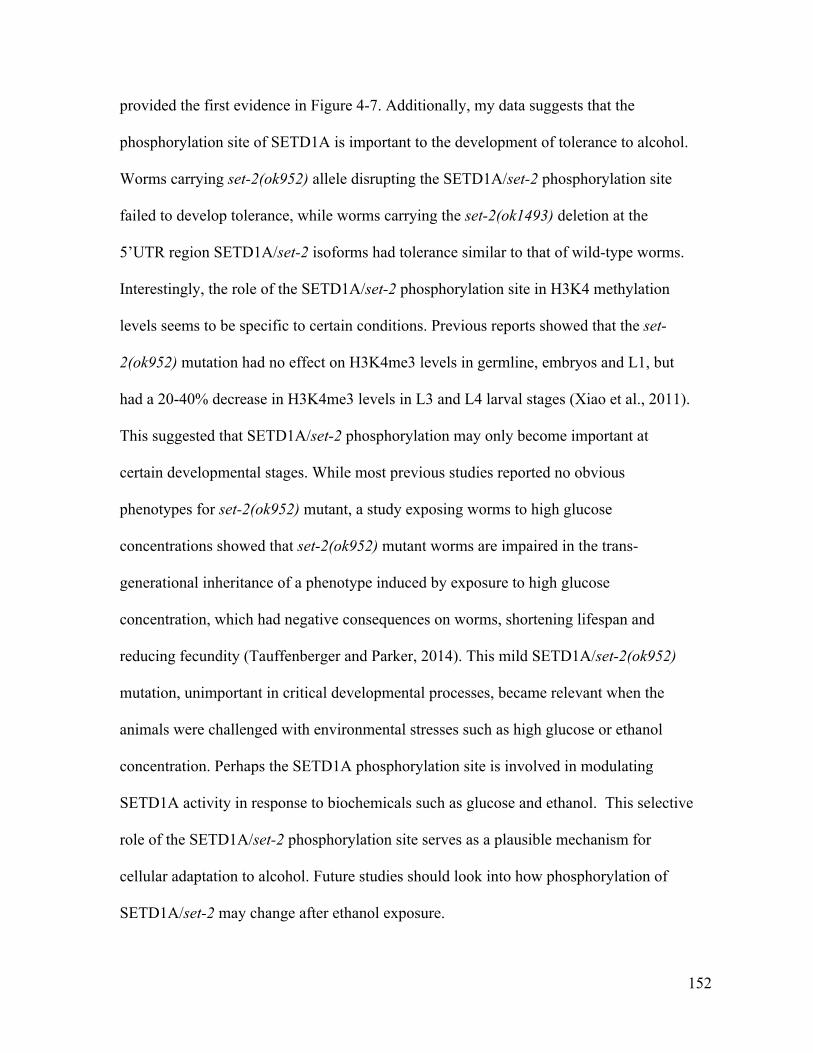
152
provided the first evidence in Figure 4-7. Additionally, my data suggests that the
phosphorylation site of SETD1A is important to the development of tolerance to alcohol.
Worms carrying set-2(ok952) allele disrupting the SETD1A/set-2 phosphorylation site
failed to develop tolerance, while worms carrying the set-2(ok1493) deletion at the
5’UTR region SETD1A/set-2 isoforms had tolerance similar to that of wild-type worms.
Interestingly, the role of the SETD1A/set-2 phosphorylation site in H3K4 methylation
levels seems to be specific to certain conditions. Previous reports showed that the set-
2(ok952) mutation had no effect on H3K4me3 levels in germline, embryos and L1, but
had a 20-40% decrease in H3K4me3 levels in L3 and L4 larval stages (Xiao et al., 2011).
This suggested that SETD1A/set-2 phosphorylation may only become important at
certain developmental stages. While most previous studies reported no obvious
phenotypes for set-2(ok952) mutant, a study exposing worms to high glucose
concentrations showed that set-2(ok952) mutant worms are impaired in the trans-
generational inheritance of a phenotype induced by exposure to high glucose
concentration, which had negative consequences on worms, shortening lifespan and
reducing fecundity (Tauffenberger and Parker, 2014). This mild SETD1A/set-2(ok952)
mutation, unimportant in critical developmental processes, became relevant when the
animals were challenged with environmental stresses such as high glucose or ethanol
concentration. Perhaps the SETD1A phosphorylation site is involved in modulating
SETD1A activity in response to biochemicals such as glucose and ethanol. This selective
role of the SETD1A/set-2 phosphorylation site serves as a plausible mechanism for
cellular adaptation to alcohol. Future studies should look into how phosphorylation of
SETD1A/set-2 may change after ethanol exposure.
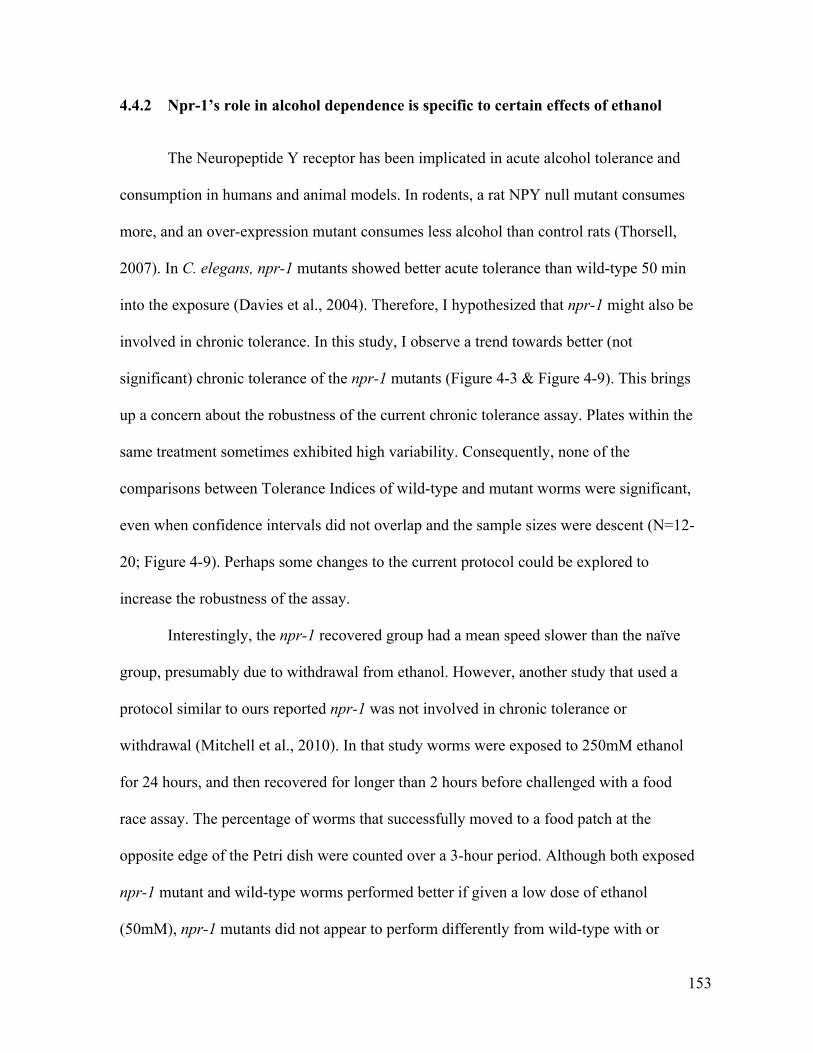
153
4.4.2 Npr-1’s role in alcohol dependence is specific to certain effects of ethanol
The Neuropeptide Y receptor has been implicated in acute alcohol tolerance and
consumption in humans and animal models. In rodents, a rat NPY null mutant consumes
more, and an over-expression mutant consumes less alcohol than control rats (Thorsell,
2007). In C. elegans, npr-1 mutants showed better acute tolerance than wild-type 50 min
into the exposure (Davies et al., 2004). Therefore, I hypothesized that npr-1 might also be
involved in chronic tolerance. In this study, I observe a trend towards better (not
significant) chronic tolerance of the npr-1 mutants (Figure 4-3 & Figure 4-9). This brings
up a concern about the robustness of the current chronic tolerance assay. Plates within the
same treatment sometimes exhibited high variability. Consequently, none of the
comparisons between Tolerance Indices of wild-type and mutant worms were significant,
even when confidence intervals did not overlap and the sample sizes were descent (N=12-
20; Figure 4-9). Perhaps some changes to the current protocol could be explored to
increase the robustness of the assay.
Interestingly, the npr-1 recovered group had a mean speed slower than the naïve
group, presumably due to withdrawal from ethanol. However, another study that used a
protocol similar to ours reported npr-1 was not involved in chronic tolerance or
withdrawal (Mitchell et al., 2010). In that study worms were exposed to 250mM ethanol
for 24 hours, and then recovered for longer than 2 hours before challenged with a food
race assay. The percentage of worms that successfully moved to a food patch at the
opposite edge of the Petri dish were counted over a 3-hour period. Although both exposed
npr-1 mutant and wild-type worms performed better if given a low dose of ethanol
(50mM), npr-1 mutants did not appear to perform differently from wild-type with or
154
without the 50mM ethanol. This suggests that npr-1 is not involved in withdrawal in this
food based assay. The differences between those findings and mine may be due to the
specificity of npr-1’s role in different effects of ethanol. For example, in the previous
Chapter we reported that npr-1 had no role in ethanol’s effect on body curve, but it does
in response plasticity. Likewise, perhaps npr-1 is involved in withdrawal of one effect of
ethanol but not others. Thus we found npr-1 mutants had enhanced withdrawal effects on
crawling speed, while others found no withdrawal effect on a food race assay. Perhaps
NPY’s involvement in alcohol related behavior is specific to only some effects of ethanol
but not others.
4.4.3 Which tolerance is it? Chronic, rapid, acute tolerance
Behavioural ethanol tolerance has been divided into three categories: acute, rapid
and chronic. Acute tolerance refers to behavioural adaptation within a single drinking
session. This adaptation occurs within minutes, and likely involves de novo physiological
adaptation to the drug. On the other hand, rapid and chronic tolerance describe
adaptations that are retained from previous drinking sessions, but differ by exposure
length and underlying molecular mechanisms (Berger et al., 2004). Rapid tolerance
develops within a shorter time frame (between 8 and 24 hours), while chronic tolerance
develops following 24 hours or more of intermittent exposure (Yuan et al., 2008). In
addition, rapid tolerance is resistant to disruption by a protein synthesis inhibitor, while
chronic tolerance is not (Berger et al., 2004).
Previous reports suggested a set of criteria distinguishing acute, rapid and chronic
tolerance (Berger et al., 2004). The first is timing: rapid tolerance is derived from
exposure less than 24 hours, but chronic tolerance is derived from repeated exposure or
155
continuous exposure longer than 24 hours. Although our 24-hour exposure time frame
was not remotely comparable to the chronic alcohol consumption seen in alcoholic
persons, the fact that we observed a role of histone methyltransferases suggests that the
effect of ethanol on histone modification can manifest as rapidly as 24 hours in C.
elegans. In support of this hypothesis, a study using rat liver cell culture demonstrated
widespread H3K4 and H3K9 methylation after a 24-hour ethanol exposure (Pal-Bhadra et
al., 2007). The second criterion is changed protein expression: rapid tolerance does not
involve protein synthesis, but chronic tolerance does. Because histone methyltransferases
merely alter methyl groups on histones, the effects would remain silent unless the genes
affected by the altered histone marks were transcribed and translated (Bernstein et al.,
2007). Therefore, the effect of altered histone methyltransferases should not be realized
without protein synthesis. Since histone methyltransferases are involved in our tolerance
model, protein synthesis should also be involved. Based on this logic, our model seems to
align more with criteria of chronic tolerance.
However, a recent report suggests that the protein expression distinction may be
more blurred than previously believed. A model in C. elegans that tested acute tolerance
that developed within 10-30 min, showed that components of the chromatin remodeling
complex was required (Mathies et al., 2015). Similar to other epigenetic mechanisms that
occur in the nucleus, like histone modification, it is challenging to argue chromatin
remodeling itself could produce acute tolerance without any associated alteration in
gene/protein expressions. Furthermore, a microarray study in C. elegans has found 15
min, 30 min, or 6 hours of ethanol exposure altered expression level of a total of 230
genes (Kwon et al., 2004). Unless translation was completely halted during these times,
156
changes in gene expression levels would likely correlate with changes in protein
expression levels. Therefore, this evidence suggests that acute and rapid tolerance, as
currently defined, may also involve gene expression/protein synthesis. Perhaps, the
distinction between acute, rapid and chronic tolerance would be better to be based not on
the total period of time (minutes, hours), or the presence or absence of protein synthesis,
but the specific mechanisms activated or altered.
A general concern for studies of chronic ethanol exposure is how this prolonged
exposure could affect the health of the animal in general, and whether these side effects,
if any, would confound the results. For example, an alternative explanation for the
attenuated speed seen in the double exposed group might be damaged muscles or motor
neurons, thereby leading to a slower speed compared to the first-time exposed group.
However, a recent C. elegans study that used the same exposure duration with double our
ethanol dose reported no structural damage of motor neurons, sensory neurons, and
muscles based on examination under confocal microscopy (Scott et al., 2016).
Additionally, an unpublished pilot study I ran that was designed to induce permanent
damage through developmental ethanol exposure suggested that 24 hours of 200mM
ethanol exposure is unlikely to cause permanent damage severe enough to affect
locomotion. In the developmental exposure paradigm, worms were exposed to 550mM
ethanol starting from larval stage one (right after hatching) for several days. Worms
recovered from this much harsher treatment moved in a manner indistinguishable from
unexposed worms (data not shown). Finally, wild-type recovered worms moved at a
similar speed as naïve worms at the time of testing (Figure 4-2A), indicating their
locomotor ability had not been seriously compromised by ethanol exposure.

157
In conclusion, this study provided the first evidence that set-2/SETD1A H3K4
methyltransferase, and possibly set-11/EHMT2 H3K9 methyltransferase, are involved in
functional tolerance of ethanol in C. elegans. Future studies should focus on dissecting
how ethanol alters histone methylation patterns. Another interesting question arising from
these results is how ethanol involves regulatory mechanisms of the histone
methyltransferases, and whether that is a way that ethanol could alter histone methylation
patterns of specific genes.
158
5 GENERAL DISCUSSION
5.1 SUMMARY
The goal of this dissertation was to better understand how behavioral plasticity is
modulated by alcohol. I have accomplished this using two alcohol exposure paradigms:
acute exposure and chronic exposure. In the acute exposure paradigm, I characterized
alcohol’s effect on body posture, locomotion, and response plasticity to repeated stimuli,
and then screened 27 candidate genes for their roles in these behaviors. In the chronic
exposure paradigm, I developed a model to study chronic tolerance in C. elegans, and
found a role of histone methyltransferases in chronic tolerance. Both approaches provided
new insights for how behavioral plasticity is modulated by alcohol.
In Chapter 2, I utilized the high-resolution data generated by the Multi-Worm
Tracker to characterize alcohol’s effects on body posture and locomotion across a period
of 60 min alcohol exposure. From this temporal data, I showed that the effect of alcohol
on behavior is temporally dynamic especially for the first 30 min. Next, I examined
alcohol’s effect on the habituation of reversal responses to repeated stimuli (taps), and
discovered that alcohol can have opposite effects on different components of reversal
responses to repeated mechanical taps to the side of the Petri plate holding the worms.
Alcohol facilitated habituation of reversal probability, had little effect on habituation of
reversal duration, and inhibited habituation of reversal speed. This conclusion was made
based on an unprecedented large dataset, and made a significant contribution to reconcile
the historical debate on whether alcohol inhibits or facilitates habituation. Furthermore, I
discovered that alcohol alters the predominant response to tap from a reversal response to
159
an acceleration forward response. These findings highlighted the complexity and
specificity of alcohol’s effect on behavioral plasticity.
In Chapter 3 I presented the first report of genes involved in alcohol’s effect on
habituation. I examined the role of 27 genes on three alcohol induced changes in
behavior: flatter body posture, facilitated habituation of reversal response probability to
repeated taps, and the elevated propensity to accelerate in response to taps. I found
different sets of genes are involved in different alcohol modulated behaviors. I showed
that 18 out of the 27 genes tested were involved in one or more alcohol behaviors (Table
3-2). Eight genes modulated alcohol’s effect on body posture and response plasticity (slo-
1, dgk-1, tom-1, unc-13, nrx-1, goa-1, unc-13, egl-30, and acy-1), 2 genes only modulated
alcohols’ effect on body posture (nlg-1, egl-2), and 7 genes only modulated the effect on
response plasticity (npr-1, flp-18, gsa-1, ric-8, pde-4, pkc-1, and ptr-6). Of the genes that
affected response plasticity, three genes only modulated reversals (flp-18, pkc-1, ptr-6),
one gene modulated reversals and posture but not accelerations (glr-1), and one gene
modulated posture and accelerations but not reversals (cnb-1). In addition, I discovered a
gene involved in alcohol’s effects on plasticity that has never been implicated in alcohol’s
effects before. This gene is tomosyn, a negative regulator of the SNARE complex.
In Chapter 4 I presented evidence supporting a role for histone methylation in the
development of chronic tolerance to alcohol. I investigated this by first developing a
chronic alcohol exposure paradigm in C. elegans that showed worms can develop chronic
tolerance to alcohol’s excitatory effect on locomotion. I then demonstrated that worms
with a mutation in a gene known to play a role in acute tolerance, the Neuropeptide Y
receptor (npr-1), seemed to have better chronic tolerance than wild-type worms in my

160
paradigm. Finally, I showed mutations in genes that encode histone methyltransferases
impaired chronic tolerance. These data suggested that histone methylation mediated by
these two histone methyltransferases play a role in the development of tolerance to
alcohol. This represents the first evidence relating histone methylation with functional
outcomes of alcohol exposure.
5.2 MAJOR CONTRIBUTIONS
My dissertation makes five major contributions to understanding how alcohol
alters behaviour in C. elegans. First, I provided evidence to reconcile the historical debate
on whether alcohol facilitates or inhibits habituation. Second, I discovered alcohol altered
response direction bias from reversals to accelerations. Third, I provided the first genetic
information underlying alcohol’s effects on habituation. Moreover, fourth I demonstrated
the first association of tomosyn with alcohol related behavior. Finally, fifth, I provided
the first evidence relating histone methylation with functional outcomes of alcohol
exposure.
5.2.1 Reconciling debates on alcohol’s effect on habituation
From the first report on alcohol’s effect on habituation in 1967 (Aschan, 1967),
whether alcohol inhibits or facilitates habituation had been an ongoing debate (Aschan,
1967; Ingle, 1973; Peeke et al., 1975; Berthoz et al., 1977; Glanzman and Epperlein,
1981; Rinaldi et al., 1983; Lister, 1987; Dinges and Kribbs, 1990; Hernandez et al.,
2014). To my knowledge, 6 publications support an inhibitory effect of alcohol on
habituation (Aschan, 1967; Ingle, 1973; Berthoz et al., 1977; Rinaldi et al., 1983; Lister,
1987; Hernandez et al., 2014), and 2 publications support a facilitative effect (Traynor et
161
al., 1977; Glanzman and Epperlein, 1981). Only one report encouraged the field to
consider alcohol may have more complex effects than a straight-forward inhibitive or
facilitative role on habituation (Peeke et al., 1975). The results in my dissertation
supported Peeke et al.’s (1975) hypothesis that alcohol can inhibit as well as facilitate
habituation based on two lines of evidence: 1) alcohol can facilitate habituation of one
component of a response and inhibit habituation of another, and 2) alcohol’s facilitative
effect on habituation was not due to fatigue.
Alcohol’s effect on habituation can be opposite in different sub-components of a
response. I found alcohol facilitates habituation of reversal probability, inhibits
habituation of reversal speed, and had only a very small effect on habituation of reversal
duration (Figure 2-8). This is similar to the opposite effects of alcohol on sub-
components of a response reported by Peeke (1975). Habituation of aggressive display
frequency towards conspecies males in cichlid fish was facilitated by alcohol exposure,
but habituation of display duration was inhibited. However, perhaps due to because of
small sample size (N=7), Peeke (1975) did not make a strong claim on the duel effects of
alcohol on habituation. In contrast, my conclusion was based on a large dataset (77
experiments containing more than 21,000 animals), thus with a much higher statistical
power to detect significant changes in complex behavioral changes influence by alcohol.
My results confirmed the facilitative effects on reversal probability and the inhibitory
effect of reversal speed are reliable with a larger sample size. Therefore, I have presented
convincing data supporting the hypothesis that alcohol can facilitate habituation of sub-
component of a response, and at the same time inhibit habituation of another. If alcohol
can inhibit habituation of one component but facilitate habituation of another component
162
of the same response, it is unlikely that alcohol is a general inhibitor or facilitator of
habituation.
My dissertation is the first to demonstrate that the alcohol-facilitated decrease in
response to repeated stimuli was in fact habituation but not due to fatigue or alcohol-
induced sedation. The major criticism of the facilitative effect of alcohol on habituation is
that the more pronounced decrement may came from sedative effect of alcohol (Rinaldi et
al., 1983). After Glanzman and Epperlein (1981) reported a facilitative role of alcohol on
the habituation of frog ventral root reflex responses to electrical dorsal root stimulation,
Rinaldi et al. (1983) replicated the experiment and found the alcohol preparation
responded less to a stimulation given 1 min after the habituation training. Therefore,
Rinaldi et al. (1983) argued that the stronger response decrement observed by Glanzmann
and Epperlein (1981) was due to alcohol sedation but not habituation. This concern was
reasonable because besides habituation, response decrement can also due to motor fatigue
(or sedation, in alcohol’s context), sensory adaptation/fatigue (Rankin et al., 2009).
Fatigue can be differentiated from habituation in two ways. First, habituation is stimuli
specific, but fatigue can generalize to other stimuli. For example, worms habituated to
taps should be able to respond to an electrical shock at the same level as worms naïve to
taps. The second way is to examine recovery from repeated stimuli given at different
frequency (Rankin et al 2009). Habituation is deeper and recovery from habituation is
faster if stimuli are given at a high frequency than at low frequency, however recovery
from fatigue should be dependent on the depth of fatigue as reflected in the depth of the
decremented response. This leads to the prediction that the deeper the response decrement
the slower the recovery - this is the opposite of what is found in habituation. Since we
163
currently do not have a way to deliver an equivalent shock to all worms on a plate the
spontaneous recovery from high and low frequency stimulation experiment made more
sense to do than giving worms electrical shock. In Chapter 2 I showed that worms on
alcohol recovered faster after habituation to taps given at higher frequency (10s) than
lower frequency (60s) (Figure 2-9). This demonstrated that the stronger decrement in
reversal probability seen in alcohol treated worms was due to habituation and not fatigue.
Note that Rinaldi et al. (1983) claimed the response decrement observed in frogs was not
due to habituation based on recovery to the same stimulus using only one stimulus
frequency. They found that the alcohol treated preparation recovered only to about 12.5%
of the initial response level while the non-alcohol control recovered to about 50%. My
reversal duration data at 60sISI also showed similar characteristics: alcohol treated
worms recovered less to stimuli delivered at 60sISI than control. However, habituation of
reversal duration in alcohol treated worms also recovered more rapidly from taps given at
10s than 60sISI. In conclusion, my dissertation provided strong evidence that alcohol can
indeed facilitate habituation.
Based on the two lines of evidence presented above, I call an end to the decades
long debate on whether alcohol is a general inhibitor or facilitator of habituation. My data
together with data from Peeke & Peeke (1975) demonstrate that alcohol can facilitate or
inhibit habituation within a single response. Additionally, I provided the first evidence
showing that the stronger response decrement observed in the alcohol treated group was
due to habituation and not due to fatigue. Hopefully, the evidence provided here will
move the field away from debating the directionality of alcohol’s effect on habitation so
164
that research can focus more on understanding the mechanisms underlying alcohol
modulated habituation of different response components.
5.2.2 Alcohol alters the directional bias of responses
The second major contribution of this dissertation is the discovery that alcohol
altered response propensity from reversal to acceleration (Figure 2-11). The directionality
of worm movement in response to environmental cues can be generally divided into
decisions between “avoid” or “approach” (Reviewed in Faumont, 2012). When given
noxious stimuli, such as heat, light, noxious chemicals, high osmolality, or a nose/head
touch, worms avoid the stimuli by moving in a direction opposite to the source of the
stimuli. Tap stimuli, on the other hand, produce vibrations without a clear direction of the
source. In this case, adult worms’ neuronal circuits are highly biased to reverse (Wicks
and Rankin, 1995; Rose and Rankin, 2001), suggesting that a reversal is an adaptive
response when the direction of the noxious stimuli isn’t clear. Other than tap, the only
other stimuli known to elicit acceleration forward is a tail touch, which is a stimulus
clearly originates from a posterior direction (Chalfie et al., 1985). In addition, the
acceleration responses I measured in Chapter 2-3 does not resemble the “approach”
behavior. Qualitatively, approach behavior looks like worms are more “determined” to
crawl towards the attractive cue, which is accomplished by inhibiting reversals and
steering towards the source of the cue (Faumont et al., 2012). This is very different from
the rapid burst of forward movement (acceleration) described in Chapter 2-3. The
acceleration response I measured was as fast as the reversal response (both can achieve a
speed of 0.3-6 mm/s), which is 2-3 times faster than the exploratory/approaching
behavior (typically between of 0.1-0.2mm/s) (Roberts et al., 2016). This suggests that the

165
acceleration response to taps, just like the reversal to taps, was more appropriately
described as a “startle” behavior, and were, in fact, classified as an “avoid” behavior in
the Faumont (2012) review.
Interestingly, worms on alcohol lost this propensity to reverse in response to
vibration (taps). Worms on alcohol were equally likely to accelerate than reverse in
response to the first tap, while worms without alcohol were about 3 times more likely to
reverse than to accelerate (Figure 2-11). This difference suggests that alcohol disturbed
the innate bias to withdrawal from a noxious stimulus without a clear source of direction.
More strikingly, after only a few taps, worms on alcohol became more likely to accelerate
than to reverse. By the 15th tap, worms on alcohol were 3 times more likely to accelerate
than to reverse. This suggests alcohol produced a behavioral bias opposite to the
propensity to reverse in response to an unfavorable stimulus. This altered response bias
represents a novel opportunity to further our understanding on alcohol’s effect on
behavior.
5.2.3 Results from the first genetic study for alcohol’s effect on habituation
I present the first report on genes involved in the effects of acute alcohol exposure
on habituation, and more generally, on responses to repeated stimuli. The results from
this genetic screen 1) replicated and added new insights into the role of well-known
alcohol genes on behavioral plasticity, 2) discovered a gene that has not been implicated
with alcohol before, and 3) demonstrated that different sets of genes are involved in
different behavioral plasticity modulated by alcohol. Overall, I demonstrated the
effectiveness of using C. elegans to screen for genes involved in alcohol’s acute effect on

166
multiple behavioral phenotypes, including more complex behavioral plasticity such as
responses to repeated stimuli.
5.2.3.1 New insights on the old players
The genes already well-known in relation to the effects of alcohol on behaviour
and their related genetic pathways that I tested were: BK potassium channel (slo-1),
Neuropeptide Y and its putative receptors (npr-1, flp-18, flp-12), glutamate receptor (glr-
1), and genes in the dopamine pathway (dop-1, cat-1).
5.2.3.1.1 BK channel
My data replicated and provided new insights on BK channel’s role in alcohol
modulated behavioral plasticity (Figure 3-4 to Figure 3-6). I replicated the effects of BK
channels on alcohol induced flattening of body curve (Davis et al., 2015). In addition, I
provided evidence that the BK channel is also involved in alcohol’s effect on a learning
behavior: habituation. Furthermore, I demonstrated that BK channel’s calcium sensing
regions are not universally involved in all alcohol related behavioral effects.
The two BK channel calcium sensing domains, RCK1 and RCK2, affect major
alcohol behavioral phenotypes observed in worms (Davies et al., 2003; Davis et al., 2015;
Scott et al., 2016). Because in vitro experiments showed that BK channel sensitivity is
dependent on the RCK1 domain (Liu et al., 2008), and the physiological effect of alcohol
on BK channel in C. elegans CEP neurons involves the RCK2 domain (Davies et al.,
2003), these two regions were thought to be critical for BK channel’s sensitivity to
alcohol. I found that four mutations in the BK channel, including 2 null mutations and 2

167
mutations specific to RCK2 and an amino acid near RCK1, reduced alcohol’s effect on
body curve. This replicated the finding from a recent report by Davis et al. (2015).
I also provided the first evidence that the BK channel is also involved in
alcohol’s effect on a learning behavior, but in this behavior, the role of the BK channel
calcium domains was not substantial. I showed that RCK2 domain may be only involved
the alcohol-modulated plasticity in acceleration responses but not reversal responses to
repeated taps. In addition, the mutation near the RCK1 domain (T381I) had no role in
alcohol-modulated response plasticity. This is contrary to the finding that T381I is
required for alcohol’s effect on locomotion and egg laying (Scott et al., 2016). However,
a recent study by Davis et al. (2015) found that RCK1 and RCK2 are required for
alcohol’s effect on crawling speed and egg laying, but not critical for displacement
distance. This is consistent with my conclusion that the calcium sensing regions are not
required for all alcohol modulated behaviors.
5.2.3.1.2 Neuropeptide Y and Neuropeptide Y receptor
I have furthered our understanding for the role of Neuropeptide Y on alcohol
modulated behaviors. NPY and its receptor have previously been implicated in alcohol
resistance, tolerance, preference, and addiction (Thiele et al., 1998; Davies et al., 2004;
Thiele et al., 2004; Thorsell, 2007). My work added alcohol’s effect on habituation and
response plasticity into the repertoire of behaviors mediated by Neuropeptide Y.
My finding suggests that the role of Neuropeptide Y is more specific than other
genes such as slo-1. In particular, NPR-1 is involved in alcohol’s effect on reversal and
acceleration but not body posture. Its ligand FLP-18 is only involved in alcohol’s effects
on reversals but not accelerations. Neuropeptide Y’s role in alcohol’s effects on behavior
168
were found to be complex and specific depending on subtypes and brain regions in
rodents (Thiele et al., 2004; Thorsell, 2007). Perhaps the same complexity is also
reflected in the C. elegans system.
Interestingly, I found npr-1 plays a role in response plasticity to taps only if
alcohol is present. This suggests that its function may become relevant only when the
animal becomes intoxicated. If we consider NPR-1’s role in the sensing food, oxygen
levels, carbon dioxide levels, and pheromones (Peymen et al., 2014), it is probable that
NPR-1 influences response plasticity only under certain external conditions.
5.2.3.1.3 Glutamate and Dopamine
Although I did not discuss my results on the glutamate and dopamine systems in
detail, those experiments provided some insights worth touching on here. My results
showed that mutations in an AMPA type glutamate receptor ortholog, glr-1, affected
alcohol’s effects on reversal response plasticity but not on accelerations. In contrast,
mutations in genes within the dopamine pathway did not alter ethanol’s effects on
habituation. These findings may be specific to the assay I conducted. Glutamate is
important in learning and memory (Lovinger, 1993; Fadda and Rossetti, 1998;
Möykkynen and Korpi, 2012), and glr-1 was found to play a role in C. elegans short term
tap habituation specific to reversal probability (Giles, 2012), and required for long-term
habituation (Rose et al., 2003). In addition, expression of glr-2, another AMPA-like
receptor subunit that is thought to form heterodimers with glr-1, was elevated within 15
min of ethanol exposure (Kwon et al., 2004). Although it was no surprise that we found
glr-1 has a role in reversal responses, it was surprising to find glr-1 did not play a role in
ethanol’s effect on acceleration. The mechanism underlying this response specificity
169
would be interesting to uncover. The role of the dopamine system on the other hand, is
most consistently found in drug seeking behavior (Chastain, 2006; Crabbe et al., 2006b),
which is not directly tested in my assays. Therefore, the types of assays I used might not
be sensitive to dopamine system’s interaction with alcohol. An alternative explanation is
that C. elegans’ response to ethanol might not involve the dopamine system. However, a
microarray study in C. elegans found 6 hours but not 15 min or 30 min of ethanol
exposure can repress expression of a predicted ortholog of dopamine-b-monooxygenase
(Kwon et al., 2004), suggesting ethanol has some effects on a member of the dopamine
system. Therefore, perhaps the dopamine system is only involved in effects that develop
from longer alcohol exposure, and/or in phenotypes not measured by my assays.
5.2.3.2 First to describe tom-1’s role in ethanol, adding another player in the synaptic
transmission group
An important discovery from the candidate gene screen is the role of tomosyn in
alcohol modulated behaviors. The discovery of tomosyn as a highly conserved regulator
of the SNARE complex is relatively recent (Fujita et al., 1998). After the first
identification in C. elegans (Fujita et al., 1998), tomosyn was determined to be as a
highly conserved inhibitor of exocytosis (Baba et al., 2005). Now an increasing number
of regulatory mechanisms for tomosyn activity are being identified and characterized in
C. elegans, Drosophila, as well as in mammals and human cell culture. Some of the
examples of processes involving tomosyn include alternative splicing, second messenger
interactions (Rho-associated serine/threonine kinase, PKA, and PKC), and calcium
signaling (Yizhar et al., 2004; Ashery et al., 2009). These results suggest that tomosyn
170
may interact with other signaling pathways to modulate the effects of ethanol on
behavior.
5.2.3.3 Different alcohol behaviors are modulated by different sets of genes
An overarching theme from the genetic screen is that different alcohol behaviors
are mediated by different sets of genes. Out of the 27 genes tested, 18 genes had effects
on one or more alcohol modulated phenotypes (Table 3-2). Eight genes modulate all three
phenotypes: slo-1, dgk-1, tom-1, unc-103, nrx-1, goa-1, unc-13, egl-30, and acy-1. Some
of these genes are expressed exclusively in neurons (dgk-1, unc-13, nrx-1, acy-1), some
exclusively in muscles, some in both (egl-30), and others have more specific expression
patterns (unc-13, goa-1, unc-103). I found 7 genes that may modulate response plasticity
but not body posture, suggesting the two behavioral effects have diverging mechanisms.
Within these, 4 genes modulate both reversal and acceleration (ric-8, pde-4, npr-1, and
gsa-1), and 3 genes modulate only reversals (ptr-6, flp-18, and pkc-1). In addition, two
genes that had some effect on body posture specifically affect reversal (glr-1) or
acceleration (cnb-1). These findings suggest different sets of genes modulate reversal and
acceleration response probability. A common set of genes may modulate the balance of
the two, and then specific sets modulate reversals or accelerations independently. The
idea that each component of responses is modulated by distinct sets of genes was
proposed by Andrew Giles in our lab (Giles, 2012). Interestingly, I have not yet identified
a gene that only affects accelerations. This could be due to bias in my candidate gene
selection process. Because our lab traditionally studies reversal responses, and I selected
genes from our database that had a role in reversal habituation, the pool of genes I
selected was heavily biased towards having effects on reversals. In the future, we can use
171
my analysis method to mine our behavioral data for genes involved in the acceleration
responses. From that we can expand our genetic candidates for genes specifically altering
accelerations.
5.2.3.3.1 Exceptionally high throughput screen for alcohol’s effect on behavior
plasticity.
Overall, my dissertation has made substantial contributions in understanding the
genetic factors contributing alcohol’s effect on response plasticity, and more specifically,
on habituation. Until now, there have been no genetic studies to further our understanding
of the underlying mechanisms for alcohol’s effect on habituation. My dissertation
provided 18 possible candidates for future investigation. This number is substantial if we
consider the number of genes implicated in alcohol related behaviors in the past. Over the
past 21 years a little over 50 genes have been implicated in alcohol related behavior for
C. elegans (Grotewiel and Bettinger, 2015). In Drosophila 90 genes have implicated in
alcohol related behaviour in 26 years (Grotewiel and Bettinger, 2015), and in mice over
100 genes have been related to alcohol’s effects on behaviour in 20 years (Crabbe et al.,
2006b). My screen found effects for 18 genes on an alcohol behavioral phenotype that
had no previous genetic evidence. This is around 20-40% of the total number of genes
reported during the last two decades.
5.2.4 First to describe histone methylation is involved in C. elegans tolerance
In the past, the functional role of histone methylation did not receive the same
amount of attention as other epigenetic mechanisms even when altered histone
methylation patterns were evident in the liver and multiple brain regions in alcoholic

172
humans (Oliva et al., 2009; Zhou et al., 2011b; Ponomarev et al., 2012; Ponomarev,
2013). In alcohol tolerant yeasts, the enhanced H3K4 histone methylation on the
promoter of an alcohol metabolic gene, SOD1, correlates with increased mRNA
expression levels of the gene. This altered histone methylation pattern also correlates with
tolerance to ethanol. However, until now, whether this histone methylation was
associated with functional tolerance in animals remained unknown. My work showed that
animals with mutations in enzymes that catalyze histone methylation have impaired
tolerance to alcohol. This work provided evidence that functional histone methylation
enzymes, thus possibly histone methylation patterns, could be important in the
development of alcohol tolerance.
Moreover, because histone methylation is considered as slower process compared
to DNA methylation and histone acetylation, many have expressed doubts about its role
in more immediate effects of alcohol. Most evidence to date on histone methylation has
been found in chronic alcohol exposure models (Ponomarev et al., 2012; Wang et al.,
2014). Few studies have examined the effect of shorter term exposure on histone
methylation patterns. There were, however, two studies using rats that did. One exposed
multiple rat tissues to 1, 3, and 12 hours of alcohol (Kim and Shukla, 2006) and found a
significant increase in histone acetylation as soon as an hour after alcohol exposure in
multiple tissues, indicating that epigenetic changes can occur rapidly. Although they did
not find significant changes in histone methylation, they did report a 1.5 fold increase
(not significant) in lung tissues after 12 hours of alcohol exposure. A later study used a
longer exposure period, and showed that histone methylation alteration could be
measured after 24 hours of ethanol exposure in rat hepatocytes (Pal-Bhadra et al., 2007).

173
Interestingly, this is the same exposure period as our exposure condition. Therefore, it is
possible that histone methylation changes have occurred during the exposure period used
in my study.
However, some questions remain. It is possible that the presence of a mutated
histone methyltransferase may produce other pleiotropic defects in the worms. These
defects could be responsible for the diminished tolerance. In fact, mutations in most of
the proteins that interact with histone methylation lead to worms that are not viable or are
sterile, indicating their crucial role in survival and development. One way to address this
concern would be by using a conditional mutation that is only activated during our
experiment. Additionally, we could follow up with ChIP-Seq study to determine whether
the histone methylation patterns are in fact altered by 24 hours of alcohol exposure, and
whether those alterations are associated with genes meaningful in the production of
behavioral tolerance.
5.3 CAVEATS
Here I discuss some caveats that should be kept in mind when considering the
results from these studies.
5.3.1 Dynamics of alcohol effects
Alcohol’s effect on behavior is known to be complex and dynamic. The effects
may differ depending on exposure condition, genetic background and other
environmental factors. In my experiments, I attempted to control the exposure conditions,
genetic background, and environmental factors to the best of my ability. There are some
key factors I found particularly important. Some of those factors were found via
174
deliberate experimental effort, others from examining variations in my data, and others
from informed knowledge. Below I discuss three main points: 1) assay time points
(during exposure and age), 2) genetic data interpretation, 3) experimental condition
(food).
5.3.1.1 Exposure conditions
Many exposure conditions can affect alcohol’s effect on behavior. The number of
variables that can change the consequences of alcohol exposure remain a big challenge in
the alcohol research field. Sometimes conflicting results simply come from slight
differences in the exposure conditions. Here I discuss some key variables I found in my
study.
5.3.1.1.1 Dose
Alcohol’s effects on behavior are dose-dependent. My data have reaffirmed dose-
dependent effects on multiple measures of behaviors (i.e. body posture, crawling speed,
and response plasticity). This idea is not new. However, I would like to use my data to
emphasize that experiments done using one particular dose should not be generalized to
other doses without further experimental confirmation.
5.3.1.1.2 Exposure duration
Alcohol’s effects on a behavioral output can be strongly influenced by the time
course within an acute exposure episode. For example, Figure 2-2 illustrated that worms
can have higher or lower crawling speed than control depending on the number of
minutes they have been exposed to alcohol. The so called “biphasic action” of alcohol

175
(Pohorecky, 1978) was particularly obvious in 4 day old worms exposed to 400mM
alcohol. If crawling speed were assayed 10 min after the exposure onset, one would
conclude that alcohol decreased speed. If the speed were assayed 30 min after the
exposure onset, one would conclude alcohol increased speed. Both conclusions would be
correct, but only for the specific assay time point. This temporal effect of alcohol is
important to keep in mind. My experiments on response plasticity were done after 30 min
of alcohol exposure because that’s the time when the effects of alcohol on locomotion
started to stabilize. However, this also means that my results for response plasticity
should not be generalized to worms with exposure periods shorter than 30 min. In
addition, this emphasizes the importance of taking exposure duration into account when
comparing results from different publications.
5.3.1.1.3 Age
Age is another factor I found that influences the response to alcohol. From the
60min alcohol exposure behavioral tracking study (Figure 2-1 and Figure 2-2), I found
that 3, 4, and 5 day old worms show different responses to the same dose of alcohol. This
was unexpected! Possible explanations for this difference were discussed in Chapter 2
(i.e. baseline movement of untreated worms or cuticle thickness). There might be
additional reasons that I have not considered. The key message here is to remember that
age is an important factor to consider when comparing data between different
publications. This age effect could be true for other organisms as well. I would encourage
the field to ensure that age of the animals or subjects are comparable or are considered
before making generalized conclusions.

176
5.3.1.1.4 Food
In Chapter 2 I discussed the effect of food (bacteria) on undisturbed crawling
speed. When food is present, worms on alcohol had similar crawling speed as worms on
alcohol free condition. In addition, detailed examination of their crawling speed and
direction using raster plots did not reveal visually observable differences (Figure 2-5).
However, when food is absent, worms without alcohol become hyperactive. This can be
seen in the intensive red (fast forward movement) seen in the raster plot. Worms off of
food, but on alcohol, still behaved the same as if there were food present. This was
illustrated in the visually indistinguishable raster plots of drunk worms on and off of
food. As a result, when the comparison was made on food, the conclusion was alcohol
did not have an effect on crawling speed, but when the comparison was made in the
absence of food, the conclusion was that alcohol reduced crawling speed. This illustrates
the importance of being aware of the exact environmental conditions used in an
experiment. Different conclusions can be drawn from experiments done under different
conditions.
5.3.1.1.5 Other factors
According to Andrew Giles’ thesis (2012), there are many other factors that could
alter habituation phenotype. This include food thickness, plate humidity, and stimuli
strength. Other factors specific to alcohol experiments include varying degree of ethanol
evaporation during handling, or difference in ethanol concentration in different regions of
the agar. In my studies, I attempted to control many of these variables to the best of my
ability. Agar plates used were streaked with the same volume of E. Coli and incubated
177
and air dried in 25C incubator for 4 days. Agar plates of 1 to 4 weeks old were used.
After ethanol was added to the plates, the plates were immediately sealed water-tight, and
gently agitated horizontally to distribute ethanol evenly across the plate. However, some
variability between experiments still existed. This could be due to variables mentioned
above in addition to others such as handling from different experimenters, variations
between day to day climate (i.e. temperature and humidity) conditions, and differences
between Trackers.
5.3.2 Genetics
When interpreting genetic data from this dissertation, several factors should be
kept in mind. Some examples are listed below.
5.3.2.1 Background mutations
Popular mutagenesis methods (i.e. EMS, UV) used to make C. elegans mutants
are known to cause multiple mutations in the genome (“background mutation”). This
caveat is general to mutants made from random mutagenesis methods. There are several
ways to be confident that the gene in question is the one responsible for the observed
phenotype. One way is to see the same phenotype with multiple alleles of the same gene;
in this dissertation, I was able to show similar phenotypes with several alleles of slo-1
and with two alleles of npr-1, however two alleles of tom-1 gave very different
phenotypes raising the question about whether the gene is responsible for the phenotypes
observed. I am genotyping these strains as a first step in this. Another approach is to
reduce the background mutations by backcrossing the mutant with wild-type worms
multiple times. If multiple lines of backcrossed mutants still show the same phenotype,
178
then we can be more confident to suggest the phenotype is likely caused by the mutation
of interest. This strategy was used for the slo-1(gk60229) mutation, where two strains,
each backcrossed 6 times, were tested. Similar results were obtained from the two
different lines (strains). About half of the mutants studied in this dissertation have not
been backcrossed: dop-1(ok398), egl-8(ok934), flp-18(gk3063), flp-21(ok889), mir-
1(gk276), nlg-1(ok259), pde-4(ok1290), pkc-1(ok563), ptr-6(ok2988), glr-1(ky176), flp-
20(ok1596), and tom-1(ok285). In addition, even for mutants that have been backcrossed,
unless whole genome sequencing is conducted, we can not conclude that all background
mutations were removed. Therefore, the conclusions made in this dissertation tend to be
more conservative (i.e. this gene “may modulate”). The “gold-standard” way to ensure
the causal relationship between gene and behaviour is to rescue the mutation with the
wild-type gene.
5.3.2.2 Rescues
Ideally, mutation studies should be complemented with rescue experiments. This
involves reintroducing wild-type copies of the gene in the mutant. In this dissertation, I
focused on screening for potential interesting candidates to orient our future direction.
Therefore, rescue experiments should be conducted for genes we decide to focus on in the
future.
I attempted rescue studies with slo-1 genes however the results obtained were
inconclusive due to the following reasons. The neuronal rescue we tested had abnormal
baseline habituation (resembling alcohol), and alcohol had an effect on acceleration but
not reversal. Muscle rescues had wild-type reversal and slightly elevated acceleration.
One strain partially rescued the alcohol effect. Another muscle rescue strain had a
179
reversed alcohol effect (increase reversals rather than decrease), and did not rescue
acceleration. These peculiar results might be due to the extrachromosomal array methods
used to make the rescue strains. First, as an ion channel, the BK channel is likely
sensitive to copy number, however the extrachromosomal array rescue method we used
does not control for copy number. Secondly, the slo-1 gene can produce 16 splice
variants (Wang et al., 2001; Johnson et al., 2011), but the rescue sequence contains a
cDNA but not a genomic version of the slo-1 gene. This is because the slo-1 gene is very
large and is notoriously difficult to clone. To my knowledge none of the laboratories
working on this gene have successfully cloned a genomic copy of slo-1. Therefore, the
current rescue effort used cDNA encoding a commonly expressed isoform. It is possible
that the isoform was not the correct version required. Thirdly, the rescues I studied used
pan-neuronal and pan-muscle promoters, but slo-1 is not expressed in all neurons and
may not express in all muscles and so there may have been off-target effects. In the
future, rescues of slo-1 with an endogenous promoter should be tried before exogenous
promoters.
5.3.2.3 Developmental compensation
Another common concern for genetic knock-out mutations is the possibly of
developmental compensation. Animals that developed with a mutation in a gene that
behaved relatively wild-type may have molecularly compensated for the absence of the
gene. Therefore, the behavioral effects we observed could come from an indirect effect of
the mutation rather than a direct effect of the mutation. A solution for this would be to
use a conditional knockout, and turned off the gene only during the alcohol assay.
Unfortunately, use of conditional knock-outs is not common in C. elegans.
180
5.3.3 Direct and indirect targets of alcohol are both important
The alcohol research field often debates about whether a gene is a direct target of
alcohol or not. I would like to be clear that I make no claim that any of the genetic effects
I found suggest that those genes were direct targets of ethanol. To show alcohol directly
“targets” a gene/protein, there are strict criteria to be met (Harris et al., 2008). For
example, the slo-1 BK channel is believed to be a highly probable alcohol target because
1) alcohol can change its conductance in vivo and in vitro, 2) site specific mutagenesis
showed particular amino acids were required for alcohol’s effect on the channel
physiology, and 3) protein structural modeling showed a binding pocket for an ethanol
molecule. I have not done any of those types of experiments. Thus, I am not in the
position to make any claims on whether effects I observed on a mutant are a result of
direct alcohol interaction with that gene.
This returns to a point I advocated in the beginning of this dissertation, which is
the value of understanding the genetic cascade involved in producing certain behavioral
effects of alcohol. This approach is as important to our understanding in alcohol behavior
as identifying the direct target of a drug. For example, the most well documented alcohol
related genes such as GABA receptors, glutamate receptors, and dopamine receptors, are
not considered as having enough evidence to be claimed as “direct targets” of alcohol.
However, regardless of whether the interaction of alcohol with these receptors was direct
or indirect, the evidence is indisputable that the functions of these receptors were affected
by alcohol exposure. In addition, the functional changes related to these molecules are
relevant to behavioral consequences of alcohol use disorder, such as withdrawal,
dependence, and tolerance. In fact, FDA-approved drugs for alcohol use disorder include
181
drugs that target the glutamate system (Acamprosate), and opioid/dopamine system
(Naltrexone), based on their therapeutic values on reducing withdrawal and drug seeking
behaviors (Krishnan-Sarin et al., 2008). However, a common theme is that these
approved drugs can be ineffective for some individuals, partly due to individual genetic
variations (Krishnan-Sarin et al., 2008). I believe that my approach adds to our
understanding in the genes involved in the mediation of alcohol induced changes in
behavioral plasticity. More detail examination of the genes I have described could lead to
deeper understanding in behavioral plasticity with or without alcohol influence.
5.4 FUTURE DIRECTION
This dissertation has raised several questions worth pursing further. The first one
is regarding rescues of BK channel mutants. Rescues for BK channel mutation should be
done to validate the role of BK channel on alcohol’s effects on response plasticity. We
could 1) test rescue strains recently developed by other laboratories, 2) continue our
rescue efforts using genetic engineering methods that can control copy number, and 3)
use the endogenous slo-1 promoter to drive the expression.
More understanding on how the neuropeptide Y system modulates response
plasticity is needed. My results suggest a specific role of the neuropeptide Y system in
tap response plasticity. For example, NPR-1 only affects reversal and acceleration but not
body posture, and its ligand FLP-18 is only involved in alcohol’s effect on reversal but
not acceleration. However, whether there is another ligand for NPY-1 that is involved
only in acceleration remains unknown. Additionally, where the plasticity occurs in the
circuit remained unknown. Within the tap circuit, FLP-18 is expressed in the premotor
command neurons AVA, which drive reversals, but not in AVB, which drives forward
182
movement (Li and Kim, 2008). The receptor of FLP-18, NPY-1, on the other hand, is
expressed in various neurons, but the only synaptic contact with FLP-18 within the tap
circuit is at the VA/DA motoneurons, which drive reversals. Therefore, the specificity of
FLP-18’s role on reversals makes sense considering its expression pattern in the circuit.
Therefore, it is possible that the plasticity modulated by FLP-18 and NPR-1 occur
between AVA and VA/DA. Currently, little is known about the functional role of FLP-18
and NPR-1 interaction in AVA and VA/DA junction. In addition, unlike
neurotransmitters, neuropeptides can work at a distance as neurohormones, which
complicates the understanding of the affected neural circuit. Perhaps more work towards
this direction can help us understand how neuropeptide Y modulate response direction.
I did not select the glutamate system as part of the highlighted results in Chapter 3
because of the slight differences between the two strains: one strain, VM3109, glr-
1(ky176) had some effect on body curve but the other strain, KP4, glr-1(n2461), did not.
In addition, glr-1(n2461) partly lost ethanol’s effect on reversal, but glr-1(ky176) showed
an reversed effect of ethanol (increased reversal rather than decrease). This could due to
differences in their mutations, or background mutations (the VM3109 outcross
information is unknown). The next step to confirm the findings could be 1) conduct
rescue experiments on the glr-1 mutants, 2) outcross VM3109 with wild-type worms to
reduce background mutations, and/or 3) test more glr-1 strains to see if similar results are
found. Additionally, we should also examine mutations in NMDA-type glutamate
receptors to see whether they are also involved in alcohol’s effect on response plasticity.
As a synaptic vesicle release regulator and as a molecule modulated by various
signaling pathways (i.e. PKC, calcium), tomosyn has great potential to further our
183
understanding on alcohol’s effect on synaptic transmission. My results that suggest that
some regions of the tomosyn protein may be important interactors with alcohol’s effect
on behavioral plasticity: specifically, the WD40 repeats, exon 4-7, and exon 9-12.
However, currently little is known about the protein motifs encoded for by some of these
regions. In addition, both tomosyn strains tested have not been substantially outcrossed.
The immediate next step should be to confirm the finding by 1) rescuing, 2) outcrossing,
and 3) testing more alleles affecting the same regions. After confirming the results, we
can invest more effort into understanding the functional roles of tomosyn protein regions
on alcohol modulated behavioral plasticity.
A finding from the genetic screen is that some genes affected both body posture
and response plasticity. This raised a question whether alcohol’s effect on body posture
and response plasticity could have overlapping cellular mechanisms. Although my data
can not answer this question, it would be interesting to explore further.
The data I collected for this dissertation can also be mined more deeply for other
behavioral phenotypes. For example, the acceleration probability phenotype I examined
occurred within milliseconds after the tap. What about acceleration duration and speed?
What about probability and duration of pauses? It is possible that alcohol could produce
different effects on those measures, and perhaps the genetic mechanisms for those would
differ from the measures I discussed in this dissertation.
I would also suggest broadening our genetic screens for acceleration phenotype.
The first set of candidates could come from mining our existing data for mutants
affecting accelerations. We could then feed those candidates into genetic pathway
analysis software to pick out additional novel candidates. From there, we may be better

184
able to understand the genetic mechanisms mediating the balance between reversal and
acceleration plasticity.
For the histone methylation study, the questions remain whether the lack of
tolerance seen in the histone methyltransferase mutants are truly a consequences of
reduced histone methylation. A ChIP-Seq study can be done to see if histone methylation
patterns are altered by the alcohol exposure conditions used in this dissertation. In
addition, experiments on rescues, double mutants, and additional mutations in histone
methyltransferase genes can be conducted to 1) confirm mutant results, 2) to see if
multiple histone methyltransferases act in parallel or together, and 3) to see which region
of the histone methyltransferases genes are important, respectively.
5.5 SIGNIFICANCE/CONCLUSIONS
5.5.1 Habituation field – habituation may not be a single process but coupled with
other modulations (reversal and acceleration balance)
With the use of our Multi Worm Tracker our behaviour analysis advanced from
one- to multi-dimensional analysis. Our previous work (i.e. Kindt et al., 2009, Giles,
2011, and Ardiel et al., 2016) led us to understand that habituation is more than just
response decrement to a repeated stimulus; it is a complex change in a variety of
components of behaviour, some of which increase, some decrease and some stay the
same as baseline. In Chapter 2 I highlighted a decrement in reversal response to taps is
coupled with an elevation in acceleration response. In other words, the decrement in
response in one direction is accompanied by increase in an opposite direction. In addition,
in Chapter 3 I showed a set of genes affected both reversal and acceleration, which
suggests that the control of the response directionality can share a common mechanism.

185
From a neural circuit perspective, the directionality of worms’ movement is thought to be
a product of competition between the reversal and forward neuronal circuit (Wicks and
Rankin, 1995). Thus, we can imagine weakening the strength of reversal circuit translates
to reduced competition for the acceleration circuit. This neuronal circuit’s perspective
reminds us that habituation of a response-stimulus pair should have an impact on other
behaviors outputs with shared neuronal circuitry. This brings us back to the “purpose” of
habituation. The biological purpose of habituation is thought to be to put less emphasis on
unimportant stimuli so that more energy can be spent on important stimuli (i.e. selective
attention). If we view habituation as part of a “balancing act” between attention to
different stimuli, then it is to no surprise that habituation of one response is coupled with
elevation in another.
Habituation also does not occur in isolation from inputs other than the stimuli the
organism is habituating to. Worms on alcohol habituated differently, indicating biological
state can alter habituation. Andrew Giles in our lab demonstrated that the presence or
absence of food can change habituation (Kindt et al.). Additionally, we know that
habituation can be different dependent on other internal or external factors such as age
and plate humidity. In addition, I found that “habituation under the influence” involved
genes that were not involved otherwise (i.e. BK channel, neuropeptide Y). Similarly,
Andrew Giles also identified habituation on food involved genes in the dopamine
pathway, that are not involved in habituation without food. This reinforces the notion that
we should think of habituation as highly plastic and specific to the state and environment
of the organism. For example, rapid habituation to traffic noise is highly adaptive if you
are trying to sleep in your apartment, but it is not so if you are driving. I argue here that
186
the circuitry controlling your habituation to traffic noise is readily malleable by inputs
from other circuits. Therefore, I hope this dissertation brings more research attention to
habituation.
5.5.2 Histone Methylation drug
Research in epigenetic mechanisms underlying alcohol’s long term effects is the
new frontier in the field. However, not much is known about the role of histone
methylation on the effects of alcohol. This is largely due to lack of evidence in linking
behavioral outcomes with alcohol consumption. My dissertation provides evidence
suggesting that functional histone methylation may be required for chronic tolerance,
which is a key diagnostic criterion for alcohol use disorder. This opens up a new direction
for the field to focus on.
Taken together my results confirm the usefulness of C. elegans as a system in
which to further our understanding of how alcohol affects the nervous system, and
showcases the advantages of the high-throughput, machine-vision Multi-Worm Tracker
as a tool to aid in the identification of genes critical for the effects of alcohol on
behaviour. Finally, this work has confirmed the rich complexity of habituation, the
simplest form of learning.
187
REFERENCES
Ahringer J (2005) Reverse genetics (April 6, 2006), WormBook, ed. The C. elegans
Research Community, WormBook, doi/10.1895/wormbook. 1.47. 1. In. Akdag SJ, Nestor PG, O'Donnell BF, Niznikiewicz MA, Shenton ME, McCarley RW
(2003) The startle reflex in schizophrenia: habituation and personality correlates. Schizophrenia research 64:165-173.
Alaimo JT, Davis SJ, Song SS, Burnette CR, Grotewiel M, Shelton KL, Pierce-Shimomura JT, Davies AG, Bettinger JC (2012) Ethanol metabolism and osmolarity modify behavioral responses to ethanol in C. elegans. Alcoholism, clinical and experimental research 36:1840-1850.
Albrecht DR, Bargmann CI (2011) High-content behavioral analysis of Caenorhabditis elegans in precise spatiotemporal chemical environments. Nature methods 8:599-605.
Altun ZF, Hall DH (2009) Introduction. In: WormAtlas. American Psychiatric Association., American Psychiatric Association. DSM-5 Task
Force., DSM Premium (2013) Diagnostic and statistical manual of mental disorders DSM-5. In, 5th Edition, p 1 online resource. Washington, D.C.: American Psychiatric Association,.
Andersen EC, Horvitz HR (2007) Two C. elegans histone methyltransferases repress lin-3 EGF transcription to inhibit vulval development. Development 134:2991-2999.
Andrea M (2013) Modulation of habituation kinetics and behavioural shifts by members of the heterotrimeric G-protein signaling pathways. In: Cell and Developmental Biology. Vancouver, BC: University of British Columbia.
Araki Y, Wu H, Kitagaki H, Akao T, Takagi H, Shimoi H (2009) Ethanol stress stimulates the Ca 2+-mediated calcineurin/Crz1 pathway in Saccharomyces cerevisiae. Journal of bioscience and bioengineering 107:1-6.
Aschan G (1967) Habituation to Repeated Rotatory Stimuli (Cupulo-Metry) and the Effect of Antinausea Drugs and Alcohol on the Results. Acta oto-laryngologica 64:95-106.
Ashery U, Bielopolski N, Barak B, Yizhar O (2009) Friends and foes in synaptic transmission: the role of tomosyn in vesicle priming. Trends Neurosci 32:275-282.
Baba T, Sakisaka T, Mochida S, Takai Y (2005) PKA-catalyzed phosphorylation of tomosyn and its implication in Ca2+-dependent exocytosis of neurotransmitter. The Journal of cell biology 170:1113-1125.
Bandyopadhyay J, Lee J, Lee J, Lee JI, Yu J-R, Jee C, Cho J-H, Jung S, Lee MH, Zannoni S (2002) Calcineurin, a calcium/calmodulin-dependent protein phosphatase, is involved in movement, fertility, egg laying, and growth inCaenorhabditis elegans. Molecular biology of the cell 13:3281-3293.
Bargmann CI (1998) Neurobiology of the Caenorhabditis elegans genome. Science 282:2028-2033.
Basavarajappa BS, Subbanna S (2016) Epigenetic Mechanisms in Developmental Alcohol-Induced Neurobehavioral Deficits. Brain Sci 6.
Bastiani C, Mendel J (2006) Heterotrimeric G proteins in C. elegans.

188
Baumgärtel K, Mansuy IM (2012) Neural functions of calcineurin in synaptic plasticity and memory. Learning & memory 19:375-384.
Becker HC (2008) Alcohol dependence, withdrawal, and relapse. Alcohol Health & Research World 31:348.
Bekdash RA, Zhang C, Sarkar DK (2013) Gestational choline supplementation normalized fetal alcohol-induced alterations in histone modifications, DNA methylation, and proopiomelanocortin (POMC) gene expression in beta-endorphin-producing POMC neurons of the hypothalamus. Alcohol Clin Exp Res 37:1133-1142.
Ben-Simon Y, Rodenas-Ruano A, Alviña K, Lam AD, Stuenkel EL, Castillo PE, Ashery U (2015) A Combined Optogenetic-Knockdown Strategy Reveals a Major Role of Tomosyn in Mossy Fiber Synaptic Plasticity. Cell reports 12:396-404.
Berger KH, Heberlein U, Moore MS (2004) Rapid and chronic: two distinct forms of ethanol tolerance in Drosophila. Alcoholism: Clinical and Experimental Research 28:1469-1480.
Bernstein BE, Meissner A, Lander ES (2007) The mammalian epigenome. Cell 128:669-681.
Berthoz A, Young L, Oliveras F (1977) Action of alcohol on vestibular compensation and habituation in the cat. Acta oto-laryngologica 84:317-327.
Bettinger JC, McIntire SL (2004) State-dependency in C. elegans. Genes, brain, and behavior 3:266-272.
Bettinger JC, Leung K, Bolling MH, Goldsmith AD, Davies AG (2012) Lipid environment modulates the development of acute tolerance to ethanol in Caenorhabditis elegans. PLoS One 7:e35192.
Biederman J, Wilens T, Mick E, Milberger S, Spencer TJ, Faraone SV (1995) Psychoactive substance use disorders in adults with attention deficit hyperactivity disorder (ADHD): effects of ADHD and psychiatric comorbidity. American Journal of Psychiatry 152:1652-1658.
Block SS (2001) Disinfection, sterilization, and preservation: Lippincott Williams & Wilkins.
Bohman M (1978) Some genetic aspects of alcoholism and criminality: A population of adoptees. Archives of general psychiatry 35:269-276.
Braff DL, Grillon C, Geyer MA (1992) Gating and habituation of the startle reflex in schizophrenic patients. Archives of general psychiatry 49:206-215.
Brenner S (1974) The genetics of Caenorhabditis elegans. Genetics 77:71-94. Brockie PJ, Mellem JE, Hills T, Madsen DM, Maricq AV (2001) The C. elegans
glutamate receptor subunit NMR-1 is required for slow NMDA-activated currents that regulate reversal frequency during locomotion. Neuron 31:617-630.
Brownlee DJ, Fairweather I (1999) Exploring the neurotransmitter labyrinth in nematodes. Trends in neurosciences 22:16-24.
Brundage L, Avery L, Katz A, Kim U-J, Mendel JE, Sternberg PW, Simon MI (1996) Mutations in a C. elegans G q α gene disrupt movement, egg laying, and viability. Neuron 16:999-1009.
Bukiya AN, Kuntamallappanavar G, Edwards J, Singh AK, Shivakumar B, Dopico AM (2014) An alcohol-sensing site in the calcium-and voltage-gated, large

189
conductance potassium (BK) channel. Proceedings of the National Academy of Sciences 111:9313-9318.
Bukiya AN, McMillan JE, Fedinec AL, Patil SA, Miller DD, Leffler CW, Parrill AL, Dopico AM (2013) Cerebrovascular dilation via selective targeting of the cholane steroid-recognition site in the BK channel β1-subunit by a novel nonsteroidal agent. Molecular pharmacology 83:1030-1044.
Bulik CM, Klump KL, Thornton L, Kaplan AS, Devlin B, Fichter MM, Halmi KA, Strober M, Woodside DB, Crow S (2004) Alcohol Use Disorder Comorbidity in Eating Disorders: A Multicenter Study.[CME]. The Journal of clinical psychiatry 65:1000-1006.
Burdina A, Gracheva E, Richmond J (2007) Dissecting the Function of C. elegans Tomosyn Domains. In: International Worm Meeting.
Butterfield M (2007) The effects of ethanol on short-term and long-term memory in Caenorhabditis elegans. In: The Faculty of Graduate Studies. (Neuroscience). University of British Columbia: University of British Columbia.
Cadoret RJ, Gath A (1978) Inheritance of alcoholism in adoptees. The British Journal of Psychiatry.
Cadoret RJ, Cain CA, Grove WM (1980) Development of alcoholism in adoptees raised apart from alcoholic biologic relatives. Archives of general psychiatry 37:561-563.
Chalfie M, Sulston JE, White JG, Southgate E, Thomson JN, Brenner S (1985) The neural circuit for touch sensitivity in Caenorhabditis elegans. The Journal of neuroscience : the official journal of the Society for Neuroscience 5:956-964.
Charlie NK, Thomure AM, Schade MA, Miller KG (2006) The Dunce cAMP phosphodiesterase PDE-4 negatively regulates Gαs-dependent and Gαs-independent cAMP pools in the Caenorhabditis elegans synaptic signaling network. Genetics 173:111-130.
Chastain G (2006) Alcohol, neurotransmitter systems, and behavior. The Journal of general psychology 133:329-335.
Chiba CM, Rankin CH (1990) A developmental analysis of spontaneous and reflexive reversals in the nematode Caenorhabditis elegans. J Neurobiol 21:543-554.
Choi M-K, Son S, Hong M, Choi MS, Kwon JY, Lee J (2016) Maintenance of Membrane Integrity and Permeability Depends on a Patched-Related Protein in Caenorhabditis elegans. Genetics 202:1411-1420.
Choudhuri S (2011) From Waddington’s epigenetic landscape to small noncoding RNA: some important milestones in the history of epigenetics research. Toxicology mechanisms and methods 21:252-274.
Cowmeadow RB, Krishnan HR, Atkinson NS (2005) The slowpoke gene is necessary for rapid ethanol tolerance in Drosophila. Alcoholism: Clinical and Experimental Research 29:1777-1786.
Crabb DW, Bosron WF, Li T-K (1987) Ethanol metabolism. Pharmacology & therapeutics 34:59-73.
Crabbe JC, Rigter H, Uijlen J, Strijbos C (1979) Rapid development of tolerance to the hypothermic effect of ethanol in mice. Journal of Pharmacology and Experimental Therapeutics 208:128-133.

190
Crabbe JC, Metten P, Ponomarev I, Prescott CA, Wahlsten D (2006a) Effects of genetic and procedural variation on measurement of alcohol sensitivity in mouse inbred strains. Behavior genetics 36:536-552.
Crabbe JC, Phillips TJ, Harris RA, Arends MA, Koob GF (2006b) REVIEW: Alcohol‐related genes: contributions from studies with genetically engineered mice. Addiction biology 11:195-269.
Crews FT, Morrow AL, Criswell H, Breese G (1995) Effects of ethanol on ion channels. International review of neurobiology 39:283-367.
Cunningham CL, Howard MA, Gill SJ, Rubinstein M, Low MJ, Grandy DK (2000) Ethanol-conditioned place preference is reduced in dopamine D2 receptor-deficient mice. Pharmacology Biochemistry and Behavior 67:693-699.
Dalley JW, Fryer TD, Brichard L, Robinson ES, Theobald DE, Lääne K, Peña Y, Murphy ER, Shah Y, Probst K (2007) Nucleus accumbens D2/3 receptors predict trait impulsivity and cocaine reinforcement. Science 315:1267-1270.
Davies AG, Bettinger JC, Thiele TR, Judy ME, McIntire SL (2004) Natural variation in the npr-1 gene modifies ethanol responses of wild strains of C. elegans. Neuron 42:731-743.
Davies AG, Friedberg RI, Gupta H, Chan CL, Shelton KL, Bettinger JC (2012) Different genes influence toluene- and ethanol-induced locomotor impairment in C. elegans. Drug Alcohol Depend 122:47-54.
Davies AG, Pierce-Shimomura JT, Kim H, VanHoven MK, Thiele TR, Bonci A, Bargmann CI, McIntire SL (2003) A central role of the BK potassium channel in behavioral responses to ethanol in C. elegans. Cell 115:655-666.
Davis SJ, Scott LL, Hu K, Pierce-Shimomura JT (2014) Conserved single residue in the BK potassium channel required for activation by alcohol and intoxication in C. elegans. The Journal of Neuroscience 34:9562-9573.
Davis SJ, Scott LL, Ordemann G, Philpo A, Cohn J, Pierce-Shimomura JT (2015) Putative calcium-binding domains of the Caenorhabditis elegans BK channel are dispensable for intoxication and ethanol activation. Genes, brain, and behavior 14:454-465.
de Bono M, Bargmann CI (1998) Natural variation in a neuropeptide Y receptor homolog modifies social behavior and food response in C. elegans. Cell 94:679-689.
De Luca MA (2015) Habituation of the responsiveness of mesolimbic and mesocortical dopamine transmission to taste stimuli. Habituation mechanisms and their impact on cognitive function.
de Wit H, Griffiths RR (1991) Testing the abuse liability of anxiolytic and hypnotic drugs in humans. Drug and Alcohol Dependence 28:83-111.
de Wit H, Phillips TJ (2012) Do initial responses to drugs predict future use or abuse? Neuroscience & Biobehavioral Reviews 36:1565-1576.
Depue RA, Fowles DC (1973) Electrodermal activity as an index of arousal in schizophrenics. Psychological Bulletin 79:233.
Dillon J, Andrianakis I, Mould R, Ient B, Liu W, James C, O'Connor V, Holden-Dye L (2013) Distinct molecular targets including SLO-1 and gap junctions are engaged across a continuum of ethanol concentrations in Caenorhabditis elegans. The FASEB Journal 27:4266-4278.
191
Dinges DF, Kribbs NB (1990) Comparison of the effects of alcohol and sleepiness on simple reaction time performance: Enhanced habituation as a common process. Alcohol, Drugs & Driving.
Dlugos CA, Rabin RA (2003) Ethanol effects on three strains of zebrafish: model system for genetic investigations. Pharmacology Biochemistry and Behavior 74:471-480.
Dopico AM, Anantharam V, Treistman SN (1998) Ethanol increases the activity of Ca++-dependent K+ (mslo) channels: functional interaction with cytosolic Ca++. Journal of Pharmacology and Experimental Therapeutics 284:258-268.
Dopico AM, Bukiya AN, Martin GE (2014) Ethanol modulation of mammalian BK channels in excitable tissues: molecular targets and their possible contribution to alcohol-induced altered behavior. Frontiers in physiology 5.
Dopico AM, Chu B, Lemos JR, Treistman SN (1999) Alcohol modulation of calcium-activated potassium channels. Neurochemistry international 35:103-106.
Drake RE, Mueser KT (2002) Co-occurring alcohol use disorder and schizophrenia. Alcohol research and Health 26:99-102.
Drake RE, Osher FC, Noordsy DL, Hurlbut SC, Teague GB, Beaudett MS (1990) Diagnosis of alcohol use disorders in schizophrenia. Schizophrenia bulletin 16:57.
Edenberg HJ (2007) The genetics of alcohol metabolism: role of alcohol dehydrogenase and aldehyde dehydrogenase variants. Alcohol Research & Health 30:5-14.
Epstein LH, Temple JL, Roemmich JN, Bouton ME (2009) Habituation as a determinant of human food intake. Psychological review 116:384.
Esfandiari F, Medici V, Wong DH, Jose S, Dolatshahi M, Quinlivan E, Dayal S, Lentz SR, Tsukamoto H, Zhang YH (2010) Epigenetic regulation of hepatic endoplasmic reticulum stress pathways in the ethanol‐fed cystathionine beta synthase–deficient mouse. Hepatology 51:932-941.
Eva C, Serra M, Mele P, Panzica G, Oberto A (2006) Physiology and gene regulation of the brain NPY Y 1 receptor. Frontiers in neuroendocrinology 27:308-339.
Fadda F, Rossetti ZL (1998) Chronic ethanol consumption: from neuroadaptation to neurodegeneration. Progress in neurobiology 56:385-431.
Faumont S, Lindsay T, Lockery S (2012) Neuronal microcircuits for decision making in C. elegans. Current opinion in neurobiology 22:580-591.
Faunce GJ (2002) Eating disorders and attentional bias: A review. Eating Disorders 10:125-139.
Fire A, Xu S, Montgomery MK, Kostas SA, Driver SE, Mello CC (1998) Potent and specific genetic interference by double-stranded RNA in Caenorhabditis elegans. nature 391:806-811.
Fischman MW, Foltin RW (1991) Utility of subjective‐effects measurements in assessing abuse liability of drugs in humans. British journal of addiction 86:1563-1570.
Fujita Y, Shirataki H, Sakisaka T, Asakura T, Ohya T, Kotani H, Yokoyama S, Nishioka H, Matsuura Y, Mizoguchi A (1998) Tomosyn: a syntaxin-1–binding protein that forms a novel complex in the neurotransmitter release process. Neuron 20:905-915.
Gatto G, Murphy J, Waller M, McBride WJ, Lumeng L, Li T-K (1987) Persistence of tolerance to a single dose of ethanol in the selectively-bred alcohol-preferring P rat. Pharmacology Biochemistry and Behavior 28:105-110.
192
Geyer MA, Braff DL (1982) Habituation of the blink reflex in normals and schizophrenic patients. Psychophysiology 19:1-6.
Ghezzi A, Al-Hasan YM, Larios LE, Bohm RA, Atkinson NS (2004) slo K+ channel gene regulation mediates rapid drug tolerance. Proceedings of the National Academy of Sciences of the United States of America 101:17276-17281.
Ghezzi A, Krishnan HR, Lew L, Prado III FJ, Ong DS, Atkinson NS (2013) Alcohol-induced histone acetylation reveals a gene network involved in alcohol tolerance. PLoS genetics 9:e1003986.
Giles AC (2012) Candidate gene and high throughput genetic analysis of habituation in Caenorhabditis elegans. In: Neuroscience, p 204. Vancouver, British Columbia, Canada: University of British Columbia.
Glanzman DL, Epperlein RC (1981) Disruption of vertebrate monosynaptic habituation by ethyl alcohol. Brain research 212:117-126.
Gloria-Soria A, Azevedo RB (2008) npr-1 Regulates foraging and dispersal strategies in Caenorhabditis elegans. Current Biology 18:1694-1699.
Goldberg JA, Wilson CJ (2005) Control of spontaneous firing patterns by the selective coupling of calcium currents to calcium-activated potassium currents in striatal cholinergic interneurons. The Journal of neuroscience 25:10230-10238.
Goodwin DW (1974) Alcoholic blackout and state-dependent learning. Federation proceedings 33:1833-1835.
Goodwin DW, Schulsinger F, Knop J, Mednick S, Guze SB (1977) Alcoholism and depression in adopted-out daughters of alcoholics. Archives of general psychiatry 34:751-755.
Gracheva EO, Burdina AO, Touroutine D, Berthelot‐Grosjean M, Parekh H, Richmond JE (2007) Tomosyn negatively regulates both synaptic transmitter and neuropeptide release at the C. elegans neuromuscular junction. The Journal of physiology 585:705-709.
Gracheva EO, Burdina AO, Holgado AM, Berthelot-Grosjean M, Ackley BD, Hadwiger G, Nonet ML, Weimer RM, Richmond JE (2006) Tomosyn inhibits synaptic vesicle priming in Caenorhabditis elegans. PLoS Biol 4:e261.
Grant BF, Harford TC (1995) Comorbidity between DSM-IV alcohol use disorders and major depression: results of a national survey. Drug and alcohol dependence 39:197-206.
Groffen AJ, Jacobsen L, Schut D, Verhage M (2005) Two distinct genes drive expression of seven tomosyn isoforms in the mammalian brain, sharing a conserved structure with a unique variable domain. Journal of neurochemistry 92:554-568.
Grotewiel M, Bettinger JC (2015) Drosophila and Caenorhabditis elegans as Discovery Platforms for Genes Involved in Human Alcohol Use Disorder. Alcoholism: Clinical and Experimental Research 39:1292-1311.
Gruzelier J, Eves F, Connolly J, Hirsch S (1981) Orienting, habituation, sensitisation, and dishabituation in the electrodermal system of consecutive, drug free, admissions for schizophrenia. Biological psychology 12:187-209.
Gustavsson L (1995) Phosphatidylethanol formation: specific effects of ethanol mediated via phospholipase D. Alcohol and alcoholism 30:391-406.
193
Harada S, Agarwal DP, Goedde HW, Ishikawa B (1983) Aldehyde dehydrogenase isozyme variation and alcoholism in Japan. Pharmacology Biochemistry and Behavior 18:151-153.
Harris RA, Trudell JR, Mihic SJ (2008) Ethanol's molecular targets. Science signaling 1:re7.
Hart AC, Sims S, Kaplan JM (1995) Synaptic code for sensory modalities revealed by C. elegans GLR-1 glutamate receptor. Nature 378:82-85.
Hatsuzawa K, Lang T, Fasshauer D, Bruns D, Jahn R (2003) The R-SNARE motif of tomosyn forms SNARE core complexes with syntaxin 1 and SNAP-25 and down-regulates exocytosis. Journal of Biological Chemistry 278:31159-31166.
Haucke V, Neher E, Sigrist SJ (2011) Protein scaffolds in the coupling of synaptic exocytosis and endocytosis. Nature Reviews Neuroscience 12:127-138.
Hawkins EG, Martin I, Kondo LM, Judy ME, Brings VE, Chan CL, Blackwell GG, Bettinger JC, Davies AG (2015) A novel cholinergic action of alcohol and the development of tolerance to that effect in Caenorhabditis elegans. Genetics 199:135-149.
Hawkins JD, Catalano RF, Miller JY (1992) Risk and protective factors for alcohol and other drug problems in adolescence and early adulthood: implications for substance abuse prevention. Psychological bulletin 112:64.
Heilig M (2004) The NPY system in stress, anxiety and depression. Neuropeptides 38:213-224.
Heilig M, McLeod S, Brot M, Heinrichs SC, Menzaghi F, Koob GF, Britton KT (1993) Anxiolytic-like action of neuropeptide Y: mediation by Y1 receptors in amygdala, and dissociation from food intake effects. Neuropsychopharmacology 8:357-363.
Heintzman ND, Stuart RK, Hon G, Fu Y, Ching CW, Hawkins RD, Barrera LO, Van Calcar S, Qu C, Ching KA (2007) Distinct and predictive chromatin signatures of transcriptional promoters and enhancers in the human genome. Nature genetics 39:311-318.
Hernandez OH, Garcia-Martinez R, Monteon V (2014) Alcohol effects on the P2 component of auditory evoked potentials. An Acad Bras Cienc 86:437-449.
Herpertz SC, Wenning B, Mueller B, Qunaibi M, Sass H, Herpertz-Dahlmann B (2001) Psychophysiological responses in ADHD boys with and without conduct disorder: Implications for adult antisocial behavior. Journal of the American Academy of Child & Adolescent Psychiatry 40:1222-1230.
Hill SY, Shen S, Zezza N, Hoffman EK, Perlin M, Allan W (2004) A genome wide search for alcoholism susceptibility genes. American Journal of Medical Genetics Part B: Neuropsychiatric Genetics 128:102-113.
Hodgkin J (1983) Male phenotypes and mating efficiency in Caenorhabditis elegans. Genetics 103:43-64.
Hollister JM, Mednick SA, Brennan P, Cannon TD (1994) Impaired autonomic nervous system habituation in those at genetic risk for schizophrenia. Archives of general psychiatry 51:552-558.
Hong RL, Svatos A, Herrmann M, Sommer RJ (2008) Species-specific recognition of beetle cues by the nematode Pristionchus maupasi. Evolution & development 10:273-279.

194
Horvitz HR, Chalfie M, Trent C, Sulston JE, Evans PD (1982) Serotonin and octopamine in the nematode Caenorhabditis elegans. Science 216:1012-1014.
Hrubec Z, Omenn GS (1981) Evidence of genetic predisposition to alcoholic cirrhosis and psychosis: twin concordances for alcoholism and its biological end points by zygosity among male veterans. Alcoholism: Clinical and Experimental Research 5:207-215.
Hu Z, Hom S, Kudze T, Tong XJ, Choi S, Aramuni G, Zhang W, Kaplan JM (2012) Neurexin and neuroligin mediate retrograde synaptic inhibition in C. elegans. Science 337:980-984.
Hunter JW, Mullen GP, McManus JR, Heatherly JM, Duke A, Rand JB (2010) Neuroligin-deficient mutants of C. elegans have sensory processing deficits and are hypersensitive to oxidative stress and mercury toxicity. Disease Models & Mechanisms 3:366-376.
Hutchison KE, Haughey H, Niculescu M, Schacht J, Kaiser A, Stitzel J, Horton WJ, Filbey F (2008) The incentive salience of alcohol: translating the effects of genetic variant in CNR1. Archives of general psychiatry 65:841-850.
Hyde R, Corkins ME, Somers GA, Hart AC (2011) PKC‐1 acts with the ERK MAPK signaling pathway to regulate Caenorhabditis elegans mechanosensory response. Genes, Brain and Behavior 10:286-298.
Iaboni F, Douglas VI, Ditto B (1997) Psychophysiological response of ADHD children to reward and extinction. Psychophysiology 34:116-123.
Ikemoto S, Panksepp J (1999) The role of nucleus accumbens dopamine in motivated behavior: a unifying interpretation with special reference to reward-seeking. Brain Research Reviews 31:6-41.
Ilveskoski E, Kajander OA, Lehtimäki T, Kunnas T, Karhunen PJ, Heinälä P, Virkkunen M, Alho H (2001) Association of neuropeptide y polymorphism with the occurrence of type 1 and type 2 alcoholism. Alcoholism: Clinical and Experimental Research 25:1420-1422.
Ingle D (1973) Reduction of habituation of prey-catching activity by alcohol intoxication in the frog. Behavioral biology 8:123-129.
Ito T (2007) Role of histone modification in chromatin dynamics. Journal of biochemistry 141:609-614.
Jacobitz S, McLaughlin MM, Livi GP, Burman M, Torphy TJ (1996) Mapping the functional domains of human recombinant phosphodiesterase 4A: structural requirements for catalytic activity and rolipram binding. Molecular pharmacology 50:891-899.
Jee C, Lee J, Lim JP, Parry D, Messing RO, McIntire SL (2013) SEB‐3, a CRF receptor‐like GPCR, regulates locomotor activity states, stress responses and ethanol tolerance in Caenorhabditis elegans. Genes, Brain and Behavior 12:250-262.
Johnson BE, Glauser DA, Dan-Glauser ES, Halling DB, Aldrich RW, Goodman MB (2011) Alternatively spliced domains interact to regulate BK potassium channel gating. Proceedings of the National Academy of Sciences of the United States of America 108:20784-20789.
Kalant H (1998) Research on tolerance: what can we learn from history? Alcoholism: Clinical and Experimental Research 22:67-76.
195
Kalant H, LeBlanc AE, Gibbins R (1971) Tolerance to, and dependence on, some non-opiate psychotropic drugs. Pharmacological Reviews 23:135-191.
Karvonen MK, Pesonen U, Koulu M, Niskanen L, Laakso M, Rissanen A, Dekker JM, Valve R, Uusitupa MI (1998) Association of a leucine (7)-to-proline (7) polymorphism in the signal peptide of neuropeptide Y with high serum cholesterol and LDL cholesterol levels. Nature medicine 4:1434-1437.
Kauhanen J, Karvonen MK, Pesonen U, Koulu M, Tuomainen TP, Uusitupa MI, Salonen JT (2000) Neuropeptide Y polymorphism and alcohol consumption in middle‐aged men. American journal of medical genetics 93:117-121.
Kim JS, Shukla SD (2006) Acute in vivo effect of ethanol (binge drinking) on histone H3 modifications in rat tissues. Alcohol and alcoholism 41:126-132.
Kimble J, Hirsh D (1979) The postembryonic cell lineages of the hermaphrodite and male gonads in Caenorhabditis elegans. Developmental biology 70:396-417.
Kindt KS, Quast KB, Giles AC, De S, Hendrey D, Nicastro I, Rankin CH, Schafer WR (2007) Dopamine mediates context-dependent modulation of sensory plasticity in C. elegans. Neuron 55:662-676.
King AC, McNamara PJ, Hasin DS, Cao D (2014) Alcohol challenge responses predict future alcohol use disorder symptoms: a 6-year prospective study. Biological psychiatry 75:798-806.
Koelle M (2016) Neurotransmitter signaling through heterotrimeric G proteins: insights from studies in C. elegans. In: WormBook (Greenwald I, ed): The C.
elegans Community. Koob GF (2010) The potential of neuroscience to inform treatment. Alcohol Research &
Health 33:144-151. Kovala T, Sanwal BD, Ball EH (1997) Recombinant expression of a type IV, cAMP-
specific phosphodiesterase: characterization and structure-function studies of deletion mutants. Biochemistry 36:2968-2976.
Kreek MJ, Nielsen DA, Butelman ER, LaForge KS (2005) Genetic influences on impulsivity, risk taking, stress responsivity and vulnerability to drug abuse and addiction. Nature neuroscience 8:1450-1457.
Krishnan-Sarin S, O’Malley S, Krystal JH (2008) Treatment Implications: Using Neuroscience to Guide the Development of New Pharmacotherapies for Alcoholism. Alcohol Research & Health 31:400.
Kumada T, Jiang Y, Cameron DB, Komuro H (2007) How does alcohol impair neuronal migration? J Neurosci Res 85:465-470.
Kurtz D, Stewart R, Zweifel M, Li T-K, Froehlich JC (1996) Genetic differences in tolerance and sensitization to the sedative/hypnotic effects of alcohol. Pharmacology Biochemistry and Behavior 53:585-591.
Kutscher LM, Shaham S (2014) Forward and reverse mutagenesis in C. elegans. WormBook: the online review of C elegans biology:1.
Kwon JY, Hong M, Choi MS, Kang S, Duke K, Kim S, Lee S, Lee J (2004) Ethanol-response genes and their regulation analyzed by a microarray and comparative genomic approach in the nematode Caenorhabditis elegans. Genomics 83:600-614.
196
Lackner MR, Nurrish SJ, Kaplan JM (1999) Facilitation of synaptic transmission by EGL-30 G q α and EGL-8 PLCβ: DAG binding to UNC-13 is required to stimulate acetylcholine release. Neuron 24:335-346.
Lambright DG, Sondek J, Bohm A, Skiba NP, Hamm HE, Sigler PB (1996) The 2.0 Å crystal structure of a heterotrimeric G protein.
Landis CA, Masters SB, Spada A, Pace AM, Bourne HR, Vallar L (1989) GTPase inhibiting mutations activate the α chain of Gs and stimulate adenylyl cyclase in human pituitary tumours.
Lappalainen J, Kranzler HR, Malison R, Price LH, Van Dyck C, Rosenheck RA, Cramer J, Southwick S, Charney D, Krystal J (2002) A functional neuropeptide Y Leu7Pro polymorphism associated with alcohol dependence in a large population sample from the United States. Archives of general psychiatry 59:825-831.
Latorre R, Miller C (1983) Conduction and selectivity in potassium channels. The Journal of membrane biology 71:11-30.
LeBlanc A, Kalant H, Gibbins R (1975a) Acute tolerance to ethanol in the rat. Psychopharmacology 41:43-46.
LeBlanc AE, Gibbins R, Kalant H (1975b) Generalization of behaviorally augmented tolerance to ethanol, and its relation to physical dependence. Psychopharmacologia 44:241-246.
LeBoeuf B, Gruninger TR, Garcia LR (2007) Food deprivation attenuates seizures through CaMKII and EAG K+ channels. PLoS Genet 3:e156.
Leckliter IN, Matarazzo JD (1989) The influence of age, education, IQ, gender, and alcohol abuse on Halstead‐Reitan neuropsychological test battery performance. Journal of Clinical Psychology 45:484-512.
Lee J, Jee C, McIntire SL (2009) Ethanol preference in C. elegans. Genes Brain Behav 8:578-585.
Lee RY, Sawin ER, Chalfie M, Horvitz HR, Avery L (1999) EAT-4, a homolog of a mammalian sodium-dependent inorganic phosphate cotransporter, is necessary for glutamatergic neurotransmission in Caenorhabditis elegans. The Journal of neuroscience 19:159-167.
Li C, Kim K (2008) Neuropeptides. WormBook: the online review of C elegans biology:1.
Lieber CS (1995) Medical disorders of alcoholism. New England Journal of Medicine 333:1058-1065.
Limosin F, Loze J-Y, Dubertret C, Gouya L, Ades J, Rouillon F, Gorwood P (2003) Impulsiveness as the intermediate link between the dopamine receptor D2 gene and alcohol dependence. Psychiatric genetics 13:127-129.
Lints R, Emmons SW (1999) Patterning of dopaminergic neurotransmitter identity among Caenorhabditis elegans ray sensory neurons by a TGFbeta family signaling pathway and a Hox gene. Development 126:5819-5831.
Lister R (1987) The effects of repeated doses of ethanol on exploration and its habituation. Psychopharmacology 92:78-83.
Liu J, Vaithianathan T, Manivannan K, Parrill A, Dopico AM (2008) Ethanol modulates BKCa channels by acting as an adjuvant of calcium. Mol Pharmacol 74:628-640.
197
Lloyd DR, Medina DJ, Hawk LW, Fosco WD, Richards JB (2015) Habituation of reinforcer effectiveness. Habituation mechanisms and their impact on cognitive function.
Loane DJ, Lima PA, Marrion NV (2007) Co-assembly of N-type Ca2+ and BK channels underlies functional coupling in rat brain. Journal of cell science 120:985-995.
Loera PA, Meichenbaum D (1993) The "potential" contributions of cognitive behavior modification to literacy training for deaf students. American annals of the deaf 138:87-95.
Lovinger DM (1993) High ethanol sensitivity of recombinant AMPA-type glutamate receptors expressed in mammalian cells. Neuroscience letters 159:83-87.
Lovinger DM, Roberto M (2013) Synaptic effects induced by alcohol. In: Behavioral Neurobiology of Alcohol Addiction, pp 31-86: Springer.
Lyons J, Landis CA, Harsh G, Vallar L, Grunewald K, Feichtinger H, Duh Q-Y, Clark OH, Kawasaki E, Bourne HR (1990) Two G protein oncogenes in human endocrine tumors. Science 249:655-659.
Maricq AV, Peckol E, Driscoll M, Bargmann CI (1995) Mechanosensory signalling in C. elegans mediated by the GLR-1 glutamate receptor. Nature 378:78-81.
Maro GS, Gao S, Olechwier AM, Hung WL, Liu M, Özkan E, Zhen M, Shen K (2015) MADD-4/punctin and neurexin organize C. elegans GABAergic postsynapses through neuroligin. Neuron 86:1420-1432.
Martin CS, Earleywine M, Musty RE, Perrine M, Swift RM (1993) Development and validation of the biphasic alcohol effects scale. Alcoholism: Clinical and Experimental Research 17:140-146.
Martin GE (2010) BK channel and alcohol, a complicated affair. International review of neurobiology 91:321-338.
Maruyama H, Rakow T, Maruyama I (2001) Synaptic exocytosis and nervous system development impaired in Caenorhabditis elegansunc-13 mutants. Neuroscience 104:287-297.
Masuda ES, Huang BC, Fisher JM, Luo Y, Scheller RH (1998) Tomosyn binds t-SNARE proteins via a VAMP-like coiled coil. Neuron 21:479-480.
Mathies LD, Blackwell GG, Austin MK, Edwards AC, Riley BP, Davies AG, Bettinger JC (2015) SWI/SNF chromatin remodeling regulates alcohol response behaviors in Caenorhabditis elegans and is associated with alcohol dependence in humans. Proceedings of the National Academy of Sciences of the United States of America 112:3032-3037.
Mayfield R, Harris R, Schuckit M (2008) Genetic factors influencing alcohol dependence. British journal of pharmacology 154:275-287.
Maze I, Feng J, Wilkinson MB, Sun H, Shen L, Nestler EJ (2011) Cocaine dynamically regulates heterochromatin and repetitive element unsilencing in nucleus accumbens. Proceedings of the National Academy of Sciences 108:3035-3040.
Maze I, Covington HE, Dietz DM, LaPlant Q, Renthal W, Russo SJ, Mechanic M, Mouzon E, Neve RL, Haggarty SJ (2010) Essential role of the histone methyltransferase G9a in cocaine-induced plasticity. Science 327:213-216.
McEwan A (2013) Modulation of habituation kinetics and behavioural shifts by members of the heterotrimeric G-protein signaling pathways. In: Cell and Developmental Biology: University of British Columbia.
198
McEwen JM, Madison JM, Dybbs M, Kaplan JM (2006) Antagonistic regulation of synaptic vesicle priming by Tomosyn and UNC-13. Neuron 51:303-315.
Messing R, Petersen P, Henrich C (1991) Chronic ethanol exposure increases levels of protein kinase C delta and epsilon and protein kinase C-mediated phosphorylation in cultured neural cells. Journal of Biological Chemistry 266:23428-23432.
Miller KG, Emerson MD, McManus JR, Rand JB (2000) RIC-8 (synembryn): A novel conserved protein that is required for Gqα signaling in the C. elegans nervous system. Neuron 27:289-299.
Mitchell P, Mould R, Dillon J, Glautier S, Andrianakis I, James C, Pugh A, Holden-Dye L, O'Connor V (2010) A differential role for neuropeptides in acute and chronic adaptive responses to alcohol: behavioural and genetic analysis in Caenorhabditis elegans. PLoS One 5:e10422.
Mitchell PH, Bull K, Glautier S, Hopper NA, Holden-Dye L, O'Connor V (2007) The concentration-dependent effects of ethanol on Caenorhabditis elegans behaviour. Pharmacogenomics J 7:411-417.
Moghaddam B, Bolinao ML (1994) Biphasic effect of ethanol on extracellular accumulation of glutamate in the hippocampus and the nucleus accumbens. Neuroscience letters 178:99-102.
Morales-Medina JC, Dumont Y, Quirion R (2010) A possible role of neuropeptide Y in depression and stress. Brain research 1314:194-205.
Morgan PG, Sedensky MM (1995) Mutations affecting sensitivity to ethanol in the nematode, Caenorhabditis elegans. Alcoholism, clinical and experimental research 19:1423-1429.
Mumby SM, Kleuss C, Gilman AG (1994) Receptor regulation of G-protein palmitoylation. Proceedings of the National Academy of Sciences 91:2800-2804.
Möykkynen T, Korpi ER (2012) Acute effects of ethanol on glutamate receptors. Basic & clinical pharmacology & toxicology 111:4-13.
Nestler EJ (2014) Epigenetic mechanisms of drug addiction. Neuropharmacology 76:259-268.
Okochi Y, Kimura KD, Ohta A, Mori I (2005) Diverse regulation of sensory signaling by C. elegans nPKC‐epsilon/eta TTX‐4. The EMBO journal 24:2127-2137.
Okubo T, Harada S (2001) Polymorphism of the neuropeptide Y gene: an association study with alcohol withdrawal. Alcoholism: Clinical and Experimental Research 25:59S-62S.
Oliva J, Dedes J, Li J, French SW, Bardag-Gorce F (2009) Epigenetics of proteasome inhibition in the liver of rats fed ethanol chronically. World J Gastroenterol 15:705-712.
Owens RJ, Catterall C, Batty D, Jappy J, Russel A, Smith B, O'Connell J, Perry MJ (1997) Human phosphodiesterase 4A: characterization of full-length and truncated enzymes expressed in COS cells. Biochemical Journal 326:53-60.
Pal-Bhadra M, Bhadra U, Jackson DE, Mamatha L, Park P-H, Shukla SD (2007) Distinct methylation patterns in histone H3 at Lys-4 and Lys-9 correlate with up-& down-regulation of genes by ethanol in hepatocytes. Life sciences 81:979-987.
Pallotta BS (1985) Calcium‐activated potassium channels in rat muscle inactivate from a short‐duration open state. The Journal of physiology 363:501-516.
199
Palmer NB, Salcedo J, Miller AL, Winiarski M, Arno P (2003) Psychiatric and social barriers to HIV medication adherence in a triply diagnosed methadone population. AIDS Patient Care STDS 17:635-644.
Pandey SC (2003) Anxiety and alcohol abuse disorders: a common role for CREB and its target, the neuropeptide Y gene. Trends in Pharmacological Sciences 24:456-460.
Park E-C, Horvitz HR (1986) Mutations with dominant effects on the behavior and morphology of the nematode Caenorhabditis elegans. Genetics 113:821-852.
Pearson C, Janz T, Ali J (2013) Mental and substance use disorders in Canada: Statistics Canada.
Peeke HV, Peeke SC, Avis HH, Ellman G (1975) Alcohol, habituation and the patterning of aggressive responses in a cichlid fish. Pharmacology Biochemistry and Behavior 3:1031-1036.
Perry JL, Carroll ME (2008) The role of impulsive behavior in drug abuse. Psychopharmacology 200:1-26.
Petersen CI, McFarland TR, Stepanovic SZ, Yang P, Reiner DJ, Hayashi K, George AL, Roden DM, Thomas JH, Balser JR (2004) In vivo identification of genes that modify ether-a-go-go-related gene activity in Caenorhabditis elegans may also affect human cardiac arrhythmia. Proceedings of the National Academy of Sciences of the United States of America 101:11773-11778.
Petrik D, Wang B, Brenner R (2011) Modulation by the BK accessory β4 subunit of phosphorylation‐dependent changes in excitability of dentate gyrus granule neurons. European Journal of Neuroscience 34:695-704.
Peymen K, Watteyne J, Frooninckx L, Schoofs L, Beets I (2014) The FMRFamide-Like Peptide Family in Nematodes. Front Endocrinol (Lausanne) 5:90.
Phillips TJ, Brown KJ, Burkhart-Kasch S, Wenger CD, Kelly MA, Rubinstein M, Grandy DK, Low MJ (1998) Alcohol preference and sensitivity are markedly reduced in mice lacking dopamine D2 receptors. Nature neuroscience 1:610-615.
Pietrzykowski AZ, Treistman SN (2008) The molecular basis of tolerance. Alcohol Health & Research World 31:298.
Pietrzykowski AZ, Martin GE, Puig SI, Knott TK, Lemos JR, Treistman SN (2004) Alcohol tolerance in large-conductance, calcium-activated potassium channels of CNS terminals is intrinsic and includes two components: decreased ethanol potentiation and decreased channel density. The Journal of neuroscience : the official journal of the Society for Neuroscience 24:8322-8332.
Piggott BJ, Liu J, Feng Z, Wescott SA, Xu XS (2011) The neural circuits and synaptic mechanisms underlying motor initiation in C. elegans. Cell 147:922-933.
Pobbati AV, Razeto A, Böddener M, Becker S, Fasshauer D (2004) Structural basis for the inhibitory role of tomosyn in exocytosis. Journal of Biological Chemistry 279:47192-47200.
Pohorecky L (1978) Biphasic action of ethanol. Biobehavioral Reviews 1:231-240. Ponomarev I (2013) Epigenetic control of gene expression in the alcoholic brain. Alcohol
Res 35:69-76. Ponomarev I, Wang S, Zhang L, Harris RA, Mayfield RD (2012) Gene coexpression
networks in human brain identify epigenetic modifications in alcohol dependence. The Journal of Neuroscience 32:1884-1897.

200
Prescott CA, Aggen SH, Kendler KS (1999) Sex differences in the sources of genetic liability to alcohol abuse and dependence in a Population‐Based sample of US twins. Alcoholism: Clinical and Experimental Research 23:1136-1144.
Qiang M, Denny A, Lieu M, Carreon S, Li J (2011) Histone H3K9 modifications are a local chromatin event involved in ethanol-induced neuroadaptation of the NR2B gene. Epigenetics 6:1095-1104.
Raabe RC, Mathies LD, Davies AG, Bettinger JC (2014) The omega-3 fatty acid eicosapentaenoic acid is required for normal alcohol response behaviors in C. elegans. PLoS One 9:e105999.
Radlow R (1994) A quantitative theory of acute tolerance to alcohol. Psychopharmacology (Berl) 114:1-8.
Raffaelli G, Saviane C, Mohajerani MH, Pedarzani P, Cherubini E (2004) BK potassium channels control transmitter release at CA3-CA3 synapses in the rat hippocampus. The Journal of physiology 557:147-157.
Rankin CH, Wicks SR (2000) Mutations of the caenorhabditis elegans brain-specific inorganic phosphate transporter eat-4 affect habituation of the tap-withdrawal response without affecting the response itself. The Journal of neuroscience : the official journal of the Society for Neuroscience 20:4337-4344.
Rankin CH, Beck CD, Chiba CM (1990) Caenorhabditis elegans: a new model system for the study of learning and memory. Behavioural brain research 37:89-92.
Rankin CH, Abrams T, Barry RJ, Bhatnagar S, Clayton DF, Colombo J, Coppola G, Geyer MA, Glanzman DL, Marsland S, McSweeney FK, Wilson DA, Wu CF, Thompson RF (2009) Habituation revisited: an updated and revised description of the behavioral characteristics of habituation. Neurobiology of learning and memory 92:135-138.
Rehm, Baliunas, Brochu, Fischer, Gnam, Patra, Popova, Sarnocinska-Hart, Taylor B, Adlaf E, Recel M, Single E (2006) The Cost of Substance Abuse in Canada 2002. In: ((CCSA) CCoSA, ed). Ottawa: Canadian Centre on Substance Abuse (CCSA).
Reiner DJ, Weinshenker D, Thomas JH (1995) Analysis of dominant mutations affecting muscle excitation in Caenorhabditis elegans. Genetics 141:961-976.
Reiner DJ, Weinshenker D, Tian H, Thomas JH, Nishiwaki K, Miwa J, Gruninger T, LeBoeuf B, Garcia LR (2006) Behavioral genetics of Caenorhabditis elegans UNC-103-encoded ERG-like K+ channel. Journal of neurogenetics 20:41-66.
Renthal W, Nestler EJ (2008) Epigenetic mechanisms in drug addiction. Trends in molecular medicine 14:341-350.
Reynolds NK, Schade MA, Miller KG (2005) Convergent, RIC-8-dependent Gα signaling pathways in the Caenorhabditis elegans synaptic signaling network. Genetics 169:651-670.
Rinaldi P, Nishimura L, Thompson R (1983) Acute Ethanol Treatment Modifies Response Properties and Habituation of the DR‐VR Reflex in the Isolated Frog Spinal Cord. Alcoholism: Clinical and Experimental Research 7:194-198.
Risinger FO, Freeman PA, Rubinstein M, Low MJ, Grandy DK (2000) Lack of operant ethanol self-administration in dopamine D2 receptor knockout mice. Psychopharmacology 152:343-350.
Roberts WM, Augustine SB, Lawton KJ, Lindsay TH, Thiele TR, Izquierdo EJ, Faumont S, Lindsay RA, Britton MC, Pokala N (2016) A stochastic neuronal model

201
predicts random search behaviors at multiple spatial scales in C. elegans. eLife:e12572.
Rodriguez LA, Wilson JR, Nagoshi CT (1993) Does psychomotor sensitivity to alcohol predict subsequent alcohol use? Alcoholism: Clinical and Experimental Research 17:155-161.
Rogozea R, Florea-Ciocoiu V (1988) Orienting reaction habituation in chronic alcoholics. The Pavlovian journal of biological science 23:43-53.
Ron D, Messing RO (2011) Signaling pathways mediating alcohol effects. In: Behavioral Neurobiology of Alcohol Addiction, pp 87-126: Springer.
Rose JK, Rankin CH (2001) Analyses of habituation in Caenorhabditis elegans. Learning & memory 8:63-69.
Rose JK, Kaun KR, Chen SH, Rankin CH (2003) GLR-1, a non-NMDA glutamate receptor homolog, is critical for long-term memory in Caenorhabditis elegans. The Journal of neuroscience : the official journal of the Society for Neuroscience 23:9595-9599.
Sakharkar AJ, Zhang H, Tang L, Shi G, Pandey SC (2012) Histone deacetylases (HDAC)-induced histone modifications in the amygdala: a role in rapid tolerance to the anxiolytic effects of ethanol. Alcoholism, clinical and experimental research 36:61-71.
Salkoff L, Butler A, Ferreira G, Santi C, Wei A (2006) High-conductance potassium channels of the SLO family. Nat Rev Neurosci 7:921-931.
Samson HH, Hodge CW (1996) Neurobehavioral regulation of ethanol intake. Pharmacological effects of ethanol on the nervous system 13:203-226.
Sanyal S, Wintle RF, Kindt KS, Nuttley WM, Arvan R, Fitzmaurice P, Bigras E, Merz DC, Hébert TE, van der Kooy D (2004) Dopamine modulates the plasticity of mechanosensory responses in Caenorhabditis elegans. The EMBO journal 23:473-482.
Sawin ER, Ranganathan R, Horvitz HR (2000) C. elegans locomotory rate is modulated by the environment through a dopaminergic pathway and by experience through a serotonergic pathway. Neuron 26:619-631.
Schade MA, Reynolds NK, Dollins CM, Miller KG (2005) Mutations that rescue the paralysis of Caenorhabditis elegans ric-8 (synembryn) mutants activate the Gαs pathway and define a third major branch of the synaptic signaling network. Genetics 169:631-649.
Scholz H, Ramond J, Singh CM, Heberlein U (2000) Functional ethanol tolerance in Drosophila. Neuron 28:261-271.
Schotta G, Lachner M, Sarma K, Ebert A, Sengupta R, Reuter G, Reinberg D, Jenuwein T (2004) A silencing pathway to induce H3-K9 and H4-K20 trimethylation at constitutive heterochromatin. Genes & development 18:1251-1262.
Schuckit MA (1987) Biological vulnerability to alcoholism. Journal of Consulting and Clinical Psychology 55:301.
Schuckit MA, Smith TL (1996) An 8-year follow-up of 450 sons of alcoholic and control subjects. Archives of general psychiatry 53:202-210.
Scott L, Davis S, Yen R, Ordemann G, Bannai D, Pierce-Shimomura J (2016) BK Channel Function Bidirectionally Influences Behavioral Deficits Following Withdrawal from Chronic Ethanol in Caenorhabditis elegans. bioRxiv:062752.
202
Selby MJ, Azrin RL (1998) Neuropsychological functioning in drug abusers. Drug Alcohol Depend 50:39-45.
Serrano-Saiz E, Poole RJ, Felton T, Zhang F, De La Cruz ED, Hobert O (2013) Modular control of glutamatergic neuronal identity in C. elegans by distinct homeodomain proteins. Cell 155:659-673.
Shenker A, Weinstein LS, Moran A, Pescovitz OH, Charest NJ, Boney CM, Van Wyk JJ, Merino MJ, Feuillan PP, Spiegel AM (1993) Severe endocrine and nonendocrine manifestations of the McCune-Albright syndrome associated with activating mutations of stimulatory G protein G s. The Journal of pediatrics 123:509-518.
Shukla SD, Lim RW (2013) Epigenetic effects of ethanol on the liver and gastrointestinal system. Alcohol Res 35:47-55.
Shukla SD, Velazquez J, French SW, Lu SC, Ticku MK, Zakhari S (2008) Emerging role of epigenetics in the actions of alcohol. Alcoholism: Clinical and Experimental Research 32:1525-1534.
Sieburth D, Madison JM, Kaplan JM (2007) PKC-1 regulates secretion of neuropeptides. Nature neuroscience 10:49-57.
Sommer W, Arlinde C, Caberlotto L, Thorsell A, Hyytia P, Heilig M (2001) Differential expression of diacylglycerol kinase iota and L18A mRNAs in the brains of alcohol-preferring AA and alcohol-avoiding ANA rats. Molecular psychiatry 6:103-108.
Sondek J, Lambright DG, Noel JP, Hamm HE, Sigler PB (1994) GTPase mechanism of Gproteins from the 1.7-Å crystal structure of transducin α-GDP AIF− 4. Nature 372:276-279.
Speca DJ, Chihara D, Ashique AM, Bowers MS, Pierce-Shimomura JT, Lee J, Rabbee N, Speed TP, Gularte RJ, Chitwood J, Medrano JF, Liao M, Sonner JM, Eger EI, 2nd, Peterson AS, McIntire SL (2010) Conserved role of unc-79 in ethanol responses in lightweight mutant mice. PLoS genetics 6.
Stewart MD, Li J, Wong J (2005) Relationship between histone H3 lysine 9 methylation, transcription repression, and heterochromatin protein 1 recruitment. Molecular and cellular biology 25:2525-2538.
Stiernagle T (2006) Maintenance of C. elegans. In: WormBook (Fay D, ed). WormBook: The C. elegans Research Community.
Subbanna S, Basavarajappa BS (2014) Pre-administration of G9a/GLP inhibitor during synaptogenesis prevents postnatal ethanol-induced LTP deficits and neurobehavioral abnormalities in adult mice. Exp Neurol 261C:34-43.
Subbanna S, Nagre NN, Shivakumar M, Umapathy NS, Psychoyos D, Basavarajappa BS (2014) Ethanol induced acetylation of histone at G9a exon1 and G9a-mediated histone H3 dimethylation leads to neurodegeneration in neonatal mice. Neuroscience 258:422-432.
Subbanna S, Shivakumar M, Umapathy NS, Saito M, Mohan PS, Kumar A, Nixon RA, Verin AD, Psychoyos D, Basavarajappa BS (2013) G9a-mediated histone methylation regulates ethanol-induced neurodegeneration in the neonatal mouse brain. Neurobiol Dis 54:475-485.
Sulston JE, Horvitz HR (1977) Post-embryonic cell lineages of the nematode, Caenorhabditis elegans. Developmental biology 56:110-156.

203
Sulston JE, Schierenberg E, White JG, Thomson J (1983) The embryonic cell lineage of the nematode Caenorhabditis elegans. Developmental biology 100:64-119.
Suo Q, Zhang M, Tang Z, Huang Z (1999) [Studies on the chemical constituents of soft coral Sarcophyton elegans]. Zhong yao cai = Zhongyaocai = Journal of Chinese medicinal materials 22:75-77.
Suo S, Sasagawa N, Ishiura S (2002) Identification of a dopamine receptor from Caenorhabditis elegans. Neuroscience letters 319:13-16.
Suwaki H, Ohara H (1985) Alcohol-induced facial flushing and drinking behavior in Japanese men. Journal of studies on alcohol 46:196-198.
Swierczek NA, Giles AC, Rankin CH, Kerr RA (2011) High-throughput behavioral analysis in C. elegans. Nature methods 8:592-598.
Tabakoff B, Hoffman PL (2000) Animal models in alcohol research. Alcohol Research and Health 24:77-84.
Tauffenberger A, Parker JA (2014) Heritable transmission of stress resistance by high dietary glucose in Caenorhabditis elegans. PLoS genetics 10:e1004346.
Thanos PK, Rivera SN, Weaver K, Grandy DK, Rubinstein M, Umegaki H, Wang GJ, Hitzemann R, Volkow ND (2005) Dopamine D2R DNA transfer in dopamine D2 receptor-deficient mice: effects on ethanol drinking. Life sciences 77:130-139.
Thiele TE, Badia-Elder NE (2003) A role for neuropeptide Y in alcohol intake control: evidence from human and animal research. Physiology & behavior 79:95-101.
Thiele TE, Koh MT, Pedrazzini T (2002) Voluntary alcohol consumption is controlled via the neuropeptide Y Y1 receptor. Journal of Neuroscience 22:RC208.
Thiele TE, Sparta DR, Hayes DM, Fee JR (2004) A role for neuropeptide Y in neurobiological responses to ethanol and drugs of abuse. Neuropeptides 38:235-243.
Thiele TE, Marsh DJ, Ste Marie L, Bernstein IL, Palmiter RD (1998) Ethanol consumption and resistance are inversely related to neuropeptide Y levels. Nature 396:366-369.
Thompson RF, Spencer WA (1966) Habituation: a model phenomenon for the study of neuronal substrates of behavior. Psychological review 73:16.
Thorsell A (2007) Neuropeptide Y (NPY) in alcohol intake and dependence. Peptides 28:480-483.
Toonen RF, Verhage M (2003) Vesicle trafficking: pleasure and pain from SM genes. Trends in cell biology 13:177-186.
Traynor ME, Woodson PB, Schlapfer WT, Barondes SH (1977) Tolerance to an effect of ethanol on post-tetanic potentiation in Aplysia. Drug and alcohol dependence 2:361-370.
Valenzuela CF (1997) Alcohol and neurotransmitter interactions. Alcohol Research and Health 21:144.
Van Dop C, Tsubokawa M, Bourne HR, Ramachandran J (1984) Amino acid sequence of retinal transducin at the site ADP-ribosylated by cholera toxin. Journal of Biological Chemistry 259:696-698.
van Huizen R, Czajkowsky DM, Shi D, Shao Z, Li M (1999) Images of oligomeric Kvβ2, a modulatory subunit of potassium channels. FEBS letters 457:107-111.
Venables P (1966) Psychophysiological aspects of schizophrenia. British Journal of Medical Psychology 39:289-297.

204
Vengeliene V, Bilbao A, Molander A, Spanagel R (2008) Neuropharmacology of alcohol addiction. British journal of pharmacology 154:299-315.
Wang H, Ji B, Ren H, Meng C (2014) The relationship between lysine 4 on histone H3 methylation levels of alcohol tolerance genes and changes of ethanol tolerance in Saccharomyces cerevisiae. Microb Biotechnol 7:307-314.
Wang Y, Krishnan HR, Ghezzi A, Yin JC, Atkinson NS (2007) Drug-induced epigenetic changes produce drug tolerance. PLoS biology 5:e265.
Wang ZW (2008) Regulation of synaptic transmission by presynaptic CaMKII and BK channels. Molecular neurobiology 38:153-166.
Wang ZW, Saifee O, Nonet ML, Salkoff L (2001) SLO-1 potassium channels control quantal content of neurotransmitter release at the C. elegans neuromuscular junction. Neuron 32:867-881.
Warde-Farley D, Donaldson SL, Comes O, Zuberi K, Badrawi R, Chao P, Franz M, Grouios C, Kazi F, Lopes CT (2010) The GeneMANIA prediction server: biological network integration for gene prioritization and predicting gene function. Nucleic acids research 38:W214-W220.
Weiss F (2005) Neurobiology of craving, conditioned reward and relapse. Current opinion in pharmacology 5:9-19.
White JG, Southgate E, Thomson JN, Brenner S (1986) The Structure of the Nervous System of the Nematode Caenorhabditis elegans. Philosophical Transactions of the Royal Society B: Biological Sciences 314:1-340.
Whitfield JB (2002) Alcohol dehydrogenase and alcohol dependence: variation in genotype-associated risk between populations. The American Journal of Human Genetics 71:1247-1250.
WHO (2014) Global Status Report on Alcohol and Health. In: World Health Organization.
Wicks S, Rankin C (1996) The integration of antagonistic reflexes revealed by laser ablation of identified neurons determines habituation kinetics of the Caenorhabditis elegans tap withdrawal response. Journal of Comparative Physiology A 179:675-685.
Wicks SR, Rankin CH (1995) Integration of mechanosensory stimuli in Caenorhabditis elegans. The Journal of neuroscience : the official journal of the Society for Neuroscience 15:2434-2444.
Wicks SR, Roehrig CJ, Rankin CH (1996) A dynamic network simulation of the nematode tap withdrawal circuit: predictions concerning synaptic function using behavioral criteria. The Journal of neuroscience : the official journal of the Society for Neuroscience 16:4017-4031.
Widberg CH, Bryant NJ, Girotti M, Rea S, James DE (2003) Tomosyn interacts with the t-SNAREs syntaxin4 and SNAP23 and plays a role in insulin-stimulated GLUT4 translocation. Journal of Biological Chemistry 278:35093-35101.
Wormbase. (2016) In: release WS252. Xiao L, Cousins G, Courtney B, Hederman L, Fahey T, Dimitrov BD (2011) Developing
an electronic health record (EHR) for methadone treatment recording and decision support. BMC Med Inform Decis Mak 11:5.
Xu L, Strome S (2001) Depletion of a novel SET-domain protein enhances the sterility of mes-3 and mes-4 mutants of Caenorhabditis elegans. Genetics 159:1019-1029.
205
Yamamoto Y, Mochida S, Miyazaki N, Kawai K, Fujikura K, Kurooka T, Iwasaki K, Sakisaka T (2010) Tomosyn inhibits synaptotagmin-1-mediated step of Ca2+-dependent neurotransmitter release through its N-terminal WD40 repeats. Journal of Biological Chemistry 285:40943-40955.
Yizhar O, Matti U, Melamed R, Hagalili Y, Bruns D, Rettig J, Ashery U (2004) Tomosyn inhibits priming of large dense-core vesicles in a calcium-dependent manner. Proceedings of the National Academy of Sciences of the United States of America 101:2578-2583.
Yizhar O, Lipstein N, Gladycheva SE, Matti U, Ernst SA, Rettig J, Stuenkel EL, Ashery U (2007) Multiple functional domains are involved in tomosyn regulation of exocytosis. Journal of neurochemistry 103:604-616.
Yokoyama S, Shirataki H, Sakisaka T, Takai Y (1999) Three splicing variants of tomosyn and identification of their syntaxin-binding region. Biochemical and biophysical research communications 256:218-222.
Yu Y, Zhi L, Guan X, Wang D, Wang D (2016) FLP-4 neuropeptide and its receptor in a neuronal circuit regulate preference choice through functions of ASH-2 trithorax complex in Caenorhabditis elegans. Scientific reports 6.
Yuan C, O'Connell RJ, Wilson A, Pietrzykowski AZ, Treistman SN (2008) Acute alcohol tolerance is intrinsic to the BKCa protein, but is modulated by the lipid environment. The Journal of biological chemistry 283:5090-5098.
Yuan P, Leonetti MD, Pico AR, Hsiung Y, MacKinnon R (2010) Structure of the human BK channel Ca2+-activation apparatus at 3.0 Å resolution. Science 329:182-186.
Zhang G, Hu YY, Xue H, Shan D, Sun Y, Yang YC, Duan S, Sun JP (2013) [Health economic evaluation for the extension clinics of methadone maintenance treatment]. Zhonghua Yu Fang Yi Xue Za Zhi 47:996-1000.
Zhang W, Lilja L, Mandic SA, Gromada J, Smidt K, Janson J, Takai Y, Bark C, Berggren P-O, Meister B (2006) Tomosyn is expressed in β-cells and negatively regulates insulin exocytosis. Diabetes 55:574-581.
Zhou FC, Zhao Q, Liu Y, Goodlett CR, Liang T, McClintick JN, Edenberg HJ, Li L (2011a) Alteration of gene expression by alcohol exposure at early neurulation. BMC genomics 12:124.
Zhou Z, Yuan Q, Mash DC, Goldman D (2011b) Substance-specific and shared transcription and epigenetic changes in the human hippocampus chronically exposed to cocaine and alcohol. Proceedings of the National Academy of Sciences 108:6626-6631.
Zhu G, Pollak L, Mottagui‐Tabar S, Wahlestedt C, Taubman J, Virkkunen M, Goldman D, Heilig M (2003) NPY Leu7Pro and alcohol dependence in Finnish and Swedish populations. Alcoholism: Clinical and Experimental Research 27:19-24.
Zilberman D, Cao X, Jacobsen SE (2003) ARGONAUTE4 control of locus-specific siRNA accumulation and DNA and histone methylation. Science 299:716-719.
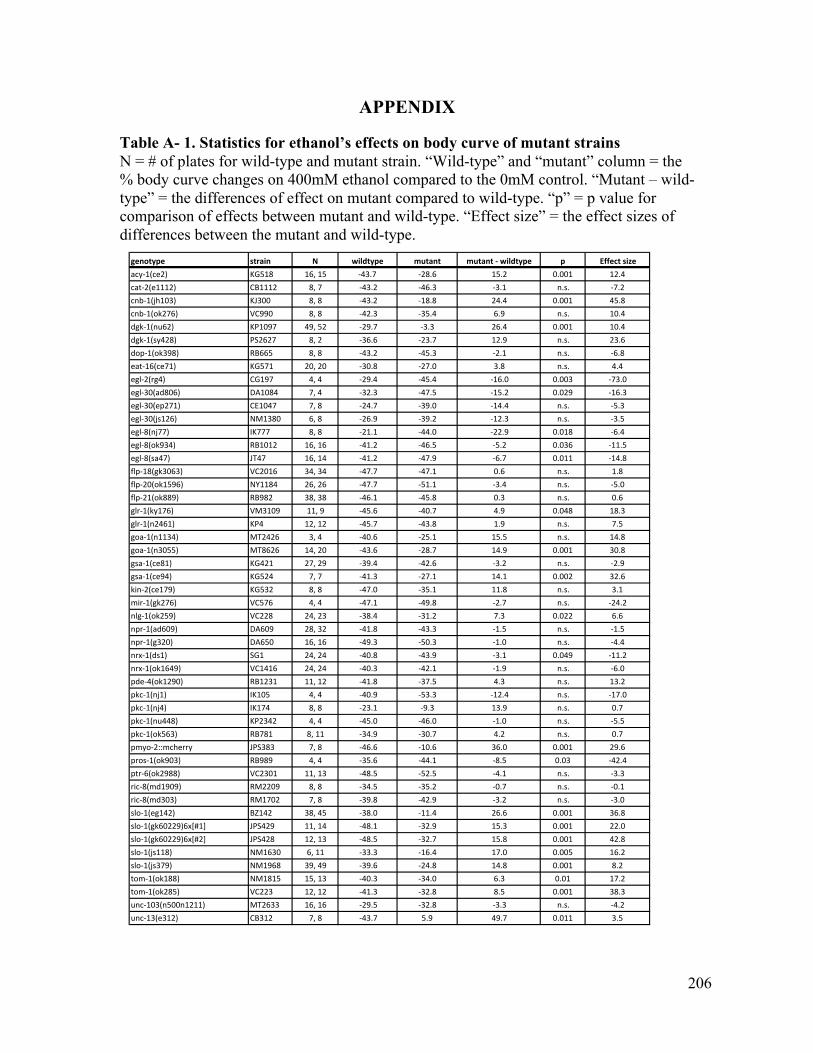
206
APPENDIX
Table A- 1. Statistics for ethanol’s effects on body curve of mutant strains N = # of plates for wild-type and mutant strain. “Wild-type” and “mutant” column = the % body curve changes on 400mM ethanol compared to the 0mM control. “Mutant – wild-type” = the differences of effect on mutant compared to wild-type. “p” = p value for comparison of effects between mutant and wild-type. “Effect size” = the effect sizes of differences between the mutant and wild-type.
genotype strain N wildtype mutant mutant-wildtype p Effectsizeacy-1(ce2) KG518 16,15 -43.7 -28.6 15.2 0.001 12.4cat-2(e1112) CB1112 8,7 -43.2 -46.3 -3.1 n.s. -7.2cnb-1(jh103) KJ300 8,8 -43.2 -18.8 24.4 0.001 45.8cnb-1(ok276) VC990 8,8 -42.3 -35.4 6.9 n.s. 10.4dgk-1(nu62) KP1097 49,52 -29.7 -3.3 26.4 0.001 10.4dgk-1(sy428) PS2627 8,2 -36.6 -23.7 12.9 n.s. 23.6dop-1(ok398) RB665 8,8 -43.2 -45.3 -2.1 n.s. -6.8eat-16(ce71) KG571 20,20 -30.8 -27.0 3.8 n.s. 4.4egl-2(rg4) CG197 4,4 -29.4 -45.4 -16.0 0.003 -73.0egl-30(ad806) DA1084 7,4 -32.3 -47.5 -15.2 0.029 -16.3egl-30(ep271) CE1047 7,8 -24.7 -39.0 -14.4 n.s. -5.3egl-30(js126) NM1380 6,8 -26.9 -39.2 -12.3 n.s. -3.5egl-8(nj77) IK777 8,8 -21.1 -44.0 -22.9 0.018 -6.4egl-8(ok934) RB1012 16,16 -41.2 -46.5 -5.2 0.036 -11.5egl-8(sa47) JT47 16,14 -41.2 -47.9 -6.7 0.011 -14.8flp-18(gk3063) VC2016 34,34 -47.7 -47.1 0.6 n.s. 1.8flp-20(ok1596) NY1184 26,26 -47.7 -51.1 -3.4 n.s. -5.0flp-21(ok889) RB982 38,38 -46.1 -45.8 0.3 n.s. 0.6glr-1(ky176) VM3109 11,9 -45.6 -40.7 4.9 0.048 18.3glr-1(n2461) KP4 12,12 -45.7 -43.8 1.9 n.s. 7.5goa-1(n1134) MT2426 3,4 -40.6 -25.1 15.5 n.s. 14.8goa-1(n3055) MT8626 14,20 -43.6 -28.7 14.9 0.001 30.8gsa-1(ce81) KG421 27,29 -39.4 -42.6 -3.2 n.s. -2.9gsa-1(ce94) KG524 7,7 -41.3 -27.1 14.1 0.002 32.6kin-2(ce179) KG532 8,8 -47.0 -35.1 11.8 n.s. 3.1mir-1(gk276) VC576 4,4 -47.1 -49.8 -2.7 n.s. -24.2nlg-1(ok259) VC228 24,23 -38.4 -31.2 7.3 0.022 6.6npr-1(ad609) DA609 28,32 -41.8 -43.3 -1.5 n.s. -1.5npr-1(g320) DA650 16,16 -49.3 -50.3 -1.0 n.s. -4.4nrx-1(ds1) SG1 24,24 -40.8 -43.9 -3.1 0.049 -11.2nrx-1(ok1649) VC1416 24,24 -40.3 -42.1 -1.9 n.s. -6.0pde-4(ok1290) RB1231 11,12 -41.8 -37.5 4.3 n.s. 13.2pkc-1(nj1) IK105 4,4 -40.9 -53.3 -12.4 n.s. -17.0pkc-1(nj4) IK174 8,8 -23.1 -9.3 13.9 n.s. 0.7pkc-1(nu448) KP2342 4,4 -45.0 -46.0 -1.0 n.s. -5.5pkc-1(ok563) RB781 8,11 -34.9 -30.7 4.2 n.s. 0.7pmyo-2::mcherry JPS383 7,8 -46.6 -10.6 36.0 0.001 29.6pros-1(ok903) RB989 4,4 -35.6 -44.1 -8.5 0.03 -42.4ptr-6(ok2988) VC2301 11,13 -48.5 -52.5 -4.1 n.s. -3.3ric-8(md1909) RM2209 8,8 -34.5 -35.2 -0.7 n.s. -0.1ric-8(md303) RM1702 7,8 -39.8 -42.9 -3.2 n.s. -3.0slo-1(eg142) BZ142 38,45 -38.0 -11.4 26.6 0.001 36.8slo-1(gk60229)6x[#1] JPS429 11,14 -48.1 -32.9 15.3 0.001 22.0slo-1(gk60229)6x[#2] JPS428 12,13 -48.5 -32.7 15.8 0.001 42.8slo-1(js118) NM1630 6,11 -33.3 -16.4 17.0 0.005 16.2slo-1(js379) NM1968 39,49 -39.6 -24.8 14.8 0.001 8.2tom-1(ok188) NM1815 15,13 -40.3 -34.0 6.3 0.01 17.2tom-1(ok285) VC223 12,12 -41.3 -32.8 8.5 0.001 38.3unc-103(n500n1211) MT2633 16,16 -29.5 -32.8 -3.3 n.s. -4.2unc-13(e312) CB312 7,8 -43.7 5.9 49.7 0.011 3.5
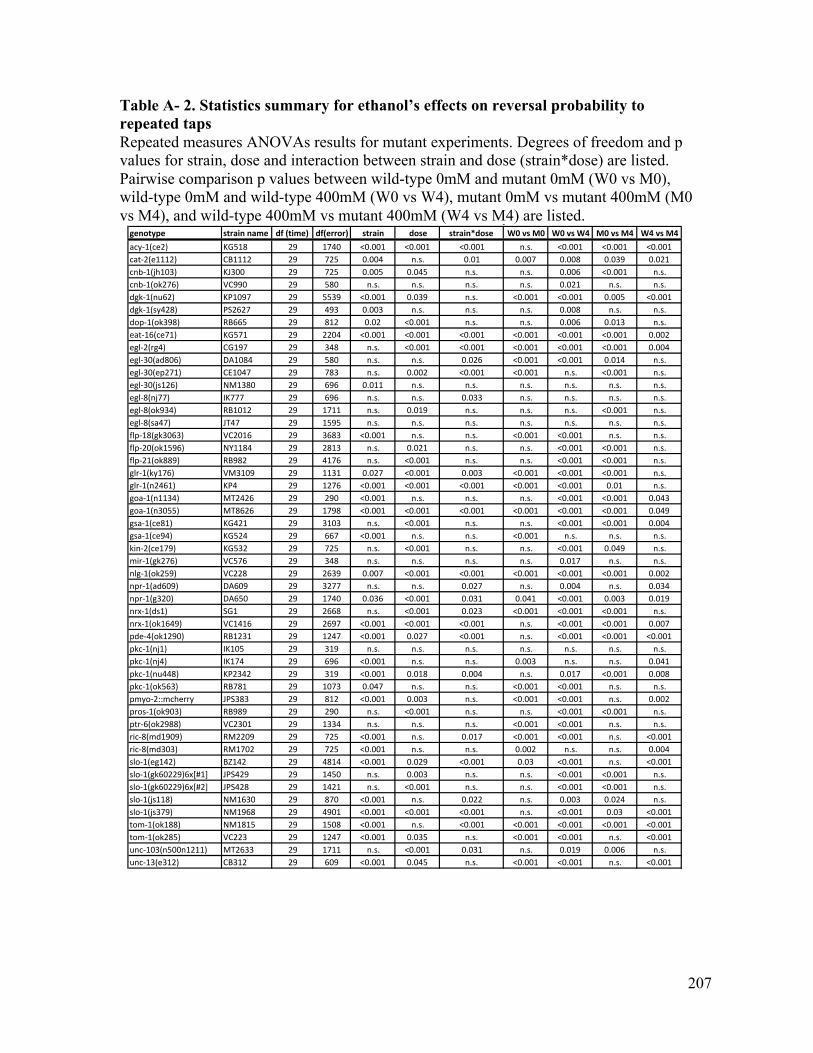
207
Table A- 2. Statistics summary for ethanol’s effects on reversal probability to repeated taps Repeated measures ANOVAs results for mutant experiments. Degrees of freedom and p values for strain, dose and interaction between strain and dose (strain*dose) are listed. Pairwise comparison p values between wild-type 0mM and mutant 0mM (W0 vs M0), wild-type 0mM and wild-type 400mM (W0 vs W4), mutant 0mM vs mutant 400mM (M0 vs M4), and wild-type 400mM vs mutant 400mM (W4 vs M4) are listed.
genotype strainname df(time) df(error) strain dose strain*dose W0vsM0 W0vsW4 M0vsM4 W4vsM4acy-1(ce2) KG518 29 1740 <0.001 <0.001 <0.001 n.s. <0.001 <0.001 <0.001cat-2(e1112) CB1112 29 725 0.004 n.s. 0.01 0.007 0.008 0.039 0.021cnb-1(jh103) KJ300 29 725 0.005 0.045 n.s. n.s. 0.006 <0.001 n.s.cnb-1(ok276) VC990 29 580 n.s. n.s. n.s. n.s. 0.021 n.s. n.s.dgk-1(nu62) KP1097 29 5539 <0.001 0.039 n.s. <0.001 <0.001 0.005 <0.001dgk-1(sy428) PS2627 29 493 0.003 n.s. n.s. n.s. 0.008 n.s. n.s.dop-1(ok398) RB665 29 812 0.02 <0.001 n.s. n.s. 0.006 0.013 n.s.eat-16(ce71) KG571 29 2204 <0.001 <0.001 <0.001 <0.001 <0.001 <0.001 0.002egl-2(rg4) CG197 29 348 n.s. <0.001 <0.001 <0.001 <0.001 <0.001 0.004egl-30(ad806) DA1084 29 580 n.s. n.s. 0.026 <0.001 <0.001 0.014 n.s.egl-30(ep271) CE1047 29 783 n.s. 0.002 <0.001 <0.001 n.s. <0.001 n.s.egl-30(js126) NM1380 29 696 0.011 n.s. n.s. n.s. n.s. n.s. n.s.egl-8(nj77) IK777 29 696 n.s. n.s. 0.033 n.s. n.s. n.s. n.s.egl-8(ok934) RB1012 29 1711 n.s. 0.019 n.s. n.s. n.s. <0.001 n.s.egl-8(sa47) JT47 29 1595 n.s. n.s. n.s. n.s. n.s. n.s. n.s.flp-18(gk3063) VC2016 29 3683 <0.001 n.s. n.s. <0.001 <0.001 n.s. n.s.flp-20(ok1596) NY1184 29 2813 n.s. 0.021 n.s. n.s. <0.001 <0.001 n.s.flp-21(ok889) RB982 29 4176 n.s. <0.001 n.s. n.s. <0.001 <0.001 n.s.glr-1(ky176) VM3109 29 1131 0.027 <0.001 0.003 <0.001 <0.001 <0.001 n.s.glr-1(n2461) KP4 29 1276 <0.001 <0.001 <0.001 <0.001 <0.001 0.01 n.s.goa-1(n1134) MT2426 29 290 <0.001 n.s. n.s. n.s. <0.001 <0.001 0.043goa-1(n3055) MT8626 29 1798 <0.001 <0.001 <0.001 <0.001 <0.001 <0.001 0.049gsa-1(ce81) KG421 29 3103 n.s. <0.001 n.s. n.s. <0.001 <0.001 0.004gsa-1(ce94) KG524 29 667 <0.001 n.s. n.s. <0.001 n.s. n.s. n.s.kin-2(ce179) KG532 29 725 n.s. <0.001 n.s. n.s. <0.001 0.049 n.s.mir-1(gk276) VC576 29 348 n.s. n.s. n.s. n.s. 0.017 n.s. n.s.nlg-1(ok259) VC228 29 2639 0.007 <0.001 <0.001 <0.001 <0.001 <0.001 0.002npr-1(ad609) DA609 29 3277 n.s. n.s. 0.027 n.s. 0.004 n.s. 0.034npr-1(g320) DA650 29 1740 0.036 <0.001 0.031 0.041 <0.001 0.003 0.019nrx-1(ds1) SG1 29 2668 n.s. <0.001 0.023 <0.001 <0.001 <0.001 n.s.nrx-1(ok1649) VC1416 29 2697 <0.001 <0.001 <0.001 n.s. <0.001 <0.001 0.007pde-4(ok1290) RB1231 29 1247 <0.001 0.027 <0.001 n.s. <0.001 <0.001 <0.001pkc-1(nj1) IK105 29 319 n.s. n.s. n.s. n.s. n.s. n.s. n.s.pkc-1(nj4) IK174 29 696 <0.001 n.s. n.s. 0.003 n.s. n.s. 0.041pkc-1(nu448) KP2342 29 319 <0.001 0.018 0.004 n.s. 0.017 <0.001 0.008pkc-1(ok563) RB781 29 1073 0.047 n.s. n.s. <0.001 <0.001 n.s. n.s.pmyo-2::mcherry JPS383 29 812 <0.001 0.003 n.s. <0.001 <0.001 n.s. 0.002pros-1(ok903) RB989 29 290 n.s. <0.001 n.s. n.s. <0.001 <0.001 n.s.ptr-6(ok2988) VC2301 29 1334 n.s. n.s. n.s. <0.001 <0.001 n.s. n.s.ric-8(md1909) RM2209 29 725 <0.001 n.s. 0.017 <0.001 <0.001 n.s. <0.001ric-8(md303) RM1702 29 725 <0.001 n.s. n.s. 0.002 n.s. n.s. 0.004slo-1(eg142) BZ142 29 4814 <0.001 0.029 <0.001 0.03 <0.001 n.s. <0.001slo-1(gk60229)6x[#1] JPS429 29 1450 n.s. 0.003 n.s. n.s. <0.001 <0.001 n.s.slo-1(gk60229)6x[#2] JPS428 29 1421 n.s. <0.001 n.s. n.s. <0.001 <0.001 n.s.slo-1(js118) NM1630 29 870 <0.001 n.s. 0.022 n.s. 0.003 0.024 n.s.slo-1(js379) NM1968 29 4901 <0.001 <0.001 <0.001 n.s. <0.001 0.03 <0.001tom-1(ok188) NM1815 29 1508 <0.001 n.s. <0.001 <0.001 <0.001 <0.001 <0.001tom-1(ok285) VC223 29 1247 <0.001 0.035 n.s. <0.001 <0.001 n.s. <0.001unc-103(n500n1211) MT2633 29 1711 n.s. <0.001 0.031 n.s. 0.019 0.006 n.s.unc-13(e312) CB312 29 609 <0.001 0.045 n.s. <0.001 <0.001 n.s. <0.001
pvalue

208
Table A- 3. Statistics summary for ethanol’s effects on acceleration probability to repeated taps Repeated measures ANOVAs results for mutant experiments. Degrees of freedom and p values for strain, dose and interaction between strain and dose (strain*dose) are listed. Pairwise comparison p values between wild-type 0mM and mutant 0mM (W0 vs M0), wild-type 0mM and wild-type 400mM (W0 vs W4), mutant 0mM vs mutant 400mM (M0 vs M4), and wild-type 400mM vs mutant 400mM (W4 vs M4) are listed.
genotype strainname df(time) df(error) strain dose strain*dose W0vsM0 W0vsW4 M0vsM4 W4vsM4acy-1(ce2) KG518 29 1740 <0.001 n.s. <0.001 <0.001 <0.001 <0.001 <0.001cat-2(e1112) CB1112 29 812 0.036 n.s. n.s. n.s. 0.002 0.024 n.s.cnb-1(jh103) KJ300 29 812 0.002 <0.001 n.s. n.s. <0.001 n.s. 0.004cnb-1(ok276) VC990 29 754 <0.001 n.s. 0.016 n.s. <0.001 0.017 <0.001dgk-1(nu62) KP1097 29 5655 <0.001 0.015 0.009 <0.001 <0.001 0.038 <0.001dgk-1(sy428) PS2627 29 551 <0.001 0.023 n.s. n.s. 0.005 n.s. n.s.dop-1(ok398) RB665 29 812 0.027 n.s. n.s. n.s. <0.001 <0.001 n.s.eat-16(ce71) KG571 29 2204 <0.001 <0.001 n.s. 0.003 <0.001 <0.001 <0.001egl-2(rg4) CG197 29 348 n.s. 0.005 n.s. n.s. <0.001 <0.001 <0.001egl-30(ad806) DA1084 29 667 <0.001 0.009 0.002 n.s. 0.004 <0.001 n.s.egl-30(ep271) CE1047 29 783 n.s. 0.031 n.s. 0.047 n.s. <0.001 n.s.egl-30(js126) NM1380 29 754 n.s. n.s. n.s. n.s. 0.003 0.038 n.s.egl-8(nj77) IK777 29 812 n.s. n.s. n.s. n.s. n.s. 0.005 n.s.egl-8(ok934) RB1012 29 1740 n.s. <0.001 n.s. n.s. <0.001 <0.001 <0.001egl-8(sa47) JT47 29 1740 n.s. <0.001 n.s. n.s. <0.001 0.002 <0.001flp-18(gk3063) VC2016 29 3973 n.s. <0.001 <0.001 <0.001 <0.001 <0.001 n.s.flp-20(ok1596) NY1184 29 3045 n.s. <0.001 n.s. n.s. <0.001 <0.001 n.s.flp-21(ok889) RB982 29 4379 n.s. <0.001 n.s. n.s. <0.001 <0.001 n.s.glr-1(ky176) VM3109 29 1160 n.s. <0.001 0.002 0.002 <0.001 <0.001 n.s.glr-1(n2461) KP4 29 1276 0.013 <0.001 n.s. <0.001 <0.001 <0.001 n.s.goa-1(n1134) MT2426 29 348 n.s. n.s. n.s. n.s. 0.002 n.s. n.s.goa-1(n3055) MT8626 29 1943 0.005 n.s. <0.001 <0.001 <0.001 <0.001 0.016gsa-1(ce81) KG421 29 3132 n.s. <0.001 n.s. n.s. <0.001 <0.001 <0.001gsa-1(ce94) KG524 29 783 0.007 n.s. n.s. <0.001 n.s. <0.001 n.s.kin-2(ce179) KG532 29 812 n.s. <0.001 n.s. n.s. <0.001 <0.001 n.s.mir-1(gk276) VC576 29 348 n.s. <0.001 n.s. n.s. <0.001 <0.001 n.s.nlg-1(ok259) VC228 29 2639 n.s. <0.001 n.s. n.s. <0.001 <0.001 n.s.npr-1(ad609) DA609 29 3422 n.s. 0.024 n.s. 0.037 <0.001 n.s. <0.001npr-1(g320) DA650 29 1740 n.s. <0.001 <0.001 n.s. <0.001 <0.001 <0.001nrx-1(ds1) SG1 29 2668 n.s. <0.001 n.s. n.s. <0.001 <0.001 0.002nrx-1(ok1649) VC1416 29 2697 <0.001 <0.001 0.031 n.s. <0.001 <0.001 <0.001pde-4(ok1290) RB1231 29 1247 0.004 n.s. <0.001 <0.001 <0.001 <0.001 <0.001pkc-1(nj1) IK105 29 348 n.s. <0.001 n.s. 0.004 <0.001 <0.001 0.005pkc-1(nj4) IK174 29 812 <0.001 0.018 <0.001 n.s. n.s. n.s. n.s.pkc-1(nu448) KP2342 29 348 0.031 <0.001 0.008 n.s. n.s. 0.015 n.s.pkc-1(ok563) RB781 29 1131 n.s. n.s. n.s. n.s. 0.011 0.005 n.s.pros-1(ok903) RB989 29 348 n.s. <0.001 n.s. n.s. <0.001 <0.001 n.s.ptr-6(ok2988) VC2301 29 1363 <0.001 n.s. <0.001 <0.001 <0.001 <0.001 0.005ric-8(md1909) RM2209 29 783 <0.001 n.s. n.s. n.s. <0.001 <0.001 n.s.ric-8(md303) RM1702 29 783 <0.001 n.s. n.s. n.s. n.s. <0.001 0.031slo-1(eg142) BZ142 29 4843 <0.001 <0.001 <0.001 0.009 <0.001 n.s. <0.001slo-1(gk60229)6x[#1] JPS429 29 1450 n.s. <0.001 n.s. 0.029 <0.001 <0.001 n.s.slo-1(gk60229)6x[#2] JPS428 29 1421 n.s. n.s. n.s. 0.042 <0.001 <0.001 n.s.slo-1(js118) NM1630 29 870 0.008 n.s. n.s. n.s. <0.001 n.s. n.s.slo-1(js379) NM1968 29 5017 n.s. 0.019 <0.001 0.004 <0.001 n.s. <0.001tom-1(ok188) NM1815 29 1566 <0.001 <0.001 <0.001 <0.001 <0.001 <0.001 n.s.tom-1(ok285) VC223 29 1247 <0.001 0.004 0.005 n.s. <0.001 n.s. <0.001unc-103(n500n1211) MT2633 29 1711 0.04 <0.001 n.s. n.s. <0.001 0.005 <0.001unc-13(e312) CB312 29 812 0.007 n.s. <0.001 n.s. <0.001 n.s. <0.001
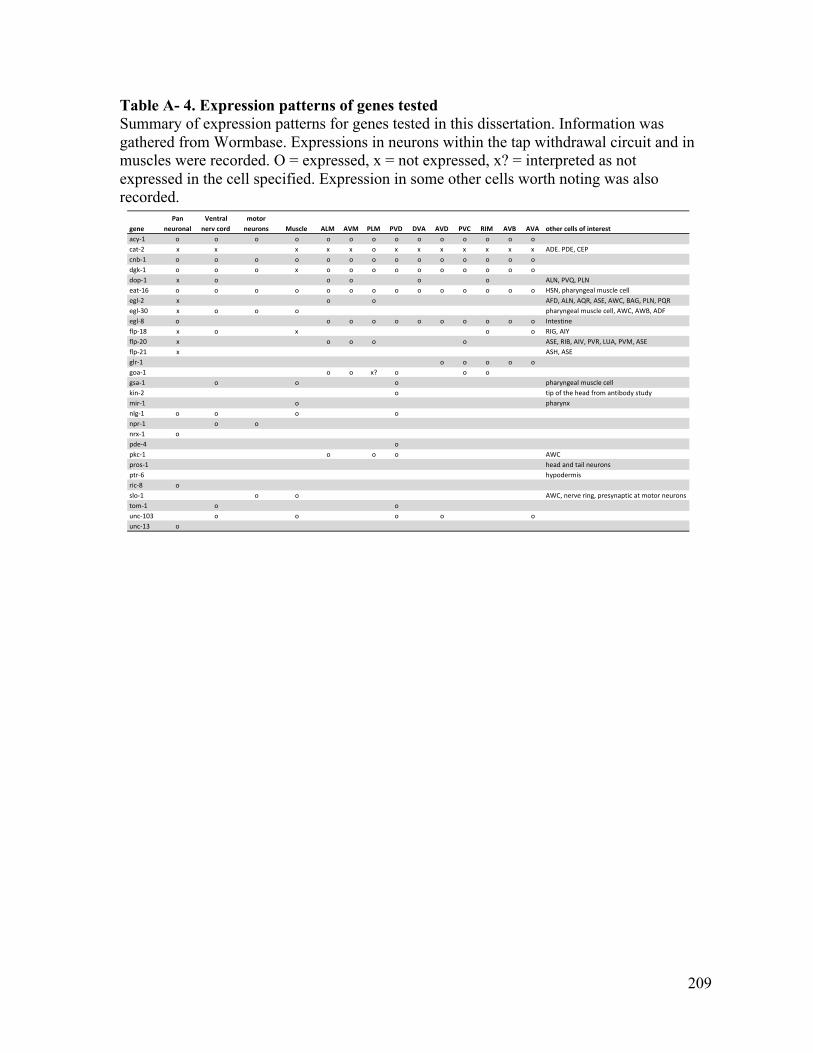
209
Table A- 4. Expression patterns of genes tested Summary of expression patterns for genes tested in this dissertation. Information was gathered from Wormbase. Expressions in neurons within the tap withdrawal circuit and in muscles were recorded. O = expressed, x = not expressed, x? = interpreted as not expressed in the cell specified. Expression in some other cells worth noting was also recorded.
genePan
neuronalVentralnervcord
motorneurons Muscle ALM AVM PLM PVD DVA AVD PVC RIM AVB AVA othercellsofinterest
acy-1 o o o o o o o o o o o o o ocat-2 x x x x x o x x x x x x x ADE.PDE,CEPcnb-1 o o o o o o o o o o o o o odgk-1 o o o x o o o o o o o o o odop-1 x o o o o o ALN,PVQ,PLNeat-16 o o o o o o o o o o o o o o HSN,pharyngealmusclecellegl-2 x o o AFD,ALN,AQR,ASE,AWC,BAG,PLN,PQRegl-30 x o o o pharyngealmusclecell,AWC,AWB,ADFegl-8 o o o o o o o o o o o Intestineflp-18 x o x o o RIG,AIYflp-20 x o o o o ASE,RIB,AIV,PVR,LUA,PVM,ASEflp-21 x ASH,ASEglr-1 o o o o ogoa-1 o o x? o o ogsa-1 o o o pharyngealmusclecellkin-2 o tipoftheheadfromantibodystudymir-1 o pharynxnlg-1 o o o onpr-1 o onrx-1 opde-4 opkc-1 o o o AWCpros-1 headandtailneuronsptr-6 hypodermisric-8 oslo-1 o o AWC,nervering,presynapticatmotorneuronstom-1 o ounc-103 o o o o ounc-13 o