mechanical, thermal and morphological behaviours of
TRANSCRIPT
Available online at www.ilcpa.pl
International Letters of Chemistry, Physics and Astronomy
4 (2013) 15-36 ISSN 2299-3843
Mechanical, Thermal and Morphological Behaviours of Polybutylene Terephthalate/Polycarbonate blend
nanocomposites
P. R. Rajakumar1, R. Nanthini2 1Department of Chemistry, Government Arts College, Chidambaram, Tamil Nadu, India
2Department of Chemistry, Pachayappa’s College, Chennai, Tamil Nadu, India
Email address: [email protected]
ABSTRACT
Polybutylene Terephthalate (PBT) / Polycarbonate (PC) nanocomposite blend was fabricated
using melt blending technique in a twin extruder. The blend composition was optimized at PBT-PC
weight ratio of 80-20. The effect of incorporation of various organically modified Montmorillonite
(OMMT) and naturally occurring sodium Montmorillonite (MMT) on the mechanical, thermal and
morphological properties of the nanocomposites blend has been investigated. It was observed that the
Izod impact strength, tensile strength and flexural strength demonstrated a significant increase with
the increase in clay loading from 1-7 weight % due to homogeneous dispersion of clay within the
blend matrix. Thermo gravimetric analysis (TGA) revealed an increase in thermal stability of the
blend with the incorporation of nanoclay. There is also decrease in the melting temperature (Tm) and
crystallisation temperature (Tc) as observed from DSC thermograms. DMA add the evidence for
TGA, DSC and mechanical results. PBT - PC blend with clay exhibited featureless XRD indicative of
exfoliated structure. TEM micrographs also confirm the same that the clay has exfoliated into
individual layers.
Keywords: -PBT, PC, TGA, DSC, DMA, XRD, TEM, Nanoclay, Untreated clay-MMT and
organically modified clay-OMMT.
1. INTRODUCTION
Blending of two or more polymers has emerged as an established route to design
tailor made polymeric materials with desired attributes for various high performance
applications1-4
. However, most of the polymer pairs are inherently immiscible that results in
incompatibility with subsequent phase separation in the blend matrix. Different approaches
such as use of compatibilising agents, copolymers, grafting agents, reactive extrusion etc.,
have been the commonly used techniques to modify the interfacial region between the blends
and increase the compatibility5, 6
.
International Letters of Chemistry, Physics and Astronomy 4 (2013) 15-36
16
More recently, PLS nanocomposites have attracted great interest both in industry and
in academic, because they often exhibit remarkable improvements in properties when
compared with virgin polymers or conventional micro and macro composites. These
improvements can include high moduli7-12
, increased strength and heat resistance13
, decreased
gas permeability14-18
and flammability19-23
and increased biodegradability of biodegradable
polymers24
. Layered silicates, with its inherent high aspect ratio ranging from 100 to 2000
offers more surface contact per unit filler within the polymer matrix resulting in enhanced
performance characteristics with a minimum loading of 3-5 % 25
.
The structures that are observed for layered silicate based nanocomposites can be
defined as either intercalated or exfoliated. An intercalated structure results when the polymer
penetrates into the galleries of the layered structure resulting in a highly ordered arrangement
of alternating clay platelet and polymer layers. An exfoliated structure is formed when the
layered silicates are delaminated. In this case individual silicate layers are completely
dispersed in the continuous polymer matrix26, 27
.
However, large improvement in the mechanical properties is observed if clay platelets
are well dispersed and exhibit an exfoliated morphology within the polymer matrix. To
achieve an exfoliated structure, it is necessary to enhance the interactions between the
polymer and filler. This can be achieved by surface treating the clay platelets.
PBT is one of the engineering plastics which have good combination of properties
such as rigidity, hardness, abrasion, solvent resistance, electrical insulation and high rates of
cyrstallisation that allow short cycle times in injection moulding28-30
.
However, PBT is strongly notch sensitive, give low notched Izod impact strength31, 32
and break in a brittle fashion when standard notched specimens are tested. Hence, PBT is
fairly resistant to crack initiation but have only modest resistance to crack propagation. The
strong notch sensitivity of PBT can be eliminated by the incorporation of impact modifiers33
such as, nanoclays or in general nanomaterials which increase the surface area which in turn
increases the mechanical properties. Thus, polymer nanocomposites, at loading levels of 2-3
% of nanomaterials exhibit enhanced mechanical properties, improved thermal properties
when compared with neat polymers or their blends34
. The cost difference between the neat
matrix and its polymer nanocomposites is about 10-15 %.
Many polymers like nylon35, 36
, polystyrene37-39
, polypropylene40-43
, polystyrene–co-
acrylonitrile44
, polyethylene–co-vinyl acetate45, 46
, EVA, PEO47
have been studied recently by
incorporating clay nanocomposites. Blends based on PC and PBT have received much
commercial attention for the last 20-30 years, especially in the automotive industry48-57
. PC is
a good engineering plastic. It has high creep resistance over a broad temperature range,
excellent toughness and dimensional stability, good impact resistance at even small thickness
and good properties retention even up to -20 C. PC has a good balance of properties which
include high modulus and strength, heat deflection temperature and toughness. However, it
has poor solvent and hydrolysis resistance. Therefore, PBT is blended with PC to improve the
chemical resistance to moulded parts. In the present work, it has been attempted to prepare
exfoliated nanocomposites with PBT/PC blend.
2. EXPERIEMENTAL
2. 1. Materials
The polymer matrix used in this research is a commercial PBT (DUPONTTM
CRASTIN®
S610SF NC010). PC was supplied by GE plastics under the trade name of
Lexan® F2000. The filler was sodium montmorillonite (MMT) unmodified clay having CEC
International Letters of Chemistry, Physics and Astronomy 4 (2013) 15-36
17
92.6 meq/100 g of clay and modified clay (cloisite ® 20A) (MMT modified by 2M2HT
dimethyl dehydrogenated Tallow, quaternary ammonium - OMMT) having CEC of 95
meq/100g of clay were obtained from M/s Southern Clay Products Inc, USA. (HT is made of
approximately 65% C18H37, 30% C16H33 and 5% C14H29). PBT was blended with PC in
different ratios like 90-10, 80-20 and 70-30. From the experimental results, 80% weight of
PBT gives better results with 20% weight of PC and it was considered as an optimized ratio.
Fillers MMT and OMMT were incorporated in the ratio of 1%, 3%, 5% and 7% by
weight with 80% PBT toughened by 20% PC.
2. 2. Preparation of Blends
Initially PBT and PC were blended without filler, to get 90-10, 80-20 and 70-30
weight ratio to establish optimized blend ratio. Based on the tensile and impact strength, the
optimized percentage of PC is 20% by weight. Then PBT/PC 80:20 blend mixture was mixed
with two different nanoclays – one untreated clay called sodium montmorillonite (MMT) and
the other is treated clay or organically modified clay called (cloisite ® 20A) (OMMT) with
different ratios such as 1%,3%,5% and 7%. 7%. PBT was dried at 100 C in an air circulated
oven for 8 hours prior to blending. The blend was prepared via melt compounding method
using twin screw extruder (Bersfort FRG Germany) at temperature range of 220 C with a
screw speed of 150 rpm. After the extrusion, the extrudate was cooled in water bath and
palletized. Finally these granules were injection molded as per ASTM using SP130 injection
molding machine (Windsor, India) having clamping force 100T fitted with dehumidifier at a
temperature range of 250-285 °C.
2. 3. Mechanical properties
The tensile tests were performed according to ASTM D 638 using SHIMADZU
AUTOGRAPH (model AG 50 RNISD MS) at room temperature of 23 1 C. The gauge
length was set as 50 mm and the cross head speed was 50mm/min.Tensile strength, tensile
modulus and elongation at break were recorded. The flexural properties of all the composites
were measured with a Lloyd instruments Ltd, LR 100 KN, UK machine according to ASTM
D 790 with a cross head rate of 2.82 mm/min. Izod impact strength was measured with a
(ATS FAAR, Italy) impact tester according to ASTM D 256, method-A with notched
samples. Five replicate specimens were used for each test and the data reported are the
average of five tests.
The density measurements are carried out for all the PBT blend nanocomposite
samples prepared as per ASTM D 1505. MFI, as per ASTM D 1238 was carried out for all
the PBT blend nanocomposite samples. As per ASTM D 257, the volume resistivity and
surface resistivity were measured for all the samples prepared. The dielectric strength
experiment was carried out as per ASTM D 149 on all the PBT blend nanocomposite
samples.
2. 4. Thermo Gravimetric Analysis (TGA)
It is commonly used to monitor polymer degradation reactions. TGA involves
monitoring weight as a function of time. The thermal stability of the samples prepared was
assessed. TGA were performed in a Perkin Elmer, USA PYRIS ITGAC under N2
atmosphere. The temperature range was 50 C to 900 C at a heating rate of 20 C/min and
corresponding weight loss was recorded.
International Letters of Chemistry, Physics and Astronomy 4 (2013) 15-36
18
2. 5. Differential Scanning Calorimetry (DSC)
The DSC scans were carried out by using a Perkin Elmer (Diamond DSC) calorimeter
in a nitrogen atmosphere. The sample was first heated from 50 C to 300 C at 10 C/min
and cooling rate was controlled at 10 C/min from 300 C to 50 C. In order to measure the
energies of melting, indium was used as standard.
2. 6. Dynamic Mechanical Analysis (DMA)
Dynamic Mechanical Analysis (DMA) was performed using Netzsch DMA 242 in
three points bending mode at frequency of 1Hz and 120 m over a temperature range of -50
C to 150 C at a heating rate of 10 C/min.
2. 7. X- Ray Diffraction Analysis (XRD)
Both for the clay and nanocomposites, XRD was recorded using Philips X’ pert MPD,
Japan make, which had a graphite monochromator and Cu K radiation source and was
operated at 40 kV and 30 mA.
2. 8. TEM Analysis
TEM analysis of the specimens was carried out using JEOL JEM 2100 HRTEM. The
HRTEM has LaB6 Filament and acceleration voltage of 200 kV. Ultra thin sections of
sample were prepared employing ULTRACUT UCT LEICA MICRO SYSTEM microtome
with a diamond knife at temperature of -60 C at N2 atmosphere.
3. RESULTS AND DISCUSSION
3. 1. Effect of loading PC on mechanical properties of PBT
The mechanical properties, among all the properties of plastic materials, are often the
most important properties because virtually all service conditions and the majority of end-use
applications involve mechanical loading58
. Impact strength is toughness as a property of
plastics probably most useful to consider59
. While it is possible to perform impact tests and to
rank a series of plastic materials, it is impossible to predict whether the material will serve
satisfactorily under the working conditions. The factors which may influence are additives,
impurities, temperature, geometry, orientation and morphology, surface condition, energy and
speed of any impacting blow, the environment and the strains due to external loads. PC was
added in small weight proportions like 10 %, 20 % and 30 % to PBT to watch out the changes
in mechanical properties of PBT.
It is evident from the Table 1 as the content of PC increases, the impact strength also
increases up to PBT-PC 80-20 weight ratio, and then for PBT-PC 70-30 weight ratio, impact
strength decreases showing that PBT-PC 80-20 weight ratio is the optimised ratio for
toughness. The increase in Izod impact strength is probably due to the PC effectively
dispersed in PBT matrix there by leading to dissipation of more impact energy.
Tensile strength increases moderately and the increase is pronounced upto PBT-PC
80-20 weight ratio after then the increase is only marginal. Flexural strength is also on
increasing trend and it is more pronounced upto PBT-PC 80-20 weight ratio. While the
increase is 17 % up to 80-20 ratio, it is only a 5 % rise for 70-30 ratio. Tensile modulus and
flexural modulus values also increase upto 80-20 ratio of PBT-PC, after which the values fall
down.
International Letters of Chemistry, Physics and Astronomy 4 (2013) 15-36
19
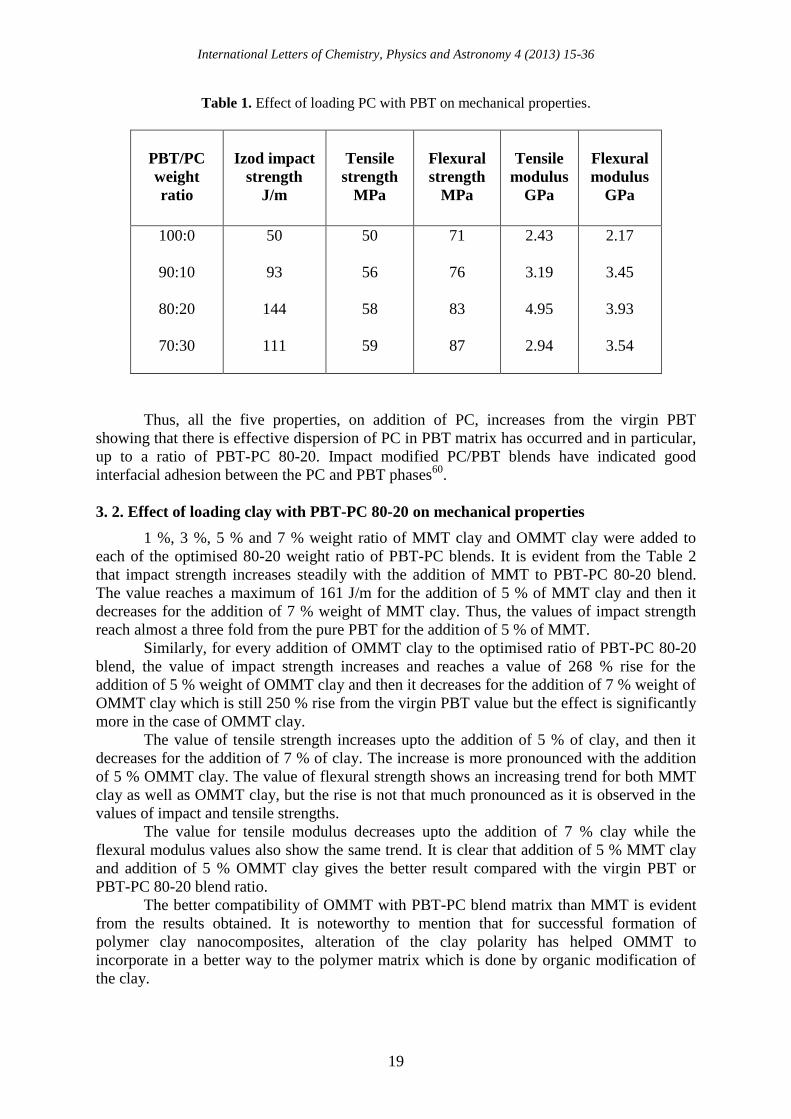
Table 1. Effect of loading PC with PBT on mechanical properties.
PBT/PC
weight
ratio
Izod impact
strength
J/m
Tensile
strength
MPa
Flexural
strength
MPa
Tensile
modulus
GPa
Flexural
modulus
GPa
100:0
90:10
80:20
70:30
50
93
144
111
50
56
58
59
71
76
83
87
2.43
3.19
4.95
2.94
2.17
3.45
3.93
3.54
Thus, all the five properties, on addition of PC, increases from the virgin PBT
showing that there is effective dispersion of PC in PBT matrix has occurred and in particular,
up to a ratio of PBT-PC 80-20. Impact modified PC/PBT blends have indicated good
interfacial adhesion between the PC and PBT phases60
.
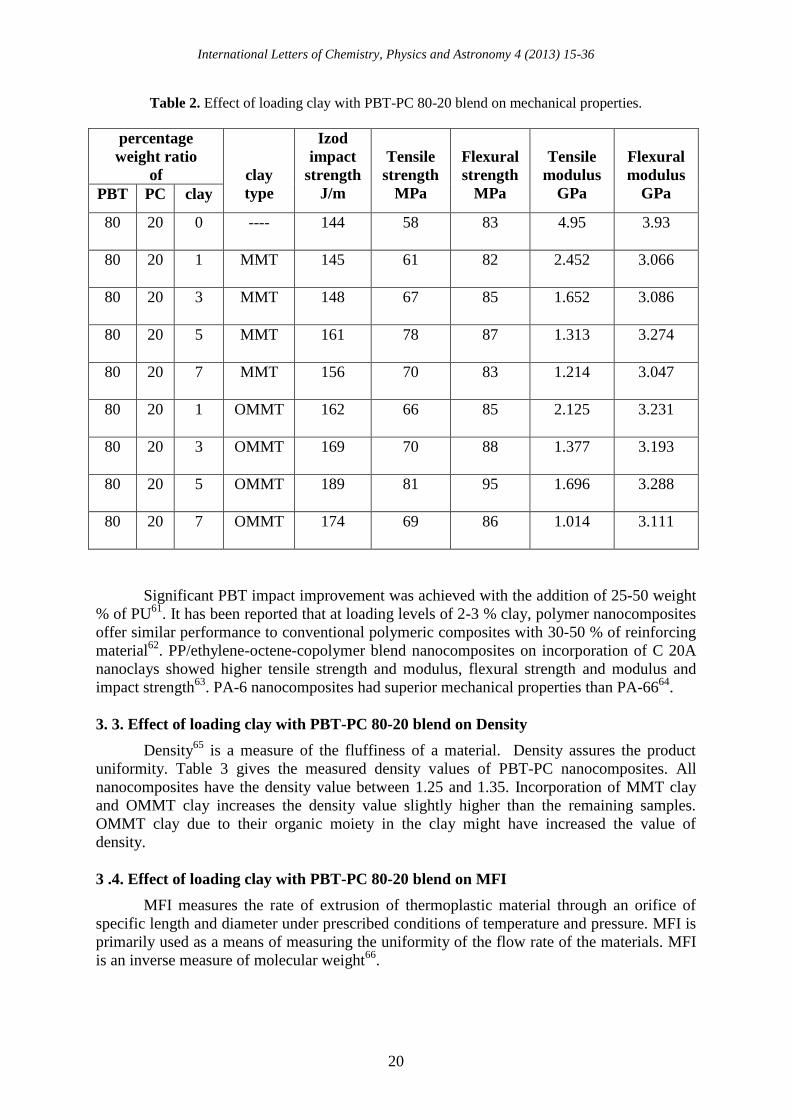
3. 2. Effect of loading clay with PBT-PC 80-20 on mechanical properties
1 %, 3 %, 5 % and 7 % weight ratio of MMT clay and OMMT clay were added to
each of the optimised 80-20 weight ratio of PBT-PC blends. It is evident from the Table 2
that impact strength increases steadily with the addition of MMT to PBT-PC 80-20 blend.
The value reaches a maximum of 161 J/m for the addition of 5 % of MMT clay and then it
decreases for the addition of 7 % weight of MMT clay. Thus, the values of impact strength
reach almost a three fold from the pure PBT for the addition of 5 % of MMT.
Similarly, for every addition of OMMT clay to the optimised ratio of PBT-PC 80-20
blend, the value of impact strength increases and reaches a value of 268 % rise for the
addition of 5 % weight of OMMT clay and then it decreases for the addition of 7 % weight of
OMMT clay which is still 250 % rise from the virgin PBT value but the effect is significantly
more in the case of OMMT clay.
The value of tensile strength increases upto the addition of 5 % of clay, and then it
decreases for the addition of 7 % of clay. The increase is more pronounced with the addition
of 5 % OMMT clay. The value of flexural strength shows an increasing trend for both MMT
clay as well as OMMT clay, but the rise is not that much pronounced as it is observed in the
values of impact and tensile strengths.
The value for tensile modulus decreases upto the addition of 7 % clay while the
flexural modulus values also show the same trend. It is clear that addition of 5 % MMT clay
and addition of 5 % OMMT clay gives the better result compared with the virgin PBT or
PBT-PC 80-20 blend ratio.
The better compatibility of OMMT with PBT-PC blend matrix than MMT is evident
from the results obtained. It is noteworthy to mention that for successful formation of
polymer clay nanocomposites, alteration of the clay polarity has helped OMMT to
incorporate in a better way to the polymer matrix which is done by organic modification of
the clay.
International Letters of Chemistry, Physics and Astronomy 4 (2013) 15-36
20
Table 2. Effect of loading clay with PBT-PC 80-20 blend on mechanical properties.
percentage
weight ratio
of
clay
type
Izod
impact
strength
J/m
Tensile
strength
MPa
Flexural
strength
MPa
Tensile
modulus
GPa
Flexural
modulus
GPa PBT PC clay
80 20 0 ---- 144 58 83 4.95 3.93
80 20 1 MMT 145 61 82 2.452 3.066
80 20 3 MMT 148 67 85 1.652 3.086
80 20 5 MMT 161 78 87 1.313 3.274
80 20 7 MMT 156 70 83 1.214 3.047
80 20 1 OMMT 162 66 85 2.125 3.231
80 20 3 OMMT 169 70 88 1.377 3.193
80 20 5 OMMT 189 81 95 1.696 3.288
80 20 7 OMMT 174 69 86 1.014 3.111
Significant PBT impact improvement was achieved with the addition of 25-50 weight
% of PU61
. It has been reported that at loading levels of 2-3 % clay, polymer nanocomposites
offer similar performance to conventional polymeric composites with 30-50 % of reinforcing
material62
. PP/ethylene-octene-copolymer blend nanocomposites on incorporation of C 20A
nanoclays showed higher tensile strength and modulus, flexural strength and modulus and
impact strength63
. PA-6 nanocomposites had superior mechanical properties than PA-6664
.
3. 3. Effect of loading clay with PBT-PC 80-20 blend on Density
Density65
is a measure of the fluffiness of a material. Density assures the product
uniformity. Table 3 gives the measured density values of PBT-PC nanocomposites. All
nanocomposites have the density value between 1.25 and 1.35. Incorporation of MMT clay
and OMMT clay increases the density value slightly higher than the remaining samples.
OMMT clay due to their organic moiety in the clay might have increased the value of
density.
3 .4. Effect of loading clay with PBT-PC 80-20 blend on MFI
MFI measures the rate of extrusion of thermoplastic material through an orifice of
specific length and diameter under prescribed conditions of temperature and pressure. MFI is
primarily used as a means of measuring the uniformity of the flow rate of the materials. MFI
is an inverse measure of molecular weight66
.
International Letters of Chemistry, Physics and Astronomy 4 (2013) 15-36
21
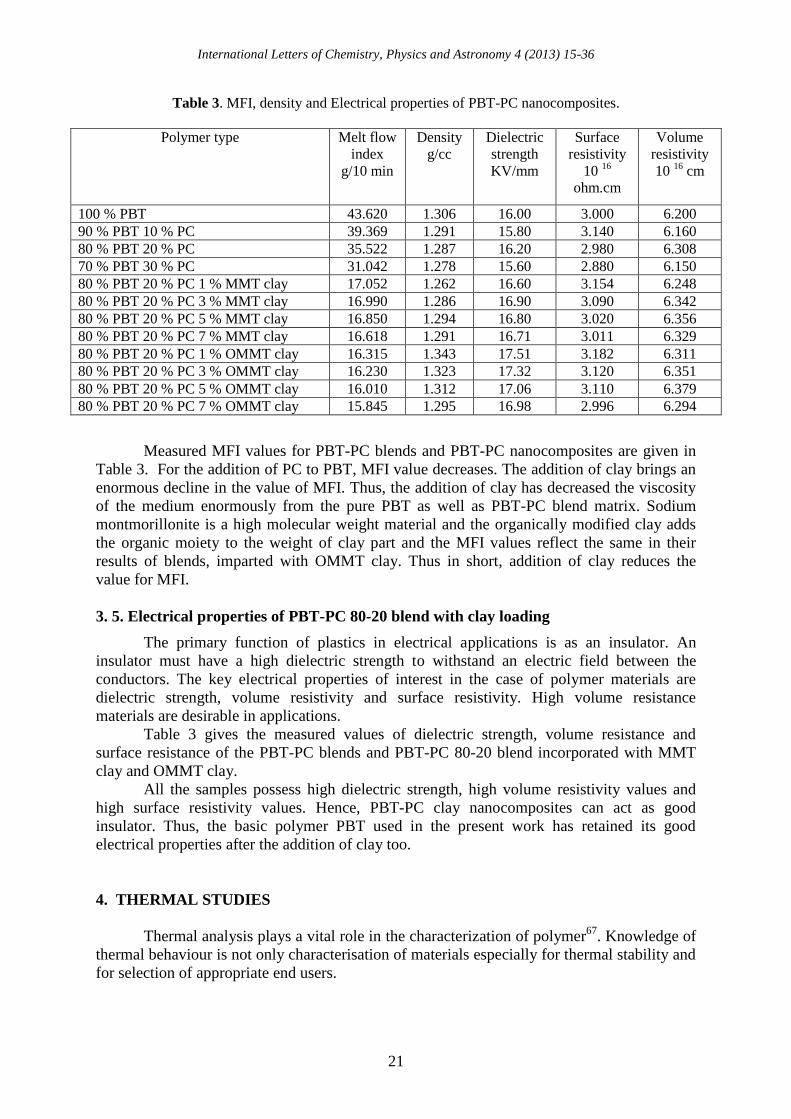
Table 3. MFI, density and Electrical properties of PBT-PC nanocomposites.
Polymer type
Melt flow
index
g/10 min
Density
g/cc
Dielectric
strength
KV/mm
Surface
resistivity
10 16
ohm.cm
Volume
resistivity
10 16
cm
100 % PBT 43.620 1.306 16.00 3.000 6.200
90 % PBT 10 % PC 39.369 1.291 15.80 3.140 6.160
80 % PBT 20 % PC 35.522 1.287 16.20 2.980 6.308
70 % PBT 30 % PC 31.042 1.278 15.60 2.880 6.150
80 % PBT 20 % PC 1 % MMT clay 17.052 1.262 16.60 3.154 6.248
80 % PBT 20 % PC 3 % MMT clay 16.990 1.286 16.90 3.090 6.342
80 % PBT 20 % PC 5 % MMT clay 16.850 1.294 16.80 3.020 6.356
80 % PBT 20 % PC 7 % MMT clay 16.618 1.291 16.71 3.011 6.329
80 % PBT 20 % PC 1 % OMMT clay 16.315 1.343 17.51 3.182 6.311
80 % PBT 20 % PC 3 % OMMT clay 16.230 1.323 17.32 3.120 6.351
80 % PBT 20 % PC 5 % OMMT clay 16.010 1.312 17.06 3.110 6.379
80 % PBT 20 % PC 7 % OMMT clay 15.845 1.295 16.98 2.996 6.294
Measured MFI values for PBT-PC blends and PBT-PC nanocomposites are given in
Table 3. For the addition of PC to PBT, MFI value decreases. The addition of clay brings an
enormous decline in the value of MFI. Thus, the addition of clay has decreased the viscosity
of the medium enormously from the pure PBT as well as PBT-PC blend matrix. Sodium
montmorillonite is a high molecular weight material and the organically modified clay adds
the organic moiety to the weight of clay part and the MFI values reflect the same in their
results of blends, imparted with OMMT clay. Thus in short, addition of clay reduces the
value for MFI.
3. 5. Electrical properties of PBT-PC 80-20 blend with clay loading
The primary function of plastics in electrical applications is as an insulator. An
insulator must have a high dielectric strength to withstand an electric field between the
conductors. The key electrical properties of interest in the case of polymer materials are
dielectric strength, volume resistivity and surface resistivity. High volume resistance
materials are desirable in applications.
Table 3 gives the measured values of dielectric strength, volume resistance and
surface resistance of the PBT-PC blends and PBT-PC 80-20 blend incorporated with MMT
clay and OMMT clay.
All the samples possess high dielectric strength, high volume resistivity values and
high surface resistivity values. Hence, PBT-PC clay nanocomposites can act as good
insulator. Thus, the basic polymer PBT used in the present work has retained its good
electrical properties after the addition of clay too.
4. THERMAL STUDIES
Thermal analysis plays a vital role in the characterization of polymer67
. Knowledge of
thermal behaviour is not only characterisation of materials especially for thermal stability and
for selection of appropriate end users.
International Letters of Chemistry, Physics and Astronomy 4 (2013) 15-36
22
4. 1. Thermo gravimetric analysis
TGA involves heating a sample to some temperature and then monitoring its weight
as a function of time. Change in weight, result from bond forming or breaking at elevated
temperatures68, 69 -75
. TGA is commonly used to monitor polymer degradation reactions.
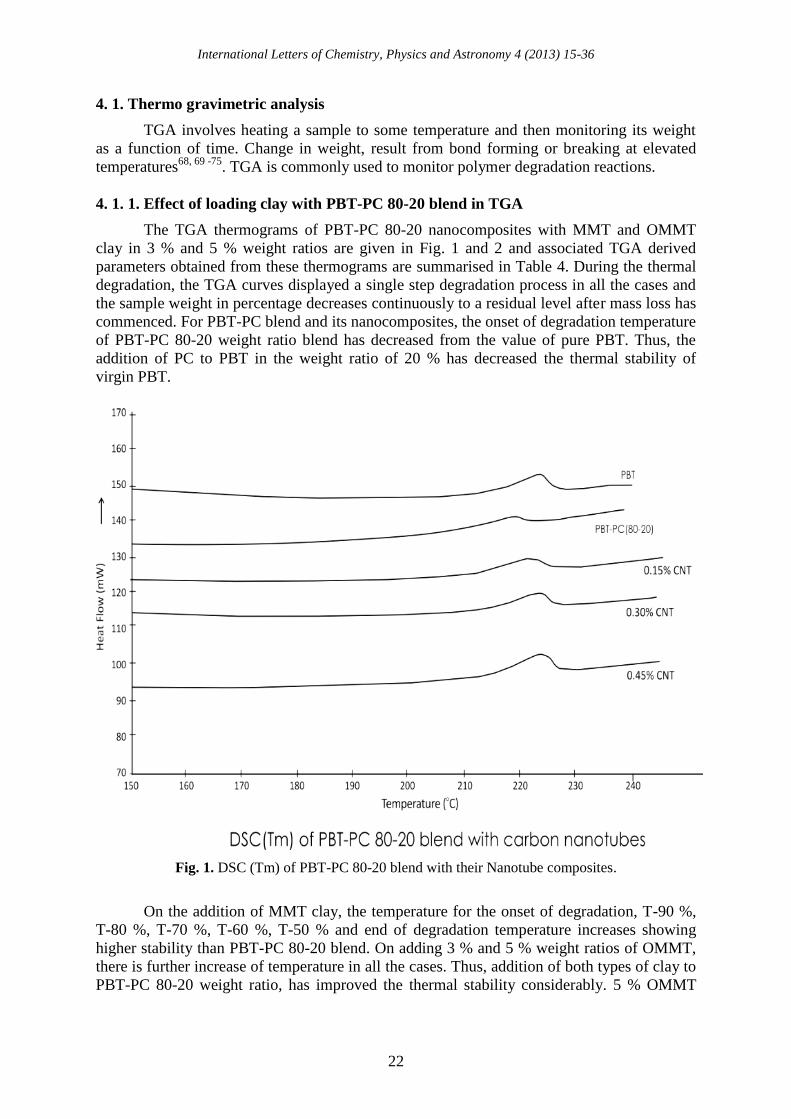
4. 1. 1. Effect of loading clay with PBT-PC 80-20 blend in TGA
The TGA thermograms of PBT-PC 80-20 nanocomposites with MMT and OMMT
clay in 3 % and 5 % weight ratios are given in Fig. 1 and 2 and associated TGA derived
parameters obtained from these thermograms are summarised in Table 4. During the thermal
degradation, the TGA curves displayed a single step degradation process in all the cases and
the sample weight in percentage decreases continuously to a residual level after mass loss has
commenced. For PBT-PC blend and its nanocomposites, the onset of degradation temperature
of PBT-PC 80-20 weight ratio blend has decreased from the value of pure PBT. Thus, the
addition of PC to PBT in the weight ratio of 20 % has decreased the thermal stability of
virgin PBT.
Fig. 1. DSC (Tm) of PBT-PC 80-20 blend with their Nanotube composites.
On the addition of MMT clay, the temperature for the onset of degradation, T-90 %,
T-80 %, T-70 %, T-60 %, T-50 % and end of degradation temperature increases showing
higher stability than PBT-PC 80-20 blend. On adding 3 % and 5 % weight ratios of OMMT,
there is further increase of temperature in all the cases. Thus, addition of both types of clay to
PBT-PC 80-20 weight ratio, has improved the thermal stability considerably. 5 % OMMT
International Letters of Chemistry, Physics and Astronomy 4 (2013) 15-36
23
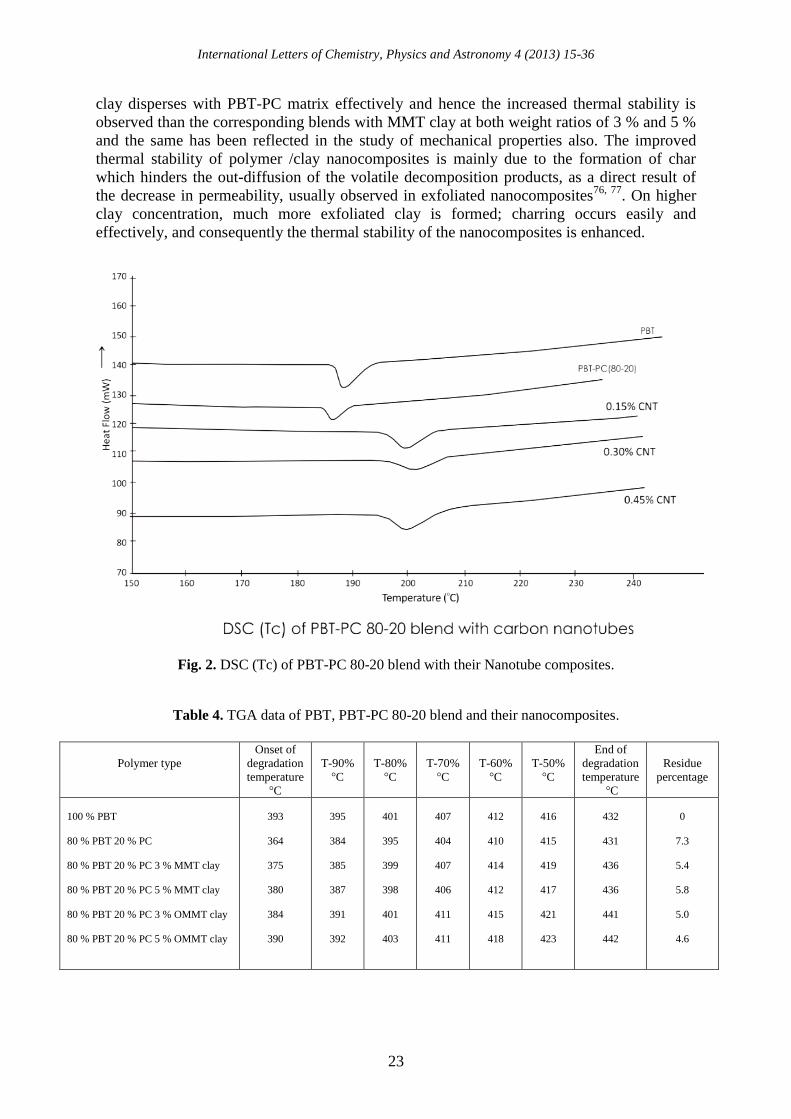
clay disperses with PBT-PC matrix effectively and hence the increased thermal stability is
observed than the corresponding blends with MMT clay at both weight ratios of 3 % and 5 %
and the same has been reflected in the study of mechanical properties also. The improved
thermal stability of polymer /clay nanocomposites is mainly due to the formation of char
which hinders the out-diffusion of the volatile decomposition products, as a direct result of
the decrease in permeability, usually observed in exfoliated nanocomposites76, 77
. On higher
clay concentration, much more exfoliated clay is formed; charring occurs easily and
effectively, and consequently the thermal stability of the nanocomposites is enhanced.
Fig. 2. DSC (Tc) of PBT-PC 80-20 blend with their Nanotube composites.
Table 4. TGA data of PBT, PBT-PC 80-20 blend and their nanocomposites.
Polymer type
Onset of
degradation
temperature
°C
T-90%
°C
T-80%
°C
T-70%
°C
T-60%
°C
T-50%
°C
End of
degradation
temperature
°C
Residue
percentage
100 % PBT
80 % PBT 20 % PC
80 % PBT 20 % PC 3 % MMT clay
80 % PBT 20 % PC 5 % MMT clay
80 % PBT 20 % PC 3 % OMMT clay
80 % PBT 20 % PC 5 % OMMT clay
393
364
375
380
384
390
395
384
385
387
391
392
401
395
399
398
401
403
407
404
407
406
411
411
412
410
414
412
415
418
416
415
419
417
421
423
432
431
436
436
441
442
0
7.3
5.4
5.8
5.0
4.6

International Letters of Chemistry, Physics and Astronomy 4 (2013) 15-36
24
4. 2. Differential scanning calorimetry
DSC is one of the most important tools used to investigate the thermal properties of
the polymers. Melting temperature Tm, crystalline temperature Tc, enthalpy of melting Hm
and percentage of crystallinity Xc has been detected from DSC thermograms.
4. 2. 1. Effect of loading clay with PBT-PC 80-20 blend
Percentage of crystallinity, Xc was calculated, taking into consideration that 100 %
PBT has a heat of fusion value of 142 J/g78
.
It is evident from Fig. 3 and 4 that the DSC thermograms of the virgin matrices, blend
matrices as well as the blend nanocomposite systems depicted single melting endotherms at a
relatively constant melting temperature of about 220 C. From the Table 5, it is observed that
the Tm of pure PBT is the highest and on the addition of 20 % PC to pure PBT, the Tm
decreases. For clay nanocomposites, Tm is lower than the pure PBT. The nanocomposites do
not show much variation in their Tm.
Pure PBT exhibits Tc at 188 C. The PBT-PC 80-20 blend and all its nanocomposites
show their Tc values lower than that of pure PBT. Thus, the addition of clay decreases both
Tm and Tc.
Out of the two clays, OMMT clay brings about more effective decrease in Tm and Tc
than MMT clay. Addition of MMT clay enhances the crystallinity. The enhancement of
crystallinity is more on adding OMMT when compared to MMT. A lower Tc implies slower
crystallisation rate, which is attributed to the clay acting as the compatibilisers. The stronger
interactions between the clay and PBT-PC matrix restricted the movements of chain
segments, thus decelerating the rate of crystallisation.
Fig. 3. DSC (Tm) of PBT-PC 80-20 blend with their nanocomposites.
International Letters of Chemistry, Physics and Astronomy 4 (2013) 15-36
25
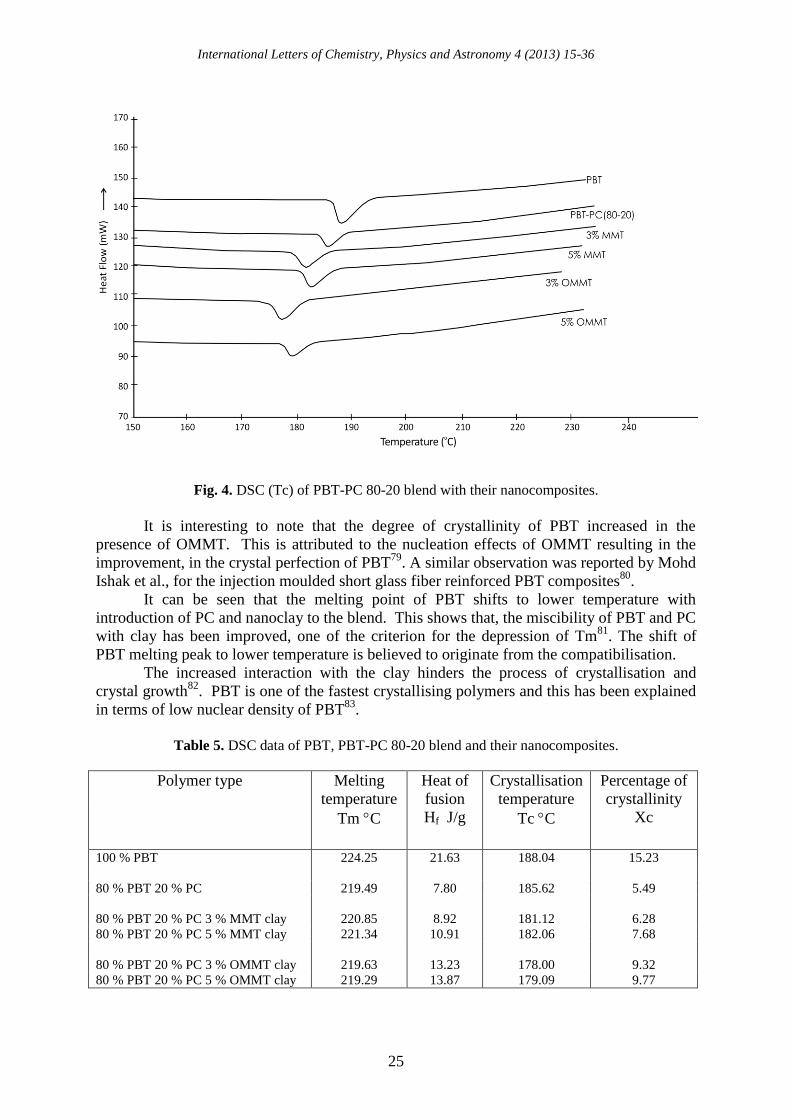
Fig. 4. DSC (Tc) of PBT-PC 80-20 blend with their nanocomposites.
It is interesting to note that the degree of crystallinity of PBT increased in the
presence of OMMT. This is attributed to the nucleation effects of OMMT resulting in the
improvement, in the crystal perfection of PBT79
. A similar observation was reported by Mohd
Ishak et al., for the injection moulded short glass fiber reinforced PBT composites80
.
It can be seen that the melting point of PBT shifts to lower temperature with
introduction of PC and nanoclay to the blend. This shows that, the miscibility of PBT and PC
with clay has been improved, one of the criterion for the depression of Tm81
. The shift of
PBT melting peak to lower temperature is believed to originate from the compatibilisation.
The increased interaction with the clay hinders the process of crystallisation and
crystal growth82
. PBT is one of the fastest crystallising polymers and this has been explained
in terms of low nuclear density of PBT83
.
Table 5. DSC data of PBT, PBT-PC 80-20 blend and their nanocomposites.
Polymer type Melting
temperature
Heat of
fusion
Crystallisation
temperature
Percentage of
crystallinity
Xc Tm C Hf J/g Tc C
100 % PBT 224.25 21.63 188.04 15.23
80 % PBT 20 % PC 219.49 7.80 185.62 5.49
80 % PBT 20 % PC 3 % MMT clay 220.85 8.92 181.12 6.28
80 % PBT 20 % PC 5 % MMT clay 221.34 10.91 182.06 7.68
80 % PBT 20 % PC 3 % OMMT clay 219.63 13.23 178.00 9.32
80 % PBT 20 % PC 5 % OMMT clay 219.29 13.87 179.09 9.77
International Letters of Chemistry, Physics and Astronomy 4 (2013) 15-36
26
With the incorporation of OMMT nanoclays, there was a considerable increase in the
Xc of the blend matrix, which indicates that the clay particles act as a nucleating agent in
crystallisation process of the PBT matrix there by increasing the crystallinity content. Similar
observations have also been reported84
where in the effect of organo clay on PP/organo
clay/elastomer ternary blends has been investigated.
4. 3. Dynamic mechanical analysis, DMA
DMA has emerged out as one of the most powerful tools available for the study of the
behaviour of plastic materials. DMA gives the fundamental aspects of morphological
structure of polymer.
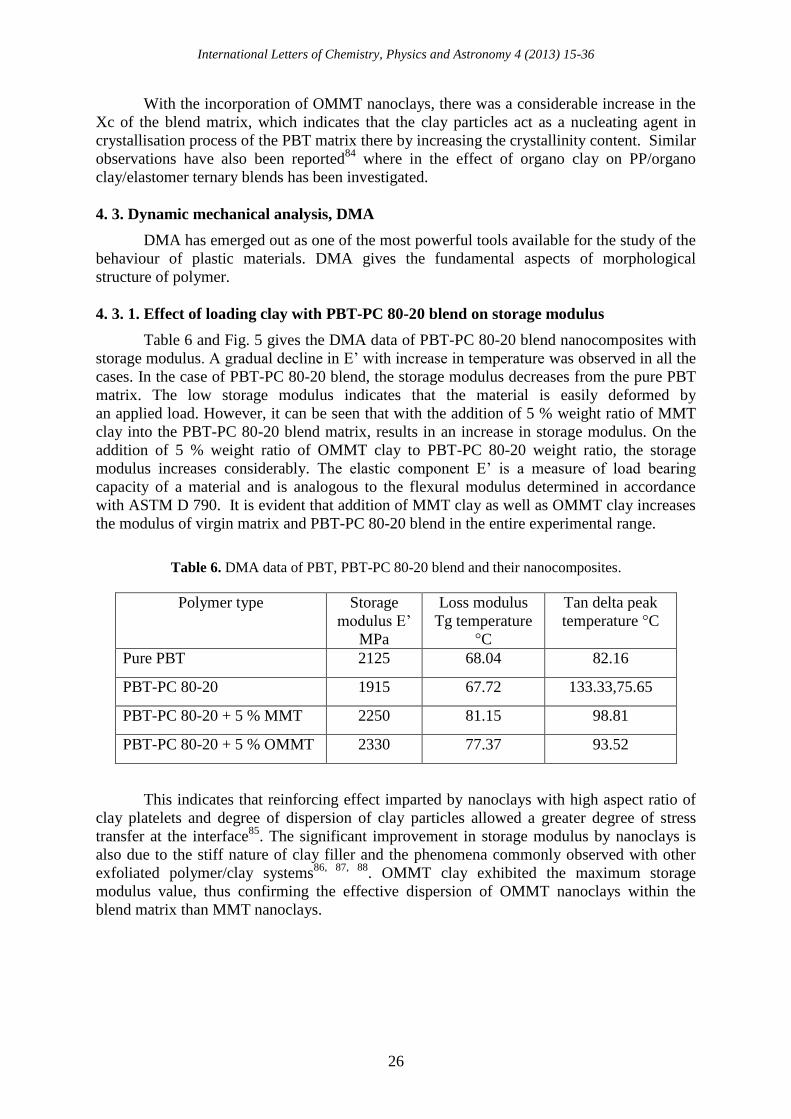
4. 3. 1. Effect of loading clay with PBT-PC 80-20 blend on storage modulus
Table 6 and Fig. 5 gives the DMA data of PBT-PC 80-20 blend nanocomposites with
storage modulus. A gradual decline in E’ with increase in temperature was observed in all the
cases. In the case of PBT-PC 80-20 blend, the storage modulus decreases from the pure PBT
matrix. The low storage modulus indicates that the material is easily deformed by
an applied load. However, it can be seen that with the addition of 5 % weight ratio of MMT
clay into the PBT-PC 80-20 blend matrix, results in an increase in storage modulus. On the
addition of 5 % weight ratio of OMMT clay to PBT-PC 80-20 weight ratio, the storage
modulus increases considerably. The elastic component E’ is a measure of load bearing
capacity of a material and is analogous to the flexural modulus determined in accordance
with ASTM D 790. It is evident that addition of MMT clay as well as OMMT clay increases
the modulus of virgin matrix and PBT-PC 80-20 blend in the entire experimental range.
Table 6. DMA data of PBT, PBT-PC 80-20 blend and their nanocomposites.
Polymer type Storage
modulus E’
MPa
Loss modulus
Tg temperature
°C
Tan delta peak
temperature °C
Pure PBT 2125 68.04 82.16
PBT-PC 80-20 1915 67.72 133.33,75.65
PBT-PC 80-20 + 5 % MMT 2250 81.15 98.81
PBT-PC 80-20 + 5 % OMMT 2330 77.37 93.52
This indicates that reinforcing effect imparted by nanoclays with high aspect ratio of
clay platelets and degree of dispersion of clay particles allowed a greater degree of stress
transfer at the interface85
. The significant improvement in storage modulus by nanoclays is
also due to the stiff nature of clay filler and the phenomena commonly observed with other
exfoliated polymer/clay systems86, 87, 88
. OMMT clay exhibited the maximum storage
modulus value, thus confirming the effective dispersion of OMMT nanoclays within the
blend matrix than MMT nanoclays.

International Letters of Chemistry, Physics and Astronomy 4 (2013) 15-36
27
Fig. 5. DMA of PBT, PBT - PC 80-20 and their clay nanocomposites.
4. 3. 2. Effect of loading clay with PBT-PC 80-20 blend on loss modulus
When blending two polymers, the resulting blend may form a single or multiphase
mixture. For a miscible system, only one Tg is observed and it is generally between the Tg’s
of the pure components. A partially miscible system exhibits two Tg’s that are slightly shifted
from that of the neat components. An immiscible system also exhibits two Tg’s but exactly
that of the neat components.
The peak of the loss modulus is conventionally identified as the Tg, even though the
DMA plot clearly shows that the transition is a process that spans a temperature range. The
loss modulus provides the best agreement with determinations made by other thermal
analysis methods and ASTM has recently codified this into D-4065.
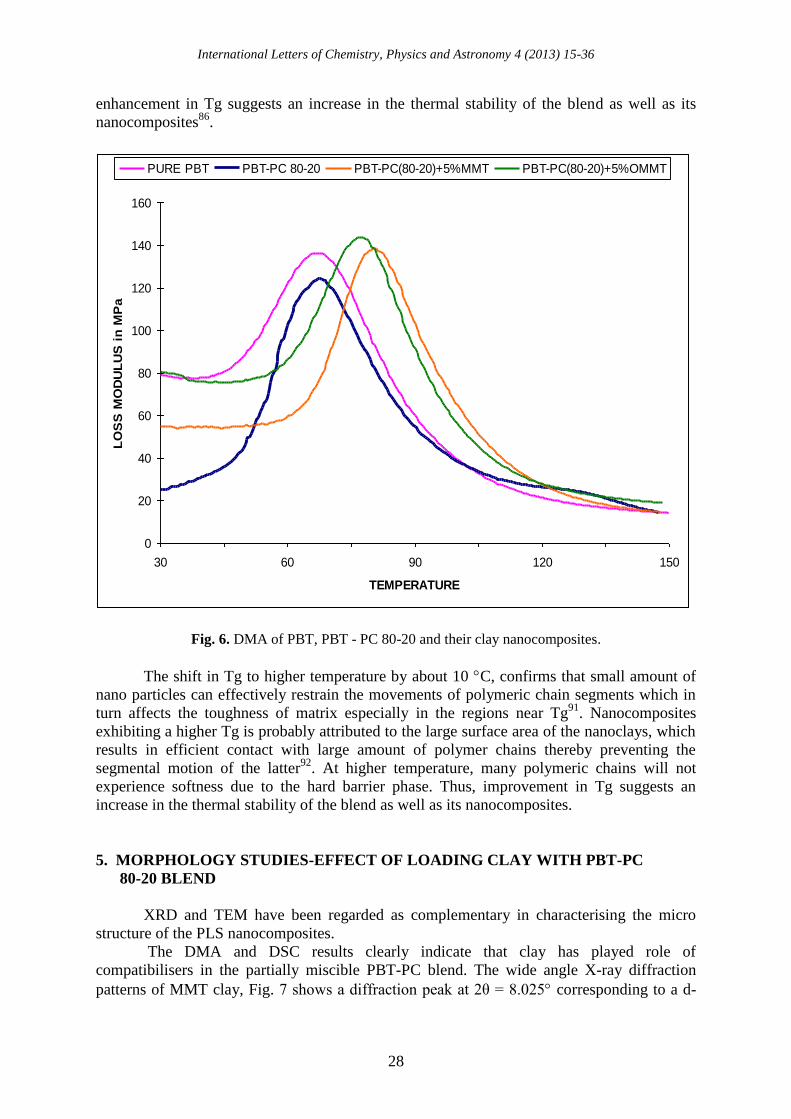
The loss modulus curves of pure PBT, PBT-PC 80-20 blend and the nanocomposites
are illustrated in Fig. 6 exhibits only one relaxation peak in each but PBT-PC 80-20 E” curve
shows two relaxation peaks. Thus, PBT-PC is partially miscible but the miscibility is
improved on the addition of clay. A single Tg in the DMA of the clay incorporated nano
composites confirms that clay acts as compatibiliser.
The addition of 20 % PC in weight ratio lowers the Tg value marginally but addition
of clay increases the Tg considerably. The increase in storage modulus and Tg values due to
clay particles could be attributed to the hindrance of macro molecular mobility of polymer
chains caused by the well dispersed MMT clay and OMMT clay silicate layers in the PBT-
PC matrix as proven in other polymer/clay systems89, 90
. Nayak et al., have reported that the
0
500
1000
1500
2000
2500
30 60 90 120 150
TEMPERATURE
ST
OR
AG
E M
OD
UL
US
E
' IN
MP
aPURE PBT PBT-PC 80-20 PBT-PC(80-20)+5%MMT PBT-PC(80-20)+5%OMMT
International Letters of Chemistry, Physics and Astronomy 4 (2013) 15-36
28
enhancement in Tg suggests an increase in the thermal stability of the blend as well as its
nanocomposites86
.
Fig. 6. DMA of PBT, PBT - PC 80-20 and their clay nanocomposites.
The shift in Tg to higher temperature by about 10 C, confirms that small amount of
nano particles can effectively restrain the movements of polymeric chain segments which in
turn affects the toughness of matrix especially in the regions near Tg91
. Nanocomposites
exhibiting a higher Tg is probably attributed to the large surface area of the nanoclays, which
results in efficient contact with large amount of polymer chains thereby preventing the
segmental motion of the latter92
. At higher temperature, many polymeric chains will not
experience softness due to the hard barrier phase. Thus, improvement in Tg suggests an
increase in the thermal stability of the blend as well as its nanocomposites.
5. MORPHOLOGY STUDIES-EFFECT OF LOADING CLAY WITH PBT-PC
80-20 BLEND
XRD and TEM have been regarded as complementary in characterising the micro
structure of the PLS nanocomposites.
The DMA and DSC results clearly indicate that clay has played role of
compatibilisers in the partially miscible PBT-PC blend. The wide angle X-ray diffraction
patterns of MMT clay, Fig. 7 shows a diffraction peak at 2θ = 8.025 corresponding to a d-
0
20
40
60
80
100
120
140
160
30 60 90 120 150
TEMPERATURE
LO
SS
MO
DU
LU
S i
n M
Pa
PURE PBT PBT-PC 80-20 PBT-PC(80-20)+5%MMT PBT-PC(80-20)+5%OMMT
International Letters of Chemistry, Physics and Astronomy 4 (2013) 15-36
29
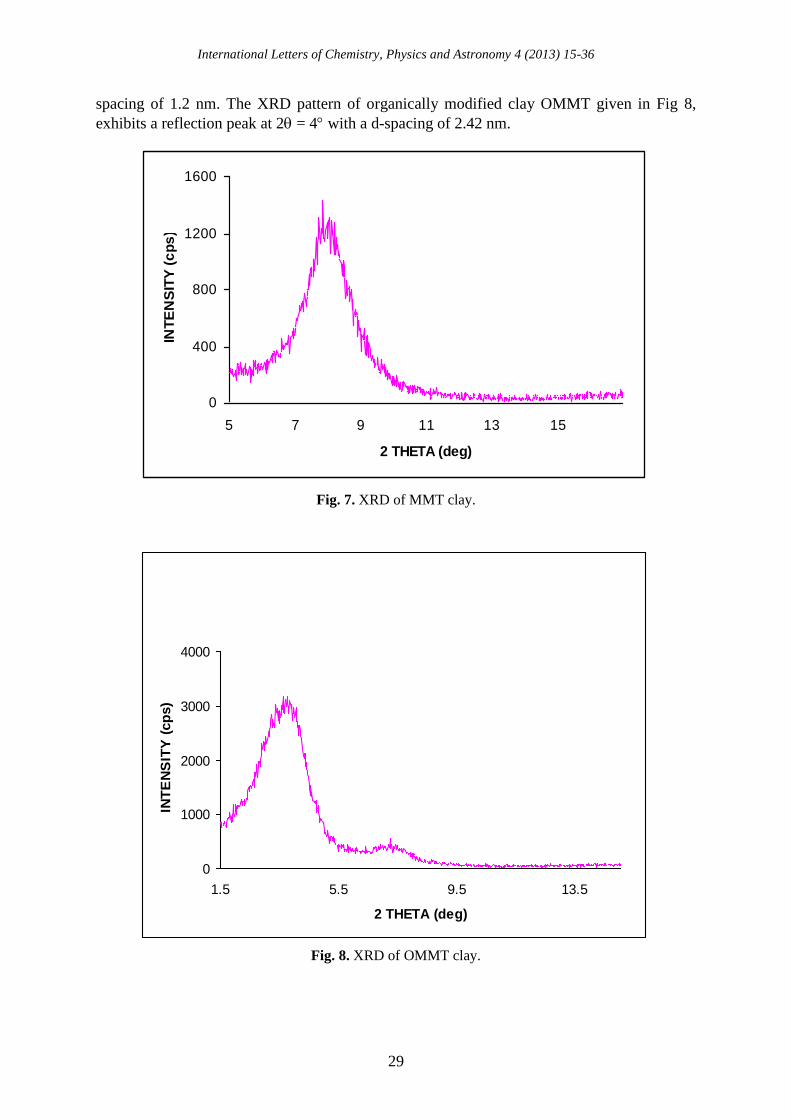
spacing of 1.2 nm. The XRD pattern of organically modified clay OMMT given in Fig 8,
exhibits a reflection peak at 2 = 4 with a d-spacing of 2.42 nm.
Fig. 7. XRD of MMT clay.
Fig. 8. XRD of OMMT clay.
0
400
800
1200
1600
5 7 9 11 13 15
2 THETA (deg)
INT
EN
SIT
Y (
cp
s)
0
1000
2000
3000
4000
1.5 5.5 9.5 13.5
2 THETA (deg)
INT
EN
SIT
Y (
cp
s)
International Letters of Chemistry, Physics and Astronomy 4 (2013) 15-36
30
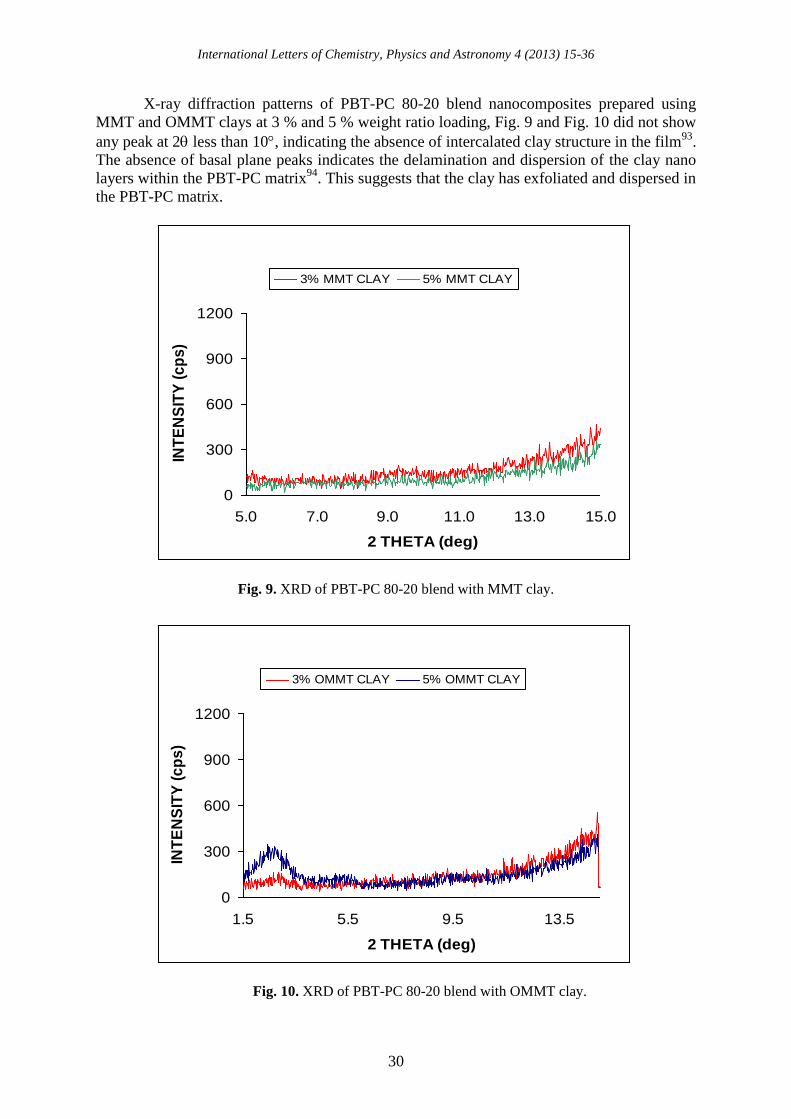
X-ray diffraction patterns of PBT-PC 80-20 blend nanocomposites prepared using
MMT and OMMT clays at 3 % and 5 % weight ratio loading, Fig. 9 and Fig. 10 did not show
any peak at 2 less than 10, indicating the absence of intercalated clay structure in the film93
.
The absence of basal plane peaks indicates the delamination and dispersion of the clay nano
layers within the PBT-PC matrix94
. This suggests that the clay has exfoliated and dispersed in
the PBT-PC matrix.
Fig. 9. XRD of PBT-PC 80-20 blend with MMT clay.
Fig. 10. XRD of PBT-PC 80-20 blend with OMMT clay.
0
300
600
900
1200
5.0 7.0 9.0 11.0 13.0 15.0
2 THETA (deg)
INT
EN
SIT
Y (
cp
s)
3% MMT CLAY 5% MMT CLAY
0
300
600
900
1200
1.5 5.5 9.5 13.5
2 THETA (deg)
INT
EN
SIT
Y (
cp
s)
3% OMMT CLAY 5% OMMT CLAY
International Letters of Chemistry, Physics and Astronomy 4 (2013) 15-36
31
It should be noted that a few completely exfoliated PLS nanocomposites exhibit no
peak, but instead display a gradual increase in the diffraction intensity towards low
diffraction angles95, 96
, this is not always the case, however. In fact, it was extensively
reported that some PLS nanocomposites show featureless XRD patterns when they exhibit
exfoliated or delaminated structures97-102
. Vain et al., 103
and Galgali et al., 104
also observed
featureless XRD patterns even for partially exfoliated nano structures.
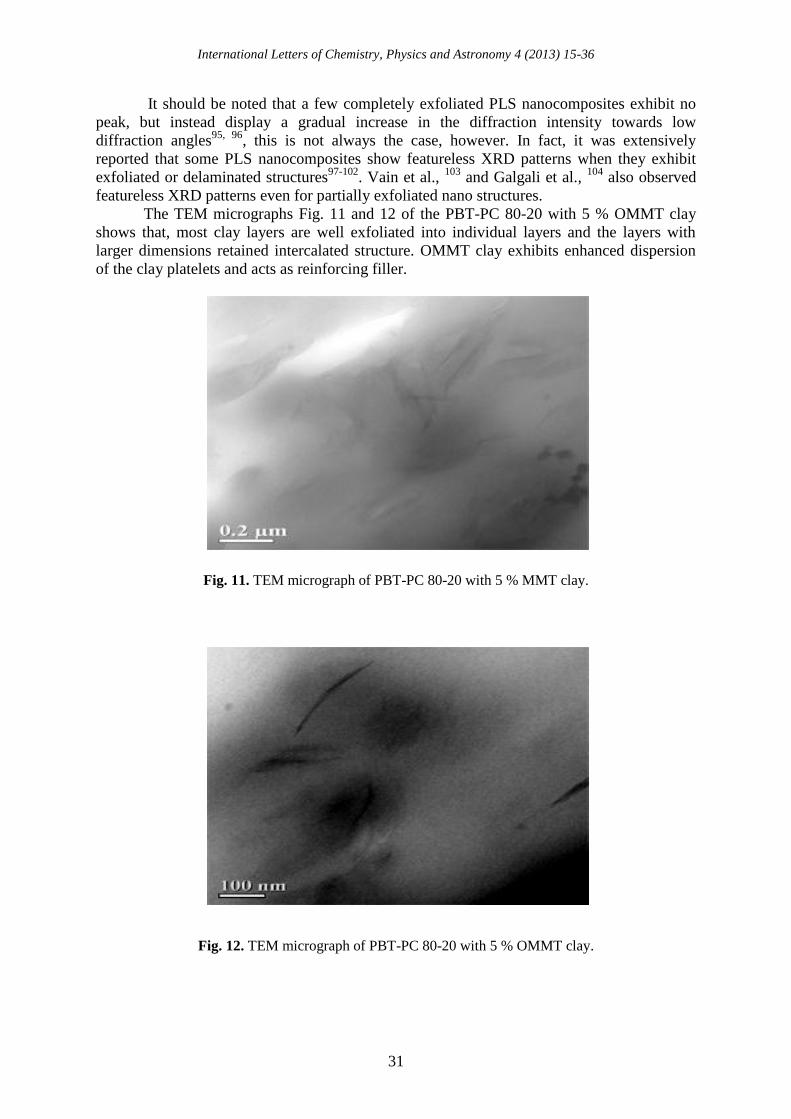
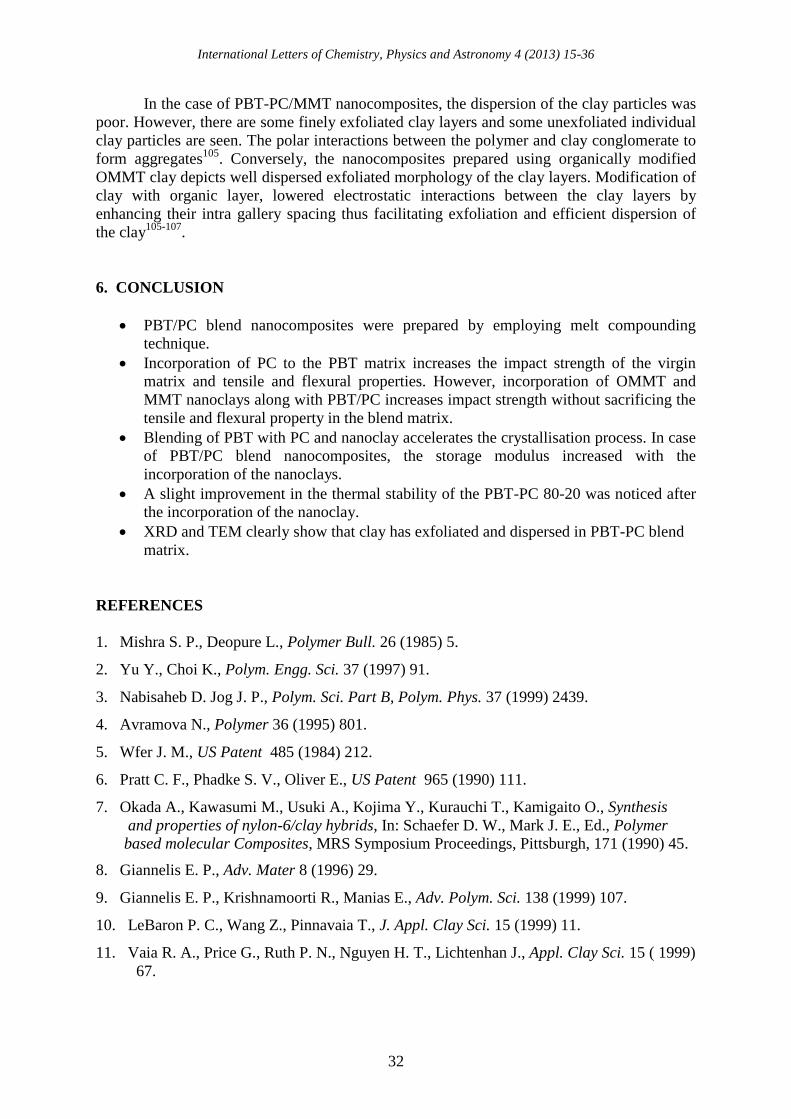
The TEM micrographs Fig. 11 and 12 of the PBT-PC 80-20 with 5 % OMMT clay
shows that, most clay layers are well exfoliated into individual layers and the layers with
larger dimensions retained intercalated structure. OMMT clay exhibits enhanced dispersion
of the clay platelets and acts as reinforcing filler.
Fig. 11. TEM micrograph of PBT-PC 80-20 with 5 % MMT clay.
Fig. 12. TEM micrograph of PBT-PC 80-20 with 5 % OMMT clay.
International Letters of Chemistry, Physics and Astronomy 4 (2013) 15-36
32
In the case of PBT-PC/MMT nanocomposites, the dispersion of the clay particles was
poor. However, there are some finely exfoliated clay layers and some unexfoliated individual
clay particles are seen. The polar interactions between the polymer and clay conglomerate to
form aggregates105
. Conversely, the nanocomposites prepared using organically modified
OMMT clay depicts well dispersed exfoliated morphology of the clay layers. Modification of
clay with organic layer, lowered electrostatic interactions between the clay layers by
enhancing their intra gallery spacing thus facilitating exfoliation and efficient dispersion of
the clay105-107
.
6. CONCLUSION
PBT/PC blend nanocomposites were prepared by employing melt compounding
technique.
Incorporation of PC to the PBT matrix increases the impact strength of the virgin
matrix and tensile and flexural properties. However, incorporation of OMMT and
MMT nanoclays along with PBT/PC increases impact strength without sacrificing the
tensile and flexural property in the blend matrix.
Blending of PBT with PC and nanoclay accelerates the crystallisation process. In case
of PBT/PC blend nanocomposites, the storage modulus increased with the
incorporation of the nanoclays.
A slight improvement in the thermal stability of the PBT-PC 80-20 was noticed after
the incorporation of the nanoclay.
XRD and TEM clearly show that clay has exfoliated and dispersed in PBT-PC blend
matrix.
REFERENCES
1. Mishra S. P., Deopure L., Polymer Bull. 26 (1985) 5.
2. Yu Y., Choi K., Polym. Engg. Sci. 37 (1997) 91.
3. Nabisaheb D. Jog J. P., Polym. Sci. Part B, Polym. Phys. 37 (1999) 2439.
4. Avramova N., Polymer 36 (1995) 801.
5. Wfer J. M., US Patent 485 (1984) 212.
6. Pratt C. F., Phadke S. V., Oliver E., US Patent 965 (1990) 111.
7. Okada A., Kawasumi M., Usuki A., Kojima Y., Kurauchi T., Kamigaito O., Synthesis
and properties of nylon-6/clay hybrids, In: Schaefer D. W., Mark J. E., Ed., Polymer
based molecular Composites, MRS Symposium Proceedings, Pittsburgh, 171 (1990) 45.
8. Giannelis E. P., Adv. Mater 8 (1996) 29.
9. Giannelis E. P., Krishnamoorti R., Manias E., Adv. Polym. Sci. 138 (1999) 107.
10. LeBaron P. C., Wang Z., Pinnavaia T., J. Appl. Clay Sci. 15 (1999) 11.
11. Vaia R. A., Price G., Ruth P. N., Nguyen H. T., Lichtenhan J., Appl. Clay Sci. 15 ( 1999)
67.
International Letters of Chemistry, Physics and Astronomy 4 (2013) 15-36
33
12. Biswas M., Sinha Ray S., Adv. Polym. Sci. 155 (2001) 167.
13. Giannelis E. P., Appl. Organomet Chem. 12 (1998) 675.
14. Xu R., Manias E., Snyder A. J., Runt J., Macromolecules 34 (2001) 337.
15. Bharadwaj R. K., Macromolecules 34 (2001) 1989.
16. Messersmith P. B., Giannelis E., J. Polym Sci., Part A: Polym. Chem. 33 (1995) 1047.
17. Yano K., Usuki A., Okada A., Kurauchi T., Kamigaito O., J Polym Sci., Part A:
Polym Chem. 31 (1993) 2493.
18. Kojima Y., Usuki A., Kawasumi M., Fukushima Y., Okada A., Kurauchi T.,
Kamigaito O., J. Mater Res. 8 (1993) 1179.
19. Gilman J. W., Kashiwagi T., Lichtenhan J. D., SAMPE J. 33 (1997) 40.
20. Gilman J. W., Appl. Clay Sci. 15 (1999) 31.
21. Dabrowski F., Bras M. Le, Bourbigot S., Gilman J. W., Kashiwagi T., Proceedings
of the Eurofillers’ 99, Lyon-Villeurbanne, France, September 1999.
22. Bourbigot S., LeBras M., Dabrowski F., Gilman J. W., Kashiwagi T., Fire Mater.
24 (2000) 201.
23. Gilman J. W., Jackson C. L., Morgan A. B., Harris Jr. R., Manias E., Giannelis E. P.,
Wuthenow M., Hilton D., Phillips S. H., Chem. Mater. 12 (2000) 1866.
24. Sinha Ray S., Yamada K., Okamoto M., Ueda K., Nano Lett. 2 (2002) 1093.
25. Lim J. W., Hassan A., Rahmat A. R., Wahit M. U., Polym. Int. 55 (2006) 204.
26. Wu Dezhen, Wang Xiaodong, Song Yongzhi, Jin Riguang, J. Appl. Polym. Sci.
92 (2004) 2714.
27. Alexandre Michael, Dubois Philippe, Sun Tao, Garces M. J., Jerome Robert, Polymer
43 (2002) 2123.
28. Mark H. F., Bikales N. M., Overberger C. G., Menges G., Kroschuritz J. I.,
Encyclopedia of polymer Science and Engineering, New York, Wiley, 1986, 12.
29. Van Berkel R. W. M., Van Hartigsveldt E. A. A., Van der Sluijs C. L., In: Olalrisi O.,
Ed. Handbook of thermoplastic, New York, Marcel Dekker, 1997, Ch. 20.
30. Jadhav J. Y., Kantor S.W., Thermoplastic Polyesters in encyclopedia of Polymer
Science and engineering, New York, 2nd
Ed,Wiley, 1985, 12.
31. Flexman E. A., Polym. Engg. Sci. 19 (1979) 564.
32. Hourston D. J., Lang S., in Rubber Toughened Engineering Plastics, Ed. A. A. Collyer,
Chapman and Hall, London 1994.
33. Gaymans R. J., In: Paul D. R., Bucknall C. B., Editors. Polymer blends, New York,
Wiley, 2000, 2, Ch. 25.
34. Kojima Y., Usuki A., Kawasumi M., Okada A., Fukushuma Y., Kurauchi T.,
Kamigaito O, J. Mater Res. 8 (1993) 1185.
International Letters of Chemistry, Physics and Astronomy 4 (2013) 15-36
34
35. Kim G. M., Lee D. D., Hoffmann B., Kressler J., Stoppelmann G., Polymer
42 (2001) 1095.
36. Cho J. W., Paul D. R., Polymer 42 (2001) 1083.
37. Xu X., Qutubuddin S., Polymer 42 (2001) 807.
38. Chen G. M., Liu S. H., Zhang S. F., Qi Z. N., Macromol. Rapid Comm. 21(11),
(2001) 746.
39. Vaia A. R., Jandt K. D., Giannelis E. P., Chem. Mater. 8 (1996) 2628.
40. Reichert P., Nitz H., Klinke S., Brandsch R., Thomann R., Mulhaupt R., Macromol.
Mater. Engg. 275(2), (2000) 8.
41. Galgali G., Ramesh C., Lele A., Macromolecules 34 (2001) 852.
42. Kawasumi M., Hasegawa N., Kato M., Usuki A., Okada A., Macromolecules 30 (1997)
6333.
43. Usuki A., Kato M., Okada A., Kurauchi J., J. Appl. Polym. Sci. 63 (1997) 137.
44. Ko M. B. Kor, Polymer J. 8 (2000) 186.
45. Zanetti M., Camino G., Thomann R., Miilhaupt R., Polymer 42 (2001) 4501.
46. Li X. C., Ha C. S., Journal Appl. Polymer Sci. 87 (2003) 1901.
47. Chen W., Xu Q., Yuan R. Z., Mater. Sci. Engg. B77 (2000) 15.
48. Wahrmund D. C., Paul D. R., Barlow J. W., J. Appl. Polym. Sci. 22 (1978) 2155.
49. Wilkinson A. N., Tattum S. B., Polymer 38 (1997) 1923.
50. Tattum S. B., Cole D., Wilkinson A. N., J. Macromol. Sci.-Phys. B 39(4), (2000) 459.
51. Hobbs S. Y., Groshans V. L., Dekkers M. E. J., Shultz A. R., Polymer Bulletin 17
(1987) 335.
52. Hanrahan B. D., Angeli S. R., Runt J., Polymer Bulletin 14 (1985) 399.
53. Hobbs S. Y., Dekkers M. E. J., Watkins V H, Polymer Bulletin, 1987, 17, 341.
54. Sanchez P., Remiro P. M., Nazbal J., J. Appl. Polym. Sci. 50 (1993) 995.
55. Delimoy D., Bailly C., Devaux J., Legras J., Polym. Engg. Sci. 28 (1988) 104.
56. Devaux J., Godard P., Mercier J. P., J. Polym. Sci. 20 (1982) 1881.
57. Delimoy D., Goffaux B., Devaux J., Legras R., Polymer 36 (1995) 3255.
58. Vishu Shah, Handbook of Plastics Testing Technology, John Wiley, New York, 1984, 8.
59. Rodriguez F., Principles of Polymer Systems, McGraw-Hill, New York, 1970, Ch.8.
60. Dekkers M. E. J., Hobbs S., Watkins V. H., J. Mater. Sci. 23 (1988) 1225.
61. Archondouli P. S., Kalfogolu N. K., Polymer 42 (2001) 3489.
62. Yonglai Lu, Ying Zhang, Guo dav Zhang, Mingshu Yang, Shouke Yan, Deyan Shen,
Polymer 45 (2004) 8999.
63. Nayak K. S., Int. J. of Plastics Tech. 12 (2008) 1027.
International Letters of Chemistry, Physics and Astronomy 4 (2013) 15-36
35
64. Chavaria F., Paul D. R., Polymer 45 (2004) 8501.
65. Vishu Shah, Handbook of Plastics Testing Technology, John Wiley, New York, 1984,
241.
66. Brydson J. A., Plastics Materials, 7th
Edn. Butterworth and Heinemann, Oxford, 2005,
73.
67. Ahn B. D., Kim S. H., Kim Y. H., Yand I. S., J. Appl. Polym. Sci. 82 (2001) 2008.
68. Wunderlich B., Thermal Analysis, Academic Press, New York, 1990.
69. Brown M. E., Gallagher P. K., Handbook of Thermal Analysis, Elsevier, Amsterdam,
2003, 2.
70. Haines P. J., Thermal Methods of Analysis, Principles, Applications and Problems,
Blackie Academic Professional, London, 1995.
71. Gallagher P. K., Gyorgy B. M., Thermal Analysis, Basal: Birkhauser, 1980, 1.
72. Reading M., Thermal Analysis-Techniques and Applications, Royal Soc. of Chemistry,
1992.
73(68). Wunderlich B, Thermal Analysis, Academic Press, New York, 1990.
74. Kemp R. B., Handbook of Thermal Analysis and Calorimetry, Elsevier, Amsterdam,
1998, 1.
75. Duvai C., Inorganic Thermo gravimetric Analysis, Elsevier, Amsterdam, 1963.
76. Alexander M., Dubois P., Mater. Sci. Engg. 28 (2000) 1.
77. Gilman J. W., Jackson C. L., Morgan A. B., Harris R., Manias E., Giannelis E. P.,
Wuthenow M., Hilton D., Philips S. H., Chem. Mater. 12 (2000) 1866.
78. Illers K. H., Colloid Polym. Sci. 258 (1980) 117.
79. Chow Wen Shyang, Malaysian Polymer Journal 3(1), (2008) 1.
80. Mohd Ishak Z. A., Ariffin A., Senawi R., Europian Polymer Journal 37 (2001) 1635.
81. Hage E., Ferrerira L. A. S., Manrich S., Persan L. A., J. Appl. Polym. Sci. 71 (1999) 423.
82. Sun S. L., Xu X. Y., Yang H. D., Zhang H. X., Polymer 46 (2005) 7632.
83. Delimoy D., Goffaux B., Devaux J., Legras R., Polymer 36 (1995) 3255.
84. Li Y. M., Mechanical Behaviour of Multiphase, Ph.D Thesis, Texas, 2001.
85. Chow W. S., Mohd Ishak Z. A., Ishiaku U. S., Karger Kocsis J., Apostolov A. A.,
J. Appl. Polym. Sci. 91 (2004) 175.
86. Sanjay K. Nayak, Int. J. of Plastics Tech. 12 (2008) 1027.
87. Smitha Mohanty, Samal S., Tripathy Y. K., Nayak S. K., Verma S. K.,
Int. J. of Plastics Tech. 9 (2005) 436.
88. Tianxi Liu, Kian Ping Lim, Wuiwui Chauhari Tjiu, Pramoda K. P., Zhi-Kuan Chen,
Polymer 44 (2003) 3529.
89. Starkweather H. W., Macromolecules 21 (1988) 1798.
International Letters of Chemistry, Physics and Astronomy 4 (2013) 15-36
36
90. Chen L. P., Yee A. F., Goetz J. M., Schaefer J., Macromolecules 31 (1998) 5371.
91. Di Y. W., Iannance S., Di M. E., Nicolais L., J. Polym. Sci. Polym. Phys. 41 (2003) 670.
92. Riva A., Zanetti M., Braglia M., Camino G., Falqui L., Polym. Degra. Stab.
77 (2002) 299.
93. Hui Zhang, Zhong Zhang, Jing-Lei Yang, Klaus Friedrich, Polymer 47 (2006) 679.
94. Chang J. H., Seo D. B. S., Wang H., Polymer 43 (2002) 2969.
95. Morgan A. B., Gilman J. W., J. Appl. Polym. Sci. 87 (2003) 1329.
96. Liu T., Lim K. P., Tjiu W. C., Pramoda K. P., Chen Z. K., Polymer 44 (2003) 3529.
97. Usuki A., Kawasumi Y., Kojima M., Fukushima Y., Kurauchi T., Kamigaito D.,
J. Mater. Res. 8 (1993) 1179.
98. Kawasumi M., Hasegawa N., Kato M., Usuki A., Okada A., Macromolecules 30 (1997)
6333.
99. Fu X., Qutubuddin S., Polymer 42 (2001) 807.
100. Lü J. K., Ke Y. C., Qi Z. N., Yi S., J. Polym. Sci., Part B: Polym. Phys. 39 (2001) 115
101. Alexandre M., Dubois P., Mater. Sci. Engg. 28 (2000) 1.
102. LeBaron P. C., Wang Z., Pinnavaia T. J., Appl. Clay Sci. 15 (1999) 11.
103. Agag T., Takeichi T., Polymer 41 (2000) 7083.
104. Chen T. K., Tien Y. I., Wei K. H., Polymer 41 (2000) 1345.
105. Vain R. A., Jandt K. D., Kramer E. J., Giannelis E. P., Chem. Mater. 8 (1996) 2628.
106. Galgali G., Ramesh C., Lele A., Macromolecules 34 (2001) 852.
107. Paul D. R., Newman S., Polymer Blends, Academic Press, New York, 1978.