modulated excitation of singly ligated carboxhyhemoglobin
TRANSCRIPT

Biophysical Journal Volume 65 November 1993 2059-2067
Modulated Excitation of Singly Ligated Carboxyhemoglobin
Dan Liao, Jie Jiang, Mingdi Zhao, and Frank A. FerroneDepartment of Physics and Atmospheric Science, Drexel University, Philadelphia, Pennsylvania 19104 USA
ABSTRACT We have extended the method of modulated excitation, a small perturbation kinetic method, to study ligand bindingand conformational change of hemoglobin tetramers with a single ligand bound. To restrict the excitation to the first ligand, only1% of the hemes have bound CO, and the remainder are kept unliganded. A detailed theory is presented which agrees wellwith the experimental observations. This method of observing ligand recombination also provides a novel and simple methodfor determination of hemoglobin concentration.
Additional relaxation processes are also observed. By fitting independently determined spectra to the spectra associated withthe relaxations, these processes are assigned as thermal excitation and thermally driven protonation/deprotonation reactions.These added relaxations arise from the deoxy-Hb portion of the samples, and demonstrate that modulated excitation can beused effectively for temperature perturbation in the absence of photodissociation. The spectra observed are not well describedby the spectra of allosteric change, however, and we conclude that there is no significant mixing of quaternary states at the firstligation step. In an appendix we present a derivation of the particular features seen in thermally modulated protonation reactions.
INTRODUCTION
Cooperative ligand binding in hemoglobin represents a dif-ference in affinity between the binding of the last ligand andthe binding of the first. Understanding the structural basis ofcooperativity requires studying various structural eventswhich accompany ligand binding. Modulated excitation is akinetic method which has been used to study changes inquaternary and tertiary structure (salt bridges) before the lastligand is bound. (Ferrone, 1991, 1994) The essence of themethod is to use periodic excitation and phase tuning to re-move the event of ligand binding and release per se so as toinvestigate the related structural events. This can be viewedas providing a reference frame for the study of the structuralevents. Thus those events are measured relative to the ligandbinding and release process.
In this paper we show that it is also possible to use modu-lated excitation to investigate events surrounding the firstligand binding process. The idea of the experiment is quitesimple. A small quantity of HbCO (about 1% of the hemes)is introduced into a sample of deoxy-Hb. Because the affinityof CO is so high, most of the CO remains bound, albeitreproportioned so that only 1% of the hemes have ligands.Thus the dominant species is deoxy-Hb, with about 1% sin-gly liganded Hb. Photolysis removes a CO molecule, whichthen will be rebound by one of the many deoxy hemes pre-sent. Because the deoxy hemes are in great excess, the ratewill be proportional to the unliganded heme concentration.This could prove useful, as will be discussed. We have pro-vided preliminary communications of these methods previ-ously (Ferrone, 1991); this is the first complete study to ad-dress modulation of the singly ligated species.
Received for publication 10 June 1993 and in final form 10 August 1993.Address reprint requests to Frank A. Ferrone at the Department of Physicsand Atmospheric Science, Drexel University, 32nd and Chestnut Sts., Phila-delphia, PA 19104.X) 1993 by the Biophysical Society0006-3495/93/11/2059/09 $2.00
In addition to the obvious interest in studying the firstligand binding event, there are specific reasons such a studyis of interest. In a study of the pH dependence of oxygenbinding isotherms, Johnson and Ackers (Johnson et al., 1984)proposed that, rather than being almost pure T structure, asubstantial fraction of the tetramers with a single ligandbound would be in the R structure.The measurements per-formed here directly test that prediction. Moreover, Mozza-relli et al. (Mozzarelli et al., 1991; Rivetti et al., 1993) haveobserved ligand binding to single crystals of hemoglobin,and found that the affinity is lower than solution measure-ments, with no evidence of a Bohr effect. The decrease inbinding constant for the first ligand is about a factor of 6, fora free energy difference of about 1 kcal/mol. It has beenproposed (Rivetti et al., 1993) that Hb might exist in theT state in two conformations which differ in the formationof a number of salt bridges, first identified by Perutz (1970a,1970b). Two states of similar free energy might interconvertreadily. Thus also we sought to use the sensitive method ofmodulated excitation to look for evidence of multiple T-stateconformations.
In this paper we present the detailed theory of modulatedexcitation with a single ligand. We find that the theory thatdescribes the kinetics of binding the first ligand agrees wellwith the data. In addition, using this procedure provides asimple method for determination of hemoglobin concentra-tion where path length is not known. Additional relaxationprocesses are observed beyond ligand binding and release.These processes are identified on the basis of independentlydetermined spectra as thermal excitation, and thermallydriven protonation/deprotonation reactions. These added re-laxations arise from the deoxy-Hb part of the samples, anddemonstrate that modulated excitation can be used effec-tively for temperature perturbation. The spectra observed arenot well described by the spectra of allosteric change, and weconclude that there is no significant mixing of quaternarystates at the first ligation step. In the Appendix we present
2059

Volume 65 November 1993
a derivation of the particular features seen in thermallymodulated protonation reactions.
THEORY OF MODULATED EXCITATION WITHONE LIGAND
This section describes the theoretical foundations of themethod. The notation of the MWC model (Monod et al.,1965) will be used, in which singly liganded molecules inthe T state have a population denoted T1, etc. The resultsare quite general, and are independent of the MWC orother model. This is because the critical constructs of themodel, e.g., equal, independent ligand binding within aquaternary structure, are not used in our analysis. The rateconstant for binding the first ligand will be denoted kT.First, we assume that there are no additional species, otherthan single and zero liganded species, To and T1. Let a bethe rate of removing a ligand from a T1 molecule. a is pro-portional to quantum yield q, path length z, intensity I,and extinction coefficient E, and is given by a =2.3qEzI =a * I. Then,
dT° =-kT[CO](4TO + 3T1) + a(e"@ + 1)T1. (1)dt
Note that a To state will have four deoxy hemes. The exci-tation term is written as a complex number because phaserelationships are simplified in that representation; the 1 isrequired to keep the excitation 2 0. Both To and T1 can bewritten as harmonic series, e.g.,
To = E To,eenwt, (2)n=O
and similarly for T1. [CO] is present is such small quanti-ties that it will also have an observable oscillatory charac-ter, and we can write
[CO] = z Xenn=O
(3)
For n 2 1 X,, = -T,,,, i.e., ligand concentration oscilla-tions are due to loss of ligand from T1. A similar conserva-tion relationship arises for the protein concentration; wecan write co = To + T1. Since the total concentration c. isnot oscillatory, the harmonic terms of To and T1 are alsonegatives of one another. This allows the rewriting of thefirst harmonic part of Eq. 1 as
oToj1= -kT(XOTO,l + XI TO,o) + a(co- o- To,,)= (-kr(Xo + Too)- a)To,1 + a(c -Too) (4)
In constructing Eq. 4 we have only kept similar harmonicterms. The total concentration of free ligand, X., will be<<T0,0. Furthermore, co - To,O is approximately theinitial CO-liganded population, Tojl. (There is a small dif-ference due to steady state photolysis.) If, as is usual inmodulated excitation, we define the tangent of absolutephase as the ratio of imaginary to real parts of To,, then
clearly,
tan 4) = - /(kTcO + aI), (5)where we have also used the approximation that co isnearly T0,0.We next consider the case in which T1 can convert to R1
spontaneously. In a complete treatment, R1 could be photo-lyzed to Ro, and a four level system would be described andsubsequently solved. Because this creates cumbersome equa-tions we will describe instead a simpler system which isphysically described by rapid conversion of Ro to To, andnegligible rates for To to Ro. Such a system is shown in Fig. 1.Because the ground state T1 is perturbed, the R1 state is alsoperturbed. The population in states R1 and T1 interchangewith rates denoted kRT and kTR. These in general will differfrom rates between R and T structures with different numbersof ligands bound. Using notation analogous to that above(denoting excitations from R and T as aR and aT), it isstraightforward to show that
i&Tjj = -(aT + kTR)Tl,l - kTco To,
+ kRTRl,l - aTTl1O (6a)
and
iwR,l = -(aR + kRT)Rll + k.RT1l - aRRl,O (6b)
Because there are three oscillatory states we have the con-servation condition that
R1 + T11 + To,, = 0. (7)We are interested in the fraction of excitations which causethe structure to change, and are out of phase with respect tothe ligand binding signal. The last condition is a practicalconcern, since it maximizes the signal in real time. Thus wewant F, which is defined as
F7 = ImI[R'l/T01]. (8)
For convenience we define the ratio p = aTTl,O/aRRl,O, and
T1
FIGURE 1 Three state model for conformational change with one ligandbound. The vertical axis represents free energy. The oscillatory depletion ofthe "ground state" T1 leads to oscillations of the R1 state in thermal equi-librium with T1. R1 is assumed to be sufficiently empty that excitations fromR1 to Ro can be neglected.
2060 Biophysical Journal
RI
Modulation of Singly Ligated Hemoglobin
the sum of the allosteric rates as kA = kRT + kTR. Then aftersome algebra it follows that
{kA + kTco + p[kA + kTCO + aT- aR]
(1 ++p)2kRR+ P)2[kA + T+ p ) + o)21 (9)
In the limit where r >> 1, as it is in usual MWC parameter-izations, then
(10)(kA + aR) + ( 10
which is completely analogous to the expression used inmodulated excitation measurements on the three ligandedstate, namely,
kRT,3(kA,3 + T[CO])2 + 2 (11)
where analogous quantities whose values differ have beendenoted with a subscript 3 (Ferrone, 1991, 1993). FromEq.10 it is clear that the concentration dependence is absentand in Eq. 9, it can be seen the co will only enter weakly.Hence a signature of any hypothesized spectral feature as-signed to the allosteric change must be its lack of dependenceon the concentration of Hb.
MATERIALS AND METHODSHemoglobin was prepared according to standard procedures used in thislaboratory and stored frozen in liquid nitrogen (Martino and Ferrone, 1989).When thawed, the hemoglobin was concentrated as required by the use ofCentricon centrifuge filtration devices. Hemoglobin was used in phosphatebuffer, at pH 7.02. Sodium dithionite at a concentration four to five timesthat of the hemoglobin was added to the solution to fully reduce and de-oxygenate samples. A separate aliquot of Hb was flushed with CO, and 1%by volume of the resulting HbCO was added to the original deoxygenatedHb. 5 to 10 ,ul of the resulting solution were placed on a microscope slideand sealed with sticky wax in a nitrogen-purged cold chamber.
Thermal difference spectra were obtained in the following way.A sampleof deoxy-Hb was sealed in a cuvette, in which a thermistor probe was alsoplaced. The cuvette was placed in the thermostatted holder of an HP 8452diode array spectrophotometer. The temperature setting of the thermostat-ting bath was then changed. Since the diode array spectrophotometer recordsa complete spectrum rapidly, we collected spectra as the temperaturechanged, recording the temperature in the cuvette at the time each spectrumwas taken. The thermostat was then changed, and the process repeated,followed by another cycle of temperature decrease and increase. By fol-lowing the temperature changes in both directions, any time-dependentchanges are excluded from the analysis.
The 49 spectra were then reduced by singular value decomposition tech-niques (Shrager and Hendler, 1982). The data matrixA is decomposed intothe product of three matrices, thusA = USVr. The matrix U contains a setof basis spectra in which the first column, U1, is the best single spectrumdescription of the data, U1 and U2 are the best two spectra description ofthe data, etc. S is a diagonal matrix whose elements are called the singularvalues, which describe the relative importance of the spectra to the completedescription. The columns of V describe the evolution of the basis spectra astime and temperature change. These mathematical descriptions of the dataA are related to physical spectra, D, which are linear combinations of thecolumns of U. Each physical spectrum corresponds to a physical process(temperature change, drift). A matrix called F describes the assumed pro-cesses. In our case, these are a constant (background), linear temperature
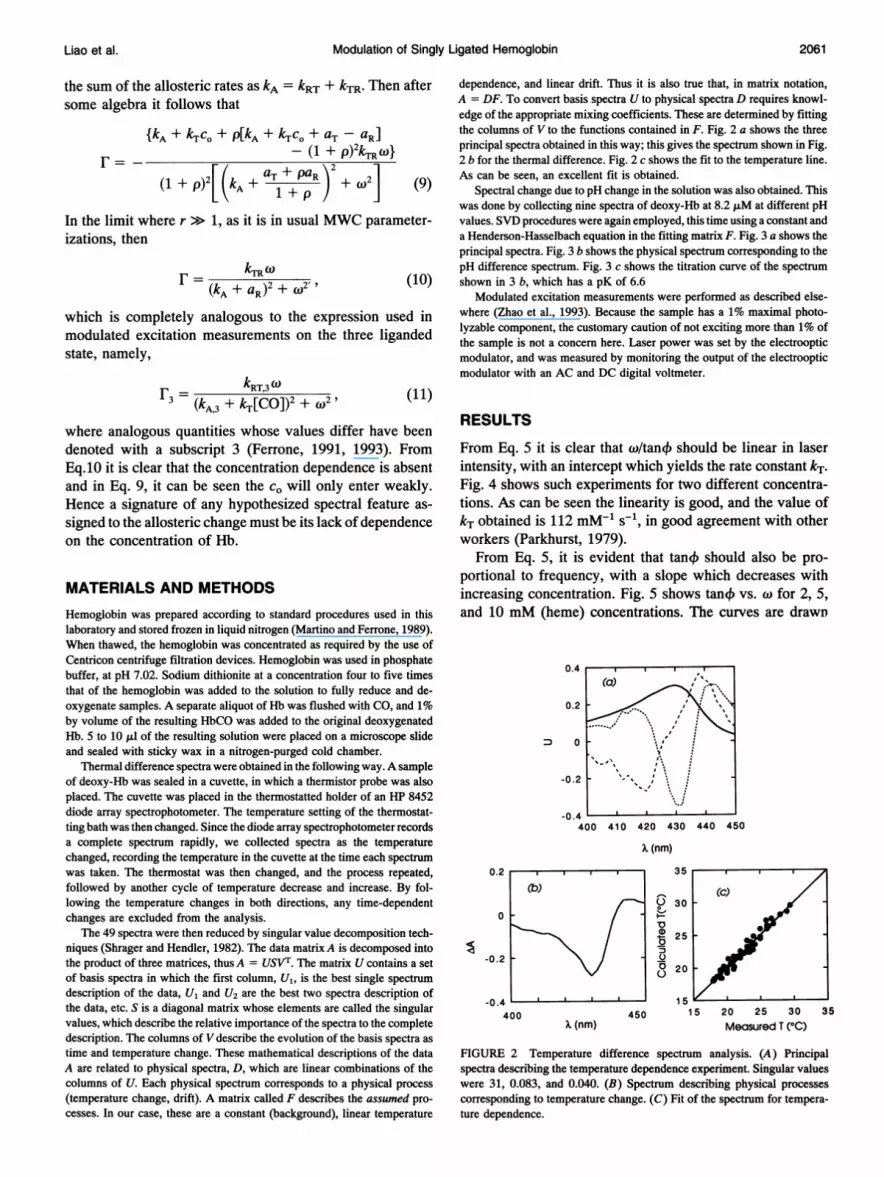
dependence, and linear drift. Thus it is also true that, in matrix notation,A = DF. To convert basis spectra U to physical spectra D requires knowl-edge of the appropriate mixing coefficients. These are determined by fittingthe columns of V to the functions contained in F. Fig. 2 a shows the threeprincipal spectra obtained in this way; this gives the spectrum shown in Fig.2 b for the thermal difference. Fig. 2 c shows the fit to the temperature line.As can be seen, an excellent fit is obtained.
Spectral change due to pH change in the solution was also obtained. Thiswas done by collecting nine spectra of deoxy-Hb at 8.2 ,uM at different pHvalues. SVD procedures were again employed, this time using a constant anda Henderson-Hasselbach equation in the fitting matrix F. Fig. 3 a shows theprincipal spectra. Fig. 3 b shows the physical spectrum corresponding to thepH difference spectrum. Fig. 3 c shows the titration curve of the spectrumshown in 3 b, which has a pK of 6.6
Modulated excitation measurements were performed as described else-where (Zhao et al., 1993). Because the sample has a 1% maximal photo-lyzable component, the customary caution of not exciting more than 1% ofthe sample is not a concern here. Laser power was set by the electroopticmodulator, and was measured by monitoring the output of the electroopticmodulator with an AC and DC digital voltmeter.
RESULTS
From Eq. 5 it is clear that w/tan4p should be linear in laserintensity, with an intercept which yields the rate constant kT.Fig. 4 shows such experiments for two different concentra-tions. As can be seen the linearity is good, and the value ofkT obtained is 112 mM-1 s-', in good agreement with otherworkers (Parkhurst, 1979).From Eq. 5, it is evident that tan4 should also be pro-
portional to frequency, with a slope which decreases withincreasing concentration. Fig. 5 shows tan4 vs. w for 2, 5,and 10 mM (heme) concentrations. The curves are drawr
0.4
0.2
O0
-0.2 I
(a) , '+
/A.' 'ss"'8,,,"'"'""N ,t'' .''\d.. ..ss ,\ .: .#\> .: :
X,^% ,
sv^ ., /
-0.4 1 l400 410 420 430 440 450
X (nm)
0.2
0
-0.2
-0.4400
X (nm)
0
0
00
- 15 '
450 15 20 25 30Measured T (OC)
35
FIGURE 2 Temperature difference spectrum analysis. (A) Principalspectra describing the temperature dependence experiment. Singular valueswere 31, 0.083, and 0.040. (B) Spectrum describing physical processescorresponding to temperature change. (C) Fit of the spectrum for tempera-ture dependence.
Liao et al. 2061

Volume 65 November 1993
0
(C)
0
*0
6.0 7.0 8.0
pH
FIGURE 3 pH difference spectrum analysis. (A) Principal spectra de-scribing the pH titration experiment. Singular values of the second, and thirdcomponents were 14%, and 1.4% of the first component. (B) Spectral dif-ference of full change between acid, and alkali forms. (C) Fit of the spectrumin B to a Henderson-Hasselbach equation with pK = 6.63.
2000
1500
1000
500
0
0 0.05 0.1 0.15 0.2
Intensity
FIGURE 4 w/tan4) versus laser intensity. The slope gives the constant a'in Eq. 5, while the intercept gives kTco. This gives kT = 112 mM'1 s-'.
from the parameters obtained in Fig. 4. The presence of largevalues of tan4 limits the usable frequency range in this ex-
periment, since for tan4 > 1, the signal level begins to falloff as 1/tan+.
Modulated excitation spectra were also collected at vari-ous frequencies between 40 and 300 Hz for 2, 5, and 10 mM(heme) concentrations. The principal components in and outof phase are shown in Fig. 6. As can be seen, the in-phasecomponent is well described by deoxy-Hb minus HbCO.However, there is also a distinct out-of-phase component.We now turn to the task of identifying that spectrum.At first sight the out-of-phase spectra resemble the classic
difference spectra seen upon conversion ofR to T quaternary
4
3
4- 2
1
00 100 200 300
f (Hz)
FIGURE 5 tan 4 versus excitation frequency ffor three different proteinconcentrations. w = 2nf. Lines are drawn from the parameters generated inFig. 4 and are not fits to this data.
structures (Olson, 1976; Perutz et al., 1974). However, anattempt to fit the data shows that there is similarity but notidentity. The peak in this data is close to 430 nm, while R-Tdifference spectra peak near 425 nm. Furthermore, the databetween 400 and 410 nm is not at all recovered in such a fit.Inclusion of the deoxy-HbCO difference spectrum to accountfor mistuning does not rectify the problem either. Fig. 7shows the fit of the data in the 5 mM sample using the in-phase and R-T difference spectra.
Moreover, from Eqs. 9 and 10, the relative magnitude ofthe out-of-phase component should not depend on the con-centration of hemes. This is also not the case, as can be seenin a rough way without curve fitting by comparison of sin-gular values. For example, the data collected at 10 mM hasout-of-phase spectra with singular values that are 13% of thein-phase spectra, while at 2 mM over essentially the samefrequency range, the weight of the out-of-phase spectra dropsto 7.5%. (Since the data are collected on essentially the samefrequency grid, this comparison can be used.)
In this experiment, the laser-induced heating is greaterthan is usually the case for CO photolysis. This is becausethe photolysis beam has no way a priori of finding the the 1%liganded hemes, and so a large flux of light is required tophotolyze the few hemes containing CO. This suggested thata thermal difference spectrum might be contributing to theout-of-phase signal. The spectrum shown in Fig. 2 b clearlyis closer to the spectrum observed, having its peak closer to430 nm, for example.To confirm the presence of thermal modulation, we pre-
pared a 5mM sample without injection of the 1% HbCO, andused the same modulation geometry and light flux. This datais shown in Fig. 8. There is still evidence for some CO (about0.1%) which must represent contamination of the originalsample. The in-phase spectra (Fig. 8 a) are no longer simple,but show evidence of the out-of-phase contribution. The out-of-phase spectrum is now 51% of the magnitude of the in-phase spectrum, and is almost identical in size with spectracollected for the 5 mM sample with 1% HbCO, although the
0.4 * . .
0.2 -
0.0 .
-0.2 -
(a) ' ,
-0.4400 410 420 430 440 450
x (nm)
0
-5E0
Ew
c0
0.5
-10 0-
-1 5
-20 *(b)
-25 . . .400 410 420 430 440 450
X (nm)
0
c
4-
a
2062 Biophysical Journal
00*60--04 *40 0
e
0
1

Modulation of Singly Ligated Hemoglobin
0.5
a)
-CQC.
-0.5
U)(I)
aaI--0
0
0.5
-0.5 0400 400 450 450
X (nm)
FIGURE 6 Principal components of modulated excitation spectra. (a-c) In-phase components for 2, 5, and 10 mM Hb, respectively. (d-f) Out-of-phasecomponents for the same set of data. Singular values for d-fwere 13, 6, and 8% as large as the components in a-c. The data have been fit by a combinationof three spectra: CO-deoxy difference spectrum, a static temperature difference spectrum (Fig. 2 b), and a pH difference spectrum (Fig. 3 b).
in-phase spectrum has deceased by about 10-fold. This ar-gues most strongly that the out-of-phase spectrum is not theresult of the photolyzed hemes (which have just decreased10-fold) but of the remainder of the hemes which have beenkept constant. Thus the principal contributor is the thermalspectrum. This agrees with the spectra observed. The thermaldifference spectrum generated in static experiments (Fig.2 b) provides a very good fit of the out-of-phase spectra inFigs. 6 and 8.
It is interesting, however, that the in-phase part of Fig. 7is not perfectly fit by the inclusion of the thermal spectrum,but shows a significant difference in the 436-440-nm region.One possible explanation for this difference is that the ther-mal difference spectrum may have more than one compo-nent, and these components may have slightly different re-laxation rates. For example, if a change in temperaturecaused a reaction to change its equilibrium point, as wellproducing purely spectroscopic changes, the net spectrumwould have a component which followed temperature per-fectly (being electronic relaxation) and a component whichhad its own relaxation kinetics due to its reaction rate. In thecase of Hb, the well known salt bridges are major enthalpiccontributors to oxygenation (Ackers, 1980), and thus achange in temperature ought to change average occupancy ofthe salt bridges as well as changing the heme spectra.Changes in salt bridges are mimicked by changes in pH, andhence we used the pH difference spectrum (Fig. 3 b) as a thirdfitting component. The fits are excellent as can be seen inFigs. 6 and 8.The frequency dependence of the tangents of phase angles
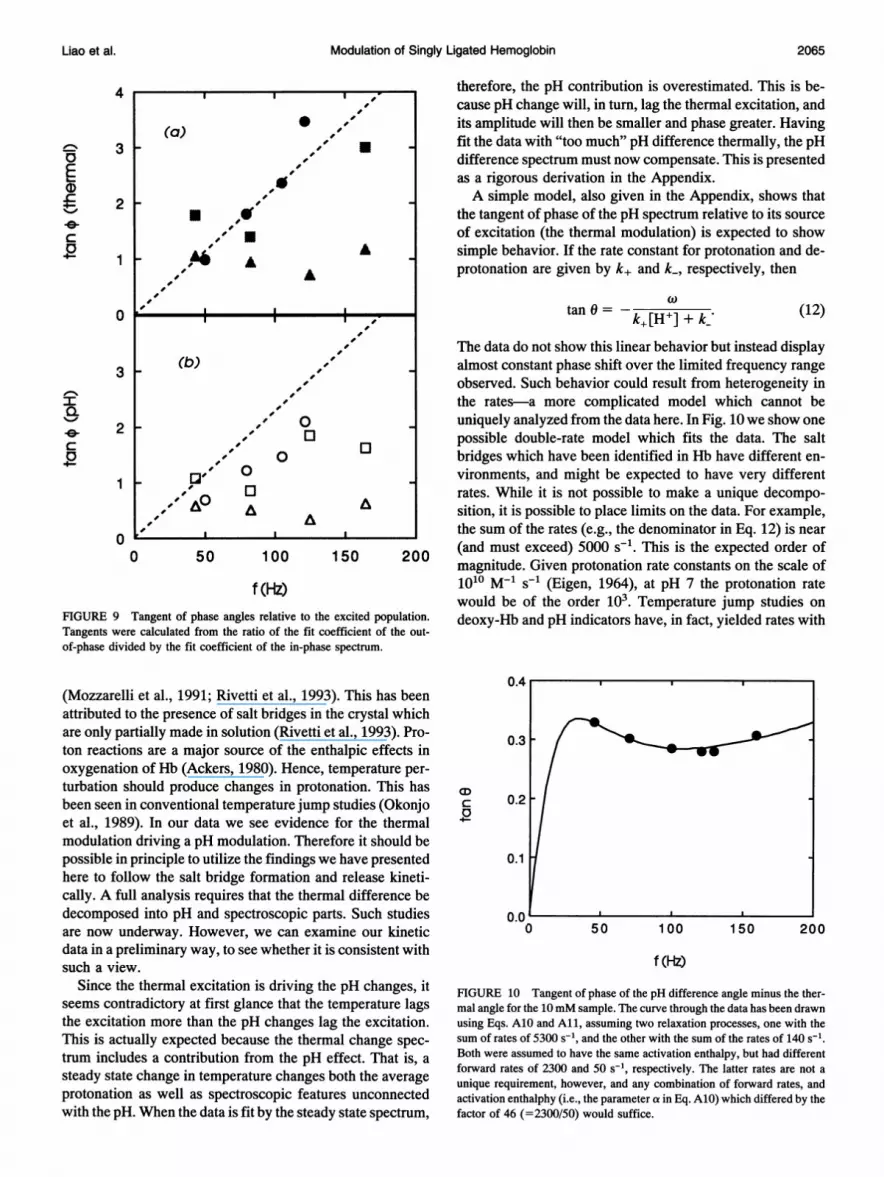
of the average thermal and the pH spectra is shown in Fig. 9.
Two things are of note. First, the tangents (and of course thephase angles) are not much larger than those observed in theligand rebinding signal (compare with Fig. 5). This indicatesthat laser heating and cooling modulated the temperature inthe sample. The higher concentration samples are thinner,and can cool faster. Therefore, they have smaller phaseangles. The second point of interest is that the pH phaseangles are smaller than the thermal angles-all the tangentsfor pH spectral change lie below those for the thermalchange. This is discussed below.
DISCUSSION
The results show that the kinetics of the first ligand bindingto Hb can be measured accurately by modulated excitation.The spectrum which corresponds to ligand release and re-binding is accompanied by smaller spectra whose magnitudedepends on the deoxy heme concentration rather than thephotolyzable component. This spectrum is well described bythermal and pH difference spectra, and is not well describedby the spectrum of allosteric change.
It has been assumed that a and 3 subunits have the sameproperties. This assumption is justified by NMR studies onCO (Ho, 1992), as well as by equilibrium studies on crystalsin which the magnitude of thermodynamic inequivalence for02 is less than a factor of three difference between the sub-units (Rivetti et al., 1993). (In the data we have collected, thislimit cannot be made smaller, and allows differences of abouta factor of 4.)
Modulated excitation of singly liganded species can be auseful tool for determination of concentration of Hb. For
Liao et al. 2063

Volume 65 November 1993
0.5
0.25a)0
c
0
-0.25
-0.5
a1)
co0Z-C0.
0
0
0.5
0
-0.5 L'400 450 450
x (nm)
FIGURE 7 5 mM sample data fit by several different spectra. (a and b)In- and out-of-phase spectra for the 5 mM sample with 1% HbCO. (c andd) In- and out-of-phase spectra for the 5 mM sample nominally deoxy-genated (with a trace HbCO). Solid line shows a fit using HbCO-Hb dif-ference spectra, and R-T difference spectra. Dashed line shows a fit usingHbCO-Hb difference spectra, and thermal spectra (from Fig. 3) only. Dottedline shows HbCO-Hb, RT difference spectra, and thermal spectra. None ofthe three provides a good overall fit. Fits in Figs. 6 and 8 have been executedusing the pH difference spectra, and those are clearly superior.
example, the concentration in an erythrocyte could be de-termined by performing the experiments described here afterexposing the red cell to a gas containing a small trace of CO.Using the same procedure as in Fig. 4, i.e., extrapolation tozero laser intensity, the concentration of hemoglobin can befound totally independent of path length.The absence of an allosteric contribution to the out-of-
phase spectrum argues that the singly liganded R state mixesvery little with the singly liganded T state. This directly chal-lenges the implication of a thermodynamic model proposedby Johnson and Ackers (1984), namely, that there is a sig-nificant population (about 27%) of R states present when asingle ligand is bound to a tetramer. From the present data,it appears that <3% of the hemes might belong to switchedstructures. Although the equilibrium studies were carried outat pH 7.4 in 0.15 M Cl buffer, instead of pH 7 phosphate, thedifferences are expected to be rather small (compare with thereview by Shulman et al. (1975)). As pointed out by Leeet al. (1988), the prediction involves the assumption that theBohr effect is identical to the R-T switch, and thus its failurecan be attributed to that assumption.
Since this is a kinetic method, the question may legiti-mately be raised whether kinetic effects suppress the ex-pected signal from allosteric conversion between stateswhich could otherwise mix given infinite equilibration time.From information available from the work of others, thismust be considered unlikely. Cho and Hopfield (1979) de-
0.5
U1)-c.rc
0.25
0
450
0.5
a)U)
0.
.4-
0
4-
Q
0.25
0
-0.25
X (nm)
(b)
-0.5 L400 450
x (nm)
FIGURE 8 Principal components in sample without added CO. (a) In-phase spectrum. Singular value of the main component is 1.16; next com-ponent (not shown) is 0.11. (b) Out-of-phase component. Singular value ofits main component is 0.59; the next component (also not shown) is again0.11. The out-of-phase and in-phase spectra are within a factor of 2 of beingthe same magnitude. This contrasts with Fig. 6, b and e, where the out-of-phase component is only 6% of the in phase.
termined the singly liganded RT rate, which they found to be1.4 X 104 s-1. If L1 (=T11R1 = kRT/kTR) - 3 as required byJohnson and Ackers (1984) then, from Eq. 9, F will have amaximum value of about 0.05. Since there are three deoxyhemes in a singly liganded tetramer which switches structure,the magnitude of the out-of-phase signal is 0.15 times thein-phase signal (i.e., a F = 0.05 for singly liganded hemo-globin is three times as prominent as that of triply ligandedhemoglobin), which is a readily observable signal level inthese experiments.We next turn to the thermal and pH effects observed. It is
important to recognize that the assignment of the spectralfeatures has been done entirely with spectra generated instatic experiments, in which the perturbation is clearly iden-tified. Moreover, while the shapes of the out-of-phase spectraat first appear to be easily described by either RT spectra orthermal spectra, the detailed fitting shown in Fig. 6-8 doesnot allow this ambiguity. Finally, it is important to note thatthe spectra must arise from the deoxy hemes since they donot change when the HbCO is drastically reduced.The oxygen affinity for T-structure crystals of Hb is no-
tably less than the affinity for the first ligand in solution
I I I
2064 Biophysical Journal
-0.25
-0.5 1
400
Modulation of Singly Ligated Hemoglobin
therefore, the pH contribution is overestimated. This is be-cause pH change will, in turn, lag the thermal excitation, andits amplitude will then be smaller and phase greater. Havingfit the data with "too much" pH difference thermally, the pHdifference spectrum must now compensate. This is presentedas a rigorous derivation in the Appendix.A simple model, also given in the Appendix, shows that
the tangent of phase of the pH spectrum relative to its sourceof excitation (the thermal modulation) is expected to showsimple behavior. If the rate constant for protonation and de-protonation are given by k+ and k_, respectively, then
k+[H ] + ki (12)
,,' The data do not show this linear behavior but instead display(b) almost constant phase shift over the limited frequency range
,,' Ofobserved. Such behavior could result from heterogeneity in
Q. 2,,' | the rates-a more complicated model which cannot be
2 , 0 uniquely analyzed from the data here. In Fig. 10we show one0' possible double-rate model which fits the data. The salt
10 , 0 bridges which have been identified in Hb have different en-
vironments, and might be expected to have very differentI ,' 1:0 rates. While it is not possible to make a unique decompo-,' A0 A A sition, it is possible to place limits on the data. For example,
0 , .I , the sum of the rates (e.g., the denominator in Eq. 12) is near
0 50 100 150 200 (and must exceed) 5000 s51. This is the expected order of
magnitude. Given protonation rate constants on the scale of
f(HZ) 1010 M-1 s-5 (Eigen, 1964), at pH 7 the protonation ratewould be of the order 103. Temperature jump studies on
FIGURE 9 Tangent of phase angles relative to the excited population. deoxy-Hb and pH indicators have, in fact, yielded rates withTangents were calculated from the ratio of the fit coefficient of the out-of-phase divided by the fit coefficient of the in-phase spectrum.
(Mozzarelli et al., 1991; Rivetti et al., 1993). This has beenattributed to the presence of salt bridges in the crystal whichare only partially made in solution (Rivetti et al., 1993). Pro-ton reactions are a major source of the enthalpic effects inoxygenation of Hb (Ackers, 1980). Hence, temperature per-turbation should produce changes in protonation. This hasbeen seen in conventional temperature jump studies (Okonjoet al., 1989). In our data we see evidence for the thermalmodulation driving a pH modulation. Therefore it should bepossible in principle to utilize the findings we have presentedhere to follow the salt bridge formation and release kineti-cally. A full analysis requires that the thermal difference bedecomposed into pH and spectroscopic parts. Such studiesare now underway. However, we can examine our kineticdata in a preliminary way, to see whether it is consistent withsuch a view.
Since the thermal excitation is driving the pH changes, itseems contradictory at first glance that the temperature lagsthe excitation more than the pH changes lag the excitation.This is actually expected because the thermal change spec-
trum includes a contribution from the pH effect. That is, a
steady state change in temperature changes both the average
protonation as well as spectroscopic features unconnectedwith the pH. When the data is fit by the steady state spectrum,
0.4
0.3
a)cD
4-
0.2
0.1l
0 50 100 150 200
f (Hz)
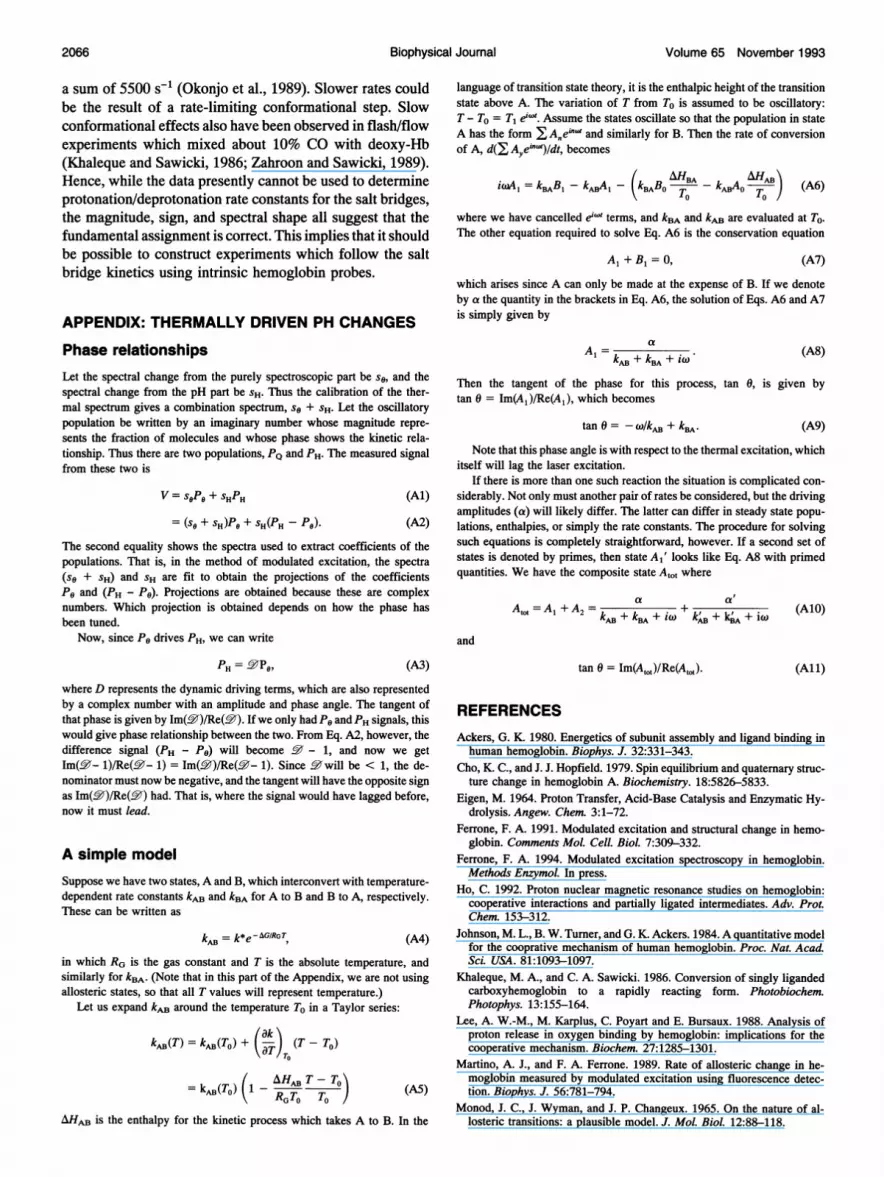
FIGURE 10 Tangent of phase of the pH difference angle minus the ther-mal angle for the 10 mM sample. The curve through the data has been drawnusing Eqs. A10 and All, assuming two relaxation processes, one with thesum of rates of 5300 s-1, and the other with the sum of the rates of 140 s-1.Both were assumed to have the same activation enthalpy, but had differentforward rates of 2300 and 50 s-1, respectively. The latter rates are not a
unique requirement, however, and any combination of forward rates, andactivation enthalphy (i.e., the parameter a in Eq. A10) which differed by thefactor of 46 (=2300/50) would suffice.
4
a)
0
3
2
1
I I p
(a) *"
0 0
I I,0
2065Liao et al.
2066 Biophysical Journal Volume 65 November 1993
a sum of 5500 s-1 (Okonjo et al., 1989). Slower rates couldbe the result of a rate-limiting conformational step. Slowconformational effects also have been observed in flash/flowexperiments which mixed about 10% CO with deoxy-Hb(Khaleque and Sawicki, 1986; Zahroon and Sawicki, 1989).Hence, while the data presently cannot be used to determineprotonation/deprotonation rate constants for the salt bridges,the magnitude, sign, and spectral shape all suggest that thefundamental assignment is correct. This implies that it shouldbe possible to construct experiments which follow the saltbridge kinetics using intrinsic hemoglobin probes.
APPENDIX: THERMALLY DRIVEN PH CHANGES
Phase relationshipsLet the spectral change from the purely spectroscopic part be so, and thespectral change from the pH part be SH. Thus the calibration of the ther-mal spectrum gives a combination spectrum, so + SH. Let the oscillatorypopulation be written by an imaginary number whose magnitude repre-sents the fraction of molecules and whose phase shows the kinetic rela-tionship. Thus there are two populations, PQ and PH. The measured signalfrom these two is
V = s0PO + SHPH (Al)
= (sO + SH)PO + SH(PH - P). (A2)
The second equality shows the spectra used to extract coefficients of thepopulations. That is, in the method of modulated excitation, the spectra(SO + SH) and SH are fit to obtain the projections of the coefficientsP6 and (PH - PO). Projections are obtained because these are complexnumbers. Which projection is obtained depends on how the phase hasbeen tuned.
Now, since Po drives PH, we can write
PH = -TPI (A3)where D represents the dynamic driving terms, which are also representedby a complex number with an amplitude and phase angle. The tangent ofthat phase is given by Im(T)/Re(T). If we only had Po and PH signals, thiswould give phase relationship between the two. From Eq. A2, however, thedifference signal (PH - P6) will become - 1, and now we getIm(T- 1)/Re(T- 1) = Im(2T)/Re(Y- 1). Since -will be < 1, the de-nominator must now be negative, and the tangent will have the opposite signas Im(§2)/Re(§T) had. That is, where the signal would have lagged before,now it must lead.
A simple modelSuppose we have two states, A and B, which interconvert with temperature-dependent rate constants k" and kBA for A to B and B to A, respectively.These can be written as
kAB = k*e-AG/RGT (A4)
in which RG is the gas constant and T is the absolute temperature, andsimilarly for kBA. (Note that in this part of the Appendix, we are not usingallosteric states, so that all T values will represent temperature.)
Let us expand kAB around the temperature To in a Taylor series:
kA(T) = k (TO) + ak (T- T)
= k.-(T-) (I - RA T To /(A)
AHAB iS the enthalpy for the kinetic process which takes A to B. In the
language of transition state theory, it is the enthalpic height of the transitionstate above A. The variation of T from To is assumed to be oscillatory:T - To = T1 e""0t. Assume the states oscillate so that the population in stateA has the form E Ane""o and similarly for B. Then the rate of conversionof A, d(j Aei'")Vdt, becomes
AHBIA __HABiwal = kBABi - kAB41- (kBABO T - kABAO TO) (A6)
where we have cancelled ei-' terms, and kBA and kAB are evaluated at To.The other equation required to solve Eq. A6 is the conservation equation
Al +B, = 0, (A7)
which arises since A can only be made at the expense of B. If we denoteby a the quantity in the brackets in Eq. A6, the solution of Eqs. A6 and A7is simply given by
a
k" + kBA + LW (A8)
Then the tangent of the phase for this process, tan 0, is given bytan 0 = Im(Al)/Re(A1), which becomes
tan 0 = -c /kAB+ kBA. (A9)
Note that this phase angle is with respect to the thermal excitation, whichitself will lag the laser excitation.
If there is more than one such reaction the situation is complicated con-siderably. Not only must another pair of rates be considered, but the drivingamplitudes (a) will likely differ. The latter can differ in steady state popu-lations, enthalpies, or simply the rate constants. The procedure for solvingsuch equations is completely straightforward, however. If a second set ofstates is denoted by primes, then state A1' looks like Eq. A8 with primedquantities. We have the composite state A1t0 where
a at
2kA+ kBA+ iw k,6 + iQ (AlO)
and
tan 0 = Im(A,1t)/Re(A,O,). (A1)
REFERENCESAckers, G. K 1980. Energetics of subunit assembly and ligand binding inhuman hemoglobin. Biophys. J. 32:331-343.
Cho, K. C., and J. J. Hopfield. 1979. Spin equilibrium and quatemary struc-ture change in hemoglobin A. Biochemistry. 18:5826-5833.
Eigen, M. 1964. Proton Transfer, Acid-Base Catalysis and Enzymatic Hy-drolysis. Angew. Chem. 3:1-72.
Ferrone, F. A. 1991. Modulated excitation and structural change in hemo-globin. Comments MoL Cell. BioL 7:309-332.
Ferrone, F. A. 1994. Modulated excitation spectroscopy in hemoglobin.Methods Enzymol. In press.
Ho, C. 1992. Proton nuclear magnetic resonance studies on hemoglobin:cooperative interactions and partially ligated intermediates. Adv. Prot.Chem. 153-312.
Johnson, M. L., B. W. Turner, and G. K. Ackers. 1984. A quantitative modelfor the cooprative mechanism of human hemoglobin. Proc. Nat. Acad.Sci. USA. 81:1093-1097.
Khaleque, M. A., and C. A. Sawicki. 1986. Conversion of singly ligandedcarboxyhemoglobin to a rapidly reacting form. Photobiochem.Photophys. 13:155-164.
Lee, A. W.-M., M. Karplus, C. Poyart and E. Bursaux. 1988. Analysis ofproton release in oxygen binding by hemoglobin: implications for thecooperative mechanism. Biochem. 27:1285-1301.
Martino, A. J., and F. A. Ferrone. 1989. Rate of allosteric change in he-moglobin measured by modulated excitation using fluorescence detec-tion. Biophys. J. 56:781-794.
Monod, J. C., J. Wyman, and J. P. Changeux. 1965. On the nature of al-losteric transitions: a plausible model. J. Mol. Biol. 12:88-118.

Liao et al. Modulation of Singly Ligated Hemoglobin 2067
Mozzarelli, A., C. Rivetti, G. L. Rossi, E. R. Henry, and W. A. Eaton. 1991.Crystals of haemoglobin with the T quatemary structure bind oxygennoncooperatively with no Bohr effect. Nature (Lond.). 351:416-419.
Okonjo, K. O., F. J. Vega-Catalan, and C. I. Ubochi. 1989. Temperature-jump studies on hemoglobin. J. Mol. Bio. 208:347-354.
Olson, J. S. 1976. Spectral differences between the a and v heme groupswithin human deoxyhemoglobin. Proc. Natl. Acad. Sci. USA. 73:1140-1144.
Parkhurst, L. J. 1979. Hemoglobin and myoglobin ligand kinetics.Ann. Rev.Phys. Chem. 30:503-546.
Perutz, M. F. 1970a. Stereochemistry of cooperative effects in haemoglobin.Haem-haem interaction and the problem of allostery. Nature (Lond.).228:726-734.
Perutz, M. F. 1970b. Stereochemistry ofcooperative effects in haemoglobin.The Bohr effect and combination with organic phosphates. Nature(Lond.). 228:734-739.
Perutz, M. F., J. E. Ladner, S. R. Simon, and C. Ho. 1974. Influence of globinstructure on the state of the heme. I. Human deoxyhemoglobin.Biochemistry. 13:2163-2173.
Rivetti, C., A. Mozzarelli, G. L. Rossi, E. H. Henry, and W. A. Eaton. 1993.Oxygen binding by single crystals of hemoglobin. Biochemistry. 32:2888-2906.
Shrager, R. I., and R. W. Hendler. 1982. Titration of individual componentsin a mixture with resolution of difference spectra, pKs and redox tran-sitions. Anal. Chem. 54:1147-1152.
Shulman, R. G., J. J. Hopfield, and S. Ogawa. 1975. Allosteric interpretationof hemoglobin properties. Quart. Rev. Biophys. 8:325-420.
Zahroon, I. A., and C. A. Sawicki. 1989. Changes in the apparent quantumefficiency for the photolysis of Hb(CO)j Biophys. J. 56:947-953.
Zhao, M., J. Jiang, M. Greene, M. E. Andracki, S. A. Fowler, J. A. Walder,and F. A. Ferrone. 1993. Allosteric kinetics and equilibria of triligated,cross-linked hemoglobin. Biophys. J. 64:1520-1532.