plasma lipid profiles discriminate bacterial from viral infection in
TRANSCRIPT
University of Groningen
Plasma lipid profiles discriminate bacterial from viral infection in febrile childrenEUCLIDS Consortium; Wang, Xinzhu; Nijman, Ruud; Camuzeaux, Stephane; Sands,Caroline; Jackson, Heather; Kaforou, Myrsini; Emonts, Marieke; Herberg, Jethro A.;Maconochie, IanPublished in:Scientific Reports
DOI:10.1038/s41598-019-53721-1
IMPORTANT NOTE: You are advised to consult the publisher's version (publisher's PDF) if you wish to cite fromit. Please check the document version below.
Document VersionPublisher's PDF, also known as Version of record
Publication date:2019
Link to publication in University of Groningen/UMCG research database
Citation for published version (APA):EUCLIDS Consortium, Wang, X., Nijman, R., Camuzeaux, S., Sands, C., Jackson, H., Kaforou, M.,Emonts, M., Herberg, J. A., Maconochie, I., Carrol, E. D., Paulus, S. C., Zenz, W., Van der Flier, M., deGroot, R., Martinon-Torres, F., Schlapbach, L. J., Pollard, A. J., Fink, C., ... McClure, M. (2019). Plasmalipid profiles discriminate bacterial from viral infection in febrile children. Scientific Reports, 9, [17714].https://doi.org/10.1038/s41598-019-53721-1
CopyrightOther than for strictly personal use, it is not permitted to download or to forward/distribute the text or part of it without the consent of theauthor(s) and/or copyright holder(s), unless the work is under an open content license (like Creative Commons).
The publication may also be distributed here under the terms of Article 25fa of the Dutch Copyright Act, indicated by the “Taverne” license.More information can be found on the University of Groningen website: https://www.rug.nl/library/open-access/self-archiving-pure/taverne-amendment.
Take-down policyIf you believe that this document breaches copyright please contact us providing details, and we will remove access to the work immediatelyand investigate your claim.
Downloaded from the University of Groningen/UMCG research database (Pure): http://www.rug.nl/research/portal. For technical reasons thenumber of authors shown on this cover page is limited to 10 maximum.
1Scientific RepoRtS | (2019) 9:17714 | https://doi.org/10.1038/s41598-019-53721-1
www.nature.com/scientificreports
Plasma lipid profiles discriminate bacterial from viral infection in febrile childrenXinzhu Wang1, Ruud Nijman1, Stephane camuzeaux2, Caroline Sands 2, Heather Jackson 1, Myrsini Kaforou 1, Marieke emonts3,4,5, Jethro A. Herberg1, Ian Maconochie6, Enitan D. carrol7,8,9, Stephane C. Paulus 8,9, Werner Zenz10, Michiel Van der Flier11,12, Ronald de Groot12, Federico Martinon-Torres 13,14, Luregn J. Schlapbach15, Andrew J. pollard16, Colin Fink17, Taco T. Kuijpers18, Suzanne Anderson19, Matthew R. Lewis2, Michael Levin1, Myra McClure1* & EUCLIDS consortium†
Fever is the most common reason that children present to Emergency Departments. Clinical signs and symptoms suggestive of bacterial infection are often non-specific, and there is no definitive test for the accurate diagnosis of infection. The ‘omics’ approaches to identifying biomarkers from the host-response to bacterial infection are promising. In this study, lipidomic analysis was carried out with plasma samples obtained from febrile children with confirmed bacterial infection (n = 20) and confirmed viral infection (n = 20). We show for the first time that bacterial and viral infection produces distinct profile in the host lipidome. Some species of glycerophosphoinositol, sphingomyelin, lysophosphatidylcholine and cholesterol sulfate were higher in the confirmed virus infected group, while some species of fatty acids, glycerophosphocholine, glycerophosphoserine, lactosylceramide and bilirubin were lower in the confirmed virus infected group when compared with confirmed bacterial infected group. A combination of three lipids achieved an area under the receiver operating characteristic (ROC) curve of 0.911 (95% CI 0.81 to 0.98). This pilot study demonstrates the potential
1Department of Infectious Disease, Imperial College London, London, W2 1PG, United Kingdom. 2National Phenome Centre and Imperial Clinical Phenotyping Centre, Department of Metabolism, Digestion and Reproduction, IRDB Building, Du Cane Road, Imperial College London, London, W12 0NN, United Kingdom. 3Great North Children’s Hospital, Paediatric Immunology, Infectious Diseases & Allergy, Newcastle upon Tyne Hospitals NHS Foundation Trust, Newcastle upon Tyne, NE1 4LP, United Kingdom. 4Translational and Clinical Research Institute, Newcastle University, Newcastle upon Tyne, NE2 4HH, United Kingdom. 5NIHR Newcastle Biomedical Research Centre based at Newcastle upon Tyne Hospitals NHS Trust and Newcastle University, Newcastle upon Tyne, NE4 5PL, United Kingdom. 6Department of Paediatric Emergency Medicine, St Mary’s Hospital, Imperial College NHS Healthcare Trust, London, W2 1NY, United Kingdom. 7Institute of Infection and Global Health, University of Liverpool, Liverpool, L69 7BE, United Kingdom. 8Department of Infectious Diseases, Alder Hey Children’s NHS Foundation Trust, Liverpool, L12 2AP, United Kingdom. 9Liverpool Health Partners, Liverpool, L3 5TF, United Kingdom. 10Department of General Paediatrics, Medical University of Graz, Graz, Auenbruggerplatz 34/2, 8036, Graz, Austria. 11Pediatric Infectious Diseases and Immunology, Wilhelmina Children’s Hospital, University Medical Center Utrecht, Utrecht, 3508 AB, The Netherlands. 12Pediatric Infectious Diseases and Immunology, Amalia Children’s Hospital, and Section Pediatric Infectious Diseases, Laboratory of Medical Immunology, Department of Laboratory Medicine, Radboud Institute for Molecular Life Sciences, Radboud University Medical Center, Nijmegen, 6500 HB, The Netherlands. 13Genetic, Vaccines and Pediatric Infectious Diseases Research Group (GENVIP), Instituto de Investigación Sanitaria de Santiago and Universidad de Santiago de Compostela (USC), Galicia, Spain. 14Translational Pediatrics and Infectious Diseases, Department of Pediatrics, Hospital Clínico Universitario de Santiago de Compostela, Galicia, 15706, Spain. 15Paediatirc Criticial Care Research Group, Child Health Research Centre, The University of Queensland and Paediatric Intensive Care Research Group, Queensland Children’s Hospital, Brisbane, Australia. 16Department of Paediatrics, University of Oxford and the NIHR Oxford Biomedical Research Centre, Oxford, OX3 9DU, United Kingdom. 17Micropathology Ltd, University of Warwick, Warwick, CV4 7EZ, United Kingdom. 18Division of Pediatric Hematology, Immunology and Infectious diseases, Emma Children’s Hospital Academic Medical Center, Amsterdam, 1105 AZ, The Netherlands. 19Medical Research Council Unit at the London School of Hygiene & Tropical Medicine, Banjul, The Gambia. †A comprehensive list of consortium members appears at the end of the paper. *email: [email protected]
open
2Scientific RepoRtS | (2019) 9:17714 | https://doi.org/10.1038/s41598-019-53721-1
www.nature.com/scientificreportswww.nature.com/scientificreports/
of metabolic biomarkers to assist clinicians in distinguishing bacterial from viral infection in febrile children, to facilitate effective clinical management and to the limit inappropriate use of antibiotics.
Fever is the one of the most common reasons that children present to Emergency departments in hospitals, especially in children under 5 years of age, in England1 and in the US2. Serious bacterial infection accounts for 5–15% of the febrile children presenting3–5 and most cases originating from a viral aetiology are self-limiting. Currently bacterial infection is confirmed by positive microbiological culture of a sterile sample (blood, clean catch urine or cerebrospinal fluids (CSF)). However, this can take 24–48 hours and is compounded by having a high false-negative4,6 and false positive7 rates by contaminating pathogens. Molecular detection of specific patho-gens is an option but results can be confounded by co-infections and samples need to be obtained from the site of infection which can be both invasive and impractical8. Because it is challenging for paediatricians to differentiate between bacterial and viral infection in acute illness, antibiotics are often prescribed as a precautionary measure, contributing to the rise of antimicrobial resistance.
It is clear that reliable biomarkers are urgently needed that distinguish bacterial from viral infection for the purpose of good clinical management and reducing antibiotic use. Host biomarkers, i.e. the physiological changes of the host in response to a specific pathogen, have untapped diagnostic potential and their discovery can be accelerated by the advances in ‘omics’ research, especially in the field of transcriptomics9–12 and proteomics13–15. Metabolomics has the added advantage that it is considered to most closely reflect the native phenotype and functional state of a biological system. One In vivo animal study revealed that distinct metabolic profiles can be derived from mice infected with different bacteria16 and several similar studies focusing on meningitis have shown that metabolic profiling of CSF can differentiate between meningitis and negative controls17, as well as between viral and bacterial meningitis18. Mason et al.19 demonstrated the possibility of diagnosis and prognosis of tuberculous meningitis with non-invasive urinary metabolic profiles. Metabolic changes in urine can be used to differentiate children with respiratory syncytial virus (RSV) from healthy control, as well as from those with bacterial causes of respiratory distress20.
Lipids are essential structural components of cell membranes and energy storage molecules. Thanks to the advances in lipidomics, a subset of metabolomics, lipids and lipid mediators have been increasingly recognised to play a crucial role in different metabolic pathways and cellular functions, particularly in immunity and inflam-mation21,22. However, the potential of lipidomics to distinguish bacterial from viral infection in febrile children has never been explored.
In this study, we undertook a lipidomic analysis of plasma taken from febrile children with confirmed bac-terial infection (n = 20) and confirmed viral infection (n = 20) as a proof of concept study. We show that bacte-rial and viral infection produces distinct profiles in the plasma lipids of febrile children that might be exploited diagnostically.
MethodsStudy population and sampling. The European Union Childhood Life-Threatening Infectious Disease Study (EUCLIDS)23 prospectively recruited patients, aged from 1 month to 18 years, with sepsis or severe focal infection from 98 participating hospitals in the UK, Austria, Germany, Lithuania, Spain and the Netherlands between 2012 and 2015. Plasma and other biosamples were collected to investigate the underlying genetics, pro-teomics and metabolomics of children with severe infectious disease phenotype.
Infections in Children in the Emergency Department (ICED) study aimed to define clinical features that would predict bacterial illness in children and patterns of proteomics, genomics and metabolomics associated with infections. This study included children aged 0–16 years at Imperial College NHS Healthcare Trust, St Mary’s Hospital, between June 2014 and March 201524.
The population consisted of children (≤17 years old) presenting with fever ≥38 °C, with diverse clinical symp-toms and a spectrum of pathogens. Both studies were approved by the local institutional review boards (ICED REC No 14/LO/0266 approved by NRES Committee London – Camden & Islington; EUCLIDS REC No 11/LO/1982 approved by NRES Committee London – Fulham). Written informed consent was obtained from par-ents and assent from children, where appropriate. All methods were performed in accordance with the relevant guidelines and regulations. For the EUCLIDS study, a common clinical protocol agreed by EUCLIDS Clinical Network and approved by the Ethics Committee was implemented at all hospitals.
Patients were divided into those with confirmed bacterial (n = 20) and confirmed viral (n = 20) infec-tion groups. The bacterial group consisted exclusively of patients with confirmed sterile site culture-positive bacterial infections, and the viral infection group consisted of only patients with culture, molecular or immunofluorescent-confirmed viral infection and having no co-existing bacterial infection.
Blood samples were collected in tubes spray-coated with EDTA at, or as close as possible to, the time of pres-entation to hospital and plasma obtained by centrifugation of blood samples for 10 mins at 1,300 g at 4 °C. Plasma was stored at −80 °C before being shipped on dry ice to Imperial College London for lipidomic analysis.
Lipidomic analysis. Lipidomic analysis was carried out as previously described25. Briefly, 50 µl of water were added to 50 µl of plasma, vortexed and shaken for 5 min at 1,400 rpm at 4 °C. Four hundred µl of isopropanol containing internal standards (9 in negative mode, 11 for positive mode covering 10 lipid sub-classes) were added for lipid extraction. Samples were shaken at 1,400 rpm for 2 hours at 4 °C then centrifuged at 3,800 g for 10 min. Two aliquots of 100 µl of the supernatant fluid were transferred to a 96-well plate for ultra-performance liquid chromatography (UPLC) –mass spectrometry (MS) lipidomics analysis in positive and negative mode.
3Scientific RepoRtS | (2019) 9:17714 | https://doi.org/10.1038/s41598-019-53721-1
www.nature.com/scientificreportswww.nature.com/scientificreports/
Liquid chromatography separation was carried out using an Acquity UPLC system (Waters Corporation, USA) with an injection volume of 1 µl and 2 µl for Positive and Negative ESI, respectively. An Acquity UPLC BEH column (C8, 2.1 × 100 mm, 1.7 µm; Waters Corporation, USA) was used for the purpose. Mobile phase A con-sisted of water/isopropanol/acetonitrile (2:1:1; v:v:v) with the addition of 5 mM ammonium acetate, 0.05% acetic acid and 20 µM phosphoric acid. Mobile phase B consisted of isopropanol: acetonitrile (1:1; v:v) with the addition of 5 mM ammonium acetate and 0.05% acetic acid. Flow rate was 0.6 ml/min with a total run time of 15 min and the gradient set as starting condition of 1% mobile phase B for 0.1 min, followed by an increase to 30% mobile phase B from 0.1 to 2 min, and to 90% mobile phase B from 2 min to 11.5 min. The gradient was held at 99.99% mobile phase B between 12 and 12.55 min before returning to the initial condition for re-equilibrium.
MS detection was achieved using a Xevo G2-S QTof mass spectrometer (Waters MS Technologies, UK) and data acquired in both positive and negative modes. The MS setting was configured as follows: capillary voltage 2.0 kV for Positive mode, 1.5 kV for Negative mode, sample cone voltage 25 V, source offset 80, source tempera-ture 120 °C, desolvation temperature 600 °C, desolvation gas flow 1000 L/h, and cone gas flow 150 L/h. Data were collected in centroid mode with a scan range of 50–2000 m/z and a scan time of 0.1 s. LockSpray mass correction was applied for mass accuracy using a 600 pg/ µL leucine enkephaline (m/z 556.2771 in ESI+, m/z 554.2615 in ESI−) solution in water/acetonitrile solution (1:1; v/v) at a flow rate of 15 µl/min.
Spectral and statistical analysis. A Study Quality Control sample (SQC) was prepared by pooling 25 µl of all samples. The SQC was diluted to seven different concentrations, extracted at the same ratio 1:4 with isopro-panol and replicates acquired at each concentration at the beginning and end of the run. A Long-Term Reference sample (LTR, made up of pooled plasma samples from external sources) and the SQC were diluted with water (1:1; v:v) and 400 µL of isopropanol containing internal standards (the same preparation as for the study samples) and injected once every 10 study samples, with 5 samples between a LTR and a SQC. Deconvolution of the spectra was carried out using the XCMS package. Extracted metabolic features were subsequently filtered and only those present with a relative coefficient of variation less than 15% across all SQC samples were retained. Additionally, metabolic features that did not correlate with a coefficient greater than 0.9 in a serial dilution series of SQC sam-ples were removed.
Multivariate data analysis was carried out using SIMCA-P 14.1 (Umetrics AB, Sweden). The dataset was pareto-scaled prior to principal component analysis (PCA) and orthogonal partial least squares discriminate analysis (OPLS-DA). While PCA is an unsupervised technique useful for observing inherent clustering and iden-tifying potential outliers in the dataset, OPLS-DA is a supervised method in which data is modelled against a specific descriptor of interest (in this case viral vs. bacterial infection classes). As for all supervised methods, model validity and robustness must be assessed before results can be interpreted. For OPLS-DA, model quality was assessed by internal cross-validation (Q2Y-hat value) and permutation testing in which the true Q2Y-hat value is compared to 999 models with random permutations of class membership. For valid and robust models (positive Q2Y-hat and permutation p-value < 0.05), metabolic features responsible for class separation were identified by examining the corresponding S-plot (a scatter plot of model loadings and correlation to class) with a cut-off of 0.05.
Metabolite annotation. Short-listed metabolic features were subjected to tandem mass spectrometry in order to obtain fragmentation patterns. Patterns were compared against metabolome databases (Lipidmaps, HMDB, Metlin). Isotopic distribution matching was also checked. In addition, when possible the fragmented patterns were matched against available authentic standards run under the same analytical setting for retention time and MS/MS patterns. Annotation level, according to the Metabolomics Standards Initiative, are summarised in Table 1 26.
Single feature ROC curve analysis. Analysis was performed with the web server, MetaboAnalyst 4.0. Sensitivities and specificities of lipids and predicted probabilities for the correct classification were presented as Receiver Operating Characteristic (ROC) curves. The Area Under the Curve (AUC) represents the discrimina-tory power of the lipids, with the value closest to 1 indicating the better classification.
Feature selection. An ‘in-house’ variable selection method, forward selection-partial least squares (FS-PLS; https://github.com/lachlancoin/fspls.git), was used to identify a small diagnostic signature for distinguishing bac-terial and viral infections. FS-PLS identifies a small signature made up non-correlated features. The first iteration of FS-PLS considers the levels of all features (N) and initially fits N univariate regression models. The regression coefficient for each model is estimated using the Maximum Likelihood Estimation (MLE) function, and the good-ness of fit is assessed by a t-test. The variable with the highest MLE and smallest p-value is selected first (SV1). Before selecting which of the N-1 remaining variables to use next, the algorithm projects the variation explained by SV1 using Singular Value Decomposition (SVD). The algorithm iteratively fits up to N-1 models, at each step projecting the variation corresponding to the already selected variables, and selecting new variables based on the residual variation. Projecting out the variation of selected features ensures that the final features in the signature are not correlated with each other. The FS-PLSprocess terminates when the MLE p-value exceeds a pre-defined threshold (pthresh). The final model includes regression coefficients for all selected variables. First, FS-PLS was applied to the abundance values for the short-listed metabolic features identified through OPLS-DA analysis.
An individual’s age and sex can impact upon their metabolome greatly. Limma27 was used for differential abundance analysis to identify metabolites that are associated with age or sex. Features were considered to be associated with age or sex if they achieved an FDR p-value lower than 0.05. FS-PLS was re-applied to the dataset after having removed these features and the resulting signature was compared to the signatures from the full dataset.
4Scientific RepoRtS | (2019) 9:17714 | https://doi.org/10.1038/s41598-019-53721-1
www.nature.com/scientificreportswww.nature.com/scientificreports/
The disease risk score (DRS) was calculated for the 3 metabolite signature. The DRS translates the abundance values of the features in the signature into a single value, indicating the disease group of the sample11.
The sensitivity and specificity of the lipid signature were presented as a receiver operating characteristic (ROC) curve with the 95% confidence regions calculated through bootstrap analysis with 500 iterations.
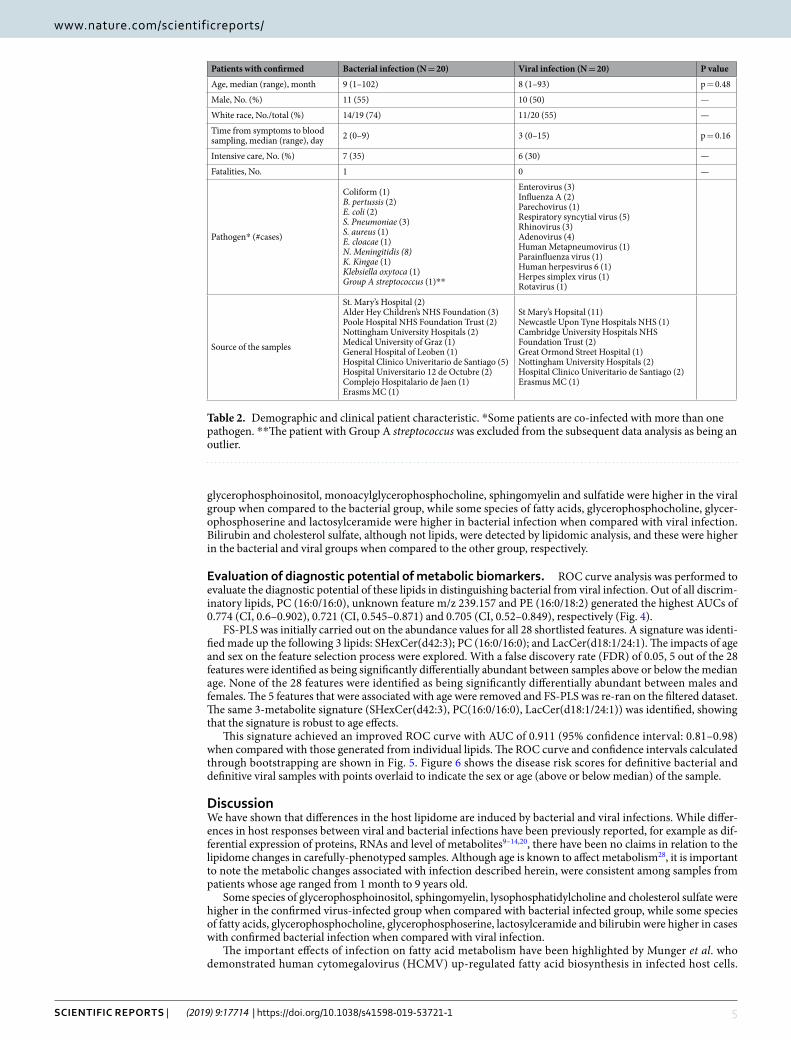
ResultsPatient characteristics. The baseline characteristics were divided into those with definitive bacterial and definitive viral infection, summarised in Table 2. When selecting patient samples, patient characteristics were matched as much as possible to ensure no particular factor would confound the model. There was no significant difference in ages between the two groups (p = 0.97). Both groups had similar sex split. Seven from definitive bacterial infection group and 6 from the definitive viral infection group were admitted to the Paediatric Intensive Care Unit (PICU). A range of pathogens was present in each group.
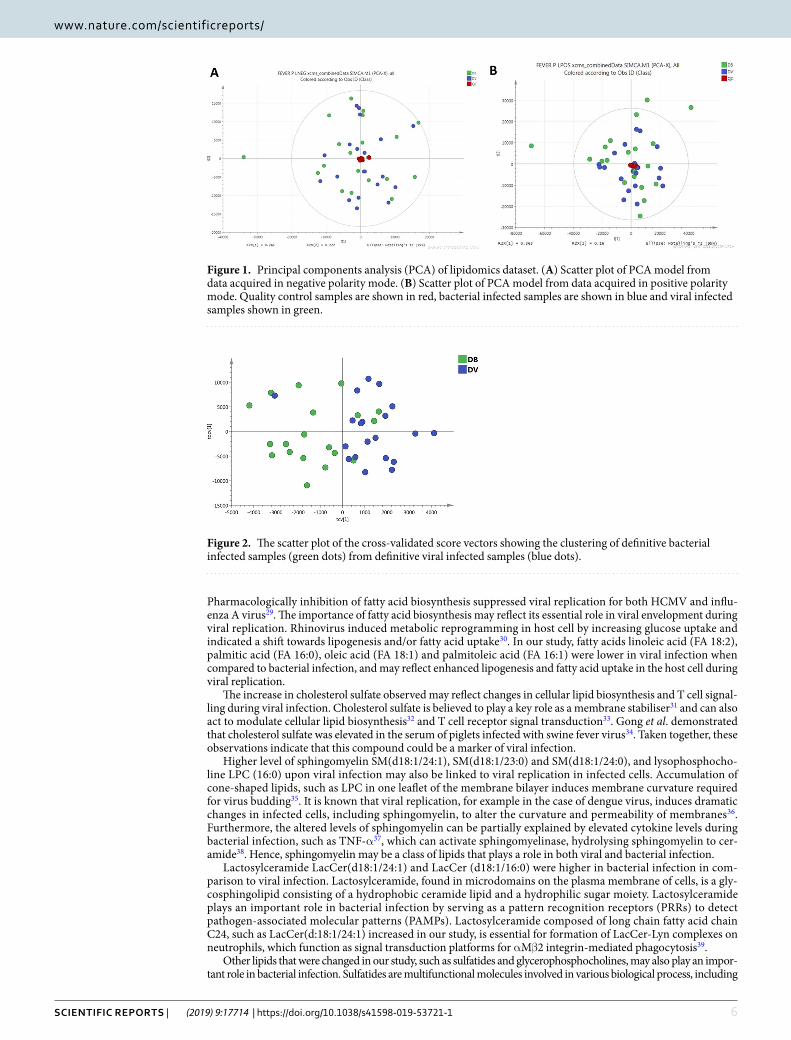
Plasma lipidome can differentiate bacterial from viral infection. PCA was conducted first to evalu-ate the data, visualise dominant patterns, and identify outliers within populations (Fig. 1). The same outlier sam-ple was present in both negative (Fig. 1A) and positive (Fig. 1B) polarity datasets and as such, was removed from subsequent analysis. SQC samples were tightly grouped together in the PCA scatter plot, indicating minimum analytical variability throughout the run.
OPLS-DA, a supervised PCA method, was carried out on both positive and negative polarity datasets. In the positive polarity mode no model was successfully built to distinguish between viral and bacterial infection groups (data not shown). However, in the negative polarity dataset, an OPLS-DA model separated bacterial infected samples from viral infected samples (with 3891 features). The robustness of the model was characterised by R2X (cum) = 0.565, R2Y-hat (cum) = 0.843 and Q2Y-hat (cum) = 0.412 and permutation p-value = 0.01 (999 tests). Cross-validated scores plot using the whole lipidome dataset indicated bacterial infected samples were more prone to miss-classification than viral infected samples (Fig. 2).
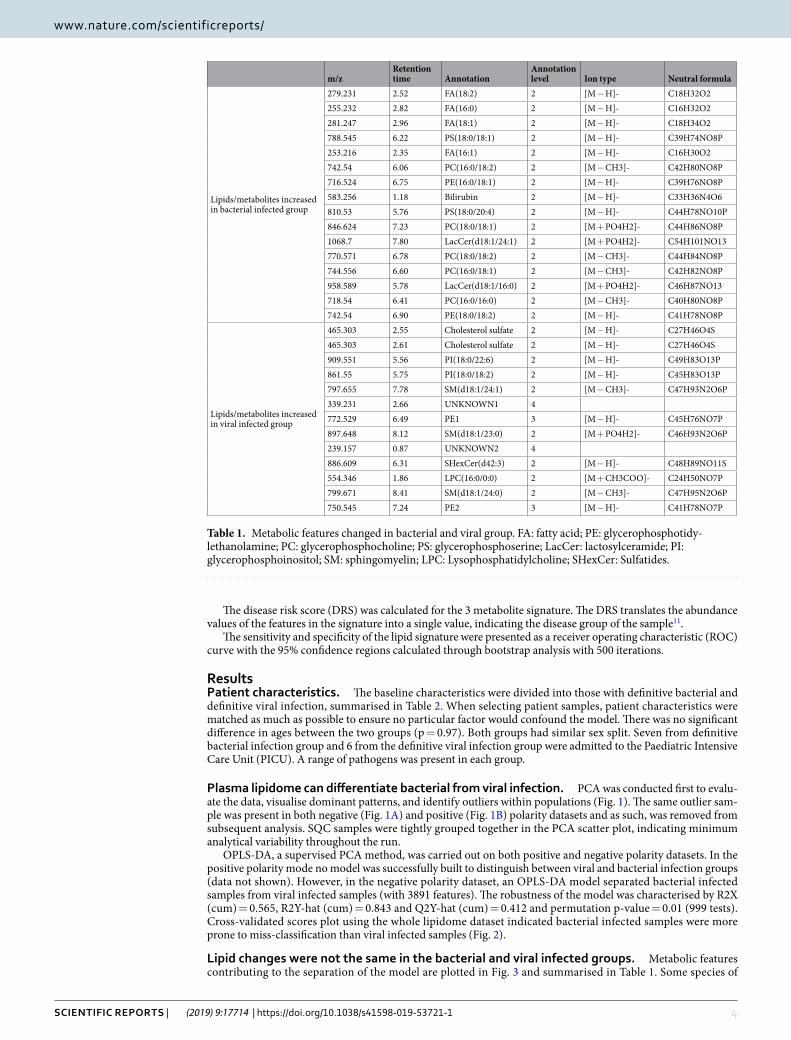
Lipid changes were not the same in the bacterial and viral infected groups. Metabolic features contributing to the separation of the model are plotted in Fig. 3 and summarised in Table 1. Some species of
m/zRetention time Annotation
Annotation level Ion type Neutral formula
Lipids/metabolites increased in bacterial infected group
279.231 2.52 FA(18:2) 2 [M − H]- C18H32O2255.232 2.82 FA(16:0) 2 [M − H]- C16H32O2281.247 2.96 FA(18:1) 2 [M − H]- C18H34O2788.545 6.22 PS(18:0/18:1) 2 [M − H]- C39H74NO8P253.216 2.35 FA(16:1) 2 [M − H]- C16H30O2742.54 6.06 PC(16:0/18:2) 2 [M − CH3]- C42H80NO8P716.524 6.75 PE(16:0/18:1) 2 [M − H]- C39H76NO8P583.256 1.18 Bilirubin 2 [M − H]- C33H36N4O6810.53 5.76 PS(18:0/20:4) 2 [M − H]- C44H78NO10P846.624 7.23 PC(18:0/18:1) 2 [M + PO4H2]- C44H86NO8P1068.7 7.80 LacCer(d18:1/24:1) 2 [M + PO4H2]- C54H101NO13770.571 6.78 PC(18:0/18:2) 2 [M − CH3]- C44H84NO8P744.556 6.60 PC(16:0/18:1) 2 [M − CH3]- C42H82NO8P958.589 5.78 LacCer(d18:1/16:0) 2 [M + PO4H2]- C46H87NO13718.54 6.41 PC(16:0/16:0) 2 [M − CH3]- C40H80NO8P742.54 6.90 PE(18:0/18:2) 2 [M − H]- C41H78NO8P
Lipids/metabolites increased in viral infected group
465.303 2.55 Cholesterol sulfate 2 [M − H]- C27H46O4S465.303 2.61 Cholesterol sulfate 2 [M − H]- C27H46O4S909.551 5.56 PI(18:0/22:6) 2 [M − H]- C49H83O13P861.55 5.75 PI(18:0/18:2) 2 [M − H]- C45H83O13P797.655 7.78 SM(d18:1/24:1) 2 [M − CH3]- C47H93N2O6P339.231 2.66 UNKNOWN1 4772.529 6.49 PE1 3 [M − H]- C45H76NO7P897.648 8.12 SM(d18:1/23:0) 2 [M + PO4H2]- C46H93N2O6P239.157 0.87 UNKNOWN2 4886.609 6.31 SHexCer(d42:3) 2 [M − H]- C48H89NO11S554.346 1.86 LPC(16:0/0:0) 2 [M + CH3COO]- C24H50NO7P799.671 8.41 SM(d18:1/24:0) 2 [M − CH3]- C47H95N2O6P750.545 7.24 PE2 3 [M − H]- C41H78NO7P
Table 1. Metabolic features changed in bacterial and viral group. FA: fatty acid; PE: glycerophosphotidy-lethanolamine; PC: glycerophosphocholine; PS: glycerophosphoserine; LacCer: lactosylceramide; PI: glycerophosphoinositol; SM: sphingomyelin; LPC: Lysophosphatidylcholine; SHexCer: Sulfatides.
5Scientific RepoRtS | (2019) 9:17714 | https://doi.org/10.1038/s41598-019-53721-1
www.nature.com/scientificreportswww.nature.com/scientificreports/
glycerophosphoinositol, monoacylglycerophosphocholine, sphingomyelin and sulfatide were higher in the viral group when compared to the bacterial group, while some species of fatty acids, glycerophosphocholine, glycer-ophosphoserine and lactosylceramide were higher in bacterial infection when compared with viral infection. Bilirubin and cholesterol sulfate, although not lipids, were detected by lipidomic analysis, and these were higher in the bacterial and viral groups when compared to the other group, respectively.
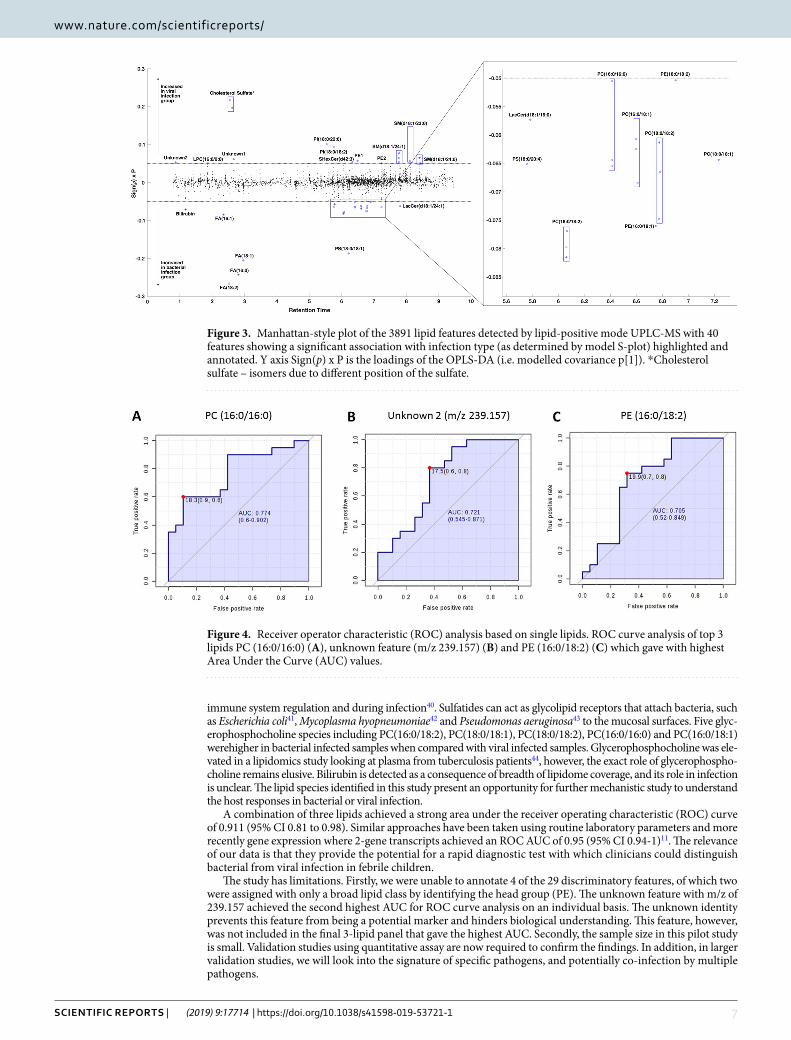
Evaluation of diagnostic potential of metabolic biomarkers. ROC curve analysis was performed to evaluate the diagnostic potential of these lipids in distinguishing bacterial from viral infection. Out of all discrim-inatory lipids, PC (16:0/16:0), unknown feature m/z 239.157 and PE (16:0/18:2) generated the highest AUCs of 0.774 (CI, 0.6–0.902), 0.721 (CI, 0.545–0.871) and 0.705 (CI, 0.52–0.849), respectively (Fig. 4).
FS-PLS was initially carried out on the abundance values for all 28 shortlisted features. A signature was identi-fied made up the following 3 lipids: SHexCer(d42:3); PC (16:0/16:0); and LacCer(d18:1/24:1). The impacts of age and sex on the feature selection process were explored. With a false discovery rate (FDR) of 0.05, 5 out of the 28 features were identified as being significantly differentially abundant between samples above or below the median age. None of the 28 features were identified as being significantly differentially abundant between males and females. The 5 features that were associated with age were removed and FS-PLS was re-ran on the filtered dataset. The same 3-metabolite signature (SHexCer(d42:3), PC(16:0/16:0), LacCer(d18:1/24:1)) was identified, showing that the signature is robust to age effects.
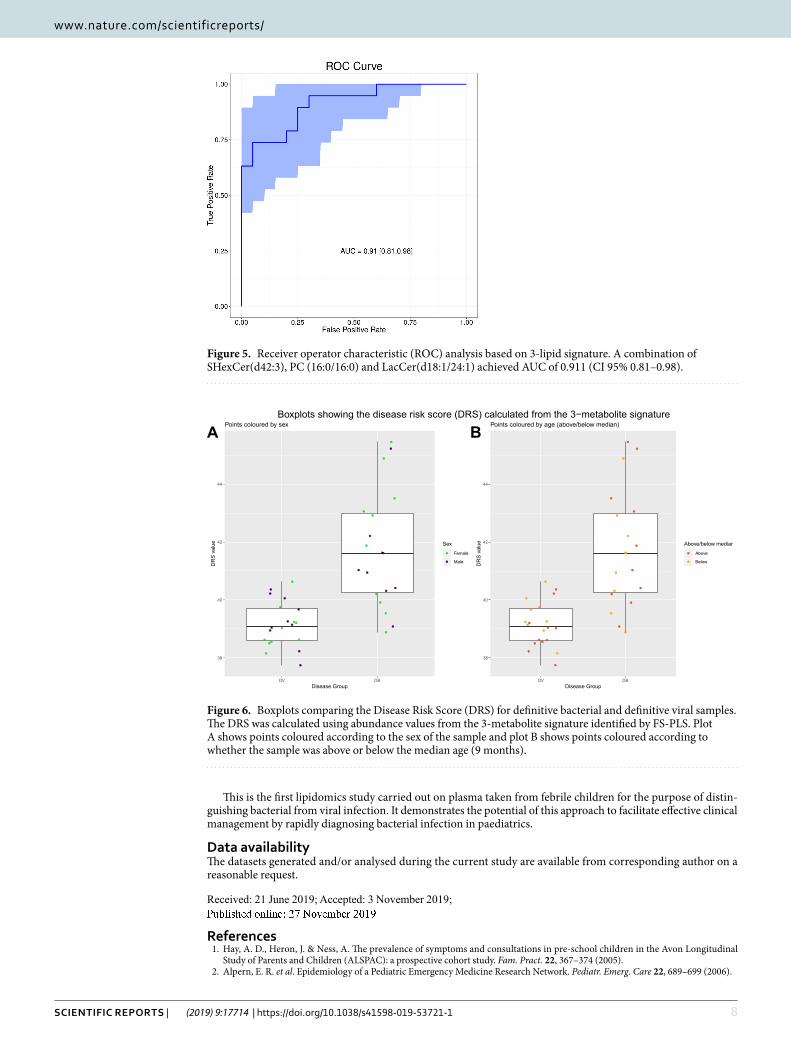
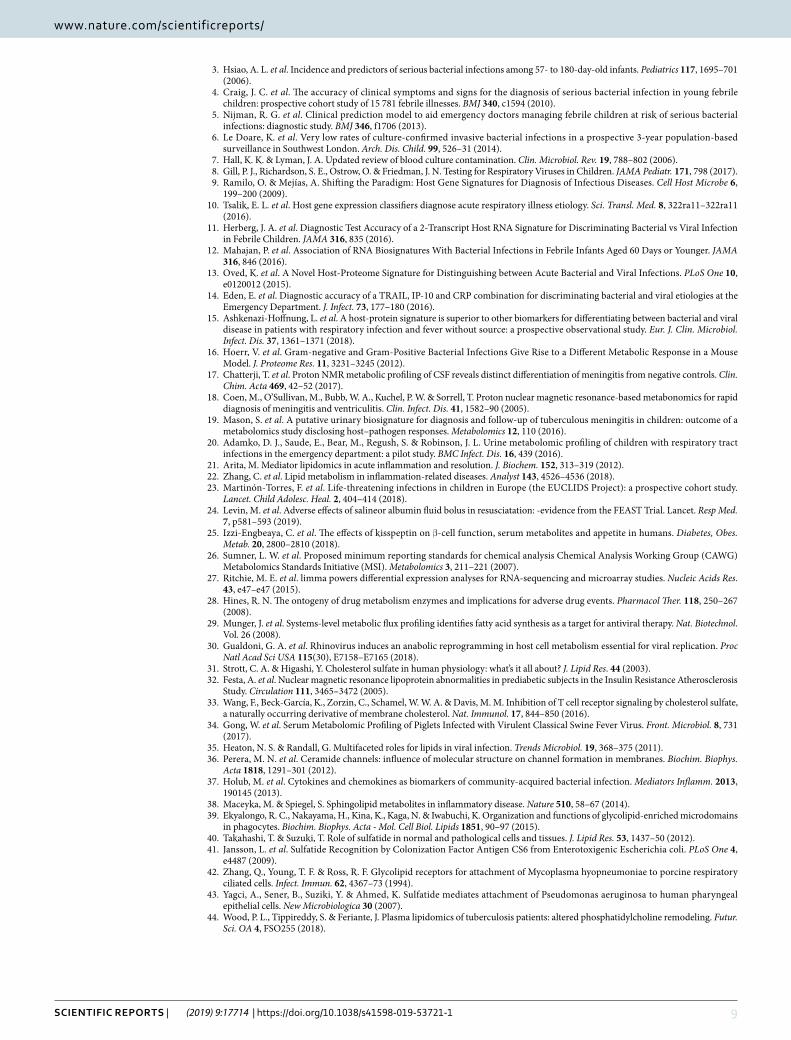
This signature achieved an improved ROC curve with AUC of 0.911 (95% confidence interval: 0.81–0.98) when compared with those generated from individual lipids. The ROC curve and confidence intervals calculated through bootstrapping are shown in Fig. 5. Figure 6 shows the disease risk scores for definitive bacterial and definitive viral samples with points overlaid to indicate the sex or age (above or below median) of the sample.
DiscussionWe have shown that differences in the host lipidome are induced by bacterial and viral infections. While differ-ences in host responses between viral and bacterial infections have been previously reported, for example as dif-ferential expression of proteins, RNAs and level of metabolites9–14,20, there have been no claims in relation to the lipidome changes in carefully-phenotyped samples. Although age is known to affect metabolism28, it is important to note the metabolic changes associated with infection described herein, were consistent among samples from patients whose age ranged from 1 month to 9 years old.
Some species of glycerophosphoinositol, sphingomyelin, lysophosphatidylcholine and cholesterol sulfate were higher in the confirmed virus-infected group when compared with bacterial infected group, while some species of fatty acids, glycerophosphocholine, glycerophosphoserine, lactosylceramide and bilirubin were higher in cases with confirmed bacterial infection when compared with viral infection.
The important effects of infection on fatty acid metabolism have been highlighted by Munger et al. who demonstrated human cytomegalovirus (HCMV) up-regulated fatty acid biosynthesis in infected host cells.
Patients with confirmed Bacterial infection (N = 20) Viral infection (N = 20) P value
Age, median (range), month 9 (1–102) 8 (1–93) p = 0.48
Male, No. (%) 11 (55) 10 (50) —
White race, No./total (%) 14/19 (74) 11/20 (55) —
Time from symptoms to blood sampling, median (range), day 2 (0–9) 3 (0–15) p = 0.16
Intensive care, No. (%) 7 (35) 6 (30) —
Fatalities, No. 1 0 —
Pathogen* (#cases)
Coliform (1)B. pertussis (2)E. coli (2)S. Pneumoniae (3)S. aureus (1)E. cloacae (1)N. Meningitidis (8)K. Kingae (1)Klebsiella oxytoca (1)Group A streptococcus (1)**
Enterovirus (3)Influenza A (2)Parechovirus (1)Respiratory syncytial virus (5)Rhinovirus (3)Adenovirus (4)Human Metapneumovirus (1)Parainfluenza virus (1)Human herpesvirus 6 (1)Herpes simplex virus (1)Rotavirus (1)
Source of the samples
St. Mary’s Hospital (2)Alder Hey Children’s NHS Foundation (3)Poole Hospital NHS Foundation Trust (2)Nottingham University Hospitals (2)Medical University of Graz (1)General Hospital of Leoben (1)Hospital Clinico Univeritario de Santiago (5)Hospital Universitario 12 de Octubre (2)Complejo Hospitalario de Jaen (1)Erasms MC (1)
St Mary’s Hopsital (11)Newcastle Upon Tyne Hospitals NHS (1)Cambridge University Hospitals NHS Foundation Trust (2)Great Ormond Street Hospital (1)Nottingham University Hospitals (2)Hospital Clinico Univeritario de Santiago (2)Erasmus MC (1)
Table 2. Demographic and clinical patient characteristic. *Some patients are co-infected with more than one pathogen. **The patient with Group A streptococcus was excluded from the subsequent data analysis as being an outlier.
6Scientific RepoRtS | (2019) 9:17714 | https://doi.org/10.1038/s41598-019-53721-1
www.nature.com/scientificreportswww.nature.com/scientificreports/
Pharmacologically inhibition of fatty acid biosynthesis suppressed viral replication for both HCMV and influ-enza A virus29. The importance of fatty acid biosynthesis may reflect its essential role in viral envelopment during viral replication. Rhinovirus induced metabolic reprogramming in host cell by increasing glucose uptake and indicated a shift towards lipogenesis and/or fatty acid uptake30. In our study, fatty acids linoleic acid (FA 18:2), palmitic acid (FA 16:0), oleic acid (FA 18:1) and palmitoleic acid (FA 16:1) were lower in viral infection when compared to bacterial infection, and may reflect enhanced lipogenesis and fatty acid uptake in the host cell during viral replication.
The increase in cholesterol sulfate observed may reflect changes in cellular lipid biosynthesis and T cell signal-ling during viral infection. Cholesterol sulfate is believed to play a key role as a membrane stabiliser31 and can also act to modulate cellular lipid biosynthesis32 and T cell receptor signal transduction33. Gong et al. demonstrated that cholesterol sulfate was elevated in the serum of piglets infected with swine fever virus34. Taken together, these observations indicate that this compound could be a marker of viral infection.
Higher level of sphingomyelin SM(d18:1/24:1), SM(d18:1/23:0) and SM(d18:1/24:0), and lysophosphocho-line LPC (16:0) upon viral infection may also be linked to viral replication in infected cells. Accumulation of cone-shaped lipids, such as LPC in one leaflet of the membrane bilayer induces membrane curvature required for virus budding35. It is known that viral replication, for example in the case of dengue virus, induces dramatic changes in infected cells, including sphingomyelin, to alter the curvature and permeability of membranes36. Furthermore, the altered levels of sphingomyelin can be partially explained by elevated cytokine levels during bacterial infection, such as TNF-α37, which can activate sphingomyelinase, hydrolysing sphingomyelin to cer-amide38. Hence, sphingomyelin may be a class of lipids that plays a role in both viral and bacterial infection.
Lactosylceramide LacCer(d18:1/24:1) and LacCer (d18:1/16:0) were higher in bacterial infection in com-parison to viral infection. Lactosylceramide, found in microdomains on the plasma membrane of cells, is a gly-cosphingolipid consisting of a hydrophobic ceramide lipid and a hydrophilic sugar moiety. Lactosylceramide plays an important role in bacterial infection by serving as a pattern recognition receptors (PRRs) to detect pathogen-associated molecular patterns (PAMPs). Lactosylceramide composed of long chain fatty acid chain C24, such as LacCer(d:18:1/24:1) increased in our study, is essential for formation of LacCer-Lyn complexes on neutrophils, which function as signal transduction platforms for αMβ2 integrin-mediated phagocytosis39.
Other lipids that were changed in our study, such as sulfatides and glycerophosphocholines, may also play an impor-tant role in bacterial infection. Sulfatides are multifunctional molecules involved in various biological process, including
Figure 1. Principal components analysis (PCA) of lipidomics dataset. (A) Scatter plot of PCA model from data acquired in negative polarity mode. (B) Scatter plot of PCA model from data acquired in positive polarity mode. Quality control samples are shown in red, bacterial infected samples are shown in blue and viral infected samples shown in green.
Figure 2. The scatter plot of the cross-validated score vectors showing the clustering of definitive bacterial infected samples (green dots) from definitive viral infected samples (blue dots).
7Scientific RepoRtS | (2019) 9:17714 | https://doi.org/10.1038/s41598-019-53721-1
www.nature.com/scientificreportswww.nature.com/scientificreports/
immune system regulation and during infection40. Sulfatides can act as glycolipid receptors that attach bacteria, such as Escherichia coli41, Mycoplasma hyopneumoniae42 and Pseudomonas aeruginosa43 to the mucosal surfaces. Five glyc-erophosphocholine species including PC(16:0/18:2), PC(18:0/18:1), PC(18:0/18:2), PC(16:0/16:0) and PC(16:0/18:1) werehigher in bacterial infected samples when compared with viral infected samples. Glycerophosphocholine was ele-vated in a lipidomics study looking at plasma from tuberculosis patients44, however, the exact role of glycerophospho-choline remains elusive. Bilirubin is detected as a consequence of breadth of lipidome coverage, and its role in infection is unclear. The lipid species identified in this study present an opportunity for further mechanistic study to understand the host responses in bacterial or viral infection.
A combination of three lipids achieved a strong area under the receiver operating characteristic (ROC) curve of 0.911 (95% CI 0.81 to 0.98). Similar approaches have been taken using routine laboratory parameters and more recently gene expression where 2-gene transcripts achieved an ROC AUC of 0.95 (95% CI 0.94-1)11. The relevance of our data is that they provide the potential for a rapid diagnostic test with which clinicians could distinguish bacterial from viral infection in febrile children.
The study has limitations. Firstly, we were unable to annotate 4 of the 29 discriminatory features, of which two were assigned with only a broad lipid class by identifying the head group (PE). The unknown feature with m/z of 239.157 achieved the second highest AUC for ROC curve analysis on an individual basis. The unknown identity prevents this feature from being a potential marker and hinders biological understanding. This feature, however, was not included in the final 3-lipid panel that gave the highest AUC. Secondly, the sample size in this pilot study is small. Validation studies using quantitative assay are now required to confirm the findings. In addition, in larger validation studies, we will look into the signature of specific pathogens, and potentially co-infection by multiple pathogens.
Figure 3. Manhattan-style plot of the 3891 lipid features detected by lipid-positive mode UPLC-MS with 40 features showing a significant association with infection type (as determined by model S-plot) highlighted and annotated. Y axis Sign(p) x P is the loadings of the OPLS-DA (i.e. modelled covariance p[1]). *Cholesterol sulfate – isomers due to different position of the sulfate.
Figure 4. Receiver operator characteristic (ROC) analysis based on single lipids. ROC curve analysis of top 3 lipids PC (16:0/16:0) (A), unknown feature (m/z 239.157) (B) and PE (16:0/18:2) (C) which gave with highest Area Under the Curve (AUC) values.
8Scientific RepoRtS | (2019) 9:17714 | https://doi.org/10.1038/s41598-019-53721-1
www.nature.com/scientificreportswww.nature.com/scientificreports/
This is the first lipidomics study carried out on plasma taken from febrile children for the purpose of distin-guishing bacterial from viral infection. It demonstrates the potential of this approach to facilitate effective clinical management by rapidly diagnosing bacterial infection in paediatrics.
Data availabilityThe datasets generated and/or analysed during the current study are available from corresponding author on a reasonable request.
Received: 21 June 2019; Accepted: 3 November 2019;Published: xx xx xxxx
References 1. Hay, A. D., Heron, J. & Ness, A. The prevalence of symptoms and consultations in pre-school children in the Avon Longitudinal
Study of Parents and Children (ALSPAC): a prospective cohort study. Fam. Pract. 22, 367–374 (2005). 2. Alpern, E. R. et al. Epidemiology of a Pediatric Emergency Medicine Research Network. Pediatr. Emerg. Care 22, 689–699 (2006).
Figure 5. Receiver operator characteristic (ROC) analysis based on 3-lipid signature. A combination of SHexCer(d42:3), PC (16:0/16:0) and LacCer(d18:1/24:1) achieved AUC of 0.911 (CI 95% 0.81–0.98).
Figure 6. Boxplots comparing the Disease Risk Score (DRS) for definitive bacterial and definitive viral samples. The DRS was calculated using abundance values from the 3-metabolite signature identified by FS-PLS. Plot A shows points coloured according to the sex of the sample and plot B shows points coloured according to whether the sample was above or below the median age (9 months).
9Scientific RepoRtS | (2019) 9:17714 | https://doi.org/10.1038/s41598-019-53721-1
www.nature.com/scientificreportswww.nature.com/scientificreports/
3. Hsiao, A. L. et al. Incidence and predictors of serious bacterial infections among 57- to 180-day-old infants. Pediatrics 117, 1695–701 (2006).
4. Craig, J. C. et al. The accuracy of clinical symptoms and signs for the diagnosis of serious bacterial infection in young febrile children: prospective cohort study of 15 781 febrile illnesses. BMJ 340, c1594 (2010).
5. Nijman, R. G. et al. Clinical prediction model to aid emergency doctors managing febrile children at risk of serious bacterial infections: diagnostic study. BMJ 346, f1706 (2013).
6. Le Doare, K. et al. Very low rates of culture-confirmed invasive bacterial infections in a prospective 3-year population-based surveillance in Southwest London. Arch. Dis. Child. 99, 526–31 (2014).
7. Hall, K. K. & Lyman, J. A. Updated review of blood culture contamination. Clin. Microbiol. Rev. 19, 788–802 (2006). 8. Gill, P. J., Richardson, S. E., Ostrow, O. & Friedman, J. N. Testing for Respiratory Viruses in Children. JAMA Pediatr. 171, 798 (2017). 9. Ramilo, O. & Mejías, A. Shifting the Paradigm: Host Gene Signatures for Diagnosis of Infectious Diseases. Cell Host Microbe 6,
199–200 (2009). 10. Tsalik, E. L. et al. Host gene expression classifiers diagnose acute respiratory illness etiology. Sci. Transl. Med. 8, 322ra11–322ra11
(2016). 11. Herberg, J. A. et al. Diagnostic Test Accuracy of a 2-Transcript Host RNA Signature for Discriminating Bacterial vs Viral Infection
in Febrile Children. JAMA 316, 835 (2016). 12. Mahajan, P. et al. Association of RNA Biosignatures With Bacterial Infections in Febrile Infants Aged 60 Days or Younger. JAMA
316, 846 (2016). 13. Oved, K. et al. A Novel Host-Proteome Signature for Distinguishing between Acute Bacterial and Viral Infections. PLoS One 10,
e0120012 (2015). 14. Eden, E. et al. Diagnostic accuracy of a TRAIL, IP-10 and CRP combination for discriminating bacterial and viral etiologies at the
Emergency Department. J. Infect. 73, 177–180 (2016). 15. Ashkenazi-Hoffnung, L. et al. A host-protein signature is superior to other biomarkers for differentiating between bacterial and viral
disease in patients with respiratory infection and fever without source: a prospective observational study. Eur. J. Clin. Microbiol. Infect. Dis. 37, 1361–1371 (2018).
16. Hoerr, V. et al. Gram-negative and Gram-Positive Bacterial Infections Give Rise to a Different Metabolic Response in a Mouse Model. J. Proteome Res. 11, 3231–3245 (2012).
17. Chatterji, T. et al. Proton NMR metabolic profiling of CSF reveals distinct differentiation of meningitis from negative controls. Clin. Chim. Acta 469, 42–52 (2017).
18. Coen, M., O’Sullivan, M., Bubb, W. A., Kuchel, P. W. & Sorrell, T. Proton nuclear magnetic resonance-based metabonomics for rapid diagnosis of meningitis and ventriculitis. Clin. Infect. Dis. 41, 1582–90 (2005).
19. Mason, S. et al. A putative urinary biosignature for diagnosis and follow-up of tuberculous meningitis in children: outcome of a metabolomics study disclosing host–pathogen responses. Metabolomics 12, 110 (2016).
20. Adamko, D. J., Saude, E., Bear, M., Regush, S. & Robinson, J. L. Urine metabolomic profiling of children with respiratory tract infections in the emergency department: a pilot study. BMC Infect. Dis. 16, 439 (2016).
21. Arita, M. Mediator lipidomics in acute inflammation and resolution. J. Biochem. 152, 313–319 (2012). 22. Zhang, C. et al. Lipid metabolism in inflammation-related diseases. Analyst 143, 4526–4536 (2018). 23. Martinón-Torres, F. et al. Life-threatening infections in children in Europe (the EUCLIDS Project): a prospective cohort study.
Lancet. Child Adolesc. Heal. 2, 404–414 (2018). 24. Levin, M. et al. Adverse effects of salineor albumin fluid bolus in resusciatation: -evidence from the FEAST Trial. Lancet. Resp Med.
7, p581–593 (2019). 25. Izzi-Engbeaya, C. et al. The effects of kisspeptin on β-cell function, serum metabolites and appetite in humans. Diabetes, Obes.
Metab. 20, 2800–2810 (2018). 26. Sumner, L. W. et al. Proposed minimum reporting standards for chemical analysis Chemical Analysis Working Group (CAWG)
Metabolomics Standards Initiative (MSI). Metabolomics 3, 211–221 (2007). 27. Ritchie, M. E. et al. limma powers differential expression analyses for RNA-sequencing and microarray studies. Nucleic Acids Res.
43, e47–e47 (2015). 28. Hines, R. N. The ontogeny of drug metabolism enzymes and implications for adverse drug events. Pharmacol Ther. 118, 250–267
(2008). 29. Munger, J. et al. Systems-level metabolic flux profiling identifies fatty acid synthesis as a target for antiviral therapy. Nat. Biotechnol.
Vol. 26 (2008). 30. Gualdoni, G. A. et al. Rhinovirus induces an anabolic reprogramming in host cell metabolism essential for viral replication. Proc
Natl Acad Sci USA 115(30), E7158–E7165 (2018). 31. Strott, C. A. & Higashi, Y. Cholesterol sulfate in human physiology: what’s it all about? J. Lipid Res. 44 (2003). 32. Festa, A. et al. Nuclear magnetic resonance lipoprotein abnormalities in prediabetic subjects in the Insulin Resistance Atherosclerosis
Study. Circulation 111, 3465–3472 (2005). 33. Wang, F., Beck-García, K., Zorzin, C., Schamel, W. W. A. & Davis, M. M. Inhibition of T cell receptor signaling by cholesterol sulfate,
a naturally occurring derivative of membrane cholesterol. Nat. Immunol. 17, 844–850 (2016). 34. Gong, W. et al. Serum Metabolomic Profiling of Piglets Infected with Virulent Classical Swine Fever Virus. Front. Microbiol. 8, 731
(2017). 35. Heaton, N. S. & Randall, G. Multifaceted roles for lipids in viral infection. Trends Microbiol. 19, 368–375 (2011). 36. Perera, M. N. et al. Ceramide channels: influence of molecular structure on channel formation in membranes. Biochim. Biophys.
Acta 1818, 1291–301 (2012). 37. Holub, M. et al. Cytokines and chemokines as biomarkers of community-acquired bacterial infection. Mediators Inflamm. 2013,
190145 (2013). 38. Maceyka, M. & Spiegel, S. Sphingolipid metabolites in inflammatory disease. Nature 510, 58–67 (2014). 39. Ekyalongo, R. C., Nakayama, H., Kina, K., Kaga, N. & Iwabuchi, K. Organization and functions of glycolipid-enriched microdomains
in phagocytes. Biochim. Biophys. Acta - Mol. Cell Biol. Lipids 1851, 90–97 (2015). 40. Takahashi, T. & Suzuki, T. Role of sulfatide in normal and pathological cells and tissues. J. Lipid Res. 53, 1437–50 (2012). 41. Jansson, L. et al. Sulfatide Recognition by Colonization Factor Antigen CS6 from Enterotoxigenic Escherichia coli. PLoS One 4,
e4487 (2009). 42. Zhang, Q., Young, T. F. & Ross, R. F. Glycolipid receptors for attachment of Mycoplasma hyopneumoniae to porcine respiratory
ciliated cells. Infect. Immun. 62, 4367–73 (1994). 43. Yagci, A., Sener, B., Suziki, Y. & Ahmed, K. Sulfatide mediates attachment of Pseudomonas aeruginosa to human pharyngeal
epithelial cells. New Microbiologica 30 (2007). 44. Wood, P. L., Tippireddy, S. & Feriante, J. Plasma lipidomics of tuberculosis patients: altered phosphatidylcholine remodeling. Futur.
Sci. OA 4, FSO255 (2018).
1 0Scientific RepoRtS | (2019) 9:17714 | https://doi.org/10.1038/s41598-019-53721-1
www.nature.com/scientificreportswww.nature.com/scientificreports/
AcknowledgementsThis work was partially supported by the European Seventh Framework Programme for Research and Technological Development (FP7) under EUCLIDS Grant Agreement no. 279185. ICED: The Research was supported by the National Institute for Health Research Biomedical Research Centre based at Imperial College. This work was further supported by the Medical Research Council and National Institute for Health Research [grant number MC_PC_12025] through funding for the MRC-NIHR National Phenome Centre, infrastructure support was provided by the National Institute for Health Research (NIHR) Biomedical Research Centre (BRC) at Imperial NHS Healthcare Trust. MK acknowledges funding from the Wellcome Trust (Sir Henry Wellcome Fellowship grant 206508/Z/17/Z). This paper is independent research funded by the NIHR Imperial BRC.
Author contributionsX.W., S.C., C.S., and Matthew L conducted lipidomics analysis. H.J. and M.K. performed feature selection analysis. R.N. selected samples from the cohort for analysis. M.M. conceived the idea and supervised the project. X.W. wrote the manuscript. M.E., J.H., E.D.C., S.C.P., W.Z., M.F., R.G., F.M.-T., L.J.S., A.J.P., C.F., T.T.K., S.A., Michael L are principal investigators of the EUCLIDS study and recruited patients, some of which were included in this study. I.M. is the principal investigators of the ICED study. All authors read and approved the final manuscript.
Competing interestsMichiel Van der Flier received CSL Behring Grant for in vitro testing novel antibody preparation and Shire grant for Quality improvement PID outpatient clinic, also has Thermo Fisher Educational event speaker honorarium. Andrew J Pollard chairs the UK department of Health and Social Care’s (DHCSC) Joint Committee on Vaccination and Immunisation and the EMA Scientific Advisory Group on vaccines, and he is a member of WHO’s Strategic Advisory Group of Experts. The views expressed in the publication are those of the author(s) and not necessarily those of the DHSC, NIHR or WHO. Other authors declare no potential conflict of interest.
Additional informationCorrespondence and requests for materials should be addressed to M.M.Reprints and permissions information is available at www.nature.com/reprints.Publisher’s note Springer Nature remains neutral with regard to jurisdictional claims in published maps and institutional affiliations.
Open Access This article is licensed under a Creative Commons Attribution 4.0 International License, which permits use, sharing, adaptation, distribution and reproduction in any medium or
format, as long as you give appropriate credit to the original author(s) and the source, provide a link to the Cre-ative Commons license, and indicate if changes were made. The images or other third party material in this article are included in the article’s Creative Commons license, unless indicated otherwise in a credit line to the material. If material is not included in the article’s Creative Commons license and your intended use is not per-mitted by statutory regulation or exceeds the permitted use, you will need to obtain permission directly from the copyright holder. To view a copy of this license, visit http://creativecommons.org/licenses/by/4.0/. © The Author(s) 2019
1 1Scientific RepoRtS | (2019) 9:17714 | https://doi.org/10.1038/s41598-019-53721-1
www.nature.com/scientificreportswww.nature.com/scientificreports/
Consortia
EUCLIDS consortiumStuart Gormley1, Shea Hamilton1, Bernardo Hourmat1, Clive Hoggart1, Vanessa Sancho-Shimizu1, Victoria Wright1, Amina Abdulla1, Paul Agapow1, Maeve Bartlett1, Evangelos Bellos1, Hariklia Eleftherohorinou1, Rachel Galassini1, David Inwald1, Meg Mashbat1, Stefanie Menikou1, Sobia Mustafa1, Simon Nadel1, Rahmeen Rahman1, Clare Thakker1, Lachlan M. J. Coin1, S. Bokhandi20, Sue Power20, Heather Barham20, Dr N Pathan21, Jenna Ridout21, Deborah White21, Sarah Thurston21, S. Faust22, S. Patel22, Jenni McCorkell22, P. Davies23, Lindsey Crate23, Helen Navarra23, Stephanie Carter23, R. Ramaiah24, Rekha Patel24, Catherine Tuffrey25, Andrew Gribbin25, Sharon McCready25, Mark Peters26, Katie Hardy26, Fran Standing26, Lauren O’Neill26, Eugenia Abelake26, Akash Deep27, Eniola Nsirim27, Louise Willis28, Zoe Young28, C. Royad29, Sonia White29, P. M. Fortune30, Phil Hudnott30, Fernando Álvez González14, Ruth Barral-Arca14,31, Miriam Cebey-López14, María José Curras-Tuala2,14, Natalia García14, Luisa García Vicente14, Alberto Gómez-Carballa14,31, Jose Gómez Rial14, Andrea Grela Beiroa14, Antonio Justicia Grande14, Pilar Leboráns Iglesias14, Alba Elena Martínez Santos14, Federico Martinón-Torres14, Nazareth MartinónTorres14, José María Martinón Sánchez14, Beatriz Morillo Gutiérrez14, Belén Mosquera Pérez14, Pablo Obando Pacheco14, Jacobo Pardo-Seco14,31, Sara Pischedda14,31, Irene RiveroCalle14, Carmen Rodríguez-Tenreiro14, Lorenzo Redondo-Collazo14, Antonio Salas Ellacuriagal14,31, Sonia Serén Fernández14, María del Sol Porto Silva14, Ana Vega14,32, Lucía Vilanova Trillo14, Antonio Salas14,31, Susana Beatriz Reyes33, María Cruz León León33, Álvaro Navarro Mingorance33, Xavier Gabaldó Barrios33, Eider Oñate Vergara34, Andrés Concha Torre35, Ana Vivanco35, Reyes Fernández35, Francisco Giménez Sánchez36, Miguel Sánchez Forte36, pablo Rojo37, J. Ruiz Contreras37, Alba Palacios37, Cristina Epalza Ibarrondo37, Elizabeth Fernández Cooke37, Marisa Navarro38, Cristina Álvarez Álvarez38, María José Lozano38, Eduardo Carreras39, Sonia Brió Sanagustín39, Olaf Neth40, Ma del Carmen Martínez Padilla41, Luis Manuel Prieto Tato42, Sara Guillén42, Laura Fernández Silveira43, David Moreno44, A. M. Tutu van Furth45, N. P. Boeddha46, G. J. A. Driessen46, M. Emonts46,47,48, J. A. Hazelzet46, D. Pajkrt18, E. A. M. Sanders49, D. van de Beek50, A. van der Ende50, H. L. A. Philipsen45, A. O. A. Adeel51, M. A. Breukels52, D. M. C. Brinkman53, C. C. M. M. de Korte54, E. de Vries55,56, W. J. de Waal57, R. Dekkers57, A. Dings-Lammertink58, R. A. Doedens59, A. E. Donker60, M. Dousma61, T. E. Faber62, G. P. J. M. Gerrits63, J. A. M. Gerver64, J. Heidema65, J. Homan-van der Veen66, M. A. M. Jacobs67, N. J. G. Jansen49, P. Kawczynski68, K. Klucovska69, M. C. J. Kneyber70, Y. Koopman-Keemink71, V. J. Langenhorst72, J. Leusink73, B. F. Loza74, I. T. Merth75, C. J. Miedema76, C. Neeleman45, J. G. Noordzij77, C. C. Obihara78, A. L. T. van Overbeek – van Gils79, G. H. Poortman80, S. T. Potgieter81, J. Potjewijd82, P. P. R. Rosias83, T. Sprong63, G. W. ten Tussher84, B. J. Thio85, G. A. Tramper-Stranders86, M. van Deuren45, H. van der Meer14, A. J. M. van Kuppevelt87, A. M. van Wermeskerken88, W. A. Verwijs89, T. F. W. Wolfs47, Philipp Agyeman90, Christoph Aebi90, Christoph Berger90, Philipp Agyeman90, Christoph Aebi90, Eric Giannoni91,92, Martin Stocker93, Klara M. Posfay-Barbe94, Ulrich Heininger95, Sara Bernhard-Stirnemann96, Anita Niederer-Loher97, Christian Kahlert97, Paul Hasters98, Christa Relly99, Walter Baer100, Christoph Berger99, Hannah Frederick101, Rebecca Jennings101, Joanne Johnston101, Rhian Kenwright101, Elli Pinnock17, Rachel Agbeko5,6, Fatou Secka19, Kalifa Bojang19, Isatou Sarr19, Ngange Kebbeh19, Gibbi Sey19, Momodou, Saidy khan19, Fatoumata Cole19, Gilleh Thomas19, Martin Antonio19, Daniela S. Klobassa11, Alexander Binder11, Nina A. Schweintzger11, Manfred Sagmeister11, Hinrich Baumgart102, Markus Baumgartner103, Uta Behrends104, Ariane Biebl105, Robert Birnbacher106, Jan-Gerd Blanke107, Carsten Boelke108, Kai Breuling104, Jürgen Brunner109, Maria Buller110, Peter Dahlem111, Beate Dietrich112, Ernst Eber113, Johannes Elias114, Josef Emhofer103, Rosa Etschmaier115, Sebastian Farr116, Ylenia Girtler117, Irina Grigorow118, Konrad Heimann119, Ulrike Ihm120, Zdenek Jaros121, Hermann Kalhoff122, Wilhelm Kaulfersch123, Christoph Kemen124, Nina Klocker125, Bernhard Köster126, Benno Kohlmaier127, Eleni Komini128, Lydia Kramer104, Antje Neubert129, Daniel Ortner130, Lydia Pescollderungg117, Klaus Pfurtscheller131, Karl Reiter132, Goran Ristic133, Siegfried Rödl131, Andrea Sellner127, Astrid Sonnleitner127, Matthias Sperl134, Wolfgang Stelzl135, Holger Till102, Andreas Trobisch127, Anne Vierzig136, Ulrich Vogel113, Christina Weingarten137, Stefanie Welke138, Andreas Wimmer139, Uwe Wintergerst140, Daniel Wüller141, Andrew Zaunschirm142, Ieva Ziuraite143 & Veslava Žukovskaja143
1 2Scientific RepoRtS | (2019) 9:17714 | https://doi.org/10.1038/s41598-019-53721-1
www.nature.com/scientificreportswww.nature.com/scientificreports/
20Poole Hospital NHS Foundation Trust, Poole, United Kingdom. 21Cambridge University Hospitals NHS Trust, Cambridge, United Kingdom. 22University Hospital Southampton, Southampton, United Kingdom. 23Nottingham University Hospital NHS Trust, Nottingham, United Kingdom. 24University Hospitals of Leicester NHS Trust, Leicester, United Kingdom. 25Portsmouth Hospitals NHS Trust, Portsmouth, United Kingdom. 26Great Ormond Street Hospital, London, United Kingdom. 27King’s College Hospital NHS Foundation Trust, London, United Kingdom. 28Oxford University Hospitals NHS Foundation Trust, Oxford, United Kingdom. 29Kettering General Hospital NHS Foundation Trust, Kettering, United Kingdom. 30Central Manchester NHS Trust, Manchester, United Kingdom. 31Unidade de Xenética, Departamento de Anatomía Patolóxica e Ciencias Forenses, Instituto de Ciencias Forenses, Facultade de Medicina, Universidade de Santiago de Compostela, and GenPop Research Group, Instituto de Investigaciones Sanitarias (IDIS), Hospital Clínico Universitario de Santiago, Galicia, Spain. 32Fundación Pública Galega de Medicina Xenómica, Servizo Galego de Saúde (SERGAS), Instituto de Investigaciones Sanitarias (IDIS), and Grupo de Medicina Xenómica, Centro de Investigación Biomédica en Red de Enfermedades Raras (CIBERER), Universidade de Santiago de Compostela (USC), Santiago de Compostela, Spain. 33Hospital Clínico Universitario Virgen de la Arrixaca, Murcia, Spain. 34Hospital de Donostia, San Sebastián, Spain. 35Hospital Universitario Central de Asturias, Asturias, Spain. 36Complejo Hospitalario Torrecárdenas, Almería, Spain. 37Hospital Universitario 12 de Octubre, Madrid, Spain. 38Hospital General Universitario Gregorio Marañón, Madrid, Spain. 39Hospital de la Santa Creu i Sant Pau, Barcelona, Spain. 40Hospital Universitario Virgen del Rocío, Sevilla, Spain. 41Complejo Hospitalario de Jaén, Jaén, Spain. 42Hospital Universitario de Getafe, Madrid, Spain. 43Hospital Universitario y Politécnico de La Fe, Valencia, Spain. 44Hospital Regional Universitario Carlos Haya, Málaga, Spain. 45Vrije Universiteit University Medical Center, Amsterdam, The Netherlands. 46Erasmus Medical Center – Sophia Children’s Hospital, Rotterdam, The Netherlands. 47Institute of Cellular Medicine, Newcastle University, Newcastle upon Tyne, United Kingdom. 48Paediatric Infectious Diseases and Immunology Department, Newcastle upon Tyne Hospitals Foundation Trust, Great North Children’s Hospital, Newcastle upon Tyne, United Kingdom. 49University Medical Center Utrecht – Wilhelmina Children’s Hospital, Utrecht, The Netherlands. 50Academic Medical Center, University of Amsterdam, Amsterdam, The Netherlands. 51Kennemer Gasthuis, Haarlem, The Netherlands. 52Elkerliek Hospital, Helmond, The Netherlands. 53Alrijne Hospital, Leiderdorp, The Netherlands. 54Beatrix Hospital, Gorinchem, The Netherlands. 55Jeroen Bosch Hospital, ‘s-Hertogenbosch, The Netherlands. 56Diakonessenhuis, Utrecht, The Netherlands. 57Maasziekenhuis Pantein, Boxmeer, The Netherlands. 58Gelre Hospitals, Zutphen, The Netherlands. 59Martini Hospital, Groningen, The Netherlands. 60Maxima Medical Center, Veldhoven, The Netherlands. 61Gemini Hospital, Den Helder, The Netherlands. 62Medical Center Leeuwarden, Leeuwarden, The Netherlands. 63Canisius-Wilhelmina Hospital, Nijmegen, The Netherlands. 64Rode Kruis Hospital, Beverwijk, The Netherlands. 65St. Antonius Hospital, Nieuwegein, The Netherlands. 66Deventer Hospital, Deventer, The Netherlands. 67Slingeland Hospital, Doetinchem, The Netherlands. 68Refaja Hospital, Stadskanaal, The Netherlands. 69Bethesda Hospital, Hoogeveen, The Netherlands. 70University Medical Center Groningen, Beatrix Children’s hospital, Groningen, The Netherlands. 71Haga Hospital – Juliana Children’s Hospital, Den Haag, The Netherlands. 72Isala Hospital, Zwolle, The Netherlands. 73Bernhoven Hospital, Uden, The Netherlands. 74VieCuri Medical Center, Venlo, The Netherlands. 75Ziekenhuisgroep Twente, Almelo-Hengelo, The Netherlands. 76Catharina Hospital, Eindhoven, The Netherlands. 77Reinier de Graaf Gasthuis, Delft, The Netherlands. 78ETZ Elisabeth, Tilburg, The Netherlands. 79Scheper Hospital, Emmen, The Netherlands. 80St. Jansdal Hospital, Hardewijk, The Netherlands. 81Laurentius Hospital, Roermond, The Netherlands. 82Isala Diaconessenhuis, Meppel, The Netherlands. 83Zuyderland Medical Center, Sittard-Geleen, The Netherlands. 84Westfriesgasthuis, Hoorn, The Netherlands. 85Medisch Spectrum Twente, Enschede, The Netherlands. 86St. Franciscus Gasthuis, Rotterdam, The Netherlands. 87Streekziekenhuis Koningin Beatrix, Winterswijk, The Netherlands. 88Flevo Hospital, Almere, The Netherlands. 89Zuwe Hofpoort Hospital, Woerden, The Netherlands. 90Department of Pediatrics, Inselspital, Bern University Hospital, University of Bern, Bern, Switzerland. 91Service of Neonatology, Lausanne University Hospital, Lausanne, Switzerland. 92Infectious Diseases Service, Lausanne University Hospital, Lausanne, Switzerland. 93Department of Pediatrics, Children’s Hospital Lucerne, Lucerne, Switzerland. 94Pediatric Infectious Diseases Unit, Children’s Hospital of Geneva, University Hospitals of Geneva, Geneva, Switzerland. 95Infectious Diseases and Vaccinology, University of Basel Children’s Hospital, Basel, Switzerland. 96Children’s Hospital Aarau, Aarau, Switzerland. 97Division of Infectious Diseases and Hospital Epidemiology, Children’s Hospital of Eastern Switzerland St. Gallen, St. Gallen, Switzerland. 98Department of Neonatology, University Hospital Zurich, Zurich, Switzerland. 99Division of Infectious Diseases and Hospital Epidemiology, and Children’s Research Center, University Children’s Hospital Zurich, Zurich, Switzerland. 100Children’s Hospital Chur, Chur, Switzerland. 101Alder Hey Children’s Hospital, Clinical Research Business Unit, Eaton Road, Liverpool, L12 2AP, United Kingdom. 102Department of Pediatric and Adolescence Surgery, Division of General Pediatric Surgery, Medical University Graz, Graz, Austria. 103Department of Pediatrics, General Hospital of Steyr, Steyr, Austria. 104Department of Pediatrics/Department of Pediatric Surgery, Technische Universität München (TUM), Munich, Germany. 105Department of Pediatrics, Kepler University Clinic, Medical Faculty of the Johannes Kepler University, Linz, Austria. 106Department of Pediatrics and Adolesecent Medicine LKH Villach, Villach, Austria. 107Department of Pediatrics and Adolescent Medicine and Neonatology, Hospital Ludmillenstift, Meppen, Germany. 108Hospital for Children’s and Youth Medicine, Oberschwabenklinik, Ravensburg, Germany. 109Department of Pediatrics, Medical University Innsbruck, Innsbruck, Austria. 110Clinic for Paediatrics and Adolescents Medicine, Sana Hanse-Klinikum Wismar, Wismar, Germany. 111Department of Pediatrics, Medical Center Coburg, Coburg, Germany. 112University Medicine Rostock, Department of Pediatrics (UKJ), Rostock, Germany. 113Department of Pulmonology, Medical University Graz, Graz, Austria. 114Institute for Hygiene and Microbiology, University of Würzburg, Würzburg, Germany. 115Clinical Institute of Medical and Chemical Laboratory Diagnostics, Medical University Graz, Graz, Austria. 116Department of Pediatric Orthopedics and Adult Foot and Ankle Surgery, Orthopedic Hospital Speising, Vienna, Austria. 117Department of Paediatrics, Regional Hospital Bolzano, Bolzano, Italy. 118Department of Pediatrics and Adolescent Medicine, General Hospital Hochsteiermark/Leoben, Leoben, Austria. 119Department of Neonatology and Paediatric Intensive Care, Children’s University Hospital, RWTH Aachen, Aachen, Germany.
13Scientific RepoRtS | (2019) 9:17714 | https://doi.org/10.1038/s41598-019-53721-1
www.nature.com/scientificreportswww.nature.com/scientificreports/
120Paediatric Intensive Care Unit, Department of Paediatric Surgery, Donauspital Vienna, Vienna, Austria. 121Department of Pediatrics, General Public Hospital, Zwettl, Austria. 122Pediatric Clinic Dortmund, Dortmund, Germany. 123Department of Pediatrics and Adolescent Medicine, Klinikum Klagenfurt am Wörthersee, Klagenfurt, Austria. 124Catholic Children’s Hospital Wilhelmstift, Department of Pediatrics, Hamburg, Germany. 125Department of Pediatrics, Krankenhaus Dornbirn, Dornbirn, Austria. 126Children’s Hospital Luedenscheid, Maerkische Kliniken, Luedenscheid, Germany. 127Department of General Paediatrics, Medical University Graz, Graz, Austria. 128Department of Paediatrics, Schwarzwald-Baar-Hospital, Villingen-Schwenningen, Germany. 129Department of Paediatrics and Adolescents Medicine, University Hospital Erlangen, Erlangen, Germany. 130Department of Pediatrics and Adolescent Medicine, Medical University of Salzburg, Salzburg, Austria. 131Paediatric Intensive Care Unit, Medical University Graz, Graz, Austria. 132Dr. von Hauner Children’s Hospital, Ludwig-Maximilians-Universitaet, Munich, Germany. 133Mother and Child Health Care Institute of Serbia, Belgrade, Serbia. 134Department of Pediatric and Adolescence Surgery, Division of Pediatric Orthopedics, Medical University Graz, Graz, Austria. 135Department of Pediatrics, Academic Teaching Hospital, Landeskrankenhaus Feldkirch, Feldkirch, Austria. 136University Children’s Hospital, University of Cologne, Cologne, Germany. 137Department of Pediatrics and Adolescent Medicine Wilheminenspital, Vienna, Austria. 138Department of Pediatric Surgery, Municipal Hospital Karlsruhe, Karlsruhe, Germany. 139Hospital of the Sisters of Mercy Ried, Department of Pediatrics and Adolescent Medicine, Ried, Austria. 140Hospital St. Josef, Braunau, Austria. 141Christophorus Kliniken Coesfeld Clinic for Pediatrics, Coesfeld, Germany. 142Department of Paediatrics, University Hospital Krems, Karl Landsteiner University of Health Sciences, Krems, Austria. 143Children’s Hospital, Affiliate of Vilnius University Hospital Santariskiu Klinikos, Vilnius, Lithuania.