physico-chemical and mass transfer considerations in microencapsulation
TRANSCRIPT
84
Physico-chemical and Mass Transfer Considerations in Microencapsulation
MATTHEUS F. A. GOOSENa
College of Engineering, Sultan Qaboos University P.O. Box 33, Muscat 123, Sultanate of Oman
ABSTRACT: To gain better insight into mass transfer problems in encapsulat-ed cell systems requires a combination of experimental investigations andmathematical modeling. Specific mass transfer studies are reviewed includingoxygen transfer in immobilized animal cell culture bioreactors, modeling ofpolymer droplet formation and encapsulated animal cell growth, and growthof somatic tissue encapsulated in alginate using electrostatics. Special emphasisis given to electrostatic droplet generation for cell immobilization.
INTRODUCTION
To be able to scale-up an encapsulated cell system, it is essential to have a goodunderstanding of the oxygen/nutrient/cell product mass transfer process. Appliedscientists and engineers are ideally suited for this task since they can combine exper-imental and theoretical/mathematical modelling studies to give a clearer insight intopotential mass transfer bottlenecks.
Microencapsulation systems have found applications in a variety of areas, includ-ing encapsulated cell therapy,1–4 immobilized biocatalysts,5,6 and polymeric drug-delivery systems.7,8 All areas, however, suffer from specific mass transfer problems.With drug-delivery systems, the release of the bioactive agent from the polymer ma-trix or capsule must be controlled so as to provide a constant steady release rate. Inthe case of immobilized cells, oxygen must be able to reach the viable cells at a suf-ficient rate to keep the cells alive, while the desired product, such as insulin in thecase of diabetes treatment, must diffuse out of the capsule, along with low molecularweight waste products. With biocatalysts, whether they be enzymes or cells, the sub-strate must be able to reach the bead/capsule interior to allow the biochemical reac-tion to occur and the desired products must be able to diffuse out of the bead.
This paper will review specific mass transfer studies performed in our laboratoryincluding oxygen transfer in immobilized animal cell culture bioreactors, modelingof polymer droplet formation and encapsulated animal cell growth, and growth of so-matic tissue encapsulated in alginate using electrostatics. Experimental and theoret-ical/modelling studies will be combined in an attempt to give the reader a betterinsight into common mass transfer problems.
aFax: (968)513-416; e-mail: [email protected] (office); [email protected] (home).

85GOOSEN: MICROENCAPSULATION
SCALE-UP OF IMMOBILIZED ANIMAL CELL CULTURE BIOREACTORS AND OXYGEN TRANSFER
Providing adequate oxygen to the cells without damaging them is perhaps themost important function of an animal cell bioreactor. In the operation of a bioreactorthe gas to bulk liquid oxygen transfer is the only resistance which can be controlled.Varying the aeration rate will affect the gas to liquid oxygen transfer which in turnwill affect the transfer of oxygen from the bulk liquid to the cell. Researchers have,therefore, focused on measuring the mass transfer coefficient kla, under various op-erating conditions, for the purpose of developing useful correlations that may be em-ployed as scale-up criteria for animal cell bioreactors. A common technique used indynamic kla measurements involves deoxygenating the reactor contents.9 Subse-quently, gas of a different oxygen concentration is admitted and the oxygen profileis monitored.
Modeling the Oxygen Transfer Process
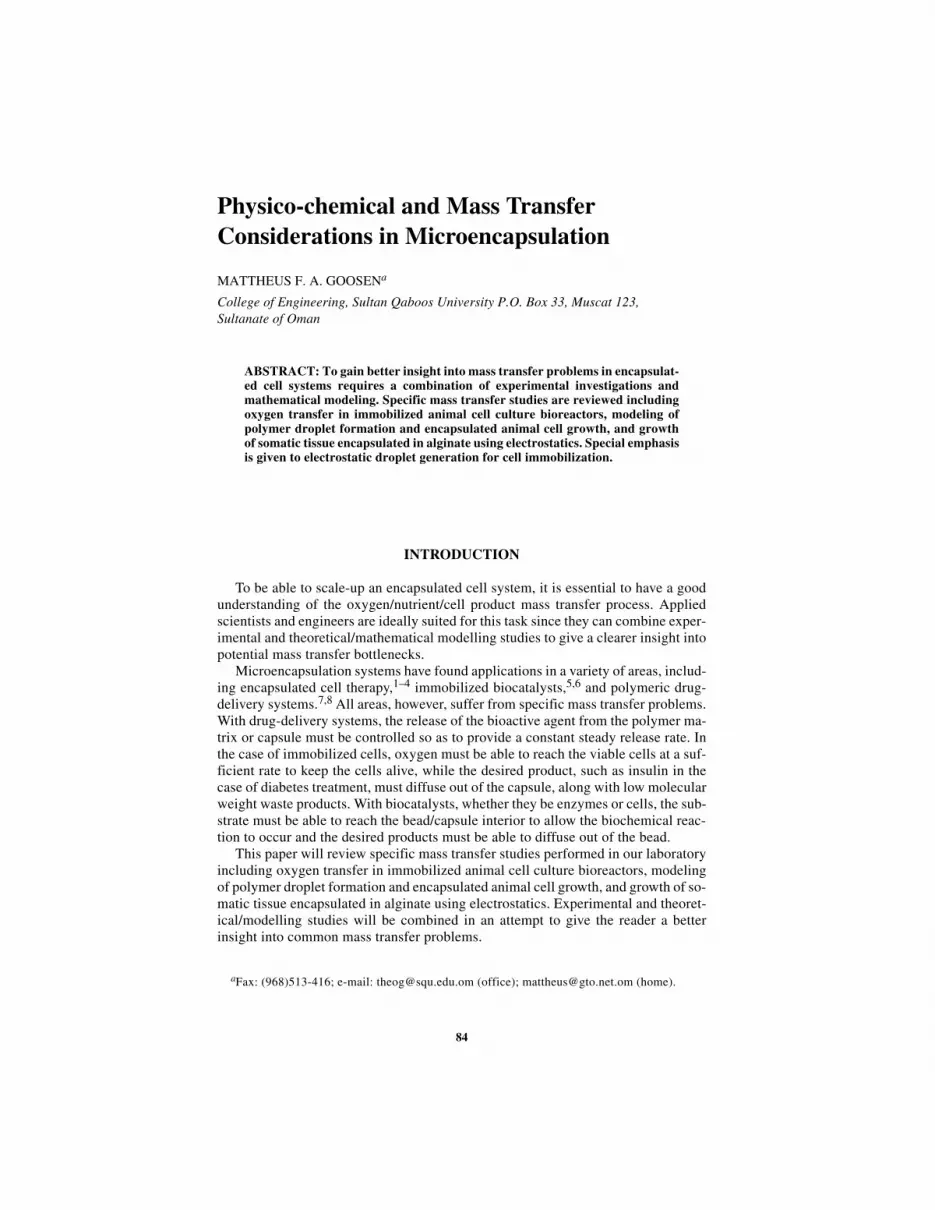
It is not adequate simply to transfer sufficient oxygen to the bulk liquid culturemedium in immobilized cell systems. Oxygen must also be transferred from the liq-uid to the cells. Consider for instance the transfer of oxygen from a gas bubble,through the culture medium to a microcapsule containing animal cells. The resis-tances to oxygen transfer from the gas phase to the inside edge of the microcapsule(i.e. gas to liquid, liquid to microcapsule, and trans-membrane resistance) (FIG. 1)can be added together resulting in the following expression for the resistance to ox-ygen transfer, R:10,11
where VL is the volume of the liquid phase, n is the number of microcapsules, ro andri are the outside and inside radius of the microcapsule, respectively, ksa is the vol-umetric mass transfer coefficient from a liquid to a solid, and Do2,m is the diffusivityof oxygen in the membrane.
Employing Fick’s Law of Diffusion12 it can be shown that the oxygen transferrate from the gas phase to the inside edge of a microcapsule, OTRG, is given by:
where C* is the oxygen concentration in equilibrium with the oxygen partial pres-sure in the gas phase, Ci, m, i, is the oxygen concentration on the inside of the mem-brane, Q is the oxygen consumption rate of cells inside a microcapsule (mgO2/Lhr),
is the oxygen consumption rate per cell, and x is the cell density. To enable thecells in the microcapsule to survive, the oxygen transfer rate, OTRG, must be greater
(1)
(2)
R 1VLkla-------------- 1
VLksa--------------
1ro---- 1
ri---–
4πnDo2 m,------------------------
+ +=
OTRG1
VLkla-------------- 1
VLksa--------------
1ro---- 1
ri---–
4πnDo2 m,------------------------+ +
1–
C* Ci m i, ,–( ) Q≥ Qo2x= =
Qo2
86 ANNALS NEW YORK ACADEMY OF SCIENCES
than (or at least equal to) the oxygen consumption rate of cells inside the capsules,Q. Based on the work of Heath and Belfort13 the oxygen concentration profile withina microcapsule can be represented by:
where r is the radius of the alginate core. If the concentration of oxygen in the centerof the microcapsules, Co, is equal to a critical oxygen concentration, Ccrit, the con-centration of oxygen at the inner surface of the membrane, Ci,m,i, can be determinedfrom Equation 3.
The performance of a one liter external-loop air-lift bioreactor was investigatedby studying the gas-liquid oxygen transfer at various aeration rates (0.1 vvm to1.06 vvm). The influence of suspended alginate beads on the hydrodynamics andmass transfer of the system was examined over a range of microbead loadings (0 to25% by volume). The intent was to investigate the effect of using various concentra-tions of cell immobilization matrices on the physical properties of the system. A
(3)Ci m i, , Co– QDo2 a,-------------1
6---r
2=
FIGURE 1. Schematic diagram of oxygen profile from gas bubble to center of micro-capsule.10

87GOOSEN: MICROENCAPSULATION
mathematical correlation was developed for expressing the dependence of kla onaeration rate and microbead loading. A mathematical study of the mass transfer re-sistances from the gas phase to the interior of a microcapsule was also performed,using experimentally determined kla values, to enable the determination of the max-imum bioreactor microcapsule loading.
The oxygen probe time constant for our studies was 27 ± 7 sec and the maximumkla value found was 0.00861 sec−1. Since this is approximately equal to 1/5 kla, theoxygen probe response time was therefore not accounted for in the determination ofthe kla values in our investigation. According to Van’t Riet,14 the response lag of anoxygen probe can be neglected if the oxygen probe time constant, τp , is less than1/5 kla.
To ensure that the kla studies would be measuring the gas-to-liquid mass transfercoefficient and not the mass transfer from the gas to the interior of the bead, the klain the presence of alginate beads was compared to that in the presence of ion-ex-change resin beads. The kla for a 10% loading of alginate beads it was determinedto be 31.7 ± 0.7 h−1 and for a 10% loading of ion-exchange resin beads it was 31.4± 1.5 h−1, at an aeration rate of 0.67 vvm. The kla values are essentially equal. Thissuggested that the alginate beads were not acting as a “sink” for oxygen and that thedesired quantity, gas-to-liquid mass transfer coefficient, was being measured.
Estimating the kla Value in the Presence of Alginate Beads
In two-phase (gas/liquid) systems such as bubble columns and airlift bioreactors,the kla is usually found to be an exponential function of the superficial gas velocityas follows:15
As a first approach to correlate the kla values with an aeration term, the kla valueswere plotted versus the normalized aeration rate, vvm (FIG. 2). In the presence ofalginate beads, this resulted in a monotonic relationship, whereby increasing the per-centage of beads in the reactor decreased the kla. It is important to note, however,that this was not valid in the absence of beads (i.e. 0% loading). For the range of aer-ation rates studied, at 0% bead loading, the bioreactor was predominantly operatedunder turbulent conditions (i.e., Re ≥ 4000). On the other hand, in the presence ofbeads, 10% to 25%, the bioreactor was mostly being operated in the transition zone.We can speculate that this could affect the kla values. Using vvm instead of the su-perficial gas velocity accounted for the presence of “internals” (i.e., alginate beads)since vvm normalizes the gas flow rate with respect to the liquid volume. Correlatingthe kla with vvm by performing a linear regression on the data and setting the con-stant equal to zero using the statistical package Minitab (Version 5.1.3, Copyright -Minitab, Inc., 1985) gave correlation coefficients (R2 values) ranging from 64.6%for 0% bead loading to 84% for 15% bead loading. This was not considered to be avery good fit of the data because of the low R2 values. Also, this did not give a singlecorrelation that would account for the presence of the beads but rather a correlationfor each bead loading was required.
To account for the presence of alginate beads, it was then proposed to add a termin the correlation. Thus, a concentration effect term, CE, was introduced. To define
kla = (4)ανsβ

88 ANNALS NEW YORK ACADEMY OF SCIENCES
the concentration effect, Einstein’s equation for the suspension of rigid spheres wasused:
where ϕ is the volume fraction occupied by the spheres (i.e., alginate beads). A mul-tiple linear regression using Minitab was used to correlate kla with vvm and CE. Thismultiple linear regression resulted in the following expression:
where kla has units of h−1.Rearranging Equation 6 into a more convenient form gave:
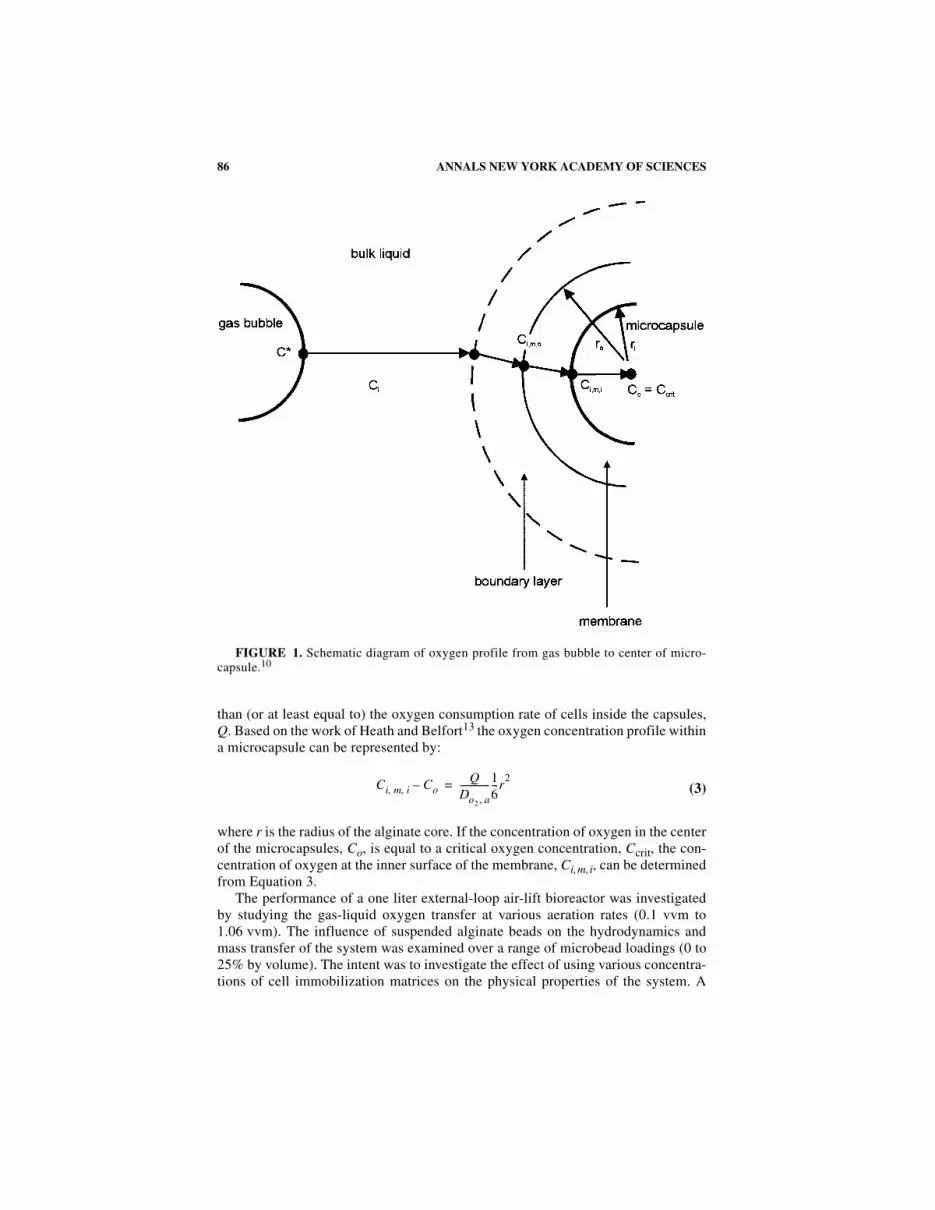
This correlation had a coefficient of 0.815 which was indicative of a good fit. Therewere no trends in the residual plots. Also, the T-ratios for the constant and coeffi-cients in the correlation were very large which indicated that these parameters weresignificant to the model. It was, therefore, concluded that this regression line was ad-equate to explain the data. Equation 7, which was used to predict the kla value for agiven aeration rate (vvm) and alginate bead loading, gave a good fit (FIG. 3).
When attempting to develop a correlation that can be used as a design parameterfor bioreactor scale-up, a single correlation that can be applied to all systems is de-sirable. Correlations involving liquid velocity were not considered to be appropriatedue to the dependence of the liquid velocity on the aeration rate. Although used suc-cessfully for describing two-phase systems,16,17 correlations involving the gassedpower per unit liquid or reactor volume (Pg /VL and Pg/V, respectively) did not ac-
CE = 1 + 2.5ϕ (5)
ln kla = 4.10 + 0.803 ln vvm − 1.67 ln CE (6)
kla = 60.34 vvm0.803CE−1.67 (7)
FIGURE 2. Mass Transfer Coefficient, kla, versus Normalized Aeration Rate (adaptedfrom refs. 10 and 11).
89GOOSEN: MICROENCAPSULATION
count for the change in bulk fluid properties due to the presence of alginate beads. Itis important to note that the correlation proposed (Equation 7) does not fit the kladata when there are no beads present due to the turbulent flow regime at 0% beadloading.
Sensitivity of kla to Microcapsule Loading
For immobilized cell systems, such as microcapsules, ensuring adequate oxygentransfer from the gas phase to the liquid medium does not necessarily ensure that ad-equate oxygen will reach the immobilized cells. It is possible that the kla may not beadequate for a certain microcapsule loading. A theoretical study was performed inour laboratory of oxygen transfer to cells immobilized in microcapsules in a biore-actor for various microcapsule loadings using Equations 2 and 3.10 A schematic di-agram of the oxygen concentration profile from a gas bubble to the center of amicroencapsule is shown in FIGURE 1. Upon arbitrarily specifying the critical oxy-gen concentration in the center of the microcapsule, the rate of oxygen transfer fromthe gas phase to the inner surface of the microencapsule membrane (OTRG, mg/h)for a certain microcapsule loading was compared to the oxygen demand of the cells(Qo2
x) for the same microcapsule loading. The study was made for Spodoptera fru-giperda (i.e., insect) cells cultivated in poly-1-lysine/alginate microcapsules at amaximum cell density of 8 × 10⁷ cells/mL capsules.18 An oxygen demand of 1.4 ×10⁻¹⁰ mmole O2/cell hour was assumed. These insect cells are usually cultivated at27°C and 33°C. Therefore our study was performed at both temperatures.
FIGURE 3. Correlation between Mass Transfer Coefficient, Normalized Aeration Rateand Bead Loading.10
90 ANNALS NEW YORK ACADEMY OF SCIENCES
91GOOSEN: MICROENCAPSULATION
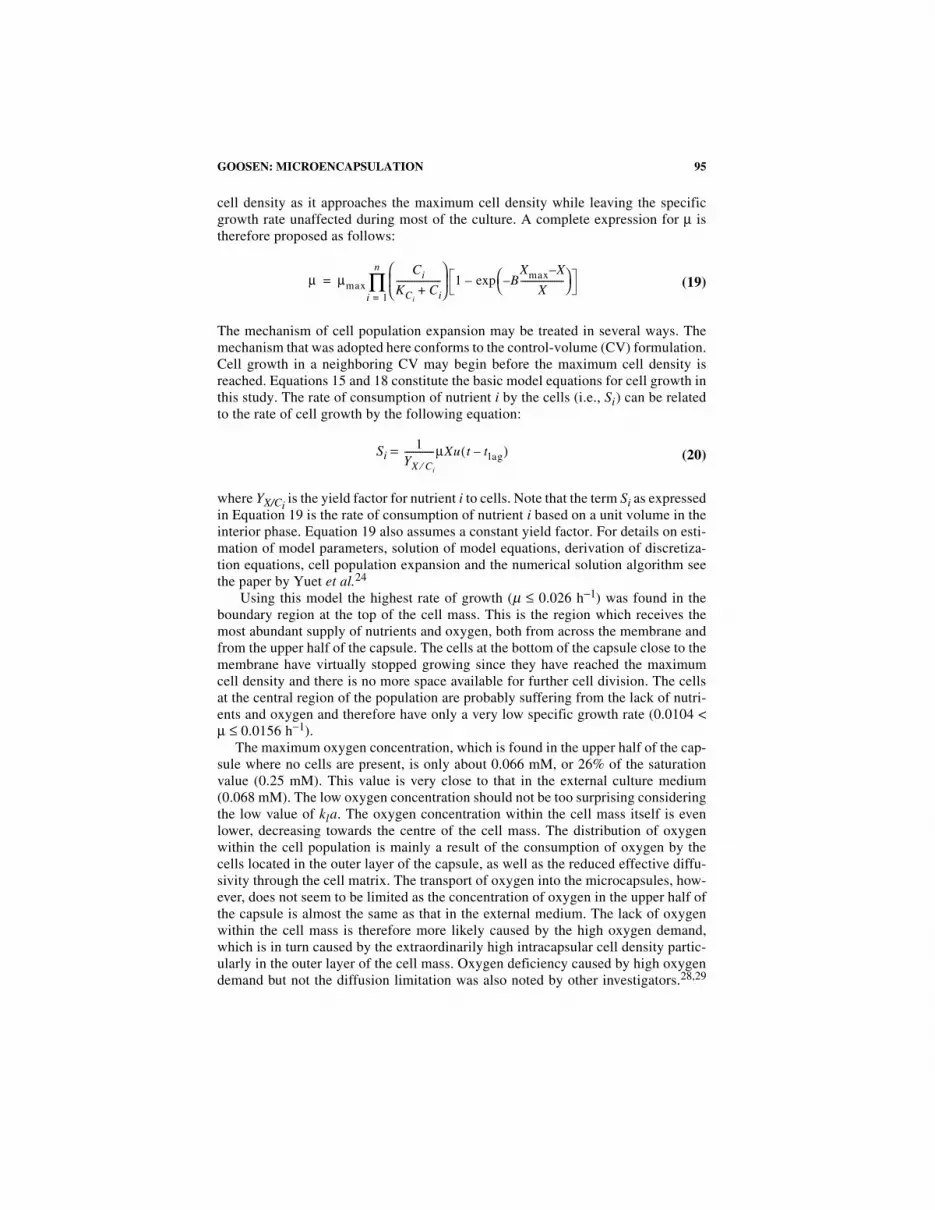
It was necessary to estimate several of the parameters used to evaluate the oxygentransfer rate. The diffusivity of oxygen in sodium alginate (the immobilization agentinside the microcapsule) was estimated to be 86% of the diffusivity of oxygen in wa-ter (i.e., approximately the same as the diffusivity of oxygen in calcium alginate).According to King et al.,18 the membrane is 5 µm thick and is composed of approx-imately 90% water. The diffusivity of oxygen through the membrane was thereforeassumed to be equal to that of oxygen in water. A critical oxygen concentration inthe center of the microcapsule was assumed to be 40% of air saturation.
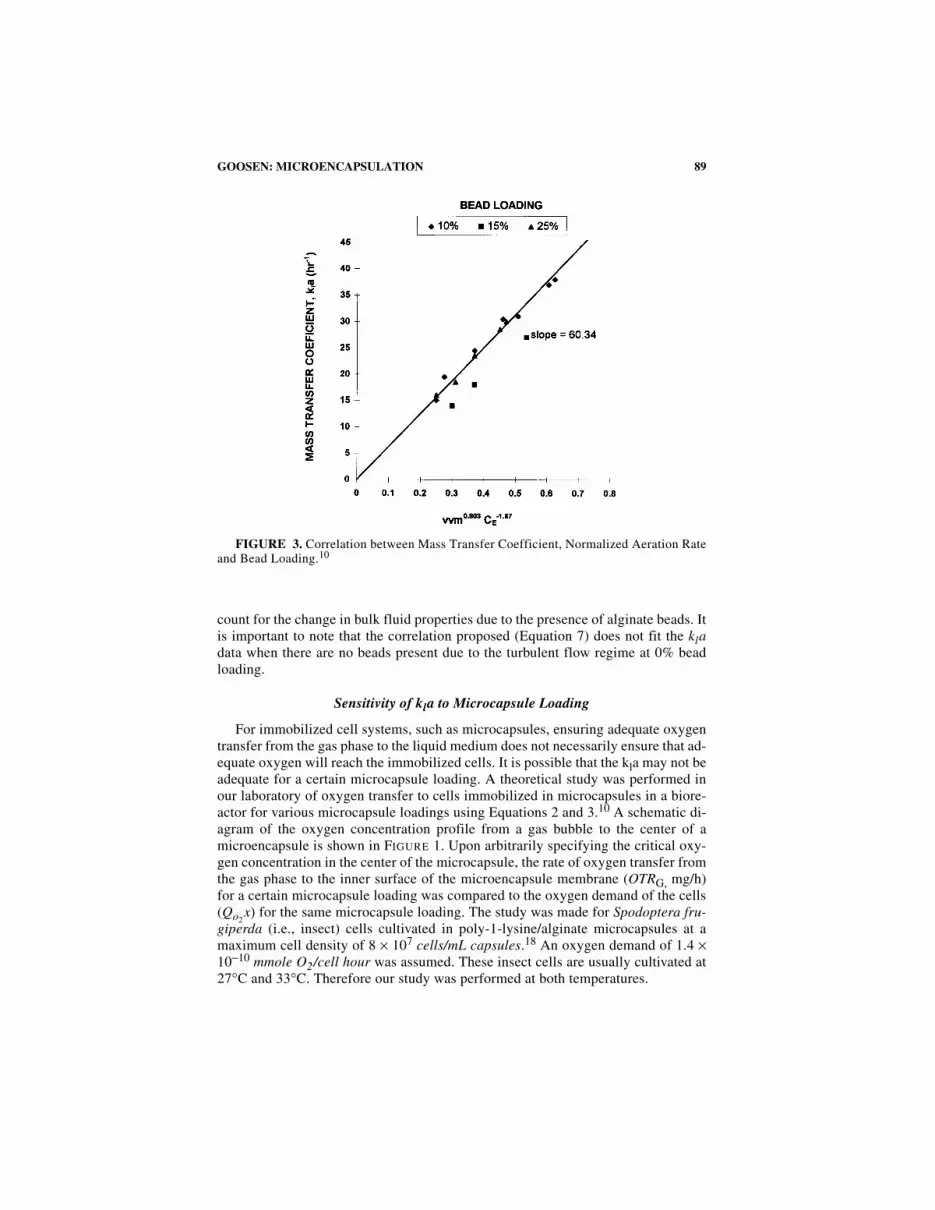
FIGURE 4 shows the results for the oxygen transfer rate, OTR attainable for mi-crocapsule loadings of 10, 15, and 25% at 33°C and 27°C as a function of the aera-tion rate. The terminal settling velocity was used to calculate the Reynold’s number.Comparing FIGURES 4A and 4B, the latter uses the difference between the bead andliquid velocities (determined experimentally) to calculate the Reynold’s number, andindicates that there is not much difference (at most 8%) between the two methods.This suggests that the terminal velocity may be used as a good approximation of therelative velocity between the bead and the liquid if it is not feasible to determine theliquid and bead velocities experimentally.
At 33°C, for 10% bead loading, the oxygen demand of the cells was achieved at0.29 vvm, which is the minimum vvm for suspension of the beads (FIG. 4A). On theother hand, for 25% bead loadings a vvm of 1.06 is required to meet the oxygen de-mand of the cells. This is quite a high aeration rate thus it may not be feasible to op-erate at 25% bead loading. Decreasing the temperature to 27°C (FIGS. 4C and 4D)increased the oxygen transfer rate but only slightly (by approximately 8%). This wasexpected since a decrease in temperature increases the solubility of oxygen in thebulk liquid which increases the driving force for oxygen transfer. This, in turn, in-creases the oxygen transfer rate to the cells. The temperature did not, however, havea very significant effect on the oxygen transfer rate. These results suggest that forthis bioreactor the cells will not be oxygen limited at microcapsule loadings of 10%and 15% (by volume). However, there is the potential for oxygen limitation at 25%microcapsule loadings if the reactor is not operated at a minimum aeration rate of1.06 vvm.
MATHEMATICAL MODELING OF POLYMER DROPLET FORMATIONAND ENCAPSULATED ANIMAL CELL GROWTH
Modeling of Electrostatic Droplet Formation
Droplet formation in the presence of an electric field has been analyzed previous-ly.19 If gravity were the only force acting on the meniscus of a droplet attached to the
FIGURE 4. Theoretical Oxygen Transfer Rate, OTR, as a function of Aeration Rate forencapsulated insect cells in bioreactor at 33°C using the Terminal Settling Velocity to cal-culate the Reynold’s Number (A); OTR at 33°C using the difference between the Bead Ve-locity and the Liquid Velocity to calculate the Reynold’s Number (B); OTR at 27°C usingthe Terminal Settling Velocity to calculate the Reynold’s Number (C); OTR at 27°C usingthe difference between the Bead Velocity and the Liquid Velocity to calculate the Reynold’sNumber (D).10
92 ANNALS NEW YORK ACADEMY OF SCIENCES
end of a tube, large uniformly sized droplets would be produced. The gravitationalforce, Fg, pulling the droplet from the end of the tube is given by:
where ρ is the density of the polymer solution, r is the droplet radius, and g is theacceleration due to gravity. The capillary surface force, Fγ , holding the droplet tothe end of the tube is given by:
where ro is the internal radius of the tube and γ is the surface tension.Equating the gravitational force on the droplet to the capillary surface tension
force holding the droplet to the tube (i.e., extrusion orifice) gives:
In the presence of an applied voltage, the electric force, Fe, acting along with thegravitational force, Fg, would reduce the critical volume for drop detachment result-ing in a smaller droplet diameter. Equating the gravitational and electrical forces onthe droplet to the capillary surface force, Fγ, yields:
In the case of a charged needle, the stress produced by the external electric field atthe needle tip is obtained by using a modified expression developed by De Shon andCarlson:20
where H is the distance between the needle tip and collecting solution, V is the ap-plied voltage, and εo is the permittivity of the air.
The effect of applied potential on the droplet radius for a charged needle arrange-ment can be derived by substituting Equations 8, 9, and 12 into Equation 11:
Equation 10 was employed to calculate the microbead diameter in the absence of anapplied voltage (i.e., 0 kV). The surface tension, γ, of the alginate solution was as-
Fg = (8)
Fγ = 2πroγ (9)
r = (10)
Fγ = Fg + Fe (11)
Fe = (12)
(13)
43---πr
3ρg
3roγρg
2------------------
1 3⁄
4πεoV
Ln 4Hro-------
--------------------
2
r 32ρg---------- roγ 2εo
V
Ln 4Hro-------
--------------------
2
–
1 3⁄
=

93GOOSEN: MICROENCAPSULATION
sumed to be 73 g/s2 which is the value for water against air.21 The density of thepolymer solution was taken as 1 g/cm3. In the presence of an applied voltage, Equa-tion 13 was used to determine microbead size. The permittivity of air, εo, used in cal-culations was 1.0 g cm/s2 kV2. This value was estimated based on previousstudies.19
Reasonably good agreement was obtained between calculated and experimentalvalues of microbead diameter (TABLE 1).22 For example, when the extrusion orificediameter decreased from 1900 to 400 microns, the calculated bead diameters de-creased from 4400 to 2600 microns, and the experimental values decreased from3700 to 2000 microns. When the extrusion orifice diameter (i.e., syringe) was keptconstant at 1900 microns and the applied voltage was increased from 0 to 10 kV,there was also a similar decrease in bead size from 4400 to 1690 microns for the cal-culated values and from 3700 to 1700 microns for the experimental values.
Development of a Mathematical Model for Animal Cell Growth in Microcapsules
A mathematical model for animal cell growth in microcapsules was also devel-oped and compared to experimental data.23,24 There have been several attempts toaddress mathematical modeling of microcapsules. Mogensen and Vieth25 studied themass transfer properties of semi-permeable microcapsules. Their model did not ac-count for any cell growth since they were dealing with enzymes. Heath and Belfort13
also provided a mathematical treatment on microcapsules, entrapping biocatalysts,but again no cell growth was taken into account.
The derivation of our model was based on the case in which microcapsules withfluid intracapsular liquid were used in stationary culture. The characteristics of thisscenario of cell growth in microcapsules is that the cells initially settle to the bottomof the capsules, and the cell population expands from the bottom up during the cul-ture period. This cell population expansion in the capsules is accounted for in themodel by a computation mechanism, which initializes the neighboring control vol-umes with cells when a control volume becomes overcrowded.
TABLE 1. Comparison of experimental and calculated microbead diameter as a functionof extrusion orifice size and applied potential
Extrusion orifice diameter(microns)
Applied potential, V (kV)
Microbead diameter (microns)
Calculateda Experimentalb
400 0 2600 2000
1000 0 3500 2800
1900 0 4400 3700
1900 5 4018 3500
1900 10 1680 1700
aBead size at 0 kV was determined using Equation 3 and 5 and 10 kV using Equation 6.bBead size using 4% w/v non-autoclaved sodium alginate in water with an electrode distance
of 6 cm and a 22 gage needle (ro = 500 microns).
94 ANNALS NEW YORK ACADEMY OF SCIENCES
The model is made up of a set of differential balance equations of the followingform:
where Ci is the concentration of a nutrient such as glucose and glutamine in a micro-capsule, Ji is the diffusive flux of the nutrient, Si is the rate of consumption of thenutrient and ε is the void fraction inside a microcapsule. Similar balance equationsare written for the capsule membrane and the culture medium. The rate of cellgrowth is expressed as:
where
X is the cell density, µ is the specific growth rate, tlag is the lag time and λ is the celldeath constant. Equation 15 describes the change in cell density from the beginningof the exponential growth phase to the end of the culture.26 The lag phase can be in-cluded mathematically by introducing a step function. The lag time will have to bedetermined experimentally. Since in an unstructured model a cell is treated as a sin-gle-component body, Equation 15 is sufficient to characterize the growth of a cellpopulation. The dependence of the specific growth rate (µ) on nutrient concentrationis expressed as:
where Ci is the concentration of rate limiting nutrient i; KCi is the saturation constant
for nutrient i; n is the total number of rate limiting nutrients; µmax is the maximumspecific growth rate. Frame and Hu27 developed a contact-inhibition model to de-scribe the dependence of specific growth rate on cell density:
where Xmax is the maximum cell density and B is an adjustable parameter. The de-gree of influence of cell density on µ depends on the value of B; if a relatively largevalue of B is used, then the specific growth rate will remain more or less unaffectedby the cell density until it is very close to Xmax. Thus, the incorporation of Equation17 into the kinetic expression with a large value of B should allow us to control the
(14)
(15)
(16)
(17)
(18)
∂∂t---- Ciε( ) div Ji( )+ Si=
Xdtd
------ u t tlag–( ) µX λ X η( ) ηdo
t
∫+=
u t tlag–( )1 if t tlag>
0 if t tlag<
=
µ µmax
Ci
KCiCi+
--------------------
i 1=
n
∏=
µ µmax 1 BXmax X–
X-------------------–
exp–=
95GOOSEN: MICROENCAPSULATION
cell density as it approaches the maximum cell density while leaving the specificgrowth rate unaffected during most of the culture. A complete expression for µ istherefore proposed as follows:
The mechanism of cell population expansion may be treated in several ways. Themechanism that was adopted here conforms to the control-volume (CV) formulation.Cell growth in a neighboring CV may begin before the maximum cell density isreached. Equations 15 and 18 constitute the basic model equations for cell growth inthis study. The rate of consumption of nutrient i by the cells (i.e., Si) can be relatedto the rate of cell growth by the following equation:
where YX/Ci is the yield factor for nutrient i to cells. Note that the term Si as expressed
in Equation 19 is the rate of consumption of nutrient i based on a unit volume in theinterior phase. Equation 19 also assumes a constant yield factor. For details on esti-mation of model parameters, solution of model equations, derivation of discretiza-tion equations, cell population expansion and the numerical solution algorithm seethe paper by Yuet et al.24
Using this model the highest rate of growth (µ ≤ 0.026 h−1) was found in theboundary region at the top of the cell mass. This is the region which receives themost abundant supply of nutrients and oxygen, both from across the membrane andfrom the upper half of the capsule. The cells at the bottom of the capsule close to themembrane have virtually stopped growing since they have reached the maximumcell density and there is no more space available for further cell division. The cellsat the central region of the population are probably suffering from the lack of nutri-ents and oxygen and therefore have only a very low specific growth rate (0.0104 <µ ≤ 0.0156 h−1).
The maximum oxygen concentration, which is found in the upper half of the cap-sule where no cells are present, is only about 0.066 mM, or 26% of the saturationvalue (0.25 mM). This value is very close to that in the external culture medium(0.068 mM). The low oxygen concentration should not be too surprising consideringthe low value of kla. The oxygen concentration within the cell mass itself is evenlower, decreasing towards the centre of the cell mass. The distribution of oxygenwithin the cell population is mainly a result of the consumption of oxygen by thecells located in the outer layer of the capsule, as well as the reduced effective diffu-sivity through the cell matrix. The transport of oxygen into the microcapsules, how-ever, does not seem to be limited as the concentration of oxygen in the upper half ofthe capsule is almost the same as that in the external medium. The lack of oxygenwithin the cell mass is therefore more likely caused by the high oxygen demand,which is in turn caused by the extraordinarily high intracapsular cell density partic-ularly in the outer layer of the cell mass. Oxygen deficiency caused by high oxygendemand but not the diffusion limitation was also noted by other investigators.28,29
(19)
Si = (20)
µ µmax
Ci
KCiCi+
--------------------
1 BXmax X–
X-------------------–
exp–i 1=
n
∏=
1YX Ci⁄-------------µXu t tlag–( )
96 ANNALS NEW YORK ACADEMY OF SCIENCES
The distribution of cell density in the microcapsule at the end of the culture periodshows that the highest density occurs close to the inner surface of the capsule mem-brane which confirms earlier experimental work.18
The scenarios of calcium alginate gel beds and microcapsules with fluid intrac-apsular liquid in suspension culture were simulated using the same model. In thecase of calcium alginate gel beads, the diffusivities of nutrients in calcium alginatewere taken as 75% of those in water; while in the two cases of fluid intracapsularliquid microcapsules suspension, kla was taken as 0.6 h−1 and 4.0 h−1 separately. Akla value of 4.0 h−1 is more realistic since the culture medium has to be agitated (ina shake flask, for example) in order to keep the microcapsules in suspension; the val-
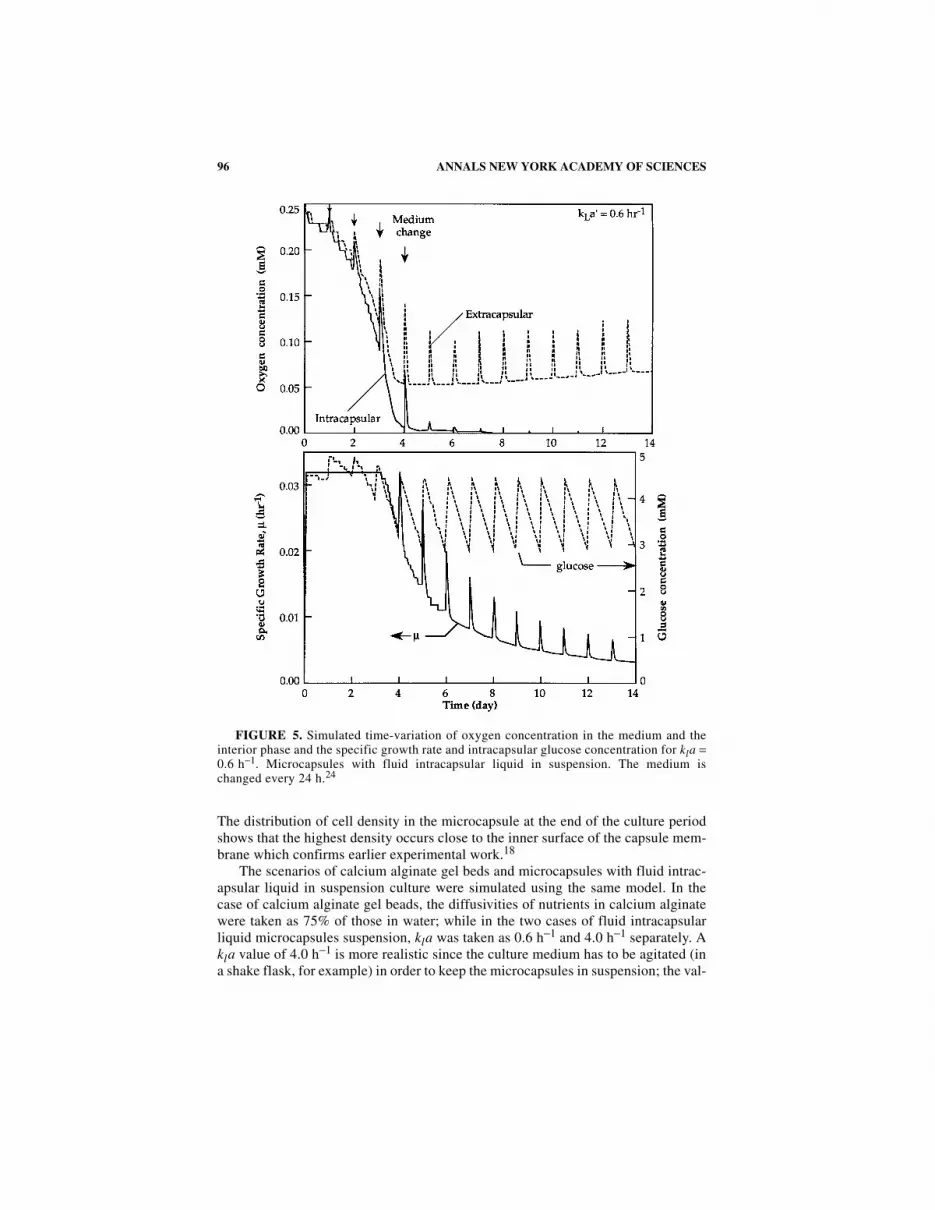
FIGURE 5. Simulated time-variation of oxygen concentration in the medium and theinterior phase and the specific growth rate and intracapsular glucose concentration for kla =0.6 h−1. Microcapsules with fluid intracapsular liquid in suspension. The medium ischanged every 24 h.24
97GOOSEN: MICROENCAPSULATION
ue of 0.6 h−1 was included for comparison. With kla equal to 4.0−1, the cell density,after 14 days of culture, is approximately 1.4 × 10i cells ml−1 while with kla equalto 0.6 h−1, the cell density reaches 7.1 × 10⁷ cells ml−1. The intracapsular cell densityalone, however, does not provide a complete picture of what is actually happeningin the microcapsule or the culture medium. A further examination of the oxygen andnutrient concentration in the system reveals a rather interesting situation regardingthe effect of nutrients on the specific growth rate.
Let us take a brief look at the case where kla is 0.6−1 (FIG. 5), keeping in mindthat the medium is changed every 24 hours. During the first three days of culture, µstays at about 0.032 h−1 because of the abundant supply of oxygen and nutrients. Inthe meantime, however, the oxygen concentrations in the intracapsular region as wellas in the medium are decreasing rapidly. At the beginning of day 4, there is a boostof oxygen concentration by the fresh supply of medium, which is saturated with ox-ygen. The oxygen concentration drops sharply during day 4, and by the end of theday, the intracapsular oxygen is reduced to 0.005 mM, while µ drops to about0.023 h−1. Beginning from day 5, the specific growth rate is boosted at the beginningof each day because of the addition of fresh medium. However, the growth rate dropsabruptly during the first 4 or 5 hours owing to the rapid depletion of intracapsularoxygen. Neglecting the pulses, the specific growth rate decreases slowly from about0.025 h−1to about 0.004 h−1 at the end of the culture. Note that the intracapsular glu-cose concentration never drops below 2.8 mM. This result suggests that from the sec-ond half of day 4 to the end of the culture, the cell growth in the microcapsule islimited by the lack of oxygen. We now conclude this chapter by looking at the en-capsulation of plant cells using electrostatics.
GROWTH OF SOMATIC TISSUE ENCAPSULATED IN ALGINATE USING ELECTROSTATICS
In recent articles,30–33 the mechanism of alginate droplet information using anelectrostatic droplet generator was investigated with a variable-voltage power sup-ply. Animal cell suspensions were successfully extruded using the electrostatic drop-let generator. The application of this technology to plant cell immobilization hasonly recently been reported.11, 22, 33 A major concern in cell and bioactive agent im-mobilization has been the production of very small microbeads so as to minimize themass-transfer resistance problem associated with large-diameter beads (>1000 µm).Klein et al.34 reported production of alginate beads with diameters from 100 to400 µm using compressed air to quickly pass the cell/gel solution through a nozzle.Few attempts have been made in the application of electric fields to the productionof micron size polymer beads for cell immobilization.35
Somatic embryogenesis is a new plant tissue culture technology in which somaticcells (i.e., any cell except a germ or seed cell) are used to produce an embryo (i.e.,plant in early state of development).36 The technique of somatic embryogenesis inliquid culture, which is believed to be an economical way for future production ofartificial seeds, may benefit from cell immobilization technology. Encapsulationmay aid in the germination of somatic embryos by allowing for higher cell densities,protecting cells from shear damage in suspension culture, allowing for surface at-

98 ANNALS NEW YORK ACADEMY OF SCIENCES
tachment in the case of anchorage dependent cells, and being very suitable for scale-up in bioreactors.
The long-term objective of the project reported in this section is the developmentof an economical method for the mass production of artificial seeds using somaticembryogenesis and cell immobilization technology. The short-term aim was to in-vestigate the production of small alginate microbeads using an electrostatic dropletgenerator. Callus tissue from carnation leaves was also immobilized and cultured.The section starts with a detailed experimental description of electrostatic dropletgeneration for those not familiar with the technique32 (FIG. 6).
Production of Alginate Beads Using Electrostatics
Attach a syringe pump to a vertical stand. Use a 10 mL plastic syringe and 22- or26-gage stainless steel needles. A variable high voltage (0–30 kV) power supplywith low current (<0.4 mA) is required. We have used a commercial power supplymodel 230–30R from Bertan (Hicksville, NY). Prepare 1.5% (w/v) CaCl2 in saline(0.85 g NaCl in 100 mL distilled water). Saline can be replaced with distilled waterif an alginate solution without cells is being extruded. Place the CaCl2 solution in apetri dish on top of an adjustable stand. The stand allows for fine- tuning of the dis-tance between the needle tip and collecting solution. Prepare 1 to 4% (W/V) low vis-cosity sodium alginate by dissolving alginate powder with stirring in a warm waterbath. Slowly add the 1 to 4 g sodium alginate to 100 mL warm saline solution (ordistilled H2O), stirring continuously. It may take several hours to dissolve all of thealginate. Add about 8 mL of the alginate solution to a 10-mL plastic syringe, putback the plunger, and attach the syringe to the upright syringe pump. Make sure thatthe stainless steel needle, 22 gage, is firmly attached and the syringe plunger is infirm contact with the movable bar on the pump. Position the petri dish (or beaker)containing CaCl2 solution so that the needle tip is about 3 cm from the top of theCaCl2 hardening solution. This is the primary reason for using an adjustable stand.Attach the positive electrode wire to the stainless steel needle and the ground wireto the collecting solution. The wires may need some additional support to preventthem from bending the needle. Switch on the syringe pump and wait for the first few
FIGURE 6. Effect of needle size on microbead diameter using variable high-voltagepower supply (± SD).33

99GOOSEN: MICROENCAPSULATION
drops to come out of the end of the needle. This could take a minute or two. Doingit this way also ensures that the needle is not plugged. After the first drop or two hasbeen produced, switch on the voltage power supply. Make sure that the voltage is setlow, <5 kV. If this is the first time that you have tried electrostatic droplet generation,raise the voltage slowly and observe what happens to the droplets. The rate at whichthey are removed from the needle tip increases until only a fine stream of dropletscan be seen. The changeover from individual droplets to a fine stream can be quitedramatic. The most effective electrode and charge arrangement for producing smalldroplets is a positively charged needle and a grounded plate. Two other arrangementsare also possible; positively charged plate attached to needle and positively chargedcollecting solution. Make sure that the positive charge is always on the needle. Thisensures that the smallest microbead size is produced at the lowest applied potential.With a 22-gage needle and an electrode spacing of 2.5–4.8 cm there will be a sharpdrop in microbead size at about 6 kV. This can be noticed visually by observing thedroplets coming from the needle tip. Standard commercially available stainless steelneedles can be employed. However, when going from a 22- to 26-gage (or higher)needle, needle oscillation may be observed. This needle vibration will produce a bi-modal bead size distribution with one peak around 50 µm diameter beads and anoth-er around 200 µm.
If a syringe pump is not available, remove the syringe plunger and attach an airline with a regulator to the end of the syringe. The alginate extrusion rate can be con-trolled by varying the air pressure on the regulator.
Lumps of sodium alginate often form if the powder is added all at once to thewarm saline. Sprinkle the alginate powder into the saline a small amount at a timewith gentle mixing. Once it has dissolved (up to 1–2 h), allow the viscous solutionto cool and then transfer it to several plastic test tubes, cap and store in the refriger-ator until required. This prevents bacterial growth. If the alginate solution is very vis-cous, air bubbles will be trapped during stirring. These bubbles will disappear if theviscous solution is left to stand overnight.
If the needle is plugged, place it in dilute citrate solution for a few minutes. Pass-ing a fine wire through the needle also helps. Resuspending cells in 1% (w/v) sodiumalginate solution will dilute the alginate solution and could give tear-drop shapedcapsules when the solution is extruded. To solve this problem, increase the concen-tration of sodium alginate solution to 3 or 4%.
Extrusion of alginate droplets using a 5.7 kV fixed-voltage power supply showedthat there is a direct relationship between the electrode distance and the bead diam-eter. For example, at 10-cm electrode distance, the bead diameter was 1500 µm whileat 2 cm it decreased to 800 µm. The greatest effect on bead diameter was observedbetween 2 and 6 cm electrode distance. While there was overlap in bead sizes be-tween 6, 8, and 10 cm electrode distance, there was a significant difference (i.e., nooverlap in SD) between bead sizes at 2 and 6-cm electrode distance. An inverse re-lationship between needle size and microbead diameter was observed. Aside fromthe 23-gage needle there was a significant difference between bead sizes producedby all needles (i.e., no SD overlap). As the needle size decreased from 19- to 26-gage, the bead size decreased from 1400 to 400 µm, respectively. These results sup-port previous work reported by Bugarski et al.31 The present investigation showedthat the alginate concentration does not appear to be important due to overlapping

100 ANNALS NEW YORK ACADEMY OF SCIENCES
SD intervals for all data points. The bead diameter was found to be 800 µm at both1% and 3% alginate concentration.
Looking more closely at the effect of needle size on bead diameter, as a functionof applied potential (FIG. 7) we see that the decrease in microbead size was greatestbetween 5 and 10 kV for all needle gages tested. For example, when the applied po-tential was increased from 5 to 10 kV, the microbead diameter decreased from 2000(±100) to 1000 (±150) µm and from 1000 (±150) to 250 (±125) µm for the 19-and26-gage needles, respectively. The smallest bead, 200 (±80) µm, was produced witha 26-gage needle at 20 kV.
FIGURE 7. Callus cells from carnation leaf encapsulated using 4% (w/v) sodium algi-nate over a one month culture period on agar gel. Top: time zero; middle: two weeks; bottom:one month.
101GOOSEN: MICROENCAPSULATION
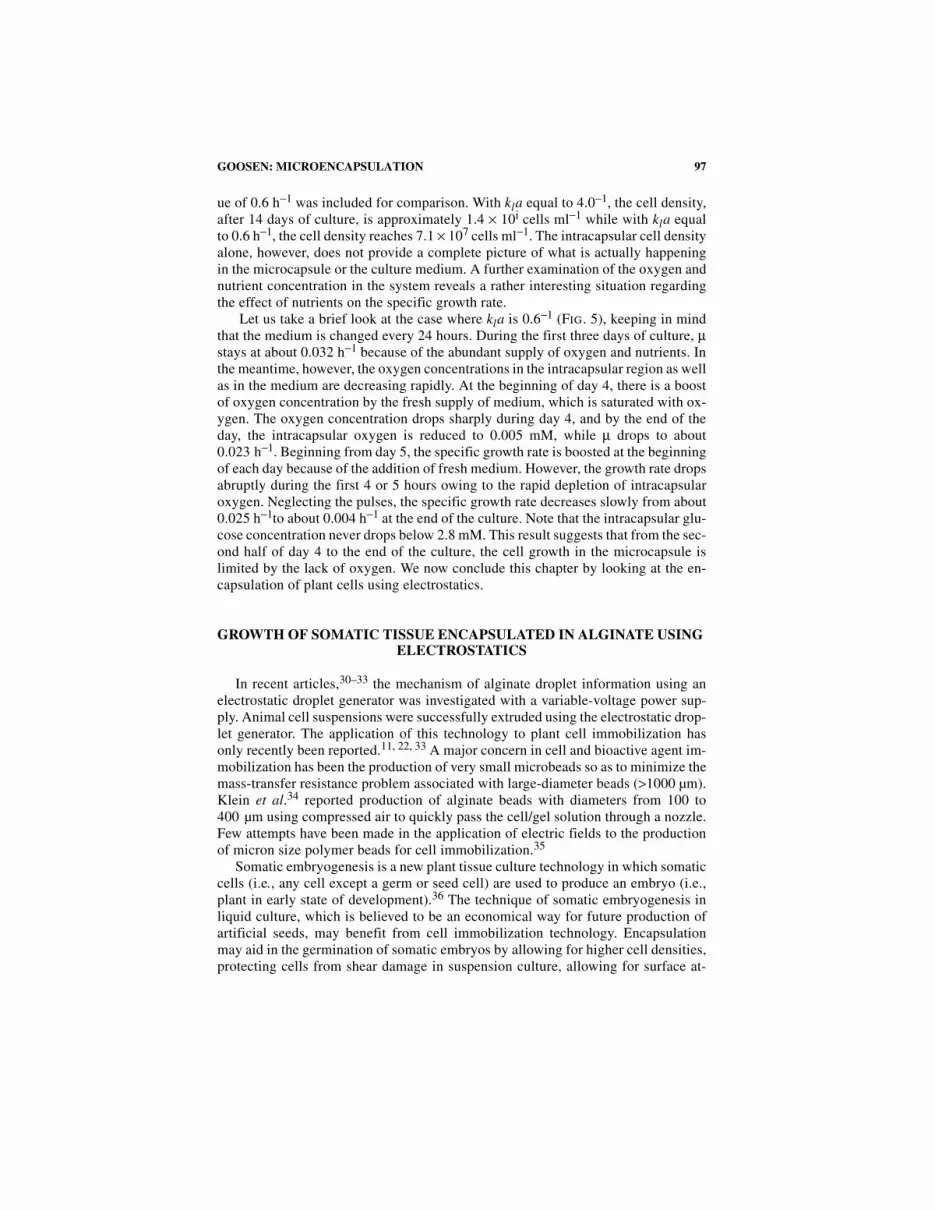
FIGURE 8. Callus cellsfrom carnation leaf encapsu-lated using 4% (w/v) sodiumalginate over a one monthculture period on agar gel:top, time zero; middle, twoweeks; bottom, one month.

102 ANNALS NEW YORK ACADEMY OF SCIENCES
Growth of Immobilized Callus Tissue
Immobilized callus cells from carnation leaves retained viability as observed bycell growth and plantelet formation (FIG. 8). In a related study, Shigeta37 was ableto germinate and grow encapsulated somatic embryos of carrot using a 1% sodiumalginate solution, as compared to a 2% alginate solution used in the present investi-gation. The main findings of the present experiment, though, indicate that somatictissue can be electrostatically extruded and aseptically cultured while retainingviability.
Plantlets obtained from 4% alginate beads on agar, originally immobilized at10 kV, 6 cm distance, were transferred to sterilized potting mixture at two monthsculture. The plantlets grew well and showed complete leaf and root development byfour months.22 Suspension culture of encapsulated somatic tissue was less success-ful. Piccioni38 in a recent study investigated the growth of plantlets from alginate en-capsulated micropropagated buds of M.26 apple rootstocks. He showed that theaddition of growth regulators (e.g., indolebutyric acid) to the somatic tissue cultureseveral days prior to the encapsulated, as well as the addition of the same regulatorsto the encapsulation matrix, improved the production of plantlets in suspension cul-ture from 10% to more than 60%. We can speculate that culturing carnation leaf so-matic tissue in the presence of growth regulators prior and during encapsulation mayenhance the production of plantlets from suspension culture. Tissue from varioustypes of plants, though, behave quite differently. For example, mulberry and bananaplantlets were attained from alginate-encapsulated tissue without any specific rootinduction treatment39,40 while Piccioni’s apple rootstock buds required growth reg-ulators.
Electrostatic droplet generation does not appear to have a negative impact on so-matic tissue viability since cell growth and plantlet formation were observed. Thisis in agreement with similar studies reported for insect cells41 and mammaliancells,35 where it was shown that high electrostatic potentials did not affect cell via-bility. Finally, the technique has great potential in medicine for encapsulating genet-ically engineered cells42 and in environmental engineering for removal of heavymetals from water using gel beads.43
CONCLUDING REMARKS
The development of successful and well understood microencapsulated cell sys-tems will necessitate close collaboration between scientists with different areas ofexpertise such as engineering, microbiology, biochemistry and medicine. Further-more, to gain better insight into mass transfer problems in encapsulated cell systemsrequires not only experimental investigations but also mathematical modeling stud-ies. As our knowledge of the physico-chemical characteristics of such systems in-creases, we can expect to see many new areas of application over the next decade.
ACKNOWLEDGMENTS
The financial support of the Natural Science and Engineering Research Councilof Canada, and Sultan Qaboos University, College of Agriculture (Grant AGBIOR

103GOOSEN: MICROENCAPSULATION
9505 to Mattheus Goosen) is gratefully acknowledged. The plant cell immobiliza-tion study was performed by H. Al-Hajry, S. Al-Maskari and L. Al-Kharousi (SQU).The assistance of Dr. O. El-Mardi in the plant tissue culture is also acknowledged.
REFERENCES
1. COLTON. C.K. 1996. Engineering challenges in cell encapsulation technology.TIBTECH 14: 158–162.
2. LANZA, R.P., J.L. HAYEs & W.L. CHICK. 1996. Encapsulated cell technology. NatureBiotechnol. 14: 1107–1111.
3. DE VOS, P. 1996. Association between capsule diameter, adequacy of encapsulation,and survival of microencapsulated rat islet allografts. Transplantation 62: 893–899.
4. STEGEMANN, J.P. & M.V. SEFTON. 1996. Video analysis of submerged jet microencap-sulation using HEMA-MMA. C. J. Chem. Eng. 74: 518–525.
5. SVEC, F. & P. GEMEINER. 1995. Engineering aspects of carriers for immobilized biocat-alysts. Biotechol. Gen. Eng. Rev. 13: 217–235.
6. TAKIZAWA, S., V. ARAVINTHAN & K. FUJITA, 1996. Nitrogen removal from domesticwastewater using immobilized bacteria. Wat. Sci. Tech. 34 (1-2): 431–440.
7. YAO, K., T. PENG, M. XU & C.YUAN. 1994. pH-Dependent hydrolysis and drug releaseof chitosan/polyether interpenetrating polymer network hydrogel Polymer Int. 34:213–219.
8. YAN, K.-H, W.P. GEUS, W. BAKKER, C.B.H.W. LAMER & H.G.M. HEIJERMAN. 1996. Invitro dissolution profiles of enteric-coated microsphere/microtablet pancreatin prep-arations at different pH values. Aliment Pharmacol Ther. 10: 771–775.
9. LINEK, V., V. VACEK & P. BENES. 1987. A critical review and experimental verificationof the correct use of the dynamic method for the determination of oxygen transfer inaerated agitated vessels to water, electrolyte solutions and viscous liquids. Chem.Eng. J. 34: 11–34.
10. SHARP, N.A., A.J. DAUGULIS & M.F.A. GOOSEN. 1998. Hydrodynamic and masstransfer studies in an external-loop air-lift bioreactor for immobilized animal cellculture. Appl. Biochem. Biotechnol. 73 (1): 57–77.
11. GOOSEN, M. F. A. 1999. Mass transfer in immobilized cell systems. In Handbook ofCell Encapsulation Technology and Therapeutics. W. M. Kuhtreiber, R. P. Lanza& W. L. Chick, Eds.: 18–28. Chap. 2. Birhäuser and Springer-Verlag.
12. MCCABE, W.L. & J.C. SMITH. 1985. Units of Chemical Engineering. McGraw-Hill.New York. p. 602.
13. HEATH, C. & G. BELFORT. 1987. Immobilization of suspended mammalian cells:analysis of hollow fiber and microcapsule bioreactors. Advances Biochem. Eng/Biotechnol. 34: 1–31.
14. VAN’T RIET, K. 1979. Review of measuring methods and results in nonviscous gas-liquid mass transfer in stirred vessels. Ind. Eng. Chem. Process Des. Dev. 18: 357–364.
15. DECKWER, W.D., R. BURCKHART & R. ZOLL. 1974. Mixing and mass transfer in tallbubble columns. Chem. Eng. Sci. 29: 2177–2188.
16. MOO-YOUNG, M. & J.W. BLANCH. 1983. Kinetics and transport phenomena in bio-logical reactor design. Biochem. Eng.
17. SIEGEL, M.H. & J.C. MERCHUK. 1988. Mass transfer in a rectangular air-lift reactor:effects of geometry and gas circulation. Biotechnol. Bioeng. 32: 1128–1137.
18. KING, G.A., A.J. DAUGULIS, P. FAULKNER & M.F.A. GOOSEN. 1987. Alginate-polyl-ysine microcapsules of controlled membrane molecular weight cut-off for mamma-lian cell culture engineering. Biotechnol. Prog. 3: 231–240.
19. BUGARSKI, B., B. AMSDEN, R.J. NEUFELD, D. PONCELET & M.F.A. GOOSEN. 1994.Effect of electrode geometry and charge on the production of polymer microbeadsby electrostatics. C. J. Chem. Eng. 72: 517–521.
20. DE SHON, E.W. & R. CARLSON. 1968. Electric field and model for electrical liquidspraying. J. Colloid Sci. 28: 161–166.
104 ANNALS NEW YORK ACADEMY OF SCIENCES
21. WEAST, R.C. 1979. Handbook of Chemistry and Physics, 59th Ed. CRC Press Inc.Boca Raton, FL. p. F45.
22. AL-HAJRY, H.A., S.A. AL-MASKARY, L.M. AL-KHAROUSI, O. EL-MARDI, W.H.SHAYYA & M.F.A. GOOSEN. 1999. Growth of somatic tissue encapsulated in algi-nate using electrostatics. Biotechnol. Progress. Submitted for publication.
23. YUET, P.K., W. KWOK, T.J. HARRIS & M.F.A. GOOSEN. 1993. Mathematical model-ling of immobilized animal cell growth: a comparison with experimental results. InFundamentals of Animal Cell Encapsulation and Immobilization. M.F.A. Goosen,Ed. CRC Press. Boca Raton, FL. p. 79.
24. YUET, P.K., T. . HARRIS & M.F.A. GOOSEN. 1995. J. Artif. Cells, Blood Substitutesand Immobilization Biotechnol. 23: 1.
25. MOGENSEN, A.O. & W.R. Vieth. 1973. Biotechnol. Bioeng. 15: 467. 26. BAILEY, J.E. & D.F. OLLIS. 1986. In Biochemical Engineering Fundamentals, 2nd ed.
J.E.B & D.F. Ollis, Eds., Chap. 7. McGraw-Hill Book Co. New York. 27. FRAME, K.K. & W.S. HU. 1988. Biotechnol. Bioeng. 32: 1061. 28. CHANG, H.N. & M. MOO-YOUNG. 1988. Appl. Microbiol. Biotechnol. 29: 107. 29. GOSMANN, B. & H. J. REHN. 1988. Appl. Microbiol. Biotechnol. 29: 554. 30. BUGARSKI, B., J. Smith, J. Wu & M.F.A. GOOSEN. 1993. Methods of animal cell
immobilization using electrostatic droplet generation. Biotechnol. Tech. 6 (9):677–682.
31. BUGARSKI, B., Q. LI, M.F.A. GOOSEN, D. PONCELET, R. NEUFELD & G. VUNJAK.1994. Electrostatic droplet generation: mechanism of polymer droplet formation.Am. Inst. Chem. Eng. J. 40 (6): 1026–1031.
32. GOOSEN, M.F.A., E.S.E. MAHMOUD, A.S. Al-GHAFRI, H.A. AL-HAJRI, Y.S. AL-SINANI & B. BUGARSKI 1996. Immobilization of cells using electrostatic dropletgeneration. In Methods in Molecular Biology: Immobilization Enzymes and Cells.G. Bickerstaff, Ed., Chap. 20: 167–174. Humana Press. Totowa, NJ.
33. GOOSEN, M.F.A., A.S. AL-GHAFRI, O. EL-MARDI, M.I.J. AL-BELUSHI, H.A. AL-HAJRI, E.S.E. MAHMOUD & E.C. CONSOLACION. 1997. Electrostatic droplet genera-tion for encapsulation of somatic tissue: assessment of high voltage power supply.Biotechnol. Prog. 13 (4): 497–502.
34. KLEIN, J., J. Stock & D.K. VORLOP 1993. Pore size and properties of spherical cal-cium alginate biocatalysts. Eur. J. Appl. Microb. Biotechnol. 18: 86.
35. GOOSEN, M.F.A., G.M. O’SHEA, M.M. GHARAPETIAN & A.M. SUN. 1986. Immobili-zation of living cells in biocompatible semipermeable microcapsules: biomedicaland potential biochemical engineering applications. In Polymers in Medicine. E.Chiellini, Ed.: 235. Plenum Publishing. New York.
36. TENG, W.-L., Y.-J. LIU, V.-C., TSAI & T.-S. SOONG 1994. Somatic embryogenesis ofcarrot in bioreactor culture systems. Hort. Sci. 29 (11): 1349–1352.
37. SHIGETA, J. 1995. Germination and growth of encapsulated somatic embryos of car-rot for mass propagation. Biotechnol. Tech. 10 (9): 771–776.
38. PICCIONI, E. 1997. Plantlets from encapsulated micropropagated buds of M.26 applerootstock. Plant Cell, Tissue and Organ Culture. 47: 255–260.
39. BAPAT, V.A. & P.S. RAO. 1990. In vivo growth of encapsulated auxiliary buds ofmulberry (Morus indica, L). Plant Cell Tissue Organ Cult. 20: 60–70.
40. GANAPATHI, T.R., P. SUPRASANNA, V.A. BAPAT & P.S. RAO. 1992. Propagation ofbanana through encapsulated shoot tips. Plant Cell. Rep. 11: 571–575.
41. KING, G.A., A.J. DAUGULIS, P. FAULKNER, D. BAYLY & M.F.A. GOOSEN. 1989. Algi-nate concentration a key factor in growth of temperature-sensitive insect cells inmicrocapsules. Biotechnol. Bioeng. 34: 1085–1091.
42. CHANG, T.M.S. & S. PRAKASH. 1998. Therapeutic uses of microencapsulated geneti-cally engineered cells. Mol. Med. Today 4 (5): 221–227.
43. HAREL, P., L. MIGNOT, J.P. SAUVAGE & G.A. JUNTER. 1998. Cadmium removal fromdilute aqueous solution by gel beads of sugar beet pectin. Industrial Crops andProducts 7: 239–247.