photochlorination of propane
TRANSCRIPT
Photoch lorination of Propane ALBERT0 E. CASSANO and J. M. SMITH
University of California, Davis, California
The chlorination of propane was studied in a tubular flow reactor, with outside illumina- tion, a t atmospheric pressure. At chlorine concentrations of less than 1.5 mole % (and inert nitrogen above 94%) a second-order (in chlorine) rate expression was indicated. At higher chlorine or propane concentrations propane affects the rate. Two rate equations, based upon different termination steps for the chain carriers, were found to fit the data. For the low concentration region the apparent activation energy for the overall reaction was 3.4 kcal./g.-mole. Most of the measurements were carried out with polychromatic light, but data taken with a narrow band of radiation, over the range 2,200 to 5,4WA, showed an increase in rate with decreasing wave length. As a first step toward reactor design, differential reactor data were used to predict the conversion for laminar flow, integral reactor conditions. A reactor model which included the effects of residence time distribution and radial variation in light intensity gave good agreement with experimental dota. A plug-flow model was less satisfactory.
The impetus for this work was an earlier study (1) on the same reaction at low chlorine concentrations. To un- derstand the objectives of the prestmt study it is necessary to mention the earlier results. In that work kinetic con- stants were determined for the photochlorination of pro- pane in a differential, tubular flow reactor operated at 30°C. and at atmos heric pressure. Chlorine concentra-
nitrogen, and an excess of propane was present. The rate of disappearance of chlorine closely fit the following equa- tion:
(1) where ko is a function of wavelength and the local light intensity at a radial position r in the reactor:
k0.x = KA 1r.h UA
Polychromatic light, directed radially into the reactor, was used and a single value of the rate constant K was ob- tained for the ran e 2,200 to 5,400 A. The li ht intensity
mission coefficients & but which gave essentially the same spectral distribution of transmitted radiation. Thus the intensity at the inside wall of the reactor for radiation in one direction is I w , i 8,4 where Ilr,,4 is the value without filters. The absorptivity of chlorine at low concentrations is small so that the intensity at any radius of the total ra- diation from both directions is given by
tions were maintaine i below 1.0 mole % by dilution with
- &IS = ko,A ( C ~ Z ) '
(2)
was varied with P 'lter solutions that had di ff erent trans-
(3)
By assuming no radial concentration gradient and sum- ming over the wave length range, the average rate across the reactor is - - 6 2 ~ 1 2 = k, ( C l z ) ' (4)
Then an average intensity 6 can be used in Equation (2) . Integration of Equation (3) from 0 to R to obtain iA and summation of Equation (2) over the wavelength range give the final expression for average values of k, and K :
Albtnto E. Cassano is on leave from the Facultad de Ingenieria Quimica., Santu Fe, Argentina.
A
The details of the derivation are given in reference 1. The uantity (r is introduced here as a measure of the light
the rate of the primary step in the photochemical proc- ess. It will be termed the specific rate of energ input.
ical reactions may be a function of wavelengti, although predictions of the effect have yet not been successful ( 4 ) . Variations of quantum yields with wavelength for acti- nometer reactions (5 to 9) are examples. One objective of the present study was to measure rate constants vs. h under the mild chlorinating conditions where Equations (1) and (2) are valid.
Equations (1) and (2) arc based upon a stationary state development, with a first-order termination step of propyl radicals assumed, either homogeneously or hetero- geneously at the reactor wall. The type and importance of the termination step in a chain reaction have a marked effect on the overall rate. Also concentration levels can influence the termination steps. Hence new data were ob- tained at higher chlorine concentrations (maintaining a fourfold excess of propane) to determine if the conditions upon which Equations (1) and (2) are based are satis- factory over a wide range of concentrations.
The complexity of design of photoreactors will be strongly dependent on the apparent activation energy for the overall reaction. In chain reactions the activation
of the termination steps acts so as to reduce the =:% value. There are experimental and theoretical studies (10 to 12) indicating that E is very low. If E is small enough, the energy and mass balances are not cou led and can be solved independently. A third goal of t ! e present work was to evaluate the activation energy for the hotochlorination of propane.
The K nal use of differential photoreactor data is for scale-up to lar er reactors and conversions. A test of
conversions for laminar flow, long reactors. These results were then compared with conversions predicted with Equations (1) and (2) and reactor models based upon plug-flow and parabolic velocity profiles.
a 7 3 sorbed by the reaction mixture, and hence determines
It is well understood (2, 3) that rates for K otochem-
longitudinal sca B e-up was carried out by measuring first
Vol. 13, No. 5 AlChE Journal Page 915
APPARATUS
The apparatus was the same as described previously ( I ) except for minor changes designed to inlprove accuracy. The same reactor (optically clear, fused quartz) 0.2 cm. 1.11. and 0.4 cm. O.D., and jacket, 1.6 cm. I.D. and 1.8 cm. O.D., were used. However, the system was operated both as a differential and as an integral reactor in the present work. The lamp was a 360-w. General Electric UA-3, medium pressure, mercury arc with characteristics described in reference I.
In the present work the maximum length of irradiated reactor was 10.0 cm. Since the lamp arc length was 15.2 cni., end effects due to nonuniform radiation in the axial direction were negligible. More accurate flow rate nieasurenlents for nitrogen were obtained by using a soap film meter, and the chlorine flow rate was held more nearly constant by installing in series a second differential-pressure flow controller. A third changc was the use of a higher capacity circulating pump for the jacket fluid, thus reducing the temperature difference between inlet and outlet of the jacket to less than 1°C.
In the actinometer runs designed to measure the light in- tensity, distilled degassed water was pumped through the reac- tor jacket. For the chlorination runs, filter solutions were used.
EXPERIMENTAL PROCEDURE
Actinometer runs were made after every 100 hr. of lamp operation to have an accurate knowledge of the decay chariic- teristics of the lamp. For these runs the feed consisted of an aqueous solution of 0.05 molal oxalic acid and itranyl sulfate, 0.01 molal, at 30°C. The coriversiorr was m;tintained betweeii 5 and 15%. Details of operating procedures and special pre- cautions are given elsewhere (1, 2, 13).
The general chlorination procedures were :IS describcd in reference 1. Ninety minutcs were generally necessary to ski- bilize the system prior to making nicasurcments. Sample col- lection periods were 10 min. or more to increase the accuracy of the chemical analyses. After each chlorination run a dark- reactor run was made to evaluate the chlorine flow rate by analysis and to chcck the presence of dark reaction. The period of continuous limp operation was lintited to 14 hr., after which a standard cleaning procedllre ( I ) was employed to clean the
'I AFTER 455hrs 0.00
0.0 0.5 1 .o - 5 (SEC.)
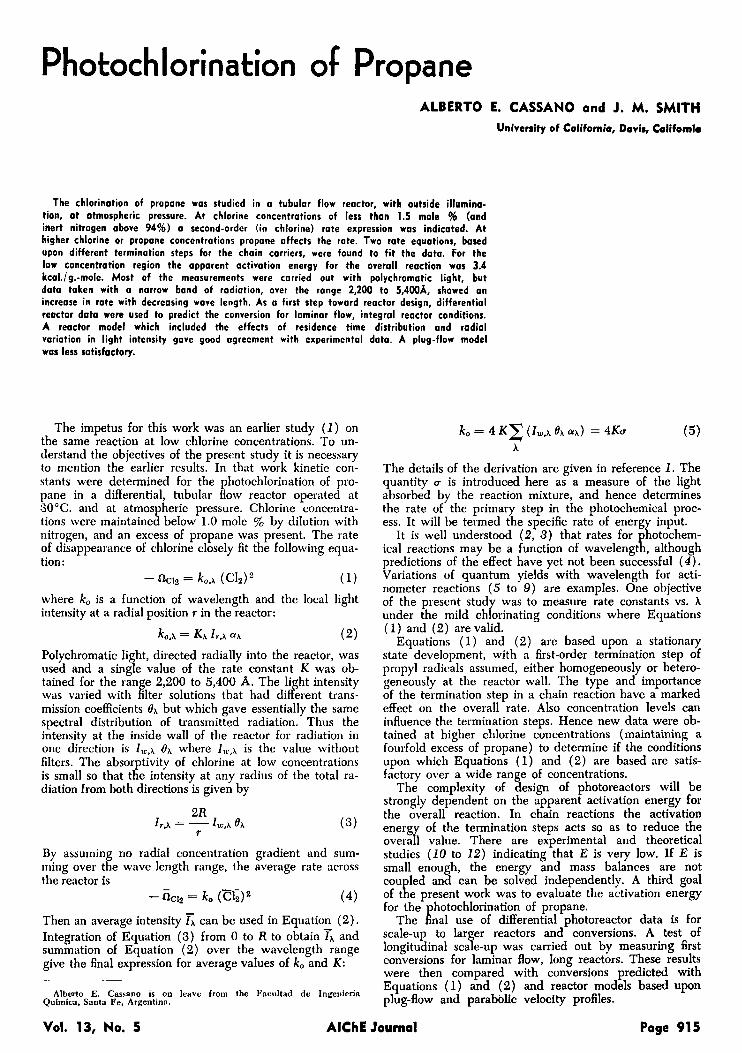
Fig. 1. Actinometer results.
Page 916
reactor walls. After each cleaning, long urge times with re- actants at normal rates were used to restagdim the system. By this procedure reproducibility of data within a few percent was possible. Samples of the filter solutions were analyzed for changes in transmission coefficients every 2 hr. with a neckman D B Spectrophotonicter.
Several operating proc-dures specific for this study were needed. First, to study the effect of spectral distribution of the light, different filter solutions were used in the reactor jacket to block re ions of emission of the lamp. Quantitative trans- mission c m k i e n t s of the various solutions over the required temperature and wavelength ranges were measured in a Cary Model 14 Spectrophotometer with a photometric accuracy bet- ter than 0.005 in the absorbance range used. Second, to oper- ate at high chlorine concentrations, reproducibility tests were necessary every 8 hr. because of the possibility of wall deposits.
SCOPE AND PRECISION OF DATA
The range of operating conditions was:
Nitrogen = 15 to 96% Propane = 3.5 to 80% Chlorine = 0.4 to 14%
Flow rate: N R ~ = 300 to 1,750 Feed composition (mole % ) :
Reactor length: 1.31 cm. for diflerential reactor
Total range of wavelen runs, 10.0 cm. for inte a1 reactor runs
2,200 to 5,400 A. Light intensity: Speci + c rate of energy input u =
(0.14 to 4.1) X Einsteins/(sec.) (g.-mole)
By careful control of flow rates, temperatures, lamp o eration, and analysis methods, the mass balances on c f: lorine, when the irradiated and dark reactor runs were compared, agreed within 2%. Light intensities were be- lieved to be accurate within 4% as determined by acti- nometer measurements a n d transmission characteristics of the filter solutions. Photochemical measurements are very difficult to duplicate quantitatively because of many poorly understood variables. It is possible however to p u t limits on re roducibility of results obtained in one laboratory.
kinetic constants, and it is believed that the values re- ported here are reproducible within 10%.
I t is appropriate to emphasize that unusual precautions are necessary to obtain satisfactory photochemical rate data, particularly for flow systems where cleaning condi- tions are sometimes difficult. It has been our experience that reproducibility requires strict adherence to precise conditions of preparation, operation, and cleaning of the system. Furthermore, long periods are required prior to measurements, even for ap arently homogeneous reac-
lamp operation, and wall behavior.
Temperature: 27" to 52°C.
The P nal results involving all the measurements are the
tions, to ensure steady con !i itions of flow temperature,
ACTINOMETER STUDIES
at the inside wall of the reactor was ob-
of oxalic acid by photochemically excited uranyl ions. It can be shown that FA is related to the rate FA of this zero order reaction by the expression:
tained The intensitfl (see re erence 1 ) by measuring the conversion ?A
According to Equation ( 6) the experimentally determined conversion should be a linear function of V,/Q with a slope proportional to FA. The data are lotted in this
but consistent decrease in slope with time. This decrease is d u e to the slow decay in output of the lamp. Data from Figure 1 giving thc rate of reaction at various times are
manner in Fig. 1, for each set of runs, an B show a small
AlChE Journal September, 1967
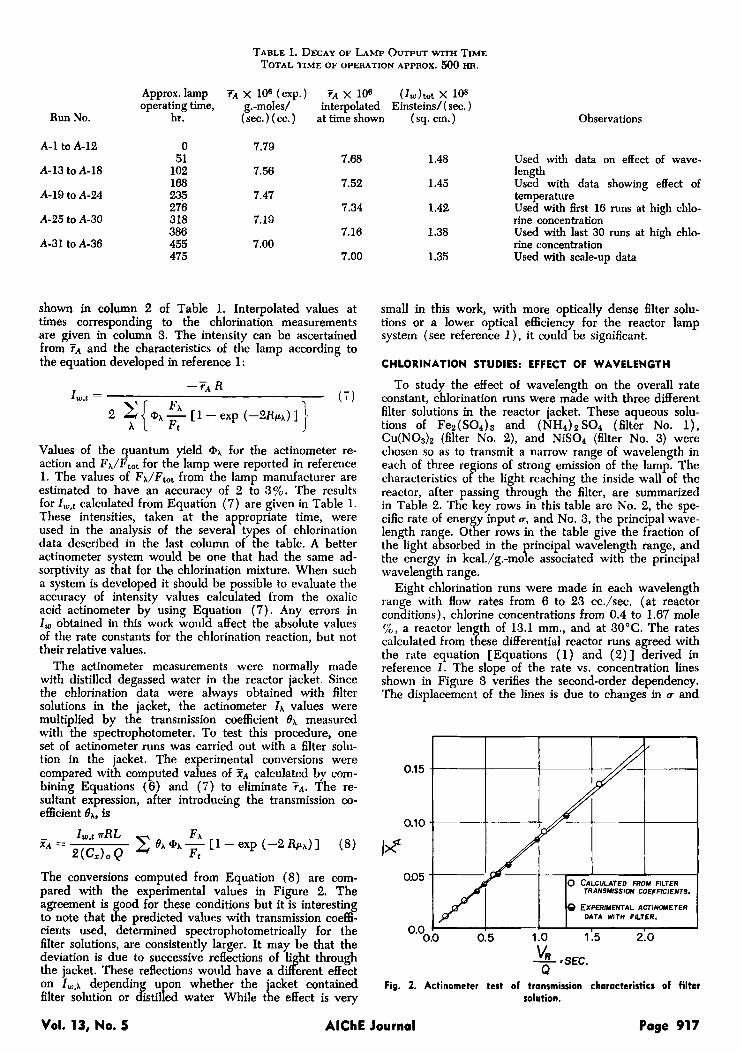
TABLE 1. DECAY OF LAMP OUTPUT WITH TIME TOTAL TIME OF OPERATION APPROX. 500 HR.
Approx. l a p TA x 108 (exp.) ?A x 108 ( I,)tot x 108 operating time, g.-moles/ interpolated Einsteins/( sec. )
Run No. hr. (sec.) (cc.) at time shown (sq. cm.)
A-1 to A-12
A-13 to A-18
A-19 to A-24
A-25 to A-30
A-31 to A-36
0 51
102 168 235 276 318 386 455 475
7.79
7.56
7.47
7.19
7.00
7.68
7.52
7.34
7.16
7.00
shown in column 2 of Table 1. Interpolated values at times corresponding to the chlorination measurements are given in column 3. The intensity can be ascertained from FA and the characteristics of the lamp according to the equation developed in reference 1 :
Values of the quantum yield @A for the actinometer re- action and FA/Ftot for the lamp were reported in reference 1. The values of FA/Ftot from the lamp manufacturer are estimated to have an accuracy of 2 to 3%. The results for I,,t calculated from Equation (7) are given in Table 1. These intensities, taken at the a propriate time, were used in the analysis of the severa Y types of chlorination data described in the last column of the table. A better actinometer system would be one that had the same ad- sorptivity as that for the chlorination mixture. When such a system is developed it should be possible to evaluate the accuracy of intensity values calculated from the oxalic acid actinometer by using Equation (7). Any errors in I , obtained in this work would affect the absolute values of the rate constants for the chlorination reaction, but not their relative values.
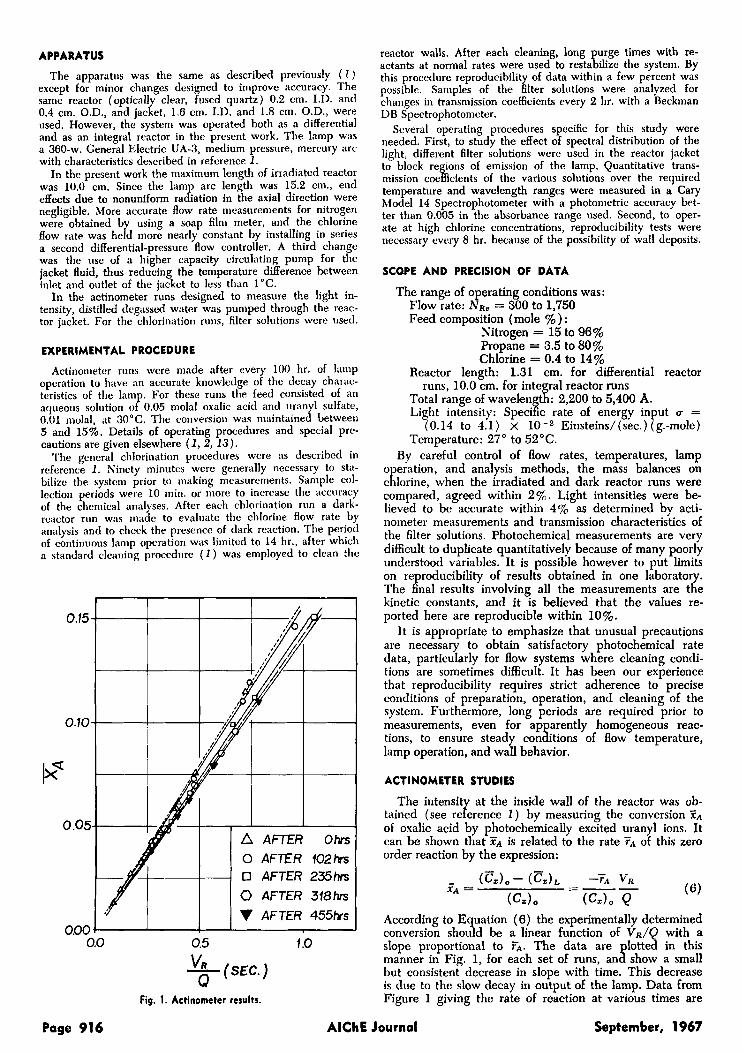
The actinometer measurements were normally made with distilled degassed water in the reactor jacket. Since the Chlorination data were always obtained with filter solutions in the jacket, the actinometer I A values were multiplied by the transmission coefficient B A measured with the spectrophotometer. To test this procedure, one set of actinometer runs was carried out with a filter solu- tion in the jacket. The experimental conversions were compared with computed values of TA calculated by com- bining Equations (6) and (7) to eliminate ?A. The re- sultant expression, after introducing the transmission co- efficient &, is
The conversions computed from Equation (8) are com- pared with the experimental values in Figure 2. The agreement is ood for these conditions but it is interesting to note that t f e predicted values with transmission coeffi- cients used, determined spectrophotometrically for the filter solutions, are consistently larger. It may be that the deviation is due to successive reflections of li ht through
on I,,k dependinf up.. whether the 'acket contained the jacket. These reflections would have a d' Iff erent effect
filter solution or istiled water While t h e effect is very
1.48
1.45
1.42
1.38
1.35
Observations
Used with data on effect of wave- length Used with data showing effect of temperature Used with first 16 runs at high chlo- rine concentration Used with last 30 runs at high chlo- rine concentration Used with scale-up data
small in this work, with more optically dense filter solu- tions or a lower optical efficiency for the reactor lamp system (see reference l ) , it could be significant.
CHLORINATION STUDIES: EFFECT OF WAVELENGTH
To study the effect of wavelength on the overall rate constant, chlorination runs were made with three different filter solutions in the reactor jacket. These aqueous solu- tions of Fez(S04)3 and (NH4)zSOr (filter No. 1). Cu(NO& (filter No. 2), and NiS04 (filter No. 3) were chosen so as to transmit a narrow range of wavelength in each of three re ions of strong emission of the lamp. The
reactor, after passing through the filter, are summarized in Table 2. The key rows in this table are No. 2, the spe- cific rate of ener input u, and No. 3, the principal wave-
the light akiorbed in the rincipal wavelength range, and
wavelength range. Eight chlorination runs were made in each wavelength
range with flow rates from 6 to 23 cc./sec. (at reactor conditions), chlorine concentrations from 0.4 to 1.67 mole %, a reactor len th of 13.1 mm., and at 30°C. The rates
the rate equation [Equations (1) and (2)] derived in reference 1. The slope of the rate vs. concentration lines shown in Figure 3 verifies the second-order dependency. The displacement of the lines is due to changes in u and
characteristics o B the light reaching the inside wall of the
length ran e. Ot Y er rows in the table give the fraction of
the energy in kcal./g.-mo P e associated with the principal
calculated from t a ese differential reactor runs agreed with
V R - tSEC. Q
Fig. 2. Actinometer test of tronsrnission characteristics of filter solution.
Vol. 13, No. 5 AlChE Journal Page 917
100
50
c j % 30 10' r 20 0 \ v, w r d
8 10
- 5
x 3
Ic 0 4 c.
(Y
$ 2 I
1 2 3 4 5 10 20 MEAN Cle CONCENTRATION x 10;
G.MOLES /CM Fig. 3. Effect of concentration on reaction rate.
K with wavelength. To establish quantitatively the effect of A on K , values of K were calculated by substituting E uations (4) and ( 5 ) in the mass balance equation for ch 1 orine:
(9)
The justification for Equation (9), where SZ is the aver- age velocity, is discussed in reference 1. Integration of Equation (9) and solution for K give
(10) Q 5 K =
V R [ClZlo (40) (1 -%)
where
K values computed in this way are somewhat more ac- curate than those obtained by calculating k o , ~ from Equa- tion (4) and the data in Figure (3), and then K from Equation ( 5 ) .
The results are summarized in Table 3, where the runs exhibiting the maximum deviation in K A (for a given wavelength range) are shown as well as the average value for each set of eight runs. A definite increase in K A with decreasing wavelength is observed in the average values. Note that the effect of wavelength on absorptivities of chlorine and filter solutions, as well as on the emission of the lamp, has been taken into account (through c) prior to evaluating K. There is considerable information in the literature (14 to 16) indicating a variation in quantum yield and even product distribution with wavelength of radiation, presumably due to a variation in efficiency of the primary process. It has been postulated (4 , 14, 16) that this effect on the primary process is related to the excess of energy over that needed to dissociate the ab- sorbing molecule into activated atoms. The data of this study agree with this postulate. The primary process is
Cl, + hu 4 2 c1*
where the energy of radiation depends upon the frequency v, and is given in row No. 7 of Table 2. The dissociation energy of chlorine is 57 kcal./g.-mole. A plot of the excess energy vs. K, Figure 4, indicates a linear relationship. The data available for Figure 4 are limited in extent and the total variation in K is not great ( 4 5 % ) . However, it is believed that the accuracy of the data is good enough to attach significance to the progressive increase in K with decrease in wavelength.
The absolute value of K , averaged for the three wave- length regions, is about 50% less than the polychromatic K determined in the earlier work (1). The explanation for this difference is difficult to pinpoint, although the problems in reproducing kinetic results in photochemical studies made at different times are well known. The re- sults reported here were obtained in the same apparatus used earlier but some operating procedures were differ- ent. The nitrogen used was 99.99% pure but did not car- ry the specification of less than 8 p.p.m. of oxygen which characterized the nitrogen used in reference ( 1 ) . The severe inhibiting effect of oxygen even in small concen- trations could account for the decrease in K . The soap
(12)
TABLE 2. WAVELENGTH CHARACTERISTICS OF LIGHT AT INSIDE W A L L OF REACTOR
Property Filter 1 Filter 2 Filter 3
1. Total wavelength range of transmission, A. 2. u, Einsteins/( sec.) (g.-mole)
3; Principal wavelength range, A.
4.
5. Principal emission lines in the principal range
6.
7. Energy in kcal./g.-mole for an approx. mean value of (3)
8. Energy in excess of dissociation energy of chlorine, kcal./g.-mole
u for principal range u for total range
Approximate u for principal line u for total range
Page 918 AlChE JournaI
3,700 to 5,000
0.141 10-2
4,000 to 4,400
0.85
4,358
0.63
66.5
9.5
3,300 to 5,000 2,300 to 5,000
2.23 10-2 4.04 10-2
3,400 to 3,700 2,900 to 3,300
0.85 0.78
3,654 3,022 to 3,131
0.77 0.70
78.6 92.2
21.6 35.2
September, 1967
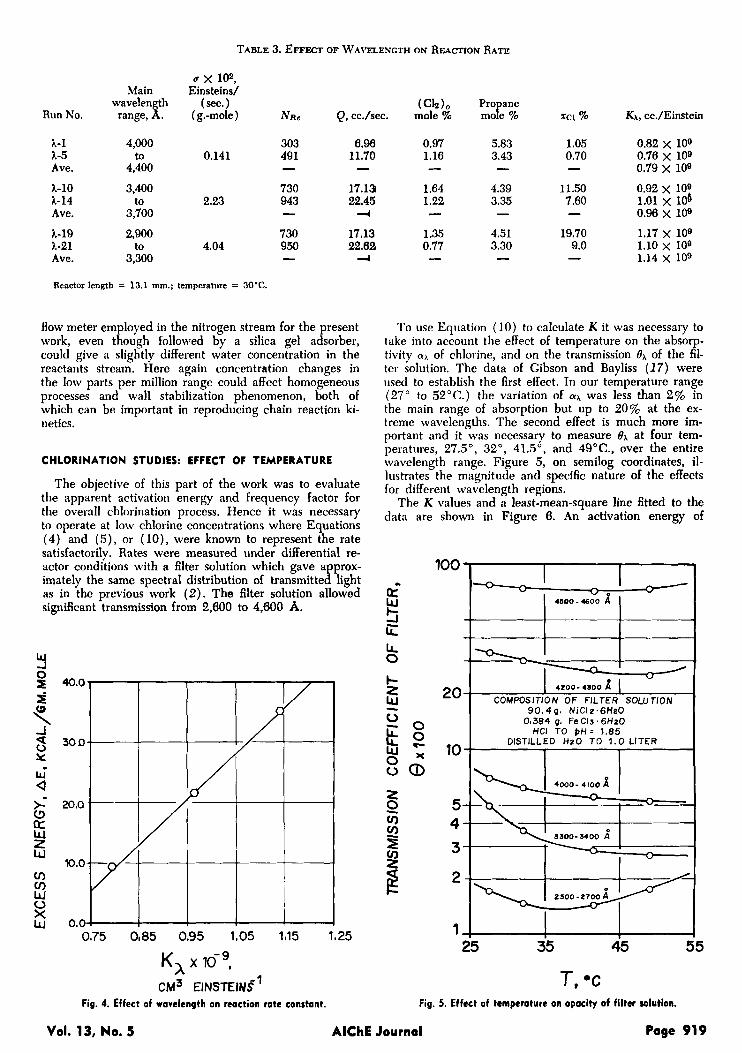
TABLE 3. EFFECT OF WAVELENGTH ON REACTION RATE
Run No.
1-1 1-5 Ave.
1-10 1-14 Ave.
1-19 1-21
Main
R$:fh 4,000 to
4,400
3,400 to
3,700
2900 to
Q x 102, EinsteIns/
(=c.) ( g.-mole ) N R ~
303 0.141 491
730 2.23 943
730 4.04 950
-
Q, cc./sec. mole (clz)o % mo e %
8.96 0.97 5.83 11.70 1.16 3.43
17.13 1.64 4.39 22.45 1.22 3.35
17.13 1.35 4.51 22.62 0.77 3.30
L - 4
~
Ave. 3,300 - 4
Reactor lenflh = 13.1 mm.; tempcratiire = 30'C.
flow meter employed in the nitrogen stream for the present work, even though followed by a silica gel adsorber, could give a slightly different water concentration in the reactants stream. Here again concentration changes in the low parts per million range could affect homogeneous processes and wall stabilization phenomenon, both of which can be important in reproducing chain reaction ki- netics.
CHLORINATION STUDIES: EFFECT OF TEMPERATURE
The objective of this part of the work was to evaluate the apparent activation energy and frequency factor for the overall chlorination process. Hence it was necessary to operate at low chlorine concentrations where Equations (4 ) and ( 5 ) , or (lo), were known to represent the rate satisfactorily. Rates were measured under differential re- actor conditions with a filter solution which gave approx- imately the same spectral distribution of transmitted light as in the previous work (2). The filter solution allowed significant transmission from 2,600 to 4,600 A.
"I".
0,75 0185 0,95 1.05 1815 1825
K, x la9, CM3 EINSTEIN$'
Fig. 4. Effect of wavelength on reaction rate constant.
xc1%
1.05 0.70
11.50 7.80
19.70 9.0
-
-
KA, cc./Einstein
0.82 x 10⁹ 0.76 x 10⁹ 0.79 x 10⁹ 0.92 x 10⁹ 1.01 x 10⁹ 0.96 x 10⁹ 1.17 x 10⁹ 1.10 x 10⁹
To use Equation (10) to calculate K it was necessary to take into account the effect of temperature on the absorp- tivity of chlorine, and on the transmission of the fil- ter solution. The data of Gibson and Bayliss (17) were used to establish the first effect. In our temperature range (27" to 52°C.) the variation of LYA was less than 2% in the main range of absorption but up to 20% at the ex- treme wavelengths. The second effect is much more im- portant and it was necessary to measure & at four tem- peratures, 27.5", 32", 41.5", and 49"C., over the entire wavelength range. Figure 5, on semilog coordinates, il- lustrates the magnitude and specific nature of the effects for different wavelength regions.
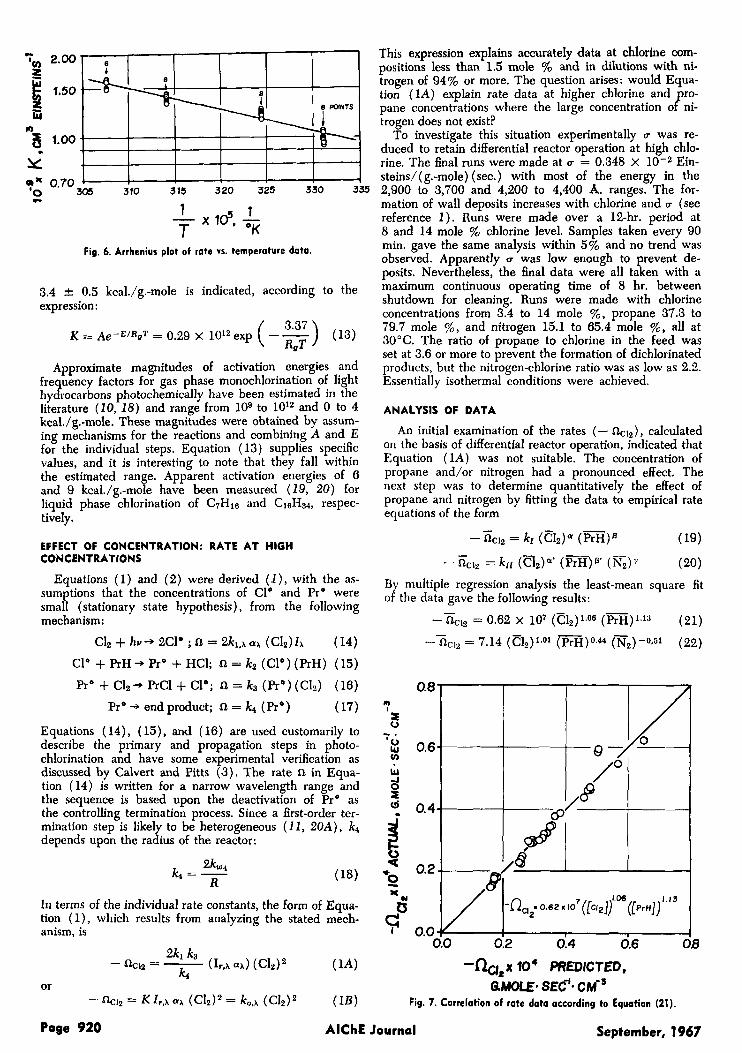
The K values and a least-mean-square line fitted to the data are shown in Figure 6. An activation energy of
6 4500 - 4600 A W 5 i i
9 0 . 4 g , N i C l e . 6 H 2 0 0,384 g, Fe C I S . 6 H 2 0
HCI TO D H = 1.85
10
25 35 45 . 1 5
T, "C Fig. 5. Effect of temperature on opacity of filter solution.
Vol. 13, No. 5 AlChE Journal Page 919
- 2.00
6 1.50
'3
'2
m3 1.00 .
0.8 -
0.6-
I I I I 1
/"
I 1 I
I
0.4-
0.2 -
I ? - x Id, - 7- "K
-
Fig. 6. Arrhenius plot of rate vs. temperature data.
3.4 2 0.5 kcal./g.-mole is indicated, according to the expression:
K = Ae-E/RaT = 0.29 X 1Ol2 exp
Approximate magnitudes of activation energies and fre uency factors for gas phase monochlorination of light hyjrocarbons photochemically have been estimated in the literature (10, 18) and range from 109 to 10l2 and 0 to 4 kcal./g.-mole. These magnitudes were obtained by assum- ing mechanisms for the reactions and combining A and E for the individual steps. Equation (13) supplies specific values, and it is interesting to note that they fall within the estimated range. Apparent activation energies of 6 and 9 kcal./g.-mole have been measured (19, 20) for liquid phase chlorination of C,H18 and C1&4, respec- tively.
EFFECT OF CONCENTRATION: RATE AT HIGH CONCENTRATIONS
Equations (1) and (2) were derived (I), with the as- sumptions that the concentrations of CIo and Pro were small (stationary state hypothesis), from the following mechanism:
clz + hv + 2c1' ; n = 2k1,~ a~ (c1r)Ix ( 14)
Cl0 + PrH + Pro + HCl; = k2 ( a o ) (PrH) (15)
Pro + Clz+ PrCl + Cl'; n = k3 (Pro) (Cl,) (16)
Pro 4 end product; = k4 (Pro) ( 17)
Equations (14), (15), and (16) are used customarily to describe the primary and propagation steps in photo- chlorination and have some experimental verification as discussed by Calvert and Pitts (3). The rate in Equa- tion (14) is written for a narrow wavelength range and the sequence is based upon the deactivation of Pro as the controlling termination process. Since a first-order ter- mination step is like1 to be heterogeneous (11, 20A), k4 depends upon the r a i u s of the reactor:
In terms of the individual rate constants, the form of Equa- tion (1) , which results from analyzing the stated mech- anism, is
This expression explains accurately data at chlorine com- positions less than 1.5 mole % and in dilutions with ni- trogen of 94% or more. The question arises: would Equa- tion (1A) explain rate data at higher chlorine and ro- pane concentrations where the large concentration oPni- trogen does not exist?
To investigate this situation experimentally u was re- duced to retain differential reactor operation at high chlo- rine. The final runs were made at u = 0.348 x 10⁻² Ein- steins/(g.-mole) (sec.) with most of the energy in the 2,900 to 3,700 and 4,200 to 4,400 A. ranges. The for- mation of wall deposits increases with chlorine and u (see reference 1). Runs were made over a 12-hr. period at 8 and 14 mole % chlorine level. Samples taken every 90 min. gave the same analysis within 5% and no trend was observed. Apparently v was low enough to prevent de- posits. Nevertheless, the final data were all taken with a maximum continuous operating time of 8 hr. between shutdown for cleaning. Runs were made with chlorine concentrations from 3.4 to 14 mole %, propane 37.3 to 79.7 mole %, and nitrogen 15.1 to 65.4 mole %, all at 30°C. The ratio of propane to chlorine in the feed was set at 3.6 or more to prevent the formation of dichlorinated products, but the nitrogen-chlorine ratio was as low as 2.2. Essentially isothermal conditions were achieved.
ANALYSIS OF DATA
An initial examination of the rates (- ac12), calculated on the basis of differential reactor operation, indicated that Equation (1A) was not suitable. The concentration of propane and/or nitrogen had a pronounced effect, The next step was to determine quantitatively the effect of propane and nitrogen by fitting the data to empirical rate equations of the form
- -&12 = kr (Cl2)a (PrH)@
- ncln = klr ( E I Z ) ~ ' ( - ) f i e (%).+ (19)
(20) -
By multiple regression analysis the least-mean square fit of the data gave the following results:
- - nc12 = 0.62 x 10⁷ (Ci2)1.06 ( P r H ) l ~ s (21) - - f k l n = 7.14 ( el2) (PrH)O.44 (N2) -0.51 (22)
8
- h e x lo' PREDlCTED, BMOLE. SEf. CMP
Fig. 7. Correlation of rate data according to Equation (21).
Page 920 AlChE Journal September, 1967
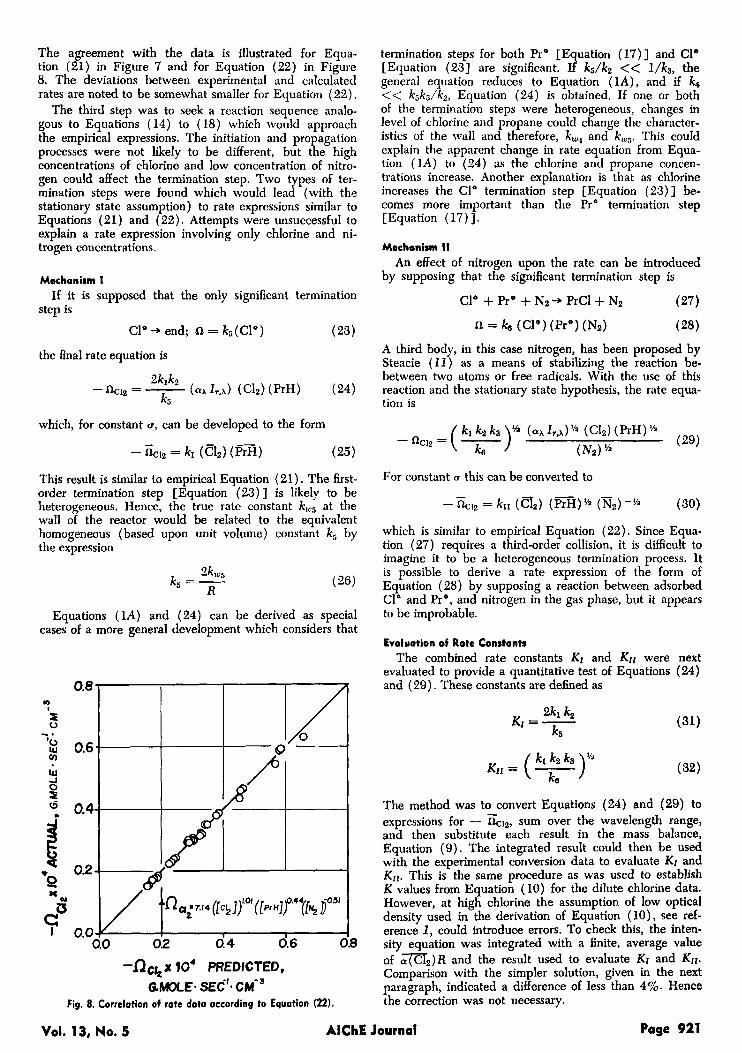
The agreement with the data is illustrated for Equa- tion (21) in Figure 7 and for Equation (22) in Figure 8. The deviations between experimental and calculated rates are noted to be somewhat smaller for Equation (22) .
The third step was to seek a rcaction sequence analo- gous to Equations (14) to (18) which woukl approach the empirical expressions. The initiation and propagation processes were not likely to be different, but the high concentrations of chlorine and low concentration of nitro- gen could affect the termination step. Two types of ter- mination steps were found which would lead (with the stationary state assumption) to rate expressions similar to Equations (21) and (22). Attempts were unsuccessful to explain a rate expression involving only chlorine and ni- trogen concentrations.
Mechanism I
step is If it is supposed that the only significant termination
CIo + end; = k5(C10) (23)
the final rate equation is
which, for constant u, can be developed to the form
- GiZ = kI (C&) (PTH) (25)
This result is similar to empirical Equation (21) I The first- order termination step [Equation (23)] is likely to be heterogeneous. Hence, the true rate constant k,, at the wall of the reactor would be related to the equivalent homogeneous (based upon unit volume) constant k, by the expression
2kw5 k5 = - R
(26)
Equations (1A) and (24) can be derived as special cases of a more general development which considers that
n I P 0
'0 W v)
W -I 0
-.
z
it *Q
u Y
c3 I
I 0.8 I
-fichx 10' PREDICTED, GMOLE. SEC'. CM-'
Fig. 8. Correlation of rate data according to Equation (22).
termination steps for both Pro [Equation (17)] and C1" [Equation (231 are significant. If kS/kz << l / k 3 , the general equation reduces to Equation ( l A ) , and if k4 << kjkg/kp, Equation (24) is obtained. If one or both of the termination steps were heterogeneous, changes in level of chlorine and propane could change the character- istics of the wall and therefore, kw, and kloj . This could explain the apparent change in rate equation from Equa- tion (In) to (24) as the chlorine and propane concen- trations increase. Another explanation is that as chlorine increases the CI' termination step [Equation (23)] be- comes more important than the Pro termination step [Equation ( 17) 1.
Meshonism I I
by supposing that the significant termination step is An effect of nitrogen upon the rate can be introduced
C1" + Pro + NZ 3 PrCl + N2 (27)
(28) n = ks ((21') (Pro) (Nz) A third body, in this case nitrogen, has been proposed by Steacie (11) as a means of stabilizing the reaction be- between two atoms or free radicals. With the use of this reaction and the stationary state hypothesis, the rate equa- tion is
For constant u this can be converted to
which is similar to empirical Equation (22). Since Equa- tion (27) requires a third-order collision, it is difficult to imagine it to be a heterogeneous termination process. It is possible to derive a rate expression of the form of Equation (28) by supposing a reaction between adsorbed C1" and Pro, and nitrogen in the gas phase, but it appears to be improbable.
Evaluation of Rote Constants The combined rate constants K I and KII were next
evaluated to provide a quantitative test of Equations (24) and (29). These constants are defined as
The method was to - convert Equations (24) and (29) to expressions for - ncIz, sum over the wavelength range, and then substitute each result in the mass balance, Equation (9 ) . The integrated result could then be used with the experimental conversion data to evaluate KI and Krr. This is the same procedure as was used to establish K values from Equation (10) for the dilute chlorine data. However, at high chlorine the assumption of low optical density used in the derivation of Equation ( l o ) , see ref- erence 1, could introduce errors. To check this, the inten- sity equation was integrated with a finite, average value of a n 2 ) R and the result used to evaluate Kr and KII . Comparison with the simpler solution, given in the next paragraph, indicated a difference of less than 476. Hence the correction was not necessary.
Vol. 13, No. 5 AlChE Journal Page 921
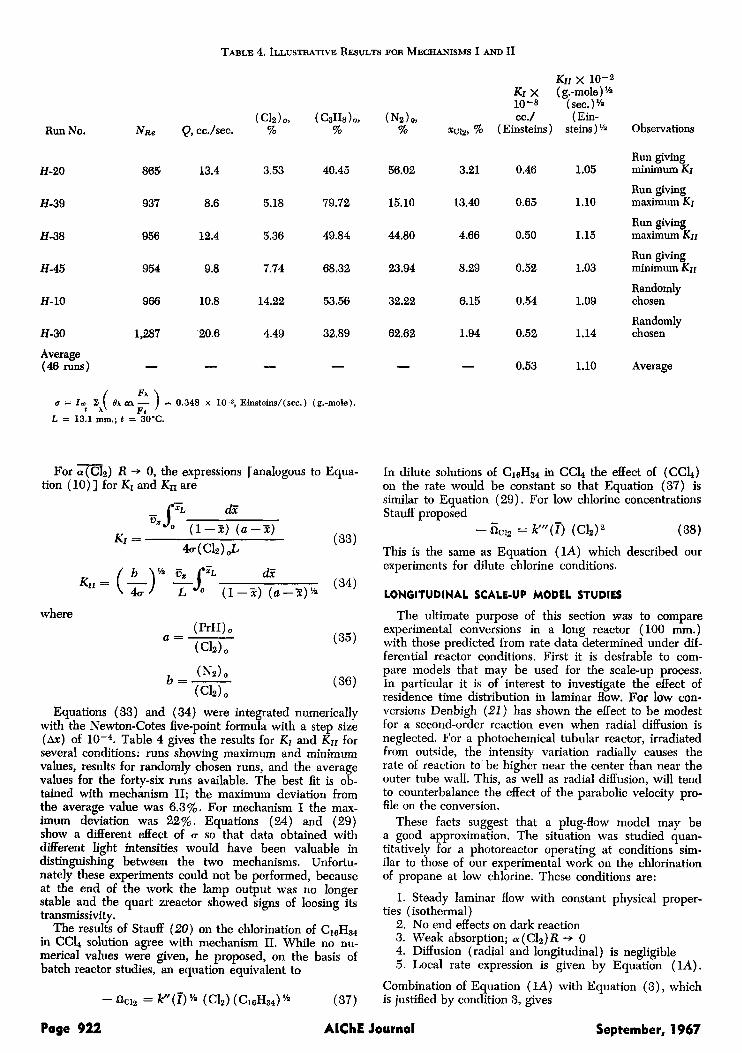
TABLE 4. ILLUSTRATIVE RESULTS FOR MECHANISMS I AND I1
Run No.
H-20
H-39
H-38
H-45
H-10
H-30
Average (46 runs)
N R ~
865
937
956
954
966
1,287
-
13.4 3.53 40.45
8.6 5.18 79.72
12.4 5.36 49.84
9.8 7.74 68.32
10.8 14.22 53.56
20.6 4.49 32.89
- - - FA
u = Im 3 ( BA UA F, ) = 0.348 x 10⁻², Einsteins/(sec.) (g.-mole). I h
L = 13.1 mm.; t = 30’C.
- For a (Cl2) A + 0, the expressions [analogous to Equa-
tion ( lo) ] for KI and K I I are
where
(35)
Equations (33) and (34) were integrated numerically with the Newton-Cotes five-point formula with a step size (Ax) of Table 4 gives the results for K I and K I I for several conditions: runs showing maximum and minimum values, results for randomly chosen runs, and the average values for the forty-six runs available. The best fit is ob- tained with mechanism 11; the maximum deviation from the average value was 6.3%. For mechanism I the max- imum deviation was 22%. Equations (24) and (29) show a different effect of u so that data obtained with different fight intensities would have been valuable in distinguishing between the two mechanisms. Unfortu- nately these experiments could not be performed, because at the end of the work the lamp output was no longer stable and the quart zreactor showed signs of loosing its transmissivity.
The results of Stauff (20) on the chlorination of C16H34 in CCl, solution agree with mechanism 11. While no nu- merical values were given, he proposed, on the basis of batch reactor studies, an equation equivalent to
- = K’ ( f) % (clz) (C16H34) ’’’ (37)
Krr x 10-2 KI x (g.-mole)G 10-8 (set.)%
( N z ) ~ Gc./ (Ein- % xc12, % (Einsteins) steins) va Observations
Run giving
Run giving
Run giving
Run giving
Randomly
Randomly
56.02 3.21 0.46 1.05 minimum K I
15.10 13.40 0.65 1.10 maximum KI
44.80 4.66 0.50 1.15 maximum Krr
23.94 8.29 0.52 1.03 minimum K I ~
32.22 6.15 0.54 1.09 chosen
62.62 1.94 0.52 1.14 chosen
- - 0.53 1.10 Average
In dilute solutions of C16H34 in CCL the effect of (CCL) on the rate would be constant so that Equation (37) is similar to Equation (29). For low chlorine concentrations Stauff proposed
(38) This is the same as Equation (1A) which described our experiments for dilute chlorine conditions.
- - -nClZ = kl” 7) (Clz) 2
LONGITUDINAL SCALE-UP MODEL STUDIES
The ultimate purpose of this section was to compare experimental conversions in a long reactor (100 mm.) with those predicted from rate data determined under dif- ferential reactor conditions. First it is desirable to com- pare models that may be used for the scale-up process. In particular it is of interest to investigate the effect of residence time distribution in laminar flow. For low con- versions Denbigh (21) has shown the effect to be modest for a second-order reaction even when radial diffusion is neglected. For a photochemical tubular reactor, irradiated from outside, the intensity variation radially causes the rate of reaction to be higher near the center than near the outer tube wall. This, as well as radial diffusion, will tend to counterbalance the effect of the parabolic velocity pro- file on the conversion.
These facts suggest that a plug-flow model may be a good approximation. The situation was studied quan- titatively for a photoreactor operating at conditions sim- ilar to those of our experimental work on the chlorination of propane at low chlorine. These conditions are:
1. Steady laminar flow with constant physical proper- ties (isothermal)
2. No end effects on dark reaction 3. Weak absorption; a (Clz) R + 0 4. Diffusion (radial and longitudinal) is negligible 5. Local rate expression is given by Equation (1A).
Combination of Equation (1A) with Equation (3) , which is justified by condition 3, gives
Page 922 AlChE Journal September, 1967
(39)
If a filter solution and polychromatic light are used, Equation (39) becomes
- nclz = - d(C1z) - - - - 2R K U (Clz)z (40) dt r
This expression gives the local rate in terms of r and 0.
Conversions for three models were compared: A. Parabolic velocity profile,
o , = 2 4 [
B. Plug-flow model (no velocity or concentration gra- dients radially)
C. Diffuse light so that the intensity is constant through- out the reactor at an average value given by the integral of Equation (3) across the radius. For a filter solution, and summed for polychromatic light, this is
- z = 40 (42)
Then the local rate Equation (40) becomes
Model A The average conversion leaving the reactor, in terms of
a residence time distribution function 4, may be written as
(44)
$dt is the volumetric flow rate for a differential annular element divided by the total flow rate Q. Denbigh (21) has shown that
(45)
where the local and mean residence time are given by L/o, and L/G, respectively. The conversion-time rela- tionship x ( t ) , obtained by integrating Equation (40) , is
0.8
0.6
0.4
02
0
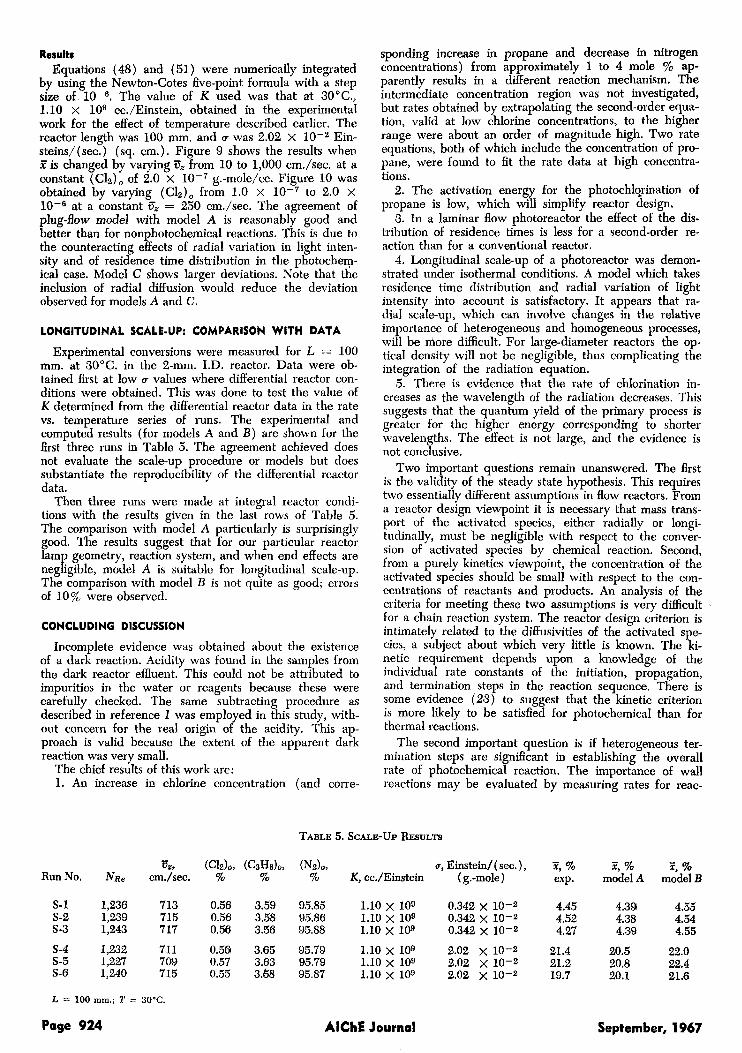
AVERAGE L I N E A R VELOCfTY, CM. . SEC?
Fig, 9. Parabolic and flat velocity profile models.
Y
I X ! 0.8 i o_
0.6 9
z 0.4
3 k
(3 0.2 a
W
Q W
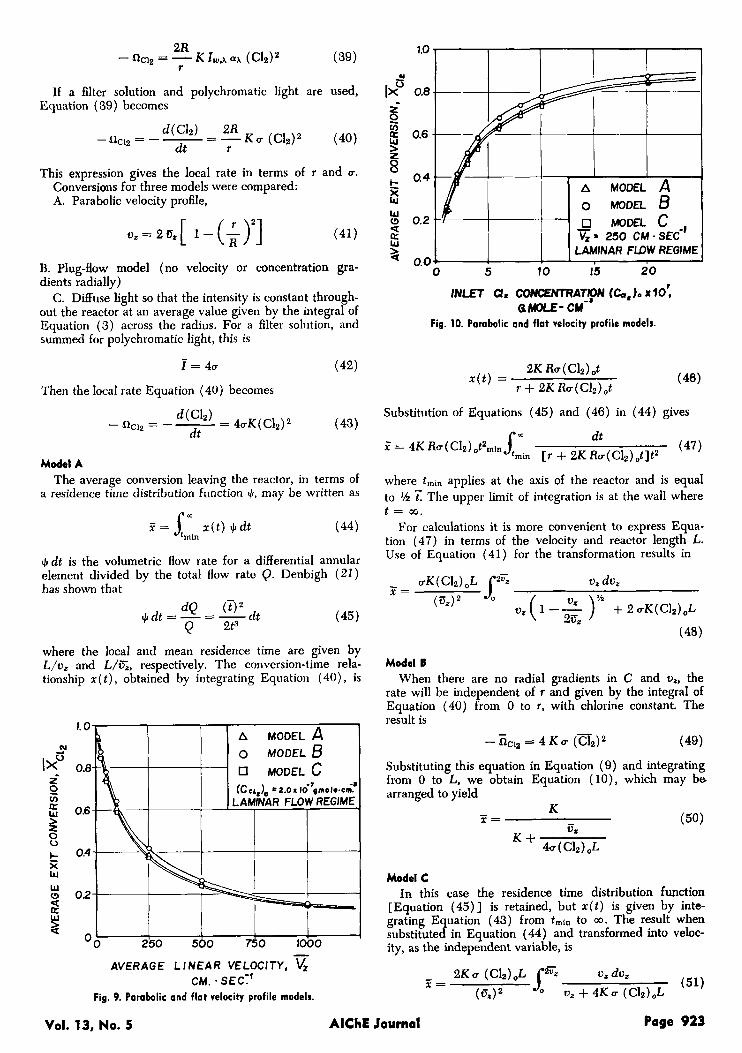
0 5 10 15 20 3 0.0
INLET CI. C0"TRATlpN (Ca, )a x 70: &MOLE- CM-
Fig. 10. Parabolic and flat velocity profile models.
2K Ru ((212) ,,t r + 2K Ro(Clz),t
x ( t ) =
Substitution of Equations (45) and (46) in (44) gives
(47) dt
l;in [r + 2K Ru(C12),t]t2 x'= 4K R~(Clz)otzm~n
where trnin applies at the axis of the reactor and is equal to M The upper limit of integration is at the wail where t = 33.
For calculations it is more convenient to express Equa- tion (47) in terms of the velocity and reactor length L. Use of Equation (41) for the transformation results in
- uK(Clp),L Jc v, do, '/a
X =
o, (1 -g ) + 2 oK(C12),L (5J2
(48)
Model B When there are no radial gradients in C and us, the
rate will be independent of r and given by the integral of Equation (40) from 0 to r, with chlorine constant. The result is
(49) -
- ncla = 4 K u (az) Substituting this equation in Equation (9) and integrating from 0 to L, we obtain Equation ( lo) , which may b e arranged to yield
(50) K -
X = 52
K + 4u(c12)oL
Model C i n this case the residence time distribution function
[Equation (45)] is retained, but x ( t ) is given by inte- grating Equation (43) from tmin to 00. The result when substituted in Equation (44) and transformed into veloc- ity, as the independent variable, is
(51) - 2Ko (Clz),L fT u a do, X = (s)2 U, + 4Ku (C1z)J
Vol. 13, No. 5 AlChE Journal Page 923
Results Equations (48) and (51) were numerically integrated
by using the Newton-Cotes five-point formula with a step size of 10-6. The value of K used was that at 30"C., 1.10 x lo9 cc./Einstein, obtained in the experimental work for the effect of temperature described earlier. The reactor length was 100 mm. and u was 2.02 x Ein- steins/(sec.) (sq. cm.). Figure 9 shows the results when f is changed by varying gz from 10 to 1,000 cm./sec. at a constant (C12) of 2.0 X lOW7 g.-mole/cc. Figure 10 was obtained by varying (C12)o from 1.0 x to 2.0 x
= 250 cm./sec. The agreement of plug-flow model with model A is reasonably good and better than for nonphotochemical reactions. This is due to the counteracting effects of radial variation in light inten- sity and of residence time distribution in the photochem- ical case. Model C shows larger deviations. Note that the inclusion of radial diffusion would reduce the deviation observed for models A and C.
at a constant
LONGITUDINAL SCALE-UP: COMPARISON WITH DATA
Experimental conversions were measured for L = 100 mm. at 30°C. in the 2-mm. I.D. reactor. Data were ob- tained first at low u values where differential reactor con- ditions were obtained. This was done to test the value of K determined from the differential reactor data in the rate vs. temperature series of runs. The experimental and computed results (for models A and B ) are shown for the first three runs in Table 5. The agreement achieved does not evaluate the scale-up procedure or models but does substantiate the reproducibility of the differential reactor data.
Then three runs were made at integral reactor condi- tions with the results given in the last rows of Table 5. The comparison with model A particularly is surprisingly good. The results suggest that for our particular reactor lam geometry, reaction system, and when end effects are
The comparison with model B is not quite as good; errors of 10% were observed.
neg P igible, model A is suitable for longitudinal scale-up.
CONCLUDING DISCUSSION
Incomplete evidence was obtained about the existence of a dark reaction. Acidity was found in the samples from the dark reactor effluent. This could not be attributed to impurities in the water or reagents because these were carefully checked. The same subtracting procedure as described in reference 1 was employed in this study, with- out concern for the real origin of the acidity. This ap- proach is valid because the extent of the apparent dark reaction was very small.
The chief results of this work are: 1. An increase in chlorine concentration (and corre-
sponding increase in propane and decrease in nitrogen concentrations) from approximately 1 to 4 mole '% ap- parently results in a different reaction mechanism. The intermediate concentration region was not investigated, but rates obtained by extrapolating the second-order equa- tion, valid at low chlorine concentrations, to the higher range were about an order of magnitude high. Two rate equations, both of which include the concentration of pro- pane, were found to fit the rate data at high concentra- tions.
2. The activation energy for the photochlqrination of. propane is low, which will simplify reactor design.
3. In a laminar flow photoreactor the effect of the dis- tribution of residence times is less for a second-order re- action than for a conventional reactor.
4. Longitudinal scaleup of a photoreactor was demoh- strated under isothermal conditions. A model which takes residence time distribution and radial variation of light intensity into account is satisfactory. It appears that ra- dial scale-up, which can involve changes in the relative importance of heterogeneous and homogeneous processes, will be More difficult. For large-diameter reactors the op- tical density will not be negligible, thus complicating the integration of the radiation equation.
5. There is evidence that the rate of chlorination in- creases as the wavelength of the radiation decreases. This suggests that the quantum yield of the primary process is greater for the higher energy corresponding to shorter wavelengths. The effect is not large, and the evidence is not conclusive.
Two important questions remain unanswered. The first is the validity of the steady state hypothesis. This requires two essentially different assumptions in flow reactors. From a reactor design viewpoint it is necessary that mass trans- port of the activated species, either radially or longi- tudinally, must be negligible with respect to the conver- sion of activated species by chemical reaction. Second, from a purely kinetics viewpoint, the concentration of the activated species should be small with respect to the con- centrations of reactants and products. An analysis of the criteria for meeting these two assumptions is very difficult for a chain reaction system. The reactor design criterion is intimately related to the diffusivities of the activated spe- cies, a subject about which very little is known. The ki- netic requirement depends upon a knowledge of the individual rate constants of the initiation, propagation, and termination steps in the reaction sequence. There is some evidence (23) to suggest that the kinetic criterion is more likely to be satisfied for photochemical than for thermal reactions.
The second important question is if heterogeneous ter- mination steps are significant in establishing the overall rate of photochemical reaction. The importance of wall reactions may be evaluated by measuring rates for reac-
TABLE 5. SCALE-UP RESULTS
- ox, (CMo, (C3HS)o, (Ndo, u, Einstein/( sec. 1, F, % T, % z, %
RunNo. N R ~ cm./sec. % % % K, cc./Einstein (g.-mole) exp. modelA modelB
s-1 1,236 713 0.56 3.59 95.85 1.10 x lo9 0.342 x 10⁻² 4.45 4.39 4.55 s-2 1,239 715 0.56 3.58 95.86 1.10 x 10⁹ 0.342 x 10⁻² 4.52 4.38 4.54 s-3 1,243 7 17 0.56 3.56 95.88 1.10 x lo9 0.342 x 10⁻² 4.27 4.39 4.55
S-4 1,232 71 1 0.56 3.65 95.79 1.10 x 10⁹ 2.02 x 10⁻² 21.4 20.5 22.0 S-5 1,227 709 0.57 3.63 95.79 1.10 x 10⁹ 2.02 x 10⁻² 21.2 20.8 22.4 S-6 1,240 715 0.55 3.68 95.87 1.10 x 10⁹ 2.02 x 10⁻² 19.7 20.1 21.6
L = 100 mm.; T = 30%
Page 924 AlChE Journal September, 1967
tors of different diameters. There have been attempts (6, 24, 25) to predict the significance of rupture of chains at the wall, but these depend for their utilization upon a knowledge of rate constants for the individrial steps in the chain reaction.
ACKNOWLEDGMENT
The financial support of U.S. Public Health Service, Grant WP AP 0095201, is gratefully acknowledged. Also the fellow- ship of the Consejo Nacional de Investigaciones of Argentina granted to Albert0 Cassano is appreciated. The authors express their appreciation to the Davis Computer Center NIH Grant No. FR-00009. Thanks are given to J . A. Kent for assistance in the calculations.
NOTATION
A = a =
b =
c = c, = E = F k =
Ftot = h = = I = I , =
kl, k2,
frequency factor, cc./Einsteins ratio of concentrations of propane and chlorine in reactor feed, Equation (35) ratio of concentrations of nitrogen and chlorine in the feed, Equation (36) concentration also denoted by ( ), g.-mole/cc. concentration of oxalic acid apparent activation energy, kcal./g.-mole flux of the light source at wavelength A, Ein- steins/sec. total flux of the lamp, Einsteins/sec. Plancks’ constant, erg( sec.) / (molecule) light intensity, Einsteins/ (sq.cm. ) (sec.) intensity of radiation from one direction at inside wall of reactor without filter solution [that is, as determined from actinometer measurements by Equation (7) ] . . ke = kinetic constants corresponding to indi- vidual steps in chain seauence
k”, k = kinetic bnstants as dkfined by Equations (37) and (38)
k, = conventional, overall kinetic constant as defined by Equation (1)
kr and k11 =; similar constants as defined by Equations (25) and (30)
K = overall kinetic constant independent of light in- put, defined by Equations ( I A ) and ( l B ) , cc./ Einstein
KI and K I I = similar constants as defined by Equations (31) and (32)
L = reactor length, cm. N R ~ = Reynolds number Q r = radial distance, cm. TA =: rate of actinometer reaction, g-mole/’( sec.) ( c x ) R = reactor radius, cm. R, t = time, sec. tlnln t o =I temperature, “C. T = temperature, O K .
VR =; reactor volume, cc. t‘, = axial velocity, cm./sec. XA x = conversion of chlorine z = axial distance, cm.
-- volumetric flow rate, cc./sec.
= gas constant, cal./(g.-mole) ( “ K . )
= minimum residence time, sec.
= conversion of oxalic acid in actinometer reaction
Greek WH a
h p Y
= mold absorptivity, defined as I / I , = c-aCd, where
= wavelength of light, cm. or A. = attenuation coefficient (a C), em-.’ = frequency of light, see.-’
d = length of light path, sq.cm./g.-mole
8 = transmission coefficient of filter solution defined
~i = rate of formation of species i, g.-mole/(sec.) (cc.) ct, = quantum efficiency, g.-moles/Einstein u = specific rate of energ input, defined by Equation
+
as 8 = e-Wd
(5) , Einsteins/ (sec. r( g.-mole) == time distribution function, set.-'
Subscripts and Superuriptr ’ A = actinometer i = individual chemical species o = reactor entrance ( ) = concentration L = reactor exit w = reactor wall r,A
of r and or A z = axial direction t = total -
= activated species or free radical
= as subscripts indicates that variable is a function
= average across diameter of reactor or mean con- centration
LITERATURE CITED
1. Cassano, A. E., and J. M. Smith, A.1.Ch.E. I . , 12, 1124
2. Cassano, A. E., P. L. Silveston, and J. M. Smith, Id. Eng.
3. Calvert. I. G., and 1. N. Pitts, Jr., “Photochemistry.”
(1968).
Chem.. 9,18 (1m6).
4.
5.
6.
7. 8.
9. 10.
11.
12.
13.
14. 15.
16.
17.
18.
19.
20.
Wiley, New York ( 196b). Meadows, L. F., and R. M. Noyes, J . Am. C h . Soc., 82,1872 (1960). Hatchard, C. G., and C. A. Parker, Proc. Royol Soo. (London) A.235,518 (1956). Leighton, W. G., and G. S. Forbes, J . Am. Chem. Soc., 52,3130 (1930). Parker, C. A. Proc. Royal SOC. (London), 220, 104 (1953). Herr and W. A. Noves. J. Am. Chern. SOC., 63. 2052 . . , . - (1940). Strachan and Blacet, ibid., 77, 5254 ( 1955). Fettis, G. C., and J. H. Knox, “Progress in Reaction Kinetics,” G. Porter, ed., Vol. 2, Pergamon Press, Oxford (1964). Steacie, E. W. R., “Atomic and Free Radical Reactions,” 2 ed., Vol. 2, Reinhold, New York (1954). b o x , J. €I., and Nelson, Trans. Foroday SOC., 55, 937 (1959). Piker, E. C., N. E. Gordon, and D. A. Wilson, J . Am.
Chem. Soc., 58,67 (1936). Davis, W., Jr., Chem. Reu., 40, 201 (1947). Noyes, W. A., Jr., G. B. Porter, and J. E. Jolley, Chem. Rsu., 56,49 (1956). Volman, D. H. “Advances in Photochemistry,” W. A. Noyes, G. S. Hammond. and 1. N. Pitts, ed., Vol. I, Interscience, New York ( 19e3). Gibson, G. E., and N. S. Bayliss, Phys. Reu., 44, 188 (1933). Chiltz, G., P. Goldfinger, G. Huybrechts, G. Martens, and G. Verbeke, Chem. Reu., 40,355 ( 1963). Stauff, J., and H. J. Schumacher, Z. Ekktrochern., 48, No. 5,271 (1942). Stauff. I. ibid.. 48. No. 10. 550 ( 1942).
20A. Noyg, W. A., and P. A. Leighton,.“The Photochemistry
21. Denbigh, K., ‘Chemical Reactor Theory,” Cambridge Univ.
22. Noyes, R. M., J . Am. Chem. Soc., 73, 3039 ( 1951). 23. Benson, S. W., J. Chem. Phys., 20, No. 10, 1605 (1952). 24. - , “The Foundations of Chemical Kinetics,” Maraw-
25. Semenoff, N. N., Ada. Physicochem, U.R.S.S., 18, No. 23,
of Gases,’’ Reinhold, New York ( 1941 ) . Press, Cambridge ( 1965).
Hill, New York (1960).
93 (1943).
Manuscript received Nowmber 9 1966; revision receiwd Jonuoy 8. 1967; paper occepted Jonuay 8, 1987.
Vol. 13, No. 5 AlChE Journal Page 925