temperature and pressure influence on explosion pressures of closed vessel propane–air...
TRANSCRIPT

Tp
Da
b
a
ARR1AA
KEECP
1
tieettbsoe
otpcrpoi
0d
Journal of Hazardous Materials 174 (2010) 548–555
Contents lists available at ScienceDirect
Journal of Hazardous Materials
journa l homepage: www.e lsev ier .com/ locate / jhazmat
emperature and pressure influence on explosion pressures of closed vesselropane–air deflagrations
omnina Razusa,∗, Venera Brinzeaa, Maria Mitua, Dumitru Oanceab
“Ilie Murgulescu” Institute of Physical Chemistry, 202 Spl. Independentei, P.O. Box 12-197, 060021 Bucharest, RomaniaDepartment of Physical Chemistry, University of Bucharest, 4-12 Bd. Elisabeta, 030018 Bucharest, Romania
r t i c l e i n f o
rticle history:eceived 15 July 2009eceived in revised form6 September 2009ccepted 16 September 2009vailable online 23 September 2009
a b s t r a c t
An experimental study on pressure evolution during closed vessel explosions of propane–air mixtureswas performed, for systems with various initial concentrations and pressures ([C3H8] = 2.50–6.20 vol.%,p0 = 0.3–1.2 bar). The explosion pressures and explosion times were measured in a spherical vessel(˚ = 10 cm), at various initial temperatures (T0 = 298–423 K) and in a cylindrical vessel (˚ = 10 cm;h = 15 cm), at ambient initial temperature. The experimental values of explosion pressures are exam-ined against literature values and compared to adiabatic explosion pressures, computed by assuming
eywords:xplosion pressurexplosion timelosed vesselropane
chemical equilibrium within the flame front. The influence of initial pressure, initial temperature andfuel concentration on explosion pressures and explosion times are discussed. At constant temperatureand fuel/oxygen ratio, the explosion pressures are linear functions of total initial pressure, as reported forother fuel–air mixtures. At constant initial pressure and composition, both the measured and calculated(adiabatic) explosion pressures are linear functions of reciprocal value of initial temperature. Such cor-relations are extremely useful for predicting the explosion pressures of flammable mixtures at elevated
sures
temperatures and/or pres. Introduction
Knowledge of explosion pressures and explosion times charac-eristic for explosions of fuel–air mixtures in enclosures is requiredn various applied research fields related to combustion phenom-na: design and construction of venting devices, prediction ofngines and combustors performance, safety recommendations forhe production, transportation or use of fuels [1]. In basic research,he explosion pressures are key values for calculating the laminarurning velocity in various conditions; both the explosion pres-ures and explosion times are important for validating modelsf combustion wave propagation, in isolated or inter-connectedxplosion vessels.
The explosion pressure (defined as the peak pressure devel-ped in a contained deflagration of a flammable mixture) andhe explosion time (defined as the time interval from ignition toeak pressure) characteristic for fuel–air gaseous deflagrations inlosed vessels, at initial ambient pressure and temperature, were
eported in many publications [2–13]. Recent data on explosionressures characteristic of gaseous closed vessel explosions werebtained from experiments in a spherical 20 L vessel with centralgnition, as recommended by European standard EN 13673-1 [14].∗ Corresponding author.E-mail address: [email protected] (D. Razus).
304-3894/$ – see front matter © 2009 Elsevier B.V. All rights reserved.oi:10.1016/j.jhazmat.2009.09.086
, when direct measurements are not available.© 2009 Elsevier B.V. All rights reserved.
The maximum explosion pressure (defined as the maximum pres-sure developed in a contained deflagration of an optimum mixture)of gaseous hydrocarbons in the presence of air at ambient initialconditions, measured by this method, is given in the German collec-tions of data [15,16]. These sources of data do not include, however,the influence of fuel concentration in fuel–air mixtures or the influ-ence of oxidant/inert concentration in fuel–oxidant–inert mixtureson explosion pressures.
Explosion pressures of fuel–air mixtures at pressures and/ortemperatures different from ambient were determined in a wideset of conditions (explosion vessels with various forms and vol-umes; ignition made by local sources with various energies, from afew mJ up to 20 J; position of the ignition source: central or asym-metric) [5,6,10,11,13,17–27]. The data refer to single fuels, such ashydrogen, methane, propane, propylene or to composite fuels (LPG,gasoline).
Either pure or blended (e.g. in the form of LPG—LiquefiedPetroleum Gas), propane is widely used as fuel for automotiveengines and domestic heaters, as a refrigerant or as feedstockfor the production of base petrochemicals; accordingly, propaneis one of the most studied fuels [5–9,12,13,18,27–30]. Measure-
ments of pressure-time history during propane–air deflagrationswere performed mostly in symmetrical vessels with central igni-tion (spheres or cylinders with h/D close to 1) of 20 L, 120 L, 1 m3or even 25.5 m3 volume [5–8,13,18]; a few data were reported forasymmetrical vessels, as well [12,27]. The authors tried to evaluate

rdous
aefea
owrtoeosvi
2
vvwwi5Aadsi
dcp(
t1wsgobee(E
D. Razus et al. / Journal of Haza
lso the influence of heat losses during explosion development onxplosion pressure and maximum rate of pressure rise for variousuel–air mixtures (including propane) and found significant differ-nces between explosion pressures measured in symmetrical andsymmetrical vessels.
In the present paper, data on constant–volume combustionf propane–air mixtures, in various conditions (initial pressuresithin 0.3–1.2 bar and initial temperatures within 295–435 K) are
eported. Experiments performed in two vessels with central igni-ion: a spherical vessel of volume VS = 0.52 L and a cylindrical vesself volume VC = 1.12 L, with a ratio height/diameter of 1.5, enable thexamination of initial pressure and initial temperature influencesn explosion pressures and explosion times. The measured explo-ion pressures are examined versus the corresponding adiabaticalues, calculated in the assumption that the chemical equilibriums reached within the flame.
. Experimental
Experiments were performed in two stainless steel combustionessels: a spherical vessel S of diameter ˚ = 10 cm and a cylindricalessel C with height h = 15 cm and diameter ˚ = 10 cm, which canithstand an internal pressure of 40 bar. Each vessel was equippedith several ports for the gas feed and evacuation valve, two ion-
zation probes (tip mounted 3 mm away from the side wall andmm, respectively), ignition electrodes and a pressure transducer.vacuum and gas-feed line, tight at pressures between 0.5 mbar
nd 4.5 bar, connected the combustion vessels with the gas cylin-ers containing fuel and air, with a metallic cylinder for mixturetorage and a vacuum pump. A scheme of the experimental set-ups given in Fig. 1.
The fuel–air gaseous mixtures were obtained in a metallic cylin-er by the partial pressure method and used 24 h after mixing theomponents, at a total pressure of 4 bar. The initial pressures ofropane–air mixtures were measured by a strain gauge manometerEdwards type EPS-10HM).
Before each test, the combustion vessels were evacuated downo 0.5 mbar; the explosive mixture was admitted and allowed5 min to become quiescent and thermally equilibrated. Ignitionas made with inductive–capacitive sparks produced between
tainless steel electrodes (1 mm diameter, round tips). The sparkap of constant width (3 mm) was located in the geometrical centref each vessel. Spark energies were adjusted to a minimum value,
etween 1 and 5 mJ, in order to avoid the turbulence produced by anxcessive energy input at initiation. The pressure variation duringxplosions was recorded with piezoelectric pressure transducersKistler 601A), connected to Charge Amplifiers (Kistler 5001SN).ach Charge Amplifier was calibrated by means of a Kistler Cali-Fig. 1. Schematic diagram o
Materials 174 (2010) 548–555 549
brator type 5357. For experiments at elevated temperatures, thespherical vessel S was electrically heated; its piezoelectric pres-sure transducer was mounted in a special adapter, maintained at(25 ± 0.1) ◦C by a water jacket. The temperature of vessel S wasadjusted by ±1 ◦C using a controller type AEM 1RT96 and monitoredby a K-type thermocouple.
The signals from the Charge Amplifier and the ionisation probewere recorded with an acquisition data system TestLabTM Tektronix2505, by means of an acquisition card type AA1, usually at 5000signals per second.
Propane–air mixtures with fuel concentration between 2.5and 6.2 vol.% were investigated, at total initial pressures between0.3 and 1.2 bar and initial temperatures between 298 and 423 K.Propane (99.99%) (SIAD—Italy) was used without further purifica-tion. Several tests performed in spherical vessel S with a 4.06 vol.%propane–air mixture at ambient initial conditions were used toexamine the reproducibility of results. Minimum 3 experimentswere performed for each initial condition of explosive mixture. Thestandard error in measured explosion pressures was ≤2%.
3. Computing program
The calculations of adiabatic explosion pressures were madewith the program ECHIMAD [31], based on a general algorithmmeant to compute the equilibrium composition of products for anyfuel–oxidizer gaseous mixture. The algorithm is based on the ther-modynamic criterion of chemical equilibrium: the minimum of freeGibbs energy, at constant temperature and pressure or minimumof free Helmholtz energy, at constant temperature and volume.Fifteen compounds, among them one solid compound (Cgraphite)were considered as products: the fuel (CnHm), Cgraphite, CO2, CO,H2O, O2, N2, CH4, C2H2, C2H4, H2, NO, H, OH and O). Their heatcapacities (expressed as functions of temperature with the form:CP = a + b · T + c · T2 + d · T−2), the standard enthalpies of forma-tion at 298 K and the standard entropies at 298 K were taken fromreferences [32,33]. Adiabatic flame temperatures were also calcu-lated, for each system, both in isobaric and isochoric combustion.
4. Results and discussion
The pressure–time history of explosions propagating in thespherical vessel, in a near-stoichiometric propane–air mixture atvarious initial pressures and temperatures is shown in Fig. 2. At
any initial pressure, the increase of initial temperature entailsthe decrease of peak (maximum) explosion pressure pmax and thedecrease of the explosion time (time from ignition to peak explo-sion pressure) �max. A similar variation was found for all examinedsystems.f the test equipment.

550 D. Razus et al. / Journal of Hazardous Materials 174 (2010) 548–555
Fig. 2. Pressure–time evolution during explosions of 4.08 vol.% propane–air mixture in s333 K; (3) 363 K; (4) 393 K; (5) 423 K; (b) at T0 = 333 K and various initial pressures: (1) 1.2
Fv
tftppr
FSs
ig. 3. Peak explosion pressures of propane–air mixtures in spherical vessel S, atarious initial temperatures and p0 = 1.0 bar.
Diagrams of peak explosion pressures reached at ambient ini-ial pressure in preheated propane–air mixtures are given in Fig. 3or several lean (2.80–3.61 vol.%) and one near-stoichiometric mix-
ure (4.20 vol.%). The same data, plotted as dimensionless explosionressures �max = pmax/p0 against the reciprocal values of initial tem-erature are linear, as seen in Fig. 4. Similar plots were obtained forich mixtures ([C3H8] = 5.5–6.22 vol.%) as well.ig. 4. Variation of dimensionless explosion pressures reached in spherical vesselat p0 = 1.0 bar, in correlation to the reciprocal temperature of lean- and near-
toichiometric propane–air mixtures.
pherical vessel S: (a) at p0 = 0.5 bar and various initial temperatures: (1) 298 K; (2)bar; (2) 1.0 bar; (3) 0.8 bar; (4) 0.6 bar.
The data in Fig. 4 are well fitted by equation:
�max = a + b
T0(1)
The slopes and intercepts of the correlations found for data mea-sured in the spherical vessel at ambient initial pressure are given inTable 1. Data measured at other initial pressures fit well (Eq. (1)),for all examined propane–air mixtures.
Such a variation was reported for both experimental and calcu-lated (adiabatic) explosion pressures of various gaseous mixtures:methane–air, by Pekalski et al. [21] (measurements made in a stan-dardized 20 L sphere); synthetic biogas (CH4–CO2 mixture)–air, byDupont and Accorsi [25] (20 L sphere); propane–air, by Desoky etal. (14 L sphere) [5]; LPG–air, by Huzayyin et al. [13] (2.56 L cylin-der). In contrast to them, measured explosion pressures on CH4–air(experiments made in a 40 L sphere) were fitted versus tempera-ture by a linear equation [23]. In all cases, the observed decrease ofpeak pressures in preheated flammable mixtures was explained bythe decrease of density for the burning charge, which releases thusa lower heat amount.
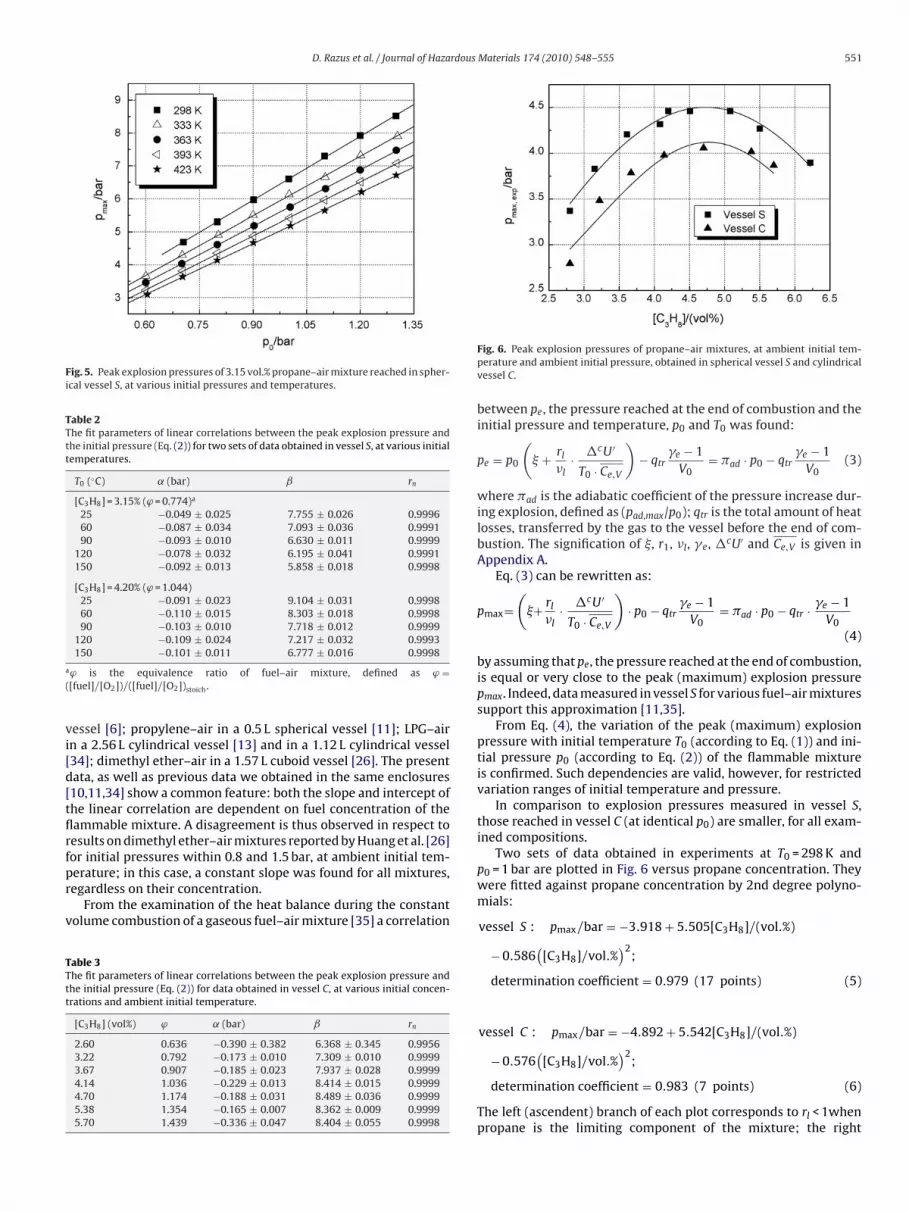
The influence of initial pressure on peak explosion pressures isshown in Fig. 5, where data referring to a lean propane–air mixture([C3H8] = 3.15 vol.%) are plotted. At constant initial temperature, themeasured explosion pressures are correlated to initial pressure bythe linear equation:
pmax = ˛ + ˇ · p0 (2)
The slope and intercept of such equations are listed in Table 2 andin Table 3, together with the determination coefficients.
Linear correlations between the peak explosion pressures andthe initial pressure of fuel–air gaseous mixtures were reported formany explosions of quiescent mixtures, in deflagration regime, e.g.methane–air in a 20 L spherical vessel [21] or in a 40 L vessel [23];propane–air in a 2.56 L cylindrical vessel [13] and in a 5 L spherical
Table 1Parameters of linear correlations between the dimensionless explosion pressure andthe reciprocal temperature, for propane–air mixtures at p0 = 1.0 bar.
[C3H8] (vol.%) a b × 103 (K)
2.80 1.710 1.4583.15 1.151 1.9523.61 1.230 2.1774.08 1.042 2.2874.20 1.125 2.3524.51 0.907 2.4325.06 1.167 2.3495.50 1.674 2.0616.22 2.106 1.674
D. Razus et al. / Journal of Hazardous Materials 174 (2010) 548–555 551
Fig. 5. Peak explosion pressures of 3.15 vol.% propane–air mixture reached in spher-ical vessel S, at various initial pressures and temperatures.
Table 2The fit parameters of linear correlations between the peak explosion pressure andthe initial pressure (Eq. (2)) for two sets of data obtained in vessel S, at various initialtemperatures.
T0 (◦C) ˛ (bar) ˇ rn
[C3H8] = 3.15% (ϕ = 0.774)a
25 −0.049 ± 0.025 7.755 ± 0.026 0.999660 −0.087 ± 0.034 7.093 ± 0.036 0.999190 −0.093 ± 0.010 6.630 ± 0.011 0.9999
120 −0.078 ± 0.032 6.195 ± 0.041 0.9991150 −0.092 ± 0.013 5.858 ± 0.018 0.9998
[C3H8] = 4.20% (ϕ = 1.044)25 −0.091 ± 0.023 9.104 ± 0.031 0.999860 −0.110 ± 0.015 8.303 ± 0.018 0.999890 −0.103 ± 0.010 7.718 ± 0.012 0.9999
120 −0.109 ± 0.024 7.217 ± 0.032 0.9993
a
(
vi[d[tflrfpr
v
TTtt
150 −0.101 ± 0.011 6.777 ± 0.016 0.9998
ϕ is the equivalence ratio of fuel–air mixture, defined as ϕ =[fuel]/[O2])/([fuel]/[O2])stoich.
essel [6]; propylene–air in a 0.5 L spherical vessel [11]; LPG–airn a 2.56 L cylindrical vessel [13] and in a 1.12 L cylindrical vessel34]; dimethyl ether–air in a 1.57 L cuboid vessel [26]. The presentata, as well as previous data we obtained in the same enclosures10,11,34] show a common feature: both the slope and intercept ofhe linear correlation are dependent on fuel concentration of theammable mixture. A disagreement is thus observed in respect toesults on dimethyl ether–air mixtures reported by Huang et al. [26]or initial pressures within 0.8 and 1.5 bar, at ambient initial tem-
erature; in this case, a constant slope was found for all mixtures,egardless on their concentration.From the examination of the heat balance during the constantolume combustion of a gaseous fuel–air mixture [35] a correlation
able 3he fit parameters of linear correlations between the peak explosion pressure andhe initial pressure (Eq. (2)) for data obtained in vessel C, at various initial concen-rations and ambient initial temperature.
[C3H8] (vol%) ϕ ˛ (bar) ˇ rn
2.60 0.636 −0.390 ± 0.382 6.368 ± 0.345 0.99563.22 0.792 −0.173 ± 0.010 7.309 ± 0.010 0.99993.67 0.907 −0.185 ± 0.023 7.937 ± 0.028 0.99994.14 1.036 −0.229 ± 0.013 8.414 ± 0.015 0.99994.70 1.174 −0.188 ± 0.031 8.489 ± 0.036 0.99995.38 1.354 −0.165 ± 0.007 8.362 ± 0.009 0.99995.70 1.439 −0.336 ± 0.047 8.404 ± 0.055 0.9998
Fig. 6. Peak explosion pressures of propane–air mixtures, at ambient initial tem-perature and ambient initial pressure, obtained in spherical vessel S and cylindricalvessel C.
between pe, the pressure reached at the end of combustion and theinitial pressure and temperature, p0 and T0 was found:
pe = p0
(� + rl
�l· �cU ′
T0 · Ce,V
)− qtr
�e − 1V0
= �ad · p0 − qtr�e − 1
V0(3)
where �ad is the adiabatic coefficient of the pressure increase dur-ing explosion, defined as (pad,max/p0); qtr is the total amount of heatlosses, transferred by the gas to the vessel before the end of com-bustion. The signification of �, r1, �l, �e, �cU′ and Ce,V is given inAppendix A.
Eq. (3) can be rewritten as:
pmax=(
�+ rl
�l· �cU ′
T0 · Ce,V
)· p0 − qtr
�e − 1V0
= �ad · p0 − qtr · �e − 1V0
(4)
by assuming that pe, the pressure reached at the end of combustion,is equal or very close to the peak (maximum) explosion pressurepmax. Indeed, data measured in vessel S for various fuel–air mixturessupport this approximation [11,35].
From Eq. (4), the variation of the peak (maximum) explosionpressure with initial temperature T0 (according to Eq. (1)) and ini-tial pressure p0 (according to Eq. (2)) of the flammable mixtureis confirmed. Such dependencies are valid, however, for restrictedvariation ranges of initial temperature and pressure.
In comparison to explosion pressures measured in vessel S,those reached in vessel C (at identical p0) are smaller, for all exam-ined compositions.
Two sets of data obtained in experiments at T0 = 298 K andp0 = 1 bar are plotted in Fig. 6 versus propane concentration. Theywere fitted against propane concentration by 2nd degree polyno-mials:
vessel S : pmax/bar = −3.918 + 5.505[C3H8]/(vol.%)
− 0.586(
[C3H8]/vol.%)2
;
determination coefficient = 0.979 (17 points) (5)
vessel C : pmax/bar = −4.892 + 5.542[C3H8]/(vol.%)( )2
− 0.576 [C3H8]/vol.% ;determination coefficient = 0.983 (7 points) (6)
The left (ascendent) branch of each plot corresponds to rl < 1whenpropane is the limiting component of the mixture; the right

552 D. Razus et al. / Journal of Hazardous Materials 174 (2010) 548–555
Fi
(i
msAtAciostism9scs
srttp
Ft
Table 4Measured explosion pressure of propane–air mixtures, at ambient initial pressureand temperature; literature data.
Nr. pexp (bar abs) [C3H8] (vol%) Explosion vessel Reference
1 9.2 4.5–5.0 Sphere, V = 1.7 L [5]2 8.9 4.5 Sphere, V = 5 L [6]3 8.2 4.5–5.0 Cylinder, h/D = 1.15,
V = 22 L[7]
4 9.2 4.8–5.2 Sphere, V = 120 L [8]5 8.8 4.5–5.0 Sphere, V = 25 m3 [8]6 3.3 4.5–5.0 Cylinder, h/D = 143 [12]7 8.4 4.8–5.2 Sphere, V = 2.56 L [13]
constant propane concentration and constant initial pressure, thisincrease of burning velocity accounts for the decrease of explo-
ig. 7. Peak explosion pressures of propane–air mixtures at p0 = 1 bar and variousnitial temperatures, measured in vessel S.
descendent) branch of each plot corresponds to rl < 1 when oxygens the limiting component of the mixture.
The influence of initial composition on peak explosion pressureseasured in vessels S and C was examined at various initial pres-
ures (both vessels) and various initial temperatures (in vessel S).set of representative results obtained in vessel S at ambient ini-
ial pressure and various initial temperatures is plotted in Fig. 7.comparison of data referring to explosions at ambient initial
onditions, from the present measurements and from literature,s given in Fig. 8. In the present study, the highest peak pressuref propane–air at ambient initial conditions is 9.1 bar, measured inpherical vessel S for [C3H8] = 4.51 vol.%. In the same initial condi-ions, the peak explosion pressure of the stoichiometric mixtures 8.7 bar. For comparison, literature data are listed in Table 4. Inymmetrical vessels (sphere or cylinder with h/˚ close to 1) theeasured maximum explosion pressure vary between 8.2 [7] and
.4 [16]. Any factor, determining the flame asymmetry (such as alight deviation of the spark gap position from vessel’s geometri-al centre) and/or appearance of cellular flames account for suchcatter, observed already for many other systems [11].
In comparison to measured values, the highest adiabatic explo-ion pressure is 9.6 bar, reached at propane concentrations in the
ange 4.50 < [C3H8] < 4.80 vol.%. Data calculated at various initialemperatures and ambient initial pressures are plotted in Fig. 9;he plots are similar to those obtained for experimental explosionressures (Fig. 7). As expected, for every concentration and/or ini-ig. 8. Peak explosion pressures of propane–air mixtures at ambient initial condi-ions, measured in vessel S (present study), compared to literature data.
8 9.4 4.5–5.0 Sphere, V = 20 L,conditions as in EN13673-1
[16]
tial temperature, the adiabatic explosion pressures are higher ascompared to experimental values measured in systems with heatlosses. At constant initial pressure, the adiabatic explosion pressuredepends on the reciprocal value of initial temperature accordingto Eq. (1); at constant initial temperature and composition, Eq. (2)holds for adiabatic explosion pressures as well. The correlations areeasily derived from Eq. (4), after neglecting the term associated toheat losses.
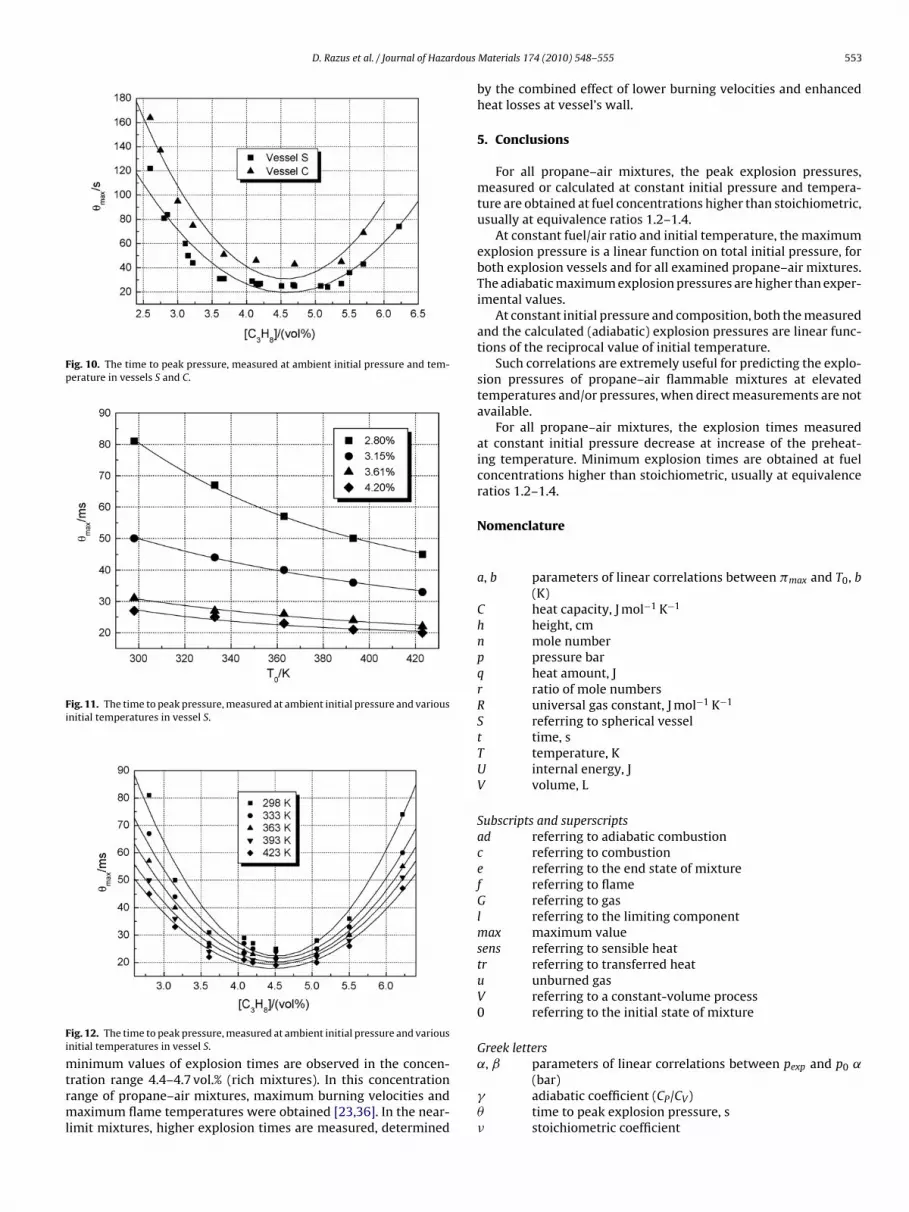
The explosion times are dependent on mixture composition andon temperature. The initial pressure variation, within the inves-tigated range, has little influence on explosion times. Illustrativedata obtained in vessels S and C are plotted in Fig. 10. Larger explo-sion times are recorded in vessel C as compared to vessel S, as aconsequence of the larger amount (volume) of flammable mixtureburning in vessel C (VS = 0.52 L; VC = 1.12 L). The influence of initialtemperature and concentration of propane–air mixtures on explo-sion times measured in vessel S is plotted in Figs. 11 and 12. Theincrease of preheat temperature determines the decrease of thetime necessary to reach the peak explosion pressure, as alreadyreported for various fuel–air mixtures [6,13,23]. The variationof explosion times plotted in Fig. 11 is highest for lean mix-tures (e.g. [C3H8] = 2.80 and 3.15 vol.%); for a near-stoichiometricpropane–air mixture, the increase of initial temperature has a muchsmaller influence. The increase of the initial temperature causesthe increase of both reaction rate and normal burning velocity. At
sion times. The influence of the initial temperature on explosiontimes is seen also in Fig. 12, where data measured at ambient ini-tial pressure are plotted. For all examined initial temperatures, the
Fig. 9. Calculated adiabatic explosion pressures of propane–air mixtures at p0 = 1 barand various initial temperatures.
D. Razus et al. / Journal of Hazardous
Fig. 10. The time to peak pressure, measured at ambient initial pressure and tem-perature in vessels S and C.
Fig. 11. The time to peak pressure, measured at ambient initial pressure and variousinitial temperatures in vessel S.
Fi
mtrml
ig. 12. The time to peak pressure, measured at ambient initial pressure and variousnitial temperatures in vessel S.
inimum values of explosion times are observed in the concen-ration range 4.4–4.7 vol.% (rich mixtures). In this concentrationange of propane–air mixtures, maximum burning velocities andaximum flame temperatures were obtained [23,36]. In the near-
imit mixtures, higher explosion times are measured, determined
Materials 174 (2010) 548–555 553
by the combined effect of lower burning velocities and enhancedheat losses at vessel’s wall.
5. Conclusions
For all propane–air mixtures, the peak explosion pressures,measured or calculated at constant initial pressure and tempera-ture are obtained at fuel concentrations higher than stoichiometric,usually at equivalence ratios 1.2–1.4.
At constant fuel/air ratio and initial temperature, the maximumexplosion pressure is a linear function on total initial pressure, forboth explosion vessels and for all examined propane–air mixtures.The adiabatic maximum explosion pressures are higher than exper-imental values.
At constant initial pressure and composition, both the measuredand the calculated (adiabatic) explosion pressures are linear func-tions of the reciprocal value of initial temperature.
Such correlations are extremely useful for predicting the explo-sion pressures of propane–air flammable mixtures at elevatedtemperatures and/or pressures, when direct measurements are notavailable.
For all propane–air mixtures, the explosion times measuredat constant initial pressure decrease at increase of the preheat-ing temperature. Minimum explosion times are obtained at fuelconcentrations higher than stoichiometric, usually at equivalenceratios 1.2–1.4.
Nomenclature
a, b parameters of linear correlations between �max and T0, b(K)
C heat capacity, J mol−1 K−1
h height, cmn mole numberp pressure barq heat amount, Jr ratio of mole numbersR universal gas constant, J mol−1 K−1
S referring to spherical vesselt time, sT temperature, KU internal energy, JV volume, L
Subscripts and superscriptsad referring to adiabatic combustionc referring to combustione referring to the end state of mixturef referring to flameG referring to gasl referring to the limiting componentmax maximum valuesens referring to sensible heattr referring to transferred heatu unburned gasV referring to a constant-volume process0 referring to the initial state of mixture
Greek letters
˛, ˇ parameters of linear correlations between pexp and p0 ˛(bar)� adiabatic coefficient (CP/CV)� time to peak explosion pressure, s� stoichiometric coefficient

5 rdous
��ϕ˚
A
oi
A
t(
p
p
we
m
(
wnefl
(
(
wini(egt
p
w�dppd
bb
(
E
p
wo
[
[
[
[
[
[
[
[
[
[
[
[
[
[
[
[
[
[
[
[
54 D. Razus et al. / Journal of Haza
dimensionless pressureratio of final to initial mole numbersequivalence ratiodiameter
cknowledgements
The present study was partly financed by the Romanian Ministryf Education, by the contract PN II - IDEI No. 546/2009, code ID 458n the frame of the National Program for Research and Innovation.
ppendix A.
The state equations applied to the initial and end conditions ofhe fuel–air gaseous mixture burning in a constant volume vesselvolume V0) are:
0V0 = n0RT0 (A.1)
eV0 = neRTe,V (A.2)
here index “0” refers to the initial conditions and “e” refers to thend conditions.
The heat balance during the adiabatic combustion of the gaseousixture can be written as [35]:
qc)V = (qsens)V (A.3)
here (qc)V is the combustion heat, evolved during combustion of0 moles of mixture and (qsens)V is the sensible heat necessary to thend products to raise their temperature from T0 to Te,V , the averageame temperature.
The terms in Eq. (A.3) can be calculated as:
qc)V = n0 · rl
�l· �cU ′ (A.4)
qsens)V = ne · Ce,V · �T = ne · Ce,V
(Te,V − T0
)(A.5)
here rl = (nl/n0) is the ratio of the number of moles correspond-ng to the limiting component of the mixture and the total initialumber of moles; �l is the stoichiometric coefficient of the lim-
ting component in the mixture and �cU′is the combustion heatat constant volume and T0) corrected by taking into account thendothermic processes; Ce,V is the molar heat capacity of the endaseous mixture, averaged for the end components and for theemperature range T0 to Te,V .
In adiabatic conditions, the heat balance is equivalent to [35]:
e = p0
(� + rl
�l· �cU ′
T0 · Ce,V
)= �ad · p0 (A.6)
here � = (ne/n0) is the ratio of final to initial mole numbers andad = (pad,max/p0) is the adiabatic coefficient of the pressure increaseuring explosion, defined as the ratio of the adiabatic explosionressure, pad,max, and the initial pressure, p0. Within a restrictedressure range, one can assume that �, �cU′ and Ce,V are indepen-ent of p0 (or their variations compensate each other).
Under non-adiabatic conditions, a heat amount qtr is transferredy the gas to the vessel before the end of combustion and the heatalance is:
qc)V = (qsens)V + qtr (A.7)
q. (A.7) can be rewritten as:
exp = �ad · p0 − qtr�e − 1
V0(A.8)
here �e is the adiabatic coefficient of the burned gas, at the endf combustion.
[
[
Materials 174 (2010) 548–555
References
[1] H. Steen, M. Hattwig (Eds.), Handbook of Explosion Prevention and Control,Wiley-VCH, London, New York, 2004 (Chapter 3).
[2] G. Harris, P. Briscoe, The effect of vessel size and degree of turbulence on gasphase explosion pressures in closed vessels, Comb. Flame 11 (1967) 17–25.
[3] Y. Nagy, E. Seiler, J. Conn, H. Verakis, Explosion development in closed vessels,in: U. S. Bureau of Mines Report of Investigations Nr. 7507, 1971.
[4] M.J. Sapko, A.L. Furno, J.M. Kuchta, Flame and pressure development of largescale CH4–air–N2 explosions, in: U. S. Bureau of Mines Report of InvestigationsNr. 8176, 1976.
[5] A.A. Desoky, Y.A. Abdel-Ghafar, R.M. El-Badrawy, Hydrogen, propane and gaso-line laminar flame development in a spherical vessel, Int. J. Hydrogen Energy15 (1990) 895–905.
[6] W. Bartknecht, G. Zwahlen, Staubexplosionen—Ablauf und Schutzma�nahmen,Springer Verlag, Berlin, 1993 (Part I, Chapter 2.4).
[7] J.A. Senecal, P.A. Beaulieu, KG: New Data and Analysis, Process Saf. Progr. 17(1998) 9–15.
[8] K. Cashdollar, I. Zlochower, G. Green, R. Thomas, M. Hertzberg, Flammabilityof methane, propane, and hydrogen gases, J. Loss Prev. Process Ind. 13 (2000)327–340.
[9] Y. Fan, D. Crowl, Predicting the maximum gas deflagration pressure over theentire flammability range, J. Loss Prev. Process Ind. 13 (2000) 361–368.
10] D. Razus, D. Oancea, F. Chirila, N.I. Ionescu, Transmission of an explosionbetween linked vessels, Fire Safety J. 38 (2003) 147–163.
11] D. Razus, C. Movileanu, V. Brinzea, D. Oancea, Explosion pressures ofhydrocarbon–air mixtures in closed vessels, J. Hazard. Mater. 135 (2006) 58–65.
12] C. Lohrer, C. Drame, B. Schalau, R. Gratz, Propane/air deflagrations and CTAmeasurements of turbulence inducing elements in closed pipes, J. Loss Prev.Process Ind. 21 (2008) 1–10.
13] A.S. Huzayyin, H.A. Moneib, M.S. Shehatta, A.M.A. Attia, Laminar burning veloc-ity and explosion index of LPG–air and propane–air mixtures, Fuel 87 (2008)39–57.
14] EN 13673-1, Determination of maximum explosion pressure and maximumexplosion pressure rise—Part I: Maximum explosion pressure 2003, Europeanstandard.
15] CHEMSAFE® Database for Recommended Safety Characteristics, BAM, PTB,DECHEMA, Germany, 2001–2009.
16] E. Brandes, W. Möller, Sicherheitstechnische Kenngrö�en, Band 1: BrennbareFlüssigkeiten und Gase, Wirtschaftsverlag NW, Bremerhaven (2003).
17] H. Maisey, Gaseous and dust explosion venting, Chem. Process Eng. (1965)527–543.
18] M. Pegg, P. Amyotte, S. Chipett, Confined and vented deflagrations ofpropane/air mixtures at initially elevated pressures, in: Proceedings of the 7-thIntern. Symp. Loss Prev. Process Ind., Taormina, Italy, Poster No. 110, 1992.
19] Yu.N. Shebeko, V.V. Azatyan, I.A. Bolodian, V.Y. Navzenya, S.N. Kopylov, D.Y.Shebeko, E.D. Zamishevski, The influence of fluorinated hydrocarbons on thecombustion of gaseous mixtures in a closed vessel, Comb. Flame 121 (2000)542–547.
20] C.-M. Shu, P.-J. Wen, R.-H. Chang, Investigations on flammability models andzones for o-xylene under various initial pressures, temperatures and oxygenconcentrations, Thermoch. Acta 392–393 (2002) 271–287.
21] A.A. Pekalski, H.P. Schildberg, P.S.D. Smallegange, S.M. Lemkowitz, J.F. Zeven-bergen, M. Braithwaite, H.J. Pasman, Determination of the explosion behaviourof methane and propene in air or oxygen at standard and elevated conditions,in: Proceedings of the 11th Intern. Symp. Loss Prev. Process Ind., Prague, 2004,pp. 2118–2138.
22] A.A. Pekalski, E. Terli, J.F. Zevenbergen, S.M. Lemkowitz, H.J. Pasman,Influence of the ignition delay time on the explosion parameters ofhydrocarbon–air–oxygen mixtures at elevated pressure and temperature, in:Proceedings of the Combust. Inst. 30, 2005, pp. 1933–1939.
23] M. Gieras, R. Klemens, G. Rarata, P. Wolanski, Determination of explosionparameters of methane–air mixtures in the chamber of 40 dm3 at normal andelevated temperature, J. Loss Prev. Process Ind. 19 (2006) 263–270.
24] F. Van den Schoor, F. Norman, F. Verplaetsen, Influence of the ignition sourcelocation on the determination of the explosion pressure at elevated initialpressures, J. Loss Prev. Process Ind. 19 (2006) 459–462.
25] L. Dupont, A. Accorsi, Explosion characteristics of synthesised biogas at varioustemperatures, J. Hazard. Mater. 136 (2006) 520–525.
26] Z. Huang, Q. Wang, H. Miao, X. Wang, K. Zeng, B. Liu, D. Jiang, Study on dimethylether–air premixed mixture combustion with a constant volume vessel, EnergyFuels 21 (2007) 2013–2017.
27] Y. Tanaka, Numerical simulations of combustion of quiescent and turbulentmixtures in confined vessels, Comb. Flame 75 (1989) 23–138.
28] V.S. Babkin, V.N. Bukharov, V.V. Mol’kov, Normal flame velocity of propane–airmixture at high pressures and temperatures, Fiz. Gorenyia Vzryva 25 (1989)52–57.
29] Z. Zhao, A. Kazakov, J. Li, F. Dryer, The initial temperature and N2 dilution effecton the laminar flame speed of propane/air, Combust. Sci. Technol. 176 (2004)1705–1723.
30] J. Jarosinski, J. Podfilipski, A. Gorczakowski, Experimental study of flame prop-agation in propane–air mixture near rich flammability limits in microgravity,Combust. Sci. Technol. 174 (2002) 21–48.
31] D. Geana, D. Popescu, M. Mihai, Adomnica, Computation of equilibrium tem-perature and composition during adiabatic combustion, Rev. Chim. (Bucharest)36 (1985) 708–714.

rdous
[
[
[
[35] D. Oancea, V. Gosa, N.I. Ionescu, D. Popescu, An experimental method for themeasurement of adiabatic maximum pressure during an explosive gaseous
D. Razus et al. / Journal of Haza
32] D. Stull, E. Westrum, G. Sinke, The Chemical Thermodynamics of Organic Coum-pounds, Wiley, New York, 1969.
33] O. Knacke, O. Kubaschewski, K. Hesselman, Thermochemical Propertiesof Inorganic Substances, 2nd ed., Springer Verlag, Berlin and New York,1991.
34] D. Razus, V. Brinzea, M. Mitu, D. Oancea, Explosion characteristics ofLPG–air mixtures in closed vessels, J. Hazard. Mater. 165 (2009) 1248–1252.
[
Materials 174 (2010) 548–555 555
combustion, Rev. Roumaine Chim. 30 (1985) 767–776.36] D. Razus, V. Brinzea, M. Mitu, D. Oancea, Experimental and computed burning
velocities of propane–air mixtures, in: Proceedings of the 7-th ISPHMIE, SanktPetersburg, Russia, July, 2008, pp. 155–165.