investigation of explosion characteristics of multiphase fuel
TRANSCRIPT
Investigation of Explosion Characteristics of Multiphase Fuel Mixtures
with Air
Dissertation for the award of the degree
Doktoringenieur (Dr.-Ing.)
By:
M.Sc. Emmanuel Kwasi Addai
Date of birth: 2nd August, 1987
In: Mim-B/A, Ghana
Accepted by the Faculty of Process and Systems Engineering of the Otto-von-
Guericke-University of Magdeburg
Graduation Committee:
Prof. Frank Beyrau (Chairman)
Prof. Ulrich Krause (Reviewer)
Prof. Paul Amyotte (Reviewer)
Dr. Michael Beyer (Reviewer)
Submitted on: 11th August, 2016
Graduation Colloquium on: 7th October, 2016
II
Copyright © 2016
Emmanuel Kwasi Addai
All rights reserved. No part of this book may be
reproduced in any form, except for the inclusion
of a brief quotation in review, without permission
in writing from author/publisher.
ISBN 978-0-9913782-2-7
Published by Western Engineering, Inc., Powell, Wyoming
Printed in the USA by Instantpublisher.com
III
Acknowledgement
I am very grateful to the almighty God for giving me life, understanding, wisdom, knowledge and
the spirit of perseverance to complete this thesis successfully.
The work presented in this thesis would not have been possible without my close association
with many people who were always there when I needed them the most. I take this opportunity
to acknowledge them and extend my sincere gratitude for helping me make this Ph.D. thesis a
possibility.
First of all, I would like thank my mentor, advisor and "doctor father" Prof Ulrich Krause whose
support and guidance made my thesis work possible. He has been actively interested in my work
and has always been available to advise me. I am very grateful for his patience, motivation,
enthusiasm and immense knowledge in the field of fire and explosion prevention and protection.
Without his encouragement, support and continuous optimism this thesis would hardly have
been completed.
I would also like to thank my second and third supervisors Professor Paul Amyotte (Dalhousie
University, Canada) and Dr Michael Beyer (Physikalisch- Technische Bundesanstalt) for guidance
and support throughout the course of this research work.
I express my heart-felt gratitude to Dr. Dieter Gabel for his constant motivation and support
during the course of my thesis. His conceptual and technical inputs throughout the project have
been very fruitful.
My sincere thanks to Mr. Michael Schmidt, Ms. Sabine Schlüsselburg, Ms. Marlies Kupfernagel,
Mr. Lutz Herbst and Mr. Thomas Moog for their help in the laboratory work.
I thank my parents Mr. and Mrs. Awuku, who are the kindest and most loving people I know. The
unconditional love and inexplicable confidence they have on me remains to be the greatest
mystery I ponder upon. They have given me the most valuable property called Education, which
can never perish nor be taken away from me.
It is my pleasure to make a special mention of my lovely wife Agnes Fosuah Addai, who has been
the woman behind my success and happiness. Her motivation, encouragement, cheerful smile
and devoted love have been the greatest source of human inspiration to me.

IV
I am grateful to my siblings especially my brother Mr. Daniel Awuku Twumasi and the wife for
their support and encouragement.
I would also like to acknowledge the support of the Dr. Samuel Tulashie, Prof Francis Acquah, Mr.
Zaheer Abbas, Mr. Okyere Galahad, Dr. Kristin Hecht, Mrs. Ruth Martey, Mr. Isaac Yeboah, Mr.
Lartey Joseph, Mr. Emmanuel Antwi Adjei, Mr. Kwadwo Afreh, Ms. Francisca Yeboah, Mr. Kwaku
Brempong, Mr. Jesse Balogun Roberts, Mr. Saquib Siddiqui and Mr. Vitor Gabriel.
I am grateful to German Academic Exchange Service (DAAD) for providing funding for this project.
Finally, I would like to appreciate all my friends and well-wishers around the globe whose
expertise and resources aided me in producing this work.

V
Dedicated to
my lovely wife (Agnes Fosuah Addai), my dear parents
(Isaac Awuku and Grace Adobah), my dear brother and
the wife (Daniel Awuku Twumasi and Margret Darkoa
Awuku) and my entire family.
VI
Abstract
Explosion hazards involving mixtures of different states of aggregation continue to occur in
facilities where dusts, gases or solvents are handled or processed. In order to prevent or mitigate
the risk associated with these mixtures, more knowledge of the explosion behavior of hybrid
mixtures is required. The aim of this study is to undertake an extensive investigation on the
explosion phenomenon of hybrid mixtures to obtain insight into the driving mechanisms and the
explosion features affecting the course of hybrid mixture explosions. This was accomplished by
performing an extensive experimental and theoretical investigation on the various explosion
parameters such as: minimum ignition temperature, minimum ignition energy, limiting oxygen
concentration, lower explosion limits and explosion severity. Mixtures of twenty combustible
dusts ranging from food substances, metals, plastics, natural products, fuels and artificial
materials; three gases; and six solvents were used to carry out this study. Three different standard
equipments: the 20-liter sphere (for testing lower explosion limits, limiting oxygen concentration
and explosion severity), the modified Hartmann apparatus (for testing minimum ignition energy)
and the modified Godbert–Greenwald (GG) furnace (for testing minimum ignition temperature)
were used. The test protocols were in accordance with the European standard procedures for
dust testing for each parameter. However, modifications were made on each equipment in order
to test the explosion properties of gases, solvents, and hybrid mixtures. The experimental results
demonstrated a significant decrease of the minimum ignition temperature, minimum ignition
energy and limiting oxygen concentration of gas or solvent and increase in the likelihood of
explosion when a small amount of dust, which was either below the minimum explosion
concentration or not ignitable by itself, was mixed with gas or solvent and vice versa. For example,
methane with minimum ignition temperature of 600 °C decreased to 530 °C when 30 g/m3 of
toner dust, which is 50 % below its minimum explosible concentration was, added. A similar
explosion behavior was observed for minimum ignition energy and limiting oxygen concentration.
Furthermore, it was generally observed that the addition of a non-explosible concentration of
flammable gas or spray to a dust-air mixture increases the maximum explosion pressure to some
extent and significantly increases the maximum rate of pressure rise of the dust mixture, even

VII
though the added concentrations of gases or vapor are below its lower explosion limit. Finally, it
could be said that, one cannot rely on the explosion properties of a single substance to ensure
full protection of an equipment or a process if substances with different states of aggregate are
present.
VIII
Table of Contents
Acknowledgement ……………………………………………………………………………………………………………….V
Dedication …………………………………………………………………………………………………………………….……VII
Abstract ................................................................................................................................. vi
Table of Content …………………………………………………………………………………………………………………….x
Table of Figures ………………………………………………………………………………………………………………..….xvi
List of Tables ……………………………………………………………………………………………………………………….xxii
Abbreviation …………………………………………………………………………………………………………….……….xxiv
Nomenclature .................................................................................................................... xxiv
Chapter One .......................................................................................................................... 1
1 Introduction .................................................................................................................... 1
1.1 Thesis outline ..................................................................................................................... 3
2 Theoretical Background .................................................................................................. 5
2.1 General overview of explosions ........................................................................................ 5
2.2 Gas / vapor explosion ........................................................................................................ 6
2.3 Spray explosion .................................................................................................................. 7
2.4 Dust explosion ................................................................................................................. 10
Mechanism of dust explosion .................................................................................. 11
Prevention and mitigation of dust explosion ........................................................... 14
2.5 Hybrid mixture explosion ................................................................................................ 15
3 Safety Characteristics ..................................................................................................... 21
3.1 Explosion relevant parameters ........................................................................................ 21
3.2 Lower explosion limit / minimum explosible concentration ........................................... 22
Models to estimate the lower explosion limit of dusts, gases and hybrid mixtures
23
IX
3.2.1.1 Models to estimate the minimum explosible concentration (MEC) of dusts ...... 24
3.2.1.1.1 Schönewald Model [98] .................................................................................. 24
3.2.1.1.2 Shevchuk et al. Model [99] ............................................................................. 24
3.2.1.1.3 Buksowicz and Wolanski Model [100] ............................................................ 25
3.2.1.2 Models to estimate the lower explosion limit (LEL) of Gases .............................. 25
3.2.1.2.1 Zabetakis model [26]....................................................................................... 25
3.2.1.2.2 Shebeko et al. model [101] ............................................................................. 26
3.2.1.2.3 Spakowski model [102] ................................................................................... 26
3.2.1.3 Models to estimate the lower explosion limit of hybrid mixtures ....................... 27
3.2.1.3.1 Le Chatelier’s model [103] .............................................................................. 27
3.2.1.3.2 Bartknecht model [104] .................................................................................. 27
3.2.1.3.3 Mannan et al. model [74] ............................................................................... 28
3.3 Limiting oxygen concentration ........................................................................................ 28
3.4 Minimum ignition energy ................................................................................................ 30
3.5 Minimum ignition temperature ....................................................................................... 32
Mathematical models to estimate the minimum ignition temperature of dusts ... 34
3.5.1.1 Cassel and Liebman model [134] .......................................................................... 35
3.5.1.2 Nagy and Surincik model [135] ............................................................................. 35
3.5.1.3 Mitsui and Tanaka model [136] ............................................................................ 36
3.5.1.4 Mittal and Guha model [137] ............................................................................... 36
3.5.1.5 Krishna and Berlad model [138] ........................................................................... 36
3.5.1.6 Zhang and Wall model [139] ................................................................................ 37
3.6 Explosion severity: maximum overpressure Pmax and the maximum rate of pressure rise
(dP/dt) max ................................................................................................................................... 37
4 Material properties and preliminary analysis .................................................................. 39
X
4.1 Dusts ................................................................................................................................ 39
Moisture content...................................................................................................... 39
Volatile Content........................................................................................................ 39
Elemental analysis .................................................................................................... 40
Particle size distribution ........................................................................................... 40
Heat of combustion .................................................................................................. 42
Microscopic images .................................................................................................. 42
4.2 Choice and properties of gases and solvents .................................................................. 44
5 Experimental Methods and Procedures .......................................................................... 46
5.1 Tests in the 20-liter sphere .............................................................................................. 46
Experimental procedure for single substances ........................................................ 49
5.1.1.1 Dusts ..................................................................................................................... 49
5.1.1.2 Gases ..................................................................................................................... 50
5.1.1.3 Vapors ................................................................................................................... 50
5.1.1.4 Sprays .................................................................................................................... 50
Experimental procedure for two-phase hybrid mixtures ........................................ 52
Experimental procedure for three-phase hybrid mixtures ...................................... 52
5.2 Explosibility parameters test ........................................................................................... 52
Lower explosible limit / minimum explosible concentration .................................. 52
Limiting oxygen concentration ................................................................................. 53
Maximum explosion overpressure, (Pmax) and maximum rate of pressure rise
(dP/dt) max ................................................................................................................................ 53
5.3 Experimental procedure for testing the MIT and LEL modified Godbert-Greenwald (GG)
furnace ........................................................................................................................................ 54
Godbert-Greenwald Furnace ................................................................................... 54
XI
Minimum ignition temperature test procedures in the GG-furnace ....................... 56
5.3.2.1 Experimental procedure for the MIT of a single component ............................... 56
5.3.2.1.1 Dusts ................................................................................................................ 57
5.3.2.1.2 Gases ............................................................................................................... 57
5.3.2.1.3 Solvent Vapors ................................................................................................ 57
5.3.2.2 Experimental procedure for the MIT of two-phase hybrid mixture .................... 58
5.3.2.3 Experimental procedure for the MIT of three Component hybrid mixtures ....... 59
The lower explosible (LEL) and the minimum explosible concentration (MEC) tests
in the GG furnace .................................................................................................................... 59
5.3.3.1 Experimental procedure for LEL/MEC of single component ................................ 59
5.3.3.2 Experimental procedure for MEC/LEL of two component hybrid mixture .......... 60
5.3.3.3 Experimental procedure for MEC/LEL of three component hybrid mixtures ...... 61
5.4 Minimum ignition energy test in the Hartmann apparatus ............................................ 61
Experimental procedure of the minimum ignition energy of dusts ........................ 63
Experimental procedure of the minimum ignition energy of hybrid mixtures........ 64
6 Results and Discussions .................................................................................................. 65
6.1 Lower explosion limits and minimum explosible concentrations ................................... 65
Lower explosion limits in the standard 20-liter sphere. .......................................... 66
6.1.1.1 Lower explosion limits of single substances ......................................................... 66
6.1.1.2 Lower explosion limits of two-phase hybrid mixtures ......................................... 68
6.1.1.3 Lower explosion limits of three-phase hybrid mixtures ....................................... 75
Representation of the lower explosion limits of three-phase hybrid mixtures in
ternary phase diagrams .......................................................................................................... 77
Lower explosion limits in the Godbert-Greenwald (GG) furnace ............................ 84
6.1.3.1 Lower explosion limits of single substances ......................................................... 85

XII
6.1.3.2 Lower explosion limits of two-phase hybrid mixtures ......................................... 86
6.1.3.3 Lower explosion limits of three component hybrid mixtures .............................. 90
Mathematical models to estimate the lower explosion limits of dusts, gases and
hybrid mixtures ....................................................................................................................... 94
6.1.4.1 Comparison of single dusts and gases models with experimental results ........... 94
6.1.4.2 Comparisons of hybrid mixture models and the experimental results ................ 96
6.2 Limiting oxygen concentration ...................................................................................... 100
Limiting oxygen concentration of single substances ............................................. 101
Limiting oxygen concentration of hybrid mixtures ................................................ 104
Models to estimate the limiting oxygen concentration of dust ............................ 109
Model to estimate the limiting oxygen concentration of gases ............................ 114
Model to estimate the limiting oxygen concentration of hybrid mixtures............ 115
6.3 Minimum ignition energy .............................................................................................. 120
Minimum ignition energy of single substances ..................................................... 121
Minimum ignition energy of hybrid mixtures ........................................................ 122
Empirical model to estimate the minimum ignition energy .................................. 131
6.4 Minimum ignition temperature ..................................................................................... 132
Minimum ignition temperature single substances ................................................ 133
Minimum ignition temperature of two-phase hybrid mixtures ............................ 135
Minimum ignition temperature of three component hybrid mixtures ................. 139
Models to predict the minimum ignition temperature of dusts............................ 144
6.4.4.1 Proposed model to estimate the minimum ignition temperature of hybrid
mixtures 145
6.5 Explosion severity .......................................................................................................... 152
Explosion severity of single substances ................................................................. 153

XIII
Explosion severity of two-phase hybrid mixtures .................................................. 156
Explosion severity for three-phase hybrid mixtures .............................................. 163
7 Conclusion and Recommendations ............................................................................... 167
7.1 Conclusion ..................................................................................................................... 167
7.2 Recommendations ......................................................................................................... 172
8 Appendixes .................................................................................................................. 188
8.1 A. Detail process diagram for test in the GG furnace. ................................................... 188
8.2 Appendix B: Test results ................................................................................................ 193
B Experimental results for dust and gas hybrid mixtures ..................................................... 193
B: Experimental results for dust and spray hybrid mixture. ................................................. 195
B.3 Experimental results for gas and spray hybrid mixture. ................................................. 200
B.4 Three-phase hybrid mixtures test results ....................................................................... 205
B.5 Comparisons between hybrid mixture models and the experimental results. .............. 212
B.6 Diagrams to estimate Limiting oxygen concentration of dusts and hybrid mixtures .... 216
8.3 Appendixes C Error and uncertainty analyses ............................................................... 220
C.1 Error and uncertainty analyses in the 20-liters sphere .................................................. 220
C.2 Uncertainty and error analysis for the minimum ignition energy test for hybrid mixtures
in the Hartmann apparatus. .................................................................................................. 221
C.3: Uncertainty and error analysis for both the minimum ignition temperature of hybrid
mixture and single dust test ................................................................................................. 224
8.4 Appendixes D: derivation of equations ......................................................................... 226
XIV
List of Figures
Figure 2.1: Relationships between the different types of explosions. ............................................. 6
Figure 2.2: Understanding of atomization [37]. ............................................................................... 8
Figure 2.3: Dust explosion pentagon[22]. ................................................................................... 10
Figure 2.4: Comparison of TG-DTG traces between sweet potato powders and Magnesium dust in
N2 and air atmosphere [59]. ........................................................................................................... 13
Figure 2.5: Schematic representation of the paths occurring during dust explosion [61]. ........... 13
Figure 3.1: Safety characteristics. ................................................................................................... 21
Figure 3.2: Influence of inert gas on the explosion limits of methane [26]. .................................. 29
Figure 3.3: Temperature influence on the limiting oxygen concentration of different dusts [112].
........................................................................................................................................................ 30
Figure 3.4: Dust explosibility characteristics: effect of particle size on some principal parameters
for atomized aluminium [121]. (1) minimum ignition energy; (2) minimum explosive
concentration; (3) maximum explosion pressure; and (4) maximum rate of pressure rise. .......... 32
Figure 3.5: The MIT of hydrocarbon-air mixtures as a function of the average carbon chain length
[26]. ................................................................................................................................................ 34
Figure 4.1: Particle size distributions of the dust samples. ............................................................ 41
Figure 4.2: Particle size distributions of the dust samples. ............................................................ 41
Figure 4.3: SEM images of dusts. .................................................................................................... 43
Figure 5.1: Technical diagram of the 20-liter sphere apparatus. ................................................... 47
Figure 5.2: (A) spray system, (B) spray control system, (C) timer (D) nozzle. ................................. 47
Figure 5.3: Experimental arrangement of the 20-liter sphere. ...................................................... 48
Figure 5.4: (A) electrical ignition assembly (B) chemical ignition assembly. .................................. 49
Figure 5.5: High speed photographs of the nozzle spray pattern with time. ................................. 51
Figure 5.6: Dimensions of the spray. .............................................................................................. 51
Figure 5.7: Pressure/time-diagram of a fuel explosion. ................................................................. 54
Figure 5.8: Schematic sketch of Godbert-Greenwald furnace. ...................................................... 55
Figure 5.9: A photo of the Godbert-Greenwald furnace experimental setup. .............................. 56
XV
Figure 5.10: A representation of how the MIT of both single dust, gas and hybrid mixtures were
obtained. ........................................................................................................................................ 58
Figure 5.11: A photo of the Hartmann apparatus experimental set-up. ....................................... 62
Figure 5.12: Technical diagram of the Hartmann apparatus. ......................................................... 62
Figure 5.13: The development of an explosion in the Hartmann apparatus. ................................ 63
Figure 6.1: Lower explosion limits of solvents as spray. ................................................................. 67
Figure 6.2: Maximum explosion pressure and rate of pressure rise of a mixture of methane and
lycopodium in dependence on the lycopodium concentration. .................................................... 69
Figure 6.3: Maximum explosion pressure and rate of pressure rise of a mixture of methane and
brown coal in dependence on the brown coal concentration. ...................................................... 69
Figure 6.4: Maximum explosion pressure and rate of pressure rise of a mixture of ethanol spray
and lycopodium in dependence on the lycopodium concentration. ............................................. 70
Figure 6.5: Maximum explosion pressure and rate of pressure rise of a mixture of ethanol spray
and brown coal in dependence on the brown coal concentration. ............................................... 71
Figure 6.6: Maximum explosion pressure and rate of pressure rise of a mixture of methane and
isopropanol spray in dependence on the isopropanol concentration. .......................................... 74
Figure 6.7: Maximum explosion pressure and rate of pressure rise of a mixture of hydrogen and
isopropanol spray in dependence on the isopropanol concentration. .......................................... 74
Figure 6.8: Maximum explosion pressure and rate of pressure rise of mixtures of lycopodium,
methane and 50 g/m3 of isopropanol spray in dependence on lycopodium concentration. ........ 75
Figure 6.9: Maximum explosion pressure and rate of pressure rise of mixtures of brown coal,
methane and 50 g/m3 of isopropanol spray in dependence on the dust concentration. ............. 76
Figure 6.10: A representation on how to obtain each point from the diagram. ............................ 78
Figure 6.11: Ternary phase diagram for the lower explosion limits of mixtures of lycopodium,
methane and ethanol. .................................................................................................................... 79
Figure 6.12: Ternary phase diagram for the lower explosion limits of mixtures of lycopodium,
methane and isopropanol. ............................................................................................................. 79
Figure 6.13: Ternary phase diagram for the lower explosion limits of mixtures of brown coal,
methane and ethanol. .................................................................................................................... 80
Figure 6.14: Ternary phase diagram for the lower explosion limits of mixtures of brown coal,
XVI
methane and isopropanol. ............................................................................................................. 81
Figure 6.15: Ternary phase diagram for the lower explosion limits of mixtures of brown coal,
hydrogen and ethanol. ................................................................................................................... 82
Figure 6.16: Ternary phase diagram for the lower explosion limits of mixtures of brown coal,
hydrogen and isopropanol. ............................................................................................................ 82
Figure 6.17: Ternary phase diagram for the lower explosion limits of mixtures of lycopodium,
hydrogen and isopropanol. ............................................................................................................ 83
Figure 6.18: Ternary phase diagram for the lower explosion limits of mixtures of lycopodium,
hydrogen and ethanol. ................................................................................................................... 83
Figure 6.19: LEL of two-phase hybrid mixture of dusts and gases or solvent- vapor (effect of
admixture of dust on the LEL of gas). ............................................................................................. 87
Figure 6.20: MEC of two-phase hybrid mixture of dusts and gases or solvents- vapor (effect of
admixture of gas on the MEC of dust). ........................................................................................... 88
Figure 6.21: LEL of hybrid mixture of solvents and gases (effect of admixture of solvent on the LEL
of gas). ............................................................................................................................................ 89
Figure 6.22: LEL of hybrid mixture of solvents and gases (effect of admixture of gas on the LEL of
solvent). .......................................................................................................................................... 90
Figure 6.23: Comparison between experimental results for the MEC of dusts and the three models.
........................................................................................................................................................ 95
Figure 6.24: Comparison between experimental results for LEL of gases and solvents for the three
models. ........................................................................................................................................... 95
Figure 6.25: Diagram showing a comparison between experimental results and three models: (A)
brown coal-methane, (B) lycopodium-methane, (C) brown coal-hydrogen, (D) lycopodium-
hydrogen. ........................................................................................................................................ 97
Figure 6.26: Diagram showing a comparison between experimental results and three models: (A)
lycopodium-isopropanol, (B) lycopodium-ethanol, (C) brown coal-isopropanol, (D) brown coal-
ethanol. .......................................................................................................................................... 98
Figure 6.27: Diagram showing a comparison between experimental results and three models: (A)
methane-isopropanol, (B) methane-ethanol, (C) hydrogen-isopropanol, (D) hydrogen-ethanol. 99
Figure 6.28: Limiting oxygen concentration of dusts with different ignition energies. ............... 102
XVII
Figure 6.29: Limiting oxygen concentration of gases with different ignition energies. ............... 104
Figure 6.30: Limiting oxygen concentration of hybrid mixtures of isopropanol spray and dusts with
different ignition energies. ........................................................................................................... 105
Figure 6.31: Limiting oxygen concentration of hybrid mixtures of acetone (left) / methane (right)
and dusts with different ignition energies. .................................................................................. 105
Figure 6.32: Limiting oxygen concentration of hybrid mixtures with 10 J electrical igniter. ....... 106
Figure 6.33: limiting oxygen concentration of hybrid mixtures with 2 kJ (left), 10 kJ (right) chemical
igniters. ......................................................................................................................................... 107
Figure 6.34: A comparison between computational and experimental results for the LOC of dusts
with different ignition energies. ................................................................................................... 113
Figure 6.35: A diagram to estimate the LOC of dust-air mixtures in dependence on MEC and the
fuel number. ................................................................................................................................. 113
Figure 6.36: A comparison between computational and experimental results for the LOC of hybrid
mixture of methane and dusts with different ignition energies. ................................................. 116
Figure 6.37: A comparison between computational and experimental results for the LOC of hybrid
mixture of acetone and dusts with different ignition energies. ................................................... 117
Figure 6.38: A comparison between computational and experimental results for the LOC of hybrid
mixture of isopropanol and dusts with different ignition energies. ............................................ 117
Figure 6.39: A diagram to estimate the LOC of hybrid mixture of methane and dusts in dependence
on LEL-hybrid and the fuel number with 2 kJ chemical igniter. ....................................................... 119
Figure 6.40: A diagram to estimate the LOC of hybrid mixture of acetone and dusts in dependence
on LEL-hybrid and the fuel number with 2 kJ chemical igniter. ....................................................... 119
Figure 6.41: A diagram to estimate the LOC of hybrid mixture of isopropanol and dusts in
dependence on LEL-hybrid and the fuel parameter fuel number with 2 kJ chemical igniter. ........ 120
Figure 6.42: Experimental results for the minimum ignition energy of dusts. ............................ 121
Figure 6.43: Ignition energy of hybrid mixture of starch with propane and methane in dependence
on gases concentration and its comparison with empirical model. ............................................ 123
Figure 6.44: Ignition energy of hybrid mixture of wheat flour with propane and methane in
dependence on gases concentration and its comparison with empirical model. ....................... 125
Figure 6.45: Ignition energy of hybrid mixture of protein with propane and methane in
XVIII
dependence on gases concentration and its comparison with empirical model. ....................... 125
Figure 6.46: Ignition energy of hybrid mixture of polypropylene with propane and methane in
dependence on gases concentration and its comparison with empirical model. ....................... 126
Figure 6.47: Ignition energy of hybrid mixture of dextrin with propane and methane in
dependence on gases concentration and its comparison with empirical model. ....................... 126
Figure 6.48: Ignition energy of hybrid mixture of peat with propane and methane in dependence
on gases concentration and its comparison with empirical model. ............................................ 128
Figure 6.49: Ignition energy of hybrid mixture of charcoal with propane and methane in
dependence on gases concentration and its comparison with empirical model. ....................... 128
Figure 6.50: Ignition energy of hybrid mixture of brown coal with propane and methane in
dependence on gases concentration and its comparison with empirical model. ....................... 129
Figure 6.51: The trend of MIE of hybrid mixture of polypropylene and propane. ...................... 131
Figure 6.52: MIT of the dust materials. ........................................................................................ 133
Figure 6.53: MIT for the gases and solvents used. ....................................................................... 134
Figure 6.54: Comparison of experimental MIT values of gases and solvent-vapor obtained with the
GG furnace and according to standard procedure by Brandes et al. ........................................... 135
Figure 6.55: MIT of two-phase hybrid mixture of dust and gas: effect of admixture of dust on the
MIT of gases. ................................................................................................................................. 137
Figure 6.56: MIT of two-phase hybrid mixture of dust and gas: effect of admixture of gas on the
MIT of dusts. ................................................................................................................................. 138
Figure 6.57: MIT of two component mixture of solvent-vapor and gas: effect of admixture of
solvent on the MIT of gases ......................................................................................................... 139
Figure 6.58: Comparing the MIT of the various dust models with the experimental results. ..... 145
Figure 6.59: A comparison between the model and the experimental result for hybrid mixtures of
various dusts and methane gas. ................................................................................................... 147
Figure 6.60: A comparison between the model and the experimental result for hybrid mixtures of
propane gas and various dusts. .................................................................................................... 148
Figure 6.61: A comparison between the model and the experimental results for hybrid mixtures
of hydrogen gas and various dusts. .............................................................................................. 149
Figure 6.62: A comparison between the model and the experimental results for hybrid mixtures
XIX
of toluene vapor and various dusts. ............................................................................................. 149
Figure 6.63: A comparison between the model and the experimental results for hybrid mixtures
of ethanol vapor and various dusts. ............................................................................................. 150
Figure 6.64: A comparison between the model and the experimental results for hybrid mixtures
of isopropanol vapor and various dusts. ...................................................................................... 151
Figure 6.65: Maximum explosion pressure and rate of pressure rise of solvents. ..................... 154
Figure 6.66: Maximum explosion pressure and rate of pressure rise of methane and hydrogen.
...................................................................................................................................................... 155
Figure 6.67: Maximum explosion pressure and rate of pressure rise of lycopodium and brown coal.
...................................................................................................................................................... 156
Figure 6.68: Maximum explosion pressure and rate of pressure rise of a mixtures of methane and
lycopodium in dependence on the lycopodium concentration. .................................................. 157
Figure 6.69: Maximum explosion pressure and rate of pressure rise of a mixtures of methane and
brown coal in dependence on the brown coal concentration. .................................................... 158
Figure 6.70: Maximum explosion pressure and rate of pressure rise of a mixtures of isopropanol
and lycopodium in dependence on the lycopodium concentration. ........................................... 159
Figure 6.71: Maximum explosion pressure and rate of pressure rise of a mixtures of isopropanol
and lycopodium in dependence on the lycopodium concentration. ........................................... 159
Figure 6.72: Maximum explosion pressure and rate of pressure rise of a mixtures of methane and
isopropanol spray in dependence on the isopropanol concentration. ........................................ 161
Figure 6.73: Maximum explosion pressure and rate of pressure rise of a mixtures of hydrogen and
isopropanol spray in dependence on the isopropanol concentration. ........................................ 162
Figure 6.74: Maximum explosion pressure and rate of pressure rise of mixtures of lycopodium,
methane and 50 g/m3 of isopropanol spray in dependence on lycopodium concentration. ..... 163
Figure 6.75: Maximum explosion pressure and rate of pressure rise of mixtures of brown coal,
methane and 50 g/m3 of isopropanol spray in dependence on the dust concentration. ........... 164
XX
List of Tables
Table 2.1:Composition of the gases obtained from starch pyrolysis [61]. ............................... 14
Table 3.1: Explosibility parameters [79]. ........................................................................................ 22
Table 3.2: Constants for Schönewald model [98]. .......................................................................... 24
Table 3.3: Summary of the MIT of alkane-air mixture [83]. ........................................................... 33
Table 4.1: Physical and chemical properties of dusts. .................................................................... 42
Table 4.2:Properties of gases [83, 150]. ......................................................................................... 44
Table 4.3: Properties of solvents [83, 150, 151]............................................................................. 45
Table 5.1: The volume fractions or masses of fuels used for the tests. ......................................... 56
Table 6.1: A summary of results for the lower explosion limits of mixtures of dusts and gases as
well as dusts and solvents (spray). ................................................................................................. 72
Table 6.2: A summary of results for the lower explosion limits of mixtures of gases and solvents
(spray). ............................................................................................................................................ 73
Table 6.3: A summary of results for the lower explosion limits of three-phase hybrid mixtures. . 77
Table 6.4: LEL and MIT of gases, the furnace temperature used in the individual and hybrid
mixtures tests as well as a comparison between the LEL according to Brandes et al. [83] and the
experimental results. ...................................................................................................................... 86
Table 6.5: MEC and MIT of dusts as well as the density of dusts and the furnace temperature used
for single substances and hybrid mixtures tests. ........................................................................... 86
Table 6.6: Effect of an admixture of gases and solvents on the MEC of dust, (dust concentrations
in g/m3). .......................................................................................................................................... 91
Table 6.7: Effect of an admixture of dusts and solvents on the LEL of gases, (gas concentrations in
vol %). ............................................................................................................................................. 92
Table 6.8: Effect of an admixture of dusts and gases on the LEL of solvents, (solvent concentrations
in vol%). .......................................................................................................................................... 93
Table 6.9: Summary results for the LOC of dusts and concentrations with different ignition
energies. ....................................................................................................................................... 107
Table 6.10: Summary results for the LOC of hybrid mixtures of methane and dusts as well as
concentrations with different ignition energies. .......................................................................... 108
Table 6.11: Summary results for the LOC of hybrid mixtures of acetone vapor and dusts as well as
XXI
concentrations with different ignition energies. .......................................................................... 108
Table 6.12: Summary results for the LOC of hybrid mixtures of isopropanol spray and dusts as well
as concentrations with different ignition energies. ..................................................................... 109
Table 6.13: Mass fractions of elements, MEC, heat of reaction and estimated fuel numbers for the
fifteen dusts. ................................................................................................................................. 111
Table 6.14: Mass fractions of elements, LEL, and the estimated fuel number for methane, acetone
and isopropanol. ........................................................................................................................... 114
Table 6.15: LEL and MEC of gases and dusts. ............................................................................... 136
Table 6.16: Effect of admixture of solvents and gases on the MIT of dusts, (all in °C). .............. 140
Table 6.17: Effect of admixture of dusts and gases on the MIT of solvents, (all in °C). ............... 141
Table 6.18: Effect of admixture of dusts and solvents on the MIT of gases, (all in °C). ............... 142
Table 6.19: Parameters used in model calculation. ...................................................................... 144
Table 6.20: Comparison between the MIT of the various dust models and the experimental results.
...................................................................................................................................................... 145
Table 6.21: Summary for comparison of the models with experimental results for hybrid mixtures
of flammable gases and various dusts. ........................................................................................ 152
Table 6.22: Summary of results for the explosion severity of dust- gas as well as dusts-spray
mixtures ........................................................................................................................................ 160
Table 6.23: Summary of results for the explosion severity of gas-spray mixtures. ...................... 162
Table 6.24: Maximum explosion pressure and rate of pressure rise for three-phase hybrid mixtures
...................................................................................................................................................... 165

XXII
Abbreviations
AC Acetone
ASTM America Standard testing method
Conc Concentration
BS British standard
DIN German institute for Standardization
(dP/dt) max Maximum rate of pressure rise
EN European standard
ET Ethanol
eq. Equation
HX Hexane
HP Heptane
HY Hydrogen
IS Isopropanol
ISO International standardization organization
Kst Specific gas constant
KG Specific dust constant
LEL Lower explosion limit
LEL-hybrid Lower explosion limit of hybrid mixture
LOC Limiting oxygen concentration
ME Methane
MEC Minimum explosible concentration
XXIII
MIE Minimum ignition energy
MIT Minimum ignition temperature
Pmax Maximum explosion overpressure
NFPA National Fire Protection Association
SEM Scanning electron image
TL Toluene
UEL Upper explosion limit
VDI Association of German Engineers
XXIV
Nomenclature
Symbol Description Units
c Specific heat capacity [J/g K]
cair Specific heat of air [J/g K]
Cd Initial dust concentration, [g/cm3]
Cs Specific heat capacity of the dusts [kJ/kg K]
Cl Minimum explosible concentration of dust [g/m3]
d Diameter of the dust particle [m]
E Activation energy [J/mol]
f Frequency factor, [cm/s]
h Heat transfer coefficient [J/m2 s K]
Δℎ𝑟 heat of reaction [J/g]
Hd Heat of combustion of dust [J/g]
Hg Heat of combustion of gas [J/g]
∆Hcomb Combustion enthalpy [J/g]
k Thermal conductivity, [W/m K]
kc Coefficient of heat transfer [1/s]
Kst Specific gas constant [bar m/s]
KG Specific dust constant [bar m/s]
LEL Lower explosion limit of gas [vol%],
LEL-hybrid Lower explosible limit of hybrid mixture [g/m3]
mc Mass combustion rate of particle, [g/s]
Md Mass of dust, [g]
XXV
Mdt Molecular weight of dust [g/mol]
Mg Mass of gas, [g]
MEC Minimum Explosive Concentration, [g/cm3]
𝑀𝐼𝐸𝑑𝑢𝑠𝑡 Minimum ignition energy of dust [mJ]
𝑀𝐼𝐸𝑔𝑎𝑠 Minimum ignition energy of gas [mJ]
Mot Molecular weight of oxygen [g/mol]
Mp Mass of dust particle [g]
np Number of dust particles in the furnace or in an
elemental dust cloud
q’’ Heat flux [W/m2]
R Gas constant [J/mol K]
S Surface area of dust cloud [cm2]
Sp Effective surface area of dust [cm2]
T Temperature [K]
T0 Ambient temperature [K]
Ti Ignition temperature [K]
Ti Minimum ignition temperature [K]
Ti,d Minimum ignition temperature of particles, [K]
Ti,g Minimum ignition temperature of gas, [K]
Ti,hybrid Minimum ignition temperature of hybrid
mixture
[K]
T0 Initial temperature of dust cloud [K]
Ts Temperature of particle surface [K]
XXVI
Xgas , Xdust Fractional content of gas and dust in the fuel
mixture,
Y Concentration of gas in the mixture [vol%]
Greek Symbols
ρ Density of the gas-air mixture [g/m3]
ρair Density of air [g/cm3]
ρd Density of dust [g/cm3]
ρg Density of gas [g/cm3]
𝜌𝑠 Density of the dust [kg/m3]
σ Stefan-Boltzmann constant [J/cm2K4s]
τ Combustion time [s]
τb The time a material to reach ignition
temperature
[s]
𝜎𝑓𝑢−𝑔 Fuel number of gas [mol/g]
𝜎𝑓𝑢−𝑑 Fuel number of dust [mol/g]
𝛽𝑔 Mass fraction of gas in the mixture
𝛽𝑑 Mass fraction of dust in the mixture
1
Chapter One
1 Introduction
Dust, gas and hybrid mixture explosions pose serious and widespread hazards in process
industries such as chemical factories, refineries, enameling plants, paint workshops, cleaning
equipment, mills or stores for milled products and other combustible dusts, as well as in tank
facilities, loading areas for flammable gases, liquids and solids etc. [1]. The accidents involving
these types of explosions can cause failure to equipment, injuries and damages to people as well
as the surrounding environment, plant shut-down and sometimes destruction of the factory
resulting in fatalities and huge financial losses. Starting from the early days of the process
industries, continuous efforts have been made to develop and improve measures to prevent or
mitigate these types of explosions [1, 2]. However, despite an extensive research and
advancement of technology in combustible dust or flammable gas hazards, these types of
explosions still occur in this modern era. For example, the US Chemical Safety Board (CSB) [3] in
2006 stated that 281 dust explosions were reported between 1980 and 2005 in the USA alone,
killing 119 workers and injuring 718. In the process industries, approximately 70% of the dusts
used are combustible. Most of the reported dust explosions were organic products from
industries such as agricultural, food, fuel and pharmaceuticals. Metal dusts have also been
reported in a growing number of explosions in the last decades due to their increased use in the
process industries like automotive, aeronautics and electronics [3].
In process industries, not only dust, gas and vapor are present, but also much more complex
mixtures such as mixtures of two or more materials of different state of aggregates (hybrid
2
mixtures). These kinds of mixtures are usually not considered in the various hazard and risk
assessments even though combustible dusts are dispersed in industrial equipment containing
flammable gas or solvents. Hybrid mixtures are usually encountered in facilities that either handle
or process combustible dust and flammable gases or vapors. For example, paint factories
(pigments and solvents), mining (coal and methane), grain elevators (small grains and
fermentation gases), pharmaceutical industries (incipient and solvents) etc. Some examples of
industrial accidents involving hybrid mixture explosion include: (1) Westray Mine, 1992, Nova
Scotia, Canada: methane gas and coal dust mixture explosion, twenty- six workers were killed [4],
(2) BPS Inc., 1997, Arkansas, USA: Azinphos methyl pesticide powder and devolatilized gas mixture
explosion, three firefighters were killed [5], (3) SEMABLA Blaye, 1997, France: grain dust and
devolatilized gas mixture explosion, 11 workers were killed [6], (4) Upper Big Branch Mine
disaster, 2010, Raleigh County, USA: coal dust and methane gas explosion, 38 miners were killed
[7], (5) AL Solutions, 2010, West Virginia, USA: zirconium metal dust and hydrogen gas mixture
explosion, three employees were killed and a contractor was injured [8] and (6) Soma Mine
Disaster, 2014, West Turkey: coal dust and methane gas explosion, 301 workers were killed [9].
Unlike solitary dust, gas or solvent explosions, which have been widely studied in the past
decades, data on explosion characteristics of hybrid mixtures are comparatively sparse. Most of
the research on hybrid mixtures concentrates only on dust and gas or vapor mixtures [10-21].
However, mixtures of spray-dusts, spray-gases, vapor-gases are generally not considered.
Moreover, the explosion behavior of complex systems such as three-component mixtures (dust,
gas and vapor) as well as three-phase mixtures (dust, gas and spray) have not been studied yet.
Furthermore, most research on hybrid mixtures use weak electric spark or chemical igniters as an
ignition source. None of the available research on hybrid mixtures considered hot surface as an
ignition source, even though, hot surfaces are considered as one of the leading sources of ignition
in industrial explosions [22]. As a result of the aforementioned reasons, the present study seeks
to undertake an investigation on the explosion phenomenon of hybrid mixtures to obtain insight
into the driving mechanisms and the explosions features affecting the course of hybrid mixture
explosion by considering the following scopes:
3
1. Experimental investigation and theoretical modeling of the minimum ignition
temperature of two-phase (dust-gas, dust-vapor), two components (gas-vapor) and three-
components (dust-gas-vapor) hybrid mixtures.
2. Experimental investigation and theoretical modeling of the limiting oxygen concentration
of two-phase (dust-gas, dust-vapor as well as dust-spray) hybrid mixtures with different
ignition energies.
3. Experimental and theoretical modeling of the minimum ignition energy of two-phase
(dust-gas) hybrid mixtures.
4. Experimental investigation and theoretical modeling of the lower explosion limits of two-
phase (dust-gas, dust-spray, dust-vapor as well as gas-spray), three-components (gas-
vapor-gas) and three-phase (dust-gas-spray) hybrid mixtures.
5. Experimental investigation of the maximum explosion pressure and maximum rate of
pressure rise of two-phase (dust-gas, dust-spray as well as gas-spray) and three-phase
(dust-gas-spray) hybrid mixtures.
1.1 Thesis outline
This thesis describes several contributions with regard to hybrid mixture explosion. All
experimental tests were performed at the University of Magdeburg, Department of Plant Design
and Process Safety, fire and explosion laboratory. In addition to this introduction (Chapter 1), the
thesis is structured as follows:
Chapter 2 (Theoretical Background and Literature reviews) outlines an overview of explosions.
Background information as well as a detailed literature review of previous work related to gas,
dust, spray and hybrid mixtures explosion are discussed.
Chapter 3 (Explosion Characteristics) discusses the relevant explosion parameters considered in
this thesis such as minimum ignition temperature, minimum ignition energy, limiting oxygen
concentration, lower explosion limit and explosion severity. Standard methods of determination
as well as the relevant factors influencing the determination of each of the parameters are
discussed. Moreover, mathematical models to estimate these parameters are also presented.
4
Chapter 4 (Material Properties and Preliminary Analysis) presents a brief description of the
properties of the investigated materials. The materials used include twenty combustible dusts,
three gases and six solvents. All twenty dust samples were analyzed for: particle size distribution,
volatile content, heat of combustion and elemental analysis. Moreover, physical, chemical and
thermodynamic properties of both the solvent and the gas samples are also reported.
Chapter 5 (Experimental Methods and Procedure) explains in detail the experimental procedure
used to determine the explosion parameters of hybrid mixtures. These experiments include: (1)
the determination of the lower explosion limit, explosion overpressure, rate of pressure rise and
limiting oxygen concentration for the ignition of dusts, gases, solvents (spray) and their mixtures
in the standard 20-liter sphere, (2) the determination of the minimum ignition temperature of
dusts, gases, solvents (vapor) and their mixtures in the modified Godbert-Greenwald furnace and
(3) the determination of the minimum ignition energy of dusts and hybrid mixtures in the
modified Hartmann apparatus.
Chapter 6 (Results and Discussions) presents detailed discussion of the results obtained from this
study. The presentation of the results for each of the considered parameters is done separately.
The following are the hierarchy on how the results are presented. (1) lower explosion limit, (2)
limiting oxygen concentration, (3) minimum ignition energy, (4) minimum ignition temperature
and (5) explosion severity. In all cases, the results from single materials are initially presented,
followed by double-phase and triple-phase. The results from mathematical models presented in
Chapter 3 are also compared with the experimental results.
Chapter 7 (Conclusion and Recommendations) closes the thesis with a summary of the presented
research topic and results. Some recommendations and perspectives regarding future research
on hybrid mixture explosion are stated.
5
Chapter Two
2 Theoretical Background
2.1 General overview of explosions
The term “explosion” has many definitions in literature, however, they are mainly divided into
two categories; one focusing on the noise due to sudden release of a strong pressure wave, and
the other considering the sudden release of chemical energy. Eckhoff [22] defined an explosion
as “an exothermal chemical/physical process that, when occurring at constant volume, gives a
sudden and significant pressure rise”. The types of explosions usually encountered in process
industries are physical and chemical explosions [23]. Subcategories of physical and chemical
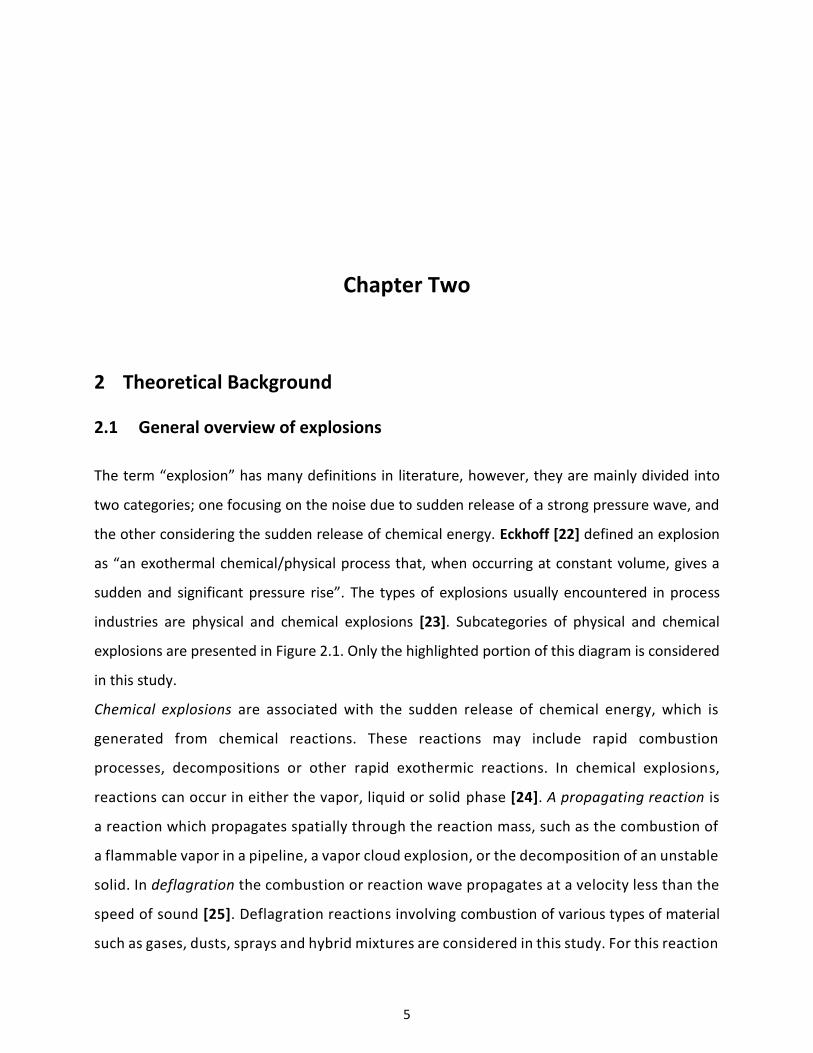
explosions are presented in Figure 2.1. Only the highlighted portion of this diagram is considered
in this study.
Chemical explosions are associated with the sudden release of chemical energy, which is
generated from chemical reactions. These reactions may include rapid combustion
processes, decompositions or other rapid exothermic reactions. In chemical explosions,
reactions can occur in either the vapor, liquid or solid phase [24]. A propagating reaction is
a reaction which propagates spatially through the reaction mass, such as the combustion of
a flammable vapor in a pipeline, a vapor cloud explosion, or the decomposition of an unstable
solid. In deflagration the combustion or reaction wave propagates at a velocity less than the
speed of sound [25]. Deflagration reactions involving combustion of various types of material
such as gases, dusts, sprays and hybrid mixtures are considered in this study. For this reaction
6
to occur, three main components need to come together in the right proportion, which
include the fuel (it could be any combustible material such as gas, dust, mist and their
mixtures), oxidants (for example, oxygen, halogen etc.) and effective ignition source (for
example, mechanical sparks, heating, smouldering spot, electrostatic discharge, hot surface,
welding, electrical equipment etc.).
Figure 2.1: Relationships between the different types of explosions.
2.2 Gas / vapor explosion
Gas is defined as the state of matter characterized by complete molecular mobility and
unlimited expansion [26]. Gas explosion phenomena depend strongly on the conditions and
structure of the system where the explosion occurs [27, 28]. Most gas explosions happen
when combustible gas from accidental releases, mixes with air in the atmosphere and
generates an explosible cloud. If the fuel-air ratio in the cloud is within the explosible range,
and there is the presence of an ignition source an explosion would occur. The consequences
of a gas explosion depend on the environment in which the gas cloud is contained [29].
7
Therefore, the environment where the explosion takes place can be classified as: Confined
Gas Explosion, Partly Confined Gas Explosion and Unconfined Gas Explosion [30]. A confined
Gas Explosion [31] occurs within physical enclosures, e.g. tanks, process equipment, pipes,
culverts, sewage systems, closed rooms and in underground installations. Pressure build-up
in a confined explosion can be analysed by knowing the gas cloud size. These types of
explosion may result in loss of containment and a subsequent event could be strong blast
waves from high pressure reservoirs, fires or toxic releases [31]. Partly Confined Gas
Explosion results when a fuel is accidentally released inside a building which is partly open
such as compressor rooms and offshore modules. The consequences of such explosions
depend on several parameters such as the type of fuel, size and concentration of the gas
cloud, ignition and geometrical layout. Unconfined Gas Explosions are usually the result of a
flammable gas release which occur within an unconfined area [24]. Gas or vapor explosion
could be prevented or mitigated by measures such as: combustible gases leak prevention
and control, installation of venting system to release the gas and reduce the explosible
atmosphere, elimination of ignition sources and blast fire barrier installation etc. More
information on the prevention of gas or vapor explosion could be referred to [24, 32-35].
2.3 Spray explosion
According to ASTM [36], “a spray is defined as a dynamic collection of drops dispersed in a gas”.
It is a momentum driven collection of droplets usually produced by atomization (generation of
small droplets) of liquid through mechanical forces for example, a pressurized release through a
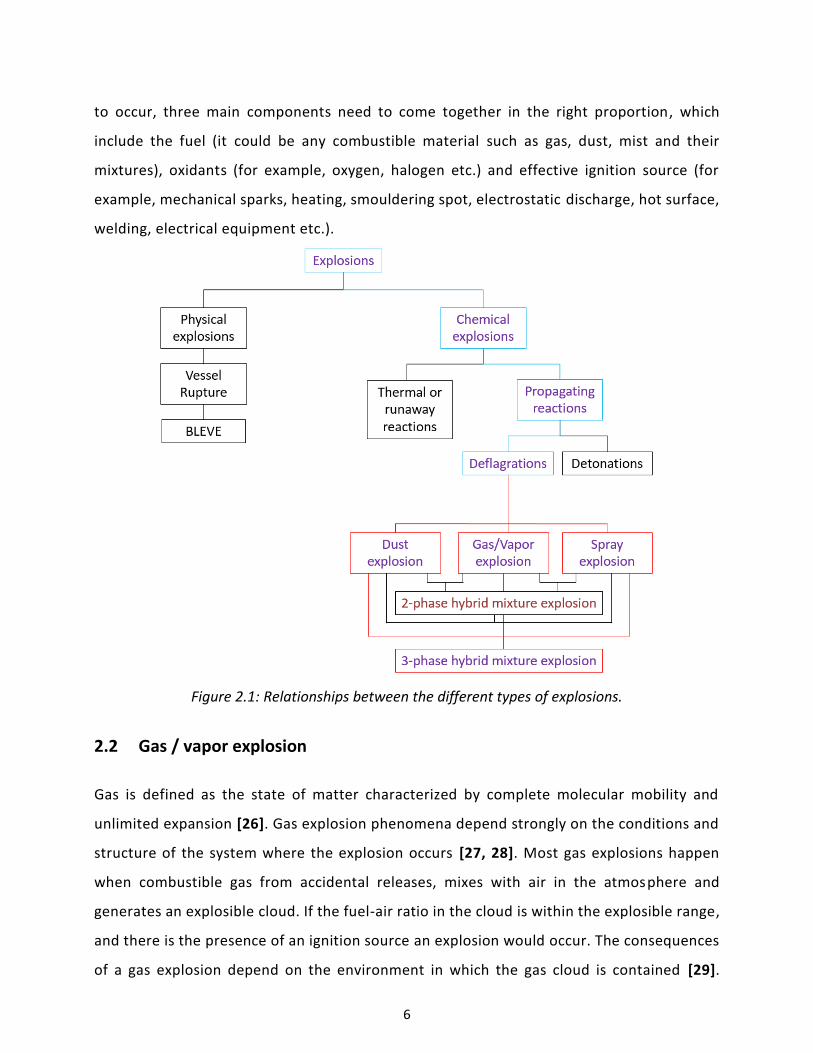
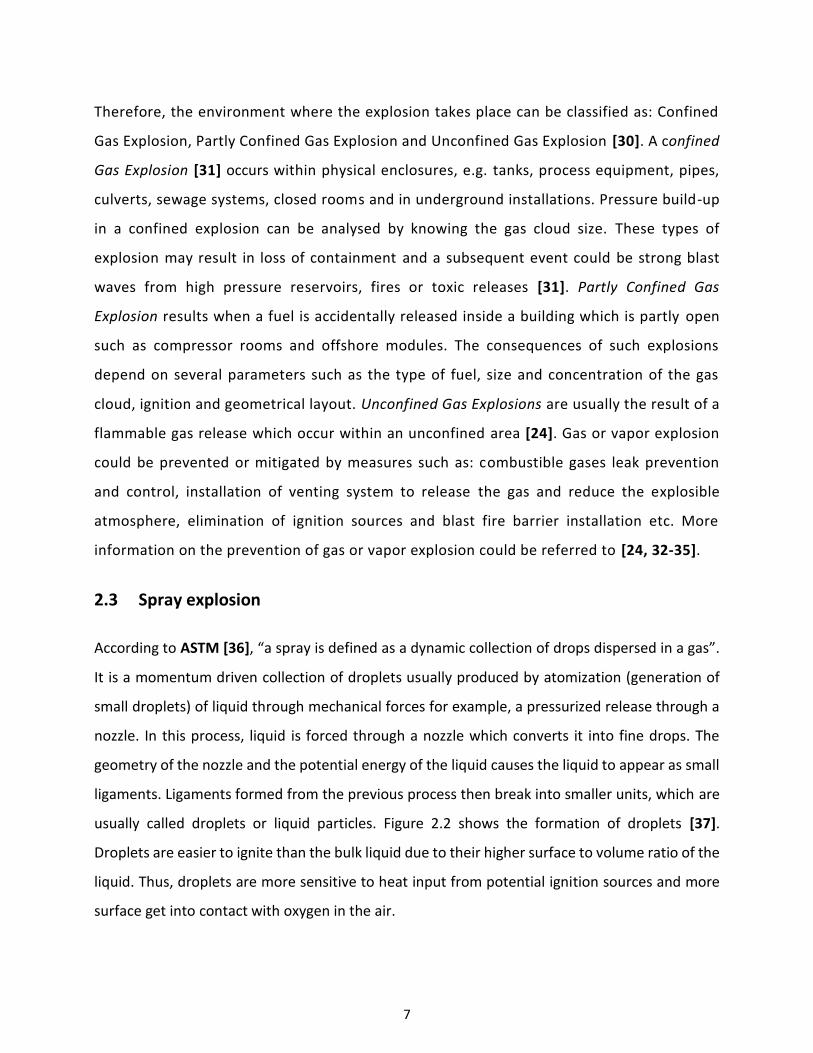
nozzle. In this process, liquid is forced through a nozzle which converts it into fine drops. The
geometry of the nozzle and the potential energy of the liquid causes the liquid to appear as small
ligaments. Ligaments formed from the previous process then break into smaller units, which are
usually called droplets or liquid particles. Figure 2.2 shows the formation of droplets [37].
Droplets are easier to ignite than the bulk liquid due to their higher surface to volume ratio of the
liquid. Thus, droplets are more sensitive to heat input from potential ignition sources and more
surface get into contact with oxygen in the air.
8
Figure 2.2: Understanding of atomization [37].
According to Eckhoff [22], sprays of combustible liquids, for example, hydrocarbons in air at
atmospheric pressure and normal temperature, with a droplet size < 100 µm and a droplet mass
concentration in the range of 100-500 g/m3 are explosible. This is so regardless of whether the
liquid is of a low or a high boiling point. In the case of a low boiling point liquid, the droplets will
evaporate readily and the cloud becomes a mixture of combustible vapor and air. If the boiling
point of the liquid is high, i.e. the vapor pressure at normal ambient conditions is low, the droplets
will, with regard to the combustion process, behave similarly to solid particles of an organic
material. Zehr [38] explained that a spray and a cloud of solid particles (dust) have common
features, in that, both consist of a finely divided dense fuel phase suspended in an oxidizing gas.
However, explosible spray clouds are less stable than explosible dust clouds because of the
collisions between droplets which give rise to coalescence and transformation to fewer and larger
droplets. When the droplet size gets sufficiently large, the droplet sedimentation velocity in the
gas becomes significant and the droplets settle out of the cloud. A similar finding was observed
by Williams [39] when he undertook a wide range of studies on spray explosions by considering
various properties of liquid fuels such as characteristics of sprays in terms of drop size and drop
velocity distributions, processes for atomization of liquid fuels and combustion of single droplet
and droplet clouds. Moreover, Forster [40] also provided very important information on
generation, ignition and combustion of sprays. The author mentioned that the mechanism of
flame propagation is strongly influenced by the droplet size. Below 10 µm, the droplets evaporate
completely before combustion and behave more like a premixed gas; on the other hand, droplets

9
size of over 50 µm burn individually and ignite further droplets around them, spreading the
combustion.
Furthermore, Gant et al. [41] undertook a comprehensive literature survey on the explosibility of
flammable solvents as spray. They discussed the following safety parameters: lower explosion
limit, minimum ignition energy and minimum ignition temperature. The authors observed that
droplet size influences the explosibility of spray. They explained that when the spray droplets are
very small (with a diameter less than 10 µm), as the flame propagates through the spray, the
droplets vaporise ahead of the flame front and the flame travels through essentially as a vapor-
air mixture. The lower explosion limit of spray in this case is therefore similar to that of the
corresponding vapor-air mixture [26, 42, 43]. However, with regards to larger droplets, there is
insufficient time for the droplets to vaporise completely before becoming engulfed in the
advancing flame front. Each droplet burns with its own diffusion flame, rather than as a
homogeneous gas mixture. With respect to droplets with a median diameter greater than 40 µm,
the heat transfer from one burning droplet to its neighbours becomes the principal mechanism
for flame propagation through the spray [42]. In the cases of the minimum ignition energy of the
spray, droplet size, fuel concentration, air velocity and the presence of any fuel vapor (in addition
to the droplets) are the predominant factors to consider. These factors have been studied in detail
by [44-47]. Decreasing the droplet size, increases the required energy for ignition to prevail.
Moreover, increase in the fuel concentration also decreases the minimum ignition energy until a
point where the fuel is too rich to support combustion. With respect to minimum ignition
temperature, it is considered that the hot surface initially vaporises a sufficient quantity of fuel
to produce flammable concentrations of vapor and, the temperature of the flammable vapor to
be sustained for a period longer than the chemical ignition delay time. The effectiveness of hot
surface ignition, therefore, depends on many factors which includes the physical properties of
the liquid, the concentration of fuel in the air, the droplet size and the shape and extent of the
heated surface. Detailed information on the effect of these factors on the minimum ignition
temperature of sprays could be found in the following articles [41, 48-51]. Similar preventive and
protective measures discussed in the previous section (gas / vapor explosion) could also be used
in this case where as more detailed discussions could be referred to the appropriate articles cited
above.
10
2.4 Dust explosion
The American National Fire Protection Association (NFPA) [52] defined combustible dust as a solid
which has the ability to explode and cause a fire or deflagration hazard when suspended in air or
some other oxidizing medium over a range of concentrations, regardless of particle size and
shape. Dust explosion can be defined as the rapid combustion of a combustible dust cloud,
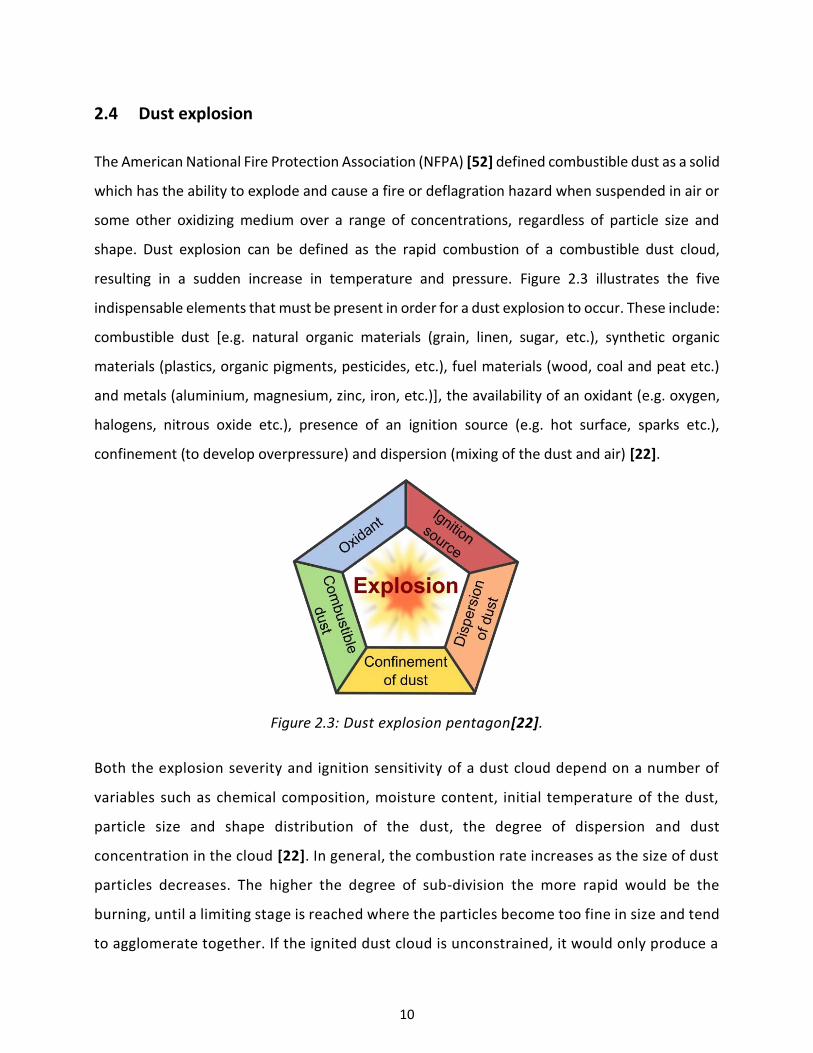
resulting in a sudden increase in temperature and pressure. Figure 2.3 illustrates the five
indispensable elements that must be present in order for a dust explosion to occur. These include:
combustible dust [e.g. natural organic materials (grain, linen, sugar, etc.), synthetic organic
materials (plastics, organic pigments, pesticides, etc.), fuel materials (wood, coal and peat etc.)
and metals (aluminium, magnesium, zinc, iron, etc.)], the availability of an oxidant (e.g. oxygen,
halogens, nitrous oxide etc.), presence of an ignition source (e.g. hot surface, sparks etc.),
confinement (to develop overpressure) and dispersion (mixing of the dust and air) [22].
Figure 2.3: Dust explosion pentagon[22].
Both the explosion severity and ignition sensitivity of a dust cloud depend on a number of
variables such as chemical composition, moisture content, initial temperature of the dust,
particle size and shape distribution of the dust, the degree of dispersion and dust
concentration in the cloud [22]. In general, the combustion rate increases as the size of dust
particles decreases. The higher the degree of sub-division the more rapid would be the
burning, until a limiting stage is reached where the particles become too fine in size and tend
to agglomerate together. If the ignited dust cloud is unconstrained, it would only produce a
11
flash fire [22]. But if the ignited dust cloud is confined, the heat from the burning may result
in rapid development of pressure to flame propagation across the dust cloud. Moreover, the
strength of an explosion also depends on the rate at which energy is being released due to
combustion relative to the degree of confinement and heat losses [53]. Dust explosions can
be subdivided into two types which include: primary and secondary dust explosions [22, 54].
Primary dust explosion is the first explosion. It occurs when a dust is suspended in an
atmosphere with sufficient amount of oxygen for combustion, in the presence of an
appropriate ignition source. If the equipment in which primary explosion occurs is of light
material, as is often the case, the burning dust particles, flames and hot gases produce
pressure capable of rupturing the enclosure. A secondary dust explosion can be initiated due
to the entrainment of dust layers by the blast wave arising from primary explosions. The
primary event might be a dust explosion originating in a process unit, or could be any
disturbance energetic enough to disperse the combustible dust layered on the floor and
other surfaces. This airborne dust in the presence of an ignition source (original source of
ignition or combustion products of the primary explosion) can result in a secondary explosion
[22, 55].
Mechanism of dust explosion
Research into dust explosions has found that volatile matter in dust plays an important role
in dust explosion mechanism. The volatile matter determines the quantity of gaseous
product that the dust releases when heated. Medard [56] explained that when a cloud of
dust burns, each unburned particle is heated by radiation from particles already burning and
undergoes pyrolysis, which creates a small sphere around it, in which the atmosphere is a
mixture of air and combustible gases (H, CO, hydrocarbon, etc.). An experimental study by
Gomez et al. [57] on ignition and combustion of single coal particle concluded that two
chemical reactions compete for the oxygen surrounding the coal particle, in which; one
involving the carbon surface (heterogeneous) and the other involving the volatile gases
(homogenous). The authors further stressed that when the coal particles are ignited
homogeneously, gas phase combustion of the volatile matter burns most of the carbon to
produce carbon dioxide. This finding was confirmed by Di Benedetto et al. [58] of which
12
they explained that dust explosion occurs via two main paths: the heterogeneous and the
homogenous combustion. Heterogeneous combustion is where the oxidation taking place at
the surface of solid particle is responsible for ignition and flame propagation (low volatile
matter content like metals) whereas, in homogeneous combustion, oxidation of volatiles
evolved from dust particles prior to ignition is responsible for ignition and flame propagation
(high volatile matter content like organics and gas).
The latter (pyrolysis with the release of volatile gases) cannot occur with combustible
substances, such as certain metals with very high boiling point, where the particles will
certainly melt but will not release combustible vapor [56]. In addition, in metals, low melting
point material may oxidize in solid phase, but due to an oxide film around each particle, this
does not result in a homogenous metal vapor/air flame. Consequently, the metal dust
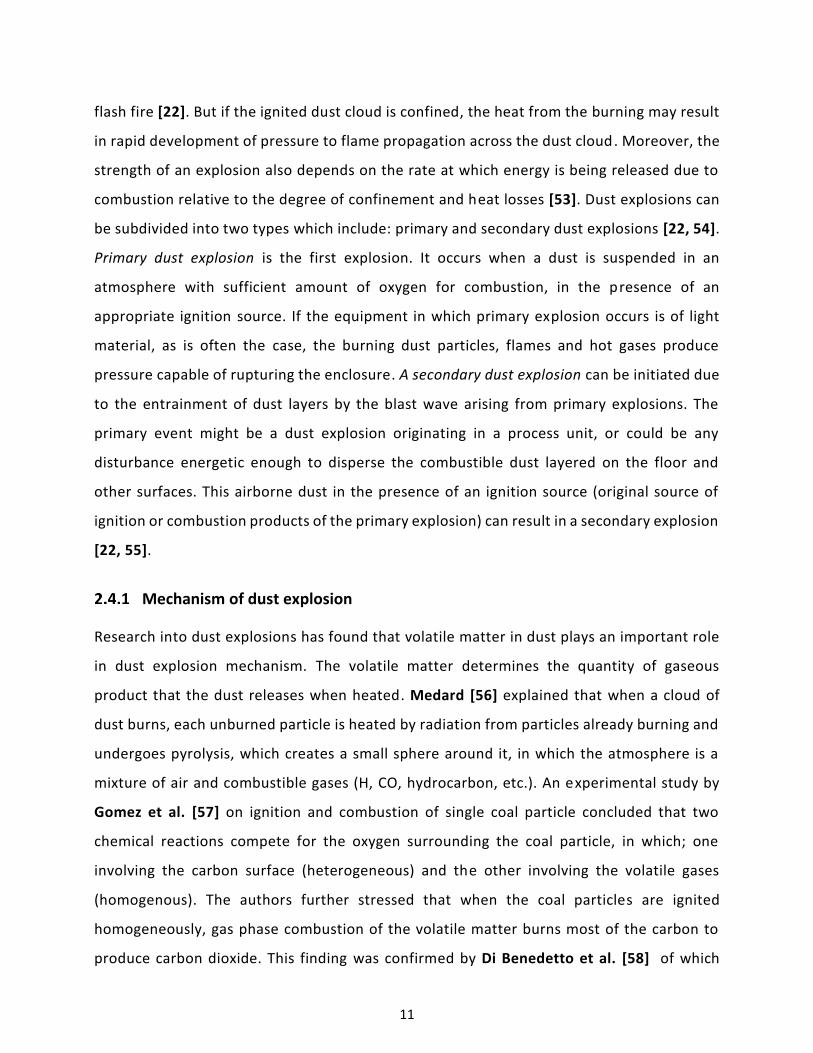
particle may react directly with oxygen diffusing towards the particles itself . Bing Du et al.
[59] studied the homogenous and heterogeneous deflagration mechanism of magnesium
dust and sweet potato powder using Thermo-Gravimetric–Analysis (TGA) as shown in Figure
2.4. The magnesium dust sample was heated with a linear rate of 15 K/min from room
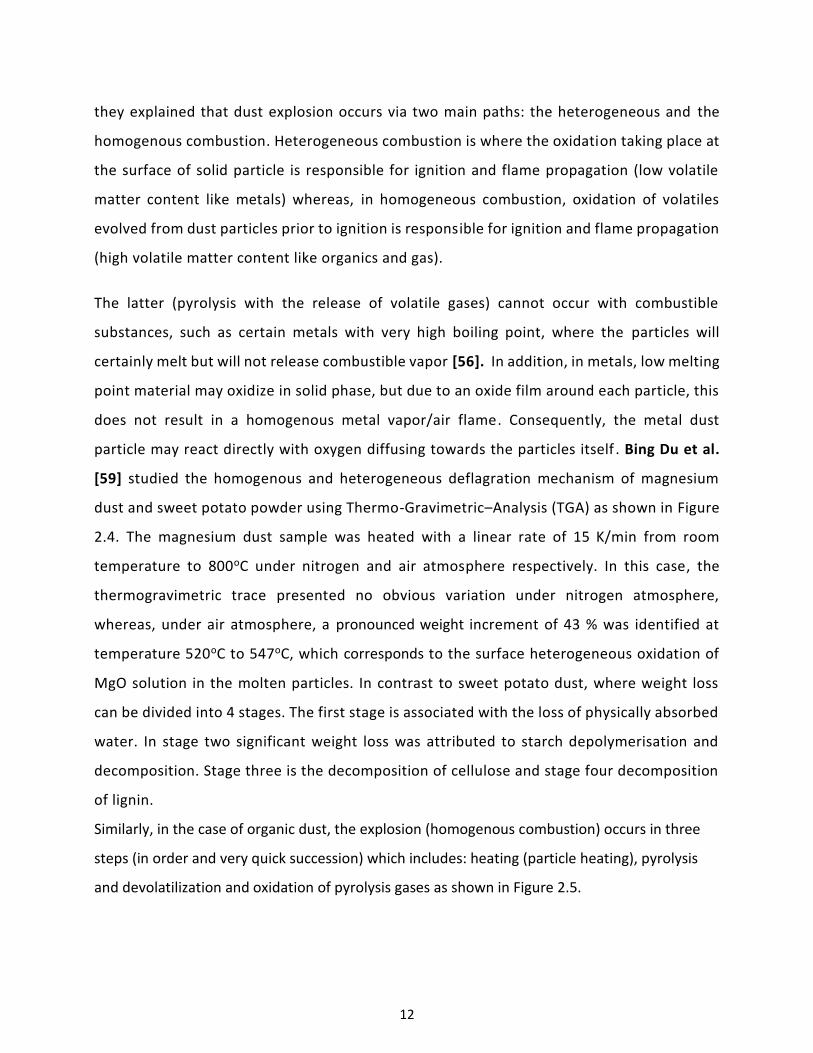
temperature to 800oC under nitrogen and air atmosphere respectively. In this case, the
thermogravimetric trace presented no obvious variation under nitrogen atmosphere,
whereas, under air atmosphere, a pronounced weight increment of 43 % was identified at
temperature 520oC to 547oC, which corresponds to the surface heterogeneous oxidation of
MgO solution in the molten particles. In contrast to sweet potato dust, where weight loss
can be divided into 4 stages. The first stage is associated with the loss of physically absorbed
water. In stage two significant weight loss was attributed to starch depolymerisation and
decomposition. Stage three is the decomposition of cellulose and stage four decomposition
of lignin.
Similarly, in the case of organic dust, the explosion (homogenous combustion) occurs in three
steps (in order and very quick succession) which includes: heating (particle heating), pyrolysis
and devolatilization and oxidation of pyrolysis gases as shown in Figure 2.5.
13
Figure 2.4: Comparison of TG-DTG traces between sweet potato powders and Magnesium dust
in N2 and air atmosphere [59].
During the pre-heating stage, the moisture or water content in the substance is vaporised.
Hence, dust with high moisture content requires high minimum ignition energy or higher
ignition temperature because evaporation and heating of water serve as an inert heat sink
[22, 60]. Eckhoff [22] further added that the water vapor is mixed with the pyrolysis gases in
the preheating zone of the combustion wave and makes the gas mixture less reactive.
Figure 2.5: Schematic representation of the paths occurring during dust explosion [61].

14
The next stage is the pyrolysis and devolatilization step. This step is considered as the first
step in the combustion process. During this stage, the organic particle is further heated,
producing volatile matter or combustible gases. The combustible gases are then mixed with
air in the space between the particle. Dufaud et al.[61] analysed the pyrolysis gas of starch
at various reactor temperatures, but always greater than 550oC. The authors stated that the
main pyrolysis products of starch are carbon monoxide and carbon dioxide and a few percent
of methane, hydrogen, ethylene and propylene as shown in Table 2.1.
Table 2.1:Composition of the gases obtained from starch pyrolysis [61].
Pyrolysis Gas Composition (wt%)
Carbon monoxide 60
Carbon dioxide 30
Methane 3.0
Ethylene 3.0
Propylene 2.0
Hydrogen 1.0
Ethane 0.7
Acetylene 0.3
The final stage is the oxidation of pyrolysis gases, where the gas phase combustion of
premixed volatile-air takes place or in other words, the oxidation of homogeneous gas takes
place. These steps are mutually dependent and are strongly affected by the particle size in
which for small particle size typically below 50 m, the oxidation in homogeneous gas phase
is the step controlling the dust combustion and the heating and pyrolysis steps are very fast
[60]. This finding has been confirmed by [22, 62, 63] but with varied critical particle size
diameter, which typically have different value for each dust. In contrast, the pyrolysis and
devolatilization of the solid particles become rate-controlling at high dust loadings and larger
particle size [61].
Prevention and mitigation of dust explosion
In order to prevent or protect dust explosion, the following measures are to be taken into
consideration. (1) preventive measures: elimination of the dust by cleaning of working
environment, elimination of oxidant by means of suitable inerting procedures, elimination of
15
ignition sources by avoiding free flames, hot surfaces, sparks and also installing appropriate
electrical systems for hazardous areas [22]. (2) protective measures: containment of explosion
that is, the employment of equipment appropriately dimensioned to withstand the maximum
explosion overpressure; separation of equipment that is, installation of different apparatus in
different places; physical division of the operations with higher explosion risk, explosion
suppression by using appropriate extinguishing substances, and venting (which consists of a
surface that can be broken against an unacceptable pressure increase). More information on the
prevention of dust explosion could be referred to [64-66].
2.5 Hybrid mixture explosion
Hybrid mixture explosions are the type of explosion that involves at least two combustible
materials of different state of aggregation, for example mixtures of combustible dust with a
flammable gas, vapor or spray. They are usually found in industrial processes that handle
combustible mixtures of different state. It has long been known that the explosion severity
and ignition sensitivity of hybrid mixtures significantly differ from that of the single
substances [10, 67-73]. Unlike single substance (i.e. dust, gas or solvent) explosions, which
have been widely studied in the past decades (see sections 2.2 to 2.4 for more information
on single substance explosion), data on explosion characteristics of hybrid mixtures are
relatively few. However, these kinds of mixtures are usually encountered at facilities where
gases, solvents and dusts are either handled or processed. As a results, several studies has
been done throughout the world with the aim of preventing the occurrences and mitigating
the consequences.
More than a century ago, Engler [67] observed that mixtures of coal dust and methane at a
concentration lower than the lower explosion limit of methane and minimum explosible
concentration of coal dust could be flammable thus producing unexpected hazardous
conditions. Since Engler´s observation, many studies have been focused on the explosion
behavior of hybrid mixture of dusts and gases.
Cardillo et al. [68] determined an empirical correlation between the content of combustible
gas (propane) in air and the minimum explosible concentration of polypropylene,
polyethylene, and iron. They observed that iron responded to the propane addition in the
16
same systematic way as the organic dusts. The minimum explosible concentration of iron
dust was found to be 200 g/m3. This concentration, then decreases to 100 g/m3 when 1 vol%
of propane which is below the lower explosion limit was added.
Pellmont [69] investigated the influence of combustible gas in air on the minimum explosible
concentration of polyvinyl chloride dust cloud. Pellmont found that the concentration of the
dusts decreased almost linearly with increasing content of propane in the air. For example,
for 20 µm particle size of polyvinyl chloride in air, the minimum explosible concentration was
500 g/m3, whereas with 1 vol% propane in the air, it was 250 g/m3.
Franke [70] reported that adding 3 vol% methane to the coal dust-air mixture can reduce the
minimum ignition energy required to ignite coal dusts clouds by factors of the order of 100.
Bartknecht [71] studied the explosibility of cellulose by adding non-explosible
concentrations of methane, butane and propane. He found that a hybrid mixture constituted
of dust and gas concentration, which is not explosible can turn into an explosible one.
Bartknecht also emphasized that when gas is added to a dust-air mixture, the maximum
explosion pressure was found to have consistent increase, whereas a more dramatic effect
was observed on the hybrid deflagration index (Kst).
Cashdollar [72] studied the explosion behavior of coal dust and methane mixtures in the 20-
liter sphere using 2500 J igniters as an ignition source. Low-volatile Pocahontas coal and high-
volatile Pittsburgh coal were tested. Cashdollar found that both coal dusts became explosible
when methane was added even though the added concentration of methane was below the
lower explosion limit.
Siwek [73] undertook a comprehensive investigation on the deflagration parameters of
organic dust and propane-air mixtures in the 20-liter sphere. He gave the following
conclusion: (1) hybrid mixtures are easier to ignite and explode with greater severity than
the corresponding pure dust-air mixtures, (2) non-explosible concentration of dust-air
mixtures and non-explosible flammable gas-air mixtures can form explosible hybrid dust-gas-
air mixtures and (3) the addition of a flammable gas to a dust-air mixture increases the
maximum explosion pressure to some extent and significantly increases the maximum rate
of pressure rise of the dust mixture, even though the concentration of the flammable gas is
below its lower explosion limit.
17
Pilao et al. [10] also investigated the behavior of the hybrid mixture of methane and cork.
They observed that the presence of methane at concentrations below the lower explosion
limit affects the explosion severity (maximum explosion pressure and maximum rate of
pressure rise) for lower dust concentration (40 g/m3), whereas both parameters are slightly
affected in the case of higher dust concentration (450 g/m3).
Denkevits [11, 12] experimentally evaluated the deflagration severity of graphite-hydrogen
as well as aluminum-hydrogen hybrid mixture with air by measuring the maximum explosion
pressure and maximum rate of pressure rise using the 20-liter explosion sphere. In Denkevits’
tests, hydrogen gas concentration was varied from 4 to 18 vol%; which is below the
stoichiometric hydrogen-air mixture concentration and the fine graphite dust concentrations
were in the range of 25 to 300 g/m3. The author performed the test with two different
ignition energies; 10 kJ chemical igniter and 10 J electric sparks. Denkevits observed that
adding hydrogen to graphite dust made the mixture explosible at any of the tested dust
concentration. He also found that the explosion involving graphite-hydrogen-air mixtures
produced higher overpressure than hydrogen-air mixtures of the same hydrogen
concentration. With respect to hydrogen-aluminium-air mixture, he observed that both the
explosion overpressure and the rate of pressure rise were noticeably higher than those of
pure hydrogen-air mixtures and pure aluminium dust-air mixtures. At lower hybrid fuel
concentrations, the mixture exploded in two steps: first hydrogen explosion followed by a
clearly separated aluminium dust explosion. With increasing concentrations, the two-phase
explosion regime transits to a single-phase regime where the two fuel component exploded
together as a single fuel. In this regime, both the hybrid explosion pressure and rate of
pressure rise were higher than either hydrogen or aluminium alone.
Dufaud et al. [13, 14, 63] studied the influence of pharmaceutical dusts such as: excipients,
vitamins, and their associated solvent (ethanol, di-isopropyl ether, toluene) concentrations
on the maximum explosion pressure and maximum rate of pressure rise. They investigated
three cases: (1) magnesium stearate and ethanol, (2) niacin and di-isopropyl ether (3)
antibiotic and toluene by using the 20-liter sphere with 10 kJ chemical igniters as an ignition
source. They observed that the deflagration index for dust-vapor-air mixtures were
significantly greater than those of the pure fuels (dust-air or vapor-air). They also noted that
18
the evolution of maximum rate of pressure rise and the combustion kinetics were not linear
and discounted the notion that most flammable compound imposes its combustion kinetics.
A significant enhancement of the combustion kinetics of the hybrid mixture (magnesium
stearate-ethanol-air mixture) was observed for concentrations pairs for magnesium stearate
and ethanol ranging from 200 g/m3, 1.0 vol% to 600 g/m3, 2.0 vol%.
Chatrathi [16] also evaluated the explosibility of hybrid mixture of cornstarch and propane
in the 1m3 spherical explosion chamber. The author measured the lower explosion limit of
hybrid mixtures. Chatrathi observed that the presence of propane concentrations below the
lower explosion limits decrease the minimum explosible concentration of cornstarch.
Similarly, the presence of cornstarch decreased the lower explosion limit of propane.
Additionally, Chatrathi further observed that the violence of hybrid mixture is higher than
that of single fuel under turbulent condition.
Sanchirico et al. [17] studied the explosion severity of hybrid mixture explosions with niacin
and acetone in the 20-liter sphere using 10 J electric spark as an ignition source. The authors
found that the dust and gas or vapor mixtures, both at concentrations below the lower
explosion limits can form an explosible mixture when combined.
Amyotte et al. [18, 19] undertook an experimental investigation on the explosion parameters
of polyethylene admixed with propane, ethylene and hexane at the standard test conditions
for dusts (in the 20-liter sphere, ignition source by 10 kJ chemical igniters and ignition delay
time of 60 ms). The authors performed the experiments by adding low gas concentrations
(1-5 vol %) of ethylene, propane and hexane (in vapor state) to polyethylene dust by changing
the dust concentration. They observed a significant increase in the deflagration index by
adding ethylene at concentrations higher than its lower explosion limit with respect to the
dust alone.
Garcia et al. [20] experimentally studied mixtures of niacin dust and methane in the 20-liter
sphere by using a weak electric spark ignition source. They concluded that the addition of
methane can intensely decrease the minimum explosible concentration of niacin.
Khalili et al. [21] undertook an experimental study on the ignition sensitivity of various gas
or vapor-dust mixtures (e.g. starch-methane, starch-hexane) in the 20-liter sphere. Their
results showed that a concentration of gas or vapor as low as 1.0 vol% causes a significant
19
decrease in the minimum explosible concentration of starch and induces changes in the rate
limiting step of the combustion reaction from boundary diffusion to homogeneous gas phase
reaction.
Jiaojun et al. [74, 75] also undertook both experimental and theoretical investigations on
the explosibility of hybrid mixture of ethane-niacin, methane-cornstarch and ethylene-niacin
in air in the 36-liter explosion chamber using 2500 J igniter as an ignition source. They
observed that the deflagration index of flammable gas was found to be significantly higher
than the results from literature due to the high turbulence inside the vessel established by
the ignition delay time. The authors also noted that the lower explosion limits of hybrid
mixtures are lower than that of individual substances. Based on the authors' experimental
results, an empirical model to predict the lower explosion limit of hybrid mixtures was
proposed, which seems to fit well with their own experimental results.
Kosinski et al. [76] undertook experimental investigation on carbon black and propane
hybrid mixtures in the standard 20-liter explosion vessel with 1-kJ chemical igniter as an
ignition source. They observed that it is possible to obtain flame propagation even when the
concentration of gaseous fuel is below the lower explosion limit. They also mentioned that
for the case when the content of volatiles is high, the flame propagation in such a system
resembles combustion of multi-component gas.
Sanchirico et al. [77] experimentally investigated hybrid mixtures of lycopodium-nicotinic
acid and methane complex in the standard 20-liter sphere with 10 J electrical spark as an
ignition source. An exceptional behavior (in terms of unexpected values of the rate of
pressure rise and pressure) was found in the complex mixtures containing lycopodium and
nicotinic acid in equal amounts. This mixture was found to be much more reactive than all
the other dust mixtures, no matter what the dust and methane concentrations were.
Li et al. [78] undertook an experimental study on the explosion characteristics of hydrogen-
methane-air and methane-coal dust-air mixtures in the standard 20-liter vessel using 2.5 kJ
chemical igniter as an ignition source. The authors observed that the presence of hydrogen
in the coal dust significantly increases the maximum explosion pressure and rate of pressure
rise. With an increase of hydrogen content in the mixture, the minimum explosible
concentration of coal dust decreased correspondingly.
20
The main conclusions from the discussion of the above literatures on the explosion parameters
of hybrid mixtures could be summarized non-exhaustively by the following assertions that: (1) the
ignition sensitivity of the dust can be strongly increased by the addition of a few percent of
combustible gases or vapor, even with concentrations lower than the respective lower explosion
limits, (2) hybrid mixtures can be explosible when the concentrations of the dust and the gas or
vapor are both below their respective lower explosion limits, (3) the explosion severities of hybrid
mixtures dust and gas are higher than single dust explosion.
From the analysis of the available literatures, it appears that the effect of hybrid mixture
explosions cannot be predicted by simply overlapping the effects of the single substance
explosion. Also, it can be deduced that the research on hybrid mixture explosions is complicated
because of the large number of complex physical processes that occur during the explosion and
the high number of parameters that should be considered during the explosion. Some parameters
related to the hybrid mixture explosions include: ignition source, the enclosure, the initial
conditions, response or output flammable parameters, combustion dynamics, available energy,
heat transfer and turbulence effects. As already mentioned in Chapter one, the research
literatures discussed above concentrate on only dusts and gases or vapor mixtures which focused
on the maximum explosion pressure, maximum rate of pressure rise, lower explosion limit and
only few data on minimum ignition energy. However, hybrid mixtures of spray-dusts, spray-gases,
vapor-gases are generally not considered. The explosion behavior of complex systems such as
three-component mixtures (dust, gas and vapor) as well as three-phase mixture (dust, gas and
spray) are not considered. Furthermore, the discussed literature used either weak electric spark
or chemical igniters as an ignition source for hybrid mixtures test. However, none of these studies
applied hot surface as an ignition source, even though, hot surfaces are considered as one of the
leading sources of ignition in industrial explosions [22]. Based on the aforementioned reasons,
this present study seeks to fill these research gaps in hybrid mixtures by performing an extensive
theoretical and experimental investigation on the explosion characteristics such as: minimum
ignition temperature, minimum ignition energy, lower explosion limits, limiting oxygen
concentration and explosion severity.
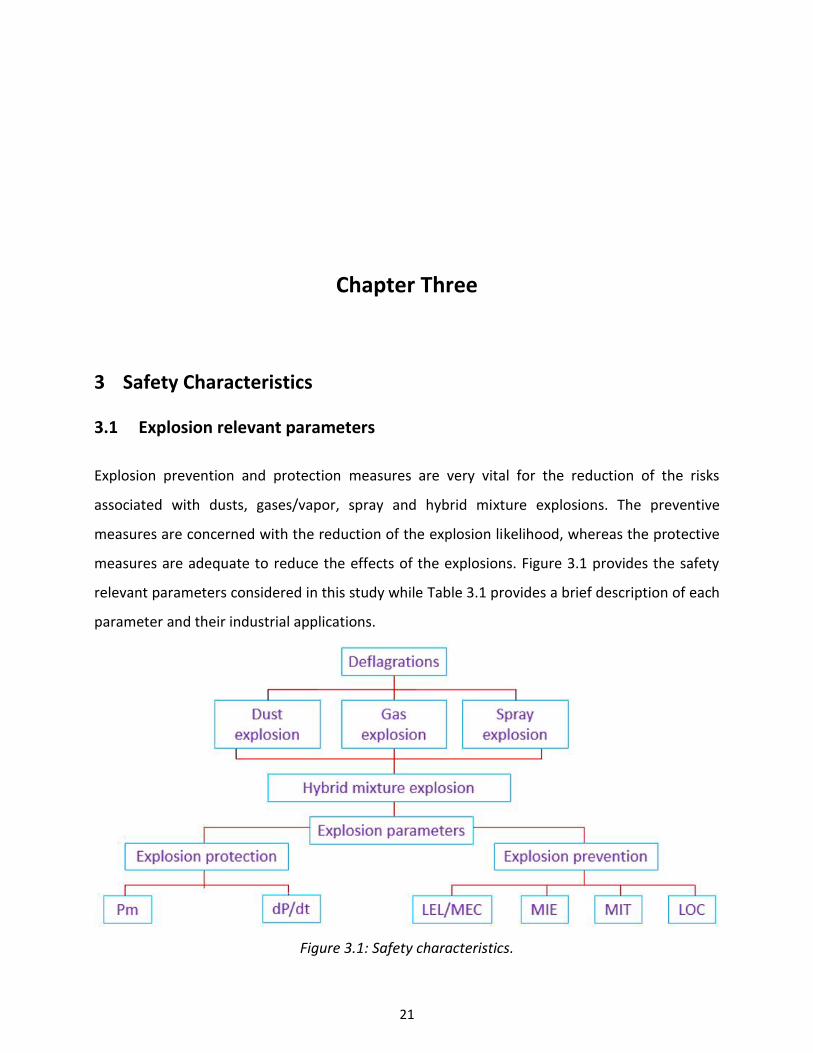
21
Chapter Three
3 Safety Characteristics
3.1 Explosion relevant parameters
Explosion prevention and protection measures are very vital for the reduction of the risks
associated with dusts, gases/vapor, spray and hybrid mixture explosions. The preventive
measures are concerned with the reduction of the explosion likelihood, whereas the protective
measures are adequate to reduce the effects of the explosions. Figure 3.1 provides the safety
relevant parameters considered in this study while Table 3.1 provides a brief description of each
parameter and their industrial applications.
Figure 3.1: Safety characteristics.
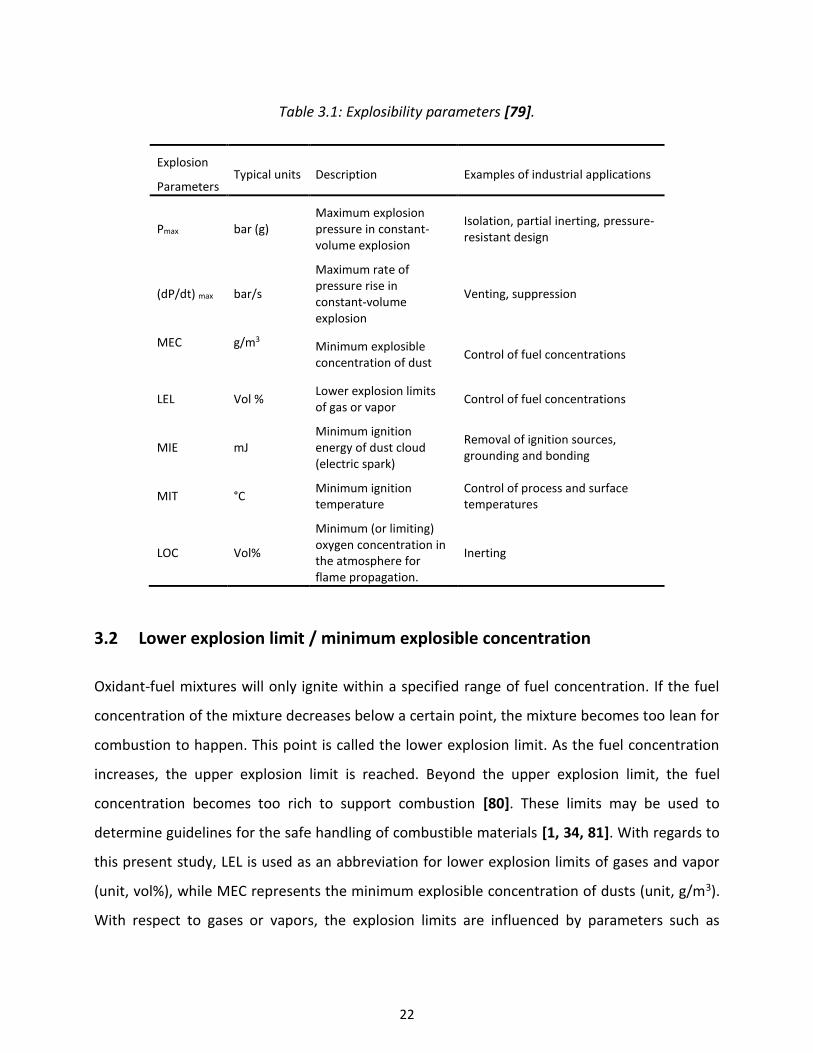
22
Table 3.1: Explosibility parameters [79].
Explosion
Parameters Typical units Description Examples of industrial applications
Pmax bar (g) Maximum explosion pressure in constant-volume explosion
Isolation, partial inerting, pressure-resistant design
(dP/dt) max bar/s
Maximum rate of pressure rise in constant-volume explosion
Venting, suppression
MEC
g/m3
Minimum explosible concentration of dust
Control of fuel concentrations
LEL Vol % Lower explosion limits of gas or vapor
Control of fuel concentrations
MIE mJ Minimum ignition energy of dust cloud (electric spark)
Removal of ignition sources, grounding and bonding
MIT °C Minimum ignition temperature
Control of process and surface temperatures
LOC Vol%
Minimum (or limiting) oxygen concentration in the atmosphere for flame propagation.
Inerting
3.2 Lower explosion limit / minimum explosible concentration
Oxidant-fuel mixtures will only ignite within a specified range of fuel concentration. If the fuel
concentration of the mixture decreases below a certain point, the mixture becomes too lean for
combustion to happen. This point is called the lower explosion limit. As the fuel concentration
increases, the upper explosion limit is reached. Beyond the upper explosion limit, the fuel
concentration becomes too rich to support combustion [80]. These limits may be used to
determine guidelines for the safe handling of combustible materials [1, 34, 81]. With regards to
this present study, LEL is used as an abbreviation for lower explosion limits of gases and vapor
(unit, vol%), while MEC represents the minimum explosible concentration of dusts (unit, g/m3).
With respect to gases or vapors, the explosion limits are influenced by parameters such as
23
pressure, temperature, oxygen concentration, ignition energy etc. Detailed discussion of these
parameters could be referred to [82-89].
In the case of dusts, the MEC is influenced by particle size, temperature, volatile matter, oxygen
content and moisture content as discussed in [90-93]. For example, the MEC values increase with
the increase in particle sizes until a size is reached that cannot be ignited. The increase in particle
size leads to the reduction of the particle specific surface area, and therefore the effective heating
and reaction area of particles decrease. Moreover, the MEC decreases with the increase of initial
temperature. This is because at higher temperature more volatile matters are vaporized
contributing to the gas phase combustion. Encinar et al. [94] undertook an experimental study
on the pyrolysis of maize and observed that an increase in temperature resulted in an increase of
methane concentration produced from the maize. The authors added that the higher the
temperature the higher the maximum gas concentration obtained and the lower the reaction
time needed to reach it. MEC is also increased by the increase of moisture content, as higher
moisture content leads to particle agglomeration, and hence reduces the particle surface area
[95]. Higher moisture content also serves as a heat sink during a combustion process.
Determination of the explosion limits for both gases and dusts are in accordance with EN 1839
[96] and EN 14034-3 [97], respectively.
The lower explosion limit of hybrid mixture is considered as the lowest concentration of fuel
mixtures of different state of aggregate with air, below which self-sustaining flame propagation
is not possible. For instance, a dust with a concentration below the minimum explosible
concentration could form an explosible atmosphere by the admixture of small amount of gas or
vapor which is below the lower explosion limits. These effects of the lower explosion limits of
hybrid mixtures have already been discussed in section 2.5.
Models to estimate the lower explosion limit of dusts, gases and hybrid
mixtures
Experimental determination of the explosion limits is time consuming and expensive as a result
of the cost of equipment and labour. Due to this, different mathematical models to estimate the
lower explosion limits of gases, dusts and hybrid mixtures are presented. Comparisons between
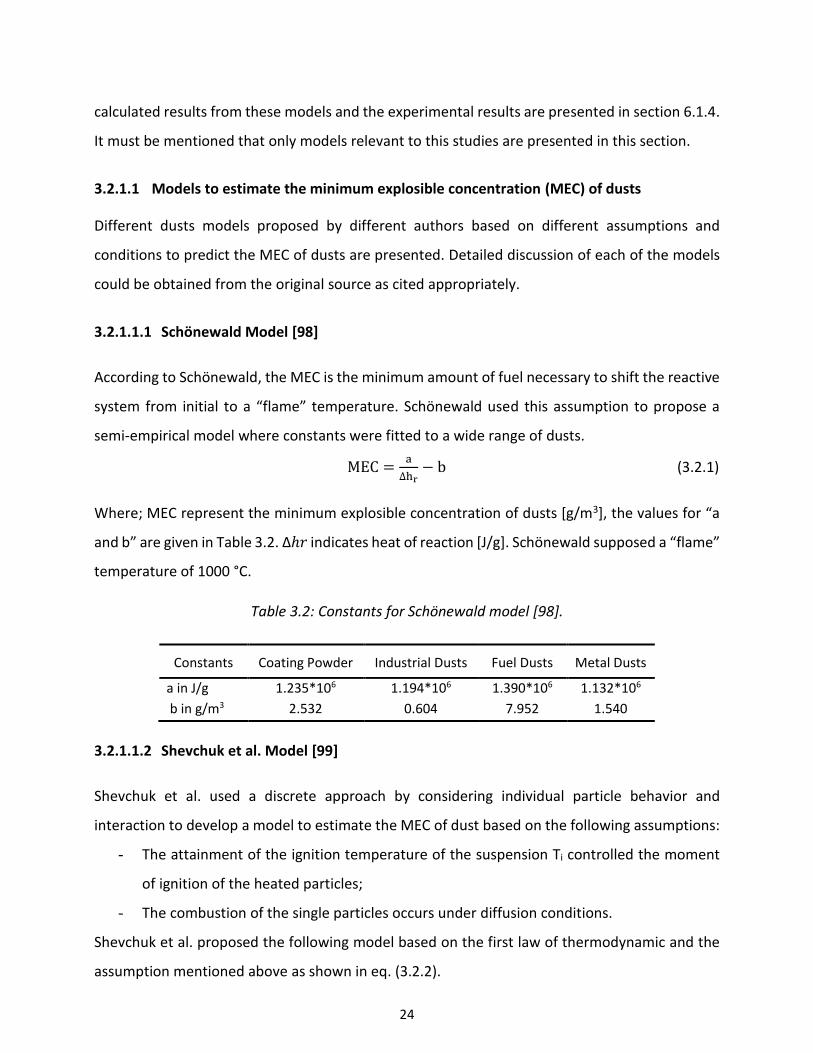
24
calculated results from these models and the experimental results are presented in section 6.1.4.
It must be mentioned that only models relevant to this studies are presented in this section.
3.2.1.1 Models to estimate the minimum explosible concentration (MEC) of dusts
Different dusts models proposed by different authors based on different assumptions and
conditions to predict the MEC of dusts are presented. Detailed discussion of each of the models
could be obtained from the original source as cited appropriately.
3.2.1.1.1 Schönewald Model [98]
According to Schönewald, the MEC is the minimum amount of fuel necessary to shift the reactive
system from initial to a “flame” temperature. Schönewald used this assumption to propose a
semi-empirical model where constants were fitted to a wide range of dusts.
MEC =a
∆hr− b (3.2.1)
Where; MEC represent the minimum explosible concentration of dusts [g/m3], the values for “a
and b” are given in Table 3.2. Δℎ𝑟 indicates heat of reaction [J/g]. Schönewald supposed a “flame”
temperature of 1000 °C.
Table 3.2: Constants for Schönewald model [98].
Constants Coating Powder Industrial Dusts Fuel Dusts Metal Dusts
a in J/g 1.235*106 1.194*106 1.390*106 1.132*106
b in g/m3 2.532 0.604 7.952 1.540
3.2.1.1.2 Shevchuk et al. Model [99]
Shevchuk et al. used a discrete approach by considering individual particle behavior and
interaction to develop a model to estimate the MEC of dust based on the following assumptions:
- The attainment of the ignition temperature of the suspension Ti controlled the moment
of ignition of the heated particles;
- The combustion of the single particles occurs under diffusion conditions.
Shevchuk et al. proposed the following model based on the first law of thermodynamic and the
assumption mentioned above as shown in eq. (3.2.2).
25
MEC =(Ti−T0)cgρg
FQ−cd(Ti−T0) (3.2.2)
Where; MEC represents the minimum explosible concentration of dust [g/m3], T0 is the ambient
temperature [K], Ti indicates the ignition temperature [K], Q indicates the heat of combustion of
the particles [[kJ/kg], cg and cd are heat capacities of gas and dust material, respectively [(kJ/kg
K)], ρg is the gas density [g/cm3], F is the special particle distribution factor resulting from this
particular analysis (in the range of 0.5 to 0.75).
3.2.1.1.3 Buksowicz and Wolanski Model [100]
Buksowicz and Wolanski expressed an empirical correlation between the heat of combustion of
the dust and the minimum explosible concentration. Eq. (3.2.2) presents a summary of the model
proposed by Buksowicz and Wolanski.
MEC = 1.55 × 10⁷𝑄−1.21 (3.2.3)
Where; MEC is the minimum explosible concentration of dust [g/m3], Q is the heat of combustion
[kJ/kg].
3.2.1.2 Models to estimate the lower explosion limit (LEL) of Gases
Mathematical models proposed by different authors based on different assumptions and
conditions to predict the LEL of gases/ vapors are presented in this section. Detailed discussions
of each of the model can be obtained from the original source and cited in the appropriate model.
3.2.1.2.1 Zabetakis model [26]
Zabetakis developed a semi-empirical model to estimate the lower explosion limit of flammable
gases in air based on the stoichiometric concentration of paraffin hydrocarbon.
LEL = 0.55100
1+1.193𝑘 (3.2.4)
k = 4C + H + 4S − 2O − N − 2Cl − 3F − 5Br (3.2.5)
Where; LEL is lower explosion limit of gas [vol%], C, H, S, O, N, Cl, F, Br are number of atoms of
carbon, hydrogen, sulphur, oxygen, nitrogen, chlorine, fluorine and bromine in the molecule.
26
3.2.1.2.2 Shebeko et al. model [101]
Shebeko et al. considered a balance of energy in the chemical reaction of combustion. The heat
losses were neglected and CO2 and H2O were the only combustion products. The equation below
allows LEL to be determined from the data of the minimum number of moles required for a flame
propagation reaction.
LEL =100
1+𝑛𝑎 (3.2.6)
Where; LEL= lower explosion limit of gas [vol%], na is the number of moles of air per mole of fuel
in the mixture at LEL.
na= 𝑔𝑓∆𝐻𝑓 + 𝑔𝐶𝑛𝐶 + 𝑔𝐻𝑛𝐻 + 𝑔𝑂𝑛𝑂 + 𝑔𝑁𝑛𝑁 (3.2.7)
𝑛𝐶 , 𝑛𝐻, 𝑛𝑂 and 𝑛𝑁 are the number of moles of carbon, hydrogen, oxygen and nitrogen in the fuel
respectively.
𝐻𝑎 𝐻𝐶𝑂2, 𝐻𝐻20, 𝐻𝑁2 𝑎𝑛𝑑 𝐻𝑂2are absolute mole enthalpies of air, carbon dioxide, steam,
nitrogen and oxygen respectively while ∆𝐻𝑓 is the mole enthalpy of formation of the fuel.
where the values gf, gC, gH, gO, gN are described by formulas below
𝑔𝑓 = 1/(𝐻𝑎0 − 𝐻𝑎
′ )
𝑔𝐶 = 𝑔𝑓(𝐻𝐶′ − 𝐻𝐶𝑂2
0 + 𝐻𝑂2
0 )
𝑔𝐻 = 0.5𝑔𝑓(𝐻𝐻2
′ − 𝐻𝐻200 + 0.5𝐻𝑂2
0 )
𝑔𝑂 = −0.5𝑔𝑓(𝐻𝑂2
0 − 𝐻𝑂2
′ )
𝑔𝑁 = −0.5𝑔𝑓(𝐻𝑁2
0 − 𝐻𝑁2
′ )
The superscript (’ and 0) correspond to initial temperature and the adiabatic temperature
respectively.
3.2.1.2.3 Spakowski model [102]
Spakowski proposed an empirical model to estimate the LEL of flammable gases based on the
combustion enthalpy as presented in eq. (3.2.8)
LEL = −43.54
∆𝐻𝑐𝑜𝑚𝑏. 100 (3.2.8)

27
Where; LEL represents the lower explosion limit of gas [vol%], ∆Hcomb is the combustion
enthalpy [J/g]
3.2.1.3 Models to estimate the lower explosion limit of hybrid mixtures
Three different mathematical models to estimate the lower explosion limits of hybrid mixtures
proposed by Le Chatelier [103], Bartknecht [104] and Mannan et al. [74] are presented. These
models are based on different assumptions and conditions with detailed discussions found in the
original article.
3.2.1.3.1 Le Chatelier’s model [103]
This model takes into account a homogeneous mixture by considering a constant flame
temperature. It shows a linear relationship between the LEL of gas and the MEC of dust, and the
weighted factor for each fuel in the fractional content in the mixture as represented in eq. (3.2.8).
LELhybrid =100
Ygas
LELgas+
XdustMECdust
(3.2.8)
Where; Ygas and Xdust are the gas and dust concentrations in the fuel mixture, respectively, MECdust
represents the minimum explosible concentration of dust [g/m3], LELgas is the lower explosion
limit of gas [vol%] and LELhybrid indicates lower explosible limit [g/m3]
3.2.1.3.2 Bartknecht model [104]
The empirical formula below was derived from measurements by Bartknecht to estimate the
lower explosion limits of hybrid mixtures. The LEL of hybrid mixtures decreases with an increase
of gas concentration by a second order as represented in eq. (3.2.9).
𝐿𝐸𝐿ℎ𝑦𝑏𝑟𝑖𝑑 = 𝑀𝐸𝐶𝑑𝑢𝑠𝑡(𝑌
𝐿𝐸𝐿𝑔𝑎𝑠− 1)2 (3.2.9)
Where; Y is the concentration of gas in the mixture [vol%], MECdust indicates minimum explosible
concentration of dust [g/m3], LELgas represents lower explosion limit of gas [vol%] and LELhybrid is
the lower explosible limit [g/m3]
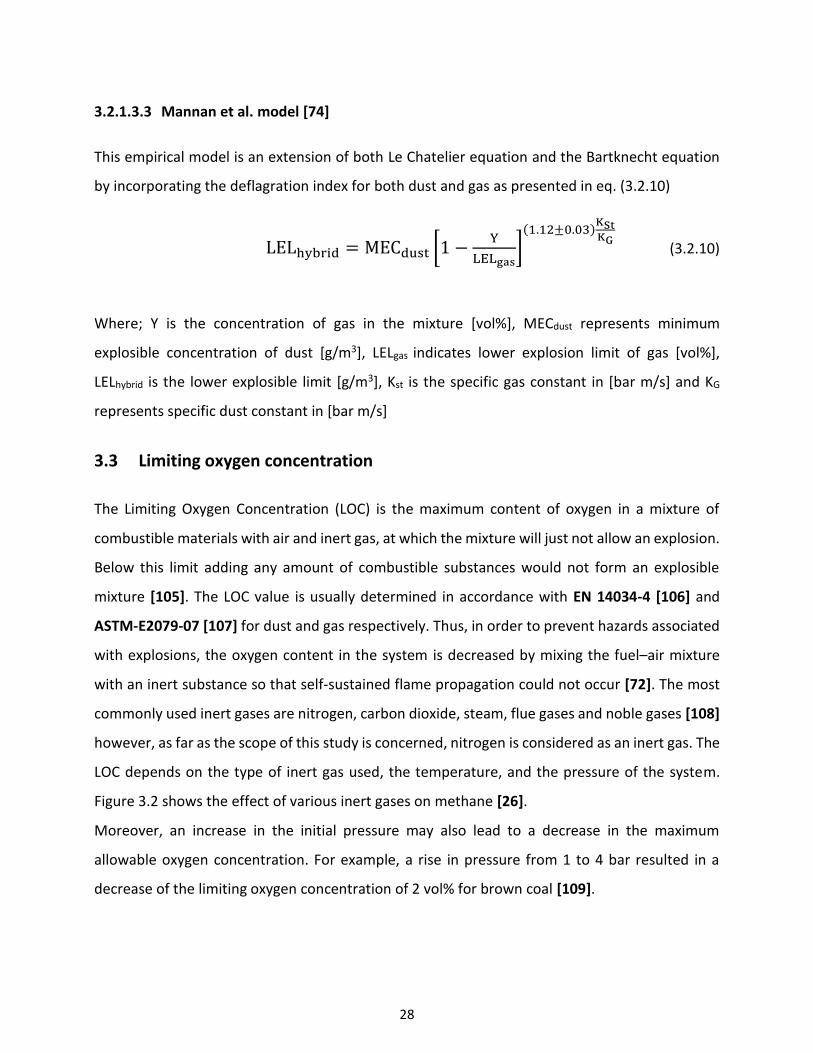
28
3.2.1.3.3 Mannan et al. model [74]
This empirical model is an extension of both Le Chatelier equation and the Bartknecht equation
by incorporating the deflagration index for both dust and gas as presented in eq. (3.2.10)
LELhybrid = MECdust [1 −Y
LELgas]
(1.12±0.03)KStKG
(3.2.10)
Where; Y is the concentration of gas in the mixture [vol%], MECdust represents minimum
explosible concentration of dust [g/m3], LELgas indicates lower explosion limit of gas [vol%],
LELhybrid is the lower explosible limit [g/m3], Kst is the specific gas constant in [bar m/s] and KG
represents specific dust constant in [bar m/s]
3.3 Limiting oxygen concentration
The Limiting Oxygen Concentration (LOC) is the maximum content of oxygen in a mixture of
combustible materials with air and inert gas, at which the mixture will just not allow an explosion.
Below this limit adding any amount of combustible substances would not form an explosible
mixture [105]. The LOC value is usually determined in accordance with EN 14034-4 [106] and
ASTM-E2079-07 [107] for dust and gas respectively. Thus, in order to prevent hazards associated
with explosions, the oxygen content in the system is decreased by mixing the fuel–air mixture
with an inert substance so that self-sustained flame propagation could not occur [72]. The most
commonly used inert gases are nitrogen, carbon dioxide, steam, flue gases and noble gases [108]
however, as far as the scope of this study is concerned, nitrogen is considered as an inert gas. The
LOC depends on the type of inert gas used, the temperature, and the pressure of the system.
Figure 3.2 shows the effect of various inert gases on methane [26].
Moreover, an increase in the initial pressure may also lead to a decrease in the maximum
allowable oxygen concentration. For example, a rise in pressure from 1 to 4 bar resulted in a
decrease of the limiting oxygen concentration of 2 vol% for brown coal [109].
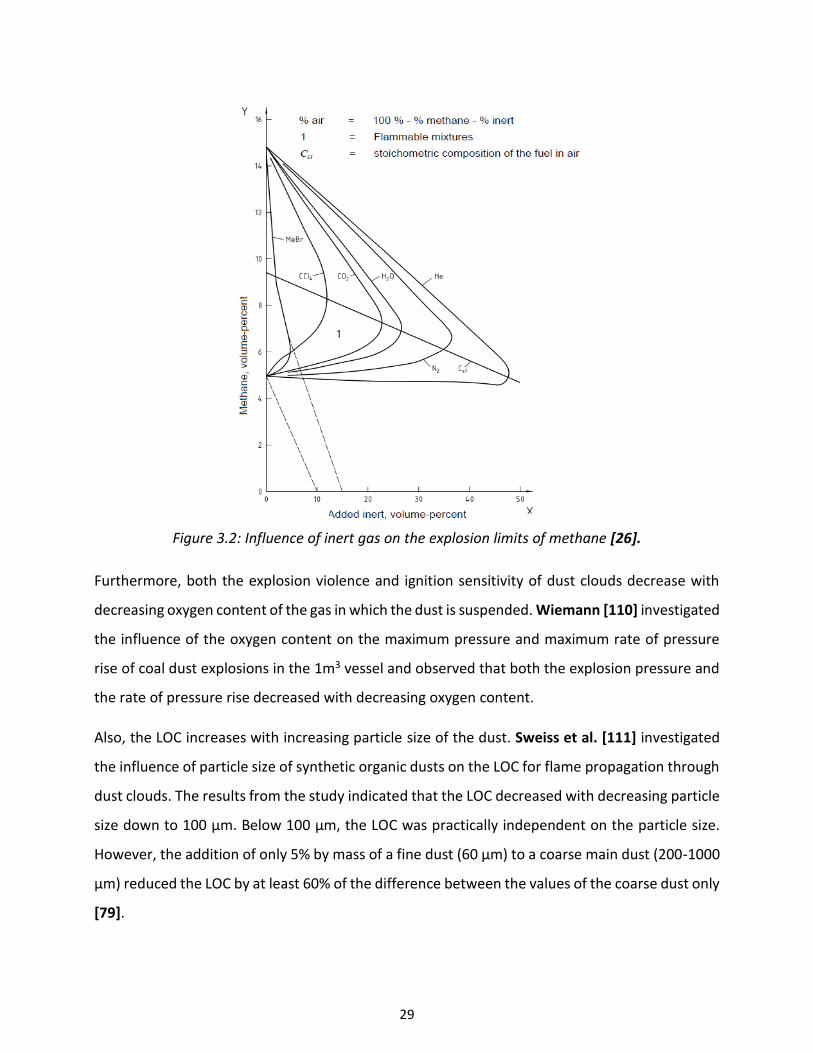
29
Figure 3.2: Influence of inert gas on the explosion limits of methane [26].
Furthermore, both the explosion violence and ignition sensitivity of dust clouds decrease with
decreasing oxygen content of the gas in which the dust is suspended. Wiemann [110] investigated
the influence of the oxygen content on the maximum pressure and maximum rate of pressure
rise of coal dust explosions in the 1m3 vessel and observed that both the explosion pressure and
the rate of pressure rise decreased with decreasing oxygen content.
Also, the LOC increases with increasing particle size of the dust. Sweiss et al. [111] investigated
the influence of particle size of synthetic organic dusts on the LOC for flame propagation through
dust clouds. The results from the study indicated that the LOC decreased with decreasing particle
size down to 100 µm. Below 100 µm, the LOC was practically independent on the particle size.
However, the addition of only 5% by mass of a fine dust (60 µm) to a coarse main dust (200-1000
µm) reduced the LOC by at least 60% of the difference between the values of the coarse dust only
[79].
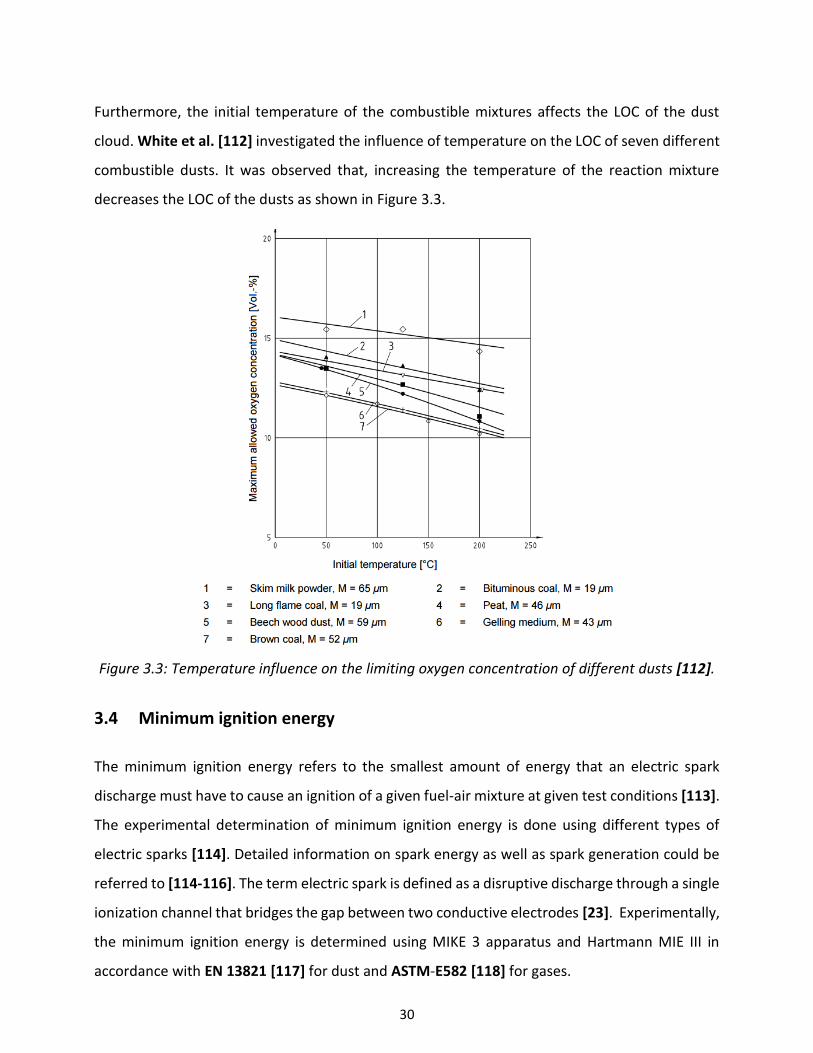
30
Furthermore, the initial temperature of the combustible mixtures affects the LOC of the dust
cloud. White et al. [112] investigated the influence of temperature on the LOC of seven different
combustible dusts. It was observed that, increasing the temperature of the reaction mixture
decreases the LOC of the dusts as shown in Figure 3.3.
Figure 3.3: Temperature influence on the limiting oxygen concentration of different dusts [112].
3.4 Minimum ignition energy
The minimum ignition energy refers to the smallest amount of energy that an electric spark
discharge must have to cause an ignition of a given fuel-air mixture at given test conditions [113].
The experimental determination of minimum ignition energy is done using different types of
electric sparks [114]. Detailed information on spark energy as well as spark generation could be
referred to [114-116]. The term electric spark is defined as a disruptive discharge through a single
ionization channel that bridges the gap between two conductive electrodes [23]. Experimentally,
the minimum ignition energy is determined using MIKE 3 apparatus and Hartmann MIE III in
accordance with EN 13821 [117] for dust and ASTM-E582 [118] for gases.
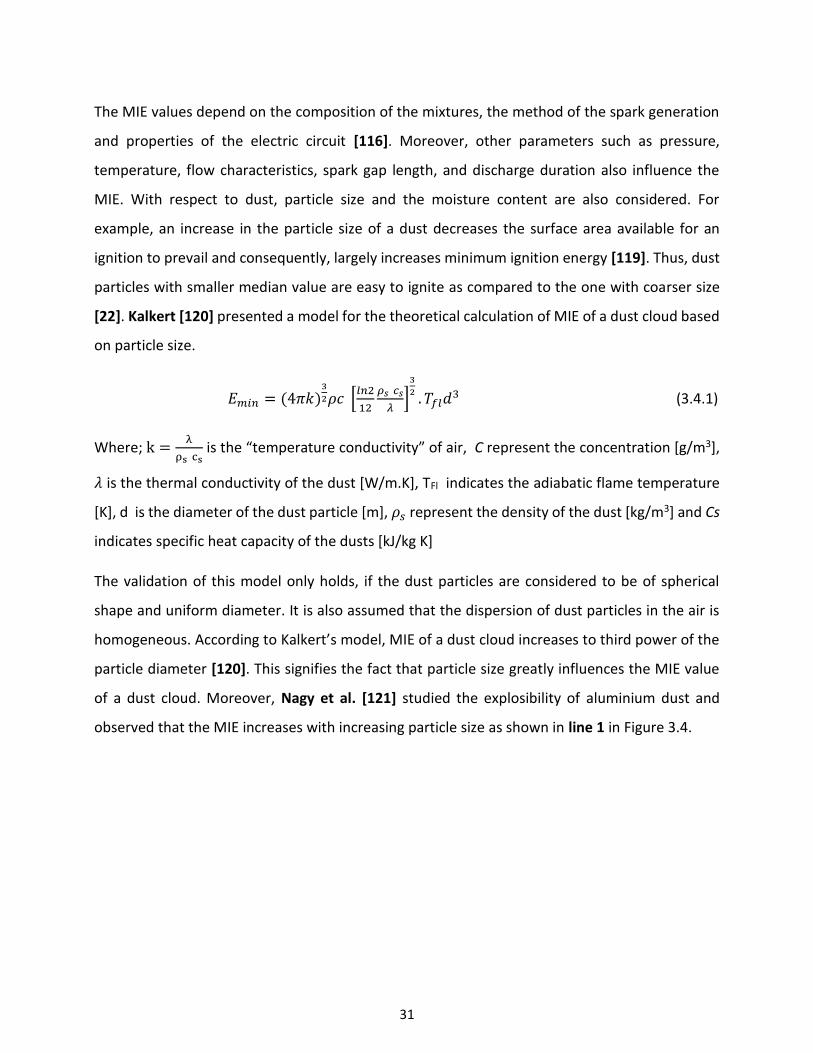
31
The MIE values depend on the composition of the mixtures, the method of the spark generation
and properties of the electric circuit [116]. Moreover, other parameters such as pressure,
temperature, flow characteristics, spark gap length, and discharge duration also influence the
MIE. With respect to dust, particle size and the moisture content are also considered. For
example, an increase in the particle size of a dust decreases the surface area available for an
ignition to prevail and consequently, largely increases minimum ignition energy [119]. Thus, dust
particles with smaller median value are easy to ignite as compared to the one with coarser size
[22]. Kalkert [120] presented a model for the theoretical calculation of MIE of a dust cloud based
on particle size.
𝐸𝑚𝑖𝑛 = (4𝜋𝑘)3
2𝜌𝑐 [𝑙𝑛2
12
𝜌𝑠 𝑐𝑠
𝜆]
3
2. 𝑇𝑓𝑙𝑑
3 (3.4.1)
Where; k =λ
ρs cs is the “temperature conductivity” of air, C represent the concentration [g/m3],
𝜆 is the thermal conductivity of the dust [W/m.K], TFl indicates the adiabatic flame temperature
[K], d is the diameter of the dust particle [m], 𝜌𝑠 represent the density of the dust [kg/m3] and Cs
indicates specific heat capacity of the dusts [kJ/kg K]
The validation of this model only holds, if the dust particles are considered to be of spherical
shape and uniform diameter. It is also assumed that the dispersion of dust particles in the air is
homogeneous. According to Kalkert’s model, MIE of a dust cloud increases to third power of the
particle diameter [120]. This signifies the fact that particle size greatly influences the MIE value
of a dust cloud. Moreover, Nagy et al. [121] studied the explosibility of aluminium dust and
observed that the MIE increases with increasing particle size as shown in line 1 in Figure 3.4.
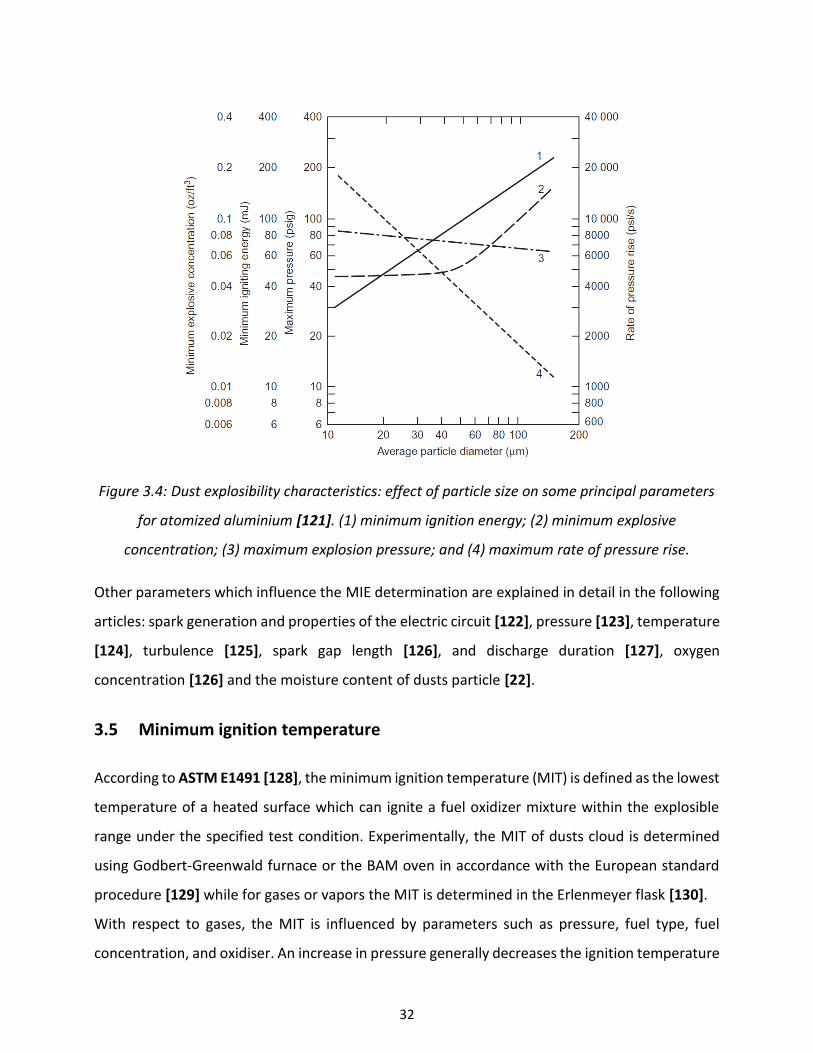
32
Figure 3.4: Dust explosibility characteristics: effect of particle size on some principal parameters
for atomized aluminium [121]. (1) minimum ignition energy; (2) minimum explosive
concentration; (3) maximum explosion pressure; and (4) maximum rate of pressure rise.
Other parameters which influence the MIE determination are explained in detail in the following
articles: spark generation and properties of the electric circuit [122], pressure [123], temperature
[124], turbulence [125], spark gap length [126], and discharge duration [127], oxygen
concentration [126] and the moisture content of dusts particle [22].
3.5 Minimum ignition temperature
According to ASTM E1491 [128], the minimum ignition temperature (MIT) is defined as the lowest
temperature of a heated surface which can ignite a fuel oxidizer mixture within the explosible
range under the specified test condition. Experimentally, the MIT of dusts cloud is determined
using Godbert-Greenwald furnace or the BAM oven in accordance with the European standard
procedure [129] while for gases or vapors the MIT is determined in the Erlenmeyer flask [130].
With respect to gases, the MIT is influenced by parameters such as pressure, fuel type, fuel
concentration, and oxidiser. An increase in pressure generally decreases the ignition temperature
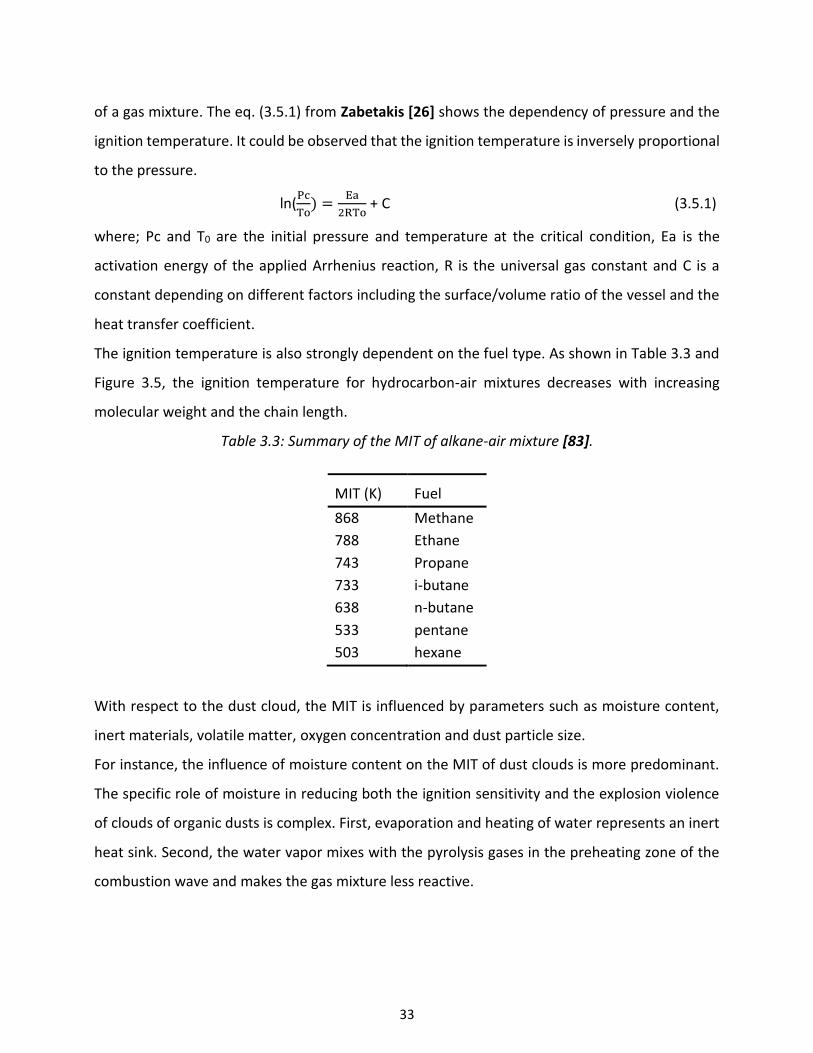
33
of a gas mixture. The eq. (3.5.1) from Zabetakis [26] shows the dependency of pressure and the
ignition temperature. It could be observed that the ignition temperature is inversely proportional
to the pressure.
ln(Pc
To) =
Ea
2RTo + C (3.5.1)
where; Pc and T0 are the initial pressure and temperature at the critical condition, Ea is the
activation energy of the applied Arrhenius reaction, R is the universal gas constant and C is a
constant depending on different factors including the surface/volume ratio of the vessel and the
heat transfer coefficient.
The ignition temperature is also strongly dependent on the fuel type. As shown in Table 3.3 and
Figure 3.5, the ignition temperature for hydrocarbon-air mixtures decreases with increasing
molecular weight and the chain length.
Table 3.3: Summary of the MIT of alkane-air mixture [83].
MIT (K) Fuel
868 Methane
788 Ethane
743 Propane
733 i-butane
638 n-butane
533 pentane
503 hexane
With respect to the dust cloud, the MIT is influenced by parameters such as moisture content,
inert materials, volatile matter, oxygen concentration and dust particle size.
For instance, the influence of moisture content on the MIT of dust clouds is more predominant.
The specific role of moisture in reducing both the ignition sensitivity and the explosion violence
of clouds of organic dusts is complex. First, evaporation and heating of water represents an inert
heat sink. Second, the water vapor mixes with the pyrolysis gases in the preheating zone of the
combustion wave and makes the gas mixture less reactive.
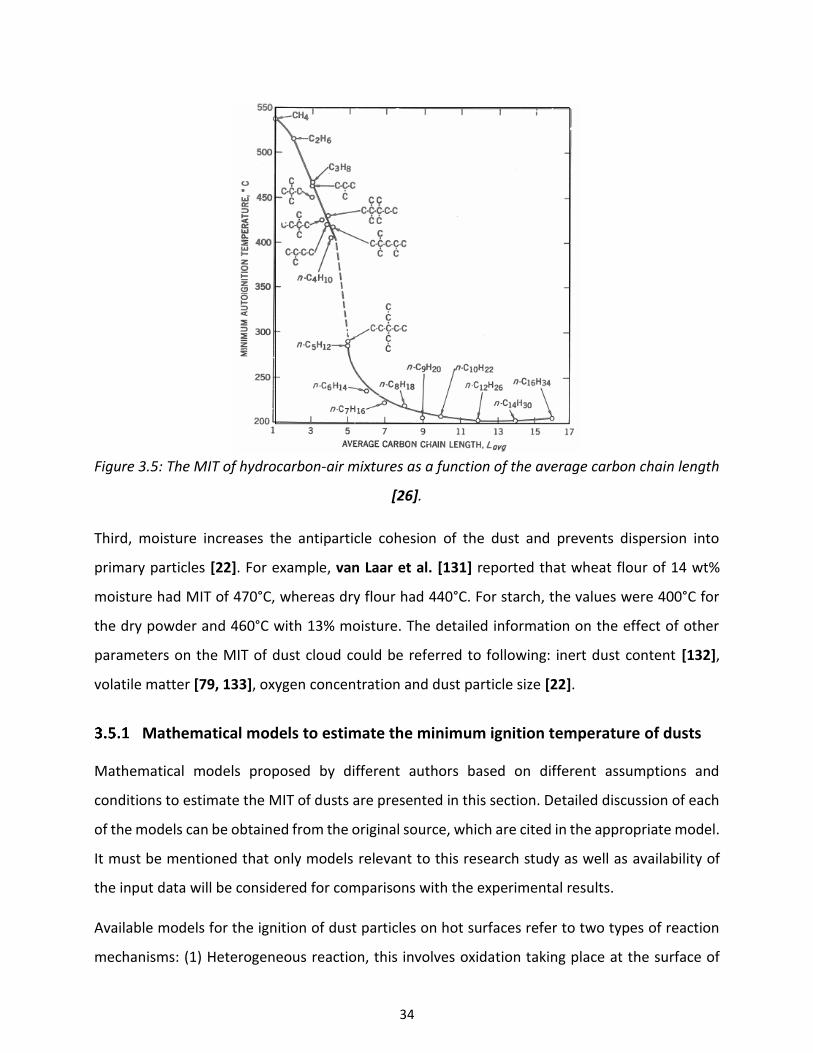
34
Figure 3.5: The MIT of hydrocarbon-air mixtures as a function of the average carbon chain length
[26].
Third, moisture increases the antiparticle cohesion of the dust and prevents dispersion into
primary particles [22]. For example, van Laar et al. [131] reported that wheat flour of 14 wt%
moisture had MIT of 470°C, whereas dry flour had 440°C. For starch, the values were 400°C for
the dry powder and 460°C with 13% moisture. The detailed information on the effect of other
parameters on the MIT of dust cloud could be referred to following: inert dust content [132],
volatile matter [79, 133], oxygen concentration and dust particle size [22].
Mathematical models to estimate the minimum ignition temperature of dusts
Mathematical models proposed by different authors based on different assumptions and
conditions to estimate the MIT of dusts are presented in this section. Detailed discussion of each
of the models can be obtained from the original source, which are cited in the appropriate model.
It must be mentioned that only models relevant to this research study as well as availability of
the input data will be considered for comparisons with the experimental results.
Available models for the ignition of dust particles on hot surfaces refer to two types of reaction
mechanisms: (1) Heterogeneous reaction, this involves oxidation taking place at the surface of
35
solid particles. (2) Homogeneous reaction, it also involves the oxidation of volatiles evolved from
dust particles prior to ignition. Six different models developed by different authors are
summarized below.
3.5.1.1 Cassel and Liebman model [134]
This model is based on single particle to dusts cloud combustion. A heterogeneous oxidation
reaction at the surface of an individual particle leads to its ignition. Conduction and radiation are
the form of heat transfer from the particle surface to the ambient. The final form of this model
presented in eq. (3.5.2) below could be used to predict the MIT of dust.
Ti = TS(1 −RTS
E) (3.5.2)
Where; Ti is the minimum ignition temperature [K], Ts represents the temperature of particle
surface [K] E indicates the activation energy of fuel, [J/mol] and R is the gas constant, [J/mol K].
3.5.1.2 Nagy and Surincik model [135]
According to this model, a heterogeneous oxidation of solid particles is responsible for the ignition
process. Heat conduction and convection both exist as heat transfer processes. This model is
based on the ignition criterion that the rates of heat generation and heat removal are equal. The
MIT of dust can be calculated from eq. (3.5.3) below.
CgFf ∗ exp(−SdE/RTF) = K′Ti2 (3.5.3)
K′ =kcRMot
SdkrHE (3.5.4)
Where; Ti indicates the minimum ignition temperature [K], CgF represents concentration of
oxygen at reaction or furnace temperature [g mol/cm3], Sd is the factor accounting for the specific
surface area of dust [-], TF is the furnace temperature [K] E indicates the activation energy of fuel,
[J/mol] and R is the gas constant, [J/mol K], kc = coefficient of heat transfer [1/s], H is the heat of
reaction [J/mol], kr indicates the reaction rate constant [J/mol s], Mot is the molecular weight of
oxygen [g/mol] and f indicates the frequency factor [cm/s].
36
3.5.1.3 Mitsui and Tanaka model [136]
In this model a spherical cloud of particles is ignited with the assumption that the oxidation and
reaction of dust particle are a surface phenomenon. The ignition temperature of dust could be
calculated from eq. (3.5.5) below.
Ti =ETs−2RTs
2
E−RTs (3.5.5)
Where; Ti is the minimum ignition temperature [K], Ts indicates the temperature of particle
surface [K], E is the activation energy of fuel [J/mol] and R indicates the gas constant [J/mol K].
3.5.1.4 Mittal and Guha model [137]
Mittal and Guha proposed this model to estimate the ignition temperature of organic dusts by
applying the thermal balance criteria for ignition. The final form of this model presented in eq.
(3.5.6) below could be used to predict the MIT of dust.
Ti = TS(1 −RTS
E) (3.5.6)
Where; Ti indicates the minimum ignition temperature [K], Ts is the temperature of particle
surface [K] E represents the activation energy of fuel [J/mol] and R indicates the gas constant
[J/mol K].
3.5.1.5 Krishna and Berlad model [138]
This model considers the ignition of a cloud of solid particles uniformly dispersed in a gas. A
heterogeneous reaction at the surface of the particles controls the ignition process. The particle
is heated by the gas/solid reaction. Heat transfer takes place from the particle to the surrounding
gas. The gas in the cloud loses heat to the ambience at the cloud/vessel boundary. A steady state
condition is assumed when both the gas and the particle temperature gradients become zero.
The ignition temperature of dust cloud could be calculated from eq. (3.5.7) below.
Ti = TS (1 −RTS
E) (3.5.7)
Ts could be obtained from eq. (3.5.8) below
37
1
TS2 exp (
−E
RTS) =
hgR
Sp1/2
EAcρgY0H (3.5.8)
Where; Ti is the minimum ignition temperature [K], Ts represents the temperature of particle
surface [K] E indicates the activation energy of fuel [J/mol] and R is the gas constant [J/mol K].
3.5.1.6 Zhang and Wall model [139]
This model defines a dust ignition of spherical particles dispersed in oxygen. The model made the
assumption that the particles undergo devolatilization and heterogeneous surface oxidations.
Heat convection and radiation are considered as heat loss from the dust cloud to the
surroundings. The ignition temperature of dust could be calculated from eq. (3.5.9) below.
Ti = Tg −Qv+npQp
hsS (3.5.9)
np could be calculated from (3.5.10) below
np = 6CdVf
πDp3 ρd
(3.5.10)
Where; Ti indicates the minimum ignition temperature [K], Ti, g is the minimum ignition
temperature of gas [K], Qv is the total rate of heat generation due to volatile matter, np is the
number of dust particles in the furnace or in an elemental dust cloud, hs is the coefficient for heat
exchange between cloud and surroundings [J/cm2 s K], S is the surface area of dust cloud [cm2],
Qp represents total rate of heat generation per particle [J/s], Dp represents initial diameter of
dust particle [cm], and ρd is the density of dust, [g/cm3].
3.6 Explosion severity: maximum overpressure Pmax and the maximum rate of
pressure rise (dP/dt) max
The Pmax indicates the highest pressure an explosion at the optimum concentration can produce
in a closed vessel while the (dP/dt) max represents the steepest slope of a tangent line at the
pressure-time curve at the optimum concentration. They describe the violence of reaction of fuel-
air mixtures of optimum concentration after ignition in a closed vessel [22]. They are essential for
any type of equipment design for handling combustible materials; in particular, these values are
38
used by manufacturers to validate the design of protection systems (such as spark detection,
explosion venting, explosion suppression and explosion containment). The violence of an
explosion is dependent on the rate of energy release from a chemical reaction. The rate of
pressure rise is defined as the slope of a tangent, laid through the point of inflection in the rising
part of the pressure/time curve as shown in Figure 5.7 in section 5.23. The term (dP/dt) max
depends on the volume of the vessel in which the explosion occurs. In order to take into account,
the influence of the volume on the course of explosion, the deflagration index, Kst for dust and KG
for gas, Cubic relationship is taken into consideration, as:
Kst or KG =(dP
dt)max * 𝑉
1
3 (3.6.1)
Determinations of the explosion severities are done in the standard 20-liter sphere in accordance
with the standard similar to the European standard EN 14034-1 [140] for Pmax and (dp/dt) max and
EN 14034-2[141] for dust and gases/vapor respectively. The determination of both Pmax and
(dp/dt) max are generally influenced by initial temperature, oxygen concentration, turbulence and
volatile content. For dusts testing the particle size and moisture content are additionally
considered. For example, the explosion severity decreases with an increase in moisture content.
As the dust becomes dry, it becomes more easily ignitable and burns with greater intensity. The
dust having greater moisture content is more difficult to ignite and will burn more slowly due to
the moisture within the dust absorbing the heat during evaporation. Eckhoff [22] investigated the
effect of moisture content on the (dP/dt) max of starch at different turbulence levels and concluded
that the (dP/dt) max decreases sharply as the moisture content increases. More information on
the influence of other parameters on the explosion severities could be referred to: initial
temperature [142], oxygen concentration [110, 143], turbulence [143], volatile content [144] and
particle size [121].
39
Chapter Four
4 Material properties and preliminary analysis
4.1 Dusts
In order to obtain a general understanding of dust and hybrid mixture explosion, a wide variety
of materials with different properties and reaction mechanisms were chosen. For the dusts,
materials as diverse as food substances, metals, plastics, natural products, fuels and artificial
materials were chosen. The raw dust samples were received in different forms and conditions.
For this reason, both physical and chemical analyses were performed on each dust sample. The
results of these analyses are explained below.
Moisture content
The moisture content is the quantity of water contained in a dust sample. It can be determined
from the weight loss registered during drying. It is usually expressed as a mass fraction (% mass
of water in the material). The moisture content was determined using a thermogravimetric
moisture analyser according to ISO 5071:1996 [145]. The results are presented in in Table 4.1.
The moisture content of all dust samples was below 2 wt%.
Volatile Content
In the context of dust explosions, materials with a high of volatile content ignite easily and
produce explosions of high severity. The reason for this phenomenon can be explained as dusts
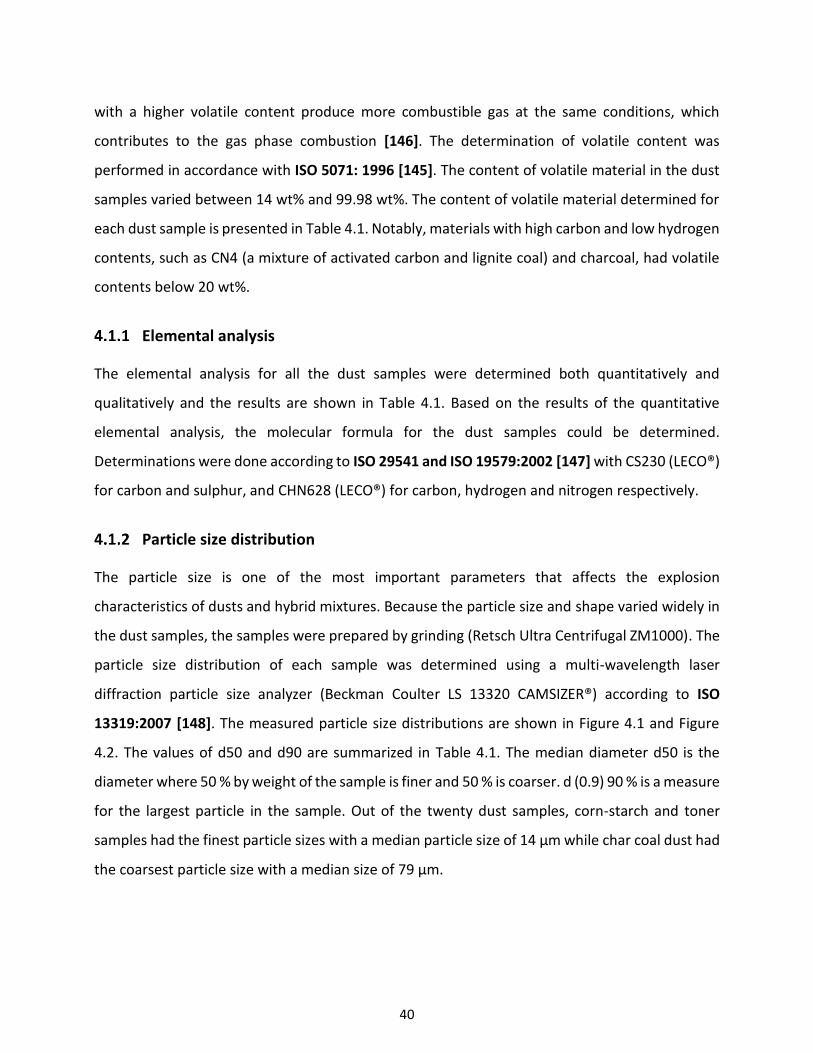
40
with a higher volatile content produce more combustible gas at the same conditions, which
contributes to the gas phase combustion [146]. The determination of volatile content was
performed in accordance with ISO 5071: 1996 [145]. The content of volatile material in the dust
samples varied between 14 wt% and 99.98 wt%. The content of volatile material determined for
each dust sample is presented in Table 4.1. Notably, materials with high carbon and low hydrogen
contents, such as CN4 (a mixture of activated carbon and lignite coal) and charcoal, had volatile
contents below 20 wt%.
Elemental analysis
The elemental analysis for all the dust samples were determined both quantitatively and
qualitatively and the results are shown in Table 4.1. Based on the results of the quantitative
elemental analysis, the molecular formula for the dust samples could be determined.
Determinations were done according to ISO 29541 and ISO 19579:2002 [147] with CS230 (LECO®)
for carbon and sulphur, and CHN628 (LECO®) for carbon, hydrogen and nitrogen respectively.
Particle size distribution
The particle size is one of the most important parameters that affects the explosion
characteristics of dusts and hybrid mixtures. Because the particle size and shape varied widely in
the dust samples, the samples were prepared by grinding (Retsch Ultra Centrifugal ZM1000). The
particle size distribution of each sample was determined using a multi-wavelength laser
diffraction particle size analyzer (Beckman Coulter LS 13320 CAMSIZER®) according to ISO
13319:2007 [148]. The measured particle size distributions are shown in Figure 4.1 and Figure
4.2. The values of d50 and d90 are summarized in Table 4.1. The median diameter d50 is the
diameter where 50 % by weight of the sample is finer and 50 % is coarser. d (0.9) 90 % is a measure
for the largest particle in the sample. Out of the twenty dust samples, corn-starch and toner
samples had the finest particle sizes with a median particle size of 14 μm while char coal dust had
the coarsest particle size with a median size of 79 μm.
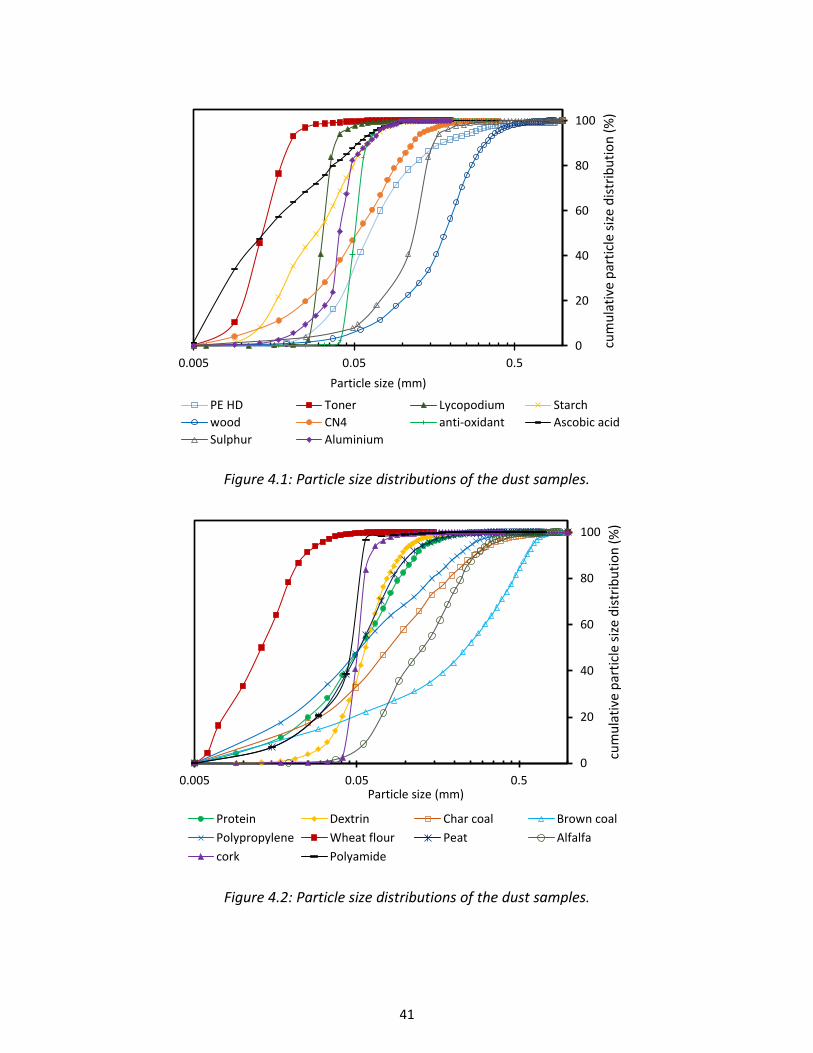
41
Figure 4.1: Particle size distributions of the dust samples.
Figure 4.2: Particle size distributions of the dust samples.
0
20
40
60
80
100
0.005 0.05 0.5
cum
ula
tive
par
ticl
e si
ze d
istr
ibu
tio
n (
%)
Particle size (mm)
PE HD Toner Lycopodium Starch
wood CN4 anti-oxidant Ascobic acid
Sulphur Aluminium
0
20
40
60
80
100
0.005 0.05 0.5
cum
ula
tive
par
ticl
e si
ze d
istr
ibu
tio
n (
%)
Particle size (mm)
Protein Dextrin Char coal Brown coal
Polypropylene Wheat flour Peat Alfalfa
cork Polyamide
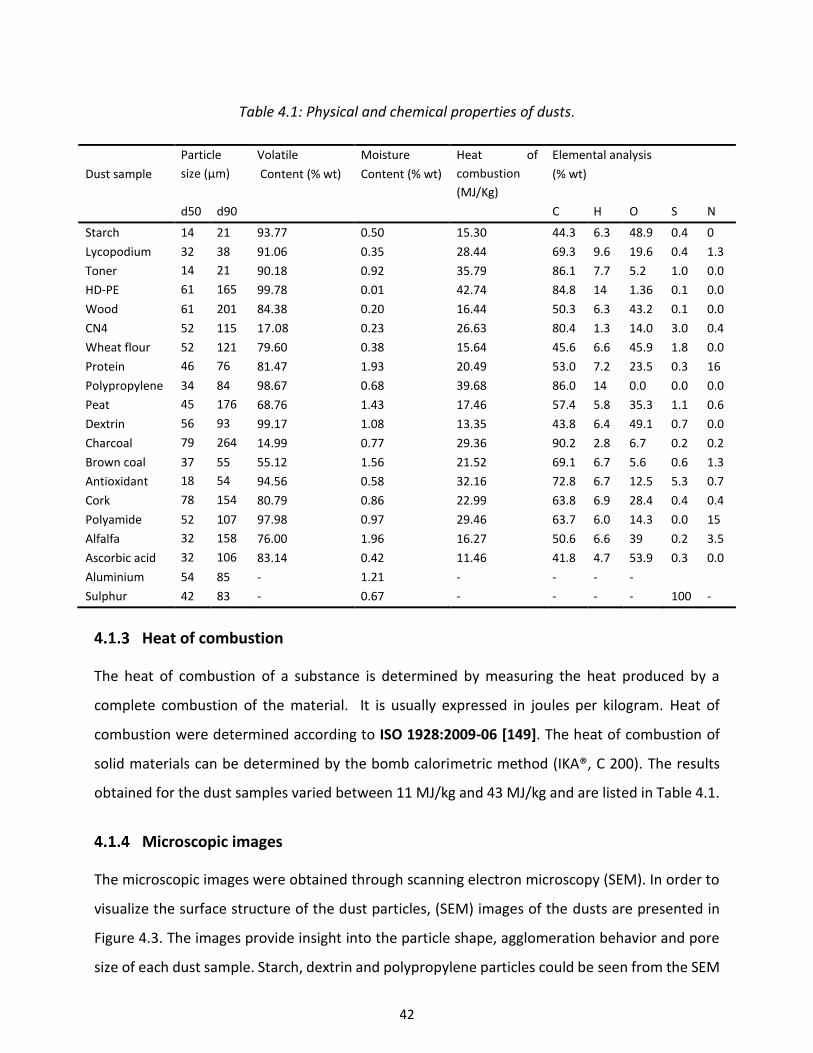
42
Table 4.1: Physical and chemical properties of dusts.
Dust sample
Particle
size (µm)
Volatile
Content (% wt)
Moisture
Content (% wt)
Heat of
combustion
(MJ/Kg)
Elemental analysis
(% wt)
d50 d90 C H O S N
Starch 14 21 93.77 0.50 15.30 44.3 6.3 48.9 0.4 0
Lycopodium 32 38 91.06 0.35 28.44 69.3 9.6 19.6 0.4 1.3
Toner 14 21 90.18 0.92 35.79 86.1 7.7 5.2 1.0 0.0
HD-PE 61 165 99.78 0.01 42.74 84.8 14 1.36 0.1 0.0
Wood 61 201 84.38 0.20 16.44 50.3 6.3 43.2 0.1 0.0
CN4 52 115 17.08 0.23 26.63 80.4 1.3 14.0 3.0 0.4
Wheat flour 52 121 79.60 0.38 15.64 45.6 6.6 45.9 1.8 0.0
Protein 46 76 81.47 1.93 20.49 53.0 7.2 23.5 0.3 16
Polypropylene 34 84 98.67 0.68 39.68 86.0 14 0.0 0.0 0.0
Peat 45 176 68.76 1.43 17.46 57.4 5.8 35.3 1.1 0.6
Dextrin 56 93 99.17 1.08 13.35 43.8 6.4 49.1 0.7 0.0
Charcoal 79 264 14.99 0.77 29.36 90.2 2.8 6.7 0.2 0.2
Brown coal 37 55 55.12 1.56 21.52 69.1 6.7 5.6 0.6 1.3
Antioxidant 18 54 94.56 0.58 32.16 72.8 6.7 12.5 5.3 0.7
Cork 78 154 80.79 0.86 22.99 63.8 6.9 28.4 0.4 0.4
Polyamide 52 107 97.98 0.97 29.46 63.7 6.0 14.3 0.0 15
Alfalfa 32 158 76.00 1.96 16.27 50.6 6.6 39 0.2 3.5
Ascorbic acid 32 106 83.14 0.42 11.46 41.8 4.7 53.9 0.3 0.0
Aluminium 54 85 - 1.21 - - - -
Sulphur 42 83 - 0.67 - - - - 100 -
Heat of combustion
The heat of combustion of a substance is determined by measuring the heat produced by a
complete combustion of the material. It is usually expressed in joules per kilogram. Heat of
combustion were determined according to ISO 1928:2009-06 [149]. The heat of combustion of
solid materials can be determined by the bomb calorimetric method (IKA®, C 200). The results
obtained for the dust samples varied between 11 MJ/kg and 43 MJ/kg and are listed in Table 4.1.
Microscopic images
The microscopic images were obtained through scanning electron microscopy (SEM). In order to
visualize the surface structure of the dust particles, (SEM) images of the dusts are presented in
Figure 4.3. The images provide insight into the particle shape, agglomeration behavior and pore
size of each dust sample. Starch, dextrin and polypropylene particles could be seen from the SEM
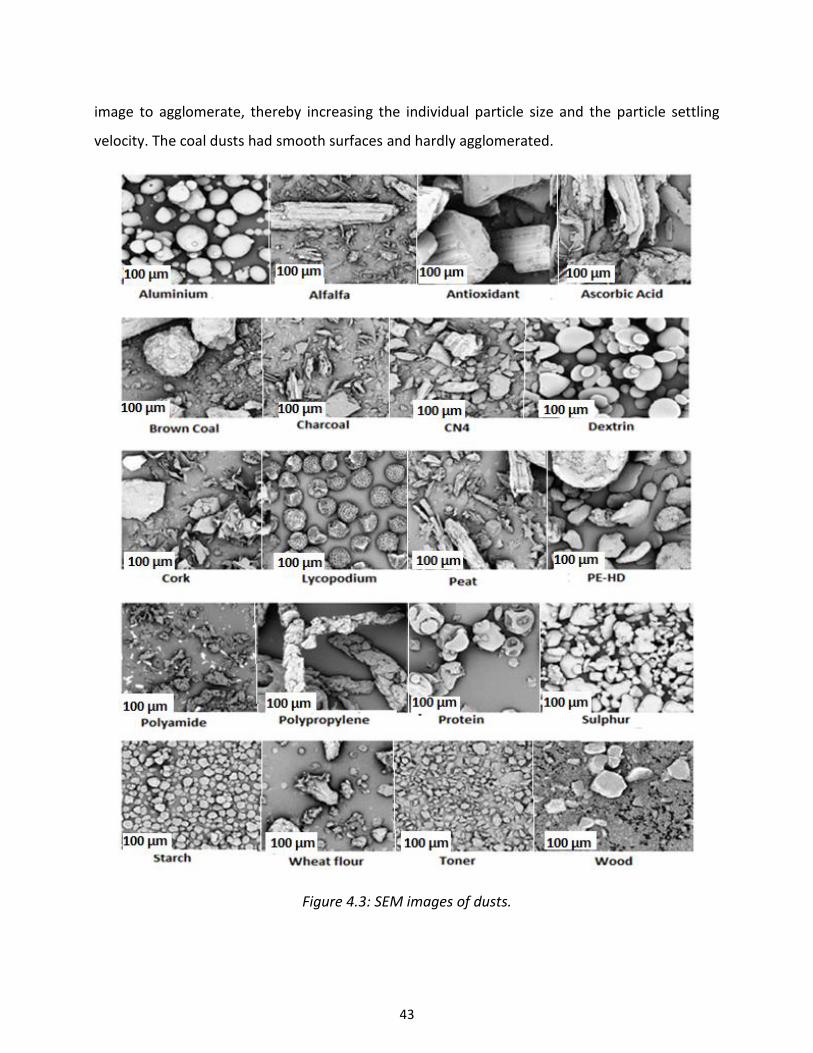
43
image to agglomerate, thereby increasing the individual particle size and the particle settling
velocity. The coal dusts had smooth surfaces and hardly agglomerated.
Figure 4.3: SEM images of dusts.
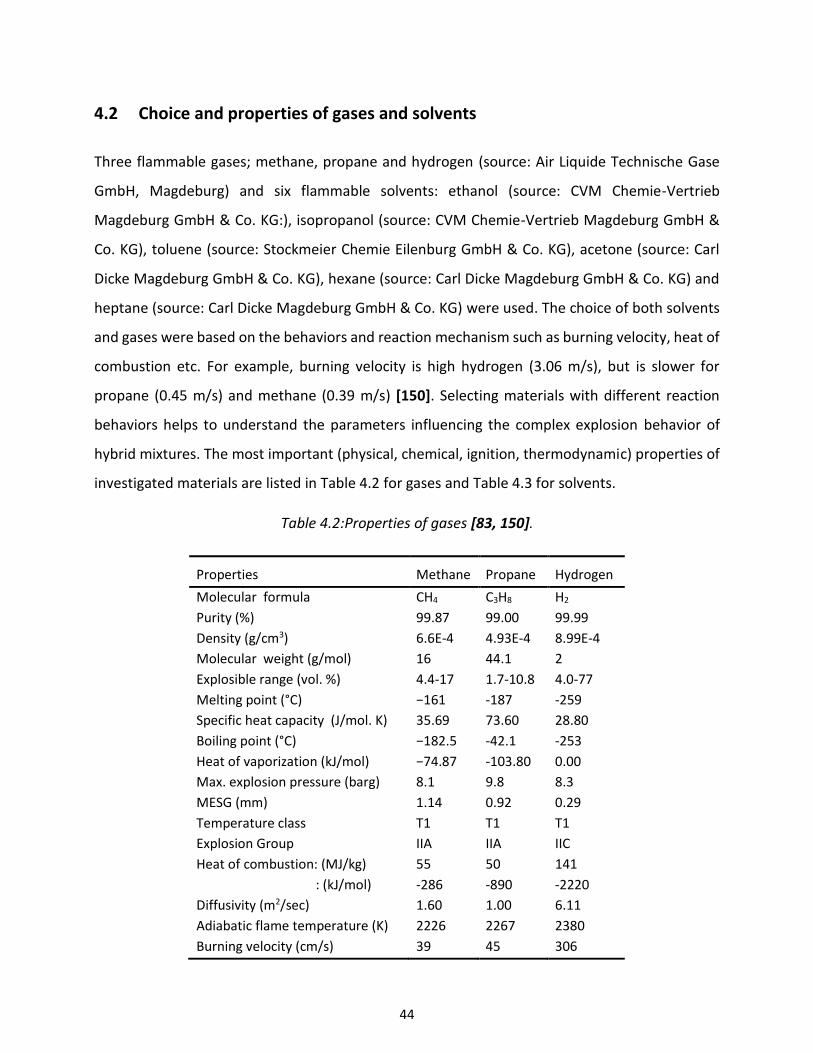
44
4.2 Choice and properties of gases and solvents
Three flammable gases; methane, propane and hydrogen (source: Air Liquide Technische Gase
GmbH, Magdeburg) and six flammable solvents: ethanol (source: CVM Chemie-Vertrieb
Magdeburg GmbH & Co. KG:), isopropanol (source: CVM Chemie-Vertrieb Magdeburg GmbH &
Co. KG), toluene (source: Stockmeier Chemie Eilenburg GmbH & Co. KG), acetone (source: Carl
Dicke Magdeburg GmbH & Co. KG), hexane (source: Carl Dicke Magdeburg GmbH & Co. KG) and
heptane (source: Carl Dicke Magdeburg GmbH & Co. KG) were used. The choice of both solvents
and gases were based on the behaviors and reaction mechanism such as burning velocity, heat of
combustion etc. For example, burning velocity is high hydrogen (3.06 m/s), but is slower for
propane (0.45 m/s) and methane (0.39 m/s) [150]. Selecting materials with different reaction
behaviors helps to understand the parameters influencing the complex explosion behavior of
hybrid mixtures. The most important (physical, chemical, ignition, thermodynamic) properties of
investigated materials are listed in Table 4.2 for gases and Table 4.3 for solvents.
Table 4.2:Properties of gases [83, 150].
Properties Methane Propane Hydrogen
Molecular formula CH4 C3H8 H2
Purity (%) 99.87 99.00 99.99
Density (g/cm3) 6.6E-4 4.93E-4 8.99E-4
Molecular weight (g/mol) 16 44.1 2
Explosible range (vol. %) 4.4-17 1.7-10.8 4.0-77
Melting point (°C) −161 -187 -259
Specific heat capacity (J/mol. K) 35.69 73.60 28.80
Boiling point (°C) −182.5 -42.1 -253
Heat of vaporization (kJ/mol) −74.87 -103.80 0.00
Max. explosion pressure (barg) 8.1 9.8 8.3
MESG (mm) 1.14 0.92 0.29
Temperature class T1 T1 T1
Explosion Group IIA IIA IIC
Heat of combustion: (MJ/kg)
: (kJ/mol)
55
-286
50
-890
141
-2220
Diffusivity (m2/sec) 1.60 1.00 6.11
Adiabatic flame temperature (K) 2226 2267 2380
Burning velocity (cm/s) 39 45 306
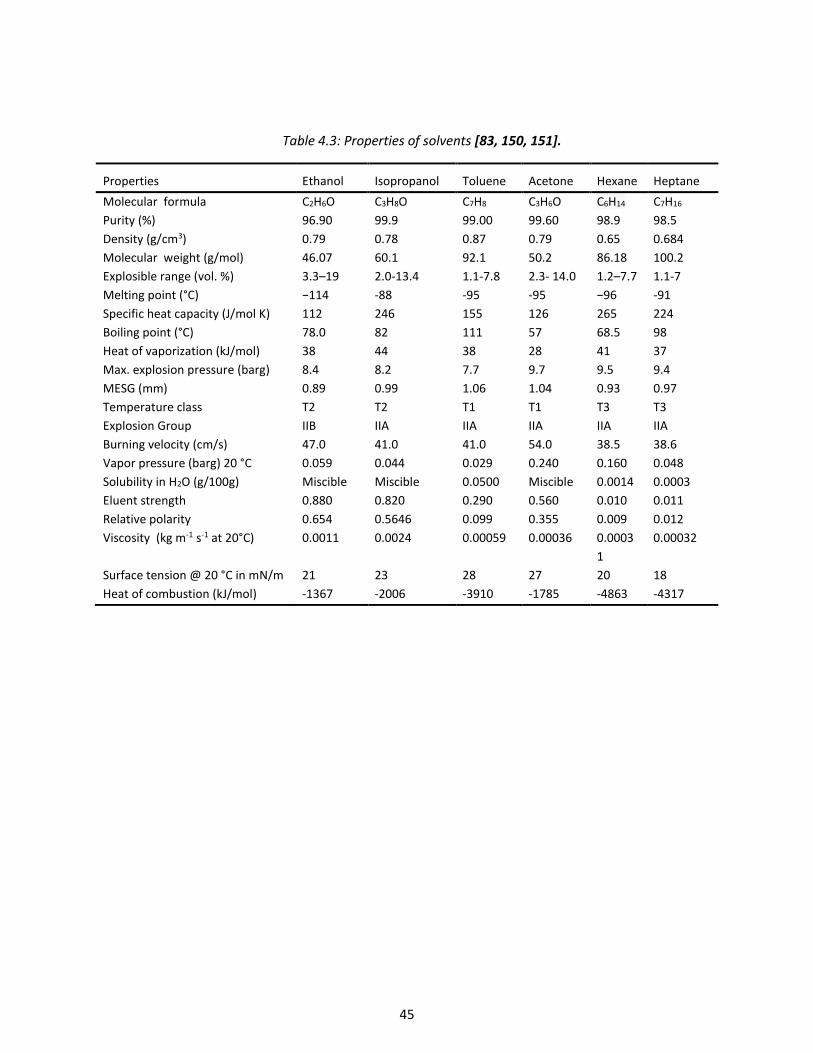
45
Table 4.3: Properties of solvents [83, 150, 151].
Properties Ethanol Isopropanol Toluene Acetone Hexane Heptane
Molecular formula C2H6O C3H8O C7H8 C3H6O C6H14 C7H16
Purity (%) 96.90 99.9 99.00 99.60 98.9 98.5
Density (g/cm3) 0.79 0.78 0.87 0.79 0.65 0.684
Molecular weight (g/mol) 46.07 60.1 92.1 50.2 86.18 100.2
Explosible range (vol. %) 3.3–19 2.0-13.4 1.1-7.8 2.3- 14.0 1.2–7.7 1.1-7
Melting point (°C) −114 -88 -95 -95 −96 -91
Specific heat capacity (J/mol K) 112 246 155 126 265 224
Boiling point (°C) 78.0 82 111 57 68.5 98
Heat of vaporization (kJ/mol) 38 44 38 28 41 37
Max. explosion pressure (barg) 8.4 8.2 7.7 9.7 9.5 9.4
MESG (mm) 0.89 0.99 1.06 1.04 0.93 0.97
Temperature class T2 T2 T1 T1 T3 T3
Explosion Group IIB IIA IIA IIA IIA IIA
Burning velocity (cm/s) 47.0 41.0 41.0 54.0 38.5 38.6
Vapor pressure (barg) 20 °C 0.059 0.044 0.029 0.240 0.160 0.048
Solubility in H2O (g/100g) Miscible Miscible 0.0500 Miscible 0.0014 0.0003
Eluent strength 0.880 0.820 0.290 0.560 0.010 0.011
Relative polarity 0.654 0.5646 0.099 0.355 0.009 0.012
Viscosity (kg m-1 s-1 at 20°C) 0.0011 0.0024 0.00059 0.00036 0.0003
1
0.00032
Surface tension @ 20 °C in mN/m 21 23 28 27 20 18
Heat of combustion (kJ/mol) -1367 -2006 -3910 -1785 -4863 -4317

46
Chapter Five
5 Experimental Methods and Procedures
5.1 Tests in the 20-liter sphere
Experiments were performed in a 20-liter sphere (Siwek Apparatus) to determine the maximum
explosion pressure (Pmax), maximum rate of pressure rise (dP/dt) max, lower explosion limit (LEL)
and limiting oxygen concentration (LOC). Measurements were performed in accordance with EN
14034 1-4 [152]. A diagram of the 20-liter sphere apparatus is presented in Figure 5.1.
The commercially-available test apparatus consisted of a hollow sphere made of a stainless steel
with an internal volume of 20-liter, a jacketed cooling system, a vacuum pump for evacuating the
chamber, distribution systems for gases and dusts, an ignition source at the center of the sphere,
pressure measurement, and a data recording system (Kuhner KSEP-Software). The apparatus was
modified to include a distribution system for liquid sprays as well as vapors and gases. The system
for introducing a liquid spray consisted of a solvent chamber (0.2-liter), a fuel injection nozzle
(Mitsubishi E7T05071), and a spray control system (time controller and nozzle voltage regulator)
as shown in Figure 5.2 and 5.3. The spray system (liquid chamber) was connected to the 20-liter
sphere at point (#9) in Figure 5.3.
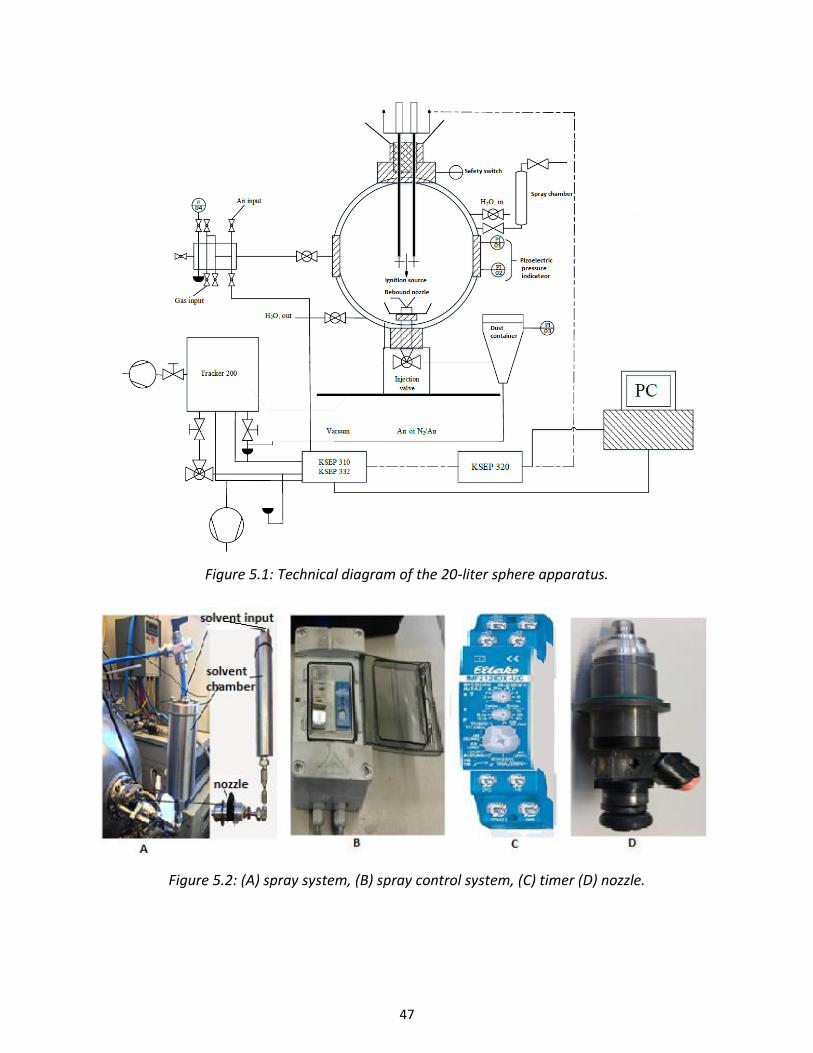
47
Figure 5.1: Technical diagram of the 20-liter sphere apparatus.
Figure 5.2: (A) spray system, (B) spray control system, (C) timer (D) nozzle.
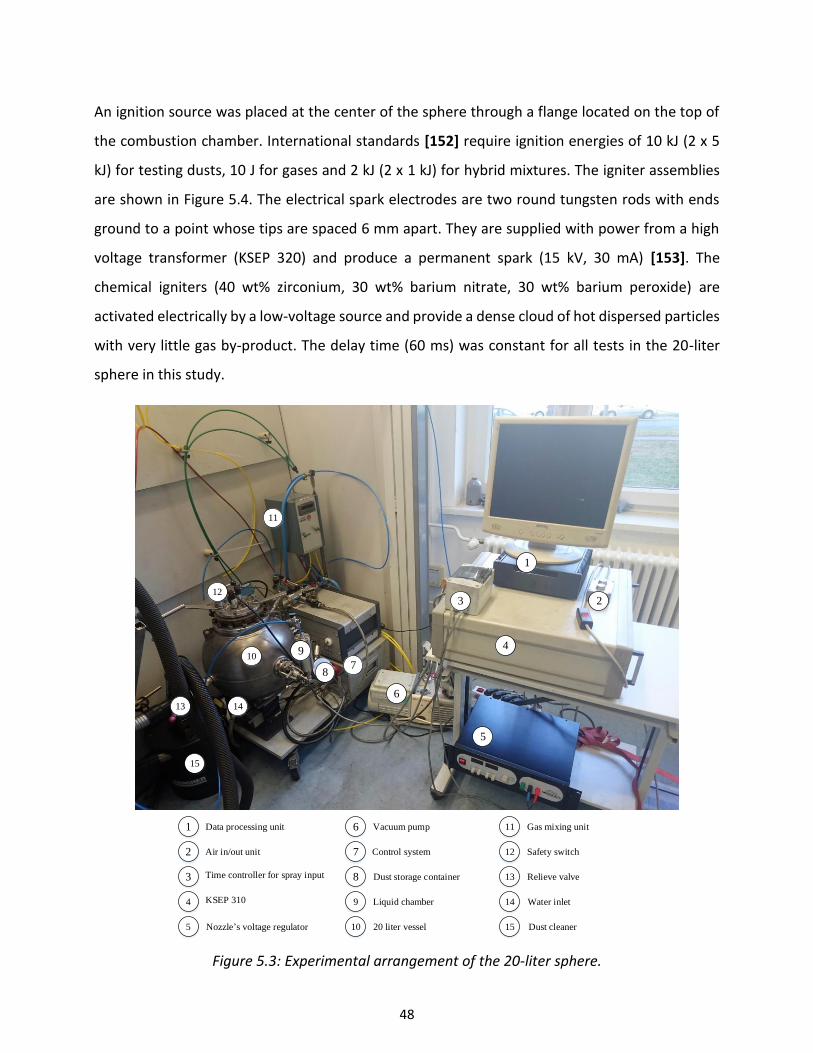
48
An ignition source was placed at the center of the sphere through a flange located on the top of
the combustion chamber. International standards [152] require ignition energies of 10 kJ (2 x 5
kJ) for testing dusts, 10 J for gases and 2 kJ (2 x 1 kJ) for hybrid mixtures. The igniter assemblies
are shown in Figure 5.4. The electrical spark electrodes are two round tungsten rods with ends
ground to a point whose tips are spaced 6 mm apart. They are supplied with power from a high
voltage transformer (KSEP 320) and produce a permanent spark (15 kV, 30 mA) [153]. The
chemical igniters (40 wt% zirconium, 30 wt% barium nitrate, 30 wt% barium peroxide) are
activated electrically by a low-voltage source and provide a dense cloud of hot dispersed particles
with very little gas by-product. The delay time (60 ms) was constant for all tests in the 20-liter
sphere in this study.
9
8
10
13
5
2
11
15
3
7
6
1
12
14
4
1 Data processing unit 6 Vacuum pump 11 Gas mixing unit
2 7 12
3 Time controller for spray input 8 Dust storage container 13 Relieve valve
4 KSEP 310 9 Liquid chamber 14 Water inlet
5 10 15Nozzle s voltage regulator 20 liter vessel Dust cleaner
Air in/out unit Control system Safety switch
Figure 5.3: Experimental arrangement of the 20-liter sphere.
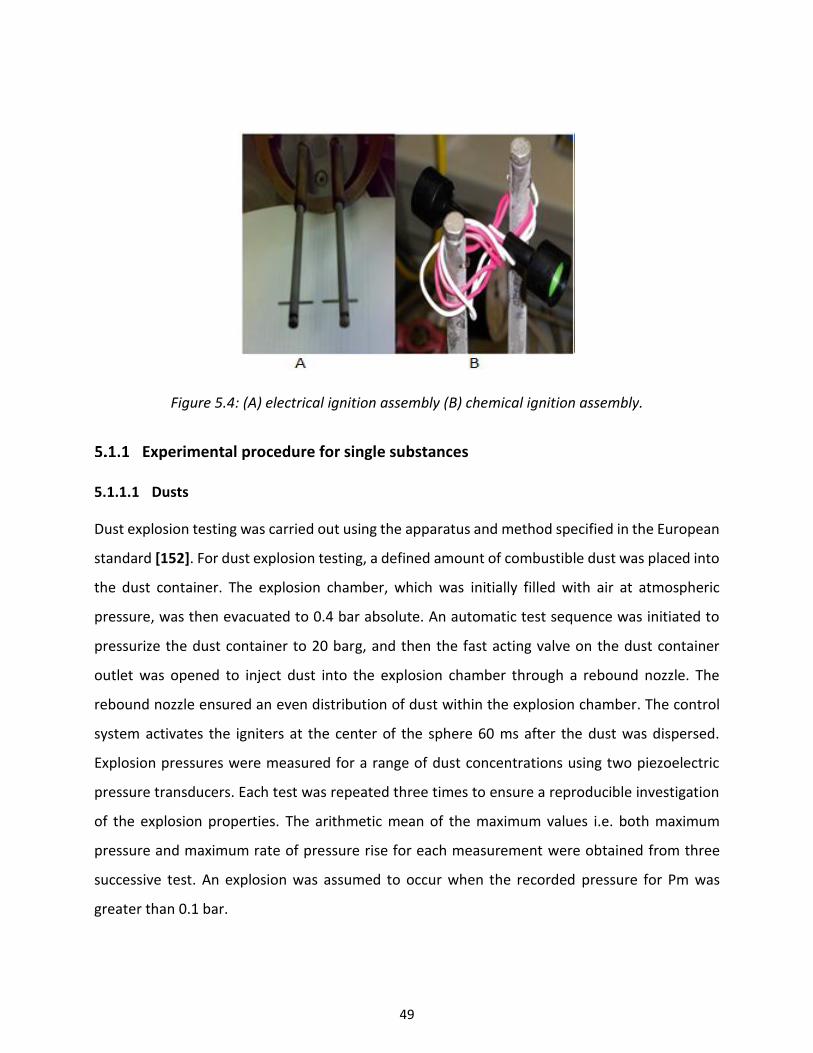
49
Figure 5.4: (A) electrical ignition assembly (B) chemical ignition assembly.
Experimental procedure for single substances
5.1.1.1 Dusts
Dust explosion testing was carried out using the apparatus and method specified in the European
standard [152]. For dust explosion testing, a defined amount of combustible dust was placed into
the dust container. The explosion chamber, which was initially filled with air at atmospheric
pressure, was then evacuated to 0.4 bar absolute. An automatic test sequence was initiated to
pressurize the dust container to 20 barg, and then the fast acting valve on the dust container
outlet was opened to inject dust into the explosion chamber through a rebound nozzle. The
rebound nozzle ensured an even distribution of dust within the explosion chamber. The control
system activates the igniters at the center of the sphere 60 ms after the dust was dispersed.
Explosion pressures were measured for a range of dust concentrations using two piezoelectric
pressure transducers. Each test was repeated three times to ensure a reproducible investigation
of the explosion properties. The arithmetic mean of the maximum values i.e. both maximum
pressure and maximum rate of pressure rise for each measurement were obtained from three
successive test. An explosion was assumed to occur when the recorded pressure for Pm was
greater than 0.1 bar.
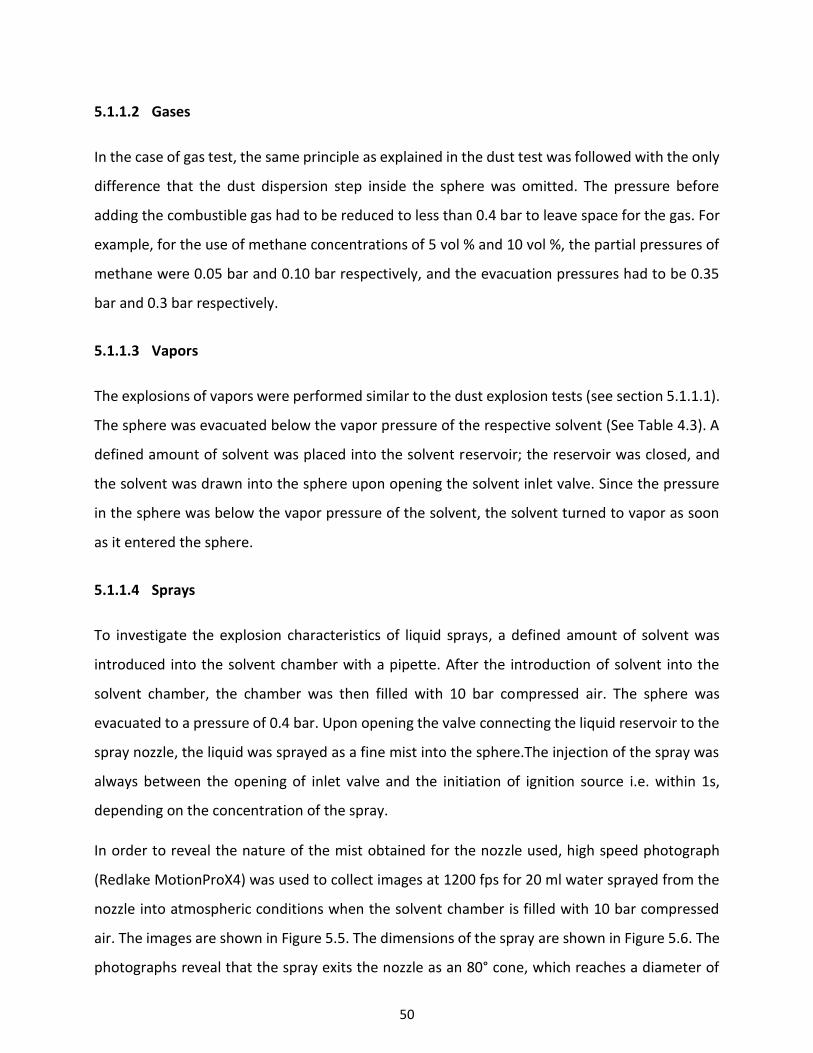
50
5.1.1.2 Gases
In the case of gas test, the same principle as explained in the dust test was followed with the only
difference that the dust dispersion step inside the sphere was omitted. The pressure before
adding the combustible gas had to be reduced to less than 0.4 bar to leave space for the gas. For
example, for the use of methane concentrations of 5 vol % and 10 vol %, the partial pressures of
methane were 0.05 bar and 0.10 bar respectively, and the evacuation pressures had to be 0.35
bar and 0.3 bar respectively.
5.1.1.3 Vapors
The explosions of vapors were performed similar to the dust explosion tests (see section 5.1.1.1).
The sphere was evacuated below the vapor pressure of the respective solvent (See Table 4.3). A
defined amount of solvent was placed into the solvent reservoir; the reservoir was closed, and
the solvent was drawn into the sphere upon opening the solvent inlet valve. Since the pressure
in the sphere was below the vapor pressure of the solvent, the solvent turned to vapor as soon
as it entered the sphere.
5.1.1.4 Sprays
To investigate the explosion characteristics of liquid sprays, a defined amount of solvent was
introduced into the solvent chamber with a pipette. After the introduction of solvent into the
solvent chamber, the chamber was then filled with 10 bar compressed air. The sphere was
evacuated to a pressure of 0.4 bar. Upon opening the valve connecting the liquid reservoir to the
spray nozzle, the liquid was sprayed as a fine mist into the sphere.The injection of the spray was
always between the opening of inlet valve and the initiation of ignition source i.e. within 1s,
depending on the concentration of the spray.
In order to reveal the nature of the mist obtained for the nozzle used, high speed photograph
(Redlake MotionProX4) was used to collect images at 1200 fps for 20 ml water sprayed from the
nozzle into atmospheric conditions when the solvent chamber is filled with 10 bar compressed
air. The images are shown in Figure 5.5. The dimensions of the spray are shown in Figure 5.6. The
photographs reveal that the spray exits the nozzle as an 80° cone, which reaches a diameter of
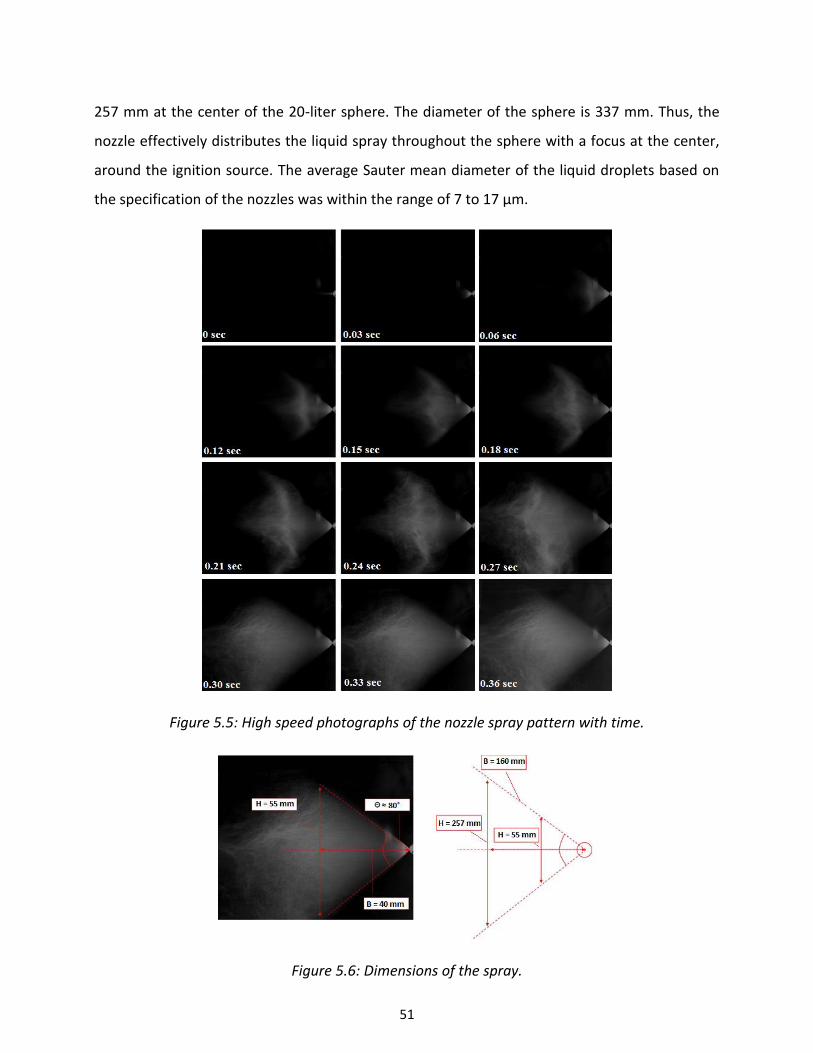
51
257 mm at the center of the 20-liter sphere. The diameter of the sphere is 337 mm. Thus, the
nozzle effectively distributes the liquid spray throughout the sphere with a focus at the center,
around the ignition source. The average Sauter mean diameter of the liquid droplets based on
the specification of the nozzles was within the range of 7 to 17 µm.
Figure 5.5: High speed photographs of the nozzle spray pattern with time.
Figure 5.6: Dimensions of the spray.
52
Experimental procedure for two-phase hybrid mixtures
The explosion characteristics of hybrid mixtures of dusts and gases, dusts and vapor, dusts and
sprays, gases and vapor, gases and sprays were investigated. The procedures for introducing the
materials into the sphere were the same as for the individual substances. Gases and vapors were
introduced into the sphere after evacuation. Dusts and sprays were injected into the sphere 60
ms prior to ignition. Hybrid mixtures were ignited using a 10 J electrical discharge
Experimental procedure for three-phase hybrid mixtures
The explosion characteristics of three-phase hybrid mixtures were investigated for mixtures of
dust/gas/vapor and dust/gas/spray. The experimental procedure was the same as for two-phase
hybrid mixtures with gases and vapors being introduced into the sphere following evacuation and
dusts and sprays being rapidly injected 60 ms before ignition. Explosions occurring at
concentrations below the LEL of the two-phase hybrid mixtures were investigated.
5.2 Explosibility parameters test
This section describes how the explosibility parameters tested in the 20-liter sphere: lower
explosive limit (LEL), limiting oxygen concentration (LOC), explosion overpressure (pm), and the
rate of pressure rise (dp/dt) were obtained.
Lower explosible limit / minimum explosible concentration
The explosion limit tests for dusts, gases, sprays and their mixtures were performed in the 20-
liter sphere in accordance with the European standard procedure EN 14034-3 [97]. With respect
to dust testing, it involves dispersing the dust sample into a sphere and attempting to ignite the
resulting dust cloud with an ignition source. At first, arbitrary concentration of the fuel was tested
to check if ignition would be obtained or not. In case no ignition was observed, the concentration
of the fuel was increased until an ignition was realized. The testing then continued and the
concentration was further reduced until a point of which no ignition of the fuel/air mixture was
observed in three successive tests. The least concentration where last ignition was obtained was
considered to be the MEC /LEL of the fuel. An explosion over pressure value recorded by the
53
piezo-electric pressure transducers greater than 0.2 bar was considered as ignition. The same
experimental principle was used to determine the lower explosible limit of gases, sprays and
hybrid mixtures. It must be mentioned that the added concentration for hybrid mixtures test were
all below the individual lower explosible limits. For the purpose of comparison 10 J electrical
ignitors was used for all tests with the same initial and testing conditions.
Limiting oxygen concentration
The limiting oxygen concentration (LOC) testing was performed in the 20-liter sphere according
to the procedure stated in the European standard EN 14034-4 [106]. Modification was done on
the equipment for the input of nitrogen gas into the sphere. In order to test for the LOC of a
specific fuel air mixture, the mixture was initially tested at 21 vol% oxygen. The test was then
continued by systematic reduction of the oxygen concentration in the combustion atmosphere
until ignition was no longer possible in three trials. The concentration of oxygen which will just
not allow an explosion of the fuel/oxygen/inert gas mixture in three consecutive tests was
considered as the limiting oxygen concentration. Different ignition energies such as electrical
ignitor (10 J) and chemical ignitors (2 kJ and 10 kJ) were used for this study and the results were
compared with each other. In order to assess an ignition, the explosion over pressure value
recorded by the piezo-electric pressure transducers must be greater than 0.2 bar. The same
testing procedure and testing conditions for dust, gas, spray and hybrid mixtures were
considered.
Maximum explosion overpressure, (Pmax) and maximum rate of pressure rise
(dP/dt) max
A typical pressure evolution curve resulting from an experiment where the explosion occurred is
shown in Figure 5.7. Gases and vapors are introduced into the sphere prior to starting of the
experiment. The sprays and dust reservoirs are pressurized and ready for injection. At t = 0 s the
experiment is initiated by the software. The injection of the dust occurs after a delay td (in the
range of 30 to 50 ms), however, with respect to spray, td could be a bit longer depending on the
concentration. A pressure rise Pd occurs due to the injection of dust or spray using pressurized
air. An electrical or chemical energies discharge is initiated after a delay of tv = 60 ms; which was
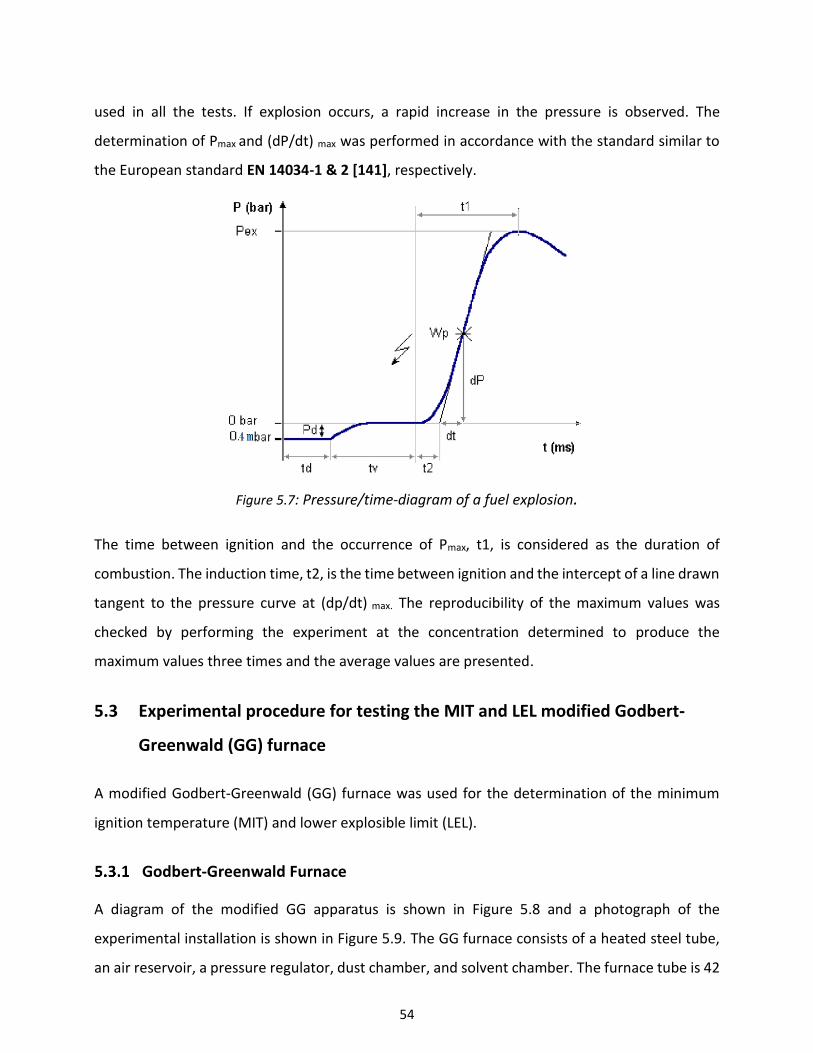
54
used in all the tests. If explosion occurs, a rapid increase in the pressure is observed. The
determination of Pmax and (dP/dt) max was performed in accordance with the standard similar to
the European standard EN 14034-1 & 2 [141], respectively.
Figure 5.7: Pressure/time-diagram of a fuel explosion.
The time between ignition and the occurrence of Pmax, t1, is considered as the duration of
combustion. The induction time, t2, is the time between ignition and the intercept of a line drawn
tangent to the pressure curve at (dp/dt) max. The reproducibility of the maximum values was
checked by performing the experiment at the concentration determined to produce the
maximum values three times and the average values are presented.
5.3 Experimental procedure for testing the MIT and LEL modified Godbert-
Greenwald (GG) furnace
A modified Godbert-Greenwald (GG) furnace was used for the determination of the minimum
ignition temperature (MIT) and lower explosible limit (LEL).
Godbert-Greenwald Furnace
A diagram of the modified GG apparatus is shown in Figure 5.8 and a photograph of the
experimental installation is shown in Figure 5.9. The GG furnace consists of a heated steel tube,
an air reservoir, a pressure regulator, dust chamber, and solvent chamber. The furnace tube is 42
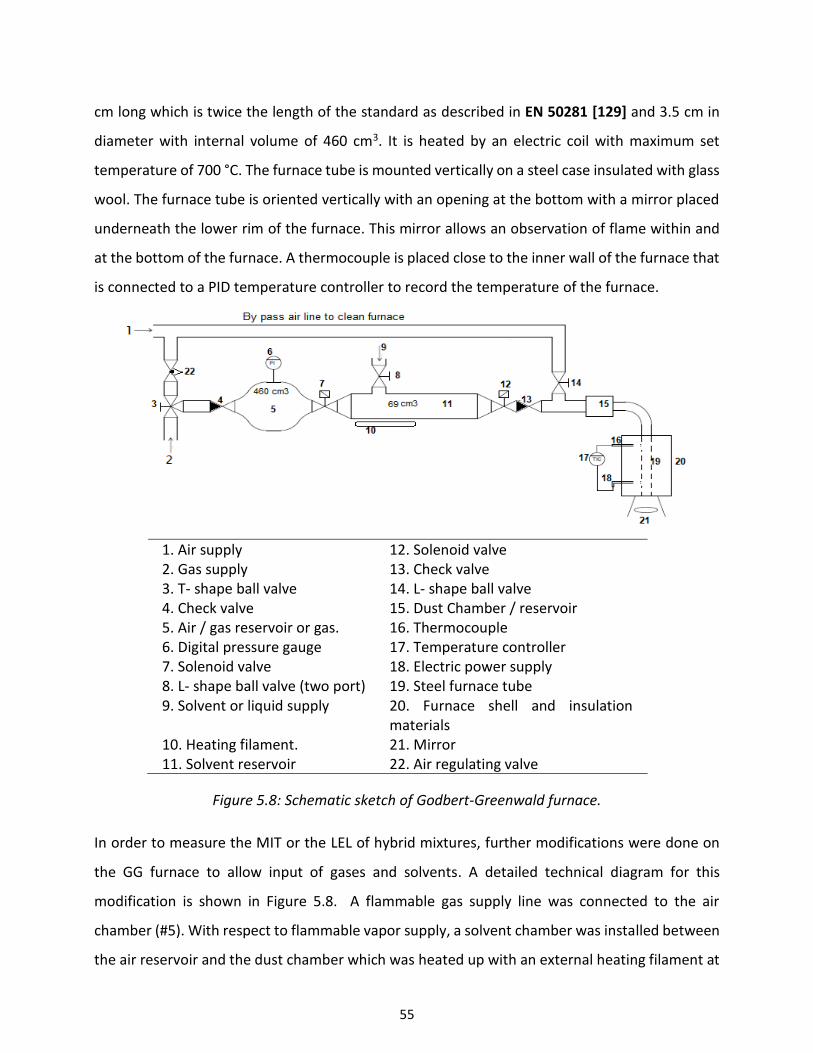
55
cm long which is twice the length of the standard as described in EN 50281 [129] and 3.5 cm in
diameter with internal volume of 460 cm3. It is heated by an electric coil with maximum set
temperature of 700 °C. The furnace tube is mounted vertically on a steel case insulated with glass
wool. The furnace tube is oriented vertically with an opening at the bottom with a mirror placed
underneath the lower rim of the furnace. This mirror allows an observation of flame within and
at the bottom of the furnace. A thermocouple is placed close to the inner wall of the furnace that
is connected to a PID temperature controller to record the temperature of the furnace.
1. Air supply 12. Solenoid valve 2. Gas supply 13. Check valve 3. T- shape ball valve 14. L- shape ball valve 4. Check valve 15. Dust Chamber / reservoir 5. Air / gas reservoir or gas. 16. Thermocouple 6. Digital pressure gauge 17. Temperature controller 7. Solenoid valve 18. Electric power supply 8. L- shape ball valve (two port) 19. Steel furnace tube 9. Solvent or liquid supply 20. Furnace shell and insulation
materials 10. Heating filament. 21. Mirror 11. Solvent reservoir 22. Air regulating valve
Figure 5.8: Schematic sketch of Godbert-Greenwald furnace.
In order to measure the MIT or the LEL of hybrid mixtures, further modifications were done on
the GG furnace to allow input of gases and solvents. A detailed technical diagram for this
modification is shown in Figure 5.8. A flammable gas supply line was connected to the air
chamber (#5). With respect to flammable vapor supply, a solvent chamber was installed between
the air reservoir and the dust chamber which was heated up with an external heating filament at
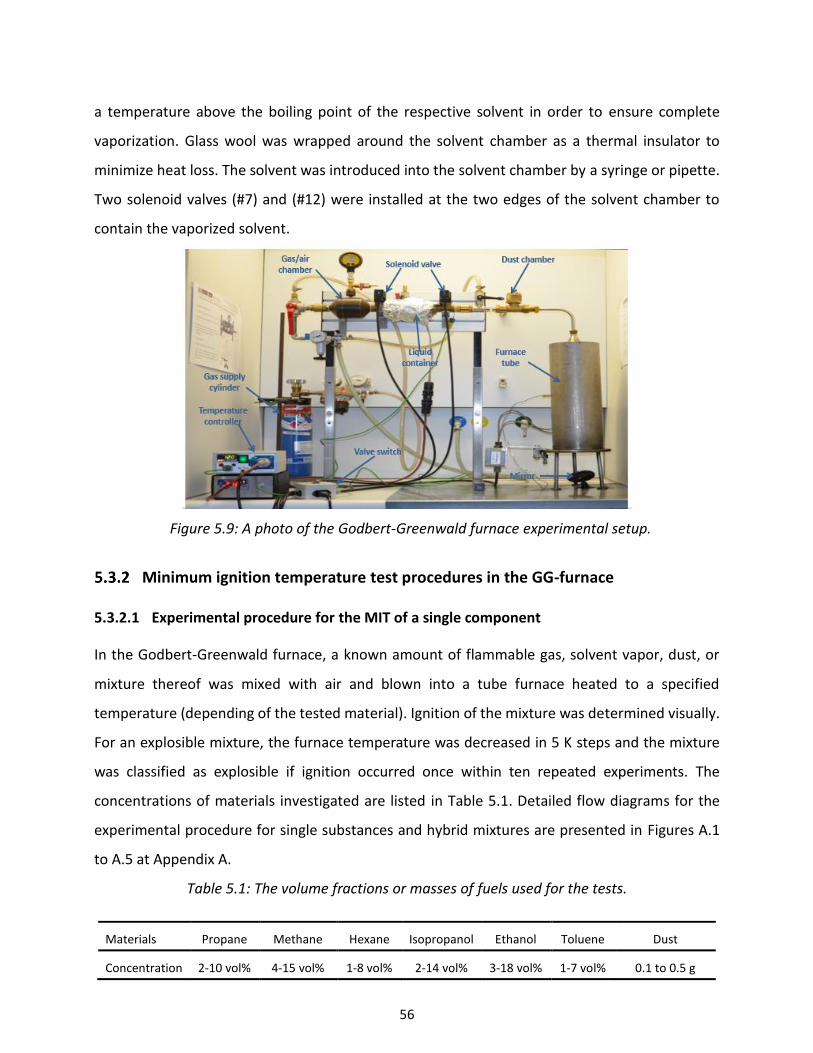
56
a temperature above the boiling point of the respective solvent in order to ensure complete
vaporization. Glass wool was wrapped around the solvent chamber as a thermal insulator to
minimize heat loss. The solvent was introduced into the solvent chamber by a syringe or pipette.
Two solenoid valves (#7) and (#12) were installed at the two edges of the solvent chamber to
contain the vaporized solvent.
Figure 5.9: A photo of the Godbert-Greenwald furnace experimental setup.
Minimum ignition temperature test procedures in the GG-furnace
5.3.2.1 Experimental procedure for the MIT of a single component
In the Godbert-Greenwald furnace, a known amount of flammable gas, solvent vapor, dust, or
mixture thereof was mixed with air and blown into a tube furnace heated to a specified
temperature (depending of the tested material). Ignition of the mixture was determined visually.
For an explosible mixture, the furnace temperature was decreased in 5 K steps and the mixture
was classified as explosible if ignition occurred once within ten repeated experiments. The
concentrations of materials investigated are listed in Table 5.1. Detailed flow diagrams for the
experimental procedure for single substances and hybrid mixtures are presented in Figures A.1
to A.5 at Appendix A.
Table 5.1: The volume fractions or masses of fuels used for the tests.
Materials Propane Methane Hexane Isopropanol Ethanol Toluene Dust
Concentration 2-10 vol% 4-15 vol% 1-8 vol% 2-14 vol% 3-18 vol% 1-7 vol% 0.1 to 0.5 g
57
5.3.2.1.1 Dusts
A known quantity of dust was placed into the dust chamber, and the chamber was closed. The air
reservoir was filled with air to an absolute pressure of 1.2 to 1.7 bar. Upon activating the solenoid
valves via a switch, the dust sample was then dispersed into the furnace tube by a blast of air. The
presence of an explosion was determined visually from observation of a flame at the bottom of
the furnace with the help of a mirror. Both the pressure (0.2 to 0.7 bar above atmospheric
pressure) and the mass of dust (0.1 to 0.5 g) were varied until a define explosion was obtained.
The condition at which the vigorous explosion was obtained was taken as the “best” explosion
condition (BEC). This condition was maintained and the furnace temperature was lowered and
testing continued until no flame was observed in ten tests. The temperature of the oven was
lowered in 5 K increments. For a given temperature, the process of injecting dust into the heated
tube and observing the presence or absence of an explosion was repeated either until an
explosion was observed or when no explosion occurred for ten repetitions. The minimum ignition
temperature (MIT) was taken to be the lowest temperature at which ignition occurred.
5.3.2.1.2 Gases
The same experimental principle as explained for dust was used for the gas test. The only
difference in this case was that, the air was premixed with the combustible gas in the air reservoir
and the dust chamber was left empty. The composition of the gas mixtures was determined based
on partial pressures. For example, in considering 5 vol% of combustible gas and a total absolute
pressure of 0.5 bar is required. At first the reservoir is filled with 0.475 bar of air follow by 0.025
bar of combustible gas to make a total pressure of 0.5 bar. The concentrations of gases
investigated are summarized in Table 5.1.
5.3.2.1.3 Solvent Vapors
The solvent chamber was heated to a temperature above the boiling point of individual solvents
with a heating filament to allow the solvent to vaporize before being dispersed into the furnace.
A given volume of solvent was measured with a syringe, placed in the solvent chamber, and
allowed to completely vaporize. The air reservoir was filled with pressurized air, and the valve to
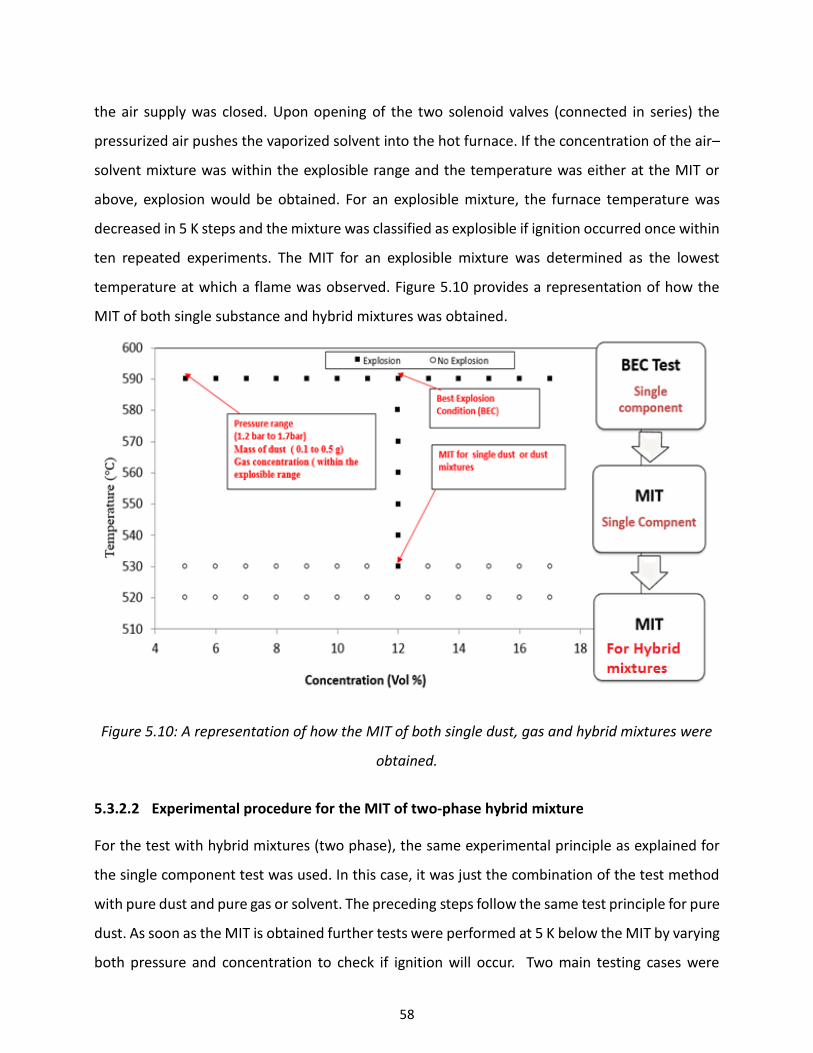
58
the air supply was closed. Upon opening of the two solenoid valves (connected in series) the
pressurized air pushes the vaporized solvent into the hot furnace. If the concentration of the air–
solvent mixture was within the explosible range and the temperature was either at the MIT or
above, explosion would be obtained. For an explosible mixture, the furnace temperature was
decreased in 5 K steps and the mixture was classified as explosible if ignition occurred once within
ten repeated experiments. The MIT for an explosible mixture was determined as the lowest
temperature at which a flame was observed. Figure 5.10 provides a representation of how the
MIT of both single substance and hybrid mixtures was obtained.
Figure 5.10: A representation of how the MIT of both single dust, gas and hybrid mixtures were
obtained.
5.3.2.2 Experimental procedure for the MIT of two-phase hybrid mixture
For the test with hybrid mixtures (two phase), the same experimental principle as explained for
the single component test was used. In this case, it was just the combination of the test method
with pure dust and pure gas or solvent. The preceding steps follow the same test principle for pure
dust. As soon as the MIT is obtained further tests were performed at 5 K below the MIT by varying
both pressure and concentration to check if ignition will occur. Two main testing cases were
59
considered, which includes: the effect of dust on the MIT of gases as well as the effect of gases on
the MIT of dusts. With respect to the first test case, the LEL of the single gas or vapor was initially
tested at a temperature equivalent to the MIT of dust. Then a concentration lower than the
already determined LEL was added to the dust below its MIT. The test procedure for the second
test case i.e. effect of adding a non-explosible concentration of dust on the MIT of gas or vapor is
just the vice versa of the first test case.
5.3.2.3 Experimental procedure for the MIT of three Component hybrid mixtures
The three component hybrid mixture tests follow the same principle as the two-phase hybrid
mixture test. It involves the combinations of the various test of dusts, gases and solvents. Three
main testing cases were considered, which included: the effect of adding non-explosible
concentrations of gas and vapor on the MIT of dust, the effect of adding non-explosible
concentrations of dust and gas on MIT of vapor and the effect of adding non-explosible
concentrations of dust and vapor on the MIT gas. For the sake of simplicity, the main component
is the component (whether a vapor, gas, or dust) on which various effects are tested. With regards
to the first test case (i.e. the effect of adding a non-explosible concentration of gas and vapor on
the MIT of dust), the LEL of the gas and vapor at a temperature equivalent to MIT of dust was
initially determined. Then, a concentration of gas and vapor, below the LEL was added to the dust
at its non-explosible temperature. It was ensured that the concentration of gas and vapor
combination does not themselves ignite at the MIT of the dust. The test procedures for the other
test cases are similar to the first test case as explained above.
The lower explosible (LEL) and the minimum explosible concentration (MEC)
tests in the GG furnace
5.3.3.1 Experimental procedure for LEL/MEC of single component
A similar experimental procedure used in the determination of MIT of single component was also
used for the determination of MEC/LEL. The initial testing conditions (dispersion pressure and
concentration) were based on the best explosion condition as already described in section 5.3.3.1.
The furnace temperature was fixed at 20 °C to 40 °C (depending on the material) above the MIT
of the individual substances obtained from the MIT of the single component test. It must be
60
mention that the explosion limit is influence by the temperature of the furnace, as a results of
this the effect of temperature on the explosion limits were initially tested (see Figure C.1 in
appendix C). Using the same temperature and dispersion pressure at the best explosion condition,
further tests were carried out by reducing the fuel concentration until no further ignition was
obtained. At the point where no ignition was obtained, the concentration was kept constant and
testing continued using lower and higher air dispersion pressure as presented in Table 5.1. In case
no ignition occurred at any combination of concentrations and dispersion pressures, the lowest
concentration at which last ignition occurred was taken as the MEC/LEL of the sample. The
concentration of the dust was estimated by dividing the mass of dusts used by the total volume
of the furnace (460 cm3).
5.3.3.2 Experimental procedure for MEC/LEL of two component hybrid mixture
For the test with hybrid mixtures, a similar experimental principle as explained for the single
component test was used. It was just the combination of the test methods with pure dust and
pure gas or solvent. The preceding steps followed the same test principle for the pure substance.
After obtaining the MEC/LEL of single components, further tests were performed below the
concentration by varying the pressure to check if ignition could be obtained. Two testing cases
were considered i.e. the effect of adding a non-explosible concentration of gas or vapor on the
MEC of dust and the effect of adding a non-explosible concentration of dust on the LEL of gas or
vapor. With respect to the first test case i.e. the effect of adding a non-explosible concentration
of gas or vapor on the MEC of dust, the LEL of gas/vapor was initially tested at the temperature
where the MEC of dust was obtained. Then, a non-explosible concentration of gas/solvent lower
than the respective LEL was added to the dust below its MEC. In case no ignition occurred, the
concentration of the mixture was kept constant and the pressure was varied. The last
concentration where ignition happens was considered as the MEC of the mixture. The second test
case i.e. the effect of adding a non-explosible concentration of dust on the MEC of gas or vapor is
just the vice versa of the first test case as explained above.
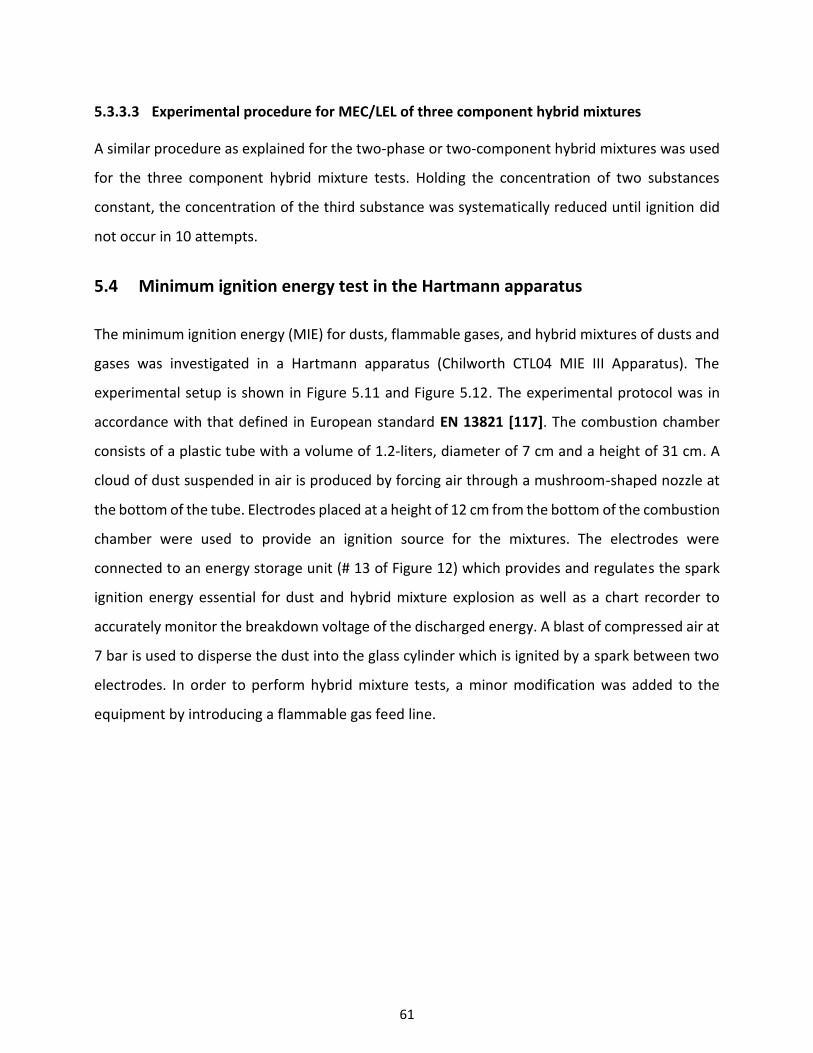
61
5.3.3.3 Experimental procedure for MEC/LEL of three component hybrid mixtures
A similar procedure as explained for the two-phase or two-component hybrid mixtures was used
for the three component hybrid mixture tests. Holding the concentration of two substances
constant, the concentration of the third substance was systematically reduced until ignition did
not occur in 10 attempts.
5.4 Minimum ignition energy test in the Hartmann apparatus
The minimum ignition energy (MIE) for dusts, flammable gases, and hybrid mixtures of dusts and
gases was investigated in a Hartmann apparatus (Chilworth CTL04 MIE III Apparatus). The
experimental setup is shown in Figure 5.11 and Figure 5.12. The experimental protocol was in
accordance with that defined in European standard EN 13821 [117]. The combustion chamber
consists of a plastic tube with a volume of 1.2-liters, diameter of 7 cm and a height of 31 cm. A
cloud of dust suspended in air is produced by forcing air through a mushroom-shaped nozzle at
the bottom of the tube. Electrodes placed at a height of 12 cm from the bottom of the combustion
chamber were used to provide an ignition source for the mixtures. The electrodes were
connected to an energy storage unit (# 13 of Figure 12) which provides and regulates the spark
ignition energy essential for dust and hybrid mixture explosion as well as a chart recorder to
accurately monitor the breakdown voltage of the discharged energy. A blast of compressed air at
7 bar is used to disperse the dust into the glass cylinder which is ignited by a spark between two
electrodes. In order to perform hybrid mixture tests, a minor modification was added to the
equipment by introducing a flammable gas feed line.
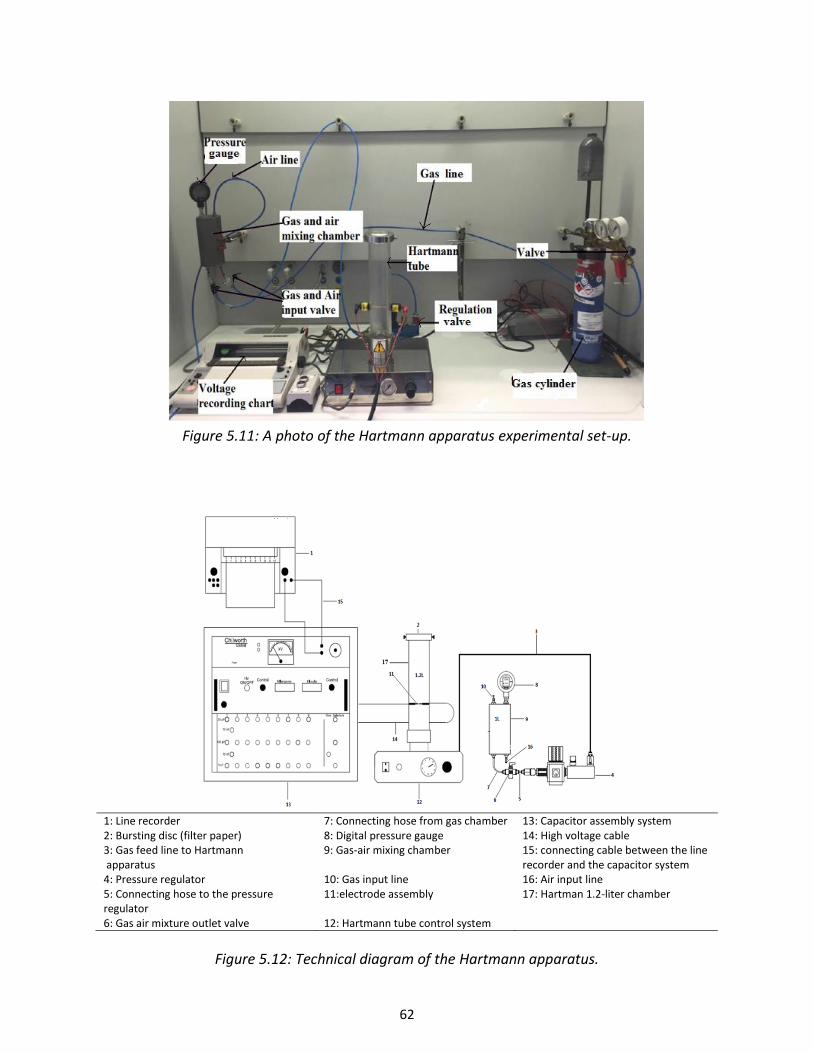
62
Figure 5.11: A photo of the Hartmann apparatus experimental set-up.
1: Line recorder 7: Connecting hose from gas chamber 13: Capacitor assembly system 2: Bursting disc (filter paper) 8: Digital pressure gauge 14: High voltage cable 3: Gas feed line to Hartmann apparatus
9: Gas-air mixing chamber 15: connecting cable between the line recorder and the capacitor system
4: Pressure regulator 10: Gas input line 16: Air input line 5: Connecting hose to the pressure regulator
11:electrode assembly 17: Hartman 1.2-liter chamber
6: Gas air mixture outlet valve 12: Hartmann tube control system
Figure 5.12: Technical diagram of the Hartmann apparatus.
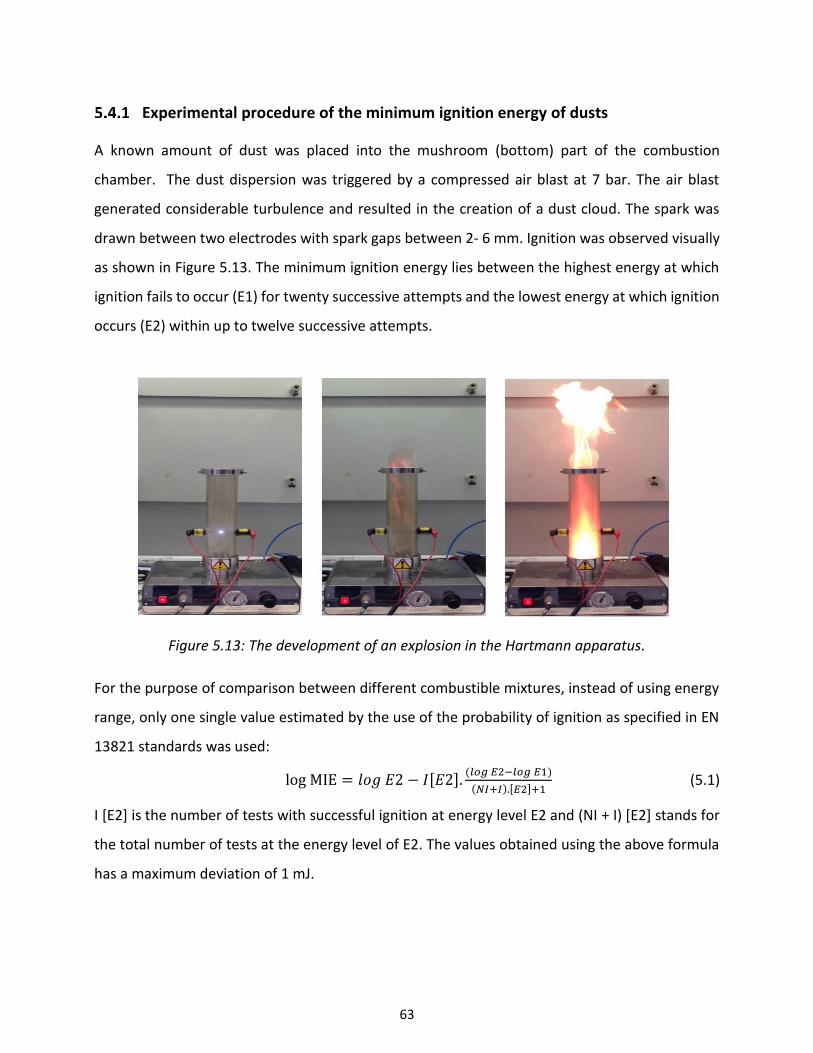
63
Experimental procedure of the minimum ignition energy of dusts
A known amount of dust was placed into the mushroom (bottom) part of the combustion
chamber. The dust dispersion was triggered by a compressed air blast at 7 bar. The air blast
generated considerable turbulence and resulted in the creation of a dust cloud. The spark was
drawn between two electrodes with spark gaps between 2- 6 mm. Ignition was observed visually
as shown in Figure 5.13. The minimum ignition energy lies between the highest energy at which
ignition fails to occur (E1) for twenty successive attempts and the lowest energy at which ignition
occurs (E2) within up to twelve successive attempts.
Figure 5.13: The development of an explosion in the Hartmann apparatus.
For the purpose of comparison between different combustible mixtures, instead of using energy
range, only one single value estimated by the use of the probability of ignition as specified in EN
13821 standards was used:
log MIE = 𝑙𝑜𝑔 𝐸2 − 𝐼[𝐸2].(𝑙𝑜𝑔 𝐸2−𝑙𝑜𝑔 𝐸1)
(𝑁𝐼+𝐼).[𝐸2]+1 (5.1)
I [E2] is the number of tests with successful ignition at energy level E2 and (NI + I) [E2] stands for
the total number of tests at the energy level of E2. The values obtained using the above formula
has a maximum deviation of 1 mJ.

64
Experimental procedure of the minimum ignition energy of hybrid mixtures
For testing hybrid mixtures containing both dusts and flammable gases, the flammable gas was
combined with air in the gas chamber. Initially the gas chamber was filled with air at atmospheric
pressure. Flammable gas was then introduced into the chamber and the pressure was increased
to Pgas, depending on the desired concentration. The gas inlet valve was then closed. The valve to
the air inlet was then opened and the container was filled with air up to a pressure of 7 bar. The
air inlet valve was then closed. The concentration of the flammable gas is related to its partial
pressure in the mixture:
𝑦𝑔𝑎𝑠 =𝑃𝑔𝑎𝑠−𝑃𝑖
𝑃_𝑒𝑛𝑑 (5.2)
Where Pgas is the pressure of flammable gas, Pi is the initial pressure in the vessel (Pi =1bar) and
Pend is the set pressure to disperse the dust. The dust was then dispersed by a blast of flammable
gas- air mixture. It must be noted that the flammable gases were tested at concentrations lower
than the lower explosion limits in air.
65
Chapter Six
6 Results and Discussions
6.1 Lower explosion limits and minimum explosible concentrations
The lower explosion limit of gas (LEL) or minimum explosible concentration of dust (MEC) is the
concentration of fuel-air mixture below which self-sustained propagation of flame is not possible
at a specific test condition. In order to prevent the risks associated with gas, dust or hybrid
mixture explosions, it is very important to know the lowest concentration of these mixtures at
which explosion can occur. Knowing these limits can help set a margin for a system so that the
concentration could always stay below these limits. Contrarily to the lower explosion limits of
solitary dust, gas or solvent which have been widely investigated in the past decades, data on
explosion limits of hybrid mixtures are comparatively sparse. Most of the studies on hybrid
mixtures focus on dust and gas mixtures, for example, coal dust and methane [154], graphite and
hydrogen [11], niacin and methane [155] etc. However, mixtures such as: sprays/vapors with
either dusts or gases have not been investigated in detail. As a result of the aforementioned
reasons, this section presents detailed results on the lower explosion limits of different
combinations of mixtures such as: spray-gas, spray-dust, gas/vapor, dust-vapor-gas as well as
spray-gas-dust. Experiments were performed in two different laboratory equipments i.e. the
standard 20-liter sphere and the Godbert-Greenwald (GG) furnace with six solvents (ethanol,

66
isopropanol, acetone, toluene, heptane, and hexane), three gases (methane, propane and
hydrogen) and five dusts (corn-starch, lycopodium, brown coal, HDPE and toner). Experimental
procedures for these tests are discussed in Section 5.2.1 and 5.3.4 for the standard 20-liter sphere
and the Godbert-Greenwald (GG) furnace, respectively.
Furthermore, accurate estimation of the explosion limits is necessary for safe handling of
combustible mixtures in industries. Theoretically, these estimations could be done through
experimental measurements but the tests are usually time and money consuming, and
sometimes impossible for the emergent requirements. Therefore, different mathematical models
to estimate explosion limits of dusts, gases and hybrid mixtures proposed by different authors
are presented and compared with the experimental results
Lower explosion limits in the standard 20-liter sphere.
The standard 20-liter sphere is an alternative standard test apparatus to the 1 m3 combustion
chamber. It is usually used to determine explosion data for dusts alone. In order to use this
equipment for gases, spray and hybrid mixtures testing, modifications were made on the sphere
to allow the input of gas and spray.
6.1.1.1 Lower explosion limits of single substances
To begin with, the lower explosion limits of single substances were tested. Figure 6.1 presents the
results obtained for the LEL of solvents (as spray). It was observed that the alcohols (ethanol and
isopropanol) recorded higher LEL compared to other solvents. Ignition of spray is strongly
influenced by the droplet size [156]: the smaller the droplet size, the easier it is to ignite.
Although, the determination of the droplet size distribution for all solvents was not performed in
the experimental capacity of this research work, the average droplet size according to the Sauter
mean diameter based on the specification of the nozzle was found to be in the range of 7 to 17
µm.
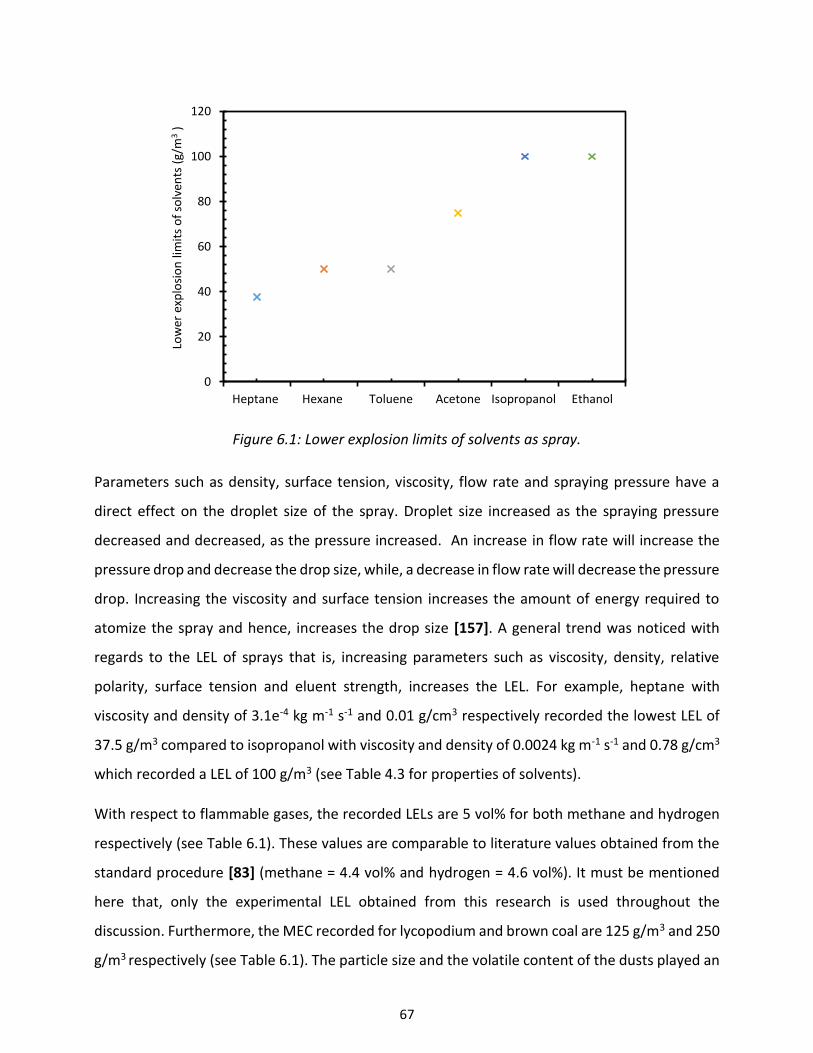
67
Figure 6.1: Lower explosion limits of solvents as spray.
Parameters such as density, surface tension, viscosity, flow rate and spraying pressure have a
direct effect on the droplet size of the spray. Droplet size increased as the spraying pressure
decreased and decreased, as the pressure increased. An increase in flow rate will increase the
pressure drop and decrease the drop size, while, a decrease in flow rate will decrease the pressure
drop. Increasing the viscosity and surface tension increases the amount of energy required to
atomize the spray and hence, increases the drop size [157]. A general trend was noticed with
regards to the LEL of sprays that is, increasing parameters such as viscosity, density, relative
polarity, surface tension and eluent strength, increases the LEL. For example, heptane with
viscosity and density of 3.1e-4 kg m-1 s-1 and 0.01 g/cm3 respectively recorded the lowest LEL of
37.5 g/m3 compared to isopropanol with viscosity and density of 0.0024 kg m-1 s-1 and 0.78 g/cm3
which recorded a LEL of 100 g/m3 (see Table 4.3 for properties of solvents).
With respect to flammable gases, the recorded LELs are 5 vol% for both methane and hydrogen
respectively (see Table 6.1). These values are comparable to literature values obtained from the
standard procedure [83] (methane = 4.4 vol% and hydrogen = 4.6 vol%). It must be mentioned
here that, only the experimental LEL obtained from this research is used throughout the
discussion. Furthermore, the MEC recorded for lycopodium and brown coal are 125 g/m3 and 250
g/m3 respectively (see Table 6.1). The particle size and the volatile content of the dusts played an
0
20
40
60
80
100
120
Heptane Hexane Toluene Acetone Isopropanol Ethanol
Low
er e
xplo
sio
n li
mit
s o
f so
lven
ts (
g/m
3)
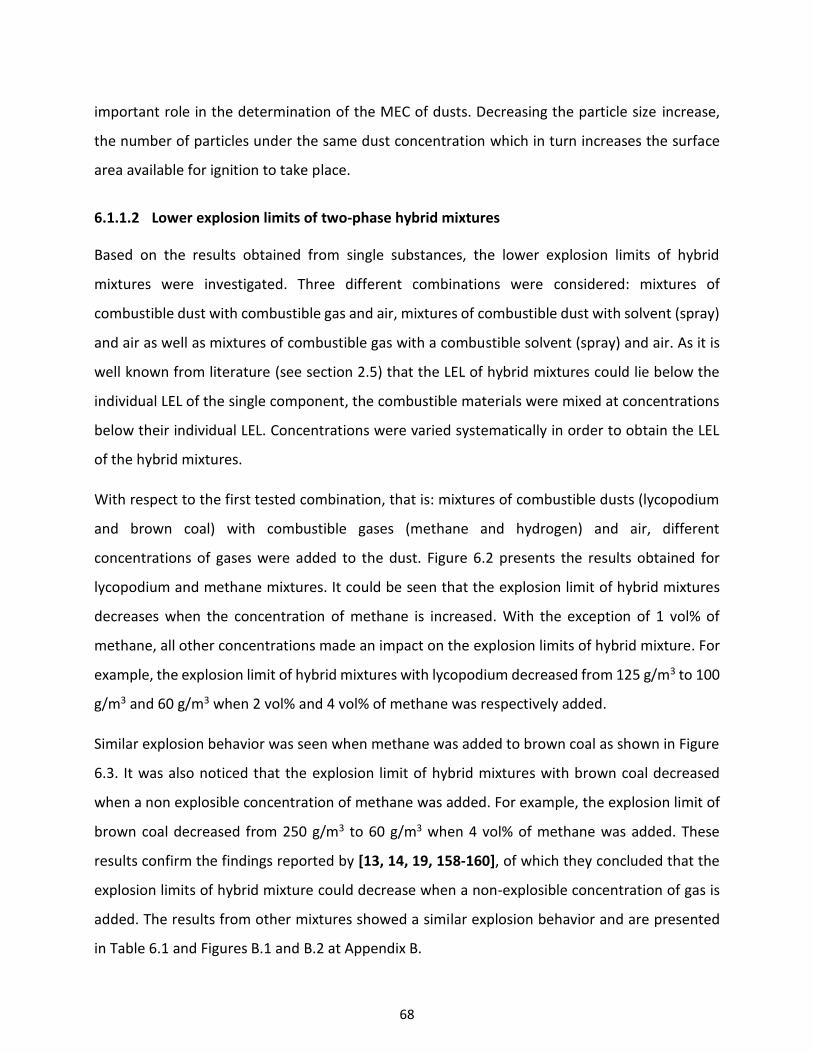
68
important role in the determination of the MEC of dusts. Decreasing the particle size increase,
the number of particles under the same dust concentration which in turn increases the surface
area available for ignition to take place.
6.1.1.2 Lower explosion limits of two-phase hybrid mixtures
Based on the results obtained from single substances, the lower explosion limits of hybrid
mixtures were investigated. Three different combinations were considered: mixtures of
combustible dust with combustible gas and air, mixtures of combustible dust with solvent (spray)
and air as well as mixtures of combustible gas with a combustible solvent (spray) and air. As it is
well known from literature (see section 2.5) that the LEL of hybrid mixtures could lie below the
individual LEL of the single component, the combustible materials were mixed at concentrations
below their individual LEL. Concentrations were varied systematically in order to obtain the LEL
of the hybrid mixtures.
With respect to the first tested combination, that is: mixtures of combustible dusts (lycopodium
and brown coal) with combustible gases (methane and hydrogen) and air, different
concentrations of gases were added to the dust. Figure 6.2 presents the results obtained for
lycopodium and methane mixtures. It could be seen that the explosion limit of hybrid mixtures
decreases when the concentration of methane is increased. With the exception of 1 vol% of
methane, all other concentrations made an impact on the explosion limits of hybrid mixture. For
example, the explosion limit of hybrid mixtures with lycopodium decreased from 125 g/m3 to 100
g/m3 and 60 g/m3 when 2 vol% and 4 vol% of methane was respectively added.
Similar explosion behavior was seen when methane was added to brown coal as shown in Figure
6.3. It was also noticed that the explosion limit of hybrid mixtures with brown coal decreased
when a non explosible concentration of methane was added. For example, the explosion limit of
brown coal decreased from 250 g/m3 to 60 g/m3 when 4 vol% of methane was added. These
results confirm the findings reported by [13, 14, 19, 158-160], of which they concluded that the
explosion limits of hybrid mixture could decrease when a non-explosible concentration of gas is
added. The results from other mixtures showed a similar explosion behavior and are presented
in Table 6.1 and Figures B.1 and B.2 at Appendix B.
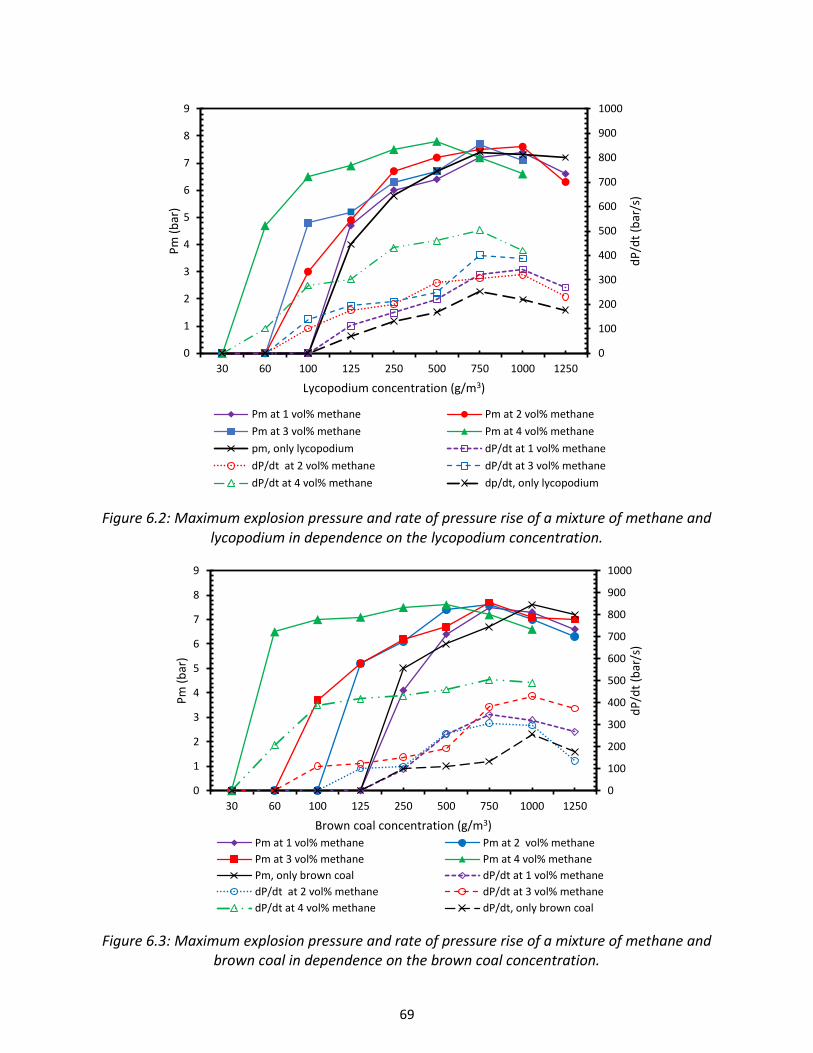
69
Figure 6.2: Maximum explosion pressure and rate of pressure rise of a mixture of methane and lycopodium in dependence on the lycopodium concentration.
Figure 6.3: Maximum explosion pressure and rate of pressure rise of a mixture of methane and brown coal in dependence on the brown coal concentration.
0
100
200
300
400
500
600
700
800
900
1000
0
1
2
3
4
5
6
7
8
9
30 60 100 125 250 500 750 1000 1250
dP
/dt
(bar
/s)
Pm
(b
ar)
Lycopodium concentration (g/m3)
Pm at 1 vol% methane Pm at 2 vol% methane
Pm at 3 vol% methane Pm at 4 vol% methane
pm, only lycopodium dP/dt at 1 vol% methane
dP/dt at 2 vol% methane dP/dt at 3 vol% methane
dP/dt at 4 vol% methane dp/dt, only lycopodium
0
100
200
300
400
500
600
700
800
900
1000
0
1
2
3
4
5
6
7
8
9
30 60 100 125 250 500 750 1000 1250
dP
/dt
(bar
/s)
Pm
(b
ar)
Brown coal concentration (g/m3)
Pm at 1 vol% methane Pm at 2 vol% methane
Pm at 3 vol% methane Pm at 4 vol% methane
Pm, only brown coal dP/dt at 1 vol% methane
dP/dt at 2 vol% methane dP/dt at 3 vol% methane
dP/dt at 4 vol% methane dP/dt, only brown coal
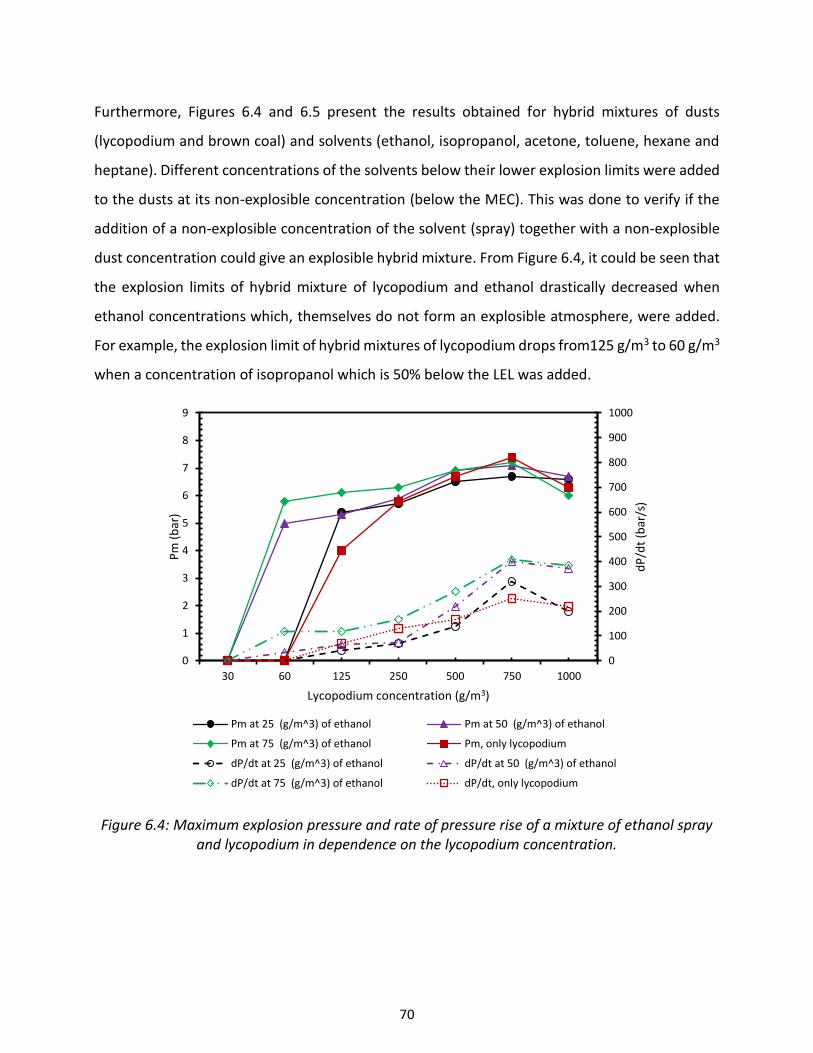
70
Furthermore, Figures 6.4 and 6.5 present the results obtained for hybrid mixtures of dusts
(lycopodium and brown coal) and solvents (ethanol, isopropanol, acetone, toluene, hexane and
heptane). Different concentrations of the solvents below their lower explosion limits were added
to the dusts at its non-explosible concentration (below the MEC). This was done to verify if the
addition of a non-explosible concentration of the solvent (spray) together with a non-explosible
dust concentration could give an explosible hybrid mixture. From Figure 6.4, it could be seen that
the explosion limits of hybrid mixture of lycopodium and ethanol drastically decreased when
ethanol concentrations which, themselves do not form an explosible atmosphere, were added.
For example, the explosion limit of hybrid mixtures of lycopodium drops from125 g/m3 to 60 g/m3
when a concentration of isopropanol which is 50% below the LEL was added.
Figure 6.4: Maximum explosion pressure and rate of pressure rise of a mixture of ethanol spray and lycopodium in dependence on the lycopodium concentration.
0
100
200
300
400
500
600
700
800
900
1000
0
1
2
3
4
5
6
7
8
9
30 60 125 250 500 750 1000
dP
/dt
(bar
/s)
Pm
(b
ar)
Lycopodium concentration (g/m3)
Pm at 25 (g/m^3) of ethanol Pm at 50 (g/m^3) of ethanol
Pm at 75 (g/m^3) of ethanol Pm, only lycopodium
dP/dt at 25 (g/m^3) of ethanol dP/dt at 50 (g/m^3) of ethanol
dP/dt at 75 (g/m^3) of ethanol dP/dt, only lycopodium
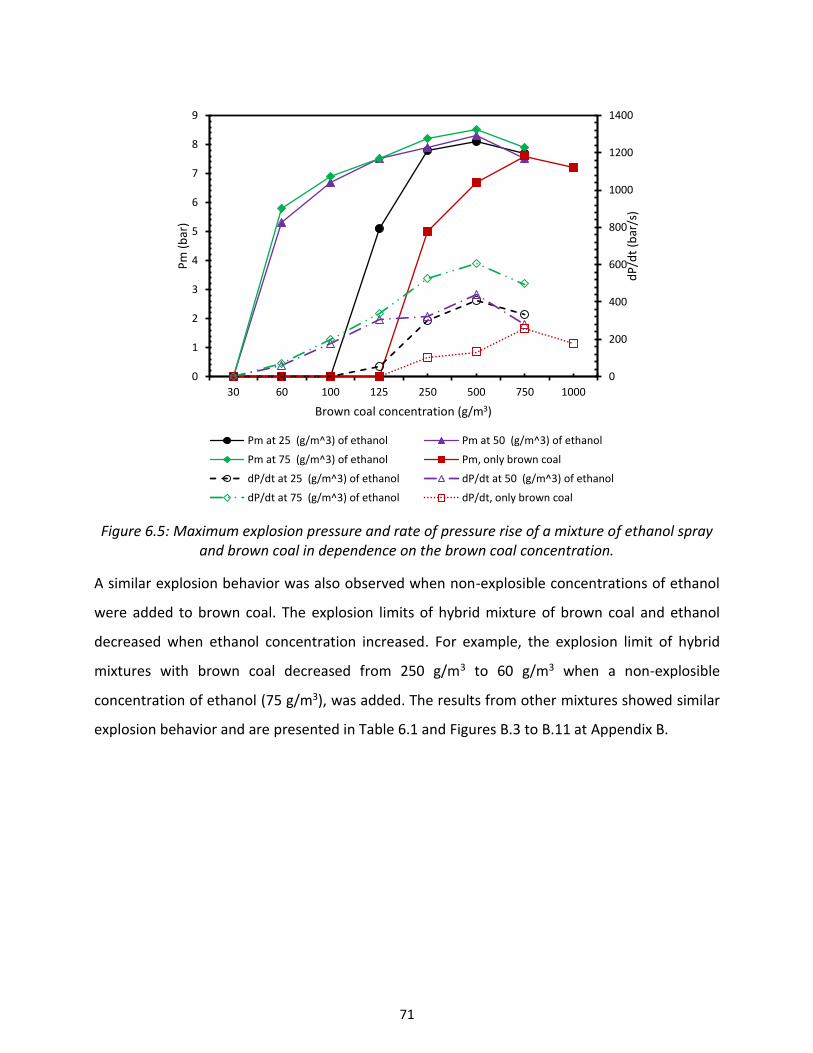
71
Figure 6.5: Maximum explosion pressure and rate of pressure rise of a mixture of ethanol spray and brown coal in dependence on the brown coal concentration.
A similar explosion behavior was also observed when non-explosible concentrations of ethanol
were added to brown coal. The explosion limits of hybrid mixture of brown coal and ethanol
decreased when ethanol concentration increased. For example, the explosion limit of hybrid
mixtures with brown coal decreased from 250 g/m3 to 60 g/m3 when a non-explosible
concentration of ethanol (75 g/m3), was added. The results from other mixtures showed similar
explosion behavior and are presented in Table 6.1 and Figures B.3 to B.11 at Appendix B.
0
200
400
600
800
1000
1200
1400
0
1
2
3
4
5
6
7
8
9
30 60 100 125 250 500 750 1000
dP
/dt
(bar
/s)
Pm
(b
ar)
Brown coal concentration (g/m3)
Pm at 25 (g/m^3) of ethanol Pm at 50 (g/m^3) of ethanol
Pm at 75 (g/m^3) of ethanol Pm, only brown coal
dP/dt at 25 (g/m^3) of ethanol dP/dt at 50 (g/m^3) of ethanol
dP/dt at 75 (g/m^3) of ethanol dP/dt, only brown coal
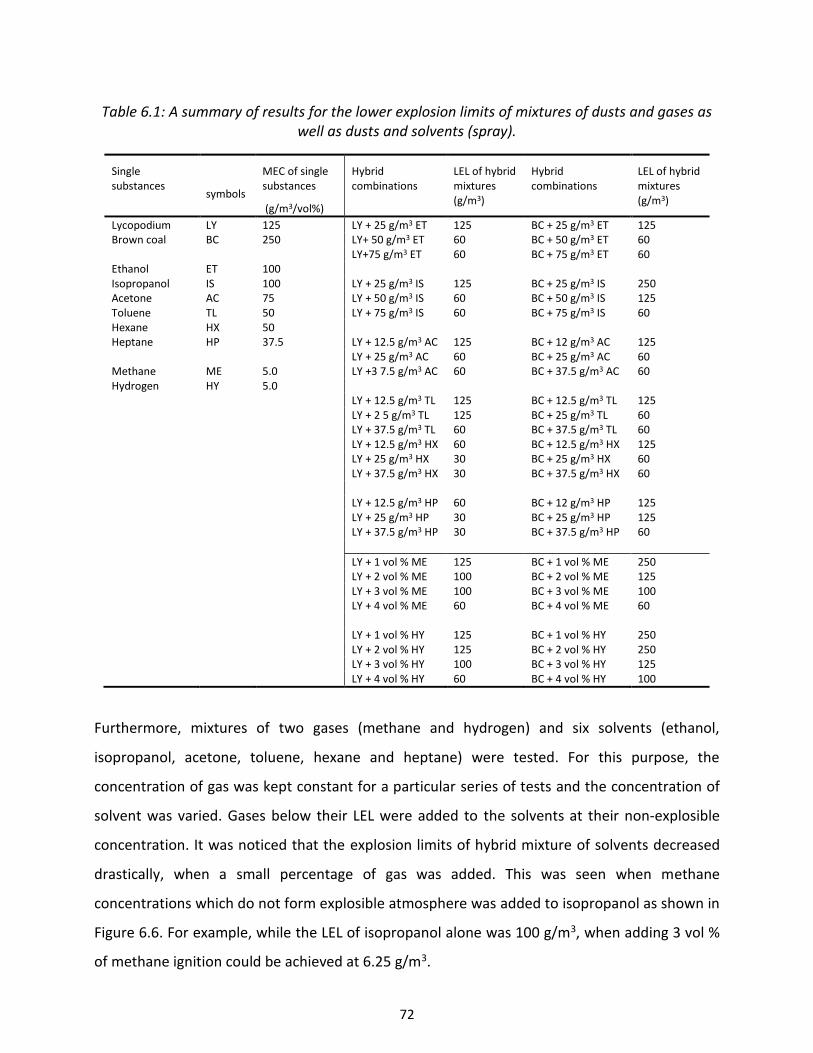
72
Table 6.1: A summary of results for the lower explosion limits of mixtures of dusts and gases as well as dusts and solvents (spray).
Single substances
symbols
MEC of single substances
(g/m3/vol%)
Hybrid combinations
LEL of hybrid mixtures (g/m3)
Hybrid combinations
LEL of hybrid mixtures (g/m3)
Lycopodium LY 125 LY + 25 g/m3 ET 125 BC + 25 g/m3 ET 125 Brown coal BC 250 LY+ 50 g/m3 ET 60 BC + 50 g/m3 ET 60 LY+75 g/m3 ET 60 BC + 75 g/m3 ET 60 Ethanol ET 100 Isopropanol IS 100 LY + 25 g/m3 IS 125 BC + 25 g/m3 IS 250 Acetone AC 75 LY + 50 g/m3 IS 60 BC + 50 g/m3 IS 125 Toluene TL 50 LY + 75 g/m3 IS 60 BC + 75 g/m3 IS 60 Hexane HX 50 Heptane HP 37.5 LY + 12.5 g/m3 AC 125 BC + 12 g/m3 AC 125 LY + 25 g/m3 AC 60 BC + 25 g/m3 AC 60 Methane ME 5.0 LY +3 7.5 g/m3 AC 60 BC + 37.5 g/m3 AC 60 Hydrogen HY 5.0 LY + 12.5 g/m3 TL 125 BC + 12.5 g/m3 TL 125 LY + 2 5 g/m3 TL 125 BC + 25 g/m3 TL 60 LY + 37.5 g/m3 TL 60 BC + 37.5 g/m3 TL 60 LY + 12.5 g/m3 HX 60 BC + 12.5 g/m3 HX 125 LY + 25 g/m3 HX 30 BC + 25 g/m3 HX 60 LY + 37.5 g/m3 HX 30 BC + 37.5 g/m3 HX 60 LY + 12.5 g/m3 HP 60 BC + 12 g/m3 HP 125 LY + 25 g/m3 HP 30 BC + 25 g/m3 HP 125 LY + 37.5 g/m3 HP 30 BC + 37.5 g/m3 HP 60
LY + 1 vol % ME 125 BC + 1 vol % ME 250 LY + 2 vol % ME 100 BC + 2 vol % ME 125 LY + 3 vol % ME 100 BC + 3 vol % ME 100 LY + 4 vol % ME 60 BC + 4 vol % ME 60 LY + 1 vol % HY 125 BC + 1 vol % HY 250 LY + 2 vol % HY 125 BC + 2 vol % HY 250 LY + 3 vol % HY 100 BC + 3 vol % HY 125 LY + 4 vol % HY 60 BC + 4 vol % HY 100
Furthermore, mixtures of two gases (methane and hydrogen) and six solvents (ethanol,
isopropanol, acetone, toluene, hexane and heptane) were tested. For this purpose, the
concentration of gas was kept constant for a particular series of tests and the concentration of
solvent was varied. Gases below their LEL were added to the solvents at their non-explosible
concentration. It was noticed that the explosion limits of hybrid mixture of solvents decreased
drastically, when a small percentage of gas was added. This was seen when methane
concentrations which do not form explosible atmosphere was added to isopropanol as shown in
Figure 6.6. For example, while the LEL of isopropanol alone was 100 g/m3, when adding 3 vol %
of methane ignition could be achieved at 6.25 g/m3.
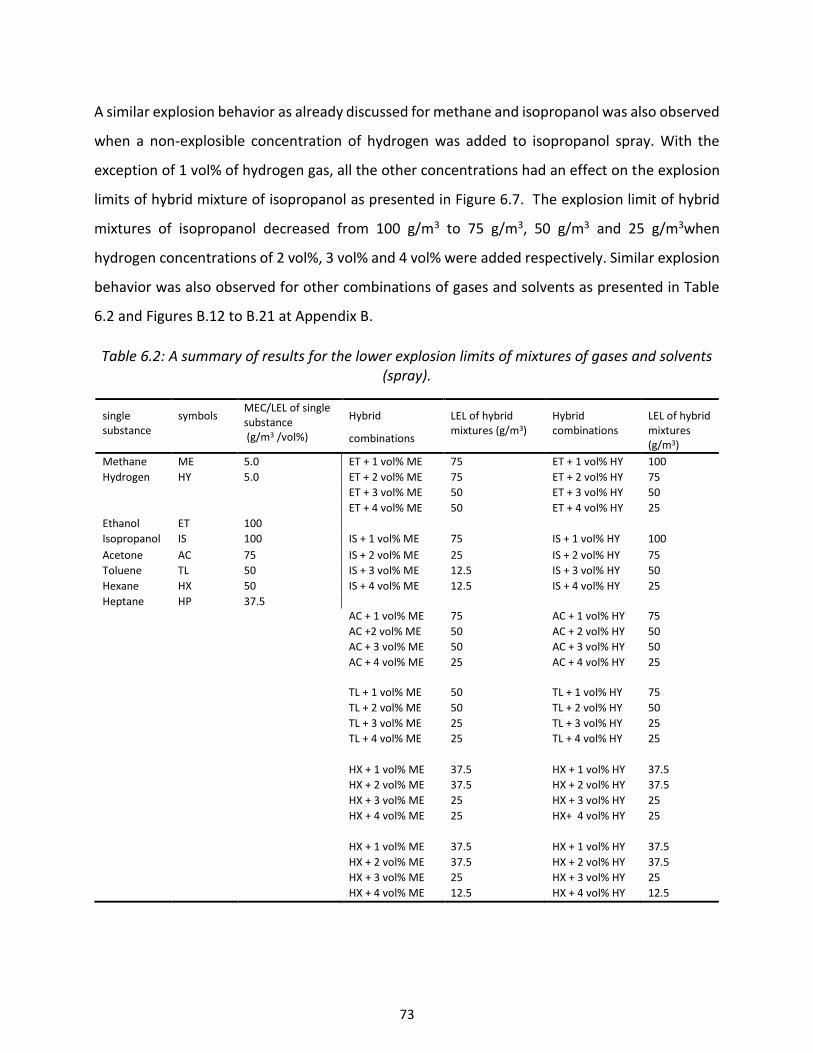
73
A similar explosion behavior as already discussed for methane and isopropanol was also observed
when a non-explosible concentration of hydrogen was added to isopropanol spray. With the
exception of 1 vol% of hydrogen gas, all the other concentrations had an effect on the explosion
limits of hybrid mixture of isopropanol as presented in Figure 6.7. The explosion limit of hybrid
mixtures of isopropanol decreased from 100 g/m3 to 75 g/m3, 50 g/m3 and 25 g/m3when
hydrogen concentrations of 2 vol%, 3 vol% and 4 vol% were added respectively. Similar explosion
behavior was also observed for other combinations of gases and solvents as presented in Table
6.2 and Figures B.12 to B.21 at Appendix B.
Table 6.2: A summary of results for the lower explosion limits of mixtures of gases and solvents (spray).
single substance
symbols MEC/LEL of single substance (g/m3 /vol%)
Hybrid
combinations
LEL of hybrid mixtures (g/m3)
Hybrid combinations
LEL of hybrid mixtures (g/m3)
Methane ME 5.0 ET + 1 vol% ME 75 ET + 1 vol% HY 100
Hydrogen HY 5.0 ET + 2 vol% ME 75 ET + 2 vol% HY 75
ET + 3 vol% ME 50 ET + 3 vol% HY 50
ET + 4 vol% ME 50 ET + 4 vol% HY 25
Ethanol ET 100
Isopropanol IS 100 IS + 1 vol% ME 75 IS + 1 vol% HY 100
Acetone AC 75 IS + 2 vol% ME 25 IS + 2 vol% HY 75
Toluene TL 50 IS + 3 vol% ME 12.5 IS + 3 vol% HY 50
Hexane HX 50 IS + 4 vol% ME 12.5 IS + 4 vol% HY 25
Heptane HP 37.5 AC + 1 vol% ME 75 AC + 1 vol% HY 75
AC +2 vol% ME 50 AC + 2 vol% HY 50
AC + 3 vol% ME 50 AC + 3 vol% HY 50
AC + 4 vol% ME 25 AC + 4 vol% HY 25
TL + 1 vol% ME 50 TL + 1 vol% HY 75
TL + 2 vol% ME 50 TL + 2 vol% HY 50
TL + 3 vol% ME 25 TL + 3 vol% HY 25
TL + 4 vol% ME 25 TL + 4 vol% HY 25
HX + 1 vol% ME 37.5 HX + 1 vol% HY 37.5
HX + 2 vol% ME 37.5 HX + 2 vol% HY 37.5
HX + 3 vol% ME 25 HX + 3 vol% HY 25
HX + 4 vol% ME 25 HX+ 4 vol% HY 25
HX + 1 vol% ME 37.5 HX + 1 vol% HY 37.5
HX + 2 vol% ME 37.5 HX + 2 vol% HY 37.5
HX + 3 vol% ME 25 HX + 3 vol% HY 25
HX + 4 vol% ME 12.5 HX + 4 vol% HY 12.5
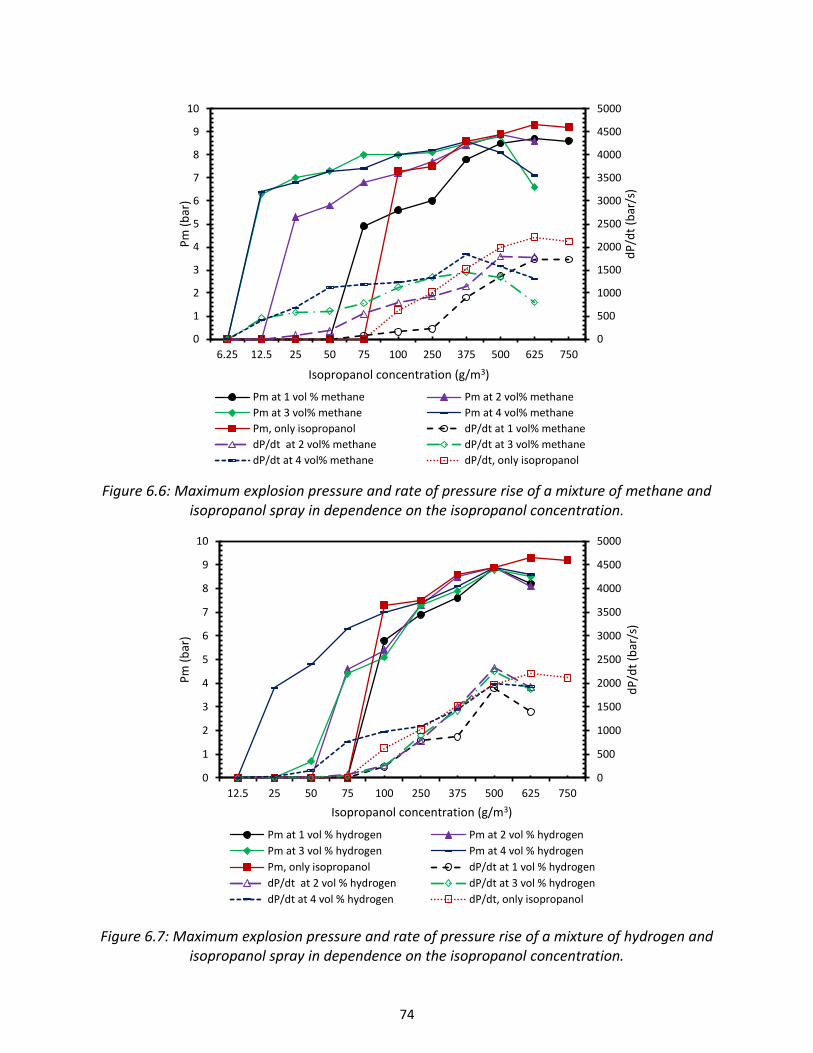
74
Figure 6.6: Maximum explosion pressure and rate of pressure rise of a mixture of methane and isopropanol spray in dependence on the isopropanol concentration.
Figure 6.7: Maximum explosion pressure and rate of pressure rise of a mixture of hydrogen and isopropanol spray in dependence on the isopropanol concentration.
0
500
1000
1500
2000
2500
3000
3500
4000
4500
5000
0
1
2
3
4
5
6
7
8
9
10
6.25 12.5 25 50 75 100 250 375 500 625 750
dP
/dt
(bar
/s)
Pm
(b
ar)
Isopropanol concentration (g/m3)
Pm at 1 vol % methane Pm at 2 vol% methane
Pm at 3 vol% methane Pm at 4 vol% methane
Pm, only isopropanol dP/dt at 1 vol% methane
dP/dt at 2 vol% methane dP/dt at 3 vol% methane
dP/dt at 4 vol% methane dP/dt, only isopropanol
0
500
1000
1500
2000
2500
3000
3500
4000
4500
5000
0
1
2
3
4
5
6
7
8
9
10
12.5 25 50 75 100 250 375 500 625 750
dP
/dt
(bar
/s)
Pm
(b
ar)
Isopropanol concentration (g/m3)
Pm at 1 vol % hydrogen Pm at 2 vol % hydrogen
Pm at 3 vol % hydrogen Pm at 4 vol % hydrogen
Pm, only isopropanol dP/dt at 1 vol % hydrogen
dP/dt at 2 vol % hydrogen dP/dt at 3 vol % hydrogen
dP/dt at 4 vol % hydrogen dP/dt, only isopropanol

75
6.1.1.3 Lower explosion limits of three-phase hybrid mixtures
Based on the results obtained from single and two-phase mixtures, the lower explosion limits of
three-phase hybrid mixtures were investigated. This was achieved by adding non-explosible
concentrations of solvent (spray) and gas to a dust at its non-explosible concentration. Figures
6.8 and 6.9 have a fixed isopropanol concentration (50 g/m3) and show the pressure development
for different methane concentrations with increasing dust concentration. Figure 6.8 shows the
results for 50 g/m3 of isopropanol with varying concentrations of methane and lycopodium. The
results revealed that increasing the methane concentration up to 4 vol% at 50 g/m3 isopropanol,
lowered the hybrid mixture at which ignition could be observed down to 10 g/m3. The special
aspect of this result is that, various combinations of two-phase hybrid mixtures where explosions
were not obtained became ignitable when just a small amount of the third phase was added. For
example, mixtures of 1 vol% methane and 60 g/m3 lycopodium, 2 vol% methane and 30 g/m3
lycopodium, which initially were not ignitable became ignitable when a concentration of
isopropanol which was 50 % lower than its LEL was added.
Figure 6.8: Maximum explosion pressure and rate of pressure rise of mixtures of lycopodium, methane and 50 g/m3 of isopropanol spray in dependence on lycopodium concentration.
0
200
400
600
800
1000
1200
1400
1600
1800
0
1
2
3
4
5
6
7
8
9
5 10 20 30 60 125 250 375 500 750 1000
dP
/dt
(bar
/s)
Pm
(b
ar)
Lycopodium concentration (g/m3)
Pm at 50 g/m^3 isopropanol + 1 vol% methane Pm at 50 g/m^3 isopropanol + 2 vol% methane
Pm at 50 g/m^3 isopropanol + 3 vol% methane Pm at 50 g/m^3 isopropanol + 4 vol% methane
Pm, only lycopodium dP/dt at 50 g/m^3 isopropanol + 1 vol% methane
dP/dt at 50 g/m^3 isopropanol + 2 vol% methane dP/dt at 50 g/m^3 isopropanol + 3 vol% methane
dP/dt at 50 g/m^3 isopropanol + 4 vol% methane dP/dt, only lycopodium

76
Moreover, Figure 6.9 presents the results obtained for 50 g/m3 of isopropanol with respect to
various concentrations of methane and brown coal. A similar explosion behavior as explained
above was noticed. Adding non-explosible concentrations of isopropanol and methane drastically
decreased the explosion limit of hybrid mixtures of brown coal. For example, brown coal with a
concentration of 60 g/m3 and 1 vol% of methane, which was originally not ignitable became
ignitable when isopropanol concentration (50 % below the LEL) which does not itself form
explosible atmosphere was added. Similar explosion behavior was also observed for other tested
combinations as presented in Table 6.3 and Figures B.22 to B.35 at Appendix B. It must be noticed
that the zero LEL in Table 6.3 indicates that, the addition of solvent and gas alone can explosion
without the dust.
Figure 6.9: Maximum explosion pressure and rate of pressure rise of mixtures of brown coal, methane and 50 g/m3 of isopropanol spray in dependence on the dust concentration.
0
200
400
600
800
1000
1200
1400
1600
1800
0
1
2
3
4
5
6
7
8
9
0 5 10 20 30 60 125 250 375 500 750 1000
dP
/dt
(bar
/s)
Pm
(b
ar)
Brown coal concentration (g/m3)
Pm at 50 g/m^3 isopropanol + 1 vol% methane Pm at 50 g/m^3 isopropanol + 2 vol% methane
Pm at 50 g/m^3 isopropanol + 3 vol% methane Pm at 50 g/m^3 isopropanol + 4 vol% methane
Pm, only brown coal dP/dt at 50 g/m^3 isopropanol + 1 vol% methane
dP/dt at 50 g/m^3 isopropanol + 2 vol% methane dP/dt at 50 g/m^3 isopropanol + 3 vol% methane
dP/dt at 50 g/m^3 isopropanol + 4 vol% methane dP/dt, only brown coal
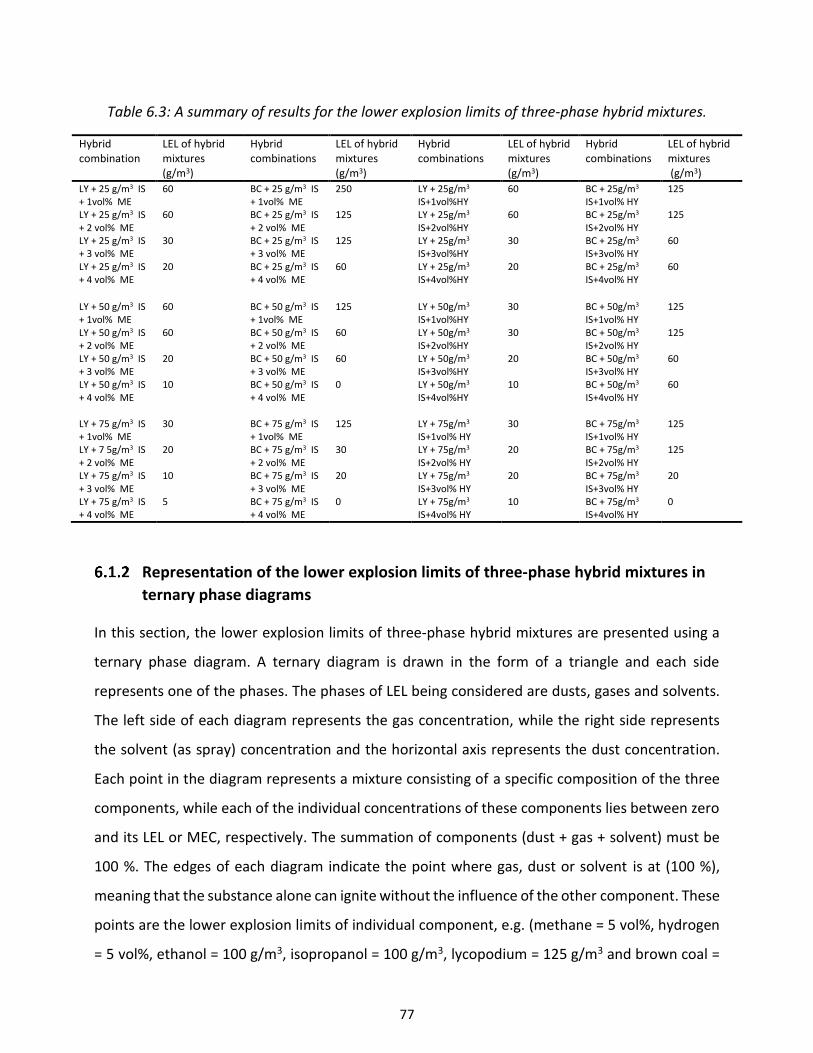
77
Table 6.3: A summary of results for the lower explosion limits of three-phase hybrid mixtures.
Hybrid combination
LEL of hybrid mixtures (g/m3)
Hybrid combinations
LEL of hybrid mixtures (g/m3)
Hybrid combinations
LEL of hybrid mixtures (g/m3)
Hybrid combinations
LEL of hybrid mixtures (g/m3)
LY + 25 g/m3 IS + 1vol% ME
60 BC + 25 g/m3 IS + 1vol% ME
250 LY + 25g/m3 IS+1vol%HY
60 BC + 25g/m3 IS+1vol% HY
125
LY + 25 g/m3 IS + 2 vol% ME
60 BC + 25 g/m3 IS + 2 vol% ME
125 LY + 25g/m3 IS+2vol%HY
60 BC + 25g/m3 IS+2vol% HY
125
LY + 25 g/m3 IS + 3 vol% ME
30 BC + 25 g/m3 IS + 3 vol% ME
125 LY + 25g/m3 IS+3vol%HY
30 BC + 25g/m3 IS+3vol% HY
60
LY + 25 g/m3 IS + 4 vol% ME
20 BC + 25 g/m3 IS + 4 vol% ME
60 LY + 25g/m3 IS+4vol%HY
20 BC + 25g/m3 IS+4vol% HY
60
LY + 50 g/m3 IS + 1vol% ME
60 BC + 50 g/m3 IS + 1vol% ME
125 LY + 50g/m3 IS+1vol%HY
30 BC + 50g/m3 IS+1vol% HY
125
LY + 50 g/m3 IS + 2 vol% ME
60 BC + 50 g/m3 IS + 2 vol% ME
60 LY + 50g/m3 IS+2vol%HY
30 BC + 50g/m3 IS+2vol% HY
125
LY + 50 g/m3 IS + 3 vol% ME
20 BC + 50 g/m3 IS + 3 vol% ME
60 LY + 50g/m3 IS+3vol%HY
20 BC + 50g/m3 IS+3vol% HY
60
LY + 50 g/m3 IS + 4 vol% ME
10 BC + 50 g/m3 IS + 4 vol% ME
0 LY + 50g/m3 IS+4vol%HY
10 BC + 50g/m3 IS+4vol% HY
60
LY + 75 g/m3 IS + 1vol% ME
30 BC + 75 g/m3 IS + 1vol% ME
125 LY + 75g/m3 IS+1vol% HY
30 BC + 75g/m3 IS+1vol% HY
125
LY + 7 5g/m3 IS + 2 vol% ME
20 BC + 75 g/m3 IS + 2 vol% ME
30 LY + 75g/m3 IS+2vol% HY
20 BC + 75g/m3 IS+2vol% HY
125
LY + 75 g/m3 IS + 3 vol% ME
10 BC + 75 g/m3 IS + 3 vol% ME
20 LY + 75g/m3 IS+3vol% HY
20 BC + 75g/m3 IS+3vol% HY
20
LY + 75 g/m3 IS + 4 vol% ME
5 BC + 75 g/m3 IS + 4 vol% ME
0 LY + 75g/m3 IS+4vol% HY
10 BC + 75g/m3 IS+4vol% HY
0
Representation of the lower explosion limits of three-phase hybrid mixtures in
ternary phase diagrams
In this section, the lower explosion limits of three-phase hybrid mixtures are presented using a
ternary phase diagram. A ternary diagram is drawn in the form of a triangle and each side
represents one of the phases. The phases of LEL being considered are dusts, gases and solvents.
The left side of each diagram represents the gas concentration, while the right side represents
the solvent (as spray) concentration and the horizontal axis represents the dust concentration.
Each point in the diagram represents a mixture consisting of a specific composition of the three
components, while each of the individual concentrations of these components lies between zero
and its LEL or MEC, respectively. The summation of components (dust + gas + solvent) must be
100 %. The edges of each diagram indicate the point where gas, dust or solvent is at (100 %),
meaning that the substance alone can ignite without the influence of the other component. These
points are the lower explosion limits of individual component, e.g. (methane = 5 vol%, hydrogen
= 5 vol%, ethanol = 100 g/m3, isopropanol = 100 g/m3, lycopodium = 125 g/m3 and brown coal =
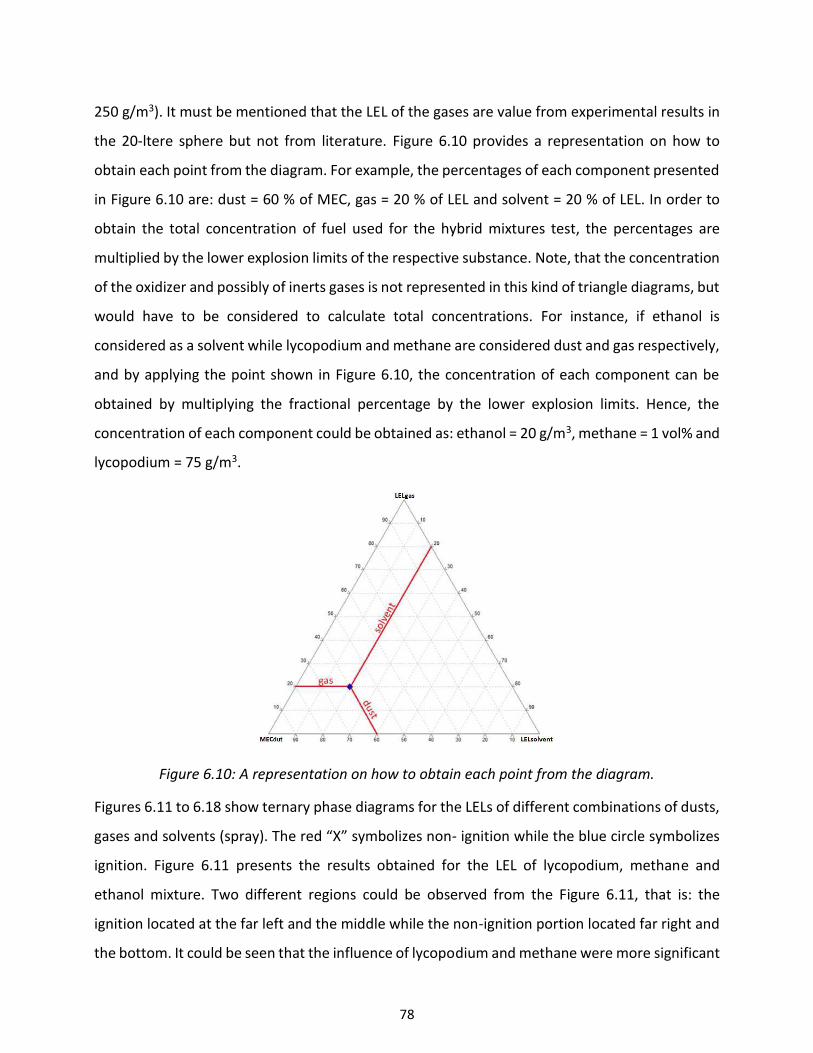
78
250 g/m3). It must be mentioned that the LEL of the gases are value from experimental results in
the 20-ltere sphere but not from literature. Figure 6.10 provides a representation on how to
obtain each point from the diagram. For example, the percentages of each component presented
in Figure 6.10 are: dust = 60 % of MEC, gas = 20 % of LEL and solvent = 20 % of LEL. In order to
obtain the total concentration of fuel used for the hybrid mixtures test, the percentages are
multiplied by the lower explosion limits of the respective substance. Note, that the concentration
of the oxidizer and possibly of inerts gases is not represented in this kind of triangle diagrams, but
would have to be considered to calculate total concentrations. For instance, if ethanol is
considered as a solvent while lycopodium and methane are considered dust and gas respectively,
and by applying the point shown in Figure 6.10, the concentration of each component can be
obtained by multiplying the fractional percentage by the lower explosion limits. Hence, the
concentration of each component could be obtained as: ethanol = 20 g/m3, methane = 1 vol% and
lycopodium = 75 g/m3.
Figure 6.10: A representation on how to obtain each point from the diagram.
Figures 6.11 to 6.18 show ternary phase diagrams for the LELs of different combinations of dusts,
gases and solvents (spray). The red “X” symbolizes non- ignition while the blue circle symbolizes
ignition. Figure 6.11 presents the results obtained for the LEL of lycopodium, methane and
ethanol mixture. Two different regions could be observed from the Figure 6.11, that is: the
ignition located at the far left and the middle while the non-ignition portion located far right and
the bottom. It could be seen that the influence of lycopodium and methane were more significant
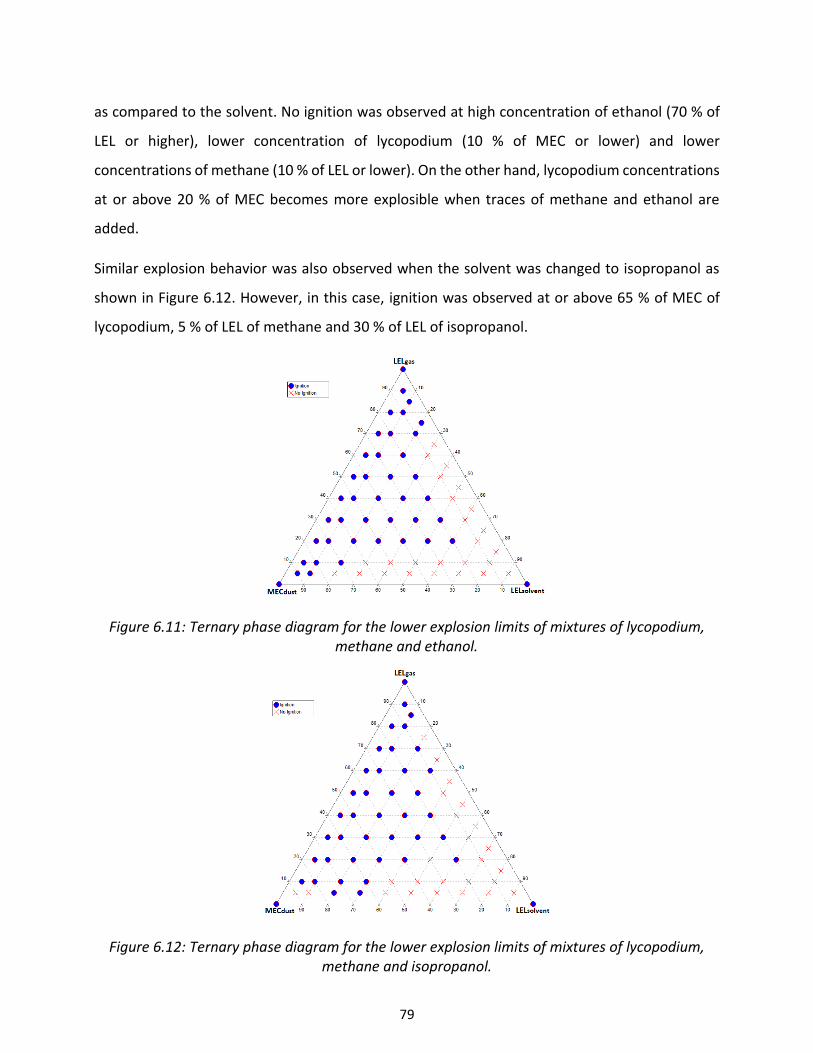
79
as compared to the solvent. No ignition was observed at high concentration of ethanol (70 % of
LEL or higher), lower concentration of lycopodium (10 % of MEC or lower) and lower
concentrations of methane (10 % of LEL or lower). On the other hand, lycopodium concentrations
at or above 20 % of MEC becomes more explosible when traces of methane and ethanol are
added.
Similar explosion behavior was also observed when the solvent was changed to isopropanol as
shown in Figure 6.12. However, in this case, ignition was observed at or above 65 % of MEC of
lycopodium, 5 % of LEL of methane and 30 % of LEL of isopropanol.
Figure 6.11: Ternary phase diagram for the lower explosion limits of mixtures of lycopodium, methane and ethanol.
Figure 6.12: Ternary phase diagram for the lower explosion limits of mixtures of lycopodium, methane and isopropanol.
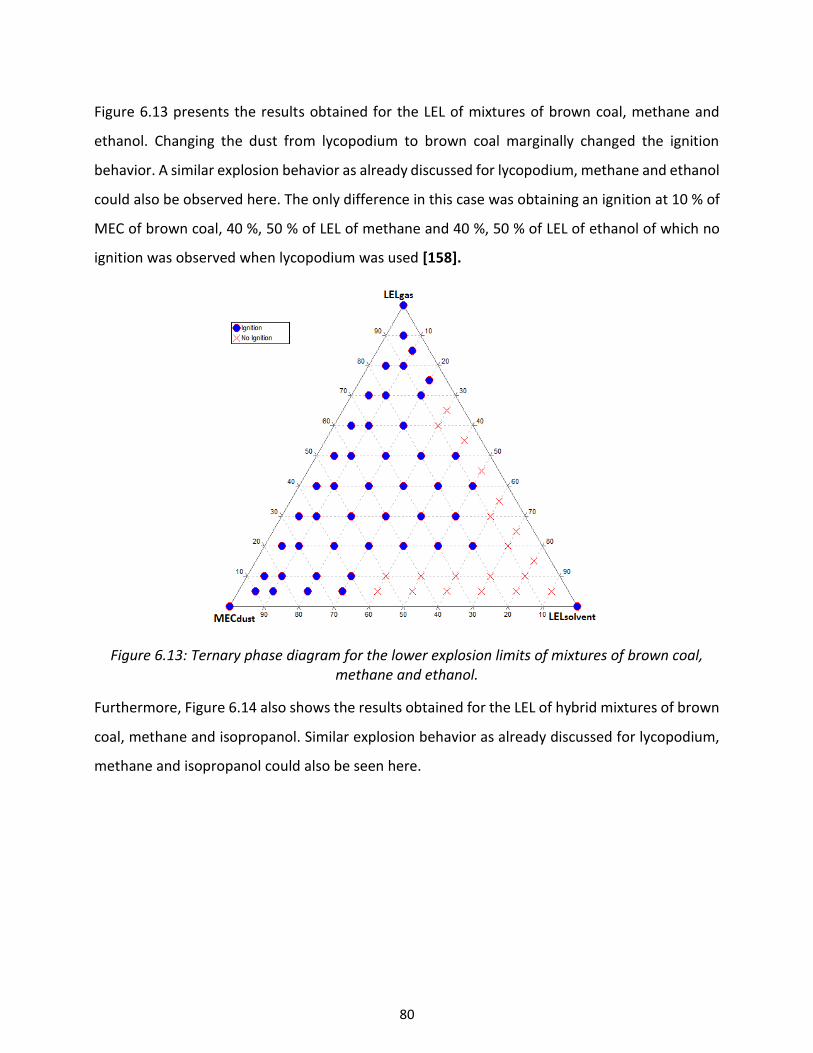
80
Figure 6.13 presents the results obtained for the LEL of mixtures of brown coal, methane and
ethanol. Changing the dust from lycopodium to brown coal marginally changed the ignition
behavior. A similar explosion behavior as already discussed for lycopodium, methane and ethanol
could also be observed here. The only difference in this case was obtaining an ignition at 10 % of
MEC of brown coal, 40 %, 50 % of LEL of methane and 40 %, 50 % of LEL of ethanol of which no
ignition was observed when lycopodium was used [158].
Figure 6.13: Ternary phase diagram for the lower explosion limits of mixtures of brown coal, methane and ethanol.
Furthermore, Figure 6.14 also shows the results obtained for the LEL of hybrid mixtures of brown
coal, methane and isopropanol. Similar explosion behavior as already discussed for lycopodium,
methane and isopropanol could also be seen here.
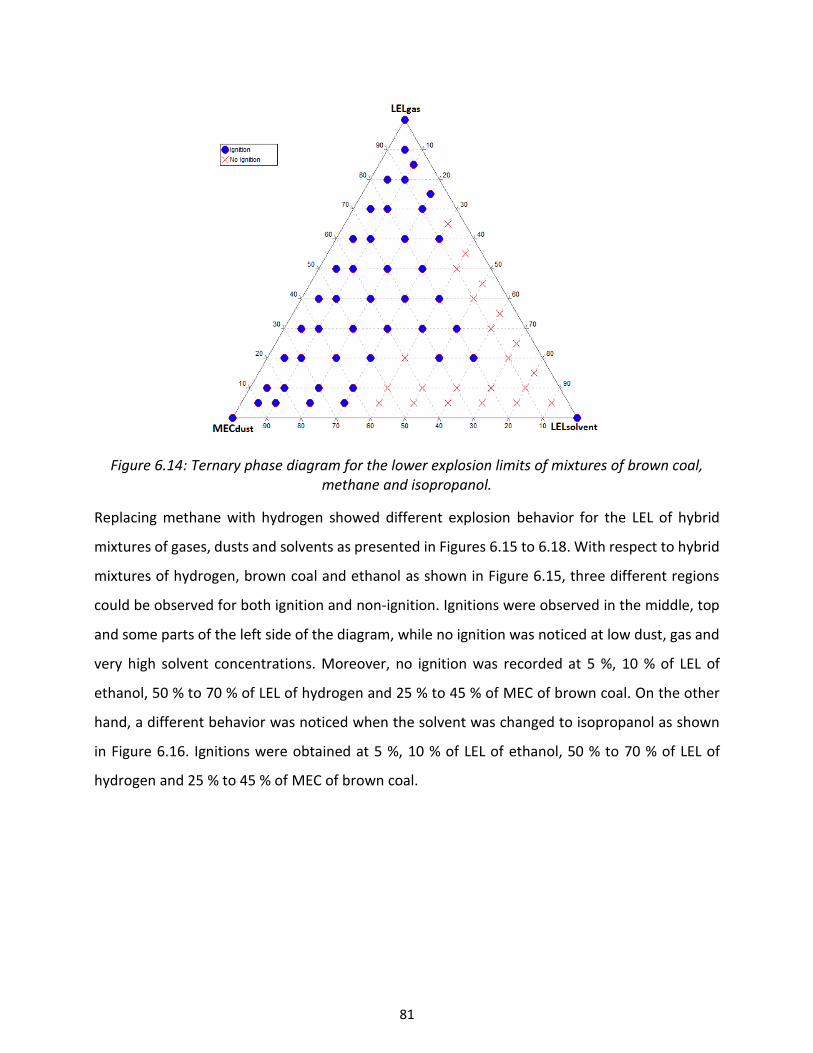
81
Figure 6.14: Ternary phase diagram for the lower explosion limits of mixtures of brown coal, methane and isopropanol.
Replacing methane with hydrogen showed different explosion behavior for the LEL of hybrid
mixtures of gases, dusts and solvents as presented in Figures 6.15 to 6.18. With respect to hybrid
mixtures of hydrogen, brown coal and ethanol as shown in Figure 6.15, three different regions
could be observed for both ignition and non-ignition. Ignitions were observed in the middle, top
and some parts of the left side of the diagram, while no ignition was noticed at low dust, gas and
very high solvent concentrations. Moreover, no ignition was recorded at 5 %, 10 % of LEL of
ethanol, 50 % to 70 % of LEL of hydrogen and 25 % to 45 % of MEC of brown coal. On the other
hand, a different behavior was noticed when the solvent was changed to isopropanol as shown
in Figure 6.16. Ignitions were obtained at 5 %, 10 % of LEL of ethanol, 50 % to 70 % of LEL of
hydrogen and 25 % to 45 % of MEC of brown coal.
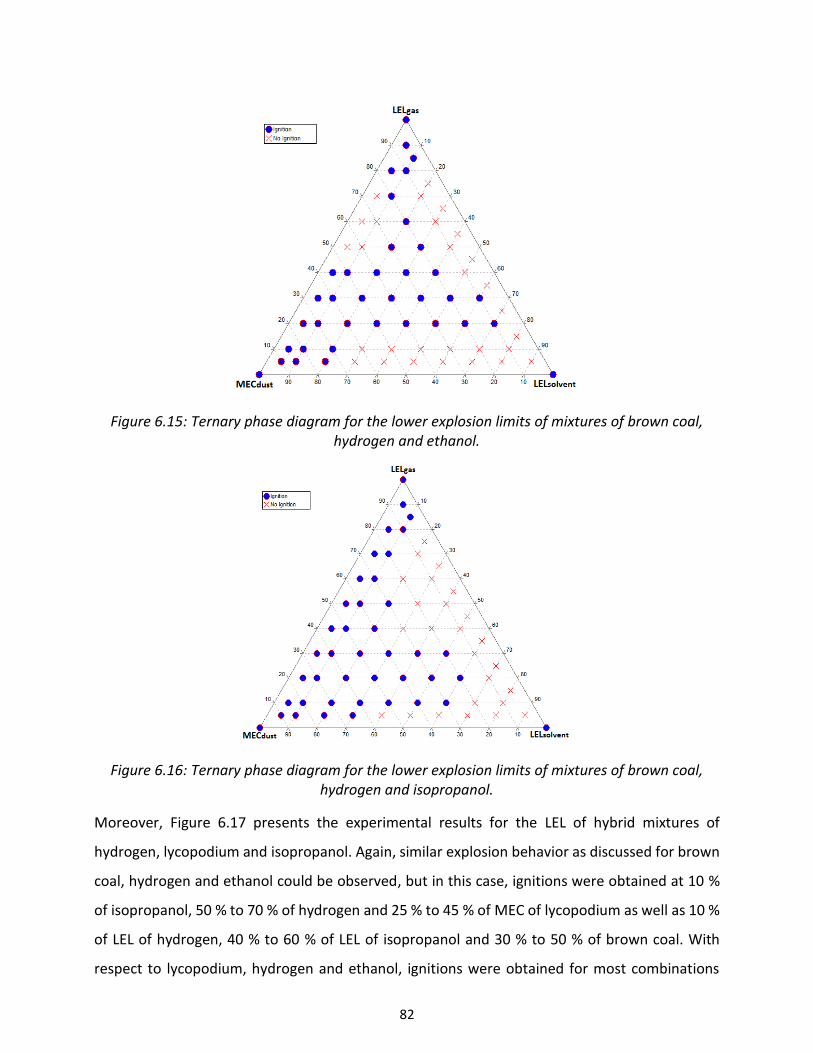
82
Figure 6.15: Ternary phase diagram for the lower explosion limits of mixtures of brown coal, hydrogen and ethanol.
Figure 6.16: Ternary phase diagram for the lower explosion limits of mixtures of brown coal, hydrogen and isopropanol.
Moreover, Figure 6.17 presents the experimental results for the LEL of hybrid mixtures of
hydrogen, lycopodium and isopropanol. Again, similar explosion behavior as discussed for brown
coal, hydrogen and ethanol could be observed, but in this case, ignitions were obtained at 10 %
of isopropanol, 50 % to 70 % of hydrogen and 25 % to 45 % of MEC of lycopodium as well as 10 %
of LEL of hydrogen, 40 % to 60 % of LEL of isopropanol and 30 % to 50 % of brown coal. With
respect to lycopodium, hydrogen and ethanol, ignitions were obtained for most combinations
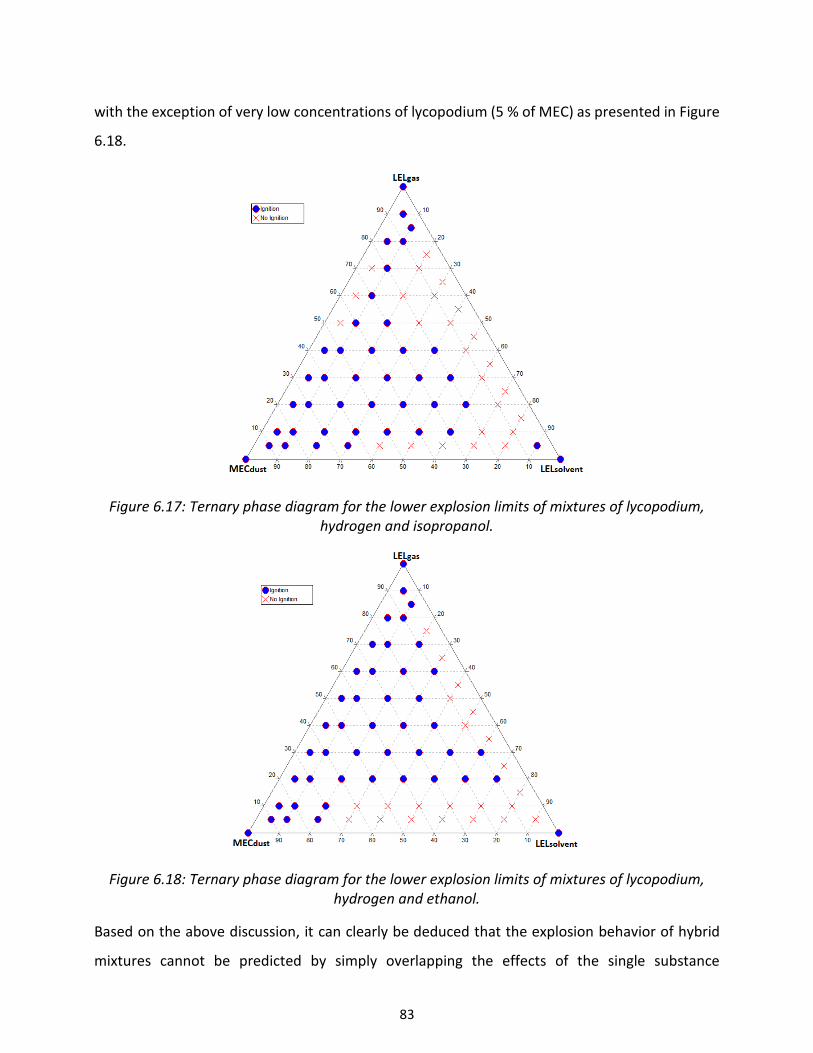
83
with the exception of very low concentrations of lycopodium (5 % of MEC) as presented in Figure
6.18.
Figure 6.17: Ternary phase diagram for the lower explosion limits of mixtures of lycopodium, hydrogen and isopropanol.
Figure 6.18: Ternary phase diagram for the lower explosion limits of mixtures of lycopodium, hydrogen and ethanol.
Based on the above discussion, it can clearly be deduced that the explosion behavior of hybrid
mixtures cannot be predicted by simply overlapping the effects of the single substance
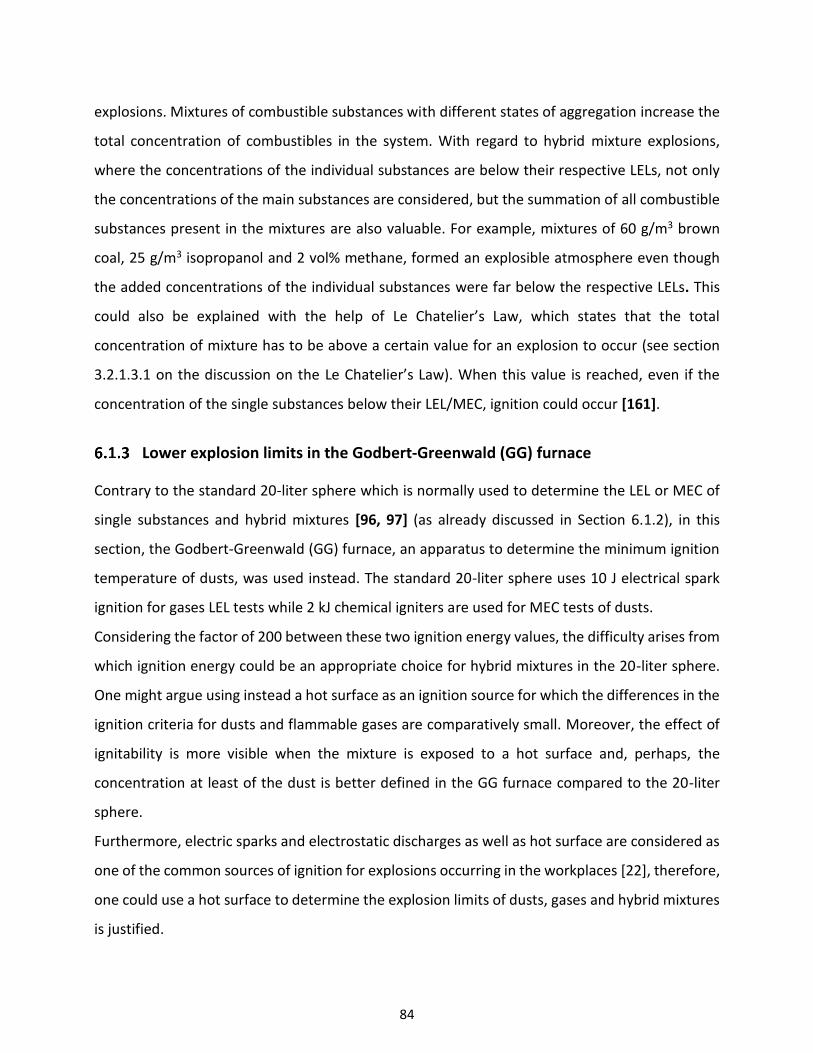
84
explosions. Mixtures of combustible substances with different states of aggregation increase the
total concentration of combustibles in the system. With regard to hybrid mixture explosions,
where the concentrations of the individual substances are below their respective LELs, not only
the concentrations of the main substances are considered, but the summation of all combustible
substances present in the mixtures are also valuable. For example, mixtures of 60 g/m3 brown
coal, 25 g/m3 isopropanol and 2 vol% methane, formed an explosible atmosphere even though
the added concentrations of the individual substances were far below the respective LELs. This
could also be explained with the help of Le Chatelier’s Law, which states that the total
concentration of mixture has to be above a certain value for an explosion to occur (see section
3.2.1.3.1 on the discussion on the Le Chatelier’s Law). When this value is reached, even if the
concentration of the single substances below their LEL/MEC, ignition could occur [161].
Lower explosion limits in the Godbert-Greenwald (GG) furnace
Contrary to the standard 20-liter sphere which is normally used to determine the LEL or MEC of
single substances and hybrid mixtures [96, 97] (as already discussed in Section 6.1.2), in this
section, the Godbert-Greenwald (GG) furnace, an apparatus to determine the minimum ignition
temperature of dusts, was used instead. The standard 20-liter sphere uses 10 J electrical spark
ignition for gases LEL tests while 2 kJ chemical igniters are used for MEC tests of dusts.
Considering the factor of 200 between these two ignition energy values, the difficulty arises from
which ignition energy could be an appropriate choice for hybrid mixtures in the 20-liter sphere.
One might argue using instead a hot surface as an ignition source for which the differences in the
ignition criteria for dusts and flammable gases are comparatively small. Moreover, the effect of
ignitability is more visible when the mixture is exposed to a hot surface and, perhaps, the
concentration at least of the dust is better defined in the GG furnace compared to the 20-liter
sphere.
Furthermore, electric sparks and electrostatic discharges as well as hot surface are considered as
one of the common sources of ignition for explosions occurring in the workplaces [22], therefore,
one could use a hot surface to determine the explosion limits of dusts, gases and hybrid mixtures
is justified.
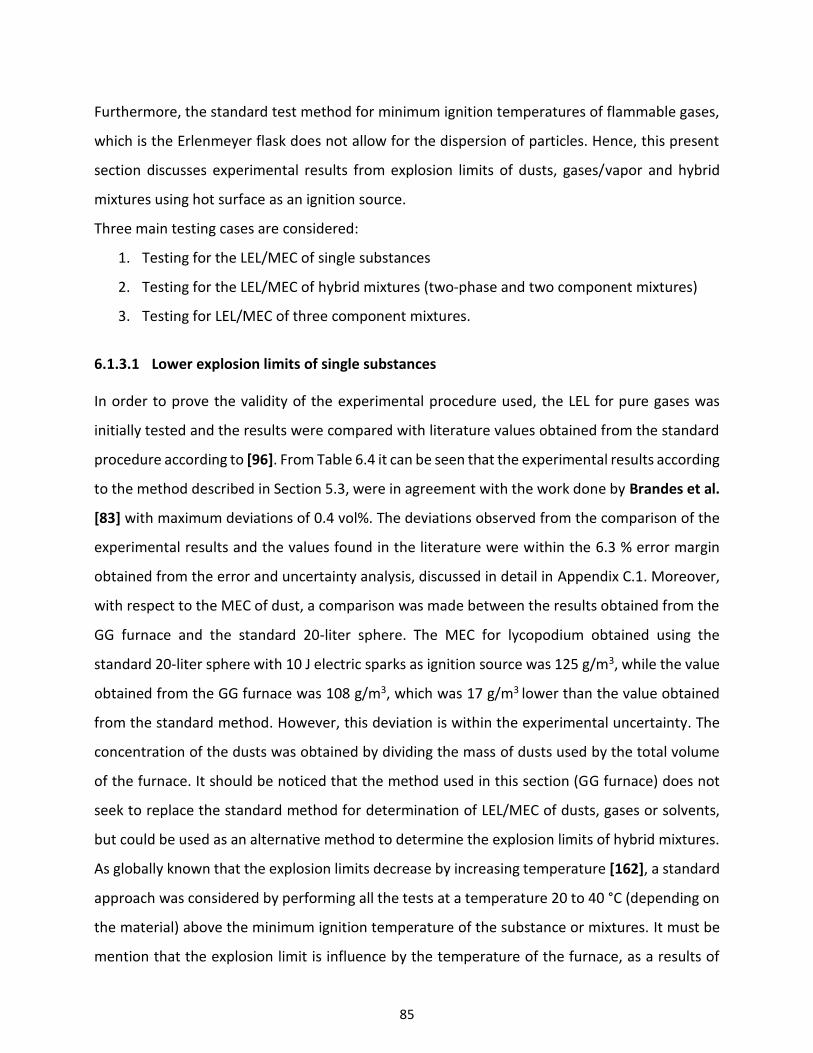
85
Furthermore, the standard test method for minimum ignition temperatures of flammable gases,
which is the Erlenmeyer flask does not allow for the dispersion of particles. Hence, this present
section discusses experimental results from explosion limits of dusts, gases/vapor and hybrid
mixtures using hot surface as an ignition source.
Three main testing cases are considered:
1. Testing for the LEL/MEC of single substances
2. Testing for the LEL/MEC of hybrid mixtures (two-phase and two component mixtures)
3. Testing for LEL/MEC of three component mixtures.
6.1.3.1 Lower explosion limits of single substances
In order to prove the validity of the experimental procedure used, the LEL for pure gases was
initially tested and the results were compared with literature values obtained from the standard
procedure according to [96]. From Table 6.4 it can be seen that the experimental results according
to the method described in Section 5.3, were in agreement with the work done by Brandes et al.
[83] with maximum deviations of 0.4 vol%. The deviations observed from the comparison of the
experimental results and the values found in the literature were within the 6.3 % error margin
obtained from the error and uncertainty analysis, discussed in detail in Appendix C.1. Moreover,
with respect to the MEC of dust, a comparison was made between the results obtained from the
GG furnace and the standard 20-liter sphere. The MEC for lycopodium obtained using the
standard 20-liter sphere with 10 J electric sparks as ignition source was 125 g/m3, while the value
obtained from the GG furnace was 108 g/m3, which was 17 g/m3 lower than the value obtained
from the standard method. However, this deviation is within the experimental uncertainty. The
concentration of the dusts was obtained by dividing the mass of dusts used by the total volume
of the furnace. It should be noticed that the method used in this section (GG furnace) does not
seek to replace the standard method for determination of LEL/MEC of dusts, gases or solvents,
but could be used as an alternative method to determine the explosion limits of hybrid mixtures.
As globally known that the explosion limits decrease by increasing temperature [162], a standard
approach was considered by performing all the tests at a temperature 20 to 40 °C (depending on
the material) above the minimum ignition temperature of the substance or mixtures. It must be
mention that the explosion limit is influence by the temperature of the furnace, as a results of
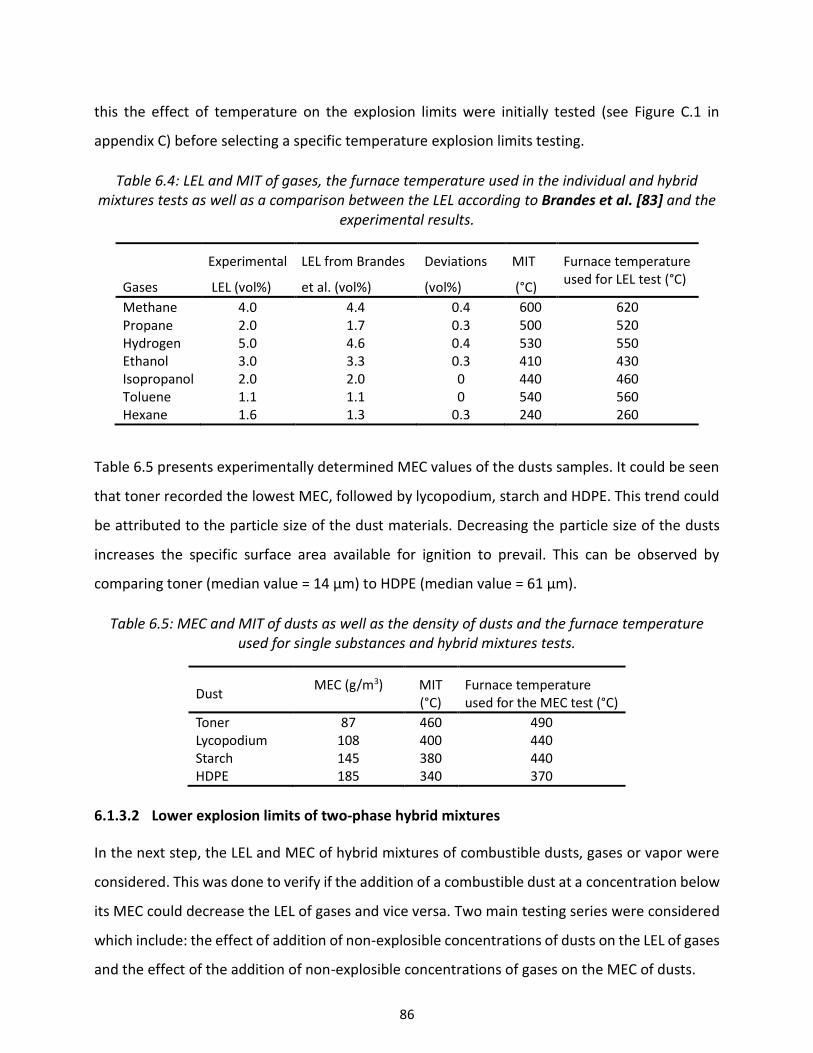
86
this the effect of temperature on the explosion limits were initially tested (see Figure C.1 in
appendix C) before selecting a specific temperature explosion limits testing.
Table 6.4: LEL and MIT of gases, the furnace temperature used in the individual and hybrid mixtures tests as well as a comparison between the LEL according to Brandes et al. [83] and the
experimental results.
Gases
Experimental
LEL (vol%)
LEL from Brandes
et al. (vol%)
Deviations
(vol%)
MIT
(°C)
Furnace temperature used for LEL test (°C)
Methane 4.0 4.4 0.4 600 620 Propane 2.0 1.7 0.3 500 520 Hydrogen 5.0 4.6 0.4 530 550 Ethanol 3.0 3.3 0.3 410 430 Isopropanol 2.0 2.0 0 440 460 Toluene 1.1 1.1 0 540 560 Hexane 1.6 1.3 0.3 240 260
Table 6.5 presents experimentally determined MEC values of the dusts samples. It could be seen
that toner recorded the lowest MEC, followed by lycopodium, starch and HDPE. This trend could
be attributed to the particle size of the dust materials. Decreasing the particle size of the dusts
increases the specific surface area available for ignition to prevail. This can be observed by
comparing toner (median value = 14 µm) to HDPE (median value = 61 µm).
Table 6.5: MEC and MIT of dusts as well as the density of dusts and the furnace temperature used for single substances and hybrid mixtures tests.
Dust MEC (g/m3) MIT
(°C) Furnace temperature used for the MEC test (°C)
Toner 87 460 490 Lycopodium 108 400 440 Starch 145 380 440 HDPE 185 340 370
6.1.3.2 Lower explosion limits of two-phase hybrid mixtures
In the next step, the LEL and MEC of hybrid mixtures of combustible dusts, gases or vapor were
considered. This was done to verify if the addition of a combustible dust at a concentration below
its MEC could decrease the LEL of gases and vice versa. Two main testing series were considered
which include: the effect of addition of non-explosible concentrations of dusts on the LEL of gases
and the effect of the addition of non-explosible concentrations of gases on the MEC of dusts.
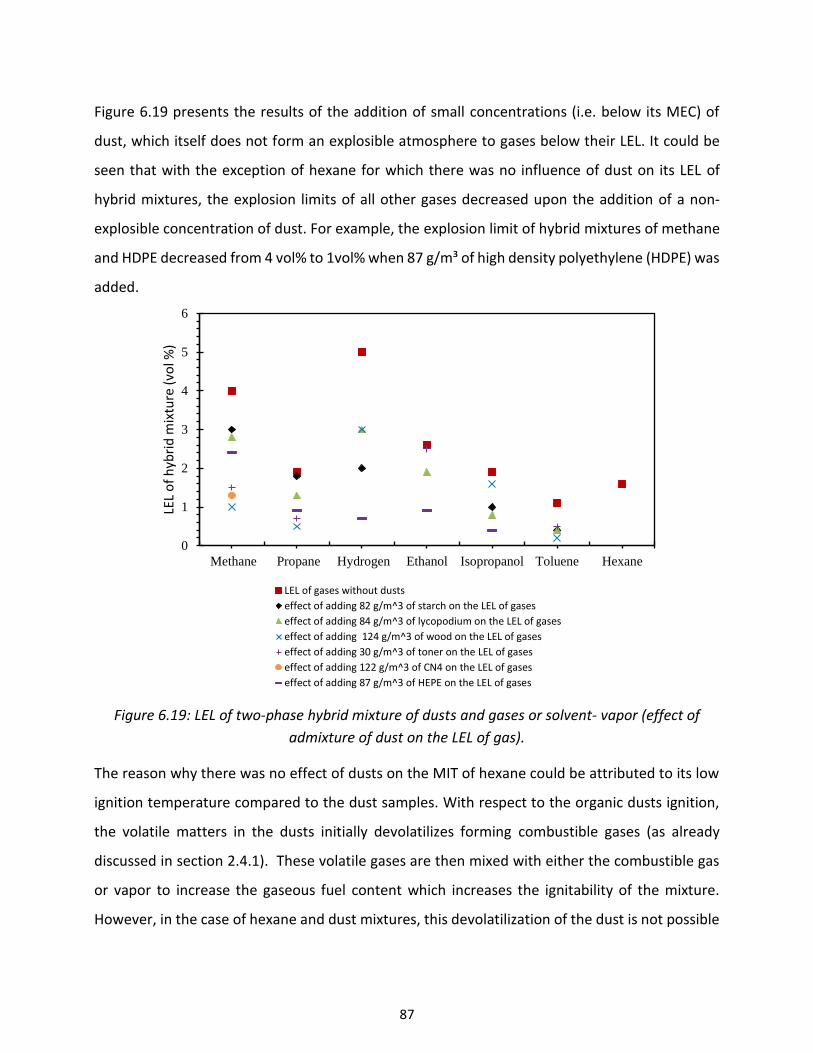
87
Figure 6.19 presents the results of the addition of small concentrations (i.e. below its MEC) of
dust, which itself does not form an explosible atmosphere to gases below their LEL. It could be
seen that with the exception of hexane for which there was no influence of dust on its LEL of
hybrid mixtures, the explosion limits of all other gases decreased upon the addition of a non-
explosible concentration of dust. For example, the explosion limit of hybrid mixtures of methane
and HDPE decreased from 4 vol% to 1vol% when 87 g/m³ of high density polyethylene (HDPE) was
added.
Figure 6.19: LEL of two-phase hybrid mixture of dusts and gases or solvent- vapor (effect of
admixture of dust on the LEL of gas).
The reason why there was no effect of dusts on the MIT of hexane could be attributed to its low
ignition temperature compared to the dust samples. With respect to the organic dusts ignition,
the volatile matters in the dusts initially devolatilizes forming combustible gases (as already
discussed in section 2.4.1). These volatile gases are then mixed with either the combustible gas
or vapor to increase the gaseous fuel content which increases the ignitability of the mixture.
However, in the case of hexane and dust mixtures, this devolatilization of the dust is not possible
0
1
2
3
4
5
6
Methane Propane Hydrogen Ethanol Isopropanol Toluene Hexane
LEL
of
hyb
rid
mix
ture
(vo
l %)
LEL of gases without dusts
effect of adding 82 g/m^3 of starch on the LEL of gases
effect of adding 84 g/m^3 of lycopodium on the LEL of gases
effect of adding 124 g/m^3 of wood on the LEL of gases
effect of adding 30 g/m^3 of toner on the LEL of gases
effect of adding 122 g/m^3 of CN4 on the LEL of gases
effect of adding 87 g/m^3 of HEPE on the LEL of gases
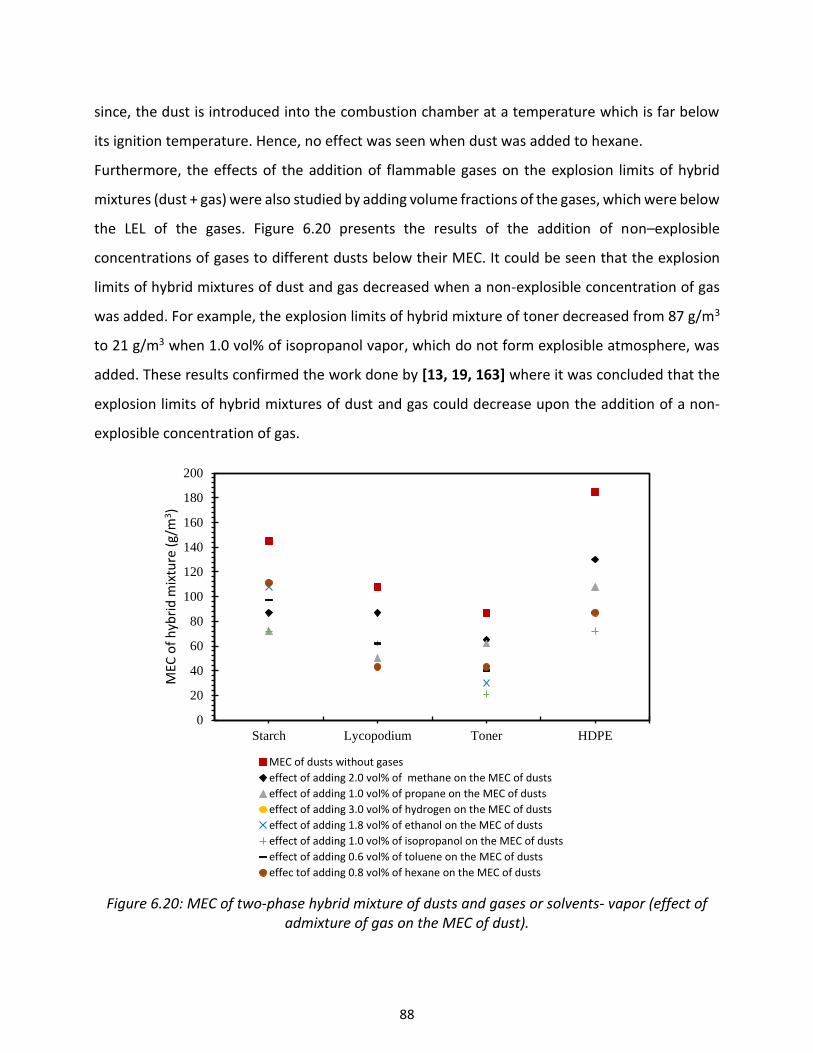
88
since, the dust is introduced into the combustion chamber at a temperature which is far below
its ignition temperature. Hence, no effect was seen when dust was added to hexane.
Furthermore, the effects of the addition of flammable gases on the explosion limits of hybrid
mixtures (dust + gas) were also studied by adding volume fractions of the gases, which were below
the LEL of the gases. Figure 6.20 presents the results of the addition of non–explosible
concentrations of gases to different dusts below their MEC. It could be seen that the explosion
limits of hybrid mixtures of dust and gas decreased when a non-explosible concentration of gas
was added. For example, the explosion limits of hybrid mixture of toner decreased from 87 g/m3
to 21 g/m3 when 1.0 vol% of isopropanol vapor, which do not form explosible atmosphere, was
added. These results confirmed the work done by [13, 19, 163] where it was concluded that the
explosion limits of hybrid mixtures of dust and gas could decrease upon the addition of a non-
explosible concentration of gas.
Figure 6.20: MEC of two-phase hybrid mixture of dusts and gases or solvents- vapor (effect of admixture of gas on the MEC of dust).
0
20
40
60
80
100
120
140
160
180
200
Starch Lycopodium Toner HDPE
MEC
of
hyb
rid
mix
ture
(g/
m3)
MEC of dusts without gases
effect of adding 2.0 vol% of methane on the MEC of dusts
effect of adding 1.0 vol% of propane on the MEC of dusts
effect of adding 3.0 vol% of hydrogen on the MEC of dusts
effect of adding 1.8 vol% of ethanol on the MEC of dusts
effect of adding 1.0 vol% of isopropanol on the MEC of dusts
effect of adding 0.6 vol% of toluene on the MEC of dusts
effec tof adding 0.8 vol% of hexane on the MEC of dusts
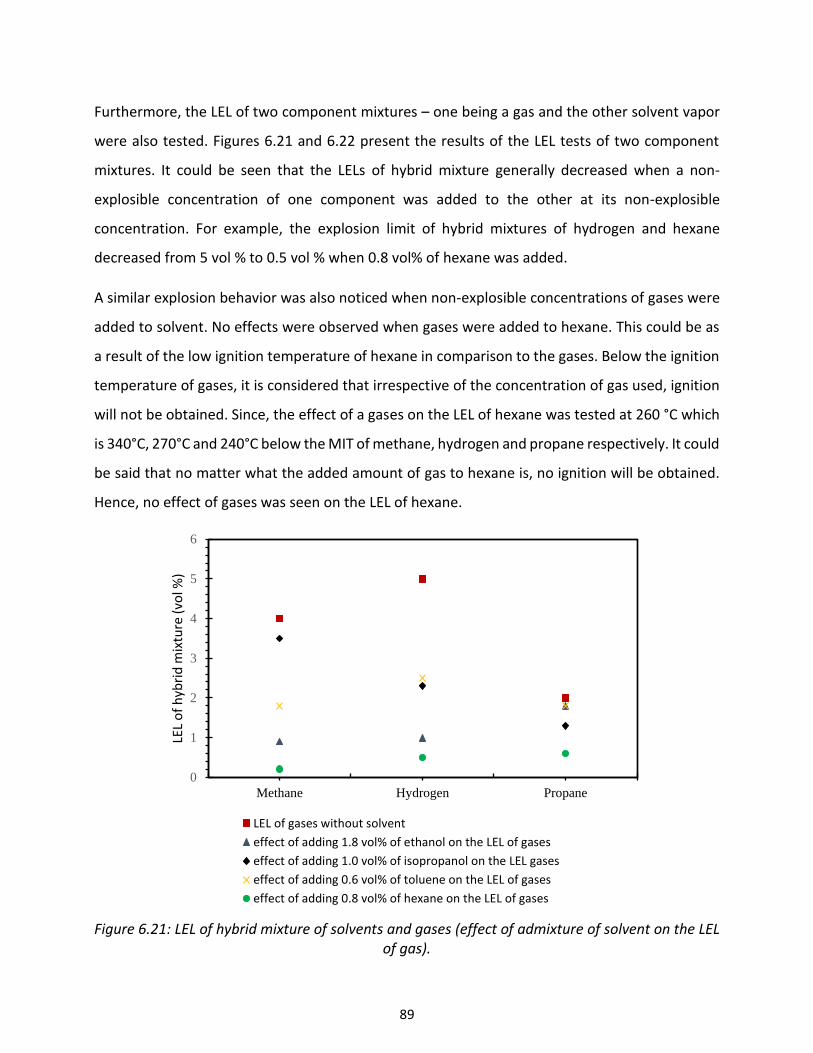
89
Furthermore, the LEL of two component mixtures – one being a gas and the other solvent vapor
were also tested. Figures 6.21 and 6.22 present the results of the LEL tests of two component
mixtures. It could be seen that the LELs of hybrid mixture generally decreased when a non-
explosible concentration of one component was added to the other at its non-explosible
concentration. For example, the explosion limit of hybrid mixtures of hydrogen and hexane
decreased from 5 vol % to 0.5 vol % when 0.8 vol% of hexane was added.
A similar explosion behavior was also noticed when non-explosible concentrations of gases were
added to solvent. No effects were observed when gases were added to hexane. This could be as
a result of the low ignition temperature of hexane in comparison to the gases. Below the ignition
temperature of gases, it is considered that irrespective of the concentration of gas used, ignition
will not be obtained. Since, the effect of a gases on the LEL of hexane was tested at 260 °C which
is 340°C, 270°C and 240°C below the MIT of methane, hydrogen and propane respectively. It could
be said that no matter what the added amount of gas to hexane is, no ignition will be obtained.
Hence, no effect of gases was seen on the LEL of hexane.
Figure 6.21: LEL of hybrid mixture of solvents and gases (effect of admixture of solvent on the LEL of gas).
0
1
2
3
4
5
6
Methane Hydrogen Propane
LEL
of
hyb
rid
mix
ture
(vo
l %)
LEL of gases without solvent
effect of adding 1.8 vol% of ethanol on the LEL of gases
effect of adding 1.0 vol% of isopropanol on the LEL gases
effect of adding 0.6 vol% of toluene on the LEL of gases
effect of adding 0.8 vol% of hexane on the LEL of gases
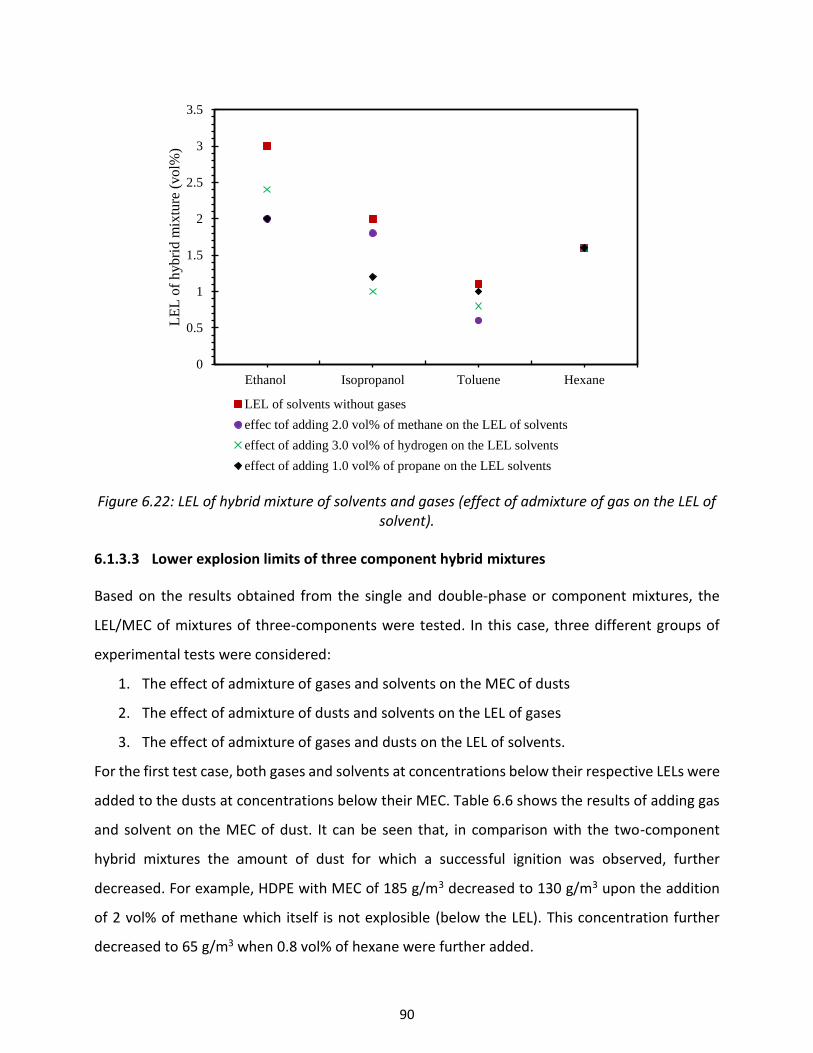
90
Figure 6.22: LEL of hybrid mixture of solvents and gases (effect of admixture of gas on the LEL of solvent).
6.1.3.3 Lower explosion limits of three component hybrid mixtures
Based on the results obtained from the single and double-phase or component mixtures, the
LEL/MEC of mixtures of three-components were tested. In this case, three different groups of
experimental tests were considered:
1. The effect of admixture of gases and solvents on the MEC of dusts
2. The effect of admixture of dusts and solvents on the LEL of gases
3. The effect of admixture of gases and dusts on the LEL of solvents.
For the first test case, both gases and solvents at concentrations below their respective LELs were
added to the dusts at concentrations below their MEC. Table 6.6 shows the results of adding gas
and solvent on the MEC of dust. It can be seen that, in comparison with the two-component
hybrid mixtures the amount of dust for which a successful ignition was observed, further
decreased. For example, HDPE with MEC of 185 g/m3 decreased to 130 g/m3 upon the addition
of 2 vol% of methane which itself is not explosible (below the LEL). This concentration further
decreased to 65 g/m3 when 0.8 vol% of hexane were further added.
0
0.5
1
1.5
2
2.5
3
3.5
Ethanol Isopropanol Toluene Hexane
LE
L o
f h
yb
rid
mix
ture
(vo
l%)
LEL of solvents without gases
effec tof adding 2.0 vol% of methane on the LEL of solvents
effect of adding 3.0 vol% of hydrogen on the LEL solvents
effect of adding 1.0 vol% of propane on the LEL solvents

91
Table 6.6: Effect of an admixture of gases and solvents on the MEC of dust, (dust concentrations in g/m3).
Dust (g/m3)
MEC of only dusts
effect of admixture of
0.8 vol% hexane on the MEC of
dusts
effect of admixture of
2.0 vol% methane on the MEC of
dusts
effect of admixture of 2.0 vol% methane and 0.8 vol%
hexane on the MEC of dusts
effect of admixture of
1.0 vol% propane on the MEC of
dusts
effect of admixture of 1.0
vol% propane and 0.8 vol%
hexane on the MEC of dusts
effect of admixture of
3.0 vol% hydrogen on the MEC of
dusts
effect of admixture of 3.0 vol%
hydrogen and 0.8 vol% hexane on the
MEC of dusts
HDPE 185 87 130 65 108 87 170 119 Lycopodium 108 43 87 33 50 43 71 28 Starch 145 111 97 96 72 50 121 65 Toner 87 43 65 22 62 43 87 48
Dust (g/m3)
MEC of only dusts
effect of admixture of
1.0 vol% isopropanol on the MEC
of dusts
effect of admixture of
2.0 vol% methane on the MEC of
dusts
effect of admixture of 2.0 vol% methane and 1.0 vol%
isopropanol on the MEC of dusts
effect of admixture of
1.0 vol% propane on the MEC of
dusts
effect of admixture of 1.0
vol% propane and 1.0 vol%
isopropanol on the MEC of dusts
effect of admixture of
3.0 vol% hydrogen on the MEC of
dusts
effect of admixture of 3.0 vol%
hydrogen and 1.0 vol% isopropanol on
the MEC of dusts
HDPE 185 145 130 72 108 43 170 170 Lycopodium 108 87 87 62 50 43 71 71 Starch 145 145 97 72 72 62 121 121 Toner 87 62 65 21 62 40 87 87
Dust (g/m3)
MEC of only dusts
effect of admixture of
1.8 vol% ethanol on the MEC of
dusts
effect of admixture of
2.0 vol% methane on the MEC of
dusts
effect of admixture of 2.0 vol% methane and 1.8 vol%
ethanol on the MEC of dusts
effect of admixture of
1.0 vol% propane on the MEC of
dusts
effect of admixture of 1.0
vol% propane and 1.8 vol%
ethanol on the MEC of dusts
effect of admixture of
3.0 vol% hydrogen on the MEC of
dusts
effect of admixture of 3.0 vol%
hydrogen and 1.8 vol% ethanol on the
MEC of dusts
HDPE 185 133 130 92 108 63 170 163 Lycopodium 108 108 87 62 50 43 71 71 Starch 145 108 97 72 72 56 121 145 Toner 87 62 65 43 62 33 87 66
Dust (g/m3)
MEC of only dusts
effect of admixture of
0.6 vol% toluene on the MEC of
dusts
effect of admixture of
2.0 vol% methane on the MEC of
dusts
effect of admixture of 2.0 vol% methane and 0.6 vol%
toluene on the MEC of dusts
effect of admixture of
1.0 vol% propane on the MEC of
dusts
effect of admixture of 1.0
vol% propane and 0.6 vol%
toluene on the MEC of dusts
effect of admixture of
3.0 vol% hydrogen on the MEC of
dusts
effect of admixture of 3.0 vol%
hydrogen and 0.6 vol% toluene on the
MEC of dusts
HDPE 185 145 130 87 108 72 170 170 lycopodium 108 87 92 62 50 50 71 71 starch 145 111 97 97 72 41 121 121 toner 87 62 65 43 62 22 87 87
Furthermore, Table 6.7 presents the results of an admixture of dusts and solvents on the LEL of
gases. Dust at a concentration below its MEC and solvent at a concentration below its LEL were
added to the gas to check if an explosion could be obtained at a concentration below the LEL of
the gas. Similar explosion behavior as explained above was also noticed. An explosion could be
obtained at the concentrations, where both dusts and solvent mixtures did not ignite. The LEL of
propane decreased from 1.9 vol% to 1.3 vol% when 84 g/m³ of lycopodium was added. This
concentration further decreased to 0.8 vol % when 1.8 vol% of ethanol was added.
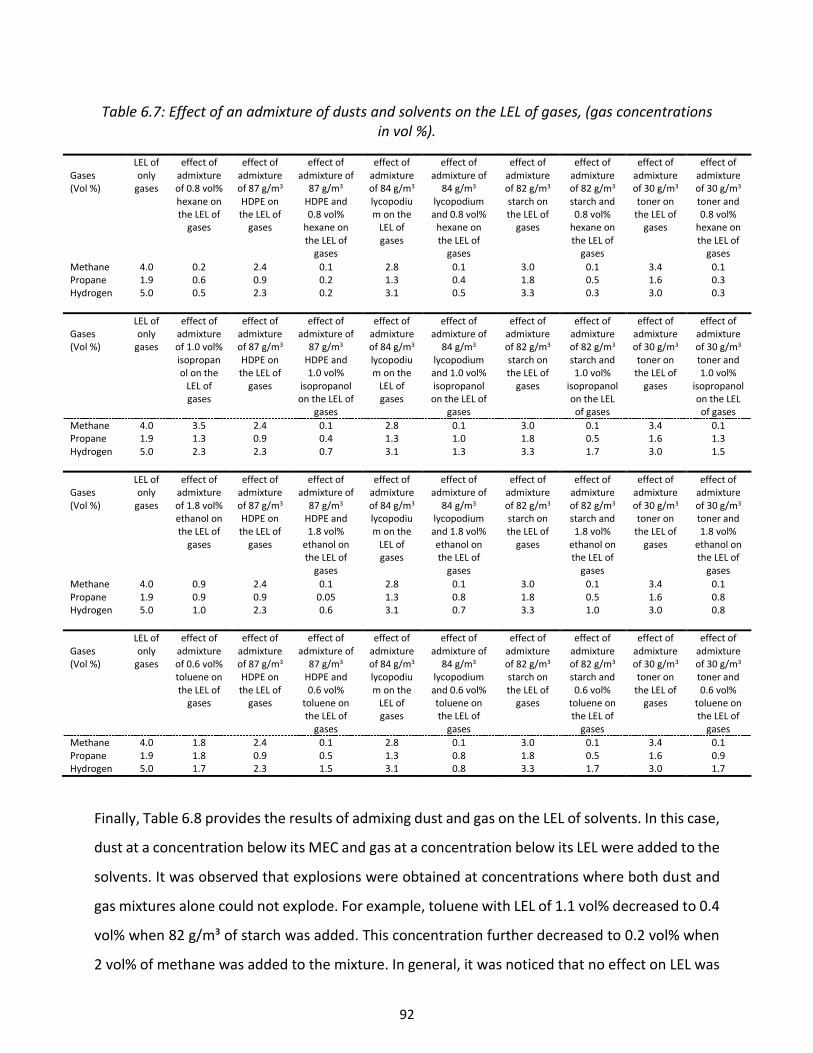
92
Table 6.7: Effect of an admixture of dusts and solvents on the LEL of gases, (gas concentrations in vol %).
Gases (Vol %)
LEL of only
gases
effect of admixture of 0.8 vol% hexane on the LEL of
gases
effect of admixture of 87 g/m3 HDPE on the LEL of
gases
effect of admixture of
87 g/m3 HDPE and 0.8 vol%
hexane on the LEL of
gases
effect of admixture of 84 g/m3 lycopodium on the
LEL of gases
effect of admixture of
84 g/m3 lycopodium and 0.8 vol%
hexane on the LEL of
gases
effect of admixture of 82 g/m3 starch on the LEL of
gases
effect of admixture of 82 g/m3 starch and 0.8 vol%
hexane on the LEL of
gases
effect of admixture of 30 g/m3 toner on
the LEL of gases
effect of admixture of 30 g/m3 toner and 0.8 vol%
hexane on the LEL of
gases
Methane 4.0 0.2 2.4 0.1 2.8 0.1 3.0 0.1 3.4 0.1 Propane 1.9 0.6 0.9 0.2 1.3 0.4 1.8 0.5 1.6 0.3 Hydrogen 5.0 0.5 2.3 0.2 3.1 0.5 3.3 0.3 3.0 0.3
Gases (Vol %)
LEL of only
gases
effect of admixture of 1.0 vol% isopropanol on the
LEL of gases
effect of admixture of 87 g/m3 HDPE on the LEL of
gases
effect of admixture of
87 g/m3 HDPE and 1.0 vol%
isopropanol on the LEL of
gases
effect of admixture of 84 g/m3 lycopodium on the
LEL of gases
effect of admixture of
84 g/m3 lycopodium and 1.0 vol% isopropanol on the LEL of
gases
effect of admixture of 82 g/m3 starch on the LEL of
gases
effect of admixture of 82 g/m3 starch and 1.0 vol%
isopropanol on the LEL of gases
effect of admixture of 30 g/m3 toner on
the LEL of gases
effect of admixture of 30 g/m3 toner and 1.0 vol%
isopropanol on the LEL of gases
Methane 4.0 3.5 2.4 0.1 2.8 0.1 3.0 0.1 3.4 0.1 Propane 1.9 1.3 0.9 0.4 1.3 1.0 1.8 0.5 1.6 1.3 Hydrogen 5.0 2.3 2.3 0.7 3.1 1.3 3.3 1.7 3.0 1.5
Gases (Vol %)
LEL of only
gases
effect of admixture of 1.8 vol% ethanol on the LEL of
gases
effect of admixture of 87 g/m3 HDPE on the LEL of
gases
effect of admixture of
87 g/m3 HDPE and 1.8 vol%
ethanol on the LEL of
gases
effect of admixture of 84 g/m3 lycopodium on the
LEL of gases
effect of admixture of
84 g/m3 lycopodium and 1.8 vol% ethanol on the LEL of
gases
effect of admixture of 82 g/m3 starch on the LEL of
gases
effect of admixture of 82 g/m3 starch and 1.8 vol%
ethanol on the LEL of
gases
effect of admixture of 30 g/m3 toner on
the LEL of gases
effect of admixture of 30 g/m3 toner and 1.8 vol%
ethanol on the LEL of
gases
Methane 4.0 0.9 2.4 0.1 2.8 0.1 3.0 0.1 3.4 0.1 Propane 1.9 0.9 0.9 0.05 1.3 0.8 1.8 0.5 1.6 0.8 Hydrogen 5.0 1.0 2.3 0.6 3.1 0.7 3.3 1.0 3.0 0.8
Gases (Vol %)
LEL of only
gases
effect of admixture of 0.6 vol% toluene on the LEL of
gases
effect of admixture of 87 g/m3 HDPE on the LEL of
gases
effect of admixture of
87 g/m3 HDPE and 0.6 vol%
toluene on the LEL of
gases
effect of admixture of 84 g/m3 lycopodium on the
LEL of gases
effect of admixture of
84 g/m3 lycopodium and 0.6 vol% toluene on the LEL of
gases
effect of admixture of 82 g/m3 starch on the LEL of
gases
effect of admixture of 82 g/m3 starch and 0.6 vol%
toluene on the LEL of
gases
effect of admixture of 30 g/m3 toner on
the LEL of gases
effect of admixture of 30 g/m3 toner and 0.6 vol%
toluene on the LEL of
gases
Methane 4.0 1.8 2.4 0.1 2.8 0.1 3.0 0.1 3.4 0.1 Propane 1.9 1.8 0.9 0.5 1.3 0.8 1.8 0.5 1.6 0.9 Hydrogen 5.0 1.7 2.3 1.5 3.1 0.8 3.3 1.7 3.0 1.7
Finally, Table 6.8 provides the results of admixing dust and gas on the LEL of solvents. In this case,
dust at a concentration below its MEC and gas at a concentration below its LEL were added to the
solvents. It was observed that explosions were obtained at concentrations where both dust and
gas mixtures alone could not explode. For example, toluene with LEL of 1.1 vol% decreased to 0.4
vol% when 82 g/m³ of starch was added. This concentration further decreased to 0.2 vol% when
2 vol% of methane was added to the mixture. In general, it was noticed that no effect on LEL was
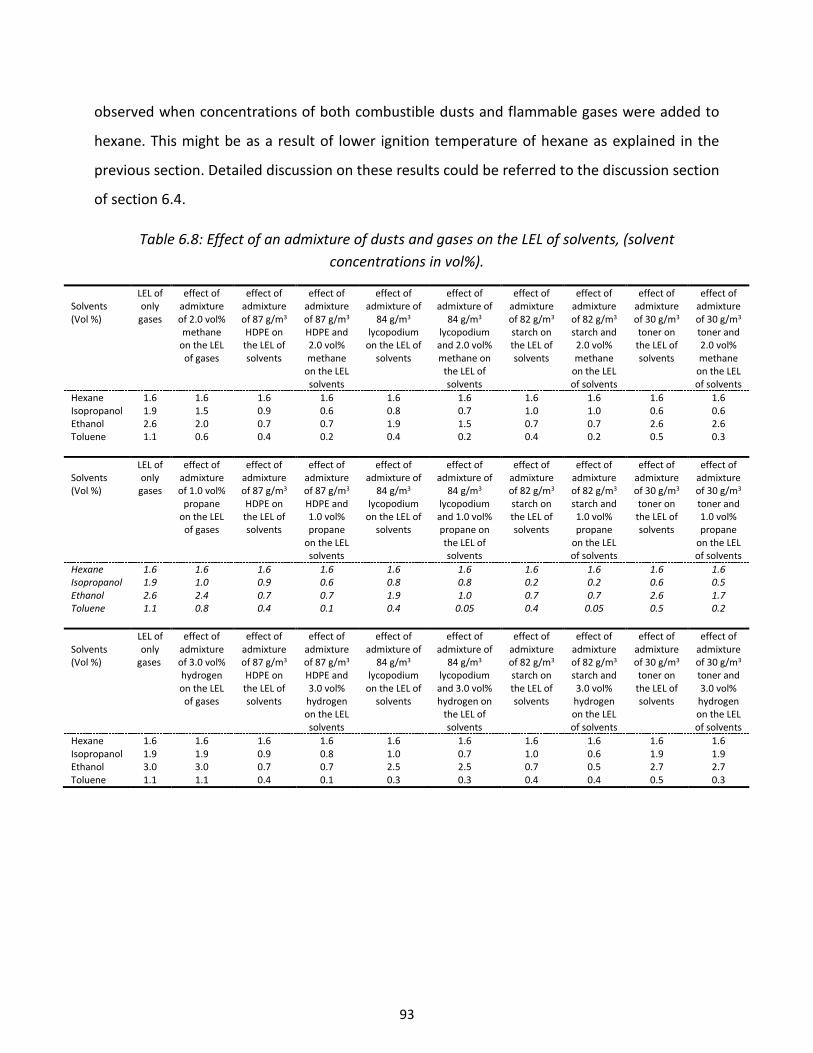
93
observed when concentrations of both combustible dusts and flammable gases were added to
hexane. This might be as a result of lower ignition temperature of hexane as explained in the
previous section. Detailed discussion on these results could be referred to the discussion section
of section 6.4.
Table 6.8: Effect of an admixture of dusts and gases on the LEL of solvents, (solvent
concentrations in vol%).
Solvents (Vol %)
LEL of only
gases
effect of admixture of 2.0 vol% methane
on the LEL of gases
effect of admixture of 87 g/m3 HDPE on the LEL of solvents
effect of admixture of 87 g/m3 HDPE and 2.0 vol% methane
on the LEL solvents
effect of admixture of
84 g/m3 lycopodium
on the LEL of solvents
effect of admixture of
84 g/m3 lycopodium and 2.0 vol% methane on
the LEL of solvents
effect of admixture of 82 g/m3 starch on the LEL of solvents
effect of admixture of 82 g/m3 starch and 2.0 vol% methane
on the LEL of solvents
effect of admixture of 30 g/m3 toner on the LEL of solvents
effect of admixture of 30 g/m3 toner and 2.0 vol% methane
on the LEL of solvents
Hexane 1.6 1.6 1.6 1.6 1.6 1.6 1.6 1.6 1.6 1.6 Isopropanol 1.9 1.5 0.9 0.6 0.8 0.7 1.0 1.0 0.6 0.6 Ethanol 2.6 2.0 0.7 0.7 1.9 1.5 0.7 0.7 2.6 2.6 Toluene 1.1 0.6 0.4 0.2 0.4 0.2 0.4 0.2 0.5 0.3
Solvents (Vol %)
LEL of only
gases
effect of admixture of 1.0 vol%
propane on the LEL of gases
effect of admixture of 87 g/m3 HDPE on the LEL of solvents
effect of admixture of 87 g/m3 HDPE and 1.0 vol% propane
on the LEL solvents
effect of admixture of
84 g/m3 lycopodium
on the LEL of solvents
effect of admixture of
84 g/m3 lycopodium and 1.0 vol% propane on the LEL of solvents
effect of admixture of 82 g/m3 starch on the LEL of solvents
effect of admixture of 82 g/m3 starch and 1.0 vol% propane
on the LEL of solvents
effect of admixture of 30 g/m3 toner on the LEL of solvents
effect of admixture of 30 g/m3 toner and 1.0 vol% propane
on the LEL of solvents
Hexane 1.6 1.6 1.6 1.6 1.6 1.6 1.6 1.6 1.6 1.6 Isopropanol 1.9 1.0 0.9 0.6 0.8 0.8 0.2 0.2 0.6 0.5 Ethanol 2.6 2.4 0.7 0.7 1.9 1.0 0.7 0.7 2.6 1.7 Toluene 1.1 0.8 0.4 0.1 0.4 0.05 0.4 0.05 0.5 0.2
Solvents (Vol %)
LEL of only
gases
effect of admixture of 3.0 vol% hydrogen on the LEL of gases
effect of admixture of 87 g/m3 HDPE on the LEL of solvents
effect of admixture of 87 g/m3 HDPE and 3.0 vol% hydrogen on the LEL solvents
effect of admixture of
84 g/m3 lycopodium
on the LEL of solvents
effect of admixture of
84 g/m3 lycopodium and 3.0 vol% hydrogen on
the LEL of solvents
effect of admixture of 82 g/m3 starch on the LEL of solvents
effect of admixture of 82 g/m3 starch and 3.0 vol% hydrogen on the LEL of solvents
effect of admixture of 30 g/m3 toner on the LEL of solvents
effect of admixture of 30 g/m3 toner and 3.0 vol% hydrogen on the LEL of solvents
Hexane 1.6 1.6 1.6 1.6 1.6 1.6 1.6 1.6 1.6 1.6 Isopropanol 1.9 1.9 0.9 0.8 1.0 0.7 1.0 0.6 1.9 1.9 Ethanol 3.0 3.0 0.7 0.7 2.5 2.5 0.7 0.5 2.7 2.7 Toluene 1.1 1.1 0.4 0.1 0.3 0.3 0.4 0.4 0.5 0.3
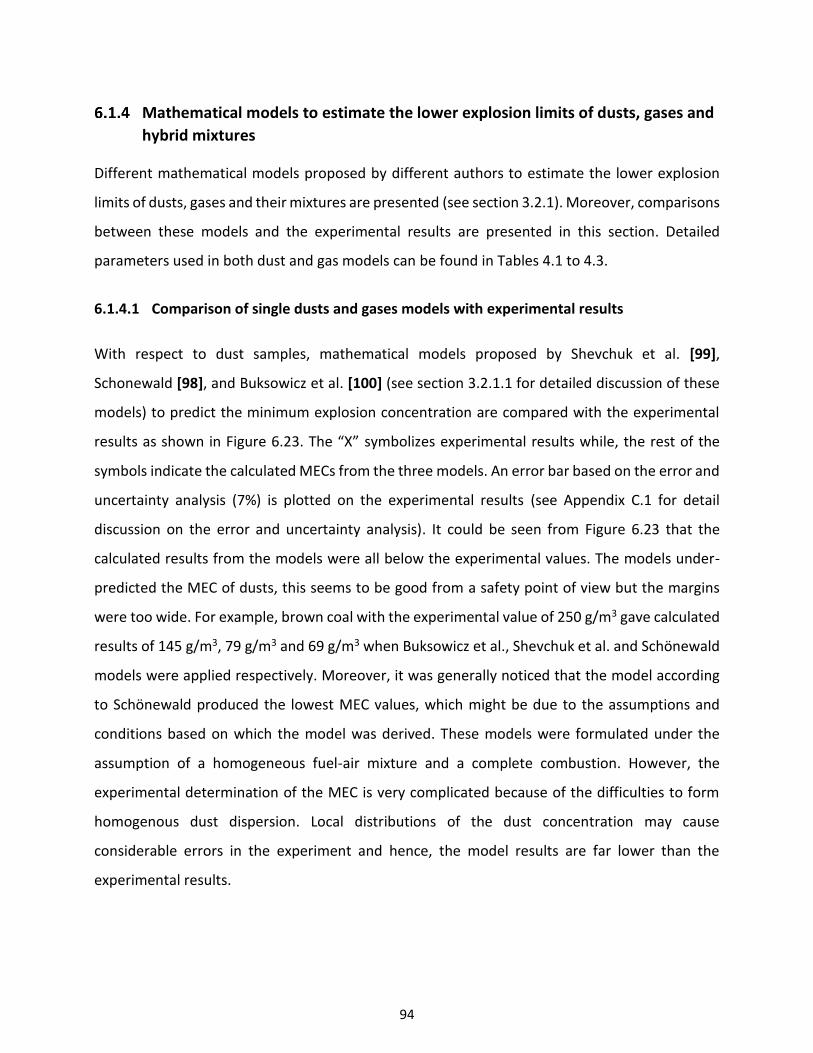
94
Mathematical models to estimate the lower explosion limits of dusts, gases and
hybrid mixtures
Different mathematical models proposed by different authors to estimate the lower explosion
limits of dusts, gases and their mixtures are presented (see section 3.2.1). Moreover, comparisons
between these models and the experimental results are presented in this section. Detailed
parameters used in both dust and gas models can be found in Tables 4.1 to 4.3.
6.1.4.1 Comparison of single dusts and gases models with experimental results
With respect to dust samples, mathematical models proposed by Shevchuk et al. [99],
Schonewald [98], and Buksowicz et al. [100] (see section 3.2.1.1 for detailed discussion of these
models) to predict the minimum explosion concentration are compared with the experimental
results as shown in Figure 6.23. The “X” symbolizes experimental results while, the rest of the
symbols indicate the calculated MECs from the three models. An error bar based on the error and
uncertainty analysis (7%) is plotted on the experimental results (see Appendix C.1 for detail
discussion on the error and uncertainty analysis). It could be seen from Figure 6.23 that the
calculated results from the models were all below the experimental values. The models under-
predicted the MEC of dusts, this seems to be good from a safety point of view but the margins
were too wide. For example, brown coal with the experimental value of 250 g/m3 gave calculated
results of 145 g/m3, 79 g/m3 and 69 g/m3 when Buksowicz et al., Shevchuk et al. and Schönewald
models were applied respectively. Moreover, it was generally noticed that the model according
to Schönewald produced the lowest MEC values, which might be due to the assumptions and
conditions based on which the model was derived. These models were formulated under the
assumption of a homogeneous fuel-air mixture and a complete combustion. However, the
experimental determination of the MEC is very complicated because of the difficulties to form
homogenous dust dispersion. Local distributions of the dust concentration may cause
considerable errors in the experiment and hence, the model results are far lower than the
experimental results.
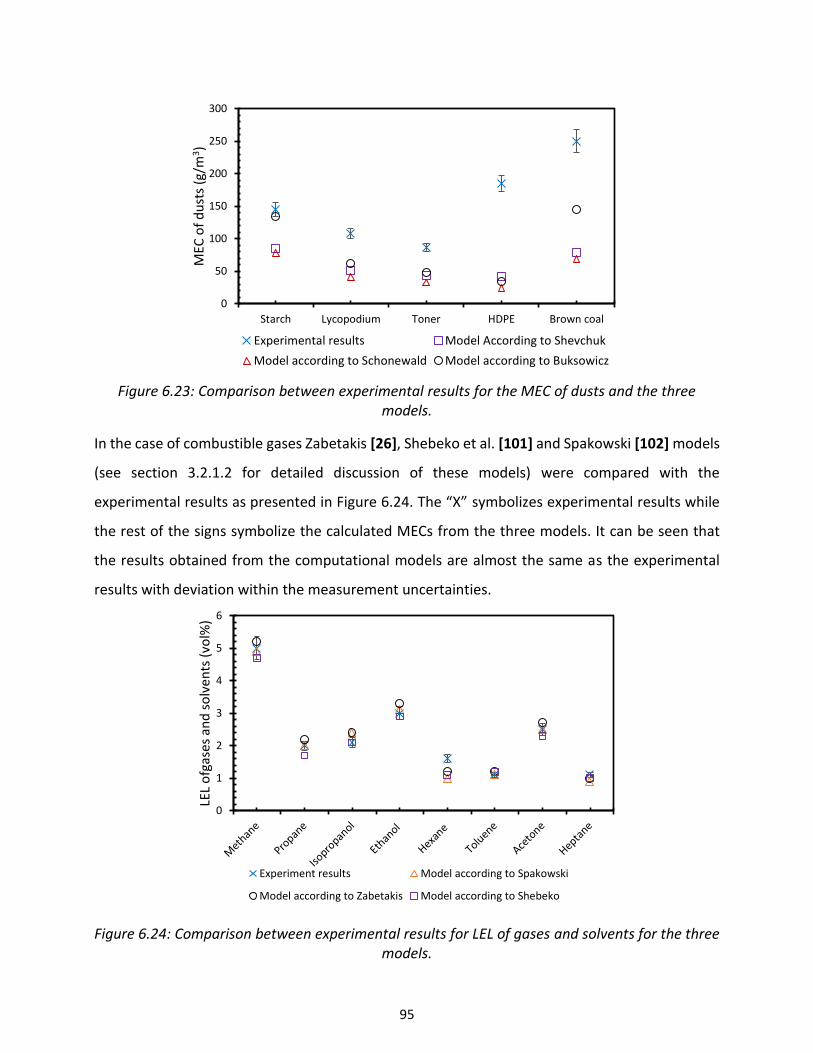
95
Figure 6.23: Comparison between experimental results for the MEC of dusts and the three models.
In the case of combustible gases Zabetakis [26], Shebeko et al. [101] and Spakowski [102] models
(see section 3.2.1.2 for detailed discussion of these models) were compared with the
experimental results as presented in Figure 6.24. The “X” symbolizes experimental results while
the rest of the signs symbolize the calculated MECs from the three models. It can be seen that
the results obtained from the computational models are almost the same as the experimental
results with deviation within the measurement uncertainties.
Figure 6.24: Comparison between experimental results for LEL of gases and solvents for the three models.
0
50
100
150
200
250
300
Starch Lycopodium Toner HDPE Brown coal
MEC
of
du
sts
(g/m
3)
Experimental results Model According to Shevchuk
Model according to Schonewald Model according to Buksowicz
0
1
2
3
4
5
6
LEL
ofg
ases
an
d s
olv
en
ts (
vol%
)
Experiment results Model according to Spakowski
Model according to Zabetakis Model according to Shebeko
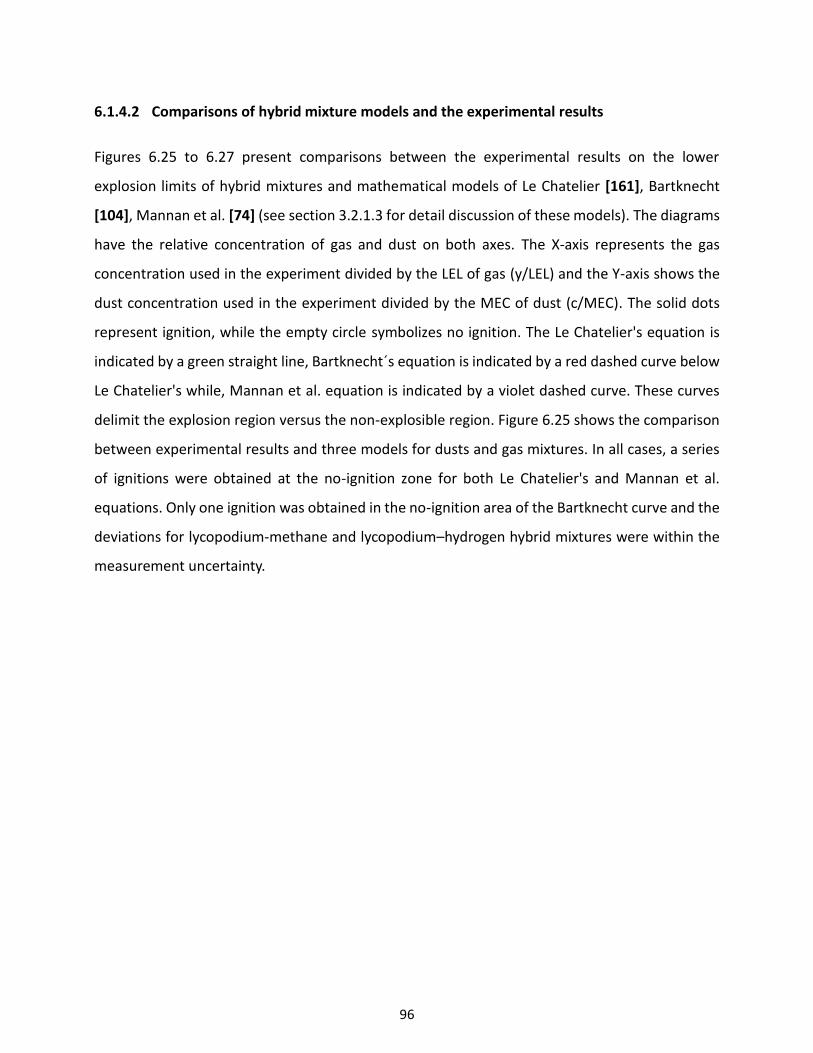
96
6.1.4.2 Comparisons of hybrid mixture models and the experimental results
Figures 6.25 to 6.27 present comparisons between the experimental results on the lower
explosion limits of hybrid mixtures and mathematical models of Le Chatelier [161], Bartknecht
[104], Mannan et al. [74] (see section 3.2.1.3 for detail discussion of these models). The diagrams
have the relative concentration of gas and dust on both axes. The X-axis represents the gas
concentration used in the experiment divided by the LEL of gas (y/LEL) and the Y-axis shows the
dust concentration used in the experiment divided by the MEC of dust (c/MEC). The solid dots
represent ignition, while the empty circle symbolizes no ignition. The Le Chatelier's equation is
indicated by a green straight line, Bartknecht´s equation is indicated by a red dashed curve below
Le Chatelier's while, Mannan et al. equation is indicated by a violet dashed curve. These curves
delimit the explosion region versus the non-explosible region. Figure 6.25 shows the comparison
between experimental results and three models for dusts and gas mixtures. In all cases, a series
of ignitions were obtained at the no-ignition zone for both Le Chatelier's and Mannan et al.
equations. Only one ignition was obtained in the no-ignition area of the Bartknecht curve and the
deviations for lycopodium-methane and lycopodium–hydrogen hybrid mixtures were within the
measurement uncertainty.
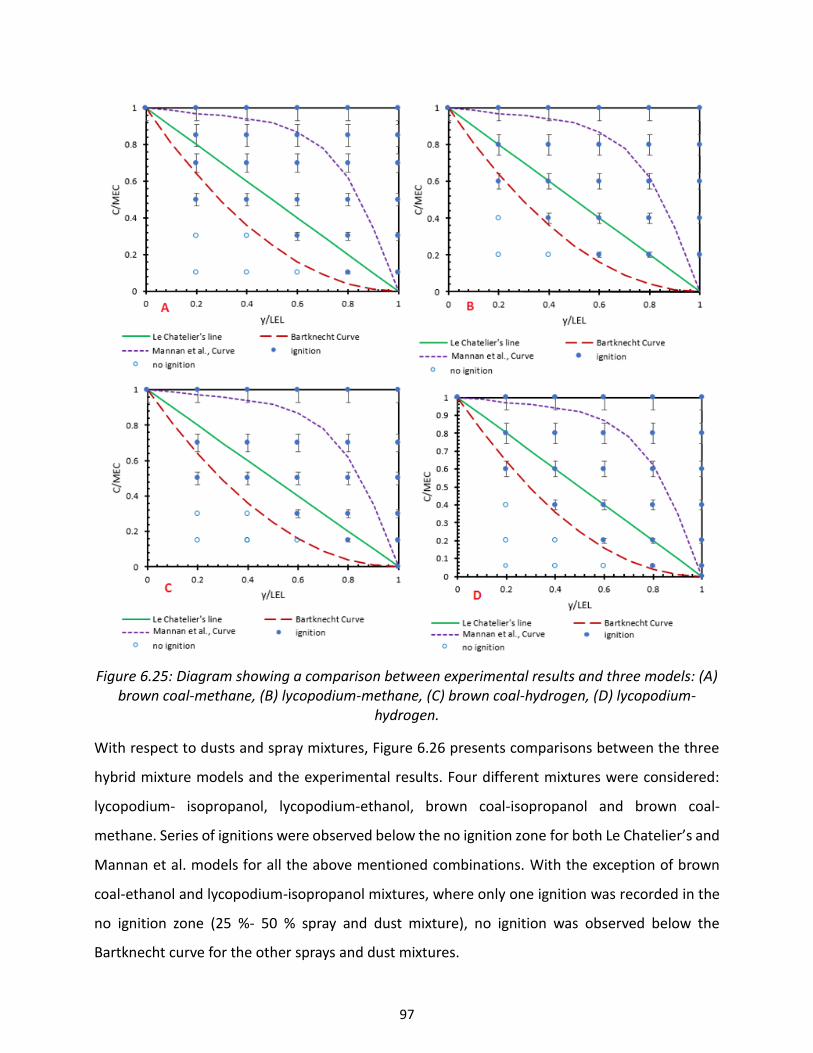
97
Figure 6.25: Diagram showing a comparison between experimental results and three models: (A) brown coal-methane, (B) lycopodium-methane, (C) brown coal-hydrogen, (D) lycopodium-
hydrogen.
With respect to dusts and spray mixtures, Figure 6.26 presents comparisons between the three
hybrid mixture models and the experimental results. Four different mixtures were considered:
lycopodium- isopropanol, lycopodium-ethanol, brown coal-isopropanol and brown coal-
methane. Series of ignitions were observed below the no ignition zone for both Le Chatelier’s and
Mannan et al. models for all the above mentioned combinations. With the exception of brown
coal-ethanol and lycopodium-isopropanol mixtures, where only one ignition was recorded in the
no ignition zone (25 %- 50 % spray and dust mixture), no ignition was observed below the
Bartknecht curve for the other sprays and dust mixtures.
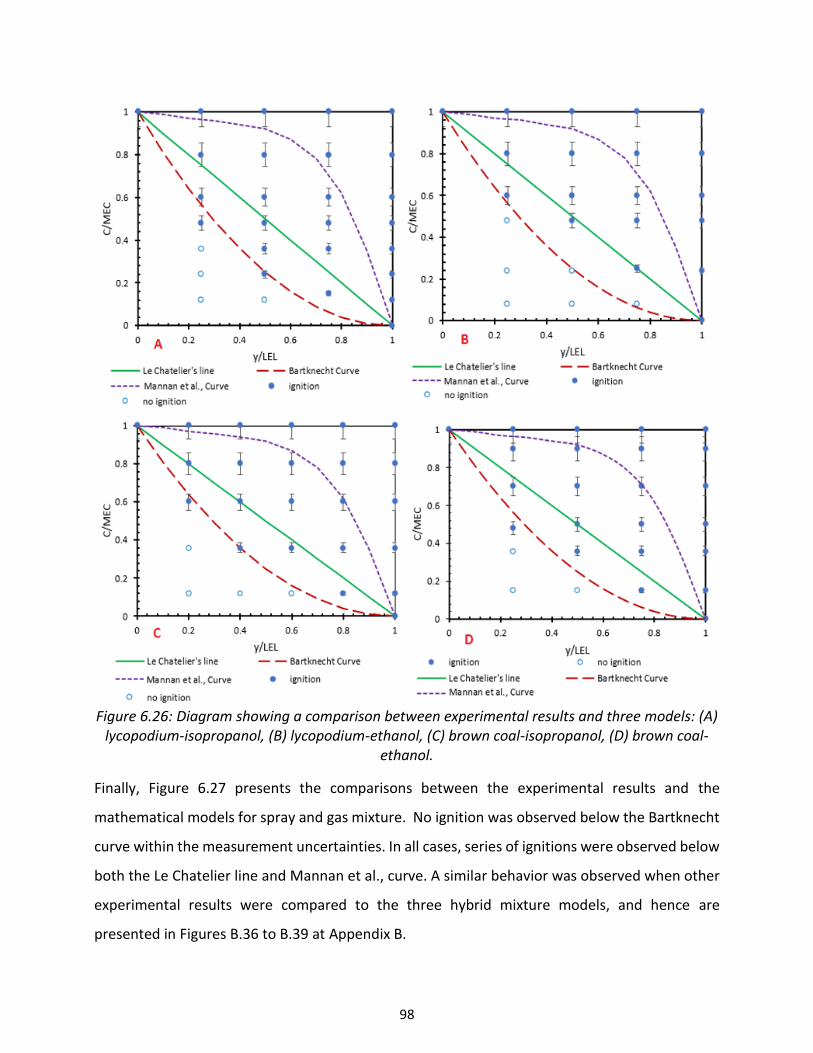
98
Figure 6.26: Diagram showing a comparison between experimental results and three models: (A)
lycopodium-isopropanol, (B) lycopodium-ethanol, (C) brown coal-isopropanol, (D) brown coal-ethanol.
Finally, Figure 6.27 presents the comparisons between the experimental results and the
mathematical models for spray and gas mixture. No ignition was observed below the Bartknecht
curve within the measurement uncertainties. In all cases, series of ignitions were observed below
both the Le Chatelier line and Mannan et al., curve. A similar behavior was observed when other
experimental results were compared to the three hybrid mixture models, and hence are
presented in Figures B.36 to B.39 at Appendix B.
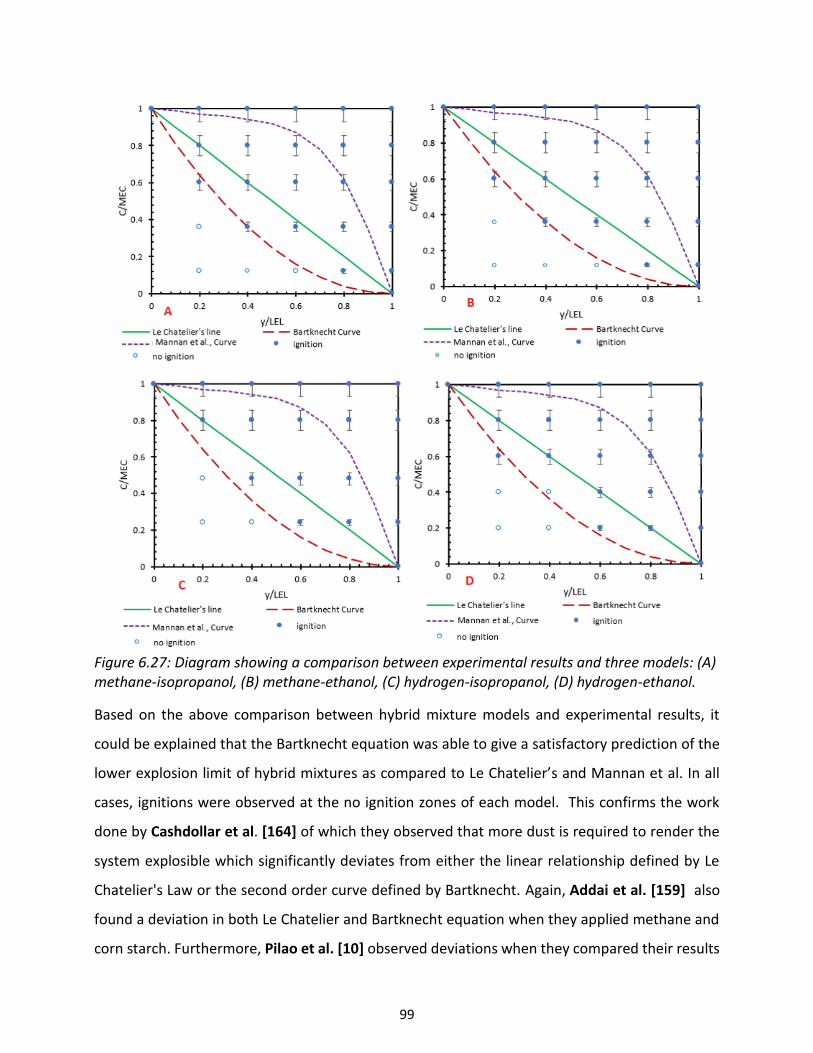
99
Figure 6.27: Diagram showing a comparison between experimental results and three models: (A) methane-isopropanol, (B) methane-ethanol, (C) hydrogen-isopropanol, (D) hydrogen-ethanol.
Based on the above comparison between hybrid mixture models and experimental results, it
could be explained that the Bartknecht equation was able to give a satisfactory prediction of the
lower explosion limit of hybrid mixtures as compared to Le Chatelier’s and Mannan et al. In all
cases, ignitions were observed at the no ignition zones of each model. This confirms the work
done by Cashdollar et al. [164] of which they observed that more dust is required to render the
system explosible which significantly deviates from either the linear relationship defined by Le
Chatelier's Law or the second order curve defined by Bartknecht. Again, Addai et al. [159] also
found a deviation in both Le Chatelier and Bartknecht equation when they applied methane and
corn starch. Furthermore, Pilao et al. [10] observed deviations when they compared their results
100
to both Bartknecht and Le Chatelier's models. Moreover, based on the results it was noticed that
the explosion of hybrid mixtures does not follow a linear trend, which implies that the Chatelier's
equation could not be applied to heterogeneous mixtures. This also confirms the finding by Prugh
[165] of which he summarized the lower explosion limits of different hybrid mixtures reported in
the literature and compared to the heat capacity and the deflagration index of each fuel. Prugh
concluded that the straight-line relationship applies only to mixtures where the ratio of the heat
capacities of the dust and gas/vapor is similar, and where the deflagration indices are roughly
equivalent. With respect to the model according Mannan et al., several deviations were observed.
This could be as a result of the assumptions and the parameters used in the equation such as:
deflagration index for both dusts (Kst) and gases (KG). It has been well established that, the
determination of deflagration index of dusts depends on several factors such as the particle size
of the dusts, the turbulence level, the moisture content and the initial temperature. Moreover,
the determination of the Kst of dusts is done under turbulence condition while KG under
quiescence environment therefore, combining these two parameters to estimate the LEL of
hybrid mixtures could lead to deviations.
6.2 Limiting oxygen concentration
The limiting oxygen concentration (LOC) is usually expressed as the percentage of oxygen
available in the fuel-oxygen- inert gas mixture. It is determined experimentally in the 20-liter
sphere following the procedure discussed in section 5.2.2. The value of the oxygen concentration
is decreased by a step of 1 vol% under the variation of fuel mixture concentration. If no ignition
is obtained at any fuel mixture concentration, the oxygen concentration at that point is
considered as the LOC. In order to protect process equipments, a safety margin of 2 vol% below
the determined LOC is usually used. Numerous researches have been done to determine the LOC
of single fuel air mixture by applying different inerting materials [72, 166-168] with the aim of
diluting the oxygen concentration in the process facility or equipment in order to mitigate or
prevent explosion hazards. Nevertheless, not only single fuel air mixtures are present in the
process facilities, but also fuel mixtures of different state of aggregates (hybrid mixture). Research
on hybrid mixtures, however, is limited as compared to the single substance especially for LOC.
This research work investigates the LOC of hybrid mixtures using fifteen combustible dusts, one
101
flammable gas and two flammable solvents. Nitrogen gas is used as an inerting material in the
standard 20-liter sphere under the same testing and initial conditions. The 2 kJ chemical igniter is
used as a standard ignition source for the determination of LOC of dust; however, in this study
three different ignition energies (10 J, 2 kJ, and 10 kJ) were employed to measure the LOC of
dusts, gases and hybrid mixtures. Comparisons between these three igniters are done in order to
estimate the effect of ignition energies on the LOC of different fuel mixtures. Moreover,
mathematical models to estimate the LOC of dusts as well as hybrid mixtures are presented and
comparisons between the models and the experimental results are performed. Furthermore,
diagrams are presented which allow the determination of the LOC directly from the lower
explosion limit (LEL) as well as the heat of combustion.
Limiting oxygen concentration of single substances
Initially, the LOC of individual materials were tested. With respect to dust testing, fifteen different
materials including organics, polymers, metals, natural products and synthetic materials were
investigated in order to obtain a wide range of results. Figure 6.28 presents experimentally
determined LOC of dusts with different ignition energies. It can be seen that the ignition energy
has a great influence on the LOC of dusts. The higher the ignition energy, the lower the LOC. The
results obtained from 10 J electrical igniter are much higher than from the chemical igniters,
which are in the range of 11 vol% to 17 vol% for aluminium and peat coal respectively. These LOC
results decrease drastically when the ignition energy is increased to 2 kJ. A further decrease is
also observed when the ignition energy is increased by a factor of five (10 kJ). For example, the
LOC obtained for brown coal with 10 J ignition energy is 16 vol%. This oxygen concentration
decreases to 8 vol% with an increase in ignition energy to 2 kJ, and to 7 vol% when the ignition
energy is increased to 10 kJ. The reason for this huge effect of the ignition energy on the LOC of
dusts could be attributed to the energy released from the ignition source during combustion. The
chemical igniters provide a dense cloud of hot dispersed particles which occupy the entire volume
of the combustion chamber. A complete combustion could be assumed since the entire fuel
mixture ignites almost at the same time. Unlike chemical igniters, electrical igniters produce
sparks only at a small region (center) of the combustion chamber and the materials in the close
proximity to this region ignite first producing energy which is then transferred to the next
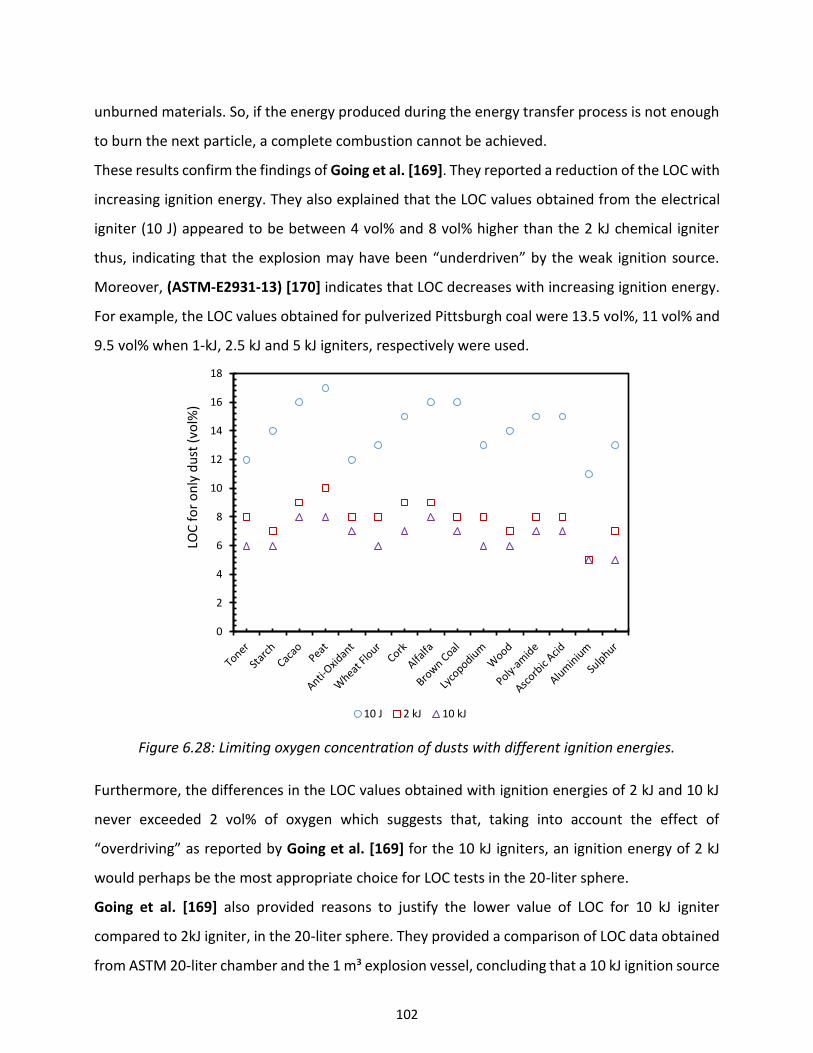
102
unburned materials. So, if the energy produced during the energy transfer process is not enough
to burn the next particle, a complete combustion cannot be achieved.
These results confirm the findings of Going et al. [169]. They reported a reduction of the LOC with
increasing ignition energy. They also explained that the LOC values obtained from the electrical
igniter (10 J) appeared to be between 4 vol% and 8 vol% higher than the 2 kJ chemical igniter
thus, indicating that the explosion may have been “underdriven” by the weak ignition source.
Moreover, (ASTM-E2931-13) [170] indicates that LOC decreases with increasing ignition energy.
For example, the LOC values obtained for pulverized Pittsburgh coal were 13.5 vol%, 11 vol% and
9.5 vol% when 1-kJ, 2.5 kJ and 5 kJ igniters, respectively were used.
Figure 6.28: Limiting oxygen concentration of dusts with different ignition energies.
Furthermore, the differences in the LOC values obtained with ignition energies of 2 kJ and 10 kJ
never exceeded 2 vol% of oxygen which suggests that, taking into account the effect of
“overdriving” as reported by Going et al. [169] for the 10 kJ igniters, an ignition energy of 2 kJ
would perhaps be the most appropriate choice for LOC tests in the 20-liter sphere.
Going et al. [169] also provided reasons to justify the lower value of LOC for 10 kJ igniter
compared to 2kJ igniter, in the 20-liter sphere. They provided a comparison of LOC data obtained
from ASTM 20-liter chamber and the 1 m³ explosion vessel, concluding that a 10 kJ ignition source
0
2
4
6
8
10
12
14
16
18
LOC
fo
r o
nly
du
st (
vol%
)
10 J 2 kJ 10 kJ
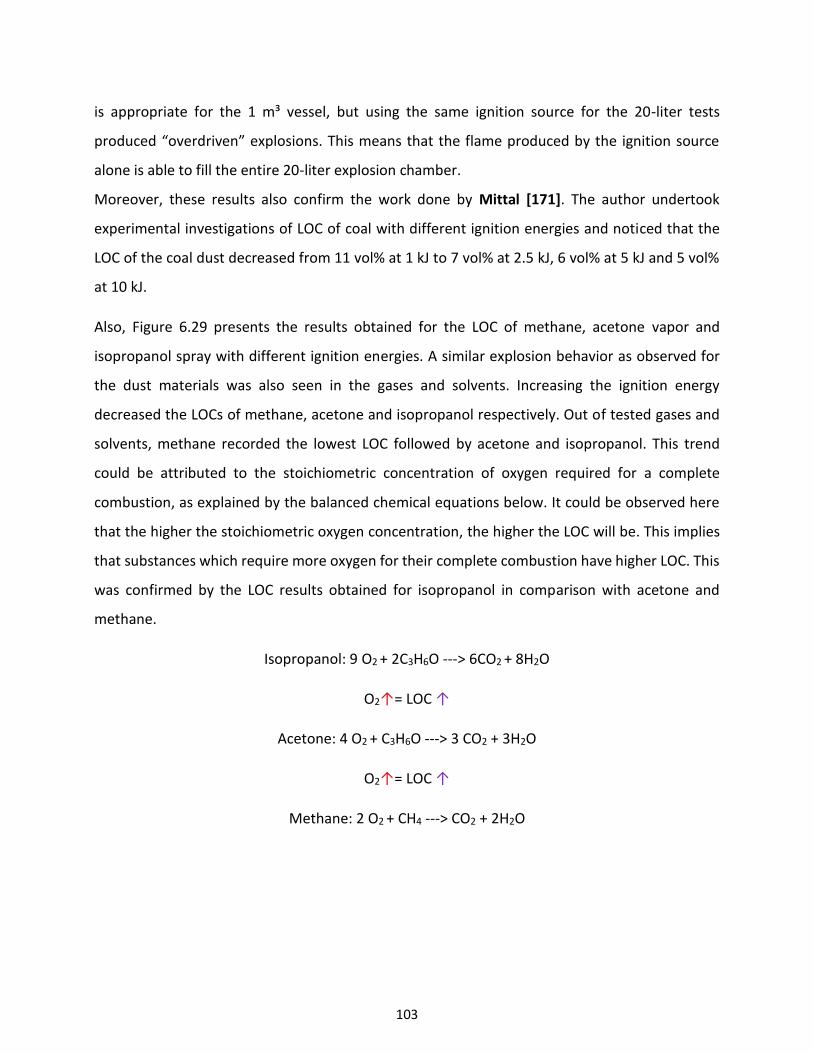
103
is appropriate for the 1 m³ vessel, but using the same ignition source for the 20-liter tests
produced “overdriven” explosions. This means that the flame produced by the ignition source
alone is able to fill the entire 20-liter explosion chamber.
Moreover, these results also confirm the work done by Mittal [171]. The author undertook
experimental investigations of LOC of coal with different ignition energies and noticed that the
LOC of the coal dust decreased from 11 vol% at 1 kJ to 7 vol% at 2.5 kJ, 6 vol% at 5 kJ and 5 vol%
at 10 kJ.
Also, Figure 6.29 presents the results obtained for the LOC of methane, acetone vapor and
isopropanol spray with different ignition energies. A similar explosion behavior as observed for
the dust materials was also seen in the gases and solvents. Increasing the ignition energy
decreased the LOCs of methane, acetone and isopropanol respectively. Out of tested gases and
solvents, methane recorded the lowest LOC followed by acetone and isopropanol. This trend
could be attributed to the stoichiometric concentration of oxygen required for a complete
combustion, as explained by the balanced chemical equations below. It could be observed here
that the higher the stoichiometric oxygen concentration, the higher the LOC will be. This implies
that substances which require more oxygen for their complete combustion have higher LOC. This
was confirmed by the LOC results obtained for isopropanol in comparison with acetone and
methane.
Isopropanol: 9 O2 + 2C3H6O ---> 6CO2 + 8H2O
O2↑= LOC ↑
Acetone: 4 O2 + C3H6O ---> 3 CO2 + 3H2O
O2↑= LOC ↑
Methane: 2 O2 + CH4 ---> CO2 + 2H2O
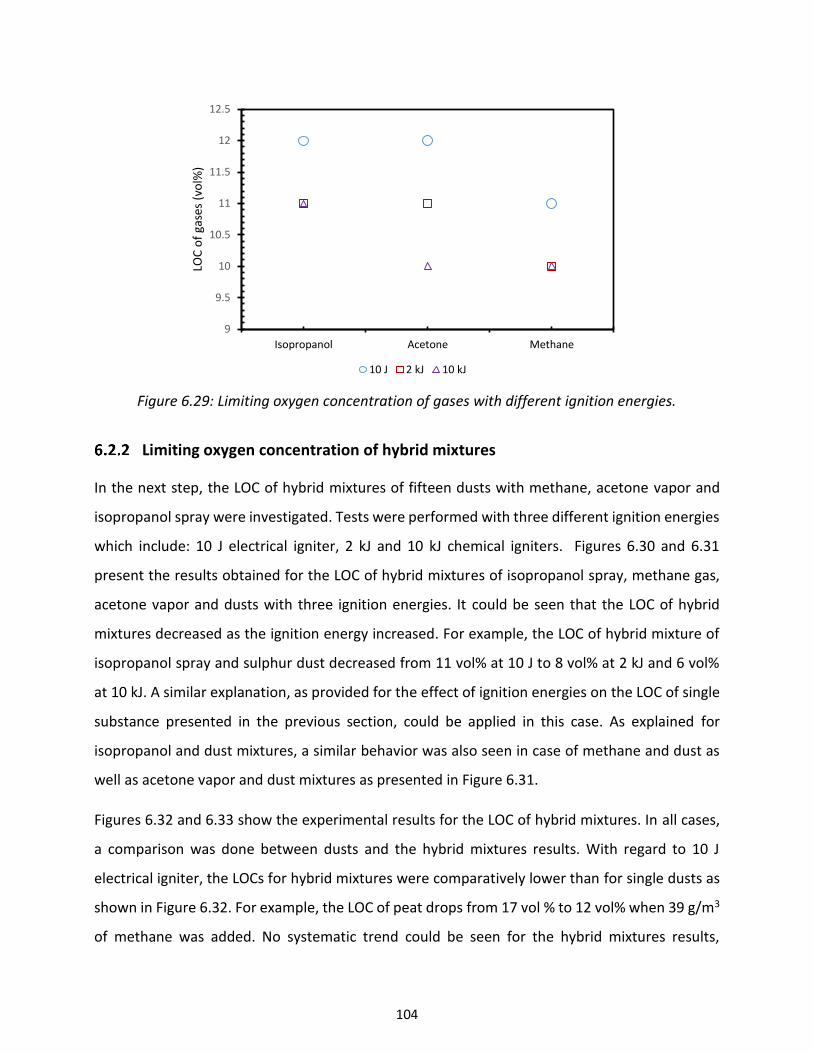
104
Figure 6.29: Limiting oxygen concentration of gases with different ignition energies.
Limiting oxygen concentration of hybrid mixtures
In the next step, the LOC of hybrid mixtures of fifteen dusts with methane, acetone vapor and
isopropanol spray were investigated. Tests were performed with three different ignition energies
which include: 10 J electrical igniter, 2 kJ and 10 kJ chemical igniters. Figures 6.30 and 6.31
present the results obtained for the LOC of hybrid mixtures of isopropanol spray, methane gas,
acetone vapor and dusts with three ignition energies. It could be seen that the LOC of hybrid
mixtures decreased as the ignition energy increased. For example, the LOC of hybrid mixture of
isopropanol spray and sulphur dust decreased from 11 vol% at 10 J to 8 vol% at 2 kJ and 6 vol%
at 10 kJ. A similar explanation, as provided for the effect of ignition energies on the LOC of single
substance presented in the previous section, could be applied in this case. As explained for
isopropanol and dust mixtures, a similar behavior was also seen in case of methane and dust as
well as acetone vapor and dust mixtures as presented in Figure 6.31.
Figures 6.32 and 6.33 show the experimental results for the LOC of hybrid mixtures. In all cases,
a comparison was done between dusts and the hybrid mixtures results. With regard to 10 J
electrical igniter, the LOCs for hybrid mixtures were comparatively lower than for single dusts as
shown in Figure 6.32. For example, the LOC of peat drops from 17 vol % to 12 vol% when 39 g/m3
of methane was added. No systematic trend could be seen for the hybrid mixtures results,
9
9.5
10
10.5
11
11.5
12
12.5
Isopropanol Acetone Methane
LOC
of
gase
s (v
ol%
)
10 J 2 kJ 10 kJ
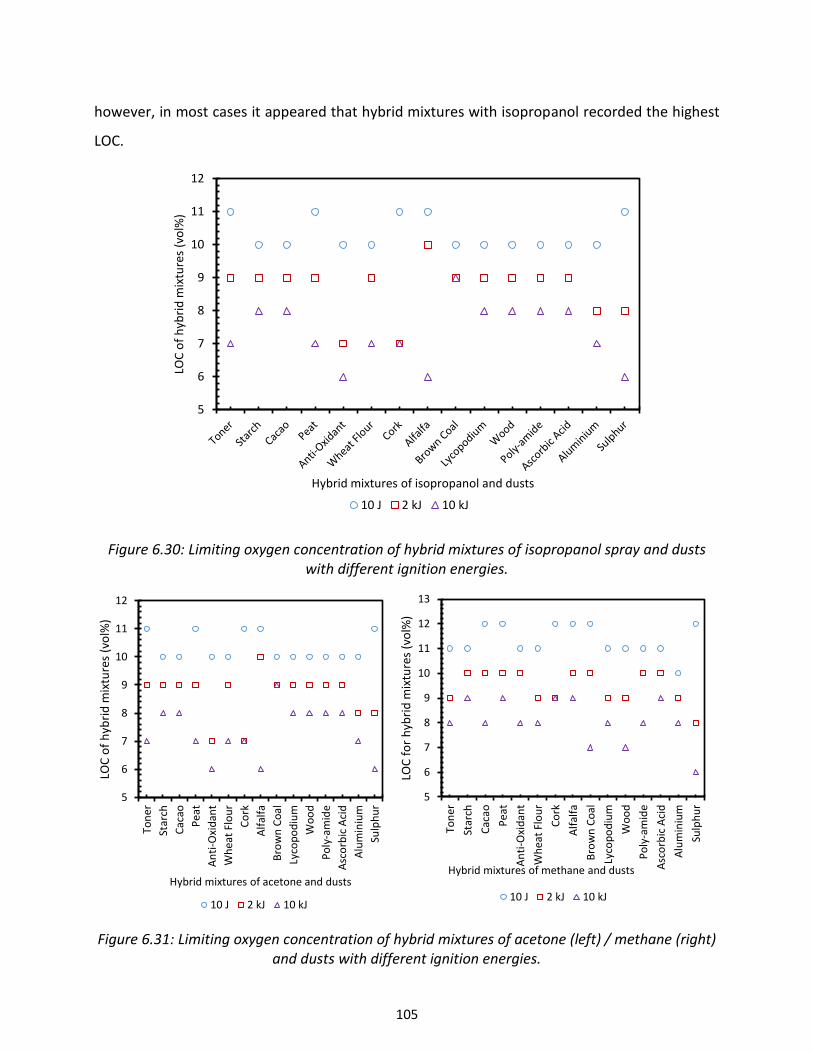
105
however, in most cases it appeared that hybrid mixtures with isopropanol recorded the highest
LOC.
Figure 6.30: Limiting oxygen concentration of hybrid mixtures of isopropanol spray and dusts with different ignition energies.
Figure 6.31: Limiting oxygen concentration of hybrid mixtures of acetone (left) / methane (right) and dusts with different ignition energies.
5
6
7
8
9
10
11
12LO
C o
f h
ybri
d m
ixtu
res
(vo
l%)
Hybrid mixtures of isopropanol and dusts
10 J 2 kJ 10 kJ
5
6
7
8
9
10
11
12
Ton
er
Star
ch
Cac
ao
Pea
t
An
ti-O
xid
ant
Wh
eat
Flo
ur
Co
rk
Alf
alfa
Bro
wn
Co
al
Lyco
po
diu
m
Wo
od
Po
ly-a
mid
e
Asc
orb
ic A
cid
Alu
min
ium
Sulp
hu
r
LOC
of
hyb
rid
mix
ture
s (v
ol%
)
Hybrid mixtures of acetone and dusts
10 J 2 kJ 10 kJ
5
6
7
8
9
10
11
12
13
Ton
er
Star
ch
Cac
ao
Pea
t
An
ti-O
xid
ant
Wh
eat
Flo
ur
Co
rk
Alf
alfa
Bro
wn
Co
al
Lyco
po
diu
m
Wo
od
Po
ly-a
mid
e
Asc
orb
ic A
cid
Alu
min
ium
Sulp
hu
r
LOC
fo
r h
ybri
d m
ixtu
res
(vo
l%)
Hybrid mixtures of methane and dusts
10 J 2 kJ 10 kJ
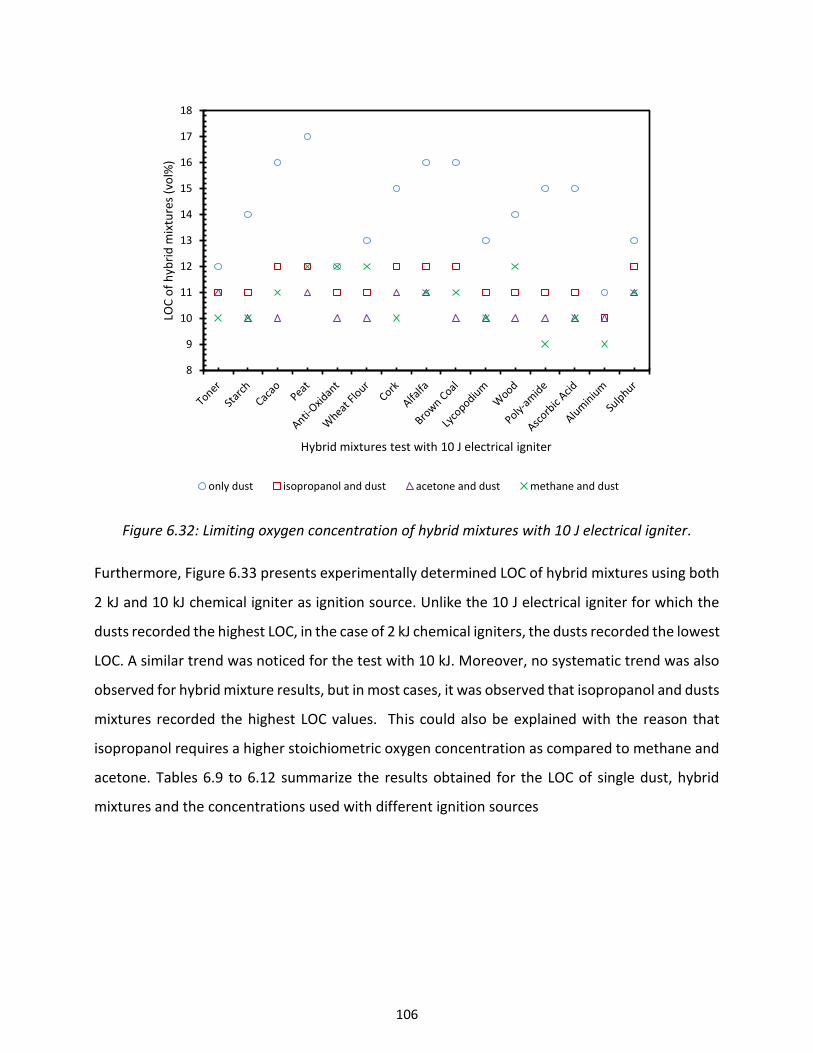
106
Figure 6.32: Limiting oxygen concentration of hybrid mixtures with 10 J electrical igniter.
Furthermore, Figure 6.33 presents experimentally determined LOC of hybrid mixtures using both
2 kJ and 10 kJ chemical igniter as ignition source. Unlike the 10 J electrical igniter for which the
dusts recorded the highest LOC, in the case of 2 kJ chemical igniters, the dusts recorded the lowest
LOC. A similar trend was noticed for the test with 10 kJ. Moreover, no systematic trend was also
observed for hybrid mixture results, but in most cases, it was observed that isopropanol and dusts
mixtures recorded the highest LOC values. This could also be explained with the reason that
isopropanol requires a higher stoichiometric oxygen concentration as compared to methane and
acetone. Tables 6.9 to 6.12 summarize the results obtained for the LOC of single dust, hybrid
mixtures and the concentrations used with different ignition sources
8
9
10
11
12
13
14
15
16
17
18
LOC
of
hyb
rid
mix
ture
s (v
ol%
)
Hybrid mixtures test with 10 J electrical igniter
only dust isopropanol and dust acetone and dust methane and dust

107
Figure 6.33: limiting oxygen concentration of hybrid mixtures with 2 kJ (left), 10 kJ (right) chemical igniters.
Table 6.9: Summary results for the LOC of dusts and concentrations with different ignition energies.
Dusts Samples
10 J 2 kJ 10 kJ
LOC (vol %)
Concentration (g/m3)
LOC (vol %)
Concentration (g/m3)
LOC (vol %)
Concentration (g/m3)
Toner 12 750 8 500 6 500
Anti-Oxidant 14 500 7 500 6 500
Lycopodium 16 500 9 375 8 375
Starch 17 1000 10 500 8 250
Wheat Flour 12 1000 8 500 7 500
Wood 13 1250 8 750 6 500
Cocoa 15 1250 9 1000 7 750
Cork 16 1000 9 625 8 500
Polyamide 16 500 8 250 7 250
Peat 13 1250 8 750 6 500
Alfalfa 14 1500 7 1000 6 750
Ascorbic Acid 15 1250 8 750 7 750
Aluminium Powder 15 500 8 500 7 250
Brown Coal 11 750 5 500 5 500
Sulphur 13 500 7 500 5 500
4
5
6
7
8
9
10
11
Ton
er
Star
ch
Cac
ao
Pea
t
An
ti-O
xid
ant
Wh
eat
Flo
ur
Co
rk
Alf
alfa
Bro
wn
Co
al
Lyco
po
diu
m
Wo
od
Po
ly-a
mid
e
Asc
orb
ic A
cid
Alu
min
ium
Sulp
hu
r
LOC
of
hyb
rid
mix
ture
s (v
ol%
)
Hybrid mixtures test wth 2 kJ chemical igniters
only dust isopropanol and dust
acetone and dust methane and dust
4
5
6
7
8
9
10
Ton
er
Star
ch
Cac
ao
Pea
t
An
ti-O
xid
ant
Wh
eat
Flo
ur
Co
rk
Alf
alfa
Bro
wn
Co
al
Lyco
po
diu
m
Wo
od
Po
ly-a
mid
e
Asc
orb
ic A
cid
Alu
min
ium
Sulp
hu
r
LOC
of
hyb
rid
mix
ture
s (v
ol%
)
Hybrid mixtures test wth 10 kJ chemical igniters
only dust isopropanol and dust
acetone and dust methane and dust
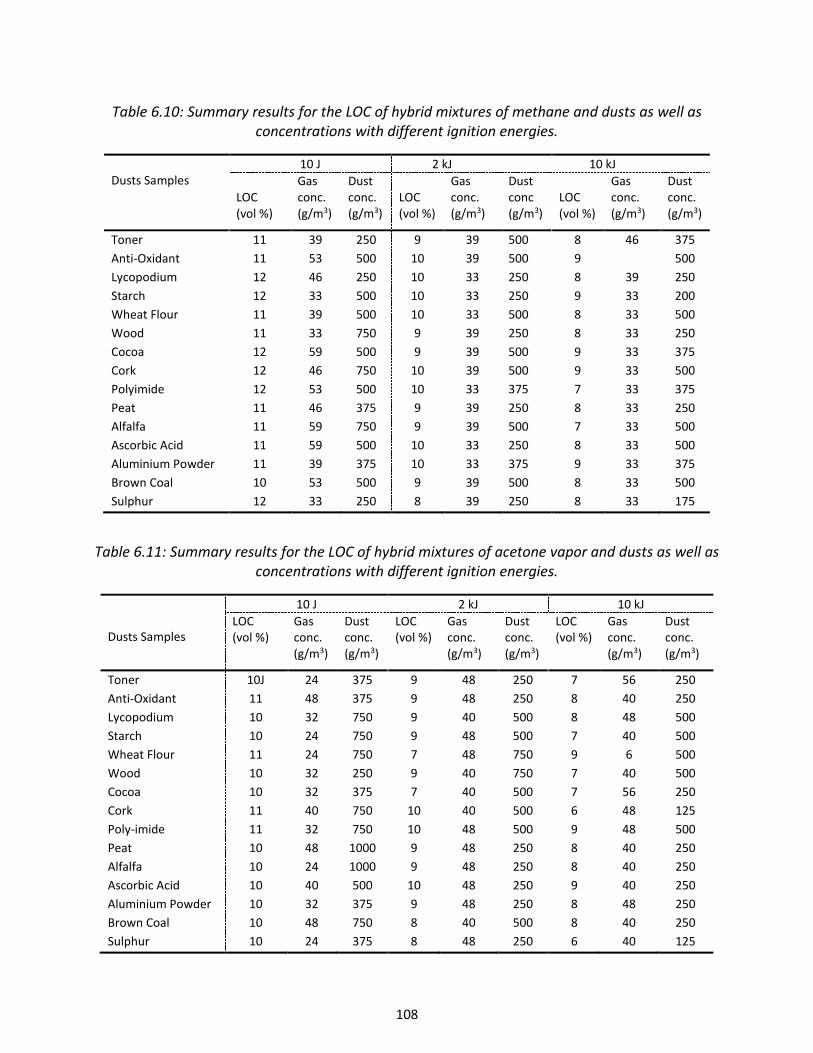
108
Table 6.10: Summary results for the LOC of hybrid mixtures of methane and dusts as well as concentrations with different ignition energies.
Dusts Samples
10 J 2 kJ 10 kJ
LOC (vol %)
Gas conc. (g/m3)
Dust conc. (g/m3)
LOC (vol %)
Gas conc. (g/m3)
Dust conc (g/m3)
LOC (vol %)
Gas conc. (g/m3)
Dust conc. (g/m3)
Toner 11 39 250 9 39 500 8 46 375
Anti-Oxidant 11 53 500 10 39 500 9 500
Lycopodium 12 46 250 10 33 250 8 39 250
Starch 12 33 500 10 33 250 9 33 200
Wheat Flour 11 39 500 10 33 500 8 33 500
Wood 11 33 750 9 39 250 8 33 250
Cocoa 12 59 500 9 39 500 9 33 375
Cork 12 46 750 10 39 500 9 33 500
Polyimide 12 53 500 10 33 375 7 33 375
Peat 11 46 375 9 39 250 8 33 250
Alfalfa 11 59 750 9 39 500 7 33 500
Ascorbic Acid 11 59 500 10 33 250 8 33 500
Aluminium Powder 11 39 375 10 33 375 9 33 375
Brown Coal 10 53 500 9 39 500 8 33 500
Sulphur 12 33 250 8 39 250 8 33 175
Table 6.11: Summary results for the LOC of hybrid mixtures of acetone vapor and dusts as well as concentrations with different ignition energies.
Dusts Samples
10 J 2 kJ 10 kJ
LOC (vol %)
Gas conc. (g/m3)
Dust conc. (g/m3)
LOC (vol %)
Gas conc. (g/m3)
Dust conc. (g/m3)
LOC (vol %)
Gas conc. (g/m3)
Dust conc. (g/m3)
Toner 10J 24 375 9 48 250 7 56 250
Anti-Oxidant 11 48 375 9 48 250 8 40 250
Lycopodium 10 32 750 9 40 500 8 48 500
Starch 10 24 750 9 48 500 7 40 500
Wheat Flour 11 24 750 7 48 750 9 6 500
Wood 10 32 250 9 40 750 7 40 500
Cocoa 10 32 375 7 40 500 7 56 250
Cork 11 40 750 10 40 500 6 48 125
Poly-imide 11 32 750 10 48 500 9 48 500
Peat 10 48 1000 9 48 250 8 40 250
Alfalfa 10 24 1000 9 48 250 8 40 250
Ascorbic Acid 10 40 500 10 48 250 9 40 250
Aluminium Powder 10 32 375 9 48 250 8 48 250
Brown Coal 10 48 750 8 40 500 8 40 250
Sulphur 10 24 375 8 48 250 6 40 125
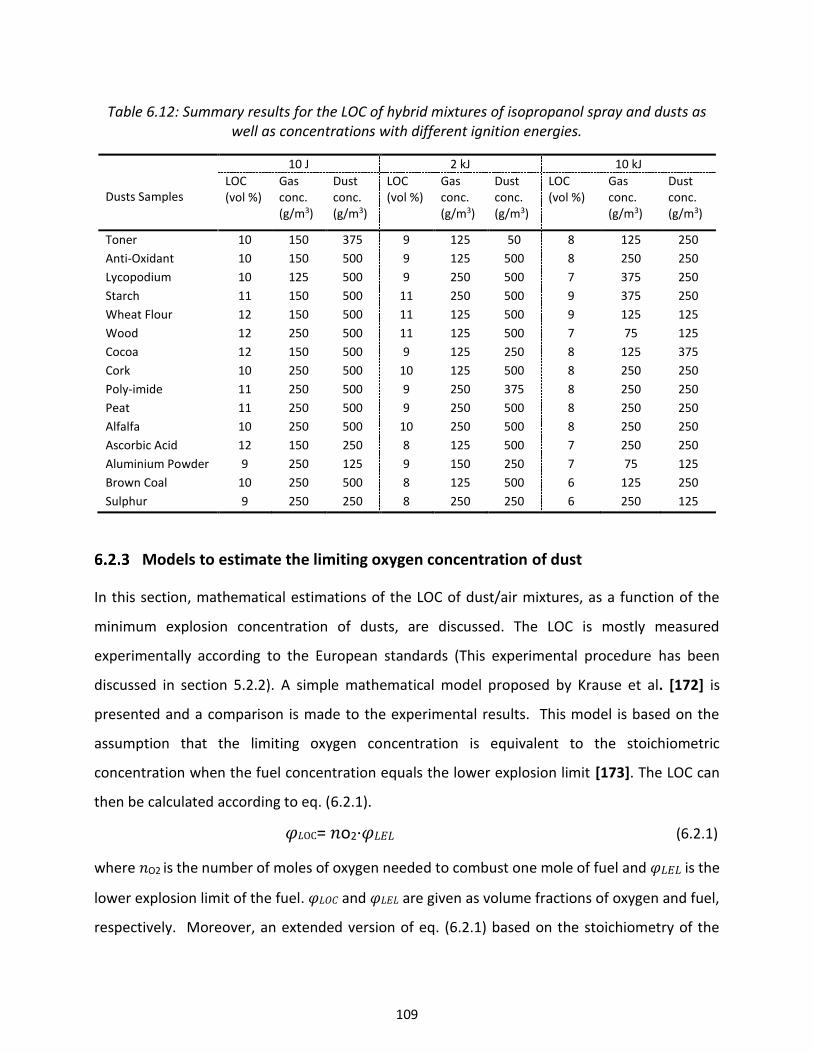
109
Table 6.12: Summary results for the LOC of hybrid mixtures of isopropanol spray and dusts as well as concentrations with different ignition energies.
Dusts Samples
10 J 2 kJ 10 kJ
LOC (vol %)
Gas conc. (g/m3)
Dust conc. (g/m3)
LOC (vol %)
Gas conc. (g/m3)
Dust conc. (g/m3)
LOC (vol %)
Gas conc. (g/m3)
Dust conc. (g/m3)
Toner 10 150 375 9 125 50 8 125 250
Anti-Oxidant 10 150 500 9 125 500 8 250 250
Lycopodium 10 125 500 9 250 500 7 375 250
Starch 11 150 500 11 250 500 9 375 250
Wheat Flour 12 150 500 11 125 500 9 125 125
Wood 12 250 500 11 125 500 7 75 125
Cocoa 12 150 500 9 125 250 8 125 375
Cork 10 250 500 10 125 500 8 250 250
Poly-imide 11 250 500 9 250 375 8 250 250
Peat 11 250 500 9 250 500 8 250 250
Alfalfa 10 250 500 10 250 500 8 250 250
Ascorbic Acid 12 150 250 8 125 500 7 250 250
Aluminium Powder 9 250 125 9 150 250 7 75 125
Brown Coal 10 250 500 8 125 500 6 125 250
Sulphur 9 250 250 8 250 250 6 250 125
Models to estimate the limiting oxygen concentration of dust
In this section, mathematical estimations of the LOC of dust/air mixtures, as a function of the
minimum explosion concentration of dusts, are discussed. The LOC is mostly measured
experimentally according to the European standards (This experimental procedure has been
discussed in section 5.2.2). A simple mathematical model proposed by Krause et al. [172] is
presented and a comparison is made to the experimental results. This model is based on the
assumption that the limiting oxygen concentration is equivalent to the stoichiometric
concentration when the fuel concentration equals the lower explosion limit [173]. The LOC can
then be calculated according to eq. (6.2.1).
𝜑𝐿OC= 𝑛o2∙𝜑𝐿𝐸𝐿 (6.2.1)
where 𝑛O2 is the number of moles of oxygen needed to combust one mole of fuel and 𝜑𝐿𝐸𝐿 is the
lower explosion limit of the fuel. 𝜑𝐿𝑂𝐶 and 𝜑𝐿𝐸𝐿 are given as volume fractions of oxygen and fuel,
respectively. Moreover, an extended version of eq. (6.2.1) based on the stoichiometry of the

110
oxidizable elements contained in the fuel could be formulated, with 𝜇𝑖 being the mass fraction of
the oxidizable element i and Mi being its molecular mass as shown in eq. (6.2.2).
𝜑 LOC = (∑ 𝑁𝑖=1 𝑣 o2,i
𝜇𝑖
𝑀𝑖 -
𝜇𝑂2
𝑀𝑂2 )
𝑀𝑂2
𝜌O2 . 𝜑LEL (6.2.2)
Where; 𝑣o2,i is the number of moles of oxygen required to burn one mole of the element i. The
term µo2 / MO2 describes the amount of oxygen contained in the fuel. 𝜑LEL represents the lower
explosion limit of the gas-air mixture, but in case of dust-air-mixtures, this value is usually given
as mass of the dust per unit volume of air in which the dust particles are dispersed. Therefore, to
describe the limit for flame propagation in dust-air-mixtures the minimum explosible
concentration MEC (g/m³) is used instead of LEL. MEC of dust could also be estimated under the
assumption of a homogeneous fuel-air mixture of a given heat of reaction, specific heat capacity
and complete combustion. The MEC is the minimum amount of fuel necessary to shift the reactive
system from “initial” to a “flame” temperature. Schönewald, [98] used this assumption to
propose the semi-empirical model as shown in eq. (6.2.3) where the constants were fitted to a
wide range of hydrocarbons (see section 3.1.2.11 for detail discussion), where Ho is the heat of
combustion of the dust while a and b are constant.
CMEC = 𝑎
𝐻𝑜− 𝑏 (6.2.3)
Based on eq. (6.2.2) and using the MEC instead of LEL, eq. (6.2.4) could be formulated
𝜑 LOC = 𝜎fu . 𝑀𝑂2
𝜌O2. CMEC (6.2.4)
Inserting the CMEC model from eq. (6.2.3) into eq. (6.2.4), eq. (6.2.5) could be obtained
𝜑 LOC = (∑ 𝑁𝑖=1 𝑣 o2,i
𝜇𝑖
𝑀𝑖 -
𝜇𝑂2
𝑀𝑂2 ).
𝑀𝑂2
𝜌O2 . (
𝑎
𝐻0− 𝑏) (6.2.5)
In this case, a simple fuel consisting of carbon, hydrogen, oxygen and non-reacting component
only that burns completely to carbon dioxide and water are considered, and based on eq. (6.2.2),
the fuel number (𝜎fu) could be estimated from eq. (6.2.6)
𝜎fu-dust=ʋo2,c→co2 𝜇𝑐
𝑀𝑐+ ʋo2,H→Ho2
𝜇𝐻
𝑀𝐻-
𝜇𝑂2
𝑀𝑂2 (6.2.6)

111
If a complete combustion with only a few elementary reactions is assumed, the value of 𝜎fu will
depend only on the chemical composition of the fuel. However, if incomplete combustion occurs,
more elementary reactions have to be taken into account. It must be mentioned here that only
complete combustion in a one-step oxidation process is considered.
For example, in case complete combustion of monomeric starch dust and air mixture is
considered, and based on the chemical formula 𝐶6𝐻10O5 and the molecular masses of carbon,
hydrogen and oxygen of 12 g/mol, 1 g/mol and 16 g/mol, the mass fractions of carbon, hydrogen
and oxygen are 𝜇𝐶=0.44, 𝜇𝐻=0.06, 𝜇O=0.50, respectively, the fuel number of starch σC6H10O5
could be estimated. Two simple reactions for the conversion of the carbonaceous combustible
dusts are assumed as presented in eq. (6.2.7) and eq. (6.2.8) [9].
C + O2 → 𝐶O2 (6.2.7)
2𝐻 + 1
2O2 → 𝐻2O (6.2.8)
With the molecular weights and the mass fractions of the elements presented in Table 6.13, the
𝜎𝐶6𝐻10𝑂5 could be obtained as presented in eq. (6.2.9)
σC6H10O5 =(0.44
12+
1
2 .
0.06
1-0.5
16 )
𝑚𝑜𝑙
𝑔 = 0.0354
𝑚𝑜𝑙
𝑔 (6.2.9)
Table 6.13: Mass fractions of elements, MEC, heat of reaction and estimated fuel numbers for the fifteen dusts.
Samples μ c μ H μ 0 MEC (g/m3) 𝜎fu(mol/g) Ho (J/g)
Wheat 0.42 0.061 0.476 64.7 0.035 18360 Starch 0.433 0.064 0.477 63.9 0.035 17310 Brown coal 0.69 0.060 0.22 69.5 0.066 17148 Wood 0.491 0.063 0.440 77.7 0.043 15395 Lycopodium 0.695 0.094 0.186 37.9 0.075 30554
Polyamide 0.637 0.097 0.142 46.4 0.073 29461 Cork 0.42 0.06 0.51 83.90 0.035 14230 Alfalfa 0.44 0.05 0.34 74.6 0.038 15990
Peat 0.50 0.05 0.3 64.8 0.044 18420 Antioxidant 0.72 0.08 0.12 37.35 0.076 31960
Ascorbic acid 0.40 0.04 0.53 104 0.024 11469 Toner 0.86 0.07 0.05 32.75 0.089 35792 Cacao 0.52 0.06 0.28 57.13 0.049 20678 Aluminium - - - - - - Sulphur - - - - - -
112
Figure 6.34 presents a comparison between the experimental and computational LOC for dust
samples with different ignition energies. The red star and green rectangle symbolize 10 kJ and 2
kJ chemical igniters respectively while the black circle symbolizes 10 J electrical igniters. An error
bar based on the error and uncertainty analysis from the experimental procedure is also plotted
on the results. The results presented in the figure are segregated into two regions, that is the
results obtained from 10 J is distinct from the 2 kJ and 10 kJ. It could be seen that the
computational values were far below the experimental results for the 10 J electrical igniters,
which seems to be good from a safety point of view. Moreover, the experimental results from 2
kJ chemical igniter were also in good agreement with the computational results. With respect to
10 kJ chemical igniter, it was observed that two of the experimental results were 1 vol% higher
than the computational values.
Furthermore, considering that the fuel number of dusts 𝜎fu presented in Table 6.14, is a constant
for each dust under the conditions presumed in eq. (6.2.4) in section 6.2.3.1, it indicates a linear
dependence of LOC on the MEC. Figure 6.35 shows a diagram where the LOC is given as a function
of MEC with 𝜎fu as a parameter. If MEC and the chemical composition of the dust samples (mass
fractions of essential elements) are known, the LOC can be obtained directly from this diagram.
However, the determination of the MEC by experiments is complicated because of the well-
known difficulties to achieve homogenous dust dispersion. Local distributions of the dust
concentration appear and may cause considerable errors. Hence, the model proposed by
Schönewald [98] shown in eq. (6.2.3) could be used to determine the MEC of dusts by knowing
only the heat of combustion of the dusts being considered.
It must be noted that, there are many assumptions and idealisations in the model, which makes
it to give a lower boundary for MEC rather than a "realistic" value. For example, polyamide with
an estimated MEC of 46 g/m3and heat of combustion of 0.073 mol/g, when traced from the Figure
6.35, gave a LOC value of 7 vol% which is the same as the experimental value.
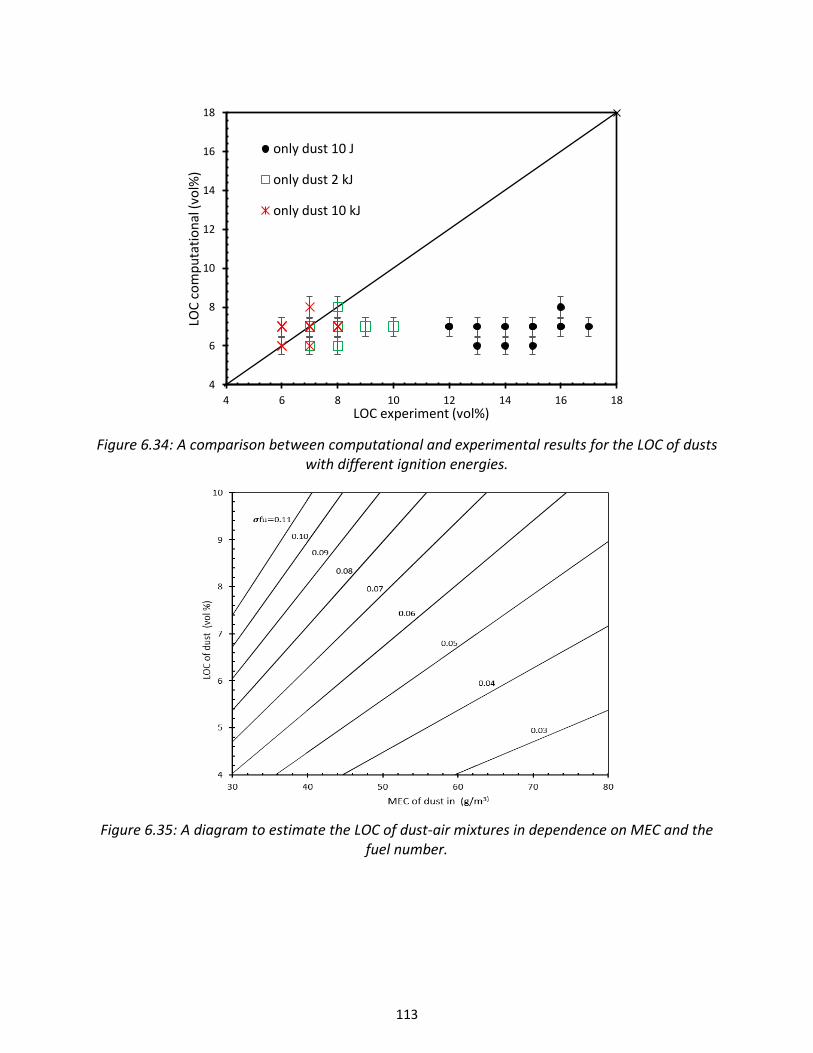
113
Figure 6.34: A comparison between computational and experimental results for the LOC of dusts with different ignition energies.
Figure 6.35: A diagram to estimate the LOC of dust-air mixtures in dependence on MEC and the fuel number.
4
6
8
10
12
14
16
18
4 6 8 10 12 14 16 18
LOC
co
mp
uta
tio
nal
(vo
l%)
LOC experiment (vol%)
only dust 10 J
only dust 2 kJ
only dust 10 kJ
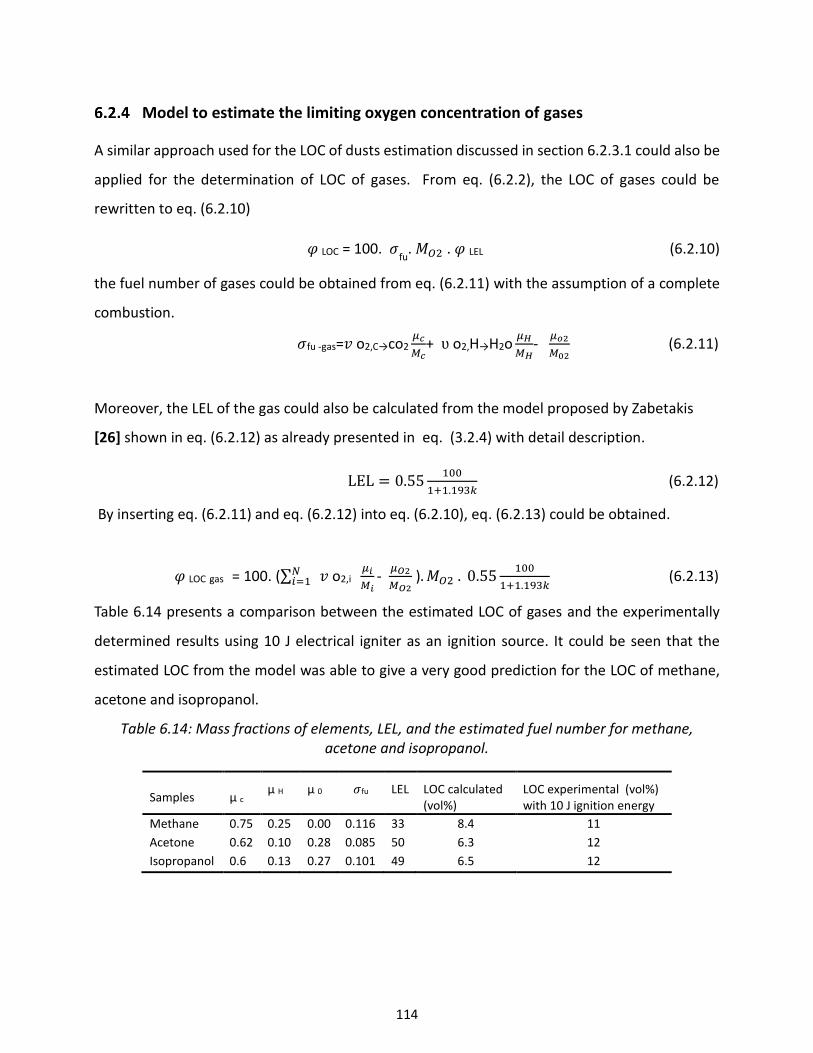
114
Model to estimate the limiting oxygen concentration of gases
A similar approach used for the LOC of dusts estimation discussed in section 6.2.3.1 could also be
applied for the determination of LOC of gases. From eq. (6.2.2), the LOC of gases could be
rewritten to eq. (6.2.10)
𝜑 LOC = 100. 𝜎fu
. 𝑀𝑂2 . 𝜑 LEL (6.2.10)
the fuel number of gases could be obtained from eq. (6.2.11) with the assumption of a complete
combustion.
𝜎fu -gas=𝑣 o2,C→co2 𝜇𝑐
𝑀𝑐+ ʋ o2,H→H2o
𝜇𝐻
𝑀𝐻-
𝜇𝑜2
𝑀02 (6.2.11)
Moreover, the LEL of the gas could also be calculated from the model proposed by Zabetakis
[26] shown in eq. (6.2.12) as already presented in eq. (3.2.4) with detail description.
LEL = 0.55100
1+1.193𝑘 (6.2.12)
By inserting eq. (6.2.11) and eq. (6.2.12) into eq. (6.2.10), eq. (6.2.13) could be obtained.
𝜑 LOC gas = 100. (∑ 𝑁𝑖=1 𝑣 o2,i
𝜇𝑖
𝑀𝑖 -
𝜇𝑂2
𝑀𝑂2 ). 𝑀𝑂2 . 0.55
100
1+1.193𝑘 (6.2.13)
Table 6.14 presents a comparison between the estimated LOC of gases and the experimentally
determined results using 10 J electrical igniter as an ignition source. It could be seen that the
estimated LOC from the model was able to give a very good prediction for the LOC of methane,
acetone and isopropanol.
Table 6.14: Mass fractions of elements, LEL, and the estimated fuel number for methane, acetone and isopropanol.
Samples μ c μ H μ 0 𝜎fu LEL LOC calculated
(vol%) LOC experimental (vol%) with 10 J ignition energy
Methane 0.75 0.25 0.00 0.116 33 8.4 11
Acetone 0.62 0.10 0.28 0.085 50 6.3 12
Isopropanol 0.6 0.13 0.27 0.101 49 6.5 12
115
Model to estimate the limiting oxygen concentration of hybrid mixtures
Based on presented models to estimate the 𝜑LOC of both dusts and gases discussed in sections
6.2.3.1 and 6.2.3.2, a model to estimate the 𝜑LOC of hybrid mixture could be derived by
considering the assumption, that the 𝜑LOC of hybrid mixtures is the summation of the 𝜑LOC of
dust and gas multiplied by the respective mass fractions of the individual component in the
mixture, as shown in eq. (6.2.14).
𝜑LOC_hybrid = 𝜑LOC_dust. βd + 𝜑LOC_gas. βg (6.2.14)
Inserting eq. (6.2.2) and eq. (6.2.10) into eq. (6.2.14); eq. (6.1.15) could be obtained
𝜑LOC_hybrid =(100. 𝜎𝑓𝑢−𝑔 . 𝑀𝑜2 . φLEL. βg) + (100. 𝜎fu_d
𝑀𝑜2
𝜌𝑜2.CMEC.βd) (6.2.15)
By inserting eq. (6.2.5) and eq. (6.2.13) into eq. (6.2.15), eq. (6.2.16) could be obtained
𝜑LOC_hybrid =(100. 𝜎𝑓𝑢−𝑔. 𝑀𝑂2 . 055100
1+1.193𝑘 .βg) + (100. 𝜎
fu_d
𝑀𝑂2
𝜌𝑂2 .(
𝑎
𝐻0− 𝑏) .βd) (6.2.16)
Moreover, eq. (6.2.16) could be rewritten to eq. eq. (6.2.17)
𝜑LOC_hybrid =100. [(𝜎𝑓𝑢−𝑔.𝑀𝑂2. (0.55
100
1+1.193𝑘 . βg) )+ (𝜎𝑓𝑢−𝑑.
𝑀𝑂2
𝜌𝑂2 . (
𝑎
𝐻0− 𝑏) .βd)] (6.2.17)
In case, eq. (6.2.6) and eq. (6.2.11) are inserted into eq. (6.2.17), eq. (6.2.18) could be obtained.
𝜑LOC_hybrid = 100.[((∑ 𝑁𝑖=1 𝑣 o2,i
𝜇𝑖
𝑀𝑖 -
𝜇𝑂2
𝑀𝑂2 )g.𝑀𝑂2. (0.55
100
1+1.193𝑘 . βg) +
((∑ 𝑁𝑖=1 𝑣o2,i
𝜇𝑖
𝑀𝑖 -
𝜇𝑂2
𝑀𝑂2 )d.
𝑀𝑂2
𝜌𝑂2. (
𝑎
𝐻0− 𝑏) .βd)] (6.2.18)
Hence, the LOC of hybrid mixtures could be estimated from eq. (6.2.18).
Where, 𝜎𝑓𝑢−𝑔 is the fuel number of gas [mol/g], 𝜎𝑓𝑢−𝑑 indicates the fuel number of dust [mol/g],
𝛽d represent the mass fraction of gas in the mixture, 𝛽d is the mass fraction of dust in the mixture,
g indicate gases and d indicate dusts.
Figures 6.36 to 6.38 present a comparison between the experimental and computational results
for hybrid mixtures with different ignition energies. The red stars and green rectangles symbolize
10 kJ and 2 kJ chemical igniters, respectively, while the black circles symbolize 10 J electrical
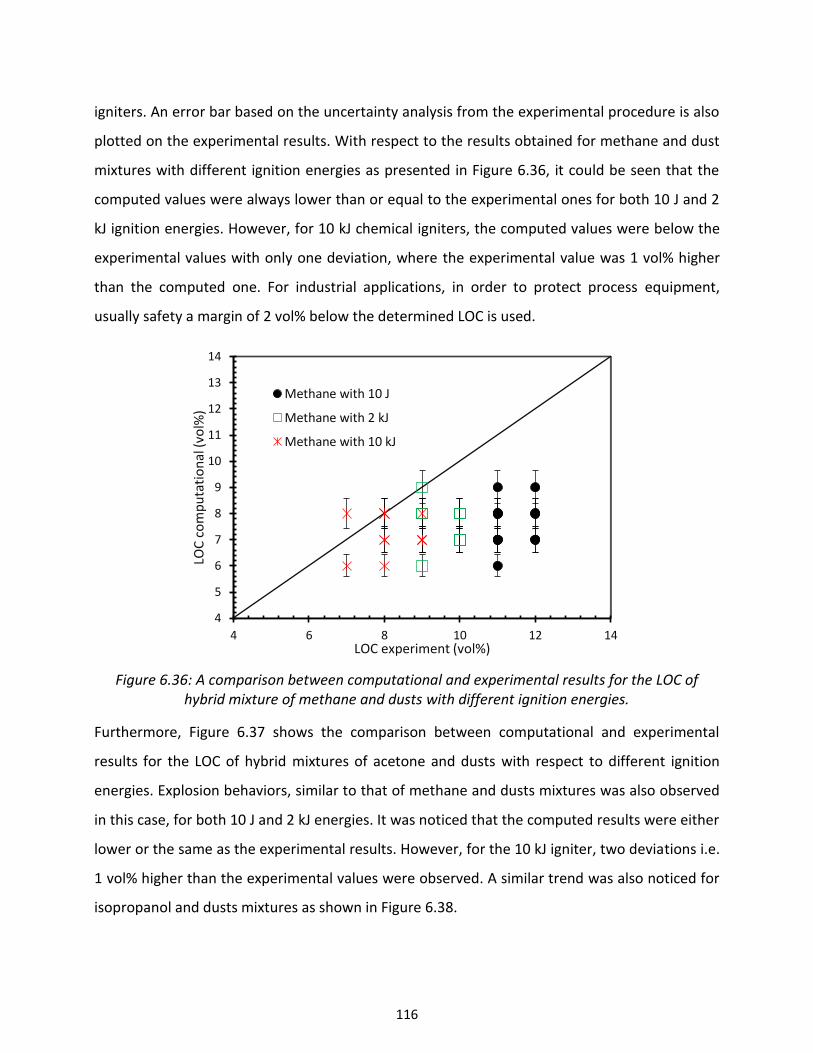
116
igniters. An error bar based on the uncertainty analysis from the experimental procedure is also
plotted on the experimental results. With respect to the results obtained for methane and dust
mixtures with different ignition energies as presented in Figure 6.36, it could be seen that the
computed values were always lower than or equal to the experimental ones for both 10 J and 2
kJ ignition energies. However, for 10 kJ chemical igniters, the computed values were below the
experimental values with only one deviation, where the experimental value was 1 vol% higher
than the computed one. For industrial applications, in order to protect process equipment,
usually safety a margin of 2 vol% below the determined LOC is used.
Figure 6.36: A comparison between computational and experimental results for the LOC of hybrid mixture of methane and dusts with different ignition energies.
Furthermore, Figure 6.37 shows the comparison between computational and experimental
results for the LOC of hybrid mixtures of acetone and dusts with respect to different ignition
energies. Explosion behaviors, similar to that of methane and dusts mixtures was also observed
in this case, for both 10 J and 2 kJ energies. It was noticed that the computed results were either
lower or the same as the experimental results. However, for the 10 kJ igniter, two deviations i.e.
1 vol% higher than the experimental values were observed. A similar trend was also noticed for
isopropanol and dusts mixtures as shown in Figure 6.38.
4
5
6
7
8
9
10
11
12
13
14
4 6 8 10 12 14
LOC
co
mp
uta
tio
nal
(vo
l%)
LOC experiment (vol%)
Methane with 10 J
Methane with 2 kJ
Methane with 10 kJ
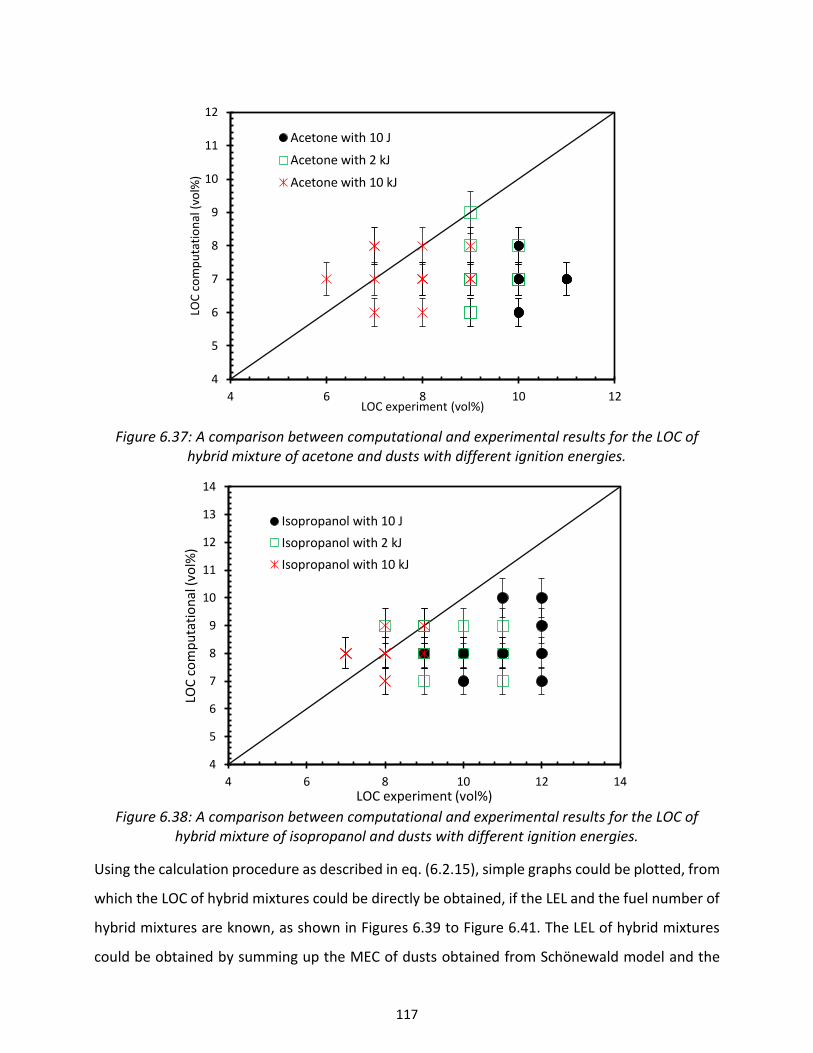
117
Figure 6.37: A comparison between computational and experimental results for the LOC of hybrid mixture of acetone and dusts with different ignition energies.
Figure 6.38: A comparison between computational and experimental results for the LOC of
hybrid mixture of isopropanol and dusts with different ignition energies.
Using the calculation procedure as described in eq. (6.2.15), simple graphs could be plotted, from
which the LOC of hybrid mixtures could be directly be obtained, if the LEL and the fuel number of
hybrid mixtures are known, as shown in Figures 6.39 to Figure 6.41. The LEL of hybrid mixtures
could be obtained by summing up the MEC of dusts obtained from Schönewald model and the
4
5
6
7
8
9
10
11
12
4 6 8 10 12
LOC
co
mp
uta
tio
nal
(vo
l%)
LOC experiment (vol%)
Acetone with 10 J
Acetone with 2 kJ
Acetone with 10 kJ
4
5
6
7
8
9
10
11
12
13
14
4 6 8 10 12 14
LOC
co
mp
uta
tio
nal
(vo
l%)
LOC experiment (vol%)
Isopropanol with 10 J
Isopropanol with 2 kJ
Isopropanol with 10 kJ
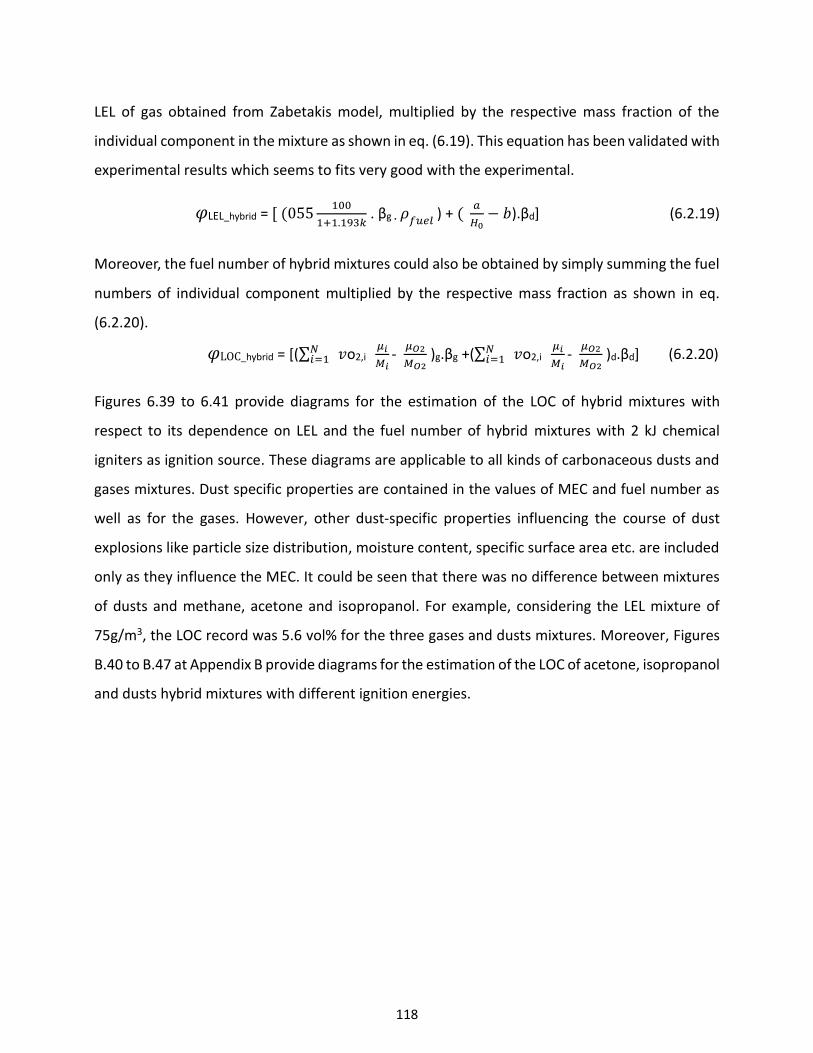
118
LEL of gas obtained from Zabetakis model, multiplied by the respective mass fraction of the
individual component in the mixture as shown in eq. (6.19). This equation has been validated with
experimental results which seems to fits very good with the experimental.
𝜑LEL_hybrid = [ (055100
1+1.193𝑘 . βg . 𝜌𝑓𝑢𝑒𝑙 ) + (
𝑎
𝐻0− 𝑏).βd] (6.2.19)
Moreover, the fuel number of hybrid mixtures could also be obtained by simply summing the fuel
numbers of individual component multiplied by the respective mass fraction as shown in eq.
(6.2.20).
𝜑LOC_hybrid = [(∑ 𝑁𝑖=1 𝑣o2,i
𝜇𝑖
𝑀𝑖 -
𝜇𝑂2
𝑀𝑂2 )g.βg +(∑ 𝑁
𝑖=1 𝑣o2,i 𝜇𝑖
𝑀𝑖 -
𝜇𝑂2
𝑀𝑂2 )d.βd] (6.2.20)
Figures 6.39 to 6.41 provide diagrams for the estimation of the LOC of hybrid mixtures with
respect to its dependence on LEL and the fuel number of hybrid mixtures with 2 kJ chemical
igniters as ignition source. These diagrams are applicable to all kinds of carbonaceous dusts and
gases mixtures. Dust specific properties are contained in the values of MEC and fuel number as
well as for the gases. However, other dust-specific properties influencing the course of dust
explosions like particle size distribution, moisture content, specific surface area etc. are included
only as they influence the MEC. It could be seen that there was no difference between mixtures
of dusts and methane, acetone and isopropanol. For example, considering the LEL mixture of
75g/m3, the LOC record was 5.6 vol% for the three gases and dusts mixtures. Moreover, Figures
B.40 to B.47 at Appendix B provide diagrams for the estimation of the LOC of acetone, isopropanol
and dusts hybrid mixtures with different ignition energies.
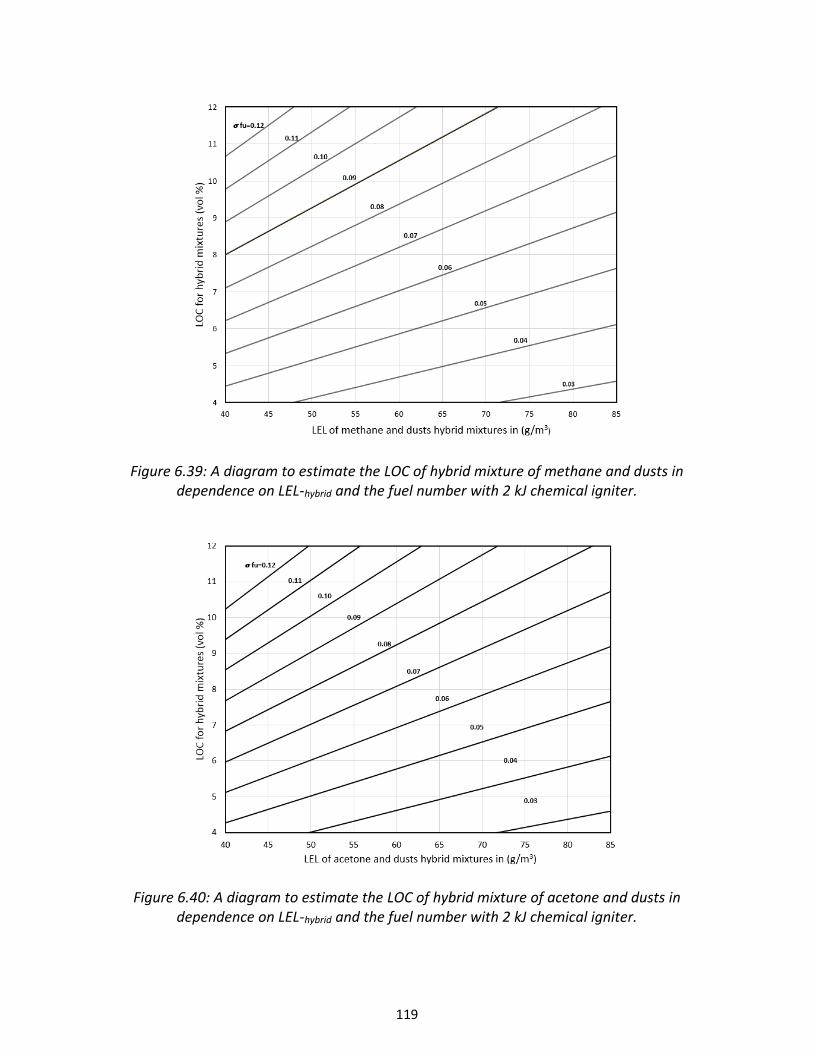
119
Figure 6.39: A diagram to estimate the LOC of hybrid mixture of methane and dusts in dependence on LEL-hybrid and the fuel number with 2 kJ chemical igniter.
Figure 6.40: A diagram to estimate the LOC of hybrid mixture of acetone and dusts in dependence on LEL-hybrid and the fuel number with 2 kJ chemical igniter.
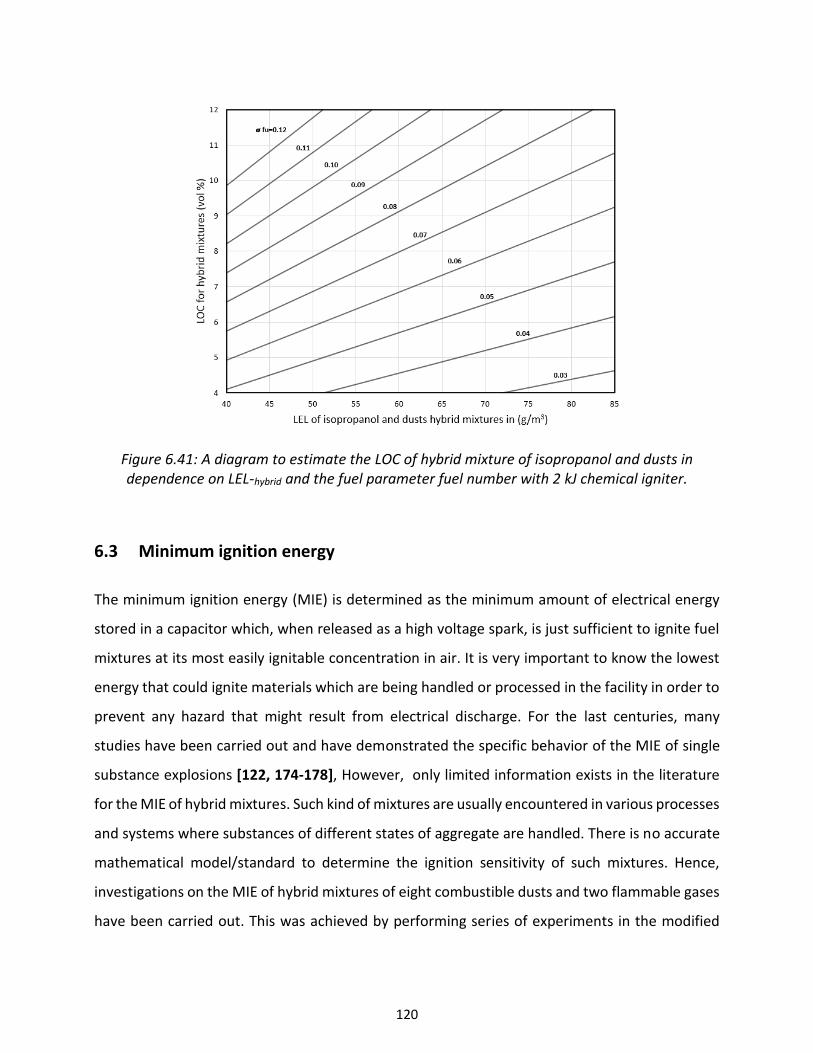
120
Figure 6.41: A diagram to estimate the LOC of hybrid mixture of isopropanol and dusts in dependence on LEL-hybrid and the fuel parameter fuel number with 2 kJ chemical igniter.
6.3 Minimum ignition energy
The minimum ignition energy (MIE) is determined as the minimum amount of electrical energy
stored in a capacitor which, when released as a high voltage spark, is just sufficient to ignite fuel
mixtures at its most easily ignitable concentration in air. It is very important to know the lowest
energy that could ignite materials which are being handled or processed in the facility in order to
prevent any hazard that might result from electrical discharge. For the last centuries, many
studies have been carried out and have demonstrated the specific behavior of the MIE of single
substance explosions [122, 174-178], However, only limited information exists in the literature
for the MIE of hybrid mixtures. Such kind of mixtures are usually encountered in various processes
and systems where substances of different states of aggregate are handled. There is no accurate
mathematical model/standard to determine the ignition sensitivity of such mixtures. Hence,
investigations on the MIE of hybrid mixtures of eight combustible dusts and two flammable gases
have been carried out. This was achieved by performing series of experiments in the modified
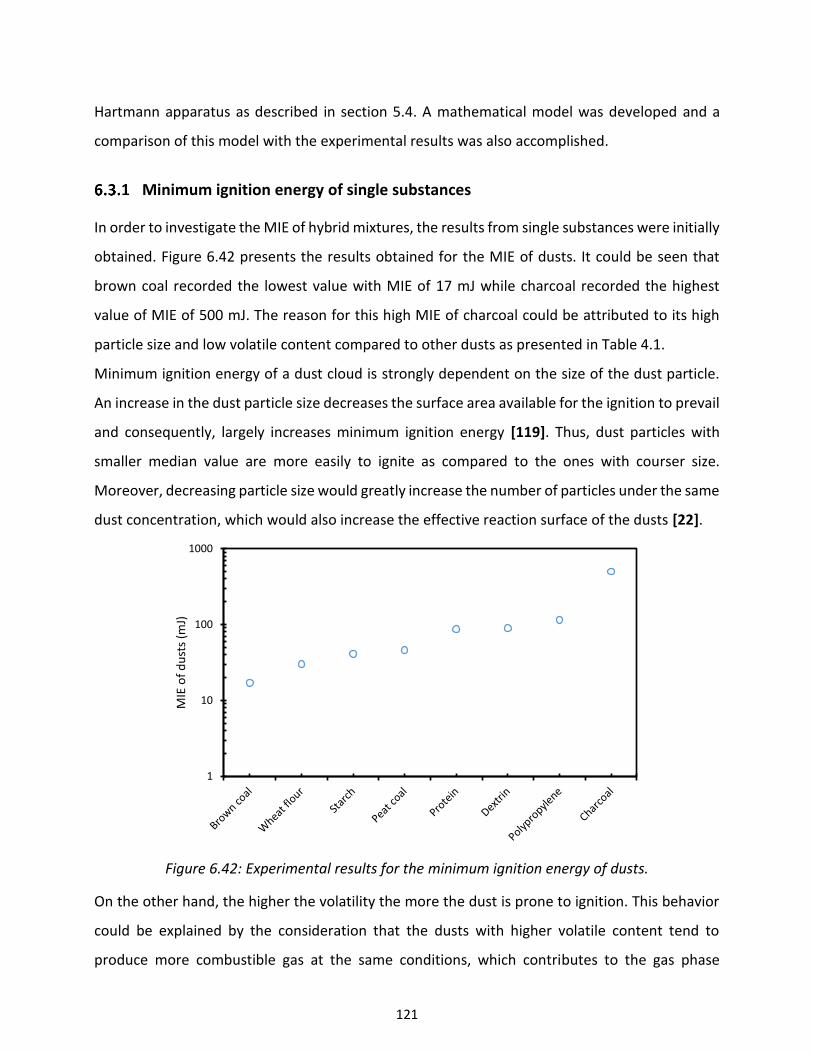
121
Hartmann apparatus as described in section 5.4. A mathematical model was developed and a
comparison of this model with the experimental results was also accomplished.
Minimum ignition energy of single substances
In order to investigate the MIE of hybrid mixtures, the results from single substances were initially
obtained. Figure 6.42 presents the results obtained for the MIE of dusts. It could be seen that
brown coal recorded the lowest value with MIE of 17 mJ while charcoal recorded the highest
value of MIE of 500 mJ. The reason for this high MIE of charcoal could be attributed to its high
particle size and low volatile content compared to other dusts as presented in Table 4.1.
Minimum ignition energy of a dust cloud is strongly dependent on the size of the dust particle.
An increase in the dust particle size decreases the surface area available for the ignition to prevail
and consequently, largely increases minimum ignition energy [119]. Thus, dust particles with
smaller median value are more easily to ignite as compared to the ones with courser size.
Moreover, decreasing particle size would greatly increase the number of particles under the same
dust concentration, which would also increase the effective reaction surface of the dusts [22].
Figure 6.42: Experimental results for the minimum ignition energy of dusts.
On the other hand, the higher the volatility the more the dust is prone to ignition. This behavior
could be explained by the consideration that the dusts with higher volatile content tend to
produce more combustible gas at the same conditions, which contributes to the gas phase
1
10
100
1000
MIE
of
du
sts
(mJ)
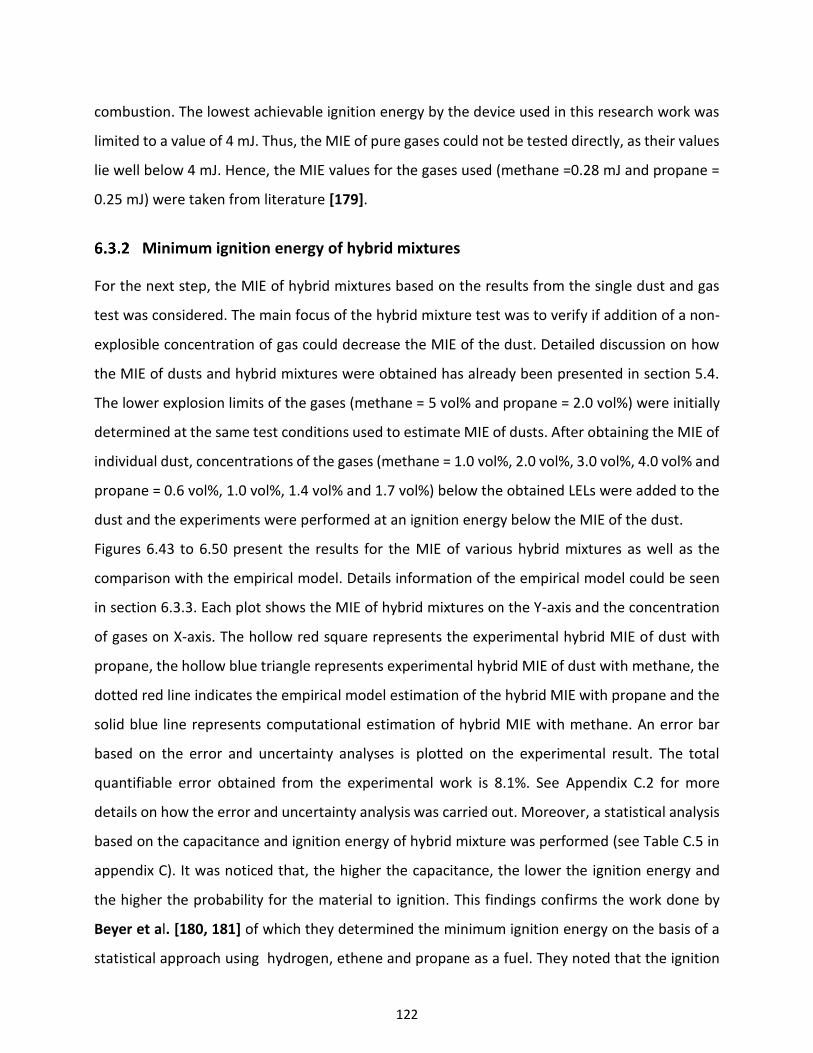
122
combustion. The lowest achievable ignition energy by the device used in this research work was
limited to a value of 4 mJ. Thus, the MIE of pure gases could not be tested directly, as their values
lie well below 4 mJ. Hence, the MIE values for the gases used (methane =0.28 mJ and propane =
0.25 mJ) were taken from literature [179].
Minimum ignition energy of hybrid mixtures
For the next step, the MIE of hybrid mixtures based on the results from the single dust and gas
test was considered. The main focus of the hybrid mixture test was to verify if addition of a non-
explosible concentration of gas could decrease the MIE of the dust. Detailed discussion on how
the MIE of dusts and hybrid mixtures were obtained has already been presented in section 5.4.
The lower explosion limits of the gases (methane = 5 vol% and propane = 2.0 vol%) were initially
determined at the same test conditions used to estimate MIE of dusts. After obtaining the MIE of
individual dust, concentrations of the gases (methane = 1.0 vol%, 2.0 vol%, 3.0 vol%, 4.0 vol% and
propane = 0.6 vol%, 1.0 vol%, 1.4 vol% and 1.7 vol%) below the obtained LELs were added to the
dust and the experiments were performed at an ignition energy below the MIE of the dust.
Figures 6.43 to 6.50 present the results for the MIE of various hybrid mixtures as well as the
comparison with the empirical model. Details information of the empirical model could be seen
in section 6.3.3. Each plot shows the MIE of hybrid mixtures on the Y-axis and the concentration
of gases on X-axis. The hollow red square represents the experimental hybrid MIE of dust with
propane, the hollow blue triangle represents experimental hybrid MIE of dust with methane, the
dotted red line indicates the empirical model estimation of the hybrid MIE with propane and the
solid blue line represents computational estimation of hybrid MIE with methane. An error bar
based on the error and uncertainty analyses is plotted on the experimental result. The total
quantifiable error obtained from the experimental work is 8.1%. See Appendix C.2 for more
details on how the error and uncertainty analysis was carried out. Moreover, a statistical analysis
based on the capacitance and ignition energy of hybrid mixture was performed (see Table C.5 in
appendix C). It was noticed that, the higher the capacitance, the lower the ignition energy and
the higher the probability for the material to ignition. This findings confirms the work done by
Beyer et al. [180, 181] of which they determined the minimum ignition energy on the basis of a
statistical approach using hydrogen, ethene and propane as a fuel. They noted that the ignition
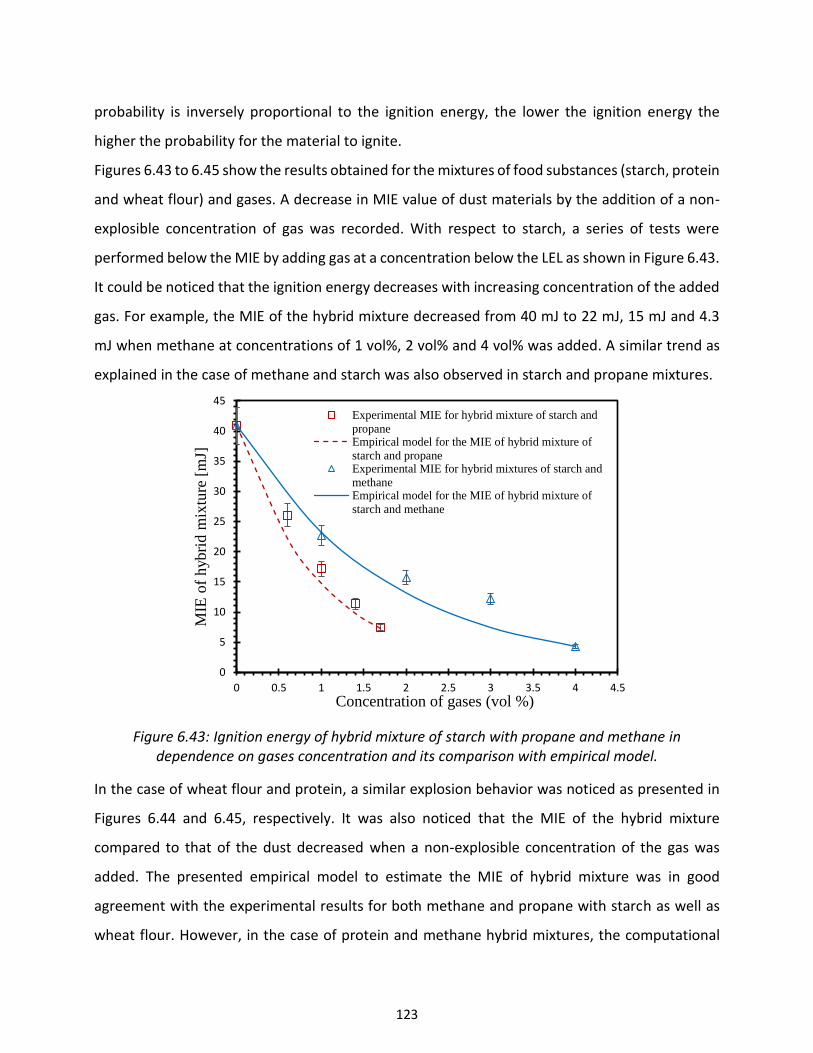
123
probability is inversely proportional to the ignition energy, the lower the ignition energy the
higher the probability for the material to ignite.
Figures 6.43 to 6.45 show the results obtained for the mixtures of food substances (starch, protein
and wheat flour) and gases. A decrease in MIE value of dust materials by the addition of a non-
explosible concentration of gas was recorded. With respect to starch, a series of tests were
performed below the MIE by adding gas at a concentration below the LEL as shown in Figure 6.43.
It could be noticed that the ignition energy decreases with increasing concentration of the added
gas. For example, the MIE of the hybrid mixture decreased from 40 mJ to 22 mJ, 15 mJ and 4.3
mJ when methane at concentrations of 1 vol%, 2 vol% and 4 vol% was added. A similar trend as
explained in the case of methane and starch was also observed in starch and propane mixtures.
Figure 6.43: Ignition energy of hybrid mixture of starch with propane and methane in dependence on gases concentration and its comparison with empirical model.
In the case of wheat flour and protein, a similar explosion behavior was noticed as presented in
Figures 6.44 and 6.45, respectively. It was also noticed that the MIE of the hybrid mixture
compared to that of the dust decreased when a non-explosible concentration of the gas was
added. The presented empirical model to estimate the MIE of hybrid mixture was in good
agreement with the experimental results for both methane and propane with starch as well as
wheat flour. However, in the case of protein and methane hybrid mixtures, the computational
0
5
10
15
20
25
30
35
40
45
0 0.5 1 1.5 2 2.5 3 3.5 4 4.5
MIE
of
hybri
d m
ixtu
re [
mJ]
Concentration of gases (vol %)
Experimental MIE for hybrid mixture of starch and
propaneEmpirical model for the MIE of hybrid mixture of
starch and propaneExperimental MIE for hybrid mixtures of starch and
methaneEmpirical model for the MIE of hybrid mixture of
starch and methane
124
estimation was a bit higher than the experimental results at methane concentrations of 1 vol%
and 2 vol% with a maximum deviation of 11 mJ which falls outside the error margin.
Out of the three food substances tested, it was noticed that the effect of the gases on the MIE of
starch was more significant, followed by protein and wheat flour with the least MIE values
obtained with the addition of 4 vol% methane being: starch = 4.3 mJ, protein = 8.5 mJ and wheat
flour = 11.7 mJ. A similar trend was observed for the other concentrations of methane as well as
propane. This trend could be explained by considering two properties of the dust which include:
particle size and volatile content. For the three food materials, the average particle sizes and
volatile contents are: starch = 14 µm, 93.8 wt%, protein = 46 µm, 81.5 wt% and wheat flour = 52
µm, 79.6 wt%. The MIE of dust cloud strongly depends on the particle size. Thus decreasing
particle size would greatly increase the number of particles under the same dust concentration,
which would also increase the effective reaction surface of the dusts. Moreover, particle size of
the dust particle could also affect the devolatilization rate. Therefore, by decreasing the particle
size the devolatilization rate increases thereby increasing the combustion rate. Furthermore,
volatile content of the dust could also play a crucial role in determination the MIE of dust and
hybrid mixtures. The dusts with higher volatile content tend to produce more combustible gases
at the same conditions which may contribute to the gas phase combustion.
0
5
10
15
20
25
30
35
0 0.5 1 1.5 2 2.5 3 3.5 4 4.5
MIE
of
hybri
d m
ixtu
res
[mJ]
Concentration of gases (vol %)
Experimental MIE for hybrid mixture wheatflour and
propane
Experimental MIE for hybrid mixture wheatflour and
methane
Empirical model for the MIE of hybrid mixture of
wheatflour and propane
Empirical model for the MIE of hybrid mixture of
wheatflour and methane
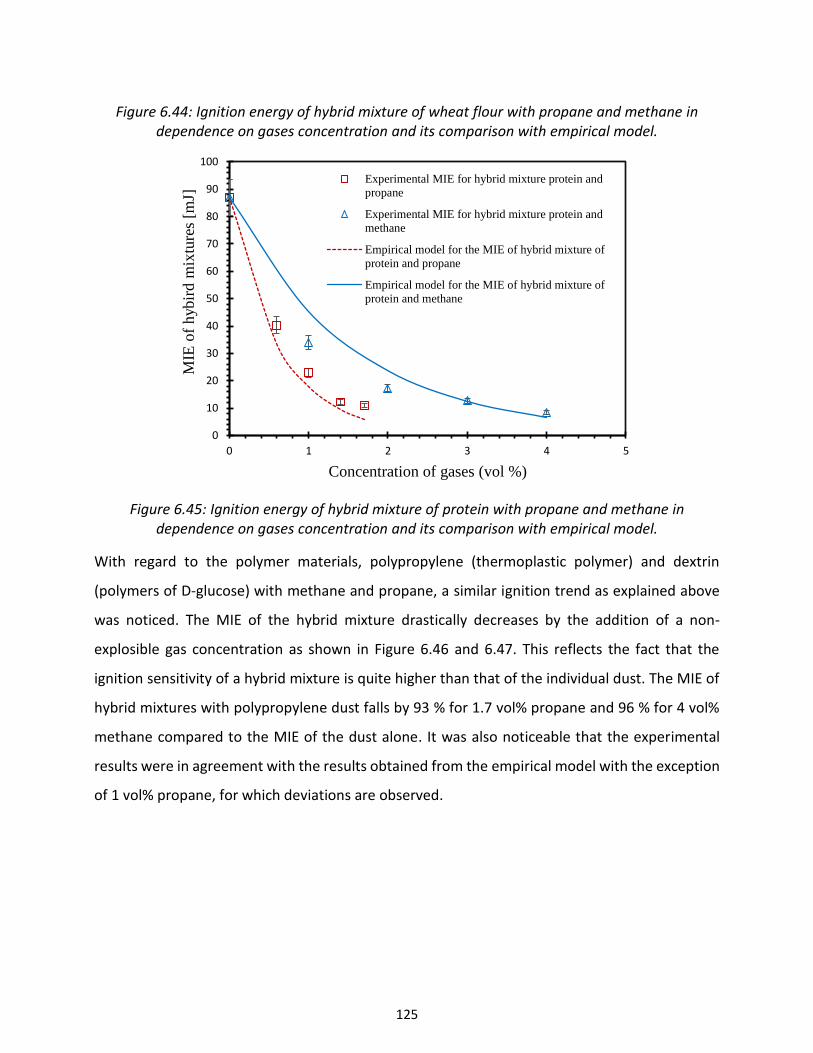
125
Figure 6.44: Ignition energy of hybrid mixture of wheat flour with propane and methane in dependence on gases concentration and its comparison with empirical model.
Figure 6.45: Ignition energy of hybrid mixture of protein with propane and methane in dependence on gases concentration and its comparison with empirical model.
With regard to the polymer materials, polypropylene (thermoplastic polymer) and dextrin
(polymers of D-glucose) with methane and propane, a similar ignition trend as explained above
was noticed. The MIE of the hybrid mixture drastically decreases by the addition of a non-
explosible gas concentration as shown in Figure 6.46 and 6.47. This reflects the fact that the
ignition sensitivity of a hybrid mixture is quite higher than that of the individual dust. The MIE of
hybrid mixtures with polypropylene dust falls by 93 % for 1.7 vol% propane and 96 % for 4 vol%
methane compared to the MIE of the dust alone. It was also noticeable that the experimental
results were in agreement with the results obtained from the empirical model with the exception
of 1 vol% propane, for which deviations are observed.
0
10
20
30
40
50
60
70
80
90
100
0 1 2 3 4 5
MIE
of
hybir
d m
ixtu
res
[mJ]
Concentration of gases (vol %)
Experimental MIE for hybrid mixture protein and
propane
Experimental MIE for hybrid mixture protein and
methane
Empirical model for the MIE of hybrid mixture of
protein and propane
Empirical model for the MIE of hybrid mixture of
protein and methane
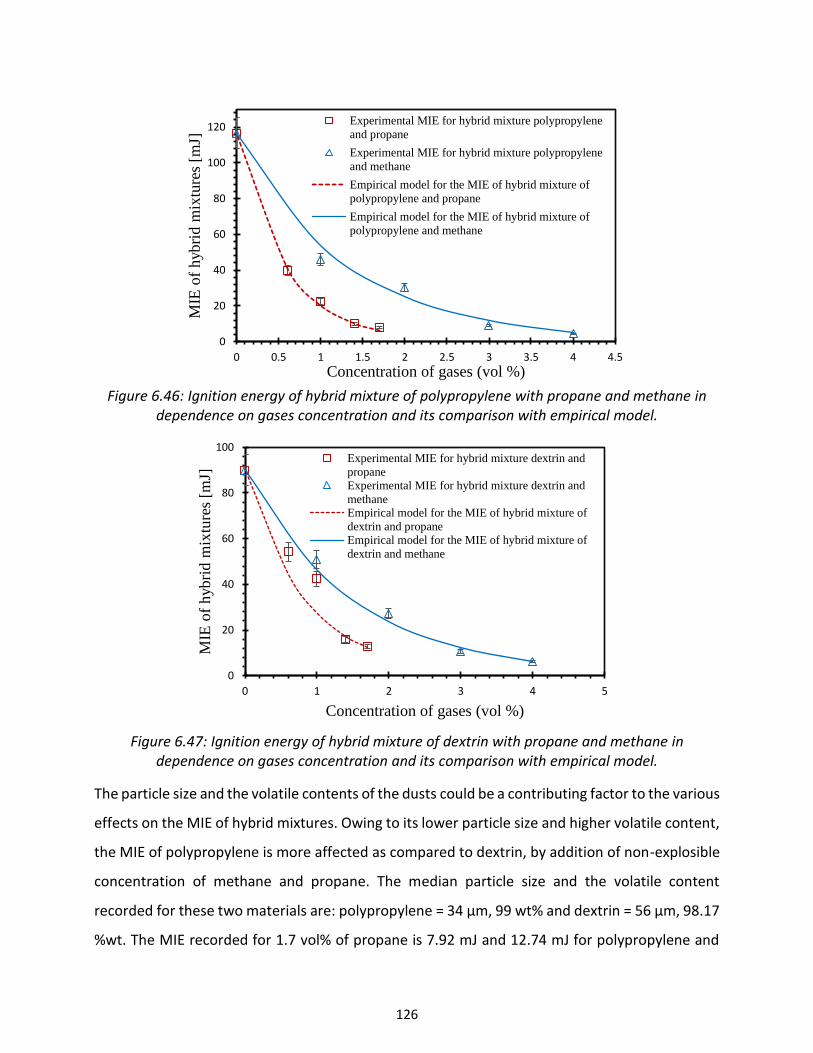
126
Figure 6.46: Ignition energy of hybrid mixture of polypropylene with propane and methane in
dependence on gases concentration and its comparison with empirical model.
Figure 6.47: Ignition energy of hybrid mixture of dextrin with propane and methane in dependence on gases concentration and its comparison with empirical model.
The particle size and the volatile contents of the dusts could be a contributing factor to the various
effects on the MIE of hybrid mixtures. Owing to its lower particle size and higher volatile content,
the MIE of polypropylene is more affected as compared to dextrin, by addition of non-explosible
concentration of methane and propane. The median particle size and the volatile content
recorded for these two materials are: polypropylene = 34 µm, 99 wt% and dextrin = 56 µm, 98.17
%wt. The MIE recorded for 1.7 vol% of propane is 7.92 mJ and 12.74 mJ for polypropylene and
0
20
40
60
80
100
120
0 0.5 1 1.5 2 2.5 3 3.5 4 4.5
MIE
of
hybri
d m
ixtu
res
[mJ]
Concentration of gases (vol %)
Experimental MIE for hybrid mixture polypropylene
and propane
Experimental MIE for hybrid mixture polypropylene
and methane
Empirical model for the MIE of hybrid mixture of
polypropylene and propane
Empirical model for the MIE of hybrid mixture of
polypropylene and methane
0
20
40
60
80
100
0 1 2 3 4 5
MIE
of
hybri
d m
ixtu
res
[mJ]
Concentration of gases (vol %)
Experimental MIE for hybrid mixture dextrin and
propaneExperimental MIE for hybrid mixture dextrin and
methaneEmpirical model for the MIE of hybrid mixture of
dextrin and propaneEmpirical model for the MIE of hybrid mixture of
dextrin and methane

127
dextrin respectively. A similar trend is also noticed for the other concentration of propane and
methane.
Again, three different coal materials (peat coal, charcoal and brown coal) were tested. The choice
of these materials was based on their reaction mechanism as well as the range of the individual
MIE. Among the three coal materials, charcoal exhibited the highest MIE of 500 mJ while peat
and brown coal recorded values of 46 mJ and 17 mJ, respectively. This might due to the reaction
mechanisms of these materials. Both peat coal and brown coal undergoes homogenous reaction
in which the combustion rate is strongly linked with the generation rate of combustible volatiles.
The coal dust initially devolatilized forming combustible volatile gas, which then mixed with air in
the space between the particle. Oxidation of pyrolysis gases, where the gas phase combustion of
premixed volatile-air then takes place or in other word, the oxidation of homogeneous gas takes
place. Contrary to peat and brown coal, charcoal undergoes a heterogeneous reaction. The
combustion rate of the surface-heterogeneous-oxidation-prone dust (charcoal) is mainly
governed by two alternative processes of particle melting and the diffusion of oxygen to particle
surface. Under low dust concentrations, the oxygen diffusion process is very fast due to the
sufficient oxygen in explosion vessel and, therefore, the particle melting rate becomes a limit one,
attributing to the larger inter-particle space and less efficient heat transfers. Conversely, when
particle melting rate is promoted to an enough high degree with the increase of dust
concentration, the combustion rate of charcoal dust would then be controlled by the oxygen
diffusion process
Figures 6.48 to 6.50 present the results obtained for the MIE of hybrid mixtures of the various
coal substances with methane and propane. A drastic reduction in the MIE of various coal dusts
was noticed upon the addition of gases concentrations below the respective explosible limit.
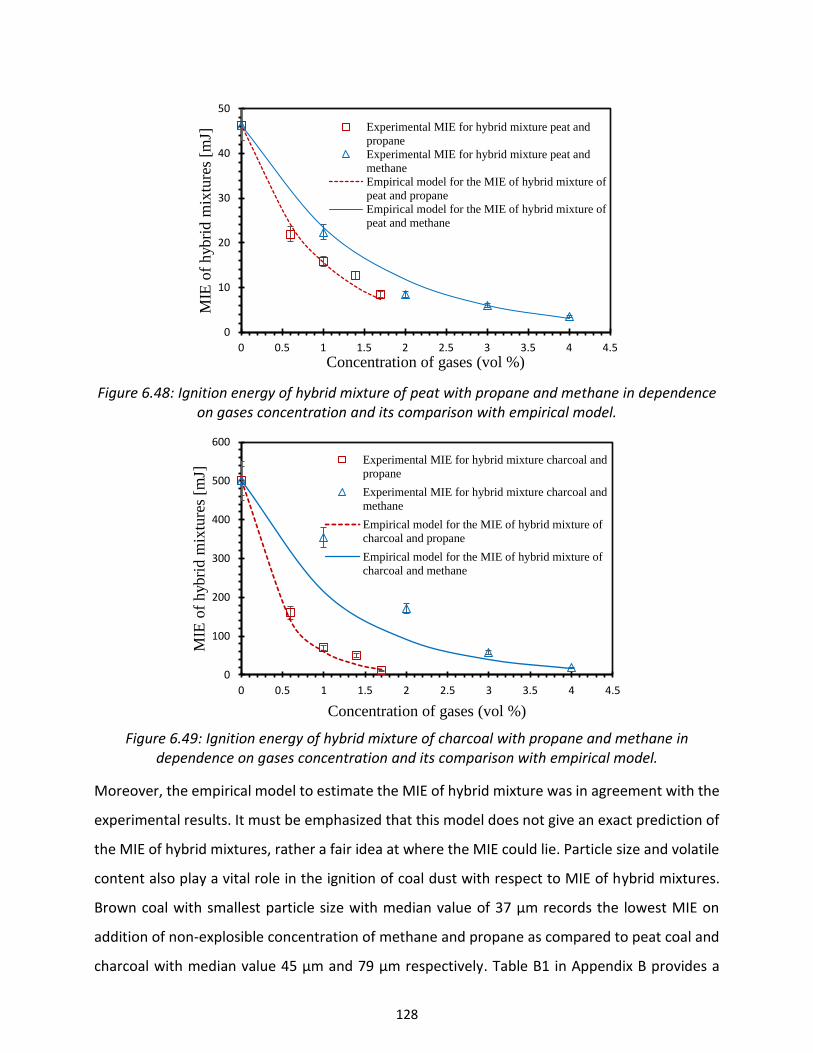
128
Figure 6.48: Ignition energy of hybrid mixture of peat with propane and methane in dependence on gases concentration and its comparison with empirical model.
Figure 6.49: Ignition energy of hybrid mixture of charcoal with propane and methane in
dependence on gases concentration and its comparison with empirical model.
Moreover, the empirical model to estimate the MIE of hybrid mixture was in agreement with the
experimental results. It must be emphasized that this model does not give an exact prediction of
the MIE of hybrid mixtures, rather a fair idea at where the MIE could lie. Particle size and volatile
content also play a vital role in the ignition of coal dust with respect to MIE of hybrid mixtures.
Brown coal with smallest particle size with median value of 37 µm records the lowest MIE on
addition of non-explosible concentration of methane and propane as compared to peat coal and
charcoal with median value 45 µm and 79 µm respectively. Table B1 in Appendix B provides a
0
10
20
30
40
50
0 0.5 1 1.5 2 2.5 3 3.5 4 4.5
MIE
of
hyb
rid
mix
ture
s [m
J]
Concentration of gases (vol %)
Experimental MIE for hybrid mixture peat and
propane
Experimental MIE for hybrid mixture peat and
methane
Empirical model for the MIE of hybrid mixture of
peat and propaneEmpirical model for the MIE of hybrid mixture of
peat and methane
0
100
200
300
400
500
600
0 0.5 1 1.5 2 2.5 3 3.5 4 4.5
MIE
of
hybri
d m
ixtu
res
[mJ]
Concentration of gases (vol %)
Experimental MIE for hybrid mixture charcoal and
propane
Experimental MIE for hybrid mixture charcoal and
methane
Empirical model for the MIE of hybrid mixture of
charcoal and propane
Empirical model for the MIE of hybrid mixture of
charcoal and methane
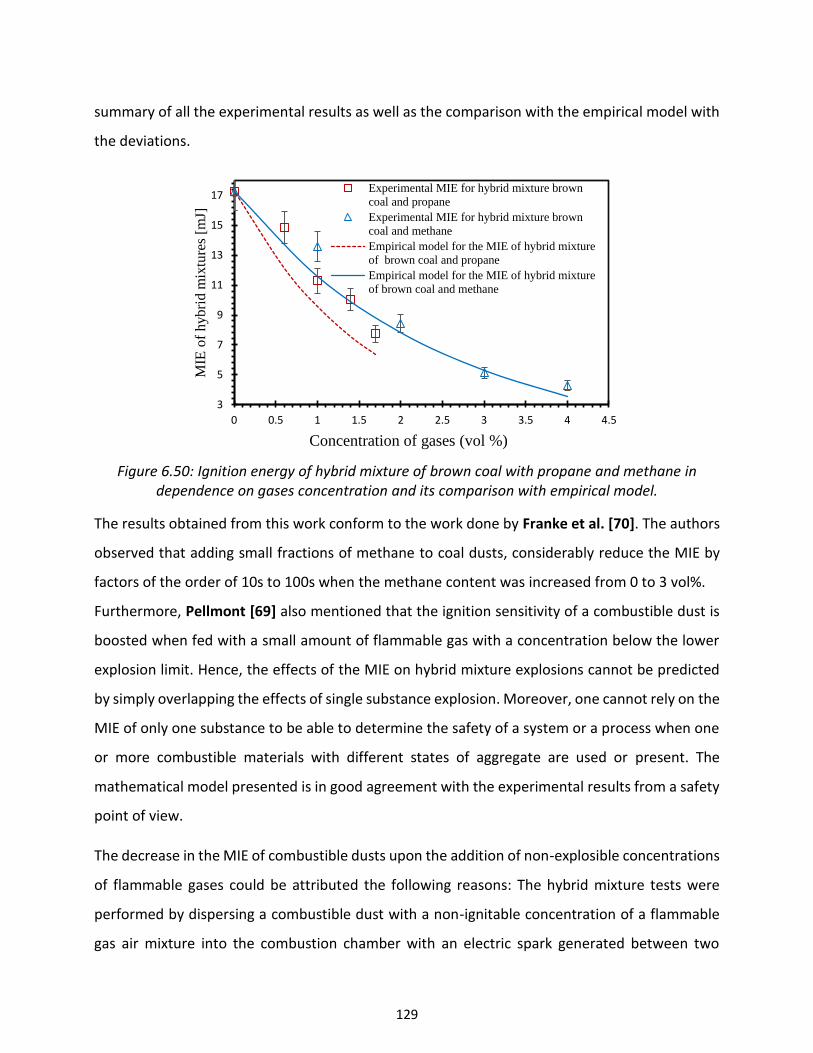
129
summary of all the experimental results as well as the comparison with the empirical model with
the deviations.
Figure 6.50: Ignition energy of hybrid mixture of brown coal with propane and methane in dependence on gases concentration and its comparison with empirical model.
The results obtained from this work conform to the work done by Franke et al. [70]. The authors
observed that adding small fractions of methane to coal dusts, considerably reduce the MIE by
factors of the order of 10s to 100s when the methane content was increased from 0 to 3 vol%.
Furthermore, Pellmont [69] also mentioned that the ignition sensitivity of a combustible dust is
boosted when fed with a small amount of flammable gas with a concentration below the lower
explosion limit. Hence, the effects of the MIE on hybrid mixture explosions cannot be predicted
by simply overlapping the effects of single substance explosion. Moreover, one cannot rely on the
MIE of only one substance to be able to determine the safety of a system or a process when one
or more combustible materials with different states of aggregate are used or present. The
mathematical model presented is in good agreement with the experimental results from a safety
point of view.
The decrease in the MIE of combustible dusts upon the addition of non-explosible concentrations
of flammable gases could be attributed the following reasons: The hybrid mixture tests were
performed by dispersing a combustible dust with a non-ignitable concentration of a flammable
gas air mixture into the combustion chamber with an electric spark generated between two
3
5
7
9
11
13
15
17
0 0.5 1 1.5 2 2.5 3 3.5 4 4.5
MIE
of
hyb
rid
mix
ture
s [m
J]
Concentration of gases (vol %)
Experimental MIE for hybrid mixture brown
coal and propane
Experimental MIE for hybrid mixture brown
coal and methane
Empirical model for the MIE of hybrid mixture
of brown coal and propane
Empirical model for the MIE of hybrid mixture
of brown coal and methane
130
electrodes as an ignition source. Usually, the spark generated is capable of igniting a flammable
gas alone (provided the concentration is within the explosible range) but since the concentration
of the gases used were below the lower explosion limits, the gases alone could not be ignited.
According to the thermal theory of electric spark ignition by Elbe et al. [182], the spark produces
a small volume of hot gas immediately after the discharge, which rapidly increases the
temperature within the flame kernel. As soon as the dust is dispersed into the chamber, the
particles located in the ignition kernel are heated by this hot gas producing volatile matters or
combustible gases. This volatile matter then mixes with air in the space between the particles as
well as the added flammable gas, thereby boosting the total concentration of combustible gases
which are capable to ignite. Adding a very low concentration of flammable gas to a combustible
dust could also induce a change in the rate-limiting step of the combustion reaction, that is from
devolatilization of the dusts to a homogeneous gas phase reaction, which implies a drastic
decrease in MIE of hybrid mixtures. The modification of rate-limiting step of the combustion
reaction depends on the size of the particle. Size reduction could alter a diffusion controlled
regime for large size particles to a kinetically controlled for small size ones [183, 184].
Moreover, adding a low concentration of flammable gas to a combustible dust could boost the
heat transfer from one burning particle to the other. The spark produced by the electrostatic
discharge in the combustion chamber generates an energy which burns the nearest particle. The
heat produced from the burnt particle is then transferred to the next particle but in case the
energy produced by the spark is not high enough, the heat produced by the first burnt particle
will not be enough to burn the next one. So, the addition of easily ignitable substances such as
flammable gas could boost the heat transfer process by bridging the heat transfer gap between
the first burnt particle and the next one.
Furthermore, the effect of adding a low concentration of gas on the MIE of dust could be
explained using the electrical theory proposed by Elbe et al. [182]. The authors explained that the
electrical discharge from the electric spark could also activate a chemical reaction by producing
free radicals/ions in the discharge zone, which diffuse into the surrounding fuel-air mixture to
initiate a self-propagating combustion chain. The ignition conditions of the mixture are
dependent on the concentration of the reactive particles. This means that, even if the free radicals
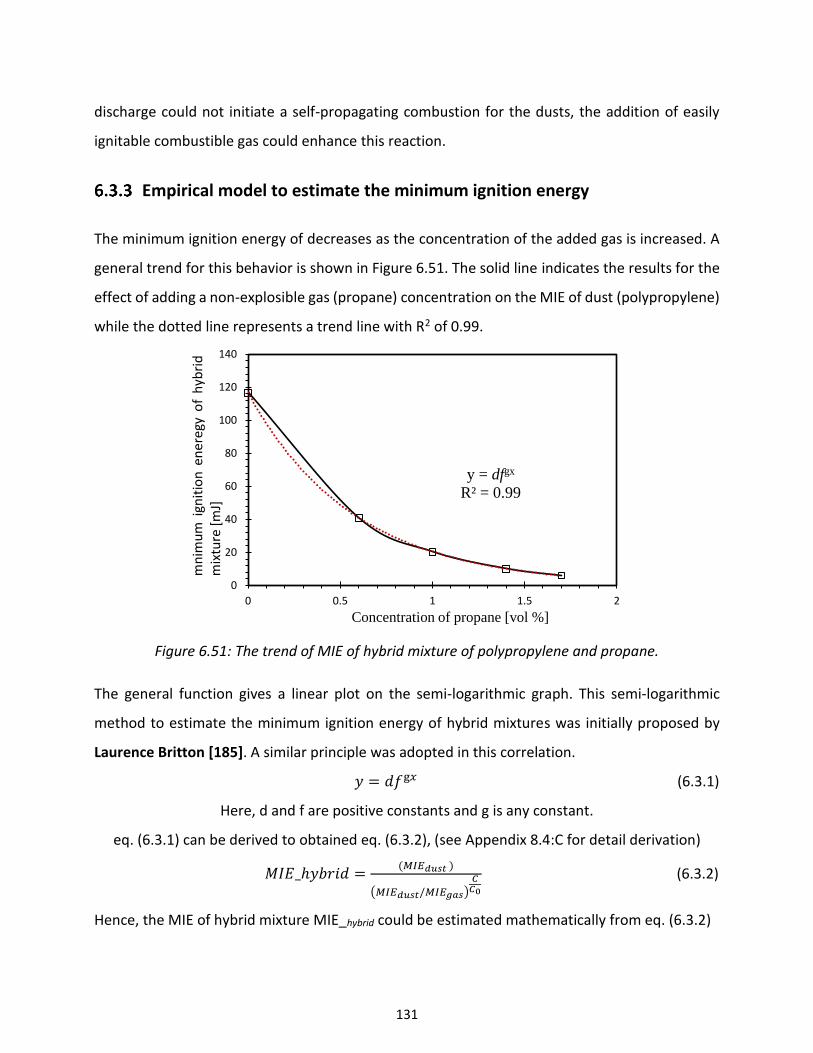
131
discharge could not initiate a self-propagating combustion for the dusts, the addition of easily
ignitable combustible gas could enhance this reaction.
Empirical model to estimate the minimum ignition energy
The minimum ignition energy of decreases as the concentration of the added gas is increased. A
general trend for this behavior is shown in Figure 6.51. The solid line indicates the results for the
effect of adding a non-explosible gas (propane) concentration on the MIE of dust (polypropylene)
while the dotted line represents a trend line with R2 of 0.99.
Figure 6.51: The trend of MIE of hybrid mixture of polypropylene and propane.
The general function gives a linear plot on the semi-logarithmic graph. This semi-logarithmic
method to estimate the minimum ignition energy of hybrid mixtures was initially proposed by
Laurence Britton [185]. A similar principle was adopted in this correlation.
𝑦 = 𝑑𝑓g𝑥 (6.3.1)
Here, d and f are positive constants and g is any constant.
eq. (6.3.1) can be derived to obtained eq. (6.3.2), (see Appendix 8.4:C for detail derivation)
𝑀𝐼𝐸_ℎ𝑦𝑏𝑟𝑖𝑑 =(𝑀𝐼𝐸𝑑𝑢𝑠𝑡 )
(𝑀𝐼𝐸𝑑𝑢𝑠𝑡/𝑀𝐼𝐸𝑔𝑎𝑠)𝐶
𝐶0
(6.3.2)
Hence, the MIE of hybrid mixture MIE_hybrid could be estimated mathematically from eq. (6.3.2)
y = dfgx
R² = 0.99
0
20
40
60
80
100
120
140
0 0.5 1 1.5 2
mn
imu
mig
nit
ion
ener
egy
of
hyb
rid
mix
ture
[mJ]
Concentration of propane [vol %]
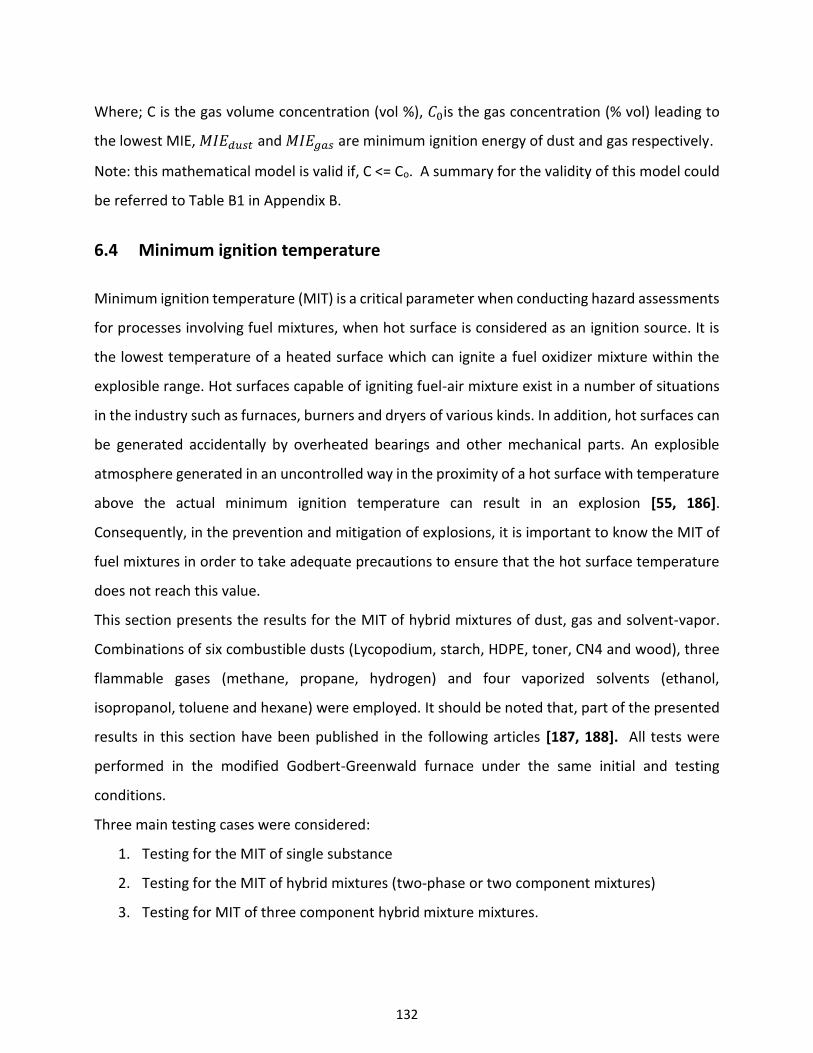
132
Where; C is the gas volume concentration (vol %), 𝐶0is the gas concentration (% vol) leading to
the lowest MIE, 𝑀𝐼𝐸𝑑𝑢𝑠𝑡 and 𝑀𝐼𝐸𝑔𝑎𝑠 are minimum ignition energy of dust and gas respectively.
Note: this mathematical model is valid if, C <= Co. A summary for the validity of this model could
be referred to Table B1 in Appendix B.
6.4 Minimum ignition temperature
Minimum ignition temperature (MIT) is a critical parameter when conducting hazard assessments
for processes involving fuel mixtures, when hot surface is considered as an ignition source. It is
the lowest temperature of a heated surface which can ignite a fuel oxidizer mixture within the
explosible range. Hot surfaces capable of igniting fuel-air mixture exist in a number of situations
in the industry such as furnaces, burners and dryers of various kinds. In addition, hot surfaces can
be generated accidentally by overheated bearings and other mechanical parts. An explosible
atmosphere generated in an uncontrolled way in the proximity of a hot surface with temperature
above the actual minimum ignition temperature can result in an explosion [55, 186].
Consequently, in the prevention and mitigation of explosions, it is important to know the MIT of
fuel mixtures in order to take adequate precautions to ensure that the hot surface temperature
does not reach this value.
This section presents the results for the MIT of hybrid mixtures of dust, gas and solvent-vapor.
Combinations of six combustible dusts (Lycopodium, starch, HDPE, toner, CN4 and wood), three
flammable gases (methane, propane, hydrogen) and four vaporized solvents (ethanol,
isopropanol, toluene and hexane) were employed. It should be noted that, part of the presented
results in this section have been published in the following articles [187, 188]. All tests were
performed in the modified Godbert-Greenwald furnace under the same initial and testing
conditions.
Three main testing cases were considered:
1. Testing for the MIT of single substance
2. Testing for the MIT of hybrid mixtures (two-phase or two component mixtures)
3. Testing for MIT of three component hybrid mixture mixtures.
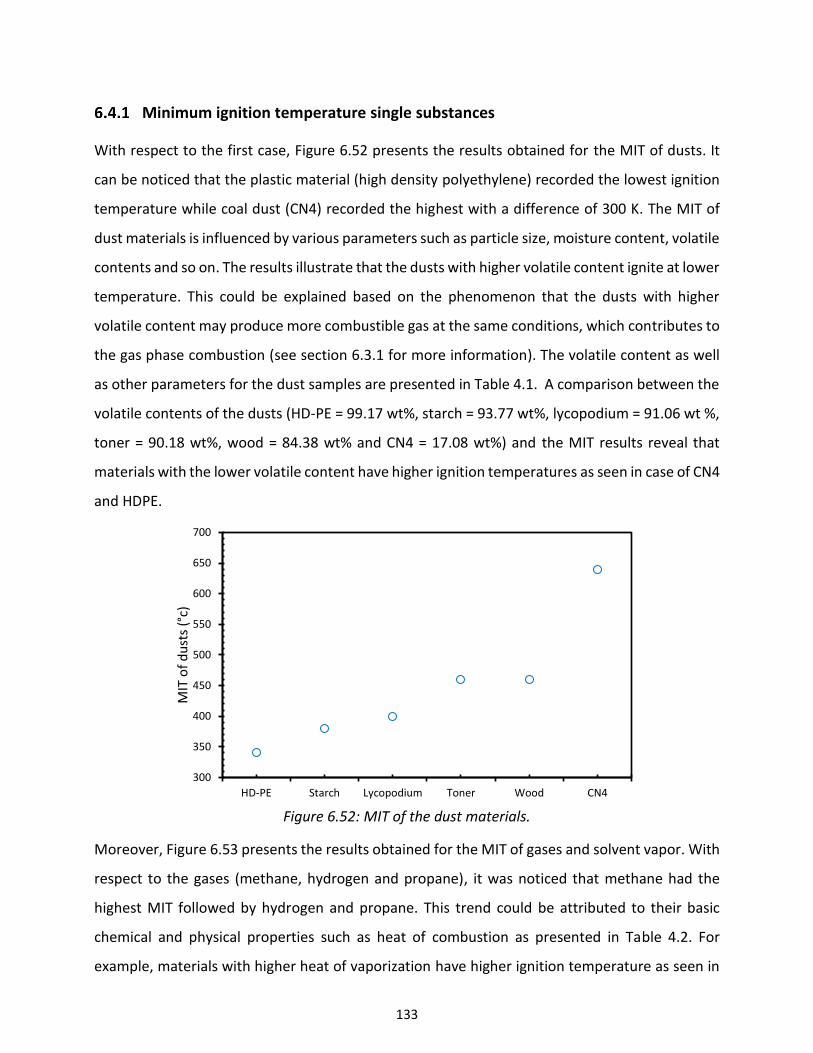
133
Minimum ignition temperature single substances
With respect to the first case, Figure 6.52 presents the results obtained for the MIT of dusts. It
can be noticed that the plastic material (high density polyethylene) recorded the lowest ignition
temperature while coal dust (CN4) recorded the highest with a difference of 300 K. The MIT of
dust materials is influenced by various parameters such as particle size, moisture content, volatile
contents and so on. The results illustrate that the dusts with higher volatile content ignite at lower
temperature. This could be explained based on the phenomenon that the dusts with higher
volatile content may produce more combustible gas at the same conditions, which contributes to
the gas phase combustion (see section 6.3.1 for more information). The volatile content as well
as other parameters for the dust samples are presented in Table 4.1. A comparison between the
volatile contents of the dusts (HD-PE = 99.17 wt%, starch = 93.77 wt%, lycopodium = 91.06 wt %,
toner = 90.18 wt%, wood = 84.38 wt% and CN4 = 17.08 wt%) and the MIT results reveal that
materials with the lower volatile content have higher ignition temperatures as seen in case of CN4
and HDPE.
Figure 6.52: MIT of the dust materials.
Moreover, Figure 6.53 presents the results obtained for the MIT of gases and solvent vapor. With
respect to the gases (methane, hydrogen and propane), it was noticed that methane had the
highest MIT followed by hydrogen and propane. This trend could be attributed to their basic
chemical and physical properties such as heat of combustion as presented in Table 4.2. For
example, materials with higher heat of vaporization have higher ignition temperature as seen in
300
350
400
450
500
550
600
650
700
HD-PE Starch Lycopodium Toner Wood CN4
MIT
of
du
sts
(°c)
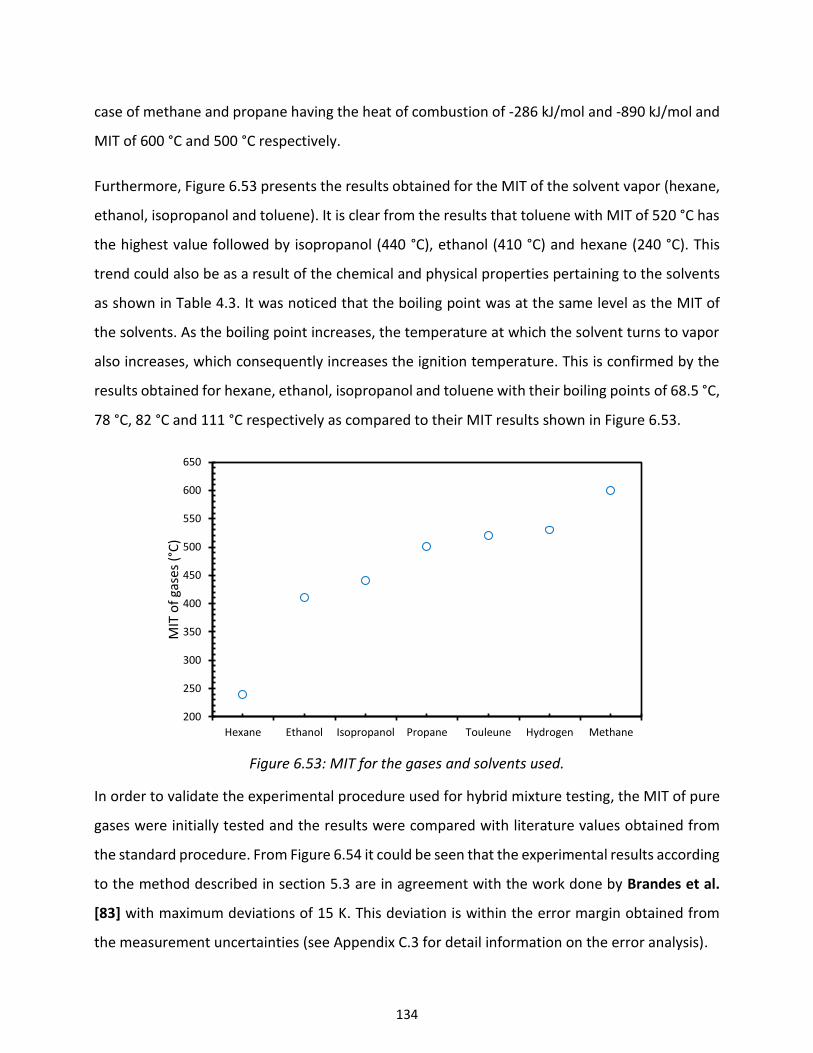
134
case of methane and propane having the heat of combustion of -286 kJ/mol and -890 kJ/mol and
MIT of 600 °C and 500 °C respectively.
Furthermore, Figure 6.53 presents the results obtained for the MIT of the solvent vapor (hexane,
ethanol, isopropanol and toluene). It is clear from the results that toluene with MIT of 520 °C has
the highest value followed by isopropanol (440 °C), ethanol (410 °C) and hexane (240 °C). This
trend could also be as a result of the chemical and physical properties pertaining to the solvents
as shown in Table 4.3. It was noticed that the boiling point was at the same level as the MIT of
the solvents. As the boiling point increases, the temperature at which the solvent turns to vapor
also increases, which consequently increases the ignition temperature. This is confirmed by the
results obtained for hexane, ethanol, isopropanol and toluene with their boiling points of 68.5 °C,
78 °C, 82 °C and 111 °C respectively as compared to their MIT results shown in Figure 6.53.
Figure 6.53: MIT for the gases and solvents used.
In order to validate the experimental procedure used for hybrid mixture testing, the MIT of pure
gases were initially tested and the results were compared with literature values obtained from
the standard procedure. From Figure 6.54 it could be seen that the experimental results according
to the method described in section 5.3 are in agreement with the work done by Brandes et al.
[83] with maximum deviations of 15 K. This deviation is within the error margin obtained from
the measurement uncertainties (see Appendix C.3 for detail information on the error analysis).
200
250
300
350
400
450
500
550
600
650
Hexane Ethanol Isopropanol Propane Touleune Hydrogen Methane
MIT
of
gase
s(°
C)
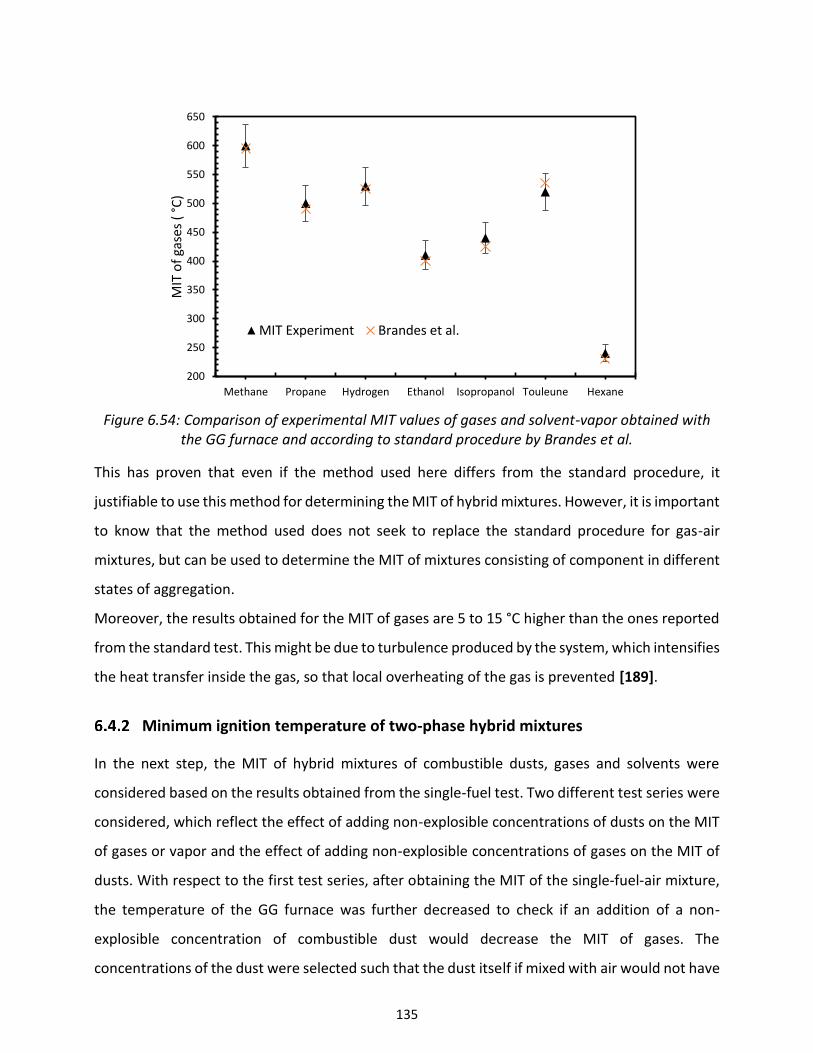
135
Figure 6.54: Comparison of experimental MIT values of gases and solvent-vapor obtained with
the GG furnace and according to standard procedure by Brandes et al.
This has proven that even if the method used here differs from the standard procedure, it
justifiable to use this method for determining the MIT of hybrid mixtures. However, it is important
to know that the method used does not seek to replace the standard procedure for gas-air
mixtures, but can be used to determine the MIT of mixtures consisting of component in different
states of aggregation.
Moreover, the results obtained for the MIT of gases are 5 to 15 °C higher than the ones reported
from the standard test. This might be due to turbulence produced by the system, which intensifies
the heat transfer inside the gas, so that local overheating of the gas is prevented [189].
Minimum ignition temperature of two-phase hybrid mixtures
In the next step, the MIT of hybrid mixtures of combustible dusts, gases and solvents were
considered based on the results obtained from the single-fuel test. Two different test series were
considered, which reflect the effect of adding non-explosible concentrations of dusts on the MIT
of gases or vapor and the effect of adding non-explosible concentrations of gases on the MIT of
dusts. With respect to the first test series, after obtaining the MIT of the single-fuel-air mixture,
the temperature of the GG furnace was further decreased to check if an addition of a non-
explosible concentration of combustible dust would decrease the MIT of gases. The
concentrations of the dust were selected such that the dust itself if mixed with air would not have
200
250
300
350
400
450
500
550
600
650
Methane Propane Hydrogen Ethanol Isopropanol Touleune Hexane
MIT
of
gase
s (
°C)
MIT Experiment Brandes et al.
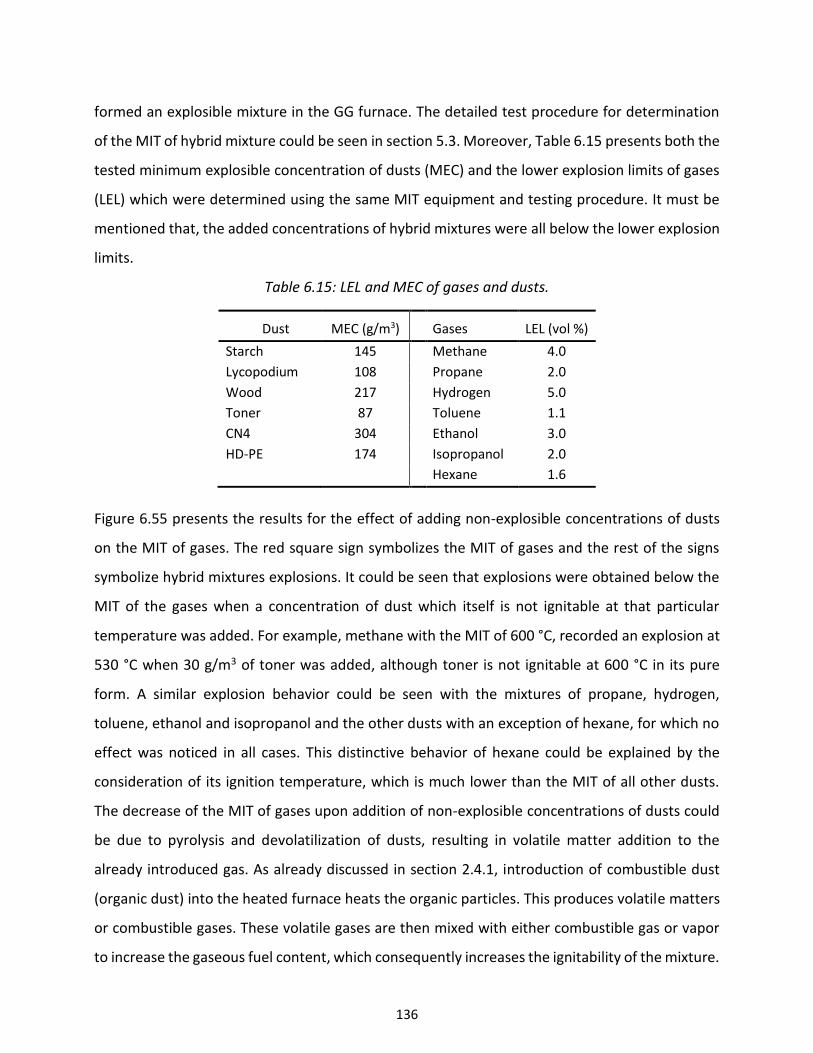
136
formed an explosible mixture in the GG furnace. The detailed test procedure for determination
of the MIT of hybrid mixture could be seen in section 5.3. Moreover, Table 6.15 presents both the
tested minimum explosible concentration of dusts (MEC) and the lower explosion limits of gases
(LEL) which were determined using the same MIT equipment and testing procedure. It must be
mentioned that, the added concentrations of hybrid mixtures were all below the lower explosion
limits.
Table 6.15: LEL and MEC of gases and dusts.
Dust MEC (g/m3) Gases LEL (vol %)
Starch 145 Methane 4.0
Lycopodium 108 Propane 2.0
Wood 217 Hydrogen 5.0
Toner 87 Toluene 1.1
CN4 304 Ethanol 3.0
HD-PE 174 Isopropanol 2.0
Hexane 1.6
Figure 6.55 presents the results for the effect of adding non-explosible concentrations of dusts
on the MIT of gases. The red square sign symbolizes the MIT of gases and the rest of the signs
symbolize hybrid mixtures explosions. It could be seen that explosions were obtained below the
MIT of the gases when a concentration of dust which itself is not ignitable at that particular
temperature was added. For example, methane with the MIT of 600 °C, recorded an explosion at
530 °C when 30 g/m3 of toner was added, although toner is not ignitable at 600 °C in its pure
form. A similar explosion behavior could be seen with the mixtures of propane, hydrogen,
toluene, ethanol and isopropanol and the other dusts with an exception of hexane, for which no
effect was noticed in all cases. This distinctive behavior of hexane could be explained by the
consideration of its ignition temperature, which is much lower than the MIT of all other dusts.
The decrease of the MIT of gases upon addition of non-explosible concentrations of dusts could
be due to pyrolysis and devolatilization of dusts, resulting in volatile matter addition to the
already introduced gas. As already discussed in section 2.4.1, introduction of combustible dust
(organic dust) into the heated furnace heats the organic particles. This produces volatile matters
or combustible gases. These volatile gases are then mixed with either combustible gas or vapor
to increase the gaseous fuel content, which consequently increases the ignitability of the mixture.

137
In the case of hexane and the dust mixtures, this mechanism does not hold since the MIT of dust
samples are all above the MIT of hexane. The effect of dusts on the MIT of hexane was tested at
a temperature well below the MIT of hexane (240 °C), which could not devolatilize any content
of dusts and hence no effect of dust was seen on the MIT of hexane.
Figure 6.55: MIT of two-phase hybrid mixture of dust and gas: effect of admixture of dust on the
MIT of gases.
Moreover, the effects of addition of non-explosible concentrations of flammable gases on the
MIT of dusts were also studied, by adding a volume fraction of gas which was below the lower
explosion limits to the dust. After obtaining the MIT of the single dusts, further tests were
performed below the MIT by adding a non-explosible concentration of gas. Figure 6.56 presents
the results obtained for the effect of gases on the MIT of dust. A similar explosion behavior as
explained above was also noticed here, the MIT of dust decreased when a non-explosible
concentration of gas was added. For example, the MIT of wood decreased from 460 °C to 420 °C
and to 400 °C when 2 vol% of methane and 0.8 vol% of hexane were added, respectively. A similar
behavior was also observed for the other dusts and gases mixtures. It was generally noticed that
220
270
320
370
420
470
520
570
620
Methane Propane Hydrogen Ethanol Isopropanol Toluene Hexane
MIT
of
hyb
rid
mix
ture
s (
°C)
MIT of gases without dusts effect of adding 82 g/m^3 of starch on MIT of gases
effect of adding 84 g/m^3 of lycopodium on the MIT of gases effect ofadding 30 g/m^3 of toner on the MIT of gases
effect of adding 124 g/m^3 of wood on the MIT of gases effect of adding 122 g/m^3 of CN4 on the MIT of gases
effect ofadding 87 g/m^3 of HDPE on gases
138
hexane had a significant effect on all the dust samples compared to the other gases. This could
be as a result of its lower ignition temperature in comparison to the dusts. When the temperature
is lower than the MIT of the dust, the volatile matters with low ignition temperature initially
devolatilizes, producing combustible gases which might not be able to ignite alone, however,
when easily combustible gas is added to devolatilized gas, it could lead to ignition. This was seen
in the case of hexane and since its MIT is far lower than that of the dusts, it becomes ignitable at
the MIT of the dusts provided the added concentrations are within the explosible range. So adding
a non-explosible concentration of hexane at the MIT of the dusts could add up to the already
present devolatilized gases generating an explosible atmosphere.
Figure 6.56: MIT of two-phase hybrid mixture of dust and gas: effect of admixture of gas on the
MIT of dusts.
Furthermore, the MIT of two component mixtures were also tested (i.e. mixtures of solvent-vapor
and gas). Figure 6.57 provides the results for the effect of solvents on the MIT of gases. It could
be seen that the MIT of a gas decreases upon addition of a non-explosible concentration of
solvent-vapor, which is either not explosible or below their respective lower explosion limit. For
example, methane and propane with the MIT of 600 °C and 500 °C decreased to 510 °C and 445
300
350
400
450
500
550
600
650
Starch Lycopodium Toner Wood CN4 HDPE
MIT
of
hyb
rid
mix
ture
s
MIT of dusts without gases effect of adding 2.0 vol% of methane on the MIT of dusts
effect of adding 1.0 vol% of propane on the MIT of dusts effect of adding 3.0 vol% of hydrogen on the MIT of dusts
effect of adding 1.8 vol% of ethanol on the MIT of dusts effect of adding 1.0 vol% of isopropanol on the MIT of dusts
effect of adding 0.6 vol% of toluene on the MIT dusts effect of adding 0.8 vol% of hexane on the MIT of dusts
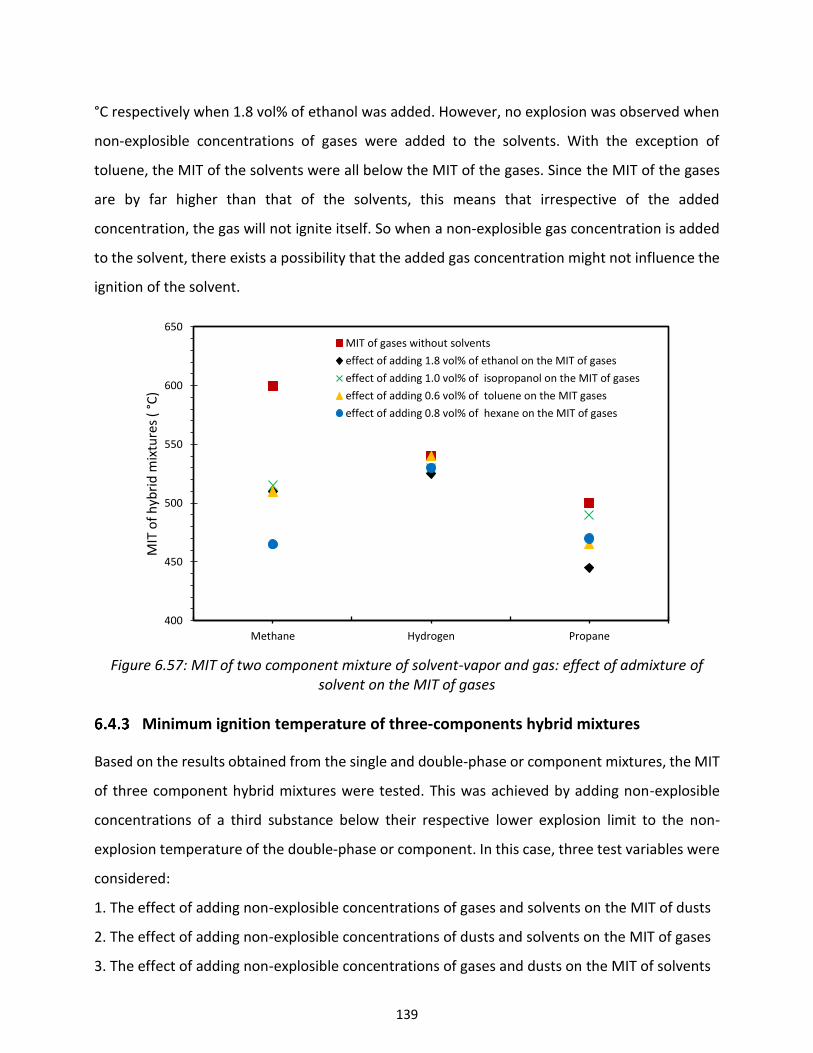
139
°C respectively when 1.8 vol% of ethanol was added. However, no explosion was observed when
non-explosible concentrations of gases were added to the solvents. With the exception of
toluene, the MIT of the solvents were all below the MIT of the gases. Since the MIT of the gases
are by far higher than that of the solvents, this means that irrespective of the added
concentration, the gas will not ignite itself. So when a non-explosible gas concentration is added
to the solvent, there exists a possibility that the added gas concentration might not influence the
ignition of the solvent.
Figure 6.57: MIT of two component mixture of solvent-vapor and gas: effect of admixture of
solvent on the MIT of gases
Minimum ignition temperature of three-components hybrid mixtures
Based on the results obtained from the single and double-phase or component mixtures, the MIT
of three component hybrid mixtures were tested. This was achieved by adding non-explosible
concentrations of a third substance below their respective lower explosion limit to the non-
explosion temperature of the double-phase or component. In this case, three test variables were
considered:
1. The effect of adding non-explosible concentrations of gases and solvents on the MIT of dusts
2. The effect of adding non-explosible concentrations of dusts and solvents on the MIT of gases
3. The effect of adding non-explosible concentrations of gases and dusts on the MIT of solvents
400
450
500
550
600
650
Methane Hydrogen Propane
MIT
of
hyb
rid
mix
ture
s (
°C)
MIT of gases without solvents
effect of adding 1.8 vol% of ethanol on the MIT of gases
effect of adding 1.0 vol% of isopropanol on the MIT of gases
effect of adding 0.6 vol% of toluene on the MIT gases
effect of adding 0.8 vol% of hexane on the MIT of gases
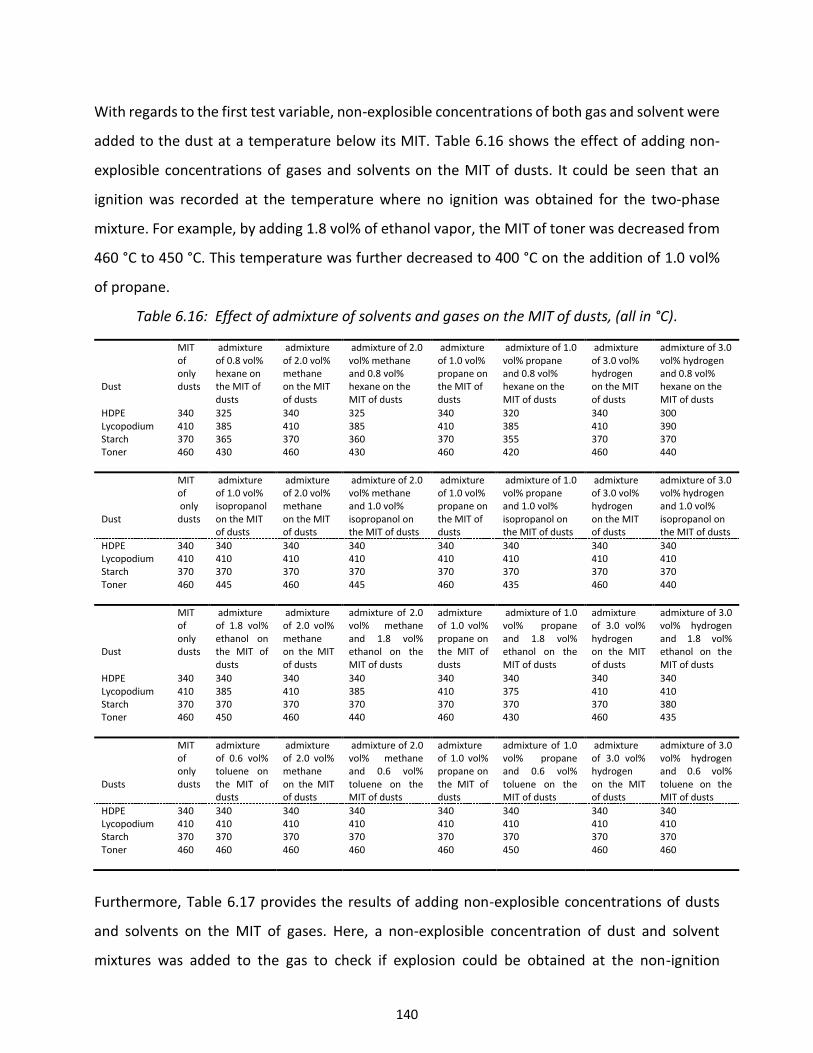
140
With regards to the first test variable, non-explosible concentrations of both gas and solvent were
added to the dust at a temperature below its MIT. Table 6.16 shows the effect of adding non-
explosible concentrations of gases and solvents on the MIT of dusts. It could be seen that an
ignition was recorded at the temperature where no ignition was obtained for the two-phase
mixture. For example, by adding 1.8 vol% of ethanol vapor, the MIT of toner was decreased from
460 °C to 450 °C. This temperature was further decreased to 400 °C on the addition of 1.0 vol%
of propane.
Table 6.16: Effect of admixture of solvents and gases on the MIT of dusts, (all in °C).
Dust
MIT of only dusts
admixture of 0.8 vol% hexane on the MIT of dusts
admixture of 2.0 vol% methane on the MIT of dusts
admixture of 2.0 vol% methane and 0.8 vol% hexane on the MIT of dusts
admixture of 1.0 vol% propane on the MIT of dusts
admixture of 1.0 vol% propane and 0.8 vol% hexane on the MIT of dusts
admixture of 3.0 vol% hydrogen on the MIT of dusts
admixture of 3.0 vol% hydrogen and 0.8 vol% hexane on the MIT of dusts
HDPE 340 325 340 325 340 320 340 300 Lycopodium 410 385 410 385 410 385 410 390 Starch 370 365 370 360 370 355 370 370 Toner 460 430 460 430 460 420 460 440
Dust
MIT of only dusts
admixture of 1.0 vol% isopropanol on the MIT of dusts
admixture of 2.0 vol% methane on the MIT of dusts
admixture of 2.0 vol% methane and 1.0 vol% isopropanol on the MIT of dusts
admixture of 1.0 vol% propane on the MIT of dusts
admixture of 1.0 vol% propane and 1.0 vol% isopropanol on the MIT of dusts
admixture of 3.0 vol% hydrogen on the MIT of dusts
admixture of 3.0 vol% hydrogen and 1.0 vol% isopropanol on the MIT of dusts
HDPE 340 340 340 340 340 340 340 340 Lycopodium 410 410 410 410 410 410 410 410 Starch 370 370 370 370 370 370 370 370 Toner 460 445 460 445 460 435 460 440
Dust
MIT of only dusts
admixture of 1.8 vol% ethanol on the MIT of dusts
admixture of 2.0 vol% methane on the MIT of dusts
admixture of 2.0 vol% methane and 1.8 vol% ethanol on the MIT of dusts
admixture of 1.0 vol% propane on the MIT of dusts
admixture of 1.0 vol% propane and 1.8 vol% ethanol on the MIT of dusts
admixture of 3.0 vol% hydrogen on the MIT of dusts
admixture of 3.0 vol% hydrogen and 1.8 vol% ethanol on the MIT of dusts
HDPE 340 340 340 340 340 340 340 340 Lycopodium 410 385 410 385 410 375 410 410 Starch 370 370 370 370 370 370 370 380 Toner 460 450 460 440 460 430 460 435
Dusts
MIT of only dusts
admixture of 0.6 vol% toluene on the MIT of dusts
admixture of 2.0 vol% methane on the MIT of dusts
admixture of 2.0 vol% methane and 0.6 vol% toluene on the MIT of dusts
admixture of 1.0 vol% propane on the MIT of dusts
admixture of 1.0 vol% propane and 0.6 vol% toluene on the MIT of dusts
admixture of 3.0 vol% hydrogen on the MIT of dusts
admixture of 3.0 vol% hydrogen and 0.6 vol% toluene on the MIT of dusts
HDPE 340 340 340 340 340 340 340 340 Lycopodium 410 410 410 410 410 410 410 410 Starch 370 370 370 370 370 370 370 370 Toner 460 460 460
460 460 450 460 460
Furthermore, Table 6.17 provides the results of adding non-explosible concentrations of dusts
and solvents on the MIT of gases. Here, a non-explosible concentration of dust and solvent
mixtures was added to the gas to check if explosion could be obtained at the non-ignition
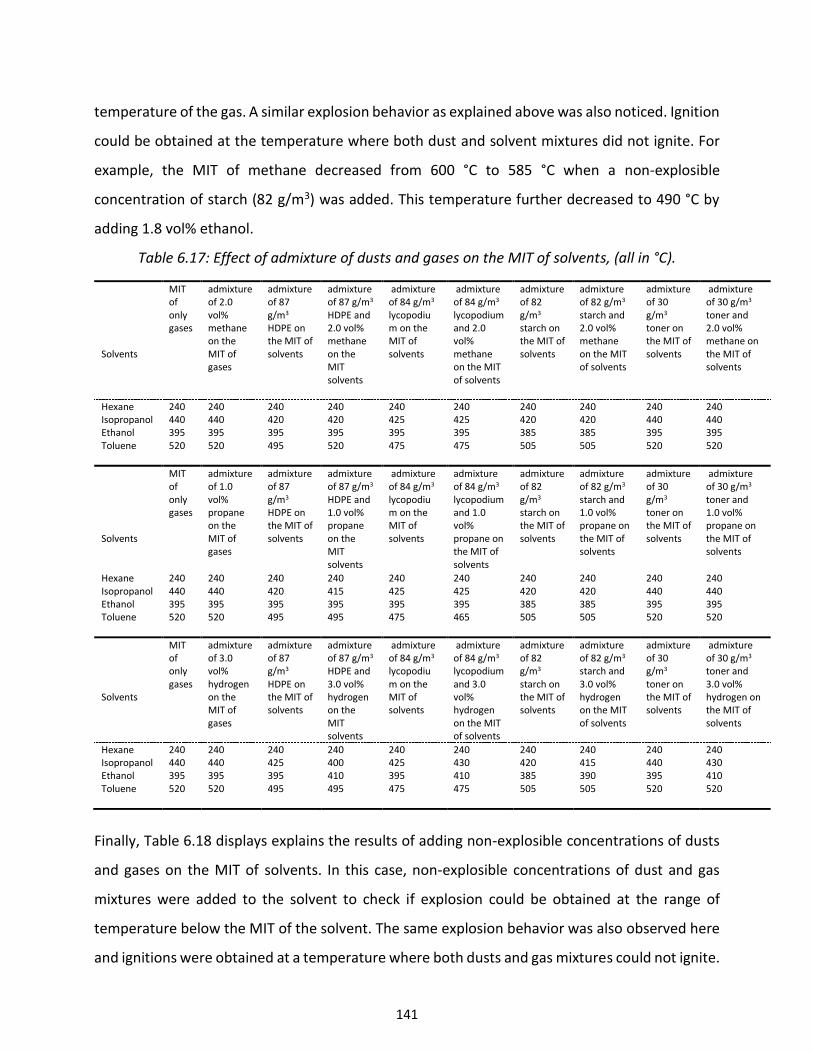
141
temperature of the gas. A similar explosion behavior as explained above was also noticed. Ignition
could be obtained at the temperature where both dust and solvent mixtures did not ignite. For
example, the MIT of methane decreased from 600 °C to 585 °C when a non-explosible
concentration of starch (82 g/m3) was added. This temperature further decreased to 490 °C by
adding 1.8 vol% ethanol.
Table 6.17: Effect of admixture of dusts and gases on the MIT of solvents, (all in °C).
Solvents
MIT of only gases
admixture of 2.0 vol% methane on the MIT of gases
admixture of 87 g/m3 HDPE on the MIT of solvents
admixture of 87 g/m3 HDPE and 2.0 vol% methane on the MIT solvents
admixture of 84 g/m3 lycopodium on the MIT of solvents
admixture of 84 g/m3 lycopodium and 2.0 vol% methane on the MIT of solvents
admixture of 82 g/m3 starch on the MIT of solvents
admixture of 82 g/m3 starch and 2.0 vol% methane on the MIT of solvents
admixture of 30 g/m3 toner on the MIT of solvents
admixture of 30 g/m3 toner and 2.0 vol% methane on the MIT of solvents
Hexane 240 240 240 240 240 240 240 240 240 240 Isopropanol 440 440 420 420 425 425 420 420 440 440 Ethanol 395 395 395 395 395 395 385 385 395 395 Toluene 520 520
495 520 475 475 505 505 520 520
Solvents
MIT of only gases
admixture of 1.0 vol% propane on the MIT of gases
admixture of 87 g/m3 HDPE on the MIT of solvents
admixture of 87 g/m3 HDPE and 1.0 vol% propane on the MIT solvents
admixture of 84 g/m3 lycopodium on the MIT of solvents
admixture of 84 g/m3 lycopodium and 1.0 vol% propane on the MIT of solvents
admixture of 82 g/m3 starch on the MIT of solvents
admixture of 82 g/m3 starch and 1.0 vol% propane on the MIT of solvents
admixture of 30 g/m3 toner on the MIT of solvents
admixture of 30 g/m3 toner and 1.0 vol% propane on the MIT of solvents
Hexane 240 240 240 240 240 240 240 240 240 240 Isopropanol 440 440 420 415 425 425 420 420 440 440 Ethanol 395 395 395 395 395 395 385 385 395 395 Toluene 520 520 495 495 475 465 505 505 520 520
Solvents
MIT of only gases
admixture of 3.0 vol% hydrogen on the MIT of gases
admixture of 87 g/m3 HDPE on the MIT of solvents
admixture of 87 g/m3 HDPE and 3.0 vol% hydrogen on the MIT solvents
admixture of 84 g/m3 lycopodium on the MIT of solvents
admixture of 84 g/m3 lycopodium and 3.0 vol% hydrogen on the MIT of solvents
admixture of 82 g/m3 starch on the MIT of solvents
admixture of 82 g/m3 starch and 3.0 vol% hydrogen on the MIT of solvents
admixture of 30 g/m3 toner on the MIT of solvents
admixture of 30 g/m3 toner and 3.0 vol% hydrogen on the MIT of solvents
Hexane 240 240 240 240 240 240 240 240 240 240 Isopropanol 440 440 425 400 425 430 420 415 440 430 Ethanol 395 395 395 410 395 410 385 390 395 410 Toluene 520 520
495 495 475 475 505 505 520 520
Finally, Table 6.18 displays explains the results of adding non-explosible concentrations of dusts
and gases on the MIT of solvents. In this case, non-explosible concentrations of dust and gas
mixtures were added to the solvent to check if explosion could be obtained at the range of
temperature below the MIT of the solvent. The same explosion behavior was also observed here
and ignitions were obtained at a temperature where both dusts and gas mixtures could not ignite.
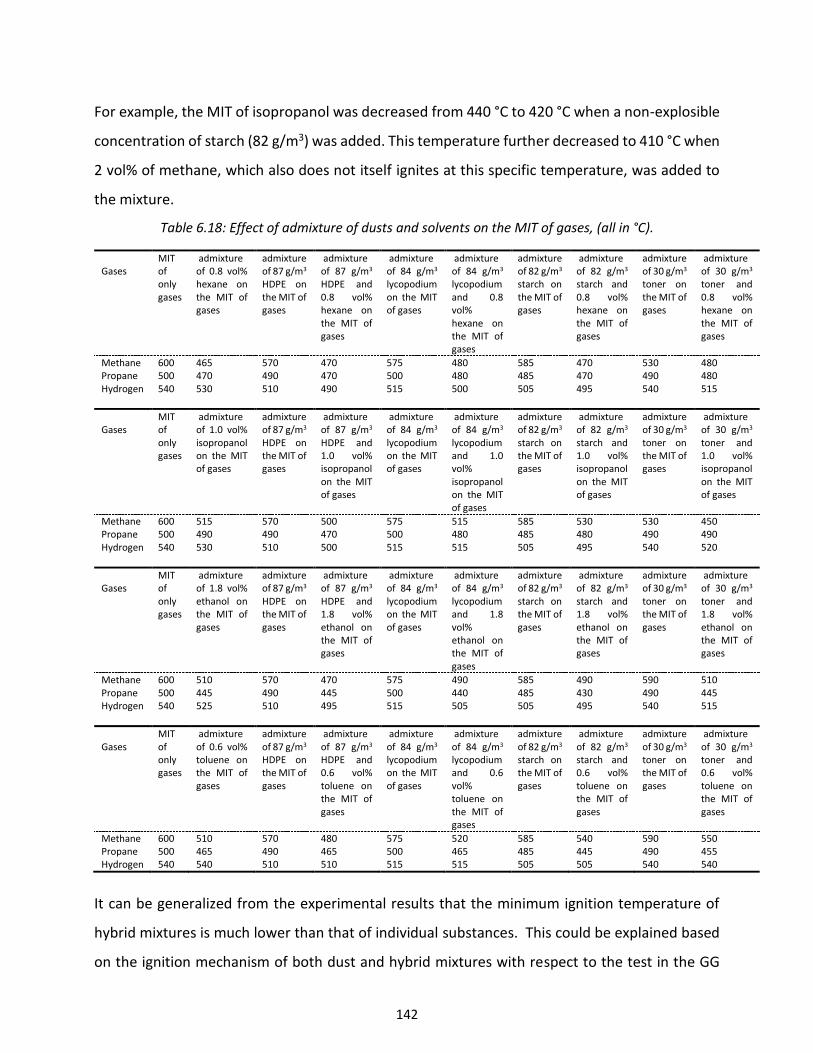
142
For example, the MIT of isopropanol was decreased from 440 °C to 420 °C when a non-explosible
concentration of starch (82 g/m3) was added. This temperature further decreased to 410 °C when
2 vol% of methane, which also does not itself ignites at this specific temperature, was added to
the mixture.
Table 6.18: Effect of admixture of dusts and solvents on the MIT of gases, (all in °C).
Gases
MIT of only gases
admixture of 0.8 vol% hexane on the MIT of gases
admixture of 87 g/m3 HDPE on the MIT of gases
admixture of 87 g/m3 HDPE and 0.8 vol% hexane on the MIT of gases
admixture of 84 g/m3 lycopodium on the MIT of gases
admixture of 84 g/m3 lycopodium and 0.8 vol% hexane on the MIT of gases
admixture of 82 g/m3 starch on the MIT of gases
admixture of 82 g/m3 starch and 0.8 vol% hexane on the MIT of gases
admixture of 30 g/m3 toner on the MIT of gases
admixture of 30 g/m3 toner and 0.8 vol% hexane on the MIT of gases
Methane 600 465 570 470 575 480 585 470 530 480 Propane 500 470 490 470 500 480 485 470 490 480 Hydrogen 540 530 510 490 515 500 505 495 540 515
Gases
MIT of only gases
admixture of 1.0 vol% isopropanol on the MIT of gases
admixture of 87 g/m3 HDPE on the MIT of gases
admixture of 87 g/m3 HDPE and 1.0 vol% isopropanol on the MIT of gases
admixture of 84 g/m3 lycopodium on the MIT of gases
admixture of 84 g/m3 lycopodium and 1.0 vol% isopropanol on the MIT of gases
admixture of 82 g/m3 starch on the MIT of gases
admixture of 82 g/m3 starch and 1.0 vol% isopropanol on the MIT of gases
admixture of 30 g/m3 toner on the MIT of gases
admixture of 30 g/m3 toner and 1.0 vol% isopropanol on the MIT of gases
Methane 600 515 570 500 575 515 585 530 530 450 Propane 500 490 490 470 500 480 485 480 490 490 Hydrogen 540 530 510 500 515 515 505 495 540 520
Gases
MIT of only gases
admixture of 1.8 vol% ethanol on the MIT of gases
admixture of 87 g/m3 HDPE on the MIT of gases
admixture of 87 g/m3 HDPE and 1.8 vol% ethanol on the MIT of gases
admixture of 84 g/m3 lycopodium on the MIT of gases
admixture of 84 g/m3 lycopodium and 1.8 vol% ethanol on the MIT of gases
admixture of 82 g/m3 starch on the MIT of gases
admixture of 82 g/m3 starch and 1.8 vol% ethanol on the MIT of gases
admixture of 30 g/m3 toner on the MIT of gases
admixture of 30 g/m3 toner and 1.8 vol% ethanol on the MIT of gases
Methane 600 510 570 470 575 490 585 490 590 510 Propane 500 445 490 445 500 440 485 430 490 445 Hydrogen 540 525 510 495 515 505 505 495 540 515
Gases
MIT of only gases
admixture of 0.6 vol% toluene on the MIT of gases
admixture of 87 g/m3 HDPE on the MIT of gases
admixture of 87 g/m3 HDPE and 0.6 vol% toluene on the MIT of gases
admixture of 84 g/m3 lycopodium on the MIT of gases
admixture of 84 g/m3 lycopodium and 0.6 vol% toluene on the MIT of gases
admixture of 82 g/m3 starch on the MIT of gases
admixture of 82 g/m3 starch and 0.6 vol% toluene on the MIT of gases
admixture of 30 g/m3 toner on the MIT of gases
admixture of 30 g/m3 toner and 0.6 vol% toluene on the MIT of gases
Methane 600 510 570 480 575 520 585 540 590 550 Propane 500 465 490 465 500 465 485 445 490 455 Hydrogen 540 540 510 510 515 515 505 505 540 540
It can be generalized from the experimental results that the minimum ignition temperature of
hybrid mixtures is much lower than that of individual substances. This could be explained based
on the ignition mechanism of both dust and hybrid mixtures with respect to the test in the GG
143
oven (the general mechanism of dust explosion has already been discussed in section 2.4.1). With
respect to organic dusts, as the dust is introduced in the furnace, some transitions occur before
the actual ignition happens. These changes are explained in the form of three main stages. In the
first stage, which is the pre-heating stage, the moisture content in the dust is vaporized. Usually,
dust with higher moisture content requires a higher ignition temperature because evaporation
and heating of water represents an inert heat sink [22, 60]. The next stage is the pyrolysis and
devolatilization step. This step is considered as the first step in the combustion process. During
this stage, the organic particle is heated, producing volatile matters or combustible gases. The
combustible gases are then mixed with air in the space between the particles. The final stage is
the oxidation stage of pyrolysis gases, where the gas phase combustion of premixed volatile-air
takes place or in other words, the oxidation of a homogenous gas takes place.
In the case of hybrid mixture explosions, where flammable gas or vaporizing solvent is added to
the dust, it can be envisaged that this addition could promote the combustion. Dufaud et al. [13]
analysed the minimum explosible concentration of dust for combustible gas-dust hybrid mixtures
and stressed the impact of the introduction of highly flammable substances on the explosivity of
dust clouds. They observed that the dust explosivity is strongly promoted by the addition of
combustible gas. The authors further highlighted that this effect is more significant below 50 %
of dust to gas ratio. Therefore, it can be deduced that dust still plays a significant role in the
combustion kinetics down to this limit; for greater amounts of gases, the specific behavior of the
combustible gases is clearly predominant. Such addition, as low as 1 vol. % induces changes in the
rate-limiting step of the combustion reaction from devolatilization to homogeneous gas phase
reaction and implies a drastic decrease in the MIT for hybrid mixtures.
Furthermore, the particle size of the dust is also a crucial factor to be considered with regard to
the MIT of both dust and hybrid mixtures. This is because, smaller particle size results in higher
the devolatilization rate. Moreover, modification of the rate-limiting step of the combustion
reaction is also dependant on the particle size of the dust materials. Size reduction could lead to
a change from a diffusion controlled regime for large size particles to kinetically controlled for
small sized ones.
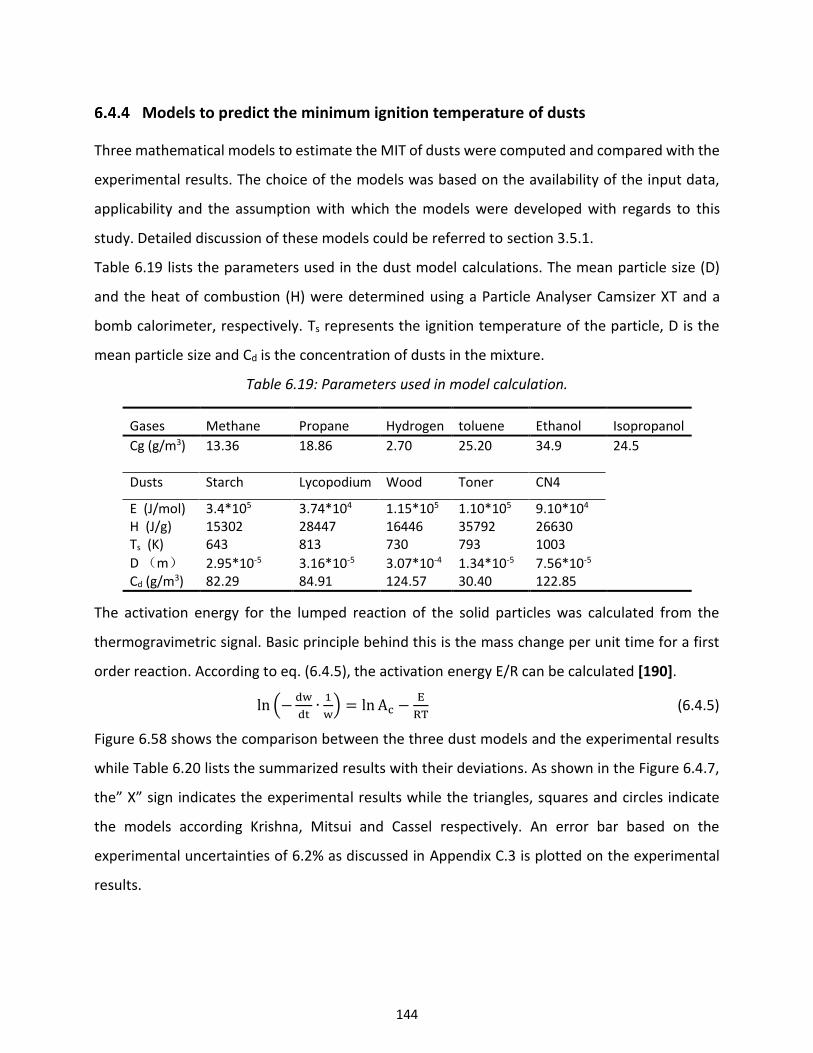
144
Models to predict the minimum ignition temperature of dusts
Three mathematical models to estimate the MIT of dusts were computed and compared with the
experimental results. The choice of the models was based on the availability of the input data,
applicability and the assumption with which the models were developed with regards to this
study. Detailed discussion of these models could be referred to section 3.5.1.
Table 6.19 lists the parameters used in the dust model calculations. The mean particle size (D)
and the heat of combustion (H) were determined using a Particle Analyser Camsizer XT and a
bomb calorimeter, respectively. Ts represents the ignition temperature of the particle, D is the
mean particle size and Cd is the concentration of dusts in the mixture.
Table 6.19: Parameters used in model calculation.
Gases Methane Propane Hydrogen toluene Ethanol Isopropanol
Cg (g/m3) 13.36 18.86 2.70 25.20 34.9 24.5
Dusts Starch Lycopodium Wood Toner CN4
E (J/mol) 3.4*105 3.74*104 1.15*105 1.10*105 9.10*104 H (J/g) 15302 28447 16446 35792 26630 Ts (K) 643 813 730 793 1003
D (m) 2.95*10-5 3.16*10-5 3.07*10-4 1.34*10-5 7.56*10-5 Cd (g/m3) 82.29 84.91 124.57 30.40 122.85
The activation energy for the lumped reaction of the solid particles was calculated from the
thermogravimetric signal. Basic principle behind this is the mass change per unit time for a first
order reaction. According to eq. (6.4.5), the activation energy E/R can be calculated [190].
ln (−dw
dt∙
1
w) = ln Ac −
E
RT (6.4.5)
Figure 6.58 shows the comparison between the three dust models and the experimental results
while Table 6.20 lists the summarized results with their deviations. As shown in the Figure 6.4.7,
the” X” sign indicates the experimental results while the triangles, squares and circles indicate
the models according Krishna, Mitsui and Cassel respectively. An error bar based on the
experimental uncertainties of 6.2% as discussed in Appendix C.3 is plotted on the experimental
results.
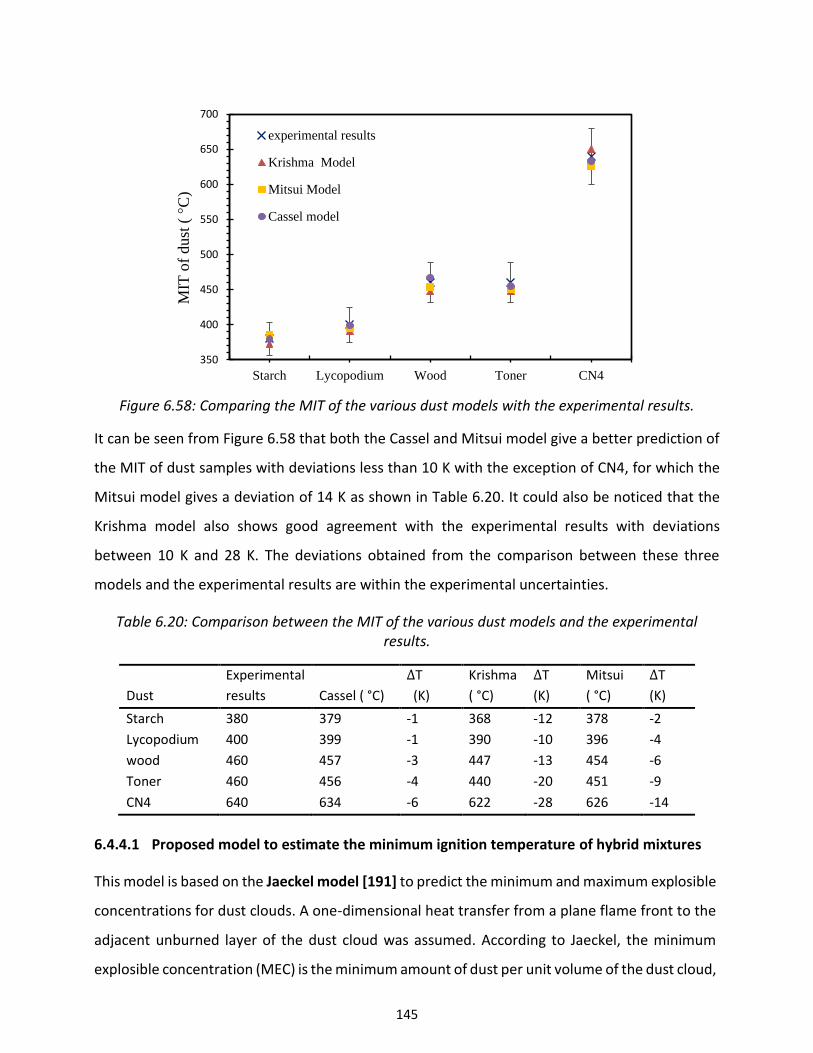
145
Figure 6.58: Comparing the MIT of the various dust models with the experimental results.
It can be seen from Figure 6.58 that both the Cassel and Mitsui model give a better prediction of
the MIT of dust samples with deviations less than 10 K with the exception of CN4, for which the
Mitsui model gives a deviation of 14 K as shown in Table 6.20. It could also be noticed that the
Krishma model also shows good agreement with the experimental results with deviations
between 10 K and 28 K. The deviations obtained from the comparison between these three
models and the experimental results are within the experimental uncertainties.
Table 6.20: Comparison between the MIT of the various dust models and the experimental results.
Dust
Experimental
results Cassel ( °C)
∆T
(K)
Krishma
( °C)
∆T
(K)
Mitsui
( °C)
∆T
(K)
Starch 380 379 -1 368 -12 378 -2
Lycopodium 400 399 -1 390 -10 396 -4
wood 460 457 -3 447 -13 454 -6
Toner 460 456 -4 440 -20 451 -9
CN4 640 634 -6 622 -28 626 -14
6.4.4.1 Proposed model to estimate the minimum ignition temperature of hybrid mixtures
This model is based on the Jaeckel model [191] to predict the minimum and maximum explosible
concentrations for dust clouds. A one-dimensional heat transfer from a plane flame front to the
adjacent unburned layer of the dust cloud was assumed. According to Jaeckel, the minimum
explosible concentration (MEC) is the minimum amount of dust per unit volume of the dust cloud,
350
400
450
500
550
600
650
700
Starch Lycopodium Wood Toner CN4
MIT
of
dust
( °
C)
experimental results
Krishma Model
Mitsui Model
Cassel model
146
which by complete combustion liberates enough energy to heat the next unit volume of dust
cloud to the ignition temperature. Jaeckel formulated the condition of self-sustained flame
propagation through the dust cloud of concentration Cd, mini<Cd, max at constant volume as:
QG = CdHd (6.4.6)
QL = L + (Ti,d − T0)(Cdcd + ρaircair) (6.4.7)
According to the Jaeckel Model:
CdHd ≥ L + (Ti,d − T0)(Cdcd + ρaircair) (6.4.8)
When Cd=MEC, by neglecting the heat loss by radiation and equating the two sides, after
rearranging, the minimum ignition temperature can be derived:
ρdHd ∙ MEC = (Ti,d − T0)(ρdcd ∙ MEC + ρaircair) (6.4.9)
Rearranging eq. (6.4.9) one obtains:
Ti,d = T0 +MEC∙Hd
MEC∙cd+ρaircair (6.4.10)
With respect to gases, eq. (6.4.9) could be rewritten to eq. (6.4.11), Cg = LEL
ρgHg ∙ LEL = (Ti,g − T0)(ρgcg ∙ LEL + ρaircair) (6.4.11)
Rearranging eq. (6.4.11) one obtains:
Ti,g = T0 +ρgHg∙LEL
ρgcg∙LEL+ρaircair (6.4.12)
The minimum ignition temperature of hybrid mixture Ti, hybrid presented in eq. (6.4.15) can be
deduced according to eq. (6.4.9, 6.4.11 and 6.4.12). See section Appendix 8.4: D-2 for detail
derivation.
Ti,hybrid = Ti,g (Ti,d
Ti,g)
C𝑔
𝐶𝑑 (6.4.15)
The ignition temperature of a hybrid mixture can then be calculated from eq. (6.4.15):
Where Tig is the MIT of gas [°C], Tid is the MIT of dust [°C], Cg is the gas concentration in the mixture
[g/m3], Cd is the dust concentration in the mixture [g/m3], ρg is the density of gas [g/m3], ρd is the
density of dust [g/m3], cg is the heat capacity of gas [kJ/kg.K], cd is the heat capacity of dust
[kJ/kg.K], cair is the heat capacity of air[kJ/kg.K], L is the heat loss by radiation [KJ], Hg is the heat
of combustion of dust [kJ/mol] , Hd is the heat of combustion of dust[kJ/mol], LEL is the lower
explosion limit of gas [vol%] and MEC is the minimum explosible concentration of dust [g/m3].
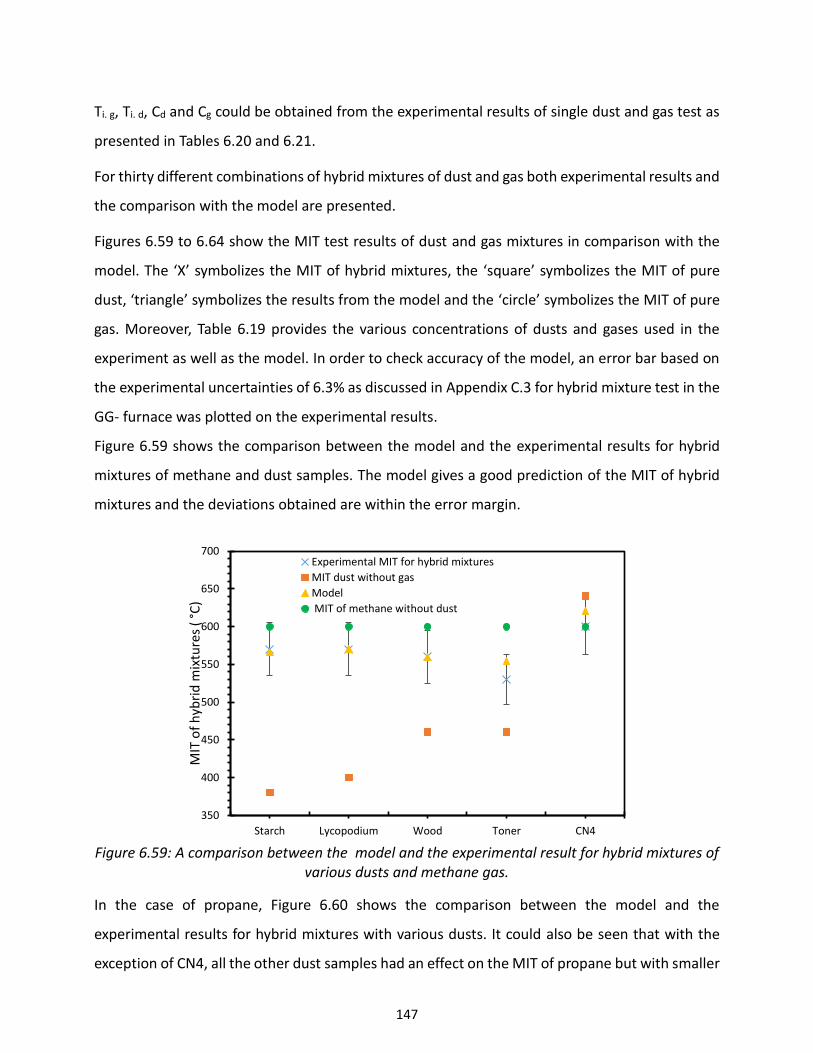
147
Ti. g, Ti. d, Cd and Cg could be obtained from the experimental results of single dust and gas test as
presented in Tables 6.20 and 6.21.
For thirty different combinations of hybrid mixtures of dust and gas both experimental results and
the comparison with the model are presented.
Figures 6.59 to 6.64 show the MIT test results of dust and gas mixtures in comparison with the
model. The ‘X’ symbolizes the MIT of hybrid mixtures, the ‘square’ symbolizes the MIT of pure
dust, ‘triangle’ symbolizes the results from the model and the ‘circle’ symbolizes the MIT of pure
gas. Moreover, Table 6.19 provides the various concentrations of dusts and gases used in the
experiment as well as the model. In order to check accuracy of the model, an error bar based on
the experimental uncertainties of 6.3% as discussed in Appendix C.3 for hybrid mixture test in the
GG- furnace was plotted on the experimental results.
Figure 6.59 shows the comparison between the model and the experimental results for hybrid
mixtures of methane and dust samples. The model gives a good prediction of the MIT of hybrid
mixtures and the deviations obtained are within the error margin.
Figure 6.59: A comparison between the model and the experimental result for hybrid mixtures of
various dusts and methane gas.
In the case of propane, Figure 6.60 shows the comparison between the model and the
experimental results for hybrid mixtures with various dusts. It could also be seen that with the
exception of CN4, all the other dust samples had an effect on the MIT of propane but with smaller
350
400
450
500
550
600
650
700
Starch Lycopodium Wood Toner CN4
MIT
of
hyb
rid
mix
ture
s (
°C)
Experimental MIT for hybrid mixtures
MIT dust without gas
Model
MIT of methane without dust
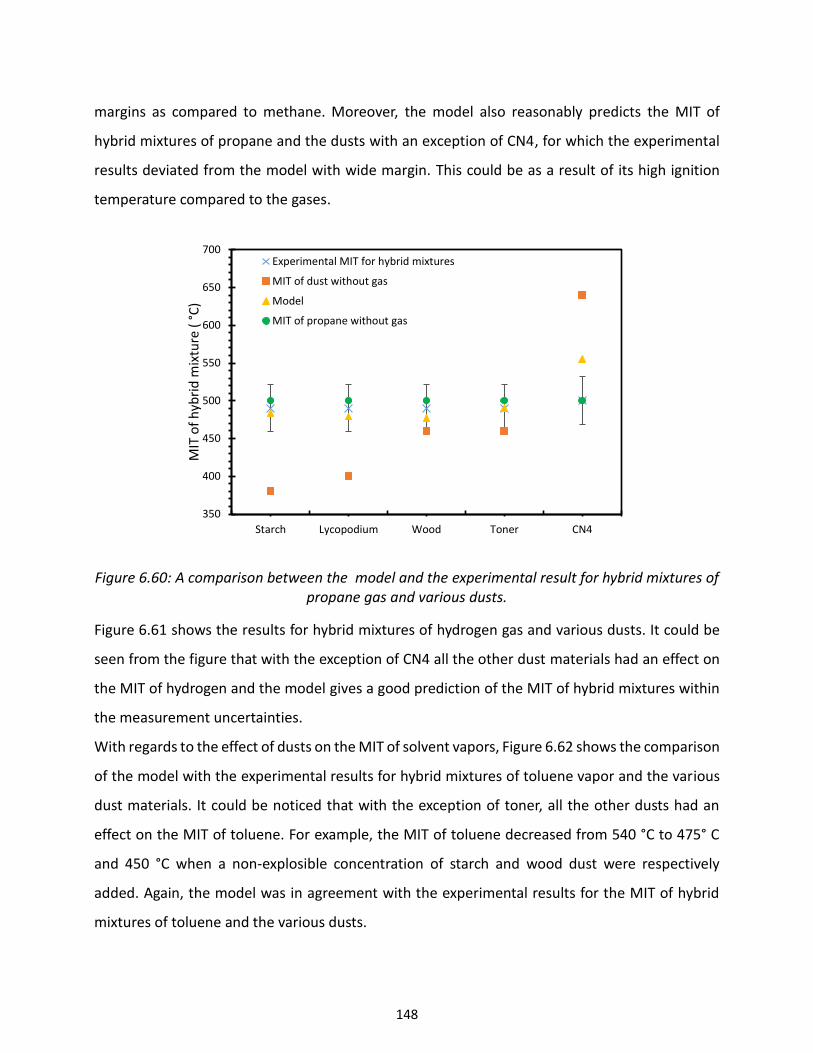
148
margins as compared to methane. Moreover, the model also reasonably predicts the MIT of
hybrid mixtures of propane and the dusts with an exception of CN4, for which the experimental
results deviated from the model with wide margin. This could be as a result of its high ignition
temperature compared to the gases.
Figure 6.60: A comparison between the model and the experimental result for hybrid mixtures of propane gas and various dusts.
Figure 6.61 shows the results for hybrid mixtures of hydrogen gas and various dusts. It could be
seen from the figure that with the exception of CN4 all the other dust materials had an effect on
the MIT of hydrogen and the model gives a good prediction of the MIT of hybrid mixtures within
the measurement uncertainties.
With regards to the effect of dusts on the MIT of solvent vapors, Figure 6.62 shows the comparison
of the model with the experimental results for hybrid mixtures of toluene vapor and the various
dust materials. It could be noticed that with the exception of toner, all the other dusts had an
effect on the MIT of toluene. For example, the MIT of toluene decreased from 540 °C to 475° C
and 450 °C when a non-explosible concentration of starch and wood dust were respectively
added. Again, the model was in agreement with the experimental results for the MIT of hybrid
mixtures of toluene and the various dusts.
350
400
450
500
550
600
650
700
Starch Lycopodium Wood Toner CN4
MIT
of
hyb
rid
mix
ture
( °
C)
Experimental MIT for hybrid mixtures
MIT of dust without gas
Model
MIT of propane without gas
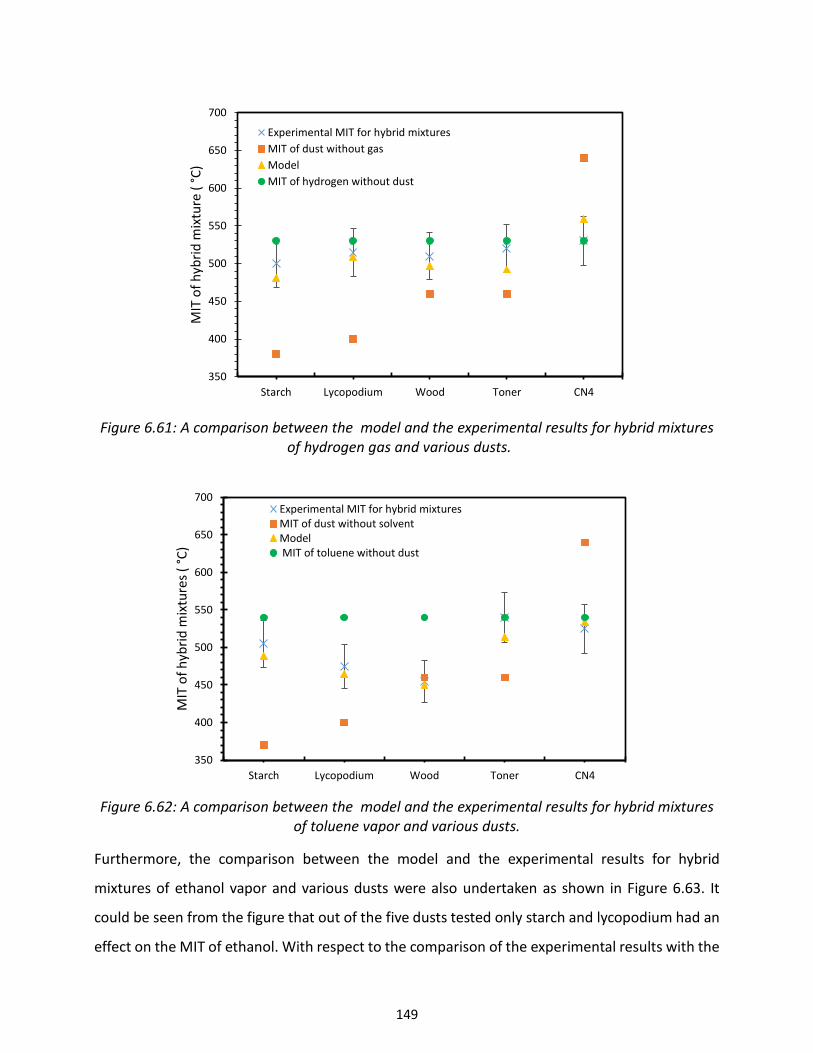
149
Figure 6.61: A comparison between the model and the experimental results for hybrid mixtures
of hydrogen gas and various dusts.
Figure 6.62: A comparison between the model and the experimental results for hybrid mixtures
of toluene vapor and various dusts.
Furthermore, the comparison between the model and the experimental results for hybrid
mixtures of ethanol vapor and various dusts were also undertaken as shown in Figure 6.63. It
could be seen from the figure that out of the five dusts tested only starch and lycopodium had an
effect on the MIT of ethanol. With respect to the comparison of the experimental results with the
350
400
450
500
550
600
650
700
Starch Lycopodium Wood Toner CN4
MIT
of
hyb
rid
mix
ture
( °
C)
Experimental MIT for hybrid mixtures
MIT of dust without gas
Model
MIT of hydrogen without dust
350
400
450
500
550
600
650
700
Starch Lycopodium Wood Toner CN4
MIT
of
hyb
rid
mix
ture
s (
°C)
Experimental MIT for hybrid mixturesMIT of dust without solventModel MIT of toluene without dust
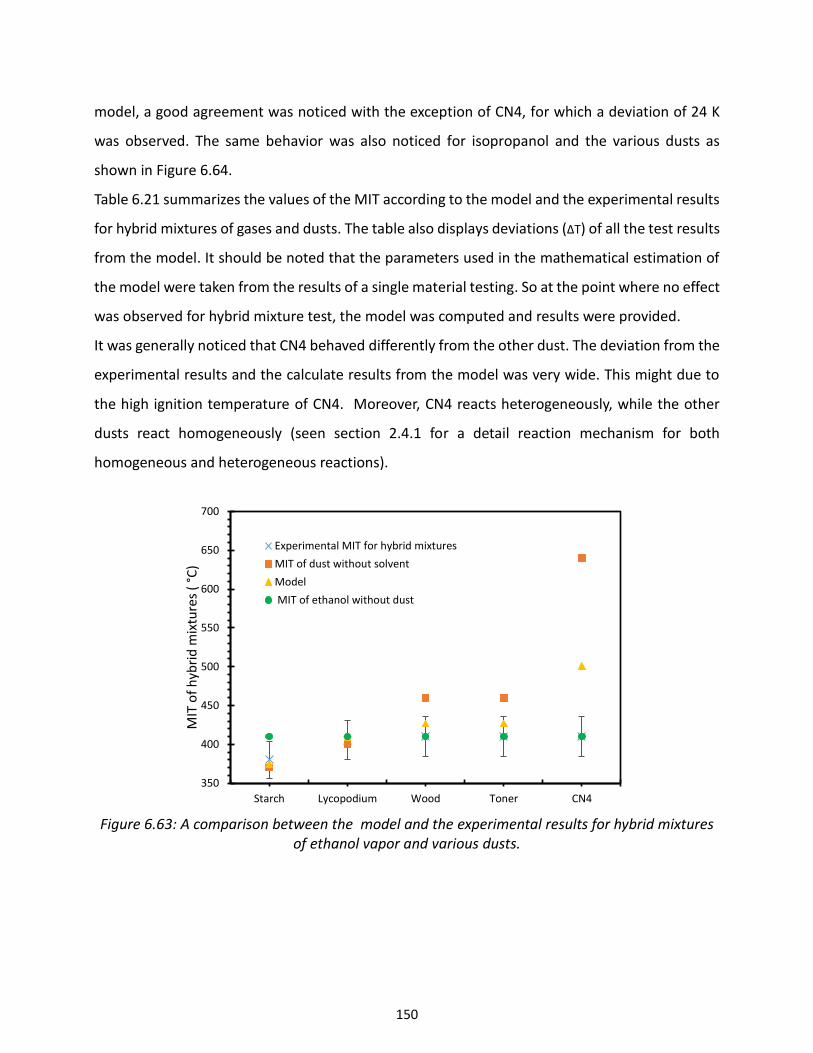
150
model, a good agreement was noticed with the exception of CN4, for which a deviation of 24 K
was observed. The same behavior was also noticed for isopropanol and the various dusts as
shown in Figure 6.64.
Table 6.21 summarizes the values of the MIT according to the model and the experimental results
for hybrid mixtures of gases and dusts. The table also displays deviations (∆T) of all the test results
from the model. It should be noted that the parameters used in the mathematical estimation of
the model were taken from the results of a single material testing. So at the point where no effect
was observed for hybrid mixture test, the model was computed and results were provided.
It was generally noticed that CN4 behaved differently from the other dust. The deviation from the
experimental results and the calculate results from the model was very wide. This might due to
the high ignition temperature of CN4. Moreover, CN4 reacts heterogeneously, while the other
dusts react homogeneously (seen section 2.4.1 for a detail reaction mechanism for both
homogeneous and heterogeneous reactions).
Figure 6.63: A comparison between the model and the experimental results for hybrid mixtures
of ethanol vapor and various dusts.
350
400
450
500
550
600
650
700
Starch Lycopodium Wood Toner CN4
MIT
of
hyb
rid
mix
ture
s (
°C)
Experimental MIT for hybrid mixtures
MIT of dust without solvent
Model
MIT of ethanol without dust
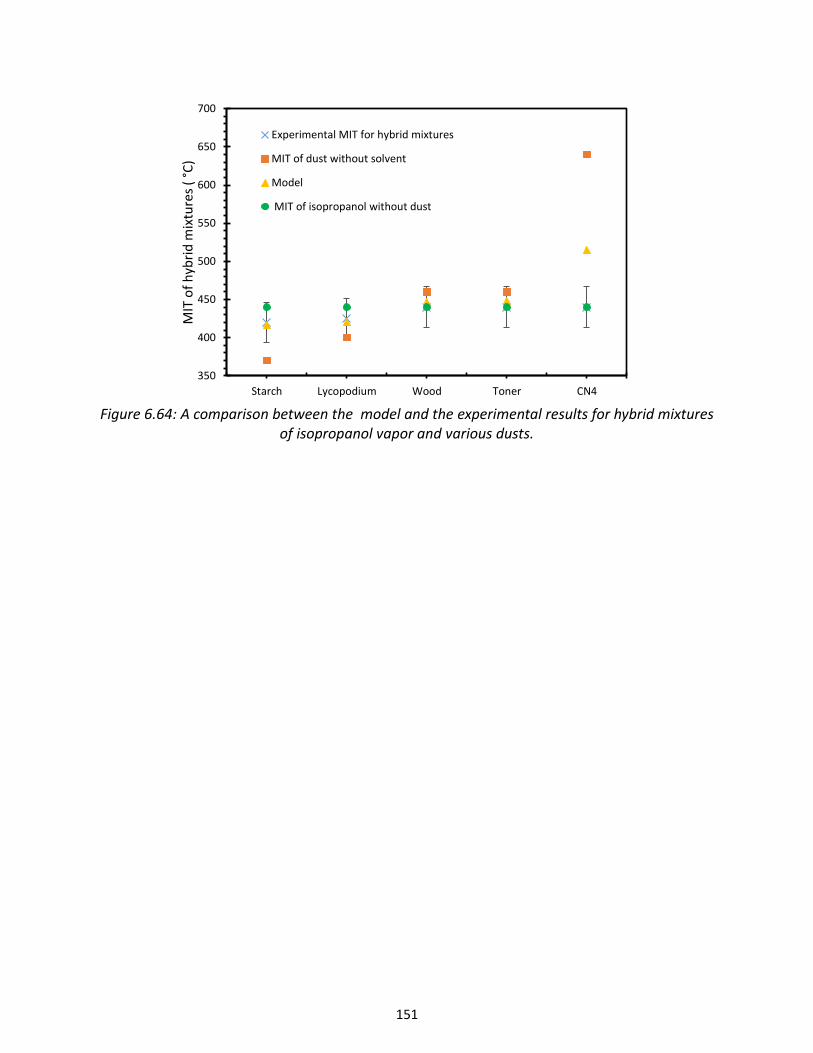
151
Figure 6.64: A comparison between the model and the experimental results for hybrid mixtures
of isopropanol vapor and various dusts.
350
400
450
500
550
600
650
700
Starch Lycopodium Wood Toner CN4
MIT
of
hyb
rid
mix
ture
s (
°C)
Experimental MIT for hybrid mixtures
MIT of dust without solvent
Model
MIT of isopropanol without dust
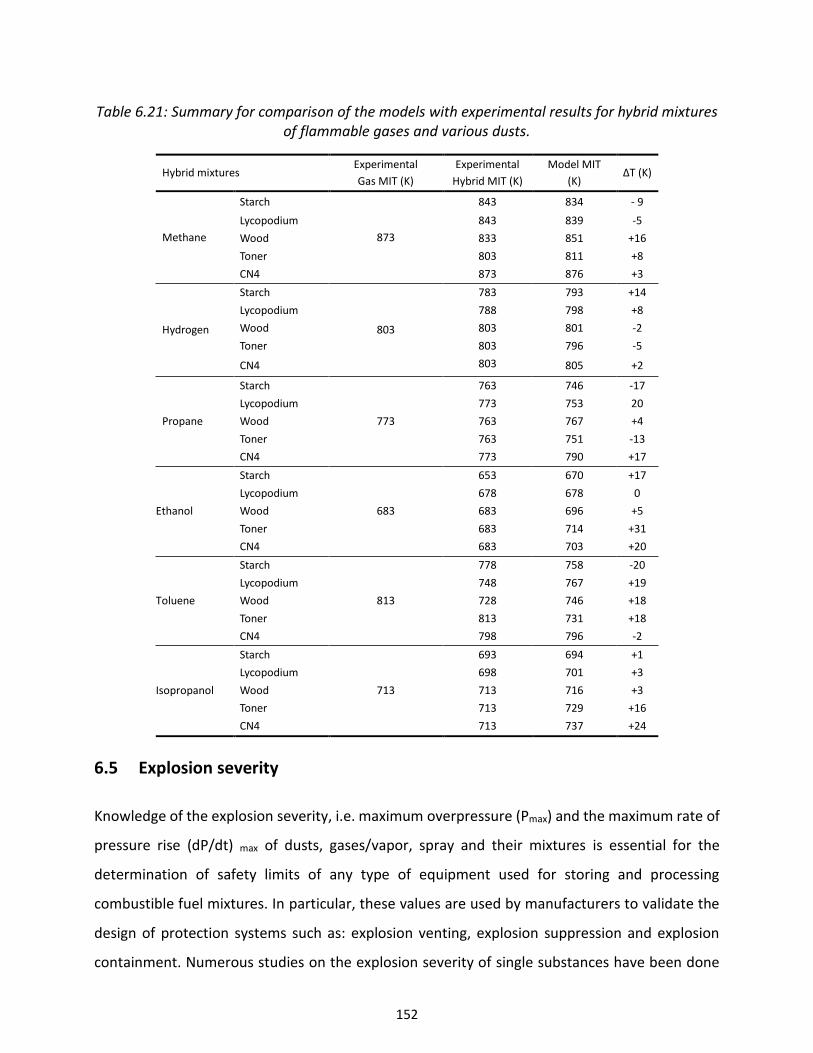
152
Table 6.21: Summary for comparison of the models with experimental results for hybrid mixtures of flammable gases and various dusts.
Hybrid mixtures Experimental
Gas MIT (K)
Experimental
Hybrid MIT (K)
Model MIT
(K) ∆T (K)
Methane
Starch
873
843 834 - 9
Lycopodium 843 839 -5
Wood 833 851 +16
Toner 803 811 +8
CN4 873 876 +3
Hydrogen
Starch
803
783 793 +14
Lycopodium 788 798 +8
Wood 803 801 -2
Toner 803 796 -5
CN4 803 805 +2
Propane
Starch
773
763 746 -17
Lycopodium 773 753 20
Wood 763 767 +4
Toner 763 751 -13
CN4 773 790 +17
Ethanol
Starch
683
653 670 +17
Lycopodium 678 678 0
Wood 683 696 +5
Toner 683 714 +31
CN4 683 703 +20
Toluene
Starch
813
778 758 -20
Lycopodium 748 767 +19
Wood 728 746 +18
Toner 813 731 +18
CN4 798 796 -2
Isopropanol
Starch
713
693 694 +1
Lycopodium 698 701 +3
Wood 713 716 +3
Toner 713 729 +16
CN4 713 737 +24
6.5 Explosion severity
Knowledge of the explosion severity, i.e. maximum overpressure (Pmax) and the maximum rate of
pressure rise (dP/dt) max of dusts, gases/vapor, spray and their mixtures is essential for the
determination of safety limits of any type of equipment used for storing and processing
combustible fuel mixtures. In particular, these values are used by manufacturers to validate the
design of protection systems such as: explosion venting, explosion suppression and explosion
containment. Numerous studies on the explosion severity of single substances have been done
153
in the past decades with the aim to prevent explosions as well as to protect equipments [22, 53,
91, 192, 193]. However, one cannot rely on the results from single substances to ensure full
protection of equipment or processes, when dealing with mixtures of different states of aggregate
(hybrid mixtures). Research on the explosion severity of hybrid mixtures is very limited and is
mostly focused on mixtures of dusts and gases. Data on mixtures such as: sprays/vapors with
either dusts or gases are not available. Hence, this section presents detailed results on the
explosion severity of different combinations of mixtures: spray-gas, spray-dust, gas-dust as well
as spray-gas-dust. For the experimental phase of this section, the 20-liter explosion sphere with
a 10 J electric spark as an ignition source was employed. All tests were performed under
turbulence condition (60 ms as ignition delay time). Mixtures of various combinations of six
solvents (ethanol, isopropanol, acetone, toluene, heptane, and hexane), three gases (methane,
propane and hydrogen) and two dusts (lycopodium and brown coal) were considered.
Explosion severity of single substances
Figure 6.65 presents the experimental results obtained for explosion over pressure and the rate
of pressure rise of solvents as spray. Out of the six solvents, hexane recorded the highest value of
both Pmax and (dP/dt) max while ethanol recorded the lowest value. This behavior could be
attributed to thermodynamic properties related to the combustion behavior of the solvents, such
as: heat capacity, heat of combustion, heat of vaporization and burning velocity as presented in
Table 4.3. For example, the heat of combustion relates to the total energy released as a result of
complete combustion of the material under standard conditions. The higher the heat of
combustion is, the higher the explosion severity will be. This was observed in the results obtained
for the solvents. For example, hexane with the highest heat of combustion (-4863 kJ/mol)
recorded the highest value of Pmax as shown in Figure 6.65 (see Table 4.3 for the heat of
combustion values for solvents).
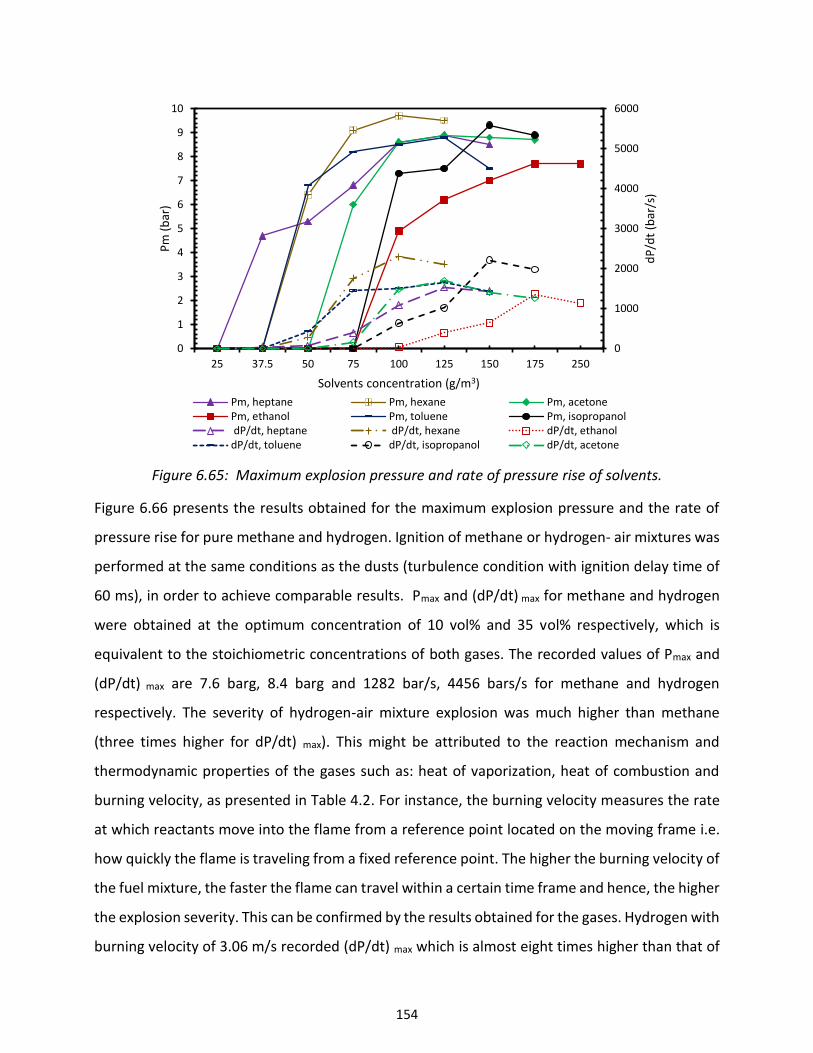
154
Figure 6.65: Maximum explosion pressure and rate of pressure rise of solvents.
Figure 6.66 presents the results obtained for the maximum explosion pressure and the rate of
pressure rise for pure methane and hydrogen. Ignition of methane or hydrogen- air mixtures was
performed at the same conditions as the dusts (turbulence condition with ignition delay time of
60 ms), in order to achieve comparable results. Pmax and (dP/dt) max for methane and hydrogen
were obtained at the optimum concentration of 10 vol% and 35 vol% respectively, which is
equivalent to the stoichiometric concentrations of both gases. The recorded values of Pmax and
(dP/dt) max are 7.6 barg, 8.4 barg and 1282 bar/s, 4456 bars/s for methane and hydrogen
respectively. The severity of hydrogen-air mixture explosion was much higher than methane
(three times higher for dP/dt) max). This might be attributed to the reaction mechanism and
thermodynamic properties of the gases such as: heat of vaporization, heat of combustion and
burning velocity, as presented in Table 4.2. For instance, the burning velocity measures the rate
at which reactants move into the flame from a reference point located on the moving frame i.e.
how quickly the flame is traveling from a fixed reference point. The higher the burning velocity of
the fuel mixture, the faster the flame can travel within a certain time frame and hence, the higher
the explosion severity. This can be confirmed by the results obtained for the gases. Hydrogen with
burning velocity of 3.06 m/s recorded (dP/dt) max which is almost eight times higher than that of
0
1000
2000
3000
4000
5000
6000
0
1
2
3
4
5
6
7
8
9
10
25 37.5 50 75 100 125 150 175 250
dP
/dt
(bar
/s)
Pm
(b
ar)
Solvents concentration (g/m3)
Pm, heptane Pm, hexane Pm, acetonePm, ethanol Pm, toluene Pm, isopropanol dP/dt, heptane dP/dt, hexane dP/dt, ethanoldP/dt, toluene dP/dt, isopropanol dP/dt, acetone
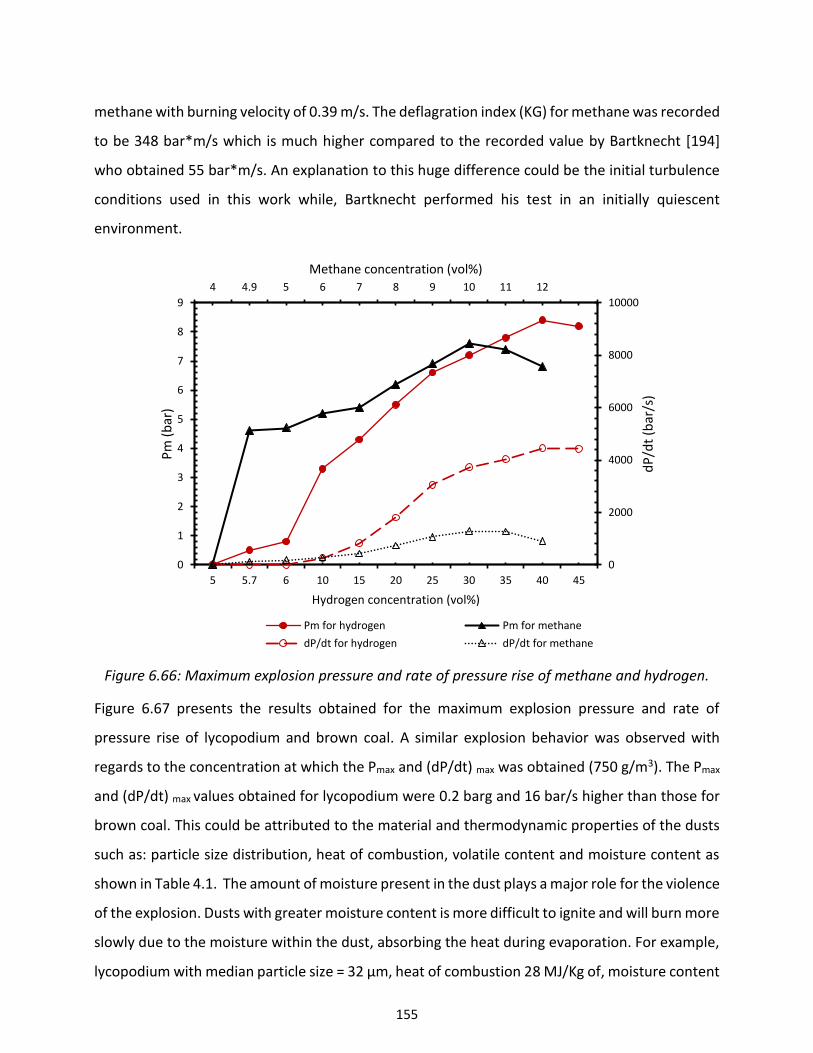
155
methane with burning velocity of 0.39 m/s. The deflagration index (KG) for methane was recorded
to be 348 bar*m/s which is much higher compared to the recorded value by Bartknecht [194]
who obtained 55 bar*m/s. An explanation to this huge difference could be the initial turbulence
conditions used in this work while, Bartknecht performed his test in an initially quiescent
environment.
Figure 6.66: Maximum explosion pressure and rate of pressure rise of methane and hydrogen.
Figure 6.67 presents the results obtained for the maximum explosion pressure and rate of
pressure rise of lycopodium and brown coal. A similar explosion behavior was observed with
regards to the concentration at which the Pmax and (dP/dt) max was obtained (750 g/m3). The Pmax
and (dP/dt) max values obtained for lycopodium were 0.2 barg and 16 bar/s higher than those for
brown coal. This could be attributed to the material and thermodynamic properties of the dusts
such as: particle size distribution, heat of combustion, volatile content and moisture content as
shown in Table 4.1. The amount of moisture present in the dust plays a major role for the violence
of the explosion. Dusts with greater moisture content is more difficult to ignite and will burn more
slowly due to the moisture within the dust, absorbing the heat during evaporation. For example,
lycopodium with median particle size = 32 µm, heat of combustion 28 MJ/Kg of, moisture content
4 4.9 5 6 7 8 9 10 11 12
0
2000
4000
6000
8000
10000
0
1
2
3
4
5
6
7
8
9
5 5.7 6 10 15 20 25 30 35 40 45
Methane concentration (vol%)
dP
/dt
(bar
/s)
Pm
(b
ar)
Hydrogen concentration (vol%)
Pm for hydrogen Pm for methane
dP/dt for hydrogen dP/dt for methane
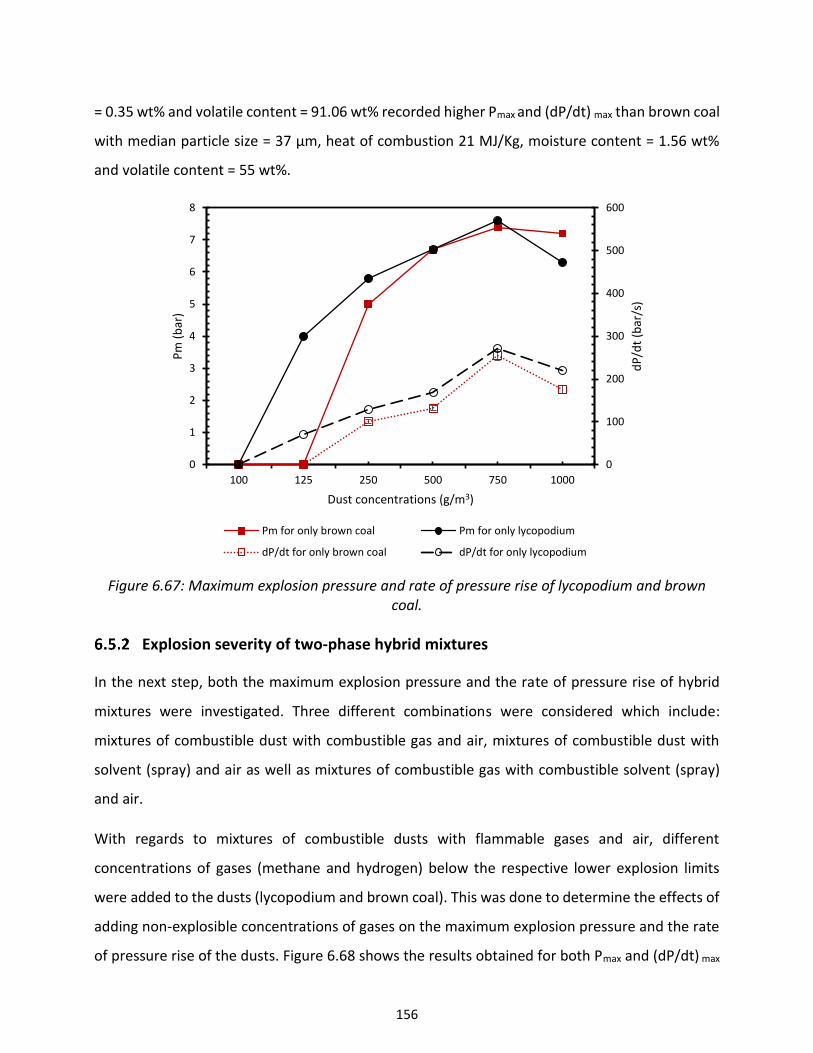
156
= 0.35 wt% and volatile content = 91.06 wt% recorded higher Pmax and (dP/dt) max than brown coal
with median particle size = 37 µm, heat of combustion 21 MJ/Kg, moisture content = 1.56 wt%
and volatile content = 55 wt%.
Figure 6.67: Maximum explosion pressure and rate of pressure rise of lycopodium and brown coal.
Explosion severity of two-phase hybrid mixtures
In the next step, both the maximum explosion pressure and the rate of pressure rise of hybrid
mixtures were investigated. Three different combinations were considered which include:
mixtures of combustible dust with combustible gas and air, mixtures of combustible dust with
solvent (spray) and air as well as mixtures of combustible gas with combustible solvent (spray)
and air.
With regards to mixtures of combustible dusts with flammable gases and air, different
concentrations of gases (methane and hydrogen) below the respective lower explosion limits
were added to the dusts (lycopodium and brown coal). This was done to determine the effects of
adding non-explosible concentrations of gases on the maximum explosion pressure and the rate
of pressure rise of the dusts. Figure 6.68 shows the results obtained for both Pmax and (dP/dt) max
0
100
200
300
400
500
600
0
1
2
3
4
5
6
7
8
100 125 250 500 750 1000
dP
/dt
(bar
/s)
Pm
(b
ar)
Dust concentrations (g/m3)
Pm for only brown coal Pm for only lycopodium
dP/dt for only brown coal dP/dt for only lycopodium
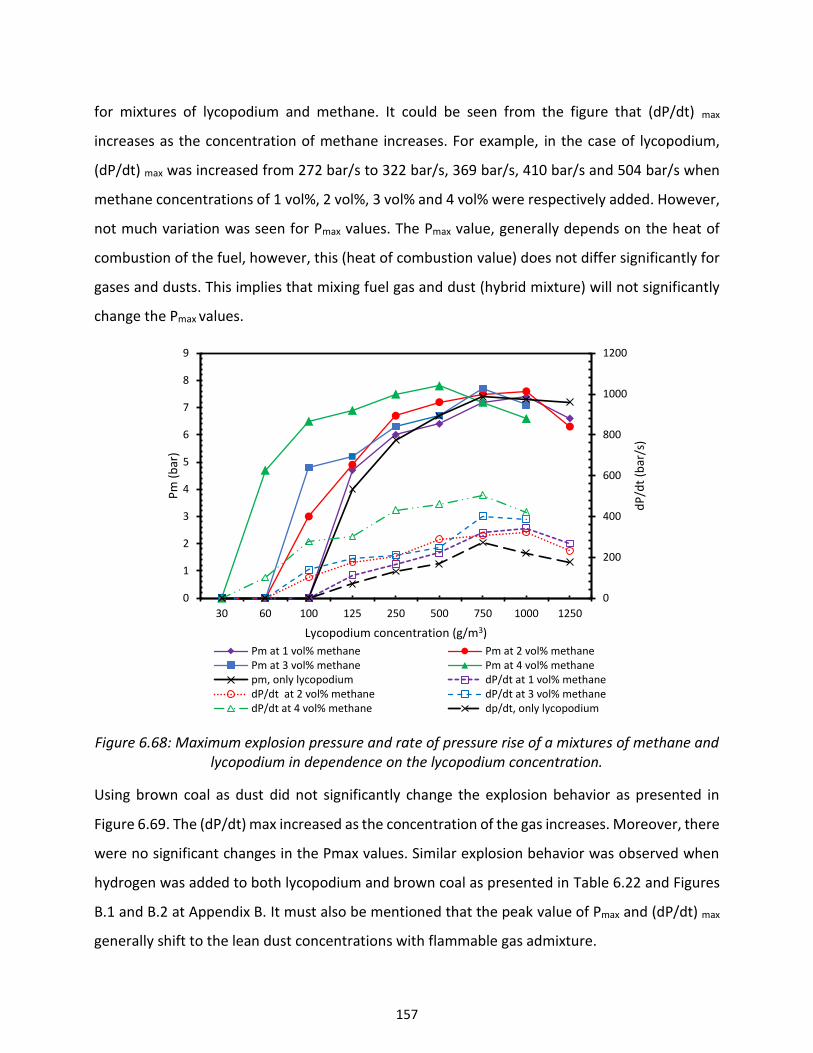
157
for mixtures of lycopodium and methane. It could be seen from the figure that (dP/dt) max
increases as the concentration of methane increases. For example, in the case of lycopodium,
(dP/dt) max was increased from 272 bar/s to 322 bar/s, 369 bar/s, 410 bar/s and 504 bar/s when
methane concentrations of 1 vol%, 2 vol%, 3 vol% and 4 vol% were respectively added. However,
not much variation was seen for Pmax values. The Pmax value, generally depends on the heat of
combustion of the fuel, however, this (heat of combustion value) does not differ significantly for
gases and dusts. This implies that mixing fuel gas and dust (hybrid mixture) will not significantly
change the Pmax values.
Figure 6.68: Maximum explosion pressure and rate of pressure rise of a mixtures of methane and lycopodium in dependence on the lycopodium concentration.
Using brown coal as dust did not significantly change the explosion behavior as presented in
Figure 6.69. The (dP/dt) max increased as the concentration of the gas increases. Moreover, there
were no significant changes in the Pmax values. Similar explosion behavior was observed when
hydrogen was added to both lycopodium and brown coal as presented in Table 6.22 and Figures
B.1 and B.2 at Appendix B. It must also be mentioned that the peak value of Pmax and (dP/dt) max
generally shift to the lean dust concentrations with flammable gas admixture.
0
200
400
600
800
1000
1200
0
1
2
3
4
5
6
7
8
9
30 60 100 125 250 500 750 1000 1250
dP
/dt
(bar
/s)
Pm
(b
ar)
Lycopodium concentration (g/m3)
Pm at 1 vol% methane Pm at 2 vol% methanePm at 3 vol% methane Pm at 4 vol% methanepm, only lycopodium dP/dt at 1 vol% methanedP/dt at 2 vol% methane dP/dt at 3 vol% methanedP/dt at 4 vol% methane dp/dt, only lycopodium
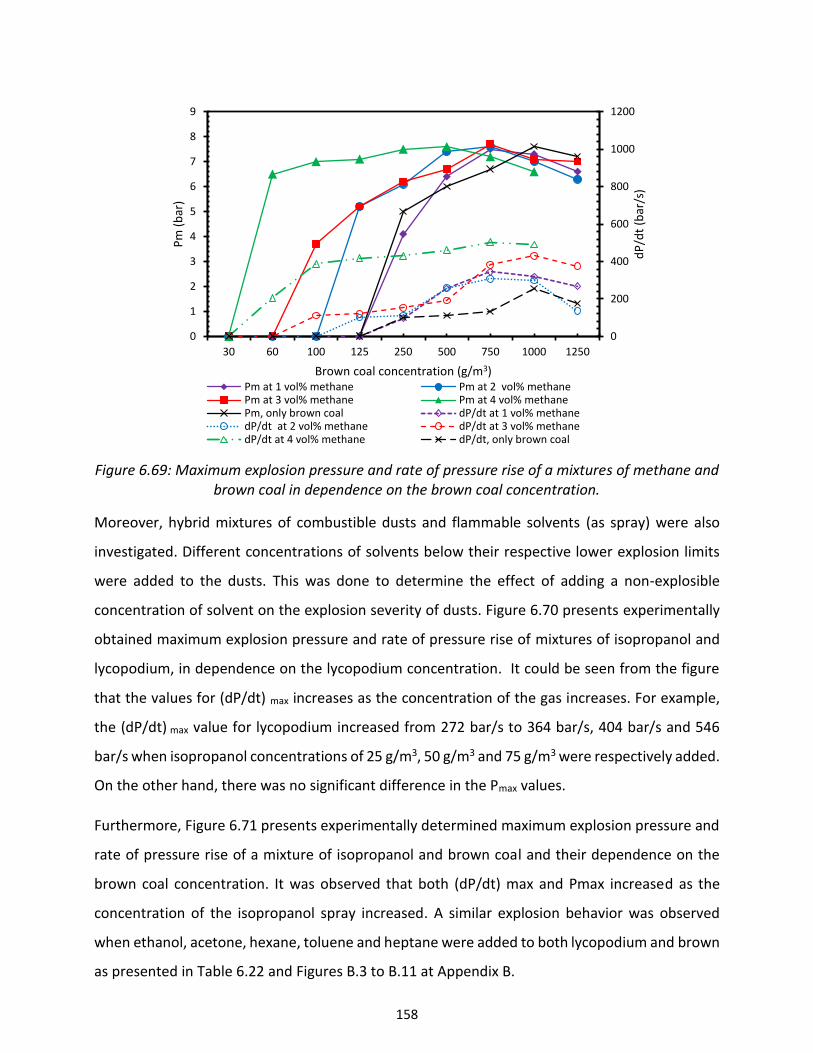
158
Figure 6.69: Maximum explosion pressure and rate of pressure rise of a mixtures of methane and brown coal in dependence on the brown coal concentration.
Moreover, hybrid mixtures of combustible dusts and flammable solvents (as spray) were also
investigated. Different concentrations of solvents below their respective lower explosion limits
were added to the dusts. This was done to determine the effect of adding a non-explosible
concentration of solvent on the explosion severity of dusts. Figure 6.70 presents experimentally
obtained maximum explosion pressure and rate of pressure rise of mixtures of isopropanol and
lycopodium, in dependence on the lycopodium concentration. It could be seen from the figure
that the values for (dP/dt) max increases as the concentration of the gas increases. For example,
the (dP/dt) max value for lycopodium increased from 272 bar/s to 364 bar/s, 404 bar/s and 546
bar/s when isopropanol concentrations of 25 g/m3, 50 g/m3 and 75 g/m3 were respectively added.
On the other hand, there was no significant difference in the Pmax values.
Furthermore, Figure 6.71 presents experimentally determined maximum explosion pressure and
rate of pressure rise of a mixture of isopropanol and brown coal and their dependence on the
brown coal concentration. It was observed that both (dP/dt) max and Pmax increased as the
concentration of the isopropanol spray increased. A similar explosion behavior was observed
when ethanol, acetone, hexane, toluene and heptane were added to both lycopodium and brown
as presented in Table 6.22 and Figures B.3 to B.11 at Appendix B.
0
200
400
600
800
1000
1200
0
1
2
3
4
5
6
7
8
9
30 60 100 125 250 500 750 1000 1250
dP
/dt
(bar
/s)
Pm
(b
ar)
Brown coal concentration (g/m3)Pm at 1 vol% methane Pm at 2 vol% methanePm at 3 vol% methane Pm at 4 vol% methanePm, only brown coal dP/dt at 1 vol% methanedP/dt at 2 vol% methane dP/dt at 3 vol% methanedP/dt at 4 vol% methane dP/dt, only brown coal

159
Figure 6.70: Maximum explosion pressure and rate of pressure rise of a mixtures of isopropanol and lycopodium in dependence on the lycopodium concentration.
Figure 6.71: Maximum explosion pressure and rate of pressure rise of a mixtures of isopropanol and lycopodium in dependence on the lycopodium concentration.
0
200
400
600
800
1000
1200
0
1
2
3
4
5
6
7
8
30 60 100 125 250 500 750 1000
dP
/dt
(bar
/s)
Pm
(b
ar)
Lycopodium concentration (g/m3)
Pm at 25 (g/m^3) of isopropanol Pm at 50 (g/m^3) of isopropanol
Pm at 75 (g/m^3) of isopropanol Pm, only lycopodium
dP/dt at 25 (g/m^3) of isopropanol dP/dt at 50 (g/m^3) of isopropanol
dP/dt at 75 (g/m^3) of isopropanol dP/dt, only lycopodium
0
200
400
600
800
1000
1200
0
1
2
3
4
5
6
7
8
9
10
60 100 125 250 500 750 1000
dP
/dt
(bar
/s)
pm
(b
ar)
Brown coal concentration
Pm at 25 (g/m^3) of isopropanol Pm at 50 (g/m^3) of isopropanol
Pm at 75 (g/m^3) of isopropanol Pm, only brown coal
dP/dt at 25 (g/m^3) of isopropanol dP/dt at 50 (g/m^3) of isopropanol
dP/dt at 75 (g/m^3) of isopropanol dP/dt, only brown coal
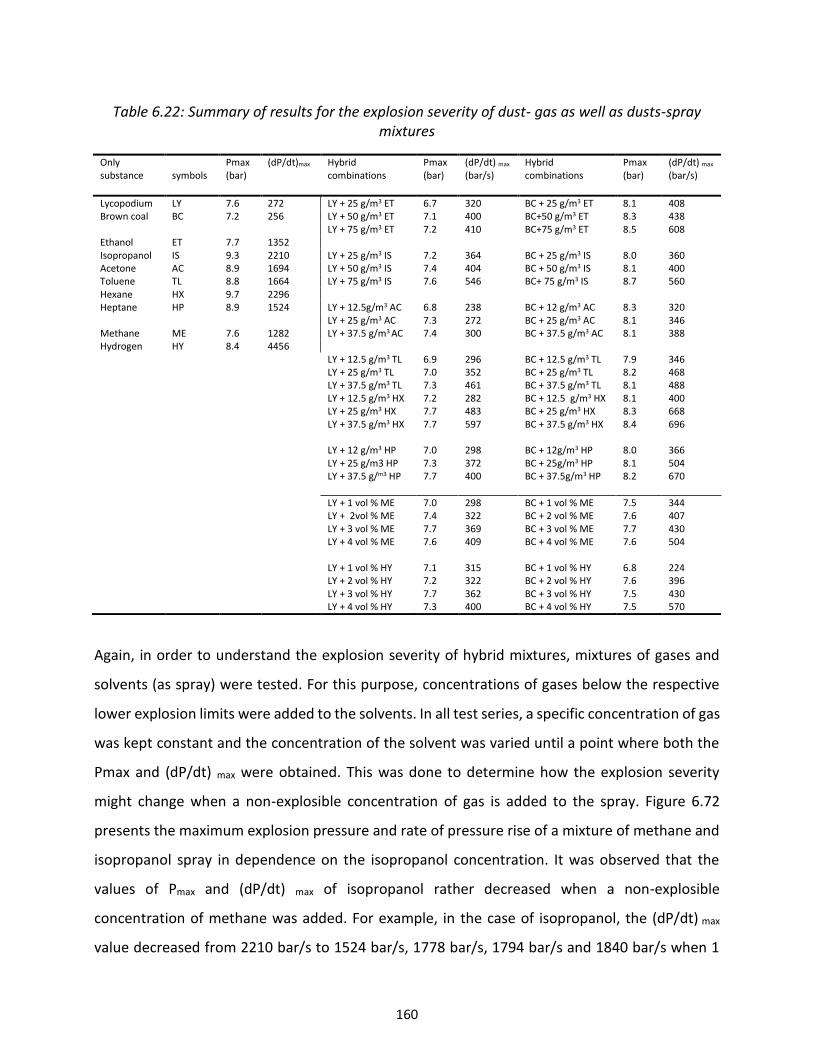
160
Table 6.22: Summary of results for the explosion severity of dust- gas as well as dusts-spray mixtures
Only substance
symbols
Pmax (bar)
(dP/dt)max Hybrid combinations
Pmax (bar)
(dP/dt) max (bar/s)
Hybrid combinations
Pmax (bar)
(dP/dt) max (bar/s)
Lycopodium LY 7.6 272 LY + 25 g/m3 ET 6.7 320 BC + 25 g/m3 ET 8.1 408 Brown coal BC 7.2 256 LY + 50 g/m3 ET 7.1 400 BC+50 g/m3 ET 8.3 438 LY + 75 g/m3 ET 7.2 410 BC+75 g/m3 ET 8.5 608 Ethanol ET 7.7 1352 Isopropanol IS 9.3 2210 LY + 25 g/m3 IS 7.2 364 BC + 25 g/m3 IS 8.0 360 Acetone AC 8.9 1694 LY + 50 g/m3 IS 7.4 404 BC + 50 g/m3 IS 8.1 400 Toluene TL 8.8 1664 LY + 75 g/m3 IS 7.6 546 BC+ 75 g/m3 IS 8.7 560 Hexane HX 9.7 2296 Heptane HP 8.9 1524 LY + 12.5g/m3 AC 6.8 238 BC + 12 g/m3 AC 8.3 320 LY + 25 g/m3 AC 7.3 272 BC + 25 g/m3 AC 8.1 346 Methane ME 7.6 1282 LY + 37.5 g/m3 AC 7.4 300 BC + 37.5 g/m3 AC 8.1 388 Hydrogen HY 8.4 4456 LY + 12.5 g/m3 TL 6.9 296 BC + 12.5 g/m3 TL 7.9 346 LY + 25 g/m3 TL 7.0 352 BC + 25 g/m3 TL 8.2 468 LY + 37.5 g/m3 TL 7.3 461 BC + 37.5 g/m3 TL 8.1 488 LY + 12.5 g/m3 HX 7.2 282 BC + 12.5 g/m3 HX 8.1 400 LY + 25 g/m3 HX 7.7 483 BC + 25 g/m3 HX 8.3 668 LY + 37.5 g/m3 HX 7.7 597 BC + 37.5 g/m3 HX 8.4 696 LY + 12 g/m3 HP 7.0 298 BC + 12g/m3 HP 8.0 366 LY + 25 g/m3 HP 7.3 372 BC + 25g/m3 HP 8.1 504 LY + 37.5 g/m3 HP 7.7 400 BC + 37.5g/m3 HP 8.2 670
LY + 1 vol % ME 7.0 298 BC + 1 vol % ME 7.5 344 LY + 2vol % ME 7.4 322 BC + 2 vol % ME 7.6 407 LY + 3 vol % ME 7.7 369 BC + 3 vol % ME 7.7 430 LY + 4 vol % ME 7.6 409 BC + 4 vol % ME 7.6 504 LY + 1 vol % HY 7.1 315 BC + 1 vol % HY 6.8 224 LY + 2 vol % HY 7.2 322 BC + 2 vol % HY 7.6 396 LY + 3 vol % HY 7.7 362 BC + 3 vol % HY 7.5 430 LY + 4 vol % HY 7.3 400 BC + 4 vol % HY 7.5 570
Again, in order to understand the explosion severity of hybrid mixtures, mixtures of gases and
solvents (as spray) were tested. For this purpose, concentrations of gases below the respective
lower explosion limits were added to the solvents. In all test series, a specific concentration of gas
was kept constant and the concentration of the solvent was varied until a point where both the
Pmax and (dP/dt) max were obtained. This was done to determine how the explosion severity
might change when a non-explosible concentration of gas is added to the spray. Figure 6.72
presents the maximum explosion pressure and rate of pressure rise of a mixture of methane and
isopropanol spray in dependence on the isopropanol concentration. It was observed that the
values of Pmax and (dP/dt) max of isopropanol rather decreased when a non-explosible
concentration of methane was added. For example, in the case of isopropanol, the (dP/dt) max
value decreased from 2210 bar/s to 1524 bar/s, 1778 bar/s, 1794 bar/s and 1840 bar/s when 1
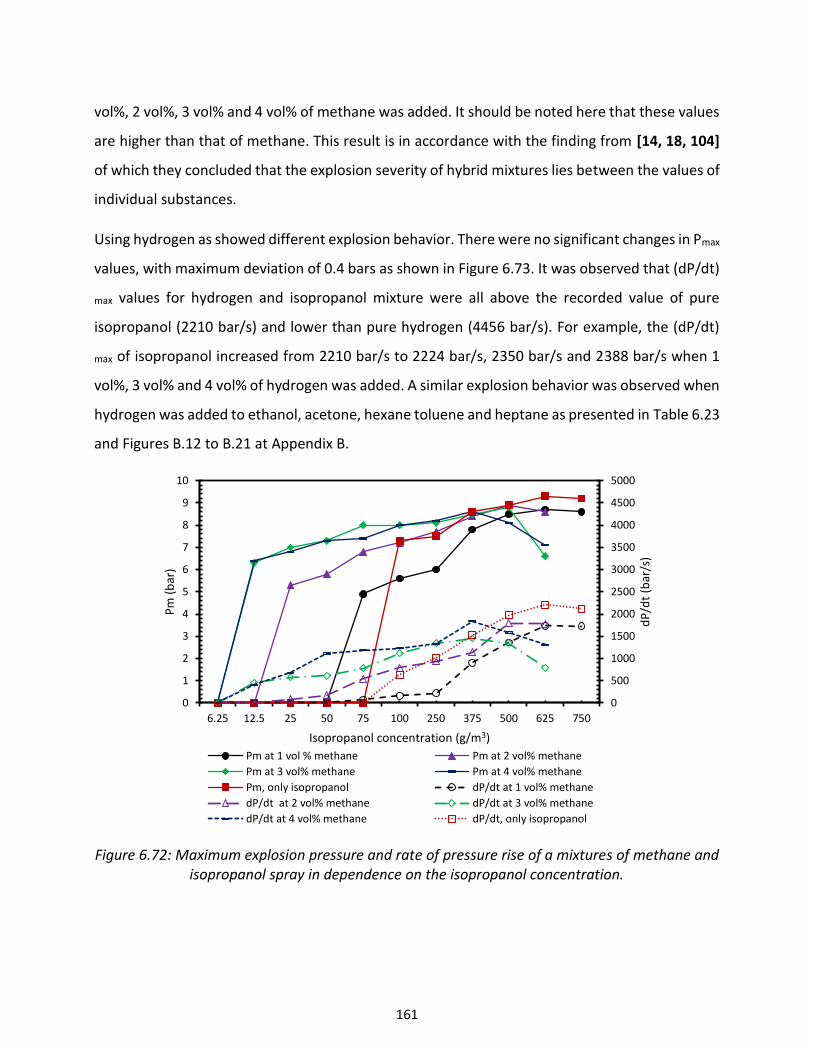
161
vol%, 2 vol%, 3 vol% and 4 vol% of methane was added. It should be noted here that these values
are higher than that of methane. This result is in accordance with the finding from [14, 18, 104]
of which they concluded that the explosion severity of hybrid mixtures lies between the values of
individual substances.
Using hydrogen as showed different explosion behavior. There were no significant changes in Pmax
values, with maximum deviation of 0.4 bars as shown in Figure 6.73. It was observed that (dP/dt)
max values for hydrogen and isopropanol mixture were all above the recorded value of pure
isopropanol (2210 bar/s) and lower than pure hydrogen (4456 bar/s). For example, the (dP/dt)
max of isopropanol increased from 2210 bar/s to 2224 bar/s, 2350 bar/s and 2388 bar/s when 1
vol%, 3 vol% and 4 vol% of hydrogen was added. A similar explosion behavior was observed when
hydrogen was added to ethanol, acetone, hexane toluene and heptane as presented in Table 6.23
and Figures B.12 to B.21 at Appendix B.
Figure 6.72: Maximum explosion pressure and rate of pressure rise of a mixtures of methane and isopropanol spray in dependence on the isopropanol concentration.
0
500
1000
1500
2000
2500
3000
3500
4000
4500
5000
0
1
2
3
4
5
6
7
8
9
10
6.25 12.5 25 50 75 100 250 375 500 625 750
dP
/dt
(bar
/s)
Pm
(b
ar)
Isopropanol concentration (g/m3)
Pm at 1 vol % methane Pm at 2 vol% methane
Pm at 3 vol% methane Pm at 4 vol% methane
Pm, only isopropanol dP/dt at 1 vol% methane
dP/dt at 2 vol% methane dP/dt at 3 vol% methane
dP/dt at 4 vol% methane dP/dt, only isopropanol
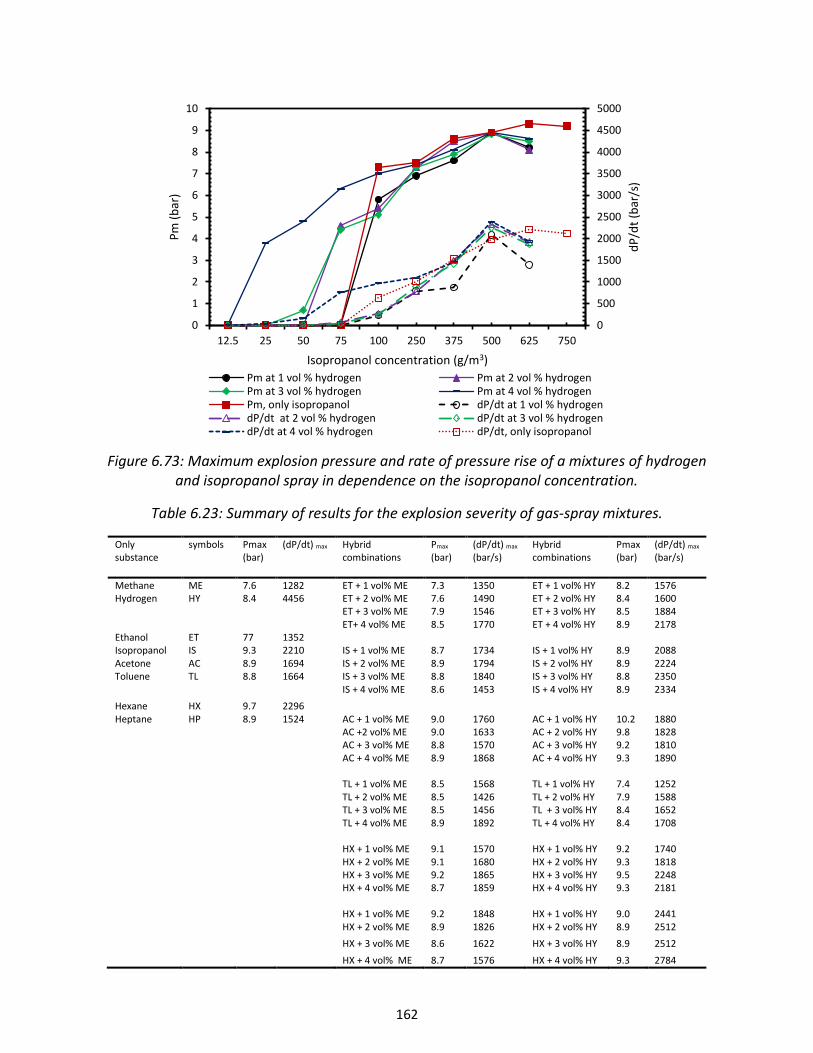
162
Figure 6.73: Maximum explosion pressure and rate of pressure rise of a mixtures of hydrogen and isopropanol spray in dependence on the isopropanol concentration.
Table 6.23: Summary of results for the explosion severity of gas-spray mixtures.
Only substance
symbols Pmax (bar)
(dP/dt) max Hybrid combinations
Pmax (bar)
(dP/dt) max (bar/s)
Hybrid combinations
Pmax (bar)
(dP/dt) max (bar/s)
Methane ME 7.6 1282 ET + 1 vol% ME 7.3 1350 ET + 1 vol% HY 8.2 1576 Hydrogen HY 8.4 4456 ET + 2 vol% ME 7.6 1490 ET + 2 vol% HY 8.4 1600 ET + 3 vol% ME 7.9 1546 ET + 3 vol% HY 8.5 1884 ET+ 4 vol% ME 8.5 1770 ET + 4 vol% HY 8.9 2178 Ethanol ET 77 1352 Isopropanol IS 9.3 2210 IS + 1 vol% ME 8.7 1734 IS + 1 vol% HY 8.9 2088 Acetone AC 8.9 1694 IS + 2 vol% ME 8.9 1794 IS + 2 vol% HY 8.9 2224 Toluene TL 8.8 1664 IS + 3 vol% ME 8.8 1840 IS + 3 vol% HY 8.8 2350 IS + 4 vol% ME 8.6 1453 IS + 4 vol% HY 8.9 2334
Hexane HX 9.7 2296 Heptane HP 8.9 1524 AC + 1 vol% ME 9.0 1760 AC + 1 vol% HY 10.2 1880 AC +2 vol% ME 9.0 1633 AC + 2 vol% HY 9.8 1828 AC + 3 vol% ME 8.8 1570 AC + 3 vol% HY 9.2 1810 AC + 4 vol% ME 8.9 1868 AC + 4 vol% HY 9.3 1890 TL + 1 vol% ME 8.5 1568 TL + 1 vol% HY 7.4 1252 TL + 2 vol% ME 8.5 1426 TL + 2 vol% HY 7.9 1588 TL + 3 vol% ME 8.5 1456 TL + 3 vol% HY 8.4 1652 TL + 4 vol% ME 8.9 1892 TL + 4 vol% HY 8.4 1708 HX + 1 vol% ME 9.1 1570 HX + 1 vol% HY 9.2 1740 HX + 2 vol% ME 9.1 1680 HX + 2 vol% HY 9.3 1818 HX + 3 vol% ME 9.2 1865 HX + 3 vol% HY 9.5 2248 HX + 4 vol% ME 8.7 1859 HX + 4 vol% HY 9.3 2181 HX + 1 vol% ME 9.2 1848 HX + 1 vol% HY 9.0 2441 HX + 2 vol% ME 8.9 1826 HX + 2 vol% HY 8.9 2512
HX + 3 vol% ME 8.6 1622 HX + 3 vol% HY 8.9 2512
HX + 4 vol% ME 8.7 1576 HX + 4 vol% HY 9.3 2784
0
500
1000
1500
2000
2500
3000
3500
4000
4500
5000
0
1
2
3
4
5
6
7
8
9
10
12.5 25 50 75 100 250 375 500 625 750
dP
/dt
(bar
/s)
Pm
(b
ar)
Isopropanol concentration (g/m3)
Pm at 1 vol % hydrogen Pm at 2 vol % hydrogenPm at 3 vol % hydrogen Pm at 4 vol % hydrogenPm, only isopropanol dP/dt at 1 vol % hydrogendP/dt at 2 vol % hydrogen dP/dt at 3 vol % hydrogendP/dt at 4 vol % hydrogen dP/dt, only isopropanol

163
Explosion severity for three-phase hybrid mixtures
Based on the results obtained from single and two-phase mixtures, both the maximum explosion
pressure and the rate of pressure rise of three-phase hybrid mixtures were investigated. During
the course of these experiments, the concentrations of gas and solvent were kept constant and
the concentration of the dust was varied until a point, where both the Pmax and (dP/dt)max were
obtained.
Figure 6.74: Maximum explosion pressure and rate of pressure rise of mixtures of lycopodium, methane and 50 g/m3 of isopropanol spray in dependence on lycopodium concentration.
Figure 6.74 presents experimentally obtained results for the maximum explosion pressure and
rate of pressure rise for the mixtures of lycopodium, methane and 50 g/m3 of isopropanol spray
and their dependence on lycopodium concentration. It was observed that both Pmax and
(dP/dt)max of lycopodium significantly increased when non-explosible concentrations of methane
and isopropanol spray were added. For instance, the (dP/dt) max of lycopodium with a value of 272
bar/s increased to 322 bar/s, 369 bar/s, 410 bar/s and 504 bar/s when methane concentrations
of 1 vol%, 2 vol%, 3 vol% and 4 vol% were respectively added. These values of (dP/dt) max were
0
200
400
600
800
1000
1200
1400
1600
0
2
4
6
8
10
5 10 20 30 60 125 250 375 500 750 1000
dP
/dt
(bar
/s)
Pm
(b
ar)
Lycopodium concentration (g/m3)
Pm at 50 g/m^3 isopropanol + 1 vol% methane Pm at 50 g/m^3 isopropanol + 2 vol% methane
Pm at 50 g/m^3 isopropanol + 3 vol% methane Pm at 50 g/m^3 isopropanol + 4 vol% methane
Pm, only lycopodium dP/dt at 50 g/m^3 isopropanol + 1 vol% methane
dP/dt at 50 g/m^3 isopropanol + 2 vol% methane dP/dt at 50 g/m^3 isopropanol + 3 vol% methane
dP/dt at 50 g/m^3 isopropanol + 4 vol% methane dP/dt, only lycopodium
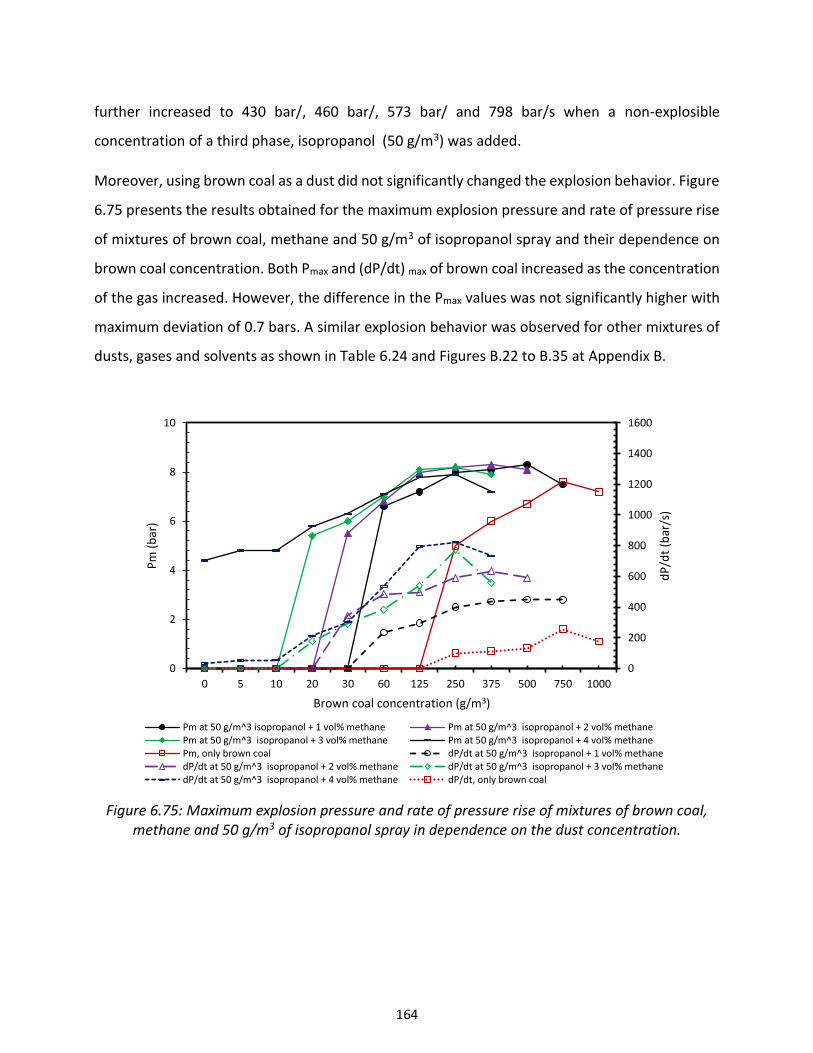
164
further increased to 430 bar/, 460 bar/, 573 bar/ and 798 bar/s when a non-explosible
concentration of a third phase, isopropanol (50 g/m3) was added.
Moreover, using brown coal as a dust did not significantly changed the explosion behavior. Figure
6.75 presents the results obtained for the maximum explosion pressure and rate of pressure rise
of mixtures of brown coal, methane and 50 g/m3 of isopropanol spray and their dependence on
brown coal concentration. Both Pmax and (dP/dt) max of brown coal increased as the concentration
of the gas increased. However, the difference in the Pmax values was not significantly higher with
maximum deviation of 0.7 bars. A similar explosion behavior was observed for other mixtures of
dusts, gases and solvents as shown in Table 6.24 and Figures B.22 to B.35 at Appendix B.
Figure 6.75: Maximum explosion pressure and rate of pressure rise of mixtures of brown coal, methane and 50 g/m3 of isopropanol spray in dependence on the dust concentration.
0
200
400
600
800
1000
1200
1400
1600
0
2
4
6
8
10
0 5 10 20 30 60 125 250 375 500 750 1000
dP
/dt
(bar
/s)
Pm
(b
ar)
Brown coal concentration (g/m3)
Pm at 50 g/m^3 isopropanol + 1 vol% methane Pm at 50 g/m^3 isopropanol + 2 vol% methanePm at 50 g/m^3 isopropanol + 3 vol% methane Pm at 50 g/m^3 isopropanol + 4 vol% methanePm, only brown coal dP/dt at 50 g/m^3 isopropanol + 1 vol% methanedP/dt at 50 g/m^3 isopropanol + 2 vol% methane dP/dt at 50 g/m^3 isopropanol + 3 vol% methanedP/dt at 50 g/m^3 isopropanol + 4 vol% methane dP/dt, only brown coal
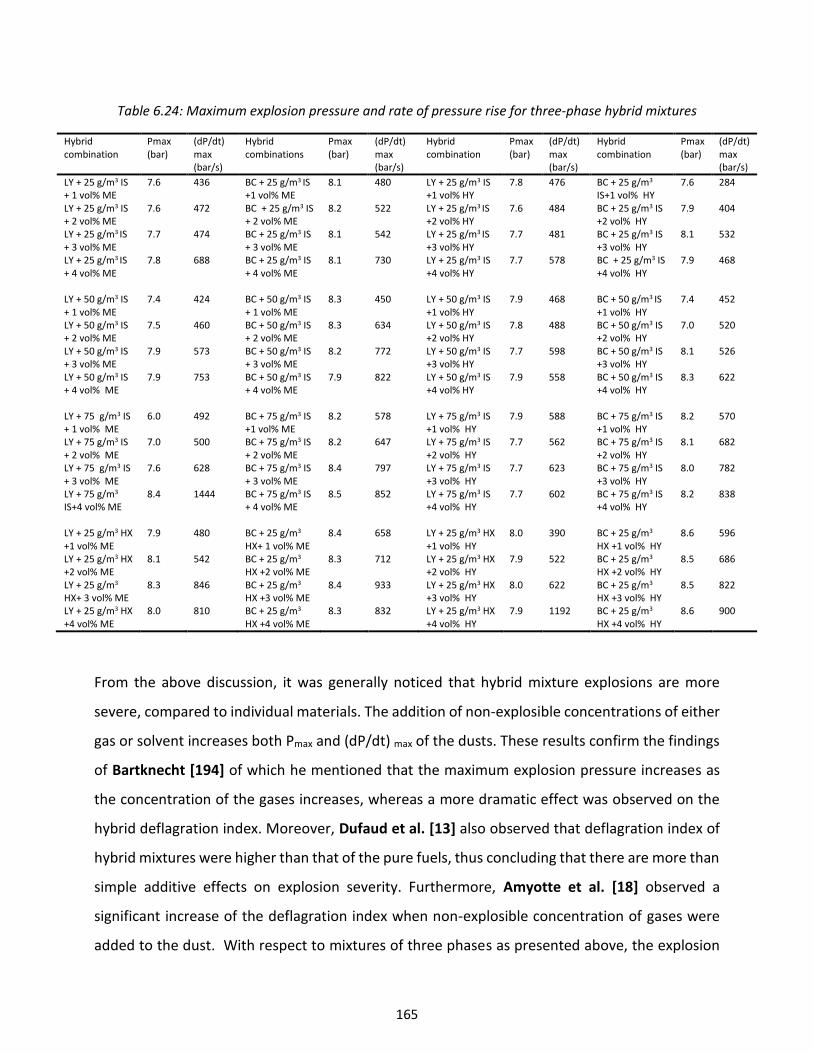
165
Table 6.24: Maximum explosion pressure and rate of pressure rise for three-phase hybrid mixtures
Hybrid combination
Pmax (bar)
(dP/dt) max (bar/s)
Hybrid combinations
Pmax (bar)
(dP/dt) max (bar/s)
Hybrid combination
Pmax (bar)
(dP/dt) max (bar/s)
Hybrid combination
Pmax (bar)
(dP/dt) max (bar/s)
LY + 25 g/m3 IS + 1 vol% ME
7.6 436 BC + 25 g/m3 IS +1 vol% ME
8.1 480 LY + 25 g/m3 IS +1 vol% HY
7.8 476 BC + 25 g/m3
IS+1 vol% HY 7.6 284
LY + 25 g/m3 IS + 2 vol% ME
7.6 472 BC + 25 g/m3 IS + 2 vol% ME
8.2 522 LY + 25 g/m3 IS +2 vol% HY
7.6 484 BC + 25 g/m3 IS +2 vol% HY
7.9 404
LY + 25 g/m3 IS + 3 vol% ME
7.7 474 BC + 25 g/m3 IS + 3 vol% ME
8.1 542 LY + 25 g/m3 IS +3 vol% HY
7.7 481 BC + 25 g/m3 IS +3 vol% HY
8.1 532
LY + 25 g/m3 IS + 4 vol% ME
7.8 688 BC + 25 g/m3 IS + 4 vol% ME
8.1 730 LY + 25 g/m3 IS +4 vol% HY
7.7 578 BC + 25 g/m3 IS +4 vol% HY
7.9 468
LY + 50 g/m3 IS + 1 vol% ME
7.4 424 BC + 50 g/m3 IS + 1 vol% ME
8.3 450 LY + 50 g/m3 IS +1 vol% HY
7.9 468 BC + 50 g/m3 IS +1 vol% HY
7.4 452
LY + 50 g/m3 IS + 2 vol% ME
7.5 460 BC + 50 g/m3 IS + 2 vol% ME
8.3 634 LY + 50 g/m3 IS +2 vol% HY
7.8 488 BC + 50 g/m3 IS +2 vol% HY
7.0 520
LY + 50 g/m3 IS + 3 vol% ME
7.9 573 BC + 50 g/m3 IS + 3 vol% ME
8.2 772 LY + 50 g/m3 IS +3 vol% HY
7.7 598 BC + 50 g/m3 IS +3 vol% HY
8.1 526
LY + 50 g/m3 IS + 4 vol% ME
7.9 753 BC + 50 g/m3 IS + 4 vol% ME
7.9 822 LY + 50 g/m3 IS +4 vol% HY
7.9 558 BC + 50 g/m3 IS +4 vol% HY
8.3 622
LY + 75 g/m3 IS + 1 vol% ME
6.0 492 BC + 75 g/m3 IS +1 vol% ME
8.2 578 LY + 75 g/m3 IS +1 vol% HY
7.9 588 BC + 75 g/m3 IS +1 vol% HY
8.2 570
LY + 75 g/m3 IS + 2 vol% ME
7.0 500 BC + 75 g/m3 IS + 2 vol% ME
8.2 647 LY + 75 g/m3 IS +2 vol% HY
7.7 562 BC + 75 g/m3 IS +2 vol% HY
8.1 682
LY + 75 g/m3 IS + 3 vol% ME
7.6 628 BC + 75 g/m3 IS + 3 vol% ME
8.4 797 LY + 75 g/m3 IS +3 vol% HY
7.7 623 BC + 75 g/m3 IS +3 vol% HY
8.0 782
LY + 75 g/m3 IS+4 vol% ME
8.4 1444 BC + 75 g/m3 IS + 4 vol% ME
8.5 852 LY + 75 g/m3 IS +4 vol% HY
7.7 602 BC + 75 g/m3 IS +4 vol% HY
8.2 838
LY + 25 g/m3 HX +1 vol% ME
7.9 480 BC + 25 g/m3
HX+ 1 vol% ME 8.4 658 LY + 25 g/m3 HX
+1 vol% HY 8.0 390 BC + 25 g/m3
HX +1 vol% HY 8.6 596
LY + 25 g/m3 HX +2 vol% ME
8.1 542 BC + 25 g/m3
HX +2 vol% ME 8.3 712 LY + 25 g/m3 HX
+2 vol% HY 7.9 522 BC + 25 g/m3
HX +2 vol% HY 8.5 686
LY + 25 g/m3 HX+ 3 vol% ME
8.3 846 BC + 25 g/m3 HX +3 vol% ME
8.4 933 LY + 25 g/m3 HX +3 vol% HY
8.0 622 BC + 25 g/m3 HX +3 vol% HY
8.5 822
LY + 25 g/m3 HX +4 vol% ME
8.0 810 BC + 25 g/m3 HX +4 vol% ME
8.3 832 LY + 25 g/m3 HX +4 vol% HY
7.9 1192 BC + 25 g/m3 HX +4 vol% HY
8.6 900
From the above discussion, it was generally noticed that hybrid mixture explosions are more
severe, compared to individual materials. The addition of non-explosible concentrations of either
gas or solvent increases both Pmax and (dP/dt) max of the dusts. These results confirm the findings
of Bartknecht [194] of which he mentioned that the maximum explosion pressure increases as
the concentration of the gases increases, whereas a more dramatic effect was observed on the
hybrid deflagration index. Moreover, Dufaud et al. [13] also observed that deflagration index of
hybrid mixtures were higher than that of the pure fuels, thus concluding that there are more than
simple additive effects on explosion severity. Furthermore, Amyotte et al. [18] observed a
significant increase of the deflagration index when non-explosible concentration of gases were
added to the dust. With respect to mixtures of three phases as presented above, the explosion

166
becomes more severe compared to single substance or two phases. Hence, based on the present
research as well as the finding from the literature, it can be concluded that the effect of the
explosion severity of hybrid mixture cannot be predicted by simply overlapping the explosion
behavior of individual materials.
167
Chapter Seven
7 Conclusion and Recommendations
7.1 Conclusion
Hybrid mixture explosions involving materials of different state of aggregation continue to occur
in industries that either handle or process combustible dusts, gases and solvents. In order to
prevent or to mitigate the hazards associated with these mixtures, various explosion parameters
of these mixtures need to be known. As a result of this, a comprehensive study on the explosion
characteristics of these mixtures has been carried out. This was done by performing an
experimental and theoretical investigation on different explosion properties such as: minimum
ignition temperature, minimum ignition energy, limiting oxygen concentration, lower explosion
limit, minimum explosible concentration and maximum explosion pressure as well as maximum
rate of pressure rise. Different combinations of twenty combustible dusts, three gases and six
solvent mixtures were investigated. Based on the findings from this research study, the following
conclusion could be made:
Lower explosion limits
The lower explosion limits of single dusts, gases, as well as two-phase and three-phase
hybrid mixtures were investigated. Experiments were performed in two different
laboratory equipments i.e. the standard 20-liter sphere and the Godbert-Greenwald (GG)
168
furnace with six different solvents, three gases and six dusts. The experimental results
demonstrated a significant enhancement in the possibility of an explosion by solvent, gas
or spray admixture with dust and vice versa. These also confirmed that a hybrid mixture
explosion is possible even when the concentrations of both components are lower than
their minimum explosion concentration or lower explosion limit. Furthermore, three
different mathematical models to predict the lower explosion limits of dusts, gases and
hybrid mixtures were presented. Comparisons between these models and the
experimental results were done. With respect to dusts, it was noticed that all the models
results were far below the experimental results which seems to be good, from a safety
point of view. Moreover, the calculated results from the gas models were in good
agreement with experimental results with a maximum deviation of 0.4 vol%. With respect
to hybrid mixtures, the calculated results from Le Chatelier's, Mannan et al. and the
Bartknecht models were below compared with the experimental values. The results of
these comparisons showed that the suggested relations to predict the lower explosion
limit are not reliable for some mixtures. The dependency on the specific material is
obvious and leads to the conclusion that a simplified formula based on the lower explosion
limits of pure substances might not be sufficiently safe. In this case more knowledge on
the reaction mechanism is necessary to better understand and predict the behavior.
Moreover, a ternary phase diagram proposed in this thesis could help to distinguish
between ignition and non-ignition regions when dealing with three-phase mixtures.
Limiting oxygen concentration
An investigation into the limiting oxygen concentration of fifteen combustible dusts, one
gas, two solvents and their mixtures in the standard 20-liter explosion chamber has been
undertaken. Three different ignition energies (10 J, 2 kJ and 10 kJ) were used as ignition
sources. The results show that an electrical igniter providing approximately 10 J of energy
led to significantly higher limiting oxygen concentration values than pyrotechnical igniters
of either 2 kJ or 10 kJ. This could be due to the fact that the chemical igniters possibly
“overdrive” the explosion by producing a hot flame which covers the entire explosion
chamber during combustion. Ignition energy of 2 kJ being used for the 20-liter sphere,
169
according to European standard EN 14034-4 would be in good agreement with the ASTM
standard E2931-13, which recommends chemical igniters of 2.5 kJ energy. Moreover, with
respect to hybrid mixtures investigation, the 20-liter sphere was modified to allow an
input of gases, vapors and sprays. The limiting oxygen concentration of the hybrid
mixtures were significantly lower than that of dust-air mixtures, when the “weak”
electrical igniter was used. However, by using chemical igniters, no significant change in
the limiting oxygen concentration could be observed. Furthermore, mathematical models
to estimate the limiting oxygen concentration of dusts, gases and hybrid mixtures were
presented. A comparison between these models and the experimental results were also
achieved. Based on the calculations from this model for the limiting oxygen concentration
of dusts and hybrid mixtures, a simple diagram was presented which allows to directly
estimate the limiting oxygen concentration from properties which are comparatively easy
to determine, namely the elemental analysis of the dust and the heat of combustion. A
good agreement between the models and the experimental results were observed for all
combinations, with the exception of 10 kJ chemical igniter where some deviations were
recorded, but these deviations were all within the safety margins.
Minimum ignition energy
Investigation of the minimum ignition energy of a hybrid mixture of two flammable gases
(methane and propane) and eight combustible dusts (wheat flour, starch, protein,
polyethylene, peat, dextrin, wood coal and brown coal) were carried out in the modified
Hartmann apparatus. The device used was limited to a lowest ignition energy of 4 mJ.
Thus, the minimum ignition energy of pure gases could not be tested directly, as their
values are all below 4 mJ. Hence these values (minimum ignition energy of gases) were
taken from the literature. The effect of adding non-explosible concentration of gas on the
minimum ignition energy of dust was the prime focus of this study. The experimental
results demonstrated a significant decrease of the minimum ignition energy of the dusts
and increase in the likelihood of explosion when a small amount of gas that was below its
lower explosion limit was mixed with the dust, thereby boosting the ignition sensitivity of
the dust. For example, the minimum ignition energy of polypropylene was observed to

170
decrease from 116 mJ to 5 mJ when only 1 vol % of propane (below its lower explosion
limit) was added. Moreover, an empirical model to predict the minimum ignition energy
of hybrid mixtures was presented and further comparison with the experimental results
was done. A good agreement between the model and the experimental results were
observed. Finally, it could be mentioned that the ignition sensitivity of hybrid mixtures
cannot be predicted by simply overlapping the effects of the single substance.
Minimum ignition temperature
Investigation of the minimum ignition temperature of dust, vapor or gas and their hybrid
mixtures was studied using the Godbert-Greenwald furnace. Six combustible dusts, three
gases and four solvent-vapors were used. These experimental results affirmed that
addition of gas or vapor and dust have an influence on minimum ignition temperature of
hybrid mixtures, even though the added concentrations are below their respective lower
explosion limits. The addition of combustible gases can be seen as a replacement for
volatiles released from the dust during pyrolysis and hence significantly affects the
minimum ignition temperature of hybrid mixtures. Based on these findings, it could be
deduced that the minimum ignition temperature of hybrid mixture explosions cannot be
predicted by simply overlapping the effects of the single substance explosion. Moreover,
three existing mathematical models to predict the minimum ignition temperature of dusts
were discussed. A comparison between these models and the experimental results was
done, which showed a good agreement with each other within the experimental
uncertainties. Finally, a mathematical model to estimate the minimum ignition
temperature of hybrid mixtures was proposed and compared with the experimental
results. It was also noticed that the newly proposed model was in good agreement with
the experimental results from a safety point of view as well as within the experimental
uncertainties, with an exception of CN4, for which some deviations were noticed. These
deviations for CN4 were attributed to the high ignition temperature in comparison to the
gases.
171
Explosion severity
The maximum explosion pressure (Pmax) and rate of pressure rise (dP/dt) max of dusts
(lycopodium and brown coal), solvents (ethanol, isopropanol, toluene, acetone, hexane
and heptane), gases (methane and hydrogen) as well as two and three-phase hybrid
mixtures were investigated. Experiments were performed in the standard 20-liter sphere
with 10 J electrical igniter as ignition source as well as 60 ms as ignition delay time. It was
generally noticed that the explosion severity of a hybrid mixture of dust and gas/spray was
higher than that of dust but lower than either gas or solvent. The addition of a flammable
gas/vapor to a dust-air mixture increases the maximum explosion pressure to some extent
and significantly increases the maximum rate of pressure rise of the dust mixture, even
though the concentration of the flammable gas/vapor is below its lower explosion limit.
For instance, lycopodium with a maximum rate of pressure rise value of 272 bar/s
increased to 322 bar/s, 369 bar/s, 410 bar/s and 504 bar/s when methane concentration
of 1 vol%, 2 vol%, 3 vol% and 4 vol% was respectively added. These values of maximum
rate of pressure rise further increased to 430 bar/s, 460 bar/s, 573 bar/s and 798 bar/s
when a non-explosible concentration of a third phase, isopropanol (50 % lower than the
lower explosion limit) was added. The explosion severity of hydrogen was found to be
more pronounced than methane. This was attributed to the higher burning velocity and
higher heat of combustion of hydrogen compared to methane.
In summary, the findings from this study have demonstrated a significant decrease in the
minimum ignition temperature, minimum ignition energy and limiting oxygen concentration of
gas, solvent or dust and increase in the possibility of explosion when a small amount of dust,
which was either below the minimum explosion concentration or not ignitable by itself, was
mixed with gas and vice versa. Moreover, it was generally observed that the addition of a non-
explosible concentration of flammable gas or spray to a dust-air mixture increases the maximum
explosion pressure to some extent and significantly increases the maximum rate of pressure rise
of the dust mixture, even though the added concentrations of gases or vapor are below its lower
explosion limit. It could finally be concluded that, one cannot rely on the explosion properties of
172
a single substance to ensure the safety of a process or system when substances with different
states of aggregate are present.
7.2 Recommendations
In view of the above conclusions, some future studies are suggested to examine the implications
of the findings presented in this thesis and improve the understanding of hybrid mixtures
explosion.
1. Development of a standard method for the determination of the explosion properties of
hybrid mixtures. A general acceptable procedure will help the comparison of results from
another laboratory.
2. Development of a standard method to measure the minimum ignition energy of hybrid
mixtures. This new method should allow for the generation of lower ignition energies. The
equipment used for the present thesis was limited to 4 mJ, as a result of this, mixtures
with lower ignition energies were not studied
3. Injection of spray into the combustion chamber should be improved. For example, the
activation of the nozzle could be done automatically instead of manual method, to avoid
human error
4. Mathematical models based on physiochemical and thermodynamic properties of hybrid
mixture should be developed to predict the explosion behavior of hybrid mixtures
5. Undertake an extensive study on the mechanism of hybrid mixture explosion
6. Based on the developed models, the explosion properties of hybrid mixtures could be
simulated and compared with the experimental results.
7. More studies should be done on the influence of properties such as particle size, initial
temperature, initial turbulence and moisture contents on the ignition sensitivity and
severity of hybrid mixtures.
8. Influence of flammable solvent on the explosion behavior of dust (pre-wetted).
173
References
1. Mannan, S., Lees' Process Safety Essentials: Hazard Identification, Assessment and Control.
2013: Butterworth-Heinemann.
2. Khan, F.I. and S. Abbasi, Major accidents in process industries and an analysis of causes
and consequences. Journal of Loss Prevention in the process Industries, 1999. 12(5): p.
361-378.
3. CSB, Investigation Report: Combustible Dust Hazard Study. Report No. 2006H1, U.S.
Chemical Safety and Hazard Investigation Board, ashington, USA. 2006.
4. Goff, C., The Westray Mine disaster: Media coverage of a corporate crime in Canada.
Contemporary issues in crime and criminal justice: Essays in honor of Gilbert Geis, 2001:
p. 191-212.
5. OSHA, E., EPA/OSHA Joint Chemical Accident Investigation Report, BPS, Inc., West Helena,
Arkansas. EPA 550-R-99-003. 1999.
6. Masson, F. Explosion d'un silo de céréales à Blaye (33): Rapport de synthèse. in Risque et
génie civil. Colloque. 2000.
7. Mann, J.A., Upper Big Branch Mine--South Mine ID: Public Briefing, June 29, 2011. 2012:
DIANE Publishing.
8. CSB, Case study, Final Report on AL Solutions Metal Dust Explosion and Fire that Killed
Three in West Virginia Leads CSB to Reemphasize Call for OSHA Combustible Dust
Standard, DC: U.S. Chemical Safety and Hazard Investigation Board. 2014.
174
9. Aksoğan, P., D. Bayram, and I. Çiftçi, Soma Coal Mine Disaster Information Report. 2014,
Amsterdam: Greenpeace.(h ttp://priceofoil. org/content/uploads/2014/06/Soma-Coal-
Mine-Disaster-Report-GPMED. pdf).
10. Pilão, R., E. Ramalho, and C. Pinho, Explosibility of cork dust in methane/air mixtures.
Journal of loss prevention in the process industries, 2006. 19(1): p. 17-23.
11. Denkevits, A., Explosibility of hydrogen–graphite dust hybrid mixtures. Journal of Loss
Prevention in the Process Industries, 2007. 20(4): p. 698-707.
12. Denkevits, A. and B. Hoess, Hybrid H 2/Al dust explosions in Siwek sphere. Journal of Loss
Prevention in the Process Industries, 2015. 36: p. 509-521.
13. Dufaud, O., L. Perrin, and M. Traore, Dust/vapour explosions: Hybrid behaviours? Journal
of Loss Prevention in the Process Industries, 2008. 21(4): p. 481-484.
14. Dufaud, O., et al., Explosions of vapour/dust hybrid mixtures: a particular class. Powder
Technology, 2009. 190(1): p. 269-273.
15. Considine, M. and G. Suter, The 12th international symposium on loss prevention and
safety promotion in the process industries translating knowledge into practice. Process
Safety and Environmental Protection, 2009. 87(1): p. 1.
16. Chatrathi, K., Dust and hybrid explosibility in a 1 m3 spherical chamber. Process Safety
Progress, 1994. 13(4): p. 183-189.
17. Sanchirico, R., et al., Study of the severity of hybrid mixture explosions and comparison to
pure dust–air and vapour–air explosions. Journal of Loss Prevention in the Process
Industries, 2011. 24(5): p. 648-655.
18. Amyotte, P., et al. Determination of hybrid mixture explosion severity. in 13th International
Symposium on Loss Prevention and Safety Promotion in the Process Industries, Brugge,
Belgium. 2010.
19. Amyotte, P., et al., Prevention and mitigation of dust and hybrid mixture explosions.
Process Safety Progress, 2010. 29(1): p. 17-21.
20. Garcia-Agreda, A., et al., Dust/gas mixtures explosion regimes. Powder Technology, 2011.
205(1): p. 81-86.
21. Khalili, I., et al., Ignition sensitivity of gas–vapor/dust hybrid mixtures. Powder technology,
2012. 217: p. 199-206.
175
22. Eckhoff, R., Dust explosions in the process industries: identification, assessment and
control of dust hazards. 2003: Gulf professional publishing.
23. Crowl, D.A., Understanding explosions. Vol. 16. 2010: John Wiley & Sons.
24. Bjerketvedt, D., J.R. Bakke, and K. Van Wingerden, Gas explosion handbook. Journal of
hazardous materials, 1997. 52(1): p. 1-150.
25. Oran, E.S. and F.A. Williams, The physics, chemistry and dynamics of explosions.
Philosophical Transactions of the Royal Society of London A: Mathematical, Physical and
Engineering Sciences, 2012. 370(1960): p. 534-543.
26. Zabetakis, M.G., Flammability characteristics of combustible gases and vapors. 1965, DTIC
Document.
27. Harris, R.J., The investigation and control of gas explosions in buildings and heating plant.
1983: E. & FN Spon in association with the British Gas Corp.
28. Harris, R., M. Marshall, and D. Moppett. The response of glass windows to explosion
pressures. in British Gas Corporation. I. Chem. E. Symposium Serious. 1977.
29. Di Sarli, V., A. Di Benedettob, and G. Russob, The Role of the Combustion Submodel for
Large Eddy Simulation of Transient Premixed Flame-Vortex Interactions in Gas Explosions.
CHEMICAL ENGINEERING, 2012. 26.
30. Maremonti, M., et al., Post-accident analysis of vapour cloud explosions in fuel storage
areas. Process safety and environmental protection, 1999. 77(6): p. 360-365.
31. Arizal, Development of Methodology for Treating Pressure Waves from Explosions
Accounting for Modeling and Data Uncertainties. 2012, Universitätsbibliothek.
32. Kumar, A., Guidelines for evaluating the characteristics of vapor cloud explosions, flash
fires, and bleves. Center for Chemical Process Safety (CCPS) of the AIChE, Published by the
American Institute of Chemical Engineers, New York, NY (1994), 387 pages,[ISBN: 0-8169-
0474-X]. Environmental Progress, 1996. 15(1).
33. Shao, H., et al., Analysis of vacuum chamber suppressing gas explosion. International
Journal of Mining Science and Technology, 2013. 23(5): p. 653-657.
34. Crowl, D.A. and J.F. Louvar, Chemical process safety: fundamentals with applications.
2001: Pearson Education.
176
35. Johnson, D. and M. Vasey. The prevention and mitigation of gas explosions. in SPE Health,
Safety and Environment in Oil and Gas Exploration and Production Conference. 1996.
Society of Petroleum Engineers.
36. ASTM, Standard E 1620: standard terminology relating to liquid particles and atomization.
Annual book of ASTM standards, 2004.
37. Schick, R., Spray technology reference guide: understanding drop size. Spraying Systems
Co. Bulletin, 2008(459C).
38. Zehr, J., Eigenschaften brennbarer Staube und Nebel in Luft. Chapter in "Handbuch der
Raumexplosionert\ edited by H.H. Freytag, Verlag Chenfie GmbH, Weinheim 1965: p. 164-
186.
39. Williams, A., Combustion of liquid fuel sprays. 2013: Butterworth-Heinemann.
40. Förster, H., Eigenschaften brennbarer Nebel und Schäume. Chapter in Steen 2000.
41. Gant, S., et al., Generation of flammable mists from high flashpoint fluids: literature
review. Health and Safety Executive, Research Report RR980, 2013.
42. Burgoyne, J. and L. Cohen. The effect of drop size on flame propagation in liquid aerosols.
in Proceedings of the Royal Society of London A: Mathematical, Physical and Engineering
Sciences. 1954. The Royal Society.
43. Faeth, G.M. and D.R. Olson, The ignition of hydrocarbon fuel droplets in air. 1968, SAE
Technical Paper.
44. Ballal, D. and A. Lefebvre. Ignition and flame quenching of quiescent fuel mists. in
Proceedings of the Royal Society of London A: Mathematical, Physical and Engineering
Sciences. 1978. The Royal Society.
45. Ballal, D. and A. Lefebvre, Ignition and flame quenching of flowing heterogeneous fuel-air
mixtures. Combustion and Flame, 1979. 35: p. 155-168.
46. Ballal, D.R. and A. Lefebvre. A general model of spark ignition for gaseous and liquid fuel-
air mixtures. in Symposium (international) on combustion. 1981. Elsevier.
47. Peters, J. and A. Mellor, An ignition model for quiescent fuel sprays. Combustion and
Flame, 1980. 38: p. 65-74.
48. Bennet, J. and C. Ballal, Ignition of combustible fluids by heated surface. Process Safety
Progress, 2001. 20(1): p. 29-36.

177
49. Babrauskas, V., Ignition handbook. 2003.
50. Freeston, H., J. Roberts, and A. Thomas, Crankcase explosions: an investigation into some
factors governing the selection of protective devices. Proceedings of the Institution of
Mechanical Engineers, 1956. 170(1): p. 811-824.
51. Jagger, S., A. Nicol, and A. Thyer, A comprehensive approach to the assessment of fire-
resistant hydraulic fluid safety. 2003, HSL Report FR/02/05, Available from the Health and
Safety Laboratory, Buxton, UK.
52. Association, N.F.P., NFPA 654: Standard for the Prevention of Fire and Dust Explosions from
the Manufacturing, Processing, and Handling of Combustible Particulate Solids. 2005:
National Fire Protection Association.
53. Abbasi, T. and S. Abbasi, Dust explosions–Cases, causes, consequences, and control.
Journal of Hazardous Materials, 2007. 140(1): p. 7-44.
54. M. Worsfold, P.A., “Fires, explosions and combustible dusts hazards”, Dalhousie University,
Halifax, NS, Canada,. 3 June 2010.
55. Amyotte, P.D., An introduction to dust explosions: understanding the myths and realities
of dust explosions for a safer workplace. 2013: Butterworth-Heinemann.
56. Medard, L.A., Accidental Explosions: Physical and chemical properties. Vol. 1. 1989:
Halsted Press.
57. Gomez, C.O. and F.J. Vastola, Ignition and combustion of single coal and char particles: A
quantitative differential approach. Fuel, 1985. 64(4): p. 558-563.
58. Di Benedetto, A. and P. Russo, Thermo-kinetic modelling of dust explosions. Journal of Loss
Prevention in the process industries, 2007. 20(4): p. 303-309.
59. Du, B., et al., Comparative study of explosion processes controlled by homogeneous and
heterogeneous combustion mechanisms. Journal of Loss Prevention in the Process
Industries, 2014. 30: p. 155-163.
60. Hertzberg, M., et al., Thermokinetic transport control and structural microscopic realities
in coal and polymer pyrolysis and devolatilization: their dominant role in dust explosions.
Prepr. Pap., Am. Chem. Soc., Div. Fuel Chem.;(United States), 1988. 32(CONF-870802-).
178
61. Dufaud, O., et al., Comparing Pyrolysis Gases and Dusts Explosivities: A Clue to
Understanding Hybrid Mixtures Explosions? Industrial & Engineering Chemistry Research,
2011. 51(22): p. 7656-7662.
62. Russoa, P. and A. Di Benedettob, Review of a Dust Explosion Modeling. CHEMICAL
ENGINEERING, 2013. 31.
63. Dufaud, O., et al., Highlighting the importance of the pyrolysis step on dusts explosion.
Chemical Engineering Transactions, 2012. 26: p. 369-374.
64. Kletz, T.A. and P. Amyotte, Process plants: A handbook for inherently safer design. 2010:
CRC Press.
65. Amyotte, P.R., M.J. Pegg, and F.I. Khan, Application of inherent safety principles to dust
explosion prevention and mitigation. Process Safety and Environmental Protection, 2009.
87(1): p. 35-39.
66. Abuswer, M., P. Amyotte, and F. Khan, A quantitative risk management framework for
dust and hybrid mixture explosions. Journal of Loss Prevention in the Process Industries,
2013. 26(2): p. 283-289.
67. Engler, K.O.V., Beiträge zur Kenntniss der Staubexplosionen. 1885: J. Springer.
68. Cardillo, P. and E. Anthony, The flammability limits of hybrid gas and dust systems. La
Rivista dei Combustibili, 1978. 32: p. 390-395.
69. Pellmont, G., Explosions-und Zündverhalten von hybriden Gemischen aus brennbaren
Stäuben und Brenngasen. 1979, Diss. Techn. Wiss. ETH Zürich, Nr. 6498, 0000. Ref.:
Richarz, W.; Korref.: Gut, G.
70. Franke, H., Bestimmung der Minderstzudenergie von Kohlenstaub/Methan/Luft
Gemisches (hybride Gemische). VDI-Berichte, 1978. 304: p. 69-72.
71. Bartknecht, W., Gas, vapor and dust explosions, fundamentals, prevention, control. Int.
Symp. Grain Elev. Explos. 1. 1981.
72. Cashdollar, K.L., Coal dust explosibility. Journal of loss prevention in the process industries,
1996. 9(1): p. 65-76.
73. Siwek, R., Determination of technical safety indices and factors influencing hazard
evaluation of dusts. Journal of Loss Prevention in the Process Industries, 1996. 9(1): p. 21-
31.
179
74. Jiang, J., Y. Liu, and M.S. Mannan, A correlation of the lower flammability limit for hybrid
mixtures. Journal of Loss Prevention in the Process Industries, 2014. 32: p. 120-126.
75. Jiang, J., et al., Validation of a new formula for predicting the lower flammability limit of
hybrid mixtures. Journal of Loss Prevention in the Process Industries, 2015. 35: p. 52-58.
76. Kosinski, P., et al., Explosions of carbon black and propane hybrid mixtures. Journal of Loss
Prevention in the Process Industries, 2013. 26(1): p. 45-51.
77. Sanchirico, R., et al., Explosion of lycopodium-nicotinic acid–methane complex hybrid
mixtures. Journal of Loss Prevention in the Process Industries, 2015. 36: p. 505-508.
78. Li, Q., et al., Explosion characteristics of H 2/CH 4/air and CH 4/coal dust/air mixtures.
Powder Technology, 2012. 229: p. 222-228.
79. Amyotte, P.R. and R.K. Eckhoff, Dust explosion causation, prevention and mitigation: An
overview. Journal of Chemical Health and Safety, 2010. 17(1): p. 15-28.
80. Coronado, C.J., et al., Flammability limits: A review with emphasis on ethanol for
aeronautical applications and description of the experimental procedure. Journal of
hazardous materials, 2012. 241: p. 32-54.
81. ASTM, Standard Test Method for Concentration Limits of Flammability of Chemicals, in
ASTM E681-85 1985.
82. Bond, J., Sources of ignition: flammability characteristics of chemicals and products. 1991:
Butterworth-Heinemann.
83. Brandes, E., et al., Sicherheitstechnische Kenngrößen. 2003: Wirtschaftsverlag NW, Verlag
für neue Wissenschaft.
84. Lian, P., et al., Flammability of heat transfer fluid aerosols produced by electrospray
measured by laser diffraction analysis. Journal of Loss Prevention in the Process Industries,
2010. 23(2): p. 337-345.
85. Lian, P., X. Gao, and M.S. Mannan, Prediction of minimum ignition energy of aerosols using
flame kernel modeling combined with flame front propagation theory. Journal of Loss
Prevention in the Process Industries, 2012. 25(1): p. 103-113.
86. Cashdollar, K.L., et al., Flammability of methane, propane, and hydrogen gases. Journal of
Loss Prevention in the Process Industries, 2000. 13(3): p. 327-340.
180
87. Molnarne, M., T. Schendler, and V. Schröder, Sicherheitstechnische Kenngrößen, Band 2:
Explosionsbereiche von Gasgemischen. 2003.
88. Vidal, M., et al., A review of estimation methods for flash points and flammability limits.
Process safety progress, 2004. 23(1): p. 47-55.
89. Coward, H.F. and G.W. Jones, Limits of flammability of gases and vapors. 1952, DTIC
Document.
90. Brötz, W., W. Bartknecht: Explosionen, Ablauf und Schutzmaßnahmen. Springer-Verlag,
Berlin, Heidelberg, New York 1978. 264 Seiten, Preis: DM 148,—. Berichte der
Bunsengesellschaft für physikalische Chemie, 1980. 84(6): p. 605-605.
91. Cashdollar, K.L., Overview of dust explosibility characteristics. Journal of Loss Prevention
in the Process Industries, 2000. 13(3): p. 183-199.
92. Amyotte, P.R., et al., Laboratory investigation of the dust explosibility characteristics of
three Nova Scotia coals. Journal of Loss Prevention in the Process Industries, 1991. 4(2):
p. 102-109.
93. Castellanos, D., et al., The effect of particle size polydispersity on the explosibility
characteristics of aluminum dust. Powder Technology, 2014. 254: p. 331-337.
94. Encinar, J.M., et al., Pyrolysis of maize, sunflower, grape and tobacco residues. Journal of
chemical technology and biotechnology, 1997. 70(4): p. 400-410.
95. Yuan, J., et al., An extensive discussion on experimental test of dust minimum explosible
concentration. Procedia Engineering, 2012. 43: p. 343-347.
96. 1839., E., Determination of explosion limits of gases and vapours. Brussels: European
Committee for Standardisation. 2003.
97. EN 14034-3; Determination of determination of minimum explosion concentration of
dusts. Brussels: European Committee for Standardisation, 2007
98. Schonewald, I., Staub explosion. 31, pp .376 -378. 1971.
99. Shevchuk, V., et al., Effect of the Structure of a Gas Suspension on the Process of Flame
Propagation. Combustion, Explosion, and Shock Waves, 1979. 15(6): p. 723-727.
100. Buksowicz W., W.P., Prog. of Astronautics and Aeronautics 87 pp. 414-425. 1983.
101. Shebeko, Y.N., et al., An analytical evaluation of flammability limits of gaseous mixtures of
combustible–oxidizer–diluent. Fire Safety Journal, 2002. 37(6): p. 549-568.
181
102. Spakowski, A. and F.E. Belles, Variation of pressure limits of flame propagation with tube
diameter for various isooctane-oxygen-nitrogen mixtures. 1952.
103. Glassman, I., R.A. Yetter, and N.G. Glumac, Combustion. 2014: Academic press.
104. Bartknecht, W., Explosions, Springer-Verlag, Berlin Heidelberg New York. 1981: Springer
Science & Business Media.
105. Zlochower, I.A. and G.M. Green, The limiting oxygen concentration and flammability limits
of gases and gas mixtures. Journal of loss prevention in the process industries, 2009. 22(4):
p. 499-505.
106. Standardization, E.C., EN 50281-2-1, Potentially Explosible Atmospheres, Explosion
Prevention and Protection, Determination of limiting oxygen concentration for Dust/air
Mixtures. ECS, Brussels, Belgium. 2007.
107. ASTM, Standard test methods for limiting oxygen (oxidant) concentration in gases and
vapors. E2079-07. In: ASTM International annual book of standards, Vol. 14.02. West
Conshohocken, PA: American Society for Testing and Materials. 2008b.
108. CEN and TR15281, Guidance on Inerting for the Prevention of Explosions. 2006.
109. 2263, V., Staubbrände und Staubexplosionen – Gefahren, Beurteilung, Schutzmaßnahmen;
Inertisierung (Dust Fires and Explosions – Hazards, Assessment, Protective Measures).
1992.
110. Wiemann, W., Einfluß der Temperatur auf Explosionskenngrößen und
Sauerstoffgrenzkonzentration. VDI-Berichte, 1984(494): p. 89-98.
111. Sweis, F. and C. Sinclair, The effect of particle size on the maximum permissible oxygen
concentration to prevent dust explosions. Journal of hazardous materials, 1985. 10(1): p.
59-71.
112. White, P. and S. Smith, Inert Atmospheres. 1962, Butterworth, London.
113. Ono, R., et al., Minimum ignition energy of hydrogen–air mixture: Effects of humidity and
spark duration. Journal of Electrostatics, 2007. 65(2): p. 87-93.
114. Maly, R., Spark ignition: its physics and effect on the internal combustion engine, in Fuel
economy. 1984, Springer. p. 91-148.
115. Strid, K.-G., Experimental techniques for the determination of ignition energy. Oxidation
and Combustion Reviews, 1973: p. 1-46.
182
116. Maly, R. and M. Vogel. Initiation and propagation of flame fronts in lean CH4-air mixtures
by the three modes of the ignition spark. in Symposium (International) on Combustion.
1979. Elsevier.
117. CEN, Determination of minimum ignition energy of dust/air mixtures, European Standard
EN13821, European Committee for Standardization, Brussels. 2002.
118. ASTM, E582 , Standard Test Method for Minimum Ignition Energy and Quenching Distance
in Gaseous Mixtures. American Society for Testing and Materials. 1988.
119. Cesana, C. and R. Siwek, MIKE 3 Minimum Ignition Energy 3.3. Kühner AG, Birsfelden,
Switzerland, 2003.
120. Kalkert, N., Theoretische und experimentelle Untersuchungen der Explosionskenndaten
von Mischungen aus mehreren gas-und staubförmigen Brennstoffkomponenten und Luft.
1980: na.
121. Nagy, J., Development and control of dust explosions. Vol. 8. 1983: CRC Press.
122. Eckhoff, R., Minimum ignition energy (MIE)—a basic ignition sensitivity parameter in
design of intrinsically safe electrical apparatus for explosive dust clouds. Journal of Loss
Prevention in the process industries, 2002. 15(4): p. 305-310.
123. Wiecrorek, C., and R. Zalosh., Effects of Spark Duration and Dust Cloud Velocity on the
Minimum Ignition Energy Requirements.” Proceedings of the Eighth International
Colloquium on Dust Explosions, Schaumburg, IL. Schaumburg: Safety Consulting Engineers,
pp. 195-203. 1998.
124. Pellmont, G., “Einfluss der Temperatur auf das Ziind- und Explosionsverhalten von
Nikotinsaure.” Report from Dr. Pellmont Explosionsschutz, Binningen, Switzerland. 1997.
125. Borghese, A., et al. Development of hot nitrogen kernel, produced by a very fast spark
discharge. in Symposium (International) on Combustion. 1989. Elsevier.
126. Glor, M. and K. Schwenzfeuer, Einfluss der Sauerstoffkonzentration auf die
Mindestzündenergie von Staüben. Dechema Jahrestagung, 1999.
127. Wiecrorek, C., and Zalosh, R., “Effects of Spark Duration and Dust Cloud Velocity on the
Minimum Ignition Energy Requirements.” Proceedings of the Eighth International
Colloquium on Dust Explosions, Schaumburg, IL. Schaumburg: Safety Consulting Engineers,
pp. 195-203. 1998.
183
128. ASTM, Standard Test Method for Minimum Ignition Temperature of Dust Clouds. ASTM
International, pp. 1–10. 2006.
129. CEN, EN 14522 Determination of the minimum ignition temperature of gases and vapours
2005.
130. CEN, EN 50281-2-1, European standard test method for the minimum ignition temperature
for dust cloud. 2007.
131. Zeeuwen, J.P., and . van Laar. G. F. M, “Ignition Sensitivity of Flammable Dust/Air
Mixtures.” Proceedings of the International Symposium on the Control of Risks in Handling
andStorage of Granular Foods, Paris: APRIA. 1985.
132. Janès, A., et al., Experimental investigation of the influence of inert solids on ignition
sensitivity of organic powders. Process Safety and Environmental Protection, 2014. 92(4):
p. 311-323.
133. Pilão, R., E. Ramalho, and C. Pinho, Overall characterization of cork dust explosion. Journal
of hazardous materials, 2006. 133(1): p. 183-195.
134. Cassel, H. and I. Liebman, The cooperative mechanism in the ignition of dust dispersions.
Combustion and Flame, 1959. 3: p. 467-475.
135. Nagy, J. and D.J. Surincik, Thermal phenomena during ignition of a heated dust dispersion.
Vol. 6811. 1966: US Dept. of the Interior, Bureau of Mines.
136. Mitsui, R. and T. Tanaka, Simple Models of Dust Explosion. Predicting Ignition Temperature
and Minimum Explosive Limit in Terms of Particle Size. Industrial & Engineering Chemistry
Process Design and Development, 1973. 12(3): p. 384-389.
137. Mittal, M. and B. Guha, Minimum ignition temperature of polyethylene dust: a theoretical
model. Fire and materials, 1997. 21(4): p. 169-177.
138. Krishna, C. and A. Berlad, A model for dust cloud autoignition. Combustion and Flame,
1980. 37: p. 207-210.
139. Zhang, D.-k. and T.F. Wall, Ignition of coal particles: the influence of experimental
technique. Fuel, 1994. 73(7): p. 1114-1119.
140. CEN, EN 14034-1,2, Determination of explosion characteristics of dust clouds Part 1:
Determination of the maximum explosion pressure and maximum rate of pressure rise.
2004.
184
141. CEN, EN 13673, 1-2 determination of the maximum explosion pressure and maximum rate
of pressure rise with time for gases and vapor. 2004.
142. Wiemann, W., Influence of temperature and pressure on the explosion characteristics of
dust/air and dust/air/inert gas mixtures, in Industrial dust explosions. 1987, ASTM
International.
143. Tamanini, F., “Turbulence Effects on Dust Explosion Venting.” Proceedings of the AIChF
Loss Prevention Symposium, Session 8, Plant Layout, Houston. 1989.
144. Carini, R.C. and K. Hules, Coal pulverizer explosions, in Industrial Dust Explosions. 1987,
ASTM International.
145. ISO-5071, Determination of the volatile and moisture contents combustible matter by
gravimetric method. 1996.
146. Li, Q., et al., Experimental research of particle size and size dispersity on the explosibility
characteristics of coal dust. Powder Technology, 2016. 292: p. 290-297.
147. ISO-17974, Determination of the content of carbon, hydrogen, nitrogen and sulphur by
infrared detection and nitrogen by thermal conductivity detection on analyser 2002.
148. STANDARD, B. and B. ISO, Determination of particle size distributions—Electrical sensing
zone method. 2007.
149. ISO-1928, Determination of gross heat of combustion by the bomb calorimetric method
and calculation of net heat of combustion. 2009.
150. Rossini, F.D., et al., Selected values of chemical thermodynamic properties. Vol. 500. 1952:
US Government Printing Office Washington, DC.
151. Reichardt, C. and T. Welton, Solvents and solvent effects in organic chemistry. 2011: John
Wiley & Sons.
152. Standardization, E.C.f., EN 14034 1-4, Potentially Explosible Atmospheres, Explosion
Prevention and Protection. Determination of explosibility and severity of dust clouds
Dust/air Mixtures in the 20-liters sphere. ECS, Brussels, Belgium 2004.
153. Kuehner, A.G., 20 Liters Apparatus and KESP 7.0 Manual. 2009.
154. Amyotte, P.R., et al., The ignitability of coal dust-air and methane-coal dust-air mixtures.
Fuel, 1993. 72(5): p. 671-679.
185
155. Garcia-Agreda, A., et al., Dust/gas mixtures explosion regimes. Powder Technology, 2011.
205(1-3): p. 81-86.
156. Liu, X., Q. Zhang, and Y. Wang, Influence of particle size on the explosion parameters in
two-phase vapor–liquid n-hexane/air mixtures. Process Safety and Environmental
Protection, 2015. 95: p. 184-194.
157. Lim, J. and Y.R. Sivathanu, Optical patternation of a multi-orifice spray nozzle. Atomization
and Sprays, 2005. 15(6).
158. Landman, G., Ignition behaviour of hybrid mixtures of coal dust, methane, and air. Journal
of the South African Institute of Mining and Metallurgy, 1995. 95(1): p. 45.
159. Addai, E.K., D. Gabel, and U. Krause, Lower explosion limit of hybrid mixtures of burnable
gas and dust. Journal of Loss Prevention in the Process Industries, 2015. 36: p. 497-504.
160. Addai, E.K., D. Gabel, and U. Krause, Explosion characteristics of three component hybrid
mixtures. Process Safety and Environmental Protection, 2015. 98: p. 72-81.
161. Le Chatelier, H., Recherches expérimentales et théoriques sur la combustion des mélanges
gazeux explosifs. 1883: Dunod.
162. report, S., Experimental investigation of explosion limits, explosion pressure and rate of
explosion pressure rise, Bundesanstalt für Materialforschung und –prüfung, Germany, part
1. 2002.
163. Addai, E.K., D. Gabel, and U. Krause, Lower explosion limit/minimum explosible
concentration testing for hybrid mixtures in the Godbert-Greenwald furnace. Process
Safety Progress, 2016.
164. Cashdollar, K.L., et al., Laboratory and mine dust explosion research at the Bureau of
Mines, in Industrial Dust Explosions. 1987, ASTM International.
165. Proust, C. and B. Veyssiere, Fundamental properties of flames propagating in starch dust-
air mixtures. Combustion Science and Technology, 1988. 62(4-6): p. 149-172.
166. Continillo, G., et al., Coal dust explosions in a spherical bomb. Journal of Loss Prevention
in the process industries, 1991. 4(4): p. 223-229.
167. Wilén, C., et al., Safe handling of renewable fuels and fuel mixtures. 1999: Technical
Research Centre of Finland.
186
168. Woskoboenko, F., Explosibility of Victorian brown coal dust. Fuel, 1988. 67(8): p. 1062-
1068.
169. Going, J.E., K. Chatrathi, and K.L. Cashdollar, Flammability limit measurements for dusts in
20-L and 1-m 3 vessels. Journal of Loss Prevention in the Process Industries, 2000. 13(3):
p. 209-219.
170. Dastidar, A.G., ASTM E2931: A new standard for the limiting oxygen concentration of
combustible dusts. Process Safety Progress, 2015.
171. Mittal, M., Limiting oxygen concentration for coal dusts for explosion hazard analysis and
safety. Journal of loss prevention in the process industries, 2013. 26(6): p. 1106-1112.
172. Krause, U., D. Weinert, and P. Wöhrn, Rechnerische und graphische Bestimmung der
Sauerstoffgrenzkonzentration explosionfähiger Staub/Luft-Gemische. Staub. Reinhaltung
der Luft, 1992. 52(10): p. 361-368.
173. Monachov, V.T. and W. Hoffmann, Brandgefährlichkeit von Stoffen:
Untersuchungsmethoden. 1984: Staatsverl. d. DDR.
174. Au, S., R. Haley, and P. Smy, The influence of the igniter-induced blast wave upon the initial
volume and expansion of the flame kernel. Combustion and flame, 1992. 88(1): p. 50-60.
175. Cesana, C., A. Kühner, and R. Siwek, Handbuch 3.4.
176. Explosionsschutz, W.B., Grundlagen und Anwendung Springer Verlag. Berlin, Heidelberg,
New York, 1993.
177. Eckhoff, R.K. and G. Enstad, Why are “long” electric sparks more effective dust explosion
initiators than “short” ones? Combustion and Flame, 1976. 27: p. 129-131.
178. Eckhoff, R.K., Towards absolute minimum ignition energies for dust clouds? Combustion
and Flame, 1975. 24: p. 53-64.
179. Haase, H., Electrostatic hazards: their evaluation and control. 1977: Wiley-VCH.
180. Wähner, A., et al., Determination of the minimum ignition energy on the basis of a
statistical approach. Journal of Loss Prevention in the Process Industries, 2013. 26(6): p.
1655-1660.
181. Langer, T., et al., MIE experiments and simultaneous measurement of the transferred
charge–A verification of the ignition threshold limits. Journal of Electrostatics, 2012. 70(1):
p. 97-104.
187
182. Lewis, B., Combustion flames and explosions of gases 2nd ed.[DEWEY]. 1961.
183. Di Benedetto, A., et al., Modelling the effect of particle size on dust explosions. Chemical
Engineering Science, 2010. 65(2): p. 772-779.
184. Bouillard, J., et al., Ignition and explosion risks of nanopowders. Journal of hazardous
materials, 2010. 181(1): p. 873-880.
185. Britton, L.G., Short communication: estimating the minimum ignition energy of hybrid
mixtures. Process Safety Progress, 1998. 17(2): p. 124-126.
186. Di Benedetto, A., V. Di Sarli, and P. Russo, On the determination of the minimum ignition
temperature for dust/air mixtures. Chemical Engineering Transactions, 2010. 19.
187. Addai, E.K., D. Gabel, and U. Krause, Experimental investigation on the minimum ignition
temperature of hybrid mixtures of dusts and gases or solvents. Journal of Hazardous
Materials, 2016. 301: p. 314-326.
188. Addai, E.K., D. Gabel, and U. Krause, Models to estimate the minimum ignition
temperature of dusts and hybrid mixtures. Journal of Hazardous Materials, 2016. 304: p.
73-83.
189. Hattwig, M. and H. Steen, Handbook of explosion prevention and protection. 2008: John
Wiley & Sons.
190. Krause, U., (ed. 1)Fires in silos: hazards, prevention, and fire fighting. 2009: John Wiley &
Sons.
191. Liao, S., et al., Determination of the laminar burning velocities for mixtures of ethanol and
air at elevated temperatures. Applied Thermal Engineering, 2007. 27(2): p. 374-380.
192. Amyotte, P.R., et al., Moderation of dust explosions. Journal of Loss Prevention in the
Process Industries, 2007. 20(4): p. 675-687.
193. Zheng, Y.-P., et al., A statistical analysis of coal mine accidents caused by coal dust
explosions in China. Journal of Loss Prevention in the Process Industries, 2009. 22(4): p.
528-532.
194. Bartknecht, W., Explosions: course, prevention, protection. Springer Science & Business
Media, 2012.
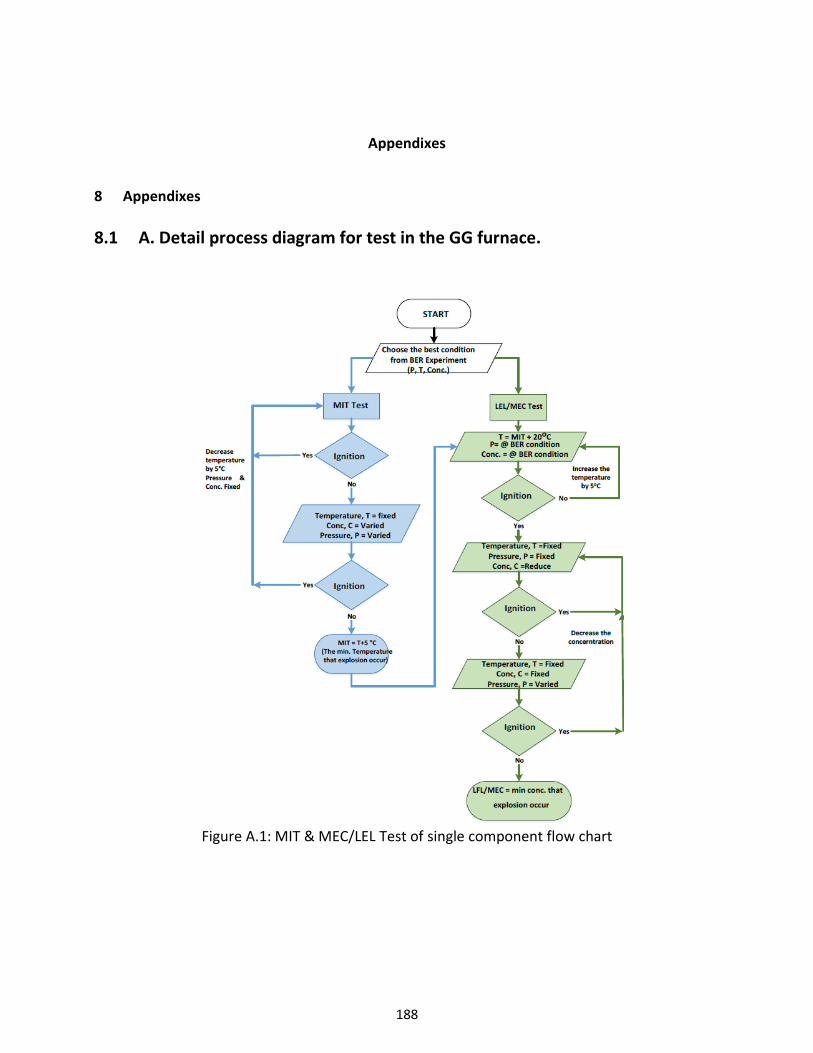
188
Appendixes
8 Appendixes
8.1 A. Detail process diagram for test in the GG furnace.
Figure A.1: MIT & MEC/LEL Test of single component flow chart
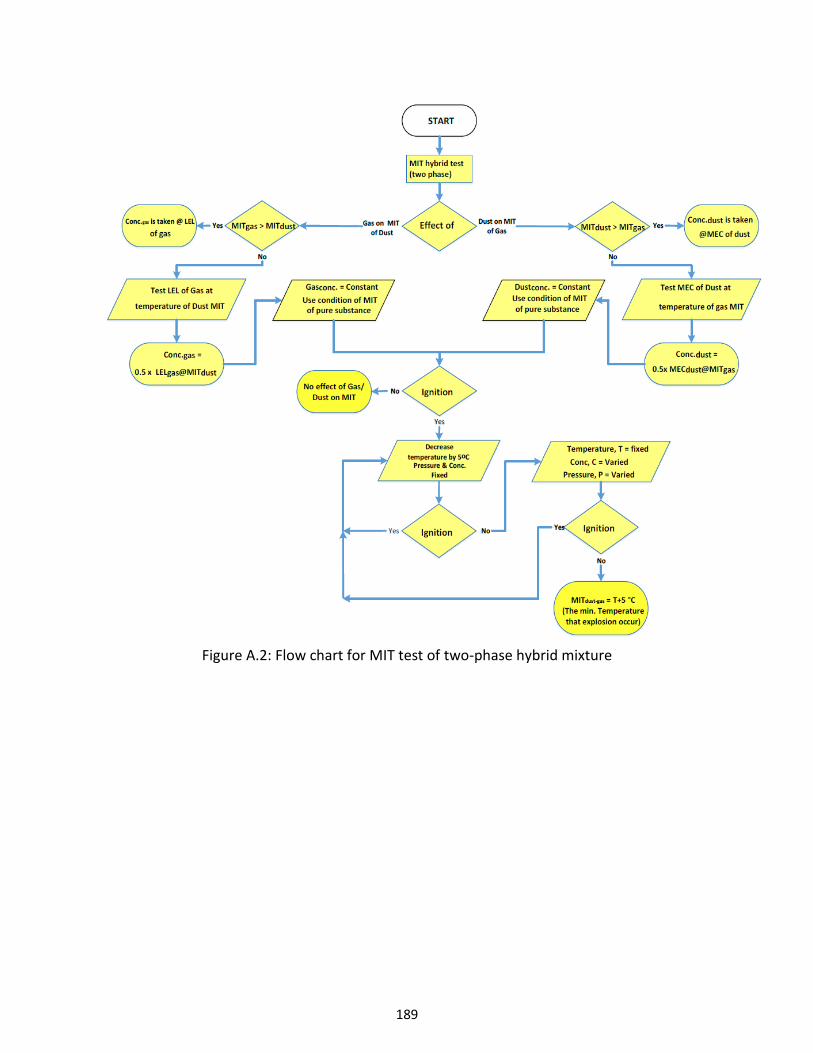
189
Figure A.2: Flow chart for MIT test of two-phase hybrid mixture
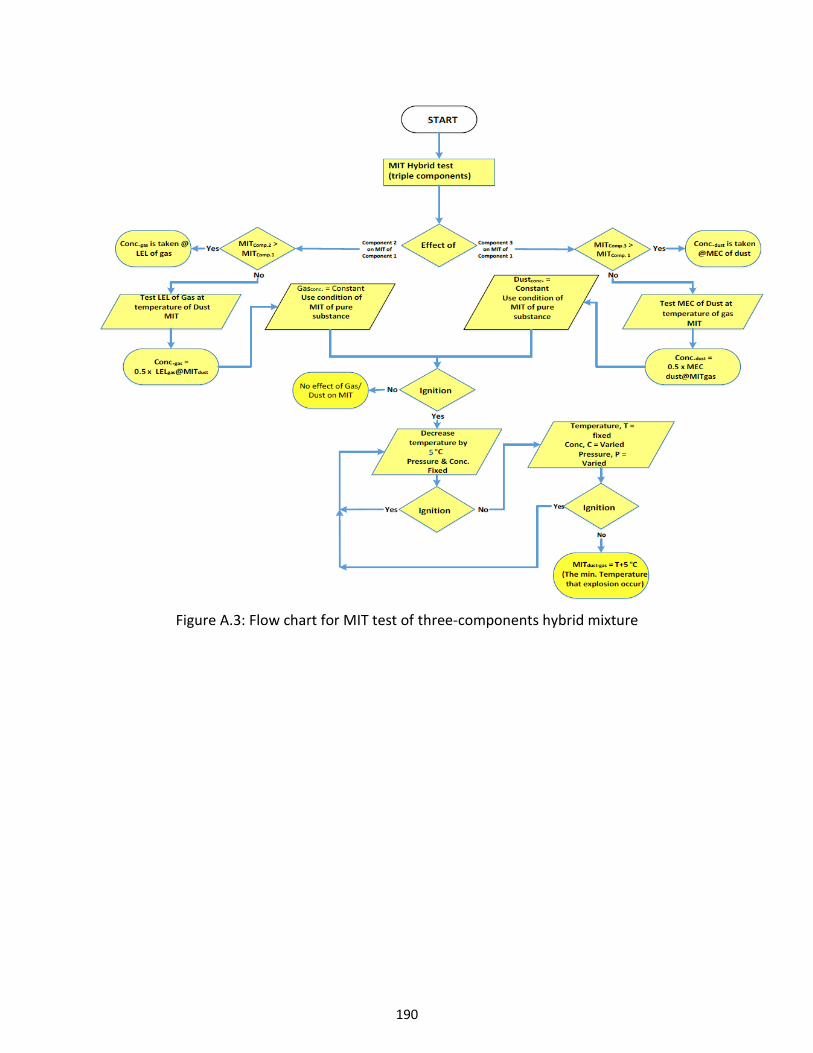
190
Figure A.3: Flow chart for MIT test of three-components hybrid mixture

191
Figure A.4: Flow chart for MEC/LEL test of two-phase hybrid mixtures

192
Figure A.5: Flow chart for MEC/LEL test of three-components hybrid mixture
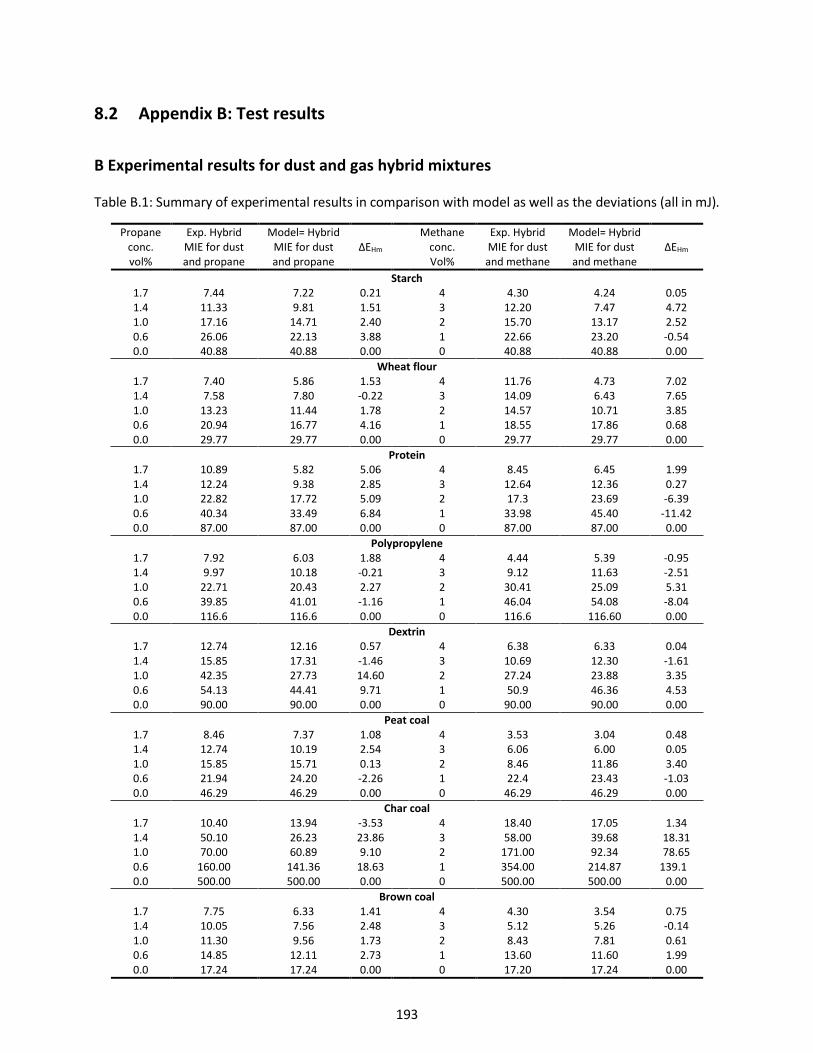
193
8.2 Appendix B: Test results
B Experimental results for dust and gas hybrid mixtures
Table B.1: Summary of experimental results in comparison with model as well as the deviations (all in mJ).
Propane conc. vol%
Exp. Hybrid MIE for dust and propane
Model= Hybrid MIE for dust and propane
∆EHm
Methane conc. Vol%
Exp. Hybrid MIE for dust and methane
Model= Hybrid MIE for dust and methane
∆EHm
Starch 1.7 7.44 7.22 0.21 4 4.30 4.24 0.05 1.4 11.33 9.81 1.51 3 12.20 7.47 4.72 1.0 17.16 14.71 2.40 2 15.70 13.17 2.52 0.6 26.06 22.13 3.88 1 22.66 23.20 -0.54 0.0 40.88 40.88 0.00 0 40.88 40.88 0.00
Wheat flour 1.7 7.40 5.86 1.53 4 11.76 4.73 7.02 1.4 7.58 7.80 -0.22 3 14.09 6.43 7.65 1.0 13.23 11.44 1.78 2 14.57 10.71 3.85 0.6 20.94 16.77 4.16 1 18.55 17.86 0.68 0.0 29.77 29.77 0.00 0 29.77 29.77 0.00
Protein 1.7 10.89 5.82 5.06 4 8.45 6.45 1.99 1.4 12.24 9.38 2.85 3 12.64 12.36 0.27 1.0 22.82 17.72 5.09 2 17.3 23.69 -6.39 0.6 40.34 33.49 6.84 1 33.98 45.40 -11.42 0.0 87.00 87.00 0.00 0 87.00 87.00 0.00
Polypropylene 1.7 7.92 6.03 1.88 4 4.44 5.39 -0.95 1.4 9.97 10.18 -0.21 3 9.12 11.63 -2.51 1.0 22.71 20.43 2.27 2 30.41 25.09 5.31 0.6 39.85 41.01 -1.16 1 46.04 54.08 -8.04 0.0 116.6 116.6 0.00 0 116.6 116.60 0.00
Dextrin 1.7 12.74 12.16 0.57 4 6.38 6.33 0.04 1.4 15.85 17.31 -1.46 3 10.69 12.30 -1.61 1.0 42.35 27.73 14.60 2 27.24 23.88 3.35 0.6 54.13 44.41 9.71 1 50.9 46.36 4.53 0.0 90.00 90.00 0.00 0 90.00 90.00 0.00
Peat coal 1.7 8.46 7.37 1.08 4 3.53 3.04 0.48 1.4 12.74 10.19 2.54 3 6.06 6.00 0.05 1.0 15.85 15.71 0.13 2 8.46 11.86 3.40 0.6 21.94 24.20 -2.26 1 22.4 23.43 -1.03 0.0 46.29 46.29 0.00 0 46.29 46.29 0.00
Char coal 1.7 10.40 13.94 -3.53 4 18.40 17.05 1.34 1.4 50.10 26.23 23.86 3 58.00 39.68 18.31 1.0 70.00 60.89 9.10 2 171.00 92.34 78.65 0.6 160.00 141.36 18.63 1 354.00 214.87 139.1 0.0 500.00 500.00 0.00 0 500.00 500.00 0.00
Brown coal 1.7 7.75 6.33 1.41 4 4.30 3.54 0.75 1.4 10.05 7.56 2.48 3 5.12 5.26 -0.14 1.0 11.30 9.56 1.73 2 8.43 7.81 0.61 0.6 14.85 12.11 2.73 1 13.60 11.60 1.99 0.0 17.24 17.24 0.00 0 17.20 17.24 0.00
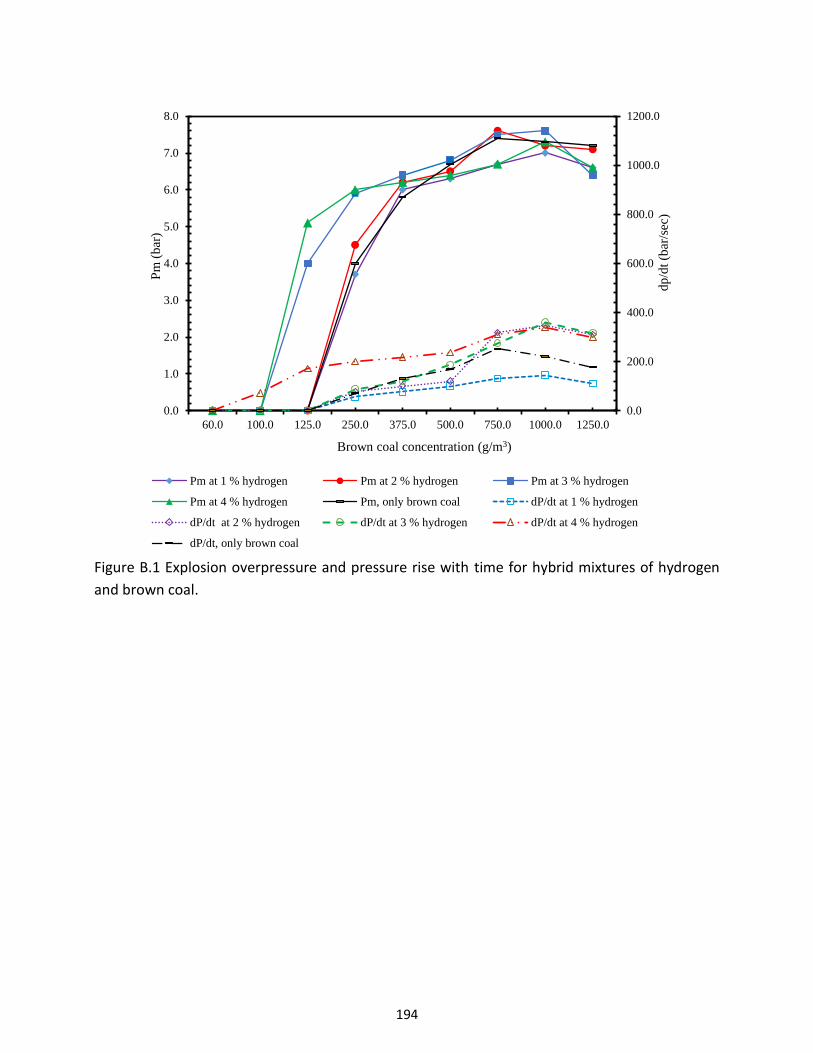
194
Figure B.1 Explosion overpressure and pressure rise with time for hybrid mixtures of hydrogen
and brown coal.
0.0
200.0
400.0
600.0
800.0
1000.0
1200.0
0.0
1.0
2.0
3.0
4.0
5.0
6.0
7.0
8.0
60.0 100.0 125.0 250.0 375.0 500.0 750.0 1000.0 1250.0
dp
/dt
(bar
/sec
)
Pm
(b
ar)
Brown coal concentration (g/m3)
Pm at 1 % hydrogen Pm at 2 % hydrogen Pm at 3 % hydrogen
Pm at 4 % hydrogen Pm, only brown coal dP/dt at 1 % hydrogen
dP/dt at 2 % hydrogen dP/dt at 3 % hydrogen dP/dt at 4 % hydrogen
dP/dt, only brown coal
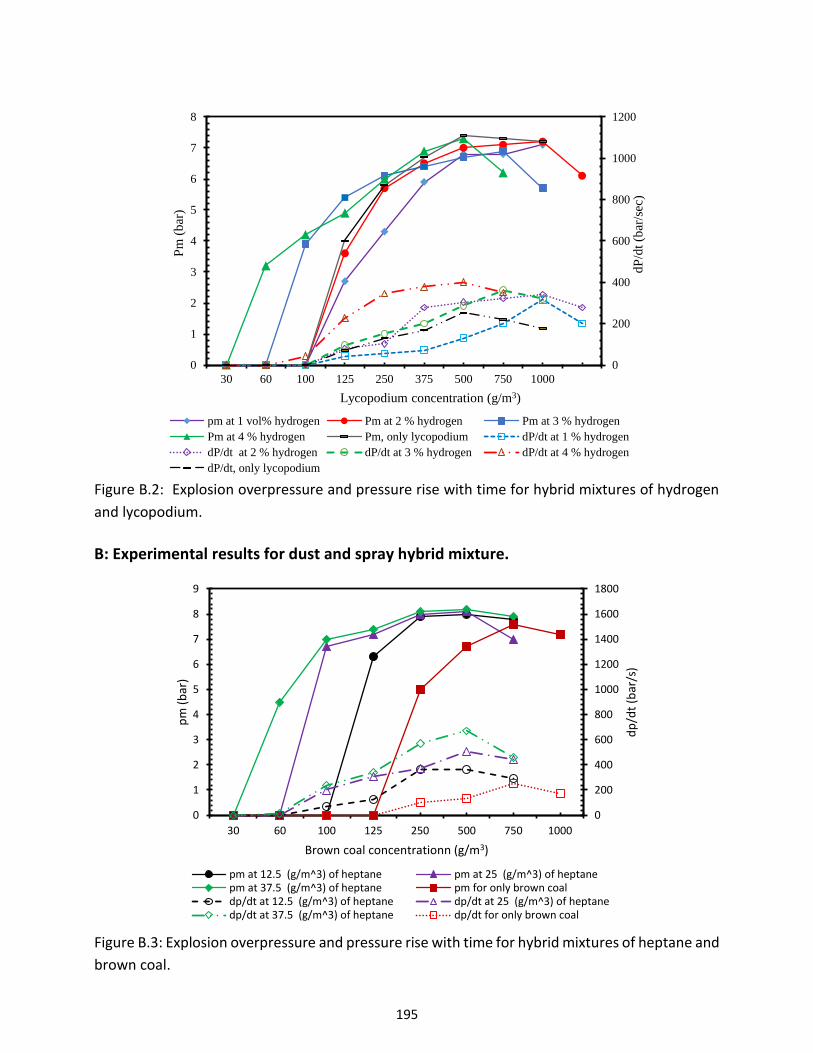
195
Figure B.2: Explosion overpressure and pressure rise with time for hybrid mixtures of hydrogen
and lycopodium.
B: Experimental results for dust and spray hybrid mixture.
Figure B.3: Explosion overpressure and pressure rise with time for hybrid mixtures of heptane and
brown coal.
0
200
400
600
800
1000
1200
0
1
2
3
4
5
6
7
8
30 60 100 125 250 375 500 750 1000
dP
/dt
(bar
/sec
)
Pm
(b
ar)
Lycopodium concentration (g/m3)
pm at 1 vol% hydrogen Pm at 2 % hydrogen Pm at 3 % hydrogen
Pm at 4 % hydrogen Pm, only lycopodium dP/dt at 1 % hydrogen
dP/dt at 2 % hydrogen dP/dt at 3 % hydrogen dP/dt at 4 % hydrogen
dP/dt, only lycopodium
0
200
400
600
800
1000
1200
1400
1600
1800
0
1
2
3
4
5
6
7
8
9
30 60 100 125 250 500 750 1000
dp
/dt
(bar
/s)
pm
(b
ar)
Brown coal concentrationn (g/m3)
pm at 12.5 (g/m^3) of heptane pm at 25 (g/m^3) of heptanepm at 37.5 (g/m^3) of heptane pm for only brown coaldp/dt at 12.5 (g/m^3) of heptane dp/dt at 25 (g/m^3) of heptanedp/dt at 37.5 (g/m^3) of heptane dp/dt for only brown coal
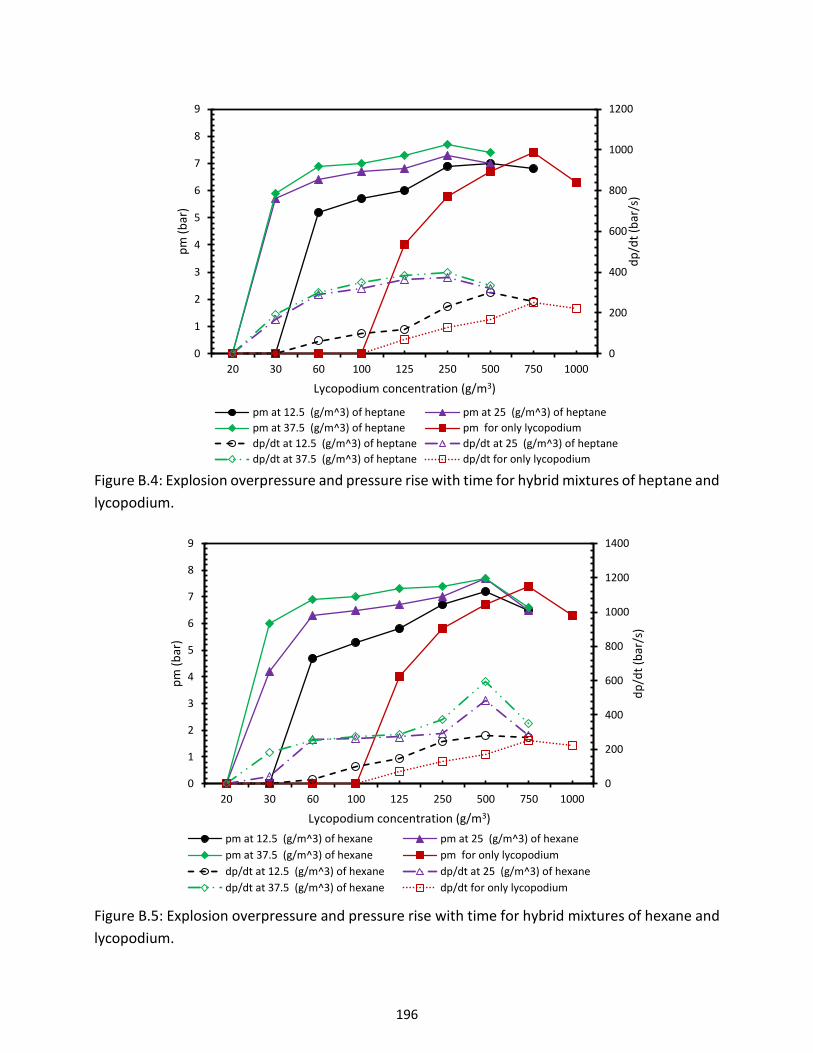
196
Figure B.4: Explosion overpressure and pressure rise with time for hybrid mixtures of heptane and
lycopodium.
Figure B.5: Explosion overpressure and pressure rise with time for hybrid mixtures of hexane and
lycopodium.
0
200
400
600
800
1000
1200
0
1
2
3
4
5
6
7
8
9
20 30 60 100 125 250 500 750 1000
dp
/dt
(bar
/s)
pm
(b
ar)
Lycopodium concentration (g/m3)
pm at 12.5 (g/m^3) of heptane pm at 25 (g/m^3) of heptane
pm at 37.5 (g/m^3) of heptane pm for only lycopodium
dp/dt at 12.5 (g/m^3) of heptane dp/dt at 25 (g/m^3) of heptane
dp/dt at 37.5 (g/m^3) of heptane dp/dt for only lycopodium
0
200
400
600
800
1000
1200
1400
0
1
2
3
4
5
6
7
8
9
20 30 60 100 125 250 500 750 1000
dp
/dt
(bar
/s)
pm
(b
ar)
Lycopodium concentration (g/m3)
pm at 12.5 (g/m^3) of hexane pm at 25 (g/m^3) of hexane
pm at 37.5 (g/m^3) of hexane pm for only lycopodium
dp/dt at 12.5 (g/m^3) of hexane dp/dt at 25 (g/m^3) of hexane
dp/dt at 37.5 (g/m^3) of hexane dp/dt for only lycopodium

197
Figure B.6: Explosion overpressure and pressure rise with time for hybrid mixtures of hexane and
brown coal.
Figure B.7: Explosion overpressure and pressure rise with time for hybrid mixtures of toluene and
brown coal.
0
200
400
600
800
1000
1200
1400
1600
0
1
2
3
4
5
6
7
8
9
30 60 100 125 250 500 750 1000
dp
/dt
(bar
/s)
pm
(b
ar)
Brown coal concentration (g/m3)
pm at 12.5 (g/m^3) of hexane pm at 25 (g/m^3) of hexane
pm at 37.5 (g/m^3) of hexane pm for only brown coal
dp/dt at 12.5 (g/m^3) of hexane dp/dt at 25 (g/m^3) of hexane
dp/dt at 37.5 (g/m^3) of hexane dp/dt for only brown coal
0
200
400
600
800
1000
1200
0
1
2
3
4
5
6
7
8
9
30 60 100 125 250 500 750 1000
dp
/dt
(bar
/s)
pm
(b
ar)
Brown coal concentration (g/m3)
pm at 12.5 (g/m^3) of toluene pm at 25 (g/m^3) of toluene
pm at 37.5 (g/m^3) of toluene pm for only brown coal
dp/dt at 12.5 (g/m^3) of toluene dp/dt at 25 (g/m^3) of toluene
dp/dt at 37.5 (g/m^3) of toluene dp/dt fro only brown coal
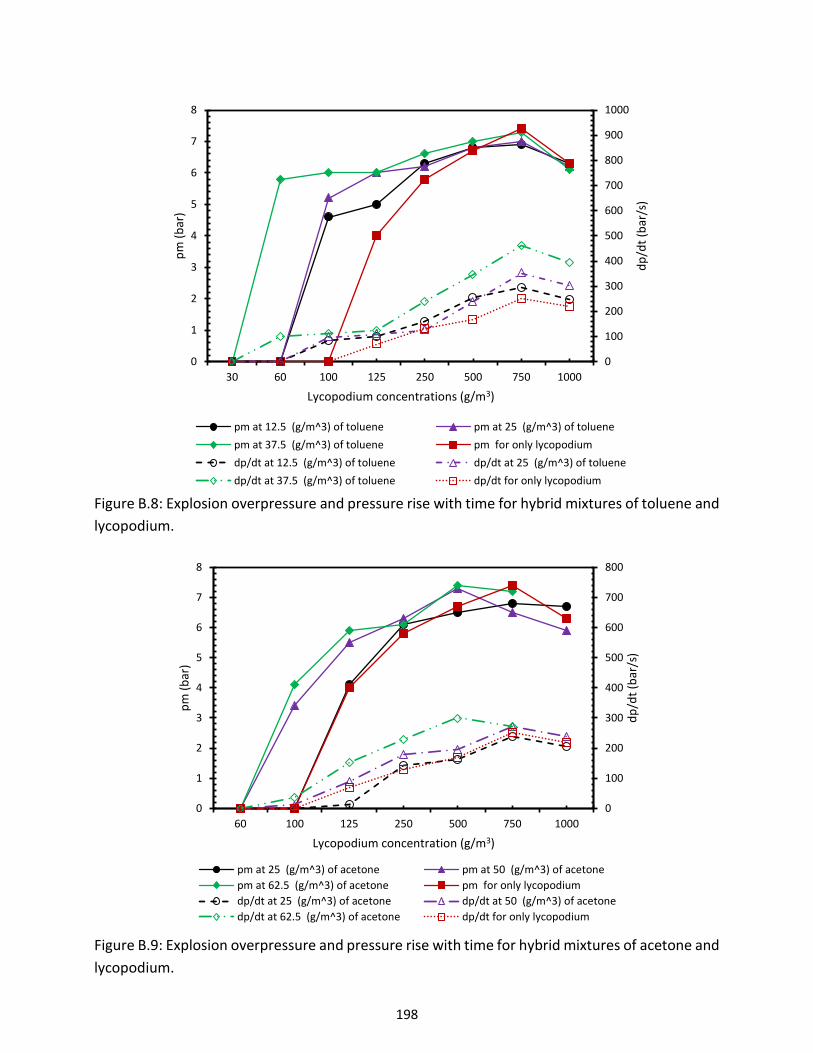
198
Figure B.8: Explosion overpressure and pressure rise with time for hybrid mixtures of toluene and
lycopodium.
Figure B.9: Explosion overpressure and pressure rise with time for hybrid mixtures of acetone and
lycopodium.
0
100
200
300
400
500
600
700
800
900
1000
0
1
2
3
4
5
6
7
8
30 60 100 125 250 500 750 1000
dp
/dt
(bar
/s)
pm
(b
ar)
Lycopodium concentrations (g/m3)
pm at 12.5 (g/m^3) of toluene pm at 25 (g/m^3) of toluene
pm at 37.5 (g/m^3) of toluene pm for only lycopodium
dp/dt at 12.5 (g/m^3) of toluene dp/dt at 25 (g/m^3) of toluene
dp/dt at 37.5 (g/m^3) of toluene dp/dt for only lycopodium
0
100
200
300
400
500
600
700
800
0
1
2
3
4
5
6
7
8
60 100 125 250 500 750 1000
dp
/dt
(bar
/s)
pm
(b
ar)
Lycopodium concentration (g/m3)
pm at 25 (g/m^3) of acetone pm at 50 (g/m^3) of acetone
pm at 62.5 (g/m^3) of acetone pm for only lycopodium
dp/dt at 25 (g/m^3) of acetone dp/dt at 50 (g/m^3) of acetone
dp/dt at 62.5 (g/m^3) of acetone dp/dt for only lycopodium
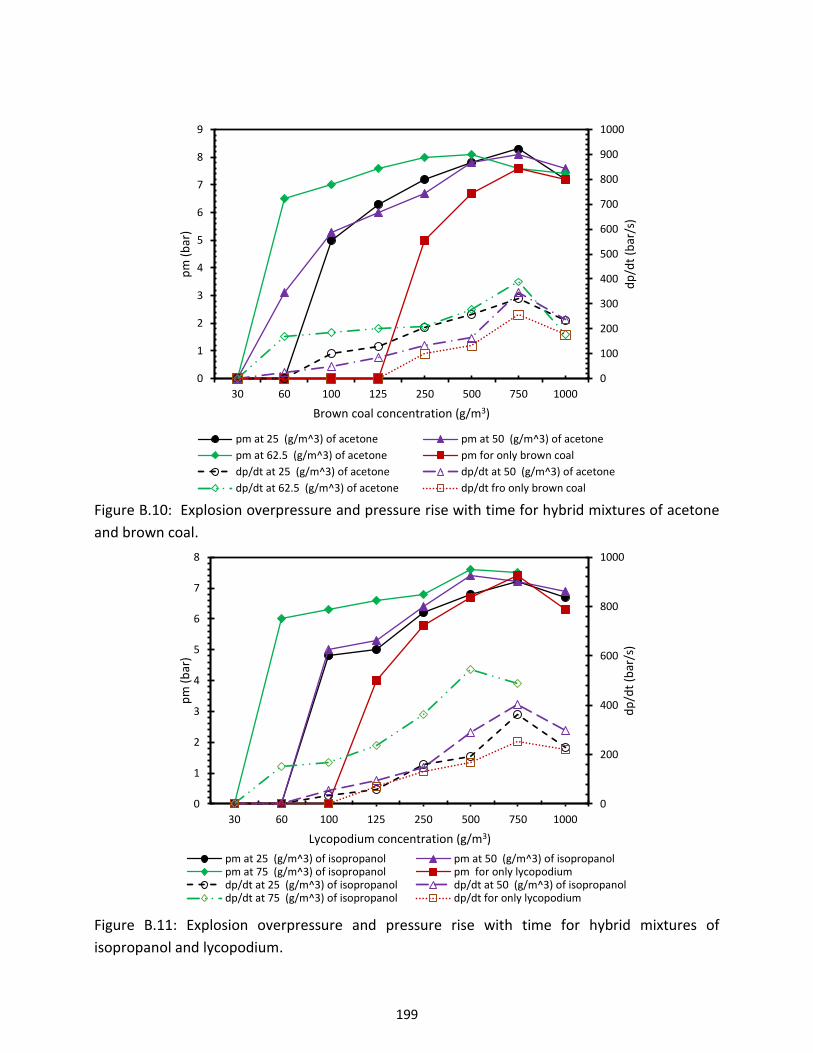
199
Figure B.10: Explosion overpressure and pressure rise with time for hybrid mixtures of acetone
and brown coal.
Figure B.11: Explosion overpressure and pressure rise with time for hybrid mixtures of
isopropanol and lycopodium.
0
100
200
300
400
500
600
700
800
900
1000
0
1
2
3
4
5
6
7
8
9
30 60 100 125 250 500 750 1000
dp
/dt
(bar
/s)
pm
(b
ar)
Brown coal concentration (g/m3)
pm at 25 (g/m^3) of acetone pm at 50 (g/m^3) of acetone
pm at 62.5 (g/m^3) of acetone pm for only brown coal
dp/dt at 25 (g/m^3) of acetone dp/dt at 50 (g/m^3) of acetone
dp/dt at 62.5 (g/m^3) of acetone dp/dt fro only brown coal
0
200
400
600
800
1000
0
1
2
3
4
5
6
7
8
30 60 100 125 250 500 750 1000
dp
/dt
(bar
/s)
pm
(b
ar)
Lycopodium concentration (g/m3)
pm at 25 (g/m^3) of isopropanol pm at 50 (g/m^3) of isopropanolpm at 75 (g/m^3) of isopropanol pm for only lycopodiumdp/dt at 25 (g/m^3) of isopropanol dp/dt at 50 (g/m^3) of isopropanoldp/dt at 75 (g/m^3) of isopropanol dp/dt for only lycopodium
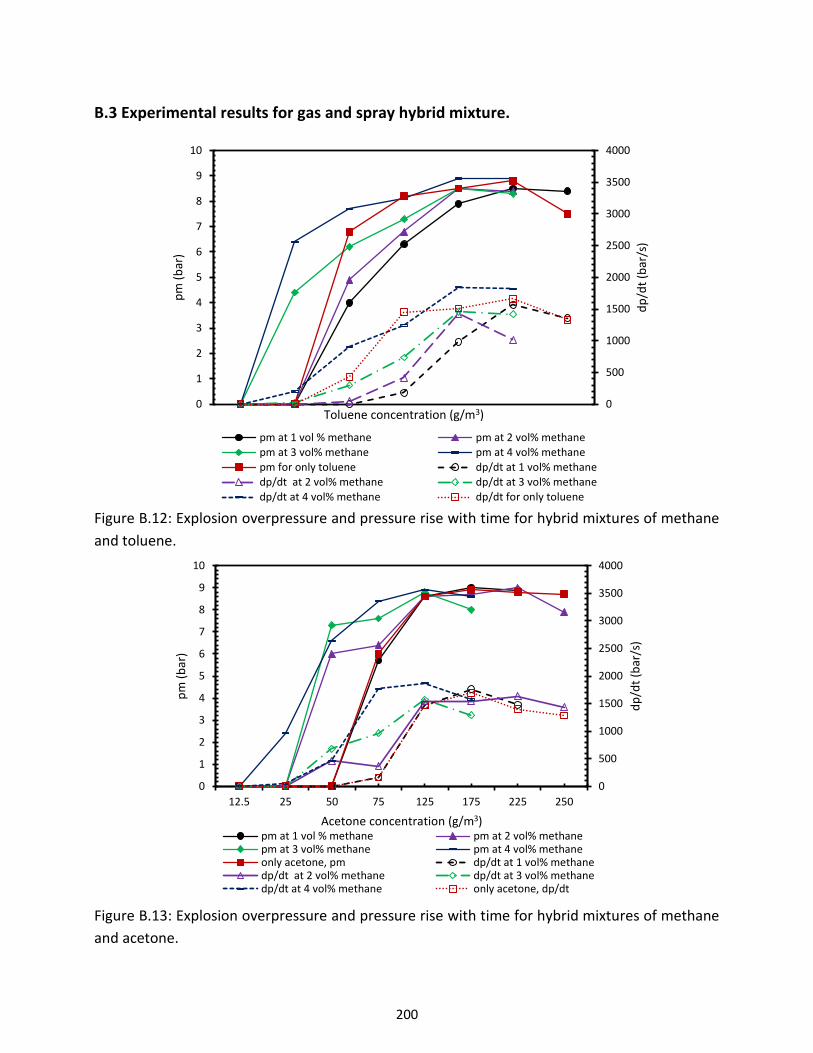
200
B.3 Experimental results for gas and spray hybrid mixture.
Figure B.12: Explosion overpressure and pressure rise with time for hybrid mixtures of methane
and toluene.
Figure B.13: Explosion overpressure and pressure rise with time for hybrid mixtures of methane
and acetone.
0
500
1000
1500
2000
2500
3000
3500
4000
0
1
2
3
4
5
6
7
8
9
10
dp
/dt
(bar
/s)
pm
(b
ar)
Toluene concentration (g/m3)
pm at 1 vol % methane pm at 2 vol% methanepm at 3 vol% methane pm at 4 vol% methanepm for only toluene dp/dt at 1 vol% methanedp/dt at 2 vol% methane dp/dt at 3 vol% methanedp/dt at 4 vol% methane dp/dt for only toluene
0
500
1000
1500
2000
2500
3000
3500
4000
0
1
2
3
4
5
6
7
8
9
10
12.5 25 50 75 125 175 225 250
dp
/dt
(bar
/s)
pm
(b
ar)
Acetone concentration (g/m3)pm at 1 vol % methane pm at 2 vol% methanepm at 3 vol% methane pm at 4 vol% methaneonly acetone, pm dp/dt at 1 vol% methanedp/dt at 2 vol% methane dp/dt at 3 vol% methanedp/dt at 4 vol% methane only acetone, dp/dt
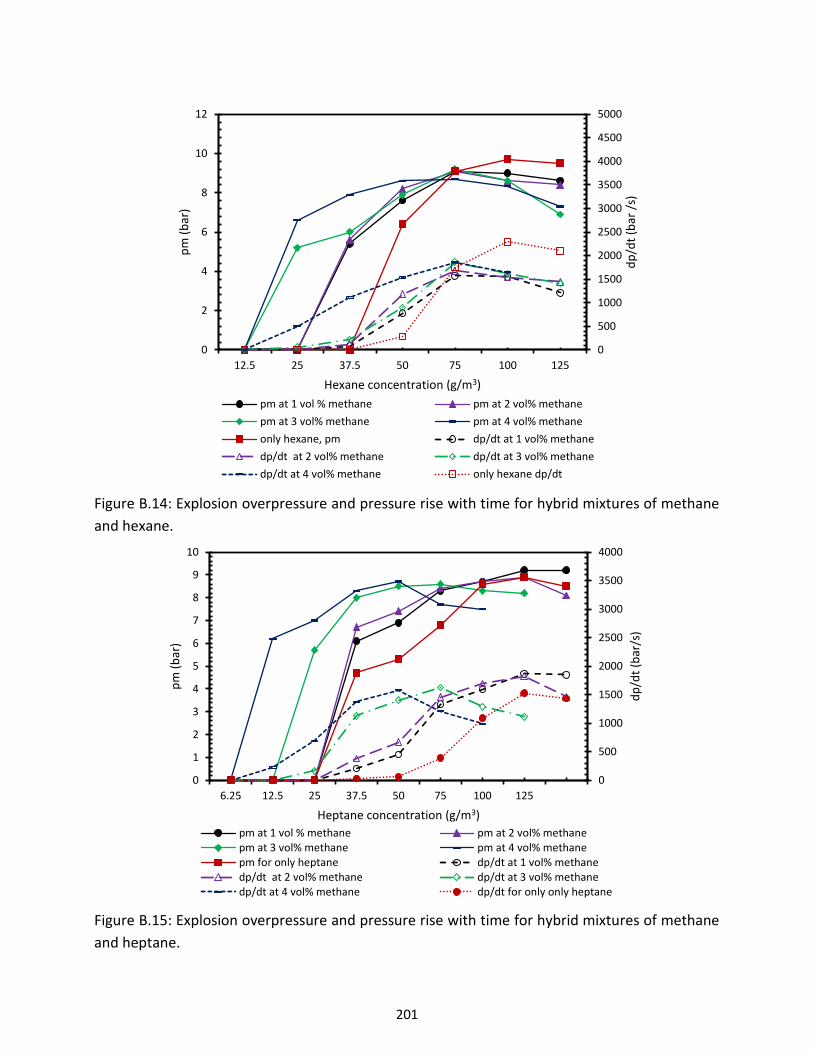
201
Figure B.14: Explosion overpressure and pressure rise with time for hybrid mixtures of methane
and hexane.
Figure B.15: Explosion overpressure and pressure rise with time for hybrid mixtures of methane
and heptane.
0
500
1000
1500
2000
2500
3000
3500
4000
4500
5000
0
2
4
6
8
10
12
12.5 25 37.5 50 75 100 125
dp
/dt
(bar
/s)
pm
(b
ar)
Hexane concentration (g/m3)
pm at 1 vol % methane pm at 2 vol% methane
pm at 3 vol% methane pm at 4 vol% methane
only hexane, pm dp/dt at 1 vol% methane
dp/dt at 2 vol% methane dp/dt at 3 vol% methane
dp/dt at 4 vol% methane only hexane dp/dt
0
500
1000
1500
2000
2500
3000
3500
4000
0
1
2
3
4
5
6
7
8
9
10
6.25 12.5 25 37.5 50 75 100 125
dp
/dt
(bar
/s)
pm
(b
ar)
Heptane concentration (g/m3)
pm at 1 vol % methane pm at 2 vol% methanepm at 3 vol% methane pm at 4 vol% methanepm for only heptane dp/dt at 1 vol% methanedp/dt at 2 vol% methane dp/dt at 3 vol% methanedp/dt at 4 vol% methane dp/dt for only only heptane
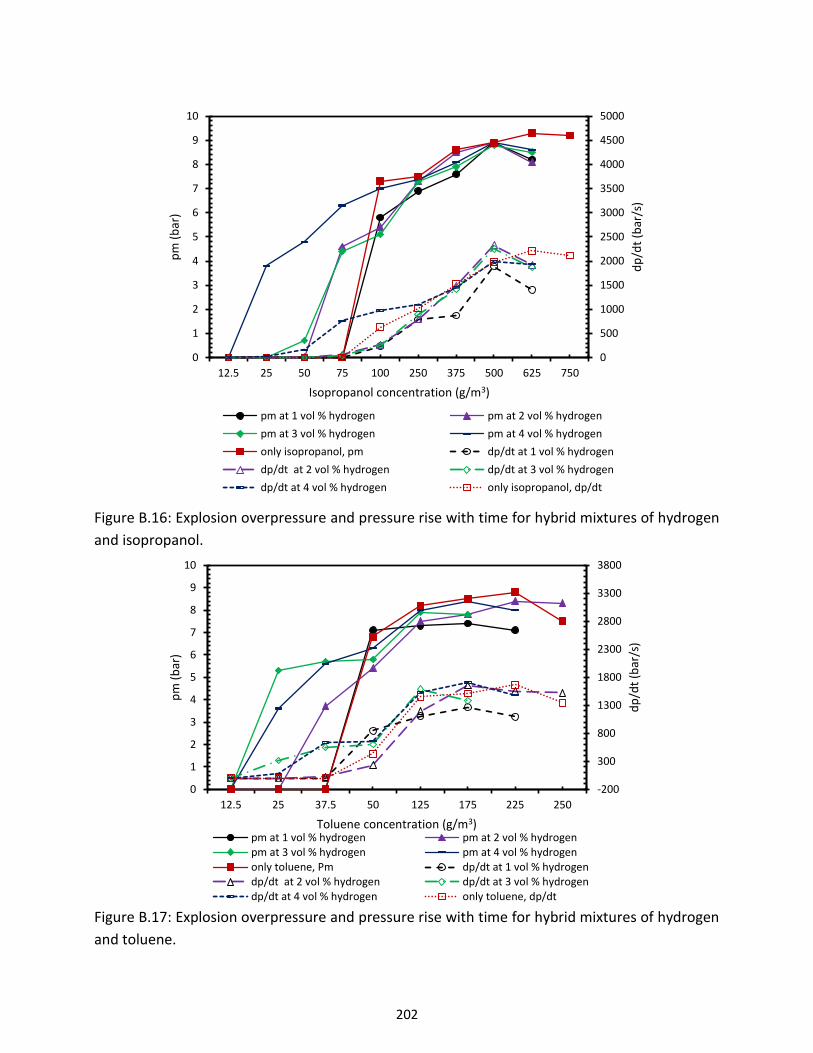
202
Figure B.16: Explosion overpressure and pressure rise with time for hybrid mixtures of hydrogen
and isopropanol.
Figure B.17: Explosion overpressure and pressure rise with time for hybrid mixtures of hydrogen
and toluene.
0
500
1000
1500
2000
2500
3000
3500
4000
4500
5000
0
1
2
3
4
5
6
7
8
9
10
12.5 25 50 75 100 250 375 500 625 750
dp
/dt
(bar
/s)
pm
(b
ar)
Isopropanol concentration (g/m3)
pm at 1 vol % hydrogen pm at 2 vol % hydrogen
pm at 3 vol % hydrogen pm at 4 vol % hydrogen
only isopropanol, pm dp/dt at 1 vol % hydrogen
dp/dt at 2 vol % hydrogen dp/dt at 3 vol % hydrogen
dp/dt at 4 vol % hydrogen only isopropanol, dp/dt
-200
300
800
1300
1800
2300
2800
3300
3800
0
1
2
3
4
5
6
7
8
9
10
12.5 25 37.5 50 125 175 225 250
dp
/dt
(bar
/s)
pm
(b
ar)
Toluene concentration (g/m3)pm at 1 vol % hydrogen pm at 2 vol % hydrogenpm at 3 vol % hydrogen pm at 4 vol % hydrogenonly toluene, Pm dp/dt at 1 vol % hydrogendp/dt at 2 vol % hydrogen dp/dt at 3 vol % hydrogendp/dt at 4 vol % hydrogen only toluene, dp/dt
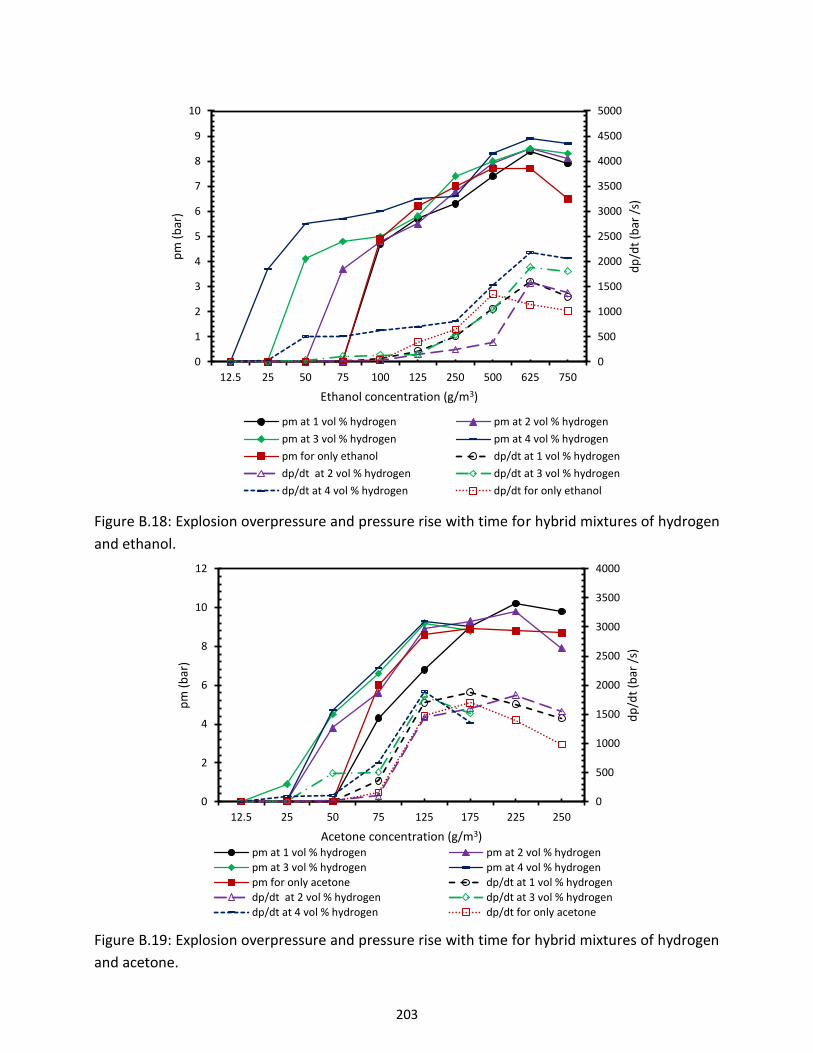
203
Figure B.18: Explosion overpressure and pressure rise with time for hybrid mixtures of hydrogen
and ethanol.
Figure B.19: Explosion overpressure and pressure rise with time for hybrid mixtures of hydrogen
and acetone.
0
500
1000
1500
2000
2500
3000
3500
4000
4500
5000
0
1
2
3
4
5
6
7
8
9
10
12.5 25 50 75 100 125 250 500 625 750
dp
/dt
(bar
/s)
pm
(b
ar)
Ethanol concentration (g/m3)
pm at 1 vol % hydrogen pm at 2 vol % hydrogen
pm at 3 vol % hydrogen pm at 4 vol % hydrogen
pm for only ethanol dp/dt at 1 vol % hydrogen
dp/dt at 2 vol % hydrogen dp/dt at 3 vol % hydrogen
dp/dt at 4 vol % hydrogen dp/dt for only ethanol
0
500
1000
1500
2000
2500
3000
3500
4000
0
2
4
6
8
10
12
12.5 25 50 75 125 175 225 250
dp
/dt
(bar
/s)
pm
(b
ar)
Acetone concentration (g/m3)pm at 1 vol % hydrogen pm at 2 vol % hydrogenpm at 3 vol % hydrogen pm at 4 vol % hydrogenpm for only acetone dp/dt at 1 vol % hydrogendp/dt at 2 vol % hydrogen dp/dt at 3 vol % hydrogendp/dt at 4 vol % hydrogen dp/dt for only acetone
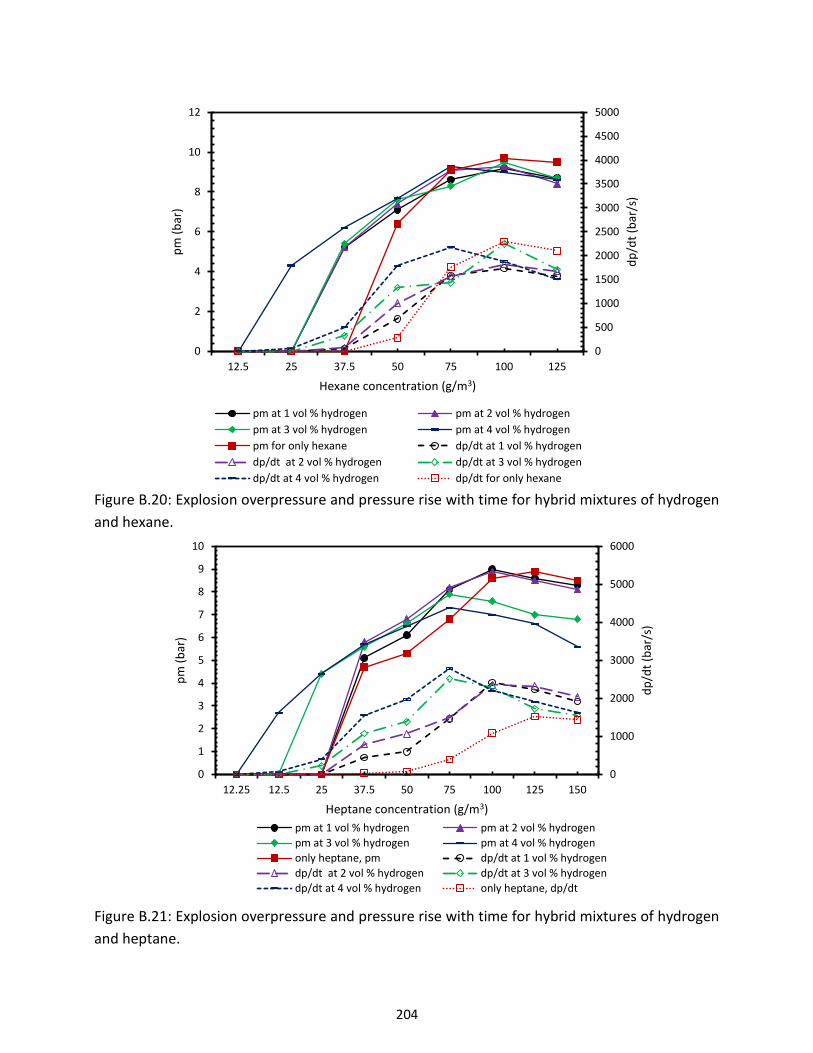
204
Figure B.20: Explosion overpressure and pressure rise with time for hybrid mixtures of hydrogen
and hexane.
Figure B.21: Explosion overpressure and pressure rise with time for hybrid mixtures of hydrogen
and heptane.
0
500
1000
1500
2000
2500
3000
3500
4000
4500
5000
0
2
4
6
8
10
12
12.5 25 37.5 50 75 100 125
dp
/dt
(bar
/s)
pm
(b
ar)
Hexane concentration (g/m3)
pm at 1 vol % hydrogen pm at 2 vol % hydrogen
pm at 3 vol % hydrogen pm at 4 vol % hydrogen
pm for only hexane dp/dt at 1 vol % hydrogen
dp/dt at 2 vol % hydrogen dp/dt at 3 vol % hydrogen
dp/dt at 4 vol % hydrogen dp/dt for only hexane
0
1000
2000
3000
4000
5000
6000
0
1
2
3
4
5
6
7
8
9
10
12.25 12.5 25 37.5 50 75 100 125 150
dp
/dt
(bar
/s)
pm
(b
ar)
Heptane concentration (g/m3)
pm at 1 vol % hydrogen pm at 2 vol % hydrogen
pm at 3 vol % hydrogen pm at 4 vol % hydrogen
only heptane, pm dp/dt at 1 vol % hydrogen
dp/dt at 2 vol % hydrogen dp/dt at 3 vol % hydrogen
dp/dt at 4 vol % hydrogen only heptane, dp/dt
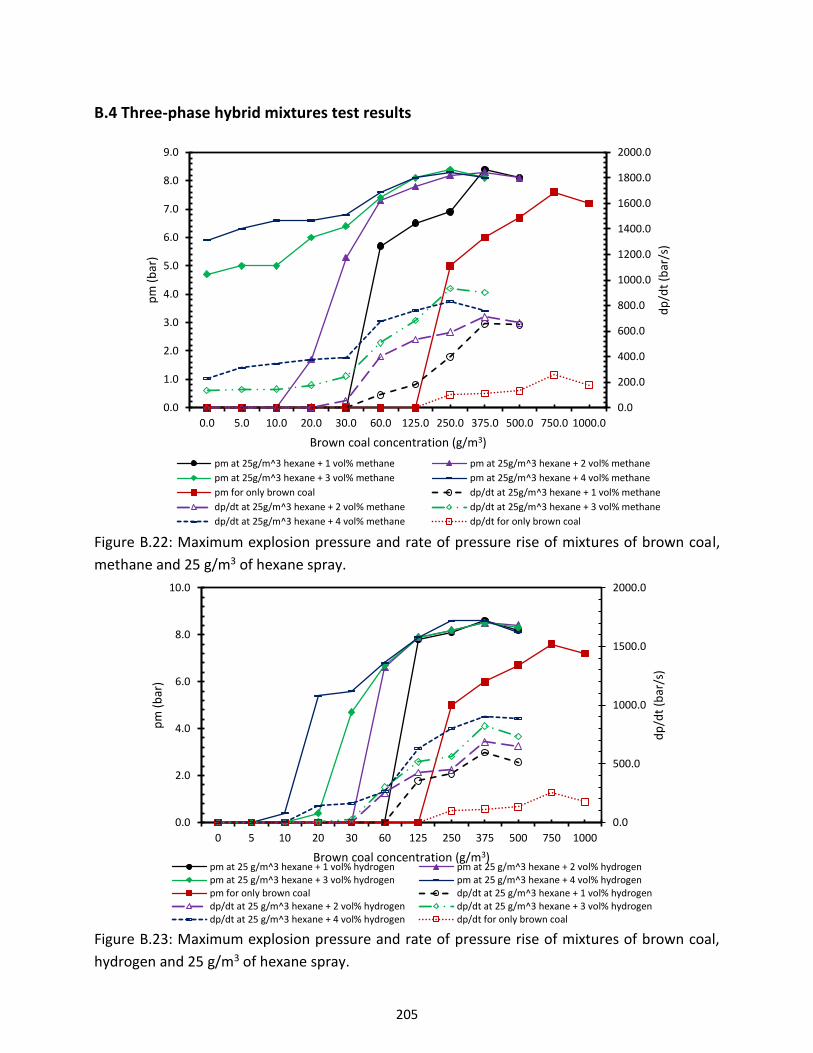
205
B.4 Three-phase hybrid mixtures test results
Figure B.22: Maximum explosion pressure and rate of pressure rise of mixtures of brown coal,
methane and 25 g/m3 of hexane spray.
Figure B.23: Maximum explosion pressure and rate of pressure rise of mixtures of brown coal,
hydrogen and 25 g/m3 of hexane spray.
0.0
200.0
400.0
600.0
800.0
1000.0
1200.0
1400.0
1600.0
1800.0
2000.0
0.0
1.0
2.0
3.0
4.0
5.0
6.0
7.0
8.0
9.0
0.0 5.0 10.0 20.0 30.0 60.0 125.0 250.0 375.0 500.0 750.0 1000.0
dp
/dt
(bar
/s)
pm
(b
ar)
Brown coal concentration (g/m3)
pm at 25g/m^3 hexane + 1 vol% methane pm at 25g/m^3 hexane + 2 vol% methane
pm at 25g/m^3 hexane + 3 vol% methane pm at 25g/m^3 hexane + 4 vol% methane
pm for only brown coal dp/dt at 25g/m^3 hexane + 1 vol% methane
dp/dt at 25g/m^3 hexane + 2 vol% methane dp/dt at 25g/m^3 hexane + 3 vol% methane
dp/dt at 25g/m^3 hexane + 4 vol% methane dp/dt for only brown coal
0.0
500.0
1000.0
1500.0
2000.0
0.0
2.0
4.0
6.0
8.0
10.0
0 5 10 20 30 60 125 250 375 500 750 1000
dp
/dt
(bar
/s)
pm
(b
ar)
Brown coal concentration (g/m3)pm at 25 g/m^3 hexane + 1 vol% hydrogen pm at 25 g/m^3 hexane + 2 vol% hydrogenpm at 25 g/m^3 hexane + 3 vol% hydrogen pm at 25 g/m^3 hexane + 4 vol% hydrogenpm for only brown coal dp/dt at 25 g/m^3 hexane + 1 vol% hydrogendp/dt at 25 g/m^3 hexane + 2 vol% hydrogen dp/dt at 25 g/m^3 hexane + 3 vol% hydrogendp/dt at 25 g/m^3 hexane + 4 vol% hydrogen dp/dt for only brown coal

206
Figure B.24: Maximum explosion pressure and rate of pressure rise of mixtures of lycopodium,
methane and 25 g/m3 of methane spray.
Figure B.25: Maximum explosion pressure and rate of pressure rise of mixtures of lycopodium,
hydrogen and 25 g/m3 of hexane spray.
0.0
200.0
400.0
600.0
800.0
1000.0
1200.0
1400.0
1600.0
1800.0
2000.0
0.0
1.0
2.0
3.0
4.0
5.0
6.0
7.0
8.0
9.0
0.0 5.0 10.0 20.0 30.0 60.0 125.0 250.0 500.0 750.0 1000.0
dp
/dt
(bar
/s)
pm
(b
ar)
Lycopodium concentration (g/m3)
pm at 25g/m^3 hexane + 1 vol% methane pm at 25g/m^3 hexane + 2 vol% methane
pm at 25g/m^3 hexane + 3 vol% methane pm at 25g/m^3 hexane + 4 vol% methane
pm for only lycopodium dp/dt at 25g/m^3 hexane + 1 vol% methane
dp/dt at 25g/m^3 hexane + 2 vol% methane dp/dt at 25g/m^3 hexane + 3 vol% methane
dp/dt at 25g/m^3 hexane + 4 vol% methane dp/dt for only lycopodium
0.0
500.0
1000.0
1500.0
2000.0
0.0
2.0
4.0
6.0
8.0
10.0
0.0 5.0 10.0 20.0 30.0 60.0 100.0 125.0 250.0 500.0 750.0 1000.0
dp
/dt
(bar
/s)
pm
(b
ar)
Lycopodium concentration (g/m3)pm at 25 g/m^3 hexane + 1 vol% hydrogen pm at 25 g/m^3 hexane + 2 vol% hydrogen
pm at 25 g/m^3 hexane + 3 vol% hydrogen pm at 25 g/m^3 hexane + 4 vol% hydrogen
pm for only lycopodium dp/dt at 25 g/m^3 hexane + 1 vol% hydrogen
dp/dt at 25 g/m^3 hexane + 2 vol% hydrogen dp/dt at 25 g/m^3 hexane + 3 vol% hydrogen
dp/dt at 25 g/m^3 hexane + 4 vol% hydrogen dp/dt for only lycopodium
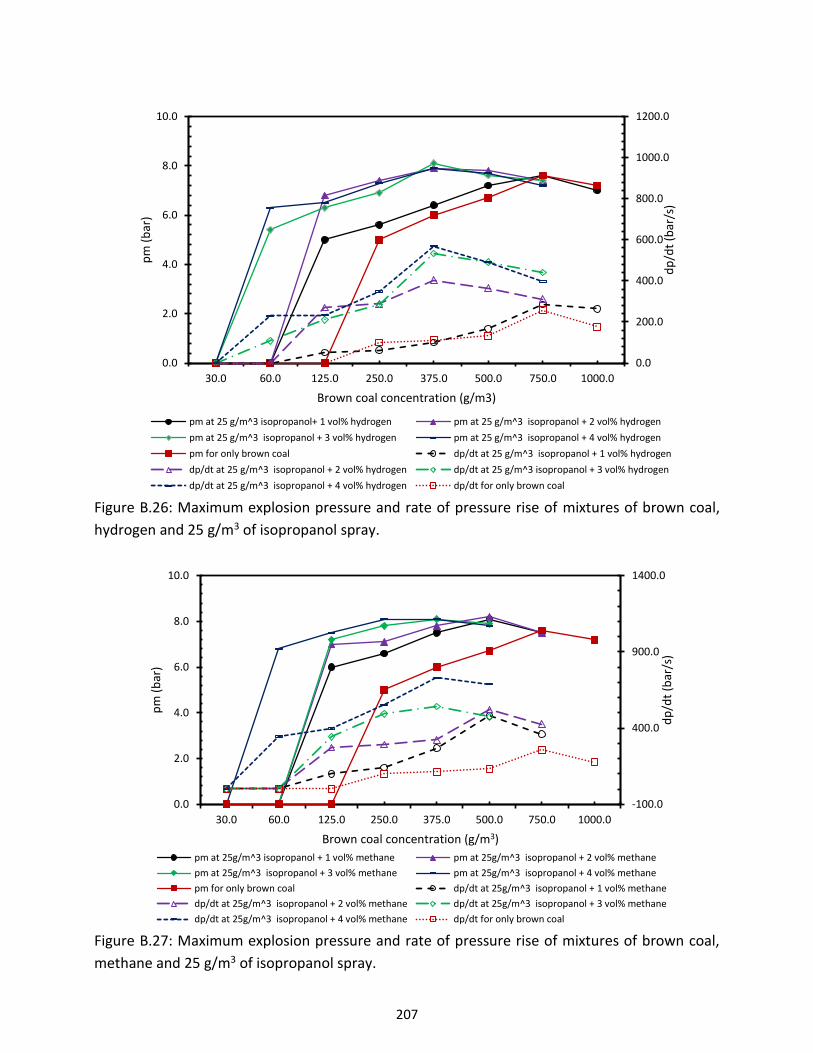
207
Figure B.26: Maximum explosion pressure and rate of pressure rise of mixtures of brown coal,
hydrogen and 25 g/m3 of isopropanol spray.
Figure B.27: Maximum explosion pressure and rate of pressure rise of mixtures of brown coal,
methane and 25 g/m3 of isopropanol spray.
0.0
200.0
400.0
600.0
800.0
1000.0
1200.0
0.0
2.0
4.0
6.0
8.0
10.0
30.0 60.0 125.0 250.0 375.0 500.0 750.0 1000.0
dp
/dt
(bar
/s)
pm
(b
ar)
Brown coal concentration (g/m3)
pm at 25 g/m^3 isopropanol+ 1 vol% hydrogen pm at 25 g/m^3 isopropanol + 2 vol% hydrogen
pm at 25 g/m^3 isopropanol + 3 vol% hydrogen pm at 25 g/m^3 isopropanol + 4 vol% hydrogen
pm for only brown coal dp/dt at 25 g/m^3 isopropanol + 1 vol% hydrogen
dp/dt at 25 g/m^3 isopropanol + 2 vol% hydrogen dp/dt at 25 g/m^3 isopropanol + 3 vol% hydrogen
dp/dt at 25 g/m^3 isopropanol + 4 vol% hydrogen dp/dt for only brown coal
-100.0
400.0
900.0
1400.0
0.0
2.0
4.0
6.0
8.0
10.0
30.0 60.0 125.0 250.0 375.0 500.0 750.0 1000.0
dp
/dt
(bar
/s)
pm
(b
ar)
Brown coal concentration (g/m3)
pm at 25g/m^3 isopropanol + 1 vol% methane pm at 25g/m^3 isopropanol + 2 vol% methane
pm at 25g/m^3 isopropanol + 3 vol% methane pm at 25g/m^3 isopropanol + 4 vol% methane
pm for only brown coal dp/dt at 25g/m^3 isopropanol + 1 vol% methane
dp/dt at 25g/m^3 isopropanol + 2 vol% methane dp/dt at 25g/m^3 isopropanol + 3 vol% methane
dp/dt at 25g/m^3 isopropanol + 4 vol% methane dp/dt for only brown coal
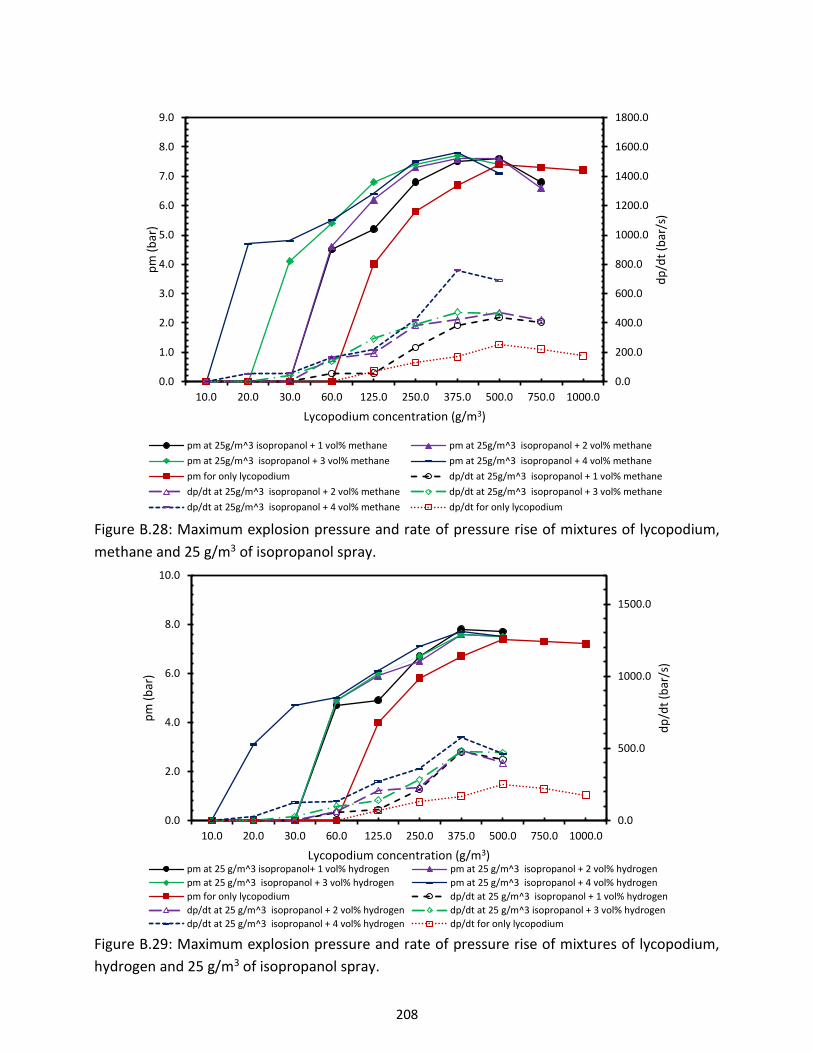
208
Figure B.28: Maximum explosion pressure and rate of pressure rise of mixtures of lycopodium,
methane and 25 g/m3 of isopropanol spray.
Figure B.29: Maximum explosion pressure and rate of pressure rise of mixtures of lycopodium,
hydrogen and 25 g/m3 of isopropanol spray.
0.0
200.0
400.0
600.0
800.0
1000.0
1200.0
1400.0
1600.0
1800.0
0.0
1.0
2.0
3.0
4.0
5.0
6.0
7.0
8.0
9.0
10.0 20.0 30.0 60.0 125.0 250.0 375.0 500.0 750.0 1000.0
dp
/dt
(bar
/s)
pm
(b
ar)
Lycopodium concentration (g/m3)
pm at 25g/m^3 isopropanol + 1 vol% methane pm at 25g/m^3 isopropanol + 2 vol% methane
pm at 25g/m^3 isopropanol + 3 vol% methane pm at 25g/m^3 isopropanol + 4 vol% methane
pm for only lycopodium dp/dt at 25g/m^3 isopropanol + 1 vol% methane
dp/dt at 25g/m^3 isopropanol + 2 vol% methane dp/dt at 25g/m^3 isopropanol + 3 vol% methane
dp/dt at 25g/m^3 isopropanol + 4 vol% methane dp/dt for only lycopodium
0.0
500.0
1000.0
1500.0
0.0
2.0
4.0
6.0
8.0
10.0
10.0 20.0 30.0 60.0 125.0 250.0 375.0 500.0 750.0 1000.0
dp
/dt
(bar
/s)
pm
(b
ar)
Lycopodium concentration (g/m3)pm at 25 g/m^3 isopropanol+ 1 vol% hydrogen pm at 25 g/m^3 isopropanol + 2 vol% hydrogen
pm at 25 g/m^3 isopropanol + 3 vol% hydrogen pm at 25 g/m^3 isopropanol + 4 vol% hydrogen
pm for only lycopodium dp/dt at 25 g/m^3 isopropanol + 1 vol% hydrogen
dp/dt at 25 g/m^3 isopropanol + 2 vol% hydrogen dp/dt at 25 g/m^3 isopropanol + 3 vol% hydrogen
dp/dt at 25 g/m^3 isopropanol + 4 vol% hydrogen dp/dt for only lycopodium
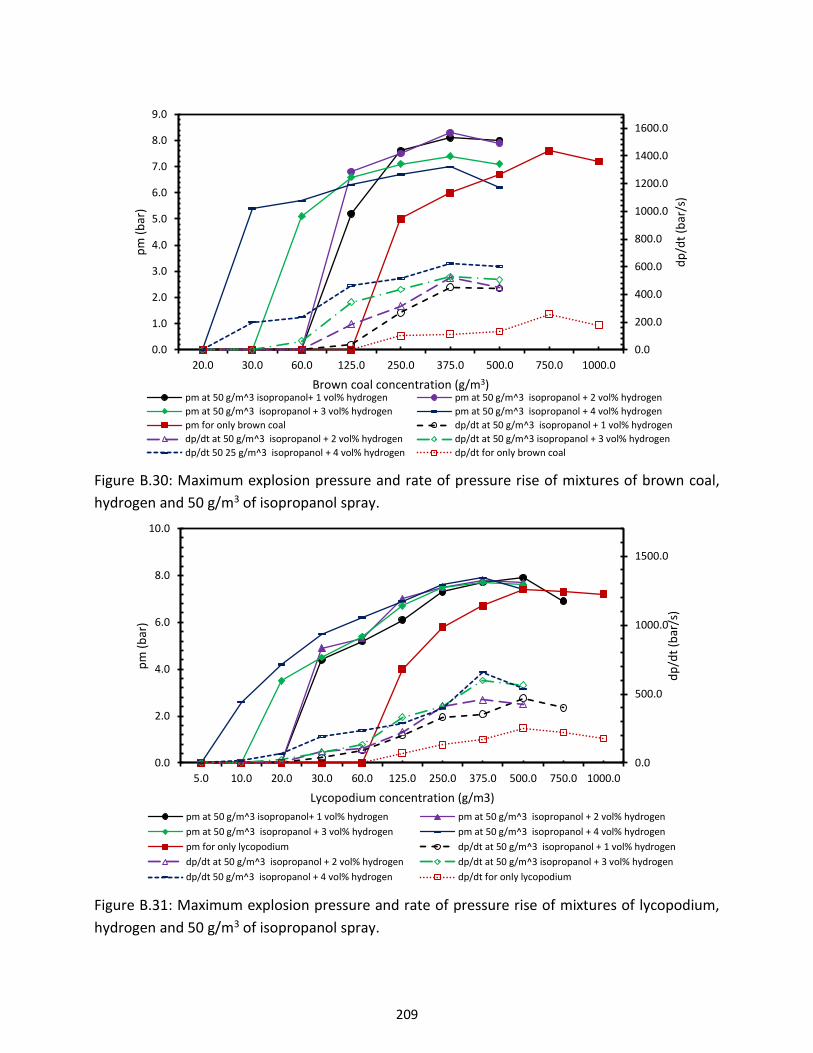
209
Figure B.30: Maximum explosion pressure and rate of pressure rise of mixtures of brown coal,
hydrogen and 50 g/m3 of isopropanol spray.
Figure B.31: Maximum explosion pressure and rate of pressure rise of mixtures of lycopodium,
hydrogen and 50 g/m3 of isopropanol spray.
0.0
200.0
400.0
600.0
800.0
1000.0
1200.0
1400.0
1600.0
0.0
1.0
2.0
3.0
4.0
5.0
6.0
7.0
8.0
9.0
20.0 30.0 60.0 125.0 250.0 375.0 500.0 750.0 1000.0
dp
/dt
(bar
/s)
pm
(b
ar)
Brown coal concentration (g/m3)pm at 50 g/m^3 isopropanol+ 1 vol% hydrogen pm at 50 g/m^3 isopropanol + 2 vol% hydrogen
pm at 50 g/m^3 isopropanol + 3 vol% hydrogen pm at 50 g/m^3 isopropanol + 4 vol% hydrogen
pm for only brown coal dp/dt at 50 g/m^3 isopropanol + 1 vol% hydrogen
dp/dt at 50 g/m^3 isopropanol + 2 vol% hydrogen dp/dt at 50 g/m^3 isopropanol + 3 vol% hydrogen
dp/dt 50 25 g/m^3 isopropanol + 4 vol% hydrogen dp/dt for only brown coal
0.0
500.0
1000.0
1500.0
0.0
2.0
4.0
6.0
8.0
10.0
5.0 10.0 20.0 30.0 60.0 125.0 250.0 375.0 500.0 750.0 1000.0
dp
/dt
(bar
/s)
pm
(b
ar)
Lycopodium concentration (g/m3)
pm at 50 g/m^3 isopropanol+ 1 vol% hydrogen pm at 50 g/m^3 isopropanol + 2 vol% hydrogen
pm at 50 g/m^3 isopropanol + 3 vol% hydrogen pm at 50 g/m^3 isopropanol + 4 vol% hydrogen
pm for only lycopodium dp/dt at 50 g/m^3 isopropanol + 1 vol% hydrogen
dp/dt at 50 g/m^3 isopropanol + 2 vol% hydrogen dp/dt at 50 g/m^3 isopropanol + 3 vol% hydrogen
dp/dt 50 g/m^3 isopropanol + 4 vol% hydrogen dp/dt for only lycopodium
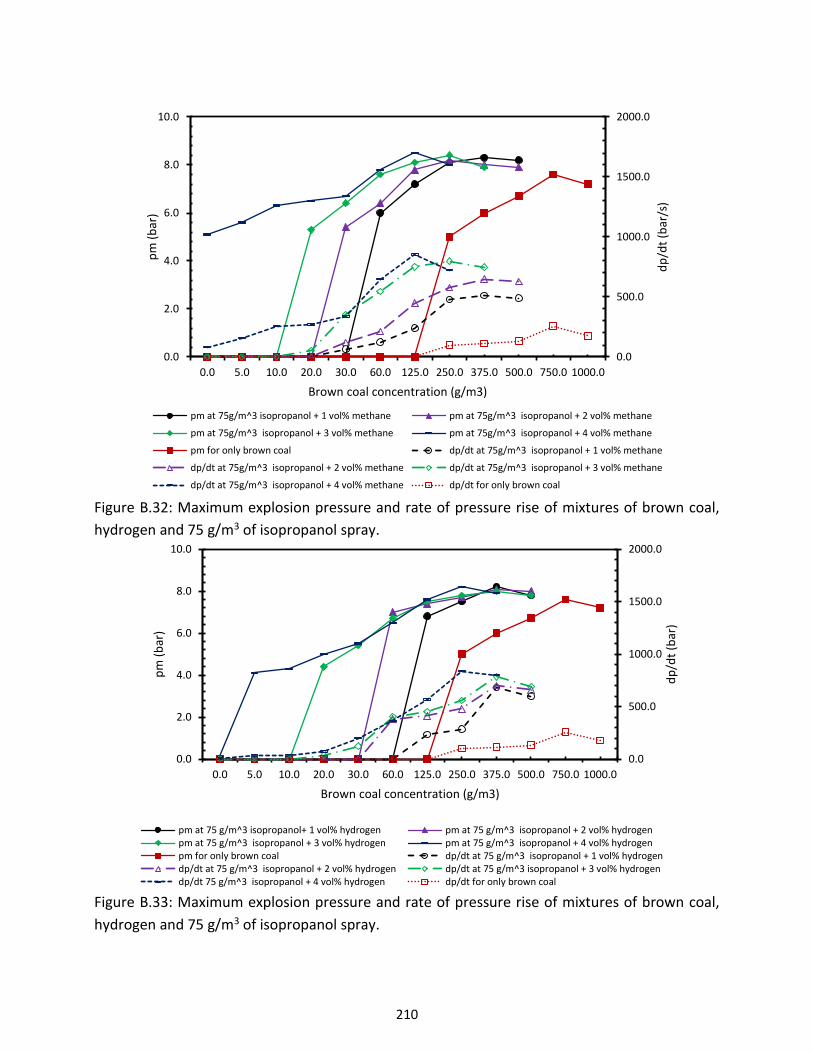
210
Figure B.32: Maximum explosion pressure and rate of pressure rise of mixtures of brown coal,
hydrogen and 75 g/m3 of isopropanol spray.
Figure B.33: Maximum explosion pressure and rate of pressure rise of mixtures of brown coal,
hydrogen and 75 g/m3 of isopropanol spray.
0.0
500.0
1000.0
1500.0
2000.0
0.0
2.0
4.0
6.0
8.0
10.0
0.0 5.0 10.0 20.0 30.0 60.0 125.0 250.0 375.0 500.0 750.0 1000.0
dp
/dt
(bar
/s)
pm
(b
ar)
Brown coal concentration (g/m3)
pm at 75g/m^3 isopropanol + 1 vol% methane pm at 75g/m^3 isopropanol + 2 vol% methane
pm at 75g/m^3 isopropanol + 3 vol% methane pm at 75g/m^3 isopropanol + 4 vol% methane
pm for only brown coal dp/dt at 75g/m^3 isopropanol + 1 vol% methane
dp/dt at 75g/m^3 isopropanol + 2 vol% methane dp/dt at 75g/m^3 isopropanol + 3 vol% methane
dp/dt at 75g/m^3 isopropanol + 4 vol% methane dp/dt for only brown coal
0.0
500.0
1000.0
1500.0
2000.0
0.0
2.0
4.0
6.0
8.0
10.0
0.0 5.0 10.0 20.0 30.0 60.0 125.0 250.0 375.0 500.0 750.0 1000.0
dp
/dt
(bar
)
pm
(b
ar)
Brown coal concentration (g/m3)
pm at 75 g/m^3 isopropanol+ 1 vol% hydrogen pm at 75 g/m^3 isopropanol + 2 vol% hydrogenpm at 75 g/m^3 isopropanol + 3 vol% hydrogen pm at 75 g/m^3 isopropanol + 4 vol% hydrogenpm for only brown coal dp/dt at 75 g/m^3 isopropanol + 1 vol% hydrogendp/dt at 75 g/m^3 isopropanol + 2 vol% hydrogen dp/dt at 75 g/m^3 isopropanol + 3 vol% hydrogendp/dt 75 g/m^3 isopropanol + 4 vol% hydrogen dp/dt for only brown coal
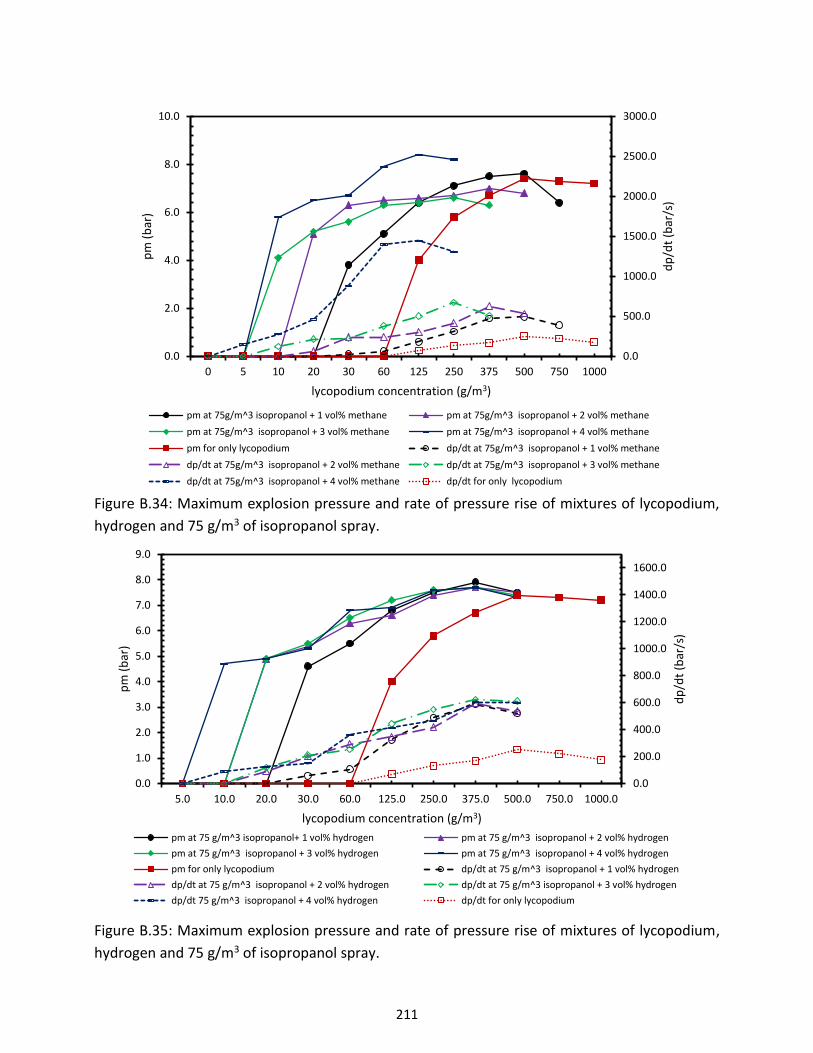
211
Figure B.34: Maximum explosion pressure and rate of pressure rise of mixtures of lycopodium,
hydrogen and 75 g/m3 of isopropanol spray.
Figure B.35: Maximum explosion pressure and rate of pressure rise of mixtures of lycopodium,
hydrogen and 75 g/m3 of isopropanol spray.
0.0
500.0
1000.0
1500.0
2000.0
2500.0
3000.0
0.0
2.0
4.0
6.0
8.0
10.0
0 5 10 20 30 60 125 250 375 500 750 1000
dp
/dt
(bar
/s)
pm
(b
ar)
lycopodium concentration (g/m3)
pm at 75g/m^3 isopropanol + 1 vol% methane pm at 75g/m^3 isopropanol + 2 vol% methane
pm at 75g/m^3 isopropanol + 3 vol% methane pm at 75g/m^3 isopropanol + 4 vol% methane
pm for only lycopodium dp/dt at 75g/m^3 isopropanol + 1 vol% methane
dp/dt at 75g/m^3 isopropanol + 2 vol% methane dp/dt at 75g/m^3 isopropanol + 3 vol% methane
dp/dt at 75g/m^3 isopropanol + 4 vol% methane dp/dt for only lycopodium
0.0
200.0
400.0
600.0
800.0
1000.0
1200.0
1400.0
1600.0
0.0
1.0
2.0
3.0
4.0
5.0
6.0
7.0
8.0
9.0
5.0 10.0 20.0 30.0 60.0 125.0 250.0 375.0 500.0 750.0 1000.0
dp
/dt
(bar
/s)
pm
(b
ar)
lycopodium concentration (g/m3)
pm at 75 g/m^3 isopropanol+ 1 vol% hydrogen pm at 75 g/m^3 isopropanol + 2 vol% hydrogen
pm at 75 g/m^3 isopropanol + 3 vol% hydrogen pm at 75 g/m^3 isopropanol + 4 vol% hydrogen
pm for only lycopodium dp/dt at 75 g/m^3 isopropanol + 1 vol% hydrogen
dp/dt at 75 g/m^3 isopropanol + 2 vol% hydrogen dp/dt at 75 g/m^3 isopropanol + 3 vol% hydrogen
dp/dt 75 g/m^3 isopropanol + 4 vol% hydrogen dp/dt for only lycopodium
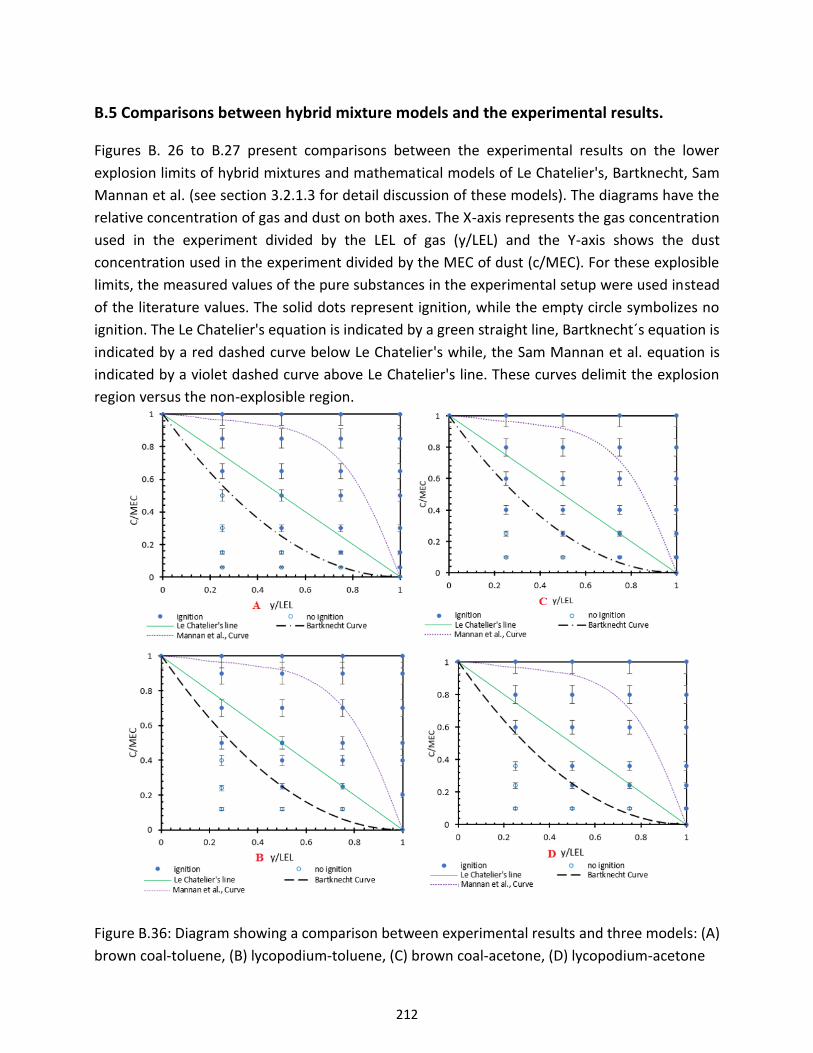
212
B.5 Comparisons between hybrid mixture models and the experimental results.
Figures B. 26 to B.27 present comparisons between the experimental results on the lower
explosion limits of hybrid mixtures and mathematical models of Le Chatelier's, Bartknecht, Sam
Mannan et al. (see section 3.2.1.3 for detail discussion of these models). The diagrams have the
relative concentration of gas and dust on both axes. The X-axis represents the gas concentration
used in the experiment divided by the LEL of gas (y/LEL) and the Y-axis shows the dust
concentration used in the experiment divided by the MEC of dust (c/MEC). For these explosible
limits, the measured values of the pure substances in the experimental setup were used instead
of the literature values. The solid dots represent ignition, while the empty circle symbolizes no
ignition. The Le Chatelier's equation is indicated by a green straight line, Bartknecht´s equation is
indicated by a red dashed curve below Le Chatelier's while, the Sam Mannan et al. equation is
indicated by a violet dashed curve above Le Chatelier's line. These curves delimit the explosion
region versus the non-explosible region.
Figure B.36: Diagram showing a comparison between experimental results and three models: (A)
brown coal-toluene, (B) lycopodium-toluene, (C) brown coal-acetone, (D) lycopodium-acetone
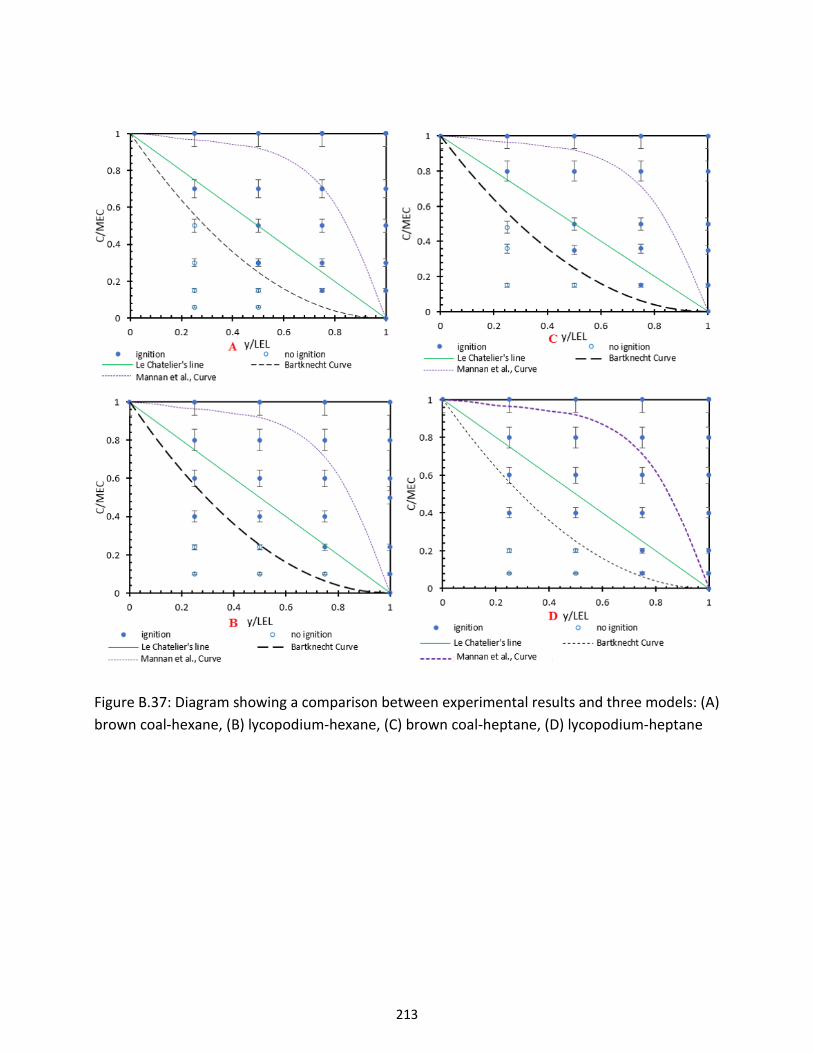
213
Figure B.37: Diagram showing a comparison between experimental results and three models: (A)
brown coal-hexane, (B) lycopodium-hexane, (C) brown coal-heptane, (D) lycopodium-heptane
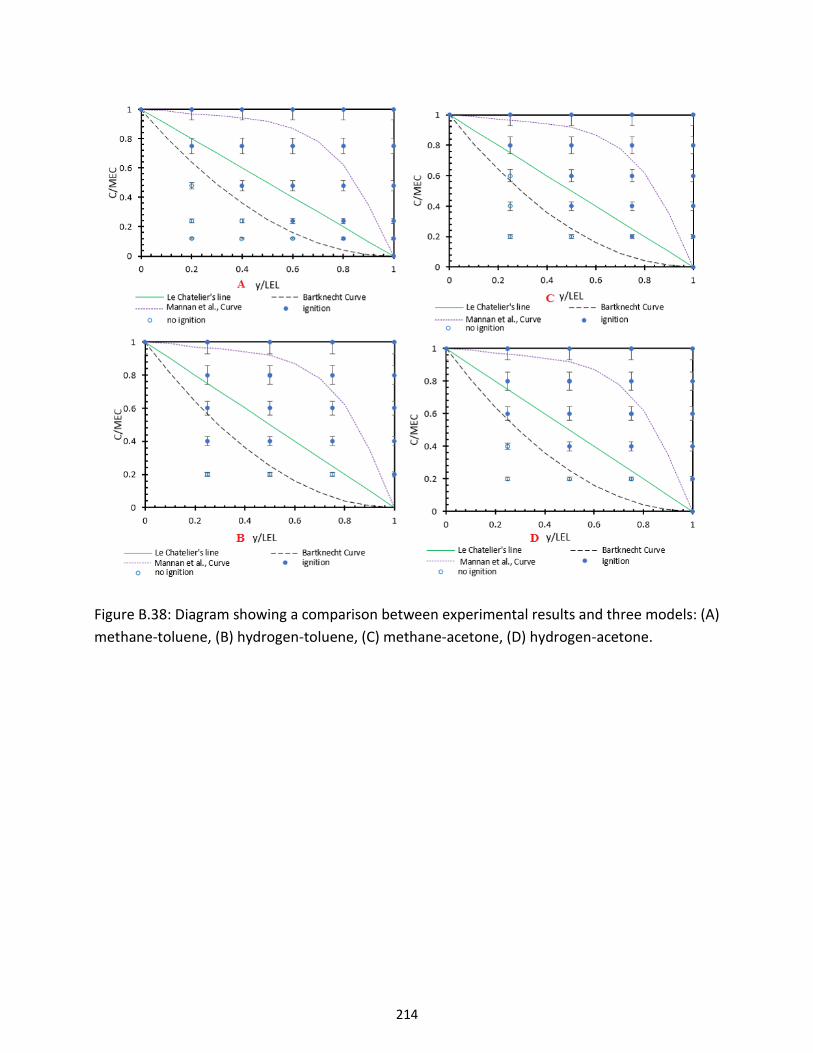
214
Figure B.38: Diagram showing a comparison between experimental results and three models: (A)
methane-toluene, (B) hydrogen-toluene, (C) methane-acetone, (D) hydrogen-acetone.
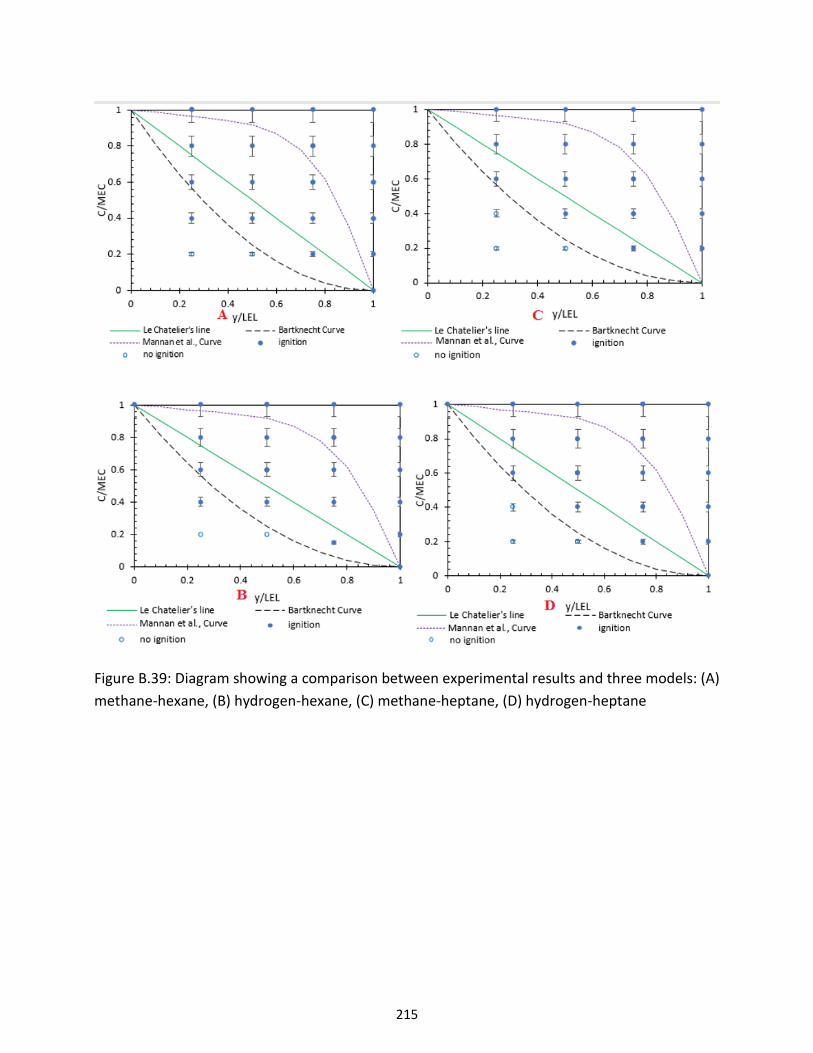
215
Figure B.39: Diagram showing a comparison between experimental results and three models: (A)
methane-hexane, (B) hydrogen-hexane, (C) methane-heptane, (D) hydrogen-heptane
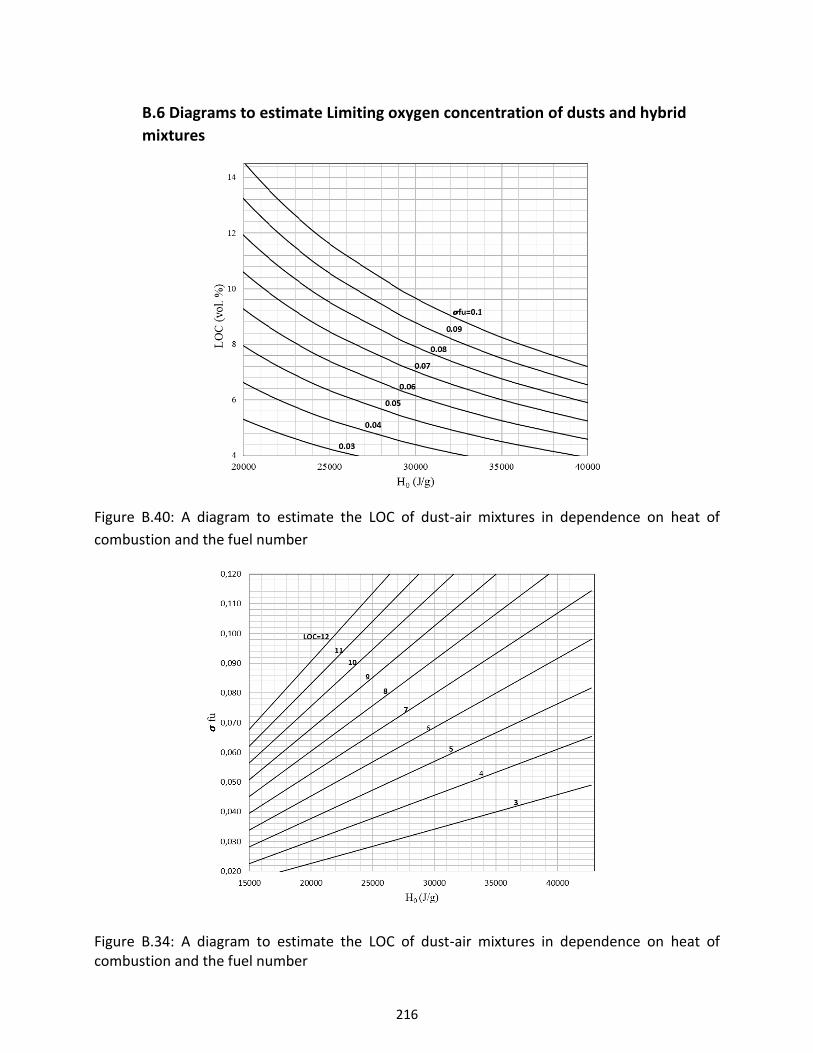
216
B.6 Diagrams to estimate Limiting oxygen concentration of dusts and hybrid
mixtures
Figure B.40: A diagram to estimate the LOC of dust-air mixtures in dependence on heat of
combustion and the fuel number
Figure B.34: A diagram to estimate the LOC of dust-air mixtures in dependence on heat of combustion and the fuel number
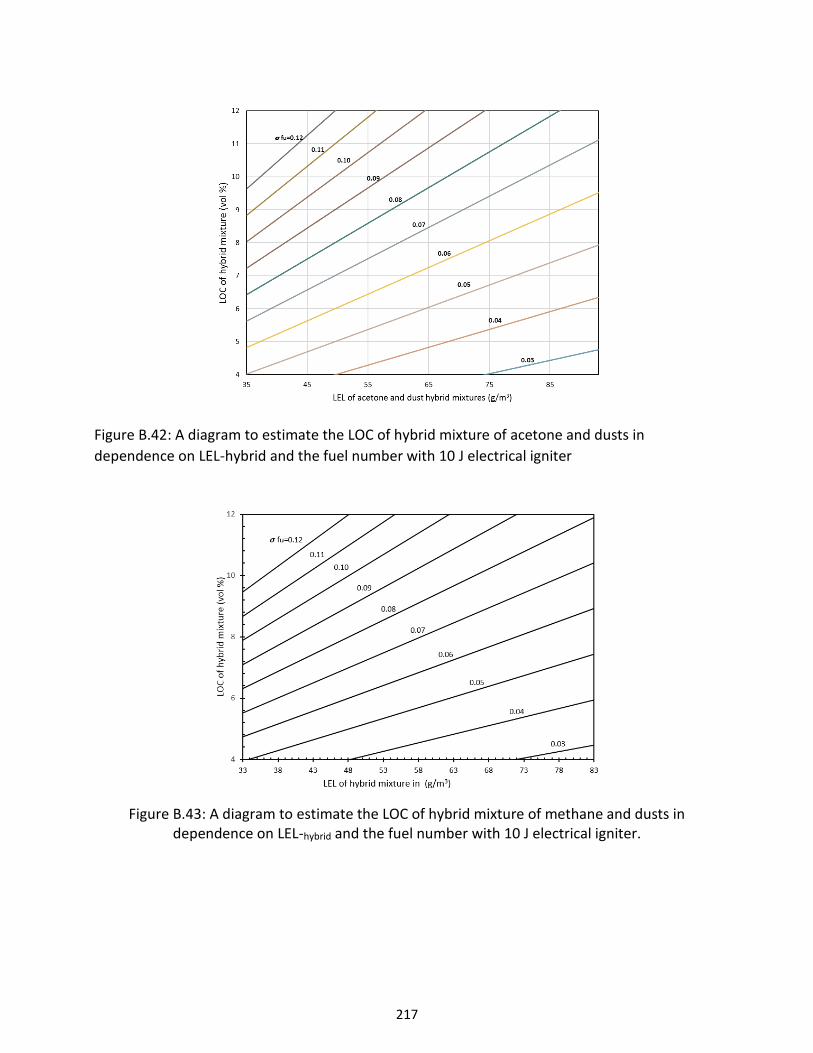
217
Figure B.42: A diagram to estimate the LOC of hybrid mixture of acetone and dusts in
dependence on LEL-hybrid and the fuel number with 10 J electrical igniter
Figure B.43: A diagram to estimate the LOC of hybrid mixture of methane and dusts in dependence on LEL-hybrid and the fuel number with 10 J electrical igniter.
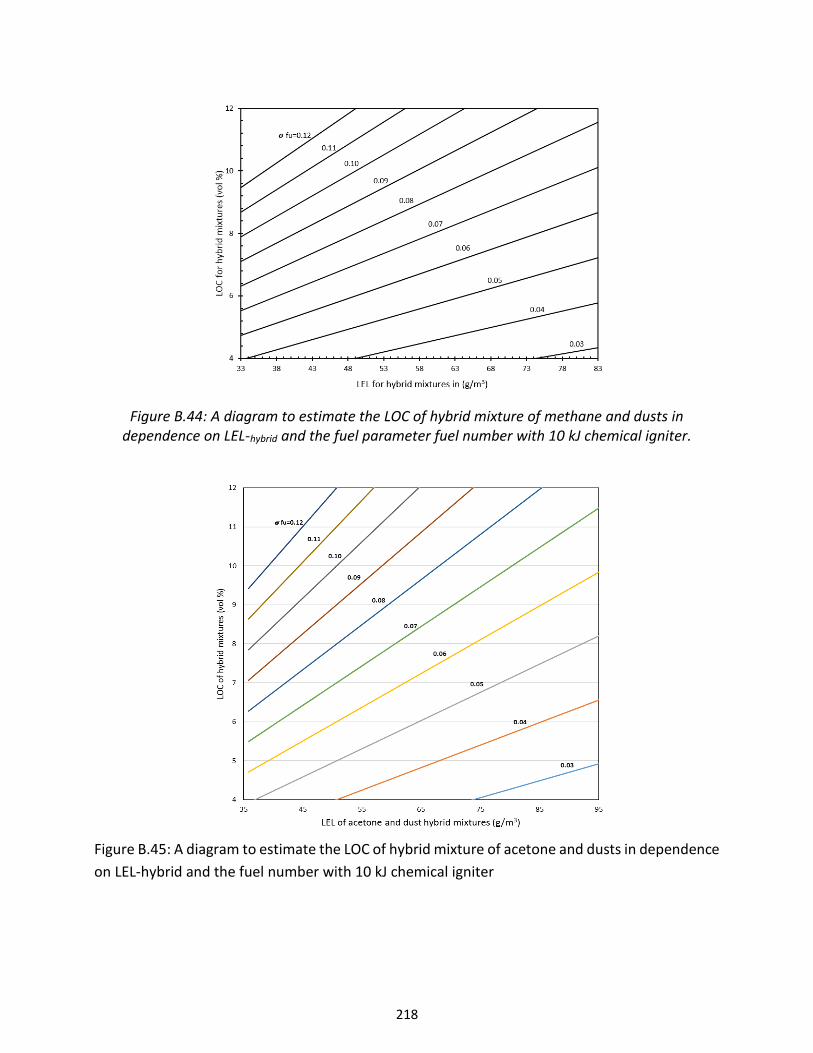
218
Figure B.44: A diagram to estimate the LOC of hybrid mixture of methane and dusts in dependence on LEL-hybrid and the fuel parameter fuel number with 10 kJ chemical igniter.
Figure B.45: A diagram to estimate the LOC of hybrid mixture of acetone and dusts in dependence
on LEL-hybrid and the fuel number with 10 kJ chemical igniter

219
Figure B.46: A diagram to estimate the LOC of hybrid mixture of isopropanol and dusts in
dependence on LEL-hybrid and the fuel number with 10 J electrical igniter.
Figure B.47: A diagram to estimate the LOC of hybrid mixture of isopropanol and dusts in
dependence on LEL-hybrid and the fuel number with 10 kJ chemical igniter.
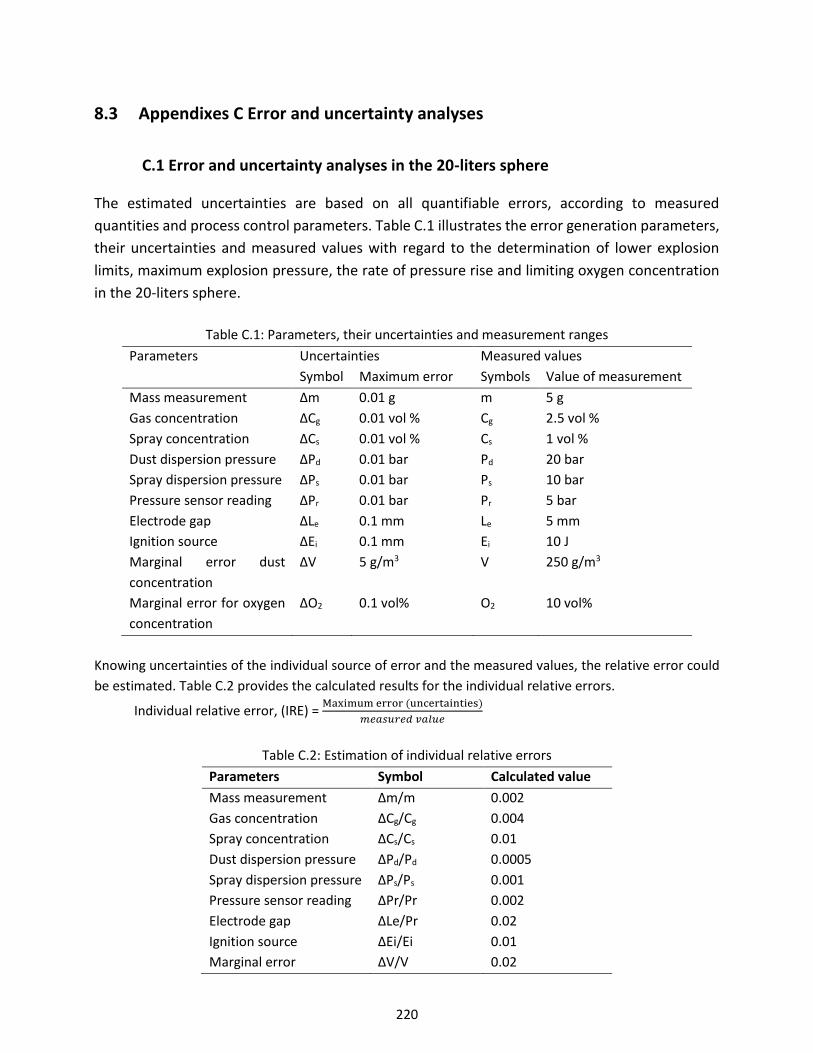
220
8.3 Appendixes C Error and uncertainty analyses
C.1 Error and uncertainty analyses in the 20-liters sphere
The estimated uncertainties are based on all quantifiable errors, according to measured
quantities and process control parameters. Table C.1 illustrates the error generation parameters,
their uncertainties and measured values with regard to the determination of lower explosion
limits, maximum explosion pressure, the rate of pressure rise and limiting oxygen concentration
in the 20-liters sphere.
Table C.1: Parameters, their uncertainties and measurement ranges
Parameters Uncertainties Measured values
Symbol Maximum error Symbols Value of measurement
Mass measurement Δm 0.01 g m 5 g
Gas concentration ΔCg 0.01 vol % Cg 2.5 vol %
Spray concentration ΔCs 0.01 vol % Cs 1 vol %
Dust dispersion pressure ΔPd 0.01 bar Pd 20 bar
Spray dispersion pressure ΔPs 0.01 bar Ps 10 bar
Pressure sensor reading ΔPr 0.01 bar Pr 5 bar
Electrode gap ΔLe 0.1 mm Le 5 mm
Ignition source ΔEi 0.1 mm Ei 10 J
Marginal error dust
concentration
ΔV 5 g/m3 V 250 g/m3
Marginal error for oxygen
concentration
ΔO2 0.1 vol% O2 10 vol%
Knowing uncertainties of the individual source of error and the measured values, the relative error could
be estimated. Table C.2 provides the calculated results for the individual relative errors.
Individual relative error, (IRE) = Maximum error (uncertainties)
𝑚𝑒𝑎𝑠𝑢𝑟𝑒𝑑 𝑣𝑎𝑙𝑢𝑒
Table C.2: Estimation of individual relative errors
Parameters Symbol Calculated value
Mass measurement Δm/m 0.002
Gas concentration ΔCg/Cg 0.004
Spray concentration ΔCs/Cs 0.01
Dust dispersion pressure ΔPd/Pd 0.0005
Spray dispersion pressure ΔPs/Ps 0.001
Pressure sensor reading ΔPr/Pr 0.002
Electrode gap ΔLe/Pr 0.02
Ignition source ΔEi/Ei 0.01
Marginal error ΔV/V 0.02
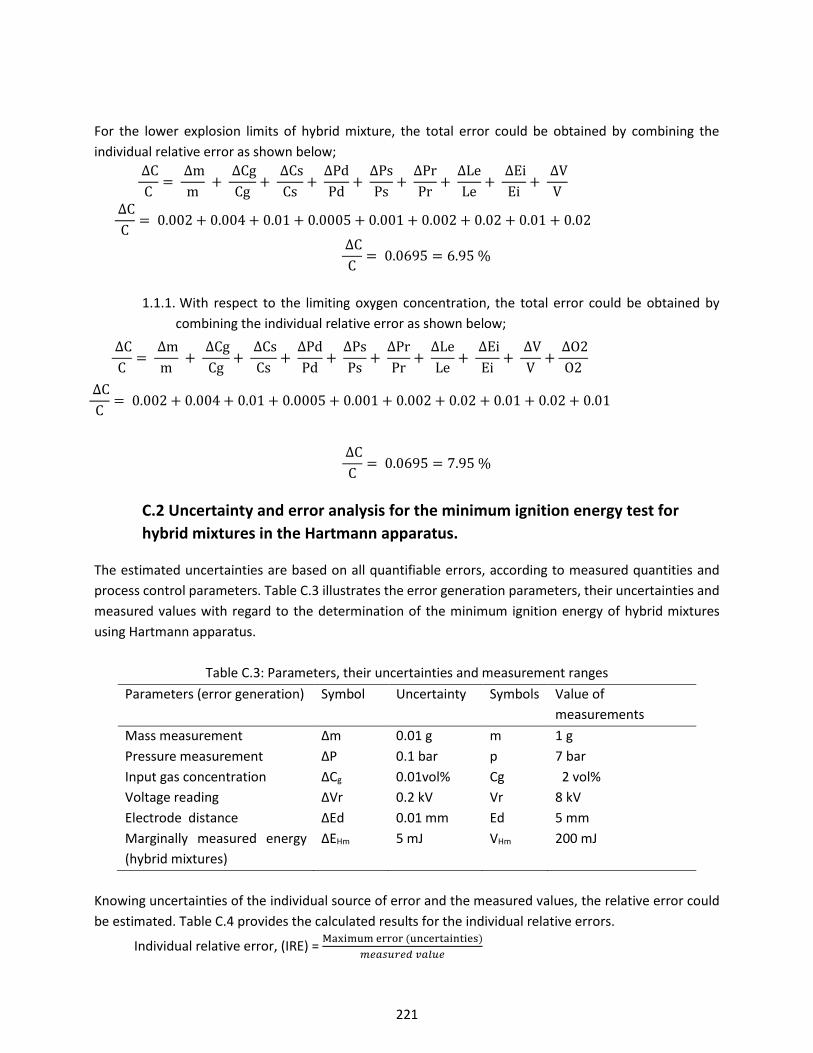
221
For the lower explosion limits of hybrid mixture, the total error could be obtained by combining the
individual relative error as shown below;
ΔC
C=
Δm
m +
ΔCg
Cg+
ΔCs
Cs+
ΔPd
Pd+
ΔPs
Ps+
ΔPr
Pr+
ΔLe
Le+
ΔEi
Ei+
ΔV
V
ΔC
C= 0.002 + 0.004 + 0.01 + 0.0005 + 0.001 + 0.002 + 0.02 + 0.01 + 0.02
ΔC
C= 0.0695 = 6.95 %
1.1.1. With respect to the limiting oxygen concentration, the total error could be obtained by
combining the individual relative error as shown below;
ΔC
C=
Δm
m +
ΔCg
Cg+
ΔCs
Cs+
ΔPd
Pd+
ΔPs
Ps+
ΔPr
Pr+
ΔLe
Le+
ΔEi
Ei+
ΔV
V+
ΔO2
O2
ΔC
C= 0.002 + 0.004 + 0.01 + 0.0005 + 0.001 + 0.002 + 0.02 + 0.01 + 0.02 + 0.01
ΔC
C= 0.0695 = 7.95 %
C.2 Uncertainty and error analysis for the minimum ignition energy test for
hybrid mixtures in the Hartmann apparatus.
The estimated uncertainties are based on all quantifiable errors, according to measured quantities and
process control parameters. Table C.3 illustrates the error generation parameters, their uncertainties and
measured values with regard to the determination of the minimum ignition energy of hybrid mixtures
using Hartmann apparatus.
Table C.3: Parameters, their uncertainties and measurement ranges
Parameters (error generation) Symbol Uncertainty Symbols Value of
measurements
Mass measurement ∆m 0.01 g m 1 g
Pressure measurement ∆P 0.1 bar p 7 bar
Input gas concentration ∆Cg 0.01vol% Cg 2 vol%
Voltage reading ∆Vr 0.2 kV Vr 8 kV
Electrode distance ∆Ed 0.01 mm Ed 5 mm
Marginally measured energy
(hybrid mixtures)
∆EHm 5 mJ VHm 200 mJ
Knowing uncertainties of the individual source of error and the measured values, the relative error could
be estimated. Table C.4 provides the calculated results for the individual relative errors.
Individual relative error, (IRE) = Maximum error (uncertainties)
𝑚𝑒𝑎𝑠𝑢𝑟𝑒𝑑 𝑣𝑎𝑙𝑢𝑒
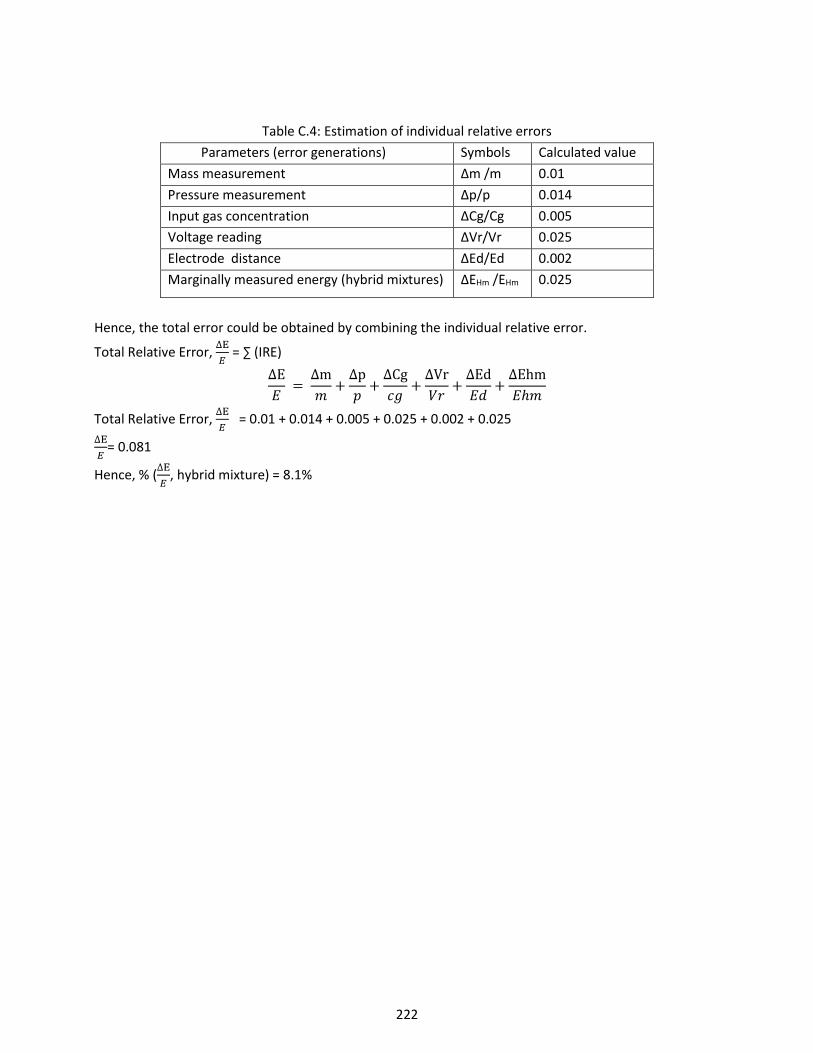
222
Table C.4: Estimation of individual relative errors
Parameters (error generations) Symbols Calculated value
Mass measurement ∆m /m 0.01
Pressure measurement ∆p/p 0.014
Input gas concentration ∆Cg/Cg 0.005
Voltage reading ∆Vr/Vr 0.025
Electrode distance ∆Ed/Ed 0.002
Marginally measured energy (hybrid mixtures) ∆EHm /EHm 0.025
Hence, the total error could be obtained by combining the individual relative error.
Total Relative Error, ∆E
𝐸 = ∑ (IRE)
∆E
𝐸 =
∆m
𝑚+
∆p
𝑝+
∆Cg
𝑐𝑔+
∆Vr
𝑉𝑟+
∆Ed
𝐸𝑑+
∆Ehm
𝐸ℎ𝑚
Total Relative Error, ∆E
𝐸 = 0.01 + 0.014 + 0.005 + 0.025 + 0.002 + 0.025
∆E
𝐸= 0.081
Hence, % (∆E
𝐸, hybrid mixture) = 8.1%
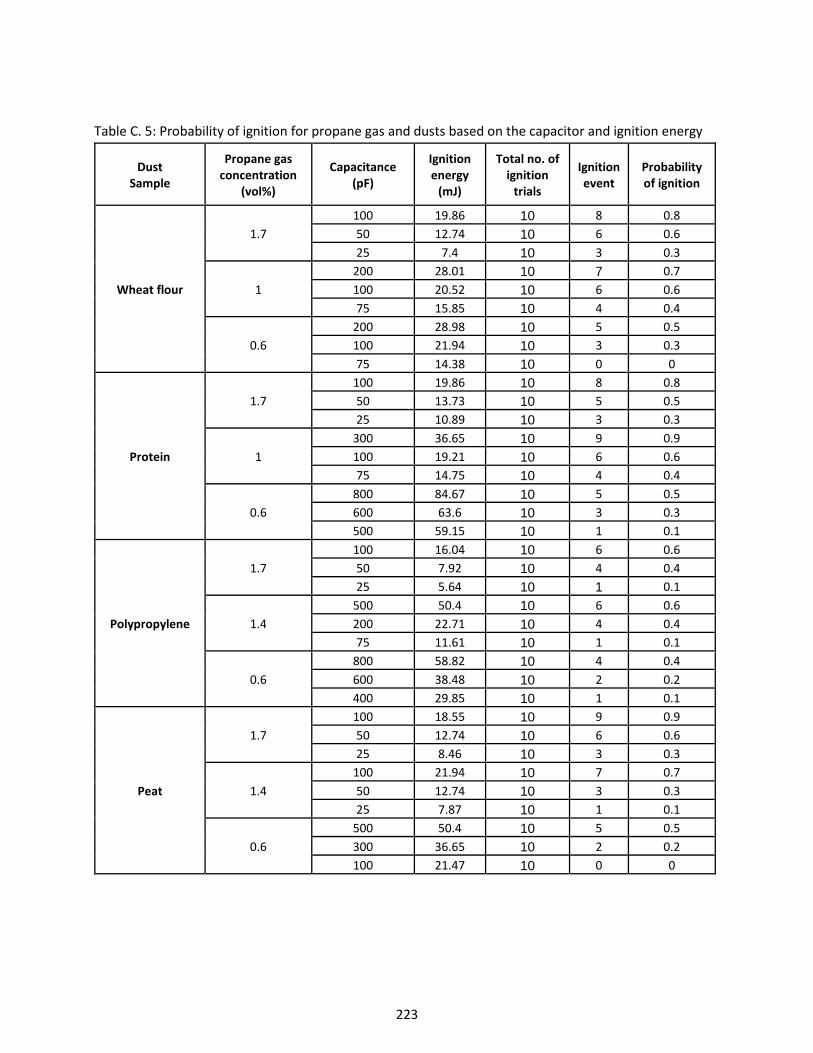
223
Table C. 5: Probability of ignition for propane gas and dusts based on the capacitor and ignition energy
Dust Sample
Propane gas concentration
(vol%)
Capacitance (pF)
Ignition energy
(mJ)
Total no. of ignition
trials
Ignition event
Probability of ignition
Wheat flour
1.7
100 19.86 10 8 0.8
50 12.74 10 6 0.6
25 7.4 10 3 0.3
1
200 28.01 10 7 0.7
100 20.52 10 6 0.6
75 15.85 10 4 0.4
0.6
200 28.98 10 5 0.5
100 21.94 10 3 0.3
75 14.38 10 0 0
Protein
1.7
100 19.86 10 8 0.8
50 13.73 10 5 0.5
25 10.89 10 3 0.3
1
300 36.65 10 9 0.9
100 19.21 10 6 0.6
75 14.75 10 4 0.4
0.6
800 84.67 10 5 0.5
600 63.6 10 3 0.3
500 59.15 10 1 0.1
Polypropylene
1.7
100 16.04 10 6 0.6
50 7.92 10 4 0.4
25 5.64 10 1 0.1
1.4
500 50.4 10 6 0.6
200 22.71 10 4 0.4
75 11.61 10 1 0.1
0.6
800 58.82 10 4 0.4
600 38.48 10 2 0.2
400 29.85 10 1 0.1
Peat
1.7
100 18.55 10 9 0.9
50 12.74 10 6 0.6
25 8.46 10 3 0.3
1.4
100 21.94 10 7 0.7
50 12.74 10 3 0.3
25 7.87 10 1 0.1
0.6
500 50.4 10 5 0.5
300 36.65 10 2 0.2
100 21.47 10 0 0
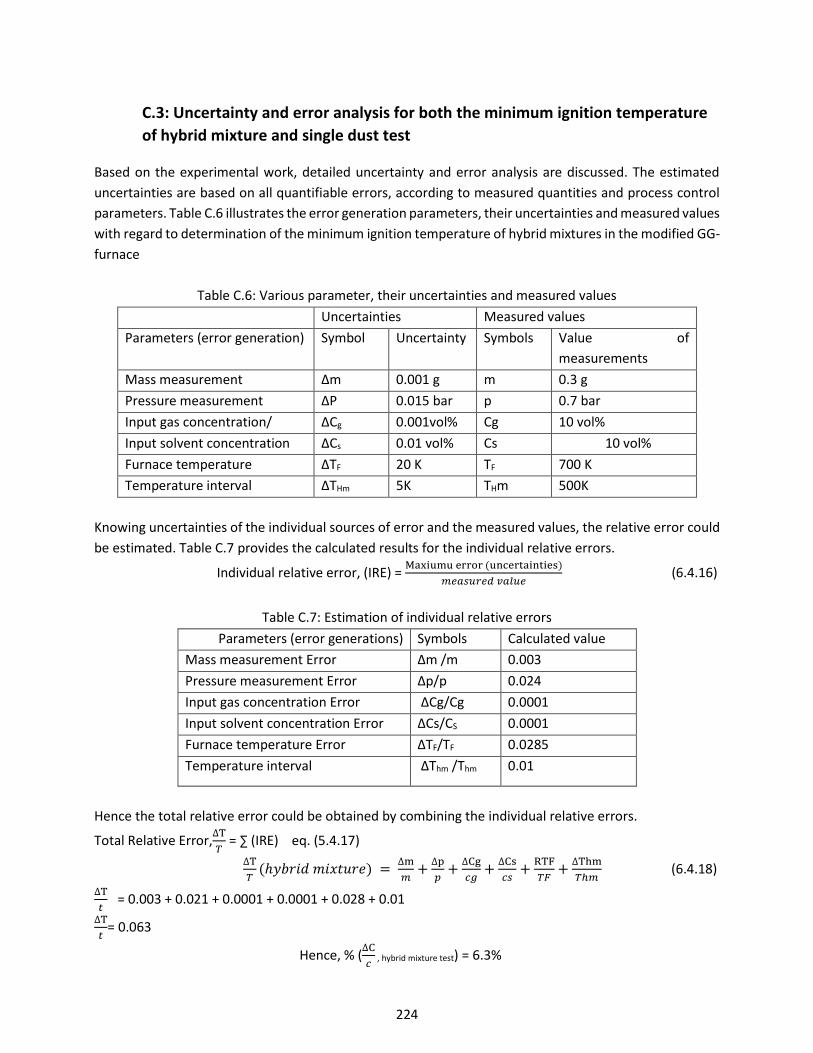
224
C.3: Uncertainty and error analysis for both the minimum ignition temperature
of hybrid mixture and single dust test
Based on the experimental work, detailed uncertainty and error analysis are discussed. The estimated
uncertainties are based on all quantifiable errors, according to measured quantities and process control
parameters. Table C.6 illustrates the error generation parameters, their uncertainties and measured values
with regard to determination of the minimum ignition temperature of hybrid mixtures in the modified GG-
furnace
Table C.6: Various parameter, their uncertainties and measured values
Uncertainties Measured values
Parameters (error generation) Symbol Uncertainty Symbols Value of
measurements
Mass measurement ∆m 0.001 g m 0.3 g
Pressure measurement ∆P 0.015 bar p 0.7 bar
Input gas concentration/ ∆Cg 0.001vol% Cg 10 vol%
Input solvent concentration ∆Cs 0.01 vol% Cs 10 vol%
Furnace temperature ∆TF 20 K TF 700 K
Temperature interval ∆THm 5K THm 500K
Knowing uncertainties of the individual sources of error and the measured values, the relative error could
be estimated. Table C.7 provides the calculated results for the individual relative errors.
Individual relative error, (IRE) = Maxiumu error (uncertainties)
𝑚𝑒𝑎𝑠𝑢𝑟𝑒𝑑 𝑣𝑎𝑙𝑢𝑒 (6.4.16)
Table C.7: Estimation of individual relative errors
Parameters (error generations) Symbols Calculated value
Mass measurement Error ∆m /m 0.003
Pressure measurement Error ∆p/p 0.024
Input gas concentration Error ∆Cg/Cg 0.0001
Input solvent concentration Error ∆Cs/CS 0.0001
Furnace temperature Error ∆TF/TF 0.0285
Temperature interval ∆Thm /Thm 0.01
Hence the total relative error could be obtained by combining the individual relative errors.
Total Relative Error,∆T
𝑇 = ∑ (IRE) eq. (5.4.17)
∆T
𝑇(ℎ𝑦𝑏𝑟𝑖𝑑 𝑚𝑖𝑥𝑡𝑢𝑟𝑒) =
∆m
𝑚+
∆p
𝑝+
∆Cg
𝑐𝑔+
∆Cs
𝑐𝑠+
RTF
𝑇𝐹+
∆Thm
𝑇ℎ𝑚 (6.4.18)
∆T
𝑡 = 0.003 + 0.021 + 0.0001 + 0.0001 + 0.028 + 0.01
∆T
𝑡= 0.063
Hence, % (∆C
𝑐 , hybrid mixture test) = 6.3%
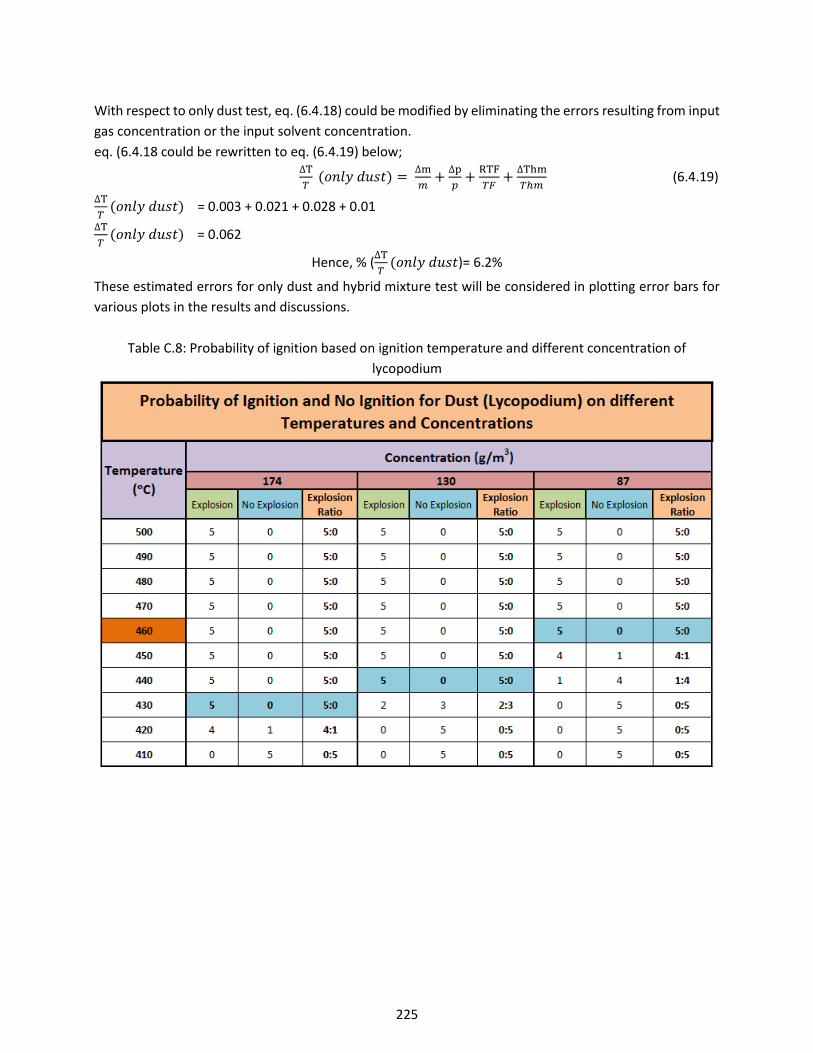
225
With respect to only dust test, eq. (6.4.18) could be modified by eliminating the errors resulting from input
gas concentration or the input solvent concentration.
eq. (6.4.18 could be rewritten to eq. (6.4.19) below;
∆T
𝑇 (𝑜𝑛𝑙𝑦 𝑑𝑢𝑠𝑡) =
∆m
𝑚+
∆p
𝑝+
RTF
𝑇𝐹+
∆Thm
𝑇ℎ𝑚 (6.4.19)
∆T
𝑇(𝑜𝑛𝑙𝑦 𝑑𝑢𝑠𝑡) = 0.003 + 0.021 + 0.028 + 0.01
∆T
𝑇(𝑜𝑛𝑙𝑦 𝑑𝑢𝑠𝑡) = 0.062
Hence, % (∆T
𝑇(𝑜𝑛𝑙𝑦 𝑑𝑢𝑠𝑡)= 6.2%
These estimated errors for only dust and hybrid mixture test will be considered in plotting error bars for
various plots in the results and discussions.
Table C.8: Probability of ignition based on ignition temperature and different concentration of
lycopodium
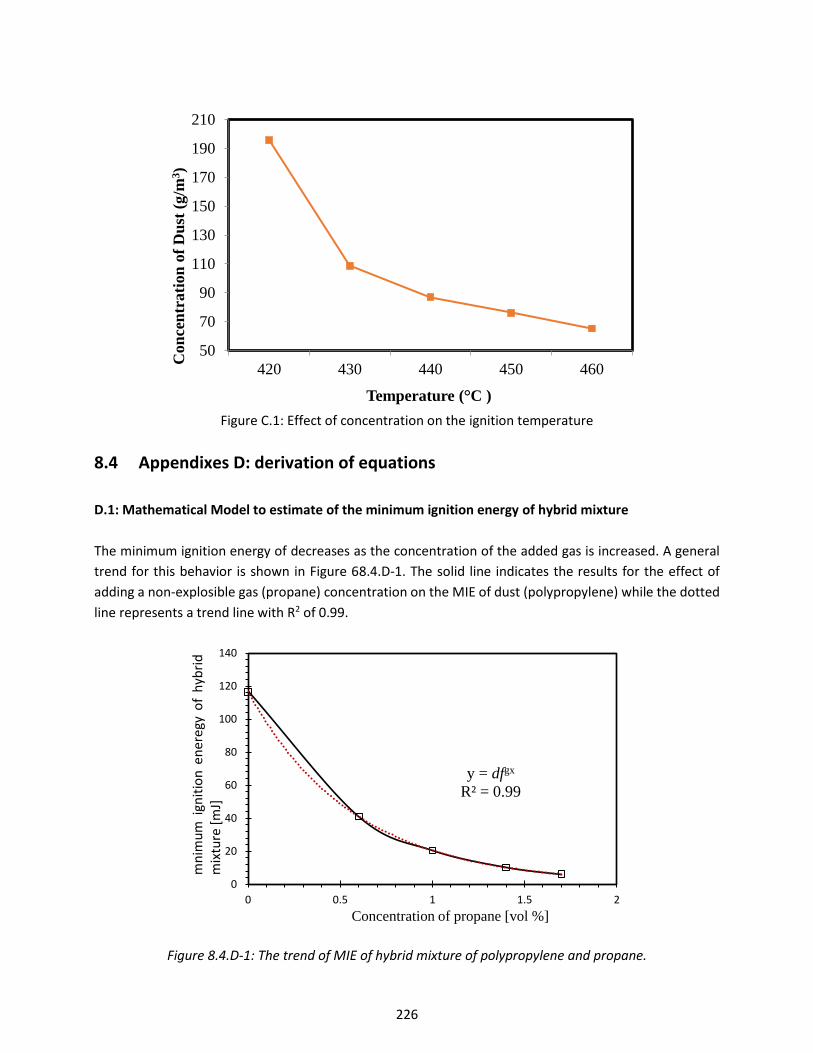
226
Figure C.1: Effect of concentration on the ignition temperature
8.4 Appendixes D: derivation of equations
D.1: Mathematical Model to estimate of the minimum ignition energy of hybrid mixture
The minimum ignition energy of decreases as the concentration of the added gas is increased. A general
trend for this behavior is shown in Figure 68.4.D-1. The solid line indicates the results for the effect of
adding a non-explosible gas (propane) concentration on the MIE of dust (polypropylene) while the dotted
line represents a trend line with R2 of 0.99.
Figure 8.4.D-1: The trend of MIE of hybrid mixture of polypropylene and propane.
50
70
90
110
130
150
170
190
210
420 430 440 450 460
Con
cen
trati
on
of
Du
st (
g/m
3)
Temperature (°C )
y = dfgx
R² = 0.99
0
20
40
60
80
100
120
140
0 0.5 1 1.5 2
mn
imu
mig
nit
ion
en
ereg
yo
fh
ybri
dm
ixtu
re[m
J]
Concentration of propane [vol %]
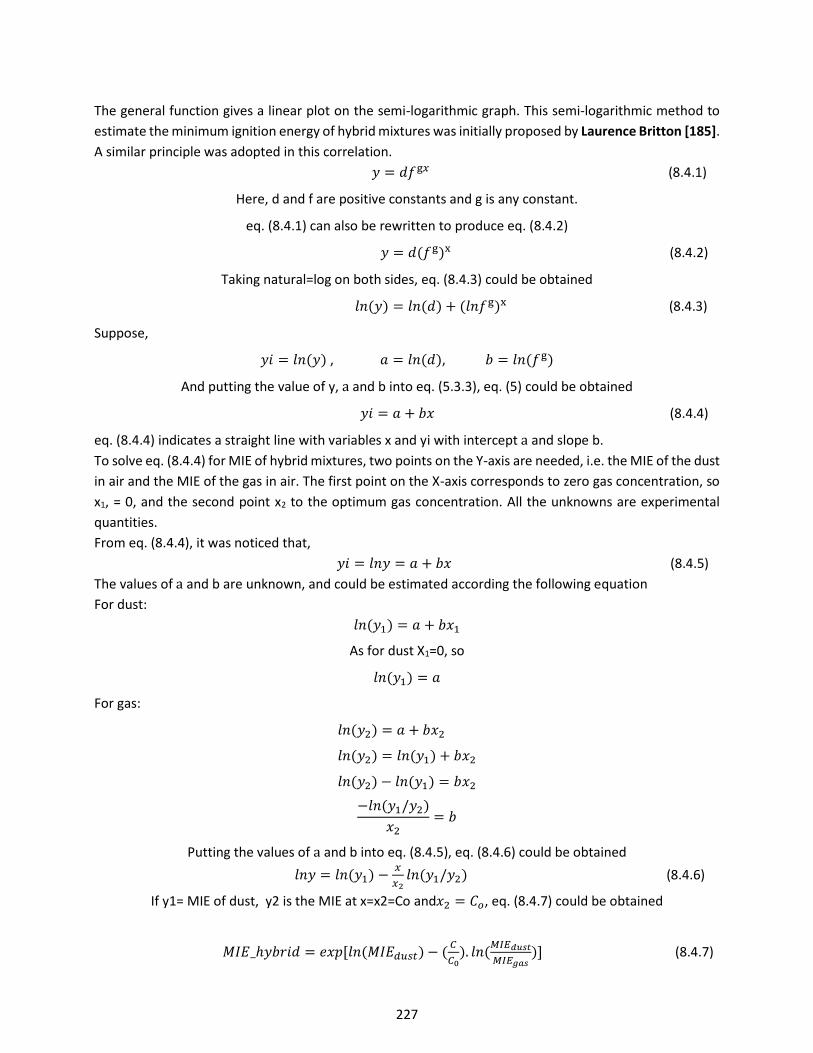
227
The general function gives a linear plot on the semi-logarithmic graph. This semi-logarithmic method to
estimate the minimum ignition energy of hybrid mixtures was initially proposed by Laurence Britton [185].
A similar principle was adopted in this correlation.
𝑦 = 𝑑𝑓g𝑥 (8.4.1)
Here, d and f are positive constants and g is any constant.
eq. (8.4.1) can also be rewritten to produce eq. (8.4.2)
𝑦 = 𝑑(𝑓g)x (8.4.2)
Taking natural=log on both sides, eq. (8.4.3) could be obtained
𝑙𝑛(𝑦) = 𝑙𝑛(𝑑) + (𝑙𝑛𝑓g)x (8.4.3)
Suppose,
𝑦𝑖 = 𝑙𝑛(𝑦) , 𝑎 = 𝑙𝑛(𝑑), 𝑏 = 𝑙𝑛(𝑓g)
And putting the value of y, a and b into eq. (5.3.3), eq. (5) could be obtained
𝑦𝑖 = 𝑎 + 𝑏𝑥 (8.4.4)
eq. (8.4.4) indicates a straight line with variables x and yi with intercept a and slope b.
To solve eq. (8.4.4) for MIE of hybrid mixtures, two points on the Y-axis are needed, i.e. the MIE of the dust
in air and the MIE of the gas in air. The first point on the X-axis corresponds to zero gas concentration, so
x1, = 0, and the second point x2 to the optimum gas concentration. All the unknowns are experimental
quantities.
From eq. (8.4.4), it was noticed that,
𝑦𝑖 = 𝑙𝑛𝑦 = 𝑎 + 𝑏𝑥 (8.4.5)
The values of a and b are unknown, and could be estimated according the following equation
For dust:
𝑙𝑛(𝑦1) = 𝑎 + 𝑏𝑥1
As for dust X1=0, so
𝑙𝑛(𝑦1) = 𝑎
For gas:
𝑙𝑛(𝑦2) = 𝑎 + 𝑏𝑥2
𝑙𝑛(𝑦2) = 𝑙𝑛(𝑦1) + 𝑏𝑥2
𝑙𝑛(𝑦2) − 𝑙𝑛(𝑦1) = 𝑏𝑥2
−𝑙𝑛(𝑦1/𝑦2)
𝑥2= 𝑏
Putting the values of a and b into eq. (8.4.5), eq. (8.4.6) could be obtained
𝑙𝑛𝑦 = 𝑙𝑛(𝑦1) −𝑥
𝑥2𝑙𝑛(𝑦1/𝑦2) (8.4.6)
If y1= MIE of dust, y2 is the MIE at x=x2=Co and𝑥2 = 𝐶𝑜, eq. (8.4.7) could be obtained
𝑀𝐼𝐸_ℎ𝑦𝑏𝑟𝑖𝑑 = 𝑒𝑥𝑝[𝑙𝑛(𝑀𝐼𝐸𝑑𝑢𝑠𝑡) − (𝐶
𝐶0). 𝑙𝑛(
𝑀𝐼𝐸𝑑𝑢𝑠𝑡
𝑀𝐼𝐸𝑔𝑎𝑠)] (8.4.7)
228
eq. (8.4.7) could be rearranged and simplify to produce eq. (8.4.8)
𝑀𝐼𝐸_ℎ𝑦𝑏𝑟𝑖𝑑 = 𝑒𝑥𝑝[𝑙𝑛(𝑀𝐼𝐸𝑑𝑢𝑠𝑡) − 𝑙𝑛 (𝑀𝐼𝐸𝑑𝑢𝑠𝑡
𝑀𝐼𝐸𝑔𝑎𝑠)
𝐶𝐶0
]
𝑀𝐼𝐸_ℎ𝑦𝑏𝑟𝑖𝑑 = 𝑒𝑥𝑝[𝑙𝑛((𝑀𝐼𝐸𝑑𝑢𝑠𝑡 )
(𝑀𝐼𝐸𝑑𝑢𝑠𝑡/𝑀𝐼𝐸𝑔𝑎𝑠)𝐶𝐶0
)]
𝑀𝐼𝐸_ℎ𝑦𝑏𝑟𝑖𝑑 =(𝑀𝐼𝐸𝑑𝑢𝑠𝑡 )
(𝑀𝐼𝐸𝑑𝑢𝑠𝑡/𝑀𝐼𝐸𝑔𝑎𝑠)𝐶
𝐶0
(8.4.8)
Hence, the MIE of hybrid mixture MIE_hybrid could be estimated mathematically from eq. (8.4.8)
Where; C is the gas volume concentration (vol %), 𝐶0is the gas concentration (% vol) leading to the lowest
MIE, 𝑀𝐼𝐸𝑑𝑢𝑠𝑡 and 𝑀𝐼𝐸𝑔𝑎𝑠 are minimum ignition energy of dust and gas respectively.
Note: this mathematical model is valid if, C <= Co.
D:2 Proposed model to estimate the minimum ignition temperature of hybrid mixtures
This model is based on the Jaeckel model [191] to predict the minimum and maximum explosible
concentrations for dust clouds. A one-dimensional heat transfer from a plane flame front to the
adjacent unburned layer of the dust cloud was assumed. According to Jaeckel, the minimum
explosible concentration (MEC) is the minimum amount of dust per unit volume of the dust cloud,
which by complete combustion liberates enough energy to heat the next unit volume of dust
cloud to the ignition temperature. Jaeckel formulated the condition of self-sustained flame
propagation through the dust cloud of concentration Cd, mini<Cd, max at constant volume as:
QG = CdHd (8.4.9)
QL = L + (Ti,d − T0)(Cdcd + ρaircair) (8.4.10)
According to the Jaeckel Model:
CdHd ≥ L + (Ti,d − T0)(Cdcd + ρaircair) (8.4.11)
When Cd=MEC, by neglecting the heat loss by radiation and equating the two sides, after rearranging, the
minimum ignition temperature can be derived:
ρdHd ∙ MEC = (Ti,d − T0)(ρdcd ∙ MEC + ρaircair) (8.4.12)
Rearranging eq. (6.4.12) one obtains:
Ti,d = T0 +MEC∙Hd
MEC∙cd+ρaircair (8.4.13)
With respect to gases, eq. (6.4.12) could be rewritten to eq. (6.4.14), Cg = LEL
ρgHg ∙ LEL = (Ti,g − T0)(ρgcg ∙ LEL + ρaircair) (8.4.14)
Rearranging eq. (6.4.14) one obtains:
Ti,g = T0 +ρgHg∙LEL
ρgcg∙LEL+ρaircair (8.4.15)
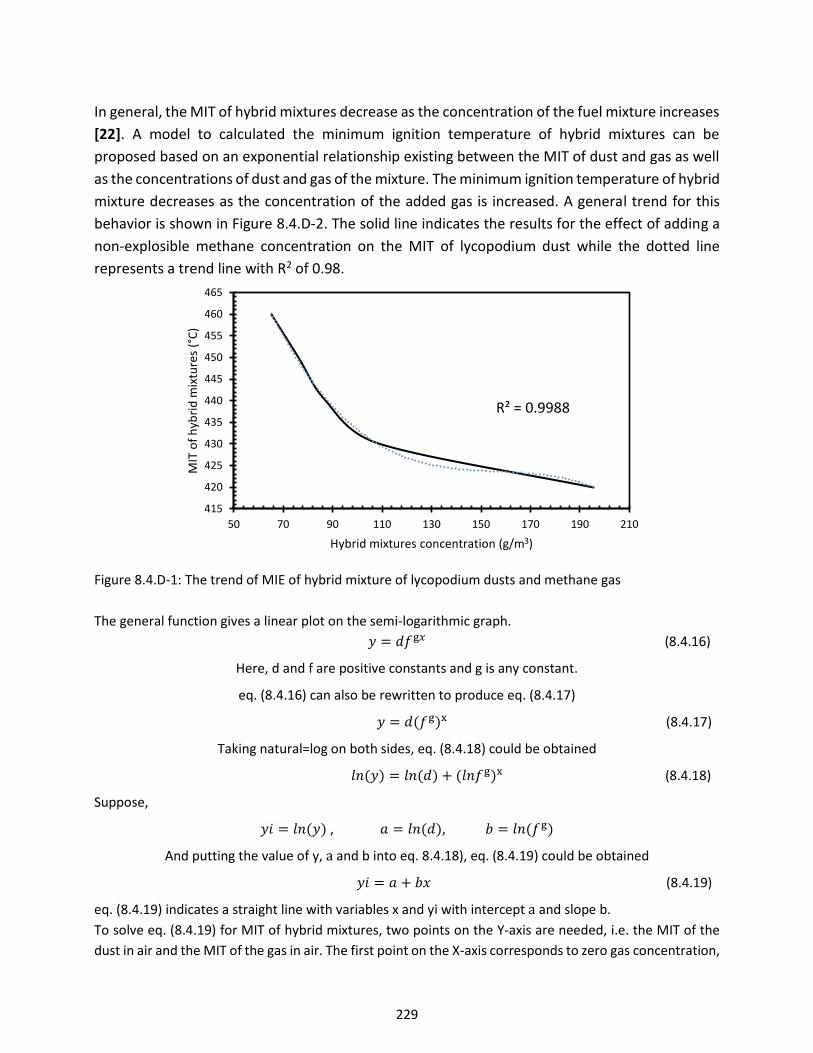
229
In general, the MIT of hybrid mixtures decrease as the concentration of the fuel mixture increases
[22]. A model to calculated the minimum ignition temperature of hybrid mixtures can be
proposed based on an exponential relationship existing between the MIT of dust and gas as well
as the concentrations of dust and gas of the mixture. The minimum ignition temperature of hybrid
mixture decreases as the concentration of the added gas is increased. A general trend for this
behavior is shown in Figure 8.4.D-2. The solid line indicates the results for the effect of adding a
non-explosible methane concentration on the MIT of lycopodium dust while the dotted line
represents a trend line with R2 of 0.98.
Figure 8.4.D-1: The trend of MIE of hybrid mixture of lycopodium dusts and methane gas
The general function gives a linear plot on the semi-logarithmic graph.
𝑦 = 𝑑𝑓g𝑥 (8.4.16)
Here, d and f are positive constants and g is any constant.
eq. (8.4.16) can also be rewritten to produce eq. (8.4.17)
𝑦 = 𝑑(𝑓g)x (8.4.17)
Taking natural=log on both sides, eq. (8.4.18) could be obtained
𝑙𝑛(𝑦) = 𝑙𝑛(𝑑) + (𝑙𝑛𝑓g)x (8.4.18)
Suppose,
𝑦𝑖 = 𝑙𝑛(𝑦) , 𝑎 = 𝑙𝑛(𝑑), 𝑏 = 𝑙𝑛(𝑓g)
And putting the value of y, a and b into eq. 8.4.18), eq. (8.4.19) could be obtained
𝑦𝑖 = 𝑎 + 𝑏𝑥 (8.4.19)
eq. (8.4.19) indicates a straight line with variables x and yi with intercept a and slope b.
To solve eq. (8.4.19) for MIT of hybrid mixtures, two points on the Y-axis are needed, i.e. the MIT of the
dust in air and the MIT of the gas in air. The first point on the X-axis corresponds to zero gas concentration,
R² = 0.9988
415
420
425
430
435
440
445
450
455
460
465
50 70 90 110 130 150 170 190 210
MIT
of
hyb
rid
mix
ture
s (°
C)
Hybrid mixtures concentration (g/m3)
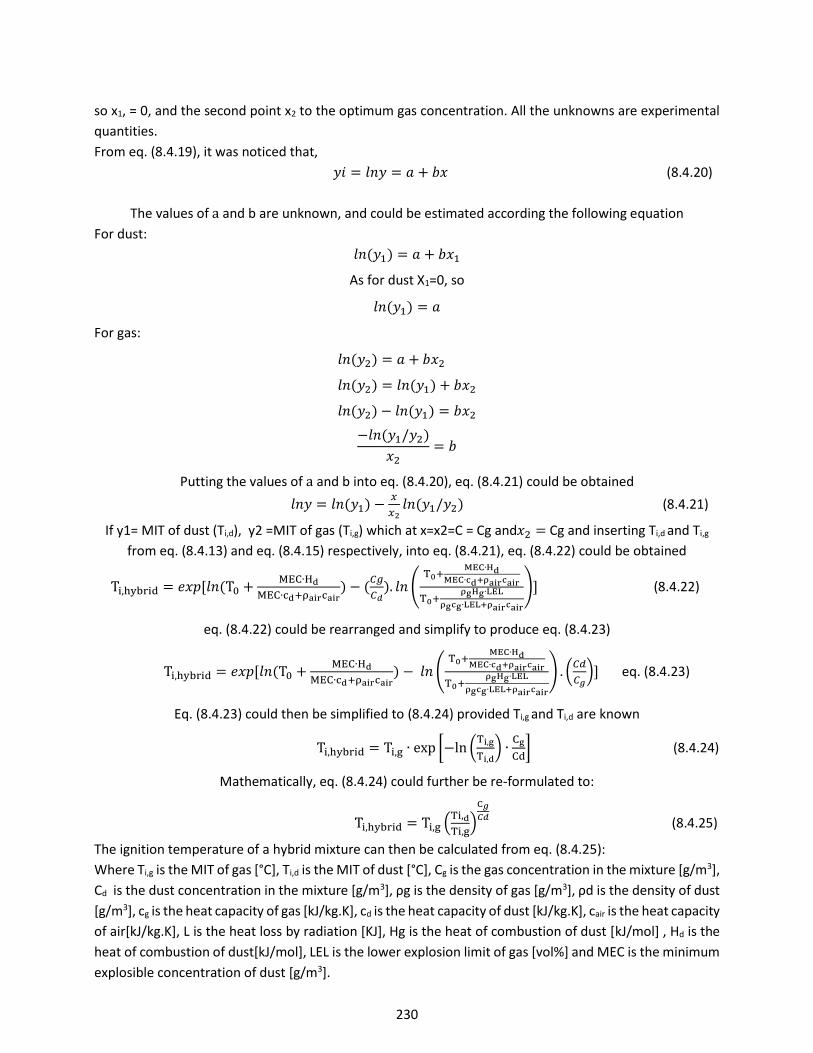
230
so x1, = 0, and the second point x2 to the optimum gas concentration. All the unknowns are experimental
quantities.
From eq. (8.4.19), it was noticed that,
𝑦𝑖 = 𝑙𝑛𝑦 = 𝑎 + 𝑏𝑥 (8.4.20)
The values of a and b are unknown, and could be estimated according the following equation
For dust:
𝑙𝑛(𝑦1) = 𝑎 + 𝑏𝑥1
As for dust X1=0, so
𝑙𝑛(𝑦1) = 𝑎
For gas:
𝑙𝑛(𝑦2) = 𝑎 + 𝑏𝑥2
𝑙𝑛(𝑦2) = 𝑙𝑛(𝑦1) + 𝑏𝑥2
𝑙𝑛(𝑦2) − 𝑙𝑛(𝑦1) = 𝑏𝑥2
−𝑙𝑛(𝑦1/𝑦2)
𝑥2= 𝑏
Putting the values of a and b into eq. (8.4.20), eq. (8.4.21) could be obtained
𝑙𝑛𝑦 = 𝑙𝑛(𝑦1) −𝑥
𝑥2𝑙𝑛(𝑦1/𝑦2) (8.4.21)
If y1= MIT of dust (Ti,d), y2 =MIT of gas (Ti,g) which at x=x2=C = Cg and𝑥2 = Cg and inserting Ti,d and Ti,g
from eq. (8.4.13) and eq. (8.4.15) respectively, into eq. (8.4.21), eq. (8.4.22) could be obtained
Ti,hybrid = 𝑒𝑥𝑝[𝑙𝑛(T0 +MEC∙Hd
MEC∙cd+ρaircair) − (
𝐶𝑔
𝐶𝑑). 𝑙𝑛 (
T0+MEC∙Hd
MEC∙cd+ρaircair
T0+ρgHg∙LEL
ρgcg∙LEL+ρaircair
)] (8.4.22)
eq. (8.4.22) could be rearranged and simplify to produce eq. (8.4.23)
Ti,hybrid = 𝑒𝑥𝑝[𝑙𝑛(T0 +MEC∙Hd
MEC∙cd+ρaircair) − 𝑙𝑛 (
T0+MEC∙Hd
MEC∙cd+ρaircair
T0+ρgHg∙LEL
ρgcg∙LEL+ρaircair
) . (𝐶𝑑
𝐶𝑔)] eq. (8.4.23)
Eq. (8.4.23) could then be simplified to (8.4.24) provided Ti,g and Ti,d are known
Ti,hybrid = Ti,g ∙ exp [−ln (Ti,g
Ti,d) ∙
Cg
Cd] (8.4.24)
Mathematically, eq. (8.4.24) could further be re-formulated to:
Ti,hybrid = Ti,g (Ti,d
Ti,g)
C𝑔
𝐶𝑑 (8.4.25)
The ignition temperature of a hybrid mixture can then be calculated from eq. (8.4.25):
Where Ti,g is the MIT of gas [°C], Ti,d is the MIT of dust [°C], Cg is the gas concentration in the mixture [g/m3],
Cd is the dust concentration in the mixture [g/m3], ρg is the density of gas [g/m3], ρd is the density of dust
[g/m3], cg is the heat capacity of gas [kJ/kg.K], cd is the heat capacity of dust [kJ/kg.K], cair is the heat capacity
of air[kJ/kg.K], L is the heat loss by radiation [KJ], Hg is the heat of combustion of dust [kJ/mol] , Hd is the
heat of combustion of dust[kJ/mol], LEL is the lower explosion limit of gas [vol%] and MEC is the minimum
explosible concentration of dust [g/m3].
231
List of publications
Peer-review journal publications directly related to my Ph.D. thesis
[1]. Addai, E. K., Gabel, D., & Krause, U. (2016). Models to estimate the minimum ignition
temperature of dusts and hybrid mixtures. Journal of hazardous materials, 304, 73-83.
[2] Addai, E. K., Gabel, D., & Krause, U. (2016). Experimental investigations of the minimum
ignition energy and the minimum ignition temperature of inert and combustible dust
cloud mixtures. Journal of hazardous materials, 307, 302-311.
[3] Addai, E. K., Gabel, D., & Krause, U. (2016). Lower explosion limit/minimum explosible
concentration testing for hybrid mixtures in the Godbert-Greenwald furnace. Process
Safety Progress. 35, 213-223
[4] Addai, E. K., Gabel, D., Kamal, M., & Krause, U. (2016). Minimum ignition energy of hybrid
mixtures of combustible dusts and gases. Process Safety and Environmental Protection,
102, 503-512.
[5] Addai, E. K., Gabel, D., & Krause, U. (2016). Models to estimate the lower explosion limits
of dusts, gases and hybrid mixtures. Chemical engineering transactions, 48, 313-318
[6] Wang, C., Huang, F., Addai, E. K., & Dong, X. (2016). Effect of concentration and obstacles
on flame velocity and overpressure of methane-air mixture. Journal of Loss Prevention in
the Process Industries, 43, 302-310.
[7] Addai, E. K., Gabel, D., & Krause, U. (2016). Experimental investigation on the minimum
ignition temperature of hybrid mixtures of dusts and gases or solvents. Journal of
hazardous materials, 301, 314-326.
[8] Addai, E. K., Gabel, D., Haider, A., & Krause, U. (2016). Minimum ignition temperature of
dusts, gases and solvents hybrid mixtures. Combustion Science and Technology, 188,
1497-1504.
232
[9] Addai, E. K., Gabel, D., & Krause, U. (2016). Investigation of the minimum ignition
temperature and lower explosion limit of multi-components hybrid mixtures. Fire
Technology Journal, (under review).
[10] Addai, E. K., Gabel, D., & Krause, U. (2015). Explosion characteristics of three component
hybrid mixtures. Process Safety and Environmental Protection, 98, 72-81.
[11] Addai, E. K., Gabel, D., & Krause, U. (2015). Lower explosion limit of hybrid mixtures of
burnable gas and dust. Journal of Loss Prevention in the Process Industries, 36, 497-504.
[12] Addai, E. K. (2015). Flame and explosion suppression using pyrobubbles. LAP LAMBERT
Acad. Publ. (ed. 1) 68, ISBN 978-3-659-76630-5 (book).
Other peer-review journal publications within the time frame of my Ph.D. thesis
[13] Addai, E. K., Tulashie, S. K., Annan, J. S., & Yeboah, I. (2016). Trend of Fire Outbreaks in
Ghana and Ways to Prevent These Incidents. Safety and Health at Work, 7, 1-9
[14] Addai, E. K., Acquah, F., Yeboah, I., & Addo, A. (2016). Reductive leaching of blended
manganese carbonate and pyrolusite ores in sulphuric acid. International Journal of
Mining and Mineral Engineering, 7(1), 18-36.
[15] Tulashie, S. K., Addai, E. K., & Annan, J. S. (2016). Exposure assessment, a preventive
process in managing workplace safety and health, challenges in Ghana. Safety Science, 84,
210-215.
[16] Annan, J. S., Addai, E. K., & Tulashie, S. K. (2015). A call for action to improve occupational
health and safety in Ghana and a critical look at the existing legal requirement and
legislation. Safety and health at work, 6(2), 146-150.
[17] Yeboah, I., Addai, E.K., Acquah, F., Tulashie, S. K. (2014). A comparative study of the super
cooling and carbonization processes of the gibbsitic Ghanaian Bauxite. International
journal of engineering, science and innovative technology, 6, 76-85.
233
Conference publication with peer-reviews
[18] Addai, E. K., Gabel, D., & Krause, U. (2016). Investigation of the minimum ignition
temperature and lower explosion limit of multi-components hybrid mixtures in the
Godbert- Greenwald furnace. In Proceedings of the eleventh International Symposium of
Hazards, Prevention, and Mitigation of Industrial Explosions (11th ISHPMIE), Dalian, China
(24-29, 07-2016) paper # 128.
[19] Krause, U., Addai, E. K., & Gabel, D. (2016). Determination of the limiting oxygen
concentration of dust/air and hybrid mixtures based on thermochemical properties. In
Proceedings of the eleventh International Symposium of Hazards, Prevention, and
Mitigation of Industrial Explosions (11th ISHPMIE), Dalian, China (24-29, 07-2016) paper #
167.
[20] Addai, E. K., & Krause, U. (2016). Experimental investigation and theoretical models to
estimate the lower explosion limits of spray/dust and spray/gas hybrid mixtures. In 15th
International Symposium on Loss Prevention and Safety Promotion in the Process
Industries, 5-8th June, 2016, Freiburg-Germany.
[21] Gabel, D., Addai, E. K., & Krause, U. (2015). Explosionscharakteristiken von aerosolen
hybriden Lösemittel/Staub-Gemischen. In Fachtagung Anlagen-, Arbeits- und
Umweltsicherheit. Köthen, Germany, ( 5 -6, 11, 2015 ; Tagungsunterlagen. Hochschule
Anhalt, insges. 2 S.
[22] Addai, E. K., Gabel, D., & Krause, U. (2015). Minimum Ignition Temperature of Hybrid
Mixtures of dusts, solvents and gases. In Fachtagung Anlagen-, Arbeits- und
Umweltsicherheit. Köthen, Germany, ( 5 -6, 11, 2015 ; Tagungsunterlagen. Hochschule
Anhalt, insges. 2 S.
[23] Addai, E. K., Gabel, D., & Krause, U. (2015). Ignition and explosion behaviour of hybrid
mixtures of two and three components. In 4th Magdeburger Brand- und
Explosionsschutztag: am 26. und 27. März 2015. - Magdeburg, insges. 11 S. Kongress:
Magdeburger Brand- und Explosionsschutztag; 4 (Magdeburg): 2015.03.26-27
234
[24] Addai, E. K., Gabel, D., & Krause, U. (2015). Minimum ignition temperature of hybrid
mixtures of burnable dusts and gases. In: Proceedings of the 25th International
Colloquium on the Dynamics of Explosions and Reactive Systems: 2-7 August 2015, Leeds,
UK. – ICDERS.
[25] Addai, E. K., Gabel, D., & Krause, U. (2014). Lower explosion limit of hybrid mixtures in:
Proceedings of the tenth International Symposium of Hazards, Prevention, and
Mitigation of Industrial Explosions. - Bergen: GexCon AS; 2014, Paper 024, S. 995-1005;
Congress: ISHPMIE; 10 (Bergen): 2014.06.10-14

235
Curriculum vitae
Emmanuel Kwasi Addai, Ph.D.
2234 west kemper Rd, Apt.1, 45240, Cincinnati, Ohio-USA. Mobile phone: Phone +15135576190
Email address: [email protected], www.linkedin.com/in/emmanuel-kwasi-addai-73574156?trk
Professional summary: Process Safety and Environmental Engineering
Key Skills
Experience in undertaking various explosibility testing, process hazard analysis and fire and
explosion hazard identification, prevention and control
Focused team leader, experience the field of fire and explosion safety professional, scheduling,
budgets, estimates, progress reports, interpret plans and specifications.
Skilled at designing and implementing safety programs, training personnel, accident investigation
and Loss Control Programs.
Ability to promote the professional development of Safety and Health within the work environment
and exemplify a positive proactive attitude towards maintaining risk free working conditions.
Very proficient in research and development in the field of fire and explosion prevention and
protection. This reflects in more than twelve peer review publication in this field.
Professional Experience
10/2013 – 10/2016
Research Fellow in Process Safety Engineering at IAUT- Otto-von-Guericke-University •
Undertake various explosibility testing such as minimum ignition temperature, minimum ignition
energy, limiting oxygen concentration, lower explosion limits and explosion severity for dusts,
gases, spray and hybrid mixtures.
Supervise master thesis on fire and explosion prevention and protection
Assist in teaching "plant design and process safety" course for masters' students.
Undertake students' laboratory work
Process hazard analysis and dust explosion hazard identification
Design of preventive and mitigation safety measures for dust, gas and hybrid mixture explosion
Hazardous area classification, ignition source identification
Incident investigation and root cause analysis
Quantitative and qualitative risk assessments in powder handling facilities
Plan and execute experimental test programs
Write technical reports, prepare and present technical results in international conference
236
02/2013-09/2013 Research Assistant in the fire and explosion laboratory at IAUT- Otto-von-Guericke-University
Undertake students' laboratory work
Undertake various explosibility testing such as minimum ignition temperature, minimum ignition energy, limiting oxygen concentration, lower explosion limits and explosion severity for dusts, gases, spray and hybrid mixtures.
06/2011- 9/2012 Safety and Environment Management at SGS Ghana
Health, Safety and Environmental Management consultant
Undertake the following activities: Environmental and social impact assessment, stack emission monitoring, ambient air monitoring, dust and noise monitoring, water quality analysis
Suggest proactive measurements that prevent incidents before they manifest as accidents
Coordinate environment health and safety aspects of project
Draft environment health and safety plans and verify any existing or proposed plans
Comply with all relevant HSE regulations and requirements
Ensure the health and safety of workers, decrease accident risks and improve onsite productivity
Give expert advice and recommendations for future safety maintenance and create a long-term safety culture
Consulted in different Africa countries such as: Mali, Cote devoir, Togo, Guinea
03/2010 - 08/2010 Process engineer (intern) at Newmont Ghana Gold Limited
Development and review Standard Operating Procedure (SOP)
Assist field operators, data analysis, safety presentations, monitor process flow.
01/2010 - 03/2010 Process chemist (intern) at SGS-Ghana- Ahafo Assay Laboratory
Undertook the following activities: Fire assaying, preparation of geological samples from the mines
Operations of spectrophotometry and atomic absorption spectroscopy for metals determination.
06/2009 - 08/2009 Process engineer and chemist at Tema, Lube Oil Company Limited
Undertook the following activities: Blending of lubricants, analyzing blended products (Lubricants) for its quality, determination of metals in the blended products,
Operations of spectrophotometer to determine metals in the blended products.
03/2009 - 05/2009 Research Assistance (intern) at Ghana Atomic Energy Commission
Operating Atomic Absorption Spectroscopy, Flame Photometer and Spectrophotometer,
Water Quality analysis and determination of Metals in soil.
06/2008 - 08/2008 Laboratory assistance- at Ghana Standard Board (3 months)
Operation of Atomic Absorption Spectrometer to determine metals in food substances,
Determination of: ash, moisture, alcohol, frees fatty acids, protein, carbohydrate, and other
laboratory analysis in food substance.
11/2005 - 06/2007
Junior high school teacher at Pentecost Preparatory School
Taught integrated science and mathematics in the junior high school

237
Education
10/2013 – Present
Doctor of Philosophy in Process Safety Engineering at Otto-von-Guericke-University
Thesis topic: Experimental and theoretical investigation of explosion characteristics of
multiphase mixtures
08/2012 - 09/2013 Master of Science in Quality, Safety and Environmental Engineering at Otto-von-Guericke-
University
Thesis topic: Flame and explosion suppression using pyrobubbles
08/2007 - 06/2011 Bachelor of Science in Industrial Chemistry at University of Cape Coast
Bachelor thesis: Redox process technology of leaching of pyrolusite using low grade
manganese carbonate ore in sulphuric acid
Professional Certificates
03/2016 CPR, AED & First Aid Training at SaveALifeX, (online learning initiative of SaveALifeX through
edX)
01/2014 - 02-2014 Certificate in project management at University of applied science Magdeburg
10/2013 - 03/2014 Certificate in health and society at Harvard University (online course through edX)
09/2013 - 11/2013 Certificate in Introduction to Water Treatment at Delft University of Technology
(online course through edX)
05/2013 - 09/2013 Certificate in Human Health and Global Environmental Change at Harvard University
(online course through edX)
03/2013 - 05/2013 Certificate in Occupational Safety and Health Management at OSHAcademy
03/2011 - 05/2011 Certificate in Oil and Gas processing at SIMA-University of Cape Coast
Relevant Skills
Strong communication skills with people both written and verbal
Fantastic ability to learn new things quickly and adapt to changes in the environment
uncommon ability to work independent and as part of team in solving complex quality, safety, environment and process engineering problems, ability to maintain a reliable and methodical approach to support and documentation

238
Competence in computer: excel, word, power point, basic Mat-lab, origin-pro, python, Latex and basic C++ computational fluid dynamic (CFD)
A proven record of reliability, the ability to perform under time constraints, and good judgement under pressure
Ability to work under critical time deadlines and to re-evaluate priorities while exercising discretion, diplomacy, and good judgment
Ability to take ownership of projects and multi-task
Excellent interpersonal skills, including the ability to maintain effective working relationships Ability to interact with consultants and staff at all levels as well as with clients and business
contacts
Professional Affiliations
The International Association for Fire Safety Science (IAFSS)
German Association of Engineers (VDI)
German Association of safety Engineers (VDSI)
DECHEMA
Process-net (process safety)
Ghana Chemical society