explosion seismic reflections from the earth's core
TRANSCRIPT
Explosion seismic re£ections from the Earth’s core
H. Thybo a;�, A.R. Ross a, A.V. Egorkin b
a Geological Institute, University of Copenhagen, �ster Voldgade 10, 1350 Copenhagen K, Denmarkb Center for Regional Geophysical and Geoecological Studies (GEON), Chistyi per. 4, Moscow 119034, Russia
Received 13 May 2003; received in revised form 29 July 2003; accepted 18 September 2003
Abstract
Recent seismological studies have presented evidence for the existence of a layer with ultra-low seismic velocities atthe core^mantle boundary at ca. 2900 km depth. We report high-amplitude, high-frequency, and laterally coherentseismic arrivals from three nuclear explosions in Siberia. With recording station intervals of 15 km, the seismic phasesare readily correlated and show the presence of a thin, ultra-low velocity zone in a region where it was not previouslyreported. The duration and complexity of the arrivals are inconsistent with a simple core^mantle boundary andrequire a hitherto unidentified, kilometre-scale, fine structure in the ultra-low velocity zone. The observations may beexplained by a ca. 7 km thick, two-layer, ultra-low velocity zone with exceptional low velocities, which indicate thepresence of high percentages of melt (s 15%), in particular in the lower part of the zone. Waveform variation implieslateral change in the thickness and physical properties of the ultra-low velocity zone with a wavelength of less than100 km.6 2003 Elsevier B.V. All rights reserved.
Keywords: core^mantle boundary; ultra-low velocity zone; lower mantle; nuclear explosions; re£ection seismology; long-rangeexplosion seismology
1. Introduction
The core^mantle boundary (CMB) is the majorphysical discontinuity within the Earth and thelower boundary layer for the mantle. It mayhave importance for the driving forces of platetectonics as the possible source of mantle plumes.Seismological investigations of the lowermostmantle have discovered a 5^50 km thick ultra-low velocity zone (ULVZ) at the CMB [1^4]
with velocity decreases of 5^20% for compression-al waves and 10^50% for shear waves. The ULVZhas been connected with the base of at least onemantle plume [5]. Studies of several seismic phases(SPdKS [5^7], PKP [8], ScP [9^13], SKS [14] andPcP [2,3,15]) and travel times [16,17] in many lo-cations around the world have been used to iden-tify ULVZs. It is generally assumed that theULVZ contains partially molten lower-mantlematerial [8,11,18] but the seismic data are alsoconsistent with a transition layer between coreand mantle [19,20]. To date, less than half ofthe CMB has been investigated for the existenceof a ULVZ, which is observed in only 12% ofthese locations [19].
0012-821X / 03 / $ ^ see front matter 6 2003 Elsevier B.V. All rights reserved.doi:10.1016/S0012-821X(03)00532-6
* Corresponding author. Tel. : +45-3532-2452;Fax: +45-3314-8322.E-mail address: [email protected] (H. Thybo).
EPSL 6850 21-11-03
Earth and Planetary Science Letters 216 (2003) 693^702
R
Available online at www.sciencedirect.com
www.elsevier.com/locate/epsl
Here we present high-resolution, high-fre-quency seismic data from nuclear sources, whichdemonstrate the existence of a very thin ULVZ attwo locations beneath Siberia in a region whereprevious studies indicate there is no ULVZpresent. Our ¢nding suggests that a ULVZ maybe present over wide areas of the Earth with athickness below the resolution limit of other seis-mological techniques applying lower frequencies,as well as strong lateral variability in its thickness.The very high frequency content of the data al-lows imaging of small-scale layering. The mod-elled, very low velocities indicate high percentagesof melts in the ULVZ.
2. Data and seismic observations
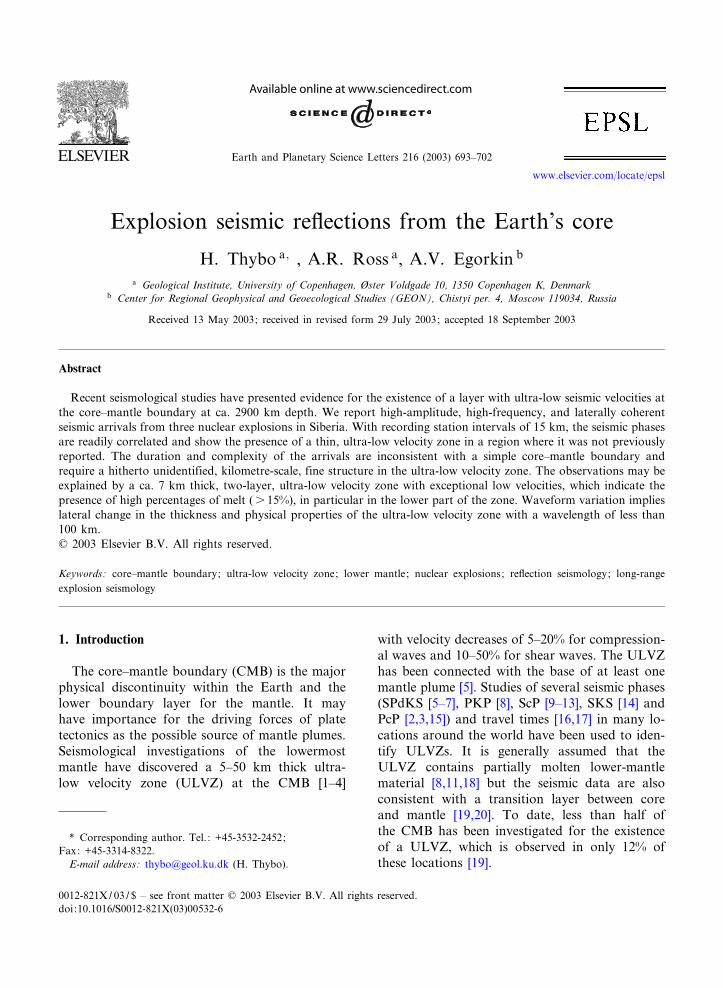
Our analysis is based on seismic recordings ofthree PNE (peaceful nuclear explosion) shots:KRATON-1 and KRATON-4 detonated in 1978and BATHOLITH-2 detonated in 1980 [21,22](Fig. 1). These explosions were part of a pro-gramme of 122 Soviet nuclear detonations be-
tween 1965 and 1988 for engineering and geo-sci-enti¢c purposes [21]. The KRATON shots hadyields of 22 kt (mb = 5.5 and 5.6, respectively[21]) and were recorded to a maximum source^receiver o¡set of 3310 km. BATHOLITH-2 hadan 8 kt yield (mb = 5.2 [21]) and was recorded to amaximum o¡set of 4390 km. Station intervalswere V15 km. Three components of ground dis-placement were recorded, but the CMB phases areonly observed on the vertical component. Typicalrecord lengths (1100 s) allow observation of arriv-als from the lower mantle and the core, in addi-tion to the primary targets, which were upper-mantle discontinuities [23].
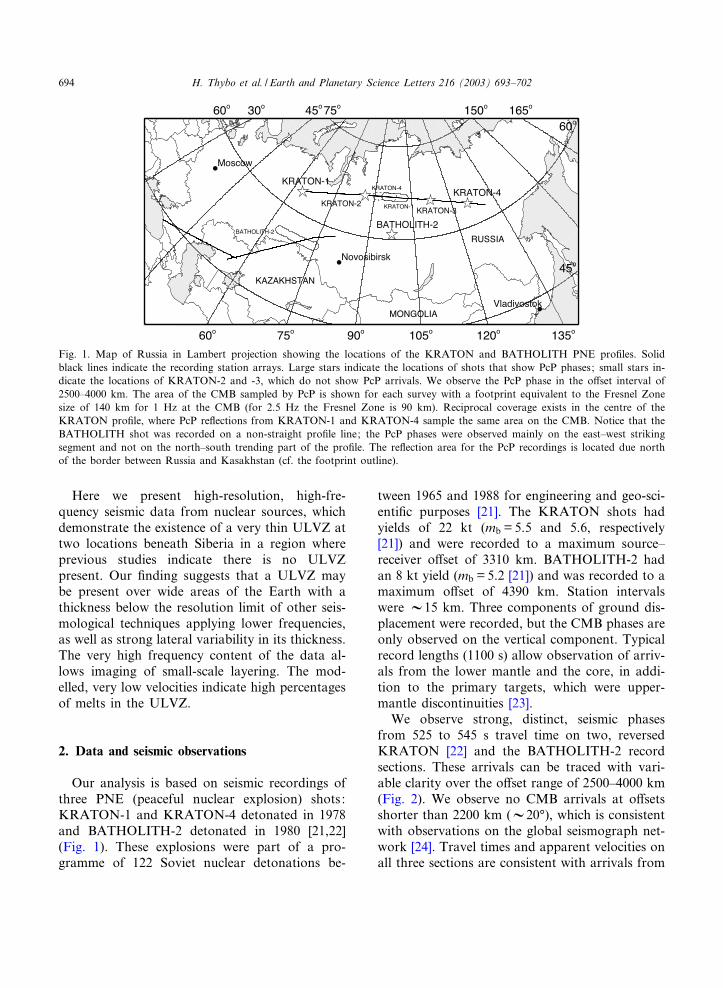
We observe strong, distinct, seismic phasesfrom 525 to 545 s travel time on two, reversedKRATON [22] and the BATHOLITH-2 recordsections. These arrivals can be traced with vari-able clarity over the o¡set range of 2500^4000 km(Fig. 2). We observe no CMB arrivals at o¡setsshorter than 2200 km (V20‡), which is consistentwith observations on the global seismograph net-work [24]. Travel times and apparent velocities onall three sections are consistent with arrivals from
Fig. 1. Map of Russia in Lambert projection showing the locations of the KRATON and BATHOLITH PNE pro¢les. Solidblack lines indicate the recording station arrays. Large stars indicate the locations of shots that show PcP phases; small stars in-dicate the locations of KRATON-2 and -3, which do not show PcP arrivals. We observe the PcP phase in the o¡set interval of2500^4000 km. The area of the CMB sampled by PcP is shown for each survey with a footprint equivalent to the Fresnel Zonesize of 140 km for 1 Hz at the CMB (for 2.5 Hz the Fresnel Zone is 90 km). Reciprocal coverage exists in the centre of theKRATON pro¢le, where PcP re£ections from KRATON-1 and KRATON-4 sample the same area on the CMB. Notice that theBATHOLITH shot was recorded on a non-straight pro¢le line; the PcP phases were observed mainly on the east^west strikingsegment and not on the north^south trending part of the pro¢le. The re£ection area for the PcP recordings is located due northof the border between Russia and Kasakhstan (cf. the footprint outline).
EPSL 6850 21-11-03
H. Thybo et al. / Earth and Planetary Science Letters 216 (2003) 693^702694
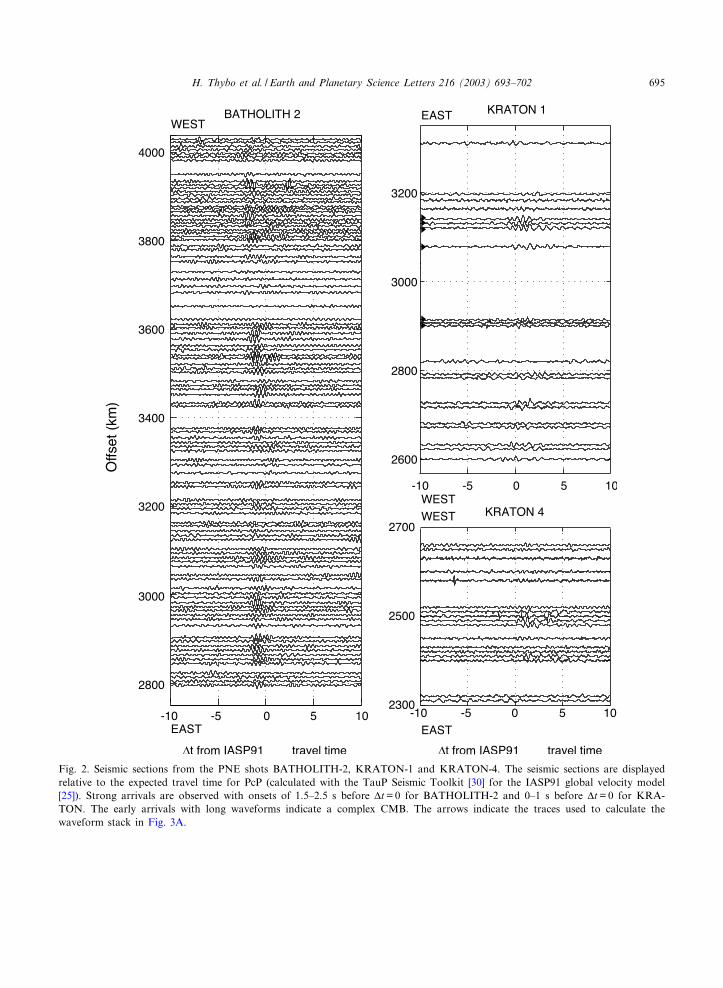
Fig. 2. Seismic sections from the PNE shots BATHOLITH-2, KRATON-1 and KRATON-4. The seismic sections are displayedrelative to the expected travel time for PcP (calculated with the TauP Seismic Toolkit [30] for the IASP91 global velocity model[25]). Strong arrivals are observed with onsets of 1.5^2.5 s before vt=0 for BATHOLITH-2 and 0^1 s before vt=0 for KRA-TON. The early arrivals with long waveforms indicate a complex CMB. The arrows indicate the traces used to calculate thewaveform stack in Fig. 3A.
EPSL 6850 21-11-03
H. Thybo et al. / Earth and Planetary Science Letters 216 (2003) 693^702 695
Fig. 3. (A) Single-trace KRATON-1 and BATHOLITH-2 CMB arrivals showing complex seismic phases together with a maxi-mum power stack for KRATON-1, calculated after a time shift corresponding to the expected move-out for the re£ection fromthe CMB (PcP). Tests have shown that no signi¢cant change applies if residual static correction is applied, indicating a very ro-bust stack. The amplitude of the precursor (PdP) changes with frequency compared to PcP (channel no. 120 from KRATON-1 isshown here as an example). A signi¢cant amplitude reduction for PdP occurs when frequencies above 1.5 Hz are removed, butnot for PcP. The waveform and length of the arrival change with o¡set for the BATHOLITH-2 data, for which we have observa-tions of PcP to very far o¡sets (2800^4000 km). The expected re£ection waveform for a single interface CMB is shown in thecentre. It shows the input waveform to the modelling with the e¡ects added from attenuation from propagation through themantle, assuming the IASP91 model. Notice its similarity to the PcP phase in the stacked seismogram. (B) First arrivals forKRATON-1 at near-o¡sets (Pn). The source waveform for modelling (single interface model) was extracted from a windowedstack of direct arrivals in the o¡set range of 180^320 km. (C) First arrivals at o¡set ranges comparable to our PcP arrivals arecomplicated because of interference between several direct seismic phases from the transition zone. Upper seismograms are NOR-SAR recordings of KRATON-1 (stations NBO). The re£ectivity-based synthetic seismogram of the ¢rst arrival at 2762 km o¡setwas calculated for a modi¢ed IASPEI model (modi¢ed to include a ‘520 km discontinuity’, here at 538 km depth; the two othertransition zone discontinuities were at 410 and 662 km depth). The arrows show expected arrival times from the transition zonein the IASP91 model. The synthetic seismogram for this model leads to an almost exact ¢t between data and synthetic seismo-gram. The duration of the waveform is the same as for the data and the two waveforms are qualitatively similar. At other o¡setranges, the ¢rst arrival is simple, as identi¢ed on Gra«fenberg array stations (GRB) for KRATON-1 and BATHOLITH-2.(D) Amplitude spectrum for the KRATON-1 stacked PdP and PcP arrivals and the modelled source waveform (IASP91). Thewindow size is 2 s for each spectrum with a cosine taper applied at both ends of the data window. Note that the PdP phase hasa signi¢cantly higher frequency content than the PcP phase.
EPSL 6850 21-11-03
H. Thybo et al. / Earth and Planetary Science Letters 216 (2003) 693^702696

the CMB. Arrivals are observed at approximatelythe same time and o¡set for both shots on thereversed pro¢le KRATON, with ca 100 km be-tween the reversal o¡sets. This provides a strongindication that the energy originates from beneaththe pro¢le and not from out of the pro¢le plane.The arrival times on KRATON are 0^1 s earlierthan the expected travel time for the PcP re£ec-tion from the CMB. On BATHOLITH-2, the on-sets are generally V1.5 s earlier than the expectedPcP time, with the time di¡erence gradually in-creasing to 2.5 s at far o¡sets. These arrivalshave the appropriate travel-time move-out forPcP and, for KRATON-1, the maximum ampli-tudes of the complex waveforms occur around theexpected travel time for PcP. These observationsmake us con¢dent that they are re£ections fromnear the CMB. The V1 s di¡erences in absolutetravel times along the BATHOLITH pro¢le andbetween the BATHOLITH and KRATON pro-¢les indicate variations in mantle velocities alongthe travel paths of the observed seismic pro¢les.The changes typically occur at intervals of 150^200 km distance along the surface. Changes arealso observed in the seismic waveform with a sim-ilar wavelength.
3. Data analysis
The data quality is high enough to observe thewaveform on single seismograms. A stack ofKRATON-1 provides a better estimate of thewaveform of the re£ection from the CMB witha duration of 3 s. This is signi¢cantly longerthan the observed near-source waveform forKRATON-1 (Fig. 3A). No near-o¡set recordingswere made for BATHOLITH-2. However, thesource parameters of the two shots are likely tobe similar, as seen on data from the Gra«fenbergarray (Fig. 3C). The recorded waveforms showthe presence of at least two separate arrivals : (1)PdP from the top of the ULVZ and (2) PcP fromthe CMB. These are the ¢rst data to show theexistence of the ULVZ in Siberia [4] and toshow internal heterogeneity of the ULVZ. ThePNE source depths (593 m for KRATON-1 and720 m for BATHOLITH-2) are too small for sur-
face ghosts to explain the waveform. Lateral var-iation of the waveform with a wavelength of 150^200 km at the surface (Fig. 2) indicates lateralvariation in the physical properties of the ULVZon a 6 100 km scale at the CMB. As this scalelength is close to the size of the ¢rst Fresnel Zone,we cannot expect to obtain better resolution ofthe lateral variability, even with these data ofvery high frequency.
It has been suggested that the complex wave-form may be a source e¡ect caused by delayedcollapse of the cavity produced by the nuclearexplosions. However, simple ¢rst-arrival wave-forms were recorded for the same shots at theGra«fenberg array at o¡sets in the interval of3400^5200 km (Fig. 3C) and along the KRATONpro¢le in the o¡set interval of 180^320 km (Pn inFig. 3B). Therefore, the waveform emitted by thesources must be simple and of short duration.
Near-surface e¡ects at the receivers, possibly,could also cause the complex PdP/PcP waveforms.However, the observed complex ¢rst arrivals inthe relevant o¡set interval of 2200^3600 km areas expected because of interference between thedirect seismic phases from the mantle transitionzone. Synthetic seismograms calculated for therelevant o¡sets with the IASP91 velocity model[25] show similarity to the observed waveformsand the same duration of ca 3 s (Fig. 3C). Thisgives con¢dence that the complex ¢rst arrivals inthe considered o¡set interval are caused by inter-ference between refracted and re£ected seismicphases from the mantle transition zone. The com-plex ¢rst arrivals are, therefore, caused by inter-ference between several direct arrivals, and notbetween a direct arrival and its multiples. Thearrivals from the transition zone and the CMBtravel along di¡erent ray paths between thesame source and receivers. Therefore, they arenot a¡ected the same way by the passage of thetransition zone, where the ¢rst arrivals travel al-most horizontally and the CMB arrivals travelalmost vertically. Hence, the CMB arrivals arenot a¡ected by the same interference pattern asthe ¢rst arrivals.
The recorded ¢rst arrivals are simple at all o¡-sets outside the range of 2200^3600 km o¡set forall PNE shots, i.e. at shorter o¡sets on the PNE
EPSL 6850 21-11-03
H. Thybo et al. / Earth and Planetary Science Letters 216 (2003) 693^702 697
stations (cf. the Pn waveforms in the o¡set inter-val of 200^250 km in Fig. 3B) and at long o¡setsbeyond ca 3600 km on the NORSAR and Gra«-fenberg arrays (Fig. 3C). It would be an unlikelycoincidence if the near-surface conditions createdringing signals exactly at the same locations as weobserve the complex PdP/PcP waveforms and notoutside this range; not least because the observa-
tions are consistently made on two pro¢les whichare laterally separated by more than 1000 km, aswell as on several permanent seismographs out-side Russian territory.
The hypothesis of near-surface e¡ects impliesthat other seismic arrivals recorded on the samereceivers should have equally complex waveforms,but we observe simple direct waveforms for thecloser KRATON-2 and -3 shots in the centralpart of the pro¢le between KRATON-1 and -4(Fig. 1). The same seismographs that show theCMB arrivals for shots 1 and 4 recorded the di-rect seismic waves from shots 2 and 3. Hence, weare con¢dent that near-surface conditions at theseismic stations can be ruled out as the cause ofthe complex waveform. KRATON-2 and -3 donot show PcP arrivals because of the relativelysmall o¡sets that were used for the recordings(6 2500 km).
Consequently, for modelling the ¢ne structurearound the CMB, we have estimated the wave-form from a stack of the recorded Pn wave closeto the source in the o¡set range of 180^320 km.The e¡ects of propagation through the mantle aretaken into account by calculation of a syntheticseismogram for the IASP91 velocity model. Theestimated waveform for a re£ection from a singleinterface CMB is very similar to the direct wave-form recorded at the Gra«fenberg array (single in-terface model in Fig. 3A, and GRB in Fig. 3C),which gives con¢dence that it has been correctlyestimated.
The stacked waveform from the CMB has twoimportant features (Fig. 3A). Firstly, amplitudesare above the ambient noise level at frequenciesup to 3.5 Hz, with a peak frequency of 2.2 Hz forPdP and 1.5 Hz for PcP, i.e. the peak frequency is0.7 Hz higher for the early (PdP) than for the late(PcP) phase (Fig. 3A,D). Secondly, the amplitudeof the precursor is close to that of the main ar-rival. Typical earthquake recordings below 1 Hzshow amplitudes signi¢cantly lower for PdP thanfor PcP and require stacking of data to resolve thePdP phase [2,3,15]. In our high-frequency data,these two phases have the same amplitude andare visible without any processing (Fig. 3A).High cut frequency ¢ltering (at 1.5^2 Hz roll-o¡) of the KRATON-1 data signi¢cantly reduces
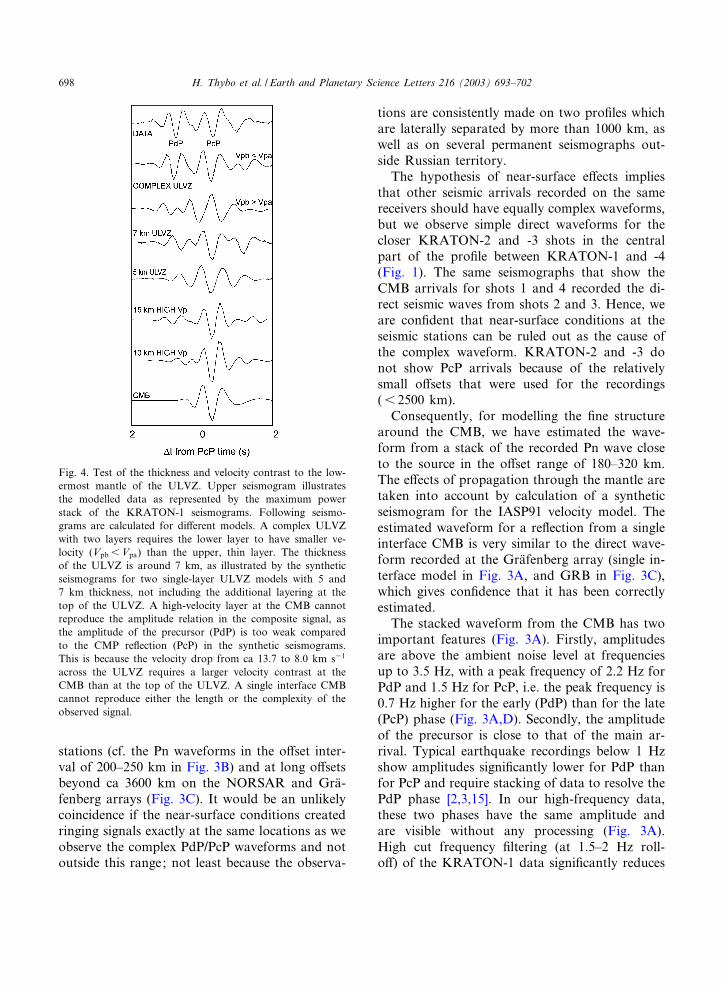
Fig. 4. Test of the thickness and velocity contrast to the low-ermost mantle of the ULVZ. Upper seismogram illustratesthe modelled data as represented by the maximum powerstack of the KRATON-1 seismograms. Following seismo-grams are calculated for di¡erent models. A complex ULVZwith two layers requires the lower layer to have smaller ve-locity (Vpb 6Vpa) than the upper, thin layer. The thicknessof the ULVZ is around 7 km, as illustrated by the syntheticseismograms for two single-layer ULVZ models with 5 and7 km thickness, not including the additional layering at thetop of the ULVZ. A high-velocity layer at the CMB cannotreproduce the amplitude relation in the composite signal, asthe amplitude of the precursor (PdP) is too weak comparedto the CMP re£ection (PcP) in the synthetic seismograms.This is because the velocity drop from ca 13.7 to 8.0 km s31
across the ULVZ requires a larger velocity contrast at theCMB than at the top of the ULVZ. A single interface CMBcannot reproduce either the length or the complexity of theobserved signal.
EPSL 6850 21-11-03
H. Thybo et al. / Earth and Planetary Science Letters 216 (2003) 693^702698
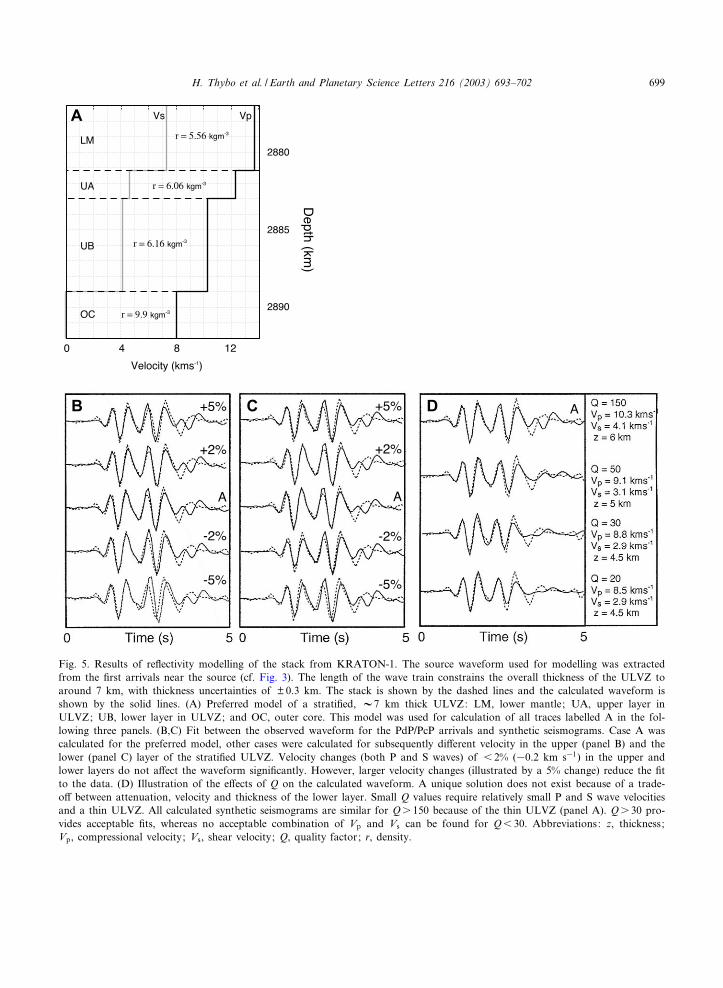
Fig. 5. Results of re£ectivity modelling of the stack from KRATON-1. The source waveform used for modelling was extractedfrom the ¢rst arrivals near the source (cf. Fig. 3). The length of the wave train constrains the overall thickness of the ULVZ toaround 7 km, with thickness uncertainties of V 0.3 km. The stack is shown by the dashed lines and the calculated waveform isshown by the solid lines. (A) Preferred model of a strati¢ed, V7 km thick ULVZ: LM, lower mantle; UA, upper layer inULVZ; UB, lower layer in ULVZ; and OC, outer core. This model was used for calculation of all traces labelled A in the fol-lowing three panels. (B,C) Fit between the observed waveform for the PdP/PcP arrivals and synthetic seismograms. Case A wascalculated for the preferred model, other cases were calculated for subsequently di¡erent velocity in the upper (panel B) and thelower (panel C) layer of the strati¢ed ULVZ. Velocity changes (both P and S waves) of 6 2% (30.2 km s31) in the upper andlower layers do not a¡ect the waveform signi¢cantly. However, larger velocity changes (illustrated by a 5% change) reduce the ¢tto the data. (D) Illustration of the e¡ects of Q on the calculated waveform. A unique solution does not exist because of a trade-o¡ between attenuation, velocity and thickness of the lower layer. Small Q values require relatively small P and S wave velocitiesand a thin ULVZ. All calculated synthetic seismograms are similar for Qs 150 because of the thin ULVZ (panel A). Qs 30 pro-vides acceptable ¢ts, whereas no acceptable combination of Vp and Vs can be found for Q6 30. Abbreviations: z, thickness;Vp, compressional velocity; Vs, shear velocity; Q, quality factor; r, density.
EPSL 6850 21-11-03
H. Thybo et al. / Earth and Planetary Science Letters 216 (2003) 693^702 699
the amplitude of the PdP phase relative to the PcPphase (Fig. 3A) and makes the seismogram sim-ilar to the other, lower-frequency observationsbased on earthquake sources, as mentionedabove. The preferential re£ection of high frequen-cies suggests tuning within a thin layer at the topof the ULVZ [26].
4. Modelling
We model the stack from KRATON-1 usingthe re£ectivity-based three-dimensional modellingpackage for 1-D models of the spherical earth[27]. We ¢t four main observations: (1) the sepa-rate PcP and PdP phases; (2) the overall length ofthe wave train; (3) the high amplitude of PdPrelative to PcP; and (4) the di¡erent frequencycontent of the two phases (Figs. 4 and 5). As aresult of the complex, long-duration waveform,neither a single interface at the CMB nor a simpleone-layer ULVZ can explain the observed wave-form (Fig. 3A and single interface model Fig. 4).A two-layer model matches the waveform whentuned to reproduce the observed frequency di¡er-ence between the two parts of the waveform. Ahigh-velocity layer produces the wrong polarity ofthe PcP arrival (Fig. 4). This constrains the veloc-ity in the ULVZ layer to between 13.6 km s31
(lower mantle) and 8.0 km s31 (core) and thethickness to between 4.8 and 8.2 km (Fig. 5).This is close to the lower thickness bound forthe ULVZ where reported in other areas [4].Our preferred model of the ULVZ consists of a1.2 km (upper) and a 6 km (lower) layer (Fig. 5).The thickness uncertainties derived from the mod-elling process are V 0.3 km and the relative veloc-ity uncertainties are V 2% or V0.2 km s31 (Fig.5). This model is an end-member model thatignores attenuation within the low-velocity layers.Attenuation has no visible e¡ect on the waveformfor Qs 150 because of the thin layers. No reason-able velocities can produce an acceptable ¢t to thedata for Q6 30, which constrains the minimumthickness of the ULVZ to 5.7 km (Figs. 4 and5D). The waveform is insensitive to the densityof the ULVZ, which may be surprising. Interpre-tations of other seismic phases indicate that the
density of the material in the ULVZ may be larg-er than in the lower mantle [13]. Introducing morethan two layers into the model is not supportedby the available data and tends to produce inter-nal multiples, which lengthen the wave train be-yond that observed.
5. Discussion
We interpret the existence of an ULVZ beneathSiberia in a region where previous investigations,based on distant earthquakes, have indicated thatthe ULVZ is absent. We only observe the PcParrivals in the data from three PNEs in Siberia.This may be because of the low signal/noise ratioin some of the seismic sections, but may also becaused by lateral variation in the CMB region.Most PNE shots show clear PcP re£ections onrecordings outside the former Soviet Union onsome of the seismographs in the global network.Our modelling shows that the thickness of theULVZ is only 6^7 km, which is close to the de-tection limit by other methods, Hence, our resultsprovide a strong indication that a thin ULVZmay be present in larger parts of the CMB thanpreviously found. We observe pronounced lateralvariability of the waveforms of the re£ectionsfrom the CMB. We suppose that the dense sam-pling of the re£ection signals along two pro¢lelines made this possible. Similar variability wasrecently interpreted for CMB re£ections from be-neath the Paci¢c Ocean based on interpretation ofmany earthquakes from the Tonga^Fiji region[13].
Our modelling has indicated ¢ne structure orinternal layering in the ULVZ on a kilometrescale. This is the ¢rst time that such heterogeneityhas been reported, probably because other studieshave primarily been based on data with lowerfrequency content and coarser spatial samplingthan used here. We ¢nd that a two-layer velocitymodel may explain the observations from KRA-TON-1. However, the modelling cannot rule outthe possibility that the complex waveforms arecaused by ¢ner-scale heterogeneity, as the resolu-tion of our modelling results is limited by theavailable bandwidth of the seismic signals with a
EPSL 6850 21-11-03
H. Thybo et al. / Earth and Planetary Science Letters 216 (2003) 693^702700
typical wavelength of 3^4 km. Although modelledby two layers, the complex waveforms may alsobe caused by lateral variability of the ULVZ, bothregarding internal velocity variation and thicknessvariation. De¢nitely, variation in thickness of theULVZ at a scale below the resolution of thewaves may contribute to the complexity of thesignals.
Our data indicate ¢ne structure in an extremelythin ULVZ beneath Siberia. Though non-unique,waveform modelling suggests that velocities arelower (325% for P-waves and 345% for S-waves)than previously reported (310% P-wave velocity,330% S-wave velocity [4]), except for a very re-cent study [13]. The extremely low velocities areconsistent with percentages of melt larger than15% [18]. The density of mantle melts at veryhigh temperature and pressure is expectedly high-er than the surrounding matrix [28,29], such thatany melt would sink to the bottom of the meltlayer. However, our modelling of the PcP obser-vations does not constrain the density of thelayers. The result is consistent with a two-layermodel with a high percentage of melt in the lowerpart of the ULVZ and a layer with less melt at thetop of the ULVZ.
Acknowledgements
This work was supported by funds from theCarlsberg Foundation, Copenhagen, Denmark,and the Danish National Research Council. Wewould like to thank Jan Fyen for providing re-cordings of the PNE data from the NORSARarray. Comments to an earlier version of themanuscript by I. Artemieva and the two reviewers(anonymous) are acknowledged.[BW]
References
[1] E.J. Garnero, D.V. Helmberger, On seismic resolution oflateral heterogeneity in the Earth’s outermost core, Phys.Earth Planet. Inter. 88 (1995) 117^130.
[2] J. Mori, D.V. Helmberger, Localized boundary layer be-low the mid-Paci¢c velocity anomaly identi¢ed from aPcP precursor, J. Geophys. Res. B 100 (1995) 20359^20365.
[3] J. Revenaugh, R. Meyer, Seismic evidence partial meltwithin a possibly ubiquitous low-velocity layer at thebase of the mantle, Science 277 (1997) 670^673.
[4] E.J. Garnero, J. Revenaugh, Q. Williams, T. Lay, L.H.Kellogg, Ultralow velocity zone at the core-mantleboundary, in: M. Gurnis, E.W. Michael, E. Knittle,A.B. Bruce (Eds.), The Core-Mantle Boundary Region,Geodynamics Series 28, AGU, Washington, DC, 1998,pp. 319^334.
[5] D.V. Helmberger, L. Wen, X. Ding, Seismic evidence thatthe source of the Iceland hotspot lies at the core-mantleboundary, Nature (London) 396 (1998) 251^255.
[6] E.J. Garnero, D.V. Helmberger, Seismic detection of athin laterally varying boundary layer at the base of themantle beneath the Central-Paci¢c, Geophys. Res. Lett.23 (1996) 977^980.
[7] E.J. Garnero, D.V. Helmberger, Further structural con-straints and uncertainties of a thin laterally varying ultra-low-velocity layer at the base of the mantle, J. Geophys.Res. B 103 (1998) 12495^12509.
[8] L. Wen, D.V. Helmberger, Ultra-low velocity zones nearthe core-mantle boundary from broadband PKP precur-sors, Science 279 (1998) 1701^1703.
[9] E.J. Garnero, S.P. Grand, D.V. Helmberger, Low P-wavevelocity at the base of the mantle, Geophys. Res. Lett. 20(1993) 1843^1846.
[10] J.C. Castle, R.D. van der Hilst, The core-mantle bound-ary under the Gulf of Alaska; no ULVZ for shear waves,Earth Planet. Sci. Lett. 176 (2000) 311^321.
[11] J.E. Vidale, M.A.H. Hedlin, Evidence for partial melt atthe core-mantle boundary north of Tonga from the strongscattering of seismic waves, Nature (London) 391 (1998)682^685.
[12] E.J. Garnero, J.E. Vidale, ScP; a probe of ultralow veloc-ity zones at the base of the mantle, Geophys. Res. Lett. 26(1999) 377^380.
[13] S. Rost, J. Revenaugh, Small-scale ultralow-velocity struc-ture imaged by ScP, J. Geophys. Res. B 108 (2003) 2056,doi: 10.1029/2001JB001627.
[14] E. Stutzmann, L. Vinnik, A. Ferreira, S. Singh, Con-straint on the S-wave velocity at the base of the mantle,Geophys. Res. Lett. 27 (2000) 1571^1574.
[15] Q. Williams, J. Revenaugh, E. Garnero, A correlationbetween ultra-low basal velocities in the mantle and hotspots, Science 281 (1998) 546^549.
[16] M. Sylvander, A. Souriau, P-velocity structure of thecore-mantle boundary region inferred from PKP(AB)-PKP(BC) di¡erential travel times, Geophys. Res. Lett.23 (1996) 853^856.
[17] M. Sylvander, B. Ponce, A. Souriau, Seismic velocities atthe core-mantle boundary inferred from P waves dif-fracted around the core, Phys. Earth Planet. Inter. 101(1997) 189^202.
[18] Q. Williams, E.J. Garnero, Seismic evidence for partialmelt at the base of Earth’s mantle, Science 273 (1996)1528^1530.
[19] E.J. Garnero, R. Jeanloz, Fuzzy patches on the Earth’s
EPSL 6850 21-11-03
H. Thybo et al. / Earth and Planetary Science Letters 216 (2003) 693^702 701
core-mantle boundary?, Geophys. Res. Lett. 27 (2000)2777^2780.
[20] B.A. Bu¡ett, E.J. Garnero, R. Jeanloz, Sediments at thetop of Earth’s core, Science 290 (2000) 1338^1342.
[21] D.D. Sultanov, J.R. Murphy, K.D. Rubinstein, A seismicsource summary for Soviet peaceful nuclear explosions,Bull. Seismol. Soc. Am. 89 (1999) 640^647.
[22] A.V. Egorkin, Study of the mantle on super long-rangegeotraverses, Izv. Phys. Solid Earth 35 (1999) 630^645.
[23] K. Fuchs, Upper Mantle Heterogeneities from Active andPassive Seismology, Kluwer Academic, Dordrecht, 1997,366 pp.
[24] L. Astiz, P. Earle, P. Shearer, Global stacking of broad-band seismograms, Seismol. Res. Lett. 67 (1996) 8^18.
[25] B.L.N. Kennett, E.R. Engdahl, Traveltimes for globalearthquake location and phase identi¢cation, Geophys.J. Int. 105 (1991) 429^465.
[26] J.P. Ake, A.R. Sanford, New evidence for the existenceand internal structure of a thin layer of magma at mid-crustal depths near Socorro, New Mexico, Bull. Seismol.Soc. Am. 78 (1988) 1335^1359.
[27] K. Fuchs, G. Mueller, Computation of synthetic seismo-grams with the re£ectivity method and comparison withobservations, Geophys. J. R. Astron. Soc. 23 (1971) 417^433.
[28] S.M. Rigden, T.J. Ahrens, E.M. Stolper, Densities of liq-uid silicates at high pressures, Science 226 (1984) 1071^1074.
[29] S.M. Rigden, T. Ahrens, E.M. Stolper, High-pressureequation of state of molten anorthite and diopside,J. Geophys. Res. B 94 (1989) 9508^9522.
[30] H.P. Crotwell, T.J. Owens, J. Ritsema, The TauP toolkit;£exible seismic travel-time and ray-path utilities, Seismol.Res. Lett. 70 (1999) 154^160.
EPSL 6850 21-11-03
H. Thybo et al. / Earth and Planetary Science Letters 216 (2003) 693^702702