phase equilibria in binary mixtures of ethane and propane with sunflower oil
TRANSCRIPT

ELSEVIER Fluid Phase Equilibria 101 (1994) 247-257
PHASE EQUILIBRIA IN BINARY MIXTURES OF ETHANE AND PROPANE WITH SUNFLOWER OIL
Juan C. de la Fuente B., Guillermo D. Mabe, Esteban A. Brignole and Susana B. Bottini*.
PLAPIQUI, UNS-CONICET, 12 Octubre 1842,800O Bahia Blanca, Argentina
Received 1 April 1994; accepted in final form 8 August 1994
KEYWORDS: Experiments; data; VLE high pressure; liquid-liquid equilibria; ethane; propane; suntlower oil.
ABSTRACT
The solubility of ethane and propane in suntlower oil has been measured at temperatures between 298 K and 373 K, and pressures up to 8.88 h4Pa. Partial liquid miscibility was observed, for mixtures of high hydrocarbon concentrations, in the near -critial region of the solvent; the compositions of the coexisting liquid phases were calculated from a mass balance in the equilibrium cell.
INTRODUCTION
Mixtures of compounds with very different molecular sizes are fiecuently encountered in industrial processes for the recovery of natural products. For example, hexane is the traditional solvent used for the extraction of vegetable oils from oil seeds. New separation techniques, such as supercritical extraction, are also potentially applicable in this field. In all cases, the study and development of these separation processes requires information on the vapor-liquid equilibrium of mixtures of low molecular weight solvents with complex substances of high molecular weight.
In this work phase equilibria have been measured in mixtures of sunflower oil and light hydrocarbons (ethane and propane). Experimental vapor-liquid and liquid- liquid equilibrium data are reported, for sub- and supercritical conditions of the solvents.
(*) Author to whom correspondence should be addressed.
0378-3812/94/$07.00 0 1994 - Elsevier Science B.V. All rights reserved
SSDI 0378-3812 (94) 02589-4
248 J.C. de la Fuente et al. /Fluid Phase Equilibria 101 (1994) 247-257
EXPERLMENTAL APPARATUS AND TECHNIQUE
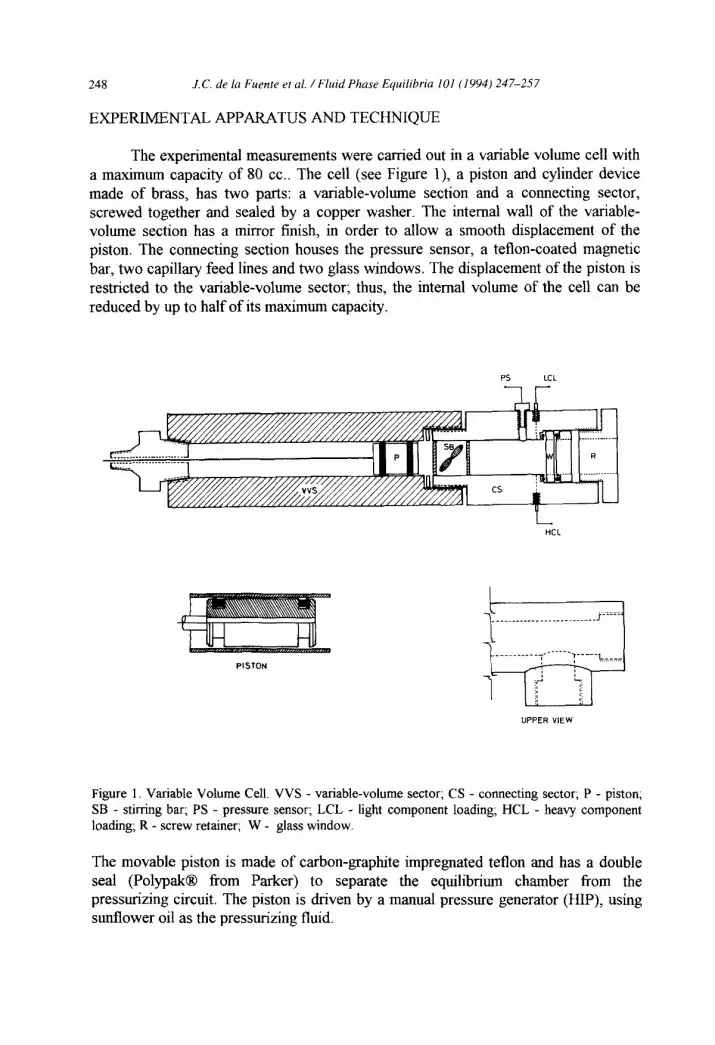
The experimental measurements were carried out in a variable volume cell with a maximum capacity of 80 cc.. The cell (see Figure I), a piston and cylinder device made of brass, has two parts: a variable-volume section and a connecting sector, screwed together and sealed by a copper washer. The internal wall of the variable- volume section has a mirror finish, in order to allow a smooth displacement of the piston. The connecting section houses the pressure sensor, a teflon-coated magnetic bar, two capillary feed lines and two glass windows. The displacement of the piston is restricted to the variable-volume sector; thus, the internal volume of the cell can be reduced by up to half of its maximum capacity.
PISTON
UPPER MEW
Figure I. Variable Volume Cell. VVS - variable-volume sector; CS - connecting sector; P - piston; SB - stirring bar; PS - pressure sensor; LCL - light component loading; HCL - heavy component loading; R - screw retainer; W - glass window.
The movable piston is made of carbon-graphite impregnated teflon and has a double seal (Polypak@ from Parker) to separate the equilibrium chamber from the pressurizing circuit. The piston is driven by a manual pressure generator (HIP), using sunflower oil as the pressurizing fluid.
J.C. de la Fuente et al. /Fluid Phase Equilibria I01 (1994) 247-257 249
The position of the piston, i.e. the internal volume of the cell, is determined by an inductance bridge. For this purpose, a stainless steel wire with a ferromagnetic tip at its end, is attached to the back of the piston. The position of the indicator tip is obtained by moving the variable branch of the inductance bridge, mounted on the sliding part of a precision caliper (sensitivity of f 0.02 mm). The caliper is rigidly fixed to the same steel frame as the equilibrium cell. The internal volume of the cell was initially calibrated by adding known weights of distilled water. A straight line relation between the internal volume of the cell and the piston position was obtained.
Screw retainers are used to hold the glass windows against the brass body of the cell. A pair of Viton O-rings provide the sealing. The front window is for visual observation and the side window for illumination.
The equilibrium cell is surrounded by a 20 mm thick aluminum jacket, externally heated by five electrical resistances connected to a temperature controller. The temperature is measured by a 100 ohm Pt resistance thermometer placed inside a groove in the aluminum jacket. The area around the jacket is covered with insulating fiber, in order to maintain better temperature control. The temperature is controlled to within 0.1 IS.
The pressure inside the cell is measured by a strain gauge transducer (Sedeme) connected to a digital indicator (Daytronic). The pressure readings were first calibrated against a Bourdon type digital manometer (Heise). The estimated accuracy of the pressure measurements is f 0.25 bar.
A teflon-coated magnetic bar, driven by an external alternating magnetic field, provides vigorous stirring inside the cell. The movement of the bar is restricted to the connecting sector by means of a stainless steel cross soldered to a thin ring.
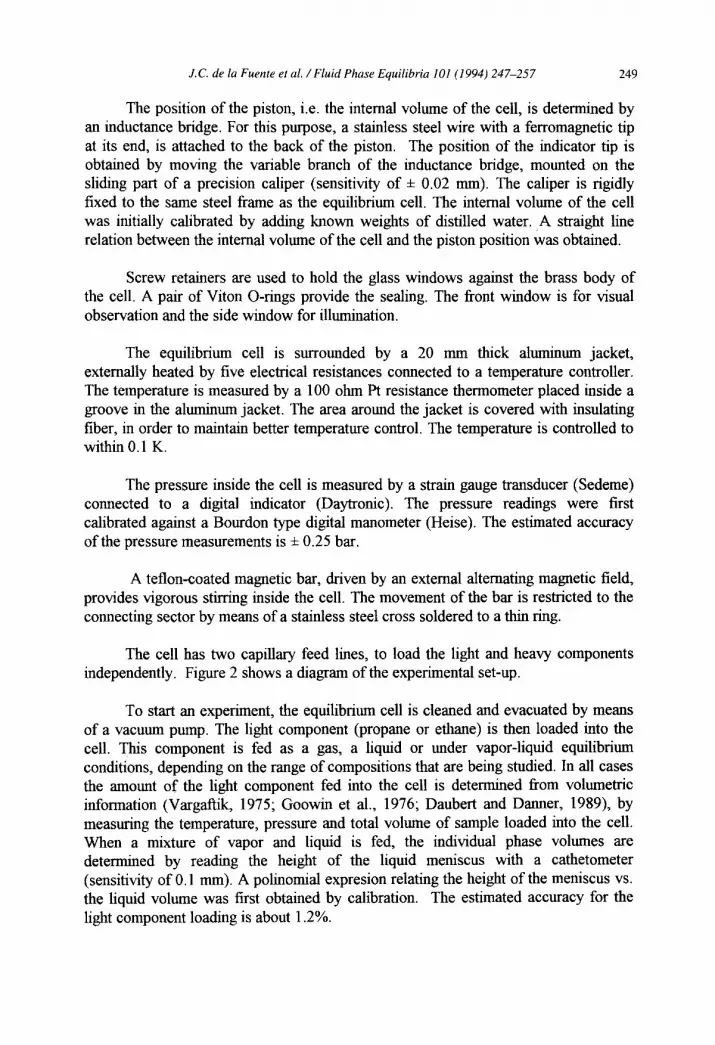
The cell has two capillary feed lines, to load the light and heavy components independently. Figure 2 shows a diagram of the experimental set-up.
To start an experiment, the equilibrium cell is cleaned and evacuated by means of a vacuum pump. The light component (propane or ethane) is then loaded into the cell. This component is fed as a gas, a liquid or under vapor-liquid equilibrium conditions, depending on the range of compositions that are being studied. In all cases the amount of the light component fed into the cell is determined from volumetric information (Vargafbk, 1975; Goowin et al., 1976; Daubert and Danner, 1989), by measuring the temperature, pressure and total volwne of sample loaded into the cell. When a mixture of vapor and liquid is fed, the individual phase volumes are determined by reading the height of the liquid meniscus with a cathetometer (sensitivity of 0.1 mm). A polinomial expresion relating the height of the meniscus vs. the liquid volume was first obtained by calibration. The estimated accuracy for the light component loading is about 1.2%.
250 LC. de la Fuente et al. /Fluid Phase Equilibria 101 (1994) 247-257
r
Figure 2. Experimental Set-Up. EC - equilibrium cell; TS - temperature sensor; TC - temperature controller; PS - pressure sensor; PI - pressure indicator; HR - heating resistances; MG - magnetic generator; PD - position detector; PG - pressure generator; VT - vacuum trap; VP - vacuum pump; OR - oil reservoir; CB - cold bath; TD - thermo-condenser; CAT - cathetometer; P - pressure gauge.
The heavy component (sunflower oil), which is also used as the pressurizing fluid, is previously degassed and stored in a reservoir, from where it is fed into the cell by means of the manual pressure generator. The amount of oil fed into the cell is determined by weighing the reservoir (Metler analytical balance, sensitivity 0.1 mg) before and after the oil has been loaded. The estimated accuracy for the heavy component loading is about 0.2%.
After both components have been fed into the cell, the working temperature is set and a vigorous stirring of the mixture is started. When the cell reaches the desired working temperature, the pressure is gradually increased by means of the manual pump, and the equilibrium pressures attained at different positions of the piston, i.e. at different volumes of the cell, are recorded. Equilibration, i.e. the attainment of a constant pressure value at given temperature and volume, takes between 10 and 40 minutes. A plot of pressure vs. volume, similar to that shown in Figure 3, is obtained for each experimental point; i.e. for each isotherm and each loading of the cell. The coordinates of the break point (pb,Vb) in this diagram represent the disappearance of the vapor phase; i.e. the bubble point of a mixture whose composition is equal to the

J.C. de la Fuente et al. /Fluid Phase Equilibria 101 (1994) 247-257 251
overall initial loading of the cell. The coordinates of the break point are, then, the bubble pressure pb and the total volume of the liquid phase Vb (i.e. saturated molar volume multiplied by the total number of moles of mixture inside the cell). The success of this experimental technique relies upon a precise determination of the coordinates (pb,Vb). It is necessary to approach the break point as closely as possible and to repeat the compression-expansion cycle around the bubble point several times, in order to assure a precise determination of the equilibrium point. The experimental set-up employed in this work is capable of measuring volume changes with a sensitivity better than 0.01 cc.
When the region of partial liquid miscibility is reached, it is possible to estimate, by solving a set of four equations, the compositions of the two coexisting liquid phases at equilibrium. These equations represent the material balances applied to the experimental results obtained for two different loadings of the cell, at the same equilibrium temperature and pressure. According to the phase rule, the two-phase equilibrium conditions of this pseudo-binary mixture are completely determined, once the temperature and pressure have been fixed. The compositions of the liquid phases at equilibrium remain independent of the overall loading, but their relative quantities will change, according to the amount of sample fed into the cell. The set of equations to be solved is:
VI V” n, =X&+X:I~
vs vs
n, = (l-x:)$+(1-#)< s Vs
V” V PII
n; =(1-x;)- vf +(1-x:‘)- V,”
nl= x: - v” +X11 V’II - v,’ 1
V,"
(1)
(2)
(3)
In these equations n,, n2, n;, n; represent the number of moles of propane(l) and sunflower ail(2) fed into the cell in the first and second loadings respectively; vi , V” , VI1 , v!” are the measured total volumes of the coexisting liquid phases (I and II) at equilibrium. The set of equations (1) to (4) is solved for
the four unknowns: X{ , xf , vi , I(’ ; i.e., the molar compositions and saturated
molar liquid volumes of the two coexisting liquid phases at equilibrium.

252 J.C. de La Fuente et al. /Fluid Phase Equilibria 101 (1994) 247-257
RESULTS AND DISCUSSION
Isothermal measurements were carried out on the propane -sunflower oil and ethane - sunflower oil systems.
The gases used in the experiments had a minimum purity of 99% molar (Matheson, Chemically Pure). The molar composition of the sunflower oil, as determined by gas chromatography, was the following (acid base): pahnitic acid 6.7%, stearic acid 3.34%, oleic acid 25.83%, linoleic acid 63.91% and linolenic acid 0.22%.
Figure 3 shows the typical Pressure vs. Volume plot obtained in the experiments. As it can be seen in this figure, the bubble points of light hydrocarbon - vegetable oil mixtures, can be determined very precisely from the intersection of two straight lines: the line of the two-phase vapor-liquid region, with a slope nearly equal to zero, and a second very steep line for the one-phase liquid region.
,,-
12
JO.5 Vb 41.5 42.5
Total Volume [ml J
43.5 44.5
Figure 3. Pressure vs. Total Volume for the Propane (1) - Sunflower Oil (2) system to 3 13.2 K ant x1 = 0.939.
Table 1 contains the bubble pressures and saturated liquid volumes of propane - sunflower oil mixtures, at 313, 333, 353 and 373 K. At 353 K and high propane concentrations, this system showed partial liquid miscibility. Table 2 gives the liquid-liquid equilibrium data. Most of the data reported in Table 2 were obtained by solving the mass-balance equations for the compositions and molar volumes of the coexisting liquid phases.

J.C. de la Fuente et al. /Fluid Phase Equilibria 101 (1994) 247-257 253
TABLE 1 Experimental Bubble Pressures and Saturated Liquid Volumes for the System Propane (1) - Sunflower Oil (2).
T WI pb WI
313.2 0.939 13.7 137 0.922 13.2 155 0.902 12.9 172 0.867 12.5 193 0.825 12.0 249 0.718 9.3 341 0.659 7.4 395 0.622 7.2 431 0.558 5.8 482 0.331 2.5 671 0.208 1.4 766
333.2
353.2
373.2
0.939 21.2 141 0.922 20.6 160 0.902 20.0 177 0.867 19.0 198 0.825 18.4 254 0.718 13.9 347 0.659 11.5 402 0.622 10.7 439 0.558 8.5 490 0.331 3.5 683 0.208 1.8 790
0.939 32.1 143 0.922 31.4 165 0.902 30.3 182 0.867 28.0 202 0.825 26.7 260 0.718 19.8 354 0.659 16.5 410 0.622 15.3 444 0.558 11.8 499 0.33 1 4.9 694 0.208 2.5 804
0.939 0.922 0.902 0.867 0.825 0.718 0.659 0.622 0.558 0.331 0.208
47.9
39.8 207 37.4 266 26.6 361 22.4 418 20.4 454 15.8 507 6.5 706 3.4 817
147
254 J.C. de la Fuente et al. /Fluid Phase Equilibria 101 (1994) 247-257
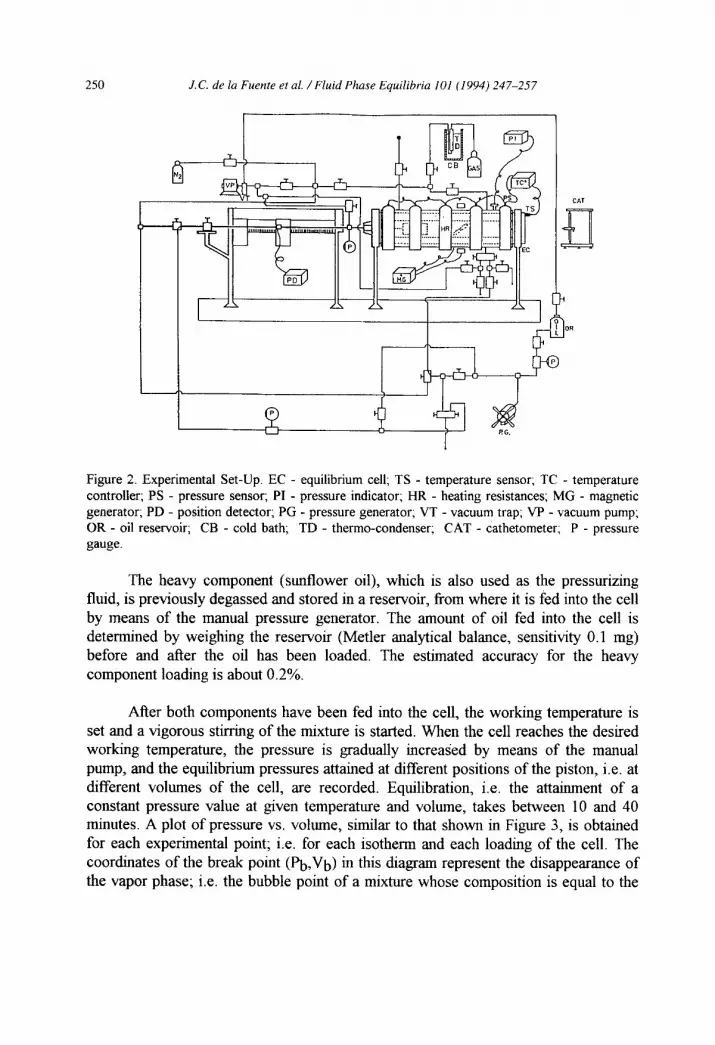
TABLE 2 Experimental Liquid-Liquid Equilibrium Data for the System Propane (1) - Sunflower Oil (2).
T P Xl1 .,‘I “S I “$
WI PaI [ml/m01 grj [ ml/m01 gr]
353.2 55.2 0.986 113 49.8 0.958 129 41.4 0.996 0.942 114 139 38.3 0.939 151 36.4 0.989 0.939 103 152 34.9 0.998 0.935 114 155 32.0 0.994 0.930 104 162 31.9 0.998 0.93 1 101 162
It should be noticed that some of the data in Table 2 give information on the molar volume and composition of only one saturated liquid phase. These data were obtained by measuring the pressure and volume at which a second liquid phase will start to separate from a liquid phase whose composition is equal to that of the overall cell loading. No liquid-phase spliting was observed at the 313 and 333 K isotherms. The lower critical solution temperature of the propane - sunflower oil system was determined to be around 340 K. No liquid-liquid equilibrium data is reported for the 373 K isotherm, due to problems with the piston sealings at this high temperature.
Figure 4 shows the experimental pressure vs. liquid phase composition curve for the propane - sunflower oil system at 323K.
The liquid-liquid and the vapor-liquid equilibrium data are shown in this figure. Weight fractions are used for the liquid phase compositions, in order to enlarge the region of partial liquid miscibility. This figure shows certain spread in the liquid-liquid equilibrium data, especially in the propane-rich liquid phase. This spread can be explained by the uncertainties in the measurement of the total volumes of the coexisting liquid phases; i.e. in the measurement of the meniscus height. The liquid- liquid equilibrium data were obtained from the mass-balance equations 1 to 4. Even though only two different overall loadings are required to mathematically solve this system for the four unknowns, a least-squares analysis on the results of a larger number of individual loadings would probably decrease the uncertainty and improve the accuracy of the results.
The results for the ethane - sunflower oil system are given in Tables 3 and 4. Table 3 contains the experimental vapor-liquid equilibrium data at 298, 303 and 308 K. Table 4 gives the liquid-liquid equilibrium data obtained from the mass- balance equations.

J.C. de la Fuente et al. /Fluid Phase Equilibria 101 (1994) 247-257 255
0.3 0.4 0.5 0.6 0.7 0.8 0.9 1.0
Propane Weight Fraction
Figure 4. Vapor-liquid and liquid-liquid equilibrium data for the Propane (1) - Sunflower Oil (2)
system at 353.2 K: Cl vapor-liquid equilibrium data; + liquid-liquid equilibrium data.
TABLE 3. Experimental Bubble Pressures and Saturated Liquid Volumes for the System Ethane (1) - Sunflower Oil (2).
T WI x1 pb [bar]
298.2 0.825 36.2 220
0.765 30.4 272
0.682 20.2 339
0.552 12.3 453
0.452 8.7 542
0.342 6.4 653
0.206 3.4 770
303.2 0.825 39.5 220
0.765 32.1 273
0.682 22.5 341
0.552 15.0 456
0.452 12.1 551
0.342 6.4 646
0.206 3.7 763
308.2 0.825 43.5 222
0.765 35.0 275
0.682 23.8 343
0.552 17.7 467
0.452
0.342 7.2 648
0.206 4.0 767

256 J.C. de la Fuente et al. /Fluid Phase Equilibria 101 (1994) 247-257
TABLE 4. Experimental Liquid-Liquid Equilibrium Data for the System Ethane (1) - Sunflower Oil (2)
T
IKI
P
P4 Xl1 .p “s
I “2’
[ml/m01 gr] [ml/m01 grj
298.2 61.8 0.995 0.883 87 167 55.8 0.992 0.888 92 164
45.6 1. 0.847 91 195
43.6 1. 0.835 92 200
303.2 79.4 0.998 0.884 86 166
75.2 0.996 0.884 88 166
71.1 0.997 0.880 89 169
67.6 1. 0.874 88 174
63.9 1. 0.871 89 177
55.4 1. 0.864 94 182
50.4 0.986 0.880 108 173
308.2 79.8 0.998 0.880 90 169
75.9 0.998 0.877 92 172
72.3 0.982 0.890 104 164
68.2 0.995 0.876 98 173
64.4 0.996 0.873 100 175
60.5 0.997 0.865 99 184
55.7 1. 0.859 110 183
90 -
80 -- + +
70 -- +k ++ + + 1
3 60 -- -O T !
50
-- +
i 40 -- E
n
a 30 0 --
20 0
--
10 -- q n 303.2 K
0 B
0 0.1 0.2 0.3 0.4 0.5 0.6 0.7 0.8 0.9 1
Ethane Weight Fraction
Figure 5 Vapor-liquid and liquid-liquid equilibrium data for the Ethane(1) - Sunflower Oil(2) system at 303.2 K: Cl vapor-liquid equilibrium data; + liquid-liquid equilibrium data

J.C. de la Fuente et al. /Fluid Phase Equilibria IO1 (1994) 247-257 251
Similar conclusions can be applied to the results shown in Figure 5 for the 303 K isotherm of the ethane - sunflower oil system.
No experimental data on the phase equilibria of light hydrocarbon - sunflower oil systems are available in the literature for comparison. The vapor pressures of pure ethane and propane at 300 K, measured at the time the equilibrium cell was being loaded with the light component under vapor-liquid equilibrium conditions, were 10 and 43.75 bar respectively, which agree with values fkom Dauber-t and Danner (1989) and Goowin et.al. (1976). The measured saturated molar liquid vohunes of both mixtures, extrapolate to values for the pure component molar liquid volumes, which match with those from the literature (Vargaftik, 1975; G oowin et.al., 1976; Bailey, 1951). Hixson and Bockelmann (1942) measured the liquid-liquid equilibria of propane - oleic acid - cottonseed oil mixtures; more recently, Coorens et.al. (1988) report experimental data on the phase equilibria of propane - tripahnitin. Even though no quantitative comparison can be made between the results of the present work and the previous data, there is a qualitative agreement about the phase-equilibrium behaviour of this type of systems.
ACKNOWLEDGMENT
The authors are grateful to Professor R. Fernandez Prim and his colleagues from the Physical-Chemistry Division, Comision National de Energla Atomica (Buenos Aires, Argentina), for valuable advice at the beginning of this project, and to the people from the workshop at PLAPIQUI for their skill in building the equilibrium cell.
REFERENCES
Bailey A., 1951. Industrial Oil and Fat Products. Interscience Publishers. Coorens H., Peters C., De Swaan Arons J., 1988. Phase equilibria in binary
mixtures of propane and tripalmitin. Fluid Phase Equilibria, 40: 135-l 5 1. Daubert T.E., Danner R.P., 1989. Physical and Thermodynamic Properties of
Pure Chemicals: Data Compilation, Hemisphere Publishing Corporation. Goowin R.D., Roder H.M., Straty G.C., 1976. Thermophysical Properties of
Ethane from 90 to 600K at Pressures up to 700 bar, NBS Technical Note 684, U.S. Department of Commerce, National Bureau of Standards.
Hixson A.W., Bockelmann J.B., 1942. Liquid-liquid extraction employing solvents in the region of their critical temperatures. Trans. A.I.Ch.E., 38: 891-930.
Vargafbk N. B., 1975. Tables on the Thermophysical Properties of Liquid and Gases. Hemisphere Publishing Corporation.