optogenetic perturbations reveal the dynamics of an oculomotor integrator
TRANSCRIPT
ORIGINAL RESEARCH ARTICLEpublished: 28 February 2014
doi: 10.3389/fncir.2014.00010
Optogenetic perturbations reveal the dynamics of anoculomotor integratorPedro J. Gonçalves1,2,3†, Aristides B. Arrenberg4,5*†, Bastian Hablitzel5, Herwig Baier4,6 and
Christian K. Machens1,2*
1 Group for Neural Theory, Departement d’Etudes Cognitives, INSERM U960, École Normale Supérieure, Paris, France2 Champalimaud Neuroscience Program, Centro Champalimaud – Champalimaud Centre for the Unknown, Lisbon, Portugal3 Gatsby Computational Neuroscience Unit, University College London, London, UK4 Neuroscience Program, Department of Physiology, University of California San Francisco, San Francisco, CA, USA5 Faculty of Biology, Center for Biological Signaling Studies, University of Freiburg, Freiburg, Germany6 Max Planck Institute of Neurobiology, Martinsried, Germany
Edited by:
German Sumbre, École NormaleSupérieure, France
Reviewed by:
Yoram Burak, Hebrew University,IsraelYonatan Loewenstein, HebrewUniversity, Israel
*Correspondence:
Aristides B. Arrenberg, Departmentof Developmental Biology, Faculty ofBiology, Center for BiologicalSignaling Studies, Institute Biology1, University of Freiburg,Hauptstrasse 1, D-79104 Freiburg,Germanye-mail: [email protected];Christian K. Machens,Champalimaud NeuroscienceProgram, Centro Champalimaud –Champalimaud Centre for theUnknown, Neurociências (26.34),Av. Brasília, Doca de Pedrouços,1400-038 Lisbon, Portugale-mail: [email protected]†These authors have contributedequally to this work.
Many neural systems can store short-term information in persistently firing neurons. Suchpersistent activity is believed to be maintained by recurrent feedback among neurons.This hypothesis has been fleshed out in detail for the oculomotor integrator (OI) for whichthe so-called “line attractor” network model can explain a large set of observations. Herewe show that there is a plethora of such models, distinguished by the relative strengthof recurrent excitation and inhibition. In each model, the firing rates of the neurons relaxtoward the persistent activity states. The dynamics of relaxation can be quite different,however, and depend on the levels of recurrent excitation and inhibition. To identify thecorrect model, we directly measure these relaxation dynamics by performing optogeneticperturbations in the OI of zebrafish expressing halorhodopsin or channelrhodopsin. Weshow that instantaneous, inhibitory stimulations of the OI lead to persistent, centripetaleye position changes ipsilateral to the stimulation. Excitatory stimulations similarly causecentripetal eye position changes, yet only contralateral to the stimulation. These resultsshow that the dynamics of the OI are organized around a central attractor state—thenull position of the eyes—which stabilizes the system against random perturbations. Ourresults pose new constraints on the circuit connectivity of the system and provide newinsights into the mechanisms underlying persistent activity.
Keywords: neural integrator, optogenetics, model, zebrafish, oculomotor system, network dynamics
INTRODUCTIONNeural activity deep within the nervous system or close to themotor periphery is largely driven by a combination of intrin-sic neuronal properties and recurrent feedback among neu-rons. Such activity is almost always dynamic, changing eitherfast, as in central pattern or sequence generators (Marder andBucher, 2001; Hahnloser et al., 2002), or slowly, as in the neuralintegrators that have been found at many levels of the ner-vous system (Robinson, 1968; Pastor et al., 1994; Gold andShadlen, 2001; Wong et al., 2007; Goldman et al., 2009). A keyquestion in neuroscience is how neural systems generate andcontrol these internal dynamics through links between individualneurons.
One of the simplest and best-studied systems to address thisquestion is the oculomotor integrator (OI) for horizontal eyemovements. Neurons in the OI are persistently active with a dis-charge rate that is directly proportional to the horizontal eye
position (Lopez-Barneo et al., 1982; Delgado-García et al., 1989;Fukushima et al., 1992; McFarland and Fuchs, 1992; Aksay et al.,2000). This graded persistent activity typifies a simple form ofshort-term memory and shares many similarities with the per-sistent activity found in higher-order brain areas during workingmemory (Brody et al., 2003; Major and Tank, 2004; Goldmanet al., 2009). Several theoretical studies have shown how thepersistent activity in the OI can be generated through preciserecurrent synaptic feedback among neurons (Cannon et al., 1983;Cannon and Robinson, 1985; Seung, 1996; Seung et al., 2000;Aksay et al., 2007). This body of work has led to a network modelof the OI that can essentially reproduce all experimentally mea-sured features in the goldfish, such as the distribution of tuningcurves (Seung et al., 2000; Aksay et al., 2007), the correlationsbetween simultaneously recorded neurons, the generation of sac-cades, or the system’s response to unilateral silencing (Aksay et al.,2007). Moreover, several candidate mechanisms were pointed out
Frontiers in Neural Circuits www.frontiersin.org February 2014 | Volume 8 | Article 10 | 1
NEURAL CIRCUITS
Gonçalves et al. Dynamics of an oculomotor integrator
to explain the remarkable robustness of the system (Koulakovet al., 2002; Goldman et al., 2003; Moreau and Sontag, 2003).
Here, we show that this network model can be understoodas a particular instantiation of a class of models, all of whichcan explain the shared experimental features across animals. Themodels are only distinguished by the specific ratio of excitatoryand inhibitory inputs to the neurons. Each network model fullyspecifies the dynamics of the OI. While the dynamics are similarin the system’s normal operating regime, they are distinct out-side of this regime. Specifically, different network models relaxdifferently toward the persistent activity states. Consequently,different instantiations of the network models make differentpredictions on how the OI will react to perturbations. These pre-dictions can be tested with the recent advances of optogenetictools which allow us to manipulate systems with high spatio-temporal precision (Nagel et al., 2003; Boyden et al., 2005; Limaand Miesenböck, 2005; Han and Boyden, 2007; Zhang et al.,2007a,b; Douglass et al., 2008; Huber et al., 2008; Arrenberg et al.,2009; Schoonheim et al., 2010; Fenno et al., 2011).
In systems that are strongly driven by their own internaldynamics, the outcome of a perturbation depends on a com-bination of the externally applied stimulation and the intrinsicnetwork dynamics. In many instances, neural systems are notsufficiently well known to disentangle the two and make preciseand quantitative predictions. The modeling approach we pursuehere, however, provides the opportunity to predict the influenceof these two competing effects, and by comparison with experi-mental data, adjust the model, and further our understanding ofthe system.
Here, we test these model predictions using transgeniczebrafish expressing either halorhodopsin (NpHR), a light-drivenchloride pump, or channelrhodospin (ChR2), a light-activatedcation channel (Zhang et al., 2007a,b; Arrenberg et al., 2009;Fenno et al., 2011). We show that these instantaneous and smallperturbations of the OI network yield crucial insights into thedynamics around the system’s normal operating regime. We showthat only one of the network models can explain all the data.This model suggests a dominance of unilateral self-excitation,concurrent with a weak coupling between OI cells in the leftand right hemisphere. While the stable states still form a lineattractor in our new model, the dynamics around the line attrac-tor differ from those of previously proposed models. Specifically,the dynamics are organized around the center of the line attrac-tor which corresponds to the null position of the eyes. Thisnetwork arrangement could be preferable for the animal, sinceany perturbations due to noise or synaptic mistuning will causedrifts toward the resting state, instead of drifting toward extremepopulation activities and eye positions.
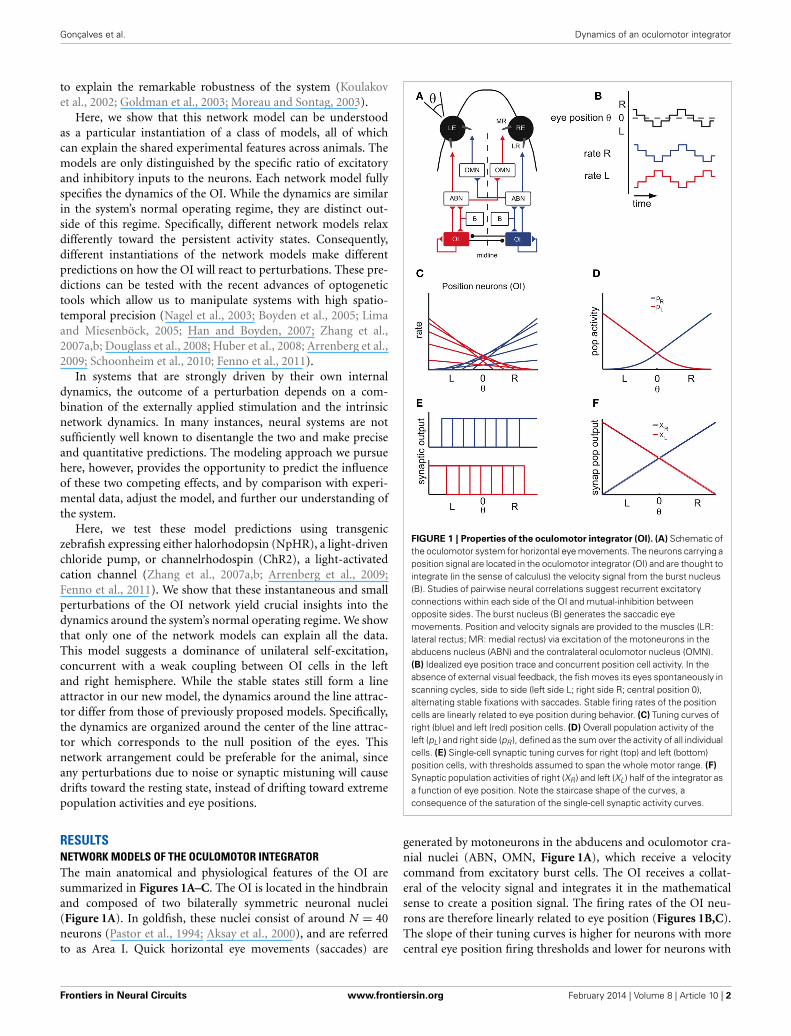
RESULTSNETWORK MODELS OF THE OCULOMOTOR INTEGRATORThe main anatomical and physiological features of the OI aresummarized in Figures 1A–C. The OI is located in the hindbrainand composed of two bilaterally symmetric neuronal nuclei(Figure 1A). In goldfish, these nuclei consist of around N = 40neurons (Pastor et al., 1994; Aksay et al., 2000), and are referredto as Area I. Quick horizontal eye movements (saccades) are
FIGURE 1 | Properties of the oculomotor integrator (OI). (A) Schematic ofthe oculomotor system for horizontal eye movements. The neurons carrying aposition signal are located in the oculomotor integrator (OI) and are thought tointegrate (in the sense of calculus) the velocity signal from the burst nucleus(B). Studies of pairwise neural correlations suggest recurrent excitatoryconnections within each side of the OI and mutual-inhibition betweenopposite sides. The burst nucleus (B) generates the saccadic eyemovements. Position and velocity signals are provided to the muscles (LR:lateral rectus; MR: medial rectus) via excitation of the motoneurons in theabducens nucleus (ABN) and the contralateral oculomotor nucleus (OMN).(B) Idealized eye position trace and concurrent position cell activity. In theabsence of external visual feedback, the fish moves its eyes spontaneously inscanning cycles, side to side (left side L; right side R; central position 0),alternating stable fixations with saccades. Stable firing rates of the positioncells are linearly related to eye position during behavior. (C) Tuning curves ofright (blue) and left (red) position cells. (D) Overall population activity of theleft (pL) and right side (pR ), defined as the sum over the activity of all individualcells. (E) Single-cell synaptic tuning curves for right (top) and left (bottom)position cells, with thresholds assumed to span the whole motor range. (F)
Synaptic population activities of right (XR ) and left (XL) half of the integrator asa function of eye position. Note the staircase shape of the curves, aconsequence of the saturation of the single-cell synaptic activity curves.
generated by motoneurons in the abducens and oculomotor cra-nial nuclei (ABN, OMN, Figure 1A), which receive a velocitycommand from excitatory burst cells. The OI receives a collat-eral of the velocity signal and integrates it in the mathematicalsense to create a position signal. The firing rates of the OI neu-rons are therefore linearly related to eye position (Figures 1B,C).The slope of their tuning curves is higher for neurons with morecentral eye position firing thresholds and lower for neurons with
Frontiers in Neural Circuits www.frontiersin.org February 2014 | Volume 8 | Article 10 | 2
Gonçalves et al. Dynamics of an oculomotor integrator
contraversive, peripheral eye position thresholds (Aksay et al.,2000), a property that has been called “recruitment order” (seeMaterials and Methods). Neurons from the same side are usu-ally positively correlated, whereas neurons from opposite sides arenegatively correlated, suggesting that the two sides are coupledby mutual inhibition and self-excitation (Aksay et al., 2003) asshown in Figure 1A. The firing rates of these “position” neuronsremain stable in the absence of visual feedback and provide thesignal that controls fixation of the horizontal eye position (Menshet al., 2004).
These observations indicate that the network of position neu-rons can maintain a continuum of persistent firing rates overseveral seconds, i.e., the time scale of a typical eye fixation. Sinceonly these persistent firing patterns are observed, the popula-tion activity of the two sides must be highly constrained. We usethese constraints to reduce the network dynamics to the dynam-ics of the two interacting populations, which we describe bytheir summed activity (Figures 1D,F – see also Figures A1D–F).We will write XL and XR for the left- and right-side populationoutput, measured as the resulting post-synaptic conductances(Figures 1E,F) and will refer to this population output as “pop-ulation activity.”
As further discussed below, our modeling framework requiresthat the synaptic currents saturate to balance the progressiverecruitment of neurons. Although such synaptic non-linearitiesare yet to be found in the OI, we here assume their presence.As discussed in the Materials and Methods, we choose stepinput-output functions to simplify the model tuning but canrelax that assumption by using smoother sigmoidal functions(see Appendix). Given this choice, the synaptic output tuningcurves are idealized, saturated versions of the firing rate tun-ing curves (Figures 1C,E). For simplicity of the model tuning,we also assume that the single-cell synaptic outputs have thresh-olds spanning the whole eye position range. This assumption canbe reconciled with the data if the synaptic currents have differ-ent thresholds (Aksay et al., 2007). In consequence, the left- andright-side synaptic population outputs XL and XR resemble astaircase function where each step is caused by the synapticinput-output function of a single neuron (Figures 1E,F—see alsoMaterials and Methods). Since there are many neurons involved,these population outputs approximate linear functions of the eyeposition.
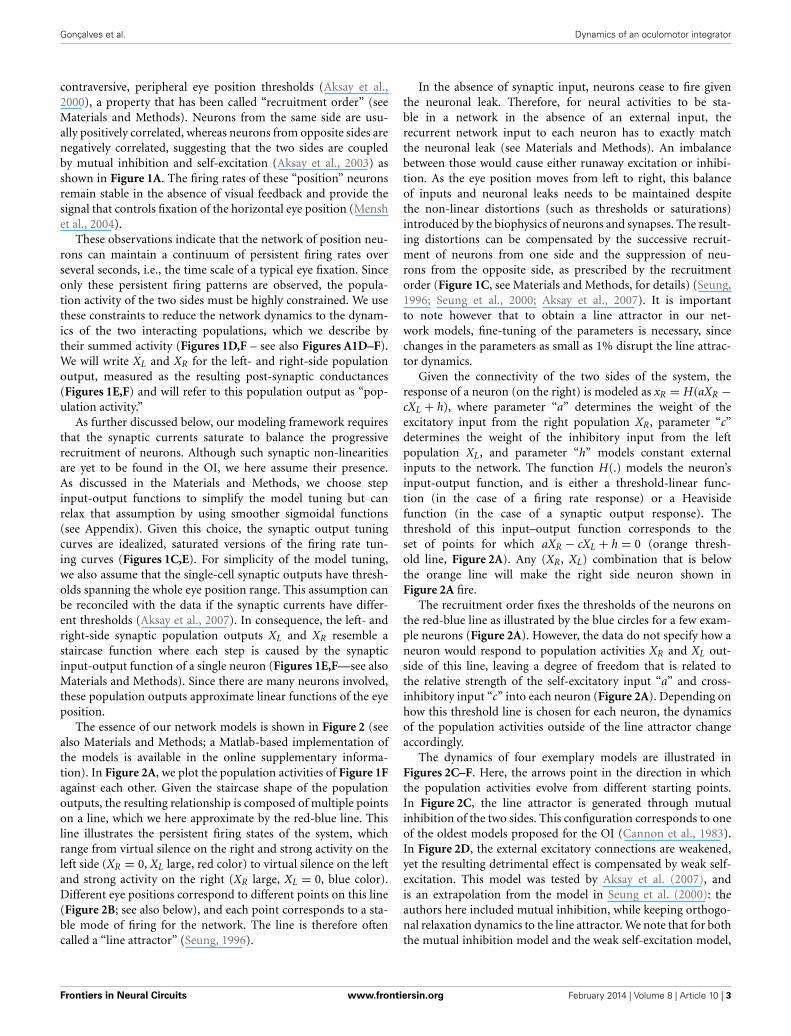
The essence of our network models is shown in Figure 2 (seealso Materials and Methods; a Matlab-based implementation ofthe models is available in the online supplementary informa-tion). In Figure 2A, we plot the population activities of Figure 1Fagainst each other. Given the staircase shape of the populationoutputs, the resulting relationship is composed of multiple pointson a line, which we here approximate by the red-blue line. Thisline illustrates the persistent firing states of the system, whichrange from virtual silence on the right and strong activity on theleft side (XR = 0, XL large, red color) to virtual silence on the leftand strong activity on the right (XR large, XL = 0, blue color).Different eye positions correspond to different points on this line(Figure 2B; see also below), and each point corresponds to a sta-ble mode of firing for the network. The line is therefore oftencalled a “line attractor” (Seung, 1996).
In the absence of synaptic input, neurons cease to fire giventhe neuronal leak. Therefore, for neural activities to be sta-ble in a network in the absence of an external input, therecurrent network input to each neuron has to exactly matchthe neuronal leak (see Materials and Methods). An imbalancebetween those would cause either runaway excitation or inhibi-tion. As the eye position moves from left to right, this balanceof inputs and neuronal leaks needs to be maintained despitethe non-linear distortions (such as thresholds or saturations)introduced by the biophysics of neurons and synapses. The result-ing distortions can be compensated by the successive recruit-ment of neurons from one side and the suppression of neu-rons from the opposite side, as prescribed by the recruitmentorder (Figure 1C, see Materials and Methods, for details) (Seung,1996; Seung et al., 2000; Aksay et al., 2007). It is importantto note however that to obtain a line attractor in our net-work models, fine-tuning of the parameters is necessary, sincechanges in the parameters as small as 1% disrupt the line attrac-tor dynamics.
Given the connectivity of the two sides of the system, theresponse of a neuron (on the right) is modeled as xR = H(aXR −cXL + h), where parameter “a” determines the weight of theexcitatory input from the right population XR, parameter “c”determines the weight of the inhibitory input from the leftpopulation XL, and parameter “h” models constant externalinputs to the network. The function H(.) models the neuron’sinput-output function, and is either a threshold-linear func-tion (in the case of a firing rate response) or a Heavisidefunction (in the case of a synaptic output response). Thethreshold of this input–output function corresponds to theset of points for which aXR − cXL + h = 0 (orange thresh-old line, Figure 2A). Any (XR, XL) combination that is belowthe orange line will make the right side neuron shown inFigure 2A fire.
The recruitment order fixes the thresholds of the neurons onthe red-blue line as illustrated by the blue circles for a few exam-ple neurons (Figure 2A). However, the data do not specify how aneuron would respond to population activities XR and XL out-side of this line, leaving a degree of freedom that is related tothe relative strength of the self-excitatory input “a” and cross-inhibitory input “c” into each neuron (Figure 2A). Depending onhow this threshold line is chosen for each neuron, the dynamicsof the population activities outside of the line attractor changeaccordingly.
The dynamics of four exemplary models are illustrated inFigures 2C–F. Here, the arrows point in the direction in whichthe population activities evolve from different starting points.In Figure 2C, the line attractor is generated through mutualinhibition of the two sides. This configuration corresponds to oneof the oldest models proposed for the OI (Cannon et al., 1983).In Figure 2D, the external excitatory connections are weakened,yet the resulting detrimental effect is compensated by weak self-excitation. This model was tested by Aksay et al. (2007), andis an extrapolation from the model in Seung et al. (2000): theauthors here included mutual inhibition, while keeping orthogo-nal relaxation dynamics to the line attractor. We note that for boththe mutual inhibition model and the weak self-excitation model,
Frontiers in Neural Circuits www.frontiersin.org February 2014 | Volume 8 | Article 10 | 3
Gonçalves et al. Dynamics of an oculomotor integrator
FIGURE 2 | Network models of the OI: construction and dynamics.
(A) State space of the network model. We assume that the state is uniquelydescribed by the value of the left and right population activities, XL and XR .The red-blue colored line corresponds to the stable equilibrium points (lineattractor) of the system. Left eye positions are on the red part of the line,right eye positions on its blue part. Blue circles indicate the eye positionthresholds of the tuning curves of neurons from the right population alongthe line attractor. Orange lines correspond to the thresholds of firing forother states of the system (orange shaded areas indicate the correspondingregions above the threshold). Left: the respective slopes are given by therelative strength of the (self-) excitatory and (cross-) inhibitory input intoeach neuron. Right: as the eyes move from left to right, more and moreneurons from the right population get recruited (compare Figure 1C). (B)
Mapping of position population activities onto eye position. The colorediso-lines correspond to different eye positions θ in the (XR , XL) space. Thegray dashed line indicates the line attractor and thereby the stableequilibrium states of the system. (C–F) Example models generated withinour theoretical framework. Top: state space of the example models. Arrowsindicate the direction of the dynamics. Points indicate stationary states.
Bottom: connectivity. Thick, thin, and dashed connectivity lines correspondto strong, weak, and very weak neural connections. The thickness of theseconnections corresponds to the absolute of the sum of the excitatorypost-synaptic potentials (EPSP) and inhibitory post-synaptic potentials (IPSP)of the neurons post-synaptic to the connection. The green lines depictexternal (e.g., vestibular) inputs to the integrator areas. (C) A model in whichneural activity is kept persistent due to mutual inhibition between the sides.(D) A model in which both mutual inhibition and self-excitation provide thestability of the persistent states. (E) The ILA model, which can reproducethe goldfish inactivation results (Aksay et al., 2007). Here, the dynamics aremostly unidirectional and involve only one population on each side (arrowsare horizontal or vertical). In the left motor range (bottom panel, top), the leftnetwork sustains its firing through self-excitation, whereas the right networkis passive, given the weakness of the recurrent inputs. Therefore, thedynamics are dominated by the left network. In the right range (bottompanel, bottom), the inputs and dynamics are reversed. (F) A model in whichpersistent activity is generated through self-excitation only. Here, both sidesare completely independent, and every combination of population activitiesis stable.
the dynamics outside of the attractor are orthogonal to the line,although the mutual inhibition model suggests faster dynamics(as indicated by the longer arrows).
The population dynamics of the model in Figure 2E wereintroduced by Aksay et al. (2007) to account for unilateralinactivation experiments in the goldfish. To obtain such dynam-ics in our modeling framework, the inhibitory and excitatory
connections are set up so that each half of the oculomotor rangeis stabilized by an independent line attractor (ILA model). As aconsequence, the population with the high activity (e.g., XR) doesnot change its activity when the other side’s population activ-ity (XL) is reduced. This situation is given when the left halfof the system is silenced, which is equivalent to setting XL = 0.Although the dynamics above the line attractor are unconstrained
Frontiers in Neural Circuits www.frontiersin.org February 2014 | Volume 8 | Article 10 | 4
Gonçalves et al. Dynamics of an oculomotor integrator
by experimental data, this model proposes that the dynamicsabove and below the line attractor are antiparallel to each other.We note that the ILA model captures the same population statespace dynamics as the model suggested in Aksay et al. (2007),although the detailed implementation differs from the one inAksay et al. (2007): the model does not incorporate input-outputfunctions with high synaptic thresholds and uses a different dis-tribution of tuning curves and cross-inhibition (see Materials andMethods).
A last example model is shown in Figure 2F. Here, theline attractor is stabilized through self-excitation only, and theinhibitory connections are non-existent. We note that this modelis an extension of the model in Seung et al. (2000) from one pop-ulation to two populations of excitatory neurons. In this case,any point outside of the line will be a potential stable fixed pointas well. The system may still be confined to the line in practice,if the burst input during saccades always moves the populationactivities back onto the line.
UNILATERAL INSTANTANEOUS PERTURBATIONS: MODELPREDICTIONSThe network models allow us to predict precisely how a per-turbation would affect the system. Most importantly, these per-turbations can be observed at the level of the eye positionwhich makes the predictions experimentally accessible. To linkthe population activities to the eye position, we note that theiso-eye-position curves are likely passing through a non-lineartransform introduced in the abducens nucleus (Figure 2B; dis-crepancy of position cell and motoneuron tuning curves—fordetails see Figure A3 and Materials and Methods). This bendingof the curves also provides a simple explanation for the resultsof unilateral silencing of the OI in which the stabilization of eyeposition remains functional in only half the motor range and forroughly half the range of population activities (Aksay et al., 2007).
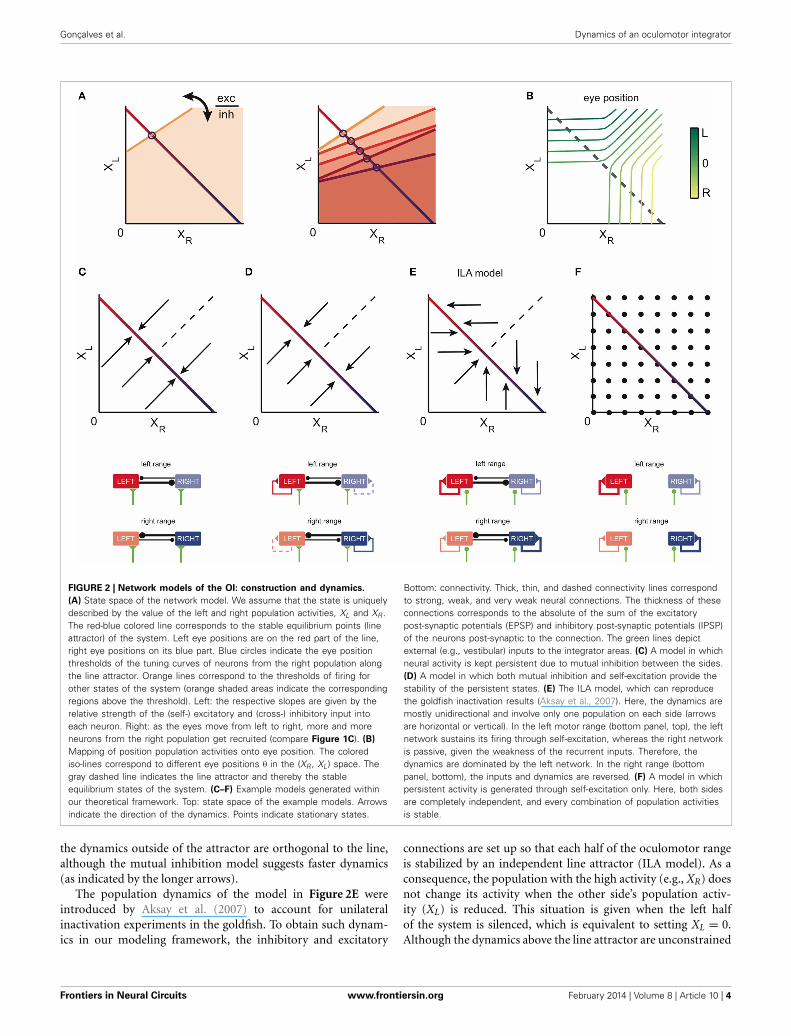
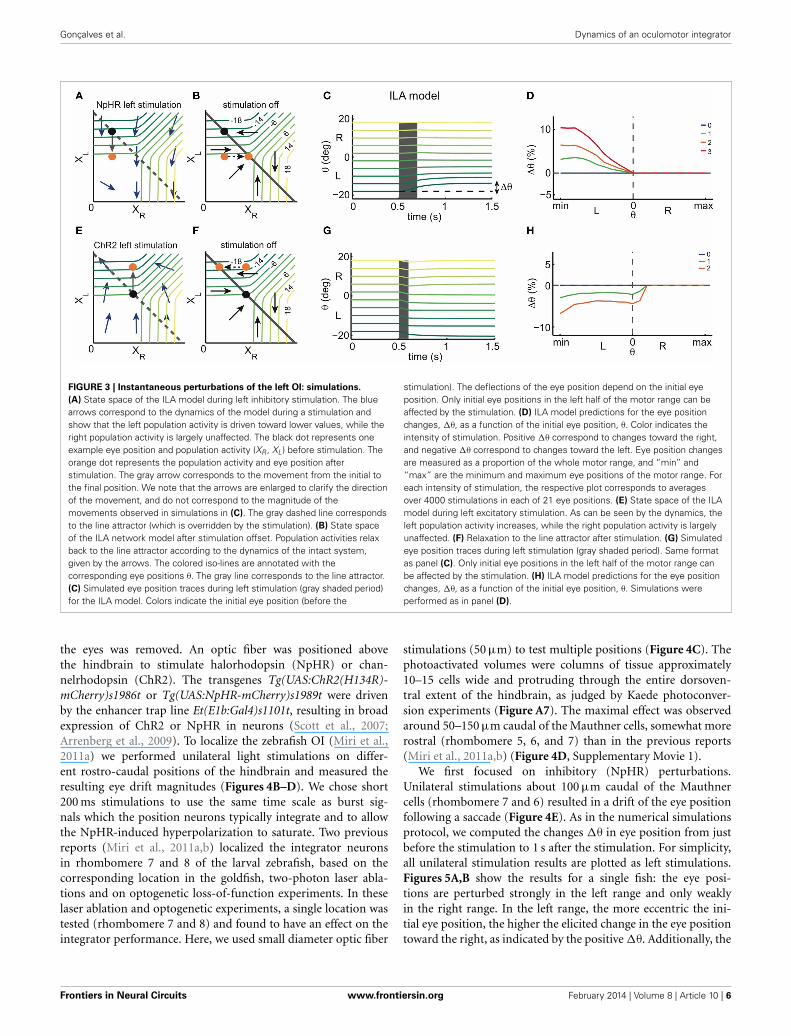
We can then simulate the response of the models to unilateralinstantaneous inhibition and excitation, mimicking optogeneticstimulations with NpHR and ChR2, respectively. This idea is illus-trated in Figure 3, where we focus on one of the network models,the ILA model (Figure 2E).
Figures 3A–D shows the effect of inhibiting the left half ofthe OI in the ILA model. Due to the extra inhibition, the leftpopulation activity XL decreases immediately, as indicated bythe arrows in Figure 3A. If the eye position before stimulation(initial eye position) is in the left range (black point), the inhi-bition causes the system state to cross θ isolines transversely sothat the eye makes large movements to the right (orange point).If the initial eye position is in the right range, the system stateshifts mostly in parallel to θ isolines, and the eye movementsare small or null. After switching-off the inhibition stimulus,the system relaxes back to the line according to the dynam-ics of the intact system (Figure 3B). We note that if the initialeye position is in the left range, XR increases, thereby mov-ing the eye further to the midline. If the initial position is inthe right range, XL increases and XR does not change after thestimulation is turned-off, so that the system returns to its ini-tial state and the net eye movement is null (Figures 3A,B). Wecan extend this perturbation analysis to all initial eye positions,
i.e., all points on the line attractor. Naturally, the results willdepend on both the length and intensity of the stimulation. Weused a brief stimulation (200 ms) and varying stimulation inten-sities. The net eye movement resulting from the combinationof stimulation and relaxation was measured as the difference�θ in eye positions just before the stimulation and 1 s afterthe stimulation (see simulations in Figure 3C). Large �θ areobserved when the initial eye position is in the left range, andnegligible �θ when the initial position is in the right range,(Figure 3D).
With similar reasoning, we can explore the system’s responseto excitatory perturbations (Figures 3E–H). During left excita-tion of the ILA model (Figure 3E), the left population activity,XL, increases. After the stimulation, the system state relaxes backto the line attractor with the dynamics of the intact system(Figure 3F). If the initial eye position is in the left range, thevalue of XL stays constant, and the right population activity,XR, decreases (Figures 3F,G). Altogether, the eye makes thereforelarge movements to the left. If the initial position is in the rightrange, the system state moves mostly in parallel to θ isolines andthe eye movements are small or null. Consequently, the pertur-bations �θ of eye position occur mostly on the ipsilateral side tothe stimulation, similar to the inhibitory perturbations, but withopposite sign (Figures 3G,H).
In both cases, the perturbations �θ reflect the relaxationdynamics of the system, i.e., the dynamics of the intact system.By measuring these simulated perturbations for the full range ofinitial eye positions, we can cover all points of the line attrac-tor. While we have illustrated these perturbations for the ILAmodel, we can perform similar predictions for the whole rangeof models. Conversely, we can measure the system’s response toperturbations in optogenetic experiments, and then simply inferthe dynamics of the system around the line attractor that areconsistent with the experiments.
We note that we here modeled NpHR stimulations as divisiveand ChR2 stimulations as additive. This distinction is based onelectrophysiological recordings from the caudal zebrafish hind-brain (not limited to OI cells) which showed that NpHR stim-ulations induce a change in firing rate that is dependent on theinitial firing rate, while for ChR2 stimulations no such effect wasobserved in the (small) range of firing rates tested (Figure A9).Therefore, for simplicity, we modeled the effect of ChR2 stimula-tion as being additive. However, assuming a subtractive influenceof NpHR on population activity, or a multiplicative influence ofChR2 yields qualitatively the same results (Gonçalves, 2012) (sim-ulation data not shown), and does not impede our ability to inferthe overall dynamics from measurements.
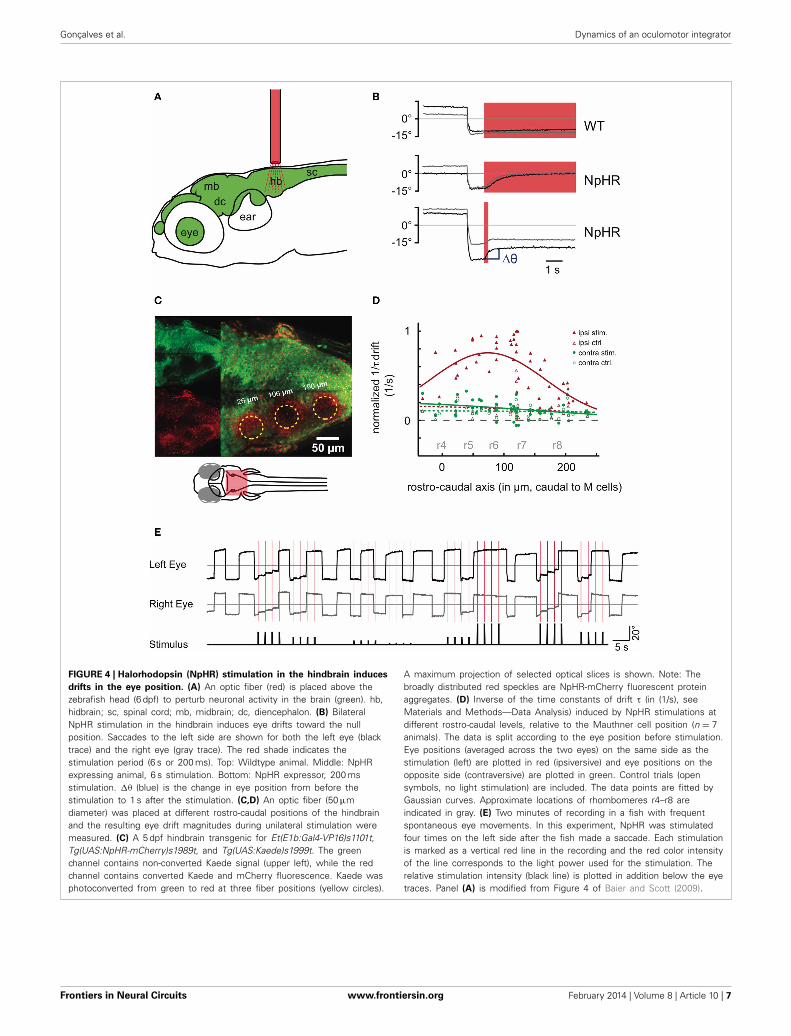
UNILATERAL OPTOGENETIC PERTURBATIONS: RESULTS OF NpHREXPERIMENTSTo measure the effects of such instantaneous perturbations, andin turn infer the dynamics around the line attractor, we used fiberoptic stimulations (Arrenberg et al., 2009) in behaving transgeniczebrafish (Figures 4A,B, Figure A7). Zebrafish are likely to havethe same basic oculomotor circuit architecture and physiology asadult goldfish. The zebrafish larvae (5–8 days post-fertilization,dpf) were immobilized in agarose, and the agarose surrounding
Frontiers in Neural Circuits www.frontiersin.org February 2014 | Volume 8 | Article 10 | 5
Gonçalves et al. Dynamics of an oculomotor integrator
FIGURE 3 | Instantaneous perturbations of the left OI: simulations.
(A) State space of the ILA model during left inhibitory stimulation. The bluearrows correspond to the dynamics of the model during a stimulation andshow that the left population activity is driven toward lower values, while theright population activity is largely unaffected. The black dot represents oneexample eye position and population activity (XR , XL) before stimulation. Theorange dot represents the population activity and eye position afterstimulation. The gray arrow corresponds to the movement from the initial tothe final position. We note that the arrows are enlarged to clarify the directionof the movement, and do not correspond to the magnitude of themovements observed in simulations in (C). The gray dashed line correspondsto the line attractor (which is overridden by the stimulation). (B) State spaceof the ILA network model after stimulation offset. Population activities relaxback to the line attractor according to the dynamics of the intact system,given by the arrows. The colored iso-lines are annotated with thecorresponding eye positions θ. The gray line corresponds to the line attractor.(C) Simulated eye position traces during left stimulation (gray shaded period)for the ILA model. Colors indicate the initial eye position (before the
stimulation). The deflections of the eye position depend on the initial eyeposition. Only initial eye positions in the left half of the motor range can beaffected by the stimulation. (D) ILA model predictions for the eye positionchanges, �θ, as a function of the initial eye position, θ. Color indicates theintensity of stimulation. Positive �θ correspond to changes toward the right,and negative �θ correspond to changes toward the left. Eye position changesare measured as a proportion of the whole motor range, and “min” and“max” are the minimum and maximum eye positions of the motor range. Foreach intensity of stimulation, the respective plot corresponds to averagesover 4000 stimulations in each of 21 eye positions. (E) State space of the ILAmodel during left excitatory stimulation. As can be seen by the dynamics, theleft population activity increases, while the right population activity is largelyunaffected. (F) Relaxation to the line attractor after stimulation. (G) Simulatedeye position traces during left stimulation (gray shaded period). Same formatas panel (C). Only initial eye positions in the left half of the motor range canbe affected by the stimulation. (H) ILA model predictions for the eye positionchanges, �θ, as a function of the initial eye position, θ. Simulations wereperformed as in panel (D).
the eyes was removed. An optic fiber was positioned abovethe hindbrain to stimulate halorhodopsin (NpHR) or chan-nelrhodopsin (ChR2). The transgenes Tg(UAS:ChR2(H134R)-mCherry)s1986t or Tg(UAS:NpHR-mCherry)s1989t were drivenby the enhancer trap line Et(E1b:Gal4)s1101t, resulting in broadexpression of ChR2 or NpHR in neurons (Scott et al., 2007;Arrenberg et al., 2009). To localize the zebrafish OI (Miri et al.,2011a) we performed unilateral light stimulations on differ-ent rostro-caudal positions of the hindbrain and measured theresulting eye drift magnitudes (Figures 4B–D). We chose short200 ms stimulations to use the same time scale as burst sig-nals which the position neurons typically integrate and to allowthe NpHR-induced hyperpolarization to saturate. Two previousreports (Miri et al., 2011a,b) localized the integrator neuronsin rhombomere 7 and 8 of the larval zebrafish, based on thecorresponding location in the goldfish, two-photon laser abla-tions and on optogenetic loss-of-function experiments. In theselaser ablation and optogenetic experiments, a single location wastested (rhombomere 7 and 8) and found to have an effect on theintegrator performance. Here, we used small diameter optic fiber
stimulations (50 μm) to test multiple positions (Figure 4C). Thephotoactivated volumes were columns of tissue approximately10–15 cells wide and protruding through the entire dorsoven-tral extent of the hindbrain, as judged by Kaede photoconver-sion experiments (Figure A7). The maximal effect was observedaround 50–150 μm caudal of the Mauthner cells, somewhat morerostral (rhombomere 5, 6, and 7) than in the previous reports(Miri et al., 2011a,b) (Figure 4D, Supplementary Movie 1).
We first focused on inhibitory (NpHR) perturbations.Unilateral stimulations about 100 μm caudal of the Mauthnercells (rhombomere 7 and 6) resulted in a drift of the eye positionfollowing a saccade (Figure 4E). As in the numerical simulationsprotocol, we computed the changes �θ in eye position from justbefore the stimulation to 1 s after the stimulation. For simplicity,all unilateral stimulation results are plotted as left stimulations.Figures 5A,B show the results for a single fish: the eye posi-tions are perturbed strongly in the left range and only weaklyin the right range. In the left range, the more eccentric the ini-tial eye position, the higher the elicited change in the eye positiontoward the right, as indicated by the positive �θ. Additionally, the
Frontiers in Neural Circuits www.frontiersin.org February 2014 | Volume 8 | Article 10 | 6
Gonçalves et al. Dynamics of an oculomotor integrator
FIGURE 4 | Halorhodopsin (NpHR) stimulation in the hindbrain induces
drifts in the eye position. (A) An optic fiber (red) is placed above thezebrafish head (6 dpf) to perturb neuronal activity in the brain (green). hb,hidbrain; sc, spinal cord; mb, midbrain; dc, diencephalon. (B) BilateralNpHR stimulation in the hindbrain induces eye drifts toward the nullposition. Saccades to the left side are shown for both the left eye (blacktrace) and the right eye (gray trace). The red shade indicates thestimulation period (6 s or 200 ms). Top: Wildtype animal. Middle: NpHRexpressing animal, 6 s stimulation. Bottom: NpHR expressor, 200 msstimulation. �θ (blue) is the change in eye position from before thestimulation to 1 s after the stimulation. (C,D) An optic fiber (50 μmdiameter) was placed at different rostro-caudal positions of the hindbrainand the resulting eye drift magnitudes during unilateral stimulation weremeasured. (C) A 5 dpf hindbrain transgenic for Et(E1b:Gal4-VP16)s1101t,Tg(UAS:NpHR-mCherry)s1989t, and Tg(UAS:Kaede)s1999t. The greenchannel contains non-converted Kaede signal (upper left), while the redchannel contains converted Kaede and mCherry fluorescence. Kaede wasphotoconverted from green to red at three fiber positions (yellow circles).
A maximum projection of selected optical slices is shown. Note: Thebroadly distributed red speckles are NpHR-mCherry fluorescent proteinaggregates. (D) Inverse of the time constants of drift τ (in (1/s), seeMaterials and Methods—Data Analysis) induced by NpHR stimulations atdifferent rostro-caudal levels, relative to the Mauthner cell position (n = 7animals). The data is split according to the eye position before stimulation.Eye positions (averaged across the two eyes) on the same side as thestimulation (left) are plotted in red (ipsiversive) and eye positions on theopposite side (contraversive) are plotted in green. Control trials (opensymbols, no light stimulation) are included. The data points are fitted byGaussian curves. Approximate locations of rhombomeres r4–r8 areindicated in gray. (E) Two minutes of recording in a fish with frequentspontaneous eye movements. In this experiment, NpHR was stimulatedfour times on the left side after the fish made a saccade. Each stimulationis marked as a vertical red line in the recording and the red color intensityof the line corresponds to the light power used for the stimulation. Therelative stimulation intensity (black line) is plotted in addition below the eyetraces. Panel (A) is modified from Figure 4 of Baier and Scott (2009).
Frontiers in Neural Circuits www.frontiersin.org February 2014 | Volume 8 | Article 10 | 7
Gonçalves et al. Dynamics of an oculomotor integrator
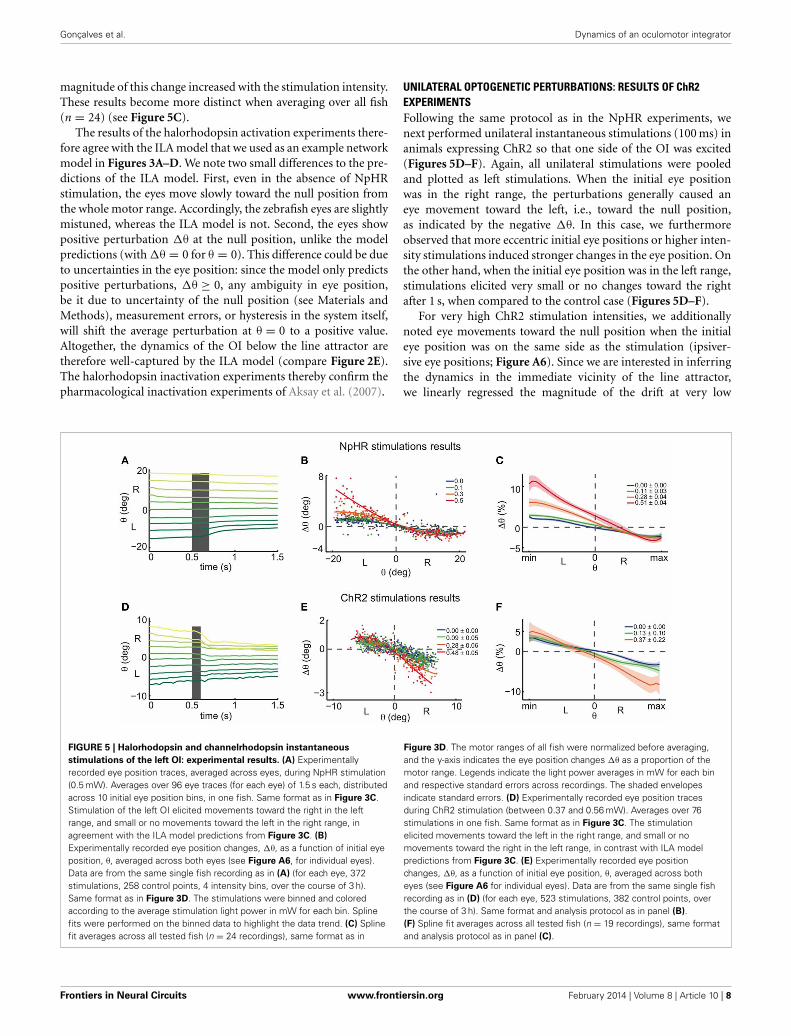
magnitude of this change increased with the stimulation intensity.These results become more distinct when averaging over all fish(n = 24) (see Figure 5C).
The results of the halorhodopsin activation experiments there-fore agree with the ILA model that we used as an example networkmodel in Figures 3A–D. We note two small differences to the pre-dictions of the ILA model. First, even in the absence of NpHRstimulation, the eyes move slowly toward the null position fromthe whole motor range. Accordingly, the zebrafish eyes are slightlymistuned, whereas the ILA model is not. Second, the eyes showpositive perturbation �θ at the null position, unlike the modelpredictions (with �θ = 0 for θ = 0). This difference could be dueto uncertainties in the eye position: since the model only predictspositive perturbations, �θ ≥ 0, any ambiguity in eye position,be it due to uncertainty of the null position (see Materials andMethods), measurement errors, or hysteresis in the system itself,will shift the average perturbation at θ = 0 to a positive value.Altogether, the dynamics of the OI below the line attractor aretherefore well-captured by the ILA model (compare Figure 2E).The halorhodopsin inactivation experiments thereby confirm thepharmacological inactivation experiments of Aksay et al. (2007).
UNILATERAL OPTOGENETIC PERTURBATIONS: RESULTS OF ChR2EXPERIMENTSFollowing the same protocol as in the NpHR experiments, wenext performed unilateral instantaneous stimulations (100 ms) inanimals expressing ChR2 so that one side of the OI was excited(Figures 5D–F). Again, all unilateral stimulations were pooledand plotted as left stimulations. When the initial eye positionwas in the right range, the perturbations generally caused aneye movement toward the left, i.e., toward the null position,as indicated by the negative �θ. In this case, we furthermoreobserved that more eccentric initial eye positions or higher inten-sity stimulations induced stronger changes in the eye position. Onthe other hand, when the initial eye position was in the left range,stimulations elicited very small or no changes toward the rightafter 1 s, when compared to the control case (Figures 5D–F).
For very high ChR2 stimulation intensities, we additionallynoted eye movements toward the null position when the initialeye position was on the same side as the stimulation (ipsiver-sive eye positions; Figure A6). Since we are interested in inferringthe dynamics in the immediate vicinity of the line attractor,we linearly regressed the magnitude of the drift at very low
FIGURE 5 | Halorhodopsin and channelrhodopsin instantaneous
stimulations of the left OI: experimental results. (A) Experimentallyrecorded eye position traces, averaged across eyes, during NpHR stimulation(0.5 mW). Averages over 96 eye traces (for each eye) of 1.5 s each, distributedacross 10 initial eye position bins, in one fish. Same format as in Figure 3C.Stimulation of the left OI elicited movements toward the right in the leftrange, and small or no movements toward the left in the right range, inagreement with the ILA model predictions from Figure 3C. (B)
Experimentally recorded eye position changes, �θ, as a function of initial eyeposition, θ, averaged across both eyes (see Figure A6, for individual eyes).Data are from the same single fish recording as in (A) (for each eye, 372stimulations, 258 control points, 4 intensity bins, over the course of 3 h).Same format as in Figure 3D. The stimulations were binned and coloredaccording to the average stimulation light power in mW for each bin. Splinefits were performed on the binned data to highlight the data trend. (C) Splinefit averages across all tested fish (n = 24 recordings), same format as in
Figure 3D. The motor ranges of all fish were normalized before averaging,and the y-axis indicates the eye position changes �θ as a proportion of themotor range. Legends indicate the light power averages in mW for each binand respective standard errors across recordings. The shaded envelopesindicate standard errors. (D) Experimentally recorded eye position tracesduring ChR2 stimulation (between 0.37 and 0.56 mW). Averages over 76stimulations in one fish. Same format as in Figure 3C. The stimulationelicited movements toward the left in the right range, and small or nomovements toward the right in the left range, in contrast with ILA modelpredictions from Figure 3C. (E) Experimentally recorded eye positionchanges, �θ, as a function of initial eye position, θ, averaged across botheyes (see Figure A6 for individual eyes). Data are from the same single fishrecording as in (D) (for each eye, 523 stimulations, 382 control points, overthe course of 3 h). Same format and analysis protocol as in panel (B).(F) Spline fit averages across all tested fish (n = 19 recordings), same formatand analysis protocol as in panel (C).
Frontiers in Neural Circuits www.frontiersin.org February 2014 | Volume 8 | Article 10 | 8
Gonçalves et al. Dynamics of an oculomotor integrator
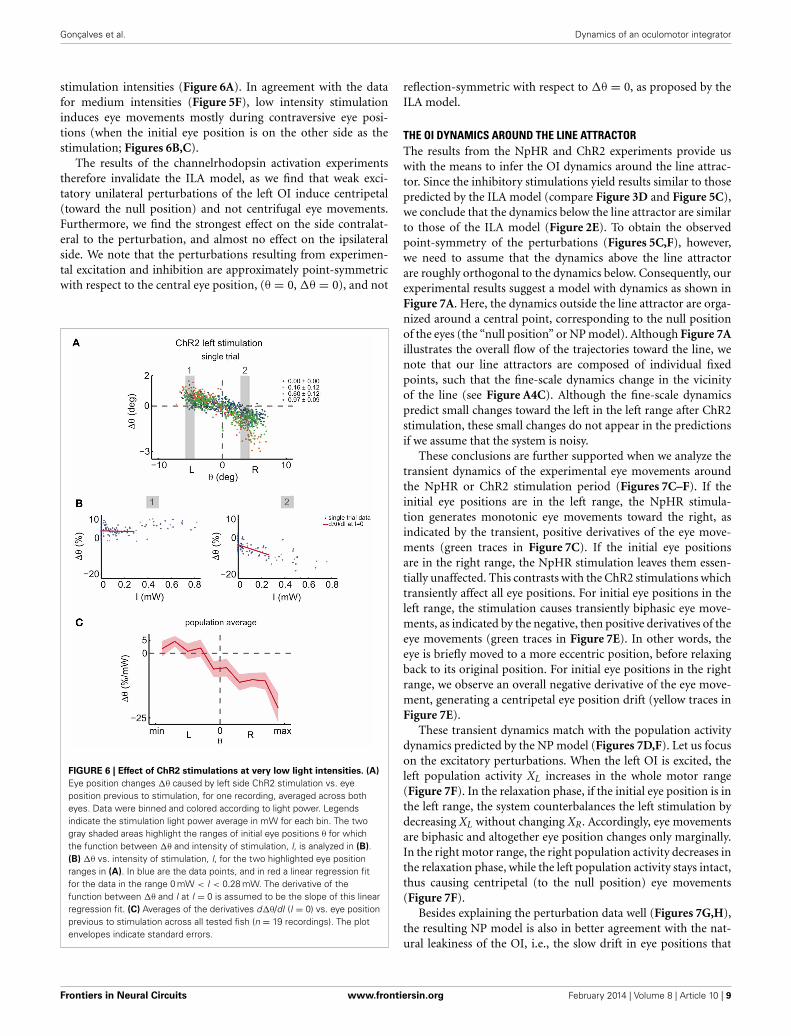
stimulation intensities (Figure 6A). In agreement with the datafor medium intensities (Figure 5F), low intensity stimulationinduces eye movements mostly during contraversive eye posi-tions (when the initial eye position is on the other side as thestimulation; Figures 6B,C).
The results of the channelrhodopsin activation experimentstherefore invalidate the ILA model, as we find that weak exci-tatory unilateral perturbations of the left OI induce centripetal(toward the null position) and not centrifugal eye movements.Furthermore, we find the strongest effect on the side contralat-eral to the perturbation, and almost no effect on the ipsilateralside. We note that the perturbations resulting from experimen-tal excitation and inhibition are approximately point-symmetricwith respect to the central eye position, (θ = 0, �θ = 0), and not
FIGURE 6 | Effect of ChR2 stimulations at very low light intensities. (A)
Eye position changes �θ caused by left side ChR2 stimulation vs. eyeposition previous to stimulation, for one recording, averaged across botheyes. Data were binned and colored according to light power. Legendsindicate the stimulation light power average in mW for each bin. The twogray shaded areas highlight the ranges of initial eye positions θ for whichthe function between �θ and intensity of stimulation, I, is analyzed in (B).(B) �θ vs. intensity of stimulation, I, for the two highlighted eye positionranges in (A). In blue are the data points, and in red a linear regression fitfor the data in the range 0 mW < I < 0.28 mW. The derivative of thefunction between �θ and I at I = 0 is assumed to be the slope of this linearregression fit. (C) Averages of the derivatives d�θ/dI (I = 0) vs. eye positionprevious to stimulation across all tested fish (n = 19 recordings). The plotenvelopes indicate standard errors.
reflection-symmetric with respect to �θ = 0, as proposed by theILA model.
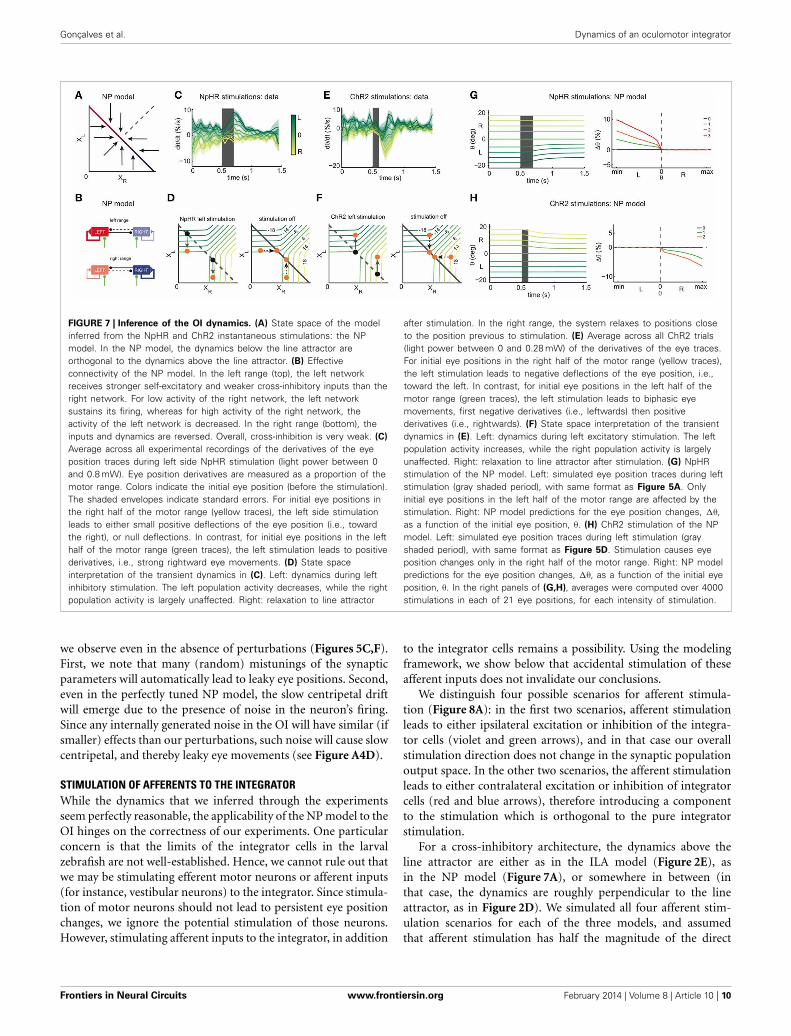
THE OI DYNAMICS AROUND THE LINE ATTRACTORThe results from the NpHR and ChR2 experiments provide uswith the means to infer the OI dynamics around the line attrac-tor. Since the inhibitory stimulations yield results similar to thosepredicted by the ILA model (compare Figure 3D and Figure 5C),we conclude that the dynamics below the line attractor are similarto those of the ILA model (Figure 2E). To obtain the observedpoint-symmetry of the perturbations (Figures 5C,F), however,we need to assume that the dynamics above the line attractorare roughly orthogonal to the dynamics below. Consequently, ourexperimental results suggest a model with dynamics as shown inFigure 7A. Here, the dynamics outside the line attractor are orga-nized around a central point, corresponding to the null positionof the eyes (the “null position” or NP model). Although Figure 7Aillustrates the overall flow of the trajectories toward the line, wenote that our line attractors are composed of individual fixedpoints, such that the fine-scale dynamics change in the vicinityof the line (see Figure A4C). Although the fine-scale dynamicspredict small changes toward the left in the left range after ChR2stimulation, these small changes do not appear in the predictionsif we assume that the system is noisy.
These conclusions are further supported when we analyze thetransient dynamics of the experimental eye movements aroundthe NpHR or ChR2 stimulation period (Figures 7C–F). If theinitial eye positions are in the left range, the NpHR stimula-tion generates monotonic eye movements toward the right, asindicated by the transient, positive derivatives of the eye move-ments (green traces in Figure 7C). If the initial eye positionsare in the right range, the NpHR stimulation leaves them essen-tially unaffected. This contrasts with the ChR2 stimulations whichtransiently affect all eye positions. For initial eye positions in theleft range, the stimulation causes transiently biphasic eye move-ments, as indicated by the negative, then positive derivatives of theeye movements (green traces in Figure 7E). In other words, theeye is briefly moved to a more eccentric position, before relaxingback to its original position. For initial eye positions in the rightrange, we observe an overall negative derivative of the eye move-ment, generating a centripetal eye position drift (yellow traces inFigure 7E).
These transient dynamics match with the population activitydynamics predicted by the NP model (Figures 7D,F). Let us focuson the excitatory perturbations. When the left OI is excited, theleft population activity XL increases in the whole motor range(Figure 7F). In the relaxation phase, if the initial eye position is inthe left range, the system counterbalances the left stimulation bydecreasing XL without changing XR. Accordingly, eye movementsare biphasic and altogether eye position changes only marginally.In the right motor range, the right population activity decreases inthe relaxation phase, while the left population activity stays intact,thus causing centripetal (to the null position) eye movements(Figure 7F).
Besides explaining the perturbation data well (Figures 7G,H),the resulting NP model is also in better agreement with the nat-ural leakiness of the OI, i.e., the slow drift in eye positions that
Frontiers in Neural Circuits www.frontiersin.org February 2014 | Volume 8 | Article 10 | 9
Gonçalves et al. Dynamics of an oculomotor integrator
FIGURE 7 | Inference of the OI dynamics. (A) State space of the modelinferred from the NpHR and ChR2 instantaneous stimulations: the NPmodel. In the NP model, the dynamics below the line attractor areorthogonal to the dynamics above the line attractor. (B) Effectiveconnectivity of the NP model. In the left range (top), the left networkreceives stronger self-excitatory and weaker cross-inhibitory inputs than theright network. For low activity of the right network, the left networksustains its firing, whereas for high activity of the right network, theactivity of the left network is decreased. In the right range (bottom), theinputs and dynamics are reversed. Overall, cross-inhibition is very weak. (C)
Average across all experimental recordings of the derivatives of the eyeposition traces during left side NpHR stimulation (light power between 0and 0.8 mW). Eye position derivatives are measured as a proportion of themotor range. Colors indicate the initial eye position (before the stimulation).The shaded envelopes indicate standard errors. For initial eye positions inthe right half of the motor range (yellow traces), the left side stimulationleads to either small positive deflections of the eye position (i.e., towardthe right), or null deflections. In contrast, for initial eye positions in the lefthalf of the motor range (green traces), the left stimulation leads to positivederivatives, i.e., strong rightward eye movements. (D) State spaceinterpretation of the transient dynamics in (C). Left: dynamics during leftinhibitory stimulation. The left population activity decreases, while the rightpopulation activity is largely unaffected. Right: relaxation to line attractor
after stimulation. In the right range, the system relaxes to positions closeto the position previous to stimulation. (E) Average across all ChR2 trials(light power between 0 and 0.28 mW) of the derivatives of the eye traces.For initial eye positions in the right half of the motor range (yellow traces),the left stimulation leads to negative deflections of the eye position, i.e.,toward the left. In contrast, for initial eye positions in the left half of themotor range (green traces), the left stimulation leads to biphasic eyemovements, first negative derivatives (i.e., leftwards) then positivederivatives (i.e., rightwards). (F) State space interpretation of the transientdynamics in (E). Left: dynamics during left excitatory stimulation. The leftpopulation activity increases, while the right population activity is largelyunaffected. Right: relaxation to line attractor after stimulation. (G) NpHRstimulation of the NP model. Left: simulated eye position traces during leftstimulation (gray shaded period), with same format as Figure 5A. Onlyinitial eye positions in the left half of the motor range are affected by thestimulation. Right: NP model predictions for the eye position changes, �θ,as a function of the initial eye position, θ. (H) ChR2 stimulation of the NPmodel. Left: simulated eye position traces during left stimulation (grayshaded period), with same format as Figure 5D. Stimulation causes eyeposition changes only in the right half of the motor range. Right: NP modelpredictions for the eye position changes, �θ, as a function of the initial eyeposition, θ. In the right panels of (G,H), averages were computed over 4000stimulations in each of 21 eye positions, for each intensity of stimulation.
we observe even in the absence of perturbations (Figures 5C,F).First, we note that many (random) mistunings of the synapticparameters will automatically lead to leaky eye positions. Second,even in the perfectly tuned NP model, the slow centripetal driftwill emerge due to the presence of noise in the neuron’s firing.Since any internally generated noise in the OI will have similar (ifsmaller) effects than our perturbations, such noise will cause slowcentripetal, and thereby leaky eye movements (see Figure A4D).
STIMULATION OF AFFERENTS TO THE INTEGRATORWhile the dynamics that we inferred through the experimentsseem perfectly reasonable, the applicability of the NP model to theOI hinges on the correctness of our experiments. One particularconcern is that the limits of the integrator cells in the larvalzebrafish are not well-established. Hence, we cannot rule out thatwe may be stimulating efferent motor neurons or afferent inputs(for instance, vestibular neurons) to the integrator. Since stimula-tion of motor neurons should not lead to persistent eye positionchanges, we ignore the potential stimulation of those neurons.However, stimulating afferent inputs to the integrator, in addition
to the integrator cells remains a possibility. Using the modelingframework, we show below that accidental stimulation of theseafferent inputs does not invalidate our conclusions.
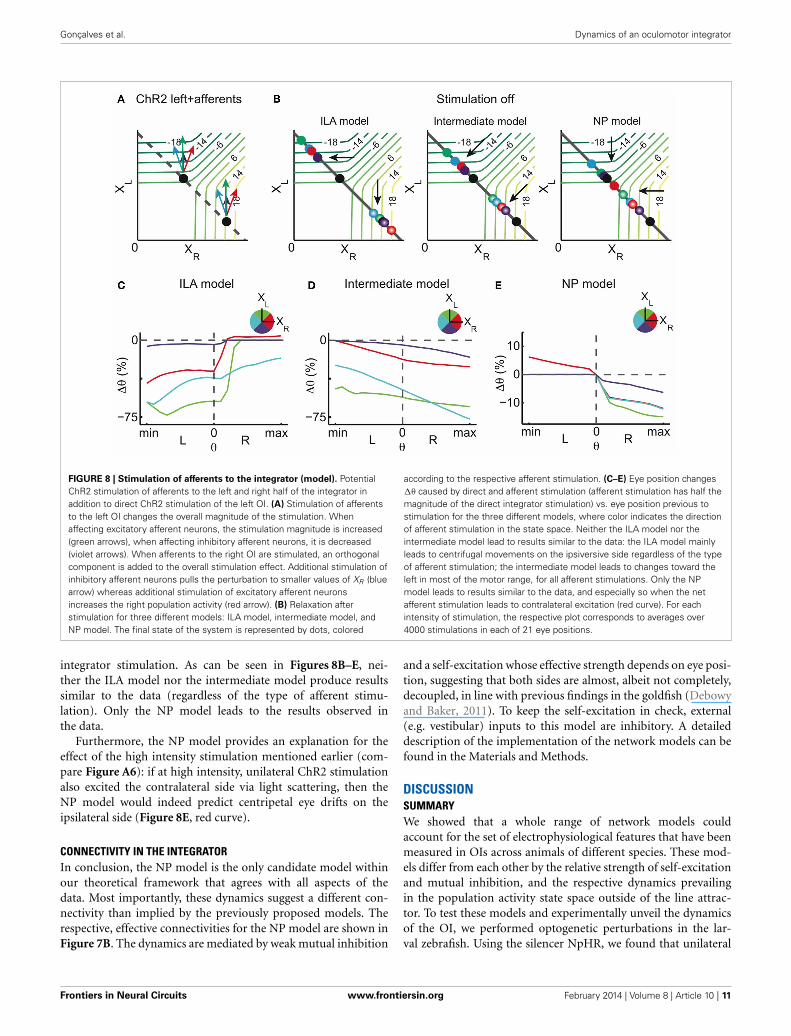
We distinguish four possible scenarios for afferent stimula-tion (Figure 8A): in the first two scenarios, afferent stimulationleads to either ipsilateral excitation or inhibition of the integra-tor cells (violet and green arrows), and in that case our overallstimulation direction does not change in the synaptic populationoutput space. In the other two scenarios, the afferent stimulationleads to either contralateral excitation or inhibition of integratorcells (red and blue arrows), therefore introducing a componentto the stimulation which is orthogonal to the pure integratorstimulation.
For a cross-inhibitory architecture, the dynamics above theline attractor are either as in the ILA model (Figure 2E), asin the NP model (Figure 7A), or somewhere in between (inthat case, the dynamics are roughly perpendicular to the lineattractor, as in Figure 2D). We simulated all four afferent stim-ulation scenarios for each of the three models, and assumedthat afferent stimulation has half the magnitude of the direct
Frontiers in Neural Circuits www.frontiersin.org February 2014 | Volume 8 | Article 10 | 10
Gonçalves et al. Dynamics of an oculomotor integrator
FIGURE 8 | Stimulation of afferents to the integrator (model). PotentialChR2 stimulation of afferents to the left and right half of the integrator inaddition to direct ChR2 stimulation of the left OI. (A) Stimulation of afferentsto the left OI changes the overall magnitude of the stimulation. Whenaffecting excitatory afferent neurons, the stimulation magnitude is increased(green arrows), when affecting inhibitory afferent neurons, it is decreased(violet arrows). When afferents to the right OI are stimulated, an orthogonalcomponent is added to the overall stimulation effect. Additional stimulation ofinhibitory afferent neurons pulls the perturbation to smaller values of XR (bluearrow) whereas additional stimulation of excitatory afferent neuronsincreases the right population activity (red arrow). (B) Relaxation afterstimulation for three different models: ILA model, intermediate model, andNP model. The final state of the system is represented by dots, colored
according to the respective afferent stimulation. (C–E) Eye position changes�θ caused by direct and afferent stimulation (afferent stimulation has half themagnitude of the direct integrator stimulation) vs. eye position previous tostimulation for the three different models, where color indicates the directionof afferent stimulation in the state space. Neither the ILA model nor theintermediate model lead to results similar to the data: the ILA model mainlyleads to centrifugal movements on the ipsiversive side regardless of the typeof afferent stimulation; the intermediate model leads to changes toward theleft in most of the motor range, for all afferent stimulations. Only the NPmodel leads to results similar to the data, and especially so when the netafferent stimulation leads to contralateral excitation (red curve). For eachintensity of stimulation, the respective plot corresponds to averages over4000 stimulations in each of 21 eye positions.
integrator stimulation. As can be seen in Figures 8B–E, nei-ther the ILA model nor the intermediate model produce resultssimilar to the data (regardless of the type of afferent stimu-lation). Only the NP model leads to the results observed inthe data.
Furthermore, the NP model provides an explanation for theeffect of the high intensity stimulation mentioned earlier (com-pare Figure A6): if at high intensity, unilateral ChR2 stimulationalso excited the contralateral side via light scattering, then theNP model would indeed predict centripetal eye drifts on theipsilateral side (Figure 8E, red curve).
CONNECTIVITY IN THE INTEGRATORIn conclusion, the NP model is the only candidate model withinour theoretical framework that agrees with all aspects of thedata. Most importantly, these dynamics suggest a different con-nectivity than implied by the previously proposed models. Therespective, effective connectivities for the NP model are shown inFigure 7B. The dynamics are mediated by weak mutual inhibition
and a self-excitation whose effective strength depends on eye posi-tion, suggesting that both sides are almost, albeit not completely,decoupled, in line with previous findings in the goldfish (Debowyand Baker, 2011). To keep the self-excitation in check, external(e.g. vestibular) inputs to this model are inhibitory. A detaileddescription of the implementation of the network models can befound in the Materials and Methods.
DISCUSSIONSUMMARYWe showed that a whole range of network models couldaccount for the set of electrophysiological features that have beenmeasured in OIs across animals of different species. These mod-els differ from each other by the relative strength of self-excitationand mutual inhibition, and the respective dynamics prevailingin the population activity state space outside of the line attrac-tor. To test these models and experimentally unveil the dynamicsof the OI, we performed optogenetic perturbations in the lar-val zebrafish. Using the silencer NpHR, we found that unilateral
Frontiers in Neural Circuits www.frontiersin.org February 2014 | Volume 8 | Article 10 | 11
Gonçalves et al. Dynamics of an oculomotor integrator
light stimulation induced eye movements back to the midpoint, ifthe eye position prior to the stimulation was on the same sideas the stimulation. The experimental results for NpHR in lar-val zebrafish were in accordance with results from goldfish usinginactivation with lidocaine (Aksay et al., 2007), therefore cor-roborating the previously proposed ILA population dynamics.However, we found that unilateral ChR2 stimulations did nothave the opposite effect to NpHR stimulations predicted by theILA dynamics, i.e., centrifugal (away from the null position) eyemovements on the stimulation side (ipsiversive eye positions).Instead, ChR2 stimulations had a centripetal (toward the nullpositions) effect on eye positions on the side opposite to thestimulation (contraversive eye positions).
Hence, perturbations always tend to drive the eye positionstoward the midpoint, indicating that this point is the focus of theOI dynamics. Consequently, we inferred the dynamics around theline attractor from these experiments, and named the resultingmodel the null-position or NP model. This model suggests an OIarchitecture with strong self-excitation and weak cross-inhibition.Only a specific combination of excitation on one side and inhibi-tion on the other will lead to actual changes in the position signalas required in saccadic eye movements (e.g., movements from onerange to the opposite range) (Gonçalves, 2012). Interestingly, ourresults can at least in part explain the findings in pharmacologi-cal experiments where glutamate or GABA agonists were injectedin the OI. Both an increase in excitation as well as an increase ininhibition resulted in centripetal eye movements, much as in ourexperiments (Arnold et al., 1999).
EXPERIMENTAL FEATURES AND LIMITATIONSIn the presented study we show how optogenetic experiments canbe combined with modeling to infer the dynamics of a neuralcircuit module for integration. In the last few years, the field ofoptogenetics has provided a powerful set of techniques to per-form gain- and loss-of-function experiments (reviewed in Zhanget al., 2007a; Luo et al., 2008; Fenno et al., 2011) and has beenapplied to zebrafish (Szobota et al., 2007; Douglass et al., 2008;Arrenberg et al., 2009; Baier and Scott, 2009; Zhu et al., 2009;Schoonheim et al., 2010). A fundamental problem in interpretingthe effects of optogenetic stimulations is that a system’s response isa combination of the stimulation magnitude and the intrinsic net-work dynamics. Indeed, the eye movements induced through theoptogenetic perturbations depended on both the light-intensity,i.e., the strength of stimulation, and on the eye position, i.e., theinternal state of the system prior to stimulation. To understandthese interdependencies, we relied on network modeling (Seung,1996; Seung et al., 2000; Goldman et al., 2003; Eliasmith, 2005;Aksay et al., 2007). In turn, the mismatches between the modelpredictions and the experimental results allowed us to constrainthe class of feasible network models and thereby improve ourunderstanding of the OI. This general approach illustrates theimportance of the internal state of a system during a pertur-bation. Wherever this internal state is at least partially known,optogenetic perturbations can provide useful clues toward theunderlying network dynamics.
In our experiments we made use of a Gal4 driver linethat drove strong expression broadly in neurons. While local
stimulation in this line led to marked behavioral changes, themanipulation was not specific to the neural integrator. The neuralintegrator in larval zebrafish is distributed across approximately150 μm in the hindbrain of the larval zebrafish (Miri et al.,2011a), with non-integrator neurons interspersed between thecells with position signals. However, our results are not easilyexplained by a stimulation of these non-integrator neurons. First,both NpHR and ChR2 stimulation induce stable and persistentchanges in eye position. This persistent change makes an influ-ence of the motoneurons that lie in close rostral proximity tothe integrator unlikely. Exclusive motoneuron stimulation shouldcause the eyes to move back to the original position immediatelyafter stimulation offset, an effect we did not observe. Second, wemay have stimulated cells which project to the integrator suchas the saccade-generating neurons. However, saccade generatingneurons are only active during saccades and unilateral stimula-tion is therefore expected to only change the saccade frequency(Schoonheim et al., 2010) and have no effect in-between saccades.Nevertheless, a low level stimulation of the saccade-generatingneurons could have occurred without the generation of a measur-able saccade: in that case, given that saccade-generating neuronsexcite the ipsilateral OI and inhibit the contralateral OI, a per-turbation of these neurons would cause an indirect stimulationof the integrator neurons roughly in the same direction as thedirect integrator stimulation, therefore not invalidating the inter-pretation of our results. Third, we may have affected some of thevestibular inputs to the OI. However, even in this scenario, ourconclusions about the integrator dynamics hold up. Since vestibu-lar inputs are included in the network models, we can simplysimulate their accidental stimulation. As shown in Figure 8, acci-dental stimulation offsets the magnitude of induced eye drifts,but overall does not alter their eye position dependence. Withinthe range of models considered, the data can therefore only beexplained by the NP model, but not by the other models.
We have stimulated excitatory and inhibitory integrator cellsat the same time, which could potentially lead to unexpectednetwork effects, e.g., due to induced imbalances of excitationand inhibition within the network. However, several observationssupport our interpretation of the data. First, electrophysiologicalrecordings in the hindbrain of the same zebrafish lines used in thisstudy suggest that more than 80% of NpHR expressing cells weresignificantly silenced during illumination and more than 90%of ChR2 expressing cells showed an increase in firing rate uponillumination (Arrenberg et al., 2009). Second, NpHR stimulationresults are in agreement with the pharmacological inactivations inthe goldfish integrator (Aksay et al., 2007), therefore confirmingthe inhibitory nature of the NpHR stimulations on the integra-tor. Third, ChR2 stimulation leads to different results than NpHRstimulation, which is proper inhibition. Fourth, both ChR2 andNpHR experiments were performed with the same Gal4 driverline. Therefore, if ChR2 stimulation led to net inhibition of theintegrator, then NpHR stimulation would lead to excitation of theintegrator which is ruled out based on the second observation.While these results suggest that optogenetic manipulations of theneural integrator changed the network activity in the expecteddirection, future zebrafish lines, e.g., with specificity for excitatoryor inhibitory neurons, will facilitate the dissection of this circuit.
Frontiers in Neural Circuits www.frontiersin.org February 2014 | Volume 8 | Article 10 | 12
Gonçalves et al. Dynamics of an oculomotor integrator
One could hypothesize that the effect of ChR2 stimulation sat-urates or reverses (depolarization block, Kleinlogel et al., 2011)with increasing stimulation intensities or for highly active cells.Our previous electrophysiological recordings provided no evi-dence for such an effect (Arrenberg et al., 2009, Figure A9).More importantly, this possibility is not supported by the eyemovement data in the range of intensities analyzed, since theeye movements scale linearly with the stimulation light intensity(Figure 6B). Also, the effect does not reverse at high light intensi-ties (Figure A6). As a final note, the modeling framework alreadyassumes that the synapses of highly active neurons are saturated,so that, at least within the model, ChR2 stimulation does notaffect these neurons.
In this study, we deliberately focused on the dynamics in theneighborhood of the stable eye position states. Consequently,our analysis was restricted to stimulation with low or mediumlight intensities. The NP model, however, makes predictions forany stimulation intensity, opening the question of what hap-pens when the stimulation intensity is increased. As shown in theFigure A6, for high NpHR stimulation intensities, we addition-ally found small centripetal movements when the eye position wason the side opposite to the stimulation. For high ChR2 stimula-tions, we found centripetal eye movements when the eyes wereon the same side as the stimulation. In the NP model, this wouldrequire a change in the dynamics far away from the line attrac-tor, requiring the arrows to bend further toward the midline.While it seems unlikely that the effects at higher light intensitiescan be explained through scattering of light into the other hemi-sphere (data not shown), the effect could potentially be explainedthrough strong stimulation of vestibular inputs. Furthermore,we notice that strong ChR2 stimulation could synchronize theactivities of cells, which may have a range of effects, includingcomplete shutting down of persistent activity (Dipoppa, 2012).We therefore refrained from including these observations in themodel.
MODEL FEATURES, LIMITATIONS, AND PREDICTIONSIntegrators are ubiquitous in the brain and are involved in severalimportant computations. For instance, in decision-making tasksrequiring sensory integrations, neurons in the lateral intrapari-etal cortex behave similar to integrators (Gold and Shadlen, 2001;Wong et al., 2007). In working memory tasks, neurons in the pre-frontal cortex exhibit almost linear dynamics during the timesin which an animal needs to remember a stimulus, similar tointegrators operating in several dimensions (Singh and Eliasmith,2006; Machens et al., 2010). In the head direction system, a headvelocity signal is integrated into head position (Zhang, 1996).
In previous line attractor models, it has generally beenassumed that noise causes random drift along the line (Seung,1996). While this is true in models with orthogonal dynamicsaround the line (such as the model illustrated in Figure 2D), inthe case of the NP model the relaxation to the line has a pre-ferred direction, therefore causing a systematic drift toward thenull position. The term “line attractor” for the NP model is there-fore strictly only valid in the limit of vanishing noise. For largenoise levels, the model shows flow toward the central eye positionwith equivalent speed from every point in the state space. Hence,
one could interpret the NP model as suggesting that the OI oper-ates like a single fixed point, and not a line attractor, as extensivelysuggested in previous literature. However, for large noise levels,we can re-tune the NP model to recover the NP dynamics in theproximity to the line by implementing stronger cross-inhibition(simulations not shown). In any case, random perturbations ofthe NP model (such as noise) are unlikely to cause a centrifugaldrift of the eye position.
Given the centripetal drift suggested by the NP model, wehypothesize that the OI features dynamics with a higher degreeof built-in “safety” than previously thought. The OI has beenobserved to be leaky on longer time scales, both in goldfish andzebrafish (Mensh et al., 2004; Miri et al., 2011a). This leakinessmay be a behaviorally advantageous feature, since, by bringing thesystem to the central position by default, it enables the relaxationof the eye muscles. Yet even higher brain systems may rely on sucha built-in leakiness. In working memory tasks that employ gradedpersistent activity (Machens et al., 2005), for instance, a tendencyto drift toward the central point while memorizing a sensory stim-ulus could explain the psychophysical errors that are known ascontraction bias (Ashourian and Loewenstein, 2011).
While this built-in “safety” may help against noise in the sys-tem, it does not solve the fine-tuning problem, i.e., the instabilityof the line attractor against perturbations in the synaptic weightsin the network. Indeed, this fine-tuning problem is a separateproblem, somewhat orthogonal to the problems that we haveinvestigated here, for which several solutions have been proposed(Koulakov et al., 2002; Goldman et al., 2003; Moreau and Sontag,2003).
While we here have assumed that neural integration in the ocu-lomotor system is generated through precise recurrent feedbackin a neural circuit, in previous literature single-cell mechanismshave been put forward to explain neural integration observedin multiple areas in the brain. In particular, following an exper-imental demonstration of integration in individual cells fromthe entorhinal cortex (Egorov et al., 2002), a body of theoret-ical work has proposed several biophysical mechanisms whichcould underlie single cell integration, dispensing synaptic feed-back (Loewenstein and Sompolinsky, 2003; Fransén et al., 2006).In the OI, unilateral disruption of the connectivity leads to neu-ral activity drifts with time constants which are typically above1 s (Pastor et al., 1994; Aksay et al., 2007), suggesting that single-cell mechanisms possibly play a role in the process of integration.However, single-cell mechanisms remain largely uncharacterizedin the integrator, and therefore we here have followed the net-work mechanisms hypothesis as in previous studies of this system(Seung, 1996; Aksay et al., 2007). The contribution of single-cellmechanisms to the slow dynamics in the integrator is a challengefor future research.
We also note that our network model is a rate-model, in whichthe activities of individual cells are described by rates rather thanprecise spike times. Although we lose biophysical realism with thistype of model, we gain analytical tractability, a very useful assetin interpreting experimental results within a theoretical frame-work, and in constructing models in accordance with data. Sincethe position cells exhibit persistent activity with regular firing(Aksay et al., 2003), temporal averages of spiking events are a good
Frontiers in Neural Circuits www.frontiersin.org February 2014 | Volume 8 | Article 10 | 13
Gonçalves et al. Dynamics of an oculomotor integrator
qualitative description of the system. Nevertheless, an equivalentmodel with spiking neurons could be built as shown in Seunget al. (2000), Eliasmith (2005).
Given the weak mutual-inhibition, the NP model behaves closeto a system with a plane of stable fixed points (see Figure 2F), andshows slow dynamics around the line. We note that the relaxationof the eye positions after stimulation is indeed slow (on the orderof 200 ms). However, these slow dynamics could be reflecting thedynamics of the muscle physics rather than the slow dynamicsof the integrator. Future work should show whether such slowdynamics can indeed be observed.
Our network model features multiple stable fixed points,which suggests that the eye positions corresponding to these fixedpoints should be held comparatively longer than eye positions in-between the fixed points. However, in our data, the system seemsto visit a range of eye positions in a homogeneous way (both dur-ing NpHR stimulation and during spontaneous, slow eye positiondecay), which contrasts with the prediction of our model. Suchhomogeneity could be due to external factors to the integrator,such as small saccadic commands causing smooth eye movementfluctuations, or the dynamics of the motor neurons and muscles.Nevertheless, the homogeneity found in the data challenges ourhypothesis of discrete fixed points in the integrator and suggestsfurther studies to elucidate this question.
Our modeling framework assumes a specific mapping fromnetwork activity to eye position, based on the difference betweenthe tuning curves of position neurons and motor neurons (seeMaterials and Methods). Although this assumption is essential inour framework to account for the unilateral inactivation resultsin Aksay et al. (2007), one could relax it and assume linearitybetween population synaptic outputs and eye position by intro-ducing high synaptic thresholds in the same fashion as in Aksayet al. (2007). However, we believe that the non-linear mapping ismost likely present in the system and should be included in futuremodeling studies of the oculomotor system.
In a recent study (Miri et al., 2011a), zebrafish position neu-rons were shown to have variable timescales of integration, sothat the associated relaxation time constants varied across neu-rons over one order of magnitude. This suggests that the dynamicsof the OI could be high-dimensional (on the order of the numberof neurons), in contrast with our line attractor model, which isimplemented with homogeneous time constants across neuronsand has low (2D) dimensional dynamics. Given that in this studywe are interested in the dynamics of the population activities, thedetails of single-cell time constants do not affect our conclusions.In the future, it will be interesting to perform optogenetic stimu-lations and at the same time measure the activities of the positioncells to explore the full state space, and realize the dimensionalityof the system’s dynamics.
Our models belong to a series of works suggesting that the OIbuilds up a line attractor by a balance between neural saturationand progressive recruitment of neurons to compensate such satu-ration (Seung, 1996; Seung et al., 2000; Aksay et al., 2007). Futurework should specifically target the validity of this assumption asit is crucial for the whole modeling framework. Specifically, thisassumption predicts that neurons have no responsibility or influ-ence on eye positions that are below their firing threshold or that
are sufficiently above that threshold (when they run into satura-tion). This prediction could e.g., be tested with single-cell ChR2stimulation. Excitatory stimulation of different cells would thenlead to movements in different eye ranges, enhancing the factthat different neurons are responsible for different stable activitieson the motor range (Gonçalves, 2012). Consequently, combin-ing single-cell optogenetics with the framework here designed hasthe potential to provide even deeper insights into the detailedstructure of the OI in the future.
MATERIALS AND METHODSEXPERIMENTSAnimalsFor all experiments, we used zebrafish larvae between the age of 5and 8 dpf. Animals were transgenic for a combination of the fol-lowing transgenes: Et(E1b:Gal4)s1101t, Tg(UAS:NpHR-mCherry)s1989t, Tg(UAS:Kaede)s1999t, Tg(UAS:ChR2-mCherry)s1986t. Inaddition, the larvae were mutant for the mitfa/nacre gene(mitfas170, mitfas184, or mitfab692 alleles), which rendered the skintransparent and facilitated fiber optic stimulation as well as eyeposition detection. Siblings that did not express NpHR or ChR2served as control groups and are labeled wt here. Adult fishwere either transgenic for Et(E1b:Gal4)s1101t or for the opto-genetic responders, since keeping optogenetic expressors in thes1101t line would have resulted in variegation of the expression.Embryos/larvae were raised in the dark and not fed. For eachexperiment, about 4 clutches were screened and the strongestexpressors were kept.
Many Gal4s1101t/UAS:NpHR expressing larvae had non-inflated swim bladders or showed only infrequent eye move-ments. For this reason, each mounted larva was observed for1 min under a stereoscope and only larvae that showed saccadesin both directions and good peripheral eye fixations were usedfor the experiments. This way, only the best behaving 20% of themounted larvae were used. Control larvae were screened the sameway, although a higher percentage of larvae could be used forexperiments. The screened NpHR expressing and non-expressinglarvae had similar eye drift rates in the absence of stimulation (seeFigure 4 in Miri et al., 2011a). The magnitudes of the induced eyeposition drifts were somewhat variable between animals stimu-lated at the same position, which we attribute to the expressionlevel/variegation variability between animals. For example, in oneanimal in Figure A8, we noted a patch of cells in which NpHRexpression was absent, which resulted in a much reduced effecton eye position (see points [0.08, 86 μm] and [0.15, 86 μm] forthe left and the right eye in the ipsi stim. condition). We excluded5 animals from the analysis in Figure 5F, since the induced eyeposition changes were much smaller than in the majority ofanimals.
MountingLarvae were mounted in a drop of low-melting agarose (1.6%)in a petri dish (35 mm diameter). A platinum wire (100 μm indiameter) glued to a pasteur pipette was used to flatten the liq-uid agarose drop by moving the wire at the perimeter of the dropand thus increasing the agarose-covered area in the dish, so thatthe height of the liquid approximately matched the height of the
Frontiers in Neural Circuits www.frontiersin.org February 2014 | Volume 8 | Article 10 | 14
Gonçalves et al. Dynamics of an oculomotor integrator
larva. This step took 10 s and ensured that the optic fiber couldbe placed close to the skin in the experiment. Next, we used thewire to position the larva dorsal side up. The agarose solidifiedfor 5–10 min and egg water was added. A second platinum wire(100 μm) that was flattened at the tip and bend 70◦ about 2 mmfrom the tip was used to make agarose incisions, moving the plat-inum wire sideways so that the flattened part acted like a knife.Sometimes the agarose would lose its adhesion and we foundthat using a fresh petri dish for every fish ameliorated this prob-lem. Also, the fish sometimes managed to escape and we foundthat inserting the platinum wire directly at the eye and mov-ing it outwards worked better than the other way round. Twoblocks surrounding the eyes were cut and the flat side of theplatinum wire was now used to scoop the blocks out. The stere-oscope backlight was set at an angle (dark field) to visualize thecut agarose and make sure that the agarose surrounding the eyeswas completely removed. After 3 min of rest, the frequency of eyemovements was observed (see Animals). To minimize water evap-oration, a dish lid was placed on the petri dish in some of therecordings. The dish lid had a 1 cm diameter hole to allow for theplacement of the optic fiber.
Laser stimulationFor laser stimulations, we used an AOTF to couple lasers of threedifferent wavelengths (633, 561, 488 nm) into a multimode opticfiber. We made use of the laser system of a disassembled confo-cal microscope. For UV photoconversions, we manually switchedthe stimulation fiber to a fiber coupled UV laser (355 nm). Fiberpreparations were described previously (Arrenberg et al., 2009).The AOTF was used to modulate the laser intensity by providingan analog voltage from the DAQ device connected to the com-puter. For some experiments we used a multi-laser system fromIkecool (Anaheim, CA), however the analog modulation was notgood enough to precisely control light intensity on a millisecond-basis (significant baseline light at 0 Volts and the intensity was notstable enough after a switch from 0 Volts to almost full power).We recommend the inclined scientist to rather buy a system fromToptica (Munich, Germany) or Omicron (Rodgau-Dudenhofen,Germany). The optic fiber (including Thorlabs’ FT030 protec-tive tubing) was placed in a glass pipette with an angled tip.The pipette was mounted on a fine micromanipulator and thefiber was positioned over the hindbrain. While x-y positioncould be judged easily by looking through the stereoscope, thez-positioning was more difficult. In cases in which the z-positionwas unclear, we used the fine micro-manipulation to lower thefiber tip slowly until (a) the mechanic strain on the agarose movedthe skin of the fish slightly or (b) until the fish startled. We thenmoved the fiber back up by a small distance (≈20 μm).
Experimental setupThe larva was placed under a stereoscope and a custom-built LEDarray was used as a backlight. White LED light was used to posi-tion the animals and IR LED light (850 nm) to image the headwith a CCD camera (up to 60 Hz, TheImagingSource, Bremen,Germany). During the experiment, dim room lights were kepton and sometimes a weak white backlight was used in addi-tion so that the experiments were performed under low lightintensity and low contrast conditions. We did not record in the
dark, because wildtype animals showed a behavioral responseto the stimulation light in the dark, which was much reducedor absent in the presence of the backlight (Miri et al., 2011a)(the larvae probably see some of the scattered stimulation light).We note that larval post-saccadic eye fixations were somewhatleakier in the dark (when compared to low light conditions),suggesting that larvae were using visual feedback to improve ocu-lar stability. However, this effect was small in comparison to eyeposition changes induced by medium light intensities, so thatwe are confident to be measuring the integrator performance inour experiments. A custom-written LabVIEW program (NationalInstruments, Austin, TX) was used to image, record angulareye positions, and to trigger stimulations via a NI USB DAQbox. Images were acquired at 30–45 Hz and particle analysis (NIVision) was used to detect eye positions and write them to a textfile (together with the stimulation time points) for later analy-sis. Eye positions were measured and plotted in real time andfiber optic stimulations were triggered based on them. In mostexperiments a single 200 ms stimulation of constant intensity wasdelivered automatically 1 s after the eyes had made a saccade. Insome experiments four consecutive stimulations were deliveredfor each saccade (1, 3, 5, and 7 s after the saccade). The stimula-tion intensities were chosen randomly: we either used five fixedintensities or the computer picked values from an exponentialdistribution of intensities that biased toward smaller intensities.No stimulation was applied after every third saccade, and theseperiods served as our control trials. Recordings typically lastedfor at least 30 min and up to 12 h. The LabVIEW program can berequested from the authors.
DATA ANALYSISThe files containing eye position trace and stimulation data wereanalyzed with custom algorithms using MATLAB. We only ana-lyzed the first 3 h of each experiment, since in some recordings(without dish lid) water evaporation affected the camera focusand thereby the correct detection of eye position angles. Theinduced eye movements were measured as the change in eye posi-tion from stimulation start to 1 s after stimulation start. Mostinduced eye movements consisted of a single monotonic driftthat was completed within 400 ms after stimulation. However, a1 s interval was chosen to account for potential variations of theduration of the post-stimulation drift. The eye position change,averaged across left and right eye, was then plotted against the ini-tial eye position, averaged across eyes. The results from each fishwere fitted by a cubic smoothing spline with boundary secondderivatives equal to zero, using the spline fit-package developedfor MATLAB by Jonas Lundgren. This fitting procedure wasrepeated for several stimulation intensity bins. A population plotwas generated by averaging the spline fits of all fish, for each inten-sity bin. We observed some variability of motor ranges acrossfish, especially in animals expressing ChR2, which tended tohave a smaller motor range (average motor range and respec-tive standard deviations in NpHR animals: [−20.0◦ ± 5◦; 18.7◦ ±4.4◦]; in ChR2 animals [−13.7◦ ± 3.9◦; 13◦ ± 3.5◦]). Therefore,before averaging across animals, we normalized all motor rangesto generate a smooth population plot. In some fish, there wasan undersampling of events at the eccentric eye positions, andtherefore we removed the 5% most eccentric events on the right
Frontiers in Neural Circuits www.frontiersin.org February 2014 | Volume 8 | Article 10 | 15
Gonçalves et al. Dynamics of an oculomotor integrator
side and on the left side before averaging across animals. In severalfish, some intensity bins did not span the full motor range, and weextrapolated the corresponding splines. To account for the uncer-tainty of the extrapolation, we performed a weighted average overfish for eccentric eye positions, with weights that decreased as theextrapolation distance increased.
The null-position of the eyes was defined as the average of theextreme eye positions. Note that this definition only works wellfor eyes which explore eye positions in both directions equallywell, which was not the case for every fish. However, in our handsthis was the best definition since other definitions (median, aver-age, fixed at +8◦/−8◦) were more subjective or decreased theacross-fish consistency of the results. An animal’s distribution ofpost-saccadic eye positions was often bimodal, since the animalexplored the peripheral positions more frequently. In some exper-iments, we stimulated multiple times (1, 3, 5, and 7 s) after asingle post-saccadic fixation in order to access the full scope ofeye positions.
The location of stimulation was in caudal proximity to thepreviously identified region containing saccade generating neu-rons (Schoonheim et al., 2010), and in a fraction of the events,the stimulation induced a saccade (more frequently for ChR2stimulations than for NpHR). Since this study focuses on theperformance of the integrator, we did not include these eventsin our analysis. In Figure 5, these were excluded by a velocitythreshold (>20◦/s). In Figure 4D, the data points result fromeye velocity vs. eye position fits (linear regression through theorigin, see Figure A8), and correspond to the inverse of the eyeposition drift time constant at a specific hindbrain location. Foreach fit, only the middle 70% of the eye velocity/eye position datapoints were fitted, thereby excluding outliers caused by saccades.For each eye, the eye drift was normalized across hindbrainpositions. Each data point in Figure 4D corresponds to onefish (average of the normalized left and right eye, for individualeyes see Figure A8) and hindbrain position. The data points forFigure 4D (eye drift vs. hindbrain position) were then fitted bygaussian functions. For the Gaussian fit functions in Figure 4D,the mean was restricted to the interval [0; 200]. This modificationwas made because for approximately flat distributions (controldata points ipsi ctrl, contra stim, contra ctrl) peripheral datapoints sometimes caused Gaussian fits with means far away fromthe tested hindbrain region.
THEORETICAL FRAMEWORK: NETWORK MODELIn previous work (Gonçalves, 2012), we show how to build a lineattractor model accounting for the main findings in the oculomo-tor integrator, using basic design principles that have previouslybeen suggested in the literature (Seung, 1996; Eliasmith, 2005;Machens and Brody, 2008). We use these principles to clarify howthe network connectivity is related to the tuning curve properties.Here, we summarize the main features of the model developed inGonçalves (2012).
We start by describing the assumptions and simplificationsunderlying the network model. Most of these assumptions areadapted from the previous literature and are based either onarguments of plausibility and simplicity or on observations aboutthe oculomotor integrator (Seung, 1996; Aksay et al., 2000; Seunget al., 2000; Aksay et al., 2007; Machens and Brody, 2008).
Assumption 1 (Two opposing populations). We assume that thedynamics are controlled by two population variables, XR andXL, one for each side. These variables shall represent the effectone population has on the postsynaptic currents of neurons inthe other population; a specific definition will follow below. Weassume that in its normal working regime, these two “synaptic”population activities oppose each other, so that, as the activity inone population grows, that of the other drops. For simplicity wetherefore assume that
β = XR + XL (1)
where β is a constant value.Assumption 2 (Eye position). We furthermore assume that
within this working regime (but not outside of it) the eye positioncan be read out as
θ = XR − XL (2)
where right range positions are defined as positive eye positions,and left range positions as negative.
Assumption 3 (Firing rates). We furthermore assume that eachneuron’s firing rate in the stationary state is determined by itsexcitatory input from the same population, scaled by a weightai, the inhibitory input from the opposite population, scaled bya weight ci, and some external (e.g., vestibular) input, hi, so that
rR,i = [aiXR − ciXL + hi]+ (3)
rL,i = [aiXL − ciXR + hi]+ (4)
where i = 1, . . . , n indexes the neuron, and [·]+ is a threshold-linear function (Figure A1A). For simplicity, we assume completesymmetry of the two systems, so that neurons in the two popula-tions have exactly the same set of parameters values.
Tuning curve constraintsUsing the (abstract) threshold-linear tuning curves, we candescribe the firing rates of the right and left position neurons, rR,i
and rL,i, as a function of the eye position θ (see Figure 1C), sothat (for i = 1, . . . , n)
rR,i = [si (θ − ti)]+ (5)
rL,i = [−si (θ − ti)]+ (6)
where si and ti are the tuning curves’ slope and threshold,which are assumed to obey the recruitment order (Aksay et al.,2000) (see Figure A2). Since the parameters si and ti are givenby the data, they constrain the possible choices of ai, ci, hi
from Equations (3,4). More specifically, on the curve defined byEquation (1), the following relations need to hold:
si = ai + ci
2(7)
ti = − (ai − ci) β + 2hi
ai + ci. (8)
To obtain the constraints on the excitatory and inhibitory inputs,ai and ci, as well as the external inputs, hi, we need to invert
Frontiers in Neural Circuits www.frontiersin.org February 2014 | Volume 8 | Article 10 | 16
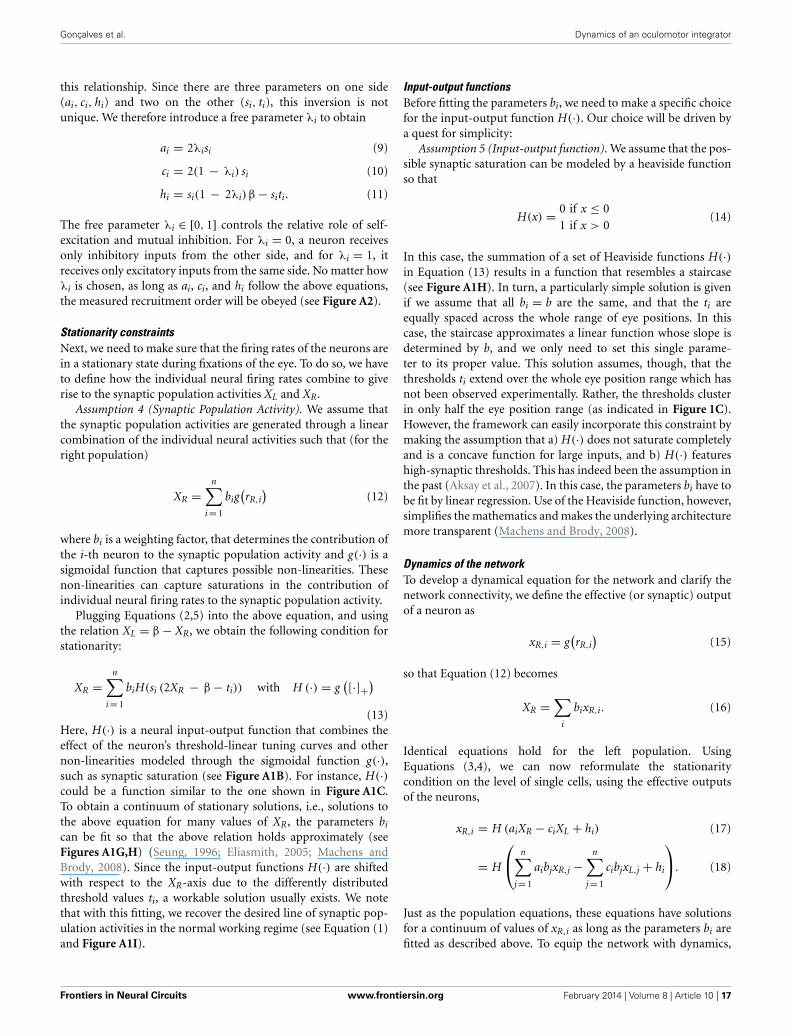
Gonçalves et al. Dynamics of an oculomotor integrator
this relationship. Since there are three parameters on one side(ai, ci, hi) and two on the other (si, ti), this inversion is notunique. We therefore introduce a free parameter λi to obtain
ai = 2λisi (9)
ci = 2(1 − λi) si (10)
hi = si(1 − 2λi) β − siti. (11)
The free parameter λi ∈ [0, 1] controls the relative role of self-excitation and mutual inhibition. For λi = 0, a neuron receivesonly inhibitory inputs from the other side, and for λi = 1, itreceives only excitatory inputs from the same side. No matter howλi is chosen, as long as ai, ci, and hi follow the above equations,the measured recruitment order will be obeyed (see Figure A2).
Stationarity constraintsNext, we need to make sure that the firing rates of the neurons arein a stationary state during fixations of the eye. To do so, we haveto define how the individual neural firing rates combine to giverise to the synaptic population activities XL and XR.
Assumption 4 (Synaptic Population Activity). We assume thatthe synaptic population activities are generated through a linearcombination of the individual neural activities such that (for theright population)
XR =n∑
i = 1
big(rR,i
)(12)
where bi is a weighting factor, that determines the contribution ofthe i-th neuron to the synaptic population activity and g(·) is asigmoidal function that captures possible non-linearities. Thesenon-linearities can capture saturations in the contribution ofindividual neural firing rates to the synaptic population activity.
Plugging Equations (2,5) into the above equation, and usingthe relation XL = β − XR, we obtain the following condition forstationarity:
XR =n∑
i = 1
biH(si (2XR − β − ti)) with H (·) = g([·]+
)
(13)Here, H(·) is a neural input-output function that combines theeffect of the neuron’s threshold-linear tuning curves and othernon-linearities modeled through the sigmoidal function g(·),such as synaptic saturation (see Figure A1B). For instance, H(·)could be a function similar to the one shown in Figure A1C.To obtain a continuum of stationary solutions, i.e., solutions tothe above equation for many values of XR, the parameters bi
can be fit so that the above relation holds approximately (seeFigures A1G,H) (Seung, 1996; Eliasmith, 2005; Machens andBrody, 2008). Since the input-output functions H(·) are shiftedwith respect to the XR-axis due to the differently distributedthreshold values ti, a workable solution usually exists. We notethat with this fitting, we recover the desired line of synaptic pop-ulation activities in the normal working regime (see Equation (1)and Figure A1I).
Input-output functionsBefore fitting the parameters bi, we need to make a specific choicefor the input-output function H(·). Our choice will be driven bya quest for simplicity:
Assumption 5 (Input-output function). We assume that the pos-sible synaptic saturation can be modeled by a heaviside functionso that
H(x) = 0 if x ≤ 01 if x > 0
(14)
In this case, the summation of a set of Heaviside functions H(·)in Equation (13) results in a function that resembles a staircase(see Figure A1H). In turn, a particularly simple solution is givenif we assume that all bi = b are the same, and that the ti areequally spaced across the whole range of eye positions. In thiscase, the staircase approximates a linear function whose slope isdetermined by b, and we only need to set this single parame-ter to its proper value. This solution assumes, though, that thethresholds ti extend over the whole eye position range which hasnot been observed experimentally. Rather, the thresholds clusterin only half the eye position range (as indicated in Figure 1C).However, the framework can easily incorporate this constraint bymaking the assumption that a) H(·) does not saturate completelyand is a concave function for large inputs, and b) H(·) featureshigh-synaptic thresholds. This has indeed been the assumption inthe past (Aksay et al., 2007). In this case, the parameters bi have tobe fit by linear regression. Use of the Heaviside function, however,simplifies the mathematics and makes the underlying architecturemore transparent (Machens and Brody, 2008).
Dynamics of the networkTo develop a dynamical equation for the network and clarify thenetwork connectivity, we define the effective (or synaptic) outputof a neuron as
xR,i = g(rR,i
)(15)
so that Equation (12) becomes
XR =∑
i
bixR,i. (16)
Identical equations hold for the left population. UsingEquations (3,4), we can now reformulate the stationaritycondition on the level of single cells, using the effective outputsof the neurons,
xR,i = H (aiXR − ciXL + hi) (17)
= H
⎛⎝
n∑j = 1
aibjxR,j −n∑
j = 1
cibjxL,j + hi
⎞⎠. (18)
Just as the population equations, these equations have solutionsfor a continuum of values of xR,i as long as the parameters bi arefitted as described above. To equip the network with dynamics,
Frontiers in Neural Circuits www.frontiersin.org February 2014 | Volume 8 | Article 10 | 17

Gonçalves et al. Dynamics of an oculomotor integrator
we need to assume how the neural activities relax to this station-ary state once the system is perturbed. Let us define the followingabbreviations,
wij,E = aibj, (19)
wij,I = cibj, (20)
where wij,E denotes the weight of an excitatory connection fromneuron j to neuron i and wij,I denotes the weight of an inhibitoryconnection from neuron j to neuron i.
Assumption 6 (Exponential relaxation). We assume that theneural activities relax exponentially to the stationary state. Thisleads to a network with standard Wilson-Cowan dynamics(Dayan and Abbott, 2001),
τxR,i(t) = −xR,i(t) + H
⎛⎝
n∑j = 1
wij,ExR,j −n∑
j = 1
wij,IxL,j + hi
⎞⎠ (21)
where now each neuron i receives excitatory and inhibitory inputsfrom the two populations. An identical equation holds for theneurons in the left population and is obtained by switching theL and R subscripts.
Firing rate dynamics are assumed to be very fast as comparedto synaptic dynamics, and are therefore always in equilibrium:
rR,i =⎡⎣
n∑j = 1
wij,ExR,j −n∑
j = 1
wij,IxL,j + hi
⎤⎦
+(22)
As previously, an identical equation holds for the neurons inthe left population and is obtained by switching the L and Rsubscripts.
In this model, neurons are excitatory to their own popula-tion and inhibitory to the opposing population. However, we canbuild equivalent models obeying Dale’s law, i.e., where neuronsare either excitatory or inhibitory, but not both at the same time(unpublished results). A systematic way of mapping networkswith mixed excitatory and inhibitory neurons to networks thatobey Dale’s law was recently proposed in Parisien et al. (2008).
As can be seen in Equations (19,20), we here assume low-rankconnectivity. This connectivity has been a standard assumptionof all previously proposed models of the oculomotor integrator(Seung, 1996; Aksay et al., 2007) for two reasons: (1) the exper-imentally observed stable activities across cells in the integratoralong the eye position range suggest that the system has lowdimensional dynamics, characteristic of a low-rank connectivitysystem; (2) this assumption simplifies the theoretical treatmentof the problem. However, the assumed connectivity should onlybe viewed as an effective connectivity rather than a direct map-ping onto biophysical synapses. Mathematically, one can relax thelow-rank assumption: the connectivity matrix can be expandedinto “modes” (using singular value decomposition, e.g.), and thedynamics of the oculomotor integrator are simply governed bythe first and strongest mode which governs the dynamics in theplane of population activities. However, one could add many
more weaker (and orthogonal) modes that would only impact thetransient dynamics of single neurons, while leaving the dynam-ics of the summed population intact. These weaker modes canchange the (biophysical) connectivity in many ways, while leavingthe effective connectivity the same.
THEORETICAL FRAMEWORK: FROM NETWORK ACTIVITY TO EYEPOSITIONSNeural integrator mapping to eye positionsOculomotor plant dynamics are the result of the innervationof two antagonist muscles (medial rectus and lateral rectus)by motor neurons delivering the position signal (Figure 1A).Consequently, we assume that the eye position θ is related tothe difference between right and left motor population activi-ties, making the function fx between synaptic population activ-ities (XR, XL) and eye position non-linear (see Appendix fordetails).
Oculomotor plant dynamicsTo model the observed inertia or sluggishness of the whole sys-tem in response to the perturbations (most likely a consequenceof muscle inertia and eye dynamics) we implemented a simpleexponential decay toward the network stable activities with a timeconstant τθ, so that
τθθ = −θ + fx(XR, XL) . (23)
By visual inspection of zebrafish eye traces, we chose τθ = 200 ms.
UNILATERAL INACTIVATIONNow that we have fully determined the relationship between theintegrator neural activities and the eye position, we can appropri-ately interpret the pharmacological inactivation results of (Aksayet al., 2007). After unilateral silencing of the oculomotor integra-tor, the animals manage to fixate the eyes on the contralateral halfof the motor range, and the activities of the intact neurons remainstable within this range. In our framework, this suggests a rangeof stable points on the upper half of the activity axis XR and XL.These stable ranges provide an important constraint for the ILAand NP models, limiting the possible choices of λi that we canmake in Equations (9–11).
PARAMETER TUNING OF NETWORK MODELSWe have clarified the dynamics along the axes required by thepharmacological inactivation results of Aksay et al. (2007), so thatwe can proceed to the final tuning of the network model.
Independent of the choice of λi, the proposed network con-nectivities feature a line attractor in the (XR, XL) space that agreeswith the recruitment order. However, the desired dynamics out-side of the attractor, e.g., the dynamics along the axes requiredby the pharmacological inactivation results, further constrain thetuning of the parameter λi. Given the low number of neurons andsimplicity of the tuning, we manually tuned this parameter tochange the dynamics around the line attractor. However, a leastsquares optimization procedure could also be built to solve theproblem.
In Figure A4, we present two model solutions presented in themain section, the independent line attractor model (ILA model)
Frontiers in Neural Circuits www.frontiersin.org February 2014 | Volume 8 | Article 10 | 18
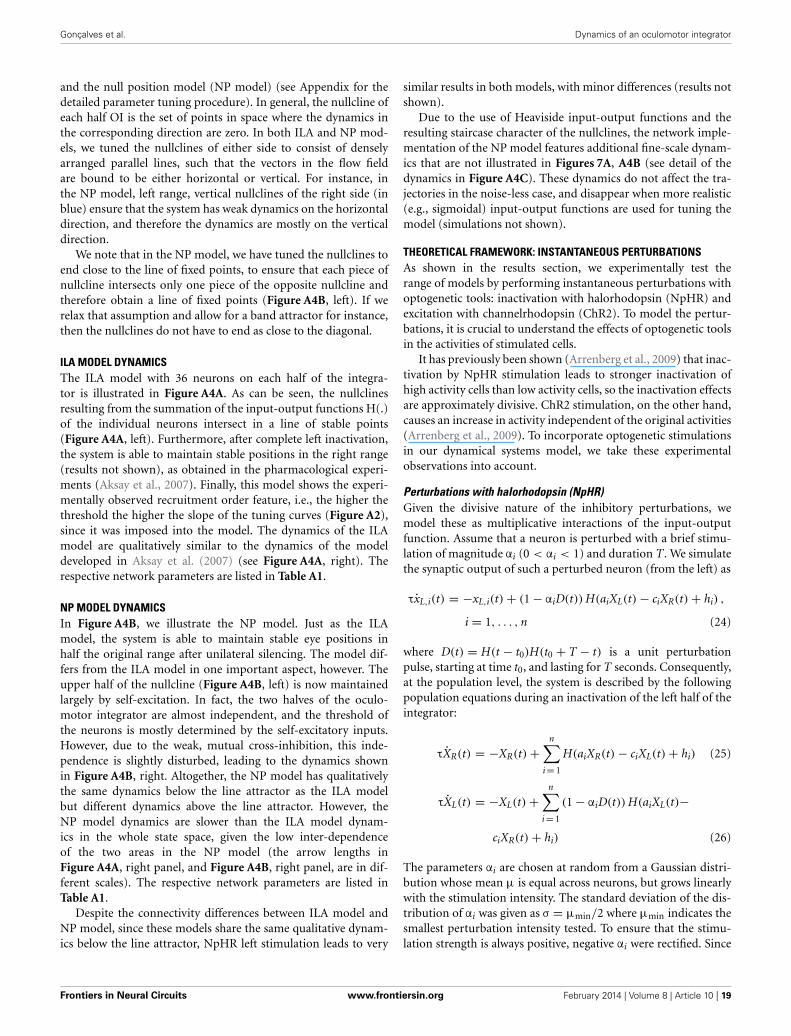
Gonçalves et al. Dynamics of an oculomotor integrator
and the null position model (NP model) (see Appendix for thedetailed parameter tuning procedure). In general, the nullcline ofeach half OI is the set of points in space where the dynamics inthe corresponding direction are zero. In both ILA and NP mod-els, we tuned the nullclines of either side to consist of denselyarranged parallel lines, such that the vectors in the flow fieldare bound to be either horizontal or vertical. For instance, inthe NP model, left range, vertical nullclines of the right side (inblue) ensure that the system has weak dynamics on the horizontaldirection, and therefore the dynamics are mostly on the verticaldirection.
We note that in the NP model, we have tuned the nullclines toend close to the line of fixed points, to ensure that each piece ofnullcline intersects only one piece of the opposite nullcline andtherefore obtain a line of fixed points (Figure A4B, left). If werelax that assumption and allow for a band attractor for instance,then the nullclines do not have to end as close to the diagonal.
ILA MODEL DYNAMICSThe ILA model with 36 neurons on each half of the integra-tor is illustrated in Figure A4A. As can be seen, the nullclinesresulting from the summation of the input-output functions H(.)of the individual neurons intersect in a line of stable points(Figure A4A, left). Furthermore, after complete left inactivation,the system is able to maintain stable positions in the right range(results not shown), as obtained in the pharmacological experi-ments (Aksay et al., 2007). Finally, this model shows the experi-mentally observed recruitment order feature, i.e., the higher thethreshold the higher the slope of the tuning curves (Figure A2),since it was imposed into the model. The dynamics of the ILAmodel are qualitatively similar to the dynamics of the modeldeveloped in Aksay et al. (2007) (see Figure A4A, right). Therespective network parameters are listed in Table A1.
NP MODEL DYNAMICSIn Figure A4B, we illustrate the NP model. Just as the ILAmodel, the system is able to maintain stable eye positions inhalf the original range after unilateral silencing. The model dif-fers from the ILA model in one important aspect, however. Theupper half of the nullcline (Figure A4B, left) is now maintainedlargely by self-excitation. In fact, the two halves of the oculo-motor integrator are almost independent, and the threshold ofthe neurons is mostly determined by the self-excitatory inputs.However, due to the weak, mutual cross-inhibition, this inde-pendence is slightly disturbed, leading to the dynamics shownin Figure A4B, right. Altogether, the NP model has qualitativelythe same dynamics below the line attractor as the ILA modelbut different dynamics above the line attractor. However, theNP model dynamics are slower than the ILA model dynam-ics in the whole state space, given the low inter-dependenceof the two areas in the NP model (the arrow lengths inFigure A4A, right panel, and Figure A4B, right panel, are in dif-ferent scales). The respective network parameters are listed inTable A1.
Despite the connectivity differences between ILA model andNP model, since these models share the same qualitative dynam-ics below the line attractor, NpHR left stimulation leads to very
similar results in both models, with minor differences (results notshown).
Due to the use of Heaviside input-output functions and theresulting staircase character of the nullclines, the network imple-mentation of the NP model features additional fine-scale dynam-ics that are not illustrated in Figures 7A, A4B (see detail of thedynamics in Figure A4C). These dynamics do not affect the tra-jectories in the noise-less case, and disappear when more realistic(e.g., sigmoidal) input-output functions are used for tuning themodel (simulations not shown).
THEORETICAL FRAMEWORK: INSTANTANEOUS PERTURBATIONSAs shown in the results section, we experimentally test therange of models by performing instantaneous perturbations withoptogenetic tools: inactivation with halorhodopsin (NpHR) andexcitation with channelrhodopsin (ChR2). To model the pertur-bations, it is crucial to understand the effects of optogenetic toolsin the activities of stimulated cells.
It has previously been shown (Arrenberg et al., 2009) that inac-tivation by NpHR stimulation leads to stronger inactivation ofhigh activity cells than low activity cells, so the inactivation effectsare approximately divisive. ChR2 stimulation, on the other hand,causes an increase in activity independent of the original activities(Arrenberg et al., 2009). To incorporate optogenetic stimulationsin our dynamical systems model, we take these experimentalobservations into account.
Perturbations with halorhodopsin (NpHR)Given the divisive nature of the inhibitory perturbations, wemodel these as multiplicative interactions of the input-outputfunction. Assume that a neuron is perturbed with a brief stimu-lation of magnitude αi (0 < αi < 1) and duration T. We simulatethe synaptic output of such a perturbed neuron (from the left) as
τxL,i(t) = −xL,i(t) + (1 − αiD(t)) H(aiXL(t) − ciXR(t) + hi) ,
i = 1, . . . , n (24)
where D(t) = H(t − t0)H(t0 + T − t) is a unit perturbationpulse, starting at time t0, and lasting for T seconds. Consequently,at the population level, the system is described by the followingpopulation equations during an inactivation of the left half of theintegrator:
τXR(t) = −XR(t) +n∑
i = 1
H(aiXR(t) − ciXL(t) + hi) (25)
τXL(t) = −XL(t) +n∑
i = 1
(1 − αiD(t)) H(aiXL(t)−
ciXR(t) + hi) (26)
The parameters αi are chosen at random from a Gaussian distri-bution whose mean μ is equal across neurons, but grows linearlywith the stimulation intensity. The standard deviation of the dis-tribution of αi was given as σ = μmin/2 where μmin indicates thesmallest perturbation intensity tested. To ensure that the stimu-lation strength is always positive, negative αi were rectified. Since
Frontiers in Neural Circuits www.frontiersin.org February 2014 | Volume 8 | Article 10 | 19
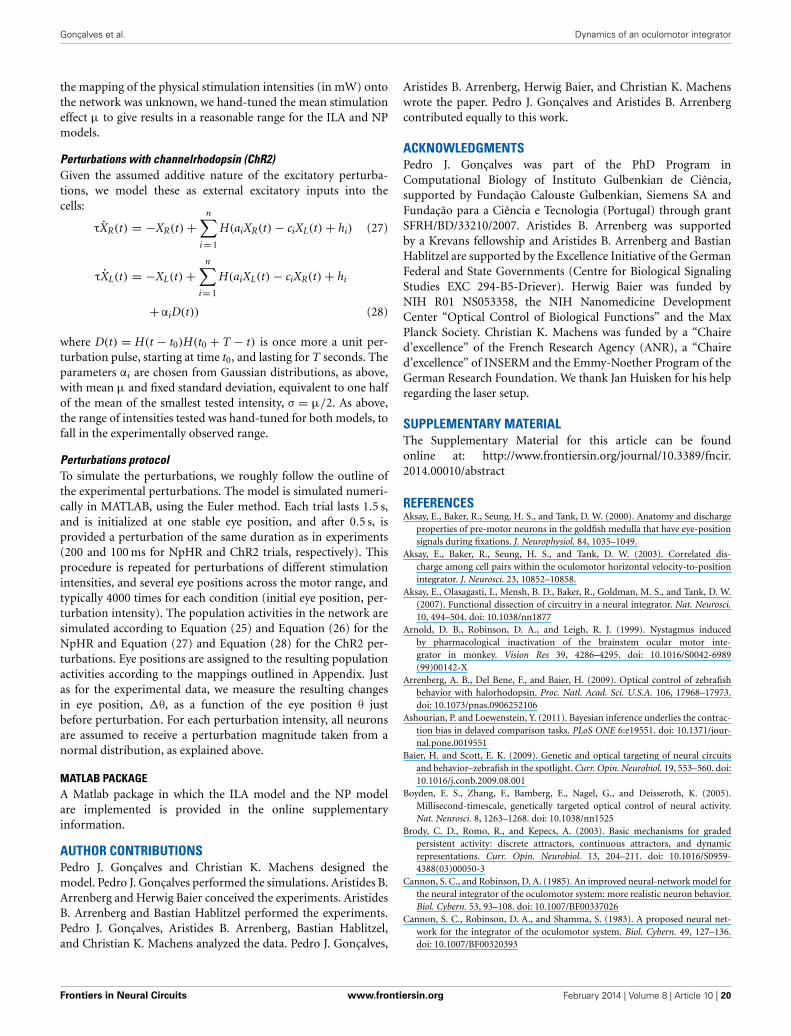
Gonçalves et al. Dynamics of an oculomotor integrator
the mapping of the physical stimulation intensities (in mW) ontothe network was unknown, we hand-tuned the mean stimulationeffect μ to give results in a reasonable range for the ILA and NPmodels.
Perturbations with channelrhodopsin (ChR2)Given the assumed additive nature of the excitatory perturba-tions, we model these as external excitatory inputs into thecells:
τXR(t) = −XR(t) +n∑
i = 1
H(aiXR(t) − ciXL(t) + hi) (27)
τXL(t) = −XL(t) +n∑
i = 1
H(aiXL(t) − ciXR(t) + hi
+ αiD(t)) (28)
where D(t) = H(t − t0)H(t0 + T − t) is once more a unit per-turbation pulse, starting at time t0, and lasting for T seconds. Theparameters αi are chosen from Gaussian distributions, as above,with mean μ and fixed standard deviation, equivalent to one halfof the mean of the smallest tested intensity, σ = μ/2. As above,the range of intensities tested was hand-tuned for both models, tofall in the experimentally observed range.
Perturbations protocolTo simulate the perturbations, we roughly follow the outline ofthe experimental perturbations. The model is simulated numeri-cally in MATLAB, using the Euler method. Each trial lasts 1.5 s,and is initialized at one stable eye position, and after 0.5 s, isprovided a perturbation of the same duration as in experiments(200 and 100 ms for NpHR and ChR2 trials, respectively). Thisprocedure is repeated for perturbations of different stimulationintensities, and several eye positions across the motor range, andtypically 4000 times for each condition (initial eye position, per-turbation intensity). The population activities in the network aresimulated according to Equation (25) and Equation (26) for theNpHR and Equation (27) and Equation (28) for the ChR2 per-turbations. Eye positions are assigned to the resulting populationactivities according to the mappings outlined in Appendix. Justas for the experimental data, we measure the resulting changesin eye position, �θ, as a function of the eye position θ justbefore perturbation. For each perturbation intensity, all neuronsare assumed to receive a perturbation magnitude taken from anormal distribution, as explained above.
MATLAB PACKAGEA Matlab package in which the ILA model and the NP modelare implemented is provided in the online supplementaryinformation.
AUTHOR CONTRIBUTIONSPedro J. Gonçalves and Christian K. Machens designed themodel. Pedro J. Gonçalves performed the simulations. Aristides B.Arrenberg and Herwig Baier conceived the experiments. AristidesB. Arrenberg and Bastian Hablitzel performed the experiments.Pedro J. Gonçalves, Aristides B. Arrenberg, Bastian Hablitzel,and Christian K. Machens analyzed the data. Pedro J. Gonçalves,
Aristides B. Arrenberg, Herwig Baier, and Christian K. Machenswrote the paper. Pedro J. Gonçalves and Aristides B. Arrenbergcontributed equally to this work.
ACKNOWLEDGMENTSPedro J. Gonçalves was part of the PhD Program inComputational Biology of Instituto Gulbenkian de Ciência,supported by Fundação Calouste Gulbenkian, Siemens SA andFundação para a Ciência e Tecnologia (Portugal) through grantSFRH/BD/33210/2007. Aristides B. Arrenberg was supportedby a Krevans fellowship and Aristides B. Arrenberg and BastianHablitzel are supported by the Excellence Initiative of the GermanFederal and State Governments (Centre for Biological SignalingStudies EXC 294-B5-Driever). Herwig Baier was funded byNIH R01 NS053358, the NIH Nanomedicine DevelopmentCenter “Optical Control of Biological Functions” and the MaxPlanck Society. Christian K. Machens was funded by a “Chaired’excellence” of the French Research Agency (ANR), a “Chaired’excellence” of INSERM and the Emmy-Noether Program of theGerman Research Foundation. We thank Jan Huisken for his helpregarding the laser setup.
SUPPLEMENTARY MATERIALThe Supplementary Material for this article can be foundonline at: http://www.frontiersin.org/journal/10.3389/fncir.2014.00010/abstract
REFERENCESAksay, E., Baker, R., Seung, H. S., and Tank, D. W. (2000). Anatomy and discharge
properties of pre-motor neurons in the goldfish medulla that have eye-positionsignals during fixations. J. Neurophysiol. 84, 1035–1049.
Aksay, E., Baker, R., Seung, H. S., and Tank, D. W. (2003). Correlated dis-charge among cell pairs within the oculomotor horizontal velocity-to-positionintegrator. J. Neurosci. 23, 10852–10858.
Aksay, E., Olasagasti, I., Mensh, B. D., Baker, R., Goldman, M. S., and Tank, D. W.(2007). Functional dissection of circuitry in a neural integrator. Nat. Neurosci.10, 494–504. doi: 10.1038/nn1877
Arnold, D. B., Robinson, D. A., and Leigh, R. J. (1999). Nystagmus inducedby pharmacological inactivation of the brainstem ocular motor inte-grator in monkey. Vision Res 39, 4286–4295. doi: 10.1016/S0042-6989(99)00142-X
Arrenberg, A. B., Del Bene, F., and Baier, H. (2009). Optical control of zebrafishbehavior with halorhodopsin. Proc. Natl. Acad. Sci. U.S.A. 106, 17968–17973.doi: 10.1073/pnas.0906252106
Ashourian, P. and Loewenstein, Y. (2011). Bayesian inference underlies the contrac-tion bias in delayed comparison tasks. PLoS ONE 6:e19551. doi: 10.1371/jour-nal.pone.0019551
Baier, H. and Scott, E. K. (2009). Genetic and optical targeting of neural circuitsand behavior–zebrafish in the spotlight. Curr. Opin. Neurobiol. 19, 553–560. doi:10.1016/j.conb.2009.08.001
Boyden, E. S., Zhang, F., Bamberg, E., Nagel, G., and Deisseroth, K. (2005).Millisecond-timescale, genetically targeted optical control of neural activity.Nat. Neurosci. 8, 1263–1268. doi: 10.1038/nn1525
Brody, C. D., Romo, R., and Kepecs, A. (2003). Basic mechanisms for gradedpersistent activity: discrete attractors, continuous attractors, and dynamicrepresentations. Curr. Opin. Neurobiol. 13, 204–211. doi: 10.1016/S0959-4388(03)00050-3
Cannon, S. C., and Robinson, D. A. (1985). An improved neural-network model forthe neural integrator of the oculomotor system: more realistic neuron behavior.Biol. Cybern. 53, 93–108. doi: 10.1007/BF00337026
Cannon, S. C., Robinson, D. A., and Shamma, S. (1983). A proposed neural net-work for the integrator of the oculomotor system. Biol. Cybern. 49, 127–136.doi: 10.1007/BF00320393
Frontiers in Neural Circuits www.frontiersin.org February 2014 | Volume 8 | Article 10 | 20
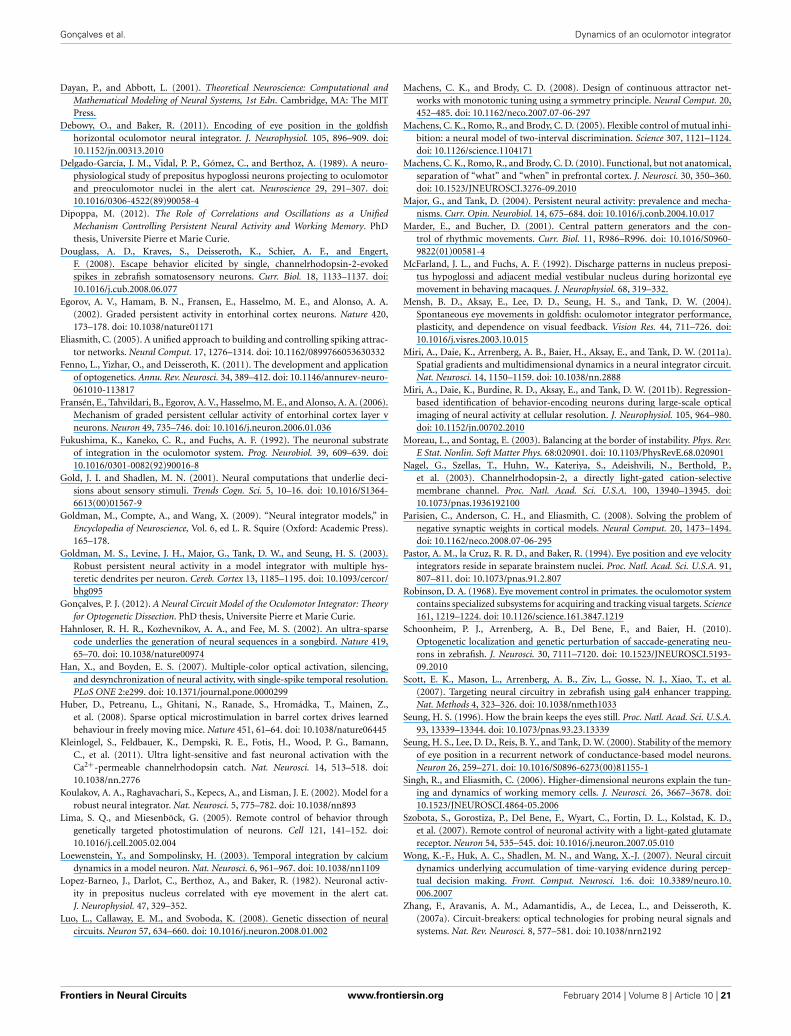
Gonçalves et al. Dynamics of an oculomotor integrator
Dayan, P., and Abbott, L. (2001). Theoretical Neuroscience: Computational andMathematical Modeling of Neural Systems, 1st Edn. Cambridge, MA: The MITPress.
Debowy, O., and Baker, R. (2011). Encoding of eye position in the goldfishhorizontal oculomotor neural integrator. J. Neurophysiol. 105, 896–909. doi:10.1152/jn.00313.2010
Delgado-García, J. M., Vidal, P. P., Gómez, C., and Berthoz, A. (1989). A neuro-physiological study of prepositus hypoglossi neurons projecting to oculomotorand preoculomotor nuclei in the alert cat. Neuroscience 29, 291–307. doi:10.1016/0306-4522(89)90058-4
Dipoppa, M. (2012). The Role of Correlations and Oscillations as a UnifiedMechanism Controlling Persistent Neural Activity and Working Memory. PhDthesis, Universite Pierre et Marie Curie.
Douglass, A. D., Kraves, S., Deisseroth, K., Schier, A. F., and Engert,F. (2008). Escape behavior elicited by single, channelrhodopsin-2-evokedspikes in zebrafish somatosensory neurons. Curr. Biol. 18, 1133–1137. doi:10.1016/j.cub.2008.06.077
Egorov, A. V., Hamam, B. N., Fransen, E., Hasselmo, M. E., and Alonso, A. A.(2002). Graded persistent activity in entorhinal cortex neurons. Nature 420,173–178. doi: 10.1038/nature01171
Eliasmith, C. (2005). A unified approach to building and controlling spiking attrac-tor networks. Neural Comput. 17, 1276–1314. doi: 10.1162/0899766053630332
Fenno, L., Yizhar, O., and Deisseroth, K. (2011). The development and applicationof optogenetics. Annu. Rev. Neurosci. 34, 389–412. doi: 10.1146/annurev-neuro-061010-113817
Fransén, E., Tahvildari, B., Egorov, A. V., Hasselmo, M. E., and Alonso, A. A. (2006).Mechanism of graded persistent cellular activity of entorhinal cortex layer vneurons. Neuron 49, 735–746. doi: 10.1016/j.neuron.2006.01.036
Fukushima, K., Kaneko, C. R., and Fuchs, A. F. (1992). The neuronal substrateof integration in the oculomotor system. Prog. Neurobiol. 39, 609–639. doi:10.1016/0301-0082(92)90016-8
Gold, J. I. and Shadlen, M. N. (2001). Neural computations that underlie deci-sions about sensory stimuli. Trends Cogn. Sci. 5, 10–16. doi: 10.1016/S1364-6613(00)01567-9
Goldman, M., Compte, A., and Wang, X. (2009). “Neural integrator models,” inEncyclopedia of Neuroscience, Vol. 6, ed L. R. Squire (Oxford: Academic Press).165–178.
Goldman, M. S., Levine, J. H., Major, G., Tank, D. W., and Seung, H. S. (2003).Robust persistent neural activity in a model integrator with multiple hys-teretic dendrites per neuron. Cereb. Cortex 13, 1185–1195. doi: 10.1093/cercor/bhg095
Gonçalves, P. J. (2012). A Neural Circuit Model of the Oculomotor Integrator: Theoryfor Optogenetic Dissection. PhD thesis, Universite Pierre et Marie Curie.
Hahnloser, R. H. R., Kozhevnikov, A. A., and Fee, M. S. (2002). An ultra-sparsecode underlies the generation of neural sequences in a songbird. Nature 419,65–70. doi: 10.1038/nature00974
Han, X., and Boyden, E. S. (2007). Multiple-color optical activation, silencing,and desynchronization of neural activity, with single-spike temporal resolution.PLoS ONE 2:e299. doi: 10.1371/journal.pone.0000299
Huber, D., Petreanu, L., Ghitani, N., Ranade, S., Hromádka, T., Mainen, Z.,et al. (2008). Sparse optical microstimulation in barrel cortex drives learnedbehaviour in freely moving mice. Nature 451, 61–64. doi: 10.1038/nature06445
Kleinlogel, S., Feldbauer, K., Dempski, R. E., Fotis, H., Wood, P. G., Bamann,C., et al. (2011). Ultra light-sensitive and fast neuronal activation with theCa2+-permeable channelrhodopsin catch. Nat. Neurosci. 14, 513–518. doi:10.1038/nn.2776
Koulakov, A. A., Raghavachari, S., Kepecs, A., and Lisman, J. E. (2002). Model for arobust neural integrator. Nat. Neurosci. 5, 775–782. doi: 10.1038/nn893
Lima, S. Q., and Miesenböck, G. (2005). Remote control of behavior throughgenetically targeted photostimulation of neurons. Cell 121, 141–152. doi:10.1016/j.cell.2005.02.004
Loewenstein, Y., and Sompolinsky, H. (2003). Temporal integration by calciumdynamics in a model neuron. Nat. Neurosci. 6, 961–967. doi: 10.1038/nn1109
Lopez-Barneo, J., Darlot, C., Berthoz, A., and Baker, R. (1982). Neuronal activ-ity in prepositus nucleus correlated with eye movement in the alert cat.J. Neurophysiol. 47, 329–352.
Luo, L., Callaway, E. M., and Svoboda, K. (2008). Genetic dissection of neuralcircuits. Neuron 57, 634–660. doi: 10.1016/j.neuron.2008.01.002
Machens, C. K., and Brody, C. D. (2008). Design of continuous attractor net-works with monotonic tuning using a symmetry principle. Neural Comput. 20,452–485. doi: 10.1162/neco.2007.07-06-297
Machens, C. K., Romo, R., and Brody, C. D. (2005). Flexible control of mutual inhi-bition: a neural model of two-interval discrimination. Science 307, 1121–1124.doi: 10.1126/science.1104171
Machens, C. K., Romo, R., and Brody, C. D. (2010). Functional, but not anatomical,separation of “what” and “when” in prefrontal cortex. J. Neurosci. 30, 350–360.doi: 10.1523/JNEUROSCI.3276-09.2010
Major, G., and Tank, D. (2004). Persistent neural activity: prevalence and mecha-nisms. Curr. Opin. Neurobiol. 14, 675–684. doi: 10.1016/j.conb.2004.10.017
Marder, E., and Bucher, D. (2001). Central pattern generators and the con-trol of rhythmic movements. Curr. Biol. 11, R986–R996. doi: 10.1016/S0960-9822(01)00581-4
McFarland, J. L., and Fuchs, A. F. (1992). Discharge patterns in nucleus preposi-tus hypoglossi and adjacent medial vestibular nucleus during horizontal eyemovement in behaving macaques. J. Neurophysiol. 68, 319–332.
Mensh, B. D., Aksay, E., Lee, D. D., Seung, H. S., and Tank, D. W. (2004).Spontaneous eye movements in goldfish: oculomotor integrator performance,plasticity, and dependence on visual feedback. Vision Res. 44, 711–726. doi:10.1016/j.visres.2003.10.015
Miri, A., Daie, K., Arrenberg, A. B., Baier, H., Aksay, E., and Tank, D. W. (2011a).Spatial gradients and multidimensional dynamics in a neural integrator circuit.Nat. Neurosci. 14, 1150–1159. doi: 10.1038/nn.2888
Miri, A., Daie, K., Burdine, R. D., Aksay, E., and Tank, D. W. (2011b). Regression-based identification of behavior-encoding neurons during large-scale opticalimaging of neural activity at cellular resolution. J. Neurophysiol. 105, 964–980.doi: 10.1152/jn.00702.2010
Moreau, L., and Sontag, E. (2003). Balancing at the border of instability. Phys. Rev.E Stat. Nonlin. Soft Matter Phys. 68:020901. doi: 10.1103/PhysRevE.68.020901
Nagel, G., Szellas, T., Huhn, W., Kateriya, S., Adeishvili, N., Berthold, P.,et al. (2003). Channelrhodopsin-2, a directly light-gated cation-selectivemembrane channel. Proc. Natl. Acad. Sci. U.S.A. 100, 13940–13945. doi:10.1073/pnas.1936192100
Parisien, C., Anderson, C. H., and Eliasmith, C. (2008). Solving the problem ofnegative synaptic weights in cortical models. Neural Comput. 20, 1473–1494.doi: 10.1162/neco.2008.07-06-295
Pastor, A. M., la Cruz, R. R. D., and Baker, R. (1994). Eye position and eye velocityintegrators reside in separate brainstem nuclei. Proc. Natl. Acad. Sci. U.S.A. 91,807–811. doi: 10.1073/pnas.91.2.807
Robinson, D. A. (1968). Eye movement control in primates. the oculomotor systemcontains specialized subsystems for acquiring and tracking visual targets. Science161, 1219–1224. doi: 10.1126/science.161.3847.1219
Schoonheim, P. J., Arrenberg, A. B., Del Bene, F., and Baier, H. (2010).Optogenetic localization and genetic perturbation of saccade-generating neu-rons in zebrafish. J. Neurosci. 30, 7111–7120. doi: 10.1523/JNEUROSCI.5193-09.2010
Scott, E. K., Mason, L., Arrenberg, A. B., Ziv, L., Gosse, N. J., Xiao, T., et al.(2007). Targeting neural circuitry in zebrafish using gal4 enhancer trapping.Nat. Methods 4, 323–326. doi: 10.1038/nmeth1033
Seung, H. S. (1996). How the brain keeps the eyes still. Proc. Natl. Acad. Sci. U.S.A.93, 13339–13344. doi: 10.1073/pnas.93.23.13339
Seung, H. S., Lee, D. D., Reis, B. Y., and Tank, D. W. (2000). Stability of the memoryof eye position in a recurrent network of conductance-based model neurons.Neuron 26, 259–271. doi: 10.1016/S0896-6273(00)81155-1
Singh, R., and Eliasmith, C. (2006). Higher-dimensional neurons explain the tun-ing and dynamics of working memory cells. J. Neurosci. 26, 3667–3678. doi:10.1523/JNEUROSCI.4864-05.2006
Szobota, S., Gorostiza, P., Del Bene, F., Wyart, C., Fortin, D. L., Kolstad, K. D.,et al. (2007). Remote control of neuronal activity with a light-gated glutamatereceptor. Neuron 54, 535–545. doi: 10.1016/j.neuron.2007.05.010
Wong, K.-F., Huk, A. C., Shadlen, M. N., and Wang, X.-J. (2007). Neural circuitdynamics underlying accumulation of time-varying evidence during percep-tual decision making. Front. Comput. Neurosci. 1:6. doi: 10.3389/neuro.10.006.2007
Zhang, F., Aravanis, A. M., Adamantidis, A., de Lecea, L., and Deisseroth, K.(2007a). Circuit-breakers: optical technologies for probing neural signals andsystems. Nat. Rev. Neurosci. 8, 577–581. doi: 10.1038/nrn2192
Frontiers in Neural Circuits www.frontiersin.org February 2014 | Volume 8 | Article 10 | 21

Gonçalves et al. Dynamics of an oculomotor integrator
Zhang, F., Wang, L.-P., Brauner, M., Liewald, J. F., Kay, K., Watzke, N., et al. (2007b).Multimodal fast optical interrogation of neural circuitry. Nature 446, 633–639.doi: 10.1038/nature05744
Zhang, K. (1996). Representation of spatial orientation by the intrinsic dynamicsof the head-direction cell ensemble: a theory. J. Neurosci. 16, 2112–2126.
Zhu, P., Narita, Y., Bundschuh, S. T., Fajardo, O., Schärer, Y.-P. Z., Chattopadhyaya,B., et al. (2009). Optogenetic dissection of neuronal circuits in zebrafishusing viral gene transfer and the tet system. Front. Neural Circuits 3:21. doi:10.3389/neuro.04.021.2009
Conflict of Interest Statement: The authors declare that the research was con-ducted in the absence of any commercial or financial relationships that could beconstrued as a potential conflict of interest.
Received: 26 February 2013; accepted: 30 January 2014; published online: 28 February2014.Citation: Gonçalves PJ, Arrenberg AB, Hablitzel B, Baier H and Machens CK (2014)Optogenetic perturbations reveal the dynamics of an oculomotor integrator. Front.Neural Circuits 8:10. doi: 10.3389/fncir.2014.00010This article was submitted to the journal Frontiers in Neural Circuits.Copyright © 2014 Gonçalves, Arrenberg, Hablitzel, Baier and Machens. This is anopen-access article distributed under the terms of the Creative Commons AttributionLicense (CC BY). The use, distribution or reproduction in other forums is permit-ted, provided the original author(s) or licensor are credited and that the originalpublication in this journal is cited, in accordance with accepted academic practice.No use, distribution or reproduction is permitted which does not comply with theseterms.
Frontiers in Neural Circuits www.frontiersin.org February 2014 | Volume 8 | Article 10 | 22