onshore oil and gas exploration and appraisal in rj-onhp
TRANSCRIPT
Draft EIA Report: Onshore Oil and Gas Exploration and Appraisal in RJ-ONHP-2017/2 Block, Barmer & Jalore District, Rajasthan
Vedanta Limited. (Division Cairn Oil & Gas) June, 2019
Quality information
Prepared/Compiled by Checked by Verified by Approved by
Debsagar Das
Consultant I
Shubhangi Jadav
Sr. Consultant
Avijit Sarkar
Associate Director
Chetan Zaveri
Executive Director
Revision History
Revision Revision date Details Authorized Name Position
01 26.06.2019 Draft EIA Study:
Onshore Oil and
Gas Exploration
and Appraisal in
RJ-ONHP-2017/2
Block, Barmer &
Jalore District,
Rajasthan
Chetan Zaveri Executive Director
Distribution List
# Hard Copies PDF Required Association / Company Name
Prepared for:
Vedanta Limited
(Division Cairn Oil & Gas)
DLF Atria, Phase 2, Jacaranda Marg,
DLF City, Gurgaon 122002
Prepared by:
AECOM India Private Limited
19th Floor, Building No.5
Tower C, Cyber City
Gurgaon 122002
Haryana, India
CIN: U74210KA2005PTC037770
T: +91 124 4682700/800
aecom.com
© 2018 AECOM India Private Limited. All Rights Reserved.
This document has been prepared by AECOM India Private Limited (“AECOM”) for sole use of our client (the
“Client”) in accordance with generally accepted consultancy principles, the budget for fees and the tAECOMs of
reference agreed between AECOM and the Client. Any information provided by third parties and referred to herein
has not been checked or verified by AECOM, unless otherwise expressly stated in the document. No third party
may rely upon this document without the prior and express written agreement of AECOM.
Table of Contents
1. Introduction .................................................................................................................................................. 1
1.1. Background .................................................................................................................................................. 1
1.2. Objective of the EIA Study ........................................................................................................................... 1
1.3. Project Status .............................................................................................................................................. 1
1.4. Brief Details of The Project .......................................................................................................................... 2
1.5. Scope of the Study....................................................................................................................................... 2
1.6. Layout the EIA Report .................................................................................................................................. 2
1.7. Compliance to ToR ....................................................................................................................................... 3
1.8. Limitations .................................................................................................................................................... 6
2. Description of the Project ............................................................................................................................. 7
2.1. Overview ...................................................................................................................................................... 7
2.2. Objectives of Proposed Project .................................................................................................................... 7
2.3. Block Location & Description ....................................................................................................................... 7
2.4. Environmental Settings of Block ................................................................................................................ 14
2.5. Well Drilling ................................................................................................................................................ 19
2.6. Early Production- If, exploratory drilling is successful ................................................................................ 29
2.7. Completion of Drilling ................................................................................................................................. 31
2.8. Well Decommissioning ............................................................................................................................... 32
2.9. Utilities & Resource Requirements, Associated Facilities .......................................................................... 32
2.10. Project Cost ............................................................................................................................................... 41
3. Description of the Baseline Environment ................................................................................................... 42
3.1. Study area ................................................................................................................................................. 42
3.2. Physiography and Geology ........................................................................................................................ 42
3.3. Hydrogeology ............................................................................................................................................. 46
3.4. Topography ................................................................................................................................................ 54
3.5. Drainage .................................................................................................................................................... 58
3.6. Vulnerability of the Site .............................................................................................................................. 60
3.7. Land use/Land Cover ................................................................................................................................. 64
3.8. Climate & Meteorology ............................................................................................................................... 66
3.9. Ambient Noise Quality ............................................................................................................................... 76
3.10. Water Environment .................................................................................................................................... 79
3.11. Soil Quality ................................................................................................................................................. 89
3.12. Traffic Survey ............................................................................................................................................. 97
3.13. Ecological Environment ........................................................................................................................... 104
3.14. Socio economic Environment .................................................................................................................. 112
4. Anticipated Environmental Impact and Mitigation Measures .................................................................... 125
4.1. Impact Assessment Methodology ............................................................................................................ 125
4.2. Impact Criteria and Ranking .................................................................................................................... 125
4.3. Impact Significance .................................................................................................................................. 126
4.4. Impact Assessment .................................................................................................................................. 130
4.5. Potential Impact and Mitigation Measures on Visual Environment & Aesthetics ...................................... 130
4.6. Potential Impact and Mitigation Measures on Land Use .......................................................................... 130
4.7. Potential impact and Mitigation Measures on Topography & Drainage .................................................... 131
4.8. Potential Impact and Mitigation Measures on Air Quality ......................................................................... 131
4.9. Potential Impact and Mitigation Measures on Noise Quality .................................................................... 137
4.10. Potential Impact and Mitigation Measures on Surface Water Quality ...................................................... 141
4.11. Potential Impact and Mitigation Measures on Ground Water Resource ................................................... 141
4.12. Potential Impact and Mitigation Measures on Soil Quality ....................................................................... 142
DRAFT
4.13. Potential Impact and Mitigation Measures on Road & Traffic ................................................................... 144
4.14. Potential Impact and mitigation Measures on Terrestrial Ecological Environment ................................... 144
4.15. Potential Impact and Mitigation Measures on Socioeconomic Environment ............................................ 145
4.16. Potential Impact and Mitigation Measures on Occupational Health and Safety ....................................... 146
4.17. Potential Impact and mitigation Measures on Community Health & Safety ............................................. 147
5. Analysis of Alternative .............................................................................................................................. 151
5.1. No Project Scenario ................................................................................................................................. 151
5.2. Alternatives for Project Site ...................................................................................................................... 151
5.3. Alternatives for Well Location................................................................................................................... 151
5.4. Alternative of Technology ......................................................................................................................... 151
5.5. Use of Water Based Mud and Synthetic Based Mud ............................................................................... 152
5.6. Conclusion ............................................................................................................................................... 152
6. Environmental Monitoring Programme ..................................................................................................... 154
6.1. Object of Monitoring ................................................................................................................................. 154
6.2. Monitoring Schedule ................................................................................................................................ 154
7. ADDITIONAL STUDIES ........................................................................................................................... 156
7.1. Public Hearing and Consultation .............................................................................................................. 156
7.2. Risk Assessment...................................................................................................................................... 156
7.3. CONSEQUENCE ANALYSIS/CALCULATIONS ....................................................................................... 160
7.4. Disaster Management Plan ...................................................................................................................... 178
8. PROJECT BENEEFITS ........................................................................................................................... 194
8.1. Revenue Earning of central & State Government .................................................................................... 194
8.2. Employment Potential .............................................................................................................................. 194
8.3. Corporate Social Responsibility ............................................................................................................... 194
8.4. Proposed CER Strategy ........................................................................................................................... 194
9. ENVIRONMENT MANAGEMENT PLAN .................................................................................................. 195
9.1. Organization Structure for HSE Management .......................................................................................... 195
9.2. Air Quality Management Plan: ................................................................................................................. 197
9.3. Waste Management Plan ......................................................................................................................... 198
9.4. Soil Quality Management Plan ................................................................................................................. 199
9.5. Spill / Release Management Plan ............................................................................................................ 199
9.6. Noise quality Management Plan .............................................................................................................. 201
9.7. Surface Water Quality Management ........................................................................................................ 202
9.8. Ground Water Quality Management Plan ................................................................................................ 202
9.9. Storm Water Management Plan ............................................................................................................... 203
9.10. Road Safety & Traffic Management Plan ................................................................................................. 203
9.11. Occupational Health & Safety Management Plan .................................................................................... 203
9.12. Flare & Illumination Management Plan .................................................................................................... 204
9.13. Site Closure Plan ..................................................................................................................................... 204
9.14. EMP BUDGET ......................................................................................................................................... 210
9.15. Corporate Environment Responsibility ..................................................................................................... 211
10. Conclusion and Recommendation ........................................................................................................... 212
11. Disclosure of Consultants ........................................................................................................................ 213
Figures
Figure 1. Coordinates of RJ-ONHP-2017/2 ............................................................................................................ 8 Figure 2. Regional Settings of RJ-ONHP-2017/2 ................................................................................................... 9 Figure 3. Location map on Toposheet of the block RJ-ONHP-2017/2 .................................................................. 10 Figure 4. Location map on satellite imagery of Block RJJ-ONHP-2017/2 ............................................................ 11 Figure 5. Accessibility map of Block RJ-ONHP-2017/2 ........................................................................................ 13
Figure 6. Environmental settings map of Block RJ-ONHP-2017/2 ....................................................................... 18 Figure 7. Typical layout of drilling pad with QPU .................................................................................................. 21 Figure 8. Typical layout of the drilling pad ............................................................................................................ 22 Figure 9. Typical drilling rig configuration ............................................................................................................. 23 Figure 10. Typical model onshore drilling process ............................................................................................... 24 Figure 11. A typical flow chart of drill cuttings separation and treatment system .................................................. 25 Figure 12. Typical view of drill cuttings separation and treatment system ............................................................ 26 Figure 13. Blow out separator .............................................................................................................................. 28 Figure 14. Process Flow of Quick Production Unit/ Early Production Unit ........................................................... 30 Figure 15. Typical view of camp site .................................................................................................................... 33 Figure 16. Water balance for the drilling phase of Oil and Gas exploration .......................................................... 37 Figure 17. Geology and Geomorphological map of Barmer district ...................................................................... 44 Figure 18. Geology and Geomorphological map of Jalore district ........................................................................ 45 Figure 19. Depth of water level (Pre monsoon -November, 2011) ........................................................................ 47 Figure 20. Depth to water level (pre-monsoon to May, 2011) ............................................................................... 48 Figure 21. Hydrological map of Barmer district .................................................................................................... 50 Figure 22. Depth to water level (pre-monsoon to May, 2011) ............................................................................... 51 Figure 23. Depth to water level (post monsoon to November, 2011) .................................................................... 52 Figure 24. Depth to water level maps of Jalore district ......................................................................................... 53 Figure 25. Elevation map of the block .................................................................................................................. 55 Figure 26. Topographical map and Rainfall distribution of Barmer district ............................................................ 56 Figure 27. Topographical Map and Rainfall Distribution of Jalore District ............................................................ 57 Figure 28. Drainage map of the block .................................................................................................................. 59 Figure 29. Seismic zone map of Rajasthan .......................................................................................................... 61 Figure 30. Draught frequency map of Rajasthan.................................................................................................. 62 Figure 31. Multi Hazard zone of Rajasthan .......................................................................................................... 63 Figure 32. Land use and land cover of the study area ......................................................................................... 64 Figure 33. Land use and land cover map of study area ....................................................................................... 65 Figure 34. Windrose Barmer (Annually) ............................................................................................................... 67 Figure 35. Windrose Bhinmal (MET station)......................................................................................................... 68 Figure 36. Air Quality, Noise, Traffic Location Map for RJ-ONHP-2017/2............................................................. 70 Figure 37. PM 10 Values at the Monitoring Locations .......................................................................................... 74 Figure 38. PM2.5 Values at the Monitoring Locations .......................................................................................... 74 Figure 39. NO2 Values at the Monitoring Locations .............................................................................................. 75 Figure 40. SO2 Values at the Monitoring Locations .............................................................................................. 75 Figure 41. Photo ................................................................................................................................................... 76 Figure 42. Day and Night time equivalent noise level .......................................................................................... 78 Figure 43. Photographs noise .............................................................................................................................. 78 Figure 44. Soil, Ground water and surface water monitoring location of the Block .............................................. 81 Figure 45. Photo of Ground water analysis .......................................................................................................... 84 Figure 46. Surface Water Sampling ..................................................................................................................... 89 Figure 47. Soil photographs ................................................................................................................................. 97 Figure 48. Hourly Traffic Profile at Intersection of SH16 & MDR26 ...................................................................... 98 Figure 49. Hourly Traffic Profile at Intersection of Bhedaba Road and MDR-16 .................................................. 99 Figure 50. Hourly Traffic Profile at Intersection of Bangala Bagora Road & Bagora Sayla Road .......................... 99 Figure 51. Peak Hour Traffic Composition (Vehicular) Intersection of SH16 & MDR26 ...................................... 100 Figure 52. Peak Hour Traffic Composition (Vehicular) Intersection of Bhedaba Road & MDR-16..................... 100 Figure 53. Peak Hour Traffic Composition (Vehicular) Intersection of Rangala Bagora Road & Bagora Sayla
Road ................................................................................................................................................................... 101 Figure 54. Total Traffic Composition (Vehicular) Intersection of SH16 & MDR26 ............................................... 103 Figure 55. Total Traffic Composition (Vehicular) Intersection of Bhedaba Road & MDR-16 ................................ 103 Figure 56. Total Traffic Composition (Vehicular) Intersection of Rangala Bagora Road & Bagora Sayla Road .. 104 Figure 57. Bio diversity survey location map ...................................................................................................... 106 Figure 58. Administrative settings of Rajasthan ................................................................................................. 118 Figure 59. Photographs of Community consultations ......................................................................................... 124 Figure 60. 24 hourly GLCs of SO2 ...................................................................................................................... 134 Figure 61. 24 hourly GLCs of NO2 ..................................................................................................................... 135 Figure 62. 24 hourly GLCs of PM 10 .................................................................................................................. 136 igure 63. Predicted noise level ........................................................................................................................... 140
Figure 64. Risk Assessment process ................................................................................................................. 157
Figure 65. UK-HSE individual Risk Criteria ........................................................................................................ 165
Figure 66. UK-HSE offsite group criteria ............................................................................................................ 166
Figure 67. F-N curve .......................................................................................................................................... 172
Figure 68. Overall ISO risk Contour ................................................................................................................... 173
Figure 69. Jet fire Results (1.5/F) – IS-01 -25 mm Leak Size ............................................................................ 176
Figure 70. Flash Fire Result (1.5/F-IS-01-255 mm Leak Size) ........................................................................... 176
Figure 71. Flash Fire Results (%/D0-IS-06-25 mm Leak Size ............................................................................ 177
Figure 72. Pool fire Results (5/D) – IS-06 -25 mm Leak Size ............................................................................. 177
Figure 73. Jet fire Results (5/D) – IS-06 -25 mm Leak Size ............................................................................... 178
Figure 74. Vendanta Limited (Division: Cairn Oil and Gas) HSE organizational structure for implementation of
EMP .................................................................................................................................................................... 195
Figure 75. HSE Policy of Vendanta Limited (Division Cairn Oil and Gas) .......................................................... 196 Figure 76. QCI-NABET Certificate ..................................................................................................................... 215
Tables
Table 1. Contents of the Report.............................................................................................................................. 2 Table 2. Details of Proposed well location ............................................................................................................ 14 Table 3. Specification of a drilling rig .................................................................................................................... 23 Table 4. Details of DG set on onshore drilling activity .......................................................................................... 35 Table 5. Details of water requirement for drilling activity ...................................................................................... 36 Table 6. Typical noise emission from construction machinery .............................................................................. 38 Table 7. Drilling rig and equipment noise level ..................................................................................................... 38 Table 8. Waste water generated during drilling and their disposal ....................................................................... 39 Table 9. Waste water generated during drilling and their mode of disposal.......................................................... 40 Table 10. Climatological profile of Barmer ........................................................................................................... 67 Table 11. Climatological profile of Jalore .............................................................................................................. 67 Table 12. Climatological profile of the study area ................................................................................................. 68 Table 13. Ambient air quality monitoring station ................................................................................................... 69 Table 14. Ambient air quality monitoring results ................................................................................................... 71 Table 15. Ambient noise monitoring locations ...................................................................................................... 77 Table 16. Noise level in the study area ................................................................................................................. 77 Table 17. Ground water sampling location ........................................................................................................... 80 Table 18. Ground water quality results ................................................................................................................. 82 Table 19. Surface water sampling location ........................................................................................................... 85 Table 20. Surface water analysis result ................................................................................................................ 86 Table 21. Soil sampling locations ......................................................................................................................... 90 Table 22. Soil analysis result ................................................................................................................................ 91 Table 23. Soil remediation intervention value as per Dutch standards ................................................................. 95 Table 24. Standard soil classification ................................................................................................................... 95 Table 25. Adopted passenger car units ................................................................................................................ 98 Table 26. Classified volume count at intersection............................................................................................... 102 Table 27. Details of sampling site ....................................................................................................................... 105 Table 28. Floristic species recorded in the study area ........................................................................................ 108 Table 29. Biodiversity indices ............................................................................................................................. 109 Table 30. RET flora of the study area .................................................................................................................. 111 Table 31. RET fauna of the study area ................................................................................................................ 111 Table 32. List of villages where proposed wells are located ............................................................................... 112 Table 33. List of villages within 2.5 km buffer of the proposed well location ....................................................... 114 Table 34. Impact prediction criteria ..................................................................................................................... 125 Table 35. Criteria based significance of impacts ................................................................................................ 126 Table 36. Impact identification matrix ................................................................................................................. 128 Table 37. Input parameter considered for modelling of DG sets......................................................................... 133 Table 38. Resultant consideration for PM10, NO2 and SO2 ................................................................................ 133 Table 39. Input data for noise modelling ............................................................................................................. 139 Table 40. Predicted noise levels ......................................................................................................................... 139 Table 41. Attenuated noise level......................................................................................................................... 140 Table 42. Impact significance matrix with mitigation ........................................................................................... 149 Table 43. Ranks/Comparison of different types of mud ...................................................................................... 152
Table 44. Proposed environmental monitoring programme ................................................................................ 154 Table 45. Accidents due to types of hazardous events ....................................................................................... 158 Table 46. Pasqual stability class......................................................................................................................... 161 Table 47. Representative weather class 5D and 1F ........................................................................................... 162 Table 48. Overpressure criteria .......................................................................................................................... 163 Table 49. Population ........................................................................................................................................... 167 Table 50. Pool fire results ................................................................................................................................... 168 Table 51. Flash fire results ................................................................................................................................. 170 Table 52. Fireball result ...................................................................................................................................... 171 Table 53. Population ........................................................................................................................................... 172 Table 54. Total ISIR operation/maintenance stuff ............................................................................................... 173 Table 55. Total ISIR non-operation/maintenance stuff ........................................................................................ 174 Table 56. Emergency classification and response team ..................................................................................... 180 Table 57. Environmental management plan ....................................................................................................... 206 Table 58. Tentative EMP budget for each well .................................................................................................... 210 Table 59. EIA TEAM ........................................................................................................................................... 213
Vedanta Limited (Division CAIRN Oil & Gas) DRAFT EIA: Onshore Oil and Gas E&A in RJ-ONHP- 2017/4 Block, Barmer District, Rajasthan
June,2019 AECOM
EX1
Executive Summary
Introduction
Vedanta Ltd. (Division Cairn Oil and Gas) has been allocated hydrocarbon block namely RJ-ONHP-2017/2 by
Government of India under the revenue sharing contract (RSC) for exploration and exploitation of hydrocarbon.
RSC (Revenue Sharing Contract) has been signed between Vedanta Ltd and MoP&NG on 1st October, 2018 for
the exploration and exploitation of hydrocarbons. Vedanta Limited (Division: Cairn and Gas) proposes to drill 64
exploratory (including appraisal) wells within the present Block boundary of RJ-ONHP-2017/2. Block encloses an
area of 1072 Sq. Km.
Vedanta Limited (Division: Cairn Oil & Gas) proposes to carry out exploration and appraisal well drilling and early
production of oil and gas in the Block. In case of a discovery (ies), the exploratory and appraisal well(s) would be
tested for extended duration by flowing hydrocarbons to ascertain the reservoir parameters and assess the quality
and commercial viability. The exploratory and appraisal wells would be drilled to explore the reservoirs in the range
of 750m to 5000m.
The proposed exploratory and appraisal drilling activities fall under category 1(b) of the EIA Notification, 2006 and
require Environmental Clearance (EC) from the Ministry of EnvironmentForests& Climate Change (MoEF&CC).
The Terms of Reference for the Project have been approved by MoEF&CC vide letter F. No IA-J-11011/103/2019-
IA-II(I)dated 25 April 2019.
AECOM India Private Limited, a NABET-QCI Accredited firm has been entrusted to conduct the Environmental
Impact Assessment (EIA) for the proposed Block RJ-ONHP-2017/2. The EIA study comprised of initial scoping, site
visits, environmental monitoring and surveys, conduct of Public Hearing (PH) and the preparation of draft and final
EIA-EMP reports.
Block location and Accessibility
The RJ-ONHP-2017/2 Block is located at Gudhamalani, Bagoda and Sayla tehsils of Barmer and Jalore districts
of Rajasthan. The Block is accessible through rail and road network. SH-28, SH16, Bagoda road and MDR 26 are
the main road network, present in the Block. Bhinmal railway station is 22.8 km south, from the Block boundary.
Land Requirement
During the site selection process, all legal requirements would be considered and surface location of the exploratory
well would be finalized. Once surface drilling location is finalized, short term lease of the land would be taken from
concerned owners. If well location falls in agricultural lands or other private lands, land and crop compensation
would be provided to the land owner, and in case of govt. land, land allotment from Govt. to be applied. Initially
temporary short-term lease would be taken for 3 - 5 years for exploration purpose and in case of commercially
viable discovery of hydrocarbon resources; the land lease would be converted into long term lease up to life of the
project. The estimated land required per drill site is approximately 9ha. No forest land would be used for drilling
purpose, so forest clearance is not applicable for the proposed project..
Description of the project
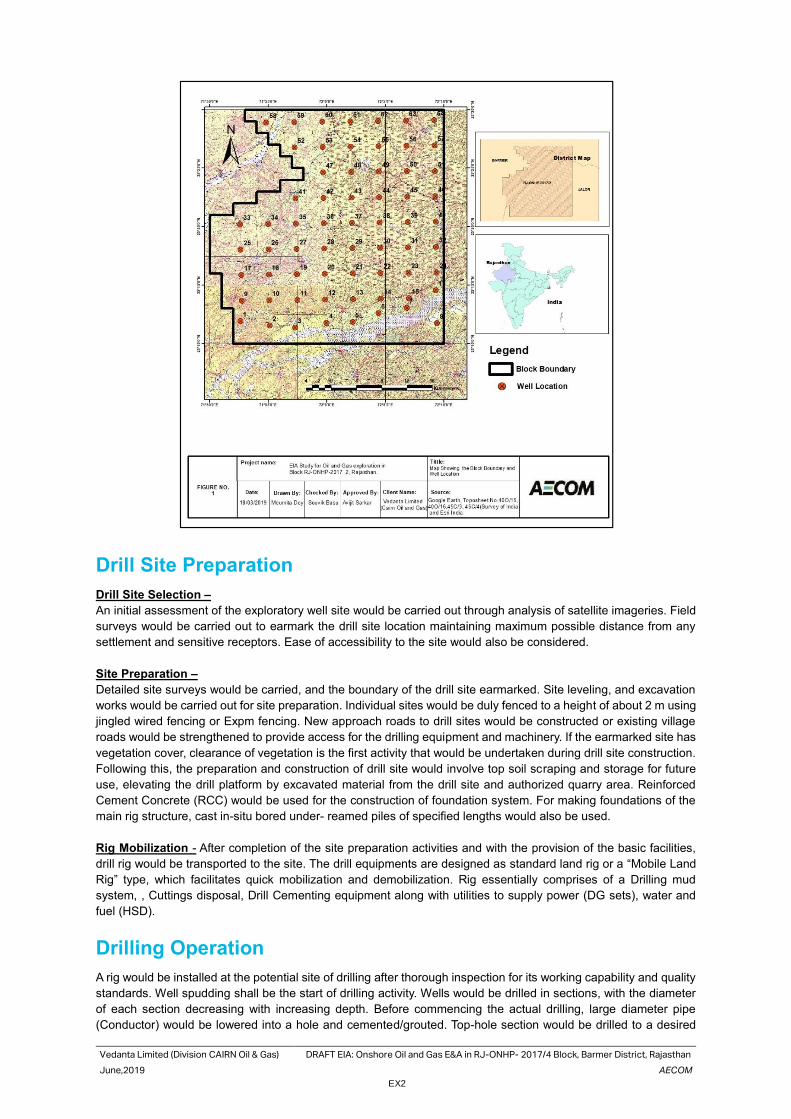
The proposed project involves proposed drilling of 64 onshore exploratory and appraisal wells and Setting up of
Early Production Units (EPUs)/ Quick Production Units (QPUs) for produced well fluid processing and production
up to 24000 BOPD crude oil and up to 3.6 MMSCFD associated natural gas in RJ-ONHP-2017/2 Block located in
Jalore and Barmer district of Rajasthan. Block Location on SOI Toposheet is presented below.
Vedanta Limited (Division CAIRN Oil & Gas) DRAFT EIA: Onshore Oil and Gas E&A in RJ-ONHP- 2017/4 Block, Barmer District, Rajasthan
June,2019 AECOM
EX2
Drill Site Preparation
Drill Site Selection –
An initial assessment of the exploratory well site would be carried out through analysis of satellite imageries. Field
surveys would be carried out to earmark the drill site location maintaining maximum possible distance from any
settlement and sensitive receptors. Ease of accessibility to the site would also be considered.
Site Preparation –
Detailed site surveys would be carried, and the boundary of the drill site earmarked. Site leveling, and excavation
works would be carried out for site preparation. Individual sites would be duly fenced to a height of about 2 m using
jingled wired fencing or Expm fencing. New approach roads to drill sites would be constructed or existing village
roads would be strengthened to provide access for the drilling equipment and machinery. If the earmarked site has
vegetation cover, clearance of vegetation is the first activity that would be undertaken during drill site construction.
Following this, the preparation and construction of drill site would involve top soil scraping and storage for future
use, elevating the drill platform by excavated material from the drill site and authorized quarry area. Reinforced
Cement Concrete (RCC) would be used for the construction of foundation system. For making foundations of the
main rig structure, cast in-situ bored under- reamed piles of specified lengths would also be used.
Rig Mobilization - After completion of the site preparation activities and with the provision of the basic facilities,
drill rig would be transported to the site. The drill equipments are designed as standard land rig or a “Mobile Land
Rig” type, which facilitates quick mobilization and demobilization. Rig essentially comprises of a Drilling mud
system, , Cuttings disposal, Drill Cementing equipment along with utilities to supply power (DG sets), water and
fuel (HSD).
Drilling Operation
A rig would be installed at the potential site of drilling after thorough inspection for its working capability and quality
standards. Well spudding shall be the start of drilling activity. Wells would be drilled in sections, with the diameter
of each section decreasing with increasing depth. Before commencing the actual drilling, large diameter pipe
(Conductor) would be lowered into a hole and cemented/grouted. Top-hole section would be drilled to a desired
Vedanta Limited (Division CAIRN Oil & Gas) DRAFT EIA: Onshore Oil and Gas E&A in RJ-ONHP- 2017/4 Block, Barmer District, Rajasthan
June,2019 AECOM
EX3
depth based on well design. After drilling top-hole section, it would be cased with a pipe called “Casing”. Once each
section of the well is completed, the drill string is lifted, and protective steel pipe or casing lowered into the well and
cemented into place. The lengths and diameters of each section of the well would be determined prior to the starting
of the drilling activities and are dependent on the geological conditions through which the well is to be drilled. This
process of drilling and casing the hole section continues until the final well depth (target) is achieved.
Drill cuttings generated from the drilling activity, would be collected and separated using a solid control system and
temporarily stored on-site in HDPE lined pits. Drilling and wash wastewater generated would also be stored at an
onsite HDPE lined pit. The waste water would be adequately treated in a mobile ETP to ensure conformance to
the S No. 72 A (ii) Schedule I - Standards for Emission or Discharge of Environmental Pollutants from Oil Drilling
and Gas Extraction Industry of CPCB.
Hydraulic Fracturing Activity-
Hydraulic fracking may be conducted in wells with low permeability formation and the wells with low pressure.
Fracking fluid would typically be 99% water and sand (or other granulated material) and approximately 1% gelled
chemicals that would be pumped at a high rate (in excess of 20 bpm) and high pressure (up to 5000 psi) to fracture
the formation and improve the well deliverability. Sites for the wells with more than 2 fracs per well (multi-stage
fracturing) would have provision of additional space for water storage for better continuity of operations.
Well Testing & Flaring-
During the exploration and appraisal drilling, where a hydrocarbon formation is found, initial well tests (generally
about one month of duration) would be carried out to establish flow rates, formation pressure and other parameters.
However, depending on the need, based on nature of the reservoirs, the exploratory and appraisal wells would be
tested for longer/extended durations to ascertain the reservoir parameters.
Associated Facilities –
Each drill site would be provided with facilities such as drilling rig foundation and cellar pit, waste and water storage
pits, chemical storage area including fuel storages, drill cutting disposal pit, flare pit and mobile STPs. The drill
cutting and spent mud disposal pits would be provided with a HDPE lining for temporary storage. Adequate
drainage and wastewater treatment system also would be installed.
Liquid Mud Plant (LMP)-
The Liquid Mud Plant (LMP) shall be located at suitable locations of the fields to prepare synthetic/water based
mud for the drilling operations.
Appraisal –
When, exploratory drilling is successful, more wells (termed as Appraisal wells) would be drilled to determine the
size and the extent of the field. The technical procedures and activities in appraisal drilling would be the same as
those employed for exploration wells Deviated or directional drilling at an angle from a site adjacent to the original
discovery well may be used to appraise other parts of the reservoir
Quick Production Unit (QPU) –
In case of commercially viable discovery, QPUs would be installed for the processing of produced well fluid
processing and early production of up to 24000 BOPD crude oil and up to 3.6 MMSCFD associated natural gas. A
QPU would be a packaged/ modular mobile unit and would mainly consists of a three-phase separator & production
heater or heater-treater, oil storage tanks, oil tanker loading system, produced water (PW) separation and disposal
system, power generation (GEG or DG), utility systems such as fuel gas, flare & Inst. Air packages, firefighting
equipment, etc. Each QPU capacity would be ~2,000 BFPD (Barrels of Fluid per Day).
Accommodation and Camp Site:
Temporary camp site (porta cabin) for the drilling of exploratory (including appraisal wells) are envisaged, which
would be dismantled after drilling of the wells. At any point of time, it is anticipated that about 50 personnel per shift
would be housed in the campsite during the well drilling campaign.
Well decommissioning
After the completion of the drilling activity, partial de-mobilization of the drilling rig and associated infrastructure
would be initiated. As discussed earlier, well testing may be carried out immediately after the drilling is completed.
The complete de-mobilization of the facilities at site would happen once well-testing completed successfully. In
case of commercially viable discovery (s) of hydrocarbons in the Block and having established the size of the
hydrocarbon field (s), proposes to immediately bring the field (s) into production using one or more of the appraisal
wells for the production of crude oil by setting up of QPU (Quick Production Unit). All other equipment, materials,
Vedanta Limited (Division CAIRN Oil & Gas) DRAFT EIA: Onshore Oil and Gas E&A in RJ-ONHP- 2017/4 Block, Barmer District, Rajasthan
June,2019 AECOM
EX4
fuel and wastes would be removed from the drilling site and reused for other drilling activities or disposed as per
the applicable regulatory requirements.
If hydrocarbons are not found, a full abandonment plan would be implemented. All concrete or steel installations
would be removed to at least 1m below ground level, to ensure that there would be no protruding surface structures.
All waste from the site would be removed and the pits would be closed. The drill sites and camps site would be
restored to its original conditions or as required by the landowner.
Utilities and Resource Requirement
Water - Total of 102 m3 per day fresh water will be required per well. From the total water, 22 m3/day water will be
used for mud preparations, 50 m3/day would be required for drilling activities and 30 m3/day freshwater would be
used for domestic purposes including drinking, washings and domestic use. In case, required water could not be
sourced from locally available approved sources, ground water would be extracted after obtaining permission from
CGWA/ State Govt. During early production, the installation of typical EPU/QPU unit water requirement for process,
domestic consumption, greenbelt and miscellaneous use will be15-18 m3/day.
Power – For drilling operations, the power would be provided through diesel generator (DG) sets (Camp site -
2x350 KVA (including one as standby), Drilling site - 3x1000 KVA (including one as standby) and Radio Room -
2x100 KVA (including one as standby)). For early production power requirement will be met through the State
Electricity and or installation of Diesel/Gas Engine Generator (GEG) of 1 MW output using produced natural gas
and a 500 KVA DG will be used as backup in emergency conditions.
Labour– It is anticipated that, at any given time, there would be about 80 - 100 personnel working on site including
technical staff, drilling crew, security staff etc.
Project Cost
The cost of the project has been estimated to be INR 1681 Crores.
Pollution Sources
Air emissions: Point source air emissions would be generated from DG sets. Fugitive emissions would occur from
vehicles involved in the drilling operations and from windblown dust from storage and staging areas within the drill
site.
Noise & Vibrations: Noise and vibration would be generated due to operation of drilling rig, DG sets and
vehicles.
Liquid wastes: During the drilling phase, approximately 30-40 m3 per day of waste water would be generated
from the drilling activity and 16-25 m3 per day of domestic waste water would be generated from each drill site.
Drill cuttings & spent mud: Approximately 500-1500 tons/well of drill cuttings from WBM, 250-500 tons/well of
drill cuttings from SBM and 250-500 tons/well of spent mud would be generated per site.
Existing Baseline Environment of the Project
Area Baseline information about the Block was collated by review of other published literature, site surveys, stakeholder
interactions and primary monitoring carried out during the period of March-May 2019 by EFRAC Laboratory (NABL
Accredited Laboratory).
Sub-surface Geology-
The Block is situated in both Jalore and Barmer district. Barmer district is underlain by intrunsive rocks at the
basement (Post Delhi formation) consisting of Jalore and Siwana granite & Malani rhyolite and granite followed by
Mesozoic and Tertiary formations consisting of sandstone, shale, conglomerate. Rocks of Mesozoic era are
comprised of Lathi series of Jurassic and Abur series of Cretaceous period. Most part of the district is covered by
desert sand and sand dunes.
Geological set-up of the Jalor district is represented by Quaternary alluvium and various igneous and meta-
sedimentary rocks. Vast area is covered by Quaternary alluvium and windblown sand. In the southeastern part of
Vedanta Limited (Division CAIRN Oil & Gas) DRAFT EIA: Onshore Oil and Gas E&A in RJ-ONHP- 2017/4 Block, Barmer District, Rajasthan
June,2019 AECOM
EX5
the district around Jaswantpura, Delhi supergroup rocks comprising of phyllite, schist and Erinpura granite and
gneisses are exposed. Erinpura granite and gneisses are also exposed near Jalor town. Younger Alluvium mainly
occurs along river courses and stream channels.
Hydrology - The rivers that passes through the Block area are Luni River, Sukri River and Bandi nadi. Jalore
district falls in parts of Luni basin is a part of the Central Luni Basin and is drained by the Luni drainage system,
which passes only through the southwestern tip of the district near Sanchore before shedding its load into Runn of
Kutch. The main rivers in the district are Jawai, Sukri, Khari, Bandi and Sagi, which are tributaries of the Luni River
and form a trellis pattern of drainage flowing due northwest. In Barmer district, the only major drainage course in
the area is Luni River, which flows from Samdari, passing through Balotra. The river is ephemeral, flowing only in
response to heavy precipitation. In the year of drought there is no run off. There is no eco sensitive or designated
biodiversity located within the Block area.
Hydrogeology and Groundwater Quality – Barmer district, the main water bearing formations in the district are
rhyolites and granites of post Delhi; Lathi sandstone, Tertiary sandstone and Quaternary alluvium. In Quaternary
alluvium, ground water occurs under semi confined to unconfined conditions. In semi consolidated Tertiary and
Mesozoic formations, it occurs under unconfined to confined conditions and in weathered and fractured zones in
hard rocks under phreatic conditions. Though ground water occurs in all the formations, but the most productive
aquifers are the Lathi sandstone, Barmer sandstone and Quaternary sediments. The Tertiary formation, which is
predominantly clayey and argillaceous, is not found as productive except locally in the sandstone horizon. In
general, the fractured and weathered zones in hard rocks form poor aquifers. In Jalore district, Ground water occurs
under unconfined condition in saturated zone of rock formation. Its occurrence is controlled by topography,
physiography and structural features of the geological formations. The movement of the groundwater in hard rock
areas is governed by size, openness, interconnection and continuity of structurally weak planes while in
unconsolidated rocks, ground water movement takes places through pore space between grains.
As reported by CGWB, in Barmer, during pre-monsoon, shallow water level varying in depth from 4.90 to 36.18
mbgl existed in Baetu, Balotra and Siwana Blocks. Deeper water levels from 52.59 to 70.95 mbgl were recorded
in Barmer, Chohtan, Dhorimanna, Sheo and Sindhari Blocks. During post monsoon, shallow water levels ranging
in depth from 4.00 to 38.07 mbgl were observed in Baetu, Balotra and Siwana Blocks. Deeper water levels from
52.99 to 71.50 mbgl depth were registered in Barmer, Chohtan, Dhorimanna, Sheo and Sindhari Blocks.
Asper the Jalore district Ground Water Brochure published by CGWB in 2013, in Jalore district, the depth to water
level varies widely depending upon topography, drainage, bedrock geology etc. During May(Pre monsoon period),
depth to water level has been observed to vary from less than 5 m to more than 50m bgl. Water level is shallower
in hard rock aquifers mainly in Bhinmal Block. Depth to water level varies from 20 to 40m in greater part of the
district. Deeper water levels (>50m) have been observed in parts of Bhinmal, Raniwara, Soyala Blocks. During
November (post monsoon period), water levels have been found to range widely from less than 3m to more than
50m bgl. Water level is shallower in eastern parts of the district. In general, depth to water level varies from 2m to
10m in Jaswantpura tehsil and between 10m to 20 m in 7 the eastern parts of the district. In rest of the district post-
monsoon water level ranges from 20 m to more than 40m.
Total of 11 ground water samples have been collected and analysed for parameters as per IS: 10500:2012
standards. Concentrations of various heavy metals like mercury, arsenic, lead, barium, cadmium and selenium
were found below detectable limits at all the sampling locations. Presence of Total and Fecal Coliforms was not
observed in any of the water sampled.
Climate and Meteorology - The Block experiences hot and arid climate typical of desert region. The predominant
wind direction is from west and southwest during the months of April to August and from north and northeast during
the months of September to March. The annual average wind speed was observed to be 7.4 kmph and 7.8 kmph
in Barmer and Jalore districts. The annual rainfall is about 104.5 mm.
Ambient Air Quality-Ambient air quality was monitored at 11 locations (for a period of 13 week - March to May’19).
The PM10 values were exceeding NAAQS, at some stations but the average value observed to be in the range of
62.28-67.72 µg/m3, which is typical of the region, due to occasional dust stroms during this dry period. The PM2.5,
SO2, NOx and NH3, Ni values were in the range of 19.12-21.50 µg/m3, 11.3-14.6 µg/m3, 33.4-42.5 µg/m3, 21.8-30.6
µg/m3 1.1-1.4 ng/m3 respectively and well within the National Ambient Air Quality Standards (NAAQS).
Ambient Noise Levels - Noise levels were monitored at 11 locations within the study area. The locations for the
noise levels are selected on the basis of locations of sensitive receptors such as health centre, educational centres,
Vedanta Limited (Division CAIRN Oil & Gas) DRAFT EIA: Onshore Oil and Gas E&A in RJ-ONHP- 2017/4 Block, Barmer District, Rajasthan
June,2019 AECOM
EX6
market place etc. The day time noise levels and night time noise levels were found to be higher than the prescribed
standards of 55 and 45 dB respectively during day and night time for rural areas.
Soil Quality -Soil samples were collected from 11 locations. The soil in general indicates saline with slightly alkaline
properties in the study area. Soil texture at all locations was observed to be sandy. pH of the soil samples ranged
from 6.9 to 8.8. The concentrations of heavy metals namely cadmium, mercury, antimony was observed to below
detectable limit. The values for Zinc, Lead, Cadmium, Copper, Nickel were found to be much below soil remediation
intervention values. Arsenic values exceeded soil remediation intervention values as specified in Soil Remediation
Circular 2009 at most of the locations.
Ecology– Quadrat based survey was carried out across the Block and it was observed that major portion of the
study area comprises of stunted, thorny, spiny or prickly, trees, shrubs and perennating herbs, showing a range of
xerophytic characteristics. The most commonly found species in the region are Khejri and Ker. Few species of
avifauna were also associated with the region in which the study area is located.
Socio- Economic Conditions- A total of 64 villages are located as a core area, where the wells are located. Major
population in the study area are farmers by occupation, mainly two types of agricultural crops are cultivated in this
area widely, Ravi (main crop of the season millet) and Khariff (main crop of the season cumin). Total population
size is 103158 in the core area of villages, sex ratio accounted to be 931, and the literacy rate of core zone villages
found to be 49.88%. As a secondary livelihood some people work as labour at nearby town Sindari. Water scarcity
is the main problem, faced by the villagers during dry season of the year. Several schedule caste and schedule
tribes, like Rajput, Debasi, Rajpurohit are present in this Block. Almost every village has a primary school.
Impact Assessment and Mitigation Measures
Site Selection & Land Procurement –
Impact
An area of approximately 300m X 300m would be taken on temporary short-term lease basis for the construction
of well pad (drill site) for exploratory and appraisal wells and the Quick Production unit / Early Production unit. For
the preparation of suitable access roads connecting to well pads, accommodating OHL and other utilities in future,
a width of 30m (approx.) RoU would be required. The drill sites are planned to be located in agricultural land and
open scrub land. Their procurement for project purposes would result in loss of landowner’s income for the lease
period. The procurement of land on lease can lead to moderate impact mainly due to expectations on compensation
package.
Mitigation Measures
• During the construction of the access road adequate cross drainage structures to be provided considering
the topography of the alignment.
• Leveling and grading operations would be undertaken with minimal disturbance to the existing contour,
thereby maintaining the general slope of site;
• Consultations to be carried out with land owners for finalizing compensation packages;
• Compensation for standing crops to be considered.
The excavated material from the drill site should be stored (temporarily /permanently) in uncultivated
land and should be away from any drainage channel.
Site Clearance and Grading
Impact
The site preparation works at campsite and drill site may result in clearance of vegetation, dust generation and loss
of topsoil. The earthworks to be carried would typically involve excavation, levelling / grading; and rolling and
compaction.
Mitigation Measures
• Water sprinkling to be carried out, while working in proximity of agricultural fields or
settlements/habitations;
• Runoff from drill sites located near ponds and catchment of tankas to be channelised through silt trap;
• If any tree felling is involved, permission from the concerned department shall be undertaken.
Construction of Drill Site
Vedanta Limited (Division CAIRN Oil & Gas) DRAFT EIA: Onshore Oil and Gas E&A in RJ-ONHP- 2017/4 Block, Barmer District, Rajasthan
June,2019 AECOM
EX7
Impact
Construction of cellar pit, water storage pit and drilling waste storage pits would result in excavation of soil from
each site. Noise from construction activity would be generated from bull dozer, DG sets and concrete-mixing plant.
Mitigation Measures
• Temporary storage sheds to be provided for storing of construction material such as cement;
• Excavated soil to be used for construction at other project sites;
• ;
• Detailed Health & Safety Plan to be provided to all civil contractors, as part of their contract with Vedanta
Ltd. (Division Cairn Oil and Gas).
Campsite Installation
Impact
The campsites would be located in the vicinity of the drill site. A typical campsite would require portable cabins to
accommodate about drilling crew and the contractor personnel. Installation of porta-cabins with associated facilities
would involve Health and Safety issues pertaining to transportation, loading - unloading of cabins and installation
of cabins.
Mitigation Measures
• Crane to be is equipped with a legible, durable load chart that shows the manufacturer's recommended load
configurations and maximum load weights; and
• Surface conditions to be examined prior to movement of crane.
Transportation of Drilling Rig and Other Components –
Impact
Transportation of drilling rig, drilling equipment, materials and manpower would involve movement of about trailer
loads spread over days use the existing roads till they reach the access road for each well site. The potential
impacts may include congestion of roads, wear and tear of existing roads and oil leaks from vehicle maintenance
areas.
Mitigation Measures
• Movement of rig & associated machinery to be avoided to the extent possible during peak traffic hours
• All vehicles (light, medium and heavy) to be required to have valid PUC (Pollution under Check) certificate.
Periodic maintenance of all project vehicles and machinery to be carried out,
Drilling and Well Testing
Impact
Water Requirement -. During drilling operation water for WBM preparation would be 600-1000m3/well, for SBM
preparation would be 150-300 m3/well, for drilling water consumption would be 30-40 m3/day/well. And water for
domestic use would be 20-30m3/day/well.
Mitigation Measures
Water requirement for all the project activities would be sourced locally through approved/ authorized sources of
surface water and/ or ground water (e.g. PHD bore wells, privately owned bore wells, Irrigation Dept./ Water
Resources Dept. of State Govt.). In case, required water could not be sourced from locally available approved
sources, ground water would be extracted after obtaining permission from CGWA/ State Govt.
Handling, transport and storage of Chemicals and wastes
Impact
The drilling operations would involve generation of spent drilling mud, drill cuttings, waste oil, used containers, etc.
The drill site would also involve storage of hazardous chemicals and fuels which has the potential to contaminate
soil and groundwater.
Mitigation Measures
• Separate drill cutting collection pits to be provided for WBM and SBM
• Drill pits to be provided with HDPE lining on bottom and side surfaces
Vedanta Limited (Division CAIRN Oil & Gas) DRAFT EIA: Onshore Oil and Gas E&A in RJ-ONHP- 2017/4 Block, Barmer District, Rajasthan
June,2019 AECOM
EX8
• The drill cuttings from the drilling operations associated with water-based mud would be used for filling
low lying areas as a sub grade construction material in construction of well pads, etc. Synthetic base mud
would be re-used in further drilling activities.
• Used hazardous chemical barrels and waste oil to be sent to SPCB authorized vendors
• Fuel tanks to be provided with secondary containment facilities and maintained as per statutory
requirements.
• All mixing tanks and chemical storage area to be paved and provided with secondary containment.
Noise Generation
Impact
The noise generation sources would include DG sets, pumps for rig and other miscellaneous equipments.
Mitigation Measures
•Installation of adequate engineering control on equipment and machinery (like mufflers & noise enclosures for DG
sets and mud pumps) to reduce noise levels at source,
•Providing Personnel Protective Equipment (PPEs) like ear plugs/muffs to workers at site.
•The DG set would be kept in acoustic enclousure.
•Undertaking periodic maintenance of vehicles to reduce noise levels
Air emissions
Impact
The drilling activities would lead to emissions from operation of diesel generator sets and flaring during well testing.
Fugitive dust emissions due to the proposed project will be principally associated with emissions of dust during the
site preparation. The dust generated would be primarily from the handling and transportation of fill material and re-
entrainment of dust during movement of the vehicles on unpaved roads.
Mitigation Measures
• DG set emissions shall be as per CPCB standards
• Flare burner characteristics to be optimized to ensure maximum burning of hydrocarbons produced during
well testing;
• In case of ground flaring, to minimize the effects of flaring, the flare pit shall be made of RCC surrounded
by a permanent wall of minimum 5m height (with refractory bricks), to reduce the radiation and glaring
effects in the adjoining areas.
• In case of elevated flaring system: Elevated flare system to be adopted, and designed with proper
enclosure height;
• Location of the flare stack to be decided at the design stage taking into consideration nearest habitations,
vegetation, public amenities or any sensitive locations
• Flaring of crude oil to be avoided, and crude oil to be effectively separated at the drill site and stored in
barrels/tankers for transportation to the nearest terminal for management; and
• Proper engineering controls to ensure complete combustion of gas;
• No cold venting would be resorted instead flaring would be done with combustion efficient elevated flare
tip; and
• Location of flare stacks to be chosen considering the sensitive receptors adjoining the site
Surface water quality
Impact
Site clearance and stripping of top soil during site construction would result in an increase in soil erosion potential
leading to an increased sediment load in the surface run-off during monsoon. Also, surface run off from drilling
waste (cuttings and drilling mud), hazardous waste (waste oil, used oil etc) and chemical storage areas may lead
to the pollution of receiving water bodies viz. natural drainage channels etc.
Mitigation Measures
• Proper treatment of all wastewater and produced water and any water discharge from well site should
comply with CPCB Inland Water Discharge Standards for Oil and Gas Industries
• Waste mud to be stored in the HDPE lined pit
• Drainage and sediment control systems at the well site would be efficiently designed
• All chemical and fuel storage areas, process areas would have proper bunds so that contaminated run-
off cannot escape into the storm-water drainage system.
Vedanta Limited (Division CAIRN Oil & Gas) DRAFT EIA: Onshore Oil and Gas E&A in RJ-ONHP- 2017/4 Block, Barmer District, Rajasthan
June,2019 AECOM
EX9
Ground water
Impact
In absence of supply of surface water resource, the potential impacts on groundwater resource would be due to
ground water abstracted for domestic needs and for drilling activities.
Mitigation Measures
• All water storages in the drill sites would be kept covered and leakage prevented;
Soil Quality
Impact
During the site preparation stripping of soil would be happened during the construction phase. Site preparatory
activities would involve the sourcing of earth-fill from borrow areas. Since in most of the cases efforts would be
made to procure the fill material from nearby existing borrow areas. Storage of drill cuttings associated with WBM
and SBM, spent drilling mud and sludge containing oil and other waste are likely to be generated, would be stored
at HDPE lined pit. Fuels, lubricants and chemical used for the drilling operations (especially daily consumption)
would be stored at site.
Mitigation Measures
• The top soil would be stored properly.
• Manage spills of contaminants on soil using spill kits;
• Storage MSW in designated areas within drill sites/production facilities;
• Adopt best practices e.g. use pumps and dispensing nozzle for transfer of fuel, use drip trays etc.
Road and Traffic
Impact
During various phases of projects like drilling, early production and decommissioning various types of vehicle /
equipment movement would be involved. The vehicular movement is expected to be more in drilling phase due to
movement of machinery & manpower.
Mitigation Measures
• Speed limits would be maintained by vehicles involved in transportation of raw material and drilling rig.
• Regular supervision would be done to control vehicular traffic movement along defined traffic routes
• Adequate training on traffic and road safety operations would be imparted to the drivers of project vehicles.
• Entry of vehicles into the drilling site area is prohibited except for material movement.
• Adequate parking would be provided outside the drilling location.
Terrestial Ecological environment
Impact
The Potential Impacts on the existing floral and faunal diversity may arise due to following activities
1. Vegetation Clearance.
2. Illimitation from Site.
3. Generation of Noise
Mitigation Measures
• The working area would always be kept minimum.
• For felling of trees prior approval from concerned Department shall be obtained;
• Appropriate shading of lights to prevent unwanted scattering.
• .
• Plantation of Local tree plantation should be undertaken;
• Fencing would be done on the camp site to avoid any unfortunate encounter with faunal species.
Socio economic environment
Impact
Vedanta Limited (Division CAIRN Oil & Gas) DRAFT EIA: Onshore Oil and Gas E&A in RJ-ONHP- 2017/4 Block, Barmer District, Rajasthan
June,2019 AECOM
EX10
Influx of population is anticipated in all stages of the project cycle particularly during exploratory drilling. The drill
site would involve the operation of about 50 onsite workers during drilling phase. Interaction between workers with
villagers of nearby areas might give rise to various issues like conflict of workers with the local population, nuisance
caused by workers due to improper sanitation facilities, etc.
Mitigation
• The shortest distance as far as avoidable / feasible would be considered for access road
• The village road identified for accessing proposed project footprints, would be strengthened and widened as
per requirement
• Appropriate awareness program on grievance redressal mechanism, would be designed and implemented
for local community around proposed project footprints;
• Concerns of local panchayat regarding any impact on their common property resources (like of use of village
road, water resource etc.) due to project activities, would be proactively identified and addressed;
Occupational Health & Safety Risks
Impact
The health and safety risks associated with drilling operations may include well kick or blow out, crane failure, fire
Hazards and radiation hazard from well logging tool handling and storage.
Mitigation Measures
• Blowout preventers to be provided;
• Flare pit to be placed at a safe distance from the well head and fuel storage areas;
• Fire-fighting measures to be provided.
Operation of Campsites
Impact
It is anticipated that, at any given time, there would be about 80 - 100 personnel working on site including technical
staff, drilling crew, security staff etc. who would be accommodated at each campsite associated with drilling. Water
for domestic use would be 20-30 m3/day/well. It is anticipated to generate 25-30 kg/day/well of domestic waste.
Inadequate disposal and handling of waste would pollute the surroundings.
Mitigation Measures
• safe drinking water to be provided at campsite for consumption.
• Segregation of waste at the source of generation to be put in practice.
• Food waste to be stored in a closed container and composted.
• The sewage from each porta-cabin to be connected to a mobile STP.
Demobilization and Abandonment
Impact
If hydrocarbons are not found, a full abandonment plan would be implemented. The impacts from decommissioning
of drill sites may include noise generation and soil contamination due to demolition of cutting pits and chemical
storage areas.
Mitigation Measures
• All the wastes to be completely removed from the site and sent to designated authorized disposal facilities
prior to commencement of demolition work.
• Prior to commencement of any demolition, a planned programme of site clearance would be formulated.
All pits, cellars and holes would be removed, and filled to ground level, any oil or otherwise
contaminated soil would be removed and disposed to Landfill.
• Roads and other paving would be removed to sufficient depth to allow soil replacement and
revegetation.
Vedanta Limited (Division CAIRN Oil & Gas) DRAFT EIA: Onshore Oil and Gas E&A in RJ-ONHP- 2017/4 Block, Barmer District, Rajasthan
June,2019 AECOM
EX11
• Any remaining topsoil that has been stocked during the site clearance would be re-spread over
appropriate portions of the site. Plantation, if possible would be commenced in and around the site.
Environment Management and Monitoring Plan
A comprehensive environmental monitoring plan has been developed for the project. Monitoring of ambient air
quality, noise levels, soil and groundwater quality to be carried out by MoEF&CC/NABL/RSPCB recognized
laboratories for pre and post drilling operations to assess the effectiveness of the environment management plan
and adopt appropriate corrective measures if it found that those are not functioning properly.
HSE Organization Structure
Vedanta Limited (Division Cairn Oil & gas) has an existing established Health, Safety and Environment (HSE)
management system for its operations. The HSE structure comprises of a corporate HSE team based in Gurgaon
office and an on-site team.
A significant portion of the project activities would be undertaken by contractors. Vedanta Limited (Cairn Oil and
Gas) shall ensure that the contractual documentation emphasizes on the need to comply with all legal requirements
and Environment Management and Monitoring Plan (EMMP). Vedanta Ltd. (Cairn Oil and Gas) shall either directly
or through its contractors, to arrange for periodic trainings of the project crew on legal requirements and EMMP.
CAIRN shall undertake regular inspections of the drill and camp sites and document them to ensure compliance to
legal requirements and the EMMP.
Proposed CER Strategy
As per MoEF &CC office memorandum number F.No 22-65/2017-IA-III dated 1st May, 2018, Corporate
Environmental Responsibility requirement would be fulfilled as per the prescribed rate.
Vedanta Limited (Division CAIRN Oil & Gas) DRAFT EIA: Onshore Oil and Gas E&A in RJ-ONHP- 2017/4 Block, Barmer District, Rajasthan
June,2019 AECOM
1
1. Introduction
India is largely dependent on import of petroleum goods to meet its requirements and imports about 80% of crude
oil demand every year. For the last 3 years including the last financial year of 2018-19, the production figures of
crude oil in India is hovering about 35 MT against a total demand of 212 MT in the last year. In addition, the demand
of petroleum products is poised to grow at an annual average rate of 4.8% till year 2022 (13th 5-year plan).
To enhance indigenous production of oil, Government of India has targeted reducing the country’s dependency on
import by 10% by the year 2022. As a lead-up to this intent Government of India has awarded Block RJ-ONHP-
2017/02 in Rajasthan to Vedanta Limited (Cairn Oil & Gas) for exploration of hydrocarbons.
1.1. Background
Revenue Sharing Contract (RSC) for Block RJ-ONHP-2017/2 has been signed between Vedanta Ltd and
MoP&NG, Govt of India on 1st October 2018 for the exploration of hydrocarbons resources. Vedanta Ltd (Cairn Oil
& Gas) proposes to carry out exploration including exploratory and appraisal well drilling and early production of oil
and gas in the above mention Block. In case of any discovery, the exploratory appraisal well(s) will be tested for
extended duration by flowing hydrocarbons to ascertain the reservoir parameters, assess the quality and
commercial viability for early production.
1.2. Vedanta Limited (Cairn Oil & Gas) proposes for drilling of 64 exploratory and appraisal wells and
setting up of early/quick production facility in RJ-ONHP-2017/2.Objective of the EIA
Study
The exploration/development of oil and gas is included under activities specified in Schedule (Activity 1b) of the
EIA Notification dated 14th September 2006 and categorized as “A” level project that requires an Environmental
Clearance (EC) from the Ministry of Environment, Forests and Climate Change (MoEF&CC).
AECOM India Pvt Ltd., a NABET-QCI accredited firm has been entrusted with the task of conducting an EIA study
and technically assisting Vedanta Limited (Division :Cairn Oil & Gas) in obtaining environmental clearance from the
MoEF&CC.
The main objectives of the EIA study are as follows:
• Establish the prevailing baseline environmental and socio-economic condition of the RJ-ONHP-2017/02
block and its surroundings along with the compliance needs for environmental approvals to carry out
hydrocarbon exploration.
• Assessing environmental and socioeconomic impacts arising out of the proposed drilling activities;
• Recommend appropriate preventive and mitigation measures to eliminate or minimize pollution,
environmental & social disturbances during the life-cycle of the project, ensuring compliance with
environmental laws and regulations applicable;
• Identifying and proposing alternative actions in terms of technology and practices that may help in abating
environmental or socio-economic impacts due to the project;
Integrating mitigative measures with environmental action plans and management systems so that they can be
implemented, monitored and suitable corrective action can be taken in case of deviations;
1.3. Project Status
Vedanta Limited (Cairn Oil & Gas) had submitted Form-1 of the EIA Notification, along with a draft Terms of
Reference (ToR) for scoping to MoEF&CC. The ministry has issued an approved ToR vide file no No.IA-J-
11011/103/2019-IA-II(I) dated 25th April 2019. The approved ToR is attached as Annexure 1.1.
Vedanta Limited (Division CAIRN Oil & Gas) DRAFT EIA: Onshore Oil and Gas E&A in RJ-ONHP- 2017/4 Block, Barmer District, Rajasthan
June,2019 AECOM
2
The baseline monitoring and all primary data collection was conducted for the summer season (March to May) of
2019, as per the requirements of the ToR. Draft EIA report has been prepared for public hearing.
1.4. Brief Details of The Project
RJ-ONHP-2017/2 block is located in Gudamalani, Sayla and Bagoda Tehsil of Barmer and Jalore district,
Rajasthan. Total area of block is 1072 sq. km. Presently Vedanta Limited (Cairn Oil & Gas) proposes to carry out
to drill 64 exploratory and appraisal wells within the block. Apart from that, setting up of Early Production Units
(EPUs)/ Quick Production Units (QPUs) for produced well fluid processing and production of up to 24000 BOPD
crude oil and associated natural gas 3.6 MMSCFD has also been planned. Total estimated cost of the project would
be Rs. 1681 cr.
1.5. Scope of the Study
The scope of the EIA study considers the impact due to drilling of 64 onshore exploratory and appraisal wells and
early/ quick production unit in RJ-ONHP-2017/2 on physical, biological and socioeconomic environment of the
surrounding areas in compliance to the approved ToR provide by MoEF&CC. The scope of the EIA study includes
the following:
• To establish the prevailing environmental and socio-economic condition of the study area;
• To assess environmental and socioeconomic impacts arising out of the proposed expansion activities;
• To recommend appropriate preventive and mitigation measures to eliminate or minimize pollution;
• To identify and propose management plans in terms of good practices that may help in abating environmental
or socio-economic impacts due to the project.
• To prepare a Disaster Management Plan (DMP) based on Risk Assessment/ studies;
Environmental baseline monitoring has been carried out during 10th March 2019 to 31st May 2019 representing
summer season and used to identify potential significant impacts.
1.6. Layout the EIA Report
The overall contents of the EIA report have been prepared as per the generic structure prescribed in the Appendix
III of EIA Notification issued by MoEF&CC, Govt. of India on 14th September 2006 and subsequent amendments.
The report consists of eleven chapters, the content of which is briefly described in Table 1.
Table 1. Contents of the Report
Sl. No. Section Brief Description
Executive Summary Executive Summary of EIA report.
1. Introduction This section covers project background; regulatory requirement and
overview of the project.
2. Project Description Presents a Description of the Existing and proposed project.
3. Environmental Baseline Study
Baseline Environment Status: The methodology for assessing
various baseline environmental components in the study area has
been identified in this chapter. The various parameters of present
environmental status are identified under different aspects, which
include location and regional setting of the area, physical aspects
such as land use, land cover and soil quality. Hydrological aspect
consists of area drainage, surface water and ground water quality.
Meteorological aspect contains all the climatic factors and ambient
air quality existing in the study area. Ecological environment
describes the flora and fauna of the region. Human aspect includes
the demographical features, socio-economic environment and
infrastructure facilities of the study area.
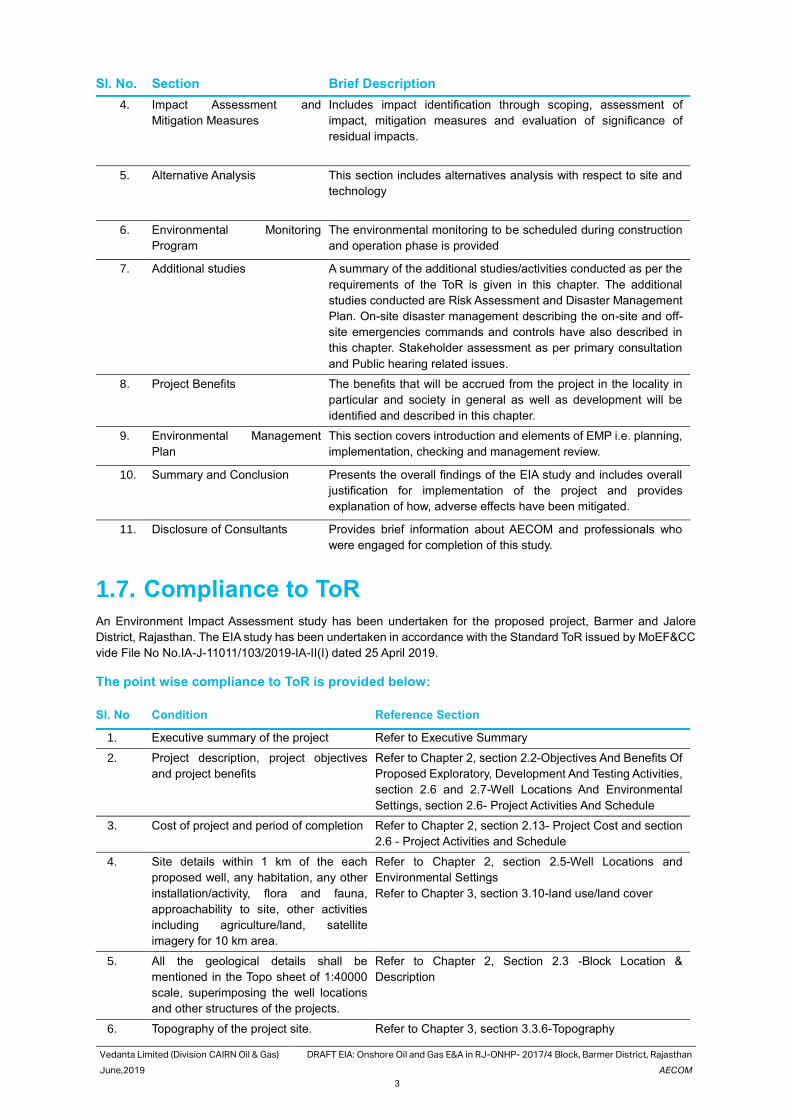
Vedanta Limited (Division CAIRN Oil & Gas) DRAFT EIA: Onshore Oil and Gas E&A in RJ-ONHP- 2017/4 Block, Barmer District, Rajasthan
June,2019 AECOM
3
Sl. No. Section Brief Description
4. Impact Assessment and
Mitigation Measures
Includes impact identification through scoping, assessment of
impact, mitigation measures and evaluation of significance of
residual impacts.
5. Alternative Analysis
This section includes alternatives analysis with respect to site and
technology
6. Environmental Monitoring
Program
The environmental monitoring to be scheduled during construction
and operation phase is provided
7. Additional studies
A summary of the additional studies/activities conducted as per the
requirements of the ToR is given in this chapter. The additional
studies conducted are Risk Assessment and Disaster Management
Plan. On-site disaster management describing the on-site and off-
site emergencies commands and controls have also described in
this chapter. Stakeholder assessment as per primary consultation
and Public hearing related issues.
8. Project Benefits The benefits that will be accrued from the project in the locality in
particular and society in general as well as development will be
identified and described in this chapter.
9. Environmental Management
Plan
This section covers introduction and elements of EMP i.e. planning,
implementation, checking and management review.
10. Summary and Conclusion
Presents the overall findings of the EIA study and includes overall
justification for implementation of the project and provides
explanation of how, adverse effects have been mitigated.
11. Disclosure of Consultants Provides brief information about AECOM and professionals who
were engaged for completion of this study.
1.7. Compliance to ToR
An Environment Impact Assessment study has been undertaken for the proposed project, Barmer and Jalore
District, Rajasthan. The EIA study has been undertaken in accordance with the Standard ToR issued by MoEF&CC
vide File No No.IA-J-11011/103/2019-IA-II(I) dated 25 April 2019.
The point wise compliance to ToR is provided below:
Sl. No Condition Reference Section
1. Executive summary of the project Refer to Executive Summary
2. Project description, project objectives
and project benefits
Refer to Chapter 2, section 2.2-Objectives And Benefits Of
Proposed Exploratory, Development And Testing Activities,
section 2.6 and 2.7-Well Locations And Environmental
Settings, section 2.6- Project Activities And Schedule
3. Cost of project and period of completion Refer to Chapter 2, section 2.13- Project Cost and section
2.6 - Project Activities and Schedule
4. Site details within 1 km of the each
proposed well, any habitation, any other
installation/activity, flora and fauna,
approachability to site, other activities
including agriculture/land, satellite
imagery for 10 km area.
Refer to Chapter 2, section 2.5-Well Locations and
Environmental Settings
Refer to Chapter 3, section 3.10-land use/land cover
5. All the geological details shall be
mentioned in the Topo sheet of 1:40000
scale, superimposing the well locations
and other structures of the projects.
Refer to Chapter 2, Section 2.3 -Block Location &
Description
6. Topography of the project site. Refer to Chapter 3, section 3.3.6-Topography
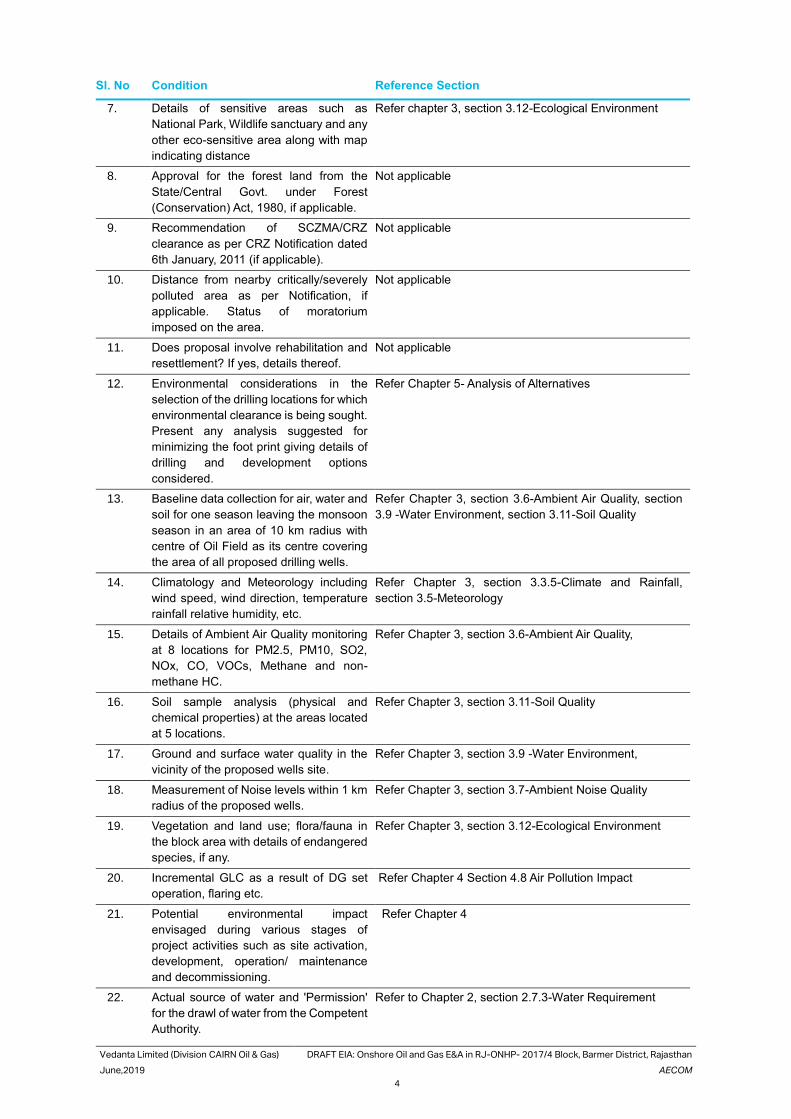
Vedanta Limited (Division CAIRN Oil & Gas) DRAFT EIA: Onshore Oil and Gas E&A in RJ-ONHP- 2017/4 Block, Barmer District, Rajasthan
June,2019 AECOM
4
Sl. No Condition Reference Section
7. Details of sensitive areas such as
National Park, Wildlife sanctuary and any
other eco-sensitive area along with map
indicating distance
Refer chapter 3, section 3.12-Ecological Environment
8. Approval for the forest land from the
State/Central Govt. under Forest
(Conservation) Act, 1980, if applicable.
Not applicable
9. Recommendation of SCZMA/CRZ
clearance as per CRZ Notification dated
6th January, 2011 (if applicable).
Not applicable
10. Distance from nearby critically/severely
polluted area as per Notification, if
applicable. Status of moratorium
imposed on the area.
Not applicable
11. Does proposal involve rehabilitation and
resettlement? If yes, details thereof.
Not applicable
12. Environmental considerations in the
selection of the drilling locations for which
environmental clearance is being sought.
Present any analysis suggested for
minimizing the foot print giving details of
drilling and development options
considered.
Refer Chapter 5- Analysis of Alternatives
13. Baseline data collection for air, water and
soil for one season leaving the monsoon
season in an area of 10 km radius with
centre of Oil Field as its centre covering
the area of all proposed drilling wells.
Refer Chapter 3, section 3.6-Ambient Air Quality, section
3.9 -Water Environment, section 3.11-Soil Quality
14. Climatology and Meteorology including
wind speed, wind direction, temperature
rainfall relative humidity, etc.
Refer Chapter 3, section 3.3.5-Climate and Rainfall,
section 3.5-Meteorology
15. Details of Ambient Air Quality monitoring
at 8 locations for PM2.5, PM10, SO2,
NOx, CO, VOCs, Methane and non-
methane HC.
Refer Chapter 3, section 3.6-Ambient Air Quality,
16. Soil sample analysis (physical and
chemical properties) at the areas located
at 5 locations.
Refer Chapter 3, section 3.11-Soil Quality
17. Ground and surface water quality in the
vicinity of the proposed wells site.
Refer Chapter 3, section 3.9 -Water Environment,
18. Measurement of Noise levels within 1 km
radius of the proposed wells.
Refer Chapter 3, section 3.7-Ambient Noise Quality
19. Vegetation and land use; flora/fauna in
the block area with details of endangered
species, if any.
Refer Chapter 3, section 3.12-Ecological Environment
20. Incremental GLC as a result of DG set
operation, flaring etc.
Refer Chapter 4 Section 4.8 Air Pollution Impact
21. Potential environmental impact
envisaged during various stages of
project activities such as site activation,
development, operation/ maintenance
and decommissioning.
Refer Chapter 4
22. Actual source of water and 'Permission'
for the drawl of water from the Competent
Authority.
Refer to Chapter 2, section 2.7.3-Water Requirement
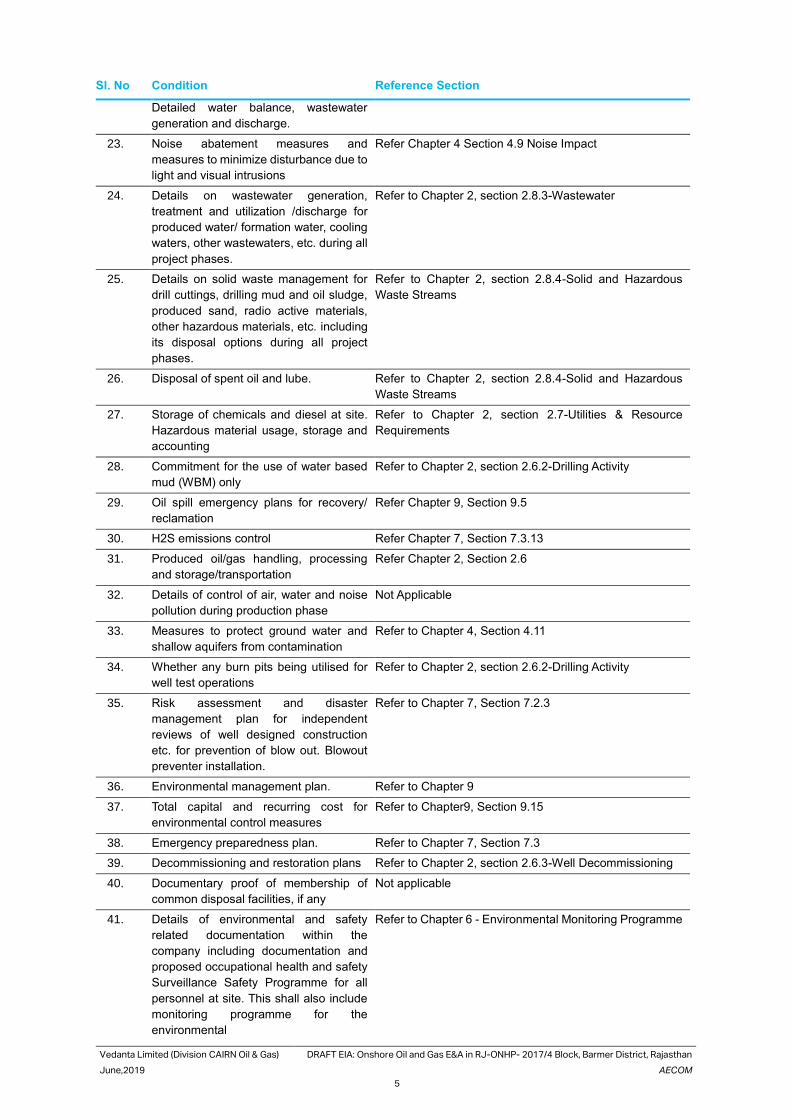
Vedanta Limited (Division CAIRN Oil & Gas) DRAFT EIA: Onshore Oil and Gas E&A in RJ-ONHP- 2017/4 Block, Barmer District, Rajasthan
June,2019 AECOM
5
Sl. No Condition Reference Section
Detailed water balance, wastewater
generation and discharge.
23. Noise abatement measures and
measures to minimize disturbance due to
light and visual intrusions
Refer Chapter 4 Section 4.9 Noise Impact
24. Details on wastewater generation,
treatment and utilization /discharge for
produced water/ formation water, cooling
waters, other wastewaters, etc. during all
project phases.
Refer to Chapter 2, section 2.8.3-Wastewater
25. Details on solid waste management for
drill cuttings, drilling mud and oil sludge,
produced sand, radio active materials,
other hazardous materials, etc. including
its disposal options during all project
phases.
Refer to Chapter 2, section 2.8.4-Solid and Hazardous
Waste Streams
26. Disposal of spent oil and lube. Refer to Chapter 2, section 2.8.4-Solid and Hazardous
Waste Streams
27. Storage of chemicals and diesel at site.
Hazardous material usage, storage and
accounting
Refer to Chapter 2, section 2.7-Utilities & Resource
Requirements
28. Commitment for the use of water based
mud (WBM) only
Refer to Chapter 2, section 2.6.2-Drilling Activity
29. Oil spill emergency plans for recovery/
reclamation
Refer Chapter 9, Section 9.5
30. H2S emissions control Refer Chapter 7, Section 7.3.13
31. Produced oil/gas handling, processing
and storage/transportation
Refer Chapter 2, Section 2.6
32. Details of control of air, water and noise
pollution during production phase
Not Applicable
33. Measures to protect ground water and
shallow aquifers from contamination
Refer to Chapter 4, Section 4.11
34. Whether any burn pits being utilised for
well test operations
Refer to Chapter 2, section 2.6.2-Drilling Activity
35. Risk assessment and disaster
management plan for independent
reviews of well designed construction
etc. for prevention of blow out. Blowout
preventer installation.
Refer to Chapter 7, Section 7.2.3
36. Environmental management plan. Refer to Chapter 9
37. Total capital and recurring cost for
environmental control measures
Refer to Chapter9, Section 9.15
38. Emergency preparedness plan. Refer to Chapter 7, Section 7.3
39. Decommissioning and restoration plans Refer to Chapter 2, section 2.6.3-Well Decommissioning
40. Documentary proof of membership of
common disposal facilities, if any
Not applicable
41. Details of environmental and safety
related documentation within the
company including documentation and
proposed occupational health and safety
Surveillance Safety Programme for all
personnel at site. This shall also include
monitoring programme for the
environmental
Refer to Chapter 6 - Environmental Monitoring Programme
Vedanta Limited (Division CAIRN Oil & Gas) DRAFT EIA: Onshore Oil and Gas E&A in RJ-ONHP- 2017/4 Block, Barmer District, Rajasthan
June,2019 AECOM
6
Sl. No Condition Reference Section
42. A copy of Corporate Environment Policy
of the company as per the Ministry's O.M.
No. J-11013/ 41/2006-IA.II(I) dated
26thApril, 2011 available on the Ministry's
website
Refer to Chapter 9, Section 9.1
Source: ToR issued By MOEF&CC
1.8. Limitations
This EIA study is based on certain scientific principles and professional judgment to certain facts with resultant
subjective interpretation. Professional judgment expressed herein is based on the available data and information.
This report has been developed based on the project related information provided by Vedanta Limited (Cairn Oil &
Gas) with the assumption that the information gathered is representative for the proposed drilling of 64 exploratory
and appraisal wells and early production units in Barmer and Jalore districts of Rajasthan. If information to the
contrary is discovered, the findings in this EIA may need to be modified accordingly. The impact assessment for
the Project is based on the project configuration as described in Section 2 on Project Description.
Vedanta Limited (Division CAIRN Oil & Gas) DRAFT EIA: Onshore Oil and Gas E&A in RJ-ONHP- 2017/4 Block, Barmer District, Rajasthan
June,2019 AECOM
7
2. Description of the Project
2.1. Overview
The proposed project includes Vedanta Limited (Cairn Oil & Gas) proposed drilling of 64 onshore exploratory and
appraisal wells and Setting up of Early Production Units (EPUs)/ Quick Production Units (QPUs) for produced well
fluid processing and production of up to 24000 BOPD crude oil and up to 3.6 MMSCFD associated natural gas in
RJ-ONHP-2017/2 block located in Jalore and Barmer district of Rajasthan.
In case of a discovery (ies), the exploratory and appraisal well(s) will be tested for extended duration by flowing
hydrocarbons to ascertain the reservoir parameters and assess the quality and commercial viability. Moreover, in
case of commercially viable discovery (ies) of hydrocarbons in the block and having established the size of the
hydrocarbon field (s), field will be immediately brought into early production of crude oil and associated gas using
some of the successful exploratory/ appraisal wells by setting up of temporary and mobile Early Production Units
(EPUs)/ QPUs (Quick Production Units) for the processing of produced well fluids.
2.2. Objectives of Proposed Project
Specific objectives of the proposed drilling activities are summarized below:
• To develop and produce hydrocarbons safely
• To augment National Production of oil and gas
2.2.1. Benefits of the proposed project
The project will ultimately cater to fulfil the energy requirement of India. The dependency of India on other countries
will be lessened to an extent. Additionally, the project will benefit people living in neighbouring villages in relation
to direct & indirect employment associated with various project activities and will boost the local economy. The
benefits of the project are listed below;
• Provision of royalty to Rajasthan Government and more cess to Govt. of India
• Provision of direct and indirect employment opportunity to local people
• Development of infrastructure (roads, culverts, bridges etc.) in the area
• Increase in business opportunity for the local people
• Energy security for the country
2.3. Block Location & Description
2.3.1. Location of Block
RJ-ONHP-2017/2 block is located inJalore and Barmer districts of Rajasthan. Total area of RJ-ONHP-2017/2 block
is 1072 sq. km. The coordinates of the block boundaries of the block is presented in figure no.1. Total 64 villages
of Gudamanali of Barmer district and Bagoda and Sayla Tehsil of Jalore district is located within the block. The
geographic location of the block is included within overlaid on the Survey of India’s Topo- Sheet No. 40 O/15, 45
C/3, 45C/4, 40 O/15.
The regional setting of block is presented in Figure 2 and the location of RJ-ONHP-2017/2 block on toposheet and
satellite imagery is shown in Figure 3 and 4 respectively.
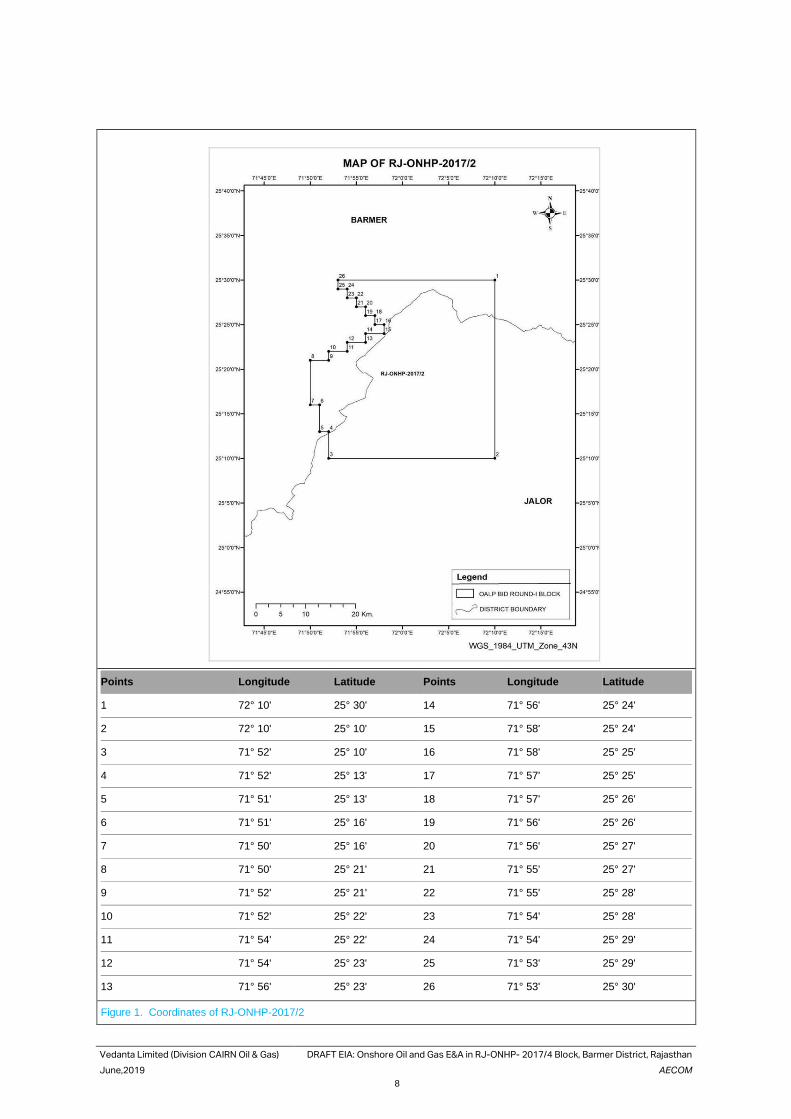
Vedanta Limited (Division CAIRN Oil & Gas) DRAFT EIA: Onshore Oil and Gas E&A in RJ-ONHP- 2017/4 Block, Barmer District, Rajasthan
June,2019 AECOM
8
Points Longitude Latitude Points Longitude Latitude
1 72° 10' 25° 30' 14 71° 56' 25° 24'
2 72° 10' 25° 10' 15 71° 58' 25° 24'
3 71° 52' 25° 10' 16 71° 58' 25° 25'
4 71° 52' 25° 13' 17 71° 57' 25° 25'
5 71° 51' 25° 13' 18 71° 57' 25° 26'
6 71° 51' 25° 16' 19 71° 56' 25° 26'
7 71° 50' 25° 16' 20 71° 56' 25° 27'
8 71° 50' 25° 21' 21 71° 55' 25° 27'
9 71° 52' 25° 21' 22 71° 55' 25° 28'
10 71° 52' 25° 22' 23 71° 54' 25° 28'
11 71° 54' 25° 22' 24 71° 54' 25° 29'
12 71° 54' 25° 23' 25 71° 53' 25° 29'
13 71° 56' 25° 23' 26 71° 53' 25° 30'
Figure 1. Coordinates of RJ-ONHP-2017/2
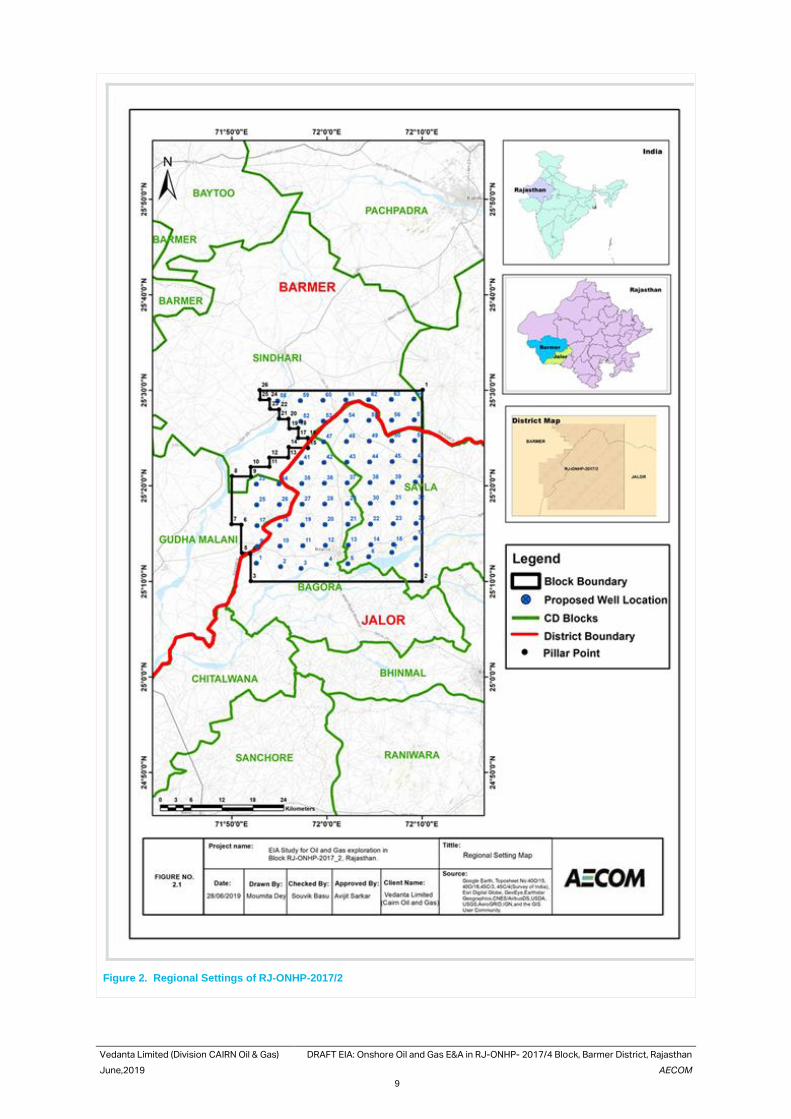
Vedanta Limited (Division CAIRN Oil & Gas) DRAFT EIA: Onshore Oil and Gas E&A in RJ-ONHP- 2017/4 Block, Barmer District, Rajasthan
June,2019 AECOM
9
Figure 2. Regional Settings of RJ-ONHP-2017/2
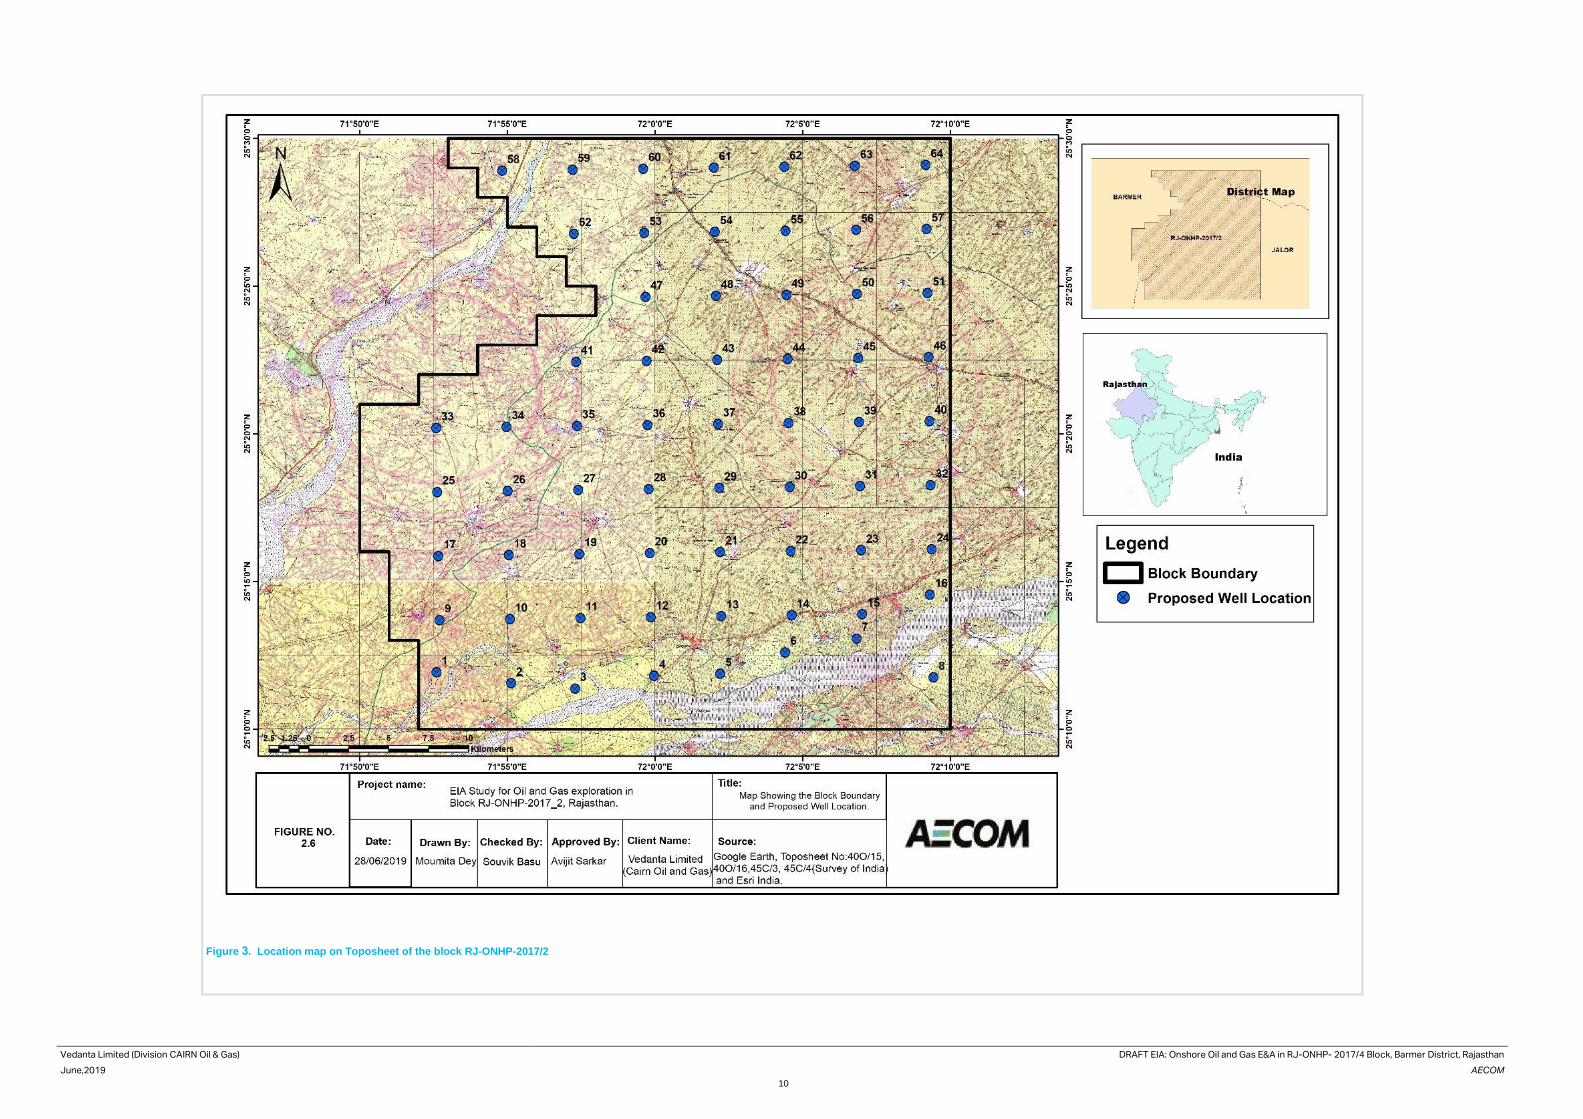
Vedanta Limited (Division CAIRN Oil & Gas) DRAFT EIA: Onshore Oil and Gas E&A in RJ-ONHP- 2017/4 Block, Barmer District, Rajasthan
June,2019 AECOM
10
Figure 3. Location map on Toposheet of the block RJ-ONHP-2017/2
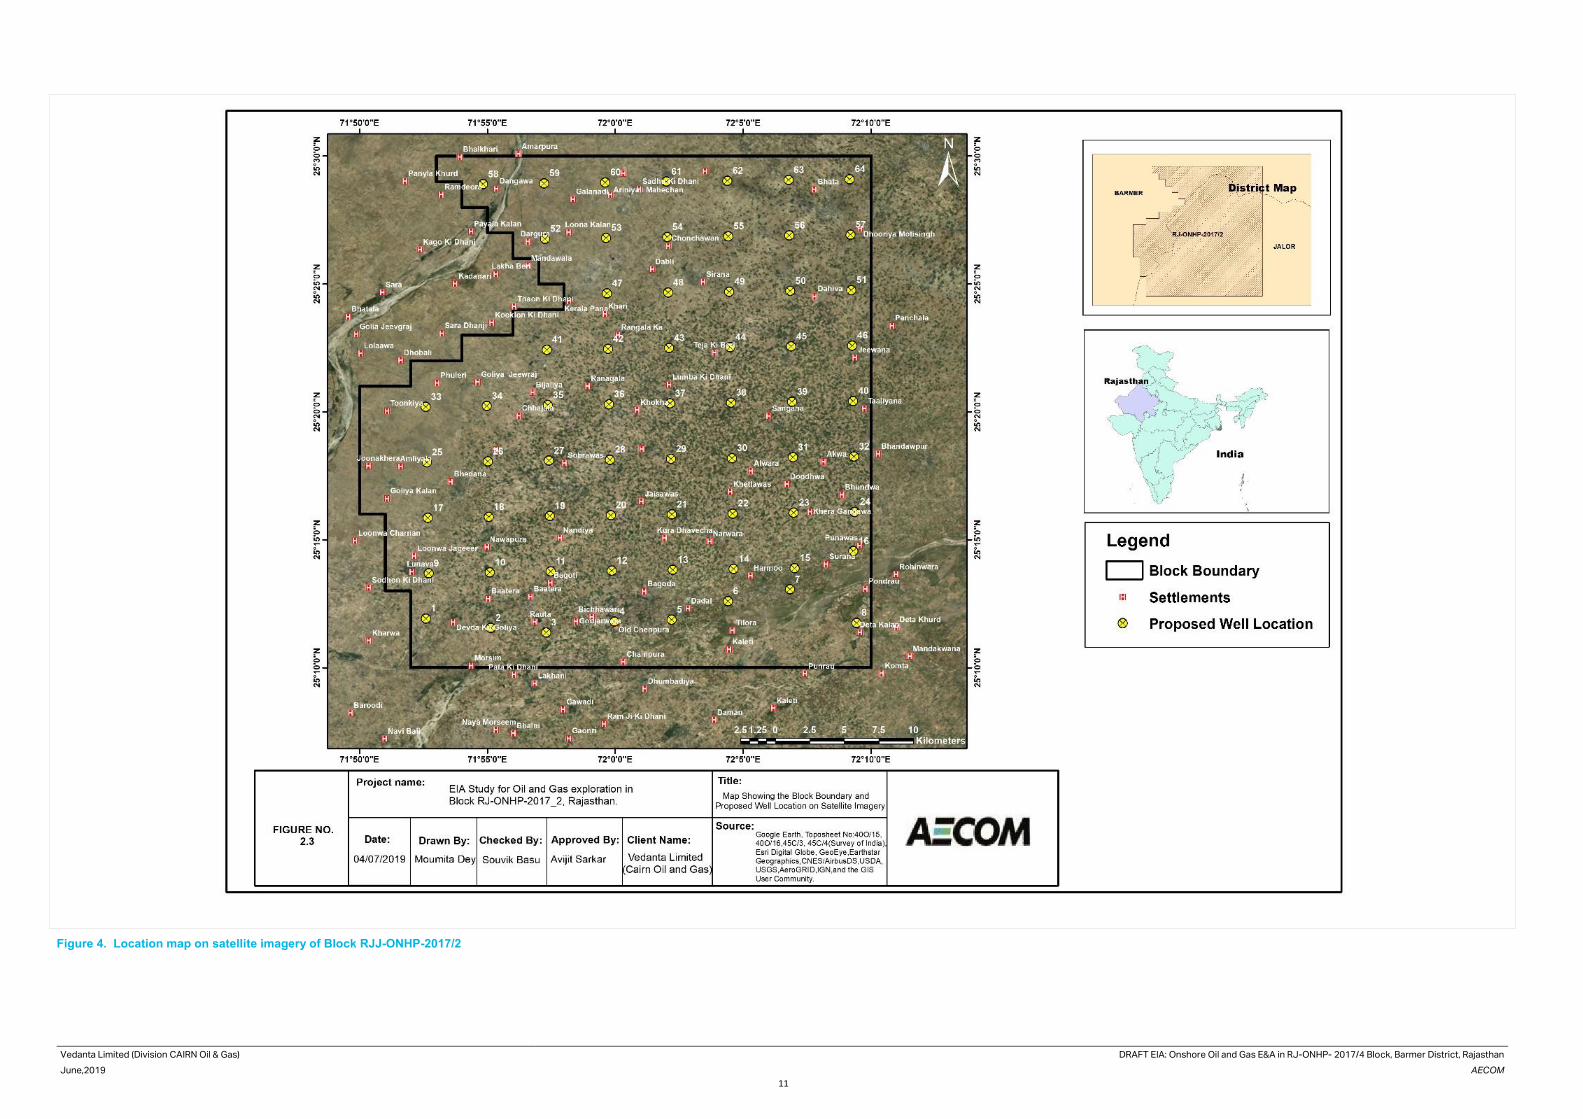
Vedanta Limited (Division CAIRN Oil & Gas) DRAFT EIA: Onshore Oil and Gas E&A in RJ-ONHP- 2017/4 Block, Barmer District, Rajasthan
June,2019 AECOM
11
Figure 4. Location map on satellite imagery of Block RJJ-ONHP-2017/2
Vedanta Limited (Division CAIRN Oil & Gas) DRAFT EIA: Onshore Oil and Gas E&A in RJ-ONHP- 2017/4 Block, Barmer District, Rajasthan
June,2019 AECOM
12
2.3.2. Block Accessibility
Roads
This block is easily accessible through the rail and road network. The nearest cities from the block are Bhinmal (23
km in south east direction), Jalore (47 km in East direction) & Barmer (54 km in north west direction), which are
well connected through state highway. State highways, SH-28 and SH-16, Bagora road & MDR 26 passes through
the block.
Railway
Barmer is connected with proper road and railway connectivity. Barmer Railway station located within the block.
Other rail connectivity available in the area are Balotra (34.5 Km in north direction), Jalore (47 km in east) and
Bhinmal (22.8 km in south east direction). Jodhpur Railway Station is located at a distance of 128 km towards north
east.
Airport
Jodhpur airport is the nearest air connectivity located 123 km towards north east from the block boundary.
Accessibility map of RJ-ONHP-2017/2 block is presented in figure 5.
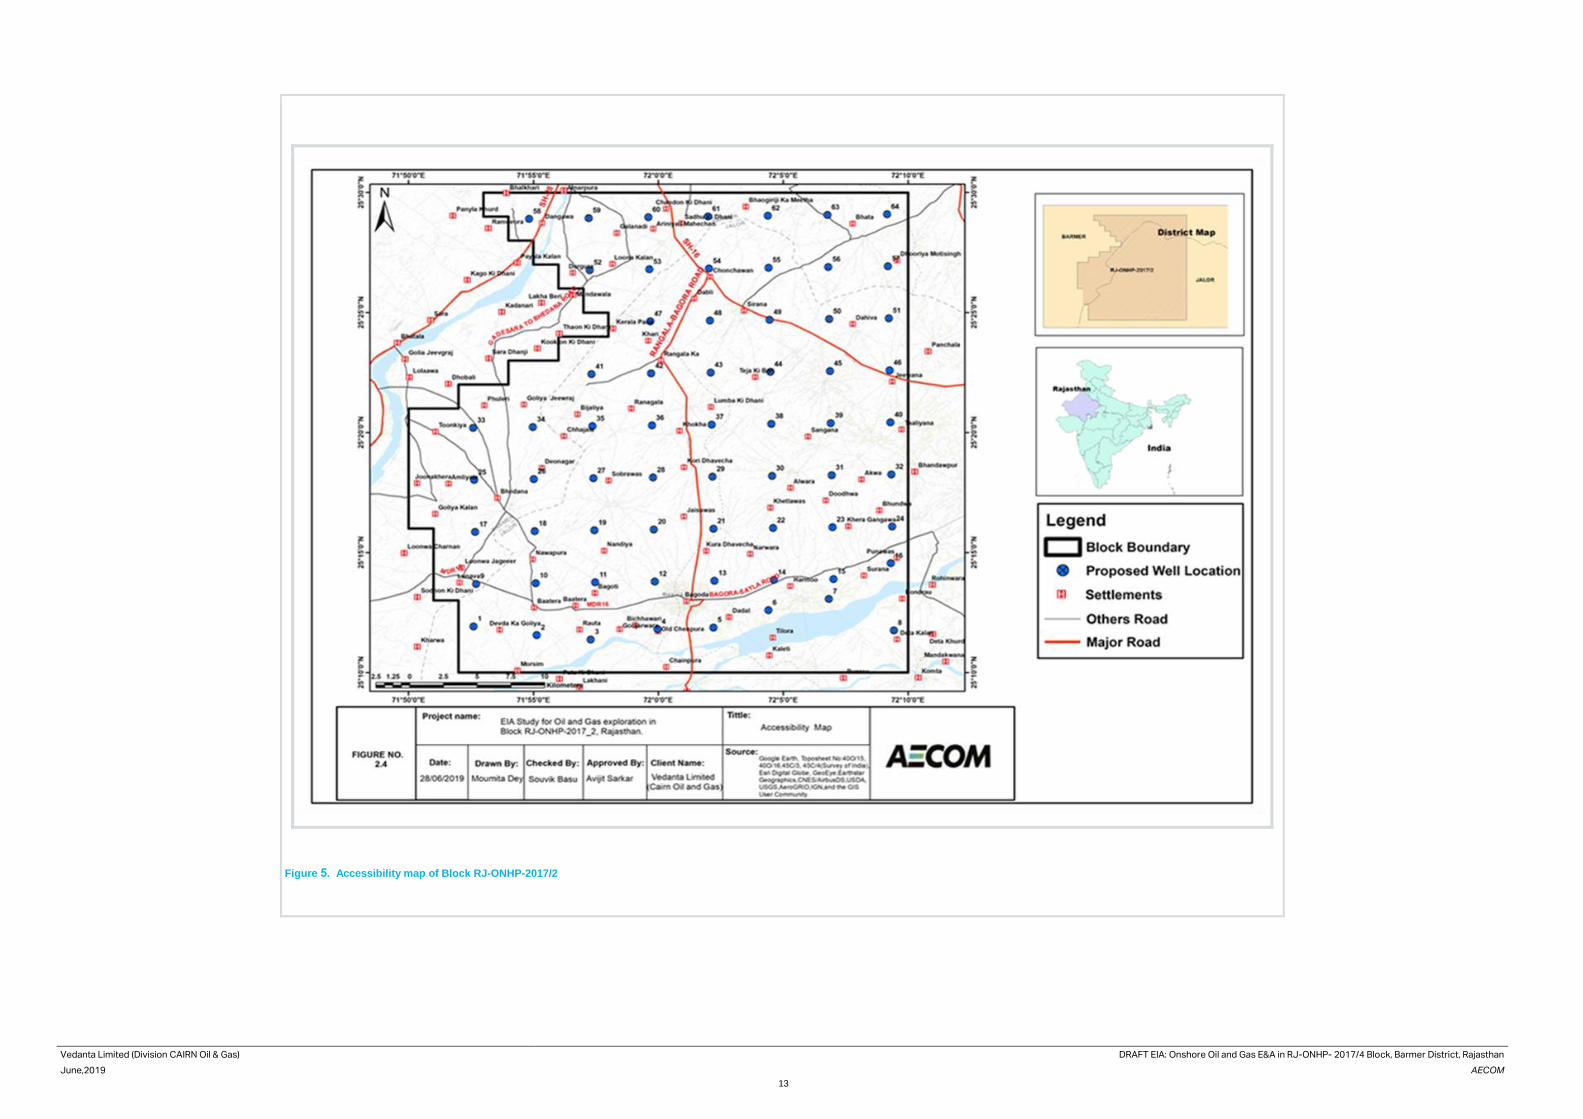
Vedanta Limited (Division CAIRN Oil & Gas) DRAFT EIA: Onshore Oil and Gas E&A in RJ-ONHP- 2017/4 Block, Barmer District, Rajasthan
June,2019 AECOM
13
Figure 5. Accessibility map of Block RJ-ONHP-2017/2
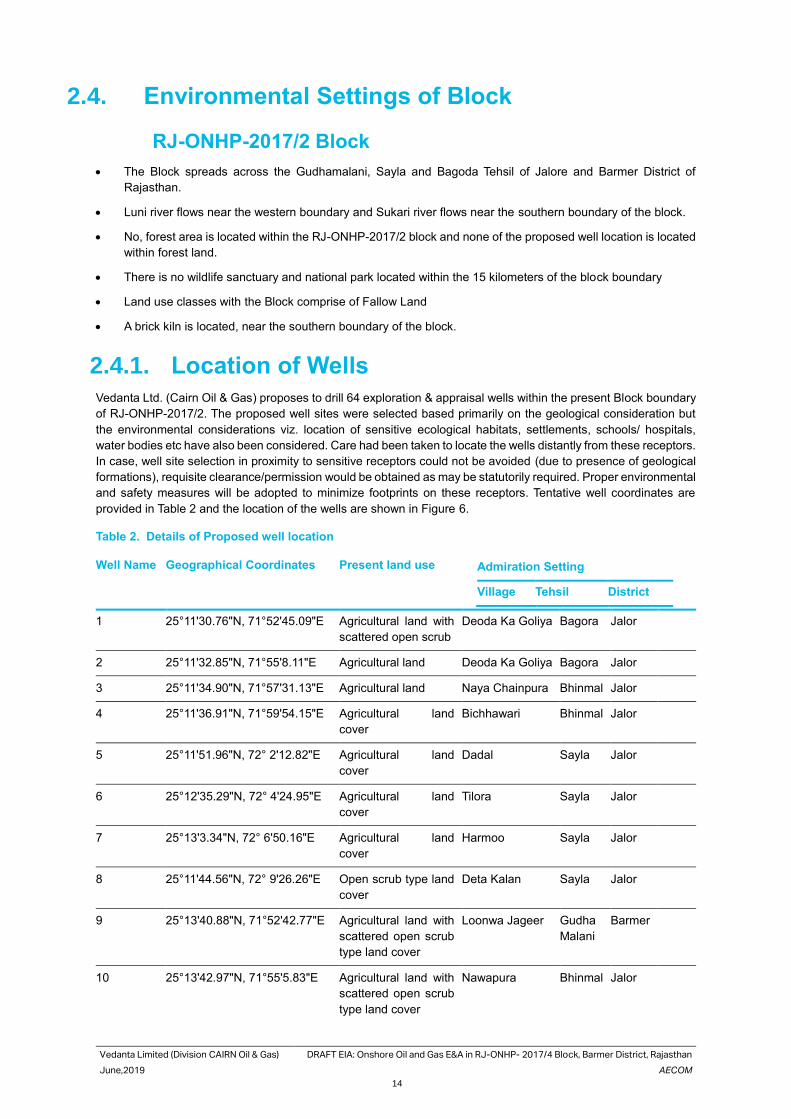
Vedanta Limited (Division CAIRN Oil & Gas) DRAFT EIA: Onshore Oil and Gas E&A in RJ-ONHP- 2017/4 Block, Barmer District, Rajasthan
June,2019 AECOM
14
2.4. Environmental Settings of Block
RJ-ONHP-2017/2 Block
• The Block spreads across the Gudhamalani, Sayla and Bagoda Tehsil of Jalore and Barmer District of
Rajasthan.
• Luni river flows near the western boundary and Sukari river flows near the southern boundary of the block.
• No, forest area is located within the RJ-ONHP-2017/2 block and none of the proposed well location is located
within forest land.
• There is no wildlife sanctuary and national park located within the 15 kilometers of the block boundary
• Land use classes with the Block comprise of Fallow Land
• A brick kiln is located, near the southern boundary of the block.
2.4.1. Location of Wells
Vedanta Ltd. (Cairn Oil & Gas) proposes to drill 64 exploration & appraisal wells within the present Block boundary
of RJ-ONHP-2017/2. The proposed well sites were selected based primarily on the geological consideration but
the environmental considerations viz. location of sensitive ecological habitats, settlements, schools/ hospitals,
water bodies etc have also been considered. Care had been taken to locate the wells distantly from these receptors.
In case, well site selection in proximity to sensitive receptors could not be avoided (due to presence of geological
formations), requisite clearance/permission would be obtained as may be statutorily required. Proper environmental
and safety measures will be adopted to minimize footprints on these receptors. Tentative well coordinates are
provided in Table 2 and the location of the wells are shown in Figure 6.
Table 2. Details of Proposed well location
Well Name Geographical Coordinates Present land use Admiration Setting
Village Tehsil District
1 25°11'30.76"N, 71°52'45.09"E Agricultural land with
scattered open scrub
Deoda Ka Goliya Bagora Jalor
2 25°11'32.85"N, 71°55'8.11"E Agricultural land Deoda Ka Goliya Bagora Jalor
3 25°11'34.90"N, 71°57'31.13"E Agricultural land Naya Chainpura Bhinmal Jalor
4 25°11'36.91"N, 71°59'54.15"E Agricultural land
cover
Bichhawari Bhinmal Jalor
5 25°11'51.96"N, 72° 2'12.82"E Agricultural land
cover
Dadal Sayla Jalor
6 25°12'35.29"N, 72° 4'24.95"E Agricultural land
cover
Tilora Sayla Jalor
7 25°13'3.34"N, 72° 6'50.16"E Agricultural land
cover
Harmoo Sayla Jalor
8 25°11'44.56"N, 72° 9'26.26"E Open scrub type land
cover
Deta Kalan Sayla Jalor
9 25°13'40.88"N, 71°52'42.77"E Agricultural land with
scattered open scrub
type land cover
Loonwa Jageer Gudha
Malani
Barmer
10 25°13'42.97"N, 71°55'5.83"E Agricultural land with
scattered open scrub
type land cover
Nawapura Bhinmal Jalor
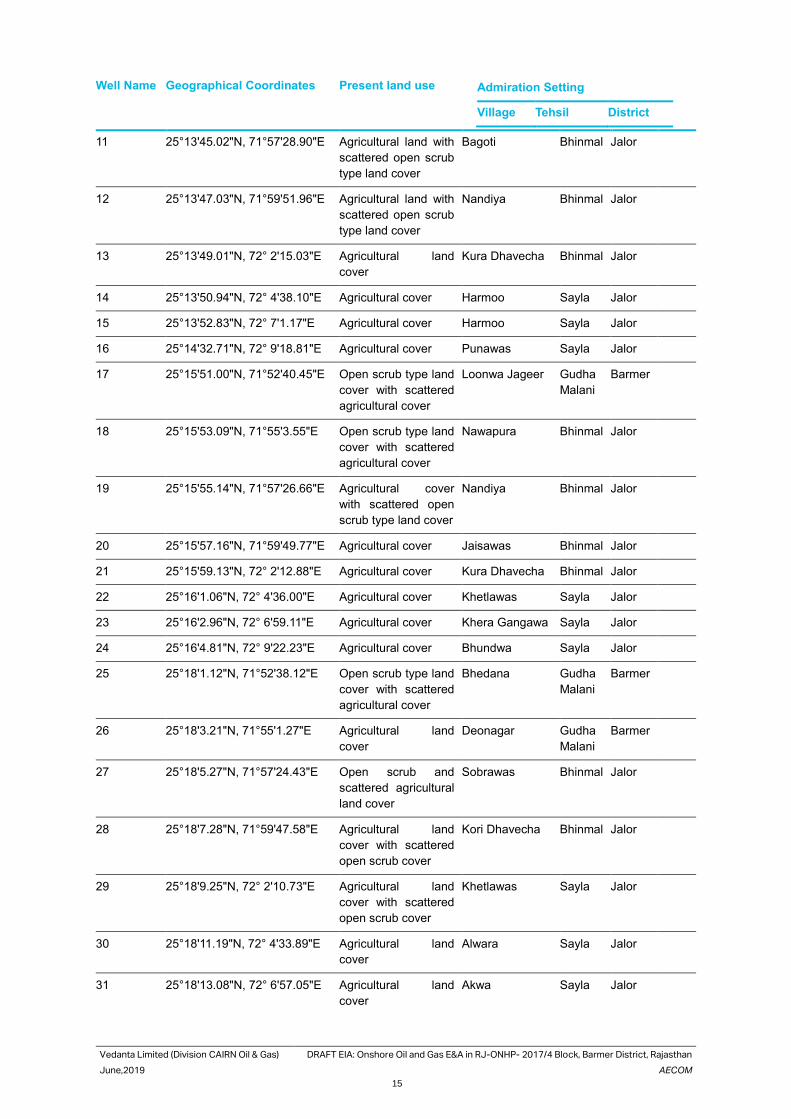
Vedanta Limited (Division CAIRN Oil & Gas) DRAFT EIA: Onshore Oil and Gas E&A in RJ-ONHP- 2017/4 Block, Barmer District, Rajasthan
June,2019 AECOM
15
Well Name Geographical Coordinates Present land use Admiration Setting
Village Tehsil District
11 25°13'45.02"N, 71°57'28.90"E Agricultural land with
scattered open scrub
type land cover
Bagoti Bhinmal Jalor
12 25°13'47.03"N, 71°59'51.96"E Agricultural land with
scattered open scrub
type land cover
Nandiya Bhinmal Jalor
13 25°13'49.01"N, 72° 2'15.03"E Agricultural land
cover
Kura Dhavecha Bhinmal Jalor
14 25°13'50.94"N, 72° 4'38.10"E Agricultural cover Harmoo Sayla Jalor
15 25°13'52.83"N, 72° 7'1.17"E Agricultural cover Harmoo Sayla Jalor
16 25°14'32.71"N, 72° 9'18.81"E Agricultural cover Punawas Sayla Jalor
17 25°15'51.00"N, 71°52'40.45"E Open scrub type land
cover with scattered
agricultural cover
Loonwa Jageer
Gudha
Malani
Barmer
18 25°15'53.09"N, 71°55'3.55"E Open scrub type land
cover with scattered
agricultural cover
Nawapura Bhinmal Jalor
19 25°15'55.14"N, 71°57'26.66"E Agricultural cover
with scattered open
scrub type land cover
Nandiya Bhinmal Jalor
20 25°15'57.16"N, 71°59'49.77"E Agricultural cover Jaisawas Bhinmal Jalor
21 25°15'59.13"N, 72° 2'12.88"E Agricultural cover Kura Dhavecha Bhinmal Jalor
22 25°16'1.06"N, 72° 4'36.00"E Agricultural cover Khetlawas Sayla Jalor
23 25°16'2.96"N, 72° 6'59.11"E Agricultural cover Khera Gangawa Sayla Jalor
24 25°16'4.81"N, 72° 9'22.23"E Agricultural cover Bhundwa Sayla Jalor
25 25°18'1.12"N, 71°52'38.12"E Open scrub type land
cover with scattered
agricultural cover
Bhedana Gudha
Malani
Barmer
26 25°18'3.21"N, 71°55'1.27"E Agricultural land
cover
Deonagar Gudha
Malani
Barmer
27 25°18'5.27"N, 71°57'24.43"E Open scrub and
scattered agricultural
land cover
Sobrawas Bhinmal Jalor
28 25°18'7.28"N, 71°59'47.58"E Agricultural land
cover with scattered
open scrub cover
Kori Dhavecha Bhinmal Jalor
29 25°18'9.25"N, 72° 2'10.73"E Agricultural land
cover with scattered
open scrub cover
Khetlawas Sayla Jalor
30 25°18'11.19"N, 72° 4'33.89"E Agricultural land
cover
Alwara Sayla Jalor
31 25°18'13.08"N, 72° 6'57.05"E Agricultural land
cover
Akwa Sayla Jalor
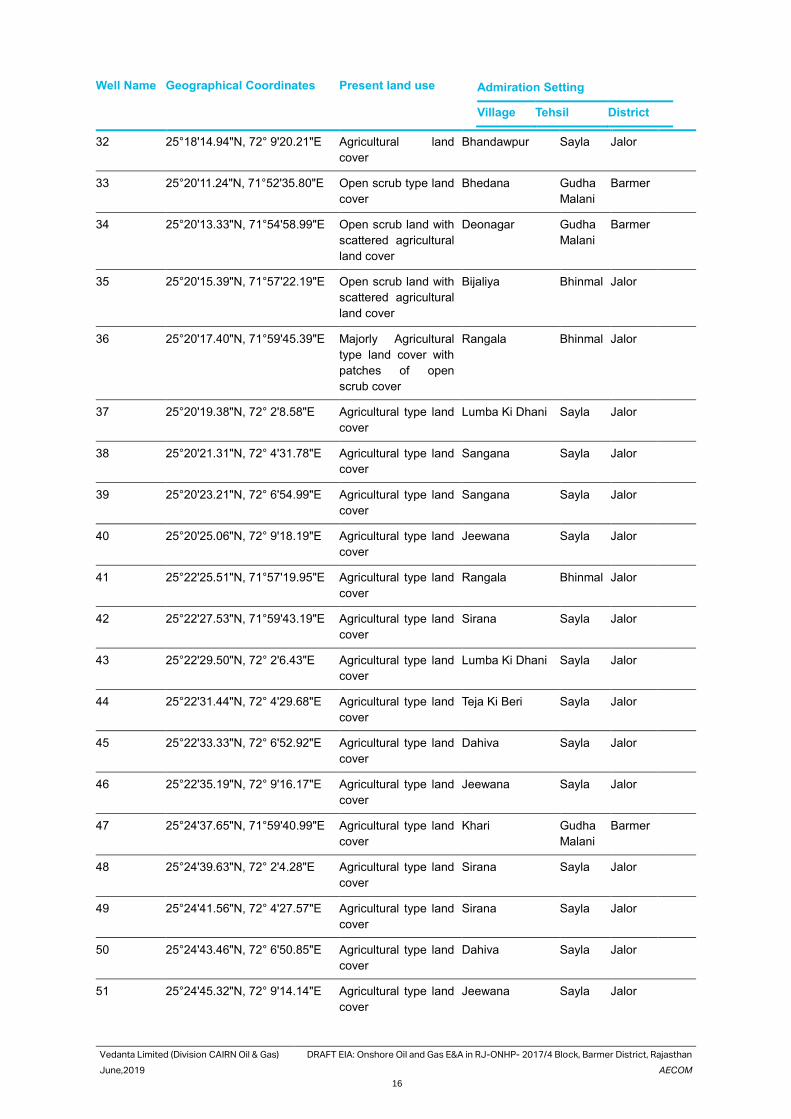
Vedanta Limited (Division CAIRN Oil & Gas) DRAFT EIA: Onshore Oil and Gas E&A in RJ-ONHP- 2017/4 Block, Barmer District, Rajasthan
June,2019 AECOM
16
Well Name Geographical Coordinates Present land use Admiration Setting
Village Tehsil District
32 25°18'14.94"N, 72° 9'20.21"E Agricultural land
cover
Bhandawpur Sayla Jalor
33 25°20'11.24"N, 71°52'35.80"E Open scrub type land
cover
Bhedana Gudha
Malani
Barmer
34 25°20'13.33"N, 71°54'58.99"E Open scrub land with
scattered agricultural
land cover
Deonagar Gudha
Malani
Barmer
35 25°20'15.39"N, 71°57'22.19"E Open scrub land with
scattered agricultural
land cover
Bijaliya Bhinmal Jalor
36 25°20'17.40"N, 71°59'45.39"E Majorly Agricultural
type land cover with
patches of open
scrub cover
Rangala Bhinmal Jalor
37 25°20'19.38"N, 72° 2'8.58"E Agricultural type land
cover
Lumba Ki Dhani Sayla Jalor
38 25°20'21.31"N, 72° 4'31.78"E Agricultural type land
cover
Sangana Sayla Jalor
39 25°20'23.21"N, 72° 6'54.99"E Agricultural type land
cover
Sangana Sayla Jalor
40 25°20'25.06"N, 72° 9'18.19"E Agricultural type land
cover
Jeewana Sayla Jalor
41 25°22'25.51"N, 71°57'19.95"E Agricultural type land
cover
Rangala Bhinmal Jalor
42 25°22'27.53"N, 71°59'43.19"E Agricultural type land
cover
Sirana Sayla Jalor
43 25°22'29.50"N, 72° 2'6.43"E Agricultural type land
cover
Lumba Ki Dhani Sayla Jalor
44 25°22'31.44"N, 72° 4'29.68"E Agricultural type land
cover
Teja Ki Beri Sayla Jalor
45 25°22'33.33"N, 72° 6'52.92"E Agricultural type land
cover
Dahiva Sayla Jalor
46 25°22'35.19"N, 72° 9'16.17"E Agricultural type land
cover
Jeewana Sayla Jalor
47 25°24'37.65"N, 71°59'40.99"E Agricultural type land
cover
Khari Gudha
Malani
Barmer
48 25°24'39.63"N, 72° 2'4.28"E Agricultural type land
cover
Sirana Sayla Jalor
49 25°24'41.56"N, 72° 4'27.57"E Agricultural type land
cover
Sirana Sayla Jalor
50 25°24'43.46"N, 72° 6'50.85"E Agricultural type land
cover
Dahiva Sayla Jalor
51 25°24'45.32"N, 72° 9'14.14"E Agricultural type land
cover
Jeewana Sayla Jalor
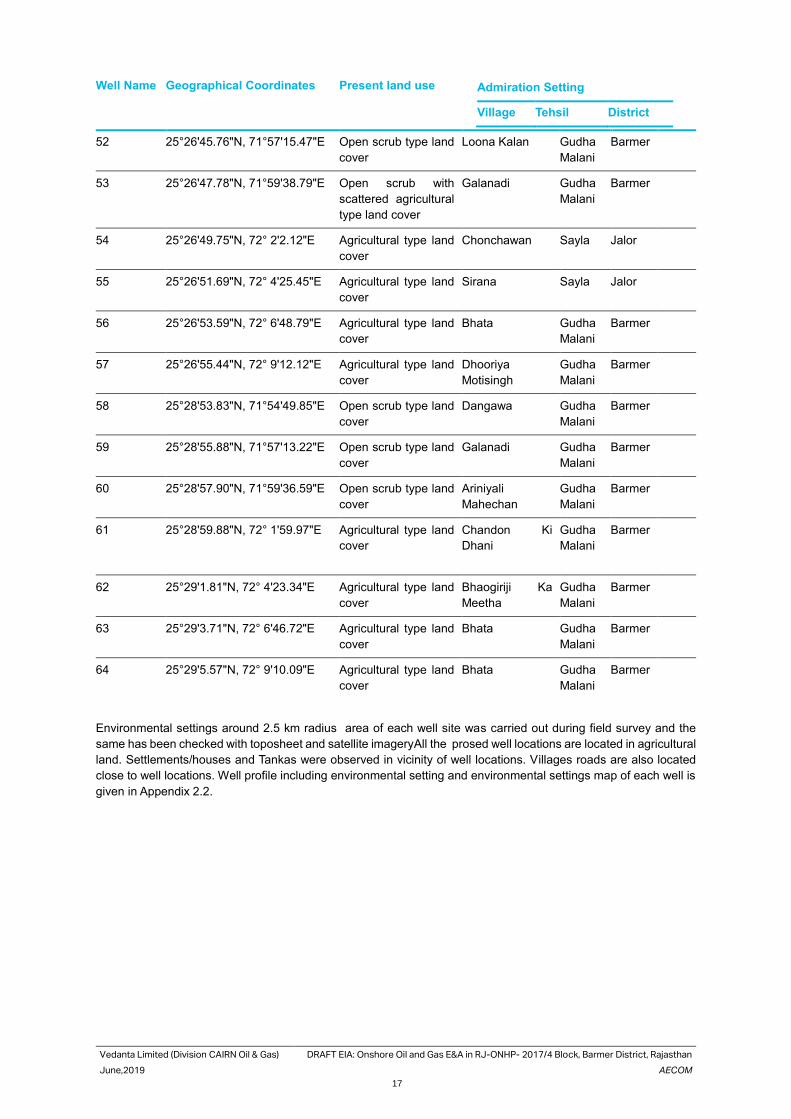
Vedanta Limited (Division CAIRN Oil & Gas) DRAFT EIA: Onshore Oil and Gas E&A in RJ-ONHP- 2017/4 Block, Barmer District, Rajasthan
June,2019 AECOM
17
Well Name Geographical Coordinates Present land use Admiration Setting
Village Tehsil District
52 25°26'45.76"N, 71°57'15.47"E Open scrub type land
cover
Loona Kalan Gudha
Malani
Barmer
53 25°26'47.78"N, 71°59'38.79"E Open scrub with
scattered agricultural
type land cover
Galanadi Gudha
Malani
Barmer
54 25°26'49.75"N, 72° 2'2.12"E Agricultural type land
cover
Chonchawan Sayla Jalor
55 25°26'51.69"N, 72° 4'25.45"E Agricultural type land
cover
Sirana Sayla Jalor
56 25°26'53.59"N, 72° 6'48.79"E Agricultural type land
cover
Bhata Gudha
Malani
Barmer
57 25°26'55.44"N, 72° 9'12.12"E Agricultural type land
cover
Dhooriya
Motisingh
Gudha
Malani
Barmer
58 25°28'53.83"N, 71°54'49.85"E Open scrub type land
cover
Dangawa Gudha
Malani
Barmer
59 25°28'55.88"N, 71°57'13.22"E Open scrub type land
cover
Galanadi Gudha
Malani
Barmer
60 25°28'57.90"N, 71°59'36.59"E Open scrub type land
cover
Ariniyali
Mahechan
Gudha
Malani
Barmer
61 25°28'59.88"N, 72° 1'59.97"E Agricultural type land
cover
Chandon Ki
Dhani
Gudha
Malani
Barmer
62 25°29'1.81"N, 72° 4'23.34"E Agricultural type land
cover
Bhaogiriji Ka
Meetha
Gudha
Malani
Barmer
63 25°29'3.71"N, 72° 6'46.72"E Agricultural type land
cover
Bhata Gudha
Malani
Barmer
64 25°29'5.57"N, 72° 9'10.09"E Agricultural type land
cover
Bhata Gudha
Malani
Barmer
Environmental settings around 2.5 km radius area of each well site was carried out during field survey and the
same has been checked with toposheet and satellite imageryAll the prosed well locations are located in agricultural
land. Settlements/houses and Tankas were observed in vicinity of well locations. Villages roads are also located
close to well locations. Well profile including environmental setting and environmental settings map of each well is
given in Appendix 2.2.
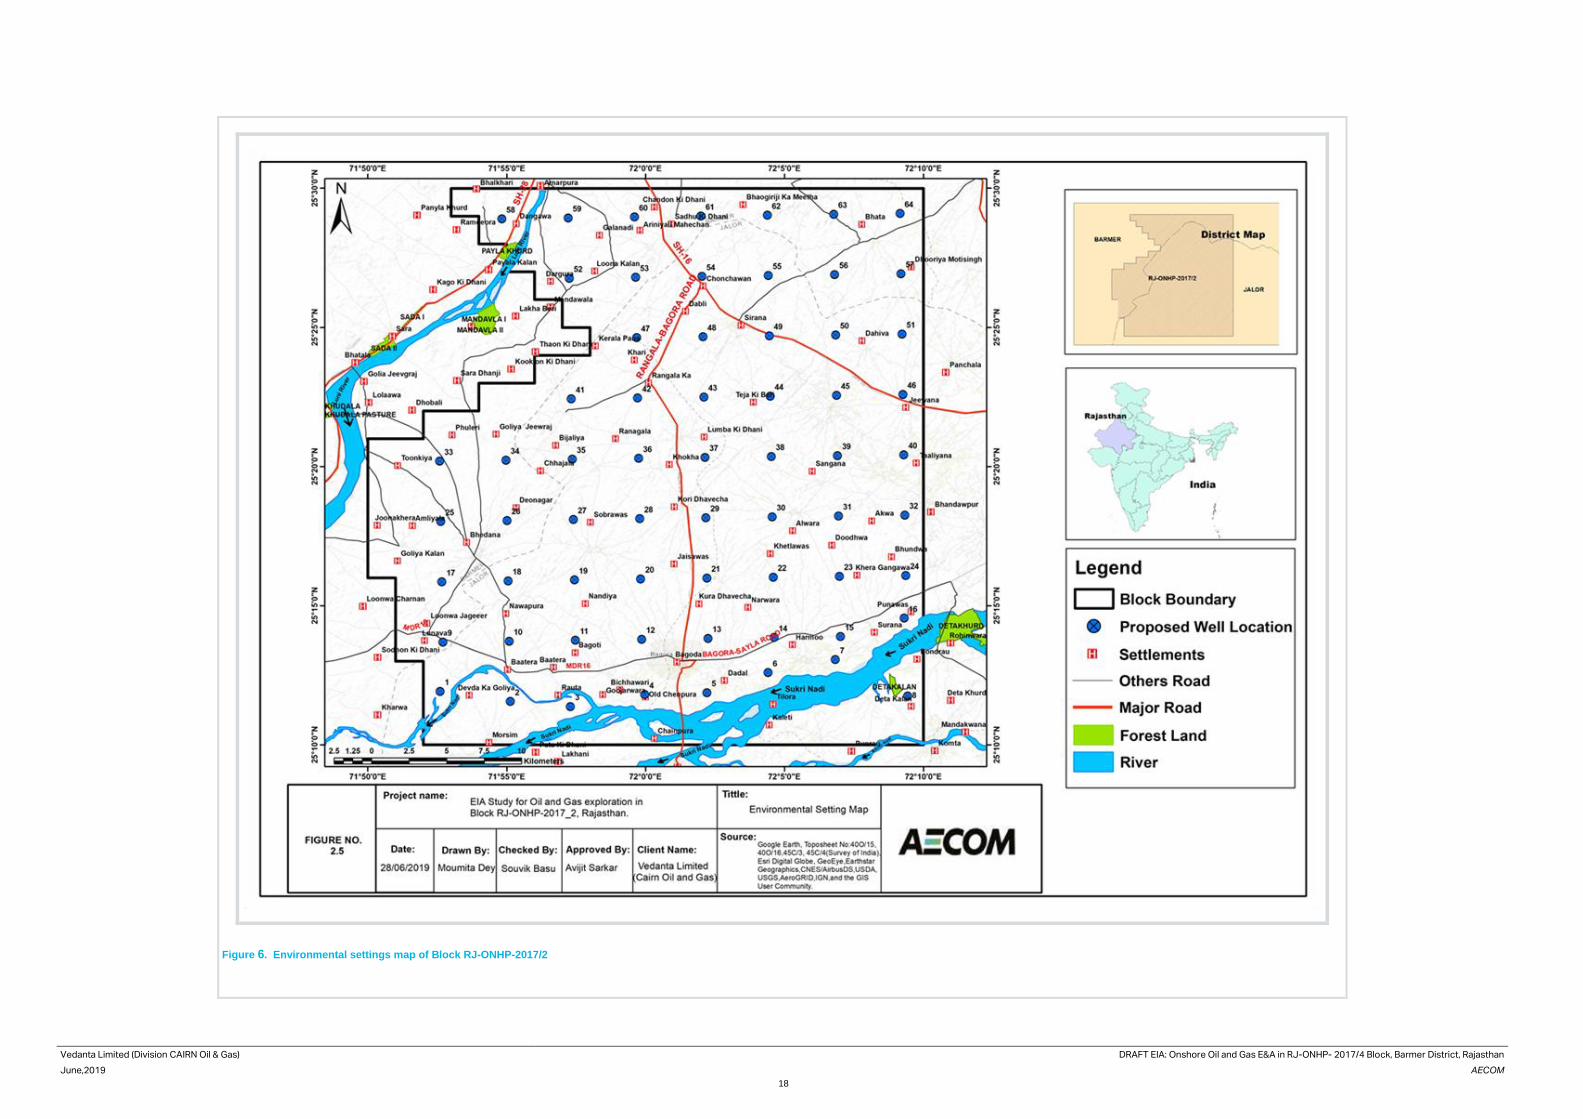
Vedanta Limited (Division CAIRN Oil & Gas) DRAFT EIA: Onshore Oil and Gas E&A in RJ-ONHP- 2017/4 Block, Barmer District, Rajasthan
June,2019 AECOM
18
Figure 6. Environmental settings map of Block RJ-ONHP-2017/2
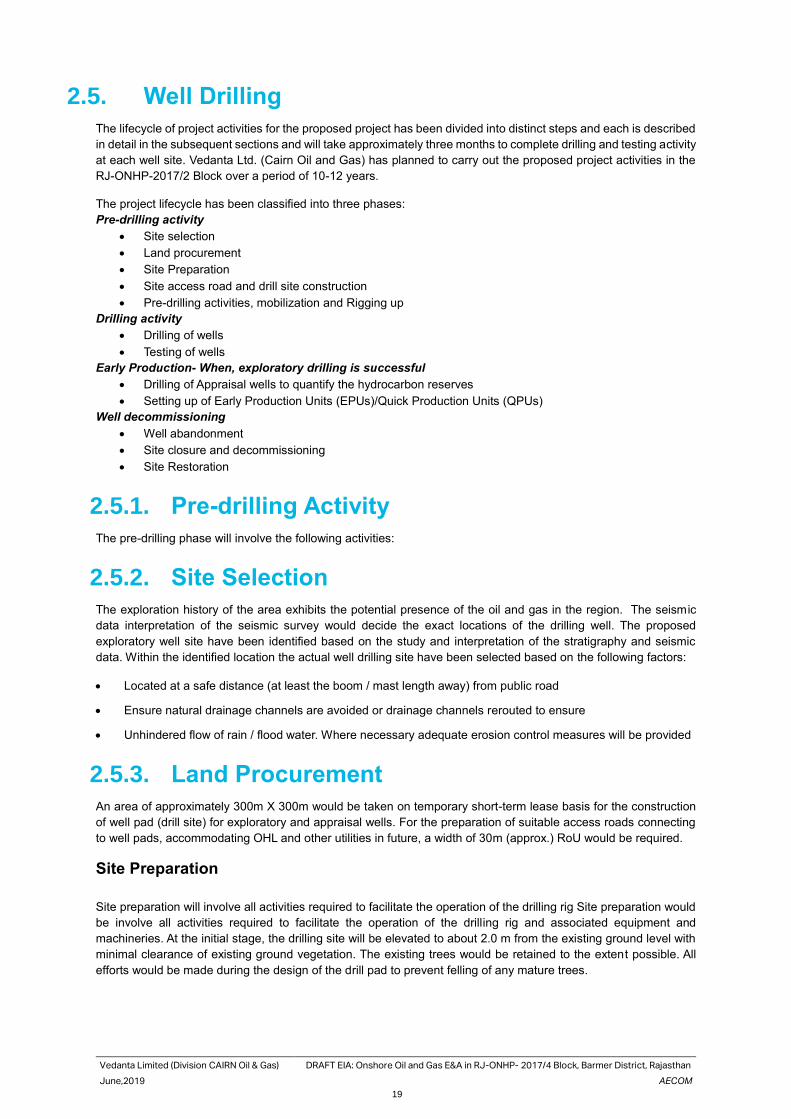
Vedanta Limited (Division CAIRN Oil & Gas) DRAFT EIA: Onshore Oil and Gas E&A in RJ-ONHP- 2017/4 Block, Barmer District, Rajasthan
June,2019 AECOM
19
2.5. Well Drilling
The lifecycle of project activities for the proposed project has been divided into distinct steps and each is described
in detail in the subsequent sections and will take approximately three months to complete drilling and testing activity
at each well site. Vedanta Ltd. (Cairn Oil and Gas) has planned to carry out the proposed project activities in the
RJ-ONHP-2017/2 Block over a period of 10-12 years.
The project lifecycle has been classified into three phases:
Pre-drilling activity
• Site selection
• Land procurement
• Site Preparation
• Site access road and drill site construction
• Pre-drilling activities, mobilization and Rigging up
Drilling activity
• Drilling of wells
• Testing of wells
Early Production- When, exploratory drilling is successful
• Drilling of Appraisal wells to quantify the hydrocarbon reserves
• Setting up of Early Production Units (EPUs)/Quick Production Units (QPUs)
Well decommissioning
• Well abandonment
• Site closure and decommissioning
• Site Restoration
2.5.1. Pre-drilling Activity
The pre-drilling phase will involve the following activities:
2.5.2. Site Selection
The exploration history of the area exhibits the potential presence of the oil and gas in the region. The seismic
data interpretation of the seismic survey would decide the exact locations of the drilling well. The proposed
exploratory well site have been identified based on the study and interpretation of the stratigraphy and seismic
data. Within the identified location the actual well drilling site have been selected based on the following factors:
• Located at a safe distance (at least the boom / mast length away) from public road
• Ensure natural drainage channels are avoided or drainage channels rerouted to ensure
• Unhindered flow of rain / flood water. Where necessary adequate erosion control measures will be provided
2.5.3. Land Procurement
An area of approximately 300m X 300m would be taken on temporary short-term lease basis for the construction
of well pad (drill site) for exploratory and appraisal wells. For the preparation of suitable access roads connecting
to well pads, accommodating OHL and other utilities in future, a width of 30m (approx.) RoU would be required.
Site Preparation
Site preparation will involve all activities required to facilitate the operation of the drilling rig Site preparation would
be involve all activities required to facilitate the operation of the drilling rig and associated equipment and
machineries. At the initial stage, the drilling site will be elevated to about 2.0 m from the existing ground level with
minimal clearance of existing ground vegetation. The existing trees would be retained to the extent possible. All
efforts would be made during the design of the drill pad to prevent felling of any mature trees.

Vedanta Limited (Division CAIRN Oil & Gas) DRAFT EIA: Onshore Oil and Gas E&A in RJ-ONHP- 2017/4 Block, Barmer District, Rajasthan
June,2019 AECOM
20
The loose top soil will be removed by using mechanical means like bulldozer and saved at a nearby place (away
from the water channels) for later use during site restoration. Levelling and compaction will be done with the help
of graders and mechanical rollers. The land filling materials and rubbles will be required for the purpose for site
preparation in sufficient amount.. Subsequently, the proposed well site & campsite will be duly fenced using chain
link and barbed wires.
Platforms for drill pad and all other heavy equipment systems or machinery, cast in-situ Reinforced Cement
Concrete (RCC) would be used for the construction of foundation system. The rig foundation will be of 20m X 20m
in size and will have an elevation of 0.6 m. For making the foundations of main rig structure, cast in-situ bored
under- reamed piles of specified lengths will also be used. The elevated structures will have proper garland drains
for storm water with sufficient gradient, made of brick masonry, to take care of surface runoff water.
Specially designed pit of an impervious HDPE liner will be provided as part of the site development for disposal of
drilling waste in the form of spent drilling mud and cuttings.
A Campsite, elevated to the height as that of the drilling site (approx.2.0 m), will be set up adjoining the well site.
Local earth and rubble will be used as the fill material. Proper surface gradients and brick masonry drains will take
care of the run-off water, where as separate septic tanks and soak pits will be provided along with the labour camp
for disposal of domestic waste water.
Though the rig and related equipment’s will be directly brought to site, spares, mud preparing chemicals and other
materials will be stored at a warehouse near to the site and will be received to the site from that intermediate
storage area. The rig equipment will however be transported directly to the drilling site during mobilization and will
be de-mobilized directly from the site. The materials will be intermittently supplied from warehouse to the drilling
site, during the operations - with some stock at the drilling site itself. A typical layout of drill site with OPU is given
in figure 7, and drill site without QPU is presented in figure 8.
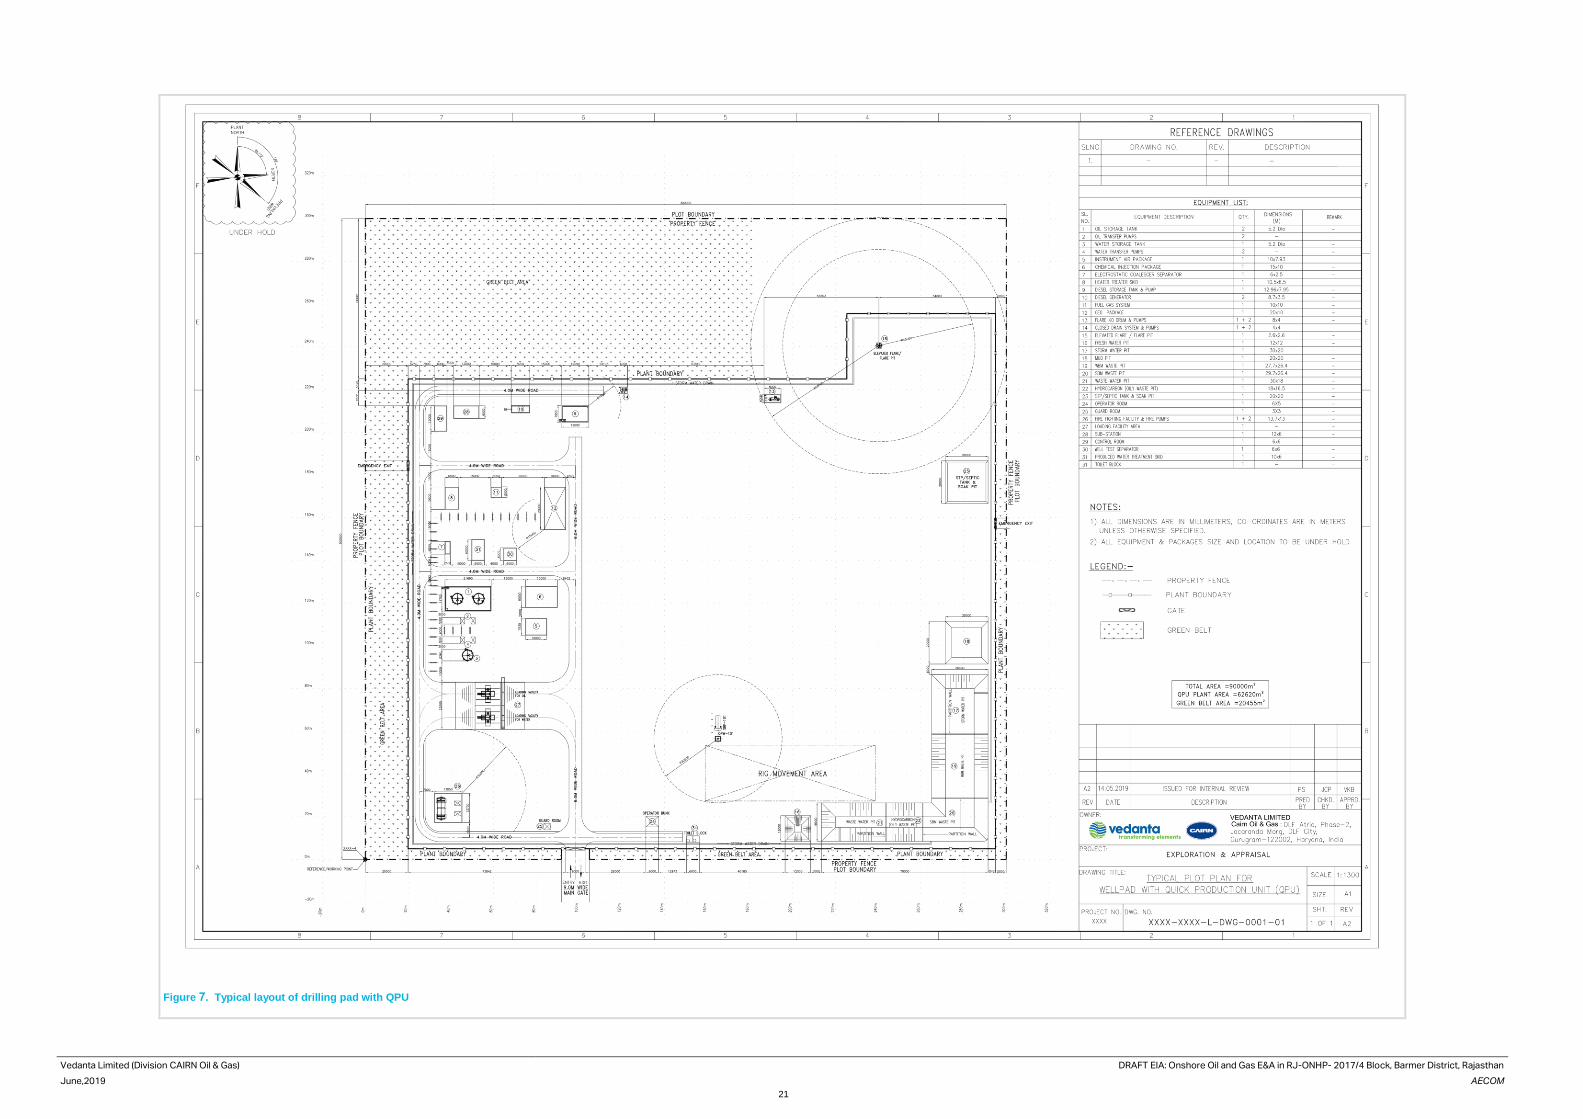
Vedanta Limited (Division CAIRN Oil & Gas) DRAFT EIA: Onshore Oil and Gas E&A in RJ-ONHP- 2017/4 Block, Barmer District, Rajasthan
June,2019 AECOM
21
Figure 7. Typical layout of drilling pad with QPU
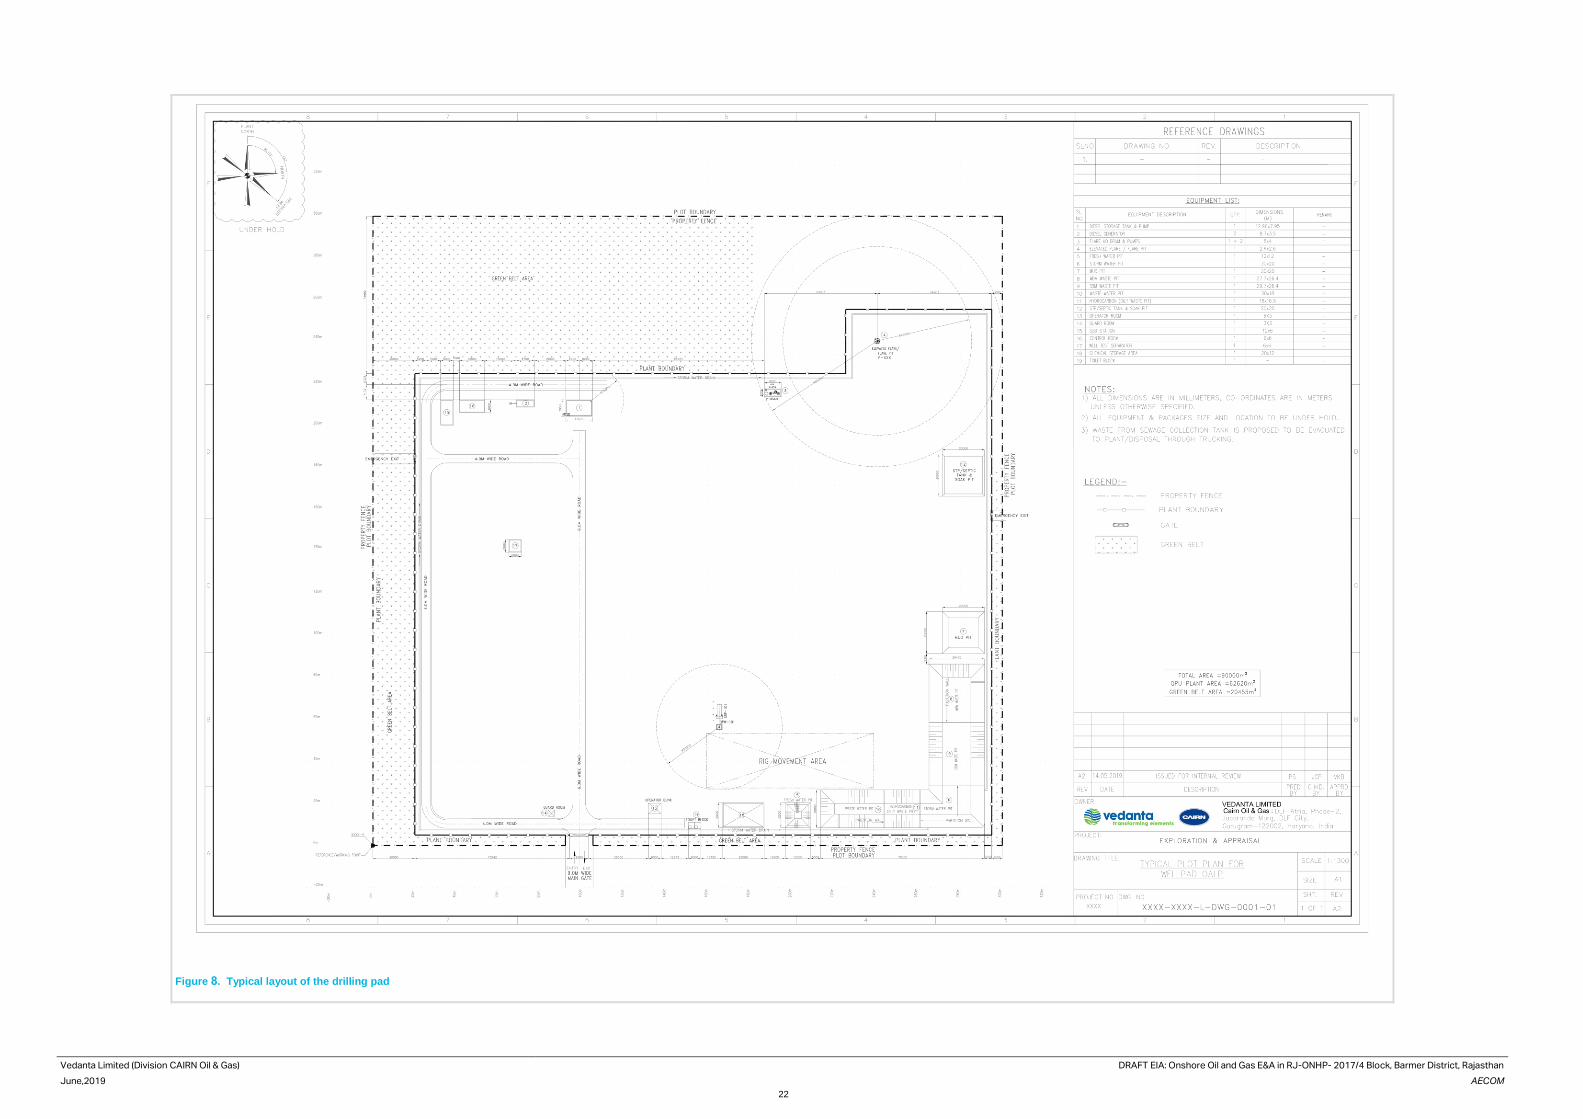
Vedanta Limited (Division CAIRN Oil & Gas) DRAFT EIA: Onshore Oil and Gas E&A in RJ-ONHP- 2017/4 Block, Barmer District, Rajasthan
June,2019 AECOM
22
Figure 8. Typical layout of the drilling pad
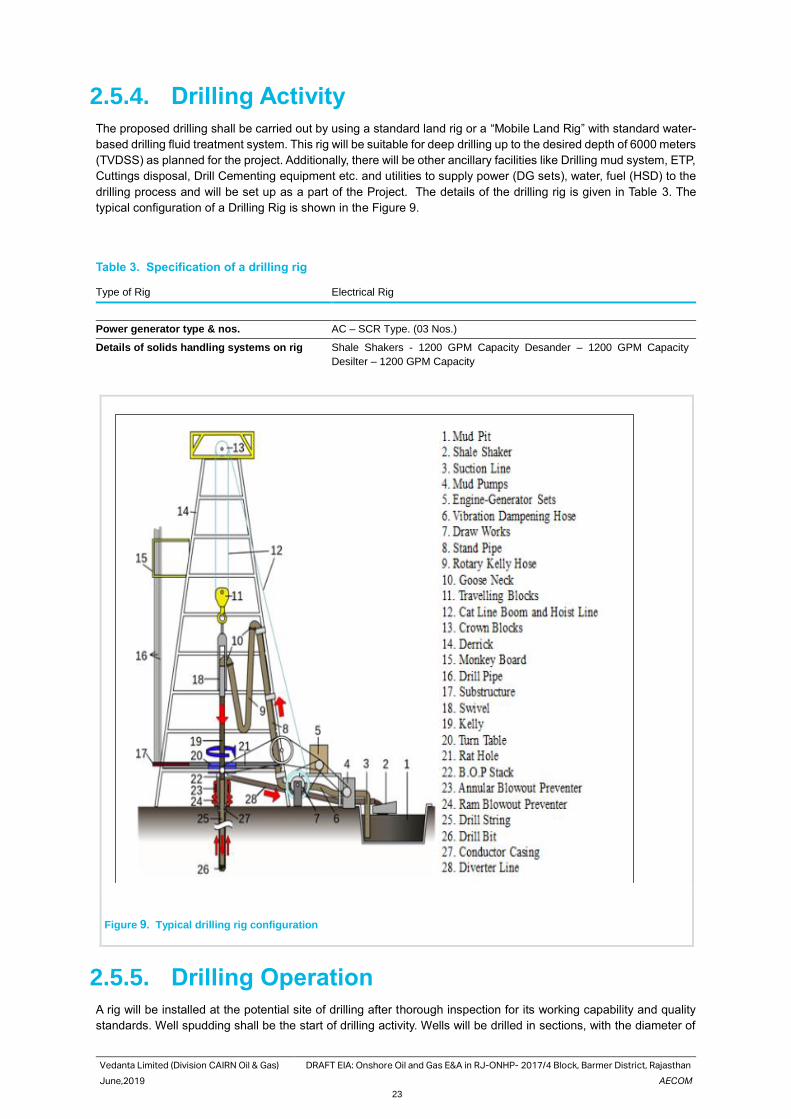
Vedanta Limited (Division CAIRN Oil & Gas) DRAFT EIA: Onshore Oil and Gas E&A in RJ-ONHP- 2017/4 Block, Barmer District, Rajasthan
June,2019 AECOM
23
2.5.4. Drilling Activity
The proposed drilling shall be carried out by using a standard land rig or a “Mobile Land Rig” with standard water-
based drilling fluid treatment system. This rig will be suitable for deep drilling up to the desired depth of 6000 meters
(TVDSS) as planned for the project. Additionally, there will be other ancillary facilities like Drilling mud system, ETP,
Cuttings disposal, Drill Cementing equipment etc. and utilities to supply power (DG sets), water, fuel (HSD) to the
drilling process and will be set up as a part of the Project. The details of the drilling rig is given in Table 3. The
typical configuration of a Drilling Rig is shown in the Figure 9.
Table 3. Specification of a drilling rig
Type of Rig Electrical Rig
Power generator type & nos. AC – SCR Type. (03 Nos.)
Details of solids handling systems on rig Shale Shakers - 1200 GPM Capacity Desander – 1200 GPM Capacity
Desilter – 1200 GPM Capacity
Figure 9. Typical drilling rig configuration
2.5.5. Drilling Operation
A rig will be installed at the potential site of drilling after thorough inspection for its working capability and quality
standards. Well spudding shall be the start of drilling activity. Wells will be drilled in sections, with the diameter of
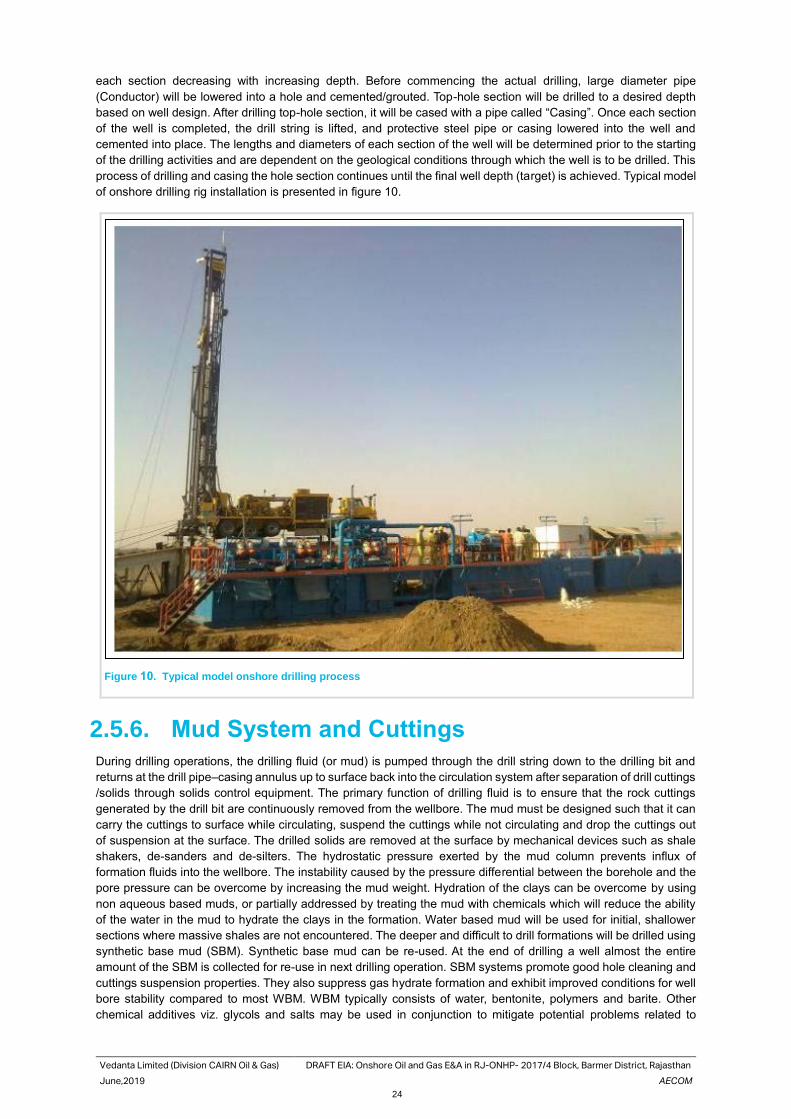
Vedanta Limited (Division CAIRN Oil & Gas) DRAFT EIA: Onshore Oil and Gas E&A in RJ-ONHP- 2017/4 Block, Barmer District, Rajasthan
June,2019 AECOM
24
each section decreasing with increasing depth. Before commencing the actual drilling, large diameter pipe
(Conductor) will be lowered into a hole and cemented/grouted. Top-hole section will be drilled to a desired depth
based on well design. After drilling top-hole section, it will be cased with a pipe called “Casing”. Once each section
of the well is completed, the drill string is lifted, and protective steel pipe or casing lowered into the well and
cemented into place. The lengths and diameters of each section of the well will be determined prior to the starting
of the drilling activities and are dependent on the geological conditions through which the well is to be drilled. This
process of drilling and casing the hole section continues until the final well depth (target) is achieved. Typical model
of onshore drilling rig installation is presented in figure 10.
Figure 10. Typical model onshore drilling process
2.5.6. Mud System and Cuttings
During drilling operations, the drilling fluid (or mud) is pumped through the drill string down to the drilling bit and
returns at the drill pipe–casing annulus up to surface back into the circulation system after separation of drill cuttings
/solids through solids control equipment. The primary function of drilling fluid is to ensure that the rock cuttings
generated by the drill bit are continuously removed from the wellbore. The mud must be designed such that it can
carry the cuttings to surface while circulating, suspend the cuttings while not circulating and drop the cuttings out
of suspension at the surface. The drilled solids are removed at the surface by mechanical devices such as shale
shakers, de-sanders and de-silters. The hydrostatic pressure exerted by the mud column prevents influx of
formation fluids into the wellbore. The instability caused by the pressure differential between the borehole and the
pore pressure can be overcome by increasing the mud weight. Hydration of the clays can be overcome by using
non aqueous based muds, or partially addressed by treating the mud with chemicals which will reduce the ability
of the water in the mud to hydrate the clays in the formation. Water based mud will be used for initial, shallower
sections where massive shales are not encountered. The deeper and difficult to drill formations will be drilled using
synthetic base mud (SBM). Synthetic base mud can be re-used. At the end of drilling a well almost the entire
amount of the SBM is collected for re-use in next drilling operation. SBM systems promote good hole cleaning and
cuttings suspension properties. They also suppress gas hydrate formation and exhibit improved conditions for well
bore stability compared to most WBM. WBM typically consists of water, bentonite, polymers and barite. Other
chemical additives viz. glycols and salts may be used in conjunction to mitigate potential problems related to
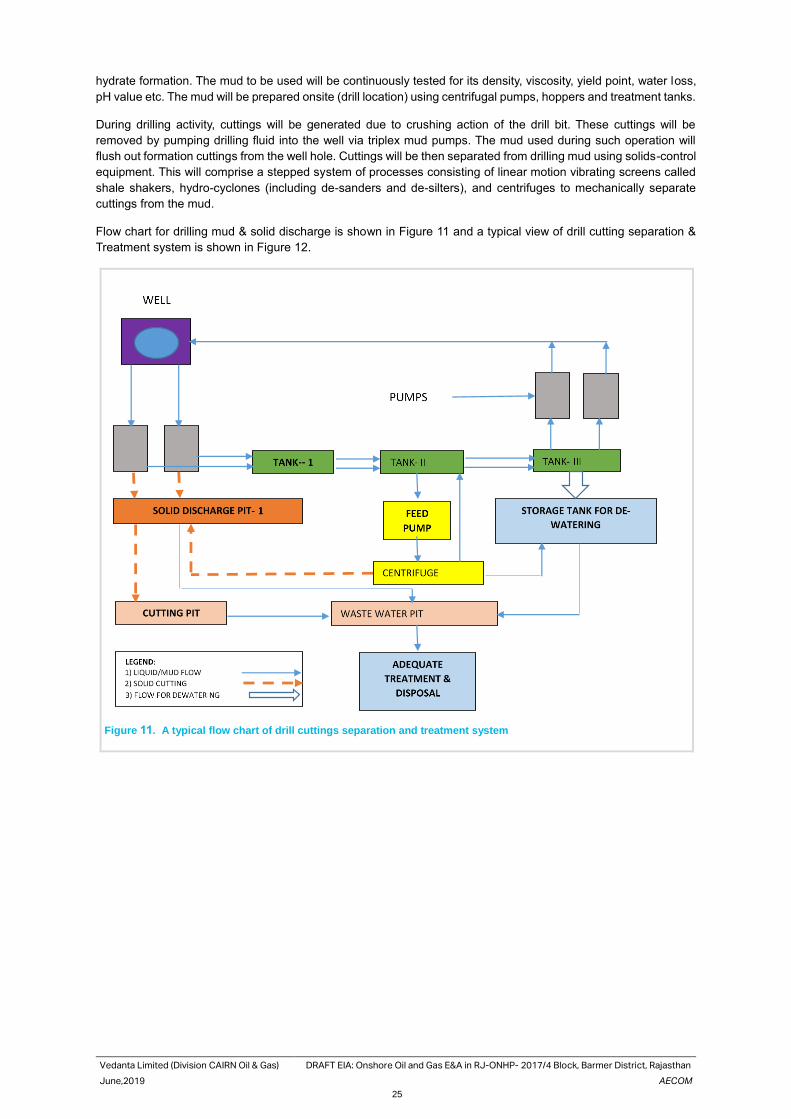
Vedanta Limited (Division CAIRN Oil & Gas) DRAFT EIA: Onshore Oil and Gas E&A in RJ-ONHP- 2017/4 Block, Barmer District, Rajasthan
June,2019 AECOM
25
hydrate formation. The mud to be used will be continuously tested for its density, viscosity, yield point, water loss,
pH value etc. The mud will be prepared onsite (drill location) using centrifugal pumps, hoppers and treatment tanks.
During drilling activity, cuttings will be generated due to crushing action of the drill bit. These cuttings will be
removed by pumping drilling fluid into the well via triplex mud pumps. The mud used during such operation will
flush out formation cuttings from the well hole. Cuttings will be then separated from drilling mud using solids-control
equipment. This will comprise a stepped system of processes consisting of linear motion vibrating screens called
shale shakers, hydro-cyclones (including de-sanders and de-silters), and centrifuges to mechanically separate
cuttings from the mud.
Flow chart for drilling mud & solid discharge is shown in Figure 11 and a typical view of drill cutting separation &
Treatment system is shown in Figure 12.
Figure 11. A typical flow chart of drill cuttings separation and treatment system
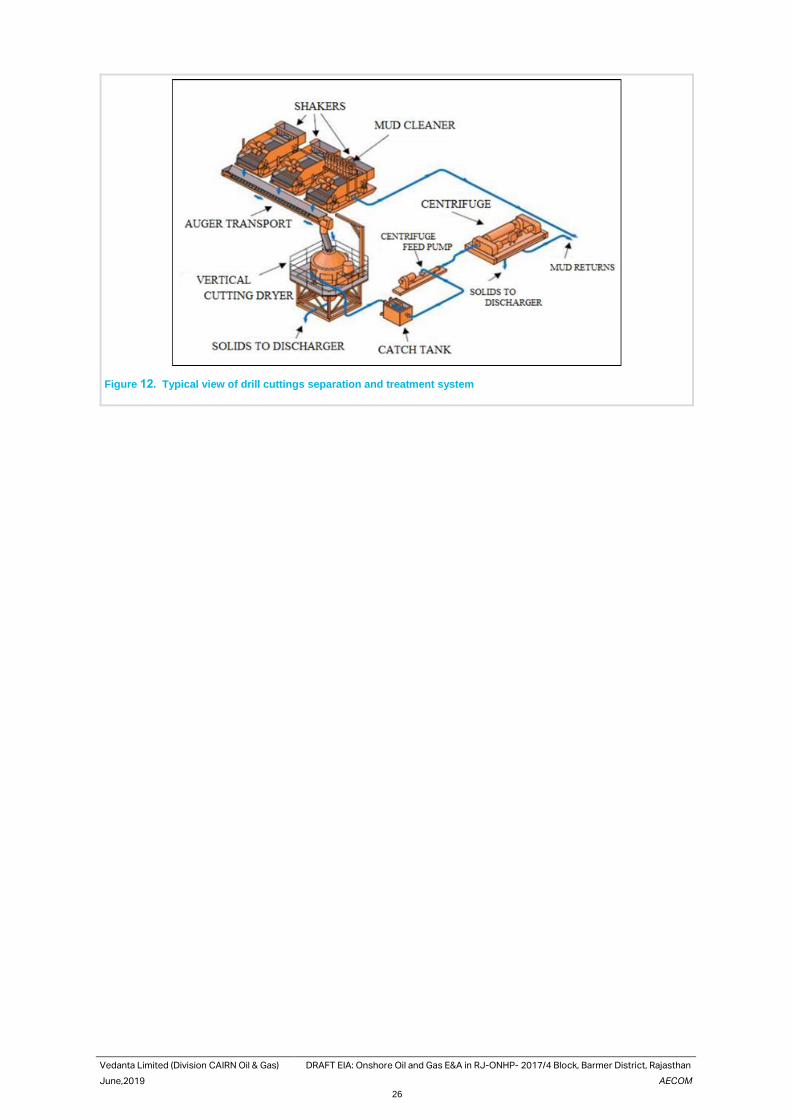
Vedanta Limited (Division CAIRN Oil & Gas) DRAFT EIA: Onshore Oil and Gas E&A in RJ-ONHP- 2017/4 Block, Barmer District, Rajasthan
June,2019 AECOM
26
Figure 12. Typical view of drill cuttings separation and treatment system
Vedanta Limited. (Division CAIRN Oil & Gas) DRAFT EIA: Onshore Oil and Gas E&A in RJ-ONHP- 2017/2 Block, Barmer District, Rajasthan
June,2019 AECOM
27
2.5.7. Cementing
Cementing is a necessary aspect of exploratory drilling of oil and gas wells. Cement is used to fulfil the following
works:
• Secure/support casing strings
• Isolate zones for production purposes
2.5.8. Well Evaluation
During the drilling operations for different zones, logging operations will be undertaken to get information on the
potential type and quantities of hydrocarbons present in the target formations. Technicians employed by a specialist
logging Service Company do well logging by different well logging techniques including electric, sonic and
radioactive techniques. Logging instruments (sensors) are attached to the bottom of a wire line and lowered to the
bottom of the well and they are then slowly brought back. No emissions to the environment or any environmental
harm is associated with wire line logging operations. The radioactive source required for well logging operations
will be kept in specially designed container.
A drill-stem test will be frequently performed to evaluate the formation or zone from which the gas show was
observed. A drill-stem test enables the exploration company to obtain a sample of the fluids and gases contained
in the formation or interval being tested as well as pressure information, which is determined by special gauges
within the test tool. The test tool contains a valve which may be opened and closed to allow formation fluids to enter
the test tool and drill string. If there is sufficient fluid and pressure within the zone being tested, the formation fluid
may rise to the surface and flow into special test tanks used for that purpose. If gas is present, it is burned at the
surface as a flare.
2.5.9. Hydraulic Fracturing – for Tight Rock
Reservoirs of Hydrocarbons
Hydraulic fracturing is used in tight rock reservoirs with low permeability, such as shale (i.e., the conductivity or
ability of hydrocarbons to flow in the formation is low because of the small pore size in the rock). The goal of
hydraulic fracturing in tight reservoir (shale) formations is to enable a well to produce the resource or to increase
the rate at which a well is able to produce the resource. Hydraulic fracturing may be conducted in wells with low
permeability formation and low pressure. Wells requiring hydraulic fracturing and numbers of stages of hydraulic
fracturing per well will depend on seismic data acquired & interpreted and data acquired during the drilling phase
of the project.
Hydraulic fracturing is a common technique used to stimulate the production of oil and natural gas by creating
fractures or cracks that extend from the well hole into the rock formations. This is accomplished by injecting fluid,
which is usually a mixture of water and high viscosity fluid additives, under extremely high pressure. The pressure
of the water will then exceed the strength of the rock, causing fractures to enlarge. After the fractures take place, a
“propping agent” known as proppant (which is usually sand) is injected into the fractures to keep them from closing.
This allows the hydrocarbon to move more efficiently from the rock to the well. A single well may require up to
15,000 m3 of water which may vary depending on the fracking requirements. For the hydraulic fracturing in a well,
proppant mass of 150,000 – 200,000 lbs per stage and fluid volume of 2500 bbls – 4000 bbls per stage will be
required.
Fracturing effluent generated will be discharged in the HDPE lined pits at the drilling well sites. Frack fluid would
be treated suitably, thus raw water required for fracturing will be minimized.
2.5.10. Well kick situation & Control measures
While drilling, if the formation pressure exceeds the hydrostatic pressure exerted by the drilling fluid,
formation fluids break out in to the well bore. This is called kick. Primary means of well control is to have
sufficient over-balance over formation pressure. For some reason if an unexpected over-pressurized
formation is encountered while drilling and if the well control situation arises, rig is equipped with
equipment to control this situation. This set of equipment is called “Blowout Preventers (BOP)”. Blow
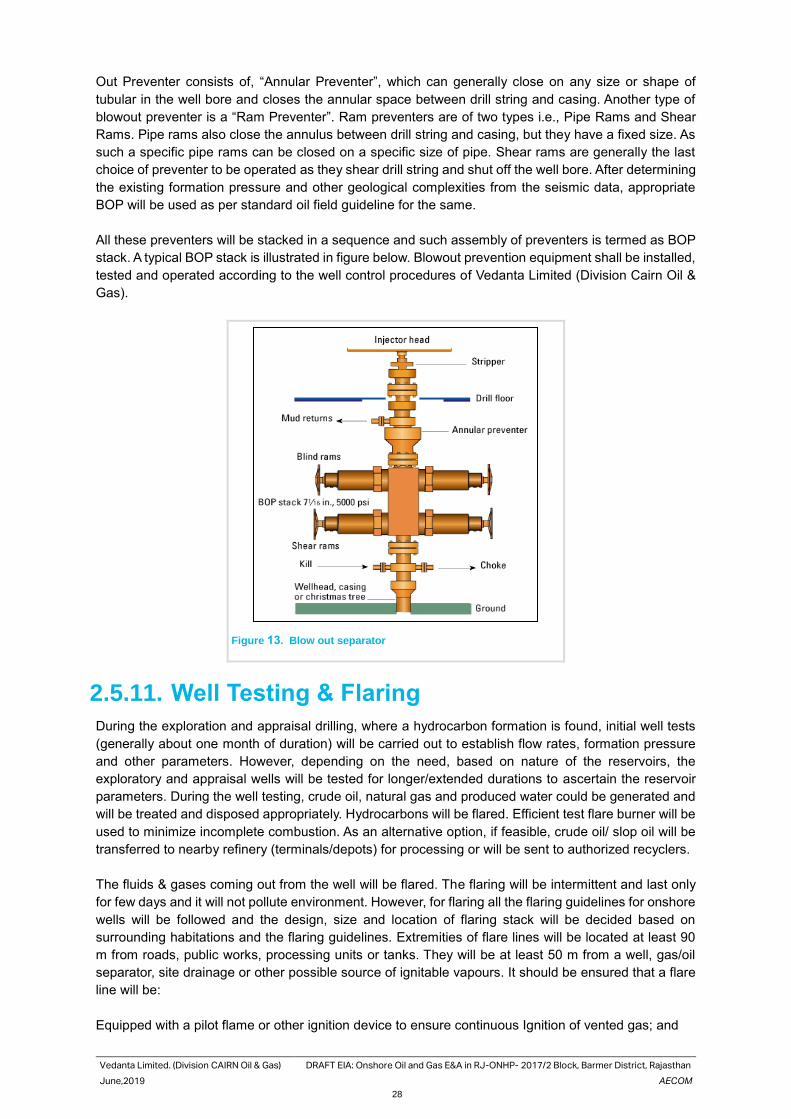
Vedanta Limited. (Division CAIRN Oil & Gas) DRAFT EIA: Onshore Oil and Gas E&A in RJ-ONHP- 2017/2 Block, Barmer District, Rajasthan
June,2019 AECOM
28
Out Preventer consists of, “Annular Preventer”, which can generally close on any size or shape of
tubular in the well bore and closes the annular space between drill string and casing. Another type of
blowout preventer is a “Ram Preventer”. Ram preventers are of two types i.e., Pipe Rams and Shear
Rams. Pipe rams also close the annulus between drill string and casing, but they have a fixed size. As
such a specific pipe rams can be closed on a specific size of pipe. Shear rams are generally the last
choice of preventer to be operated as they shear drill string and shut off the well bore. After determining
the existing formation pressure and other geological complexities from the seismic data, appropriate
BOP will be used as per standard oil field guideline for the same.
All these preventers will be stacked in a sequence and such assembly of preventers is termed as BOP
stack. A typical BOP stack is illustrated in figure below. Blowout prevention equipment shall be installed,
tested and operated according to the well control procedures of Vedanta Limited (Division Cairn Oil &
Gas).
Figure 13. Blow out separator
2.5.11. Well Testing & Flaring
During the exploration and appraisal drilling, where a hydrocarbon formation is found, initial well tests
(generally about one month of duration) will be carried out to establish flow rates, formation pressure
and other parameters. However, depending on the need, based on nature of the reservoirs, the
exploratory and appraisal wells will be tested for longer/extended durations to ascertain the reservoir
parameters. During the well testing, crude oil, natural gas and produced water could be generated and
will be treated and disposed appropriately. Hydrocarbons will be flared. Efficient test flare burner will be
used to minimize incomplete combustion. As an alternative option, if feasible, crude oil/ slop oil will be
transferred to nearby refinery (terminals/depots) for processing or will be sent to authorized recyclers.
The fluids & gases coming out from the well will be flared. The flaring will be intermittent and last only
for few days and it will not pollute environment. However, for flaring all the flaring guidelines for onshore
wells will be followed and the design, size and location of flaring stack will be decided based on
surrounding habitations and the flaring guidelines. Extremities of flare lines will be located at least 90
m from roads, public works, processing units or tanks. They will be at least 50 m from a well, gas/oil
separator, site drainage or other possible source of ignitable vapours. It should be ensured that a flare
line will be:
Equipped with a pilot flame or other ignition device to ensure continuous Ignition of vented gas; and
Vedanta Limited. (Division CAIRN Oil & Gas) DRAFT EIA: Onshore Oil and Gas E&A in RJ-ONHP- 2017/2 Block, Barmer District, Rajasthan
June,2019 AECOM
29
Equipped with a guard to protect the flame from being extinguished by the wind. The zones expected
to be gas bearing will be identified based on the wire line log data and same will undergo testing to
confirm the same. Approximately duration of the test flaring is around 24-48 days during developmental
drilling. Temporary test separators with facilities for flow metering will be provided which will separate
oil, gas and water. The crude oil produced during the well testing at appraisal stage will be collected
and sent to nearby refineries and /or approved waste oil recyclers.
2.6. Early Production- If, exploratory drilling is
successful
Drilling of Appraisal wells to Quantify the Hydrocarbon
Reserves
When, exploratory drilling is successful, more wells (termed as Appraisal wells) will be drilled to determine the size
and the extent of the field. Wells drilled to quantify the hydrocarbon reserves found are called as ‘appraisal’ wells.
The appraisal activity will be carried out with an aim to evaluate the size and nature of the reservoir, to determine
the number of confirming or appraisal wells required, and whether any further seismic survey is necessary. The
technical procedures and activities in appraisal drilling will be the same as those employed for exploration wells. A
number of wells may be drilled from a single well pad/ drill site. Deviated or directional drilling at an angle from a
site adjacent to the original discovery well may be used to appraise other parts of the reservoir, in order to reduce
the land requirement.
Brief Process description for Early Production Units (EPUs)/
Quick Production units (QPUs):
Early Production Units (EPUs) or Quick Production Units (QPUs) will be installed for the processing of produced
well fluid. A EPU/ QPU will be a packaged/ modular mobile unit and will mainly consists of a heater-treater separator
or a production heater followed with a three phase separator, electrostatic coalescer, oil storage tanks, oil tanker
loading system, produced water separation and disposal system, power generation (GEG or DG), test separator
skid, utility systems such as fuel gas, flare, Inst. Air package, diesel storage, firefighting equipment, etc. A QPF will
be designed for a capacity of 2,000 BLPD (Barrels of liquid per Day) with water cut variation from 0 – 50 vol%.
Typical process Flow of QPU/EPU is presented in the Figure 14.
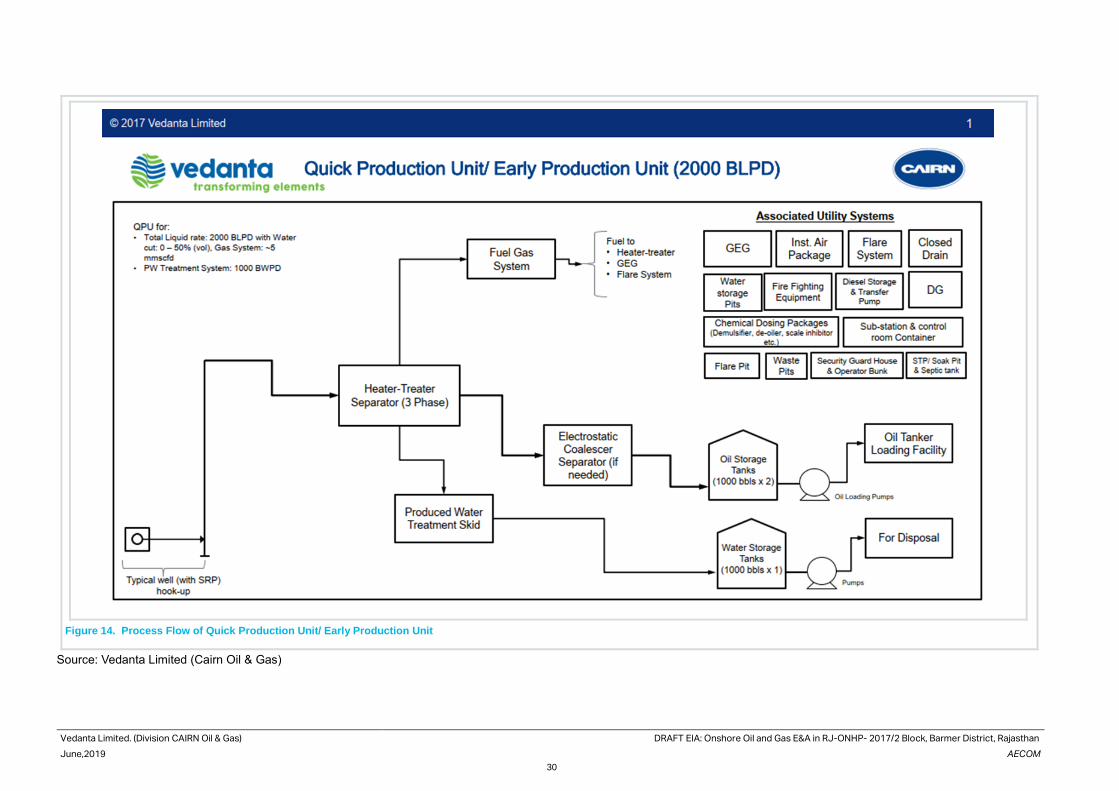
Vedanta Limited. (Division CAIRN Oil & Gas) DRAFT EIA: Onshore Oil and Gas E&A in RJ-ONHP- 2017/2 Block, Barmer District, Rajasthan
June,2019 AECOM
30
Figure 14. Process Flow of Quick Production Unit/ Early Production Unit
Source: Vedanta Limited (Cairn Oil & Gas)
Vedanta Limited. (Division CAIRN Oil & Gas) DRAFT EIA: Onshore Oil and Gas E&A in RJ-ONHP- 2017/2 Block, Barmer District, Rajasthan
June,2019 AECOM
31
Produced well fluid from one or more successful exploratory/ appraisal wells will be gathered & sent to heater-
treater separator skid for primary separation & heating purpose. Gathered produced fluid will be heated & degassed
in heater-treater separator skid operating at ~2.5 – 3 Barg and ~70 – 80 0C and separated in to gas, oil and water
streams. The separated produced (associated) gas will be either routed to fuel gas system or to flare depending
on the quantity and richness of produced (associated) gas. In case of sufficient quantity of produced gas, a part of
the produced gas will be used for power generation using gas engine generator (GEG), for firing in heater-treater
separator skid and for blanketing & purging purpose. The surplus gas post internal consumption (if any) will be
routed to flare for safe atmospheric discharge.
Separated oil from heater-treater separator skid will be sent to electrostatic coalescer separator (if needed, based
on oil properties) to separate the residual water and achieve BS&W specifications. The treated crude oil from
electrostatic coalescer separator will be sent to oil storage tanks. From oil storage tanks, oil will be pumped &
loaded in to road tanker using the tanker loading facility for evacuation of crude oil to the nearby available facilities
like terminals/ depots of consumers.
Separated produced water (PW) from heater-treater separator skid will be sent to degasser vessel operating at low
pressure. The evolved HC gases from degasser vessel will be routed to flare for safe disposal and the degassed
water sent to PW treatment package.
The PW treatment package will consists of a compact flotation unit or other equivalent gas floatation based de-
oiling (oil removal) system and a filtration system. The treated water from PW treated skid will be stored in PW
storage tanks. The produced water will be treated to achieve MoEF&CC/ CPCB/ SPCB specifications (discharge
standards) and will be disposed off. The treated effluent (i.e. produced water) will be disposed-off using either a
nearby down hole disposal well (by reinjection in abandoned well) or other available and suitable onshore disposal
medium or solar/ mechanical evaporators depending on the quantity and feasibility.
The power requirement will be met through either state electricity grid and/ or installation of Diesel/ Gas Engine
Generator(s) using produced gas. If produced gas is sufficient quantity, then power generation using produced gas
will be preferred.
Along with above processing facility, a well test separator skid will be installed at pad. It will be used for well testing
purpose. Well under testing will be routed to test separator skid. The separated gas, oil & water will be sent back
to inlet of heater-treater separator skid for further processing. Quick production set-up will have following utility
systems & infrastructure for supporting the operations.
• Wells with selected artificial lift and flow lines
• Fuel gas system consisting of filters & a super-heater
• Instrument Air package or Instrument as system
• Chemical dosing packages i.e. corrosion inhibitor, de-mulsifier & scale inhibitor etc.
• Elevated flare system or enclosed ground flare or ground flare
• Closed drain system, storm water drain system
• Fresh water storage
• Diesel storage
• Power generation (GEG and / or DG)
• Firefighting equipment
• Domestic sewage treatment facility (STP or septic tank & soak pit system);
2.7. Completion of Drilling
On completion of activities, the well will be either plugged and suspended (if the well evaluations indicate
commercial quantities of hydrocarbons) or will be killed and permanently abandoned. In the event of a decision to
suspend the well, it will be filled with a brine solution containing very small quantities of inhibitors to protect the
well. The well will be sealed with cement plugs and some of the wellhead equipment (Blind Flange) will be left on
Vedanta Limited. (Division CAIRN Oil & Gas) DRAFT EIA: Onshore Oil and Gas E&A in RJ-ONHP- 2017/2 Block, Barmer District, Rajasthan
June,2019 AECOM
32
the surface (Cellar). If the well is abandoned it will be sealed with a series of cement plugs, all the wellhead
equipment will be removed, by leaving the surface clear of any debris and the site will be restored.
2.8. Well Decommissioning
After the completion of the drilling activity, partial de-mobilization of the drilling rig and associated infrastructure will
be initiated. As discussed earlier, well testing may be carried out immediately after the drilling is completed. The
complete de-mobilization of the facilities at site will happen once well-testing completed successfully. This will
involve the dismantling of the rig, all associated equipment and the residential camp, and transporting it out of the
project area. It is expected that demobilization will take approximately 20-25 days and will involve the trucking away
of materials, equipment and other materials from the site to bring it back to its original condition. It is estimated that
about 50 truckloads will be transported out of site during this period. If no indication of any commercially viable
amount of oil or gas is encountered either before or after testing, the well will be declared dry and accordingly will
be plugged of and abandoned, and the site will be restored in line with regulations and good industry practice.
2.9. Utilities & Resource Requirements, Associated
Facilities
2.9.1. Liquid Mud Plant (LMP)
The Liquid Mud Plant (LMP) shall be located at suitable locations to prepare drilling mud for the drilling operations.
It is estimated around 3 – 5 LMP’s will be set-up at any a given point of time for the proposed drilling operations.
All the tanks, equipment’s, civil works, pumps, mud laboratory with testing equipment along with the mud waste
disposal pits will be constructed within a single location.
The entire LMP area shall be provided with containment area and with facilities for fork lift movement and
transportation of solid waste skips. The area shall be designed to facilitate tanks for SBM mixing/ storage, tanks of
base oil storage and another tanks for brine mixing/storage. These tanks are interconnected with piping and
manifold with mixing hoppers, pumps connections, centrifuges connection with complete mud conditioning set-up,
loading-unloading piping/hoses connections.
The Mud Plant area will be surrounded with a containment boundary wall. All the liquid transferred from the LMP
to the drilling site will be through road tankers. For power supply requirement DG sets shall be required with one
operational and one standby.
The LMP shall have water storage tanks, bunk houses for operating office and site laboratory, dry chemical storage
area in paved surface, truck loading and unloading area with parking facility, cranes & forklifts maintenance and
parking facility, septic tank with soak pits, DG area, diesel storage area and power distribution panel & facility.
2.9.2. Accommodation & Camp Site
Drilling camp sites will be set-up within the vicinity of the drilling sites to allow for easy movement of the crew
between the camp and the drilling sites. The camp site would generally comprise of 30-40 transportable container
cabins (portable cabin) of 20 feet and 40 feet size to provide accommodation to operational crew. Each cabin will
house 2 to 4 persons. A typical view of Vedanta Limited. (Division Cairn Oil & Gas)’s camp site has been presented
in figure 2-14 below. Toilet facilities will be built as part of the accommodation unit. The sewage lines from the units
shall be connected through a pipeline system to a septic tank and soak pit system. Additionally, there will be
dedicated cabins to serve as kitchen, cold storage, dining area, recreation area, laundry etc.
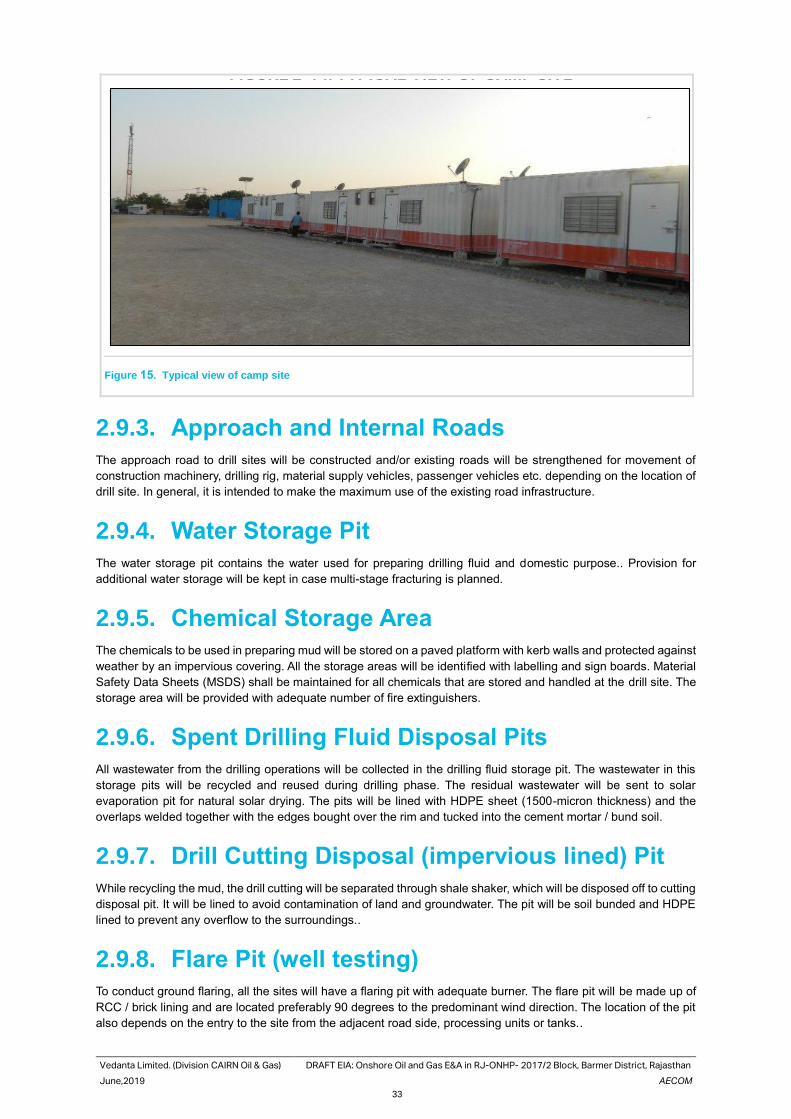
Vedanta Limited. (Division CAIRN Oil & Gas) DRAFT EIA: Onshore Oil and Gas E&A in RJ-ONHP- 2017/2 Block, Barmer District, Rajasthan
June,2019 AECOM
33
Figure 15. Typical view of camp site
2.9.3. Approach and Internal Roads
The approach road to drill sites will be constructed and/or existing roads will be strengthened for movement of
construction machinery, drilling rig, material supply vehicles, passenger vehicles etc. depending on the location of
drill site. In general, it is intended to make the maximum use of the existing road infrastructure.
2.9.4. Water Storage Pit
The water storage pit contains the water used for preparing drilling fluid and domestic purpose.. Provision for
additional water storage will be kept in case multi-stage fracturing is planned.
2.9.5. Chemical Storage Area
The chemicals to be used in preparing mud will be stored on a paved platform with kerb walls and protected against
weather by an impervious covering. All the storage areas will be identified with labelling and sign boards. Material
Safety Data Sheets (MSDS) shall be maintained for all chemicals that are stored and handled at the drill site. The
storage area will be provided with adequate number of fire extinguishers.
2.9.6. Spent Drilling Fluid Disposal Pits
All wastewater from the drilling operations will be collected in the drilling fluid storage pit. The wastewater in this
storage pits will be recycled and reused during drilling phase. The residual wastewater will be sent to solar
evaporation pit for natural solar drying. The pits will be lined with HDPE sheet (1500-micron thickness) and the
overlaps welded together with the edges bought over the rim and tucked into the cement mortar / bund soil.
2.9.7. Drill Cutting Disposal (impervious lined) Pit
While recycling the mud, the drill cutting will be separated through shale shaker, which will be disposed off to cutting
disposal pit. It will be lined to avoid contamination of land and groundwater. The pit will be soil bunded and HDPE
lined to prevent any overflow to the surroundings..
2.9.8. Flare Pit (well testing)
To conduct ground flaring, all the sites will have a flaring pit with adequate burner. The flare pit will be made up of
RCC / brick lining and are located preferably 90 degrees to the predominant wind direction. The location of the pit
also depends on the entry to the site from the adjacent road side, processing units or tanks..
FIGURE 2-14: TYPICAL VIEW OF CAMP SITE
Vedanta Limited. (Division CAIRN Oil & Gas) DRAFT EIA: Onshore Oil and Gas E&A in RJ-ONHP- 2017/2 Block, Barmer District, Rajasthan
June,2019 AECOM
34
2.9.9. Flare Stack
A flare system consists of the flare stack or boom and pipes which collect the gases to be flared. The flare tip at
the end of the stack or boom is designed to assist entrainment of air into the flare to improve burn efficiency. Seals
installed in the stack prevent flashback of the flame, and a vessel at the base of the stack removes and conserves
any liquids from the gas passing to the flare.
• For effective flaring CPCB’s document “Oil & Gas drilling and extraction industry” June 2006 will be
followed :
• Standard flare design - An efficient test flare burner head will be selected to minimize incomplete
combustion, black smoke, and hydrocarbon fallout. Volumes of hydrocarbons flared will be recorded.
• Location and height of the flare stack based on maximum ground level concentration criteria & maximum
radiation intensity exposure criteria
• Flare stack- Minimum physical height of stack should be 30 m from ground level. Only in those situations
and or locations where elevated flares are not technical feasible, then ground flaring may be resorted to,
such as when there is a crop cultivation / vegetation in the vicinity of the well pad or / and where flared
gas volume is <0.5 MMSCFD (due to this low volume, sometimes elevated flare gets extinguished in
presence of wind).
2.9.10. Diesel Storage Tank
The fuel (diesel) will be received in bulk quantity through tankers and shall be stored in above ground steel diesel
tanks. The tank area is generally of 12.9m x 7.9m and is provided with secondary containment of adequate capacity
to control any accidental leaks.
2.9.11. Waste Storage
Hazardous wastes generated from drilling activities such as used oil from pumps and machinery, empty chemical
and fuel barrels, contaminated oil rags and soil etc will be collected and stored in a designated storage area. The
storage area will have paved flooring, containment bund and roof. Waste oil from pumps and machinery will be
collected and stored in used oil barrels and shall be kept in a designated storage area.. The contaminated soil and
cotton rags will be disposed of at approved secured Land fill as per the legal provision. Used oil will be disposed
off through recyclers/ re-processors registered with the Central Pollution Control Board and authorized by State
Pollution Control Board.
2.9.12. Storm Water Drainage System
Adequate drain will be provided all around the drilling site to prevent runoff of any oil containing waste water into
the nearby natural drainage area. The storm water drain shall be provided with oil trap and the collected water shall
be sent to storm water pit of dimension 30 m x 20 m.
2.9.13. Spill Containment System
Containment systems and oil traps will be provided to trap any spillage of oil at the drilling site. All potential sources
of spillage will be equipped with drip pans in order to contain spills.
2.9.14. Sewage Treatment Plant (STP)
Mobile Modular STP of capacity 30 m3/day for treatment of sewage and sullage Water generated within the well
pad limits. Each well site and camp site will have toilets which will be provided with septic tanks and soak pit
arrangement. To cater to about people that will stay in the camps site, adequately sized septic tanks and soak pits
will be provided.
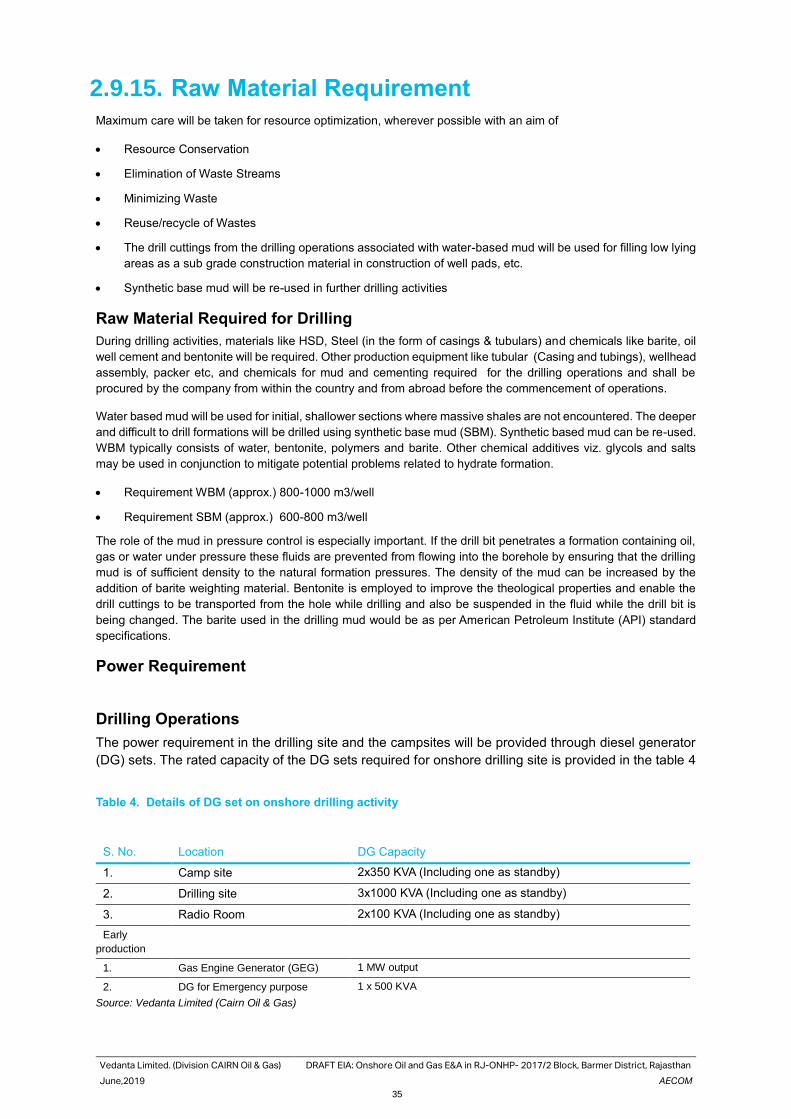
Vedanta Limited. (Division CAIRN Oil & Gas) DRAFT EIA: Onshore Oil and Gas E&A in RJ-ONHP- 2017/2 Block, Barmer District, Rajasthan
June,2019 AECOM
35
2.9.15. Raw Material Requirement
Maximum care will be taken for resource optimization, wherever possible with an aim of
• Resource Conservation
• Elimination of Waste Streams
• Minimizing Waste
• Reuse/recycle of Wastes
• The drill cuttings from the drilling operations associated with water-based mud will be used for filling low lying
areas as a sub grade construction material in construction of well pads, etc.
• Synthetic base mud will be re-used in further drilling activities
Raw Material Required for Drilling
During drilling activities, materials like HSD, Steel (in the form of casings & tubulars) and chemicals like barite, oil
well cement and bentonite will be required. Other production equipment like tubular (Casing and tubings), wellhead
assembly, packer etc, and chemicals for mud and cementing required for the drilling operations and shall be
procured by the company from within the country and from abroad before the commencement of operations.
Water based mud will be used for initial, shallower sections where massive shales are not encountered. The deeper
and difficult to drill formations will be drilled using synthetic base mud (SBM). Synthetic based mud can be re-used.
WBM typically consists of water, bentonite, polymers and barite. Other chemical additives viz. glycols and salts
may be used in conjunction to mitigate potential problems related to hydrate formation.
• Requirement WBM (approx.) 800-1000 m3/well
• Requirement SBM (approx.) 600-800 m3/well
The role of the mud in pressure control is especially important. If the drill bit penetrates a formation containing oil,
gas or water under pressure these fluids are prevented from flowing into the borehole by ensuring that the drilling
mud is of sufficient density to the natural formation pressures. The density of the mud can be increased by the
addition of barite weighting material. Bentonite is employed to improve the theological properties and enable the
drill cuttings to be transported from the hole while drilling and also be suspended in the fluid while the drill bit is
being changed. The barite used in the drilling mud would be as per American Petroleum Institute (API) standard
specifications.
Power Requirement
Drilling Operations
The power requirement in the drilling site and the campsites will be provided through diesel generator
(DG) sets. The rated capacity of the DG sets required for onshore drilling site is provided in the table 4
Table 4. Details of DG set on onshore drilling activity
S. No. Location DG Capacity
1. Camp site 2x350 KVA (Including one as standby)
2. Drilling site 3x1000 KVA (Including one as standby)
3. Radio Room 2x100 KVA (Including one as standby)
Early
production
1. Gas Engine Generator (GEG) 1 MW output
2. DG for Emergency purpose 1 x 500 KVA
Source: Vedanta Limited (Cairn Oil & Gas)
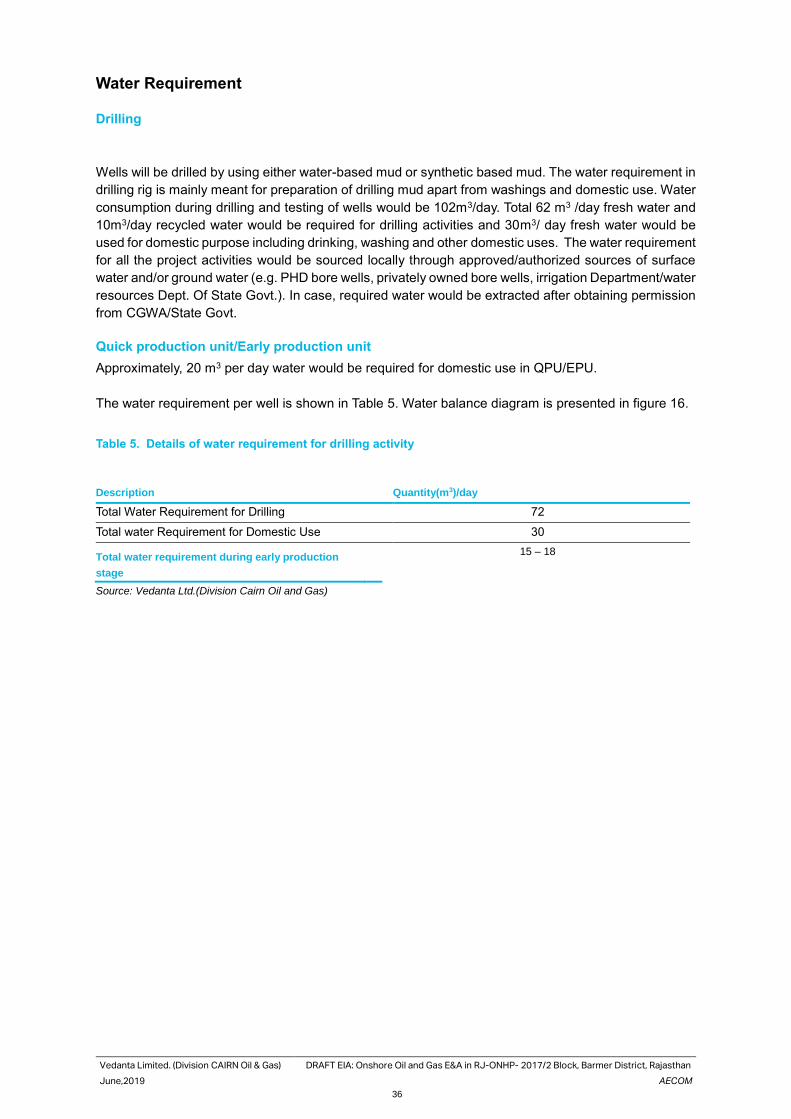
Vedanta Limited. (Division CAIRN Oil & Gas) DRAFT EIA: Onshore Oil and Gas E&A in RJ-ONHP- 2017/2 Block, Barmer District, Rajasthan
June,2019 AECOM
36
Water Requirement
Drilling
Wells will be drilled by using either water-based mud or synthetic based mud. The water requirement in
drilling rig is mainly meant for preparation of drilling mud apart from washings and domestic use. Water
consumption during drilling and testing of wells would be 102m3/day. Total 62 m3 /day fresh water and
10m3/day recycled water would be required for drilling activities and 30m3/ day fresh water would be
used for domestic purpose including drinking, washing and other domestic uses. The water requirement
for all the project activities would be sourced locally through approved/authorized sources of surface
water and/or ground water (e.g. PHD bore wells, privately owned bore wells, irrigation Department/water
resources Dept. Of State Govt.). In case, required water would be extracted after obtaining permission
from CGWA/State Govt.
Quick production unit/Early production unit
Approximately, 20 m3 per day water would be required for domestic use in QPU/EPU.
The water requirement per well is shown in Table 5. Water balance diagram is presented in figure 16.
Table 5. Details of water requirement for drilling activity
Description Quantity(m3)/day
Total Water Requirement for Drilling 72
Total water Requirement for Domestic Use 30
Total water requirement during early production
stage
15 – 18
Source: Vedanta Ltd.(Division Cairn Oil and Gas)
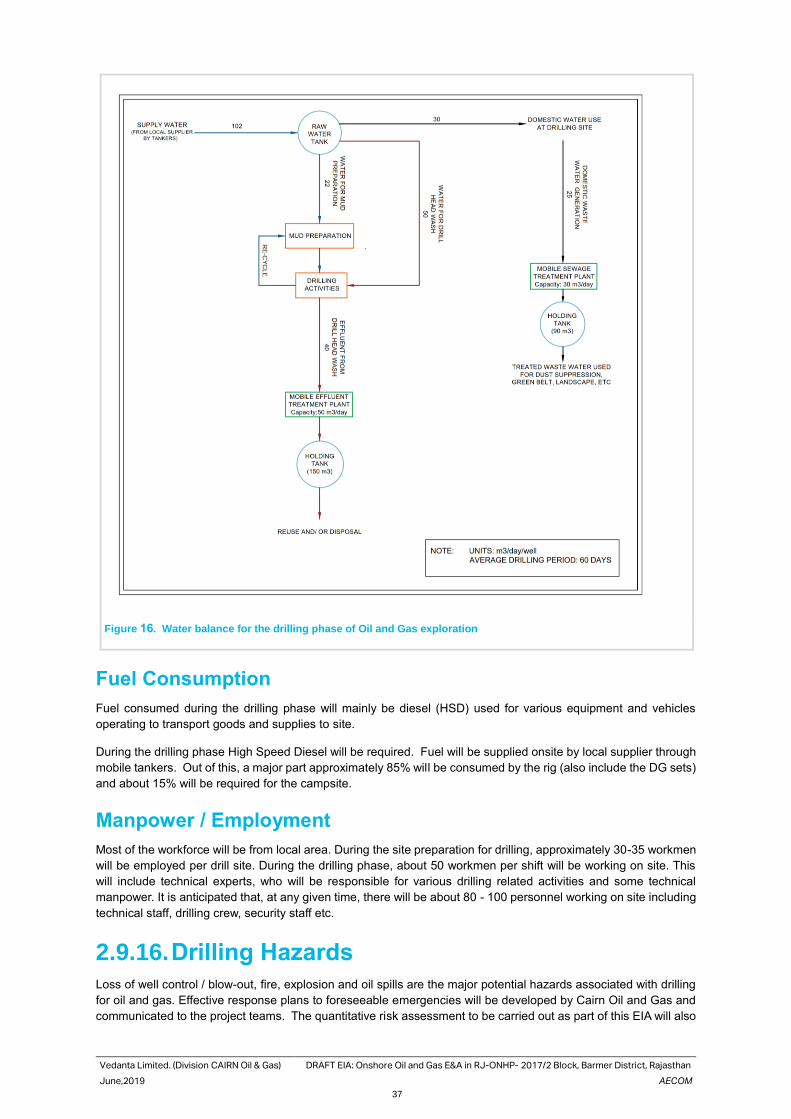
Vedanta Limited. (Division CAIRN Oil & Gas) DRAFT EIA: Onshore Oil and Gas E&A in RJ-ONHP- 2017/2 Block, Barmer District, Rajasthan
June,2019 AECOM
37
Figure 16. Water balance for the drilling phase of Oil and Gas exploration
Fuel Consumption
Fuel consumed during the drilling phase will mainly be diesel (HSD) used for various equipment and vehicles
operating to transport goods and supplies to site.
During the drilling phase High Speed Diesel will be required. Fuel will be supplied onsite by local supplier through
mobile tankers. Out of this, a major part approximately 85% will be consumed by the rig (also include the DG sets)
and about 15% will be required for the campsite.
Manpower / Employment
Most of the workforce will be from local area. During the site preparation for drilling, approximately 30-35 workmen
will be employed per drill site. During the drilling phase, about 50 workmen per shift will be working on site. This
will include technical experts, who will be responsible for various drilling related activities and some technical
manpower. It is anticipated that, at any given time, there will be about 80 - 100 personnel working on site including
technical staff, drilling crew, security staff etc.
2.9.16. Drilling Hazards
Loss of well control / blow-out, fire, explosion and oil spills are the major potential hazards associated with drilling
for oil and gas. Effective response plans to foreseeable emergencies will be developed by Cairn Oil and Gas and
communicated to the project teams. The quantitative risk assessment to be carried out as part of this EIA will also
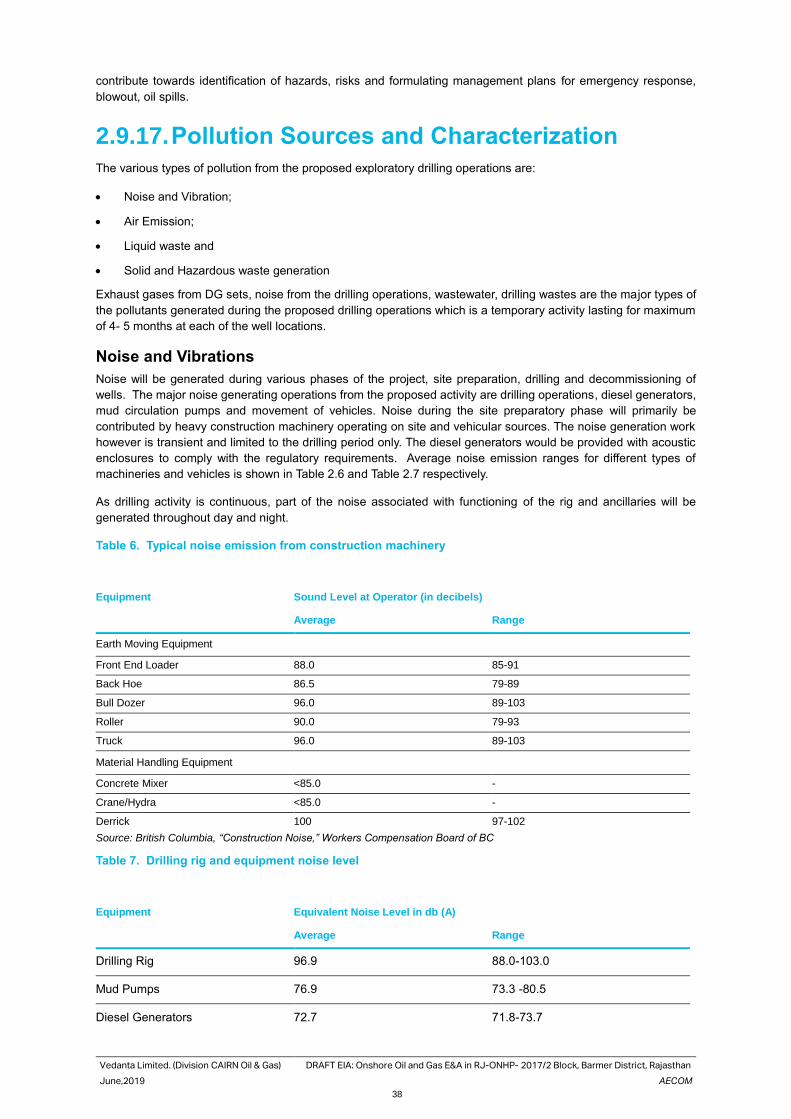
Vedanta Limited. (Division CAIRN Oil & Gas) DRAFT EIA: Onshore Oil and Gas E&A in RJ-ONHP- 2017/2 Block, Barmer District, Rajasthan
June,2019 AECOM
38
contribute towards identification of hazards, risks and formulating management plans for emergency response,
blowout, oil spills.
2.9.17. Pollution Sources and Characterization
The various types of pollution from the proposed exploratory drilling operations are:
• Noise and Vibration;
• Air Emission;
• Liquid waste and
• Solid and Hazardous waste generation
Exhaust gases from DG sets, noise from the drilling operations, wastewater, drilling wastes are the major types of
the pollutants generated during the proposed drilling operations which is a temporary activity lasting for maximum
of 4- 5 months at each of the well locations.
Noise and Vibrations
Noise will be generated during various phases of the project, site preparation, drilling and decommissioning of
wells. The major noise generating operations from the proposed activity are drilling operations, diesel generators,
mud circulation pumps and movement of vehicles. Noise during the site preparatory phase will primarily be
contributed by heavy construction machinery operating on site and vehicular sources. The noise generation work
however is transient and limited to the drilling period only. The diesel generators would be provided with acoustic
enclosures to comply with the regulatory requirements. Average noise emission ranges for different types of
machineries and vehicles is shown in Table 2.6 and Table 2.7 respectively.
As drilling activity is continuous, part of the noise associated with functioning of the rig and ancillaries will be
generated throughout day and night.
Table 6. Typical noise emission from construction machinery
Equipment Sound Level at Operator (in decibels)
Average Range
Earth Moving Equipment
Front End Loader 88.0 85-91
Back Hoe 86.5 79-89
Bull Dozer 96.0 89-103
Roller 90.0 79-93
Truck 96.0 89-103
Material Handling Equipment
Concrete Mixer <85.0 -
Crane/Hydra <85.0 -
Derrick 100 97-102
Source: British Columbia, “Construction Noise,” Workers Compensation Board of BC
Table 7. Drilling rig and equipment noise level
Equipment Equivalent Noise Level in db (A)
Average Range
Drilling Rig 96.9 88.0-103.0
Mud Pumps 76.9 73.3 -80.5
Diesel Generators 72.7 71.8-73.7
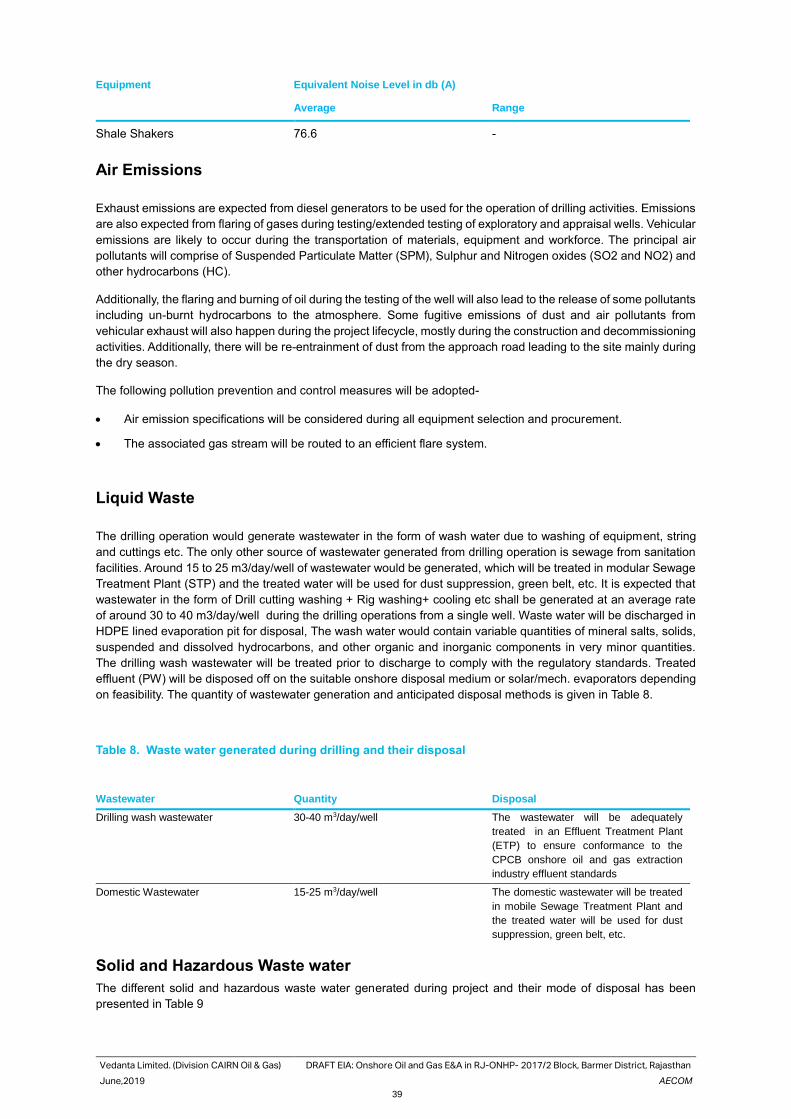
Vedanta Limited. (Division CAIRN Oil & Gas) DRAFT EIA: Onshore Oil and Gas E&A in RJ-ONHP- 2017/2 Block, Barmer District, Rajasthan
June,2019 AECOM
39
Equipment Equivalent Noise Level in db (A)
Average Range
Shale Shakers 76.6 -
Air Emissions
Exhaust emissions are expected from diesel generators to be used for the operation of drilling activities. Emissions
are also expected from flaring of gases during testing/extended testing of exploratory and appraisal wells. Vehicular
emissions are likely to occur during the transportation of materials, equipment and workforce. The principal air
pollutants will comprise of Suspended Particulate Matter (SPM), Sulphur and Nitrogen oxides (SO2 and NO2) and
other hydrocarbons (HC).
Additionally, the flaring and burning of oil during the testing of the well will also lead to the release of some pollutants
including un-burnt hydrocarbons to the atmosphere. Some fugitive emissions of dust and air pollutants from
vehicular exhaust will also happen during the project lifecycle, mostly during the construction and decommissioning
activities. Additionally, there will be re-entrainment of dust from the approach road leading to the site mainly during
the dry season.
The following pollution prevention and control measures will be adopted-
• Air emission specifications will be considered during all equipment selection and procurement.
• The associated gas stream will be routed to an efficient flare system.
Liquid Waste
The drilling operation would generate wastewater in the form of wash water due to washing of equipment, string
and cuttings etc. The only other source of wastewater generated from drilling operation is sewage from sanitation
facilities. Around 15 to 25 m3/day/well of wastewater would be generated, which will be treated in modular Sewage
Treatment Plant (STP) and the treated water will be used for dust suppression, green belt, etc. It is expected that
wastewater in the form of Drill cutting washing + Rig washing+ cooling etc shall be generated at an average rate
of around 30 to 40 m3/day/well during the drilling operations from a single well. Waste water will be discharged in
HDPE lined evaporation pit for disposal, The wash water would contain variable quantities of mineral salts, solids,
suspended and dissolved hydrocarbons, and other organic and inorganic components in very minor quantities.
The drilling wash wastewater will be treated prior to discharge to comply with the regulatory standards. Treated
effluent (PW) will be disposed off on the suitable onshore disposal medium or solar/mech. evaporators depending
on feasibility. The quantity of wastewater generation and anticipated disposal methods is given in Table 8.
Table 8. Waste water generated during drilling and their disposal
Wastewater Quantity Disposal
Drilling wash wastewater 30-40 m3/day/well The wastewater will be adequately
treated in an Effluent Treatment Plant
(ETP) to ensure conformance to the
CPCB onshore oil and gas extraction
industry effluent standards
Domestic Wastewater 15-25 m3/day/well The domestic wastewater will be treated
in mobile Sewage Treatment Plant and
the treated water will be used for dust
suppression, green belt, etc.
Solid and Hazardous Waste water
The different solid and hazardous waste water generated during project and their mode of disposal has been
presented in Table 9
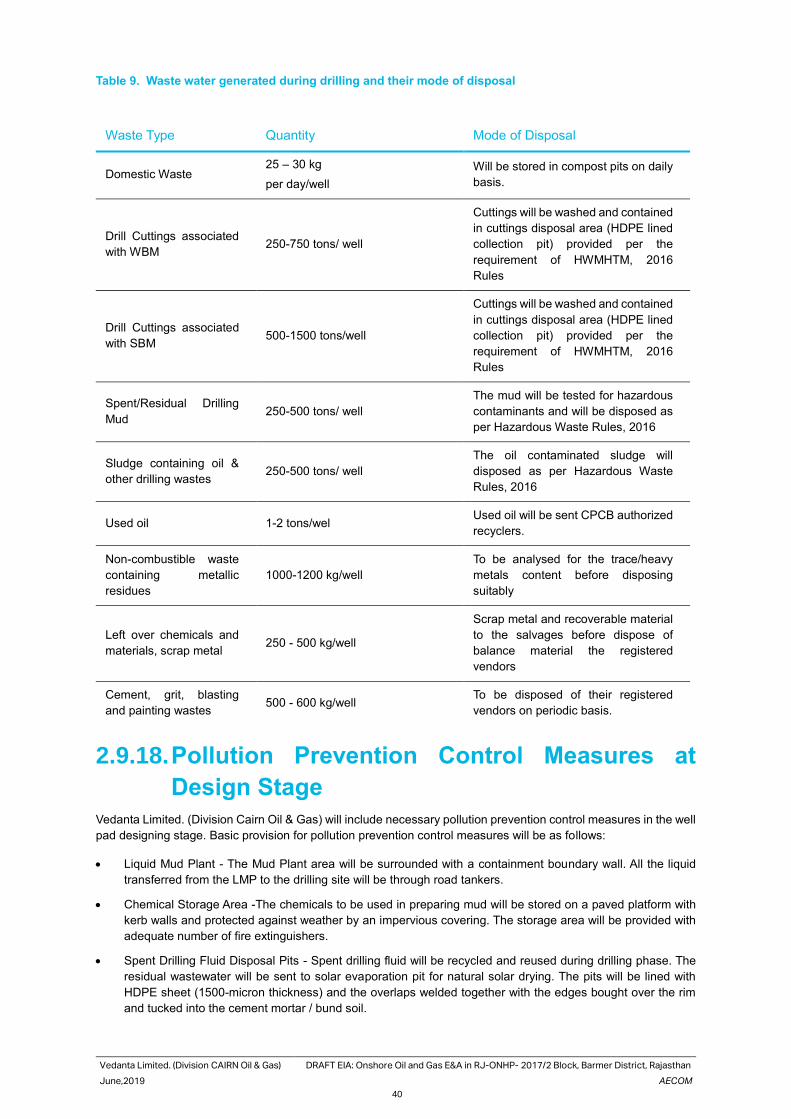
Vedanta Limited. (Division CAIRN Oil & Gas) DRAFT EIA: Onshore Oil and Gas E&A in RJ-ONHP- 2017/2 Block, Barmer District, Rajasthan
June,2019 AECOM
40
Table 9. Waste water generated during drilling and their mode of disposal
Waste Type Quantity Mode of Disposal
Domestic Waste 25 – 30 kg
per day/well
Will be stored in compost pits on daily
basis.
Drill Cuttings associated
with WBM 250-750 tons/ well
Cuttings will be washed and contained
in cuttings disposal area (HDPE lined
collection pit) provided per the
requirement of HWMHTM, 2016
Rules
Drill Cuttings associated
with SBM 500-1500 tons/well
Cuttings will be washed and contained
in cuttings disposal area (HDPE lined
collection pit) provided per the
requirement of HWMHTM, 2016
Rules
Spent/Residual Drilling
Mud 250-500 tons/ well
The mud will be tested for hazardous
contaminants and will be disposed as
per Hazardous Waste Rules, 2016
Sludge containing oil &
other drilling wastes 250-500 tons/ well
The oil contaminated sludge will
disposed as per Hazardous Waste
Rules, 2016
Used oil 1-2 tons/wel Used oil will be sent CPCB authorized
recyclers.
Non-combustible waste
containing metallic
residues
1000-1200 kg/well
To be analysed for the trace/heavy
metals content before disposing
suitably
Left over chemicals and
materials, scrap metal 250 - 500 kg/well
Scrap metal and recoverable material
to the salvages before dispose of
balance material the registered
vendors
Cement, grit, blasting
and painting wastes 500 - 600 kg/well
To be disposed of their registered
vendors on periodic basis.
2.9.18. Pollution Prevention Control Measures at
Design Stage
Vedanta Limited. (Division Cairn Oil & Gas) will include necessary pollution prevention control measures in the well
pad designing stage. Basic provision for pollution prevention control measures will be as follows:
• Liquid Mud Plant - The Mud Plant area will be surrounded with a containment boundary wall. All the liquid
transferred from the LMP to the drilling site will be through road tankers.
• Chemical Storage Area -The chemicals to be used in preparing mud will be stored on a paved platform with
kerb walls and protected against weather by an impervious covering. The storage area will be provided with
adequate number of fire extinguishers.
• Spent Drilling Fluid Disposal Pits - Spent drilling fluid will be recycled and reused during drilling phase. The
residual wastewater will be sent to solar evaporation pit for natural solar drying. The pits will be lined with
HDPE sheet (1500-micron thickness) and the overlaps welded together with the edges bought over the rim
and tucked into the cement mortar / bund soil.
Vedanta Limited. (Division CAIRN Oil & Gas) DRAFT EIA: Onshore Oil and Gas E&A in RJ-ONHP- 2017/2 Block, Barmer District, Rajasthan
June,2019 AECOM
41
• Drill Cutting Disposal -Drill Cuttings would be disposed of in lined pitsto avoid contamination of land and
groundwater. The pit will be soil bunded and HDPE lined to prevent any overflow to the surroundings.
• Flare Pit (well testing) - To conduct ground flaring, all the sites will have a flaring pit with adequate burner. The
flare pit will be made up of RCC / brick lining and are located preferably 90 degrees to the wind direction.
• Diesel Storage Tank - The tank area will be provided with secondary containment (dykewalls)of adequate
capacity to control any accidental leaks.
• Waste/ Lubricating Oil Storage - The storage area will have paved flooring, containment bund and roof. Waste
oil from pumps and machinery will be collected and stored in used oil barrels and shall be kept in a designated
storage area.
• Storm Water Drainage System - A garland drain will be provided all around the drilling site to prevent runoff
of any oil containing waste into the nearby area. The storm water drain shall be provided with oil trap and the
collected water shall be sent to storm water pit.
• Spill Containment System - Containment systems and oil traps will be provided to trap any spillage of oil at
the drilling site. All potential sources of spillage will be equipped with drip pans in order to contain spills.
• Modular STP - Each well site and camp site will have toilets which will be provided with modular STP for
treatment of sewage generated within the well facility.
2.10. Project Cost
Vedanta Limited (Division Cairn Oil and Gas) has planned to carry out the proposed project activities in the RJ-
ONHP-2017/2 Block over a period of 10-12 years.
The cost of the project is estimated is given below:
• Average drilling cost per well for exploratory & appraisal well is estimated to be INR 14 Crore.
• Average cost of each EPU (Early Production Unit)/ QPU (Quick Production Unit) is estimated to be INR 44
Crore.
• The estimated project cost would be Rs. 1681 cr.
Vedanta Limited. (Division CAIRN Oil & Gas) DRAFT EIA: Onshore Oil and Gas E&A in RJ-ONHP- 2017/2 Block, Barmer District, Rajasthan
June,2019 AECOM
42
3. Description of the Baseline
Environment
This chapter describes the prevailing baseline environmental settings in study area, including RJ-ONHP-2017/2
block and its close vicinity. This includes the physical environment comprising air, water and land components, the
biological environment, and socio-economic environment. Attributes of the physical environment like air, water, soil
quality and noise level in the surrounding area were assessed primarily through monitoring and analysis of samples
collected from field. Ambient air, traffic and ambient noise, surface and ground water and soil primary monitoring
was carried out by Edward Food Research and Analysis Centre (EFRAC) (a NABL certified laboratory) during
summer season (March to May) of 2019. All monitoring at field were undertaken under the guidance and
supervision of AECOM India Pvt Ltd personnel. Information about geology, hydrology, past records of natural
hazards like floods, earthquakes etc. have been collected from literature reviews, IMD sources and authenticated
information made available by government departments. Surveys were carried out to understand and record the
biological environment prevailing in the area and the same was verified against published information and literature.
The socio-economic environment has been studied through consultations with various stakeholders in the villages
within the RJ-ONHP-2017/2 Block. Additionally, demography data have been obtained from the Census of India
2011district reports.
3.1. Study area
RJ-ONHP-2017/2 is laying between 25° 10' to 25° 30’ latitude and 71° 10' to 71° 58' longitude. Block is
located in a flat terrain with average elevation ranging from 20 to 75 meter from mean sea level. Study
area has been delineated on the basis of the guideline provided in approved ToR provided by MoEF&CC and it is
comprising of 10 kilometers radius of the RJ-ONHP-2017/2 block.
3.2. Physiography and Geology
3.2.1. Physiography
The proposed block is located in Barmer & Jalore district of Rajasthan. Apart from a small offshoot of the Aravalli
hills in the east, the area is a vast sand covered tract with substratum of gneiss, hornblende and quartz, which here
and there rises up through the sand, in some instances to a height of about 243 to 304 metres. In the extreme
north and west, the sandy plain is broken by sand hills called tibbas which sometimes rise to a height of 91 to 122
metres. This area is dreary and inhospitable and forms part of Thar Desert. The highest peak in the district is the
Chhappan-ka-Pahar in Siwana tehsil, which is about 973 metres above the sea-level. The only river of any
consequence is the Luni (Salt river), which rises in the hills south-west of Ajmer City, After flowing through Nagaur,
Pali and, Jodhpur districts it enters this district near village Rampur in Pachpadra tehsil and flows westward till just
beyond Tilwara where it alters course to south-west in the years of heavy rains which, however, are rare, the river
overflows (known as Rel) when crops of wheat, gram and barley become possible. After flowing into Jalore district,
it finally loses itself in marshy ground at the head of the Rann of Kutch. Another river is Sukri which enters Barmer
tehsil of the district from Jalore district, flows through a small portion of the district and then joins the river Luni near
Samdari. Other rivers of the district are Mitri and Sukri.
Barmer District
Barmer is located in the western part of the state forming a part of the Thar Desert. The district borders Jaisalmer
district in the north, Jalore district in the south, Pali district and Jodhpur district in the east, and Pakistan in the west.
Apart from a small offshoot of the Aravalli hills in the east, the area is a vast sand covered tract with substratum of
gneiss, hornblende and quartz, which here and there rises up through the sand, in some instances to a height of
about 243 to 304 metres. In the extreme north and west, the sandy plain is broken by sand hills called tibbas which
sometimes rise to a height of 91 to 122 metres. This area is dreary and inhospitable and forms part of Thar Desert.
The highest peak in the district is the Chhappan-ka-Pahar in Siwana tehsil, which is about 973 metres above the
sea-level. The only river present in the district is Luni (Salt river), which rises in the hills south-west of Ajmer City,
after flowing through Nagaur, Pali and, Jodhpur districts it enters this district near village Rampur in Pachpadra
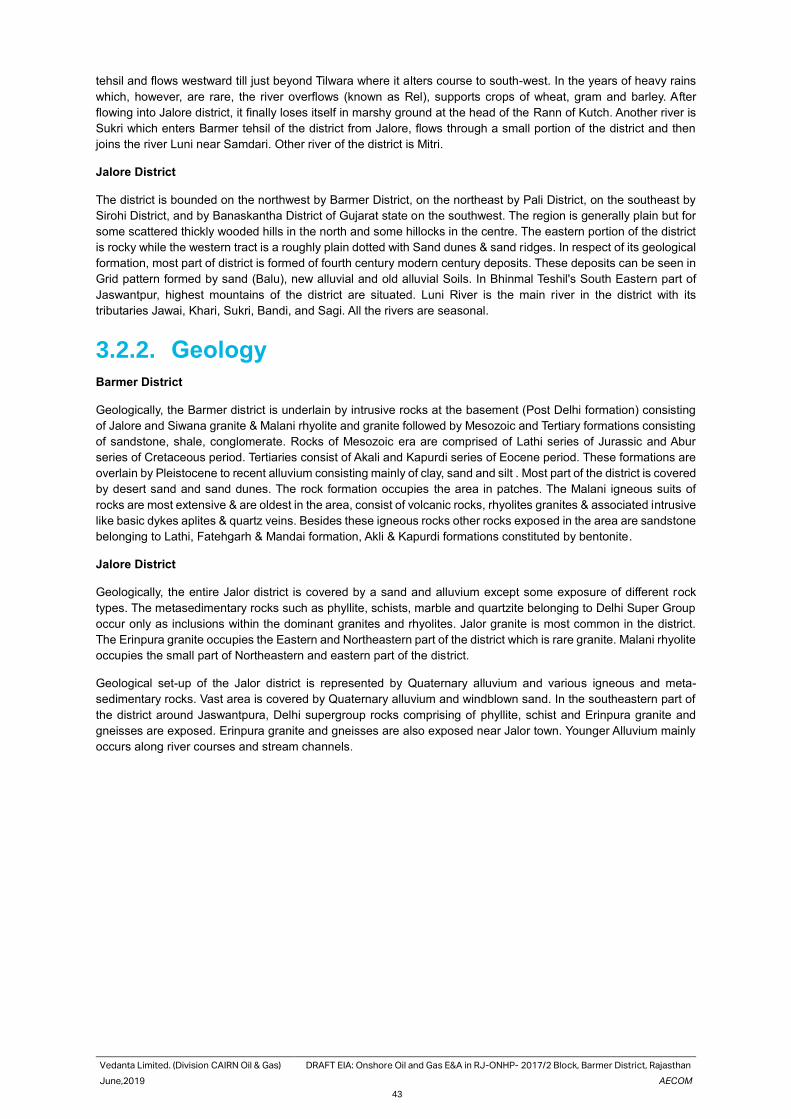
Vedanta Limited. (Division CAIRN Oil & Gas) DRAFT EIA: Onshore Oil and Gas E&A in RJ-ONHP- 2017/2 Block, Barmer District, Rajasthan
June,2019 AECOM
43
tehsil and flows westward till just beyond Tilwara where it alters course to south-west. In the years of heavy rains
which, however, are rare, the river overflows (known as Rel), supports crops of wheat, gram and barley. After
flowing into Jalore district, it finally loses itself in marshy ground at the head of the Rann of Kutch. Another river is
Sukri which enters Barmer tehsil of the district from Jalore, flows through a small portion of the district and then
joins the river Luni near Samdari. Other river of the district is Mitri.
Jalore District
The district is bounded on the northwest by Barmer District, on the northeast by Pali District, on the southeast by
Sirohi District, and by Banaskantha District of Gujarat state on the southwest. The region is generally plain but for
some scattered thickly wooded hills in the north and some hillocks in the centre. The eastern portion of the district
is rocky while the western tract is a roughly plain dotted with Sand dunes & sand ridges. In respect of its geological
formation, most part of district is formed of fourth century modern century deposits. These deposits can be seen in
Grid pattern formed by sand (Balu), new alluvial and old alluvial Soils. In Bhinmal Teshil's South Eastern part of
Jaswantpur, highest mountains of the district are situated. Luni River is the main river in the district with its
tributaries Jawai, Khari, Sukri, Bandi, and Sagi. All the rivers are seasonal.
3.2.2. Geology
Barmer District
Geologically, the Barmer district is underlain by intrusive rocks at the basement (Post Delhi formation) consisting
of Jalore and Siwana granite & Malani rhyolite and granite followed by Mesozoic and Tertiary formations consisting
of sandstone, shale, conglomerate. Rocks of Mesozoic era are comprised of Lathi series of Jurassic and Abur
series of Cretaceous period. Tertiaries consist of Akali and Kapurdi series of Eocene period. These formations are
overlain by Pleistocene to recent alluvium consisting mainly of clay, sand and silt . Most part of the district is covered
by desert sand and sand dunes. The rock formation occupies the area in patches. The Malani igneous suits of
rocks are most extensive & are oldest in the area, consist of volcanic rocks, rhyolites granites & associated intrusive
like basic dykes aplites & quartz veins. Besides these igneous rocks other rocks exposed in the area are sandstone
belonging to Lathi, Fatehgarh & Mandai formation, Akli & Kapurdi formations constituted by bentonite.
Jalore District
Geologically, the entire Jalor district is covered by a sand and alluvium except some exposure of different rock
types. The metasedimentary rocks such as phyllite, schists, marble and quartzite belonging to Delhi Super Group
occur only as inclusions within the dominant granites and rhyolites. Jalor granite is most common in the district.
The Erinpura granite occupies the Eastern and Northeastern part of the district which is rare granite. Malani rhyolite
occupies the small part of Northeastern and eastern part of the district.
Geological set-up of the Jalor district is represented by Quaternary alluvium and various igneous and meta-
sedimentary rocks. Vast area is covered by Quaternary alluvium and windblown sand. In the southeastern part of
the district around Jaswantpura, Delhi supergroup rocks comprising of phyllite, schist and Erinpura granite and
gneisses are exposed. Erinpura granite and gneisses are also exposed near Jalor town. Younger Alluvium mainly
occurs along river courses and stream channels.
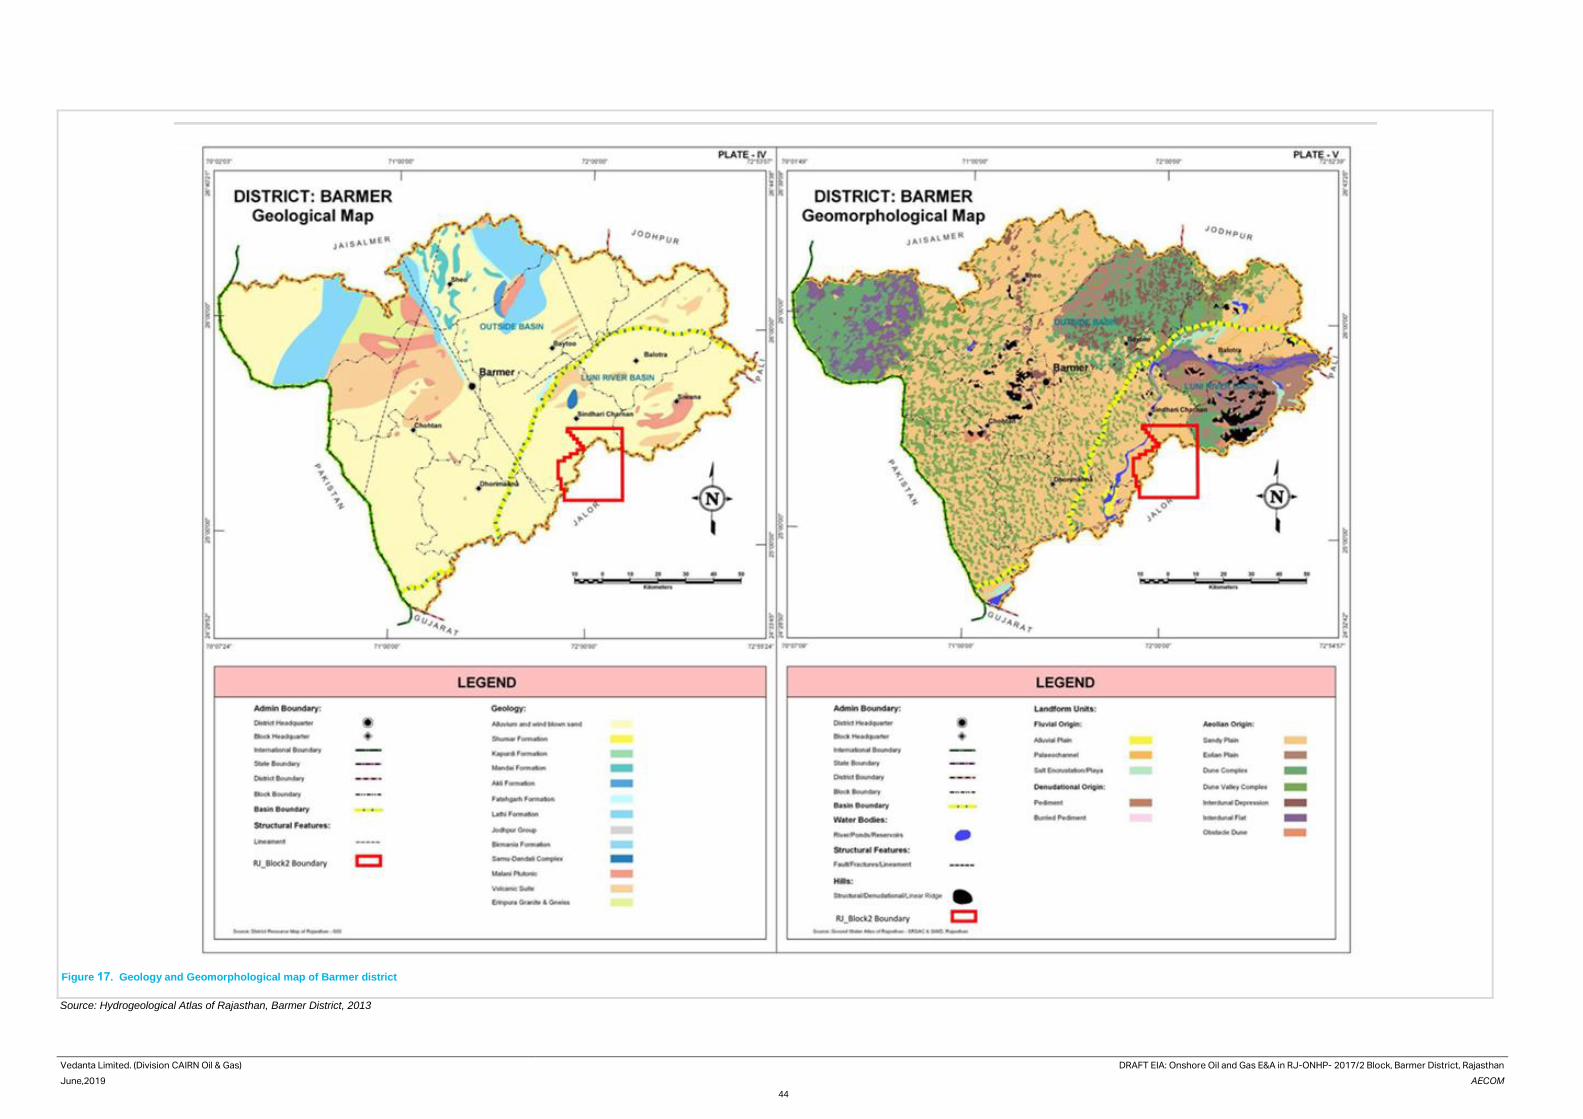
Vedanta Limited. (Division CAIRN Oil & Gas) DRAFT EIA: Onshore Oil and Gas E&A in RJ-ONHP- 2017/2 Block, Barmer District, Rajasthan
June,2019 AECOM
44
Source: Hydrogeological Atlas of Rajasthan, Barmer District, 2013
Figure 17. Geology and Geomorphological map of Barmer district
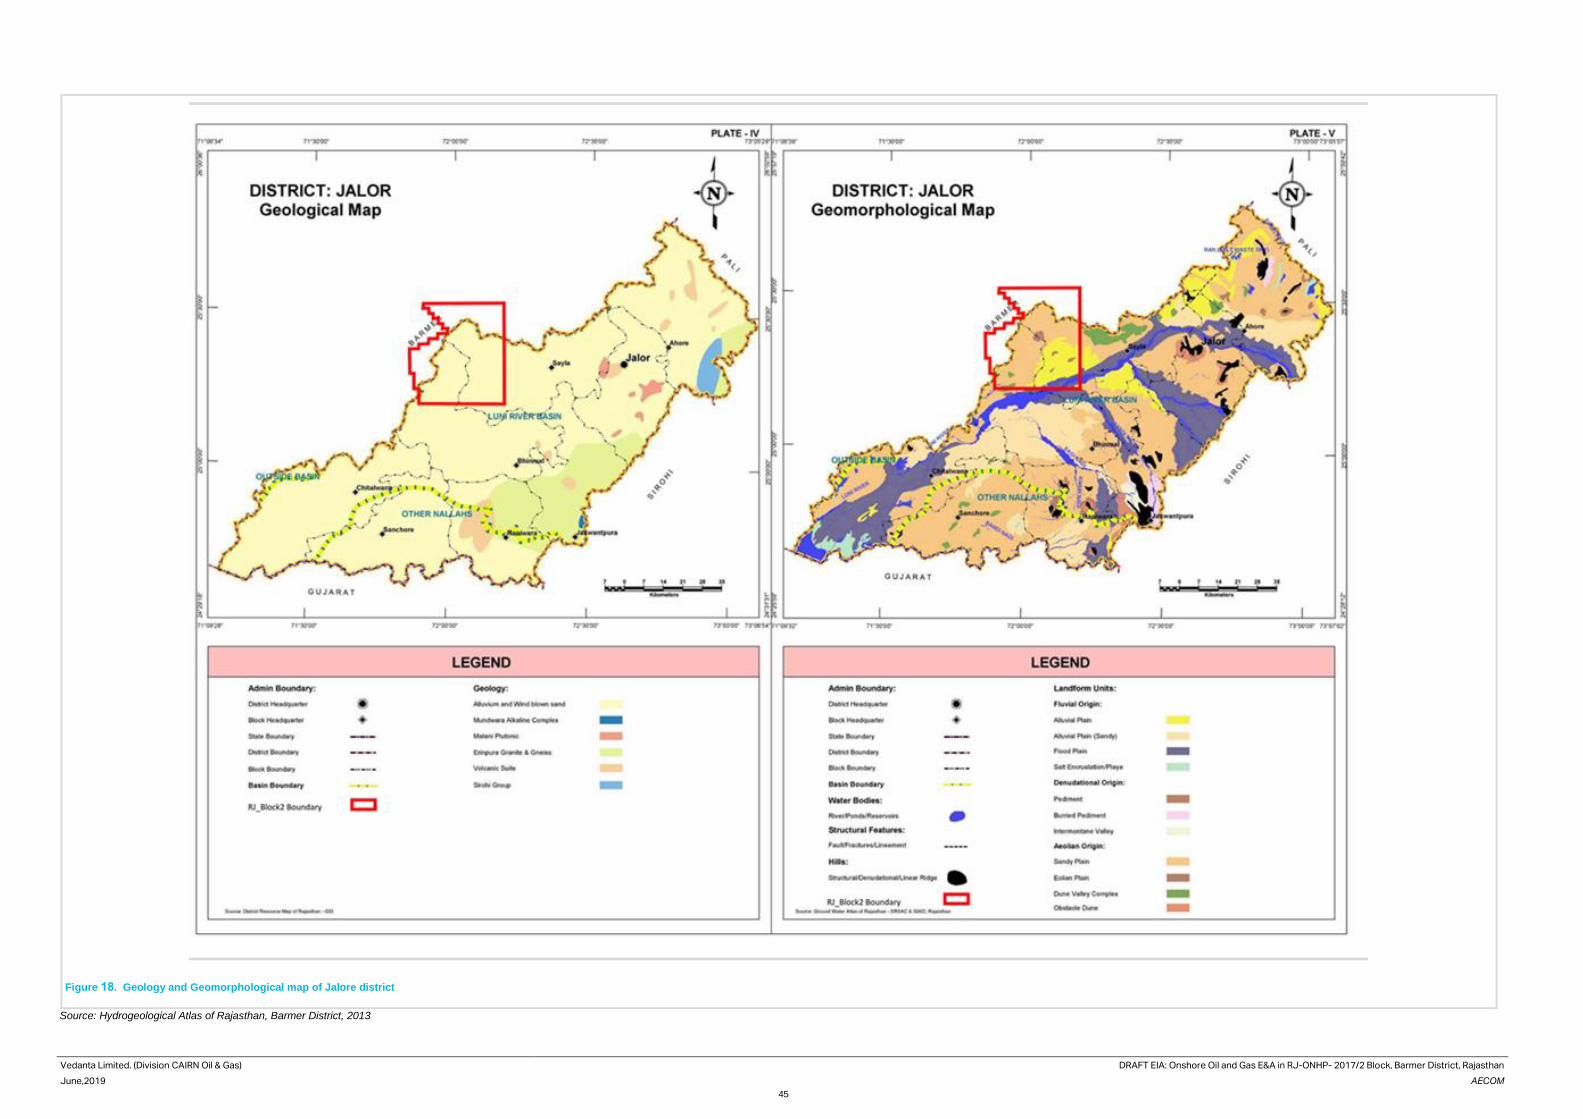
Vedanta Limited. (Division CAIRN Oil & Gas) DRAFT EIA: Onshore Oil and Gas E&A in RJ-ONHP- 2017/2 Block, Barmer District, Rajasthan
June,2019 AECOM
45
Figure 18. Geology and Geomorphological map of Jalore district
Source: Hydrogeological Atlas of Rajasthan, Barmer District, 2013
Vedanta Limited. (Division CAIRN Oil & Gas) DRAFT EIA: Onshore Oil and Gas E&A in RJ-ONHP- 2017/2 Block, Barmer District, Rajasthan
June,2019 AECOM
46
3.3. Hydrogeology
Barmer District
The main water bearing formations in the Barmer district are rhyolites and granites of post Delhi; Lathi sandstone,
Tertiary sandstone and Quaternary alluvium. In Quaternary alluvium, ground water occurs under semi confined to
unconfined conditions. In semi consolidated Tertiary and Mesozoic formations, it occurs under unconfined to
confined conditions and in weathered and fractured zones in hard rocks under phreatic conditions. Though ground
water occurs in all the formations, but the most productive aquifers are the Lathi sandstone, Barmer sandstone and
Quaternary sediments. The Tertiary formation, which is predominantly clayey and argillaceous, is not found as
productive except locally in the sandstone horizon. In general, the fractured and weathered zones in hard rocks
form poor aquifers. Hydrogeological map of Barmer District is presented in below.
As reported by CGWB, during pre-monsoon, shallow water level varying in depth from 4.90 to 36.18 mbgl existed
in Baetu, Balotra and Siwana blocks. Deeper water levels from 52.59 to 70.95 mbgl were recorded in Barmer,
Chohtan, Dhorimanna, Sheo and Sindhari blocks.
During post monsoon, shallow water levels ranging in depth from 4.00 to 38.07 mbgl were observed in Baetu,
Balotra and Siwana blocks. Deeper water levels from 52.99 to 71.50 mbgl depth were registered, in Barmer,
Chohtan, Dhorimanna, Sheo and Sindhari blocks.
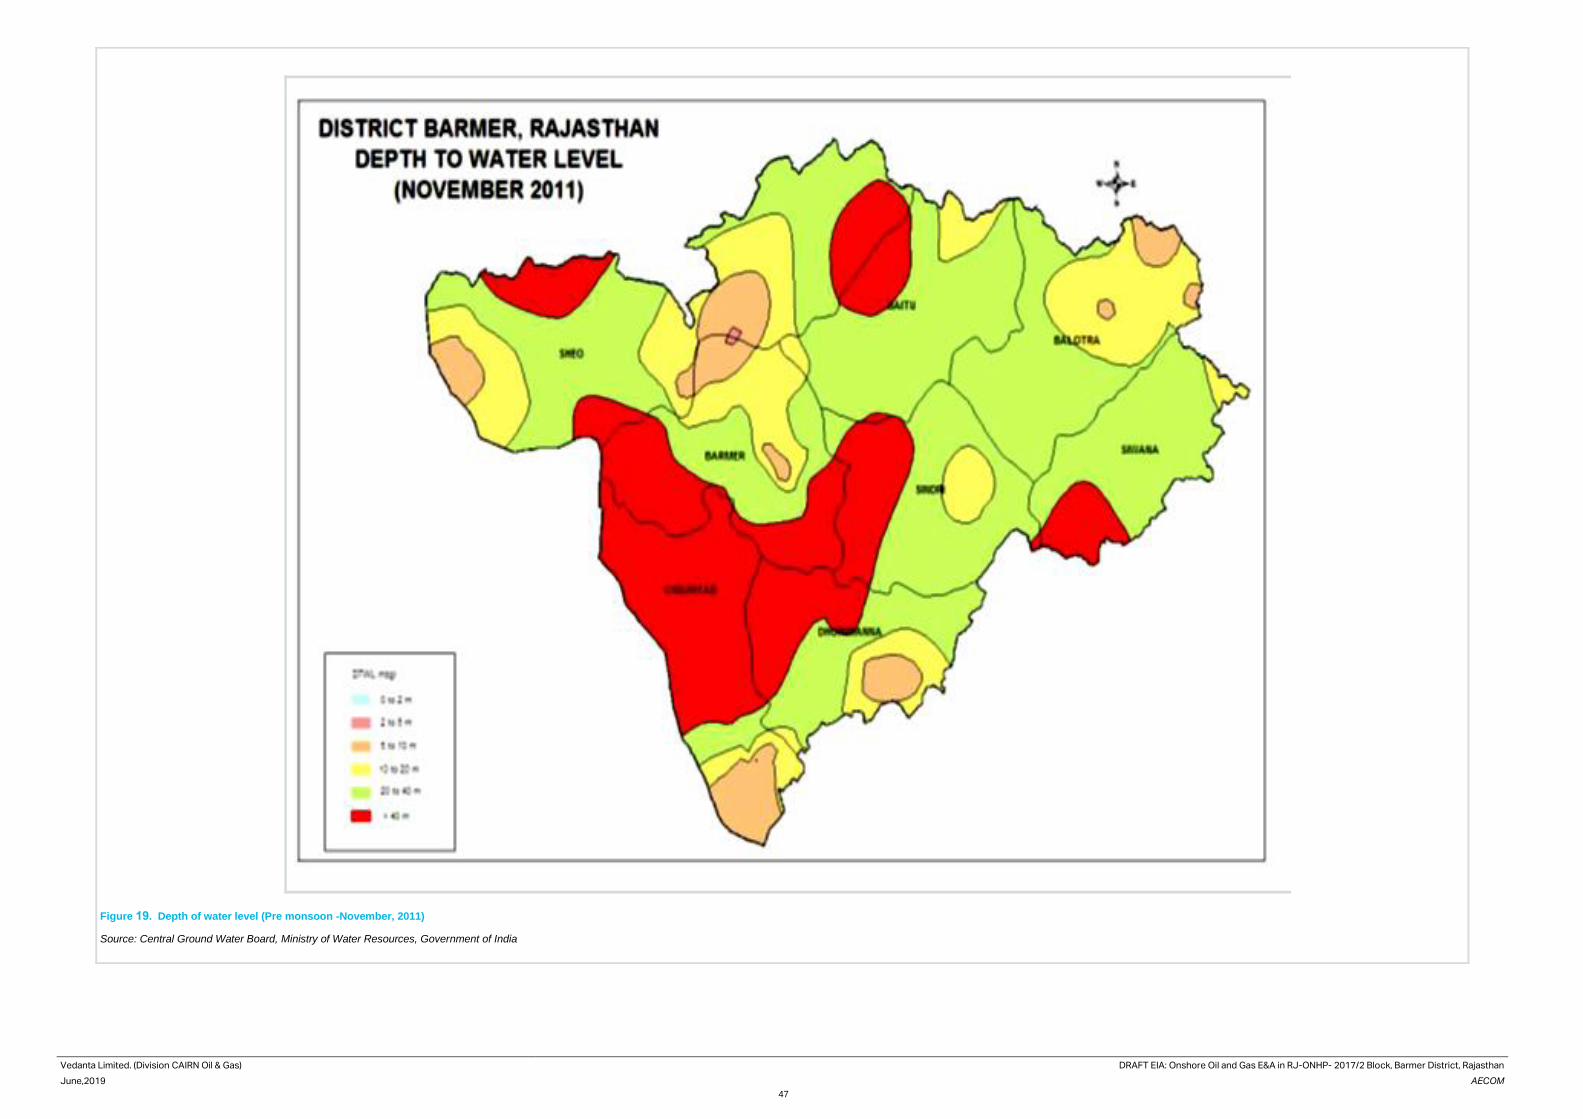
Vedanta Limited. (Division CAIRN Oil & Gas) DRAFT EIA: Onshore Oil and Gas E&A in RJ-ONHP- 2017/2 Block, Barmer District, Rajasthan
June,2019 AECOM
47
Figure 19. Depth of water level (Pre monsoon -November, 2011)
Source: Central Ground Water Board, Ministry of Water Resources, Government of India
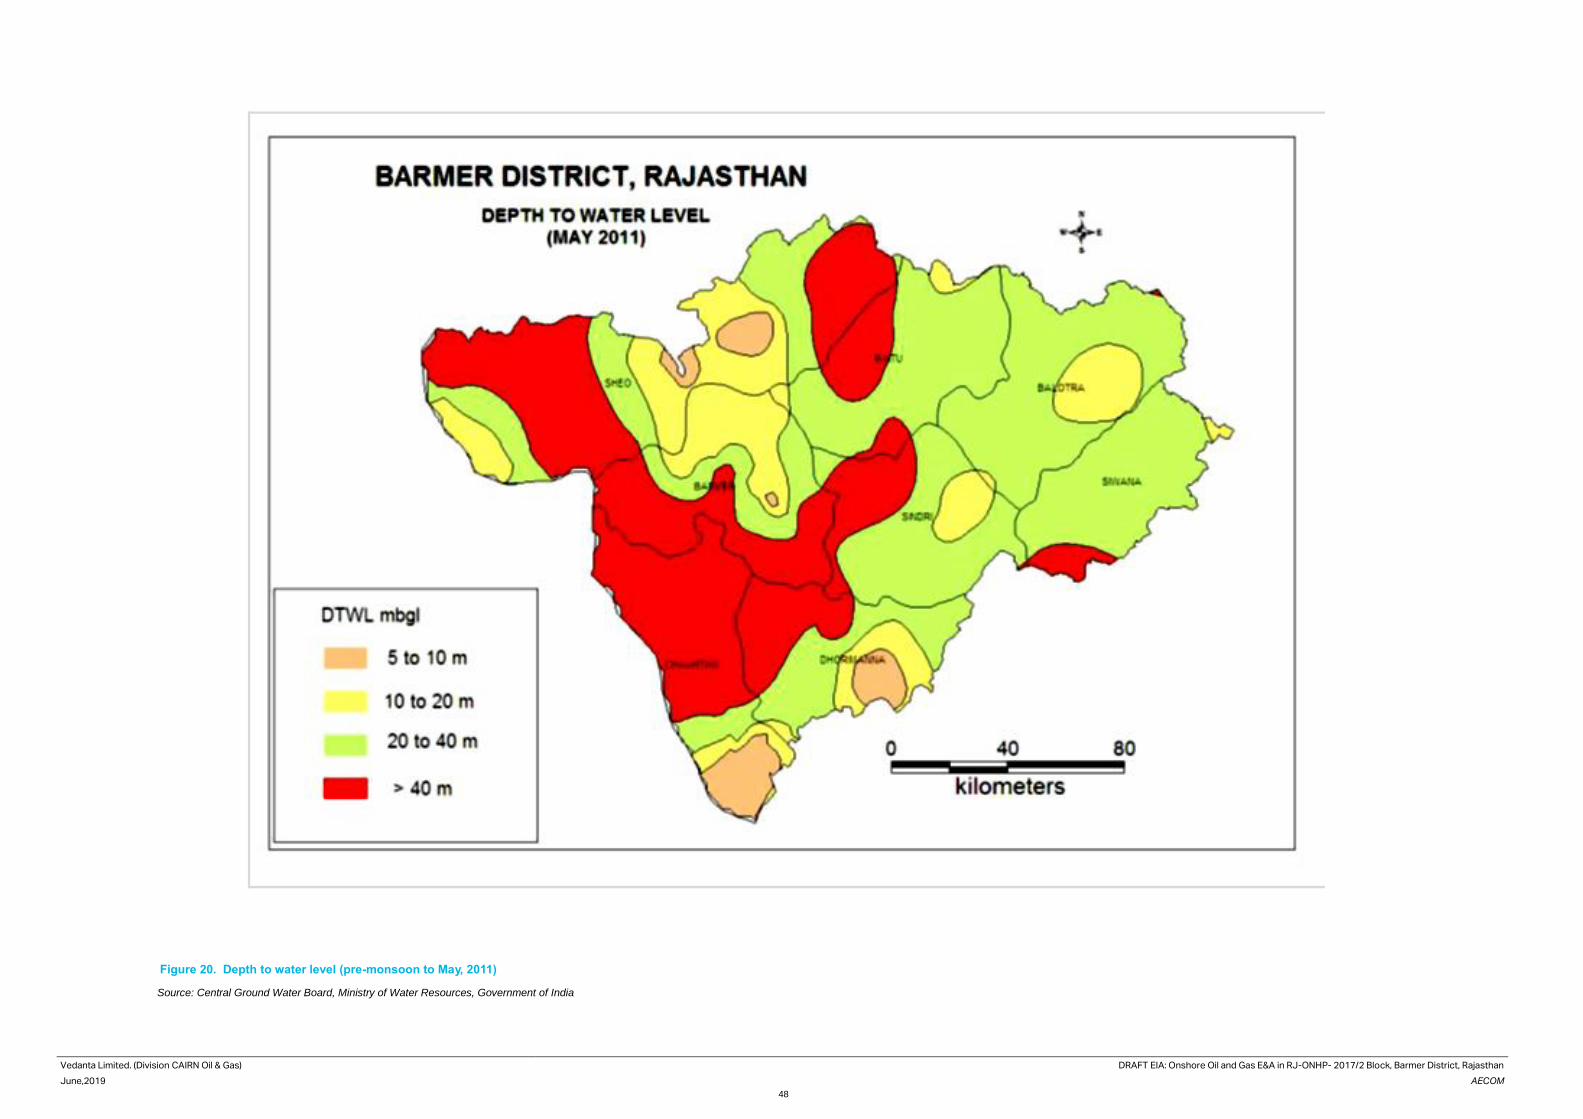
Vedanta Limited. (Division CAIRN Oil & Gas) DRAFT EIA: Onshore Oil and Gas E&A in RJ-ONHP- 2017/2 Block, Barmer District, Rajasthan
June,2019 AECOM
48
Figure 20. Depth to water level (pre-monsoon to May, 2011)
Source: Central Ground Water Board, Ministry of Water Resources, Government of India

Vedanta Limited. (Division CAIRN Oil & Gas) DRAFT EIA: Onshore Oil and Gas E&A in RJ-ONHP- 2017/2 Block, Barmer District, Rajasthan
June,2019 AECOM
49
The project area comes under tertiary formations consisting of alternative layers of clay and shale associated with
fuller's earth are unproductive aquifers. The CGWB study boreholes tapping these formations were abandoned
due to very poor yield and due to salinity of formation water.
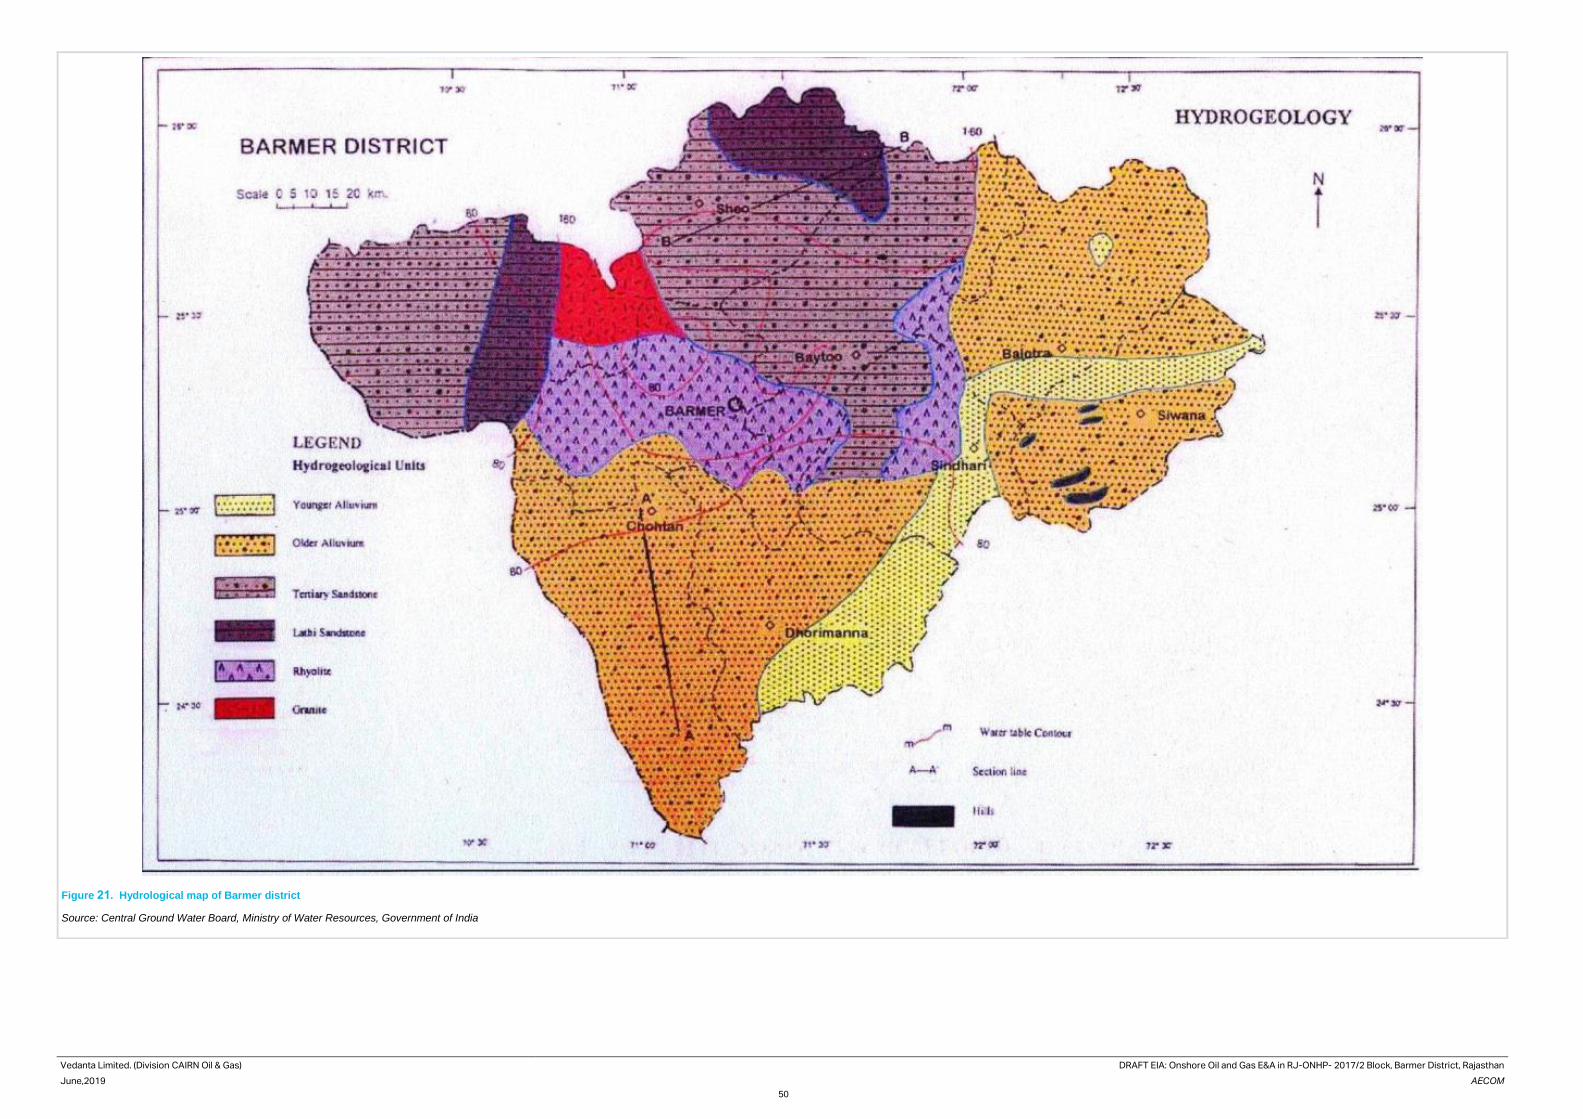
Vedanta Limited. (Division CAIRN Oil & Gas) DRAFT EIA: Onshore Oil and Gas E&A in RJ-ONHP- 2017/2 Block, Barmer District, Rajasthan
June,2019 AECOM
50
Figure 21. Hydrological map of Barmer district
Source: Central Ground Water Board, Ministry of Water Resources, Government of India
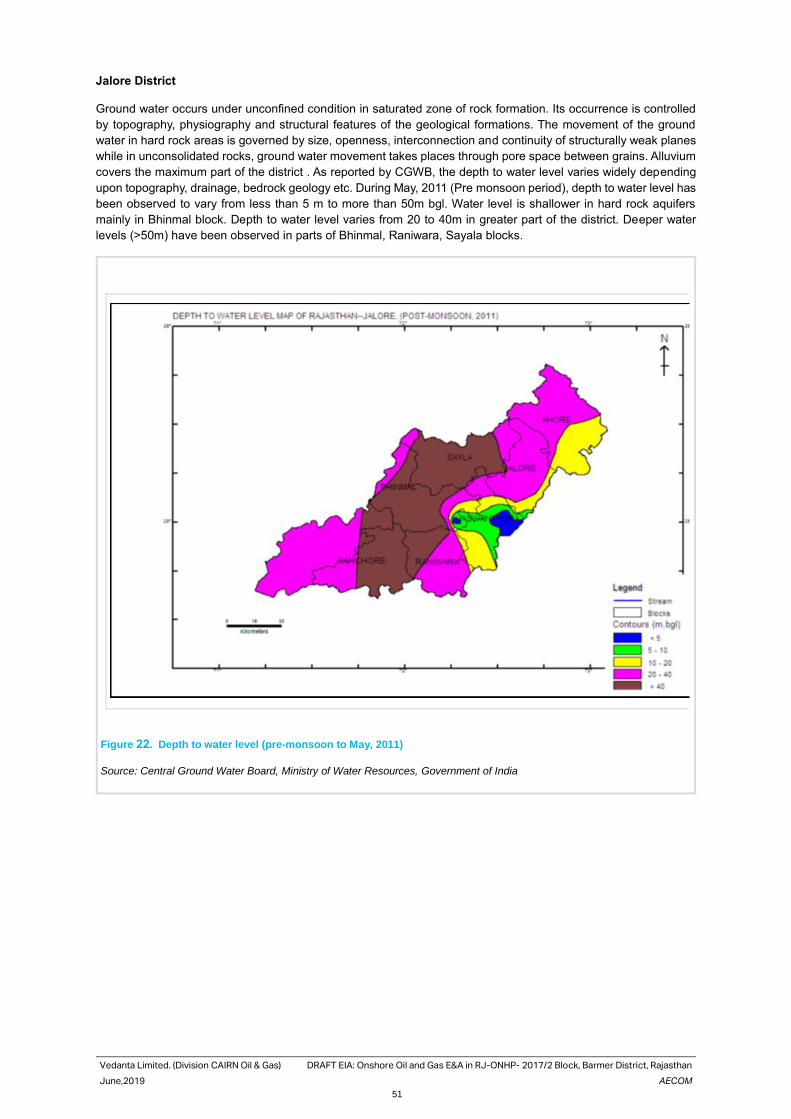
Vedanta Limited. (Division CAIRN Oil & Gas) DRAFT EIA: Onshore Oil and Gas E&A in RJ-ONHP- 2017/2 Block, Barmer District, Rajasthan
June,2019 AECOM
51
Jalore District
Ground water occurs under unconfined condition in saturated zone of rock formation. Its occurrence is controlled
by topography, physiography and structural features of the geological formations. The movement of the ground
water in hard rock areas is governed by size, openness, interconnection and continuity of structurally weak planes
while in unconsolidated rocks, ground water movement takes places through pore space between grains. Alluvium
covers the maximum part of the district . As reported by CGWB, the depth to water level varies widely depending
upon topography, drainage, bedrock geology etc. During May, 2011 (Pre monsoon period), depth to water level has
been observed to vary from less than 5 m to more than 50m bgl. Water level is shallower in hard rock aquifers
mainly in Bhinmal block. Depth to water level varies from 20 to 40m in greater part of the district. Deeper water
levels (>50m) have been observed in parts of Bhinmal, Raniwara, Sayala blocks.
Figure 22. Depth to water level (pre-monsoon to May, 2011)
Source: Central Ground Water Board, Ministry of Water Resources, Government of India
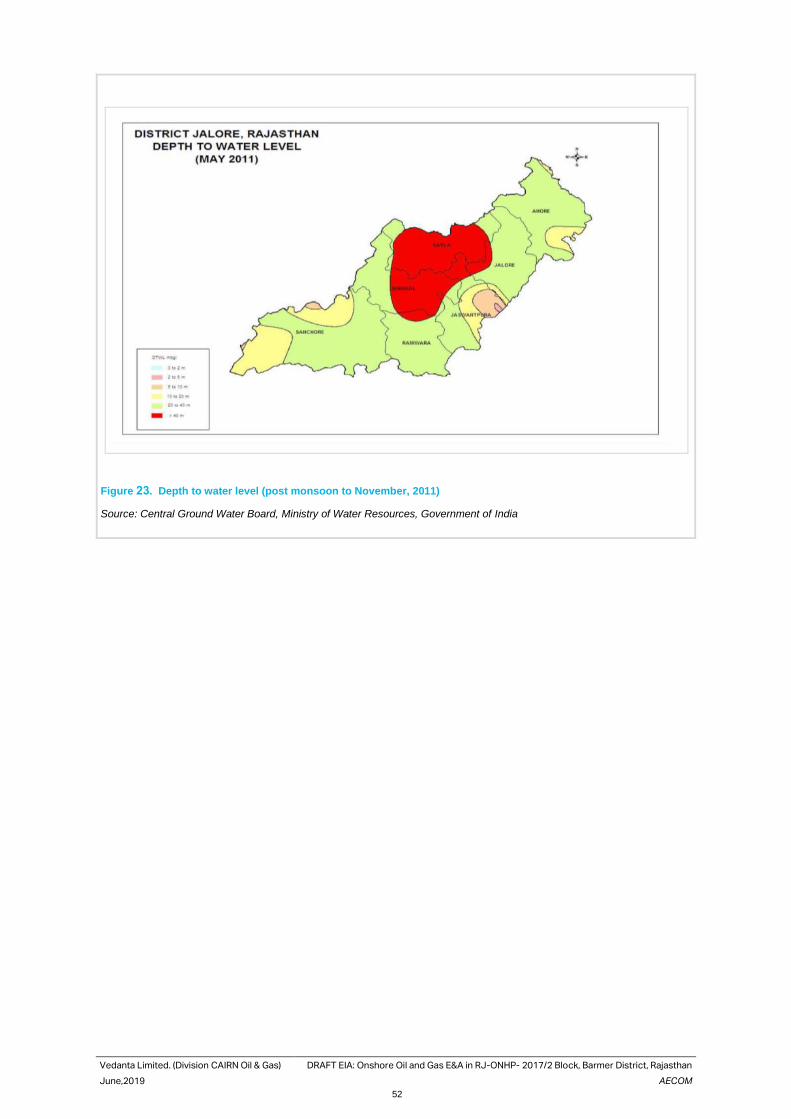
Vedanta Limited. (Division CAIRN Oil & Gas) DRAFT EIA: Onshore Oil and Gas E&A in RJ-ONHP- 2017/2 Block, Barmer District, Rajasthan
June,2019 AECOM
52
Figure 23. Depth to water level (post monsoon to November, 2011)
Source: Central Ground Water Board, Ministry of Water Resources, Government of India
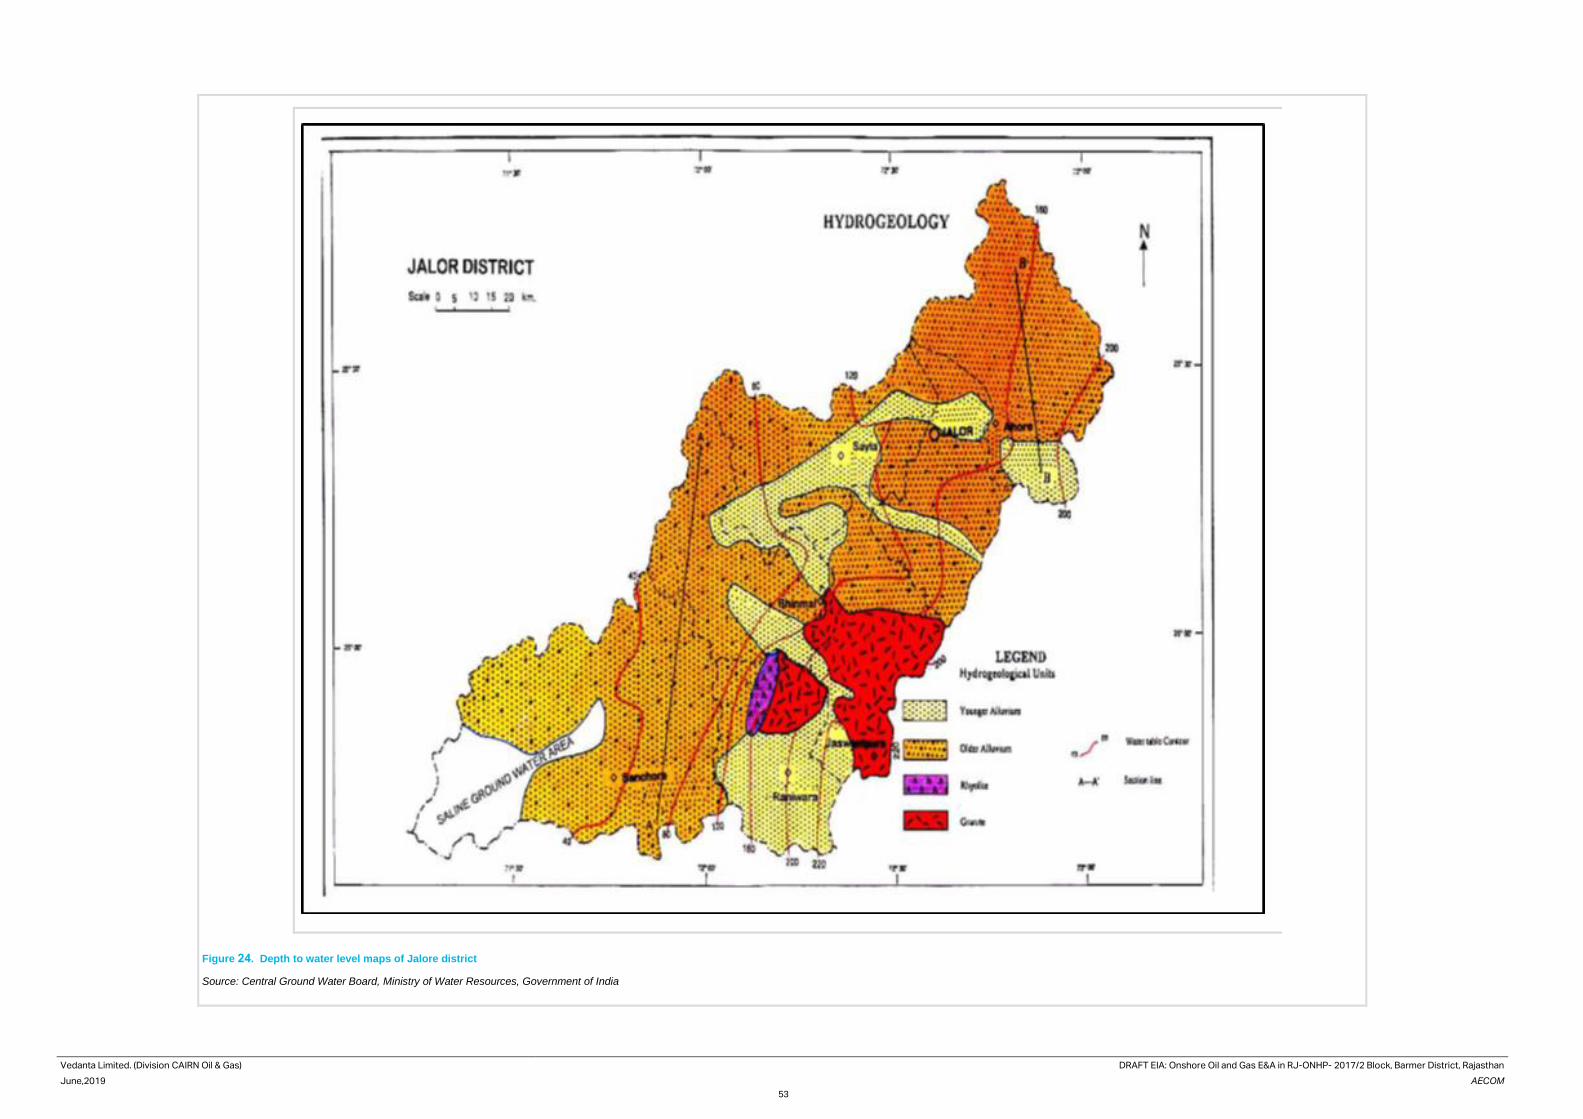
Vedanta Limited. (Division CAIRN Oil & Gas) DRAFT EIA: Onshore Oil and Gas E&A in RJ-ONHP- 2017/2 Block, Barmer District, Rajasthan
June,2019 AECOM
53
Figure 24. Depth to water level maps of Jalore district
Source: Central Ground Water Board, Ministry of Water Resources, Government of India
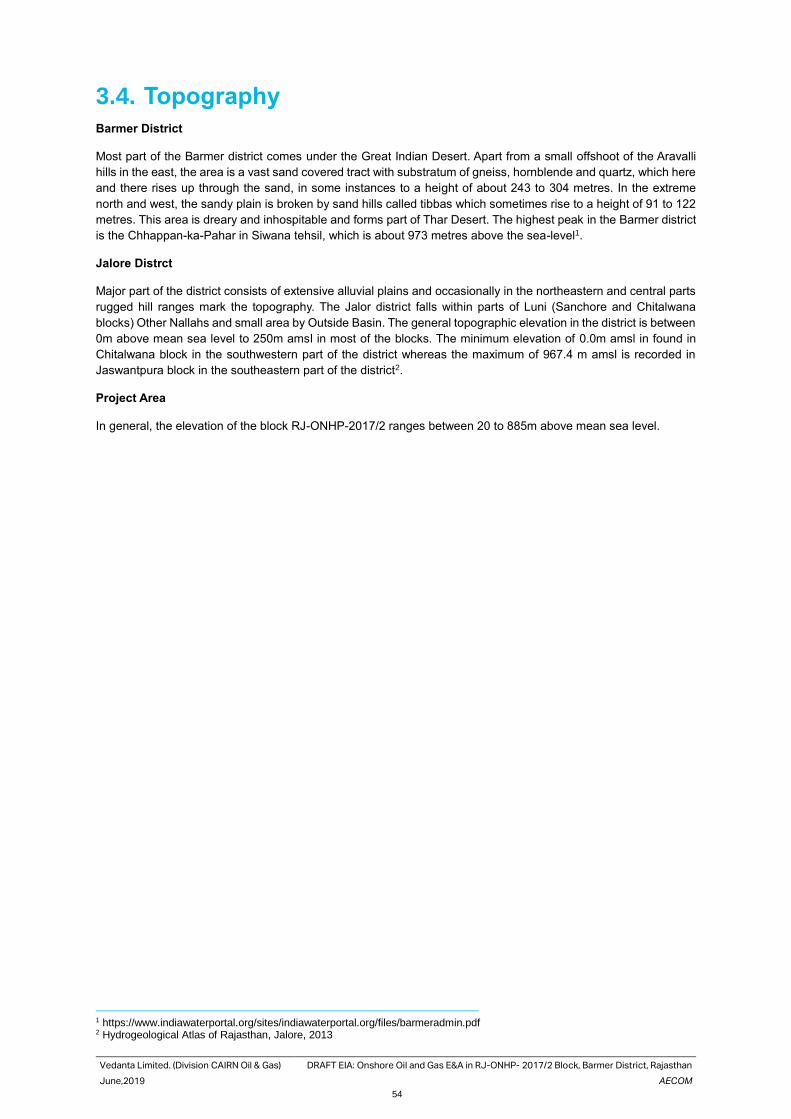
Vedanta Limited. (Division CAIRN Oil & Gas) DRAFT EIA: Onshore Oil and Gas E&A in RJ-ONHP- 2017/2 Block, Barmer District, Rajasthan
June,2019 AECOM
54
3.4. Topography
Barmer District
Most part of the Barmer district comes under the Great Indian Desert. Apart from a small offshoot of the Aravalli
hills in the east, the area is a vast sand covered tract with substratum of gneiss, hornblende and quartz, which here
and there rises up through the sand, in some instances to a height of about 243 to 304 metres. In the extreme
north and west, the sandy plain is broken by sand hills called tibbas which sometimes rise to a height of 91 to 122
metres. This area is dreary and inhospitable and forms part of Thar Desert. The highest peak in the Barmer district
is the Chhappan-ka-Pahar in Siwana tehsil, which is about 973 metres above the sea-level1.
Jalore Distrct
Major part of the district consists of extensive alluvial plains and occasionally in the northeastern and central parts
rugged hill ranges mark the topography. The Jalor district falls within parts of Luni (Sanchore and Chitalwana
blocks) Other Nallahs and small area by Outside Basin. The general topographic elevation in the district is between
0m above mean sea level to 250m amsl in most of the blocks. The minimum elevation of 0.0m amsl in found in
Chitalwana block in the southwestern part of the district whereas the maximum of 967.4 m amsl is recorded in
Jaswantpura block in the southeastern part of the district2.
Project Area
In general, the elevation of the block RJ-ONHP-2017/2 ranges between 20 to 885m above mean sea level.
1 https://www.indiawaterportal.org/sites/indiawaterportal.org/files/barmeradmin.pdf 2 Hydrogeological Atlas of Rajasthan, Jalore, 2013
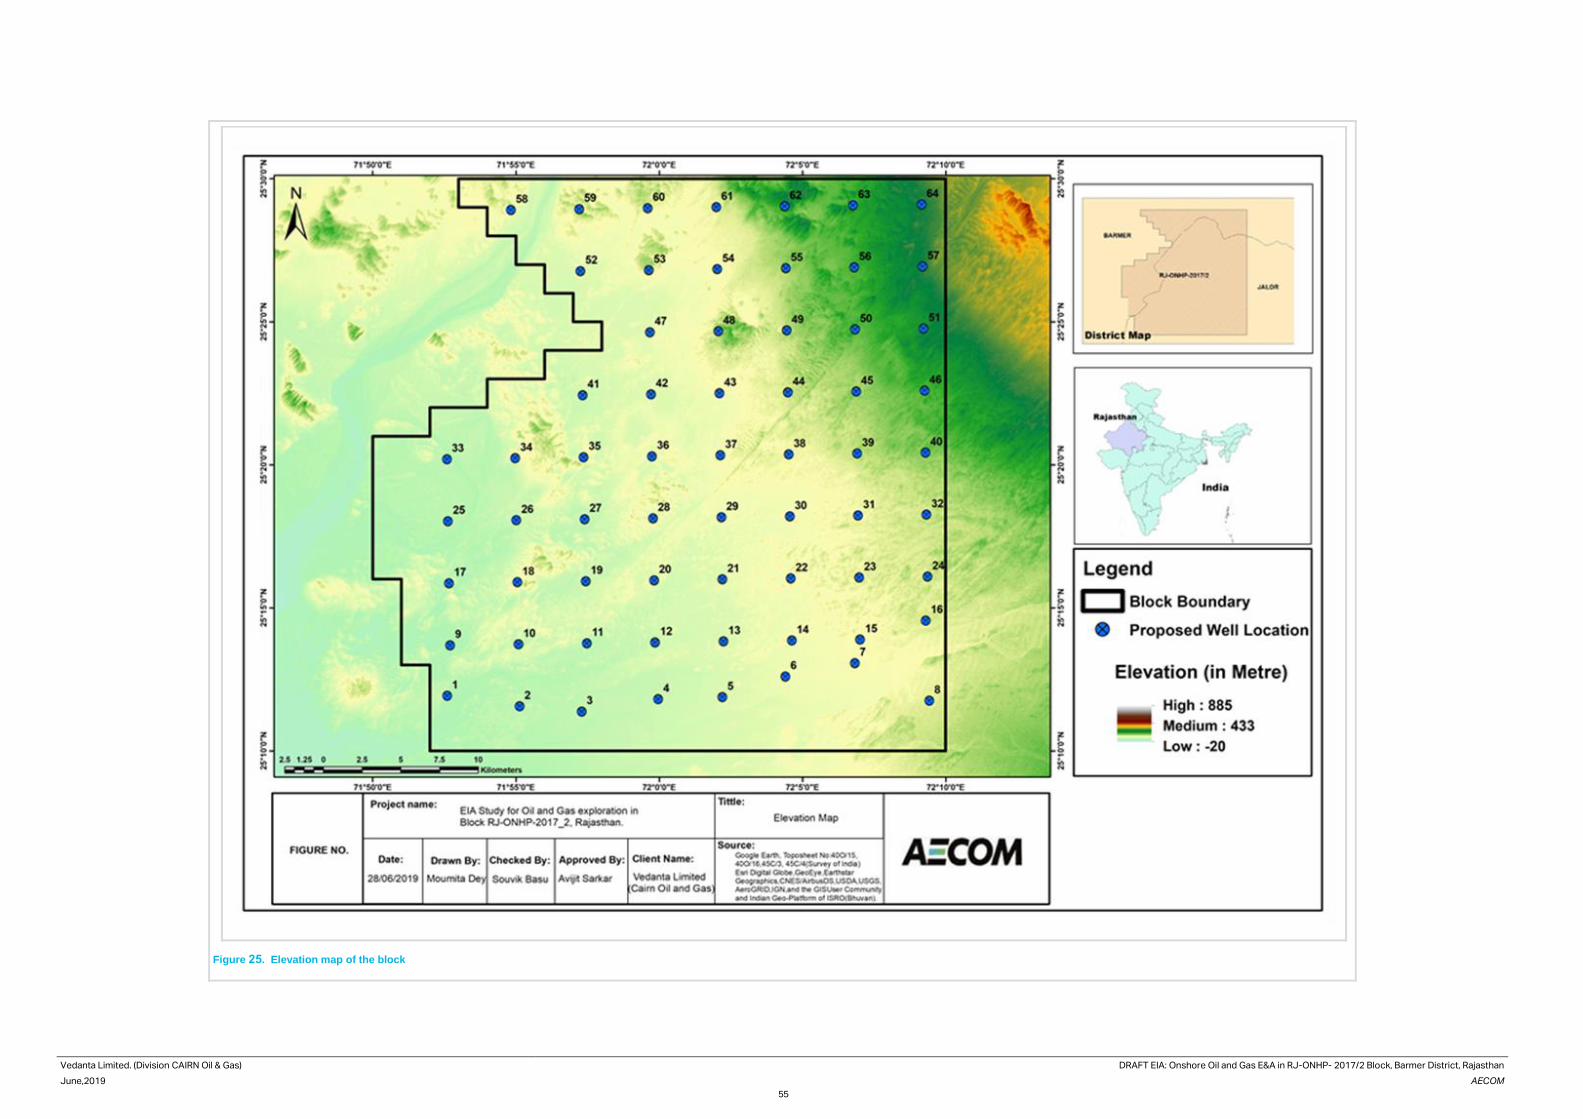
Vedanta Limited. (Division CAIRN Oil & Gas) DRAFT EIA: Onshore Oil and Gas E&A in RJ-ONHP- 2017/2 Block, Barmer District, Rajasthan
June,2019 AECOM
55
Figure 25. Elevation map of the block
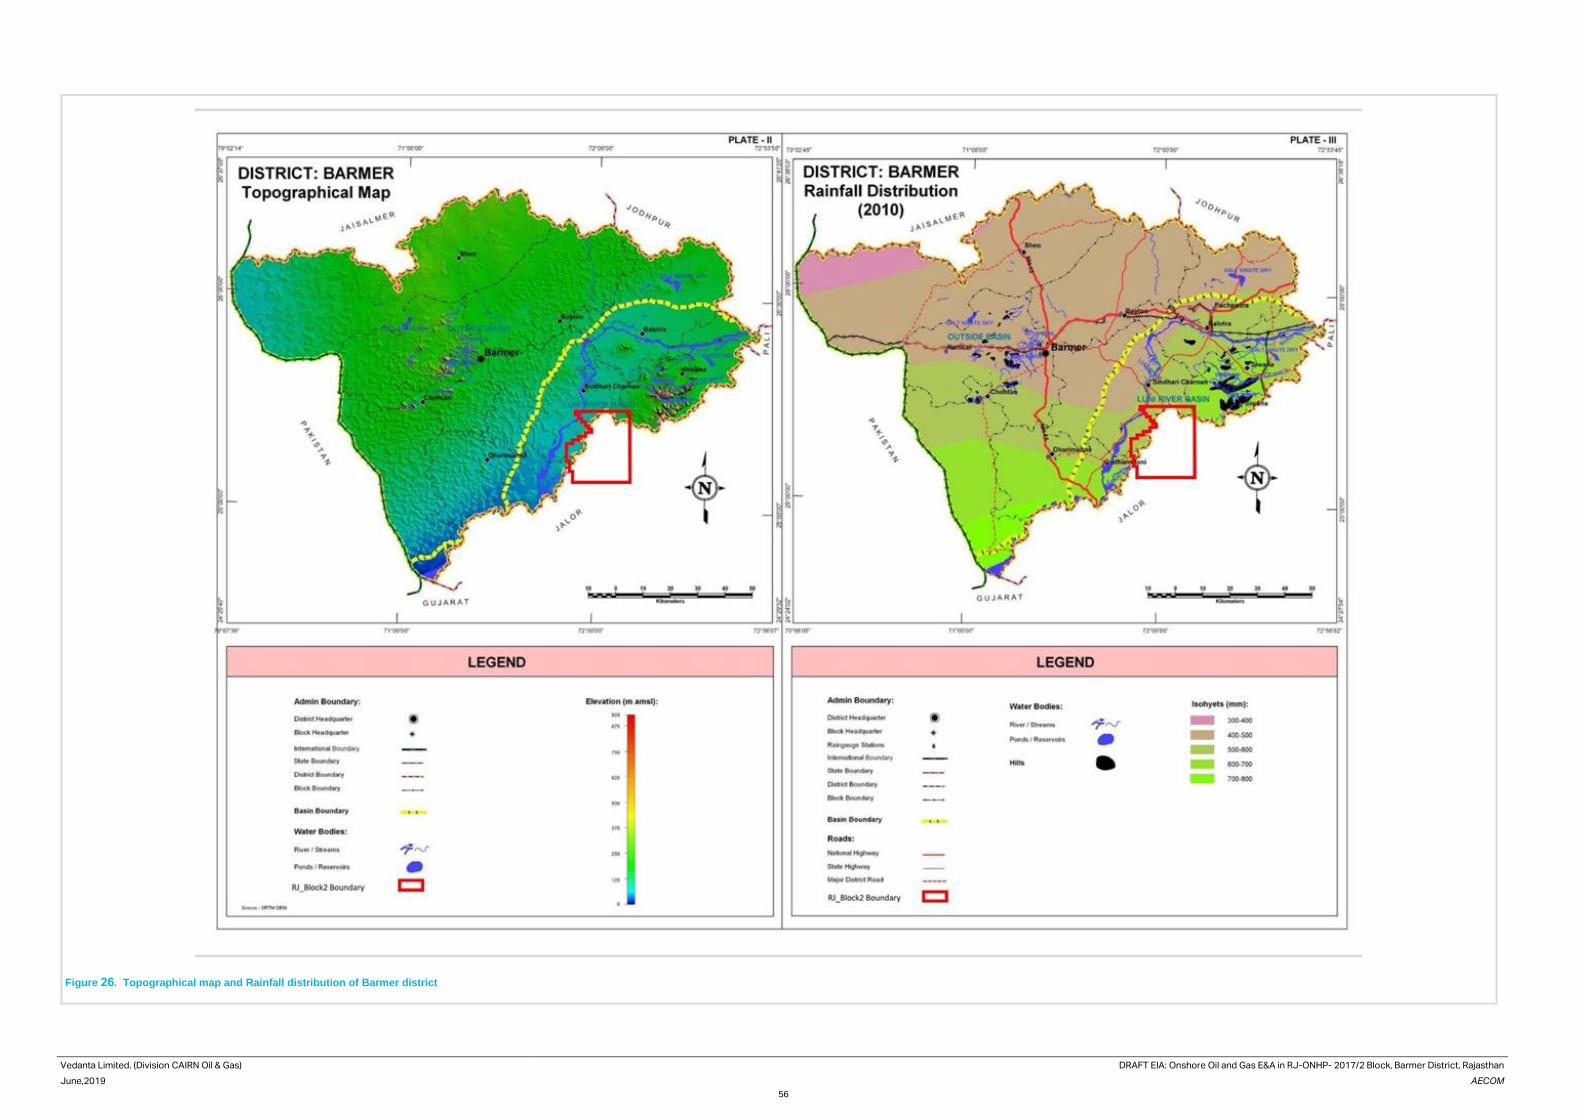
Vedanta Limited. (Division CAIRN Oil & Gas) DRAFT EIA: Onshore Oil and Gas E&A in RJ-ONHP- 2017/2 Block, Barmer District, Rajasthan
June,2019 AECOM
56
Figure 26. Topographical map and Rainfall distribution of Barmer district
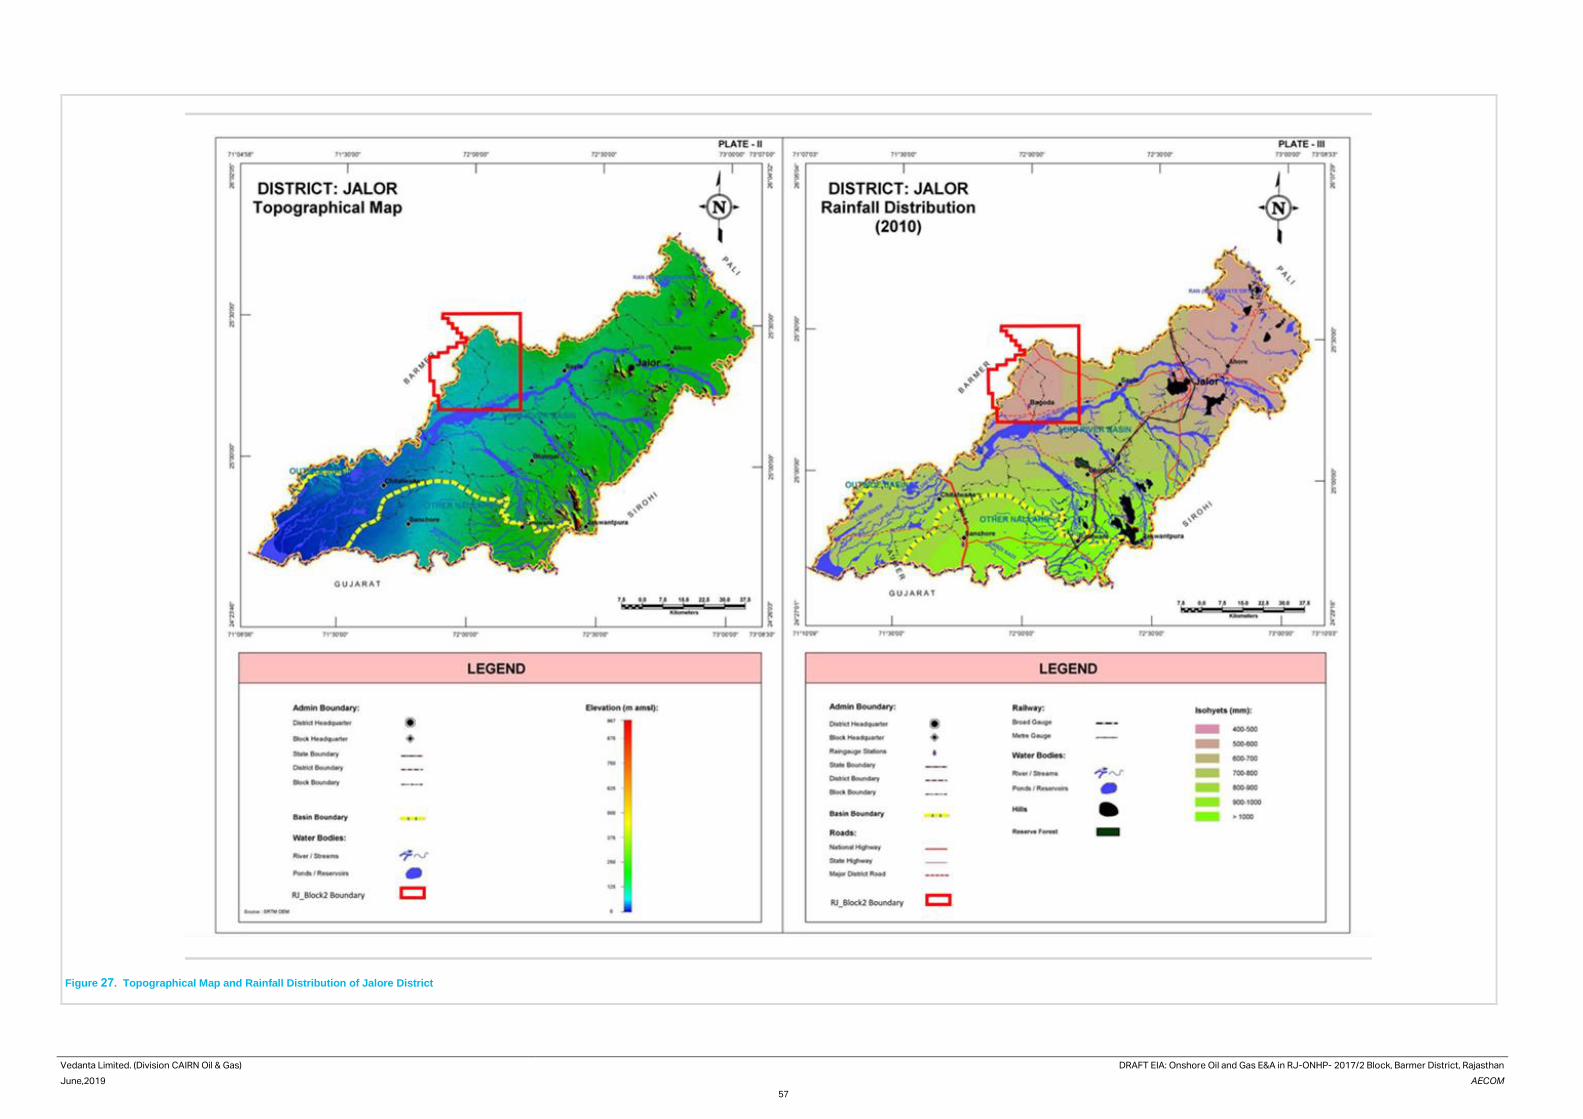
Vedanta Limited. (Division CAIRN Oil & Gas) DRAFT EIA: Onshore Oil and Gas E&A in RJ-ONHP- 2017/2 Block, Barmer District, Rajasthan
June,2019 AECOM
57
Figure 27. Topographical Map and Rainfall Distribution of Jalore District
Vedanta Limited. (Division CAIRN Oil & Gas) DRAFT EIA: Onshore Oil and Gas E&A in RJ-ONHP- 2017/2 Block, Barmer District, Rajasthan
June,2019 AECOM
58
3.5. Drainage
Barmer District
Geographically, the area as a whole form a part of the Great Indian Desert. The south-eastern part of the Barmer
district is drained by Luni River but significant part of the district does not have a systematic drainage system. The
only major drainage course in the area is Luni River, which flows from Balotra and Sindhari Charnan block towards
Jalor district. The river is ephemeral, flowing only in response to heavy precipitation. In the year of drought there is
no run off.
Jalore District
Jalore district falls in parts of Luni basin (82.8%), Other Nallahs (16.9%) and Outside Basin (0.3%). The Jalor district
forms a part of the Central Luni Basin and is drained by the Luni drainage system, which passes only through the
southwestern tip of the district near Sanchore before shedding its load into Runn of Kutch, originating from the
Aravalli hill ranges. The main rivers in the district are Jawai, Sukri, Khari, Bandi and Sagi, which are tributaries of
the Luni River and form a trellis pattern of drainage flowing due northwest. All rivers are ephemeral with graded
and meandering courses and wide flood plains.
Project Area
Luni river flows in north-eastern corner of block. Sukri river flows in southern part of block. The toposheet presents
1st, 2nd and 3rd order streams in project block, these are mainly seasonal drains which receive water only during
rainy days. The drainage map for project block is presented below.
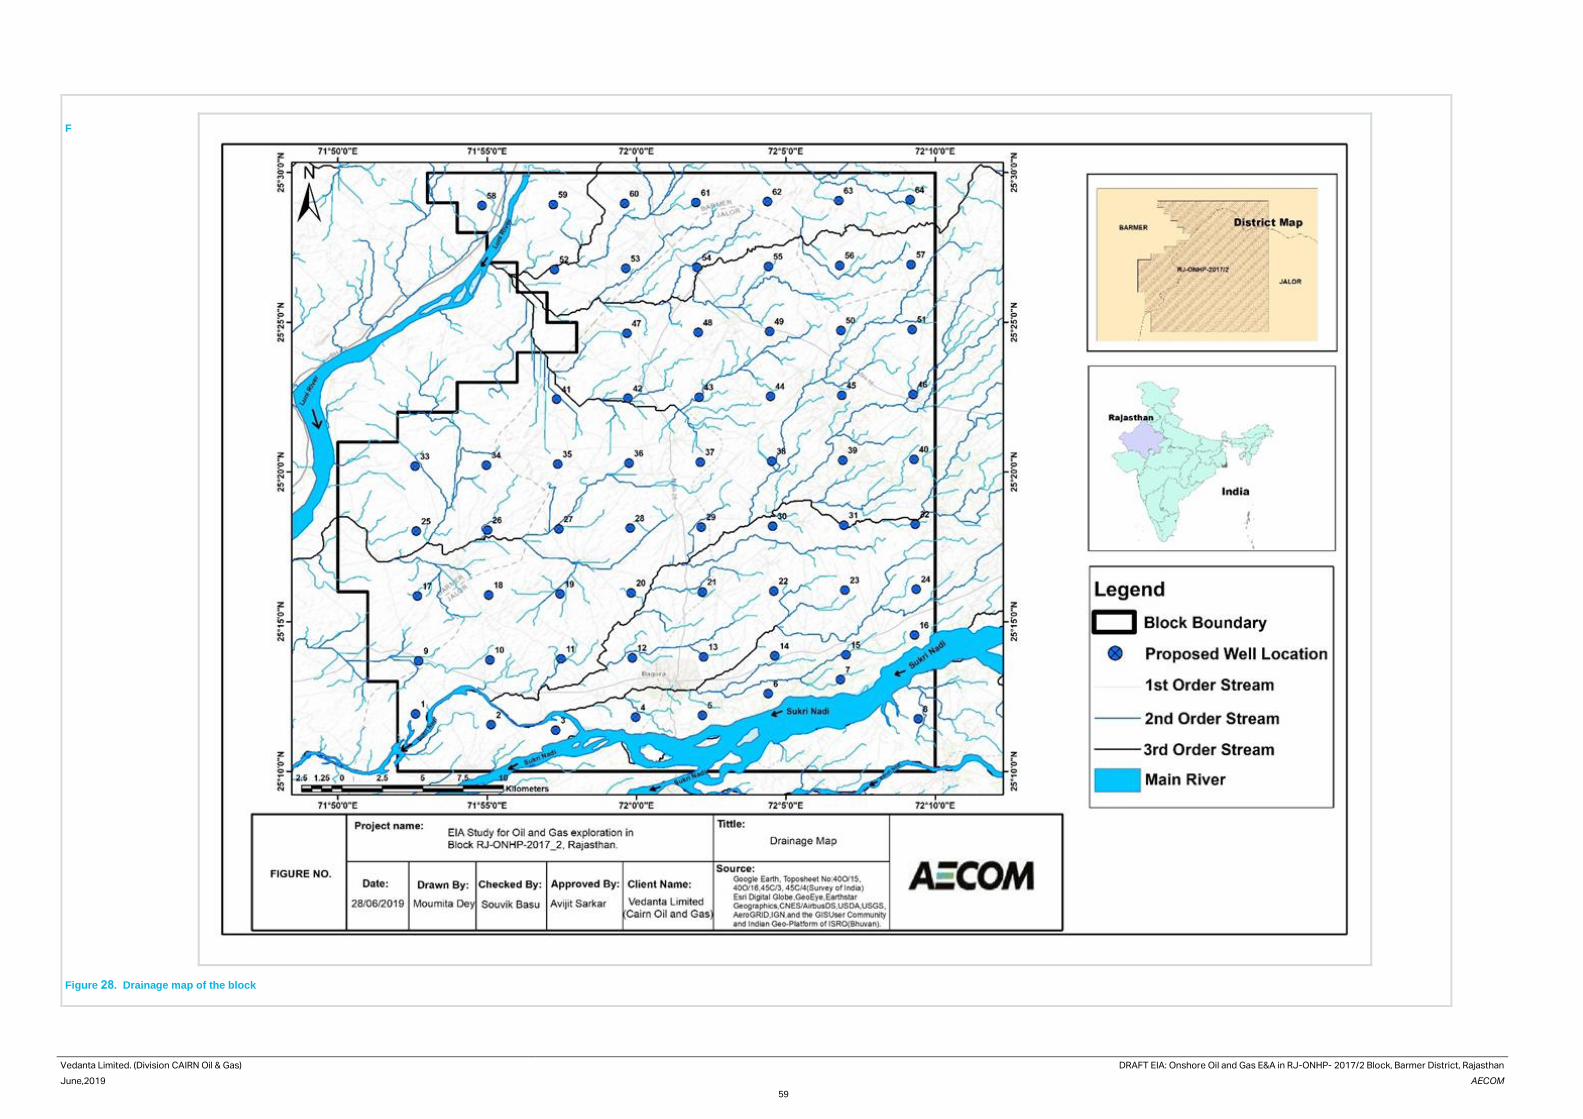
Vedanta Limited. (Division CAIRN Oil & Gas) DRAFT EIA: Onshore Oil and Gas E&A in RJ-ONHP- 2017/2 Block, Barmer District, Rajasthan
June,2019 AECOM
59
F
Figure 28. Drainage map of the block
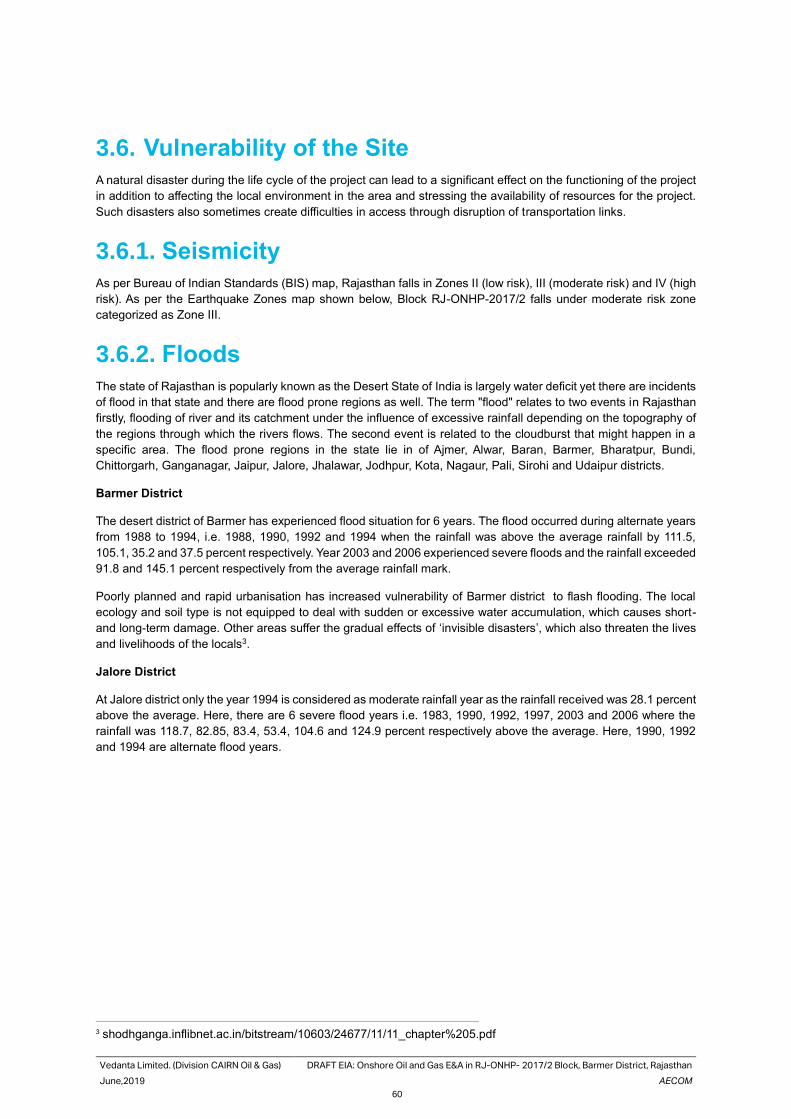
Vedanta Limited. (Division CAIRN Oil & Gas) DRAFT EIA: Onshore Oil and Gas E&A in RJ-ONHP- 2017/2 Block, Barmer District, Rajasthan
June,2019 AECOM
60
3.6. Vulnerability of the Site
A natural disaster during the life cycle of the project can lead to a significant effect on the functioning of the project
in addition to affecting the local environment in the area and stressing the availability of resources for the project.
Such disasters also sometimes create difficulties in access through disruption of transportation links.
3.6.1. Seismicity
As per Bureau of Indian Standards (BIS) map, Rajasthan falls in Zones II (low risk), III (moderate risk) and IV (high
risk). As per the Earthquake Zones map shown below, Block RJ-ONHP-2017/2 falls under moderate risk zone
categorized as Zone III.
3.6.2. Floods
The state of Rajasthan is popularly known as the Desert State of India is largely water deficit yet there are incidents
of flood in that state and there are flood prone regions as well. The term "flood" relates to two events in Rajasthan
firstly, flooding of river and its catchment under the influence of excessive rainfall depending on the topography of
the regions through which the rivers flows. The second event is related to the cloudburst that might happen in a
specific area. The flood prone regions in the state lie in of Ajmer, Alwar, Baran, Barmer, Bharatpur, Bundi,
Chittorgarh, Ganganagar, Jaipur, Jalore, Jhalawar, Jodhpur, Kota, Nagaur, Pali, Sirohi and Udaipur districts.
Barmer District
The desert district of Barmer has experienced flood situation for 6 years. The flood occurred during alternate years
from 1988 to 1994, i.e. 1988, 1990, 1992 and 1994 when the rainfall was above the average rainfall by 111.5,
105.1, 35.2 and 37.5 percent respectively. Year 2003 and 2006 experienced severe floods and the rainfall exceeded
91.8 and 145.1 percent respectively from the average rainfall mark.
Poorly planned and rapid urbanisation has increased vulnerability of Barmer district to flash flooding. The local
ecology and soil type is not equipped to deal with sudden or excessive water accumulation, which causes short-
and long-term damage. Other areas suffer the gradual effects of ‘invisible disasters’, which also threaten the lives
and livelihoods of the locals3.
Jalore District
At Jalore district only the year 1994 is considered as moderate rainfall year as the rainfall received was 28.1 percent
above the average. Here, there are 6 severe flood years i.e. 1983, 1990, 1992, 1997, 2003 and 2006 where the
rainfall was 118.7, 82.85, 83.4, 53.4, 104.6 and 124.9 percent respectively above the average. Here, 1990, 1992
and 1994 are alternate flood years.
3 shodhganga.inflibnet.ac.in/bitstream/10603/24677/11/11_chapter%205.pdf
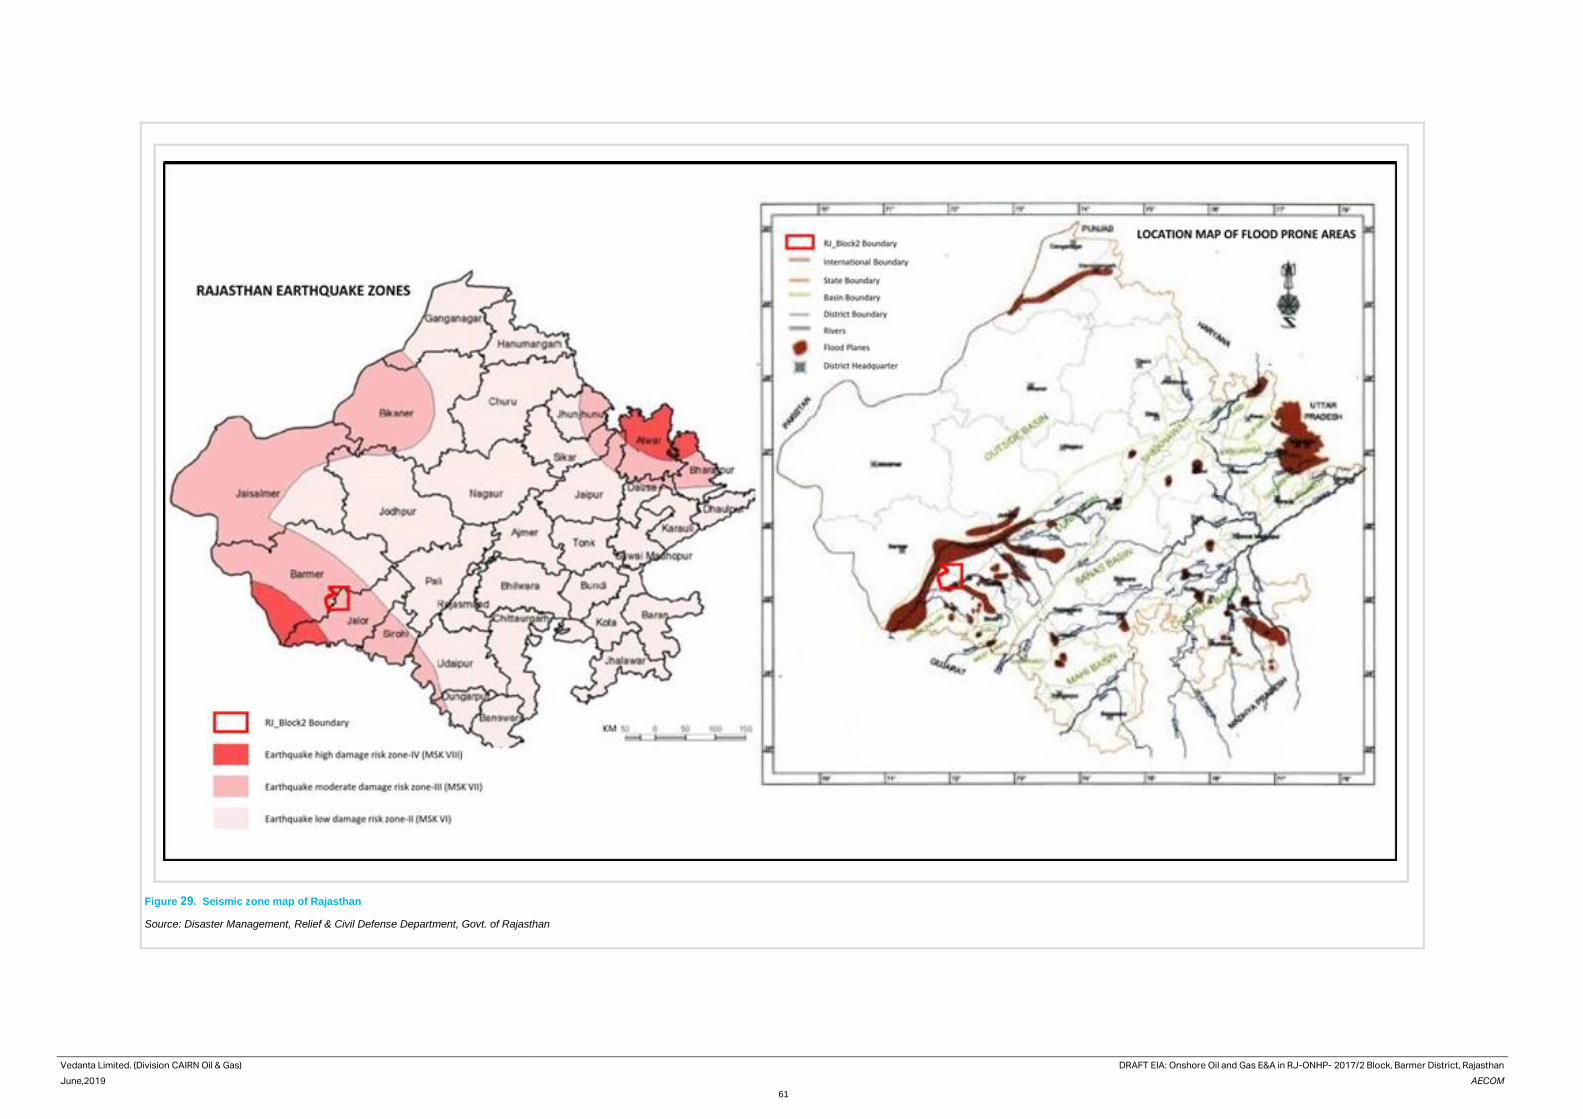
Vedanta Limited. (Division CAIRN Oil & Gas) DRAFT EIA: Onshore Oil and Gas E&A in RJ-ONHP- 2017/2 Block, Barmer District, Rajasthan
June,2019 AECOM
61
Figure 29. Seismic zone map of Rajasthan
Source: Disaster Management, Relief & Civil Defense Department, Govt. of Rajasthan
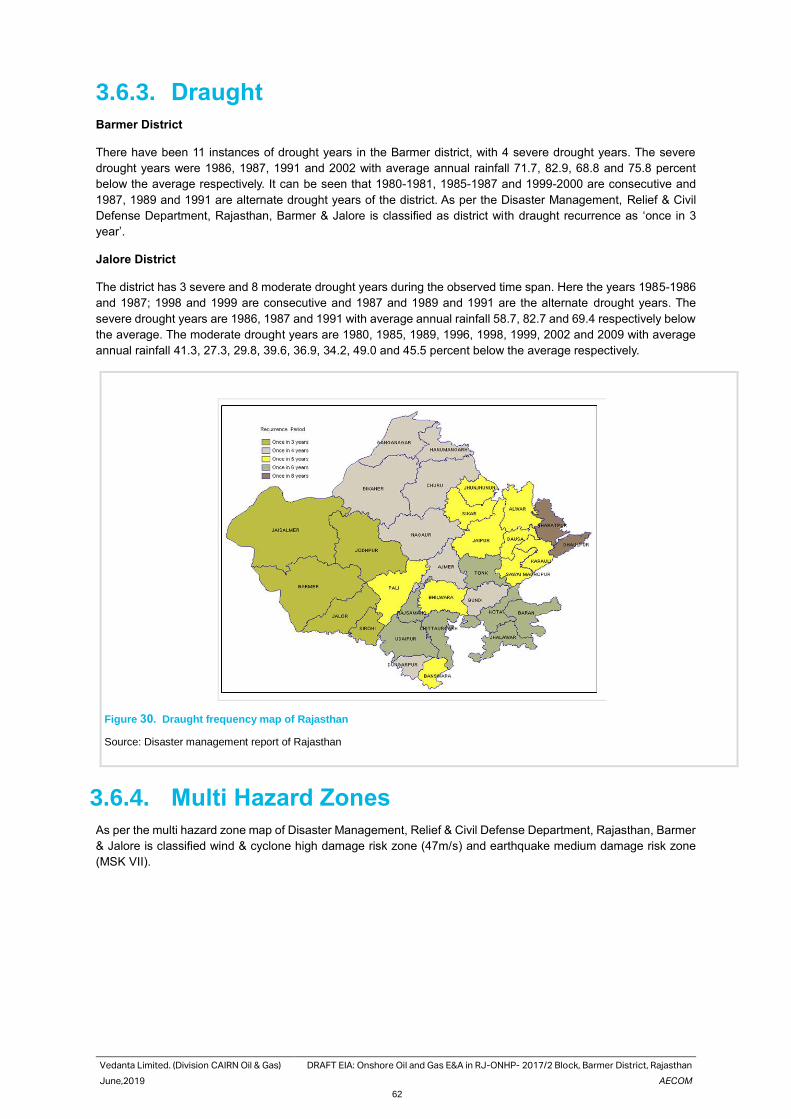
Vedanta Limited. (Division CAIRN Oil & Gas) DRAFT EIA: Onshore Oil and Gas E&A in RJ-ONHP- 2017/2 Block, Barmer District, Rajasthan
June,2019 AECOM
62
3.6.3. Draught
Barmer District
There have been 11 instances of drought years in the Barmer district, with 4 severe drought years. The severe
drought years were 1986, 1987, 1991 and 2002 with average annual rainfall 71.7, 82.9, 68.8 and 75.8 percent
below the average respectively. It can be seen that 1980-1981, 1985-1987 and 1999-2000 are consecutive and
1987, 1989 and 1991 are alternate drought years of the district. As per the Disaster Management, Relief & Civil
Defense Department, Rajasthan, Barmer & Jalore is classified as district with draught recurrence as ‘once in 3
year’.
Jalore District
The district has 3 severe and 8 moderate drought years during the observed time span. Here the years 1985-1986
and 1987; 1998 and 1999 are consecutive and 1987 and 1989 and 1991 are the alternate drought years. The
severe drought years are 1986, 1987 and 1991 with average annual rainfall 58.7, 82.7 and 69.4 respectively below
the average. The moderate drought years are 1980, 1985, 1989, 1996, 1998, 1999, 2002 and 2009 with average
annual rainfall 41.3, 27.3, 29.8, 39.6, 36.9, 34.2, 49.0 and 45.5 percent below the average respectively.
Figure 30. Draught frequency map of Rajasthan
Source: Disaster management report of Rajasthan
3.6.4. Multi Hazard Zones
As per the multi hazard zone map of Disaster Management, Relief & Civil Defense Department, Rajasthan, Barmer
& Jalore is classified wind & cyclone high damage risk zone (47m/s) and earthquake medium damage risk zone
(MSK VII).
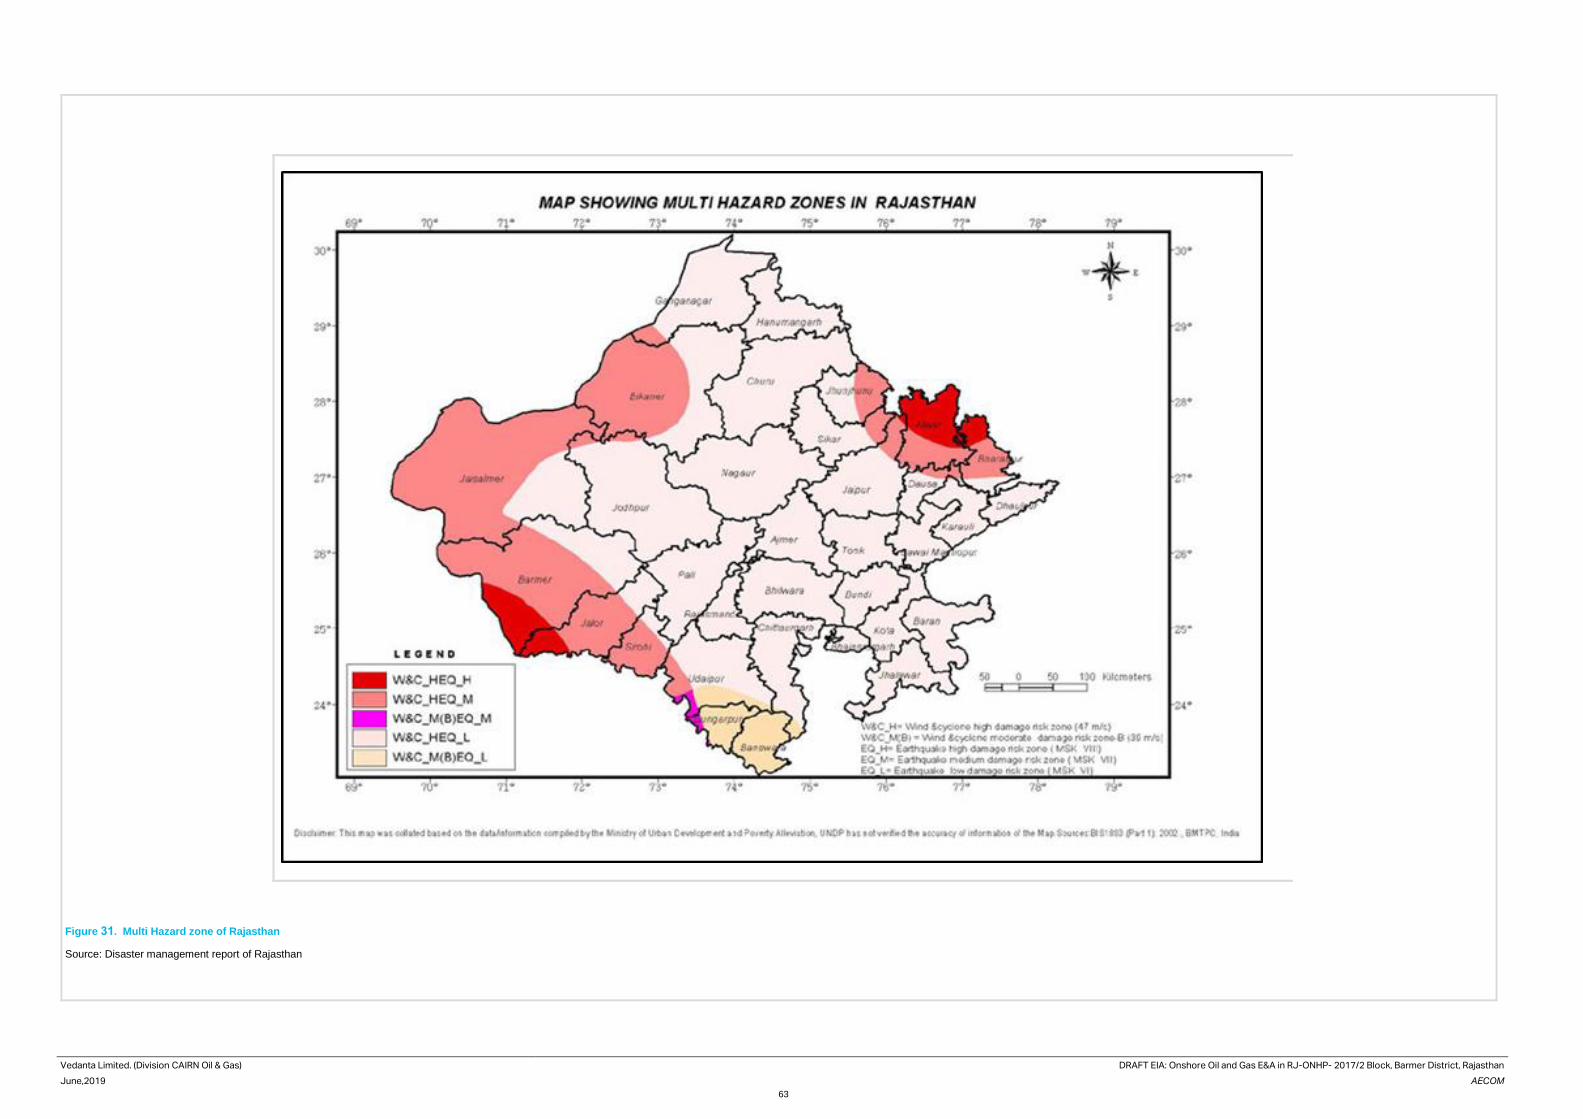
Vedanta Limited. (Division CAIRN Oil & Gas) DRAFT EIA: Onshore Oil and Gas E&A in RJ-ONHP- 2017/2 Block, Barmer District, Rajasthan
June,2019 AECOM
63
Figure 31. Multi Hazard zone of Rajasthan
Source: Disaster management report of Rajasthan
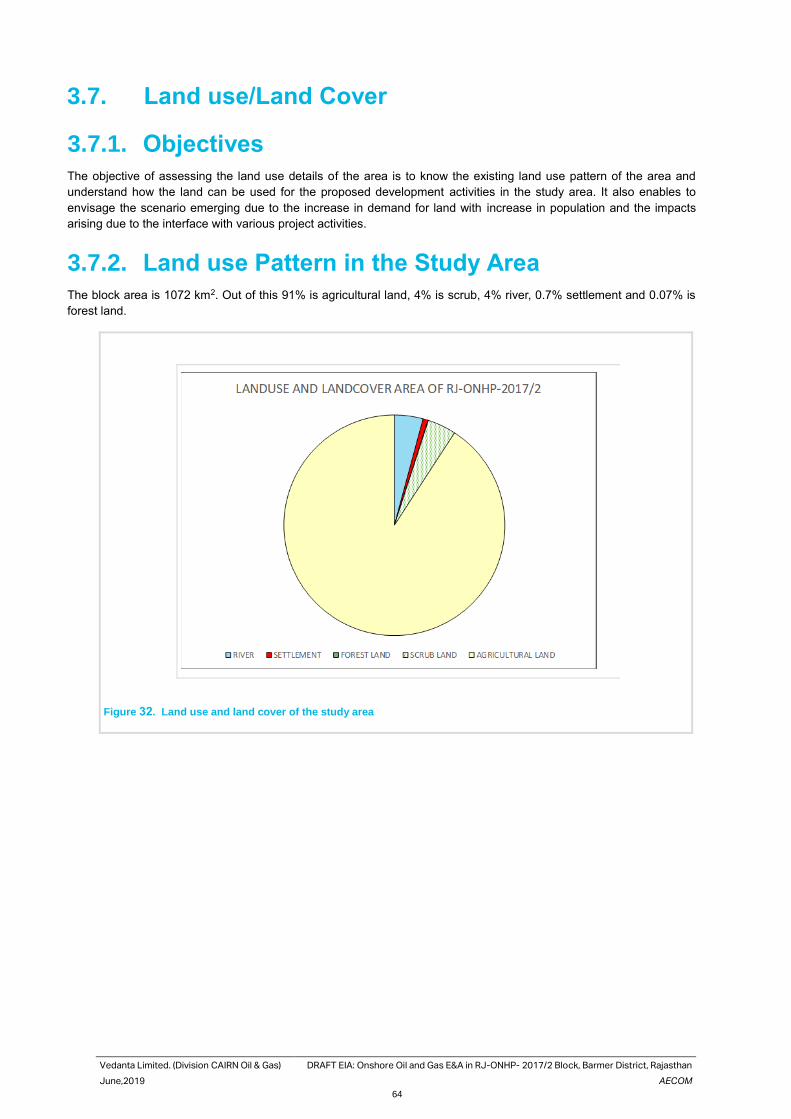
Vedanta Limited. (Division CAIRN Oil & Gas) DRAFT EIA: Onshore Oil and Gas E&A in RJ-ONHP- 2017/2 Block, Barmer District, Rajasthan
June,2019 AECOM
64
3.7. Land use/Land Cover
3.7.1. Objectives
The objective of assessing the land use details of the area is to know the existing land use pattern of the area and
understand how the land can be used for the proposed development activities in the study area. It also enables to
envisage the scenario emerging due to the increase in demand for land with increase in population and the impacts
arising due to the interface with various project activities.
3.7.2. Land use Pattern in the Study Area
The block area is 1072 km2. Out of this 91% is agricultural land, 4% is scrub, 4% river, 0.7% settlement and 0.07% is
forest land.
Figure 32. Land use and land cover of the study area
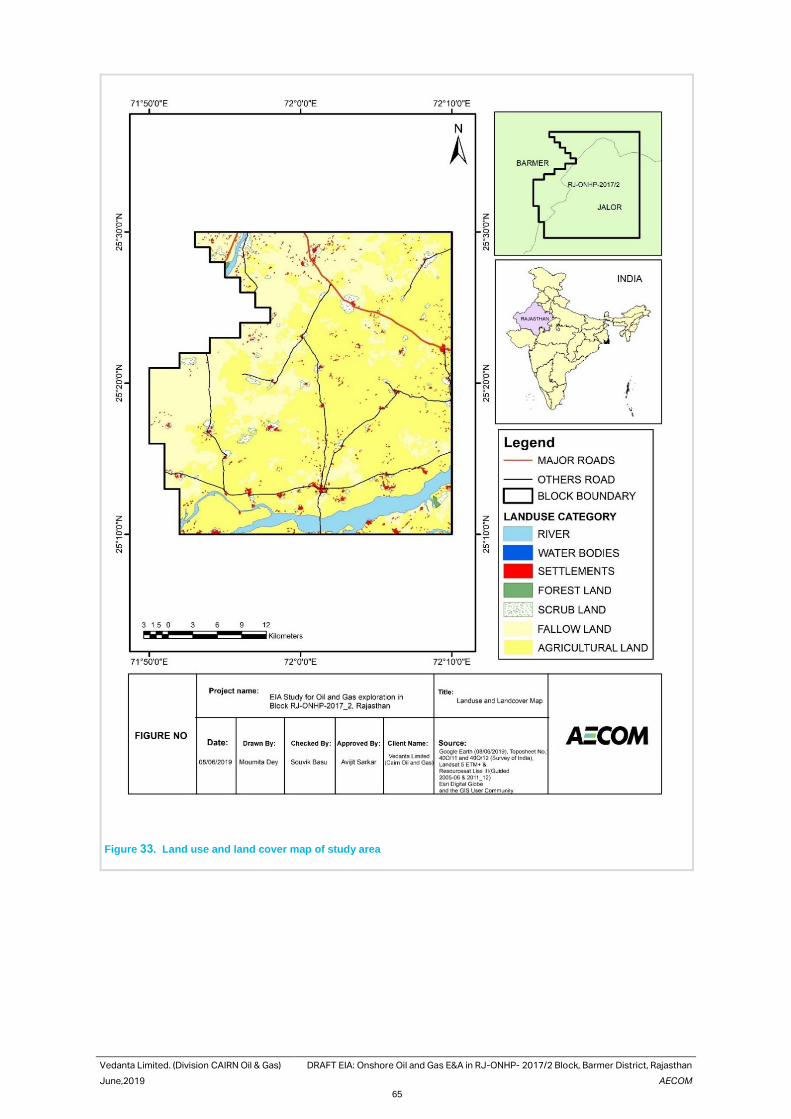
Vedanta Limited. (Division CAIRN Oil & Gas) DRAFT EIA: Onshore Oil and Gas E&A in RJ-ONHP- 2017/2 Block, Barmer District, Rajasthan
June,2019 AECOM
65
Figure 33. Land use and land cover map of study area
Vedanta Limited. (Division CAIRN Oil & Gas) DRAFT EIA: Onshore Oil and Gas E&A in RJ-ONHP- 2017/2 Block, Barmer District, Rajasthan
June,2019 AECOM
66
3.8. Climate & Meteorology
3.8.1. Temperature
In Barmer & Jalore, the hot season attains its highest value in May which begins by March when the temperature
begins to rise rapidly. The district witnesses’ intense heat and heat waves intensify summers in the region.
During the cold season, the temperatures are low especially in the night and January is the coldest month. The
diurnal range of temperature is large in all the months.
Barmer District
As per the Climatological Normals (1981-2010), in Winter maximum mean temperature recorded as 31.9°C, and
minimum mean temperature was recorded as 7.1°C. In summer maximum mean temperature rise up to 42.9°C,
whereas lowest was accounted as 17.7°C. July, August and September is regarded as monsoon season in
Rajasthan, and the highest and lowest mean temperature recorded as 41.2°C and 23.3°C.
Jalore District
As per the Climatological Normals (1981-2010), in Winter maximum mean temperature recorded as 29.1°C, and
minimum mean temperature was recorded as 11.3°C. In summer maximum mean temperature rise up to 38.33°C,
whereas lowest was accounted as 23.2°C. July, August and September is regarded as monsoon season in
Rajasthan, and the highest and lowest mean temperature recorded as 36.27°C and 26.15°C.
3.8.2. Relative Humidity
Barmer District
As per the Climatological Normals (1981-2010), mean relative humidity in winter, at day time was recorded as
52.3%, whereas the mean night time relative humidity was 29%. In summer mean day time relative humidity
accounted as 49.3%, and mean night time relative humidity recorded as 22% only. Day time mean relative humidity
in monsoon season recorded as 74.3% and night time mean relative humidity recorded as 44.3%.
Jalore District
As per the Climatological Normals (1981-2010), mean relative humidity in winter, at day time was recorded as 60%,
whereas the mean night time relative humidity was 39.3%. In summer mean day time relative humidity accounted
as 52%, and mean night time relative humidity recorded as 33% only. Day time mean relative humidity in monsoon
season recorded as 72.25% and night time mean relative humidity recorded as 23.25%.
3.8.3. Rainfall
Barmer District
Barmer has annual mean rainfall of 68.33 mm throughout the year. Highest rainfall recorded in monsoon, near
about 61.35 mm.
Jalore District
Jalore has annual mean rainfall of 104.5 mm throughout the year. Highest rainfall recorded in monsoon, near about
94.45 mm.
3.8.4. Wind Speed and Wind Direction
As per the Atlas of Windrose (1971-2000) by Indian Meteorological Department, highest monthly mean wind speed
is 2.5 m/s and lowest monthly mean wind speed is 0.5 m/s in November. Predominant wind direction is southwest
(SW) direction, occurring around 28% of the year with annual strongest wind greater than 7 m/s coming from
southwest.
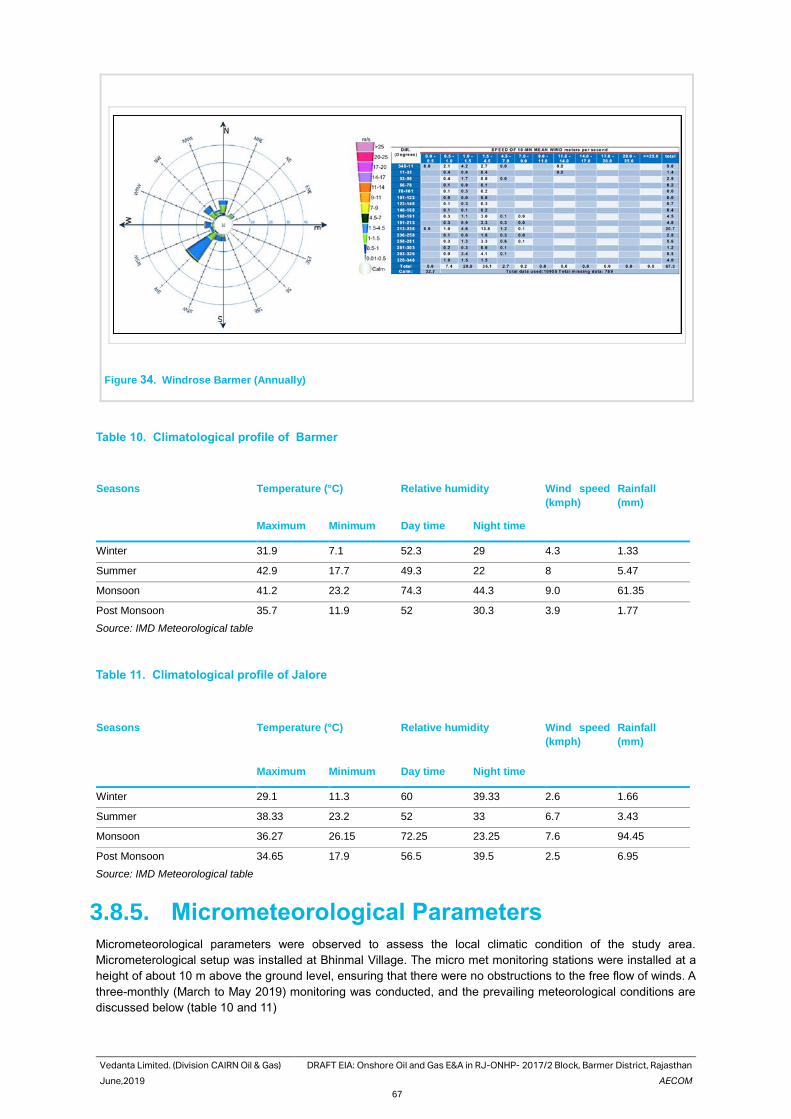
Vedanta Limited. (Division CAIRN Oil & Gas) DRAFT EIA: Onshore Oil and Gas E&A in RJ-ONHP- 2017/2 Block, Barmer District, Rajasthan
June,2019 AECOM
67
Figure 34. Windrose Barmer (Annually)
Table 10. Climatological profile of Barmer
Seasons
Temperature (°C) Relative humidity Wind speed
(kmph)
Rainfall
(mm)
Maximum Minimum Day time Night time
Winter 31.9 7.1 52.3 29 4.3 1.33
Summer 42.9 17.7 49.3 22 8 5.47
Monsoon 41.2 23.2 74.3 44.3 9.0 61.35
Post Monsoon 35.7 11.9 52 30.3 3.9 1.77
Source: IMD Meteorological table
Table 11. Climatological profile of Jalore
Seasons
Temperature (°C) Relative humidity Wind speed
(kmph)
Rainfall
(mm)
Maximum Minimum Day time Night time
Winter 29.1 11.3 60 39.33 2.6 1.66
Summer 38.33 23.2 52 33 6.7 3.43
Monsoon 36.27 26.15 72.25 23.25 7.6 94.45
Post Monsoon 34.65 17.9 56.5 39.5 2.5 6.95
Source: IMD Meteorological table
3.8.5. Micrometeorological Parameters
Micrometeorological parameters were observed to assess the local climatic condition of the study area.
Micrometerological setup was installed at Bhinmal Village. The micro met monitoring stations were installed at a
height of about 10 m above the ground level, ensuring that there were no obstructions to the free flow of winds. A
three-monthly (March to May 2019) monitoring was conducted, and the prevailing meteorological conditions are
discussed below (table 10 and 11)
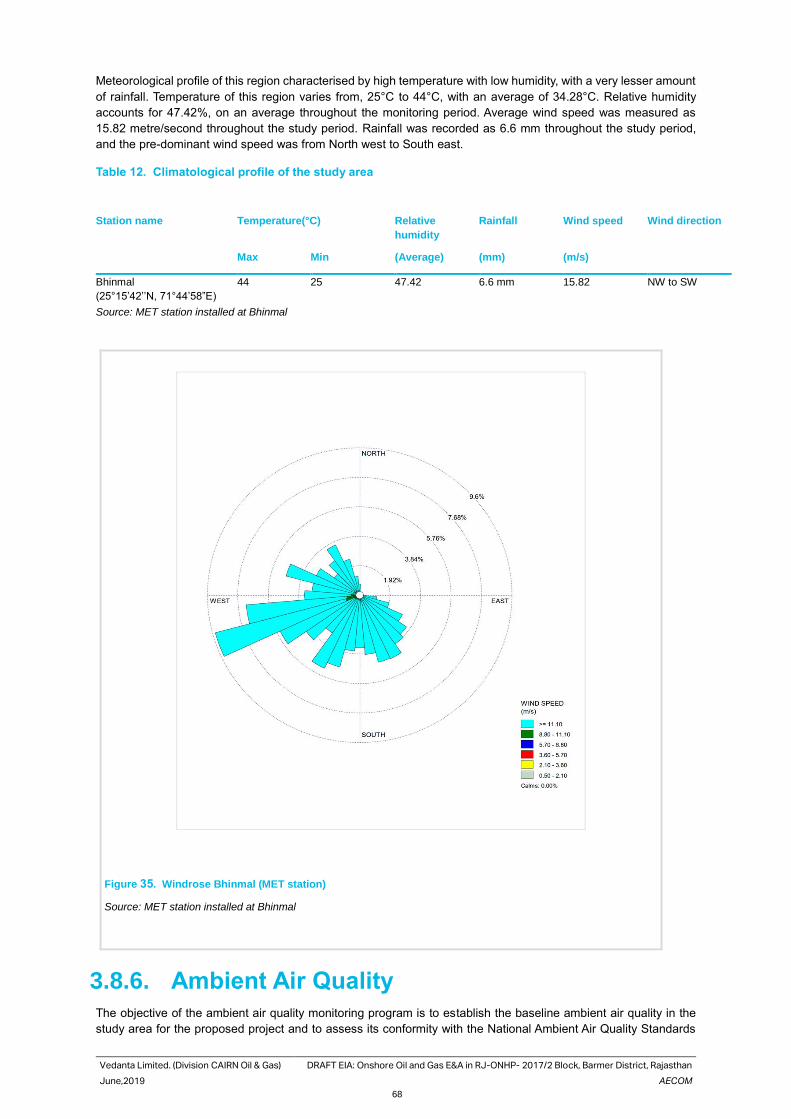
Vedanta Limited. (Division CAIRN Oil & Gas) DRAFT EIA: Onshore Oil and Gas E&A in RJ-ONHP- 2017/2 Block, Barmer District, Rajasthan
June,2019 AECOM
68
Meteorological profile of this region characterised by high temperature with low humidity, with a very lesser amount
of rainfall. Temperature of this region varies from, 25°C to 44°C, with an average of 34.28°C. Relative humidity
accounts for 47.42%, on an average throughout the monitoring period. Average wind speed was measured as
15.82 metre/second throughout the study period. Rainfall was recorded as 6.6 mm throughout the study period,
and the pre-dominant wind speed was from North west to South east.
Table 12. Climatological profile of the study area
Station name Temperature(°C) Relative
humidity
Rainfall Wind speed Wind direction
Max Min (Average) (mm) (m/s)
Bhinmal
(25°15’42’’N, 71°44’58”E)
44 25 47.42 6.6 mm 15.82 NW to SW
Source: MET station installed at Bhinmal
Figure 35. Windrose Bhinmal (MET station)
Source: MET station installed at Bhinmal
3.8.6. Ambient Air Quality
The objective of the ambient air quality monitoring program is to establish the baseline ambient air quality in the
study area for the proposed project and to assess its conformity with the National Ambient Air Quality Standards
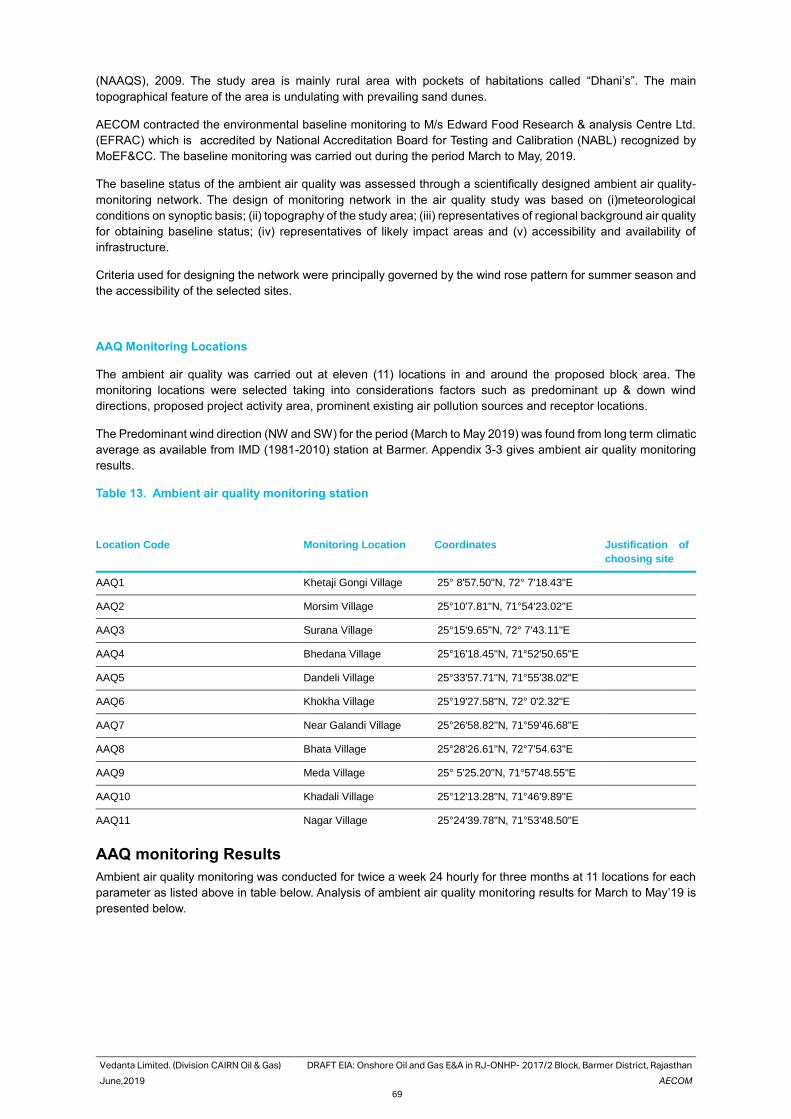
Vedanta Limited. (Division CAIRN Oil & Gas) DRAFT EIA: Onshore Oil and Gas E&A in RJ-ONHP- 2017/2 Block, Barmer District, Rajasthan
June,2019 AECOM
69
(NAAQS), 2009. The study area is mainly rural area with pockets of habitations called “Dhani’s”. The main
topographical feature of the area is undulating with prevailing sand dunes.
AECOM contracted the environmental baseline monitoring to M/s Edward Food Research & analysis Centre Ltd.
(EFRAC) which is accredited by National Accreditation Board for Testing and Calibration (NABL) recognized by
MoEF&CC. The baseline monitoring was carried out during the period March to May, 2019.
The baseline status of the ambient air quality was assessed through a scientifically designed ambient air quality-
monitoring network. The design of monitoring network in the air quality study was based on (i)meteorological
conditions on synoptic basis; (ii) topography of the study area; (iii) representatives of regional background air quality
for obtaining baseline status; (iv) representatives of likely impact areas and (v) accessibility and availability of
infrastructure.
Criteria used for designing the network were principally governed by the wind rose pattern for summer season and
the accessibility of the selected sites.
AAQ Monitoring Locations
The ambient air quality was carried out at eleven (11) locations in and around the proposed block area. The
monitoring locations were selected taking into considerations factors such as predominant up & down wind
directions, proposed project activity area, prominent existing air pollution sources and receptor locations.
The Predominant wind direction (NW and SW) for the period (March to May 2019) was found from long term climatic
average as available from IMD (1981-2010) station at Barmer. Appendix 3-3 gives ambient air quality monitoring
results.
Table 13. Ambient air quality monitoring station
Location Code Monitoring Location Coordinates Justification of
choosing site
AAQ1 Khetaji Gongi Village 25° 8'57.50"N, 72° 7'18.43"E
AAQ2 Morsim Village 25°10'7.81"N, 71°54'23.02"E
AAQ3 Surana Village 25°15'9.65"N, 72° 7'43.11"E
AAQ4 Bhedana Village 25°16'18.45"N, 71°52'50.65"E
AAQ5 Dandeli Village 25°33'57.71"N, 71°55'38.02"E
AAQ6 Khokha Village 25°19'27.58"N, 72° 0'2.32"E
AAQ7 Near Galandi Village 25°26'58.82"N, 71°59'46.68"E
AAQ8 Bhata Village 25°28'26.61"N, 72°7'54.63"E
AAQ9 Meda Village 25° 5'25.20"N, 71°57'48.55"E
AAQ10 Khadali Village 25°12'13.28"N, 71°46'9.89"E
AAQ11 Nagar Village 25°24'39.78"N, 71°53'48.50"E
AAQ monitoring Results
Ambient air quality monitoring was conducted for twice a week 24 hourly for three months at 11 locations for each
parameter as listed above in table below. Analysis of ambient air quality monitoring results for March to May’19 is
presented below.
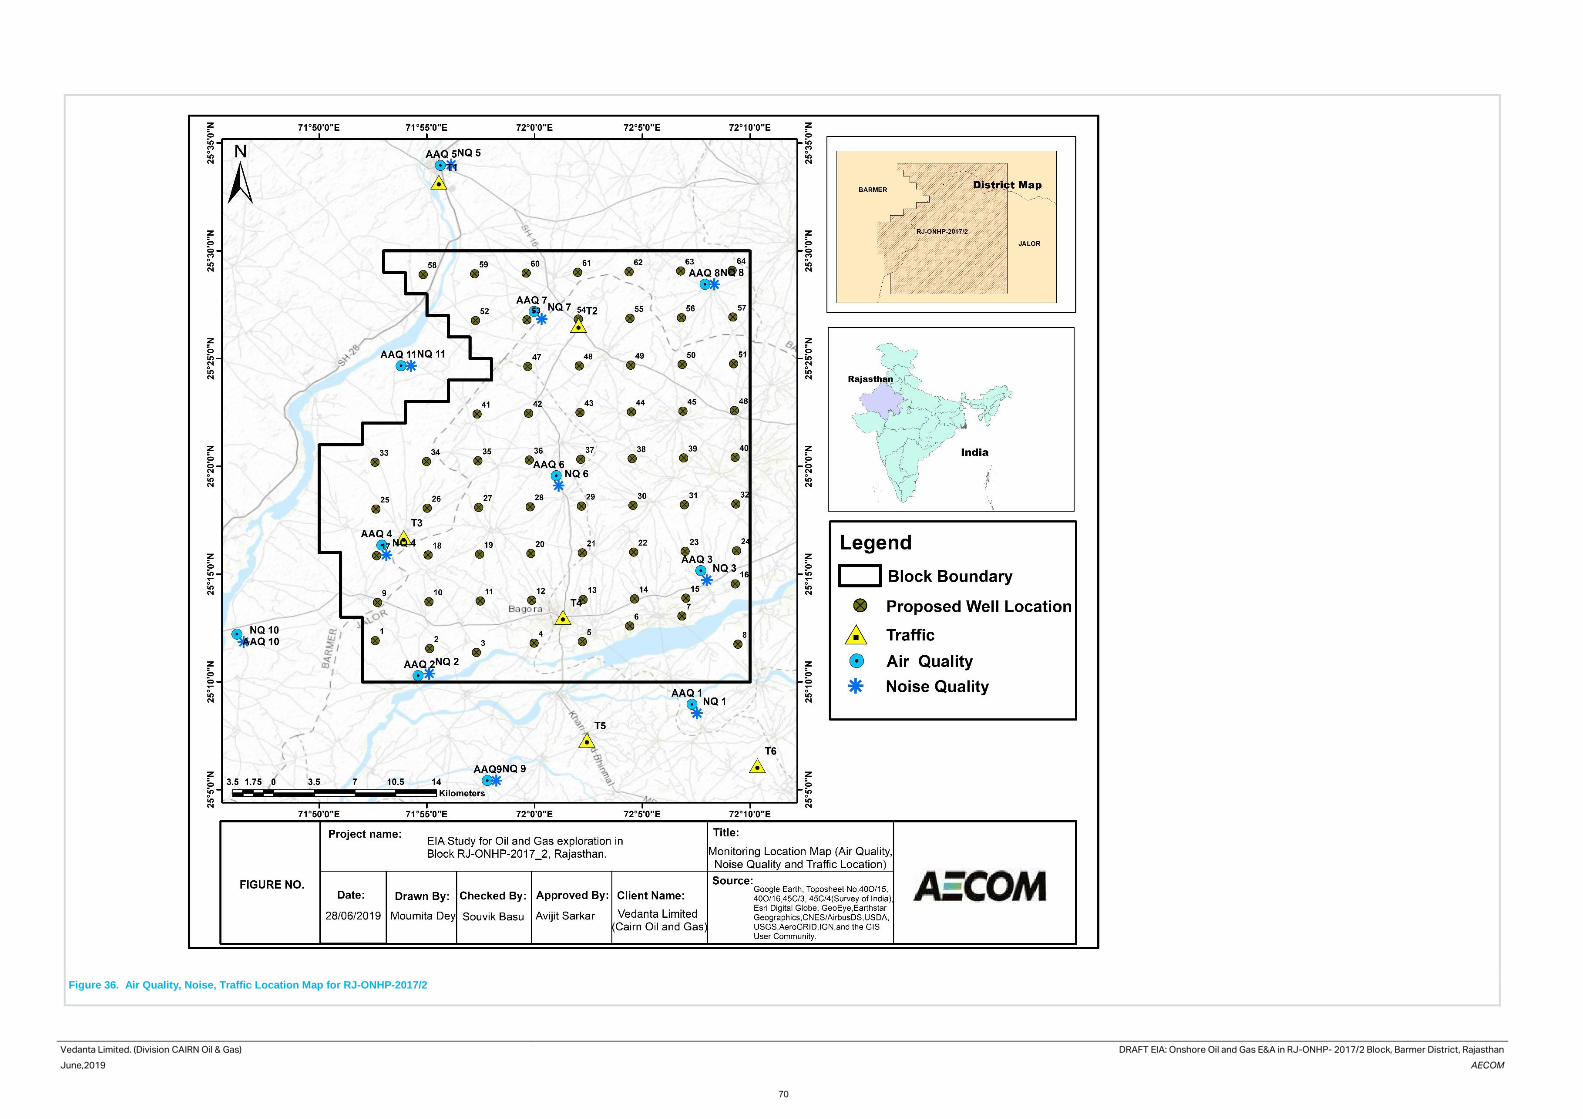
Vedanta Limited. (Division CAIRN Oil & Gas) DRAFT EIA: Onshore Oil and Gas E&A in RJ-ONHP- 2017/2 Block, Barmer District, Rajasthan
June,2019 AECOM
70
Figure 36. Air Quality, Noise, Traffic Location Map for RJ-ONHP-2017/2
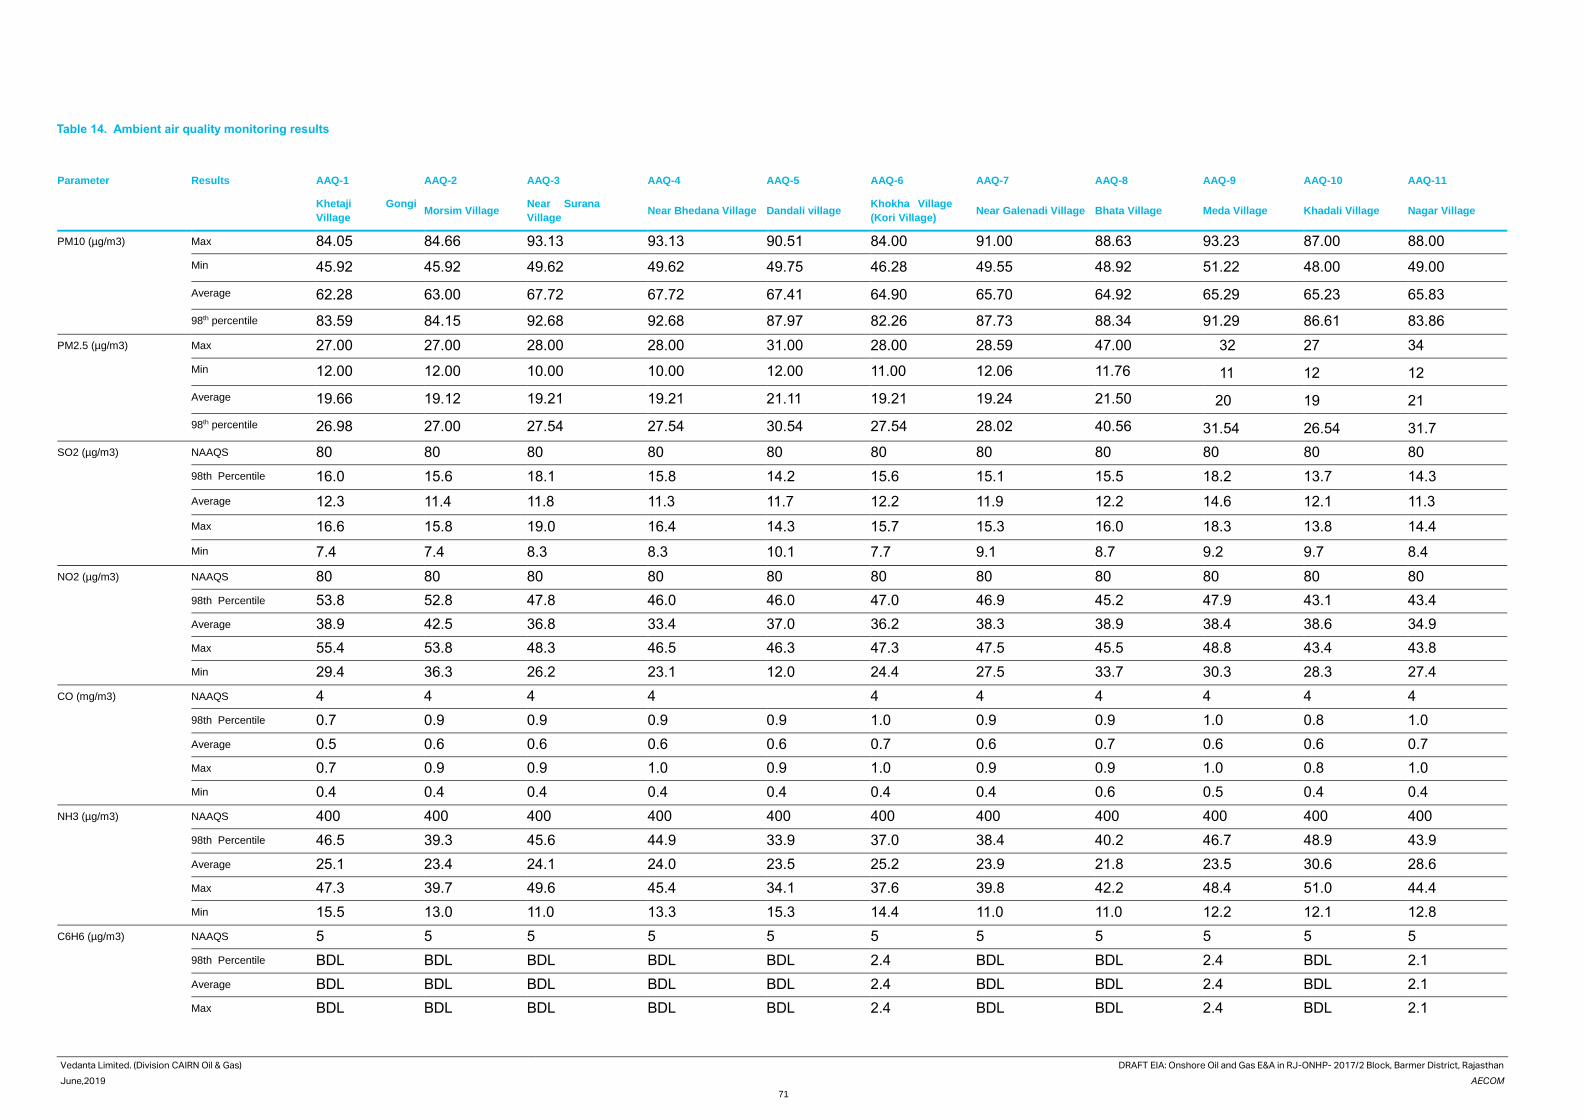
Vedanta Limited. (Division CAIRN Oil & Gas) DRAFT EIA: Onshore Oil and Gas E&A in RJ-ONHP- 2017/2 Block, Barmer District, Rajasthan
June,2019 AECOM
71
Table 14. Ambient air quality monitoring results
Parameter Results AAQ-1 AAQ-2 AAQ-3 AAQ-4 AAQ-5 AAQ-6 AAQ-7 AAQ-8 AAQ-9 AAQ-10 AAQ-11
Khetaji Gongi
Village Morsim Village
Near Surana
Village Near Bhedana Village Dandali village
Khokha Village
(Kori Village) Near Galenadi Village Bhata Village Meda Village Khadali Village Nagar Village
PM10 (µg/m3) Max 84.05 84.66 93.13 93.13 90.51 84.00 91.00 88.63 93.23 87.00 88.00
Min 45.92 45.92 49.62 49.62 49.75 46.28 49.55 48.92 51.22 48.00 49.00
Average 62.28 63.00 67.72 67.72 67.41 64.90 65.70 64.92 65.29 65.23 65.83
98th percentile 83.59 84.15 92.68 92.68 87.97 82.26 87.73 88.34 91.29 86.61 83.86
PM2.5 (µg/m3) Max 27.00 27.00 28.00 28.00 31.00 28.00 28.59 47.00 32 27 34
Min 12.00 12.00 10.00 10.00 12.00 11.00 12.06 11.76 11 12 12
Average 19.66 19.12 19.21 19.21 21.11 19.21 19.24 21.50 20 19 21
98th percentile 26.98 27.00 27.54 27.54 30.54 27.54 28.02 40.56 31.54 26.54 31.7
SO2 (µg/m3) NAAQS 80 80 80 80 80 80 80 80 80 80 80
98th Percentile 16.0 15.6 18.1 15.8 14.2 15.6 15.1 15.5 18.2 13.7 14.3
Average 12.3 11.4 11.8 11.3 11.7 12.2 11.9 12.2 14.6 12.1 11.3
Max 16.6 15.8 19.0 16.4 14.3 15.7 15.3 16.0 18.3 13.8 14.4
Min 7.4 7.4 8.3 8.3 10.1 7.7 9.1 8.7 9.2 9.7 8.4
NO2 (µg/m3) NAAQS 80 80 80 80 80 80 80 80 80 80 80
98th Percentile 53.8 52.8 47.8 46.0 46.0 47.0 46.9 45.2 47.9 43.1 43.4
Average 38.9 42.5 36.8 33.4 37.0 36.2 38.3 38.9 38.4 38.6 34.9
Max 55.4 53.8 48.3 46.5 46.3 47.3 47.5 45.5 48.8 43.4 43.8
Min 29.4 36.3 26.2 23.1 12.0 24.4 27.5 33.7 30.3 28.3 27.4
CO (mg/m3) NAAQS 4 4 4 4 4 4 4 4 4 4
98th Percentile 0.7 0.9 0.9 0.9 0.9 1.0 0.9 0.9 1.0 0.8 1.0
Average 0.5 0.6 0.6 0.6 0.6 0.7 0.6 0.7 0.6 0.6 0.7
Max 0.7 0.9 0.9 1.0 0.9 1.0 0.9 0.9 1.0 0.8 1.0
Min 0.4 0.4 0.4 0.4 0.4 0.4 0.4 0.6 0.5 0.4 0.4
NH3 (µg/m3) NAAQS 400 400 400 400 400 400 400 400 400 400 400
98th Percentile 46.5 39.3 45.6 44.9 33.9 37.0 38.4 40.2 46.7 48.9 43.9
Average 25.1 23.4 24.1 24.0 23.5 25.2 23.9 21.8 23.5 30.6 28.6
Max 47.3 39.7 49.6 45.4 34.1 37.6 39.8 42.2 48.4 51.0 44.4
Min 15.5 13.0 11.0 13.3 15.3 14.4 11.0 11.0 12.2 12.1 12.8
C6H6 (µg/m3) NAAQS 5 5 5 5 5 5 5 5 5 5 5
98th Percentile BDL BDL BDL BDL BDL 2.4 BDL BDL 2.4 BDL 2.1
Average BDL BDL BDL BDL BDL 2.4 BDL BDL 2.4 BDL 2.1
Max BDL BDL BDL BDL BDL 2.4 BDL BDL 2.4 BDL 2.1
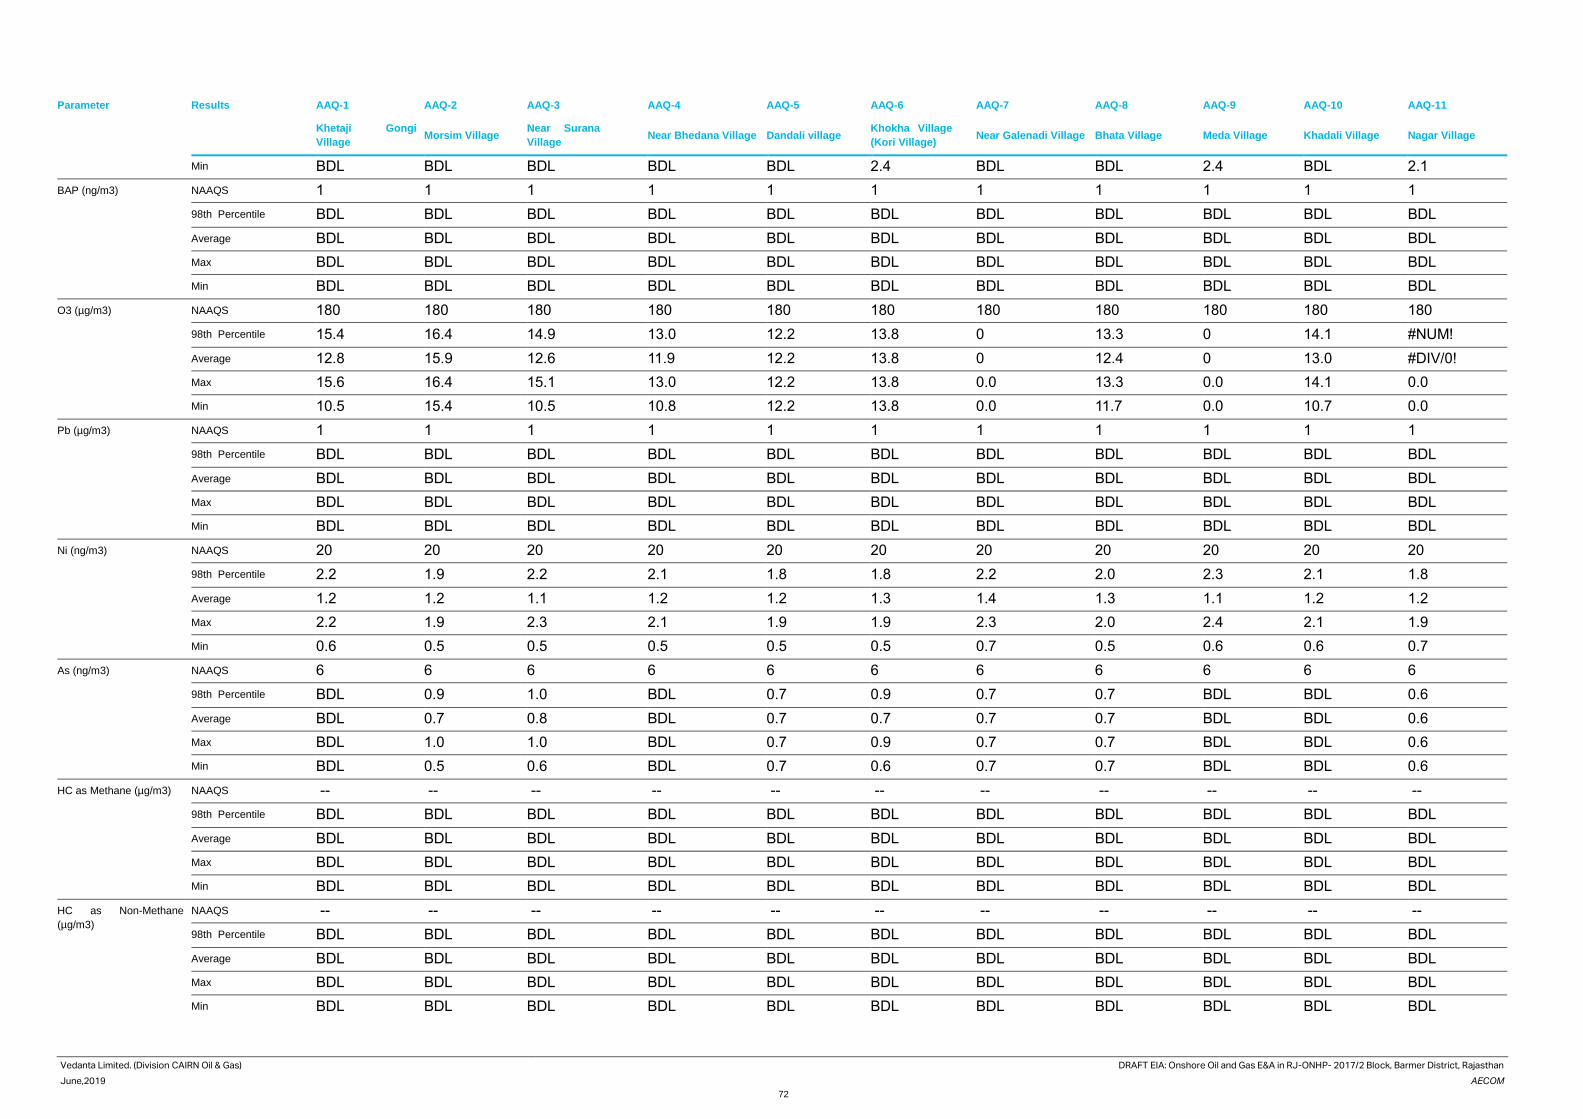
Vedanta Limited. (Division CAIRN Oil & Gas) DRAFT EIA: Onshore Oil and Gas E&A in RJ-ONHP- 2017/2 Block, Barmer District, Rajasthan
June,2019 AECOM
72
Parameter Results AAQ-1 AAQ-2 AAQ-3 AAQ-4 AAQ-5 AAQ-6 AAQ-7 AAQ-8 AAQ-9 AAQ-10 AAQ-11
Khetaji Gongi
Village Morsim Village
Near Surana
Village Near Bhedana Village Dandali village
Khokha Village
(Kori Village) Near Galenadi Village Bhata Village Meda Village Khadali Village Nagar Village
Min BDL BDL BDL BDL BDL 2.4 BDL BDL 2.4 BDL 2.1
BAP (ng/m3) NAAQS 1 1 1 1 1 1 1 1 1 1 1
98th Percentile BDL BDL BDL BDL BDL BDL BDL BDL BDL BDL BDL
Average BDL BDL BDL BDL BDL BDL BDL BDL BDL BDL BDL
Max BDL BDL BDL BDL BDL BDL BDL BDL BDL BDL BDL
Min BDL BDL BDL BDL BDL BDL BDL BDL BDL BDL BDL
O3 (µg/m3) NAAQS 180 180 180 180 180 180 180 180 180 180 180
98th Percentile 15.4 16.4 14.9 13.0 12.2 13.8 0 13.3 0 14.1 #NUM!
Average 12.8 15.9 12.6 11.9 12.2 13.8 0 12.4 0 13.0 #DIV/0!
Max 15.6 16.4 15.1 13.0 12.2 13.8 0.0 13.3 0.0 14.1 0.0
Min 10.5 15.4 10.5 10.8 12.2 13.8 0.0 11.7 0.0 10.7 0.0
Pb (µg/m3) NAAQS 1 1 1 1 1 1 1 1 1 1 1
98th Percentile BDL BDL BDL BDL BDL BDL BDL BDL BDL BDL BDL
Average BDL BDL BDL BDL BDL BDL BDL BDL BDL BDL BDL
Max BDL BDL BDL BDL BDL BDL BDL BDL BDL BDL BDL
Min BDL BDL BDL BDL BDL BDL BDL BDL BDL BDL BDL
Ni (ng/m3) NAAQS 20 20 20 20 20 20 20 20 20 20 20
98th Percentile 2.2 1.9 2.2 2.1 1.8 1.8 2.2 2.0 2.3 2.1 1.8
Average 1.2 1.2 1.1 1.2 1.2 1.3 1.4 1.3 1.1 1.2 1.2
Max 2.2 1.9 2.3 2.1 1.9 1.9 2.3 2.0 2.4 2.1 1.9
Min 0.6 0.5 0.5 0.5 0.5 0.5 0.7 0.5 0.6 0.6 0.7
As (ng/m3) NAAQS 6 6 6 6 6 6 6 6 6 6 6
98th Percentile BDL 0.9 1.0 BDL 0.7 0.9 0.7 0.7 BDL BDL 0.6
Average BDL 0.7 0.8 BDL 0.7 0.7 0.7 0.7 BDL BDL 0.6
Max BDL 1.0 1.0 BDL 0.7 0.9 0.7 0.7 BDL BDL 0.6
Min BDL 0.5 0.6 BDL 0.7 0.6 0.7 0.7 BDL BDL 0.6
HC as Methane (µg/m3) NAAQS -- -- -- -- -- -- -- -- -- -- --
98th Percentile BDL BDL BDL BDL BDL BDL BDL BDL BDL BDL BDL
Average BDL BDL BDL BDL BDL BDL BDL BDL BDL BDL BDL
Max BDL BDL BDL BDL BDL BDL BDL BDL BDL BDL BDL
Min BDL BDL BDL BDL BDL BDL BDL BDL BDL BDL BDL
HC as Non-Methane
(µg/m3)
NAAQS -- -- -- -- -- -- -- -- -- -- --
98th Percentile BDL BDL BDL BDL BDL BDL BDL BDL BDL BDL BDL
Average BDL BDL BDL BDL BDL BDL BDL BDL BDL BDL BDL
Max BDL BDL BDL BDL BDL BDL BDL BDL BDL BDL BDL
Min BDL BDL BDL BDL BDL BDL BDL BDL BDL BDL BDL
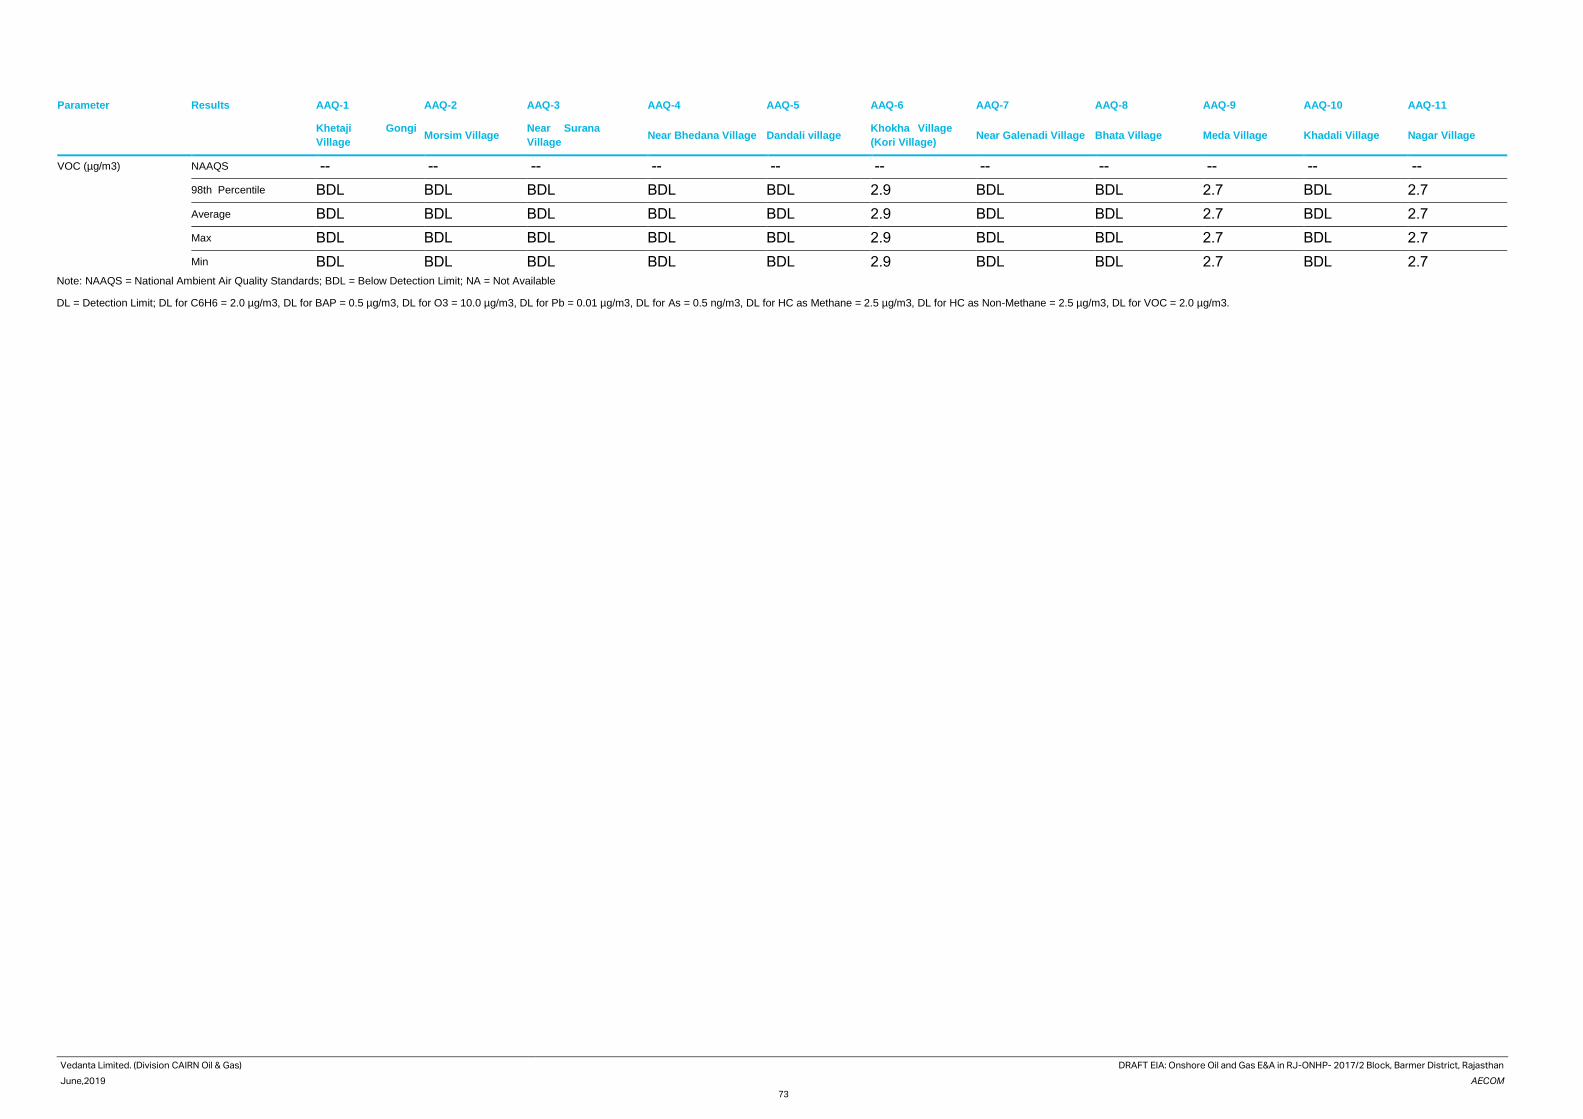
Vedanta Limited. (Division CAIRN Oil & Gas) DRAFT EIA: Onshore Oil and Gas E&A in RJ-ONHP- 2017/2 Block, Barmer District, Rajasthan
June,2019 AECOM
73
Parameter Results AAQ-1 AAQ-2 AAQ-3 AAQ-4 AAQ-5 AAQ-6 AAQ-7 AAQ-8 AAQ-9 AAQ-10 AAQ-11
Khetaji Gongi
Village Morsim Village
Near Surana
Village Near Bhedana Village Dandali village
Khokha Village
(Kori Village) Near Galenadi Village Bhata Village Meda Village Khadali Village Nagar Village
VOC (µg/m3) NAAQS -- -- -- -- -- -- -- -- -- -- --
98th Percentile BDL BDL BDL BDL BDL 2.9 BDL BDL 2.7 BDL 2.7
Average BDL BDL BDL BDL BDL 2.9 BDL BDL 2.7 BDL 2.7
Max BDL BDL BDL BDL BDL 2.9 BDL BDL 2.7 BDL 2.7
Min BDL BDL BDL BDL BDL 2.9 BDL BDL 2.7 BDL 2.7
Note: NAAQS = National Ambient Air Quality Standards; BDL = Below Detection Limit; NA = Not Available
DL = Detection Limit; DL for C6H6 = 2.0 µg/m3, DL for BAP = 0.5 µg/m3, DL for O3 = 10.0 µg/m3, DL for Pb = 0.01 µg/m3, DL for As = 0.5 ng/m3, DL for HC as Methane = 2.5 µg/m3, DL for HC as Non-Methane = 2.5 µg/m3, DL for VOC = 2.0 µg/m3.
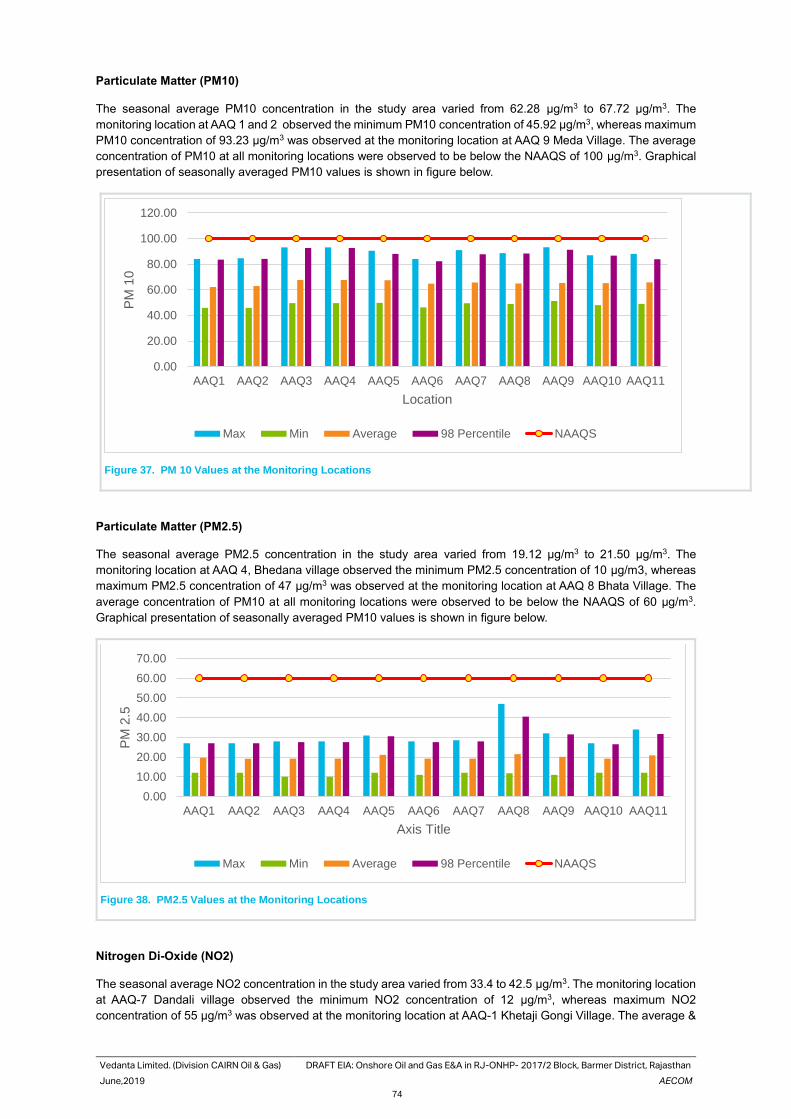
Vedanta Limited. (Division CAIRN Oil & Gas) DRAFT EIA: Onshore Oil and Gas E&A in RJ-ONHP- 2017/2 Block, Barmer District, Rajasthan
June,2019 AECOM
74
Particulate Matter (PM10)
The seasonal average PM10 concentration in the study area varied from 62.28 μg/m3 to 67.72 μg/m3. The
monitoring location at AAQ 1 and 2 observed the minimum PM10 concentration of 45.92 μg/m3, whereas maximum
PM10 concentration of 93.23 μg/m3 was observed at the monitoring location at AAQ 9 Meda Village. The average
concentration of PM10 at all monitoring locations were observed to be below the NAAQS of 100 μg/m3. Graphical
presentation of seasonally averaged PM10 values is shown in figure below.
Figure 37. PM 10 Values at the Monitoring Locations
Particulate Matter (PM2.5)
The seasonal average PM2.5 concentration in the study area varied from 19.12 μg/m3 to 21.50 μg/m3. The
monitoring location at AAQ 4, Bhedana village observed the minimum PM2.5 concentration of 10 μg/m3, whereas
maximum PM2.5 concentration of 47 μg/m3 was observed at the monitoring location at AAQ 8 Bhata Village. The
average concentration of PM10 at all monitoring locations were observed to be below the NAAQS of 60 μg/m3.
Graphical presentation of seasonally averaged PM10 values is shown in figure below.
Figure 38. PM2.5 Values at the Monitoring Locations
Nitrogen Di-Oxide (NO2)
The seasonal average NO2 concentration in the study area varied from 33.4 to 42.5 μg/m3. The monitoring location
at AAQ-7 Dandali village observed the minimum NO2 concentration of 12 μg/m3, whereas maximum NO2
concentration of 55 μg/m3 was observed at the monitoring location at AAQ-1 Khetaji Gongi Village. The average &
0.00
20.00
40.00
60.00
80.00
100.00
120.00
AAQ1 AAQ2 AAQ3 AAQ4 AAQ5 AAQ6 AAQ7 AAQ8 AAQ9 AAQ10 AAQ11
PM
10
Location
Max Min Average 98 Percentile NAAQS
0.00
10.00
20.00
30.00
40.00
50.00
60.00
70.00
AAQ1 AAQ2 AAQ3 AAQ4 AAQ5 AAQ6 AAQ7 AAQ8 AAQ9 AAQ10 AAQ11
PM
2.5
Axis Title
Max Min Average 98 Percentile NAAQS
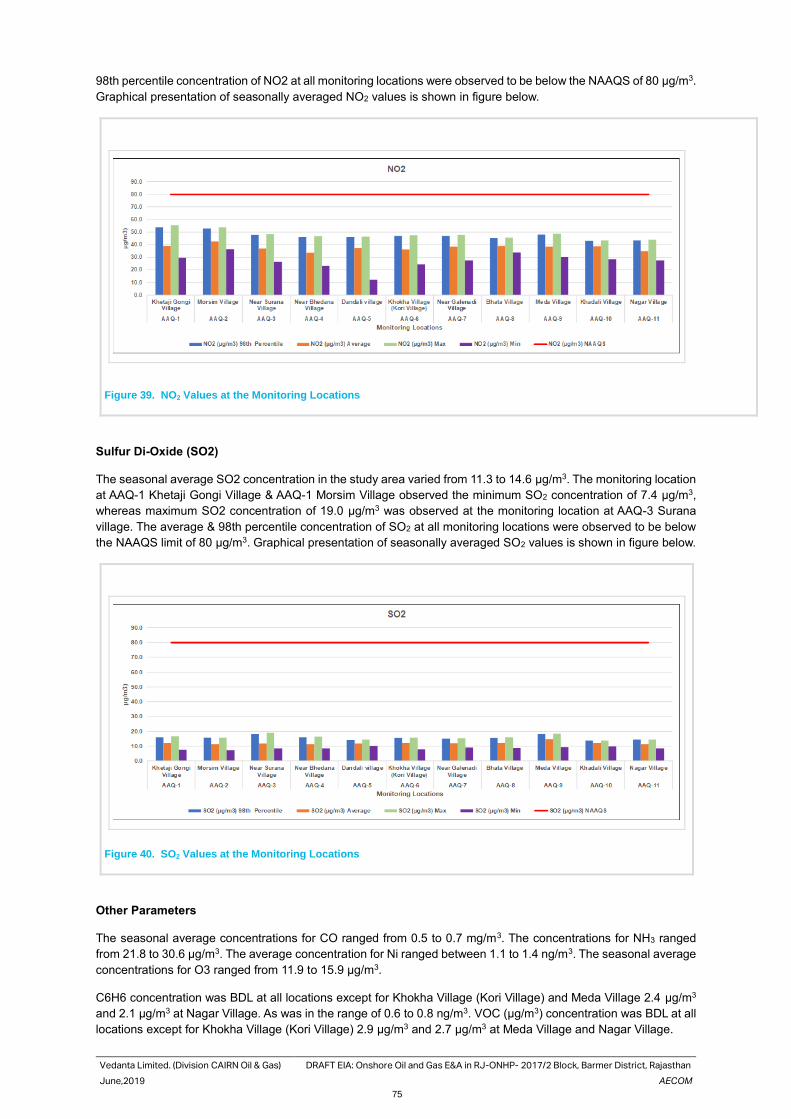
Vedanta Limited. (Division CAIRN Oil & Gas) DRAFT EIA: Onshore Oil and Gas E&A in RJ-ONHP- 2017/2 Block, Barmer District, Rajasthan
June,2019 AECOM
75
98th percentile concentration of NO2 at all monitoring locations were observed to be below the NAAQS of 80 μg/m3.
Graphical presentation of seasonally averaged NO2 values is shown in figure below.
Figure 39. NO2 Values at the Monitoring Locations
Sulfur Di-Oxide (SO2)
The seasonal average SO2 concentration in the study area varied from 11.3 to 14.6 μg/m3. The monitoring location
at AAQ-1 Khetaji Gongi Village & AAQ-1 Morsim Village observed the minimum SO2 concentration of 7.4 μg/m3,
whereas maximum SO2 concentration of 19.0 μg/m3 was observed at the monitoring location at AAQ-3 Surana
village. The average & 98th percentile concentration of SO2 at all monitoring locations were observed to be below
the NAAQS limit of 80 μg/m3. Graphical presentation of seasonally averaged SO2 values is shown in figure below.
Figure 40. SO2 Values at the Monitoring Locations
Other Parameters
The seasonal average concentrations for CO ranged from 0.5 to 0.7 mg/m3. The concentrations for NH3 ranged
from 21.8 to 30.6 μg/m3. The average concentration for Ni ranged between 1.1 to 1.4 ng/m3. The seasonal average
concentrations for O3 ranged from 11.9 to 15.9 μg/m3.
C6H6 concentration was BDL at all locations except for Khokha Village (Kori Village) and Meda Village 2.4 μg/m3
and 2.1 μg/m3 at Nagar Village. As was in the range of 0.6 to 0.8 ng/m3. VOC (µg/m3) concentration was BDL at all
locations except for Khokha Village (Kori Village) 2.9 μg/m3 and 2.7 μg/m3 at Meda Village and Nagar Village.
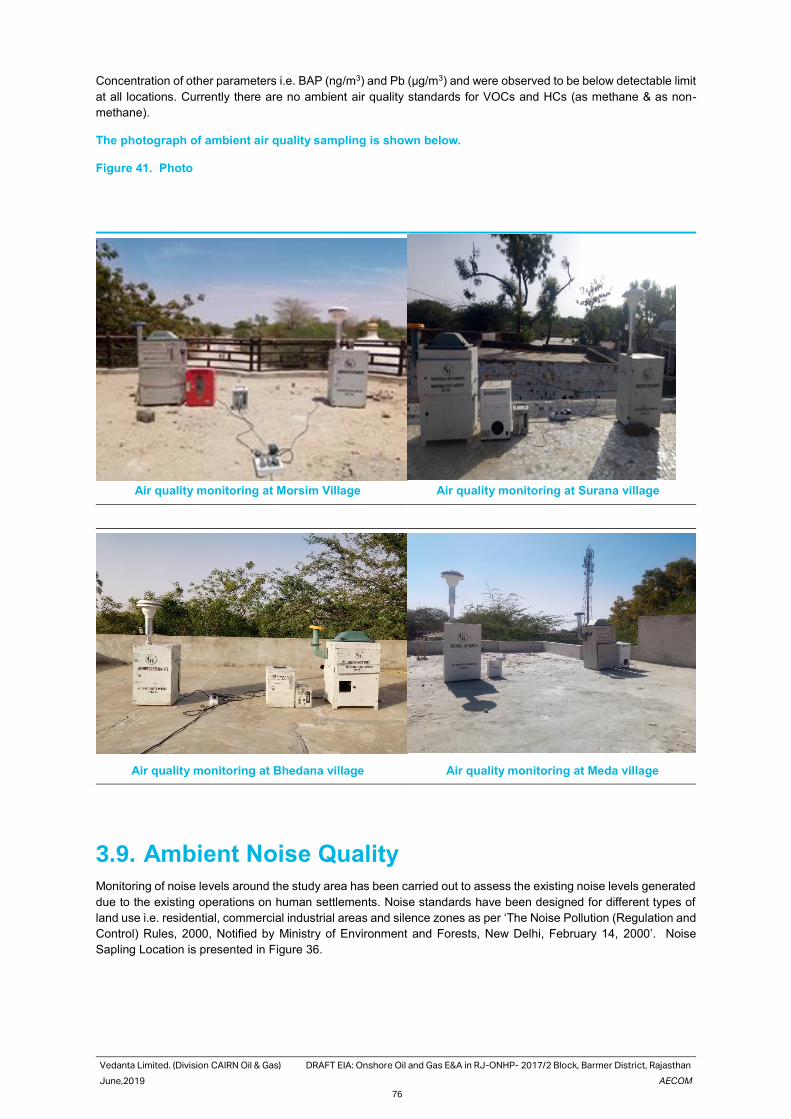
Vedanta Limited. (Division CAIRN Oil & Gas) DRAFT EIA: Onshore Oil and Gas E&A in RJ-ONHP- 2017/2 Block, Barmer District, Rajasthan
June,2019 AECOM
76
Concentration of other parameters i.e. BAP (ng/m3) and Pb (µg/m3) and were observed to be below detectable limit
at all locations. Currently there are no ambient air quality standards for VOCs and HCs (as methane & as non-
methane).
The photograph of ambient air quality sampling is shown below.
Figure 41. Photo
Air quality monitoring at Morsim Village Air quality monitoring at Surana village
Air quality monitoring at Bhedana village Air quality monitoring at Meda village
3.9. Ambient Noise Quality
Monitoring of noise levels around the study area has been carried out to assess the existing noise levels generated
due to the existing operations on human settlements. Noise standards have been designed for different types of
land use i.e. residential, commercial industrial areas and silence zones as per ‘The Noise Pollution (Regulation and
Control) Rules, 2000, Notified by Ministry of Environment and Forests, New Delhi, February 14, 2000’. Noise
Sapling Location is presented in Figure 36.
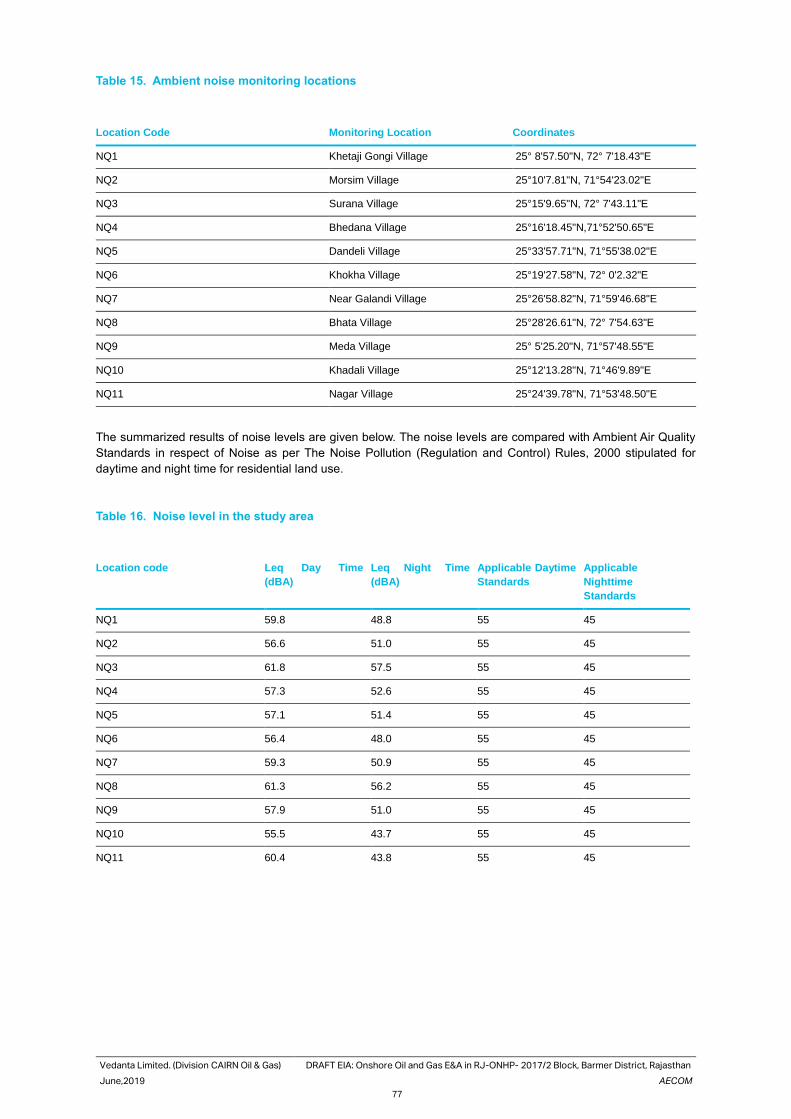
Vedanta Limited. (Division CAIRN Oil & Gas) DRAFT EIA: Onshore Oil and Gas E&A in RJ-ONHP- 2017/2 Block, Barmer District, Rajasthan
June,2019 AECOM
77
Table 15. Ambient noise monitoring locations
Location Code Monitoring Location Coordinates
NQ1 Khetaji Gongi Village 25° 8'57.50"N, 72° 7'18.43"E
NQ2 Morsim Village 25°10'7.81"N, 71°54'23.02"E
NQ3 Surana Village 25°15'9.65"N, 72° 7'43.11"E
NQ4 Bhedana Village 25°16'18.45"N,71°52'50.65"E
NQ5 Dandeli Village 25°33'57.71"N, 71°55'38.02"E
NQ6 Khokha Village 25°19'27.58"N, 72° 0'2.32"E
NQ7 Near Galandi Village 25°26'58.82"N, 71°59'46.68"E
NQ8 Bhata Village 25°28'26.61"N, 72° 7'54.63"E
NQ9 Meda Village 25° 5'25.20"N, 71°57'48.55"E
NQ10 Khadali Village 25°12'13.28"N, 71°46'9.89"E
NQ11 Nagar Village 25°24'39.78"N, 71°53'48.50"E
The summarized results of noise levels are given below. The noise levels are compared with Ambient Air Quality
Standards in respect of Noise as per The Noise Pollution (Regulation and Control) Rules, 2000 stipulated for
daytime and night time for residential land use.
Table 16. Noise level in the study area
Location code Leq Day Time
(dBA)
Leq Night Time
(dBA)
Applicable Daytime
Standards
Applicable
Nighttime
Standards
NQ1 59.8 48.8 55 45
NQ2 56.6 51.0 55 45
NQ3 61.8 57.5 55 45
NQ4 57.3 52.6 55 45
NQ5 57.1 51.4 55 45
NQ6 56.4 48.0 55 45
NQ7 59.3 50.9 55 45
NQ8 61.3 56.2 55 45
NQ9 57.9 51.0 55 45
NQ10 55.5 43.7 55 45
NQ11 60.4 43.8 55 45
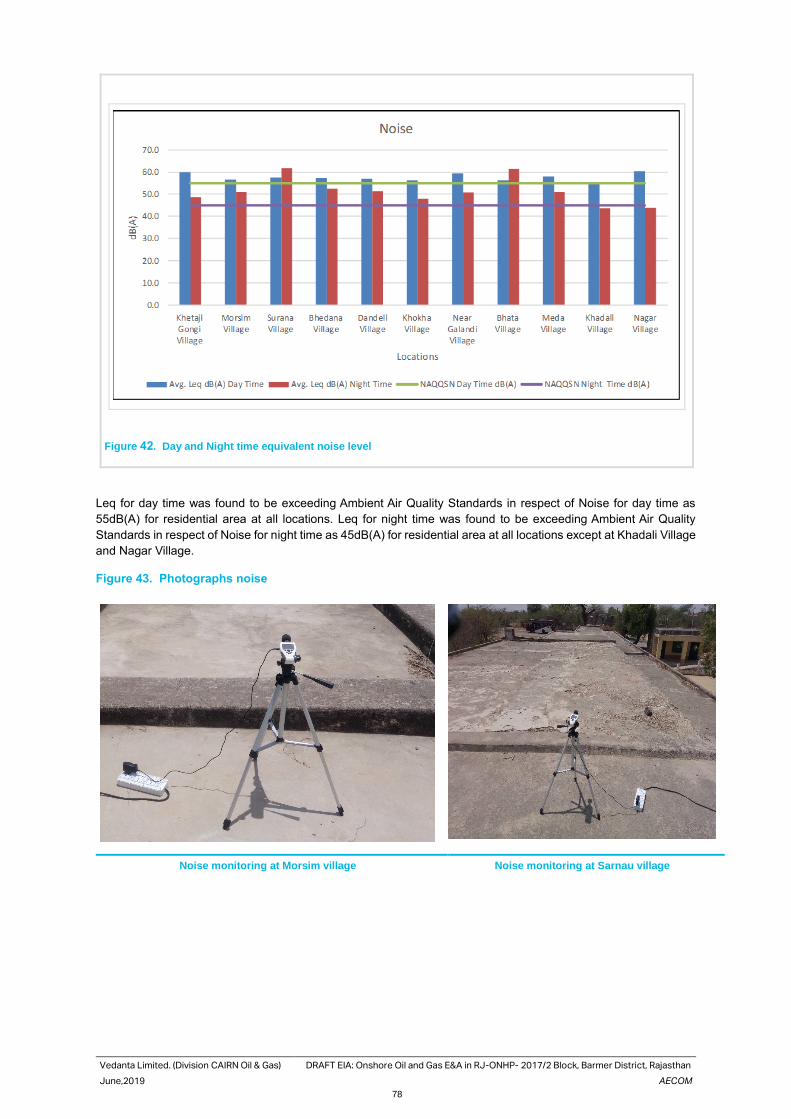
Vedanta Limited. (Division CAIRN Oil & Gas) DRAFT EIA: Onshore Oil and Gas E&A in RJ-ONHP- 2017/2 Block, Barmer District, Rajasthan
June,2019 AECOM
78
Figure 42. Day and Night time equivalent noise level
Leq for day time was found to be exceeding Ambient Air Quality Standards in respect of Noise for day time as
55dB(A) for residential area at all locations. Leq for night time was found to be exceeding Ambient Air Quality
Standards in respect of Noise for night time as 45dB(A) for residential area at all locations except at Khadali Village
and Nagar Village.
Figure 43. Photographs noise
Noise monitoring at Morsim village Noise monitoring at Sarnau village
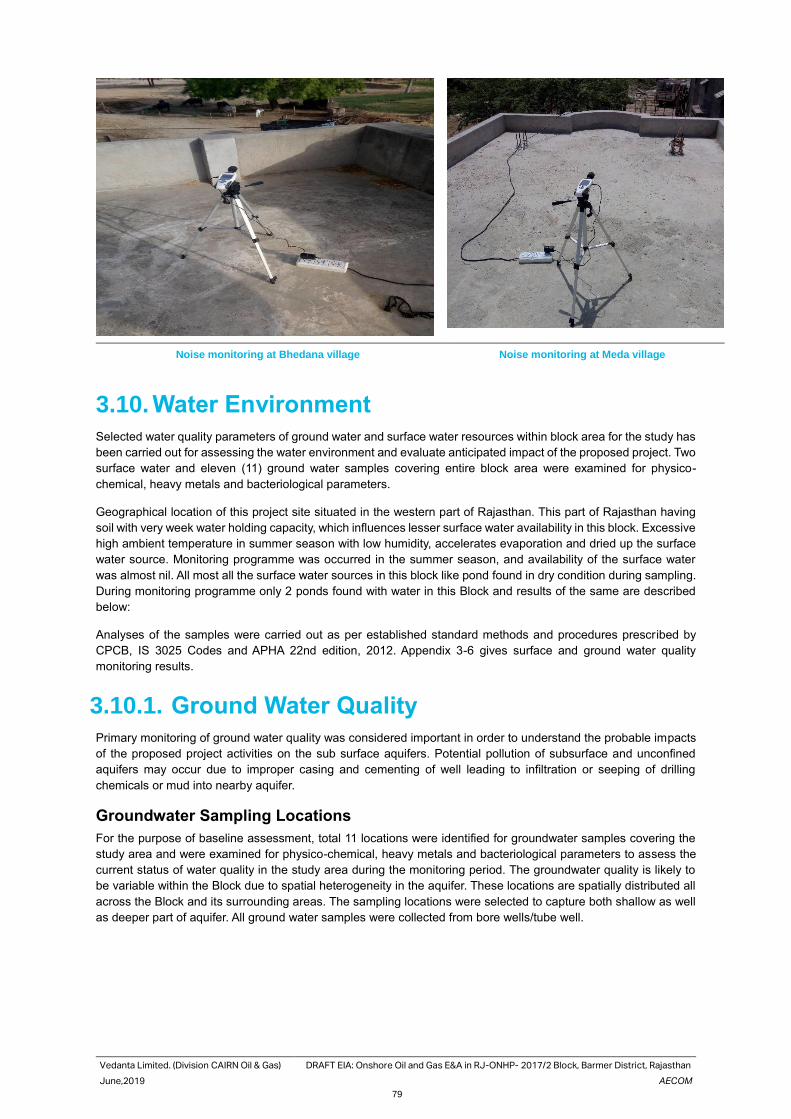
Vedanta Limited. (Division CAIRN Oil & Gas) DRAFT EIA: Onshore Oil and Gas E&A in RJ-ONHP- 2017/2 Block, Barmer District, Rajasthan
June,2019 AECOM
79
3.10. Water Environment
Selected water quality parameters of ground water and surface water resources within block area for the study has
been carried out for assessing the water environment and evaluate anticipated impact of the proposed project. Two
surface water and eleven (11) ground water samples covering entire block area were examined for physico-
chemical, heavy metals and bacteriological parameters.
Geographical location of this project site situated in the western part of Rajasthan. This part of Rajasthan having
soil with very week water holding capacity, which influences lesser surface water availability in this block. Excessive
high ambient temperature in summer season with low humidity, accelerates evaporation and dried up the surface
water source. Monitoring programme was occurred in the summer season, and availability of the surface water
was almost nil. All most all the surface water sources in this block like pond found in dry condition during sampling.
During monitoring programme only 2 ponds found with water in this Block and results of the same are described
below:
Analyses of the samples were carried out as per established standard methods and procedures prescribed by
CPCB, IS 3025 Codes and APHA 22nd edition, 2012. Appendix 3-6 gives surface and ground water quality
monitoring results.
3.10.1. Ground Water Quality
Primary monitoring of ground water quality was considered important in order to understand the probable impacts
of the proposed project activities on the sub surface aquifers. Potential pollution of subsurface and unconfined
aquifers may occur due to improper casing and cementing of well leading to infiltration or seeping of drilling
chemicals or mud into nearby aquifer.
Groundwater Sampling Locations
For the purpose of baseline assessment, total 11 locations were identified for groundwater samples covering the
study area and were examined for physico-chemical, heavy metals and bacteriological parameters to assess the
current status of water quality in the study area during the monitoring period. The groundwater quality is likely to
be variable within the Block due to spatial heterogeneity in the aquifer. These locations are spatially distributed all
across the Block and its surrounding areas. The sampling locations were selected to capture both shallow as well
as deeper part of aquifer. All ground water samples were collected from bore wells/tube well.
Noise monitoring at Bhedana village Noise monitoring at Meda village
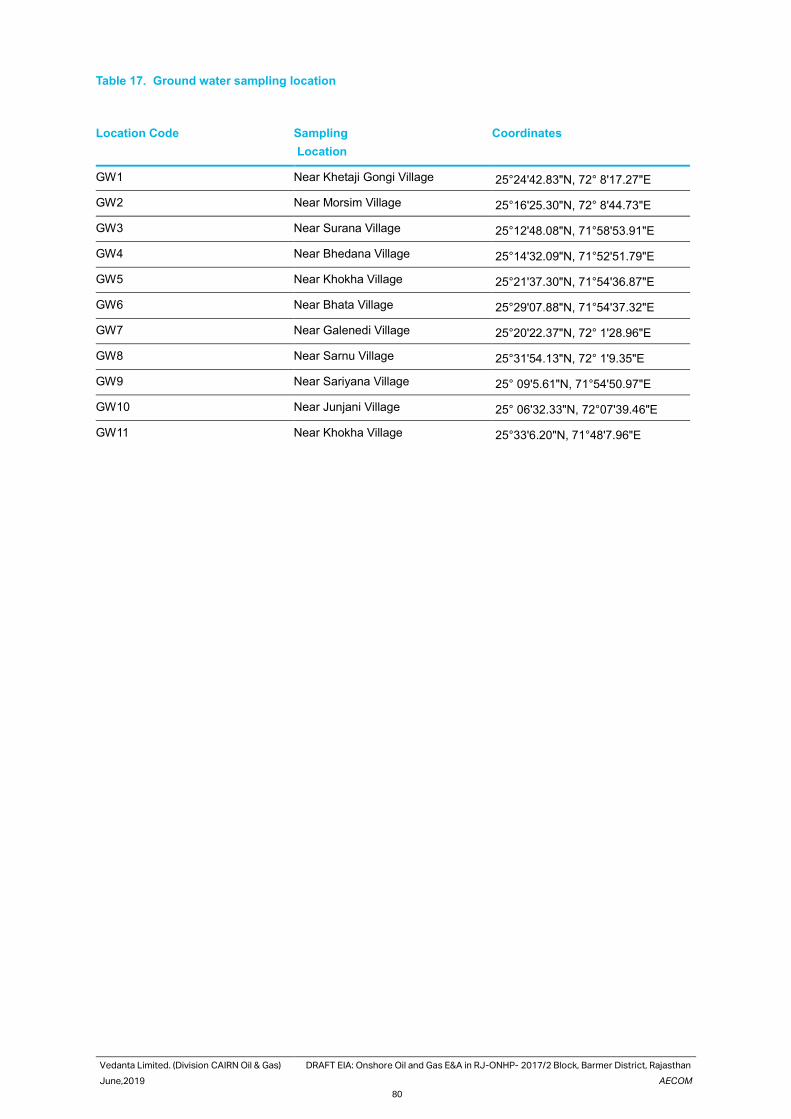
Vedanta Limited. (Division CAIRN Oil & Gas) DRAFT EIA: Onshore Oil and Gas E&A in RJ-ONHP- 2017/2 Block, Barmer District, Rajasthan
June,2019 AECOM
80
Table 17. Ground water sampling location
Location Code Sampling
Location
Coordinates
GW1 Near Khetaji Gongi Village 25°24'42.83"N, 72° 8'17.27"E
GW2 Near Morsim Village 25°16'25.30"N, 72° 8'44.73"E
GW3 Near Surana Village 25°12'48.08"N, 71°58'53.91"E
GW4 Near Bhedana Village 25°14'32.09"N, 71°52'51.79"E
GW5 Near Khokha Village 25°21'37.30"N, 71°54'36.87"E
GW6 Near Bhata Village 25°29'07.88"N, 71°54'37.32"E
GW7 Near Galenedi Village 25°20'22.37"N, 72° 1'28.96"E
GW8 Near Sarnu Village 25°31'54.13"N, 72° 1'9.35"E
GW9 Near Sariyana Village 25° 09'5.61"N, 71°54'50.97"E
GW10 Near Junjani Village 25° 06'32.33"N, 72°07'39.46"E
GW11 Near Khokha Village 25°33'6.20"N, 71°48'7.96"E
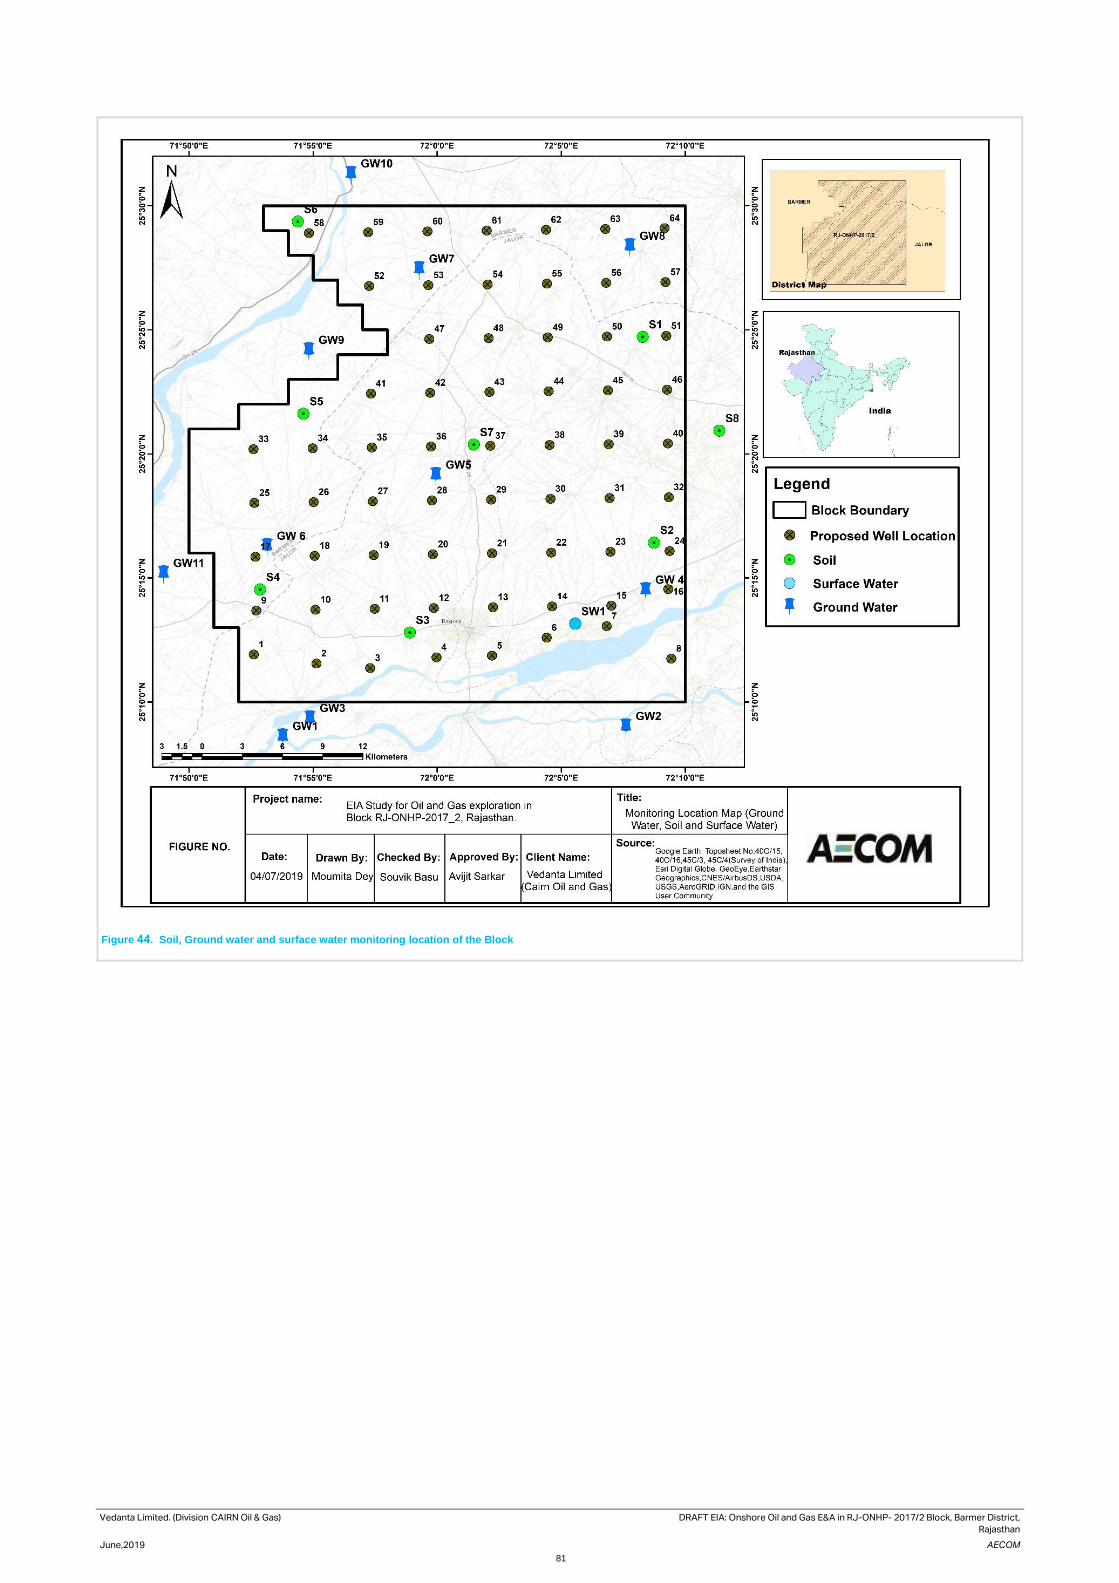
Vedanta Limited. (Division CAIRN Oil & Gas) DRAFT EIA: Onshore Oil and Gas E&A in RJ-ONHP- 2017/2 Block, Barmer District,
Rajasthan
June,2019 AECOM
81
Figure 44. Soil, Ground water and surface water monitoring location of the Block
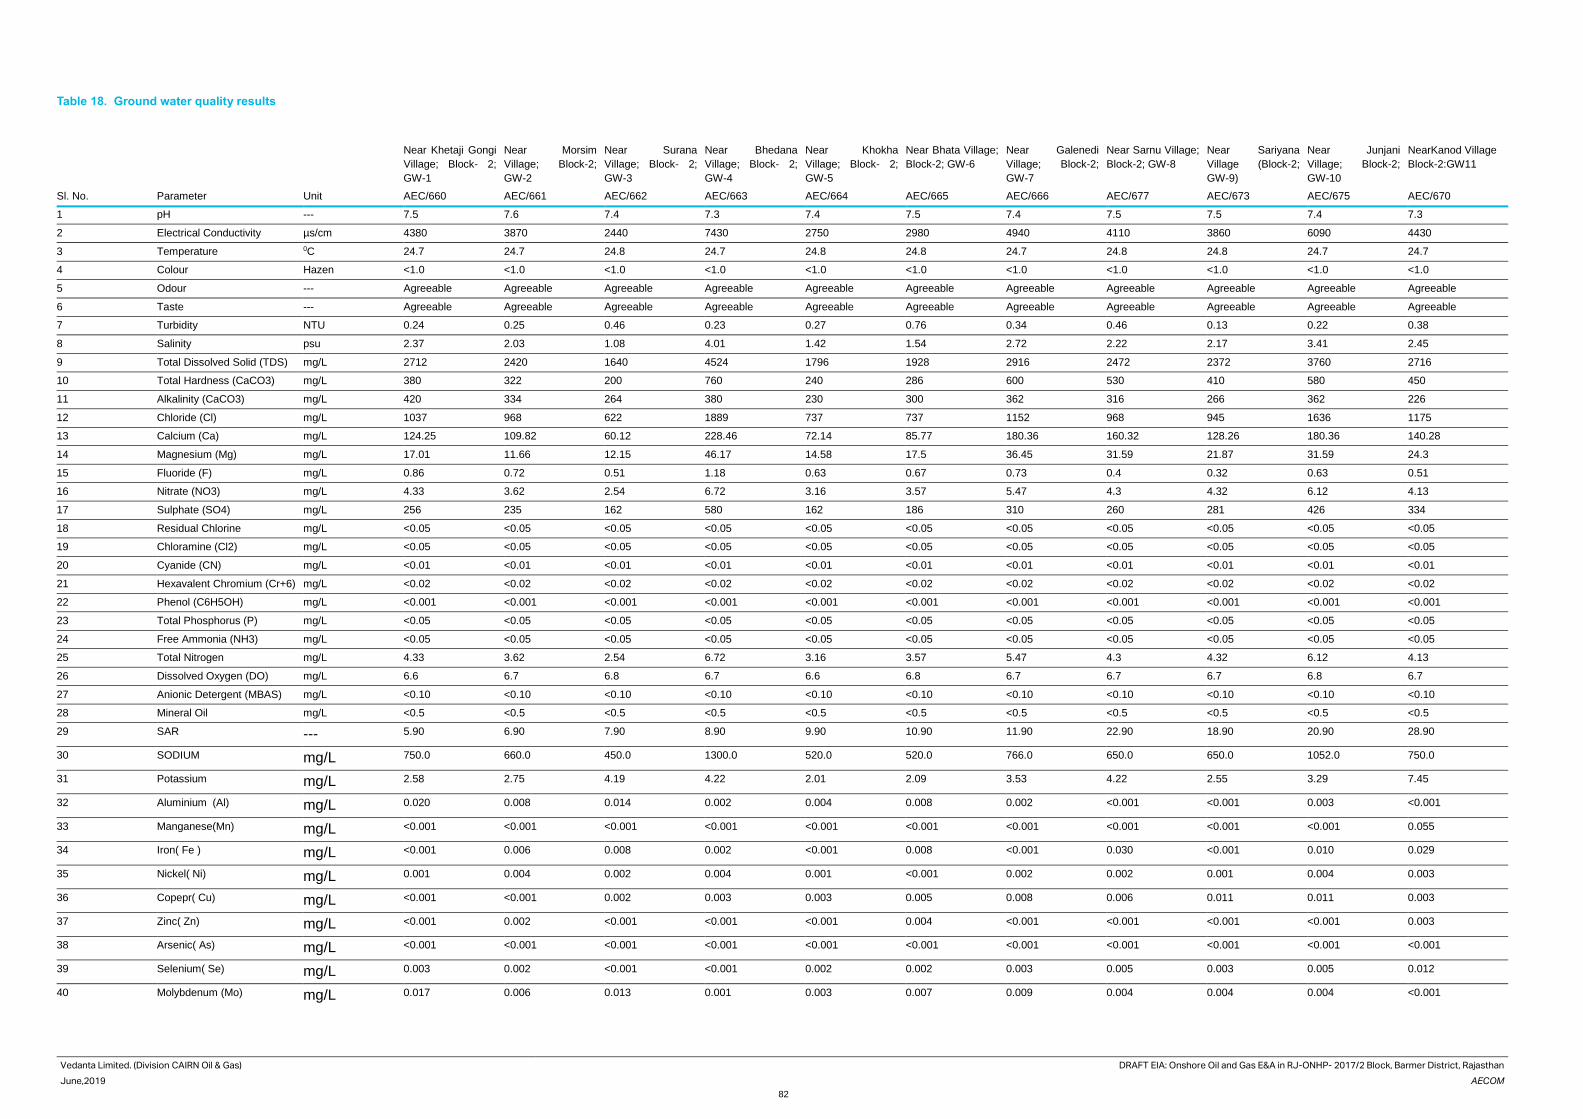
Vedanta Limited. (Division CAIRN Oil & Gas) DRAFT EIA: Onshore Oil and Gas E&A in RJ-ONHP- 2017/2 Block, Barmer District, Rajasthan
June,2019 AECOM
82
Table 18. Ground water quality results
Near Khetaji Gongi
Village; Block- 2;
GW-1
Near Morsim
Village; Block-2;
GW-2
Near Surana
Village; Block- 2;
GW-3
Near Bhedana
Village; Block- 2;
GW-4
Near Khokha
Village; Block- 2;
GW-5
Near Bhata Village;
Block-2; GW-6
Near Galenedi
Village; Block-2;
GW-7
Near Sarnu Village;
Block-2; GW-8
Near Sariyana
Village (Block-2;
GW-9)
Near Junjani
Village; Block-2;
GW-10
NearKanod Village
Block-2:GW11
Sl. No. Parameter Unit AEC/660 AEC/661 AEC/662 AEC/663 AEC/664 AEC/665 AEC/666 AEC/677 AEC/673 AEC/675 AEC/670
1 pH --- 7.5 7.6 7.4 7.3 7.4 7.5 7.4 7.5 7.5 7.4 7.3
2 Electrical Conductivity µs/cm 4380 3870 2440 7430 2750 2980 4940 4110 3860 6090 4430
3 Temperature 0C 24.7 24.7 24.8 24.7 24.8 24.8 24.7 24.8 24.8 24.7 24.7
4 Colour Hazen <1.0 <1.0 <1.0 <1.0 <1.0 <1.0 <1.0 <1.0 <1.0 <1.0 <1.0
5 Odour --- Agreeable Agreeable Agreeable Agreeable Agreeable Agreeable Agreeable Agreeable Agreeable Agreeable Agreeable
6 Taste --- Agreeable Agreeable Agreeable Agreeable Agreeable Agreeable Agreeable Agreeable Agreeable Agreeable Agreeable
7 Turbidity NTU 0.24 0.25 0.46 0.23 0.27 0.76 0.34 0.46 0.13 0.22 0.38
8 Salinity psu 2.37 2.03 1.08 4.01 1.42 1.54 2.72 2.22 2.17 3.41 2.45
9 Total Dissolved Solid (TDS) mg/L 2712 2420 1640 4524 1796 1928 2916 2472 2372 3760 2716
10 Total Hardness (CaCO3) mg/L 380 322 200 760 240 286 600 530 410 580 450
11 Alkalinity (CaCO3) mg/L 420 334 264 380 230 300 362 316 266 362 226
12 Chloride (Cl) mg/L 1037 968 622 1889 737 737 1152 968 945 1636 1175
13 Calcium (Ca) mg/L 124.25 109.82 60.12 228.46 72.14 85.77 180.36 160.32 128.26 180.36 140.28
14 Magnesium (Mg) mg/L 17.01 11.66 12.15 46.17 14.58 17.5 36.45 31.59 21.87 31.59 24.3
15 Fluoride (F) mg/L 0.86 0.72 0.51 1.18 0.63 0.67 0.73 0.4 0.32 0.63 0.51
16 Nitrate (NO3) mg/L 4.33 3.62 2.54 6.72 3.16 3.57 5.47 4.3 4.32 6.12 4.13
17 Sulphate (SO4) mg/L 256 235 162 580 162 186 310 260 281 426 334
18 Residual Chlorine mg/L <0.05 <0.05 <0.05 <0.05 <0.05 <0.05 <0.05 <0.05 <0.05 <0.05 <0.05
19 Chloramine (Cl2) mg/L <0.05 <0.05 <0.05 <0.05 <0.05 <0.05 <0.05 <0.05 <0.05 <0.05 <0.05
20 Cyanide (CN) mg/L <0.01 <0.01 <0.01 <0.01 <0.01 <0.01 <0.01 <0.01 <0.01 <0.01 <0.01
21 Hexavalent Chromium (Cr+6) mg/L <0.02 <0.02 <0.02 <0.02 <0.02 <0.02 <0.02 <0.02 <0.02 <0.02 <0.02
22 Phenol (C6H5OH) mg/L <0.001 <0.001 <0.001 <0.001 <0.001 <0.001 <0.001 <0.001 <0.001 <0.001 <0.001
23 Total Phosphorus (P) mg/L <0.05 <0.05 <0.05 <0.05 <0.05 <0.05 <0.05 <0.05 <0.05 <0.05 <0.05
24 Free Ammonia (NH3) mg/L <0.05 <0.05 <0.05 <0.05 <0.05 <0.05 <0.05 <0.05 <0.05 <0.05 <0.05
25 Total Nitrogen mg/L 4.33 3.62 2.54 6.72 3.16 3.57 5.47 4.3 4.32 6.12 4.13
26 Dissolved Oxygen (DO) mg/L 6.6 6.7 6.8 6.7 6.6 6.8 6.7 6.7 6.7 6.8 6.7
27 Anionic Detergent (MBAS) mg/L <0.10 <0.10 <0.10 <0.10 <0.10 <0.10 <0.10 <0.10 <0.10 <0.10 <0.10
28 Mineral Oil mg/L <0.5 <0.5 <0.5 <0.5 <0.5 <0.5 <0.5 <0.5 <0.5 <0.5 <0.5
29 SAR --- 5.90 6.90 7.90 8.90 9.90 10.90 11.90 22.90 18.90 20.90 28.90
30 SODIUM mg/L 750.0 660.0 450.0 1300.0 520.0 520.0 766.0 650.0 650.0 1052.0 750.0
31 Potassium mg/L 2.58 2.75 4.19 4.22 2.01 2.09 3.53 4.22 2.55 3.29 7.45
32 Aluminium (Al) mg/L 0.020 0.008 0.014 0.002 0.004 0.008 0.002 <0.001 <0.001 0.003 <0.001
33 Manganese(Mn) mg/L <0.001 <0.001 <0.001 <0.001 <0.001 <0.001 <0.001 <0.001 <0.001 <0.001 0.055
34 Iron( Fe ) mg/L <0.001 0.006 0.008 0.002 <0.001 0.008 <0.001 0.030 <0.001 0.010 0.029
35 Nickel( Ni) mg/L 0.001 0.004 0.002 0.004 0.001 <0.001 0.002 0.002 0.001 0.004 0.003
36 Copepr( Cu) mg/L <0.001 <0.001 0.002 0.003 0.003 0.005 0.008 0.006 0.011 0.011 0.003
37 Zinc( Zn) mg/L <0.001 0.002 <0.001 <0.001 <0.001 0.004 <0.001 <0.001 <0.001 <0.001 0.003
38 Arsenic( As) mg/L <0.001 <0.001 <0.001 <0.001 <0.001 <0.001 <0.001 <0.001 <0.001 <0.001 <0.001
39 Selenium( Se) mg/L 0.003 0.002 <0.001 <0.001 0.002 0.002 0.003 0.005 0.003 0.005 0.012
40 Molybdenum (Mo) mg/L 0.017 0.006 0.013 0.001 0.003 0.007 0.009 0.004 0.004 0.004 <0.001
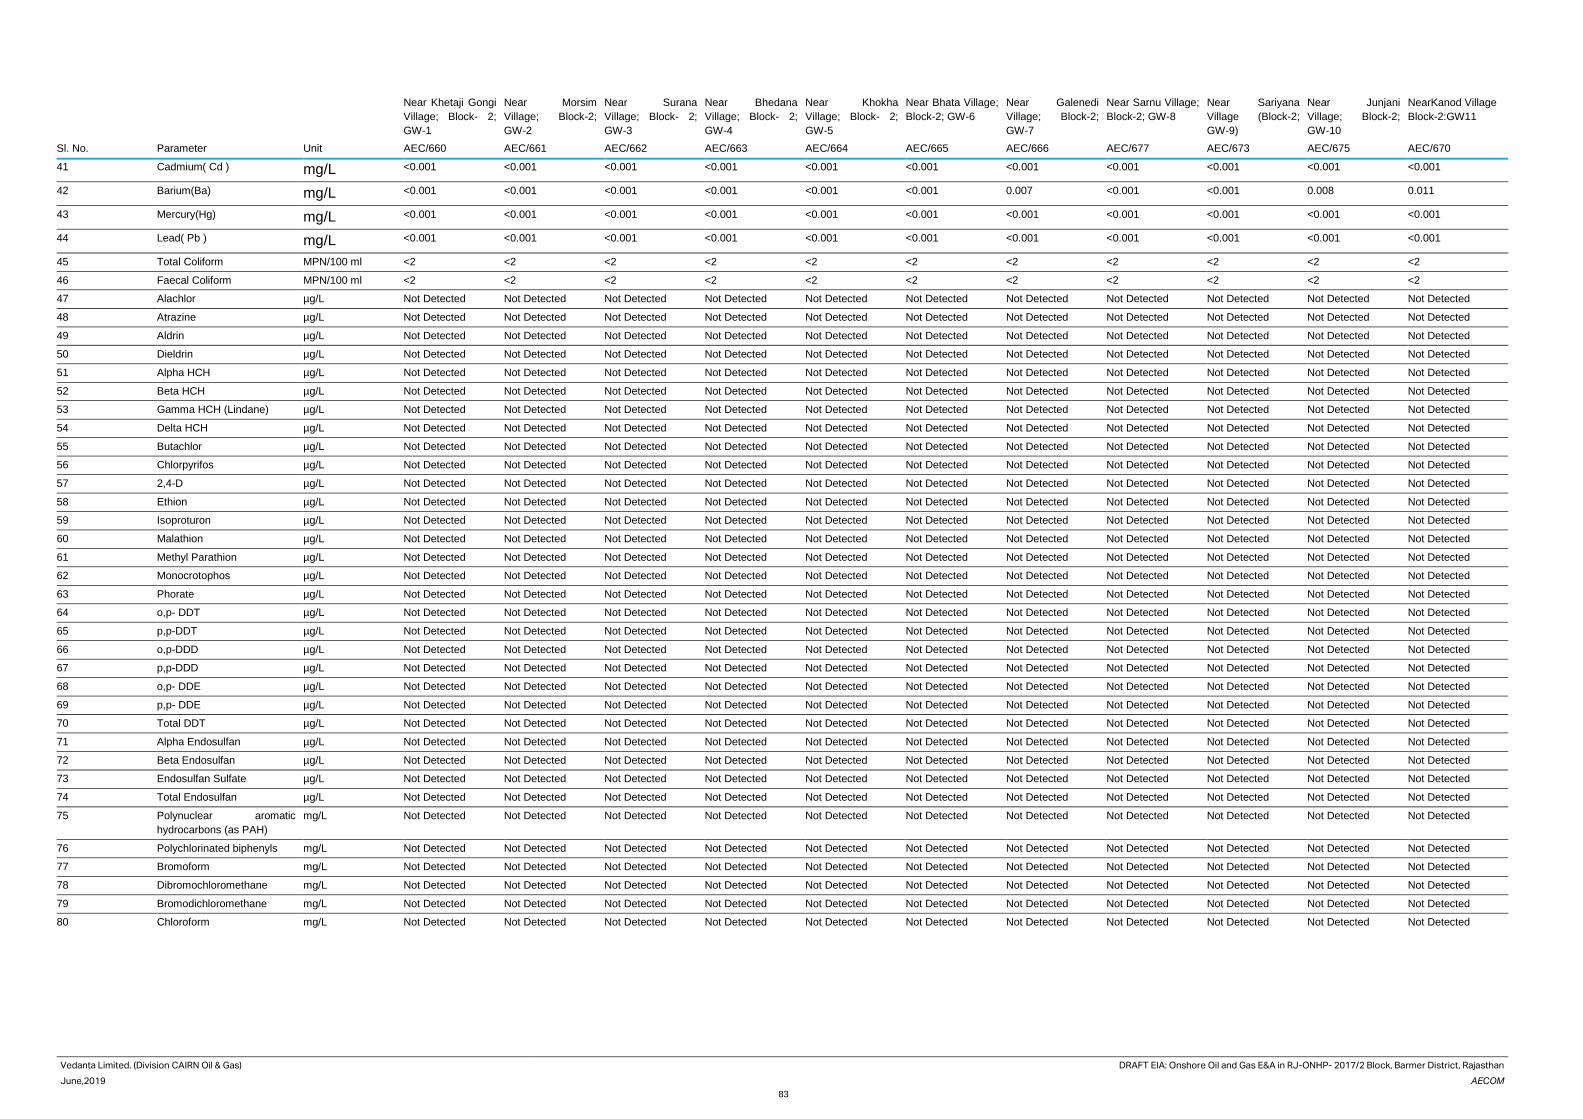
Vedanta Limited. (Division CAIRN Oil & Gas) DRAFT EIA: Onshore Oil and Gas E&A in RJ-ONHP- 2017/2 Block, Barmer District, Rajasthan
June,2019 AECOM
83
Near Khetaji Gongi
Village; Block- 2;
GW-1
Near Morsim
Village; Block-2;
GW-2
Near Surana
Village; Block- 2;
GW-3
Near Bhedana
Village; Block- 2;
GW-4
Near Khokha
Village; Block- 2;
GW-5
Near Bhata Village;
Block-2; GW-6
Near Galenedi
Village; Block-2;
GW-7
Near Sarnu Village;
Block-2; GW-8
Near Sariyana
Village (Block-2;
GW-9)
Near Junjani
Village; Block-2;
GW-10
NearKanod Village
Block-2:GW11
Sl. No. Parameter Unit AEC/660 AEC/661 AEC/662 AEC/663 AEC/664 AEC/665 AEC/666 AEC/677 AEC/673 AEC/675 AEC/670
41 Cadmium( Cd ) mg/L <0.001 <0.001 <0.001 <0.001 <0.001 <0.001 <0.001 <0.001 <0.001 <0.001 <0.001
42 Barium(Ba) mg/L <0.001 <0.001 <0.001 <0.001 <0.001 <0.001 0.007 <0.001 <0.001 0.008 0.011
43 Mercury(Hg) mg/L <0.001 <0.001 <0.001 <0.001 <0.001 <0.001 <0.001 <0.001 <0.001 <0.001 <0.001
44 Lead( Pb ) mg/L <0.001 <0.001 <0.001 <0.001 <0.001 <0.001 <0.001 <0.001 <0.001 <0.001 <0.001
45 Total Coliform MPN/100 ml <2 <2 <2 <2 <2 <2 <2 <2 <2 <2 <2
46 Faecal Coliform MPN/100 ml <2 <2 <2 <2 <2 <2 <2 <2 <2 <2 <2
47 Alachlor µg/L Not Detected Not Detected Not Detected Not Detected Not Detected Not Detected Not Detected Not Detected Not Detected Not Detected Not Detected
48 Atrazine µg/L Not Detected Not Detected Not Detected Not Detected Not Detected Not Detected Not Detected Not Detected Not Detected Not Detected Not Detected
49 Aldrin µg/L Not Detected Not Detected Not Detected Not Detected Not Detected Not Detected Not Detected Not Detected Not Detected Not Detected Not Detected
50 Dieldrin µg/L Not Detected Not Detected Not Detected Not Detected Not Detected Not Detected Not Detected Not Detected Not Detected Not Detected Not Detected
51 Alpha HCH µg/L Not Detected Not Detected Not Detected Not Detected Not Detected Not Detected Not Detected Not Detected Not Detected Not Detected Not Detected
52 Beta HCH µg/L Not Detected Not Detected Not Detected Not Detected Not Detected Not Detected Not Detected Not Detected Not Detected Not Detected Not Detected
53 Gamma HCH (Lindane) µg/L Not Detected Not Detected Not Detected Not Detected Not Detected Not Detected Not Detected Not Detected Not Detected Not Detected Not Detected
54 Delta HCH µg/L Not Detected Not Detected Not Detected Not Detected Not Detected Not Detected Not Detected Not Detected Not Detected Not Detected Not Detected
55 Butachlor µg/L Not Detected Not Detected Not Detected Not Detected Not Detected Not Detected Not Detected Not Detected Not Detected Not Detected Not Detected
56 Chlorpyrifos µg/L Not Detected Not Detected Not Detected Not Detected Not Detected Not Detected Not Detected Not Detected Not Detected Not Detected Not Detected
57 2,4-D µg/L Not Detected Not Detected Not Detected Not Detected Not Detected Not Detected Not Detected Not Detected Not Detected Not Detected Not Detected
58 Ethion µg/L Not Detected Not Detected Not Detected Not Detected Not Detected Not Detected Not Detected Not Detected Not Detected Not Detected Not Detected
59 Isoproturon µg/L Not Detected Not Detected Not Detected Not Detected Not Detected Not Detected Not Detected Not Detected Not Detected Not Detected Not Detected
60 Malathion µg/L Not Detected Not Detected Not Detected Not Detected Not Detected Not Detected Not Detected Not Detected Not Detected Not Detected Not Detected
61 Methyl Parathion µg/L Not Detected Not Detected Not Detected Not Detected Not Detected Not Detected Not Detected Not Detected Not Detected Not Detected Not Detected
62 Monocrotophos µg/L Not Detected Not Detected Not Detected Not Detected Not Detected Not Detected Not Detected Not Detected Not Detected Not Detected Not Detected
63 Phorate µg/L Not Detected Not Detected Not Detected Not Detected Not Detected Not Detected Not Detected Not Detected Not Detected Not Detected Not Detected
64 o,p- DDT µg/L Not Detected Not Detected Not Detected Not Detected Not Detected Not Detected Not Detected Not Detected Not Detected Not Detected Not Detected
65 p,p-DDT µg/L Not Detected Not Detected Not Detected Not Detected Not Detected Not Detected Not Detected Not Detected Not Detected Not Detected Not Detected
66 o,p-DDD µg/L Not Detected Not Detected Not Detected Not Detected Not Detected Not Detected Not Detected Not Detected Not Detected Not Detected Not Detected
67 p,p-DDD µg/L Not Detected Not Detected Not Detected Not Detected Not Detected Not Detected Not Detected Not Detected Not Detected Not Detected Not Detected
68 o,p- DDE µg/L Not Detected Not Detected Not Detected Not Detected Not Detected Not Detected Not Detected Not Detected Not Detected Not Detected Not Detected
69 p,p- DDE µg/L Not Detected Not Detected Not Detected Not Detected Not Detected Not Detected Not Detected Not Detected Not Detected Not Detected Not Detected
70 Total DDT µg/L Not Detected Not Detected Not Detected Not Detected Not Detected Not Detected Not Detected Not Detected Not Detected Not Detected Not Detected
71 Alpha Endosulfan µg/L Not Detected Not Detected Not Detected Not Detected Not Detected Not Detected Not Detected Not Detected Not Detected Not Detected Not Detected
72 Beta Endosulfan µg/L Not Detected Not Detected Not Detected Not Detected Not Detected Not Detected Not Detected Not Detected Not Detected Not Detected Not Detected
73 Endosulfan Sulfate µg/L Not Detected Not Detected Not Detected Not Detected Not Detected Not Detected Not Detected Not Detected Not Detected Not Detected Not Detected
74 Total Endosulfan µg/L Not Detected Not Detected Not Detected Not Detected Not Detected Not Detected Not Detected Not Detected Not Detected Not Detected Not Detected
75 Polynuclear aromatic
hydrocarbons (as PAH)
mg/L Not Detected Not Detected Not Detected Not Detected Not Detected Not Detected Not Detected Not Detected Not Detected Not Detected Not Detected
76 Polychlorinated biphenyls mg/L Not Detected Not Detected Not Detected Not Detected Not Detected Not Detected Not Detected Not Detected Not Detected Not Detected Not Detected
77 Bromoform mg/L Not Detected Not Detected Not Detected Not Detected Not Detected Not Detected Not Detected Not Detected Not Detected Not Detected Not Detected
78 Dibromochloromethane mg/L Not Detected Not Detected Not Detected Not Detected Not Detected Not Detected Not Detected Not Detected Not Detected Not Detected Not Detected
79 Bromodichloromethane mg/L Not Detected Not Detected Not Detected Not Detected Not Detected Not Detected Not Detected Not Detected Not Detected Not Detected Not Detected
80 Chloroform mg/L Not Detected Not Detected Not Detected Not Detected Not Detected Not Detected Not Detected Not Detected Not Detected Not Detected Not Detected
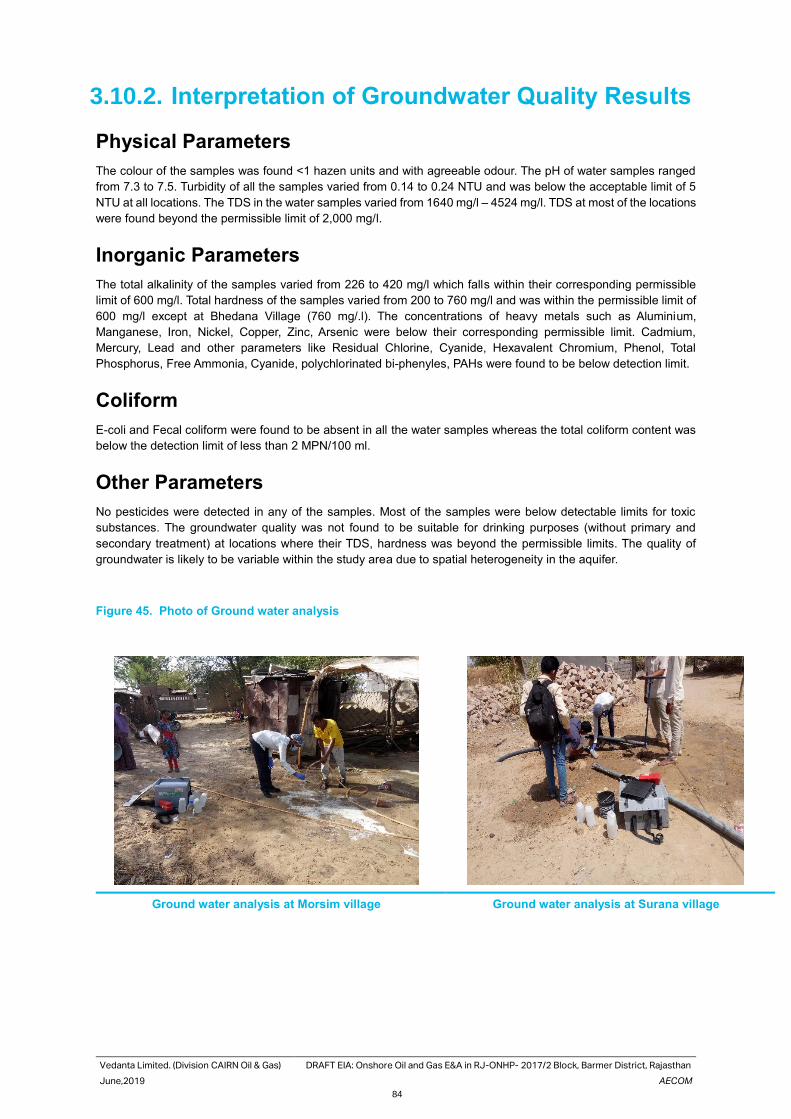
Vedanta Limited. (Division CAIRN Oil & Gas) DRAFT EIA: Onshore Oil and Gas E&A in RJ-ONHP- 2017/2 Block, Barmer District, Rajasthan
June,2019 AECOM
84
3.10.2. Interpretation of Groundwater Quality Results
Physical Parameters
The colour of the samples was found <1 hazen units and with agreeable odour. The pH of water samples ranged
from 7.3 to 7.5. Turbidity of all the samples varied from 0.14 to 0.24 NTU and was below the acceptable limit of 5
NTU at all locations. The TDS in the water samples varied from 1640 mg/l – 4524 mg/l. TDS at most of the locations
were found beyond the permissible limit of 2,000 mg/l.
Inorganic Parameters
The total alkalinity of the samples varied from 226 to 420 mg/l which falls within their corresponding permissible
limit of 600 mg/l. Total hardness of the samples varied from 200 to 760 mg/l and was within the permissible limit of
600 mg/l except at Bhedana Village (760 mg/.l). The concentrations of heavy metals such as Aluminium,
Manganese, Iron, Nickel, Copper, Zinc, Arsenic were below their corresponding permissible limit. Cadmium,
Mercury, Lead and other parameters like Residual Chlorine, Cyanide, Hexavalent Chromium, Phenol, Total
Phosphorus, Free Ammonia, Cyanide, polychlorinated bi-phenyles, PAHs were found to be below detection limit.
Coliform
E-coli and Fecal coliform were found to be absent in all the water samples whereas the total coliform content was
below the detection limit of less than 2 MPN/100 ml.
Other Parameters
No pesticides were detected in any of the samples. Most of the samples were below detectable limits for toxic
substances. The groundwater quality was not found to be suitable for drinking purposes (without primary and
secondary treatment) at locations where their TDS, hardness was beyond the permissible limits. The quality of
groundwater is likely to be variable within the study area due to spatial heterogeneity in the aquifer.
Figure 45. Photo of Ground water analysis
Ground water analysis at Morsim village Ground water analysis at Surana village
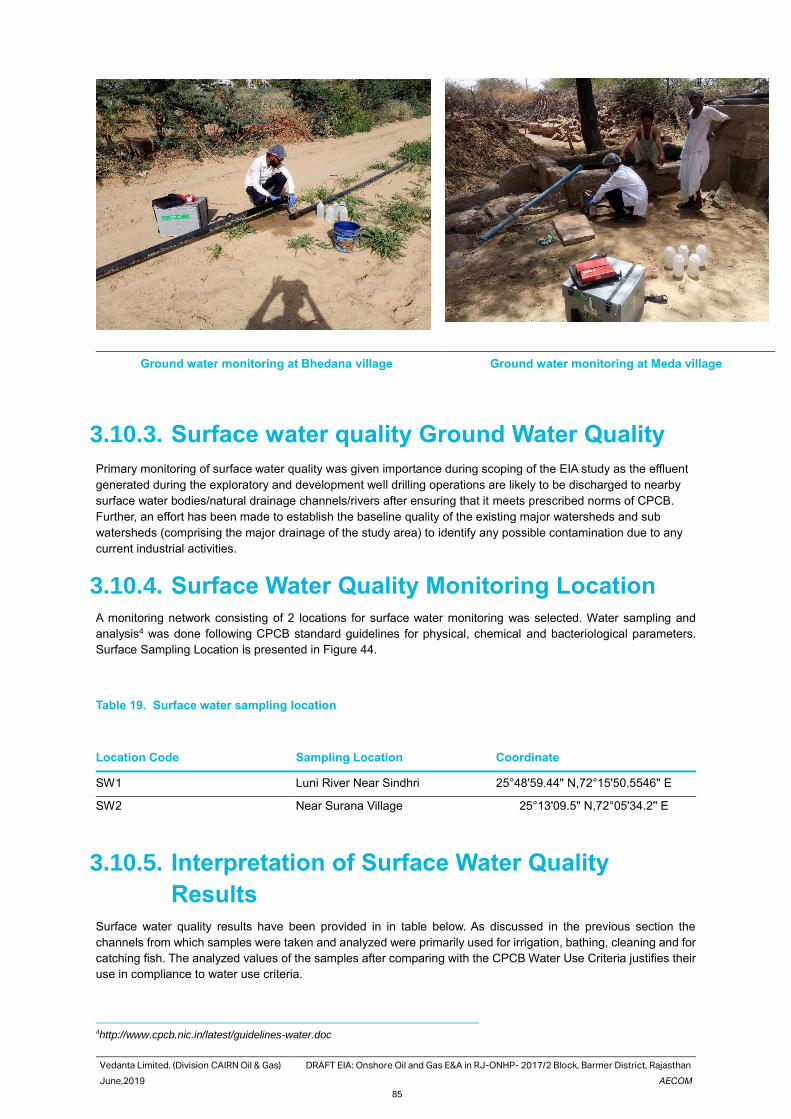
Vedanta Limited. (Division CAIRN Oil & Gas) DRAFT EIA: Onshore Oil and Gas E&A in RJ-ONHP- 2017/2 Block, Barmer District, Rajasthan
June,2019 AECOM
85
Ground water monitoring at Bhedana village Ground water monitoring at Meda village
3.10.3. Surface water quality Ground Water Quality
Primary monitoring of surface water quality was given importance during scoping of the EIA study as the effluent
generated during the exploratory and development well drilling operations are likely to be discharged to nearby
surface water bodies/natural drainage channels/rivers after ensuring that it meets prescribed norms of CPCB.
Further, an effort has been made to establish the baseline quality of the existing major watersheds and sub
watersheds (comprising the major drainage of the study area) to identify any possible contamination due to any
current industrial activities.
3.10.4. Surface Water Quality Monitoring Location
A monitoring network consisting of 2 locations for surface water monitoring was selected. Water sampling and
analysis4 was done following CPCB standard guidelines for physical, chemical and bacteriological parameters.
Surface Sampling Location is presented in Figure 44.
Table 19. Surface water sampling location
Location Code Sampling Location Coordinate
SW1 Luni River Near Sindhri 25°48'59.44" N,72°15'50.5546" E
SW2 Near Surana Village 25°13'09.5" N,72°05'34.2'' E
3.10.5. Interpretation of Surface Water Quality
Results
Surface water quality results have been provided in in table below. As discussed in the previous section the
channels from which samples were taken and analyzed were primarily used for irrigation, bathing, cleaning and for
catching fish. The analyzed values of the samples after comparing with the CPCB Water Use Criteria justifies their
use in compliance to water use criteria.
4http://www.cpcb.nic.in/latest/guidelines-water.doc
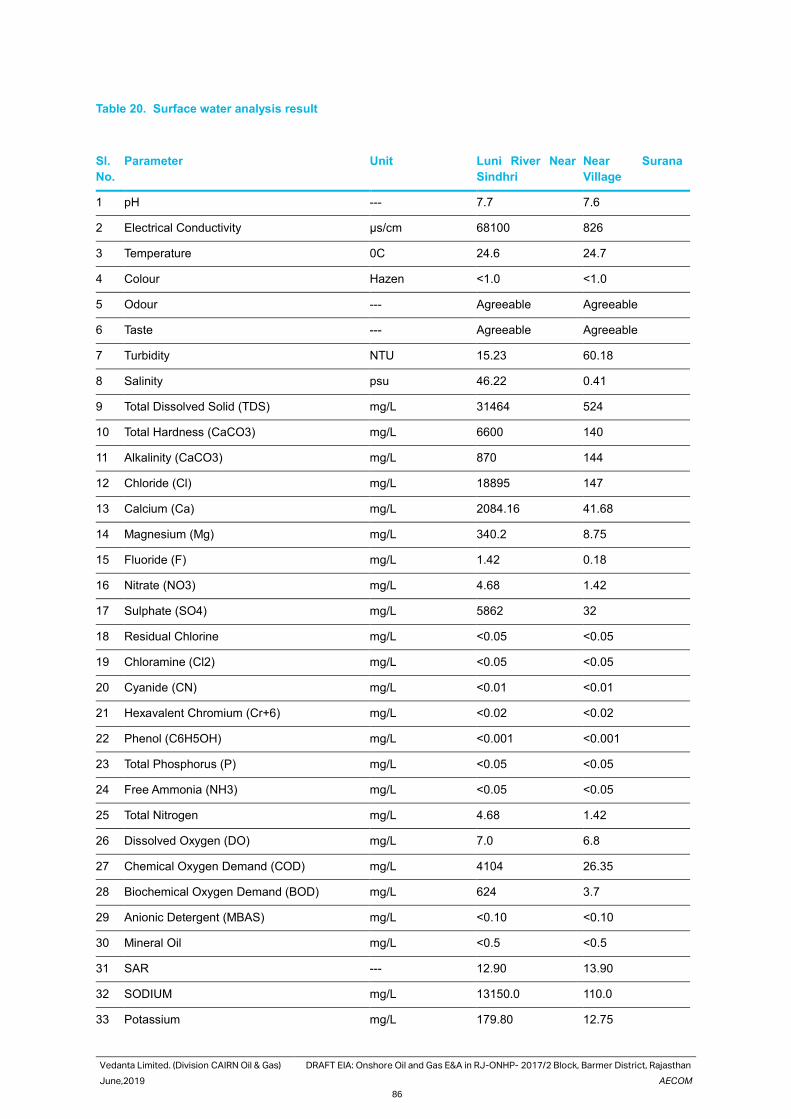
Vedanta Limited. (Division CAIRN Oil & Gas) DRAFT EIA: Onshore Oil and Gas E&A in RJ-ONHP- 2017/2 Block, Barmer District, Rajasthan
June,2019 AECOM
86
Table 20. Surface water analysis result
Sl.
No.
Parameter Unit Luni River Near
Sindhri
Near Surana
Village
1 pH --- 7.7 7.6
2 Electrical Conductivity µs/cm 68100 826
3 Temperature 0C 24.6 24.7
4 Colour Hazen <1.0 <1.0
5 Odour --- Agreeable Agreeable
6 Taste --- Agreeable Agreeable
7 Turbidity NTU 15.23 60.18
8 Salinity psu 46.22 0.41
9 Total Dissolved Solid (TDS) mg/L 31464 524
10 Total Hardness (CaCO3) mg/L 6600 140
11 Alkalinity (CaCO3) mg/L 870 144
12 Chloride (Cl) mg/L 18895 147
13 Calcium (Ca) mg/L 2084.16 41.68
14 Magnesium (Mg) mg/L 340.2 8.75
15 Fluoride (F) mg/L 1.42 0.18
16 Nitrate (NO3) mg/L 4.68 1.42
17 Sulphate (SO4) mg/L 5862 32
18 Residual Chlorine mg/L <0.05 <0.05
19 Chloramine (Cl2) mg/L <0.05 <0.05
20 Cyanide (CN) mg/L <0.01 <0.01
21 Hexavalent Chromium (Cr+6) mg/L <0.02 <0.02
22 Phenol (C6H5OH) mg/L <0.001 <0.001
23 Total Phosphorus (P) mg/L <0.05 <0.05
24 Free Ammonia (NH3) mg/L <0.05 <0.05
25 Total Nitrogen mg/L 4.68 1.42
26 Dissolved Oxygen (DO) mg/L 7.0 6.8
27 Chemical Oxygen Demand (COD) mg/L 4104 26.35
28 Biochemical Oxygen Demand (BOD) mg/L 624 3.7
29 Anionic Detergent (MBAS) mg/L <0.10 <0.10
30 Mineral Oil mg/L <0.5 <0.5
31 SAR --- 12.90 13.90
32 SODIUM mg/L 13150.0 110.0
33 Potassium mg/L 179.80 12.75
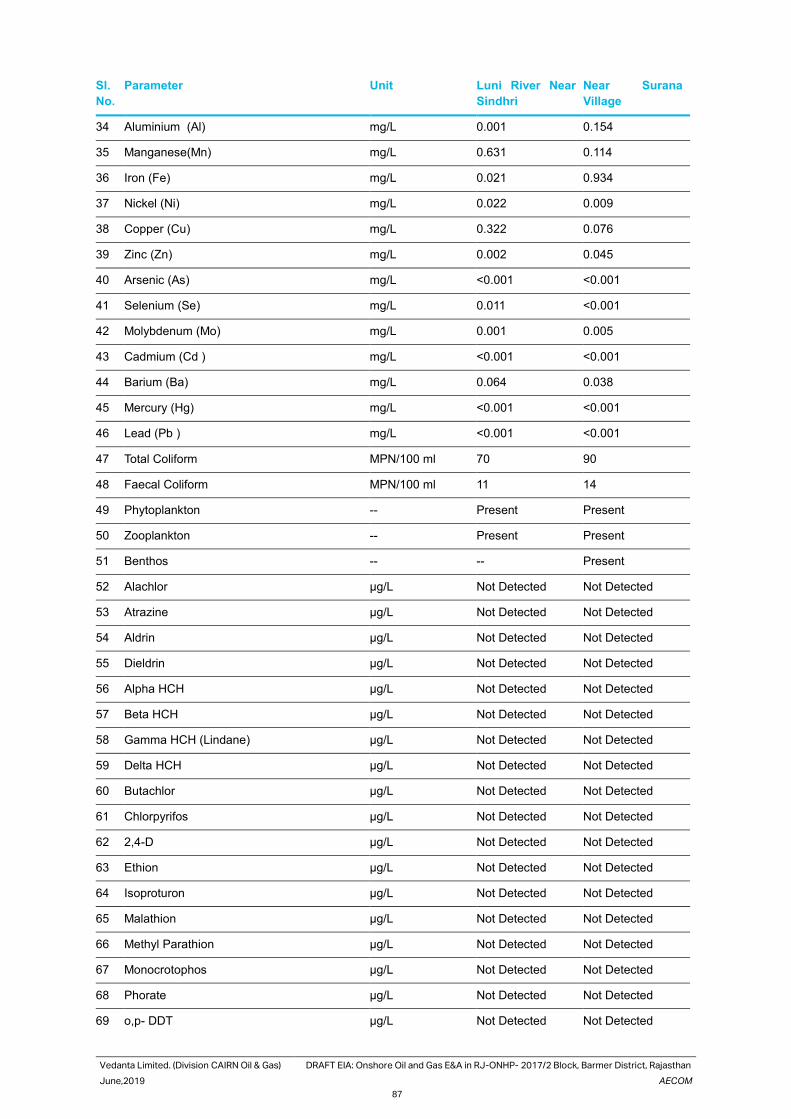
Vedanta Limited. (Division CAIRN Oil & Gas) DRAFT EIA: Onshore Oil and Gas E&A in RJ-ONHP- 2017/2 Block, Barmer District, Rajasthan
June,2019 AECOM
87
Sl.
No.
Parameter Unit Luni River Near
Sindhri
Near Surana
Village
34 Aluminium (Al) mg/L 0.001 0.154
35 Manganese(Mn) mg/L 0.631 0.114
36 Iron (Fe) mg/L 0.021 0.934
37 Nickel (Ni) mg/L 0.022 0.009
38 Copper (Cu) mg/L 0.322 0.076
39 Zinc (Zn) mg/L 0.002 0.045
40 Arsenic (As) mg/L <0.001 <0.001
41 Selenium (Se) mg/L 0.011 <0.001
42 Molybdenum (Mo) mg/L 0.001 0.005
43 Cadmium (Cd ) mg/L <0.001 <0.001
44 Barium (Ba) mg/L 0.064 0.038
45 Mercury (Hg) mg/L <0.001 <0.001
46 Lead (Pb ) mg/L <0.001 <0.001
47 Total Coliform MPN/100 ml 70 90
48 Faecal Coliform MPN/100 ml 11 14
49 Phytoplankton -- Present Present
50 Zooplankton -- Present Present
51 Benthos -- -- Present
52 Alachlor µg/L Not Detected Not Detected
53 Atrazine µg/L Not Detected Not Detected
54 Aldrin µg/L Not Detected Not Detected
55 Dieldrin µg/L Not Detected Not Detected
56 Alpha HCH µg/L Not Detected Not Detected
57 Beta HCH µg/L Not Detected Not Detected
58 Gamma HCH (Lindane) µg/L Not Detected Not Detected
59 Delta HCH µg/L Not Detected Not Detected
60 Butachlor µg/L Not Detected Not Detected
61 Chlorpyrifos µg/L Not Detected Not Detected
62 2,4-D µg/L Not Detected Not Detected
63 Ethion µg/L Not Detected Not Detected
64 Isoproturon µg/L Not Detected Not Detected
65 Malathion µg/L Not Detected Not Detected
66 Methyl Parathion µg/L Not Detected Not Detected
67 Monocrotophos µg/L Not Detected Not Detected
68 Phorate µg/L Not Detected Not Detected
69 o,p- DDT µg/L Not Detected Not Detected
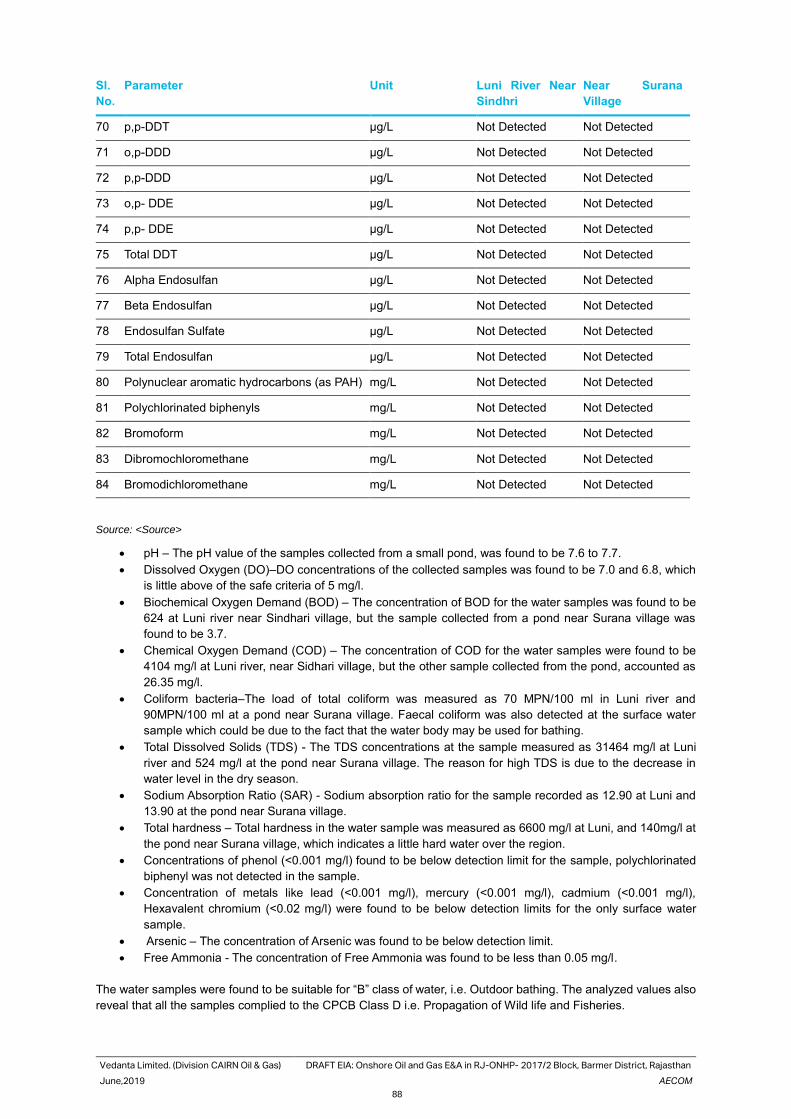
Vedanta Limited. (Division CAIRN Oil & Gas) DRAFT EIA: Onshore Oil and Gas E&A in RJ-ONHP- 2017/2 Block, Barmer District, Rajasthan
June,2019 AECOM
88
Sl.
No.
Parameter Unit Luni River Near
Sindhri
Near Surana
Village
70 p,p-DDT µg/L Not Detected Not Detected
71 o,p-DDD µg/L Not Detected Not Detected
72 p,p-DDD µg/L Not Detected Not Detected
73 o,p- DDE µg/L Not Detected Not Detected
74 p,p- DDE µg/L Not Detected Not Detected
75 Total DDT µg/L Not Detected Not Detected
76 Alpha Endosulfan µg/L Not Detected Not Detected
77 Beta Endosulfan µg/L Not Detected Not Detected
78 Endosulfan Sulfate µg/L Not Detected Not Detected
79 Total Endosulfan µg/L Not Detected Not Detected
80 Polynuclear aromatic hydrocarbons (as PAH) mg/L Not Detected Not Detected
81 Polychlorinated biphenyls mg/L Not Detected Not Detected
82 Bromoform mg/L Not Detected Not Detected
83 Dibromochloromethane mg/L Not Detected Not Detected
84 Bromodichloromethane mg/L Not Detected Not Detected
Source: <Source>
• pH – The pH value of the samples collected from a small pond, was found to be 7.6 to 7.7.
• Dissolved Oxygen (DO)–DO concentrations of the collected samples was found to be 7.0 and 6.8, which
is little above of the safe criteria of 5 mg/l.
• Biochemical Oxygen Demand (BOD) – The concentration of BOD for the water samples was found to be
624 at Luni river near Sindhari village, but the sample collected from a pond near Surana village was
found to be 3.7.
• Chemical Oxygen Demand (COD) – The concentration of COD for the water samples were found to be
4104 mg/l at Luni river, near Sidhari village, but the other sample collected from the pond, accounted as
26.35 mg/l.
• Coliform bacteria–The load of total coliform was measured as 70 MPN/100 ml in Luni river and
90MPN/100 ml at a pond near Surana village. Faecal coliform was also detected at the surface water
sample which could be due to the fact that the water body may be used for bathing.
• Total Dissolved Solids (TDS) - The TDS concentrations at the sample measured as 31464 mg/l at Luni
river and 524 mg/l at the pond near Surana village. The reason for high TDS is due to the decrease in
water level in the dry season.
• Sodium Absorption Ratio (SAR) - Sodium absorption ratio for the sample recorded as 12.90 at Luni and
13.90 at the pond near Surana village.
• Total hardness – Total hardness in the water sample was measured as 6600 mg/l at Luni, and 140mg/l at
the pond near Surana village, which indicates a little hard water over the region.
• Concentrations of phenol (<0.001 mg/l) found to be below detection limit for the sample, polychlorinated
biphenyl was not detected in the sample.
• Concentration of metals like lead (<0.001 mg/l), mercury (<0.001 mg/l), cadmium (<0.001 mg/l),
Hexavalent chromium (<0.02 mg/l) were found to be below detection limits for the only surface water
sample.
• Arsenic – The concentration of Arsenic was found to be below detection limit.
• Free Ammonia - The concentration of Free Ammonia was found to be less than 0.05 mg/l.
The water samples were found to be suitable for “B” class of water, i.e. Outdoor bathing. The analyzed values also
reveal that all the samples complied to the CPCB Class D i.e. Propagation of Wild life and Fisheries.
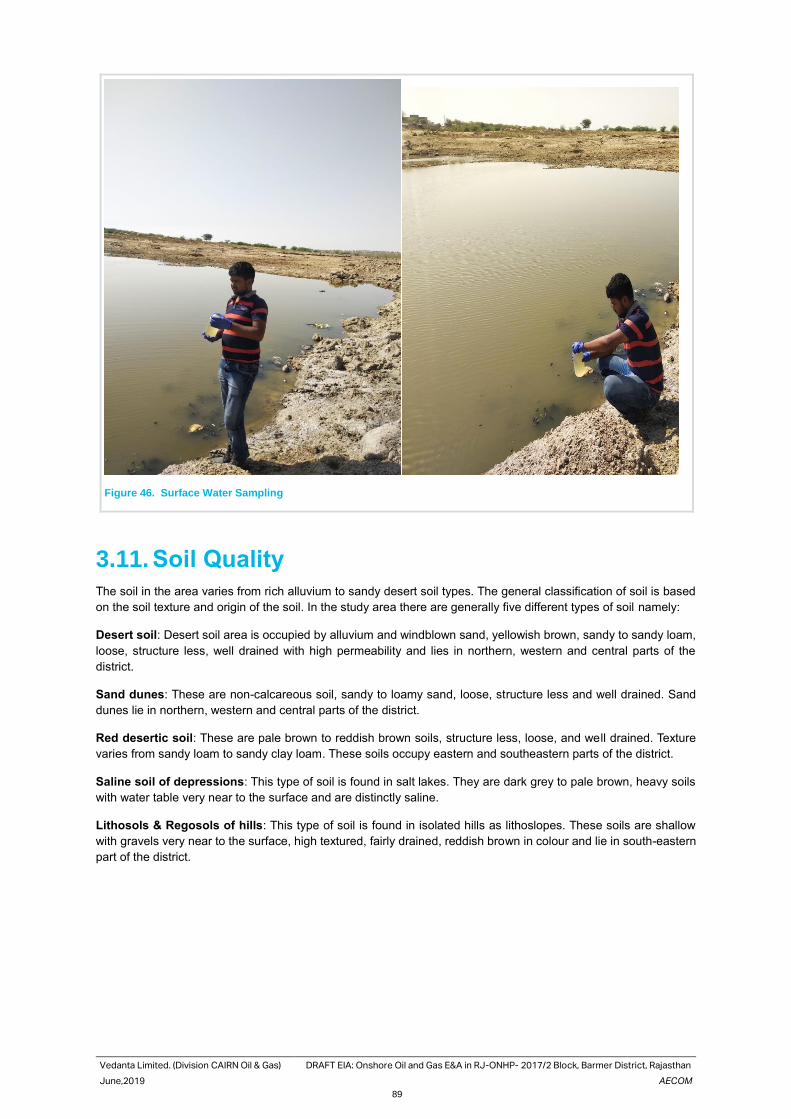
Vedanta Limited. (Division CAIRN Oil & Gas) DRAFT EIA: Onshore Oil and Gas E&A in RJ-ONHP- 2017/2 Block, Barmer District, Rajasthan
June,2019 AECOM
89
Figure 46. Surface Water Sampling
3.11. Soil Quality
The soil in the area varies from rich alluvium to sandy desert soil types. The general classification of soil is based
on the soil texture and origin of the soil. In the study area there are generally five different types of soil namely:
Desert soil: Desert soil area is occupied by alluvium and windblown sand, yellowish brown, sandy to sandy loam,
loose, structure less, well drained with high permeability and lies in northern, western and central parts of the
district.
Sand dunes: These are non-calcareous soil, sandy to loamy sand, loose, structure less and well drained. Sand
dunes lie in northern, western and central parts of the district.
Red desertic soil: These are pale brown to reddish brown soils, structure less, loose, and well drained. Texture
varies from sandy loam to sandy clay loam. These soils occupy eastern and southeastern parts of the district.
Saline soil of depressions: This type of soil is found in salt lakes. They are dark grey to pale brown, heavy soils
with water table very near to the surface and are distinctly saline.
Lithosols & Regosols of hills: This type of soil is found in isolated hills as lithoslopes. These soils are shallow
with gravels very near to the surface, high textured, fairly drained, reddish brown in colour and lie in south-eastern
part of the district.
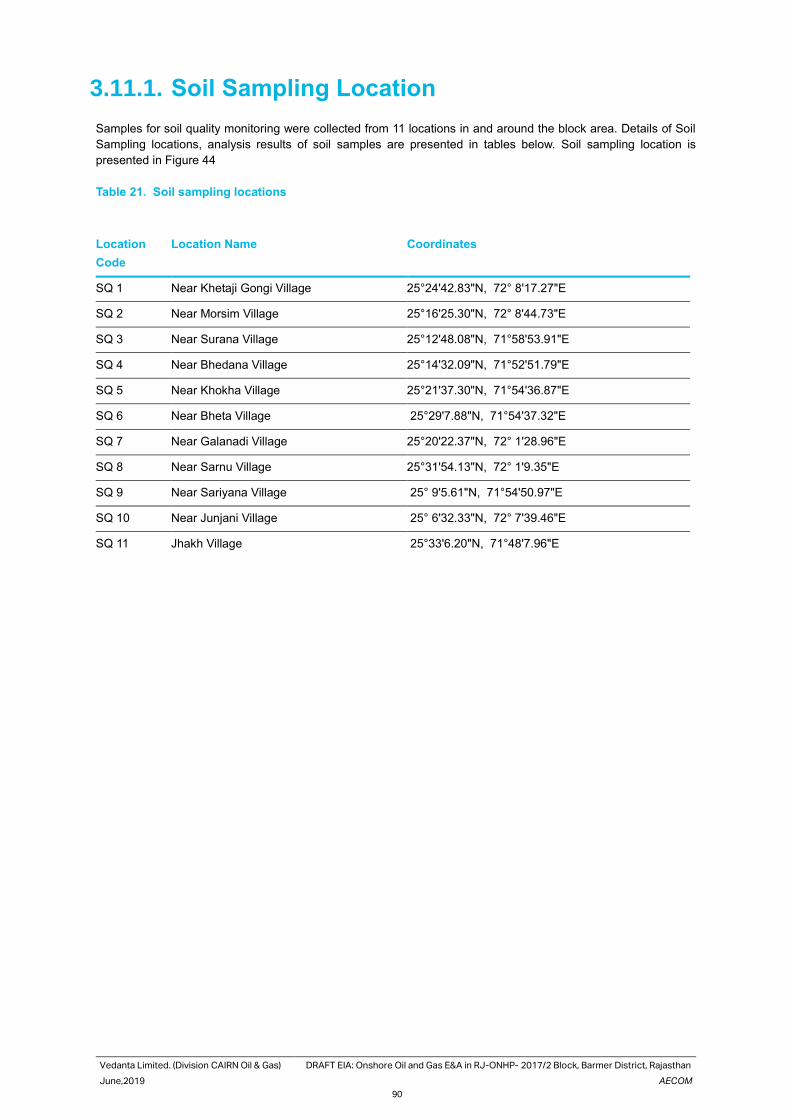
Vedanta Limited. (Division CAIRN Oil & Gas) DRAFT EIA: Onshore Oil and Gas E&A in RJ-ONHP- 2017/2 Block, Barmer District, Rajasthan
June,2019 AECOM
90
3.11.1. Soil Sampling Location
Samples for soil quality monitoring were collected from 11 locations in and around the block area. Details of Soil
Sampling locations, analysis results of soil samples are presented in tables below. Soil sampling location is
presented in Figure 44
Table 21. Soil sampling locations
Location
Code
Location Name Coordinates
SQ 1 Near Khetaji Gongi Village 25°24'42.83"N, 72° 8'17.27"E
SQ 2 Near Morsim Village 25°16'25.30"N, 72° 8'44.73"E
SQ 3 Near Surana Village 25°12'48.08"N, 71°58'53.91"E
SQ 4 Near Bhedana Village 25°14'32.09"N, 71°52'51.79"E
SQ 5 Near Khokha Village 25°21'37.30"N, 71°54'36.87"E
SQ 6 Near Bheta Village 25°29'7.88"N, 71°54'37.32"E
SQ 7 Near Galanadi Village 25°20'22.37"N, 72° 1'28.96"E
SQ 8 Near Sarnu Village 25°31'54.13"N, 72° 1'9.35"E
SQ 9 Near Sariyana Village 25° 9'5.61"N, 71°54'50.97"E
SQ 10 Near Junjani Village 25° 6'32.33"N, 72° 7'39.46"E
SQ 11 Jhakh Village 25°33'6.20"N, 71°48'7.96"E
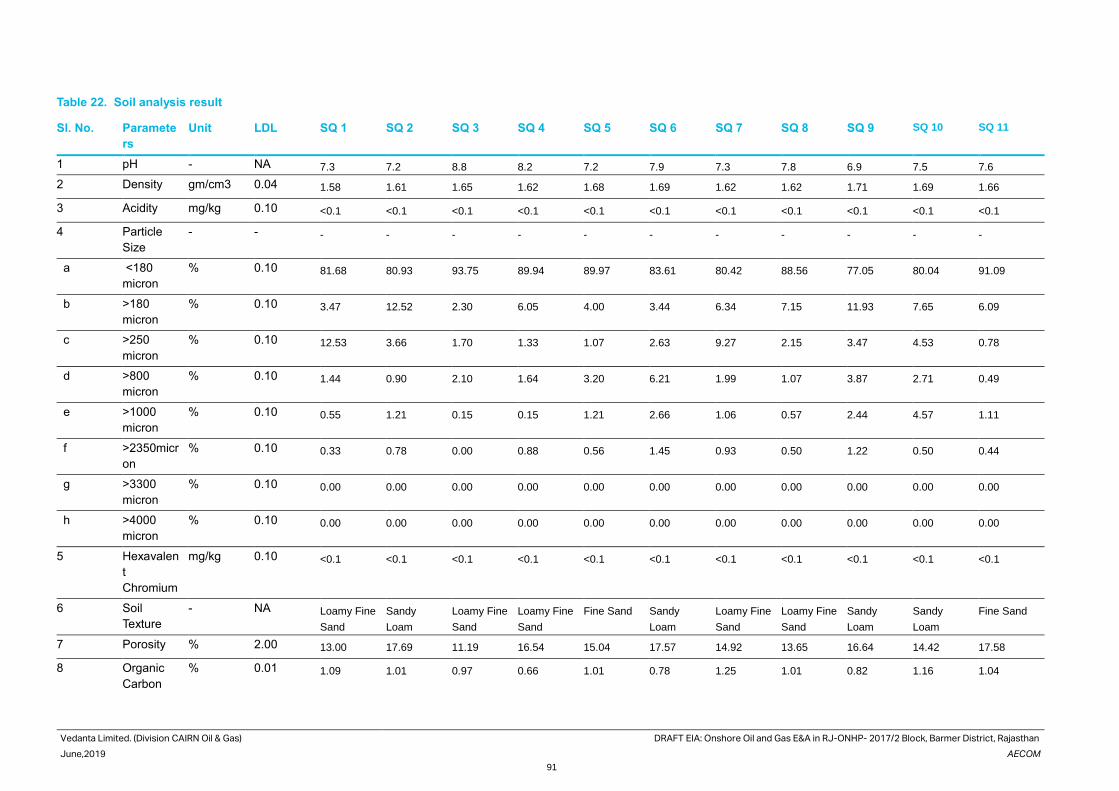
Vedanta Limited. (Division CAIRN Oil & Gas) DRAFT EIA: Onshore Oil and Gas E&A in RJ-ONHP- 2017/2 Block, Barmer District, Rajasthan
June,2019 AECOM
91
Table 22. Soil analysis result
Sl. No. Paramete
rs
Unit LDL SQ 1 SQ 2 SQ 3 SQ 4 SQ 5 SQ 6 SQ 7 SQ 8 SQ 9 SQ 10 SQ 11
1 pH - NA 7.3 7.2 8.8 8.2 7.2 7.9 7.3 7.8 6.9 7.5 7.6
2 Density gm/cm3 0.04 1.58 1.61 1.65 1.62 1.68 1.69 1.62 1.62 1.71 1.69 1.66
3 Acidity mg/kg 0.10 <0.1 <0.1 <0.1 <0.1 <0.1 <0.1 <0.1 <0.1 <0.1 <0.1 <0.1
4 Particle
Size
- - - - - - - - - - - - -
a <180
micron
% 0.10 81.68 80.93 93.75 89.94 89.97 83.61 80.42 88.56 77.05 80.04 91.09
b >180
micron
% 0.10 3.47 12.52 2.30 6.05 4.00 3.44 6.34 7.15 11.93 7.65 6.09
c >250
micron
% 0.10 12.53 3.66 1.70 1.33 1.07 2.63 9.27 2.15 3.47 4.53 0.78
d >800
micron
% 0.10 1.44 0.90 2.10 1.64 3.20 6.21 1.99 1.07 3.87 2.71 0.49
e >1000
micron
% 0.10 0.55 1.21 0.15 0.15 1.21 2.66 1.06 0.57 2.44 4.57 1.11
f >2350micr
on
% 0.10 0.33 0.78 0.00 0.88 0.56 1.45 0.93 0.50 1.22 0.50 0.44
g >3300
micron
% 0.10 0.00 0.00 0.00 0.00 0.00 0.00 0.00 0.00 0.00 0.00 0.00
h >4000
micron
% 0.10 0.00 0.00 0.00 0.00 0.00 0.00 0.00 0.00 0.00 0.00 0.00
5 Hexavalen
t
Chromium
mg/kg 0.10 <0.1 <0.1 <0.1 <0.1 <0.1 <0.1 <0.1 <0.1 <0.1 <0.1 <0.1
6 Soil
Texture
- NA Loamy Fine
Sand
Sandy
Loam
Loamy Fine
Sand
Loamy Fine
Sand
Fine Sand Sandy
Loam
Loamy Fine
Sand
Loamy Fine
Sand
Sandy
Loam
Sandy
Loam
Fine Sand
7 Porosity % 2.00 13.00 17.69 11.19 16.54 15.04 17.57 14.92 13.65 16.64 14.42 17.58
8 Organic
Carbon
% 0.01 1.09 1.01 0.97 0.66 1.01 0.78 1.25 1.01 0.82 1.16 1.04
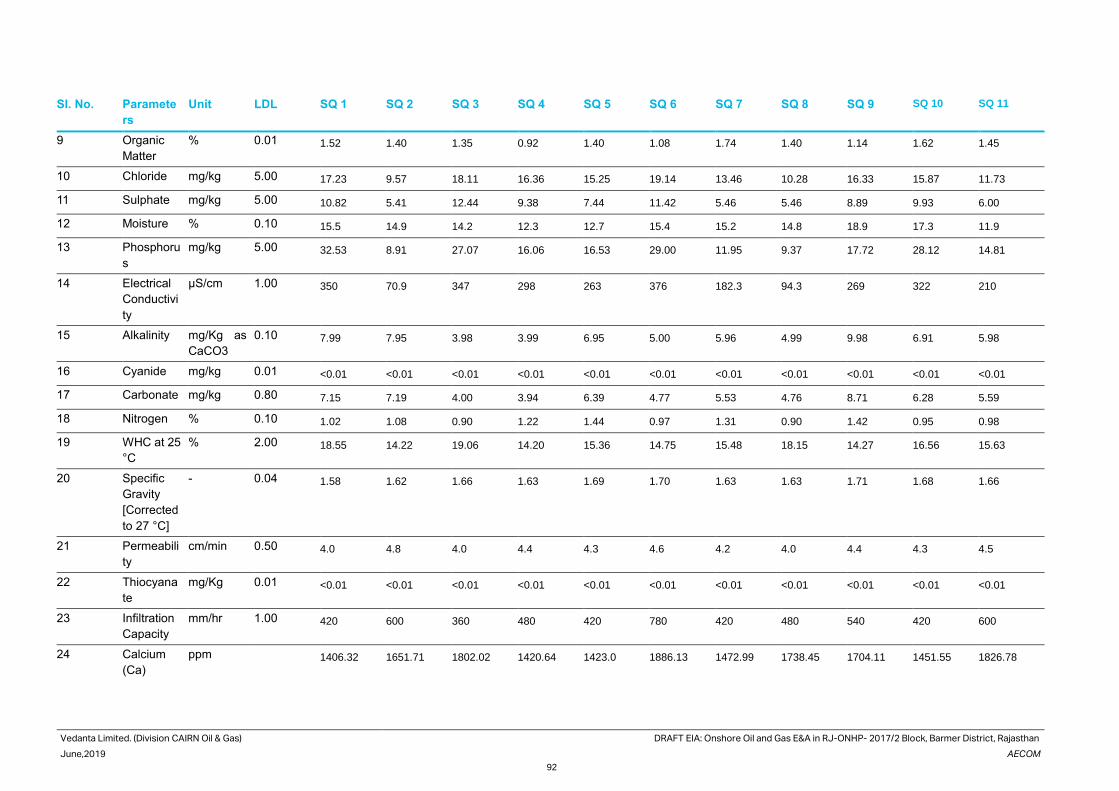
Vedanta Limited. (Division CAIRN Oil & Gas) DRAFT EIA: Onshore Oil and Gas E&A in RJ-ONHP- 2017/2 Block, Barmer District, Rajasthan
June,2019 AECOM
92
Sl. No. Paramete
rs
Unit LDL SQ 1 SQ 2 SQ 3 SQ 4 SQ 5 SQ 6 SQ 7 SQ 8 SQ 9 SQ 10 SQ 11
9 Organic
Matter
% 0.01 1.52 1.40 1.35 0.92 1.40 1.08 1.74 1.40 1.14 1.62 1.45
10 Chloride mg/kg 5.00 17.23 9.57 18.11 16.36 15.25 19.14 13.46 10.28 16.33 15.87 11.73
11 Sulphate mg/kg 5.00 10.82 5.41 12.44 9.38 7.44 11.42 5.46 5.46 8.89 9.93 6.00
12 Moisture % 0.10 15.5 14.9 14.2 12.3 12.7 15.4 15.2 14.8 18.9 17.3 11.9
13 Phosphoru
s
mg/kg 5.00 32.53 8.91 27.07 16.06 16.53 29.00 11.95 9.37 17.72 28.12 14.81
14 Electrical
Conductivi
ty
µS/cm 1.00 350 70.9 347 298 263 376 182.3 94.3 269 322 210
15 Alkalinity mg/Kg as
CaCO3
0.10 7.99 7.95 3.98 3.99 6.95 5.00 5.96 4.99 9.98 6.91 5.98
16 Cyanide mg/kg 0.01 <0.01 <0.01 <0.01 <0.01 <0.01 <0.01 <0.01 <0.01 <0.01 <0.01 <0.01
17 Carbonate mg/kg 0.80 7.15 7.19 4.00 3.94 6.39 4.77 5.53 4.76 8.71 6.28 5.59
18 Nitrogen % 0.10 1.02 1.08 0.90 1.22 1.44 0.97 1.31 0.90 1.42 0.95 0.98
19 WHC at 25
°C
% 2.00 18.55 14.22 19.06 14.20 15.36 14.75 15.48 18.15 14.27 16.56 15.63
20 Specific
Gravity
[Corrected
to 27 °C]
- 0.04 1.58 1.62 1.66 1.63 1.69 1.70 1.63 1.63 1.71 1.68 1.66
21 Permeabili
ty
cm/min 0.50 4.0 4.8 4.0 4.4 4.3 4.6 4.2 4.0 4.4 4.3 4.5
22 Thiocyana
te
mg/Kg 0.01 <0.01 <0.01 <0.01 <0.01 <0.01 <0.01 <0.01 <0.01 <0.01 <0.01 <0.01
23 Infiltration
Capacity
mm/hr 1.00 420 600 360 480 420 780 420 480 540 420 600
24 Calcium
(Ca)
ppm 1406.32 1651.71 1802.02 1420.64 1423.0 1886.13 1472.99 1738.45 1704.11 1451.55 1826.78
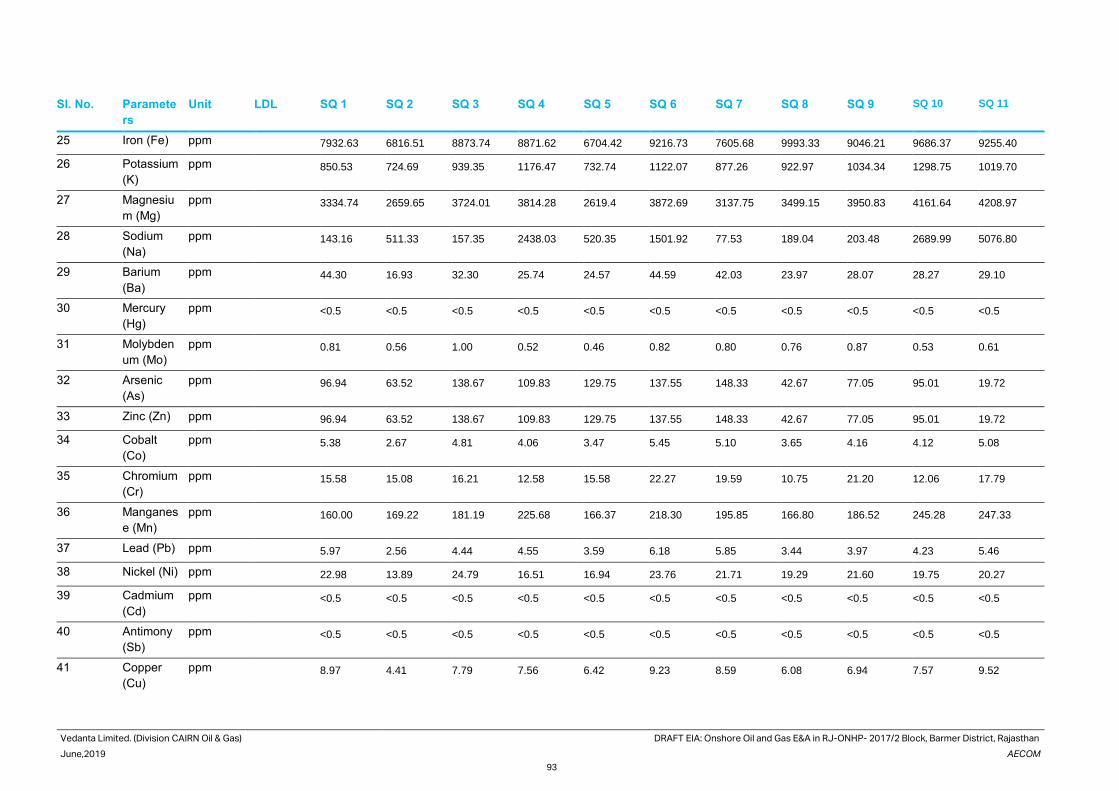
Vedanta Limited. (Division CAIRN Oil & Gas) DRAFT EIA: Onshore Oil and Gas E&A in RJ-ONHP- 2017/2 Block, Barmer District, Rajasthan
June,2019 AECOM
93
Sl. No. Paramete
rs
Unit LDL SQ 1 SQ 2 SQ 3 SQ 4 SQ 5 SQ 6 SQ 7 SQ 8 SQ 9 SQ 10 SQ 11
25 Iron (Fe) ppm 7932.63 6816.51 8873.74 8871.62 6704.42 9216.73 7605.68 9993.33 9046.21 9686.37 9255.40
26 Potassium
(K)
ppm 850.53 724.69 939.35 1176.47 732.74 1122.07 877.26 922.97 1034.34 1298.75 1019.70
27 Magnesiu
m (Mg)
ppm 3334.74 2659.65 3724.01 3814.28 2619.4 3872.69 3137.75 3499.15 3950.83 4161.64 4208.97
28 Sodium
(Na)
ppm 143.16 511.33 157.35 2438.03 520.35 1501.92 77.53 189.04 203.48 2689.99 5076.80
29 Barium
(Ba)
ppm 44.30 16.93 32.30 25.74 24.57 44.59 42.03 23.97 28.07 28.27 29.10
30 Mercury
(Hg)
ppm <0.5 <0.5 <0.5 <0.5 <0.5 <0.5 <0.5 <0.5 <0.5 <0.5 <0.5
31 Molybden
um (Mo)
ppm 0.81 0.56 1.00 0.52 0.46 0.82 0.80 0.76 0.87 0.53 0.61
32 Arsenic
(As)
ppm 96.94 63.52 138.67 109.83 129.75 137.55 148.33 42.67 77.05 95.01 19.72
33 Zinc (Zn) ppm 96.94 63.52 138.67 109.83 129.75 137.55 148.33 42.67 77.05 95.01 19.72
34 Cobalt
(Co)
ppm 5.38 2.67 4.81 4.06 3.47 5.45 5.10 3.65 4.16 4.12 5.08
35 Chromium
(Cr)
ppm 15.58 15.08 16.21 12.58 15.58 22.27 19.59 10.75 21.20 12.06 17.79
36 Manganes
e (Mn)
ppm 160.00 169.22 181.19 225.68 166.37 218.30 195.85 166.80 186.52 245.28 247.33
37 Lead (Pb) ppm 5.97 2.56 4.44 4.55 3.59 6.18 5.85 3.44 3.97 4.23 5.46
38 Nickel (Ni) ppm 22.98 13.89 24.79 16.51 16.94 23.76 21.71 19.29 21.60 19.75 20.27
39 Cadmium
(Cd)
ppm <0.5 <0.5 <0.5 <0.5 <0.5 <0.5 <0.5 <0.5 <0.5 <0.5 <0.5
40 Antimony
(Sb)
ppm <0.5 <0.5 <0.5 <0.5 <0.5 <0.5 <0.5 <0.5 <0.5 <0.5 <0.5
41 Copper
(Cu)
ppm 8.97 4.41 7.79 7.56 6.42 9.23 8.59 6.08 6.94 7.57 9.52
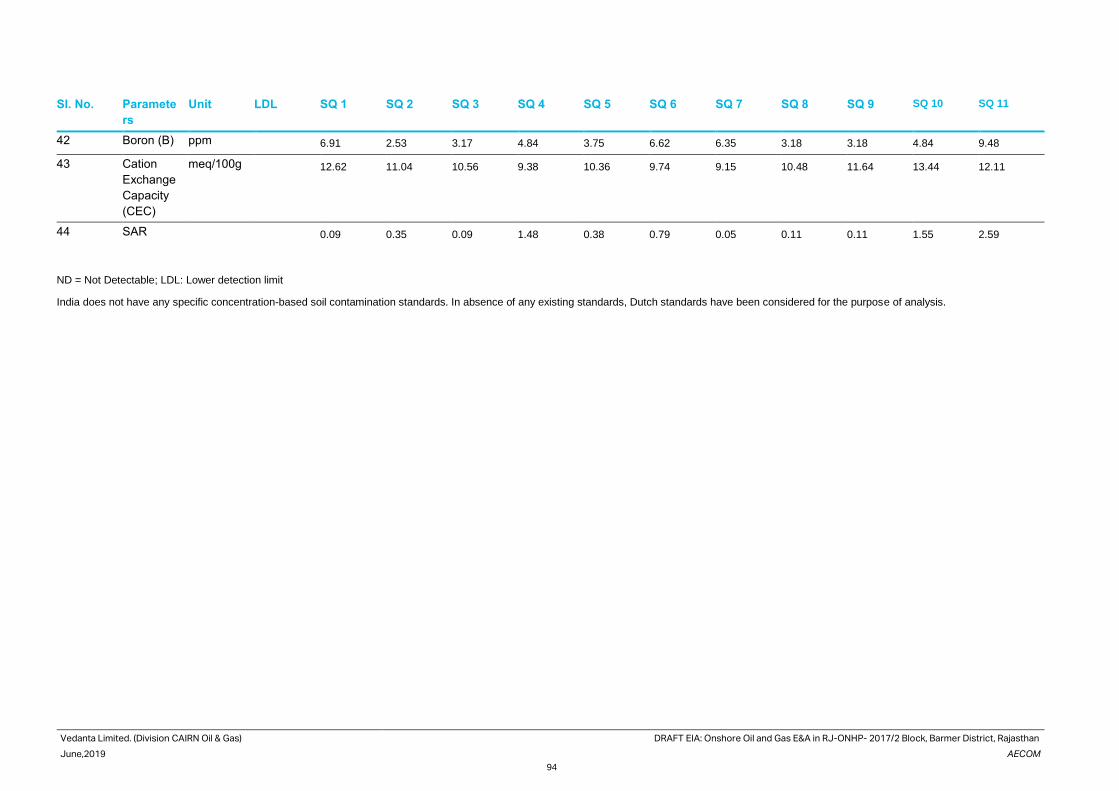
Vedanta Limited. (Division CAIRN Oil & Gas) DRAFT EIA: Onshore Oil and Gas E&A in RJ-ONHP- 2017/2 Block, Barmer District, Rajasthan
June,2019 AECOM
94
Sl. No. Paramete
rs
Unit LDL SQ 1 SQ 2 SQ 3 SQ 4 SQ 5 SQ 6 SQ 7 SQ 8 SQ 9 SQ 10 SQ 11
42 Boron (B) ppm 6.91 2.53 3.17 4.84 3.75 6.62 6.35 3.18 3.18 4.84 9.48
43 Cation
Exchange
Capacity
(CEC)
meq/100g 12.62 11.04 10.56 9.38 10.36 9.74 9.15 10.48 11.64 13.44 12.11
44 SAR
0.09 0.35 0.09 1.48 0.38 0.79 0.05 0.11 0.11 1.55 2.59
ND = Not Detectable; LDL: Lower detection limit
India does not have any specific concentration-based soil contamination standards. In absence of any existing standards, Dutch standards have been considered for the purpose of analysis.
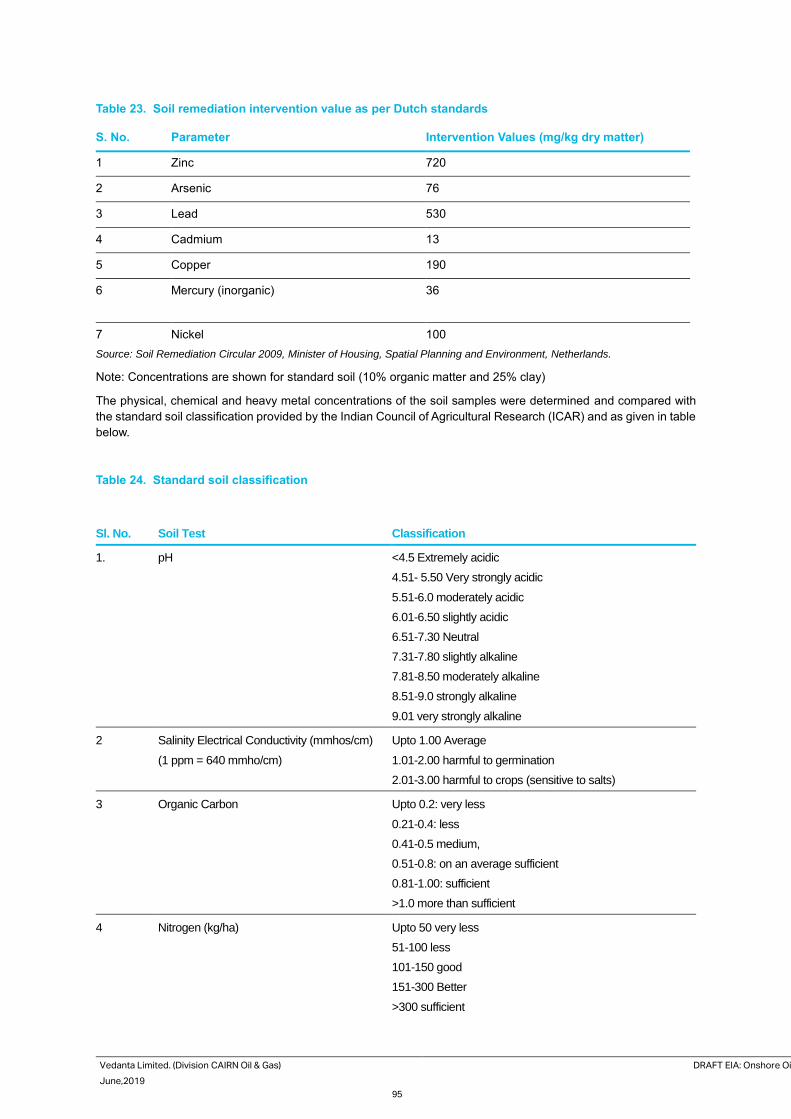
Vedanta Limited. (Division CAIRN Oil & Gas) DRAFT EIA: Onshore Oil and Gas E&A in RJ-ONHP- 2017/2 Block, Barmer District, Rajasthan
June,2019 AECOM
95
Table 23. Soil remediation intervention value as per Dutch standards
S. No. Parameter Intervention Values (mg/kg dry matter)
1 Zinc 720
2 Arsenic 76
3 Lead 530
4 Cadmium 13
5 Copper 190
6 Mercury (inorganic) 36
7 Nickel 100
Source: Soil Remediation Circular 2009, Minister of Housing, Spatial Planning and Environment, Netherlands.
Note: Concentrations are shown for standard soil (10% organic matter and 25% clay)
The physical, chemical and heavy metal concentrations of the soil samples were determined and compared with
the standard soil classification provided by the Indian Council of Agricultural Research (ICAR) and as given in table
below.
Table 24. Standard soil classification
Sl. No. Soil Test Classification
1. pH <4.5 Extremely acidic
4.51- 5.50 Very strongly acidic
5.51-6.0 moderately acidic
6.01-6.50 slightly acidic
6.51-7.30 Neutral
7.31-7.80 slightly alkaline
7.81-8.50 moderately alkaline
8.51-9.0 strongly alkaline
9.01 very strongly alkaline
2 Salinity Electrical Conductivity (mmhos/cm)
(1 ppm = 640 mmho/cm)
Upto 1.00 Average
1.01-2.00 harmful to germination
2.01-3.00 harmful to crops (sensitive to salts)
3 Organic Carbon Upto 0.2: very less
0.21-0.4: less
0.41-0.5 medium,
0.51-0.8: on an average sufficient
0.81-1.00: sufficient
>1.0 more than sufficient
4 Nitrogen (kg/ha) Upto 50 very less
51-100 less
101-150 good
151-300 Better
>300 sufficient
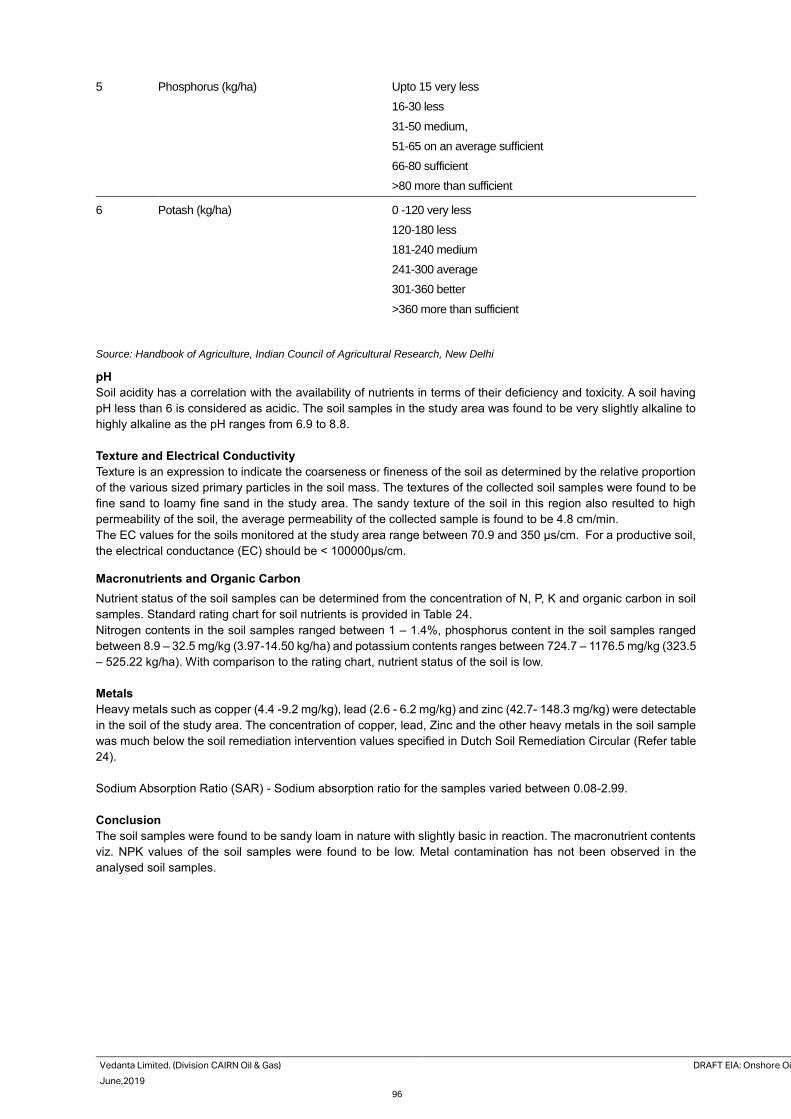
Vedanta Limited. (Division CAIRN Oil & Gas) DRAFT EIA: Onshore Oil and Gas E&A in RJ-ONHP- 2017/2 Block, Barmer District, Rajasthan
June,2019 AECOM
96
5 Phosphorus (kg/ha) Upto 15 very less
16-30 less
31-50 medium,
51-65 on an average sufficient
66-80 sufficient
>80 more than sufficient
6 Potash (kg/ha) 0 -120 very less
120-180 less
181-240 medium
241-300 average
301-360 better
>360 more than sufficient
Source: Handbook of Agriculture, Indian Council of Agricultural Research, New Delhi
pH
Soil acidity has a correlation with the availability of nutrients in terms of their deficiency and toxicity. A soil having
pH less than 6 is considered as acidic. The soil samples in the study area was found to be very slightly alkaline to
highly alkaline as the pH ranges from 6.9 to 8.8.
Texture and Electrical Conductivity
Texture is an expression to indicate the coarseness or fineness of the soil as determined by the relative proportion
of the various sized primary particles in the soil mass. The textures of the collected soil samples were found to be
fine sand to loamy fine sand in the study area. The sandy texture of the soil in this region also resulted to high
permeability of the soil, the average permeability of the collected sample is found to be 4.8 cm/min.
The EC values for the soils monitored at the study area range between 70.9 and 350 µs/cm. For a productive soil,
the electrical conductance (EC) should be < 100000µs/cm.
Macronutrients and Organic Carbon
Nutrient status of the soil samples can be determined from the concentration of N, P, K and organic carbon in soil
samples. Standard rating chart for soil nutrients is provided in Table 24.
Nitrogen contents in the soil samples ranged between 1 – 1.4%, phosphorus content in the soil samples ranged
between 8.9 – 32.5 mg/kg (3.97-14.50 kg/ha) and potassium contents ranges between 724.7 – 1176.5 mg/kg (323.5
– 525.22 kg/ha). With comparison to the rating chart, nutrient status of the soil is low.
Metals
Heavy metals such as copper (4.4 -9.2 mg/kg), lead (2.6 - 6.2 mg/kg) and zinc (42.7- 148.3 mg/kg) were detectable
in the soil of the study area. The concentration of copper, lead, Zinc and the other heavy metals in the soil sample
was much below the soil remediation intervention values specified in Dutch Soil Remediation Circular (Refer table
24).
Sodium Absorption Ratio (SAR) - Sodium absorption ratio for the samples varied between 0.08-2.99.
Conclusion
The soil samples were found to be sandy loam in nature with slightly basic in reaction. The macronutrient contents
viz. NPK values of the soil samples were found to be low. Metal contamination has not been observed in the
analysed soil samples.
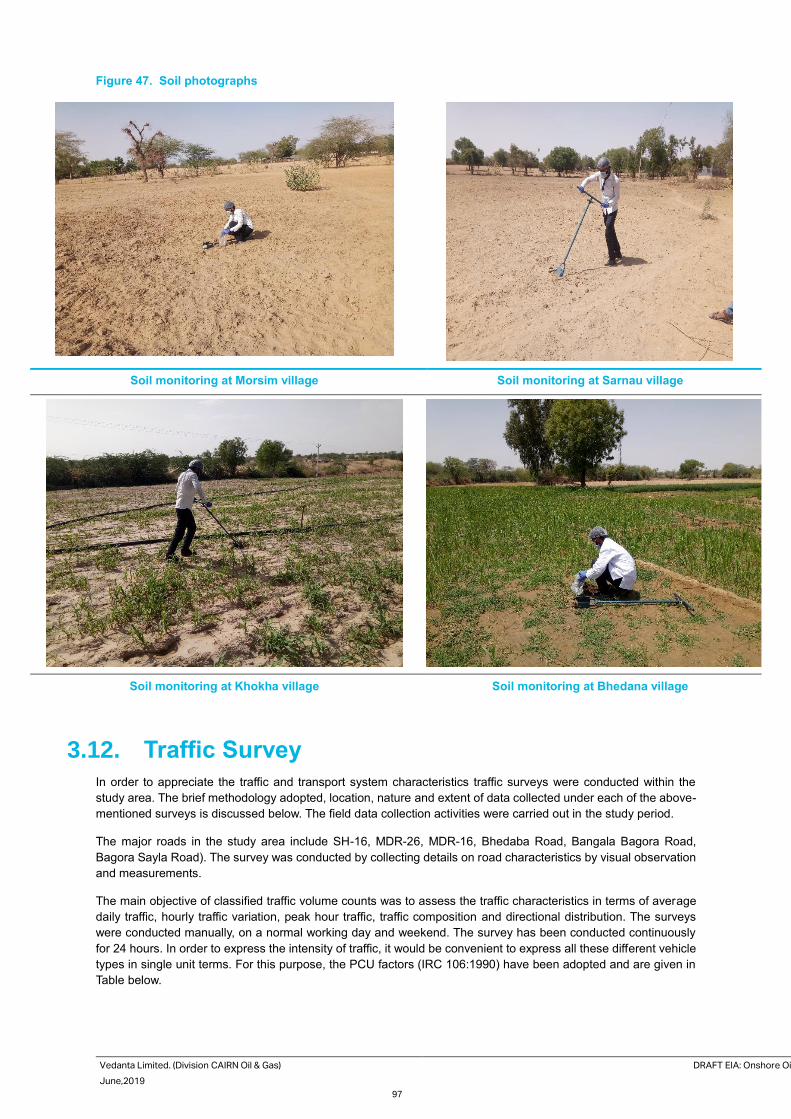
Vedanta Limited. (Division CAIRN Oil & Gas) DRAFT EIA: Onshore Oil and Gas E&A in RJ-ONHP- 2017/2 Block, Barmer District, Rajasthan
June,2019 AECOM
97
Figure 47. Soil photographs
Soil monitoring at Morsim village Soil monitoring at Sarnau village
Soil monitoring at Khokha village Soil monitoring at Bhedana village
3.12. Traffic Survey
In order to appreciate the traffic and transport system characteristics traffic surveys were conducted within the
study area. The brief methodology adopted, location, nature and extent of data collected under each of the above-
mentioned surveys is discussed below. The field data collection activities were carried out in the study period.
The major roads in the study area include SH-16, MDR-26, MDR-16, Bhedaba Road, Bangala Bagora Road,
Bagora Sayla Road). The survey was conducted by collecting details on road characteristics by visual observation
and measurements.
The main objective of classified traffic volume counts was to assess the traffic characteristics in terms of average
daily traffic, hourly traffic variation, peak hour traffic, traffic composition and directional distribution. The surveys
were conducted manually, on a normal working day and weekend. The survey has been conducted continuously
for 24 hours. In order to express the intensity of traffic, it would be convenient to express all these different vehicle
types in single unit terms. For this purpose, the PCU factors (IRC 106:1990) have been adopted and are given in
Table below.
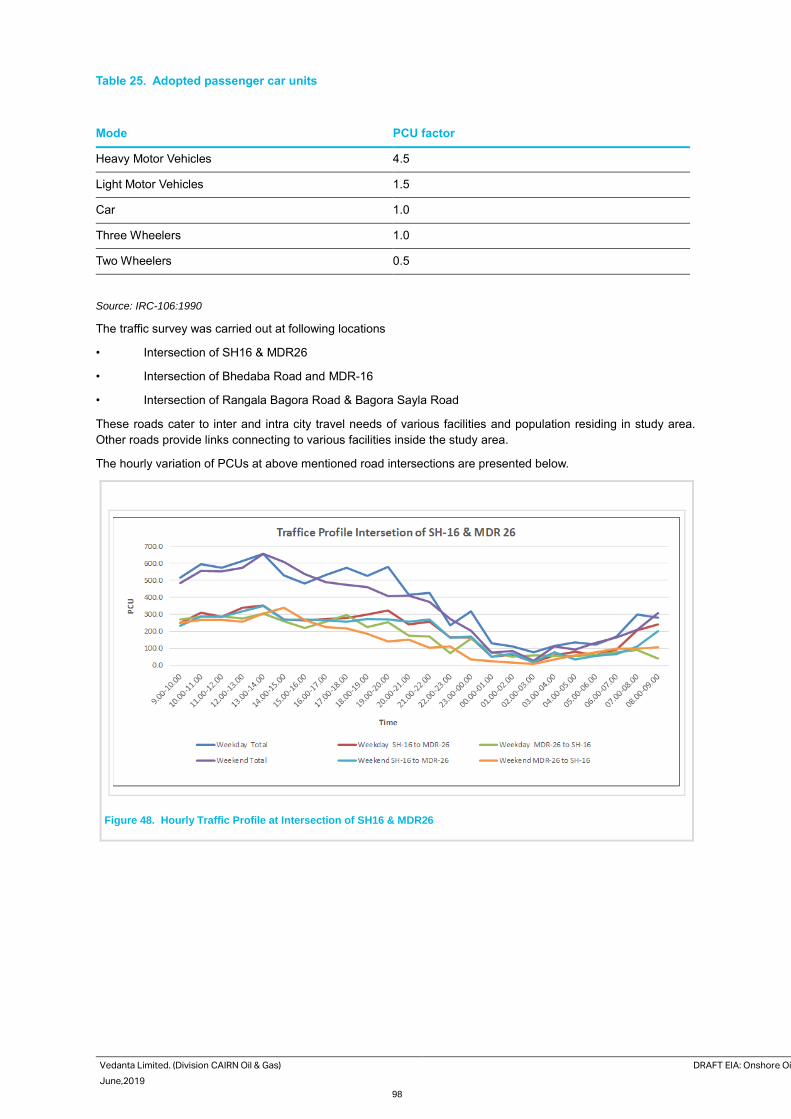
Vedanta Limited. (Division CAIRN Oil & Gas) DRAFT EIA: Onshore Oil and Gas E&A in RJ-ONHP- 2017/2 Block, Barmer District, Rajasthan
June,2019 AECOM
98
Table 25. Adopted passenger car units
Mode PCU factor
Heavy Motor Vehicles 4.5
Light Motor Vehicles 1.5
Car 1.0
Three Wheelers 1.0
Two Wheelers 0.5
Source: IRC-106:1990
The traffic survey was carried out at following locations
• Intersection of SH16 & MDR26
• Intersection of Bhedaba Road and MDR-16
• Intersection of Rangala Bagora Road & Bagora Sayla Road
These roads cater to inter and intra city travel needs of various facilities and population residing in study area.
Other roads provide links connecting to various facilities inside the study area.
The hourly variation of PCUs at above mentioned road intersections are presented below.
Figure 48. Hourly Traffic Profile at Intersection of SH16 & MDR26
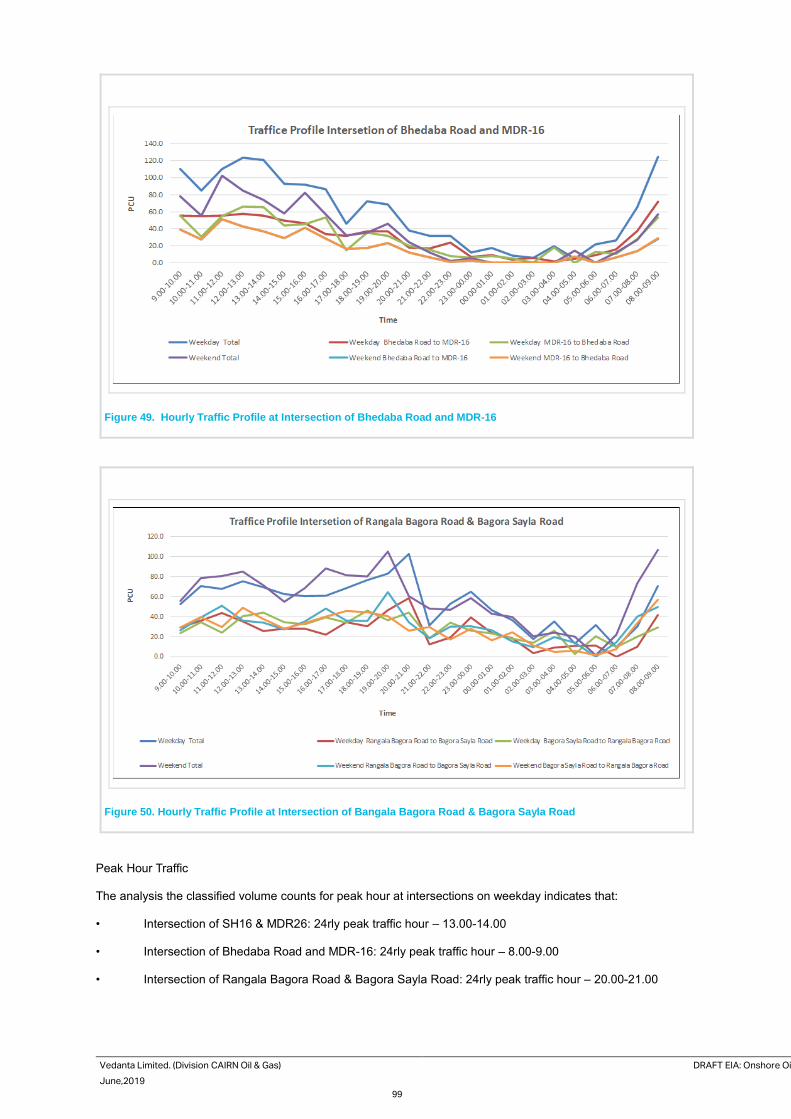
Vedanta Limited. (Division CAIRN Oil & Gas) DRAFT EIA: Onshore Oil and Gas E&A in RJ-ONHP- 2017/2 Block, Barmer District, Rajasthan
June,2019 AECOM
99
Figure 49. Hourly Traffic Profile at Intersection of Bhedaba Road and MDR-16
Figure 50. Hourly Traffic Profile at Intersection of Bangala Bagora Road & Bagora Sayla Road
Peak Hour Traffic
The analysis the classified volume counts for peak hour at intersections on weekday indicates that:
• Intersection of SH16 & MDR26: 24rly peak traffic hour – 13.00-14.00
• Intersection of Bhedaba Road and MDR-16: 24rly peak traffic hour – 8.00-9.00
• Intersection of Rangala Bagora Road & Bagora Sayla Road: 24rly peak traffic hour – 20.00-21.00
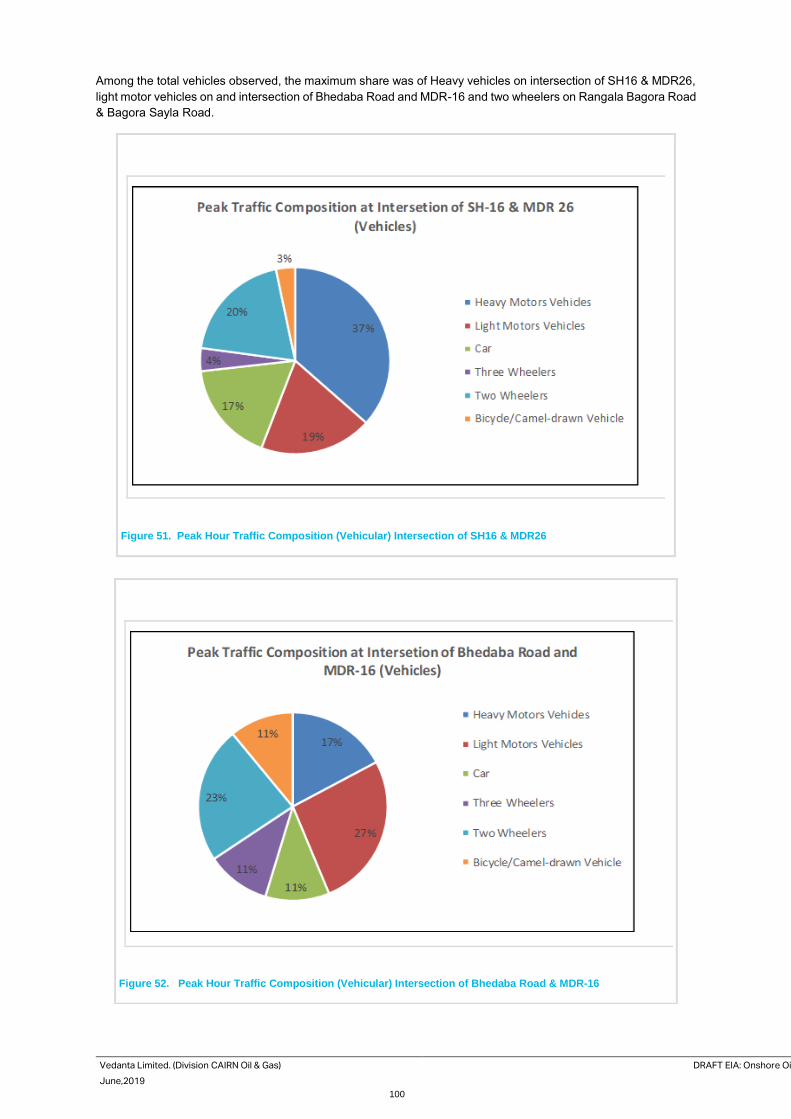
Vedanta Limited. (Division CAIRN Oil & Gas) DRAFT EIA: Onshore Oil and Gas E&A in RJ-ONHP- 2017/2 Block, Barmer District, Rajasthan
June,2019 AECOM
100
Among the total vehicles observed, the maximum share was of Heavy vehicles on intersection of SH16 & MDR26,
light motor vehicles on and intersection of Bhedaba Road and MDR-16 and two wheelers on Rangala Bagora Road
& Bagora Sayla Road.
Figure 51. Peak Hour Traffic Composition (Vehicular) Intersection of SH16 & MDR26
Figure 52. Peak Hour Traffic Composition (Vehicular) Intersection of Bhedaba Road & MDR-16
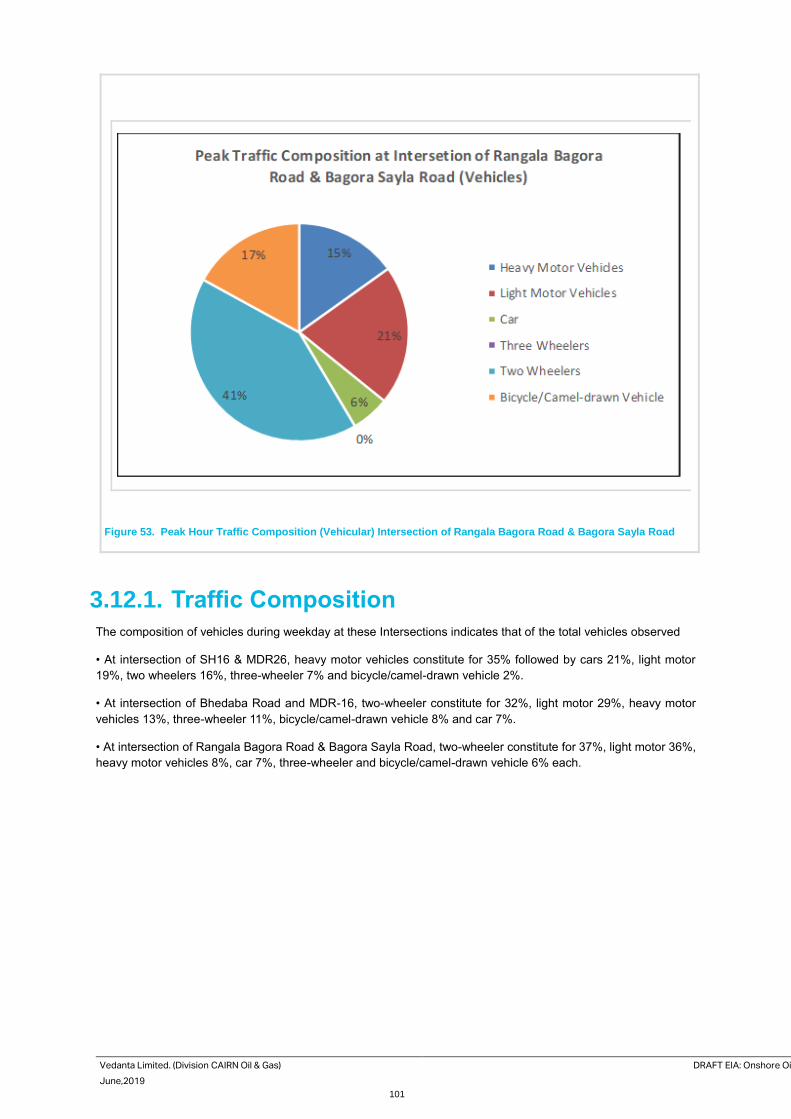
Vedanta Limited. (Division CAIRN Oil & Gas) DRAFT EIA: Onshore Oil and Gas E&A in RJ-ONHP- 2017/2 Block, Barmer District, Rajasthan
June,2019 AECOM
101
Figure 53. Peak Hour Traffic Composition (Vehicular) Intersection of Rangala Bagora Road & Bagora Sayla Road
3.12.1. Traffic Composition
The composition of vehicles during weekday at these Intersections indicates that of the total vehicles observed
• At intersection of SH16 & MDR26, heavy motor vehicles constitute for 35% followed by cars 21%, light motor
19%, two wheelers 16%, three-wheeler 7% and bicycle/camel-drawn vehicle 2%.
• At intersection of Bhedaba Road and MDR-16, two-wheeler constitute for 32%, light motor 29%, heavy motor
vehicles 13%, three-wheeler 11%, bicycle/camel-drawn vehicle 8% and car 7%.
• At intersection of Rangala Bagora Road & Bagora Sayla Road, two-wheeler constitute for 37%, light motor 36%,
heavy motor vehicles 8%, car 7%, three-wheeler and bicycle/camel-drawn vehicle 6% each.
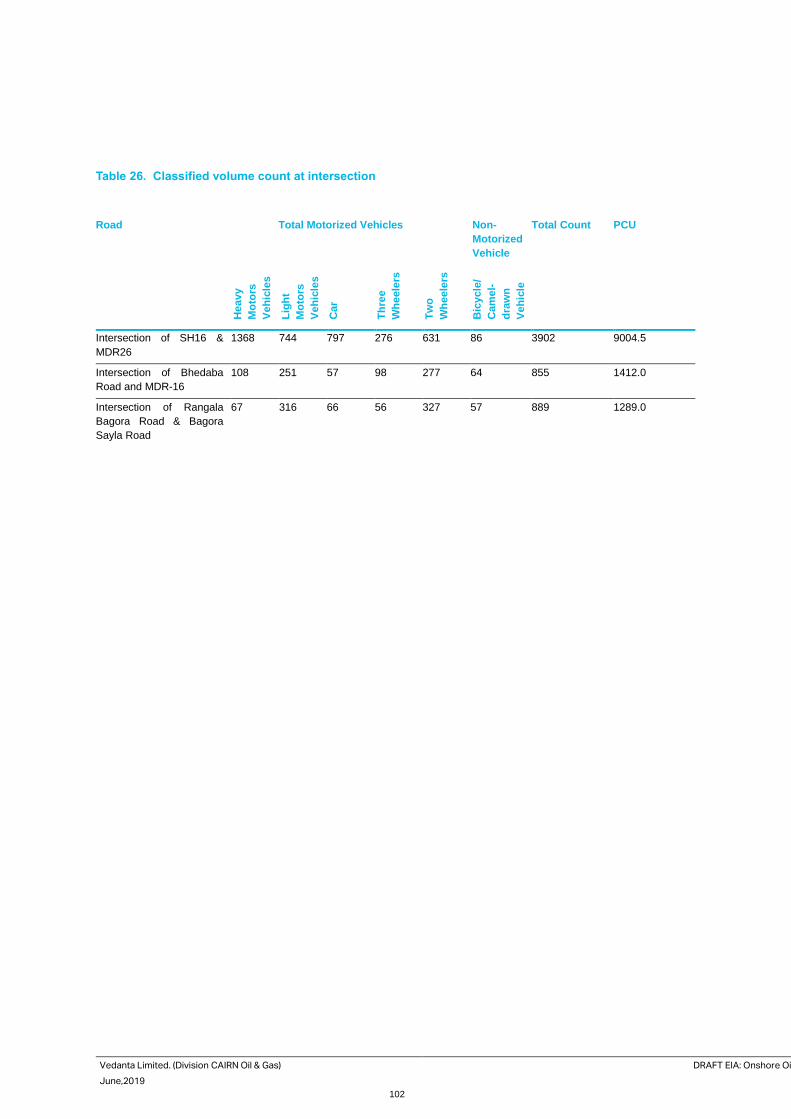
Vedanta Limited. (Division CAIRN Oil & Gas) DRAFT EIA: Onshore Oil and Gas E&A in RJ-ONHP- 2017/2 Block, Barmer District, Rajasthan
June,2019 AECOM
102
Table 26. Classified volume count at intersection
Road Total Motorized Vehicles Non-
Motorized
Vehicle
Total Count PCU
Heavy
Mo
tors
Veh
icle
s
Lig
ht
Mo
tors
Veh
icle
s
Car
Th
ree
Wh
eele
rs
Tw
o
Wh
eele
rs
Bic
ycle
/
Cam
el-
dra
wn
Veh
icle
Intersection of SH16 &
MDR26
1368 744 797 276 631 86 3902 9004.5
Intersection of Bhedaba
Road and MDR-16
108 251 57 98 277 64 855 1412.0
Intersection of Rangala
Bagora Road & Bagora
Sayla Road
67 316 66 56 327 57 889 1289.0
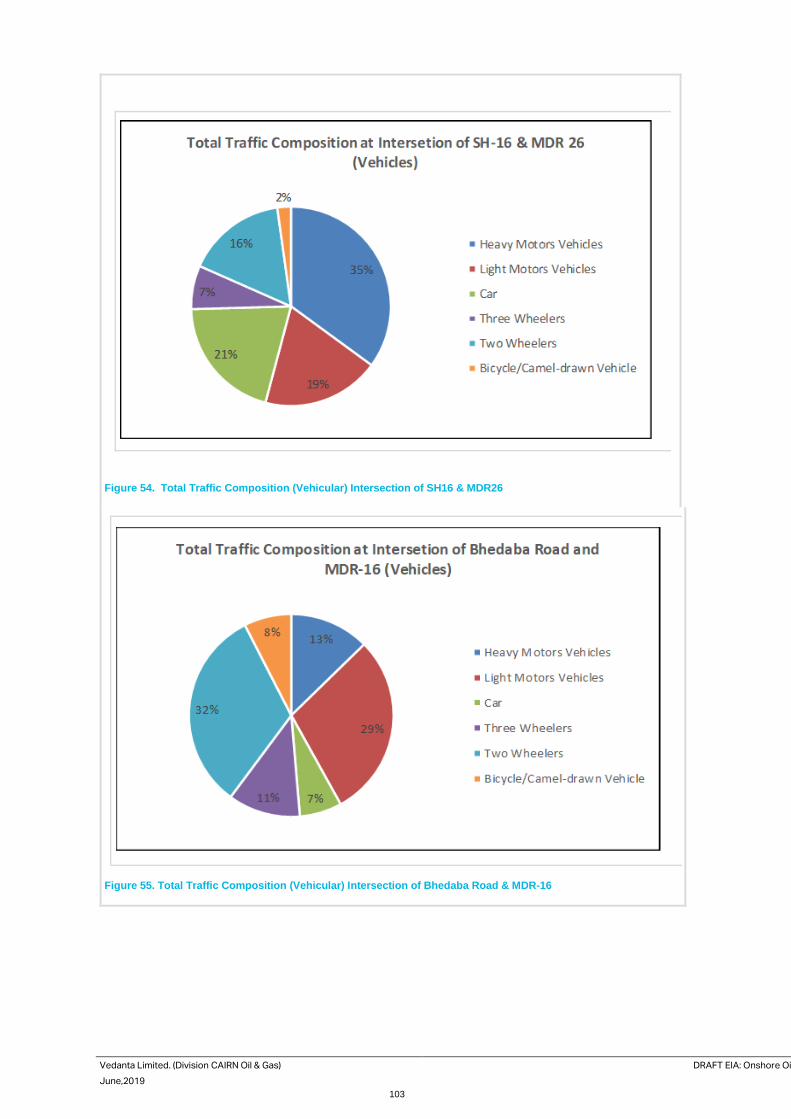
Vedanta Limited. (Division CAIRN Oil & Gas) DRAFT EIA: Onshore Oil and Gas E&A in RJ-ONHP- 2017/2 Block, Barmer District, Rajasthan
June,2019 AECOM
103
Figure 54. Total Traffic Composition (Vehicular) Intersection of SH16 & MDR26
Figure 55. Total Traffic Composition (Vehicular) Intersection of Bhedaba Road & MDR-16
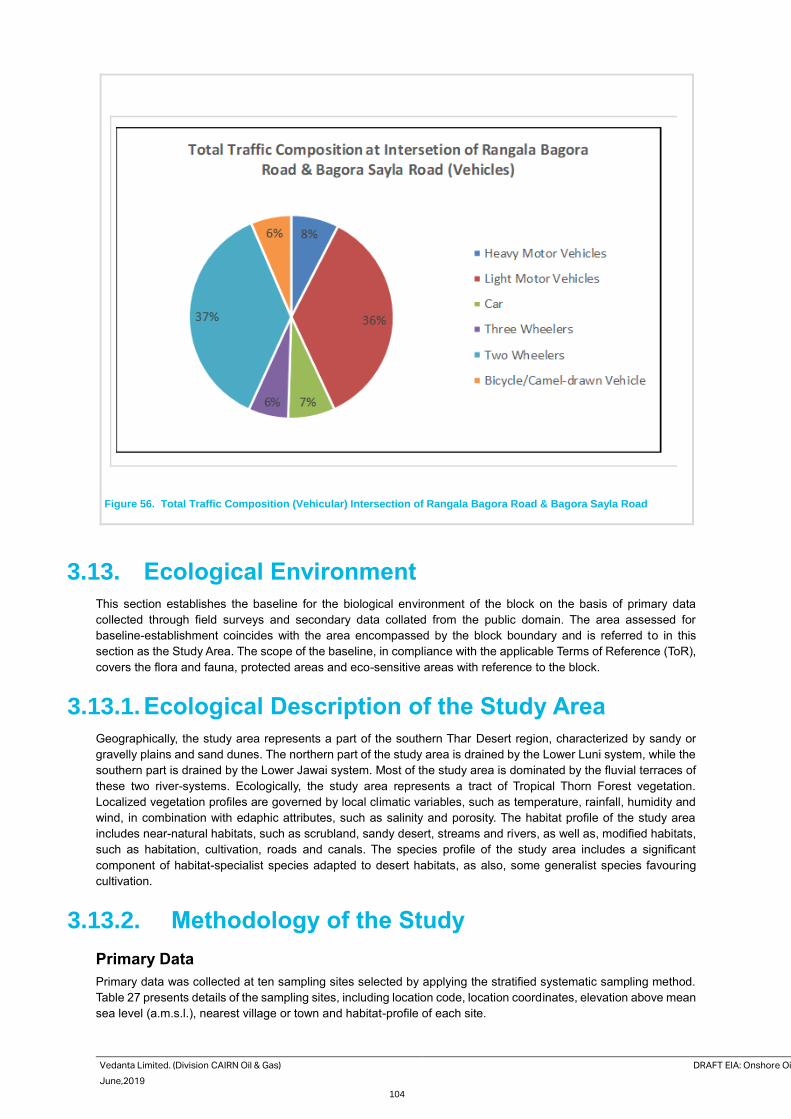
Vedanta Limited. (Division CAIRN Oil & Gas) DRAFT EIA: Onshore Oil and Gas E&A in RJ-ONHP- 2017/2 Block, Barmer District, Rajasthan
June,2019 AECOM
104
Figure 56. Total Traffic Composition (Vehicular) Intersection of Rangala Bagora Road & Bagora Sayla Road
3.13. Ecological Environment
This section establishes the baseline for the biological environment of the block on the basis of primary data
collected through field surveys and secondary data collated from the public domain. The area assessed for
baseline-establishment coincides with the area encompassed by the block boundary and is referred to in this
section as the Study Area. The scope of the baseline, in compliance with the applicable Terms of Reference (ToR),
covers the flora and fauna, protected areas and eco-sensitive areas with reference to the block.
3.13.1. Ecological Description of the Study Area
Geographically, the study area represents a part of the southern Thar Desert region, characterized by sandy or
gravelly plains and sand dunes. The northern part of the study area is drained by the Lower Luni system, while the
southern part is drained by the Lower Jawai system. Most of the study area is dominated by the fluvial terraces of
these two river-systems. Ecologically, the study area represents a tract of Tropical Thorn Forest vegetation.
Localized vegetation profiles are governed by local climatic variables, such as temperature, rainfall, humidity and
wind, in combination with edaphic attributes, such as salinity and porosity. The habitat profile of the study area
includes near-natural habitats, such as scrubland, sandy desert, streams and rivers, as well as, modified habitats,
such as habitation, cultivation, roads and canals. The species profile of the study area includes a significant
component of habitat-specialist species adapted to desert habitats, as also, some generalist species favouring
cultivation.
3.13.2. Methodology of the Study
Primary Data
Primary data was collected at ten sampling sites selected by applying the stratified systematic sampling method.
Table 27 presents details of the sampling sites, including location code, location coordinates, elevation above mean
sea level (a.m.s.l.), nearest village or town and habitat-profile of each site.
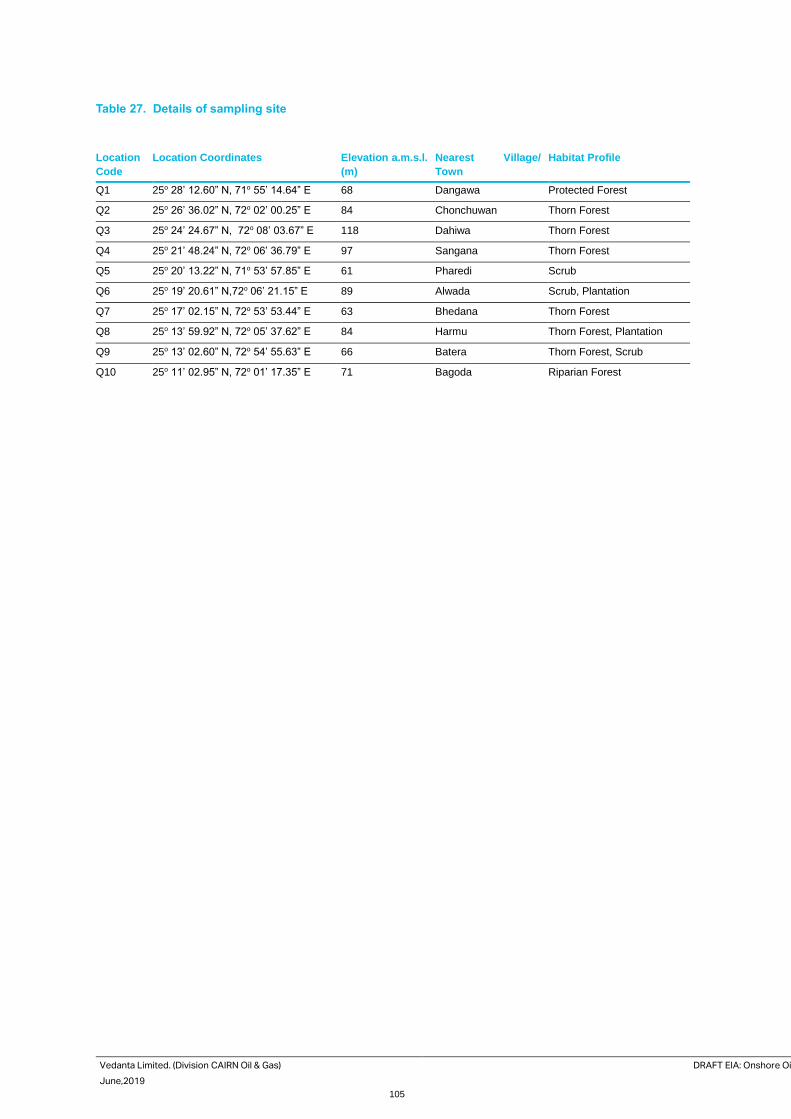
Vedanta Limited. (Division CAIRN Oil & Gas) DRAFT EIA: Onshore Oil and Gas E&A in RJ-ONHP- 2017/2 Block, Barmer District, Rajasthan
June,2019 AECOM
105
Table 27. Details of sampling site
Location
Code
Location Coordinates Elevation a.m.s.l.
(m)
Nearest Village/
Town
Habitat Profile
Q1 25o 28’ 12.60” N, 71o 55’ 14.64” E 68 Dangawa Protected Forest
Q2 25o 26’ 36.02” N, 72o 02’ 00.25” E 84 Chonchuwan Thorn Forest
Q3 25o 24’ 24.67” N, 72o 08’ 03.67” E 118 Dahiwa Thorn Forest
Q4 25o 21’ 48.24” N, 72o 06’ 36.79” E 97 Sangana Thorn Forest
Q5 25o 20’ 13.22” N, 71o 53’ 57.85” E 61 Pharedi Scrub
Q6 25o 19’ 20.61” N,72o 06’ 21.15” E 89 Alwada Scrub, Plantation
Q7 25o 17’ 02.15” N, 72o 53’ 53.44” E 63 Bhedana Thorn Forest
Q8 25o 13’ 59.92” N, 72o 05’ 37.62” E 84 Harmu Thorn Forest, Plantation
Q9 25o 13’ 02.60” N, 72o 54’ 55.63” E 66 Batera Thorn Forest, Scrub
Q10 25o 11’ 02.95” N, 72o 01’ 17.35” E 71 Bagoda Riparian Forest
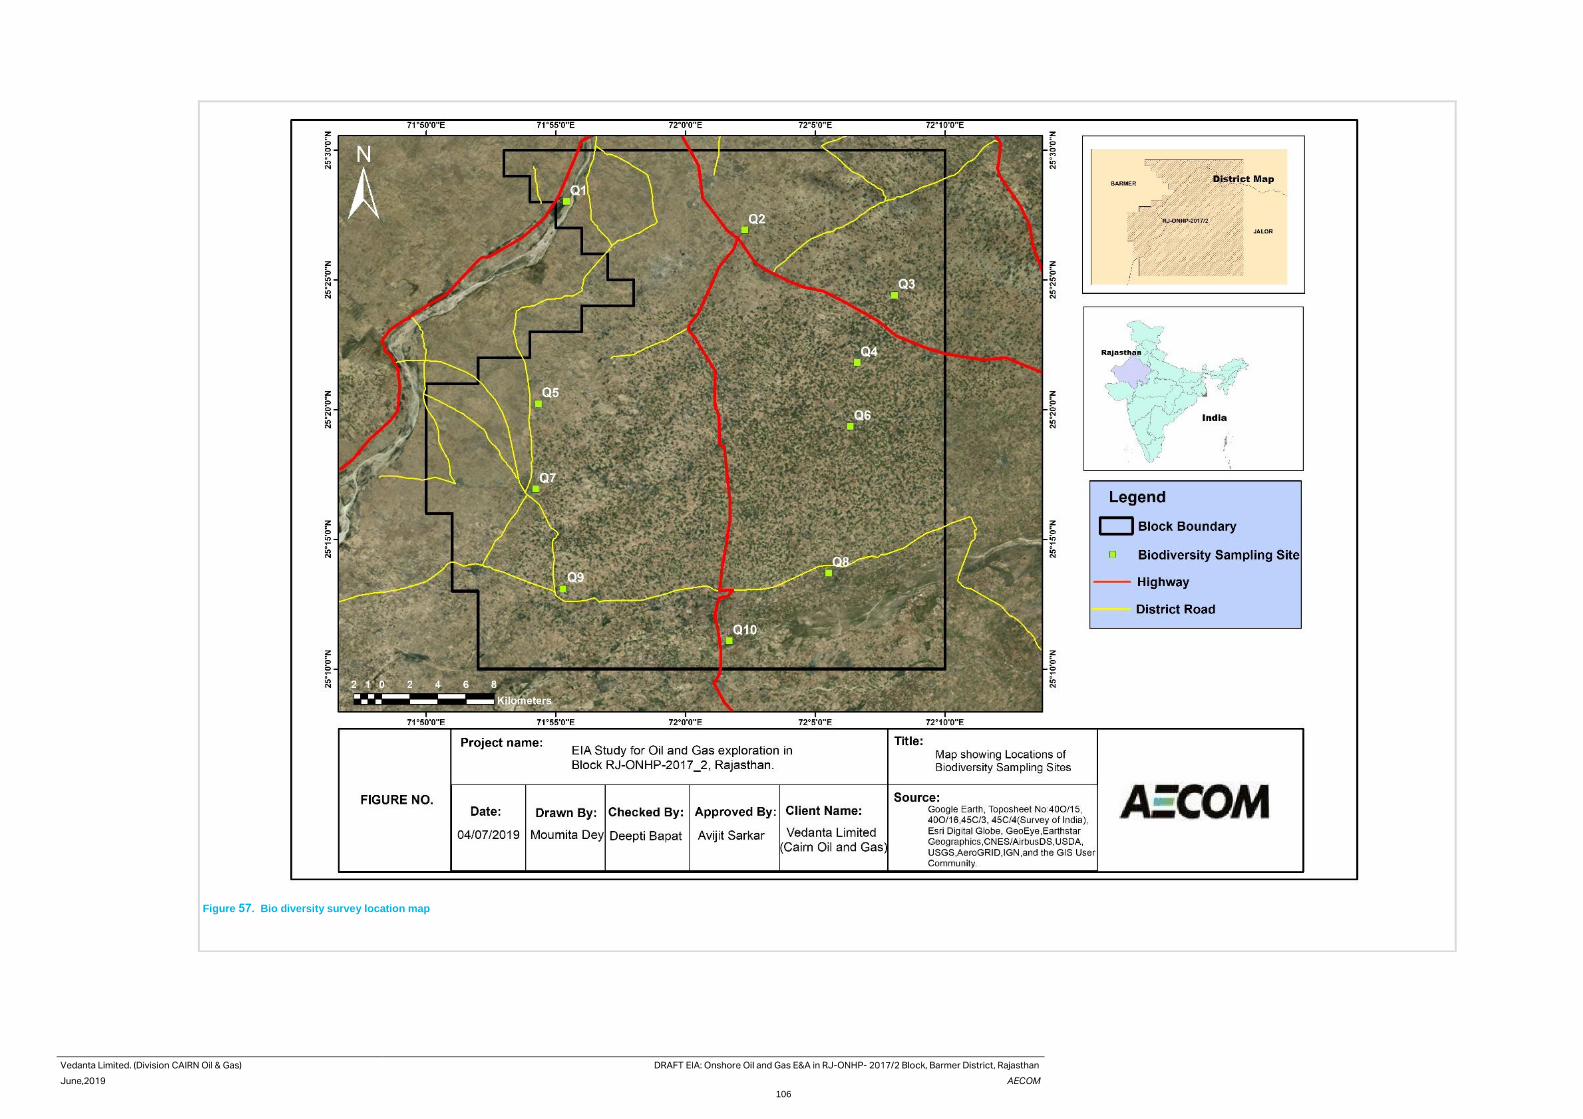
Vedanta Limited. (Division CAIRN Oil & Gas) DRAFT EIA: Onshore Oil and Gas E&A in RJ-ONHP- 2017/2 Block, Barmer District, Rajasthan
June,2019 AECOM
106
Figure 57. Bio diversity survey location map

Vedanta Limited. (Division CAIRN Oil & Gas) DRAFT EIA: Onshore Oil and Gas E&A in RJ-ONHP- 2017/2 Block, Barmer District, Rajasthan
June,2019 AECOM
107
In case of floristic species, qualitative and quantitative data was collected at each sampling site, using the standard
quadrat methodology. Quadrat sizes employed were 20m x 20m for trees, 5m x 5m for shrubs and 1m x 1m for
herbs. Only higher floristic species, namely angiosperms were covered. In case of faunal species, qualitative data
was collected mainly at each sampling site. Any species recorded outside the sampling sites were ascribed to the
nearest sampling site. Faunal records are based on direct sightings, as well as, indirect evidence, such as calls,
burrows, nests, droppings or scats. Only higher faunal species, namely vertebrates, including mammals, birds,
reptiles, amphibians and fishes, were covered. Primary data was collected through most of the diurnal period from
early morning till late evening.
Secondary Data
Secondary data was collated from suitably authenticated sources in the public domain. Sources of secondary data
mainly comprise standard field guides, published research papers or articles, governmental publications and
websites of internationally recognized conservation organizations such as International Union for Conservation of
Nature and Natural Resources (IUCN), Birdlife International, Conservation International, Wildlife Conservation
Society (WCS) and World Wildlife Fund (WWF). Supplementary information was obtained through informal
interactions with local communities.
Flora of the Study Area
The floristic baseline of the study area is based on the Forest Types identified within the study area, supported by
the primary floristic data recorded at the sampling sites.
Forest Types
Type 6B/C1 (Sub-group 6B - Northern Tropical Thorn Forests, Climax Type C1 – Desert
Thorn Forest)
This forest-type is found to occur at the ends of the range of the sub-group. It is associated with flat to undulating
land broken by hills or low hillocks. The associated soils are partly in situ, but mainly fluvial or aeolian deposits.
The typical form of this forest is associated with unstable sand in various stages of consolidation, while variant
forms develop on riverain strips or shifting sand. The typical form is composed of very scattered trees or shrubs
and characterized by an extremely open canopy. Consociations of certain species, notably Prosopis cineraria and
Vachellia senegal, are locally prominent.
Species typically associated with this forest-type include –
Tree Species- Prosopis cineraria, Salvadora oleoides, Vachellia senegal, Vachellia leucophloea, Holoptelea
integrifolia, Azadirachta indica, Flacourtia indica, Balanites aegyptiaca, Tecomella undulata, Maytenus emarginata,
Butea monosperma and Limonia acidissima;
Shrub Species- Aerva javanica, Crotalaria burhia, Leptadenia pyrotechnica, Calligonum polygonoides, Vachellia
jacquemontii, Grewia pilosa, Capparis zeylanica, Calotropis gigantea, Calotropis procera, Euphorbia nivulia,
Ziziphus nummularia and Tephrosia purpurea; and
Type 6B/E4 (Sub-group 6B - Northern Tropical Thorn Forests, Edaphic Type E4 –
Salvadora Scrub)
This forest-type is an edaphic type associated with semi-arid or arid saline or alkaline soils.
Species typically associated with this forest-type include –
Tree Species- Salvadora oleoides, Salvadora persica and Tamarix aphylla.
Type 6B/1S1 (Sub-group 6B - Northern Tropical Thorn Forests, Seral Type 1S1 – Desert
Dune Scrub)
This forest-type is a seral type determined by dry, sandy, unstable soil which is mounded up by wind into dunes.
The typical form is a very open and irregular formation composed of stunted trees and shrubs covering a very small
proportion of the soil. If the soil is composed of sand mixed with gravel, a distinct variant form develops. The trees
associated with both forms are thorny and all species making up the vegetation are markedly xerophytic.
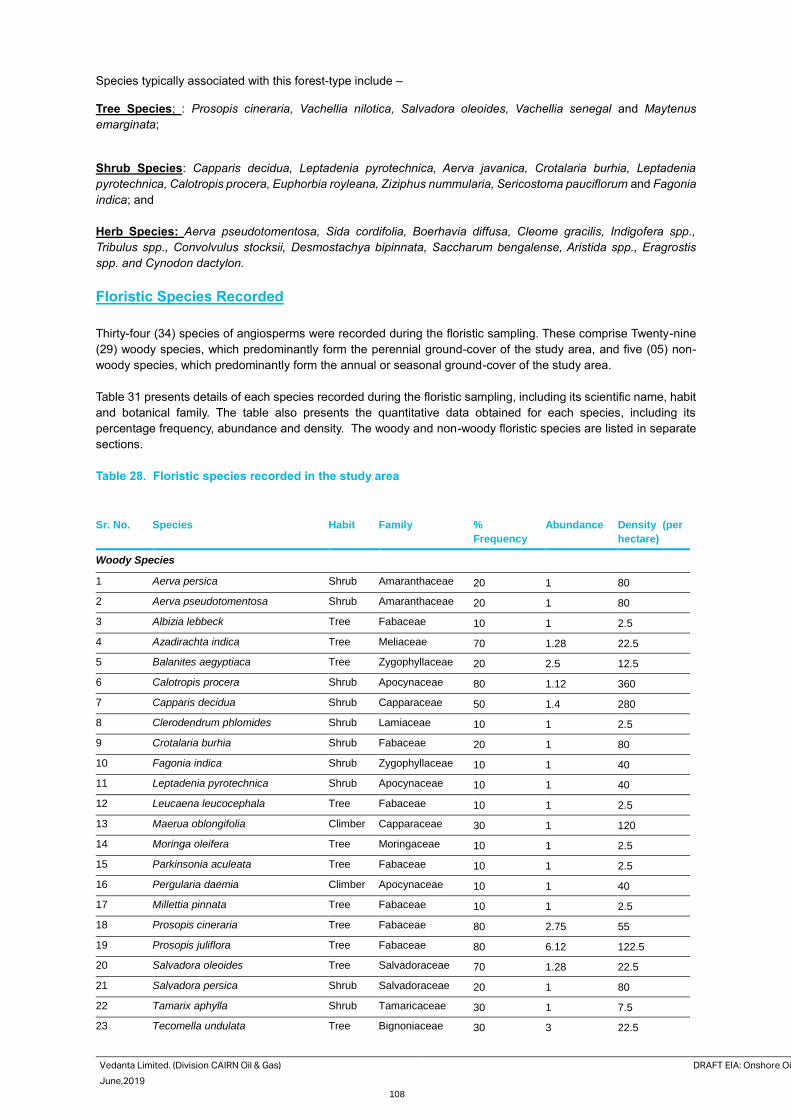
Vedanta Limited. (Division CAIRN Oil & Gas) DRAFT EIA: Onshore Oil and Gas E&A in RJ-ONHP- 2017/2 Block, Barmer District, Rajasthan
June,2019 AECOM
108
Species typically associated with this forest-type include –
Tree Species; : Prosopis cineraria, Vachellia nilotica, Salvadora oleoides, Vachellia senegal and Maytenus
emarginata;
Shrub Species: Capparis decidua, Leptadenia pyrotechnica, Aerva javanica, Crotalaria burhia, Leptadenia
pyrotechnica, Calotropis procera, Euphorbia royleana, Ziziphus nummularia, Sericostoma pauciflorum and Fagonia
indica; and
Herb Species: Aerva pseudotomentosa, Sida cordifolia, Boerhavia diffusa, Cleome gracilis, Indigofera spp.,
Tribulus spp., Convolvulus stocksii, Desmostachya bipinnata, Saccharum bengalense, Aristida spp., Eragrostis
spp. and Cynodon dactylon.
Floristic Species Recorded
Thirty-four (34) species of angiosperms were recorded during the floristic sampling. These comprise Twenty-nine
(29) woody species, which predominantly form the perennial ground-cover of the study area, and five (05) non-
woody species, which predominantly form the annual or seasonal ground-cover of the study area.
Table 31 presents details of each species recorded during the floristic sampling, including its scientific name, habit
and botanical family. The table also presents the quantitative data obtained for each species, including its
percentage frequency, abundance and density. The woody and non-woody floristic species are listed in separate
sections.
Table 28. Floristic species recorded in the study area
Sr. No. Species Habit Family %
Frequency
Abundance Density (per
hectare)
Woody Species
1 Aerva persica Shrub Amaranthaceae 20 1 80
2 Aerva pseudotomentosa Shrub Amaranthaceae 20 1 80
3 Albizia lebbeck Tree Fabaceae 10 1 2.5
4 Azadirachta indica Tree Meliaceae 70 1.28 22.5
5 Balanites aegyptiaca Tree Zygophyllaceae 20 2.5 12.5
6 Calotropis procera Shrub Apocynaceae 80 1.12 360
7 Capparis decidua Shrub Capparaceae 50 1.4 280
8 Clerodendrum phlomides Shrub Lamiaceae 10 1 2.5
9 Crotalaria burhia Shrub Fabaceae 20 1 80
10 Fagonia indica Shrub Zygophyllaceae 10 1 40
11 Leptadenia pyrotechnica Shrub Apocynaceae 10 1 40
12 Leucaena leucocephala Tree Fabaceae 10 1 2.5
13 Maerua oblongifolia Climber Capparaceae 30 1 120
14 Moringa oleifera Tree Moringaceae 10 1 2.5
15 Parkinsonia aculeata Tree Fabaceae 10 1 2.5
16 Pergularia daemia Climber Apocynaceae 10 1 40
17 Millettia pinnata Tree Fabaceae 10 1 2.5
18 Prosopis cineraria Tree Fabaceae 80 2.75 55
19 Prosopis juliflora Tree Fabaceae 80 6.12 122.5
20 Salvadora oleoides Tree Salvadoraceae 70 1.28 22.5
21 Salvadora persica Shrub Salvadoraceae 20 1 80
22 Tamarix aphylla Shrub Tamaricaceae 30 1 7.5
23 Tecomella undulata Tree Bignoniaceae 30 3 22.5
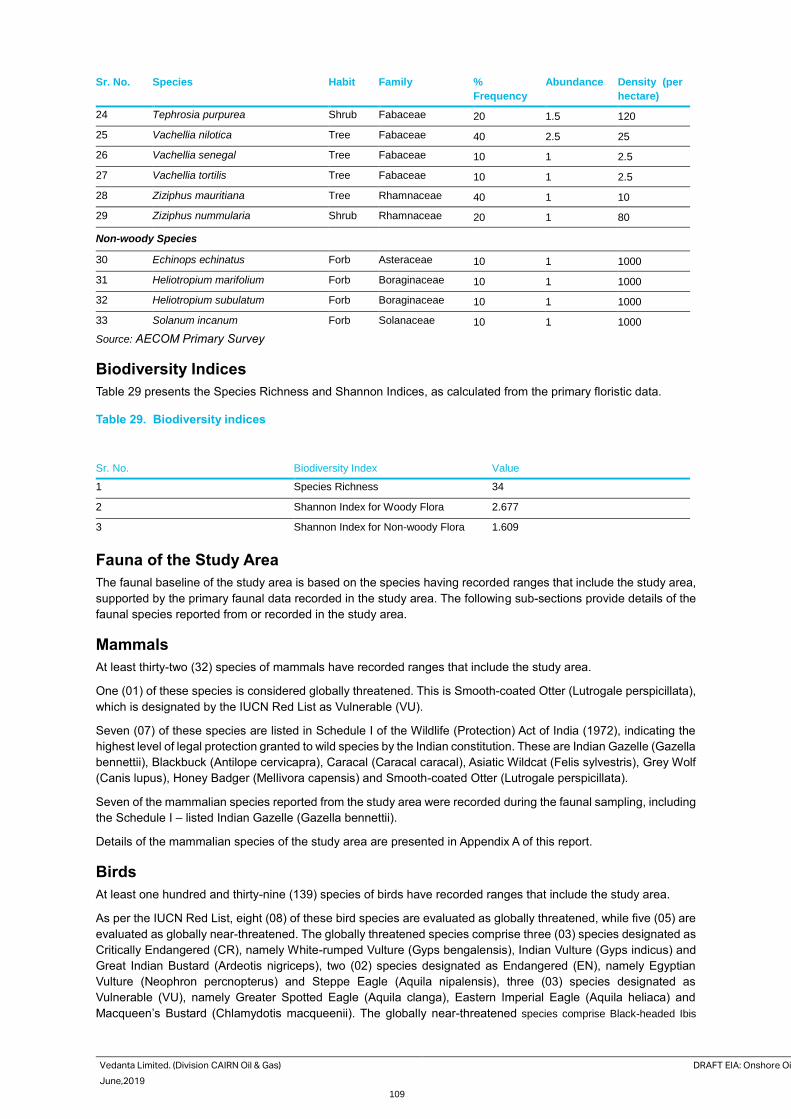
Vedanta Limited. (Division CAIRN Oil & Gas) DRAFT EIA: Onshore Oil and Gas E&A in RJ-ONHP- 2017/2 Block, Barmer District, Rajasthan
June,2019 AECOM
109
Sr. No. Species Habit Family %
Frequency
Abundance Density (per
hectare)
24 Tephrosia purpurea Shrub Fabaceae 20 1.5 120
25 Vachellia nilotica Tree Fabaceae 40 2.5 25
26 Vachellia senegal Tree Fabaceae 10 1 2.5
27 Vachellia tortilis Tree Fabaceae 10 1 2.5
28 Ziziphus mauritiana Tree Rhamnaceae 40 1 10
29 Ziziphus nummularia Shrub Rhamnaceae 20 1 80
Non-woody Species
30 Echinops echinatus Forb Asteraceae 10 1 1000
31 Heliotropium marifolium Forb Boraginaceae 10 1 1000
32 Heliotropium subulatum Forb Boraginaceae 10 1 1000
33 Solanum incanum Forb Solanaceae 10 1 1000
Source: AECOM Primary Survey
Biodiversity Indices
Table 29 presents the Species Richness and Shannon Indices, as calculated from the primary floristic data.
Table 29. Biodiversity indices
Sr. No. Biodiversity Index Value
1 Species Richness 34
2 Shannon Index for Woody Flora 2.677
3 Shannon Index for Non-woody Flora 1.609
Fauna of the Study Area
The faunal baseline of the study area is based on the species having recorded ranges that include the study area,
supported by the primary faunal data recorded in the study area. The following sub-sections provide details of the
faunal species reported from or recorded in the study area.
Mammals
At least thirty-two (32) species of mammals have recorded ranges that include the study area.
One (01) of these species is considered globally threatened. This is Smooth-coated Otter (Lutrogale perspicillata),
which is designated by the IUCN Red List as Vulnerable (VU).
Seven (07) of these species are listed in Schedule I of the Wildlife (Protection) Act of India (1972), indicating the
highest level of legal protection granted to wild species by the Indian constitution. These are Indian Gazelle (Gazella
bennettii), Blackbuck (Antilope cervicapra), Caracal (Caracal caracal), Asiatic Wildcat (Felis sylvestris), Grey Wolf
(Canis lupus), Honey Badger (Mellivora capensis) and Smooth-coated Otter (Lutrogale perspicillata).
Seven of the mammalian species reported from the study area were recorded during the faunal sampling, including
the Schedule I – listed Indian Gazelle (Gazella bennettii).
Details of the mammalian species of the study area are presented in Appendix A of this report.
Birds
At least one hundred and thirty-nine (139) species of birds have recorded ranges that include the study area.
As per the IUCN Red List, eight (08) of these bird species are evaluated as globally threatened, while five (05) are
evaluated as globally near-threatened. The globally threatened species comprise three (03) species designated as
Critically Endangered (CR), namely White-rumped Vulture (Gyps bengalensis), Indian Vulture (Gyps indicus) and
Great Indian Bustard (Ardeotis nigriceps), two (02) species designated as Endangered (EN), namely Egyptian
Vulture (Neophron percnopterus) and Steppe Eagle (Aquila nipalensis), three (03) species designated as
Vulnerable (VU), namely Greater Spotted Eagle (Aquila clanga), Eastern Imperial Eagle (Aquila heliaca) and
Macqueen’s Bustard (Chlamydotis macqueenii). The globally near-threatened species comprise Black-headed Ibis
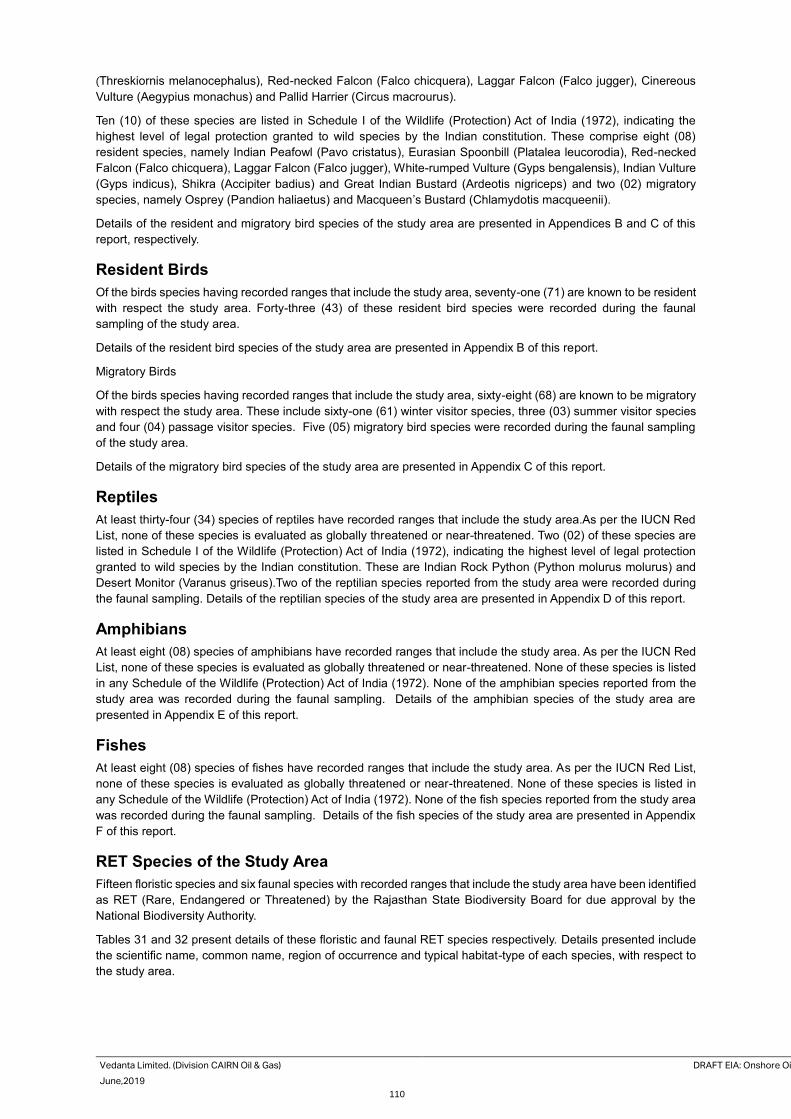
Vedanta Limited. (Division CAIRN Oil & Gas) DRAFT EIA: Onshore Oil and Gas E&A in RJ-ONHP- 2017/2 Block, Barmer District, Rajasthan
June,2019 AECOM
110
(Threskiornis melanocephalus), Red-necked Falcon (Falco chicquera), Laggar Falcon (Falco jugger), Cinereous
Vulture (Aegypius monachus) and Pallid Harrier (Circus macrourus).
Ten (10) of these species are listed in Schedule I of the Wildlife (Protection) Act of India (1972), indicating the
highest level of legal protection granted to wild species by the Indian constitution. These comprise eight (08)
resident species, namely Indian Peafowl (Pavo cristatus), Eurasian Spoonbill (Platalea leucorodia), Red-necked
Falcon (Falco chicquera), Laggar Falcon (Falco jugger), White-rumped Vulture (Gyps bengalensis), Indian Vulture
(Gyps indicus), Shikra (Accipiter badius) and Great Indian Bustard (Ardeotis nigriceps) and two (02) migratory
species, namely Osprey (Pandion haliaetus) and Macqueen’s Bustard (Chlamydotis macqueenii).
Details of the resident and migratory bird species of the study area are presented in Appendices B and C of this
report, respectively.
Resident Birds
Of the birds species having recorded ranges that include the study area, seventy-one (71) are known to be resident
with respect the study area. Forty-three (43) of these resident bird species were recorded during the faunal
sampling of the study area.
Details of the resident bird species of the study area are presented in Appendix B of this report.
Migratory Birds
Of the birds species having recorded ranges that include the study area, sixty-eight (68) are known to be migratory
with respect the study area. These include sixty-one (61) winter visitor species, three (03) summer visitor species
and four (04) passage visitor species. Five (05) migratory bird species were recorded during the faunal sampling
of the study area.
Details of the migratory bird species of the study area are presented in Appendix C of this report.
Reptiles
At least thirty-four (34) species of reptiles have recorded ranges that include the study area.As per the IUCN Red
List, none of these species is evaluated as globally threatened or near-threatened. Two (02) of these species are
listed in Schedule I of the Wildlife (Protection) Act of India (1972), indicating the highest level of legal protection
granted to wild species by the Indian constitution. These are Indian Rock Python (Python molurus molurus) and
Desert Monitor (Varanus griseus).Two of the reptilian species reported from the study area were recorded during
the faunal sampling. Details of the reptilian species of the study area are presented in Appendix D of this report.
Amphibians
At least eight (08) species of amphibians have recorded ranges that include the study area. As per the IUCN Red
List, none of these species is evaluated as globally threatened or near-threatened. None of these species is listed
in any Schedule of the Wildlife (Protection) Act of India (1972). None of the amphibian species reported from the
study area was recorded during the faunal sampling. Details of the amphibian species of the study area are
presented in Appendix E of this report.
Fishes
At least eight (08) species of fishes have recorded ranges that include the study area. As per the IUCN Red List,
none of these species is evaluated as globally threatened or near-threatened. None of these species is listed in
any Schedule of the Wildlife (Protection) Act of India (1972). None of the fish species reported from the study area
was recorded during the faunal sampling. Details of the fish species of the study area are presented in Appendix
F of this report.
RET Species of the Study Area
Fifteen floristic species and six faunal species with recorded ranges that include the study area have been identified
as RET (Rare, Endangered or Threatened) by the Rajasthan State Biodiversity Board for due approval by the
National Biodiversity Authority.
Tables 31 and 32 present details of these floristic and faunal RET species respectively. Details presented include
the scientific name, common name, region of occurrence and typical habitat-type of each species, with respect to
the study area.
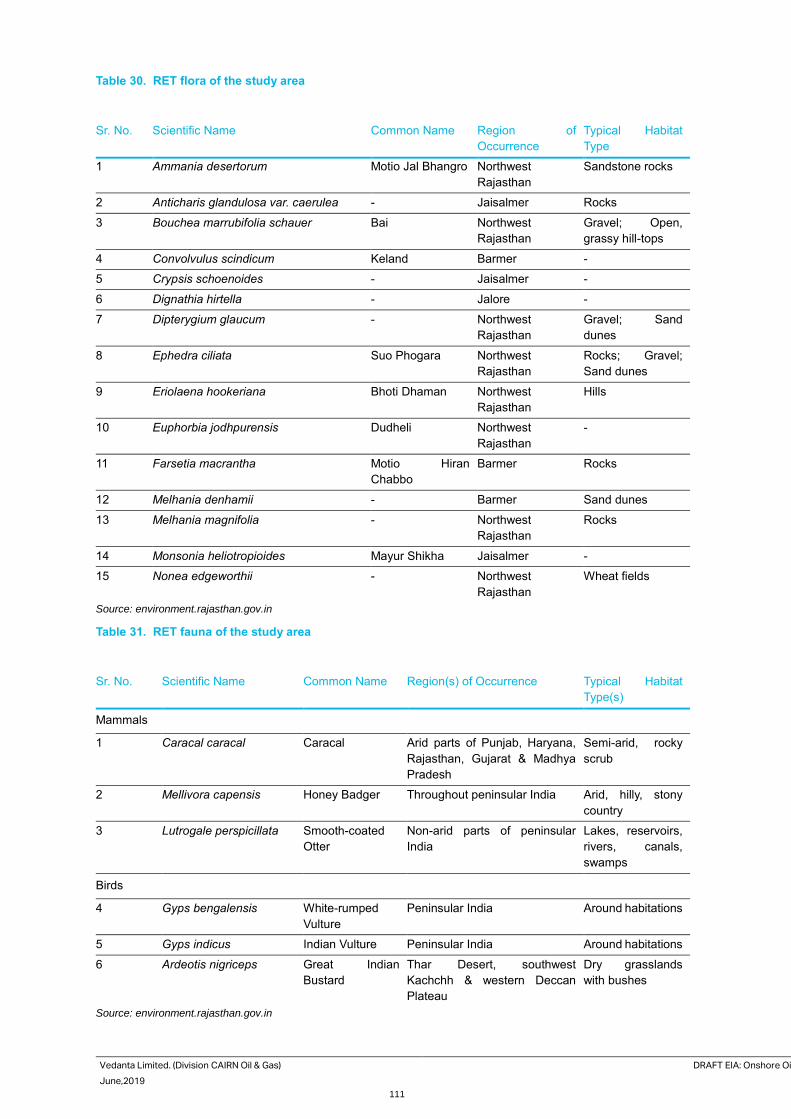
Vedanta Limited. (Division CAIRN Oil & Gas) DRAFT EIA: Onshore Oil and Gas E&A in RJ-ONHP- 2017/2 Block, Barmer District, Rajasthan
June,2019 AECOM
111
Table 30. RET flora of the study area
Sr. No. Scientific Name Common Name Region of
Occurrence
Typical Habitat
Type
1 Ammania desertorum Motio Jal Bhangro Northwest
Rajasthan
Sandstone rocks
2 Anticharis glandulosa var. caerulea - Jaisalmer Rocks
3 Bouchea marrubifolia schauer Bai Northwest
Rajasthan
Gravel; Open,
grassy hill-tops
4 Convolvulus scindicum Keland Barmer -
5 Crypsis schoenoides - Jaisalmer -
6 Dignathia hirtella - Jalore -
7 Dipterygium glaucum - Northwest
Rajasthan
Gravel; Sand
dunes
8 Ephedra ciliata Suo Phogara Northwest
Rajasthan
Rocks; Gravel;
Sand dunes
9 Eriolaena hookeriana Bhoti Dhaman Northwest
Rajasthan
Hills
10 Euphorbia jodhpurensis Dudheli Northwest
Rajasthan
-
11 Farsetia macrantha Motio Hiran
Chabbo
Barmer Rocks
12 Melhania denhamii - Barmer Sand dunes
13 Melhania magnifolia - Northwest
Rajasthan
Rocks
14 Monsonia heliotropioides Mayur Shikha Jaisalmer -
15 Nonea edgeworthii - Northwest
Rajasthan
Wheat fields
Source: environment.rajasthan.gov.in
Table 31. RET fauna of the study area
Sr. No. Scientific Name Common Name Region(s) of Occurrence Typical Habitat
Type(s)
Mammals
1 Caracal caracal Caracal Arid parts of Punjab, Haryana,
Rajasthan, Gujarat & Madhya
Pradesh
Semi-arid, rocky
scrub
2 Mellivora capensis Honey Badger Throughout peninsular India Arid, hilly, stony
country
3 Lutrogale perspicillata Smooth-coated
Otter
Non-arid parts of peninsular
India
Lakes, reservoirs,
rivers, canals,
swamps
Birds
4 Gyps bengalensis White-rumped
Vulture
Peninsular India Around habitations
5 Gyps indicus Indian Vulture Peninsular India Around habitations
6 Ardeotis nigriceps Great Indian
Bustard
Thar Desert, southwest
Kachchh & western Deccan
Plateau
Dry grasslands
with bushes
Source: environment.rajasthan.gov.in
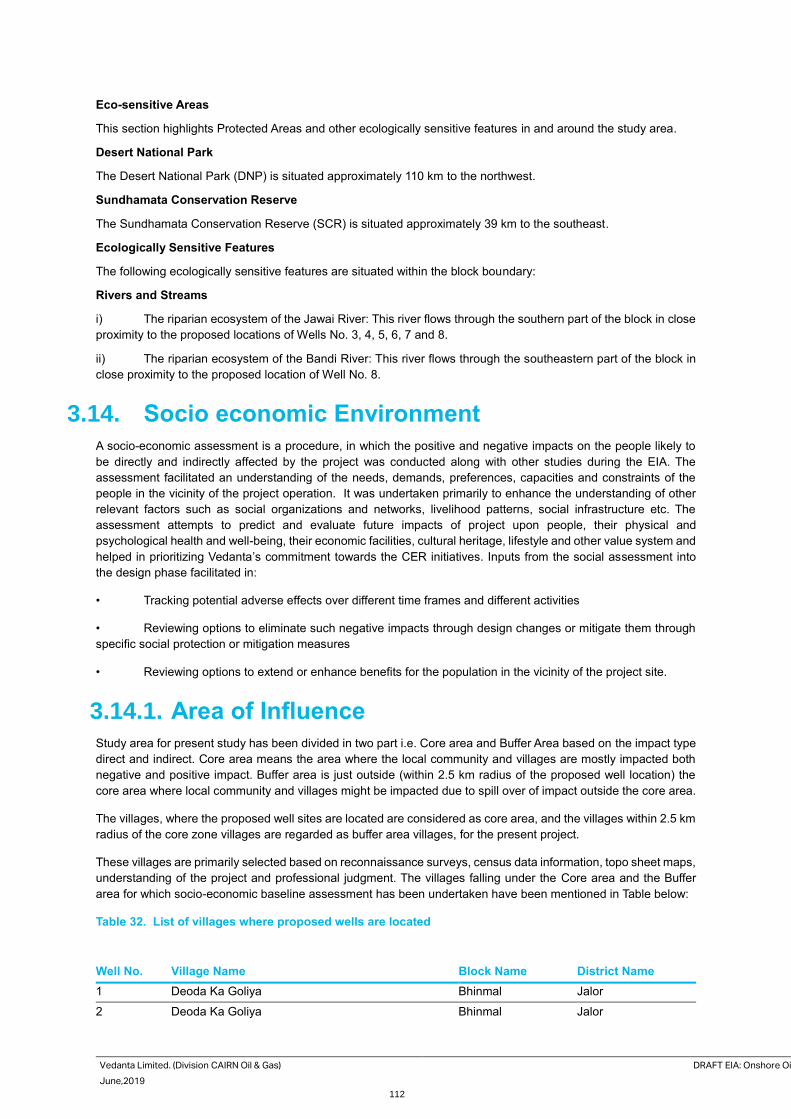
Vedanta Limited. (Division CAIRN Oil & Gas) DRAFT EIA: Onshore Oil and Gas E&A in RJ-ONHP- 2017/2 Block, Barmer District, Rajasthan
June,2019 AECOM
112
Eco-sensitive Areas
This section highlights Protected Areas and other ecologically sensitive features in and around the study area.
Desert National Park
The Desert National Park (DNP) is situated approximately 110 km to the northwest.
Sundhamata Conservation Reserve
The Sundhamata Conservation Reserve (SCR) is situated approximately 39 km to the southeast.
Ecologically Sensitive Features
The following ecologically sensitive features are situated within the block boundary:
Rivers and Streams
i) The riparian ecosystem of the Jawai River: This river flows through the southern part of the block in close
proximity to the proposed locations of Wells No. 3, 4, 5, 6, 7 and 8.
ii) The riparian ecosystem of the Bandi River: This river flows through the southeastern part of the block in
close proximity to the proposed location of Well No. 8.
3.14. Socio economic Environment
A socio-economic assessment is a procedure, in which the positive and negative impacts on the people likely to
be directly and indirectly affected by the project was conducted along with other studies during the EIA. The
assessment facilitated an understanding of the needs, demands, preferences, capacities and constraints of the
people in the vicinity of the project operation. It was undertaken primarily to enhance the understanding of other
relevant factors such as social organizations and networks, livelihood patterns, social infrastructure etc. The
assessment attempts to predict and evaluate future impacts of project upon people, their physical and
psychological health and well-being, their economic facilities, cultural heritage, lifestyle and other value system and
helped in prioritizing Vedanta’s commitment towards the CER initiatives. Inputs from the social assessment into
the design phase facilitated in:
• Tracking potential adverse effects over different time frames and different activities
• Reviewing options to eliminate such negative impacts through design changes or mitigate them through
specific social protection or mitigation measures
• Reviewing options to extend or enhance benefits for the population in the vicinity of the project site.
3.14.1. Area of Influence
Study area for present study has been divided in two part i.e. Core area and Buffer Area based on the impact type
direct and indirect. Core area means the area where the local community and villages are mostly impacted both
negative and positive impact. Buffer area is just outside (within 2.5 km radius of the proposed well location) the
core area where local community and villages might be impacted due to spill over of impact outside the core area.
The villages, where the proposed well sites are located are considered as core area, and the villages within 2.5 km
radius of the core zone villages are regarded as buffer area villages, for the present project.
These villages are primarily selected based on reconnaissance surveys, census data information, topo sheet maps,
understanding of the project and professional judgment. The villages falling under the Core area and the Buffer
area for which socio-economic baseline assessment has been undertaken have been mentioned in Table below:
Table 32. List of villages where proposed wells are located
Well No. Village Name Block Name District Name
1 Deoda Ka Goliya Bhinmal Jalor
2 Deoda Ka Goliya Bhinmal Jalor
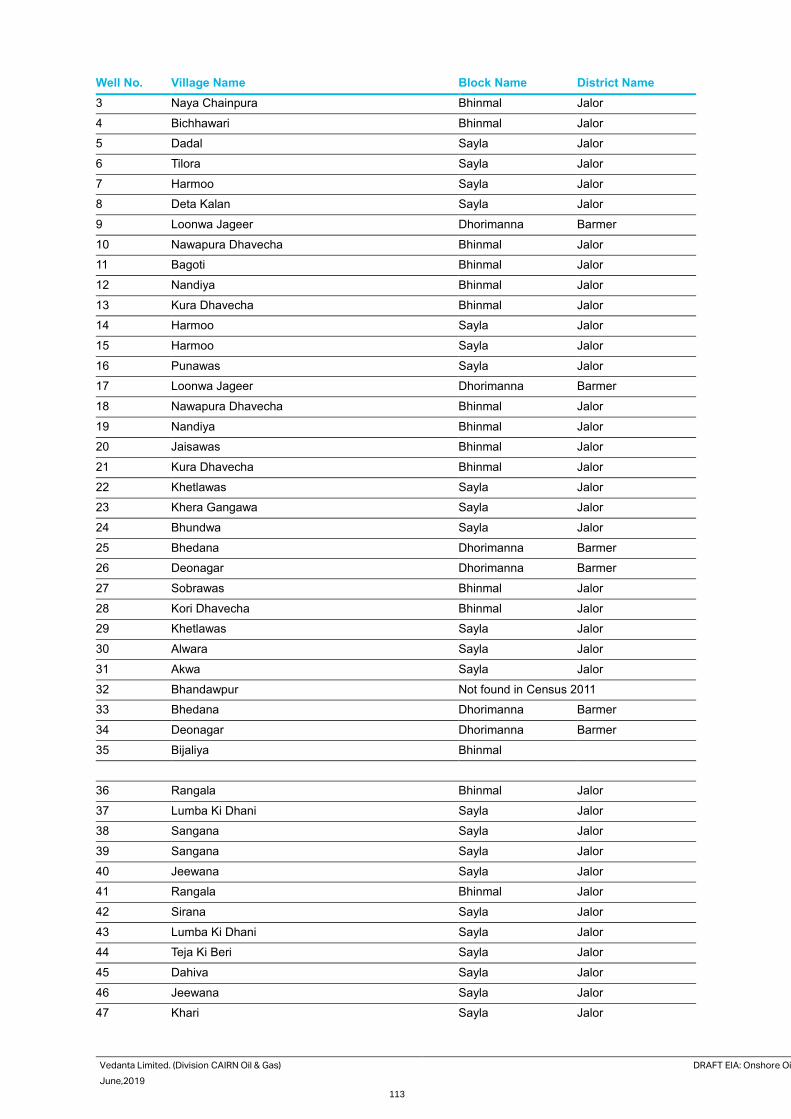
Vedanta Limited. (Division CAIRN Oil & Gas) DRAFT EIA: Onshore Oil and Gas E&A in RJ-ONHP- 2017/2 Block, Barmer District, Rajasthan
June,2019 AECOM
113
Well No. Village Name Block Name District Name
3 Naya Chainpura Bhinmal Jalor
4 Bichhawari Bhinmal Jalor
5 Dadal Sayla Jalor
6 Tilora Sayla Jalor
7 Harmoo Sayla Jalor
8 Deta Kalan Sayla Jalor
9 Loonwa Jageer Dhorimanna Barmer
10 Nawapura Dhavecha Bhinmal Jalor
11 Bagoti Bhinmal Jalor
12 Nandiya Bhinmal Jalor
13 Kura Dhavecha Bhinmal Jalor
14 Harmoo Sayla Jalor
15 Harmoo Sayla Jalor
16 Punawas Sayla Jalor
17 Loonwa Jageer Dhorimanna Barmer
18 Nawapura Dhavecha Bhinmal Jalor
19 Nandiya Bhinmal Jalor
20 Jaisawas Bhinmal Jalor
21 Kura Dhavecha Bhinmal Jalor
22 Khetlawas Sayla Jalor
23 Khera Gangawa Sayla Jalor
24 Bhundwa Sayla Jalor
25 Bhedana Dhorimanna Barmer
26 Deonagar Dhorimanna Barmer
27 Sobrawas Bhinmal Jalor
28 Kori Dhavecha Bhinmal Jalor
29 Khetlawas Sayla Jalor
30 Alwara Sayla Jalor
31 Akwa Sayla Jalor
32 Bhandawpur Not found in Census 2011
33 Bhedana Dhorimanna Barmer
34 Deonagar Dhorimanna Barmer
35 Bijaliya Bhinmal
36 Rangala Bhinmal Jalor
37 Lumba Ki Dhani Sayla Jalor
38 Sangana Sayla Jalor
39 Sangana Sayla Jalor
40 Jeewana Sayla Jalor
41 Rangala Bhinmal Jalor
42 Sirana Sayla Jalor
43 Lumba Ki Dhani Sayla Jalor
44 Teja Ki Beri Sayla Jalor
45 Dahiva Sayla Jalor
46 Jeewana Sayla Jalor
47 Khari Sayla Jalor
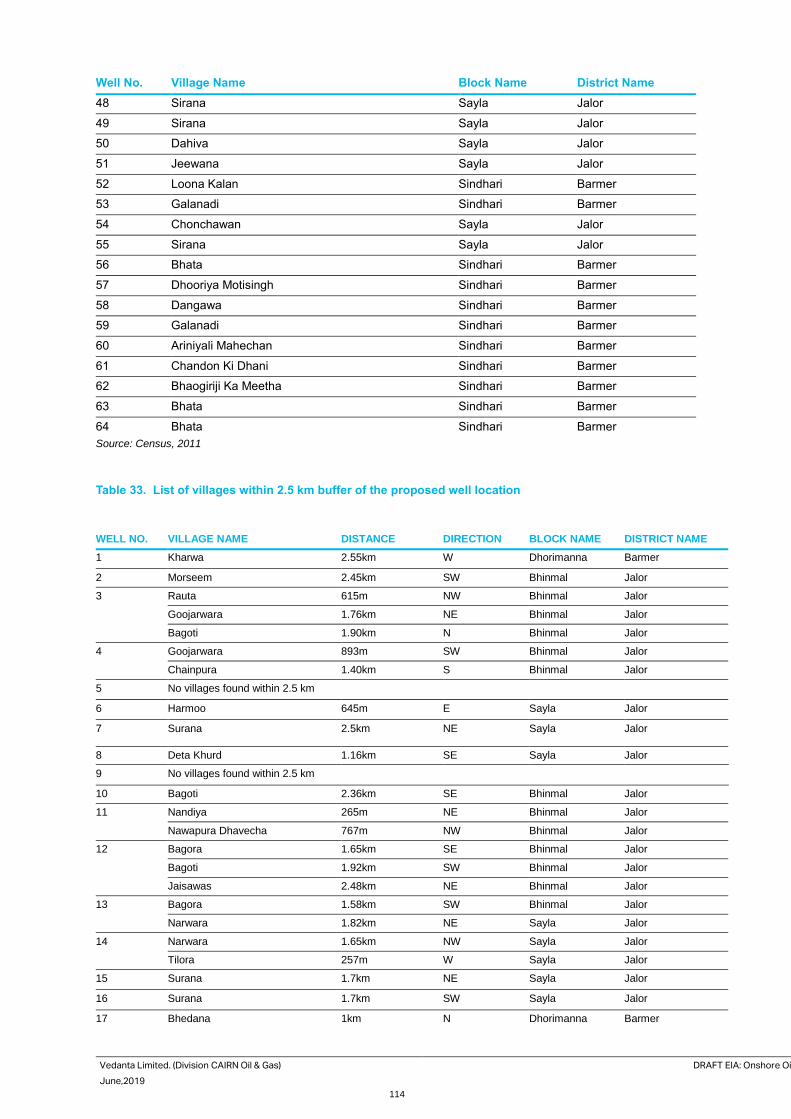
Vedanta Limited. (Division CAIRN Oil & Gas) DRAFT EIA: Onshore Oil and Gas E&A in RJ-ONHP- 2017/2 Block, Barmer District, Rajasthan
June,2019 AECOM
114
Well No. Village Name Block Name District Name
48 Sirana Sayla Jalor
49 Sirana Sayla Jalor
50 Dahiva Sayla Jalor
51 Jeewana Sayla Jalor
52 Loona Kalan Sindhari Barmer
53 Galanadi Sindhari Barmer
54 Chonchawan Sayla Jalor
55 Sirana Sayla Jalor
56 Bhata Sindhari Barmer
57 Dhooriya Motisingh Sindhari Barmer
58 Dangawa Sindhari Barmer
59 Galanadi Sindhari Barmer
60 Ariniyali Mahechan Sindhari Barmer
61 Chandon Ki Dhani Sindhari Barmer
62 Bhaogiriji Ka Meetha Sindhari Barmer
63 Bhata Sindhari Barmer
64 Bhata Sindhari Barmer
Source: Census, 2011
Table 33. List of villages within 2.5 km buffer of the proposed well location
WELL NO. VILLAGE NAME DISTANCE DIRECTION BLOCK NAME DISTRICT NAME
1 Kharwa 2.55km W Dhorimanna Barmer
2 Morseem 2.45km SW Bhinmal Jalor
3 Rauta 615m NW Bhinmal Jalor
Goojarwara 1.76km NE Bhinmal Jalor
Bagoti 1.90km N Bhinmal Jalor
4 Goojarwara 893m SW Bhinmal Jalor
Chainpura 1.40km S Bhinmal Jalor
5 No villages found within 2.5 km
6 Harmoo 645m E Sayla Jalor
7 Surana 2.5km NE Sayla Jalor
8 Deta Khurd 1.16km SE Sayla Jalor
9 No villages found within 2.5 km
10 Bagoti 2.36km SE Bhinmal Jalor
11 Nandiya 265m NE Bhinmal Jalor
Nawapura Dhavecha 767m NW Bhinmal Jalor
12 Bagora 1.65km SE Bhinmal Jalor
Bagoti 1.92km SW Bhinmal Jalor
Jaisawas 2.48km NE Bhinmal Jalor
13 Bagora 1.58km SW Bhinmal Jalor
Narwara 1.82km NE Sayla Jalor
14 Narwara 1.65km NW Sayla Jalor
Tilora 257m W Sayla Jalor
15 Surana 1.7km NE Sayla Jalor
16 Surana 1.7km SW Sayla Jalor
17 Bhedana 1km N Dhorimanna Barmer
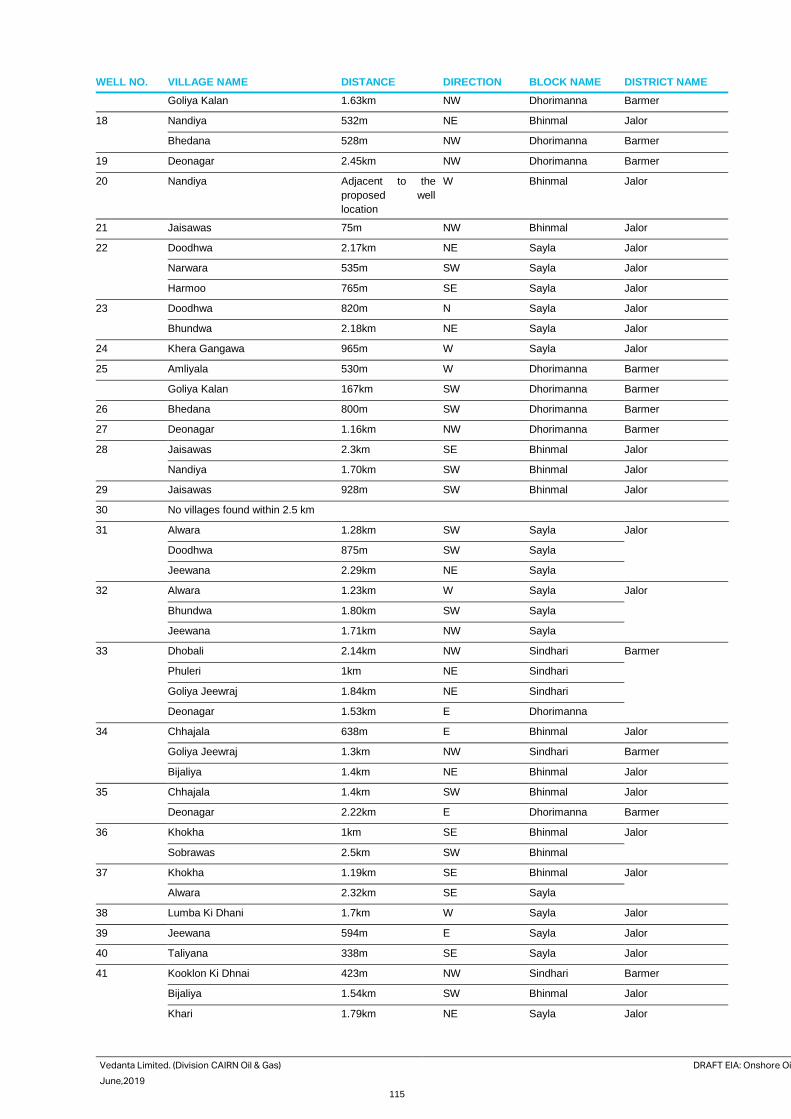
Vedanta Limited. (Division CAIRN Oil & Gas) DRAFT EIA: Onshore Oil and Gas E&A in RJ-ONHP- 2017/2 Block, Barmer District, Rajasthan
June,2019 AECOM
115
WELL NO. VILLAGE NAME DISTANCE DIRECTION BLOCK NAME DISTRICT NAME
Goliya Kalan 1.63km NW Dhorimanna Barmer
18 Nandiya 532m NE Bhinmal Jalor
Bhedana 528m NW Dhorimanna Barmer
19 Deonagar 2.45km NW Dhorimanna Barmer
20 Nandiya Adjacent to the
proposed well
location
W Bhinmal Jalor
21 Jaisawas 75m NW Bhinmal Jalor
22 Doodhwa 2.17km NE Sayla Jalor
Narwara 535m SW Sayla Jalor
Harmoo 765m SE Sayla Jalor
23 Doodhwa 820m N Sayla Jalor
Bhundwa 2.18km NE Sayla Jalor
24 Khera Gangawa 965m W Sayla Jalor
25 Amliyala 530m W Dhorimanna Barmer
Goliya Kalan 167km SW Dhorimanna Barmer
26 Bhedana 800m SW Dhorimanna Barmer
27 Deonagar 1.16km NW Dhorimanna Barmer
28 Jaisawas 2.3km SE Bhinmal Jalor
Nandiya 1.70km SW Bhinmal Jalor
29 Jaisawas 928m SW Bhinmal Jalor
30 No villages found within 2.5 km
31 Alwara 1.28km SW Sayla Jalor
Doodhwa 875m SW Sayla
Jeewana 2.29km NE Sayla
32 Alwara 1.23km W Sayla Jalor
Bhundwa 1.80km SW Sayla
Jeewana 1.71km NW Sayla
33 Dhobali 2.14km NW Sindhari Barmer
Phuleri 1km NE Sindhari
Goliya Jeewraj 1.84km NE Sindhari
Deonagar 1.53km E Dhorimanna
34 Chhajala 638m E Bhinmal Jalor
Goliya Jeewraj 1.3km NW Sindhari Barmer
Bijaliya 1.4km NE Bhinmal Jalor
35 Chhajala 1.4km SW Bhinmal Jalor
Deonagar 2.22km E Dhorimanna Barmer
36 Khokha 1km SE Bhinmal Jalor
Sobrawas 2.5km SW Bhinmal
37 Khokha 1.19km SE Bhinmal Jalor
Alwara 2.32km SE Sayla
38 Lumba Ki Dhani 1.7km W Sayla Jalor
39 Jeewana 594m E Sayla Jalor
40 Taliyana 338m SE Sayla Jalor
41 Kooklon Ki Dhnai 423m NW Sindhari Barmer
Bijaliya 1.54km SW Bhinmal Jalor
Khari 1.79km NE Sayla Jalor
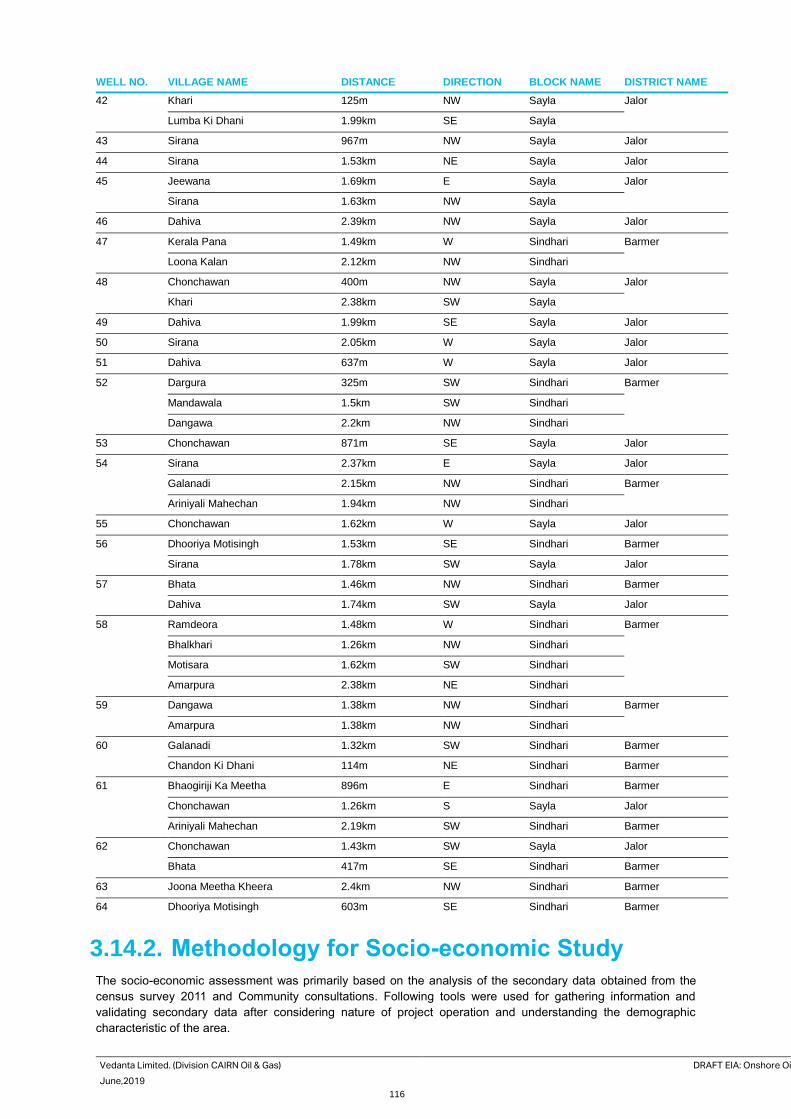
Vedanta Limited. (Division CAIRN Oil & Gas) DRAFT EIA: Onshore Oil and Gas E&A in RJ-ONHP- 2017/2 Block, Barmer District, Rajasthan
June,2019 AECOM
116
WELL NO. VILLAGE NAME DISTANCE DIRECTION BLOCK NAME DISTRICT NAME
42 Khari 125m NW Sayla Jalor
Lumba Ki Dhani 1.99km SE Sayla
43 Sirana 967m NW Sayla Jalor
44 Sirana 1.53km NE Sayla Jalor
45 Jeewana 1.69km E Sayla Jalor
Sirana 1.63km NW Sayla
46 Dahiva 2.39km NW Sayla Jalor
47 Kerala Pana 1.49km W Sindhari Barmer
Loona Kalan 2.12km NW Sindhari
48 Chonchawan 400m NW Sayla Jalor
Khari 2.38km SW Sayla
49 Dahiva 1.99km SE Sayla Jalor
50 Sirana 2.05km W Sayla Jalor
51 Dahiva 637m W Sayla Jalor
52 Dargura 325m SW Sindhari Barmer
Mandawala 1.5km SW Sindhari
Dangawa 2.2km NW Sindhari
53 Chonchawan 871m SE Sayla Jalor
54 Sirana 2.37km E Sayla Jalor
Galanadi 2.15km NW Sindhari Barmer
Ariniyali Mahechan 1.94km NW Sindhari
55 Chonchawan 1.62km W Sayla Jalor
56 Dhooriya Motisingh 1.53km SE Sindhari Barmer
Sirana 1.78km SW Sayla Jalor
57 Bhata 1.46km NW Sindhari Barmer
Dahiva 1.74km SW Sayla Jalor
58 Ramdeora 1.48km W Sindhari Barmer
Bhalkhari 1.26km NW Sindhari
Motisara 1.62km SW Sindhari
Amarpura 2.38km NE Sindhari
59 Dangawa 1.38km NW Sindhari Barmer
Amarpura 1.38km NW Sindhari
60 Galanadi 1.32km SW Sindhari Barmer
Chandon Ki Dhani 114m NE Sindhari Barmer
61 Bhaogiriji Ka Meetha 896m E Sindhari Barmer
Chonchawan 1.26km S Sayla Jalor
Ariniyali Mahechan 2.19km SW Sindhari Barmer
62 Chonchawan 1.43km SW Sayla Jalor
Bhata 417m SE Sindhari Barmer
63 Joona Meetha Kheera 2.4km NW Sindhari Barmer
64 Dhooriya Motisingh 603m SE Sindhari Barmer
3.14.2. Methodology for Socio-economic Study
The socio-economic assessment was primarily based on the analysis of the secondary data obtained from the
census survey 2011 and Community consultations. Following tools were used for gathering information and
validating secondary data after considering nature of project operation and understanding the demographic
characteristic of the area.
Vedanta Limited. (Division CAIRN Oil & Gas) DRAFT EIA: Onshore Oil and Gas E&A in RJ-ONHP- 2017/2 Block, Barmer District, Rajasthan
June,2019 AECOM
117
Secondary Data Analysis
To evaluate socio-economic environment in the study area, secondary information from the 2011 Census handbook
has been referred to and details pertaining to habitations in the study area have been extracted and assessed.
Apart from that district level secondary information has also been collected for district statistical hand book, Year
2011.
Stakeholder Consultation
At the beginning of the EIA process, the AECOM team conducted a preliminary identification of probable
stakeholders. An inventory of actual / potential stakeholders, including local groups and individuals, local institutions
like the panchayats which may be directly or indirectly affected by the project or with interest in the development
activities of the region was made at preliminary.
Consultations with community are a continuous process that was carried in the EIA process and would be continued
during the construction and operation phases of the project. Issues like land and resource damage, social
disturbance, severance and increased congestion, noise and air pollution, employment opportunities, need for
development of basic infrastructure, safe drinking water, sanitation facilities in the villages located in 2.5 km
periphery were discussed during the consultations so that they can be adequately addressed through the
environment management plans. The consultations also helped in developing preliminary understanding of the
requirement of social development initiatives, which are required in the project village and may be undertaken as
part of the Vedanta’s CER activity.
3.14.3. Administrative set up
Barmer district lies in Western Rajasthan. The district falls under the Jodhpur administrative division. It is bounded
by Jaisalmer district, Pakistan and Jalore district in the north, west and south respectively. The district of Jodhpur
forms its eastern border. The district is divided into 4 sub-divisions – Barmer, Balotra, Sheo and Guda Malani; 8
tehsils – Barmer, Baytoo, Chohtan, Guda Malani, Panchapadra, Dhorimana, Sheo and Siwana encompassing
2,160 villages under 17 Panchayat Samitis. Total population of the district as per Census 2011 is 7299090 with
male and female population of 3838560 and 3460530 respectively.
Jalore district is part of Jodhpur Division and is composed of five sub-divisions viz. Jalore, Ahore, Bhinmal,
Sanchore, Raniwara which cover seven tehsils viz: Jalore, Ahore, Bhinmal, Sanchore, Raniwara, Sayala, Bagora
and seven blocks viz: Jalore, Ahore, Bhinmal, Sanchore, Raniwara, Sayala & Jaswantpura. Total number of villages
in the district is 802 and it also has 3 urban towns. Total population of the district as per Census 2011 is 1828730
with male and female population of 936634 and 892096 respectively.
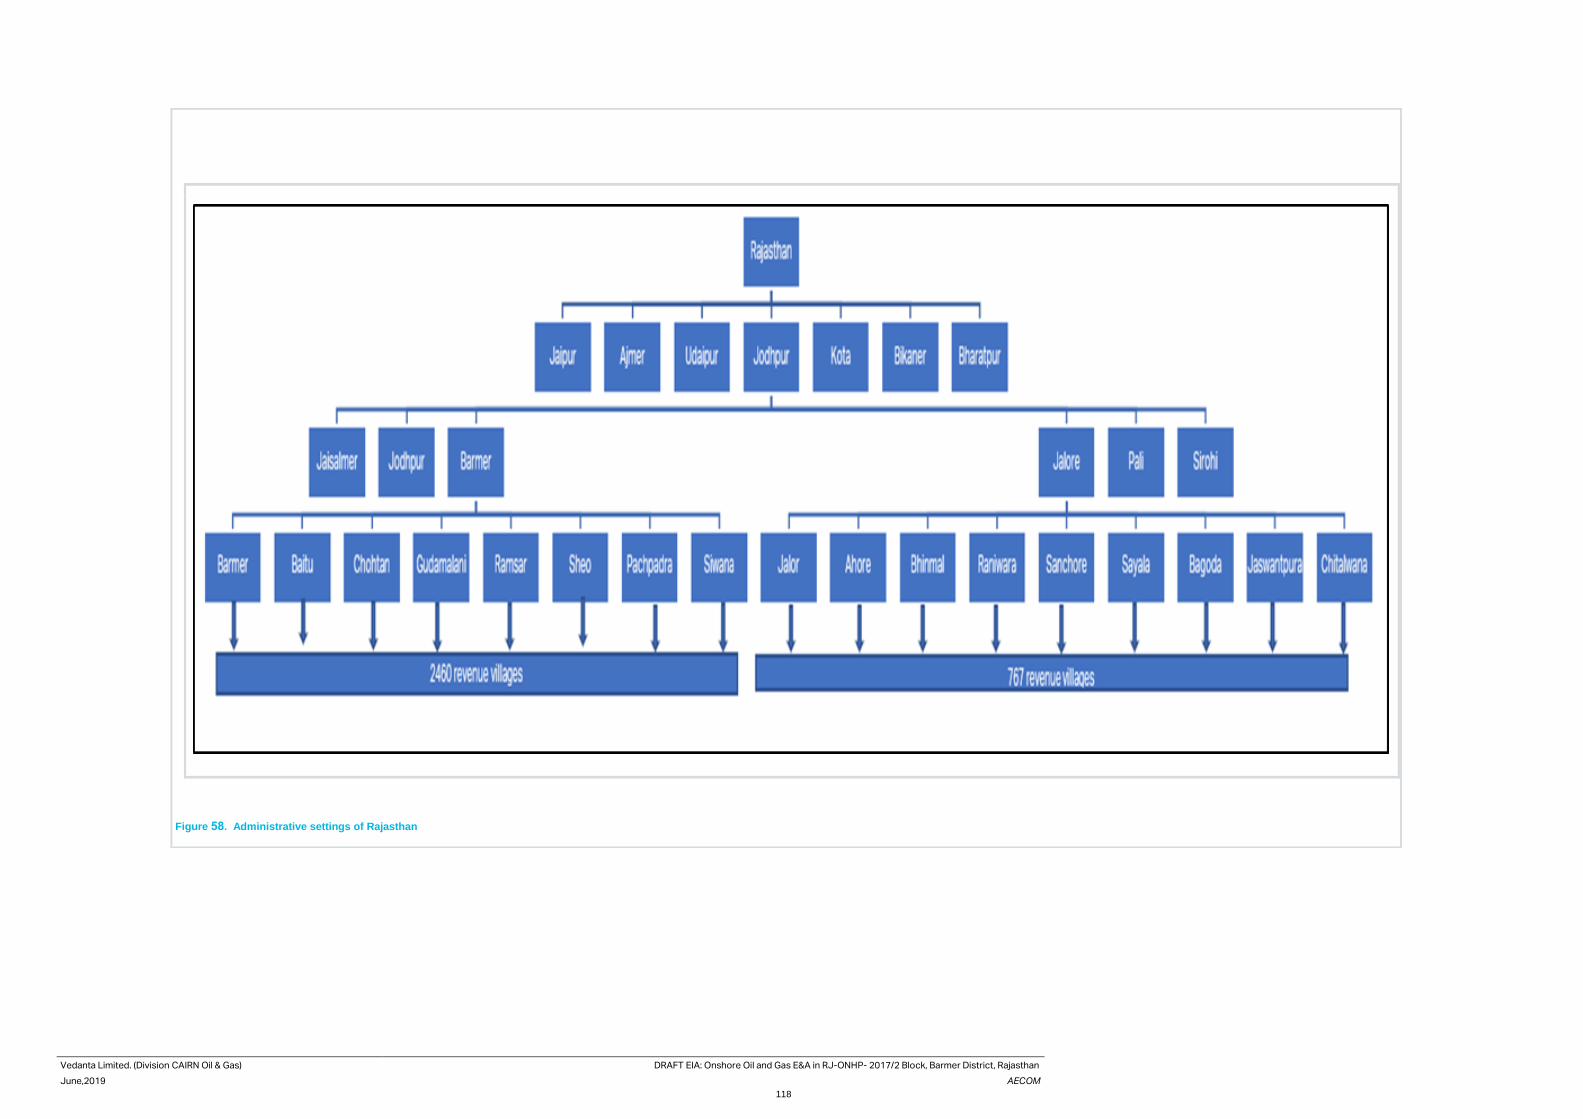
Vedanta Limited. (Division CAIRN Oil & Gas) DRAFT EIA: Onshore Oil and Gas E&A in RJ-ONHP- 2017/2 Block, Barmer District, Rajasthan
June,2019 AECOM
118
Figure 58. Administrative settings of Rajasthan
Vedanta Limited. (Division CAIRN Oil & Gas) DRAFT EIA: Onshore Oil and Gas E&A in RJ-ONHP- 2017/2 Block, Barmer District, Rajasthan
June,2019 AECOM
119
3.14.4. Socio-economic profile
Demographic Profile
Core Zone
A total number of 40 villages are coming under core zone area, where the proposed wells are located. According
to Census 2011, household size ranges from 5.11 to 7.38 in the core zone villages. Sirana village, in Jalore shows
the highest population of 6108, the lowest populated village is Khera Gangawa, Jalore with population size of 375.
The average sex ratio of the core zone villages is accounted as 931, which is marginally higher than the sex ratio
of Barmer (902), and lower than the sex ratio of Jalore (952), the average sex ratio of state Rajasthan is 926, which
is close to the core zone villages sex ratio.
Buffer Zone
A total number of 13 villages are located, which are present in the 2.5 km radius of the well location, considered as
buffer zone. According to Census 2011, the household size ranges from 4.63 to 7.04 in the buffer area villages.
Taliyana village of Jalore shows the highest population with a population number of 3372, among the buffer area
villages. Average sex ratio of the buffer area villages accounted as 932, which is close to the sex ration of both the
district; Barmer and Jalore.
SC/ST Communities
Core Zone
SC population accounts for 16.64% of the total population in the core zone villages, which is little lower than district
SC population percentage (19.5%) of Jalore and almost same with the district percentage of Barmer (16.8%).
Jaisawas in Jalore district has the highest SC population (1341), in the core zone villages. Similarly, the ST
population of core zone villages is only 5.04% of the total population, which is lower than the district percentage of
Jalore (9.8%), and Barmer (6.8%). Nandiya in Jalore district, shows the maximum population of ST community,
with a population number of 725.
During consultations in the core zone villages of this block, it has been found that, SC and ST communities are
present in a large number, some villages are found, where the total population are coming under these two above
mentioned communities, of several castes.
Buffer Zone
SC population in the buffer area villages accounted as 21.74% of the total population, which is higher than the
district percentage of both the districts, Barmer and Jalore. Taliyana village in Jalore has the SC population (1095)
in buffer area villages. ST population present in the buffer zone area, is only 2.46% of the total population, which
is lower than the district average of ST population in both districts, Barmer and Jalore.
Educational profile
Core Zone
The average literacy rate of core zone villages is found to be 49.98%, which is lower than the literacy rate of both
the districts Barmer (56.5%) and Jalore (54.9%), and also lower than the state literacy rate (66.1%) of Rajasthan.
Male literacy rate in core zone villages showed a figure of 66.38%, which is again lower than the male literacy rate
of both the districts, Barmer (70.9%) and Jalore (70.7%) respectively. Female literacy rate of the core zone area
villages accounted as 32.37%, which is marginally lower than the district female literacy rate of 40.6% and 38.5%,
of Barmer and Jalore respectively, but typically lower than the state literacy rate of 52.12 %. Though, for the past
few years the female literacy rate has increased in a substantial rate in Rajasthan, but during the consultation in
the core zone villages, the main reason of low literacy of female, has come up, as unapproachability of primary and
lower primary school in core zone villages. Deonagar, Barmer showed the highest literacy rate of 63.97%, in the
Vedanta Limited. (Division CAIRN Oil & Gas) DRAFT EIA: Onshore Oil and Gas E&A in RJ-ONHP- 2017/2 Block, Barmer District, Rajasthan
June,2019 AECOM
120
core zone villages, male literacy rate is maximum as 81.93% in Deonagar in Barmer and Nayapura Davecha in
Jalore has the highest female literacy rate of 46.94%, among the villages of core zone.
Buffer Zone
The overall literacy rate in buffer zone accounted as 54.79%, which is close to the literacy rate of both the district,
Barmer and Jalore respectively, but lower than the state literacy rate of Rajasthan. Amarpura in Barmer showed
the highest literacy rate of 73.13%, among the buffer area villages. Similarly, Male literacy rate of 70.34%, is almost
equal with the male literacy rate of Barmer and Jalore district, but lower than the state male literacy rate. Amarpura
village of Barmer showed the highest male and female literacy rate of 90.91% and 56.63% respectively, among the
buffer area villages.
Occupation and Livelihood
Work Participation
Work Participation Ratio (WPR) is defined as percentage of total workers including main and marginal workers out
of the total population of the study area.
Core zone
The WPR in the core zone area of the villages are reported to be 53.82%, as compared to 49% and 46.2% at the
district level of Barmer and Jalore. Main workers in the core zone area are accounted as 72.42%, where more of
them are engaged in agriculture and cultivation. Marginal workers are reported to be 27.58%, in the core zone area
of the villages. As per the engagement category, cultivation comes up with highest engagement of 76.35% in the
core zone area, followed by other agricultural worker with the average of 13.19%.
Buffer zone
The WPR in the buffer zone area accounted as 47.28%, as compared to 49% and 46.2% at the district level of
Barmer and Jalore. Main workers in the buffer zone area are accounted as 81.63%, where more of them are
engaged in agriculture and cultivation. Cultivators are reported to be the dominant workforce with a percentage of
79.03%, followed by other household industry of 10.04%.
Agriculture
Landholding
Consultation with several farmers of that region reveal that, every farmer is owner of his own land and record of
rights of the land is with them. Consultation with a group of farmers also reveal that, every farmer in that region
own 2-3 hectares of land on an average. Cultivation is done mostly twice in a year; Ravi crop is cultivated in summer
season, and kharif is cultivated in the month of winter. The farmers also showed their concern, about the fact of
low availability of water in the canal, which has resulted to crop loss in the region.
Other farm-based Livelihood
Other than agriculture people of that region also engaged in animal husbandry, poultry farming etc.
Irrigation
Core zone
Census 2011, reveal that 33.35% land of the total sown area is unirrigated. The 66.65% irrigated land draw water
from mainly to potential sources – Canal (7.26%) and wells/tube wells (83.88%). Sirana in Jalore district accounts
for the most irrigated land (2558.07 Hec.) in the core zone area. Only Dangwa village don’t have access to any
form of irrigation. Only Sirana village has the access to canal water and wells or tube wells serve as a soul source
of irrigation in most of the core zone villages.
Buffer zone
As per the Census data, 2011, 69.40% of the land is unirrigated, in the buffer zone villages. The total irrigated area
in the buffer zone, accounted as 30.59%, which draw water for, mainly from wells or tube wells, contributed about
100%, as there is no access of canal water. There are 2 numbers of villages, Panyala Khurd and Ramdeora, which
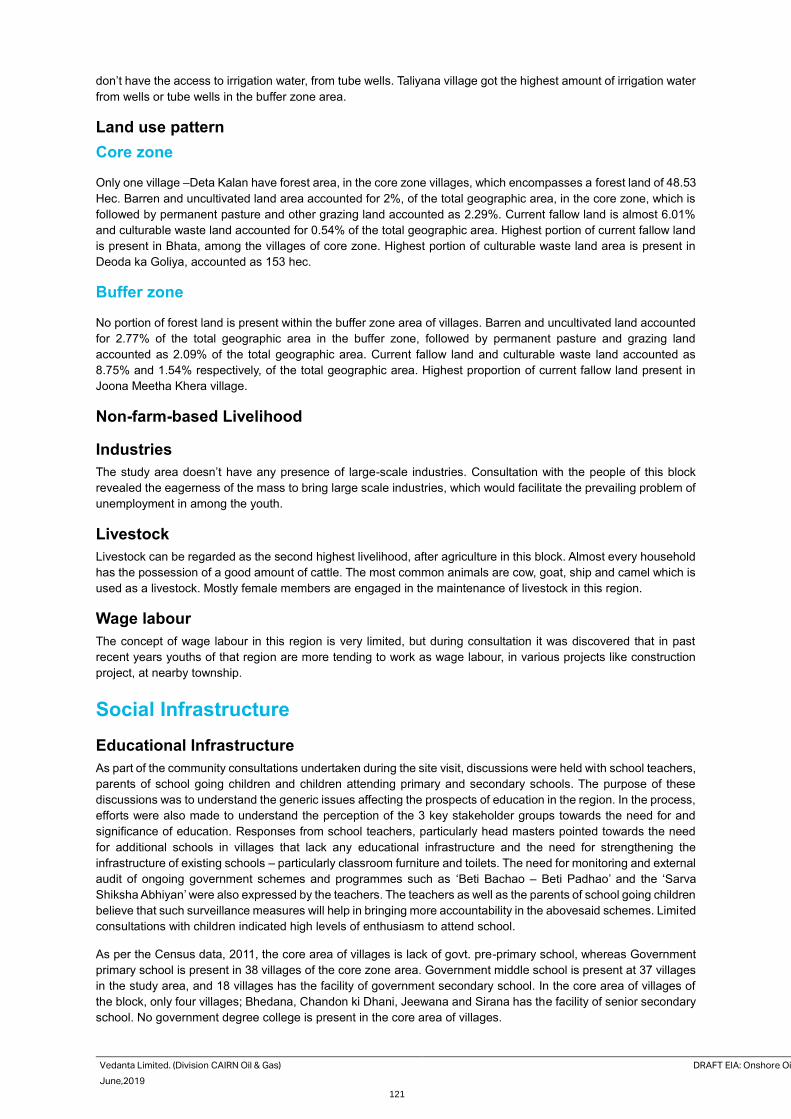
Vedanta Limited. (Division CAIRN Oil & Gas) DRAFT EIA: Onshore Oil and Gas E&A in RJ-ONHP- 2017/2 Block, Barmer District, Rajasthan
June,2019 AECOM
121
don’t have the access to irrigation water, from tube wells. Taliyana village got the highest amount of irrigation water
from wells or tube wells in the buffer zone area.
Land use pattern
Core zone
Only one village –Deta Kalan have forest area, in the core zone villages, which encompasses a forest land of 48.53
Hec. Barren and uncultivated land area accounted for 2%, of the total geographic area, in the core zone, which is
followed by permanent pasture and other grazing land accounted as 2.29%. Current fallow land is almost 6.01%
and culturable waste land accounted for 0.54% of the total geographic area. Highest portion of current fallow land
is present in Bhata, among the villages of core zone. Highest portion of culturable waste land area is present in
Deoda ka Goliya, accounted as 153 hec.
Buffer zone
No portion of forest land is present within the buffer zone area of villages. Barren and uncultivated land accounted
for 2.77% of the total geographic area in the buffer zone, followed by permanent pasture and grazing land
accounted as 2.09% of the total geographic area. Current fallow land and culturable waste land accounted as
8.75% and 1.54% respectively, of the total geographic area. Highest proportion of current fallow land present in
Joona Meetha Khera village.
Non-farm-based Livelihood
Industries
The study area doesn’t have any presence of large-scale industries. Consultation with the people of this block
revealed the eagerness of the mass to bring large scale industries, which would facilitate the prevailing problem of
unemployment in among the youth.
Livestock
Livestock can be regarded as the second highest livelihood, after agriculture in this block. Almost every household
has the possession of a good amount of cattle. The most common animals are cow, goat, ship and camel which is
used as a livestock. Mostly female members are engaged in the maintenance of livestock in this region.
Wage labour
The concept of wage labour in this region is very limited, but during consultation it was discovered that in past
recent years youths of that region are more tending to work as wage labour, in various projects like construction
project, at nearby township.
Social Infrastructure
Educational Infrastructure
As part of the community consultations undertaken during the site visit, discussions were held with school teachers,
parents of school going children and children attending primary and secondary schools. The purpose of these
discussions was to understand the generic issues affecting the prospects of education in the region. In the process,
efforts were also made to understand the perception of the 3 key stakeholder groups towards the need for and
significance of education. Responses from school teachers, particularly head masters pointed towards the need
for additional schools in villages that lack any educational infrastructure and the need for strengthening the
infrastructure of existing schools – particularly classroom furniture and toilets. The need for monitoring and external
audit of ongoing government schemes and programmes such as ‘Beti Bachao – Beti Padhao’ and the ‘Sarva
Shiksha Abhiyan’ were also expressed by the teachers. The teachers as well as the parents of school going children
believe that such surveillance measures will help in bringing more accountability in the abovesaid schemes. Limited
consultations with children indicated high levels of enthusiasm to attend school.
As per the Census data, 2011, the core area of villages is lack of govt. pre-primary school, whereas Government
primary school is present in 38 villages of the core zone area. Government middle school is present at 37 villages
in the study area, and 18 villages has the facility of government secondary school. In the core area of villages of
the block, only four villages; Bhedana, Chandon ki Dhani, Jeewana and Sirana has the facility of senior secondary
school. No government degree college is present in the core area of villages.
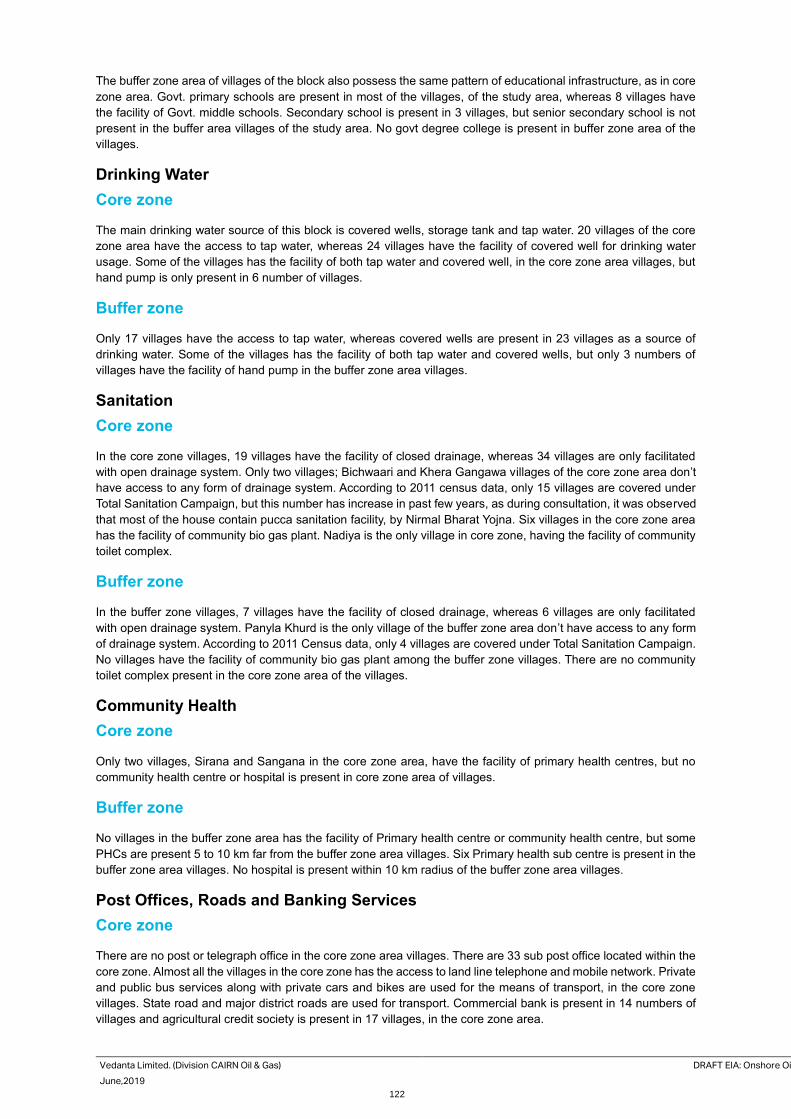
Vedanta Limited. (Division CAIRN Oil & Gas) DRAFT EIA: Onshore Oil and Gas E&A in RJ-ONHP- 2017/2 Block, Barmer District, Rajasthan
June,2019 AECOM
122
The buffer zone area of villages of the block also possess the same pattern of educational infrastructure, as in core
zone area. Govt. primary schools are present in most of the villages, of the study area, whereas 8 villages have
the facility of Govt. middle schools. Secondary school is present in 3 villages, but senior secondary school is not
present in the buffer area villages of the study area. No govt degree college is present in buffer zone area of the
villages.
Drinking Water
Core zone
The main drinking water source of this block is covered wells, storage tank and tap water. 20 villages of the core
zone area have the access to tap water, whereas 24 villages have the facility of covered well for drinking water
usage. Some of the villages has the facility of both tap water and covered well, in the core zone area villages, but
hand pump is only present in 6 number of villages.
Buffer zone
Only 17 villages have the access to tap water, whereas covered wells are present in 23 villages as a source of
drinking water. Some of the villages has the facility of both tap water and covered wells, but only 3 numbers of
villages have the facility of hand pump in the buffer zone area villages.
Sanitation
Core zone
In the core zone villages, 19 villages have the facility of closed drainage, whereas 34 villages are only facilitated
with open drainage system. Only two villages; Bichwaari and Khera Gangawa villages of the core zone area don’t
have access to any form of drainage system. According to 2011 census data, only 15 villages are covered under
Total Sanitation Campaign, but this number has increase in past few years, as during consultation, it was observed
that most of the house contain pucca sanitation facility, by Nirmal Bharat Yojna. Six villages in the core zone area
has the facility of community bio gas plant. Nadiya is the only village in core zone, having the facility of community
toilet complex.
Buffer zone
In the buffer zone villages, 7 villages have the facility of closed drainage, whereas 6 villages are only facilitated
with open drainage system. Panyla Khurd is the only village of the buffer zone area don’t have access to any form
of drainage system. According to 2011 Census data, only 4 villages are covered under Total Sanitation Campaign.
No villages have the facility of community bio gas plant among the buffer zone villages. There are no community
toilet complex present in the core zone area of the villages.
Community Health
Core zone
Only two villages, Sirana and Sangana in the core zone area, have the facility of primary health centres, but no
community health centre or hospital is present in core zone area of villages.
Buffer zone
No villages in the buffer zone area has the facility of Primary health centre or community health centre, but some
PHCs are present 5 to 10 km far from the buffer zone area villages. Six Primary health sub centre is present in the
buffer zone area villages. No hospital is present within 10 km radius of the buffer zone area villages.
Post Offices, Roads and Banking Services
Core zone
There are no post or telegraph office in the core zone area villages. There are 33 sub post office located within the
core zone. Almost all the villages in the core zone has the access to land line telephone and mobile network. Private
and public bus services along with private cars and bikes are used for the means of transport, in the core zone
villages. State road and major district roads are used for transport. Commercial bank is present in 14 numbers of
villages and agricultural credit society is present in 17 villages, in the core zone area.
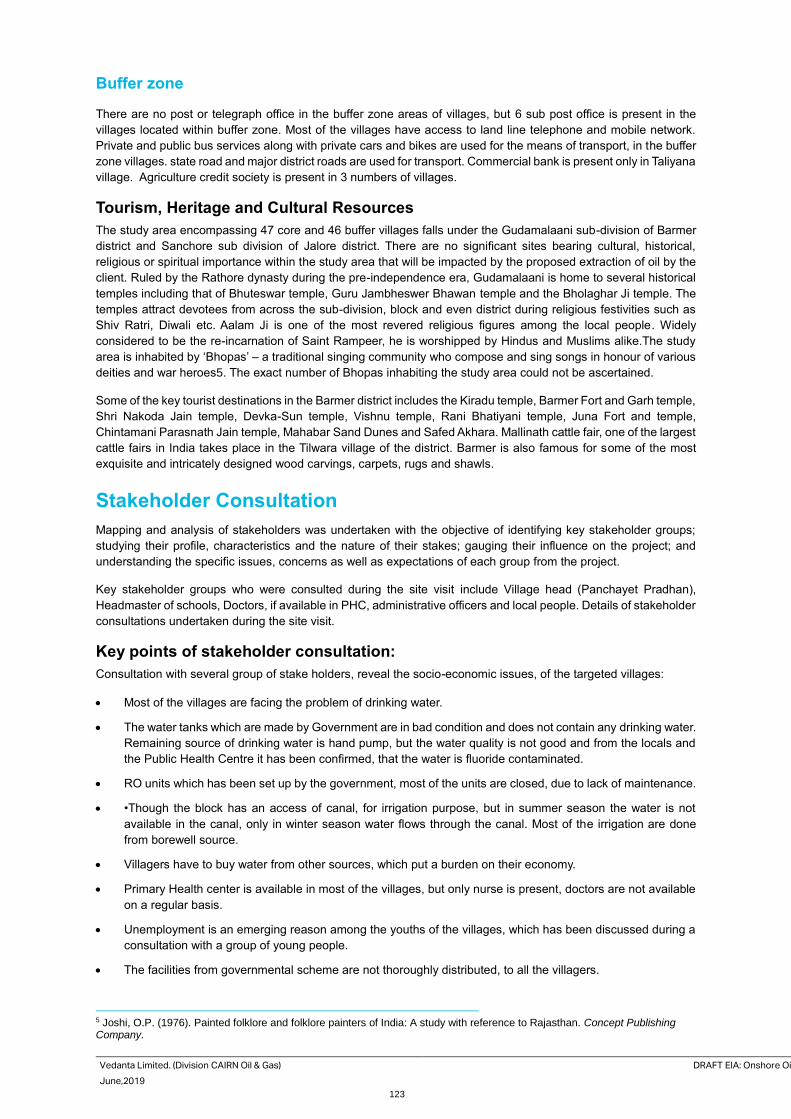
Vedanta Limited. (Division CAIRN Oil & Gas) DRAFT EIA: Onshore Oil and Gas E&A in RJ-ONHP- 2017/2 Block, Barmer District, Rajasthan
June,2019 AECOM
123
Buffer zone
There are no post or telegraph office in the buffer zone areas of villages, but 6 sub post office is present in the
villages located within buffer zone. Most of the villages have access to land line telephone and mobile network.
Private and public bus services along with private cars and bikes are used for the means of transport, in the buffer
zone villages. state road and major district roads are used for transport. Commercial bank is present only in Taliyana
village. Agriculture credit society is present in 3 numbers of villages.
Tourism, Heritage and Cultural Resources
The study area encompassing 47 core and 46 buffer villages falls under the Gudamalaani sub-division of Barmer
district and Sanchore sub division of Jalore district. There are no significant sites bearing cultural, historical,
religious or spiritual importance within the study area that will be impacted by the proposed extraction of oil by the
client. Ruled by the Rathore dynasty during the pre-independence era, Gudamalaani is home to several historical
temples including that of Bhuteswar temple, Guru Jambheswer Bhawan temple and the Bholaghar Ji temple. The
temples attract devotees from across the sub-division, block and even district during religious festivities such as
Shiv Ratri, Diwali etc. Aalam Ji is one of the most revered religious figures among the local people. Widely
considered to be the re-incarnation of Saint Rampeer, he is worshipped by Hindus and Muslims alike.The study
area is inhabited by ‘Bhopas’ – a traditional singing community who compose and sing songs in honour of various
deities and war heroes5. The exact number of Bhopas inhabiting the study area could not be ascertained.
Some of the key tourist destinations in the Barmer district includes the Kiradu temple, Barmer Fort and Garh temple,
Shri Nakoda Jain temple, Devka-Sun temple, Vishnu temple, Rani Bhatiyani temple, Juna Fort and temple,
Chintamani Parasnath Jain temple, Mahabar Sand Dunes and Safed Akhara. Mallinath cattle fair, one of the largest
cattle fairs in India takes place in the Tilwara village of the district. Barmer is also famous for some of the most
exquisite and intricately designed wood carvings, carpets, rugs and shawls.
Stakeholder Consultation
Mapping and analysis of stakeholders was undertaken with the objective of identifying key stakeholder groups;
studying their profile, characteristics and the nature of their stakes; gauging their influence on the project; and
understanding the specific issues, concerns as well as expectations of each group from the project.
Key stakeholder groups who were consulted during the site visit include Village head (Panchayet Pradhan),
Headmaster of schools, Doctors, if available in PHC, administrative officers and local people. Details of stakeholder
consultations undertaken during the site visit.
Key points of stakeholder consultation:
Consultation with several group of stake holders, reveal the socio-economic issues, of the targeted villages:
• Most of the villages are facing the problem of drinking water.
• The water tanks which are made by Government are in bad condition and does not contain any drinking water.
Remaining source of drinking water is hand pump, but the water quality is not good and from the locals and
the Public Health Centre it has been confirmed, that the water is fluoride contaminated.
• RO units which has been set up by the government, most of the units are closed, due to lack of maintenance.
• •Though the block has an access of canal, for irrigation purpose, but in summer season the water is not
available in the canal, only in winter season water flows through the canal. Most of the irrigation are done
from borewell source.
• Villagers have to buy water from other sources, which put a burden on their economy.
• Primary Health center is available in most of the villages, but only nurse is present, doctors are not available
on a regular basis.
• Unemployment is an emerging reason among the youths of the villages, which has been discussed during a
consultation with a group of young people.
• The facilities from governmental scheme are not thoroughly distributed, to all the villagers.
5 Joshi, O.P. (1976). Painted folklore and folklore painters of India: A study with reference to Rajasthan. Concept Publishing Company.
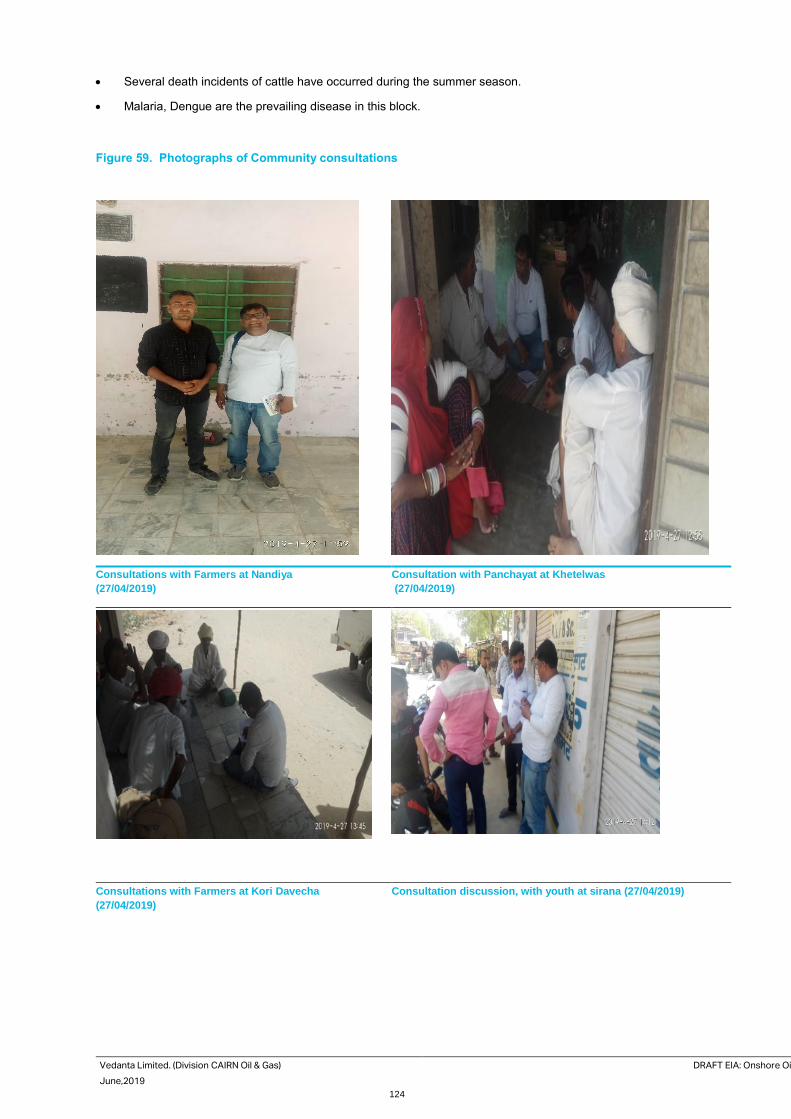
Vedanta Limited. (Division CAIRN Oil & Gas) DRAFT EIA: Onshore Oil and Gas E&A in RJ-ONHP- 2017/2 Block, Barmer District, Rajasthan
June,2019 AECOM
124
• Several death incidents of cattle have occurred during the summer season.
• Malaria, Dengue are the prevailing disease in this block.
Figure 59. Photographs of Community consultations
Consultations with Farmers at Nandiya
(27/04/2019) Consultation with Panchayat at Khetelwas
(27/04/2019)
Consultations with Farmers at Kori Davecha
(27/04/2019) Consultation discussion, with youth at sirana (27/04/2019)
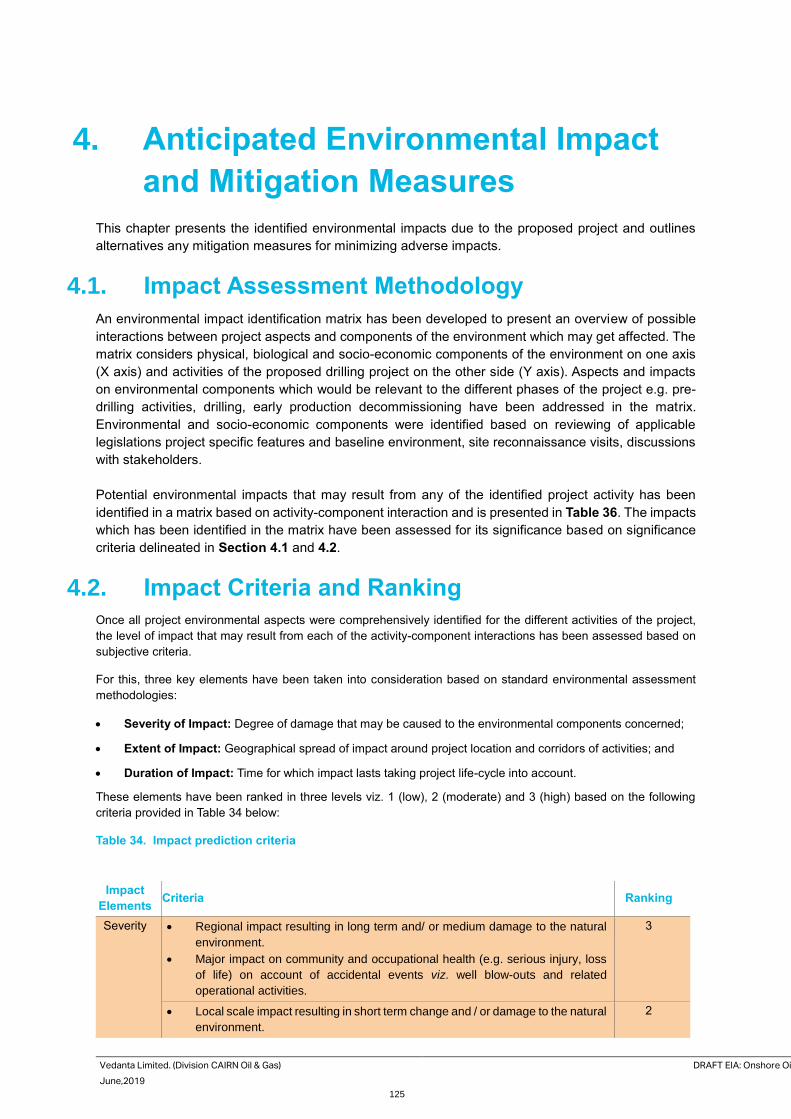
Vedanta Limited. (Division CAIRN Oil & Gas) DRAFT EIA: Onshore Oil and Gas E&A in RJ-ONHP- 2017/2 Block, Barmer District, Rajasthan
June,2019 AECOM
125
4. Anticipated Environmental Impact
and Mitigation Measures
This chapter presents the identified environmental impacts due to the proposed project and outlines
alternatives any mitigation measures for minimizing adverse impacts.
4.1. Impact Assessment Methodology
An environmental impact identification matrix has been developed to present an overview of possible
interactions between project aspects and components of the environment which may get affected. The
matrix considers physical, biological and socio-economic components of the environment on one axis
(X axis) and activities of the proposed drilling project on the other side (Y axis). Aspects and impacts
on environmental components which would be relevant to the different phases of the project e.g. pre-
drilling activities, drilling, early production decommissioning have been addressed in the matrix.
Environmental and socio-economic components were identified based on reviewing of applicable
legislations project specific features and baseline environment, site reconnaissance visits, discussions
with stakeholders.
Potential environmental impacts that may result from any of the identified project activity has been
identified in a matrix based on activity-component interaction and is presented in Table 36. The impacts
which has been identified in the matrix have been assessed for its significance based on significance
criteria delineated in Section 4.1 and 4.2.
4.2. Impact Criteria and Ranking
Once all project environmental aspects were comprehensively identified for the different activities of the project,
the level of impact that may result from each of the activity-component interactions has been assessed based on
subjective criteria.
For this, three key elements have been taken into consideration based on standard environmental assessment
methodologies:
• Severity of Impact: Degree of damage that may be caused to the environmental components concerned;
• Extent of Impact: Geographical spread of impact around project location and corridors of activities; and
• Duration of Impact: Time for which impact lasts taking project life-cycle into account.
These elements have been ranked in three levels viz. 1 (low), 2 (moderate) and 3 (high) based on the following
criteria provided in Table 34 below:
Table 34. Impact prediction criteria
Impact
Elements Criteria Ranking
Severity • Regional impact resulting in long term and/ or medium damage to the natural
environment.
• Major impact on community and occupational health (e.g. serious injury, loss
of life) on account of accidental events viz. well blow-outs and related
operational activities.
3
• Local scale impact resulting in short term change and / or damage to the natural
environment.
2
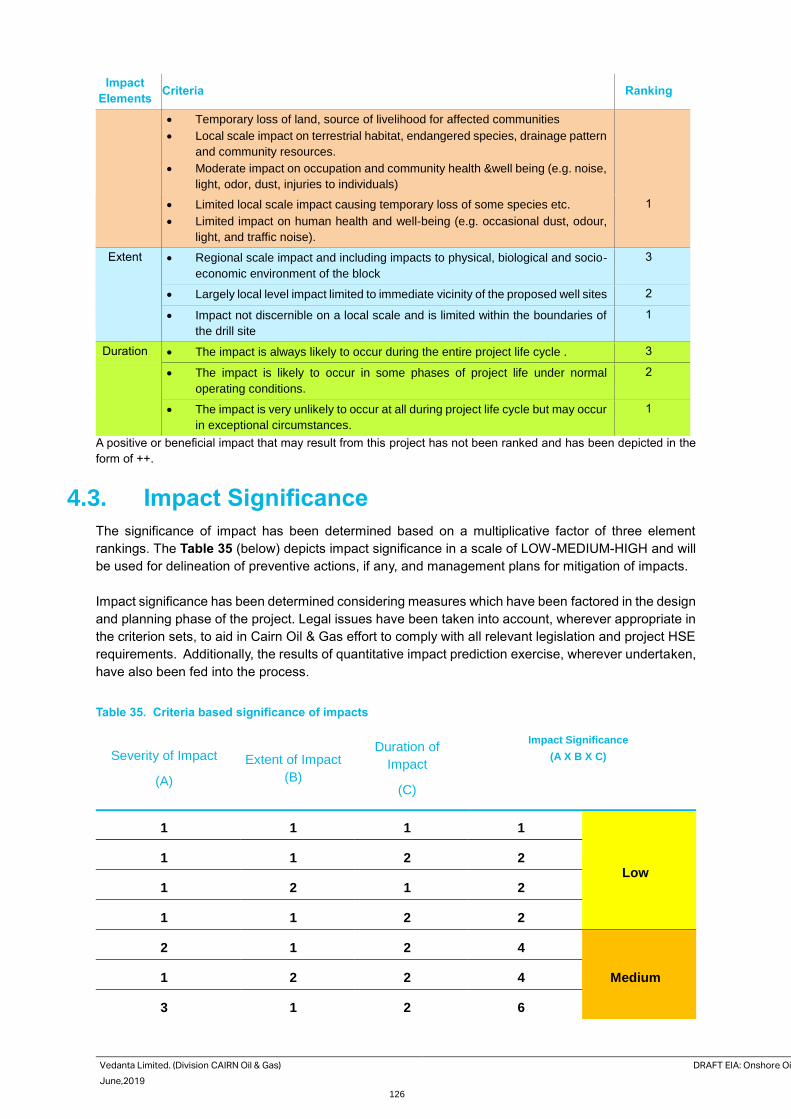
Vedanta Limited. (Division CAIRN Oil & Gas) DRAFT EIA: Onshore Oil and Gas E&A in RJ-ONHP- 2017/2 Block, Barmer District, Rajasthan
June,2019 AECOM
126
Impact
Elements Criteria Ranking
• Temporary loss of land, source of livelihood for affected communities
• Local scale impact on terrestrial habitat, endangered species, drainage pattern
and community resources.
• Moderate impact on occupation and community health &well being (e.g. noise,
light, odor, dust, injuries to individuals)
• Limited local scale impact causing temporary loss of some species etc.
• Limited impact on human health and well-being (e.g. occasional dust, odour,
light, and traffic noise).
1
Extent • Regional scale impact and including impacts to physical, biological and socio-
economic environment of the block
3
• Largely local level impact limited to immediate vicinity of the proposed well sites 2
• Impact not discernible on a local scale and is limited within the boundaries of
the drill site
1
Duration • The impact is always likely to occur during the entire project life cycle . 3
• The impact is likely to occur in some phases of project life under normal
operating conditions.
2
• The impact is very unlikely to occur at all during project life cycle but may occur
in exceptional circumstances.
1
A positive or beneficial impact that may result from this project has not been ranked and has been depicted in the
form of ++.
4.3. Impact Significance
The significance of impact has been determined based on a multiplicative factor of three element
rankings. The Table 35 (below) depicts impact significance in a scale of LOW-MEDIUM-HIGH and will
be used for delineation of preventive actions, if any, and management plans for mitigation of impacts.
Impact significance has been determined considering measures which have been factored in the design
and planning phase of the project. Legal issues have been taken into account, wherever appropriate in
the criterion sets, to aid in Cairn Oil & Gas effort to comply with all relevant legislation and project HSE
requirements. Additionally, the results of quantitative impact prediction exercise, wherever undertaken,
have also been fed into the process.
Table 35. Criteria based significance of impacts
Severity of Impact
(A)
Extent of Impact
(B)
Duration of
Impact
(C)
Impact Significance
(A X B X C)
1 1 1 1
Low 1 1 2 2
1 2 1 2
1 1 2 2
2 1 2 4
Medium 1 2 2 4
3 1 2 6
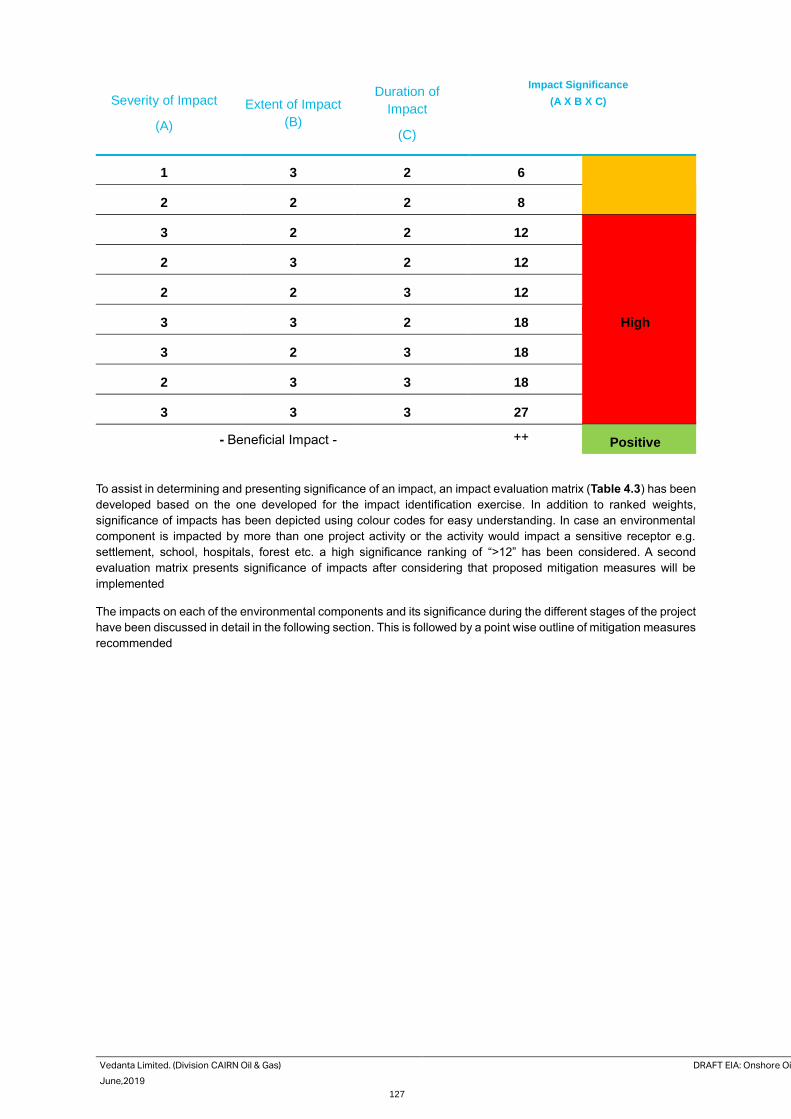
Vedanta Limited. (Division CAIRN Oil & Gas) DRAFT EIA: Onshore Oil and Gas E&A in RJ-ONHP- 2017/2 Block, Barmer District, Rajasthan
June,2019 AECOM
127
Severity of Impact
(A)
Extent of Impact
(B)
Duration of
Impact
(C)
Impact Significance
(A X B X C)
1 3 2 6
2 2 2 8
3 2 2 12
High
2 3 2 12
2 2 3 12
3 3 2 18
3 2 3 18
2 3 3 18
3 3 3 27
- Beneficial Impact - ++ Positive
To assist in determining and presenting significance of an impact, an impact evaluation matrix (Table 4.3) has been
developed based on the one developed for the impact identification exercise. In addition to ranked weights,
significance of impacts has been depicted using colour codes for easy understanding. In case an environmental
component is impacted by more than one project activity or the activity would impact a sensitive receptor e.g.
settlement, school, hospitals, forest etc. a high significance ranking of “>12” has been considered. A second
evaluation matrix presents significance of impacts after considering that proposed mitigation measures will be
implemented
The impacts on each of the environmental components and its significance during the different stages of the project
have been discussed in detail in the following section. This is followed by a point wise outline of mitigation measures
recommended
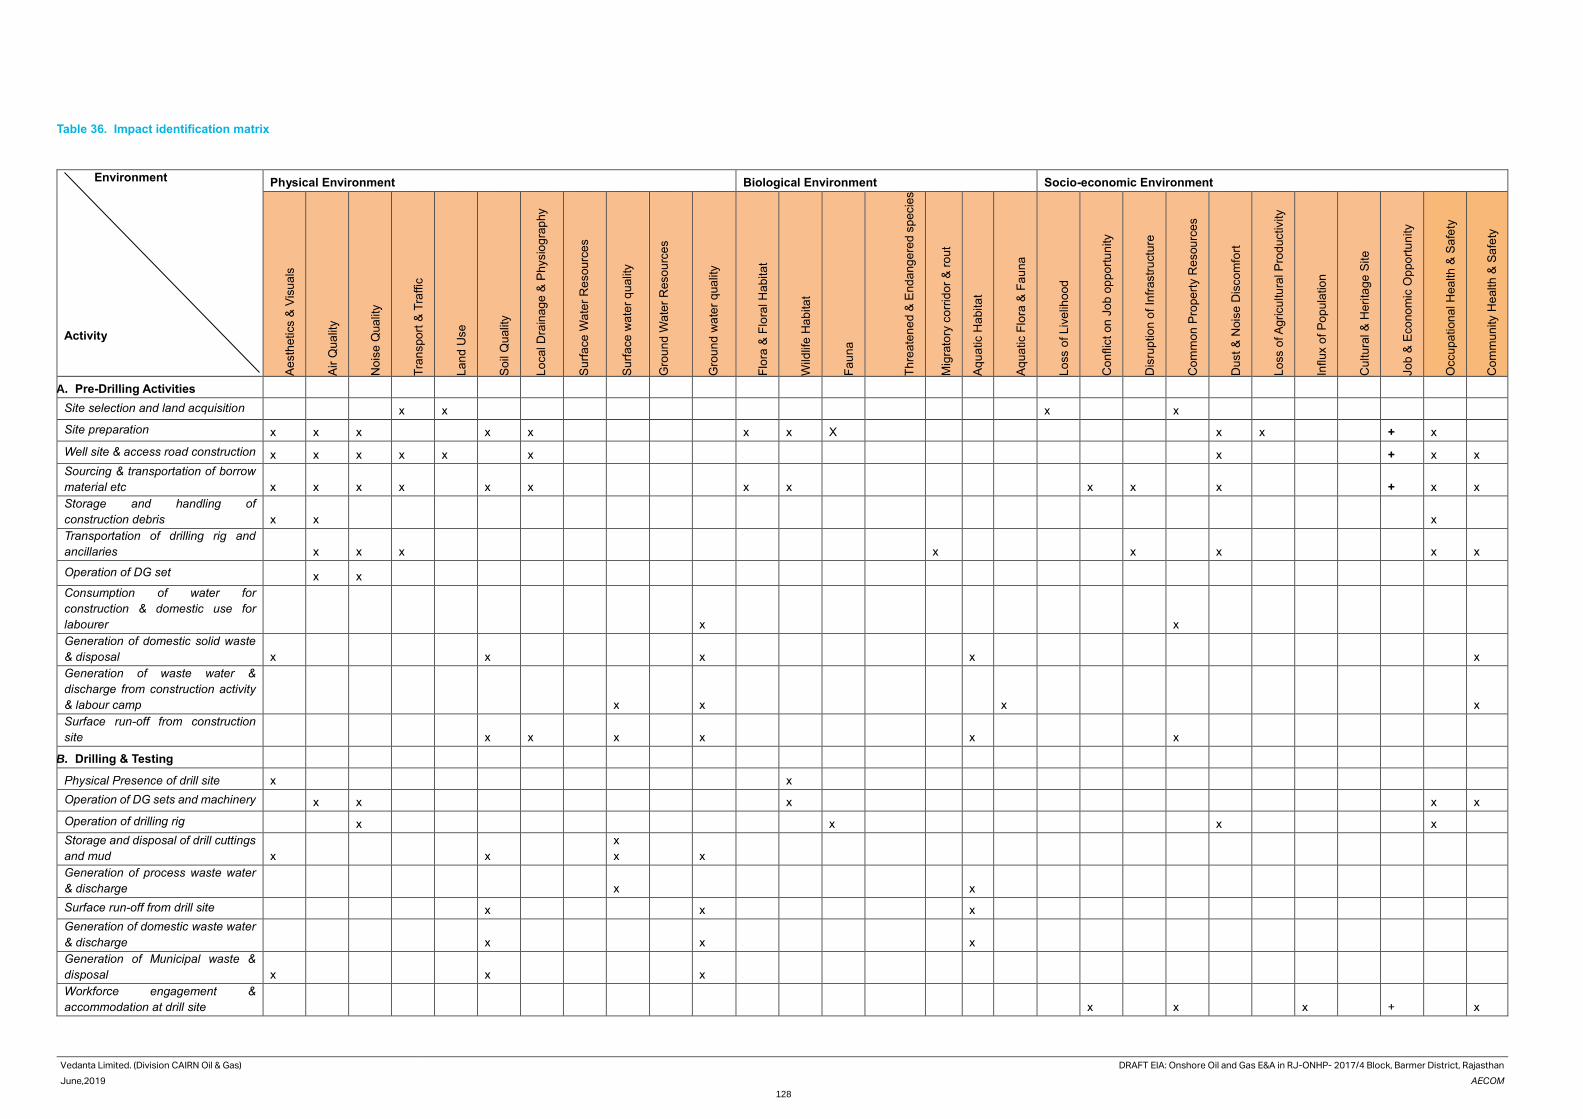
Vedanta Limited. (Division CAIRN Oil & Gas) DRAFT EIA: Onshore Oil and Gas E&A in RJ-ONHP- 2017/4 Block, Barmer District, Rajasthan
June,2019 AECOM
128
Table 36. Impact identification matrix
Environment
Activity
Physical Environment Biological Environment Socio-economic Environment
Ae
sth
etics &
Vis
ua
ls
Air
Qu
alit
y
No
ise
Qua
lity
Tra
nspo
rt &
Tra
ffic
La
nd
Use
So
il Q
ualit
y
Lo
cal D
rain
ag
e &
Physio
gra
phy
Su
rfa
ce
Wa
ter
Re
sou
rce
s
Su
rfa
ce
wa
ter
qu
alit
y
Gro
un
d W
ate
r R
eso
urc
es
Gro
un
d w
ate
r q
ua
lity
Flo
ra &
Flo
ral H
abita
t
Wild
life
Ha
bita
t
Fa
un
a
Th
rea
ten
ed
& E
nd
ang
ere
d s
pecie
s
Mig
rato
ry c
orr
ido
r &
ro
ut
Aq
ua
tic H
abita
t
Aq
ua
tic F
lora
& F
au
na
Lo
ss o
f L
ive
liho
od
Co
nflic
t on
Jo
b o
pp
ort
un
ity
Dis
rup
tio
n o
f In
frastr
uctu
re
Co
mm
on
Pro
pe
rty R
esou
rce
s
Du
st
& N
ois
e D
isco
mfo
rt
Lo
ss o
f A
gricu
ltu
ral P
rod
uctivity
Influx o
f P
op
ula
tio
n
Cu
ltu
ral &
He
rita
ge
Site
Jo
b &
Eco
no
mic
Op
po
rtu
nity
Occu
pa
tion
al H
ea
lth
& S
afe
ty
Co
mm
un
ity H
ealth
& S
afe
ty
A. Pre-Drilling Activities
Site selection and land acquisition x x x x
Site preparation x x x x x x x X x x + x
Well site & access road construction x x x x x x x + x x
Sourcing & transportation of borrow
material etc x x x x x x x x x x x + x x
Storage and handling of
construction debris x x x Transportation of drilling rig and
ancillaries x x x x x x x x
Operation of DG set x x
Consumption of water for
construction & domestic use for
labourer x x Generation of domestic solid waste
& disposal x x x x x
Generation of waste water &
discharge from construction activity
& labour camp x x x x
Surface run-off from construction
site x x x x x x
B. Drilling & Testing
Physical Presence of drill site x x
Operation of DG sets and machinery x x x x x
Operation of drilling rig x x x x
Storage and disposal of drill cuttings
and mud x x
x
x x Generation of process waste water
& discharge x x
Surface run-off from drill site x x x
Generation of domestic waste water
& discharge x x x Generation of Municipal waste &
disposal x x x Workforce engagement &
accommodation at drill site x x x + x
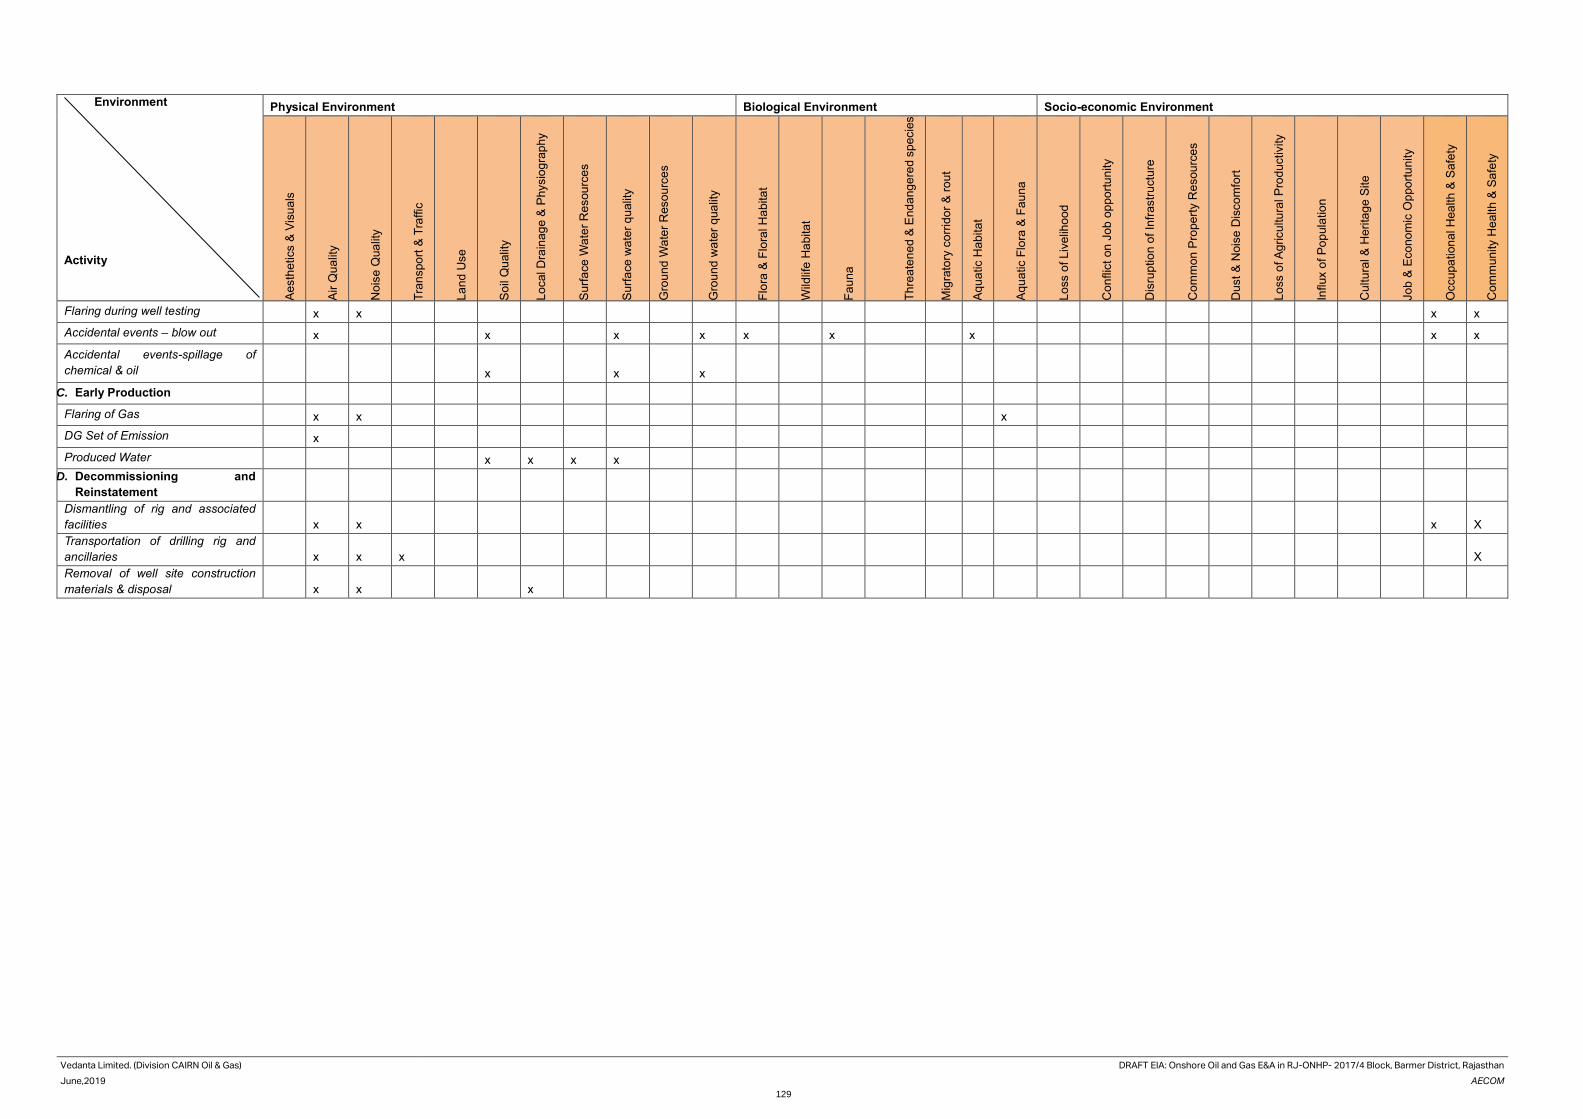
Vedanta Limited. (Division CAIRN Oil & Gas) DRAFT EIA: Onshore Oil and Gas E&A in RJ-ONHP- 2017/4 Block, Barmer District, Rajasthan
June,2019 AECOM
129
Environment
Activity
Physical Environment Biological Environment Socio-economic Environment
Ae
sth
etics &
Vis
ua
ls
Air
Qu
alit
y
No
ise
Qua
lity
Tra
nspo
rt &
Tra
ffic
La
nd
Use
So
il Q
ualit
y
Lo
cal D
rain
ag
e &
Physio
gra
phy
Su
rfa
ce
Wa
ter
Re
sou
rce
s
Su
rfa
ce
wa
ter
qu
alit
y
Gro
un
d W
ate
r R
eso
urc
es
Gro
un
d w
ate
r q
ua
lity
Flo
ra &
Flo
ral H
abita
t
Wild
life
Ha
bita
t
Fa
un
a
Th
rea
ten
ed
& E
nd
ang
ere
d s
pecie
s
Mig
rato
ry c
orr
ido
r &
ro
ut
Aq
ua
tic H
abita
t
Aq
ua
tic F
lora
& F
au
na
Lo
ss o
f L
ive
liho
od
Co
nflic
t on
Jo
b o
pp
ort
un
ity
Dis
rup
tio
n o
f In
frastr
uctu
re
Co
mm
on
Pro
pe
rty R
esou
rce
s
Du
st
& N
ois
e D
isco
mfo
rt
Lo
ss o
f A
gricu
ltu
ral P
rod
uctivity
Influx o
f P
op
ula
tio
n
Cu
ltu
ral &
He
rita
ge
Site
Jo
b &
Eco
no
mic
Op
po
rtu
nity
Occu
pa
tion
al H
ea
lth
& S
afe
ty
Co
mm
un
ity H
ealth
& S
afe
ty
Flaring during well testing x x x x
Accidental events – blow out x x x x x x x x x
Accidental events-spillage of
chemical & oil x x x
C. Early Production
Flaring of Gas x x x
DG Set of Emission x
Produced Water x x x x
D. Decommissioning and
Reinstatement Dismantling of rig and associated
facilities x x x X
Transportation of drilling rig and
ancillaries x x x X
Removal of well site construction
materials & disposal x x x
Vedanta Limited. (Division CAIRN Oil & Gas) DRAFT EIA: Onshore Oil and Gas E&A in RJ-ONHP- 2017/4 Block, Barmer District, Rajasthan
June,2019 AECOM
130
4.4. Impact Assessment
This section discusses the impacts of the project activities on the environmental receptors It discusses probable
impacts during various phases of the project lifecycle on the environmental and socio-economic components.
Rankings for every activity – component interaction is based on the criterion set earlier and resulting environmental
significance with necessary justification that has been recorded below for every set of impacts and the same has
been represented in evaluation matrices. In broader context, it is however important to remember that operations
related to drilling, testing and early production activities also include positive socio-economic impacts in terms of
increase in local business opportunities and on a larger perspective, by providing potential energy security at a
national level.
4.5. Potential Impact and Mitigation Measures on
Visual Environment & Aesthetics
Source of Impact: Aesthetics and visual environment impacts due to proposed project would be of low scale and
temporary in nature. There would be no significant change in landuse. Only the drilling rig boom with associated
facilities would be visible from the adjoining road and settlement area. The land area of disturbance is also very
less of the order of 9 Ha and the elevated rig would be visible from a distance.
Mitigation Measures:
If no hydro-carbon is found drom the well for economic recovery, then same would be closed and all supporting
facilities would be demobilized. The surface of earth after any unsuccessful attempts of oil exploration would be
restored back to normalcy in line with the prevailing landuse status of the area.
4.6. Potential Impact and Mitigation Measures on
Land Use
Source of impact: Land would be required for the drilling operations. In case of QPU the same drill site would be
used, and no new area would be procured.
Assessment of Impact
Site preparation
Potential impact on drainage is primarily anticipated in the form of disruption of natural drainage pattern during site
preparation and approach road construction. Since site preparation involves rising of acquired land to about 2 m
from the ground level it may lead to alteration of onsite micro-drainage pattern leading to potential problems of
obstruction of natural flow of water. Since the block is located in the arid region of Barmer district the impacts may
not be pronounced during normal climatic conditions. This problem is likely to be further aggravated due to flash
floods experienced in the district.
The access to majority of the drill sites in RJ-ONHP-2017/2 is characterized by paved and unpaved rural roads.
Well specific environmental setting study shows that most of the wells can be approached by an existing road.
However, for site approach a road need to be constructed. The length of the approach road which would be
constructed varies from 400-800 m. Widening and strengthening of existing paved/unpaved road will be required
for transportation of drilling rig and heavy equipment to the well site. Widening/ new construction of roads could
result in the alteration of drainage unless proper cross drainage structures are provided and may lead to water-
logging of adjacent lands.
Well Site Restoration
Site restoration will be initiated for well site not indicative of any commercially exploitable hydrocarbon reserves.
Unplanned restoration may lead to the long-term disruption in natural drainage pattern and water logging in
neighbouring agricultural land abutting the site. However, adequate care will be taken by Vedanta Limited. (Division
Cairn Oil & Gas) to restore the site back to its original condition based on the originally existing contours and
predominant slope to prevent any such adverse drainage impacts. The impact is considered to be of medium
significance with onsite drainage being dependent on the proper site restoration.
Vedanta Limited. (Division CAIRN Oil & Gas) DRAFT EIA: Onshore Oil and Gas E&A in RJ-ONHP- 2017/4 Block, Barmer District, Rajasthan
June,2019 AECOM
131
Severity of Impact 2 Extent of Impact 1 Duration of Impact 2
Impact Significance = 4 i.e. Low
Mitigation Measure
• During the construction of the access road adequate cross drainage structures to be provided
considering the topography of the alignment.
• Leveling and grading operations will be undertaken with minimal disturbance to the existing contour,
thereby maintaining the general slope of site;
• Disruption/alteration of micro-watershed drainage pattern will be minimized to the extent possible.
• .
• The excavated material from the drill site should be stored (temporarily /permanently) in uncultivated
land and should be away from any drainage channel.
4.7. Potential impact and Mitigation Measures on
Topography & Drainage
Potential impact on drainage and topography viz. alteration of drainage pattern are anticipated during well site
preparation, widening/strengthening of access roads and restoration of well facilities. The impact details have been
discussed in the below section.
Impacts during road & site development
The strengthening of the access road would require some earth works especially at the sharp bends. The existing
access road, culverts will not be disturbed. Thus, no change in the micro-drainage pattern along the access roads
is expected.
For drilling operations approximately 9 ha site will be required. The site will be selected taking considering drainage
pattern, thus during site preparation the cutting and filling would be limited. No change in the micro-drainage pattern
and slope of the areas in the vicinity of the site is expected. In case of unplanned disposal of soils and other waste
blockage of local drainage channels can happen. Considering the above factors all these impacts would be
temporary (in construction phase only) are largely at local level.
Severity of Impact 2 Extent of Impact 1 Duration of Impact 2
Impact Significance = 8 i.e. Medium
Mitigation Measure
• Leveling and grading operations will be undertaken with minimal disturbance to the existing contour,
thereby maintaining the general slope of site;
• Provision of drainage system will be made for surface run-off.
4.8. Potential Impact and Mitigation Measures on Air
Quality
Source of Pollution: The probable sources of impact on ambient air quality during different phase of the
project are listed below.
• Pre-drilling phase, construction of production facilities:
o Site development;
o Operation of vehicles and construction machinery;
Vedanta Limited. (Division CAIRN Oil & Gas) DRAFT EIA: Onshore Oil and Gas E&A in RJ-ONHP- 2017/4 Block, Barmer District, Rajasthan
June,2019 AECOM
132
o Transportation, storage, handling of construction material, disposal of construction
waste;
o Operation of DG sets.
• Drilling phase:
o Operation of DG sets;
o Emissions from flare stack;
o Transport of drilling chemical and manpower etc.
• De-commissioning phase:
o Decommissioning of rig and associated facilities;
o Transport of de-mobilised rigs and machineries.
• Operation of Production facilities
o Emission from DG sets
o Emission from flare stacks
Embedded Control Measures: Project embedded control measures are as follows:
• Vehicle, equipment and machinery used for drilling would conform to applicable emission norms;
• Drilling chemical and materials would be stored in covered areas to prevent fugitive emissions;
• DG set stacks would have adequate height, as per statutory requirements, to be able to
adequately disperse exhaust gases; and
• Flare stacks of adequate height would be provided.
Assessment of Impact: The potential impact due to above mentioned activities has been discussed
in following section.
Fugitive emission: Fugitive dust emissions due to the proposed project will be principally associated
with emissions of dust during the site preparation. The dust generated would be primarily from the
handling and transportation of fill material and re-entrainment of dust during movement of the vehicles
on unpaved roads. The generation of such fugitive dust is likely to be governed by wind speed and
direction. Effects of dust emissions are heightened by dry weather and high wind speeds and effectively
reduced to zero when soils and/or ambient conditions are wet. However, dust generated from the site
development and construction activity will generally settle down on the adjacent areas within a short
period due to its larger particle size.
Emissions from Vehicles/Equipment: The pre-drilling and decommissioning operations would involve
movement of diesel operated vehicles and operation of machineries and equipment. Heavy vehicles
will be particularly intense during site preparation and decommissioning phases. Gaseous pollutants
such as NOx, SO2, PM10 and CO are likely to be emitted from operation of vehicles and machineries.
Impacts from Operation of DG sets and Flaring: The proposed project will involve the operation of
one diesel driven 350KVA and two 1000 KVA generators for drilling of each development and appraisal
wells. Combustion of fuel in a DG sets typically happens at high temperatures resulting in generation
of considerable amounts of NO2. The SO2 concentration in emissions is dependent on the Sulphur
content in fuel burnt and particulate matter consisting of unburnt carbon particles. The emissions from
the DG set will be discharged into the atmosphere through an adequate stack height.
Flaring of gases primarily during the well testing phase will contribute to additional air pollution. Flaring
involves high temperature oxidation process to burn combustible gases that may be generated from the
proposed well sites.
Elevated flaring (30m) will be done during operation of QPU/EPU.
In order to predict the Ground Level Concentrations (GLCs) at various distances from the source, of the
above-mentioned pollutants, an air quality modelling exercise has been undertaken and is discussed in
the impact prediction section below.
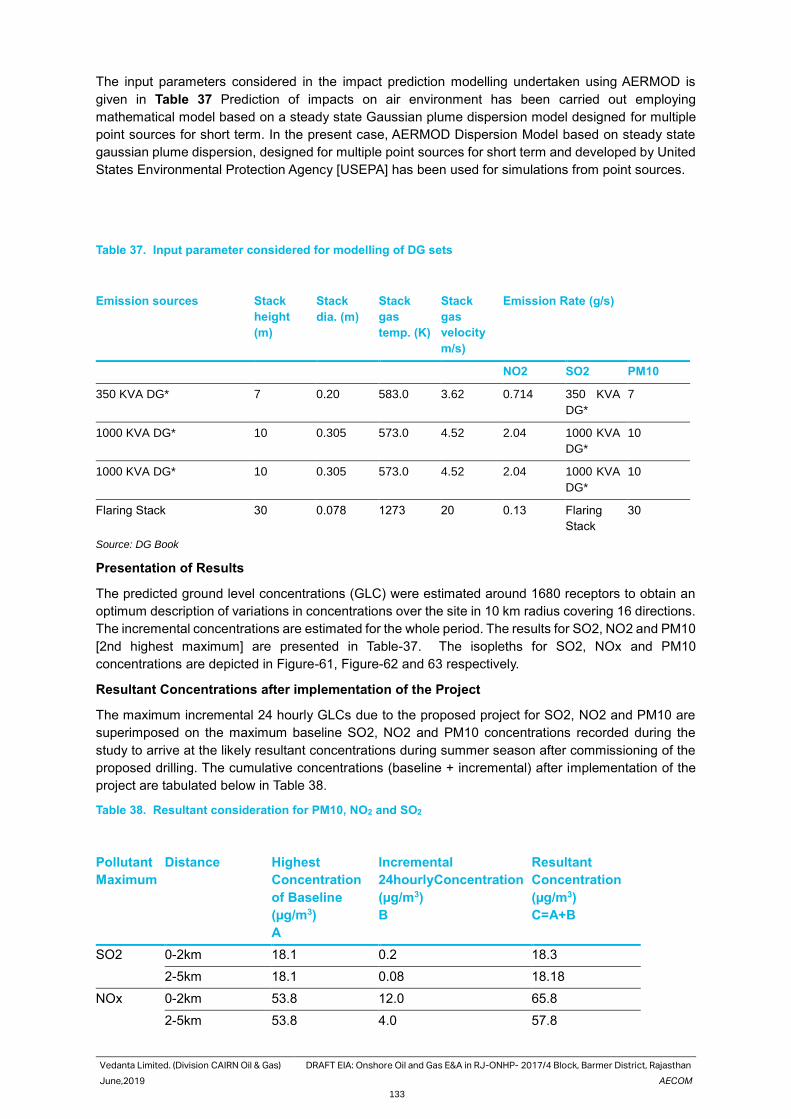
Vedanta Limited. (Division CAIRN Oil & Gas) DRAFT EIA: Onshore Oil and Gas E&A in RJ-ONHP- 2017/4 Block, Barmer District, Rajasthan
June,2019 AECOM
133
The input parameters considered in the impact prediction modelling undertaken using AERMOD is
given in Table 37 Prediction of impacts on air environment has been carried out employing
mathematical model based on a steady state Gaussian plume dispersion model designed for multiple
point sources for short term. In the present case, AERMOD Dispersion Model based on steady state
gaussian plume dispersion, designed for multiple point sources for short term and developed by United
States Environmental Protection Agency [USEPA] has been used for simulations from point sources.
Table 37. Input parameter considered for modelling of DG sets
Emission sources Stack
height
(m)
Stack
dia. (m)
Stack
gas
temp. (K)
Stack
gas
velocity
m/s)
Emission Rate (g/s)
NO2 SO2 PM10
350 KVA DG* 7 0.20 583.0 3.62 0.714 350 KVA
DG*
7
1000 KVA DG* 10 0.305 573.0 4.52 2.04 1000 KVA
DG*
10
1000 KVA DG* 10 0.305 573.0 4.52 2.04 1000 KVA
DG*
10
Flaring Stack 30 0.078 1273 20 0.13 Flaring
Stack
30
Source: DG Book
Presentation of Results
The predicted ground level concentrations (GLC) were estimated around 1680 receptors to obtain an
optimum description of variations in concentrations over the site in 10 km radius covering 16 directions.
The incremental concentrations are estimated for the whole period. The results for SO2, NO2 and PM10
[2nd highest maximum] are presented in Table-37. The isopleths for SO2, NOx and PM10
concentrations are depicted in Figure-61, Figure-62 and 63 respectively.
Resultant Concentrations after implementation of the Project
The maximum incremental 24 hourly GLCs due to the proposed project for SO2, NO2 and PM10 are
superimposed on the maximum baseline SO2, NO2 and PM10 concentrations recorded during the
study to arrive at the likely resultant concentrations during summer season after commissioning of the
proposed drilling. The cumulative concentrations (baseline + incremental) after implementation of the
project are tabulated below in Table 38.
Table 38. Resultant consideration for PM10, NO2 and SO2
Pollutant
Maximum
Distance Highest
Concentration
of Baseline
(µg/m3)
A
Incremental
24hourlyConcentration
(µg/m3)
B
Resultant
Concentration
(µg/m3)
C=A+B
SO2 0-2km 18.1 0.2 18.3
2-5km 18.1 0.08 18.18
NOx 0-2km 53.8 12.0 65.8
2-5km 53.8 4.0 57.8
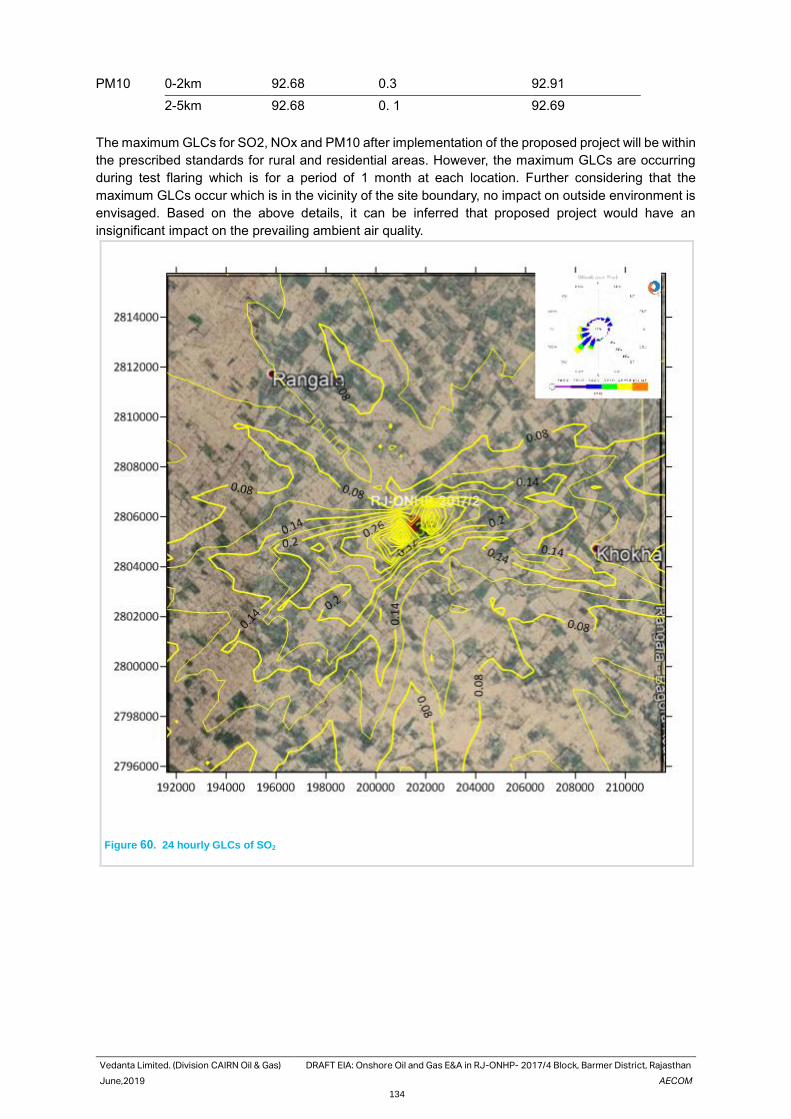
Vedanta Limited. (Division CAIRN Oil & Gas) DRAFT EIA: Onshore Oil and Gas E&A in RJ-ONHP- 2017/4 Block, Barmer District, Rajasthan
June,2019 AECOM
134
PM10 0-2km 92.68 0.3 92.91
2-5km 92.68 0. 1 92.69
The maximum GLCs for SO2, NOx and PM10 after implementation of the proposed project will be within
the prescribed standards for rural and residential areas. However, the maximum GLCs are occurring
during test flaring which is for a period of 1 month at each location. Further considering that the
maximum GLCs occur which is in the vicinity of the site boundary, no impact on outside environment is
envisaged. Based on the above details, it can be inferred that proposed project would have an
insignificant impact on the prevailing ambient air quality.
Figure 60. 24 hourly GLCs of SO2
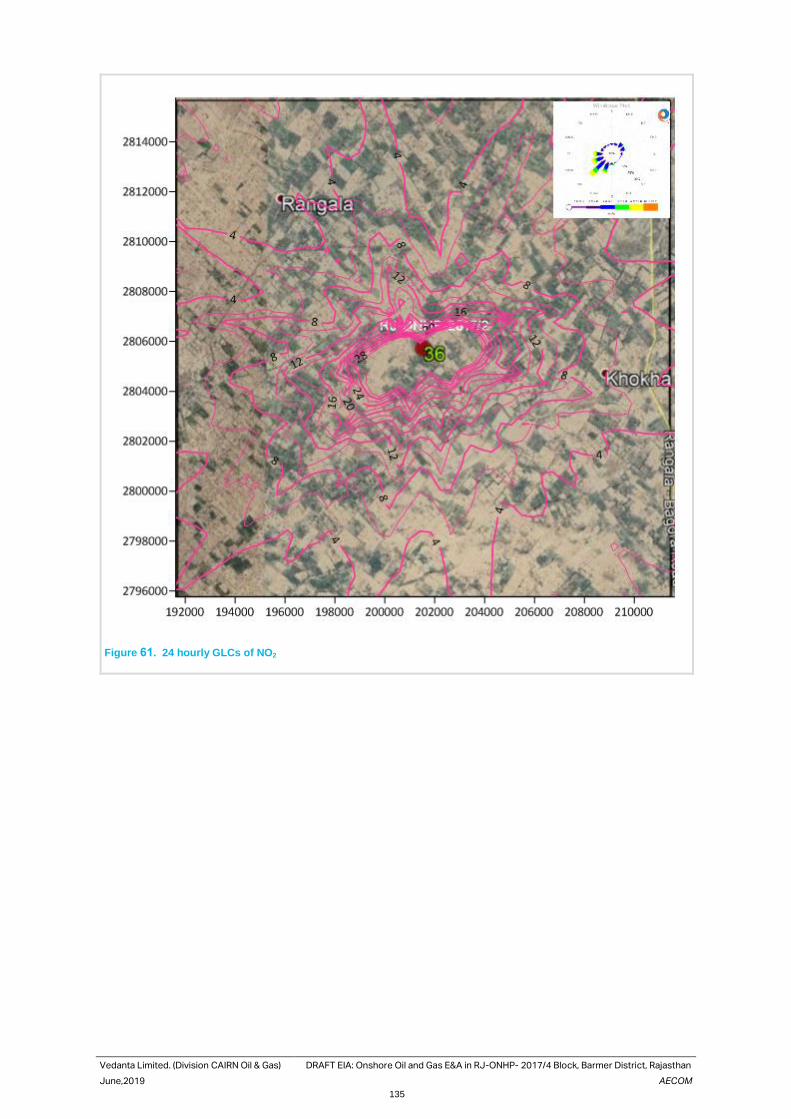
Vedanta Limited. (Division CAIRN Oil & Gas) DRAFT EIA: Onshore Oil and Gas E&A in RJ-ONHP- 2017/4 Block, Barmer District, Rajasthan
June,2019 AECOM
135
Figure 61. 24 hourly GLCs of NO2
Vedanta Limited. (Division CAIRN Oil & Gas) DRAFT EIA: Onshore Oil and Gas E&A in RJ-ONHP- 2017/4 Block, Barmer District, Rajasthan
June,2019 AECOM
136
Figure 62. 24 hourly GLCs of PM 10
Severity of Impact 2 Extent of Impact 1 Duration of Impact 2
Impact Significance = 4 i.e. Low
Mitigation Measures: The proposed mitigation measures are as follows:
To minimise emission of fugitive dusts the following measures would be adopted:
• Carry out regular water sprinkling at the site during dry season especially during the construction
and decommissioning activities;
• Efforts would be made to maintain the stockpile against the wall or obstruction so that it works as a
windbreak and the fugitive emissions by strong winds can be avoided;
• The trucks used for transport of fill material during the site preparation and debris transport during
the decommissioning shall be provided with impervious sheeting;
• During construction, the approach road will be kept clean, free from mud and slurry to prevent any
entrainment of dust;
• Location of construction materials will be away from nearby worker’s camps;
• Proper handling of materials to ensure minimal emission of dust.
Vedanta Limited. (Division CAIRN Oil & Gas) DRAFT EIA: Onshore Oil and Gas E&A in RJ-ONHP- 2017/4 Block, Barmer District, Rajasthan
June,2019 AECOM
137
To minimise emission from the vehicles, equipment and machinery the following measures
would be adopted:
• Movement of construction vehicles will be minimised and a speed of 20 km/hr will be enforced along
the access and approach roads;
• All diesel-powered equipment will be regularly maintained and idling time reduced to minimise
emissions;
• Low sulphur diesel (S<0.5%) will be used in diesel powered equipment and best management
practices would be adhered to;
• Vehicle / equipment air emissions will be controlled by good practice procedures (such as turning
off equipment when not in use); and
• Vehicle / equipment exhausts observed emitting significant black smoke in their exhausts would be
serviced/replaced.
To minimise the adverse impacts of flaring the following measures should be adopted:
• Proper engineering controls to ensure complete combustion of gas;
• No cold venting will be resorted instead flaring will be done with combustion efficient elevated flare
tip; and
• Location of flare stacks to be chosen considering the sensitive receptors adjoining the site.
4.9. Potential Impact and Mitigation Measures on
Noise Quality
Potential impact on noise quality is anticipated from vehicular movement, operation of construction machinery,
access road strengthening during well site preparation and operation of drilling rig and ancillary equipments during
drilling operation and early production.
Source of Impact:
The potential impacts on noise quality may arise out of the following:
• Pre-drilling phase,
─ Site development/preparation ;
─ Operation of vehicles and construction machinery;
─ Transportation, storage, handling of construction material, disposal of construction waste;
• Operation of DG sets Drilling phase:
─ Operation of DG sets and drilling rig
─ Operation of machineries & equipment;
─ Vehicular traffic.
• Decommissioning phase:
─ Demobilization activity
─ Vehicular traffic.
• Quick/ Early Production:
─ Flaring of the Gas
─ Opeartion of CEG/DG sets.
Assessment of Noise Impacts due to Site Activities
Driller rotors and the power generators and pumps would be the main sources of noise pollution during the drilling
activity. Noise due to vehicular movement will be intermittent but will also add to the background noise levels. The
Vedanta Limited. (Division CAIRN Oil & Gas) DRAFT EIA: Onshore Oil and Gas E&A in RJ-ONHP- 2017/4 Block, Barmer District, Rajasthan
June,2019 AECOM
138
well site during excavation phase of the site preparation where heavy earth moving machinery will be in operation,
noise level of the vehicle should not be more than the 90 dB (A).
Typically, the noise generating sources for the onshore drilling activity are provided below (in the immediate vicinity)
• GEG/ Diesel Generator: 75 dB(A)
• Pumps at the Rig: 85 to 90 dB(A)
• Mud pumps: 73.3-80.5 dB(A)
• Control Room & Quarters: 50 to 60 dB(A)
• Drilling: 85-90 dB(A)
• Flaring: 86.0 dB(A)
In order to predict ambient noise levels due to the proposed drilling of exploratory wells. The preparative modeling
has been done. For computing the noise levels at various distances with respect to the proposed site, noise levels
are predicted using an user friendly model the details of which is elaborated below.
Mathematical Model for Sound Wave Propagation During Operation
For an approximate estimation of dispersion of noise in the ambient from the source point, a standard mathematical
model for sound wave propagation is used. The sound pressure level generated by noise sources decreases with
increasing distance from the source due to wave divergence. An additional decrease in sound pressure level with
distance from the source is expected due to atmospheric effect or its interaction with objects in the transmission
path.
For hemispherical sound wave propagation through homogenous loss free medium, one can estimate noise levels
at various locations, due to different sources using model based on first principles, as per the following equat
Lp2 =Lp1-20log (r2 /r1) (1)
Where Lp2 and Lp1 are Sound Pressure Levels (SPLs) at points located at distances r2 and r1 from the source.
The combined effect of all the sources then can be determined at various locations by the following equation.
Lp(total) = 10 x LOG10 (SUM[10^(L1/10) + 10^(L2/10) … (2)
Where, Lp1, Lp2, Lp3 are noise pressure levels at a point due to different sources. Based on the above equations
an user friendly model has been developed. The details of the model are as follows:
Based on the above equations an user friendly model has been developed. The details of the model are as follows:
• Noise levels can be predicted at any distance specified from the source;
• Model is designed to take topography or flat terrain;
• Coordinates of the sources in meters;
• Maximum and Minimum levels are calculated by the model;
• Output of the model in the form of isopleths; and
• Environmental attenuation factors and machine corrections have not been incorporated in the model but
corrections are made for the measured Leq levels.
Input for the Model
The incremental increase in noise levels due to the operation phase of the exploratory drilling has been done.
Noise levels are mainly generated from DG sets, air compressors, pumps and transformers. The noise sources
have been defined with respect to center of drill site. The input data pertaining to corresponding noise level are
tabulated below.
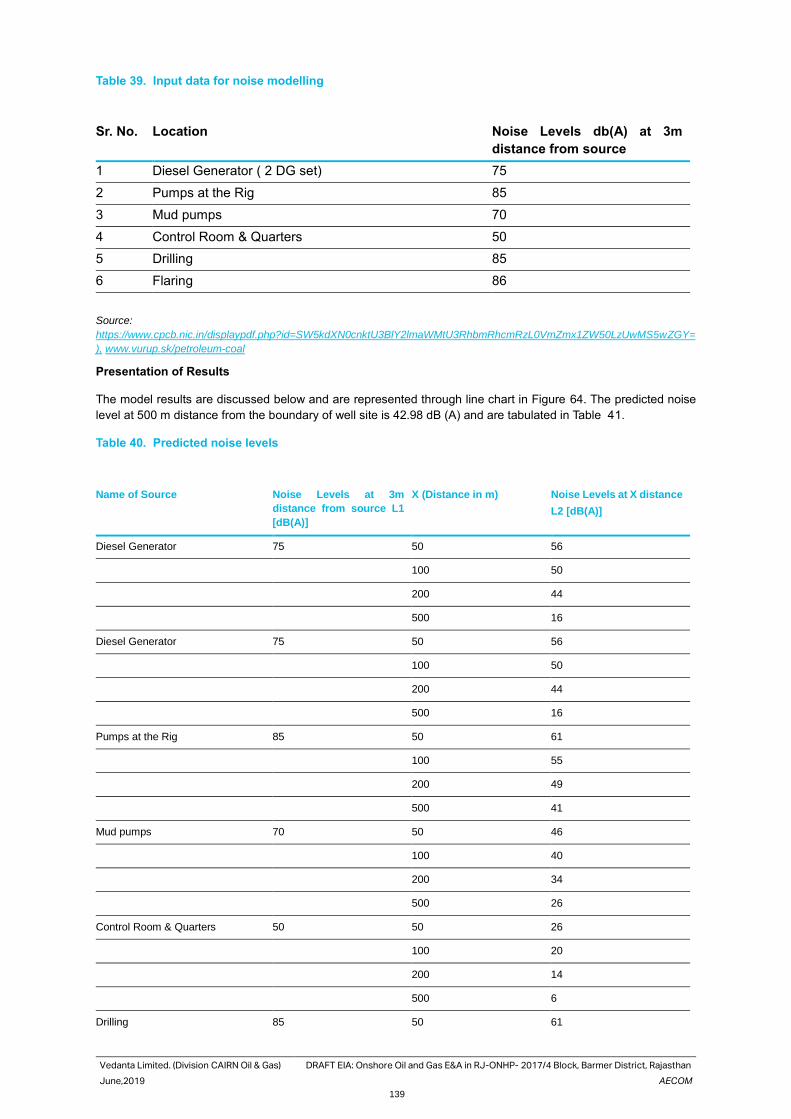
Vedanta Limited. (Division CAIRN Oil & Gas) DRAFT EIA: Onshore Oil and Gas E&A in RJ-ONHP- 2017/4 Block, Barmer District, Rajasthan
June,2019 AECOM
139
Table 39. Input data for noise modelling
Sr. No. Location Noise Levels db(A) at 3m
distance from source
1 Diesel Generator ( 2 DG set) 75
2 Pumps at the Rig 85
3 Mud pumps 70
4 Control Room & Quarters 50
5 Drilling 85
6 Flaring 86
Source:
https://www.cpcb.nic.in/displaypdf.php?id=SW5kdXN0cnktU3BlY2lmaWMtU3RhbmRhcmRzL0VmZmx1ZW50LzUwMS5wZGY=
), www.vurup.sk/petroleum-coal
Presentation of Results
The model results are discussed below and are represented through line chart in Figure 64. The predicted noise
level at 500 m distance from the boundary of well site is 42.98 dB (A) and are tabulated in Table 41.
Table 40. Predicted noise levels
Name of Source Noise Levels at 3m
distance from source L1
[dB(A)]
X (Distance in m) Noise Levels at X distance
L2 [dB(A)]
Diesel Generator 75 50 56
100 50
200 44
500 16
Diesel Generator 75 50 56
100 50
200 44
500 16
Pumps at the Rig 85 50 61
100 55
200 49
500 41
Mud pumps 70 50 46
100 40
200 34
500 26
Control Room & Quarters 50 50 26
100 20
200 14
500 6
Drilling 85 50 61
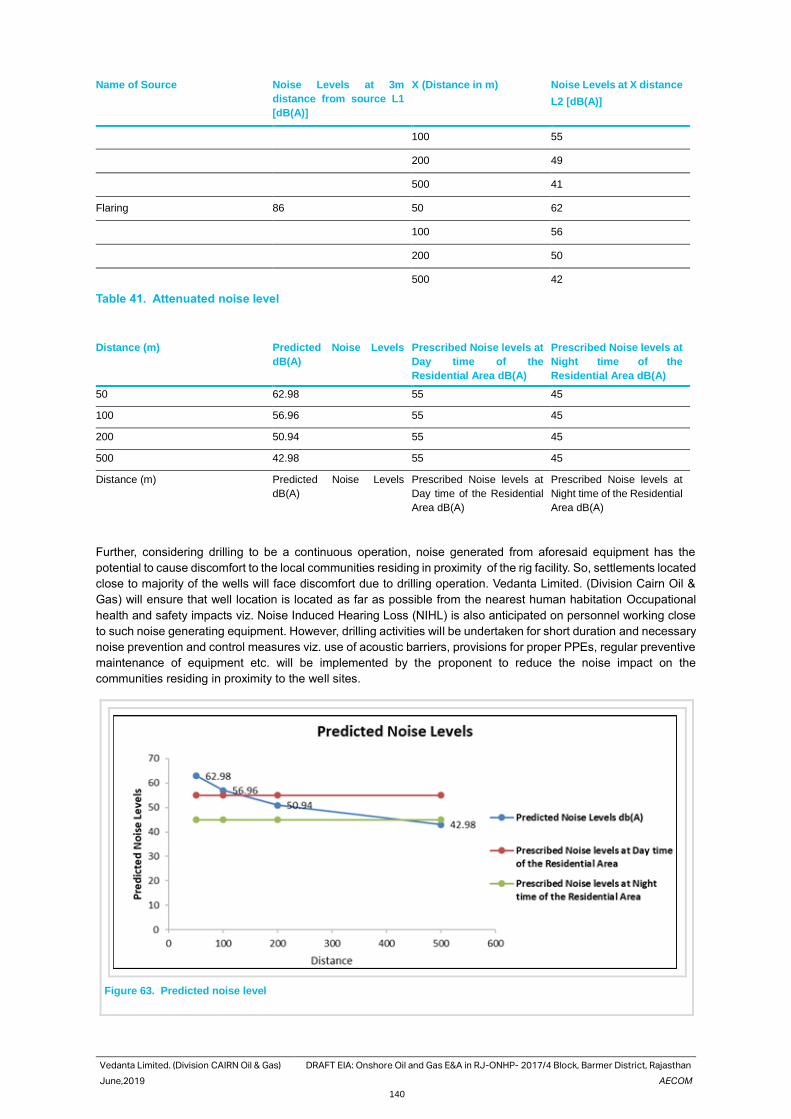
Vedanta Limited. (Division CAIRN Oil & Gas) DRAFT EIA: Onshore Oil and Gas E&A in RJ-ONHP- 2017/4 Block, Barmer District, Rajasthan
June,2019 AECOM
140
Name of Source Noise Levels at 3m
distance from source L1
[dB(A)]
X (Distance in m) Noise Levels at X distance
L2 [dB(A)]
100 55
200 49
500 41
Flaring 86 50 62
100 56
200 50
500 42
Table 41. Attenuated noise level
Distance (m) Predicted Noise Levels
dB(A)
Prescribed Noise levels at
Day time of the
Residential Area dB(A)
Prescribed Noise levels at
Night time of the
Residential Area dB(A)
50 62.98 55 45
100 56.96 55 45
200 50.94 55 45
500 42.98 55 45
Distance (m) Predicted Noise Levels
dB(A)
Prescribed Noise levels at
Day time of the Residential
Area dB(A)
Prescribed Noise levels at
Night time of the Residential
Area dB(A)
Further, considering drilling to be a continuous operation, noise generated from aforesaid equipment has the
potential to cause discomfort to the local communities residing in proximity of the rig facility. So, settlements located
close to majority of the wells will face discomfort due to drilling operation. Vedanta Limited. (Division Cairn Oil &
Gas) will ensure that well location is located as far as possible from the nearest human habitation Occupational
health and safety impacts viz. Noise Induced Hearing Loss (NIHL) is also anticipated on personnel working close
to such noise generating equipment. However, drilling activities will be undertaken for short duration and necessary
noise prevention and control measures viz. use of acoustic barriers, provisions for proper PPEs, regular preventive
maintenance of equipment etc. will be implemented by the proponent to reduce the noise impact on the
communities residing in proximity to the well sites.
Figure 63. Predicted noise level
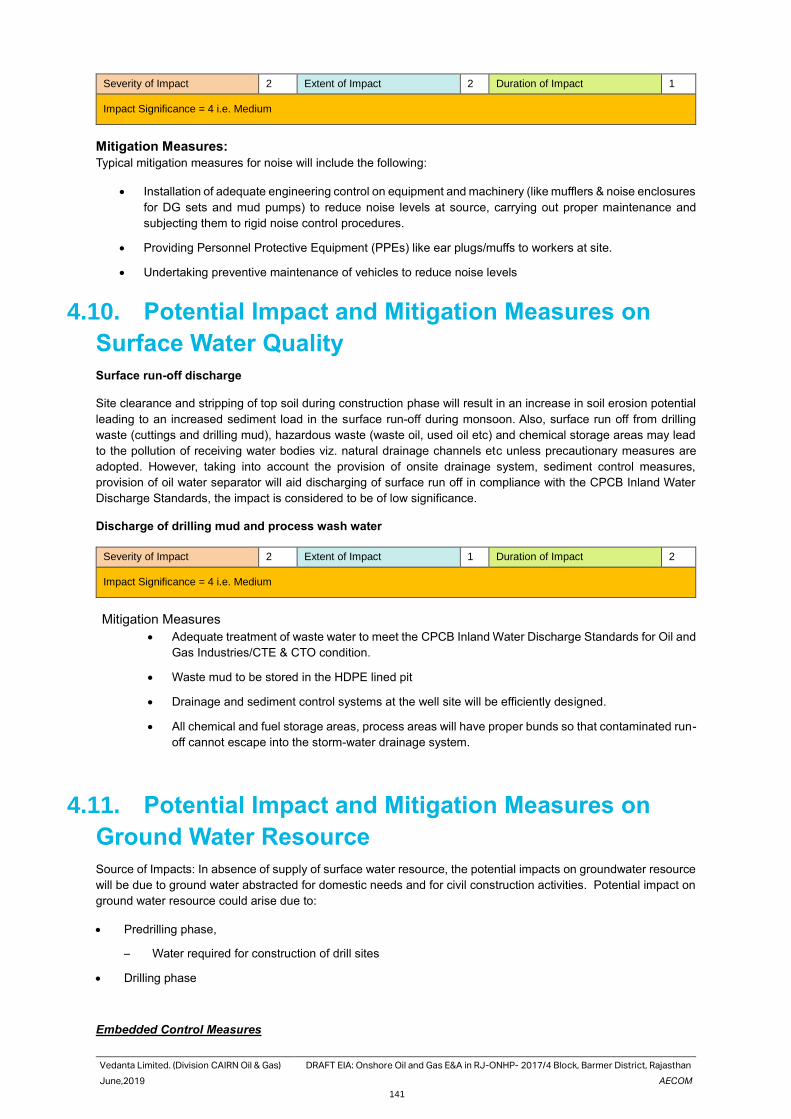
Vedanta Limited. (Division CAIRN Oil & Gas) DRAFT EIA: Onshore Oil and Gas E&A in RJ-ONHP- 2017/4 Block, Barmer District, Rajasthan
June,2019 AECOM
141
Severity of Impact 2 Extent of Impact 2 Duration of Impact 1
Impact Significance = 4 i.e. Medium
Mitigation Measures:
Typical mitigation measures for noise will include the following:
• Installation of adequate engineering control on equipment and machinery (like mufflers & noise enclosures
for DG sets and mud pumps) to reduce noise levels at source, carrying out proper maintenance and
subjecting them to rigid noise control procedures.
• Providing Personnel Protective Equipment (PPEs) like ear plugs/muffs to workers at site.
• Undertaking preventive maintenance of vehicles to reduce noise levels
4.10. Potential Impact and Mitigation Measures on
Surface Water Quality
Surface run-off discharge
Site clearance and stripping of top soil during construction phase will result in an increase in soil erosion potential
leading to an increased sediment load in the surface run-off during monsoon. Also, surface run off from drilling
waste (cuttings and drilling mud), hazardous waste (waste oil, used oil etc) and chemical storage areas may lead
to the pollution of receiving water bodies viz. natural drainage channels etc unless precautionary measures are
adopted. However, taking into account the provision of onsite drainage system, sediment control measures,
provision of oil water separator will aid discharging of surface run off in compliance with the CPCB Inland Water
Discharge Standards, the impact is considered to be of low significance.
Discharge of drilling mud and process wash water
Severity of Impact 2 Extent of Impact 1 Duration of Impact 2
Impact Significance = 4 i.e. Medium
Mitigation Measures
• Adequate treatment of waste water to meet the CPCB Inland Water Discharge Standards for Oil and
Gas Industries/CTE & CTO condition.
• Waste mud to be stored in the HDPE lined pit
• Drainage and sediment control systems at the well site will be efficiently designed.
• All chemical and fuel storage areas, process areas will have proper bunds so that contaminated run-
off cannot escape into the storm-water drainage system.
4.11. Potential Impact and Mitigation Measures on
Ground Water Resource
Source of Impacts: In absence of supply of surface water resource, the potential impacts on groundwater resource
will be due to ground water abstracted for domestic needs and for civil construction activities. Potential impact on
ground water resource could arise due to:
• Predrilling phase,
─ Water required for construction of drill sites
• Drilling phase
Embedded Control Measures
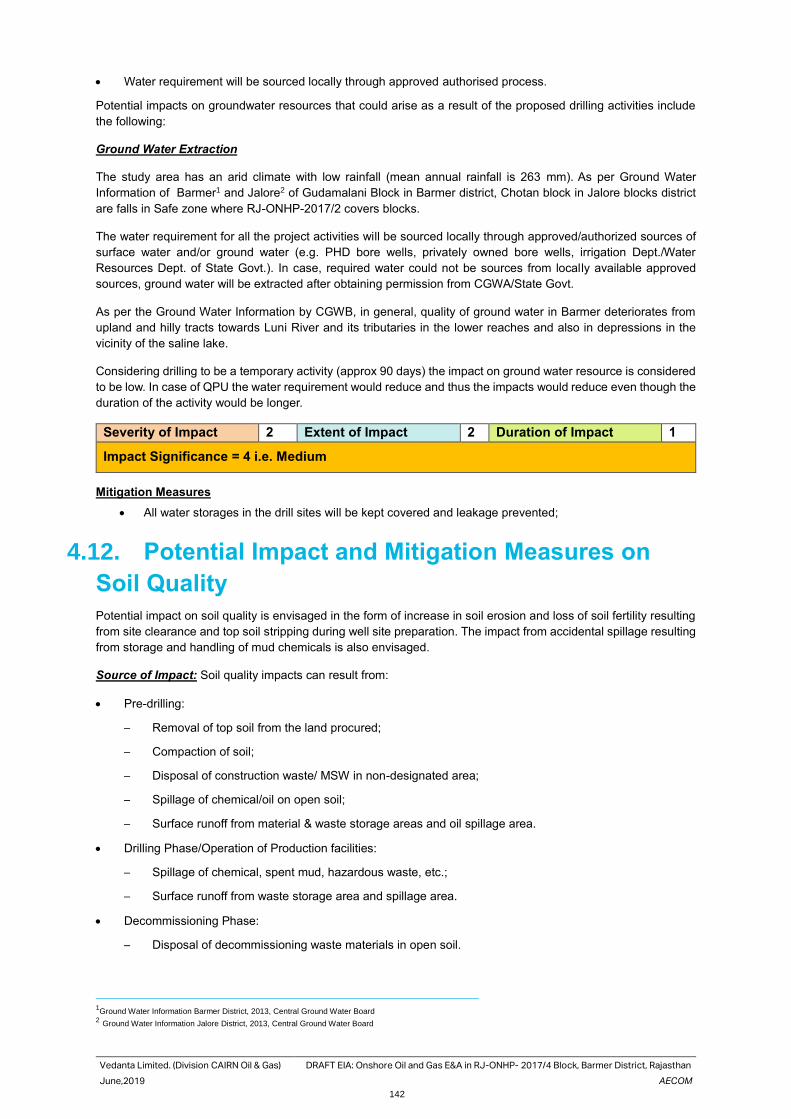
Vedanta Limited. (Division CAIRN Oil & Gas) DRAFT EIA: Onshore Oil and Gas E&A in RJ-ONHP- 2017/4 Block, Barmer District, Rajasthan
June,2019 AECOM
142
• Water requirement will be sourced locally through approved authorised process.
Potential impacts on groundwater resources that could arise as a result of the proposed drilling activities include
the following:
Ground Water Extraction
The study area has an arid climate with low rainfall (mean annual rainfall is 263 mm). As per Ground Water
Information of Barmer1 and Jalore2 of Gudamalani Block in Barmer district, Chotan block in Jalore blocks district
are falls in Safe zone where RJ-ONHP-2017/2 covers blocks.
The water requirement for all the project activities will be sourced locally through approved/authorized sources of
surface water and/or ground water (e.g. PHD bore wells, privately owned bore wells, irrigation Dept./Water
Resources Dept. of State Govt.). In case, required water could not be sources from locally available approved
sources, ground water will be extracted after obtaining permission from CGWA/State Govt.
As per the Ground Water Information by CGWB, in general, quality of ground water in Barmer deteriorates from
upland and hilly tracts towards Luni River and its tributaries in the lower reaches and also in depressions in the
vicinity of the saline lake.
Considering drilling to be a temporary activity (approx 90 days) the impact on ground water resource is considered
to be low. In case of QPU the water requirement would reduce and thus the impacts would reduce even though the
duration of the activity would be longer.
Severity of Impact 2 Extent of Impact 2 Duration of Impact 1
Impact Significance = 4 i.e. Medium
Mitigation Measures
• All water storages in the drill sites will be kept covered and leakage prevented;
4.12. Potential Impact and Mitigation Measures on
Soil Quality
Potential impact on soil quality is envisaged in the form of increase in soil erosion and loss of soil fertility resulting
from site clearance and top soil stripping during well site preparation. The impact from accidental spillage resulting
from storage and handling of mud chemicals is also envisaged.
Source of Impact: Soil quality impacts can result from:
• Pre-drilling:
─ Removal of top soil from the land procured;
─ Compaction of soil;
─ Disposal of construction waste/ MSW in non-designated area;
─ Spillage of chemical/oil on open soil;
─ Surface runoff from material & waste storage areas and oil spillage area.
• Drilling Phase/Operation of Production facilities:
─ Spillage of chemical, spent mud, hazardous waste, etc.;
─ Surface runoff from waste storage area and spillage area.
• Decommissioning Phase:
─ Disposal of decommissioning waste materials in open soil.
1Ground Water Information Barmer District, 2013, Central Ground Water Board
2 Ground Water Information Jalore District, 2013, Central Ground Water Board
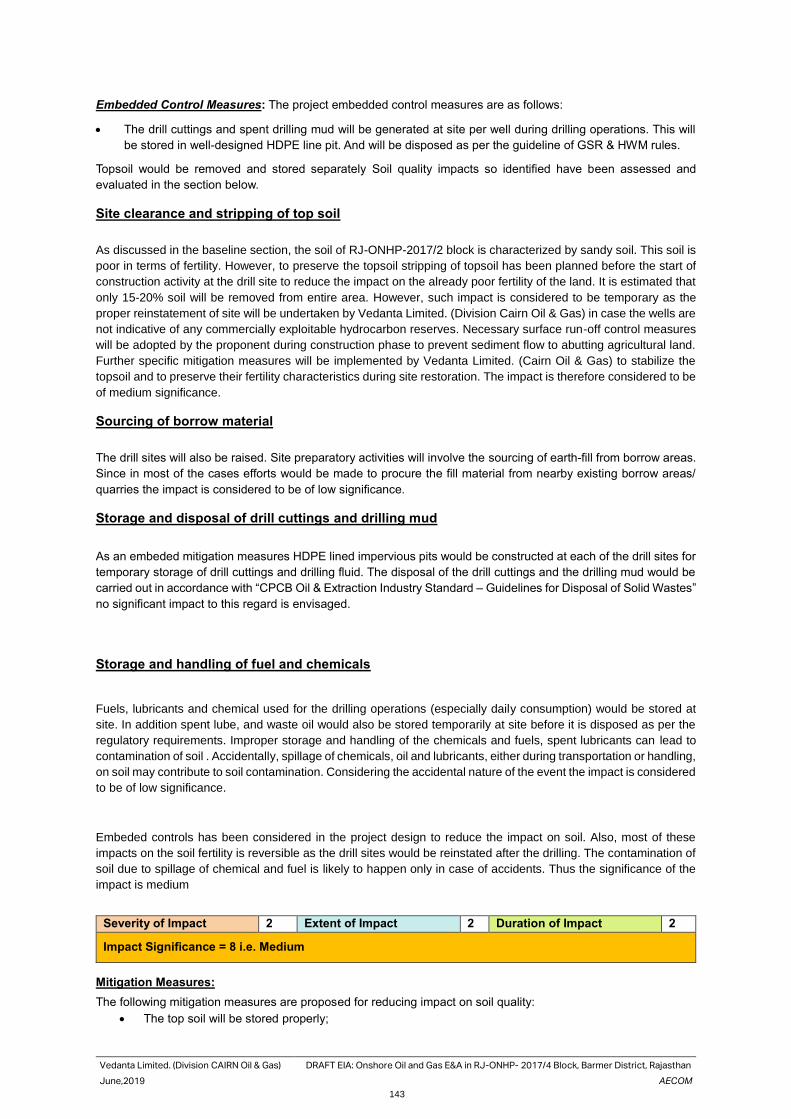
Vedanta Limited. (Division CAIRN Oil & Gas) DRAFT EIA: Onshore Oil and Gas E&A in RJ-ONHP- 2017/4 Block, Barmer District, Rajasthan
June,2019 AECOM
143
Embedded Control Measures: The project embedded control measures are as follows:
• The drill cuttings and spent drilling mud will be generated at site per well during drilling operations. This will
be stored in well-designed HDPE line pit. And will be disposed as per the guideline of GSR & HWM rules.
Topsoil would be removed and stored separately Soil quality impacts so identified have been assessed and
evaluated in the section below.
Site clearance and stripping of top soil
As discussed in the baseline section, the soil of RJ-ONHP-2017/2 block is characterized by sandy soil. This soil is
poor in terms of fertility. However, to preserve the topsoil stripping of topsoil has been planned before the start of
construction activity at the drill site to reduce the impact on the already poor fertility of the land. It is estimated that
only 15-20% soil will be removed from entire area. However, such impact is considered to be temporary as the
proper reinstatement of site will be undertaken by Vedanta Limited. (Division Cairn Oil & Gas) in case the wells are
not indicative of any commercially exploitable hydrocarbon reserves. Necessary surface run-off control measures
will be adopted by the proponent during construction phase to prevent sediment flow to abutting agricultural land.
Further specific mitigation measures will be implemented by Vedanta Limited. (Cairn Oil & Gas) to stabilize the
topsoil and to preserve their fertility characteristics during site restoration. The impact is therefore considered to be
of medium significance.
Sourcing of borrow material
The drill sites will also be raised. Site preparatory activities will involve the sourcing of earth-fill from borrow areas.
Since in most of the cases efforts would be made to procure the fill material from nearby existing borrow areas/
quarries the impact is considered to be of low significance.
Storage and disposal of drill cuttings and drilling mud
As an embeded mitigation measures HDPE lined impervious pits would be constructed at each of the drill sites for
temporary storage of drill cuttings and drilling fluid. The disposal of the drill cuttings and the drilling mud would be
carried out in accordance with “CPCB Oil & Extraction Industry Standard – Guidelines for Disposal of Solid Wastes”
no significant impact to this regard is envisaged.
Storage and handling of fuel and chemicals
Fuels, lubricants and chemical used for the drilling operations (especially daily consumption) would be stored at
site. In addition spent lube, and waste oil would also be stored temporarily at site before it is disposed as per the
regulatory requirements. Improper storage and handling of the chemicals and fuels, spent lubricants can lead to
contamination of soil . Accidentally, spillage of chemicals, oil and lubricants, either during transportation or handling,
on soil may contribute to soil contamination. Considering the accidental nature of the event the impact is considered
to be of low significance.
Embeded controls has been considered in the project design to reduce the impact on soil. Also, most of these
impacts on the soil fertility is reversible as the drill sites would be reinstated after the drilling. The contamination of
soil due to spillage of chemical and fuel is likely to happen only in case of accidents. Thus the significance of the
impact is medium
Severity of Impact 2 Extent of Impact 2 Duration of Impact 2
Impact Significance = 8 i.e. Medium
Mitigation Measures:
The following mitigation measures are proposed for reducing impact on soil quality:
• The top soil will be stored properly;
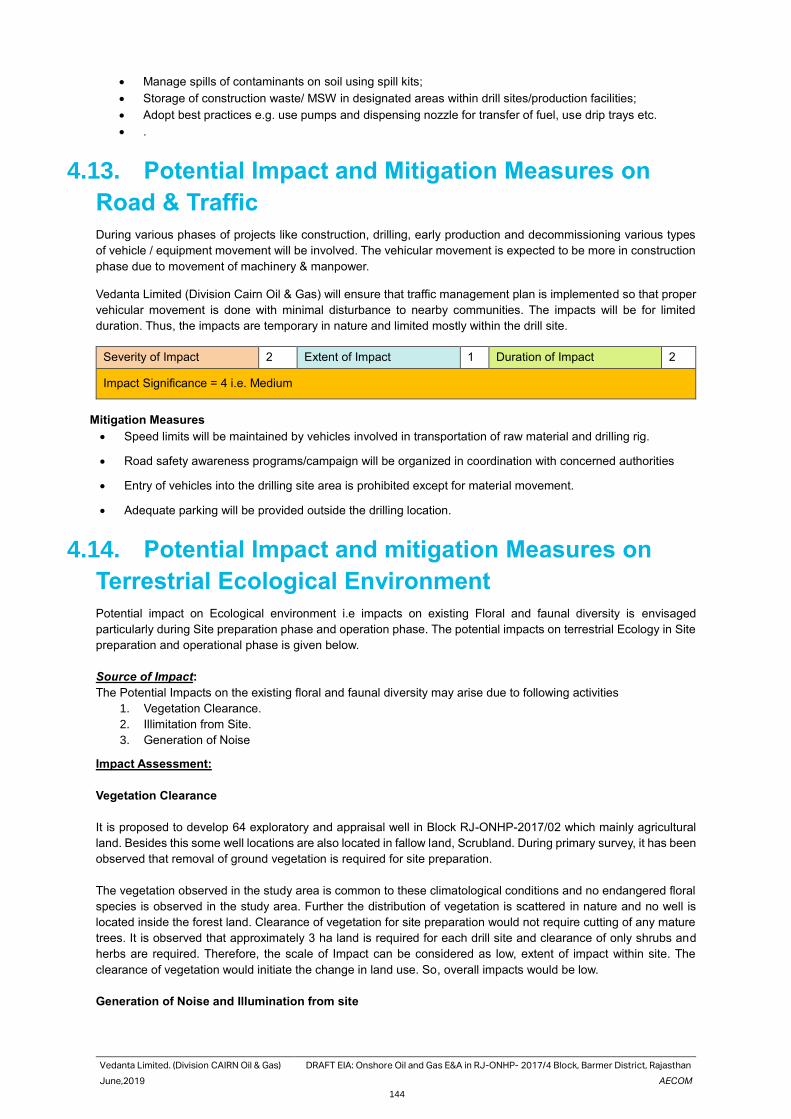
Vedanta Limited. (Division CAIRN Oil & Gas) DRAFT EIA: Onshore Oil and Gas E&A in RJ-ONHP- 2017/4 Block, Barmer District, Rajasthan
June,2019 AECOM
144
• Manage spills of contaminants on soil using spill kits;
• Storage of construction waste/ MSW in designated areas within drill sites/production facilities;
• Adopt best practices e.g. use pumps and dispensing nozzle for transfer of fuel, use drip trays etc.
• .
4.13. Potential Impact and Mitigation Measures on
Road & Traffic
During various phases of projects like construction, drilling, early production and decommissioning various types
of vehicle / equipment movement will be involved. The vehicular movement is expected to be more in construction
phase due to movement of machinery & manpower.
Vedanta Limited (Division Cairn Oil & Gas) will ensure that traffic management plan is implemented so that proper
vehicular movement is done with minimal disturbance to nearby communities. The impacts will be for limited
duration. Thus, the impacts are temporary in nature and limited mostly within the drill site.
Severity of Impact 2 Extent of Impact 1 Duration of Impact 2
Impact Significance = 4 i.e. Medium
Mitigation Measures
• Speed limits will be maintained by vehicles involved in transportation of raw material and drilling rig.
• Road safety awareness programs/campaign will be organized in coordination with concerned authorities
• Entry of vehicles into the drilling site area is prohibited except for material movement.
• Adequate parking will be provided outside the drilling location.
4.14. Potential Impact and mitigation Measures on
Terrestrial Ecological Environment
Potential impact on Ecological environment i.e impacts on existing Floral and faunal diversity is envisaged
particularly during Site preparation phase and operation phase. The potential impacts on terrestrial Ecology in Site
preparation and operational phase is given below.
Source of Impact:
The Potential Impacts on the existing floral and faunal diversity may arise due to following activities
1. Vegetation Clearance.
2. Illimitation from Site.
3. Generation of Noise
Impact Assessment:
Vegetation Clearance
It is proposed to develop 64 exploratory and appraisal well in Block RJ-ONHP-2017/02 which mainly agricultural
land. Besides this some well locations are also located in fallow land, Scrubland. During primary survey, it has been
observed that removal of ground vegetation is required for site preparation.
The vegetation observed in the study area is common to these climatological conditions and no endangered floral
species is observed in the study area. Further the distribution of vegetation is scattered in nature and no well is
located inside the forest land. Clearance of vegetation for site preparation would not require cutting of any mature
trees. It is observed that approximately 3 ha land is required for each drill site and clearance of only shrubs and
herbs are required. Therefore, the scale of Impact can be considered as low, extent of impact within site. The
clearance of vegetation would initiate the change in land use. So, overall impacts would be low.
Generation of Noise and Illumination from site
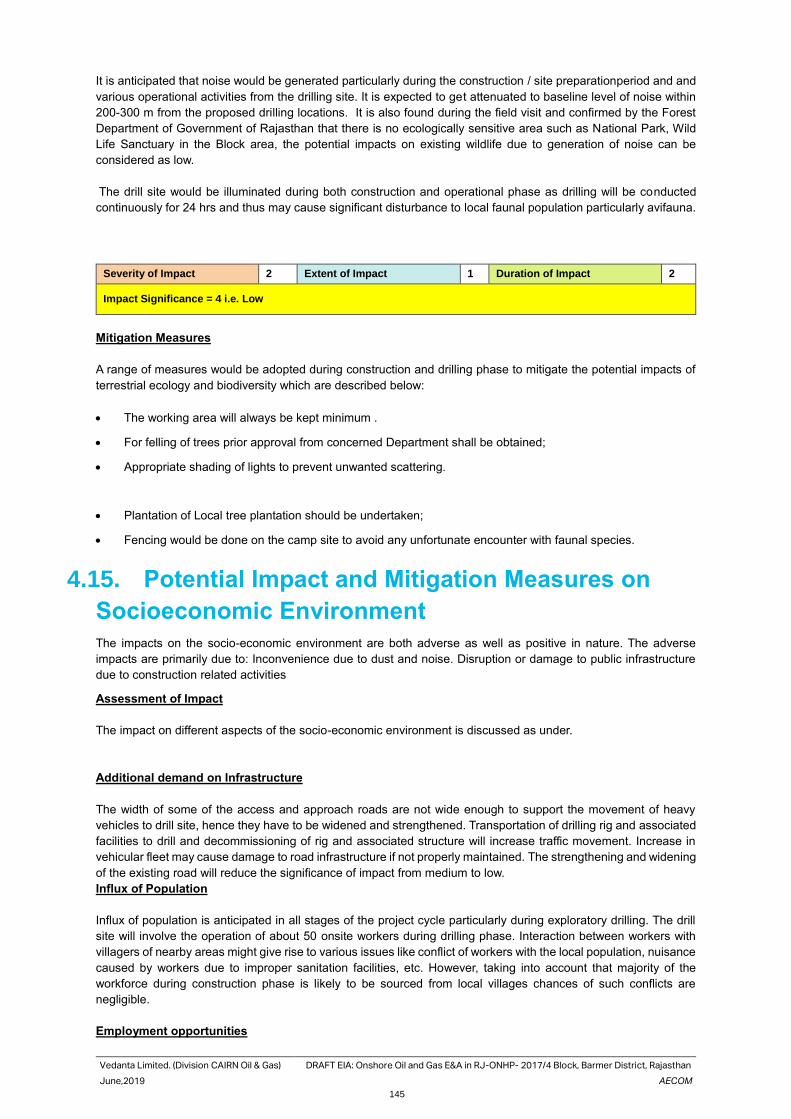
Vedanta Limited. (Division CAIRN Oil & Gas) DRAFT EIA: Onshore Oil and Gas E&A in RJ-ONHP- 2017/4 Block, Barmer District, Rajasthan
June,2019 AECOM
145
It is anticipated that noise would be generated particularly during the construction / site preparationperiod and and
various operational activities from the drilling site. It is expected to get attenuated to baseline level of noise within
200-300 m from the proposed drilling locations. It is also found during the field visit and confirmed by the Forest
Department of Government of Rajasthan that there is no ecologically sensitive area such as National Park, Wild
Life Sanctuary in the Block area, the potential impacts on existing wildlife due to generation of noise can be
considered as low.
The drill site would be illuminated during both construction and operational phase as drilling will be conducted
continuously for 24 hrs and thus may cause significant disturbance to local faunal population particularly avifauna.
Severity of Impact 2 Extent of Impact 1 Duration of Impact 2
Impact Significance = 4 i.e. Low
Mitigation Measures
A range of measures would be adopted during construction and drilling phase to mitigate the potential impacts of
terrestrial ecology and biodiversity which are described below:
• The working area will always be kept minimum .
• For felling of trees prior approval from concerned Department shall be obtained;
• Appropriate shading of lights to prevent unwanted scattering.
• Plantation of Local tree plantation should be undertaken;
• Fencing would be done on the camp site to avoid any unfortunate encounter with faunal species.
4.15. Potential Impact and Mitigation Measures on
Socioeconomic Environment
The impacts on the socio-economic environment are both adverse as well as positive in nature. The adverse
impacts are primarily due to: Inconvenience due to dust and noise. Disruption or damage to public infrastructure
due to construction related activities
Assessment of Impact
The impact on different aspects of the socio-economic environment is discussed as under.
Additional demand on Infrastructure
The width of some of the access and approach roads are not wide enough to support the movement of heavy
vehicles to drill site, hence they have to be widened and strengthened. Transportation of drilling rig and associated
facilities to drill and decommissioning of rig and associated structure will increase traffic movement. Increase in
vehicular fleet may cause damage to road infrastructure if not properly maintained. The strengthening and widening
of the existing road will reduce the significance of impact from medium to low.
Influx of Population
Influx of population is anticipated in all stages of the project cycle particularly during exploratory drilling. The drill
site will involve the operation of about 50 onsite workers during drilling phase. Interaction between workers with
villagers of nearby areas might give rise to various issues like conflict of workers with the local population, nuisance
caused by workers due to improper sanitation facilities, etc. However, taking into account that majority of the
workforce during construction phase is likely to be sourced from local villages chances of such conflicts are
negligible.
Employment opportunities
Vedanta Limited. (Division CAIRN Oil & Gas) DRAFT EIA: Onshore Oil and Gas E&A in RJ-ONHP- 2017/4 Block, Barmer District, Rajasthan
June,2019 AECOM
146
Project will benefit people living in the neighbouring villages temporarily by creating opportunity for direct & indirect
employment associated with the various project activities . Site preparation phase will involve certain number of
laborers and there is a possibility that local people can be engaged for this purpose. Drilling process will involve a
number of skilled and unskilled workers. Generation of short time employment opportunities during the project
phase would improve the employment scenario of the area.
Cultural & Heritage Site
Impact on cultural environment may occur due to site preparation, operation of drilling rig and also during vehicular
movement with respect to the proposed exploration activities. There is no designated historical or cultural spots
close to the well sites or access roads hence; no impact in this regard is envisaged.
Corporate Social Responsibility
Vedanta Limited (Division Cairn Oil & Gas) has taken up various CSR initiatives in and around present operational
areas for the benefit of the residents as per the CSR Act and Rules, Govt. of India. CSR measures will be taken
up by Vedanta Limited. (Division Cairn Oil & Gas) in case of commercially viable hydrocarbon discovery & further
full-fledged development of the fields and production and associated facilities.
Mitigation Measures
• The shortest distance as far as available/feasible would be considered for access road, with additional care
to avoid division of land parcels into agriculturally unviable fractions;
• The village road identified for accessing proposed project footprints, would be strengthened and widened as
per requirement before starting construction work;
• Appropriate awareness program on grievance redressal mechanism, would be designed and implemented
for local community around proposed project footprints;
Impact Significance = ++ i.e. POSITIVE
4.16. Potential Impact and Mitigation Measures on
Occupational Health and Safety
Construction
Source of Impact Occupational health and safety impacts during construction phase are anticipated primarily from:
• Operation of construction machineries/equipment;
• Exposure to high noise generation areas.
Embedded Control Measures The project embedded control measures are as follows:
• Provision of proper PPEs for the contractor workers onsite;
• Provision of drinking water facility, sanitation and cooking facilities.
Assessment of Impact
Impact on occupational health and safety of contractor workers is anticipated from exposure to high noise
generated from operation of heavy machinery/equipment and fugitive dust generated from material stockpiles,
earth works and vehicular emission. It is estimated that about 50-60 workers would be deployed by the
contractor at each drill site and 10-20 workers in the production facility. The outstation project workforce would
be housed in labour camp located within the drill site. Continuous exposure of workers to high noise levels and
fugitive dust and inadequate facilities and unhygienic conditions at such camps may lead to adverse health
impacts viz. headache, asthma, allergy, hearing loss etc. indicating a high receptor sensitivity. However, extent
of the impact would be limited to the well site and production facility only hence the impact would be localized
only. Also considering the temporary nature of the construction phase activities, operation of
machinery/equipment will be short term and with provision of proper PPEs and training for the workers scale
of the impact will be low. Hence, the impact magnitude for occupation health and safety due to above
mentioned construction activities have been assessed to be of medium and significance would be moderate.
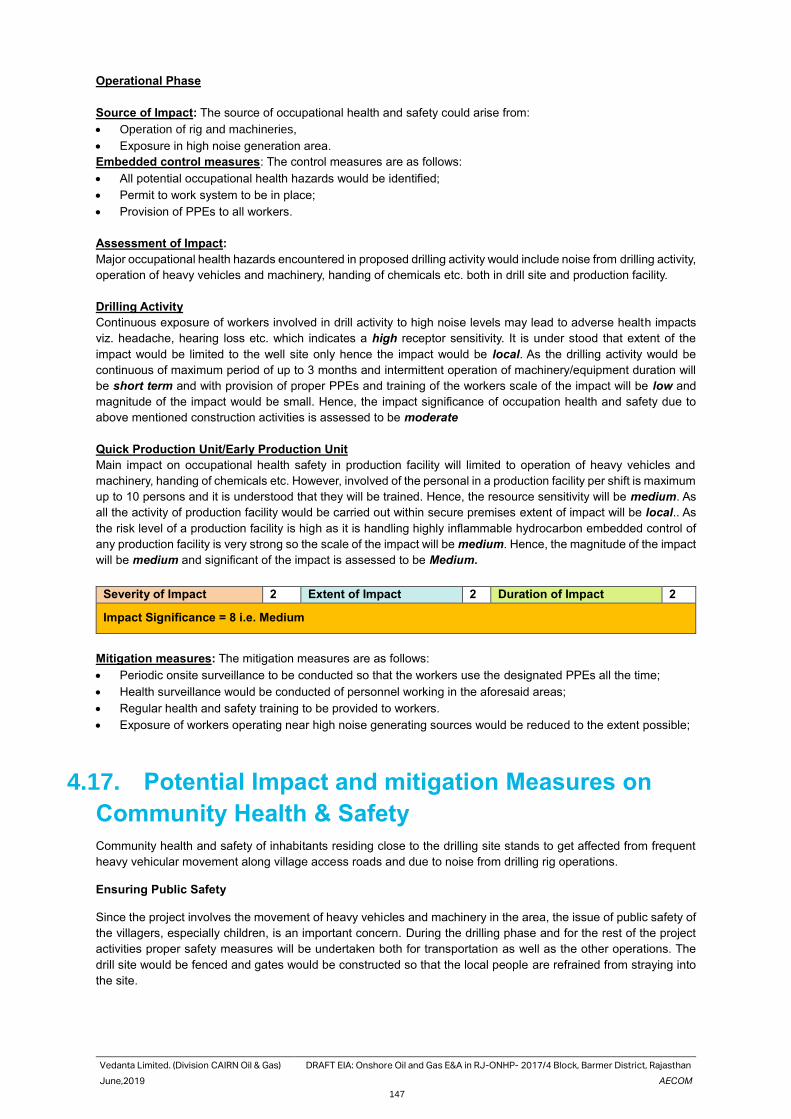
Vedanta Limited. (Division CAIRN Oil & Gas) DRAFT EIA: Onshore Oil and Gas E&A in RJ-ONHP- 2017/4 Block, Barmer District, Rajasthan
June,2019 AECOM
147
Operational Phase
Source of Impact: The source of occupational health and safety could arise from:
• Operation of rig and machineries,
• Exposure in high noise generation area.
Embedded control measures: The control measures are as follows:
• All potential occupational health hazards would be identified;
• Permit to work system to be in place;
• Provision of PPEs to all workers.
Assessment of Impact:
Major occupational health hazards encountered in proposed drilling activity would include noise from drilling activity,
operation of heavy vehicles and machinery, handing of chemicals etc. both in drill site and production facility.
Drilling Activity
Continuous exposure of workers involved in drill activity to high noise levels may lead to adverse health impacts
viz. headache, hearing loss etc. which indicates a high receptor sensitivity. It is under stood that extent of the
impact would be limited to the well site only hence the impact would be local. As the drilling activity would be
continuous of maximum period of up to 3 months and intermittent operation of machinery/equipment duration will
be short term and with provision of proper PPEs and training of the workers scale of the impact will be low and
magnitude of the impact would be small. Hence, the impact significance of occupation health and safety due to
above mentioned construction activities is assessed to be moderate
Quick Production Unit/Early Production Unit
Main impact on occupational health safety in production facility will limited to operation of heavy vehicles and
machinery, handing of chemicals etc. However, involved of the personal in a production facility per shift is maximum
up to 10 persons and it is understood that they will be trained. Hence, the resource sensitivity will be medium. As
all the activity of production facility would be carried out within secure premises extent of impact will be local.. As
the risk level of a production facility is high as it is handling highly inflammable hydrocarbon embedded control of
any production facility is very strong so the scale of the impact will be medium. Hence, the magnitude of the impact
will be medium and significant of the impact is assessed to be Medium.
Severity of Impact 2 Extent of Impact 2 Duration of Impact 2
Impact Significance = 8 i.e. Medium
Mitigation measures: The mitigation measures are as follows:
• Periodic onsite surveillance to be conducted so that the workers use the designated PPEs all the time;
• Health surveillance would be conducted of personnel working in the aforesaid areas;
• Regular health and safety training to be provided to workers.
• Exposure of workers operating near high noise generating sources would be reduced to the extent possible;
4.17. Potential Impact and mitigation Measures on
Community Health & Safety
Community health and safety of inhabitants residing close to the drilling site stands to get affected from frequent
heavy vehicular movement along village access roads and due to noise from drilling rig operations.
Ensuring Public Safety
Since the project involves the movement of heavy vehicles and machinery in the area, the issue of public safety of
the villagers, especially children, is an important concern. During the drilling phase and for the rest of the project
activities proper safety measures will be undertaken both for transportation as well as the other operations. The
drill site would be fenced and gates would be constructed so that the local people are refrained from straying into
the site.

Vedanta Limited. (Division CAIRN Oil & Gas) DRAFT EIA: Onshore Oil and Gas E&A in RJ-ONHP- 2017/4 Block, Barmer District, Rajasthan
June,2019 AECOM
148
The movement of traffic is also likely to disrupt access conditions of the inhabitants residing close to the access
road. The increase in traffic will have implications on their safety too, as well as create congestion, potential delays
and inconvenience for pedestrians.
Health and safety impact arising from technological emergencies viz. well blow outs, explosions will be dealt
separately in the Quantitative Risk Assessment (QRA) section.
Although the aforesaid activities are temporary in nature it may not adversely affect community health and safety
in the long term. Mitigation measures will be taken as outlined in environmental management plan to reduce the
impacts arising out of project activities.
Severity of Impact 2 Extent of Impact 2 Duration of Impact 2
Impact Significance = 8 i.e. Medium
Mitigation Measures:
• Drilling activities should be under proper fencing
• Proper hoardings in English and local language should be displayed during construction and operation phase
to prevent people from encroaching the fenced area or to make them aware of the danger associated with
the construction
• Traffic management plan will be developed and implemented at site.
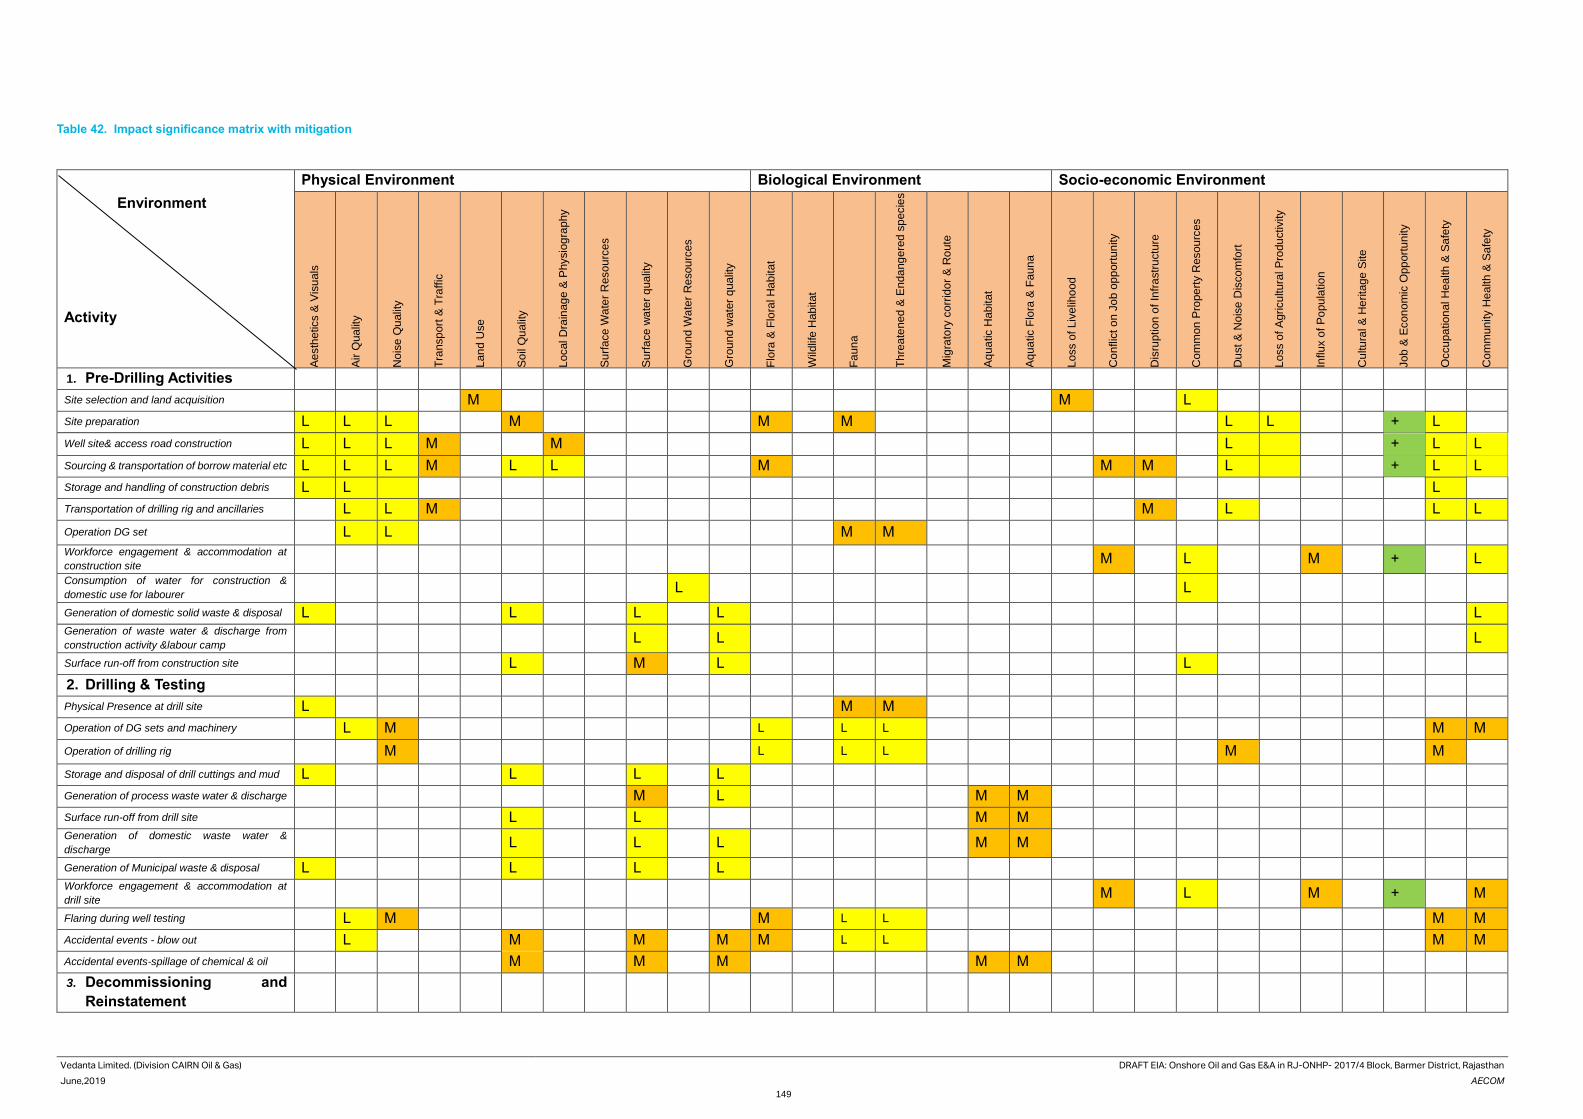
Vedanta Limited. (Division CAIRN Oil & Gas) DRAFT EIA: Onshore Oil and Gas E&A in RJ-ONHP- 2017/4 Block, Barmer District, Rajasthan
June,2019 AECOM
149
Table 42. Impact significance matrix with mitigation
Environment
Activity
Physical Environment Biological Environment Socio-economic Environment
Ae
sth
etics &
Vis
uals
Air
Qua
lity
No
ise
Qu
alit
y
Tra
nsp
ort
& T
raffic
Lan
d U
se
So
il Q
ualit
y
Local D
rain
ag
e &
Physio
gra
phy
Su
rfa
ce
Wa
ter
Resou
rces
Su
rfa
ce
wa
ter
qua
lity
Gro
und
Wa
ter
Re
sou
rces
Gro
und
wate
r q
ua
lity
Flo
ra &
Flo
ral H
ab
itat
Wild
life
Hab
itat
Fa
un
a
Th
rea
tened
& E
nda
ng
ere
d s
pecie
s
Mig
rato
ry c
orr
ido
r &
Ro
ute
Aq
ua
tic H
ab
itat
Aq
ua
tic F
lora
& F
aun
a
Loss o
f L
ive
liho
od
Co
nflic
t o
n J
ob o
pp
ort
un
ity
Dis
ruption
of
Infr
astr
uctu
re
Co
mm
on
Pro
pe
rty R
esou
rces
Du
st &
No
ise
Dis
co
mfo
rt
Loss o
f A
gricu
ltura
l P
rodu
ctivity
Influx o
f P
opu
latio
n
Cu
ltu
ral &
He
rita
ge
Site
Job
& E
con
om
ic O
pp
ort
un
ity
Occu
pa
tion
al H
ea
lth
& S
afe
ty
Co
mm
un
ity H
ea
lth &
Sa
fety
1. Pre-Drilling Activities
Site selection and land acquisition M M L
Site preparation L L L M M M L L + L
Well site& access road construction L L L M M L + L L
Sourcing & transportation of borrow material etc L L L M L L M M M L + L L
Storage and handling of construction debris L L L
Transportation of drilling rig and ancillaries L L M M L L L
Operation DG set L L M M
Workforce engagement & accommodation at
construction site M L M + L
Consumption of water for construction &
domestic use for labourer L L
Generation of domestic solid waste & disposal L L L L L
Generation of waste water & discharge from
construction activity &labour camp L L L
Surface run-off from construction site L M L L
2. Drilling & Testing
Physical Presence at drill site L M M
Operation of DG sets and machinery L M L L L M M
Operation of drilling rig M L L L M M
Storage and disposal of drill cuttings and mud L L L L
Generation of process waste water & discharge M L M M
Surface run-off from drill site L L M M
Generation of domestic waste water &
discharge L L L M M
Generation of Municipal waste & disposal L L L L
Workforce engagement & accommodation at
drill site M L M + M
Flaring during well testing L M M L L M M
Accidental events - blow out L M M M M L L M M
Accidental events-spillage of chemical & oil M M M M M
3. Decommissioning and
Reinstatement
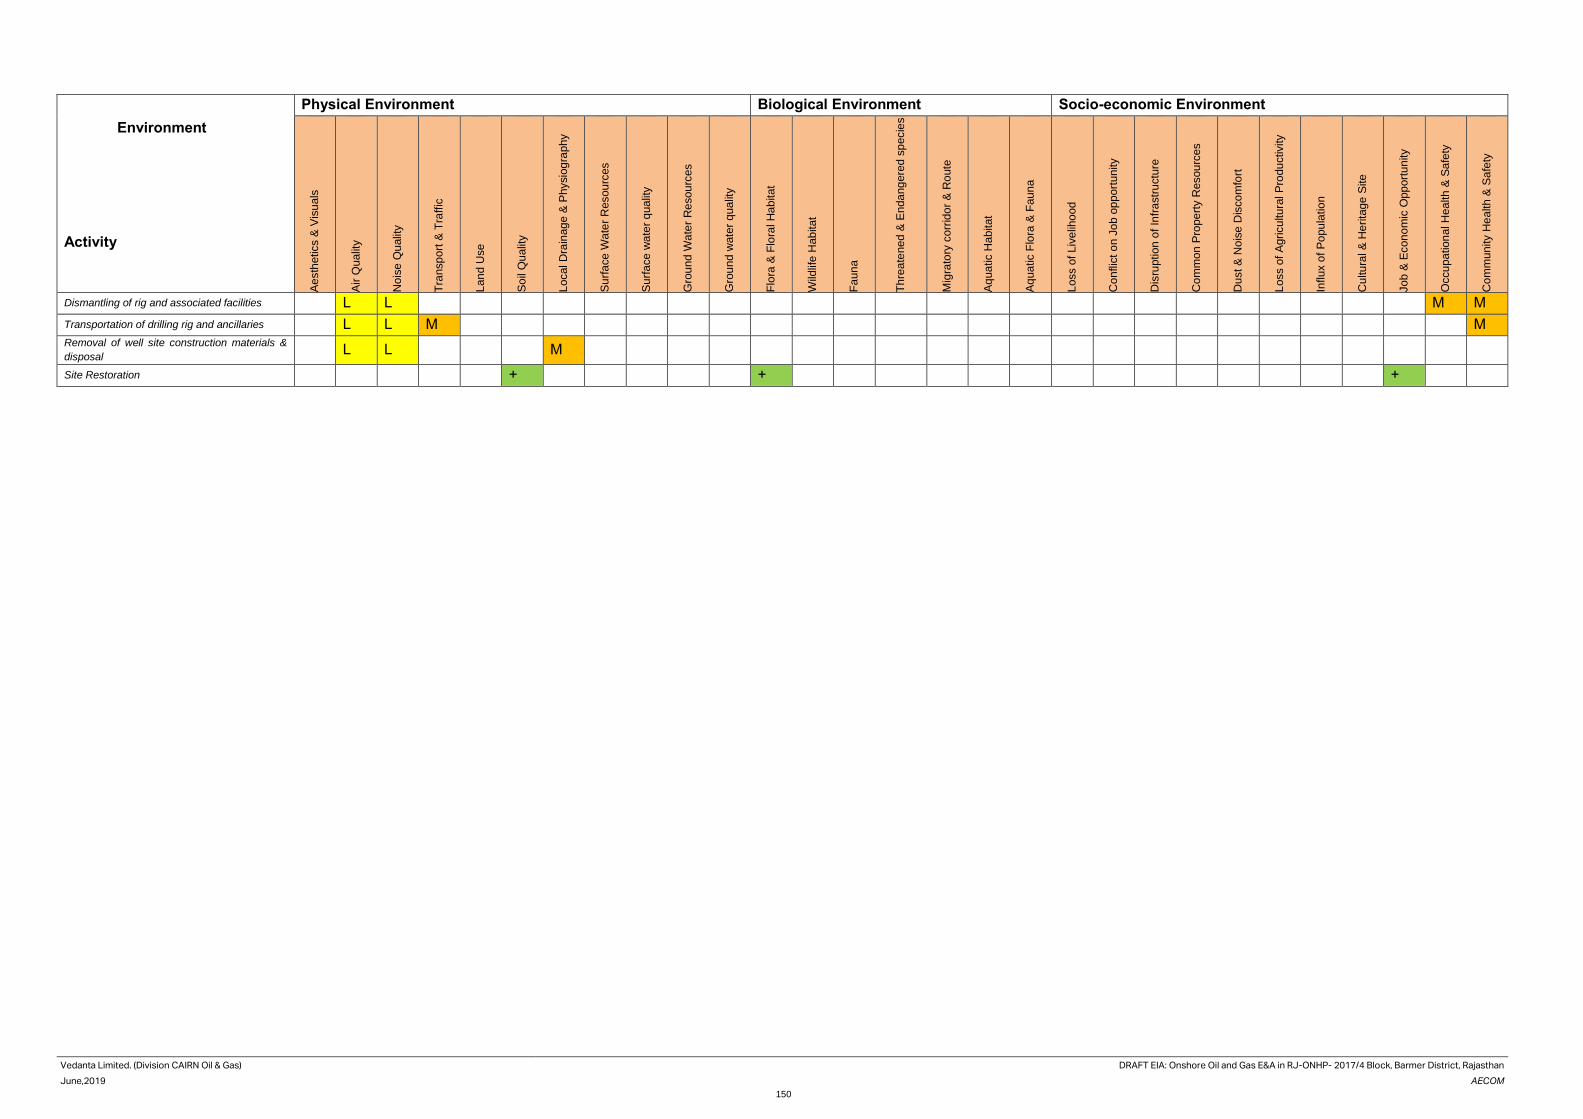
Vedanta Limited. (Division CAIRN Oil & Gas) DRAFT EIA: Onshore Oil and Gas E&A in RJ-ONHP- 2017/4 Block, Barmer District, Rajasthan
June,2019 AECOM
150
Environment
Activity
Physical Environment Biological Environment Socio-economic Environment
Ae
sth
etics &
Vis
uals
Air
Qua
lity
No
ise
Qu
alit
y
Tra
nsp
ort
& T
raffic
Lan
d U
se
So
il Q
ualit
y
Local D
rain
ag
e &
Physio
gra
phy
Su
rfa
ce
Wa
ter
Resou
rces
Su
rfa
ce
wa
ter
qua
lity
Gro
und
Wa
ter
Re
sou
rces
Gro
und
wate
r q
ua
lity
Flo
ra &
Flo
ral H
ab
itat
Wild
life
Hab
itat
Fa
un
a
Th
rea
tened
& E
nda
ng
ere
d s
pecie
s
Mig
rato
ry c
orr
ido
r &
Ro
ute
Aq
ua
tic H
ab
itat
Aq
ua
tic F
lora
& F
aun
a
Loss o
f L
ive
liho
od
Co
nflic
t o
n J
ob o
pp
ort
un
ity
Dis
ruption
of
Infr
astr
uctu
re
Co
mm
on
Pro
pe
rty R
esou
rces
Du
st &
No
ise
Dis
co
mfo
rt
Loss o
f A
gricu
ltura
l P
rodu
ctivity
Influx o
f P
opu
latio
n
Cu
ltu
ral &
He
rita
ge
Site
Job
& E
con
om
ic O
pp
ort
un
ity
Occu
pa
tion
al H
ea
lth
& S
afe
ty
Co
mm
un
ity H
ea
lth &
Sa
fety
Dismantling of rig and associated facilities L L M M
Transportation of drilling rig and ancillaries L L M M
Removal of well site construction materials &
disposal L L M
Site Restoration + + +
Vedanta Limited. (Division CAIRN Oil & Gas) DRAFT EIA: Onshore Oil and Gas E&A in RJ-ONHP- 2017/4 Block, Barmer District, Rajasthan
June,2019 AECOM
151
5. Analysis of Alternative
Consideration of alternatives to a project proposal is a requirement of the EIA process. During the scoping process,
alternatives to a proposal can be considered or refined, either directly or by reference to the key issues identified.
A comparison of alternatives helps to determine the best method of achieving the project objectives with minimum
environmental impacts or indicate the most environmentally friendly and cost effective options. The consideration
of alternatives is most useful when the EIA is undertaken early in the projects cycle. The type and range of
alternatives open for consideration include:
• Site alternatives (e.g. advantage of proposed site, details of any other sites, if explored, etc)
• Input or supply alternatives (e.g. use of raw materials, sourcing, etc)
• Technology alternatives (e.g. feasibility of different technologies available and advantage of proposed
technology, etc)
After analysis of the various factors the most environmentally compatible alternative is selected. Reference may
be made to available technologies, policy objectives, social attitudes, environmental and site constraints, projects
economic etc.
This section provides an analysis of alternatives in relation to the conception and planning phase of the project.
This includes the following:
5.1. No Project Scenario
The no project scenario has been analyzed to understand what would be reasonably expected to occur in the near
future if the proposed development drilling of hydrocarbons and production of hydrocarbon are not conducted in
the area. In such a scenario, there would not be any pressure on use of local resources and infrastructure, and no
adverse effect on local ecology or incremental pollution to baseline environmental components (air, water and noise
levels). At the same time, there would not be any positive impact on socioeconomic status of the area resulting
from direct/ indirect employment and economic benefits that such a project can provide. With no project scenario,
dependence of the country on import of crude oil and demand for foreign exchange will grow.
5.2. Alternatives for Project Site
The block is allocated by the Government of India under the Revenue Sharing Contract (RSC). Vedanta Limited.
(Division Cairn Oil & Gas) is the Operator for this block. Drilling locations are proposed based on geo-scientific
information and alternate sites cannot be considered for the proposed project facilities due to the following reasons:
The location is within the existing RSC boundary of the field/block. The surface locations of wells are selected
considering the drilling configuration (reach to potential reservoirs).
5.3. Alternatives for Well Location
The seismic data interpretation of the seismic survey would decide the exact locations of the drilling well. The
proposed exploratory well site have been identified based on the study and interpretation of the stratigraphy and
already available seismic data. Within the identified location the actual well drilling site will be selected based on
the following factors:
• Located at a safe distance from public road and human settlement.
• Ensure natural drainage channels are avoided or drainage channels rerouted to ensure unhindered flow of
rain / flood water. Where necessary adequate erosion control measures will be provided
5.4. Alternative of Technology
The technical and process related alternatives are discussed in the section.
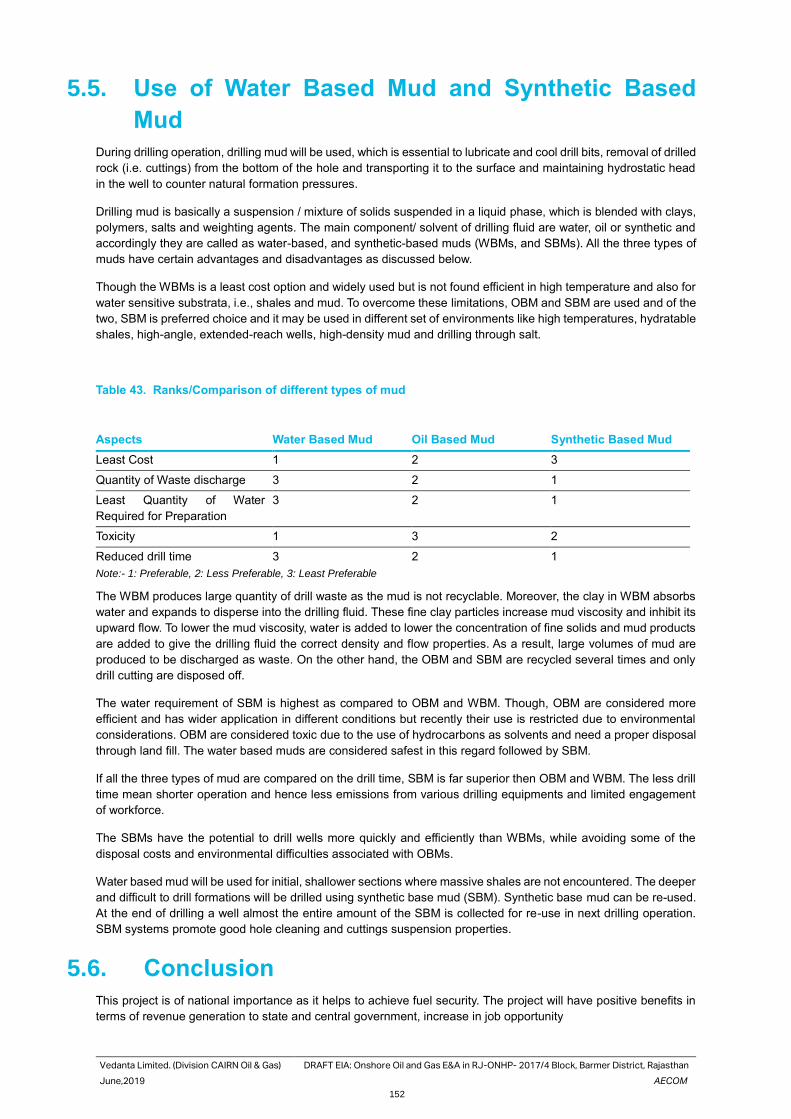
Vedanta Limited. (Division CAIRN Oil & Gas) DRAFT EIA: Onshore Oil and Gas E&A in RJ-ONHP- 2017/4 Block, Barmer District, Rajasthan
June,2019 AECOM
152
5.5. Use of Water Based Mud and Synthetic Based
Mud
During drilling operation, drilling mud will be used, which is essential to lubricate and cool drill bits, removal of drilled
rock (i.e. cuttings) from the bottom of the hole and transporting it to the surface and maintaining hydrostatic head
in the well to counter natural formation pressures.
Drilling mud is basically a suspension / mixture of solids suspended in a liquid phase, which is blended with clays,
polymers, salts and weighting agents. The main component/ solvent of drilling fluid are water, oil or synthetic and
accordingly they are called as water-based, and synthetic-based muds (WBMs, and SBMs). All the three types of
muds have certain advantages and disadvantages as discussed below.
Though the WBMs is a least cost option and widely used but is not found efficient in high temperature and also for
water sensitive substrata, i.e., shales and mud. To overcome these limitations, OBM and SBM are used and of the
two, SBM is preferred choice and it may be used in different set of environments like high temperatures, hydratable
shales, high-angle, extended-reach wells, high-density mud and drilling through salt.
Table 43. Ranks/Comparison of different types of mud
Aspects Water Based Mud Oil Based Mud Synthetic Based Mud
Least Cost 1 2 3
Quantity of Waste discharge 3 2 1
Least Quantity of Water
Required for Preparation
3 2 1
Toxicity 1 3 2
Reduced drill time 3 2 1
Note:- 1: Preferable, 2: Less Preferable, 3: Least Preferable
The WBM produces large quantity of drill waste as the mud is not recyclable. Moreover, the clay in WBM absorbs
water and expands to disperse into the drilling fluid. These fine clay particles increase mud viscosity and inhibit its
upward flow. To lower the mud viscosity, water is added to lower the concentration of fine solids and mud products
are added to give the drilling fluid the correct density and flow properties. As a result, large volumes of mud are
produced to be discharged as waste. On the other hand, the OBM and SBM are recycled several times and only
drill cutting are disposed off.
The water requirement of SBM is highest as compared to OBM and WBM. Though, OBM are considered more
efficient and has wider application in different conditions but recently their use is restricted due to environmental
considerations. OBM are considered toxic due to the use of hydrocarbons as solvents and need a proper disposal
through land fill. The water based muds are considered safest in this regard followed by SBM.
If all the three types of mud are compared on the drill time, SBM is far superior then OBM and WBM. The less drill
time mean shorter operation and hence less emissions from various drilling equipments and limited engagement
of workforce.
The SBMs have the potential to drill wells more quickly and efficiently than WBMs, while avoiding some of the
disposal costs and environmental difficulties associated with OBMs.
Water based mud will be used for initial, shallower sections where massive shales are not encountered. The deeper
and difficult to drill formations will be drilled using synthetic base mud (SBM). Synthetic base mud can be re-used.
At the end of drilling a well almost the entire amount of the SBM is collected for re-use in next drilling operation.
SBM systems promote good hole cleaning and cuttings suspension properties.
5.6. Conclusion
This project is of national importance as it helps to achieve fuel security. The project will have positive benefits in
terms of revenue generation to state and central government, increase in job opportunity

Vedanta Limited. (Division CAIRN Oil & Gas) DRAFT EIA: Onshore Oil and Gas E&A in RJ-ONHP- 2017/4 Block, Barmer District, Rajasthan
June,2019 AECOM
153
Site selection would be carried out taking into consideration the nearest habitation, proximity to any sensitive
receptor and natural drainage.
In addition, Vedanta Limited (Division :Cairn Oil & Gas) will ensure that the final site selection is made after due
consideration to all environmental considerations mentioned. Also use of alternate method technology to avoid
sensitive locations will be made to the extent possible. Consideration of these alternatives with strict compliance
to the Environment Management and Monitoring Plans suggested will ensure minimal impact on the Environment.
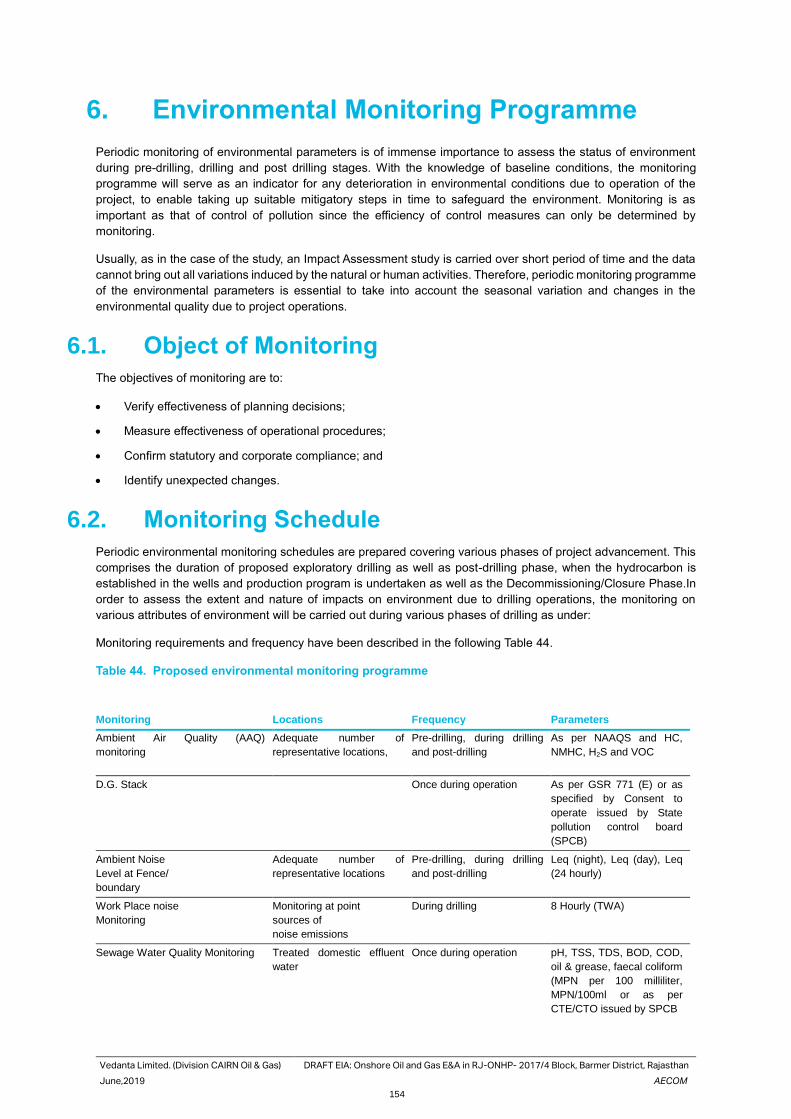
Vedanta Limited. (Division CAIRN Oil & Gas) DRAFT EIA: Onshore Oil and Gas E&A in RJ-ONHP- 2017/4 Block, Barmer District, Rajasthan
June,2019 AECOM
154
6. Environmental Monitoring Programme
Periodic monitoring of environmental parameters is of immense importance to assess the status of environment
during pre-drilling, drilling and post drilling stages. With the knowledge of baseline conditions, the monitoring
programme will serve as an indicator for any deterioration in environmental conditions due to operation of the
project, to enable taking up suitable mitigatory steps in time to safeguard the environment. Monitoring is as
important as that of control of pollution since the efficiency of control measures can only be determined by
monitoring.
Usually, as in the case of the study, an Impact Assessment study is carried over short period of time and the data
cannot bring out all variations induced by the natural or human activities. Therefore, periodic monitoring programme
of the environmental parameters is essential to take into account the seasonal variation and changes in the
environmental quality due to project operations.
6.1. Object of Monitoring
The objectives of monitoring are to:
• Verify effectiveness of planning decisions;
• Measure effectiveness of operational procedures;
• Confirm statutory and corporate compliance; and
• Identify unexpected changes.
6.2. Monitoring Schedule
Periodic environmental monitoring schedules are prepared covering various phases of project advancement. This
comprises the duration of proposed exploratory drilling as well as post-drilling phase, when the hydrocarbon is
established in the wells and production program is undertaken as well as the Decommissioning/Closure Phase.In
order to assess the extent and nature of impacts on environment due to drilling operations, the monitoring on
various attributes of environment will be carried out during various phases of drilling as under:
Monitoring requirements and frequency have been described in the following Table 44.
Table 44. Proposed environmental monitoring programme
Monitoring Locations Frequency Parameters
Ambient Air Quality (AAQ)
monitoring
Adequate number of
representative locations,
Pre-drilling, during drilling
and post-drilling
As per NAAQS and HC,
NMHC, H2S and VOC
D.G. Stack Once during operation As per GSR 771 (E) or as
specified by Consent to
operate issued by State
pollution control board
(SPCB)
Ambient Noise
Level at Fence/
boundary
Adequate number of
representative locations
Pre-drilling, during drilling
and post-drilling
Leq (night), Leq (day), Leq
(24 hourly)
Work Place noise
Monitoring
Monitoring at point
sources of
noise emissions
During drilling 8 Hourly (TWA)
Sewage Water Quality Monitoring Treated domestic effluent
water
Once during operation pH, TSS, TDS, BOD, COD,
oil & grease, faecal coliform
(MPN per 100 milliliter,
MPN/100ml or as per
CTE/CTO issued by SPCB
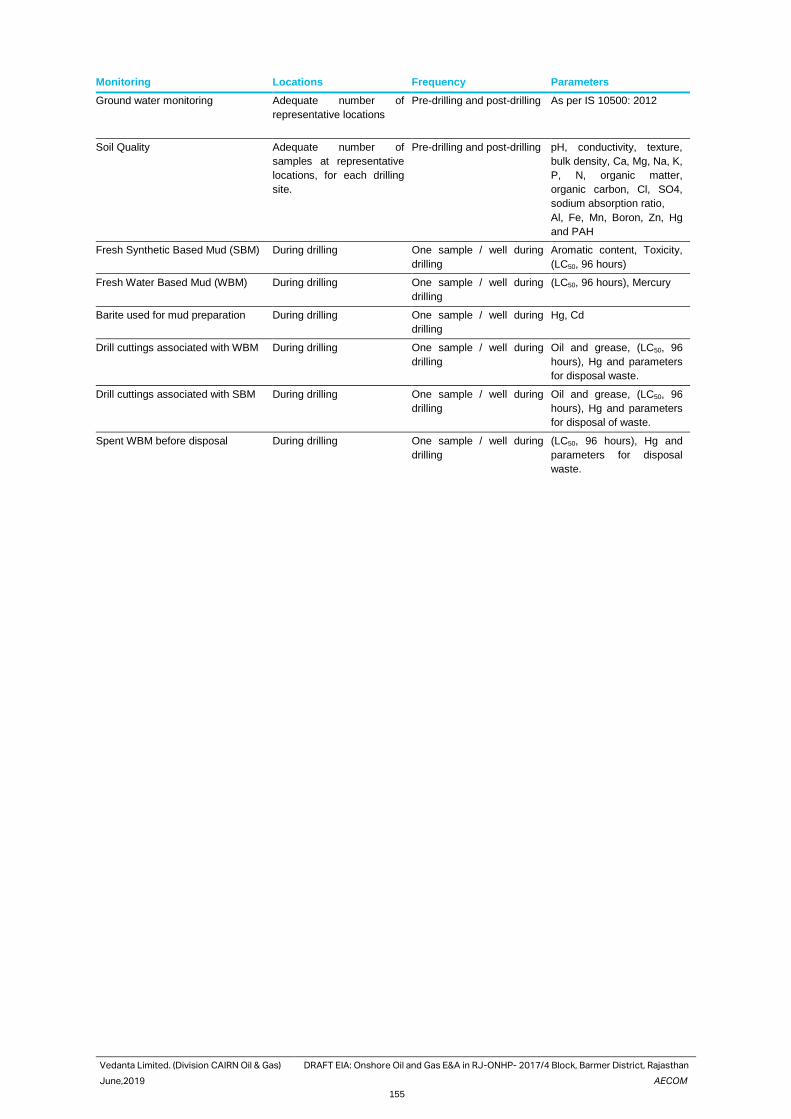
Vedanta Limited. (Division CAIRN Oil & Gas) DRAFT EIA: Onshore Oil and Gas E&A in RJ-ONHP- 2017/4 Block, Barmer District, Rajasthan
June,2019 AECOM
155
Monitoring Locations Frequency Parameters
Ground water monitoring Adequate number of
representative locations
Pre-drilling and post-drilling As per IS 10500: 2012
Soil Quality Adequate number of
samples at representative
locations, for each drilling
site.
Pre-drilling and post-drilling pH, conductivity, texture,
bulk density, Ca, Mg, Na, K,
P, N, organic matter,
organic carbon, Cl, SO4,
sodium absorption ratio,
Al, Fe, Mn, Boron, Zn, Hg
and PAH
Fresh Synthetic Based Mud (SBM) During drilling One sample / well during
drilling
Aromatic content, Toxicity,
(LC50, 96 hours)
Fresh Water Based Mud (WBM) During drilling One sample / well during
drilling
(LC50, 96 hours), Mercury
Barite used for mud preparation During drilling One sample / well during
drilling
Hg, Cd
Drill cuttings associated with WBM During drilling One sample / well during
drilling
Oil and grease, (LC50, 96
hours), Hg and parameters
for disposal waste.
Drill cuttings associated with SBM During drilling One sample / well during
drilling
Oil and grease, (LC50, 96
hours), Hg and parameters
for disposal of waste.
Spent WBM before disposal During drilling One sample / well during
drilling
(LC50, 96 hours), Hg and
parameters for disposal
waste.

Vedanta Limited. (Division CAIRN Oil & Gas) DRAFT EIA: Onshore Oil and Gas E&A in RJ-ONHP- 2017/4 Block, Barmer District, Rajasthan
June,2019 AECOM
156
7. ADDITIONAL STUDIES
Based on the TOR specified by the Ministry of Environment & Forest and Climate Change (MoEF&CC) issued vide
letter no. F. No. IA-J-11011/80/2019-IA-II(I), dated 13th April 2019 for preparation of EIA/EMP Report for proposed
Greenfield project, several studies were conducted and planned to be conducted to provide a clear picture of the
project area. The studies and activities suggested in EIA Notification includes: -
• Public Hearing and Consultation
• Risk Assessment Study including Disaster Management Plan
• Disaster Management plan
7.1. Public Hearing and Consultation
7.1.1. Public Hearing
As per the Environment Impact Assessment Notification, 2006, a public hearing will be carried out by SPCB.
This draft EIA report is prepared and submitted to SPCB for public hearing.
After completion of the Public Hearing, the applicant shall address all the environmental concerns expressed
during this process and make appropriate changes in the draft EIA and EMP Report. The final EIA report, so
prepared, shall be submitted by the applicant to MoEF&CC for appraisal.
7.2. Risk Assessment
The objective of the RA study is to identify major risk contributing events, demarcate vulnerable zones and evaluate
the nature of risk posed to nearby areas due to proposed drilling activity, in addition to ensure compliance to
statutory rules and regulations. The scope of work for the study is described below:
• Identify potential risk scenarios that may arise from the proposed drilling and other associated activities
• Analyze the possible likelihood and frequency of such risk scenarios by reviewing historical accident related
data.
• Predict the consequences of such potential risk scenarios and if consequences are high, establish the same
by through application of quantitative simulations.
• Recommend feasible preventive and risk mitigation measures as well as provide inputs for drawing up of
Emergency Response Plan (ERP) for the project.
• The assessments to be based on various existing documents including Emergency Response Plan (ERP),
Disaster Management Plan (DMP).
7.2.1. Quantitative Risk Assessment
Risk” is defined as the combination of the expected frequency and consequence of accidents that could occur as
a result of an activity. Risk assessment is a formal process of increasing one understands of the risk associated
with an activity. The process of risk assessment includes answering three questions:
• What can go wrong?
• How likely is it?
• What are the impacts?
Qualitative answers to one or more of these questions are often sufficient for making good decisions about the
allocation of resources for safety improvements. But, as managers seek quantitative cost/benefit information upon
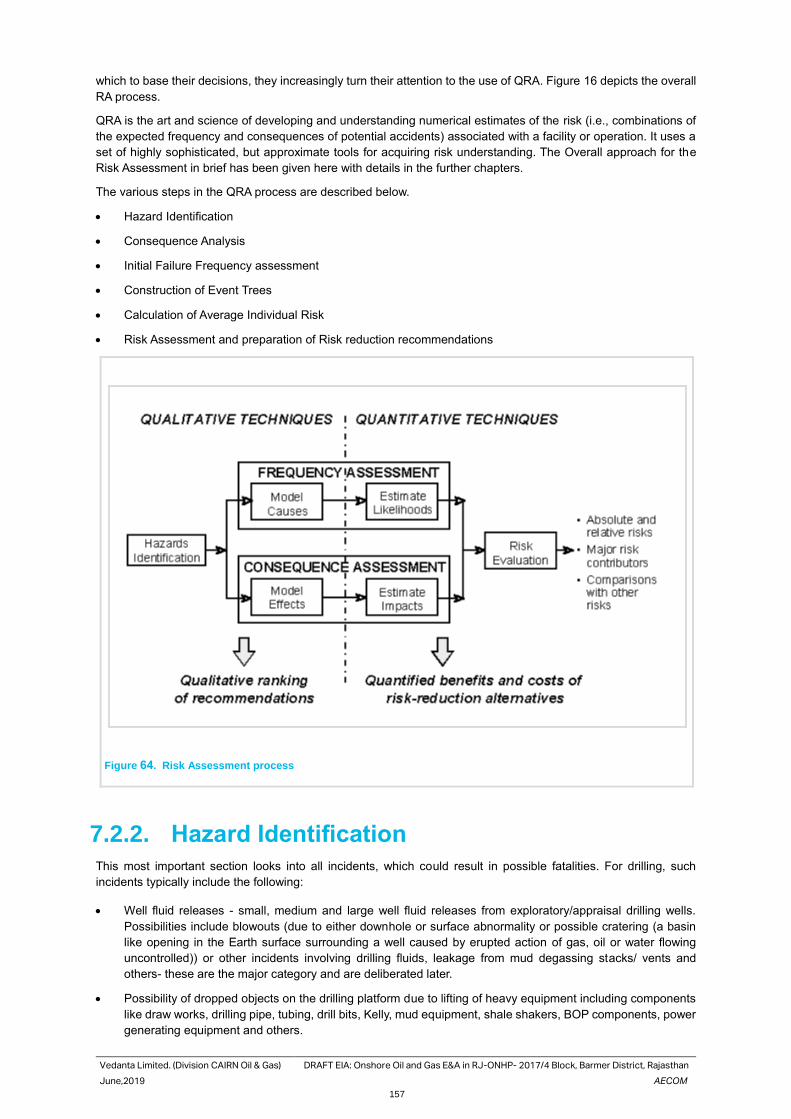
Vedanta Limited. (Division CAIRN Oil & Gas) DRAFT EIA: Onshore Oil and Gas E&A in RJ-ONHP- 2017/4 Block, Barmer District, Rajasthan
June,2019 AECOM
157
which to base their decisions, they increasingly turn their attention to the use of QRA. Figure 16 depicts the overall
RA process.
QRA is the art and science of developing and understanding numerical estimates of the risk (i.e., combinations of
the expected frequency and consequences of potential accidents) associated with a facility or operation. It uses a
set of highly sophisticated, but approximate tools for acquiring risk understanding. The Overall approach for the
Risk Assessment in brief has been given here with details in the further chapters.
The various steps in the QRA process are described below.
• Hazard Identification
• Consequence Analysis
• Initial Failure Frequency assessment
• Construction of Event Trees
• Calculation of Average Individual Risk
• Risk Assessment and preparation of Risk reduction recommendations
Figure 64. Risk Assessment process
7.2.2. Hazard Identification
This most important section looks into all incidents, which could result in possible fatalities. For drilling, such
incidents typically include the following:
• Well fluid releases - small, medium and large well fluid releases from exploratory/appraisal drilling wells.
Possibilities include blowouts (due to either downhole or surface abnormality or possible cratering (a basin
like opening in the Earth surface surrounding a well caused by erupted action of gas, oil or water flowing
uncontrolled)) or other incidents involving drilling fluids, leakage from mud degassing stacks/ vents and
others- these are the major category and are deliberated later.
• Possibility of dropped objects on the drilling platform due to lifting of heavy equipment including components
like draw works, drilling pipe, tubing, drill bits, Kelly, mud equipment, shale shakers, BOP components, power
generating equipment and others.
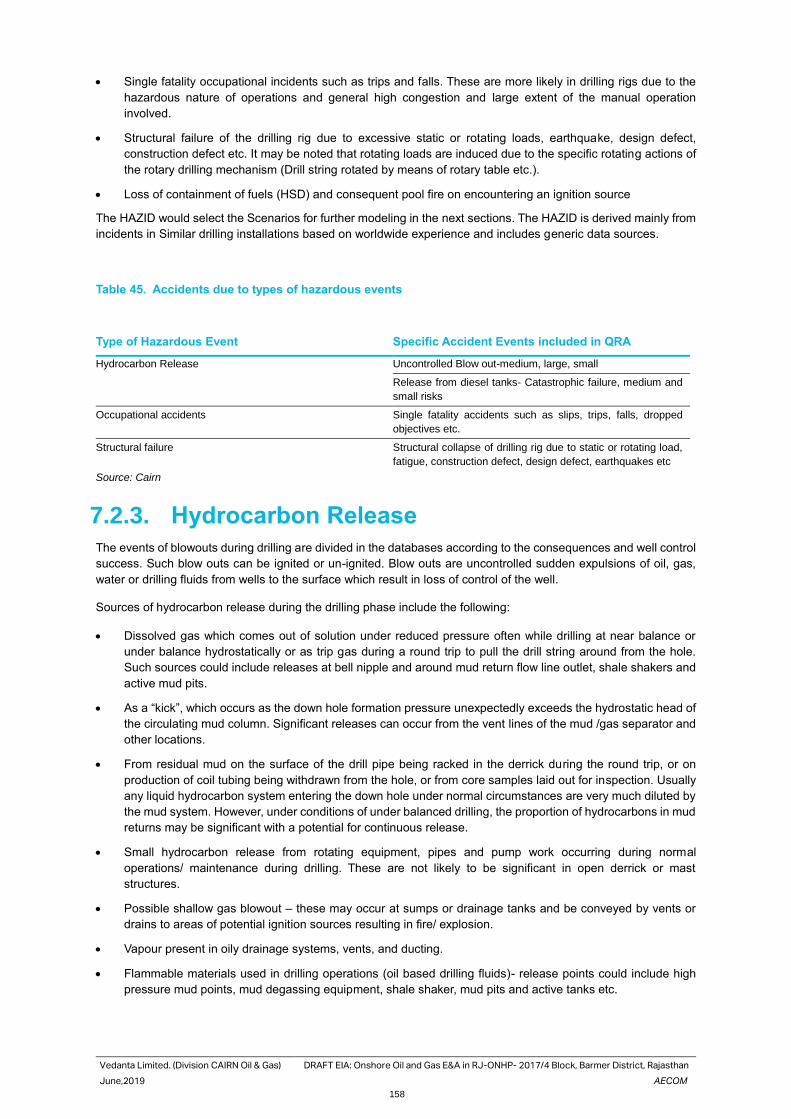
Vedanta Limited. (Division CAIRN Oil & Gas) DRAFT EIA: Onshore Oil and Gas E&A in RJ-ONHP- 2017/4 Block, Barmer District, Rajasthan
June,2019 AECOM
158
• Single fatality occupational incidents such as trips and falls. These are more likely in drilling rigs due to the
hazardous nature of operations and general high congestion and large extent of the manual operation
involved.
• Structural failure of the drilling rig due to excessive static or rotating loads, earthquake, design defect,
construction defect etc. It may be noted that rotating loads are induced due to the specific rotating actions of
the rotary drilling mechanism (Drill string rotated by means of rotary table etc.).
• Loss of containment of fuels (HSD) and consequent pool fire on encountering an ignition source
The HAZID would select the Scenarios for further modeling in the next sections. The HAZID is derived mainly from
incidents in Similar drilling installations based on worldwide experience and includes generic data sources.
Table 45. Accidents due to types of hazardous events
Type of Hazardous Event Specific Accident Events included in QRA
Hydrocarbon Release Uncontrolled Blow out-medium, large, small
Release from diesel tanks- Catastrophic failure, medium and
small risks
Occupational accidents Single fatality accidents such as slips, trips, falls, dropped
objectives etc.
Structural failure Structural collapse of drilling rig due to static or rotating load,
fatigue, construction defect, design defect, earthquakes etc
Source: Cairn
7.2.3. Hydrocarbon Release
The events of blowouts during drilling are divided in the databases according to the consequences and well control
success. Such blow outs can be ignited or un-ignited. Blow outs are uncontrolled sudden expulsions of oil, gas,
water or drilling fluids from wells to the surface which result in loss of control of the well.
Sources of hydrocarbon release during the drilling phase include the following:
• Dissolved gas which comes out of solution under reduced pressure often while drilling at near balance or
under balance hydrostatically or as trip gas during a round trip to pull the drill string around from the hole.
Such sources could include releases at bell nipple and around mud return flow line outlet, shale shakers and
active mud pits.
• As a “kick”, which occurs as the down hole formation pressure unexpectedly exceeds the hydrostatic head of
the circulating mud column. Significant releases can occur from the vent lines of the mud /gas separator and
other locations.
• From residual mud on the surface of the drill pipe being racked in the derrick during the round trip, or on
production of coil tubing being withdrawn from the hole, or from core samples laid out for inspection. Usually
any liquid hydrocarbon system entering the down hole under normal circumstances are very much diluted by
the mud system. However, under conditions of under balanced drilling, the proportion of hydrocarbons in mud
returns may be significant with a potential for continuous release.
• Small hydrocarbon release from rotating equipment, pipes and pump work occurring during normal
operations/ maintenance during drilling. These are not likely to be significant in open derrick or mast
structures.
• Possible shallow gas blowout – these may occur at sumps or drainage tanks and be conveyed by vents or
drains to areas of potential ignition sources resulting in fire/ explosion.
• Vapour present in oily drainage systems, vents, and ducting.
• Flammable materials used in drilling operations (oil based drilling fluids)- release points could include high
pressure mud points, mud degassing equipment, shale shaker, mud pits and active tanks etc.
Vedanta Limited. (Division CAIRN Oil & Gas) DRAFT EIA: Onshore Oil and Gas E&A in RJ-ONHP- 2017/4 Block, Barmer District, Rajasthan
June,2019 AECOM
159
7.2.4. Protection against Blowouts
The primary protections against blow outs during drilling are the BOPs or Blow out Preventers. These are used to
shut in and control the well in the event of gas or oil being encountered at pressures higher than those exerted by
the column of mud in the hole.
BOPs typically consist of 2-3 ram preventers designed at high pressures- (ram preventer is basically a double
operated valve with one ram or gate on each side of the bore hole). The BOPs are hydraulically operated with a
second remote control panel situated someway away from the rig for use in emergencies when the rig is
unapproachable. Connected to the side of the ram type preventers (usually below the blind rams) are the kill and
choke lines which are used to control the well in the event of any imbalance between the drilling fluid column
pressure and the formation pressure. Both lines are high pressure 2-3 inch hydraulic pipes, the kill line being
connected to the mud circulation system and the high pressure cement pumps and the choke line leading to a back
pressure control Manifold and the mud degasser unit.
In the event of the high pressure kick with the drill string in the hole, the BOP is closed around the drill pipe and the
mud is circulated down the drill string and back to the mud tanks through the choke line and back pressure manifold.
The manifold consists of a series of valves and chokes - the choke can be adjusted to give the orifice opening
required such as to give a back pressure on the well in order to control it. There would be two chokes in order to
allow maintenance on one.
If a kick or blow out occurs with the drill string out of the hole, the blind rams are closed and heavy mud is pumped
into the well through the kill line. Any gas can be bled off through the choke line and fluids are usually squeezed
back into the formation.
The correct installation of the drilling equipment and the operational reliability of the BOPs are essential for the
safety of well drilling operation. In addition, initial and periodic testing of the BOPs, choke and kill manifolds, high
pressure/ heavy mud system etc. before installation and periodically is absolutely essential. Most important is the
presence of highly trained skilled personnel on the rig! In addition, the use of the correct drilling fluid in the
circulatory system is extremely vital.
• The drilling fluid basically does the following:
• To cool and lubricate the drilling bit and the drill string
• To remove drill solids and allowing the release at their surface.
• To form a gel to suspend the drill cuttings and any fluid material when the column is static
• To control sub surface pressures
• To prevent squeezing and caving if formations
• To plaster the sides of the borehole
• To minimize the damage to any potential production zone.
Pressures associated with the sub surface oil, gas or water can be controlled by increasing the specific gravity of
the fluid and thereby by reducing the hydrostatic head of the drilling fluid column. The squeezing of formations in
the drilled hole can be checked by increasing the hydrostatic head of the drilling fluid. Special additives for the
drilling fluid for controlling viscosity, lubricating properties, gelling properties etc. play an important role in the drilling
fluid integrity. Sealing agents such as cellulose, mica can also be added to make up the drilling fluid loss into the
porous and fractured formations.
The historical records show that the drilling of an exploration well has a higher chance of blow out occurring than
does drilling a development well. A blow out can be expected for about 400 exploration wells drilled. As a well takes
about 20-25 days to drill this equates to one blow out approximately every 50 years if drilling was continuous.
Historically, ignited blowouts have caused an average of three deaths per blow out.
7.2.5. Release of the other flammable material
HSD is used in the mobile generators at the drill sites to cater to the power requirement of the drill equipment, area
lighting, etc. The material will be stored in 180 MT vertical cylindrical tank. Spill containment system in the form of
1.2m high bund wall is envisaged to contain 110% of the tank volume. Storage of fuels would primarily pose fire
hazard. The credible accident scenarios include:
• Catastrophic tank rupture (Large Leak)
Vedanta Limited. (Division CAIRN Oil & Gas) DRAFT EIA: Onshore Oil and Gas E&A in RJ-ONHP- 2017/4 Block, Barmer District, Rajasthan
June,2019 AECOM
160
• Leak from a 4” pipeline (Medium Leak)
• A 2” leak from the tank/pipe/flange (Small Leak)
The catastrophic Rupture (CR) of the tank would involve a large leak/big hole in the tank or disengagement of a
joint/large leak from a flange sufficient enough to discharge tank inventory in a short time. The spilled material shall
get filled into the dyke area. In presence of an ignition source, it may catch fire and result in Pool fire of the dyke
area.
A 4” leak from a pipeline or a flange shall have similar consequences as to CR, only the time for loss of containment
may be more. Fire being a surface phenomenon, the pool fire in the dyke area would pose similar heat radiation to
the surrounding area.
A 2” leak from the tank or the pipeline would result in the loss of inventory at a much reduced rate. Counter-
measures shall be available to arrest the leak within reasonable time. With a limited loss of inventory, the damage
distances in such case would be less in comparison to the above two cases.
The tank design and construction takes into account the possible stress loads imposed due to exploration and
appraisal activities at the drill site. Dyke with adequate capacity (110%) is being provided to contain the spill, if any.
Standard well area inspection and maintenance procedures of CIL shall be implemented at the exploratory and
appraisal wells to identify any abnormalities.
7.3. CONSEQUENCE ANALYSIS/CALCULATIONS
Consequence analysis involves the calculation of the initial “release rate” and then predicting the consequence of
the release through computer modeling- it forms an important ingredient in the QRA approach. Consequence
analysis is a complex procedure involving numerous calculations. It must also be noted that a single starting
incident could have numerous outcomes depending upon factors such as escalation, ignition and others.
The various factors of importance in this drilling rig study with respect to consequence analysis are described
below.
7.3.1. Loss of Containment- leak sizes
It must be understood that there are an infinite range of possible releases of flammable material on the facilities
For example, a hole could appear at any point in a well, at any time of the year and the hole could have any size
(right from pinhole to catastrophic line guillotine rupture) and also possibly any shape! In order to allow management
of the study, it is per force necessary to divide the infinite range into a number of smaller ranges through
representation as a single event or a failure case.
In the study, only small, medium and large well fluid blowouts were considered.
Hydrocarbon Leaks due to Loss of Containment (Leak during Well Testing) were not taken into consideration since
they are likely to be controlled about 95% of the time. The category includes releases that may be isolated from
the reservoir fluids, typically release from the well testing equipment and mud line.
7.3.2. Inventory
Inventory can get discharged to Environment due to Loss of Containment. Inventory Analysis is commonly used in
understanding the relative hazards and short listing of release scenarios and plays an important role in regard to
the potential hazard. The larger the inventory of a vessel or a “system”, the larger the quantity of potential release.
The potential release depends upon the quantity of release, the properties of the materials and the operating
conditions (pressure, temperature etc. described later).
7.3.3. Blowouts
A blowout on the topsides may take one of several forms and release locations. Any release not immediately ignited
would give a flammable vapour cloud, which could cause a vapour cloud explosion in the drill floor or the mud pit
areas.
A pressurized jet release could lead to a very large jet fire, producing high levels of thermal radiation. The flame
could impinge on structural members in the derrick. These could then fail as they lose their mechanical properties
at high temperature. This may lead to objects falling from the derrick and causing more damage below, especially
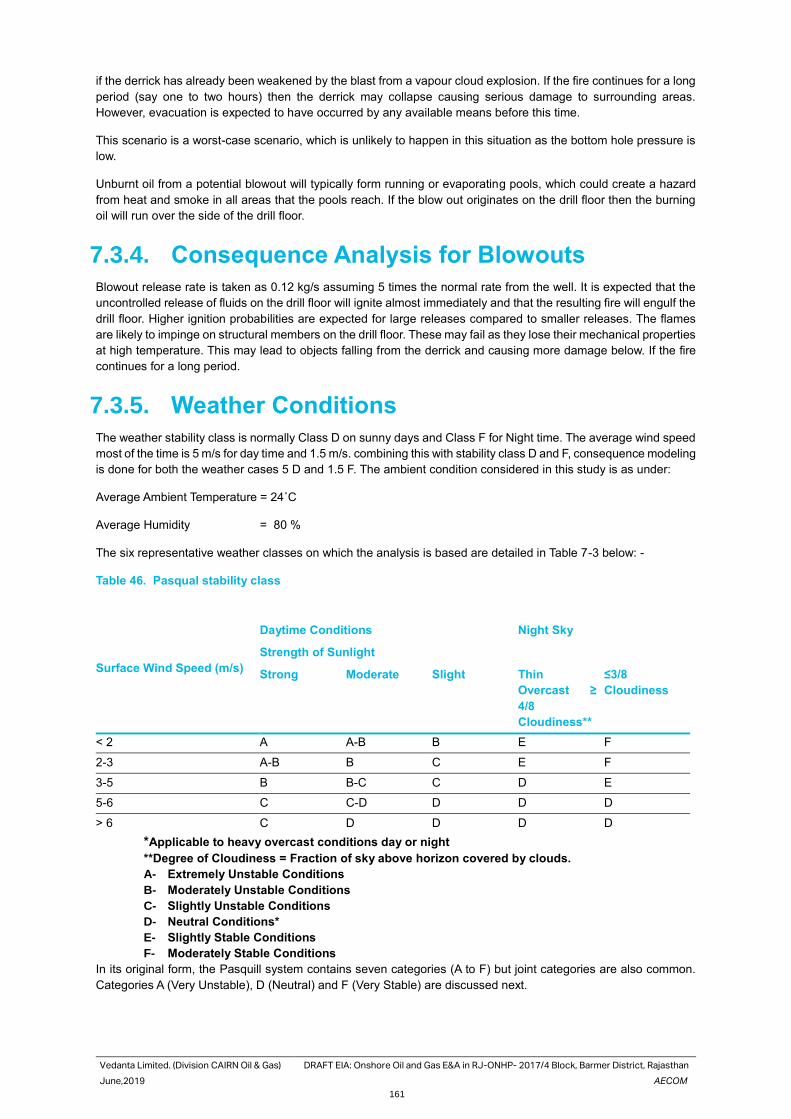
Vedanta Limited. (Division CAIRN Oil & Gas) DRAFT EIA: Onshore Oil and Gas E&A in RJ-ONHP- 2017/4 Block, Barmer District, Rajasthan
June,2019 AECOM
161
if the derrick has already been weakened by the blast from a vapour cloud explosion. If the fire continues for a long
period (say one to two hours) then the derrick may collapse causing serious damage to surrounding areas.
However, evacuation is expected to have occurred by any available means before this time.
This scenario is a worst-case scenario, which is unlikely to happen in this situation as the bottom hole pressure is
low.
Unburnt oil from a potential blowout will typically form running or evaporating pools, which could create a hazard
from heat and smoke in all areas that the pools reach. If the blow out originates on the drill floor then the burning
oil will run over the side of the drill floor.
7.3.4. Consequence Analysis for Blowouts
Blowout release rate is taken as 0.12 kg/s assuming 5 times the normal rate from the well. It is expected that the
uncontrolled release of fluids on the drill floor will ignite almost immediately and that the resulting fire will engulf the
drill floor. Higher ignition probabilities are expected for large releases compared to smaller releases. The flames
are likely to impinge on structural members on the drill floor. These may fail as they lose their mechanical properties
at high temperature. This may lead to objects falling from the derrick and causing more damage below. If the fire
continues for a long period.
7.3.5. Weather Conditions
The weather stability class is normally Class D on sunny days and Class F for Night time. The average wind speed
most of the time is 5 m/s for day time and 1.5 m/s. combining this with stability class D and F, consequence modeling
is done for both the weather cases 5 D and 1.5 F. The ambient condition considered in this study is as under:
Average Ambient Temperature = 24˚C
Average Humidity = 80 %
The six representative weather classes on which the analysis is based are detailed in Table 7-3 below: -
Table 46. Pasqual stability class
Surface Wind Speed (m/s)
Daytime Conditions Night Sky
Strength of Sunlight
Strong Moderate Slight Thin
Overcast ≥
4/8
Cloudiness**
≤3/8
Cloudiness
< 2 A A-B B E F
2-3 A-B B C E F
3-5 B B-C C D E
5-6 C C-D D D D
> 6 C D D D D
*Applicable to heavy overcast conditions day or night
**Degree of Cloudiness = Fraction of sky above horizon covered by clouds.
A- Extremely Unstable Conditions
B- Moderately Unstable Conditions
C- Slightly Unstable Conditions
D- Neutral Conditions*
E- Slightly Stable Conditions
F- Moderately Stable Conditions
In its original form, the Pasquill system contains seven categories (A to F) but joint categories are also common.
Categories A (Very Unstable), D (Neutral) and F (Very Stable) are discussed next.
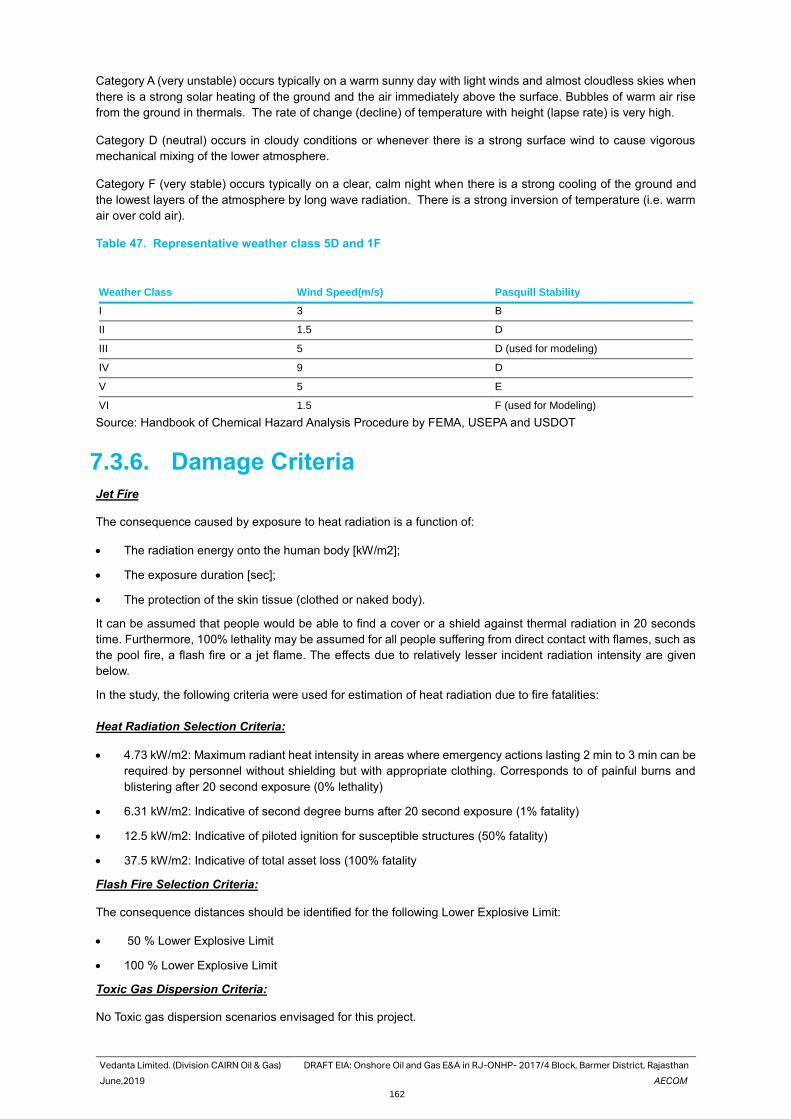
Vedanta Limited. (Division CAIRN Oil & Gas) DRAFT EIA: Onshore Oil and Gas E&A in RJ-ONHP- 2017/4 Block, Barmer District, Rajasthan
June,2019 AECOM
162
Category A (very unstable) occurs typically on a warm sunny day with light winds and almost cloudless skies when
there is a strong solar heating of the ground and the air immediately above the surface. Bubbles of warm air rise
from the ground in thermals. The rate of change (decline) of temperature with height (lapse rate) is very high.
Category D (neutral) occurs in cloudy conditions or whenever there is a strong surface wind to cause vigorous
mechanical mixing of the lower atmosphere.
Category F (very stable) occurs typically on a clear, calm night when there is a strong cooling of the ground and
the lowest layers of the atmosphere by long wave radiation. There is a strong inversion of temperature (i.e. warm
air over cold air).
Table 47. Representative weather class 5D and 1F
Weather Class Wind Speed(m/s) Pasquill Stability
I 3 B
II 1.5 D
III 5 D (used for modeling)
IV 9 D
V 5 E
VI 1.5 F (used for Modeling)
Source: Handbook of Chemical Hazard Analysis Procedure by FEMA, USEPA and USDOT
7.3.6. Damage Criteria
Jet Fire
The consequence caused by exposure to heat radiation is a function of:
• The radiation energy onto the human body [kW/m2];
• The exposure duration [sec];
• The protection of the skin tissue (clothed or naked body).
It can be assumed that people would be able to find a cover or a shield against thermal radiation in 20 seconds
time. Furthermore, 100% lethality may be assumed for all people suffering from direct contact with flames, such as
the pool fire, a flash fire or a jet flame. The effects due to relatively lesser incident radiation intensity are given
below.
In the study, the following criteria were used for estimation of heat radiation due to fire fatalities:
Heat Radiation Selection Criteria:
• 4.73 kW/m2: Maximum radiant heat intensity in areas where emergency actions lasting 2 min to 3 min can be
required by personnel without shielding but with appropriate clothing. Corresponds to of painful burns and
blistering after 20 second exposure (0% lethality)
• 6.31 kW/m2: Indicative of second degree burns after 20 second exposure (1% fatality)
• 12.5 kW/m2: Indicative of piloted ignition for susceptible structures (50% fatality)
• 37.5 kW/m2: Indicative of total asset loss (100% fatality
Flash Fire Selection Criteria:
The consequence distances should be identified for the following Lower Explosive Limit:
• 50 % Lower Explosive Limit
• 100 % Lower Explosive Limit
Toxic Gas Dispersion Criteria:
No Toxic gas dispersion scenarios envisaged for this project.
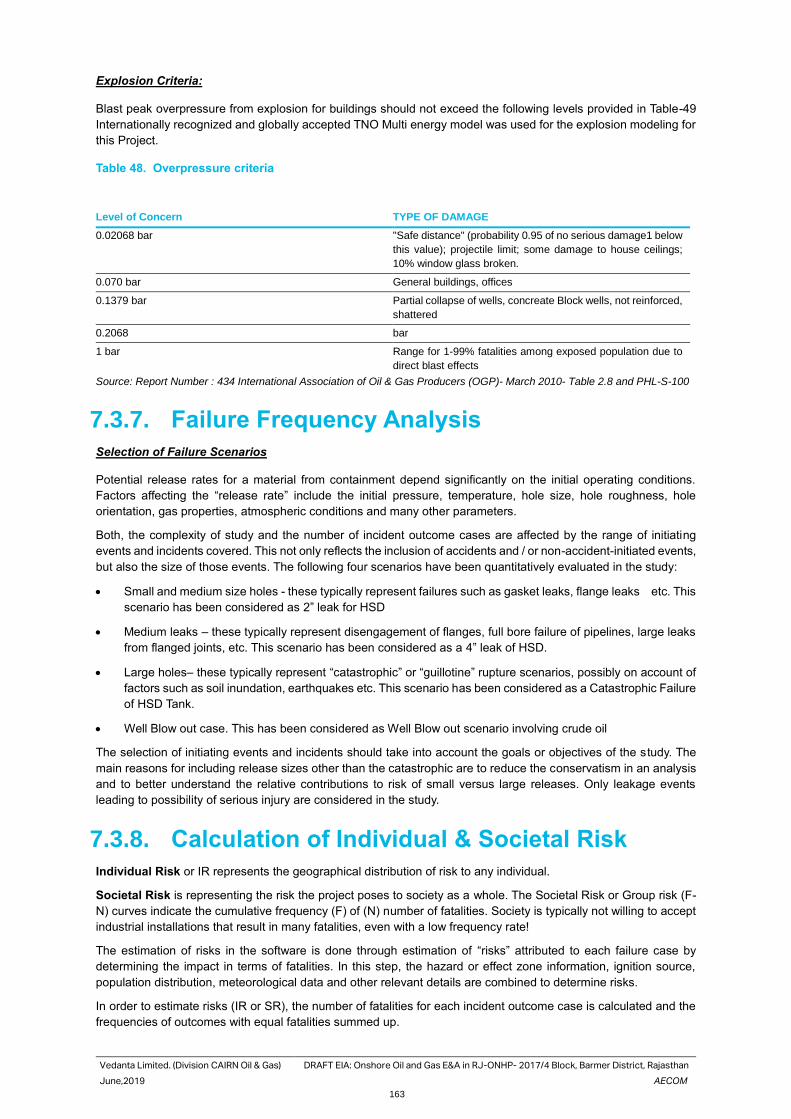
Vedanta Limited. (Division CAIRN Oil & Gas) DRAFT EIA: Onshore Oil and Gas E&A in RJ-ONHP- 2017/4 Block, Barmer District, Rajasthan
June,2019 AECOM
163
Explosion Criteria:
Blast peak overpressure from explosion for buildings should not exceed the following levels provided in Table-49
Internationally recognized and globally accepted TNO Multi energy model was used for the explosion modeling for
this Project.
Table 48. Overpressure criteria
Level of Concern TYPE OF DAMAGE
0.02068 bar "Safe distance" (probability 0.95 of no serious damage1 below
this value); projectile limit; some damage to house ceilings;
10% window glass broken.
0.070 bar General buildings, offices
0.1379 bar Partial collapse of wells, concreate Block wells, not reinforced,
shattered
0.2068 bar
1 bar Range for 1-99% fatalities among exposed population due to
direct blast effects
Source: Report Number : 434 International Association of Oil & Gas Producers (OGP)- March 2010- Table 2.8 and PHL-S-100
7.3.7. Failure Frequency Analysis
Selection of Failure Scenarios
Potential release rates for a material from containment depend significantly on the initial operating conditions.
Factors affecting the “release rate” include the initial pressure, temperature, hole size, hole roughness, hole
orientation, gas properties, atmospheric conditions and many other parameters.
Both, the complexity of study and the number of incident outcome cases are affected by the range of initiating
events and incidents covered. This not only reflects the inclusion of accidents and / or non-accident-initiated events,
but also the size of those events. The following four scenarios have been quantitatively evaluated in the study:
• Small and medium size holes - these typically represent failures such as gasket leaks, flange leaks etc. This
scenario has been considered as 2” leak for HSD
• Medium leaks – these typically represent disengagement of flanges, full bore failure of pipelines, large leaks
from flanged joints, etc. This scenario has been considered as a 4” leak of HSD.
• Large holes– these typically represent “catastrophic” or “guillotine” rupture scenarios, possibly on account of
factors such as soil inundation, earthquakes etc. This scenario has been considered as a Catastrophic Failure
of HSD Tank.
• Well Blow out case. This has been considered as Well Blow out scenario involving crude oil
The selection of initiating events and incidents should take into account the goals or objectives of the study. The
main reasons for including release sizes other than the catastrophic are to reduce the conservatism in an analysis
and to better understand the relative contributions to risk of small versus large releases. Only leakage events
leading to possibility of serious injury are considered in the study.
7.3.8. Calculation of Individual & Societal Risk
Individual Risk or IR represents the geographical distribution of risk to any individual.
Societal Risk is representing the risk the project poses to society as a whole. The Societal Risk or Group risk (F-
N) curves indicate the cumulative frequency (F) of (N) number of fatalities. Society is typically not willing to accept
industrial installations that result in many fatalities, even with a low frequency rate!
The estimation of risks in the software is done through estimation of “risks” attributed to each failure case by
determining the impact in terms of fatalities. In this step, the hazard or effect zone information, ignition source,
population distribution, meteorological data and other relevant details are combined to determine risks.
In order to estimate risks (IR or SR), the number of fatalities for each incident outcome case is calculated and the
frequencies of outcomes with equal fatalities summed up.
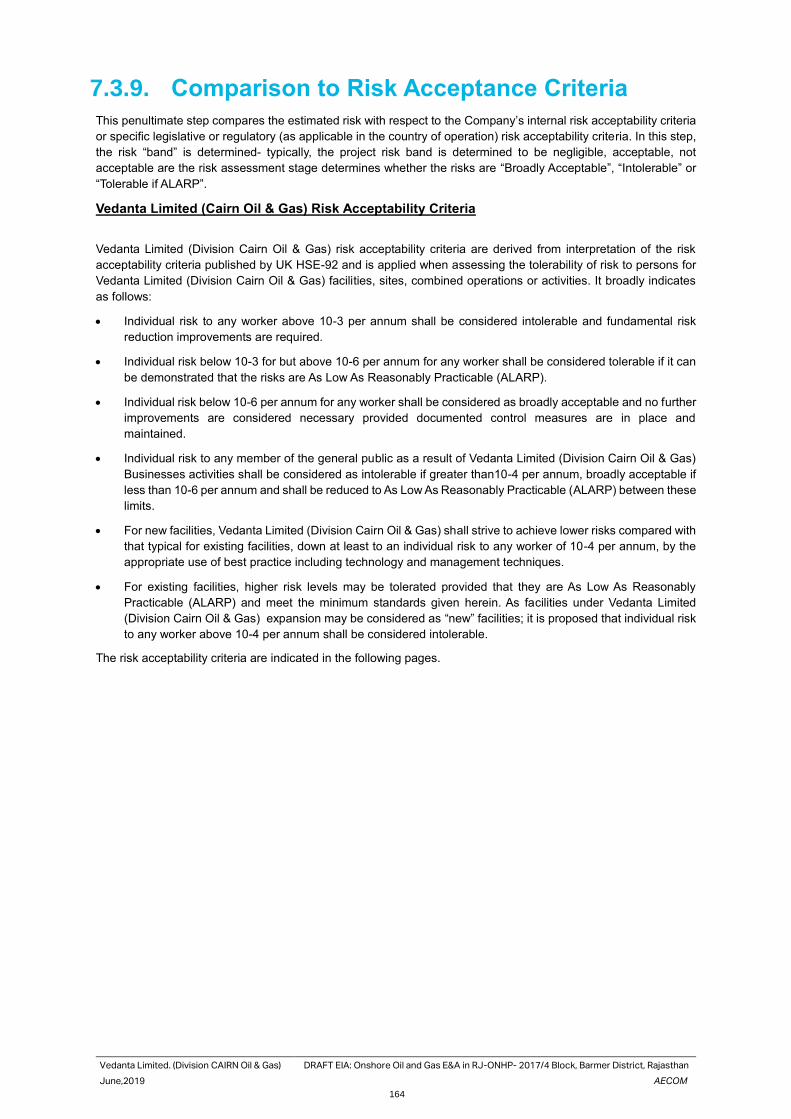
Vedanta Limited. (Division CAIRN Oil & Gas) DRAFT EIA: Onshore Oil and Gas E&A in RJ-ONHP- 2017/4 Block, Barmer District, Rajasthan
June,2019 AECOM
164
7.3.9. Comparison to Risk Acceptance Criteria
This penultimate step compares the estimated risk with respect to the Company’s internal risk acceptability criteria
or specific legislative or regulatory (as applicable in the country of operation) risk acceptability criteria. In this step,
the risk “band” is determined- typically, the project risk band is determined to be negligible, acceptable, not
acceptable are the risk assessment stage determines whether the risks are “Broadly Acceptable”, “Intolerable” or
“Tolerable if ALARP”.
Vedanta Limited (Cairn Oil & Gas) Risk Acceptability Criteria
Vedanta Limited (Division Cairn Oil & Gas) risk acceptability criteria are derived from interpretation of the risk
acceptability criteria published by UK HSE-92 and is applied when assessing the tolerability of risk to persons for
Vedanta Limited (Division Cairn Oil & Gas) facilities, sites, combined operations or activities. It broadly indicates
as follows:
• Individual risk to any worker above 10-3 per annum shall be considered intolerable and fundamental risk
reduction improvements are required.
• Individual risk below 10-3 for but above 10-6 per annum for any worker shall be considered tolerable if it can
be demonstrated that the risks are As Low As Reasonably Practicable (ALARP).
• Individual risk below 10-6 per annum for any worker shall be considered as broadly acceptable and no further
improvements are considered necessary provided documented control measures are in place and
maintained.
• Individual risk to any member of the general public as a result of Vedanta Limited (Division Cairn Oil & Gas)
Businesses activities shall be considered as intolerable if greater than10-4 per annum, broadly acceptable if
less than 10-6 per annum and shall be reduced to As Low As Reasonably Practicable (ALARP) between these
limits.
• For new facilities, Vedanta Limited (Division Cairn Oil & Gas) shall strive to achieve lower risks compared with
that typical for existing facilities, down at least to an individual risk to any worker of 10-4 per annum, by the
appropriate use of best practice including technology and management techniques.
• For existing facilities, higher risk levels may be tolerated provided that they are As Low As Reasonably
Practicable (ALARP) and meet the minimum standards given herein. As facilities under Vedanta Limited
(Division Cairn Oil & Gas) expansion may be considered as “new” facilities; it is proposed that individual risk
to any worker above 10-4 per annum shall be considered intolerable.
The risk acceptability criteria are indicated in the following pages.
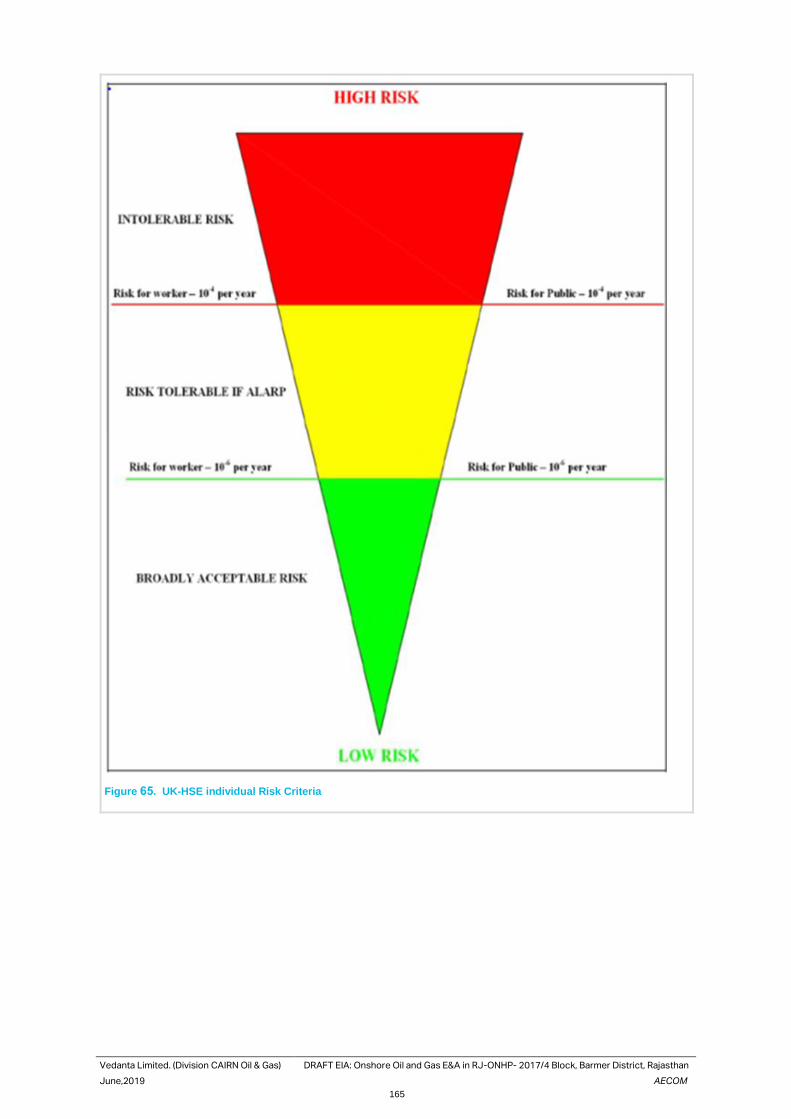
Vedanta Limited. (Division CAIRN Oil & Gas) DRAFT EIA: Onshore Oil and Gas E&A in RJ-ONHP- 2017/4 Block, Barmer District, Rajasthan
June,2019 AECOM
165
Figure 65. UK-HSE individual Risk Criteria
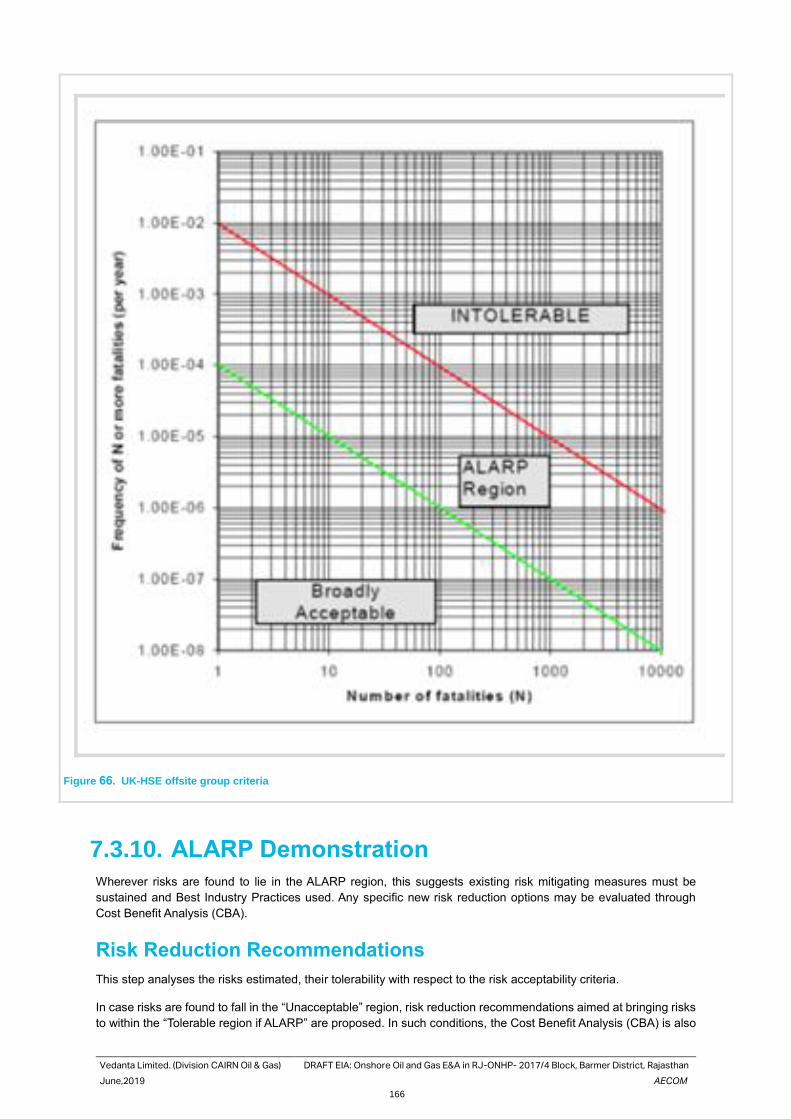
Vedanta Limited. (Division CAIRN Oil & Gas) DRAFT EIA: Onshore Oil and Gas E&A in RJ-ONHP- 2017/4 Block, Barmer District, Rajasthan
June,2019 AECOM
166
Figure 66. UK-HSE offsite group criteria
7.3.10. ALARP Demonstration
Wherever risks are found to lie in the ALARP region, this suggests existing risk mitigating measures must be
sustained and Best Industry Practices used. Any specific new risk reduction options may be evaluated through
Cost Benefit Analysis (CBA).
Risk Reduction Recommendations
This step analyses the risks estimated, their tolerability with respect to the risk acceptability criteria.
In case risks are found to fall in the “Unacceptable” region, risk reduction recommendations aimed at bringing risks
to within the “Tolerable region if ALARP” are proposed. In such conditions, the Cost Benefit Analysis (CBA) is also
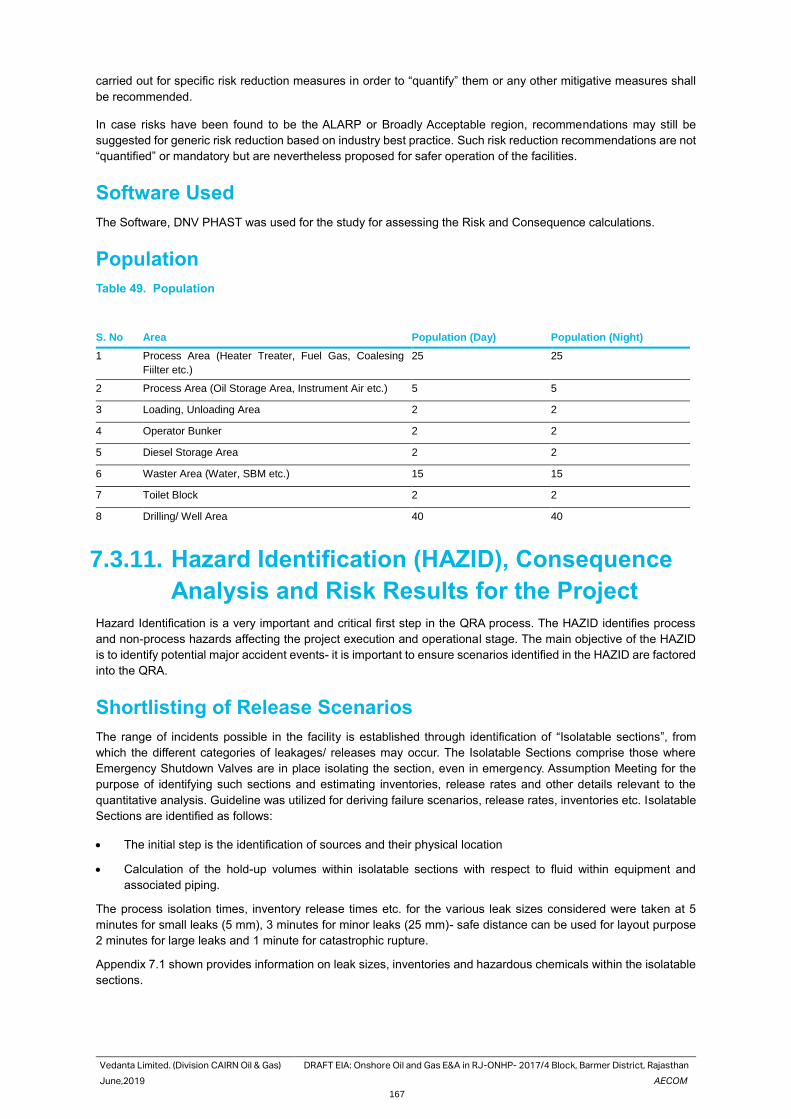
Vedanta Limited. (Division CAIRN Oil & Gas) DRAFT EIA: Onshore Oil and Gas E&A in RJ-ONHP- 2017/4 Block, Barmer District, Rajasthan
June,2019 AECOM
167
carried out for specific risk reduction measures in order to “quantify” them or any other mitigative measures shall
be recommended.
In case risks have been found to be the ALARP or Broadly Acceptable region, recommendations may still be
suggested for generic risk reduction based on industry best practice. Such risk reduction recommendations are not
“quantified” or mandatory but are nevertheless proposed for safer operation of the facilities.
Software Used
The Software, DNV PHAST was used for the study for assessing the Risk and Consequence calculations.
Population
Table 49. Population
S. No Area Population (Day) Population (Night)
1 Process Area (Heater Treater, Fuel Gas, Coalesing
Fiilter etc.)
25 25
2 Process Area (Oil Storage Area, Instrument Air etc.) 5 5
3 Loading, Unloading Area 2 2
4 Operator Bunker 2 2
5 Diesel Storage Area 2 2
6 Waster Area (Water, SBM etc.) 15 15
7 Toilet Block 2 2
8 Drilling/ Well Area 40 40
7.3.11. Hazard Identification (HAZID), Consequence
Analysis and Risk Results for the Project
Hazard Identification is a very important and critical first step in the QRA process. The HAZID identifies process
and non-process hazards affecting the project execution and operational stage. The main objective of the HAZID
is to identify potential major accident events- it is important to ensure scenarios identified in the HAZID are factored
into the QRA.
Shortlisting of Release Scenarios
The range of incidents possible in the facility is established through identification of “Isolatable sections”, from
which the different categories of leakages/ releases may occur. The Isolatable Sections comprise those where
Emergency Shutdown Valves are in place isolating the section, even in emergency. Assumption Meeting for the
purpose of identifying such sections and estimating inventories, release rates and other details relevant to the
quantitative analysis. Guideline was utilized for deriving failure scenarios, release rates, inventories etc. Isolatable
Sections are identified as follows:
• The initial step is the identification of sources and their physical location
• Calculation of the hold-up volumes within isolatable sections with respect to fluid within equipment and
associated piping.
The process isolation times, inventory release times etc. for the various leak sizes considered were taken at 5
minutes for small leaks (5 mm), 3 minutes for minor leaks (25 mm)- safe distance can be used for layout purpose
2 minutes for large leaks and 1 minute for catastrophic rupture.
Appendix 7.1 shown provides information on leak sizes, inventories and hazardous chemicals within the isolatable
sections.
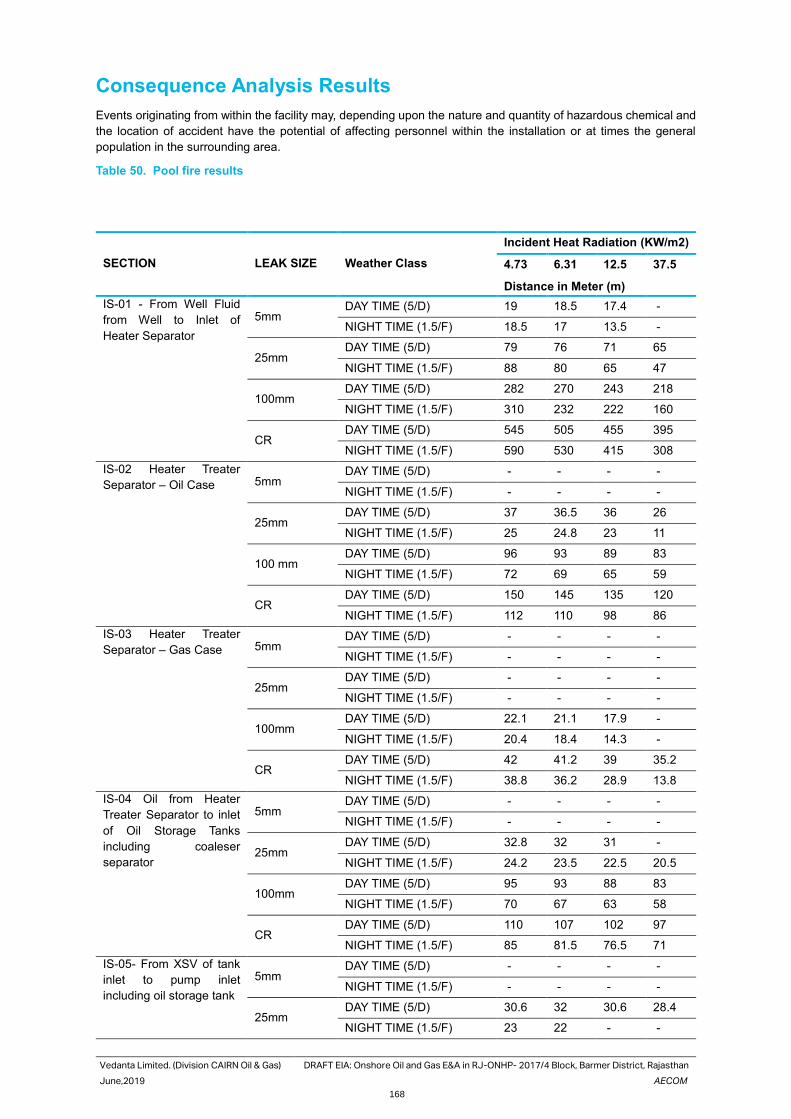
Vedanta Limited. (Division CAIRN Oil & Gas) DRAFT EIA: Onshore Oil and Gas E&A in RJ-ONHP- 2017/4 Block, Barmer District, Rajasthan
June,2019 AECOM
168
Consequence Analysis Results
Events originating from within the facility may, depending upon the nature and quantity of hazardous chemical and
the location of accident have the potential of affecting personnel within the installation or at times the general
population in the surrounding area.
Table 50. Pool fire results
SECTION LEAK SIZE Weather Class
Incident Heat Radiation (KW/m2)
4.73 6.31 12.5 37.5
Distance in Meter (m)
IS-01 - From Well Fluid
from Well to Inlet of
Heater Separator
5mm DAY TIME (5/D) 19 18.5 17.4 -
NIGHT TIME (1.5/F) 18.5 17 13.5 -
25mm DAY TIME (5/D) 79 76 71 65
NIGHT TIME (1.5/F) 88 80 65 47
100mm DAY TIME (5/D) 282 270 243 218
NIGHT TIME (1.5/F) 310 232 222 160
CR DAY TIME (5/D) 545 505 455 395
NIGHT TIME (1.5/F) 590 530 415 308
IS-02 Heater Treater
Separator – Oil Case 5mm DAY TIME (5/D) - - - -
NIGHT TIME (1.5/F) - - - -
25mm DAY TIME (5/D) 37 36.5 36 26
NIGHT TIME (1.5/F) 25 24.8 23 11
100 mm DAY TIME (5/D) 96 93 89 83
NIGHT TIME (1.5/F) 72 69 65 59
CR DAY TIME (5/D) 150 145 135 120
NIGHT TIME (1.5/F) 112 110 98 86
IS-03 Heater Treater
Separator – Gas Case 5mm DAY TIME (5/D) - - - -
NIGHT TIME (1.5/F) - - - -
25mm DAY TIME (5/D) - - - -
NIGHT TIME (1.5/F) - - - -
100mm DAY TIME (5/D) 22.1 21.1 17.9 -
NIGHT TIME (1.5/F) 20.4 18.4 14.3 -
CR DAY TIME (5/D) 42 41.2 39 35.2
NIGHT TIME (1.5/F) 38.8 36.2 28.9 13.8
IS-04 Oil from Heater
Treater Separator to inlet
of Oil Storage Tanks
including coaleser
separator
5mm DAY TIME (5/D) - - - -
NIGHT TIME (1.5/F) - - - -
25mm DAY TIME (5/D) 32.8 32 31 -
NIGHT TIME (1.5/F) 24.2 23.5 22.5 20.5
100mm DAY TIME (5/D) 95 93 88 83
NIGHT TIME (1.5/F) 70 67 63 58
CR DAY TIME (5/D) 110 107 102 97
NIGHT TIME (1.5/F) 85 81.5 76.5 71
IS-05- From XSV of tank
inlet to pump inlet
including oil storage tank
5mm DAY TIME (5/D) - - - -
NIGHT TIME (1.5/F) - - - -
25mm DAY TIME (5/D) 30.6 32 30.6 28.4
NIGHT TIME (1.5/F) 23 22 - -
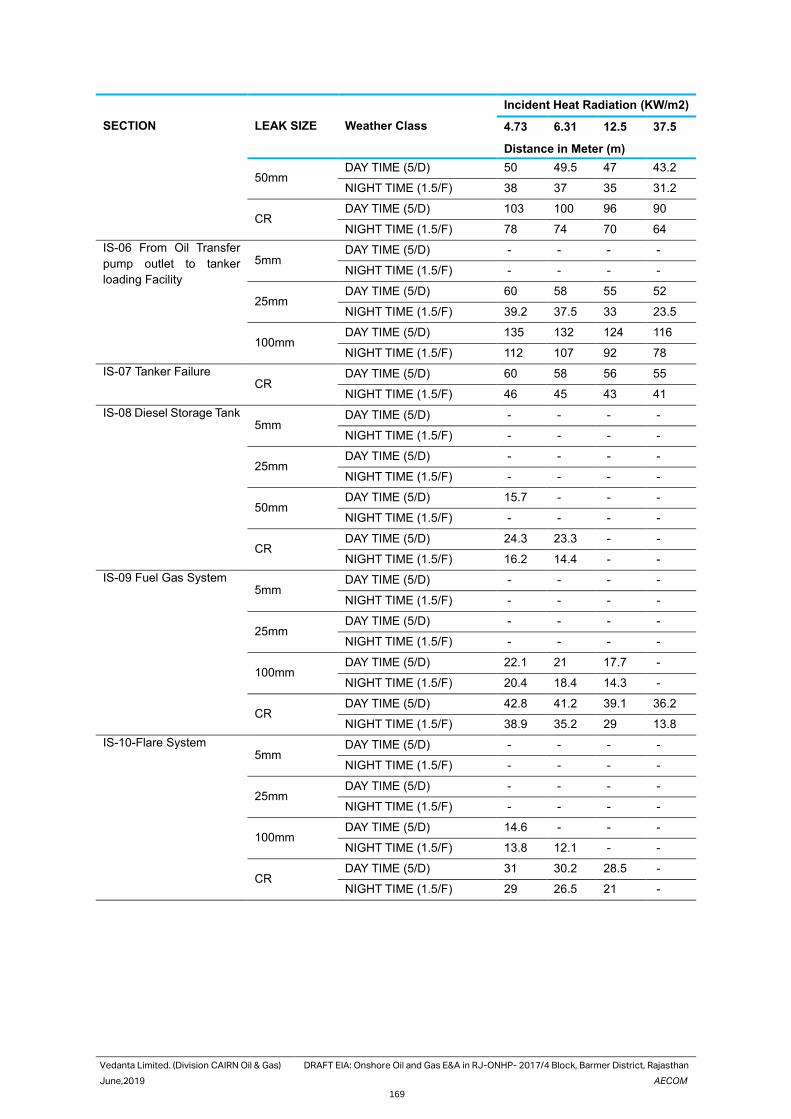
Vedanta Limited. (Division CAIRN Oil & Gas) DRAFT EIA: Onshore Oil and Gas E&A in RJ-ONHP- 2017/4 Block, Barmer District, Rajasthan
June,2019 AECOM
169
SECTION LEAK SIZE Weather Class
Incident Heat Radiation (KW/m2)
4.73 6.31 12.5 37.5
Distance in Meter (m)
50mm DAY TIME (5/D) 50 49.5 47 43.2
NIGHT TIME (1.5/F) 38 37 35 31.2
CR DAY TIME (5/D) 103 100 96 90
NIGHT TIME (1.5/F) 78 74 70 64
IS-06 From Oil Transfer
pump outlet to tanker
loading Facility
5mm DAY TIME (5/D) - - - -
NIGHT TIME (1.5/F) - - - -
25mm DAY TIME (5/D) 60 58 55 52
NIGHT TIME (1.5/F) 39.2 37.5 33 23.5
100mm DAY TIME (5/D) 135 132 124 116
NIGHT TIME (1.5/F) 112 107 92 78
IS-07 Tanker Failure CR
DAY TIME (5/D) 60 58 56 55
NIGHT TIME (1.5/F) 46 45 43 41
IS-08 Diesel Storage Tank 5mm
DAY TIME (5/D) - - - -
NIGHT TIME (1.5/F) - - - -
25mm DAY TIME (5/D) - - - -
NIGHT TIME (1.5/F) - - - -
50mm DAY TIME (5/D) 15.7 - - -
NIGHT TIME (1.5/F) - - - -
CR DAY TIME (5/D) 24.3 23.3 - -
NIGHT TIME (1.5/F) 16.2 14.4 - -
IS-09 Fuel Gas System 5mm
DAY TIME (5/D) - - - -
NIGHT TIME (1.5/F) - - - -
25mm DAY TIME (5/D) - - - -
NIGHT TIME (1.5/F) - - - -
100mm DAY TIME (5/D) 22.1 21 17.7 -
NIGHT TIME (1.5/F) 20.4 18.4 14.3 -
CR DAY TIME (5/D) 42.8 41.2 39.1 36.2
NIGHT TIME (1.5/F) 38.9 35.2 29 13.8
IS-10-Flare System 5mm
DAY TIME (5/D) - - - -
NIGHT TIME (1.5/F) - - - -
25mm DAY TIME (5/D) - - - -
NIGHT TIME (1.5/F) - - - -
100mm DAY TIME (5/D) 14.6 - - -
NIGHT TIME (1.5/F) 13.8 12.1 - -
CR DAY TIME (5/D) 31 30.2 28.5 -
NIGHT TIME (1.5/F) 29 26.5 21 -
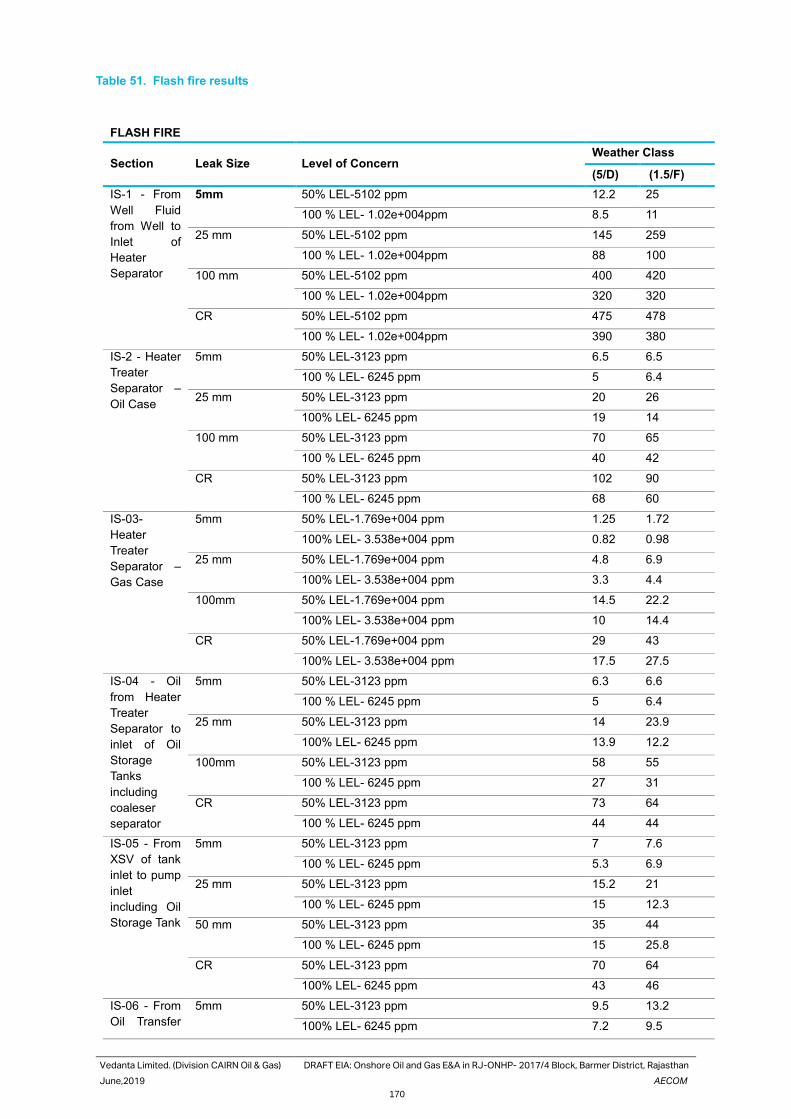
Vedanta Limited. (Division CAIRN Oil & Gas) DRAFT EIA: Onshore Oil and Gas E&A in RJ-ONHP- 2017/4 Block, Barmer District, Rajasthan
June,2019 AECOM
170
Table 51. Flash fire results
FLASH FIRE
Section Leak Size Level of Concern Weather Class
(5/D) (1.5/F)
IS-1 - From
Well Fluid
from Well to
Inlet of
Heater
Separator
5mm 50% LEL-5102 ppm 12.2 25
100 % LEL- 1.02e+004ppm 8.5 11
25 mm 50% LEL-5102 ppm 145 259
100 % LEL- 1.02e+004ppm 88 100
100 mm 50% LEL-5102 ppm 400 420
100 % LEL- 1.02e+004ppm 320 320
CR 50% LEL-5102 ppm 475 478
100 % LEL- 1.02e+004ppm 390 380
IS-2 - Heater
Treater
Separator –
Oil Case
5mm 50% LEL-3123 ppm 6.5 6.5
100 % LEL- 6245 ppm 5 6.4
25 mm 50% LEL-3123 ppm 20 26
100% LEL- 6245 ppm 19 14
100 mm 50% LEL-3123 ppm 70 65
100 % LEL- 6245 ppm 40 42
CR 50% LEL-3123 ppm 102 90
100 % LEL- 6245 ppm 68 60
IS-03-
Heater
Treater
Separator –
Gas Case
5mm 50% LEL-1.769e+004 ppm 1.25 1.72
100% LEL- 3.538e+004 ppm 0.82 0.98
25 mm 50% LEL-1.769e+004 ppm 4.8 6.9
100% LEL- 3.538e+004 ppm 3.3 4.4
100mm 50% LEL-1.769e+004 ppm 14.5 22.2
100% LEL- 3.538e+004 ppm 10 14.4
CR 50% LEL-1.769e+004 ppm 29 43
100% LEL- 3.538e+004 ppm 17.5 27.5
IS-04 - Oil
from Heater
Treater
Separator to
inlet of Oil
Storage
Tanks
including
coaleser
separator
5mm 50% LEL-3123 ppm 6.3 6.6
100 % LEL- 6245 ppm 5 6.4
25 mm 50% LEL-3123 ppm 14 23.9
100% LEL- 6245 ppm 13.9 12.2
100mm 50% LEL-3123 ppm 58 55
100 % LEL- 6245 ppm 27 31
CR 50% LEL-3123 ppm 73 64
100 % LEL- 6245 ppm 44 44
IS-05 - From
XSV of tank
inlet to pump
inlet
including Oil
Storage Tank
5mm 50% LEL-3123 ppm 7 7.6
100 % LEL- 6245 ppm 5.3 6.9
25 mm 50% LEL-3123 ppm 15.2 21
100 % LEL- 6245 ppm 15 12.3
50 mm 50% LEL-3123 ppm 35 44
100 % LEL- 6245 ppm 15 25.8
CR 50% LEL-3123 ppm 70 64
100% LEL- 6245 ppm 43 46
IS-06 - From
Oil Transfer
5mm 50% LEL-3123 ppm 9.5 13.2
100% LEL- 6245 ppm 7.2 9.5
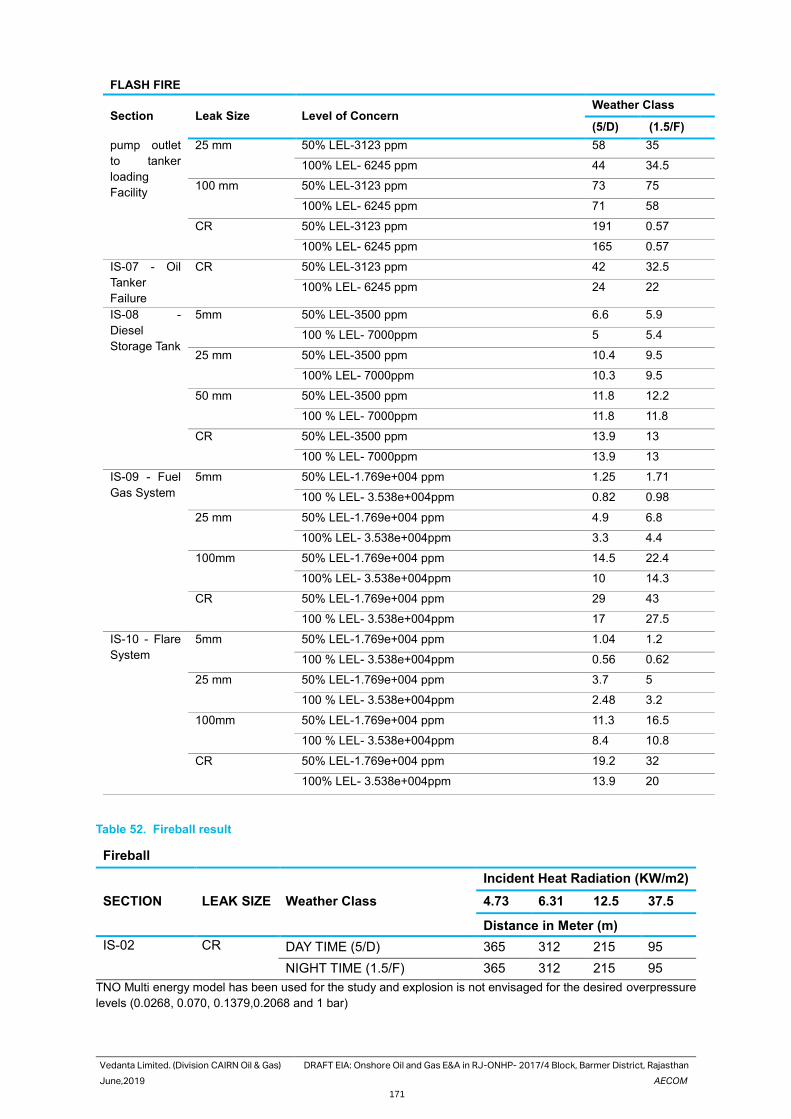
Vedanta Limited. (Division CAIRN Oil & Gas) DRAFT EIA: Onshore Oil and Gas E&A in RJ-ONHP- 2017/4 Block, Barmer District, Rajasthan
June,2019 AECOM
171
FLASH FIRE
Section Leak Size Level of Concern Weather Class
(5/D) (1.5/F)
pump outlet
to tanker
loading
Facility
25 mm 50% LEL-3123 ppm 58 35
100% LEL- 6245 ppm 44 34.5
100 mm 50% LEL-3123 ppm 73 75
100% LEL- 6245 ppm 71 58
CR 50% LEL-3123 ppm 191 0.57
100% LEL- 6245 ppm 165 0.57
IS-07 - Oil
Tanker
Failure
CR 50% LEL-3123 ppm 42 32.5
100% LEL- 6245 ppm 24 22
IS-08 -
Diesel
Storage Tank
5mm 50% LEL-3500 ppm 6.6 5.9
100 % LEL- 7000ppm 5 5.4
25 mm 50% LEL-3500 ppm 10.4 9.5
100% LEL- 7000ppm 10.3 9.5
50 mm 50% LEL-3500 ppm 11.8 12.2
100 % LEL- 7000ppm 11.8 11.8
CR 50% LEL-3500 ppm 13.9 13
100 % LEL- 7000ppm 13.9 13
IS-09 - Fuel
Gas System
5mm 50% LEL-1.769e+004 ppm 1.25 1.71
100 % LEL- 3.538e+004ppm 0.82 0.98
25 mm 50% LEL-1.769e+004 ppm 4.9 6.8
100% LEL- 3.538e+004ppm 3.3 4.4
100mm 50% LEL-1.769e+004 ppm 14.5 22.4
100% LEL- 3.538e+004ppm 10 14.3
CR 50% LEL-1.769e+004 ppm 29 43
100 % LEL- 3.538e+004ppm 17 27.5
IS-10 - Flare
System
5mm 50% LEL-1.769e+004 ppm 1.04 1.2
100 % LEL- 3.538e+004ppm 0.56 0.62
25 mm 50% LEL-1.769e+004 ppm 3.7 5
100 % LEL- 3.538e+004ppm 2.48 3.2
100mm 50% LEL-1.769e+004 ppm 11.3 16.5
100 % LEL- 3.538e+004ppm 8.4 10.8
CR 50% LEL-1.769e+004 ppm 19.2 32
100% LEL- 3.538e+004ppm 13.9 20
Table 52. Fireball result
Fireball
SECTION LEAK SIZE Weather Class
Incident Heat Radiation (KW/m2)
4.73 6.31 12.5 37.5
Distance in Meter (m)
IS-02 CR DAY TIME (5/D) 365 312 215 95
NIGHT TIME (1.5/F) 365 312 215 95
TNO Multi energy model has been used for the study and explosion is not envisaged for the desired overpressure
levels (0.0268, 0.070, 0.1379,0.2068 and 1 bar)
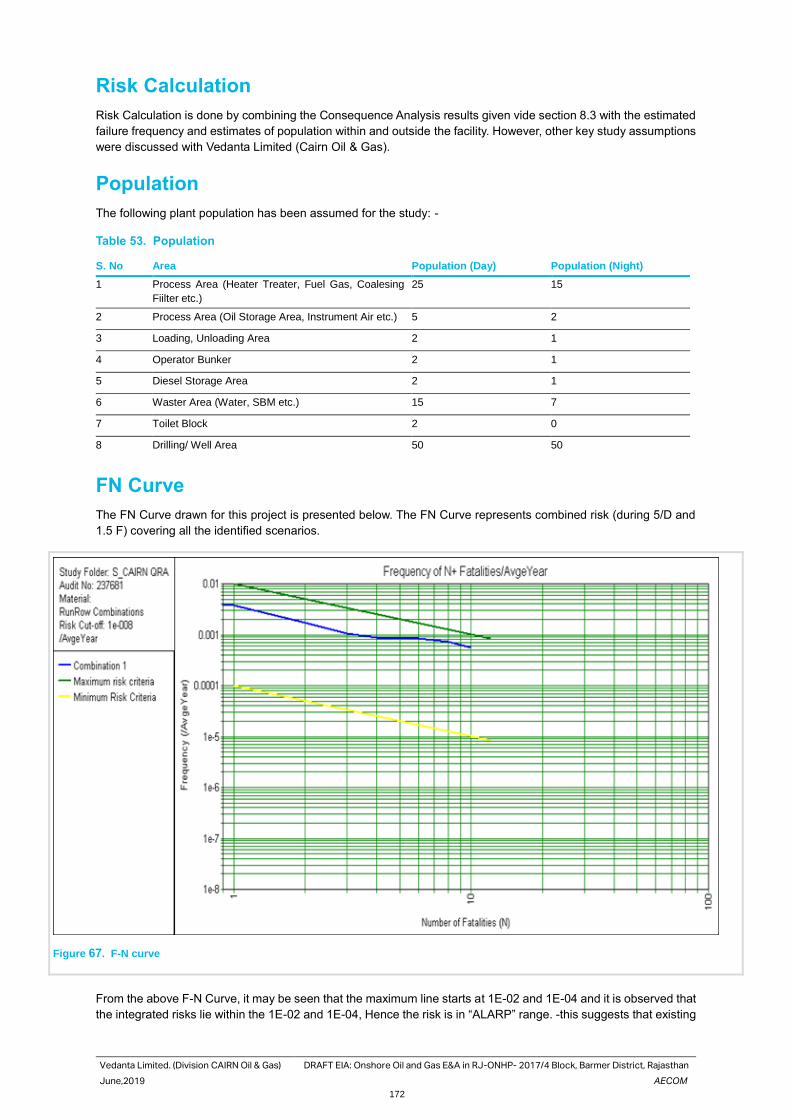
Vedanta Limited. (Division CAIRN Oil & Gas) DRAFT EIA: Onshore Oil and Gas E&A in RJ-ONHP- 2017/4 Block, Barmer District, Rajasthan
June,2019 AECOM
172
Risk Calculation
Risk Calculation is done by combining the Consequence Analysis results given vide section 8.3 with the estimated
failure frequency and estimates of population within and outside the facility. However, other key study assumptions
were discussed with Vedanta Limited (Cairn Oil & Gas).
Population
The following plant population has been assumed for the study: -
Table 53. Population
S. No Area Population (Day) Population (Night)
1 Process Area (Heater Treater, Fuel Gas, Coalesing
Fiilter etc.)
25 15
2 Process Area (Oil Storage Area, Instrument Air etc.) 5 2
3 Loading, Unloading Area 2 1
4 Operator Bunker 2 1
5 Diesel Storage Area 2 1
6 Waster Area (Water, SBM etc.) 15 7
7 Toilet Block 2 0
8 Drilling/ Well Area 50 50
FN Curve
The FN Curve drawn for this project is presented below. The FN Curve represents combined risk (during 5/D and
1.5 F) covering all the identified scenarios.
Figure 67. F-N curve
From the above F-N Curve, it may be seen that the maximum line starts at 1E-02 and 1E-04 and it is observed that
the integrated risks lie within the 1E-02 and 1E-04, Hence the risk is in “ALARP” range. -this suggests that existing
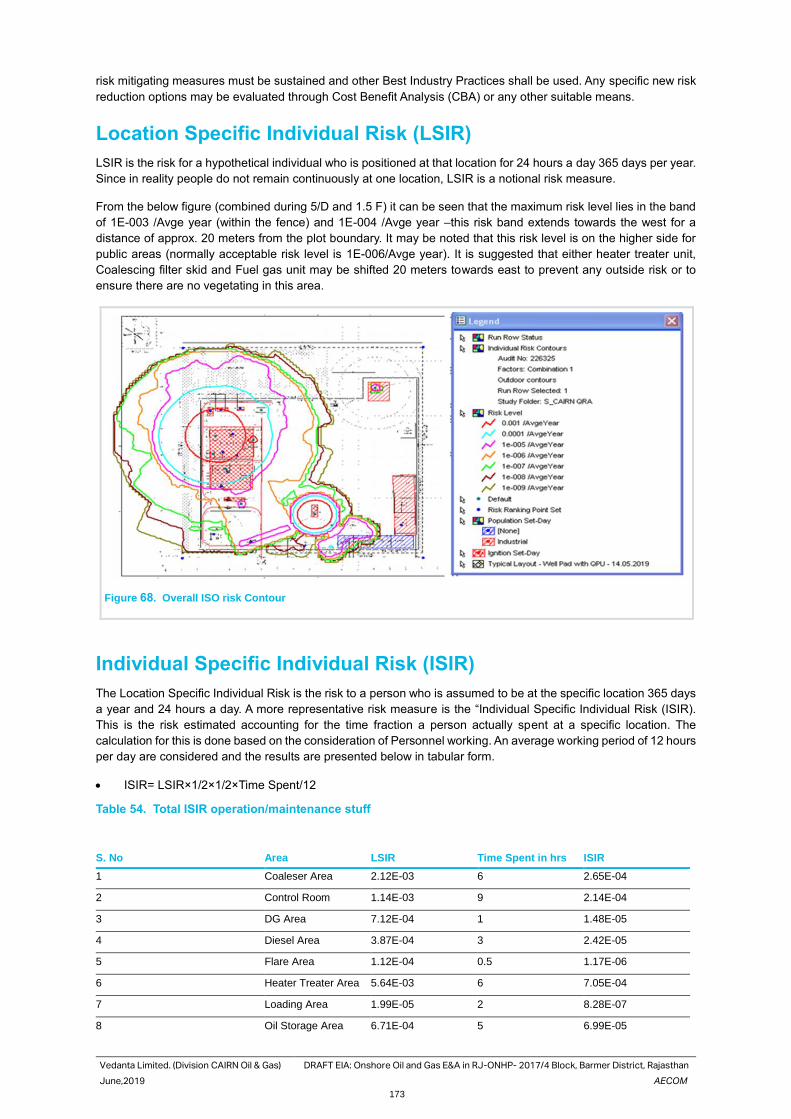
Vedanta Limited. (Division CAIRN Oil & Gas) DRAFT EIA: Onshore Oil and Gas E&A in RJ-ONHP- 2017/4 Block, Barmer District, Rajasthan
June,2019 AECOM
173
risk mitigating measures must be sustained and other Best Industry Practices shall be used. Any specific new risk
reduction options may be evaluated through Cost Benefit Analysis (CBA) or any other suitable means.
Location Specific Individual Risk (LSIR)
LSIR is the risk for a hypothetical individual who is positioned at that location for 24 hours a day 365 days per year.
Since in reality people do not remain continuously at one location, LSIR is a notional risk measure.
From the below figure (combined during 5/D and 1.5 F) it can be seen that the maximum risk level lies in the band
of 1E-003 /Avge year (within the fence) and 1E-004 /Avge year –this risk band extends towards the west for a
distance of approx. 20 meters from the plot boundary. It may be noted that this risk level is on the higher side for
public areas (normally acceptable risk level is 1E-006/Avge year). It is suggested that either heater treater unit,
Coalescing filter skid and Fuel gas unit may be shifted 20 meters towards east to prevent any outside risk or to
ensure there are no vegetating in this area.
Figure 68. Overall ISO risk Contour
Individual Specific Individual Risk (ISIR)
The Location Specific Individual Risk is the risk to a person who is assumed to be at the specific location 365 days
a year and 24 hours a day. A more representative risk measure is the “Individual Specific Individual Risk (ISIR).
This is the risk estimated accounting for the time fraction a person actually spent at a specific location. The
calculation for this is done based on the consideration of Personnel working. An average working period of 12 hours
per day are considered and the results are presented below in tabular form.
• ISIR= LSIR×1/2×1/2×Time Spent/12
Table 54. Total ISIR operation/maintenance stuff
S. No Area LSIR Time Spent in hrs ISIR
1 Coaleser Area 2.12E-03 6 2.65E-04
2 Control Room 1.14E-03 9 2.14E-04
3 DG Area 7.12E-04 1 1.48E-05
4 Diesel Area 3.87E-04 3 2.42E-05
5 Flare Area 1.12E-04 0.5 1.17E-06
6 Heater Treater Area 5.64E-03 6 7.05E-04
7 Loading Area 1.99E-05 2 8.28E-07
8 Oil Storage Area 6.71E-04 5 6.99E-05
Vedanta Limited. (Division CAIRN Oil & Gas) DRAFT EIA: Onshore Oil and Gas E&A in RJ-ONHP- 2017/4 Block, Barmer District, Rajasthan
June,2019 AECOM
174
S. No Area LSIR Time Spent in hrs ISIR
9 Well Area 5.86E-03 4 4.88E-04
10 Fuel Gas Area 2.02E-03 5 2.10E-04
Total 3.44E-06
Table 55. Total ISIR non-operation/maintenance stuff
S. No Area LSIR Time Spent in hrs ISIR
1 Fire Water Area 1.29E-08 2 5.38E-10
2 Toilet Block 1.29E-08 1 2.69E-10
3 Security Cabin 1.00E-07 10 2.08E-08
4 Operator Block 1.00E-07 4 8.33E-09
Total 3.00E-08
From the above values it is seen that the operation/maintenance ISIR value is in ALARP range for operation person
and broadly acceptable for Non-operation. The following measures are available to address the same.
▪ Safeguarding of human life is Cairn Oil & Gas top most priority. To this effect, Vedanta Limited (Division
Cairn Oil & Gas) has issued and implemented a comprehensive HSE POLICY backed up with appropriate
safety management systems and procedures.
▪ Vedanta Limited (Division Cairn Oil & Gas) operating procedures lay a strong focus on hazard identification
and risk assessment covering each and every hazardous operation, procedure and equipment. Risks and
mitigating measures for each are clearly carried out and measures implemented and monitored. This
ensures risk minimisation to the worker group.
▪ The facility to be built based on the applicable National / International codes and best practice. Individual
equipment is of highest quality, certified and of highest safety integrity. This ensures risk minimisation to
the worker group through operational and maintenance periods. In addition, equipment hazard
identification has to be carried out for each of the equipment time to time.
▪ Mock drills should be carried out periodically to ensure the highest state of emergency response incase
of any incident.
Risk Reduction Measures
The main conclusions drawn from the Consequence Analysis and Risk calculations are given below- critical actions
for safeguarding against the incidents are also mentioned below: -
• From the F-N Curve, it is observed that the integrated risks lie within the “ALARP” range. -this suggests
existing risk mitigating measures must be sustained and Best Industry Practices be used. Any specific new
risk reduction options may be evaluated through Cost Benefit Analysis (CBA).
• it can be seen that the maximum risk level lies in the band of 1E-003 /Avge year (within the fence) and 1E-
004 /Avge year –this risk band extends towards the west for a distance of approx. 20 meters from the plot
boundary. It may be noted that this risk level is on the higher side for public areas (normally acceptable risk
level is 1E-006/Avge year). It is suggested that either heater treater unit, Coalescing filter skid and Fuel gas
unit may be shifted 20 meters towards east to prevent any outside risk or to ensure there are no vegetating
in this area.
• It is seen that the control room is falls under 1E-03 /Avge year it advised to shift the Control room to a safe
location.
• As Living areas are likely to be affected due to large incidents on the Rig Floor, it is essential to ensure the
upkeep of the safety devices (Smoke Detection, Fast Rescue Craft (FRC), escape routes and it must be
ensured that Mock evacuation drills are carried out periodically.
• Escape routes for personnel on the Drill Floor towards the LQ must be properly protected and kept free of
any debris/obstructions etc. to ensure minimum loss of life.
• The correct installation of Safety Critical Equipment and their operational reliability are essential for the safety
of the facility. In addition, initial and periodic testing of the Safety Critical Equipment before installation and
periodically is absolutely essential and the same must be ensured.
Vedanta Limited. (Division CAIRN Oil & Gas) DRAFT EIA: Onshore Oil and Gas E&A in RJ-ONHP- 2017/4 Block, Barmer District, Rajasthan
June,2019 AECOM
175
• Storage tank enclosures must be drained periodically during the rainy season in particular.
• As hydrocarbon related risks exist at the facility, ignition source control must be ensured during routine and
non-routine operations.
• Ensuring that the public in vicinity of the facility is made aware of the hazards and also the hazards of
unplanned and irregular third-party activities- this may be done through frequent safety awareness
programmes, warning signage, explicit display of Do’s and Don’ts etc.
• Emergency Response Drills must be carried out frequently both internally within Vedanta Limited (Division
Cairn Oil & Gas) and also involving external authorities. Lessons learnt must be assimilated and disseminated
to concerned persons.
• The correct installation of the Safety Critical Equipment and their operational reliability are essential for the
safety of the facility. In addition, initial and periodic testing of the Safety Critical Equipment before installation
and periodically is essential and the same must be ensured.
• For Jetfire scenarios for small leaks may be safeguarded against through proper fire protection means (Fire
and gas Detectors, Passive and Active firefighting systems.Proper firefighting system design and
implementation and fire drills, training etc. are essential and must be sustained through the project life cycle.
• The damage distance arises due to the Flash Fire mitigated by ensuring the that the area must be kept free
of ignition sources to the extent possible and the same must be ensured even during maintenance activity.
Non-sparking tools must be used and personnel entering the area must be “de-earthed” before entering. A
hazardous area classification study is suggested for placement of electrical equipment in the classified area.
• The damage distance for pool fire arising due the pool fire for small leaks shall be safeguarded against through
proper fire protection means
• Key non-routine activities must be preceded by a Job Safety Analysis and Job or Task Risk Assessment
involving key personnel that would be working on the facility.
• Work Permit System must be implemented during the construction and operational phases of the project to
safeguard against any accidents. It must subsequently also cover the operational phase.
• Trips and falls hazard, electrical hazards etc. must be minimized through periodic safety audits and site
inspections using third party and Internal audit teams. Actions arising out of the audits must be implemented
in a time bound manner and followed up for closure.
• Vedanta Limited (Division Cairn Oil & Gas) must ensure suitable training to all personnel (Company as well
as Contractor personnel) to help prevent incidents/ accidents- such training must be refreshed periodically,
and a list of trained personnel must be maintained by Vedanta Limited (Division Cairn Oil & Gas)
• As ignition related risks exist at the facility, ignition source control must be ensured during routine and non-
routine operations.
• Apart from the process risks assessed, another very important category of incidents possible are those
associated with well operations. These risks could include uncontrolled blowouts, incidents associated with
rig movement/rig walk, wireline risks during wireline operations, well bore clean out risks, risks associated
with specific chemicals during drilling/well repair/ activation/other activities.
• On-site personnel are subject to standard occupational risks and Vedanta Limited (Division Cairn Oil & Gas)
must direct effort and resources into reducing these risks. Incidents connected with well operations, dropped
objects, personnel falls from height, electrocution incidents etc. are top priorities which Vedanta Limited
(Division Cairn Oil & Gas) should concentrate significant effort to prevent, prepare for and respond to. This
must be implemented through the Vedanta Limited (Division Cairn Oil & Gas) HSE Management System.
• HAZOP to be done once design is reasonably complete and before start up. In addition, a basic safeguarding
must be in place during the testing/early production phase- well shut/ surface facilities basic shut down must
be possible. A basic functioning F&G system too must be put in place with well shut down incase of F&G
activation. Initial phase well behavior could be unpredictable and necessary safeguarding must be in place-
essentially, the EPU must be equipped with basic shutdown facilities, typically “fit for purpose”. It is also
necessary that initial well operations are manned continuously- this of course, will be the case, since data
logging/monitoring would also be taking place.
• Storage Tank vents to be routed at safe height and location to acvoid toxic/sudden vapour egress with
toxic/flammable hazard.
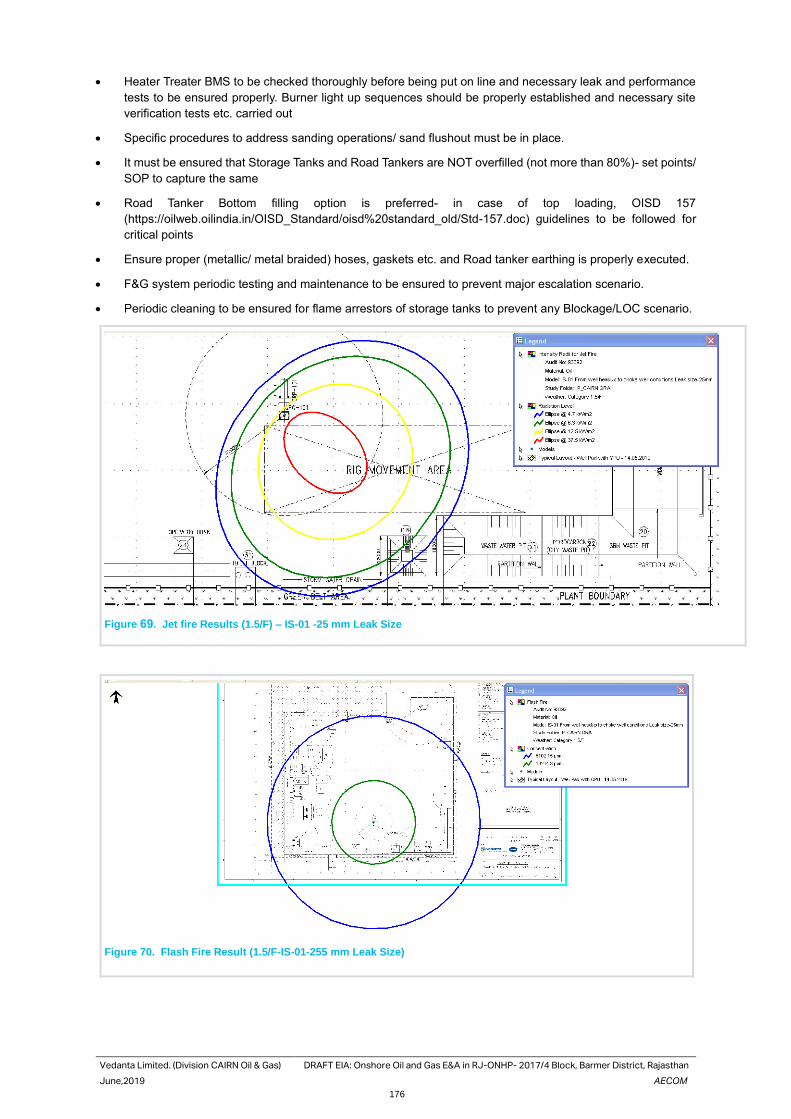
Vedanta Limited. (Division CAIRN Oil & Gas) DRAFT EIA: Onshore Oil and Gas E&A in RJ-ONHP- 2017/4 Block, Barmer District, Rajasthan
June,2019 AECOM
176
• Heater Treater BMS to be checked thoroughly before being put on line and necessary leak and performance
tests to be ensured properly. Burner light up sequences should be properly established and necessary site
verification tests etc. carried out
• Specific procedures to address sanding operations/ sand flushout must be in place.
• It must be ensured that Storage Tanks and Road Tankers are NOT overfilled (not more than 80%)- set points/
SOP to capture the same
• Road Tanker Bottom filling option is preferred- in case of top loading, OISD 157
(https://oilweb.oilindia.in/OISD_Standard/oisd%20standard_old/Std-157.doc) guidelines to be followed for
critical points
• Ensure proper (metallic/ metal braided) hoses, gaskets etc. and Road tanker earthing is properly executed.
• F&G system periodic testing and maintenance to be ensured to prevent major escalation scenario.
• Periodic cleaning to be ensured for flame arrestors of storage tanks to prevent any Blockage/LOC scenario.
Figure 69. Jet fire Results (1.5/F) – IS-01 -25 mm Leak Size
Figure 70. Flash Fire Result (1.5/F-IS-01-255 mm Leak Size)
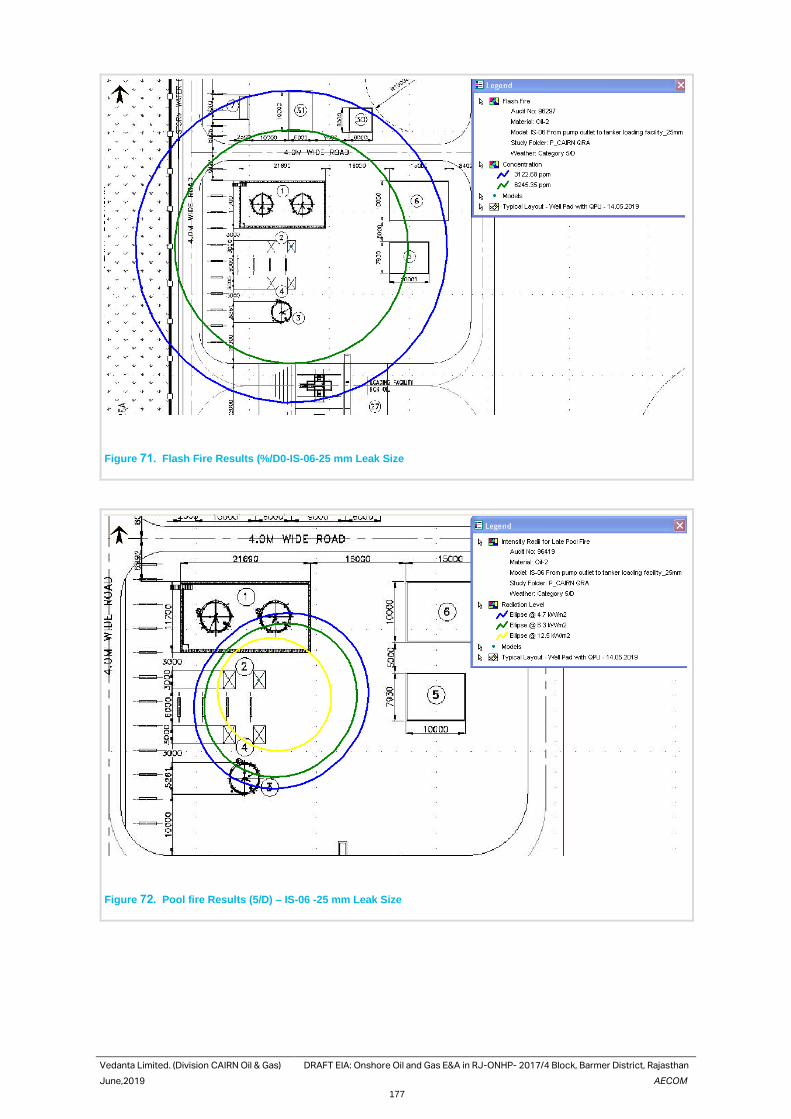
Vedanta Limited. (Division CAIRN Oil & Gas) DRAFT EIA: Onshore Oil and Gas E&A in RJ-ONHP- 2017/4 Block, Barmer District, Rajasthan
June,2019 AECOM
177
Figure 71. Flash Fire Results (%/D0-IS-06-25 mm Leak Size
Figure 72. Pool fire Results (5/D) – IS-06 -25 mm Leak Size
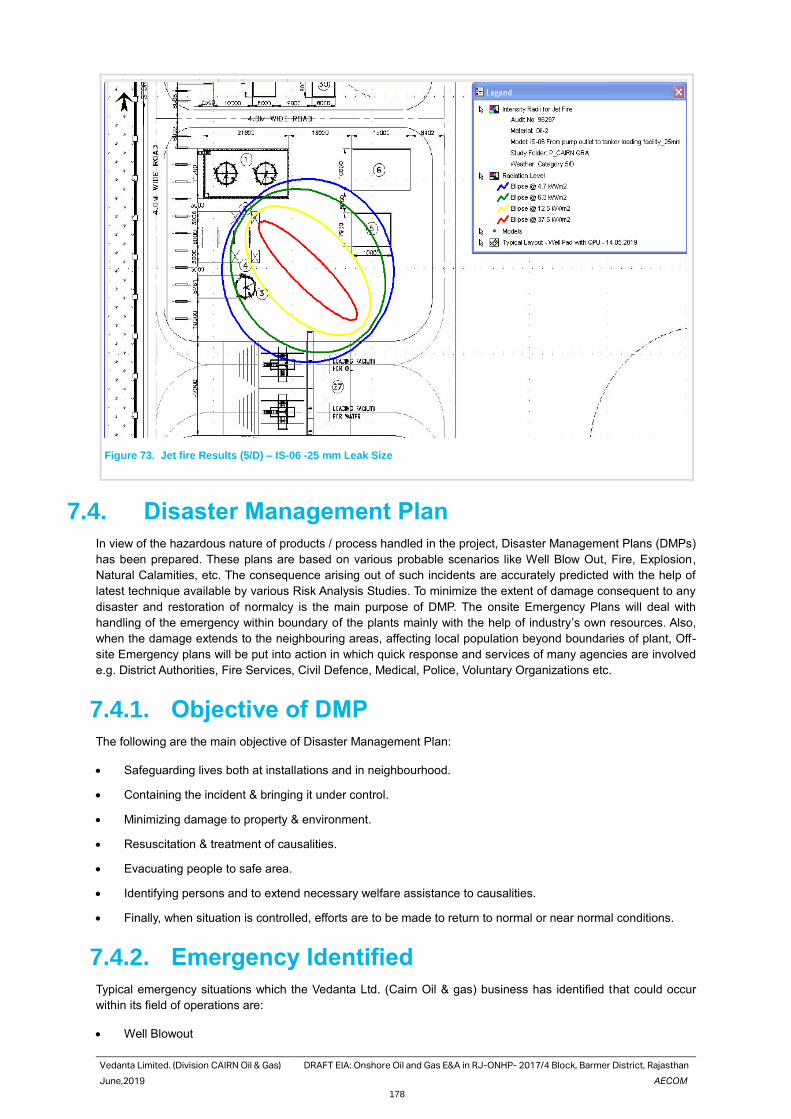
Vedanta Limited. (Division CAIRN Oil & Gas) DRAFT EIA: Onshore Oil and Gas E&A in RJ-ONHP- 2017/4 Block, Barmer District, Rajasthan
June,2019 AECOM
178
Figure 73. Jet fire Results (5/D) – IS-06 -25 mm Leak Size
7.4. Disaster Management Plan
In view of the hazardous nature of products / process handled in the project, Disaster Management Plans (DMPs)
has been prepared. These plans are based on various probable scenarios like Well Blow Out, Fire, Explosion,
Natural Calamities, etc. The consequence arising out of such incidents are accurately predicted with the help of
latest technique available by various Risk Analysis Studies. To minimize the extent of damage consequent to any
disaster and restoration of normalcy is the main purpose of DMP. The onsite Emergency Plans will deal with
handling of the emergency within boundary of the plants mainly with the help of industry’s own resources. Also,
when the damage extends to the neighbouring areas, affecting local population beyond boundaries of plant, Off-
site Emergency plans will be put into action in which quick response and services of many agencies are involved
e.g. District Authorities, Fire Services, Civil Defence, Medical, Police, Voluntary Organizations etc.
7.4.1. Objective of DMP
The following are the main objective of Disaster Management Plan:
• Safeguarding lives both at installations and in neighbourhood.
• Containing the incident & bringing it under control.
• Minimizing damage to property & environment.
• Resuscitation & treatment of causalities.
• Evacuating people to safe area.
• Identifying persons and to extend necessary welfare assistance to causalities.
• Finally, when situation is controlled, efforts are to be made to return to normal or near normal conditions.
7.4.2. Emergency Identified
Typical emergency situations which the Vedanta Ltd. (Cairn Oil & gas) business has identified that could occur
within its field of operations are:
• Well Blowout
Vedanta Limited. (Division CAIRN Oil & Gas) DRAFT EIA: Onshore Oil and Gas E&A in RJ-ONHP- 2017/4 Block, Barmer District, Rajasthan
June,2019 AECOM
179
• Fire / Explosion
• Gas Leakage (H2S, Natural Gas, etc.)
• Natural disaster such as earthquake, floods, storms, etc.
• Human injuries from accidents, falls, etc.
7.4.3. Emergency Classification - Tiers of
Emergency Response
Response strategies shall be commensurate with the nature, scale and associated hazards and risks for relevant
emergency event.
The emergencies are classified as Tier 1, 2 & 3. The examples of Tier 1, 2 and 3 incidents are given in table below.
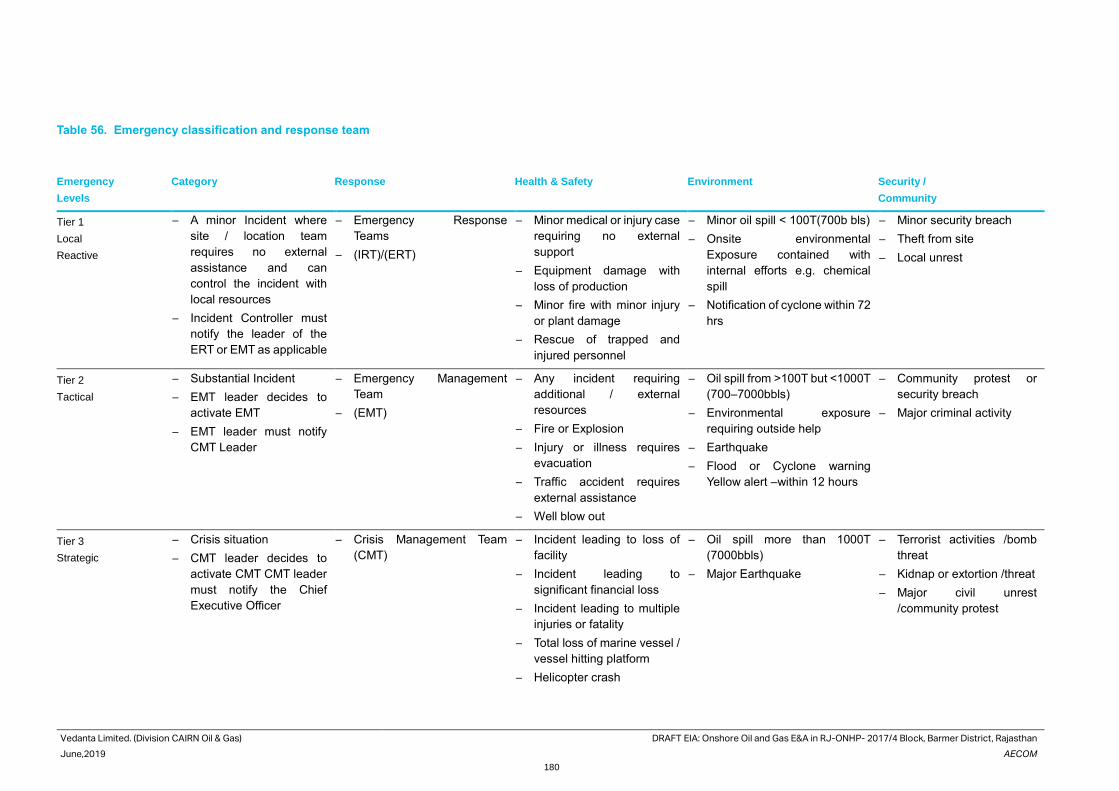
Vedanta Limited. (Division CAIRN Oil & Gas) DRAFT EIA: Onshore Oil and Gas E&A in RJ-ONHP- 2017/4 Block, Barmer District, Rajasthan
June,2019 AECOM
180
Table 56. Emergency classification and response team
Emergency
Levels
Category Response Health & Safety Environment Security /
Community
Tier 1
Local
Reactive
─ A minor Incident where
site / location team
requires no external
assistance and can
control the incident with
local resources
─ Incident Controller must
notify the leader of the
ERT or EMT as applicable
─ Emergency Response
Teams
─ (IRT)/(ERT)
─ Minor medical or injury case
requiring no external
support
─ Equipment damage with
loss of production
─ Minor fire with minor injury
or plant damage
─ Rescue of trapped and
injured personnel
─ Minor oil spill < 100T(700b bls)
─ Onsite environmental
Exposure contained with
internal efforts e.g. chemical
spill
─ Notification of cyclone within 72
hrs
─ Minor security breach
─ Theft from site
─ Local unrest
Tier 2
Tactical
─ Substantial Incident
─ EMT leader decides to
activate EMT
─ EMT leader must notify
CMT Leader
─ Emergency Management
Team
─ (EMT)
─ Any incident requiring
additional / external
resources
─ Fire or Explosion
─ Injury or illness requires
evacuation
─ Traffic accident requires
external assistance
─ Well blow out
─ Oil spill from >100T but <1000T
(700–7000bbls)
─ Environmental exposure
requiring outside help
─ Earthquake
─ Flood or Cyclone warning
Yellow alert –within 12 hours
─ Community protest or
security breach
─ Major criminal activity
Tier 3
Strategic
─ Crisis situation
─ CMT leader decides to
activate CMT CMT leader
must notify the Chief
Executive Officer
─ Crisis Management Team
(CMT)
─ Incident leading to loss of
facility
─ Incident leading to
significant financial loss
─ Incident leading to multiple
injuries or fatality
─ Total loss of marine vessel /
vessel hitting platform
─ Helicopter crash
─ Oil spill more than 1000T
(7000bbls)
─ Major Earthquake
─ Terrorist activities /bomb
threat
─ Kidnap or extortion /threat
─ Major civil unrest
/community protest
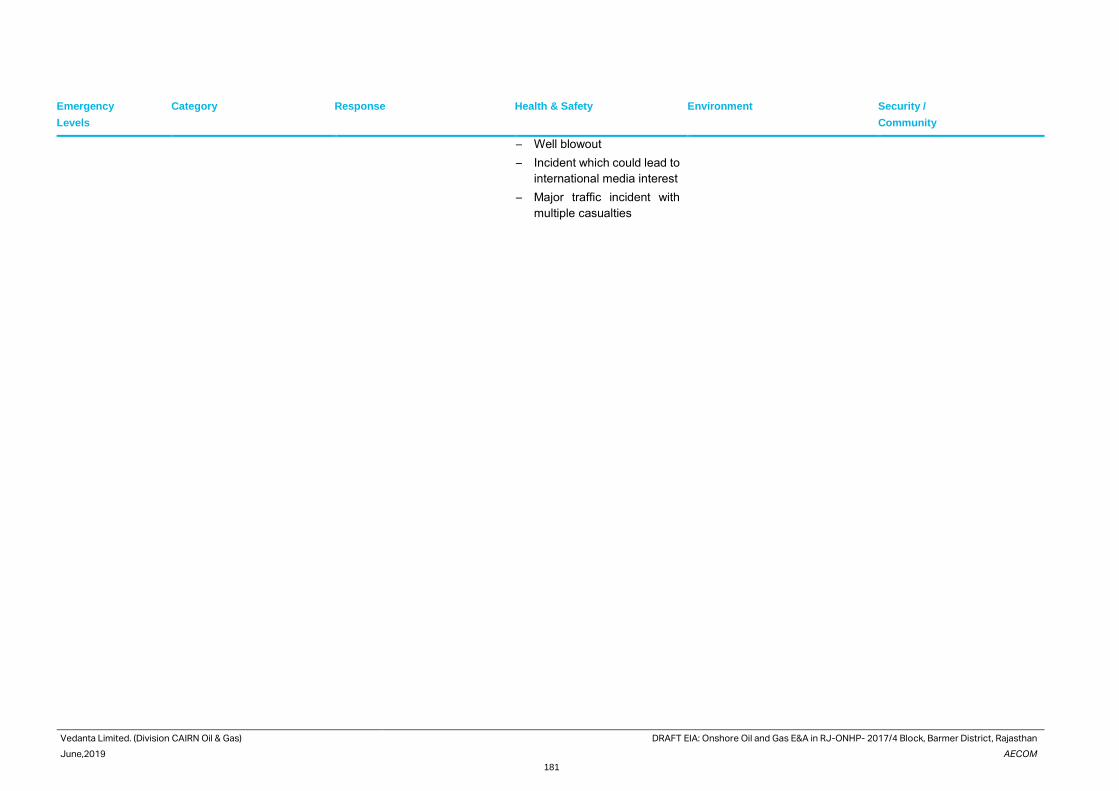
Vedanta Limited. (Division CAIRN Oil & Gas) DRAFT EIA: Onshore Oil and Gas E&A in RJ-ONHP- 2017/4 Block, Barmer District, Rajasthan
June,2019 AECOM
181
Emergency
Levels
Category Response Health & Safety Environment Security /
Community
─ Well blowout
─ Incident which could lead to
international media interest
─ Major traffic incident with
multiple casualties
Vedanta Limited. (Division CAIRN Oil & Gas) DRAFT EIA: Onshore Oil and Gas E&A in RJ-ONHP- 2017/4 Block, Barmer District, Rajasthan
June,2019 AECOM
182
7.4.4. On-site Emergency Response Plan
The Onsite & Offsite Disaster Management Plan (DMP) and Emergency Response Plan (ERP) are planned for
facilities, which are also extended to proposed activities. The scope of the DMP On-site Emergency Preparedness
Plan is to evaluate the various types of emergencies that can occur at rig installations and processing/production
facilities (Drilling and Production activities) and to formulate emergency plans, procedures that can be implemented
by Vedanta Ltd. (Cairn Oil & Gas) in house. In case the contingency exceed in dimension or geographical coverage
beyond Vedanta Ltd. (Cairn Oil & Gas)’s capability, the offsite Emergency plan shall be activated concurrently with
the help of District administration
Based on the incident classification and response team matrix mentioned above, Incident Response Team,
Emergency Response Team and Emergency Management Team gets involved.
Tier 1 Incident Response Team (IRT):
• The emergency or incident can be effectively and safely managed, and contained within the site, location or
facility by local staff.
• Emergency or incident has no impact outside the site, location or facility. IRT may provide support through
effective interaction with local stakeholders.
• Loss of life or severe environmental damage or material loss of asset or organisation’s reputation is not a
consequence of event / emergency.
Tier 1 incidents are managed by Site IRT, each site has own IRT.
Tier 1 Emergency Response Team (ERT):
• The ERT provide assistance and local support to the IRT’s in relevant area.
• The ERT have access to local outside site / external emergency services.
• For tier 2 emergency events.
Tier 2 Emergency Management Team (EMT)
• The incident cannot be effectively and safely managed or contained at the site location or facility by
operational local staff and additional support is required.
• The incident is having or has potential of impact beyond the site, location or facility and external support may
be required.
• Loss of life or severe environment damage or loss of asset or organisation’s reputation is possible
consequence of event / emergency.
• IRT may provide support through effective interactions with local stakeholders.
• ERT acts as interface between EMT and IRT for Midstream pipeline operations.
Tier 2 EMT is primarily for tactical response to the incident but may on occasions required to act in reactive mode.
Tier 3 Crisis Management Team (CMT):
• The incident has escalated to a level having potential of loss of life, adverse effect on public or company’s
operations / reputation.
• Incident may have requirement of immediate action / guidance from Top Management.
Tier 3 incidents are incident escalating to the point requiring involvement of CMT
7.4.5. Responsibilities of the Individual Response
Organisations
The Incident Response Team is responsibility for managing all incidents and emergencies which may occur at or
in close proximity to their operational area. For emergencies where additional / external support is required the
person in charge of the incident response, the Incident Controller at a remote location, site or facility must notify
Vedanta Limited. (Division CAIRN Oil & Gas) DRAFT EIA: Onshore Oil and Gas E&A in RJ-ONHP- 2017/4 Block, Barmer District, Rajasthan
June,2019 AECOM
183
and request support and assistance from the next level in the emergency management organisation. The ERT /
EMT should be notified of all incidents within 30 minutes of the IRT activation at a remote location, site or facility.
The key role and responsibilities of the IRT Leader will be
• To manage the response to any and all incident or emergencies at the Site, Plant or Field Location
• To Control the incident by preventing escalation and minimizing risk to personnel
• Direct and coordinate the activities of the Incident Control and Forward Response Teams.
• Ensuring sufficient trained and competent personnel are available to support the Response Teams.
• Ensuring the safety of all personnel working at the Site, Plant or Field location
• Evaluate and initiate immediate actions, to contain and mitigate effects of the incident or emergency. Monitor
the situation & determine need for evacuation.
• Establish head count and potential whereabouts of any missing personnel and if necessary prepare search,
rescue and recovery plan.
• Follow Incident Response Plan and if required develop a plan of action to deal with the incident or emergency
and communicating this plan to the IRT members
Emergency Response Team (ERT) – Pipeline (Reactive/Tactical)
This is Emergency Response Team, responsible for coordinating overall incident and emergency response for
pipeline incident at any of midstream pipeline locations.
The role and responsibilities of the ERT Leader will be:
• Co-ordination and Support of responses for all incident and emergency situations for the pipeline;
• Reporting all incident and emergency situations in the pipeline operations to the EMT Leader in line with
notification requirements;
• Provide and deploy additional resources as needed by the Incident Controller;
• Ensure all direct communications with the EMT;
• Determine the actual and possible impact of the incident;
• Ensure that information associated with the incident is promptly considered by the Support Team;
Emergency Management Team (EMT) – Tactical/Strategic Response
In the event of an incident or emergency the Emergency Management Team Leader will make a decision whether
or not to mobilise the EMT. If the decision is taken to mobilise the EMT then all EMT duty personnel are required
to proceed promptly to the Emergency Management Team Room and manage emergency in accordance with their
role, responsibility and as directed by the duty EMT Leader. DOA shall be nominated for absence.
The EMT organisation has following roles and responsibilities:
• EMT Leader – In overall in-charge / team leader, responsible for Company’s tactical response to all
emergency situations in respective SBU. They are also responsible for reporting incidents to the regulating
authorities.
• Human Resources Coordinator – Responsible for providing HR services advice and support
• Logistics Co-ordinator – Responsible for providing transport and logistics support as required
• Operation and Technical Coordinator – Responsible for providing operational and technical support and
advice
• Finance – Responsible for providing financial support and advice.
• HSE Coordinator – Responsible for providing health, safety, environmental support and response.
• Recorder – Responsible for maintaining a timed log of key events and actions
• Security Coordinator – Responsible for providing security support advice and assisting others as required by
EMT Leader
Vedanta Limited. (Division CAIRN Oil & Gas) DRAFT EIA: Onshore Oil and Gas E&A in RJ-ONHP- 2017/4 Block, Barmer District, Rajasthan
June,2019 AECOM
184
The above list identifies a number of key EMT roles, following additional supporting roles may be called on when
as and when required, typical roles being:
• Air Medevac Nodal Officer – Responsible for facilitating air medevac.
• IT/Telecommunication Co-ordinator – Responsible for providing the EMT with technical support associated
with the communications hardware and software
• Company Medical Officer – Responsible for providing advice and assistance on health and medical issues.
• Legal – Responsible for providing support on legal / regulatory aspects.
• Public Relation / Corp Com – Responsible for communication with media and external stake holders.
• Contractor’s representatives – who may be called in to assist the EMT should the incident involve members
of their organisation
Crisis Management Team (CMT) Roles
The Crisis Management Team is comprised of small core of senior executives. The CMT will collectively have
responsibility for all major actions taken before; during, and after the crisis situation has occurred.
The role and responsibilities of the CMT will be:
• Select additional specialist resources to join the CMT or to advise the CMT during a crisis, depending on the
nature of the crisis
• Develop and implement crisis management strategy
• Develop and communicate the operating mandate of the CMT to those with responsibility for the on-scene
activities
• Nominate spokesperson to cover media interviews
• Establish contact and communicate with appropriate government or other agencies
• Prepare to coordinate business continuity and recovery strategy
Emergency Response Strategies / Evacuation Plan
Emergency response strategies (ERS) are the documented decisions on required emergency response measures
for identified emergencies, based on risk evaluation and assessment process. It shall consider all statutory
requirements applicable to the installations.
The objective of ERS is to identify the means to be used to secure adequate emergency response. It provides
basis for monitoring of the adequacy of the emergency response measures so that they can be modified when
essential. ERS should include appropriate standard of performance for response measures associated with each
type of identified major accident hazard and installation specific factors.
ERS should include the following elements:
• Organisation
• Procedures
• Equipment
• Information
• Competency building measures (Training & refresher courses and Drills & exercises)
• The role of any other measure essential for achieving successful emergency response
Emergency response measures shall consider the available resources as below:
• Installation resources: They are immediately available on the installation and are under control of installation
Manager / In-charge. These include personnel and equipment that can be assigned emergency role.
• Area resources: These resources are available on the installations in the vicinity, within same area and are
not under control of Installation In-charge. The resources may be available within the Vedanta Ltd. (Cairn Oil
& Gas) or available by a mutual aid or cooperation agreement.
Vedanta Limited. (Division CAIRN Oil & Gas) DRAFT EIA: Onshore Oil and Gas E&A in RJ-ONHP- 2017/4 Block, Barmer District, Rajasthan
June,2019 AECOM
185
• External resources: These resources are available by a mutual aid or cooperation agreement at regional,
national or international level and include organisations, professional bodies and resource persons.
The general requirements as per Vedanta Technical Standard VED/CORP/SUST/TS 13 on Emergency and Crisis
Management are:
• Crisis situations shall be managed centrally by Cairn Oil and Gas business, in accordance with the
requirements outlined in the standard.
• SBU operations shall also have procedures in place to ensure crisis situations are escalated to Cairn Oil and
Gas business and Vedanta Group as appropriate.
• Emergency situations shall be managed by SBU operations and reported to Cairn Oil and Gas business and
Vedanta Group as appropriate.
• Incidents shall be managed at the SBU operation level and reported in accordance with SBU operations,
Cairn Oil and Gas business, Vedanta Group and regulatory reporting requirements. Also refer Management
Standard MS11 on Incident Reporting, Escalation and Investigation.
• Emergency Preparedness and Response Plans shall be developed, implemented and maintained at the SBU
operation, Cairn Oil and Gas business and Group level to deal with incidents, emergencies and crisis
situations.
Additional Vedanta Ltd. (Cairn Oil and Gas) requirements are:
• The objective of emergency response planning is to have clear written procedures for expected actions during
anticipated emergencies. Emergency response plan includes operational and procedural requirements for
various emergency scenarios that are relevant for the installation.
• Ensure that appropriate resources and incident / emergency response plans are prepared, practiced and
available. The procedures shall include provision for emergency arrangements with contractors.
• Critical resources of emergency response should include:
─ Emergency power systems
─ Fire and gas detection systems
─ Active fire protection
─ Passive fire protection
─ Shutdown system
─ Explosion mitigation and protection systems
─ Evacuation escape and rescue arrangements
• Every Cairn business unit (including projects and offices) shall be covered by trained Incident and Emergency
Management Teams who will manage and execute the emergency plans.
• All members of the emergency organisations should be trained and competent to perform their assigned role
within the incident response (IRT) / emergency response (ERT) / emergency management (EMT).
• Arrangements for emergency medical treatment shall consider injuries to persons as a result of minor
accidents & major accidental events, illness of persons on installation, transportation & evacuation of sick and
injured personnel.
• Controlled medicines shall be stored in a secure place accessible only to those who are trained to administer
these.
• The level of medical facilities and trained personnel provided should be in line with the requirements identified
in emergency response strategy. Key points to be considered is identification of medical facilities / hospitals
• Emergency response plans shall comply with all relevant legislative and regulatory requirements to ensure
emergency capabilities are maintained and achieved.
• Procedure for designing emergency response measures should be based on:
• Integration of emergency response with / into design and operations
• Automatic or remotely operated safety systems to mitigate the effects of an incident
Vedanta Limited. (Division CAIRN Oil & Gas) DRAFT EIA: Onshore Oil and Gas E&A in RJ-ONHP- 2017/4 Block, Barmer District, Rajasthan
June,2019 AECOM
186
• Emergency response organisation structure
• Wherever applicable offsite emergency response / disaster management plans shall be ensured.
• Essential safety system (such as control stations, temporary refuge, muster areas, fire pumps) shall be
located where they are least likely to be affected by fires and explosions.
• Emergency shut down (ESD) system shall be designed such, that it is capable of fulfilling its function under
the conditions of incident. If installation is in operation, the essential shutdown functions shall be available
during maintenance activities, which affect the operation of the ESD system. ESD system shall contain
facilities for testing of both input / output devices and internal functions.
• Evacuation and escape routes shall be provided from all areas of an installation where personnel may be
expected to be present during their normal activities. Alternative means to allow persons to safely leave the
installation in an emergency shall be provided.
• Evacuation and escape routes shall have adequate illumination with emergency lighting and shall be marked
to ensure that ‘they can be used during emergency conditions’. All escape routes shall be unobstructed
(including vertical clearance) and readily accessible.
• Personal protective equipment for use in major accident hazards should be suitable for the circumstances in
which it may have to be used and the individuals who may have to use it.
• PPE for use in an emergency should be for all persons on the installation for use in condition of fire, heat, gas
release or smoke to enable them to reach muster areas, temporary refuges and evacuation or escape points.
Those with specific emergency duties shall also be provided appropriate PPE for use like fire suits and
breathing apparatus etc.
• During an emergency, security arrangements shall ensure that unauthorised persons do not enter the incident
site by controlling assess and if need arises the area around the site can be evacuated and cordoned to
ensure safety of the persons.
• Environmental emergency response should consider:
─ Oil-pollution control equipment that should be located on the installation
─ Environmental conditions that may be present when the equipment is deployed
─ Capacity of the oil recovery system
─ Characteristics of the oil / emulsion to be recovered
─ Means to identify the extent of the spill
─ Facilities to handle any recovered oil.
• International conventions have introduced the requirements to develop national plans for oil-spill response in
offshore, and Offshore Assets / SBUs / Operations should ensure that their installations’ emergency response
plans are aligned with the national requirements.
Responsibilities of the Employees
The establishment and maintenance of best possible conditions of work is, no doubt, the responsibility of the Project
Management. It is also necessary that each employee follows prescribed safe methods of work. He should take
reasonable care for the health and safety of himself, or his fellow employees and of other persons who may be
affected by his action at work. With this in mind, employees shall be trained to be health and safety conscious in
the following aspects:
Report Potential Hazards
Observe Safety rules, procedures and codes of practice
Use Tools and equipments with all care and responsibility
Participate In safety training course when called upon to do so.
Make Use Of safety suggestion schemes.
Take An active and personal interest in promoting health and safety
Each unit shall identify and document the resources required to ensure the effective implementation of the
emergency and crisis management procedures. Resource requirements shall meet the requirements of the
Vedanta Limited. (Division CAIRN Oil & Gas) DRAFT EIA: Onshore Oil and Gas E&A in RJ-ONHP- 2017/4 Block, Barmer District, Rajasthan
June,2019 AECOM
187
Vedanta Management Standard MS01 on Leadership, Responsibilities and Resources. The following resources
shall be considered and made available as necessary:
• Trained and competent personnel;
• Equipment and other materials including Personal Protective Equipment (PPE);
• Warning devices;
• Medical services, including personnel trained in first aid, and medical equipment that is appropriate to the
type of operation;
• Emergency services support; and
• Emergency funding, along with an appropriate mechanism for delivering funds.
The capacity of external resources, such as local firefighting capacity, shall be assessed, and additional resources
acquired and maintained at the operation where external resources are deemed insufficient.
The resources identified shall be maintained and tested on a regular basis, and their adequacy reviewed
periodically.
Communication Systems
Emergency response relies upon effective and reliable communication between all personnel involved in response.
Communication systems shall:
• Provide sufficient reliable information / alarm to personnel on the installation to enable them to take the
appropriate emergency actions.
• Provide means for those on the installation to communicate with the person in overall charge.
• Provide reliable arrangements to allow the person in overall charge to communicate with all personnel on the
installation regarding the nature of any emergency and the actions they are required to take.
• Provide reliable means to allow the person in overall charge to communicate with area and external resources
who have a role in emergency response.
• Suitable equipment, information processing and procedures shall be in place to enable effective
communications. The means of communication shall be selected based on the need for communication in
likely scenarios including operational conditions under which they are to function like, noise, ambient
conditions and susceptibility to damage. So far as reasonable, communication arrangements should remain
available throughout the emergency
• Alarm signals used and their meanings should be described in the emergency response plan along with the
procedures to be followed in the event of an alarm. Persons should be provided with adequate information to
allow them to, initiate alarms where necessary, distinguish between alarms and respond to alarms.
• Adequate alarms and warning devices, along with other forms of communication, shall be maintained to
reliably alert persons across the whole site in the event of an emergency.
• Independent secondary / back-up communications systems shall be provided in case the emergency incident
makes the normal communication system inoperable.
• Ensure that the means are in place to alert to the connected installations, the local community / neighboring
businesses in the event of an emergency that has the potential interface with them.
Training and Emergency Response Drills / Mock
All persons on the installation or in connected activities (including contractor’s personnel) shall be trained
periodically for emergency response and evacuation procedures. Training for employees having assigned roles in
emergency response shall be completed before they are called upon to perform in real emergencies. Emergency
response organisation structure (IRT/ERT/EMT/CMT) shall ensure command by competent persons, which can be
maintained, so far as is practicable, throughout an emergency.
• Key persons such as the Installation Incharge and Shift Incharge / control room operator shall be assessed
for required competence to perform emergencies duties before assigning of duties. As far as possible,
assessment should be under simulated emergency conditions.
Vedanta Limited. (Division CAIRN Oil & Gas) DRAFT EIA: Onshore Oil and Gas E&A in RJ-ONHP- 2017/4 Block, Barmer District, Rajasthan
June,2019 AECOM
188
• Competency and training needs shall meet the requirements of the Vedanta management Standard MS06 on
Competency, Training and Awareness
• An emergency response table top exercise / emergency response drill is a focused activity that places the
participants in a simulated situation requiring them to function in the capacity that would be expected of them
in a real event. Its purpose is to ensure preparedness by testing policies and plans and by training personnel.
One objective of an exercise is to be able to identify problem areas for resolution/ corrective action before an
actual emergency occurs.
• The drills need to address the readiness of personnel and their familiarity / proficiency with emergency
equipment and procedures. All personnel on the installation involved including contractor’s employees should
participate in the drills.
• The drills and table top exercises shall be carried out as often as appropriate, against documented schedule.
To be scheduled regularly, at least once a year for full drills and six monthly for desk-based exercises, although
the exact frequency and type of drills may depend on the nature and scale of the operations, and the
associated risks.
• Emergency response plan shall be reviewed and revised as appropriate in line with the findings from drills
and table top exercises.
• Involve external emergency response agencies and other external stakeholders, where appropriate.
Performance Measures
• Key elements of functionality, survivability, reliability and availability shall be included in performance
standards. Achievability of performance standards should be validated.
• Effective operations, inspection, testing and maintenance procedures shall be established to ensure that the
functional requirements of the equipment and systems provided for emergency escape, evacuation and
rescue response are maintained.
• A written scheme shall be prepared, detailing the inspection, testing and maintenance routines and
frequencies to be followed. All emergency equipment and systems shall be thoroughly inspected, following
established procedures. Adequate records of the results of the inspection, testing and maintenance shall be
kept and shall be periodically reviewed to confirm that the written scheme is appropriate and is being
adequately implemented.
Monitoring, Evaluation and Review
Documented reviews should be carried out after all drills and actual emergency responses to determine the
effectiveness of the Emergency Preparedness and Response Plans, with a full debrief to identify what worked well
and what aspects require improvement.
Lessons learned following exercises or actual emergency situations/incidents shall be documented, and any gaps
in planning and implementation shall be addressed in revised versions of the Emergency Preparedness and
Response Plans. Lessons learned shall be shared across Vedanta’s operations where appropriate.
All Emergency Preparedness and Response Plans shall be reviewed and updated periodically, at least on an
annual basis, to ensure they remain appropriate and relevant. Reviews shall also meet the requirements of the
Vedanta Management Standard MS14 on Management Review and Continual Improvement.
Preventive and Mitigation Measures for Well Blow out
Blow-out (uncontrolled gushing of oil & gas) is the worst situation, which may arise at oil wells during drilling, work-
over operations, perforation, and reservoir studies at active wells, etc. or due to some unforeseen reasons.
A blow out, though rare, in a drilling operation is often accompanied by fire and explosion exposing workers to
serious danger to their lives, burns and poisoning. To understand the failure modes resulting to formation of kick
and subsequent blow outs, one has to understand the safety systems installed for blow out prevention.
Prevention of blow outs rests primarily on control of any kick in the well bore. A kick means entry of formation fluids
into well bore in large enough quantity to require shutting in the well under pressure. Once a kick is detected, steps
Vedanta Limited. (Division CAIRN Oil & Gas) DRAFT EIA: Onshore Oil and Gas E&A in RJ-ONHP- 2017/4 Block, Barmer District, Rajasthan
June,2019 AECOM
189
can be taken to control entry of formation fluids into the well bore by over balancing the expected bottom hole
pressure with properly conditioned mud and operation of safety valves i.e. Blow Out Preventer (BOP), whereby the
space between the drill pipes and the casings can be closed and well itself shut off completely. Several instruments
are provided on a drilling rig for detection of kicks.
Instrumentation in Mud System
Continuous monitoring of condition of mud in the well provides information useful for well control. The following
processes are used in the drilling mud system for this purpose:
• A pit level indicator registering increase or decrease in drilling mud volume. It is connected with an audio-
visual alarm near the drillers control panel.
• A trip with float-marking device to accurately measure the volume of mud going in to the well. This is useful
to keep the well fed with required quantity of mud at all times.
• A gas detector or explosive meter installed at the primary shale shaker together with an audio-visual alarm at
the drillers control panel to indicate the well presence of gas-cut mud in the well.
• The kick in the well is prevented by keeping the hydrostatic head of the drilling fluid greater than the formation
pressure. The primary control can be lost in the following situations:
• If there is reduction in hydrostatic pressure in the well due to swabbing, which maybe caused if the drilling
string is pulled out too fast or by a balled-up or clogged bit, which is indicated by insufficient filling of mud.
Preventive Measures for Handling Natural Gas
The natural gas is a colourless, odourless, flammable gas, mainly methane which may cause flash fire. Electrostatic
charge may be generated by flow, agitation etc. No occupational exposure limits have been established for natural
gas. The preventive measures to be taken to avoid impact due to leakages are
• Provide local exhaust ventilation system: Ventilation equipment should be explosion-resistant if explosive
concentrations of material are present.
• Gloves: Wear appropriate chemical resistant gloves.
• Respirator: Under conditions of frequent use or heavy exposure, respiratory protection may be needed.
Leakage of H2S Gas
Hydrogen sulphide is a colourless, flammable, extremely hazardous gas with “rotten egg” smell. Low
concentrations of H2S irritate the eyes, nose, throat and respiratory system e.g. burning / tearing of eyes, cough,
and shortness of breath. Repeated or prolonged exposures may cause eye inflammation, headache, fatigue,
irritability, insomnia, digestive disturbances and weight loss.
The preventive measures to be taken up in case of presence of H2S in geological formation, appropriate mitigation
measure will be taken up:
• Stop the source of leakage (i.e. close the well)
• Remove victim, if any to fresh air, if breathing, maintain victim at rest & administer oxygen, if available, if
person is not breathing, start artificial respiration immediately or start mechanical/ automatic resuscitator. Call
ambulance and sent victim to hospital or doctor.
• Pull out all inflammable material i.e. HSD, Gas Cylinders, Chemicals etc. from the premises of well /
installation.
• Pull out all possible equipment to safe distances.
• Call for fire tender and start spraying water on the sources of leakage to dissolve H2S in water.
• Evacuate personnel in 500 mts area from down wind direction.
• Warn nearby inhabitants, if required.
Vedanta Limited. (Division CAIRN Oil & Gas) DRAFT EIA: Onshore Oil and Gas E&A in RJ-ONHP- 2017/4 Block, Barmer District, Rajasthan
June,2019 AECOM
190
Vedanta Ltd. (Cairn Oil & Gas)’s operations in the Block have indicated that there is no naturally occurring H2S in
the reservoir and therefore release of H2S during drilling operations is not expected.
Preventing Fire and Explosion Hazards
Fire is one of the major hazards, related to oil and natural gas well. Fire prevention and code enforcement is the
area of responsibility of the fire service. Safe operating practices reduce the probability of an accidental fire on a
platform. Personnel should understand their duties and responsibilities and be attentive to conditions that might
lead to fire. The following precautions are recommended:
• Fire control cannot be achieved until the source of fuel and ignition is isolated. Fire control cannot be achieved
until the source of fuel and ignition is isolated. An emergency shut down (ESD) system shall be provided to
isolate the installation from the major hydrocarbon inventories within pipelines and reservoirs, which if
released on failure, would pose an intolerable risk to personnel, environment and the equipment / assets.
• There should be provision for safe handling and storage of dirty rags, trash and waste oil. Flammable liquids
and chemicals spilled on platform should be immediately cleaned.
• Containers of paints and HC samples, gas cylinders should be stored properly. Gas cylinders should be
transported in hand-carts
• Cutting and welding operations should be conducted in accordance with safe procedures
• Smoking should be restricted to designated platform areas and “no smoking” areas should be clearly identified
by warning signs
• Platform equipment should be maintained in good operating condition and kept free from external
accumulation of dust and hydrocarbons. Particular attention should be given to crude oil pump, seals, diesel
and gas engines which could be potential source of ignition in the event of a failure
• The Disaster Management Plan will address the issue of a fire event at any location on the well and the
procedure to be adopted in the very unlikely event of this occurring. If a fire starts in any well, that section of
the well will be isolated by closing the section (block) valves, as quickly as possible and surrounding facilities
will be cooled with water.
Off-site Emergency Plan
The Off-Site Emergency Plan is a compilation of various emergency scenarios and also includes the probable
impact off-site locations due to emergency and the action plan to combat / mitigate the consequences of a disaster
situation. Emergency is a sudden unexpected event, which can cause serious damage to personnel life, property
and environment as a whole, which necessitate evolving off-site emergency plan to combat any such eventuality.
Emergencies can be handled by an organized multi-disciplinary approach. If it becomes necessary to evacuate
people, then this can be done in orderly way.
Under the Environmental (Protection) Act 1986, the responsibility of preparation of Off-Site Emergency Plan lies
with the State Government. The Collector/ Deputy Collector by virtue of their occupation are normally nominated
by the concerned State Government to plan Off-Site Emergency Plan. The different agencies involved in evacuation
of people are civil administration (both state and central) and police authorities.
Purpose
• To save life and prevent/reduce loss of properties
• To make explicit inter related set of actions to be undertaken in the event of an accident posing hazards to
the community
• To plan for rescue and recuperation of casualties and injuries. To plan for relief and rehabilitation
• To plan for prevention of harms, total loss and recurrence of disaster. It will be ensured that absolute safety
and security is achieved within the shortest time
The activities of the government, Non-Government organizations and concerned personnel involved in off-site
disaster management plan are as follows:
These will include the safety procedures to be followed during emergencies such as posters, talks and mass media
in different languages including local language. Leaflets containing do’s/ don’ts should be circulated to educate the
people in vicinity

Vedanta Limited. (Division CAIRN Oil & Gas) DRAFT EIA: Onshore Oil and Gas E&A in RJ-ONHP- 2017/4 Block, Barmer District, Rajasthan
June,2019 AECOM
191
Medical Help consisted of doctors and supporting staff for medical help to the injured persons because of disaster
should be formed. Functions and duties of the committee include, providing first Said treatment for injured at the
spot or at some convenient place and shift those to nearby hospitals for further treatment if required
The police will assist in controlling of the accident site, organizing evacuation and shifting of injured people to
nearby hospitals.
The fire brigade shall organize to put out fires other than gas fires and provide assistance as required. Approach
roads to accident site and means of escape should be properly identified. Chief fire officer should co-ordinate entire
fire control measures. Routine training of fire fighting equipment and special rescue equipment should be carried
out. Concerned officer should ensure adequate supply of fire water and fire fighting agents at the site of emergency.
Maintenance of standby equipment / personnel for fire fighting should be ready at any given time.
Mutual Aid
Disaster / emergency / risk, when becomes difficult to control by in house team / management, help from nearby
industries, institutions, etc. can be taken. A group of mutual aid can be formed where emergency control systems
like ambulance, fire fighting equipments, medical & fire-fighting team, etc. can be shared in the event of need.
Post Emergency Relief to the Victims
The Public Liability Insurance (PLI) Act, 1991 provides for the owner who has control over handling hazardous
substances to pay specified amount of money to the victims as interim relief by taking insurance policy for this
purpose. The District Collector has definite role in implementation of this act. After proper assessment of the
incident, he shall invite applications for relief, conduct an enquiry into the claims and arrange payment of the relief
amount to the victims.
General Health and Safety
The project will adhere to health & safety norms of The Factories Act, 1948 and Rajasthan Factory Rules, 1951,
as applicable along with Best Industry Practices.
General health and safety issues during various project activities are similar to those of most large infrastructure
and industrial facilities and their prevention and control. These issues include among others, exposure to dust and
hazardous materials, hazardous materials components, and physical hazards associated with the use of heavy
equipment, etc.
Specific health and safety issues primarily include the following:
• Physical hazards
• Chemical hazards
• Confined spaces
Physical Hazards - The main sources of physical hazards are associated with machinery and vehicles. General
electrical equipment safety, working in confined spaces, hot work, high temperature areas are expected to be
present.
Chemical Hazards - workers may be exposed to chemical hazards especially if their work entails direct contact with
fuels or chemicals, flare & DG set emission or depending on the nature of activities.
Noise - Noise sources include drilling, DG operations, including vehicular traffic. In order to evaluate the impacts
of proposed project on the health of workers, baseline health studies will be carried out on every worker before
joining their duties.
The hierarchy of control specific for health & safety (in order of priority):
• Eliminate the use of a harmful product or substance and use a safer one;
• Substituting wherever reasonably practicable, a non-hazardous material which presents no risk to health,
where a hazardous material is used intentionally, i.e. use a safer form of the product;
• Modifying a process to eliminate the use of risk, the production of a hazardous by-product or waste product,
including reducing the quantities of the hazardous material which are used & stored, i.e. change the process
to emit less of the substance;
• Enclose the process so that the product does not escape;
Vedanta Limited. (Division CAIRN Oil & Gas) DRAFT EIA: Onshore Oil and Gas E&A in RJ-ONHP- 2017/4 Block, Barmer District, Rajasthan
June,2019 AECOM
192
• Extract emissions of the substance near the source;
• Provide personal protective equipment (PPE) such as gloves, coveralls and a respirator. PPE must fit the
wearer.
Personal Protective Equipment
Often it is not possible, or practicable, to eliminate exposure to materials hazardous to health completely. In such
cases, operations should consider how to prevent employees being exposed and the prevention of exposure should
be achieved by measures other than the use of PPE or Respiratory Protective Equipment (RPE), which is the last
line of defence.
Situations where PPE/RPE will normally be necessary include:
• where adequate control of exposure cannot be achieved solely by good practice and the application of
operational or engineering measures;
• where new or revised assessment shows that PPE/RPE is necessary until adequate control is achieved by
other means;
• where there is temporary failure to achieve adequate control of the process, e.g. because of plant failure, and
the only practicable solution to maintain adequate control in the time available may be the provision and use
of suitable PPE/RPE; and
• where maintenance operations have to be carried out.
Key personal protective equipments will include:
• Hand gloves
• Helmet
• Safety shoes
• Safety harness
• Eye shield
• Ear muffs
First Aid
Medical services, including personnel trained in first aid, and medical equipment that is appropriate to the type of
operation will be provided at project.
All persons on an installation should have at least basic training in emergency response, basic first aid, use of life
saving appliances and firefighting. Individual competencies shall be periodically tested to identify further
requirement of training and knowledge to perform emergency duties.
It will be ensured that any auxiliary medical teams e.g. nurses and first aid personnel are fully trained and
conversant with their roles and responsibilities.
Contact details & capacities of nearby medical facilities and medical experts will be made available at strategic
locations.
Disaster Management Plan for Natural Hazard
Key natural hazards that occur in Rajasthan are earthquake, flash flood, hailstorms, sand storm, etc.
• Earthquake - As per the BMPTC Atlas, various parts of the State of Rajasthan fall under earthquake zones
III. General awareness and wide dissemination of do’s and don’ts through electronic and print media issued
by state disaster management agency should be followed.
• Flood - Though most parts of Rajasthan receive scanty rainfall, the State has a history of floods and
inundations, mostly along the basins of rivers like Luni. Besides the floods in natural drainage systems, there
are other reasons for inundation. Changes in rainfall patterns have also increased the risk of flash floods in
many areas that were not flood prone historically. IMD and other government department warnings should be
Vedanta Limited. (Division CAIRN Oil & Gas) DRAFT EIA: Onshore Oil and Gas E&A in RJ-ONHP- 2017/4 Block, Barmer District, Rajasthan
June,2019 AECOM
193
monitored and in case of any such warning, relevant steps as guided by on site disaster management plan
should be followed. Instruction given by key departments like IMD, district disaster management center, etc.
to be followed
• Hailstorms - cause heavy damage to crops and vegetations. Secondary hazards like snapping of electric
poles due to uprooting of trees, disruption of communication links, etc. are also attributed to hailstorms. Frost
is a regular feature in many parts of Rajasthan. Measure like avoiding traveling, clearing of area, etc. should
be taken along with onsite disaster management plan.
• Sand storms are typical features of south-western Rajasthan. High velocity winds along with sand, often
cyclonic in nature, blow through most of the western districts, particularly in months from March to June. High
wind and sand storms severely disrupt the routine life, transportation, electricity and other essential services.
• Human Epidemics - Although, Rajasthan has a history of disease outbreaks such as Cholera, Gastroenteritis,
Acute Diarrhoea/ Dysentery, Infective Hepatitis, Encephalitis, Poliomyelitis, Typhoid and recently H1NI; the
State is particularly prone to Malaria. Conduct regular hygeine awareness and conduct targeted vaccination
drives as required. Workers to be trained for hygienic work environment, sanitation & living conditions.
It has been observed that natural hazards can be minimized by the presence of a well functioning communication
/ warning system. A well prepared administration needs to have its communication/early warning system in place
to enable precautionary & mitigation measures on receiving warning for impending disasters and in the process
minimise loss of life & property.
Data from different reliable sources should collected and monitored in real or near real time and analysed to
generate a warning alert in the event of likelihood of a disaster.
• The Indian Meteorological Department (IMD) will be the nodal agency for the monitoring of seismic activity,
flood, etc.
• Tie up / contacts / communication with State Disaster Response Force (SDRF), district disaster management
center should be maintain SDRF has been constituted in the State with stations at locations i.e. Jodhpur,
Jaipur & Kota.
• Local Search and Rescue Team at the local level comprising of retired Army and Police personnel, Civil
Defence and Home Guard, volunteers can be identified and trained to perform initial Search and Rescue
operations.
• Apart from the above, Community volunteers/ representatives would be identified and trained on search and
rescue operations through community Based Disaster Management programme.
• Disaster Management and Relief Department website/ communication along with other line departments like
fire, polic, health, etc. will be checked.

Vedanta Limited. (Division CAIRN Oil & Gas) DRAFT EIA: Onshore Oil and Gas E&A in RJ-ONHP- 2017/4 Block, Barmer District, Rajasthan
June,2019 AECOM
194
8. PROJECT BENEEFITS
The proposed project will establish the potential of hydrocarbons in the Block. The development of the oil Block will
result in considerable growth of service sector and will also generate direct/indirect employment and business
opportunities in the area. The major benefits of the project include reduction of the oil import bill of the nation as
well as reduction of the imbalance in oil production and consumption.
The commercial development will also lead to investment in Rajasthan, bringing oil and gas revenues both to the
State and to the Central Government. The presence of Vedanta Limited (Cairn Oil & Gas) in the region will
substantially improve the socio-economic conditions of the region. Employment opportunity for local people as
contract/daily wages in nearby areas.
8.1. Revenue Earning of central & State Government
Vedanta Limited (Division Cairn Oil & Gas) has been alloted with an exploration Block in Barmer Basin, namely
RJ-ONHP-2017/02 by Government of India under the Revenue Sharing Contract (RSC) for exploration and
exploitation of hydrocarbon. A Revenue Sharing Contract (RSC) was signed between the Government of India
(GoI) and Vedanta Limited (Division Cairn Oil and Gas) on 1st October, 2018.
Due to hydrocarbon discovery and then its production, use & sell, central as well as state government will get
benefited.
8.2. Employment Potential
The employment of local people in primary and secondary sectors of project shall upgrade the prosperity of the
region. This in-turn will improve the socio-economic conditions of the area.
• Direct and indirect employment opportunities to many unskilled and semiskilled labour in nearby villages. In
case the hydrocarbon is established in the Block, considerable number of people will be benefited by provision
of services to the residents including hotels, restaurants, transport services etc. Thus, the direct and indirect
employment generation by this project.
8.3. Corporate Social Responsibility
Vedanta Limited (Division Cairn Oil & Gas) has taken up various CSR initiatives in and around present operational
areas as per the CSR Act and Rules, Govt. of India.
CSR measures will be taken up by Vedanta Limited. (Division Cairn Oil & Gas) in case of commercially viable
hydrocarbon discovery & further full-fledged development of the fields and production and associated facilities.
8.4. Proposed CER Strategy
The company will comply with the 1st May 2018 OM w.r.t. CER and the cost will be assessed on actual project
capex expenditure of that particular financial year.
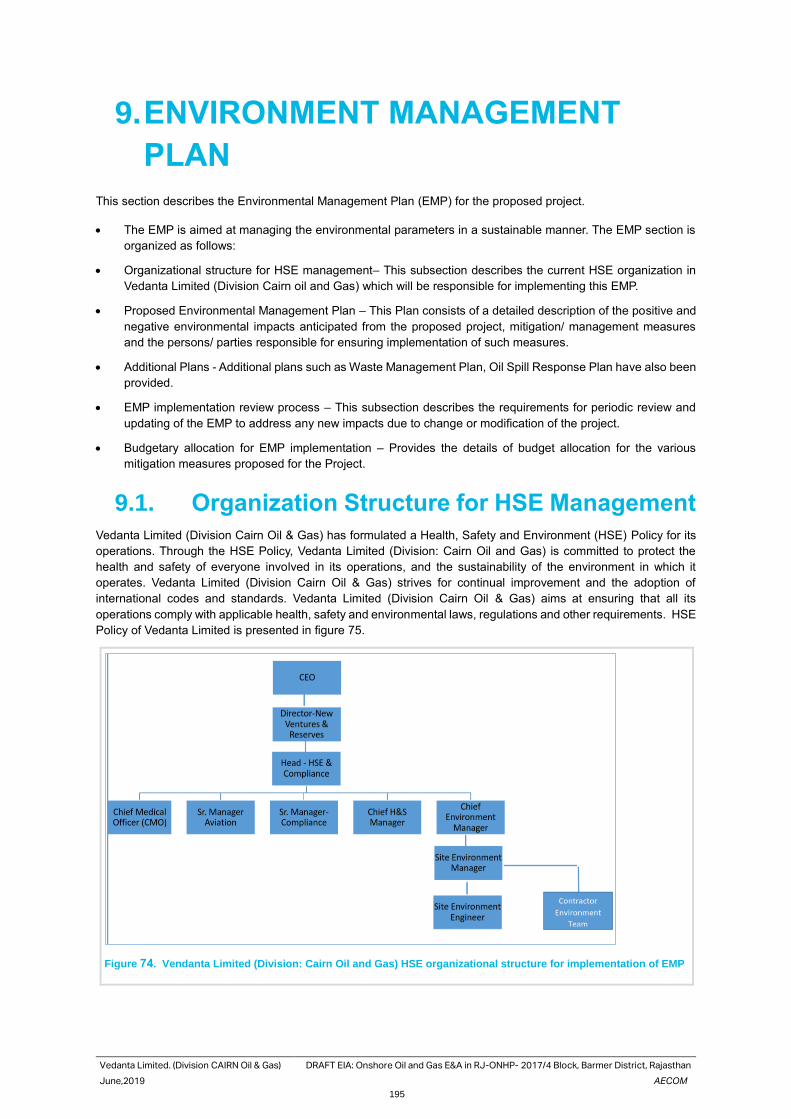
Vedanta Limited. (Division CAIRN Oil & Gas) DRAFT EIA: Onshore Oil and Gas E&A in RJ-ONHP- 2017/4 Block, Barmer District, Rajasthan
June,2019 AECOM
195
9. ENVIRONMENT MANAGEMENT
PLAN
This section describes the Environmental Management Plan (EMP) for the proposed project.
• The EMP is aimed at managing the environmental parameters in a sustainable manner. The EMP section is
organized as follows:
• Organizational structure for HSE management– This subsection describes the current HSE organization in
Vedanta Limited (Division Cairn oil and Gas) which will be responsible for implementing this EMP.
• Proposed Environmental Management Plan – This Plan consists of a detailed description of the positive and
negative environmental impacts anticipated from the proposed project, mitigation/ management measures
and the persons/ parties responsible for ensuring implementation of such measures.
• Additional Plans - Additional plans such as Waste Management Plan, Oil Spill Response Plan have also been
provided.
• EMP implementation review process – This subsection describes the requirements for periodic review and
updating of the EMP to address any new impacts due to change or modification of the project.
• Budgetary allocation for EMP implementation – Provides the details of budget allocation for the various
mitigation measures proposed for the Project.
9.1. Organization Structure for HSE Management
Vedanta Limited (Division Cairn Oil & Gas) has formulated a Health, Safety and Environment (HSE) Policy for its
operations. Through the HSE Policy, Vedanta Limited (Division: Cairn Oil and Gas) is committed to protect the
health and safety of everyone involved in its operations, and the sustainability of the environment in which it
operates. Vedanta Limited (Division Cairn Oil & Gas) strives for continual improvement and the adoption of
international codes and standards. Vedanta Limited (Division Cairn Oil & Gas) aims at ensuring that all its
operations comply with applicable health, safety and environmental laws, regulations and other requirements. HSE
Policy of Vedanta Limited is presented in figure 75.
Figure 74. Vendanta Limited (Division: Cairn Oil and Gas) HSE organizational structure for implementation of EMP
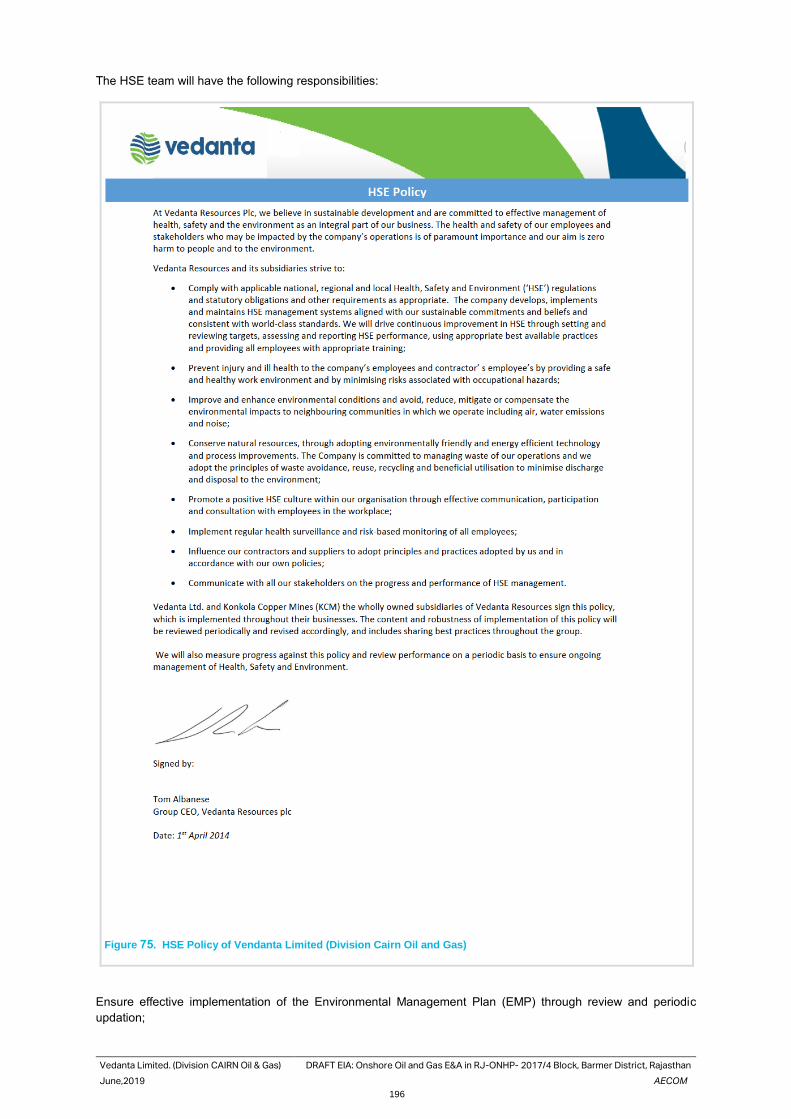
Vedanta Limited. (Division CAIRN Oil & Gas) DRAFT EIA: Onshore Oil and Gas E&A in RJ-ONHP- 2017/4 Block, Barmer District, Rajasthan
June,2019 AECOM
196
The HSE team will have the following responsibilities:
Figure 75. HSE Policy of Vendanta Limited (Division Cairn Oil and Gas)
Ensure effective implementation of the Environmental Management Plan (EMP) through review and periodic
updation;
Vedanta Limited. (Division CAIRN Oil & Gas) DRAFT EIA: Onshore Oil and Gas E&A in RJ-ONHP- 2017/4 Block, Barmer District, Rajasthan
June,2019 AECOM
197
Vedanta Limited (Division: Cairn Oil and Gas) would have the ultimate responsibility of implementing the
environment management plan along with drilling contractor. The drilling contractor will have an HSE management
system, which will be reviewed by Vedanta Limited (Division: Cairn oil and Gas) prior to implementation.
9.2. Air Quality Management Plan:
The Air Quality Management Plan (AQMP) encompasses both constructions, drilling and early production phase
activities for the proposed project that has the potential to adversely affect ambient air quality due to the proposed
project.
The AQMP establishes specific measures and guidelines aimed at effectively addressing and mitigating the air
quality impacts that may arise as result of construction of well sites, production facilities and pipelines, drilling
operations, operation of production facilities and decommissioning/site closure of well sites. The plan also details
out roles and responsibilities of Vedanta Limited (Division: Cairn Oil & Gas) and the contractors to ensure effective
implementation of the plan.
Mitigation Measures:
Phase Mitigation Measures
Construction/ drill Site Preparation Designing, Planning & Procurement
• ;
• Storage and handling of construction material and
debris to be carefully managed to prevent
generation of fugitive dust;
• All vehicles use in transportation of raw material
and personnel will have valid Pollution under
Control Certificate (PUC). Vehicular exhaust will be
complying with the CPCB specified emission
norms for vehicular Emission;
• The top soil stripped from site preparation activities would
be stored suitably;
• Adequate stack height to be provided to DG sets in
accordance with CPCB standards.
Dust Suppression
• Sprinkling of water on earthworks, material
haulage and transportation routes on a regular
basis, especially in dry season.
Drilling and early production
Operation of Machineries, Vehicle & Drilling Rig
• Exhausts of diesel/gas generators will be
positioned at a sufficient height to ensure dispersal
of exhaust emissions; engines will not be left
running unnecessarily;
• Vehicles involved in the transportation of project
personnel will have valid PUC Certificate and will
be subjected to periodic preventive maintenance;
Periodic Maintenance of Machinery and Vehicles
• Preventive maintenance of DG sets will be
undertaken;
• Flaring will be undertaken in accordance with the
CPCB Guidelines for Gaseous Emissions for Oil &
Gas;
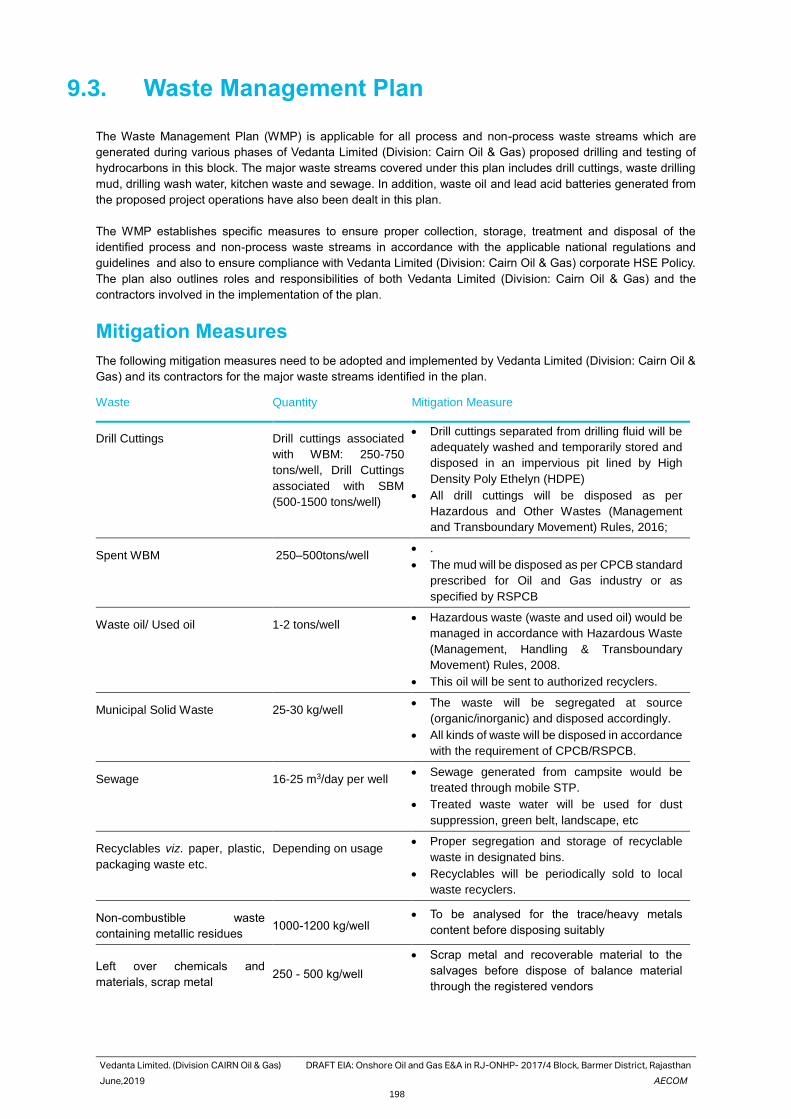
Vedanta Limited. (Division CAIRN Oil & Gas) DRAFT EIA: Onshore Oil and Gas E&A in RJ-ONHP- 2017/4 Block, Barmer District, Rajasthan
June,2019 AECOM
198
9.3. Waste Management Plan
The Waste Management Plan (WMP) is applicable for all process and non-process waste streams which are
generated during various phases of Vedanta Limited (Division: Cairn Oil & Gas) proposed drilling and testing of
hydrocarbons in this block. The major waste streams covered under this plan includes drill cuttings, waste drilling
mud, drilling wash water, kitchen waste and sewage. In addition, waste oil and lead acid batteries generated from
the proposed project operations have also been dealt in this plan.
The WMP establishes specific measures to ensure proper collection, storage, treatment and disposal of the
identified process and non-process waste streams in accordance with the applicable national regulations and
guidelines and also to ensure compliance with Vedanta Limited (Division: Cairn Oil & Gas) corporate HSE Policy.
The plan also outlines roles and responsibilities of both Vedanta Limited (Division: Cairn Oil & Gas) and the
contractors involved in the implementation of the plan.
Mitigation Measures
The following mitigation measures need to be adopted and implemented by Vedanta Limited (Division: Cairn Oil &
Gas) and its contractors for the major waste streams identified in the plan.
Waste Quantity Mitigation Measure
Drill Cuttings Drill cuttings associated
with WBM: 250-750
tons/well, Drill Cuttings
associated with SBM
(500-1500 tons/well)
• Drill cuttings separated from drilling fluid will be
adequately washed and temporarily stored and
disposed in an impervious pit lined by High
Density Poly Ethelyn (HDPE)
• All drill cuttings will be disposed as per
Hazardous and Other Wastes (Management
and Transboundary Movement) Rules, 2016;
Spent WBM 250–500tons/well
• .
• The mud will be disposed as per CPCB standard
prescribed for Oil and Gas industry or as
specified by RSPCB
Waste oil/ Used oil 1-2 tons/well • Hazardous waste (waste and used oil) would be
managed in accordance with Hazardous Waste
(Management, Handling & Transboundary
Movement) Rules, 2008.
• This oil will be sent to authorized recyclers.
Municipal Solid Waste 25-30 kg/well • The waste will be segregated at source
(organic/inorganic) and disposed accordingly.
• All kinds of waste will be disposed in accordance
with the requirement of CPCB/RSPCB.
Sewage 16-25 m3/day per well • Sewage generated from campsite would be
treated through mobile STP.
• Treated waste water will be used for dust
suppression, green belt, landscape, etc
Recyclables viz. paper, plastic,
packaging waste etc.
Depending on usage • Proper segregation and storage of recyclable
waste in designated bins.
• Recyclables will be periodically sold to local
waste recyclers.
Non-combustible waste
containing metallic residues 1000-1200 kg/well
• To be analysed for the trace/heavy metals
content before disposing suitably
Left over chemicals and
materials, scrap metal 250 - 500 kg/well
• Scrap metal and recoverable material to the
salvages before dispose of balance material
through the registered vendors
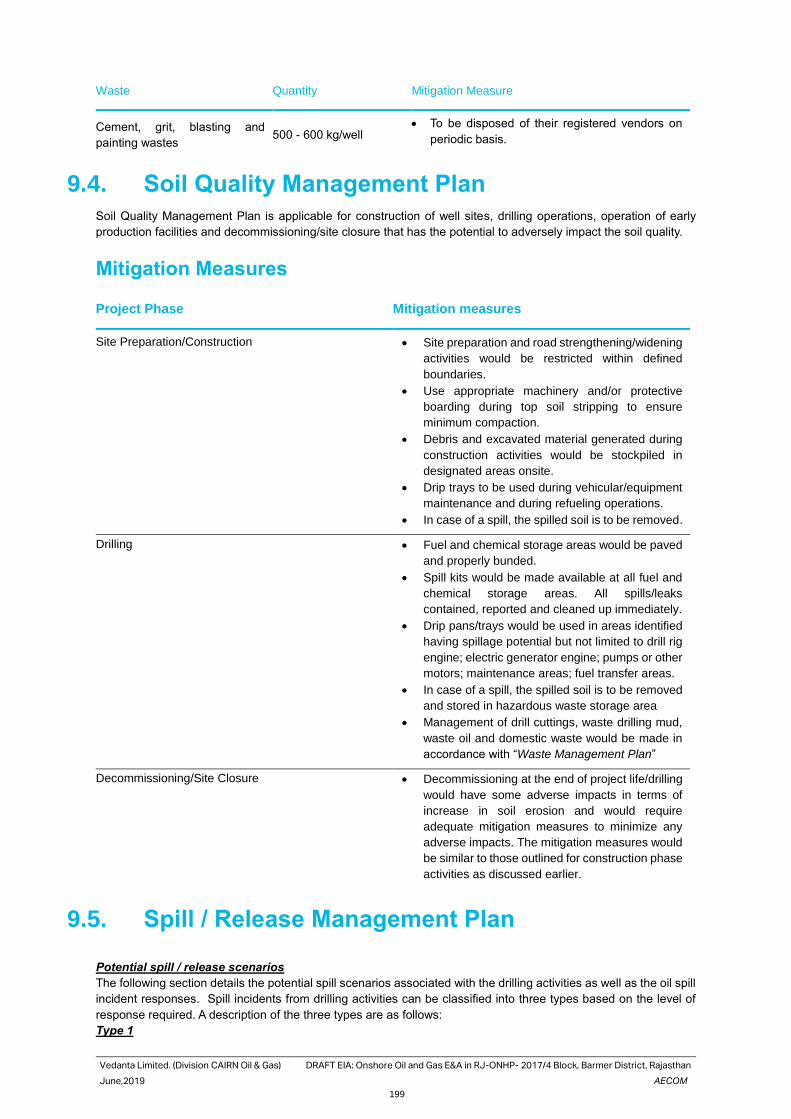
Vedanta Limited. (Division CAIRN Oil & Gas) DRAFT EIA: Onshore Oil and Gas E&A in RJ-ONHP- 2017/4 Block, Barmer District, Rajasthan
June,2019 AECOM
199
Waste Quantity Mitigation Measure
Cement, grit, blasting and
painting wastes 500 - 600 kg/well
• To be disposed of their registered vendors on
periodic basis.
9.4. Soil Quality Management Plan
Soil Quality Management Plan is applicable for construction of well sites, drilling operations, operation of early
production facilities and decommissioning/site closure that has the potential to adversely impact the soil quality.
Mitigation Measures
Project Phase Mitigation measures
Site Preparation/Construction • Site preparation and road strengthening/widening
activities would be restricted within defined
boundaries.
• Use appropriate machinery and/or protective
boarding during top soil stripping to ensure
minimum compaction.
• Debris and excavated material generated during
construction activities would be stockpiled in
designated areas onsite.
• Drip trays to be used during vehicular/equipment
maintenance and during refueling operations.
• In case of a spill, the spilled soil is to be removed.
Drilling • Fuel and chemical storage areas would be paved
and properly bunded.
• Spill kits would be made available at all fuel and
chemical storage areas. All spills/leaks
contained, reported and cleaned up immediately.
• Drip pans/trays would be used in areas identified
having spillage potential but not limited to drill rig
engine; electric generator engine; pumps or other
motors; maintenance areas; fuel transfer areas.
• In case of a spill, the spilled soil is to be removed
and stored in hazardous waste storage area
• Management of drill cuttings, waste drilling mud,
waste oil and domestic waste would be made in
accordance with “Waste Management Plan”
Decommissioning/Site Closure • Decommissioning at the end of project life/drilling
would have some adverse impacts in terms of
increase in soil erosion and would require
adequate mitigation measures to minimize any
adverse impacts. The mitigation measures would
be similar to those outlined for construction phase
activities as discussed earlier.
9.5. Spill / Release Management Plan
Potential spill / release scenarios
The following section details the potential spill scenarios associated with the drilling activities as well as the oil spill
incident responses. Spill incidents from drilling activities can be classified into three types based on the level of
response required. A description of the three types are as follows:
Type 1
Vedanta Limited. (Division CAIRN Oil & Gas) DRAFT EIA: Onshore Oil and Gas E&A in RJ-ONHP- 2017/4 Block, Barmer District, Rajasthan
June,2019 AECOM
200
A small oil or chemical spill incident which can respond to and can be controlled with the existing resources,
equipment and resources at the site and without any further escalation. Most of the potential drill stage spill risks
are Type 1. As the spill / release incident as the volumes involved are limited due to the extent of hydrocarbons or
chemicals used or stored at site. Such possible incidents are likely to include:
• Diesel spills from refuelling i.e., drill rig ‐ hose leaks, overfilling or connection/disconnection incidents.
• The use of liquid chemicals i.e., during drilling the volumes are limited by the storage containers used, drums
etc.
• Hydraulic oil spill resulting from a split hydraulic hose or failed connector (moderate pressure, low volume
lines).
• Drilling fluid leaks from tanks, pumps or other associated equipment within the closed loop recirculation
system.
Type 2
Type 2 spill / release incidents are those that are beyond capability of the immediate resources on‐site to effectively
manage and contain, requiring additional external resources to assist with the response to the spill incident. Type
2 spill incidents may require initiate Emergency operations and will involve call out of the Fire Service (in the event
of danger to people) and/or regional resources. For such potential spill incidents, the resources of the local
administration or suppliers may be required. Such possible incidents are likely to include:
• Transportation incidents associated with the delivery of diesel or drilling fluids to site i.e., truck rollover or
collision from external suppliers (drilling fluids and diesel).
• Complete failure of an on‐site drilling fluid (base oil) storage tank(s).
Type 3
Type 3 spill / release incidents are significant spill incidents that escalate from a Type 1 or 2 and exceed the
capabilities of the on‐site and local administrative resources to respond, requiring a State /National response. An
uncontrollable well blow out scenario would fall into this category.
Spill / Release Response Strategies
Spill / release response strategies for combating spill / release incidents include:
• Prevent or reduce further spillage.
• Monitoring and evaluation (no active intervention but the spill is under observation).
• Mechanical containment and recovery.
• Any combination of the above strategies.
A brief explanation of these various response strategies is provided in the following sections.
Prevent or reduce a spill / release incident
One of the first response actions, if safe to do so, is the isolation or prevention of the source of the spill / release in
an attempt to limit any further discharge. Such first response actions can involve an emergency shutdown of the
particular equipment, isolation of a valve or line causing the spill or providing some immediate containment to
prevent the further spread of a spill / release. Such measures are only a first immediate response prior to a more
coordinate effort being planned and undertaken.
Monitoring and Evaluation
Knowing the position of spillage / release source and having the ability to forecast its movement or direction is an
essential component of spill response. Monitoring and evaluation is used to:
• Determine the location and movement of the spill / release (if any).
• Describe its appearance.
• Estimate the size and quantity of the spill / release
• Note changes in the appearance and distribution of the spill over time.

Vedanta Limited. (Division CAIRN Oil & Gas) DRAFT EIA: Onshore Oil and Gas E&A in RJ-ONHP- 2017/4 Block, Barmer District, Rajasthan
June,2019 AECOM
201
• Assess the potential threat to the environment and the resources required to combat the spill / release (more
effective and coordinate response)
Mechanical Containment and Recovery
Mechanical containment and recovery is the restriction of a spill / release movement through the use of booms or
some other form of physical barriers and its subsequent removal using skimmers and other mechanical means.
These operations may be required for large spills or spills / release which may impact environmentally sensitive
areas. This response option will be used if the spill / release:
• Threatens environmental sensitive areas, or
• The spill is unlikely to be removed by natural processes.
The feasibility of a containment and recovery response is dependent upon having surface pollution that is capable
of being contained and recovered and having suitable conditions for equipment deployment. The spill containment
plan shall be addressed in line with the recommendation of QRA analysis as prescribed in chapter 7.
Clean‐up
Oil or chemical spills may be allowed to collect or strand on a specific location in order to assist with clean‐up
operations. Regardless of land type the spill impacts on, the method of clean‐up is usually labour intensive. Once
a spill is controlled in terms of isolating the source, a response to a spill normally changes from an emergency to a
project and needs to be managed as such. This may involve earthmoving equipment used to recover the absorbed
spill and contaminated soil. Such operations usually involve the collection of significantly greater volumes of
material than was originally spilt.
Waste Management
Solid waste due to clean up operation will be collected and treated and disposed in line with the Hazardous Waste
Guideline.
9.6. Noise quality Management Plan
The noise control plan is applicable for construction of well sites, early production system, drilling operations and
decommissioning/site closure of well sites.
The noise control plan to ensure specific measures to minimize noise levels in the project site as 75 dB(A) per
CPCB noise rules. The plan also outlines roles and responsibilities of both Vedanta Limited (Division Cairn Oil &
Gas) and the contractors involved in the implementation of the plan.
Mitigation Measures
Project Phase Mitigation measures
Site Preparation/Construction • Selection and use of low noise generating
equipment equipped with engineering controls
viz. mufflers, silencers etc.
• .
• Periodic preventive maintenance of equipment
• All vehicles utilized in transportation of raw
material and personnel would have valid Pollution
under Control (PUC) Certificate
• Engines of vehicles and construction equipment
would be turned off when not in use for long
periods.
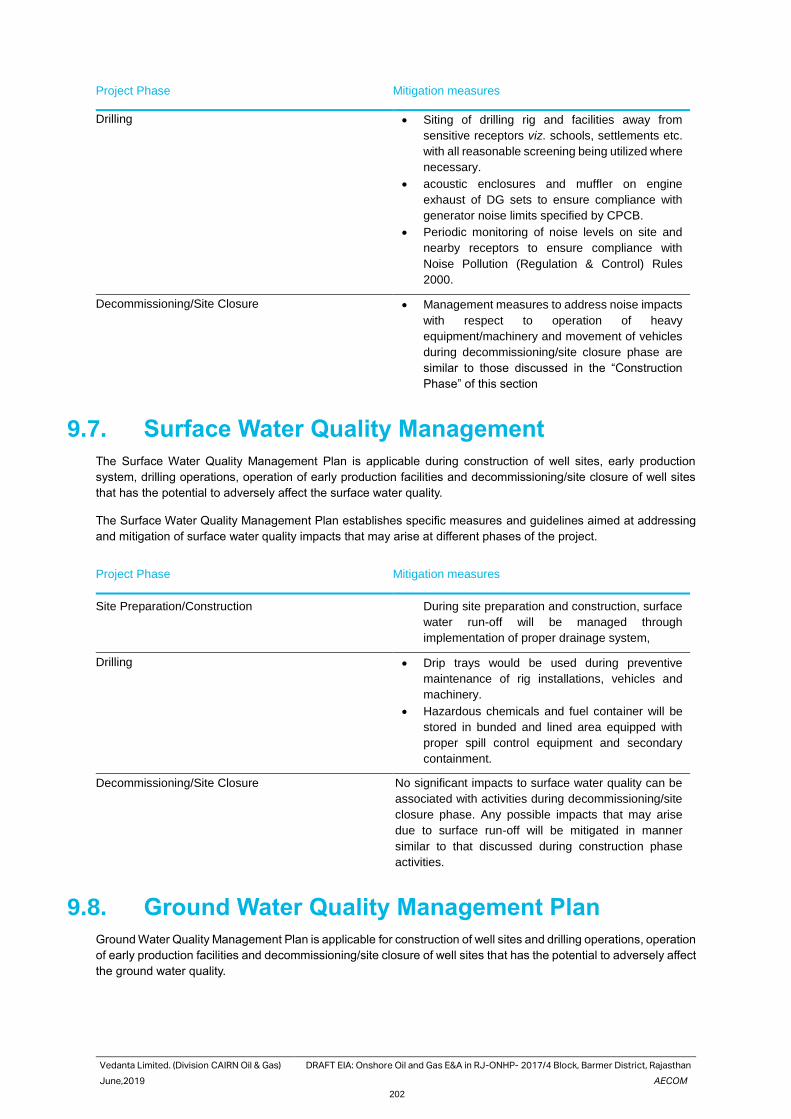
Vedanta Limited. (Division CAIRN Oil & Gas) DRAFT EIA: Onshore Oil and Gas E&A in RJ-ONHP- 2017/4 Block, Barmer District, Rajasthan
June,2019 AECOM
202
Project Phase Mitigation measures
Drilling • Siting of drilling rig and facilities away from
sensitive receptors viz. schools, settlements etc.
with all reasonable screening being utilized where
necessary.
• acoustic enclosures and muffler on engine
exhaust of DG sets to ensure compliance with
generator noise limits specified by CPCB.
• Periodic monitoring of noise levels on site and
nearby receptors to ensure compliance with
Noise Pollution (Regulation & Control) Rules
2000.
Decommissioning/Site Closure • Management measures to address noise impacts
with respect to operation of heavy
equipment/machinery and movement of vehicles
during decommissioning/site closure phase are
similar to those discussed in the “Construction
Phase” of this section
9.7. Surface Water Quality Management
The Surface Water Quality Management Plan is applicable during construction of well sites, early production
system, drilling operations, operation of early production facilities and decommissioning/site closure of well sites
that has the potential to adversely affect the surface water quality.
The Surface Water Quality Management Plan establishes specific measures and guidelines aimed at addressing
and mitigation of surface water quality impacts that may arise at different phases of the project.
Project Phase Mitigation measures
Site Preparation/Construction During site preparation and construction, surface
water run-off will be managed through
implementation of proper drainage system,
Drilling • Drip trays would be used during preventive
maintenance of rig installations, vehicles and
machinery.
• Hazardous chemicals and fuel container will be
stored in bunded and lined area equipped with
proper spill control equipment and secondary
containment.
Decommissioning/Site Closure No significant impacts to surface water quality can be
associated with activities during decommissioning/site
closure phase. Any possible impacts that may arise
due to surface run-off will be mitigated in manner
similar to that discussed during construction phase
activities.
9.8. Ground Water Quality Management Plan
Ground Water Quality Management Plan is applicable for construction of well sites and drilling operations, operation
of early production facilities and decommissioning/site closure of well sites that has the potential to adversely affect
the ground water quality.

Vedanta Limited. (Division CAIRN Oil & Gas) DRAFT EIA: Onshore Oil and Gas E&A in RJ-ONHP- 2017/4 Block, Barmer District, Rajasthan
June,2019 AECOM
203
Project Phase Mitigation measures
Site Preparation/Construction • No significant impact on the ground water quality
can be associated with the construction phase
activities
Drilling • Proper casing and cementing of well will be done
Periodic monitoring of ground water quality will be
carried out for surrounding wells located outside
the project boundary to assess the level of ground
water contamination, if any.
• Storage and disposal of drill cutting and waste
mud to be planned in accordance with “Solid &
Hazardous Waste Management Plan”
Decommissioning/Site Closure • No significant impacts to ground water quality can
be associated with activities during
decommissioning/site closure phase
9.9. Storm Water Management Plan
The following mitigation measures need to be adopted and implemented by Vedanta Limited (Division Cairn Oil &
Gas) and its contractors in construction, operation and decommissioning phase.
• Necessary measures would be undertaken during construction/site preparation phase to prevent earth and
stone material from blocking cross drainage structures.
• Periodic cleaning will be undertaken to cross drainage structures and road drainage system to maintain
uninterrupted storm water flow.
9.10. Road Safety & Traffic Management Plan
Road Safety & Traffic Management Plan outlines specific measures would adopted and implemented by Vedanta
Limited (Division: Cairn Oil & Gas) to mitigate any potential impact on community health and safety that may arise
out of movement of vehicles and transportation of drilling rig and other heavy equipment during construction, drilling
and decommissioning of well sites.
Mitigation Measures
• Proper signage will be displayed at important traffic junctions along the predefined access routes,
• Parking of project vehicles along village access roads would be prohibited;
• Traffic flows would be scheduled wherever practicable during period of increased commuter movement;
• Adequate training on traffic and road safety operations would be imparted to the drivers of project vehicles.
9.11. Occupational Health & Safety Management Plan
The Occupation Health & Safety Management Plan (OHSMP) has been formulated to address the occupational
health and safety related impacts that may arise from proposed project activities viz. drilling and testing, operation
of construction machinery/equipment, storage and handling of fuel and chemicals, and decommissioning/site
closure.
Mitigation Measures
The following mitigation measure need to be adopted and implemented by Vedanta Limited (Division: Cairn Oil &
Gas) and its contractors in construction, drilling, and early production and decommissioning phase.
• All workers will be provided with proper PPEs viz. safety boots, masks, protected glass etc.
Vedanta Limited. (Division CAIRN Oil & Gas) DRAFT EIA: Onshore Oil and Gas E&A in RJ-ONHP- 2017/4 Block, Barmer District, Rajasthan
June,2019 AECOM
204
• Provision of ear plugs/ear muffs etc. and rotation of workers operating near high noise generating areas,
would be ensured.
• Hazardous and risk prone areas, installations, materials, safety measures, emergency exits, etc. would be
appropriately marked in every conspicuous location.
• All chemicals and hazardous materials storage container will be properly labeled and marked according to
national and internationally recognized requirements and standards. Materials Safety Data Sheets (MSDS)
or equivalent data/information in an easily understood language must be readily available to exposed workers
and first-aid personnel.
• Workplace must be equipped with fire detectors, alarm systems and fire-fighting equipment. Equipment shall
be periodically inspected and maintained to keep in good working condition.
• Adequate sanitation facilities will be provided
• Garbage bins would be provided in the camp and regularly removed and the garbage disposed off in a
hygienic manner.
• Training programs would be organized for the operational workforce regarding proper usage of PPEs,
handling and storage of fuels and chemicals etc.
9.12. Flare & Illumination Management Plan
The glare from the flare and illumination not only cause visual impacts but also causes ecological impacts.
Work Zone Illumination
Low height (less than 8 m), sodium vapour lamp that are most energy efficient can help to reduce the ecological
impacts. Further, illumination will be provided only in required locations and has placed UV filters on lamps. Such
UV filtered lights have been found to be less distractive to migrating birds.
9.13. Site Closure Plan
The site closure plan will identify all the activities which would be performed during the restoration of a well site in
case the well is not economically viable, and no further use of that particular well bore is envisaged. Along with the
well site the approach road connecting the well will be restored accordingly.
The following activities would be considered in the closure plan:
• Plugging & Abandonment of well: Close the well head properly to prevent any further leakage
• Decommissioning Phase: Removal of the materials form the site
• Waste/mud pit closure and reclamation
• Reinstatement Phase: regeneration of the land
• Handover Phase : Returning the land to the original owner
9.13.1. Plugging & Abandonment of well
As and when the well will be declared as unsuccessfully/to be suspended, plugging of the well will be performed
to close and abandon the well to prevent any leakage of oil or gas.
9.13.2. Decommissioning
The decommissioning phase includes activities dismantling and removal of surface facilities from the well site and
storage in the Material Dumping Area. The activities which are envisaged during this phase are:
• Waste Management: clean up the site and remove all waste materials e.g. HDPE liners, any waste material
etc. The waste will be dumped in the designated area as per the guidelines of Rajasthan State pollution control
board.
Vedanta Limited. (Division CAIRN Oil & Gas) DRAFT EIA: Onshore Oil and Gas E&A in RJ-ONHP- 2017/4 Block, Barmer District, Rajasthan
June,2019 AECOM
205
• Road Restoration: The fill materials should be removed, and the site would be restored to previous conditions
or as per recommendation of administrative department of Tehsil.
9.13.3. Waste and Mud Pit Closure and Reclamation
Following decommissioning and abandonment of the well site the waste and mud pits would be subject to closure
through onsite burial of solids in accordance with lease and obligations and with local, state and national
regulations. Reclamation of closed pits or any other temporary retaining pits, including reserve pits, would be
carried out within a period of one year from well closure/abandonment. All such reclamation activities would be
carried out based on the climatic conditions.
9.13.4. Reinstatement
The reinstatement phase includes all activities for preparation of the soil for plantation of trees at the concerned
site. The preparation of topsoil and fertility regeneration of topsoil would be same as referred earlier. Site restoration
shall be taken up matching to the surrounding land use pattern. Selection of plants for plantation would be
undertaken based on the species that were cut down at the time of site preparation activities.
Environment Management plan for the proposed project is presented in Table 57.
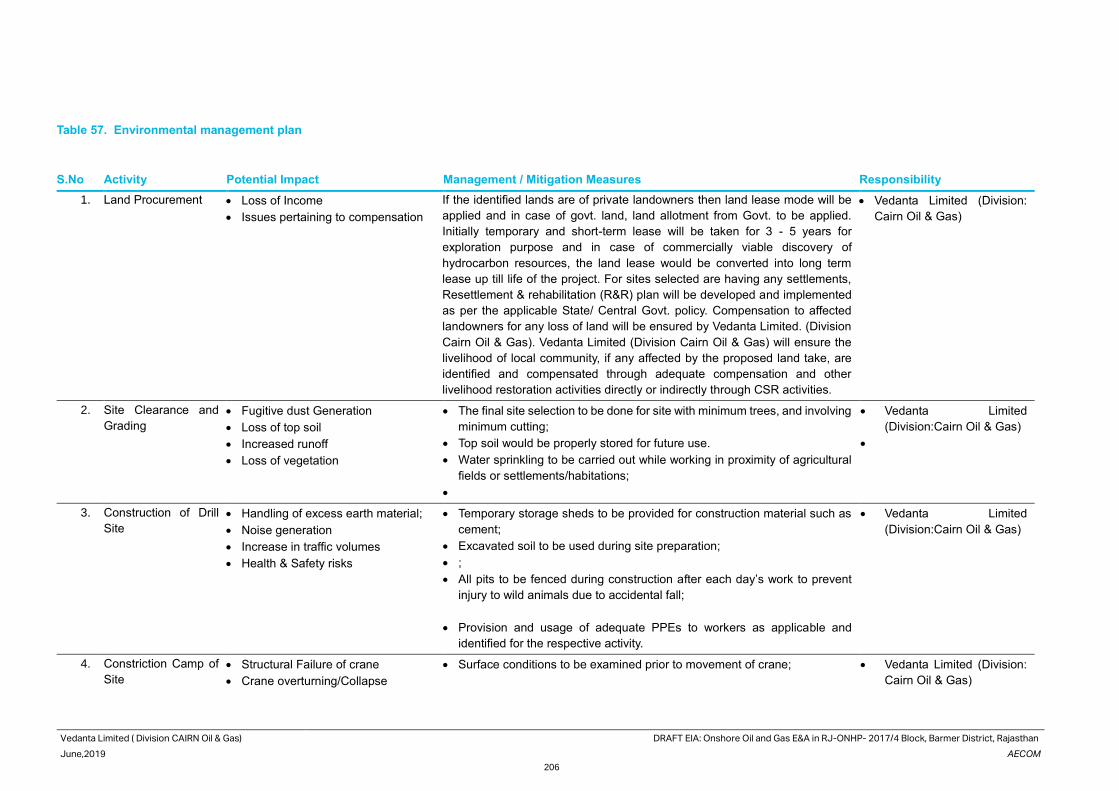
Vedanta Limited ( Division CAIRN Oil & Gas) DRAFT EIA: Onshore Oil and Gas E&A in RJ-ONHP- 2017/4 Block, Barmer District, Rajasthan
June,2019 AECOM
206
Table 57. Environmental management plan
S.No Activity Potential Impact Management / Mitigation Measures Responsibility
1. Land Procurement • Loss of Income
• Issues pertaining to compensation
If the identified lands are of private landowners then land lease mode will be
applied and in case of govt. land, land allotment from Govt. to be applied.
Initially temporary and short-term lease will be taken for 3 - 5 years for
exploration purpose and in case of commercially viable discovery of
hydrocarbon resources, the land lease would be converted into long term
lease up till life of the project. For sites selected are having any settlements,
Resettlement & rehabilitation (R&R) plan will be developed and implemented
as per the applicable State/ Central Govt. policy. Compensation to affected
landowners for any loss of land will be ensured by Vedanta Limited. (Division
Cairn Oil & Gas). Vedanta Limited (Division Cairn Oil & Gas) will ensure the
livelihood of local community, if any affected by the proposed land take, are
identified and compensated through adequate compensation and other
livelihood restoration activities directly or indirectly through CSR activities.
• Vedanta Limited (Division:
Cairn Oil & Gas)
2. Site Clearance and
Grading
• Fugitive dust Generation
• Loss of top soil
• Increased runoff
• Loss of vegetation
• The final site selection to be done for site with minimum trees, and involving
minimum cutting;
• Top soil would be properly stored for future use.
• Water sprinkling to be carried out while working in proximity of agricultural
fields or settlements/habitations;
•
• Vedanta Limited
(Division:Cairn Oil & Gas)
•
3. Construction of Drill
Site
• Handling of excess earth material;
• Noise generation
• Increase in traffic volumes
• Health & Safety risks
• Temporary storage sheds to be provided for construction material such as
cement;
• Excavated soil to be used during site preparation;
• ;
• All pits to be fenced during construction after each day’s work to prevent
injury to wild animals due to accidental fall;
• Provision and usage of adequate PPEs to workers as applicable and
identified for the respective activity.
• Vedanta Limited
(Division:Cairn Oil & Gas)
4. Constriction Camp of
Site
• Structural Failure of crane
• Crane overturning/Collapse
• Surface conditions to be examined prior to movement of crane; • Vedanta Limited (Division:
Cairn Oil & Gas)
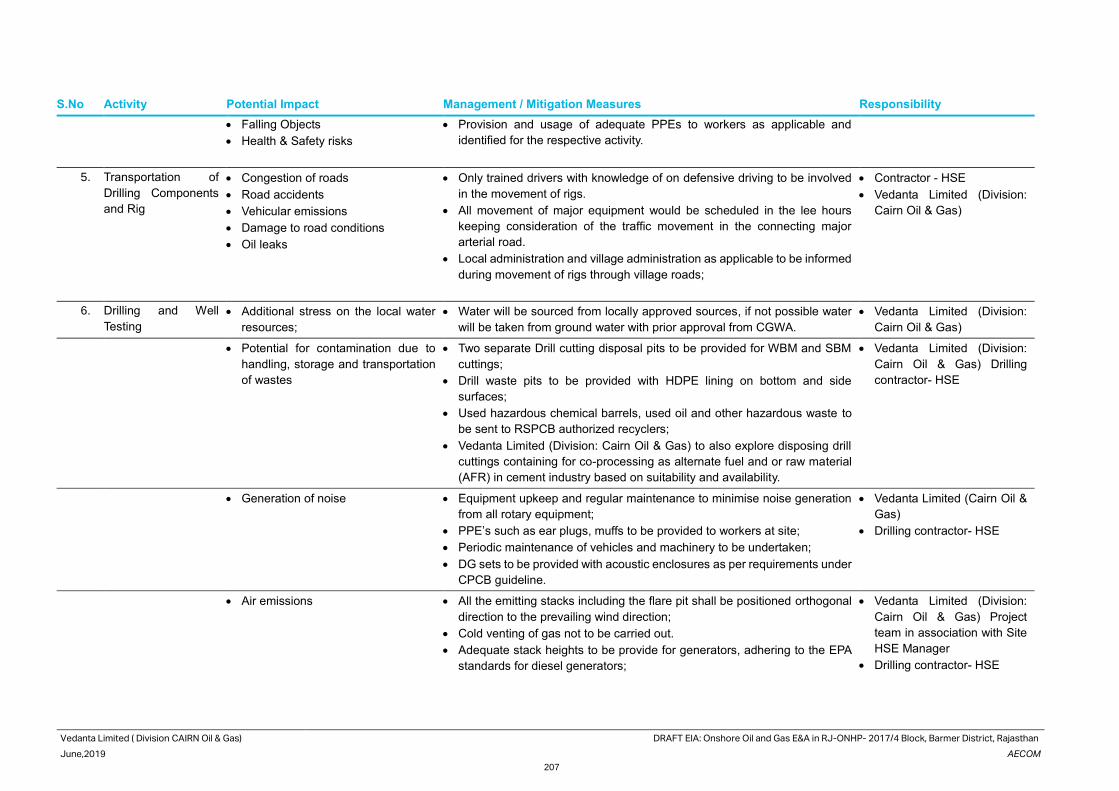
Vedanta Limited ( Division CAIRN Oil & Gas) DRAFT EIA: Onshore Oil and Gas E&A in RJ-ONHP- 2017/4 Block, Barmer District, Rajasthan
June,2019 AECOM
207
S.No Activity Potential Impact Management / Mitigation Measures Responsibility
• Falling Objects
• Health & Safety risks
• Provision and usage of adequate PPEs to workers as applicable and
identified for the respective activity.
5. Transportation of
Drilling Components
and Rig
• Congestion of roads
• Road accidents
• Vehicular emissions
• Damage to road conditions
• Oil leaks
• Only trained drivers with knowledge of on defensive driving to be involved
in the movement of rigs.
• All movement of major equipment would be scheduled in the lee hours
keeping consideration of the traffic movement in the connecting major
arterial road.
• Local administration and village administration as applicable to be informed
during movement of rigs through village roads;
• Contractor - HSE
• Vedanta Limited (Division:
Cairn Oil & Gas)
6. Drilling and Well
Testing
• Additional stress on the local water
resources;
• Water will be sourced from locally approved sources, if not possible water
will be taken from ground water with prior approval from CGWA.
• Vedanta Limited (Division:
Cairn Oil & Gas)
• Potential for contamination due to
handling, storage and transportation
of wastes
• Two separate Drill cutting disposal pits to be provided for WBM and SBM
cuttings;
• Drill waste pits to be provided with HDPE lining on bottom and side
surfaces;
• Used hazardous chemical barrels, used oil and other hazardous waste to
be sent to RSPCB authorized recyclers;
• Vedanta Limited (Division: Cairn Oil & Gas) to also explore disposing drill
cuttings containing for co-processing as alternate fuel and or raw material
(AFR) in cement industry based on suitability and availability.
• Vedanta Limited (Division:
Cairn Oil & Gas) Drilling
contractor- HSE
• Generation of noise • Equipment upkeep and regular maintenance to minimise noise generation
from all rotary equipment;
• PPE’s such as ear plugs, muffs to be provided to workers at site;
• Periodic maintenance of vehicles and machinery to be undertaken;
• DG sets to be provided with acoustic enclosures as per requirements under
CPCB guideline.
• Vedanta Limited (Cairn Oil &
Gas)
• Drilling contractor- HSE
• Air emissions • All the emitting stacks including the flare pit shall be positioned orthogonal
direction to the prevailing wind direction;
• Cold venting of gas not to be carried out.
• Adequate stack heights to be provide for generators, adhering to the EPA
standards for diesel generators;
• Vedanta Limited (Division:
Cairn Oil & Gas) Project
team in association with Site
HSE Manager
• Drilling contractor- HSE
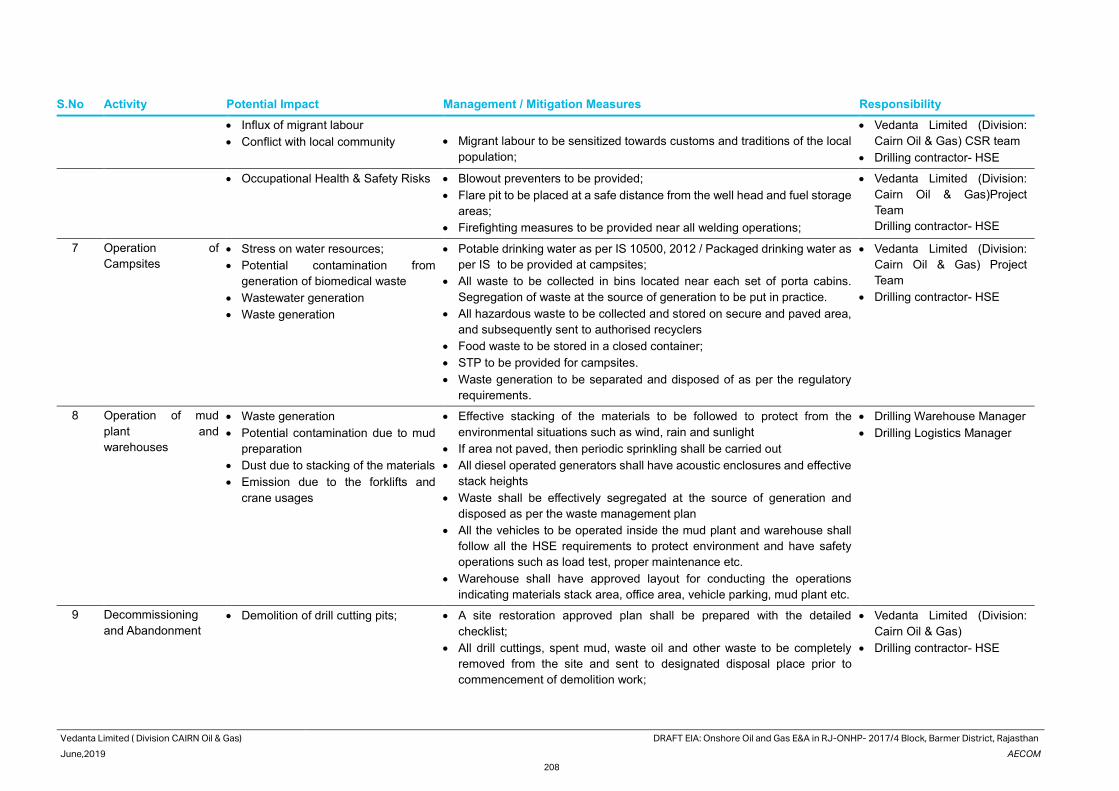
Vedanta Limited ( Division CAIRN Oil & Gas) DRAFT EIA: Onshore Oil and Gas E&A in RJ-ONHP- 2017/4 Block, Barmer District, Rajasthan
June,2019 AECOM
208
S.No Activity Potential Impact Management / Mitigation Measures Responsibility
• Influx of migrant labour
• Conflict with local community
• Migrant labour to be sensitized towards customs and traditions of the local
population;
• Vedanta Limited (Division:
Cairn Oil & Gas) CSR team
• Drilling contractor- HSE
• Occupational Health & Safety Risks • Blowout preventers to be provided;
• Flare pit to be placed at a safe distance from the well head and fuel storage
areas;
• Firefighting measures to be provided near all welding operations;
• Vedanta Limited (Division:
Cairn Oil & Gas)Project
Team
Drilling contractor- HSE
7 Operation of
Campsites
• Stress on water resources;
• Potential contamination from
generation of biomedical waste
• Wastewater generation
• Waste generation
• Potable drinking water as per IS 10500, 2012 / Packaged drinking water as
per IS to be provided at campsites;
• All waste to be collected in bins located near each set of porta cabins.
Segregation of waste at the source of generation to be put in practice.
• All hazardous waste to be collected and stored on secure and paved area,
and subsequently sent to authorised recyclers
• Food waste to be stored in a closed container;
• STP to be provided for campsites.
• Waste generation to be separated and disposed of as per the regulatory
requirements.
• Vedanta Limited (Division:
Cairn Oil & Gas) Project
Team
• Drilling contractor- HSE
8 Operation of mud
plant and
warehouses
• Waste generation
• Potential contamination due to mud
preparation
• Dust due to stacking of the materials
• Emission due to the forklifts and
crane usages
• Effective stacking of the materials to be followed to protect from the
environmental situations such as wind, rain and sunlight
• If area not paved, then periodic sprinkling shall be carried out
• All diesel operated generators shall have acoustic enclosures and effective
stack heights
• Waste shall be effectively segregated at the source of generation and
disposed as per the waste management plan
• All the vehicles to be operated inside the mud plant and warehouse shall
follow all the HSE requirements to protect environment and have safety
operations such as load test, proper maintenance etc.
• Warehouse shall have approved layout for conducting the operations
indicating materials stack area, office area, vehicle parking, mud plant etc.
• Drilling Warehouse Manager
• Drilling Logistics Manager
9 Decommissioning
and Abandonment
• Demolition of drill cutting pits;
• A site restoration approved plan shall be prepared with the detailed
checklist;
• All drill cuttings, spent mud, waste oil and other waste to be completely
removed from the site and sent to designated disposal place prior to
commencement of demolition work;
• Vedanta Limited (Division:
Cairn Oil & Gas)
• Drilling contractor- HSE
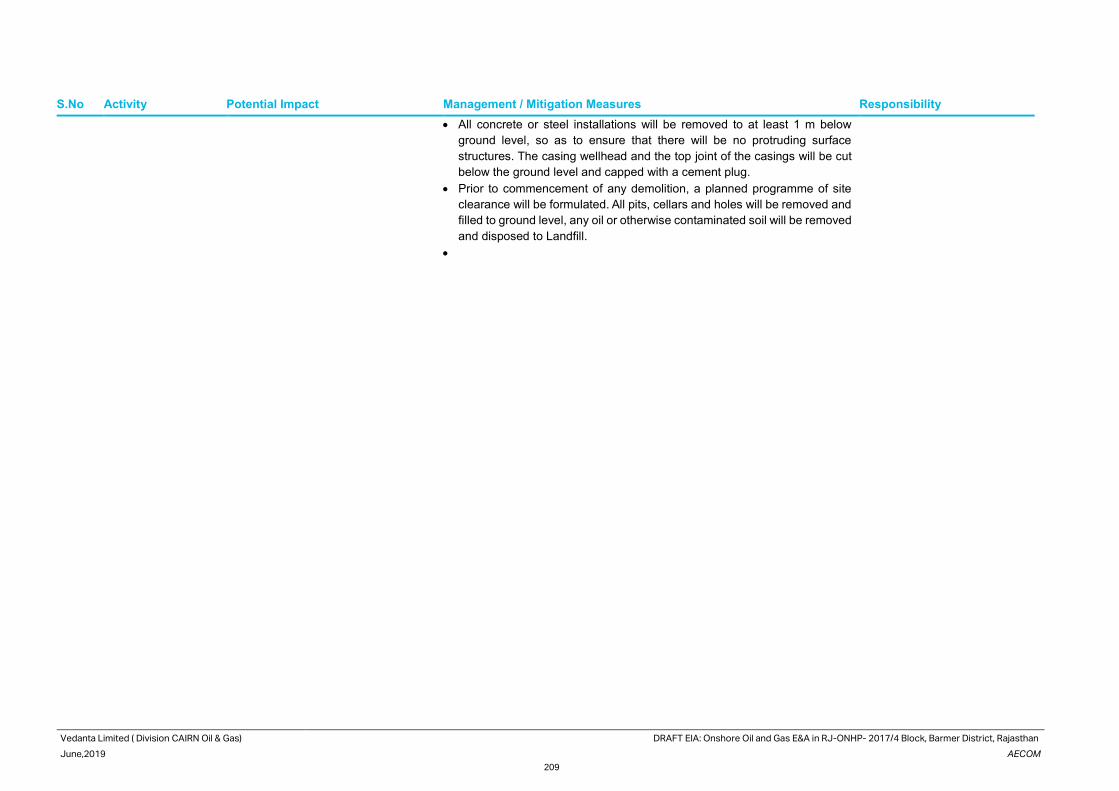
Vedanta Limited ( Division CAIRN Oil & Gas) DRAFT EIA: Onshore Oil and Gas E&A in RJ-ONHP- 2017/4 Block, Barmer District, Rajasthan
June,2019 AECOM
209
S.No Activity Potential Impact Management / Mitigation Measures Responsibility
• All concrete or steel installations will be removed to at least 1 m below
ground level, so as to ensure that there will be no protruding surface
structures. The casing wellhead and the top joint of the casings will be cut
below the ground level and capped with a cement plug.
• Prior to commencement of any demolition, a planned programme of site
clearance will be formulated. All pits, cellars and holes will be removed and
filled to ground level, any oil or otherwise contaminated soil will be removed
and disposed to Landfill.
•
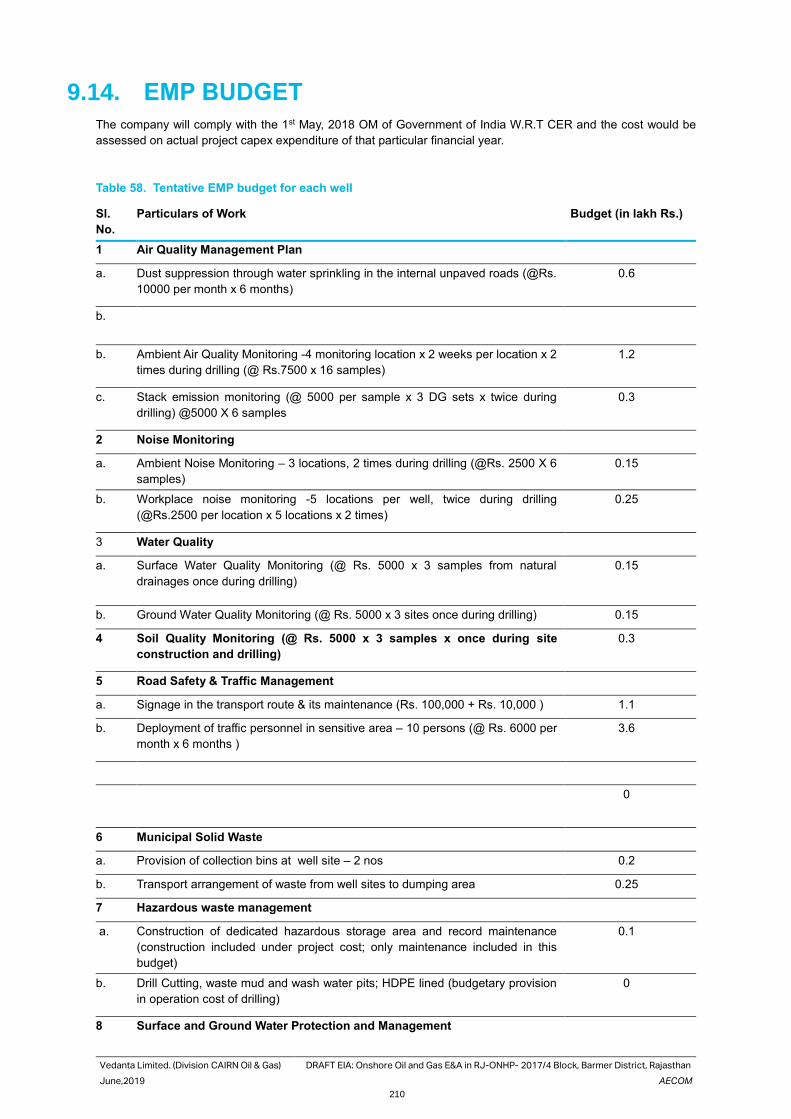
Vedanta Limited. (Division CAIRN Oil & Gas) DRAFT EIA: Onshore Oil and Gas E&A in RJ-ONHP- 2017/4 Block, Barmer District, Rajasthan
June,2019 AECOM
210
9.14. EMP BUDGET
The company will comply with the 1st May, 2018 OM of Government of India W.R.T CER and the cost would be
assessed on actual project capex expenditure of that particular financial year.
Table 58. Tentative EMP budget for each well
Sl.
No.
Particulars of Work Budget (in lakh Rs.)
1 Air Quality Management Plan
a. Dust suppression through water sprinkling in the internal unpaved roads (@Rs.
10000 per month x 6 months)
0.6
b.
b. Ambient Air Quality Monitoring -4 monitoring location x 2 weeks per location x 2
times during drilling (@ Rs.7500 x 16 samples)
1.2
c. Stack emission monitoring (@ 5000 per sample x 3 DG sets x twice during
drilling) @5000 X 6 samples
0.3
2 Noise Monitoring
a. Ambient Noise Monitoring – 3 locations, 2 times during drilling (@Rs. 2500 X 6
samples)
0.15
b. Workplace noise monitoring -5 locations per well, twice during drilling
(@Rs.2500 per location x 5 locations x 2 times)
0.25
3 Water Quality
a. Surface Water Quality Monitoring (@ Rs. 5000 x 3 samples from natural
drainages once during drilling)
0.15
b. Ground Water Quality Monitoring (@ Rs. 5000 x 3 sites once during drilling) 0.15
4 Soil Quality Monitoring (@ Rs. 5000 x 3 samples x once during site
construction and drilling)
0.3
5 Road Safety & Traffic Management
a. Signage in the transport route & its maintenance (Rs. 100,000 + Rs. 10,000 ) 1.1
b. Deployment of traffic personnel in sensitive area – 10 persons (@ Rs. 6000 per
month x 6 months )
3.6
0
6 Municipal Solid Waste
a. Provision of collection bins at well site – 2 nos 0.2
b. Transport arrangement of waste from well sites to dumping area 0.25
7 Hazardous waste management
a. Construction of dedicated hazardous storage area and record maintenance
(construction included under project cost; only maintenance included in this
budget)
0.1
b. Drill Cutting, waste mud and wash water pits; HDPE lined (budgetary provision
in operation cost of drilling)
0
8 Surface and Ground Water Protection and Management
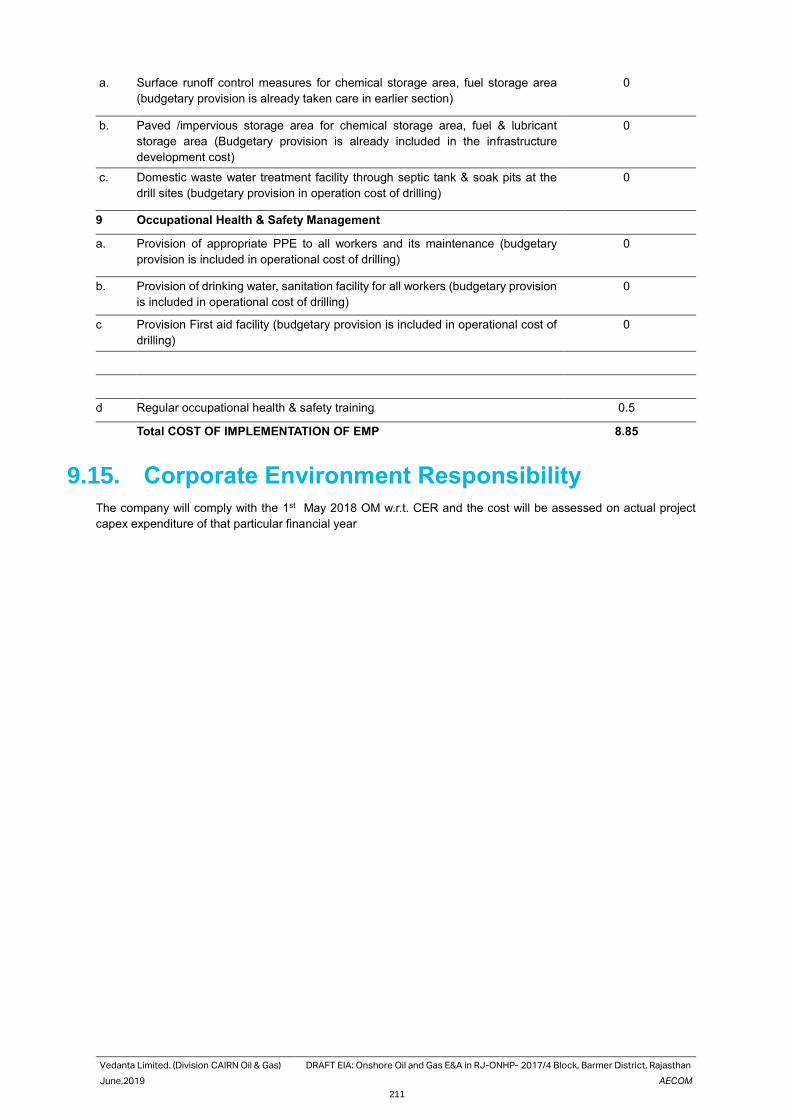
Vedanta Limited. (Division CAIRN Oil & Gas) DRAFT EIA: Onshore Oil and Gas E&A in RJ-ONHP- 2017/4 Block, Barmer District, Rajasthan
June,2019 AECOM
211
a. Surface runoff control measures for chemical storage area, fuel storage area
(budgetary provision is already taken care in earlier section)
0
b. Paved /impervious storage area for chemical storage area, fuel & lubricant
storage area (Budgetary provision is already included in the infrastructure
development cost)
0
c. Domestic waste water treatment facility through septic tank & soak pits at the
drill sites (budgetary provision in operation cost of drilling)
0
9 Occupational Health & Safety Management
a. Provision of appropriate PPE to all workers and its maintenance (budgetary
provision is included in operational cost of drilling)
0
b. Provision of drinking water, sanitation facility for all workers (budgetary provision
is included in operational cost of drilling)
0
c Provision First aid facility (budgetary provision is included in operational cost of
drilling)
0
d Regular occupational health & safety training 0.5
Total COST OF IMPLEMENTATION OF EMP 8.85
9.15. Corporate Environment Responsibility
The company will comply with the 1st May 2018 OM w.r.t. CER and the cost will be assessed on actual project
capex expenditure of that particular financial year
Vedanta Limited. (Division CAIRN Oil & Gas) DRAFT EIA: Onshore Oil and Gas E&A in RJ-ONHP- 2017/4 Block, Barmer District, Rajasthan
June,2019 AECOM
212
10. Conclusion and Recommendation
RJ-ONHP-2017/2 Block is located in Barmer and Jalore district in the state of Rajasthan and covers a total area of
1072 Sq. Km. The Vedanta Limited (Cairn Oil & Gas division) intends to carry out further Exploration and Appraisal
Drilling activities in the Block, wherein 64 new drilling (exploratory and appraisal) wells are proposed to be drilled
over 5 years. In case of successful discovery of crude oil, setting up of Early Production Units (EPUs)/ Quick
Production Units (QPUs) for produced well fluid processing and production of up to 3.6 MMSCFD associated
natural gasoil of about 24000 BOPD and 3.6 MMSCFD of associated gas for captive power generation.
ToR has been approved by MoEF&CC dated on 25th April, 2019 and MoEF&CC vide File No No. No.IA-J-
11011/103/2019-IA-II(I). The baseline monitoring and all primary data collection was conducted for the summer
season (rom March to May), of 2019, as per the requirements of the ToR. This is the Draft EIA report has been
prepared for conducting the public hearing.
The draft EIA report has assessed the overall significance of environmental impacts likely to arise from Drilling
drilling of proposed exploratory and appraisal wells. The overall impacts from the individual drilling sites is have
been assessed to be of moderate to minor in nature when appropriate mitigation measures are would be
implemented with proper planning and design.
To adequately address the impacts, mitigation measures and management plans suggested are as per the best
practices followed in the Oil & Gas Industry. These plans include environmental management plan, monitoring plan,
labour management plan, traffic management plan. Vedanta Limited (Cairn Oil & Gas) shall put in place a robust
mechanism with adequate resources to implement the suggested mitigation measures and management plans.
The measures will help to prevent any deterioration contamination of air, soil, groundwater and surface water quality
beyond the prevailing status. Adequate safety measures would be adopted along with suitable emergency
response and disaster management plan to safeguard against all man-made and natural disasters. Environmental
monitoring of ambient air quality, noise levels, surface & groundwater etc. would be carried out at regular intervals
to monitor and prevent any deterioration of baseline environmental quality due to the proposed project.
Compliance to all legal requirements and adherence to the suggested mitigation measures and plans would also
enable Vedanta Limited (Cairn Oil & Gas) in minimizing its impact on environmental and social parameter. This
Report in the final form is being submitted to MoEF&CC for obtaining Environmental Clearance (EC) of the
proposed project before commencement of site activity.
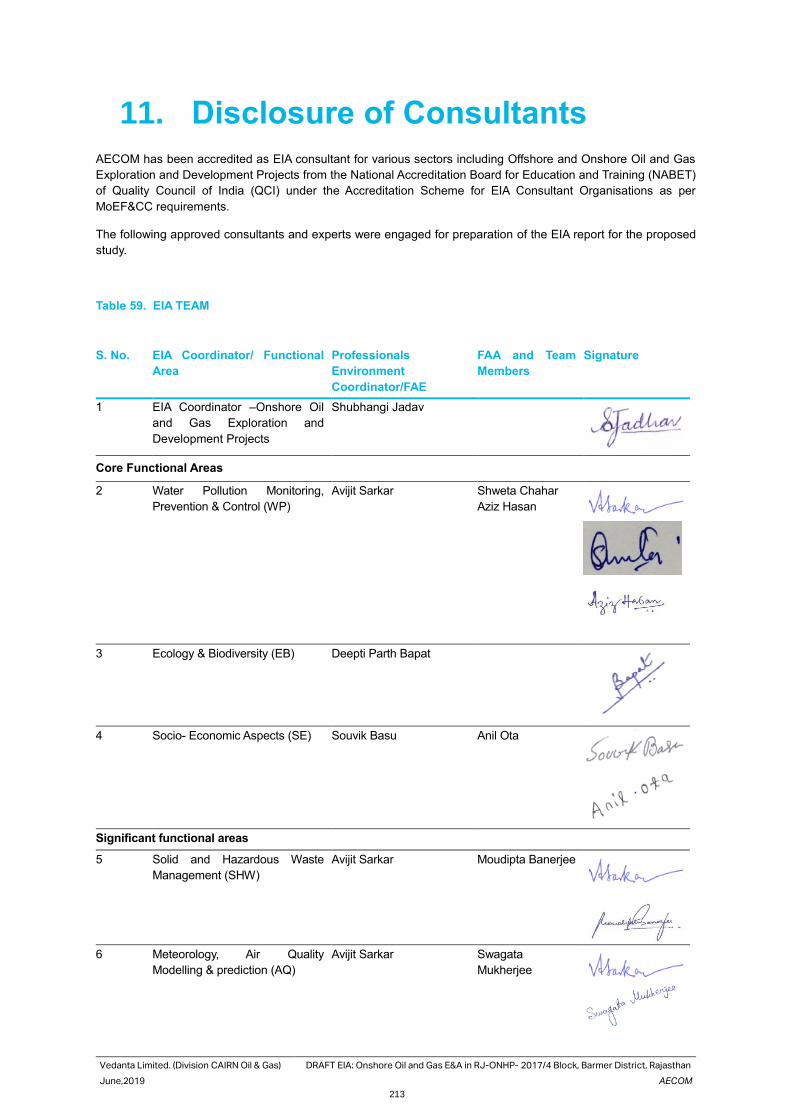
Vedanta Limited. (Division CAIRN Oil & Gas) DRAFT EIA: Onshore Oil and Gas E&A in RJ-ONHP- 2017/4 Block, Barmer District, Rajasthan
June,2019 AECOM
213
11. Disclosure of Consultants
AECOM has been accredited as EIA consultant for various sectors including Offshore and Onshore Oil and Gas
Exploration and Development Projects from the National Accreditation Board for Education and Training (NABET)
of Quality Council of India (QCI) under the Accreditation Scheme for EIA Consultant Organisations as per
MoEF&CC requirements.
The following approved consultants and experts were engaged for preparation of the EIA report for the proposed
study.
Table 59. EIA TEAM
S. No. EIA Coordinator/ Functional
Area
Professionals
Environment
Coordinator/FAE
FAA and Team
Members
Signature
1 EIA Coordinator –Onshore Oil
and Gas Exploration and
Development Projects
Shubhangi Jadav
Core Functional Areas
2 Water Pollution Monitoring,
Prevention & Control (WP)
Avijit Sarkar Shweta Chahar
Aziz Hasan
3 Ecology & Biodiversity (EB) Deepti Parth Bapat
4 Socio- Economic Aspects (SE) Souvik Basu Anil Ota
Significant functional areas
5 Solid and Hazardous Waste
Management (SHW)
Avijit Sarkar Moudipta Banerjee
6 Meteorology, Air Quality
Modelling & prediction (AQ)
Avijit Sarkar Swagata
Mukherjee
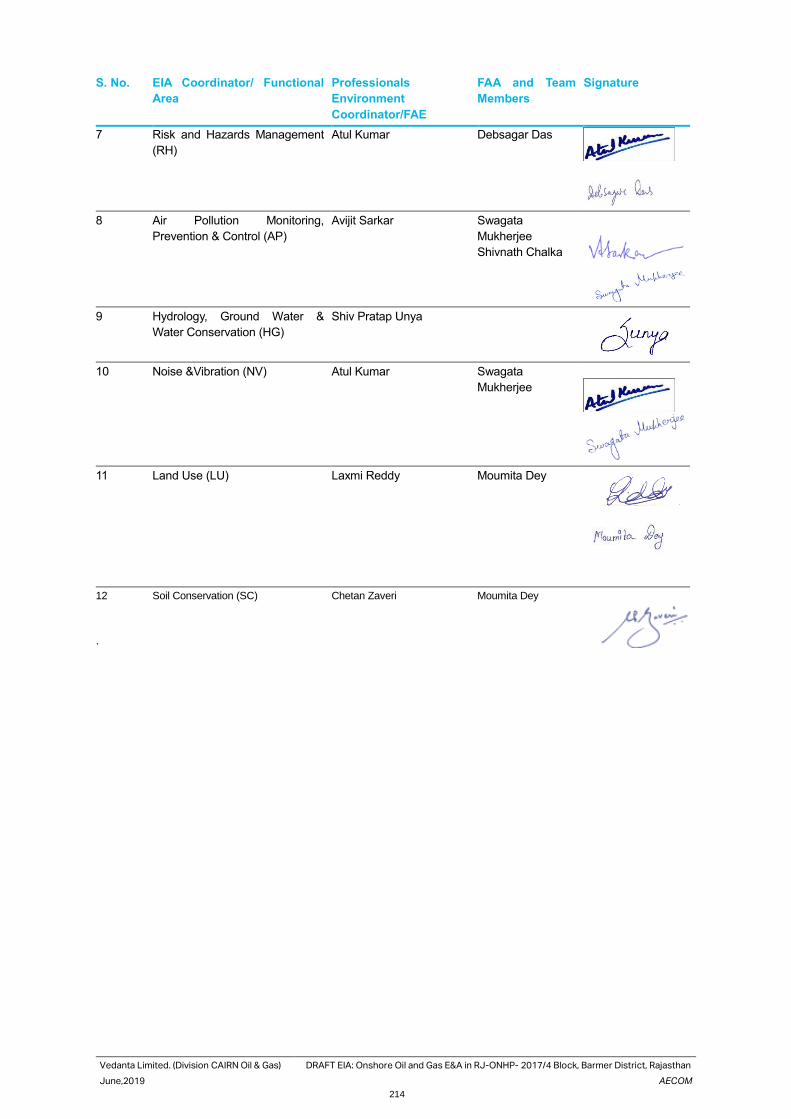
Vedanta Limited. (Division CAIRN Oil & Gas) DRAFT EIA: Onshore Oil and Gas E&A in RJ-ONHP- 2017/4 Block, Barmer District, Rajasthan
June,2019 AECOM
214
S. No. EIA Coordinator/ Functional
Area
Professionals
Environment
Coordinator/FAE
FAA and Team
Members
Signature
7 Risk and Hazards Management
(RH)
Atul Kumar
Debsagar Das
8 Air Pollution Monitoring,
Prevention & Control (AP)
Avijit Sarkar
Swagata
Mukherjee
Shivnath Chalka
9 Hydrology, Ground Water &
Water Conservation (HG)
Shiv Pratap Unya
10 Noise &Vibration (NV) Atul Kumar
Swagata
Mukherjee
11 Land Use (LU) Laxmi Reddy
Moumita Dey
12 Soil Conservation (SC) Chetan Zaveri
Moumita Dey
.
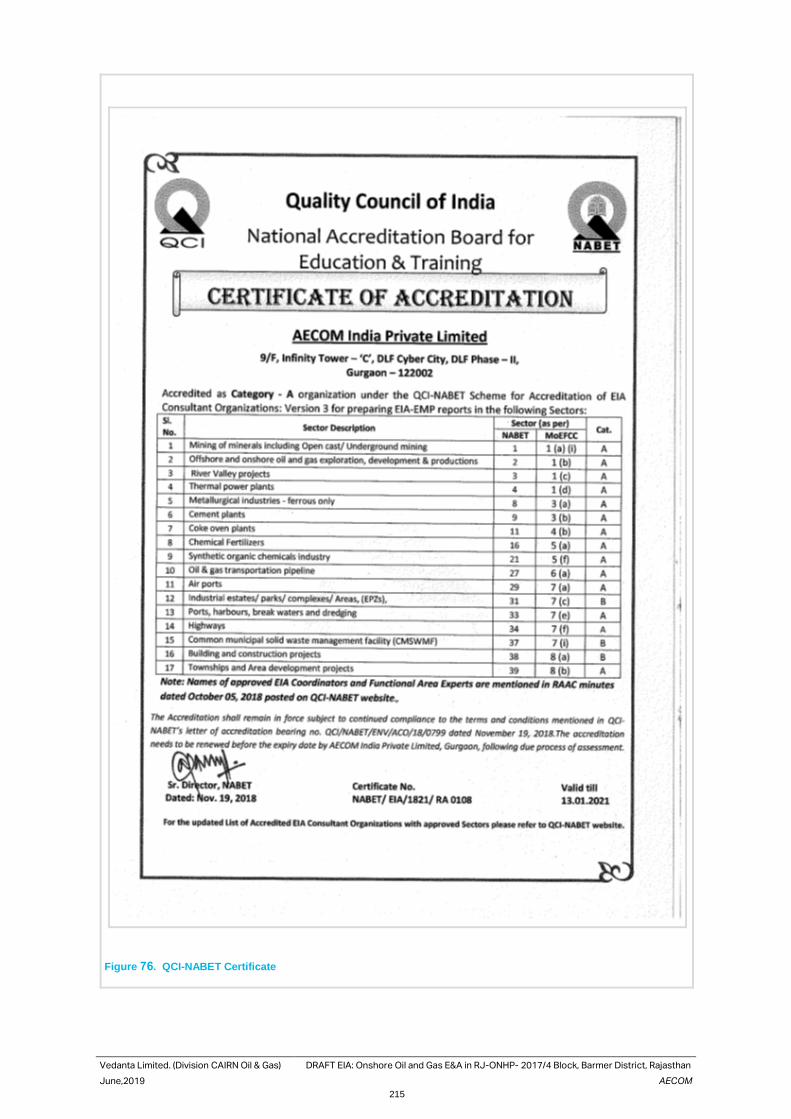
Vedanta Limited. (Division CAIRN Oil & Gas) DRAFT EIA: Onshore Oil and Gas E&A in RJ-ONHP- 2017/4 Block, Barmer District, Rajasthan
June,2019 AECOM
215
Figure 76. QCI-NABET Certificate

APPENDIX
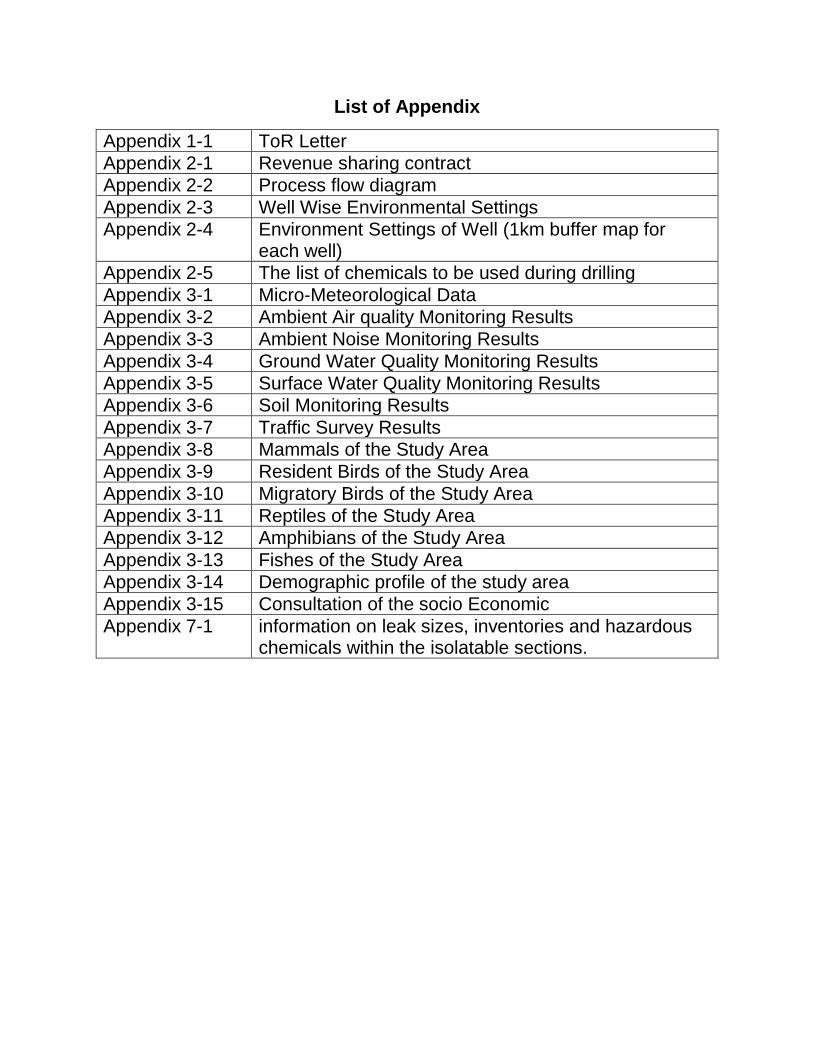
List of Appendix
Appendix 1-1 ToR Letter
Appendix 2-1 Revenue sharing contract
Appendix 2-2 Process flow diagram
Appendix 2-3 Well Wise Environmental Settings
Appendix 2-4 Environment Settings of Well (1km buffer map for each well)
Appendix 2-5 The list of chemicals to be used during drilling
Appendix 3-1 Micro-Meteorological Data
Appendix 3-2 Ambient Air quality Monitoring Results
Appendix 3-3 Ambient Noise Monitoring Results
Appendix 3-4 Ground Water Quality Monitoring Results
Appendix 3-5 Surface Water Quality Monitoring Results
Appendix 3-6 Soil Monitoring Results
Appendix 3-7 Traffic Survey Results
Appendix 3-8 Mammals of the Study Area
Appendix 3-9 Resident Birds of the Study Area
Appendix 3-10 Migratory Birds of the Study Area
Appendix 3-11 Reptiles of the Study Area
Appendix 3-12 Amphibians of the Study Area
Appendix 3-13 Fishes of the Study Area
Appendix 3-14 Demographic profile of the study area
Appendix 3-15 Consultation of the socio Economic
Appendix 7-1 information on leak sizes, inventories and hazardous chemicals within the isolatable sections.

Appendix 1.1:
ToR Letter
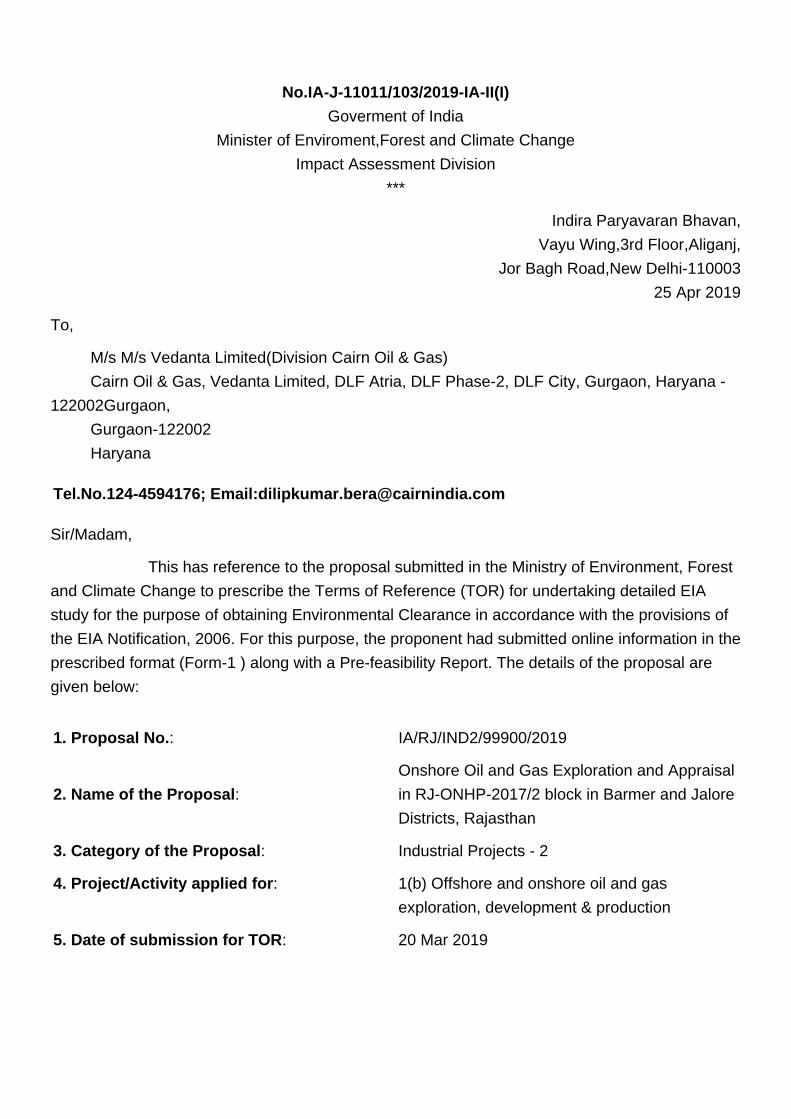
No.IA-J-11011/103/2019-IA-II(I)
Goverment of India
Minister of Enviroment,Forest and Climate Change
Impact Assessment Division
***
Indira Paryavaran Bhavan,
Vayu Wing,3rd Floor,Aliganj,
Jor Bagh Road,New Delhi-110003
25 Apr 2019
To,
M/s M/s Vedanta Limited(Division Cairn Oil & Gas)
Cairn Oil & Gas, Vedanta Limited, DLF Atria, DLF Phase-2, DLF City, Gurgaon, Haryana -
122002Gurgaon,
Gurgaon-122002
Haryana
Tel.No.124-4594176; Email:[email protected]
Sir/Madam,
This has reference to the proposal submitted in the Ministry of Environment, Forest
and Climate Change to prescribe the Terms of Reference (TOR) for undertaking detailed EIA
study for the purpose of obtaining Environmental Clearance in accordance with the provisions of
the EIA Notification, 2006. For this purpose, the proponent had submitted online information in the
prescribed format (Form-1 ) along with a Pre-feasibility Report. The details of the proposal are
given below:
1. Proposal No.: IA/RJ/IND2/99900/2019
2. Name of the Proposal:
Onshore Oil and Gas Exploration and Appraisal
in RJ-ONHP-2017/2 block in Barmer and Jalore
Districts, Rajasthan
3. Category of the Proposal: Industrial Projects - 2
4. Project/Activity applied for: 1(b) Offshore and onshore oil and gas
exploration, development & production
5. Date of submission for TOR: 20 Mar 2019

In this regard, under the provisions of the EIA Notification 2006 as amended, the Standard TOR
for the purpose of preparing environment impact assessment report and environment
management plan for obtaining prior environment clearance is prescribed with public consultation
as follows:
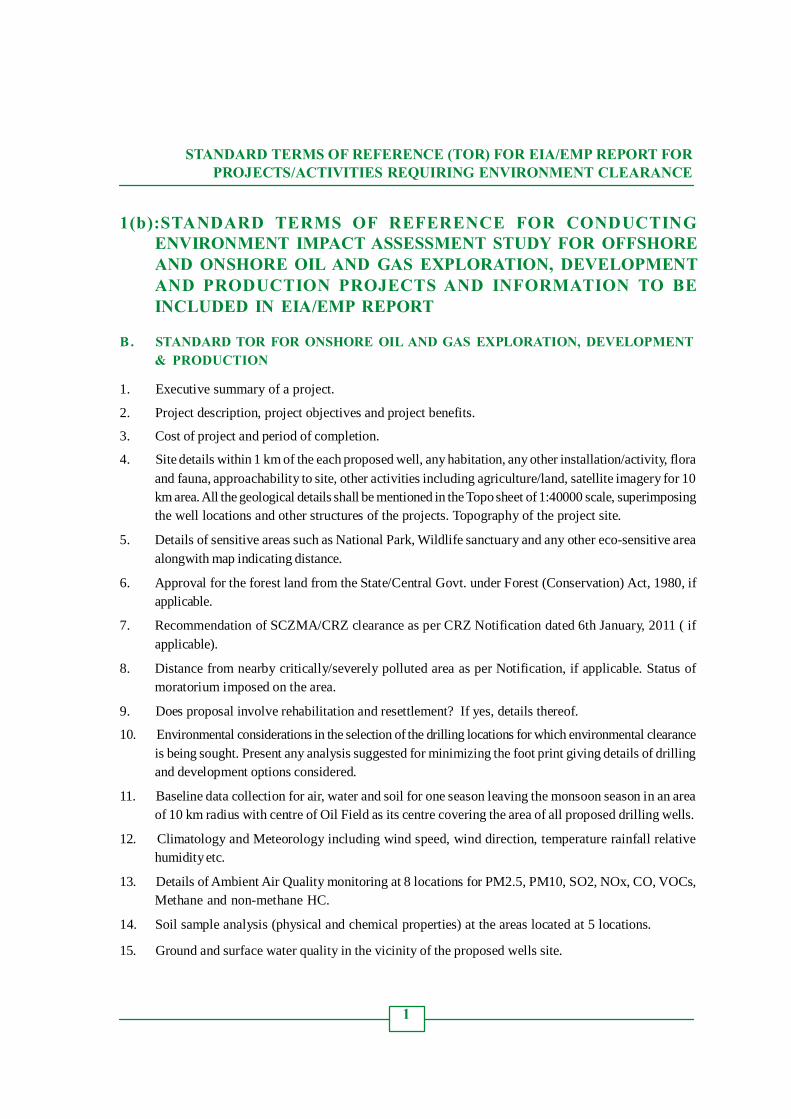
STANDARD TERMS OF REFERENCE (TOR) FOR EIA/EMP REPORT FOR PROJECTS/ACTIVITIES REQUIRING ENVIRONMENT CLEARANCE
1(b):STANDARD TERMS OF REFERENCE FOR CONDUCTING
ENVIRONMENT IMPACT ASSESSMENT STUDY FOR OFFSHORE AND ONSHORE OIL AND GAS EXPLORATION, DEVELOPMENT AND PRODUCTION PROJECTS AND INFORMATION TO BE INCLUDED IN EIA/EMP REPORT
B . STANDARD TOR FOR ONSHORE OIL AND GAS EXPLORATION, DEVELOPMENT
& PRODUCTION
1. Executive summary of a project.
2. Project description, project objectives and project benefits.
3. Cost of project and period of completion.
4. Site details within 1 km of the each proposed well, any habitation, any other installation/activity, flora and fauna, approachability to site, other activities including agriculture/land, satellite imagery for 10 km area. All the geological details shall be mentioned in the Topo sheet of 1:40000 scale, superimposing the well locations and other structures of the projects. Topography of the project site.
5. Details of sensitive areas such as National Park, Wildlife sanctuary and any other eco-sensitive area alongwith map indicating distance.
6. Approval for the forest land from the State/Central Govt. under Forest (Conservation) Act, 1980, if applicable.
7. Recommendation of SCZMA/CRZ clearance as per CRZ Notification dated 6th January, 2011 ( if applicable).
8. Distance from nearby critically/severely polluted area as per Notification, if applicable. Status of moratorium imposed on the area.
9. Does proposal involve rehabilitation and resettlement? If yes, details thereof.
10. Environmental considerations in the selection of the drilling locations for which environmental clearance is being sought. Present any analysis suggested for minimizing the foot print giving details of drilling and development options considered.
11. Baseline data collection for air, water and soil for one season leaving the monsoon season in an area of 10 km radius with centre of Oil Field as its centre covering the area of all proposed drilling wells.
12. Climatology and Meteorology including wind speed, wind direction, temperature rainfall relative humidity etc.
13. Details of Ambient Air Quality monitoring at 8 locations for PM2.5, PM10, SO2, NOx, CO, VOCs, Methane and non-methane HC.
14. Soil sample analysis (physical and chemical properties) at the areas located at 5 locations.
15. Ground and surface water quality in the vicinity of the proposed wells site.
1
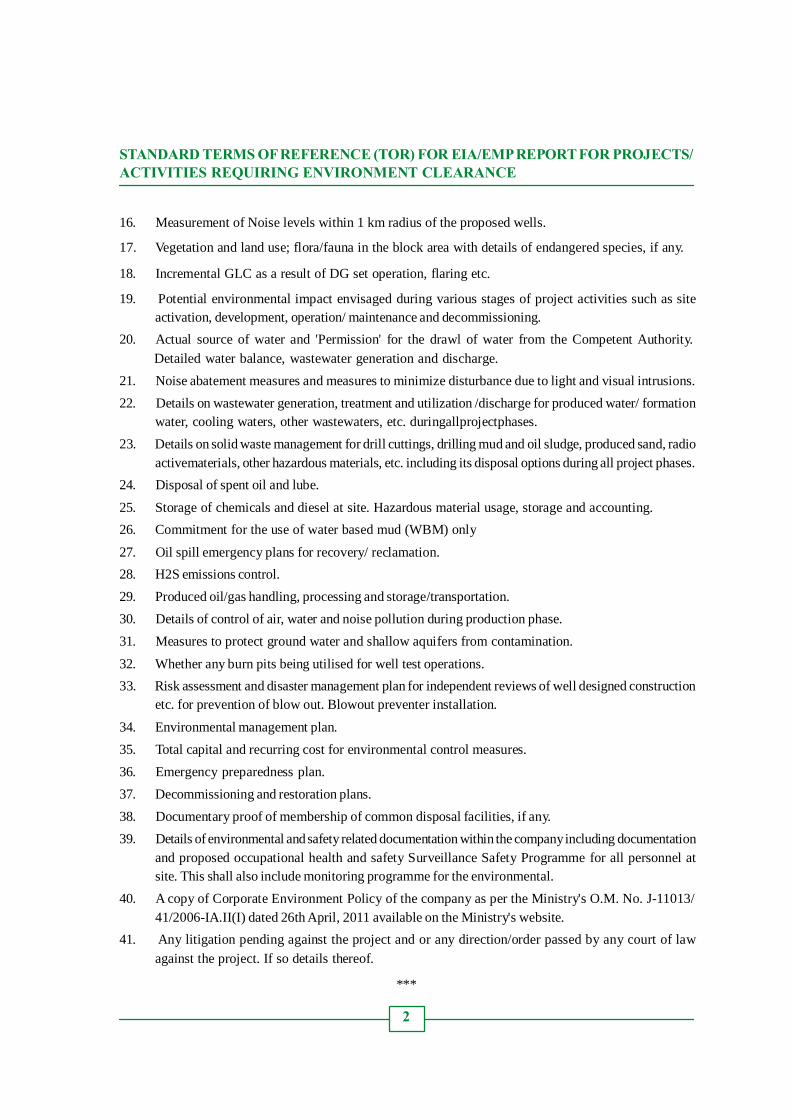
STANDARD TERMS OF REFERENCE (TOR) FOR EIA/EMP REPORT FOR PROJECTS/ ACTIVITIES REQUIRING ENVIRONMENT CLEARANCE
16. Measurement of Noise levels within 1 km radius of the proposed wells.
17. Vegetation and land use; flora/fauna in the block area with details of endangered species, if any.
18. Incremental GLC as a result of DG set operation, flaring etc.
19. Potential environmental impact envisaged during various stages of project activities such as site activation, development, operation/ maintenance and decommissioning.
20. Actual source of water and 'Permission' for the drawl of water from the Competent Authority. Detailed water balance, wastewater generation and discharge.
21. Noise abatement measures and measures to minimize disturbance due to light and visual intrusions.
22. Details on wastewater generation, treatment and utilization /discharge for produced water/ formation water, cooling waters, other wastewaters, etc. duringallprojectphases.
23. Details on solid waste management for drill cuttings, drilling mud and oil sludge, produced sand, radio activematerials, other hazardous materials, etc. including its disposal options during all project phases.
24. Disposal of spent oil and lube.
25. Storage of chemicals and diesel at site. Hazardous material usage, storage and accounting.
26. Commitment for the use of water based mud (WBM) only
27. Oil spill emergency plans for recovery/ reclamation.
28. H2S emissions control.
29. Produced oil/gas handling, processing and storage/transportation.
30. Details of control of air, water and noise pollution during production phase.
31. Measures to protect ground water and shallow aquifers from contamination.
32. Whether any burn pits being utilised for well test operations.
33. Risk assessment and disaster management plan for independent reviews of well designed construction etc. for prevention of blow out. Blowout preventer installation.
34. Environmental management plan.
35. Total capital and recurring cost for environmental control measures.
36. Emergency preparedness plan.
37. Decommissioning and restoration plans.
38. Documentary proof of membership of common disposal facilities, if any.
39. Details of environmental and safety related documentation within the company including documentation and proposed occupational health and safety Surveillance Safety Programme for all personnel at site. This shall also include monitoring programme for the environmental.
40. A copy of Corporate Environment Policy of the company as per the Ministry's O.M. No. J-11013/ 41/2006-IA.II(I) dated 26th April, 2011 available on the Ministry's website.
41. Any litigation pending against the project and or any direction/order passed by any court of law against the project. If so details thereof.
***
2

Appendix 2.1:
Revenue Sharing
Contract
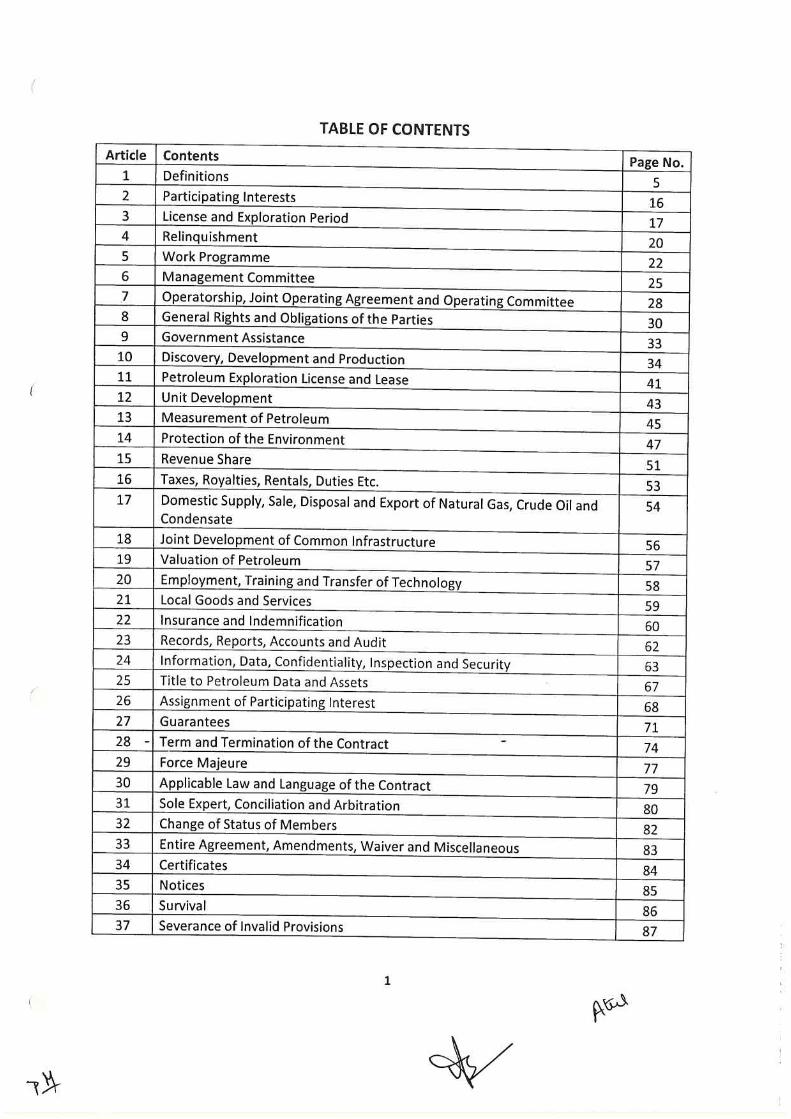
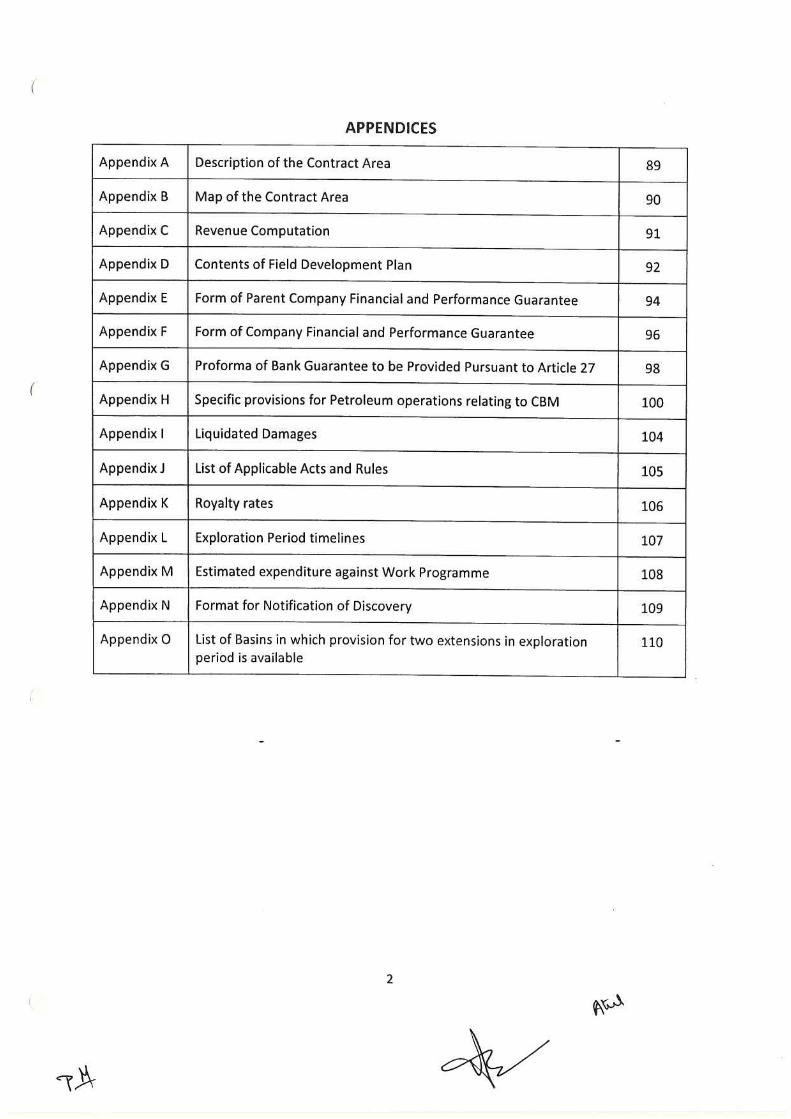
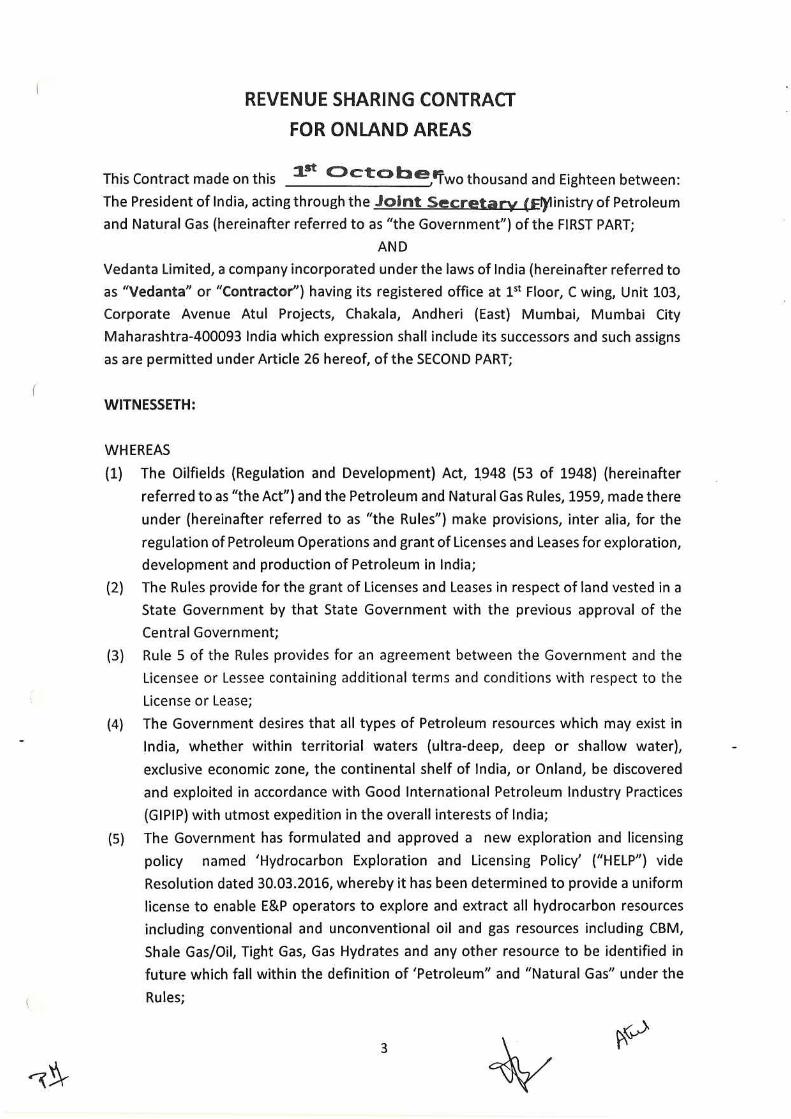
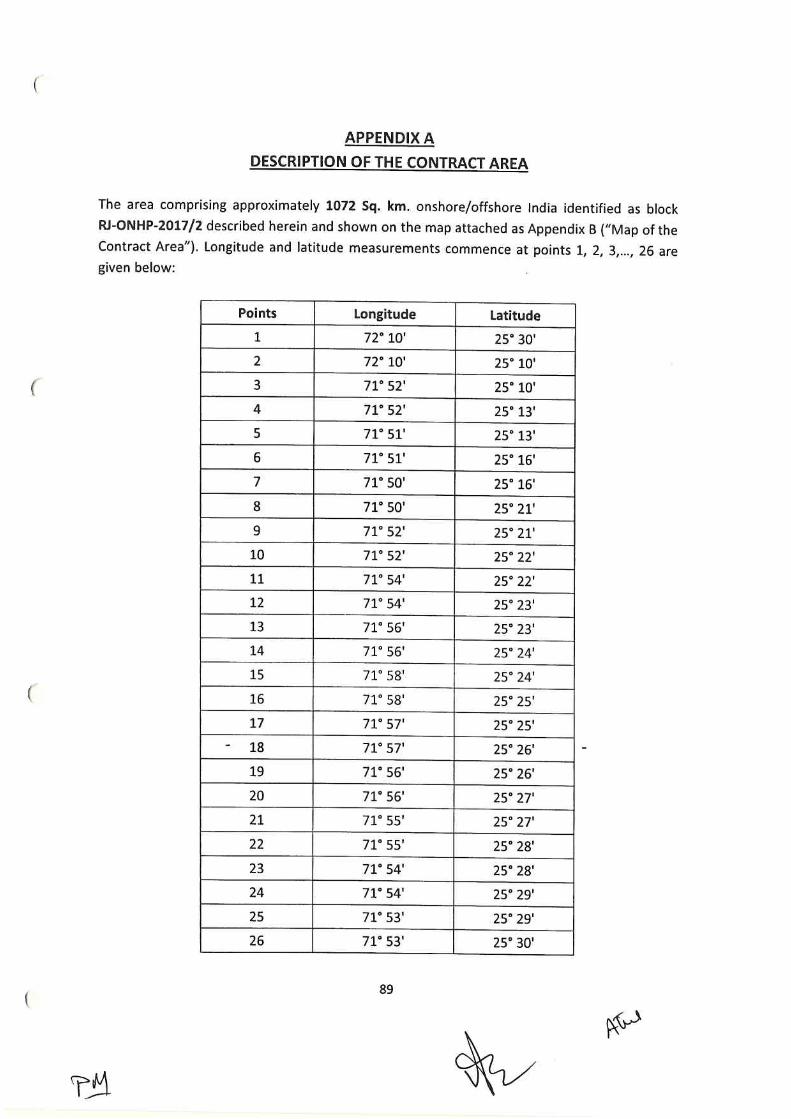
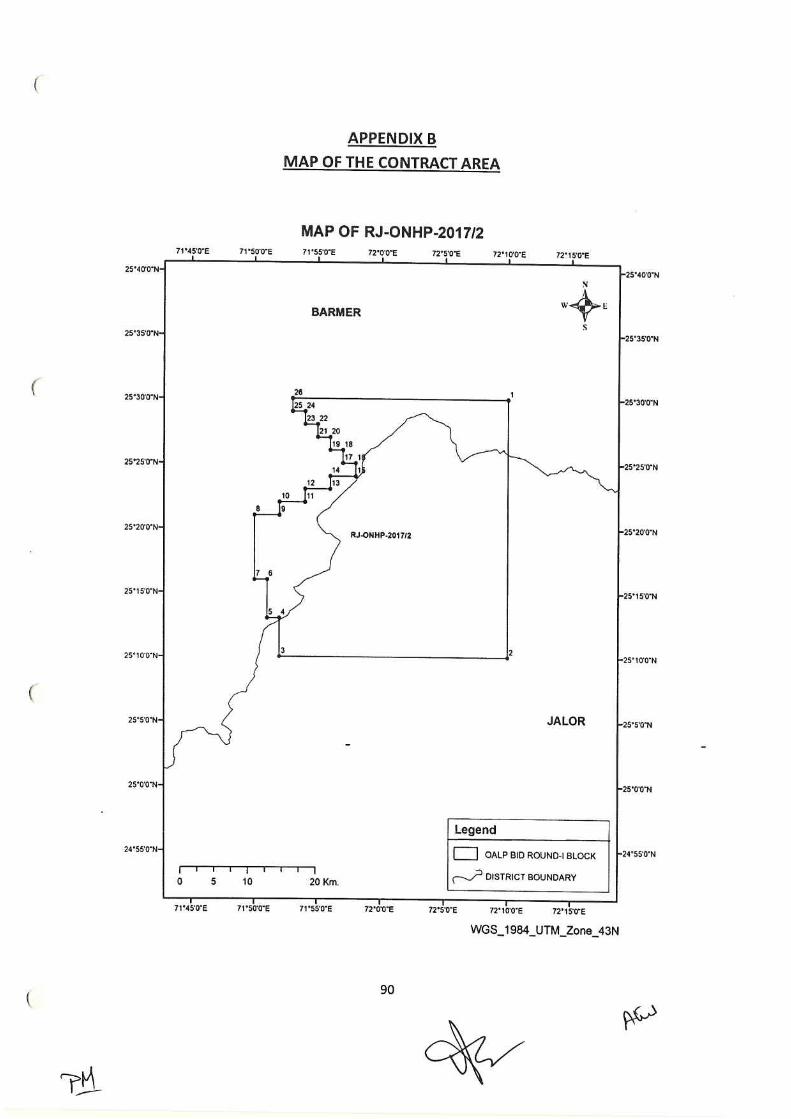
Appendix 2.2:
Process Flow
Diagram
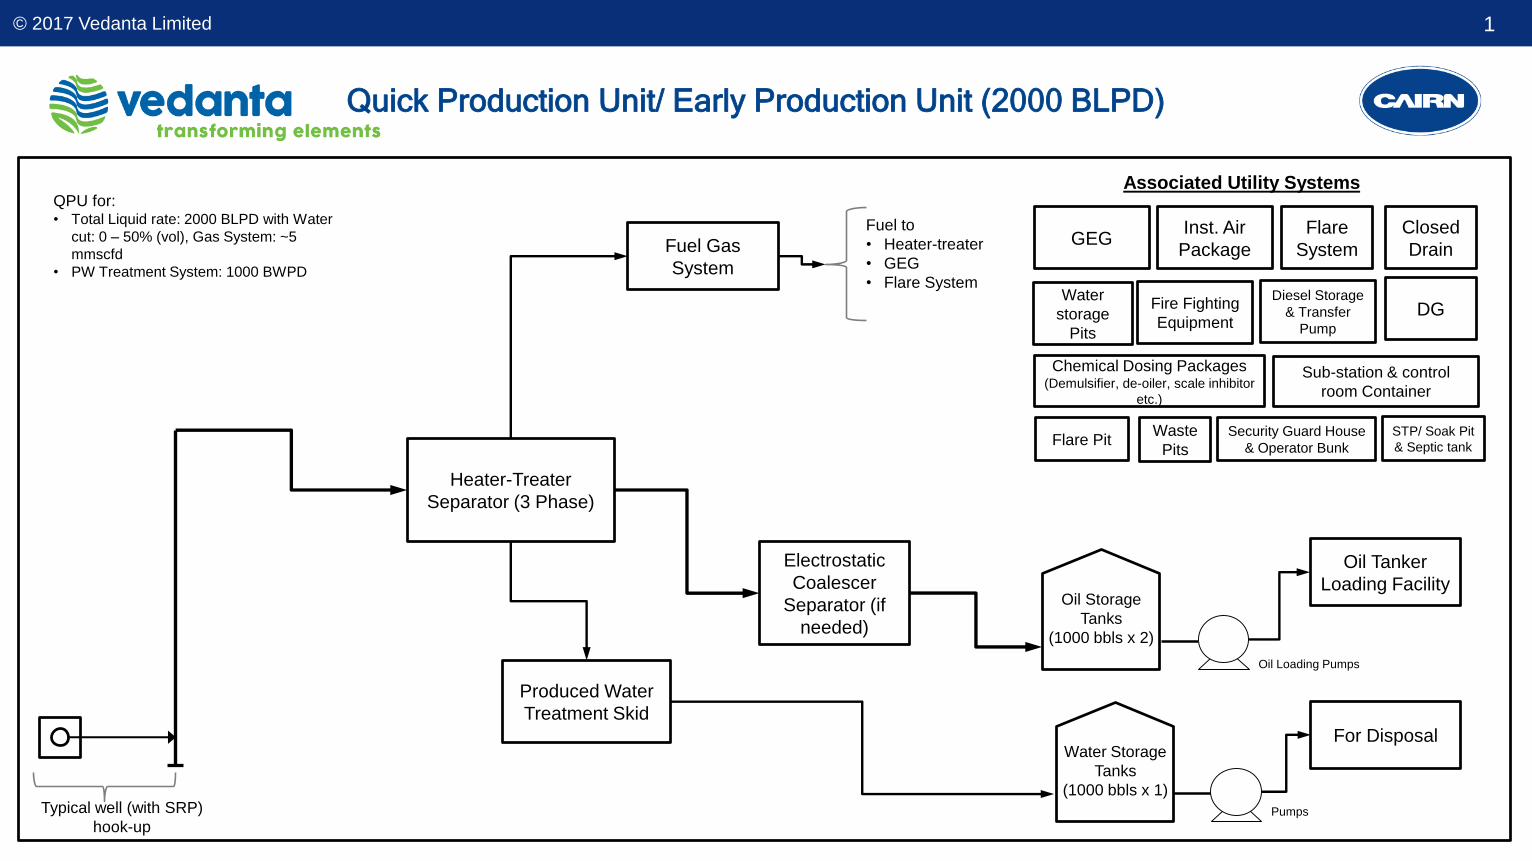
© 2017 Vedanta Limited 1
Quick Production Unit/ Early Production Unit (2000 BLPD)
Heater-Treater
Separator (3 Phase)
Electrostatic
Coalescer
Separator (if
needed)
Produced Water
Treatment Skid
Typical well (with SRP)
hook-up
Oil Storage
Tanks
(1000 bbls x 2)
Fuel Gas
System
GEG
Water Storage
Tanks
(1000 bbls x 1)
Oil Tanker
Loading Facility
For Disposal
Associated Utility Systems
Flare
System
Inst. Air
Package
Fuel to
• Heater-treater
• GEG
• Flare System
Closed
Drain
Fire Fighting
Equipment
Sub-station & control
room Container
DG
Oil Loading Pumps
Pumps
Diesel Storage
& Transfer
Pump
Flare PitWaste
Pits
Security Guard House
& Operator Bunk
STP/ Soak Pit
& Septic tank
Chemical Dosing Packages (Demulsifier, de-oiler, scale inhibitor
etc.)
QPU for:• Total Liquid rate: 2000 BLPD with Water
cut: 0 – 50% (vol), Gas System: ~5
mmscfd
• PW Treatment System: 1000 BWPD
Water
storage
Pits
Appendix 2.3:
Well Wise
Environmental
Settings
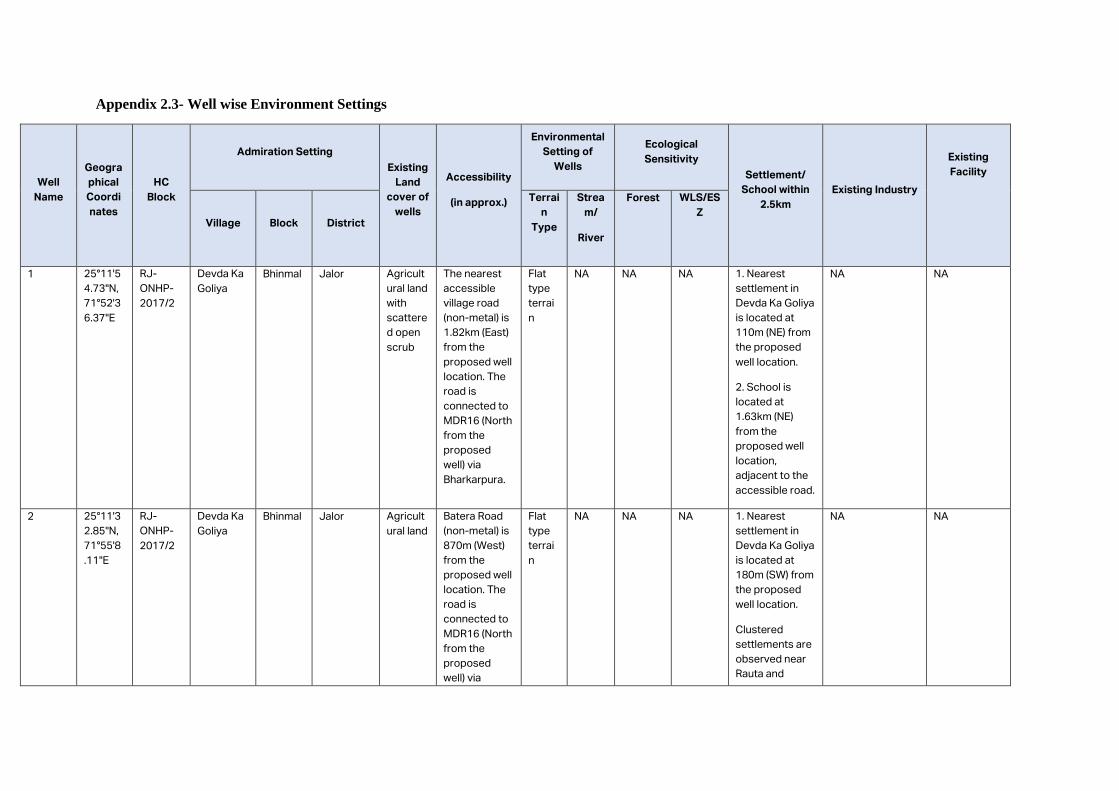
Appendix 2.3- Well wise Environment Settings
Well
Name
Geogra
phical
Coordi
nates
HC
Block
Admiration Setting
Existing
Land
cover of
wells
Accessibility
(in approx.)
Environmental
Setting of
Wells
Ecological
Sensitivity
Settlement/
School within
2.5km
Existing Industry
Existing
Facility
Village
Block
District
Terrai
n
Type
Strea
m/
River
Forest WLS/ES
Z
1 25°11'5
4.73"N,
71°52'3
6.37"E
RJ-
ONHP-
2017/2
Devda Ka
Goliya
Bhinmal Jalor Agricult
ural land
with
scattere
d open
scrub
The nearest
accessible
village road
(non-metal) is
1.82km (East)
from the
proposed well
location. The
road is
connected to
MDR16 (North
from the
proposed
well) via
Bharkarpura.
Flat
type
terrai
n
NA NA NA 1. Nearest
settlement in
Devda Ka Goliya
is located at
110m (NE) from
the proposed
well location.
2. School is
located at
1.63km (NE)
from the
proposed well
location,
adjacent to the
accessible road.
NA NA
2 25°11'3
2.85"N,
71°55'8
.11"E
RJ-
ONHP-
2017/2
Devda Ka
Goliya
Bhinmal Jalor Agricult
ural land
Batera Road
(non-metal) is
870m (West)
from the
proposed well
location. The
road is
connected to
MDR16 (North
from the
proposed
well) via
Flat
type
terrai
n
NA NA NA 1. Nearest
settlement in
Devda Ka Goliya
is located at
180m (SW) from
the proposed
well location.
Clustered
settlements are
observed near
Rauta and
NA NA
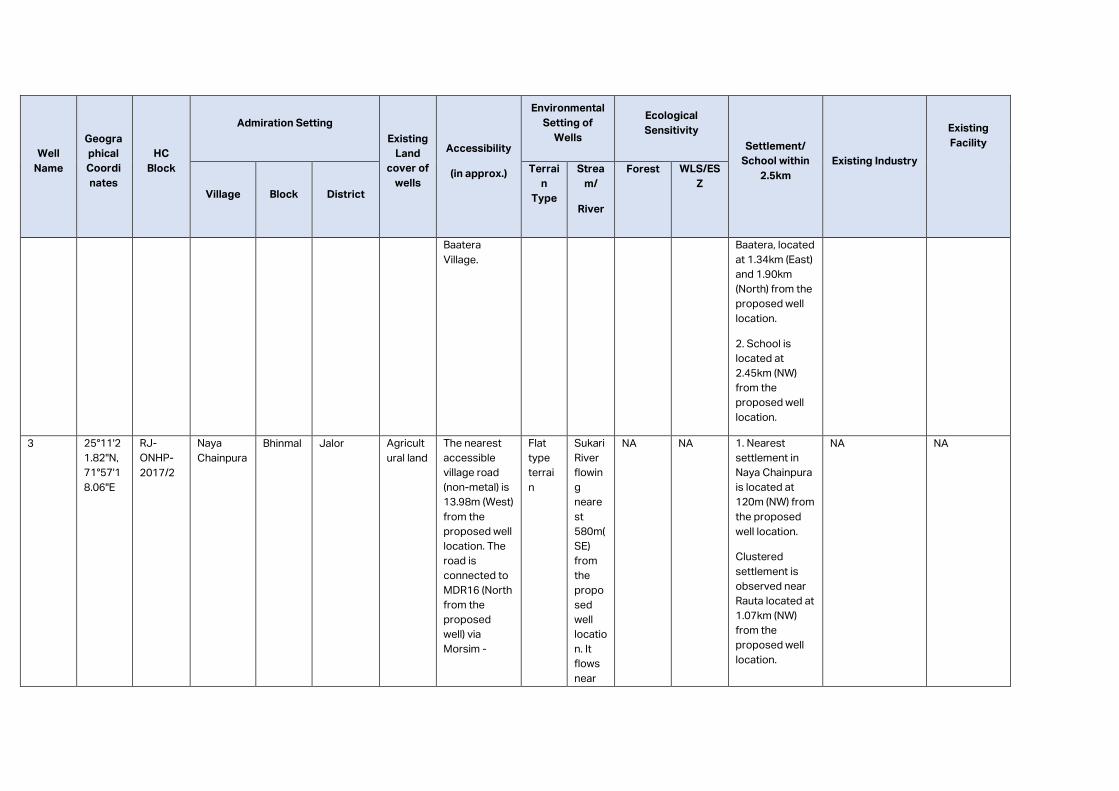
Well
Name
Geogra
phical
Coordi
nates
HC
Block
Admiration Setting
Existing
Land
cover of
wells
Accessibility
(in approx.)
Environmental
Setting of
Wells
Ecological
Sensitivity
Settlement/
School within
2.5km
Existing Industry
Existing
Facility
Village
Block
District
Terrai
n
Type
Strea
m/
River
Forest WLS/ES
Z
Baatera
Village.
Baatera, located
at 1.34km (East)
and 1.90km
(North) from the
proposed well
location.
2. School is
located at
2.45km (NW)
from the
proposed well
location.
3 25°11'2
1.82"N,
71°57'1
8.06"E
RJ-
ONHP-
2017/2
Naya
Chainpura
Bhinmal Jalor Agricult
ural land
The nearest
accessible
village road
(non-metal) is
13.98m (West)
from the
proposed well
location. The
road is
connected to
MDR16 (North
from the
proposed
well) via
Morsim -
Flat
type
terrai
n
Sukari
River
flowin
g
neare
st
580m(
SE)
from
the
propo
sed
well
locatio
n. It
flows
near
NA NA 1. Nearest
settlement in
Naya Chainpura
is located at
120m (NW) from
the proposed
well location.
Clustered
settlement is
observed near
Rauta located at
1.07km (NW)
from the
proposed well
location.
NA NA
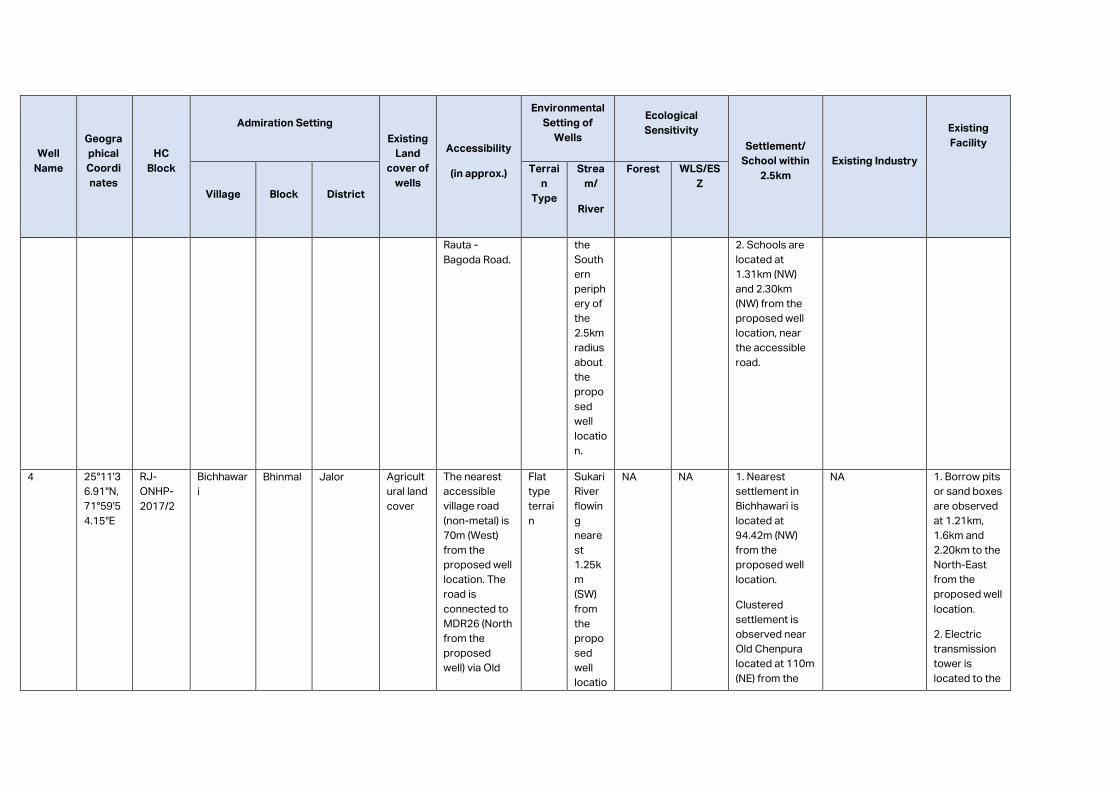
Well
Name
Geogra
phical
Coordi
nates
HC
Block
Admiration Setting
Existing
Land
cover of
wells
Accessibility
(in approx.)
Environmental
Setting of
Wells
Ecological
Sensitivity
Settlement/
School within
2.5km
Existing Industry
Existing
Facility
Village
Block
District
Terrai
n
Type
Strea
m/
River
Forest WLS/ES
Z
Rauta -
Bagoda Road.
the
South
ern
periph
ery of
the
2.5km
radius
about
the
propo
sed
well
locatio
n.
2. Schools are
located at
1.31km (NW)
and 2.30km
(NW) from the
proposed well
location, near
the accessible
road.
4 25°11'3
6.91"N,
71°59'5
4.15"E
RJ-
ONHP-
2017/2
Bichhawar
i
Bhinmal Jalor Agricult
ural land
cover
The nearest
accessible
village road
(non-metal) is
70m (West)
from the
proposed well
location. The
road is
connected to
MDR26 (North
from the
proposed
well) via Old
Flat
type
terrai
n
Sukari
River
flowin
g
neare
st
1.25k
m
(SW)
from
the
propo
sed
well
locatio
NA NA 1. Nearest
settlement in
Bichhawari is
located at
94.42m (NW)
from the
proposed well
location.
Clustered
settlement is
observed near
Old Chenpura
located at 110m
(NE) from the
NA 1. Borrow pits
or sand boxes
are observed
at 1.21km,
1.6km and
2.20km to the
North-East
from the
proposed well
location.
2. Electric
transmission
tower is
located to the
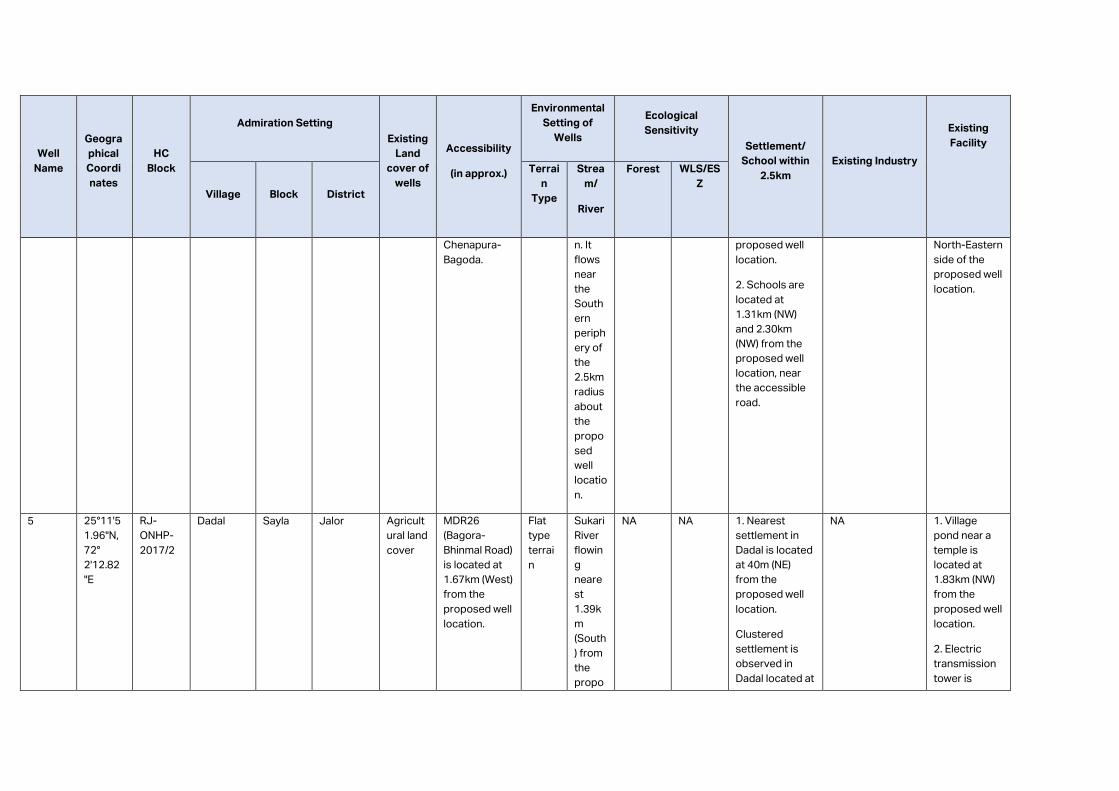
Well
Name
Geogra
phical
Coordi
nates
HC
Block
Admiration Setting
Existing
Land
cover of
wells
Accessibility
(in approx.)
Environmental
Setting of
Wells
Ecological
Sensitivity
Settlement/
School within
2.5km
Existing Industry
Existing
Facility
Village
Block
District
Terrai
n
Type
Strea
m/
River
Forest WLS/ES
Z
Chenapura-
Bagoda.
n. It
flows
near
the
South
ern
periph
ery of
the
2.5km
radius
about
the
propo
sed
well
locatio
n.
proposed well
location.
2. Schools are
located at
1.31km (NW)
and 2.30km
(NW) from the
proposed well
location, near
the accessible
road.
North-Eastern
side of the
proposed well
location.
5 25°11'5
1.96"N,
72°
2'12.82
"E
RJ-
ONHP-
2017/2
Dadal Sayla Jalor Agricult
ural land
cover
MDR26
(Bagora-
Bhinmal Road)
is located at
1.67km (West)
from the
proposed well
location.
Flat
type
terrai
n
Sukari
River
flowin
g
neare
st
1.39k
m
(South
) from
the
propo
NA NA 1. Nearest
settlement in
Dadal is located
at 40m (NE)
from the
proposed well
location.
Clustered
settlement is
observed in
Dadal located at
NA 1. Village
pond near a
temple is
located at
1.83km (NW)
from the
proposed well
location.
2. Electric
transmission
tower is
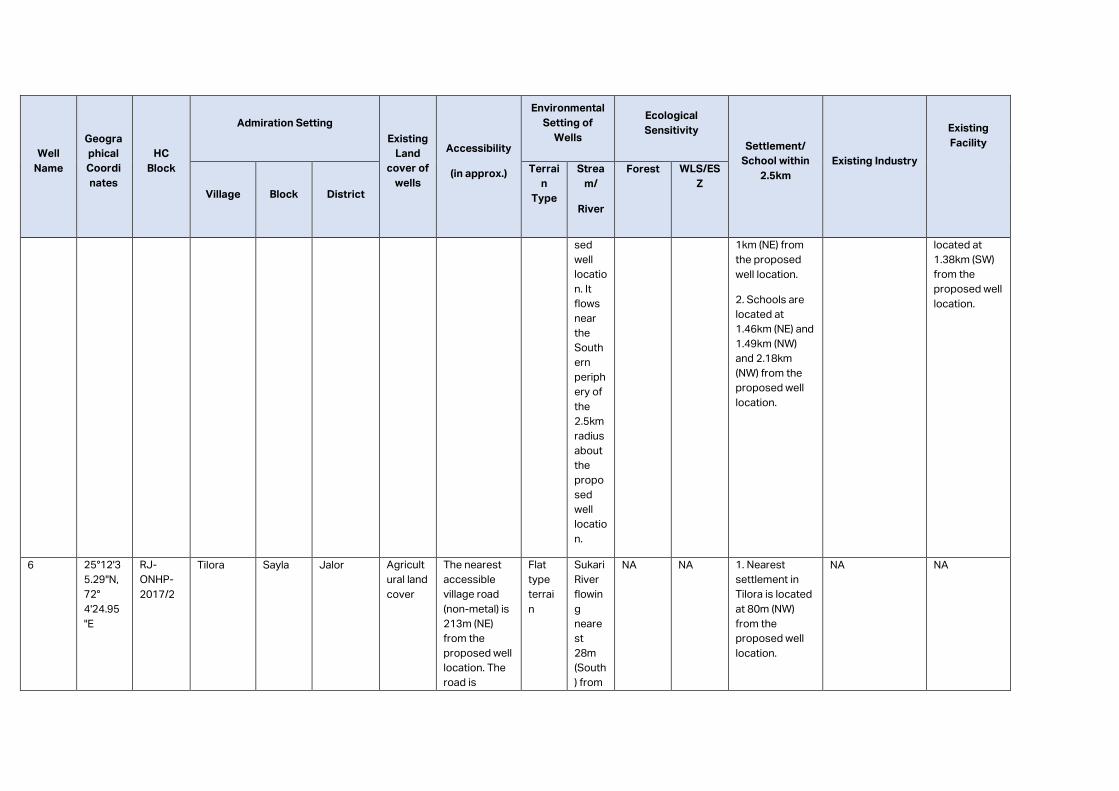
Well
Name
Geogra
phical
Coordi
nates
HC
Block
Admiration Setting
Existing
Land
cover of
wells
Accessibility
(in approx.)
Environmental
Setting of
Wells
Ecological
Sensitivity
Settlement/
School within
2.5km
Existing Industry
Existing
Facility
Village
Block
District
Terrai
n
Type
Strea
m/
River
Forest WLS/ES
Z
sed
well
locatio
n. It
flows
near
the
South
ern
periph
ery of
the
2.5km
radius
about
the
propo
sed
well
locatio
n.
1km (NE) from
the proposed
well location.
2. Schools are
located at
1.46km (NE) and
1.49km (NW)
and 2.18km
(NW) from the
proposed well
location.
located at
1.38km (SW)
from the
proposed well
location.
6 25°12'3
5.29"N,
72°
4'24.95
"E
RJ-
ONHP-
2017/2
Tilora Sayla Jalor Agricult
ural land
cover
The nearest
accessible
village road
(non-metal) is
213m (NE)
from the
proposed well
location. The
road is
Flat
type
terrai
n
Sukari
River
flowin
g
neare
st
28m
(South
) from
NA NA 1. Nearest
settlement in
Tilora is located
at 80m (NW)
from the
proposed well
location.
NA NA
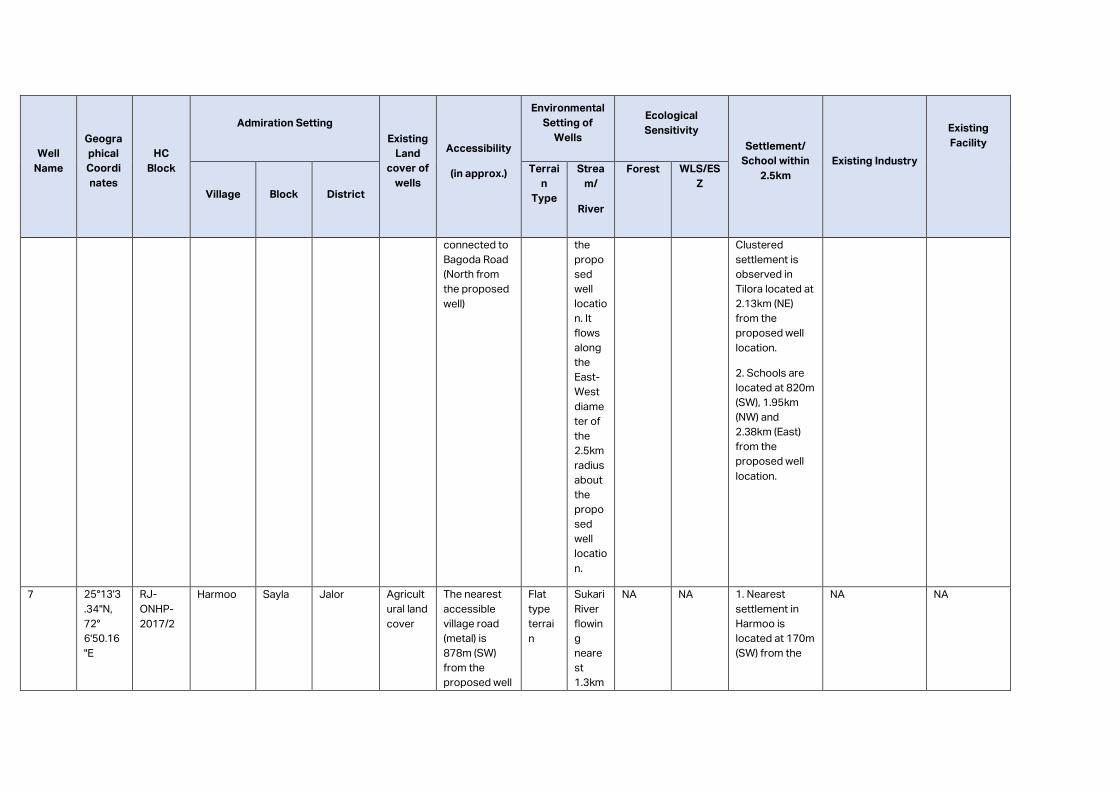
Well
Name
Geogra
phical
Coordi
nates
HC
Block
Admiration Setting
Existing
Land
cover of
wells
Accessibility
(in approx.)
Environmental
Setting of
Wells
Ecological
Sensitivity
Settlement/
School within
2.5km
Existing Industry
Existing
Facility
Village
Block
District
Terrai
n
Type
Strea
m/
River
Forest WLS/ES
Z
connected to
Bagoda Road
(North from
the proposed
well)
the
propo
sed
well
locatio
n. It
flows
along
the
East-
West
diame
ter of
the
2.5km
radius
about
the
propo
sed
well
locatio
n.
Clustered
settlement is
observed in
Tilora located at
2.13km (NE)
from the
proposed well
location.
2. Schools are
located at 820m
(SW), 1.95km
(NW) and
2.38km (East)
from the
proposed well
location.
7 25°13'3
.34"N,
72°
6'50.16
"E
RJ-
ONHP-
2017/2
Harmoo Sayla Jalor Agricult
ural land
cover
The nearest
accessible
village road
(metal) is
878m (SW)
from the
proposed well
Flat
type
terrai
n
Sukari
River
flowin
g
neare
st
1.3km
NA NA 1. Nearest
settlement in
Harmoo is
located at 170m
(SW) from the
NA NA
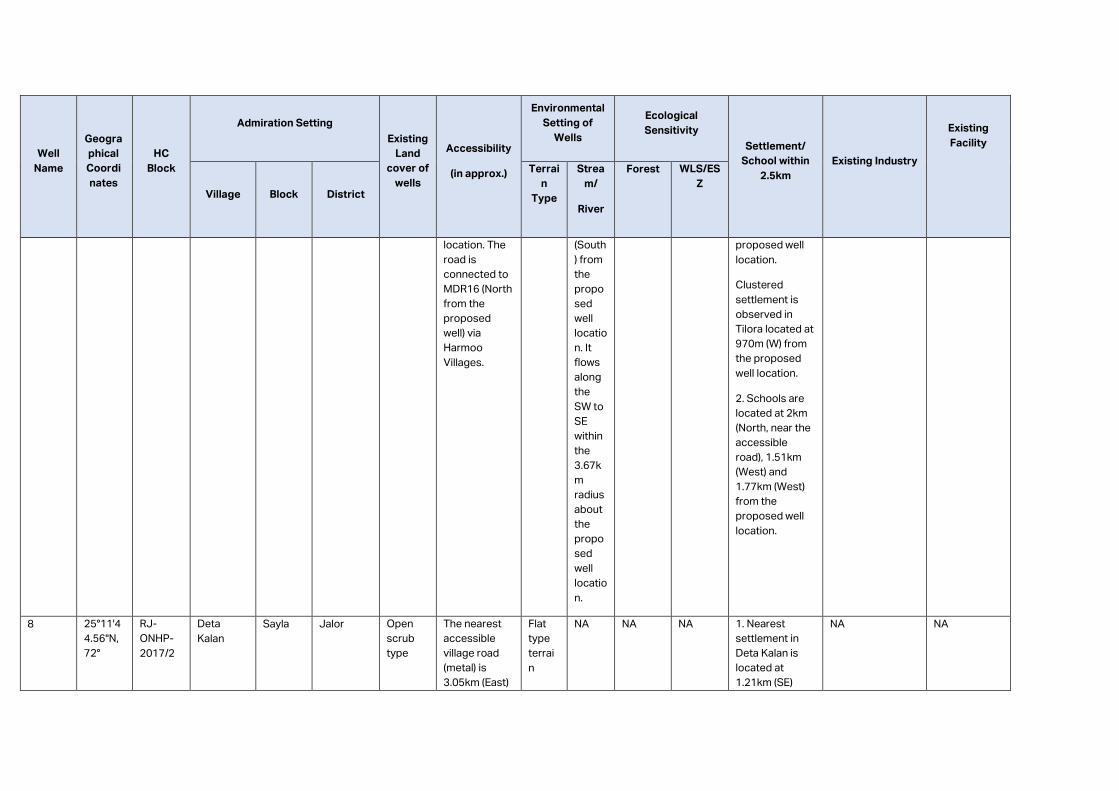
Well
Name
Geogra
phical
Coordi
nates
HC
Block
Admiration Setting
Existing
Land
cover of
wells
Accessibility
(in approx.)
Environmental
Setting of
Wells
Ecological
Sensitivity
Settlement/
School within
2.5km
Existing Industry
Existing
Facility
Village
Block
District
Terrai
n
Type
Strea
m/
River
Forest WLS/ES
Z
location. The
road is
connected to
MDR16 (North
from the
proposed
well) via
Harmoo
Villages.
(South
) from
the
propo
sed
well
locatio
n. It
flows
along
the
SW to
SE
within
the
3.67k
m
radius
about
the
propo
sed
well
locatio
n.
proposed well
location.
Clustered
settlement is
observed in
Tilora located at
970m (W) from
the proposed
well location.
2. Schools are
located at 2km
(North, near the
accessible
road), 1.51km
(West) and
1.77km (West)
from the
proposed well
location.
8 25°11'4
4.56"N,
72°
RJ-
ONHP-
2017/2
Deta
Kalan
Sayla Jalor Open
scrub
type
The nearest
accessible
village road
(metal) is
3.05km (East)
Flat
type
terrai
n
NA
NA NA 1. Nearest
settlement in
Deta Kalan is
located at
1.21km (SE)
NA NA
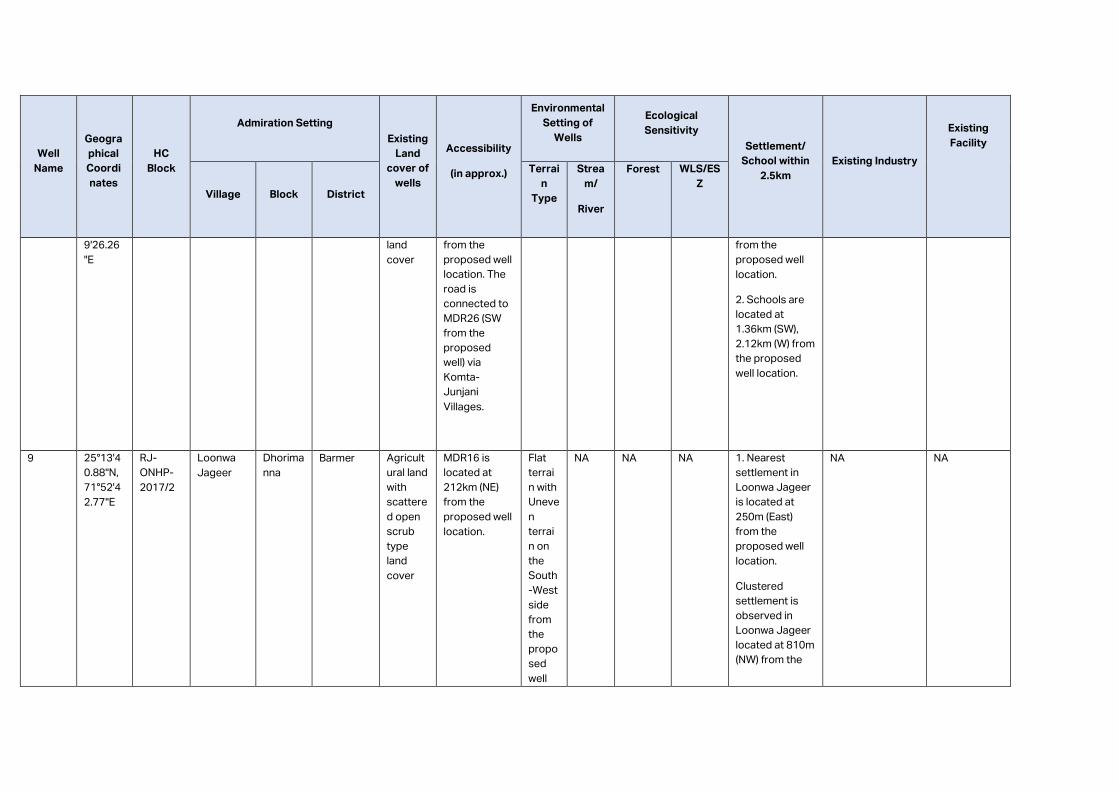
Well
Name
Geogra
phical
Coordi
nates
HC
Block
Admiration Setting
Existing
Land
cover of
wells
Accessibility
(in approx.)
Environmental
Setting of
Wells
Ecological
Sensitivity
Settlement/
School within
2.5km
Existing Industry
Existing
Facility
Village
Block
District
Terrai
n
Type
Strea
m/
River
Forest WLS/ES
Z
9'26.26
"E
land
cover
from the
proposed well
location. The
road is
connected to
MDR26 (SW
from the
proposed
well) via
Komta-
Junjani
Villages.
from the
proposed well
location.
2. Schools are
located at
1.36km (SW),
2.12km (W) from
the proposed
well location.
9 25°13'4
0.88"N,
71°52'4
2.77"E
RJ-
ONHP-
2017/2
Loonwa
Jageer
Dhorima
nna
Barmer Agricult
ural land
with
scattere
d open
scrub
type
land
cover
MDR16 is
located at
212km (NE)
from the
proposed well
location.
Flat
terrai
n with
Uneve
n
terrai
n on
the
South
-West
side
from
the
propo
sed
well
NA NA NA 1. Nearest
settlement in
Loonwa Jageer
is located at
250m (East)
from the
proposed well
location.
Clustered
settlement is
observed in
Loonwa Jageer
located at 810m
(NW) from the
NA NA
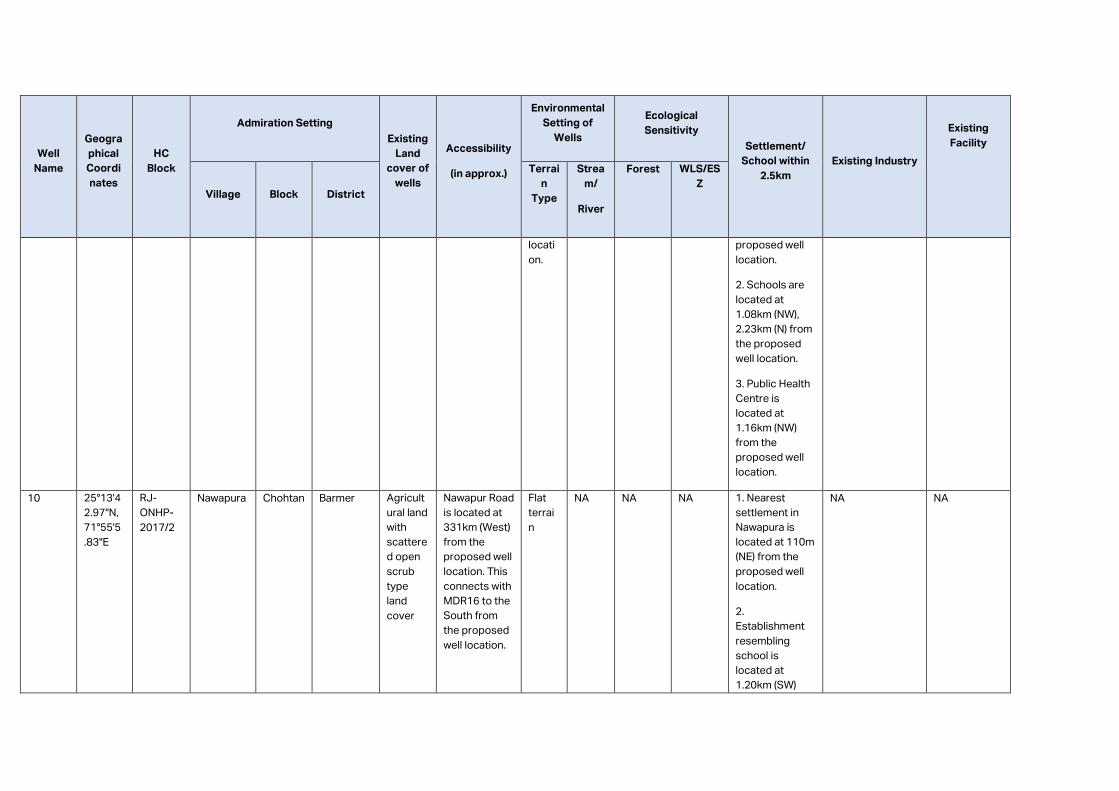
Well
Name
Geogra
phical
Coordi
nates
HC
Block
Admiration Setting
Existing
Land
cover of
wells
Accessibility
(in approx.)
Environmental
Setting of
Wells
Ecological
Sensitivity
Settlement/
School within
2.5km
Existing Industry
Existing
Facility
Village
Block
District
Terrai
n
Type
Strea
m/
River
Forest WLS/ES
Z
locati
on.
proposed well
location.
2. Schools are
located at
1.08km (NW),
2.23km (N) from
the proposed
well location.
3. Public Health
Centre is
located at
1.16km (NW)
from the
proposed well
location.
10 25°13'4
2.97"N,
71°55'5
.83"E
RJ-
ONHP-
2017/2
Nawapura Chohtan Barmer Agricult
ural land
with
scattere
d open
scrub
type
land
cover
Nawapur Road
is located at
331km (West)
from the
proposed well
location. This
connects with
MDR16 to the
South from
the proposed
well location.
Flat
terrai
n
NA NA NA 1. Nearest
settlement in
Nawapura is
located at 110m
(NE) from the
proposed well
location.
2.
Establishment
resembling
school is
located at
1.20km (SW)
NA NA
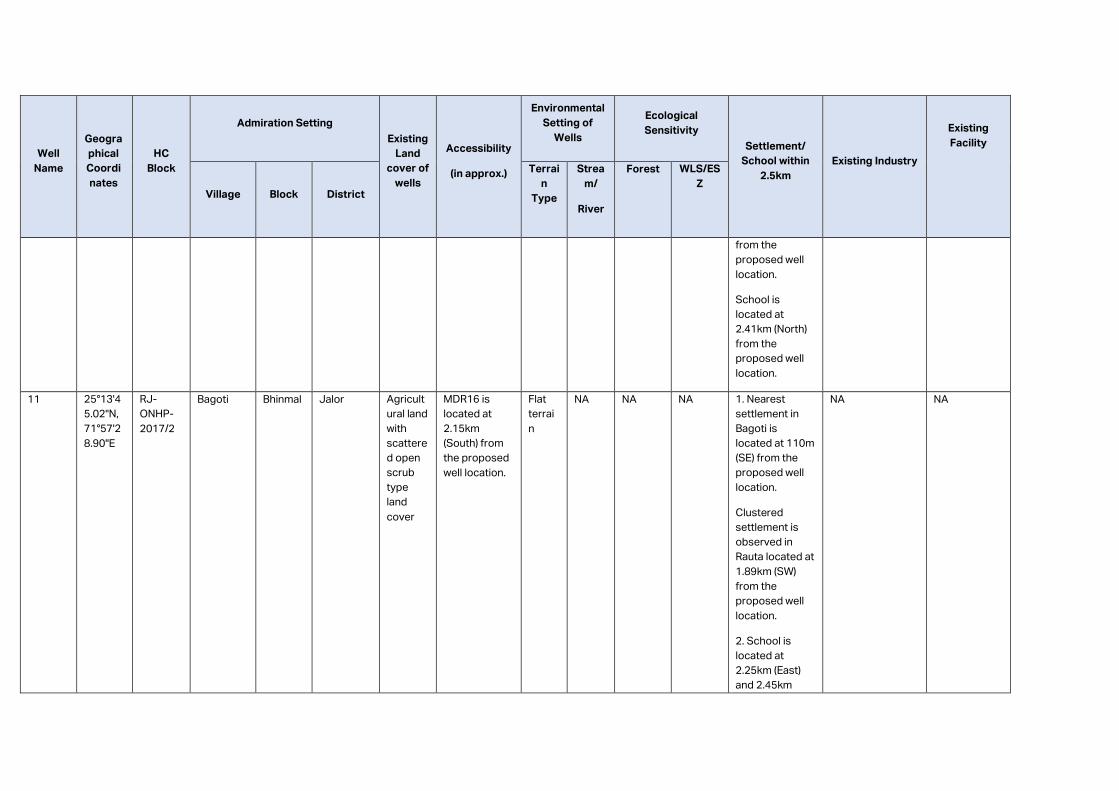
Well
Name
Geogra
phical
Coordi
nates
HC
Block
Admiration Setting
Existing
Land
cover of
wells
Accessibility
(in approx.)
Environmental
Setting of
Wells
Ecological
Sensitivity
Settlement/
School within
2.5km
Existing Industry
Existing
Facility
Village
Block
District
Terrai
n
Type
Strea
m/
River
Forest WLS/ES
Z
from the
proposed well
location.
School is
located at
2.41km (North)
from the
proposed well
location.
11 25°13'4
5.02"N,
71°57'2
8.90"E
RJ-
ONHP-
2017/2
Bagoti Bhinmal Jalor Agricult
ural land
with
scattere
d open
scrub
type
land
cover
MDR16 is
located at
2.15km
(South) from
the proposed
well location.
Flat
terrai
n
NA NA NA 1. Nearest
settlement in
Bagoti is
located at 110m
(SE) from the
proposed well
location.
Clustered
settlement is
observed in
Rauta located at
1.89km (SW)
from the
proposed well
location.
2. School is
located at
2.25km (East)
and 2.45km
NA NA
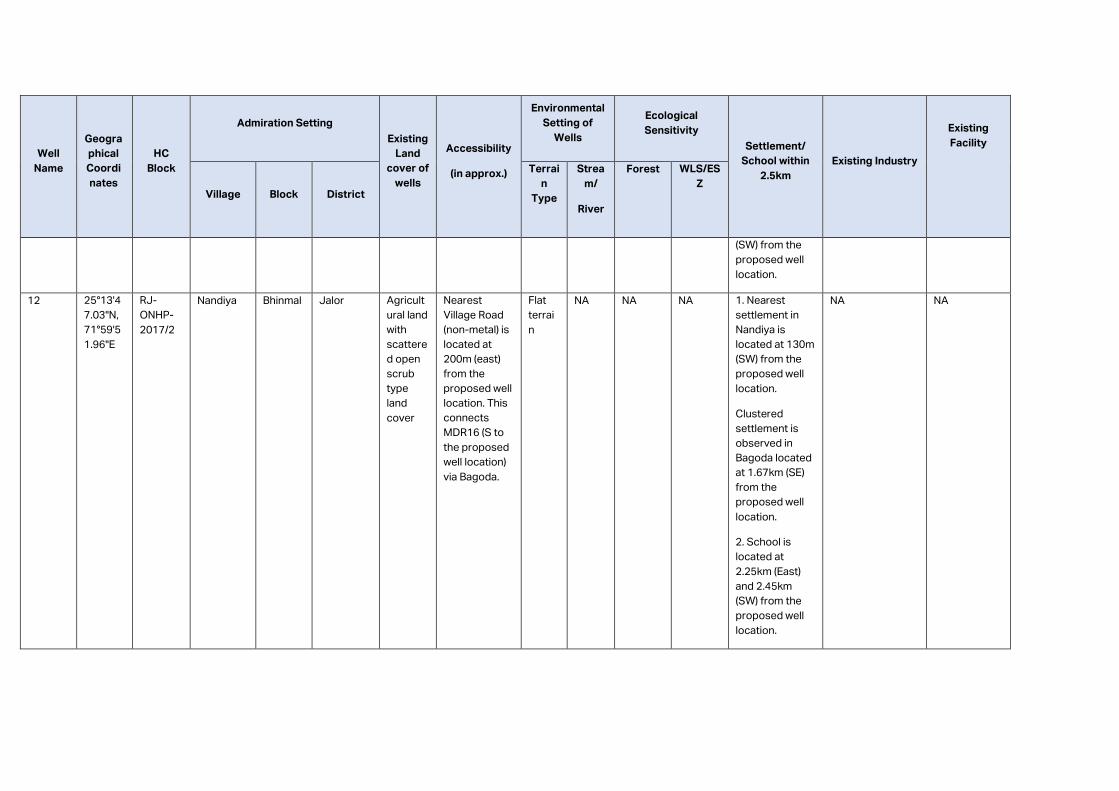
Well
Name
Geogra
phical
Coordi
nates
HC
Block
Admiration Setting
Existing
Land
cover of
wells
Accessibility
(in approx.)
Environmental
Setting of
Wells
Ecological
Sensitivity
Settlement/
School within
2.5km
Existing Industry
Existing
Facility
Village
Block
District
Terrai
n
Type
Strea
m/
River
Forest WLS/ES
Z
(SW) from the
proposed well
location.
12 25°13'4
7.03"N,
71°59'5
1.96"E
RJ-
ONHP-
2017/2
Nandiya Bhinmal Jalor Agricult
ural land
with
scattere
d open
scrub
type
land
cover
Nearest
Village Road
(non-metal) is
located at
200m (east)
from the
proposed well
location. This
connects
MDR16 (S to
the proposed
well location)
via Bagoda.
Flat
terrai
n
NA NA NA 1. Nearest
settlement in
Nandiya is
located at 130m
(SW) from the
proposed well
location.
Clustered
settlement is
observed in
Bagoda located
at 1.67km (SE)
from the
proposed well
location.
2. School is
located at
2.25km (East)
and 2.45km
(SW) from the
proposed well
location.
NA NA
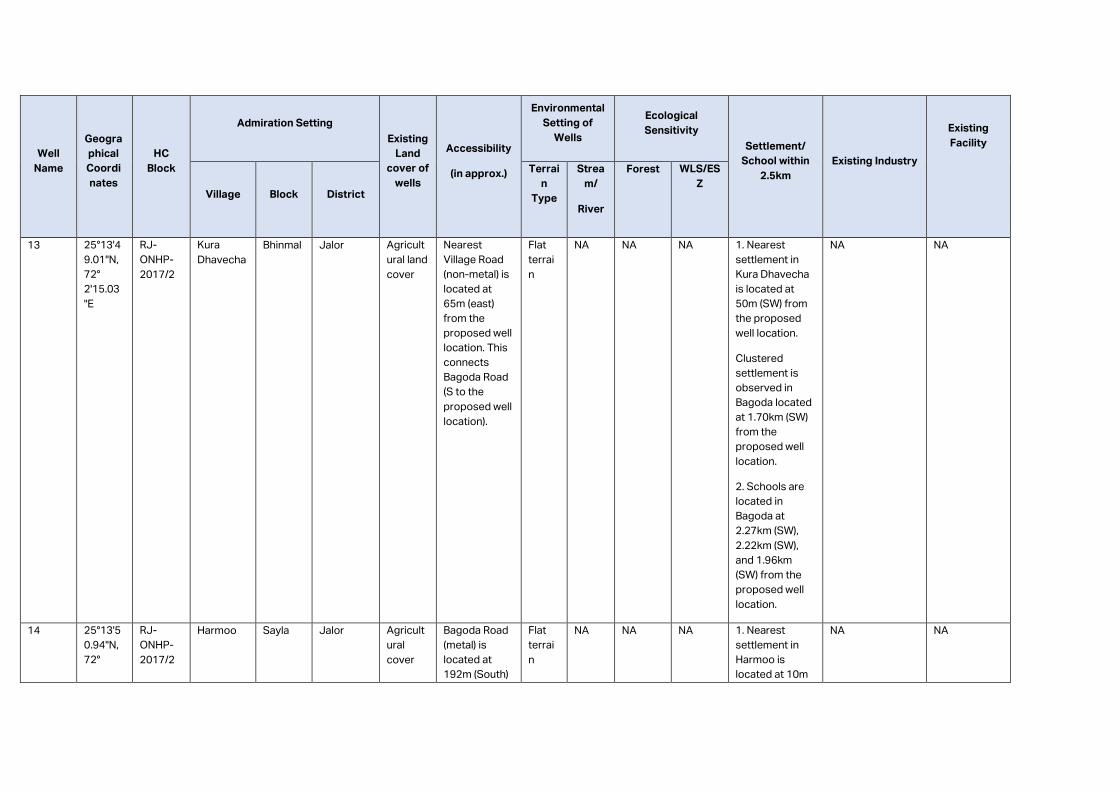
Well
Name
Geogra
phical
Coordi
nates
HC
Block
Admiration Setting
Existing
Land
cover of
wells
Accessibility
(in approx.)
Environmental
Setting of
Wells
Ecological
Sensitivity
Settlement/
School within
2.5km
Existing Industry
Existing
Facility
Village
Block
District
Terrai
n
Type
Strea
m/
River
Forest WLS/ES
Z
13 25°13'4
9.01"N,
72°
2'15.03
"E
RJ-
ONHP-
2017/2
Kura
Dhavecha
Bhinmal Jalor Agricult
ural land
cover
Nearest
Village Road
(non-metal) is
located at
65m (east)
from the
proposed well
location. This
connects
Bagoda Road
(S to the
proposed well
location).
Flat
terrai
n
NA NA NA 1. Nearest
settlement in
Kura Dhavecha
is located at
50m (SW) from
the proposed
well location.
Clustered
settlement is
observed in
Bagoda located
at 1.70km (SW)
from the
proposed well
location.
2. Schools are
located in
Bagoda at
2.27km (SW),
2.22km (SW),
and 1.96km
(SW) from the
proposed well
location.
NA NA
14 25°13'5
0.94"N,
72°
RJ-
ONHP-
2017/2
Harmoo Sayla Jalor Agricult
ural
cover
Bagoda Road
(metal) is
located at
192m (South)
Flat
terrai
n
NA NA NA 1. Nearest
settlement in
Harmoo is
located at 10m
NA NA
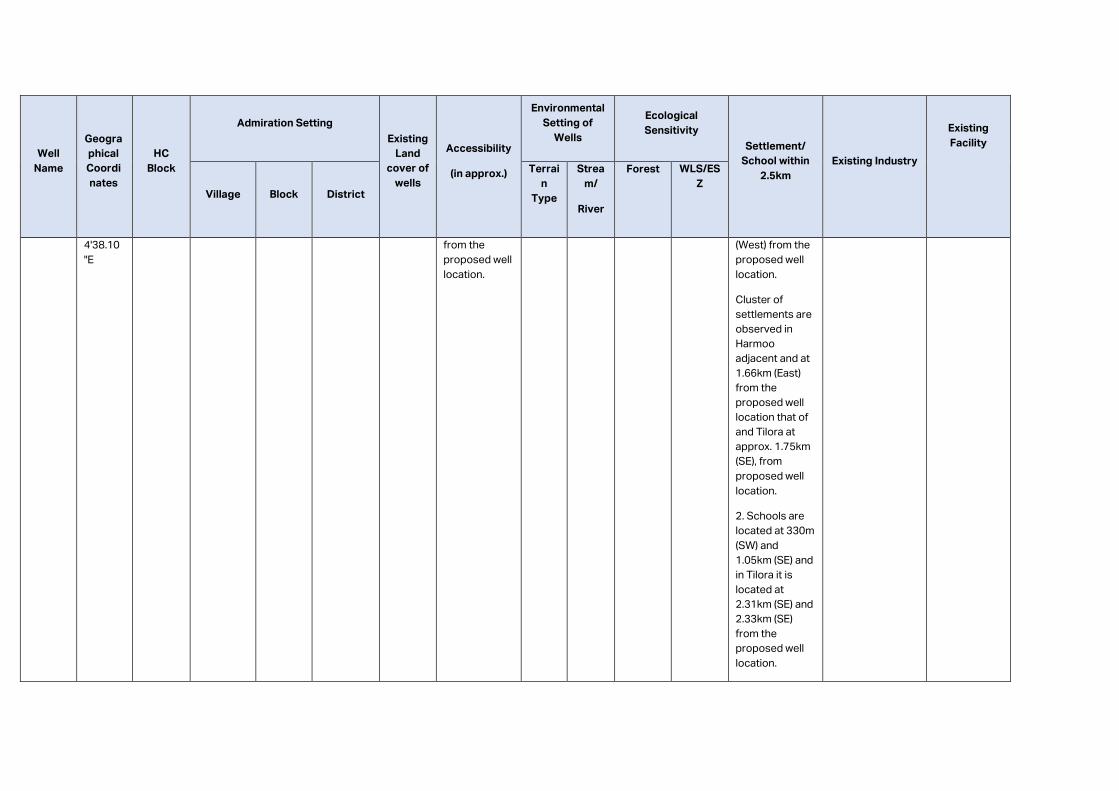
Well
Name
Geogra
phical
Coordi
nates
HC
Block
Admiration Setting
Existing
Land
cover of
wells
Accessibility
(in approx.)
Environmental
Setting of
Wells
Ecological
Sensitivity
Settlement/
School within
2.5km
Existing Industry
Existing
Facility
Village
Block
District
Terrai
n
Type
Strea
m/
River
Forest WLS/ES
Z
4'38.10
"E
from the
proposed well
location.
(West) from the
proposed well
location.
Cluster of
settlements are
observed in
Harmoo
adjacent and at
1.66km (East)
from the
proposed well
location that of
and Tilora at
approx. 1.75km
(SE), from
proposed well
location.
2. Schools are
located at 330m
(SW) and
1.05km (SE) and
in Tilora it is
located at
2.31km (SE) and
2.33km (SE)
from the
proposed well
location.
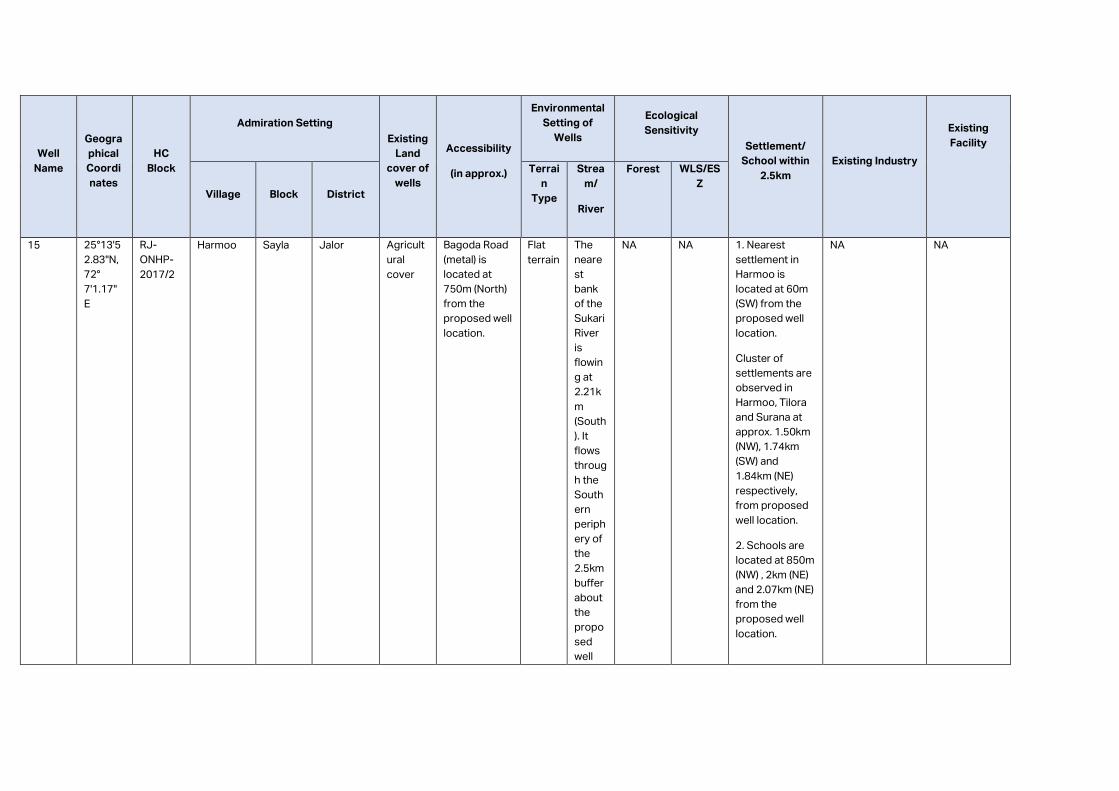
Well
Name
Geogra
phical
Coordi
nates
HC
Block
Admiration Setting
Existing
Land
cover of
wells
Accessibility
(in approx.)
Environmental
Setting of
Wells
Ecological
Sensitivity
Settlement/
School within
2.5km
Existing Industry
Existing
Facility
Village
Block
District
Terrai
n
Type
Strea
m/
River
Forest WLS/ES
Z
15 25°13'5
2.83"N,
72°
7'1.17"
E
RJ-
ONHP-
2017/2
Harmoo Sayla Jalor Agricult
ural
cover
Bagoda Road
(metal) is
located at
750m (North)
from the
proposed well
location.
Flat
terrain
The
neare
st
bank
of the
Sukari
River
is
flowin
g at
2.21k
m
(South
). It
flows
throug
h the
South
ern
periph
ery of
the
2.5km
buffer
about
the
propo
sed
well
NA NA 1. Nearest
settlement in
Harmoo is
located at 60m
(SW) from the
proposed well
location.
Cluster of
settlements are
observed in
Harmoo, Tilora
and Surana at
approx. 1.50km
(NW), 1.74km
(SW) and
1.84km (NE)
respectively,
from proposed
well location.
2. Schools are
located at 850m
(NW) , 2km (NE)
and 2.07km (NE)
from the
proposed well
location.
NA NA
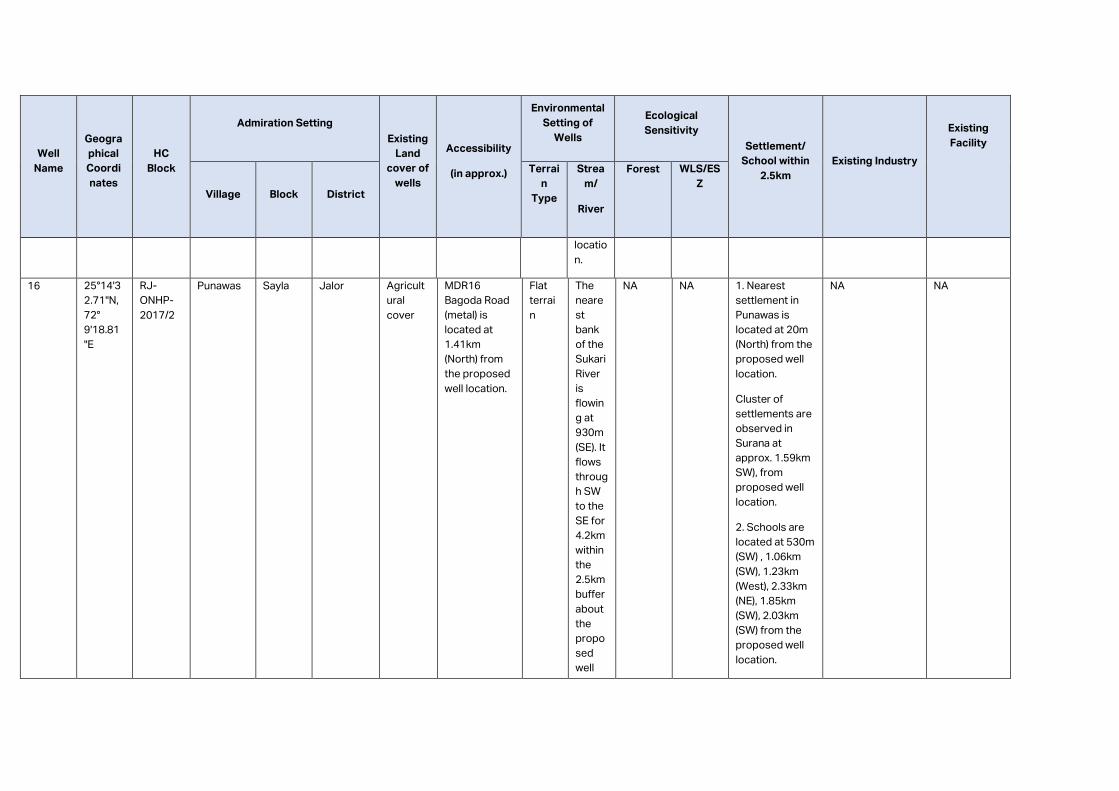
Well
Name
Geogra
phical
Coordi
nates
HC
Block
Admiration Setting
Existing
Land
cover of
wells
Accessibility
(in approx.)
Environmental
Setting of
Wells
Ecological
Sensitivity
Settlement/
School within
2.5km
Existing Industry
Existing
Facility
Village
Block
District
Terrai
n
Type
Strea
m/
River
Forest WLS/ES
Z
locatio
n.
16 25°14'3
2.71"N,
72°
9'18.81
"E
RJ-
ONHP-
2017/2
Punawas Sayla Jalor Agricult
ural
cover
MDR16
Bagoda Road
(metal) is
located at
1.41km
(North) from
the proposed
well location.
Flat
terrai
n
The
neare
st
bank
of the
Sukari
River
is
flowin
g at
930m
(SE). It
flows
throug
h SW
to the
SE for
4.2km
within
the
2.5km
buffer
about
the
propo
sed
well
NA NA 1. Nearest
settlement in
Punawas is
located at 20m
(North) from the
proposed well
location.
Cluster of
settlements are
observed in
Surana at
approx. 1.59km
SW), from
proposed well
location.
2. Schools are
located at 530m
(SW) , 1.06km
(SW), 1.23km
(West), 2.33km
(NE), 1.85km
(SW), 2.03km
(SW) from the
proposed well
location.
NA NA
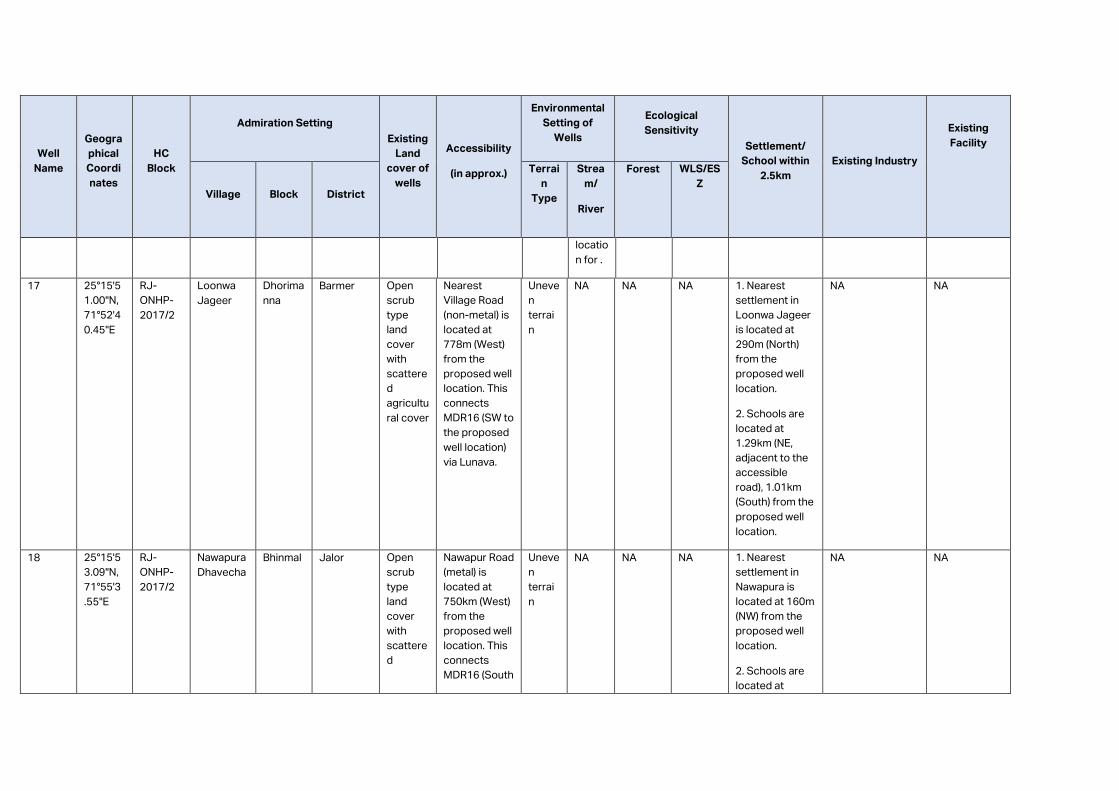
Well
Name
Geogra
phical
Coordi
nates
HC
Block
Admiration Setting
Existing
Land
cover of
wells
Accessibility
(in approx.)
Environmental
Setting of
Wells
Ecological
Sensitivity
Settlement/
School within
2.5km
Existing Industry
Existing
Facility
Village
Block
District
Terrai
n
Type
Strea
m/
River
Forest WLS/ES
Z
locatio
n for .
17 25°15'5
1.00"N,
71°52'4
0.45"E
RJ-
ONHP-
2017/2
Loonwa
Jageer
Dhorima
nna
Barmer Open
scrub
type
land
cover
with
scattere
d
agricultu
ral cover
Nearest
Village Road
(non-metal) is
located at
778m (West)
from the
proposed well
location. This
connects
MDR16 (SW to
the proposed
well location)
via Lunava.
Uneve
n
terrai
n
NA NA NA 1. Nearest
settlement in
Loonwa Jageer
is located at
290m (North)
from the
proposed well
location.
2. Schools are
located at
1.29km (NE,
adjacent to the
accessible
road), 1.01km
(South) from the
proposed well
location.
NA NA
18 25°15'5
3.09"N,
71°55'3
.55"E
RJ-
ONHP-
2017/2
Nawapura
Dhavecha
Bhinmal Jalor Open
scrub
type
land
cover
with
scattere
d
Nawapur Road
(metal) is
located at
750km (West)
from the
proposed well
location. This
connects
MDR16 (South
Uneve
n
terrai
n
NA NA NA 1. Nearest
settlement in
Nawapura is
located at 160m
(NW) from the
proposed well
location.
2. Schools are
located at
NA NA
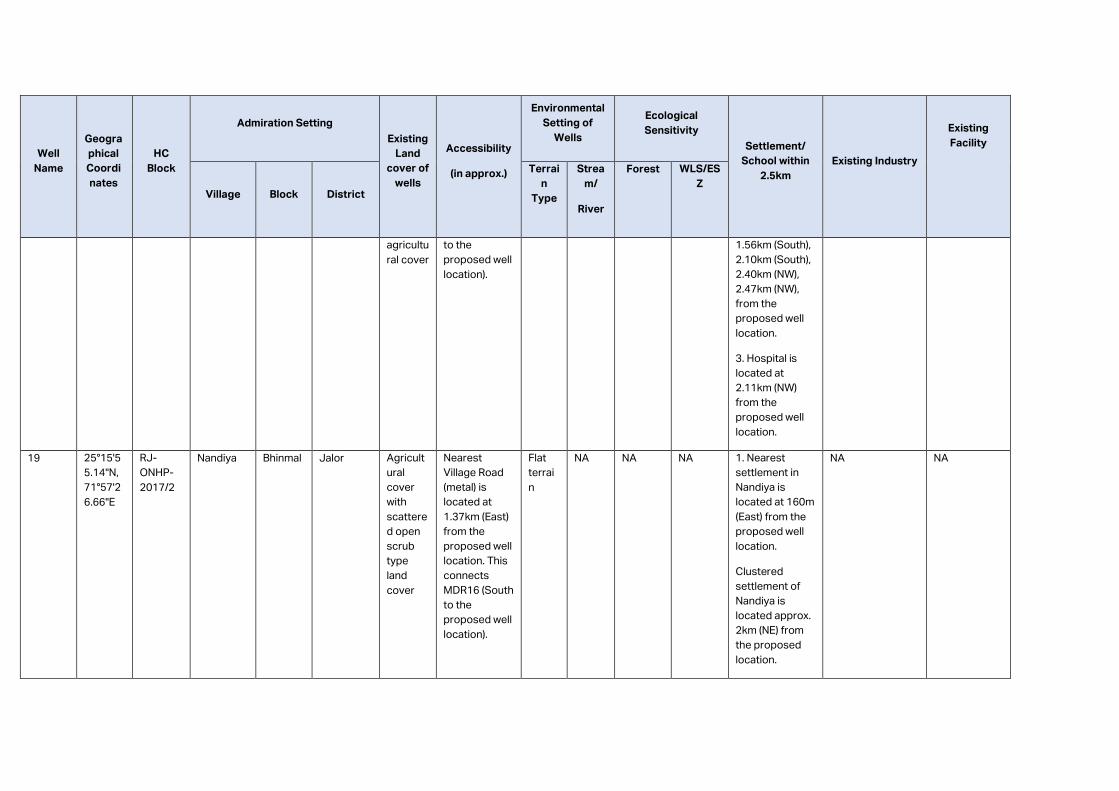
Well
Name
Geogra
phical
Coordi
nates
HC
Block
Admiration Setting
Existing
Land
cover of
wells
Accessibility
(in approx.)
Environmental
Setting of
Wells
Ecological
Sensitivity
Settlement/
School within
2.5km
Existing Industry
Existing
Facility
Village
Block
District
Terrai
n
Type
Strea
m/
River
Forest WLS/ES
Z
agricultu
ral cover
to the
proposed well
location).
1.56km (South),
2.10km (South),
2.40km (NW),
2.47km (NW),
from the
proposed well
location.
3. Hospital is
located at
2.11km (NW)
from the
proposed well
location.
19 25°15'5
5.14"N,
71°57'2
6.66"E
RJ-
ONHP-
2017/2
Nandiya Bhinmal Jalor Agricult
ural
cover
with
scattere
d open
scrub
type
land
cover
Nearest
Village Road
(metal) is
located at
1.37km (East)
from the
proposed well
location. This
connects
MDR16 (South
to the
proposed well
location).
Flat
terrai
n
NA NA NA 1. Nearest
settlement in
Nandiya is
located at 160m
(East) from the
proposed well
location.
Clustered
settlement of
Nandiya is
located approx.
2km (NE) from
the proposed
location.
NA NA
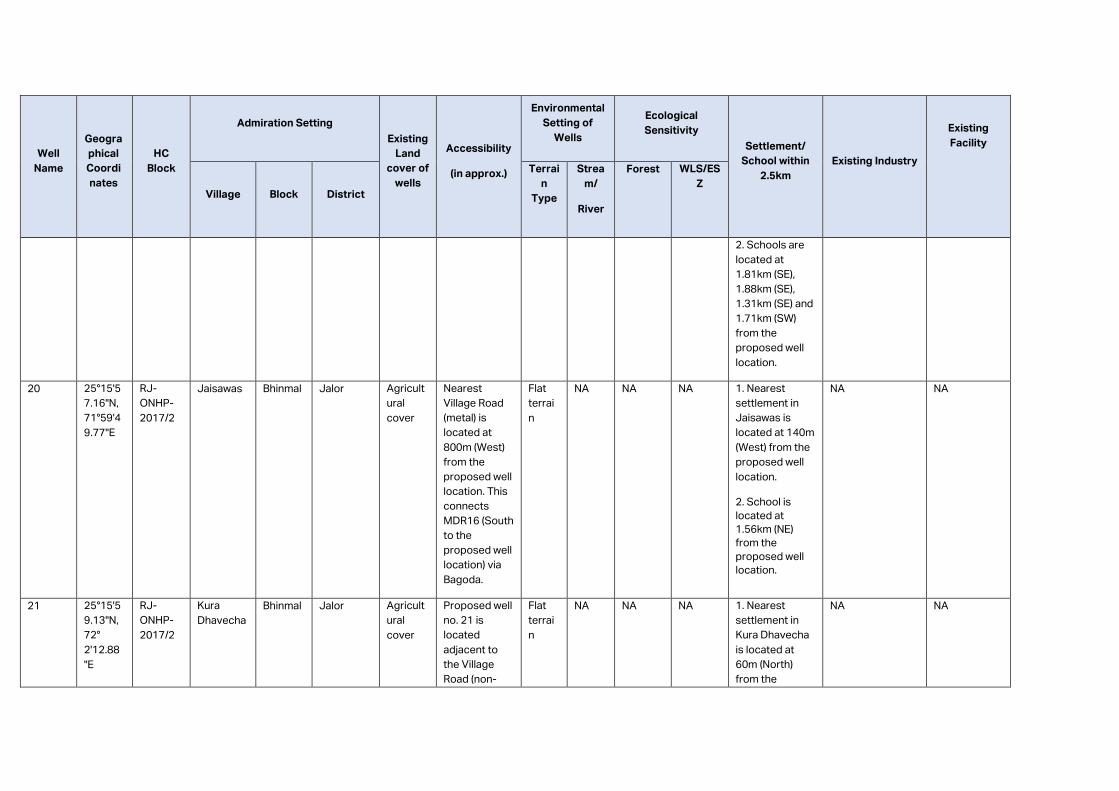
Well
Name
Geogra
phical
Coordi
nates
HC
Block
Admiration Setting
Existing
Land
cover of
wells
Accessibility
(in approx.)
Environmental
Setting of
Wells
Ecological
Sensitivity
Settlement/
School within
2.5km
Existing Industry
Existing
Facility
Village
Block
District
Terrai
n
Type
Strea
m/
River
Forest WLS/ES
Z
2. Schools are
located at
1.81km (SE),
1.88km (SE),
1.31km (SE) and
1.71km (SW)
from the
proposed well
location.
20 25°15'5
7.16"N,
71°59'4
9.77"E
RJ-
ONHP-
2017/2
Jaisawas Bhinmal Jalor Agricult
ural
cover
Nearest
Village Road
(metal) is
located at
800m (West)
from the
proposed well
location. This
connects
MDR16 (South
to the
proposed well
location) via
Bagoda.
Flat
terrai
n
NA NA NA 1. Nearest
settlement in
Jaisawas is
located at 140m
(West) from the
proposed well
location.
2. School is
located at
1.56km (NE)
from the
proposed well
location.
NA NA
21 25°15'5
9.13"N,
72°
2'12.88
"E
RJ-
ONHP-
2017/2
Kura
Dhavecha
Bhinmal Jalor Agricult
ural
cover
Proposed well
no. 21 is
located
adjacent to
the Village
Road (non-
Flat
terrai
n
NA NA NA 1. Nearest
settlement in
Kura Dhavecha
is located at
60m (North)
from the
NA NA
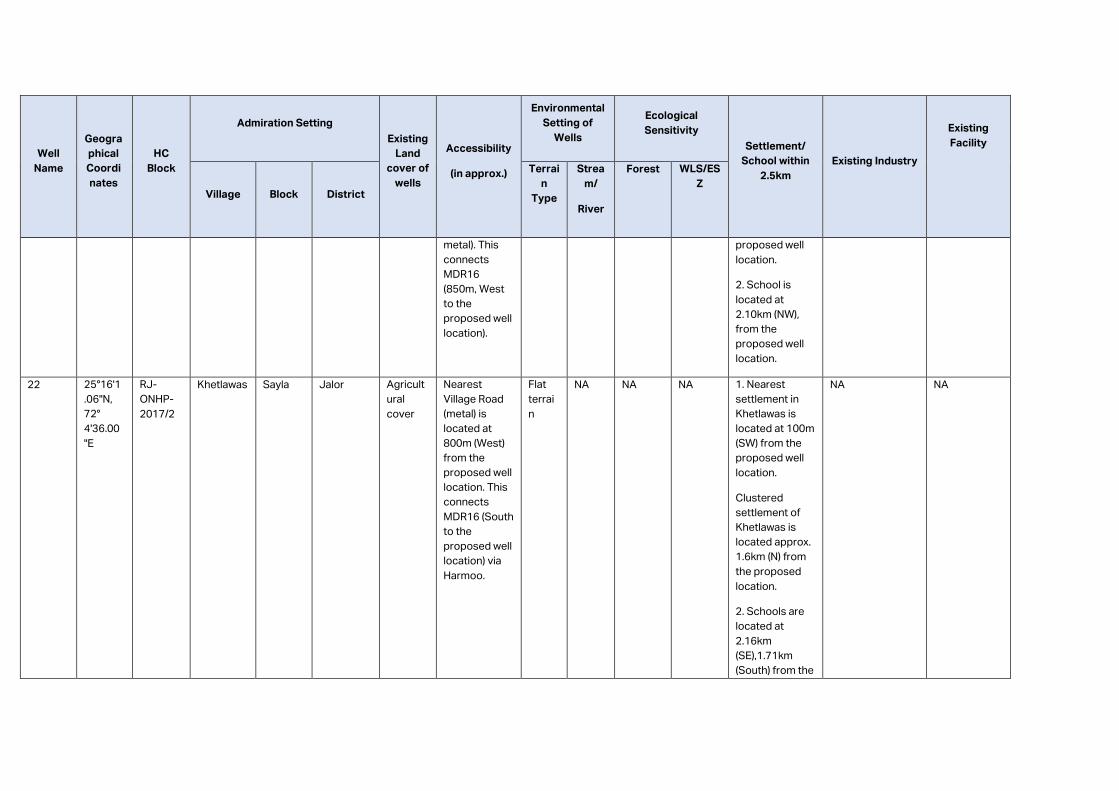
Well
Name
Geogra
phical
Coordi
nates
HC
Block
Admiration Setting
Existing
Land
cover of
wells
Accessibility
(in approx.)
Environmental
Setting of
Wells
Ecological
Sensitivity
Settlement/
School within
2.5km
Existing Industry
Existing
Facility
Village
Block
District
Terrai
n
Type
Strea
m/
River
Forest WLS/ES
Z
metal). This
connects
MDR16
(850m, West
to the
proposed well
location).
proposed well
location.
2. School is
located at
2.10km (NW),
from the
proposed well
location.
22 25°16'1
.06"N,
72°
4'36.00
"E
RJ-
ONHP-
2017/2
Khetlawas Sayla Jalor Agricult
ural
cover
Nearest
Village Road
(metal) is
located at
800m (West)
from the
proposed well
location. This
connects
MDR16 (South
to the
proposed well
location) via
Harmoo.
Flat
terrai
n
NA NA NA 1. Nearest
settlement in
Khetlawas is
located at 100m
(SW) from the
proposed well
location.
Clustered
settlement of
Khetlawas is
located approx.
1.6km (N) from
the proposed
location.
2. Schools are
located at
2.16km
(SE),1.71km
(South) from the
NA NA
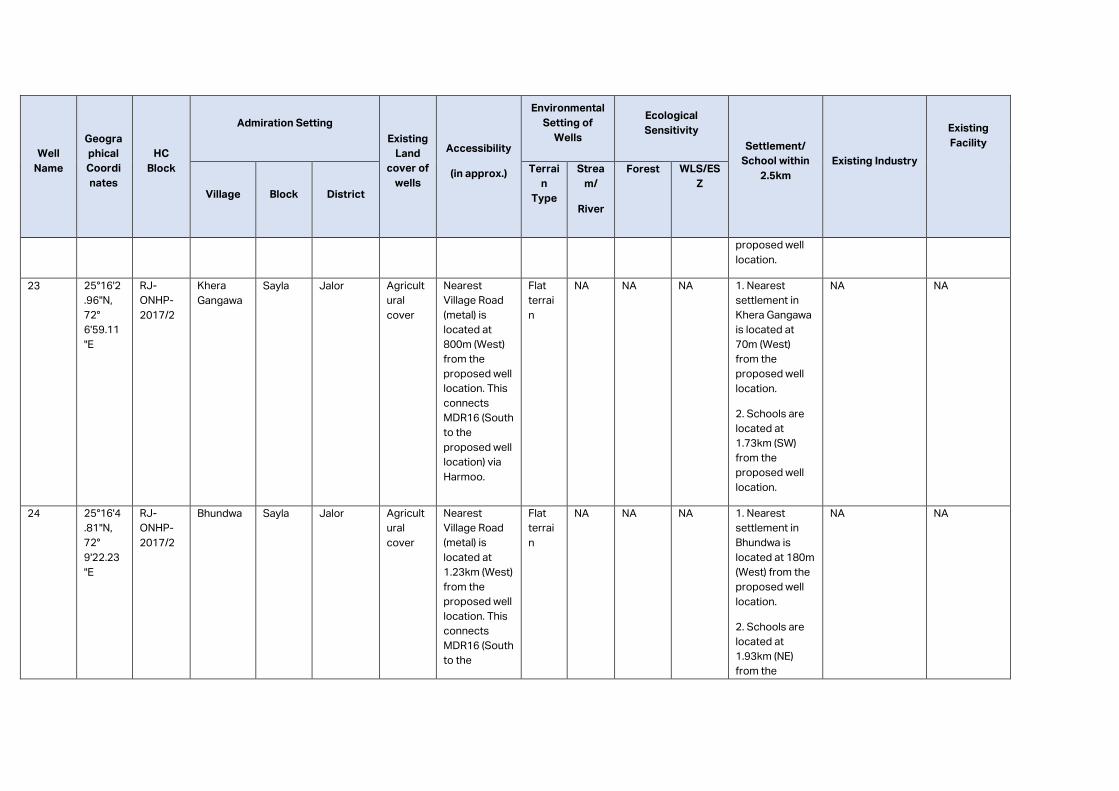
Well
Name
Geogra
phical
Coordi
nates
HC
Block
Admiration Setting
Existing
Land
cover of
wells
Accessibility
(in approx.)
Environmental
Setting of
Wells
Ecological
Sensitivity
Settlement/
School within
2.5km
Existing Industry
Existing
Facility
Village
Block
District
Terrai
n
Type
Strea
m/
River
Forest WLS/ES
Z
proposed well
location.
23 25°16'2
.96"N,
72°
6'59.11
"E
RJ-
ONHP-
2017/2
Khera
Gangawa
Sayla Jalor Agricult
ural
cover
Nearest
Village Road
(metal) is
located at
800m (West)
from the
proposed well
location. This
connects
MDR16 (South
to the
proposed well
location) via
Harmoo.
Flat
terrai
n
NA NA NA 1. Nearest
settlement in
Khera Gangawa
is located at
70m (West)
from the
proposed well
location.
2. Schools are
located at
1.73km (SW)
from the
proposed well
location.
NA NA
24 25°16'4
.81"N,
72°
9'22.23
"E
RJ-
ONHP-
2017/2
Bhundwa Sayla Jalor Agricult
ural
cover
Nearest
Village Road
(metal) is
located at
1.23km (West)
from the
proposed well
location. This
connects
MDR16 (South
to the
Flat
terrai
n
NA NA NA 1. Nearest
settlement in
Bhundwa is
located at 180m
(West) from the
proposed well
location.
2. Schools are
located at
1.93km (NE)
from the
NA NA
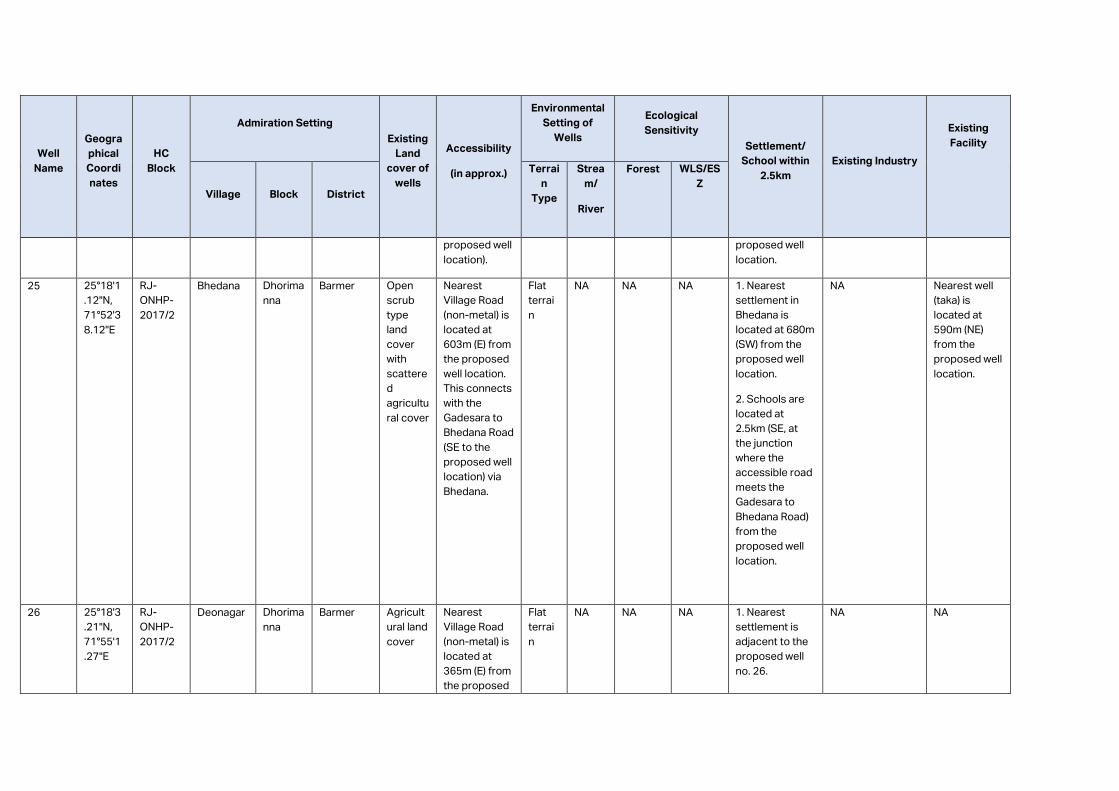
Well
Name
Geogra
phical
Coordi
nates
HC
Block
Admiration Setting
Existing
Land
cover of
wells
Accessibility
(in approx.)
Environmental
Setting of
Wells
Ecological
Sensitivity
Settlement/
School within
2.5km
Existing Industry
Existing
Facility
Village
Block
District
Terrai
n
Type
Strea
m/
River
Forest WLS/ES
Z
proposed well
location).
proposed well
location.
25 25°18'1
.12"N,
71°52'3
8.12"E
RJ-
ONHP-
2017/2
Bhedana Dhorima
nna
Barmer Open
scrub
type
land
cover
with
scattere
d
agricultu
ral cover
Nearest
Village Road
(non-metal) is
located at
603m (E) from
the proposed
well location.
This connects
with the
Gadesara to
Bhedana Road
(SE to the
proposed well
location) via
Bhedana.
Flat
terrai
n
NA NA NA 1. Nearest
settlement in
Bhedana is
located at 680m
(SW) from the
proposed well
location.
2. Schools are
located at
2.5km (SE, at
the junction
where the
accessible road
meets the
Gadesara to
Bhedana Road)
from the
proposed well
location.
NA Nearest well
(taka) is
located at
590m (NE)
from the
proposed well
location.
26 25°18'3
.21"N,
71°55'1
.27"E
RJ-
ONHP-
2017/2
Deonagar Dhorima
nna
Barmer Agricult
ural land
cover
Nearest
Village Road
(non-metal) is
located at
365m (E) from
the proposed
Flat
terrai
n
NA NA NA 1. Nearest
settlement is
adjacent to the
proposed well
no. 26.
NA NA
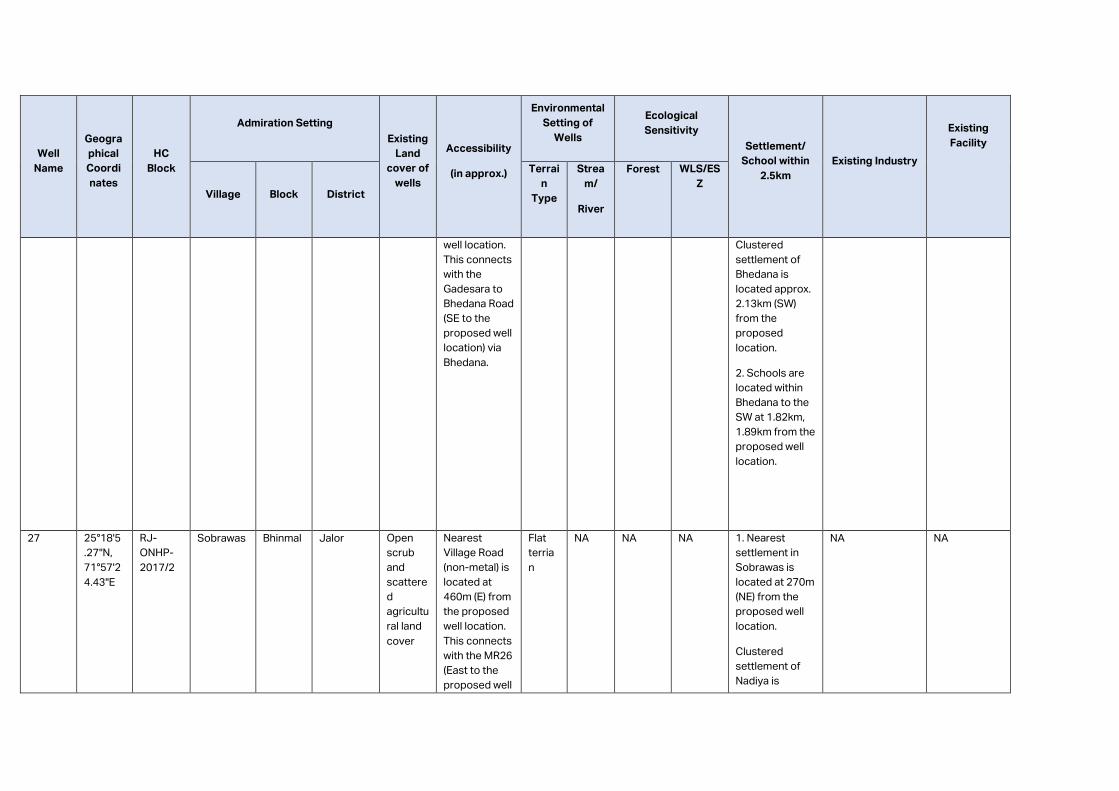
Well
Name
Geogra
phical
Coordi
nates
HC
Block
Admiration Setting
Existing
Land
cover of
wells
Accessibility
(in approx.)
Environmental
Setting of
Wells
Ecological
Sensitivity
Settlement/
School within
2.5km
Existing Industry
Existing
Facility
Village
Block
District
Terrai
n
Type
Strea
m/
River
Forest WLS/ES
Z
well location.
This connects
with the
Gadesara to
Bhedana Road
(SE to the
proposed well
location) via
Bhedana.
Clustered
settlement of
Bhedana is
located approx.
2.13km (SW)
from the
proposed
location.
2. Schools are
located within
Bhedana to the
SW at 1.82km,
1.89km from the
proposed well
location.
27 25°18'5
.27"N,
71°57'2
4.43"E
RJ-
ONHP-
2017/2
Sobrawas Bhinmal Jalor Open
scrub
and
scattere
d
agricultu
ral land
cover
Nearest
Village Road
(non-metal) is
located at
460m (E) from
the proposed
well location.
This connects
with the MR26
(East to the
proposed well
Flat
terria
n
NA NA NA 1. Nearest
settlement in
Sobrawas is
located at 270m
(NE) from the
proposed well
location.
Clustered
settlement of
Nadiya is
NA NA
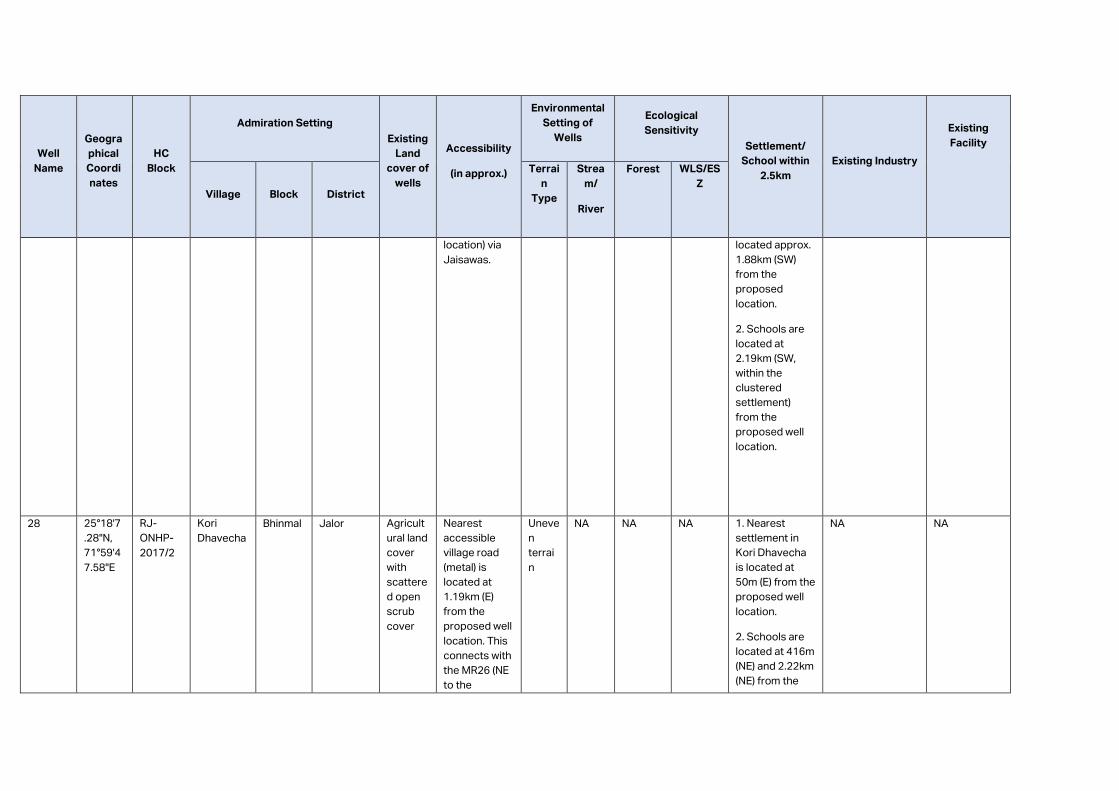
Well
Name
Geogra
phical
Coordi
nates
HC
Block
Admiration Setting
Existing
Land
cover of
wells
Accessibility
(in approx.)
Environmental
Setting of
Wells
Ecological
Sensitivity
Settlement/
School within
2.5km
Existing Industry
Existing
Facility
Village
Block
District
Terrai
n
Type
Strea
m/
River
Forest WLS/ES
Z
location) via
Jaisawas.
located approx.
1.88km (SW)
from the
proposed
location.
2. Schools are
located at
2.19km (SW,
within the
clustered
settlement)
from the
proposed well
location.
28 25°18'7
.28"N,
71°59'4
7.58"E
RJ-
ONHP-
2017/2
Kori
Dhavecha
Bhinmal Jalor Agricult
ural land
cover
with
scattere
d open
scrub
cover
Nearest
accessible
village road
(metal) is
located at
1.19km (E)
from the
proposed well
location. This
connects with
the MR26 (NE
to the
Uneve
n
terrai
n
NA NA NA 1. Nearest
settlement in
Kori Dhavecha
is located at
50m (E) from the
proposed well
location.
2. Schools are
located at 416m
(NE) and 2.22km
(NE) from the
NA NA
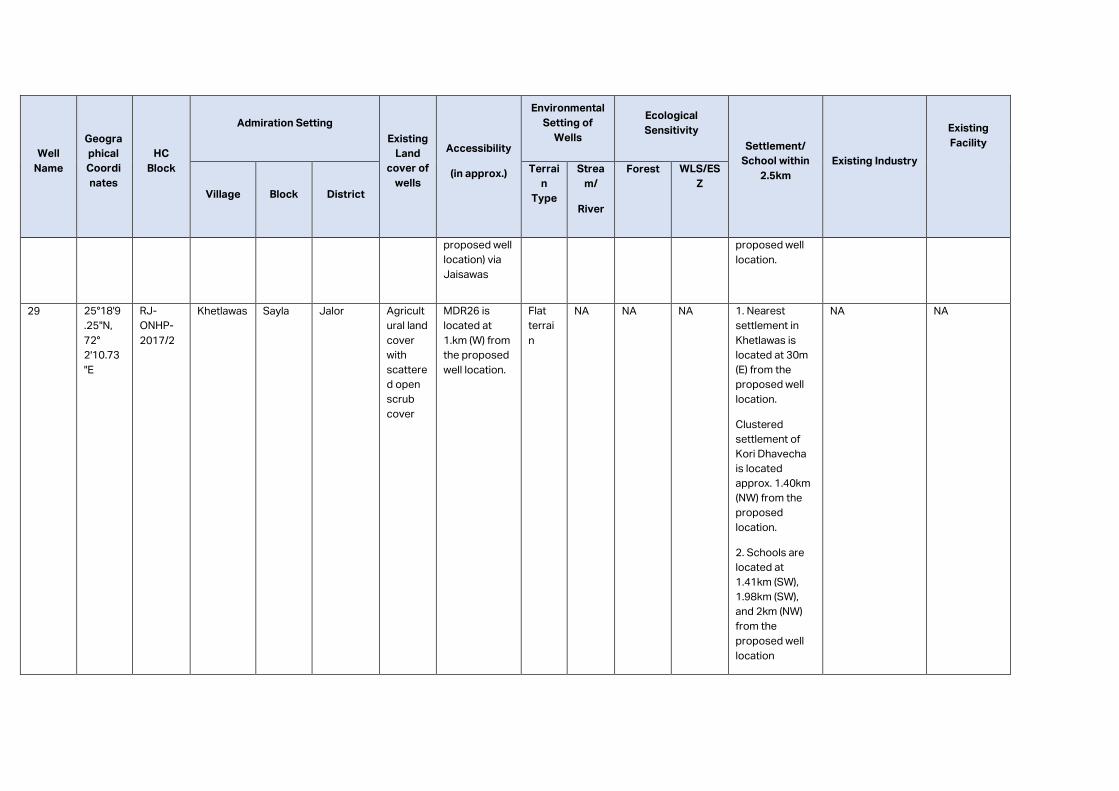
Well
Name
Geogra
phical
Coordi
nates
HC
Block
Admiration Setting
Existing
Land
cover of
wells
Accessibility
(in approx.)
Environmental
Setting of
Wells
Ecological
Sensitivity
Settlement/
School within
2.5km
Existing Industry
Existing
Facility
Village
Block
District
Terrai
n
Type
Strea
m/
River
Forest WLS/ES
Z
proposed well
location) via
Jaisawas
proposed well
location.
29 25°18'9
.25"N,
72°
2'10.73
"E
RJ-
ONHP-
2017/2
Khetlawas Sayla Jalor Agricult
ural land
cover
with
scattere
d open
scrub
cover
MDR26 is
located at
1.km (W) from
the proposed
well location.
Flat
terrai
n
NA NA NA 1. Nearest
settlement in
Khetlawas is
located at 30m
(E) from the
proposed well
location.
Clustered
settlement of
Kori Dhavecha
is located
approx. 1.40km
(NW) from the
proposed
location.
2. Schools are
located at
1.41km (SW),
1.98km (SW),
and 2km (NW)
from the
proposed well
location
NA NA
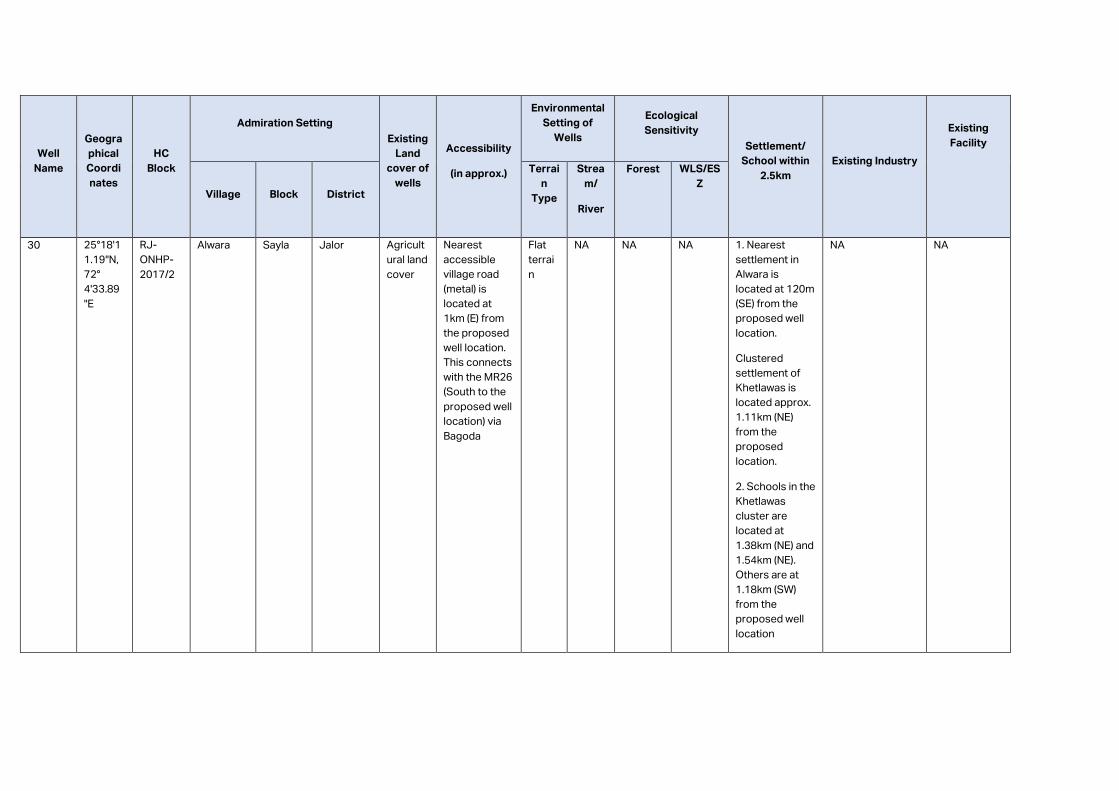
Well
Name
Geogra
phical
Coordi
nates
HC
Block
Admiration Setting
Existing
Land
cover of
wells
Accessibility
(in approx.)
Environmental
Setting of
Wells
Ecological
Sensitivity
Settlement/
School within
2.5km
Existing Industry
Existing
Facility
Village
Block
District
Terrai
n
Type
Strea
m/
River
Forest WLS/ES
Z
30 25°18'1
1.19"N,
72°
4'33.89
"E
RJ-
ONHP-
2017/2
Alwara Sayla Jalor Agricult
ural land
cover
Nearest
accessible
village road
(metal) is
located at
1km (E) from
the proposed
well location.
This connects
with the MR26
(South to the
proposed well
location) via
Bagoda
Flat
terrai
n
NA NA NA 1. Nearest
settlement in
Alwara is
located at 120m
(SE) from the
proposed well
location.
Clustered
settlement of
Khetlawas is
located approx.
1.11km (NE)
from the
proposed
location.
2. Schools in the
Khetlawas
cluster are
located at
1.38km (NE) and
1.54km (NE).
Others are at
1.18km (SW)
from the
proposed well
location
NA NA
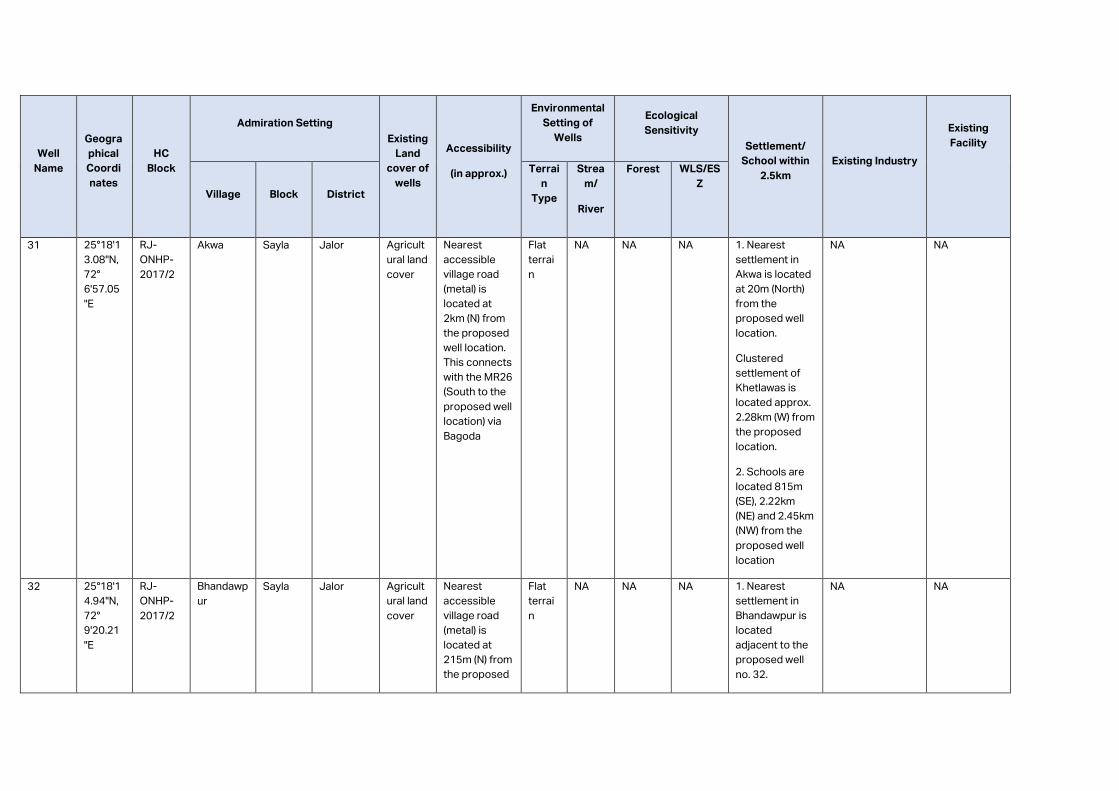
Well
Name
Geogra
phical
Coordi
nates
HC
Block
Admiration Setting
Existing
Land
cover of
wells
Accessibility
(in approx.)
Environmental
Setting of
Wells
Ecological
Sensitivity
Settlement/
School within
2.5km
Existing Industry
Existing
Facility
Village
Block
District
Terrai
n
Type
Strea
m/
River
Forest WLS/ES
Z
31 25°18'1
3.08"N,
72°
6'57.05
"E
RJ-
ONHP-
2017/2
Akwa Sayla Jalor Agricult
ural land
cover
Nearest
accessible
village road
(metal) is
located at
2km (N) from
the proposed
well location.
This connects
with the MR26
(South to the
proposed well
location) via
Bagoda
Flat
terrai
n
NA NA NA 1. Nearest
settlement in
Akwa is located
at 20m (North)
from the
proposed well
location.
Clustered
settlement of
Khetlawas is
located approx.
2.28km (W) from
the proposed
location.
2. Schools are
located 815m
(SE), 2.22km
(NE) and 2.45km
(NW) from the
proposed well
location
NA NA
32 25°18'1
4.94"N,
72°
9'20.21
"E
RJ-
ONHP-
2017/2
Bhandawp
ur
Sayla Jalor Agricult
ural land
cover
Nearest
accessible
village road
(metal) is
located at
215m (N) from
the proposed
Flat
terrai
n
NA NA NA 1. Nearest
settlement in
Bhandawpur is
located
adjacent to the
proposed well
no. 32.
NA NA
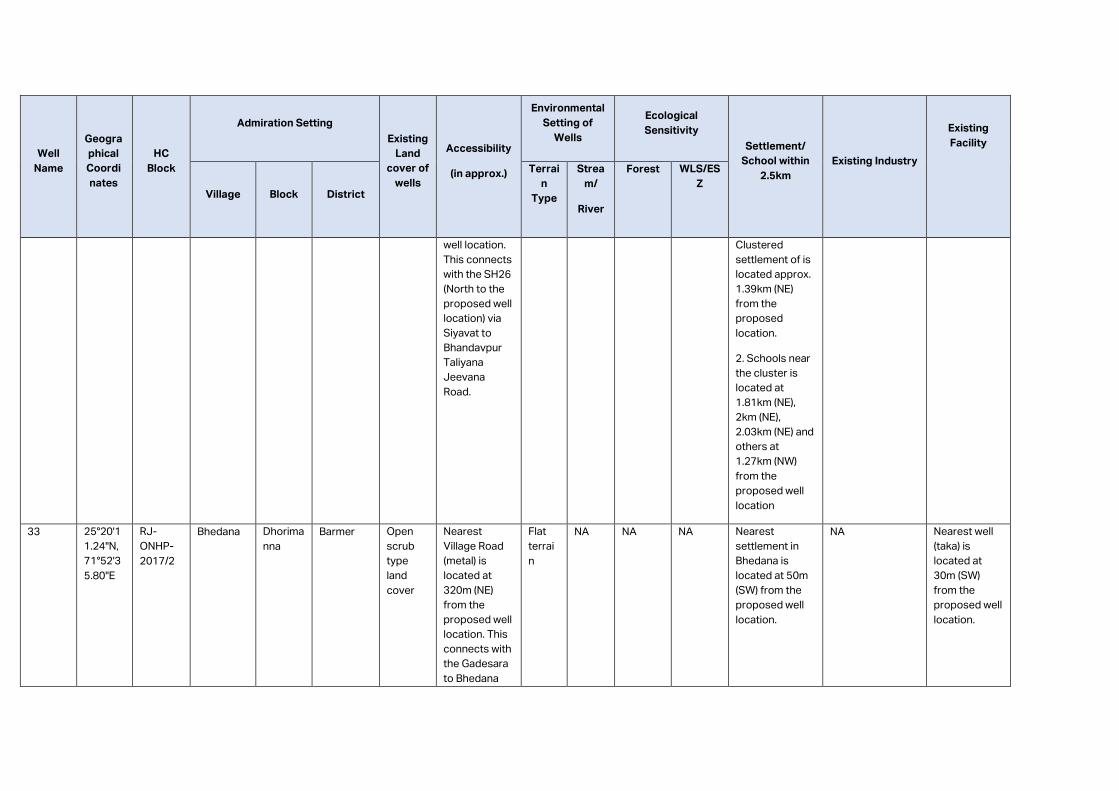
Well
Name
Geogra
phical
Coordi
nates
HC
Block
Admiration Setting
Existing
Land
cover of
wells
Accessibility
(in approx.)
Environmental
Setting of
Wells
Ecological
Sensitivity
Settlement/
School within
2.5km
Existing Industry
Existing
Facility
Village
Block
District
Terrai
n
Type
Strea
m/
River
Forest WLS/ES
Z
well location.
This connects
with the SH26
(North to the
proposed well
location) via
Siyavat to
Bhandavpur
Taliyana
Jeevana
Road.
Clustered
settlement of is
located approx.
1.39km (NE)
from the
proposed
location.
2. Schools near
the cluster is
located at
1.81km (NE),
2km (NE),
2.03km (NE) and
others at
1.27km (NW)
from the
proposed well
location
33 25°20'1
1.24"N,
71°52'3
5.80"E
RJ-
ONHP-
2017/2
Bhedana Dhorima
nna
Barmer Open
scrub
type
land
cover
Nearest
Village Road
(metal) is
located at
320m (NE)
from the
proposed well
location. This
connects with
the Gadesara
to Bhedana
Flat
terrai
n
NA NA NA Nearest
settlement in
Bhedana is
located at 50m
(SW) from the
proposed well
location.
NA Nearest well
(taka) is
located at
30m (SW)
from the
proposed well
location.
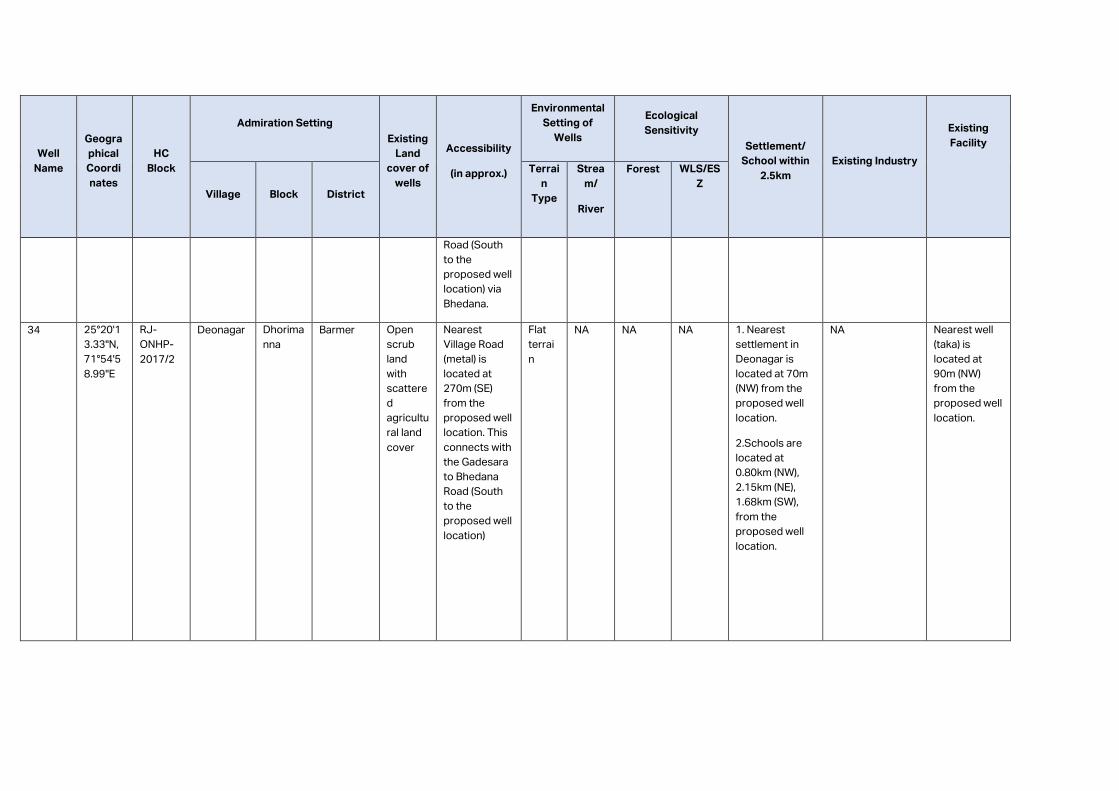
Well
Name
Geogra
phical
Coordi
nates
HC
Block
Admiration Setting
Existing
Land
cover of
wells
Accessibility
(in approx.)
Environmental
Setting of
Wells
Ecological
Sensitivity
Settlement/
School within
2.5km
Existing Industry
Existing
Facility
Village
Block
District
Terrai
n
Type
Strea
m/
River
Forest WLS/ES
Z
Road (South
to the
proposed well
location) via
Bhedana.
34 25°20'1
3.33"N,
71°54'5
8.99"E
RJ-
ONHP-
2017/2
Deonagar Dhorima
nna
Barmer Open
scrub
land
with
scattere
d
agricultu
ral land
cover
Nearest
Village Road
(metal) is
located at
270m (SE)
from the
proposed well
location. This
connects with
the Gadesara
to Bhedana
Road (South
to the
proposed well
location)
Flat
terrai
n
NA NA NA 1. Nearest
settlement in
Deonagar is
located at 70m
(NW) from the
proposed well
location.
2.Schools are
located at
0.80km (NW),
2.15km (NE),
1.68km (SW),
from the
proposed well
location.
NA Nearest well
(taka) is
located at
90m (NW)
from the
proposed well
location.
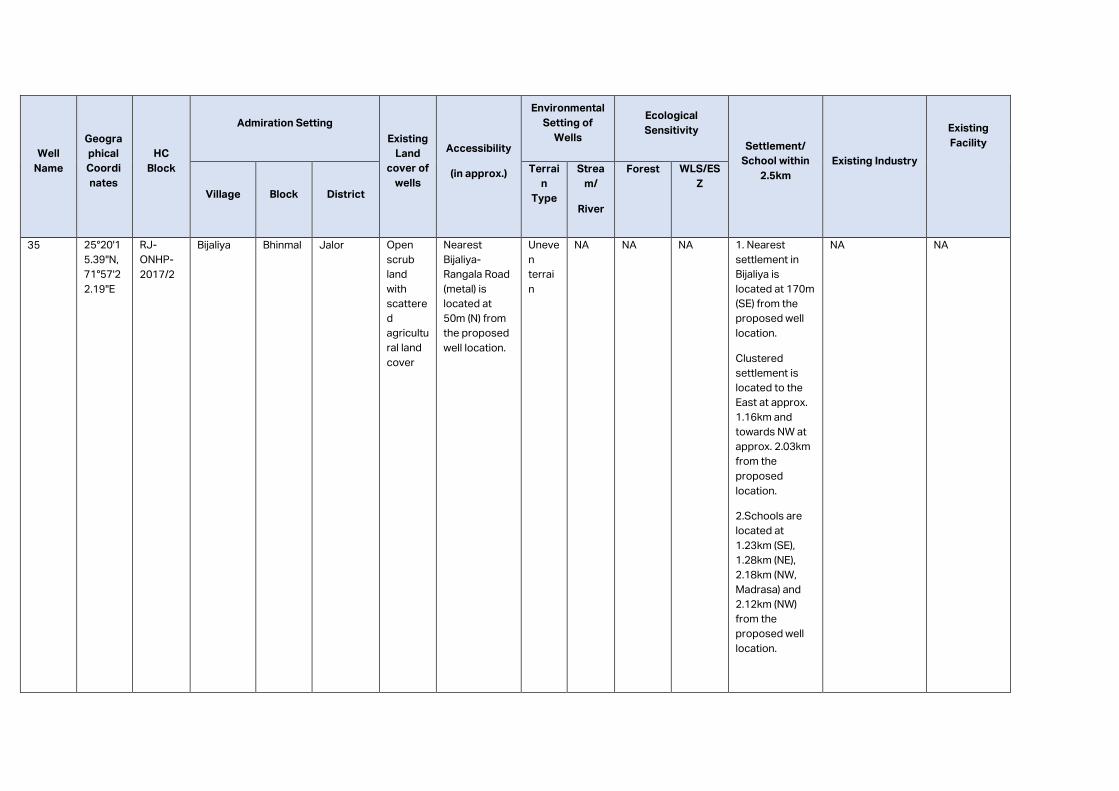
Well
Name
Geogra
phical
Coordi
nates
HC
Block
Admiration Setting
Existing
Land
cover of
wells
Accessibility
(in approx.)
Environmental
Setting of
Wells
Ecological
Sensitivity
Settlement/
School within
2.5km
Existing Industry
Existing
Facility
Village
Block
District
Terrai
n
Type
Strea
m/
River
Forest WLS/ES
Z
35 25°20'1
5.39"N,
71°57'2
2.19"E
RJ-
ONHP-
2017/2
Bijaliya Bhinmal Jalor Open
scrub
land
with
scattere
d
agricultu
ral land
cover
Nearest
Bijaliya-
Rangala Road
(metal) is
located at
50m (N) from
the proposed
well location.
Uneve
n
terrai
n
NA NA NA 1. Nearest
settlement in
Bijaliya is
located at 170m
(SE) from the
proposed well
location.
Clustered
settlement is
located to the
East at approx.
1.16km and
towards NW at
approx. 2.03km
from the
proposed
location.
2.Schools are
located at
1.23km (SE),
1.28km (NE),
2.18km (NW,
Madrasa) and
2.12km (NW)
from the
proposed well
location.
NA NA
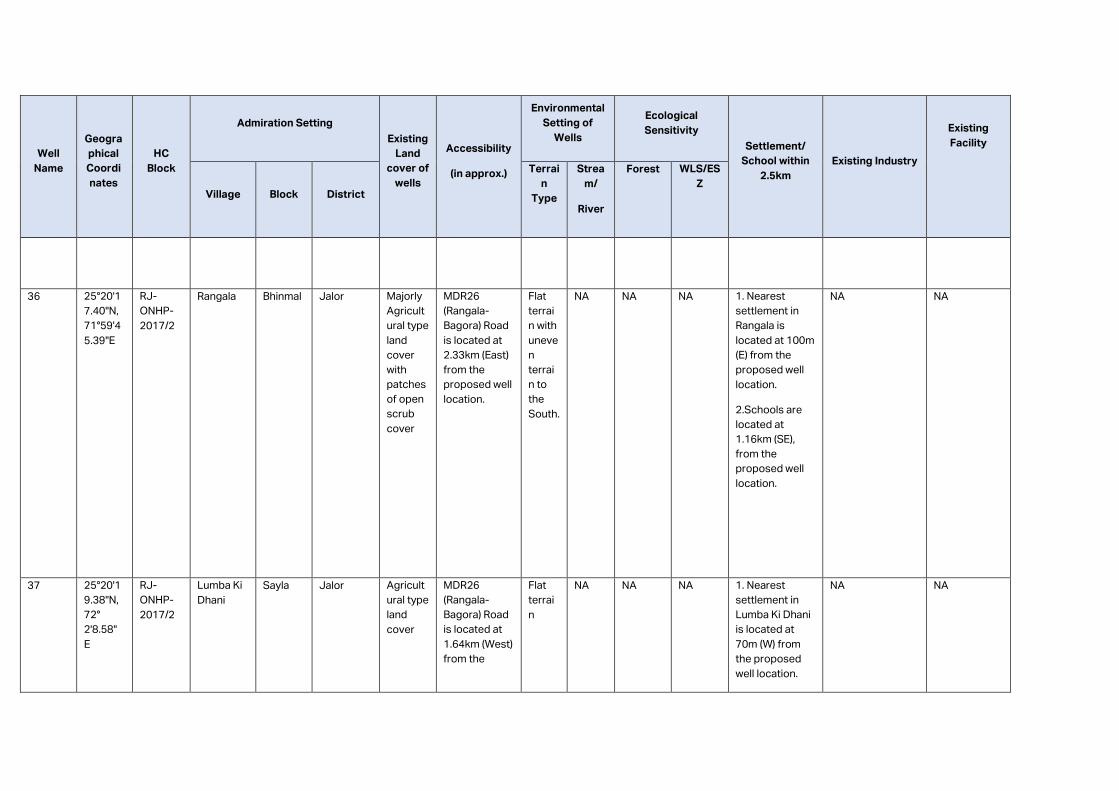
Well
Name
Geogra
phical
Coordi
nates
HC
Block
Admiration Setting
Existing
Land
cover of
wells
Accessibility
(in approx.)
Environmental
Setting of
Wells
Ecological
Sensitivity
Settlement/
School within
2.5km
Existing Industry
Existing
Facility
Village
Block
District
Terrai
n
Type
Strea
m/
River
Forest WLS/ES
Z
36 25°20'1
7.40"N,
71°59'4
5.39"E
RJ-
ONHP-
2017/2
Rangala Bhinmal Jalor Majorly
Agricult
ural type
land
cover
with
patches
of open
scrub
cover
MDR26
(Rangala-
Bagora) Road
is located at
2.33km (East)
from the
proposed well
location.
Flat
terrai
n with
uneve
n
terrai
n to
the
South.
NA NA NA 1. Nearest
settlement in
Rangala is
located at 100m
(E) from the
proposed well
location.
2.Schools are
located at
1.16km (SE),
from the
proposed well
location.
NA NA
37 25°20'1
9.38"N,
72°
2'8.58"
E
RJ-
ONHP-
2017/2
Lumba Ki
Dhani
Sayla Jalor Agricult
ural type
land
cover
MDR26
(Rangala-
Bagora) Road
is located at
1.64km (West)
from the
Flat
terrai
n
NA NA NA 1. Nearest
settlement in
Lumba Ki Dhani
is located at
70m (W) from
the proposed
well location.
NA NA
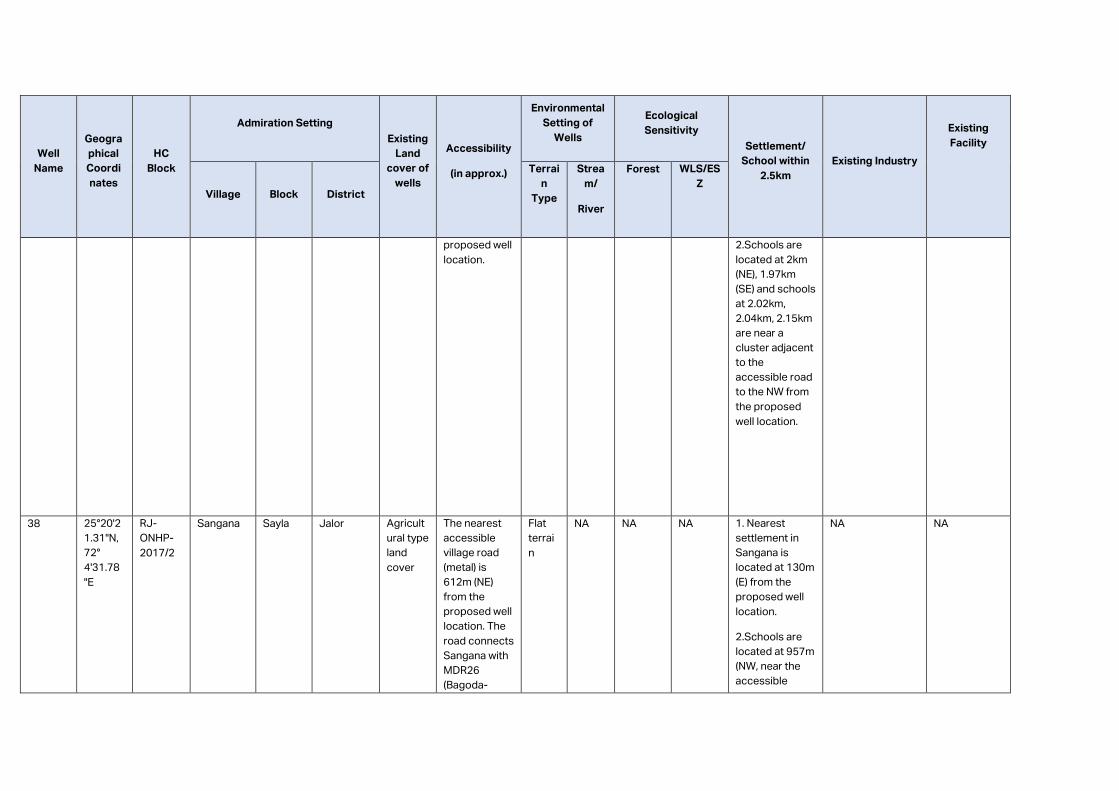
Well
Name
Geogra
phical
Coordi
nates
HC
Block
Admiration Setting
Existing
Land
cover of
wells
Accessibility
(in approx.)
Environmental
Setting of
Wells
Ecological
Sensitivity
Settlement/
School within
2.5km
Existing Industry
Existing
Facility
Village
Block
District
Terrai
n
Type
Strea
m/
River
Forest WLS/ES
Z
proposed well
location.
2.Schools are
located at 2km
(NE), 1.97km
(SE) and schools
at 2.02km,
2.04km, 2.15km
are near a
cluster adjacent
to the
accessible road
to the NW from
the proposed
well location.
38 25°20'2
1.31"N,
72°
4'31.78
"E
RJ-
ONHP-
2017/2
Sangana Sayla Jalor Agricult
ural type
land
cover
The nearest
accessible
village road
(metal) is
612m (NE)
from the
proposed well
location. The
road connects
Sangana with
MDR26
(Bagoda-
Flat
terrai
n
NA NA NA 1. Nearest
settlement in
Sangana is
located at 130m
(E) from the
proposed well
location.
2.Schools are
located at 957m
(NW, near the
accessible
NA NA
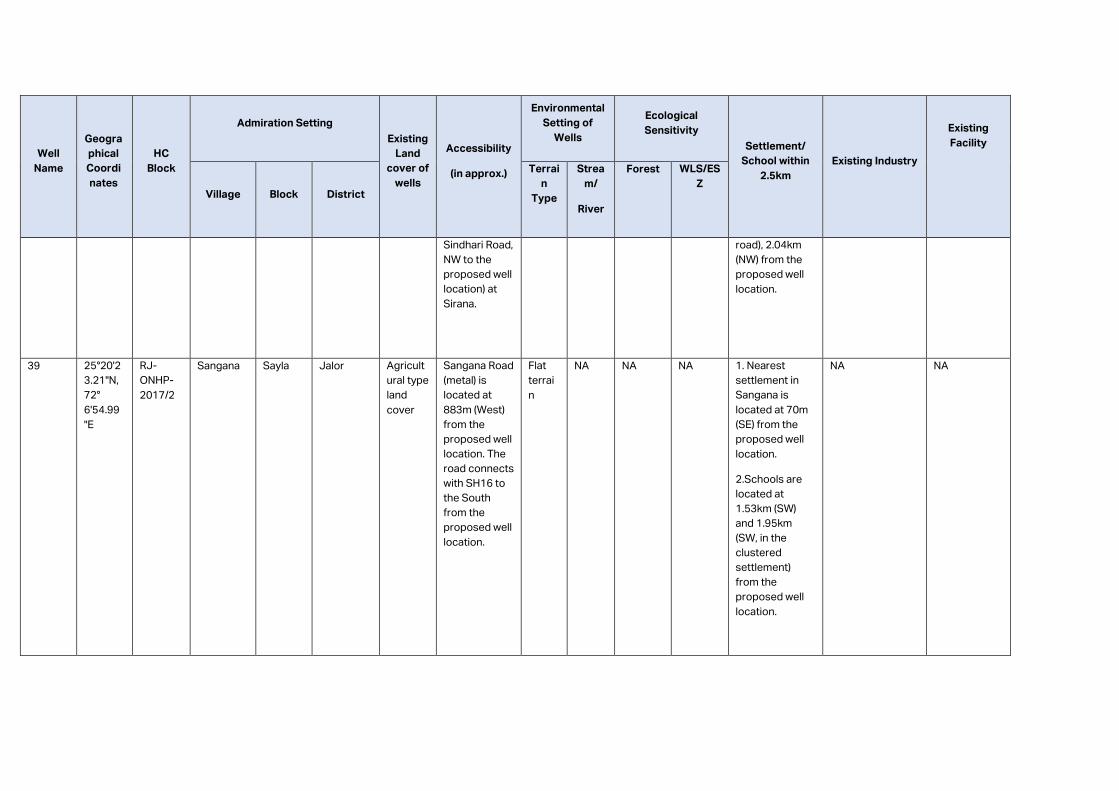
Well
Name
Geogra
phical
Coordi
nates
HC
Block
Admiration Setting
Existing
Land
cover of
wells
Accessibility
(in approx.)
Environmental
Setting of
Wells
Ecological
Sensitivity
Settlement/
School within
2.5km
Existing Industry
Existing
Facility
Village
Block
District
Terrai
n
Type
Strea
m/
River
Forest WLS/ES
Z
Sindhari Road,
NW to the
proposed well
location) at
Sirana.
road), 2.04km
(NW) from the
proposed well
location.
39 25°20'2
3.21"N,
72°
6'54.99
"E
RJ-
ONHP-
2017/2
Sangana Sayla Jalor Agricult
ural type
land
cover
Sangana Road
(metal) is
located at
883m (West)
from the
proposed well
location. The
road connects
with SH16 to
the South
from the
proposed well
location.
Flat
terrai
n
NA NA NA 1. Nearest
settlement in
Sangana is
located at 70m
(SE) from the
proposed well
location.
2.Schools are
located at
1.53km (SW)
and 1.95km
(SW, in the
clustered
settlement)
from the
proposed well
location.
NA NA
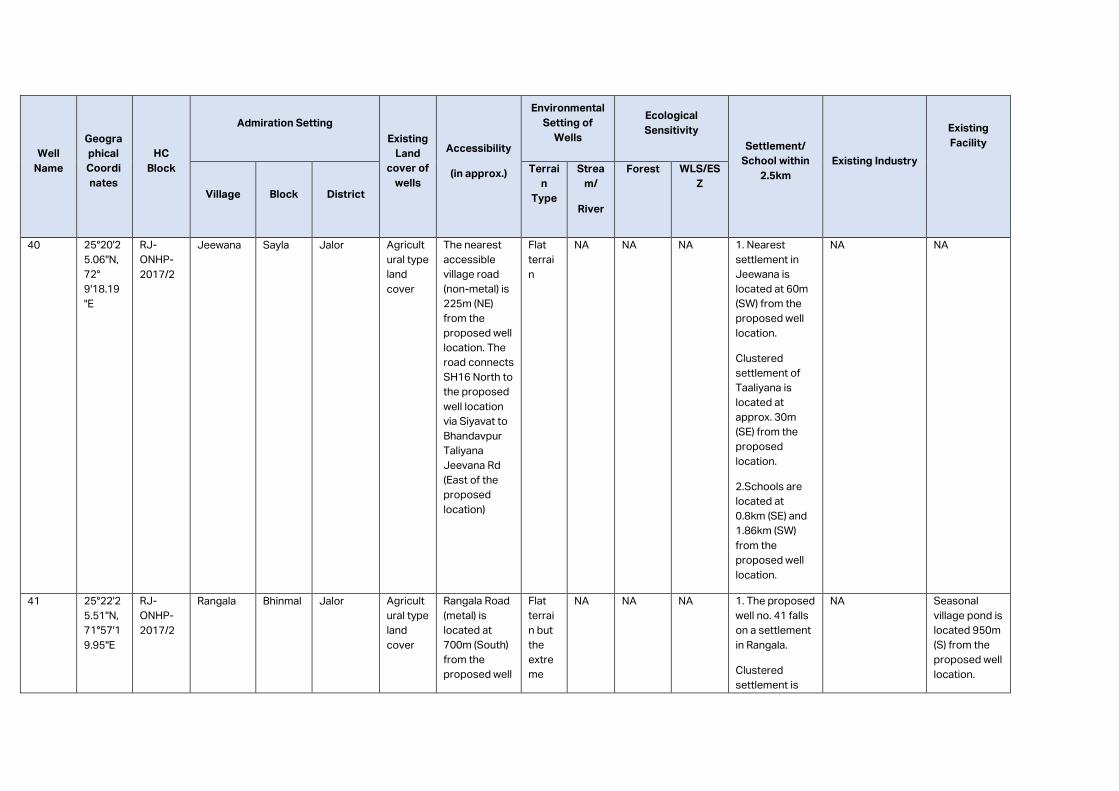
Well
Name
Geogra
phical
Coordi
nates
HC
Block
Admiration Setting
Existing
Land
cover of
wells
Accessibility
(in approx.)
Environmental
Setting of
Wells
Ecological
Sensitivity
Settlement/
School within
2.5km
Existing Industry
Existing
Facility
Village
Block
District
Terrai
n
Type
Strea
m/
River
Forest WLS/ES
Z
40 25°20'2
5.06"N,
72°
9'18.19
"E
RJ-
ONHP-
2017/2
Jeewana Sayla Jalor Agricult
ural type
land
cover
The nearest
accessible
village road
(non-metal) is
225m (NE)
from the
proposed well
location. The
road connects
SH16 North to
the proposed
well location
via Siyavat to
Bhandavpur
Taliyana
Jeevana Rd
(East of the
proposed
location)
Flat
terrai
n
NA NA NA 1. Nearest
settlement in
Jeewana is
located at 60m
(SW) from the
proposed well
location.
Clustered
settlement of
Taaliyana is
located at
approx. 30m
(SE) from the
proposed
location.
2.Schools are
located at
0.8km (SE) and
1.86km (SW)
from the
proposed well
location.
NA NA
41 25°22'2
5.51"N,
71°57'1
9.95"E
RJ-
ONHP-
2017/2
Rangala Bhinmal Jalor Agricult
ural type
land
cover
Rangala Road
(metal) is
located at
700m (South)
from the
proposed well
Flat
terrai
n but
the
extre
me
NA NA NA 1. The proposed
well no. 41 falls
on a settlement
in Rangala.
Clustered
settlement is
NA Seasonal
village pond is
located 950m
(S) from the
proposed well
location.
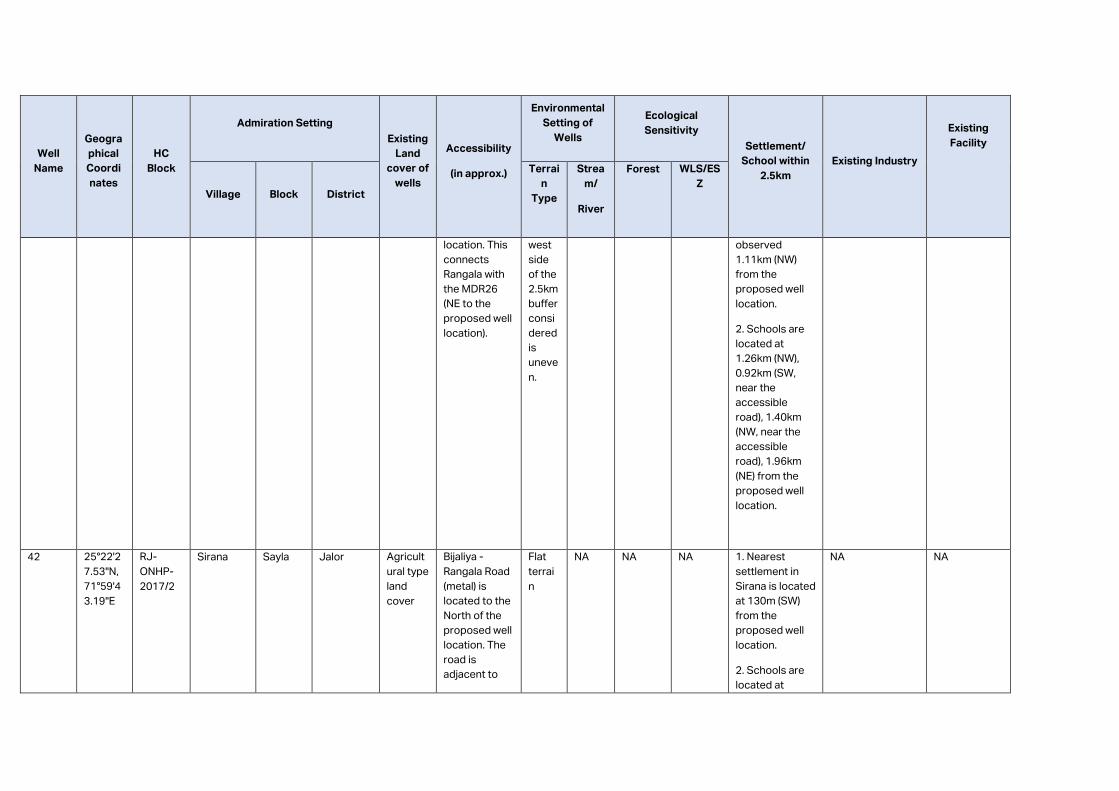
Well
Name
Geogra
phical
Coordi
nates
HC
Block
Admiration Setting
Existing
Land
cover of
wells
Accessibility
(in approx.)
Environmental
Setting of
Wells
Ecological
Sensitivity
Settlement/
School within
2.5km
Existing Industry
Existing
Facility
Village
Block
District
Terrai
n
Type
Strea
m/
River
Forest WLS/ES
Z
location. This
connects
Rangala with
the MDR26
(NE to the
proposed well
location).
west
side
of the
2.5km
buffer
consi
dered
is
uneve
n.
observed
1.11km (NW)
from the
proposed well
location.
2. Schools are
located at
1.26km (NW),
0.92km (SW,
near the
accessible
road), 1.40km
(NW, near the
accessible
road), 1.96km
(NE) from the
proposed well
location.
42 25°22'2
7.53"N,
71°59'4
3.19"E
RJ-
ONHP-
2017/2
Sirana Sayla Jalor Agricult
ural type
land
cover
Bijaliya -
Rangala Road
(metal) is
located to the
North of the
proposed well
location. The
road is
adjacent to
Flat
terrai
n
NA NA NA 1. Nearest
settlement in
Sirana is located
at 130m (SW)
from the
proposed well
location.
2. Schools are
located at
NA NA
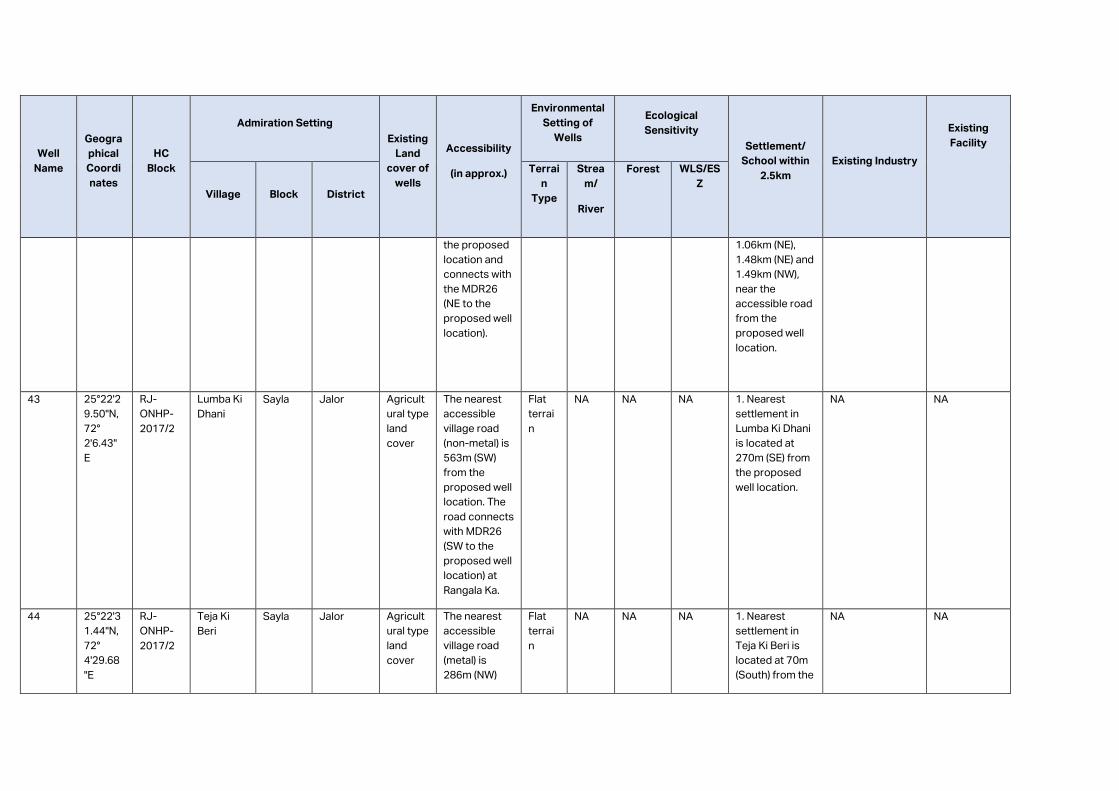
Well
Name
Geogra
phical
Coordi
nates
HC
Block
Admiration Setting
Existing
Land
cover of
wells
Accessibility
(in approx.)
Environmental
Setting of
Wells
Ecological
Sensitivity
Settlement/
School within
2.5km
Existing Industry
Existing
Facility
Village
Block
District
Terrai
n
Type
Strea
m/
River
Forest WLS/ES
Z
the proposed
location and
connects with
the MDR26
(NE to the
proposed well
location).
1.06km (NE),
1.48km (NE) and
1.49km (NW),
near the
accessible road
from the
proposed well
location.
43 25°22'2
9.50"N,
72°
2'6.43"
E
RJ-
ONHP-
2017/2
Lumba Ki
Dhani
Sayla Jalor Agricult
ural type
land
cover
The nearest
accessible
village road
(non-metal) is
563m (SW)
from the
proposed well
location. The
road connects
with MDR26
(SW to the
proposed well
location) at
Rangala Ka.
Flat
terrai
n
NA NA NA 1. Nearest
settlement in
Lumba Ki Dhani
is located at
270m (SE) from
the proposed
well location.
NA NA
44 25°22'3
1.44"N,
72°
4'29.68
"E
RJ-
ONHP-
2017/2
Teja Ki
Beri
Sayla Jalor Agricult
ural type
land
cover
The nearest
accessible
village road
(metal) is
286m (NW)
Flat
terrai
n
NA NA NA 1. Nearest
settlement in
Teja Ki Beri is
located at 70m
(South) from the
NA NA
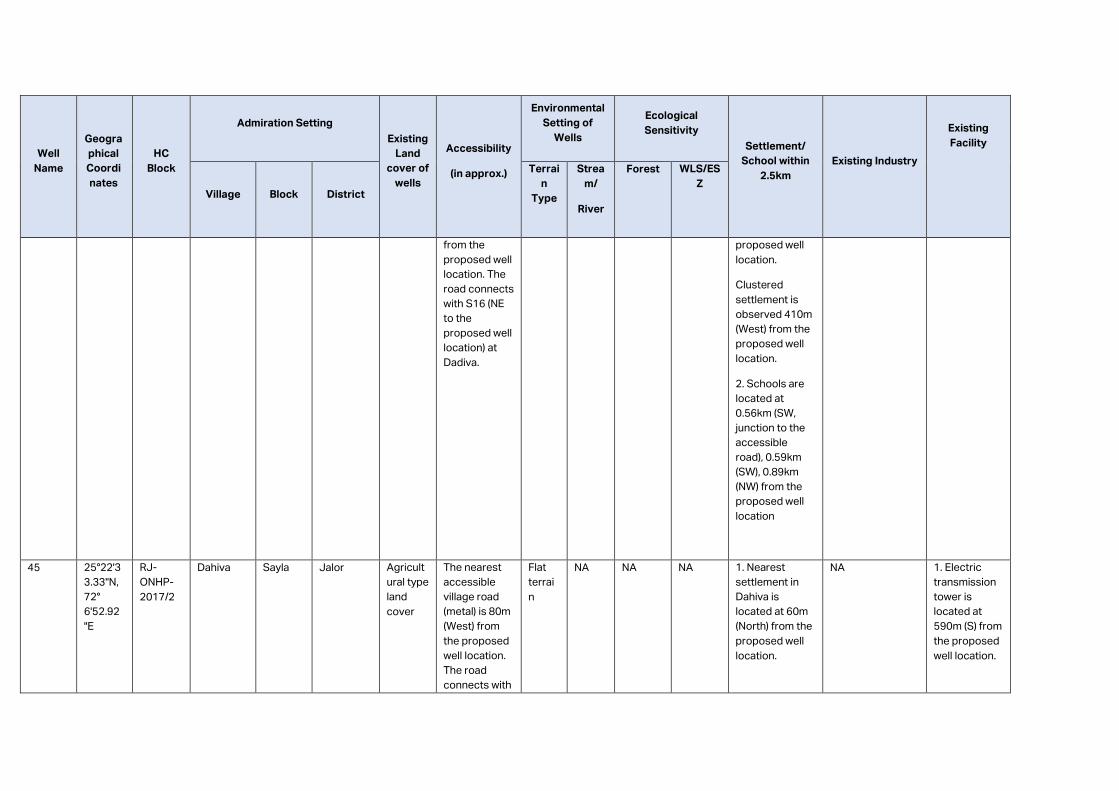
Well
Name
Geogra
phical
Coordi
nates
HC
Block
Admiration Setting
Existing
Land
cover of
wells
Accessibility
(in approx.)
Environmental
Setting of
Wells
Ecological
Sensitivity
Settlement/
School within
2.5km
Existing Industry
Existing
Facility
Village
Block
District
Terrai
n
Type
Strea
m/
River
Forest WLS/ES
Z
from the
proposed well
location. The
road connects
with S16 (NE
to the
proposed well
location) at
Dadiva.
proposed well
location.
Clustered
settlement is
observed 410m
(West) from the
proposed well
location.
2. Schools are
located at
0.56km (SW,
junction to the
accessible
road), 0.59km
(SW), 0.89km
(NW) from the
proposed well
location
45 25°22'3
3.33"N,
72°
6'52.92
"E
RJ-
ONHP-
2017/2
Dahiva Sayla Jalor Agricult
ural type
land
cover
The nearest
accessible
village road
(metal) is 80m
(West) from
the proposed
well location.
The road
connects with
Flat
terrai
n
NA NA NA 1. Nearest
settlement in
Dahiva is
located at 60m
(North) from the
proposed well
location.
NA 1. Electric
transmission
tower is
located at
590m (S) from
the proposed
well location.
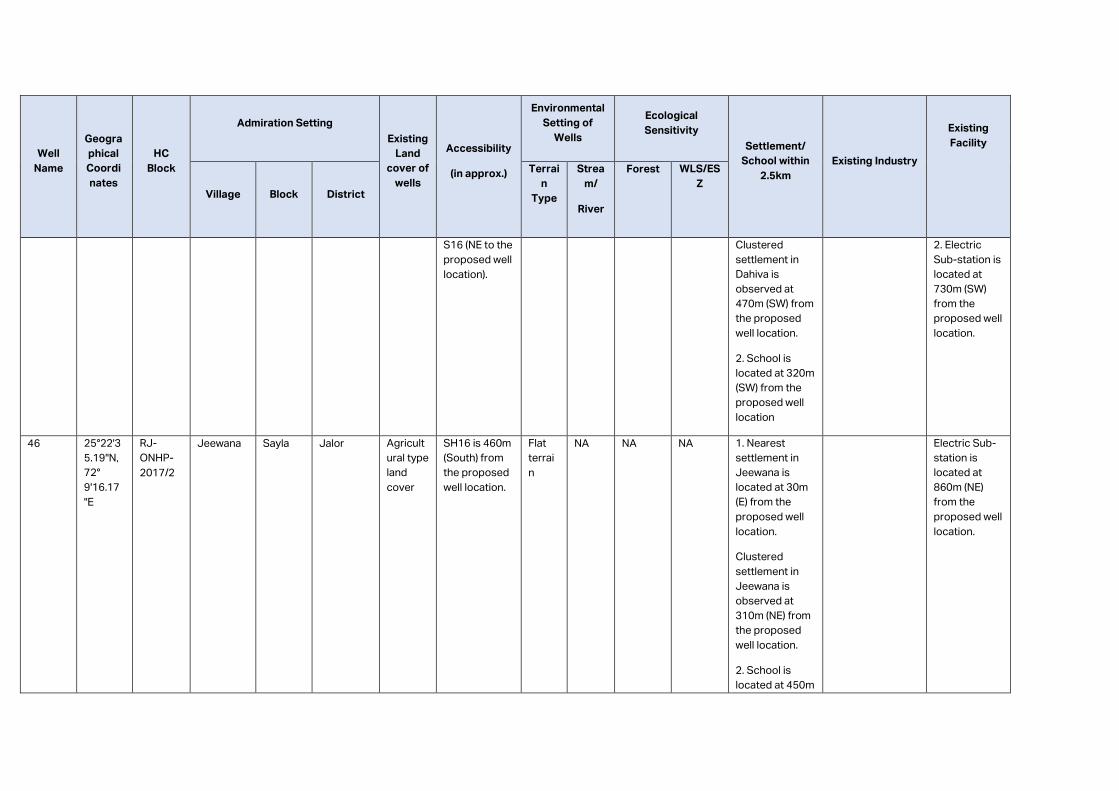
Well
Name
Geogra
phical
Coordi
nates
HC
Block
Admiration Setting
Existing
Land
cover of
wells
Accessibility
(in approx.)
Environmental
Setting of
Wells
Ecological
Sensitivity
Settlement/
School within
2.5km
Existing Industry
Existing
Facility
Village
Block
District
Terrai
n
Type
Strea
m/
River
Forest WLS/ES
Z
S16 (NE to the
proposed well
location).
Clustered
settlement in
Dahiva is
observed at
470m (SW) from
the proposed
well location.
2. School is
located at 320m
(SW) from the
proposed well
location
2. Electric
Sub-station is
located at
730m (SW)
from the
proposed well
location.
46 25°22'3
5.19"N,
72°
9'16.17
"E
RJ-
ONHP-
2017/2
Jeewana Sayla Jalor Agricult
ural type
land
cover
SH16 is 460m
(South) from
the proposed
well location.
Flat
terrai
n
NA NA NA 1. Nearest
settlement in
Jeewana is
located at 30m
(E) from the
proposed well
location.
Clustered
settlement in
Jeewana is
observed at
310m (NE) from
the proposed
well location.
2. School is
located at 450m
Electric Sub-
station is
located at
860m (NE)
from the
proposed well
location.
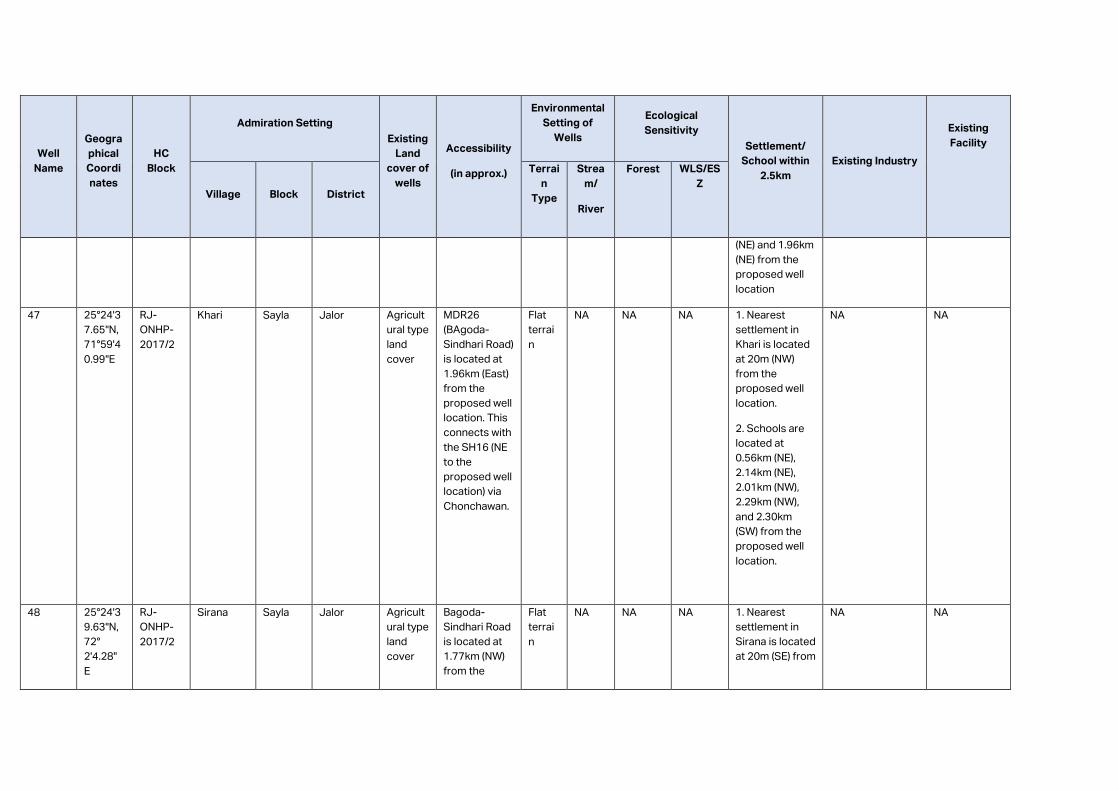
Well
Name
Geogra
phical
Coordi
nates
HC
Block
Admiration Setting
Existing
Land
cover of
wells
Accessibility
(in approx.)
Environmental
Setting of
Wells
Ecological
Sensitivity
Settlement/
School within
2.5km
Existing Industry
Existing
Facility
Village
Block
District
Terrai
n
Type
Strea
m/
River
Forest WLS/ES
Z
(NE) and 1.96km
(NE) from the
proposed well
location
47 25°24'3
7.65"N,
71°59'4
0.99"E
RJ-
ONHP-
2017/2
Khari Sayla Jalor Agricult
ural type
land
cover
MDR26
(BAgoda-
Sindhari Road)
is located at
1.96km (East)
from the
proposed well
location. This
connects with
the SH16 (NE
to the
proposed well
location) via
Chonchawan.
Flat
terrai
n
NA NA NA 1. Nearest
settlement in
Khari is located
at 20m (NW)
from the
proposed well
location.
2. Schools are
located at
0.56km (NE),
2.14km (NE),
2.01km (NW),
2.29km (NW),
and 2.30km
(SW) from the
proposed well
location.
NA NA
48 25°24'3
9.63"N,
72°
2'4.28"
E
RJ-
ONHP-
2017/2
Sirana Sayla Jalor Agricult
ural type
land
cover
Bagoda-
Sindhari Road
is located at
1.77km (NW)
from the
Flat
terrai
n
NA NA NA 1. Nearest
settlement in
Sirana is located
at 20m (SE) from
NA NA
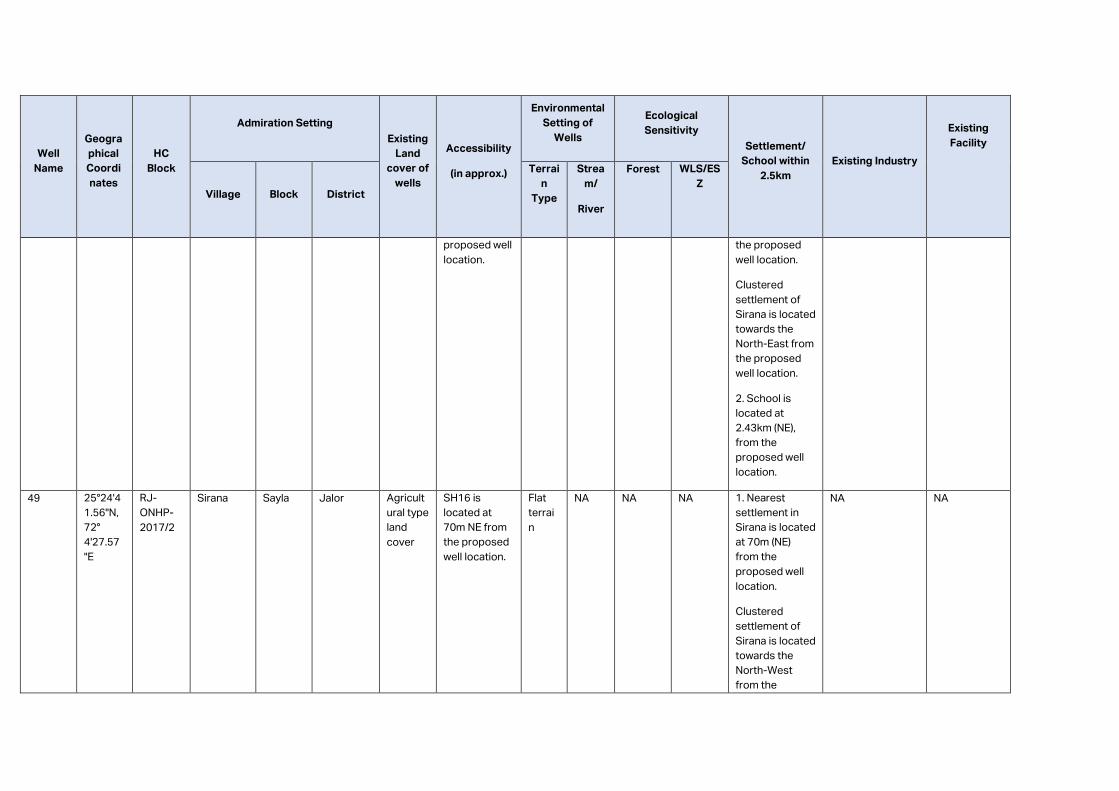
Well
Name
Geogra
phical
Coordi
nates
HC
Block
Admiration Setting
Existing
Land
cover of
wells
Accessibility
(in approx.)
Environmental
Setting of
Wells
Ecological
Sensitivity
Settlement/
School within
2.5km
Existing Industry
Existing
Facility
Village
Block
District
Terrai
n
Type
Strea
m/
River
Forest WLS/ES
Z
proposed well
location.
the proposed
well location.
Clustered
settlement of
Sirana is located
towards the
North-East from
the proposed
well location.
2. School is
located at
2.43km (NE),
from the
proposed well
location.
49 25°24'4
1.56"N,
72°
4'27.57
"E
RJ-
ONHP-
2017/2
Sirana Sayla Jalor Agricult
ural type
land
cover
SH16 is
located at
70m NE from
the proposed
well location.
Flat
terrai
n
NA NA NA 1. Nearest
settlement in
Sirana is located
at 70m (NE)
from the
proposed well
location.
Clustered
settlement of
Sirana is located
towards the
North-West
from the
NA NA
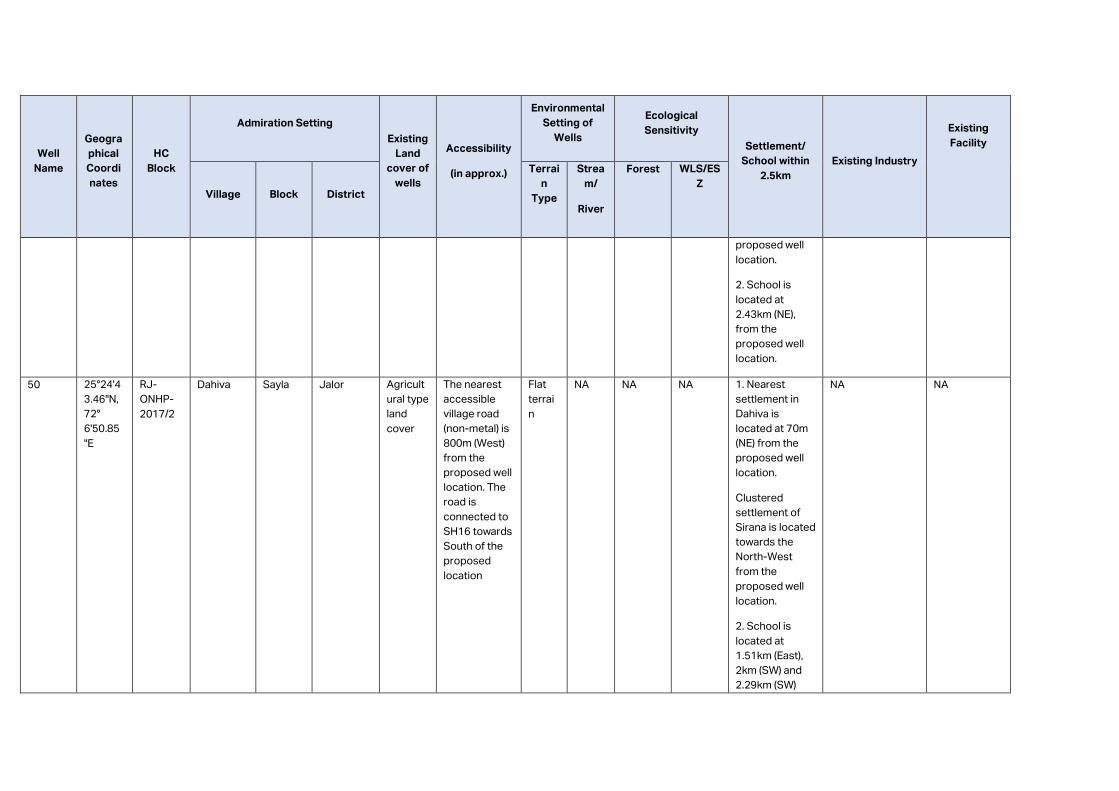
Well
Name
Geogra
phical
Coordi
nates
HC
Block
Admiration Setting
Existing
Land
cover of
wells
Accessibility
(in approx.)
Environmental
Setting of
Wells
Ecological
Sensitivity
Settlement/
School within
2.5km
Existing Industry
Existing
Facility
Village
Block
District
Terrai
n
Type
Strea
m/
River
Forest WLS/ES
Z
proposed well
location.
2. School is
located at
2.43km (NE),
from the
proposed well
location.
50 25°24'4
3.46"N,
72°
6'50.85
"E
RJ-
ONHP-
2017/2
Dahiva Sayla Jalor Agricult
ural type
land
cover
The nearest
accessible
village road
(non-metal) is
800m (West)
from the
proposed well
location. The
road is
connected to
SH16 towards
South of the
proposed
location
Flat
terrai
n
NA NA NA 1. Nearest
settlement in
Dahiva is
located at 70m
(NE) from the
proposed well
location.
Clustered
settlement of
Sirana is located
towards the
North-West
from the
proposed well
location.
2. School is
located at
1.51km (East),
2km (SW) and
2.29km (SW)
NA NA
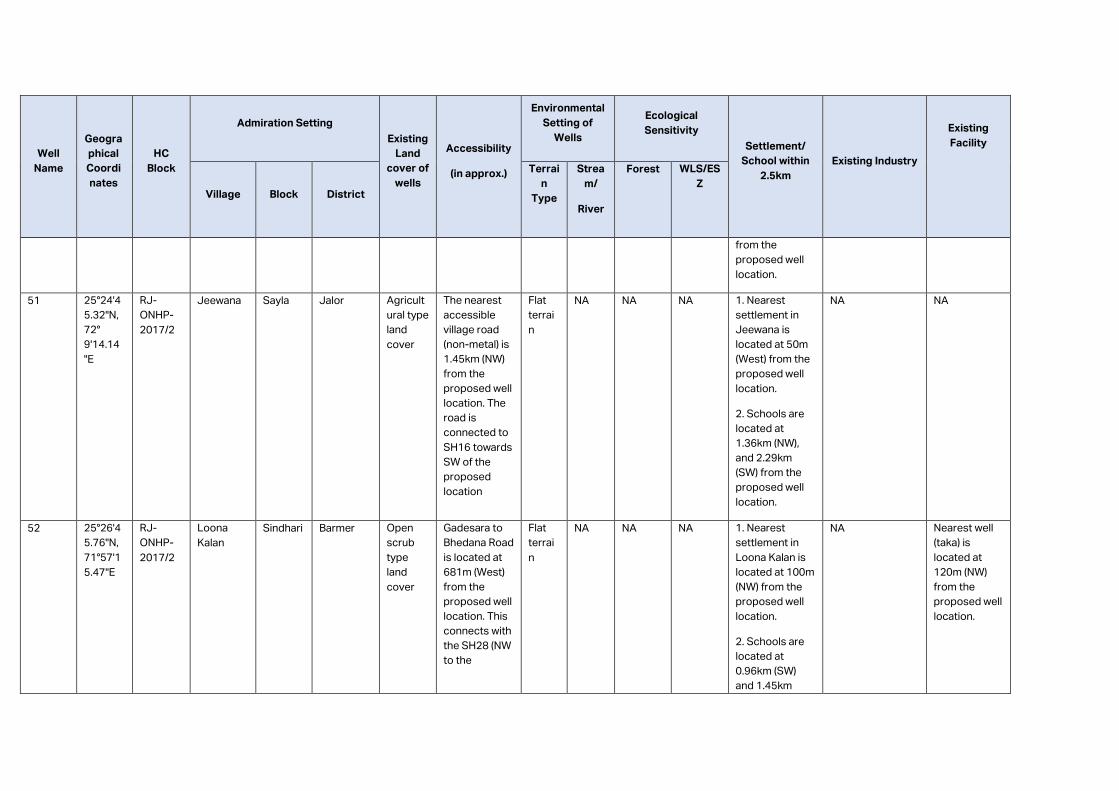
Well
Name
Geogra
phical
Coordi
nates
HC
Block
Admiration Setting
Existing
Land
cover of
wells
Accessibility
(in approx.)
Environmental
Setting of
Wells
Ecological
Sensitivity
Settlement/
School within
2.5km
Existing Industry
Existing
Facility
Village
Block
District
Terrai
n
Type
Strea
m/
River
Forest WLS/ES
Z
from the
proposed well
location.
51 25°24'4
5.32"N,
72°
9'14.14
"E
RJ-
ONHP-
2017/2
Jeewana Sayla Jalor Agricult
ural type
land
cover
The nearest
accessible
village road
(non-metal) is
1.45km (NW)
from the
proposed well
location. The
road is
connected to
SH16 towards
SW of the
proposed
location
Flat
terrai
n
NA NA NA 1. Nearest
settlement in
Jeewana is
located at 50m
(West) from the
proposed well
location.
2. Schools are
located at
1.36km (NW),
and 2.29km
(SW) from the
proposed well
location.
NA NA
52 25°26'4
5.76"N,
71°57'1
5.47"E
RJ-
ONHP-
2017/2
Loona
Kalan
Sindhari Barmer Open
scrub
type
land
cover
Gadesara to
Bhedana Road
is located at
681m (West)
from the
proposed well
location. This
connects with
the SH28 (NW
to the
Flat
terrai
n
NA NA NA 1. Nearest
settlement in
Loona Kalan is
located at 100m
(NW) from the
proposed well
location.
2. Schools are
located at
0.96km (SW)
and 1.45km
NA Nearest well
(taka) is
located at
120m (NW)
from the
proposed well
location.
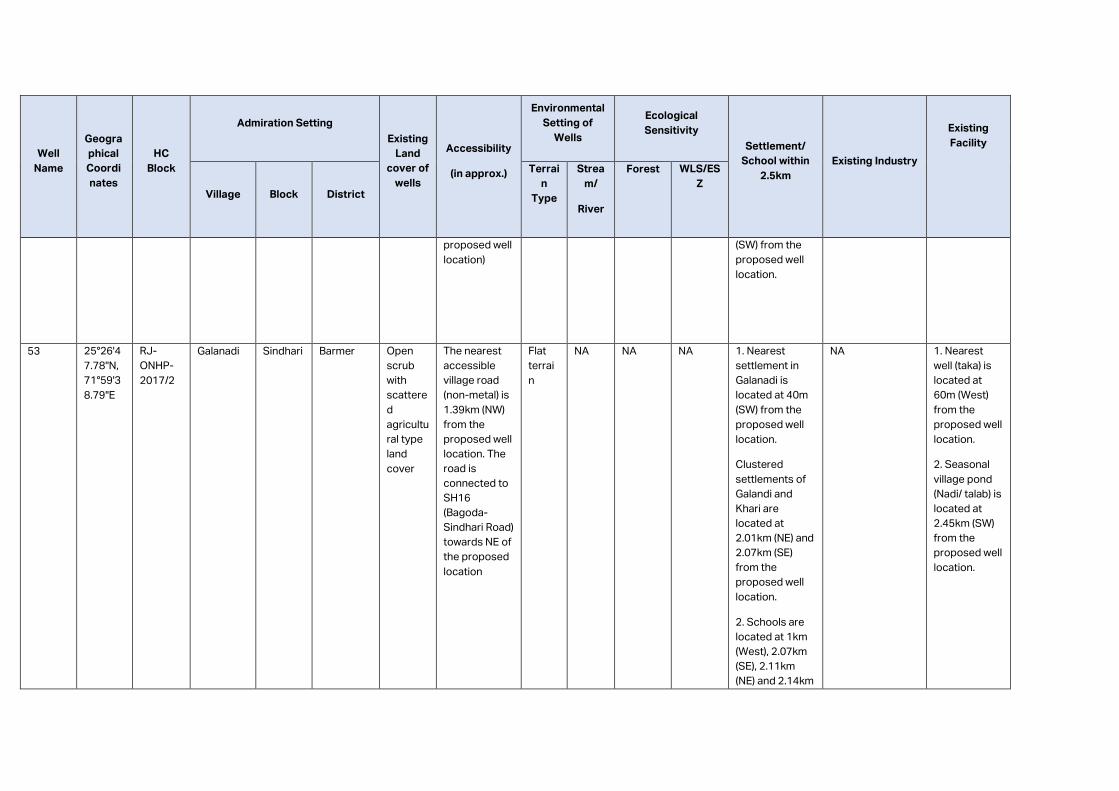
Well
Name
Geogra
phical
Coordi
nates
HC
Block
Admiration Setting
Existing
Land
cover of
wells
Accessibility
(in approx.)
Environmental
Setting of
Wells
Ecological
Sensitivity
Settlement/
School within
2.5km
Existing Industry
Existing
Facility
Village
Block
District
Terrai
n
Type
Strea
m/
River
Forest WLS/ES
Z
proposed well
location)
(SW) from the
proposed well
location.
53 25°26'4
7.78"N,
71°59'3
8.79"E
RJ-
ONHP-
2017/2
Galanadi Sindhari Barmer Open
scrub
with
scattere
d
agricultu
ral type
land
cover
The nearest
accessible
village road
(non-metal) is
1.39km (NW)
from the
proposed well
location. The
road is
connected to
SH16
(Bagoda-
Sindhari Road)
towards NE of
the proposed
location
Flat
terrai
n
NA NA NA 1. Nearest
settlement in
Galanadi is
located at 40m
(SW) from the
proposed well
location.
Clustered
settlements of
Galandi and
Khari are
located at
2.01km (NE) and
2.07km (SE)
from the
proposed well
location.
2. Schools are
located at 1km
(West), 2.07km
(SE), 2.11km
(NE) and 2.14km
NA 1. Nearest
well (taka) is
located at
60m (West)
from the
proposed well
location.
2. Seasonal
village pond
(Nadi/ talab) is
located at
2.45km (SW)
from the
proposed well
location.
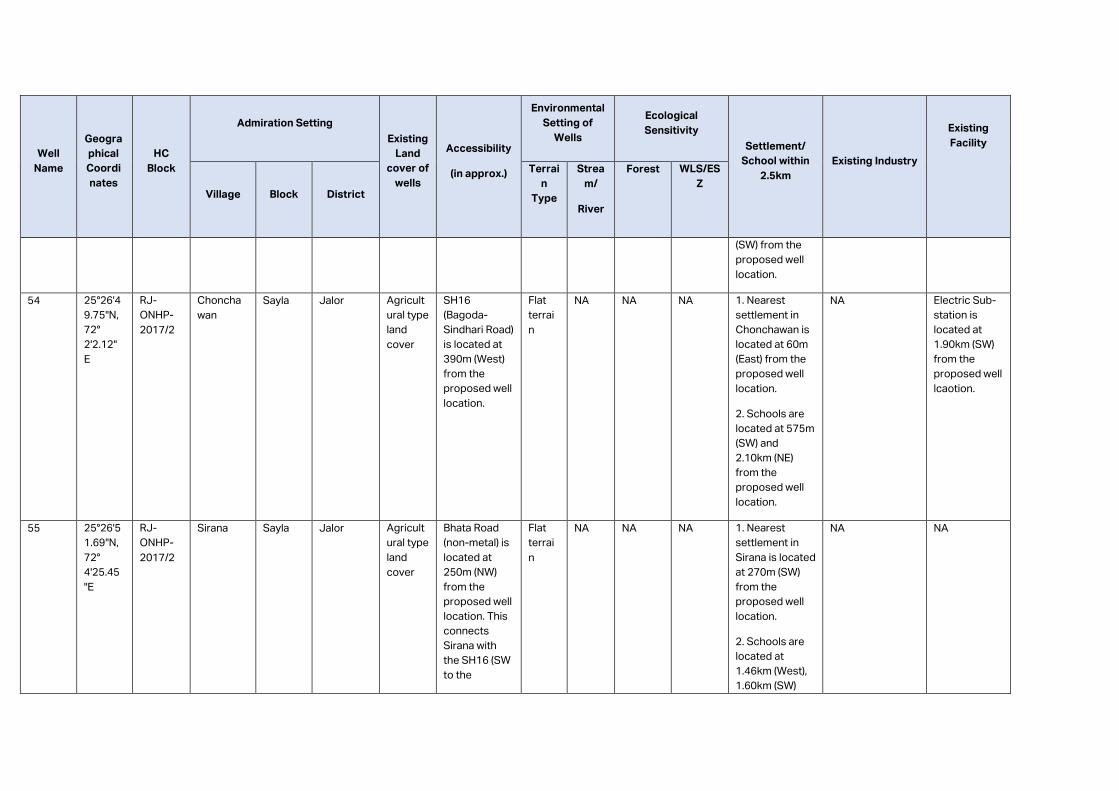
Well
Name
Geogra
phical
Coordi
nates
HC
Block
Admiration Setting
Existing
Land
cover of
wells
Accessibility
(in approx.)
Environmental
Setting of
Wells
Ecological
Sensitivity
Settlement/
School within
2.5km
Existing Industry
Existing
Facility
Village
Block
District
Terrai
n
Type
Strea
m/
River
Forest WLS/ES
Z
(SW) from the
proposed well
location.
54 25°26'4
9.75"N,
72°
2'2.12"
E
RJ-
ONHP-
2017/2
Choncha
wan
Sayla Jalor Agricult
ural type
land
cover
SH16
(Bagoda-
Sindhari Road)
is located at
390m (West)
from the
proposed well
location.
Flat
terrai
n
NA NA NA 1. Nearest
settlement in
Chonchawan is
located at 60m
(East) from the
proposed well
location.
2. Schools are
located at 575m
(SW) and
2.10km (NE)
from the
proposed well
location.
NA Electric Sub-
station is
located at
1.90km (SW)
from the
proposed well
lcaotion.
55 25°26'5
1.69"N,
72°
4'25.45
"E
RJ-
ONHP-
2017/2
Sirana Sayla Jalor Agricult
ural type
land
cover
Bhata Road
(non-metal) is
located at
250m (NW)
from the
proposed well
location. This
connects
Sirana with
the SH16 (SW
to the
Flat
terrai
n
NA NA NA 1. Nearest
settlement in
Sirana is located
at 270m (SW)
from the
proposed well
location.
2. Schools are
located at
1.46km (West),
1.60km (SW)
NA NA
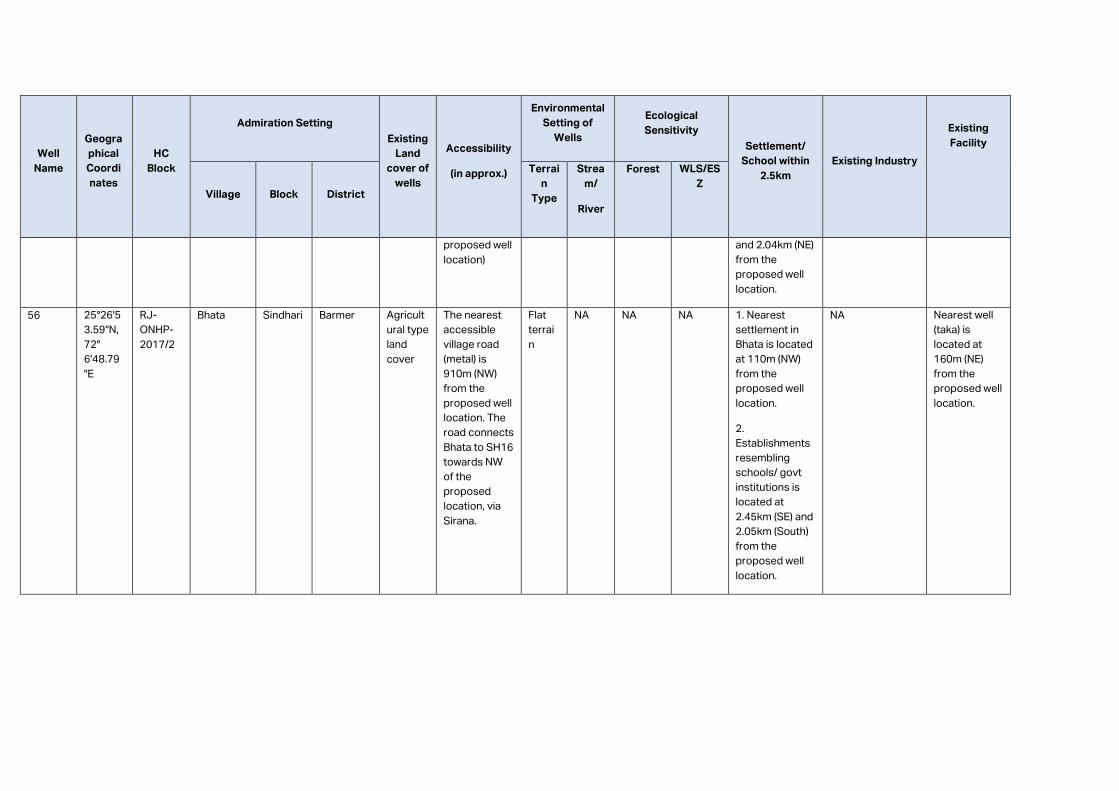
Well
Name
Geogra
phical
Coordi
nates
HC
Block
Admiration Setting
Existing
Land
cover of
wells
Accessibility
(in approx.)
Environmental
Setting of
Wells
Ecological
Sensitivity
Settlement/
School within
2.5km
Existing Industry
Existing
Facility
Village
Block
District
Terrai
n
Type
Strea
m/
River
Forest WLS/ES
Z
proposed well
location)
and 2.04km (NE)
from the
proposed well
location.
56 25°26'5
3.59"N,
72°
6'48.79
"E
RJ-
ONHP-
2017/2
Bhata Sindhari Barmer Agricult
ural type
land
cover
The nearest
accessible
village road
(metal) is
910m (NW)
from the
proposed well
location. The
road connects
Bhata to SH16
towards NW
of the
proposed
location, via
Sirana.
Flat
terrai
n
NA NA NA 1. Nearest
settlement in
Bhata is located
at 110m (NW)
from the
proposed well
location.
2.
Establishments
resembling
schools/ govt
institutions is
located at
2.45km (SE) and
2.05km (South)
from the
proposed well
location.
NA Nearest well
(taka) is
located at
160m (NE)
from the
proposed well
location.
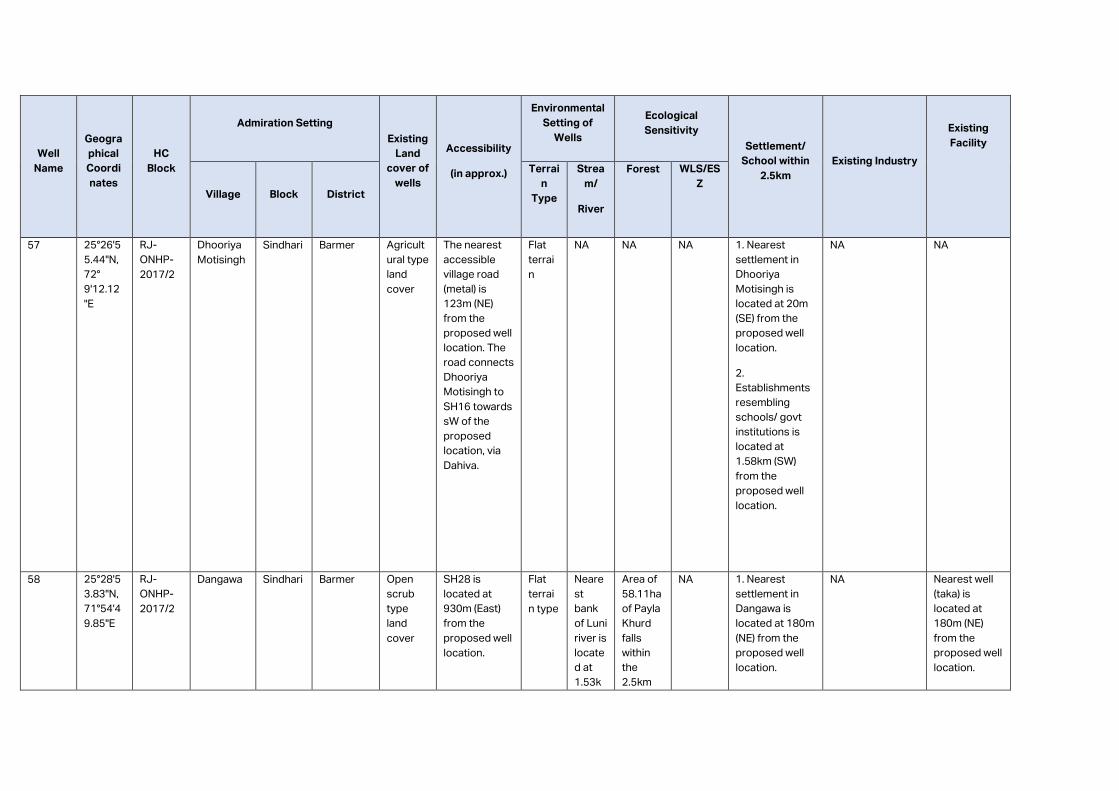
Well
Name
Geogra
phical
Coordi
nates
HC
Block
Admiration Setting
Existing
Land
cover of
wells
Accessibility
(in approx.)
Environmental
Setting of
Wells
Ecological
Sensitivity
Settlement/
School within
2.5km
Existing Industry
Existing
Facility
Village
Block
District
Terrai
n
Type
Strea
m/
River
Forest WLS/ES
Z
57 25°26'5
5.44"N,
72°
9'12.12
"E
RJ-
ONHP-
2017/2
Dhooriya
Motisingh
Sindhari Barmer Agricult
ural type
land
cover
The nearest
accessible
village road
(metal) is
123m (NE)
from the
proposed well
location. The
road connects
Dhooriya
Motisingh to
SH16 towards
sW of the
proposed
location, via
Dahiva.
Flat
terrai
n
NA NA NA 1. Nearest
settlement in
Dhooriya
Motisingh is
located at 20m
(SE) from the
proposed well
location.
2.
Establishments
resembling
schools/ govt
institutions is
located at
1.58km (SW)
from the
proposed well
location.
NA NA
58 25°28'5
3.83"N,
71°54'4
9.85"E
RJ-
ONHP-
2017/2
Dangawa Sindhari Barmer Open
scrub
type
land
cover
SH28 is
located at
930m (East)
from the
proposed well
location.
Flat
terrai
n type
Neare
st
bank
of Luni
river is
locate
d at
1.53k
Area of
58.11ha
of Payla
Khurd
falls
within
the
2.5km
NA 1. Nearest
settlement in
Dangawa is
located at 180m
(NE) from the
proposed well
location.
NA Nearest well
(taka) is
located at
180m (NE)
from the
proposed well
location.
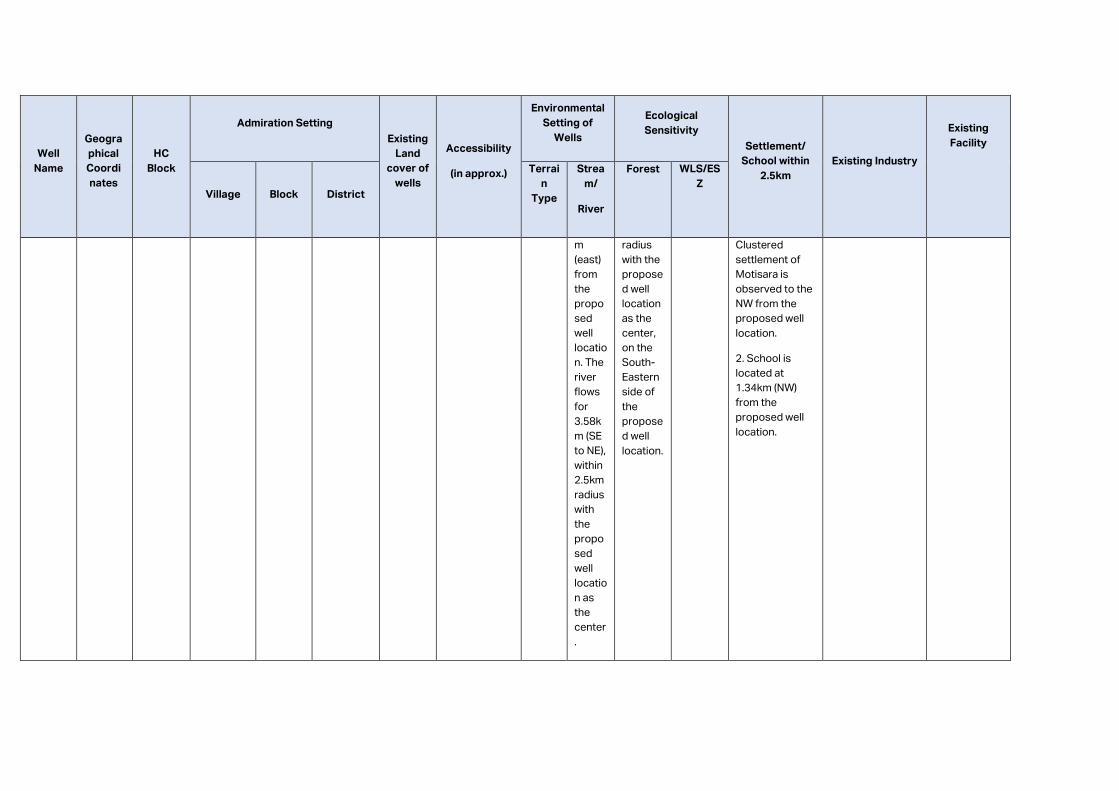
Well
Name
Geogra
phical
Coordi
nates
HC
Block
Admiration Setting
Existing
Land
cover of
wells
Accessibility
(in approx.)
Environmental
Setting of
Wells
Ecological
Sensitivity
Settlement/
School within
2.5km
Existing Industry
Existing
Facility
Village
Block
District
Terrai
n
Type
Strea
m/
River
Forest WLS/ES
Z
m
(east)
from
the
propo
sed
well
locatio
n. The
river
flows
for
3.58k
m (SE
to NE),
within
2.5km
radius
with
the
propo
sed
well
locatio
n as
the
center
.
radius
with the
propose
d well
location
as the
center,
on the
South-
Eastern
side of
the
propose
d well
location.
Clustered
settlement of
Motisara is
observed to the
NW from the
proposed well
location.
2. School is
located at
1.34km (NW)
from the
proposed well
location.
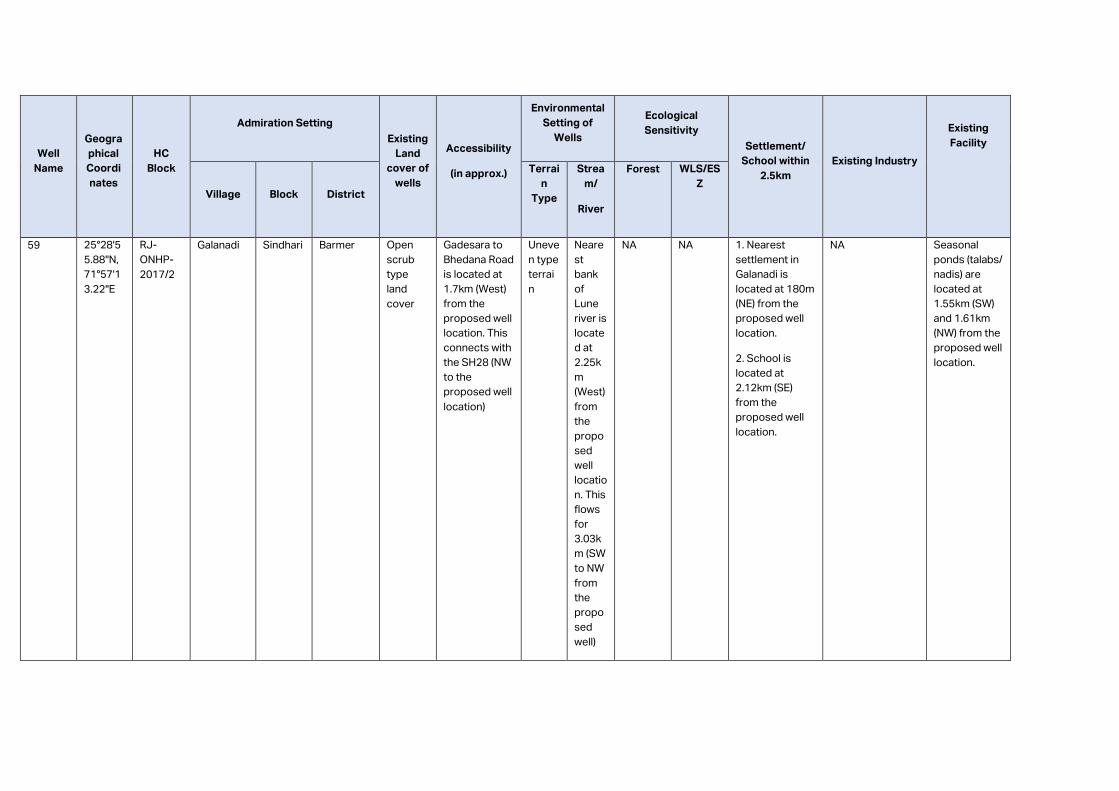
Well
Name
Geogra
phical
Coordi
nates
HC
Block
Admiration Setting
Existing
Land
cover of
wells
Accessibility
(in approx.)
Environmental
Setting of
Wells
Ecological
Sensitivity
Settlement/
School within
2.5km
Existing Industry
Existing
Facility
Village
Block
District
Terrai
n
Type
Strea
m/
River
Forest WLS/ES
Z
59 25°28'5
5.88"N,
71°57'1
3.22"E
RJ-
ONHP-
2017/2
Galanadi Sindhari Barmer Open
scrub
type
land
cover
Gadesara to
Bhedana Road
is located at
1.7km (West)
from the
proposed well
location. This
connects with
the SH28 (NW
to the
proposed well
location)
Uneve
n type
terrai
n
Neare
st
bank
of
Lune
river is
locate
d at
2.25k
m
(West)
from
the
propo
sed
well
locatio
n. This
flows
for
3.03k
m (SW
to NW
from
the
propo
sed
well)
NA NA 1. Nearest
settlement in
Galanadi is
located at 180m
(NE) from the
proposed well
location.
2. School is
located at
2.12km (SE)
from the
proposed well
location.
NA Seasonal
ponds (talabs/
nadis) are
located at
1.55km (SW)
and 1.61km
(NW) from the
proposed well
location.
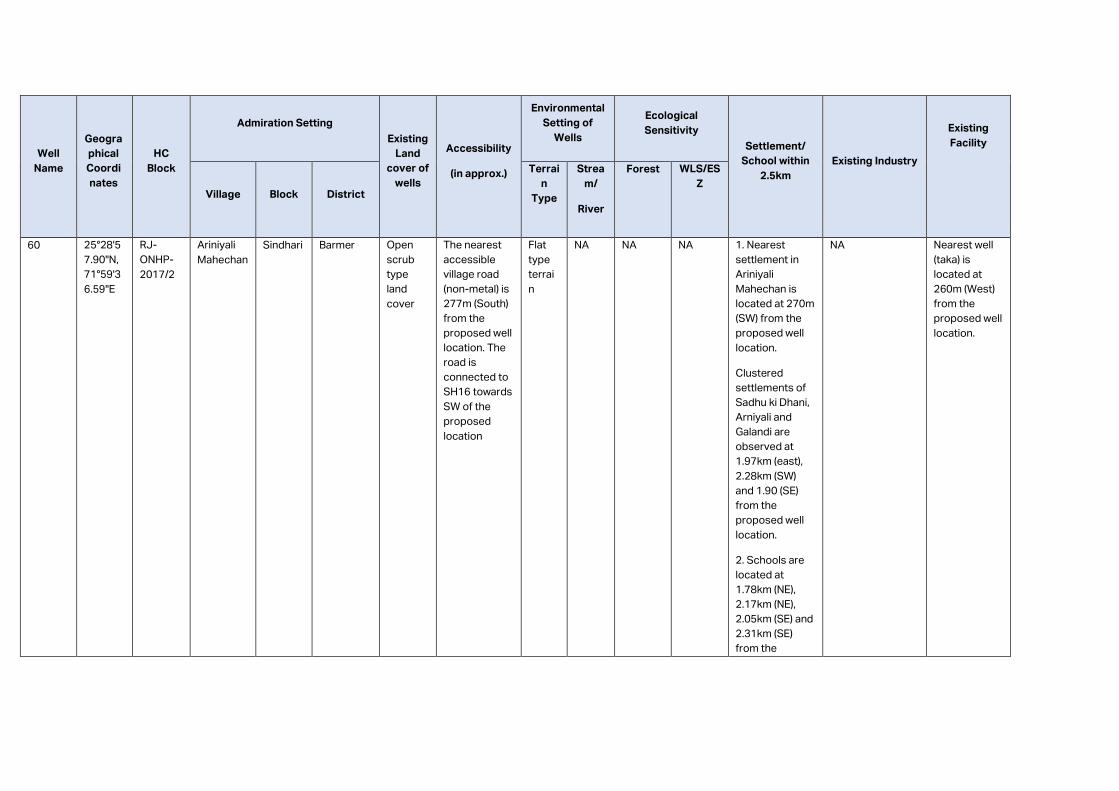
Well
Name
Geogra
phical
Coordi
nates
HC
Block
Admiration Setting
Existing
Land
cover of
wells
Accessibility
(in approx.)
Environmental
Setting of
Wells
Ecological
Sensitivity
Settlement/
School within
2.5km
Existing Industry
Existing
Facility
Village
Block
District
Terrai
n
Type
Strea
m/
River
Forest WLS/ES
Z
60 25°28'5
7.90"N,
71°59'3
6.59"E
RJ-
ONHP-
2017/2
Ariniyali
Mahechan
Sindhari Barmer Open
scrub
type
land
cover
The nearest
accessible
village road
(non-metal) is
277m (South)
from the
proposed well
location. The
road is
connected to
SH16 towards
SW of the
proposed
location
Flat
type
terrai
n
NA NA NA 1. Nearest
settlement in
Ariniyali
Mahechan is
located at 270m
(SW) from the
proposed well
location.
Clustered
settlements of
Sadhu ki Dhani,
Arniyali and
Galandi are
observed at
1.97km (east),
2.28km (SW)
and 1.90 (SE)
from the
proposed well
location.
2. Schools are
located at
1.78km (NE),
2.17km (NE),
2.05km (SE) and
2.31km (SE)
from the
NA Nearest well
(taka) is
located at
260m (West)
from the
proposed well
location.
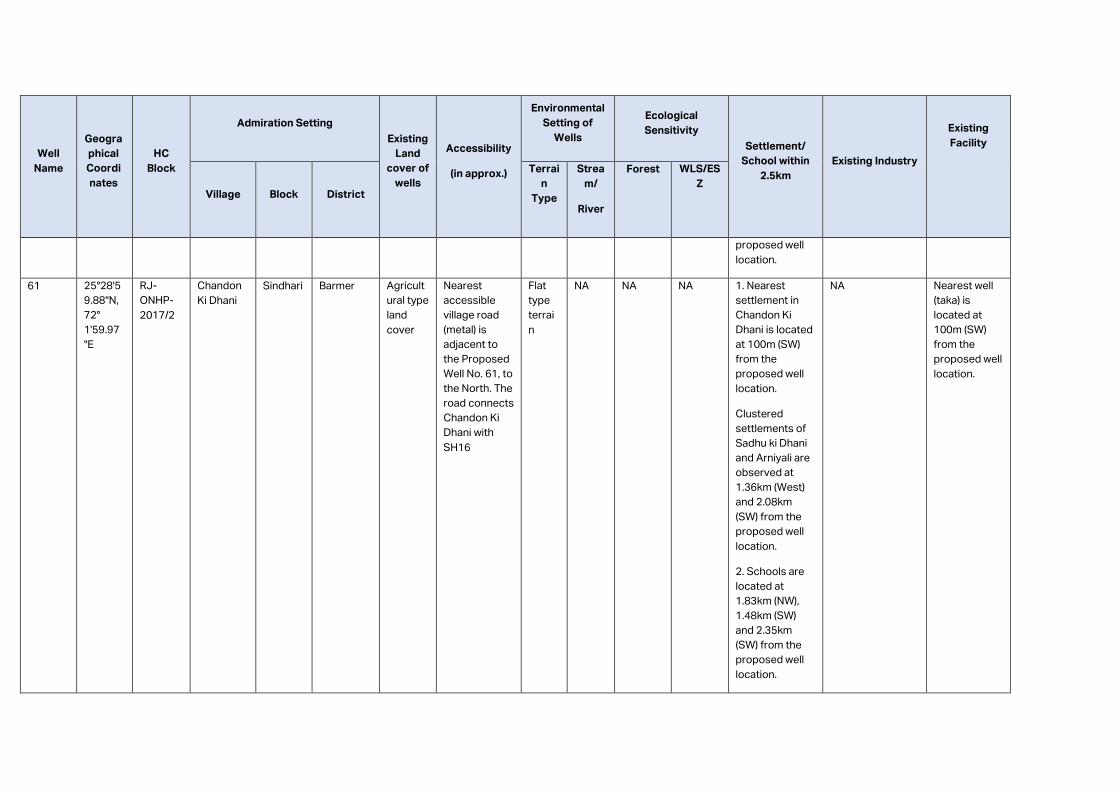
Well
Name
Geogra
phical
Coordi
nates
HC
Block
Admiration Setting
Existing
Land
cover of
wells
Accessibility
(in approx.)
Environmental
Setting of
Wells
Ecological
Sensitivity
Settlement/
School within
2.5km
Existing Industry
Existing
Facility
Village
Block
District
Terrai
n
Type
Strea
m/
River
Forest WLS/ES
Z
proposed well
location.
61 25°28'5
9.88"N,
72°
1'59.97
"E
RJ-
ONHP-
2017/2
Chandon
Ki Dhani
Sindhari Barmer Agricult
ural type
land
cover
Nearest
accessible
village road
(metal) is
adjacent to
the Proposed
Well No. 61, to
the North. The
road connects
Chandon Ki
Dhani with
SH16
Flat
type
terrai
n
NA NA NA 1. Nearest
settlement in
Chandon Ki
Dhani is located
at 100m (SW)
from the
proposed well
location.
Clustered
settlements of
Sadhu ki Dhani
and Arniyali are
observed at
1.36km (West)
and 2.08km
(SW) from the
proposed well
location.
2. Schools are
located at
1.83km (NW),
1.48km (SW)
and 2.35km
(SW) from the
proposed well
location.
NA Nearest well
(taka) is
located at
100m (SW)
from the
proposed well
location.
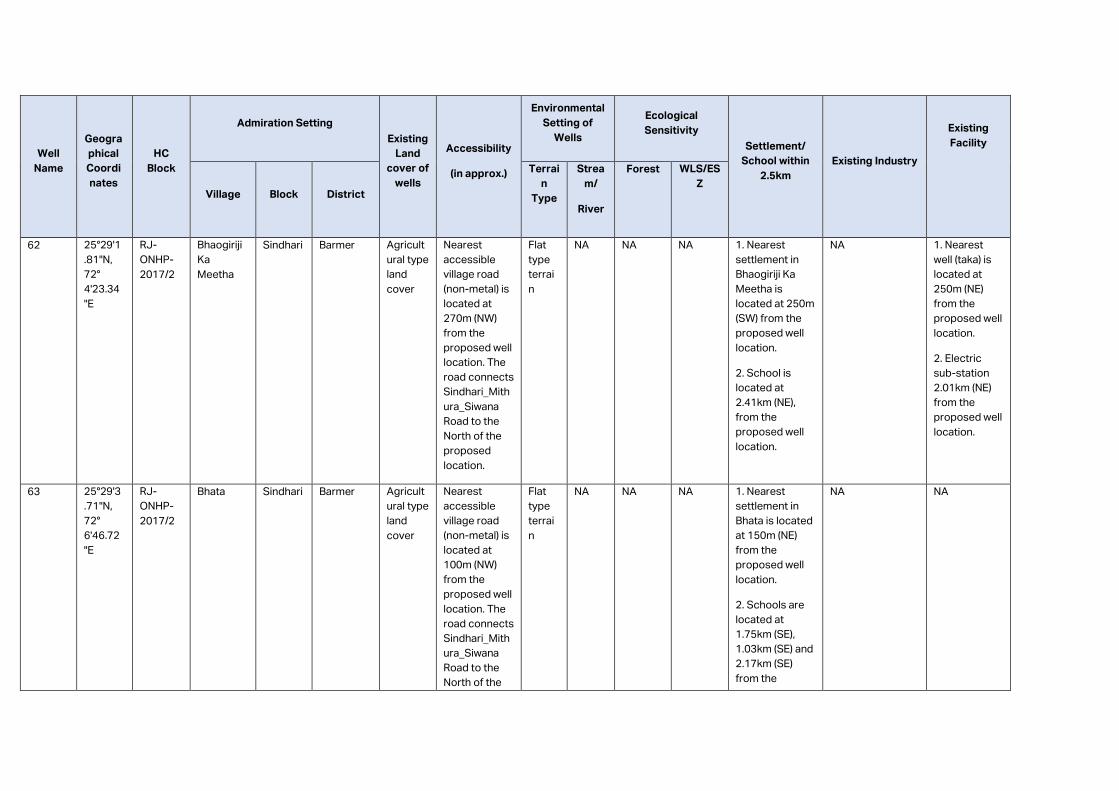
Well
Name
Geogra
phical
Coordi
nates
HC
Block
Admiration Setting
Existing
Land
cover of
wells
Accessibility
(in approx.)
Environmental
Setting of
Wells
Ecological
Sensitivity
Settlement/
School within
2.5km
Existing Industry
Existing
Facility
Village
Block
District
Terrai
n
Type
Strea
m/
River
Forest WLS/ES
Z
62 25°29'1
.81"N,
72°
4'23.34
"E
RJ-
ONHP-
2017/2
Bhaogiriji
Ka
Meetha
Sindhari Barmer Agricult
ural type
land
cover
Nearest
accessible
village road
(non-metal) is
located at
270m (NW)
from the
proposed well
location. The
road connects
Sindhari_Mith
ura_Siwana
Road to the
North of the
proposed
location.
Flat
type
terrai
n
NA NA NA 1. Nearest
settlement in
Bhaogiriji Ka
Meetha is
located at 250m
(SW) from the
proposed well
location.
2. School is
located at
2.41km (NE),
from the
proposed well
location.
NA 1. Nearest
well (taka) is
located at
250m (NE)
from the
proposed well
location.
2. Electric
sub-station
2.01km (NE)
from the
proposed well
location.
63 25°29'3
.71"N,
72°
6'46.72
"E
RJ-
ONHP-
2017/2
Bhata Sindhari Barmer Agricult
ural type
land
cover
Nearest
accessible
village road
(non-metal) is
located at
100m (NW)
from the
proposed well
location. The
road connects
Sindhari_Mith
ura_Siwana
Road to the
North of the
Flat
type
terrai
n
NA NA NA 1. Nearest
settlement in
Bhata is located
at 150m (NE)
from the
proposed well
location.
2. Schools are
located at
1.75km (SE),
1.03km (SE) and
2.17km (SE)
from the
NA NA
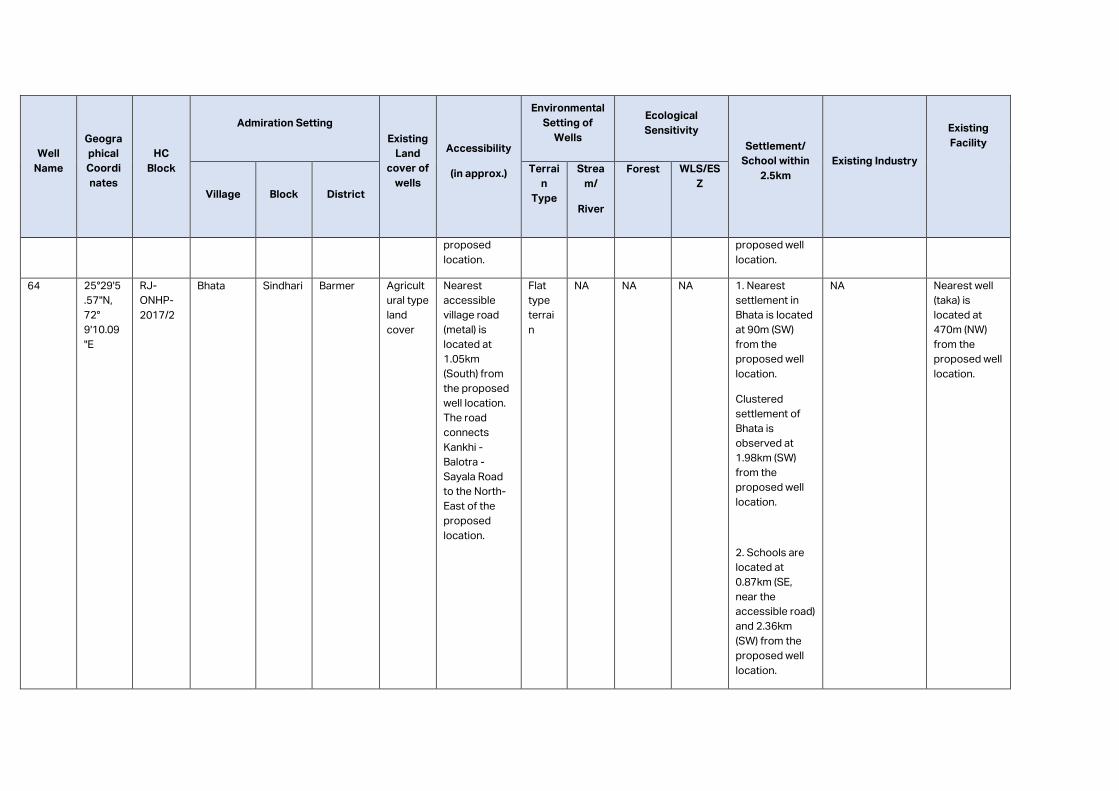
Well
Name
Geogra
phical
Coordi
nates
HC
Block
Admiration Setting
Existing
Land
cover of
wells
Accessibility
(in approx.)
Environmental
Setting of
Wells
Ecological
Sensitivity
Settlement/
School within
2.5km
Existing Industry
Existing
Facility
Village
Block
District
Terrai
n
Type
Strea
m/
River
Forest WLS/ES
Z
proposed
location.
proposed well
location.
64 25°29'5
.57"N,
72°
9'10.09
"E
RJ-
ONHP-
2017/2
Bhata Sindhari Barmer Agricult
ural type
land
cover
Nearest
accessible
village road
(metal) is
located at
1.05km
(South) from
the proposed
well location.
The road
connects
Kankhi -
Balotra -
Sayala Road
to the North-
East of the
proposed
location.
Flat
type
terrai
n
NA NA NA 1. Nearest
settlement in
Bhata is located
at 90m (SW)
from the
proposed well
location.
Clustered
settlement of
Bhata is
observed at
1.98km (SW)
from the
proposed well
location.
2. Schools are
located at
0.87km (SE,
near the
accessible road)
and 2.36km
(SW) from the
proposed well
location.
NA Nearest well
(taka) is
located at
470m (NW)
from the
proposed well
location.
Appendix 2.4:
Environment
Settings of Well
(1km buffer map for
each well)
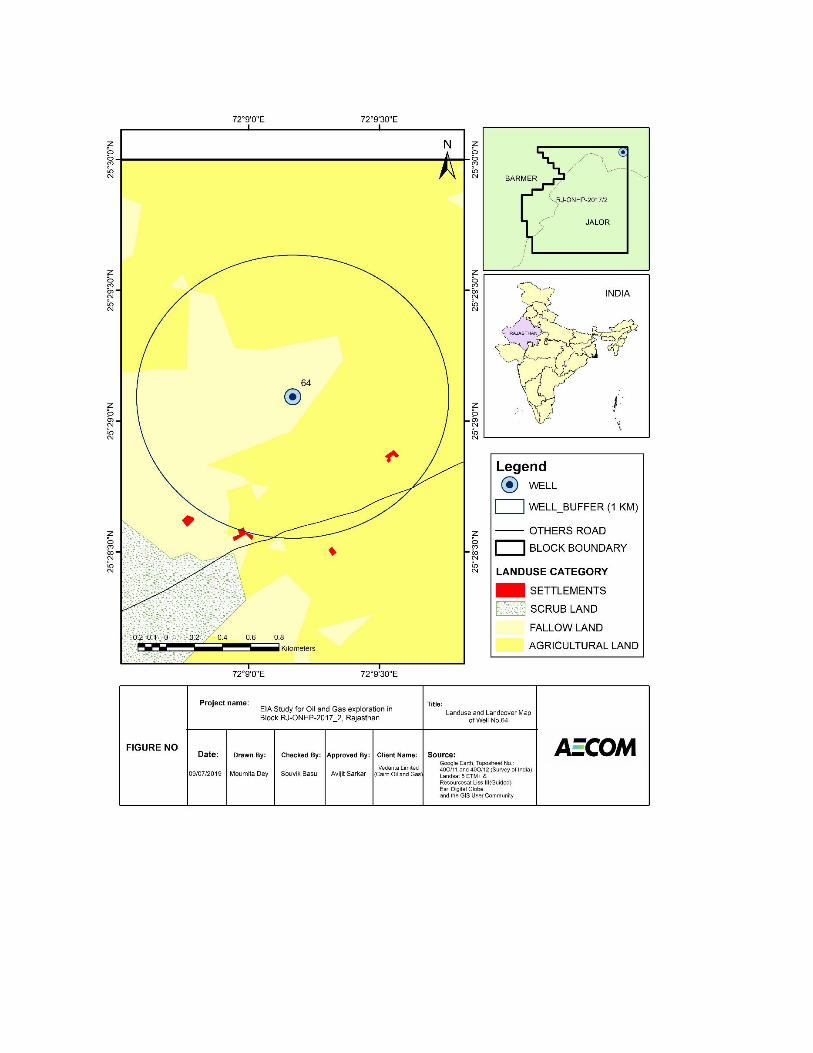
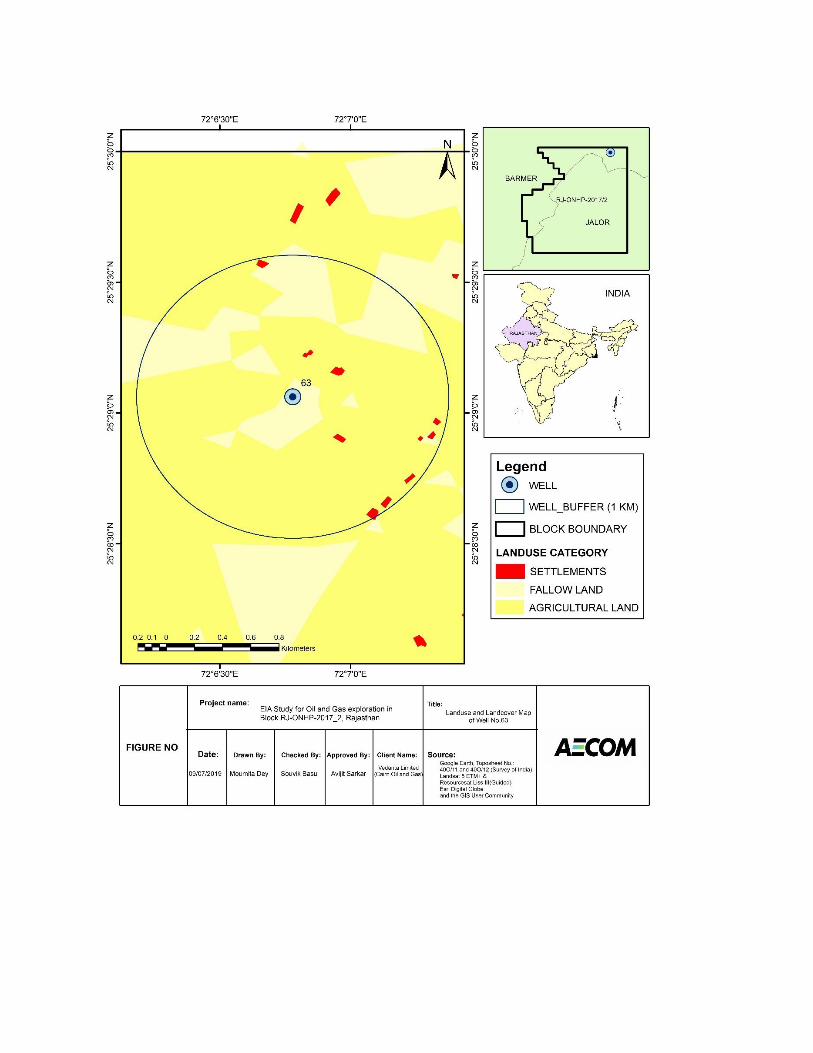
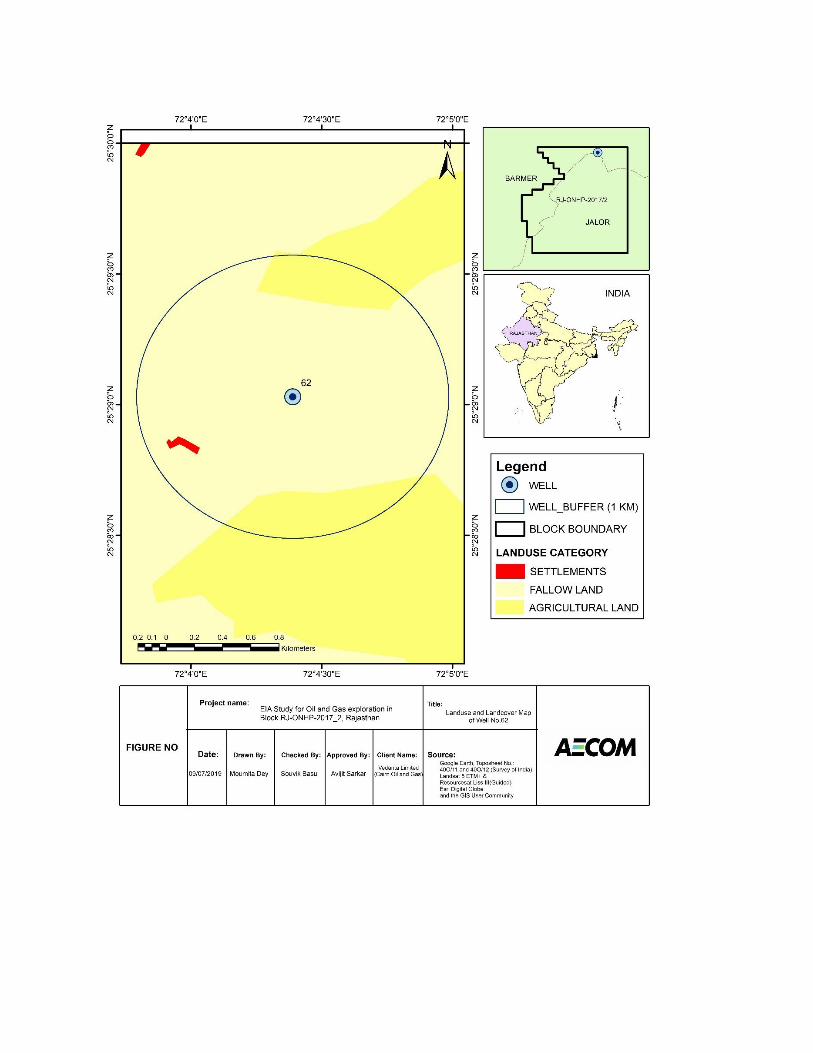
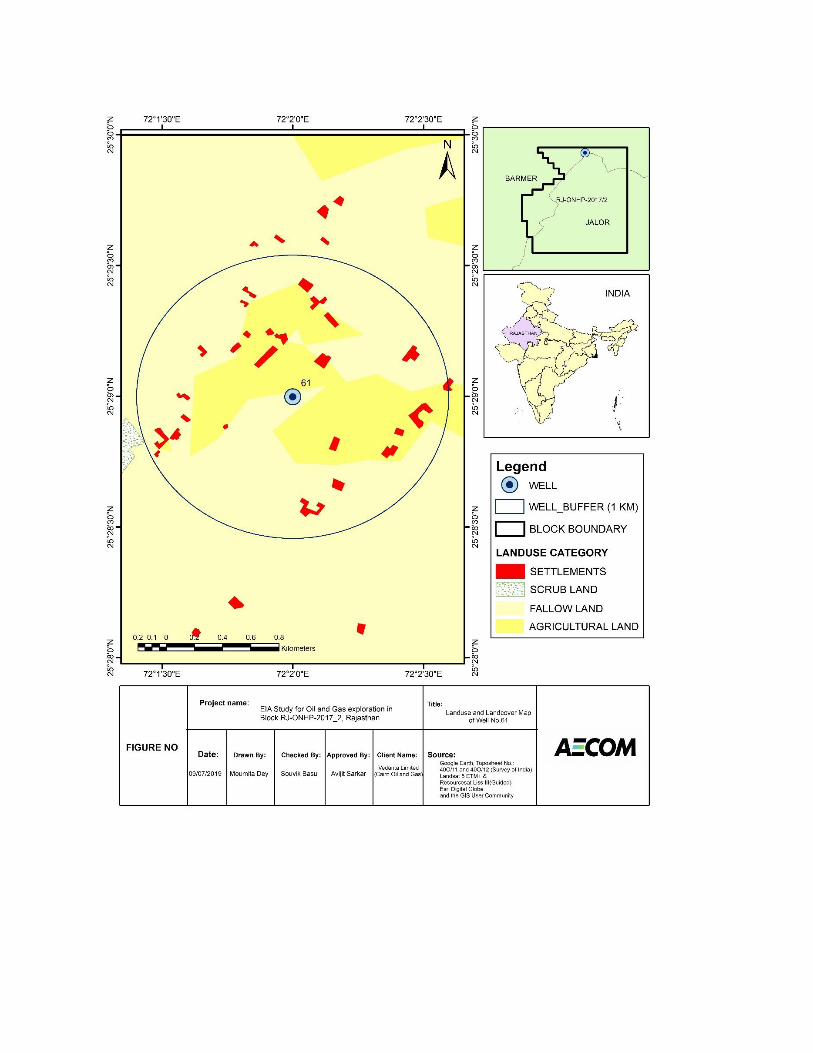
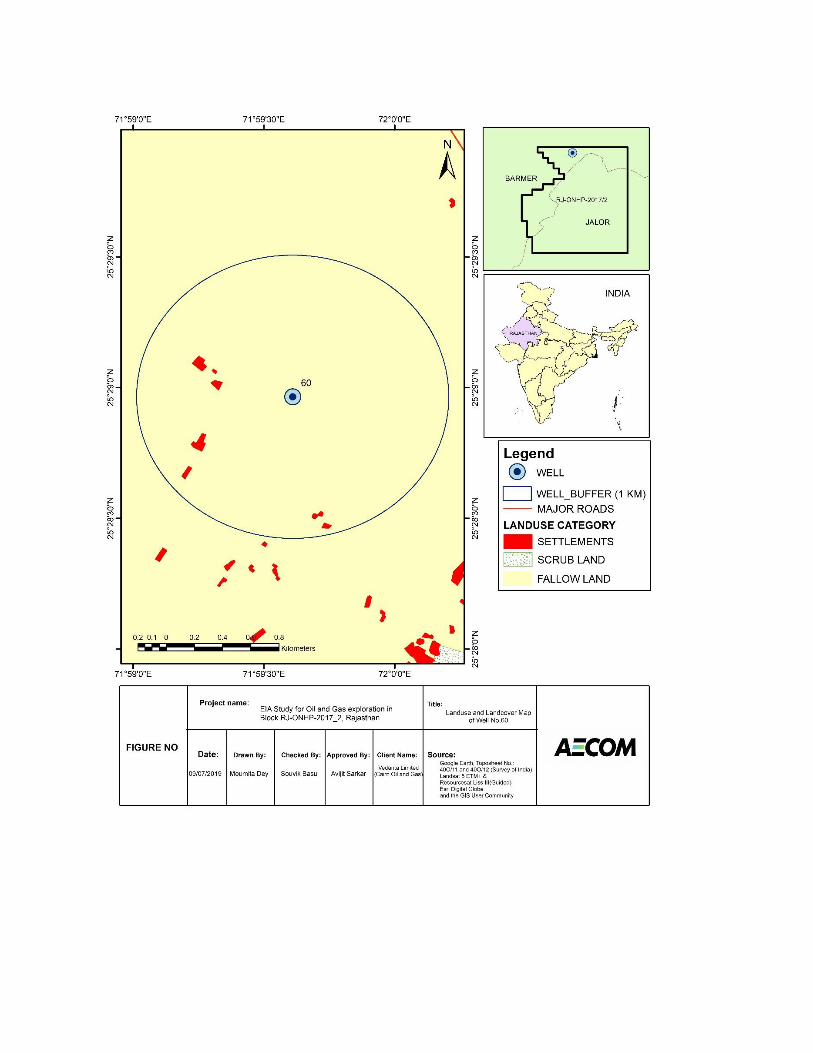
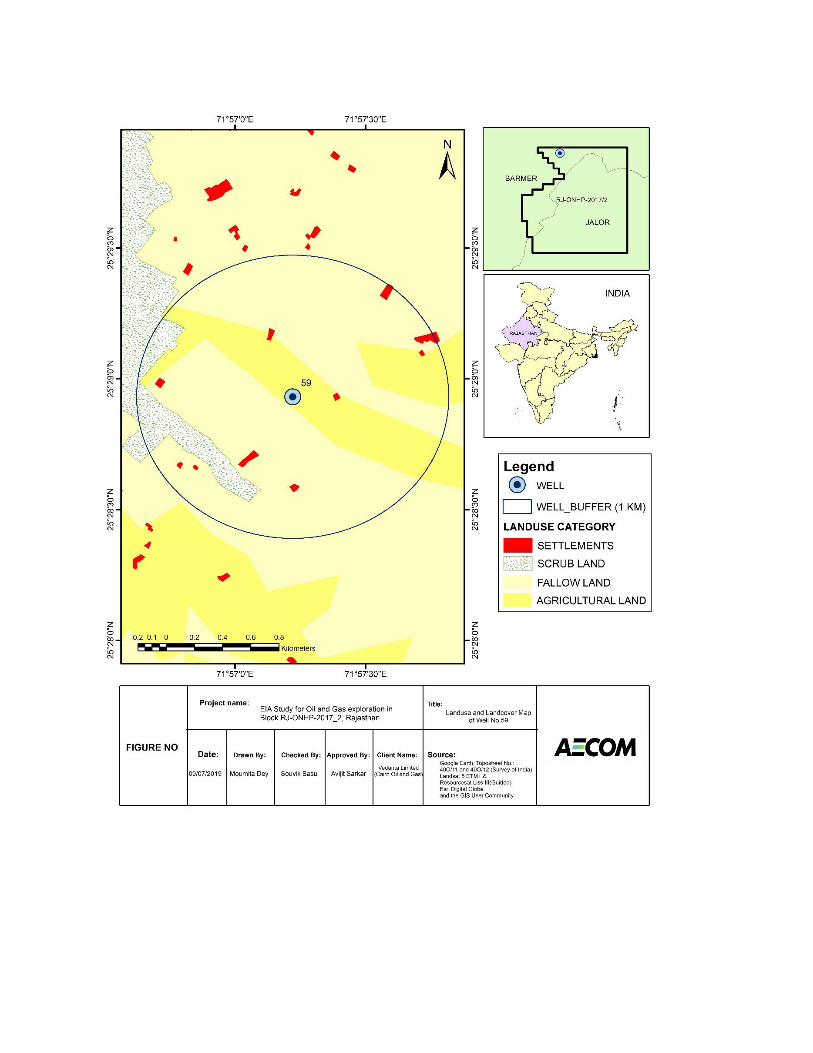
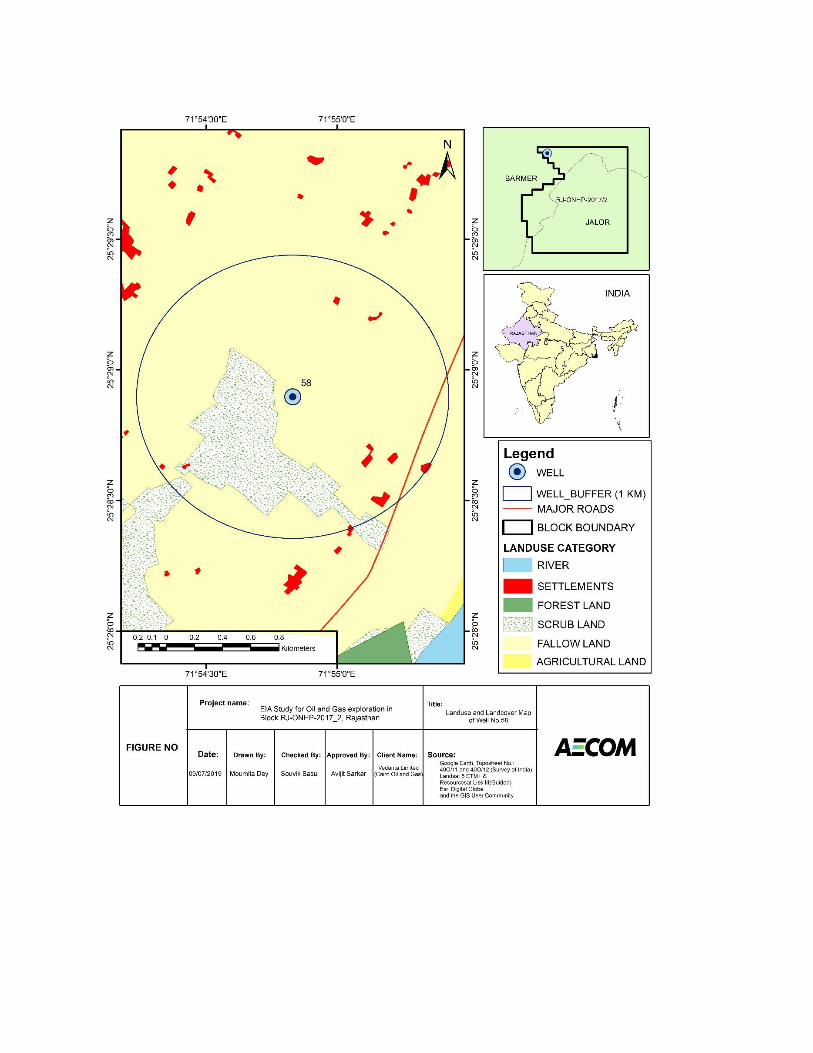
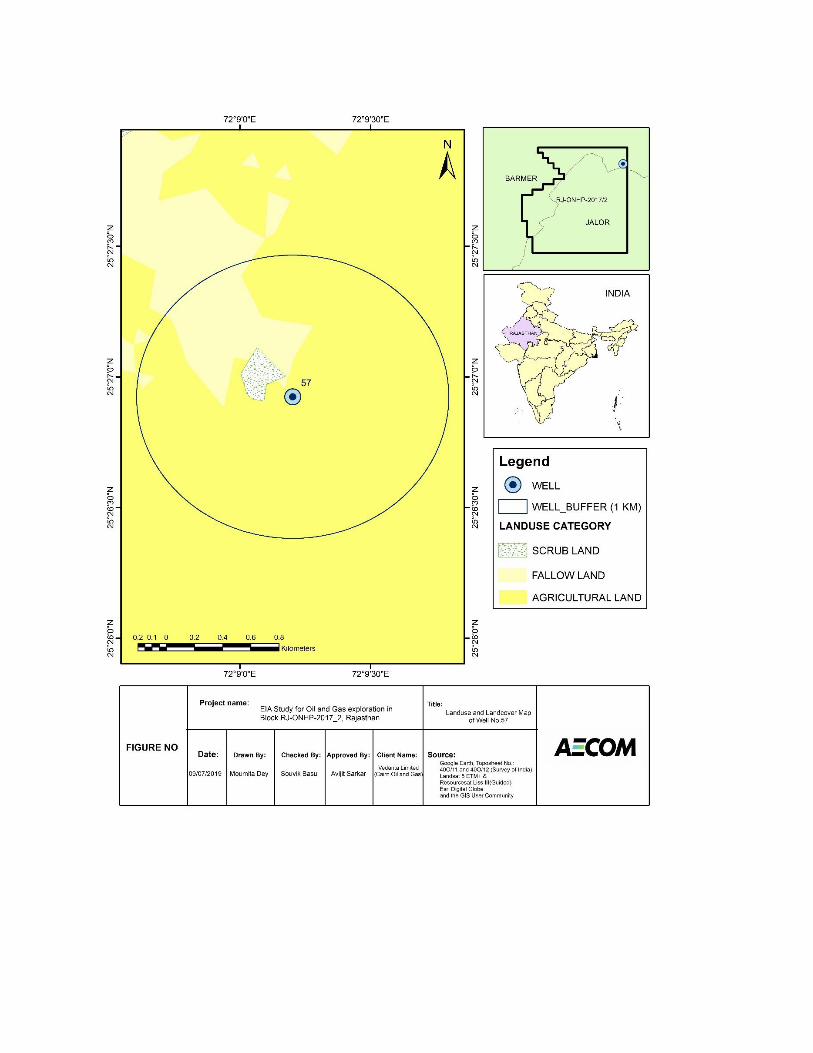
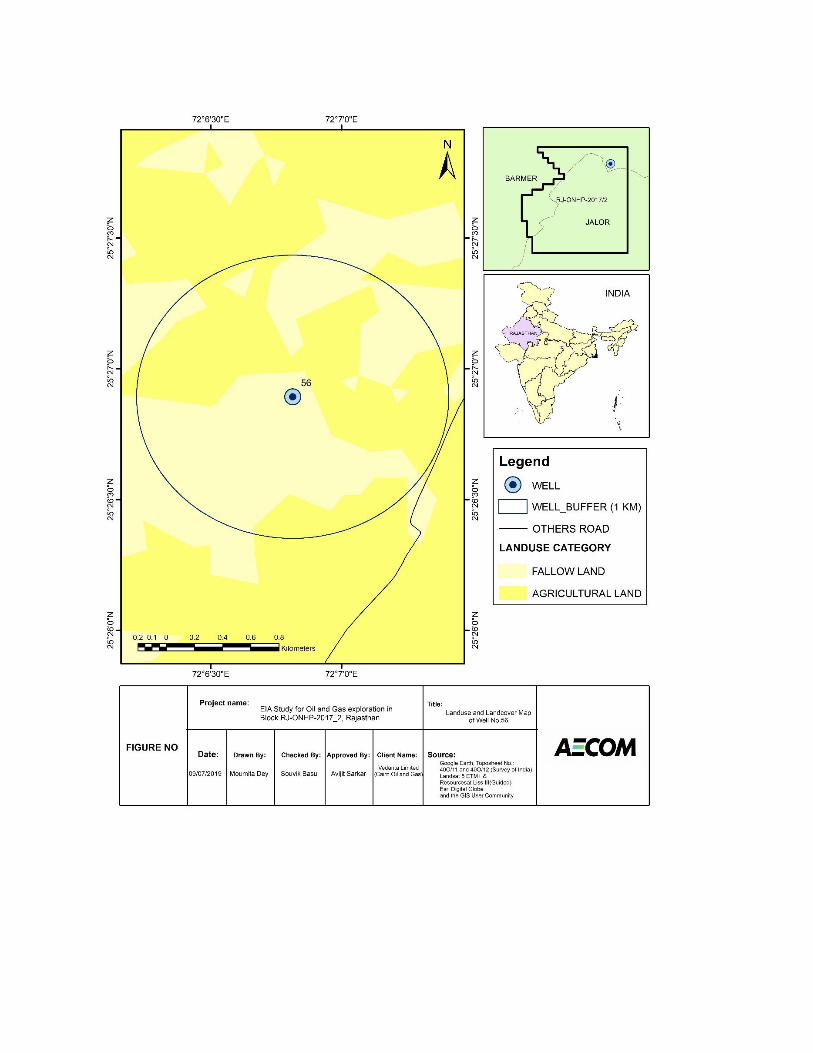
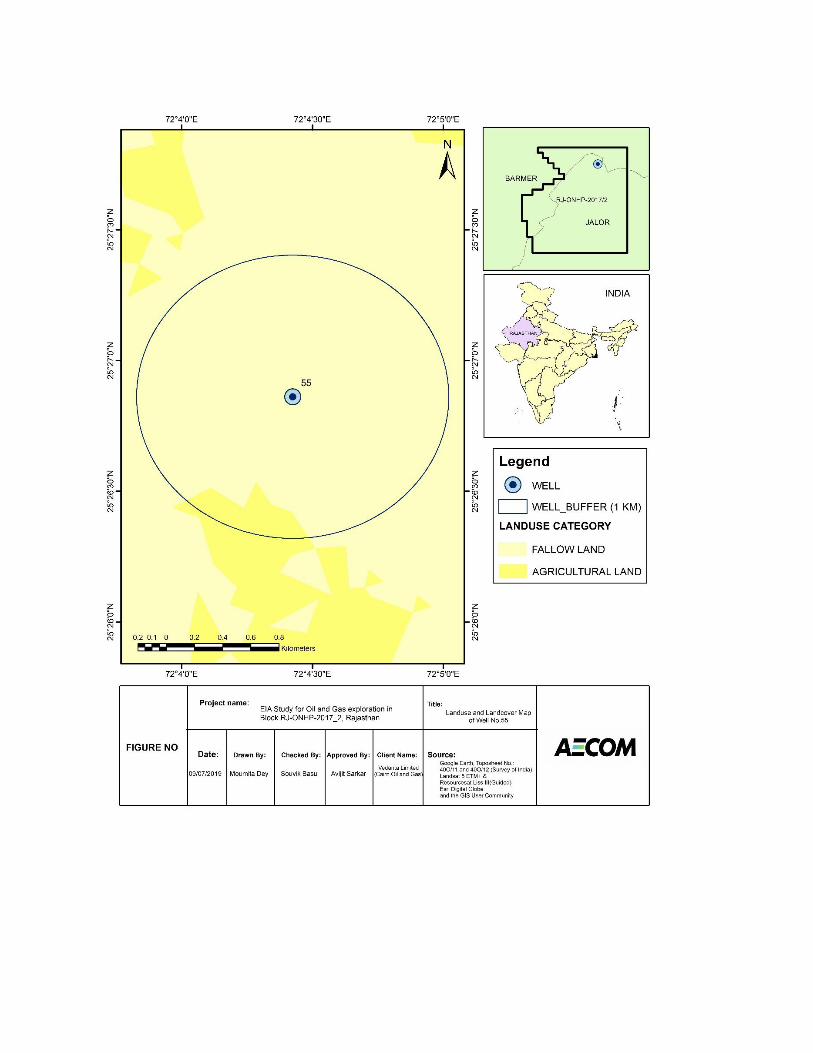
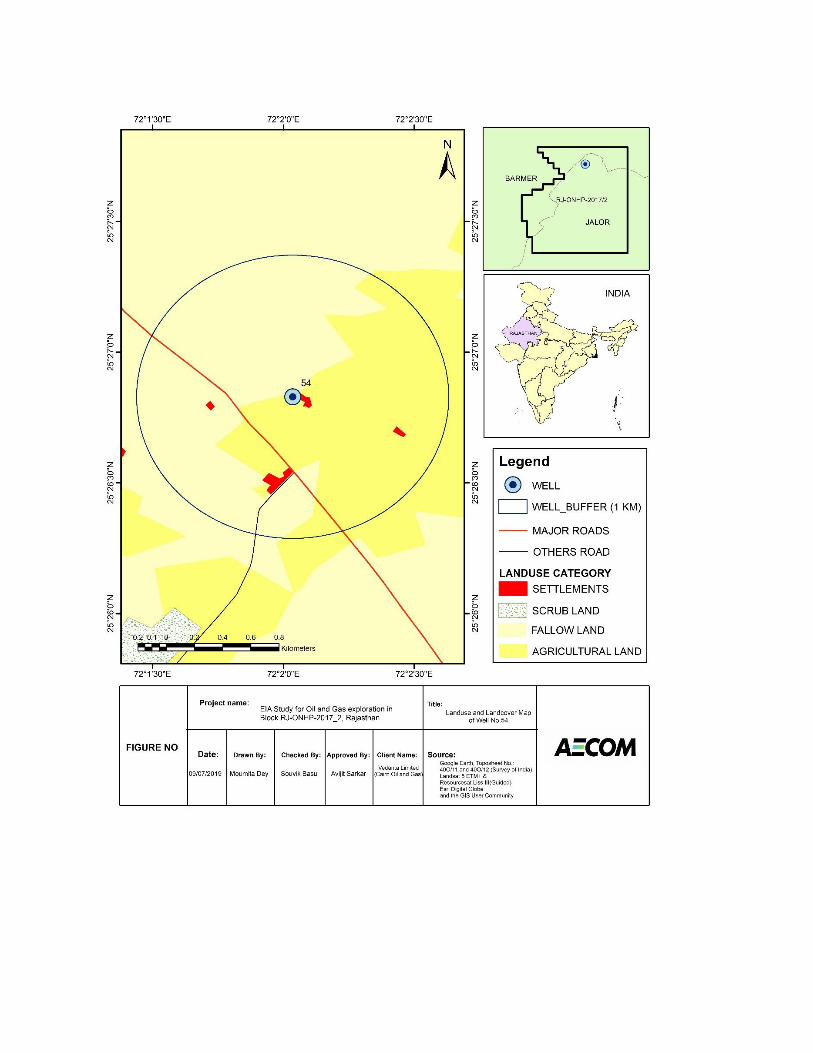
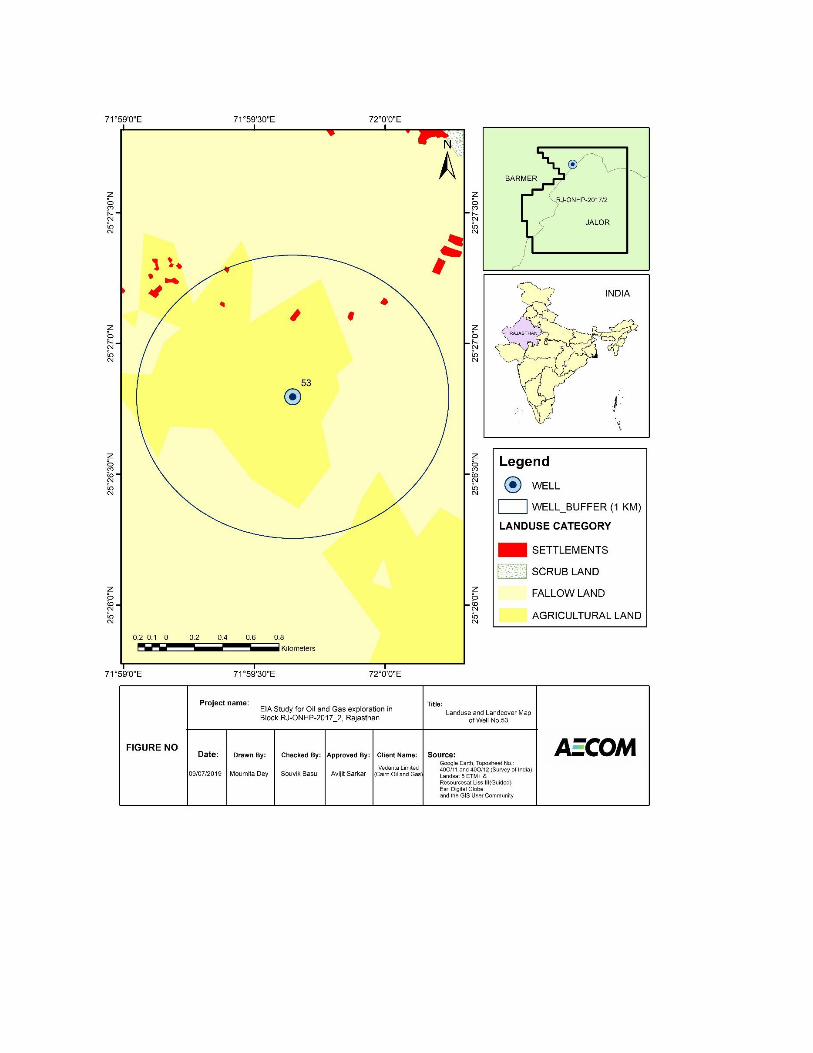
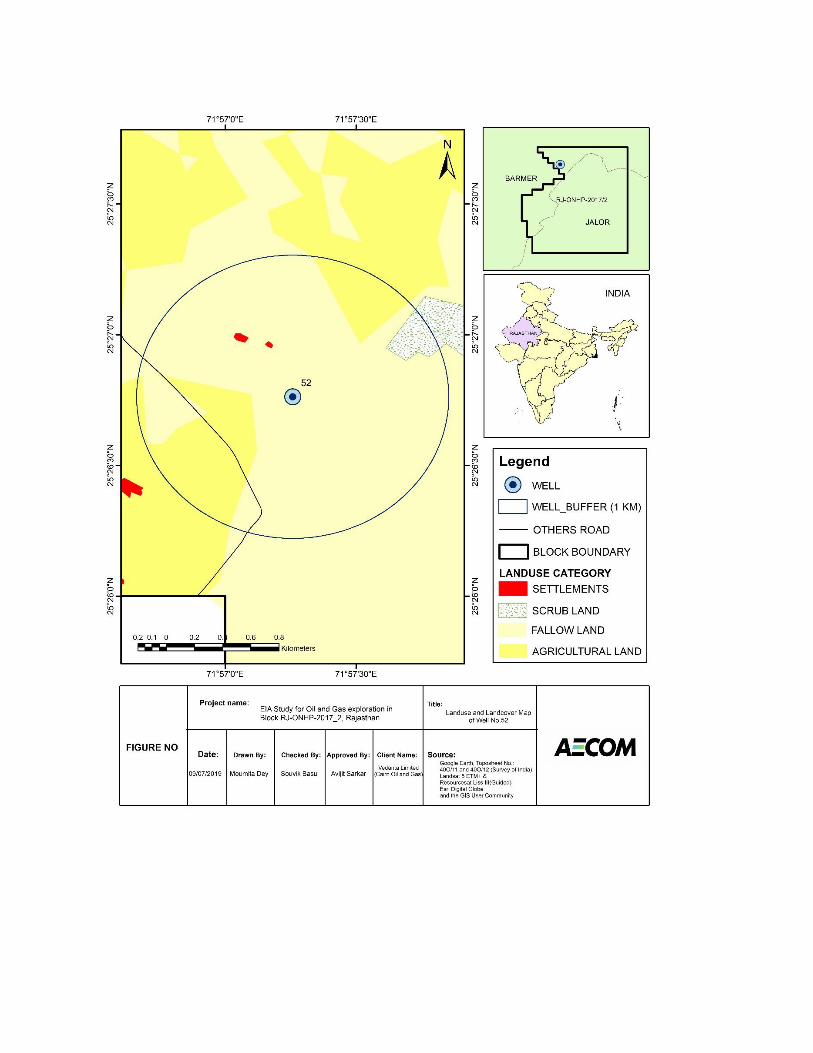
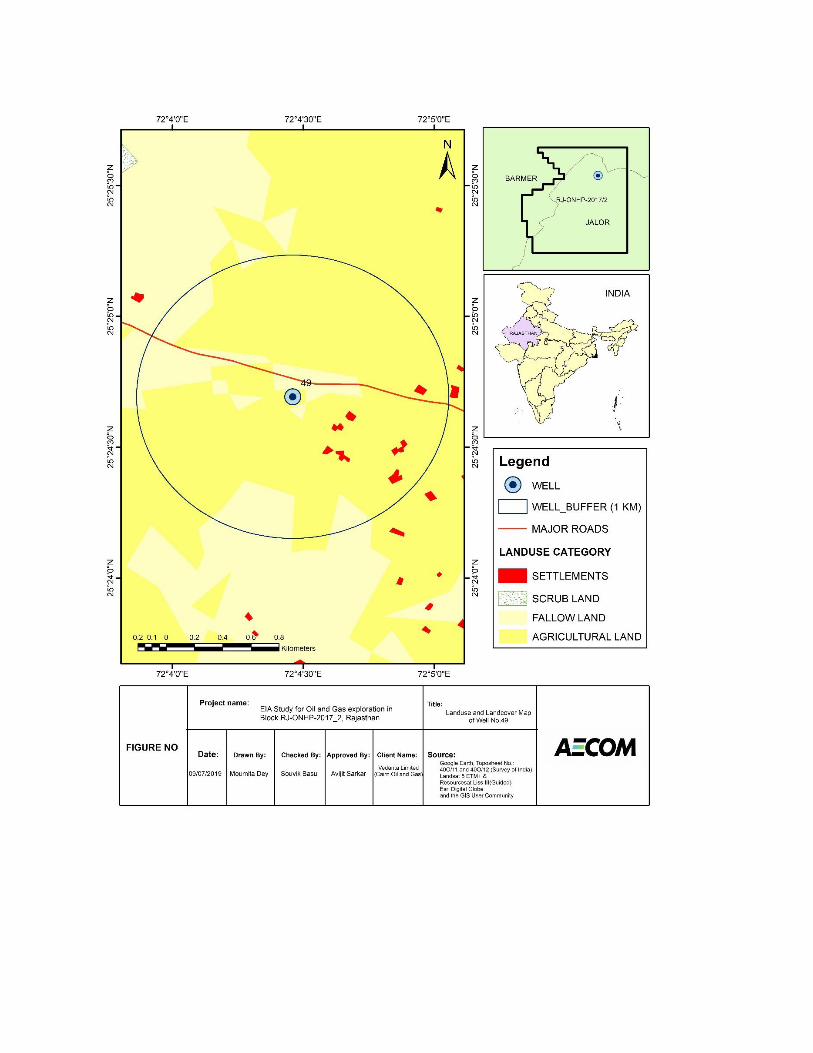
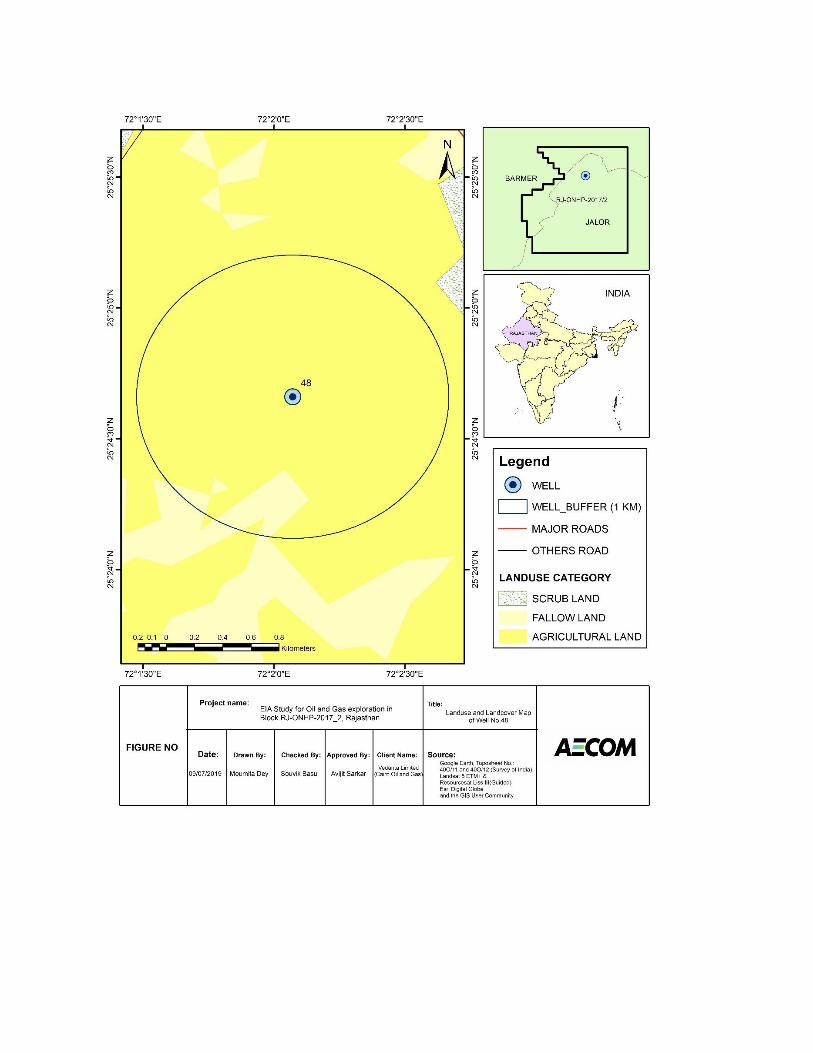
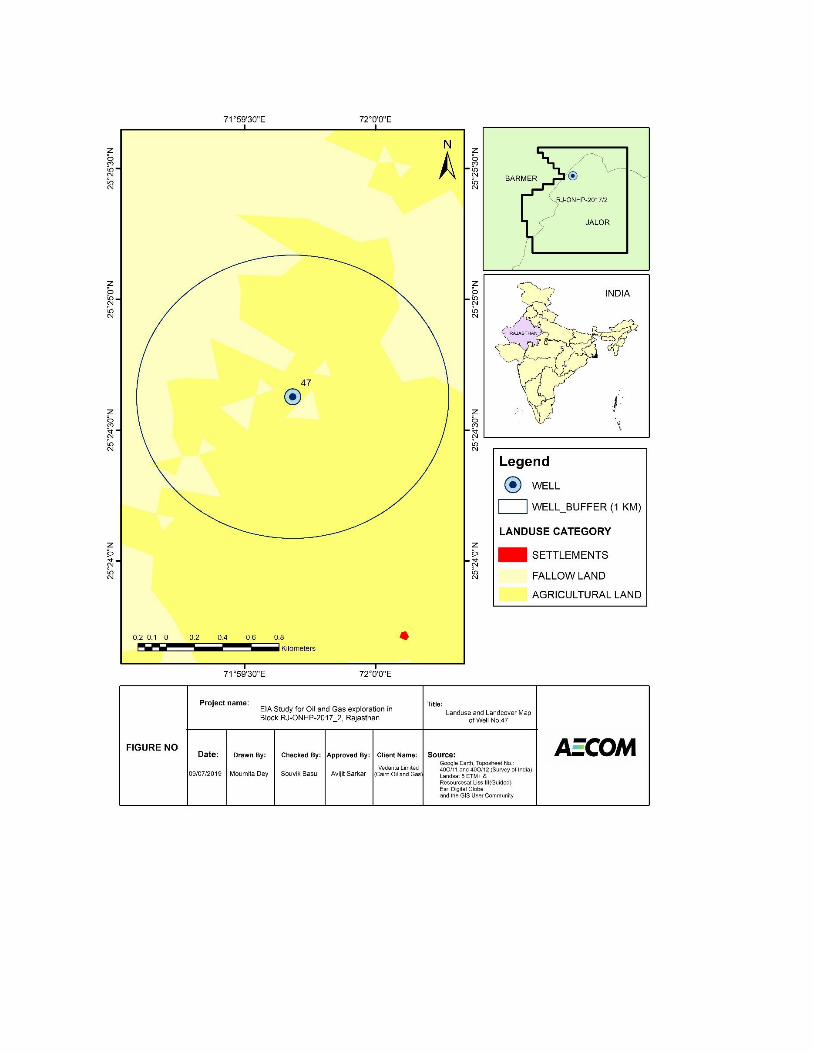
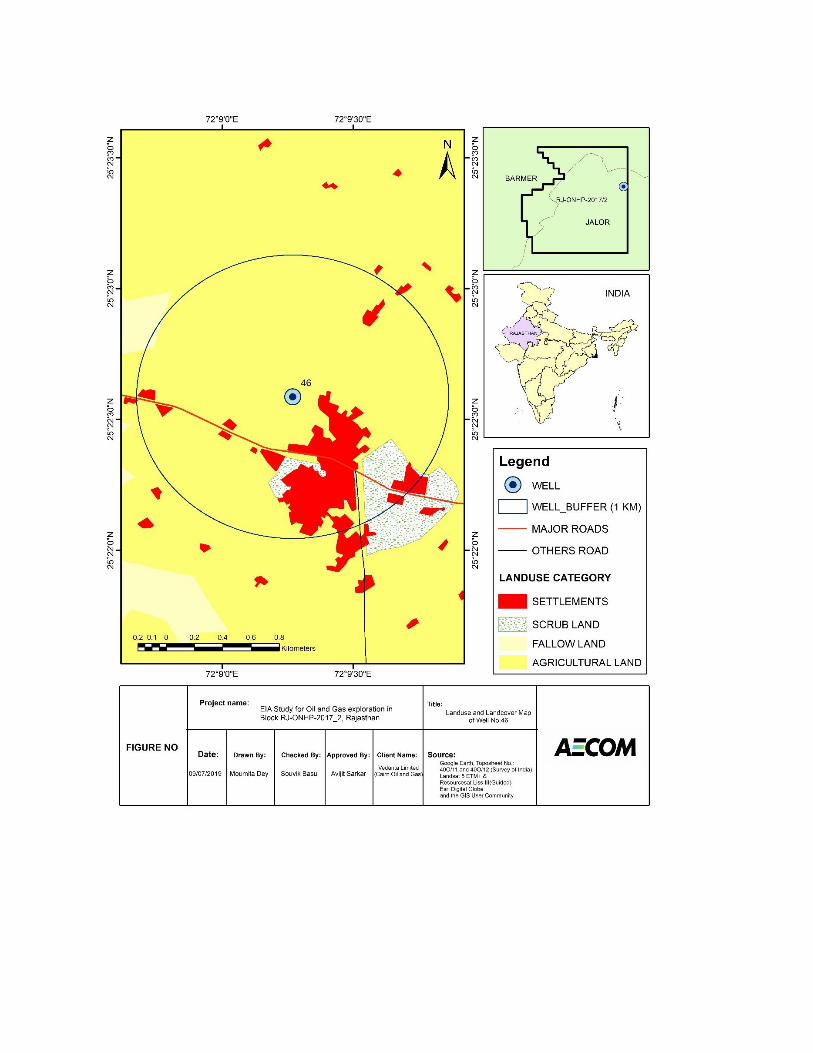
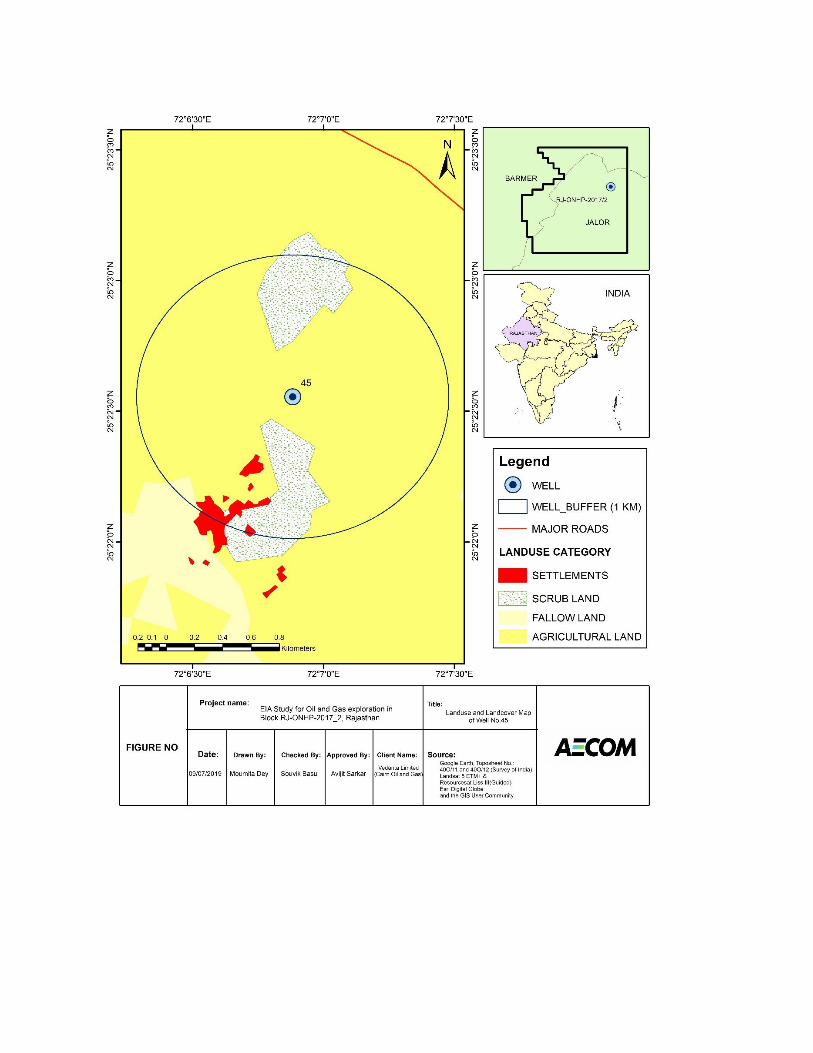
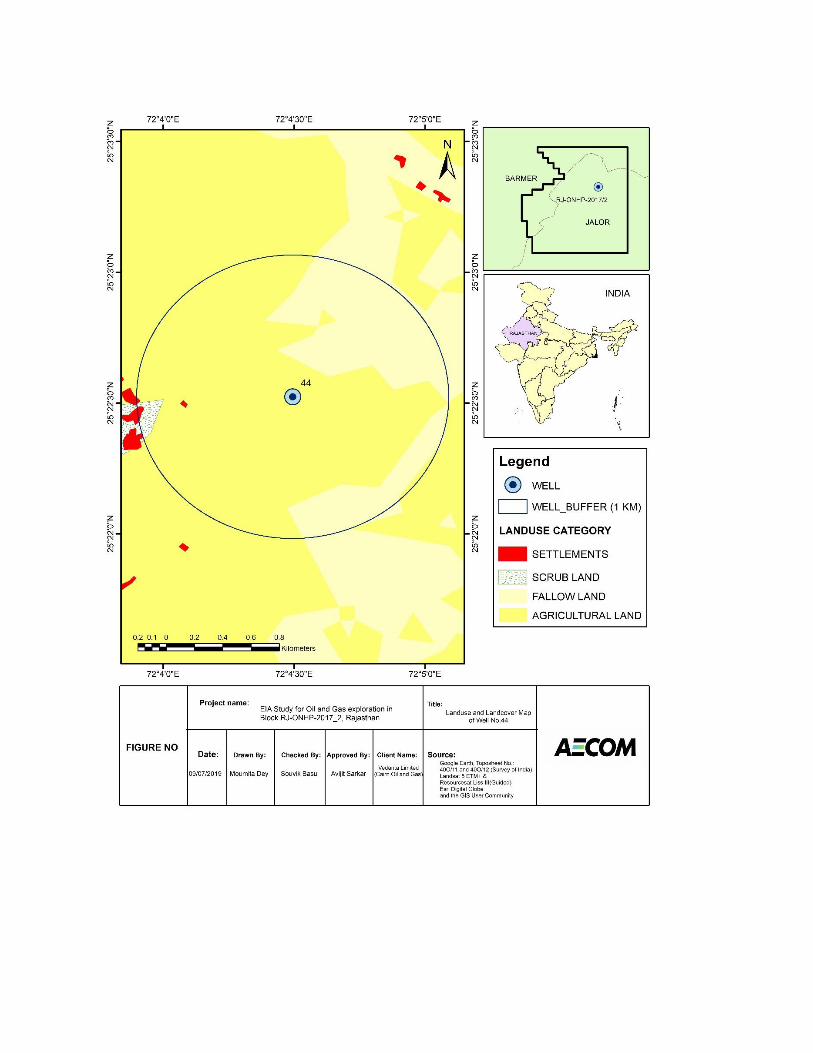
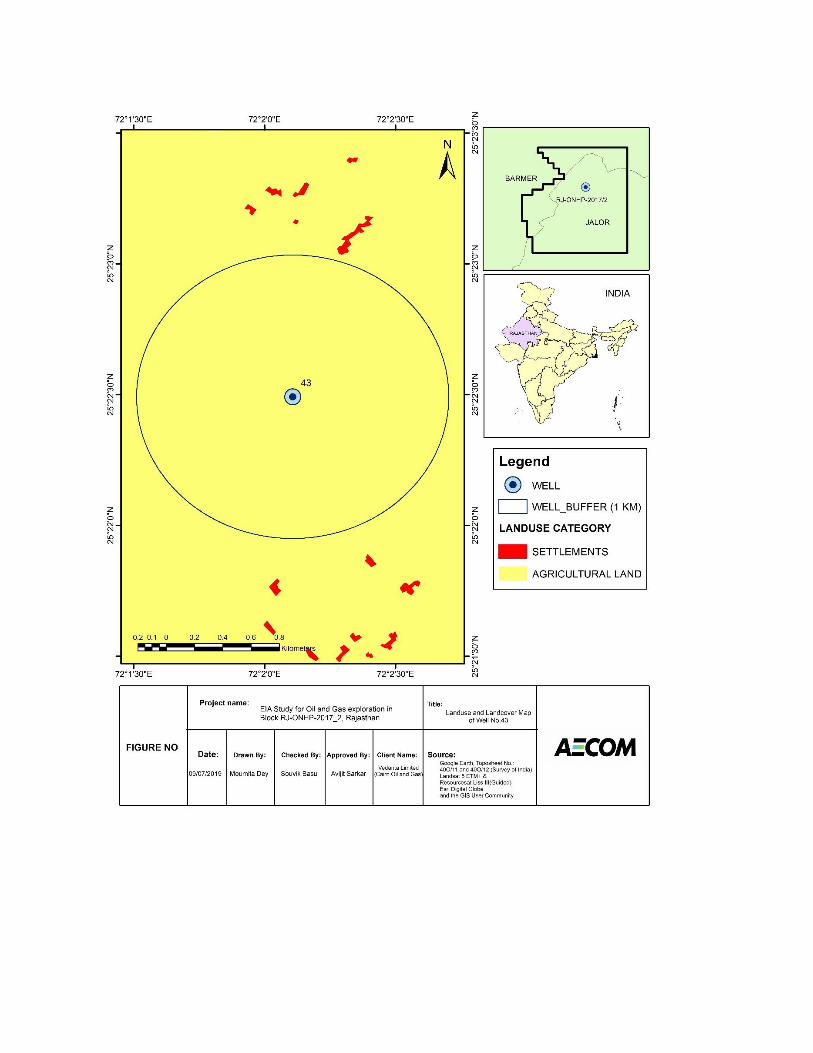
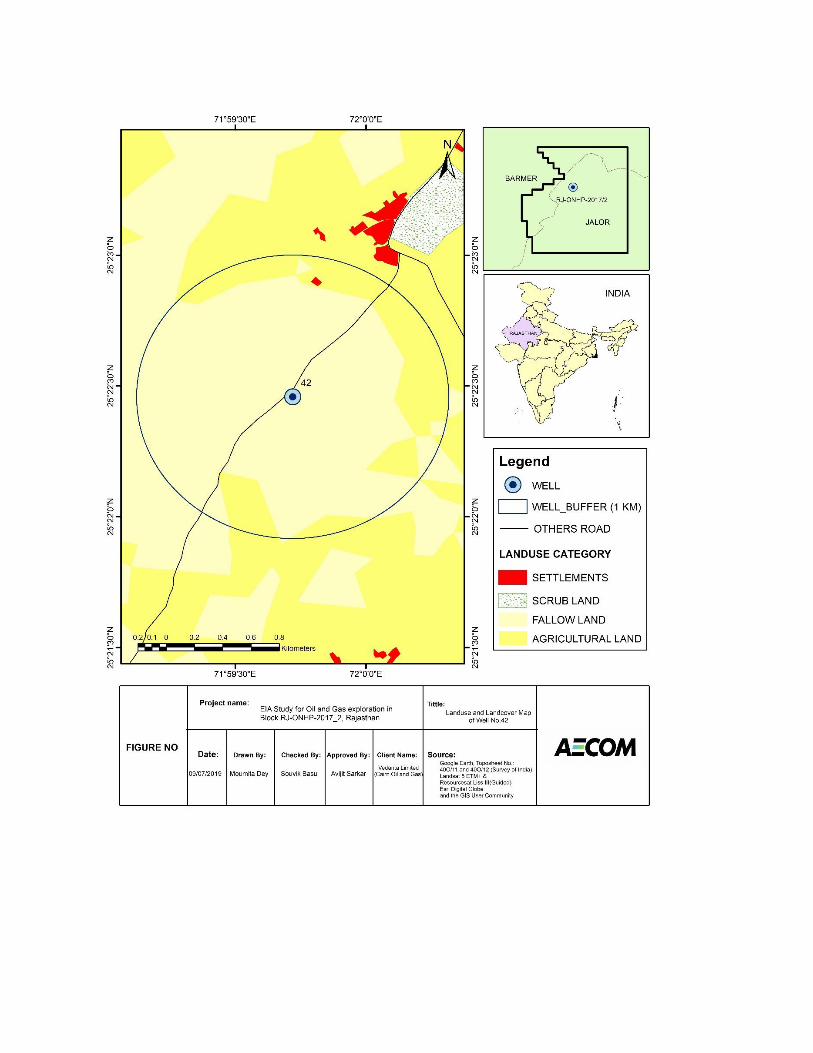
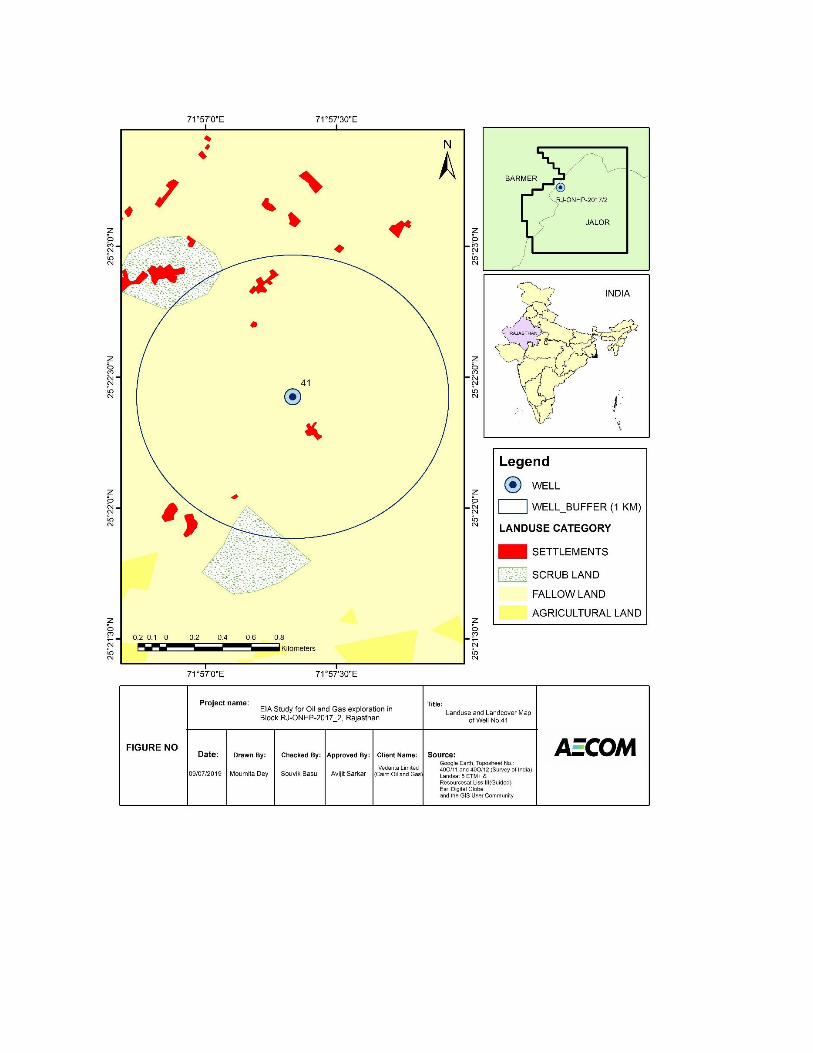
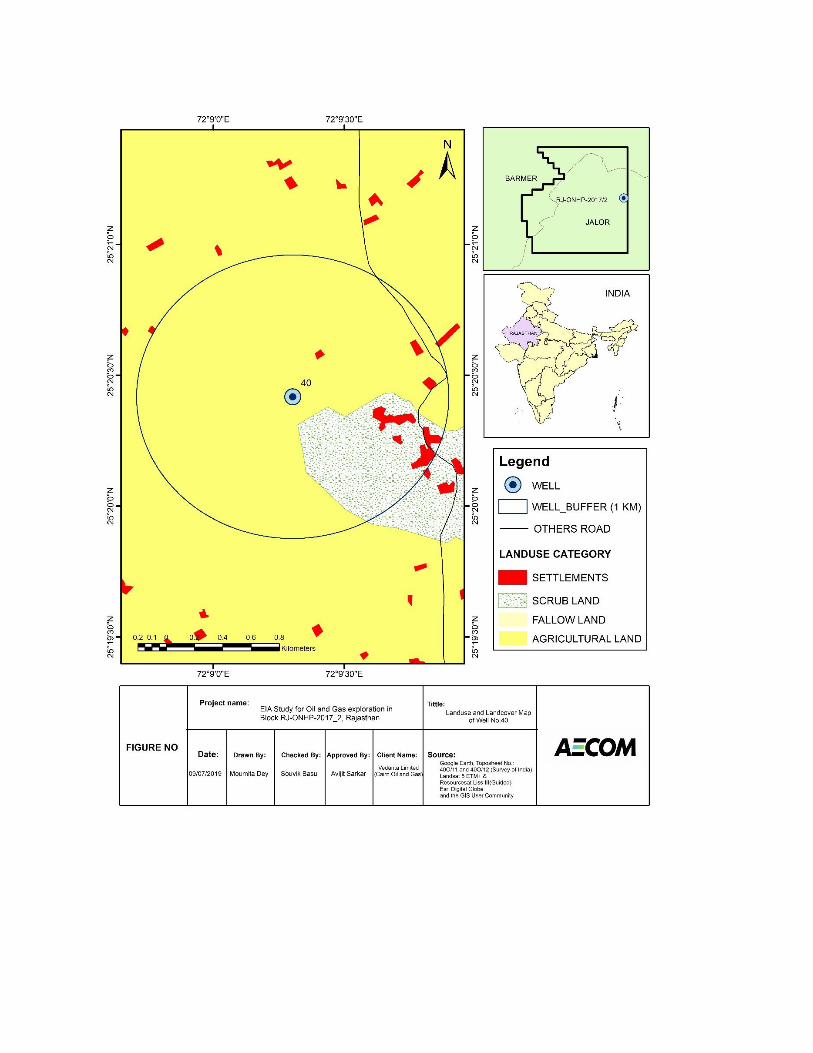
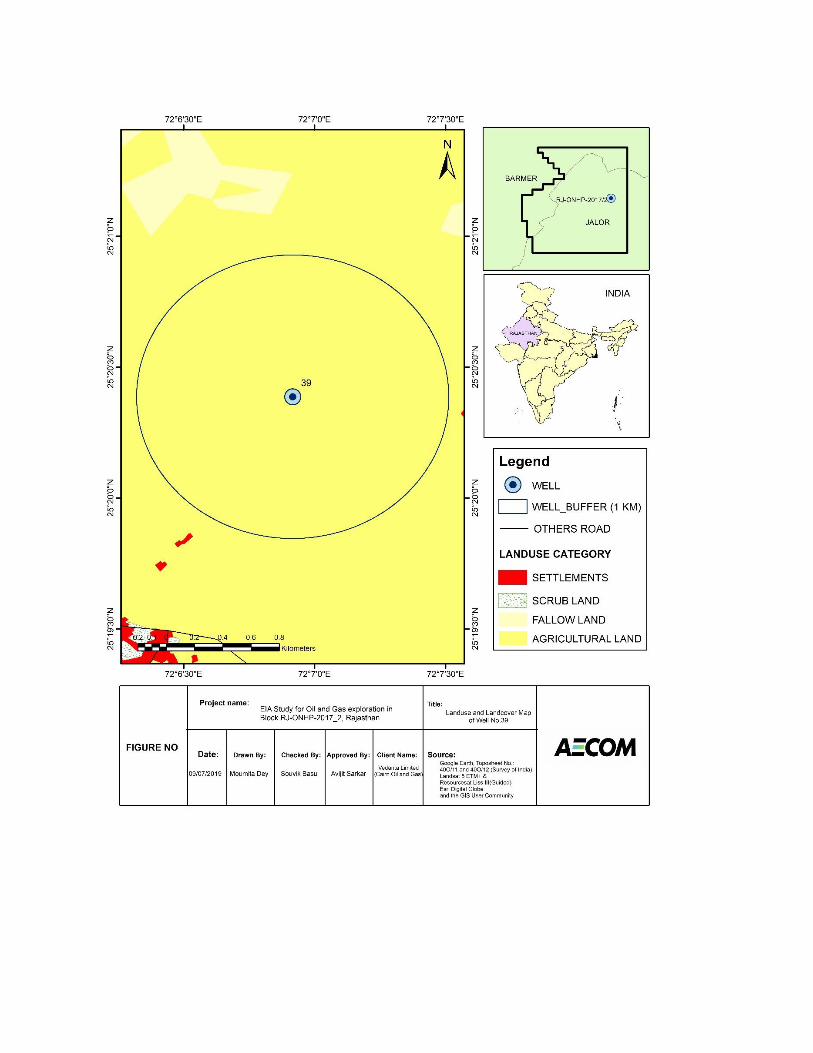
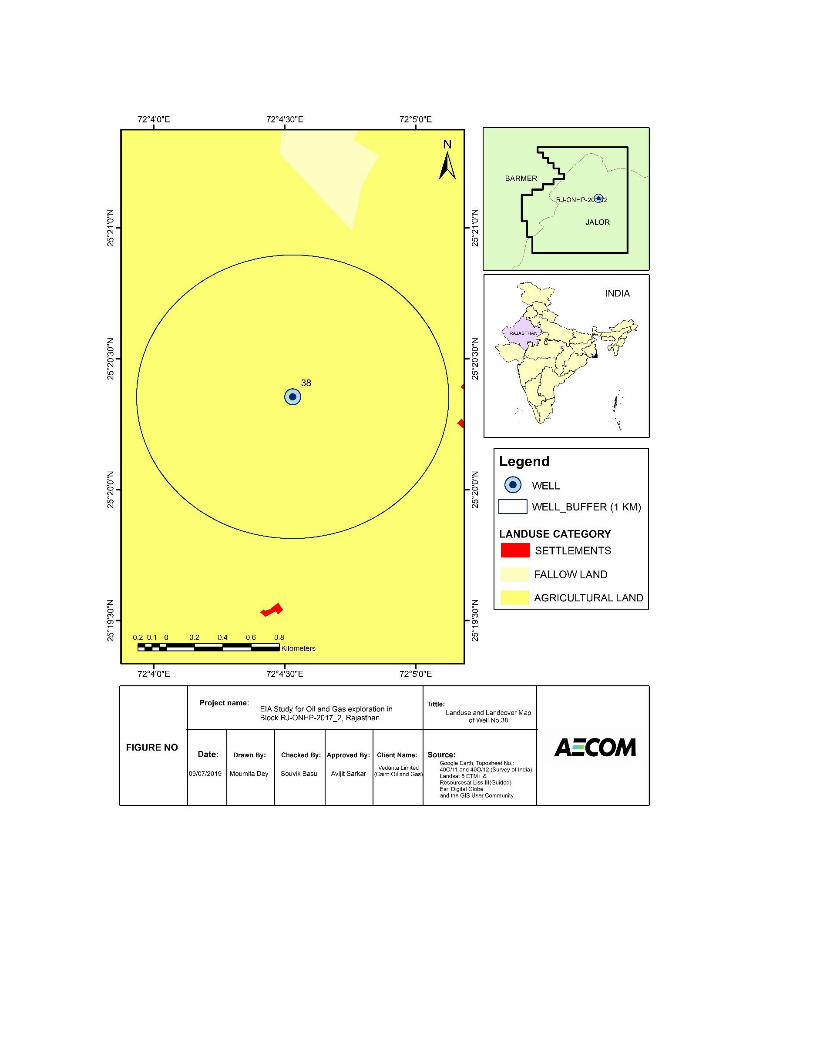
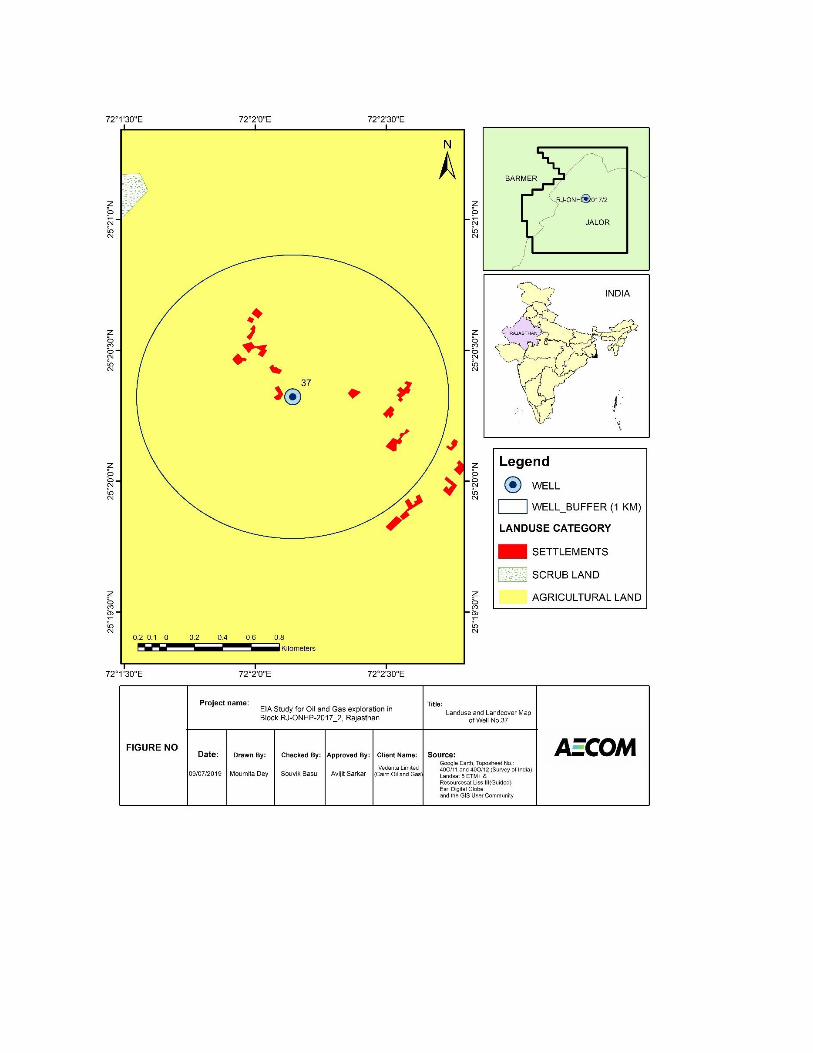
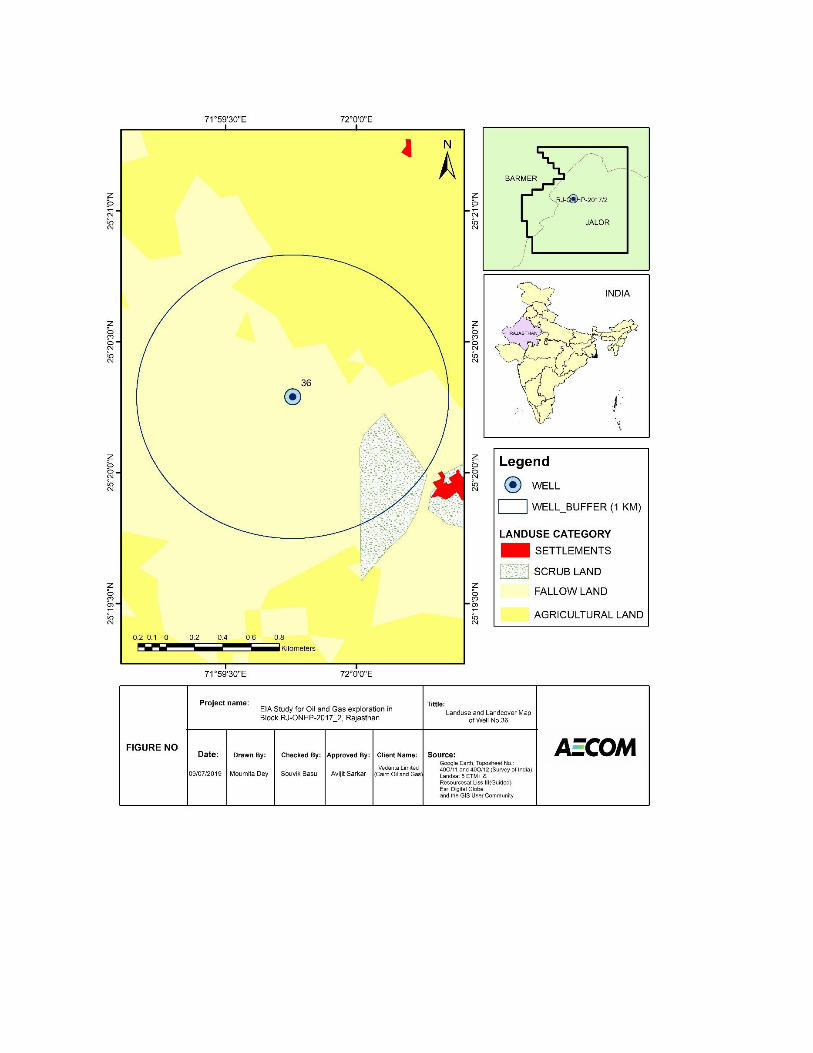
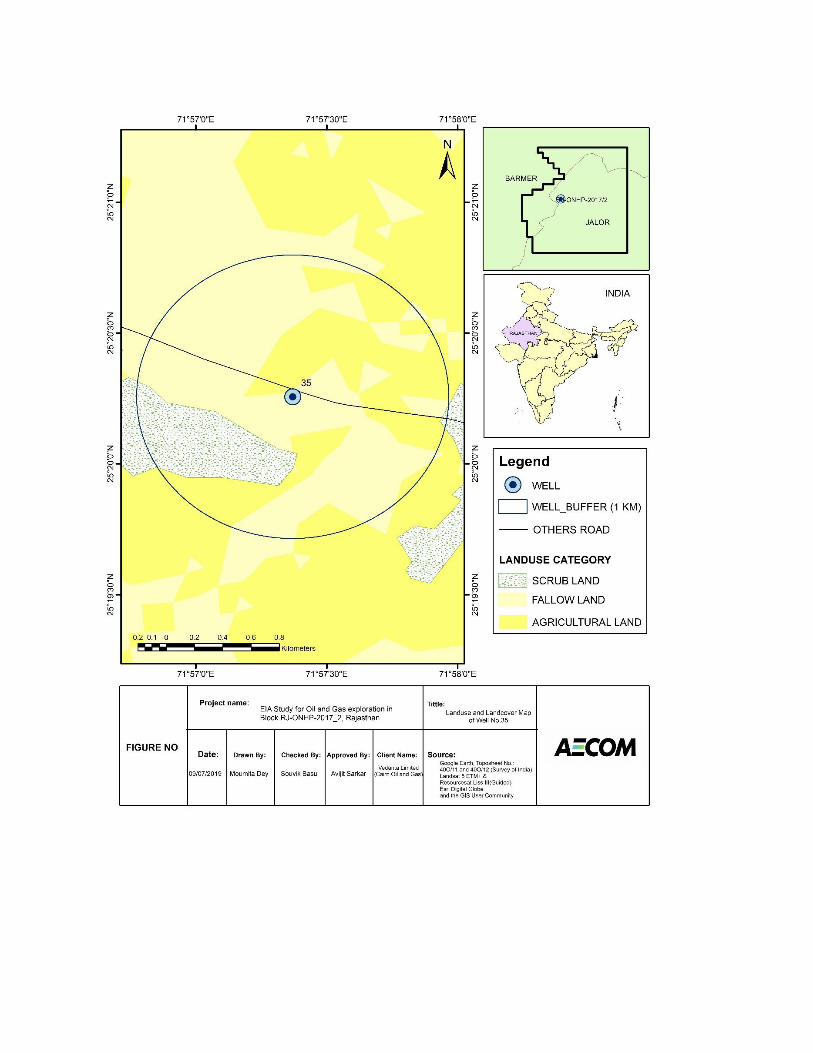
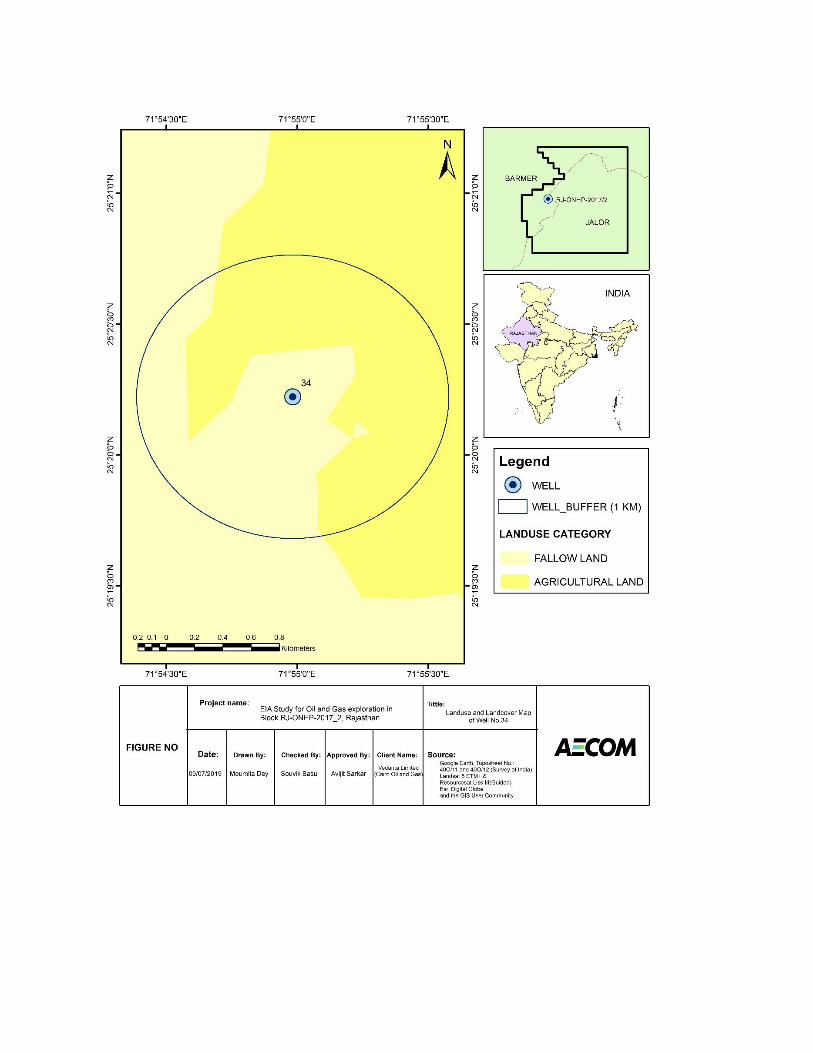
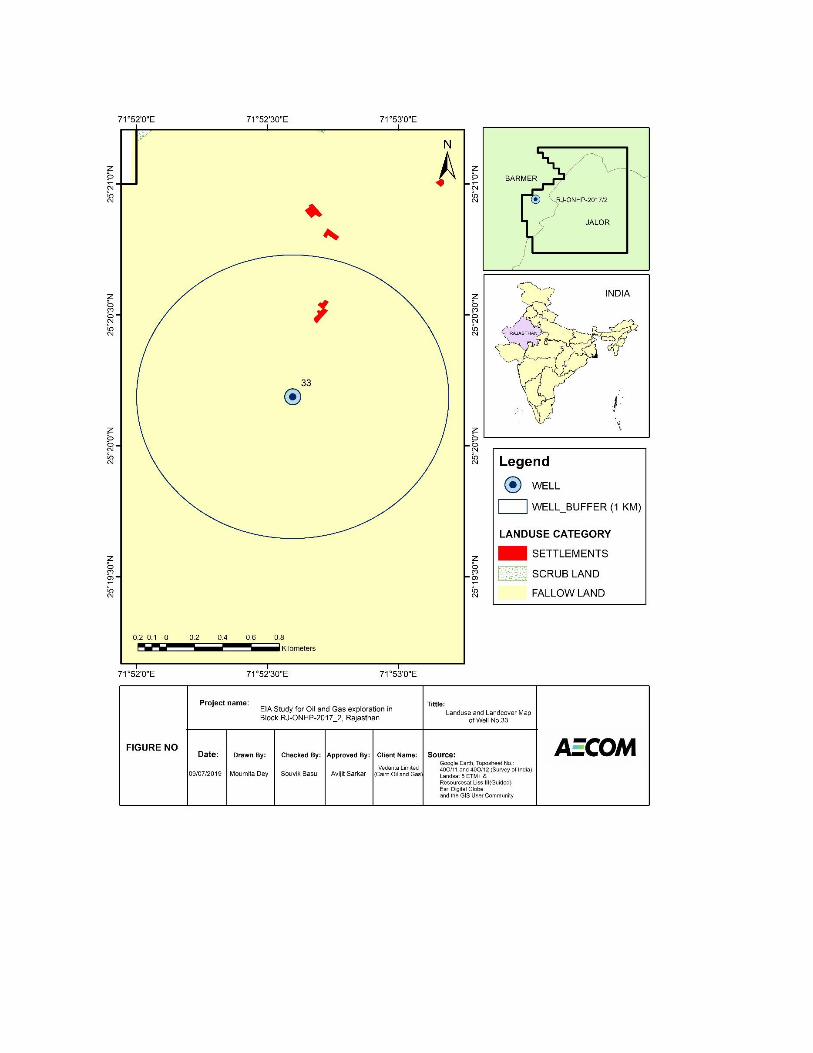
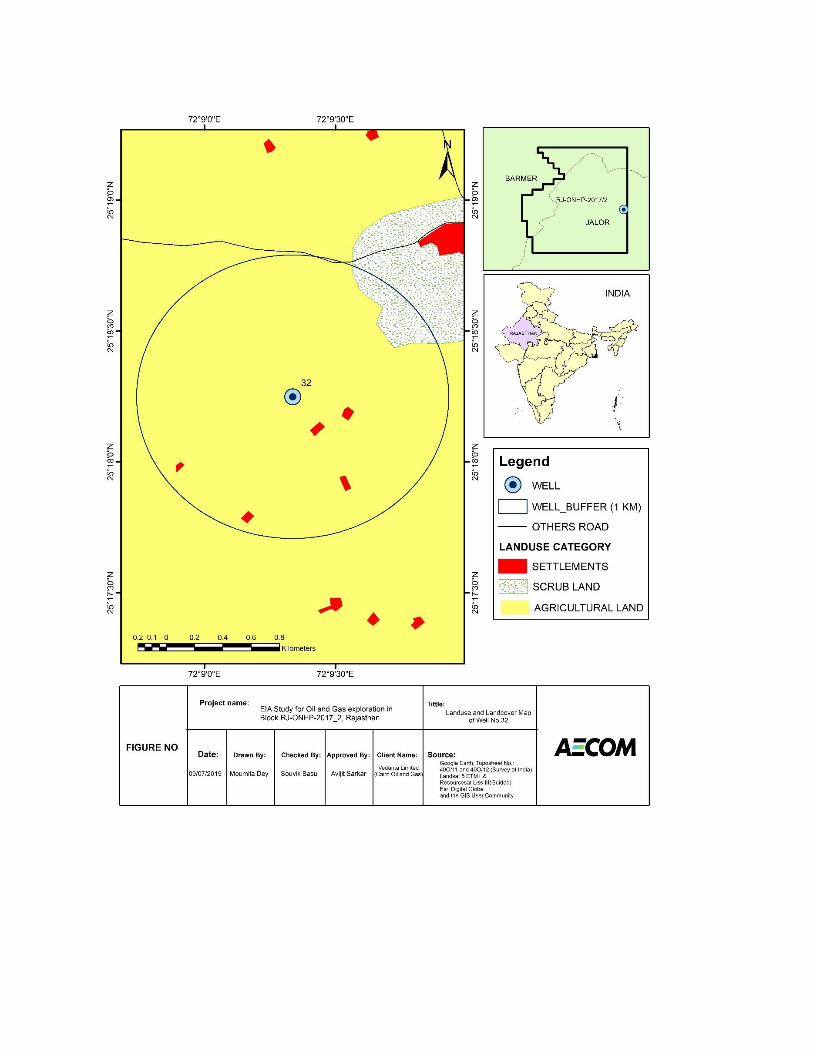
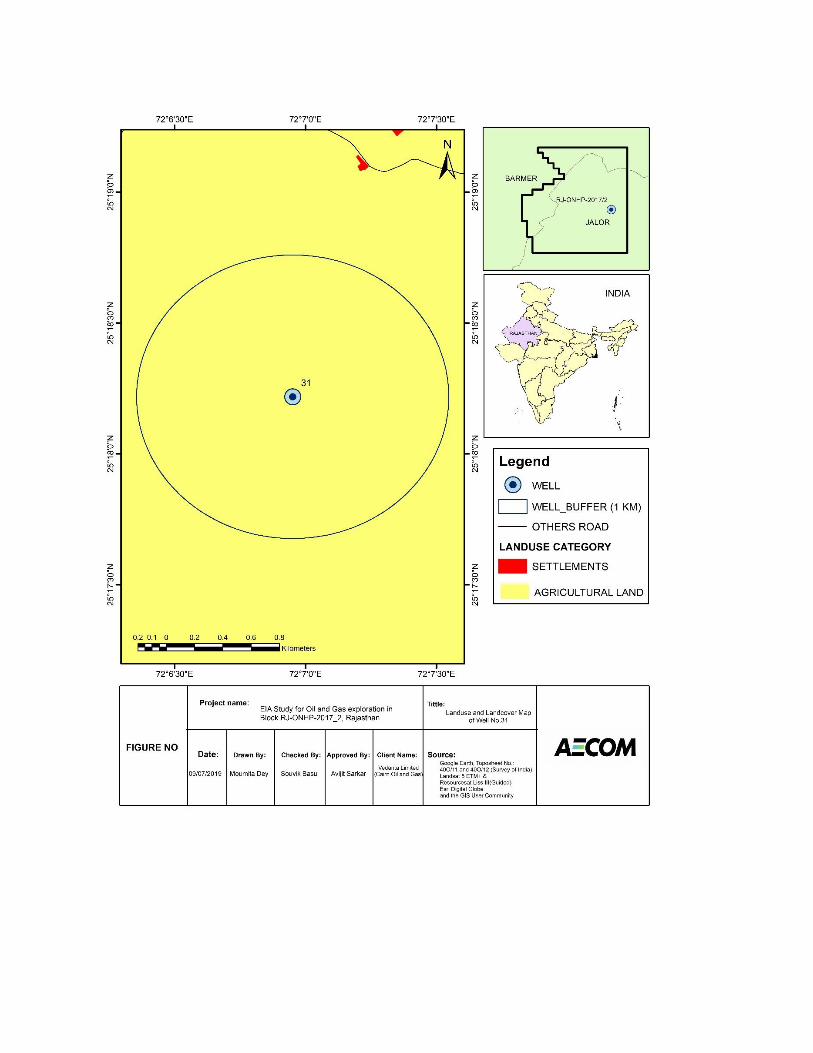
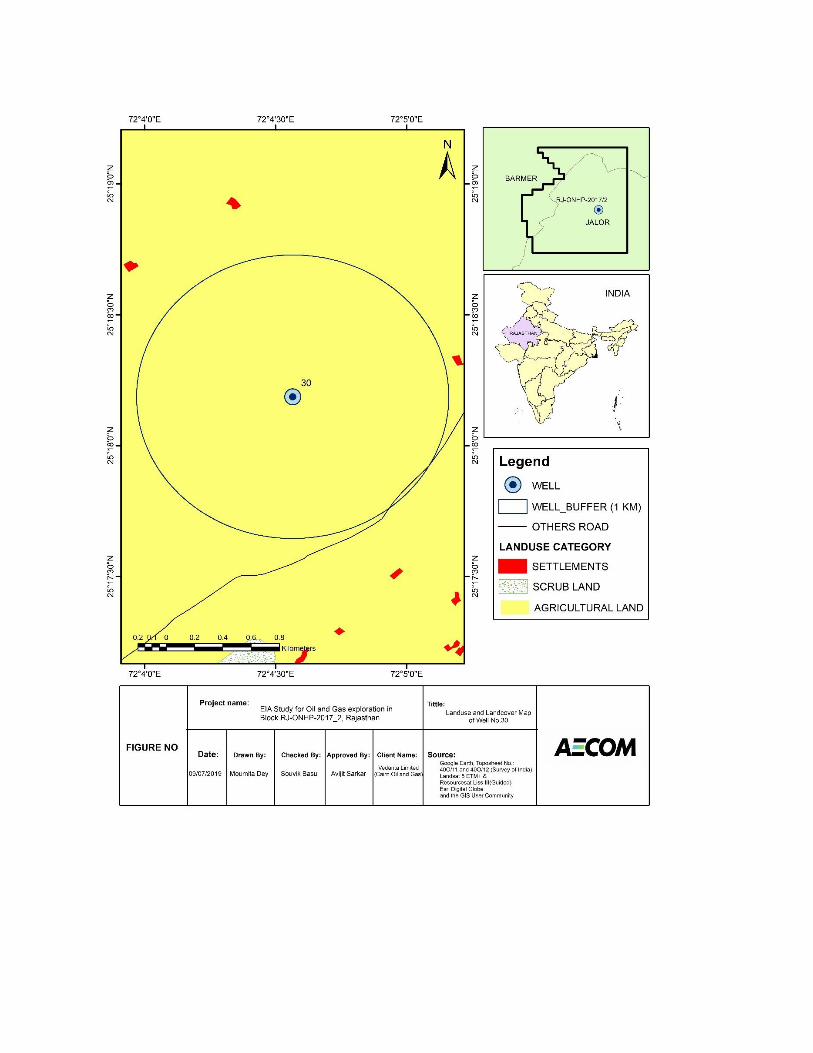
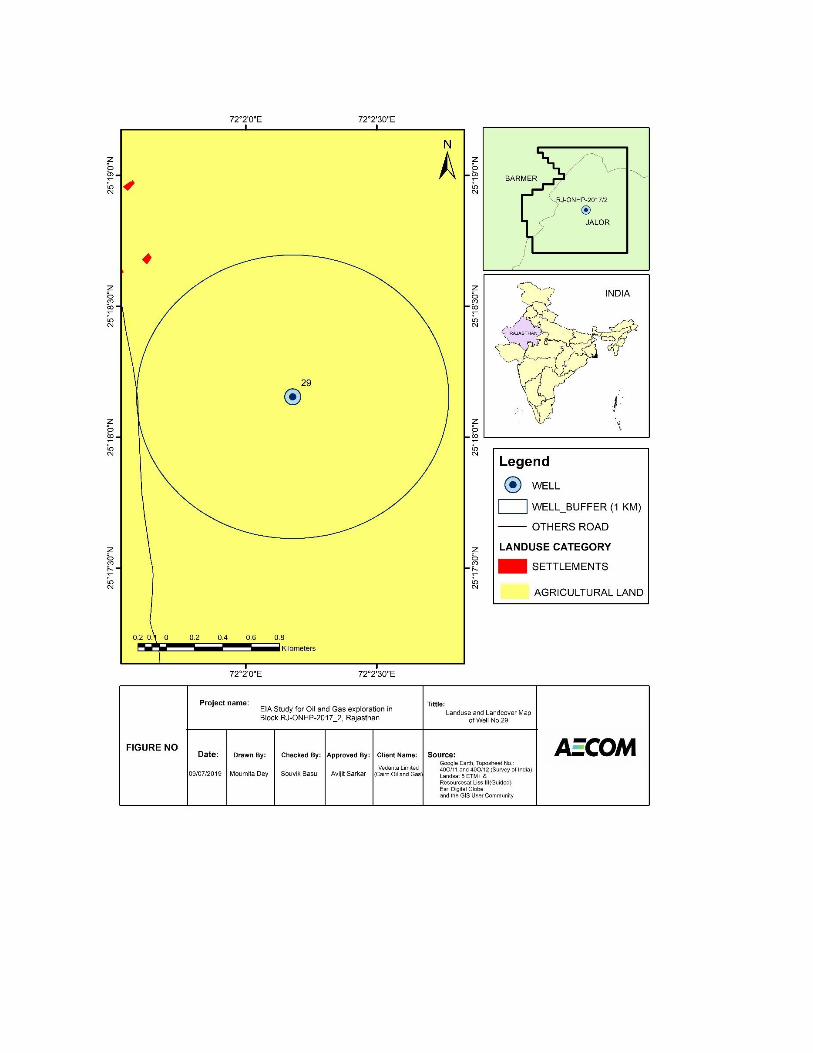
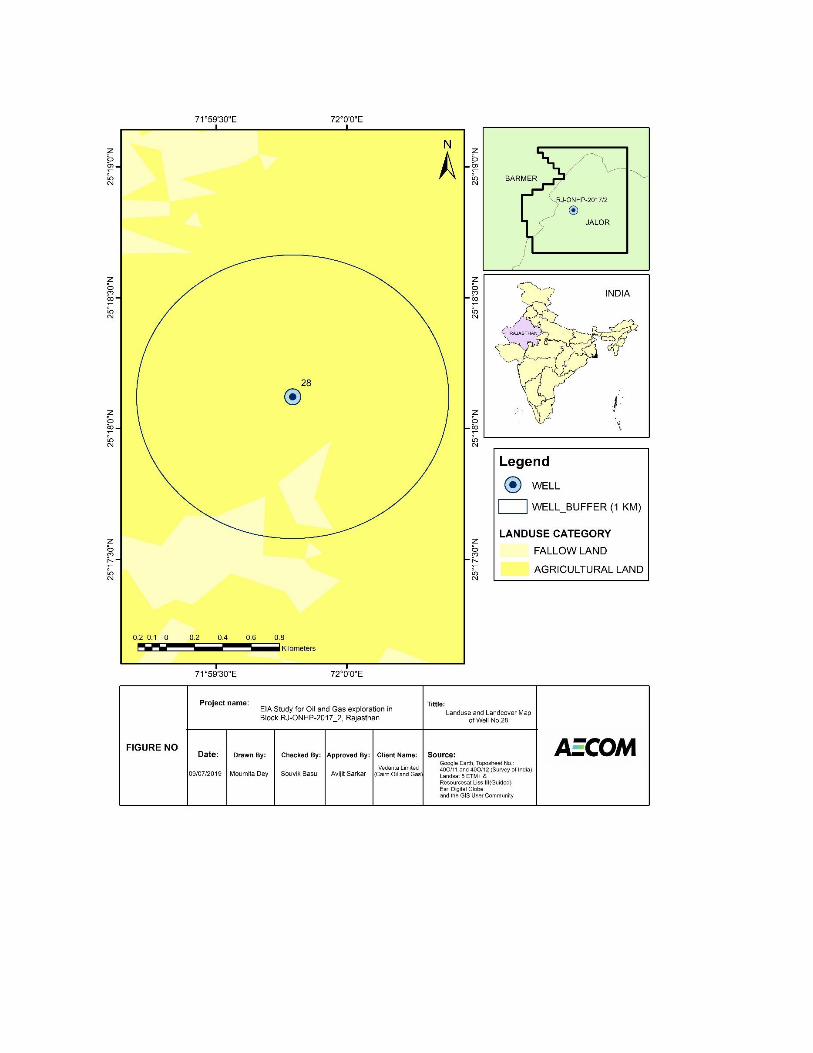
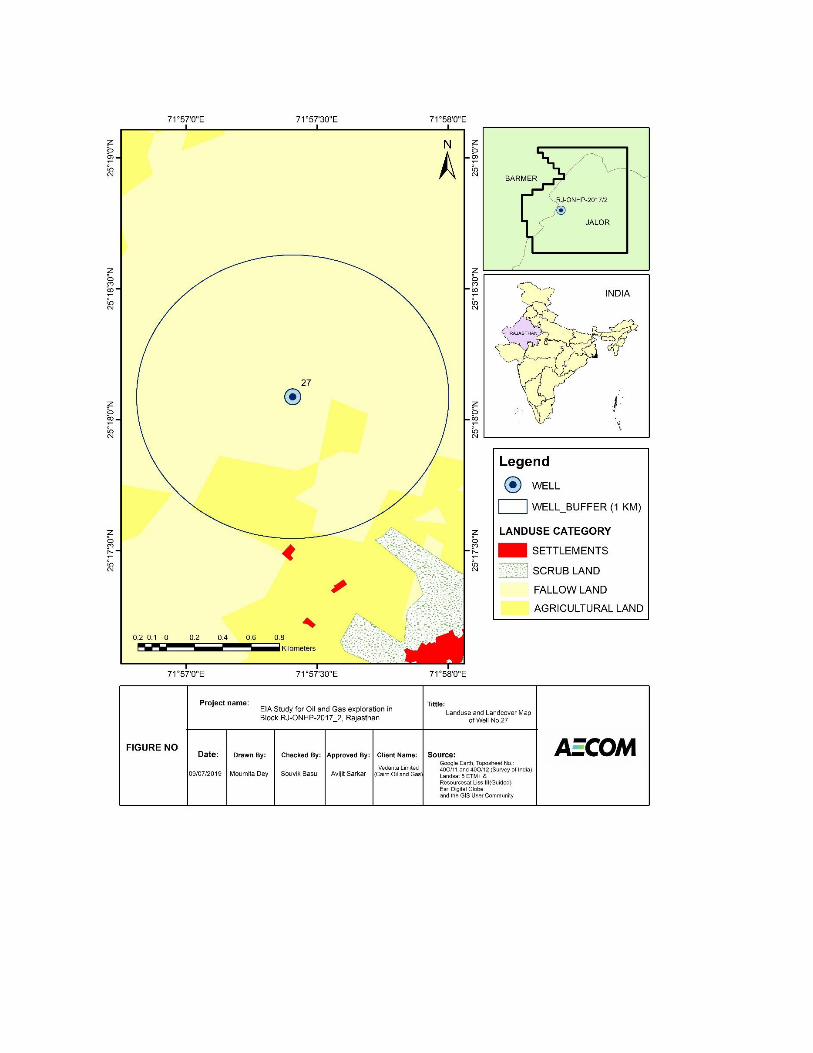
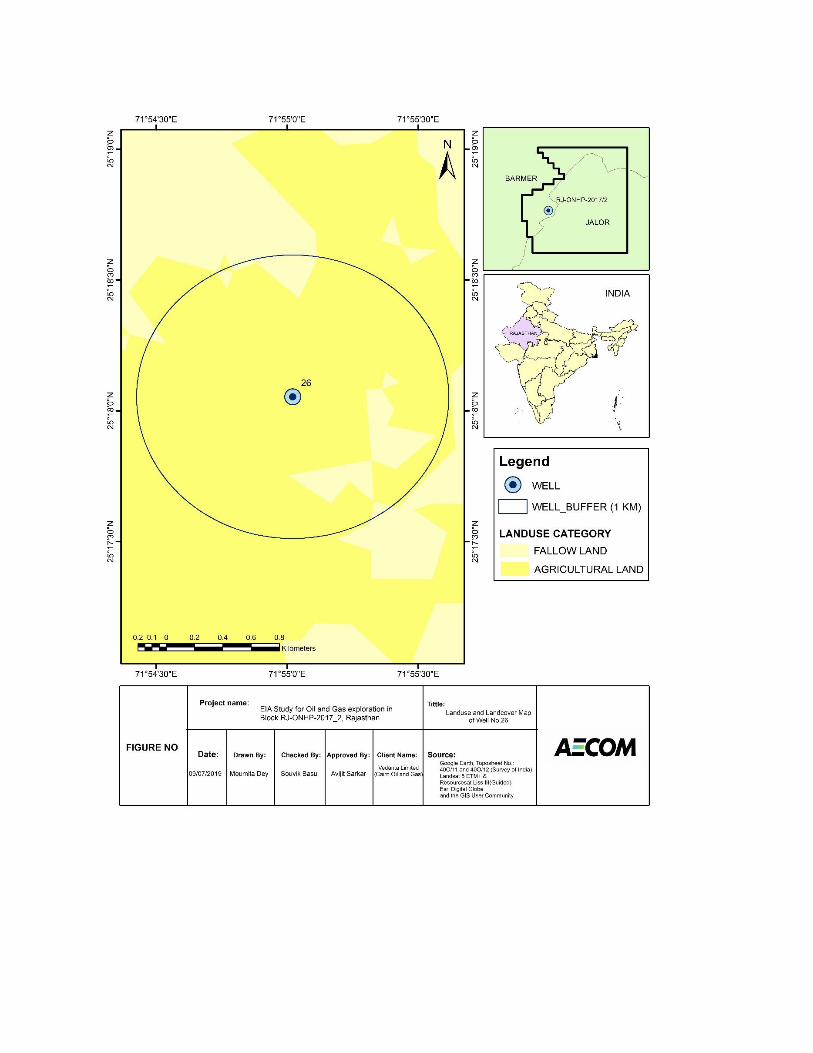
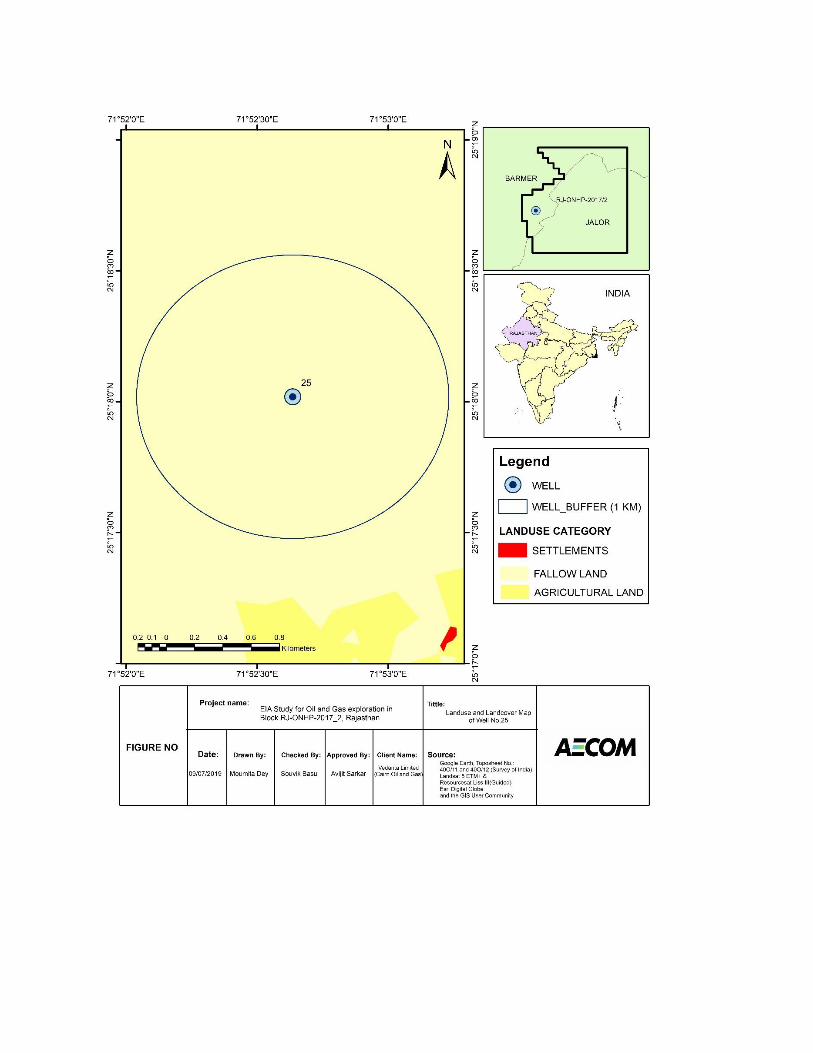
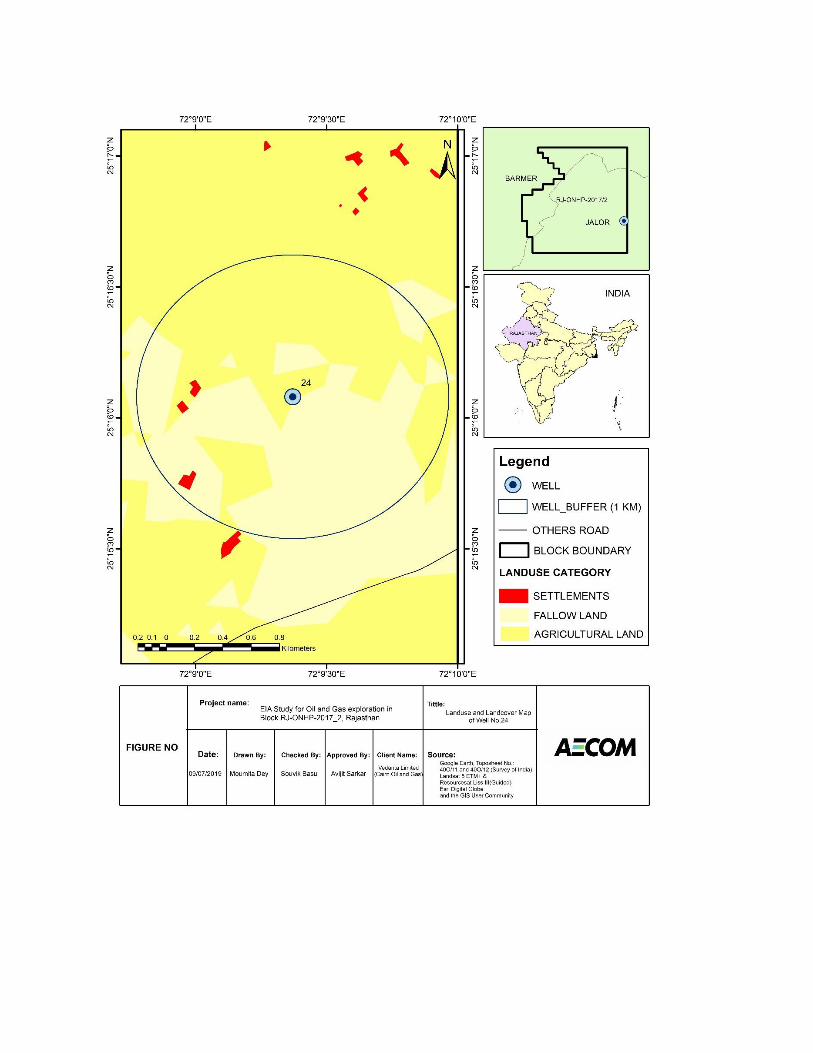
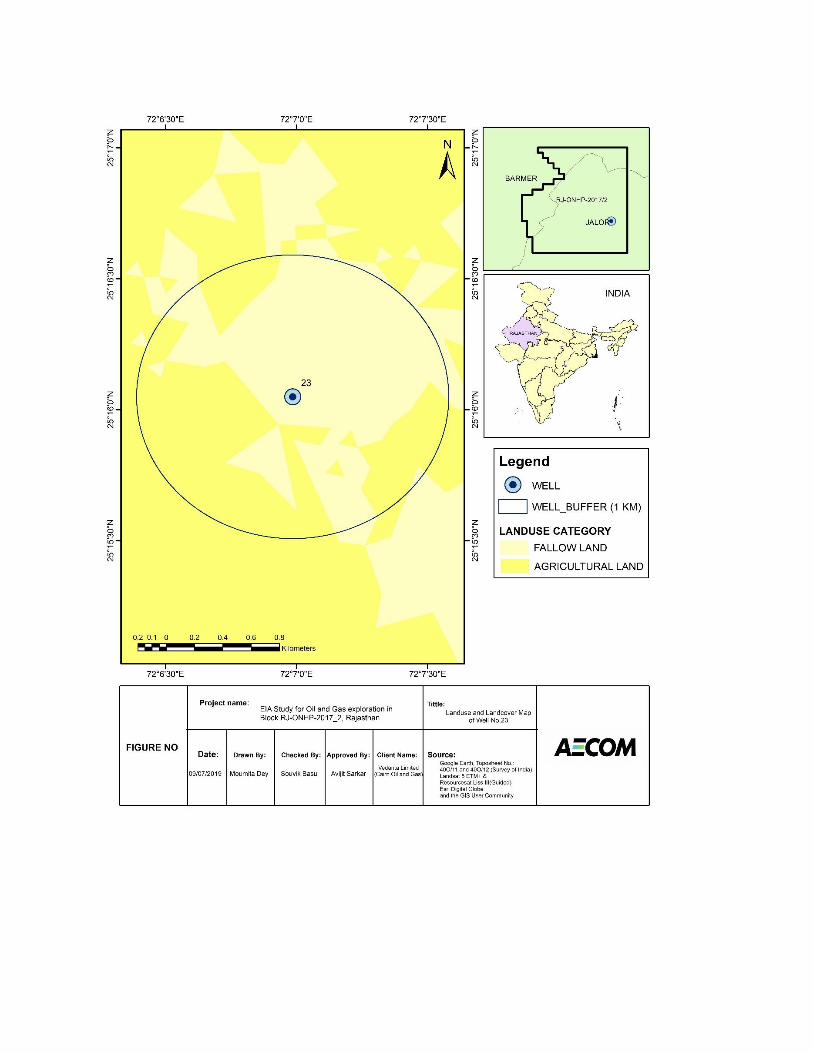
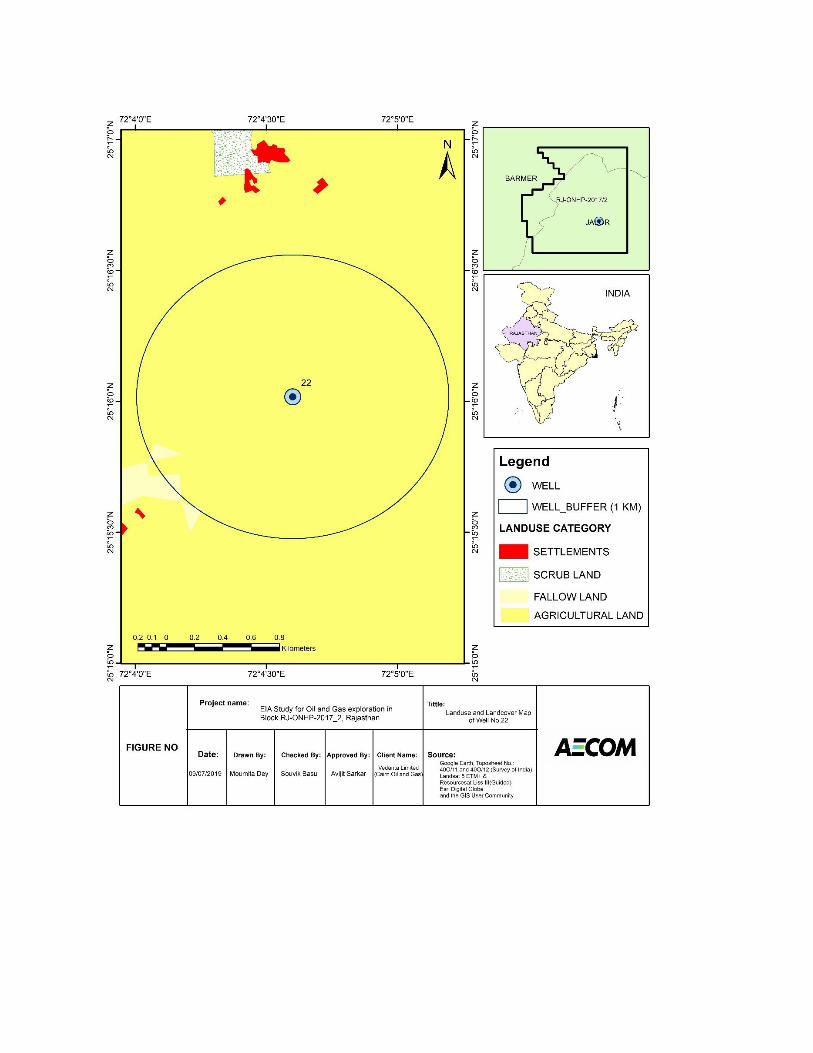
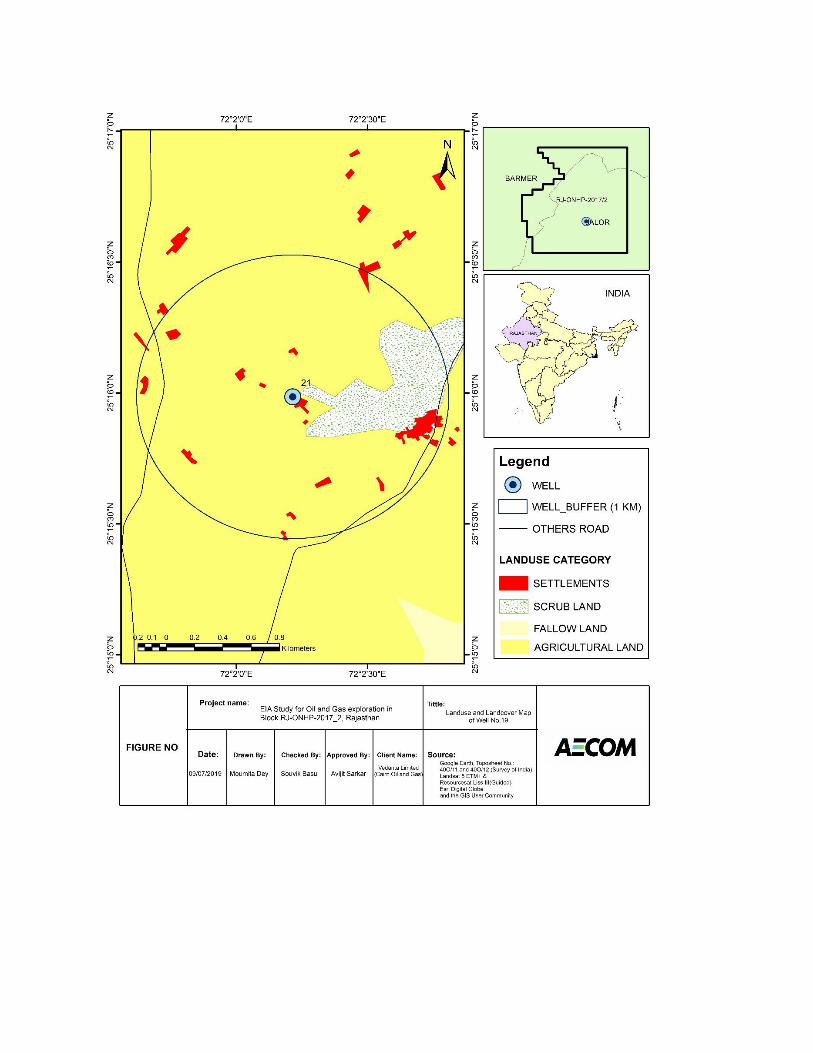
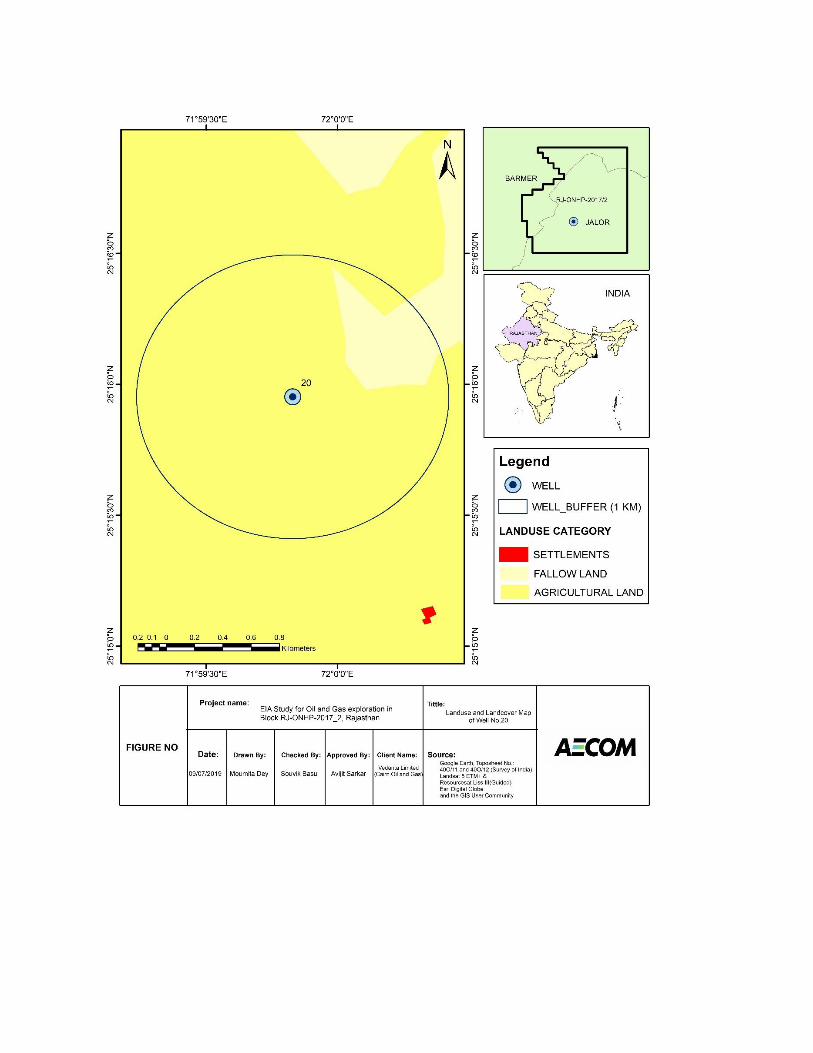
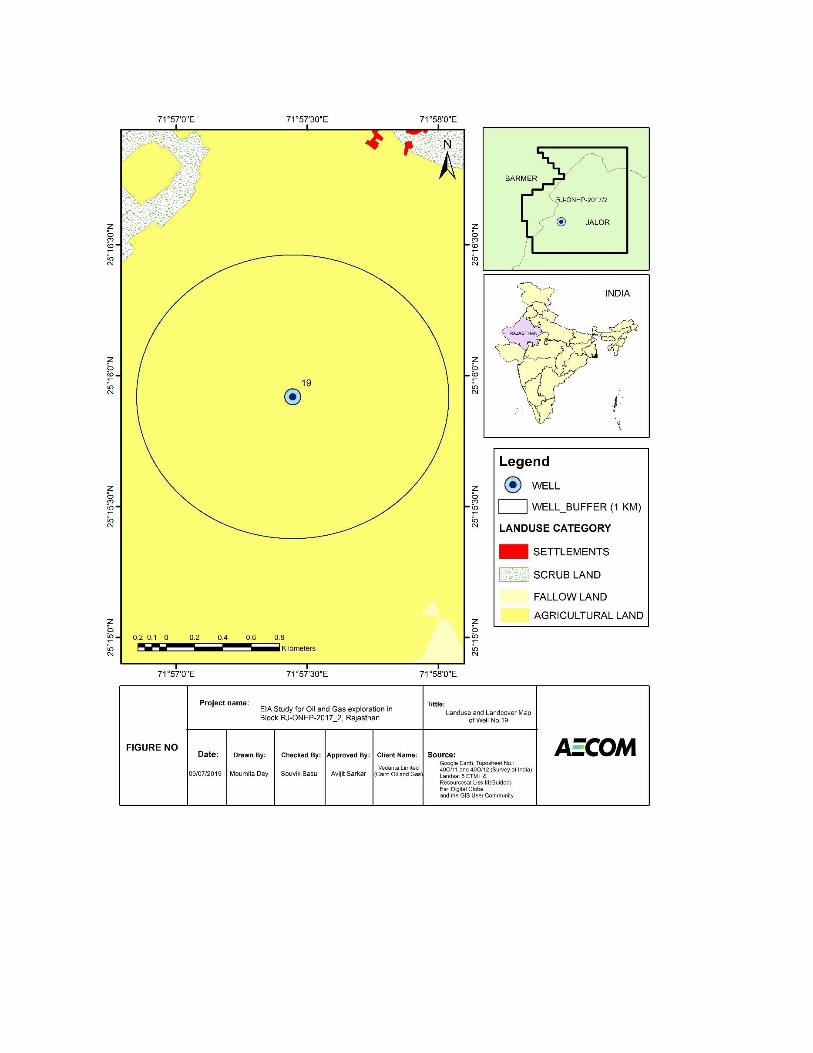
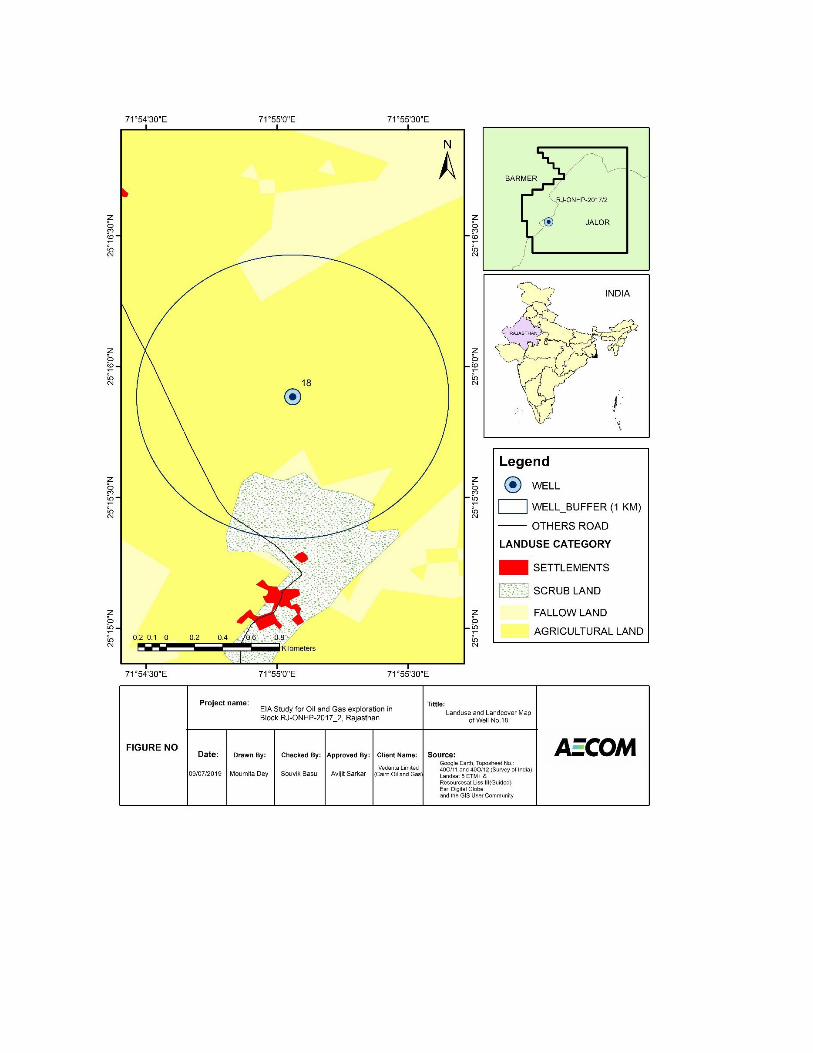
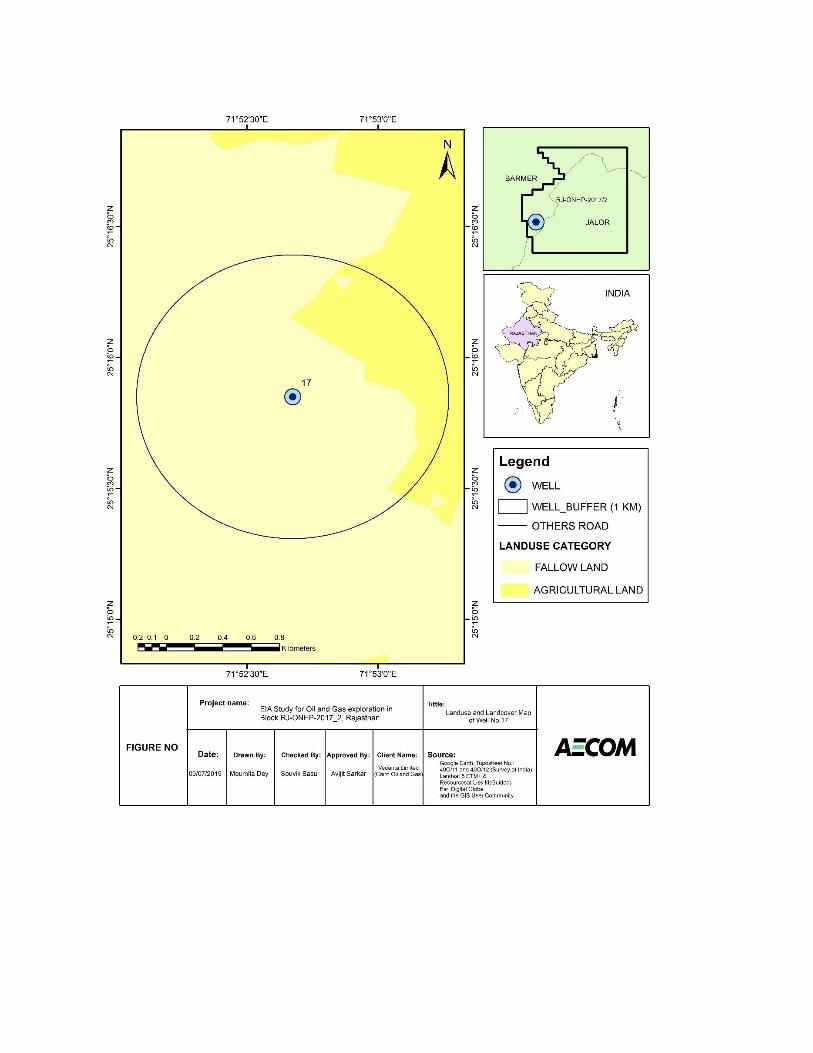
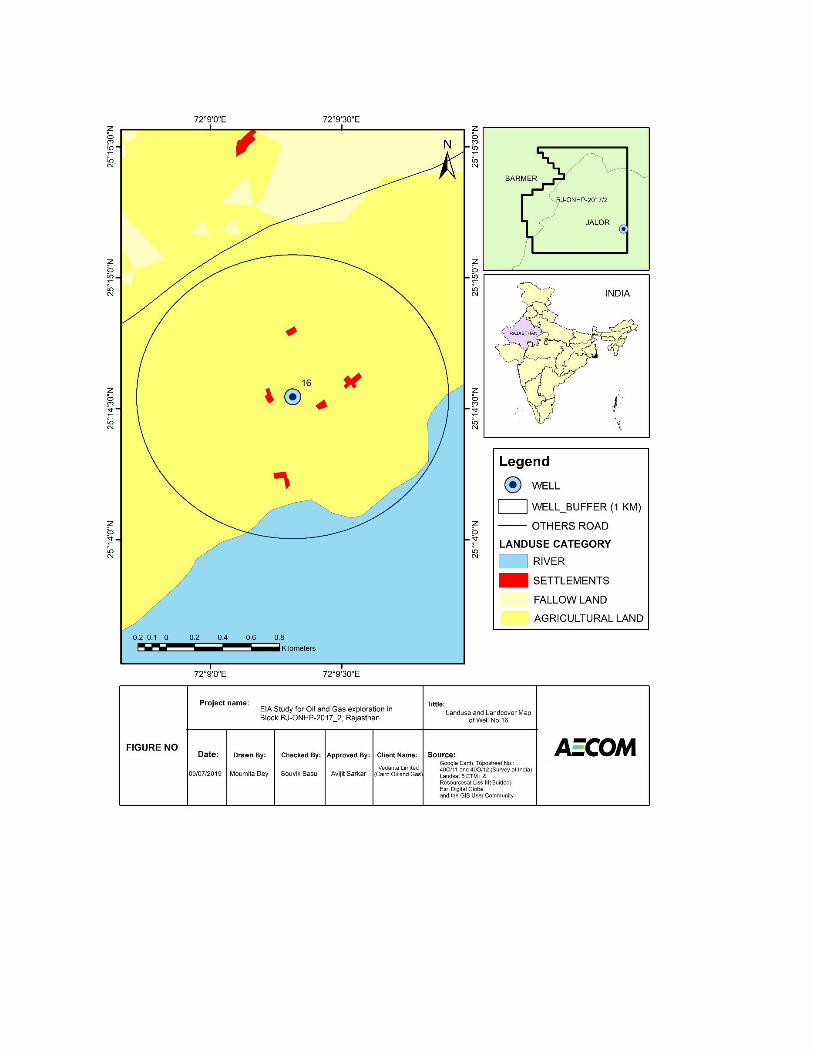
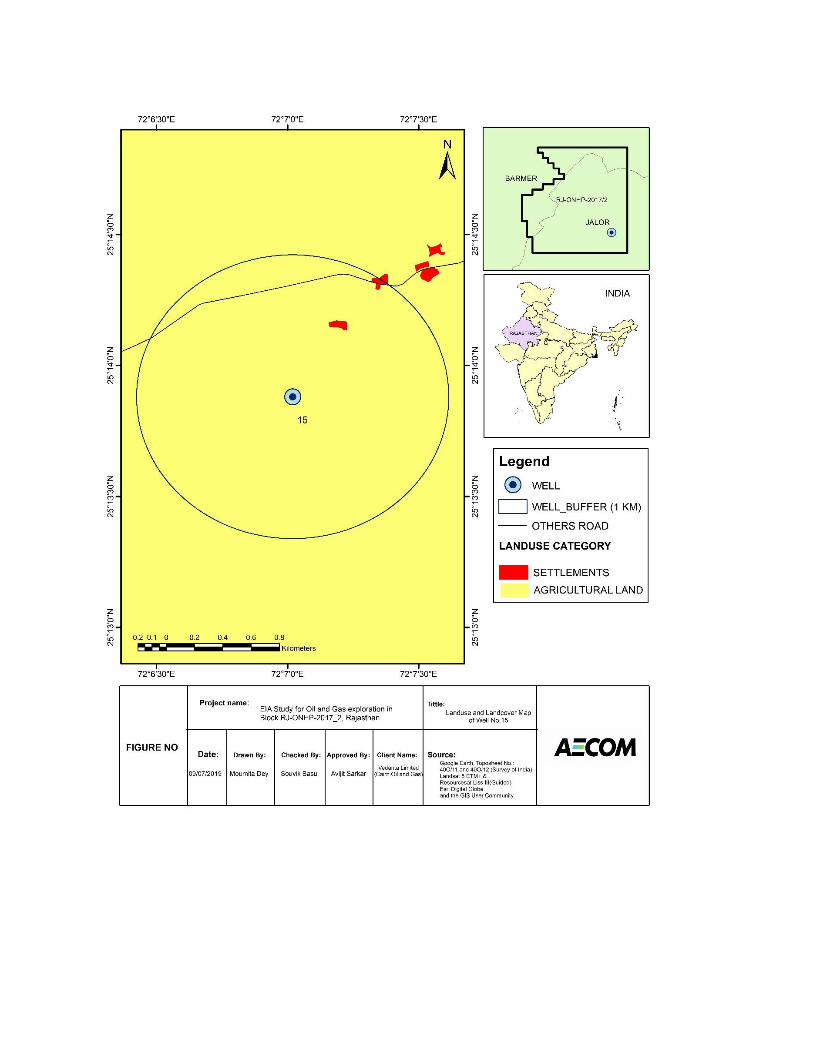
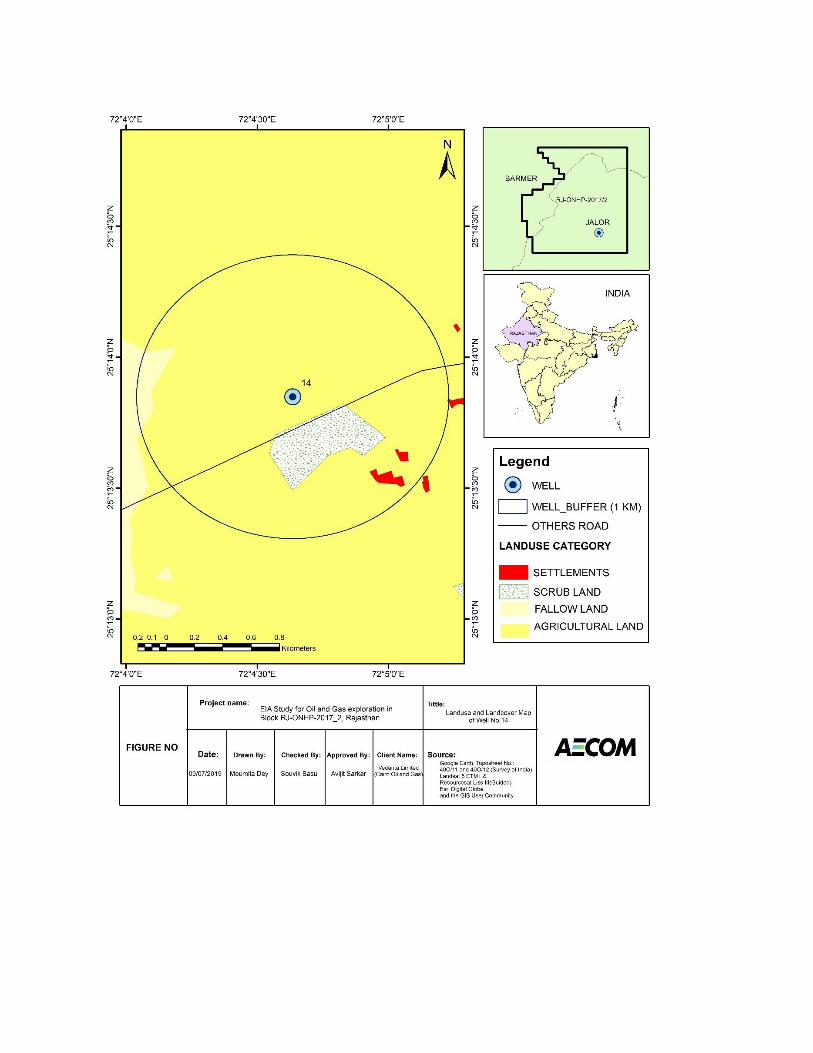
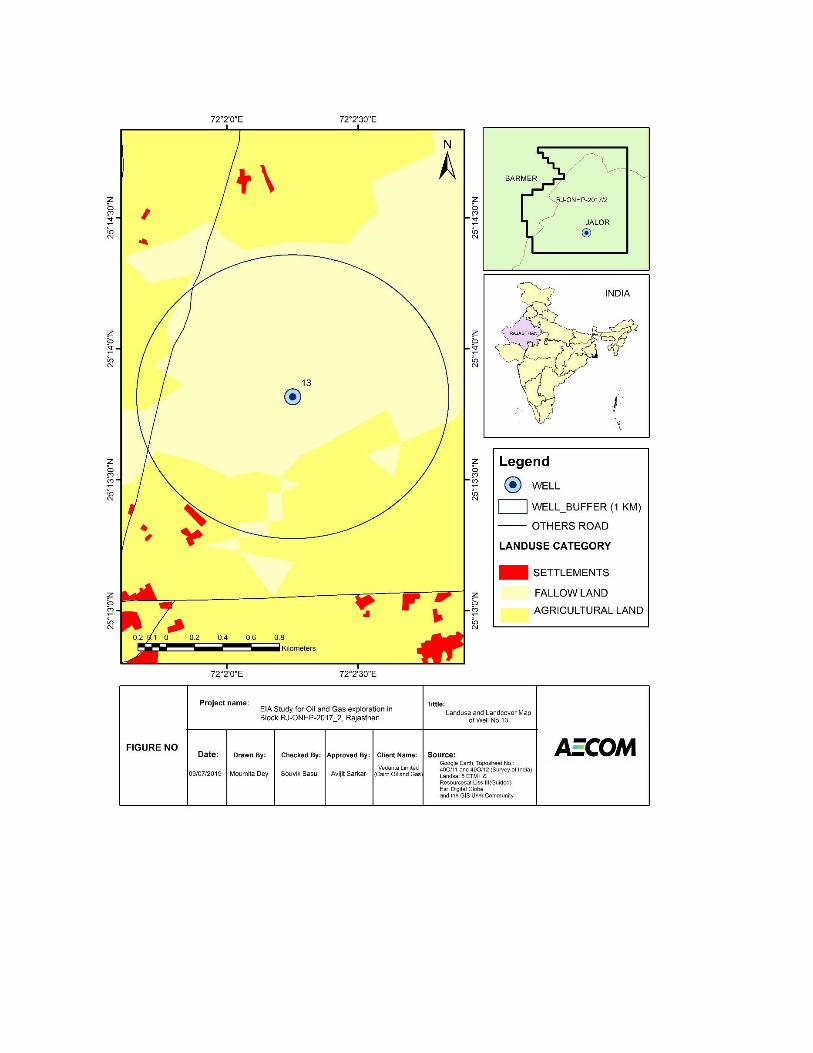
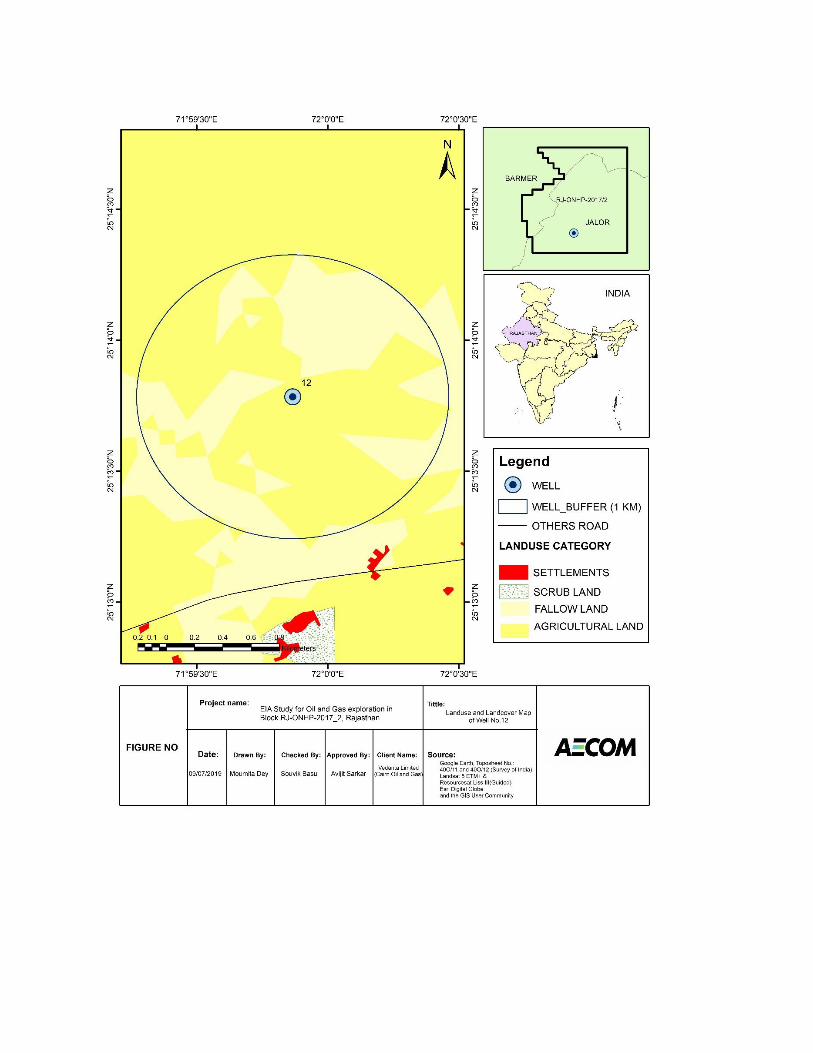
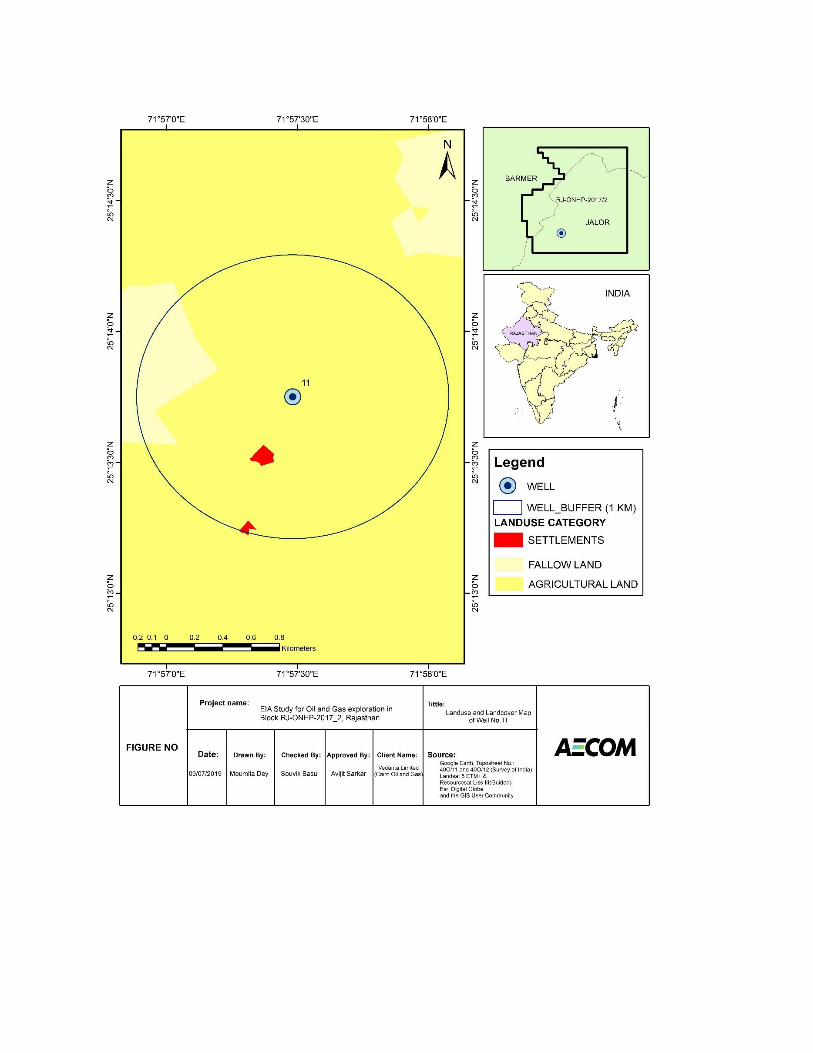
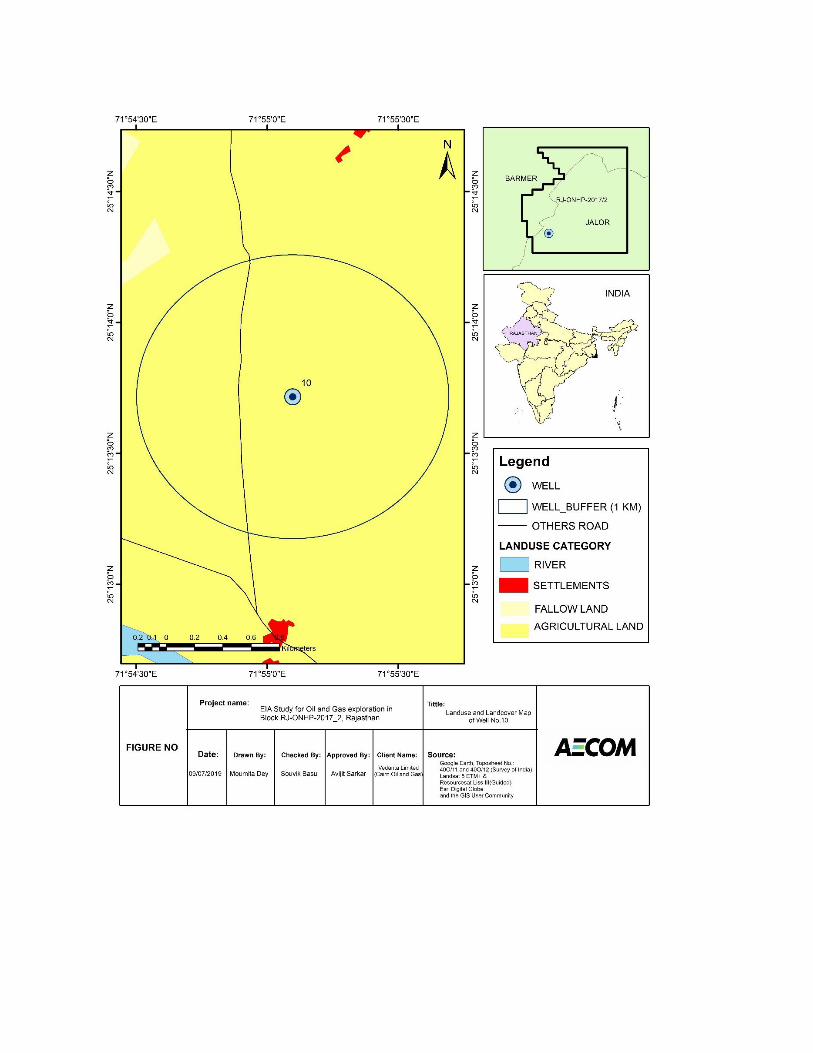
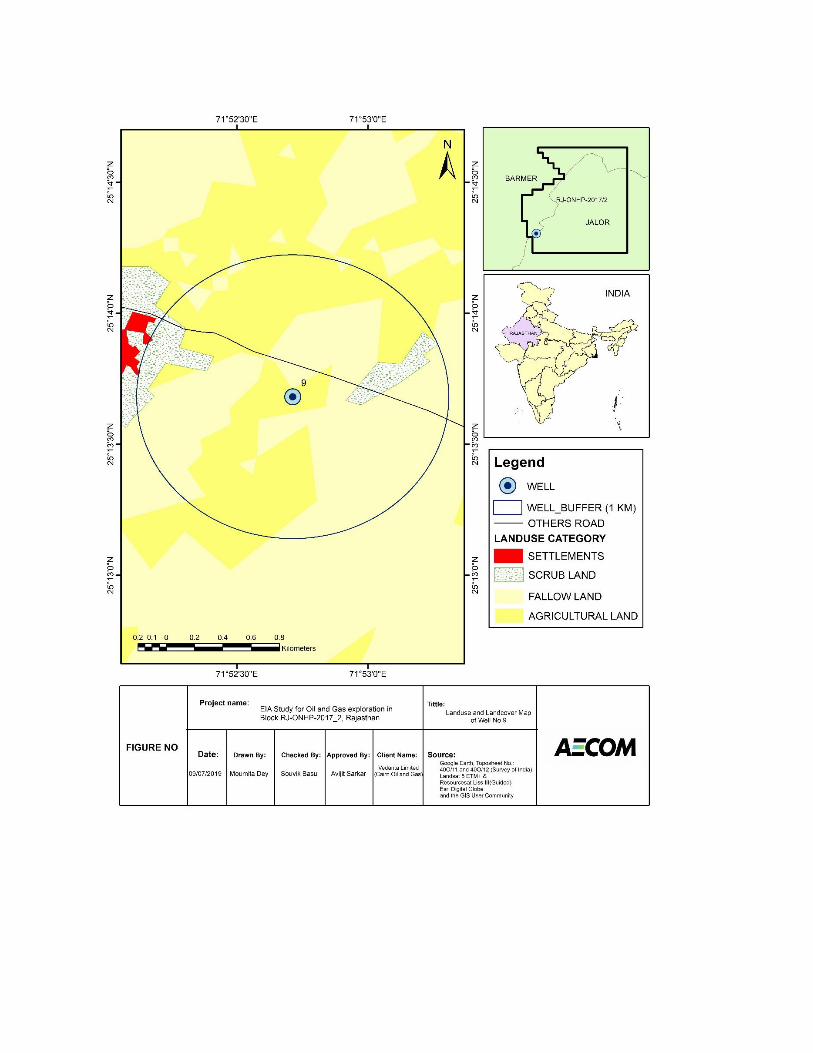
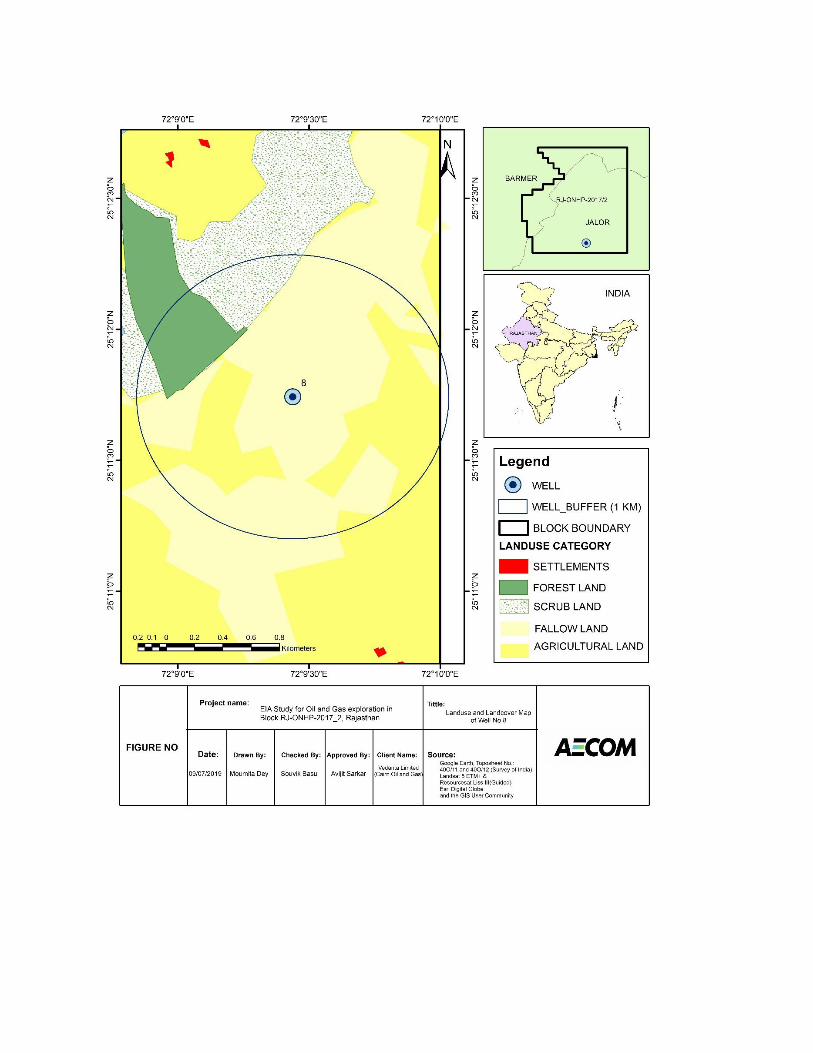
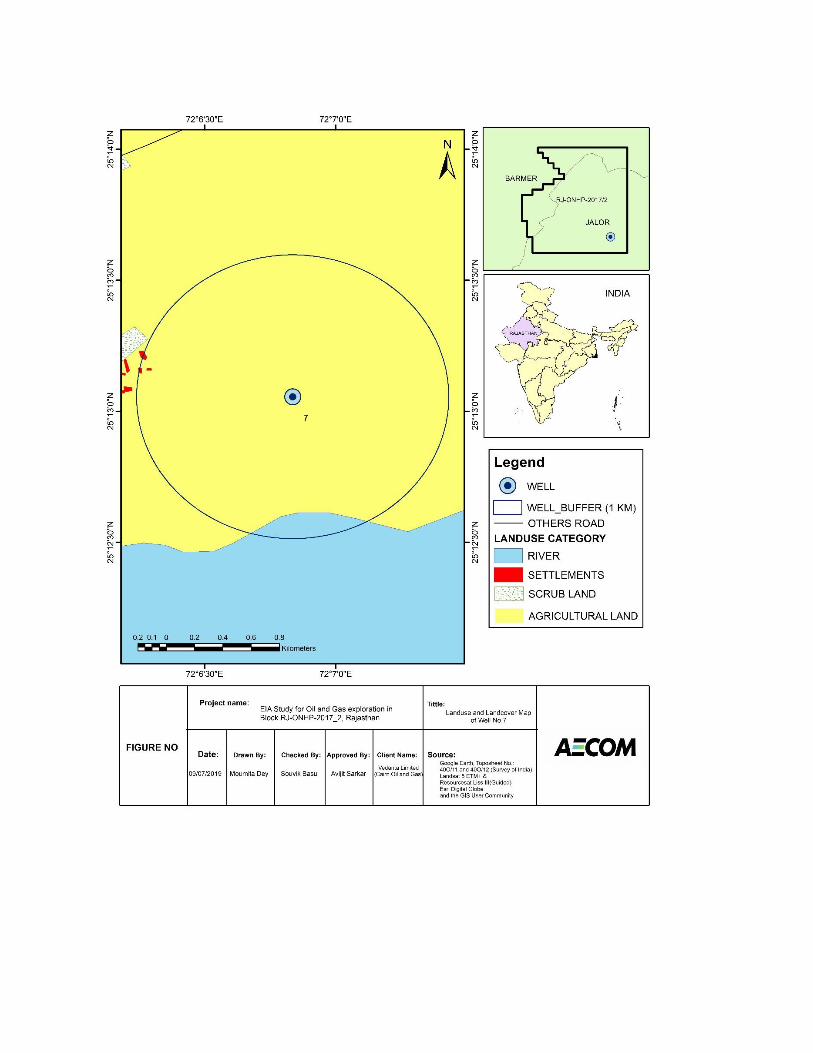
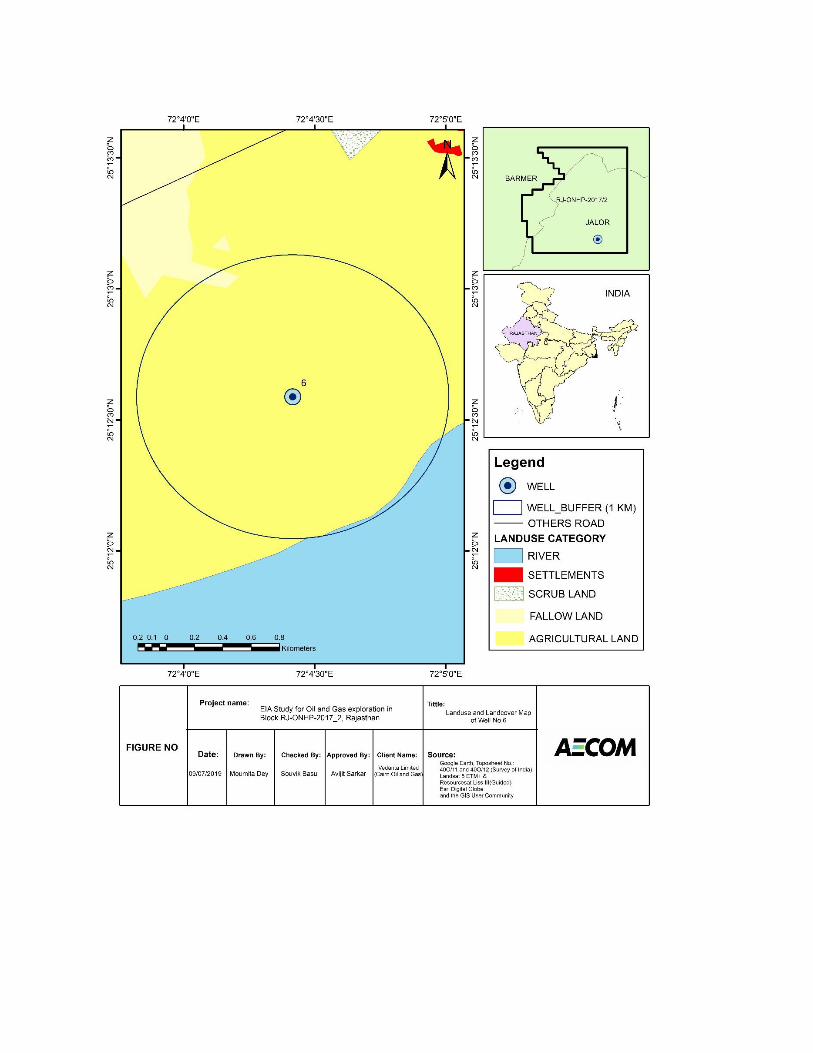
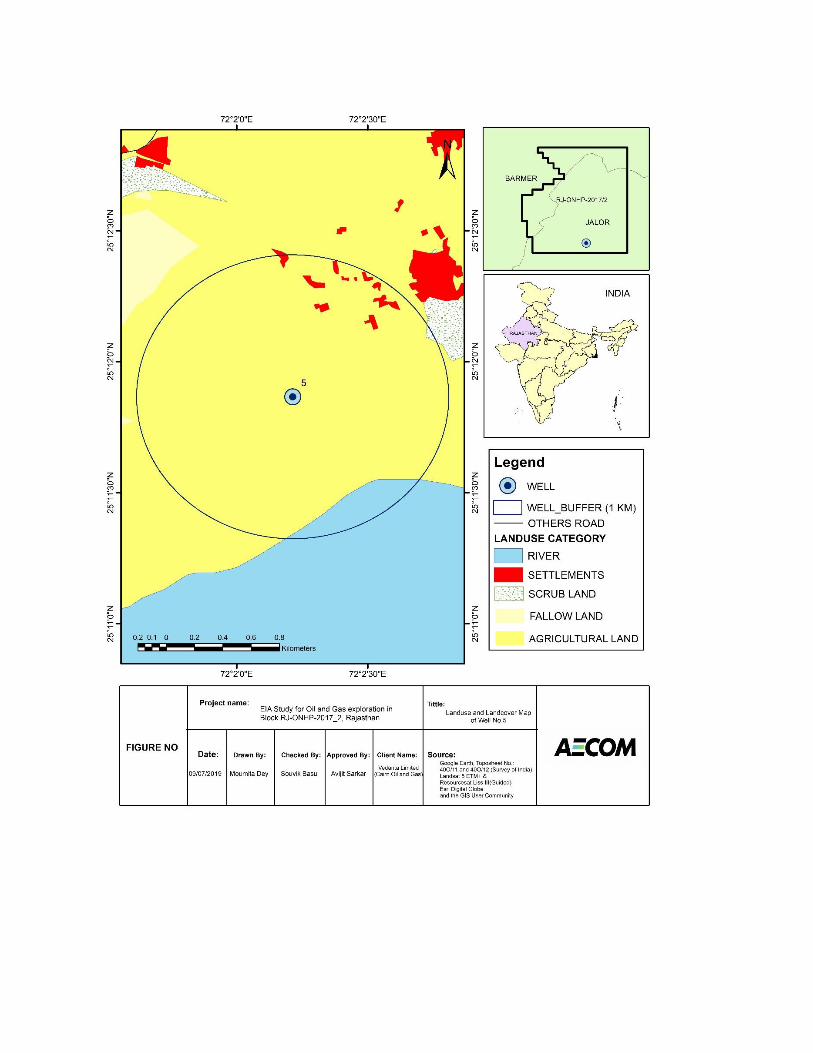
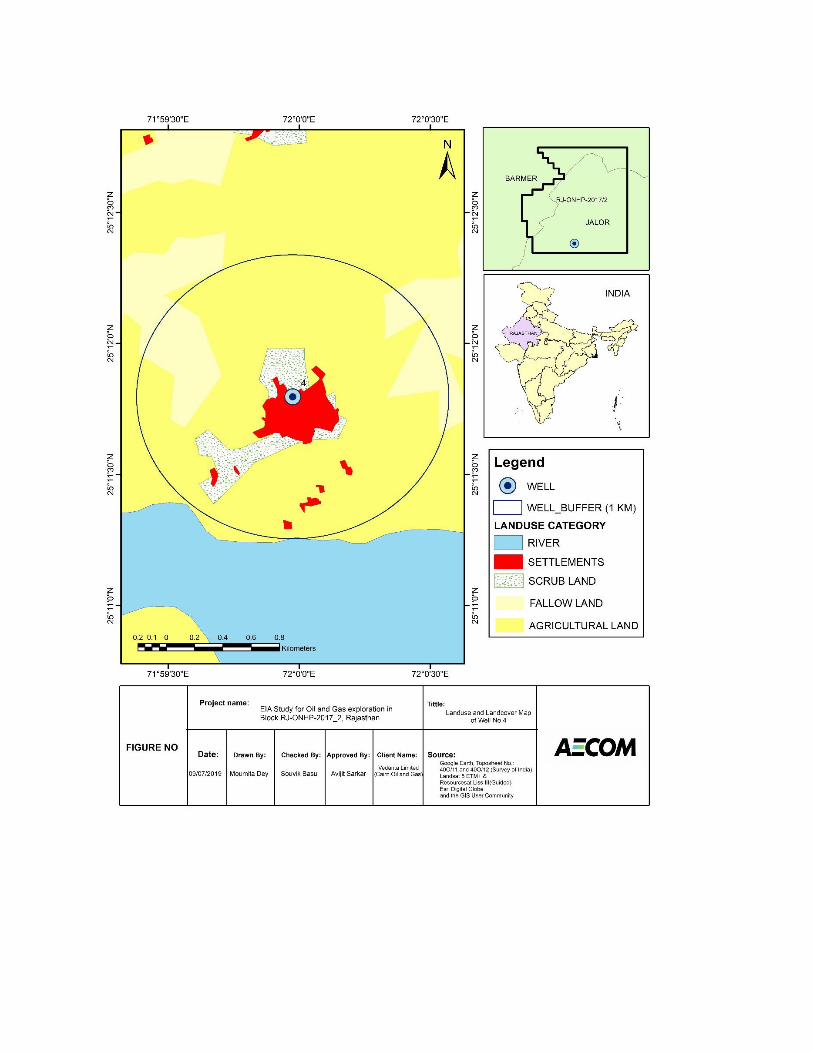
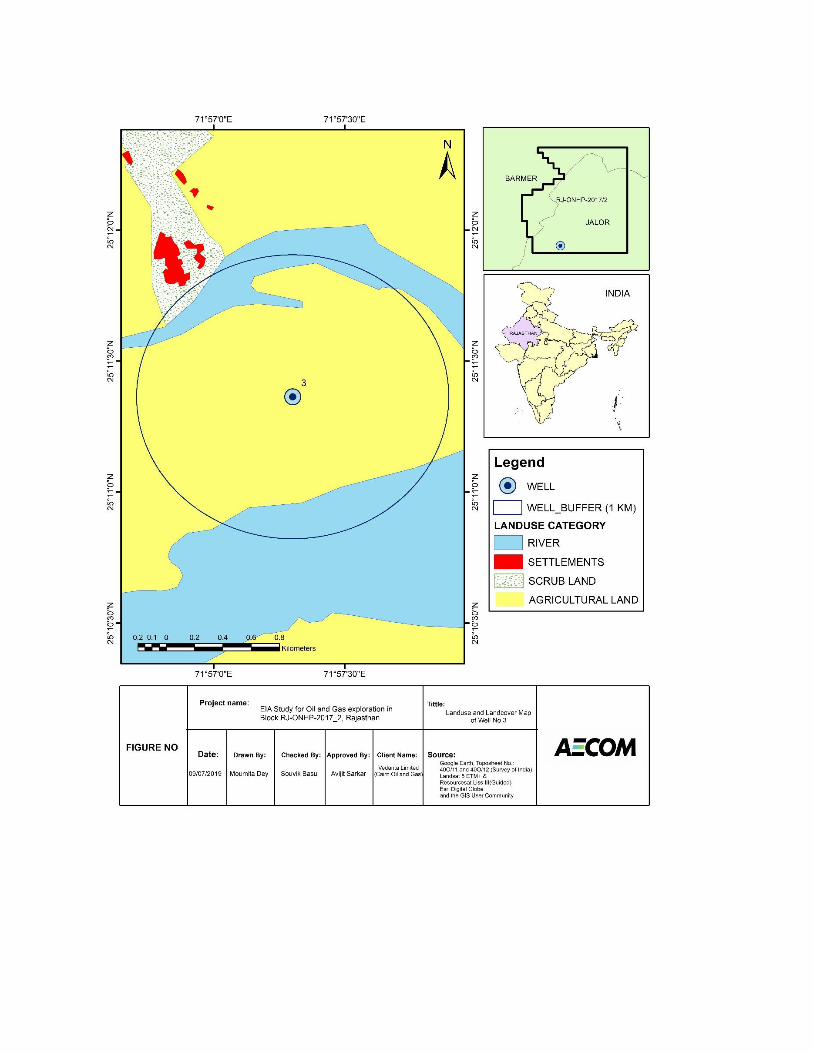
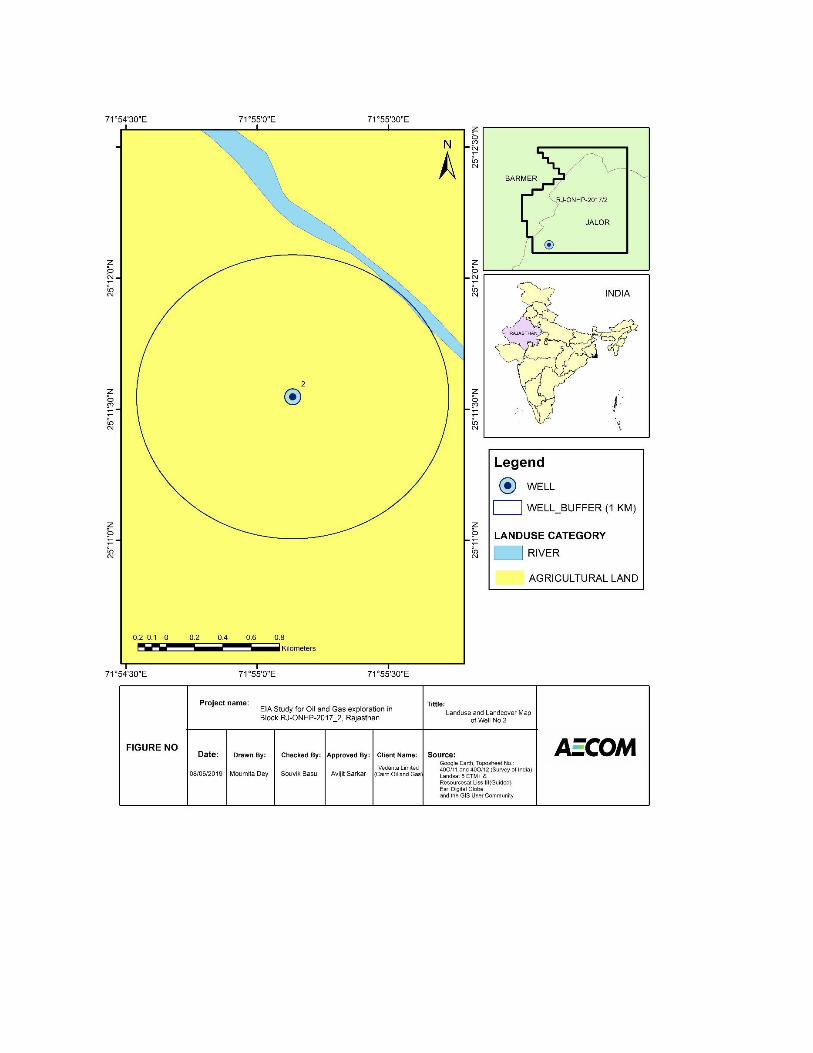
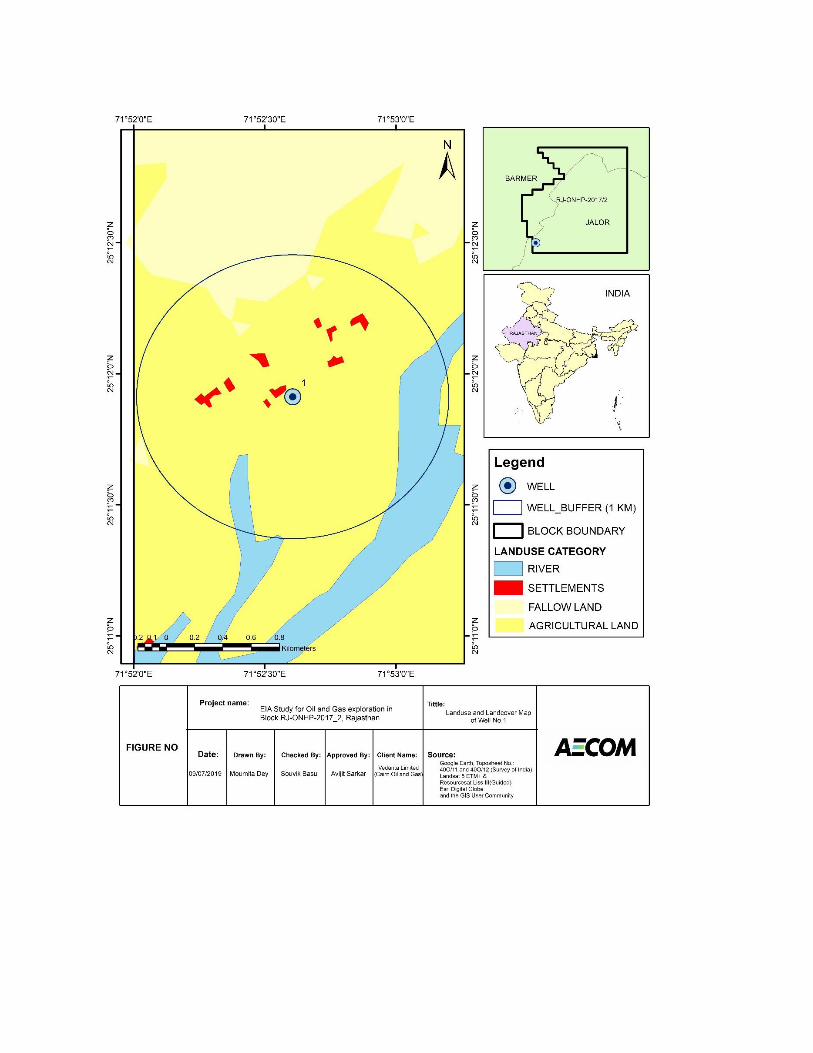
Appendix 2.5:
The List of
Chemicals to be
Used During Drilling
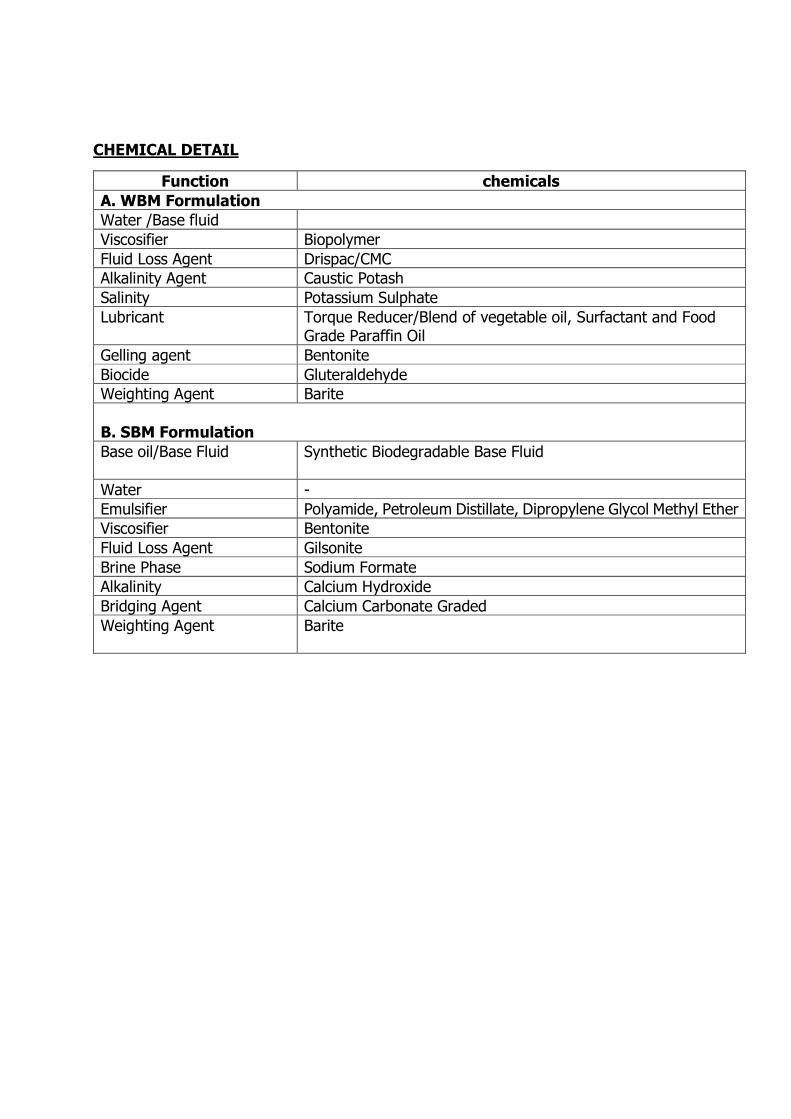
CHEMICAL DETAIL
Function chemicals
A. WBM Formulation
Water /Base fluid
Viscosifier Biopolymer
Fluid Loss Agent Drispac/CMC
Alkalinity Agent Caustic Potash
Salinity Potassium Sulphate
Lubricant Torque Reducer/Blend of vegetable oil, Surfactant and Food Grade Paraffin Oil
Gelling agent Bentonite
Biocide Gluteraldehyde
Weighting Agent Barite
B. SBM Formulation
Base oil/Base Fluid
Synthetic Biodegradable Base Fluid
Water -
Emulsifier Polyamide, Petroleum Distillate, Dipropylene Glycol Methyl Ether
Viscosifier Bentonite
Fluid Loss Agent Gilsonite
Brine Phase Sodium Formate
Alkalinity Calcium Hydroxide
Bridging Agent Calcium Carbonate Graded
Weighting Agent Barite
Appendix 3.1: Micro-
Meteorological Data
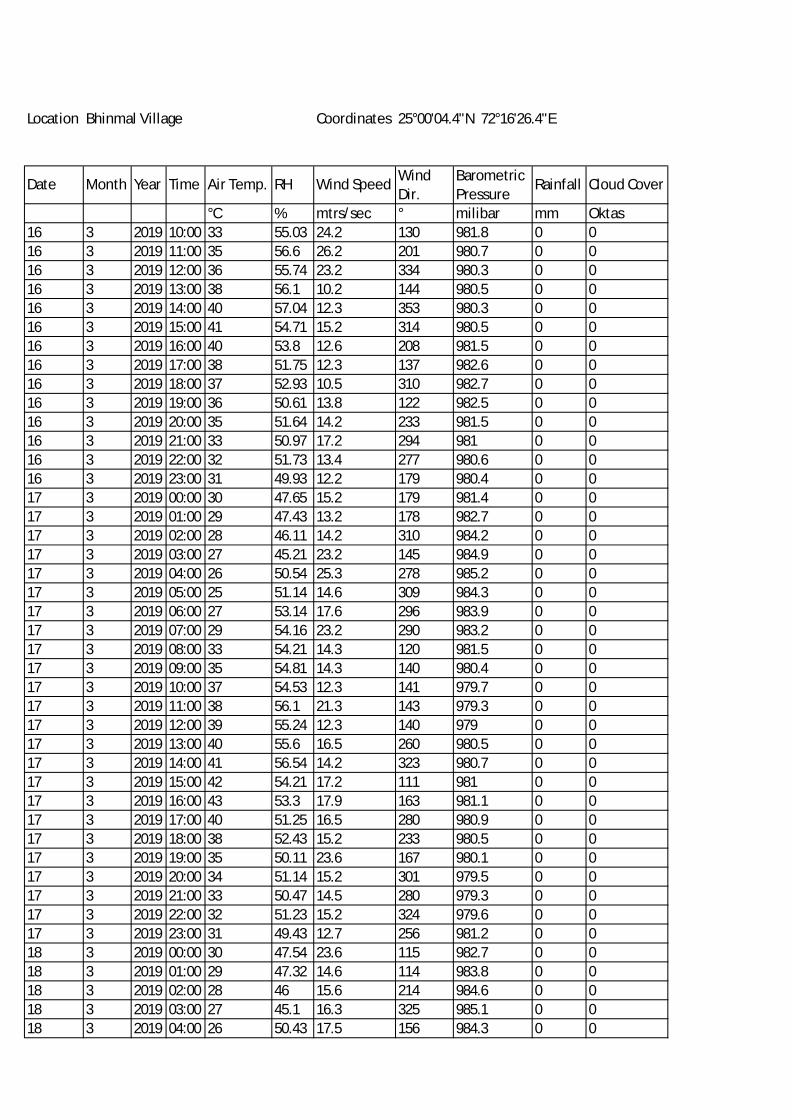
Location Bhinmal Village Coordinates 25°00'04.4"N 72°16'26.4"E
Date Month Year Time Air Temp. RH Wind Speed WindDir.
BarometricPressure
Rainfall Cloud Cover
°C % mtrs/sec ° milibar mm Oktas16 3 2019 10:00 33 55.03 24.2 130 981.8 0 016 3 2019 11:00 35 56.6 26.2 201 980.7 0 016 3 2019 12:00 36 55.74 23.2 334 980.3 0 016 3 2019 13:00 38 56.1 10.2 144 980.5 0 016 3 2019 14:00 40 57.04 12.3 353 980.3 0 016 3 2019 15:00 41 54.71 15.2 314 980.5 0 016 3 2019 16:00 40 53.8 12.6 208 981.5 0 016 3 2019 17:00 38 51.75 12.3 137 982.6 0 016 3 2019 18:00 37 52.93 10.5 310 982.7 0 016 3 2019 19:00 36 50.61 13.8 122 982.5 0 016 3 2019 20:00 35 51.64 14.2 233 981.5 0 016 3 2019 21:00 33 50.97 17.2 294 981 0 016 3 2019 22:00 32 51.73 13.4 277 980.6 0 016 3 2019 23:00 31 49.93 12.2 179 980.4 0 017 3 2019 00:00 30 47.65 15.2 179 981.4 0 017 3 2019 01:00 29 47.43 13.2 178 982.7 0 017 3 2019 02:00 28 46.11 14.2 310 984.2 0 017 3 2019 03:00 27 45.21 23.2 145 984.9 0 017 3 2019 04:00 26 50.54 25.3 278 985.2 0 017 3 2019 05:00 25 51.14 14.6 309 984.3 0 017 3 2019 06:00 27 53.14 17.6 296 983.9 0 017 3 2019 07:00 29 54.16 23.2 290 983.2 0 017 3 2019 08:00 33 54.21 14.3 120 981.5 0 017 3 2019 09:00 35 54.81 14.3 140 980.4 0 017 3 2019 10:00 37 54.53 12.3 141 979.7 0 017 3 2019 11:00 38 56.1 21.3 143 979.3 0 017 3 2019 12:00 39 55.24 12.3 140 979 0 017 3 2019 13:00 40 55.6 16.5 260 980.5 0 017 3 2019 14:00 41 56.54 14.2 323 980.7 0 017 3 2019 15:00 42 54.21 17.2 111 981 0 017 3 2019 16:00 43 53.3 17.9 163 981.1 0 017 3 2019 17:00 40 51.25 16.5 280 980.9 0 017 3 2019 18:00 38 52.43 15.2 233 980.5 0 017 3 2019 19:00 35 50.11 23.6 167 980.1 0 017 3 2019 20:00 34 51.14 15.2 301 979.5 0 017 3 2019 21:00 33 50.47 14.5 280 979.3 0 017 3 2019 22:00 32 51.23 15.2 324 979.6 0 017 3 2019 23:00 31 49.43 12.7 256 981.2 0 018 3 2019 00:00 30 47.54 23.6 115 982.7 0 018 3 2019 01:00 29 47.32 14.6 114 983.8 0 018 3 2019 02:00 28 46 15.6 214 984.6 0 018 3 2019 03:00 27 45.1 16.3 325 985.1 0 018 3 2019 04:00 26 50.43 17.5 156 984.3 0 0
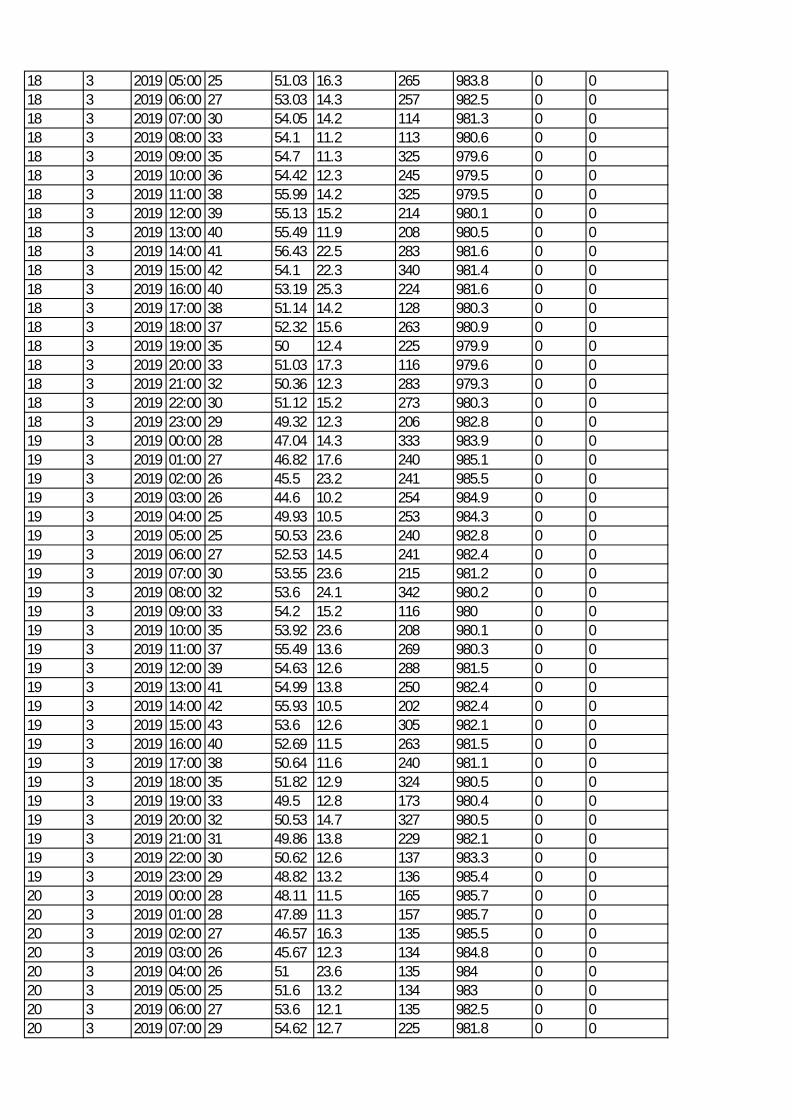
18 3 2019 05:00 25 51.03 16.3 265 983.8 0 018 3 2019 06:00 27 53.03 14.3 257 982.5 0 018 3 2019 07:00 30 54.05 14.2 114 981.3 0 018 3 2019 08:00 33 54.1 11.2 113 980.6 0 018 3 2019 09:00 35 54.7 11.3 325 979.6 0 018 3 2019 10:00 36 54.42 12.3 245 979.5 0 018 3 2019 11:00 38 55.99 14.2 325 979.5 0 018 3 2019 12:00 39 55.13 15.2 214 980.1 0 018 3 2019 13:00 40 55.49 11.9 208 980.5 0 018 3 2019 14:00 41 56.43 22.5 283 981.6 0 018 3 2019 15:00 42 54.1 22.3 340 981.4 0 018 3 2019 16:00 40 53.19 25.3 224 981.6 0 018 3 2019 17:00 38 51.14 14.2 128 980.3 0 018 3 2019 18:00 37 52.32 15.6 263 980.9 0 018 3 2019 19:00 35 50 12.4 225 979.9 0 018 3 2019 20:00 33 51.03 17.3 116 979.6 0 018 3 2019 21:00 32 50.36 12.3 283 979.3 0 018 3 2019 22:00 30 51.12 15.2 273 980.3 0 018 3 2019 23:00 29 49.32 12.3 206 982.8 0 019 3 2019 00:00 28 47.04 14.3 333 983.9 0 019 3 2019 01:00 27 46.82 17.6 240 985.1 0 019 3 2019 02:00 26 45.5 23.2 241 985.5 0 019 3 2019 03:00 26 44.6 10.2 254 984.9 0 019 3 2019 04:00 25 49.93 10.5 253 984.3 0 019 3 2019 05:00 25 50.53 23.6 240 982.8 0 019 3 2019 06:00 27 52.53 14.5 241 982.4 0 019 3 2019 07:00 30 53.55 23.6 215 981.2 0 019 3 2019 08:00 32 53.6 24.1 342 980.2 0 019 3 2019 09:00 33 54.2 15.2 116 980 0 019 3 2019 10:00 35 53.92 23.6 208 980.1 0 019 3 2019 11:00 37 55.49 13.6 269 980.3 0 019 3 2019 12:00 39 54.63 12.6 288 981.5 0 019 3 2019 13:00 41 54.99 13.8 250 982.4 0 019 3 2019 14:00 42 55.93 10.5 202 982.4 0 019 3 2019 15:00 43 53.6 12.6 305 982.1 0 019 3 2019 16:00 40 52.69 11.5 263 981.5 0 019 3 2019 17:00 38 50.64 11.6 240 981.1 0 019 3 2019 18:00 35 51.82 12.9 324 980.5 0 019 3 2019 19:00 33 49.5 12.8 173 980.4 0 019 3 2019 20:00 32 50.53 14.7 327 980.5 0 019 3 2019 21:00 31 49.86 13.8 229 982.1 0 019 3 2019 22:00 30 50.62 12.6 137 983.3 0 019 3 2019 23:00 29 48.82 13.2 136 985.4 0 020 3 2019 00:00 28 48.11 11.5 165 985.7 0 020 3 2019 01:00 28 47.89 11.3 157 985.7 0 020 3 2019 02:00 27 46.57 16.3 135 985.5 0 020 3 2019 03:00 26 45.67 12.3 134 984.8 0 020 3 2019 04:00 26 51 23.6 135 984 0 020 3 2019 05:00 25 51.6 13.2 134 983 0 020 3 2019 06:00 27 53.6 12.1 135 982.5 0 020 3 2019 07:00 29 54.62 12.7 225 981.8 0 0
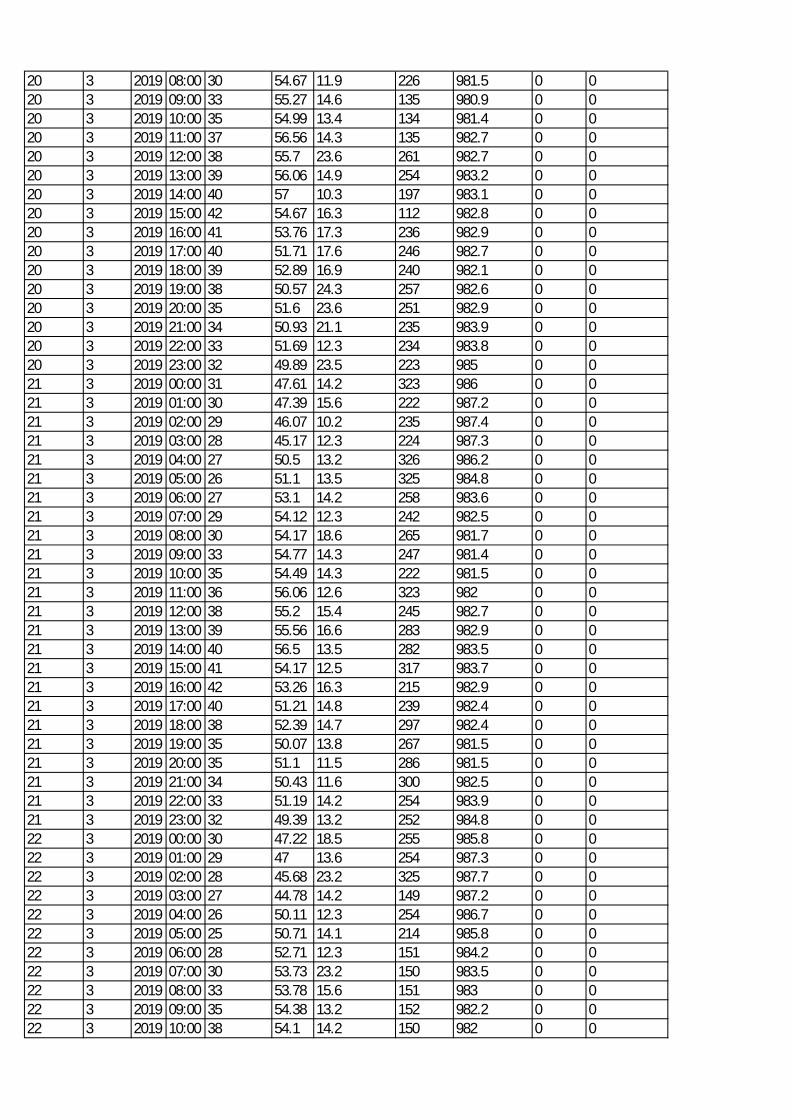
20 3 2019 08:00 30 54.67 11.9 226 981.5 0 020 3 2019 09:00 33 55.27 14.6 135 980.9 0 020 3 2019 10:00 35 54.99 13.4 134 981.4 0 020 3 2019 11:00 37 56.56 14.3 135 982.7 0 020 3 2019 12:00 38 55.7 23.6 261 982.7 0 020 3 2019 13:00 39 56.06 14.9 254 983.2 0 020 3 2019 14:00 40 57 10.3 197 983.1 0 020 3 2019 15:00 42 54.67 16.3 112 982.8 0 020 3 2019 16:00 41 53.76 17.3 236 982.9 0 020 3 2019 17:00 40 51.71 17.6 246 982.7 0 020 3 2019 18:00 39 52.89 16.9 240 982.1 0 020 3 2019 19:00 38 50.57 24.3 257 982.6 0 020 3 2019 20:00 35 51.6 23.6 251 982.9 0 020 3 2019 21:00 34 50.93 21.1 235 983.9 0 020 3 2019 22:00 33 51.69 12.3 234 983.8 0 020 3 2019 23:00 32 49.89 23.5 223 985 0 021 3 2019 00:00 31 47.61 14.2 323 986 0 021 3 2019 01:00 30 47.39 15.6 222 987.2 0 021 3 2019 02:00 29 46.07 10.2 235 987.4 0 021 3 2019 03:00 28 45.17 12.3 224 987.3 0 021 3 2019 04:00 27 50.5 13.2 326 986.2 0 021 3 2019 05:00 26 51.1 13.5 325 984.8 0 021 3 2019 06:00 27 53.1 14.2 258 983.6 0 021 3 2019 07:00 29 54.12 12.3 242 982.5 0 021 3 2019 08:00 30 54.17 18.6 265 981.7 0 021 3 2019 09:00 33 54.77 14.3 247 981.4 0 021 3 2019 10:00 35 54.49 14.3 222 981.5 0 021 3 2019 11:00 36 56.06 12.6 323 982 0 021 3 2019 12:00 38 55.2 15.4 245 982.7 0 021 3 2019 13:00 39 55.56 16.6 283 982.9 0 021 3 2019 14:00 40 56.5 13.5 282 983.5 0 021 3 2019 15:00 41 54.17 12.5 317 983.7 0 021 3 2019 16:00 42 53.26 16.3 215 982.9 0 021 3 2019 17:00 40 51.21 14.8 239 982.4 0 021 3 2019 18:00 38 52.39 14.7 297 982.4 0 021 3 2019 19:00 35 50.07 13.8 267 981.5 0 021 3 2019 20:00 35 51.1 11.5 286 981.5 0 021 3 2019 21:00 34 50.43 11.6 300 982.5 0 021 3 2019 22:00 33 51.19 14.2 254 983.9 0 021 3 2019 23:00 32 49.39 13.2 252 984.8 0 022 3 2019 00:00 30 47.22 18.5 255 985.8 0 022 3 2019 01:00 29 47 13.6 254 987.3 0 022 3 2019 02:00 28 45.68 23.2 325 987.7 0 022 3 2019 03:00 27 44.78 14.2 149 987.2 0 022 3 2019 04:00 26 50.11 12.3 254 986.7 0 022 3 2019 05:00 25 50.71 14.1 214 985.8 0 022 3 2019 06:00 28 52.71 12.3 151 984.2 0 022 3 2019 07:00 30 53.73 23.2 150 983.5 0 022 3 2019 08:00 33 53.78 15.6 151 983 0 022 3 2019 09:00 35 54.38 13.2 152 982.2 0 022 3 2019 10:00 38 54.1 14.2 150 982 0 0
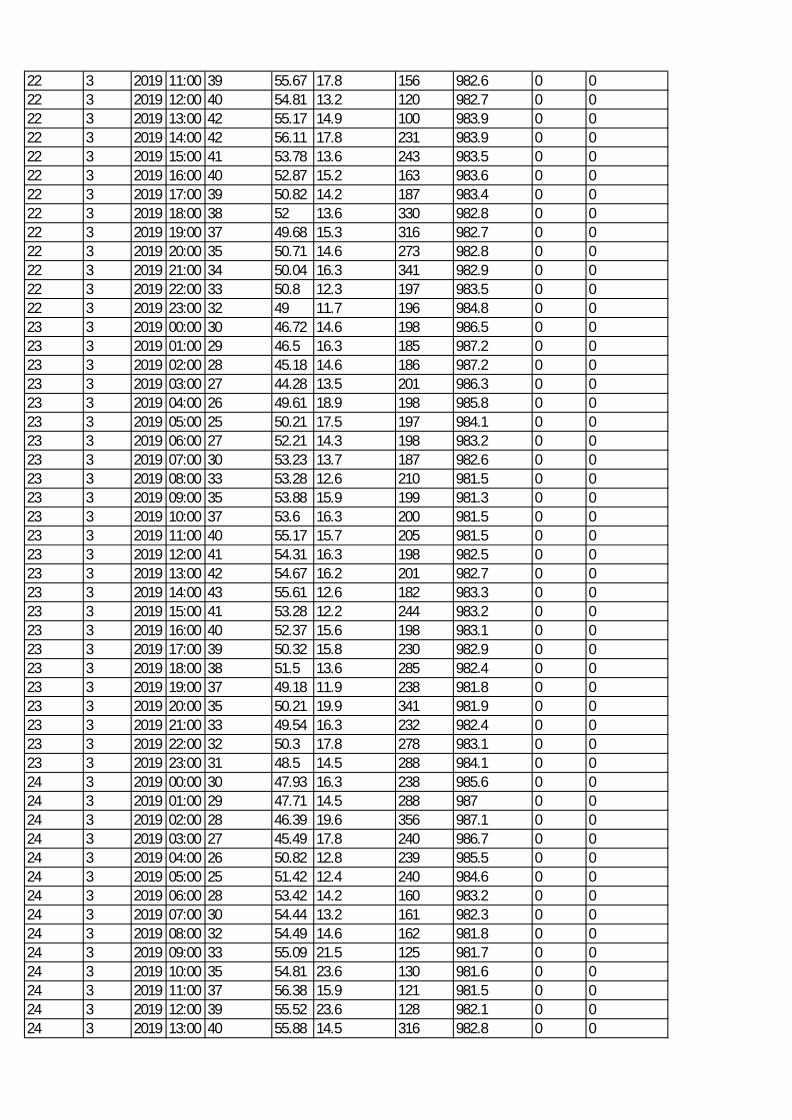
22 3 2019 11:00 39 55.67 17.8 156 982.6 0 022 3 2019 12:00 40 54.81 13.2 120 982.7 0 022 3 2019 13:00 42 55.17 14.9 100 983.9 0 022 3 2019 14:00 42 56.11 17.8 231 983.9 0 022 3 2019 15:00 41 53.78 13.6 243 983.5 0 022 3 2019 16:00 40 52.87 15.2 163 983.6 0 022 3 2019 17:00 39 50.82 14.2 187 983.4 0 022 3 2019 18:00 38 52 13.6 330 982.8 0 022 3 2019 19:00 37 49.68 15.3 316 982.7 0 022 3 2019 20:00 35 50.71 14.6 273 982.8 0 022 3 2019 21:00 34 50.04 16.3 341 982.9 0 022 3 2019 22:00 33 50.8 12.3 197 983.5 0 022 3 2019 23:00 32 49 11.7 196 984.8 0 023 3 2019 00:00 30 46.72 14.6 198 986.5 0 023 3 2019 01:00 29 46.5 16.3 185 987.2 0 023 3 2019 02:00 28 45.18 14.6 186 987.2 0 023 3 2019 03:00 27 44.28 13.5 201 986.3 0 023 3 2019 04:00 26 49.61 18.9 198 985.8 0 023 3 2019 05:00 25 50.21 17.5 197 984.1 0 023 3 2019 06:00 27 52.21 14.3 198 983.2 0 023 3 2019 07:00 30 53.23 13.7 187 982.6 0 023 3 2019 08:00 33 53.28 12.6 210 981.5 0 023 3 2019 09:00 35 53.88 15.9 199 981.3 0 023 3 2019 10:00 37 53.6 16.3 200 981.5 0 023 3 2019 11:00 40 55.17 15.7 205 981.5 0 023 3 2019 12:00 41 54.31 16.3 198 982.5 0 023 3 2019 13:00 42 54.67 16.2 201 982.7 0 023 3 2019 14:00 43 55.61 12.6 182 983.3 0 023 3 2019 15:00 41 53.28 12.2 244 983.2 0 023 3 2019 16:00 40 52.37 15.6 198 983.1 0 023 3 2019 17:00 39 50.32 15.8 230 982.9 0 023 3 2019 18:00 38 51.5 13.6 285 982.4 0 023 3 2019 19:00 37 49.18 11.9 238 981.8 0 023 3 2019 20:00 35 50.21 19.9 341 981.9 0 023 3 2019 21:00 33 49.54 16.3 232 982.4 0 023 3 2019 22:00 32 50.3 17.8 278 983.1 0 023 3 2019 23:00 31 48.5 14.5 288 984.1 0 024 3 2019 00:00 30 47.93 16.3 238 985.6 0 024 3 2019 01:00 29 47.71 14.5 288 987 0 024 3 2019 02:00 28 46.39 19.6 356 987.1 0 024 3 2019 03:00 27 45.49 17.8 240 986.7 0 024 3 2019 04:00 26 50.82 12.8 239 985.5 0 024 3 2019 05:00 25 51.42 12.4 240 984.6 0 024 3 2019 06:00 28 53.42 14.2 160 983.2 0 024 3 2019 07:00 30 54.44 13.2 161 982.3 0 024 3 2019 08:00 32 54.49 14.6 162 981.8 0 024 3 2019 09:00 33 55.09 21.5 125 981.7 0 024 3 2019 10:00 35 54.81 23.6 130 981.6 0 024 3 2019 11:00 37 56.38 15.9 121 981.5 0 024 3 2019 12:00 39 55.52 23.6 128 982.1 0 024 3 2019 13:00 40 55.88 14.5 316 982.8 0 0
24 3 2019 14:00 41 56.82 24.2 130 982.9 0 024 3 2019 15:00 42 54.49 14.5 290 982.4 0 024 3 2019 16:00 41 53.58 17.8 241 982.3 0 024 3 2019 17:00 40 51.53 19.6 211 981.6 0 024 3 2019 18:00 39 52.71 18.5 326 981.3 0 024 3 2019 19:00 38 50.39 16.9 246 981.5 0 024 3 2019 20:00 37 51.42 12.3 242 981.3 0 024 3 2019 21:00 35 50.75 12.5 263 981.8 0 024 3 2019 22:00 34 51.51 14.3 245 982.8 0 024 3 2019 23:00 33 49.71 12.3 246 983.8 0 025 3 2019 00:00 32 47.43 16.9 245 985.4 0 025 3 2019 01:00 31 47.21 16.3 244 986.9 0 025 3 2019 02:00 30 45.89 12.2 246 986 0 025 3 2019 03:00 29 44.99 12.7 245 985.6 0 025 3 2019 04:00 28 50.32 12.5 243 984.9 0 025 3 2019 05:00 27 50.92 15.6 247 983.6 0 025 3 2019 06:00 30 52.92 19.6 245 982.9 0 025 3 2019 07:00 31 53.94 16.2 246 981.6 0 025 3 2019 08:00 33 53.99 14.5 249 980.8 0 025 3 2019 09:00 35 54.59 16.3 245 980.5 0 025 3 2019 10:00 37 54.31 13.9 256 980.8 0 025 3 2019 11:00 39 55.88 14.7 246 981.3 0 025 3 2019 12:00 40 55.02 10.9 290 981.6 0 025 3 2019 13:00 41 55.38 12.6 322 982.3 0 025 3 2019 14:00 42 56.32 12.9 164 982.9 0 025 3 2019 15:00 43 53.99 15.6 312 982.4 0 025 3 2019 16:00 41 53.08 14.3 191 982.4 0 025 3 2019 17:00 40 51.03 15.9 162 981.6 0 025 3 2019 18:00 39 52.21 12.9 329 981.3 0 025 3 2019 19:00 37 49.89 19.6 343 980.4 0 025 3 2019 20:00 35 50.92 17.5 296 980.7 0 025 3 2019 21:00 34 50.25 10.2 112 981.2 0 025 3 2019 22:00 33 51.01 12.3 193 982.3 0 025 3 2019 23:00 32 49.21 13.6 294 982.9 0 026 3 2019 00:00 31 48.79 15.9 164 984.5 0 026 3 2019 01:00 30 48.57 12.4 165 985.2 0 026 3 2019 02:00 29 47.25 12.1 265 985.2 0 026 3 2019 03:00 28 46.35 11.4 287 984.9 0 026 3 2019 04:00 27 51.68 13.2 187 983.7 0 026 3 2019 05:00 26 52.28 18.3 207 982.6 0 026 3 2019 06:00 29 54.28 13.2 292 981.6 0 026 3 2019 07:00 30 55.3 17.5 289 980.4 0 026 3 2019 08:00 33 55.35 16.9 191 979.9 0 026 3 2019 09:00 35 55.95 17.8 187 979.6 0 026 3 2019 10:00 36 55.67 14.2 186 979.6 0 026 3 2019 11:00 38 57.24 12.4 156 979.4 0 026 3 2019 12:00 39 56.38 14.6 162 980.5 0 026 3 2019 13:00 40 56.74 16.3 308 980.3 0 026 3 2019 14:00 41 57.68 14.2 274 980.8 0 026 3 2019 15:00 42 55.35 17.9 224 980.3 0 026 3 2019 16:00 40 54.44 16.2 237 980.4 0 0
26 3 2019 17:00 39 52.39 15.3 125 980.3 0 026 3 2019 18:00 38 53.57 13.6 217 979.6 0 026 3 2019 19:00 36 51.25 19.6 204 979 0 026 3 2019 20:00 34 52.28 17.8 214 979.2 0 026 3 2019 21:00 33 51.61 19.6 209 979.8 0 026 3 2019 22:00 32 52.37 13.6 210 980.2 0 026 3 2019 23:00 31 50.57 10.2 211 981.5 0 027 3 2019 00:00 30 48.29 13.5 103 982.4 0 027 3 2019 01:00 29 48.07 14.2 159 982.7 0 027 3 2019 02:00 28 46.75 12.3 161 982.9 0 027 3 2019 03:00 27 45.85 12.6 158 981.6 0 027 3 2019 04:00 27 51.18 14.5 262 981.3 0 027 3 2019 05:00 26 51.78 11.9 263 980.2 0 027 3 2019 06:00 29 53.78 19.9 161 978.6 0 027 3 2019 07:00 30 54.8 11.9 154 977.6 0 027 3 2019 08:00 33 54.85 13.8 155 977.4 0 027 3 2019 09:00 35 55.45 15.3 153 976.9 0 027 3 2019 10:00 36 55.17 15.6 158 976.3 0 027 3 2019 11:00 38 56.74 14.2 318 976.5 0 027 3 2019 12:00 39 55.88 15.2 140 977 0 027 3 2019 13:00 40 56.24 15.2 328 977.4 0 027 3 2019 14:00 42 57.18 16.3 227 977.4 0 027 3 2019 15:00 39 54.85 15.2 247 977.5 0 027 3 2019 16:00 37 53.94 16.2 166 977 0 027 3 2019 17:00 35 51.89 14.2 226 977.3 0 027 3 2019 18:00 33 53.07 13.2 190 977.2 0 027 3 2019 19:00 32 50.75 14.6 304 976.2 0 027 3 2019 20:00 31 51.78 13.2 255 977.1 0 027 3 2019 21:00 30 51.11 12.6 267 978.2 0 027 3 2019 22:00 29 51.87 14.2 226 978.1 0 027 3 2019 23:00 28 50.07 19.5 225 979.4 0 028 3 2019 00:00 27 47.81 11.7 226 980.6 0 028 3 2019 01:00 26 47.59 11.6 225 981.1 0 028 3 2019 02:00 26 46.27 17.2 148 981.3 0 028 3 2019 03:00 25 45.37 17.5 256 981.3 0 028 3 2019 04:00 25 50.7 12.3 149 980.7 0 028 3 2019 05:00 27 51.3 15.3 161 979.4 0 028 3 2019 06:00 29 53.3 11.6 120 978.1 0 028 3 2019 07:00 30 54.32 11.7 132 977.2 0 028 3 2019 08:00 31 54.37 12.8 143 977.5 0 028 3 2019 09:00 33 54.97 13.2 162 976.9 0 028 3 2019 10:00 35 54.69 15.2 163 977 0 028 3 2019 11:00 36 56.26 15.7 177 977.2 0 028 3 2019 12:00 37 55.4 23.5 178 978 0 028 3 2019 13:00 39 55.76 13.6 133 979.2 0 028 3 2019 14:00 41 56.7 17.6 313 980.2 0 028 3 2019 15:00 42 54.37 12.3 119 980.8 0 028 3 2019 16:00 40 53.46 16.3 178 980.3 0 028 3 2019 17:00 38 51.41 14.2 275 980.6 0 028 3 2019 18:00 37 52.59 12.6 295 980.3 0 028 3 2019 19:00 35 50.27 23.6 134 980.1 0 0
28 3 2019 20:00 34 51.3 12.4 145 980.2 0 028 3 2019 21:00 33 50.63 14.5 165 981.1 0 028 3 2019 22:00 32 51.39 12.3 125 981.4 0 028 3 2019 23:00 31 49.59 23.2 126 982.8 0 029 3 2019 00:00 30 47.31 18.2 154 983.8 0 029 3 2019 01:00 29 47.09 17.5 155 984 0 029 3 2019 02:00 28 45.77 12.5 106 983.9 0 029 3 2019 03:00 27 44.87 14.2 143 983.4 0 029 3 2019 04:00 26 50.2 14.6 119 982.6 0 029 3 2019 05:00 25 50.8 13.9 335 981.4 0 029 3 2019 06:00 29 52.8 15.2 337 980.5 0 029 3 2019 07:00 30 53.82 14.2 138 979.1 0 029 3 2019 08:00 32 53.87 16.3 266 978.6 0 029 3 2019 09:00 33 54.47 17.2 138 978.3 0 029 3 2019 10:00 35 54.19 13.2 132 978.8 0 029 3 2019 11:00 36 55.76 14.5 139 979.4 0 029 3 2019 12:00 37 54.9 15.2 289 980.2 0 029 3 2019 13:00 38 55.26 16.3 311 980.5 0 029 3 2019 14:00 39 56.2 13.2 112 981.6 0 029 3 2019 15:00 41 53.87 16.2 311 981.4 0 029 3 2019 16:00 42 52.96 14.9 252 980.5 0 029 3 2019 17:00 40 50.91 16.3 291 980.4 0 029 3 2019 18:00 39 52.09 15.2 273 979.8 0 029 3 2019 19:00 38 49.77 11.6 300 980 0 029 3 2019 20:00 37 50.8 17.6 237 980.3 0 029 3 2019 21:00 36 50.13 14.2 315 980.3 0 029 3 2019 22:00 35 50.89 14.2 229 981 0 029 3 2019 23:00 34 49.09 13.2 226 982.4 0 030 3 2019 00:00 33 48.53 21.3 265 983.4 0 030 3 2019 01:00 32 48.31 23.5 245 983.8 0 030 3 2019 02:00 31 46.99 24.3 152 984 0 030 3 2019 03:00 30 46.09 12.3 150 983.5 0 030 3 2019 04:00 29 51.42 13.6 117 982.5 0 030 3 2019 05:00 28 52.02 26.3 133 981.5 0 030 3 2019 06:00 29 54.02 14.2 135 980.2 0 030 3 2019 07:00 30 55.04 12.3 232 979.3 0 030 3 2019 08:00 33 55.09 15.6 205 978.5 0 030 3 2019 09:00 35 55.69 23.2 121 978.2 0 030 3 2019 10:00 37 55.41 21.2 176 978.2 0 030 3 2019 11:00 39 56.98 14.5 158 978.4 0 030 3 2019 12:00 40 56.12 21.6 185 979.1 0 030 3 2019 13:00 42 56.48 12.3 231 979.3 0 030 3 2019 14:00 43 57.42 23.6 182 980 0 030 3 2019 15:00 41 55.09 14.6 193 980.1 0 030 3 2019 16:00 40 54.18 25.6 173 979.3 0 030 3 2019 17:00 39 52.13 14.6 162 978.9 0 030 3 2019 18:00 38 53.31 21.6 160 978.3 0 030 3 2019 19:00 37 50.99 13.5 155 978.3 0 030 3 2019 20:00 35 52.02 15.4 181 978.5 0 030 3 2019 21:00 32 51.35 19.6 182 978.6 0 030 3 2019 22:00 33 52.11 12.6 162 980.4 0 0
30 3 2019 23:00 32 50.31 11.9 114 980.8 0 031 3 2019 00:00 30 48.03 14.2 113 981.7 0 031 3 2019 01:00 29 47.81 16.2 141 982.4 0 031 3 2019 02:00 28 46.49 17.5 205 982.7 0 031 3 2019 03:00 27 45.59 11.2 346 982.4 0 031 3 2019 04:00 26 50.92 13.2 152 981.2 0 031 3 2019 05:00 25 51.52 11.3 142 980.6 0 031 3 2019 06:00 29 53.52 11.7 140 979.5 0 031 3 2019 07:00 30 54.54 12.7 142 978.4 0 031 3 2019 08:00 33 54.59 23.2 132 977.5 0 031 3 2019 09:00 35 55.19 12.8 138 977.1 0 031 3 2019 10:00 37 54.91 14.9 136 977.2 0 031 3 2019 11:00 39 56.48 23.6 342 977.2 0 031 3 2019 12:00 40 55.62 25.3 322 977.3 0 031 3 2019 13:00 42 55.98 14.3 324 978.1 0 031 3 2019 14:00 43 56.92 26.3 129 978.4 0 031 3 2019 15:00 41 54.59 14.2 332 978.3 0 031 3 2019 16:00 40 53.68 22.3 151 978.1 0 031 3 2019 17:00 39 51.63 23.6 179 977.7 0 031 3 2019 18:00 38 52.81 12.3 115 977.3 0 031 3 2019 19:00 36 50.49 14.5 299 977.1 0 031 3 2019 20:00 35 51.52 18.9 300 977.2 0 031 3 2019 21:00 34 50.85 12.3 145 977.9 0 031 3 2019 22:00 33 51.61 21.3 197 978.5 0 031 3 2019 23:00 32 49.81 14.5 116 979.7 0 01 4 2019 00:00 30 47.64 14.5 321 981.2 0 01 4 2019 01:00 29 47.42 23.6 293 982.2 0 01 4 2019 02:00 28 46.1 17.5 115 982.4 0 01 4 2019 03:00 27 45.2 12.6 173 981.5 0 01 4 2019 04:00 26 50.53 24.6 347 980.6 0 01 4 2019 05:00 25 51.13 24.5 341 979.7 0 01 4 2019 06:00 27 53.13 26.3 324 978.8 0 01 4 2019 07:00 30 54.15 22.6 266 977.7 0 01 4 2019 08:00 33 54.2 11.6 156 977.1 0 01 4 2019 09:00 35 54.8 14.5 286 976.9 0 01 4 2019 10:00 38 54.52 23.5 177 976.3 0 01 4 2019 11:00 39 56.09 12.3 256 977.1 0 01 4 2019 12:00 40 55.23 21.3 245 977.2 0 01 4 2019 13:00 42 55.59 24.5 246 977.8 0 01 4 2019 14:00 43 56.53 26.9 296 978.4 0 01 4 2019 15:00 41 54.2 14.3 145 978.4 0 01 4 2019 16:00 40 53.29 17.8 177 977.7 0 01 4 2019 17:00 39 51.24 26.3 145 977.3 0 01 4 2019 18:00 37 52.42 11.4 187 976.8 0 01 4 2019 19:00 35 50.1 23.4 312 976.4 0 01 4 2019 20:00 34 51.13 26.3 145 977.3 0 01 4 2019 21:00 33 50.46 17.6 302 977.1 0 01 4 2019 22:00 32 51.22 19.6 157 977.9 0 01 4 2019 23:00 30 49.42 17.5 136 979.4 0 02 4 2019 00:00 29 47.14 11.4 290 980.4 0 02 4 2019 01:00 28 46.92 16.3 256 981.5 0 0
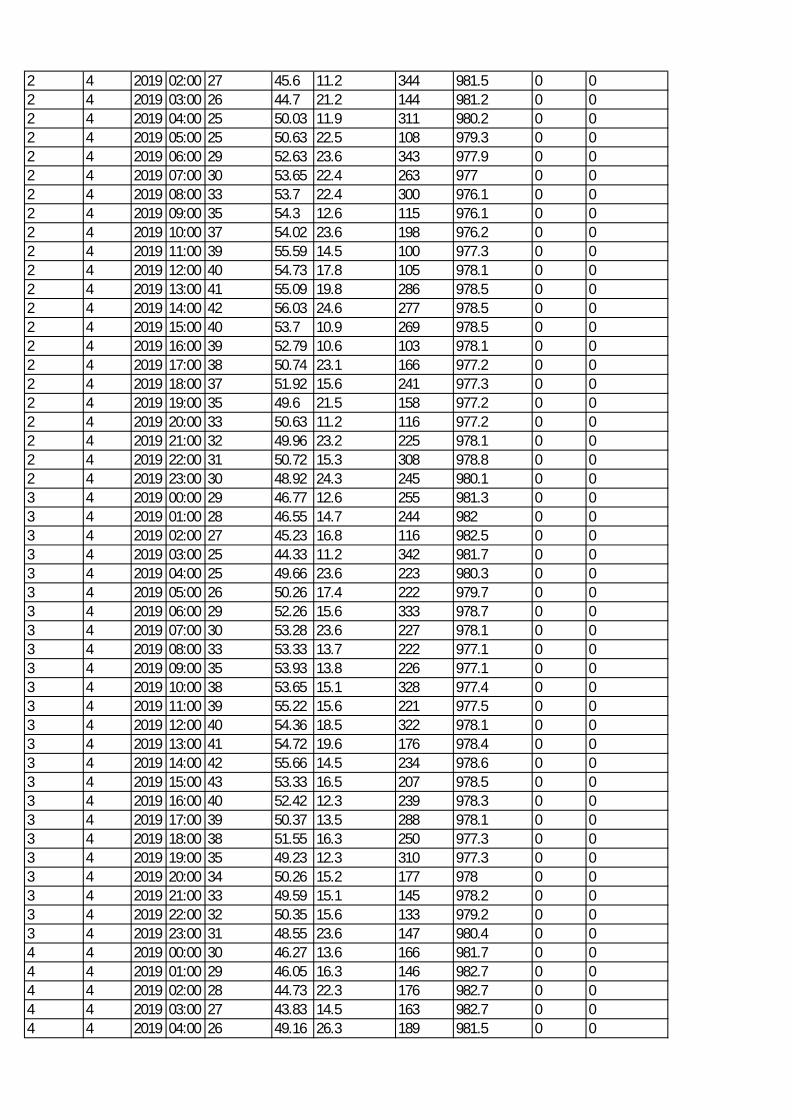
2 4 2019 02:00 27 45.6 11.2 344 981.5 0 02 4 2019 03:00 26 44.7 21.2 144 981.2 0 02 4 2019 04:00 25 50.03 11.9 311 980.2 0 02 4 2019 05:00 25 50.63 22.5 108 979.3 0 02 4 2019 06:00 29 52.63 23.6 343 977.9 0 02 4 2019 07:00 30 53.65 22.4 263 977 0 02 4 2019 08:00 33 53.7 22.4 300 976.1 0 02 4 2019 09:00 35 54.3 12.6 115 976.1 0 02 4 2019 10:00 37 54.02 23.6 198 976.2 0 02 4 2019 11:00 39 55.59 14.5 100 977.3 0 02 4 2019 12:00 40 54.73 17.8 105 978.1 0 02 4 2019 13:00 41 55.09 19.8 286 978.5 0 02 4 2019 14:00 42 56.03 24.6 277 978.5 0 02 4 2019 15:00 40 53.7 10.9 269 978.5 0 02 4 2019 16:00 39 52.79 10.6 103 978.1 0 02 4 2019 17:00 38 50.74 23.1 166 977.2 0 02 4 2019 18:00 37 51.92 15.6 241 977.3 0 02 4 2019 19:00 35 49.6 21.5 158 977.2 0 02 4 2019 20:00 33 50.63 11.2 116 977.2 0 02 4 2019 21:00 32 49.96 23.2 225 978.1 0 02 4 2019 22:00 31 50.72 15.3 308 978.8 0 02 4 2019 23:00 30 48.92 24.3 245 980.1 0 03 4 2019 00:00 29 46.77 12.6 255 981.3 0 03 4 2019 01:00 28 46.55 14.7 244 982 0 03 4 2019 02:00 27 45.23 16.8 116 982.5 0 03 4 2019 03:00 25 44.33 11.2 342 981.7 0 03 4 2019 04:00 25 49.66 23.6 223 980.3 0 03 4 2019 05:00 26 50.26 17.4 222 979.7 0 03 4 2019 06:00 29 52.26 15.6 333 978.7 0 03 4 2019 07:00 30 53.28 23.6 227 978.1 0 03 4 2019 08:00 33 53.33 13.7 222 977.1 0 03 4 2019 09:00 35 53.93 13.8 226 977.1 0 03 4 2019 10:00 38 53.65 15.1 328 977.4 0 03 4 2019 11:00 39 55.22 15.6 221 977.5 0 03 4 2019 12:00 40 54.36 18.5 322 978.1 0 03 4 2019 13:00 41 54.72 19.6 176 978.4 0 03 4 2019 14:00 42 55.66 14.5 234 978.6 0 03 4 2019 15:00 43 53.33 16.5 207 978.5 0 03 4 2019 16:00 40 52.42 12.3 239 978.3 0 03 4 2019 17:00 39 50.37 13.5 288 978.1 0 03 4 2019 18:00 38 51.55 16.3 250 977.3 0 03 4 2019 19:00 35 49.23 12.3 310 977.3 0 03 4 2019 20:00 34 50.26 15.2 177 978 0 03 4 2019 21:00 33 49.59 15.1 145 978.2 0 03 4 2019 22:00 32 50.35 15.6 133 979.2 0 03 4 2019 23:00 31 48.55 23.6 147 980.4 0 04 4 2019 00:00 30 46.27 13.6 166 981.7 0 04 4 2019 01:00 29 46.05 16.3 146 982.7 0 04 4 2019 02:00 28 44.73 22.3 176 982.7 0 04 4 2019 03:00 27 43.83 14.5 163 982.7 0 04 4 2019 04:00 26 49.16 26.3 189 981.5 0 0
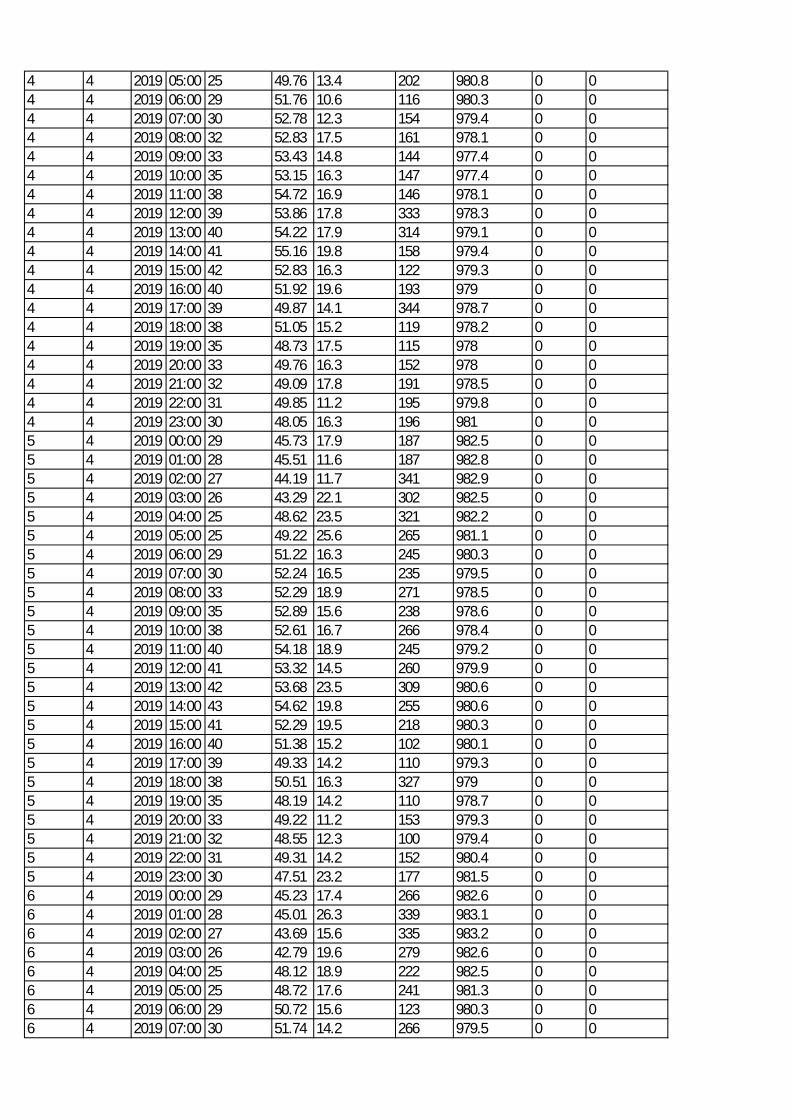
4 4 2019 05:00 25 49.76 13.4 202 980.8 0 04 4 2019 06:00 29 51.76 10.6 116 980.3 0 04 4 2019 07:00 30 52.78 12.3 154 979.4 0 04 4 2019 08:00 32 52.83 17.5 161 978.1 0 04 4 2019 09:00 33 53.43 14.8 144 977.4 0 04 4 2019 10:00 35 53.15 16.3 147 977.4 0 04 4 2019 11:00 38 54.72 16.9 146 978.1 0 04 4 2019 12:00 39 53.86 17.8 333 978.3 0 04 4 2019 13:00 40 54.22 17.9 314 979.1 0 04 4 2019 14:00 41 55.16 19.8 158 979.4 0 04 4 2019 15:00 42 52.83 16.3 122 979.3 0 04 4 2019 16:00 40 51.92 19.6 193 979 0 04 4 2019 17:00 39 49.87 14.1 344 978.7 0 04 4 2019 18:00 38 51.05 15.2 119 978.2 0 04 4 2019 19:00 35 48.73 17.5 115 978 0 04 4 2019 20:00 33 49.76 16.3 152 978 0 04 4 2019 21:00 32 49.09 17.8 191 978.5 0 04 4 2019 22:00 31 49.85 11.2 195 979.8 0 04 4 2019 23:00 30 48.05 16.3 196 981 0 05 4 2019 00:00 29 45.73 17.9 187 982.5 0 05 4 2019 01:00 28 45.51 11.6 187 982.8 0 05 4 2019 02:00 27 44.19 11.7 341 982.9 0 05 4 2019 03:00 26 43.29 22.1 302 982.5 0 05 4 2019 04:00 25 48.62 23.5 321 982.2 0 05 4 2019 05:00 25 49.22 25.6 265 981.1 0 05 4 2019 06:00 29 51.22 16.3 245 980.3 0 05 4 2019 07:00 30 52.24 16.5 235 979.5 0 05 4 2019 08:00 33 52.29 18.9 271 978.5 0 05 4 2019 09:00 35 52.89 15.6 238 978.6 0 05 4 2019 10:00 38 52.61 16.7 266 978.4 0 05 4 2019 11:00 40 54.18 18.9 245 979.2 0 05 4 2019 12:00 41 53.32 14.5 260 979.9 0 05 4 2019 13:00 42 53.68 23.5 309 980.6 0 05 4 2019 14:00 43 54.62 19.8 255 980.6 0 05 4 2019 15:00 41 52.29 19.5 218 980.3 0 05 4 2019 16:00 40 51.38 15.2 102 980.1 0 05 4 2019 17:00 39 49.33 14.2 110 979.3 0 05 4 2019 18:00 38 50.51 16.3 327 979 0 05 4 2019 19:00 35 48.19 14.2 110 978.7 0 05 4 2019 20:00 33 49.22 11.2 153 979.3 0 05 4 2019 21:00 32 48.55 12.3 100 979.4 0 05 4 2019 22:00 31 49.31 14.2 152 980.4 0 05 4 2019 23:00 30 47.51 23.2 177 981.5 0 06 4 2019 00:00 29 45.23 17.4 266 982.6 0 06 4 2019 01:00 28 45.01 26.3 339 983.1 0 06 4 2019 02:00 27 43.69 15.6 335 983.2 0 06 4 2019 03:00 26 42.79 19.6 279 982.6 0 06 4 2019 04:00 25 48.12 18.9 222 982.5 0 06 4 2019 05:00 25 48.72 17.6 241 981.3 0 06 4 2019 06:00 29 50.72 15.6 123 980.3 0 06 4 2019 07:00 30 51.74 14.2 266 979.5 0 0
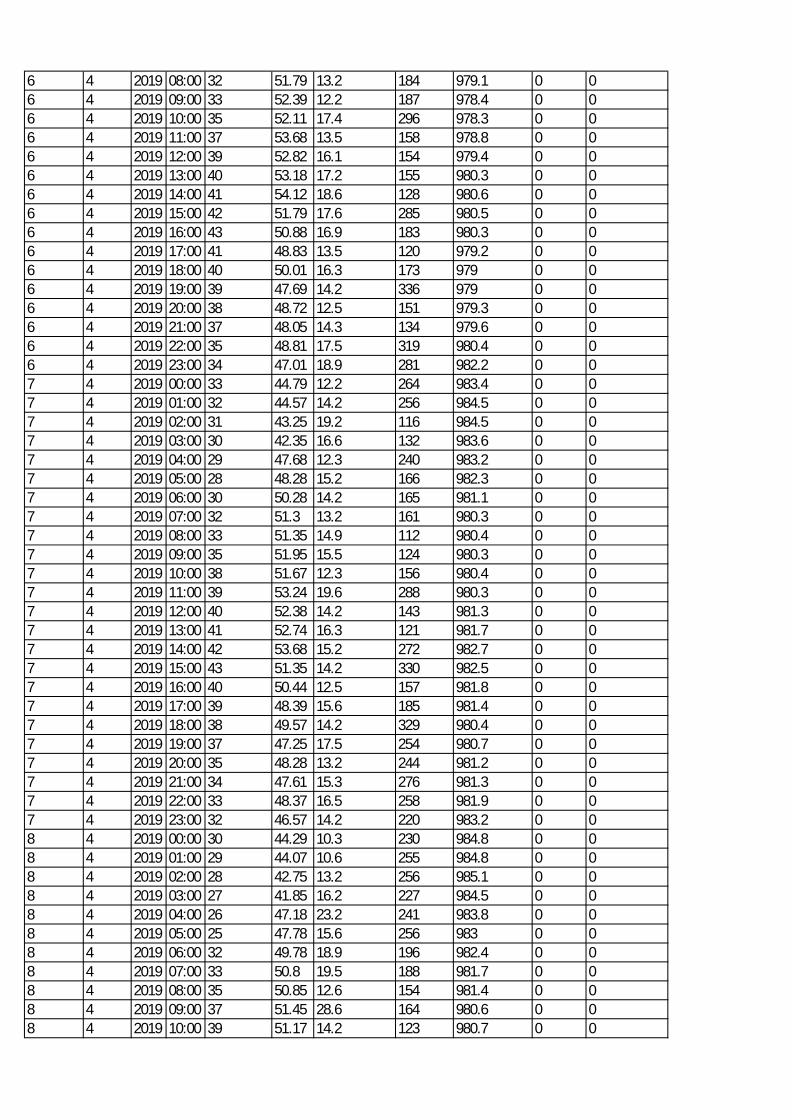
6 4 2019 08:00 32 51.79 13.2 184 979.1 0 06 4 2019 09:00 33 52.39 12.2 187 978.4 0 06 4 2019 10:00 35 52.11 17.4 296 978.3 0 06 4 2019 11:00 37 53.68 13.5 158 978.8 0 06 4 2019 12:00 39 52.82 16.1 154 979.4 0 06 4 2019 13:00 40 53.18 17.2 155 980.3 0 06 4 2019 14:00 41 54.12 18.6 128 980.6 0 06 4 2019 15:00 42 51.79 17.6 285 980.5 0 06 4 2019 16:00 43 50.88 16.9 183 980.3 0 06 4 2019 17:00 41 48.83 13.5 120 979.2 0 06 4 2019 18:00 40 50.01 16.3 173 979 0 06 4 2019 19:00 39 47.69 14.2 336 979 0 06 4 2019 20:00 38 48.72 12.5 151 979.3 0 06 4 2019 21:00 37 48.05 14.3 134 979.6 0 06 4 2019 22:00 35 48.81 17.5 319 980.4 0 06 4 2019 23:00 34 47.01 18.9 281 982.2 0 07 4 2019 00:00 33 44.79 12.2 264 983.4 0 07 4 2019 01:00 32 44.57 14.2 256 984.5 0 07 4 2019 02:00 31 43.25 19.2 116 984.5 0 07 4 2019 03:00 30 42.35 16.6 132 983.6 0 07 4 2019 04:00 29 47.68 12.3 240 983.2 0 07 4 2019 05:00 28 48.28 15.2 166 982.3 0 07 4 2019 06:00 30 50.28 14.2 165 981.1 0 07 4 2019 07:00 32 51.3 13.2 161 980.3 0 07 4 2019 08:00 33 51.35 14.9 112 980.4 0 07 4 2019 09:00 35 51.95 15.5 124 980.3 0 07 4 2019 10:00 38 51.67 12.3 156 980.4 0 07 4 2019 11:00 39 53.24 19.6 288 980.3 0 07 4 2019 12:00 40 52.38 14.2 143 981.3 0 07 4 2019 13:00 41 52.74 16.3 121 981.7 0 07 4 2019 14:00 42 53.68 15.2 272 982.7 0 07 4 2019 15:00 43 51.35 14.2 330 982.5 0 07 4 2019 16:00 40 50.44 12.5 157 981.8 0 07 4 2019 17:00 39 48.39 15.6 185 981.4 0 07 4 2019 18:00 38 49.57 14.2 329 980.4 0 07 4 2019 19:00 37 47.25 17.5 254 980.7 0 07 4 2019 20:00 35 48.28 13.2 244 981.2 0 07 4 2019 21:00 34 47.61 15.3 276 981.3 0 07 4 2019 22:00 33 48.37 16.5 258 981.9 0 07 4 2019 23:00 32 46.57 14.2 220 983.2 0 08 4 2019 00:00 30 44.29 10.3 230 984.8 0 08 4 2019 01:00 29 44.07 10.6 255 984.8 0 08 4 2019 02:00 28 42.75 13.2 256 985.1 0 08 4 2019 03:00 27 41.85 16.2 227 984.5 0 08 4 2019 04:00 26 47.18 23.2 241 983.8 0 08 4 2019 05:00 25 47.78 15.6 256 983 0 08 4 2019 06:00 32 49.78 18.9 196 982.4 0 08 4 2019 07:00 33 50.8 19.5 188 981.7 0 08 4 2019 08:00 35 50.85 12.6 154 981.4 0 08 4 2019 09:00 37 51.45 28.6 164 980.6 0 08 4 2019 10:00 39 51.17 14.2 123 980.7 0 0
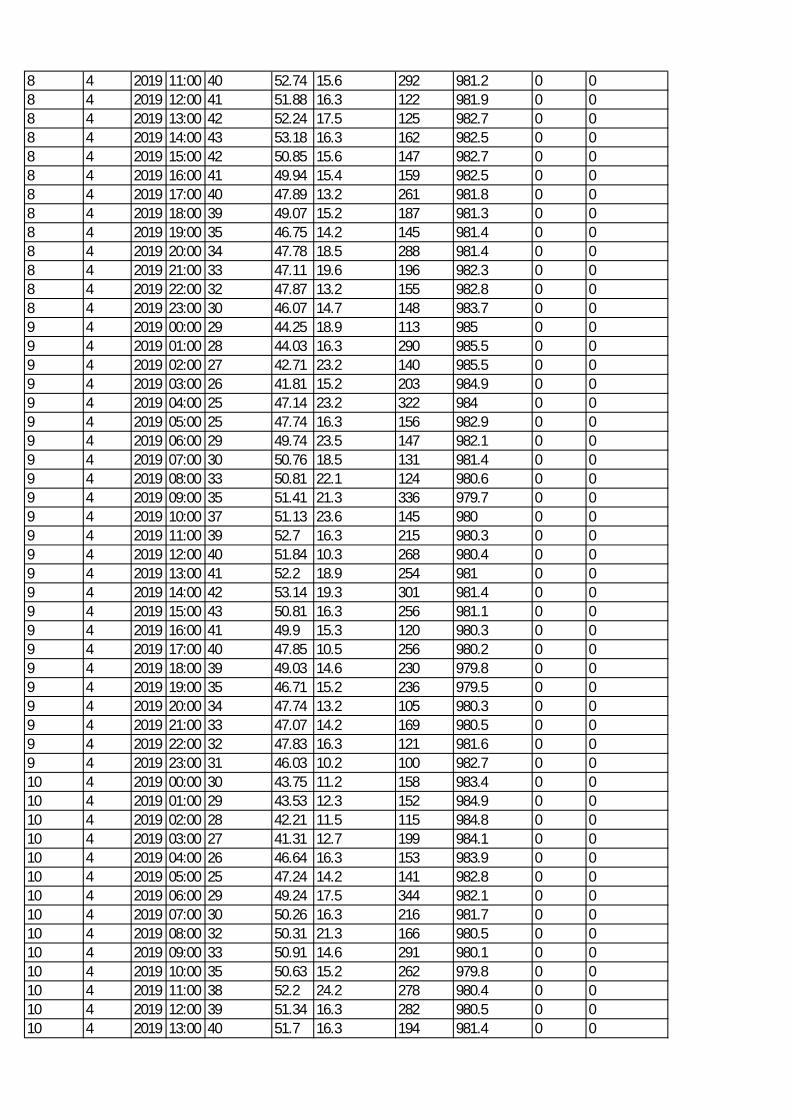
8 4 2019 11:00 40 52.74 15.6 292 981.2 0 08 4 2019 12:00 41 51.88 16.3 122 981.9 0 08 4 2019 13:00 42 52.24 17.5 125 982.7 0 08 4 2019 14:00 43 53.18 16.3 162 982.5 0 08 4 2019 15:00 42 50.85 15.6 147 982.7 0 08 4 2019 16:00 41 49.94 15.4 159 982.5 0 08 4 2019 17:00 40 47.89 13.2 261 981.8 0 08 4 2019 18:00 39 49.07 15.2 187 981.3 0 08 4 2019 19:00 35 46.75 14.2 145 981.4 0 08 4 2019 20:00 34 47.78 18.5 288 981.4 0 08 4 2019 21:00 33 47.11 19.6 196 982.3 0 08 4 2019 22:00 32 47.87 13.2 155 982.8 0 08 4 2019 23:00 30 46.07 14.7 148 983.7 0 09 4 2019 00:00 29 44.25 18.9 113 985 0 09 4 2019 01:00 28 44.03 16.3 290 985.5 0 09 4 2019 02:00 27 42.71 23.2 140 985.5 0 09 4 2019 03:00 26 41.81 15.2 203 984.9 0 09 4 2019 04:00 25 47.14 23.2 322 984 0 09 4 2019 05:00 25 47.74 16.3 156 982.9 0 09 4 2019 06:00 29 49.74 23.5 147 982.1 0 09 4 2019 07:00 30 50.76 18.5 131 981.4 0 09 4 2019 08:00 33 50.81 22.1 124 980.6 0 09 4 2019 09:00 35 51.41 21.3 336 979.7 0 09 4 2019 10:00 37 51.13 23.6 145 980 0 09 4 2019 11:00 39 52.7 16.3 215 980.3 0 09 4 2019 12:00 40 51.84 10.3 268 980.4 0 09 4 2019 13:00 41 52.2 18.9 254 981 0 09 4 2019 14:00 42 53.14 19.3 301 981.4 0 09 4 2019 15:00 43 50.81 16.3 256 981.1 0 09 4 2019 16:00 41 49.9 15.3 120 980.3 0 09 4 2019 17:00 40 47.85 10.5 256 980.2 0 09 4 2019 18:00 39 49.03 14.6 230 979.8 0 09 4 2019 19:00 35 46.71 15.2 236 979.5 0 09 4 2019 20:00 34 47.74 13.2 105 980.3 0 09 4 2019 21:00 33 47.07 14.2 169 980.5 0 09 4 2019 22:00 32 47.83 16.3 121 981.6 0 09 4 2019 23:00 31 46.03 10.2 100 982.7 0 010 4 2019 00:00 30 43.75 11.2 158 983.4 0 010 4 2019 01:00 29 43.53 12.3 152 984.9 0 010 4 2019 02:00 28 42.21 11.5 115 984.8 0 010 4 2019 03:00 27 41.31 12.7 199 984.1 0 010 4 2019 04:00 26 46.64 16.3 153 983.9 0 010 4 2019 05:00 25 47.24 14.2 141 982.8 0 010 4 2019 06:00 29 49.24 17.5 344 982.1 0 010 4 2019 07:00 30 50.26 16.3 216 981.7 0 010 4 2019 08:00 32 50.31 21.3 166 980.5 0 010 4 2019 09:00 33 50.91 14.6 291 980.1 0 010 4 2019 10:00 35 50.63 15.2 262 979.8 0 010 4 2019 11:00 38 52.2 24.2 278 980.4 0 010 4 2019 12:00 39 51.34 16.3 282 980.5 0 010 4 2019 13:00 40 51.7 16.3 194 981.4 0 0
10 4 2019 14:00 42 52.64 18.9 133 981.5 0 010 4 2019 15:00 43 50.31 16.3 114 981.6 0 010 4 2019 16:00 41 49.4 11.2 303 980.9 0 010 4 2019 17:00 40 47.35 11.5 206 980.7 0 010 4 2019 18:00 39 48.53 15.2 291 980.1 0 010 4 2019 19:00 38 46.21 14.2 142 981 0 010 4 2019 20:00 35 47.24 13.2 249 980.8 0 010 4 2019 21:00 34 46.57 10.6 263 981.4 0 010 4 2019 22:00 33 47.33 12.3 267 982.4 0 010 4 2019 23:00 32 45.53 12.4 277 982.6 0 011 4 2019 00:00 31 45.76 16.3 275 983.4 0 011 4 2019 01:00 30 45.54 14.3 256 983.8 0 011 4 2019 02:00 29 44.22 17.8 211 984.2 0 011 4 2019 03:00 28 43.32 19.6 330 983.7 0 011 4 2019 04:00 27 44.11 13.5 262 983.5 0 011 4 2019 05:00 26 45.64 15.7 242 982.8 0 011 4 2019 06:00 29 47.41 14.2 223 981.3 0 011 4 2019 07:00 30 47.64 13.2 211 980.5 0 011 4 2019 08:00 32 48.74 12.3 227 980.1 0 011 4 2019 09:00 35 48.96 17.2 236 979.5 0 011 4 2019 10:00 38 49.41 12.9 110 979.5 0 011 4 2019 11:00 39 49.74 10.9 283 980.3 0 011 4 2019 12:00 40 50.3 14.5 276 981.1 0 011 4 2019 13:00 41 50.53 23.5 168 981.5 0 011 4 2019 14:00 42 51.11 12.5 214 981.8 0 011 4 2019 15:00 43 51.33 12.5 264 981.6 0 011 4 2019 16:00 41 52.11 16.3 284 981.6 0 011 4 2019 17:00 40 49.36 14.2 250 980.9 0 011 4 2019 18:00 39 50.54 14.2 257 981.1 0 011 4 2019 19:00 38 48.22 15.3 256 982.1 0 011 4 2019 20:00 35 49.25 21.3 108 982.6 0 011 4 2019 21:00 33 48.58 21.7 161 982.7 0 011 4 2019 22:00 32 42.3 12.3 245 982.6 0 011 4 2019 23:00 30 40.12 25.6 280 983.6 0 012 4 2019 00:00 29 39.64 19.6 200 984.8 0 012 4 2019 01:00 28 39.14 23.6 184 985.8 0 012 4 2019 02:00 27 38.3 14.5 146 985.5 0 012 4 2019 03:00 26 38.11 26.3 308 985.3 0 012 4 2019 04:00 25 37.97 11.2 197 985 0 012 4 2019 05:00 25 42.33 12.6 293 984 0 012 4 2019 06:00 28 44.11 14.2 180 983.3 0 012 4 2019 07:00 30 48.44 10.6 320 982.2 0 012 4 2019 08:00 32 51.82 23.2 321 981.5 0 012 4 2019 09:00 34 52.42 12.3 325 980.5 0 012 4 2019 10:00 35 52.14 26.3 326 981.2 0 012 4 2019 11:00 38 53.71 14.2 327 981.8 0 012 4 2019 12:00 39 52.85 23.5 227 982.5 0 012 4 2019 13:00 40 53.21 21.3 205 982.9 0 012 4 2019 14:00 42 54.15 24.3 295 982.6 0 012 4 2019 15:00 43 51.82 15.6 360 983.1 0 012 4 2019 16:00 41 50.91 17.6 340 983.5 0 0
12 4 2019 17:00 40 48.86 10.5 221 983.5 0 012 4 2019 18:00 39 50.04 10.9 190 983.8 0 012 4 2019 19:00 38 47.72 10.6 346 983.3 0 012 4 2019 20:00 35 48.75 15.2 102 983.7 0 012 4 2019 21:00 33 48.08 15.2 298 983.7 0 012 4 2019 22:00 32 48.84 11.3 158 984.5 0 012 4 2019 23:00 31 47.04 16.3 263 985.6 0 013 4 2019 00:00 30 45.22 14.3 158 986.9 0 013 4 2019 01:00 29 45 11.2 256 987.1 0 013 4 2019 02:00 28 43.68 13.8 145 987.1 0 013 4 2019 03:00 27 42.78 13.5 229 987.2 0 013 4 2019 04:00 26 48.11 13.7 226 985.9 0 013 4 2019 05:00 25 48.71 11.2 232 985.2 0 013 4 2019 06:00 29 50.71 13.4 274 984.5 0 013 4 2019 07:00 30 51.73 23.5 271 983.7 0 013 4 2019 08:00 32 51.78 14.2 300 982.9 0 013 4 2019 09:00 34 52.38 13.2 248 982.6 0 013 4 2019 10:00 36 52.1 15.3 194 982.5 0 013 4 2019 11:00 38 53.67 12.6 236 982.6 0 013 4 2019 12:00 39 52.81 13.8 238 982.7 0 013 4 2019 13:00 40 53.17 16.3 263 983.2 0 013 4 2019 14:00 41 54.11 18.5 207 983.7 0 013 4 2019 15:00 42 51.78 17.2 241 983.6 0 013 4 2019 16:00 43 50.87 13.8 210 983.4 0 013 4 2019 17:00 40 48.82 17.5 243 982.7 0 013 4 2019 18:00 39 50 13.2 276 982.6 0 013 4 2019 19:00 38 47.68 16.3 309 982.7 0 013 4 2019 20:00 37 48.71 12.9 218 982.8 0 013 4 2019 21:00 35 48.04 11.9 265 982.9 0 013 4 2019 22:00 34 48.8 16.3 268 983.9 0 013 4 2019 23:00 33 47 12.4 211 984.9 0 014 4 2019 00:00 32 44.72 10.6 265 985.9 0 014 4 2019 01:00 31 44.5 16.7 256 986.7 0 014 4 2019 02:00 30 43.18 14.6 245 987 0 014 4 2019 03:00 29 42.28 11.9 242 986.3 0 014 4 2019 04:00 28 47.61 11.2 217 985.7 0 014 4 2019 05:00 27 48.21 13.2 218 984.7 0 014 4 2019 06:00 29 50.21 15.2 279 983.8 0 014 4 2019 07:00 30 51.23 16.3 207 982.8 0 014 4 2019 08:00 32 51.28 13.2 130 981.6 0 014 4 2019 09:00 33 51.88 14.5 107 981.3 0 014 4 2019 10:00 35 51.6 10.5 268 981.5 0 014 4 2019 11:00 36 53.17 10.6 321 981.5 0 014 4 2019 12:00 38 52.31 16.8 288 982.4 0 014 4 2019 13:00 39 52.67 10.6 283 982.8 0 014 4 2019 14:00 40 53.61 10.5 256 983.2 0 014 4 2019 15:00 41 51.28 23.2 260 983.1 0 014 4 2019 16:00 42 50.37 14.5 223 982.6 0 014 4 2019 17:00 40 48.32 21.4 342 981.4 0 014 4 2019 18:00 39 49.5 26.3 284 981.5 0 014 4 2019 19:00 35 47.18 15.6 112 980.8 0 0
14 4 2019 20:00 34 48.21 17.6 279 981.3 0 014 4 2019 21:00 33 47.54 19.6 210 982.5 0 014 4 2019 22:00 32 48.3 17.2 280 983 0 014 4 2019 23:00 31 46.5 22.3 229 984.5 0 015 4 2019 00:00 30 44.87 14.2 245 985.7 0 015 4 2019 01:00 29 44.65 16.3 244 986 0 015 4 2019 02:00 28 43.33 11.9 246 986.9 0 015 4 2019 03:00 27 42.43 14.2 245 986.6 0 015 4 2019 04:00 26 43.22 18.9 246 985.6 0 015 4 2019 05:00 25 44.75 22.7 246 984.5 0 015 4 2019 06:00 29 46.52 23.1 245 983.6 0 015 4 2019 07:00 30 46.75 11.2 246 982.8 0 015 4 2019 08:00 31 47.85 10.6 246 981.5 0 015 4 2019 09:00 32 48.07 23.6 245 981.5 0 015 4 2019 10:00 35 48.52 25.2 245 981.5 0 015 4 2019 11:00 37 48.85 21.6 246 981.5 0 015 4 2019 12:00 39 49.41 23.6 290 982.3 0 015 4 2019 13:00 40 49.64 12.3 322 982.7 0 015 4 2019 14:00 42 50.22 10.9 164 982.7 0 015 4 2019 15:00 43 50.44 25.3 312 982.5 0 015 4 2019 16:00 40 51.22 12.6 191 982.5 0 015 4 2019 17:00 39 48.47 10.2 162 981.5 0 015 4 2019 18:00 37 49.65 12.3 329 981.5 0 015 4 2019 19:00 35 47.33 12.3 343 981.5 0 015 4 2019 20:00 34 48.36 16.3 296 981.3 0 015 4 2019 21:00 33 47.69 14.2 212 981.5 0 015 4 2019 22:00 32 41.41 12.3 293 982.2 0 015 4 2019 23:00 31 39.23 15.6 281 983.4 0 016 4 2019 00:00 30 38.75 16.3 265 984.6 0 016 4 2019 01:00 29 38.25 14.2 254 985.4 0 016 4 2019 02:00 28 37.41 15.2 265 985.4 0 016 4 2019 03:00 27 37.22 12.9 287 985 0 016 4 2019 04:00 26 37.08 18.2 289 984.2 0 016 4 2019 05:00 25 41.44 23.2 290 983.5 0 016 4 2019 06:00 29 43.22 23.6 285 982.6 0 016 4 2019 07:00 30 47.55 14.5 286 981.4 0 016 4 2019 08:00 31 50.93 13.6 230 980.7 0 016 4 2019 09:00 32 51.53 12.8 200 980.5 0 016 4 2019 10:00 33 51.25 14.6 245 980.5 0 016 4 2019 11:00 34 52.82 10.6 265 980.6 0 016 4 2019 12:00 35 51.96 14.2 262 981.1 0 016 4 2019 13:00 38 52.32 15.2 308 982.5 0 016 4 2019 14:00 39 53.26 10.9 274 982.6 0 016 4 2019 15:00 40 50.93 23.6 245 982.7 0 016 4 2019 16:00 41 50.02 16.3 278 982.6 0 016 4 2019 17:00 42 47.97 15.6 125 982.9 0 016 4 2019 18:00 39 49.15 14.6 217 982.6 0 016 4 2019 19:00 35 46.83 16.9 204 981.5 0 016 4 2019 20:00 33 47.86 14.9 214 981.9 0 016 4 2019 21:00 32 47.19 15.6 209 982.7 0 016 4 2019 22:00 31 47.95 11.8 209 983.5 0 0
16 4 2019 23:00 30 46.15 15.6 210 984.7 0 017 4 2019 00:00 29 44.33 16.9 103 986 0 017 4 2019 01:00 27 44.11 13.2 259 986.5 0 017 4 2019 02:00 26 42.79 18.2 261 986.4 0 017 4 2019 03:00 25 41.89 14.8 257 986.5 0 017 4 2019 04:00 25 47.22 17.8 262 986 0 017 4 2019 05:00 29 47.82 10.6 257 984.8 0 017 4 2019 06:00 32 49.82 16.3 259 983.4 0 017 4 2019 07:00 33 50.84 15.6 254 981.9 0 017 4 2019 08:00 34 50.89 19.8 255 981.4 0 017 4 2019 09:00 35 51.49 14.2 353 980.4 0 017 4 2019 10:00 36 51.21 14.8 358 981.4 0 017 4 2019 11:00 39 52.78 10.6 318 983.5 0 017 4 2019 12:00 40 51.92 10.5 240 982.8 0 017 4 2019 13:00 41 52.28 11.5 328 982.6 0 017 4 2019 14:00 42 53.22 11.2 210 983.9 0 017 4 2019 15:00 40 50.89 14.8 247 984.4 0 017 4 2019 16:00 39 49.98 15.2 166 984.7 0 017 4 2019 17:00 35 47.93 15.6 217 984.9 0 017 4 2019 18:00 33 49.11 14.2 190 984.3 0 017 4 2019 19:00 32 46.79 12.3 304 984.8 0 017 4 2019 20:00 31 47.82 14.2 255 983.6 0 017 4 2019 21:00 30 47.15 13.2 267 983.7 0 017 4 2019 22:00 29 47.91 19.6 226 984.7 0 017 4 2019 23:00 28 46.11 23.5 226 985.8 0 018 4 2019 00:00 28 43.83 24.5 226 986.9 0 018 4 2019 01:00 28 43.61 25.6 225 987.8 0 018 4 2019 02:00 27 42.29 20.5 245 986.9 0 018 4 2019 03:00 27 41.39 13.2 325 986.9 0 018 4 2019 04:00 26 46.72 12.3 248 985.6 0 018 4 2019 05:00 29 47.32 12.6 256 984.8 0 018 4 2019 06:00 30 49.32 12.9 241 983.3 0 018 4 2019 07:00 31 50.34 13.3 254 982.3 0 018 4 2019 08:00 32 50.39 13.6 248 981.4 0 018 4 2019 09:00 33 50.99 24.5 125 982 0 018 4 2019 10:00 35 50.71 17.3 236 981.4 0 018 4 2019 11:00 37 52.28 12.5 177 981.6 0 018 4 2019 12:00 39 51.42 23.6 180 982.7 0 018 4 2019 13:00 40 51.78 23.6 256 982.6 0 018 4 2019 14:00 41 52.72 22.5 313 982.6 0 018 4 2019 15:00 42 50.39 23.6 290 982.6 0 018 4 2019 16:00 43 49.48 27.5 178 981.7 0 018 4 2019 17:00 40 47.43 17.5 275 981.2 0 018 4 2019 18:00 39 48.61 10.3 295 981.8 0 018 4 2019 19:00 37 46.29 23.6 334 981.5 0 018 4 2019 20:00 36 47.32 21.6 359 981.6 0 018 4 2019 21:00 35 46.65 11.2 360 982.6 0 018 4 2019 22:00 33 47.41 12.3 225 982.3 0 018 4 2019 23:00 32 45.61 23.6 226 983.7 0 019 4 2019 00:00 31 44 12.5 256 984.8 0 019 4 2019 01:00 30 43.78 13.2 112 985.8 0 0
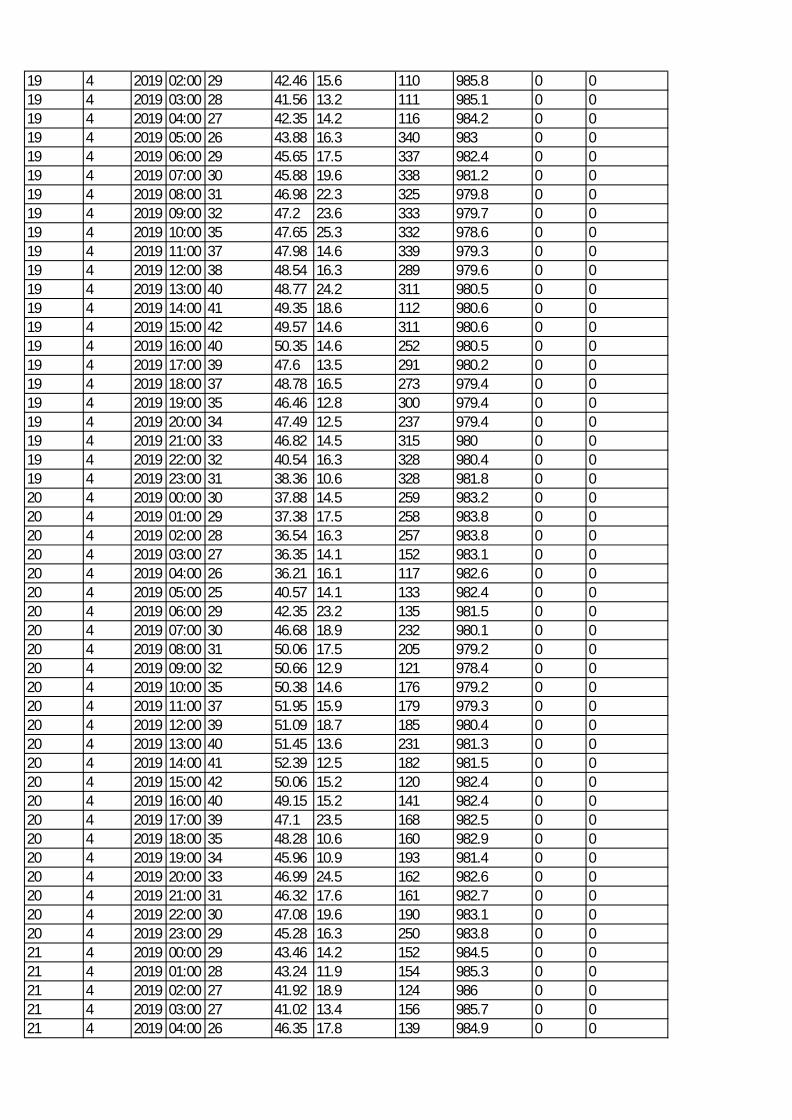
19 4 2019 02:00 29 42.46 15.6 110 985.8 0 019 4 2019 03:00 28 41.56 13.2 111 985.1 0 019 4 2019 04:00 27 42.35 14.2 116 984.2 0 019 4 2019 05:00 26 43.88 16.3 340 983 0 019 4 2019 06:00 29 45.65 17.5 337 982.4 0 019 4 2019 07:00 30 45.88 19.6 338 981.2 0 019 4 2019 08:00 31 46.98 22.3 325 979.8 0 019 4 2019 09:00 32 47.2 23.6 333 979.7 0 019 4 2019 10:00 35 47.65 25.3 332 978.6 0 019 4 2019 11:00 37 47.98 14.6 339 979.3 0 019 4 2019 12:00 38 48.54 16.3 289 979.6 0 019 4 2019 13:00 40 48.77 24.2 311 980.5 0 019 4 2019 14:00 41 49.35 18.6 112 980.6 0 019 4 2019 15:00 42 49.57 14.6 311 980.6 0 019 4 2019 16:00 40 50.35 14.6 252 980.5 0 019 4 2019 17:00 39 47.6 13.5 291 980.2 0 019 4 2019 18:00 37 48.78 16.5 273 979.4 0 019 4 2019 19:00 35 46.46 12.8 300 979.4 0 019 4 2019 20:00 34 47.49 12.5 237 979.4 0 019 4 2019 21:00 33 46.82 14.5 315 980 0 019 4 2019 22:00 32 40.54 16.3 328 980.4 0 019 4 2019 23:00 31 38.36 10.6 328 981.8 0 020 4 2019 00:00 30 37.88 14.5 259 983.2 0 020 4 2019 01:00 29 37.38 17.5 258 983.8 0 020 4 2019 02:00 28 36.54 16.3 257 983.8 0 020 4 2019 03:00 27 36.35 14.1 152 983.1 0 020 4 2019 04:00 26 36.21 16.1 117 982.6 0 020 4 2019 05:00 25 40.57 14.1 133 982.4 0 020 4 2019 06:00 29 42.35 23.2 135 981.5 0 020 4 2019 07:00 30 46.68 18.9 232 980.1 0 020 4 2019 08:00 31 50.06 17.5 205 979.2 0 020 4 2019 09:00 32 50.66 12.9 121 978.4 0 020 4 2019 10:00 35 50.38 14.6 176 979.2 0 020 4 2019 11:00 37 51.95 15.9 179 979.3 0 020 4 2019 12:00 39 51.09 18.7 185 980.4 0 020 4 2019 13:00 40 51.45 13.6 231 981.3 0 020 4 2019 14:00 41 52.39 12.5 182 981.5 0 020 4 2019 15:00 42 50.06 15.2 120 982.4 0 020 4 2019 16:00 40 49.15 15.2 141 982.4 0 020 4 2019 17:00 39 47.1 23.5 168 982.5 0 020 4 2019 18:00 35 48.28 10.6 160 982.9 0 020 4 2019 19:00 34 45.96 10.9 193 981.4 0 020 4 2019 20:00 33 46.99 24.5 162 982.6 0 020 4 2019 21:00 31 46.32 17.6 161 982.7 0 020 4 2019 22:00 30 47.08 19.6 190 983.1 0 020 4 2019 23:00 29 45.28 16.3 250 983.8 0 021 4 2019 00:00 29 43.46 14.2 152 984.5 0 021 4 2019 01:00 28 43.24 11.9 154 985.3 0 021 4 2019 02:00 27 41.92 18.9 124 986 0 021 4 2019 03:00 27 41.02 13.4 156 985.7 0 021 4 2019 04:00 26 46.35 17.8 139 984.9 0 0
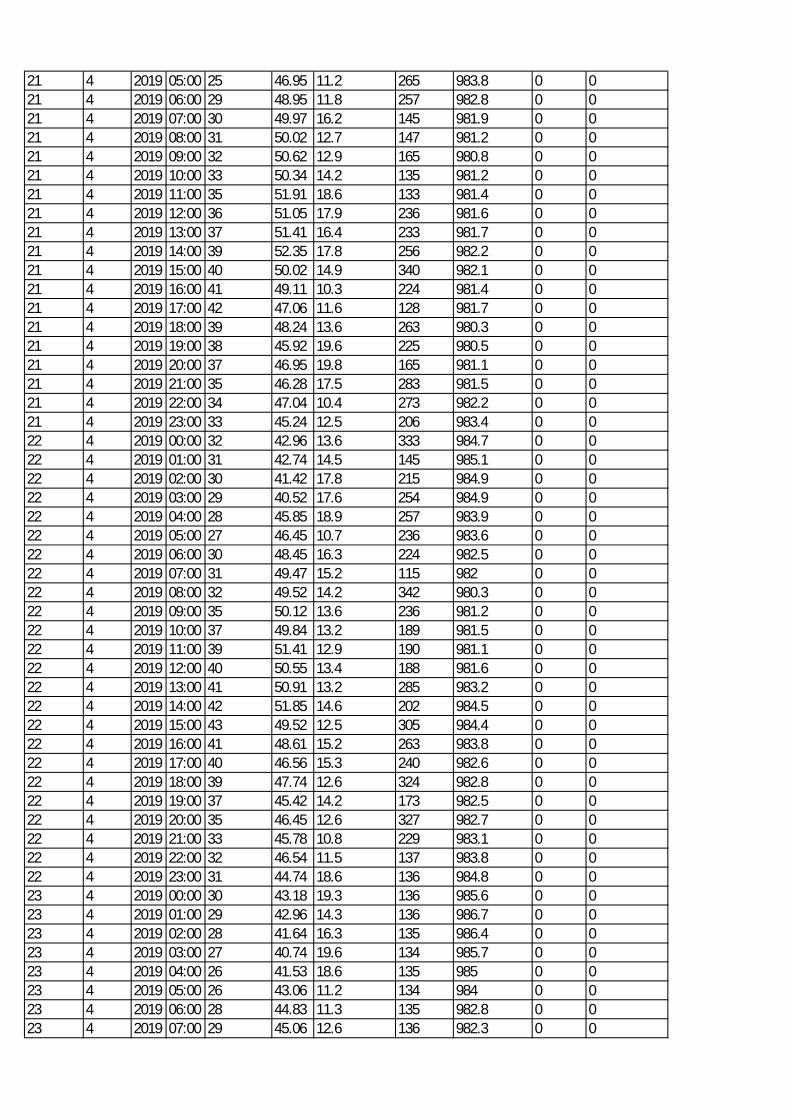
21 4 2019 05:00 25 46.95 11.2 265 983.8 0 021 4 2019 06:00 29 48.95 11.8 257 982.8 0 021 4 2019 07:00 30 49.97 16.2 145 981.9 0 021 4 2019 08:00 31 50.02 12.7 147 981.2 0 021 4 2019 09:00 32 50.62 12.9 165 980.8 0 021 4 2019 10:00 33 50.34 14.2 135 981.2 0 021 4 2019 11:00 35 51.91 18.6 133 981.4 0 021 4 2019 12:00 36 51.05 17.9 236 981.6 0 021 4 2019 13:00 37 51.41 16.4 233 981.7 0 021 4 2019 14:00 39 52.35 17.8 256 982.2 0 021 4 2019 15:00 40 50.02 14.9 340 982.1 0 021 4 2019 16:00 41 49.11 10.3 224 981.4 0 021 4 2019 17:00 42 47.06 11.6 128 981.7 0 021 4 2019 18:00 39 48.24 13.6 263 980.3 0 021 4 2019 19:00 38 45.92 19.6 225 980.5 0 021 4 2019 20:00 37 46.95 19.8 165 981.1 0 021 4 2019 21:00 35 46.28 17.5 283 981.5 0 021 4 2019 22:00 34 47.04 10.4 273 982.2 0 021 4 2019 23:00 33 45.24 12.5 206 983.4 0 022 4 2019 00:00 32 42.96 13.6 333 984.7 0 022 4 2019 01:00 31 42.74 14.5 145 985.1 0 022 4 2019 02:00 30 41.42 17.8 215 984.9 0 022 4 2019 03:00 29 40.52 17.6 254 984.9 0 022 4 2019 04:00 28 45.85 18.9 257 983.9 0 022 4 2019 05:00 27 46.45 10.7 236 983.6 0 022 4 2019 06:00 30 48.45 16.3 224 982.5 0 022 4 2019 07:00 31 49.47 15.2 115 982 0 022 4 2019 08:00 32 49.52 14.2 342 980.3 0 022 4 2019 09:00 35 50.12 13.6 236 981.2 0 022 4 2019 10:00 37 49.84 13.2 189 981.5 0 022 4 2019 11:00 39 51.41 12.9 190 981.1 0 022 4 2019 12:00 40 50.55 13.4 188 981.6 0 022 4 2019 13:00 41 50.91 13.2 285 983.2 0 022 4 2019 14:00 42 51.85 14.6 202 984.5 0 022 4 2019 15:00 43 49.52 12.5 305 984.4 0 022 4 2019 16:00 41 48.61 15.2 263 983.8 0 022 4 2019 17:00 40 46.56 15.3 240 982.6 0 022 4 2019 18:00 39 47.74 12.6 324 982.8 0 022 4 2019 19:00 37 45.42 14.2 173 982.5 0 022 4 2019 20:00 35 46.45 12.6 327 982.7 0 022 4 2019 21:00 33 45.78 10.8 229 983.1 0 022 4 2019 22:00 32 46.54 11.5 137 983.8 0 022 4 2019 23:00 31 44.74 18.6 136 984.8 0 023 4 2019 00:00 30 43.18 19.3 136 985.6 0 023 4 2019 01:00 29 42.96 14.3 136 986.7 0 023 4 2019 02:00 28 41.64 16.3 135 986.4 0 023 4 2019 03:00 27 40.74 19.6 134 985.7 0 023 4 2019 04:00 26 41.53 18.6 135 985 0 023 4 2019 05:00 26 43.06 11.2 134 984 0 023 4 2019 06:00 28 44.83 11.3 135 982.8 0 023 4 2019 07:00 29 45.06 12.6 136 982.3 0 0
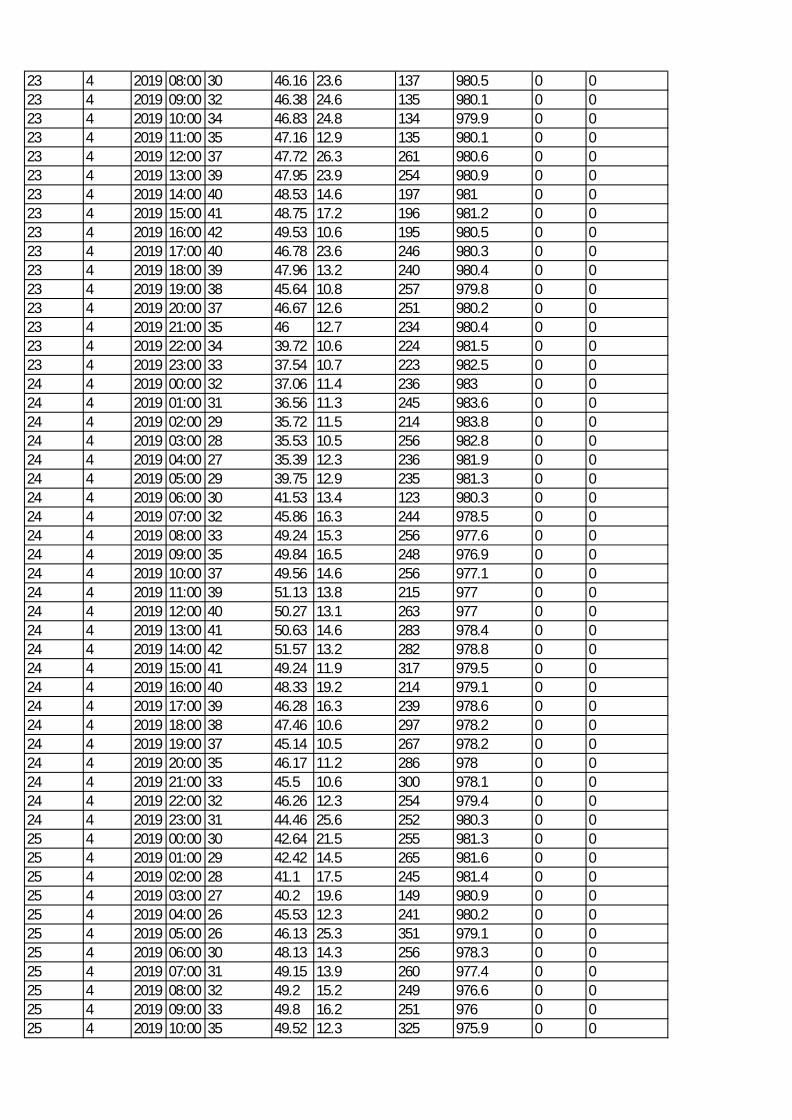
23 4 2019 08:00 30 46.16 23.6 137 980.5 0 023 4 2019 09:00 32 46.38 24.6 135 980.1 0 023 4 2019 10:00 34 46.83 24.8 134 979.9 0 023 4 2019 11:00 35 47.16 12.9 135 980.1 0 023 4 2019 12:00 37 47.72 26.3 261 980.6 0 023 4 2019 13:00 39 47.95 23.9 254 980.9 0 023 4 2019 14:00 40 48.53 14.6 197 981 0 023 4 2019 15:00 41 48.75 17.2 196 981.2 0 023 4 2019 16:00 42 49.53 10.6 195 980.5 0 023 4 2019 17:00 40 46.78 23.6 246 980.3 0 023 4 2019 18:00 39 47.96 13.2 240 980.4 0 023 4 2019 19:00 38 45.64 10.8 257 979.8 0 023 4 2019 20:00 37 46.67 12.6 251 980.2 0 023 4 2019 21:00 35 46 12.7 234 980.4 0 023 4 2019 22:00 34 39.72 10.6 224 981.5 0 023 4 2019 23:00 33 37.54 10.7 223 982.5 0 024 4 2019 00:00 32 37.06 11.4 236 983 0 024 4 2019 01:00 31 36.56 11.3 245 983.6 0 024 4 2019 02:00 29 35.72 11.5 214 983.8 0 024 4 2019 03:00 28 35.53 10.5 256 982.8 0 024 4 2019 04:00 27 35.39 12.3 236 981.9 0 024 4 2019 05:00 29 39.75 12.9 235 981.3 0 024 4 2019 06:00 30 41.53 13.4 123 980.3 0 024 4 2019 07:00 32 45.86 16.3 244 978.5 0 024 4 2019 08:00 33 49.24 15.3 256 977.6 0 024 4 2019 09:00 35 49.84 16.5 248 976.9 0 024 4 2019 10:00 37 49.56 14.6 256 977.1 0 024 4 2019 11:00 39 51.13 13.8 215 977 0 024 4 2019 12:00 40 50.27 13.1 263 977 0 024 4 2019 13:00 41 50.63 14.6 283 978.4 0 024 4 2019 14:00 42 51.57 13.2 282 978.8 0 024 4 2019 15:00 41 49.24 11.9 317 979.5 0 024 4 2019 16:00 40 48.33 19.2 214 979.1 0 024 4 2019 17:00 39 46.28 16.3 239 978.6 0 024 4 2019 18:00 38 47.46 10.6 297 978.2 0 024 4 2019 19:00 37 45.14 10.5 267 978.2 0 024 4 2019 20:00 35 46.17 11.2 286 978 0 024 4 2019 21:00 33 45.5 10.6 300 978.1 0 024 4 2019 22:00 32 46.26 12.3 254 979.4 0 024 4 2019 23:00 31 44.46 25.6 252 980.3 0 025 4 2019 00:00 30 42.64 21.5 255 981.3 0 025 4 2019 01:00 29 42.42 14.5 265 981.6 0 025 4 2019 02:00 28 41.1 17.5 245 981.4 0 025 4 2019 03:00 27 40.2 19.6 149 980.9 0 025 4 2019 04:00 26 45.53 12.3 241 980.2 0 025 4 2019 05:00 26 46.13 25.3 351 979.1 0 025 4 2019 06:00 30 48.13 14.3 256 978.3 0 025 4 2019 07:00 31 49.15 13.9 260 977.4 0 025 4 2019 08:00 32 49.2 15.2 249 976.6 0 025 4 2019 09:00 33 49.8 16.2 251 976 0 025 4 2019 10:00 35 49.52 12.3 325 975.9 0 0
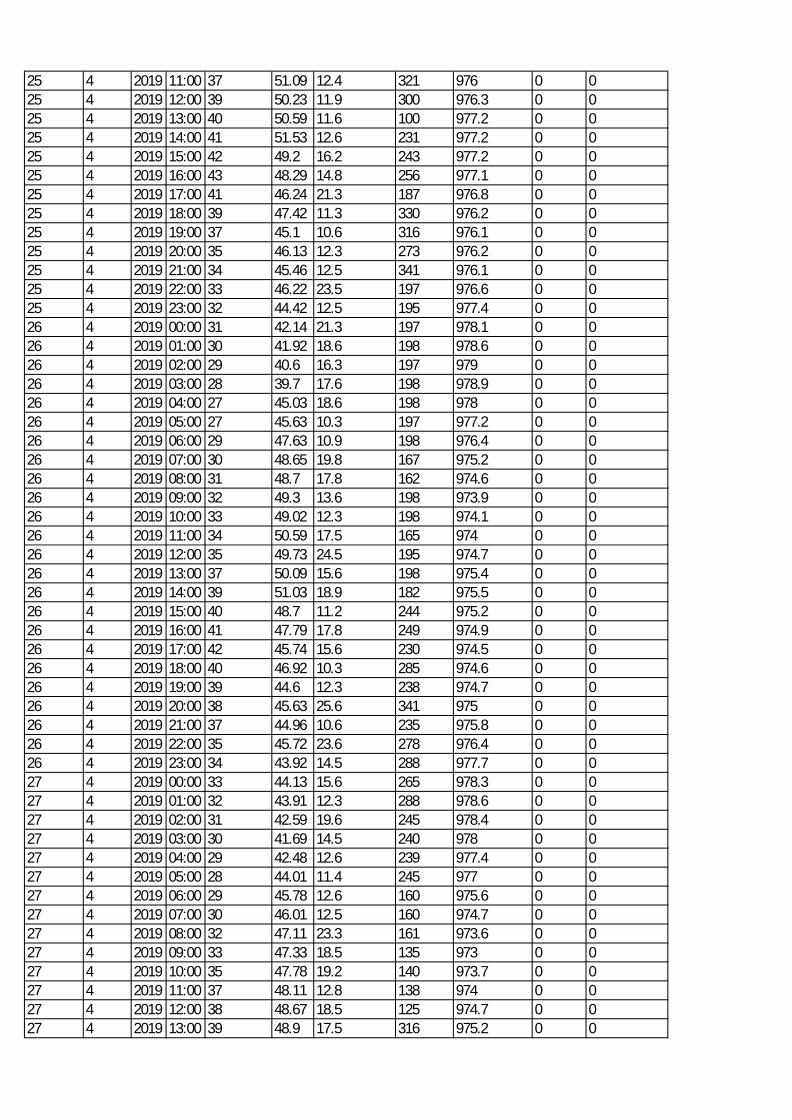
25 4 2019 11:00 37 51.09 12.4 321 976 0 025 4 2019 12:00 39 50.23 11.9 300 976.3 0 025 4 2019 13:00 40 50.59 11.6 100 977.2 0 025 4 2019 14:00 41 51.53 12.6 231 977.2 0 025 4 2019 15:00 42 49.2 16.2 243 977.2 0 025 4 2019 16:00 43 48.29 14.8 256 977.1 0 025 4 2019 17:00 41 46.24 21.3 187 976.8 0 025 4 2019 18:00 39 47.42 11.3 330 976.2 0 025 4 2019 19:00 37 45.1 10.6 316 976.1 0 025 4 2019 20:00 35 46.13 12.3 273 976.2 0 025 4 2019 21:00 34 45.46 12.5 341 976.1 0 025 4 2019 22:00 33 46.22 23.5 197 976.6 0 025 4 2019 23:00 32 44.42 12.5 195 977.4 0 026 4 2019 00:00 31 42.14 21.3 197 978.1 0 026 4 2019 01:00 30 41.92 18.6 198 978.6 0 026 4 2019 02:00 29 40.6 16.3 197 979 0 026 4 2019 03:00 28 39.7 17.6 198 978.9 0 026 4 2019 04:00 27 45.03 18.6 198 978 0 026 4 2019 05:00 27 45.63 10.3 197 977.2 0 026 4 2019 06:00 29 47.63 10.9 198 976.4 0 026 4 2019 07:00 30 48.65 19.8 167 975.2 0 026 4 2019 08:00 31 48.7 17.8 162 974.6 0 026 4 2019 09:00 32 49.3 13.6 198 973.9 0 026 4 2019 10:00 33 49.02 12.3 198 974.1 0 026 4 2019 11:00 34 50.59 17.5 165 974 0 026 4 2019 12:00 35 49.73 24.5 195 974.7 0 026 4 2019 13:00 37 50.09 15.6 198 975.4 0 026 4 2019 14:00 39 51.03 18.9 182 975.5 0 026 4 2019 15:00 40 48.7 11.2 244 975.2 0 026 4 2019 16:00 41 47.79 17.8 249 974.9 0 026 4 2019 17:00 42 45.74 15.6 230 974.5 0 026 4 2019 18:00 40 46.92 10.3 285 974.6 0 026 4 2019 19:00 39 44.6 12.3 238 974.7 0 026 4 2019 20:00 38 45.63 25.6 341 975 0 026 4 2019 21:00 37 44.96 10.6 235 975.8 0 026 4 2019 22:00 35 45.72 23.6 278 976.4 0 026 4 2019 23:00 34 43.92 14.5 288 977.7 0 027 4 2019 00:00 33 44.13 15.6 265 978.3 0 027 4 2019 01:00 32 43.91 12.3 288 978.6 0 027 4 2019 02:00 31 42.59 19.6 245 978.4 0 027 4 2019 03:00 30 41.69 14.5 240 978 0 027 4 2019 04:00 29 42.48 12.6 239 977.4 0 027 4 2019 05:00 28 44.01 11.4 245 977 0 027 4 2019 06:00 29 45.78 12.6 160 975.6 0 027 4 2019 07:00 30 46.01 12.5 160 974.7 0 027 4 2019 08:00 32 47.11 23.3 161 973.6 0 027 4 2019 09:00 33 47.33 18.5 135 973 0 027 4 2019 10:00 35 47.78 19.2 140 973.7 0 027 4 2019 11:00 37 48.11 12.8 138 974 0 027 4 2019 12:00 38 48.67 18.5 125 974.7 0 027 4 2019 13:00 39 48.9 17.5 316 975.2 0 0
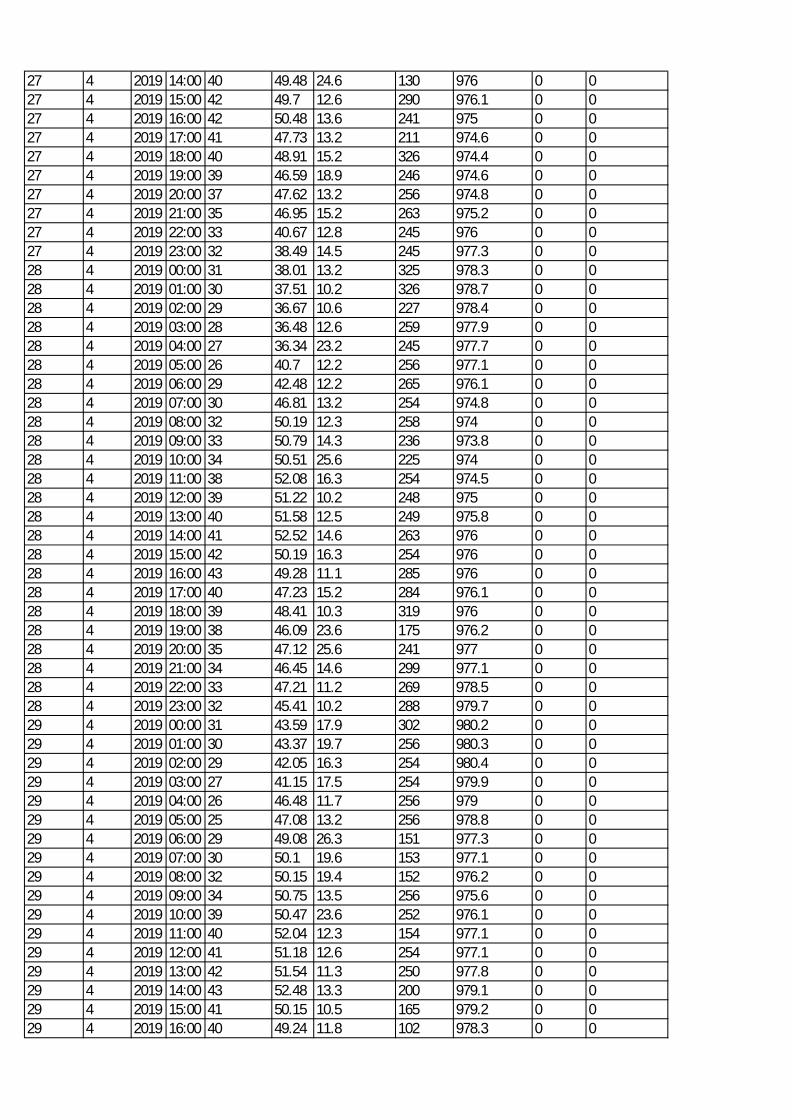
27 4 2019 14:00 40 49.48 24.6 130 976 0 027 4 2019 15:00 42 49.7 12.6 290 976.1 0 027 4 2019 16:00 42 50.48 13.6 241 975 0 027 4 2019 17:00 41 47.73 13.2 211 974.6 0 027 4 2019 18:00 40 48.91 15.2 326 974.4 0 027 4 2019 19:00 39 46.59 18.9 246 974.6 0 027 4 2019 20:00 37 47.62 13.2 256 974.8 0 027 4 2019 21:00 35 46.95 15.2 263 975.2 0 027 4 2019 22:00 33 40.67 12.8 245 976 0 027 4 2019 23:00 32 38.49 14.5 245 977.3 0 028 4 2019 00:00 31 38.01 13.2 325 978.3 0 028 4 2019 01:00 30 37.51 10.2 326 978.7 0 028 4 2019 02:00 29 36.67 10.6 227 978.4 0 028 4 2019 03:00 28 36.48 12.6 259 977.9 0 028 4 2019 04:00 27 36.34 23.2 245 977.7 0 028 4 2019 05:00 26 40.7 12.2 256 977.1 0 028 4 2019 06:00 29 42.48 12.2 265 976.1 0 028 4 2019 07:00 30 46.81 13.2 254 974.8 0 028 4 2019 08:00 32 50.19 12.3 258 974 0 028 4 2019 09:00 33 50.79 14.3 236 973.8 0 028 4 2019 10:00 34 50.51 25.6 225 974 0 028 4 2019 11:00 38 52.08 16.3 254 974.5 0 028 4 2019 12:00 39 51.22 10.2 248 975 0 028 4 2019 13:00 40 51.58 12.5 249 975.8 0 028 4 2019 14:00 41 52.52 14.6 263 976 0 028 4 2019 15:00 42 50.19 16.3 254 976 0 028 4 2019 16:00 43 49.28 11.1 285 976 0 028 4 2019 17:00 40 47.23 15.2 284 976.1 0 028 4 2019 18:00 39 48.41 10.3 319 976 0 028 4 2019 19:00 38 46.09 23.6 175 976.2 0 028 4 2019 20:00 35 47.12 25.6 241 977 0 028 4 2019 21:00 34 46.45 14.6 299 977.1 0 028 4 2019 22:00 33 47.21 11.2 269 978.5 0 028 4 2019 23:00 32 45.41 10.2 288 979.7 0 029 4 2019 00:00 31 43.59 17.9 302 980.2 0 029 4 2019 01:00 30 43.37 19.7 256 980.3 0 029 4 2019 02:00 29 42.05 16.3 254 980.4 0 029 4 2019 03:00 27 41.15 17.5 254 979.9 0 029 4 2019 04:00 26 46.48 11.7 256 979 0 029 4 2019 05:00 25 47.08 13.2 256 978.8 0 029 4 2019 06:00 29 49.08 26.3 151 977.3 0 029 4 2019 07:00 30 50.1 19.6 153 977.1 0 029 4 2019 08:00 32 50.15 19.4 152 976.2 0 029 4 2019 09:00 34 50.75 13.5 256 975.6 0 029 4 2019 10:00 39 50.47 23.6 252 976.1 0 029 4 2019 11:00 40 52.04 12.3 154 977.1 0 029 4 2019 12:00 41 51.18 12.6 254 977.1 0 029 4 2019 13:00 42 51.54 11.3 250 977.8 0 029 4 2019 14:00 43 52.48 13.3 200 979.1 0 029 4 2019 15:00 41 50.15 10.5 165 979.2 0 029 4 2019 16:00 40 49.24 11.8 102 978.3 0 0
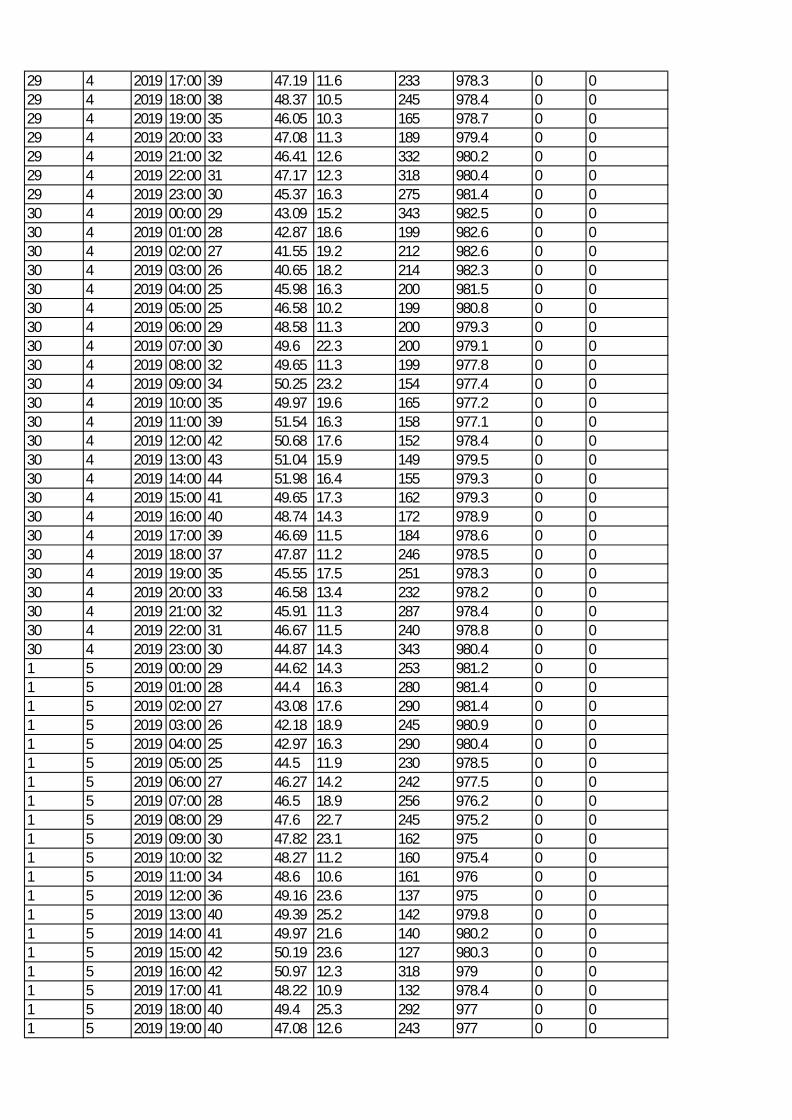
29 4 2019 17:00 39 47.19 11.6 233 978.3 0 029 4 2019 18:00 38 48.37 10.5 245 978.4 0 029 4 2019 19:00 35 46.05 10.3 165 978.7 0 029 4 2019 20:00 33 47.08 11.3 189 979.4 0 029 4 2019 21:00 32 46.41 12.6 332 980.2 0 029 4 2019 22:00 31 47.17 12.3 318 980.4 0 029 4 2019 23:00 30 45.37 16.3 275 981.4 0 030 4 2019 00:00 29 43.09 15.2 343 982.5 0 030 4 2019 01:00 28 42.87 18.6 199 982.6 0 030 4 2019 02:00 27 41.55 19.2 212 982.6 0 030 4 2019 03:00 26 40.65 18.2 214 982.3 0 030 4 2019 04:00 25 45.98 16.3 200 981.5 0 030 4 2019 05:00 25 46.58 10.2 199 980.8 0 030 4 2019 06:00 29 48.58 11.3 200 979.3 0 030 4 2019 07:00 30 49.6 22.3 200 979.1 0 030 4 2019 08:00 32 49.65 11.3 199 977.8 0 030 4 2019 09:00 34 50.25 23.2 154 977.4 0 030 4 2019 10:00 35 49.97 19.6 165 977.2 0 030 4 2019 11:00 39 51.54 16.3 158 977.1 0 030 4 2019 12:00 42 50.68 17.6 152 978.4 0 030 4 2019 13:00 43 51.04 15.9 149 979.5 0 030 4 2019 14:00 44 51.98 16.4 155 979.3 0 030 4 2019 15:00 41 49.65 17.3 162 979.3 0 030 4 2019 16:00 40 48.74 14.3 172 978.9 0 030 4 2019 17:00 39 46.69 11.5 184 978.6 0 030 4 2019 18:00 37 47.87 11.2 246 978.5 0 030 4 2019 19:00 35 45.55 17.5 251 978.3 0 030 4 2019 20:00 33 46.58 13.4 232 978.2 0 030 4 2019 21:00 32 45.91 11.3 287 978.4 0 030 4 2019 22:00 31 46.67 11.5 240 978.8 0 030 4 2019 23:00 30 44.87 14.3 343 980.4 0 01 5 2019 00:00 29 44.62 14.3 253 981.2 0 01 5 2019 01:00 28 44.4 16.3 280 981.4 0 01 5 2019 02:00 27 43.08 17.6 290 981.4 0 01 5 2019 03:00 26 42.18 18.9 245 980.9 0 01 5 2019 04:00 25 42.97 16.3 290 980.4 0 01 5 2019 05:00 25 44.5 11.9 230 978.5 0 01 5 2019 06:00 27 46.27 14.2 242 977.5 0 01 5 2019 07:00 28 46.5 18.9 256 976.2 0 01 5 2019 08:00 29 47.6 22.7 245 975.2 0 01 5 2019 09:00 30 47.82 23.1 162 975 0 01 5 2019 10:00 32 48.27 11.2 160 975.4 0 01 5 2019 11:00 34 48.6 10.6 161 976 0 01 5 2019 12:00 36 49.16 23.6 137 975 0 01 5 2019 13:00 40 49.39 25.2 142 979.8 0 01 5 2019 14:00 41 49.97 21.6 140 980.2 0 01 5 2019 15:00 42 50.19 23.6 127 980.3 0 01 5 2019 16:00 42 50.97 12.3 318 979 0 01 5 2019 17:00 41 48.22 10.9 132 978.4 0 01 5 2019 18:00 40 49.4 25.3 292 977 0 01 5 2019 19:00 40 47.08 12.6 243 977 0 0
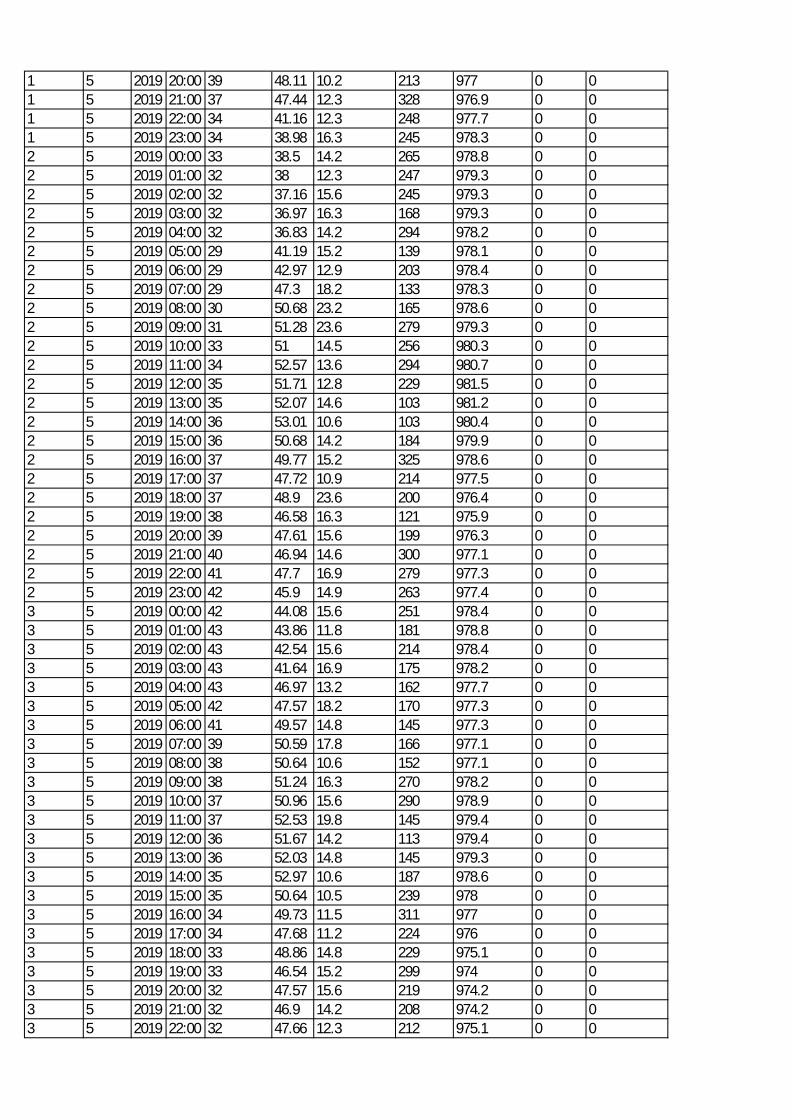
1 5 2019 20:00 39 48.11 10.2 213 977 0 01 5 2019 21:00 37 47.44 12.3 328 976.9 0 01 5 2019 22:00 34 41.16 12.3 248 977.7 0 01 5 2019 23:00 34 38.98 16.3 245 978.3 0 02 5 2019 00:00 33 38.5 14.2 265 978.8 0 02 5 2019 01:00 32 38 12.3 247 979.3 0 02 5 2019 02:00 32 37.16 15.6 245 979.3 0 02 5 2019 03:00 32 36.97 16.3 168 979.3 0 02 5 2019 04:00 32 36.83 14.2 294 978.2 0 02 5 2019 05:00 29 41.19 15.2 139 978.1 0 02 5 2019 06:00 29 42.97 12.9 203 978.4 0 02 5 2019 07:00 29 47.3 18.2 133 978.3 0 02 5 2019 08:00 30 50.68 23.2 165 978.6 0 02 5 2019 09:00 31 51.28 23.6 279 979.3 0 02 5 2019 10:00 33 51 14.5 256 980.3 0 02 5 2019 11:00 34 52.57 13.6 294 980.7 0 02 5 2019 12:00 35 51.71 12.8 229 981.5 0 02 5 2019 13:00 35 52.07 14.6 103 981.2 0 02 5 2019 14:00 36 53.01 10.6 103 980.4 0 02 5 2019 15:00 36 50.68 14.2 184 979.9 0 02 5 2019 16:00 37 49.77 15.2 325 978.6 0 02 5 2019 17:00 37 47.72 10.9 214 977.5 0 02 5 2019 18:00 37 48.9 23.6 200 976.4 0 02 5 2019 19:00 38 46.58 16.3 121 975.9 0 02 5 2019 20:00 39 47.61 15.6 199 976.3 0 02 5 2019 21:00 40 46.94 14.6 300 977.1 0 02 5 2019 22:00 41 47.7 16.9 279 977.3 0 02 5 2019 23:00 42 45.9 14.9 263 977.4 0 03 5 2019 00:00 42 44.08 15.6 251 978.4 0 03 5 2019 01:00 43 43.86 11.8 181 978.8 0 03 5 2019 02:00 43 42.54 15.6 214 978.4 0 03 5 2019 03:00 43 41.64 16.9 175 978.2 0 03 5 2019 04:00 43 46.97 13.2 162 977.7 0 03 5 2019 05:00 42 47.57 18.2 170 977.3 0 03 5 2019 06:00 41 49.57 14.8 145 977.3 0 03 5 2019 07:00 39 50.59 17.8 166 977.1 0 03 5 2019 08:00 38 50.64 10.6 152 977.1 0 03 5 2019 09:00 38 51.24 16.3 270 978.2 0 03 5 2019 10:00 37 50.96 15.6 290 978.9 0 03 5 2019 11:00 37 52.53 19.8 145 979.4 0 03 5 2019 12:00 36 51.67 14.2 113 979.4 0 03 5 2019 13:00 36 52.03 14.8 145 979.3 0 03 5 2019 14:00 35 52.97 10.6 187 978.6 0 03 5 2019 15:00 35 50.64 10.5 239 978 0 03 5 2019 16:00 34 49.73 11.5 311 977 0 03 5 2019 17:00 34 47.68 11.2 224 976 0 03 5 2019 18:00 33 48.86 14.8 229 975.1 0 03 5 2019 19:00 33 46.54 15.2 299 974 0 03 5 2019 20:00 32 47.57 15.6 219 974.2 0 03 5 2019 21:00 32 46.9 14.2 208 974.2 0 03 5 2019 22:00 32 47.66 12.3 212 975.1 0 0
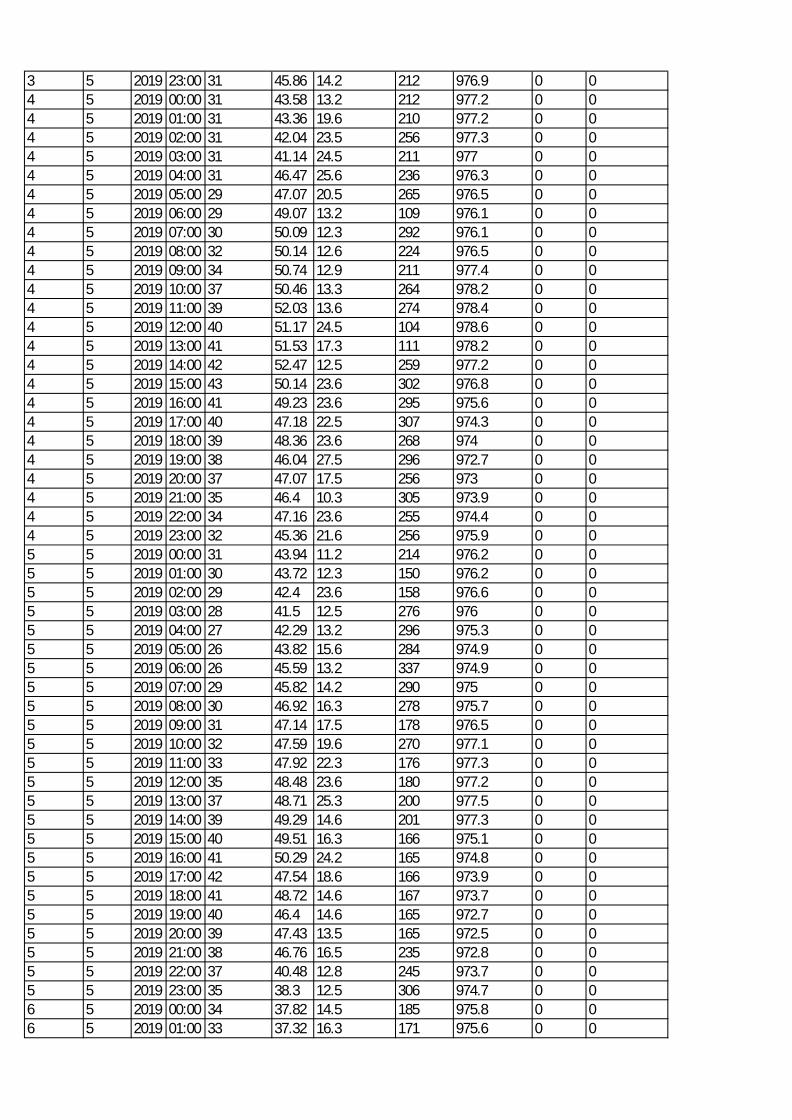
3 5 2019 23:00 31 45.86 14.2 212 976.9 0 04 5 2019 00:00 31 43.58 13.2 212 977.2 0 04 5 2019 01:00 31 43.36 19.6 210 977.2 0 04 5 2019 02:00 31 42.04 23.5 256 977.3 0 04 5 2019 03:00 31 41.14 24.5 211 977 0 04 5 2019 04:00 31 46.47 25.6 236 976.3 0 04 5 2019 05:00 29 47.07 20.5 265 976.5 0 04 5 2019 06:00 29 49.07 13.2 109 976.1 0 04 5 2019 07:00 30 50.09 12.3 292 976.1 0 04 5 2019 08:00 32 50.14 12.6 224 976.5 0 04 5 2019 09:00 34 50.74 12.9 211 977.4 0 04 5 2019 10:00 37 50.46 13.3 264 978.2 0 04 5 2019 11:00 39 52.03 13.6 274 978.4 0 04 5 2019 12:00 40 51.17 24.5 104 978.6 0 04 5 2019 13:00 41 51.53 17.3 111 978.2 0 04 5 2019 14:00 42 52.47 12.5 259 977.2 0 04 5 2019 15:00 43 50.14 23.6 302 976.8 0 04 5 2019 16:00 41 49.23 23.6 295 975.6 0 04 5 2019 17:00 40 47.18 22.5 307 974.3 0 04 5 2019 18:00 39 48.36 23.6 268 974 0 04 5 2019 19:00 38 46.04 27.5 296 972.7 0 04 5 2019 20:00 37 47.07 17.5 256 973 0 04 5 2019 21:00 35 46.4 10.3 305 973.9 0 04 5 2019 22:00 34 47.16 23.6 255 974.4 0 04 5 2019 23:00 32 45.36 21.6 256 975.9 0 05 5 2019 00:00 31 43.94 11.2 214 976.2 0 05 5 2019 01:00 30 43.72 12.3 150 976.2 0 05 5 2019 02:00 29 42.4 23.6 158 976.6 0 05 5 2019 03:00 28 41.5 12.5 276 976 0 05 5 2019 04:00 27 42.29 13.2 296 975.3 0 05 5 2019 05:00 26 43.82 15.6 284 974.9 0 05 5 2019 06:00 26 45.59 13.2 337 974.9 0 05 5 2019 07:00 29 45.82 14.2 290 975 0 05 5 2019 08:00 30 46.92 16.3 278 975.7 0 05 5 2019 09:00 31 47.14 17.5 178 976.5 0 05 5 2019 10:00 32 47.59 19.6 270 977.1 0 05 5 2019 11:00 33 47.92 22.3 176 977.3 0 05 5 2019 12:00 35 48.48 23.6 180 977.2 0 05 5 2019 13:00 37 48.71 25.3 200 977.5 0 05 5 2019 14:00 39 49.29 14.6 201 977.3 0 05 5 2019 15:00 40 49.51 16.3 166 975.1 0 05 5 2019 16:00 41 50.29 24.2 165 974.8 0 05 5 2019 17:00 42 47.54 18.6 166 973.9 0 05 5 2019 18:00 41 48.72 14.6 167 973.7 0 05 5 2019 19:00 40 46.4 14.6 165 972.7 0 05 5 2019 20:00 39 47.43 13.5 165 972.5 0 05 5 2019 21:00 38 46.76 16.5 235 972.8 0 05 5 2019 22:00 37 40.48 12.8 245 973.7 0 05 5 2019 23:00 35 38.3 12.5 306 974.7 0 06 5 2019 00:00 34 37.82 14.5 185 975.8 0 06 5 2019 01:00 33 37.32 16.3 171 975.6 0 0
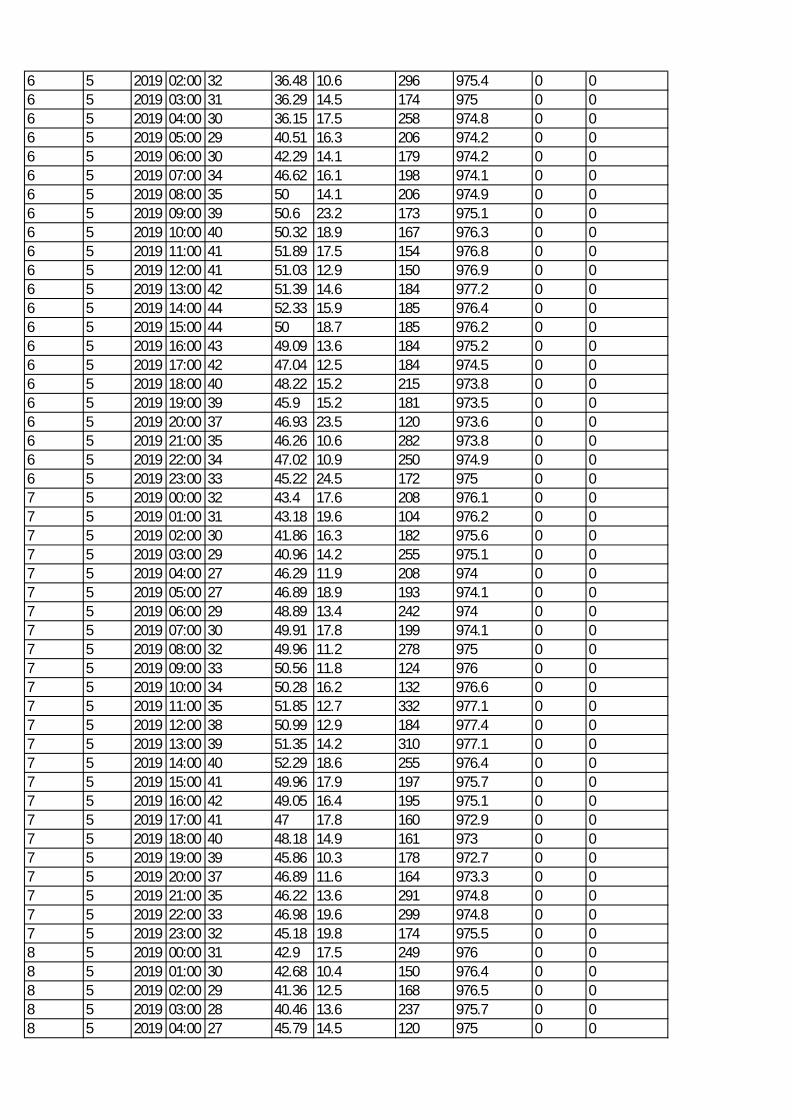
6 5 2019 02:00 32 36.48 10.6 296 975.4 0 06 5 2019 03:00 31 36.29 14.5 174 975 0 06 5 2019 04:00 30 36.15 17.5 258 974.8 0 06 5 2019 05:00 29 40.51 16.3 206 974.2 0 06 5 2019 06:00 30 42.29 14.1 179 974.2 0 06 5 2019 07:00 34 46.62 16.1 198 974.1 0 06 5 2019 08:00 35 50 14.1 206 974.9 0 06 5 2019 09:00 39 50.6 23.2 173 975.1 0 06 5 2019 10:00 40 50.32 18.9 167 976.3 0 06 5 2019 11:00 41 51.89 17.5 154 976.8 0 06 5 2019 12:00 41 51.03 12.9 150 976.9 0 06 5 2019 13:00 42 51.39 14.6 184 977.2 0 06 5 2019 14:00 44 52.33 15.9 185 976.4 0 06 5 2019 15:00 44 50 18.7 185 976.2 0 06 5 2019 16:00 43 49.09 13.6 184 975.2 0 06 5 2019 17:00 42 47.04 12.5 184 974.5 0 06 5 2019 18:00 40 48.22 15.2 215 973.8 0 06 5 2019 19:00 39 45.9 15.2 181 973.5 0 06 5 2019 20:00 37 46.93 23.5 120 973.6 0 06 5 2019 21:00 35 46.26 10.6 282 973.8 0 06 5 2019 22:00 34 47.02 10.9 250 974.9 0 06 5 2019 23:00 33 45.22 24.5 172 975 0 07 5 2019 00:00 32 43.4 17.6 208 976.1 0 07 5 2019 01:00 31 43.18 19.6 104 976.2 0 07 5 2019 02:00 30 41.86 16.3 182 975.6 0 07 5 2019 03:00 29 40.96 14.2 255 975.1 0 07 5 2019 04:00 27 46.29 11.9 208 974 0 07 5 2019 05:00 27 46.89 18.9 193 974.1 0 07 5 2019 06:00 29 48.89 13.4 242 974 0 07 5 2019 07:00 30 49.91 17.8 199 974.1 0 07 5 2019 08:00 32 49.96 11.2 278 975 0 07 5 2019 09:00 33 50.56 11.8 124 976 0 07 5 2019 10:00 34 50.28 16.2 132 976.6 0 07 5 2019 11:00 35 51.85 12.7 332 977.1 0 07 5 2019 12:00 38 50.99 12.9 184 977.4 0 07 5 2019 13:00 39 51.35 14.2 310 977.1 0 07 5 2019 14:00 40 52.29 18.6 255 976.4 0 07 5 2019 15:00 41 49.96 17.9 197 975.7 0 07 5 2019 16:00 42 49.05 16.4 195 975.1 0 07 5 2019 17:00 41 47 17.8 160 972.9 0 07 5 2019 18:00 40 48.18 14.9 161 973 0 07 5 2019 19:00 39 45.86 10.3 178 972.7 0 07 5 2019 20:00 37 46.89 11.6 164 973.3 0 07 5 2019 21:00 35 46.22 13.6 291 974.8 0 07 5 2019 22:00 33 46.98 19.6 299 974.8 0 07 5 2019 23:00 32 45.18 19.8 174 975.5 0 08 5 2019 00:00 31 42.9 17.5 249 976 0 08 5 2019 01:00 30 42.68 10.4 150 976.4 0 08 5 2019 02:00 29 41.36 12.5 168 976.5 0 08 5 2019 03:00 28 40.46 13.6 237 975.7 0 08 5 2019 04:00 27 45.79 14.5 120 975 0 0

8 5 2019 05:00 26 46.39 17.8 185 974.9 0 08 5 2019 06:00 30 48.39 17.6 189 974.7 0 08 5 2019 07:00 31 49.41 18.9 114 975.2 0 08 5 2019 08:00 32 49.46 10.7 228 975.2 0 08 5 2019 09:00 33 50.06 16.3 182 976.8 0 08 5 2019 10:00 35 49.78 15.2 348 977.1 0 08 5 2019 11:00 37 51.35 14.2 125 977.2 0 08 5 2019 12:00 39 50.49 13.6 316 977.7 0 08 5 2019 13:00 40 50.85 13.2 220 977 0 08 5 2019 14:00 42 51.79 12.9 219 977.2 0 08 5 2019 15:00 43 49.46 13.4 287 976.4 0 08 5 2019 16:00 40 48.55 13.2 172 975.8 0 08 5 2019 17:00 39 46.5 14.6 161 975 0 08 5 2019 18:00 38 47.68 12.5 165 974.2 0 08 5 2019 19:00 37 45.36 15.2 134 975.1 0 08 5 2019 20:00 35 46.39 15.3 184 974.7 0 08 5 2019 21:00 33 45.72 12.6 199 975.2 0 08 5 2019 22:00 32 46.48 14.2 192 975.7 0 08 5 2019 23:00 31 44.68 12.6 213 976.3 0 09 5 2019 00:00 30 44.99 10.8 233 977.3 0 09 5 2019 01:00 29 44.77 11.5 239 977.1 0 09 5 2019 02:00 28 43.45 18.6 196 977.1 0 09 5 2019 03:00 27 42.55 19.3 183 976.9 0 09 5 2019 04:00 27 43.34 14.3 220 977 0 09 5 2019 05:00 26 44.87 16.3 146 976.9 0 09 5 2019 06:00 29 46.64 19.6 159 977 0 09 5 2019 07:00 30 46.87 18.6 167 977.1 0 09 5 2019 08:00 31 47.97 11.2 120 977.2 0 09 5 2019 09:00 35 48.19 11.3 163 977.6 0 09 5 2019 10:00 36 48.64 12.6 198 978.2 0 09 5 2019 11:00 38 48.97 23.6 318 979.5 0 09 5 2019 12:00 39 49.53 24.6 108 979.5 0 09 5 2019 13:00 40 49.76 24.8 172 979 0 09 5 2019 14:00 41 50.34 12.9 177 978.5 0 09 5 2019 15:00 42 50.56 26.3 178 979 0 09 5 2019 16:00 41 51.34 23.9 167 978.3 0 09 5 2019 17:00 40 48.59 14.6 221 977 0 09 5 2019 18:00 39 49.77 17.2 210 976.6 0 09 5 2019 19:00 37 47.45 10.6 256 975.8 0 09 5 2019 20:00 35 48.48 23.6 277 976.1 0 09 5 2019 21:00 33 47.81 13.2 226 976 0 09 5 2019 22:00 32 41.53 10.8 211 976.3 0 09 5 2019 23:00 31 39.35 12.6 240 976.9 0 010 5 2019 00:00 30 38.87 12.7 219 977.7 0 010 5 2019 01:00 29 38.37 10.6 215 977.9 0 010 5 2019 02:00 27 37.53 10.7 169 977.9 0 010 5 2019 03:00 27 37.34 11.4 201 977.3 0 010 5 2019 04:00 26 37.2 11.3 220 976.9 0 010 5 2019 05:00 26 41.56 11.5 344 976.4 0 010 5 2019 06:00 29 43.34 10.5 130 976.3 0 010 5 2019 07:00 30 47.67 12.3 146 976.2 0 0
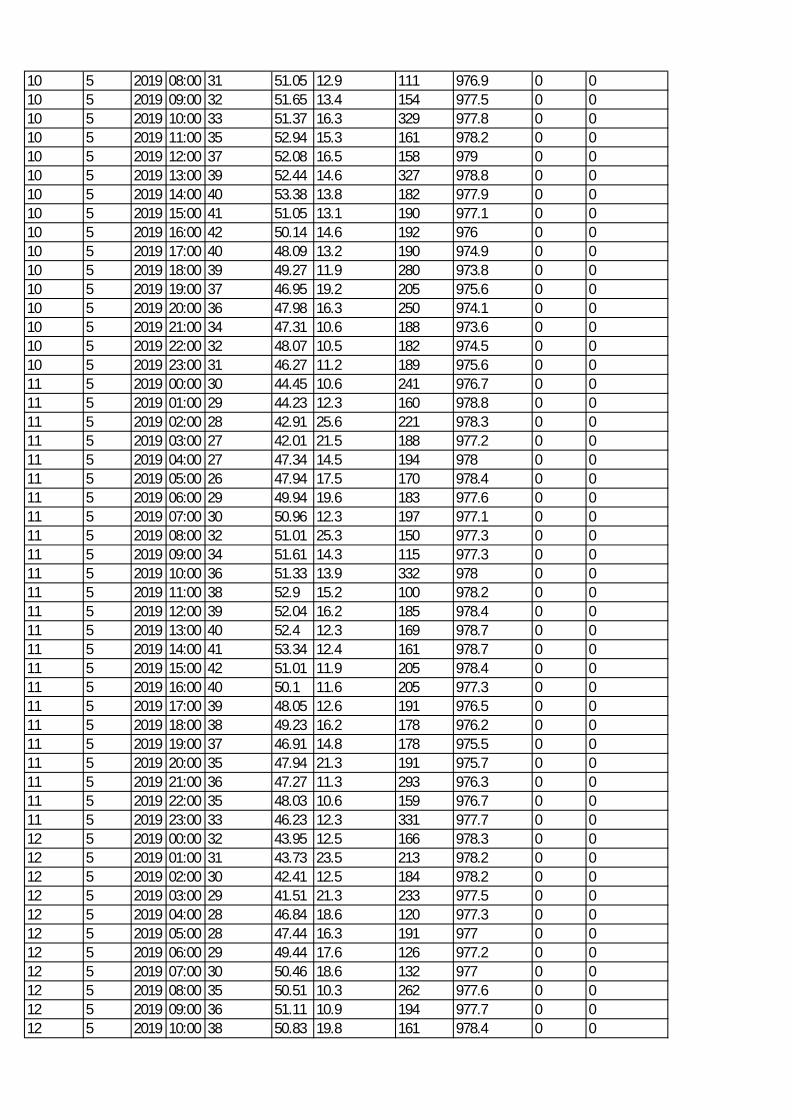
10 5 2019 08:00 31 51.05 12.9 111 976.9 0 010 5 2019 09:00 32 51.65 13.4 154 977.5 0 010 5 2019 10:00 33 51.37 16.3 329 977.8 0 010 5 2019 11:00 35 52.94 15.3 161 978.2 0 010 5 2019 12:00 37 52.08 16.5 158 979 0 010 5 2019 13:00 39 52.44 14.6 327 978.8 0 010 5 2019 14:00 40 53.38 13.8 182 977.9 0 010 5 2019 15:00 41 51.05 13.1 190 977.1 0 010 5 2019 16:00 42 50.14 14.6 192 976 0 010 5 2019 17:00 40 48.09 13.2 190 974.9 0 010 5 2019 18:00 39 49.27 11.9 280 973.8 0 010 5 2019 19:00 37 46.95 19.2 205 975.6 0 010 5 2019 20:00 36 47.98 16.3 250 974.1 0 010 5 2019 21:00 34 47.31 10.6 188 973.6 0 010 5 2019 22:00 32 48.07 10.5 182 974.5 0 010 5 2019 23:00 31 46.27 11.2 189 975.6 0 011 5 2019 00:00 30 44.45 10.6 241 976.7 0 011 5 2019 01:00 29 44.23 12.3 160 978.8 0 011 5 2019 02:00 28 42.91 25.6 221 978.3 0 011 5 2019 03:00 27 42.01 21.5 188 977.2 0 011 5 2019 04:00 27 47.34 14.5 194 978 0 011 5 2019 05:00 26 47.94 17.5 170 978.4 0 011 5 2019 06:00 29 49.94 19.6 183 977.6 0 011 5 2019 07:00 30 50.96 12.3 197 977.1 0 011 5 2019 08:00 32 51.01 25.3 150 977.3 0 011 5 2019 09:00 34 51.61 14.3 115 977.3 0 011 5 2019 10:00 36 51.33 13.9 332 978 0 011 5 2019 11:00 38 52.9 15.2 100 978.2 0 011 5 2019 12:00 39 52.04 16.2 185 978.4 0 011 5 2019 13:00 40 52.4 12.3 169 978.7 0 011 5 2019 14:00 41 53.34 12.4 161 978.7 0 011 5 2019 15:00 42 51.01 11.9 205 978.4 0 011 5 2019 16:00 40 50.1 11.6 205 977.3 0 011 5 2019 17:00 39 48.05 12.6 191 976.5 0 011 5 2019 18:00 38 49.23 16.2 178 976.2 0 011 5 2019 19:00 37 46.91 14.8 178 975.5 0 011 5 2019 20:00 35 47.94 21.3 191 975.7 0 011 5 2019 21:00 36 47.27 11.3 293 976.3 0 011 5 2019 22:00 35 48.03 10.6 159 976.7 0 011 5 2019 23:00 33 46.23 12.3 331 977.7 0 012 5 2019 00:00 32 43.95 12.5 166 978.3 0 012 5 2019 01:00 31 43.73 23.5 213 978.2 0 012 5 2019 02:00 30 42.41 12.5 184 978.2 0 012 5 2019 03:00 29 41.51 21.3 233 977.5 0 012 5 2019 04:00 28 46.84 18.6 120 977.3 0 012 5 2019 05:00 28 47.44 16.3 191 977 0 012 5 2019 06:00 29 49.44 17.6 126 977.2 0 012 5 2019 07:00 30 50.46 18.6 132 977 0 012 5 2019 08:00 35 50.51 10.3 262 977.6 0 012 5 2019 09:00 36 51.11 10.9 194 977.7 0 012 5 2019 10:00 38 50.83 19.8 161 978.4 0 0
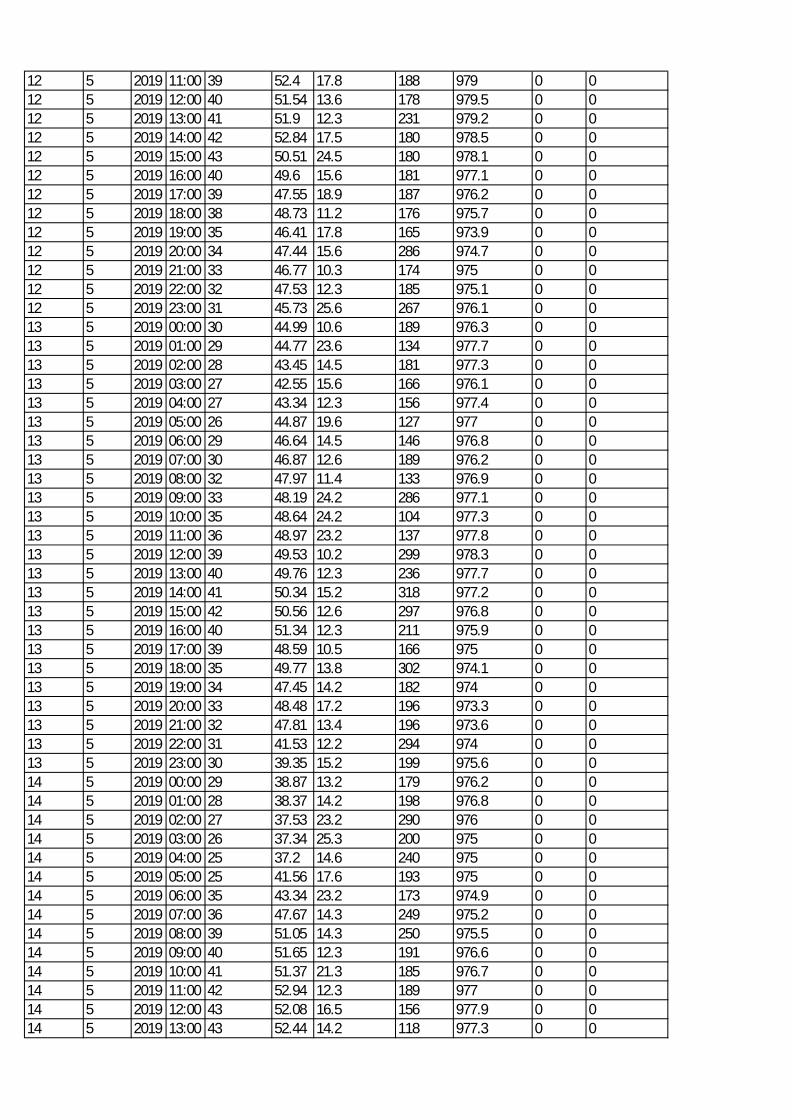
12 5 2019 11:00 39 52.4 17.8 188 979 0 012 5 2019 12:00 40 51.54 13.6 178 979.5 0 012 5 2019 13:00 41 51.9 12.3 231 979.2 0 012 5 2019 14:00 42 52.84 17.5 180 978.5 0 012 5 2019 15:00 43 50.51 24.5 180 978.1 0 012 5 2019 16:00 40 49.6 15.6 181 977.1 0 012 5 2019 17:00 39 47.55 18.9 187 976.2 0 012 5 2019 18:00 38 48.73 11.2 176 975.7 0 012 5 2019 19:00 35 46.41 17.8 165 973.9 0 012 5 2019 20:00 34 47.44 15.6 286 974.7 0 012 5 2019 21:00 33 46.77 10.3 174 975 0 012 5 2019 22:00 32 47.53 12.3 185 975.1 0 012 5 2019 23:00 31 45.73 25.6 267 976.1 0 013 5 2019 00:00 30 44.99 10.6 189 976.3 0 013 5 2019 01:00 29 44.77 23.6 134 977.7 0 013 5 2019 02:00 28 43.45 14.5 181 977.3 0 013 5 2019 03:00 27 42.55 15.6 166 976.1 0 013 5 2019 04:00 27 43.34 12.3 156 977.4 0 013 5 2019 05:00 26 44.87 19.6 127 977 0 013 5 2019 06:00 29 46.64 14.5 146 976.8 0 013 5 2019 07:00 30 46.87 12.6 189 976.2 0 013 5 2019 08:00 32 47.97 11.4 133 976.9 0 013 5 2019 09:00 33 48.19 24.2 286 977.1 0 013 5 2019 10:00 35 48.64 24.2 104 977.3 0 013 5 2019 11:00 36 48.97 23.2 137 977.8 0 013 5 2019 12:00 39 49.53 10.2 299 978.3 0 013 5 2019 13:00 40 49.76 12.3 236 977.7 0 013 5 2019 14:00 41 50.34 15.2 318 977.2 0 013 5 2019 15:00 42 50.56 12.6 297 976.8 0 013 5 2019 16:00 40 51.34 12.3 211 975.9 0 013 5 2019 17:00 39 48.59 10.5 166 975 0 013 5 2019 18:00 35 49.77 13.8 302 974.1 0 013 5 2019 19:00 34 47.45 14.2 182 974 0 013 5 2019 20:00 33 48.48 17.2 196 973.3 0 013 5 2019 21:00 32 47.81 13.4 196 973.6 0 013 5 2019 22:00 31 41.53 12.2 294 974 0 013 5 2019 23:00 30 39.35 15.2 199 975.6 0 014 5 2019 00:00 29 38.87 13.2 179 976.2 0 014 5 2019 01:00 28 38.37 14.2 198 976.8 0 014 5 2019 02:00 27 37.53 23.2 290 976 0 014 5 2019 03:00 26 37.34 25.3 200 975 0 014 5 2019 04:00 25 37.2 14.6 240 975 0 014 5 2019 05:00 25 41.56 17.6 193 975 0 014 5 2019 06:00 35 43.34 23.2 173 974.9 0 014 5 2019 07:00 36 47.67 14.3 249 975.2 0 014 5 2019 08:00 39 51.05 14.3 250 975.5 0 014 5 2019 09:00 40 51.65 12.3 191 976.6 0 014 5 2019 10:00 41 51.37 21.3 185 976.7 0 014 5 2019 11:00 42 52.94 12.3 189 977 0 014 5 2019 12:00 43 52.08 16.5 156 977.9 0 014 5 2019 13:00 43 52.44 14.2 118 977.3 0 0
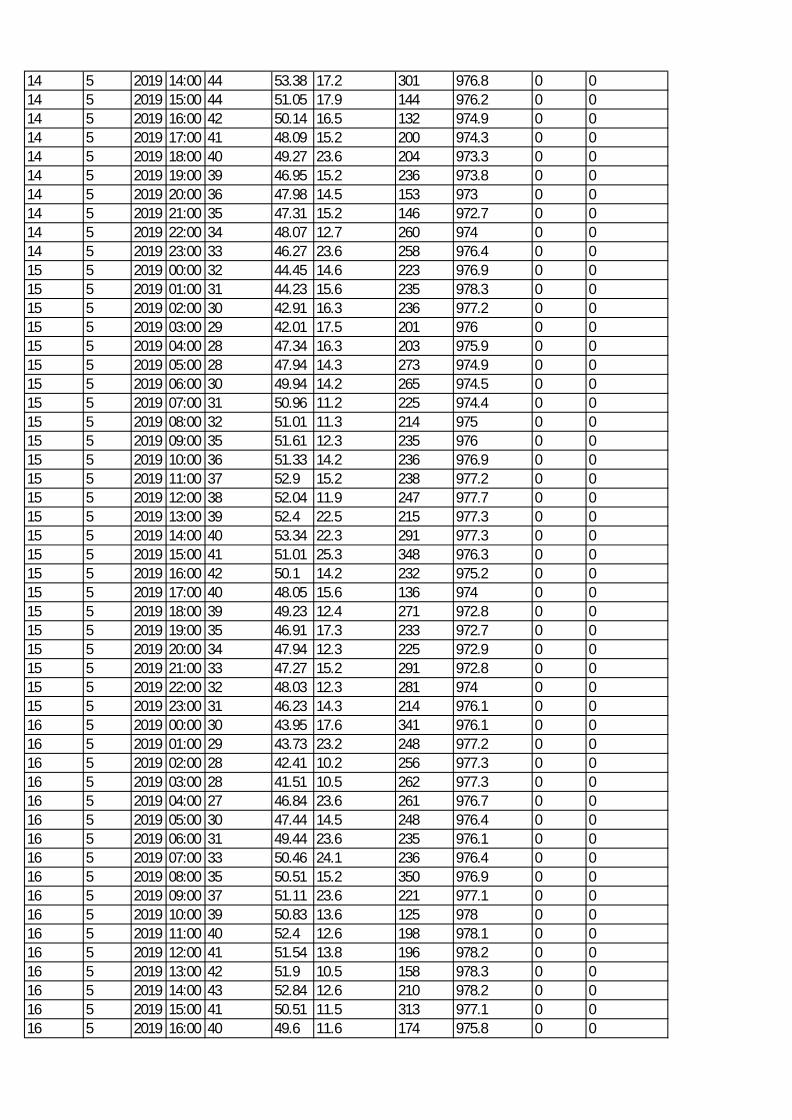
14 5 2019 14:00 44 53.38 17.2 301 976.8 0 014 5 2019 15:00 44 51.05 17.9 144 976.2 0 014 5 2019 16:00 42 50.14 16.5 132 974.9 0 014 5 2019 17:00 41 48.09 15.2 200 974.3 0 014 5 2019 18:00 40 49.27 23.6 204 973.3 0 014 5 2019 19:00 39 46.95 15.2 236 973.8 0 014 5 2019 20:00 36 47.98 14.5 153 973 0 014 5 2019 21:00 35 47.31 15.2 146 972.7 0 014 5 2019 22:00 34 48.07 12.7 260 974 0 014 5 2019 23:00 33 46.27 23.6 258 976.4 0 015 5 2019 00:00 32 44.45 14.6 223 976.9 0 015 5 2019 01:00 31 44.23 15.6 235 978.3 0 015 5 2019 02:00 30 42.91 16.3 236 977.2 0 015 5 2019 03:00 29 42.01 17.5 201 976 0 015 5 2019 04:00 28 47.34 16.3 203 975.9 0 015 5 2019 05:00 28 47.94 14.3 273 974.9 0 015 5 2019 06:00 30 49.94 14.2 265 974.5 0 015 5 2019 07:00 31 50.96 11.2 225 974.4 0 015 5 2019 08:00 32 51.01 11.3 214 975 0 015 5 2019 09:00 35 51.61 12.3 235 976 0 015 5 2019 10:00 36 51.33 14.2 236 976.9 0 015 5 2019 11:00 37 52.9 15.2 238 977.2 0 015 5 2019 12:00 38 52.04 11.9 247 977.7 0 015 5 2019 13:00 39 52.4 22.5 215 977.3 0 015 5 2019 14:00 40 53.34 22.3 291 977.3 0 015 5 2019 15:00 41 51.01 25.3 348 976.3 0 015 5 2019 16:00 42 50.1 14.2 232 975.2 0 015 5 2019 17:00 40 48.05 15.6 136 974 0 015 5 2019 18:00 39 49.23 12.4 271 972.8 0 015 5 2019 19:00 35 46.91 17.3 233 972.7 0 015 5 2019 20:00 34 47.94 12.3 225 972.9 0 015 5 2019 21:00 33 47.27 15.2 291 972.8 0 015 5 2019 22:00 32 48.03 12.3 281 974 0 015 5 2019 23:00 31 46.23 14.3 214 976.1 0 016 5 2019 00:00 30 43.95 17.6 341 976.1 0 016 5 2019 01:00 29 43.73 23.2 248 977.2 0 016 5 2019 02:00 28 42.41 10.2 256 977.3 0 016 5 2019 03:00 28 41.51 10.5 262 977.3 0 016 5 2019 04:00 27 46.84 23.6 261 976.7 0 016 5 2019 05:00 30 47.44 14.5 248 976.4 0 016 5 2019 06:00 31 49.44 23.6 235 976.1 0 016 5 2019 07:00 33 50.46 24.1 236 976.4 0 016 5 2019 08:00 35 50.51 15.2 350 976.9 0 016 5 2019 09:00 37 51.11 23.6 221 977.1 0 016 5 2019 10:00 39 50.83 13.6 125 978 0 016 5 2019 11:00 40 52.4 12.6 198 978.1 0 016 5 2019 12:00 41 51.54 13.8 196 978.2 0 016 5 2019 13:00 42 51.9 10.5 158 978.3 0 016 5 2019 14:00 43 52.84 12.6 210 978.2 0 016 5 2019 15:00 41 50.51 11.5 313 977.1 0 016 5 2019 16:00 40 49.6 11.6 174 975.8 0 0
16 5 2019 17:00 39 47.55 12.9 248 975 0 016 5 2019 18:00 38 48.73 12.8 332 974 0 016 5 2019 19:00 36 46.41 14.7 181 975 0 016 5 2019 20:00 34 47.44 13.8 335 975 0 016 5 2019 21:00 33 46.77 12.6 137 974.7 0 016 5 2019 22:00 32 47.53 13.2 145 975.8 0 016 5 2019 23:00 30 45.73 14.2 144 976.2 0 017 5 2019 00:00 29 44.99 13.6 144 977.2 0 017 5 2019 01:00 28 43.73 17.1 145 977.9 0 017 5 2019 02:00 27 42.41 16.3 143 979.4 0 017 5 2019 03:00 26 41.51 17.8 142 978.3 0 017 5 2019 04:00 26 47.84 19.6 143 977.1 0 017 5 2019 05:00 25 48.66 10.7 142 976.1 0 017 5 2019 06:00 29 49.44 19.3 143 976.2 0 017 5 2019 07:00 30 51.75 12.7 136 975.9 0 017 5 2019 08:00 31 48.95 14.2 137 976.1 0 017 5 2019 09:00 33 51.17 13.2 143 976.9 0 017 5 2019 10:00 35 52.78 13.1 142 977.5 0 017 5 2019 11:00 37 52.4 12.9 143 978.5 0 017 5 2019 12:00 39 54.95 10.6 269 978.3 0 017 5 2019 13:00 40 54.3 10.5 262 978.4 0 017 5 2019 14:00 41 53.95 14.6 105 978.2 0 017 5 2019 15:00 42 52.28 12.5 125 978.2 0 017 5 2019 16:00 40 48.75 14.3 214 977.2 0 017 5 2019 17:00 39 49.95 18.6 254 975.9 0 017 5 2019 18:00 38 48.73 17.5 145 975.9 0 017 5 2019 19:00 36 50.85 14.3 265 974.6 0 017 5 2019 20:00 35 54.42 12.3 259 975.1 0 017 5 2019 21:00 34 46.53 10.8 214 976 0 017 5 2019 22:00 33 46.98 17.5 256 977.3 0 017 5 2019 23:00 32 49.17 19.3 235 978.3 0 018 5 2019 00:00 30 50.15 13.2 230 977.1 0 018 5 2019 01:00 29 49.93 17.5 236 977.9 0 018 5 2019 02:00 28 48.61 16.3 234 977.8 0 018 5 2019 03:00 28 47.71 14.2 235 977.7 0 018 5 2019 04:00 27 53.04 16.3 310 977.1 0 018 5 2019 05:00 26 53.64 11.2 312 976.4 0 018 5 2019 06:00 29 55.64 11.2 315 976.5 0 018 5 2019 07:00 30 56.66 21.3 325 976.9 0 018 5 2019 08:00 31 56.71 23.2 325 977.1 0 018 5 2019 09:00 32 57.31 14.5 324 977.5 0 018 5 2019 10:00 33 57.03 24.5 314 978.3 0 018 5 2019 11:00 35 58.6 22.6 320 978.4 0 018 5 2019 12:00 39 57.74 13.2 321 978.4 0 018 5 2019 13:00 40 58.1 13.9 325 978.2 0 018 5 2019 14:00 41 59.04 14.2 325 977.6 0 018 5 2019 15:00 42 56.71 11.7 325 977.2 0 018 5 2019 16:00 40 55.8 10.2 233 976.5 0 018 5 2019 17:00 39 53.75 15.2 247 975 0 018 5 2019 18:00 35 54.93 12.6 305 973.9 0 018 5 2019 19:00 33 52.61 10.8 275 973.8 0 0
18 5 2019 20:00 32 53.64 12.2 294 974 0 018 5 2019 21:00 32 52.97 12.7 308 974.4 0 018 5 2019 22:00 31 53.73 10.9 262 975 0 018 5 2019 23:00 31 51.93 23.6 260 975.1 0 019 5 2019 00:00 30 49.65 11.4 236 975.5 0 019 5 2019 01:00 30 49.43 13.2 254 976 0 019 5 2019 02:00 29 48.11 15.2 262 976.2 0 019 5 2019 03:00 29 47.21 15.2 157 976 0 019 5 2019 04:00 28 52.54 10.2 259 974.9 0 019 5 2019 05:00 28 53.14 12.6 248 974.4 0 019 5 2019 06:00 30 55.14 13.2 254 973.8 0 019 5 2019 07:00 32 56.16 14.3 356 973.8 0 019 5 2019 08:00 35 56.21 13.2 359 974.2 0 019 5 2019 09:00 37 56.81 15.6 300 974.6 0 019 5 2019 10:00 39 56.53 18.6 300 975.1 0 019 5 2019 11:00 40 58.1 13.8 298 975.1 0 019 5 2019 12:00 41 57.24 13.1 300 975.5 0 019 5 2019 13:00 42 57.6 14.6 108 975.5 0 019 5 2019 14:00 42 58.54 13.2 239 974.9 0 019 5 2019 15:00 43 56.21 11.9 251 974.2 0 019 5 2019 16:00 40 55.3 10.3 171 973.4 0 019 5 2019 17:00 39 53.25 13.2 195 972.7 0 019 5 2019 18:00 37 54.43 10.6 338 972.1 0 019 5 2019 19:00 35 52.11 10.8 324 970.9 0 019 5 2019 20:00 33 53.14 11.3 281 971.7 0 019 5 2019 21:00 32 52.47 10.7 349 972.5 0 019 5 2019 22:00 31 53.23 12.3 205 972.4 0 019 5 2019 23:00 30 51.43 14.5 205 973.1 0 020 5 2019 00:00 29 49.54 16.3 205 974 0 020 5 2019 01:00 29 49.32 17.9 206 974.9 0 020 5 2019 02:00 28 48 13.5 193 974.7 0 020 5 2019 03:00 28 47.1 16.3 209 974.5 0 020 5 2019 04:00 27 52.43 23.2 206 974.3 0 020 5 2019 05:00 27 53.03 25.6 205 973.3 0 020 5 2019 06:00 29 55.03 26.3 206 972.8 0 020 5 2019 07:00 30 56.05 23.2 308 972.7 0 020 5 2019 08:00 30 56.1 15.2 218 973.1 0 020 5 2019 09:00 31 56.7 26.3 207 974 0 020 5 2019 10:00 32 56.42 12.3 208 974 0 020 5 2019 11:00 34 57.99 12.4 213 974.2 0 020 5 2019 12:00 35 57.13 11.9 206 975 0 020 5 2019 13:00 39 57.49 11.9 206 975.1 0 020 5 2019 14:00 40 58.43 23.5 190 975.1 0 020 5 2019 15:00 41 56.1 18.3 252 974.4 0 020 5 2019 16:00 42 55.19 14.8 208 973.4 0 020 5 2019 17:00 40 53.14 21.3 238 972.7 0 020 5 2019 18:00 39 54.32 12.6 293 971.9 0 020 5 2019 19:00 38 52 25.2 246 971.5 0 020 5 2019 20:00 35 53.03 14.5 349 971.8 0 020 5 2019 21:00 34 52.36 16.3 231 972.5 0 020 5 2019 22:00 33 53.12 14.5 286 973.2 0 0
20 5 2019 23:00 32 51.32 16.3 296 974 0 021 5 2019 00:00 31 49.04 18.6 244 974.8 0 021 5 2019 01:00 30 48.82 16.3 296 974.5 0 021 5 2019 02:00 29 47.5 10.4 246 974.9 0 021 5 2019 03:00 29 46.6 23.2 248 974.9 0 021 5 2019 04:00 28 51.93 24.1 348 974.1 0 021 5 2019 05:00 28 52.53 10.2 148 973.9 0 021 5 2019 06:00 31 54.53 23.6 168 973.7 0 021 5 2019 07:00 35 55.55 15.6 168 973.9 0 021 5 2019 08:00 36 55.6 15 168 974 0 021 5 2019 09:00 37 56.2 14.2 133 974.2 0 021 5 2019 10:00 38 55.92 22.3 138 974.8 0 021 5 2019 11:00 39 57.49 27.6 129 975 0 021 5 2019 12:00 40 56.63 18.9 136 976.1 0 021 5 2019 13:00 41 56.99 17.5 324 976.1 0 021 5 2019 14:00 42 57.93 16.5 138 975.8 0 021 5 2019 15:00 42 55.6 11.3 298 975.3 0 021 5 2019 16:00 40 54.69 23.2 249 974.6 0 021 5 2019 17:00 39 52.64 16.3 219 974.1 0 021 5 2019 18:00 38 53.82 14.2 334 973.5 0 021 5 2019 19:00 35 51.5 10.6 254 973.3 0 021 5 2019 20:00 34 52.53 11.2 210 973.6 0 021 5 2019 21:00 33 51.86 1.7 271 972.9 0 021 5 2019 22:00 32 52.62 10.9 253 974 0 021 5 2019 23:00 30 50.82 15.3 253 975 0 022 5 2019 00:00 29 50.11 14.6 253 976.3 0 022 5 2019 01:00 28 49.89 10.7 252 976.1 0 022 5 2019 02:00 28 48.57 12.3 254 976 0 022 5 2019 03:00 27 47.67 10.2 253 975 0 022 5 2019 04:00 27 53 12.3 251 975 0 022 5 2019 05:00 27 53.6 14.2 251 974.9 0 022 5 2019 06:00 30 55.6 14.2 253 974.2 0 022 5 2019 07:00 31 56.62 25.2 254 974.3 0 022 5 2019 08:00 32 56.67 23.6 254 974.7 0 022 5 2019 09:00 33 57.27 18.5 253 975 0 022 5 2019 10:00 35 56.99 19.2 253 975.3 0 022 5 2019 11:00 36 58.56 23.2 254 976.4 0 022 5 2019 12:00 37 57.7 16.2 298 976.4 0 022 5 2019 13:00 38 58.06 17.2 330 975.9 0 022 5 2019 14:00 39 59 24.2 172 975.7 0 022 5 2019 15:00 40 56.67 26.3 320 975.5 0 022 5 2019 16:00 42 55.76 23.6 199 974.9 0 022 5 2019 17:00 43 53.71 15.6 170 973.8 0 022 5 2019 18:00 41 54.89 14.2 337 972.9 0 022 5 2019 19:00 40 52.57 16.3 351 973.7 0 022 5 2019 20:00 39 53.6 13.2 304 972.8 0 022 5 2019 21:00 37 52.93 15.2 220 973.4 0 022 5 2019 22:00 35 53.69 27.8 101 973.5 0 022 5 2019 23:00 35 51.89 12.2 102 975.1 0 023 5 2019 00:00 33 49.61 23.2 172 975.6 0 023 5 2019 01:00 32 49.39 24.2 174 975.4 0 0
23 5 2019 02:00 31 48.07 23.6 175 976 0 023 5 2019 03:00 30 47.17 21.2 195 975 0 023 5 2019 04:00 30 52.5 20.4 162 974.9 0 023 5 2019 05:00 29 53.1 11.2 132 974.6 0 023 5 2019 06:00 32 55.1 22.3 100 974.3 0 023 5 2019 07:00 33 56.12 11.3 165 974.1 0 023 5 2019 08:00 34 56.17 23.2 199 974.9 0 023 5 2019 09:00 36 56.77 13.2 295 974.7 0 023 5 2019 10:00 38 56.49 24.3 194 974.8 0 023 5 2019 11:00 39 58.06 16.3 195 975.4 0 023 5 2019 12:00 40 57.2 23.2 174 976.1 0 023 5 2019 13:00 41 57.56 12.2 316 975.9 0 023 5 2019 14:00 42 58.5 27.2 282 976 0 023 5 2019 15:00 43 56.17 16.3 335 975.5 0 023 5 2019 16:00 41 55.26 11.2 345 974.9 0 023 5 2019 17:00 40 53.21 21.2 133 974.7 0 023 5 2019 18:00 39 54.39 10.3 225 973.7 0 023 5 2019 19:00 36 52.07 23.1 212 974.2 0 023 5 2019 20:00 35 53.1 14.5 222 973.9 0 023 5 2019 21:00 32 52.43 15.6 217 974.7 0 023 5 2019 22:00 31 53.19 12.3 217 975.1 0 023 5 2019 23:00 30 51.39 23.1 217 975.6 0 024 5 2019 00:00 29 49.22 21.3 111 975.2 0 024 5 2019 01:00 28 49 26.3 167 975.9 0 024 5 2019 02:00 28 47.68 24.6 169 976 0 024 5 2019 03:00 27 46.78 18.6 166 976.2 0 024 5 2019 04:00 27 52.11 15.6 145 975.1 0 024 5 2019 05:00 26 52.71 14.2 171 975 0 024 5 2019 06:00 29 54.71 13.2 169 975.2 0 024 5 2019 07:00 30 55.73 15.6 165 974.8 0 024 5 2019 08:00 32 55.78 11.9 163 975.3 0 024 5 2019 09:00 33 56.38 14.5 145 976 0 024 5 2019 10:00 35 56.1 12.3 166 976 0 024 5 2019 11:00 37 57.67 12.3 326 976.3 0 024 5 2019 12:00 39 56.81 24.5 148 977.1 0 024 5 2019 13:00 40 57.17 11.2 336 976.3 0 024 5 2019 14:00 41 58.11 23.2 135 976.3 0 024 5 2019 15:00 42 55.78 24.2 255 975.9 0 024 5 2019 16:00 43 54.87 11.4 174 975.2 0 024 5 2019 17:00 41 52.82 23.6 234 975 0 024 5 2019 18:00 39 54 12.5 198 973.9 0 024 5 2019 19:00 35 51.68 11.6 312 973.9 0 024 5 2019 20:00 33 52.71 23.6 263 973.8 0 024 5 2019 21:00 32 52.04 24.9 275 973.7 0 024 5 2019 22:00 31 52.8 23.6 234 974.5 0 024 5 2019 23:00 30 51 18.9 234 975.2 0 025 5 2019 00:00 29 48.72 14.5 161 976.2 0 025 5 2019 01:00 28 48.5 16.3 160 976 0 025 5 2019 02:00 28 47.18 12.3 256 975.3 0 025 5 2019 03:00 27 46.28 14.3 155 974.8 0 025 5 2019 04:00 27 51.61 16.3 157 974.1 0 0
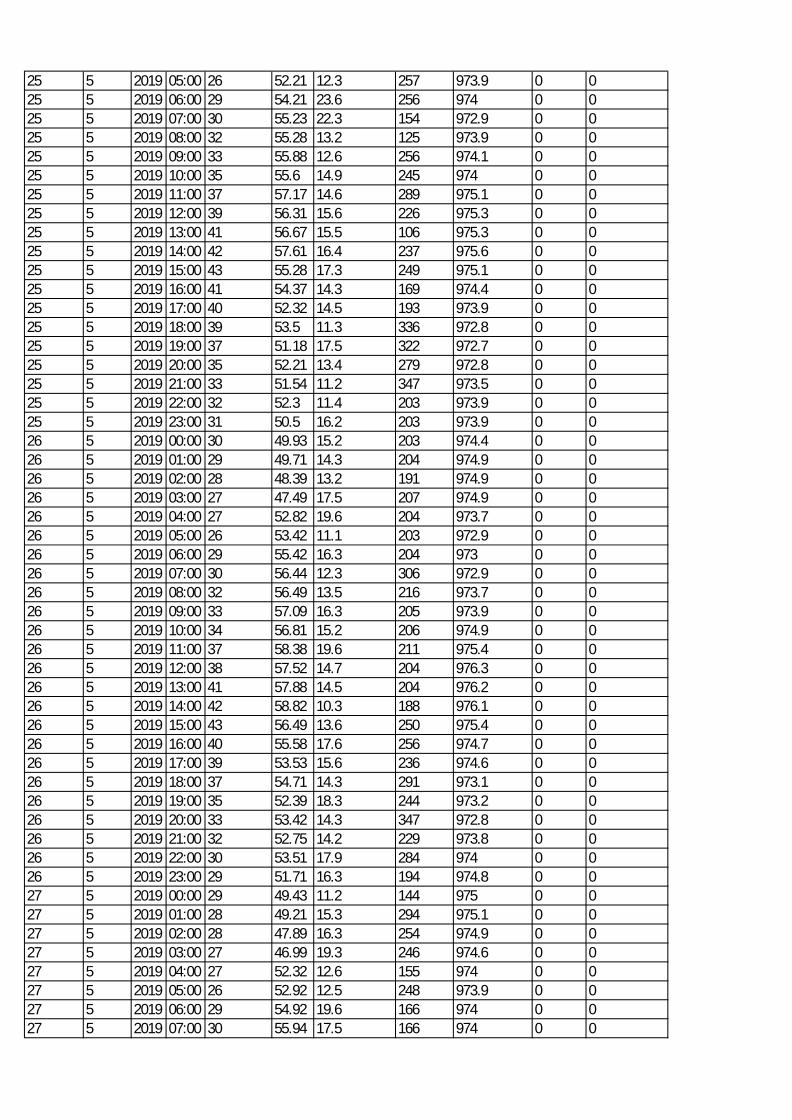
25 5 2019 05:00 26 52.21 12.3 257 973.9 0 025 5 2019 06:00 29 54.21 23.6 256 974 0 025 5 2019 07:00 30 55.23 22.3 154 972.9 0 025 5 2019 08:00 32 55.28 13.2 125 973.9 0 025 5 2019 09:00 33 55.88 12.6 256 974.1 0 025 5 2019 10:00 35 55.6 14.9 245 974 0 025 5 2019 11:00 37 57.17 14.6 289 975.1 0 025 5 2019 12:00 39 56.31 15.6 226 975.3 0 025 5 2019 13:00 41 56.67 15.5 106 975.3 0 025 5 2019 14:00 42 57.61 16.4 237 975.6 0 025 5 2019 15:00 43 55.28 17.3 249 975.1 0 025 5 2019 16:00 41 54.37 14.3 169 974.4 0 025 5 2019 17:00 40 52.32 14.5 193 973.9 0 025 5 2019 18:00 39 53.5 11.3 336 972.8 0 025 5 2019 19:00 37 51.18 17.5 322 972.7 0 025 5 2019 20:00 35 52.21 13.4 279 972.8 0 025 5 2019 21:00 33 51.54 11.2 347 973.5 0 025 5 2019 22:00 32 52.3 11.4 203 973.9 0 025 5 2019 23:00 31 50.5 16.2 203 973.9 0 026 5 2019 00:00 30 49.93 15.2 203 974.4 0 026 5 2019 01:00 29 49.71 14.3 204 974.9 0 026 5 2019 02:00 28 48.39 13.2 191 974.9 0 026 5 2019 03:00 27 47.49 17.5 207 974.9 0 026 5 2019 04:00 27 52.82 19.6 204 973.7 0 026 5 2019 05:00 26 53.42 11.1 203 972.9 0 026 5 2019 06:00 29 55.42 16.3 204 973 0 026 5 2019 07:00 30 56.44 12.3 306 972.9 0 026 5 2019 08:00 32 56.49 13.5 216 973.7 0 026 5 2019 09:00 33 57.09 16.3 205 973.9 0 026 5 2019 10:00 34 56.81 15.2 206 974.9 0 026 5 2019 11:00 37 58.38 19.6 211 975.4 0 026 5 2019 12:00 38 57.52 14.7 204 976.3 0 026 5 2019 13:00 41 57.88 14.5 204 976.2 0 026 5 2019 14:00 42 58.82 10.3 188 976.1 0 026 5 2019 15:00 43 56.49 13.6 250 975.4 0 026 5 2019 16:00 40 55.58 17.6 256 974.7 0 026 5 2019 17:00 39 53.53 15.6 236 974.6 0 026 5 2019 18:00 37 54.71 14.3 291 973.1 0 026 5 2019 19:00 35 52.39 18.3 244 973.2 0 026 5 2019 20:00 33 53.42 14.3 347 972.8 0 026 5 2019 21:00 32 52.75 14.2 229 973.8 0 026 5 2019 22:00 30 53.51 17.9 284 974 0 026 5 2019 23:00 29 51.71 16.3 194 974.8 0 027 5 2019 00:00 29 49.43 11.2 144 975 0 027 5 2019 01:00 28 49.21 15.3 294 975.1 0 027 5 2019 02:00 28 47.89 16.3 254 974.9 0 027 5 2019 03:00 27 46.99 19.3 246 974.6 0 027 5 2019 04:00 27 52.32 12.6 155 974 0 027 5 2019 05:00 26 52.92 12.5 248 973.9 0 027 5 2019 06:00 29 54.92 19.6 166 974 0 027 5 2019 07:00 30 55.94 17.5 166 974 0 0
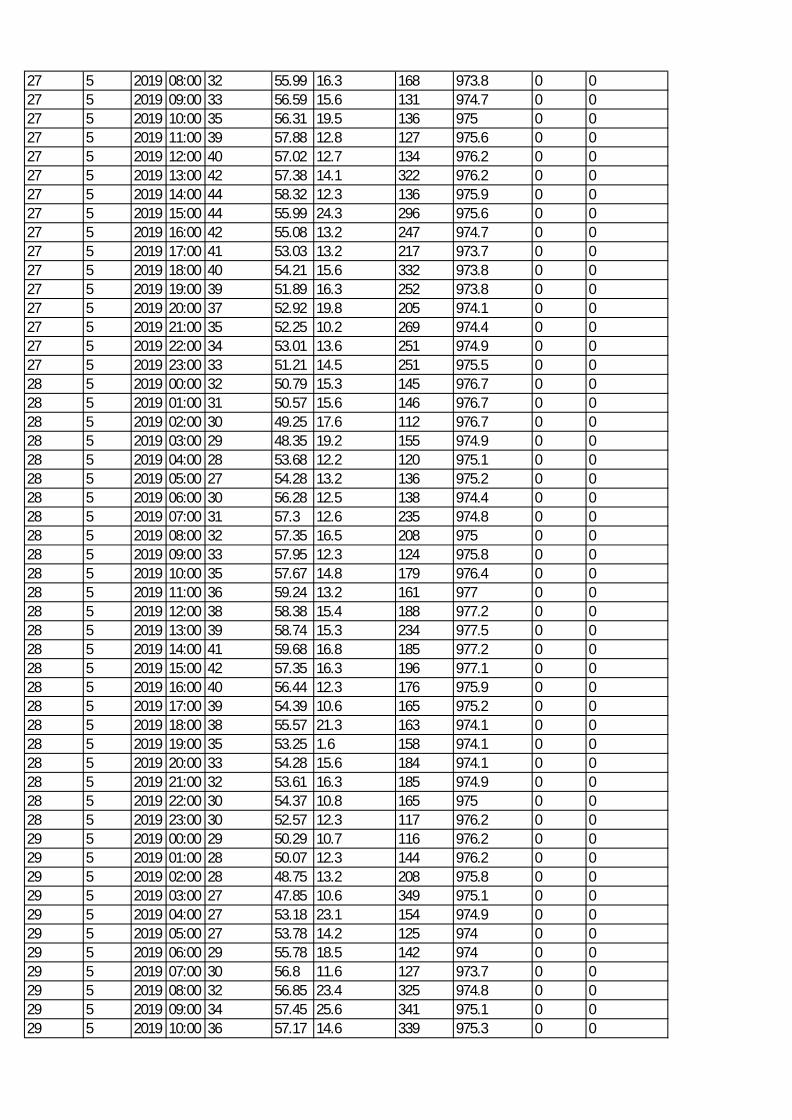
27 5 2019 08:00 32 55.99 16.3 168 973.8 0 027 5 2019 09:00 33 56.59 15.6 131 974.7 0 027 5 2019 10:00 35 56.31 19.5 136 975 0 027 5 2019 11:00 39 57.88 12.8 127 975.6 0 027 5 2019 12:00 40 57.02 12.7 134 976.2 0 027 5 2019 13:00 42 57.38 14.1 322 976.2 0 027 5 2019 14:00 44 58.32 12.3 136 975.9 0 027 5 2019 15:00 44 55.99 24.3 296 975.6 0 027 5 2019 16:00 42 55.08 13.2 247 974.7 0 027 5 2019 17:00 41 53.03 13.2 217 973.7 0 027 5 2019 18:00 40 54.21 15.6 332 973.8 0 027 5 2019 19:00 39 51.89 16.3 252 973.8 0 027 5 2019 20:00 37 52.92 19.8 205 974.1 0 027 5 2019 21:00 35 52.25 10.2 269 974.4 0 027 5 2019 22:00 34 53.01 13.6 251 974.9 0 027 5 2019 23:00 33 51.21 14.5 251 975.5 0 028 5 2019 00:00 32 50.79 15.3 145 976.7 0 028 5 2019 01:00 31 50.57 15.6 146 976.7 0 028 5 2019 02:00 30 49.25 17.6 112 976.7 0 028 5 2019 03:00 29 48.35 19.2 155 974.9 0 028 5 2019 04:00 28 53.68 12.2 120 975.1 0 028 5 2019 05:00 27 54.28 13.2 136 975.2 0 028 5 2019 06:00 30 56.28 12.5 138 974.4 0 028 5 2019 07:00 31 57.3 12.6 235 974.8 0 028 5 2019 08:00 32 57.35 16.5 208 975 0 028 5 2019 09:00 33 57.95 12.3 124 975.8 0 028 5 2019 10:00 35 57.67 14.8 179 976.4 0 028 5 2019 11:00 36 59.24 13.2 161 977 0 028 5 2019 12:00 38 58.38 15.4 188 977.2 0 028 5 2019 13:00 39 58.74 15.3 234 977.5 0 028 5 2019 14:00 41 59.68 16.8 185 977.2 0 028 5 2019 15:00 42 57.35 16.3 196 977.1 0 028 5 2019 16:00 40 56.44 12.3 176 975.9 0 028 5 2019 17:00 39 54.39 10.6 165 975.2 0 028 5 2019 18:00 38 55.57 21.3 163 974.1 0 028 5 2019 19:00 35 53.25 1.6 158 974.1 0 028 5 2019 20:00 33 54.28 15.6 184 974.1 0 028 5 2019 21:00 32 53.61 16.3 185 974.9 0 028 5 2019 22:00 30 54.37 10.8 165 975 0 028 5 2019 23:00 30 52.57 12.3 117 976.2 0 029 5 2019 00:00 29 50.29 10.7 116 976.2 0 029 5 2019 01:00 28 50.07 12.3 144 976.2 0 029 5 2019 02:00 28 48.75 13.2 208 975.8 0 029 5 2019 03:00 27 47.85 10.6 349 975.1 0 029 5 2019 04:00 27 53.18 23.1 154 974.9 0 029 5 2019 05:00 27 53.78 14.2 125 974 0 029 5 2019 06:00 29 55.78 18.5 142 974 0 029 5 2019 07:00 30 56.8 11.6 127 973.7 0 029 5 2019 08:00 32 56.85 23.4 325 974.8 0 029 5 2019 09:00 34 57.45 25.6 341 975.1 0 029 5 2019 10:00 36 57.17 14.6 339 975.3 0 0
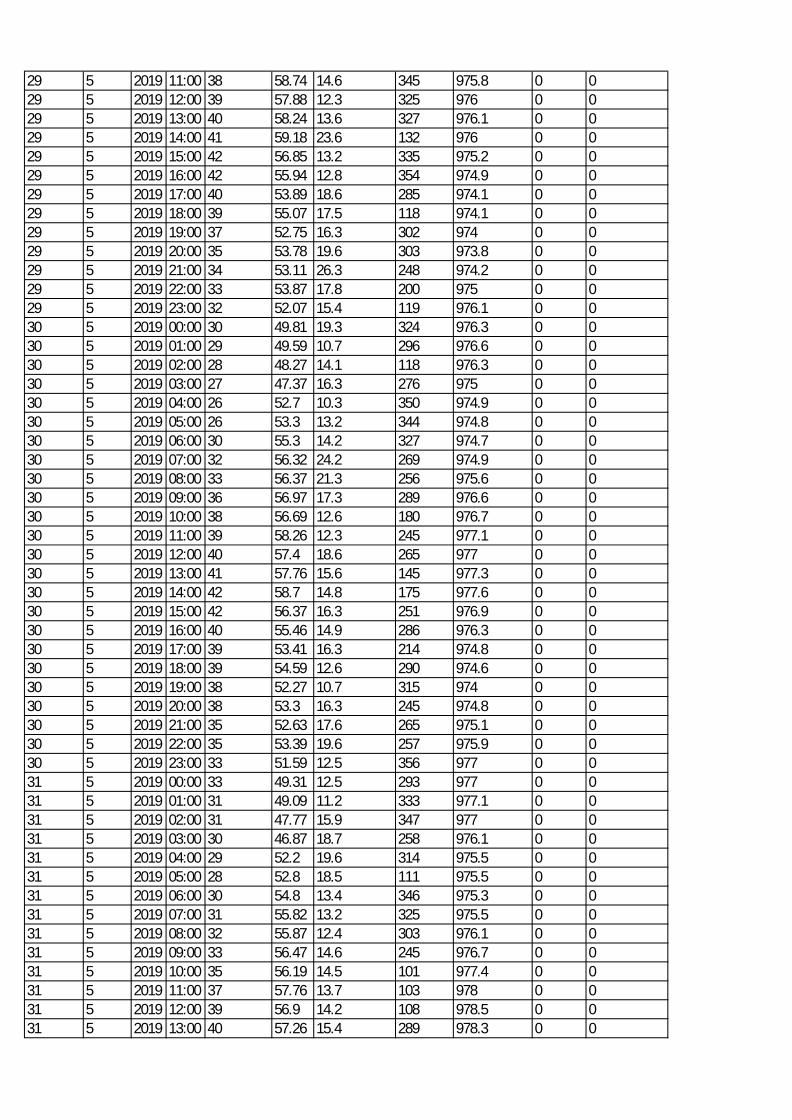
29 5 2019 11:00 38 58.74 14.6 345 975.8 0 029 5 2019 12:00 39 57.88 12.3 325 976 0 029 5 2019 13:00 40 58.24 13.6 327 976.1 0 029 5 2019 14:00 41 59.18 23.6 132 976 0 029 5 2019 15:00 42 56.85 13.2 335 975.2 0 029 5 2019 16:00 42 55.94 12.8 354 974.9 0 029 5 2019 17:00 40 53.89 18.6 285 974.1 0 029 5 2019 18:00 39 55.07 17.5 118 974.1 0 029 5 2019 19:00 37 52.75 16.3 302 974 0 029 5 2019 20:00 35 53.78 19.6 303 973.8 0 029 5 2019 21:00 34 53.11 26.3 248 974.2 0 029 5 2019 22:00 33 53.87 17.8 200 975 0 029 5 2019 23:00 32 52.07 15.4 119 976.1 0 030 5 2019 00:00 30 49.81 19.3 324 976.3 0 030 5 2019 01:00 29 49.59 10.7 296 976.6 0 030 5 2019 02:00 28 48.27 14.1 118 976.3 0 030 5 2019 03:00 27 47.37 16.3 276 975 0 030 5 2019 04:00 26 52.7 10.3 350 974.9 0 030 5 2019 05:00 26 53.3 13.2 344 974.8 0 030 5 2019 06:00 30 55.3 14.2 327 974.7 0 030 5 2019 07:00 32 56.32 24.2 269 974.9 0 030 5 2019 08:00 33 56.37 21.3 256 975.6 0 030 5 2019 09:00 36 56.97 17.3 289 976.6 0 030 5 2019 10:00 38 56.69 12.6 180 976.7 0 030 5 2019 11:00 39 58.26 12.3 245 977.1 0 030 5 2019 12:00 40 57.4 18.6 265 977 0 030 5 2019 13:00 41 57.76 15.6 145 977.3 0 030 5 2019 14:00 42 58.7 14.8 175 977.6 0 030 5 2019 15:00 42 56.37 16.3 251 976.9 0 030 5 2019 16:00 40 55.46 14.9 286 976.3 0 030 5 2019 17:00 39 53.41 16.3 214 974.8 0 030 5 2019 18:00 39 54.59 12.6 290 974.6 0 030 5 2019 19:00 38 52.27 10.7 315 974 0 030 5 2019 20:00 38 53.3 16.3 245 974.8 0 030 5 2019 21:00 35 52.63 17.6 265 975.1 0 030 5 2019 22:00 35 53.39 19.6 257 975.9 0 030 5 2019 23:00 33 51.59 12.5 356 977 0 031 5 2019 00:00 33 49.31 12.5 293 977 0 031 5 2019 01:00 31 49.09 11.2 333 977.1 0 031 5 2019 02:00 31 47.77 15.9 347 977 0 031 5 2019 03:00 30 46.87 18.7 258 976.1 0 031 5 2019 04:00 29 52.2 19.6 314 975.5 0 031 5 2019 05:00 28 52.8 18.5 111 975.5 0 031 5 2019 06:00 30 54.8 13.4 346 975.3 0 031 5 2019 07:00 31 55.82 13.2 325 975.5 0 031 5 2019 08:00 32 55.87 12.4 303 976.1 0 031 5 2019 09:00 33 56.47 14.6 245 976.7 0 031 5 2019 10:00 35 56.19 14.5 101 977.4 0 031 5 2019 11:00 37 57.76 13.7 103 978 0 031 5 2019 12:00 39 56.9 14.2 108 978.5 0 031 5 2019 13:00 40 57.26 15.4 289 978.3 0 0
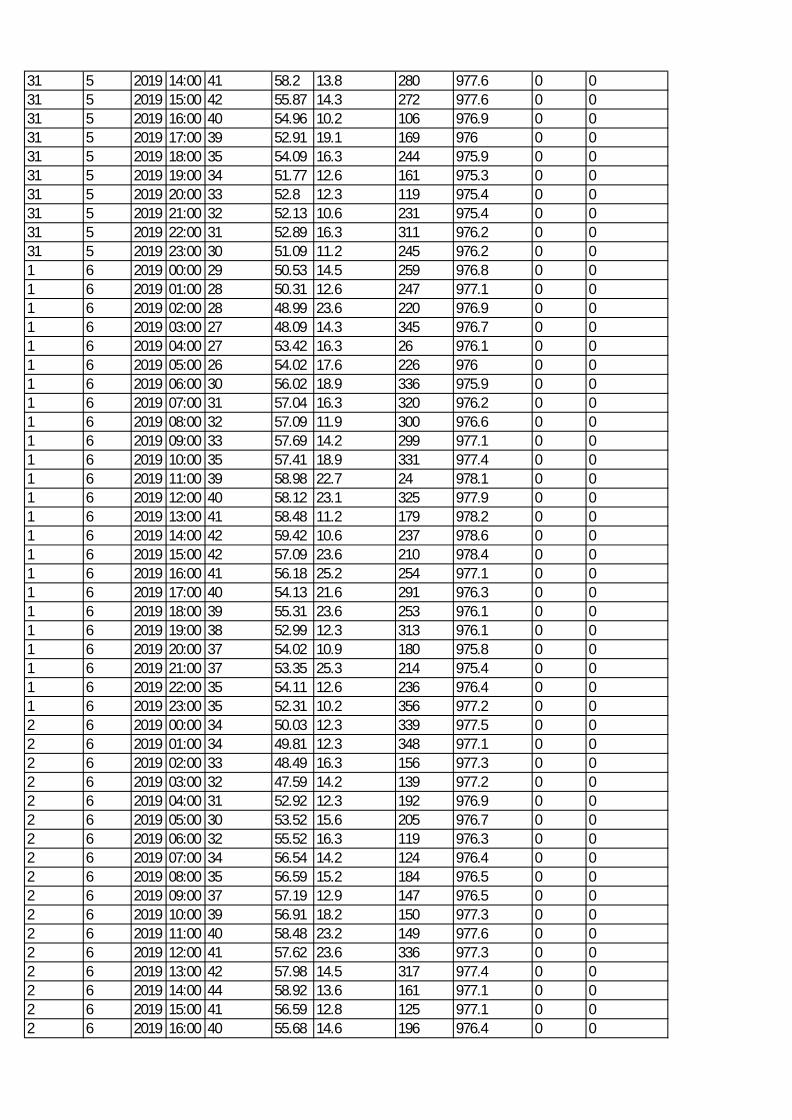
31 5 2019 14:00 41 58.2 13.8 280 977.6 0 031 5 2019 15:00 42 55.87 14.3 272 977.6 0 031 5 2019 16:00 40 54.96 10.2 106 976.9 0 031 5 2019 17:00 39 52.91 19.1 169 976 0 031 5 2019 18:00 35 54.09 16.3 244 975.9 0 031 5 2019 19:00 34 51.77 12.6 161 975.3 0 031 5 2019 20:00 33 52.8 12.3 119 975.4 0 031 5 2019 21:00 32 52.13 10.6 231 975.4 0 031 5 2019 22:00 31 52.89 16.3 311 976.2 0 031 5 2019 23:00 30 51.09 11.2 245 976.2 0 01 6 2019 00:00 29 50.53 14.5 259 976.8 0 01 6 2019 01:00 28 50.31 12.6 247 977.1 0 01 6 2019 02:00 28 48.99 23.6 220 976.9 0 01 6 2019 03:00 27 48.09 14.3 345 976.7 0 01 6 2019 04:00 27 53.42 16.3 26 976.1 0 01 6 2019 05:00 26 54.02 17.6 226 976 0 01 6 2019 06:00 30 56.02 18.9 336 975.9 0 01 6 2019 07:00 31 57.04 16.3 320 976.2 0 01 6 2019 08:00 32 57.09 11.9 300 976.6 0 01 6 2019 09:00 33 57.69 14.2 299 977.1 0 01 6 2019 10:00 35 57.41 18.9 331 977.4 0 01 6 2019 11:00 39 58.98 22.7 24 978.1 0 01 6 2019 12:00 40 58.12 23.1 325 977.9 0 01 6 2019 13:00 41 58.48 11.2 179 978.2 0 01 6 2019 14:00 42 59.42 10.6 237 978.6 0 01 6 2019 15:00 42 57.09 23.6 210 978.4 0 01 6 2019 16:00 41 56.18 25.2 254 977.1 0 01 6 2019 17:00 40 54.13 21.6 291 976.3 0 01 6 2019 18:00 39 55.31 23.6 253 976.1 0 01 6 2019 19:00 38 52.99 12.3 313 976.1 0 01 6 2019 20:00 37 54.02 10.9 180 975.8 0 01 6 2019 21:00 37 53.35 25.3 214 975.4 0 01 6 2019 22:00 35 54.11 12.6 236 976.4 0 01 6 2019 23:00 35 52.31 10.2 356 977.2 0 02 6 2019 00:00 34 50.03 12.3 339 977.5 0 02 6 2019 01:00 34 49.81 12.3 348 977.1 0 02 6 2019 02:00 33 48.49 16.3 156 977.3 0 02 6 2019 03:00 32 47.59 14.2 139 977.2 0 02 6 2019 04:00 31 52.92 12.3 192 976.9 0 02 6 2019 05:00 30 53.52 15.6 205 976.7 0 02 6 2019 06:00 32 55.52 16.3 119 976.3 0 02 6 2019 07:00 34 56.54 14.2 124 976.4 0 02 6 2019 08:00 35 56.59 15.2 184 976.5 0 02 6 2019 09:00 37 57.19 12.9 147 976.5 0 02 6 2019 10:00 39 56.91 18.2 150 977.3 0 02 6 2019 11:00 40 58.48 23.2 149 977.6 0 02 6 2019 12:00 41 57.62 23.6 336 977.3 0 02 6 2019 13:00 42 57.98 14.5 317 977.4 0 02 6 2019 14:00 44 58.92 13.6 161 977.1 0 02 6 2019 15:00 41 56.59 12.8 125 977.1 0 02 6 2019 16:00 40 55.68 14.6 196 976.4 0 0
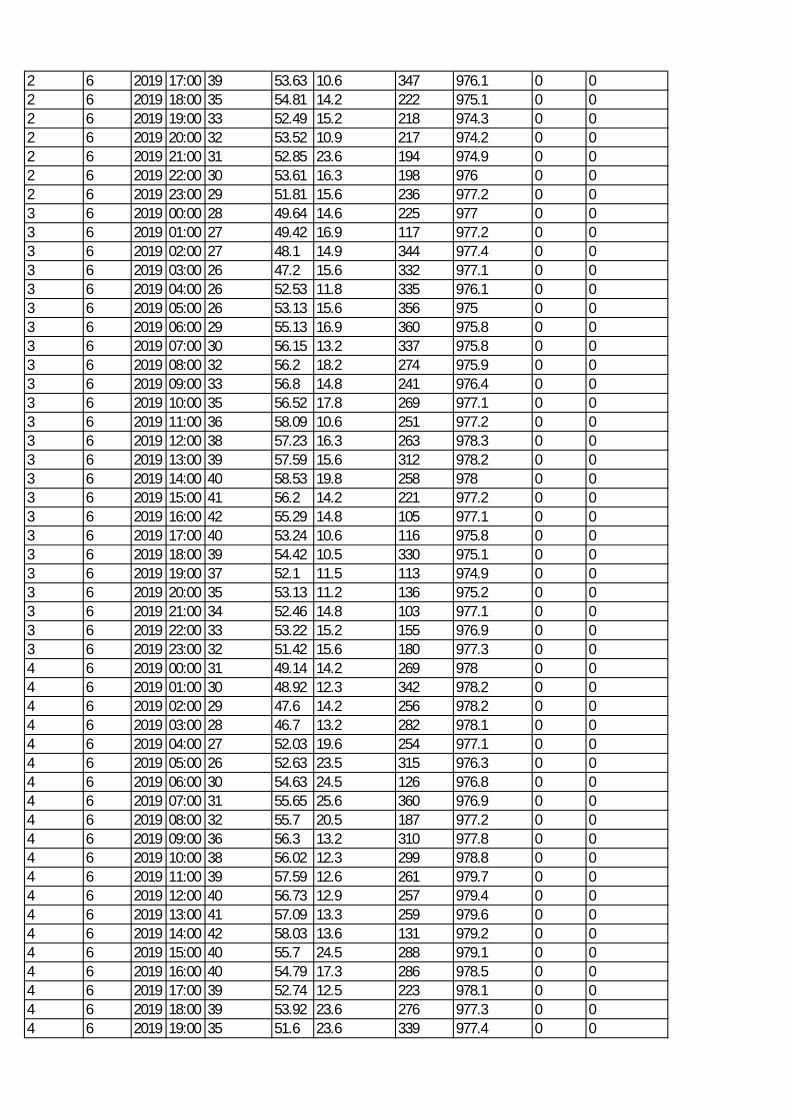
2 6 2019 17:00 39 53.63 10.6 347 976.1 0 02 6 2019 18:00 35 54.81 14.2 222 975.1 0 02 6 2019 19:00 33 52.49 15.2 218 974.3 0 02 6 2019 20:00 32 53.52 10.9 217 974.2 0 02 6 2019 21:00 31 52.85 23.6 194 974.9 0 02 6 2019 22:00 30 53.61 16.3 198 976 0 02 6 2019 23:00 29 51.81 15.6 236 977.2 0 03 6 2019 00:00 28 49.64 14.6 225 977 0 03 6 2019 01:00 27 49.42 16.9 117 977.2 0 03 6 2019 02:00 27 48.1 14.9 344 977.4 0 03 6 2019 03:00 26 47.2 15.6 332 977.1 0 03 6 2019 04:00 26 52.53 11.8 335 976.1 0 03 6 2019 05:00 26 53.13 15.6 356 975 0 03 6 2019 06:00 29 55.13 16.9 360 975.8 0 03 6 2019 07:00 30 56.15 13.2 337 975.8 0 03 6 2019 08:00 32 56.2 18.2 274 975.9 0 03 6 2019 09:00 33 56.8 14.8 241 976.4 0 03 6 2019 10:00 35 56.52 17.8 269 977.1 0 03 6 2019 11:00 36 58.09 10.6 251 977.2 0 03 6 2019 12:00 38 57.23 16.3 263 978.3 0 03 6 2019 13:00 39 57.59 15.6 312 978.2 0 03 6 2019 14:00 40 58.53 19.8 258 978 0 03 6 2019 15:00 41 56.2 14.2 221 977.2 0 03 6 2019 16:00 42 55.29 14.8 105 977.1 0 03 6 2019 17:00 40 53.24 10.6 116 975.8 0 03 6 2019 18:00 39 54.42 10.5 330 975.1 0 03 6 2019 19:00 37 52.1 11.5 113 974.9 0 03 6 2019 20:00 35 53.13 11.2 136 975.2 0 03 6 2019 21:00 34 52.46 14.8 103 977.1 0 03 6 2019 22:00 33 53.22 15.2 155 976.9 0 03 6 2019 23:00 32 51.42 15.6 180 977.3 0 04 6 2019 00:00 31 49.14 14.2 269 978 0 04 6 2019 01:00 30 48.92 12.3 342 978.2 0 04 6 2019 02:00 29 47.6 14.2 256 978.2 0 04 6 2019 03:00 28 46.7 13.2 282 978.1 0 04 6 2019 04:00 27 52.03 19.6 254 977.1 0 04 6 2019 05:00 26 52.63 23.5 315 976.3 0 04 6 2019 06:00 30 54.63 24.5 126 976.8 0 04 6 2019 07:00 31 55.65 25.6 360 976.9 0 04 6 2019 08:00 32 55.7 20.5 187 977.2 0 04 6 2019 09:00 36 56.3 13.2 310 977.8 0 04 6 2019 10:00 38 56.02 12.3 299 978.8 0 04 6 2019 11:00 39 57.59 12.6 261 979.7 0 04 6 2019 12:00 40 56.73 12.9 257 979.4 0 04 6 2019 13:00 41 57.09 13.3 259 979.6 0 04 6 2019 14:00 42 58.03 13.6 131 979.2 0 04 6 2019 15:00 40 55.7 24.5 288 979.1 0 04 6 2019 16:00 40 54.79 17.3 286 978.5 0 04 6 2019 17:00 39 52.74 12.5 223 978.1 0 04 6 2019 18:00 39 53.92 23.6 276 977.3 0 04 6 2019 19:00 35 51.6 23.6 339 977.4 0 0
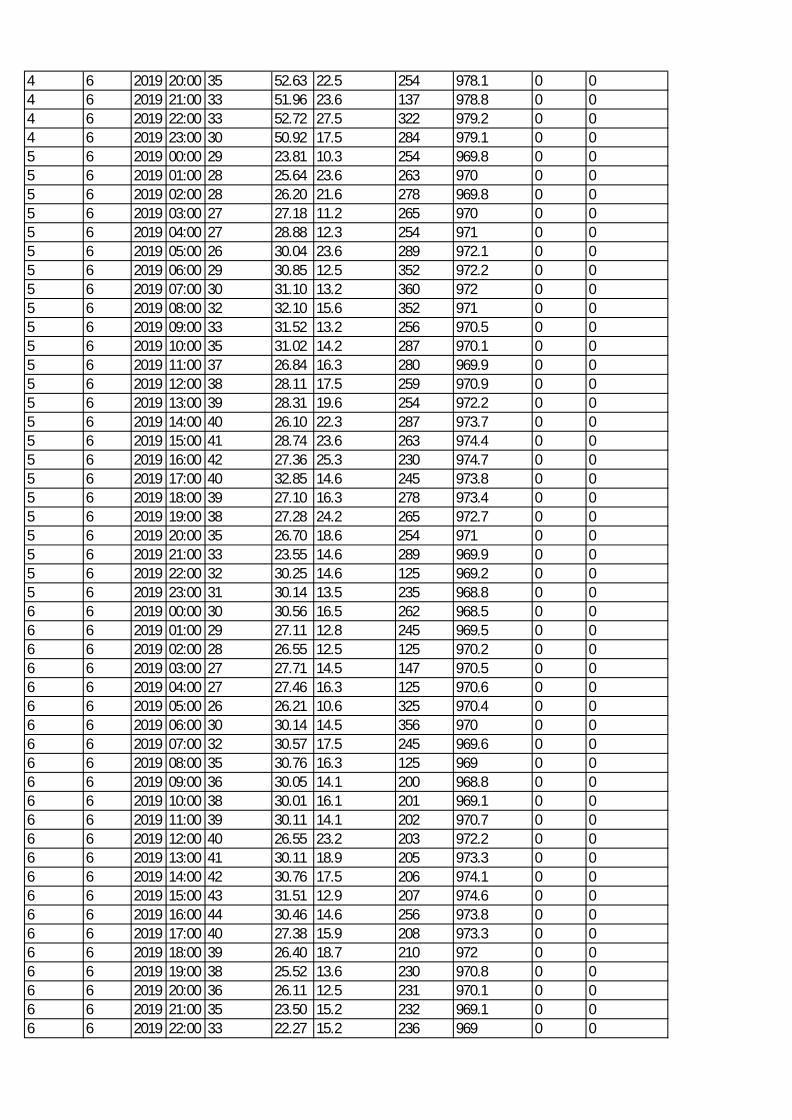
4 6 2019 20:00 35 52.63 22.5 254 978.1 0 04 6 2019 21:00 33 51.96 23.6 137 978.8 0 04 6 2019 22:00 33 52.72 27.5 322 979.2 0 04 6 2019 23:00 30 50.92 17.5 284 979.1 0 05 6 2019 00:00 29 23.81 10.3 254 969.8 0 05 6 2019 01:00 28 25.64 23.6 263 970 0 05 6 2019 02:00 28 26.20 21.6 278 969.8 0 05 6 2019 03:00 27 27.18 11.2 265 970 0 05 6 2019 04:00 27 28.88 12.3 254 971 0 05 6 2019 05:00 26 30.04 23.6 289 972.1 0 05 6 2019 06:00 29 30.85 12.5 352 972.2 0 05 6 2019 07:00 30 31.10 13.2 360 972 0 05 6 2019 08:00 32 32.10 15.6 352 971 0 05 6 2019 09:00 33 31.52 13.2 256 970.5 0 05 6 2019 10:00 35 31.02 14.2 287 970.1 0 05 6 2019 11:00 37 26.84 16.3 280 969.9 0 05 6 2019 12:00 38 28.11 17.5 259 970.9 0 05 6 2019 13:00 39 28.31 19.6 254 972.2 0 05 6 2019 14:00 40 26.10 22.3 287 973.7 0 05 6 2019 15:00 41 28.74 23.6 263 974.4 0 05 6 2019 16:00 42 27.36 25.3 230 974.7 0 05 6 2019 17:00 40 32.85 14.6 245 973.8 0 05 6 2019 18:00 39 27.10 16.3 278 973.4 0 05 6 2019 19:00 38 27.28 24.2 265 972.7 0 05 6 2019 20:00 35 26.70 18.6 254 971 0 05 6 2019 21:00 33 23.55 14.6 289 969.9 0 05 6 2019 22:00 32 30.25 14.6 125 969.2 0 05 6 2019 23:00 31 30.14 13.5 235 968.8 0 06 6 2019 00:00 30 30.56 16.5 262 968.5 0 06 6 2019 01:00 29 27.11 12.8 245 969.5 0 06 6 2019 02:00 28 26.55 12.5 125 970.2 0 06 6 2019 03:00 27 27.71 14.5 147 970.5 0 06 6 2019 04:00 27 27.46 16.3 125 970.6 0 06 6 2019 05:00 26 26.21 10.6 325 970.4 0 06 6 2019 06:00 30 30.14 14.5 356 970 0 06 6 2019 07:00 32 30.57 17.5 245 969.6 0 06 6 2019 08:00 35 30.76 16.3 125 969 0 06 6 2019 09:00 36 30.05 14.1 200 968.8 0 06 6 2019 10:00 38 30.01 16.1 201 969.1 0 06 6 2019 11:00 39 30.11 14.1 202 970.7 0 06 6 2019 12:00 40 26.55 23.2 203 972.2 0 06 6 2019 13:00 41 30.11 18.9 205 973.3 0 06 6 2019 14:00 42 30.76 17.5 206 974.1 0 06 6 2019 15:00 43 31.51 12.9 207 974.6 0 06 6 2019 16:00 44 30.46 14.6 256 973.8 0 06 6 2019 17:00 40 27.38 15.9 208 973.3 0 06 6 2019 18:00 39 26.40 18.7 210 972 0 06 6 2019 19:00 38 25.52 13.6 230 970.8 0 06 6 2019 20:00 36 26.11 12.5 231 970.1 0 06 6 2019 21:00 35 23.50 15.2 232 969.1 0 06 6 2019 22:00 33 22.27 15.2 236 969 0 0
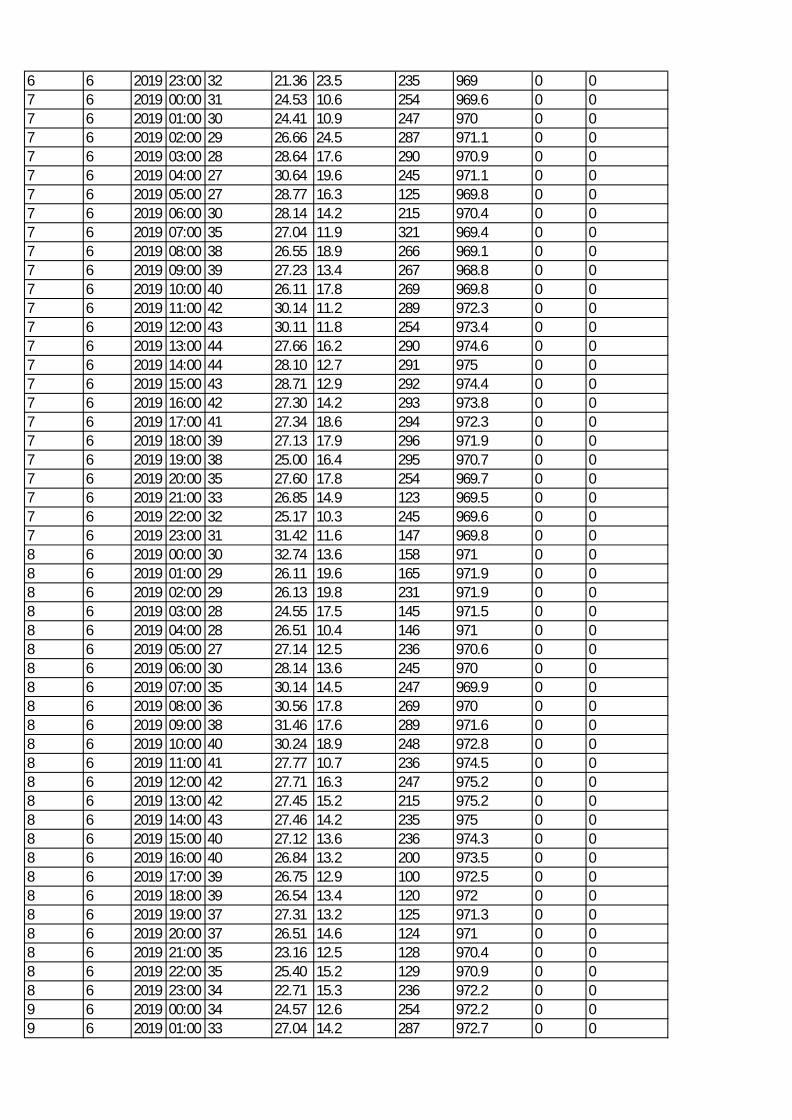
6 6 2019 23:00 32 21.36 23.5 235 969 0 07 6 2019 00:00 31 24.53 10.6 254 969.6 0 07 6 2019 01:00 30 24.41 10.9 247 970 0 07 6 2019 02:00 29 26.66 24.5 287 971.1 0 07 6 2019 03:00 28 28.64 17.6 290 970.9 0 07 6 2019 04:00 27 30.64 19.6 245 971.1 0 07 6 2019 05:00 27 28.77 16.3 125 969.8 0 07 6 2019 06:00 30 28.14 14.2 215 970.4 0 07 6 2019 07:00 35 27.04 11.9 321 969.4 0 07 6 2019 08:00 38 26.55 18.9 266 969.1 0 07 6 2019 09:00 39 27.23 13.4 267 968.8 0 07 6 2019 10:00 40 26.11 17.8 269 969.8 0 07 6 2019 11:00 42 30.14 11.2 289 972.3 0 07 6 2019 12:00 43 30.11 11.8 254 973.4 0 07 6 2019 13:00 44 27.66 16.2 290 974.6 0 07 6 2019 14:00 44 28.10 12.7 291 975 0 07 6 2019 15:00 43 28.71 12.9 292 974.4 0 07 6 2019 16:00 42 27.30 14.2 293 973.8 0 07 6 2019 17:00 41 27.34 18.6 294 972.3 0 07 6 2019 18:00 39 27.13 17.9 296 971.9 0 07 6 2019 19:00 38 25.00 16.4 295 970.7 0 07 6 2019 20:00 35 27.60 17.8 254 969.7 0 07 6 2019 21:00 33 26.85 14.9 123 969.5 0 07 6 2019 22:00 32 25.17 10.3 245 969.6 0 07 6 2019 23:00 31 31.42 11.6 147 969.8 0 08 6 2019 00:00 30 32.74 13.6 158 971 0 08 6 2019 01:00 29 26.11 19.6 165 971.9 0 08 6 2019 02:00 29 26.13 19.8 231 971.9 0 08 6 2019 03:00 28 24.55 17.5 145 971.5 0 08 6 2019 04:00 28 26.51 10.4 146 971 0 08 6 2019 05:00 27 27.14 12.5 236 970.6 0 08 6 2019 06:00 30 28.14 13.6 245 970 0 08 6 2019 07:00 35 30.14 14.5 247 969.9 0 08 6 2019 08:00 36 30.56 17.8 269 970 0 08 6 2019 09:00 38 31.46 17.6 289 971.6 0 08 6 2019 10:00 40 30.24 18.9 248 972.8 0 08 6 2019 11:00 41 27.77 10.7 236 974.5 0 08 6 2019 12:00 42 27.71 16.3 247 975.2 0 08 6 2019 13:00 42 27.45 15.2 215 975.2 0 08 6 2019 14:00 43 27.46 14.2 235 975 0 08 6 2019 15:00 40 27.12 13.6 236 974.3 0 08 6 2019 16:00 40 26.84 13.2 200 973.5 0 08 6 2019 17:00 39 26.75 12.9 100 972.5 0 08 6 2019 18:00 39 26.54 13.4 120 972 0 08 6 2019 19:00 37 27.31 13.2 125 971.3 0 08 6 2019 20:00 37 26.51 14.6 124 971 0 08 6 2019 21:00 35 23.16 12.5 128 970.4 0 08 6 2019 22:00 35 25.40 15.2 129 970.9 0 08 6 2019 23:00 34 22.71 15.3 236 972.2 0 09 6 2019 00:00 34 24.57 12.6 254 972.2 0 09 6 2019 01:00 33 27.04 14.2 287 972.7 0 0
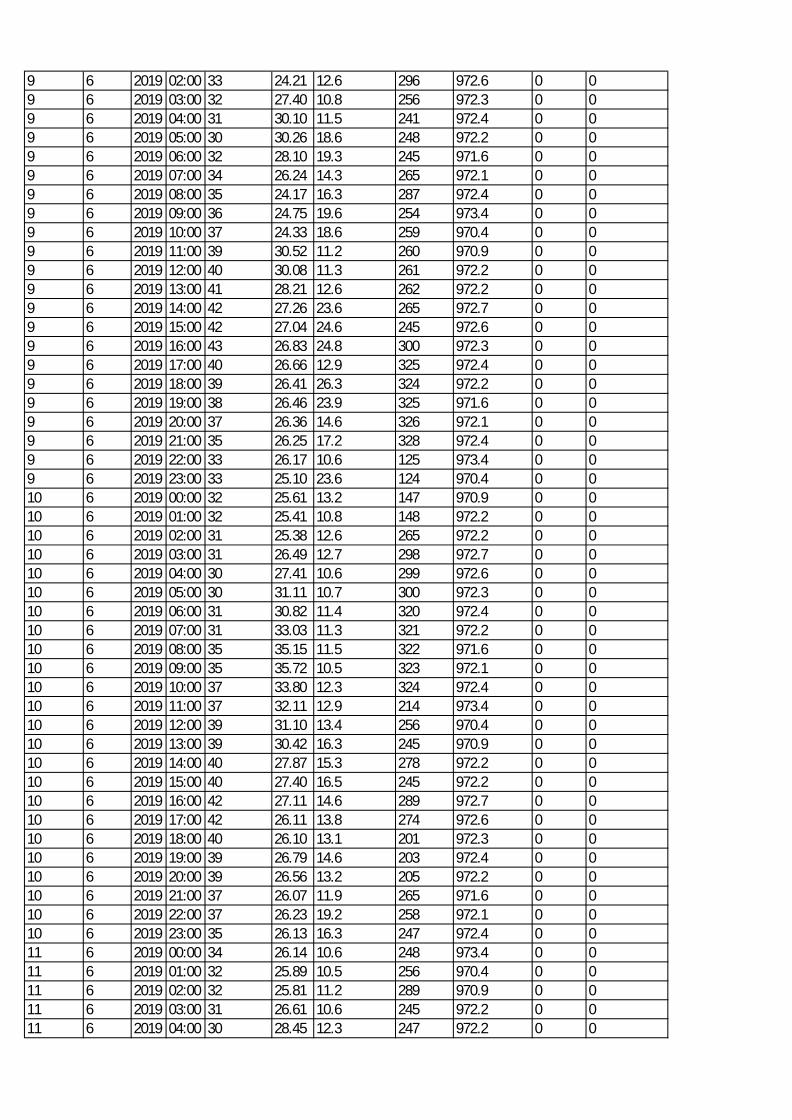
9 6 2019 02:00 33 24.21 12.6 296 972.6 0 09 6 2019 03:00 32 27.40 10.8 256 972.3 0 09 6 2019 04:00 31 30.10 11.5 241 972.4 0 09 6 2019 05:00 30 30.26 18.6 248 972.2 0 09 6 2019 06:00 32 28.10 19.3 245 971.6 0 09 6 2019 07:00 34 26.24 14.3 265 972.1 0 09 6 2019 08:00 35 24.17 16.3 287 972.4 0 09 6 2019 09:00 36 24.75 19.6 254 973.4 0 09 6 2019 10:00 37 24.33 18.6 259 970.4 0 09 6 2019 11:00 39 30.52 11.2 260 970.9 0 09 6 2019 12:00 40 30.08 11.3 261 972.2 0 09 6 2019 13:00 41 28.21 12.6 262 972.2 0 09 6 2019 14:00 42 27.26 23.6 265 972.7 0 09 6 2019 15:00 42 27.04 24.6 245 972.6 0 09 6 2019 16:00 43 26.83 24.8 300 972.3 0 09 6 2019 17:00 40 26.66 12.9 325 972.4 0 09 6 2019 18:00 39 26.41 26.3 324 972.2 0 09 6 2019 19:00 38 26.46 23.9 325 971.6 0 09 6 2019 20:00 37 26.36 14.6 326 972.1 0 09 6 2019 21:00 35 26.25 17.2 328 972.4 0 09 6 2019 22:00 33 26.17 10.6 125 973.4 0 09 6 2019 23:00 33 25.10 23.6 124 970.4 0 010 6 2019 00:00 32 25.61 13.2 147 970.9 0 010 6 2019 01:00 32 25.41 10.8 148 972.2 0 010 6 2019 02:00 31 25.38 12.6 265 972.2 0 010 6 2019 03:00 31 26.49 12.7 298 972.7 0 010 6 2019 04:00 30 27.41 10.6 299 972.6 0 010 6 2019 05:00 30 31.11 10.7 300 972.3 0 010 6 2019 06:00 31 30.82 11.4 320 972.4 0 010 6 2019 07:00 31 33.03 11.3 321 972.2 0 010 6 2019 08:00 35 35.15 11.5 322 971.6 0 010 6 2019 09:00 35 35.72 10.5 323 972.1 0 010 6 2019 10:00 37 33.80 12.3 324 972.4 0 010 6 2019 11:00 37 32.11 12.9 214 973.4 0 010 6 2019 12:00 39 31.10 13.4 256 970.4 0 010 6 2019 13:00 39 30.42 16.3 245 970.9 0 010 6 2019 14:00 40 27.87 15.3 278 972.2 0 010 6 2019 15:00 40 27.40 16.5 245 972.2 0 010 6 2019 16:00 42 27.11 14.6 289 972.7 0 010 6 2019 17:00 42 26.11 13.8 274 972.6 0 010 6 2019 18:00 40 26.10 13.1 201 972.3 0 010 6 2019 19:00 39 26.79 14.6 203 972.4 0 010 6 2019 20:00 39 26.56 13.2 205 972.2 0 010 6 2019 21:00 37 26.07 11.9 265 971.6 0 010 6 2019 22:00 37 26.23 19.2 258 972.1 0 010 6 2019 23:00 35 26.13 16.3 247 972.4 0 011 6 2019 00:00 34 26.14 10.6 248 973.4 0 011 6 2019 01:00 32 25.89 10.5 256 970.4 0 011 6 2019 02:00 32 25.81 11.2 289 970.9 0 011 6 2019 03:00 31 26.61 10.6 245 972.2 0 011 6 2019 04:00 30 28.45 12.3 247 972.2 0 0
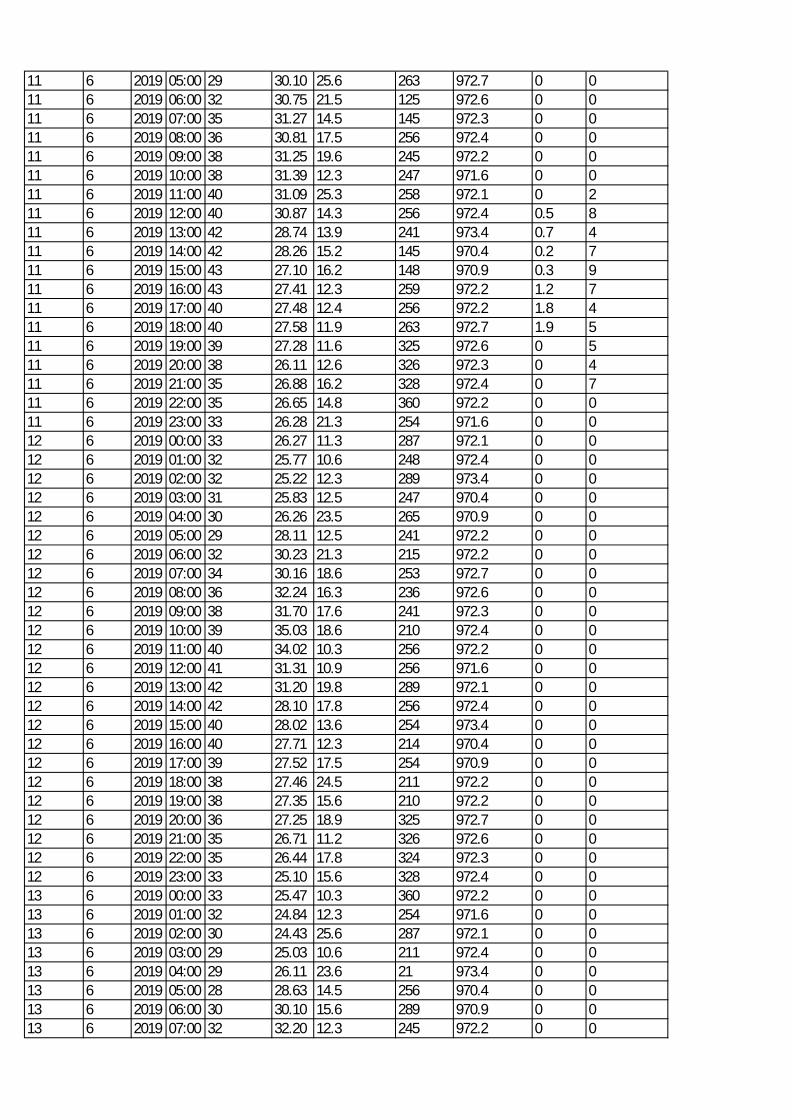
11 6 2019 05:00 29 30.10 25.6 263 972.7 0 011 6 2019 06:00 32 30.75 21.5 125 972.6 0 011 6 2019 07:00 35 31.27 14.5 145 972.3 0 011 6 2019 08:00 36 30.81 17.5 256 972.4 0 011 6 2019 09:00 38 31.25 19.6 245 972.2 0 011 6 2019 10:00 38 31.39 12.3 247 971.6 0 011 6 2019 11:00 40 31.09 25.3 258 972.1 0 211 6 2019 12:00 40 30.87 14.3 256 972.4 0.5 811 6 2019 13:00 42 28.74 13.9 241 973.4 0.7 411 6 2019 14:00 42 28.26 15.2 145 970.4 0.2 711 6 2019 15:00 43 27.10 16.2 148 970.9 0.3 911 6 2019 16:00 43 27.41 12.3 259 972.2 1.2 711 6 2019 17:00 40 27.48 12.4 256 972.2 1.8 411 6 2019 18:00 40 27.58 11.9 263 972.7 1.9 511 6 2019 19:00 39 27.28 11.6 325 972.6 0 511 6 2019 20:00 38 26.11 12.6 326 972.3 0 411 6 2019 21:00 35 26.88 16.2 328 972.4 0 711 6 2019 22:00 35 26.65 14.8 360 972.2 0 011 6 2019 23:00 33 26.28 21.3 254 971.6 0 012 6 2019 00:00 33 26.27 11.3 287 972.1 0 012 6 2019 01:00 32 25.77 10.6 248 972.4 0 012 6 2019 02:00 32 25.22 12.3 289 973.4 0 012 6 2019 03:00 31 25.83 12.5 247 970.4 0 012 6 2019 04:00 30 26.26 23.5 265 970.9 0 012 6 2019 05:00 29 28.11 12.5 241 972.2 0 012 6 2019 06:00 32 30.23 21.3 215 972.2 0 012 6 2019 07:00 34 30.16 18.6 253 972.7 0 012 6 2019 08:00 36 32.24 16.3 236 972.6 0 012 6 2019 09:00 38 31.70 17.6 241 972.3 0 012 6 2019 10:00 39 35.03 18.6 210 972.4 0 012 6 2019 11:00 40 34.02 10.3 256 972.2 0 012 6 2019 12:00 41 31.31 10.9 256 971.6 0 012 6 2019 13:00 42 31.20 19.8 289 972.1 0 012 6 2019 14:00 42 28.10 17.8 256 972.4 0 012 6 2019 15:00 40 28.02 13.6 254 973.4 0 012 6 2019 16:00 40 27.71 12.3 214 970.4 0 012 6 2019 17:00 39 27.52 17.5 254 970.9 0 012 6 2019 18:00 38 27.46 24.5 211 972.2 0 012 6 2019 19:00 38 27.35 15.6 210 972.2 0 012 6 2019 20:00 36 27.25 18.9 325 972.7 0 012 6 2019 21:00 35 26.71 11.2 326 972.6 0 012 6 2019 22:00 35 26.44 17.8 324 972.3 0 012 6 2019 23:00 33 25.10 15.6 328 972.4 0 013 6 2019 00:00 33 25.47 10.3 360 972.2 0 013 6 2019 01:00 32 24.84 12.3 254 971.6 0 013 6 2019 02:00 30 24.43 25.6 287 972.1 0 013 6 2019 03:00 29 25.03 10.6 211 972.4 0 013 6 2019 04:00 29 26.11 23.6 21 973.4 0 013 6 2019 05:00 28 28.63 14.5 256 970.4 0 013 6 2019 06:00 30 30.10 15.6 289 970.9 0 013 6 2019 07:00 32 32.20 12.3 245 972.2 0 0
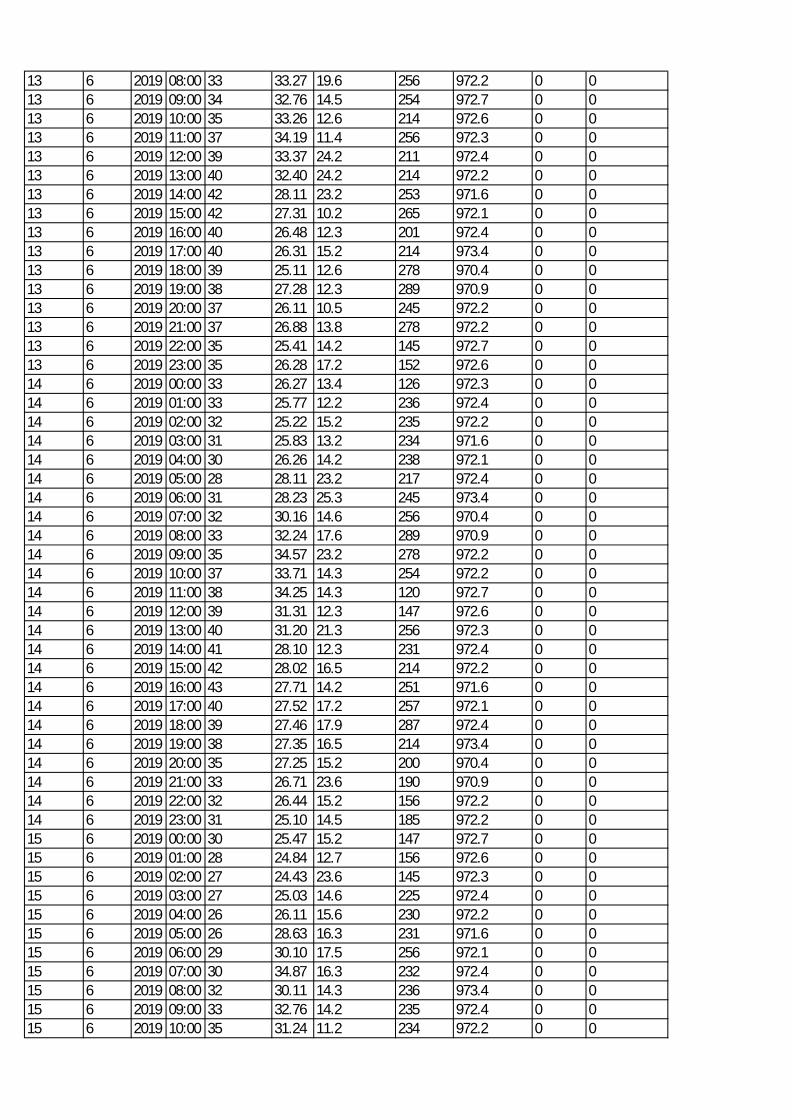
13 6 2019 08:00 33 33.27 19.6 256 972.2 0 013 6 2019 09:00 34 32.76 14.5 254 972.7 0 013 6 2019 10:00 35 33.26 12.6 214 972.6 0 013 6 2019 11:00 37 34.19 11.4 256 972.3 0 013 6 2019 12:00 39 33.37 24.2 211 972.4 0 013 6 2019 13:00 40 32.40 24.2 214 972.2 0 013 6 2019 14:00 42 28.11 23.2 253 971.6 0 013 6 2019 15:00 42 27.31 10.2 265 972.1 0 013 6 2019 16:00 40 26.48 12.3 201 972.4 0 013 6 2019 17:00 40 26.31 15.2 214 973.4 0 013 6 2019 18:00 39 25.11 12.6 278 970.4 0 013 6 2019 19:00 38 27.28 12.3 289 970.9 0 013 6 2019 20:00 37 26.11 10.5 245 972.2 0 013 6 2019 21:00 37 26.88 13.8 278 972.2 0 013 6 2019 22:00 35 25.41 14.2 145 972.7 0 013 6 2019 23:00 35 26.28 17.2 152 972.6 0 014 6 2019 00:00 33 26.27 13.4 126 972.3 0 014 6 2019 01:00 33 25.77 12.2 236 972.4 0 014 6 2019 02:00 32 25.22 15.2 235 972.2 0 014 6 2019 03:00 31 25.83 13.2 234 971.6 0 014 6 2019 04:00 30 26.26 14.2 238 972.1 0 014 6 2019 05:00 28 28.11 23.2 217 972.4 0 014 6 2019 06:00 31 28.23 25.3 245 973.4 0 014 6 2019 07:00 32 30.16 14.6 256 970.4 0 014 6 2019 08:00 33 32.24 17.6 289 970.9 0 014 6 2019 09:00 35 34.57 23.2 278 972.2 0 014 6 2019 10:00 37 33.71 14.3 254 972.2 0 014 6 2019 11:00 38 34.25 14.3 120 972.7 0 014 6 2019 12:00 39 31.31 12.3 147 972.6 0 014 6 2019 13:00 40 31.20 21.3 256 972.3 0 014 6 2019 14:00 41 28.10 12.3 231 972.4 0 014 6 2019 15:00 42 28.02 16.5 214 972.2 0 014 6 2019 16:00 43 27.71 14.2 251 971.6 0 014 6 2019 17:00 40 27.52 17.2 257 972.1 0 014 6 2019 18:00 39 27.46 17.9 287 972.4 0 014 6 2019 19:00 38 27.35 16.5 214 973.4 0 014 6 2019 20:00 35 27.25 15.2 200 970.4 0 014 6 2019 21:00 33 26.71 23.6 190 970.9 0 014 6 2019 22:00 32 26.44 15.2 156 972.2 0 014 6 2019 23:00 31 25.10 14.5 185 972.2 0 015 6 2019 00:00 30 25.47 15.2 147 972.7 0 015 6 2019 01:00 28 24.84 12.7 156 972.6 0 015 6 2019 02:00 27 24.43 23.6 145 972.3 0 015 6 2019 03:00 27 25.03 14.6 225 972.4 0 015 6 2019 04:00 26 26.11 15.6 230 972.2 0 015 6 2019 05:00 26 28.63 16.3 231 971.6 0 015 6 2019 06:00 29 30.10 17.5 256 972.1 0 015 6 2019 07:00 30 34.87 16.3 232 972.4 0 015 6 2019 08:00 32 30.11 14.3 236 973.4 0 015 6 2019 09:00 33 32.76 14.2 235 972.4 0 015 6 2019 10:00 35 31.24 11.2 234 972.2 0 0

15 6 2019 11:00 37 33.21 11.3 214 971.6 0 015 6 2019 12:00 39 30.12 12.3 247 972.1 0 015 6 2019 13:00 40 34.12 14.2 256 972.4 0 015 6 2019 14:00 42 30.24 15.2 247 973.4 0 015 6 2019 15:00 42 27.31 11.9 125 972.2 0 015 6 2019 16:00 40 26.48 22.5 128 971.6 0 0
Appendix 3.2:
Ambient Air quality
Monitoring Results
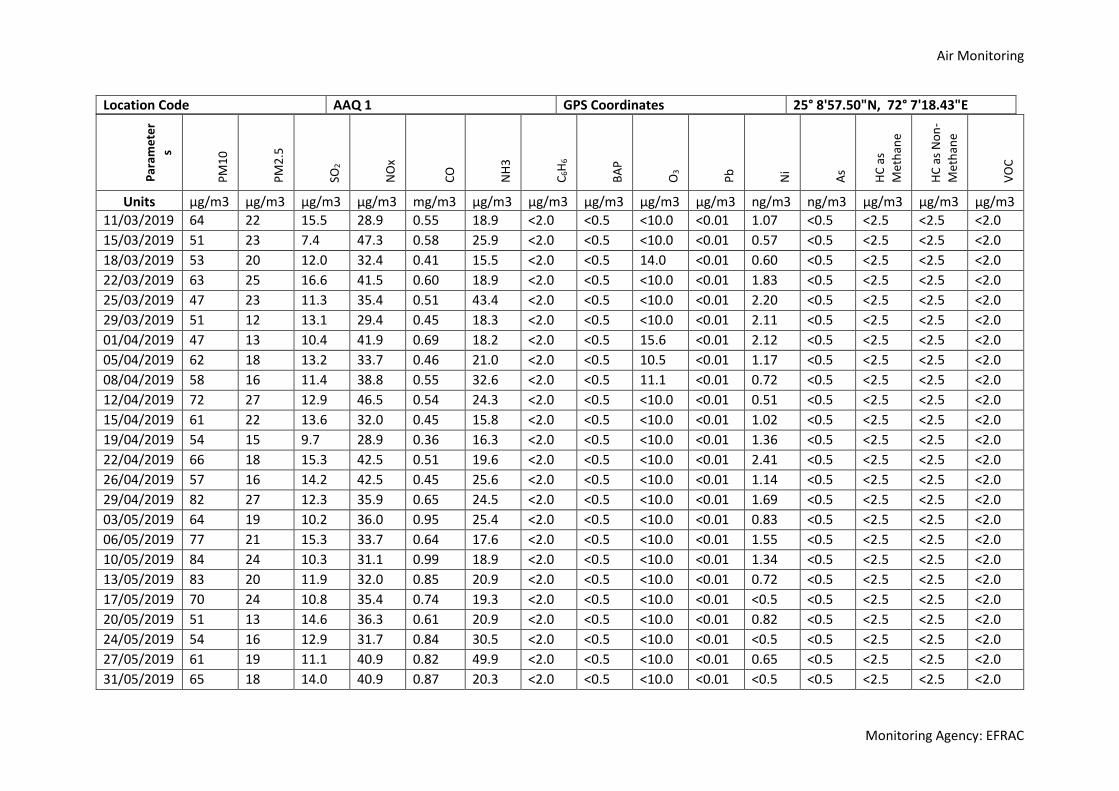
Air Monitoring
Monitoring Agency: EFRAC
Location Code AAQ 1 GPS Coordinates 25° 8'57.50"N, 72° 7'18.43"E
Par
ame
ter
s
PM
10
PM
2.5
SO2
NO
x
CO
NH
3
C6H
6
BA
P
O3
Pb
Ni
As
HC
as
Met
han
e
HC
as
No
n-
Met
han
e
VO
C
Units µg/m3 µg/m3 µg/m3 µg/m3 mg/m3 µg/m3 µg/m3 µg/m3 µg/m3 µg/m3 ng/m3 ng/m3 µg/m3 µg/m3 µg/m3
11/03/2019 64 22 15.5 28.9 0.55 18.9 <2.0 <0.5 <10.0 <0.01 1.07 <0.5 <2.5 <2.5 <2.0
15/03/2019 51 23 7.4 47.3 0.58 25.9 <2.0 <0.5 <10.0 <0.01 0.57 <0.5 <2.5 <2.5 <2.0
18/03/2019 53 20 12.0 32.4 0.41 15.5 <2.0 <0.5 14.0 <0.01 0.60 <0.5 <2.5 <2.5 <2.0
22/03/2019 63 25 16.6 41.5 0.60 18.9 <2.0 <0.5 <10.0 <0.01 1.83 <0.5 <2.5 <2.5 <2.0
25/03/2019 47 23 11.3 35.4 0.51 43.4 <2.0 <0.5 <10.0 <0.01 2.20 <0.5 <2.5 <2.5 <2.0
29/03/2019 51 12 13.1 29.4 0.45 18.3 <2.0 <0.5 <10.0 <0.01 2.11 <0.5 <2.5 <2.5 <2.0
01/04/2019 47 13 10.4 41.9 0.69 18.2 <2.0 <0.5 15.6 <0.01 2.12 <0.5 <2.5 <2.5 <2.0
05/04/2019 62 18 13.2 33.7 0.46 21.0 <2.0 <0.5 10.5 <0.01 1.17 <0.5 <2.5 <2.5 <2.0
08/04/2019 58 16 11.4 38.8 0.55 32.6 <2.0 <0.5 11.1 <0.01 0.72 <0.5 <2.5 <2.5 <2.0
12/04/2019 72 27 12.9 46.5 0.54 24.3 <2.0 <0.5 <10.0 <0.01 0.51 <0.5 <2.5 <2.5 <2.0
15/04/2019 61 22 13.6 32.0 0.45 15.8 <2.0 <0.5 <10.0 <0.01 1.02 <0.5 <2.5 <2.5 <2.0
19/04/2019 54 15 9.7 28.9 0.36 16.3 <2.0 <0.5 <10.0 <0.01 1.36 <0.5 <2.5 <2.5 <2.0
22/04/2019 66 18 15.3 42.5 0.51 19.6 <2.0 <0.5 <10.0 <0.01 2.41 <0.5 <2.5 <2.5 <2.0
26/04/2019 57 16 14.2 42.5 0.45 25.6 <2.0 <0.5 <10.0 <0.01 1.14 <0.5 <2.5 <2.5 <2.0
29/04/2019 82 27 12.3 35.9 0.65 24.5 <2.0 <0.5 <10.0 <0.01 1.69 <0.5 <2.5 <2.5 <2.0
03/05/2019 64 19 10.2 36.0 0.95 25.4 <2.0 <0.5 <10.0 <0.01 0.83 <0.5 <2.5 <2.5 <2.0
06/05/2019 77 21 15.3 33.7 0.64 17.6 <2.0 <0.5 <10.0 <0.01 1.55 <0.5 <2.5 <2.5 <2.0
10/05/2019 84 24 10.3 31.1 0.99 18.9 <2.0 <0.5 <10.0 <0.01 1.34 <0.5 <2.5 <2.5 <2.0
13/05/2019 83 20 11.9 32.0 0.85 20.9 <2.0 <0.5 <10.0 <0.01 0.72 <0.5 <2.5 <2.5 <2.0
17/05/2019 70 24 10.8 35.4 0.74 19.3 <2.0 <0.5 <10.0 <0.01 <0.5 <0.5 <2.5 <2.5 <2.0
20/05/2019 51 13 14.6 36.3 0.61 20.9 <2.0 <0.5 <10.0 <0.01 0.82 <0.5 <2.5 <2.5 <2.0
24/05/2019 54 16 12.9 31.7 0.84 30.5 <2.0 <0.5 <10.0 <0.01 <0.5 <0.5 <2.5 <2.5 <2.0
27/05/2019 61 19 11.1 40.9 0.82 49.9 <2.0 <0.5 <10.0 <0.01 0.65 <0.5 <2.5 <2.5 <2.0
31/05/2019 65 18 14.0 40.9 0.87 20.3 <2.0 <0.5 <10.0 <0.01 <0.5 <0.5 <2.5 <2.5 <2.0

Air Monitoring
Monitoring Agency: EFRAC
Location Code AAQ 2 GPS Coordinates 25°10'7.81"N, 71°54'23.02"E
Par
ame
ters
PM
10
PM
2.5
SO2
NO
x
CO
NH
3
C6H
6
BA
P
O3
Pb
Ni
As
HC
as
Met
han
e
HC
as
No
n-
Met
han
e
VO
C
Units µg/m3 µg/m3 µg/m3 µg/m3 mg/m3 µg/m3 µg/m3 µg/m3 µg/m3 µg/m3 ng/m3 ng/m3 µg/m3 µg/m3 µg/m3
11/03/2019 85 22 12.3 34.0 0.42 20.9 <2.0 <0.5 <10.0 <0.01 <0.5 <0.5 <2.5 <2.5 <2.0
15/03/2019 74 19 12.7 36.3 0.62 13.5 <2.0 <0.5 <10.0 <0.01 0.70 <0.5 <2.5 <2.5 <2.0
18/03/2019 81 23 11.9 37.9 0.57 17.0 <2.0 <0.5 16.4 <0.01 0.52 <0.5 <2.5 <2.5 <2.0
22/03/2019 57 18 14.9 48.1 0.68 31.9 <2.0 <0.5 <10.0 <0.01 1.90 <0.5 <2.5 <2.5 <2.0
25/03/2019 53 14 13.7 37.5 0.63 20.5 <2.0 <0.5 <10.0 <0.01 0.76 <0.5 <2.5 <2.5 <2.0
29/03/2019 65 18 15.1 53.8 0.73 39.7 <2.0 <0.5 15.4 <0.01 1.05 0.5 <2.5 <2.5 <2.0
01/04/2019 49 15 15.8 38.2 0.47 14.2 <2.0 <0.5 <10.0 <0.01 1.64 <0.5 <2.5 <2.5 <2.0
05/04/2019 46 13 9.3 49.3 0.88 13.2 <2.0 <0.5 <10.0 <0.01 1.24 <0.5 <2.5 <2.5 <2.0
08/04/2019 53 18 8.6 42.1 0.56 13.0 <2.0 <0.5 <10.0 <0.01 0.85 <0.5 <2.5 <2.5 <2.0
12/04/2019 66 20 11.2 42.3 0.59 26.5 <2.0 <0.5 <10.0 <0.01 1.64 0.95 <2.5 <2.5 <2.0
15/04/2019 61 16 15.7 21.1 0.36 24.3 <2.0 <0.5 <10.0 <0.01 0.83 <0.5 <2.5 <2.5 <2.0
19/04/2019 63 27 8.7 39.8 0.56 18.0 <2.0 <0.5 <10.0 <0.01 1.05 <0.5 <2.5 <2.5 <2.0
22/04/2019 57 19 5.3 47.3 0.79 24.3 <2.0 <0.5 <10.0 <0.01 0.63 <0.5 <2.5 <2.5 <2.0
26/04/2019 66 21 8.2 41.5 0.89 20.3 <2.0 <0.5 <10.0 <0.01 0.84 <0.5 <2.5 <2.5 <2.0
29/04/2019 78 27 12.4 41.5 1.98 19.6 <2.0 <0.5 <10.0 <0.01 2.12 <0.5 <2.5 <2.5 <2.0
03/05/2019 72 25 14.2 32.2 0.66 21.5 <2.0 <0.5 <10.0 <0.01 1.80 <0.5 <2.5 <2.5 <2.0
06/05/2019 63 18 14.2 44.0 0.58 19.6 <2.0 <0.5 <10.0 <0.01 1.49 <0.5 <2.5 <2.5 <2.0
10/05/2019 57 19 15.3 35.5 0.8 23.6 <2.0 <0.5 <10.0 <0.01 0.55 <0.5 <2.5 <2.5 <2.0
13/05/2019 53 19 14.2 26.8 1.25 18.6 <2.0 <0.5 <10.0 <0.01 1.27 <0.5 <2.5 <2.5 <2.0
17/05/2019 58 12 12.1 31.7 0.98 24.3 <2.0 <0.5 <10.0 <0.01 0.8 <0.5 <2.5 <2.5 <2.0
20/05/2019 51 20 12.8 32.4 0.54 21.3 <2.0 <0.5 <10.0 <0.01 0.75 <0.5 <2.5 <2.5 <2.0
24/05/2019 63 17 13.3 33.7 0.77 22.7 <2.0 <0.5 <10.0 <0.01 0.58 <0.5 <2.5 <2.5 <2.0
27/05/2019 84 22 13.5 29.8 0.43 31.4 <2.0 <0.5 <10.0 <0.01 <0.5 <0.5 <2.5 <2.5 <2.0
31/05/2019 56 17 14.6 39.3 0.61 49.5 <2.0 <0.5 <10.0 <0.01 0.59 <0.5 <2.5 <2.5 <2.0
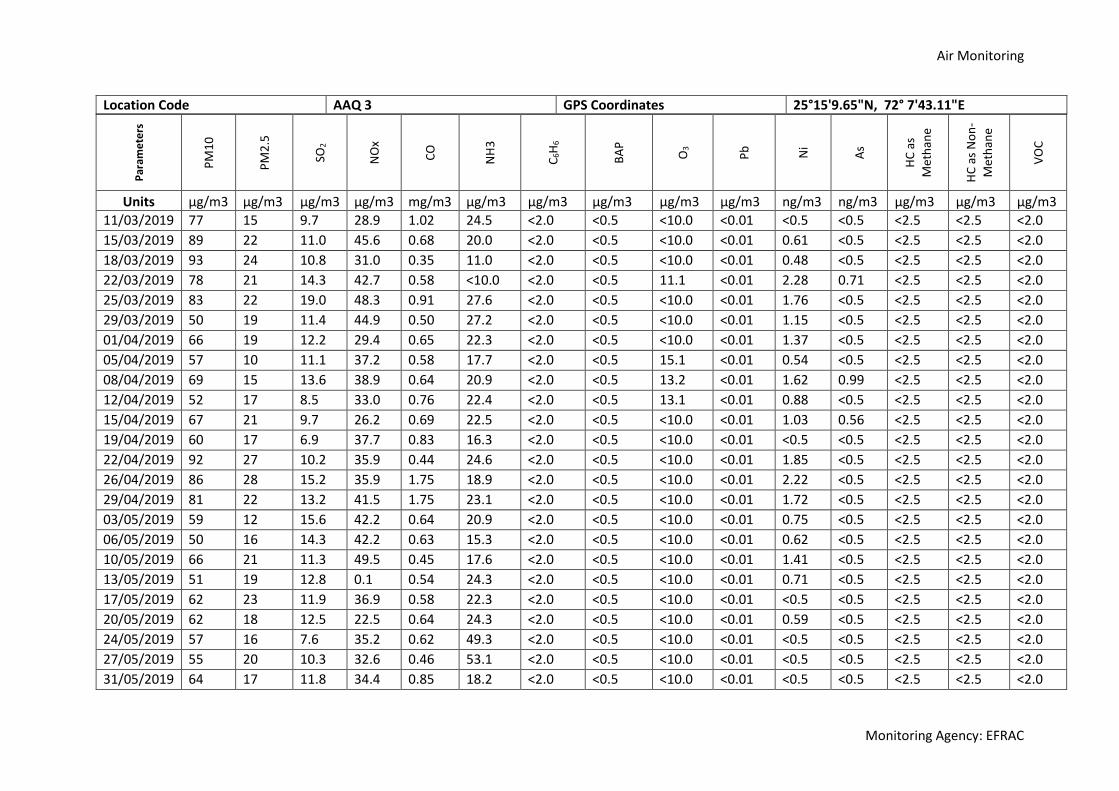
Air Monitoring
Monitoring Agency: EFRAC
Location Code AAQ 3 GPS Coordinates 25°15'9.65"N, 72° 7'43.11"E
Par
ame
ters
PM
10
PM
2.5
SO2
NO
x
CO
NH
3
C6H
6
BA
P
O3
Pb
Ni
As
HC
as
Met
han
e
HC
as
No
n-
Met
han
e
VO
C
Units µg/m3 µg/m3 µg/m3 µg/m3 mg/m3 µg/m3 µg/m3 µg/m3 µg/m3 µg/m3 ng/m3 ng/m3 µg/m3 µg/m3 µg/m3
11/03/2019 77 15 9.7 28.9 1.02 24.5 <2.0 <0.5 <10.0 <0.01 <0.5 <0.5 <2.5 <2.5 <2.0
15/03/2019 89 22 11.0 45.6 0.68 20.0 <2.0 <0.5 <10.0 <0.01 0.61 <0.5 <2.5 <2.5 <2.0
18/03/2019 93 24 10.8 31.0 0.35 11.0 <2.0 <0.5 <10.0 <0.01 0.48 <0.5 <2.5 <2.5 <2.0
22/03/2019 78 21 14.3 42.7 0.58 <10.0 <2.0 <0.5 11.1 <0.01 2.28 0.71 <2.5 <2.5 <2.0
25/03/2019 83 22 19.0 48.3 0.91 27.6 <2.0 <0.5 <10.0 <0.01 1.76 <0.5 <2.5 <2.5 <2.0
29/03/2019 50 19 11.4 44.9 0.50 27.2 <2.0 <0.5 <10.0 <0.01 1.15 <0.5 <2.5 <2.5 <2.0
01/04/2019 66 19 12.2 29.4 0.65 22.3 <2.0 <0.5 <10.0 <0.01 1.37 <0.5 <2.5 <2.5 <2.0
05/04/2019 57 10 11.1 37.2 0.58 17.7 <2.0 <0.5 15.1 <0.01 0.54 <0.5 <2.5 <2.5 <2.0
08/04/2019 69 15 13.6 38.9 0.64 20.9 <2.0 <0.5 13.2 <0.01 1.62 0.99 <2.5 <2.5 <2.0
12/04/2019 52 17 8.5 33.0 0.76 22.4 <2.0 <0.5 13.1 <0.01 0.88 <0.5 <2.5 <2.5 <2.0
15/04/2019 67 21 9.7 26.2 0.69 22.5 <2.0 <0.5 <10.0 <0.01 1.03 0.56 <2.5 <2.5 <2.0
19/04/2019 60 17 6.9 37.7 0.83 16.3 <2.0 <0.5 <10.0 <0.01 <0.5 <0.5 <2.5 <2.5 <2.0
22/04/2019 92 27 10.2 35.9 0.44 24.6 <2.0 <0.5 <10.0 <0.01 1.85 <0.5 <2.5 <2.5 <2.0
26/04/2019 86 28 15.2 35.9 1.75 18.9 <2.0 <0.5 <10.0 <0.01 2.22 <0.5 <2.5 <2.5 <2.0
29/04/2019 81 22 13.2 41.5 1.75 23.1 <2.0 <0.5 <10.0 <0.01 1.72 <0.5 <2.5 <2.5 <2.0
03/05/2019 59 12 15.6 42.2 0.64 20.9 <2.0 <0.5 <10.0 <0.01 0.75 <0.5 <2.5 <2.5 <2.0
06/05/2019 50 16 14.3 42.2 0.63 15.3 <2.0 <0.5 <10.0 <0.01 0.62 <0.5 <2.5 <2.5 <2.0
10/05/2019 66 21 11.3 49.5 0.45 17.6 <2.0 <0.5 <10.0 <0.01 1.41 <0.5 <2.5 <2.5 <2.0
13/05/2019 51 19 12.8 0.1 0.54 24.3 <2.0 <0.5 <10.0 <0.01 0.71 <0.5 <2.5 <2.5 <2.0
17/05/2019 62 23 11.9 36.9 0.58 22.3 <2.0 <0.5 <10.0 <0.01 <0.5 <0.5 <2.5 <2.5 <2.0
20/05/2019 62 18 12.5 22.5 0.64 24.3 <2.0 <0.5 <10.0 <0.01 0.59 <0.5 <2.5 <2.5 <2.0
24/05/2019 57 16 7.6 35.2 0.62 49.3 <2.0 <0.5 <10.0 <0.01 <0.5 <0.5 <2.5 <2.5 <2.0
27/05/2019 55 20 10.3 32.6 0.46 53.1 <2.0 <0.5 <10.0 <0.01 <0.5 <0.5 <2.5 <2.5 <2.0
31/05/2019 64 17 11.8 34.4 0.85 18.2 <2.0 <0.5 <10.0 <0.01 <0.5 <0.5 <2.5 <2.5 <2.0
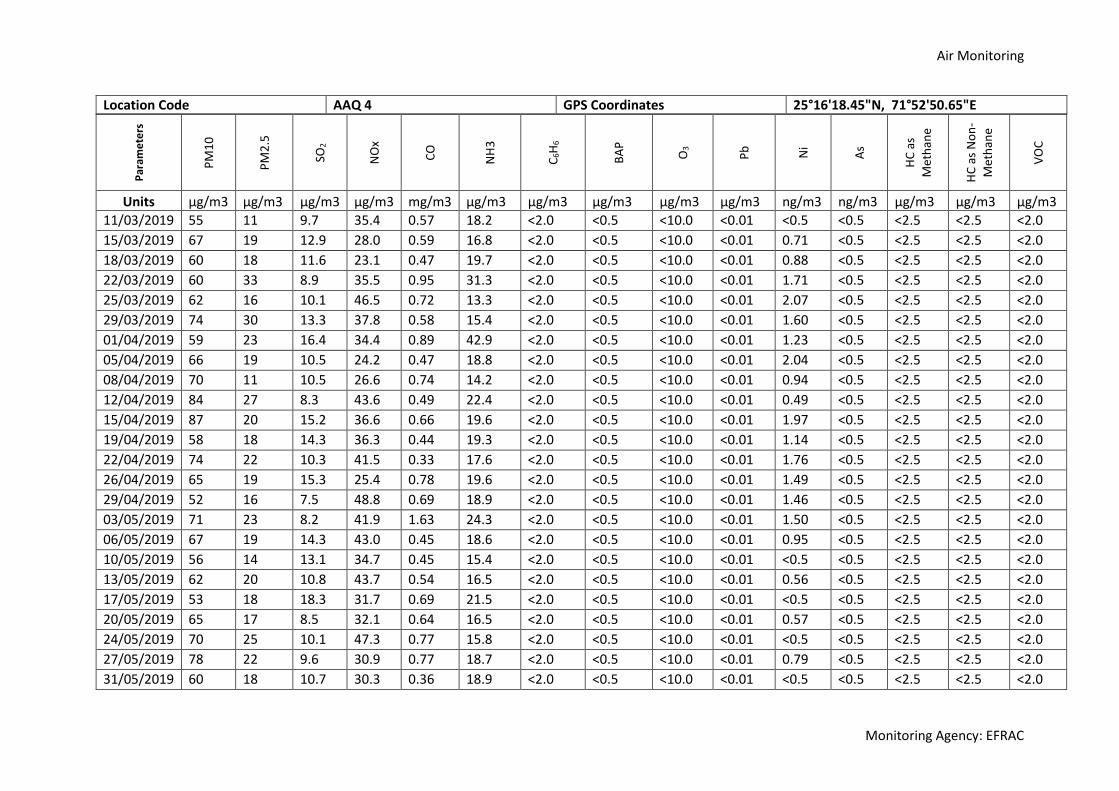
Air Monitoring
Monitoring Agency: EFRAC
Location Code AAQ 4 GPS Coordinates 25°16'18.45"N, 71°52'50.65"E
Par
ame
ters
PM
10
PM
2.5
SO2
NO
x
CO
NH
3
C6H
6
BA
P
O3
Pb
Ni
As
HC
as
Met
han
e
HC
as
No
n-
Met
han
e
VO
C
Units µg/m3 µg/m3 µg/m3 µg/m3 mg/m3 µg/m3 µg/m3 µg/m3 µg/m3 µg/m3 ng/m3 ng/m3 µg/m3 µg/m3 µg/m3
11/03/2019 55 11 9.7 35.4 0.57 18.2 <2.0 <0.5 <10.0 <0.01 <0.5 <0.5 <2.5 <2.5 <2.0
15/03/2019 67 19 12.9 28.0 0.59 16.8 <2.0 <0.5 <10.0 <0.01 0.71 <0.5 <2.5 <2.5 <2.0
18/03/2019 60 18 11.6 23.1 0.47 19.7 <2.0 <0.5 <10.0 <0.01 0.88 <0.5 <2.5 <2.5 <2.0
22/03/2019 60 33 8.9 35.5 0.95 31.3 <2.0 <0.5 <10.0 <0.01 1.71 <0.5 <2.5 <2.5 <2.0
25/03/2019 62 16 10.1 46.5 0.72 13.3 <2.0 <0.5 <10.0 <0.01 2.07 <0.5 <2.5 <2.5 <2.0
29/03/2019 74 30 13.3 37.8 0.58 15.4 <2.0 <0.5 <10.0 <0.01 1.60 <0.5 <2.5 <2.5 <2.0
01/04/2019 59 23 16.4 34.4 0.89 42.9 <2.0 <0.5 <10.0 <0.01 1.23 <0.5 <2.5 <2.5 <2.0
05/04/2019 66 19 10.5 24.2 0.47 18.8 <2.0 <0.5 <10.0 <0.01 2.04 <0.5 <2.5 <2.5 <2.0
08/04/2019 70 11 10.5 26.6 0.74 14.2 <2.0 <0.5 <10.0 <0.01 0.94 <0.5 <2.5 <2.5 <2.0
12/04/2019 84 27 8.3 43.6 0.49 22.4 <2.0 <0.5 <10.0 <0.01 0.49 <0.5 <2.5 <2.5 <2.0
15/04/2019 87 20 15.2 36.6 0.66 19.6 <2.0 <0.5 <10.0 <0.01 1.97 <0.5 <2.5 <2.5 <2.0
19/04/2019 58 18 14.3 36.3 0.44 19.3 <2.0 <0.5 <10.0 <0.01 1.14 <0.5 <2.5 <2.5 <2.0
22/04/2019 74 22 10.3 41.5 0.33 17.6 <2.0 <0.5 <10.0 <0.01 1.76 <0.5 <2.5 <2.5 <2.0
26/04/2019 65 19 15.3 25.4 0.78 19.6 <2.0 <0.5 <10.0 <0.01 1.49 <0.5 <2.5 <2.5 <2.0
29/04/2019 52 16 7.5 48.8 0.69 18.9 <2.0 <0.5 <10.0 <0.01 1.46 <0.5 <2.5 <2.5 <2.0
03/05/2019 71 23 8.2 41.9 1.63 24.3 <2.0 <0.5 <10.0 <0.01 1.50 <0.5 <2.5 <2.5 <2.0
06/05/2019 67 19 14.3 43.0 0.45 18.6 <2.0 <0.5 <10.0 <0.01 0.95 <0.5 <2.5 <2.5 <2.0
10/05/2019 56 14 13.1 34.7 0.45 15.4 <2.0 <0.5 <10.0 <0.01 <0.5 <0.5 <2.5 <2.5 <2.0
13/05/2019 62 20 10.8 43.7 0.54 16.5 <2.0 <0.5 <10.0 <0.01 0.56 <0.5 <2.5 <2.5 <2.0
17/05/2019 53 18 18.3 31.7 0.69 21.5 <2.0 <0.5 <10.0 <0.01 <0.5 <0.5 <2.5 <2.5 <2.0
20/05/2019 65 17 8.5 32.1 0.64 16.5 <2.0 <0.5 <10.0 <0.01 0.57 <0.5 <2.5 <2.5 <2.0
24/05/2019 70 25 10.1 47.3 0.77 15.8 <2.0 <0.5 <10.0 <0.01 <0.5 <0.5 <2.5 <2.5 <2.0
27/05/2019 78 22 9.6 30.9 0.77 18.7 <2.0 <0.5 <10.0 <0.01 0.79 <0.5 <2.5 <2.5 <2.0
31/05/2019 60 18 10.7 30.3 0.36 18.9 <2.0 <0.5 <10.0 <0.01 <0.5 <0.5 <2.5 <2.5 <2.0
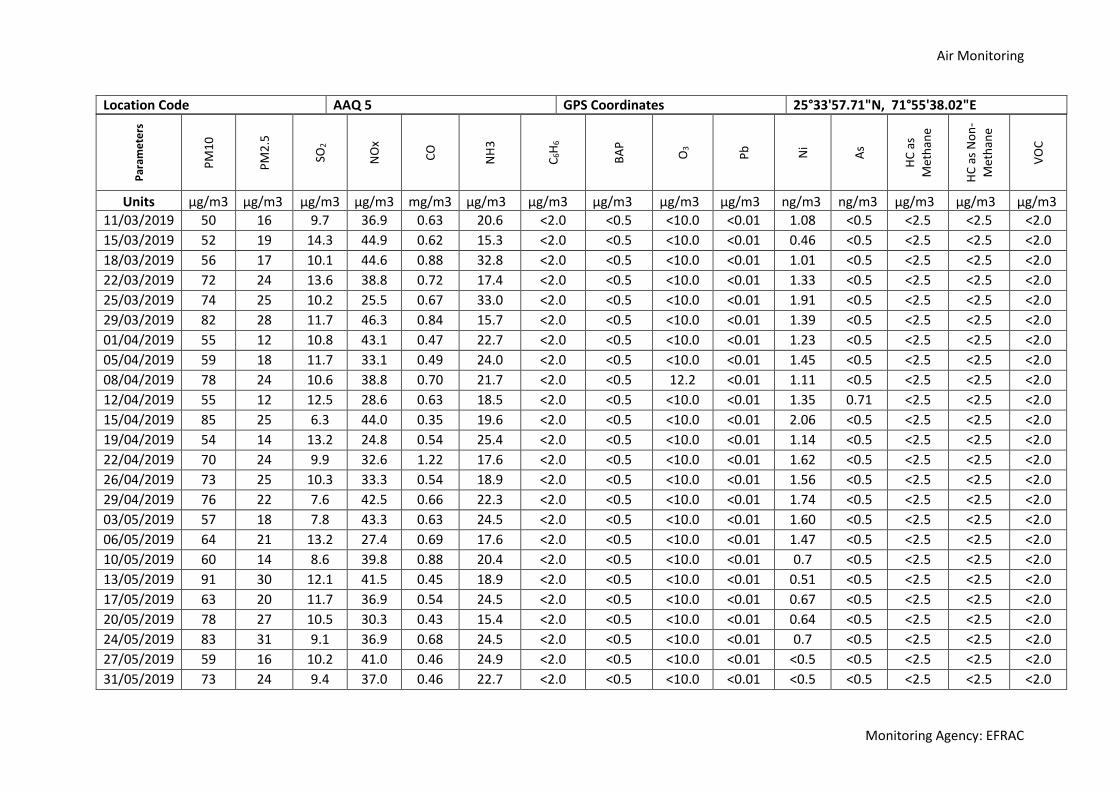
Air Monitoring
Monitoring Agency: EFRAC
Location Code AAQ 5 GPS Coordinates 25°33'57.71"N, 71°55'38.02"E
Par
ame
ters
PM
10
PM
2.5
SO2
NO
x
CO
NH
3
C6H
6
BA
P
O3
Pb
Ni
As
HC
as
Met
han
e
HC
as
No
n-
Met
han
e
VO
C
Units µg/m3 µg/m3 µg/m3 µg/m3 mg/m3 µg/m3 µg/m3 µg/m3 µg/m3 µg/m3 ng/m3 ng/m3 µg/m3 µg/m3 µg/m3
11/03/2019 50 16 9.7 36.9 0.63 20.6 <2.0 <0.5 <10.0 <0.01 1.08 <0.5 <2.5 <2.5 <2.0
15/03/2019 52 19 14.3 44.9 0.62 15.3 <2.0 <0.5 <10.0 <0.01 0.46 <0.5 <2.5 <2.5 <2.0
18/03/2019 56 17 10.1 44.6 0.88 32.8 <2.0 <0.5 <10.0 <0.01 1.01 <0.5 <2.5 <2.5 <2.0
22/03/2019 72 24 13.6 38.8 0.72 17.4 <2.0 <0.5 <10.0 <0.01 1.33 <0.5 <2.5 <2.5 <2.0
25/03/2019 74 25 10.2 25.5 0.67 33.0 <2.0 <0.5 <10.0 <0.01 1.91 <0.5 <2.5 <2.5 <2.0
29/03/2019 82 28 11.7 46.3 0.84 15.7 <2.0 <0.5 <10.0 <0.01 1.39 <0.5 <2.5 <2.5 <2.0
01/04/2019 55 12 10.8 43.1 0.47 22.7 <2.0 <0.5 <10.0 <0.01 1.23 <0.5 <2.5 <2.5 <2.0
05/04/2019 59 18 11.7 33.1 0.49 24.0 <2.0 <0.5 <10.0 <0.01 1.45 <0.5 <2.5 <2.5 <2.0
08/04/2019 78 24 10.6 38.8 0.70 21.7 <2.0 <0.5 12.2 <0.01 1.11 <0.5 <2.5 <2.5 <2.0
12/04/2019 55 12 12.5 28.6 0.63 18.5 <2.0 <0.5 <10.0 <0.01 1.35 0.71 <2.5 <2.5 <2.0
15/04/2019 85 25 6.3 44.0 0.35 19.6 <2.0 <0.5 <10.0 <0.01 2.06 <0.5 <2.5 <2.5 <2.0
19/04/2019 54 14 13.2 24.8 0.54 25.4 <2.0 <0.5 <10.0 <0.01 1.14 <0.5 <2.5 <2.5 <2.0
22/04/2019 70 24 9.9 32.6 1.22 17.6 <2.0 <0.5 <10.0 <0.01 1.62 <0.5 <2.5 <2.5 <2.0
26/04/2019 73 25 10.3 33.3 0.54 18.9 <2.0 <0.5 <10.0 <0.01 1.56 <0.5 <2.5 <2.5 <2.0
29/04/2019 76 22 7.6 42.5 0.66 22.3 <2.0 <0.5 <10.0 <0.01 1.74 <0.5 <2.5 <2.5 <2.0
03/05/2019 57 18 7.8 43.3 0.63 24.5 <2.0 <0.5 <10.0 <0.01 1.60 <0.5 <2.5 <2.5 <2.0
06/05/2019 64 21 13.2 27.4 0.69 17.6 <2.0 <0.5 <10.0 <0.01 1.47 <0.5 <2.5 <2.5 <2.0
10/05/2019 60 14 8.6 39.8 0.88 20.4 <2.0 <0.5 <10.0 <0.01 0.7 <0.5 <2.5 <2.5 <2.0
13/05/2019 91 30 12.1 41.5 0.45 18.9 <2.0 <0.5 <10.0 <0.01 0.51 <0.5 <2.5 <2.5 <2.0
17/05/2019 63 20 11.7 36.9 0.54 24.5 <2.0 <0.5 <10.0 <0.01 0.67 <0.5 <2.5 <2.5 <2.0
20/05/2019 78 27 10.5 30.3 0.43 15.4 <2.0 <0.5 <10.0 <0.01 0.64 <0.5 <2.5 <2.5 <2.0
24/05/2019 83 31 9.1 36.9 0.68 24.5 <2.0 <0.5 <10.0 <0.01 0.7 <0.5 <2.5 <2.5 <2.0
27/05/2019 59 16 10.2 41.0 0.46 24.9 <2.0 <0.5 <10.0 <0.01 <0.5 <0.5 <2.5 <2.5 <2.0
31/05/2019 73 24 9.4 37.0 0.46 22.7 <2.0 <0.5 <10.0 <0.01 <0.5 <0.5 <2.5 <2.5 <2.0
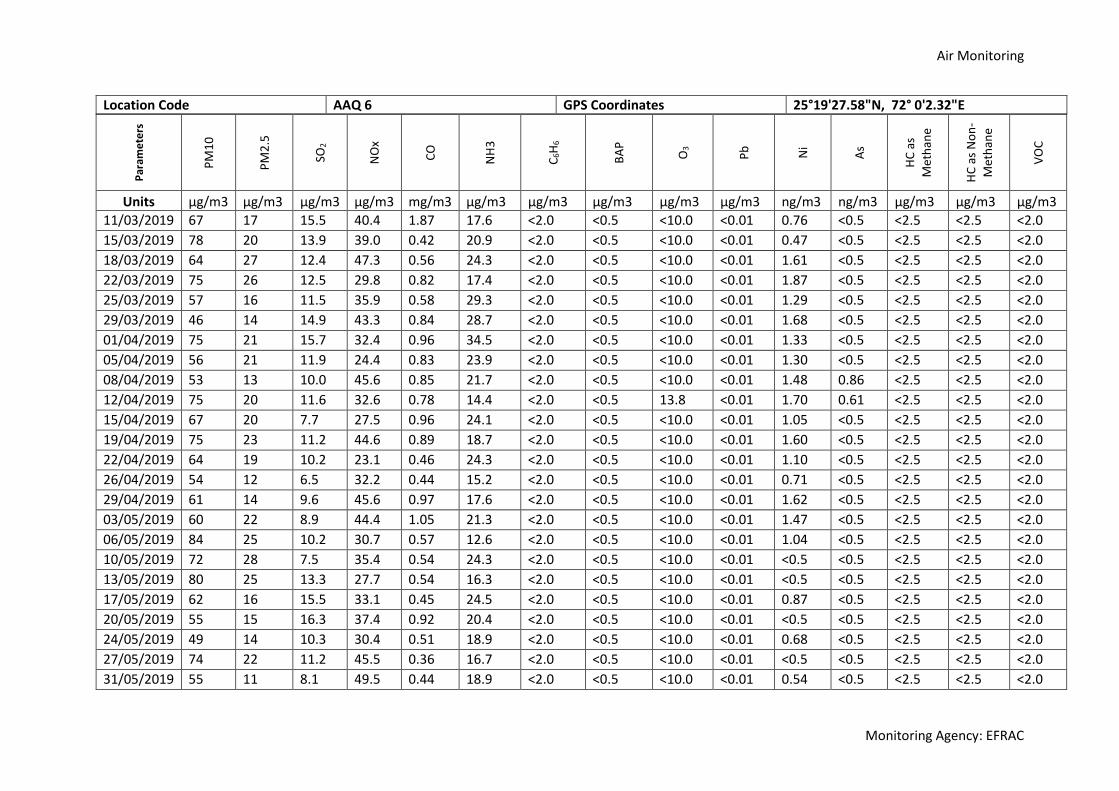
Air Monitoring
Monitoring Agency: EFRAC
Location Code AAQ 6 GPS Coordinates 25°19'27.58"N, 72° 0'2.32"E
Par
ame
ters
PM
10
PM
2.5
SO2
NO
x
CO
NH
3
C6H
6
BA
P
O3
Pb
Ni
As
HC
as
Met
han
e
HC
as
No
n-
Met
han
e
VO
C
Units µg/m3 µg/m3 µg/m3 µg/m3 mg/m3 µg/m3 µg/m3 µg/m3 µg/m3 µg/m3 ng/m3 ng/m3 µg/m3 µg/m3 µg/m3
11/03/2019 67 17 15.5 40.4 1.87 17.6 <2.0 <0.5 <10.0 <0.01 0.76 <0.5 <2.5 <2.5 <2.0
15/03/2019 78 20 13.9 39.0 0.42 20.9 <2.0 <0.5 <10.0 <0.01 0.47 <0.5 <2.5 <2.5 <2.0
18/03/2019 64 27 12.4 47.3 0.56 24.3 <2.0 <0.5 <10.0 <0.01 1.61 <0.5 <2.5 <2.5 <2.0
22/03/2019 75 26 12.5 29.8 0.82 17.4 <2.0 <0.5 <10.0 <0.01 1.87 <0.5 <2.5 <2.5 <2.0
25/03/2019 57 16 11.5 35.9 0.58 29.3 <2.0 <0.5 <10.0 <0.01 1.29 <0.5 <2.5 <2.5 <2.0
29/03/2019 46 14 14.9 43.3 0.84 28.7 <2.0 <0.5 <10.0 <0.01 1.68 <0.5 <2.5 <2.5 <2.0
01/04/2019 75 21 15.7 32.4 0.96 34.5 <2.0 <0.5 <10.0 <0.01 1.33 <0.5 <2.5 <2.5 <2.0
05/04/2019 56 21 11.9 24.4 0.83 23.9 <2.0 <0.5 <10.0 <0.01 1.30 <0.5 <2.5 <2.5 <2.0
08/04/2019 53 13 10.0 45.6 0.85 21.7 <2.0 <0.5 <10.0 <0.01 1.48 0.86 <2.5 <2.5 <2.0
12/04/2019 75 20 11.6 32.6 0.78 14.4 <2.0 <0.5 13.8 <0.01 1.70 0.61 <2.5 <2.5 <2.0
15/04/2019 67 20 7.7 27.5 0.96 24.1 <2.0 <0.5 <10.0 <0.01 1.05 <0.5 <2.5 <2.5 <2.0
19/04/2019 75 23 11.2 44.6 0.89 18.7 <2.0 <0.5 <10.0 <0.01 1.60 <0.5 <2.5 <2.5 <2.0
22/04/2019 64 19 10.2 23.1 0.46 24.3 <2.0 <0.5 <10.0 <0.01 1.10 <0.5 <2.5 <2.5 <2.0
26/04/2019 54 12 6.5 32.2 0.44 15.2 <2.0 <0.5 <10.0 <0.01 0.71 <0.5 <2.5 <2.5 <2.0
29/04/2019 61 14 9.6 45.6 0.97 17.6 <2.0 <0.5 <10.0 <0.01 1.62 <0.5 <2.5 <2.5 <2.0
03/05/2019 60 22 8.9 44.4 1.05 21.3 <2.0 <0.5 <10.0 <0.01 1.47 <0.5 <2.5 <2.5 <2.0
06/05/2019 84 25 10.2 30.7 0.57 12.6 <2.0 <0.5 <10.0 <0.01 1.04 <0.5 <2.5 <2.5 <2.0
10/05/2019 72 28 7.5 35.4 0.54 24.3 <2.0 <0.5 <10.0 <0.01 <0.5 <0.5 <2.5 <2.5 <2.0
13/05/2019 80 25 13.3 27.7 0.54 16.3 <2.0 <0.5 <10.0 <0.01 <0.5 <0.5 <2.5 <2.5 <2.0
17/05/2019 62 16 15.5 33.1 0.45 24.5 <2.0 <0.5 <10.0 <0.01 0.87 <0.5 <2.5 <2.5 <2.0
20/05/2019 55 15 16.3 37.4 0.92 20.4 <2.0 <0.5 <10.0 <0.01 <0.5 <0.5 <2.5 <2.5 <2.0
24/05/2019 49 14 10.3 30.4 0.51 18.9 <2.0 <0.5 <10.0 <0.01 0.68 <0.5 <2.5 <2.5 <2.0
27/05/2019 74 22 11.2 45.5 0.36 16.7 <2.0 <0.5 <10.0 <0.01 <0.5 <0.5 <2.5 <2.5 <2.0
31/05/2019 55 11 8.1 49.5 0.44 18.9 <2.0 <0.5 <10.0 <0.01 0.54 <0.5 <2.5 <2.5 <2.0
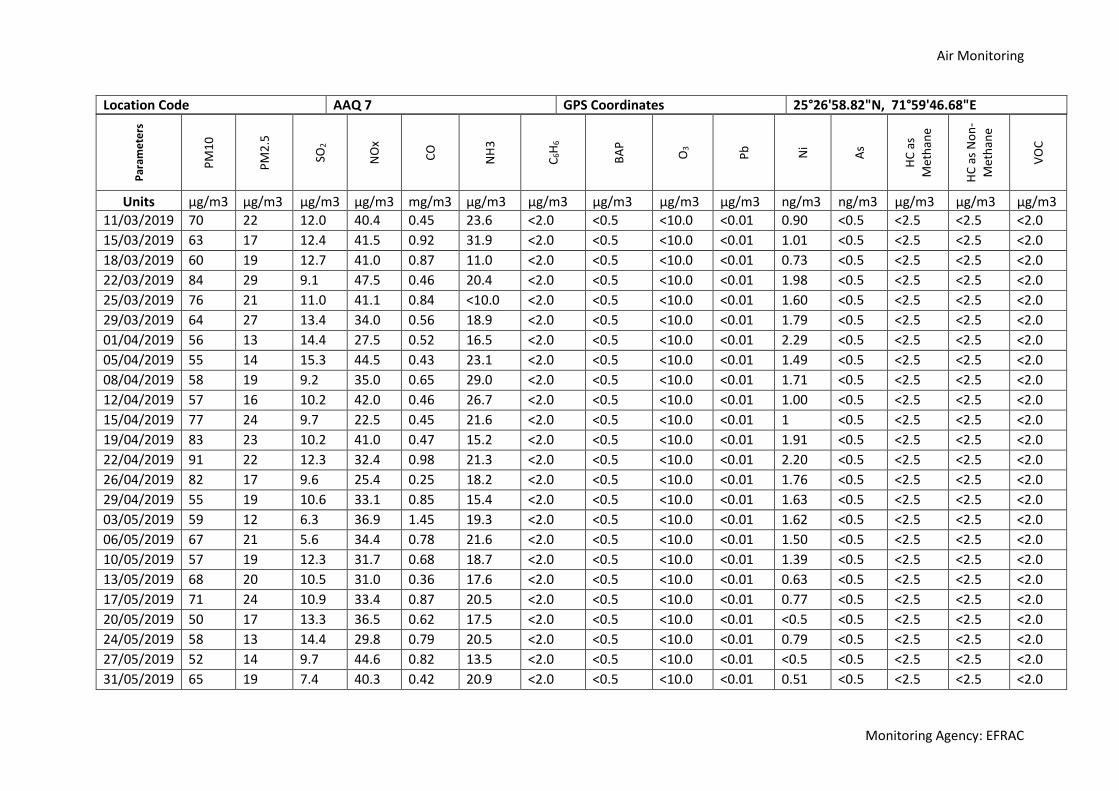
Air Monitoring
Monitoring Agency: EFRAC
Location Code AAQ 7 GPS Coordinates 25°26'58.82"N, 71°59'46.68"E
Par
ame
ters
PM
10
PM
2.5
SO2
NO
x
CO
NH
3
C6H
6
BA
P
O3
Pb
Ni
As
HC
as
Met
han
e
HC
as
No
n-
Met
han
e
VO
C
Units µg/m3 µg/m3 µg/m3 µg/m3 mg/m3 µg/m3 µg/m3 µg/m3 µg/m3 µg/m3 ng/m3 ng/m3 µg/m3 µg/m3 µg/m3
11/03/2019 70 22 12.0 40.4 0.45 23.6 <2.0 <0.5 <10.0 <0.01 0.90 <0.5 <2.5 <2.5 <2.0
15/03/2019 63 17 12.4 41.5 0.92 31.9 <2.0 <0.5 <10.0 <0.01 1.01 <0.5 <2.5 <2.5 <2.0
18/03/2019 60 19 12.7 41.0 0.87 11.0 <2.0 <0.5 <10.0 <0.01 0.73 <0.5 <2.5 <2.5 <2.0
22/03/2019 84 29 9.1 47.5 0.46 20.4 <2.0 <0.5 <10.0 <0.01 1.98 <0.5 <2.5 <2.5 <2.0
25/03/2019 76 21 11.0 41.1 0.84 <10.0 <2.0 <0.5 <10.0 <0.01 1.60 <0.5 <2.5 <2.5 <2.0
29/03/2019 64 27 13.4 34.0 0.56 18.9 <2.0 <0.5 <10.0 <0.01 1.79 <0.5 <2.5 <2.5 <2.0
01/04/2019 56 13 14.4 27.5 0.52 16.5 <2.0 <0.5 <10.0 <0.01 2.29 <0.5 <2.5 <2.5 <2.0
05/04/2019 55 14 15.3 44.5 0.43 23.1 <2.0 <0.5 <10.0 <0.01 1.49 <0.5 <2.5 <2.5 <2.0
08/04/2019 58 19 9.2 35.0 0.65 29.0 <2.0 <0.5 <10.0 <0.01 1.71 <0.5 <2.5 <2.5 <2.0
12/04/2019 57 16 10.2 42.0 0.46 26.7 <2.0 <0.5 <10.0 <0.01 1.00 <0.5 <2.5 <2.5 <2.0
15/04/2019 77 24 9.7 22.5 0.45 21.6 <2.0 <0.5 <10.0 <0.01 1 <0.5 <2.5 <2.5 <2.0
19/04/2019 83 23 10.2 41.0 0.47 15.2 <2.0 <0.5 <10.0 <0.01 1.91 <0.5 <2.5 <2.5 <2.0
22/04/2019 91 22 12.3 32.4 0.98 21.3 <2.0 <0.5 <10.0 <0.01 2.20 <0.5 <2.5 <2.5 <2.0
26/04/2019 82 17 9.6 25.4 0.25 18.2 <2.0 <0.5 <10.0 <0.01 1.76 <0.5 <2.5 <2.5 <2.0
29/04/2019 55 19 10.6 33.1 0.85 15.4 <2.0 <0.5 <10.0 <0.01 1.63 <0.5 <2.5 <2.5 <2.0
03/05/2019 59 12 6.3 36.9 1.45 19.3 <2.0 <0.5 <10.0 <0.01 1.62 <0.5 <2.5 <2.5 <2.0
06/05/2019 67 21 5.6 34.4 0.78 21.6 <2.0 <0.5 <10.0 <0.01 1.50 <0.5 <2.5 <2.5 <2.0
10/05/2019 57 19 12.3 31.7 0.68 18.7 <2.0 <0.5 <10.0 <0.01 1.39 <0.5 <2.5 <2.5 <2.0
13/05/2019 68 20 10.5 31.0 0.36 17.6 <2.0 <0.5 <10.0 <0.01 0.63 <0.5 <2.5 <2.5 <2.0
17/05/2019 71 24 10.9 33.4 0.87 20.5 <2.0 <0.5 <10.0 <0.01 0.77 <0.5 <2.5 <2.5 <2.0
20/05/2019 50 17 13.3 36.5 0.62 17.5 <2.0 <0.5 <10.0 <0.01 <0.5 <0.5 <2.5 <2.5 <2.0
24/05/2019 58 13 14.4 29.8 0.79 20.5 <2.0 <0.5 <10.0 <0.01 0.79 <0.5 <2.5 <2.5 <2.0
27/05/2019 52 14 9.7 44.6 0.82 13.5 <2.0 <0.5 <10.0 <0.01 <0.5 <0.5 <2.5 <2.5 <2.0
31/05/2019 65 19 7.4 40.3 0.42 20.9 <2.0 <0.5 <10.0 <0.01 0.51 <0.5 <2.5 <2.5 <2.0
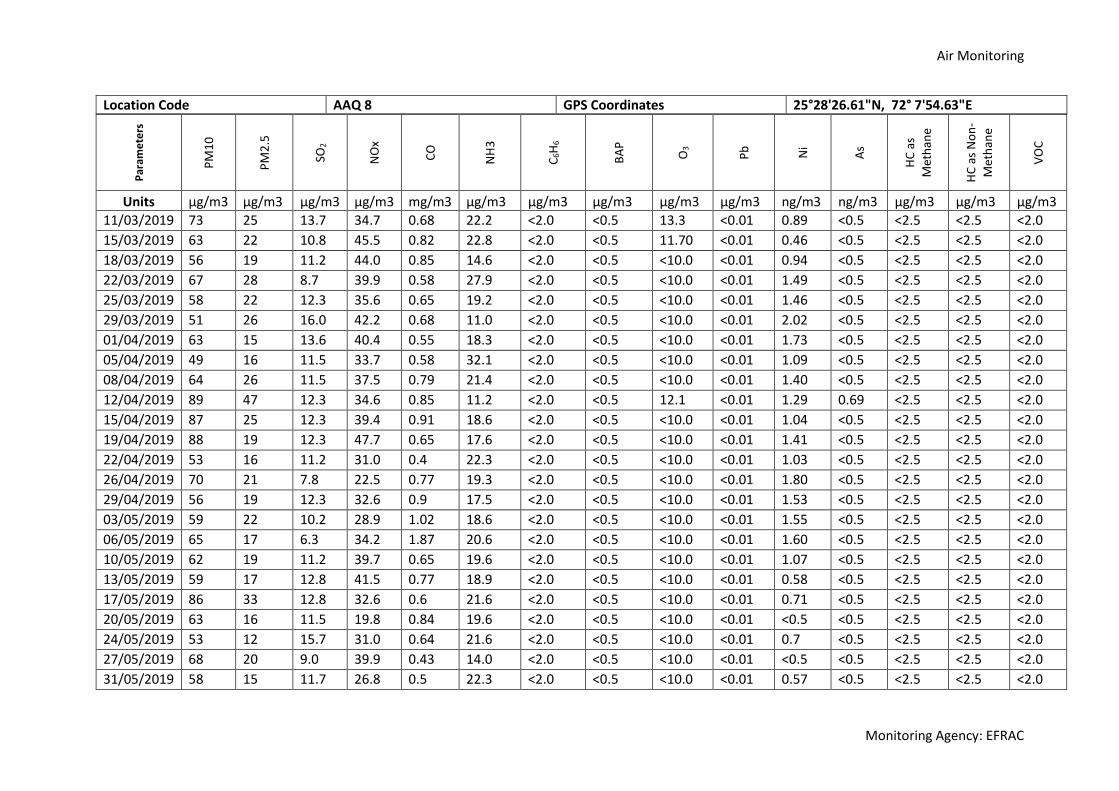
Air Monitoring
Monitoring Agency: EFRAC
Location Code AAQ 8 GPS Coordinates 25°28'26.61"N, 72° 7'54.63"E
Par
ame
ters
PM
10
PM
2.5
SO2
NO
x
CO
NH
3
C6H
6
BA
P
O3
Pb
Ni
As
HC
as
Met
han
e
HC
as
No
n-
Met
han
e
VO
C
Units µg/m3 µg/m3 µg/m3 µg/m3 mg/m3 µg/m3 µg/m3 µg/m3 µg/m3 µg/m3 ng/m3 ng/m3 µg/m3 µg/m3 µg/m3
11/03/2019 73 25 13.7 34.7 0.68 22.2 <2.0 <0.5 13.3 <0.01 0.89 <0.5 <2.5 <2.5 <2.0
15/03/2019 63 22 10.8 45.5 0.82 22.8 <2.0 <0.5 11.70 <0.01 0.46 <0.5 <2.5 <2.5 <2.0
18/03/2019 56 19 11.2 44.0 0.85 14.6 <2.0 <0.5 <10.0 <0.01 0.94 <0.5 <2.5 <2.5 <2.0
22/03/2019 67 28 8.7 39.9 0.58 27.9 <2.0 <0.5 <10.0 <0.01 1.49 <0.5 <2.5 <2.5 <2.0
25/03/2019 58 22 12.3 35.6 0.65 19.2 <2.0 <0.5 <10.0 <0.01 1.46 <0.5 <2.5 <2.5 <2.0
29/03/2019 51 26 16.0 42.2 0.68 11.0 <2.0 <0.5 <10.0 <0.01 2.02 <0.5 <2.5 <2.5 <2.0
01/04/2019 63 15 13.6 40.4 0.55 18.3 <2.0 <0.5 <10.0 <0.01 1.73 <0.5 <2.5 <2.5 <2.0
05/04/2019 49 16 11.5 33.7 0.58 32.1 <2.0 <0.5 <10.0 <0.01 1.09 <0.5 <2.5 <2.5 <2.0
08/04/2019 64 26 11.5 37.5 0.79 21.4 <2.0 <0.5 <10.0 <0.01 1.40 <0.5 <2.5 <2.5 <2.0
12/04/2019 89 47 12.3 34.6 0.85 11.2 <2.0 <0.5 12.1 <0.01 1.29 0.69 <2.5 <2.5 <2.0
15/04/2019 87 25 12.3 39.4 0.91 18.6 <2.0 <0.5 <10.0 <0.01 1.04 <0.5 <2.5 <2.5 <2.0
19/04/2019 88 19 12.3 47.7 0.65 17.6 <2.0 <0.5 <10.0 <0.01 1.41 <0.5 <2.5 <2.5 <2.0
22/04/2019 53 16 11.2 31.0 0.4 22.3 <2.0 <0.5 <10.0 <0.01 1.03 <0.5 <2.5 <2.5 <2.0
26/04/2019 70 21 7.8 22.5 0.77 19.3 <2.0 <0.5 <10.0 <0.01 1.80 <0.5 <2.5 <2.5 <2.0
29/04/2019 56 19 12.3 32.6 0.9 17.5 <2.0 <0.5 <10.0 <0.01 1.53 <0.5 <2.5 <2.5 <2.0
03/05/2019 59 22 10.2 28.9 1.02 18.6 <2.0 <0.5 <10.0 <0.01 1.55 <0.5 <2.5 <2.5 <2.0
06/05/2019 65 17 6.3 34.2 1.87 20.6 <2.0 <0.5 <10.0 <0.01 1.60 <0.5 <2.5 <2.5 <2.0
10/05/2019 62 19 11.2 39.7 0.65 19.6 <2.0 <0.5 <10.0 <0.01 1.07 <0.5 <2.5 <2.5 <2.0
13/05/2019 59 17 12.8 41.5 0.77 18.9 <2.0 <0.5 <10.0 <0.01 0.58 <0.5 <2.5 <2.5 <2.0
17/05/2019 86 33 12.8 32.6 0.6 21.6 <2.0 <0.5 <10.0 <0.01 0.71 <0.5 <2.5 <2.5 <2.0
20/05/2019 63 16 11.5 19.8 0.84 19.6 <2.0 <0.5 <10.0 <0.01 <0.5 <0.5 <2.5 <2.5 <2.0
24/05/2019 53 12 15.7 31.0 0.64 21.6 <2.0 <0.5 <10.0 <0.01 0.7 <0.5 <2.5 <2.5 <2.0
27/05/2019 68 20 9.0 39.9 0.43 14.0 <2.0 <0.5 <10.0 <0.01 <0.5 <0.5 <2.5 <2.5 <2.0
31/05/2019 58 15 11.7 26.8 0.5 22.3 <2.0 <0.5 <10.0 <0.01 0.57 <0.5 <2.5 <2.5 <2.0
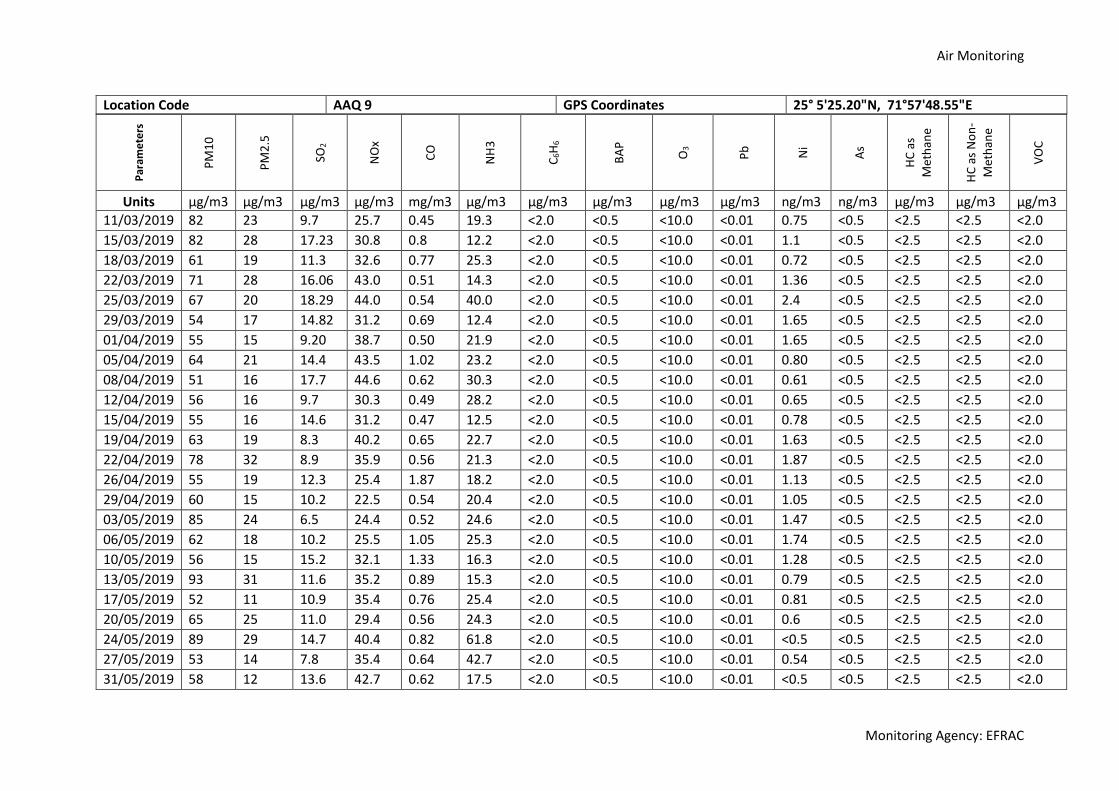
Air Monitoring
Monitoring Agency: EFRAC
Location Code AAQ 9 GPS Coordinates 25° 5'25.20"N, 71°57'48.55"E
Par
ame
ters
PM
10
PM
2.5
SO2
NO
x
CO
NH
3
C6H
6
BA
P
O3
Pb
Ni
As
HC
as
Met
han
e
HC
as
No
n-
Met
han
e
VO
C
Units µg/m3 µg/m3 µg/m3 µg/m3 mg/m3 µg/m3 µg/m3 µg/m3 µg/m3 µg/m3 ng/m3 ng/m3 µg/m3 µg/m3 µg/m3
11/03/2019 82 23 9.7 25.7 0.45 19.3 <2.0 <0.5 <10.0 <0.01 0.75 <0.5 <2.5 <2.5 <2.0
15/03/2019 82 28 17.23 30.8 0.8 12.2 <2.0 <0.5 <10.0 <0.01 1.1 <0.5 <2.5 <2.5 <2.0
18/03/2019 61 19 11.3 32.6 0.77 25.3 <2.0 <0.5 <10.0 <0.01 0.72 <0.5 <2.5 <2.5 <2.0
22/03/2019 71 28 16.06 43.0 0.51 14.3 <2.0 <0.5 <10.0 <0.01 1.36 <0.5 <2.5 <2.5 <2.0
25/03/2019 67 20 18.29 44.0 0.54 40.0 <2.0 <0.5 <10.0 <0.01 2.4 <0.5 <2.5 <2.5 <2.0
29/03/2019 54 17 14.82 31.2 0.69 12.4 <2.0 <0.5 <10.0 <0.01 1.65 <0.5 <2.5 <2.5 <2.0
01/04/2019 55 15 9.20 38.7 0.50 21.9 <2.0 <0.5 <10.0 <0.01 1.65 <0.5 <2.5 <2.5 <2.0
05/04/2019 64 21 14.4 43.5 1.02 23.2 <2.0 <0.5 <10.0 <0.01 0.80 <0.5 <2.5 <2.5 <2.0
08/04/2019 51 16 17.7 44.6 0.62 30.3 <2.0 <0.5 <10.0 <0.01 0.61 <0.5 <2.5 <2.5 <2.0
12/04/2019 56 16 9.7 30.3 0.49 28.2 <2.0 <0.5 <10.0 <0.01 0.65 <0.5 <2.5 <2.5 <2.0
15/04/2019 55 16 14.6 31.2 0.47 12.5 <2.0 <0.5 <10.0 <0.01 0.78 <0.5 <2.5 <2.5 <2.0
19/04/2019 63 19 8.3 40.2 0.65 22.7 <2.0 <0.5 <10.0 <0.01 1.63 <0.5 <2.5 <2.5 <2.0
22/04/2019 78 32 8.9 35.9 0.56 21.3 <2.0 <0.5 <10.0 <0.01 1.87 <0.5 <2.5 <2.5 <2.0
26/04/2019 55 19 12.3 25.4 1.87 18.2 <2.0 <0.5 <10.0 <0.01 1.13 <0.5 <2.5 <2.5 <2.0
29/04/2019 60 15 10.2 22.5 0.54 20.4 <2.0 <0.5 <10.0 <0.01 1.05 <0.5 <2.5 <2.5 <2.0
03/05/2019 85 24 6.5 24.4 0.52 24.6 <2.0 <0.5 <10.0 <0.01 1.47 <0.5 <2.5 <2.5 <2.0
06/05/2019 62 18 10.2 25.5 1.05 25.3 <2.0 <0.5 <10.0 <0.01 1.74 <0.5 <2.5 <2.5 <2.0
10/05/2019 56 15 15.2 32.1 1.33 16.3 <2.0 <0.5 <10.0 <0.01 1.28 <0.5 <2.5 <2.5 <2.0
13/05/2019 93 31 11.6 35.2 0.89 15.3 <2.0 <0.5 <10.0 <0.01 0.79 <0.5 <2.5 <2.5 <2.0
17/05/2019 52 11 10.9 35.4 0.76 25.4 <2.0 <0.5 <10.0 <0.01 0.81 <0.5 <2.5 <2.5 <2.0
20/05/2019 65 25 11.0 29.4 0.56 24.3 <2.0 <0.5 <10.0 <0.01 0.6 <0.5 <2.5 <2.5 <2.0
24/05/2019 89 29 14.7 40.4 0.82 61.8 <2.0 <0.5 <10.0 <0.01 <0.5 <0.5 <2.5 <2.5 <2.0
27/05/2019 53 14 7.8 35.4 0.64 42.7 <2.0 <0.5 <10.0 <0.01 0.54 <0.5 <2.5 <2.5 <2.0
31/05/2019 58 12 13.6 42.7 0.62 17.5 <2.0 <0.5 <10.0 <0.01 <0.5 <0.5 <2.5 <2.5 <2.0

Air Monitoring
Monitoring Agency: EFRAC
Location Code AAQ 10 GPS Coordinates 25°12'13.28"N, 71°46'9.89"E
Par
ame
ters
PM
10
PM
2.5
SO2
NO
x
CO
NH
3
C6H
6
BA
P
O3
Pb
Ni
As
HC
as
Met
han
e
HC
as
No
n-
Met
han
e
VO
C
Units µg/m3 µg/m3 µg/m3 µg/m3 mg/m3 µg/m3 µg/m3 µg/m3 µg/m3 µg/m3 ng/m3 ng/m3 µg/m3 µg/m3 µg/m3
11/03/2019 71 19 11.6 40.5 0.82 41.6 <2.0 <0.5 <10.0 <0.01 0.56 <0.5 <2.5 <2.5 <2.0
15/03/2019 48 15 12.0 43.4 0.76 51.0 <2.0 <0.5 <10.0 <0.01 2.11 <0.5 <2.5 <2.5 <2.0
18/03/2019 59 19 12.6 28.3 0.50 31.8 <2.0 <0.5 <10.0 <0.01 0.72 <0.5 <2.5 <2.5 <2.0
22/03/2019 68 21 9.7 34.2 0.61 39.5 <2.0 <0.5 <10.0 <0.01 0.9 <0.5 <2.5 <2.5 <2.0
25/03/2019 76 22 11.3 42.2 0.75 12.1 <2.0 <0.5 <10.0 <0.01 1.18 <0.5 <2.5 <2.5 <2.0
29/03/2019 53 24 13.6 39.7 0.51 30.6 <2.0 <0.5 <10.0 <0.01 1.77 <0.5 <2.5 <2.5 <2.0
01/04/2019 80 24 12.5 40.9 0.42 24.5 <2.0 <0.5 <10.0 <0.01 0.72 <0.5 <2.5 <2.5 <2.0
05/04/2019 58 17 13.8 40.0 0.66 31.2 <2.0 <0.5 14.1 <0.01 1.23 <0.5 <2.5 <2.5 <2.0
08/04/2019 68 17 13.3 40.1 0.57 31.2 <2.0 <0.5 <10.0 <0.01 0.95 <0.5 <2.5 <2.5 <2.0
12/04/2019 59 15 11.0 37.2 0.64 20.2 <2.0 <0.5 13.4 <0.01 0.74 <0.5 <2.5 <2.5 <2.0
15/04/2019 58 13 13.3 38.3 0.84 21.3 <2.0 <0.5 13.6 <0.01 2.06 <0.5 <2.5 <2.5 <2.0
19/04/2019 56 15 11.1 37.7 0.45 32.3 <2.0 <0.5 10.7 <0.01 1.01 <0.5 <2.5 <2.5 <2.0
22/04/2019 82 22 14.2 29.4 0.47 17.6 <2.0 <0.5 <10.0 <0.01 <0.5 <0.5 <2.5 <2.5 <2.0
26/04/2019 68 21 11.3 39.9 0.54 18.6 <2.0 <0.5 <10.0 <0.01 0.53 <0.5 <2.5 <2.5 <2.0
29/04/2019 86 25 6.2 41.1 0.53 25.3 <2.0 <0.5 <10.0 <0.01 0.50 <0.5 <2.5 <2.5 <2.0
03/05/2019 67 18 12.3 27.5 0.61 20.3 <2.0 <0.5 <10.0 <0.01 <0.5 <0.5 <2.5 <2.5 <2.0
06/05/2019 62 21 7.8 45.4 0.48 17.5 <2.0 <0.5 <10.0 <0.01 <0.5 <0.5 <2.5 <2.5 <2.0
10/05/2019 52 15 12.3 43.2 0.74 16.3 <2.0 <0.5 <10.0 <0.01 0.54 <0.5 <2.5 <2.5 <2.0
13/05/2019 70 26 11.2 27.8 0.55 19.6 <2.0 <0.5 <10.0 <0.01 0.70 <0.5 <2.5 <2.5 <2.0
17/05/2019 56 16 5.3 27.8 0.65 25.3 <2.0 <0.5 <10.0 <0.01 0.51 <0.5 <2.5 <2.5 <2.0
20/05/2019 72 27 10.3 32.6 0.87 15.3 <2.0 <0.5 <10.0 <0.01 0.51 <0.5 <2.5 <2.5 <2.0
24/05/2019 59 13 14.1 49.9 0.68 45.8 <2.0 <0.5 <10.0 <0.01 0.68 <0.5 <2.5 <2.5 <2.0
27/05/2019 87 26 11.3 23.1 0.84 51.0 <2.0 <0.5 <10.0 <0.01 0.52 <0.5 <2.5 <2.5 <2.0
31/05/2019 48 12 10.9 34.2 0.47 23.6 <2.0 <0.5 <10.0 <0.01 0.51 <0.5 <2.5 <2.5 <2.0

Air Monitoring
Monitoring Agency: EFRAC
Location Code AAQ 11 GPS Coordinates 25°24'39.78"N, 71°53'48.50"E
Par
ame
ter
s
PM
10
PM
2.5
SO2
NO
x
CO
NH
3
C6H
6
BA
P
O3
Pb
Ni
As
HC
as
Met
han
e
HC
as
No
n-
Met
han
e
VO
C
Units µg/m3 µg/m3 µg/m3 µg/m3 mg/m3 µg/m3 µg/m3 µg/m3 µg/m3 µg/m3 ng/m3 ng/m3 µg/m3 µg/m3 µg/m3
11/03/2019 88 20 10.1 30.3 0.41 22.3 2.14 <0.5 <10.0 <0.01 1.75 <0.5 <2.5 <2.5 2.66
15/03/2019 74 26 10.9 27.7 0.39 19.3 <2.0 <0.5 <10.0 <0.01 0.87 <0.5 <2.5 <2.5 <2.0
18/03/2019 77 21 12.0 43.8 0.48 24.4 <2.0 <0.5 <10.0 <0.01 0.71 <0.5 <2.5 <2.5 <2.0
22/03/2019 79 28 9.0 29.4 0.92 13.3 <2.0 <0.5 <10.0 <0.01 1.85 <0.5 <2.5 <2.5 <2.0
25/03/2019 53 15 10.2 41.2 0.77 24.5 <2.0 <0.5 <10.0 <0.01 <0.5 <0.5 <2.5 <2.5 <2.0
29/03/2019 56 17 10.5 33.8 0.59 17.0 <2.0 <0.5 <10.0 <0.01 1.32 <0.5 <2.5 <2.5 <2.0
01/04/2019 61 14 11.7 30.9 0.82 17.5 <2.0 <0.5 <10.0 <0.01 0.55 <0.5 <2.5 <2.5 <2.0
05/04/2019 78 27 14.4 35.5 0.83 20.6 <2.0 <0.5 <10.0 <0.01 1.04 <0.5 <2.5 <2.5 <2.0
08/04/2019 73 22 12.5 37.2 0.61 25.0 <2.0 <0.5 <10.0 <0.01 1.16 0.61 <2.5 <2.5 <2.0
12/04/2019 70 18 14.0 41.8 1.01 21.9 <2.0 <0.5 <10.0 <0.01 0.92 <0.5 <2.5 <2.5 <2.0
15/04/2019 49 12 13.3 36.0 0.77 16.9 <2.0 <0.5 <10.0 <0.01 1.37 <0.5 <2.5 <2.5 <2.0
19/04/2019 64 18 10.7 38.6 0.82 19.3 <2.0 <0.5 <10.0 <0.01 1.21 <0.5 <2.5 <2.5 <2.0
22/04/2019 74 23 9.5 37.0 0.35 15.2 <2.0 <0.5 <10.0 <0.01 <0.5 <0.5 <2.5 <2.5 <2.0
26/04/2019 51 18 14.2 46.5 0.36 12.6 <2.0 <0.5 <10.0 <0.01 0.54 <0.5 <2.5 <2.5 <2.0
29/04/2019 77 27 12.3 35.4 0.86 20.8 <2.0 <0.5 <10.0 <0.01 0.50 <0.5 <2.5 <2.5 <2.0
03/05/2019 60 28 12.3 30.3 0.64 21.3 <2.0 <0.5 <10.0 <0.01 0.51 <0.5 <2.5 <2.5 <2.0
06/05/2019 51 19 9.6 39.8 0.68 19.3 <2.0 <0.5 <10.0 <0.01 <0.5 <0.5 <2.5 <2.5 <2.0
10/05/2019 65 23 12.3 37.5 0.21 18.6 <2.0 <0.5 <10.0 <0.01 0.70 <0.5 <2.5 <2.5 <2.0
13/05/2019 75 34 12.3 36.9 0.84 24.6 <2.0 <0.5 <10.0 <0.01 0.72 <0.5 <2.5 <2.5 <2.0
17/05/2019 54 17 8.3 36.9 0.63 21.3 <2.0 <0.5 <10.0 <0.01 0.61 <0.5 <2.5 <2.5 <2.0
20/05/2019 71 29 9.6 21.1 0.63 16.3 <2.0 <0.5 <10.0 <0.01 <0.5 <0.5 <2.5 <2.5 <2.0
24/05/2019 50 14 12.5 29.2 0.69 24.7 <2.0 <0.5 <10.0 <0.01 0.71 <0.5 <2.5 <2.5 <2.0
27/05/2019 62 14 13.1 41.3 0.62 24.5 <2.0 <0.5 <10.0 <0.01 <0.5 <0.5 <2.5 <2.5 <2.0
31/05/2019 68 16 13.2 40.4 0.35 25.3 <2.0 <0.5 <10.0 <0.01 <0.5 <0.5 <2.5 <2.5 <2.0
Appendix 3.3:
Ambient Noise
Monitoring Results
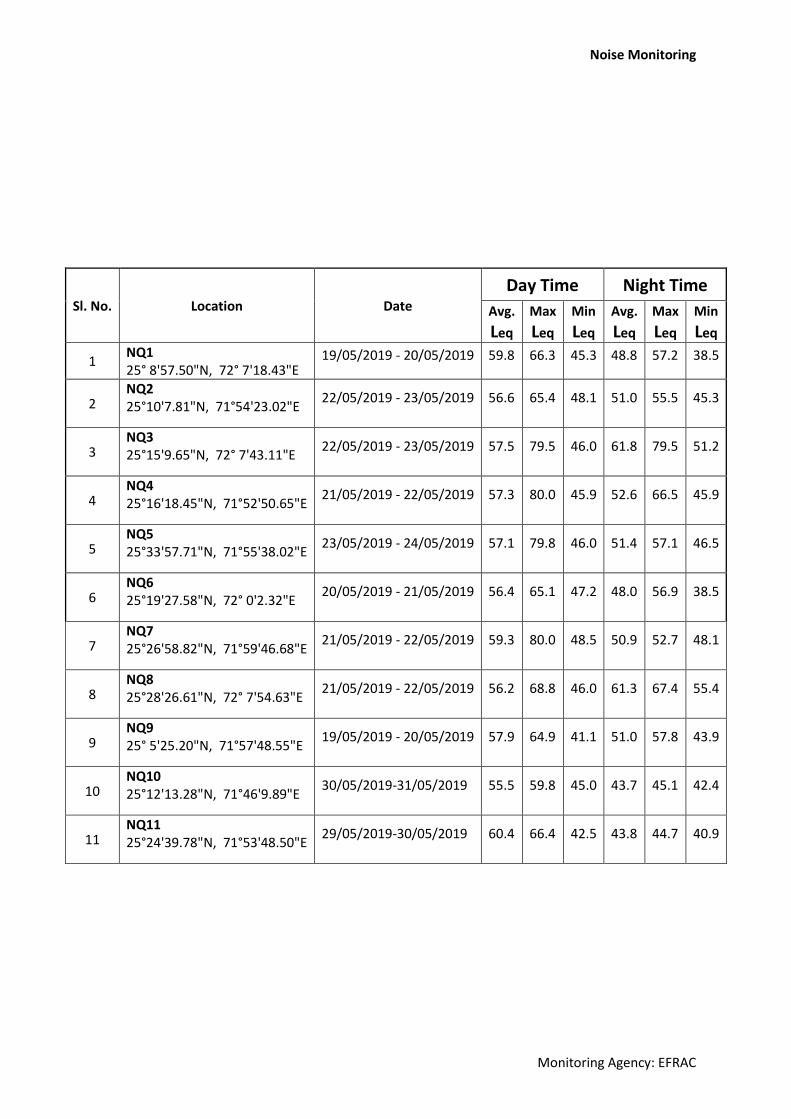
Noise Monitoring
Monitoring Agency: EFRAC
Sl. No. Location Date
Day Time Night Time
Avg.
Leq
Max
Leq
Min Leq
Avg.
Leq
Max
Leq
Min Leq
1 NQ1 25° 8'57.50"N, 72° 7'18.43"E
19/05/2019 - 20/05/2019 59.8 66.3 45.3 48.8 57.2 38.5
2 NQ2 25°10'7.81"N, 71°54'23.02"E
22/05/2019 - 23/05/2019 56.6 65.4 48.1 51.0 55.5 45.3
3 NQ3 25°15'9.65"N, 72° 7'43.11"E
22/05/2019 - 23/05/2019 57.5 79.5 46.0 61.8 79.5 51.2
4 NQ4 25°16'18.45"N, 71°52'50.65"E
21/05/2019 - 22/05/2019 57.3 80.0 45.9 52.6 66.5 45.9
5 NQ5 25°33'57.71"N, 71°55'38.02"E
23/05/2019 - 24/05/2019 57.1 79.8 46.0 51.4 57.1 46.5
6 NQ6 25°19'27.58"N, 72° 0'2.32"E
20/05/2019 - 21/05/2019 56.4 65.1 47.2 48.0 56.9 38.5
7 NQ7 25°26'58.82"N, 71°59'46.68"E
21/05/2019 - 22/05/2019 59.3 80.0 48.5 50.9 52.7 48.1
8 NQ8 25°28'26.61"N, 72° 7'54.63"E
21/05/2019 - 22/05/2019 56.2 68.8 46.0 61.3 67.4 55.4
9 NQ9 25° 5'25.20"N, 71°57'48.55"E
19/05/2019 - 20/05/2019 57.9 64.9 41.1 51.0 57.8 43.9
10 NQ10 25°12'13.28"N, 71°46'9.89"E
30/05/2019-31/05/2019 55.5 59.8 45.0 43.7 45.1 42.4
11 NQ11 25°24'39.78"N, 71°53'48.50"E
29/05/2019-30/05/2019 60.4 66.4 42.5 43.8 44.7 40.9
Appendix 3.4:
Ground Water
Quality Monitoring
Results
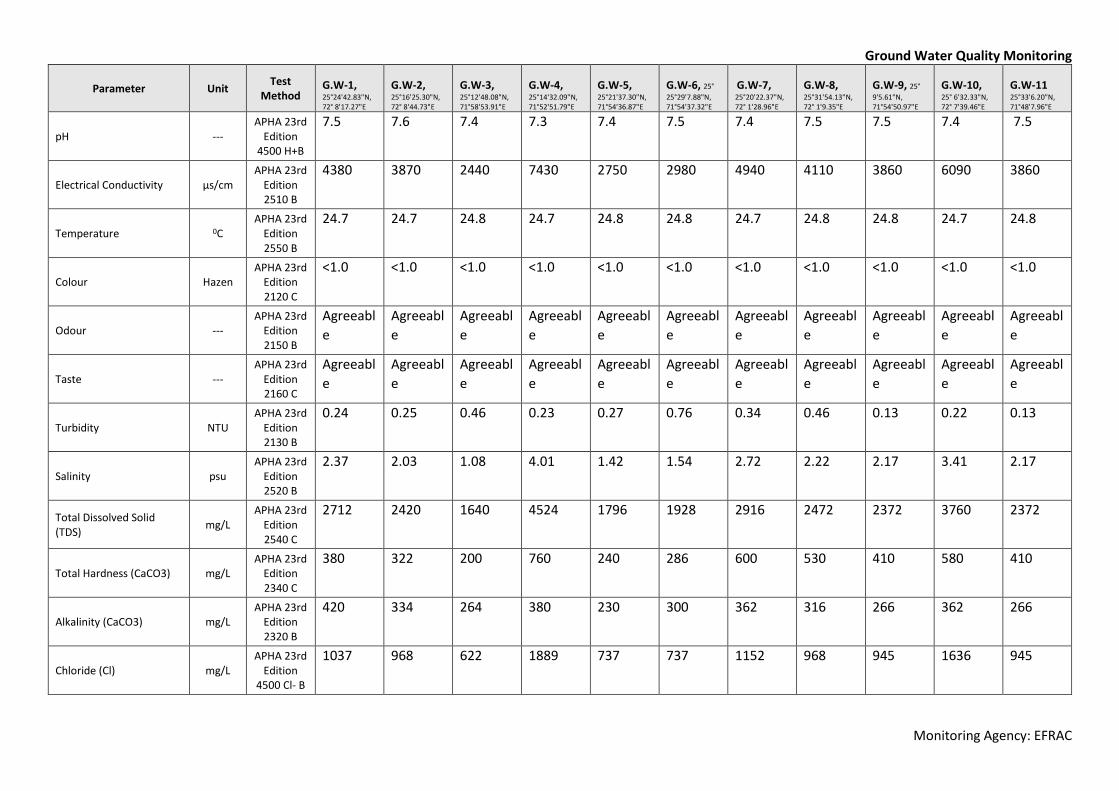
Ground Water Quality Monitoring
Monitoring Agency: EFRAC
Parameter Unit Test
Method G.W-1, 25°24'42.83"N, 72° 8'17.27"E
G.W-2, 25°16'25.30"N, 72° 8'44.73"E
G.W-3, 25°12'48.08"N, 71°58'53.91"E
G.W-4, 25°14'32.09"N, 71°52'51.79"E
G.W-5, 25°21'37.30"N, 71°54'36.87"E
G.W-6, 25°
25°29'7.88"N, 71°54'37.32"E
G.W-7, 25°20'22.37"N, 72° 1'28.96"E
G.W-8, 25°31'54.13"N, 72° 1'9.35"E
G.W-9, 25°
9'5.61"N, 71°54'50.97"E
G.W-10, 25° 6'32.33"N, 72° 7'39.46"E
G.W-11 25°33'6.20"N, 71°48'7.96"E
pH --- APHA 23rd
Edition 4500 H+B
7.5 7.6 7.4 7.3 7.4 7.5 7.4 7.5 7.5 7.4 7.5
Electrical Conductivity µs/cm APHA 23rd
Edition 2510 B
4380 3870 2440 7430 2750 2980 4940 4110 3860 6090 3860
Temperature 0C APHA 23rd
Edition 2550 B
24.7 24.7 24.8 24.7 24.8 24.8 24.7 24.8 24.8 24.7 24.8
Colour Hazen APHA 23rd
Edition 2120 C
<1.0 <1.0 <1.0 <1.0 <1.0 <1.0 <1.0 <1.0 <1.0 <1.0 <1.0
Odour --- APHA 23rd
Edition 2150 B
Agreeabl
e
Agreeabl
e
Agreeabl
e
Agreeabl
e
Agreeabl
e
Agreeabl
e
Agreeabl
e
Agreeabl
e
Agreeabl
e
Agreeabl
e
Agreeabl
e
Taste --- APHA 23rd
Edition 2160 C
Agreeabl
e
Agreeabl
e
Agreeabl
e
Agreeabl
e
Agreeabl
e
Agreeabl
e
Agreeabl
e
Agreeabl
e
Agreeabl
e
Agreeabl
e
Agreeabl
e
Turbidity NTU APHA 23rd
Edition 2130 B
0.24 0.25 0.46 0.23 0.27 0.76 0.34 0.46 0.13 0.22 0.13
Salinity psu APHA 23rd
Edition 2520 B
2.37 2.03 1.08 4.01 1.42 1.54 2.72 2.22 2.17 3.41 2.17
Total Dissolved Solid (TDS)
mg/L APHA 23rd
Edition 2540 C
2712 2420 1640 4524 1796 1928 2916 2472 2372 3760 2372
Total Hardness (CaCO3) mg/L APHA 23rd
Edition 2340 C
380 322 200 760 240 286 600 530 410 580 410
Alkalinity (CaCO3) mg/L APHA 23rd
Edition 2320 B
420 334 264 380 230 300 362 316 266 362 266
Chloride (Cl) mg/L APHA 23rd
Edition 4500 Cl- B
1037 968 622 1889 737 737 1152 968 945 1636 945
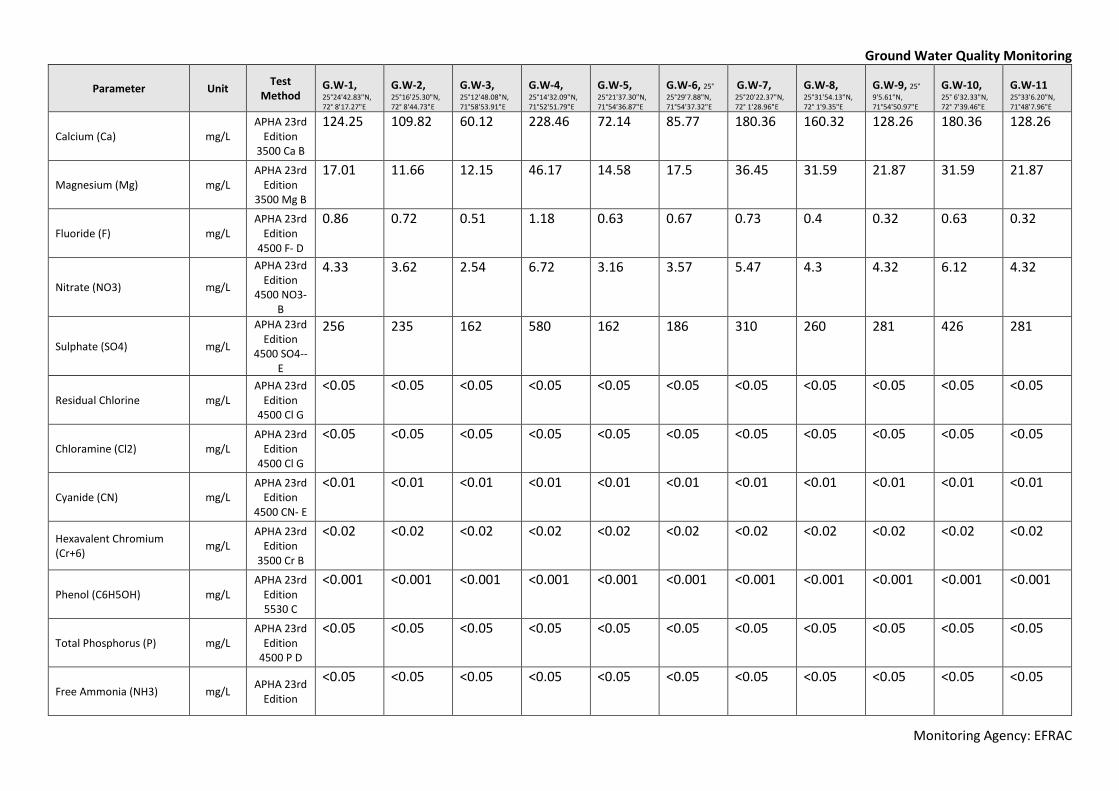
Ground Water Quality Monitoring
Monitoring Agency: EFRAC
Parameter Unit Test
Method G.W-1, 25°24'42.83"N, 72° 8'17.27"E
G.W-2, 25°16'25.30"N, 72° 8'44.73"E
G.W-3, 25°12'48.08"N, 71°58'53.91"E
G.W-4, 25°14'32.09"N, 71°52'51.79"E
G.W-5, 25°21'37.30"N, 71°54'36.87"E
G.W-6, 25°
25°29'7.88"N, 71°54'37.32"E
G.W-7, 25°20'22.37"N, 72° 1'28.96"E
G.W-8, 25°31'54.13"N, 72° 1'9.35"E
G.W-9, 25°
9'5.61"N, 71°54'50.97"E
G.W-10, 25° 6'32.33"N, 72° 7'39.46"E
G.W-11 25°33'6.20"N, 71°48'7.96"E
Calcium (Ca) mg/L APHA 23rd
Edition 3500 Ca B
124.25 109.82 60.12 228.46 72.14 85.77 180.36 160.32 128.26 180.36 128.26
Magnesium (Mg) mg/L APHA 23rd
Edition 3500 Mg B
17.01 11.66 12.15 46.17 14.58 17.5 36.45 31.59 21.87 31.59 21.87
Fluoride (F) mg/L APHA 23rd
Edition 4500 F- D
0.86 0.72 0.51 1.18 0.63 0.67 0.73 0.4 0.32 0.63 0.32
Nitrate (NO3) mg/L
APHA 23rd Edition
4500 NO3- B
4.33 3.62 2.54 6.72 3.16 3.57 5.47 4.3 4.32 6.12 4.32
Sulphate (SO4) mg/L
APHA 23rd Edition
4500 SO4-- E
256 235 162 580 162 186 310 260 281 426 281
Residual Chlorine mg/L APHA 23rd
Edition 4500 Cl G
<0.05 <0.05 <0.05 <0.05 <0.05 <0.05 <0.05 <0.05 <0.05 <0.05 <0.05
Chloramine (Cl2) mg/L APHA 23rd
Edition 4500 Cl G
<0.05 <0.05 <0.05 <0.05 <0.05 <0.05 <0.05 <0.05 <0.05 <0.05 <0.05
Cyanide (CN) mg/L APHA 23rd
Edition 4500 CN- E
<0.01 <0.01 <0.01 <0.01 <0.01 <0.01 <0.01 <0.01 <0.01 <0.01 <0.01
Hexavalent Chromium (Cr+6)
mg/L APHA 23rd
Edition 3500 Cr B
<0.02 <0.02 <0.02 <0.02 <0.02 <0.02 <0.02 <0.02 <0.02 <0.02 <0.02
Phenol (C6H5OH) mg/L APHA 23rd
Edition 5530 C
<0.001 <0.001 <0.001 <0.001 <0.001 <0.001 <0.001 <0.001 <0.001 <0.001 <0.001
Total Phosphorus (P) mg/L APHA 23rd
Edition 4500 P D
<0.05 <0.05 <0.05 <0.05 <0.05 <0.05 <0.05 <0.05 <0.05 <0.05 <0.05
Free Ammonia (NH3) mg/L APHA 23rd
Edition
<0.05 <0.05 <0.05 <0.05 <0.05 <0.05 <0.05 <0.05 <0.05 <0.05 <0.05
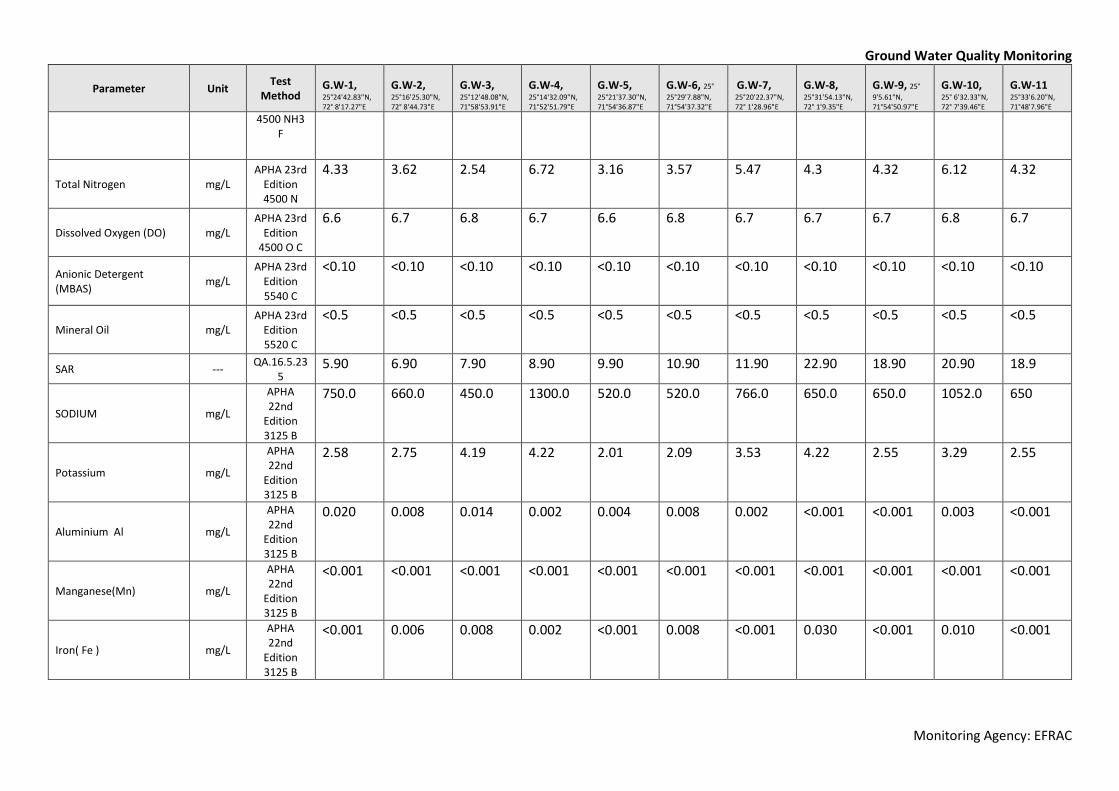
Ground Water Quality Monitoring
Monitoring Agency: EFRAC
Parameter Unit Test
Method G.W-1, 25°24'42.83"N, 72° 8'17.27"E
G.W-2, 25°16'25.30"N, 72° 8'44.73"E
G.W-3, 25°12'48.08"N, 71°58'53.91"E
G.W-4, 25°14'32.09"N, 71°52'51.79"E
G.W-5, 25°21'37.30"N, 71°54'36.87"E
G.W-6, 25°
25°29'7.88"N, 71°54'37.32"E
G.W-7, 25°20'22.37"N, 72° 1'28.96"E
G.W-8, 25°31'54.13"N, 72° 1'9.35"E
G.W-9, 25°
9'5.61"N, 71°54'50.97"E
G.W-10, 25° 6'32.33"N, 72° 7'39.46"E
G.W-11 25°33'6.20"N, 71°48'7.96"E
4500 NH3 F
Total Nitrogen mg/L APHA 23rd
Edition 4500 N
4.33 3.62 2.54 6.72 3.16 3.57 5.47 4.3 4.32 6.12 4.32
Dissolved Oxygen (DO) mg/L APHA 23rd
Edition 4500 O C
6.6 6.7 6.8 6.7 6.6 6.8 6.7 6.7 6.7 6.8 6.7
Anionic Detergent (MBAS)
mg/L APHA 23rd
Edition 5540 C
<0.10 <0.10 <0.10 <0.10 <0.10 <0.10 <0.10 <0.10 <0.10 <0.10 <0.10
Mineral Oil mg/L APHA 23rd
Edition 5520 C
<0.5 <0.5 <0.5 <0.5 <0.5 <0.5 <0.5 <0.5 <0.5 <0.5 <0.5
SAR --- QA.16.5.23
5 5.90 6.90 7.90 8.90 9.90 10.90 11.90 22.90 18.90 20.90 18.9
SODIUM mg/L
APHA 22nd
Edition 3125 B
750.0 660.0 450.0 1300.0 520.0 520.0 766.0 650.0 650.0 1052.0 650
Potassium mg/L
APHA 22nd
Edition 3125 B
2.58 2.75 4.19 4.22 2.01 2.09 3.53 4.22 2.55 3.29 2.55
Aluminium Al mg/L
APHA 22nd
Edition 3125 B
0.020 0.008 0.014 0.002 0.004 0.008 0.002 <0.001 <0.001 0.003 <0.001
Manganese(Mn) mg/L
APHA 22nd
Edition 3125 B
<0.001 <0.001 <0.001 <0.001 <0.001 <0.001 <0.001 <0.001 <0.001 <0.001 <0.001
Iron( Fe ) mg/L
APHA 22nd
Edition 3125 B
<0.001 0.006 0.008 0.002 <0.001 0.008 <0.001 0.030 <0.001 0.010 <0.001
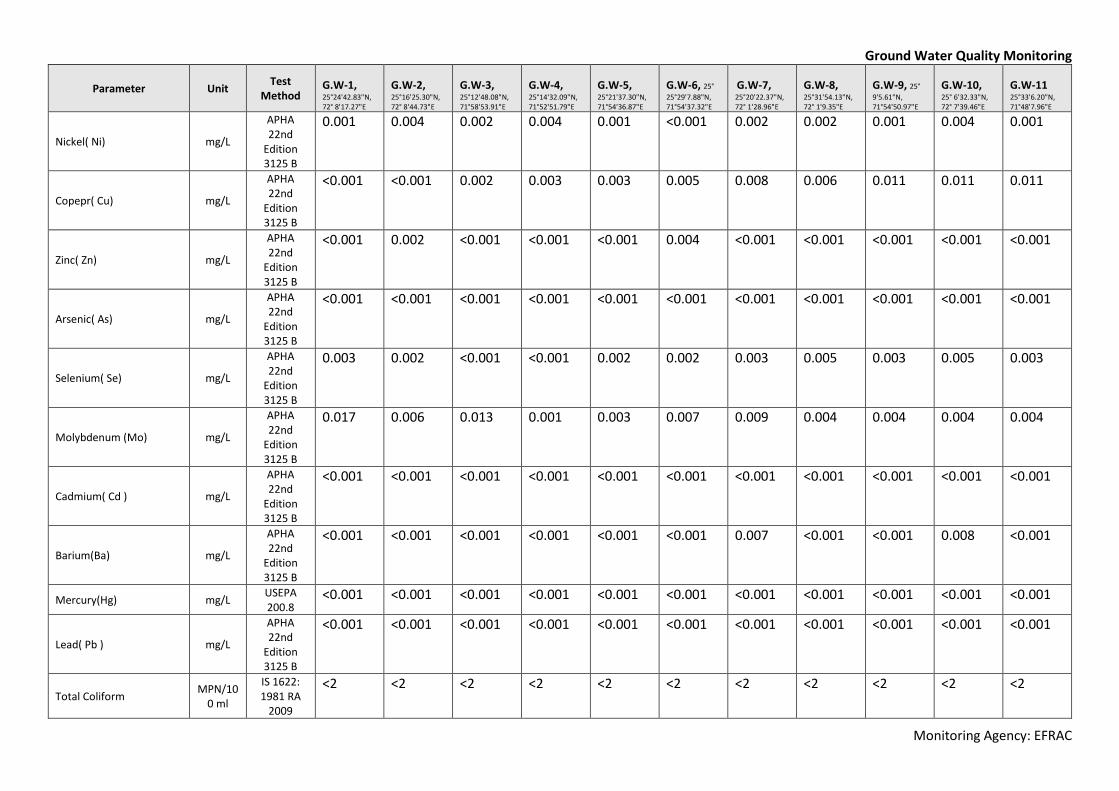
Ground Water Quality Monitoring
Monitoring Agency: EFRAC
Parameter Unit Test
Method G.W-1, 25°24'42.83"N, 72° 8'17.27"E
G.W-2, 25°16'25.30"N, 72° 8'44.73"E
G.W-3, 25°12'48.08"N, 71°58'53.91"E
G.W-4, 25°14'32.09"N, 71°52'51.79"E
G.W-5, 25°21'37.30"N, 71°54'36.87"E
G.W-6, 25°
25°29'7.88"N, 71°54'37.32"E
G.W-7, 25°20'22.37"N, 72° 1'28.96"E
G.W-8, 25°31'54.13"N, 72° 1'9.35"E
G.W-9, 25°
9'5.61"N, 71°54'50.97"E
G.W-10, 25° 6'32.33"N, 72° 7'39.46"E
G.W-11 25°33'6.20"N, 71°48'7.96"E
Nickel( Ni) mg/L
APHA 22nd
Edition 3125 B
0.001 0.004 0.002 0.004 0.001 <0.001 0.002 0.002 0.001 0.004 0.001
Copepr( Cu) mg/L
APHA 22nd
Edition 3125 B
<0.001 <0.001 0.002 0.003 0.003 0.005 0.008 0.006 0.011 0.011 0.011
Zinc( Zn) mg/L
APHA 22nd
Edition 3125 B
<0.001 0.002 <0.001 <0.001 <0.001 0.004 <0.001 <0.001 <0.001 <0.001 <0.001
Arsenic( As) mg/L
APHA 22nd
Edition 3125 B
<0.001 <0.001 <0.001 <0.001 <0.001 <0.001 <0.001 <0.001 <0.001 <0.001 <0.001
Selenium( Se) mg/L
APHA 22nd
Edition 3125 B
0.003 0.002 <0.001 <0.001 0.002 0.002 0.003 0.005 0.003 0.005 0.003
Molybdenum (Mo) mg/L
APHA 22nd
Edition 3125 B
0.017 0.006 0.013 0.001 0.003 0.007 0.009 0.004 0.004 0.004 0.004
Cadmium( Cd ) mg/L
APHA 22nd
Edition 3125 B
<0.001 <0.001 <0.001 <0.001 <0.001 <0.001 <0.001 <0.001 <0.001 <0.001 <0.001
Barium(Ba) mg/L
APHA 22nd
Edition 3125 B
<0.001 <0.001 <0.001 <0.001 <0.001 <0.001 0.007 <0.001 <0.001 0.008 <0.001
Mercury(Hg) mg/L USEPA 200.8
<0.001 <0.001 <0.001 <0.001 <0.001 <0.001 <0.001 <0.001 <0.001 <0.001 <0.001
Lead( Pb ) mg/L
APHA 22nd
Edition 3125 B
<0.001 <0.001 <0.001 <0.001 <0.001 <0.001 <0.001 <0.001 <0.001 <0.001 <0.001
Total Coliform MPN/10
0 ml
IS 1622: 1981 RA
2009
<2 <2 <2 <2 <2 <2 <2 <2 <2 <2 <2
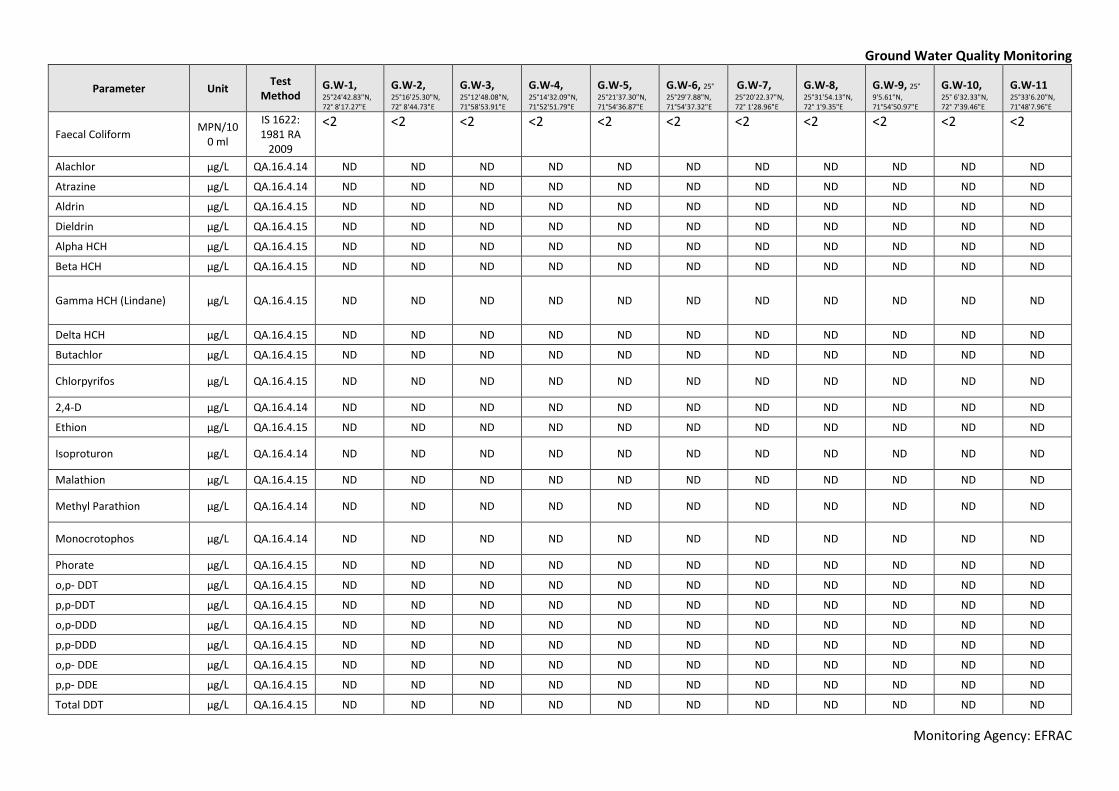
Ground Water Quality Monitoring
Monitoring Agency: EFRAC
Parameter Unit Test
Method G.W-1, 25°24'42.83"N, 72° 8'17.27"E
G.W-2, 25°16'25.30"N, 72° 8'44.73"E
G.W-3, 25°12'48.08"N, 71°58'53.91"E
G.W-4, 25°14'32.09"N, 71°52'51.79"E
G.W-5, 25°21'37.30"N, 71°54'36.87"E
G.W-6, 25°
25°29'7.88"N, 71°54'37.32"E
G.W-7, 25°20'22.37"N, 72° 1'28.96"E
G.W-8, 25°31'54.13"N, 72° 1'9.35"E
G.W-9, 25°
9'5.61"N, 71°54'50.97"E
G.W-10, 25° 6'32.33"N, 72° 7'39.46"E
G.W-11 25°33'6.20"N, 71°48'7.96"E
Faecal Coliform MPN/10
0 ml
IS 1622: 1981 RA
2009
<2 <2 <2 <2 <2 <2 <2 <2 <2 <2 <2
Alachlor µg/L QA.16.4.14 ND ND ND ND ND ND ND ND ND ND ND
Atrazine µg/L QA.16.4.14 ND ND ND ND ND ND ND ND ND ND ND
Aldrin µg/L QA.16.4.15 ND ND ND ND ND ND ND ND ND ND ND
Dieldrin µg/L QA.16.4.15 ND ND ND ND ND ND ND ND ND ND ND
Alpha HCH µg/L QA.16.4.15 ND ND ND ND ND ND ND ND ND ND ND
Beta HCH µg/L QA.16.4.15 ND ND ND ND ND ND ND ND ND ND ND
Gamma HCH (Lindane) µg/L QA.16.4.15 ND ND ND ND ND ND ND ND ND ND ND
Delta HCH µg/L QA.16.4.15 ND ND ND ND ND ND ND ND ND ND ND
Butachlor µg/L QA.16.4.15 ND ND ND ND ND ND ND ND ND ND ND
Chlorpyrifos µg/L QA.16.4.15 ND ND ND ND ND ND ND ND ND ND ND
2,4-D µg/L QA.16.4.14 ND ND ND ND ND ND ND ND ND ND ND
Ethion µg/L QA.16.4.15 ND ND ND ND ND ND ND ND ND ND ND
Isoproturon µg/L QA.16.4.14 ND ND ND ND ND ND ND ND ND ND ND
Malathion µg/L QA.16.4.15 ND ND ND ND ND ND ND ND ND ND ND
Methyl Parathion µg/L QA.16.4.14 ND ND ND ND ND ND ND ND ND ND ND
Monocrotophos µg/L QA.16.4.14 ND ND ND ND ND ND ND ND ND ND ND
Phorate µg/L QA.16.4.15 ND ND ND ND ND ND ND ND ND ND ND
o,p- DDT µg/L QA.16.4.15 ND ND ND ND ND ND ND ND ND ND ND
p,p-DDT µg/L QA.16.4.15 ND ND ND ND ND ND ND ND ND ND ND
o,p-DDD µg/L QA.16.4.15 ND ND ND ND ND ND ND ND ND ND ND
p,p-DDD µg/L QA.16.4.15 ND ND ND ND ND ND ND ND ND ND ND
o,p- DDE µg/L QA.16.4.15 ND ND ND ND ND ND ND ND ND ND ND
p,p- DDE µg/L QA.16.4.15 ND ND ND ND ND ND ND ND ND ND ND
Total DDT µg/L QA.16.4.15 ND ND ND ND ND ND ND ND ND ND ND
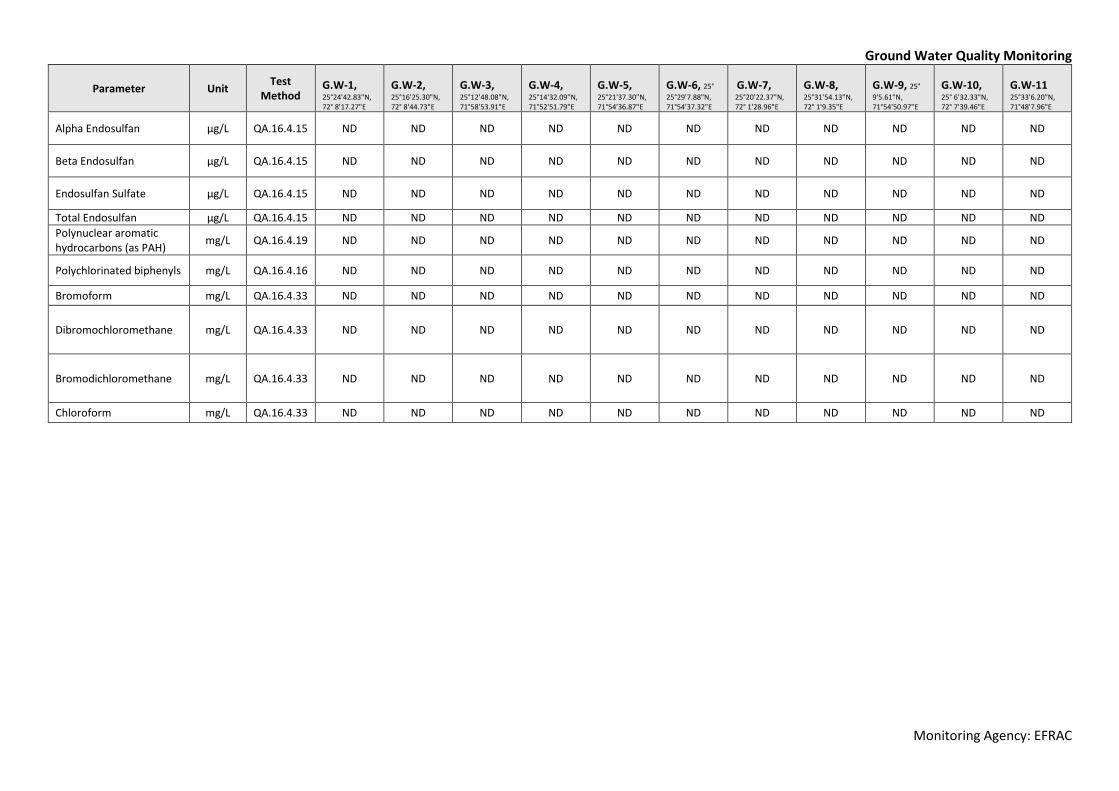
Ground Water Quality Monitoring
Monitoring Agency: EFRAC
Parameter Unit Test
Method G.W-1, 25°24'42.83"N, 72° 8'17.27"E
G.W-2, 25°16'25.30"N, 72° 8'44.73"E
G.W-3, 25°12'48.08"N, 71°58'53.91"E
G.W-4, 25°14'32.09"N, 71°52'51.79"E
G.W-5, 25°21'37.30"N, 71°54'36.87"E
G.W-6, 25°
25°29'7.88"N, 71°54'37.32"E
G.W-7, 25°20'22.37"N, 72° 1'28.96"E
G.W-8, 25°31'54.13"N, 72° 1'9.35"E
G.W-9, 25°
9'5.61"N, 71°54'50.97"E
G.W-10, 25° 6'32.33"N, 72° 7'39.46"E
G.W-11 25°33'6.20"N, 71°48'7.96"E
Alpha Endosulfan µg/L QA.16.4.15 ND ND ND ND ND ND ND ND ND ND ND
Beta Endosulfan µg/L QA.16.4.15 ND ND ND ND ND ND ND ND ND ND ND
Endosulfan Sulfate µg/L QA.16.4.15 ND ND ND ND ND ND ND ND ND ND ND
Total Endosulfan µg/L QA.16.4.15 ND ND ND ND ND ND ND ND ND ND ND
Polynuclear aromatic hydrocarbons (as PAH)
mg/L QA.16.4.19 ND ND ND ND ND ND ND ND ND ND ND
Polychlorinated biphenyls mg/L QA.16.4.16 ND ND ND ND ND ND ND ND ND ND ND
Bromoform mg/L QA.16.4.33 ND ND ND ND ND ND ND ND ND ND ND
Dibromochloromethane mg/L QA.16.4.33 ND ND ND ND ND ND ND ND ND ND ND
Bromodichloromethane mg/L QA.16.4.33 ND ND ND ND ND ND ND ND ND ND ND
Chloroform mg/L QA.16.4.33 ND ND ND ND ND ND ND ND ND ND ND
Appendix 3.5:
Surface Water
Quality Monitoring
Results
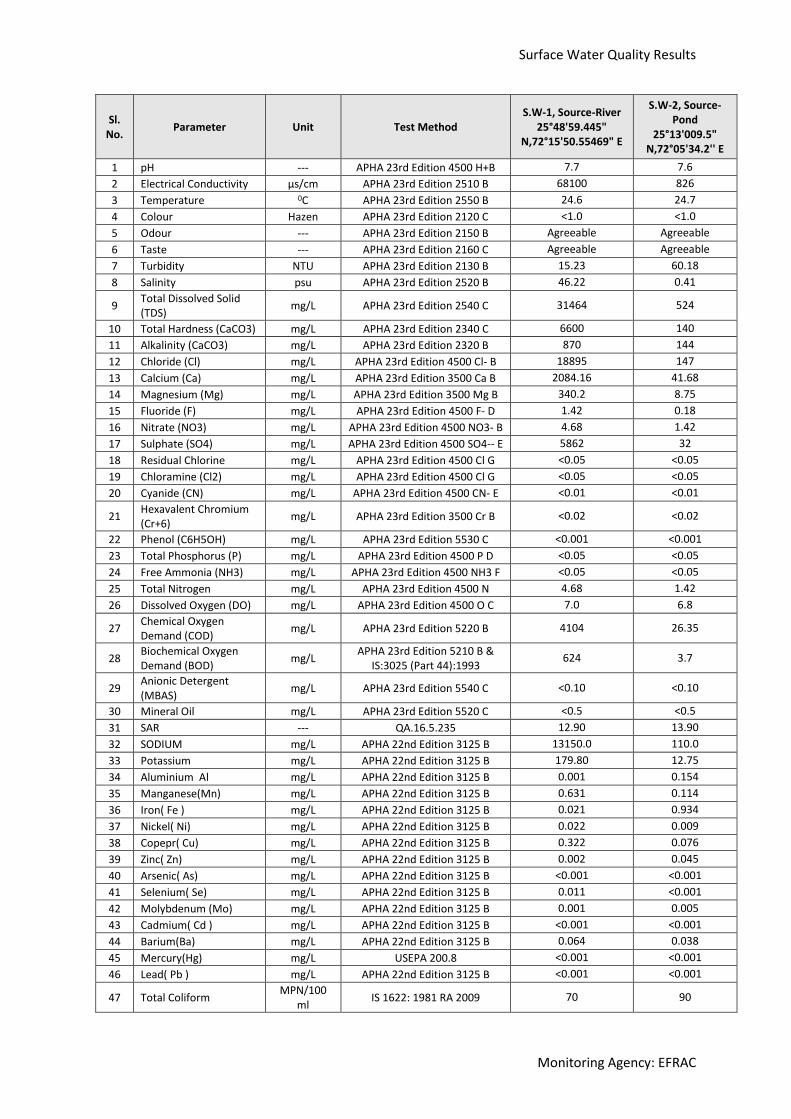
Surface Water Quality Results
Monitoring Agency: EFRAC
Sl. No.
Parameter Unit Test Method S.W-1, Source-River
25°48'59.445" N,72°15'50.55469" E
S.W-2, Source-Pond
25°13'009.5" N,72°05'34.2'' E
1 pH --- APHA 23rd Edition 4500 H+B 7.7 7.6
2 Electrical Conductivity µs/cm APHA 23rd Edition 2510 B 68100 826
3 Temperature 0C APHA 23rd Edition 2550 B 24.6 24.7
4 Colour Hazen APHA 23rd Edition 2120 C <1.0 <1.0
5 Odour --- APHA 23rd Edition 2150 B Agreeable Agreeable
6 Taste --- APHA 23rd Edition 2160 C Agreeable Agreeable
7 Turbidity NTU APHA 23rd Edition 2130 B 15.23 60.18
8 Salinity psu APHA 23rd Edition 2520 B 46.22 0.41
9 Total Dissolved Solid (TDS)
mg/L APHA 23rd Edition 2540 C 31464 524
10 Total Hardness (CaCO3) mg/L APHA 23rd Edition 2340 C 6600 140
11 Alkalinity (CaCO3) mg/L APHA 23rd Edition 2320 B 870 144
12 Chloride (Cl) mg/L APHA 23rd Edition 4500 Cl- B 18895 147
13 Calcium (Ca) mg/L APHA 23rd Edition 3500 Ca B 2084.16 41.68
14 Magnesium (Mg) mg/L APHA 23rd Edition 3500 Mg B 340.2 8.75
15 Fluoride (F) mg/L APHA 23rd Edition 4500 F- D 1.42 0.18
16 Nitrate (NO3) mg/L APHA 23rd Edition 4500 NO3- B 4.68 1.42
17 Sulphate (SO4) mg/L APHA 23rd Edition 4500 SO4-- E 5862 32
18 Residual Chlorine mg/L APHA 23rd Edition 4500 Cl G <0.05 <0.05
19 Chloramine (Cl2) mg/L APHA 23rd Edition 4500 Cl G <0.05 <0.05
20 Cyanide (CN) mg/L APHA 23rd Edition 4500 CN- E <0.01 <0.01
21 Hexavalent Chromium (Cr+6)
mg/L APHA 23rd Edition 3500 Cr B <0.02 <0.02
22 Phenol (C6H5OH) mg/L APHA 23rd Edition 5530 C <0.001 <0.001
23 Total Phosphorus (P) mg/L APHA 23rd Edition 4500 P D <0.05 <0.05
24 Free Ammonia (NH3) mg/L APHA 23rd Edition 4500 NH3 F <0.05 <0.05
25 Total Nitrogen mg/L APHA 23rd Edition 4500 N 4.68 1.42
26 Dissolved Oxygen (DO) mg/L APHA 23rd Edition 4500 O C 7.0 6.8
27 Chemical Oxygen Demand (COD)
mg/L APHA 23rd Edition 5220 B 4104 26.35
28 Biochemical Oxygen Demand (BOD)
mg/L APHA 23rd Edition 5210 B &
IS:3025 (Part 44):1993 624 3.7
29 Anionic Detergent (MBAS)
mg/L APHA 23rd Edition 5540 C <0.10 <0.10
30 Mineral Oil mg/L APHA 23rd Edition 5520 C <0.5 <0.5
31 SAR --- QA.16.5.235 12.90 13.90
32 SODIUM mg/L APHA 22nd Edition 3125 B 13150.0 110.0
33 Potassium mg/L APHA 22nd Edition 3125 B 179.80 12.75
34 Aluminium Al mg/L APHA 22nd Edition 3125 B 0.001 0.154
35 Manganese(Mn) mg/L APHA 22nd Edition 3125 B 0.631 0.114
36 Iron( Fe ) mg/L APHA 22nd Edition 3125 B 0.021 0.934
37 Nickel( Ni) mg/L APHA 22nd Edition 3125 B 0.022 0.009
38 Copepr( Cu) mg/L APHA 22nd Edition 3125 B 0.322 0.076
39 Zinc( Zn) mg/L APHA 22nd Edition 3125 B 0.002 0.045
40 Arsenic( As) mg/L APHA 22nd Edition 3125 B <0.001 <0.001
41 Selenium( Se) mg/L APHA 22nd Edition 3125 B 0.011 <0.001
42 Molybdenum (Mo) mg/L APHA 22nd Edition 3125 B 0.001 0.005
43 Cadmium( Cd ) mg/L APHA 22nd Edition 3125 B <0.001 <0.001
44 Barium(Ba) mg/L APHA 22nd Edition 3125 B 0.064 0.038
45 Mercury(Hg) mg/L USEPA 200.8 <0.001 <0.001
46 Lead( Pb ) mg/L APHA 22nd Edition 3125 B <0.001 <0.001
47 Total Coliform MPN/100
ml IS 1622: 1981 RA 2009 70 90
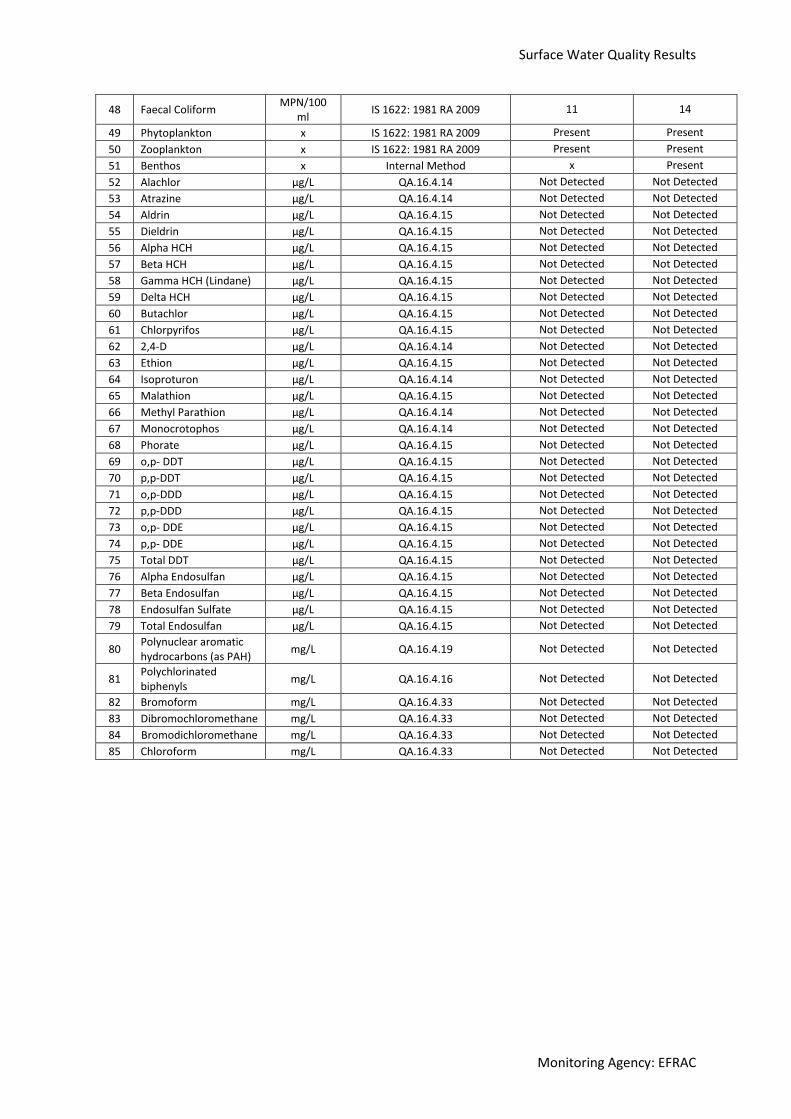
Surface Water Quality Results
Monitoring Agency: EFRAC
48 Faecal Coliform MPN/100
ml IS 1622: 1981 RA 2009 11 14
49 Phytoplankton x IS 1622: 1981 RA 2009 Present Present
50 Zooplankton x IS 1622: 1981 RA 2009 Present Present
51 Benthos x Internal Method x Present
52 Alachlor µg/L QA.16.4.14 Not Detected Not Detected
53 Atrazine µg/L QA.16.4.14 Not Detected Not Detected
54 Aldrin µg/L QA.16.4.15 Not Detected Not Detected
55 Dieldrin µg/L QA.16.4.15 Not Detected Not Detected
56 Alpha HCH µg/L QA.16.4.15 Not Detected Not Detected
57 Beta HCH µg/L QA.16.4.15 Not Detected Not Detected
58 Gamma HCH (Lindane) µg/L QA.16.4.15 Not Detected Not Detected
59 Delta HCH µg/L QA.16.4.15 Not Detected Not Detected
60 Butachlor µg/L QA.16.4.15 Not Detected Not Detected
61 Chlorpyrifos µg/L QA.16.4.15 Not Detected Not Detected
62 2,4-D µg/L QA.16.4.14 Not Detected Not Detected
63 Ethion µg/L QA.16.4.15 Not Detected Not Detected
64 Isoproturon µg/L QA.16.4.14 Not Detected Not Detected
65 Malathion µg/L QA.16.4.15 Not Detected Not Detected
66 Methyl Parathion µg/L QA.16.4.14 Not Detected Not Detected
67 Monocrotophos µg/L QA.16.4.14 Not Detected Not Detected
68 Phorate µg/L QA.16.4.15 Not Detected Not Detected
69 o,p- DDT µg/L QA.16.4.15 Not Detected Not Detected
70 p,p-DDT µg/L QA.16.4.15 Not Detected Not Detected
71 o,p-DDD µg/L QA.16.4.15 Not Detected Not Detected
72 p,p-DDD µg/L QA.16.4.15 Not Detected Not Detected
73 o,p- DDE µg/L QA.16.4.15 Not Detected Not Detected
74 p,p- DDE µg/L QA.16.4.15 Not Detected Not Detected
75 Total DDT µg/L QA.16.4.15 Not Detected Not Detected
76 Alpha Endosulfan µg/L QA.16.4.15 Not Detected Not Detected
77 Beta Endosulfan µg/L QA.16.4.15 Not Detected Not Detected
78 Endosulfan Sulfate µg/L QA.16.4.15 Not Detected Not Detected
79 Total Endosulfan µg/L QA.16.4.15 Not Detected Not Detected
80 Polynuclear aromatic hydrocarbons (as PAH)
mg/L QA.16.4.19 Not Detected Not Detected
81 Polychlorinated biphenyls
mg/L QA.16.4.16 Not Detected Not Detected
82 Bromoform mg/L QA.16.4.33 Not Detected Not Detected
83 Dibromochloromethane mg/L QA.16.4.33 Not Detected Not Detected
84 Bromodichloromethane mg/L QA.16.4.33 Not Detected Not Detected
85 Chloroform mg/L QA.16.4.33 Not Detected Not Detected
Appendix 3.6: Soil
Monitoring Results
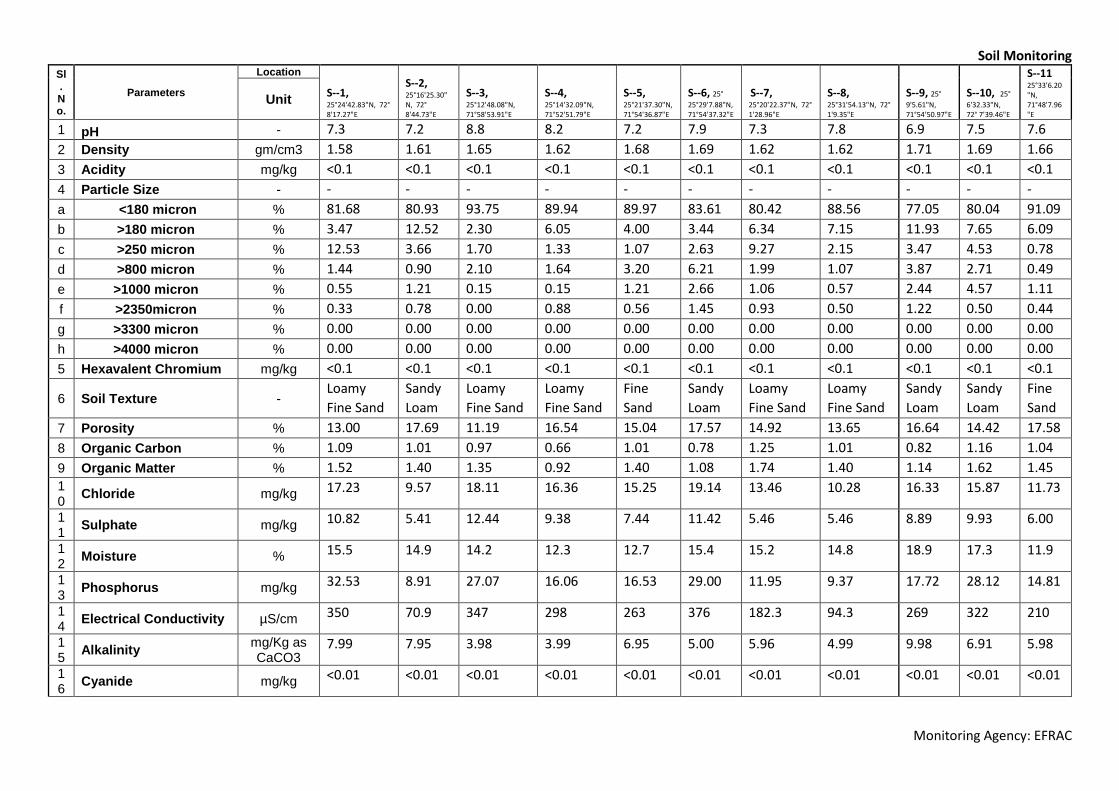
Soil Monitoring
Monitoring Agency: EFRAC
Sl. No.
Parameters
Location
S--1, 25°24'42.83"N, 72° 8'17.27"E
S--2, 25°16'25.30"N, 72° 8'44.73"E
S--3, 25°12'48.08"N, 71°58'53.91"E
S--4, 25°14'32.09"N, 71°52'51.79"E
S--5, 25°21'37.30"N, 71°54'36.87"E
S--6, 25°
25°29'7.88"N, 71°54'37.32"E
S--7, 25°20'22.37"N, 72° 1'28.96"E
S--8, 25°31'54.13"N, 72° 1'9.35"E
S--9, 25°
9'5.61"N, 71°54'50.97"E
S--10, 25°
6'32.33"N, 72° 7'39.46"E
S--11 25°33'6.20"N, 71°48'7.96"E
Unit
1 pH - 7.3 7.2 8.8 8.2 7.2 7.9 7.3 7.8 6.9 7.5 7.6
2 Density gm/cm3 1.58 1.61 1.65 1.62 1.68 1.69 1.62 1.62 1.71 1.69 1.66
3 Acidity mg/kg <0.1 <0.1 <0.1 <0.1 <0.1 <0.1 <0.1 <0.1 <0.1 <0.1 <0.1
4 Particle Size - - - - - - - - - - - -
a <180 micron % 81.68 80.93 93.75 89.94 89.97 83.61 80.42 88.56 77.05 80.04 91.09
b >180 micron % 3.47 12.52 2.30 6.05 4.00 3.44 6.34 7.15 11.93 7.65 6.09
c >250 micron % 12.53 3.66 1.70 1.33 1.07 2.63 9.27 2.15 3.47 4.53 0.78
d >800 micron % 1.44 0.90 2.10 1.64 3.20 6.21 1.99 1.07 3.87 2.71 0.49
e >1000 micron % 0.55 1.21 0.15 0.15 1.21 2.66 1.06 0.57 2.44 4.57 1.11
f >2350micron % 0.33 0.78 0.00 0.88 0.56 1.45 0.93 0.50 1.22 0.50 0.44
g >3300 micron % 0.00 0.00 0.00 0.00 0.00 0.00 0.00 0.00 0.00 0.00 0.00
h >4000 micron % 0.00 0.00 0.00 0.00 0.00 0.00 0.00 0.00 0.00 0.00 0.00
5 Hexavalent Chromium mg/kg <0.1 <0.1 <0.1 <0.1 <0.1 <0.1 <0.1 <0.1 <0.1 <0.1 <0.1
6 Soil Texture - Loamy
Fine Sand
Sandy
Loam
Loamy
Fine Sand
Loamy
Fine Sand
Fine
Sand
Sandy
Loam
Loamy
Fine Sand
Loamy
Fine Sand
Sandy
Loam
Sandy
Loam
Fine
Sand
7 Porosity % 13.00 17.69 11.19 16.54 15.04 17.57 14.92 13.65 16.64 14.42 17.58
8 Organic Carbon % 1.09 1.01 0.97 0.66 1.01 0.78 1.25 1.01 0.82 1.16 1.04
9 Organic Matter % 1.52 1.40 1.35 0.92 1.40 1.08 1.74 1.40 1.14 1.62 1.45 10
Chloride mg/kg 17.23 9.57 18.11 16.36 15.25 19.14 13.46 10.28 16.33 15.87 11.73
11
Sulphate mg/kg 10.82 5.41 12.44 9.38 7.44 11.42 5.46 5.46 8.89 9.93 6.00
12
Moisture % 15.5 14.9 14.2 12.3 12.7 15.4 15.2 14.8 18.9 17.3 11.9
13
Phosphorus mg/kg 32.53 8.91 27.07 16.06 16.53 29.00 11.95 9.37 17.72 28.12 14.81
14
Electrical Conductivity µS/cm 350 70.9 347 298 263 376 182.3 94.3 269 322 210
15
Alkalinity mg/Kg as CaCO3
7.99 7.95 3.98 3.99 6.95 5.00 5.96 4.99 9.98 6.91 5.98
16
Cyanide mg/kg <0.01 <0.01 <0.01 <0.01 <0.01 <0.01 <0.01 <0.01 <0.01 <0.01 <0.01
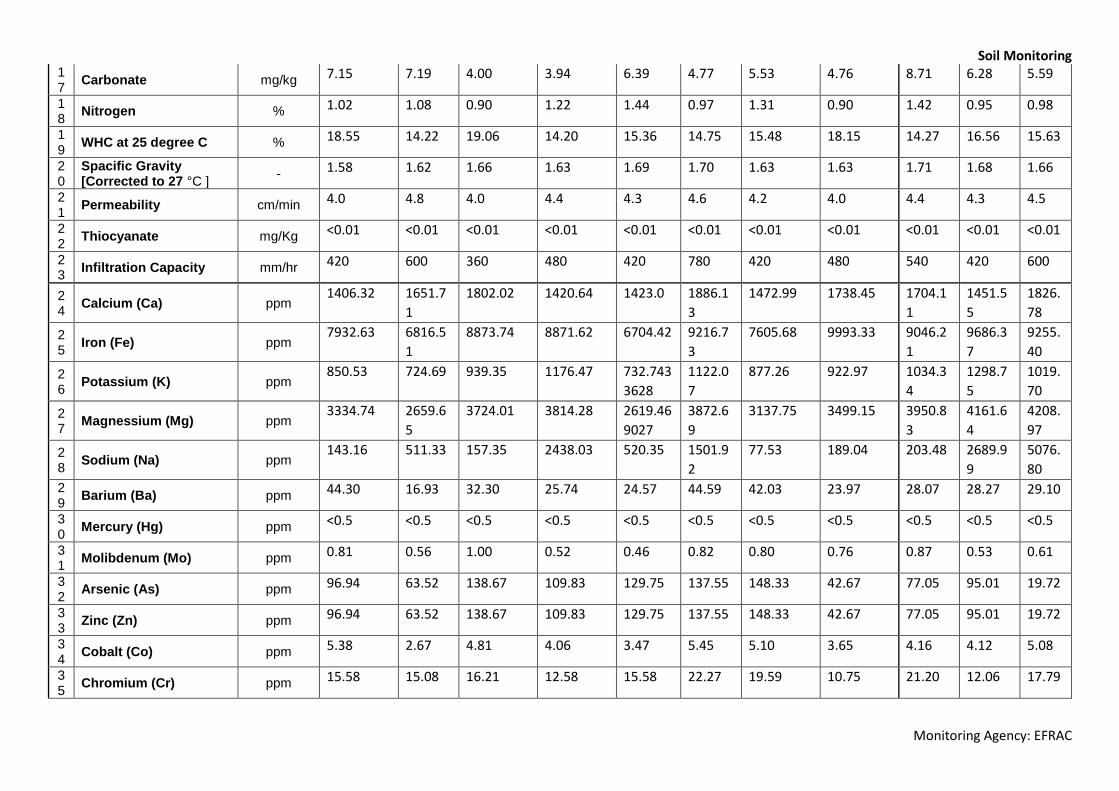
Soil Monitoring
Monitoring Agency: EFRAC
17
Carbonate mg/kg 7.15 7.19 4.00 3.94 6.39 4.77 5.53 4.76 8.71 6.28 5.59
18
Nitrogen % 1.02 1.08 0.90 1.22 1.44 0.97 1.31 0.90 1.42 0.95 0.98
19
WHC at 25 degree C % 18.55 14.22 19.06 14.20 15.36 14.75 15.48 18.15 14.27 16.56 15.63
20
Spacific Gravity [Corrected to 27 °C ]
- 1.58 1.62 1.66 1.63 1.69 1.70 1.63 1.63 1.71 1.68 1.66
21
Permeability cm/min 4.0 4.8 4.0 4.4 4.3 4.6 4.2 4.0 4.4 4.3 4.5
22
Thiocyanate mg/Kg <0.01 <0.01 <0.01 <0.01 <0.01 <0.01 <0.01 <0.01 <0.01 <0.01 <0.01
23
Infiltration Capacity mm/hr 420 600 360 480 420 780 420 480 540 420 600
24
Calcium (Ca) ppm 1406.32 1651.7
1
1802.02 1420.64 1423.0 1886.1
3
1472.99 1738.45 1704.1
1
1451.5
5
1826.
78
25
Iron (Fe) ppm 7932.63 6816.5
1
8873.74 8871.62 6704.42 9216.7
3
7605.68 9993.33 9046.2
1
9686.3
7
9255.
40
26
Potassium (K) ppm 850.53 724.69 939.35 1176.47 732.743
3628
1122.0
7
877.26 922.97 1034.3
4
1298.7
5
1019.
70
27
Magnessium (Mg) ppm 3334.74 2659.6
5
3724.01 3814.28 2619.46
9027
3872.6
9
3137.75 3499.15 3950.8
3
4161.6
4
4208.
97
28
Sodium (Na) ppm 143.16 511.33 157.35 2438.03 520.35 1501.9
2
77.53 189.04 203.48 2689.9
9
5076.
80
29
Barium (Ba) ppm 44.30 16.93 32.30 25.74 24.57 44.59 42.03 23.97 28.07 28.27 29.10
30
Mercury (Hg) ppm <0.5 <0.5 <0.5 <0.5 <0.5 <0.5 <0.5 <0.5 <0.5 <0.5 <0.5
31
Molibdenum (Mo) ppm 0.81 0.56 1.00 0.52 0.46 0.82 0.80 0.76 0.87 0.53 0.61
32
Arsenic (As) ppm 96.94 63.52 138.67 109.83 129.75 137.55 148.33 42.67 77.05 95.01 19.72
33
Zinc (Zn) ppm 96.94 63.52 138.67 109.83 129.75 137.55 148.33 42.67 77.05 95.01 19.72
34
Cobalt (Co) ppm 5.38 2.67 4.81 4.06 3.47 5.45 5.10 3.65 4.16 4.12 5.08
35
Chromium (Cr) ppm 15.58 15.08 16.21 12.58 15.58 22.27 19.59 10.75 21.20 12.06 17.79
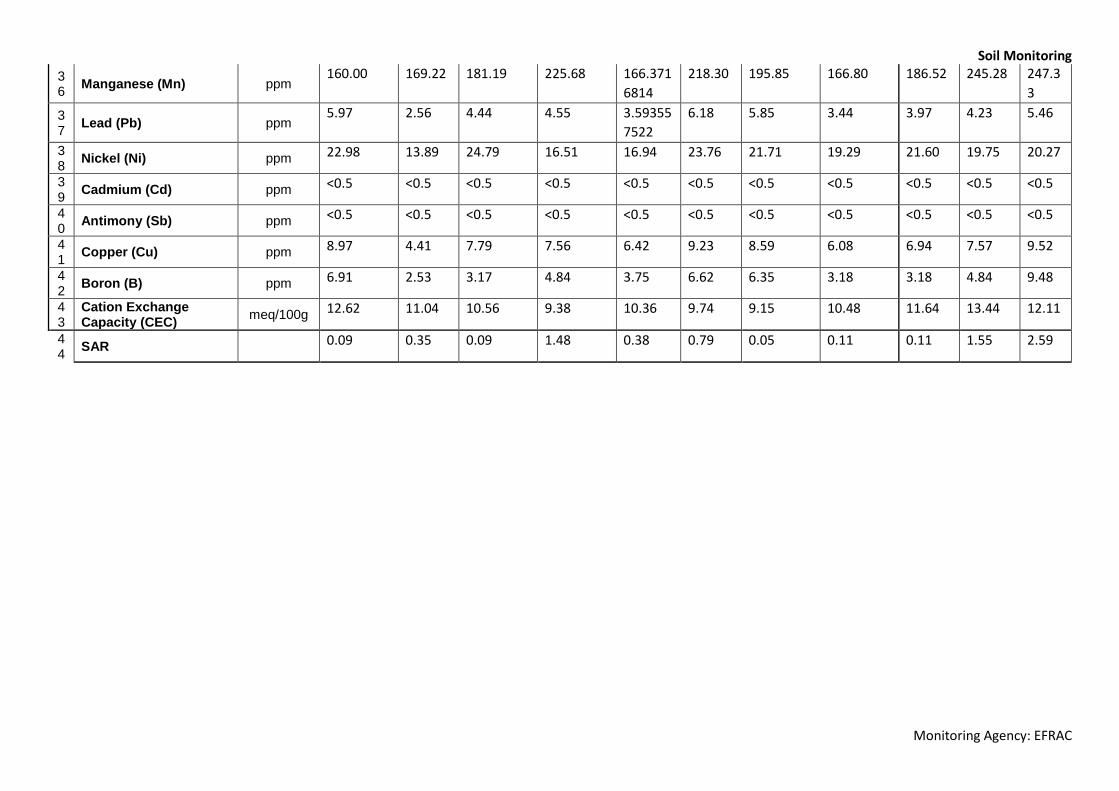
Soil Monitoring
Monitoring Agency: EFRAC
36
Manganese (Mn) ppm 160.00 169.22 181.19 225.68 166.371
6814
218.30 195.85 166.80 186.52 245.28 247.3
3
37
Lead (Pb) ppm 5.97 2.56 4.44 4.55 3.59355
7522
6.18 5.85 3.44 3.97 4.23 5.46
38
Nickel (Ni) ppm 22.98 13.89 24.79 16.51 16.94 23.76 21.71 19.29 21.60 19.75 20.27
39
Cadmium (Cd) ppm <0.5 <0.5 <0.5 <0.5 <0.5 <0.5 <0.5 <0.5 <0.5 <0.5 <0.5
40
Antimony (Sb) ppm <0.5 <0.5 <0.5 <0.5 <0.5 <0.5 <0.5 <0.5 <0.5 <0.5 <0.5
41
Copper (Cu) ppm 8.97 4.41 7.79 7.56 6.42 9.23 8.59 6.08 6.94 7.57 9.52
42
Boron (B) ppm 6.91 2.53 3.17 4.84 3.75 6.62 6.35 3.18 3.18 4.84 9.48
43
Cation Exchange Capacity (CEC)
meq/100g 12.62 11.04 10.56 9.38 10.36 9.74 9.15 10.48 11.64 13.44 12.11
44
SAR 0.09 0.35 0.09 1.48 0.38 0.79 0.05 0.11 0.11 1.55 2.59

Appendix 3.7: Traffic
Survey Results
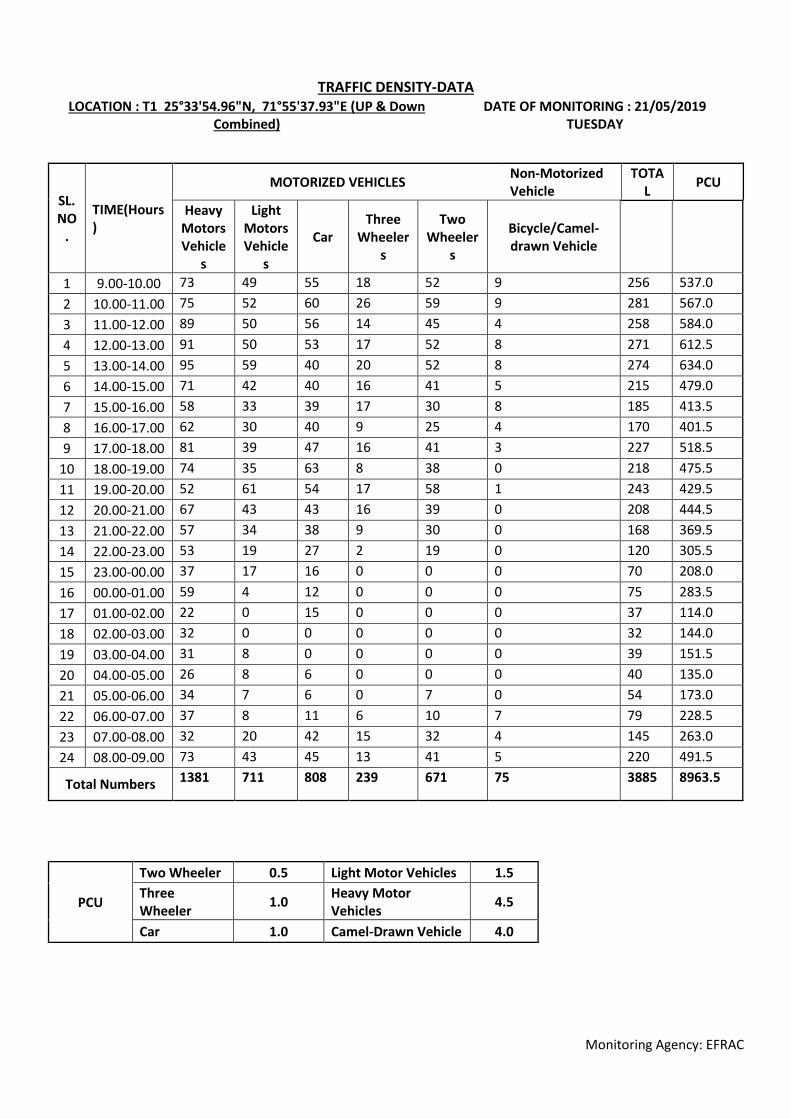
Monitoring Agency: EFRAC
TRAFFIC DENSITY-DATA LOCATION : T1 25°33'54.96"N, 71°55'37.93"E (UP & Down
Combined) DATE OF MONITORING : 21/05/2019
TUESDAY
SL. NO
.
TIME(Hours)
MOTORIZED VEHICLES Non-Motorized Vehicle
TOTAL
PCU
Heavy Motors Vehicle
s
Light Motors Vehicle
s
Car Three
Wheelers
Two Wheeler
s
Bicycle/Camel-drawn Vehicle
1 9.00-10.00 73 49 55 18 52 9 256 537.0
2 10.00-11.00 75 52 60 26 59 9 281 567.0
3 11.00-12.00 89 50 56 14 45 4 258 584.0
4 12.00-13.00 91 50 53 17 52 8 271 612.5
5 13.00-14.00 95 59 40 20 52 8 274 634.0
6 14.00-15.00 71 42 40 16 41 5 215 479.0
7 15.00-16.00 58 33 39 17 30 8 185 413.5
8 16.00-17.00 62 30 40 9 25 4 170 401.5
9 17.00-18.00 81 39 47 16 41 3 227 518.5
10 18.00-19.00 74 35 63 8 38 0 218 475.5
11 19.00-20.00 52 61 54 17 58 1 243 429.5
12 20.00-21.00 67 43 43 16 39 0 208 444.5
13 21.00-22.00 57 34 38 9 30 0 168 369.5
14 22.00-23.00 53 19 27 2 19 0 120 305.5
15 23.00-00.00 37 17 16 0 0 0 70 208.0
16 00.00-01.00 59 4 12 0 0 0 75 283.5
17 01.00-02.00 22 0 15 0 0 0 37 114.0
18 02.00-03.00 32 0 0 0 0 0 32 144.0
19 03.00-04.00 31 8 0 0 0 0 39 151.5
20 04.00-05.00 26 8 6 0 0 0 40 135.0
21 05.00-06.00 34 7 6 0 7 0 54 173.0
22 06.00-07.00 37 8 11 6 10 7 79 228.5
23 07.00-08.00 32 20 42 15 32 4 145 263.0
24 08.00-09.00 73 43 45 13 41 5 220 491.5
Total Numbers 1381 711 808 239 671 75 3885 8963.5
PCU
Two Wheeler 0.5 Light Motor Vehicles 1.5
Three Wheeler
1.0 Heavy Motor Vehicles
4.5
Car 1.0 Camel-Drawn Vehicle 4.0
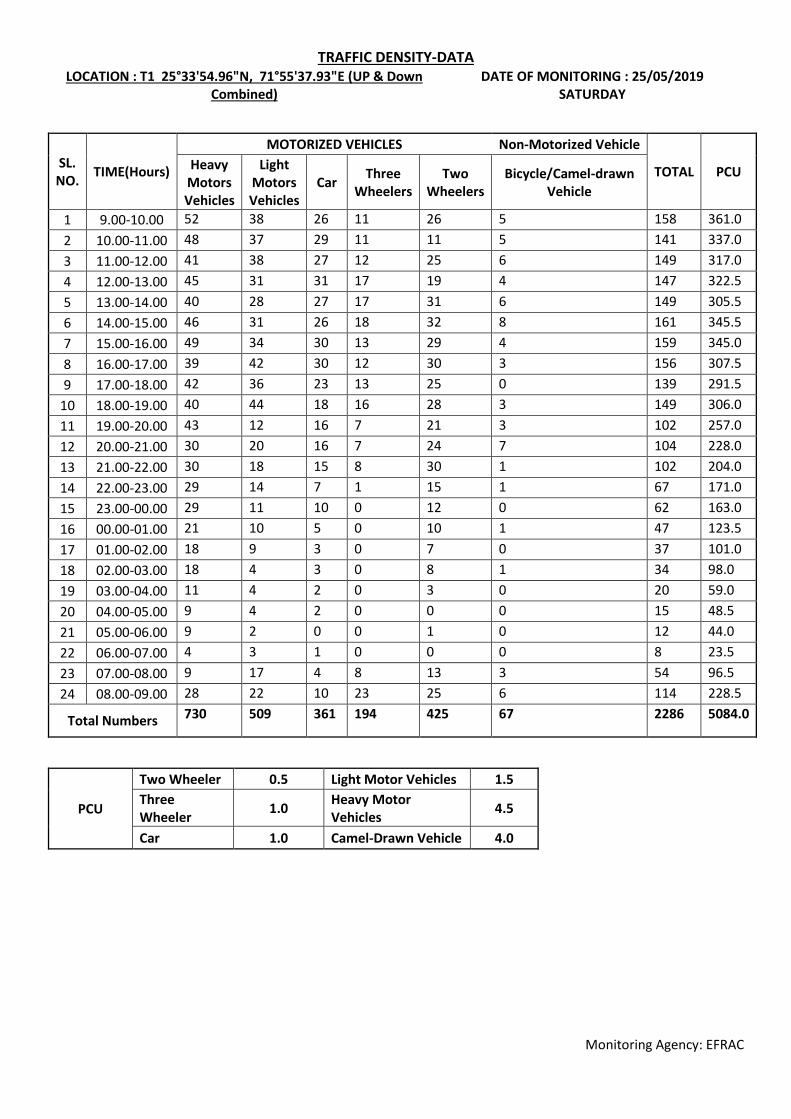
Monitoring Agency: EFRAC
TRAFFIC DENSITY-DATA LOCATION : T1 25°33'54.96"N, 71°55'37.93"E (UP & Down
Combined) DATE OF MONITORING : 25/05/2019
SATURDAY
SL. NO.
TIME(Hours)
MOTORIZED VEHICLES Non-Motorized Vehicle
TOTAL PCU Heavy Motors Vehicles
Light Motors Vehicles
Car Three
Wheelers Two
Wheelers Bicycle/Camel-drawn
Vehicle
1 9.00-10.00 52 38 26 11 26 5 158 361.0
2 10.00-11.00 48 37 29 11 11 5 141 337.0
3 11.00-12.00 41 38 27 12 25 6 149 317.0
4 12.00-13.00 45 31 31 17 19 4 147 322.5
5 13.00-14.00 40 28 27 17 31 6 149 305.5
6 14.00-15.00 46 31 26 18 32 8 161 345.5
7 15.00-16.00 49 34 30 13 29 4 159 345.0
8 16.00-17.00 39 42 30 12 30 3 156 307.5
9 17.00-18.00 42 36 23 13 25 0 139 291.5
10 18.00-19.00 40 44 18 16 28 3 149 306.0
11 19.00-20.00 43 12 16 7 21 3 102 257.0
12 20.00-21.00 30 20 16 7 24 7 104 228.0
13 21.00-22.00 30 18 15 8 30 1 102 204.0
14 22.00-23.00 29 14 7 1 15 1 67 171.0
15 23.00-00.00 29 11 10 0 12 0 62 163.0
16 00.00-01.00 21 10 5 0 10 1 47 123.5
17 01.00-02.00 18 9 3 0 7 0 37 101.0
18 02.00-03.00 18 4 3 0 8 1 34 98.0
19 03.00-04.00 11 4 2 0 3 0 20 59.0
20 04.00-05.00 9 4 2 0 0 0 15 48.5
21 05.00-06.00 9 2 0 0 1 0 12 44.0
22 06.00-07.00 4 3 1 0 0 0 8 23.5
23 07.00-08.00 9 17 4 8 13 3 54 96.5
24 08.00-09.00 28 22 10 23 25 6 114 228.5
Total Numbers 730 509 361 194 425 67 2286 5084.0
PCU
Two Wheeler 0.5 Light Motor Vehicles 1.5
Three Wheeler
1.0 Heavy Motor Vehicles
4.5
Car 1.0 Camel-Drawn Vehicle 4.0

Monitoring Agency: EFRAC
TRAFFIC DENSITY-DATA LOCATION : T2 25°26'32.26"N, 72° 2'2.37"E (UP & Down
Combined) DATE OF MONITORING : 17/05/2019
FRIDAY
SL. NO.
TIME(Hours)
MOTORIZED VEHICLES Non-Motorized Vehicle TOTAL PCU
Heavy Motors Vehicles
Light Motors Vehicles
Car Three
Wheelers Two
Wheelers Bicycle/Camel-drawn
Vehicle
1 9.00-10.00 70 48 52 24 35 9 238 516.5
2 10.00-11.00 84 57 54 24 50 7 276 594.5
3 11.00-12.00 79 55 58 25 55 6 278 572.5
4 12.00-13.00 94 47 42 18 47 9 257 613.0
5 13.00-14.00 101 53 48 11 54 9 276 656.0
6 14.00-15.00 78 55 43 15 43 4 238 529.0
7 15.00-16.00 70 48 52 16 30 3 219 482.0
8 16.00-17.00 79 44 43 9 26 11 212 530.5
9 17.00-18.00 87 52 46 19 44 4 252 572.5
10 18.00-19.00 78 47 57 19 40 2 243 525.5
11 19.00-20.00 91 40 51 14 63 3 262 578.0
12 20.00-21.00 65 28 39 19 39 1 191 416.0
13 21.00-22.00 70 32 32 13 27 1 175 425.5
14 22.00-23.00 39 14 24 7 18 0 102 236.5
15 23.00-00.00 62 15 17 0 0 0 94 318.5
16 00.00-01.00 26 1 11 0 0 0 38 129.5
17 01.00-02.00 21 2 15 0 0 0 38 112.5
18 02.00-03.00 15 0 8 1 0 0 24 76.5
19 03.00-04.00 24 2 1 1 0 0 28 113.0
20 04.00-05.00 24 4 22 0 0 0 50 136.0
21 05.00-06.00 18 10 18 2 10 0 58 121.0
22 06.00-07.00 22 18 17 11 9 3 80 170.5
23 07.00-08.00 37 38 22 12 18 8 135 298.5
24 08.00-09.00 34 34 25 16 23 6 138 280.5
Total Numbers 1368 744 797 276 631 86 3902 9004.5
PCU
Two Wheeler 0.5 Light Motor Vehicles 1.5
Three Wheeler
1.0 Heavy Motor Vehicles
4.5
Car 1.0 Camel-Drawn Vehicle 4.0
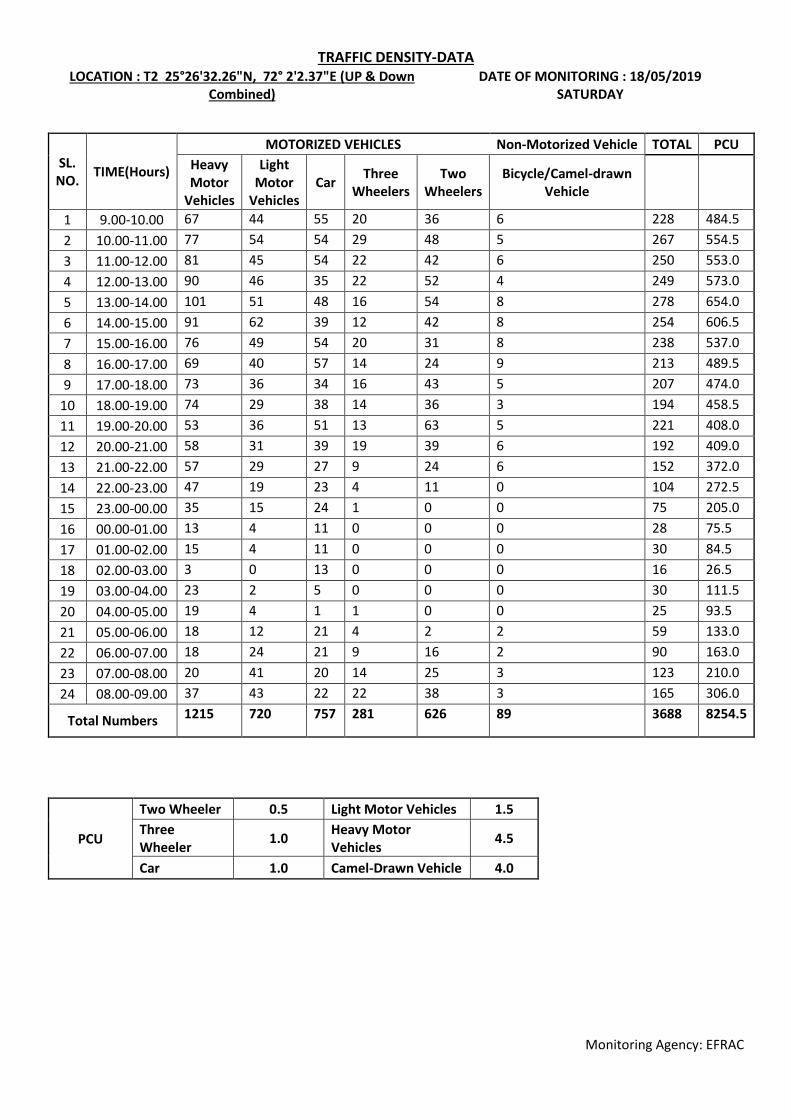
Monitoring Agency: EFRAC
TRAFFIC DENSITY-DATA LOCATION : T2 25°26'32.26"N, 72° 2'2.37"E (UP & Down
Combined) DATE OF MONITORING : 18/05/2019
SATURDAY
SL. NO.
TIME(Hours)
MOTORIZED VEHICLES Non-Motorized Vehicle TOTAL PCU
Heavy Motor
Vehicles
Light Motor
Vehicles Car
Three Wheelers
Two Wheelers
Bicycle/Camel-drawn Vehicle
1 9.00-10.00 67 44 55 20 36 6 228 484.5
2 10.00-11.00 77 54 54 29 48 5 267 554.5
3 11.00-12.00 81 45 54 22 42 6 250 553.0
4 12.00-13.00 90 46 35 22 52 4 249 573.0
5 13.00-14.00 101 51 48 16 54 8 278 654.0
6 14.00-15.00 91 62 39 12 42 8 254 606.5
7 15.00-16.00 76 49 54 20 31 8 238 537.0
8 16.00-17.00 69 40 57 14 24 9 213 489.5
9 17.00-18.00 73 36 34 16 43 5 207 474.0
10 18.00-19.00 74 29 38 14 36 3 194 458.5
11 19.00-20.00 53 36 51 13 63 5 221 408.0
12 20.00-21.00 58 31 39 19 39 6 192 409.0
13 21.00-22.00 57 29 27 9 24 6 152 372.0
14 22.00-23.00 47 19 23 4 11 0 104 272.5
15 23.00-00.00 35 15 24 1 0 0 75 205.0
16 00.00-01.00 13 4 11 0 0 0 28 75.5
17 01.00-02.00 15 4 11 0 0 0 30 84.5
18 02.00-03.00 3 0 13 0 0 0 16 26.5
19 03.00-04.00 23 2 5 0 0 0 30 111.5
20 04.00-05.00 19 4 1 1 0 0 25 93.5
21 05.00-06.00 18 12 21 4 2 2 59 133.0
22 06.00-07.00 18 24 21 9 16 2 90 163.0
23 07.00-08.00 20 41 20 14 25 3 123 210.0
24 08.00-09.00 37 43 22 22 38 3 165 306.0
Total Numbers 1215 720 757 281 626 89 3688 8254.5
PCU
Two Wheeler 0.5 Light Motor Vehicles 1.5
Three Wheeler
1.0 Heavy Motor Vehicles
4.5
Car 1.0 Camel-Drawn Vehicle 4.0
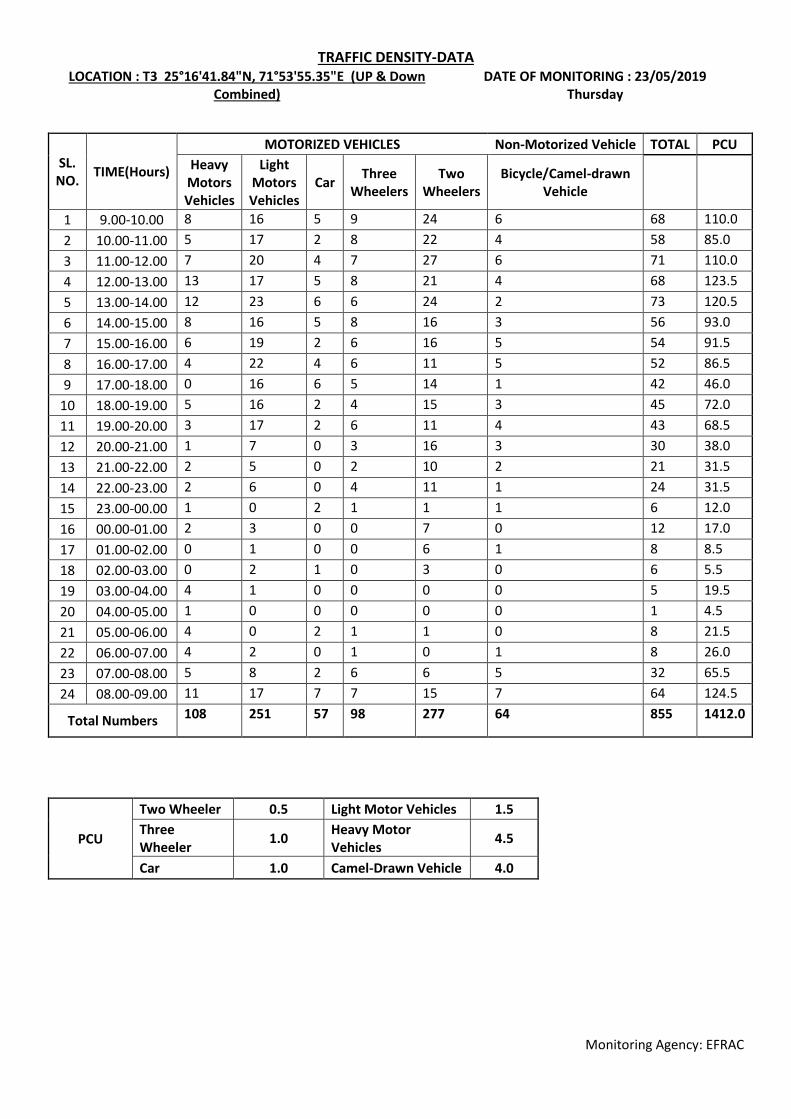
Monitoring Agency: EFRAC
TRAFFIC DENSITY-DATA LOCATION : T3 25°16'41.84"N, 71°53'55.35"E (UP & Down
Combined) DATE OF MONITORING : 23/05/2019
Thursday
SL. NO.
TIME(Hours)
MOTORIZED VEHICLES Non-Motorized Vehicle TOTAL PCU
Heavy Motors Vehicles
Light Motors Vehicles
Car Three
Wheelers Two
Wheelers Bicycle/Camel-drawn
Vehicle
1 9.00-10.00 8 16 5 9 24 6 68 110.0
2 10.00-11.00 5 17 2 8 22 4 58 85.0
3 11.00-12.00 7 20 4 7 27 6 71 110.0
4 12.00-13.00 13 17 5 8 21 4 68 123.5
5 13.00-14.00 12 23 6 6 24 2 73 120.5
6 14.00-15.00 8 16 5 8 16 3 56 93.0
7 15.00-16.00 6 19 2 6 16 5 54 91.5
8 16.00-17.00 4 22 4 6 11 5 52 86.5
9 17.00-18.00 0 16 6 5 14 1 42 46.0
10 18.00-19.00 5 16 2 4 15 3 45 72.0
11 19.00-20.00 3 17 2 6 11 4 43 68.5
12 20.00-21.00 1 7 0 3 16 3 30 38.0
13 21.00-22.00 2 5 0 2 10 2 21 31.5
14 22.00-23.00 2 6 0 4 11 1 24 31.5
15 23.00-00.00 1 0 2 1 1 1 6 12.0
16 00.00-01.00 2 3 0 0 7 0 12 17.0
17 01.00-02.00 0 1 0 0 6 1 8 8.5
18 02.00-03.00 0 2 1 0 3 0 6 5.5
19 03.00-04.00 4 1 0 0 0 0 5 19.5
20 04.00-05.00 1 0 0 0 0 0 1 4.5
21 05.00-06.00 4 0 2 1 1 0 8 21.5
22 06.00-07.00 4 2 0 1 0 1 8 26.0
23 07.00-08.00 5 8 2 6 6 5 32 65.5
24 08.00-09.00 11 17 7 7 15 7 64 124.5
Total Numbers 108 251 57 98 277 64 855 1412.0
PCU
Two Wheeler 0.5 Light Motor Vehicles 1.5
Three Wheeler
1.0 Heavy Motor Vehicles
4.5
Car 1.0 Camel-Drawn Vehicle 4.0
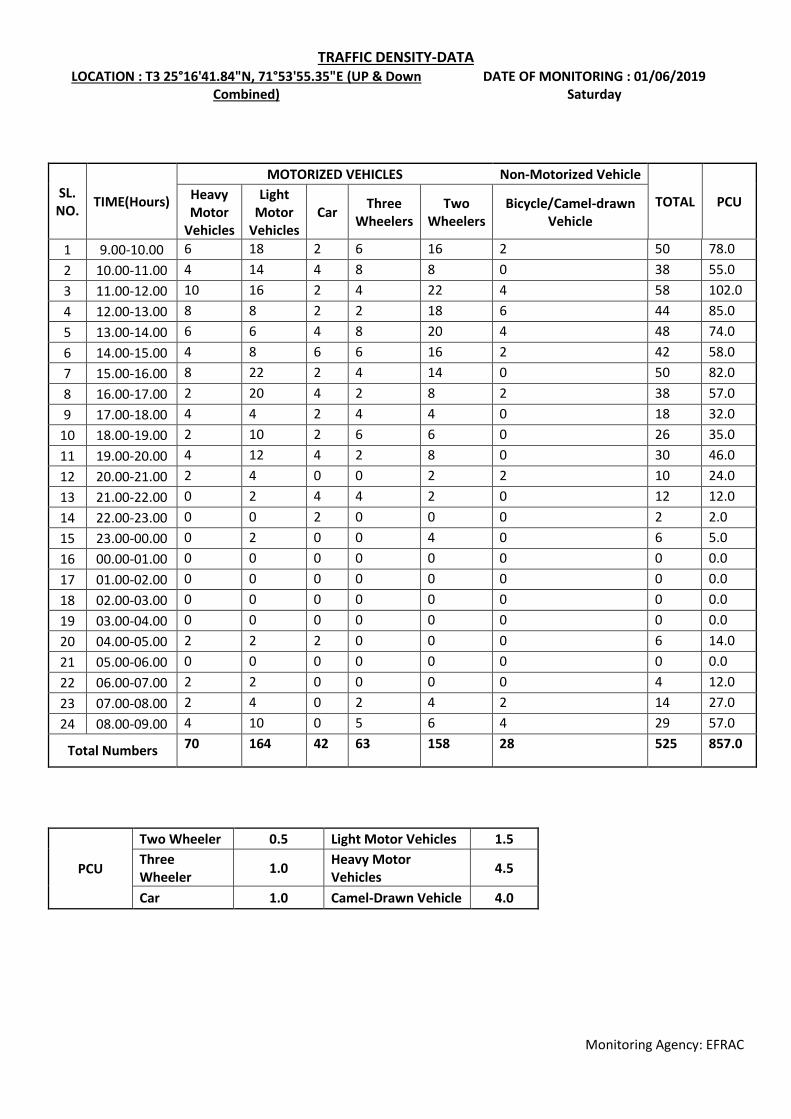
Monitoring Agency: EFRAC
TRAFFIC DENSITY-DATA LOCATION : T3 25°16'41.84"N, 71°53'55.35"E (UP & Down
Combined) DATE OF MONITORING : 01/06/2019
Saturday
SL. NO.
TIME(Hours)
MOTORIZED VEHICLES Non-Motorized Vehicle
TOTAL PCU Heavy Motor
Vehicles
Light Motor
Vehicles Car
Three Wheelers
Two Wheelers
Bicycle/Camel-drawn Vehicle
1 9.00-10.00 6 18 2 6 16 2 50 78.0
2 10.00-11.00 4 14 4 8 8 0 38 55.0
3 11.00-12.00 10 16 2 4 22 4 58 102.0
4 12.00-13.00 8 8 2 2 18 6 44 85.0
5 13.00-14.00 6 6 4 8 20 4 48 74.0
6 14.00-15.00 4 8 6 6 16 2 42 58.0
7 15.00-16.00 8 22 2 4 14 0 50 82.0
8 16.00-17.00 2 20 4 2 8 2 38 57.0
9 17.00-18.00 4 4 2 4 4 0 18 32.0
10 18.00-19.00 2 10 2 6 6 0 26 35.0
11 19.00-20.00 4 12 4 2 8 0 30 46.0
12 20.00-21.00 2 4 0 0 2 2 10 24.0
13 21.00-22.00 0 2 4 4 2 0 12 12.0
14 22.00-23.00 0 0 2 0 0 0 2 2.0
15 23.00-00.00 0 2 0 0 4 0 6 5.0
16 00.00-01.00 0 0 0 0 0 0 0 0.0
17 01.00-02.00 0 0 0 0 0 0 0 0.0
18 02.00-03.00 0 0 0 0 0 0 0 0.0
19 03.00-04.00 0 0 0 0 0 0 0 0.0
20 04.00-05.00 2 2 2 0 0 0 6 14.0
21 05.00-06.00 0 0 0 0 0 0 0 0.0
22 06.00-07.00 2 2 0 0 0 0 4 12.0
23 07.00-08.00 2 4 0 2 4 2 14 27.0
24 08.00-09.00 4 10 0 5 6 4 29 57.0
Total Numbers 70 164 42 63 158 28 525 857.0
PCU
Two Wheeler 0.5 Light Motor Vehicles 1.5
Three Wheeler
1.0 Heavy Motor Vehicles
4.5
Car 1.0 Camel-Drawn Vehicle 4.0
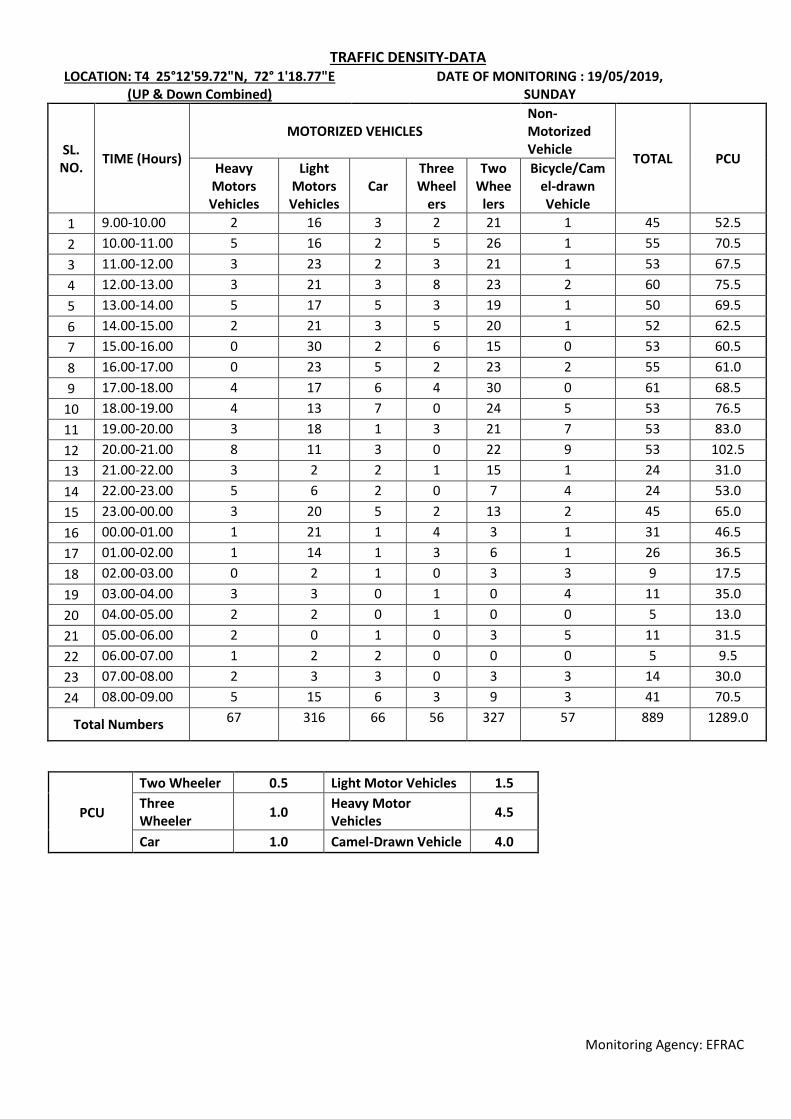
Monitoring Agency: EFRAC
TRAFFIC DENSITY-DATA LOCATION: T4 25°12'59.72"N, 72° 1'18.77"E
(UP & Down Combined) DATE OF MONITORING : 19/05/2019,
SUNDAY
SL. NO.
TIME (Hours)
MOTORIZED VEHICLES Non-Motorized Vehicle
TOTAL PCU Heavy
Motors Vehicles
Light Motors Vehicles
Car Three Wheel
ers
Two Whee
lers
Bicycle/Camel-drawn Vehicle
1 9.00-10.00 2 16 3 2 21 1 45 52.5
2 10.00-11.00 5 16 2 5 26 1 55 70.5
3 11.00-12.00 3 23 2 3 21 1 53 67.5
4 12.00-13.00 3 21 3 8 23 2 60 75.5
5 13.00-14.00 5 17 5 3 19 1 50 69.5
6 14.00-15.00 2 21 3 5 20 1 52 62.5
7 15.00-16.00 0 30 2 6 15 0 53 60.5
8 16.00-17.00 0 23 5 2 23 2 55 61.0
9 17.00-18.00 4 17 6 4 30 0 61 68.5
10 18.00-19.00 4 13 7 0 24 5 53 76.5
11 19.00-20.00 3 18 1 3 21 7 53 83.0
12 20.00-21.00 8 11 3 0 22 9 53 102.5
13 21.00-22.00 3 2 2 1 15 1 24 31.0
14 22.00-23.00 5 6 2 0 7 4 24 53.0
15 23.00-00.00 3 20 5 2 13 2 45 65.0
16 00.00-01.00 1 21 1 4 3 1 31 46.5
17 01.00-02.00 1 14 1 3 6 1 26 36.5
18 02.00-03.00 0 2 1 0 3 3 9 17.5
19 03.00-04.00 3 3 0 1 0 4 11 35.0
20 04.00-05.00 2 2 0 1 0 0 5 13.0
21 05.00-06.00 2 0 1 0 3 5 11 31.5
22 06.00-07.00 1 2 2 0 0 0 5 9.5
23 07.00-08.00 2 3 3 0 3 3 14 30.0
24 08.00-09.00 5 15 6 3 9 3 41 70.5
Total Numbers 67 316 66 56 327 57 889 1289.0
PCU
Two Wheeler 0.5 Light Motor Vehicles 1.5
Three Wheeler
1.0 Heavy Motor Vehicles
4.5
Car 1.0 Camel-Drawn Vehicle 4.0
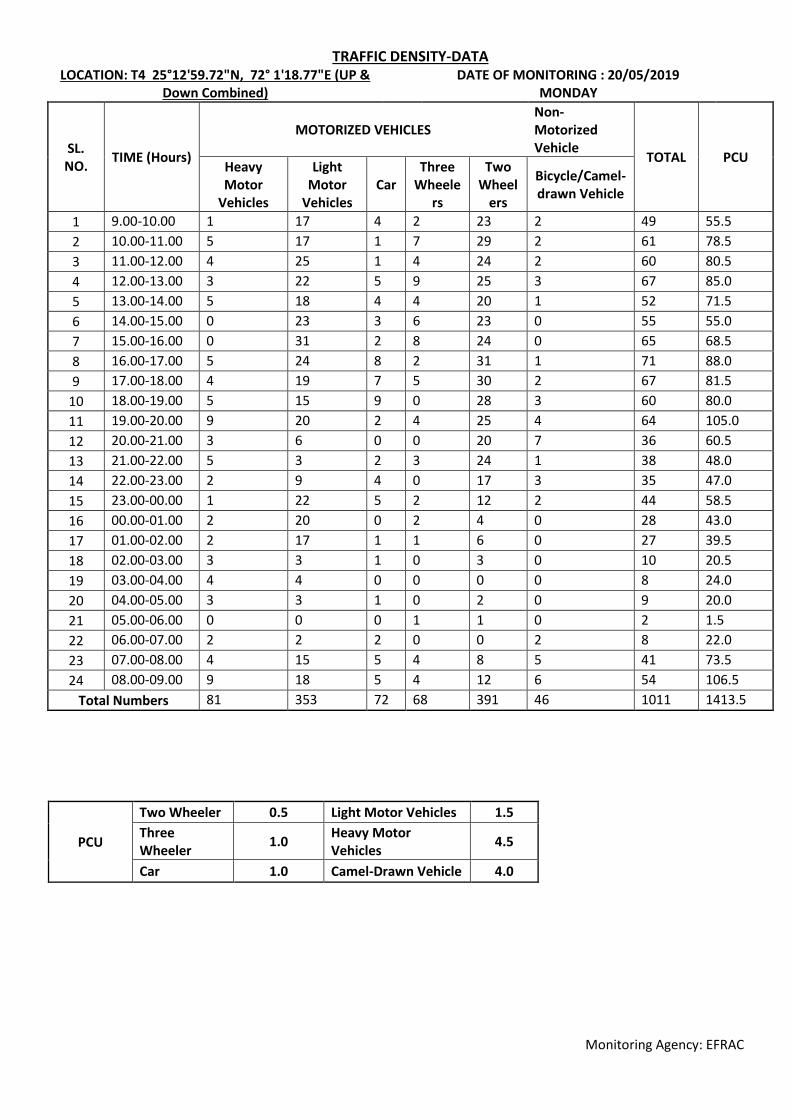
Monitoring Agency: EFRAC
TRAFFIC DENSITY-DATA LOCATION: T4 25°12'59.72"N, 72° 1'18.77"E (UP &
Down Combined) DATE OF MONITORING : 20/05/2019
MONDAY
SL. NO.
TIME (Hours)
MOTORIZED VEHICLES Non-Motorized Vehicle
TOTAL PCU Heavy Motor
Vehicles
Light Motor
Vehicles Car
Three Wheele
rs
Two Wheel
ers
Bicycle/Camel-drawn Vehicle
1 9.00-10.00 1 17 4 2 23 2 49 55.5
2 10.00-11.00 5 17 1 7 29 2 61 78.5
3 11.00-12.00 4 25 1 4 24 2 60 80.5
4 12.00-13.00 3 22 5 9 25 3 67 85.0
5 13.00-14.00 5 18 4 4 20 1 52 71.5
6 14.00-15.00 0 23 3 6 23 0 55 55.0
7 15.00-16.00 0 31 2 8 24 0 65 68.5
8 16.00-17.00 5 24 8 2 31 1 71 88.0
9 17.00-18.00 4 19 7 5 30 2 67 81.5
10 18.00-19.00 5 15 9 0 28 3 60 80.0
11 19.00-20.00 9 20 2 4 25 4 64 105.0
12 20.00-21.00 3 6 0 0 20 7 36 60.5
13 21.00-22.00 5 3 2 3 24 1 38 48.0
14 22.00-23.00 2 9 4 0 17 3 35 47.0
15 23.00-00.00 1 22 5 2 12 2 44 58.5
16 00.00-01.00 2 20 0 2 4 0 28 43.0
17 01.00-02.00 2 17 1 1 6 0 27 39.5
18 02.00-03.00 3 3 1 0 3 0 10 20.5
19 03.00-04.00 4 4 0 0 0 0 8 24.0
20 04.00-05.00 3 3 1 0 2 0 9 20.0
21 05.00-06.00 0 0 0 1 1 0 2 1.5
22 06.00-07.00 2 2 2 0 0 2 8 22.0
23 07.00-08.00 4 15 5 4 8 5 41 73.5
24 08.00-09.00 9 18 5 4 12 6 54 106.5
Total Numbers 81 353 72 68 391 46 1011 1413.5
PCU
Two Wheeler 0.5 Light Motor Vehicles 1.5
Three Wheeler
1.0 Heavy Motor Vehicles
4.5
Car 1.0 Camel-Drawn Vehicle 4.0
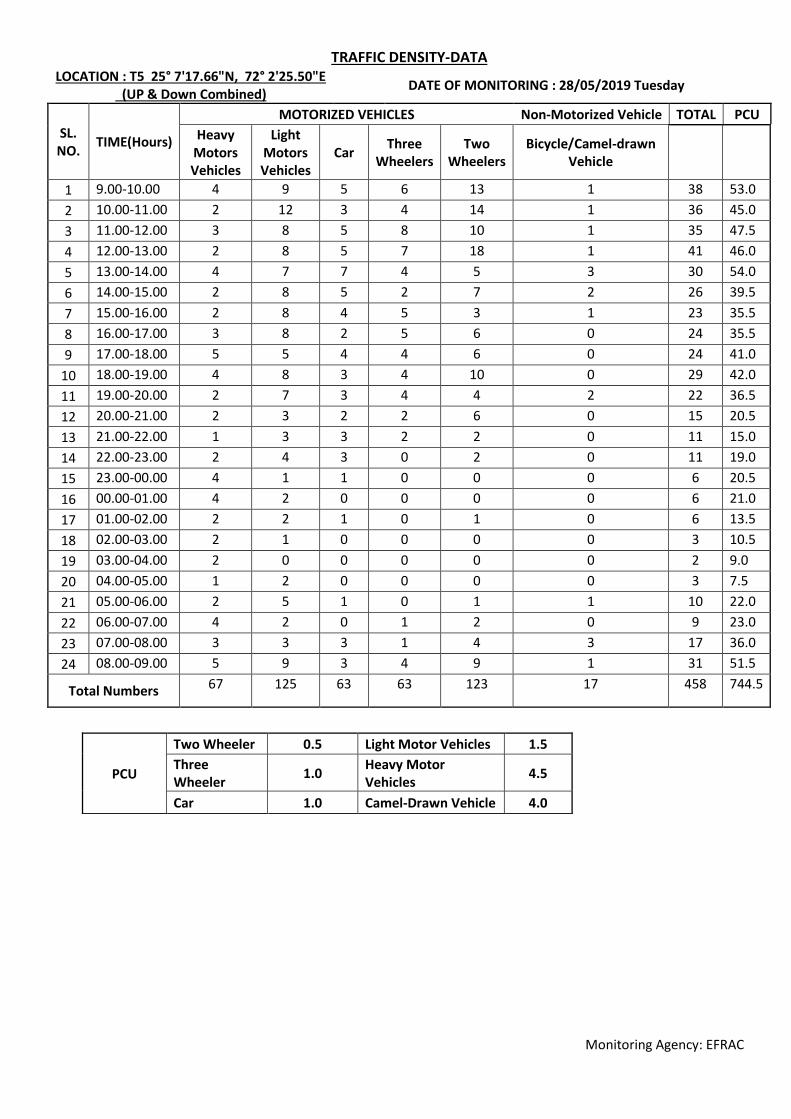
Monitoring Agency: EFRAC
TRAFFIC DENSITY-DATA LOCATION : T5 25° 7'17.66"N, 72° 2'25.50"E
(UP & Down Combined) DATE OF MONITORING : 28/05/2019 Tuesday
SL. NO.
TIME(Hours)
MOTORIZED VEHICLES Non-Motorized Vehicle TOTAL PCU
Heavy Motors Vehicles
Light Motors Vehicles
Car Three
Wheelers Two
Wheelers Bicycle/Camel-drawn
Vehicle
1 9.00-10.00 4 9 5 6 13 1 38 53.0
2 10.00-11.00 2 12 3 4 14 1 36 45.0
3 11.00-12.00 3 8 5 8 10 1 35 47.5
4 12.00-13.00 2 8 5 7 18 1 41 46.0
5 13.00-14.00 4 7 7 4 5 3 30 54.0
6 14.00-15.00 2 8 5 2 7 2 26 39.5
7 15.00-16.00 2 8 4 5 3 1 23 35.5
8 16.00-17.00 3 8 2 5 6 0 24 35.5
9 17.00-18.00 5 5 4 4 6 0 24 41.0
10 18.00-19.00 4 8 3 4 10 0 29 42.0
11 19.00-20.00 2 7 3 4 4 2 22 36.5
12 20.00-21.00 2 3 2 2 6 0 15 20.5
13 21.00-22.00 1 3 3 2 2 0 11 15.0
14 22.00-23.00 2 4 3 0 2 0 11 19.0
15 23.00-00.00 4 1 1 0 0 0 6 20.5
16 00.00-01.00 4 2 0 0 0 0 6 21.0
17 01.00-02.00 2 2 1 0 1 0 6 13.5
18 02.00-03.00 2 1 0 0 0 0 3 10.5
19 03.00-04.00 2 0 0 0 0 0 2 9.0
20 04.00-05.00 1 2 0 0 0 0 3 7.5
21 05.00-06.00 2 5 1 0 1 1 10 22.0
22 06.00-07.00 4 2 0 1 2 0 9 23.0
23 07.00-08.00 3 3 3 1 4 3 17 36.0
24 08.00-09.00 5 9 3 4 9 1 31 51.5
Total Numbers 67 125 63 63 123 17 458 744.5
PCU
Two Wheeler 0.5 Light Motor Vehicles 1.5
Three Wheeler
1.0 Heavy Motor Vehicles
4.5
Car 1.0 Camel-Drawn Vehicle 4.0
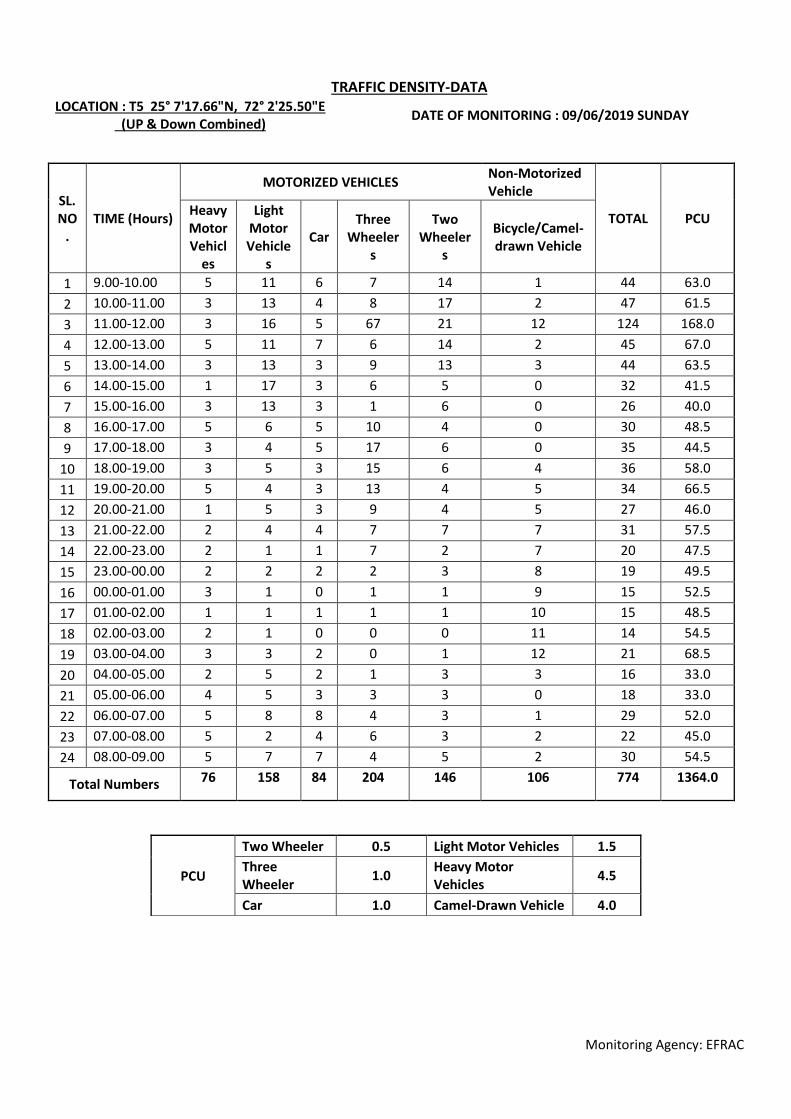
Monitoring Agency: EFRAC
TRAFFIC DENSITY-DATA LOCATION : T5 25° 7'17.66"N, 72° 2'25.50"E
(UP & Down Combined) DATE OF MONITORING : 09/06/2019 SUNDAY
SL. NO
. TIME (Hours)
MOTORIZED VEHICLES Non-Motorized Vehicle
TOTAL PCU Heavy Motor Vehicl
es
Light Motor Vehicle
s
Car Three
Wheelers
Two Wheeler
s
Bicycle/Camel-drawn Vehicle
1 9.00-10.00 5 11 6 7 14 1 44 63.0
2 10.00-11.00 3 13 4 8 17 2 47 61.5
3 11.00-12.00 3 16 5 67 21 12 124 168.0
4 12.00-13.00 5 11 7 6 14 2 45 67.0
5 13.00-14.00 3 13 3 9 13 3 44 63.5
6 14.00-15.00 1 17 3 6 5 0 32 41.5
7 15.00-16.00 3 13 3 1 6 0 26 40.0
8 16.00-17.00 5 6 5 10 4 0 30 48.5
9 17.00-18.00 3 4 5 17 6 0 35 44.5
10 18.00-19.00 3 5 3 15 6 4 36 58.0
11 19.00-20.00 5 4 3 13 4 5 34 66.5
12 20.00-21.00 1 5 3 9 4 5 27 46.0
13 21.00-22.00 2 4 4 7 7 7 31 57.5
14 22.00-23.00 2 1 1 7 2 7 20 47.5
15 23.00-00.00 2 2 2 2 3 8 19 49.5
16 00.00-01.00 3 1 0 1 1 9 15 52.5
17 01.00-02.00 1 1 1 1 1 10 15 48.5
18 02.00-03.00 2 1 0 0 0 11 14 54.5
19 03.00-04.00 3 3 2 0 1 12 21 68.5
20 04.00-05.00 2 5 2 1 3 3 16 33.0
21 05.00-06.00 4 5 3 3 3 0 18 33.0
22 06.00-07.00 5 8 8 4 3 1 29 52.0
23 07.00-08.00 5 2 4 6 3 2 22 45.0
24 08.00-09.00 5 7 7 4 5 2 30 54.5
Total Numbers 76 158 84 204 146 106 774 1364.0
PCU
Two Wheeler 0.5 Light Motor Vehicles 1.5
Three Wheeler
1.0 Heavy Motor Vehicles
4.5
Car 1.0 Camel-Drawn Vehicle 4.0
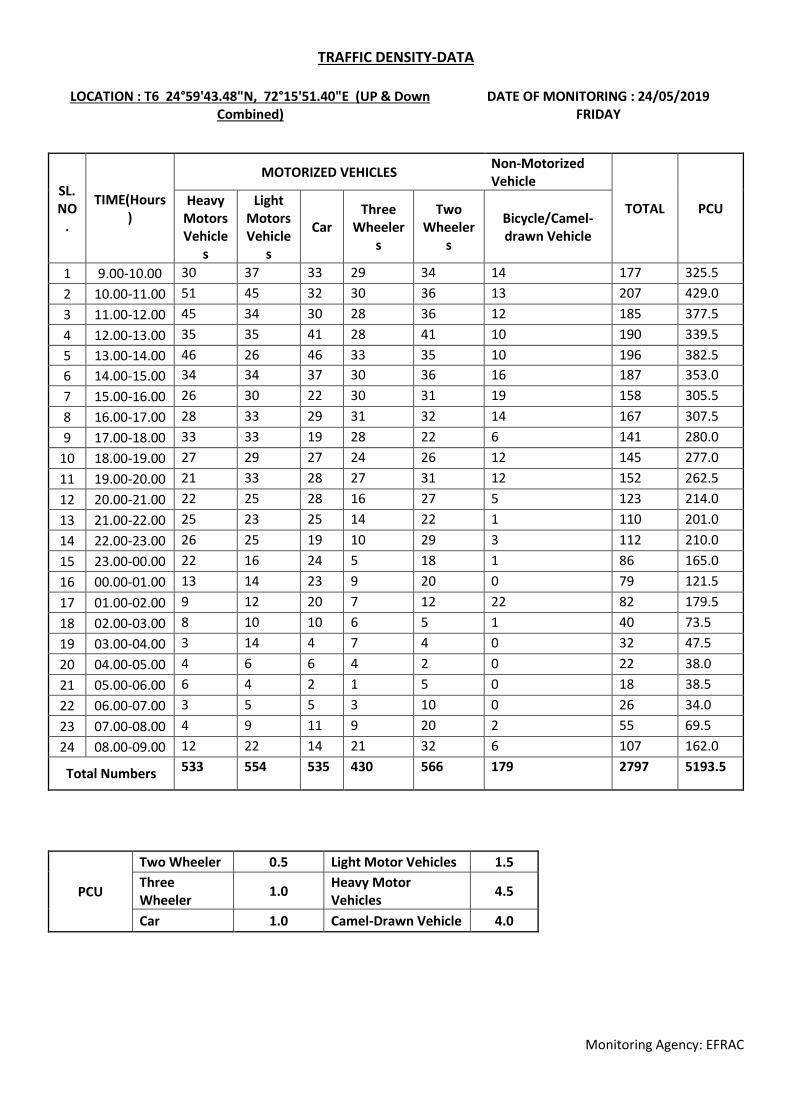
Monitoring Agency: EFRAC
TRAFFIC DENSITY-DATA
LOCATION : T6 24°59'43.48"N, 72°15'51.40"E (UP & Down Combined)
DATE OF MONITORING : 24/05/2019 FRIDAY
SL. NO
.
TIME(Hours)
MOTORIZED VEHICLES Non-Motorized Vehicle
TOTAL PCU Heavy
Motors Vehicle
s
Light Motors Vehicle
s
Car Three
Wheelers
Two Wheeler
s
Bicycle/Camel-drawn Vehicle
1 9.00-10.00 30 37 33 29 34 14 177 325.5
2 10.00-11.00 51 45 32 30 36 13 207 429.0
3 11.00-12.00 45 34 30 28 36 12 185 377.5
4 12.00-13.00 35 35 41 28 41 10 190 339.5
5 13.00-14.00 46 26 46 33 35 10 196 382.5
6 14.00-15.00 34 34 37 30 36 16 187 353.0
7 15.00-16.00 26 30 22 30 31 19 158 305.5
8 16.00-17.00 28 33 29 31 32 14 167 307.5
9 17.00-18.00 33 33 19 28 22 6 141 280.0
10 18.00-19.00 27 29 27 24 26 12 145 277.0
11 19.00-20.00 21 33 28 27 31 12 152 262.5
12 20.00-21.00 22 25 28 16 27 5 123 214.0
13 21.00-22.00 25 23 25 14 22 1 110 201.0
14 22.00-23.00 26 25 19 10 29 3 112 210.0
15 23.00-00.00 22 16 24 5 18 1 86 165.0
16 00.00-01.00 13 14 23 9 20 0 79 121.5
17 01.00-02.00 9 12 20 7 12 22 82 179.5
18 02.00-03.00 8 10 10 6 5 1 40 73.5
19 03.00-04.00 3 14 4 7 4 0 32 47.5
20 04.00-05.00 4 6 6 4 2 0 22 38.0
21 05.00-06.00 6 4 2 1 5 0 18 38.5
22 06.00-07.00 3 5 5 3 10 0 26 34.0
23 07.00-08.00 4 9 11 9 20 2 55 69.5
24 08.00-09.00 12 22 14 21 32 6 107 162.0
Total Numbers 533 554 535 430 566 179 2797 5193.5
PCU
Two Wheeler 0.5 Light Motor Vehicles 1.5
Three Wheeler
1.0 Heavy Motor Vehicles
4.5
Car 1.0 Camel-Drawn Vehicle 4.0
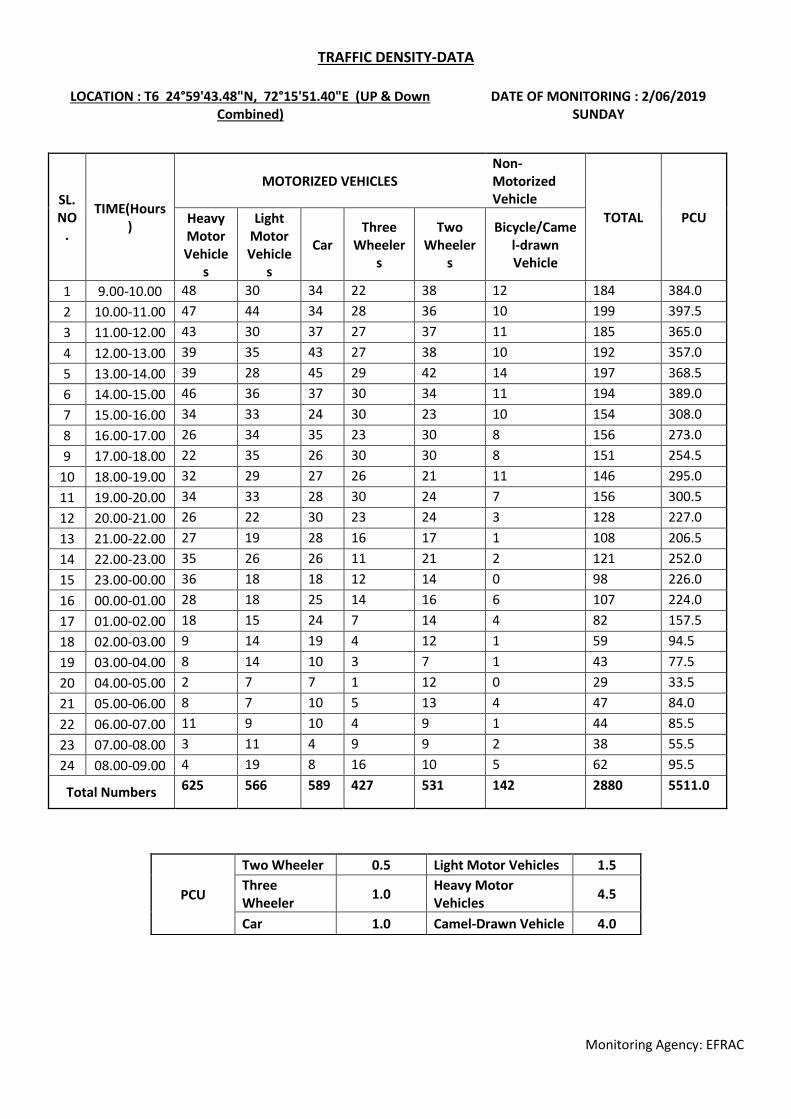
Monitoring Agency: EFRAC
TRAFFIC DENSITY-DATA
LOCATION : T6 24°59'43.48"N, 72°15'51.40"E (UP & Down Combined)
DATE OF MONITORING : 2/06/2019 SUNDAY
SL. NO
.
TIME(Hours)
MOTORIZED VEHICLES Non-Motorized Vehicle
TOTAL PCU Heavy Motor Vehicle
s
Light Motor Vehicle
s
Car Three
Wheelers
Two Wheeler
s
Bicycle/Camel-drawn Vehicle
1 9.00-10.00 48 30 34 22 38 12 184 384.0
2 10.00-11.00 47 44 34 28 36 10 199 397.5
3 11.00-12.00 43 30 37 27 37 11 185 365.0
4 12.00-13.00 39 35 43 27 38 10 192 357.0
5 13.00-14.00 39 28 45 29 42 14 197 368.5
6 14.00-15.00 46 36 37 30 34 11 194 389.0
7 15.00-16.00 34 33 24 30 23 10 154 308.0
8 16.00-17.00 26 34 35 23 30 8 156 273.0
9 17.00-18.00 22 35 26 30 30 8 151 254.5
10 18.00-19.00 32 29 27 26 21 11 146 295.0
11 19.00-20.00 34 33 28 30 24 7 156 300.5
12 20.00-21.00 26 22 30 23 24 3 128 227.0
13 21.00-22.00 27 19 28 16 17 1 108 206.5
14 22.00-23.00 35 26 26 11 21 2 121 252.0
15 23.00-00.00 36 18 18 12 14 0 98 226.0
16 00.00-01.00 28 18 25 14 16 6 107 224.0
17 01.00-02.00 18 15 24 7 14 4 82 157.5
18 02.00-03.00 9 14 19 4 12 1 59 94.5
19 03.00-04.00 8 14 10 3 7 1 43 77.5
20 04.00-05.00 2 7 7 1 12 0 29 33.5
21 05.00-06.00 8 7 10 5 13 4 47 84.0
22 06.00-07.00 11 9 10 4 9 1 44 85.5
23 07.00-08.00 3 11 4 9 9 2 38 55.5
24 08.00-09.00 4 19 8 16 10 5 62 95.5
Total Numbers 625 566 589 427 531 142 2880 5511.0
PCU
Two Wheeler 0.5 Light Motor Vehicles 1.5
Three Wheeler
1.0 Heavy Motor Vehicles
4.5
Car 1.0 Camel-Drawn Vehicle 4.0

Appendix 3.8:
Mammals of the
Study Area
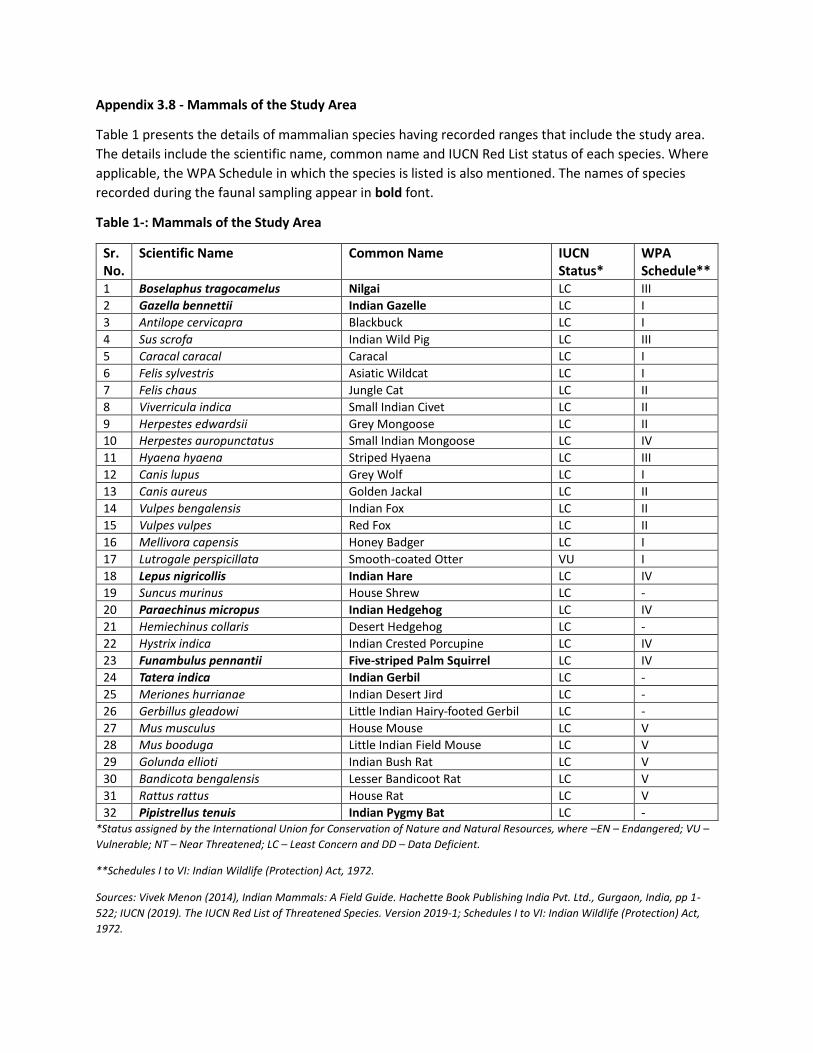
Appendix 3.8 - Mammals of the Study Area
Table 1 presents the details of mammalian species having recorded ranges that include the study area.
The details include the scientific name, common name and IUCN Red List status of each species. Where
applicable, the WPA Schedule in which the species is listed is also mentioned. The names of species
recorded during the faunal sampling appear in bold font.
Table 1-: Mammals of the Study Area
Sr. No.
Scientific Name Common Name IUCN Status*
WPA Schedule**
1 Boselaphus tragocamelus Nilgai LC III
2 Gazella bennettii Indian Gazelle LC I
3 Antilope cervicapra Blackbuck LC I
4 Sus scrofa Indian Wild Pig LC III
5 Caracal caracal Caracal LC I
6 Felis sylvestris Asiatic Wildcat LC I
7 Felis chaus Jungle Cat LC II
8 Viverricula indica Small Indian Civet LC II
9 Herpestes edwardsii Grey Mongoose LC II
10 Herpestes auropunctatus Small Indian Mongoose LC IV
11 Hyaena hyaena Striped Hyaena LC III
12 Canis lupus Grey Wolf LC I
13 Canis aureus Golden Jackal LC II
14 Vulpes bengalensis Indian Fox LC II
15 Vulpes vulpes Red Fox LC II
16 Mellivora capensis Honey Badger LC I
17 Lutrogale perspicillata Smooth-coated Otter VU I
18 Lepus nigricollis Indian Hare LC IV
19 Suncus murinus House Shrew LC -
20 Paraechinus micropus Indian Hedgehog LC IV
21 Hemiechinus collaris Desert Hedgehog LC -
22 Hystrix indica Indian Crested Porcupine LC IV
23 Funambulus pennantii Five-striped Palm Squirrel LC IV
24 Tatera indica Indian Gerbil LC -
25 Meriones hurrianae Indian Desert Jird LC -
26 Gerbillus gleadowi Little Indian Hairy-footed Gerbil LC -
27 Mus musculus House Mouse LC V
28 Mus booduga Little Indian Field Mouse LC V
29 Golunda ellioti Indian Bush Rat LC V
30 Bandicota bengalensis Lesser Bandicoot Rat LC V
31 Rattus rattus House Rat LC V
32 Pipistrellus tenuis Indian Pygmy Bat LC - *Status assigned by the International Union for Conservation of Nature and Natural Resources, where –EN – Endangered; VU –
Vulnerable; NT – Near Threatened; LC – Least Concern and DD – Data Deficient.
**Schedules I to VI: Indian Wildlife (Protection) Act, 1972.
Sources: Vivek Menon (2014), Indian Mammals: A Field Guide. Hachette Book Publishing India Pvt. Ltd., Gurgaon, India, pp 1-
522; IUCN (2019). The IUCN Red List of Threatened Species. Version 2019-1; Schedules I to VI: Indian Wildlife (Protection) Act,
1972.
Appendix 3.9:
Resident Birds of
the Study Area
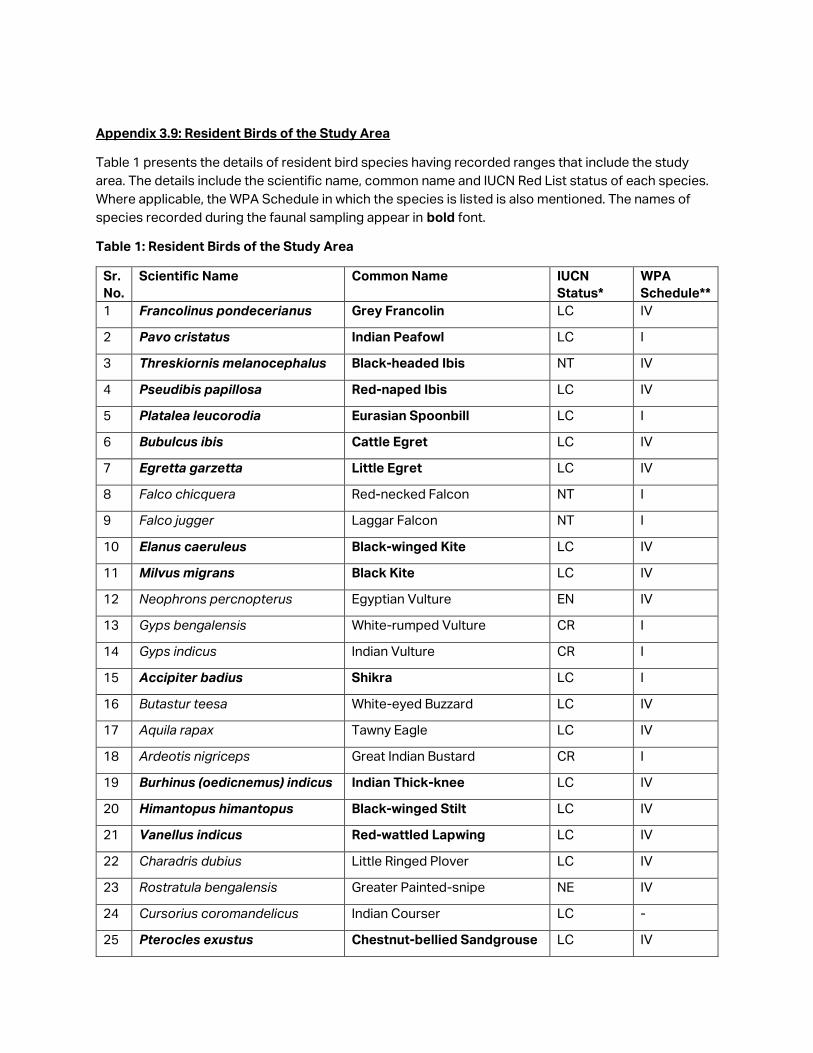
Appendix 3.9: Resident Birds of the Study Area
Table 1 presents the details of resident bird species having recorded ranges that include the study
area. The details include the scientific name, common name and IUCN Red List status of each species.
Where applicable, the WPA Schedule in which the species is listed is also mentioned. The names of
species recorded during the faunal sampling appear in bold font.
Table 1: Resident Birds of the Study Area
Sr.
No.
Scientific Name Common Name IUCN
Status*
WPA
Schedule**
1 Francolinus pondecerianus Grey Francolin LC IV
2 Pavo cristatus Indian Peafowl LC I
3 Threskiornis melanocephalus Black-headed Ibis NT IV
4 Pseudibis papillosa Red-naped Ibis LC IV
5 Platalea leucorodia Eurasian Spoonbill LC I
6 Bubulcus ibis Cattle Egret LC IV
7 Egretta garzetta Little Egret LC IV
8 Falco chicquera Red-necked Falcon NT I
9 Falco jugger Laggar Falcon NT I
10 Elanus caeruleus Black-winged Kite LC IV
11 Milvus migrans Black Kite LC IV
12 Neophrons percnopterus Egyptian Vulture EN IV
13 Gyps bengalensis White-rumped Vulture CR I
14 Gyps indicus Indian Vulture CR I
15 Accipiter badius Shikra LC I
16 Butastur teesa White-eyed Buzzard LC IV
17 Aquila rapax Tawny Eagle LC IV
18 Ardeotis nigriceps Great Indian Bustard CR I
19 Burhinus (oedicnemus) indicus Indian Thick-knee LC IV
20 Himantopus himantopus Black-winged Stilt LC IV
21 Vanellus indicus Red-wattled Lapwing LC IV
22 Charadris dubius Little Ringed Plover LC IV
23 Rostratula bengalensis Greater Painted-snipe NE IV
24 Cursorius coromandelicus Indian Courser LC -
25 Pterocles exustus Chestnut-bellied Sandgrouse LC IV
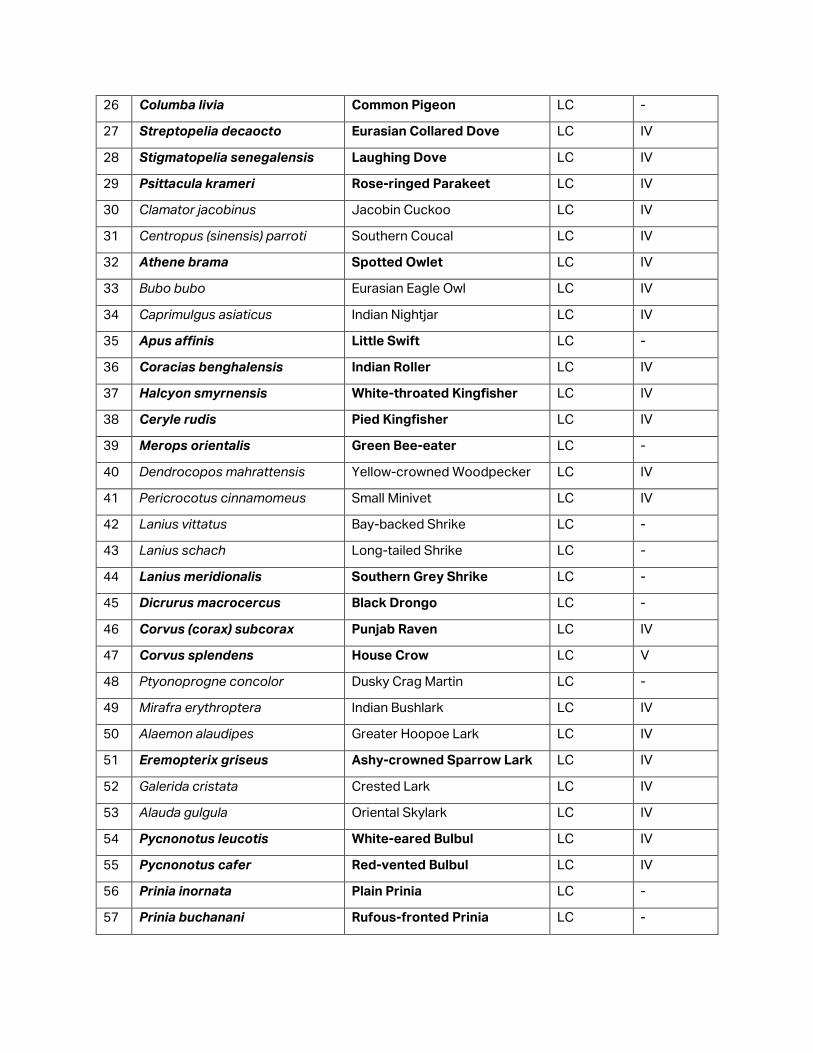
26 Columba livia Common Pigeon LC -
27 Streptopelia decaocto Eurasian Collared Dove LC IV
28 Stigmatopelia senegalensis Laughing Dove LC IV
29 Psittacula krameri Rose-ringed Parakeet LC IV
30 Clamator jacobinus Jacobin Cuckoo LC IV
31 Centropus (sinensis) parroti Southern Coucal LC IV
32 Athene brama Spotted Owlet LC IV
33 Bubo bubo Eurasian Eagle Owl LC IV
34 Caprimulgus asiaticus Indian Nightjar LC IV
35 Apus affinis Little Swift LC -
36 Coracias benghalensis Indian Roller LC IV
37 Halcyon smyrnensis White-throated Kingfisher LC IV
38 Ceryle rudis Pied Kingfisher LC IV
39 Merops orientalis Green Bee-eater LC -
40 Dendrocopos mahrattensis Yellow-crowned Woodpecker LC IV
41 Pericrocotus cinnamomeus Small Minivet LC IV
42 Lanius vittatus Bay-backed Shrike LC -
43 Lanius schach Long-tailed Shrike LC -
44 Lanius meridionalis Southern Grey Shrike LC -
45 Dicrurus macrocercus Black Drongo LC -
46 Corvus (corax) subcorax Punjab Raven LC IV
47 Corvus splendens House Crow LC V
48 Ptyonoprogne concolor Dusky Crag Martin LC -
49 Mirafra erythroptera Indian Bushlark LC IV
50 Alaemon alaudipes Greater Hoopoe Lark LC IV
51 Eremopterix griseus Ashy-crowned Sparrow Lark LC IV
52 Galerida cristata Crested Lark LC IV
53 Alauda gulgula Oriental Skylark LC IV
54 Pycnonotus leucotis White-eared Bulbul LC IV
55 Pycnonotus cafer Red-vented Bulbul LC IV
56 Prinia inornata Plain Prinia LC -
57 Prinia buchanani Rufous-fronted Prinia LC -
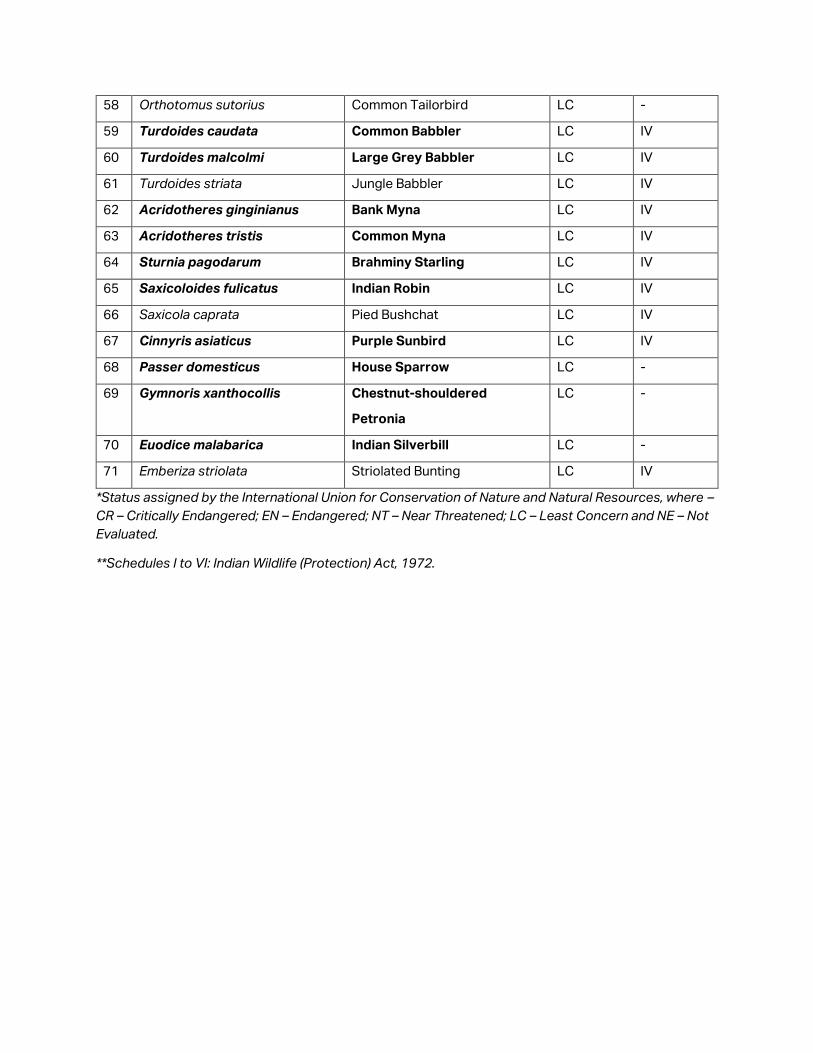
58 Orthotomus sutorius Common Tailorbird LC -
59 Turdoides caudata Common Babbler LC IV
60 Turdoides malcolmi Large Grey Babbler LC IV
61 Turdoides striata Jungle Babbler LC IV
62 Acridotheres ginginianus Bank Myna LC IV
63 Acridotheres tristis Common Myna LC IV
64 Sturnia pagodarum Brahminy Starling LC IV
65 Saxicoloides fulicatus Indian Robin LC IV
66 Saxicola caprata Pied Bushchat LC IV
67 Cinnyris asiaticus Purple Sunbird LC IV
68 Passer domesticus House Sparrow LC -
69 Gymnoris xanthocollis Chestnut-shouldered
Petronia
LC -
70 Euodice malabarica Indian Silverbill LC -
71 Emberiza striolata Striolated Bunting LC IV
*Status assigned by the International Union for Conservation of Nature and Natural Resources, where –
CR – Critically Endangered; EN – Endangered; NT – Near Threatened; LC – Least Concern and NE – Not
Evaluated.
**Schedules I to VI: Indian Wildlife (Protection) Act, 1972.
Appendix 3.10:
Migratory Birds of
the Study Area
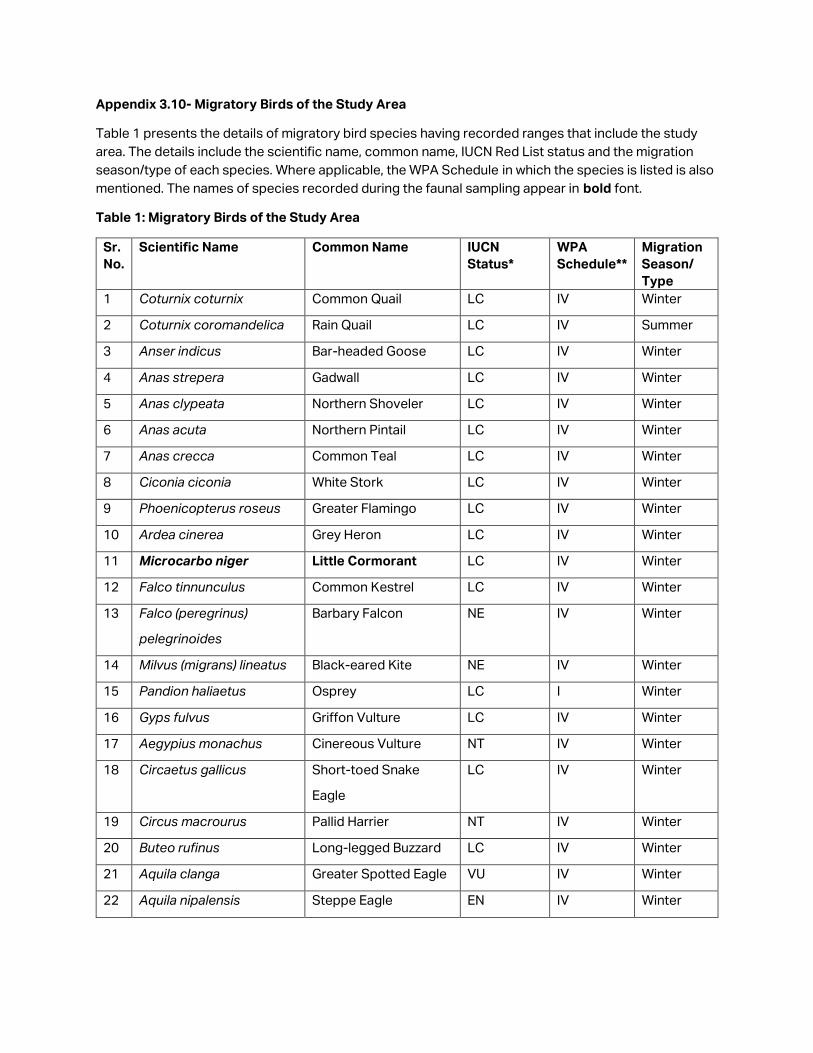
Appendix 3.10- Migratory Birds of the Study Area
Table 1 presents the details of migratory bird species having recorded ranges that include the study
area. The details include the scientific name, common name, IUCN Red List status and the migration
season/type of each species. Where applicable, the WPA Schedule in which the species is listed is also
mentioned. The names of species recorded during the faunal sampling appear in bold font.
Table 1: Migratory Birds of the Study Area
Sr.
No.
Scientific Name Common Name IUCN
Status*
WPA
Schedule**
Migration
Season/
Type
1 Coturnix coturnix Common Quail LC IV Winter
2 Coturnix coromandelica Rain Quail LC IV Summer
3 Anser indicus Bar-headed Goose LC IV Winter
4 Anas strepera Gadwall LC IV Winter
5 Anas clypeata Northern Shoveler LC IV Winter
6 Anas acuta Northern Pintail LC IV Winter
7 Anas crecca Common Teal LC IV Winter
8 Ciconia ciconia White Stork LC IV Winter
9 Phoenicopterus roseus Greater Flamingo LC IV Winter
10 Ardea cinerea Grey Heron LC IV Winter
11 Microcarbo niger Little Cormorant LC IV Winter
12 Falco tinnunculus Common Kestrel LC IV Winter
13 Falco (peregrinus)
pelegrinoides
Barbary Falcon NE IV Winter
14 Milvus (migrans) lineatus Black-eared Kite NE IV Winter
15 Pandion haliaetus Osprey LC I Winter
16 Gyps fulvus Griffon Vulture LC IV Winter
17 Aegypius monachus Cinereous Vulture NT IV Winter
18 Circaetus gallicus Short-toed Snake
Eagle
LC IV Winter
19 Circus macrourus Pallid Harrier NT IV Winter
20 Buteo rufinus Long-legged Buzzard LC IV Winter
21 Aquila clanga Greater Spotted Eagle VU IV Winter
22 Aquila nipalensis Steppe Eagle EN IV Winter
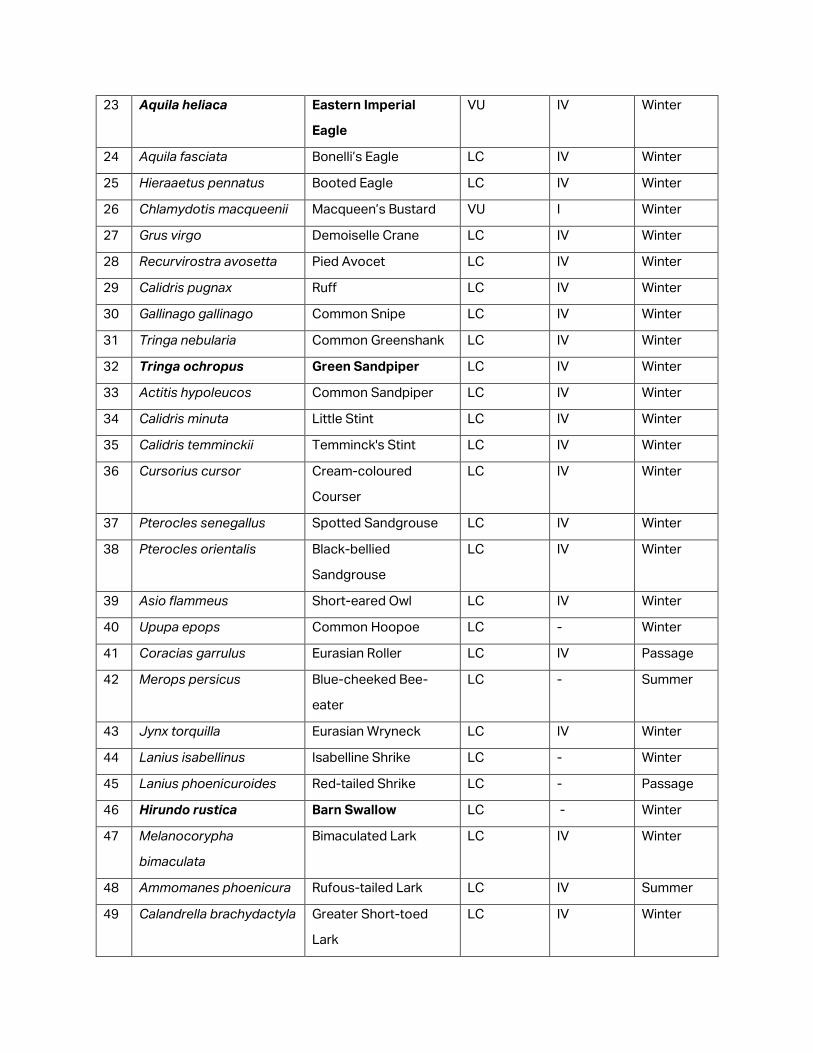
23 Aquila heliaca Eastern Imperial
Eagle
VU IV Winter
24 Aquila fasciata Bonelli’s Eagle LC IV Winter
25 Hieraaetus pennatus Booted Eagle LC IV Winter
26 Chlamydotis macqueenii Macqueen’s Bustard VU I Winter
27 Grus virgo Demoiselle Crane LC IV Winter
28 Recurvirostra avosetta Pied Avocet LC IV Winter
29 Calidris pugnax Ruff LC IV Winter
30 Gallinago gallinago Common Snipe LC IV Winter
31 Tringa nebularia Common Greenshank LC IV Winter
32 Tringa ochropus Green Sandpiper LC IV Winter
33 Actitis hypoleucos Common Sandpiper LC IV Winter
34 Calidris minuta Little Stint LC IV Winter
35 Calidris temminckii Temminck's Stint LC IV Winter
36 Cursorius cursor Cream-coloured
Courser
LC IV Winter
37 Pterocles senegallus Spotted Sandgrouse LC IV Winter
38 Pterocles orientalis Black-bellied
Sandgrouse
LC IV Winter
39 Asio flammeus Short-eared Owl LC IV Winter
40 Upupa epops Common Hoopoe LC - Winter
41 Coracias garrulus Eurasian Roller LC IV Passage
42 Merops persicus Blue-cheeked Bee-
eater
LC - Summer
43 Jynx torquilla Eurasian Wryneck LC IV Winter
44 Lanius isabellinus Isabelline Shrike LC - Winter
45 Lanius phoenicuroides Red-tailed Shrike LC - Passage
46 Hirundo rustica Barn Swallow LC - Winter
47 Melanocorypha
bimaculata
Bimaculated Lark LC IV Winter
48 Ammomanes phoenicura Rufous-tailed Lark LC IV Summer
49 Calandrella brachydactyla Greater Short-toed
Lark
LC IV Winter
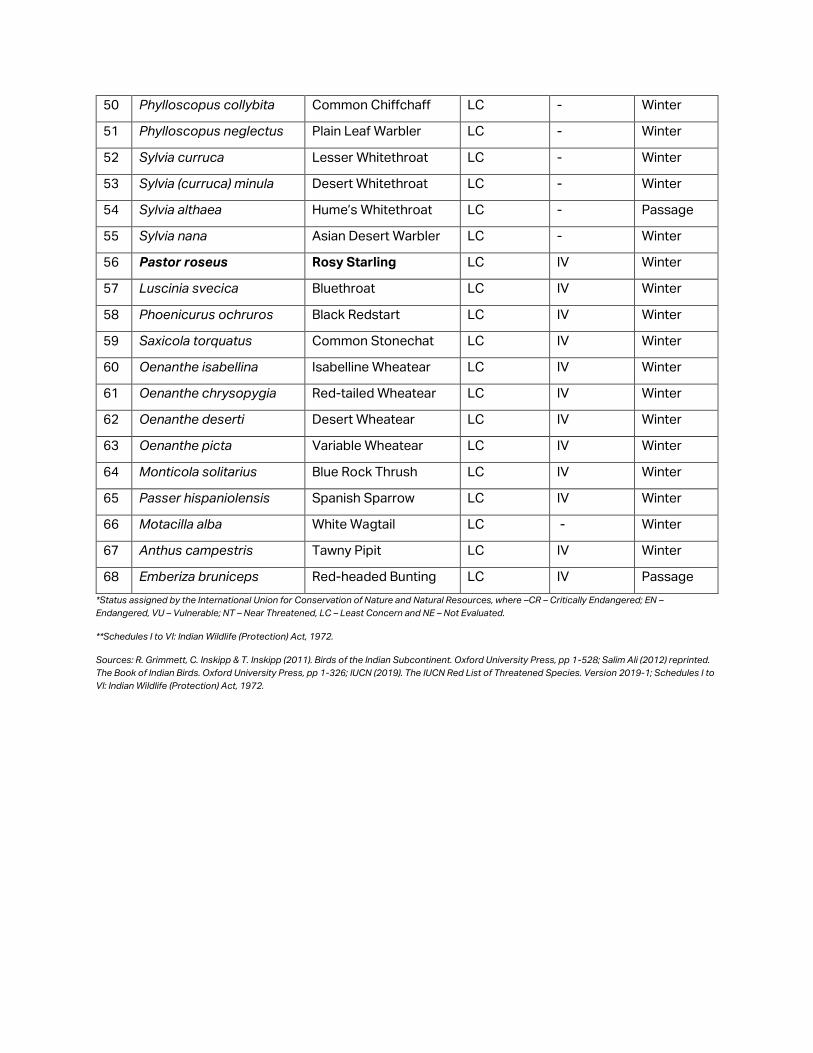
50 Phylloscopus collybita Common Chiffchaff LC - Winter
51 Phylloscopus neglectus Plain Leaf Warbler LC - Winter
52 Sylvia curruca Lesser Whitethroat LC - Winter
53 Sylvia (curruca) minula Desert Whitethroat LC - Winter
54 Sylvia althaea Hume’s Whitethroat LC - Passage
55 Sylvia nana Asian Desert Warbler LC - Winter
56 Pastor roseus Rosy Starling LC IV Winter
57 Luscinia svecica Bluethroat LC IV Winter
58 Phoenicurus ochruros Black Redstart LC IV Winter
59 Saxicola torquatus Common Stonechat LC IV Winter
60 Oenanthe isabellina Isabelline Wheatear LC IV Winter
61 Oenanthe chrysopygia Red-tailed Wheatear LC IV Winter
62 Oenanthe deserti Desert Wheatear LC IV Winter
63 Oenanthe picta Variable Wheatear LC IV Winter
64 Monticola solitarius Blue Rock Thrush LC IV Winter
65 Passer hispaniolensis Spanish Sparrow LC IV Winter
66 Motacilla alba White Wagtail LC - Winter
67 Anthus campestris Tawny Pipit LC IV Winter
68 Emberiza bruniceps Red-headed Bunting LC IV Passage
*Status assigned by the International Union for Conservation of Nature and Natural Resources, where –CR – Critically Endangered; EN –
Endangered, VU – Vulnerable; NT – Near Threatened, LC – Least Concern and NE – Not Evaluated.
**Schedules I to VI: Indian Wildlife (Protection) Act, 1972.
Sources: R. Grimmett, C. Inskipp & T. Inskipp (2011). Birds of the Indian Subcontinent. Oxford University Press, pp 1-528; Salim Ali (2012) reprinted.
The Book of Indian Birds. Oxford University Press, pp 1-326; IUCN (2019). The IUCN Red List of Threatened Species. Version 2019-1; Schedules I to
VI: Indian Wildlife (Protection) Act, 1972.
Appendix 3.11:
Reptiles of the
Study Area
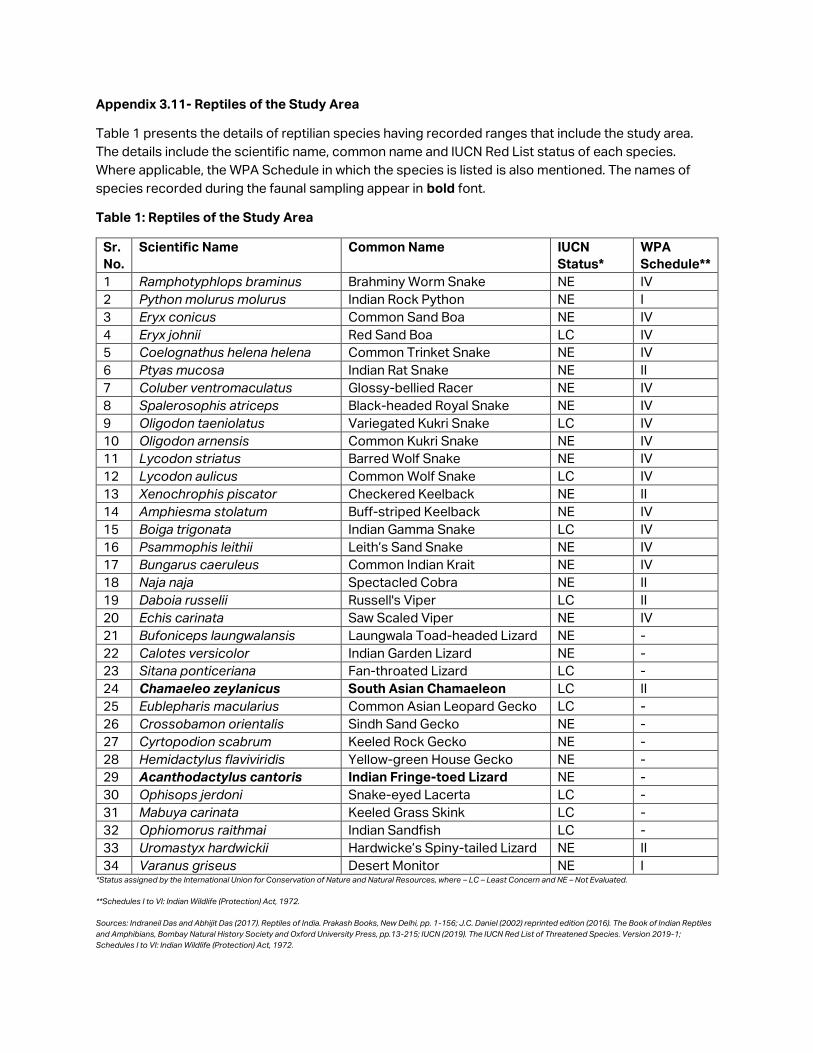
Appendix 3.11- Reptiles of the Study Area
Table 1 presents the details of reptilian species having recorded ranges that include the study area.
The details include the scientific name, common name and IUCN Red List status of each species.
Where applicable, the WPA Schedule in which the species is listed is also mentioned. The names of
species recorded during the faunal sampling appear in bold font.
Table 1: Reptiles of the Study Area
Sr.
No.
Scientific Name Common Name IUCN
Status*
WPA
Schedule**
1 Ramphotyphlops braminus Brahminy Worm Snake NE IV
2 Python molurus molurus Indian Rock Python NE I
3 Eryx conicus Common Sand Boa NE IV
4 Eryx johnii Red Sand Boa LC IV
5 Coelognathus helena helena Common Trinket Snake NE IV
6 Ptyas mucosa Indian Rat Snake NE II
7 Coluber ventromaculatus Glossy-bellied Racer NE IV
8 Spalerosophis atriceps Black-headed Royal Snake NE IV
9 Oligodon taeniolatus Variegated Kukri Snake LC IV
10 Oligodon arnensis Common Kukri Snake NE IV
11 Lycodon striatus Barred Wolf Snake NE IV
12 Lycodon aulicus Common Wolf Snake LC IV
13 Xenochrophis piscator Checkered Keelback NE II
14 Amphiesma stolatum Buff-striped Keelback NE IV
15 Boiga trigonata Indian Gamma Snake LC IV
16 Psammophis leithii Leith’s Sand Snake NE IV
17 Bungarus caeruleus Common Indian Krait NE IV
18 Naja naja Spectacled Cobra NE II
19 Daboia russelii Russell's Viper LC II
20 Echis carinata Saw Scaled Viper NE IV
21 Bufoniceps laungwalansis Laungwala Toad-headed Lizard NE -
22 Calotes versicolor Indian Garden Lizard NE -
23 Sitana ponticeriana Fan-throated Lizard LC -
24 Chamaeleo zeylanicus South Asian Chamaeleon LC II
25 Eublepharis macularius Common Asian Leopard Gecko LC -
26 Crossobamon orientalis Sindh Sand Gecko NE -
27 Cyrtopodion scabrum Keeled Rock Gecko NE -
28 Hemidactylus flaviviridis Yellow-green House Gecko NE -
29 Acanthodactylus cantoris Indian Fringe-toed Lizard NE -
30 Ophisops jerdoni Snake-eyed Lacerta LC -
31 Mabuya carinata Keeled Grass Skink LC -
32 Ophiomorus raithmai Indian Sandfish LC -
33 Uromastyx hardwickii Hardwicke’s Spiny-tailed Lizard NE II
34 Varanus griseus Desert Monitor NE I *Status assigned by the International Union for Conservation of Nature and Natural Resources, where – LC – Least Concern and NE – Not Evaluated.
**Schedules I to VI: Indian Wildlife (Protection) Act, 1972.
Sources: Indraneil Das and Abhijit Das (2017). Reptiles of India. Prakash Books, New Delhi, pp. 1-156; J.C. Daniel (2002) reprinted edition (2016). The Book of Indian Reptiles
and Amphibians, Bombay Natural History Society and Oxford University Press, pp.13-215; IUCN (2019). The IUCN Red List of Threatened Species. Version 2019-1;
Schedules I to VI: Indian Wildlife (Protection) Act, 1972.
Appendix 3.12:
Amphibians of the
Study Area
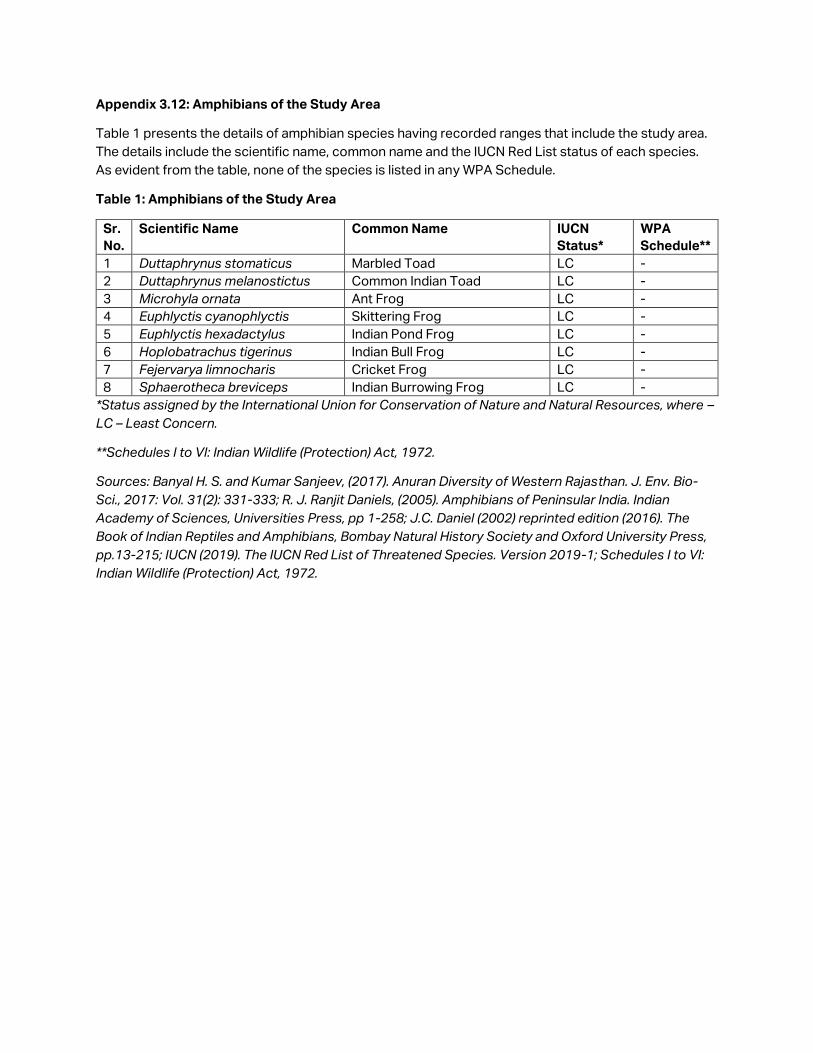
Appendix 3.12: Amphibians of the Study Area
Table 1 presents the details of amphibian species having recorded ranges that include the study area.
The details include the scientific name, common name and the IUCN Red List status of each species.
As evident from the table, none of the species is listed in any WPA Schedule.
Table 1: Amphibians of the Study Area
Sr.
No.
Scientific Name Common Name IUCN
Status*
WPA
Schedule**
1 Duttaphrynus stomaticus Marbled Toad LC -
2 Duttaphrynus melanostictus Common Indian Toad LC -
3 Microhyla ornata Ant Frog LC -
4 Euphlyctis cyanophlyctis Skittering Frog LC -
5 Euphlyctis hexadactylus Indian Pond Frog LC -
6 Hoplobatrachus tigerinus Indian Bull Frog LC -
7 Fejervarya limnocharis Cricket Frog LC -
8 Sphaerotheca breviceps Indian Burrowing Frog LC -
*Status assigned by the International Union for Conservation of Nature and Natural Resources, where –
LC – Least Concern.
**Schedules I to VI: Indian Wildlife (Protection) Act, 1972.
Sources: Banyal H. S. and Kumar Sanjeev, (2017). Anuran Diversity of Western Rajasthan. J. Env. Bio-
Sci., 2017: Vol. 31(2): 331-333; R. J. Ranjit Daniels, (2005). Amphibians of Peninsular India. Indian
Academy of Sciences, Universities Press, pp 1-258; J.C. Daniel (2002) reprinted edition (2016). The
Book of Indian Reptiles and Amphibians, Bombay Natural History Society and Oxford University Press,
pp.13-215; IUCN (2019). The IUCN Red List of Threatened Species. Version 2019-1; Schedules I to VI:
Indian Wildlife (Protection) Act, 1972.
Appendix 3.13:
Fishes of the Study
Area
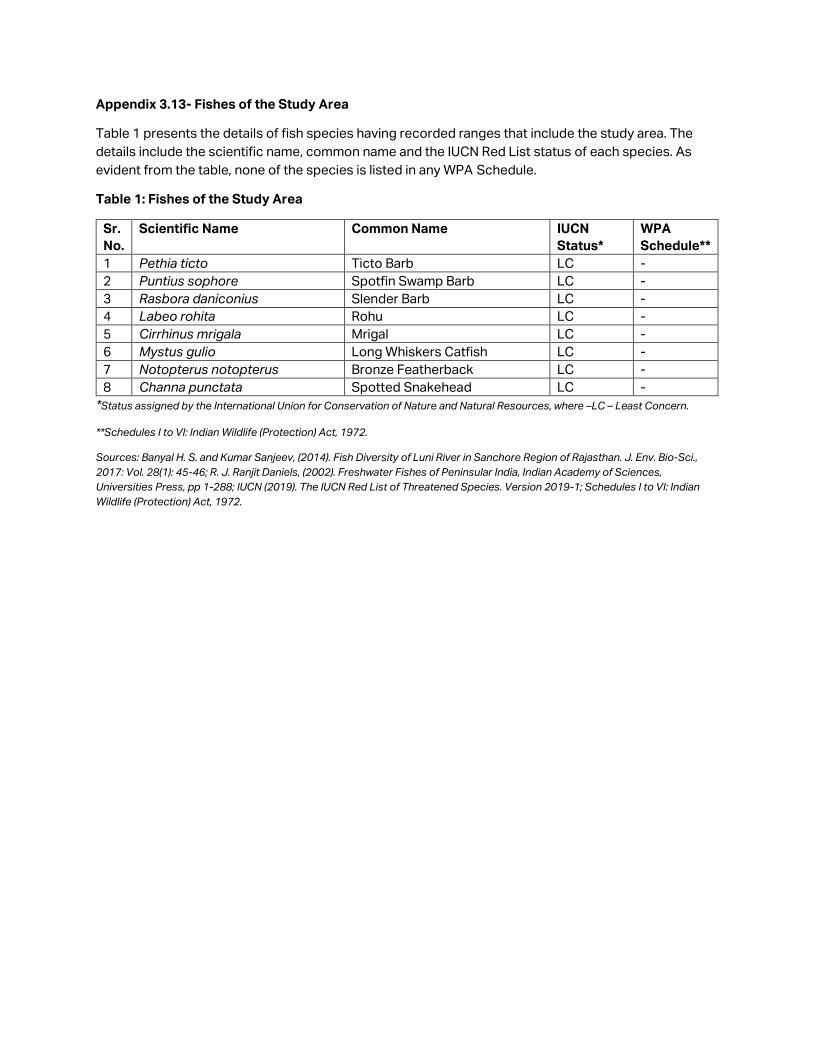
Appendix 3.13- Fishes of the Study Area
Table 1 presents the details of fish species having recorded ranges that include the study area. The
details include the scientific name, common name and the IUCN Red List status of each species. As
evident from the table, none of the species is listed in any WPA Schedule.
Table 1: Fishes of the Study Area
Sr.
No.
Scientific Name Common Name IUCN
Status*
WPA
Schedule**
1 Pethia ticto Ticto Barb LC -
2 Puntius sophore Spotfin Swamp Barb LC -
3 Rasbora daniconius Slender Barb LC -
4 Labeo rohita Rohu LC -
5 Cirrhinus mrigala Mrigal LC -
6 Mystus gulio Long Whiskers Catfish LC -
7 Notopterus notopterus Bronze Featherback LC -
8 Channa punctata Spotted Snakehead LC -
*Status assigned by the International Union for Conservation of Nature and Natural Resources, where –LC – Least Concern.
**Schedules I to VI: Indian Wildlife (Protection) Act, 1972.
Sources: Banyal H. S. and Kumar Sanjeev, (2014). Fish Diversity of Luni River in Sanchore Region of Rajasthan. J. Env. Bio-Sci.,
2017: Vol. 28(1): 45-46; R. J. Ranjit Daniels, (2002). Freshwater Fishes of Peninsular India, Indian Academy of Sciences,
Universities Press, pp 1-288; IUCN (2019). The IUCN Red List of Threatened Species. Version 2019-1; Schedules I to VI: Indian
Wildlife (Protection) Act, 1972.

Appendix 3.14:
Demographic
Profile of the Study
Area
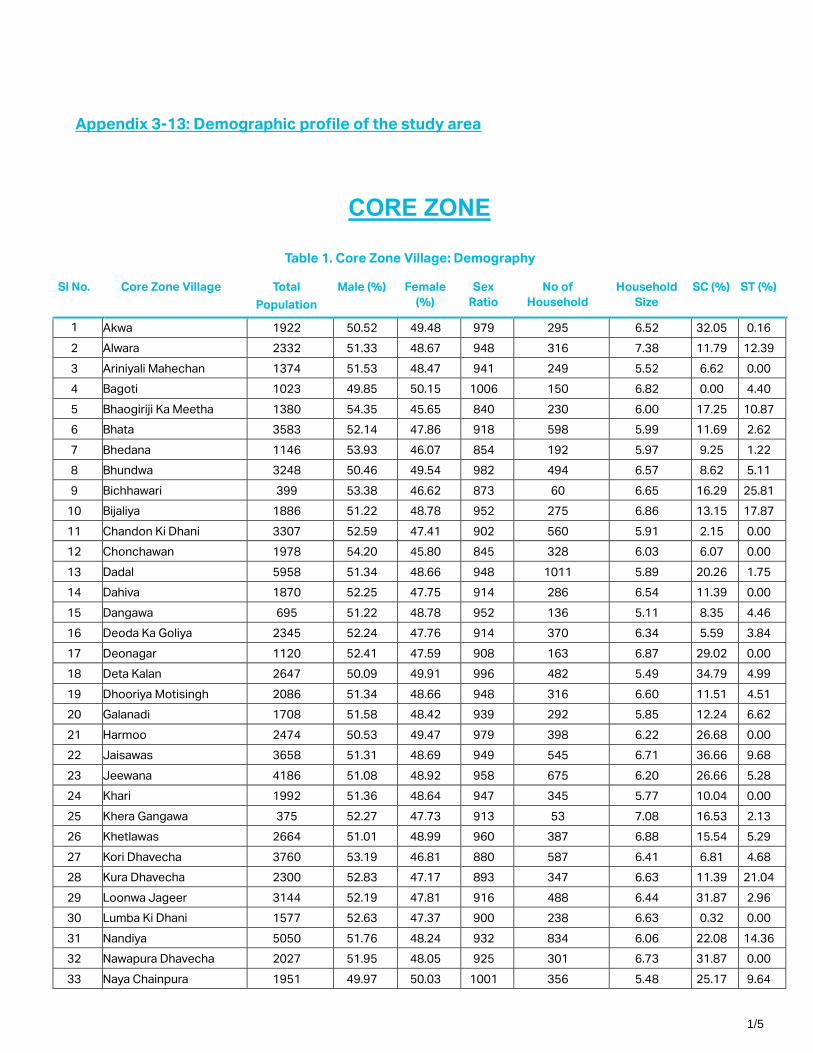
1/5
Appendix 3-13: Demographic profile of the study area
CORE ZONE
Table 1. Core Zone Village: Demography
Sl No. Core Zone Village Total
Population
Male (%) Female
(%)
Sex
Ratio
No of
Household
Household
Size
SC (%) ST (%)
1 Akwa 1922 50.52 49.48 979 295 6.52 32.05 0.16
2 Alwara 2332 51.33 48.67 948 316 7.38 11.79 12.39
3 Ariniyali Mahechan 1374 51.53 48.47 941 249 5.52 6.62 0.00
4 Bagoti 1023 49.85 50.15 1006 150 6.82 0.00 4.40
5 Bhaogiriji Ka Meetha 1380 54.35 45.65 840 230 6.00 17.25 10.87
6 Bhata 3583 52.14 47.86 918 598 5.99 11.69 2.62
7 Bhedana 1146 53.93 46.07 854 192 5.97 9.25 1.22
8 Bhundwa 3248 50.46 49.54 982 494 6.57 8.62 5.11
9 Bichhawari 399 53.38 46.62 873 60 6.65 16.29 25.81
10 Bijaliya 1886 51.22 48.78 952 275 6.86 13.15 17.87
11 Chandon Ki Dhani 3307 52.59 47.41 902 560 5.91 2.15 0.00
12 Chonchawan 1978 54.20 45.80 845 328 6.03 6.07 0.00
13 Dadal 5958 51.34 48.66 948 1011 5.89 20.26 1.75
14 Dahiva 1870 52.25 47.75 914 286 6.54 11.39 0.00
15 Dangawa 695 51.22 48.78 952 136 5.11 8.35 4.46
16 Deoda Ka Goliya 2345 52.24 47.76 914 370 6.34 5.59 3.84
17 Deonagar 1120 52.41 47.59 908 163 6.87 29.02 0.00
18 Deta Kalan 2647 50.09 49.91 996 482 5.49 34.79 4.99
19 Dhooriya Motisingh 2086 51.34 48.66 948 316 6.60 11.51 4.51
20 Galanadi 1708 51.58 48.42 939 292 5.85 12.24 6.62
21 Harmoo 2474 50.53 49.47 979 398 6.22 26.68 0.00
22 Jaisawas 3658 51.31 48.69 949 545 6.71 36.66 9.68
23 Jeewana 4186 51.08 48.92 958 675 6.20 26.66 5.28
24 Khari 1992 51.36 48.64 947 345 5.77 10.04 0.00
25 Khera Gangawa 375 52.27 47.73 913 53 7.08 16.53 2.13
26 Khetlawas 2664 51.01 48.99 960 387 6.88 15.54 5.29
27 Kori Dhavecha 3760 53.19 46.81 880 587 6.41 6.81 4.68
28 Kura Dhavecha 2300 52.83 47.17 893 347 6.63 11.39 21.04
29 Loonwa Jageer 3144 52.19 47.81 916 488 6.44 31.87 2.96
30 Lumba Ki Dhani 1577 52.63 47.37 900 238 6.63 0.32 0.00
31 Nandiya 5050 51.76 48.24 932 834 6.06 22.08 14.36
32 Nawapura Dhavecha 2027 51.95 48.05 925 301 6.73 31.87 0.00
33 Naya Chainpura 1951 49.97 50.03 1001 356 5.48 25.17 9.64
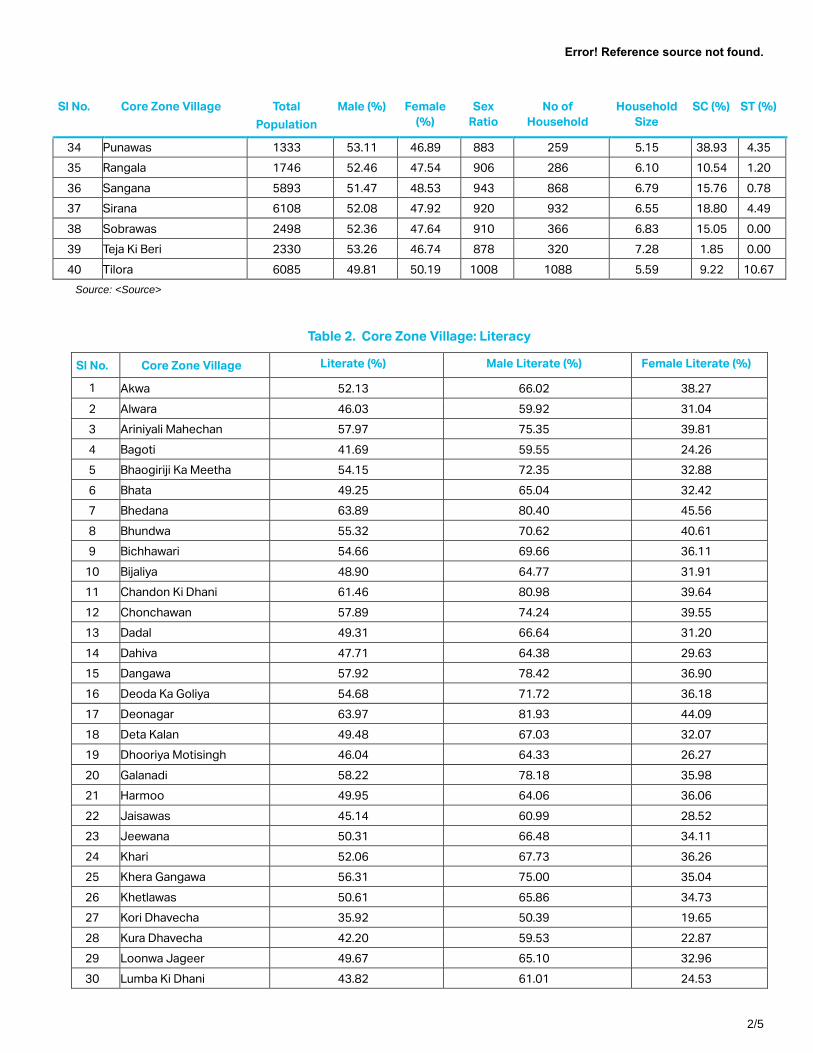
Error! Reference source not found.
2/5
Sl No. Core Zone Village Total
Population
Male (%) Female
(%)
Sex
Ratio
No of
Household
Household
Size
SC (%) ST (%)
34 Punawas 1333 53.11 46.89 883 259 5.15 38.93 4.35
35 Rangala 1746 52.46 47.54 906 286 6.10 10.54 1.20
36 Sangana 5893 51.47 48.53 943 868 6.79 15.76 0.78
37 Sirana 6108 52.08 47.92 920 932 6.55 18.80 4.49
38 Sobrawas 2498 52.36 47.64 910 366 6.83 15.05 0.00
39 Teja Ki Beri 2330 53.26 46.74 878 320 7.28 1.85 0.00
40 Tilora 6085 49.81 50.19 1008 1088 5.59 9.22 10.67
Source: <Source>
Table 2. Core Zone Village: Literacy
Sl No. Core Zone Village Literate (%) Male Literate (%) Female Literate (%)
1 Akwa 52.13 66.02 38.27
2 Alwara 46.03 59.92 31.04
3 Ariniyali Mahechan 57.97 75.35 39.81
4 Bagoti 41.69 59.55 24.26
5 Bhaogiriji Ka Meetha 54.15 72.35 32.88
6 Bhata 49.25 65.04 32.42
7 Bhedana 63.89 80.40 45.56
8 Bhundwa 55.32 70.62 40.61
9 Bichhawari 54.66 69.66 36.11
10 Bijaliya 48.90 64.77 31.91
11 Chandon Ki Dhani 61.46 80.98 39.64
12 Chonchawan 57.89 74.24 39.55
13 Dadal 49.31 66.64 31.20
14 Dahiva 47.71 64.38 29.63
15 Dangawa 57.92 78.42 36.90
16 Deoda Ka Goliya 54.68 71.72 36.18
17 Deonagar 63.97 81.93 44.09
18 Deta Kalan 49.48 67.03 32.07
19 Dhooriya Motisingh 46.04 64.33 26.27
20 Galanadi 58.22 78.18 35.98
21 Harmoo 49.95 64.06 36.06
22 Jaisawas 45.14 60.99 28.52
23 Jeewana 50.31 66.48 34.11
24 Khari 52.06 67.73 36.26
25 Khera Gangawa 56.31 75.00 35.04
26 Khetlawas 50.61 65.86 34.73
27 Kori Dhavecha 35.92 50.39 19.65
28 Kura Dhavecha 42.20 59.53 22.87
29 Loonwa Jageer 49.67 65.10 32.96
30 Lumba Ki Dhani 43.82 61.01 24.53
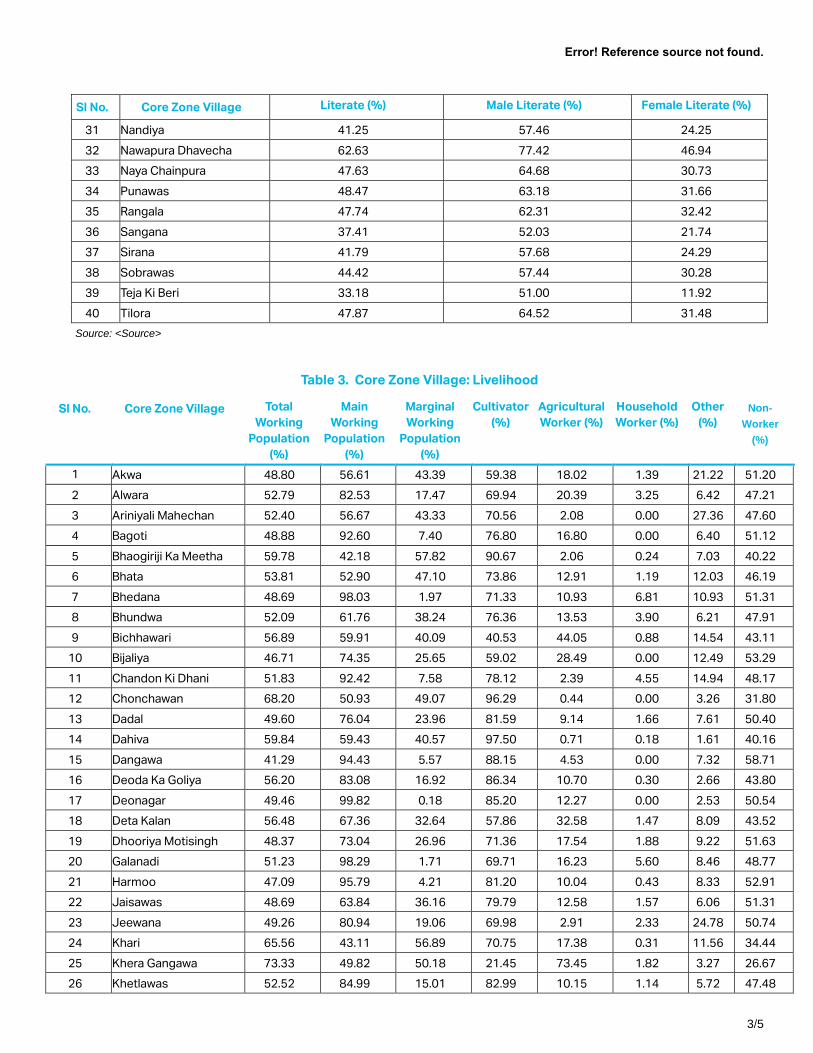
Error! Reference source not found.
3/5
Sl No. Core Zone Village Literate (%) Male Literate (%) Female Literate (%)
31 Nandiya 41.25 57.46 24.25
32 Nawapura Dhavecha 62.63 77.42 46.94
33 Naya Chainpura 47.63 64.68 30.73
34 Punawas 48.47 63.18 31.66
35 Rangala 47.74 62.31 32.42
36 Sangana 37.41 52.03 21.74
37 Sirana 41.79 57.68 24.29
38 Sobrawas 44.42 57.44 30.28
39 Teja Ki Beri 33.18 51.00 11.92
40 Tilora 47.87 64.52 31.48
Source: <Source>
Table 3. Core Zone Village: Livelihood
Sl No. Core Zone Village Total
Working
Population
(%)
Main
Working
Population
(%)
Marginal
Working
Population
(%)
Cultivator
(%)
Agricultural
Worker (%)
Household
Worker (%)
Other
(%) Non-
Worker
(%)
1 Akwa 48.80 56.61 43.39 59.38 18.02 1.39 21.22 51.20
2 Alwara 52.79 82.53 17.47 69.94 20.39 3.25 6.42 47.21
3 Ariniyali Mahechan 52.40 56.67 43.33 70.56 2.08 0.00 27.36 47.60
4 Bagoti 48.88 92.60 7.40 76.80 16.80 0.00 6.40 51.12
5 Bhaogiriji Ka Meetha 59.78 42.18 57.82 90.67 2.06 0.24 7.03 40.22
6 Bhata 53.81 52.90 47.10 73.86 12.91 1.19 12.03 46.19
7 Bhedana 48.69 98.03 1.97 71.33 10.93 6.81 10.93 51.31
8 Bhundwa 52.09 61.76 38.24 76.36 13.53 3.90 6.21 47.91
9 Bichhawari 56.89 59.91 40.09 40.53 44.05 0.88 14.54 43.11
10 Bijaliya 46.71 74.35 25.65 59.02 28.49 0.00 12.49 53.29
11 Chandon Ki Dhani 51.83 92.42 7.58 78.12 2.39 4.55 14.94 48.17
12 Chonchawan 68.20 50.93 49.07 96.29 0.44 0.00 3.26 31.80
13 Dadal 49.60 76.04 23.96 81.59 9.14 1.66 7.61 50.40
14 Dahiva 59.84 59.43 40.57 97.50 0.71 0.18 1.61 40.16
15 Dangawa 41.29 94.43 5.57 88.15 4.53 0.00 7.32 58.71
16 Deoda Ka Goliya 56.20 83.08 16.92 86.34 10.70 0.30 2.66 43.80
17 Deonagar 49.46 99.82 0.18 85.20 12.27 0.00 2.53 50.54
18 Deta Kalan 56.48 67.36 32.64 57.86 32.58 1.47 8.09 43.52
19 Dhooriya Motisingh 48.37 73.04 26.96 71.36 17.54 1.88 9.22 51.63
20 Galanadi 51.23 98.29 1.71 69.71 16.23 5.60 8.46 48.77
21 Harmoo 47.09 95.79 4.21 81.20 10.04 0.43 8.33 52.91
22 Jaisawas 48.69 63.84 36.16 79.79 12.58 1.57 6.06 51.31
23 Jeewana 49.26 80.94 19.06 69.98 2.91 2.33 24.78 50.74
24 Khari 65.56 43.11 56.89 70.75 17.38 0.31 11.56 34.44
25 Khera Gangawa 73.33 49.82 50.18 21.45 73.45 1.82 3.27 26.67
26 Khetlawas 52.52 84.99 15.01 82.99 10.15 1.14 5.72 47.48
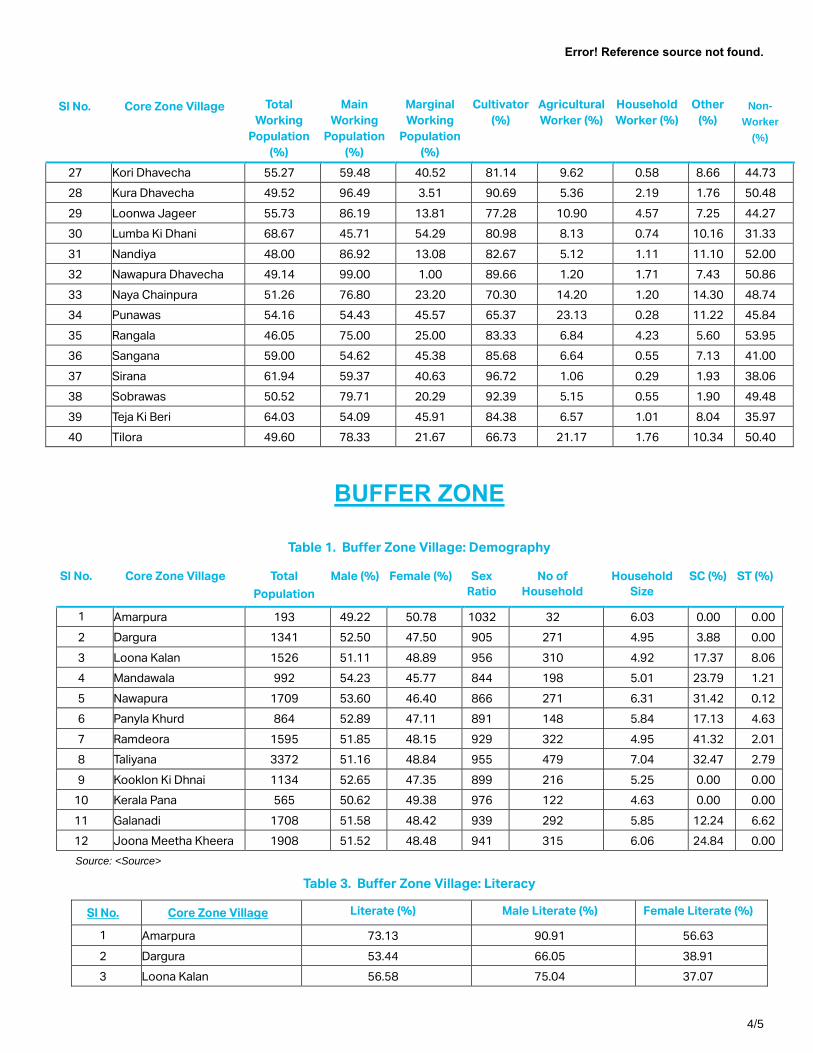
Error! Reference source not found.
4/5
Sl No. Core Zone Village Total
Working
Population
(%)
Main
Working
Population
(%)
Marginal
Working
Population
(%)
Cultivator
(%)
Agricultural
Worker (%)
Household
Worker (%)
Other
(%) Non-
Worker
(%)
27 Kori Dhavecha 55.27 59.48 40.52 81.14 9.62 0.58 8.66 44.73
28 Kura Dhavecha 49.52 96.49 3.51 90.69 5.36 2.19 1.76 50.48
29 Loonwa Jageer 55.73 86.19 13.81 77.28 10.90 4.57 7.25 44.27
30 Lumba Ki Dhani 68.67 45.71 54.29 80.98 8.13 0.74 10.16 31.33
31 Nandiya 48.00 86.92 13.08 82.67 5.12 1.11 11.10 52.00
32 Nawapura Dhavecha 49.14 99.00 1.00 89.66 1.20 1.71 7.43 50.86
33 Naya Chainpura 51.26 76.80 23.20 70.30 14.20 1.20 14.30 48.74
34 Punawas 54.16 54.43 45.57 65.37 23.13 0.28 11.22 45.84
35 Rangala 46.05 75.00 25.00 83.33 6.84 4.23 5.60 53.95
36 Sangana 59.00 54.62 45.38 85.68 6.64 0.55 7.13 41.00
37 Sirana 61.94 59.37 40.63 96.72 1.06 0.29 1.93 38.06
38 Sobrawas 50.52 79.71 20.29 92.39 5.15 0.55 1.90 49.48
39 Teja Ki Beri 64.03 54.09 45.91 84.38 6.57 1.01 8.04 35.97
40 Tilora 49.60 78.33 21.67 66.73 21.17 1.76 10.34 50.40
BUFFER ZONE
Table 1. Buffer Zone Village: Demography
Sl No. Core Zone Village Total
Population
Male (%) Female (%) Sex
Ratio
No of
Household
Household
Size
SC (%) ST (%)
1 Amarpura 193 49.22 50.78 1032 32 6.03 0.00 0.00
2 Dargura 1341 52.50 47.50 905 271 4.95 3.88 0.00
3 Loona Kalan 1526 51.11 48.89 956 310 4.92 17.37 8.06
4 Mandawala 992 54.23 45.77 844 198 5.01 23.79 1.21
5 Nawapura 1709 53.60 46.40 866 271 6.31 31.42 0.12
6 Panyla Khurd 864 52.89 47.11 891 148 5.84 17.13 4.63
7 Ramdeora 1595 51.85 48.15 929 322 4.95 41.32 2.01
8 Taliyana 3372 51.16 48.84 955 479 7.04 32.47 2.79
9 Kooklon Ki Dhnai 1134 52.65 47.35 899 216 5.25 0.00 0.00
10 Kerala Pana 565 50.62 49.38 976 122 4.63 0.00 0.00
11 Galanadi 1708 51.58 48.42 939 292 5.85 12.24 6.62
12 Joona Meetha Kheera 1908 51.52 48.48 941 315 6.06 24.84 0.00
Source: <Source>
Table 3. Buffer Zone Village: Literacy
Sl No. Core Zone Village Literate (%) Male Literate (%) Female Literate (%)
1 Amarpura 73.13 90.91 56.63
2 Dargura 53.44 66.05 38.91
3 Loona Kalan 56.58 75.04 37.07
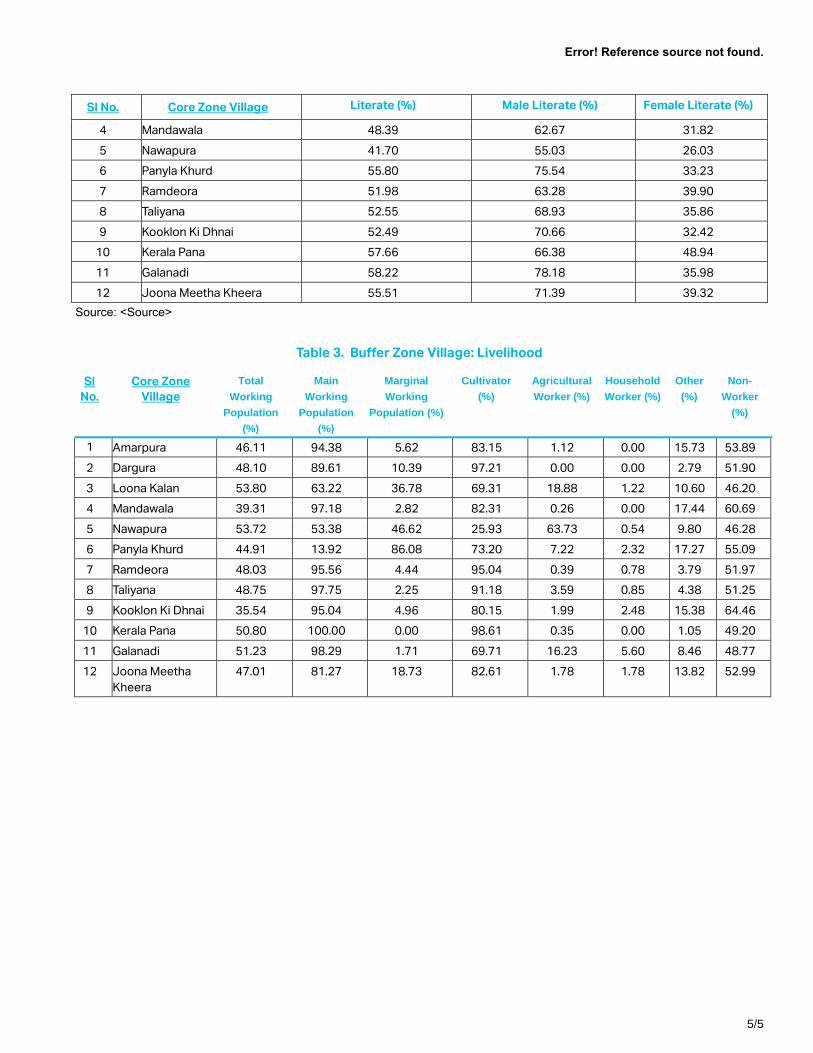
Error! Reference source not found.
5/5
Sl No. Core Zone Village Literate (%) Male Literate (%) Female Literate (%)
4 Mandawala 48.39 62.67 31.82
5 Nawapura 41.70 55.03 26.03
6 Panyla Khurd 55.80 75.54 33.23
7 Ramdeora 51.98 63.28 39.90
8 Taliyana 52.55 68.93 35.86
9 Kooklon Ki Dhnai 52.49 70.66 32.42
10 Kerala Pana 57.66 66.38 48.94
11 Galanadi 58.22 78.18 35.98
12 Joona Meetha Kheera 55.51 71.39 39.32
Source: <Source>
Table 3. Buffer Zone Village: Livelihood
Sl
No.
Core Zone
Village
Total
Working
Population
(%)
Main
Working
Population
(%)
Marginal
Working
Population (%)
Cultivator
(%)
Agricultural
Worker (%)
Household
Worker (%)
Other
(%)
Non-
Worker
(%)
1 Amarpura 46.11 94.38 5.62 83.15 1.12 0.00 15.73 53.89
2 Dargura 48.10 89.61 10.39 97.21 0.00 0.00 2.79 51.90
3 Loona Kalan 53.80 63.22 36.78 69.31 18.88 1.22 10.60 46.20
4 Mandawala 39.31 97.18 2.82 82.31 0.26 0.00 17.44 60.69
5 Nawapura 53.72 53.38 46.62 25.93 63.73 0.54 9.80 46.28
6 Panyla Khurd 44.91 13.92 86.08 73.20 7.22 2.32 17.27 55.09
7 Ramdeora 48.03 95.56 4.44 95.04 0.39 0.78 3.79 51.97
8 Taliyana 48.75 97.75 2.25 91.18 3.59 0.85 4.38 51.25
9 Kooklon Ki Dhnai 35.54 95.04 4.96 80.15 1.99 2.48 15.38 64.46
10 Kerala Pana 50.80 100.00 0.00 98.61 0.35 0.00 1.05 49.20
11 Galanadi 51.23 98.29 1.71 69.71 16.23 5.60 8.46 48.77
12 Joona Meetha
Kheera
47.01 81.27 18.73 82.61 1.78 1.78 13.82 52.99
Appendix 3.15
Consultation of the
Socio Economic
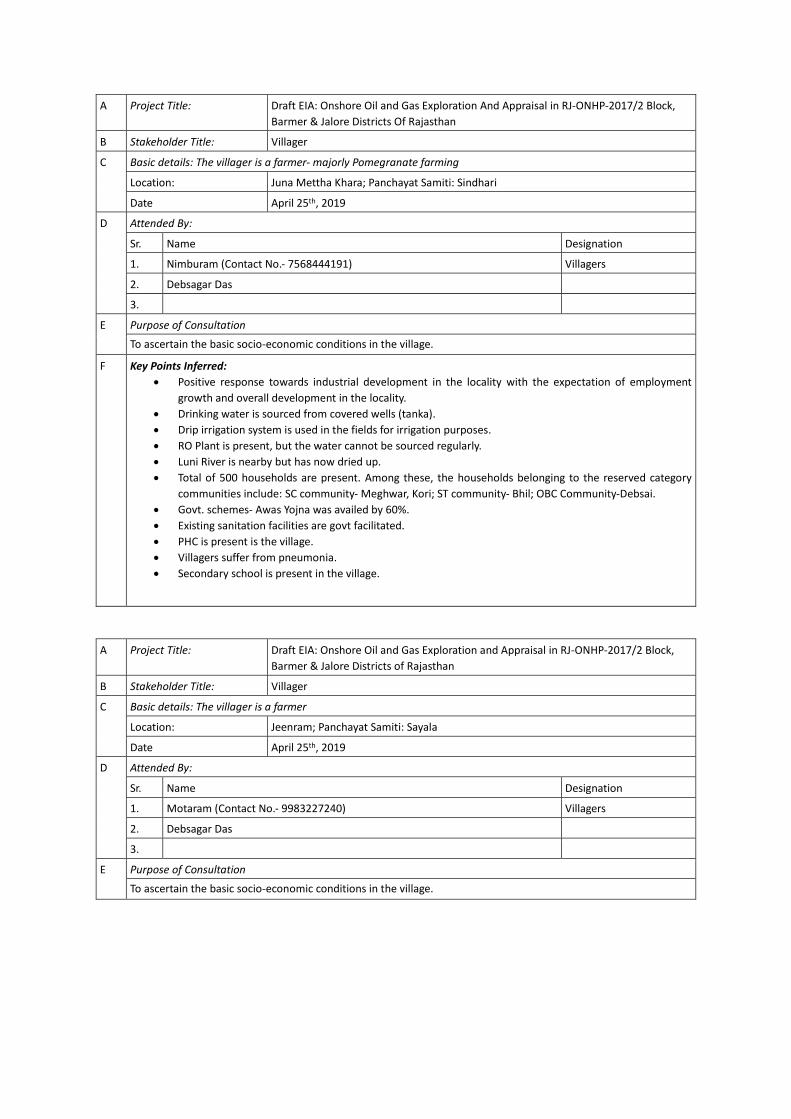
A Project Title: Draft EIA: Onshore Oil and Gas Exploration And Appraisal in RJ-ONHP-2017/2 Block,
Barmer & Jalore Districts Of Rajasthan
B Stakeholder Title: Villager
C Basic details: The villager is a farmer- majorly Pomegranate farming
Location: Juna Mettha Khara; Panchayat Samiti: Sindhari
Date April 25th, 2019
D Attended By:
Sr. Name Designation
1. Nimburam (Contact No.- 7568444191) Villagers
2. Debsagar Das
3.
E Purpose of Consultation
To ascertain the basic socio-economic conditions in the village.
F Key Points Inferred:
• Positive response towards industrial development in the locality with the expectation of employment
growth and overall development in the locality.
• Drinking water is sourced from covered wells (tanka).
• Drip irrigation system is used in the fields for irrigation purposes.
• RO Plant is present, but the water cannot be sourced regularly.
• Luni River is nearby but has now dried up.
• Total of 500 households are present. Among these, the households belonging to the reserved category
communities include: SC community- Meghwar, Kori; ST community- Bhil; OBC Community-Debsai.
• Govt. schemes- Awas Yojna was availed by 60%.
• Existing sanitation facilities are govt facilitated.
• PHC is present is the village.
• Villagers suffer from pneumonia.
• Secondary school is present in the village.
A Project Title: Draft EIA: Onshore Oil and Gas Exploration and Appraisal in RJ-ONHP-2017/2 Block,
Barmer & Jalore Districts of Rajasthan
B Stakeholder Title: Villager
C Basic details: The villager is a farmer
Location: Jeenram; Panchayat Samiti: Sayala
Date April 25th, 2019
D Attended By:
Sr. Name Designation
1. Motaram (Contact No.- 9983227240) Villagers
2. Debsagar Das
3.
E Purpose of Consultation
To ascertain the basic socio-economic conditions in the village.
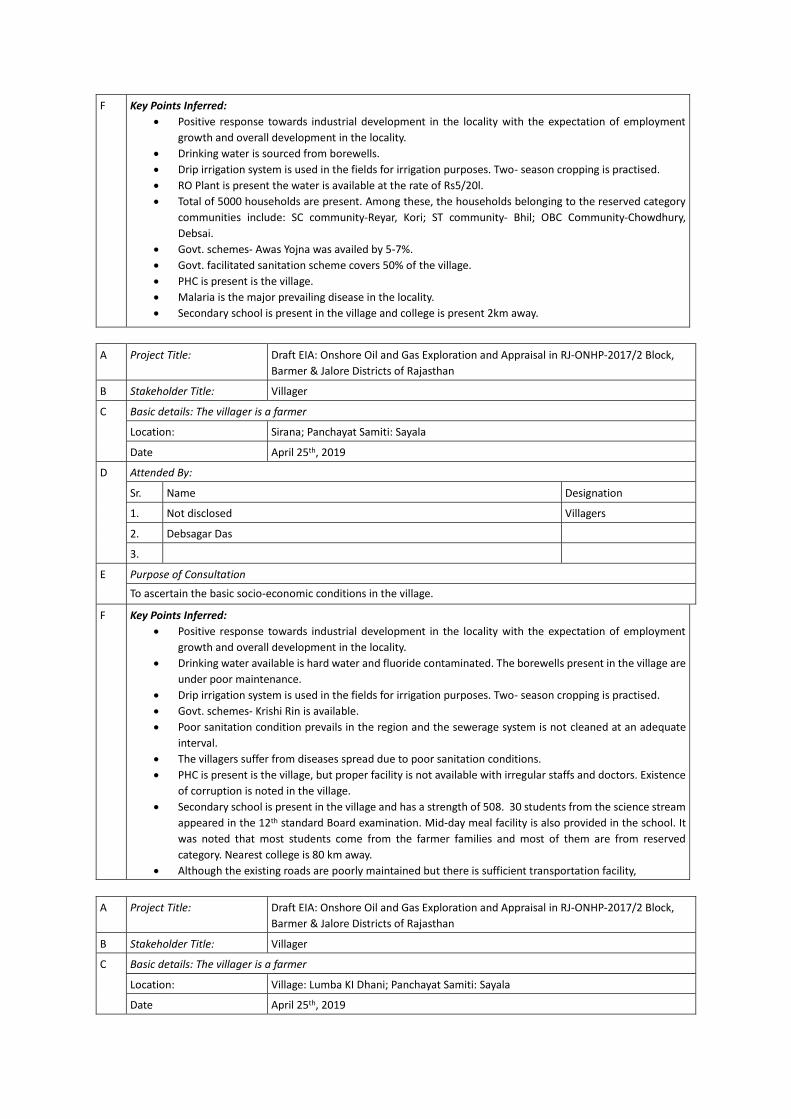
F Key Points Inferred:
• Positive response towards industrial development in the locality with the expectation of employment
growth and overall development in the locality.
• Drinking water is sourced from borewells.
• Drip irrigation system is used in the fields for irrigation purposes. Two- season cropping is practised.
• RO Plant is present the water is available at the rate of Rs5/20l.
• Total of 5000 households are present. Among these, the households belonging to the reserved category
communities include: SC community-Reyar, Kori; ST community- Bhil; OBC Community-Chowdhury,
Debsai.
• Govt. schemes- Awas Yojna was availed by 5-7%.
• Govt. facilitated sanitation scheme covers 50% of the village.
• PHC is present is the village.
• Malaria is the major prevailing disease in the locality.
• Secondary school is present in the village and college is present 2km away.
A Project Title: Draft EIA: Onshore Oil and Gas Exploration and Appraisal in RJ-ONHP-2017/2 Block,
Barmer & Jalore Districts of Rajasthan
B Stakeholder Title: Villager
C Basic details: The villager is a farmer
Location: Sirana; Panchayat Samiti: Sayala
Date April 25th, 2019
D Attended By:
Sr. Name Designation
1. Not disclosed Villagers
2. Debsagar Das
3.
E Purpose of Consultation
To ascertain the basic socio-economic conditions in the village.
F Key Points Inferred:
• Positive response towards industrial development in the locality with the expectation of employment
growth and overall development in the locality.
• Drinking water available is hard water and fluoride contaminated. The borewells present in the village are
under poor maintenance.
• Drip irrigation system is used in the fields for irrigation purposes. Two- season cropping is practised.
• Govt. schemes- Krishi Rin is available.
• Poor sanitation condition prevails in the region and the sewerage system is not cleaned at an adequate
interval.
• The villagers suffer from diseases spread due to poor sanitation conditions.
• PHC is present is the village, but proper facility is not available with irregular staffs and doctors. Existence
of corruption is noted in the village.
• Secondary school is present in the village and has a strength of 508. 30 students from the science stream
appeared in the 12th standard Board examination. Mid-day meal facility is also provided in the school. It
was noted that most students come from the farmer families and most of them are from reserved
category. Nearest college is 80 km away.
• Although the existing roads are poorly maintained but there is sufficient transportation facility,
A Project Title: Draft EIA: Onshore Oil and Gas Exploration and Appraisal in RJ-ONHP-2017/2 Block,
Barmer & Jalore Districts of Rajasthan
B Stakeholder Title: Villager
C Basic details: The villager is a farmer
Location: Village: Lumba KI Dhani; Panchayat Samiti: Sayala
Date April 25th, 2019
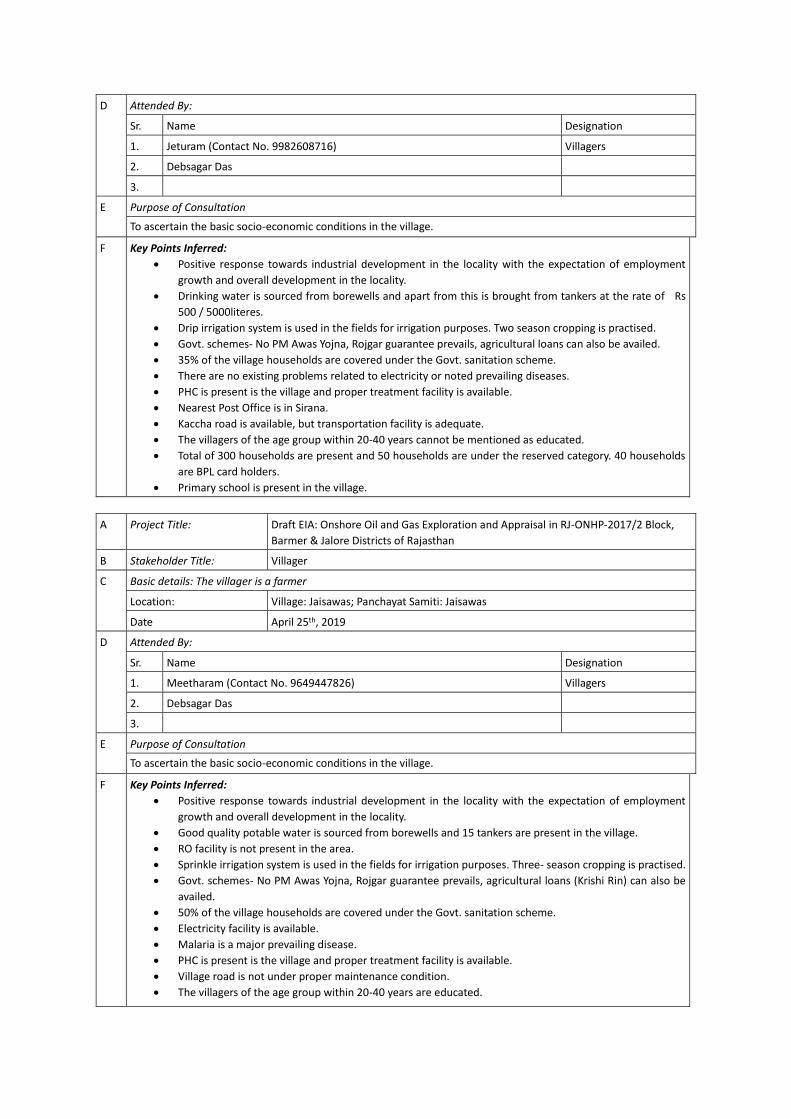
D Attended By:
Sr. Name Designation
1. Jeturam (Contact No. 9982608716) Villagers
2. Debsagar Das
3.
E Purpose of Consultation
To ascertain the basic socio-economic conditions in the village.
F Key Points Inferred:
• Positive response towards industrial development in the locality with the expectation of employment
growth and overall development in the locality.
• Drinking water is sourced from borewells and apart from this is brought from tankers at the rate of Rs
500 / 5000literes.
• Drip irrigation system is used in the fields for irrigation purposes. Two season cropping is practised.
• Govt. schemes- No PM Awas Yojna, Rojgar guarantee prevails, agricultural loans can also be availed.
• 35% of the village households are covered under the Govt. sanitation scheme.
• There are no existing problems related to electricity or noted prevailing diseases.
• PHC is present is the village and proper treatment facility is available.
• Nearest Post Office is in Sirana.
• Kaccha road is available, but transportation facility is adequate.
• The villagers of the age group within 20-40 years cannot be mentioned as educated.
• Total of 300 households are present and 50 households are under the reserved category. 40 households
are BPL card holders.
• Primary school is present in the village.
A Project Title: Draft EIA: Onshore Oil and Gas Exploration and Appraisal in RJ-ONHP-2017/2 Block,
Barmer & Jalore Districts of Rajasthan
B Stakeholder Title: Villager
C Basic details: The villager is a farmer
Location: Village: Jaisawas; Panchayat Samiti: Jaisawas
Date April 25th, 2019
D Attended By:
Sr. Name Designation
1. Meetharam (Contact No. 9649447826) Villagers
2. Debsagar Das
3.
E Purpose of Consultation
To ascertain the basic socio-economic conditions in the village.
F Key Points Inferred:
• Positive response towards industrial development in the locality with the expectation of employment
growth and overall development in the locality.
• Good quality potable water is sourced from borewells and 15 tankers are present in the village.
• RO facility is not present in the area.
• Sprinkle irrigation system is used in the fields for irrigation purposes. Three- season cropping is practised.
• Govt. schemes- No PM Awas Yojna, Rojgar guarantee prevails, agricultural loans (Krishi Rin) can also be
availed.
• 50% of the village households are covered under the Govt. sanitation scheme.
• Electricity facility is available.
• Malaria is a major prevailing disease.
• PHC is present is the village and proper treatment facility is available.
• Village road is not under proper maintenance condition.
• The villagers of the age group within 20-40 years are educated.
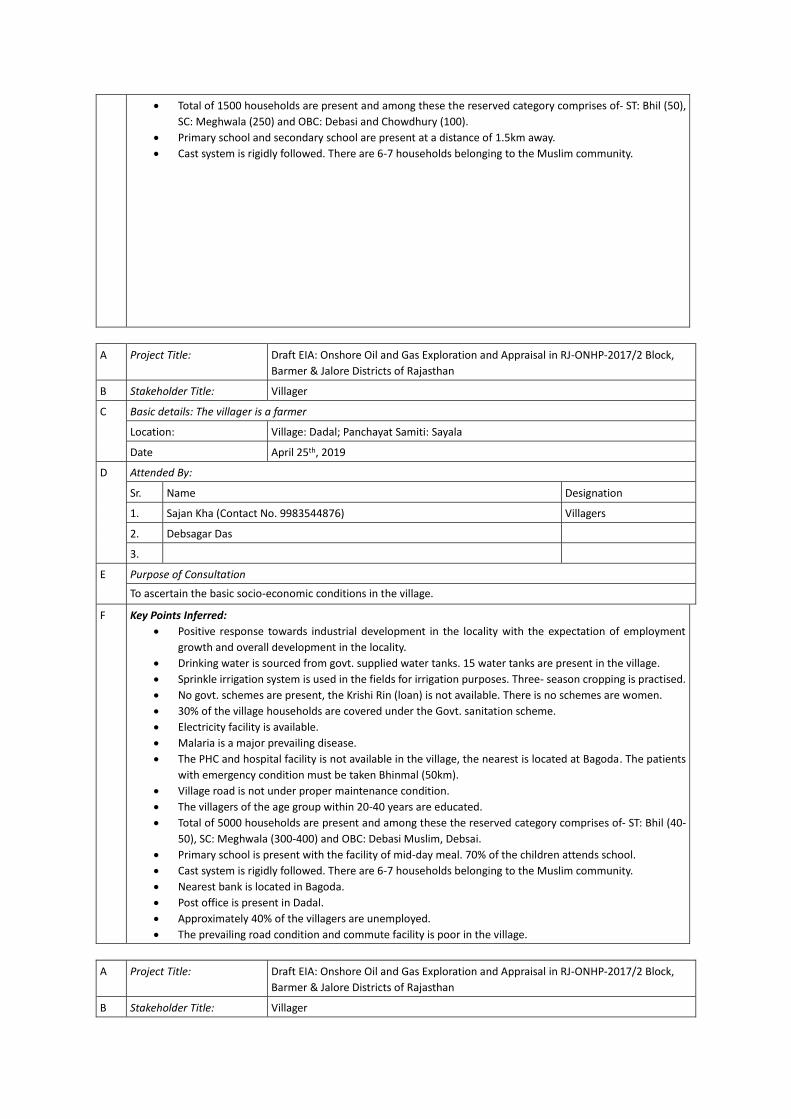
• Total of 1500 households are present and among these the reserved category comprises of- ST: Bhil (50),
SC: Meghwala (250) and OBC: Debasi and Chowdhury (100).
• Primary school and secondary school are present at a distance of 1.5km away.
• Cast system is rigidly followed. There are 6-7 households belonging to the Muslim community.
A Project Title: Draft EIA: Onshore Oil and Gas Exploration and Appraisal in RJ-ONHP-2017/2 Block,
Barmer & Jalore Districts of Rajasthan
B Stakeholder Title: Villager
C Basic details: The villager is a farmer
Location: Village: Dadal; Panchayat Samiti: Sayala
Date April 25th, 2019
D Attended By:
Sr. Name Designation
1. Sajan Kha (Contact No. 9983544876) Villagers
2. Debsagar Das
3.
E Purpose of Consultation
To ascertain the basic socio-economic conditions in the village.
F Key Points Inferred:
• Positive response towards industrial development in the locality with the expectation of employment
growth and overall development in the locality.
• Drinking water is sourced from govt. supplied water tanks. 15 water tanks are present in the village.
• Sprinkle irrigation system is used in the fields for irrigation purposes. Three- season cropping is practised.
• No govt. schemes are present, the Krishi Rin (loan) is not available. There is no schemes are women.
• 30% of the village households are covered under the Govt. sanitation scheme.
• Electricity facility is available.
• Malaria is a major prevailing disease.
• The PHC and hospital facility is not available in the village, the nearest is located at Bagoda. The patients
with emergency condition must be taken Bhinmal (50km).
• Village road is not under proper maintenance condition.
• The villagers of the age group within 20-40 years are educated.
• Total of 5000 households are present and among these the reserved category comprises of- ST: Bhil (40-
50), SC: Meghwala (300-400) and OBC: Debasi Muslim, Debsai.
• Primary school is present with the facility of mid-day meal. 70% of the children attends school.
• Cast system is rigidly followed. There are 6-7 households belonging to the Muslim community.
• Nearest bank is located in Bagoda.
• Post office is present in Dadal.
• Approximately 40% of the villagers are unemployed.
• The prevailing road condition and commute facility is poor in the village.
A Project Title: Draft EIA: Onshore Oil and Gas Exploration and Appraisal in RJ-ONHP-2017/2 Block,
Barmer & Jalore Districts of Rajasthan
B Stakeholder Title: Villager
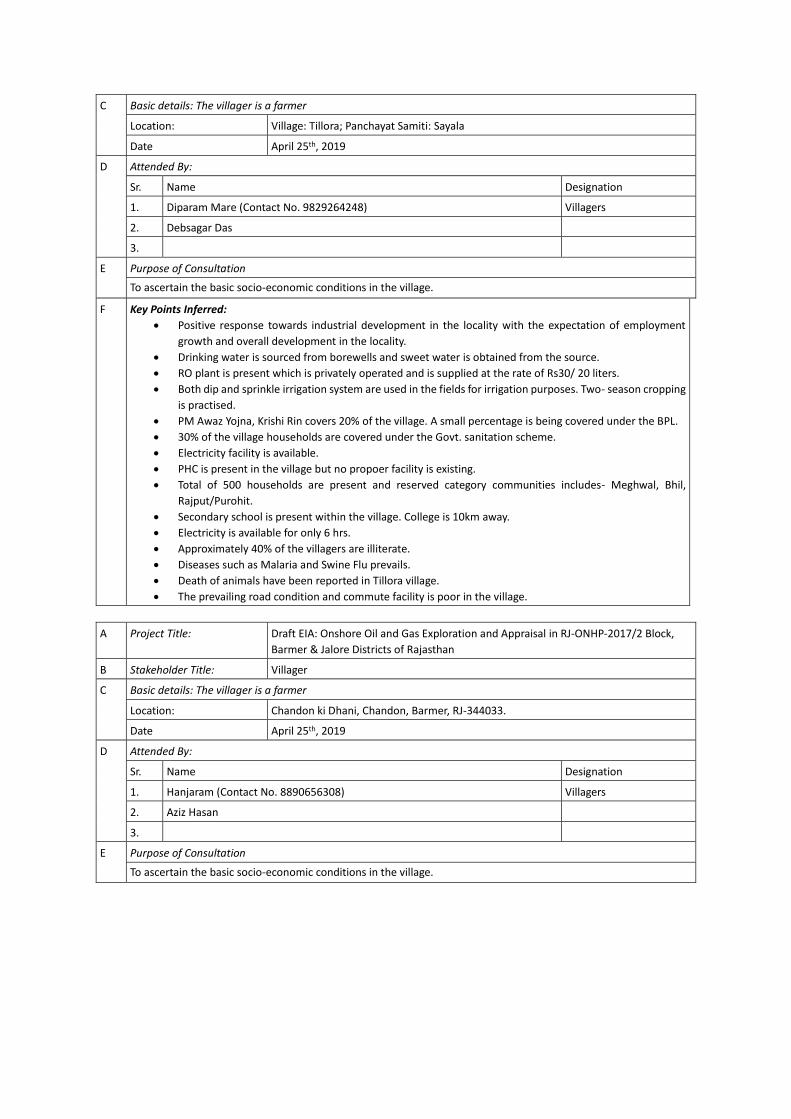
C Basic details: The villager is a farmer
Location: Village: Tillora; Panchayat Samiti: Sayala
Date April 25th, 2019
D Attended By:
Sr. Name Designation
1. Diparam Mare (Contact No. 9829264248) Villagers
2. Debsagar Das
3.
E Purpose of Consultation
To ascertain the basic socio-economic conditions in the village.
F Key Points Inferred:
• Positive response towards industrial development in the locality with the expectation of employment
growth and overall development in the locality.
• Drinking water is sourced from borewells and sweet water is obtained from the source.
• RO plant is present which is privately operated and is supplied at the rate of Rs30/ 20 liters.
• Both dip and sprinkle irrigation system are used in the fields for irrigation purposes. Two- season cropping
is practised.
• PM Awaz Yojna, Krishi Rin covers 20% of the village. A small percentage is being covered under the BPL.
• 30% of the village households are covered under the Govt. sanitation scheme.
• Electricity facility is available.
• PHC is present in the village but no propoer facility is existing.
• Total of 500 households are present and reserved category communities includes- Meghwal, Bhil,
Rajput/Purohit.
• Secondary school is present within the village. College is 10km away.
• Electricity is available for only 6 hrs.
• Approximately 40% of the villagers are illiterate.
• Diseases such as Malaria and Swine Flu prevails.
• Death of animals have been reported in Tillora village.
• The prevailing road condition and commute facility is poor in the village.
A Project Title: Draft EIA: Onshore Oil and Gas Exploration and Appraisal in RJ-ONHP-2017/2 Block,
Barmer & Jalore Districts of Rajasthan
B Stakeholder Title: Villager
C Basic details: The villager is a farmer
Location: Chandon ki Dhani, Chandon, Barmer, RJ-344033.
Date April 25th, 2019
D Attended By:
Sr. Name Designation
1. Hanjaram (Contact No. 8890656308) Villagers
2. Aziz Hasan
3.
E Purpose of Consultation
To ascertain the basic socio-economic conditions in the village.
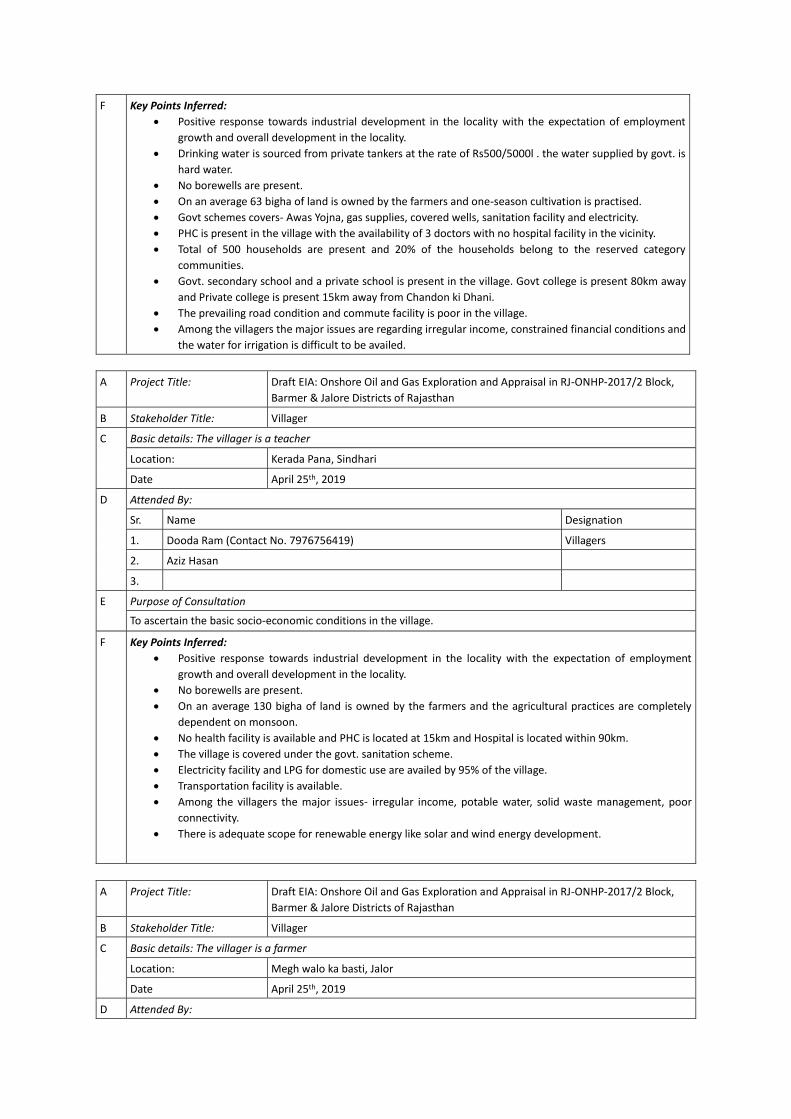
F Key Points Inferred:
• Positive response towards industrial development in the locality with the expectation of employment
growth and overall development in the locality.
• Drinking water is sourced from private tankers at the rate of Rs500/5000l . the water supplied by govt. is
hard water.
• No borewells are present.
• On an average 63 bigha of land is owned by the farmers and one-season cultivation is practised.
• Govt schemes covers- Awas Yojna, gas supplies, covered wells, sanitation facility and electricity.
• PHC is present in the village with the availability of 3 doctors with no hospital facility in the vicinity.
• Total of 500 households are present and 20% of the households belong to the reserved category
communities.
• Govt. secondary school and a private school is present in the village. Govt college is present 80km away
and Private college is present 15km away from Chandon ki Dhani.
• The prevailing road condition and commute facility is poor in the village.
• Among the villagers the major issues are regarding irregular income, constrained financial conditions and
the water for irrigation is difficult to be availed.
A Project Title: Draft EIA: Onshore Oil and Gas Exploration and Appraisal in RJ-ONHP-2017/2 Block,
Barmer & Jalore Districts of Rajasthan
B Stakeholder Title: Villager
C Basic details: The villager is a teacher
Location: Kerada Pana, Sindhari
Date April 25th, 2019
D Attended By:
Sr. Name Designation
1. Dooda Ram (Contact No. 7976756419) Villagers
2. Aziz Hasan
3.
E Purpose of Consultation
To ascertain the basic socio-economic conditions in the village.
F Key Points Inferred:
• Positive response towards industrial development in the locality with the expectation of employment
growth and overall development in the locality.
• No borewells are present.
• On an average 130 bigha of land is owned by the farmers and the agricultural practices are completely
dependent on monsoon.
• No health facility is available and PHC is located at 15km and Hospital is located within 90km.
• The village is covered under the govt. sanitation scheme.
• Electricity facility and LPG for domestic use are availed by 95% of the village.
• Transportation facility is available.
• Among the villagers the major issues- irregular income, potable water, solid waste management, poor
connectivity.
• There is adequate scope for renewable energy like solar and wind energy development.
A Project Title: Draft EIA: Onshore Oil and Gas Exploration and Appraisal in RJ-ONHP-2017/2 Block,
Barmer & Jalore Districts of Rajasthan
B Stakeholder Title: Villager
C Basic details: The villager is a farmer
Location: Megh walo ka basti, Jalor
Date April 25th, 2019
D Attended By:
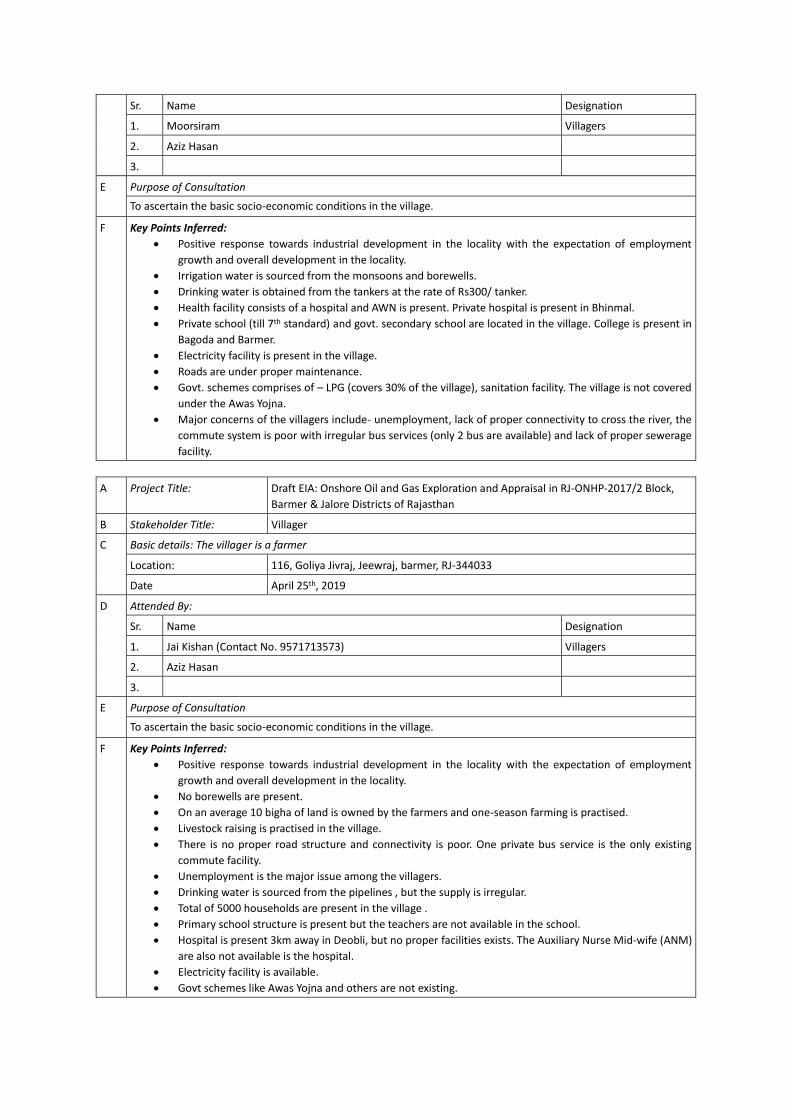
Sr. Name Designation
1. Moorsiram Villagers
2. Aziz Hasan
3.
E Purpose of Consultation
To ascertain the basic socio-economic conditions in the village.
F Key Points Inferred:
• Positive response towards industrial development in the locality with the expectation of employment
growth and overall development in the locality.
• Irrigation water is sourced from the monsoons and borewells.
• Drinking water is obtained from the tankers at the rate of Rs300/ tanker.
• Health facility consists of a hospital and AWN is present. Private hospital is present in Bhinmal.
• Private school (till 7th standard) and govt. secondary school are located in the village. College is present in
Bagoda and Barmer.
• Electricity facility is present in the village.
• Roads are under proper maintenance.
• Govt. schemes comprises of – LPG (covers 30% of the village), sanitation facility. The village is not covered
under the Awas Yojna.
• Major concerns of the villagers include- unemployment, lack of proper connectivity to cross the river, the
commute system is poor with irregular bus services (only 2 bus are available) and lack of proper sewerage
facility.
A Project Title: Draft EIA: Onshore Oil and Gas Exploration and Appraisal in RJ-ONHP-2017/2 Block,
Barmer & Jalore Districts of Rajasthan
B Stakeholder Title: Villager
C Basic details: The villager is a farmer
Location: 116, Goliya Jivraj, Jeewraj, barmer, RJ-344033
Date April 25th, 2019
D Attended By:
Sr. Name Designation
1. Jai Kishan (Contact No. 9571713573) Villagers
2. Aziz Hasan
3.
E Purpose of Consultation
To ascertain the basic socio-economic conditions in the village.
F Key Points Inferred:
• Positive response towards industrial development in the locality with the expectation of employment
growth and overall development in the locality.
• No borewells are present.
• On an average 10 bigha of land is owned by the farmers and one-season farming is practised.
• Livestock raising is practised in the village.
• There is no proper road structure and connectivity is poor. One private bus service is the only existing
commute facility.
• Unemployment is the major issue among the villagers.
• Drinking water is sourced from the pipelines , but the supply is irregular.
• Total of 5000 households are present in the village .
• Primary school structure is present but the teachers are not available in the school.
• Hospital is present 3km away in Deobli, but no proper facilities exists. The Auxiliary Nurse Mid-wife (ANM)
are also not available is the hospital.
• Electricity facility is available.
• Govt schemes like Awas Yojna and others are not existing.
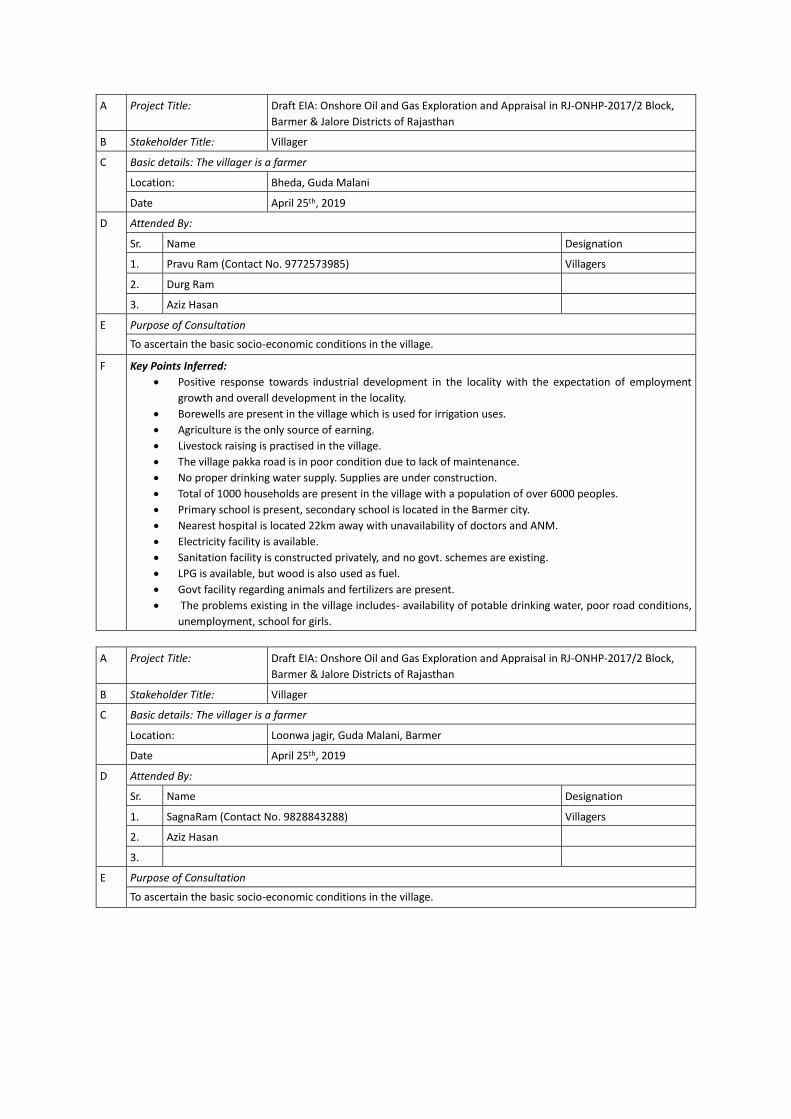
A Project Title: Draft EIA: Onshore Oil and Gas Exploration and Appraisal in RJ-ONHP-2017/2 Block,
Barmer & Jalore Districts of Rajasthan
B Stakeholder Title: Villager
C Basic details: The villager is a farmer
Location: Bheda, Guda Malani
Date April 25th, 2019
D Attended By:
Sr. Name Designation
1. Pravu Ram (Contact No. 9772573985) Villagers
2. Durg Ram
3. Aziz Hasan
E Purpose of Consultation
To ascertain the basic socio-economic conditions in the village.
F Key Points Inferred:
• Positive response towards industrial development in the locality with the expectation of employment
growth and overall development in the locality.
• Borewells are present in the village which is used for irrigation uses.
• Agriculture is the only source of earning.
• Livestock raising is practised in the village.
• The village pakka road is in poor condition due to lack of maintenance.
• No proper drinking water supply. Supplies are under construction.
• Total of 1000 households are present in the village with a population of over 6000 peoples.
• Primary school is present, secondary school is located in the Barmer city.
• Nearest hospital is located 22km away with unavailability of doctors and ANM.
• Electricity facility is available.
• Sanitation facility is constructed privately, and no govt. schemes are existing.
• LPG is available, but wood is also used as fuel.
• Govt facility regarding animals and fertilizers are present.
• The problems existing in the village includes- availability of potable drinking water, poor road conditions,
unemployment, school for girls.
A Project Title: Draft EIA: Onshore Oil and Gas Exploration and Appraisal in RJ-ONHP-2017/2 Block,
Barmer & Jalore Districts of Rajasthan
B Stakeholder Title: Villager
C Basic details: The villager is a farmer
Location: Loonwa jagir, Guda Malani, Barmer
Date April 25th, 2019
D Attended By:
Sr. Name Designation
1. SagnaRam (Contact No. 9828843288) Villagers
2. Aziz Hasan
3.
E Purpose of Consultation
To ascertain the basic socio-economic conditions in the village.
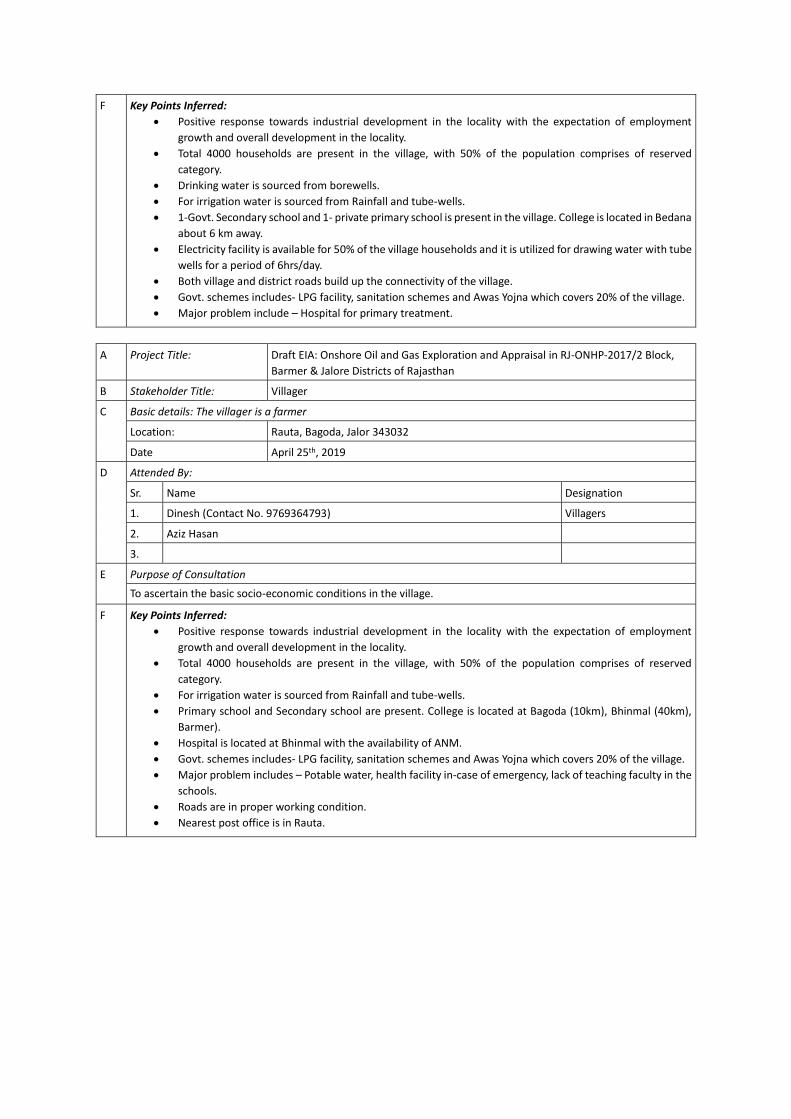
F Key Points Inferred:
• Positive response towards industrial development in the locality with the expectation of employment
growth and overall development in the locality.
• Total 4000 households are present in the village, with 50% of the population comprises of reserved
category.
• Drinking water is sourced from borewells.
• For irrigation water is sourced from Rainfall and tube-wells.
• 1-Govt. Secondary school and 1- private primary school is present in the village. College is located in Bedana
about 6 km away.
• Electricity facility is available for 50% of the village households and it is utilized for drawing water with tube
wells for a period of 6hrs/day.
• Both village and district roads build up the connectivity of the village.
• Govt. schemes includes- LPG facility, sanitation schemes and Awas Yojna which covers 20% of the village.
• Major problem include – Hospital for primary treatment.
A Project Title: Draft EIA: Onshore Oil and Gas Exploration and Appraisal in RJ-ONHP-2017/2 Block,
Barmer & Jalore Districts of Rajasthan
B Stakeholder Title: Villager
C Basic details: The villager is a farmer
Location: Rauta, Bagoda, Jalor 343032
Date April 25th, 2019
D Attended By:
Sr. Name Designation
1. Dinesh (Contact No. 9769364793) Villagers
2. Aziz Hasan
3.
E Purpose of Consultation
To ascertain the basic socio-economic conditions in the village.
F Key Points Inferred:
• Positive response towards industrial development in the locality with the expectation of employment
growth and overall development in the locality.
• Total 4000 households are present in the village, with 50% of the population comprises of reserved
category.
• For irrigation water is sourced from Rainfall and tube-wells.
• Primary school and Secondary school are present. College is located at Bagoda (10km), Bhinmal (40km),
Barmer).
• Hospital is located at Bhinmal with the availability of ANM.
• Govt. schemes includes- LPG facility, sanitation schemes and Awas Yojna which covers 20% of the village.
• Major problem includes – Potable water, health facility in-case of emergency, lack of teaching faculty in the
schools.
• Roads are in proper working condition.
• Nearest post office is in Rauta.

Appendix 7.1 Leak
Sizes, Inventories
and Hazardous
Chemicals within
the Isolatable
Sections
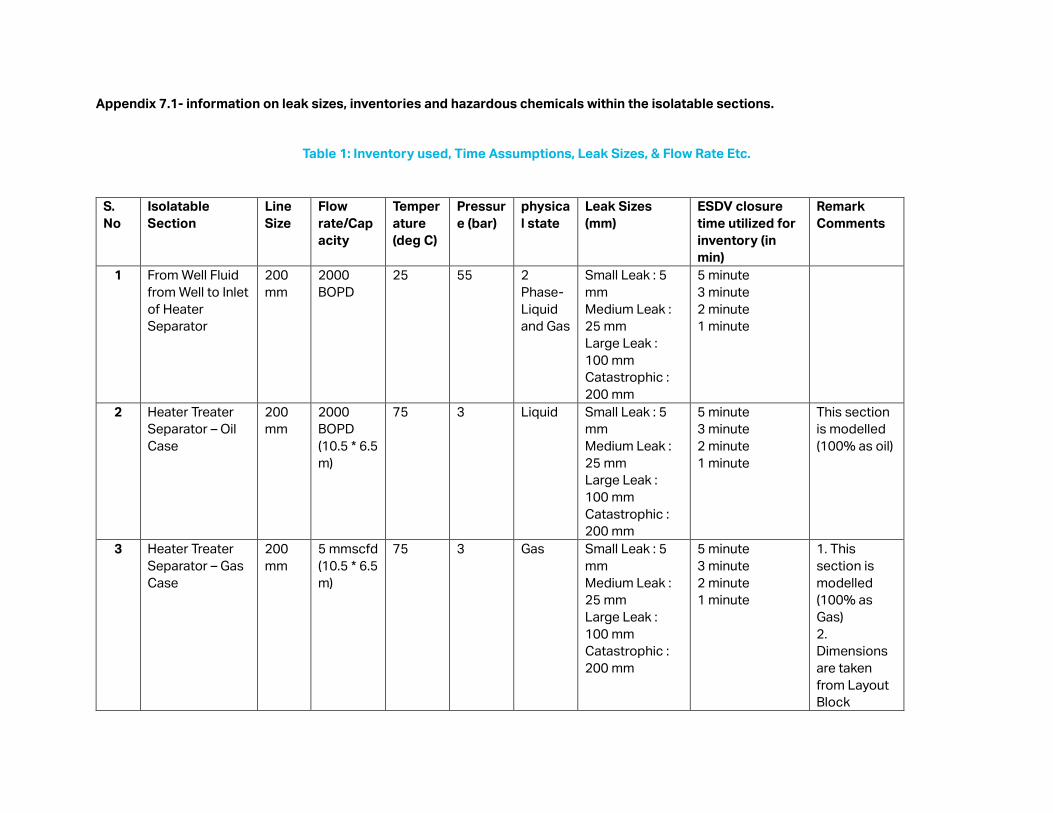
Appendix 7.1- information on leak sizes, inventories and hazardous chemicals within the isolatable sections.
Table 1: Inventory used, Time Assumptions, Leak Sizes, & Flow Rate Etc.
S.
No
Isolatable
Section
Line
Size
Flow
rate/Cap
acity
Temper
ature
(deg C)
Pressur
e (bar)
physica
l state
Leak Sizes
(mm)
ESDV closure
time utilized for
inventory (in
min)
Remark
Comments
1 From Well Fluid
from Well to Inlet
of Heater
Separator
200
mm
2000
BOPD
25 55 2
Phase-
Liquid
and Gas
Small Leak : 5
mm
Medium Leak :
25 mm
Large Leak :
100 mm
Catastrophic :
200 mm
5 minute
3 minute
2 minute
1 minute
2 Heater Treater
Separator – Oil
Case
200
mm
2000
BOPD
(10.5 * 6.5
m)
75 3 Liquid Small Leak : 5
mm
Medium Leak :
25 mm
Large Leak :
100 mm
Catastrophic :
200 mm
5 minute
3 minute
2 minute
1 minute
This section
is modelled
(100% as oil)
3 Heater Treater
Separator – Gas
Case
200
mm
5 mmscfd
(10.5 * 6.5
m)
75 3 Gas Small Leak : 5
mm
Medium Leak :
25 mm
Large Leak :
100 mm
Catastrophic :
200 mm
5 minute
3 minute
2 minute
1 minute
1. This
section is
modelled
(100% as
Gas)
2.
Dimensions
are taken
from Layout
Block
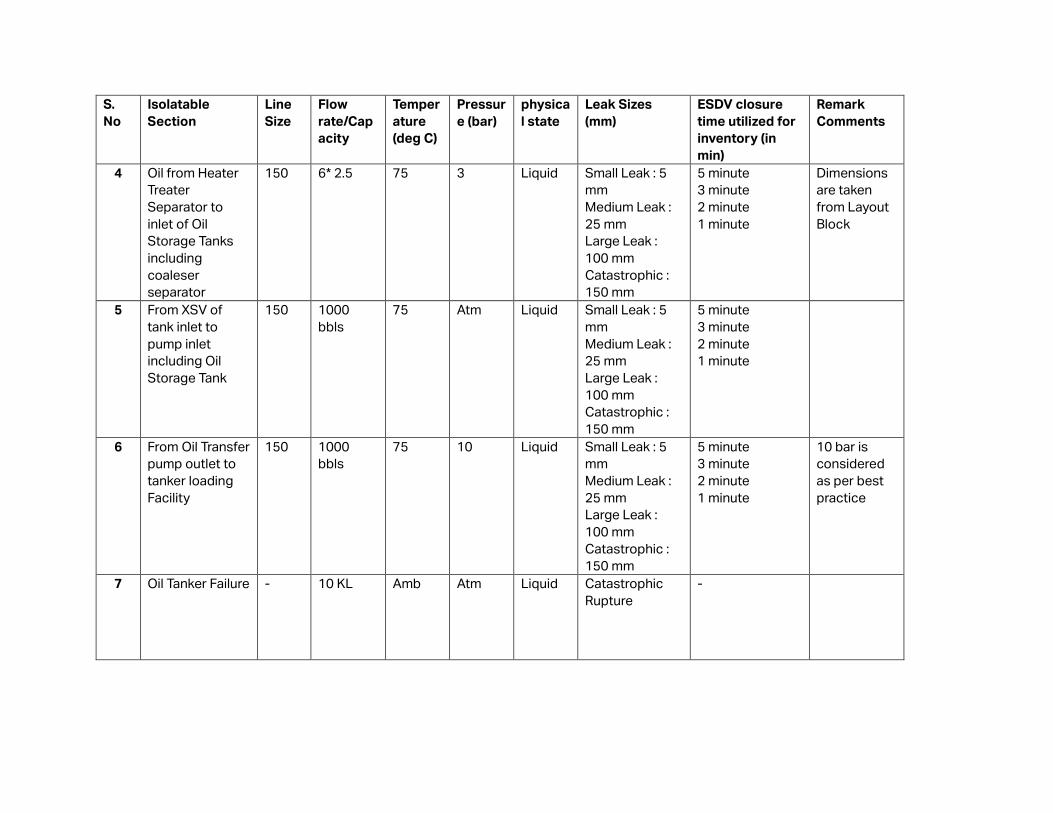
S.
No
Isolatable
Section
Line
Size
Flow
rate/Cap
acity
Temper
ature
(deg C)
Pressur
e (bar)
physica
l state
Leak Sizes
(mm)
ESDV closure
time utilized for
inventory (in
min)
Remark
Comments
4 Oil from Heater
Treater
Separator to
inlet of Oil
Storage Tanks
including
coaleser
separator
150 6* 2.5 75 3
Liquid Small Leak : 5
mm
Medium Leak :
25 mm
Large Leak :
100 mm
Catastrophic :
150 mm
5 minute
3 minute
2 minute
1 minute
Dimensions
are taken
from Layout
Block
5 From XSV of
tank inlet to
pump inlet
including Oil
Storage Tank
150 1000
bbls
75 Atm Liquid Small Leak : 5
mm
Medium Leak :
25 mm
Large Leak :
100 mm
Catastrophic :
150 mm
5 minute
3 minute
2 minute
1 minute
6 From Oil Transfer
pump outlet to
tanker loading
Facility
150 1000
bbls
75 10 Liquid Small Leak : 5
mm
Medium Leak :
25 mm
Large Leak :
100 mm
Catastrophic :
150 mm
5 minute
3 minute
2 minute
1 minute
10 bar is
considered
as per best
practice
7 Oil Tanker Failure - 10 KL Amb Atm Liquid Catastrophic
Rupture
-
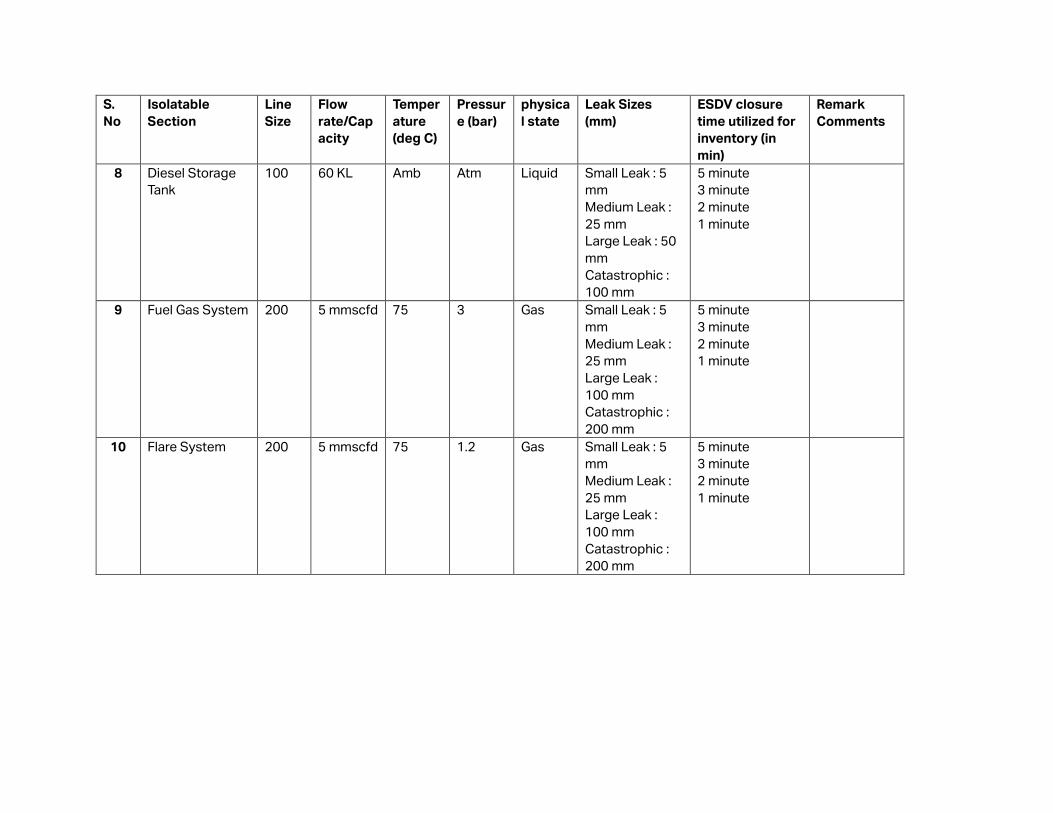
S.
No
Isolatable
Section
Line
Size
Flow
rate/Cap
acity
Temper
ature
(deg C)
Pressur
e (bar)
physica
l state
Leak Sizes
(mm)
ESDV closure
time utilized for
inventory (in
min)
Remark
Comments
8 Diesel Storage
Tank
100 60 KL Amb Atm Liquid Small Leak : 5
mm
Medium Leak :
25 mm
Large Leak : 50
mm
Catastrophic :
100 mm
5 minute
3 minute
2 minute
1 minute
9 Fuel Gas System 200 5 mmscfd 75 3 Gas Small Leak : 5
mm
Medium Leak :
25 mm
Large Leak :
100 mm
Catastrophic :
200 mm
5 minute
3 minute
2 minute
1 minute
10 Flare System 200 5 mmscfd 75 1.2 Gas Small Leak : 5
mm
Medium Leak :
25 mm
Large Leak :
100 mm
Catastrophic :
200 mm
5 minute
3 minute
2 minute
1 minute

Vedanta Limited. (Division CAIRN Oil & Gas) DRAFT EIA: Onshore Oil and Gas E&A in RJ-ONHP- 2017/4 Block, Barmer District, Rajasthan
June,2019 AECOM
216