ecommerce rj survey shows increasing fashion resale
TRANSCRIPT
US RESEARCH | PUBLISHED BYRAYMOND JAMES & ASSOCIATES
INTERNET | ECOMMERCEAaron Kessler, CFA | (415) 616-8959 | [email protected]
FEBRUARY 21, 2020 | 12:05 AM ESTINDUSTRY BRIEF
RJ Survey Shows Increasing Fashion Resale Market Adoption
We recently surveyed ~465 Internet users (ages of 13-45) to gauge their usage and outlook of Internet websites and applications, including fashionsresale websites. As we covered into our 2019 Fashion Resale Report: Rise of the Fashion Resale Marketplaces, we believe online fashion resalemarketplaces offer numerous advantages over traditional secondhand and off-price stores, including: larger selection, more convenient shoppingexperience, and authentication services. In addition to these benefits, consumers are rapidly adopting resale marketplaces as a result of increasingawareness of the category and benefits of shopping resale, as well as less stigma around buying secondhand. Our latest survey shows: 1) moreconsumers shifting to online resale (18% currently use and 17% are very likely to use in future); 2) Frequency of shopping largest correlation withwho shops resale; 3) Saving money and finding something unique remained key reason for shopping resale; 4) Apparel (64%) followed by shoes(42%) were most in demand categories; 5) Brand awareness improved for all of the key resale websites including Poshmark (58%), ThredUp (35%),and The RealReal (20%). Across age groups, younger cohorts had higher awareness of Depop, GOAT, and StockX.
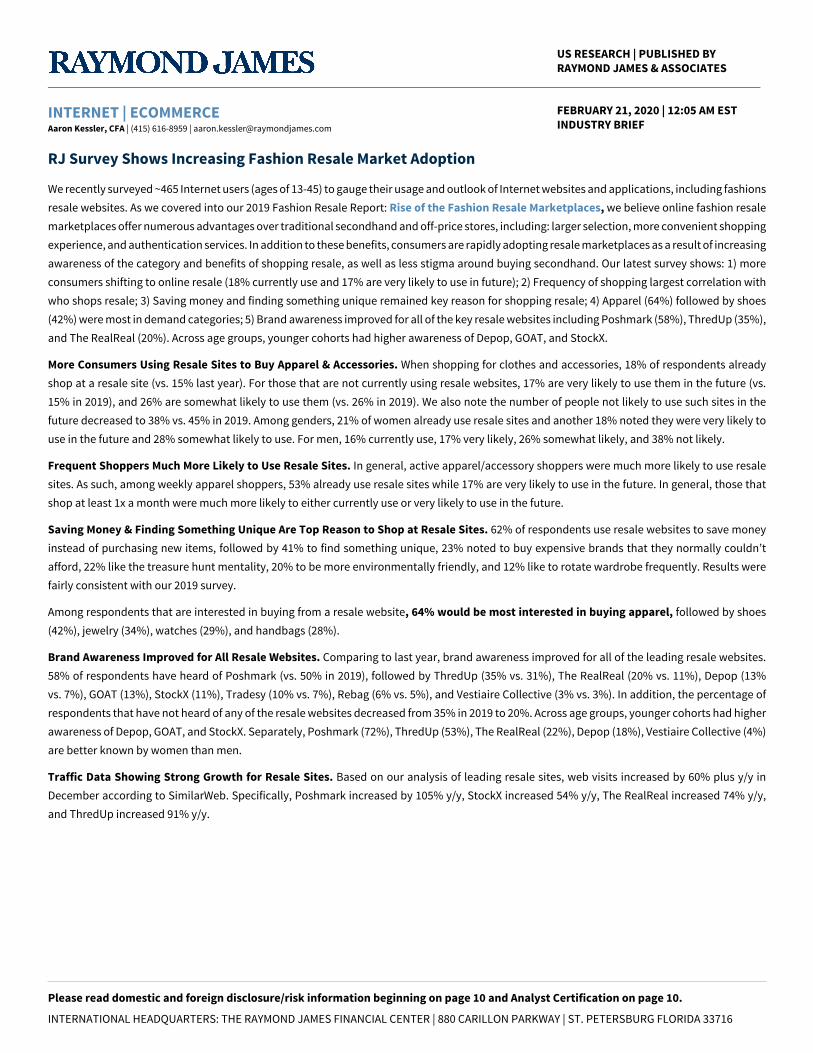
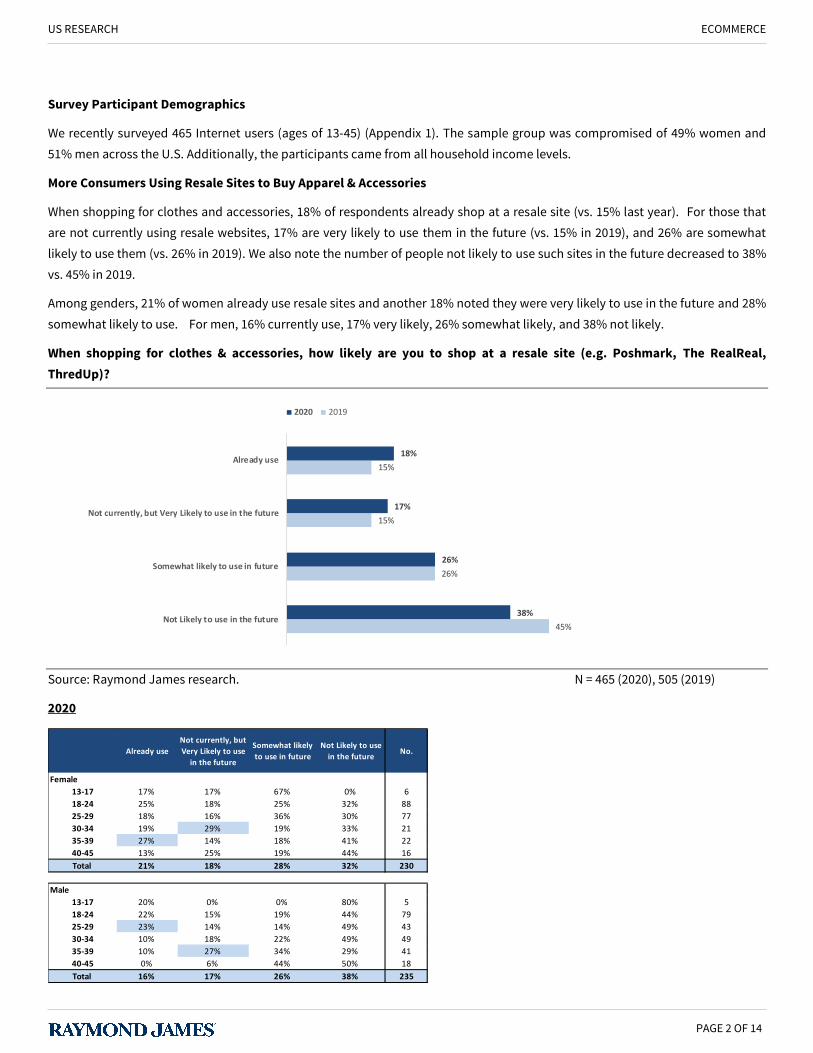
More Consumers Using Resale Sites to Buy Apparel & Accessories. When shopping for clothes and accessories, 18% of respondents alreadyshop at a resale site (vs. 15% last year). For those that are not currently using resale websites, 17% are very likely to use them in the future (vs.15% in 2019), and 26% are somewhat likely to use them (vs. 26% in 2019). We also note the number of people not likely to use such sites in thefuture decreased to 38% vs. 45% in 2019. Among genders, 21% of women already use resale sites and another 18% noted they were very likely touse in the future and 28% somewhat likely to use. For men, 16% currently use, 17% very likely, 26% somewhat likely, and 38% not likely.
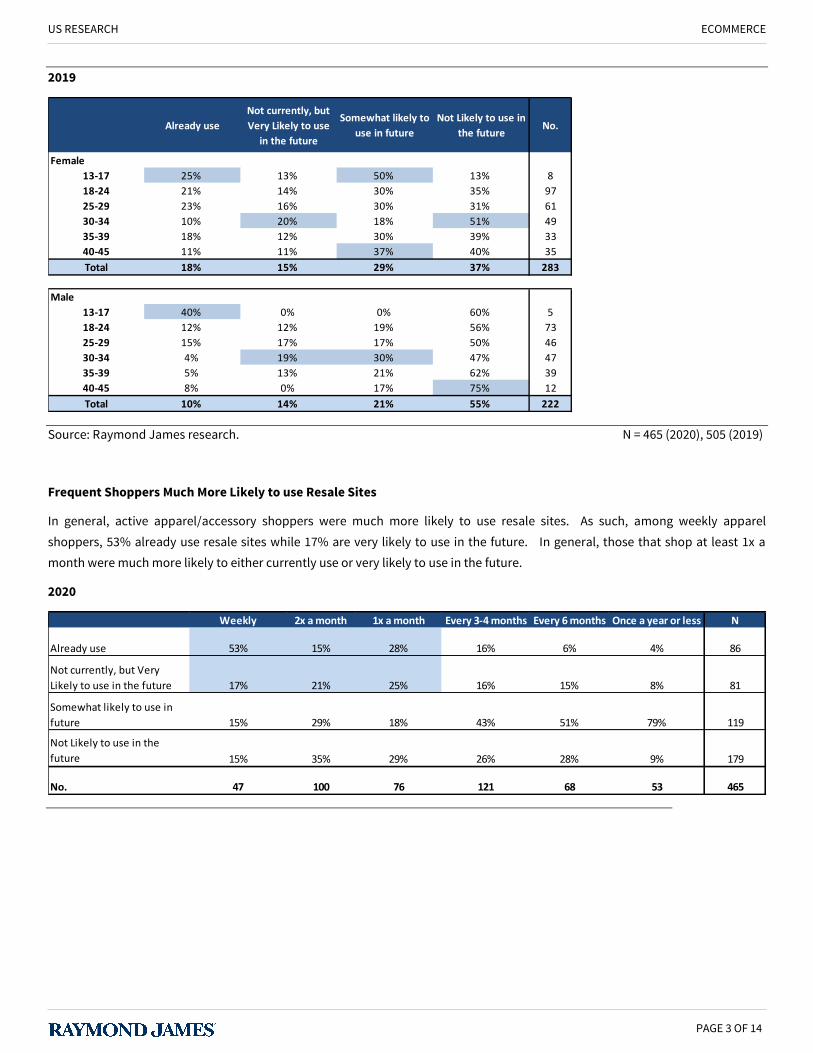
Frequent Shoppers Much More Likely to Use Resale Sites. In general, active apparel/accessory shoppers were much more likely to use resalesites. As such, among weekly apparel shoppers, 53% already use resale sites while 17% are very likely to use in the future. In general, those thatshop at least 1x a month were much more likely to either currently use or very likely to use in the future.
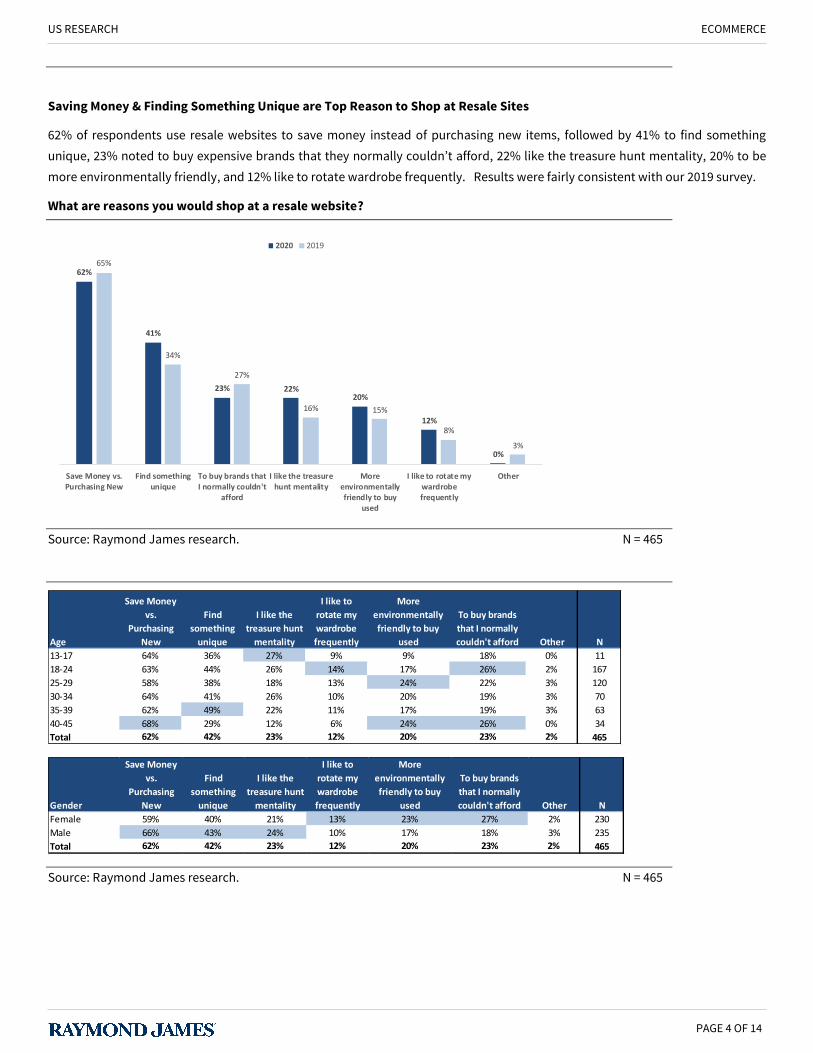
Saving Money & Finding Something Unique Are Top Reason to Shop at Resale Sites. 62% of respondents use resale websites to save moneyinstead of purchasing new items, followed by 41% to find something unique, 23% noted to buy expensive brands that they normally couldn’tafford, 22% like the treasure hunt mentality, 20% to be more environmentally friendly, and 12% like to rotate wardrobe frequently. Results werefairly consistent with our 2019 survey.
Among respondents that are interested in buying from a resale website, 64% would be most interested in buying apparel, followed by shoes(42%), jewelry (34%), watches (29%), and handbags (28%).
Brand Awareness Improved for All Resale Websites. Comparing to last year, brand awareness improved for all of the leading resale websites.58% of respondents have heard of Poshmark (vs. 50% in 2019), followed by ThredUp (35% vs. 31%), The RealReal (20% vs. 11%), Depop (13%vs. 7%), GOAT (13%), StockX (11%), Tradesy (10% vs. 7%), Rebag (6% vs. 5%), and Vestiaire Collective (3% vs. 3%). In addition, the percentage ofrespondents that have not heard of any of the resale websites decreased from 35% in 2019 to 20%. Across age groups, younger cohorts had higherawareness of Depop, GOAT, and StockX. Separately, Poshmark (72%), ThredUp (53%), The RealReal (22%), Depop (18%), Vestiaire Collective (4%)are better known by women than men.
Traffic Data Showing Strong Growth for Resale Sites. Based on our analysis of leading resale sites, web visits increased by 60% plus y/y inDecember according to SimilarWeb. Specifically, Poshmark increased by 105% y/y, StockX increased 54% y/y, The RealReal increased 74% y/y,and ThredUp increased 91% y/y.
Please read domestic and foreign disclosure/risk information beginning on page 10 and Analyst Certification on page 10.
INTERNATIONAL HEADQUARTERS: THE RAYMOND JAMES FINANCIAL CENTER | 880 CARILLON PARKWAY | ST. PETERSBURG FLORIDA 33716
Survey Participant Demographics
We recently surveyed 465 Internet users (ages of 13-45) (Appendix 1). The sample group was compromised of 49% women and
51% men across the U.S. Additionally, the participants came from all household income levels.
More Consumers Using Resale Sites to Buy Apparel & Accessories
When shopping for clothes and accessories, 18% of respondents already shop at a resale site (vs. 15% last year). For those that
are not currently using resale websites, 17% are very likely to use them in the future (vs. 15% in 2019), and 26% are somewhat
likely to use them (vs. 26% in 2019). We also note the number of people not likely to use such sites in the future decreased to 38%
vs. 45% in 2019.
Among genders, 21% of women already use resale sites and another 18% noted they were very likely to use in the future and 28%
somewhat likely to use. For men, 16% currently use, 17% very likely, 26% somewhat likely, and 38% not likely.
When shopping for clothes & accessories, how likely are you to shop at a resale site (e.g. Poshmark, The RealReal,
ThredUp)?
Source: Raymond James research. N = 465 (2020), 505 (2019)
2020
45%
26%
15%
15%
38%
26%
17%
18%
Not Likely to use in the future
Somewhat likely to use in future
Not currently, but Very Likely to use in the future
Already use
2020 2019
Already use
Not currently, but
Very Likely to use
in the future
Somewhat likely
to use in future
Not Likely to use
in the futureNo.
Female
13-17 17% 17% 67% 0% 6
18-24 25% 18% 25% 32% 88
25-29 18% 16% 36% 30% 77
30-34 19% 29% 19% 33% 21
35-39 27% 14% 18% 41% 22
40-45 13% 25% 19% 44% 16
Total 21% 18% 28% 32% 230
Male
13-17 20% 0% 0% 80% 5
18-24 22% 15% 19% 44% 79
25-29 23% 14% 14% 49% 43
30-34 10% 18% 22% 49% 49
35-39 10% 27% 34% 29% 41
40-45 0% 6% 44% 50% 18
Total 16% 17% 26% 38% 235
PAGE 2 OF 14
US RESEARCH ECOMMERCE
2019
Source: Raymond James research. N = 465 (2020), 505 (2019)
Frequent Shoppers Much More Likely to use Resale Sites
In general, active apparel/accessory shoppers were much more likely to use resale sites. As such, among weekly apparel
shoppers, 53% already use resale sites while 17% are very likely to use in the future. In general, those that shop at least 1x a
month were much more likely to either currently use or very likely to use in the future.
2020
Already use
Not currently, but
Very Likely to use
in the future
Somewhat likely to
use in future
Not Likely to use in
the futureNo.
Female
13-17 25% 13% 50% 13% 8
18-24 21% 14% 30% 35% 97
25-29 23% 16% 30% 31% 61
30-34 10% 20% 18% 51% 49
35-39 18% 12% 30% 39% 33
40-45 11% 11% 37% 40% 35
Total 18% 15% 29% 37% 283
Male
13-17 40% 0% 0% 60% 5
18-24 12% 12% 19% 56% 73
25-29 15% 17% 17% 50% 46
30-34 4% 19% 30% 47% 47
35-39 5% 13% 21% 62% 39
40-45 8% 0% 17% 75% 12
Total 10% 14% 21% 55% 222
Weekly 2x a month 1x a month Every 3-4 months Every 6 months Once a year or less N
Already use 53% 15% 28% 16% 6% 4% 86
Not currently, but Very
Likely to use in the future 17% 21% 25% 16% 15% 8% 81
Somewhat likely to use in
future 15% 29% 18% 43% 51% 79% 119
Not Likely to use in the
future 15% 35% 29% 26% 28% 9% 179
No. 47 100 76 121 68 53 465
PAGE 3 OF 14
US RESEARCH ECOMMERCE
Saving Money & Finding Something Unique are Top Reason to Shop at Resale Sites
62% of respondents use resale websites to save money instead of purchasing new items, followed by 41% to find something
unique, 23% noted to buy expensive brands that they normally couldn’t afford, 22% like the treasure hunt mentality, 20% to be
more environmentally friendly, and 12% like to rotate wardrobe frequently. Results were fairly consistent with our 2019 survey.
What are reasons you would shop at a resale website?
Source: Raymond James research. N = 465
Source: Raymond James research. N = 465
62%
41%
23% 22%20%
12%
0%
65%
34%
27%
16% 15%
8%
3%
Save Money vs.Purchasing New
Find somethingunique
To buy brands thatI normally couldn't
afford
I like the treasurehunt mentality
Moreenvironmentallyfriendly to buy
used
I like to rotate mywardrobefrequently
Other
2020 2019
Age
Save Money
vs.
Purchasing
New
Find
something
unique
I like the
treasure hunt
mentality
I like to
rotate my
wardrobe
frequently
More
environmentally
friendly to buy
used
To buy brands
that I normally
couldn't afford Other N
13-17 64% 36% 27% 9% 9% 18% 0% 11
18-24 63% 44% 26% 14% 17% 26% 2% 167
25-29 58% 38% 18% 13% 24% 22% 3% 120
30-34 64% 41% 26% 10% 20% 19% 3% 70
35-39 62% 49% 22% 11% 17% 19% 3% 63
40-45 68% 29% 12% 6% 24% 26% 0% 34
Total 62% 42% 23% 12% 20% 23% 2% 465
Gender
Save Money
vs.
Purchasing
New
Find
something
unique
I like the
treasure hunt
mentality
I like to
rotate my
wardrobe
frequently
More
environmentally
friendly to buy
used
To buy brands
that I normally
couldn't afford Other N
Female 59% 40% 21% 13% 23% 27% 2% 230
Male 66% 43% 24% 10% 17% 18% 3% 235
Total 62% 42% 23% 12% 20% 23% 2% 465
PAGE 4 OF 14
US RESEARCH ECOMMERCE
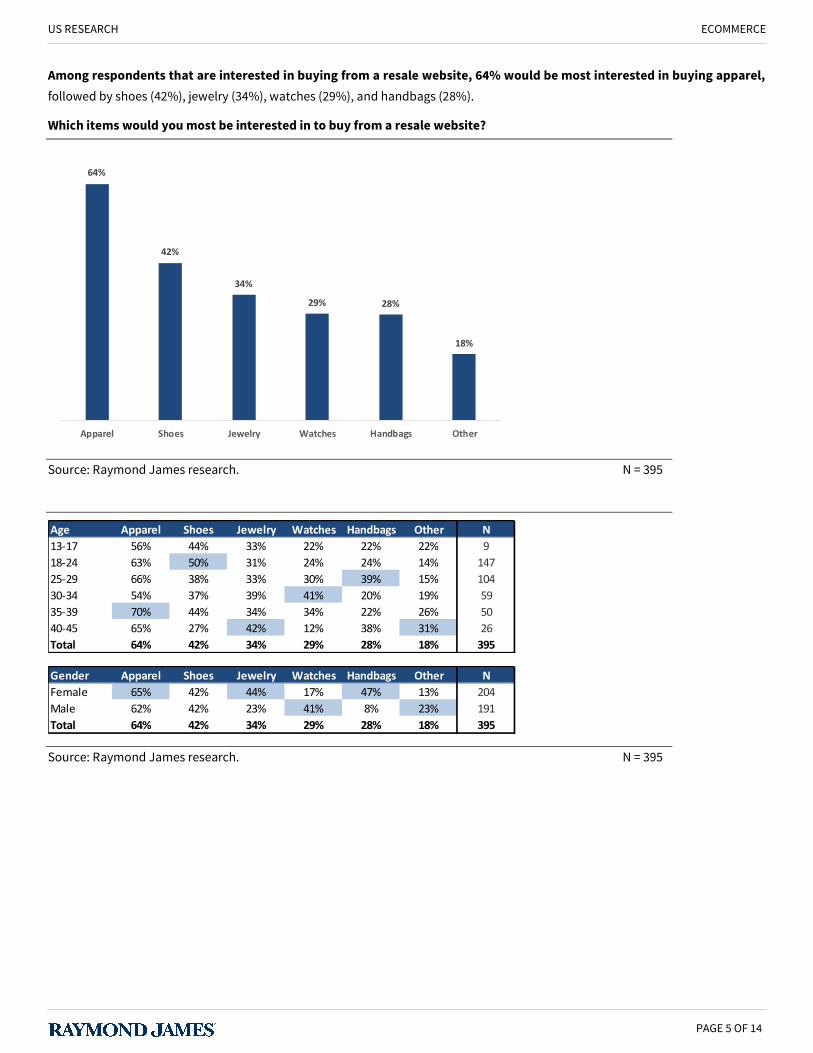
Among respondents that are interested in buying from a resale website, 64% would be most interested in buying apparel,
followed by shoes (42%), jewelry (34%), watches (29%), and handbags (28%).
Which items would you most be interested in to buy from a resale website?
Source: Raymond James research. N = 395
Source: Raymond James research. N = 395
64%
42%
34%
29% 28%
18%
Apparel Shoes Jewelry Watches Handbags Other
Age Apparel Shoes Jewelry Watches Handbags Other N
13-17 56% 44% 33% 22% 22% 22% 9
18-24 63% 50% 31% 24% 24% 14% 147
25-29 66% 38% 33% 30% 39% 15% 104
30-34 54% 37% 39% 41% 20% 19% 59
35-39 70% 44% 34% 34% 22% 26% 50
40-45 65% 27% 42% 12% 38% 31% 26
Total 64% 42% 34% 29% 28% 18% 395
Gender Apparel Shoes Jewelry Watches Handbags Other N
Female 65% 42% 44% 17% 47% 13% 204
Male 62% 42% 23% 41% 8% 23% 191
Total 64% 42% 34% 29% 28% 18% 395
PAGE 5 OF 14
US RESEARCH ECOMMERCE
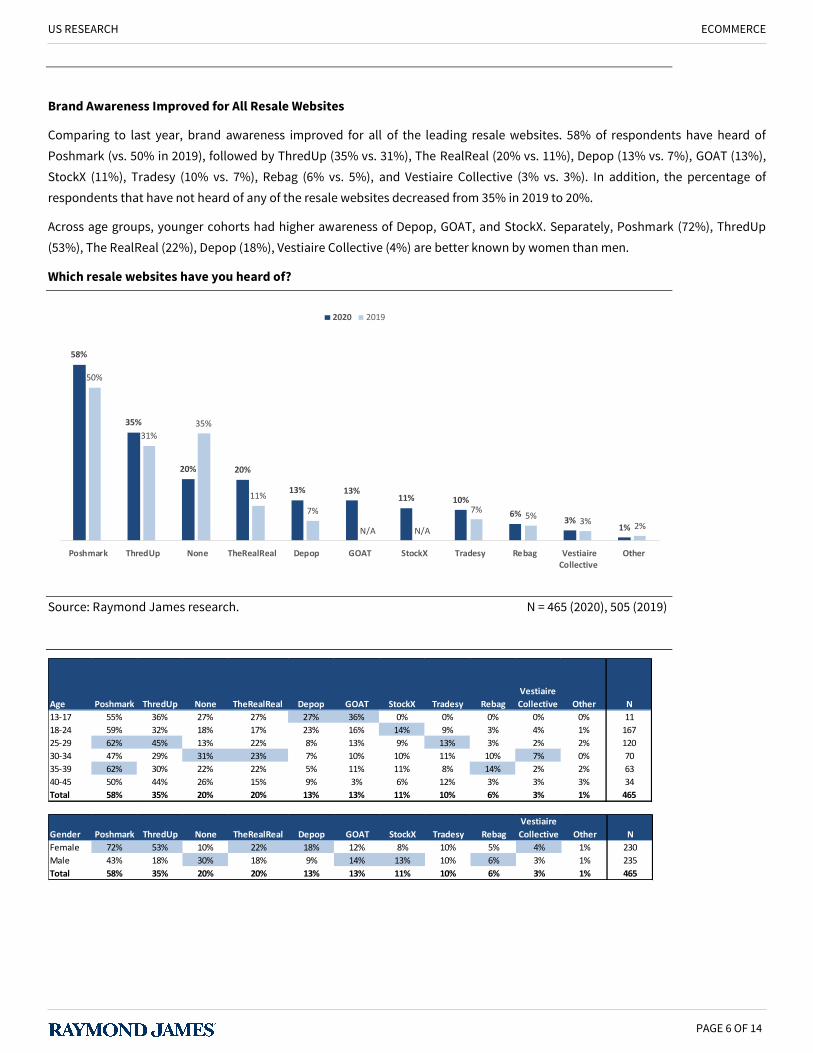
Brand Awareness Improved for All Resale Websites
Comparing to last year, brand awareness improved for all of the leading resale websites. 58% of respondents have heard of
Poshmark (vs. 50% in 2019), followed by ThredUp (35% vs. 31%), The RealReal (20% vs. 11%), Depop (13% vs. 7%), GOAT (13%),
StockX (11%), Tradesy (10% vs. 7%), Rebag (6% vs. 5%), and Vestiaire Collective (3% vs. 3%). In addition, the percentage of
respondents that have not heard of any of the resale websites decreased from 35% in 2019 to 20%.
Across age groups, younger cohorts had higher awareness of Depop, GOAT, and StockX. Separately, Poshmark (72%), ThredUp
(53%), The RealReal (22%), Depop (18%), Vestiaire Collective (4%) are better known by women than men.
Which resale websites have you heard of?
Source: Raymond James research. N = 465 (2020), 505 (2019)
58%
35%
20% 20%
13% 13%11% 10%
6%3%
1%
50%
31%
35%
11%
7%
N/A N/A
7%5%
3%2%
Poshmark ThredUp None TheRealReal Depop GOAT StockX Tradesy Rebag VestiaireCollective
Other
2020 2019
Age Poshmark ThredUp None TheRealReal Depop GOAT StockX Tradesy Rebag
Vestiaire
Collective Other N
13-17 55% 36% 27% 27% 27% 36% 0% 0% 0% 0% 0% 11
18-24 59% 32% 18% 17% 23% 16% 14% 9% 3% 4% 1% 167
25-29 62% 45% 13% 22% 8% 13% 9% 13% 3% 2% 2% 120
30-34 47% 29% 31% 23% 7% 10% 10% 11% 10% 7% 0% 70
35-39 62% 30% 22% 22% 5% 11% 11% 8% 14% 2% 2% 63
40-45 50% 44% 26% 15% 9% 3% 6% 12% 3% 3% 3% 34
Total 58% 35% 20% 20% 13% 13% 11% 10% 6% 3% 1% 465
Gender Poshmark ThredUp None TheRealReal Depop GOAT StockX Tradesy Rebag
Vestiaire
Collective Other N
Female 72% 53% 10% 22% 18% 12% 8% 10% 5% 4% 1% 230
Male 43% 18% 30% 18% 9% 14% 13% 10% 6% 3% 1% 235
Total 58% 35% 20% 20% 13% 13% 11% 10% 6% 3% 1% 465
PAGE 6 OF 14
US RESEARCH ECOMMERCE
Source: Raymond James research. N = 465
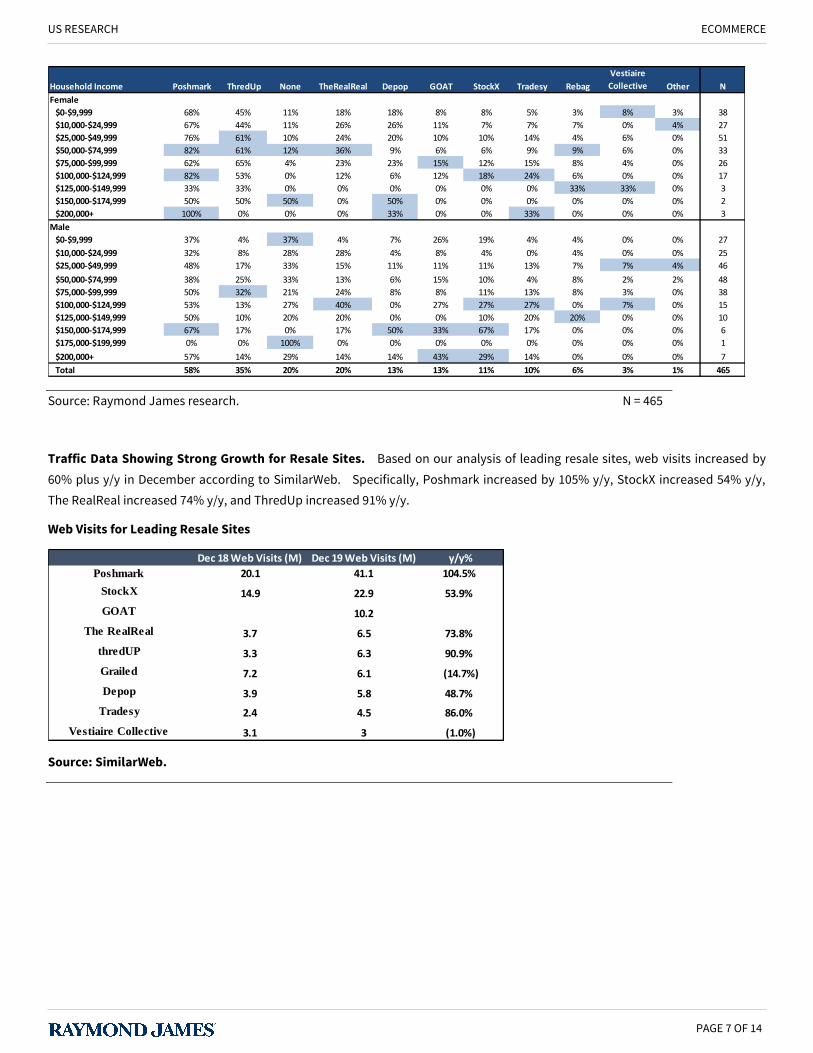
Traffic Data Showing Strong Growth for Resale Sites. Based on our analysis of leading resale sites, web visits increased by
60% plus y/y in December according to SimilarWeb. Specifically, Poshmark increased by 105% y/y, StockX increased 54% y/y,
The RealReal increased 74% y/y, and ThredUp increased 91% y/y.
Web Visits for Leading Resale Sites
Source: SimilarWeb.
Household Income Poshmark ThredUp None TheRealReal Depop GOAT StockX Tradesy Rebag
Vestiaire
Collective Other N
Female
$0-$9,999 68% 45% 11% 18% 18% 8% 8% 5% 3% 8% 3% 38
$10,000-$24,999 67% 44% 11% 26% 26% 11% 7% 7% 7% 0% 4% 27
$25,000-$49,999 76% 61% 10% 24% 20% 10% 10% 14% 4% 6% 0% 51
$50,000-$74,999 82% 61% 12% 36% 9% 6% 6% 9% 9% 6% 0% 33
$75,000-$99,999 62% 65% 4% 23% 23% 15% 12% 15% 8% 4% 0% 26
$100,000-$124,999 82% 53% 0% 12% 6% 12% 18% 24% 6% 0% 0% 17
$125,000-$149,999 33% 33% 0% 0% 0% 0% 0% 0% 33% 33% 0% 3
$150,000-$174,999 50% 50% 50% 0% 50% 0% 0% 0% 0% 0% 0% 2
$200,000+ 100% 0% 0% 0% 33% 0% 0% 33% 0% 0% 0% 3
Male
$0-$9,999 37% 4% 37% 4% 7% 26% 19% 4% 4% 0% 0% 27
$10,000-$24,999 32% 8% 28% 28% 4% 8% 4% 0% 4% 0% 0% 25
$25,000-$49,999 48% 17% 33% 15% 11% 11% 11% 13% 7% 7% 4% 46
$50,000-$74,999 38% 25% 33% 13% 6% 15% 10% 4% 8% 2% 2% 48
$75,000-$99,999 50% 32% 21% 24% 8% 8% 11% 13% 8% 3% 0% 38
$100,000-$124,999 53% 13% 27% 40% 0% 27% 27% 27% 0% 7% 0% 15
$125,000-$149,999 50% 10% 20% 20% 0% 0% 10% 20% 20% 0% 0% 10
$150,000-$174,999 67% 17% 0% 17% 50% 33% 67% 17% 0% 0% 0% 6
$175,000-$199,999 0% 0% 100% 0% 0% 0% 0% 0% 0% 0% 0% 1
$200,000+ 57% 14% 29% 14% 14% 43% 29% 14% 0% 0% 0% 7
Total 58% 35% 20% 20% 13% 13% 11% 10% 6% 3% 1% 465
Dec 18 Web Visits (M) Dec 19 Web Visits (M) y/y%
Poshmark 20.1 41.1 104.5%
StockX 14.9 22.9 53.9%
GOAT 10.2
The RealReal 3.7 6.5 73.8%
thredUP 3.3 6.3 90.9%
Grailed 7.2 6.1 (14.7%)
Depop 3.9 5.8 48.7%
Tradesy 2.4 4.5 86.0%
Vestiaire Collective 3.1 3 (1.0%)
PAGE 7 OF 14
US RESEARCH ECOMMERCE
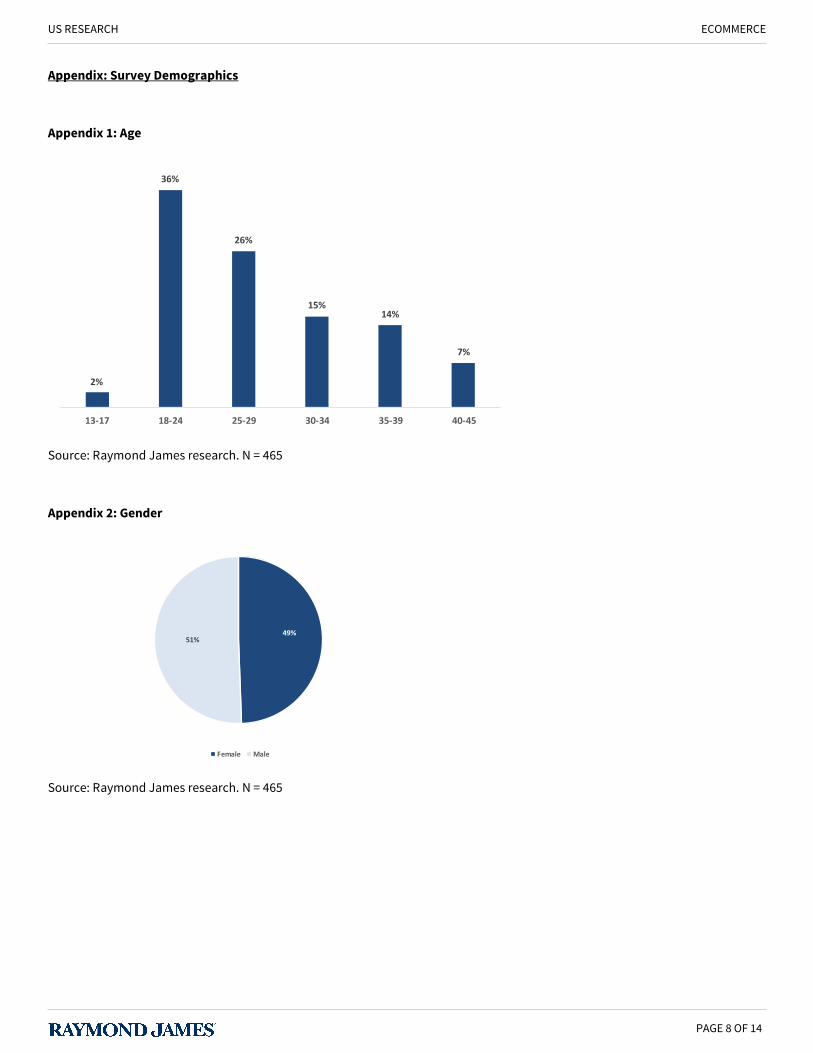
Appendix: Survey Demographics
Appendix 1: Age
Source: Raymond James research. N = 465
Appendix 2: Gender
Source: Raymond James research. N = 465
2%
36%
26%
15%14%
7%
13-17 18-24 25-29 30-34 35-39 40-45
49%51%
Female Male
PAGE 8 OF 14
US RESEARCH ECOMMERCE
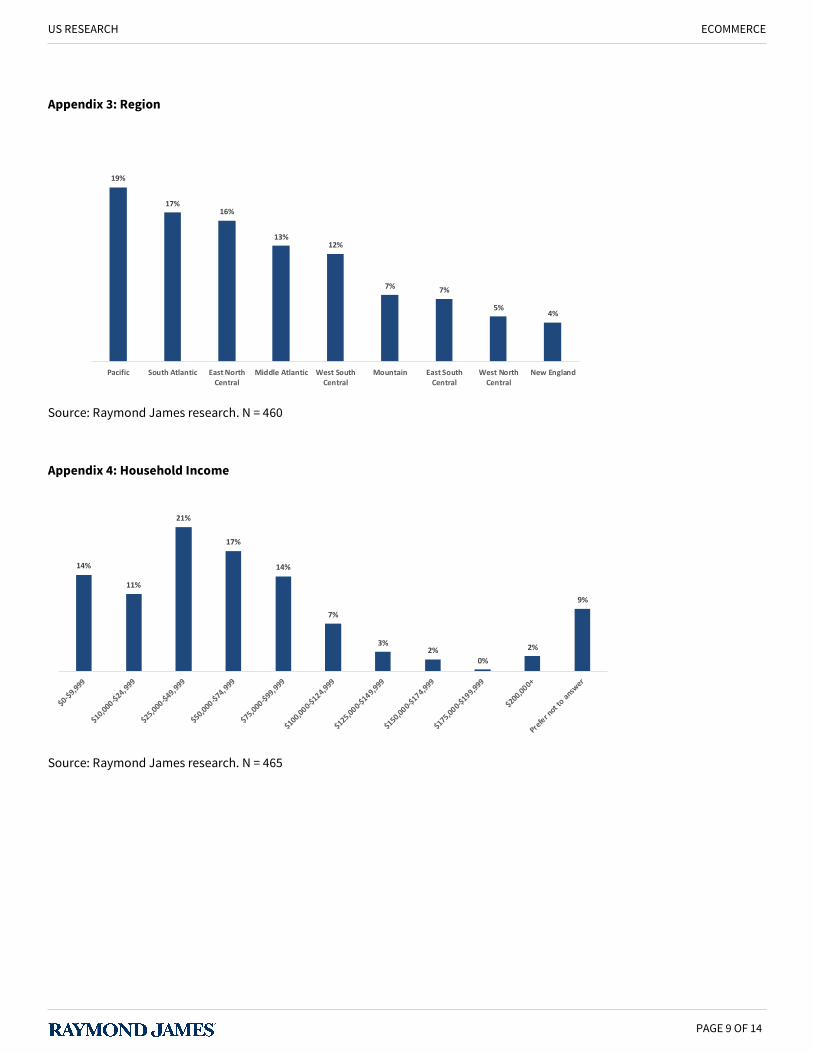
Appendix 3: Region
Source: Raymond James research. N = 460
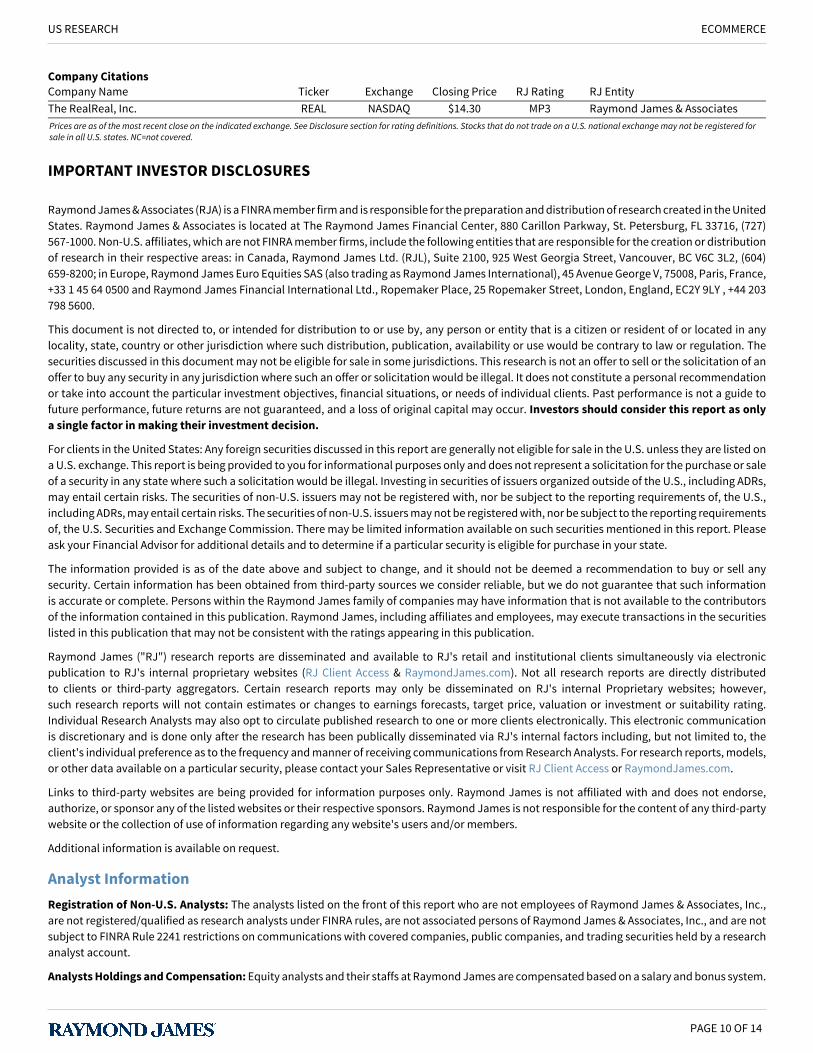
Appendix 4: Household Income
Source: Raymond James research. N = 465
19%
17%16%
13%12%
7% 7%
5%4%
Pacific South Atlantic East NorthCentral
Middle Atlantic West SouthCentral
Mountain East SouthCentral
West NorthCentral
New England
14%
11%
21%
17%
14%
7%
3%2%
0%
2%
9%
PAGE 9 OF 14
US RESEARCH ECOMMERCE
Company CitationsCompany Name Ticker Exchange Closing Price RJ Rating RJ EntityThe RealReal, Inc. REAL NASDAQ $14.30 MP3 Raymond James & AssociatesPrices�are�as�of�the�most�recent�close�on�the�indicated�exchange.�See�Disclosure�section�for�rating�definitions.�Stocks�that�do�not�trade�on�a�U.S.�national�exchange�may�not�be�registered�forsale�in�all�U.S.�states.�NC=not�covered.
IMPORTANT INVESTOR DISCLOSURES
Raymond James & Associates (RJA) is a FINRA member firm and is responsible for the preparation and distribution of research created in the UnitedStates. Raymond James & Associates is located at The Raymond James Financial Center, 880 Carillon Parkway, St. Petersburg, FL 33716, (727)567-1000. Non-U.S. affiliates, which are not FINRA member firms, include the following entities that are responsible for the creation or distributionof research in their respective areas: in Canada, Raymond James Ltd. (RJL), Suite 2100, 925 West Georgia Street, Vancouver, BC V6C 3L2, (604)659-8200; in Europe, Raymond James Euro Equities SAS (also trading as Raymond James International), 45 Avenue George V, 75008, Paris, France,+33 1 45 64 0500 and Raymond James Financial International Ltd., Ropemaker Place, 25 Ropemaker Street, London, England, EC2Y 9LY , +44 203798 5600.
This document is not directed to, or intended for distribution to or use by, any person or entity that is a citizen or resident of or located in anylocality, state, country or other jurisdiction where such distribution, publication, availability or use would be contrary to law or regulation. Thesecurities discussed in this document may not be eligible for sale in some jurisdictions. This research is not an offer to sell or the solicitation of anoffer to buy any security in any jurisdiction where such an offer or solicitation would be illegal. It does not constitute a personal recommendationor take into account the particular investment objectives, financial situations, or needs of individual clients. Past performance is not a guide tofuture performance, future returns are not guaranteed, and a loss of original capital may occur. Investors should consider this report as onlya single factor in making their investment decision.
For clients in the United States: Any foreign securities discussed in this report are generally not eligible for sale in the U.S. unless they are listed ona U.S. exchange. This report is being provided to you for informational purposes only and does not represent a solicitation for the purchase or saleof a security in any state where such a solicitation would be illegal. Investing in securities of issuers organized outside of the U.S., including ADRs,may entail certain risks. The securities of non-U.S. issuers may not be registered with, nor be subject to the reporting requirements of, the U.S.,including ADRs, may entail certain risks. The securities of non-U.S. issuers may not be registered with, nor be subject to the reporting requirementsof, the U.S. Securities and Exchange Commission. There may be limited information available on such securities mentioned in this report. Pleaseask your Financial Advisor for additional details and to determine if a particular security is eligible for purchase in your state.
The information provided is as of the date above and subject to change, and it should not be deemed a recommendation to buy or sell anysecurity. Certain information has been obtained from third-party sources we consider reliable, but we do not guarantee that such informationis accurate or complete. Persons within the Raymond James family of companies may have information that is not available to the contributorsof the information contained in this publication. Raymond James, including affiliates and employees, may execute transactions in the securitieslisted in this publication that may not be consistent with the ratings appearing in this publication.
Raymond James ("RJ") research reports are disseminated and available to RJ's retail and institutional clients simultaneously via electronicpublication to RJ's internal proprietary websites (RJ Client Access & RaymondJames.com). Not all research reports are directly distributedto clients or third-party aggregators. Certain research reports may only be disseminated on RJ's internal Proprietary websites; however,such research reports will not contain estimates or changes to earnings forecasts, target price, valuation or investment or suitability rating.Individual Research Analysts may also opt to circulate published research to one or more clients electronically. This electronic communicationis discretionary and is done only after the research has been publically disseminated via RJ's internal factors including, but not limited to, theclient's individual preference as to the frequency and manner of receiving communications from Research Analysts. For research reports, models,or other data available on a particular security, please contact your Sales Representative or visit RJ Client Access or RaymondJames.com.
Links to third-party websites are being provided for information purposes only. Raymond James is not affiliated with and does not endorse,authorize, or sponsor any of the listed websites or their respective sponsors. Raymond James is not responsible for the content of any third-partywebsite or the collection of use of information regarding any website's users and/or members.
Additional information is available on request.
Analyst InformationRegistration of Non-U.S. Analysts: The analysts listed on the front of this report who are not employees of Raymond James & Associates, Inc.,are not registered/qualified as research analysts under FINRA rules, are not associated persons of Raymond James & Associates, Inc., and are notsubject to FINRA Rule 2241 restrictions on communications with covered companies, public companies, and trading securities held by a researchanalyst account.
Analysts Holdings and Compensation: Equity analysts and their staffs at Raymond James are compensated based on a salary and bonus system.
PAGE 10 OF 14
US RESEARCH ECOMMERCE
Several factors enter into the bonus determination, including quality and performance of research product, the analyst's success in rating stocksversus an industry index, and support effectiveness to trading and the retail and institutional sales forces. Other factors may include but are notlimited to: overall ratings from internal (other than investment banking) or external parties and the general productivity and revenue generatedin covered stocks.
The analyst Aaron Kessler, primarily responsible for the preparation of this research report, attests to the following: (1) that the viewsand opinions rendered in this research report reflect his or her personal views about the subject companies or issuers and (2) that no partof the research analyst’s compensation was, is, or will be directly or indirectly related to the specific recommendations or views in thisresearch report. In addition, said analyst(s) has not received compensation from any subject company in the last 12 months.
Ratings and DefinitionsRaymond James & Associates (U.S.) definitions: Strong Buy (SB1) Expected to appreciate, produce a total return of at least 15%, andoutperform the S&P 500 over the next six to 12 months. For higher yielding and more conservative equities, such as REITs and certain MLPs, atotal return of 15% is expected to be realized over the next 12 months. Outperform (MO2) Expected to appreciate and outperform the S&P 500over the next 12-18 months. For higher yielding and more conservative equities, such as REITs and certain MLPs, an Outperform rating is used forsecurities where we are comfortable with the relative safety of the dividend and expect a total return modestly exceeding the dividend yield overthe next 12-18 months. Market Perform (MP3) Expected to perform generally in line with the S&P 500 over the next 12 months. Underperform(MU4) Expected to underperform the S&P 500 or its sector over the next six to 12 months and should be sold. Suspended (S) The rating andprice target have been suspended temporarily. This action may be due to market events that made coverage impracticable, or to comply withapplicable regulations or firm policies in certain circumstances, including when Raymond James may be providing investment banking servicesto the company. The previous rating and price target are no longer in effect for this security and should not be relied upon.
Raymond James Ltd. (Canada) definitions: Strong Buy (SB1) The stock is expected to appreciate and produce a total return of at least 15% andoutperform the S&P/TSX Composite Index over the next six months. Outperform (MO2) The stock is expected to appreciate and outperform theS&P/TSX Composite Index over the next twelve months. Market Perform (MP3) The stock is expected to perform generally in line with the S&P/TSX Composite Index over the next twelve months and is potentially a source of funds for more highly rated securities. Underperform (MU4) Thestock is expected to underperform the S&P/TSX Composite Index or its sector over the next six to twelve months and should be sold. Suspended(S) The rating and price target have been suspended temporarily. This action may be due to market events that made coverage impracticable,or to comply with applicable regulations or firm policies in certain circumstances, including when Raymond James may be providing investmentbanking services to the company. The previous rating and price target are no longer in effect for this security and should not be relied upon.
In transacting in any security, investors should be aware that other securities in the Raymond James research coverage universe might carry ahigher or lower rating. Investors should feel free to contact their Financial Advisor to discuss the merits of other available investments.
Coverage Universe Rating Distribution* Investment Banking Relationships
RJA RJL RJA RJL
Strong Buy and Outperform (Buy)Market Perform (Hold)Underperform (Sell)
56% 61%41% 35%4% 3%
21% 21%12% 21%6% 0%
*�Columns�may�not�add�to�100%�due�to�rounding.
Suitability Ratings (SR)
Medium Risk/Income (M/INC) Lower to average risk equities of companies with sound financials, consistent earnings, and dividend yields abovethat of the S&P 500. Many securities in this category are structured with a focus on providing a consistent dividend or return of capital.
Medium Risk/Growth (M/GRW) Lower to average risk equities of companies with sound financials, consistent earnings growth, the potential forlong-term price appreciation, a potential dividend yield, and/or share repurchase program.
High Risk/Income (H/INC) Medium to higher risk equities of companies that are structured with a focus on providing a meaningful dividendbut may face less predictable earnings (or losses), more leveraged balance sheets, rapidly changing market dynamics, financial and competitiveissues, higher price volatility (beta), and potential risk of principal. Securities of companies in this category may have a less predictable incomestream from dividends or distributions of capital.
High Risk/Growth (H/GRW) Medium to higher risk equities of companies in fast growing and competitive industries, with less predictable earnings(or losses), more leveraged balance sheets, rapidly changing market dynamics, financial or legal issues, higher price volatility (beta), and potentialrisk of principal.
High Risk/Speculation (H/SPEC) High risk equities of companies with a short or unprofitable operating history, limited or less predictable
PAGE 11 OF 14
US RESEARCH ECOMMERCE
revenues, very high risk associated with success, significant financial or legal issues, or a substantial risk/loss of principal.
Raymond James Relationship DisclosuresCertain affiliates of the RJ Group expect to receive or intend to seek compensation for investment banking services from all companies underresearch coverage within the next three months.
Company Name DisclosureThe RealReal, Inc. Raymond James & Associates, Inc. makes a market in the shares of The RealReal, Inc..The RealReal, Inc. Raymond James & Associates has managed or co-managed an offering of securities for The RealReal, Inc.
within the past 12 months.
Stock Charts, Target Prices, and Valuation MethodologiesValuation Methodology: The Raymond James methodology for assigning ratings and target prices includes a number of qualitative andquantitative factors, including an assessment of industry size, structure, business trends, and overall attractiveness; management effectiveness;competition; visibility; financial condition; and expected total return, among other factors. These factors are subject to change depending onoverall economic conditions or industry- or company-specific occurrences.
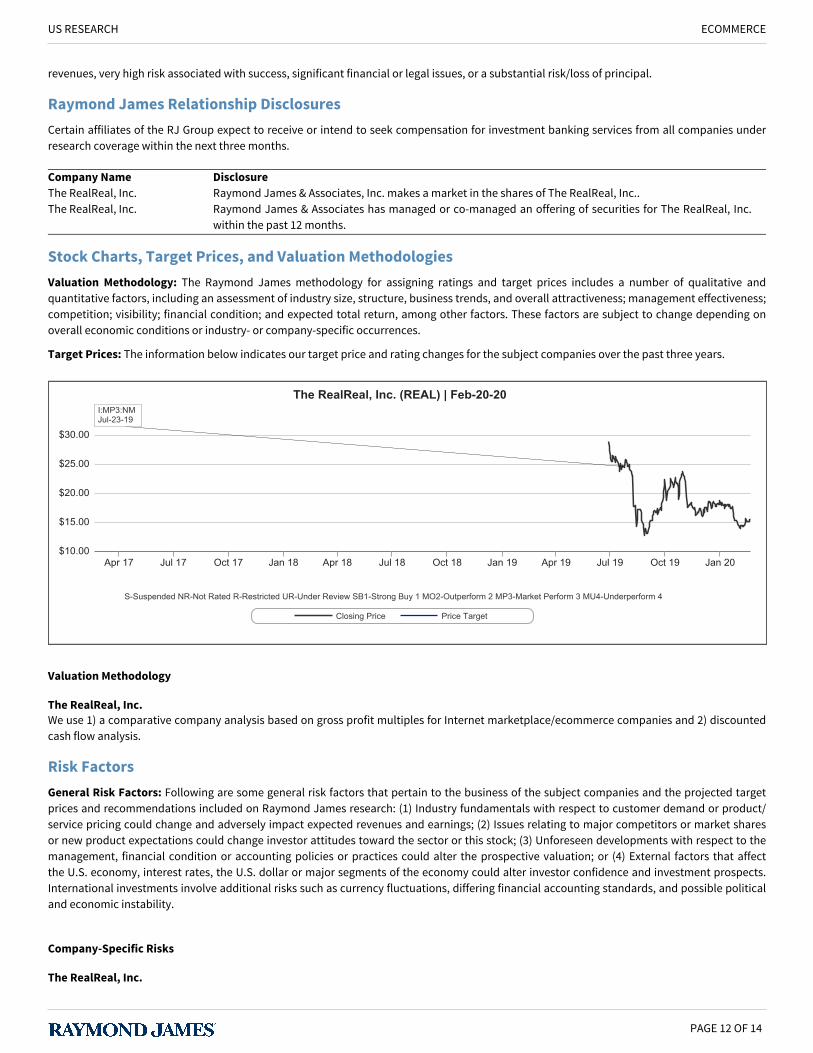
Target Prices: The information below indicates our target price and rating changes for the subject companies over the past three years.
The RealReal, Inc. (REAL) | Feb-20-20
$30.00
$25.00
$20.00
$15.00
$10.00Apr 17 Jul 17 Oct 17 Jan 18 Apr 18 Jul 18 Oct 18 Jan 19 Apr 19 Jul 19 Oct 19 Jan 20
I:MP3:NMJul-23-19
S-Suspended NR-Not Rated R-Restricted UR-Under Review SB1-Strong Buy 1 MO2-Outperform 2 MP3-Market Perform 3 MU4-Underperform 4
Closing Price Price Target
Valuation Methodology
The RealReal, Inc.We use 1) a comparative company analysis based on gross profit multiples for Internet marketplace/ecommerce companies and 2) discountedcash flow analysis.
Risk FactorsGeneral Risk Factors: Following are some general risk factors that pertain to the business of the subject companies and the projected targetprices and recommendations included on Raymond James research: (1) Industry fundamentals with respect to customer demand or product/service pricing could change and adversely impact expected revenues and earnings; (2) Issues relating to major competitors or market sharesor new product expectations could change investor attitudes toward the sector or this stock; (3) Unforeseen developments with respect to themanagement, financial condition or accounting policies or practices could alter the prospective valuation; or (4) External factors that affectthe U.S. economy, interest rates, the U.S. dollar or major segments of the economy could alter investor confidence and investment prospects.International investments involve additional risks such as currency fluctuations, differing financial accounting standards, and possible politicaland economic instability.
Company-Specific Risks
The RealReal, Inc.
PAGE 12 OF 14
US RESEARCH ECOMMERCE
Ability to Generate Sufficient Supply of Pre-Owned Luxury GoodsThe RealReal’s success depends on its ability to cost-effectively attract, retain, and grow relationships with consignors to generate a constantsupply of luxury goods. The RealReal finds new consignors through its online marketplace, its retail stores, luxury consignment offices, paidadvertising, referral programs, organic word-of-mouth, press coverage, Internet search engine results, partnerships (e.g., Stella McCartney),etc. Additionally, The RealReal depends on its sales professionals to drive supply of luxury goods by identifying, developing, and maintainingrelationships with consignors. If the company fails to cost effectively attract new consignors or drive repeat consignments, its growth could benegatively impacted.Ability to Attract and Retain BuyersThe RealReal’s success depends on its ability to attract new buyers and retain buyers. The company expects to continue investing heavily inmarketing to attract new buyers. Failure to attract new buyers in a cost-effective manner and to maintain relationships with existing buyers couldnegatively affect its results.Consumer Discretionary Spending May be Affected by Economic DownturnsFactors that may negatively affect consumer spending on luxury goods include high levels of unemployment, higher consumer debt levels,reductions in net worth, market uncertainty, reductions in home values, fluctuating interest rates and credit availability, and uncertainty regardingthe future of the political and economic environment. Historically, consumer purchases of new luxury goods have declined during periods ofeconomic uncertainty. A decrease in new luxury purchases may slow the rate at which consumers choose to consign their goods, which couldresult in a decrease of items available for The RealReal marketplace.CompetitionThe RealReal faces competition from both online and offline resale players. The RealReal competes on the basis of consignor and buyer experience,product authenticity, quality and assortment, breadth of brand offering, convenience, and price. The RealReal competes with luxury resellers,which include brick-and-mortar consignment stores, pawn shops and auction houses (i.e., Sotheby’s), and niche or single category luxury resellers.Additionally, the company competes with online marketplaces including eBay, Poshmark, Tradesy, as well as other ecommerce companies thatsell luxury goods.Failure to Authenticate AccuratelyThe RealReal’s success depends on its ability to accurately and cost-effectively authenticate products. The RealReal has a sophisticatedauthentication process but as the sophistication of counterfeiters increases, it may be increasingly difficult to identify counterfeit products. Thesale or alleged sale of any counterfeit goods may damage the company’s reputation, which may impact the company’s ability to attract andmaintain repeat consignors and buyers.Logistics & Fulfillment ProblemsThe RealReal is building automation, machine learning, and other capabilities to drive efficiencies in merchandising and fulfillment operationsincluding pricing, copywriting, authentication, photography, and photo retouching. Flaws or failures of such technologies may limit operatingefficiencies and margin expansion.Lawsuits and Other ClaimsThe RealReal is at risk of claims by others that it has infringed their copyrights, trademarks, or patents, or improperly used or disclosed their tradesecrets. In particular, third parties may allege that goods consigned to them are counterfeit or that by offering goods of a particular brand TheRealReal is suggesting that it is sponsored by or affiliated with that brand. For example, in November 2018, Chanel, Inc. (“Chanel”) filed a lawsuitagainst The RealReal in the U.S. District Court for the Southern District of New York bringing various trademark and advertising-related claimsunder the Lanham Act and New York state law analogues. Chanel alleges, among other things, that The RealReal have misrepresented certaincounterfeit Chanel products as authentic Chanel products, that its resale of Chanel products confuses consumers into believing that Chanel isaffiliated with The RealReal and involved in authenticating consignors’ goods, and that only Chanel is capable of authenticating second-handChanel goods. This litigation is in its early stages. The results of any such litigation, investigations, and other legal proceedings are inherentlyunpredictable and expensive.High Risk/Growth SuitabilityWe assign a suitability of High Risk given the company's history of earnings losses and our expectation for continued near-term losses.
Additional Risk and Disclosure information, as well as more information on the Raymond James rating system and suitability categories,is available at raymondjames.bluematrix.com/sellside/Disclosures.action. Copies of research or Raymond James' summary policies relatingto research analyst independence can be obtained by contacting any Raymond James & Associates or Raymond James Financial Servicesoffice (please see RaymondJames.com for office locations) or by calling 727-567-1000, toll free 800-237-5643.
International DisclosuresFor�clients�in�the�United�Kingdom:
For clients of Raymond James Financial International Limited (RJFI): This document and any investment to which this document relates isintended for the sole use of the persons to whom it is addressed, being persons who are Eligible Counterparties or Professional Clients as describedin the FCA rules or persons described in Articles 19(5) (Investment professionals) or 49(2) (high net worth companies, unincorporated associations,etc.) of the Financial Services and Markets Act 2000 (Financial Promotion) Order 2005 (as amended)or any other person to whom this promotionmay lawfully be directed. It is not intended to be distributed or passed on, directly or indirectly, to any other class of persons and may not be relied
PAGE 13 OF 14
US RESEARCH ECOMMERCE
upon by such persons and is, therefore, not intended for private individuals or those who would be classified as Retail Clients.
For clients of Raymond James Investment Services, Ltd.: This report is for the use of professional investment advisers and managers and isnot intended for use by clients.
For purposes of the Financial Conduct Authority requirements, this research report is classified as independent with respect to conflict of interestmanagement. RJFI, and Raymond James Investment Services, Ltd. are authorised and regulated by the Financial Conduct Authority in the UnitedKingdom.
For�clients�in�France:
This document and any investment to which this document relates is intended for the sole use of the persons to whom it is addressed, beingpersons who are Eligible Counterparties or Professional Clients as described in "Code Monetaire et Financier" and Reglement General de l'Autoritedes marches Financiers. It is not intended to be distributed or passed on, directly or indirectly, to any other class of persons and may not be reliedupon by such persons and is, therefore, not intended for private individuals or those who would be classified as Retail Clients.
For clients of Raymond James Euro Equities: Raymond James Euro Equities is authorised and regulated by the Autorite de Controle Prudentielet de Resolution and the Autorite des Marches Financiers.
For�institutional�clients�in�the�European�Economic��rea�(EE�)�outside�of�the�United�Kingdom:
This document (and any attachments or exhibits hereto) is intended only for EEA institutional clients or others to whom it may lawfully besubmitted.
For�Canadian�clients:
This report is not prepared subject to Canadian disclosure requirements, unless a Canadian analyst has contributed to the content of the report.In the case where there is Canadian analyst contribution, the report meets all applicable IIROC disclosure requirements.
Proprietary Rights Notice: By accepting a copy of this report, you acknowledge and agree as follows:
This report is provided to clients of Raymond James only for your personal, noncommercial use. Except as expressly authorized by RaymondJames, you may not copy, reproduce, transmit, sell, display, distribute, publish, broadcast, circulate, modify, disseminate, or commercially exploitthe information contained in this report, in printed, electronic, or any other form, in any manner, without the prior express written consent ofRaymond James. You also agree not to use the information provided in this report for any unlawful purpose.
This report and its contents are the property of Raymond James and are protected by applicable copyright, trade secret, or other intellectualproperty laws (of the United States and other countries). United States law, 17 U.S.C. Sec. 501 et seq, provides for civil and criminal penalties forcopyright infringement. No copyright claimed in incorporated U.S. government works.
PAGE 14 OF 14
US RESEARCH ECOMMERCE