online and offline information sources used by international
TRANSCRIPT
Online and Offline Information Sources Used By International Tourists and Their Effectiveness in Constructing Destination Attributes: A Case Study of Bali
By
PARDEDE, Elfridanche Widya S.
THESIS
Submitted to
KDI School of Public Policy and Management
In Partial Fulfillment of the Requirements
For the Degree of
MASTER OF DEVELOPMENT POLICY
2020
Professor Lee, Junesoo
ABSTRACT
ONLINE AND OFFLINE INFORMATION SOURCES USED BY INTERNATIONAL TOURISTS AND THEIR EFFECTIVENESS IN CONSTRUCTING DESTINATION
ATTRIBUTES: A CASE STUDY OF BALI
By
PARDEDE, Elfridanche Widya Sundari
Tourism is an important industry globally and a critical industry for Indonesia. Despite
the importance of tourism to Indonesia’s economy, there is a general view that the industry has
untapped potential. Given Indonesia’s prodigious tourism resources and strategic geographical
location, it fails to draw the highest possible tourist numbers and receipts. Government has
implemented some ambitious and strategic efforts to boost the number of foreign tourists to
Indonesia. However, the country still lags behind its regional competitors in number of foreign
tourists and receipts. Therefore, this study investigates information sources, both online and
offline, as the lifeblood of the travel and tourism industry. Using factor analysis, information
source attributes were examined to discover the rationale behind the selection of sources by
international tourists. This paper also analyzed which sources used and constructed destination
attributes, in acknowledgement of the significance of a destination image as a factor of travel
decision making. This research focuses on international tourists and uses Bali as the case study.
Results indicate that international tourists use both online and offline sources. The findings
also indicate that the main reasons for the selection of sources are the interactivity and user-
generated content of sources. The results of this research can be used in tourism policy and
marketing strategies by central and local governments as well as tourism communities.
Key words: Information source, tourism, online, offline, attribute, tourism policy, marketing
strategy.
ACKNOWLEDGEMENTS
The researcher would like to extend her boundless gratitude and appreciation to
everyone who has helped her bring this study into reality. Foremost, to Jesus Christ, for never
giving up on her (Luke 15:14). To Professor Lee, Junesoo, Ph.D., her major supervisor, whose
continuous support, guidance, understanding, and patience help her to make this study possible.
To Professor Taejun Lee, Ph.D., member of the POS Committee who has kindly given
constructive comments and suggestions.
To Melva Simangunsong, her best friend, who has provided the researcher such
invaluable assistance in distributing the questionnaires to her college friends in Netherlands.
To the Writing Center Editor, Justin O’Connor, who- beyond his effort in proofreading and
editing this paper- has encouraged her through great support, enthusiasm and advices in
completing this work. Finally, to the KDI School of Public Policy and Management and all the
staff for the excellent learning opportunities and kind support.
.
vi
Table of Contents
List of Tables .......................................................................................................................... vii
List of Figures ....................................................................................................................... viii
List of Abbreviations .............................................................................................................. ix
I. Introduction ....................................................................................................................... 1
1.1. Tourism in Indonesia: Recent Developments and Challenges .................................. 1 1.2. Untouched Solution: Investigating Tourism Information Sources (TIS) ................... 3 1.3. Research Questions ................................................................................................... 5
II. Literature Review ............................................................................................................. 6
2.1. Tourism Information Sources (TIS) ........................................................................... 6 2.2. Online TIS .................................................................................................................. 8 2.3. Offline TIS ............................................................................................................... 11 2.4. Attributes of TIS ....................................................................................................... 13 2.5. Tourism Destination Attributes ............................................................................... 14 2.6. Background to Bali as a tourism destination .......................................................... 15 2.7. International Tourists .............................................................................................. 16 2.8. Effectiveness ............................................................................................................ 17 2.9. Hypotheses Development ........................................................................................ 19
III. Methodology .................................................................................................................... 20
3.1. Design of the Study .................................................................................................. 20 3.2. Variables and Measurement Scales ........................................................................ 21 3.3. Sample ..................................................................................................................... 23
IV. Data Analysis ................................................................................................................... 24
4.1. Reliability and Validity of Data ............................................................................... 24 4.2. The Most Important Tourism Information Sources ................................................. 25 4.3. Factors for the Selection of Tourism Information Sources ..................................... 29 4.3. Effective TIS that Construct Destination Attributes that Attract International Tourists to Bali ................................................................................................................. 38
V. Conclusions ...................................................................................................................... 40
5.1. Implications ............................................................................................................. 43 5.2. Limitations and Future Studies ............................................................................... 47
Appendices .............................................................................................................................. 48
Appendix A. Respondent Characteristics ......................................................................... 48 Appendix B. Survey Questionnaire ................................................................................... 50
References ............................................................................................................................... 57

vii
List of Tables
Table 1. Offline Tourism Information Sources ....................................................................... 12
Table 2. Technical Details ....................................................................................................... 22
Table 3. Information sources, mean, median, standard deviations, skewness, kurtosis ......... 26
Table 4. TIS Meet International Tourists’ Need ..................................................................... 26
Table 5. Rotated Factor Loading of Likely to Use TIS in the Future ..................................... 28
Table 6. Rotated Factor Loading of Quality of Information of TIS ........................................ 31
Table 7. Rotated Factor Loading of TIS Visual Appealing .................................................... 33
Table 8. Rotated Factor Loading of Attribute Security ........................................................... 34
Table 9. Rotated Factor Loading of Attribute Ease of Use ..................................................... 35
Table 10. Rotated Factor Loading of Attribute Cost ............................................................... 36
Table 11. Rotated Factor Loading of Attribute Responsive .................................................... 37
Table 12. Mean and Standard Deviation of Tourism Destination Attributes.......................... 38
Table 13. Rotated Factor Loading of Perceived vs Real Tourism Destination Attributes ...... 39
viii
List of Figures
Figure 1. A conceptual model of the research ........................................................................ 18
Figure 2. Destination Image Formation .................................................................................. 18
ix
List of Abbreviations
ASEAN Association of Southeast Asian Nations
APEC Asia-Pacific Economic Cooperation
BBC British Broadcasting Corporation
CNN Cable News Network
Fam Trip Familiarization Trip
GDP Gross domestic product
GRDP Gross regional domestic product
IRTS International Recommendations for Tourism Statistics
ITB Berlin Internationale Tourismus-Börse Berlin
TV Television
WEF World Economic Forum
WTTC World Travel and Tourism Council
1
I. Introduction
1.1. Tourism in Indonesia: Recent Developments and Challenges
Tourism is an important industry globally and a critical industry for Indonesia.
The United Nations World Tourism Organization (UNWTO) and World Trade
Organization (WTO) reported that tourism was the world’s third largest export
category, after automotive and food industries (2019). Tourism matters as an
economic driver, employment generator and inclusion promoter (UNWTO, 2018).
Tourism also matters for Indonesia. It played a key role as one of the top 5 sources of
foreign currency in 2017. In addition, it generated 12.3% of total employment in 2016
(Ollivaud & Haxton, 2019).
Despite the importance of tourism to Indonesia’s economy, there is a general
view that the industry has untapped potential. The World Bank (2014) said given
Indonesia’s prodigious tourism resources and stunning natural environment, named as
the world’s largest archipelago of around 17,500 islands, has around 40% of APEC’s
biodiversity plus strategic geographical location, it fails to draw the highest tourist
numbers and receipts compared to its regional peers (Indonesia Investments, 2014).
While Indonesia attracted 10.4 million foreign tourists in 2015, Malaysia welcomed
25.7 million tourists and Thailand 29.9 million international tourists (ASEAN
Secretariat, 2017). In terms of GDP contribution, the UNWTO and World Travel &
Tourism Council (as cited by WEF, 2017) reported Indonesia’s tourism industry only
contributed 3.3% to the nation’s GDP in 2016, which is relatively low compared to
Thailand 9.3%. In other words, the industry is growing but not achieving its potential
(Indonesia Investments, 2014). Former Minister of Tourism of Indonesia, Arief Yahya,
recognized problems within marketing, infrastructure and education (Bali Discovery,
2014).
2
Realizing the tremendous power of tourism as a driver to achieve faster and
more inclusive growth, the new President of Indonesia, Joko Widodo, has set tourism
as the government’s top priority since 2014 (Ollivaud & Haxton, 2019). One of the
most ambitious efforts is investing massive infrastructure in 10 prioritised destinations
which are projected to be the 10 New Balis. Also, there are other various strategies
that have been implemented to boost the number of foreign tourists that visit Indonesia.
From stipulating Presidential Regulation No. 21/2016 on Exemptions of Visit Visa to
citizens of 174 countries, doing FAM Trips, sales missions, hot deals, Customer Data
Management (CDM) up to promoting country branding- ‘Wonderful Indonesia’- in
some major countries such as the UK, US, France and many others (Ministry of
Tourism, 2018).
Those initiatives appear to have been fruitful. Renowned UK publisher, Rough
Guides in 2019 included Indonesia at No. 6 for Most Beautiful Country in the World
and No.1 the most beautiful country in Asia (as reported by the Jakarta Post, 2019).
Indonesia’s competitiveness as a tourist destination improved from 70th in 2013 to
40th in 2019. However, the campaigns’ effectiveness in attracting tourists ranks only
51st, as opposed to 7th for Malaysia and 20th for Thailand (WEF, 2019).
The question is how a country voted the most beautiful in Asia, after all the
efforts above, still lags behind its regional competitors in number of foreign tourists
and receipts. This study provides solutions and evidence-based policy implications for
tourism stakeholders, mainly Indonesia’s central and local governments as well as the
tourism communities.
3
1.2. Untouched Solution: Investigating Tourism Information Sources (TIS)
A destination’s image leads to travel decision-making and thus determines the
fundamental role in the success of a tourist destination (Beerli and Martin, 2004). There
are two factors that determine destination’s image: personal factors and information
sources (Baloglu & McCleary, 1999). Regarding personal factors, there have been
many long-standing marketing strategies implemented by Indonesian authorities, such
as market segmentation. However, the result has yet to be significant in bringing foreign
tourists to Indonesia.
Meanwhile, another factor that has not been taken care of rigorously is TIS. In
fact, information is one of the most influential factors when forming travel decisions
(Maser & Weiermair, 1998). Though the numbers show an increase in international
visitors to Indonesia as a direct effect of the campaigns, the results need to be examined
more cautiously. Lately the Indonesian government has put more efforts into country
branding promotion by BAS (Branding, Advertising and Sales) and using global media
coverage such as the Discovery Channel, National Geographic, BBC, CNN
International, et cetera as well as participating in international events like ITB Berlin
and WTM London, and also supported the TV series, The Amazing Race Asia (2016).
The figures compared to neighboring countries such as Malaysia and Singapore, show
that advertising a country as a tourism destination requires much more than allocating
ambitious amounts of budgets (Rudenko & P. Tedjakusuma, 2018).
Tourism is an information-intensive industry (Bieger and Laesser, 2004).
Information is the vital force of the industry because the image of a destination is critical
for travel decision making, and is influenced by various information sources (Echtner
& Ritchie, 1991). Tourists’ knowledge, preference and decision of tourism depend on
the information available to and used by them (Goeldner & Ritchie, 2009).
4
Understanding how tourists acquire knowledge and why a tourist use particular
TIS are of great importance to developing effective marketing communication
strategies or campaigns (López & Sicilia, 2011). The central role of any marketing
programs is to provide the information needed by the potential travelers visibly and
accessibly (Xiang and Pan, 2011). Therefore, this study is essential to identify the
information sources consulted by tourists to get the knowledge they required.
Previous studies mostly agreed that the internet has evolved to become a prime
source of tourist information guiding purchasing decisions. Information
Communication Technologies (ICTs) have been changing the entire tourism industry
(Werthner and Klein, 1999; Buhalis & Law, 2008; Crnojevac et al., 2010).
Despite this, tourists usually mix the channels they use to look for more
information and data comparison (Snepenger, 1990; Zeithaml, 1988). Though much
research specifically supports online TIS, other research shows that the internet cannot
be the sole source for distributing tourism information (Gronflaten, 2009). The
information can be collected from different information sources, both online and offline
through handbooks and word-of-mouth referrals (Pearce & Schott, 2005; Gronflaten,
2009).
However, there are some gaps in the previous studies. First, most of the
preceding studies heavily discuss online TIS. It is undeniable that the internet has
changed tourist behavior in information searching (Crnojevac et al., 2010). However,
it is crucial to get a thorough understanding of information sources both offline and
online in order to find the most effective TIS to improve marketing communication
with international tourism consumers (Dey and Sarma, 2010; López & Sicilia, 2011).
Secondly, most of the previous studies did not determine a specific target
population. In this study, the targeted population is international tourists. The sample
5
taken in this research includes only international tourists that visit Bali, as the initial
purpose of the study is to increase the number of international tourists and receipts.
Also, there are different tendencies between a foreign and domestic vacation (López &
Sicilia, 2011). A foreign vacation, by and large, requires a more extensive decision-
making process compared to a domestic vacation, thus making tourists’ approaches to
information searching and sources different (Bargeman and Van der Poel, 2006).
By using a specific sample category and more comprehensive scope of
information sources studied, this research can strengthen and complement the results
from preceding studies of tourism information sources. This study does not intend to
emphasize debates about preferences and differences between offline and online TIS.
1.3. Research Questions
Based on the objectives of the research and acknowledging the above-
mentioned facts, related literature and preceding findings, thus following are the
research questions:
1) What are the tourism information sources chosen and used by the international
tourists to get information of the destination they want to visit?
2) What are the reasons behind the selections of tourism information sources by
international tourists?
3) Have the tourism information sources that are used by international tourists
effectively constructed destination attributes/images?
To answer those research questions, the paper shall begin by reviewing the literature
and proposing a set of hypotheses. It will then explain the methodology used and the analysis
conducted. The paper concludes by presenting the implications of this research.

6
II. Literature Review
This study will synthesize, analyze and evaluate the literature about TIS to show why
the research questions proposed need to be addressed. It will discuss TIS on the whole,
examine and identify the characteristics of each online and offline TIS, and discuss the
attributes of information sources and tourism destination. Moreover, this study also gives
some background about Bali as the case study and some definitions of international tourists
and effectiveness in order to give clear understanding of the concept used in this study and
scope of the study. Finally, this section will propose a research design and a set of
hypotheses.
2.1. Tourism Information Sources (TIS)
It is a widely accepted theory that information sources are the key to destination
image creation. According to Baloglu & McCleary (1999), destination image is
determined by two factors, personal factors and stimulus factors. Personal factors are
related to characteristics of tourists which include psychological and social elements.
Stimulus factors are external factors related with resources of information. This study
will focus on the information resources because information is the vital part to form
destination image and decision-making process (Gartner, 1993; Dey & Sarma, 2010).
In line with that, the establishment of a destination's prior‐visit image for tourists is
based on the information sources they apply (Frías, Rodríguez, Castañeda, Sabiote, and
Buhalis, 2011).
As with tangible products, information plays critical importance for intangible
products/services. Travel products that are intangible are associated, ceteris paribus,
with higher risks (Murray as cited by March and Woodside, 2005). Thus, such products
require information sources for risk avoidance and uncertainty avoidance on the tourists’
side (V. G. Wilson, 2014). In addition, the functions of tourism-related information are
7
to trigger people think positively of having a holiday by raising expectations and
building imaginations, to assist in choosing options and increase recognition of the
tourism destination, and to justify the travelling decision (Van Raaij and Francken,
1984). Moreover, understanding which tourists' information sources are used is
essential for developing marketing strategy and service delivery on marketer’s side
(Hamidizadeh et al., 2016).
To the best of my knowledge there has been little research conducted that
quantitatively analyzed the variables included in this paper. Especially in Indonesia,
there were few studies on TIS. Three existing studies from Indonesian scholars
explained this issue from different perspectives. Suroto evaluated the usage of websites
in supporting tourism promotion and marketing. This study was conducted from an IT
perspective using mBSC (modified Balanced Scorecard) and attempted to find out the
impact of websites’ performance on tourism business (Adi, 2014). Sumaco and
Richardson analyzed how international tourists know about the “Visit Indonesia 2008”
branding campaign, and the result was that most of the international tourists saw the
campaign from websites (Sumaco & Richardson, 2011). And the last study did by
Fatanti and Suyadnya discussed specifically about Instagram’s role as a social media
for online photography in providing tourism information, and furthermore how its role
shaped tourism destination brands (Fatanti & Suyadnya, 2015).
Though TIS’ importance and theory have been established, which type of TIS,
online or offline, is most preferred and effective for tourists is still debated. Same as
the studies of Indonesian scholars above, there are more studies on online TIS rather
than offline TIS and most of them agreed that the internet has become the main source
of information (Buhalis & Law, 2008; Pan & Fesenmaier, 2006). It is beyond doubt
that the continued growth of internet users has resulted in the World Wide Web
8
becoming the indispensable source for people searching to use tourist information.
Moreover, Wang, Head, and Arthur pointed out the benefits of online tourism
information searches include the relatively affordable, ease to compare products,
interactivity, virtual community establishment, and 24/7 accessibility (as cited in C. I.
Ho et al., 2012).
However, some studies argued that tourists use both TIS, online and offline
(Crnojevac et al., 2010; Del Chiappa & Balboni, 2019; Ho et al., 2012; Llodrà-Riera et
al., 2015; López & Sicilia, 2011). Therefore, this study intends to investigate which TIS
are used specifically by international tourists. This study wants to evaluate both types.
If it is true that online TIS prevail like what most previous studies indicated, then it
follows that the cohort of online TIS would dominate the results.
In addition to the sources, this study also intends to investigate deeper to uncover
the reasons behind international tourists’ selection of the TIS. Further, this paper
investigates the effectiveness of TIS, both online and offline, to construct the attributes
of a destination.
2.2. Online TIS
Research on the influence of Information and Communication Technologies
(ICTs) in the tourism sector has been developed significantly over the past three
decades. There has been heavy interest from researchers toward exploring tourist online
TIS behavior (Mariani et al., 2016). Research in the tourism sector has proved that
online reviews affect hotel room sales (Ye, Law, & Gu, 2009). As an example of the
power of online TIS, eight out of ten travelers said that comments on travel forums are
an important element of the decision-making process according to Skyscanner’s 2012
Travel Trends survey, 52% of Facebook users admit that checking friends’ vacation
pictures encouraged them to go to that certain destination (Tourism Economics, 2013).
9
However, many of the existing studies are limited to discussing use of only one
type of online TIS. There is little study on categorizing a variety of both online and
offline TIS and then comparing and examining the attributes of those sources (No &
Kim, 2015a). Online TIS that most studied were social media, including search engines
and web blogs. But, to get the answer of which TIS are used by international tourists,
this study uses a comprehensive and a broad variety of sources both for online and
offline. For online TIS, this paper will evaluate personal blogs, company,
government/public and accommodation websites (e.g. Airbnb), social media or social
networking, search engines, mobile phone applications, photo (e.g. Instagram, Flickr)
and video sharing (e.g. Youtube), recommendation platforms (Lonely Planet,
TripAdvisor), tourist resources and activities portals (e.g. wikitravel), and online maps
(e.g. maps.google).
Social media is the biggest source since it covers most of the online TIS. Kaplan
and Haenlein (2010) identified six types of social media: social networking websites
(i.e. Facebook, CouchSurfing, TripConnect, WAYN, Bluenity, iTourist, BeWelcome,
Flight Club, Dopplr, YowTRIP), blogs, content communities (i.e. YouTube, Flickr,
Scrib, Matador, TravBuddy, 43Places), collaborative projects (i.e. Wikipedia,
Wikitravel, World66), virtual social worlds (i.e. Sosauce, Trayle, Triporama, Second
Life, Virtual Tourist), and virtual game worlds (i.e. World of Warcraft). Still, that
taxonomy does not include other types of social media such as microblogs (i.e. Twitter,
Travellerspoint), consumer review & rating websites (i.e. Real Travel, TripAdvisor,
BootsnAll, Tripwolf) and internet forums (i.e. ThornTree, Fodor’s Travel Talk,
FlayerTalk). Social media another different form is poll sites (e.g. Digg) (Munar &
Jacobsen, 2013).
10
Social media is applied through all stages of the tourists’ decision-making
process (Sigala et al., 2012). Social media is becoming more and more crucial to travel
planning, functioning as crucial information sources and providing access to other
tourists’ experiences (Chung & Buhalis, 2008). Beyond that, social media sustain
storytelling, on a ‘24/7’ basis to massive forum, and provides a sense of belonging into
virtual travel societies (Gretzel, Fesenmaier, & O'Leary, 2006).
The photo and video sharing era are booming with search engines and YouTube
as top online sources of inspiration. Online travel videos are influential in early stages
initiation (Ipsos MediaCT, 2014). The internet permits users to distribute their opinions
and travel experiences with others, and means everyone can be a content creator and
information is no longer managed solely by tourism companies, but by ordinary users
as well, through social media sites that promote consumer-generated content (CGC)
such as blogs, pictures, videos, wikis, social networks, virtual communities, etc.
(Hernández-Méndez et al., 2015a).
Over the last 30 years ICTs on the economy have totally changed the human
activities (Mariani et al., 2016). The digital age and internet have made relationships
between things (products, services, places, etc.) and people possible through connected
technology and various platforms. The technology revolution has transformed the way
people communicate or live their lives.
However, does this transformation change the basic need or nature of people,
especially toward information search? During information search processes, tourists
need other travelers’ experiences as a means to increase their exchange utility and lower
uncertainty (Kotler, Bowen, & Maken, 2010). Harvey J. Miller argues it is hard to
exclude any urban activity, be it shopping, studying, or entertainment, which does not
11
involve valued face-to-face interactions that the convenience of online access cannot
replace (Miller, Harvey J., 2007).
In the past we knew an owning economy, now a sharing economy, but product
selling remains the same. Before, we may buy a bicycle for transportation now we rent
it using a mobile application. But the need is the same: a bicycle for transportation.
Before, we may buy a book to read. Now we buy an e-book. Similar with TIS, before
we read magazines, books and brochures to get information of a destination. Now we
watch videos on YouTube, observe photos on Instagram, etc. The need is the same,
accurate first-hand information, in other words, a testimony or user-generated content.
Recommendations from trusted people that they know are the most reliable and
powerful sources of information (Book et al., 2018; Marketing Charts, 2013). It is these
very kind of reasons (behind the selection or utility of TIS by tourists) that this paper
illuminates, in order to be able to create a better marketing communication strategy to
attract international tourists.
2.3. Offline TIS
Tourism marketers find travel risk is a critical issue as tourism services are
intangible goods, and thus cannot be examined prior consumption. Therefore, the
importance of interpersonal influence is needed to reduce uncertainty before purchase
(Lewis and Chambers, 2000). In addition, growing evidence is showing that word-of-
mouth (WOM) via friends, relatives or colleagues reflects the most crucial information
source for travelers (Dey and Sarma, 2010).
Pearce and Schott advocate the view that the internet was not the only source
for information searching. The information can be gathered electronically or from other
offline sources, such as handbooks and other people’s recommendations. Gronflaten
pointed that tourism information searches depend on both online and offline methods
12
(as cited in C. I. Ho et al., 2012). Snepenger mentioned several offline tourism sources
including relatives and friends, destination publication or reading, and travel advisers.
Gitelson and Purdue suggest that some travellers have been found to apply other
specific information sources, such as welcome centres, and other studies indicated other
offline sources, such as travel agents, professional recommendation, word-of-mouth,
advertisements, and non-tourism books or movies, as well as personal
recommendations at the destination, third-party referrals, such as those by local
residents. This shows that a variety of tourism information sources were employed
throughout the process of travel decision-making (C. I. Ho et al., 2012).
Word-of-Mouth (WOM) is one of the most effective offline sources for tourists.
When making purchase decisions, to reduce uncertainty and perceived risks, tourists
often look for WOM referrals. There has been extensive evidence demonstrating that
WOM is important in purchase decision and choice behavior (Lee and Youn, 2009).
Existing research supports that personal sources (WOM) are more influential on
behavior than impersonal sources (Bickart and Schindler, 2001).
Fodness and Murray (1999) classify offline TIS by type of information and
source of information. In this paper a broad variety of offline TIS will be evaluated:
friends and family (WOM), television, written media (magazines, brochures, books,
etc.), travel fair and travel agent.
Table 1. Offline Tourism Information Sources
Source of Information Type of Information
Impersonal Personal
Commercial Brochure ClubsTravel guides Travel agenciesLocal tourist office
Non-commercial Magazines Friends and family Newspapers Personal experience
Source: Fodness and Murray (1999).
13
2.4. Attributes of TIS
There have been many studies about attributes or characteristics of tourism
information sources. Thus, this paper does not intend to reinvent the wheel. This paper
does not investigate the TIS’ attributes but adopts and uses some TIS’ attributes that
have been developed from different existing studies. Studying the attributes of TIS is
important to know what makes tourists compelled to use them.
Eunjung No and Jin Ki Kim found that there are five attributes of information
sources: interaction, info-trust, availability, security, and personalization (No & Kim,
2015a). Furthermore, Huang and Benyoucef (2014) presented an empirical study that
evaluates two attributes of E-government websites, usability and credibility. Ho and
Lee (2007) analyzed five website uses: information quality, security, functionality,
customer relationships, responsiveness and fulfilment, which determined customer
satisfaction.
Moreover, Dong Jin Kim, Woo Gon Kim, Jin Soo Han (2006) proposed nine
attributes to choose online travel agencies: security, ease of use, low rates, handy and
related material, design of the website, the speed to process the transaction, capacity to
do many tasks in one transaction, flexibility, and sorting option. Five factors are offered
to gain consumer trust towards Consumer-generated Media (CGM): source credibility,
quality of information, quality of website, customer satisfaction, and user experience
with CGM (Filieri et al., 2015).
Those attributes from preceding studies are synthesized and used in this paper.
This paper will use online TIS’ attributes to measure both online and offline TIS’ due
to there is no research yet about offline TIS’ attributes. Attributes of TIS that are used
in this paper are quality of information (related with accuracy and reliability), appealing
visual, security, ease of use, the cost, and responsiveness. Though this study does not
14
want to emphasize on the attributes but the TIS’ attributes are used to investigate
reasons behind the selection of particular TIS by international tourists to use.
2.5. Tourism Destination Attributes
The tourism industry sells services. Tourism products are physically seen (such
as beaches, mountains, underwater views, lakes, etc.), but the real products are
intangible services, and thus relate to the tourist’s feeling after visiting a destination and
doing tourism activities. As such, tourism depends on images shown by the tourism
information sources, both online and offline, in driving tourists’ decision-making
(Alikiliç, 2008). Attributes of TIS play an important role in the selection of the
information sources, while attributes of tourism destination demonstrate a significant
role in directing the tourists’ decision-making.
The tourism destination attribute or image is a concept that influences the
customer’s view of a tourist destination and their intention (Lai and Li, 2016). It is also
the idea or behavior of customers to the destination (Tasci, Gartner, and Tamer Cavusgil,
2007) and also their beliefs, opinions, and impressions regarding the destination (H.
Kim and Richardson, 2003). It has been recognized that the attribute or image perceived
by tourists of a destination plays a key role in their decision-making and destination
choice (Baloglu & McCleary, 1999).
Dann (1977) states a destination attribute as the ‘pull factors.’ The pull factors
according to Dann- such as landscape, culture, price, service, climate etc.- can pull a
tourist to some tourism supplies such as attractions and destinations. The pull factors
can direct a tourist to select one destination over another. Dann also examined the ‘push
factors’ which are related to the internal needs of the traveller, such as the desire to
escape from their mundane life, relaxation, nostalgia, rest, prestige, knowledge,
experience, and social interaction. The ‘push-pull framework’ demonstrates an
15
approach to know tourists’ urges for traveling, and the reason a tourist chooses a
destination.
According to some studies, tourism destination attributes are price, culture,
entertainment, beautiful environment, nice weather and climate, accessibility, safety,
hospitality of the local people, and service (Zhou, 2005). Attributes of destination that
are studied in this paper are beauty nature/landscape, traditions, arts and cultures, fun
night life, tasty foods; friendly and helpful Indonesians, good facilities, Bali’s good
reputation, diverse tourist attractions, affordability, accessibility and modernity.
2.6. Background to Bali as a tourism destination
Bali is located to the east of the island Java. Its size 5.780 km², which is 0.3%
of Indonesia’s landmass. It has two active volcanos: Mount Batur and Mount Agung.
The latter exploded last June 2019. The population of Bali is 4,292,200 (BPS Bali;
2018). About 93.18% of Bali’s population follows Balinese Hinduism, it is a
combination of existing local beliefs and Hindu influences from mainland Southeast
Asia and South Asia.
Bali is an island that is a province of Indonesia. It has known as a center for
culture in Indonesia, and its role as a favorite tourist destination in the world has boosted
its economy. Bali remains the dominant tourist destination having the biggest
concentration of international tourists and tourism infrastructure (Badan Pusan Statistik,
2014).
Bali is the top of mind for Indonesia’s tourism. This underpins why Bali was
chosen as the case study. Because it has been developed in the tourism sector and many
international tourists from all over the world have visited Bali. Bali’s well-established
tourism industry simplifies the sampling process.
16
Bali is one of the prominent destinations in the world. Bali has everything a
destination should have: two active volcanos, beaches- Kuta Beach is well known as a
surfers’ paradise, rice terraces, a national park, lakes, temples, and many more
attractions. In 2015, Bali was ranked second out of the 10 best islands in the world
according to the magazine published by the American "Travel and Leisure."
The contribution of Balinese tourism to National Tourism is highly important,
because 36% of the total foreign tourists visiting Indonesia in 2015 come directly to
Bali. The contribution of tourism to the economy of Bali (Bali GRDP) amounted to
65.28% in 2010 increased to be 68.28% in 2014 (Antara & Sumarniasih, 2017).
2.7. International Tourists
Unlike previous studies that consider the tourist population in general, this study
focuses on international tourists due to the intention to discover which TIS international
tourists use. Also, the focus on international tourists is designed to answer the problem
of the study which is the small number of international tourists coming to Indonesia
compared to its neighboring countries.
An international tourist (or by UNWTO is called International Visitor) is an
individual who is on a tourism trip or tour and is a non-resident travelling in the country
of reference or a resident travelling outside of it (IRTS 2008, 2010). Moreover,
international inbound tourists are those who visit a country other than the country of
their residence outside their usual environment for a period of not more than 12 months,
and whose main purpose is an activity other than one employed inside the country
visited (Ilban & Yıldırım, 2017). This paper only discusses about inbound international
tourists that visit Bali.
International tourists are important part of this study. The number of
international tourists and receipts are criteria for determining tourism income to the
17
economy of a country, and are also very important to promote a country’s reputation
and attract more tourists in the future. International tourism receipts are spending by
international inbound visitors (Ilban & Yıldırım, 2017). In addition, international
tourism is significant to bring in foreign exchange for the receiving country (Ding,
2009).
2.8. Effectiveness
The definition of ‘effectiveness’ by Webster-Merriam on-line is the power to
generate the desired outcome. Effectiveness is measured as the quality of the results (M.
Wilson et al., 2018). Moreover, Macquarie Dictionary defines ‘effective’ as to affect
the objective; generating the expected outcome. The effectiveness term is usually
followed by the efficiency term (Commission, 2013). However, this paper does not
discuss about efficiency because it will need more resources and deeper research
instruments.
Effectiveness in this paper will refer to whether TIS has successfully
constructed the destination attributes. The effectiveness of TIS constructing attributes
of the destination is drawing from comparing perceived attributes during information
searching and real attributes after tourists arrived at the destination.
Demonstrating the effectiveness of TIS in constructing a destination attributes
is important because tourists decide to travel to a destination because of the attributes
or images of the destination that have been developed in a tourist’s mind obtained from
the information sources. Therefore, besides knowing which TIS international tourists
used, it is necessary to know which TIS is the most effective in constructing destination
attributes. This means determining whether TIS not only succeeds in influencing
tourists to come to a destination but is also effective in depicting the real attributes of

18
the destination. In this way, tourists will not be disappointed and will likely use the
same TIS in the future.
Figure 1. A conceptual model of the research
Source: This study refers to (No & Kim, 2015a).
The conceptual model above is in accordance with destination image formation model
by Dann (1977). In short, adjusting with the conceptual model above, the Dann’s model of
destination image formation can be described as seen in Figure 2. From this figure can clearly
see the relationship between information sources, destination image and tourist’s travel
decision or destination selection.
Figure 2. Destination Image Formation
Source: Dann, 1977
19
2.9. Hypotheses Development
The hypotheses of this paper are developed based on the observations of the
previous studies and aforementioned related theories on online and offline tourism
information sources, information sources attributes and tourism destination attributes.
Particularly, Dann’s theory (1977) that says information sources affect destination
image and many other preceding studies (Hunt, 1975; Goodrich, 1978; and Milman
& Pizam, 1995) have demonstrated that a destination image crucially influences
tourist’s decision on destination selection.
This study attempts to discover which TIS are the most important for
international tourists and why. The previous studies haven’t used comprehensive
information sources and targeted international tourists specifically. This study also
tries to find out which TIS have constructed destination image. Therefore, this paper
proposes the following hypotheses (H):
H1 The most used/important TIS for international tourists in decision making are
online TIS.
H2 During information search, international tourists mix the use of online and
offline TIS.
H3 The rationales of TIS selection by international tourists are user-generated
content and interactivity service of sources.
H4 TIS with user-generated content are most effective in constructing the
destination attributes.
20
III. Methodology
3.1. Design of the Study
This research investigated TIS that international tourists used to acquire
knowledge of a destination. Furthermore, the study investigated the rationales behind
their choices of TIS as well as whether the TIS they used have been effective in
constructing destination attributes. The investigation done by analyzing TIS and the
attributes used by international tourists, and also by analyzing destination attributes
according to international tourists’ opinion and the TIS which construct them.
In order to test the hypotheses formulated in the previous sections, a descriptive
and quantitative analysis method were chosen to understand which the most important
TIS used by international tourists, the reasons behind the TIS selection and which TIS
have constructed the destination attributes. This study relied on an online questionnaire
which was conducted based on the platform of Survey Monkey, the online platform to
assist create and distribute a questionnaire and collect responses. An online link was
created so that the questionnaire could easily be distributed through email and social
media. All survey processes and communications were conducted online.
For the empirical investigation, Bali is used as a case study. Bali is a mature
tourist destination and one of the main tourism destinations in the world, for which the
main type of tourism is nature and culture. The survey contained a broad range of
questions, related to different variables associated with sources of tourism information
used by international tourists that visit Bali, attributes of the TIS, and attributes of the
destination which is in this case, Bali. Moreover, there are questions regarding sample
demographic information.
The survey was comprised of 32 questions with some questions having multiple
choices as well as open-ended questions. As the targeted sample was international
21
tourists, survey questions were conducted in English. The questionnaire (Appendix B)
was divided into three parts: part 1 were comprised of the questions on Bali as a tourist
destination; part 2 consisted of questions regarding online and offline tourism
information sources; and the last part consisted of socio-demographic characteristics
questions of the sample.
3.2. Variables and Measurement Scales
The variables used in this study are online and offline tourism information
sources (14 items), destination attributes (12 items), activities of tourists (18 items),
image comparison before and after (11 items), types of information usually used by
tourists and whether that information easy or not easy to find (18 items), whether TIS
meet tourists’ needs (15 items), TIS’ likeliness to re-use in the future (17 items), Six
attributes for each TIS, including quality of information, visual appeal, security,
easiness to use, cost using TIS, and responsiveness. Other variables related with sample
demographic information such as gender, age, education, income, etc. are also included.
The scale was measured by a 5-point Likert scale. This scale is a type of
psychometric response scale in which responders specify their level of agreement to a
statement typically in five points (Survey Monkey, 2020). Where one represented a
response of the least and five represented the most positive. This scale is also used by
other previous studies for their survey on tourism information sources (Lluis and
Raquel, 2016; No and Kim, 2015; Zhou, 2005; Ding, 2009; Llodrà-Riera, Martínez-
Ruiz, Jiménez-Zarco and Izquierdo-Yusta, 2015).
To establish the constructs used in the subsequent analysis, the study conducted
exploratory factor analysis with survey data.
22
Factor Analysis is commonly used for research in the social field. This study
uses factor analysis due to the fact that there is no dependent and independent variables
(this study does not have y and x variables) as in regression or other types of
methodology. Factor analysis is also called an interdependence technique. Unlike
variables can be directly measured such as speed, height, weight, etc., some variables
like egoism, creativity, happiness, religiosity, comfort, etc. are not a single measure
entity. They cannot be measured directly. Usually they need several other items before
we can finally get the exact meaningful variable/factor/explanation. Factor analysis is
usually used by marketers to investigate the psychological profile of consumers’ need
(Nayak, K. Jogendra, lecture, 2018). This study tries to investigate the reasons behind
TIS selection and use, and such it is appropriate to conduct this research using factor
analysis.
The objective of factor analysis is simplification of items into a subset of
concepts or measures through which the researcher can get the construct or latent
variables that define or explain intercorrelations among the variables (Comrey and Lee,
1973).
Table 2. Technical Details Universe International tourists
Sample unit International tourists that visit Bali
Information collecting method Online questionnaire
Sample procedure Non-probabilistic method Sample design Information was collected using an online questionnaire
(Survey Monkey). The link was sent via e-mail and published in social media.
Number surveyed 127 valid surveys out of 143 Period of information collection Statistical analysis
July to October, 2016 Stata 13.1

23
3.3. Sample
The analysed sample consists of 127 valid surveys, gathered online between
July and October, 2016. Replies arrived from all over the world. The universe
comprises international tourists. As the population is large and randomization is
impossible to do due to limited resources, time and workforce, convenience sampling
was chosen as the preferred method to collect required data. The following tables
describe sample demographic information. This study tends to obtain various
demographic data as it is useful for the factor analysis method.
The online questionnaires were distributed or sent to, and collected, from the
138 identified survey subjects during the month of July to October 2016. Among them,
10 questionnaires cannot be used due to they are not international tourists, which
amounted to 128 valid responses, for a valid response rate of 92.75%.
The characteristics of valid samples subjects are as follows: (1) Sex: 53 female
(41.4%) and 31 male (24.22%); (2) Age: almost half of the subjects are between the
ages of 25 and 44, 46.09% (59 subjects); (3) Education: up to 54 subjects hold a
bachelor’s degree and completed graduate school; (4) Occupation: work in private
sector predominates (48 subjects, 37.5%); (5) Employment Status: Employed, working
full-time predominates (43.75%); (6) Ethnicity: White and Asian people predominate
(25% and 23.43%); (7) Objectives of visit: Mostly for pleasure (102 subjects, 79.68%);
(8) Method of visit: 47 subjects used tour package, and 44 subjects self-organized the
tour (see Appendix A for more detail respondent characteristics).
24
IV. Data Analysis
4.1. Reliability and Validity of Data
According to Rosenthal & Rosnow (1984), reliability is a measure to check the
data consistency and stability, and the validity inspects the relation between a construct
and its measures.
This study first tested whether the data satisfied the basic assumption for a factor
analysis. The following three steps were implemented: the correlation coefficient was
obtained from the questionnaires, a Bartlett’s test of sphericity was established, and a
Kaiser–Meyer–Olkin (KMO) measure of sampling adequacy (MSA) was specified.
In order to check the reliability of the data, Bartlett’s test of sphericity, Kaiser-
Meyer-Olkin (KMO) test and Cronbach’s Alpha were conducted. In this study, all
variables can be grouped and correlated significantly. The p-values of Bartlett's test of
sphericity tests for all variables are less than 0.001, thus we can reject the Null
Hypothesis (H0) that all variables are correlated and is not identity matrix.
The most basic assumption in multivariate data analysis is the normality of the
data, which has been tested using the Kaiser-Meyer-Olkin (KMO) measure of sampling
adequacy. In this study, all factor analysis done for all variables provided a KMO MSA
value of > 0.80, indicating that the model is meritorious (Hair, Black, Babin, Anderson,
2010). For reference, Kaiser and Rice (1974) put the following values on the results: to
0.49 unacceptable; 0.50 to 0.59 miserable; 0.60 to 0.69 mediocre; 0.70 to 0.79 middling;
0.80 to 0.89 meritorious; and 0.90 to 1.00 marvelous.
For reliability testing Cronbach’s α was assessed for every construct. This study
set Cronbach’s Alpha of > 0.70 for each construct which indicates a very good level of
reliability for the items and the scales or measures that were used in this study (Nunnally,
1978). The key output here is the “scale reliability coefficient” – which is Cronbach’s
25
α. The rule of thumb is that this coefficient should be at least 0.50, with many analysts
seeking a value of 0.70 or higher before they are willing to accept the set of items as
being related to a single latent factor (Pad & Analysis, 2007).
This study tested validity of data by examining factor correlations. All variables
are correlated by ≤ 0.7. Validity is the extent to which a construct or measurement is
well-grounded and conforms accurately to what we know or measure. In other words,
it is the degree to which it measures what it is supposed to measure (No & Kim, 2015b).
Stata 13.1 was used as a statistical package for the testing. All statistics
supported the overall measurement quality given the number of indicators. In this study,
all factors constructed provide the Kaiser-Meyer-Olkin measure of sampling adequacy
approached 1, and the Bartlett test was satisfactory, with a significance level of less
than .01 and all variables are correlated by ≤ 0.7. Therefore, reliability and validity were
established.
4.2. The Most Important Tourism Information Sources
The first research question is to understand the tourism information sources
chosen and used by international tourists to get information about the destination they
want to visit. In other words, what are the most important TIS for international tourists.
To answer this question, mean, median and standard deviation are provided.
Among the information sources, the top three sources are Friends and Family (WOM,
word-of-mouth), Search Engines and Social Media. All three of these TIS have one
similar characteristic, which is that all of them are user-generated content. From this
result, it can be concluded that the most important TIS for international tourists are user-
generated content TIS, which means international tourists prefer to get information
26
about the destination they would like to visit from other people’s recommendations or
testimonies about their first-hand travel experience to the destination.
Table 3. Information sources, mean, median, standard deviations, skewness, kurtosis
Variable Code Obs Mean Std. Dev. Skewness Kurtosis
Friends and Family tis9 127 .5984252 .4921582 ‐.4015579 1.161.249
Search engines tis5 127 .4251969 .4963307 .3026184 1.091.578
Social media (Fb, Twitter, Travellerspoint, etc.) tis4 127 .3307087 .4723316 .7196716 1.517.927
Blogs tis1 127 .2519685 .4358627 1.142.625 2.305.592
Company website (hotel, agoda, etc.) tis2 127 .2362205 .4264414 1.242.019 2.542.612
Brochure, book, magazine, newspaper tis11 127 .1732283 .3799434 1,72692 3.982.251
Photo‐sharing (Flickr, Instagram, etc.) tis8 127 .0787402 .2703994 3.128.174 1.078.547
Travel agent/consultant tis13 127 .0787402 .2703994 3.128.174 1.078.547
Public/government website tis3 127 .0708661 .2576174 3.344.754 1.218.738
Video‐sharing (e.g. YouTube) tis7 127 .0708661 .2576174 3.344.754 1.218.738
Applications on mobile phone tis6 127 .0393701 .195244 4.737.192 2.344.098
Television tis10 127 .0314961 .1753458 5.364.934 2.978.252
Past Experience tis14 127 .023622 .15247 6.273.558 4.035.753
Travel fair tis12 127 .007874 .0887357 1.113.589 1.250.079
The above results also get confirmed by examining the data of TIS meeting the
international tourists’ information needs. From Table 4 we get similar results with Table
3 for the top three TIS, which are search engines, friends and family, and social media.
To conclude, from two different cohorts of variables or measures, we get almost the
same results for the most important TIS for international tourists; Only, blogs in Table
4 is slightly higher than social media.
Table 4. TIS Meet International Tourists’ Need
Variable Code Obs Mean Std. Dev. Skewness Kurtosis
Search engines sem 127 2,50394 2,23917 -0,09463 1,20602
Friends and Family friendm 127 2,25197 2,33663 0,16611 1,13926
Blogs blogm 127 1,55906 2,04960 0,72282 1,75218
Social media (Fb, Twitter, Travellerspoint, etc.) socmedm 127 1,29134 1,77330 0,87384 2,19037
Tourist resource and activities portal meet turesm 127 1,14961 1,76868 1,11993 2,64743
Rent Accommodation portal meet rentm 127 1,13386 1,85747 1,21363 2,75764
Company website (hotel, agoda, etc.) comwebm 127 1,09449 1,65440 1,08418 2,59979
Public/government website pgwm 127 1,00000 1,50660 1,16033 2,92207
Applications on mobile phone appm 127 0,79528 1,56519 1,72613 4,43638
Brochure, book, magazine, newspaper brochm 127 0,79528 1,50838 1,66041 4,28567

27
Photo-sharing (Flickr, Instagram, etc.) photom 127 0,58268 1,31801 2,22120 6,72751
Travel agent/consultant tragentm 127 0,51181 1,27781 2,52849 8,14791
Video-sharing (e.g. YouTube) vidm 127 0,44882 1,12482 2,71471 9,55825
Television tvm 127 0,40157 1,02555 2,99276 1,18508
Travel fair trafairm 127 0,29134 0,83676 3,41032 1,50931
From the above findings we can draw a conclusion that the most important TIS
for international tourist are search engines and friends and family. Thus, the First
Hypothesis (H1) is not supported, because the most important/used sources by
international tourists are search engines, which is an online source, and friends and
family is an offline TIS.
This result is in accordance with Fesenmaier, Xiang and Pan’s (2011) rank of
travel-related websites, that produced the following order sources of information:
search engines, suppliers' sites, OTAs, friends and family, etc. Also, Verma, Stock, and
McCarthy (2012) argue that tourists use different online sources during various phases,
with search engines being more crucial in the beginning of information searching.
Though the search engines are not information sources as such, but they are
devices for searching information and thus act a mediating role for customers in the
inquiry process. Search engines are the primary information sources, despite they are
not the content owners (Murphy et al., 2016).
The finding of Friends and Family as one of the most prime sources is also
supported by Hernández-Méndez et al. (2015b). The study shows that when arranging
travel, tourists continue to be affected to a greater extent by the views and
recommendations of friends and relatives (known as offline word-of-mouth or WOM)
than by other internet users (eWOM).
Moreover, to test the second hypothesis, whether during information searching
international tourists mix the use of online and offline TIS, this study provides factor
loading scores of the likeliness of international tourists to use TIS in the future. The
28
patterns shown in Table 5 are interesting as the Factor 1 consists of variables of TIS
that are mixed between online and offline sources. Whereas three other factors consist
of TIS with same category only- online or offline.
From this finding particularly from Factor 1, we conclude that Hypothesis 2 (H2)
is supported that during information searching, international tourists tend to mix the
TIS they use, both online and offline. Further, the online TIS that they use also varies,
between interactive and user-generated content. As we can see in Factor 1 there are four
online TIS which are both interactive and user-generated content (Recommendation
Platform, Tourist Resource, Rent Accommodation, Online Maps, and Search Engine)
and one offline TIS which is Friends and Family (usually called Word of Mouth/WOM).
Table 5. Rotated Factor Loading of Likely to Use TIS in the Future Variable Code Factor1 Factor2 Factor3 Factor4 UniquenessRecommendation platform future use reclkly 0.8157 0.2232 0.1290 0.2573 0.2020Tourist resource future use tureslkly 0.7707 0.1770 0.2496 0.0512 0.3098Rent accommodation future use accmlkly 0.7624 0.3266 0.1363 0.1315 0.2762Online Maps future use maplkly 0.6398 0.2439 0.3036 0.2536 0.3746Search engine future use selkly 0.6188 0.0366 0.1661 0.4823 0.3556Friends and families future use friendlkly 0.4762 0.1547 0.2133 0.4735 0.4796Video sharing future use vidlkly 0.3048 0.8043 0.2926 0.0176 0.1744Photo sharing future use photolkly 0.2408 0.7538 0.2282 0.1757 0.2909Social media future use socmedlkly 0.0699 0.6546 0.0211 0.4744 0.3411Application on mobile phone future use applkly 0.4437 0.5858 0.2700 0.0961 0.3778Television future use tvlkly 0.0871 0.3739 0.7468 0.1906 0.2585Travel fair future use trafairlkly 0.2763 0.3276 0.7319 0.0410 0.2790Written media future use writlkly 0.1478 0.3119 0.7283 0.1853 0.3162Travel agent future use tragentlkly 0.3030 -0.1637 0.7051 0.0738 0.3787Public gov web future use pgwlkly 0.2487 -0.0526 0.2144 0.6785 0.4291Company web future use comweblkly 0.3291 0.3044 0.1449 0.6733 0.3247Blog future use bloglkly 0.1335 0.2704 0.0877 0.6579 0.4686Number of items 6 4 4 3
All Uniqueness
<0.6
Eigenvalue 7,525 1,504 1,283 1,052 Proportion 0.4426 0.0885 0.0755 0.0619 Cronbach's alpha 0.8752 0.7956 0.7770 0.6765 KMO 0.850
Bartlett test of sphericity p‐value = 0.000

29
4.3. Factors for the Selection of Tourism Information Sources
The second research question is “what are the reasons behind the selections of
tourism information sources by international tourists?”. To answer this question, Factor
Analysis of all TIS attributes was conducted. In Table 6, there are three factors extracted,
however Factor 3 is not reliable because of a Cronbach’s alpha of less than 0.70. It can be
concluded that international tourists do not see that Travel Fairs, Travel Agents and
Public/Government Websites have the quality of information that they need.
From Table 6, we can see out of 17 sources, Factor Analysis reduces them into three
Factors, and only two Factors are reliable: Factor 1 and Factor 2. Factor 1 consists of nine
variables/sources: Video Sharing Portals, Photo Sharing Portals, Tourist Social Network,
Television, Application on Mobile Phone, Rent Accommodation Portals, Written Media,
Social Media and Tourist Resource Portals. Factor 2 consists of five sources: Search Engines,
Company Websites, Blogs, Friends and Family and Recommendation Platforms. This
finding is in accordance with the statement that tourists no longer only depend on
information provided by businesses or public/government descriptions of a destination,
because now everyone can share information, and people can shortly access comments from
other customers who have been to the destination (WTTC, 2011).
Factor 1 and 2 make two cohorts with different types. Factor 1 is a cohort of TIS
with more experience-sharing platforms. On these platforms, tourists share useful
information such as photos and stories, meet up with someone while traveling or find
reviews from other travelers. There are two offline TIS in this cohort: Television and Written
Media. So, Factor 1 is a mix of variables of online and offline TIS.
Factor 2 refers mainly to TIS in which tourists can get information, rather than use
them as experience-sharing/connecting platforms. These TIS include Search Engines,
Company Websites, Blogs, Friends and Family and Recommendation Platforms; all
30
generally used by tourists to get information only. To share and connect to other travelers,
they usually use social media or networks like the TIS cohort in Factor 1.
These findings show similarities to theory saying that social media/network websites
enable internet users to develop virtual travel communities (VTCs) that make it easier for
them to find information, maintain connections, develop relationships, and eventually make
travel decisions (Ayeh, Au, & Law, 2013; Stepchenkova, Mills, & Jiang, 2007). Moreover,
Munar and Jacobsen (2013) found that information sharing is commonly related to textual
and narrative communicative practices (e.g. blogs and written reviews), and the sharing of
experiences related to the creation and online sharing of audio-visual content (e.g. photos
and videos). In tourism, users are dependent on experience reviews shared by other users
through photos and videos on the internet. Thus, social networking has become an important
communication tool to connect individuals or to interact with friends (Subrahmanyam,
Reich, Waechter and Espinoza, 2008).
There is one offline TIS in this cohort which is Friends and Family. Thus, Factor 1
and 2 show a clear division between sources for connecting to each other and sources for
getting information, though still mixed in terms of offline and online sources. The findings
are in line with notions that the hospitality and tourism industry have become an essential
tool for accessing different sources of tourism information (Law et al., 2009; Sigala et al.,
2012).
In other words, from this finding we know that in terms of quality of information,
international tourists prefer TIS through which they can connect to other travelers and TIS
which allows them to obtain information from first-hand experience. These statements hold
true for online TIS. Regarding offline TIS, and the quality of information, international
tourists tend to use television, written media, and information from friends and family.
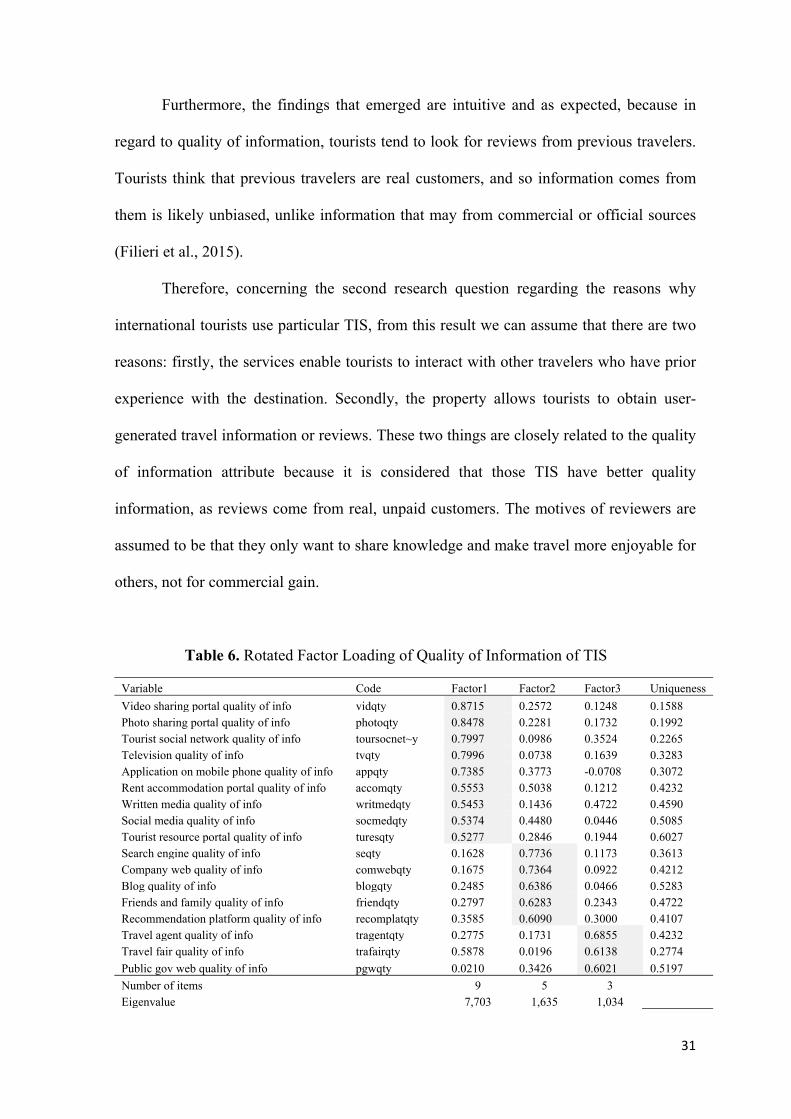
31
Furthermore, the findings that emerged are intuitive and as expected, because in
regard to quality of information, tourists tend to look for reviews from previous travelers.
Tourists think that previous travelers are real customers, and so information comes from
them is likely unbiased, unlike information that may from commercial or official sources
(Filieri et al., 2015).
Therefore, concerning the second research question regarding the reasons why
international tourists use particular TIS, from this result we can assume that there are two
reasons: firstly, the services enable tourists to interact with other travelers who have prior
experience with the destination. Secondly, the property allows tourists to obtain user-
generated travel information or reviews. These two things are closely related to the quality
of information attribute because it is considered that those TIS have better quality
information, as reviews come from real, unpaid customers. The motives of reviewers are
assumed to be that they only want to share knowledge and make travel more enjoyable for
others, not for commercial gain.
Table 6. Rotated Factor Loading of Quality of Information of TIS
Variable Code Factor1 Factor2 Factor3 Uniqueness
Video sharing portal quality of info vidqty 0.8715 0.2572 0.1248 0.1588Photo sharing portal quality of info photoqty 0.8478 0.2281 0.1732 0.1992Tourist social network quality of info toursocnet~y 0.7997 0.0986 0.3524 0.2265Television quality of info tvqty 0.7996 0.0738 0.1639 0.3283Application on mobile phone quality of info appqty 0.7385 0.3773 -0.0708 0.3072Rent accommodation portal quality of info accomqty 0.5553 0.5038 0.1212 0.4232Written media quality of info writmedqty 0.5453 0.1436 0.4722 0.4590Social media quality of info socmedqty 0.5374 0.4480 0.0446 0.5085Tourist resource portal quality of info turesqty 0.5277 0.2846 0.1944 0.6027Search engine quality of info seqty 0.1628 0.7736 0.1173 0.3613Company web quality of info comwebqty 0.1675 0.7364 0.0922 0.4212Blog quality of info blogqty 0.2485 0.6386 0.0466 0.5283Friends and family quality of info friendqty 0.2797 0.6283 0.2343 0.4722Recommendation platform quality of info recomplatqty 0.3585 0.6090 0.3000 0.4107Travel agent quality of info tragentqty 0.2775 0.1731 0.6855 0.4232Travel fair quality of info trafairqty 0.5878 0.0196 0.6138 0.2774
Public gov web quality of info pgwqty 0.0210 0.3426 0.6021 0.5197
Number of items 9 5 3 Eigenvalue 7,703 1,635 1,034
32
Proportion 45% 10% 11%
Cronbach's alpha 0.9003 0.8014 0.5314
KMO 0.891
Bartlett test of sphericity p‐value = 0.000
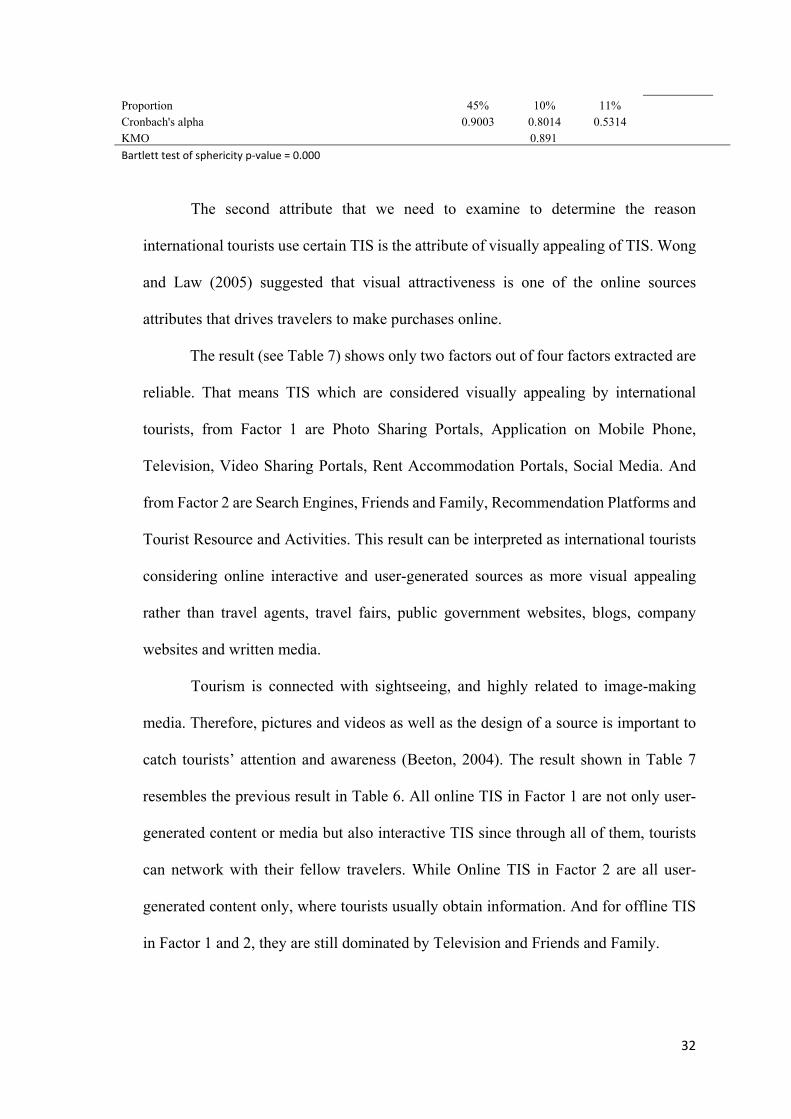
The second attribute that we need to examine to determine the reason
international tourists use certain TIS is the attribute of visually appealing of TIS. Wong
and Law (2005) suggested that visual attractiveness is one of the online sources
attributes that drives travelers to make purchases online.
The result (see Table 7) shows only two factors out of four factors extracted are
reliable. That means TIS which are considered visually appealing by international
tourists, from Factor 1 are Photo Sharing Portals, Application on Mobile Phone,
Television, Video Sharing Portals, Rent Accommodation Portals, Social Media. And
from Factor 2 are Search Engines, Friends and Family, Recommendation Platforms and
Tourist Resource and Activities. This result can be interpreted as international tourists
considering online interactive and user-generated sources as more visual appealing
rather than travel agents, travel fairs, public government websites, blogs, company
websites and written media.
Tourism is connected with sightseeing, and highly related to image-making
media. Therefore, pictures and videos as well as the design of a source is important to
catch tourists’ attention and awareness (Beeton, 2004). The result shown in Table 7
resembles the previous result in Table 6. All online TIS in Factor 1 are not only user-
generated content or media but also interactive TIS since through all of them, tourists
can network with their fellow travelers. While Online TIS in Factor 2 are all user-
generated content only, where tourists usually obtain information. And for offline TIS
in Factor 1 and 2, they are still dominated by Television and Friends and Family.
33
Being visually appealing, by delivering pictures of the destination, as well as
having a good design and presentation of the source, is essential in meeting customers’
expectations (Kaynama & Black, 2000). Visual materials such as photos, illustrations
and texts are all considered likeable (Siu and Fung, 1998). Visual materials are an
important factor in tourists’ information searching and decision making. Pictures are
more attractive than text and it is profitable to include attractive graphics (Edell and
Staelin, 1983).
Table 7. Rotated Factor Loading of TIS Visual Appealing
Variable Code Factor1 Factor2 Factor3 Factor4 Uniqueness
Photo sharing portal visual photovis 0.8356 0.1007 0.2522 0.1742 0.1977
Application on mobile phone visual appvis 0.7544 0.2836 0.0642 0.2013 0.3058
Television visual tvvis 0.7372 0.1421 0.3610 0.0611 0.3023
Video sharing portal visual vidvis 0.6961 0.1401 0.1886 0.3307 0.3510
Rent accommodation portal visual accmvis 0.6409 0.5201 0.0246 0.0291 0.3173
Social media visual socmedvis 0.5377 0.1944 -0.0590 0.5261 0.3928
Search engine visual sevis 0.1355 0.7295 0.1275 0.2651 0.3630
Friends and families visual friendvis 0.1119 0.6916 0.2119 0.1638 0.4374
Recommendation platform visual recvis 0.5118 0.6222 0.0757 0.0741 0.3397
Tourist resource and activities visual turesvis 0.4267 0.5197 0.3431 0.1696 0.4013
Travel agent visual tragentvis 0.1198 0.1760 0.8203 0.0050 0.2818
Travel fair visual trafairvis 0.4182 -0.0439 0.6460 0.4218 0.2279
Written media visual writvis 0.4288 0.3235 0.5272 -0.0186 0.4332
Public gov web visual pgvis 0.0811 0.2052 0.3608 0.7110 0.3156
Blog visual blogvis 0.3213 0.1044 0.0150 0.5795 0.5499
Company web visual cwvis 0.2502 0.4015 -0.1311 0.5662 0.4385
Number of items 6 4 3 3
All Uniqueness
<0.6
Eigenvalue 6,900 1,302 1,106 1,037
Proportion 43,12% 8,14% 6,91% 6,48%
Cronbach's alpha 0.8623 0.7545 0.6775 0.5814
KMO 0.860
Bartlett test of sphericity p‐value = 0.000
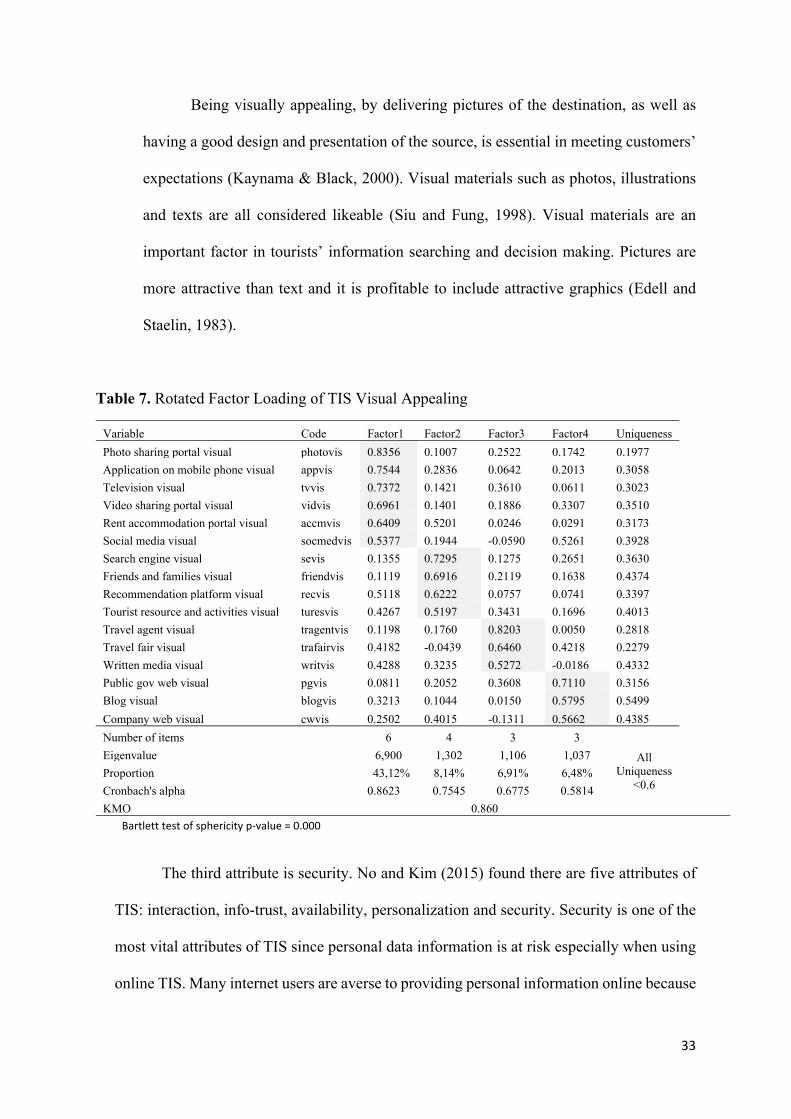
The third attribute is security. No and Kim (2015) found there are five attributes of
TIS: interaction, info-trust, availability, personalization and security. Security is one of the
most vital attributes of TIS since personal data information is at risk especially when using
online TIS. Many internet users are averse to providing personal information online because
34
they do not trust e-commerce security (Kim et al., 2011, p. 257). Park and Gretzel (2007)
describe security in three ways: safeguard information during transmission and following
storage, security for online purchases or booking, and confidentiality information. Mills and
Morrison (2003) define security as the safety of personal information during transactions on
an online source.
TIS must demonstrate themselves to be trustworthy concerning the safeguard of a
user’s personal information to gain their trust. Trust affects tourists' intention to follow
others' advice. Trust is expected to foresee suggestions adoption and word of mouth (WOM).
By using Factor Analysis method, this study empirically demonstrates interactive
online TIS get higher factor loading scores. In the extracted Factor 1 and 2 in Table 8 for
attribute security, there are several highly interactive sources such as video sharing portals,
photo sharing portals, mobile applications and tourism social network. Online textual user-
generated content TIS are not included, such as social media, blogs, and search engines.
From this finding we can say that international tourists feel more secure on interactive social
media.
According to previous studies mentioned above, security is not only about the
safeness of consumers’ personal and confidential information, but also about the
information shared in the sources. From this result for online TIS, apparently international
tourists feel more secure in the information shared through interactive social media. In terms
of offline TIS, the result is still the same, with television, and friends and family preferred
for use as well for its security.
Table 8. Rotated Factor Loading of Attribute Security
Variable Code Factor1 Factor2 Factor3 Factor4 UniquenessVideo sharing security vidsec 0.8633 0.2053 0.1664 0.2417 0.1263Photo sharing security photosec 0.8366 0.3053 0.2505 0.1646 0.1171Television security tvsec 0.7819 0.1706 0.2757 0.1552 0.2594Application on mobile phone security appsec 0.7664 0.2162 -0.0504 0.2155 0.3169Tourism social network security tswsec 0.7218 0.3078 0.3871 0.2381 0.1778
35
Travel fair security trafairsec 0.6292 0.0665 0.5778 -0.0055 0.2658Tourist resource security turessec 0.5020 0.4551 0.2590 0.0656 0.4695Online Maps Portal security mapsec 0.3114 0.7658 0.0629 0.2220 0.2633Recommendation platform security recsec 0.4041 0.7201 0.1779 -0.0604 0.2828Rent accommodation security accmsec 0.5130 0.6129 -0.0776 -0.0107 0.3550Friends and family security friendsec -0.0159 0.5789 0.1177 0.5658 0.3306Travel agent security tragentsec 0.1967 0.0185 0.8694 0.0927 0.1965Written media security writsec 0.3005 0.4345 0.5788 0.1287 0.3693Public gov web security pgsec 0.1544 0.3655 0.4027 0.2941 0.5939Blog security blogsec 0.2877 0.0421 0.1963 0.7552 0.3065Social media security socmedsec 0.4659 0.0726 -0.0242 0.7071 0.2771Number of items 7 4 3 2
All Uniqueness
<0.6
Eigenvalue 7,7375 1,3017 1,1473 1,1056 Proportion 48,36% 8,14% 7,17% 6,91% Cronbach's alpha 0.9174 0.7562 0.6138 0.6957 KMO 0,887
Bartlett test of sphericity p‐value = 0.000
From Table 9, the interesting findings of this study may contribute to verifying that
using interactive and user-generated content/media is easier than using travel agents and
getting information from written media. In terms of ease of use, the interactive social media
such as video and photo sharing and mobile applications are considered the easiest to use.
In line with the research conducted by Google, leisure travelers overwhelmingly rely on
search engines via smartphones (Ipsos MediaCT, 2014). Television and Friends and Family
still manage to be the most used by international tourists for the offline TIS category.
Saving time and ease of use are the two major causes that stir users to look for tourist
information on the Internet (Heung, 2003). Another reason is it allows tourists to be more
involved in the travel planning process. The definition of ease of use in this matter is that
consumers enjoy convenience and more control in making transactions online (Fesenmaier,
Cook, & Sheatsley, 2009). Further, Jeong and Lambert (2001) stated that ease of use has a
positive influence on a users’s motives to use the information obtained on the website for
making transactions.
Table 9. Rotated Factor Loading of Attribute Ease of Use
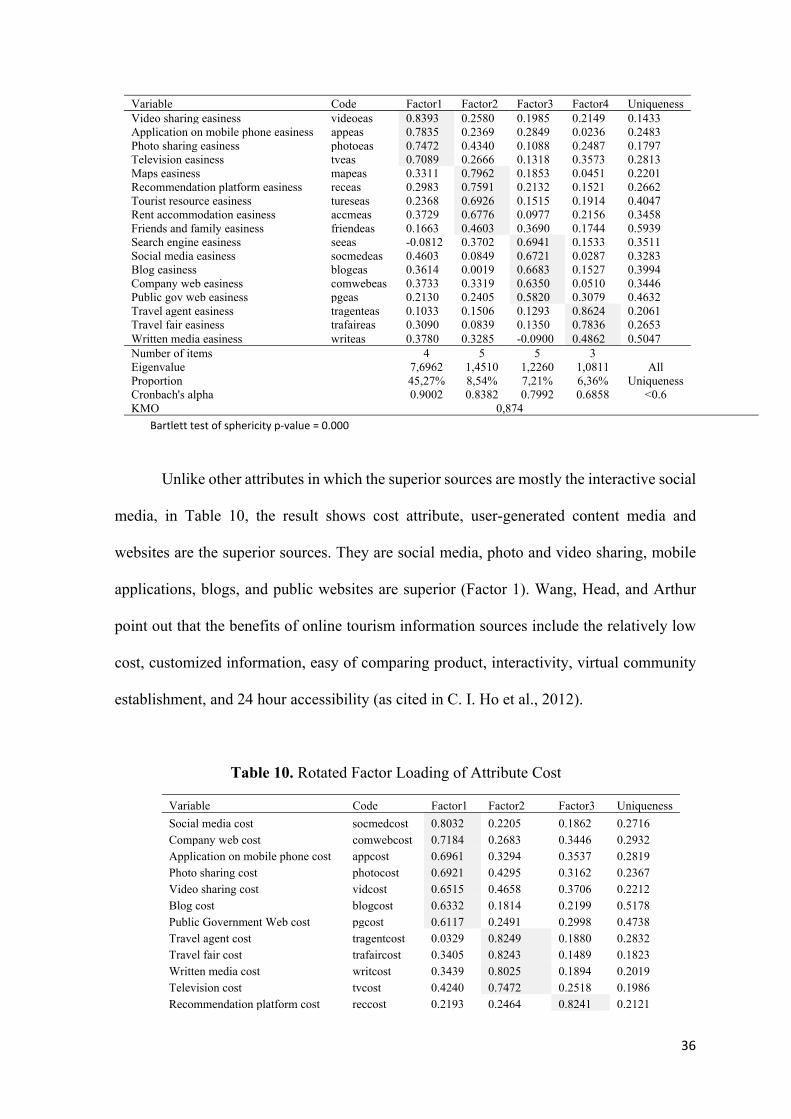
36
Variable Code Factor1 Factor2 Factor3 Factor4 UniquenessVideo sharing easiness videoeas 0.8393 0.2580 0.1985 0.2149 0.1433Application on mobile phone easiness appeas 0.7835 0.2369 0.2849 0.0236 0.2483Photo sharing easiness photoeas 0.7472 0.4340 0.1088 0.2487 0.1797Television easiness tveas 0.7089 0.2666 0.1318 0.3573 0.2813Maps easiness mapeas 0.3311 0.7962 0.1853 0.0451 0.2201Recommendation platform easiness receas 0.2983 0.7591 0.2132 0.1521 0.2662Tourist resource easiness tureseas 0.2368 0.6926 0.1515 0.1914 0.4047Rent accommodation easiness accmeas 0.3729 0.6776 0.0977 0.2156 0.3458Friends and family easiness friendeas 0.1663 0.4603 0.3690 0.1744 0.5939Search engine easiness seeas -0.0812 0.3702 0.6941 0.1533 0.3511Social media easiness socmedeas 0.4603 0.0849 0.6721 0.0287 0.3283Blog easiness blogeas 0.3614 0.0019 0.6683 0.1527 0.3994Company web easiness comwebeas 0.3733 0.3319 0.6350 0.0510 0.3446Public gov web easiness pgeas 0.2130 0.2405 0.5820 0.3079 0.4632Travel agent easiness tragenteas 0.1033 0.1506 0.1293 0.8624 0.2061Travel fair easiness trafaireas 0.3090 0.0839 0.1350 0.7836 0.2653Written media easiness writeas 0.3780 0.3285 -0.0900 0.4862 0.5047Number of items 4 5 5 3
All Uniqueness
<0.6
Eigenvalue 7,6962 1,4510 1,2260 1,0811 Proportion 45,27% 8,54% 7,21% 6,36% Cronbach's alpha 0.9002 0.8382 0.7992 0.6858 KMO 0,874
Bartlett test of sphericity p‐value = 0.000
Unlike other attributes in which the superior sources are mostly the interactive social
media, in Table 10, the result shows cost attribute, user-generated content media and
websites are the superior sources. They are social media, photo and video sharing, mobile
applications, blogs, and public websites are superior (Factor 1). Wang, Head, and Arthur
point out that the benefits of online tourism information sources include the relatively low
cost, customized information, easy of comparing product, interactivity, virtual community
establishment, and 24 hour accessibility (as cited in C. I. Ho et al., 2012).
Table 10. Rotated Factor Loading of Attribute Cost
Variable Code Factor1 Factor2 Factor3 Uniqueness
Social media cost socmedcost 0.8032 0.2205 0.1862 0.2716 Company web cost comwebcost 0.7184 0.2683 0.3446 0.2932 Application on mobile phone cost appcost 0.6961 0.3294 0.3537 0.2819 Photo sharing cost photocost 0.6921 0.4295 0.3162 0.2367 Video sharing cost vidcost 0.6515 0.4658 0.3706 0.2212 Blog cost blogcost 0.6332 0.1814 0.2199 0.5178 Public Government Web cost pgcost 0.6117 0.2491 0.2998 0.4738 Travel agent cost tragentcost 0.0329 0.8249 0.1880 0.2832 Travel fair cost trafaircost 0.3405 0.8243 0.1489 0.1823 Written media cost writcost 0.3439 0.8025 0.1894 0.2019 Television cost tvcost 0.4240 0.7472 0.2518 0.1986 Recommendation platform cost reccost 0.2193 0.2464 0.8241 0.2121

37
Search engine cost secost 0.2911 -0.0017 0.7888 0.2930 Tourist resource cost turescost 0.1526 0.4854 0.6921 0.2621 Maps cost mapcost 0.3983 0.2510 0.6711 0.3279 Rent accommodation cost accmcost 0.3943 0.3527 0.6513 0.2960
Friends and families cost friendcost 0.2902 0.2681 0.5198 0.5738
Number of items 7 4 6
All Uniqueness
<0.6
Eigenvalue 9,332 1,432 1,108 Proportion 54,90% 8,42% 6,52% Cronbach's alpha 0.9047 0.9004 0.8800 KMO 0.884
Bartlett test of sphericity p‐value = 0.000
The last attribute is responsiveness. Responsiveness includes communications,
easiness of inquiries, effectively functioning system of FAQs, feedback, and users
opinions such as forum for discussions, complaints, etc. Altogether, it includes all
attributes that allow the source personnel to respond to customers' inquiries (Zeithaml
et al., 2002).
The results remain the same from the first attribute until the last one and the
results are consistent that interactive user-generated content such as video and photo
sharing platforms and mobile applications dominate in all the attributes. Also, this
study echoes findings from the Google Travel Study that leisure travelers rely on a
mix of sources. The results show no decisive separation between online and offline
sources (Ipsos MediaCT, 2014).
Table 11. Rotated Factor Loading of Attribute Responsive
Variable Code Factor1 Factor2 Factor3 UniquenessVideo sharing quick response vidquik 0.9079 0.2053 0.1800 0.1012Photo sharing quick response photoquik 0.8965 0.2628 0.1525 0.1040Television quick response tvquik 0.8221 0.0908 0.1660 0.2883Application on mobile phone quick response appquik 0.7070 0.3702 0.2828 0.2831Travel agent quick response tragentquik 0.2054 0.7823 0.0762 0.3400Travel fair quick response trafairquik 0.3837 0.7068 0.1026 0.3427Recommendation platform quick response recquik 0.3465 0.7035 0.3404 0.2692Public gov web quick response pgwquik 0.1955 0.6040 0.1019 0.5865Company web quick response comwebquik 0.2550 0.5606 0.4628 0.4065Search engine quick response sequik 0.3113 0.0890 0.7193 0.3778Friends and family quick response friendquik 0.1329 0.2049 0.7084 0.4386Social media quick response socmedquik 0.3920 0.1505 0.6709 0.3735Blog quick response blogquik 0.1414 0.2645 0.4981 0.6619
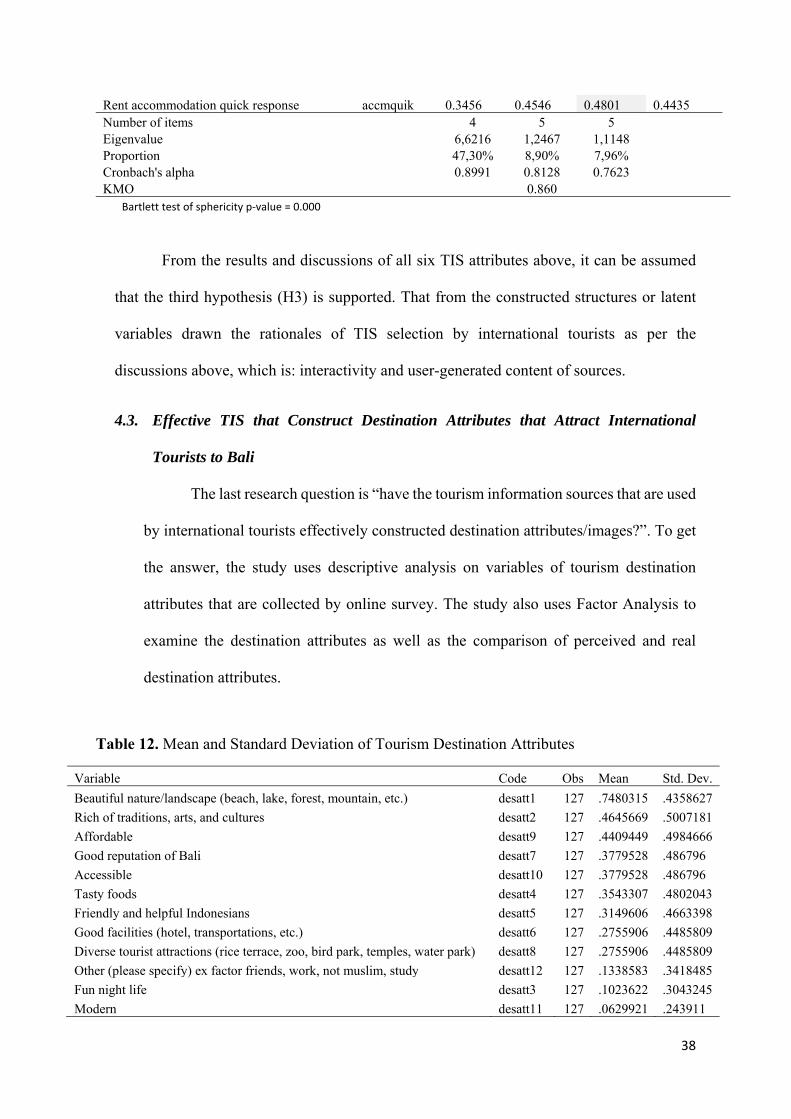
38
Rent accommodation quick response accmquik 0.3456 0.4546 0.4801 0.4435Number of items 4 5 5 Eigenvalue 6,6216 1,2467 1,1148 Proportion 47,30% 8,90% 7,96% Cronbach's alpha 0.8991 0.8128 0.7623 KMO 0.860
Bartlett test of sphericity p‐value = 0.000
From the results and discussions of all six TIS attributes above, it can be assumed
that the third hypothesis (H3) is supported. That from the constructed structures or latent
variables drawn the rationales of TIS selection by international tourists as per the
discussions above, which is: interactivity and user-generated content of sources.
4.3. Effective TIS that Construct Destination Attributes that Attract International
Tourists to Bali
The last research question is “have the tourism information sources that are used
by international tourists effectively constructed destination attributes/images?”. To get
the answer, the study uses descriptive analysis on variables of tourism destination
attributes that are collected by online survey. The study also uses Factor Analysis to
examine the destination attributes as well as the comparison of perceived and real
destination attributes.
Table 12. Mean and Standard Deviation of Tourism Destination Attributes
Variable Code Obs Mean Std. Dev.
Beautiful nature/landscape (beach, lake, forest, mountain, etc.) desatt1 127 .7480315 .4358627
Rich of traditions, arts, and cultures desatt2 127 .4645669 .5007181
Affordable desatt9 127 .4409449 .4984666
Good reputation of Bali desatt7 127 .3779528 .486796
Accessible desatt10 127 .3779528 .486796
Tasty foods desatt4 127 .3543307 .4802043
Friendly and helpful Indonesians desatt5 127 .3149606 .4663398
Good facilities (hotel, transportations, etc.) desatt6 127 .2755906 .4485809
Diverse tourist attractions (rice terrace, zoo, bird park, temples, water park) desatt8 127 .2755906 .4485809
Other (please specify) ex factor friends, work, not muslim, study desatt12 127 .1338583 .3418485
Fun night life desatt3 127 .1023622 .3043245
Modern desatt11 127 .0629921 .243911
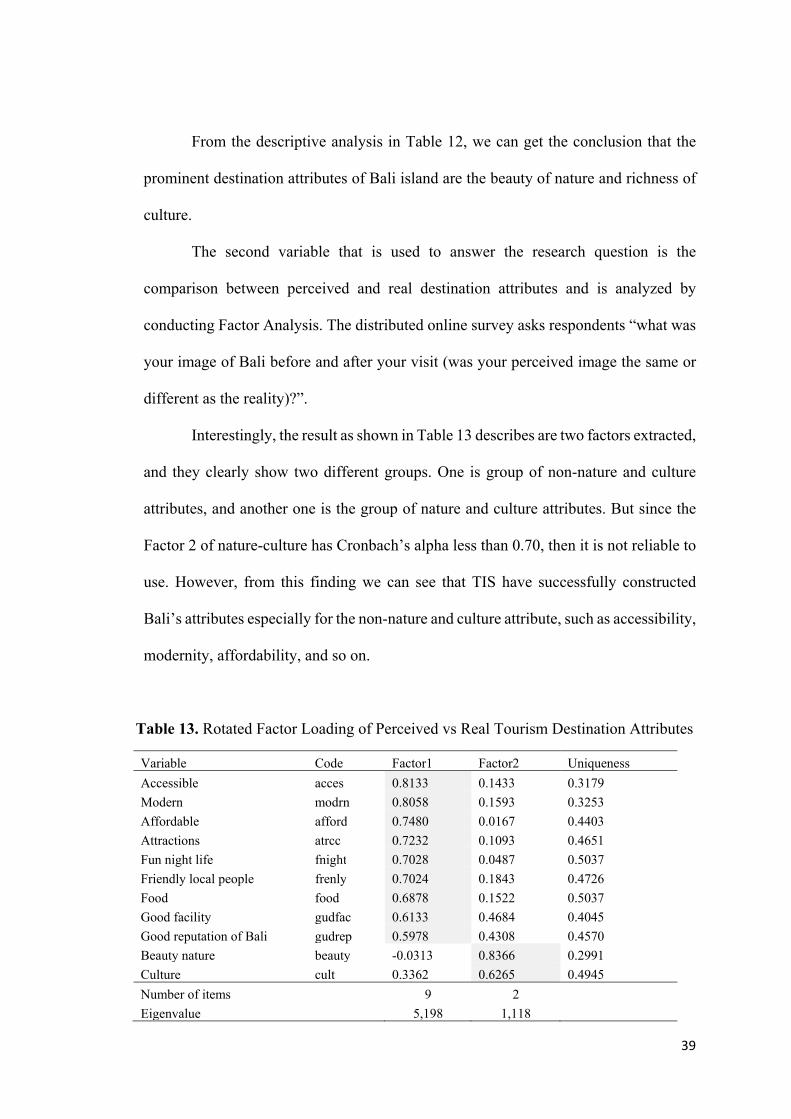
39
From the descriptive analysis in Table 12, we can get the conclusion that the
prominent destination attributes of Bali island are the beauty of nature and richness of
culture.
The second variable that is used to answer the research question is the
comparison between perceived and real destination attributes and is analyzed by
conducting Factor Analysis. The distributed online survey asks respondents “what was
your image of Bali before and after your visit (was your perceived image the same or
different as the reality)?”.
Interestingly, the result as shown in Table 13 describes are two factors extracted,
and they clearly show two different groups. One is group of non-nature and culture
attributes, and another one is the group of nature and culture attributes. But since the
Factor 2 of nature-culture has Cronbach’s alpha less than 0.70, then it is not reliable to
use. However, from this finding we can see that TIS have successfully constructed
Bali’s attributes especially for the non-nature and culture attribute, such as accessibility,
modernity, affordability, and so on.
Table 13. Rotated Factor Loading of Perceived vs Real Tourism Destination Attributes
Variable Code Factor1 Factor2 Uniqueness
Accessible acces 0.8133 0.1433 0.3179
Modern modrn 0.8058 0.1593 0.3253
Affordable afford 0.7480 0.0167 0.4403
Attractions atrcc 0.7232 0.1093 0.4651
Fun night life fnight 0.7028 0.0487 0.5037
Friendly local people frenly 0.7024 0.1843 0.4726
Food food 0.6878 0.1522 0.5037
Good facility gudfac 0.6133 0.4684 0.4045
Good reputation of Bali gudrep 0.5978 0.4308 0.4570
Beauty nature beauty -0.0313 0.8366 0.2991
Culture cult 0.3362 0.6265 0.4945
Number of items 9 2
Eigenvalue 5,198 1,118
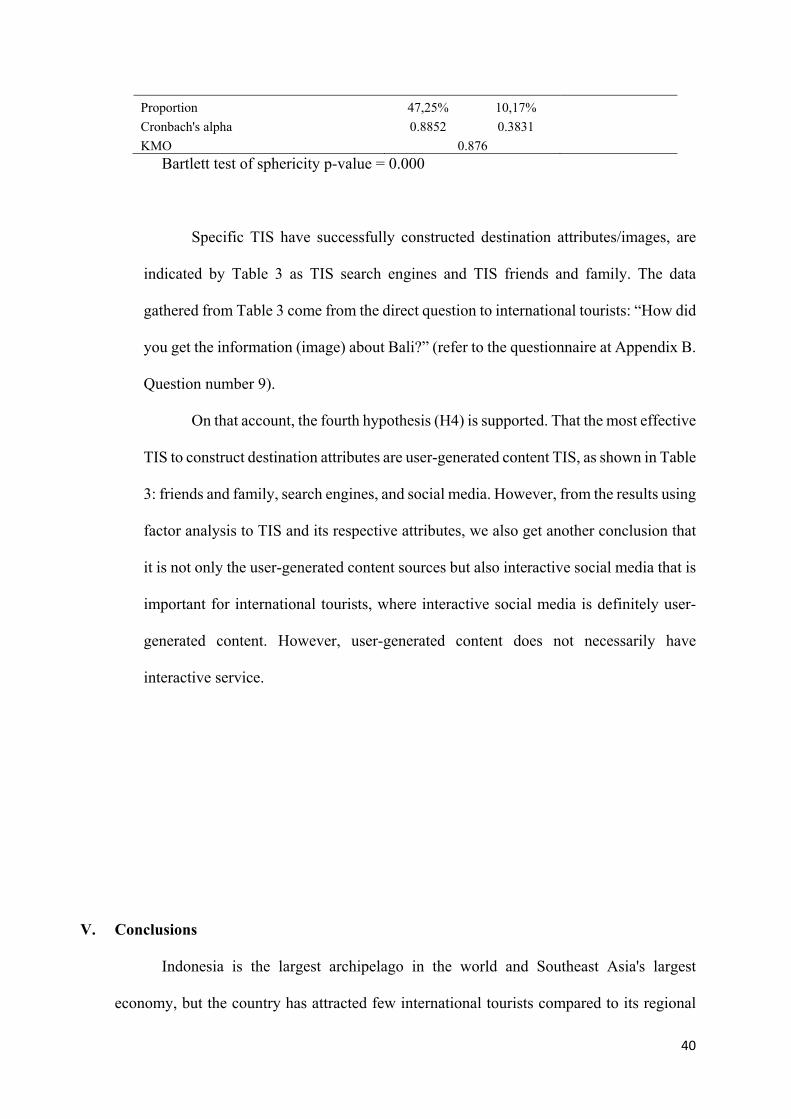
40
Proportion 47,25% 10,17%
Cronbach's alpha 0.8852 0.3831
KMO 0.876
Bartlett test of sphericity p-value = 0.000
Specific TIS have successfully constructed destination attributes/images, are
indicated by Table 3 as TIS search engines and TIS friends and family. The data
gathered from Table 3 come from the direct question to international tourists: “How did
you get the information (image) about Bali?” (refer to the questionnaire at Appendix B.
Question number 9).
On that account, the fourth hypothesis (H4) is supported. That the most effective
TIS to construct destination attributes are user-generated content TIS, as shown in Table
3: friends and family, search engines, and social media. However, from the results using
factor analysis to TIS and its respective attributes, we also get another conclusion that
it is not only the user-generated content sources but also interactive social media that is
important for international tourists, where interactive social media is definitely user-
generated content. However, user-generated content does not necessarily have
interactive service.
V. Conclusions
Indonesia is the largest archipelago in the world and Southeast Asia's largest
economy, but the country has attracted few international tourists compared to its regional
41
peers. Considering its tremendous tourism potential, it is obvious that Indonesia must
change to better take advantage of its full capacity (Indonesia Investment, 2013). Though
many marketing strategies and policies have been implemented, they seem to have not
brought significant results. Tourism information sources, as one of the primary factors that
affect travel decision-making, have not been managed seriously, especially towards
international tourists. Thus, this research makes necessary contributions to the body of
knowledge concerning TIS and tourism problems in Indonesia.
Information is vital to influence and determine consumer behaviour (Maser and
Weiermair, 1998) because the formation of a destination's prior‐visit image- which
determines the consumer behavior- among travelers is based on the information sources they
use. On that account, information sources are the key to destination image formation and
travel decision-making (Baloglu & McCleary, 1999).
Although the internet is becoming one of the most crucial information sources in the
travel and tourism industry, this study shows that offline sources still prevail in travelers’
information search strategies. Four major findings emerge from this research. First, the most
important TIS for international tourists are user-generated content as well as interactive
social media. This means international tourists prefer to get information about the
destination they would like to visit from TIS where other people share testimony about their
first-hand travel experience to the destination (experience-sharing) as well as from TIS
where they can interact/get connect with other travelers. From thorough analysis of all six
TIS attributes, this study empirically concludes that for online TIS, the most important
sources are interactive social media that are video and photo sharing and mobile applications.
And for offline TIS, the most important sources are television and friends and family
(WOM).
42
Secondly, though it is revealed that the most important and used TIS are online TIS,
in practice during information searching, international tourists tend to mix the TIS they use,
both online and offline.
Thirdly, the fundamental rationales behind this selection of interactive social media
and user-generated content by international tourists are (1) the TIS coming from unpaid real
customers who can give unbiased information and real first-hand experience
information/testimony/recommendations; (2) the TIS provide services where users can
connect/interact to each other; (3) the TIS have visual effects or using appealing photos and
videos as the main product of tourism is a sight-seeing product; (4) the sources give more
security in terms of quality of the information as well as protecting the personal information
of the users. It appears in the results above that official websites are also superior in this
feature; (5) the TIS are convenient and easiest to use; and (6) the TIS are relatively low-cost.
Lastly, this study interestingly reveals that there are two cohorts of destination
attributes successfully constructed by TIS: the non-nature and culture attribute, and the
nature and culture attribute. From this finding, we can assume that Bali’s image in
international tourists’ mind is not only prominent for its natural beauty and amazing culture
but also other attributes related with entertainment, accessibility and affordability. The
findings also show that the TIS that have successfully constructed destination attributes are
user-generated content and interactive sources.
The Internet has essentially transformed the way tourism information is shared and
the ways people plan their travels (Buhalis and Law 2008). However, from the findings
discussed above we can see that people still need accurate information from the real
experience of customers and also need to be connected with other tourists while searching
for information.
43
Identifying international tourists’ behavior towards sources of information is crucial
to understand the needs, reasons and tendencies of tourists. This then allows governments
and businesses to incorporate such understanding into the development of effective and
efficient tourism policy and marketing communication strategies and campaigns (Dey and
Sarma 2010; Xiang and Gretzel 2010). The success of any marketing effort requires
marketers to ensure they provide accurate information and features desired by their potential
visitors (Xiang and Pan 2011). Therefore, it is essential for policy makers and marketers to
identify the information sources consulted by tourists.
5.1. Implications
The primary purpose of this paper is to offer suggestions to policy makers and
tourism managers in Indonesia regarding tourism policy and marketing strategies
related to tourism information sources. Several previous marketing and promotion
strategies have been implemented in Indonesia that do not significantly attract
international tourists and gain the potential revenue. From the literature and empirical
findings discussed, this study discovers that tourism information sources (TIS) are key
to attracting more significant international tourists, as TIS are the primary factor to
tourist’s decision making. Thus, following are several policies and managerial
implications offered to related stakeholders regarding TIS.
Results obtained suggest that international tourists prefer to use interactive and
user-generated content information sources. The most important online TIS revealed in
this study are photo and video sharing portals, mobile applications, tourist social
network and social media. As for offline TIS, this research discovered that television
and recommendations from friends and family (WOM) are the two primary TIS for
44
international tourists. Thus, policy makers and businesses should focus on interactive
and user-generated content sources to better attract international tourists to Indonesia.
The world is going beyond online as part of what is known as the fourth
industrial revolution. This revolution describes the current phenomenon of how digital
technology is reshaping how people make decisions and enhancing customer
experiences (Das et al., 2016). More and more countries now updating their traditional
marketing strategies and policy and embracing digitization for their industries. This
shift also holds true for the tourism industry.
This section will discuss two countries- New Zealand and Australia- who have
modernized their tourism policy and marketing strategy and have proved that using
online and digital information sources significantly contributes to tourism growth. This
is to show that focusing on interactive social media and user-generated content
increases the number of international tourists and receipts. The aim is to give ideas or
inspiration to develop a policy and strategy on online and digital utilization of
technology for tourism information sources in Indonesia.
For Australia, tourism is considered a main industry for economic growth, and
the advantages of online and digital technologies for tourism have led to a strong role
in the policy context for encouraging technology uptake. Therefore, in 2009, the
government has developed a national online tourism policy called NOST. The purpose
of the National Online Strategy for Tourism (NOST) is to significantly raise the online
distribution and visibility of Australia’s tourism product in global market. It gives a
plan for the digital enablement of the tourism sector that will make sure Australia
surpasses in the promotion and distribution of tourism products online (Australian
Government, 2009).
45
Methods of communication with tourism consumers have transformed
significantly in the last 10 years and traditional distribution channels have assembled
with digital channels. Online bookings in Australia have upgraded from 5% in 2001 to
almost 35% in 2008 at an average annual growth rate of 34.6% (Australian Government,
2009).
International tourism also demonstrates a significant role in the New Zealand
economy. To achieve its tourism goals, New Zealand is focusing tourism policy and
communication strategy toward a digital approach. The approach has included its well-
known country brand: ‘100% Pure New Zealand’. New Zealand has substantially
shifted broadcast media to digital media to target better market segment and
measurability. The country has also accelerated usage of social media to promote New
Zealand (across pre, during, & post visit periods), increase use of paid Web searches
(SEM) and the rebuilding of NewZealand.com to ensure better natural (algorithmic)
search results, the first country to use mobile Web for promotion and to increase tourist
experience, building prospective visitor lists, and the use eCRM to turn interest to
purchase. In short, they are focused on investing to develop a comprehensive digital
platform that will take 100% Pure New Zealand globally.
Tourism New Zealand's advertising is advancing from print and billboard
advertising. This is with the purpose of greater use of technology to reach its target
audience wherever they are. This means taking up new media such as mobile
technology, social media, and online advertising.
The easiest way to see New Zealand’s great online and digital strategy is through
its world-class travel website www.newzealand.com. It is New Zealand’s policy to
make the website as the main way to provide information for international visitors and
also to link consumers with travel sellers. The site offers interactive planning tools,

46
special travel deals, operator catalogs, comprehensive information about New Zealand,
and interesting pictures and designs all over the website. The website is very
comprehensive in information and services as well as interactive. The website has twice
rewarded as the best tourism site in the world in the international Webby Award (“What
We Do”, 2020).
As for Indonesia, to improve its communication methods or specifically tourism
information sources to online and digital will require a big step. This is particularly so
as Indonesia is constrained by limited access to technology. ICT infrastructure is weak
and internet penetration is low (Das et al., 2016). In ICT Readiness, WEF ranked
Indonesia in position number 67, far below Malaysia 44 and Thailand 49 (Forum, 2019).
However, this big step must be taken. To win in this digital age, especially for
developing the tourism sector- its one of the main income generators-, the Indonesian
government must focus on increasing the spread of internet penetration and more evenly
spreading access to all tourism destinations.
As for offline TIS, television and WOM, Tuclea and Nistoreanu (2011)
conclude that movies and television series are influential to emphasizing the appeal of
the destination and builds top-of the mind awareness. Their study shows several films
that impacted on tourism, such as Braveheart, that increased visitor numbers to Scotland
by 300% within a year of release, and Harry Potter, that increased visitors by 50% in
all film locations (various location in UK), along with many other films. They argue
that both movies and television series act as an image-making tool, increasing the
attractiveness of tourism destinations. Tourism in New Zealand has also flourished
thanks to the Lord of Rings trilogy. The country conducted a huge marketing campaign
aimed at making the country looks like “middle-earth” (“The Rise of Destination”,
2013).

47
Word of Mouth remains indeed one of the most powerful marketing tools.
Recently, working together with respected influencers such as opinion leaders, writers
and thinkers who endorse tourism destinations has become a trend in promoting
national and international tourism effectively. The credibility of the influencer is the
key that makes their word of mouth powerful and effective (“What We Do”, 2020).
5.2. Limitations and Future Studies
While this study contributes to fill a gap in existing knowledge and does propose
some implications for policy makers and practitioners, limitations remain. This research
used attributes of online TIS since there is no study or theory of offline TIS attributes
yet. Therefore, it will be beneficial for future studies to consider offline TIS attributes
to know whether there is any difference between online and offline TIS attributes.
Moreover, because the sampling method used was non-probability (convenient
sampling), a future study with more comprehensive sampling technique and larger
sample size could be carried out to get a more precise idea.
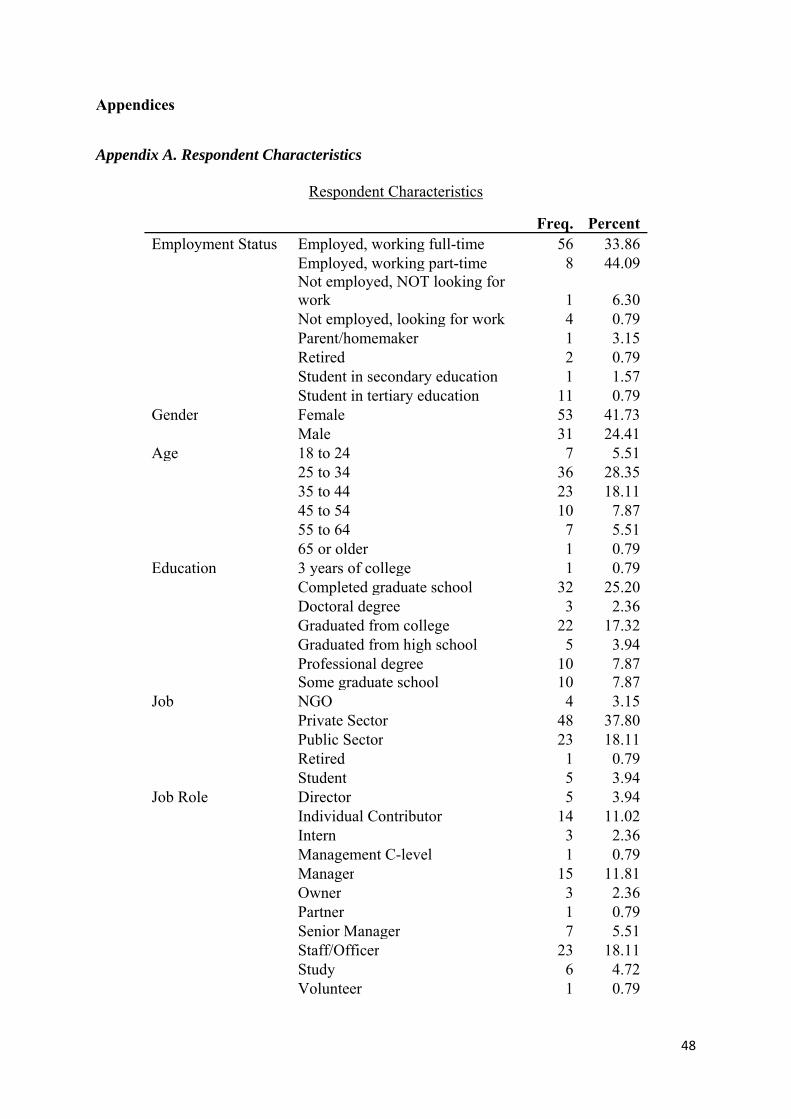
48
Appendices
Appendix A. Respondent Characteristics
Respondent Characteristics
Freq. Percent Employment Status Employed, working full-time 56 33.86
Employed, working part-time 8 44.09
Not employed, NOT looking for work 1 6.30
Not employed, looking for work 4 0.79
Parent/homemaker 1 3.15
Retired 2 0.79
Student in secondary education 1 1.57
Student in tertiary education 11 0.79 Gender Female 53 41.73
Male 31 24.41 Age 18 to 24 7 5.51
25 to 34 36 28.35
35 to 44 23 18.11
45 to 54 10 7.87
55 to 64 7 5.51
65 or older 1 0.79 Education 3 years of college 1 0.79
Completed graduate school 32 25.20
Doctoral degree 3 2.36
Graduated from college 22 17.32
Graduated from high school 5 3.94
Professional degree 10 7.87 Some graduate school 10 7.87
Job NGO 4 3.15
Private Sector 48 37.80
Public Sector 23 18.11
Retired 1 0.79
Student 5 3.94 Job Role Director 5 3.94
Individual Contributor 14 11.02
Intern 3 2.36
Management C-level 1 0.79
Manager 15 11.81
Owner 3 2.36
Partner 1 0.79
Senior Manager 7 5.51
Staff/Officer 23 18.11
Study 6 4.72
Volunteer 1 0.79
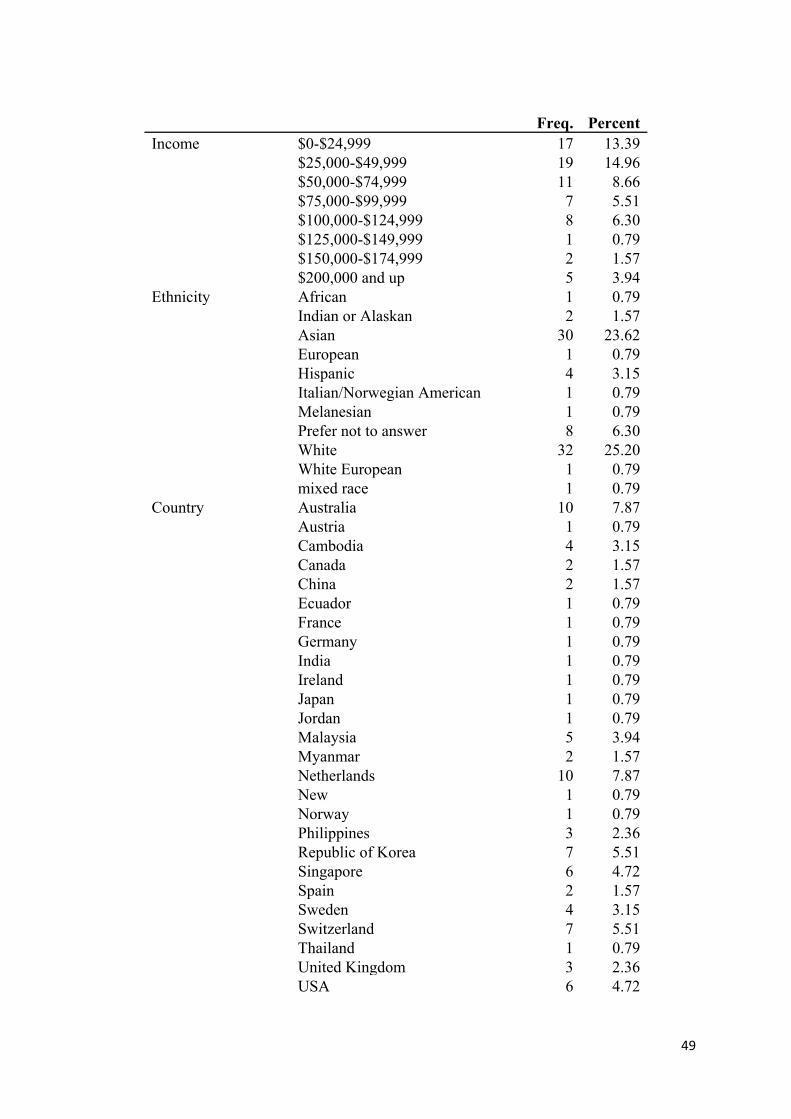
49
Freq. Percent Income $0-$24,999 17 13.39
$25,000-$49,999 19 14.96
$50,000-$74,999 11 8.66
$75,000-$99,999 7 5.51
$100,000-$124,999 8 6.30
$125,000-$149,999 1 0.79
$150,000-$174,999 2 1.57
$200,000 and up 5 3.94 Ethnicity African 1 0.79
Indian or Alaskan 2 1.57
Asian 30 23.62
European 1 0.79
Hispanic 4 3.15
Italian/Norwegian American 1 0.79
Melanesian 1 0.79
Prefer not to answer 8 6.30
White 32 25.20
White European 1 0.79
mixed race 1 0.79 Country Australia 10 7.87
Austria 1 0.79
Cambodia 4 3.15
Canada 2 1.57
China 2 1.57
Ecuador 1 0.79
France 1 0.79
Germany 1 0.79
India 1 0.79
Ireland 1 0.79
Japan 1 0.79
Jordan 1 0.79
Malaysia 5 3.94
Myanmar 2 1.57
Netherlands 10 7.87
New 1 0.79
Norway 1 0.79
Philippines 3 2.36
Republic of Korea 7 5.51
Singapore 6 4.72
Spain 2 1.57
Sweden 4 3.15
Switzerland 7 5.51
Thailand 1 0.79
United Kingdom 3 2.36
USA 6 4.72

50
Freq. Percent Relationship Status Divorced 3 2.36
In a domestic partnership 3 2.36
Married and have child 24 18.90
Married without child 10 7.87
Separated 1 0.79
Single but cohabiting 6 4.72
Single never married 32 25.20
Widowed 1 0.79 Number of Visit 1 65 51.18
2 13 10.24
3 9 7.09
4 7 5.51
≥ 5 33 25.98 Method of Visit Backpacking 3 2.36
organized 44 34.65
Tour package 47 37.01 Objectives of visit Both 13 10.24
Business 9 7.09
Pleasure 102 80.31
Studying 1 0.79
Appendix B. Survey Questionnaire
Tourism Information Sources Survey (A Case Study of Bali)
Welcome to My Survey
This survey is conducted for academic research (thesis) Thank you for participating. Your
feedback is important.
A. Bali as a tourist destination
1. How many times have you visited Bali?
o 1 time
o 2 times
o 3 times
o 4 times
o ≥ 5 times
2. When was your latest visit to Bali? (year)
3. How long did you stay in Bali during your latest visit? (days)
51
4. Main objectives of the latest visit
o Business
o Pleasure
o Both
o Other (please specify)
5. What method did you use for your last trip to Bali?
o Backpacking
o Tour Package
o Other (please specify)
6. What activities did you do in your last visit to Bali? (Multiple responses allowed. Don't
have to answer all)
o Visiting natural landscape
o Visiting historical sites
o Shopping
o Gastronomy
o Enjoying city scenery
o Seeing cultural and traditional attractions
o Visiting museums
o Visiting art center and galleries
o Visiting (water) theme park
o Enjoying night life
o Yoga, meditation and religious activities
o Spa
o Sport activities
o Scuba diving
o Snorkeling
o Participating in leisure activities
o Participating in business activities
o Working
o Other (please specify)
7. Why did you choose Bali as your preferred destination? (You may choose multiple options)
o Beautiful nature/landscape
o Rich of tradition, art, and culture
o Fun night life
52
o Tasty foods
o Friendly and helpful Indonesians
o Good facilities
o Good reputation of Bali
o Diverse tourist attractions
o Affordable
o Accessible
o Modern
o Other (please specify)
8. How did you get the information about Bali in the previous question #7? (Multiple
responses are allowed)
o Blogs
o Company websites (hotel, agoda, etc.)
o Public/government website
o Social media (Facebook, Twitter, Travellerspoint, etc.)
o Search engines
o Application on mobile phone
o Video-sharing portals (e.g. YouTube)
o Photo-sharing portals (e.g. Instagram, Flickr, etc.)
o Friends and family
o Television
o Brochure, book, magazine, newspaper
o Travel Fair
o Travel Agent/consultant
o Other (please specify)
9. What was your image of Bali before and after your visit (your perceived image versus
reality was the same or different?
o Same
o Different
10. Do you have any suggestions or ideas to improve Bali as a tourism destination?
B. Online and offline tourism information sources
53
11. Did you look for the following information about Bali prior to the trip? Yes/No (Y/N). If
so, how easy was it to find it? Easy/Not Easy (E/NE)
12. Where did you get the information in the previous question #11?
o Blogs
o Company websites (hotel, agoda, etc.)
o Public/government website
o Social media (Facebook, Twitter, Travellerspoint, etc.)
o Search engines
o Application on mobile phone
o Video-sharing portals (e.g. YouTube)
o Photo-sharing portals (e.g. Instagram, Flickr, etc.)
o Accommodation portals
o Tourist resources and activities portals
o Friends and family
o Television
o Brochure, book, magazine, newspaper
o Travel Fair
o Travel Agent/consultant
o Other (please specify)
13. What medium did you use most often to get the information online?
o Laptop
o PC (desktop)
o Tablets
o Smartphone
o Other (please specify)
14. How well did the tourism information sources you used meet your information needs about
the trip to Bali?
15. How would you rate the quality of information (accuracy & reliability) you got from these
tourism information sources?
16. How visually appealing is the tourism information source you used?
1 2 3 4 5
1 2 3 4 5
Very Useful Not useful at all
Very low quality Very high quality
Not appealing at all
Very appealing
54
17. How do you rate the security (e.g. privacy, pc virus, etc.) of these tourism information
sources?
18. How easy was it for you to access the tourism information sources?
19. How would you rate the cost of using these tourism information sources?
20. How responsive are these tourism information sources? (definition of responsive: quick
response between the users and the administrators/real-time feedback in sharing
information or idea.
21. How likely are you willing to use these tourism information sources again for your next
trip?
22. Do you have any suggestions to improve the tourism information sources related to Bali?
C. Socio-demographic characteristics
23. What is your gender?
o Female
o Male
24. What is your age?
o 17 or younger
o 18 to 24
1 2 3 4 5
1 2 3 4 5
1 2 3 4 5
1 2 3 4 5
1 2 3 4 5
1 2 3 4 5
Very not secure Very secure
Very difficult Very easy
Very costly Very cheap
Least responsive Most responsive
Very unlikely Very likely
55
o 25 to 34
o 35 to 44
o 45 to 54
o 55 to 64
o 65 or older
25. What is the highest level of education you have completed?
o Did not attend school
o 11th grade or less
o Graduated from high school
o 1 year of college
o 2 years of college
o 3 years of college
o Graduated from college
o Some graduate school
o Completed graduate school (Master Degree)
o Doctoral degree
o Professional degree
o IVT (Institutions of Vocational Training)
26. Which of the following categories best describes your employment status?
o Employed, working full-time
o Employed, working part-time
o Not employed, looking for work
o Not employed, NOT looking for work
o Retired
o Disabled, not able to work
o Parent/homemaker
o Student in secondary education
o Student in tertiary education
27. What is your job?
o Private sector
o Public sector
o Other (please specify)
28. What is your job role?
o Individual Contributor
56
o Team Lead
o Manager
o Senior Manager
o Regional Manager
o Vice President
o Management / C-Level
o Partner
o Owner
o Volunteer
o Intern
o Other (please specify)
29. What is your approximate average household income per year?
o $0-$24,999
o $25,000-$49,999
o $50,000-$74,999
o $75,000-$99,999
o $100,000-$124,999
o $125,000-$149,999
o $150,000-$174,999
o $175,000-$199,999
o $200,000 and up
30. What is your ethnicity? (Please select all that apply)
o American Indian or Alaskan Native
o Asian or Pacific Islander
o Black or African American
o Hispanic or Latino
o White / Caucasian
o Prefer not to answer
o Other (please specify)
31. In what country do you live? (select country option)
32. What is your current relationship status?
o Married and have child (children)
o Married without child
o Widowed
57
o Divorced
o Separated
o In a domestic partnership or civil union
o Single, but cohabiting with a significant other
o Single, never married
References
Adi, S. (2014). Evaluation on the effectiveness of the web technology usage in promoting and
58
marketing Indonesia tourism. Journal of Theoretical and Applied Information Technology, 68(3), 622–629.
Alikiliç, Ö. (2008). USER GENERATED CONTENT IN TOURISM MARKETING Dr. Özlem ALİKILI. Tourism, 3(37), 1061–1080. Retrieved from http://joy.yasar.edu.tr/makale/no9_vol3/06_alikilic.pdf
Antara, M., & Sumarniasih, M. S. (2017). Role of Tourism in Economy of Bali and Indonesia. Journal of Tourism and Hospitality Management, 5(2), 34–44. https://doi.org/10.15640/jthm.v5n2a4
ASEAN. (2017). Tourism Statistics. Retrieved from https://asean.org/?static_post=tourism-statistics
Australian Government. (2009). National Online Strategy for Tourism.
Ayeh, J. K., Au, N., & Law, R. (2013). Predicting the intention to use consumer- generated media for travel planning. Tourism Management, 35,132e143.
Bali Discovery. (2014). Indonesian Tourism Promotion Board and New Tourism Minister Identify Crucial Problems Preventing Tourism Growth. Retrieved from http://www.tourismindonesia.com/2014/11/tourism-problems-come-in-fours.html
Bali Population. (2020-02-18). Retrieved 2020-05-27, from http://worldpopulationreview.com/world-cities/bali/
Baloglu, S. and K.W. McCleary, 1999. A model of destination image formation. Annals of Tourism Research, 26(4): 868-897.
Bargeman, B. and Van der Poel, H. (2006), ‘The role of routines in the vaca-tion decision-making process of Dutch vacationers’, Tourism Management, 27: 4, pp. 707–20.
Beerli, A., & Martín, J.D. (2004). Factors influencing destination image. Annals of Tourism Research, 31 (3), 657 - 681.
Beeton, S. (2004). Rural tourism in Australia: has the gaze altered? Tracking rural images through film and tourism promotion. Progress in Tourism and Hospitality Research, 6(3), 125e135.
Bieger, T. and Laesser, C. (2004), ‘Information sources for travel decisions: Toward a source process model’, Journal of Travel Research, 42: 4, pp. 357–71.
Bickart, B., Schindler, RM. (2001). Internet forums as influential sources of consumer information. Journal of Interactive Marketing. 15, 31-40.
Boell, S.K., Kecmanovic, D.C. (2010). Attributes of Information.Conference Paper. DBLP Conference: Sustainable IT Collaboration Around the Globe. 16th Americas Conference on Information Systems, AMCIS 2010, At Lima, Peru.
Boone, L. E., & Kurtz, D. L. (2007). Contemporarymarketing (13th ed.). Mason, OH: Thomson/South-Western.
Book, L. A., Tanford, S., Montgomery, R., & Love, C. (2018). Online Traveler Reviews as Social Influence: Price Is No Longer King. Journal of Hospitality and Tourism Research, 42(3), 445–475. https://doi.org/10.1177/1096348015597029
Brinkhoff, T. (2010). Bali province in indonesia. Retrieved from
59
https://www.citypopulation.de/php/indonesia-admin.php?adm1id=51
Buhalis, D., & Law, R. (2008). Progress in information technology and tourism management: 20 years on and 10 years after the Internet, the state of e-tourism research. Tourism Management, 29(4), 609e623.
Cahyoputra, LAL. (2015, December 8). Ini strategi menpar promosikan "wonderful indonesia". Berita Satu. Retrieved from https://www.beritasatu.com/destinasi/328869-ini-strategi-menpar-promosikan-wonderful-indonesia.html
Chung, Y., & Buhalis, D. (2008). Information Needs in Online Social Networks. Information Technology & Tourism, 10(4), 267-281.
Commission, P. (2013). On efficiency and effectiveness : some definitions. May.
Comrey, A.L., Lee, H.B. (1973). A first course in factor analysis. New York: Lawrence Erlbaum Associates, Inc., Publishers.
Coromina, L., & Camprubí, R. (2016). Analysis of tourism information sources using a Mokken Scale perspective. Tourism Management, 56, 75–84. https://doi.org/10.1016/j.tourman.2016.03.025
Crnojevac, I. H., Gugić, J., & Karlovčan, S. (2010). eTourism: A comparison of online and offline bookings and the importance of hotel attributes. Journal of Information and Organizational Sciences, 34(1), 41–54.
Dann, G.M.S. 1977. Anomie, Ego-Enhancement and Tourism. Annals of Tourism Research. 4(4): 184-94.
Das, K., Gryseels, M., Sudhir, P., & Tan, K. T. (2016). Unlocking Indonesia’s Digital Opportunity. McKinsey & Company, October, 1–28. https://www.mckinsey.com/~/media/McKinsey/Locations/Asia/Indonesia/Our Insights/Unlocking Indonesias digital opportunity/Unlocking_Indonesias_digital_opportunity.ashx
Del Chiappa, G., & Balboni, B. (2019). Travellers’ choice of information sources and information channels for domestic trips. Tourismos: An International Multidisciplinary Journal of Tourism, 1(14), 37–54.
Dey, B. and Sarma, M. K. (2010), ‘Information sources usage among motive-based segments of travelers to newly emerging tourist destinations’, Tourism Management, 31: 3, pp. 341–344.
Ding, K. (2009). Exploring the differences between domestic and foreign cultural tourist behaviour visiting Malacca. http://dspace.fsktm.um.edu.my/handle/1812/575
Echtner, C., & Ritchie, J. (1991). The meaning and measurement of destination image. Journal of Tourism Studies, 2(2), 2–12.
Edell, J. A., & Staelin, R. (1983). The information processing of pictures in print advertisements. The Journal ofConsumer Research, 10(1), 45–61.
Fatanti, M. N., & Suyadnya, I. W. (2015). Beyond User Gaze: How Instagram Creates Tourism Destination Brand? Procedia - Social and Behavioral Sciences, 211(September), 1089–1095. http://doi.org/10.1016/j.sbspro.2015.11.145
Fesenmaier, D., Cook, S., & Sheatsley, D. (2009). Travelers’ use ofthe Internet. Retrieved
60
November 17, 2012, from http://travel.utah.gov/publications/newsletters/files/2010_01_21/Travelers% 20Use%20of%20the%20Internet%20-%202009.pdf
Fesenmaier, D. R., Xiang, Z., Pan, B., & Law, R. (2011). A framework of search engine use for travel planning. Journal of Travel Research, 50(6), 587e601. http:// dx.doi.org/10.1177/0047287510385466.
Filieri, R., Alguezaui, S., & McLeay, F. (2015). Why do travelers trust TripAdvisor? Antecedents of trust towards consumer-generated media and its influence on recommendation adoption and word of mouth. Tourism Management, 51, 174–185. https://doi.org/10.1016/j.tourman.2015.05.007
Fodness, D., & Murray, B. (1999). A model of tourist information search behavior. Journal of Travel Research, 37(3), 220–230.
Forum, W. E. (2019). The Travel and Tourism Competitiveness Report 2019. http://www3.weforum.org/docs/WEF_TTCR_2019.pdf
Frias, D.M., Rodriguez, M.A., Castaneda, J.A., Sabiote, C.M., Buhalis, D. (2011). The Formation of a Tourist Destination's Image via Information Sources: the Moderating Effect of Culture. Retrieved from https://doi.org/10.1002/jtr.870
Gartner, W.C.1993 Image formation process, Journal of Travel and Tourism Marketing, 2 (2/3), 191, 215.
Goeldner, C., & Ritchie, B. (2009). Tourism: Principles, Practices and Philosophies. In Tourism. https://doi.org/10.1159/000470892
Goodrich, J. N. 1978. The Relationship between Preferences for and Perceptions of Vacation Destinations. Journal of Travel Research. 17(2): 8-13.
Gretzel, U., Fesenmaier, D., & O'Leary, J. (2006). The transformation of consumer behaviour. Tourism Business Frontiers: Consumers, Products and Industry, 9-18.
Hair, J. F., Black, W. C., Babin, B. J., & Anderson, R. E. (2010). Multivariate data analysis (7th ed.). Upper Saddle River, New Jersey: Prentice Hall.
Hamidizadeh, M. R., Cheh, M. G., Moghadam, A. H., & Salimipour, S. (2016). Proposing a Model of the Effect of Word of Mouth on Destination Image of Tourists and Travel Intention. International Journal of Asian Social Science, 6(2), 108–119. https://doi.org/10.18488/journal.1/2016.6.2/1.2.108.119
Hernández-Méndez, J., Muñoz-Leiva, F., & Sánchez-Fernández, J. (2015). The influence of e-word-of-mouth on travel decision-making: consumer profiles. Current Issues in Tourism, 18(11), 1001–1021. https://doi.org/10.1080/13683500.2013.802764
Heung, V. C. S. (2003). Internet usage by international travellers: reasons and barriers. International Journal ofContemporary Hospitality Management, 15(7), 370–378.
Ho, C.I., Lee, Y.L. (2007). The development of an e-travel service quality scale. Tourism Management, 28(6). 1434-1449.
Ho, C. I., Lin, M. H., & Chen, H. M. (2012). Web users’ behavioural patterns of tourism information search: From online to offline. Tourism Management, 33(6), 1468–1482. https://doi.org/10.1016/j.tourman.2012.01.016

61
Huang, Z., Benyoucef, M. (2014). Usability and credibility of e-government websites. Government Information Quarterly, 31, 4.
Hunt, J. D. 1975. Image as a Factor in Tourism Development. Journal of Travel Research. 13(3): 1-7.
IBM Knowledge Center. (2020). Retrieved from https://www.ibm.com/support/knowledgecenter/SSLVMB_23.0.0/spss/tutorials/fac_telco_kmo_01.html
Ilban, M. O., & Yıldırım, H. H. (2017). Determination of tourism activities of the world’s best tourism destinations using the multi-criteria decision-making method. Cogent Social Sciences, 3(1). https://doi.org/10.1080/23311886.2017.1301763
Sukhraj, R. (2018, April 7). 7 Must-Have Word-of-Mouth Marketing Strategies [Infographic]. Impact Learning Center Retrieved from https://www.impactbnd.com/blog/word-of-mouth-marketing-strategies-infographic.
Indonesia Investments. (2013). Tourism in Indonesia: One of Indonesia's Untapped Potentials? (Part I). Retrieved from https://www.indonesia-investments.com/business/business-columns/tourism-in-indonesia-one-of-indonesias-untapped-potentials-part-i/item630
Indonesia Investments. (2014). Tourism in Indonesia: Growing but not Reaching its Potential. Retrieved from https://www.indonesia-investments.com/news/todays-headlines/tourism-in-indonesia-growing-but-not-reaching-its-potential/item2386
Ipsos MediaCT. (2014). Google travel study: The 2014 traveler’s road to decision. June, 1–59.
Jacobson, T.E. & Mackey, T. (2013). What’s in the name?: Information literacy, metaliteracy, or transliteracy [Powerpoint slides]. Retrieved from http://www.slideshare.net/tmackey/acrl-2013
Jeong, M., & Lambert, C. U. (2001). Adaptation of an information quality framework to measure customers’ behavioral intentions to use lodging Web sites. International Journal of Hospitality Management, 20(2), 129–146.
Kaplan, A., & Haenlein, M. (2010). Users of the world, unite! The challenges and opportunities of Social Media. Business Horizons, 53(1), 59-68.
Kaynama, S., & Black, C. (2000). A proposal to assess the service quality of online travel agencies: An exploratory study. Journal ofProfessional Services Marketing, 21(1), 63–88.
KC Global Media. (2016, October 13). From hero to zero. The Amazing Race Asia Season 5. Retrieved from https://www.axn-asia.com/programs/amazing-race-asia/episodes/hero-zero
Kim, D.J., Kim, W.G. (2006). A perceptual mapping of online travel agencies and preference attributes, Tourism Management, 28(2), 591-603.
Kim, H., and S. L. Richardson. 2003. “Motion Picture Impacts on Destination Images.” Annals of Tourism Research 30 (1): 216–37.
Knoeman. (2012). Bali. Retrieved from https://knoema.com/atlas/Indonesia/Bali/topics/Demographics
Kotler, P., Bowen, J., & Makens, J. C. (2010). Marketing for hospitality and tourism (5th ed.).
62
Boston, MA: Pearson Education.
Lai, K., and X. Li. 2016. “Tourism Destination Image: Conceptual Problems and Definitional Solutions.” Journal of Travel Research 55 (8): 1065–80.
Llodrà-Riera, I., Martínez-Ruiz, M. P., Jiménez-Zarco, A. I., & Izquierdo-Yusta, A. (2015). A multidimensional analysis of the information sources construct and its relevance for destination image formation. Tourism Management, 48, 319–328. https://doi.org/10.1016/j.tourman.2014.11.012
López, M., & Sicilia, M. (2011). Use of online versus offline information sources by tourists. In Catalan Journal of Communication & Cultural Studies (Vol. 3, Issue 2, pp. 273–288). https://doi.org/10.1386/cjcs.3.2.273_1
March, R., Woodside, A.G., (2005). Tourism behavior : travelers' decisions and actions. Wallingford, Oxfordshire, UK ; Cambridge, MA.
Mariani, M. M. (2015). Coordination in inter-network co-opetitition: Evidence from the tourism sector. Industrial Marketing Management. http://dx.doi.org/10.1016/ j.indmarman.2015.11.015.
Mariani, M. M., Di Felice, M., & Mura, M. (2016). Facebook as a destination marketing tool: Evidence from Italian regional Destination Management Organizations. Tourism Management, 54, 321–343. https://doi.org/10.1016/j.tourman.2015.12.008
Marketing Charts. (2014). Word-of-mouth: A bigger purchase influence for Millennials than Boomers, who rely more on ads. Retrieved from http://www.mar- ketingcharts.com/traditional/word-of-mouth-a-bigger-purchase-influence-for-millen- nials-than-boomers-who-rely-more-on-advertising-39207/
McIntosh, R. W. and Goeldner, C. R. (1990), Tourism: Principles, Practices, Philosophies, 6th ed., New York: John Wiley and Sons.
Maser, B., &Weiermair, K. (1998). Travel decision-making: From the vantage point ofperceived risk and information preferences. Journal of Travel and Tourism Marketing, 7(4), 107–121.
Miller Harvey J., Societies and Cities in the Age of Instant Access. Springer. The Netherlands. 2007
Milman, A., and Pizam, A. 1995. The Role of Awareness and Familiarity with a Destination: The Central Florida Case. Journal of Travel Research. 33(3): 21-27.
Munar, A. M., & Jacobsen, J. K. S. (2013). Trust and involvement in tourism social media and web-based travel information sources. Scandinavian Journal of Hospitality and Tourism, 13(1), 1-19.
Murphy, H. C., Chen, M. M., & Cossutta, M. (2016). An investigation of multiple devices and information sources used in the hotel booking process. Tourism Management, 52(2016), 44–51. https://doi.org/10.1016/j.tourman.2015.06.004
Lee, M., Youn, S., 2009. Electronic word of mouth (eWOM): how eWOM platforms influence consumer product judgment. Int. J. Advert. 28 (3), 473–499.
Lewis, R. C. and Chambers, R. E. (2000), Marketing Leadership in Hospitality. Foundations and Practices, 3rd ed., New York: Wiley.
63
No, E., & Kim, J. K. (2015). Comparing the attributes of online tourism information sources. Computers in Human Behavior, 50, 564–575. https://doi.org/10.1016/j.chb.2015.02.063
Nunnally, J. C. (1978). Psychometric theory (2nd ed.). New York, NY: McGraw-Hill.
Ohanian, R. (1990). Construction and validation of a scale to measure celebrity endorsers' perceived expertise, trustworthiness, and attractiveness. Journal of Advertising, 19(3), 39e52.
Ollivaud, P., & Haxton, P. (2019). Making the most of tourism in indonesia to promote sustainable regional development. Journal of Organisation for Economic Co-Operation and Development, 4, 1–41. https://doi.org/JT03442792
Oxford Business Group. (2018). Indonesia's tourism sector indicates strong expansion. Retrieved from https://oxfordbusinessgroup.com/overview/island-attraction-legacy-destinations-and-new-offerings-indicate-strong-expansion
Pad, A., & Analysis, F. (2007). Factor Analysis: Handout. 1–20. https://www.albany.edu/faculty/kretheme/PAD705/SupportMat/FactorAnalysisTheory.pdf
Pan, B., & Fesenmaier, D. R. (2006). Online information search. Vacation planning process. Annals of Tourism Research, 33(3), 809e832
Rosenthal, R., and Rosnow, R. L. 1984. Essentials of Behavioral Research: Methods and Data Analysis. New York: McGraw-Hill.
Rudenko, S., & P. Tedjakusuma, A. (2018). qWonderful Indonesiaq country marketing campaign - how visible Indonesia as a tourism destination for Europeans. 186(Insyma), 178–181. https://doi.org/10.2991/insyma-18.2018.44
Schwab, Klaus. (2016). The Fourth Industrial Revolution. 12-13.
Schwab, K., Sala-i-Martin, X. (2017). The Global Competitiveness Report 2017–2018. Retrieved from http://www3.weforum.org/docs/GCR2017-2018/05FullReport/TheGlobalCompetitivenessReport2017%E2%80%932018.pdf
Sigala, M., Christou, E., Gretzel, U., 2012. Social Media in Travel, Tourism and Hospitality: Theory, Practice, and Cases. Printed and Bound in Great Britain by the MPG Books Group, UK.
Siu, W., & Fung, M. (1998). Hotel advertisements in China: A content analysis. Journal of Professional Services Marketing, 17(2), 99–108.
Statistics How To. (2020). Kaiser-Meyer-Olkin (KMO) Test for Sampling Adequacy. Retrieved from https://www.statisticshowto.com/kaiser-meyer-olkin/
Stepchenkova, S., Mills, J. E., & Jiang, H. (2007). Virtual travel communities: self- reported experiences and satisfaction. In M. Sigala, L. Mich, & J. Murphy (Eds.), Information and communication technologies in tourism 2007 (pp. 163e174). New York: Springer Wien.
Subrahmanyam, K., Reich, S.M., Waechter, N., & Espinoza, G. (2008). Online and offline social networks: Use of social networking sites by emerging adults. Journal of Applied Development Psychology 29(6). 420-433.
Sumaco, F. T., & Richardson, S. (2011). An Analysis on International Tourists ’ Perceptions towards Destination Branding : “ Visit Indonesia 2008 ” Marketing Campaign. Service

64
Management, (July), 26–30.
Survey Monkey. (2020). Learn when and how to use Likert scale survey questions. Retrieved from https://www.surveymonkey.com/mp/likert-scale/
Tasci, A. D., W. C. Gartner, and S. Tamer Cavusgil. 2007. “Conceptualization and Operationalization of Destination Image.” Journal of Hospitality & Tourism Research 31 (2): 194–223.
The Jakarta Post. (2019). Indonesia sixth in top-20 ranking of ‘most beautiful countries’. Retrieved from https://www.thejakartapost.com/travel/2019/02/04/indonesia-sixth-in-top-20-ranking-of-most-beautiful-countries.html
The World Bank. (2014). World Bank and Environment in Indonesia. Retrieved from https://www.worldbank.org/en/country/indonesia/brief/world-bank-and-environment-in-indonesia
Toral, S.E., Torres, R.M., Rodriguez, M.R.G. (2017). Identification of the Unique Attributes of Tourist Destinations from Online Reviews. Journal of Travel Research, 57.
Tourism Economics. (2013). Tourism Economics: The Impact of Online Content on European Tourism. July, 58. https://sete.gr/_fileuploads/entries/Online library/GR/131204_The Impact of Online Content on European Tourism.pdf
Trivett, V. The Rise of Destination Marketing Through Movies and TV. (2013, November). Retrieved from https://research.skift.com/report/the-rise-of-destination-marketing-through-movies-and-tv/
Tuclea, C., Nistoreanu, P. (2011). How film and television programs can promote tourism and increase the competitiveness of tourist destinations. In Cactus Tourism Journal Vol. 2, Issue 2/2011, Pages 25-30.
United Nations. (2010). International recommendations for tourism statistics 2008. New York: United Nations.
UNWTO. (2019). International Tourism Highlights. Retrieved from https://www.e-unwto.org/doi/pdf/10.18111/9789284421152
UNWTO. (2018). Global report on inclusive tourism destinations: model and success stories. Spain: UNWTO
Van Raaij, W.F. and Francken, D.A. (1984) ‘Vacation decisions, activities, and satisfactions’, Annals of Tourism Research, 11 (1), 101-112.
Verma, R., Stock, D., & McCarthy, L. (2012). Customer preferences for online, social media, and mobile innovations in the hospitality industry. Cornell Hospitality Quarterly. http://dx.doi.org/10.1177/1938965512445161.
Werthner, H. and Klein, S. (1999), Information Technology and Tourism – A Challenging Relationship, New York: Springer.
What We Do. (2020, May 27). Retrieved from https://www.tourismnewzealand.com/about/what‐we‐do/campaign‐and‐activity/
Wilson, M., Wnuk, K., Silvander, J., & Gorschek, T. (2018). A literature review on the effectiveness and efficiency of business modeling. In E-Informatica Software Engineering Journal (Vol. 12, Issue 1). https://doi.org/10.5277/e-Inf180111

65
Wilson, V. G. (2014). Impact of Travel Information Search Behavior on the Image of Tanzania as a Tourist Destination. Athens Journal of Tourism, 1(2), 135–146. https://doi.org/10.30958/ajt.1-2-3
WTTC. (2011). Travel and tourism 2011. World Travel and Tourism Council 2011. http:// www.wttc.org/site_media/uploads/downloads/traveltourism2011.pdf Accessed 22.05.13.
Yahya, A. Raih Target Wisman 20 Juta. Paper presented at Rakornas IV Kemenpar, Jakarta
Ye, Q., Law, R., & Gu, B. (2009). The impact of online user reviews on hotel room sales. International Journal of Hospitality Management, 28,180-182.
Xiang, Z. and Gretzel, U. (2010), ‘Role of social media in online travel infor-mation search’, Tourism Management, 31: 2, pp. 179–88.
Xiang, Z. and Pan, B. (2011), ‘Travel queries on cities in the United States: Implications for search engine marketing for tourist destinations’, Tourism Management, 32: 1, pp. 88–97.
Zeithaml, V. A., Parasuraman, A., & Malhotra, A. (2002). Service quality delivery through web sites: A critical review of extant knowledge. Journal of the Academy of Marketing Science, 30(4), 362–375.
Zhou, L. (2005). Destination Attributes That Attract. November, 121.