revitalization of offline fashion stores: exploring strategies
TRANSCRIPT
sustainability
Article
Revitalization of Offline Fashion Stores: Exploring Strategiesto Improve the Smart Retailing Experience by ApplyingMobile Technology
Yunjeong Kim
�����������������
Citation: Kim, Y. Revitalization of
Offline Fashion Stores: Exploring
Strategies to Improve the Smart
Retailing Experience by Applying
Mobile Technology. Sustainability
2021, 13, 3434. https://doi.org/
10.3390/su13063434
Academic Editor: Marta Frasquet
Received: 10 February 2021
Accepted: 17 March 2021
Published: 19 March 2021
Publisher’s Note: MDPI stays neutral
with regard to jurisdictional claims in
published maps and institutional affil-
iations.
Copyright: © 2021 by the author.
Licensee MDPI, Basel, Switzerland.
This article is an open access article
distributed under the terms and
conditions of the Creative Commons
Attribution (CC BY) license (https://
creativecommons.org/licenses/by/
4.0/).
Department of Fashion, College of Arts, Chung-Ang University, Anseong 17546, Korea; [email protected]
Abstract: With the reduction in offline fashion stores, retailers are trying to revitalize offline storesby applying smart retail technologies. This study aimed to determine how factors related to theoffline–mobile connected smart retailing experience affected satisfaction through perceived qualityand perceived risk. An online survey was conducted on female consumers in their 20s and 30s,and 302 questionnaires were distributed. The analysis, which utilized a structural equation model,confirmed that, from among five smart retailing experience-related factors, perceived advantage,perceived enjoyment, and interactivity affected perceived quality and that perceived advantage andinteractivity significantly affected perceived risk. However, perceived control and personalizationdid not affect perceived quality and perceived risk. Furthermore, perceived quality significantlyaffected overall satisfaction, offline satisfaction, and mobile satisfaction, while perceived risk did notaffect mobile satisfaction. This study confirmed that the perceived advantage and interactivity ofsmart retailing experiences play an important role in enhancing customer satisfaction.
Keywords: smart retailing experience; perceived advantage; perceived enjoyment; perceived control;personalization; interactivity; perceived quality; perceived risk; satisfaction
1. Introduction
With the development of information and communication technology, online andmobile consumption is rapidly increasing, while traditional offline sales are decreasing.Specifically, due to the development of e-commerce, the need for offline stores has rapidlydeclined, and the number of offline stores has decreased accordingly. In particular, as therecent pandemic continues, department store chains such as Macy’s, Sears, and JCPenneyhave closed several branches, as have famous brands such as Polo and Abercrombie &Fitch. According to a Wall Street Journal report, more than 5000 retail stores have closedin the United States since April, 2020 [1]. As the “untact” lifestyle spreads further, thescale of e-commerce has gradually increased, and the COVID-19 pandemic has become anopportunity for e-commerce brands to grow rapidly, while offline-based companies areresponding to crises by expanding omnichannel strategies. The omnichannel strategy is onethat can reduce risks and increase opportunities for companies because it employs variouschannels such as offline, online, and mobile. However, even if the retail environmentis changing, offline stores are an important retail channel for fashion consumers whowant to inspect products for quality and purchase them immediately. Accordingly, manyfashion companies are striving to provide opportunities for offline stores to move forwardwhile also increasing online and mobile growth through retailing strategies using variouschannels, such as omnichannels.
McKinsey [2] suggested that traditional offline stores should redesign the in-storeshopping experience as a strategy for responding to changes in the retail sector. The goalof strategies centered on customer experience is to engage consumers, become part oftheir lives and memories, and foster an emotional bond between the company and thecustomer [3]. Consumers want more than products; they also want experiences, for which
Sustainability 2021, 13, 3434. https://doi.org/10.3390/su13063434 https://www.mdpi.com/journal/sustainability
Sustainability 2021, 13, 3434 2 of 16
they show willingness to pay more [3]. As a result, many new marketing approaches,including experiential marketing and sensory marketing, have emerged [4,5]. Retailers arestriving to meet the customers’ changing expectations by providing new technologies andservices, allowing consumers to easily access various channels within a store and optimiz-ing the customer-centered shopping experience [6]. For fashion retailers specifically, asdeveloping hedonistic experiences is particularly important, they are increasingly investingin experiential retail services [7].
In line with these changes, many fashion stores are evolving into smart shoppingspaces that maximize consumer convenience by utilizing cutting-edge technology. Ac-cordingly, a new concept called “smart retailing” has emerged. Smart retailing refers toa platform where retailers offer customers smart technologies to recreate and strengthentheir role in a sustainable economy and improve consumer experience quality [8]. Thus,fashion retailers are trying to revitalize offline stores by introducing advanced technologyto provide a variety of shopping experiences, such as convenient shopping experiences,product-related experiences, and customized services tailored to individual consumers,thereby evolving into smart retailing environments. Recently, retailers have been usingvarious smart retail technologies, such as artificial intelligence (AI), augmented reality(AR), virtual reality (VR) interactive displays, smart shopping carts, radio frequency iden-tification systems (RFID), shopping assistance systems, and near-field communicationsystems (NFC). Such smart technology can improve the consumer experience by providingexcellent and customized retail services [9,10]. In particular, as a large part of smart retailtechnology (e.g., AR, QR codes, NFC, etc.) is delivered by connecting with consumers’mobile devices, there is a growing need to explore smart technology that links offline andmobile shopping environments and related consumer experiences.
As technologically sophisticated retail services gradually expand, it is necessary toexamine how consumer experiences with smart retail technology are structured and whatoutcomes these experiences will achieve. Research has been conducted on smart retailtechnologies, such as AR and VR [11–19], shopping assistants, and RFID [20–23], as well asfactors that induce consumer adoption of smart retail technology [24–27]. However, priorstudies have mainly focused on how technical characteristics affect consumer perceptions,intentions, or behaviors. To date, research on consumer experiences in an offline storeenvironment that utilizes smart retail technology has been insufficient, and it is particularlydifficult to find studies on consumer experiences with mobile and smart technology use infashion stores. This study aimed to examine the offline−mobile smart retailing experiencein fashion stores from the consumer’s point of view and the effect of that experience oncustomer satisfaction through consumer evaluation. The research questions specificallydevised to achieve the research objectives were as follows. First, how would the smartretailing experience factors in fashion offline stores affect consumers' evaluation and satis-faction? Second, what are the important smart retailing experience factors that influencecustomer satisfaction?
2. Theoretical Background and Research Hypotheses2.1. Smart Retailing Experience
Smart retailing represents a differentiated stage of information and communicationtechnology development, in which the physical and digital dimensions of retailing are com-bined [8,27]. Whereas traditional retailing emphasizes retail channels and dual interactions(i.e., the relationship between retailers and consumers), smart retailing emphasizes inter-actions between customers, smart devices, products, retailers, and retail channels. Smartretailing enables interconnections between smart devices through wireless technology andenables the connection of offline and mobile channels in a retail context. As such, throughsmart retailing that connects the physical and digital worlds, retailers can acquire newcapabilities [28,29]. In addition, by using various smart retail technologies, shopping valuecan be created for customers and the customer shopping experience can be improved [27].Since customer experience affects consumers’ preferences and purchasing decisions, and
Sustainability 2021, 13, 3434 3 of 16
plays an important role in deciding a company’s success [30], it is important to obtainpositive outcomes from smart retailing experiences.
In this study, we considered smart retailing to be an offline−mobile interconnectedretail system that improves customer experience based on smart technology use, andattempted to examine the impact of such smart retailing experiences. Therefore, a “smartretailing experience” was defined as “a technology-mediated retailing experience thatlinks offline and mobile environments.” Recently, retailers have been changing the retailenvironment to enhance the consumer experience by using smart retail technologies thatutilize mobile applications in stores, such as augmented reality, QR codes, and paymentsystems. In offline stores, consumers can enjoy a seamless smart retailing experience, suchas using their mobile devices to access additional product information. The mobile-linkedsmart retailing experience addressed in this study can be connected to performance throughconsumer evaluation, as the partnership between customers and retailers is the foundation.Therefore, compared to retail technology that is unilaterally provided by offline stores,mobile-linked technology is thought to be able to further enhance consumer experience inthat consumers must experience it through their mobile devices.
2.2. Research Framework
Internet and mobile technologies have provided retailers with opportunities to retainexisting customers and acquire new ones through personalized offers and in-store pushnotifications [31]. Recent empirical evidence has confirmed that, compared to traditionalshopping experiences that do not utilize technology, smart retail technology is simpler, eas-ier to use, more attractive, and provides a more meaningful customer experience [32–34].As such, retailers are recognizing that smart retail technology provides a retail experi-ence that drives customer satisfaction. Therefore, to increase both operational efficiencyand profits, retailers now encourage customers to actively use smart retail technology intheir stores.
Technology adoption theory can help explain corporate outcomes of potential cus-tomer experiences related to smart retailing technology. According to technology adoptiontheory, the relationship between system attributes and outcomes can be mediated by userevaluation of the technology [35,36]. By applying the technology adoption framework,previous studies showed that quality and risk perception play important mediating roles inservices connecting various channels [37–40]. Thus, improvements in perceived quality andreductions in perceived risk for technology-related products and services have been shownto positively effect retailer performance. Therefore, in this study, we aimed to identify howfactors related to the smart retailing experience influence customer satisfaction through themediators of perceived quality and perceived risk.
2.3. Smart Retailing Experience and Customer Evaluation
For decades, retail marketing researchers have explored the relationship betweenin-store retail environments and consumer experiences [13,41–43]. With the advent ofsmart technology, the number of contact points between companies and consumers hasincreased, making it necessary to monitor various experiences created at those contactpoints. Technology-related consumer experiences are known to be formed by combiningfactors from several areas, such as perception, cognition, behavior, and emotion [44].
Previous studies on smart retailing experiences examined several related factors, in-cluding cognitive factors, such as relative advantages [45] and perceived interaction [10];emotional factors, such as perceived enjoyment [46,47] and perceived control [48]; andbehavioral factors, such as personalization [8,49]. Further, as the smart retailing expe-rience includes direct interaction with a customer's smart technology [50,51], this studyalso focused on cognitive, emotional, and behavioral factors. Specifically, we aimed toinvestigate the effects of the following five smart retailing experience factors: perceivedbenefits, perceived enjoyment, perceived control, personalization, and interactivity.
Sustainability 2021, 13, 3434 4 of 16
The first element of the smart retailing experience is perceived advantages, whichrefers to the degree to which consumers perceive smart technology in a retail environ-ment to be superior to existing retail technology [52] and reflects advantages in terms oftechnology, convenience, and function [53]. Customers are more likely to have a favor-able opinion of technology if it provides benefits above what they could expect withoutit, such as time-saving and convenience [24,54]. Therefore, the following hypotheseswere established:
Hypothesis 1a (H1a). Perceived advantages in the smart retailing experience will have a positiveeffect on perceived quality.
Hypothesis 2a (H2a). Perceived advantages in the smart retailing experience will have a negativeeffect on perceived risk.
The second factor, perceived enjoyment, is the degree to which consumers viewsmart retailing experiences as being enjoyable [46]. Perceived enjoyment emphasizesthe emotional aspect of the smart retailing experience apart from its potential functionalperformance. Consumers can experience novelty through using smart retailing technology,which is linked to the fun or pleasure of the retail experience [55]. Previous studies haveshown that enjoyment in using a specific type of information technology affects positiveattitudes or intentions [56] and can significantly influence retailer success [57]. Therefore, itwas expected that perceived enjoyment in the smart retailing experience would increaseperceived quality and lower perceived risk, hypothesized as follows:
Hypothesis 1b (H1b). Perceived enjoyment in the smart retailing experience will have a positiveeffect on perceived quality.
Hypothesis 2b (H2b). Perceived enjoyment in the smart retailing experience will have a negativeeffect on perceived risk.
The third factor is perceived control, indicating the degree to which consumers per-ceive themselves to be in control when using smart retailing technology [58]. Studiesreported that when individuals encounter an event with high uncertainty, believing theycan maintain psychological control tends to alleviate negative experiences, such as avoid-ance intention, and facilitate positive experiences, such as satisfaction. [59,60]. Tucker [61]suggested that the overall control consumers perceive when using online services cansignificantly reduce purchase-related risks. Further, previous research has shown thatsmart service business customers view lack of control options as a major obstacle to smartservice adoption, and such customers express a strong desire for control [10,62]. Thus, thefollowing hypotheses were established with the expectation that consumers can increaseperceived quality and reduce risk if they can exercise control to achieve their shoppinggoals and obtain desirable results:
Hypothesis 1c (H1c). Perceived control in the smart retailing experience will have a positive effecton perceived quality.
Hypothesis 2c (H2c). Perceived control in the smart retailing experience will have a negativeeffect on perceived risk.
The fourth factor is personalization. Technology-mediated personalization is based oninformation technology [63], and smart retail technology's ability to provide personalizedor customized services to consumers is personalization in a smart retail environment [49].This is a behavioral aspect of the smart retailing experience. Smart retail technologyenables technology-based personalization by combining historical and real-time datato individual customers in stores to provide relevant and context-sensitive information.
Sustainability 2021, 13, 3434 5 of 16
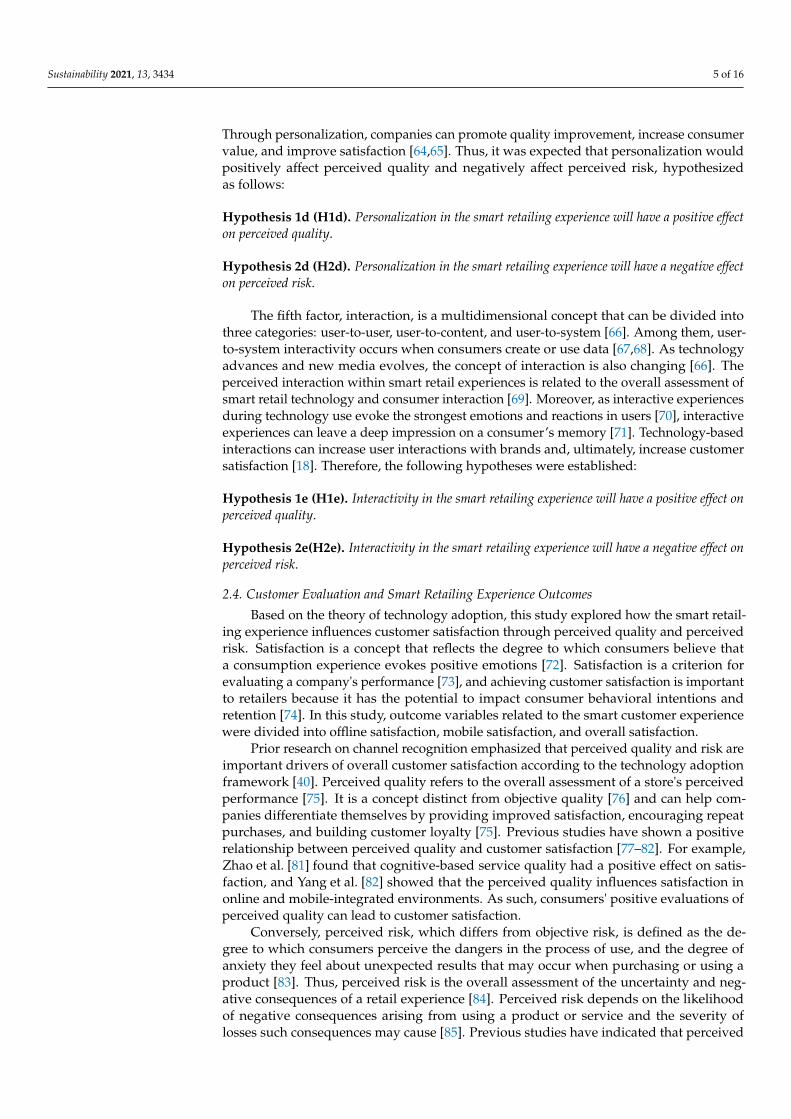
Through personalization, companies can promote quality improvement, increase consumervalue, and improve satisfaction [64,65]. Thus, it was expected that personalization wouldpositively affect perceived quality and negatively affect perceived risk, hypothesizedas follows:
Hypothesis 1d (H1d). Personalization in the smart retailing experience will have a positive effecton perceived quality.
Hypothesis 2d (H2d). Personalization in the smart retailing experience will have a negative effecton perceived risk.
The fifth factor, interaction, is a multidimensional concept that can be divided intothree categories: user-to-user, user-to-content, and user-to-system [66]. Among them, user-to-system interactivity occurs when consumers create or use data [67,68]. As technologyadvances and new media evolves, the concept of interaction is also changing [66]. Theperceived interaction within smart retail experiences is related to the overall assessment ofsmart retail technology and consumer interaction [69]. Moreover, as interactive experiencesduring technology use evoke the strongest emotions and reactions in users [70], interactiveexperiences can leave a deep impression on a consumer’s memory [71]. Technology-basedinteractions can increase user interactions with brands and, ultimately, increase customersatisfaction [18]. Therefore, the following hypotheses were established:
Hypothesis 1e (H1e). Interactivity in the smart retailing experience will have a positive effect onperceived quality.
Hypothesis 2e(H2e). Interactivity in the smart retailing experience will have a negative effect onperceived risk.
2.4. Customer Evaluation and Smart Retailing Experience Outcomes
Based on the theory of technology adoption, this study explored how the smart retail-ing experience influences customer satisfaction through perceived quality and perceivedrisk. Satisfaction is a concept that reflects the degree to which consumers believe thata consumption experience evokes positive emotions [72]. Satisfaction is a criterion forevaluating a company's performance [73], and achieving customer satisfaction is importantto retailers because it has the potential to impact consumer behavioral intentions andretention [74]. In this study, outcome variables related to the smart customer experiencewere divided into offline satisfaction, mobile satisfaction, and overall satisfaction.
Prior research on channel recognition emphasized that perceived quality and risk areimportant drivers of overall customer satisfaction according to the technology adoptionframework [40]. Perceived quality refers to the overall assessment of a store's perceivedperformance [75]. It is a concept distinct from objective quality [76] and can help com-panies differentiate themselves by providing improved satisfaction, encouraging repeatpurchases, and building customer loyalty [75]. Previous studies have shown a positiverelationship between perceived quality and customer satisfaction [77–82]. For example,Zhao et al. [81] found that cognitive-based service quality had a positive effect on satis-faction, and Yang et al. [82] showed that the perceived quality influences satisfaction inonline and mobile-integrated environments. As such, consumers' positive evaluations ofperceived quality can lead to customer satisfaction.
Conversely, perceived risk, which differs from objective risk, is defined as the de-gree to which consumers perceive the dangers in the process of use, and the degree ofanxiety they feel about unexpected results that may occur when purchasing or using aproduct [83]. Thus, perceived risk is the overall assessment of the uncertainty and neg-ative consequences of a retail experience [84]. Perceived risk depends on the likelihoodof negative consequences arising from using a product or service and the severity oflosses such consequences may cause [85]. Previous studies have indicated that perceived
Sustainability 2021, 13, 3434 6 of 16
risk increases with new products, higher prices, technical complexity, and lack of expe-rience or confidence in use [86,87]. If risk is perceived in relation to a technology-based,offline−mobile connected smart retailing experience, it is expected that this would lead tonegative consumer evaluations and reduced satisfaction. In this study, we assumed thatthe perceived quality of the offline-mobile connected smart retailing experience wouldconstitute a positive effect on overall satisfaction, as well as offline and mobile satisfaction,while perceived risk would have a negative effect. Accordingly, the following hypotheseswere established:
Hypothesis 3 (H3). Perceived quality in the smart retailing experience will have a positive effecton (a) overall satisfaction, (b) offline satisfaction, and (c) mobile satisfaction.
Hypothesis 4(H4). Perceived risk in the smart retailing experience will have a negative effect on(a) overall satisfaction, (b) offline satisfaction, and (c) mobile satisfaction.
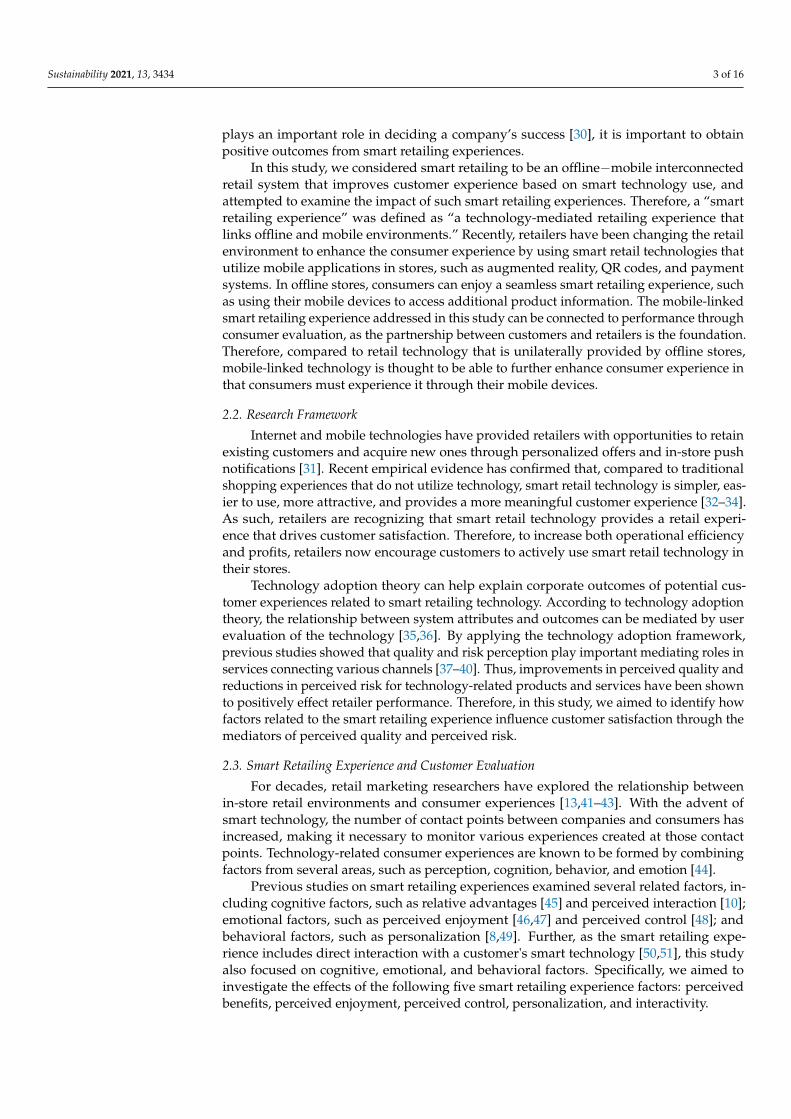
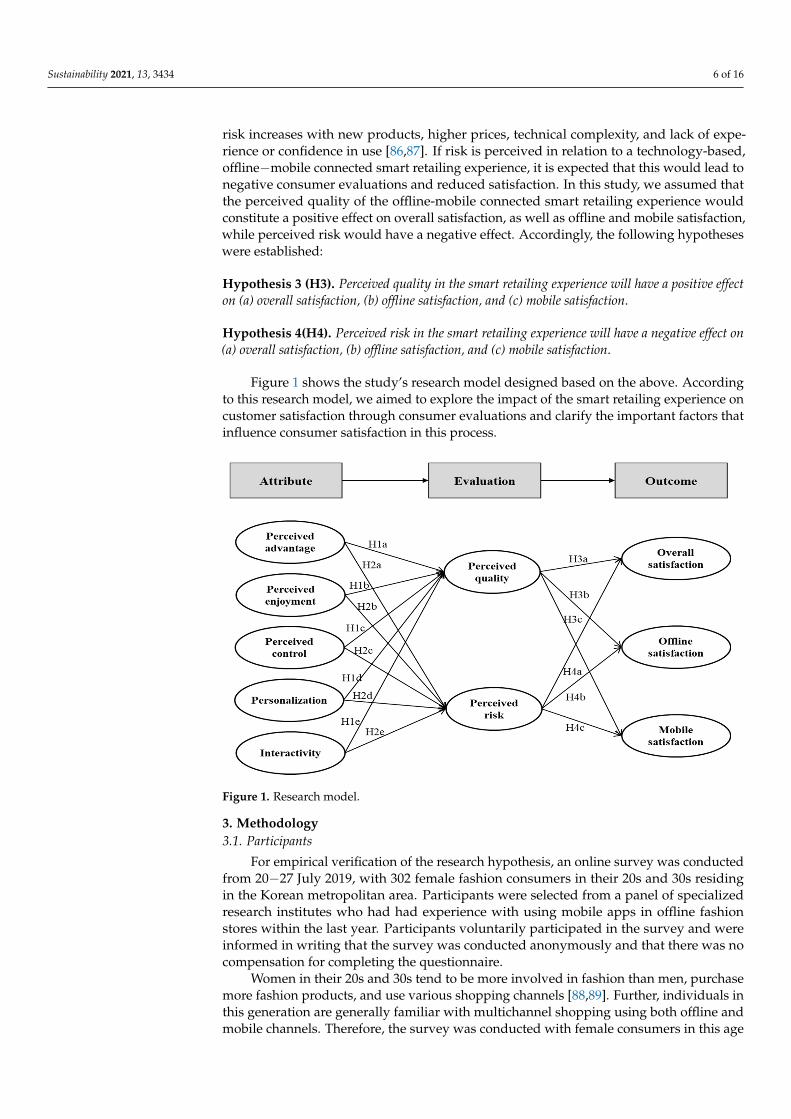
Figure 1 shows the study’s research model designed based on the above. Accordingto this research model, we aimed to explore the impact of the smart retailing experience oncustomer satisfaction through consumer evaluations and clarify the important factors thatinfluence consumer satisfaction in this process.
Sustainability 2021, 13, 3434 6 of 16
with new products, higher prices, technical complexity, and lack of experience or confi-dence in use [86,87]. If risk is perceived in relation to a technology-based, offline−mobile connected smart retailing experience, it is expected that this would lead to negative con-sumer evaluations and reduced satisfaction. In this study, we assumed that the perceived quality of the offline-mobile connected smart retailing experience would constitute a pos-itive effect on overall satisfaction, as well as offline and mobile satisfaction, while per-ceived risk would have a negative effect. Accordingly, the following hypotheses were es-tablished:
Hypothesis 3 (H3). Perceived quality in the smart retailing experience will have a positive effect on (a) overall satisfaction, (b) offline satisfaction, and (c) mobile satisfaction. Hypothesis 4(H4). Perceived risk in the smart retailing experience will have a negative effect on (a) overall satisfaction, (b) offline satisfaction, and (c) mobile satisfaction.
Figure 1 shows the study’s research model designed based on the above. According to this research model, we aimed to explore the impact of the smart retailing experience on customer satisfaction through consumer evaluations and clarify the important factors that influence consumer satisfaction in this process.
Figure 1. Research model.
3. Methodology 3.1. Participants
For empirical verification of the research hypothesis, an online survey was conducted from July 20−27, 2019, with 302 female fashion consumers in their 20s and 30s residing in the Korean metropolitan area. Participants were selected from a panel of specialized re-search institutes who had had experience with using mobile apps in offline fashion stores within the last year. Participants voluntarily participated in the survey and were informed in writing that the survey was conducted anonymously and that there was no compensa-tion for completing the questionnaire.
Women in their 20s and 30s tend to be more involved in fashion than men, purchase more fashion products, and use various shopping channels [88,89]. Further, individuals in this generation are generally familiar with multichannel shopping using both offline and mobile channels. Therefore, the survey was conducted with female consumers in this age group residing in a metropolitan area in Korea. Of the participants, 42.73% (128) were
Figure 1. Research model.
3. Methodology3.1. Participants
For empirical verification of the research hypothesis, an online survey was conductedfrom 20−27 July 2019, with 302 female fashion consumers in their 20s and 30s residingin the Korean metropolitan area. Participants were selected from a panel of specializedresearch institutes who had had experience with using mobile apps in offline fashionstores within the last year. Participants voluntarily participated in the survey and wereinformed in writing that the survey was conducted anonymously and that there was nocompensation for completing the questionnaire.
Women in their 20s and 30s tend to be more involved in fashion than men, purchasemore fashion products, and use various shopping channels [88,89]. Further, individuals inthis generation are generally familiar with multichannel shopping using both offline andmobile channels. Therefore, the survey was conducted with female consumers in this age
Sustainability 2021, 13, 3434 7 of 16
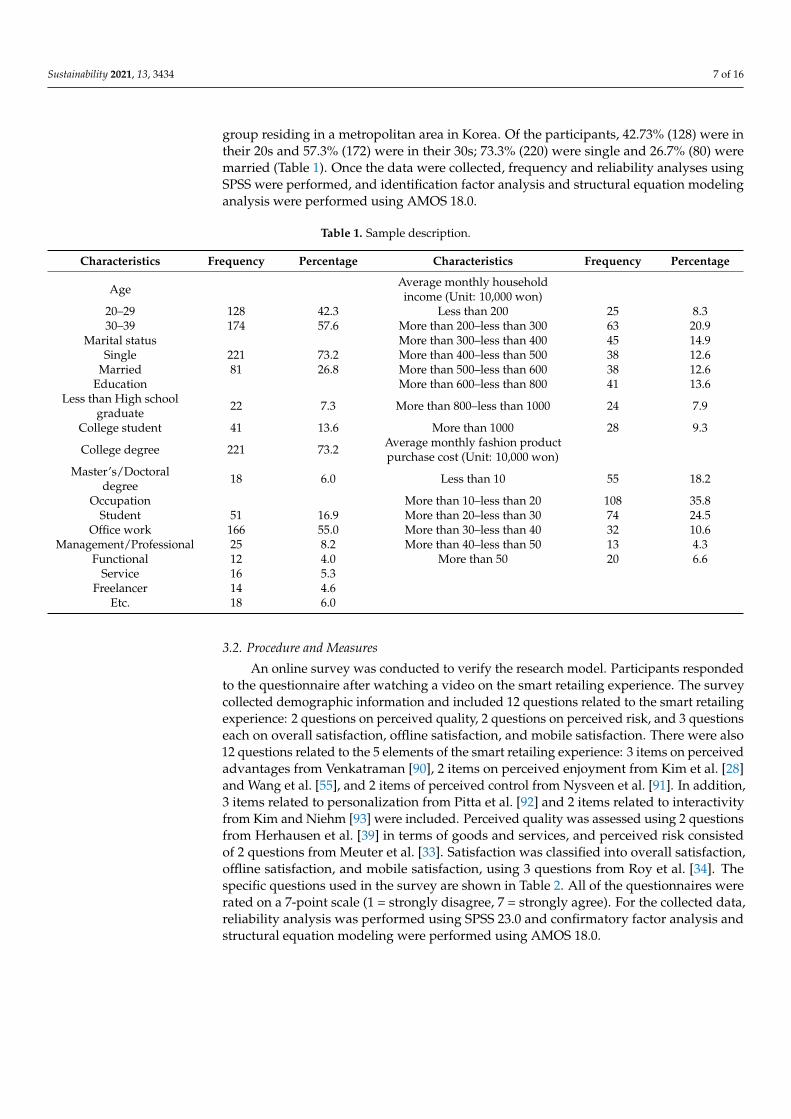
group residing in a metropolitan area in Korea. Of the participants, 42.73% (128) were intheir 20s and 57.3% (172) were in their 30s; 73.3% (220) were single and 26.7% (80) weremarried (Table 1). Once the data were collected, frequency and reliability analyses usingSPSS were performed, and identification factor analysis and structural equation modelinganalysis were performed using AMOS 18.0.
Table 1. Sample description.
Characteristics Frequency Percentage Characteristics Frequency Percentage
Age Average monthly householdincome (Unit: 10,000 won)
20–29 128 42.3 Less than 200 25 8.330–39 174 57.6 More than 200–less than 300 63 20.9
Marital status More than 300–less than 400 45 14.9Single 221 73.2 More than 400–less than 500 38 12.6
Married 81 26.8 More than 500–less than 600 38 12.6Education More than 600–less than 800 41 13.6
Less than High schoolgraduate 22 7.3 More than 800–less than 1000 24 7.9
College student 41 13.6 More than 1000 28 9.3
College degree 221 73.2 Average monthly fashion productpurchase cost (Unit: 10,000 won)
Master’s/Doctoraldegree 18 6.0 Less than 10 55 18.2
Occupation More than 10–less than 20 108 35.8Student 51 16.9 More than 20–less than 30 74 24.5
Office work 166 55.0 More than 30–less than 40 32 10.6Management/Professional 25 8.2 More than 40–less than 50 13 4.3
Functional 12 4.0 More than 50 20 6.6Service 16 5.3
Freelancer 14 4.6Etc. 18 6.0
3.2. Procedure and Measures
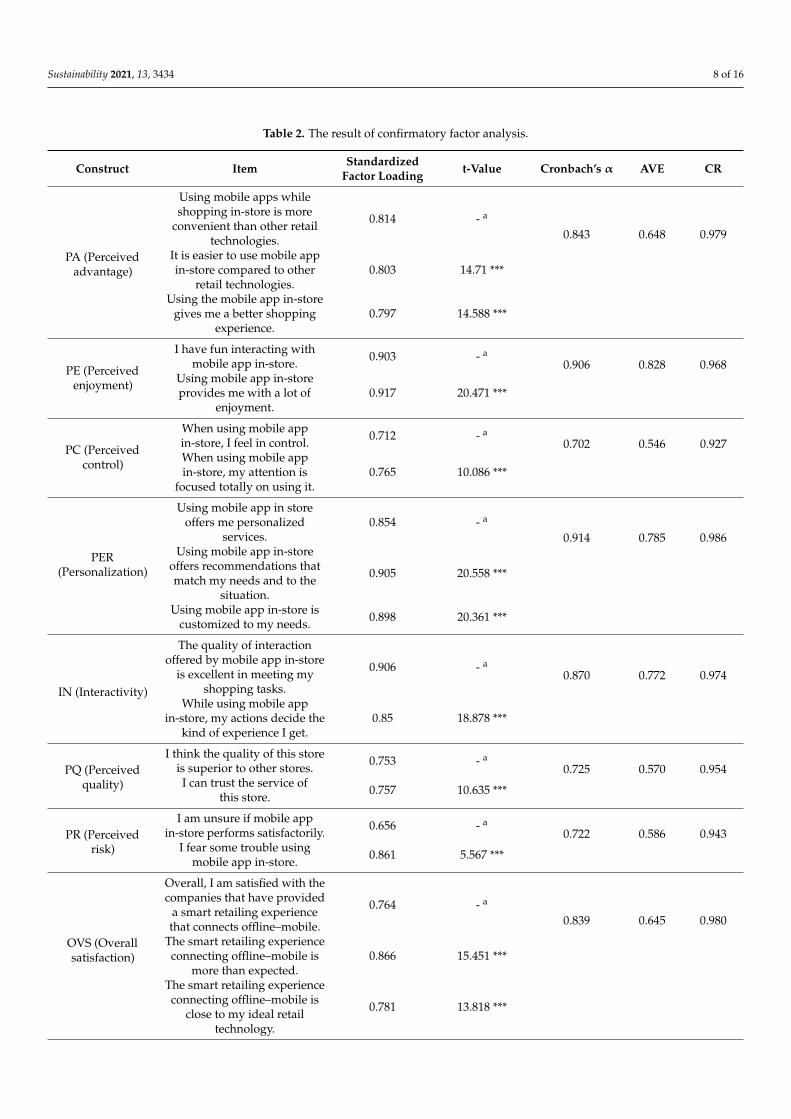
An online survey was conducted to verify the research model. Participants respondedto the questionnaire after watching a video on the smart retailing experience. The surveycollected demographic information and included 12 questions related to the smart retailingexperience: 2 questions on perceived quality, 2 questions on perceived risk, and 3 questionseach on overall satisfaction, offline satisfaction, and mobile satisfaction. There were also12 questions related to the 5 elements of the smart retailing experience: 3 items on perceivedadvantages from Venkatraman [90], 2 items on perceived enjoyment from Kim et al. [28]and Wang et al. [55], and 2 items of perceived control from Nysveen et al. [91]. In addition,3 items related to personalization from Pitta et al. [92] and 2 items related to interactivityfrom Kim and Niehm [93] were included. Perceived quality was assessed using 2 questionsfrom Herhausen et al. [39] in terms of goods and services, and perceived risk consistedof 2 questions from Meuter et al. [33]. Satisfaction was classified into overall satisfaction,offline satisfaction, and mobile satisfaction, using 3 questions from Roy et al. [34]. Thespecific questions used in the survey are shown in Table 2. All of the questionnaires wererated on a 7-point scale (1 = strongly disagree, 7 = strongly agree). For the collected data,reliability analysis was performed using SPSS 23.0 and confirmatory factor analysis andstructural equation modeling were performed using AMOS 18.0.
Sustainability 2021, 13, 3434 8 of 16
Table 2. The result of confirmatory factor analysis.
Construct Item StandardizedFactor Loading t-Value Cronbach’s α AVE CR
PA (Perceivedadvantage)
Using mobile apps whileshopping in-store is more
convenient than other retailtechnologies.
0.814 - a
0.843 0.648 0.979
It is easier to use mobile appin-store compared to other
retail technologies.0.803 14.71 ***
Using the mobile app in-storegives me a better shopping
experience.0.797 14.588 ***
PE (Perceivedenjoyment)
I have fun interacting withmobile app in-store. 0.903 - a
0.906 0.828 0.968Using mobile app in-storeprovides me with a lot of
enjoyment.0.917 20.471 ***
PC (Perceivedcontrol)
When using mobile appin-store, I feel in control. 0.712 - a
0.702 0.546 0.927When using mobile appin-store, my attention is
focused totally on using it.0.765 10.086 ***
PER(Personalization)
Using mobile app in storeoffers me personalized
services.0.854 - a
0.914 0.785 0.986Using mobile app in-store
offers recommendations thatmatch my needs and to the
situation.
0.905 20.558 ***
Using mobile app in-store iscustomized to my needs. 0.898 20.361 ***
IN (Interactivity)
The quality of interactionoffered by mobile app in-store
is excellent in meeting myshopping tasks.
0.906 - a0.870 0.772 0.974
While using mobile appin-store, my actions decide the
kind of experience I get.0.85 18.878 ***
PQ (Perceivedquality)
I think the quality of this storeis superior to other stores. 0.753 - a
0.725 0.570 0.954I can trust the service of
this store. 0.757 10.635 ***
PR (Perceivedrisk)
I am unsure if mobile appin-store performs satisfactorily. 0.656 - a
0.722 0.586 0.943I fear some trouble using
mobile app in-store. 0.861 5.567 ***
OVS (Overallsatisfaction)
Overall, I am satisfied with thecompanies that have provided
a smart retailing experiencethat connects offline–mobile.
0.764 - a
0.839 0.645 0.980
The smart retailing experienceconnecting offline–mobile is
more than expected.0.866 15.451 ***
The smart retailing experienceconnecting offline–mobile is
close to my ideal retailtechnology.
0.781 13.818 ***
Sustainability 2021, 13, 3434 9 of 16
Table 2. Cont.
Construct Item StandardizedFactor Loading t-Value Cronbach’s α AVE CR
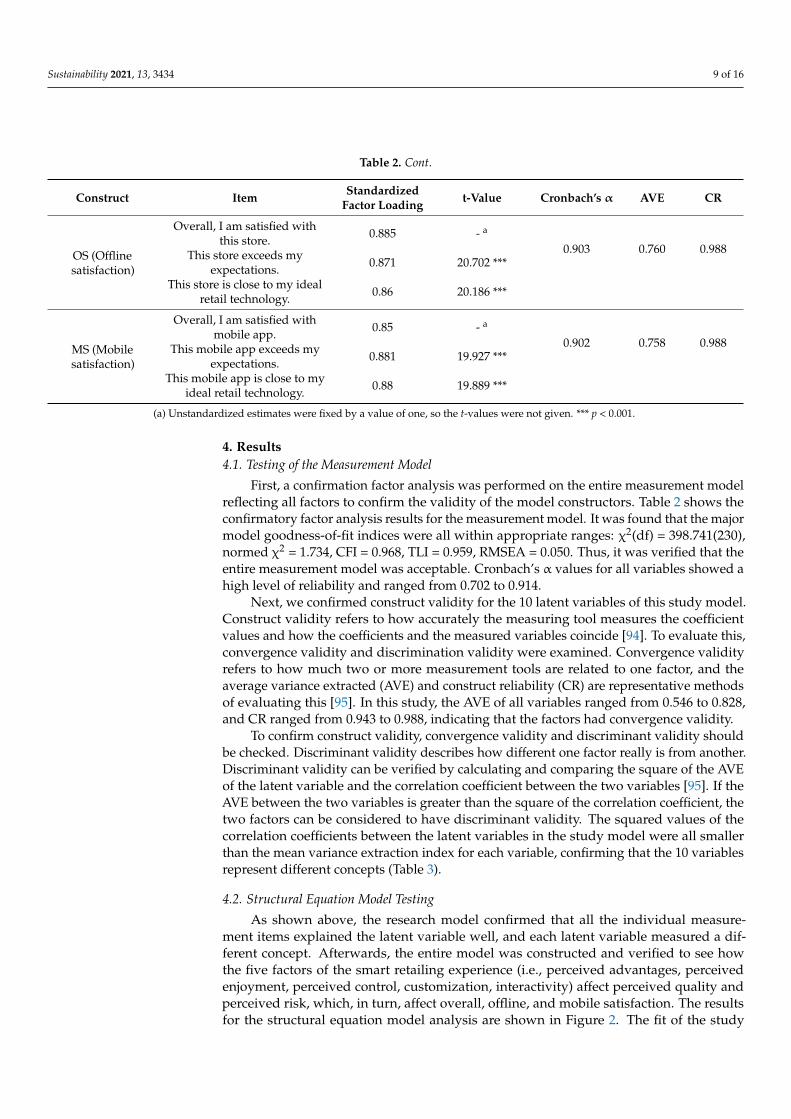
OS (Offlinesatisfaction)
Overall, I am satisfied withthis store. 0.885 - a
0.903 0.760 0.988This store exceeds myexpectations. 0.871 20.702 ***
This store is close to my idealretail technology. 0.86 20.186 ***
MS (Mobilesatisfaction)
Overall, I am satisfied withmobile app. 0.85 - a
0.902 0.758 0.988This mobile app exceeds myexpectations. 0.881 19.927 ***
This mobile app is close to myideal retail technology. 0.88 19.889 ***
(a) Unstandardized estimates were fixed by a value of one, so the t-values were not given. *** p < 0.001.
4. Results4.1. Testing of the Measurement Model
First, a confirmation factor analysis was performed on the entire measurement modelreflecting all factors to confirm the validity of the model constructors. Table 2 shows theconfirmatory factor analysis results for the measurement model. It was found that the majormodel goodness-of-fit indices were all within appropriate ranges: χ2(df) = 398.741(230),normed χ2 = 1.734, CFI = 0.968, TLI = 0.959, RMSEA = 0.050. Thus, it was verified that theentire measurement model was acceptable. Cronbach’s α values for all variables showed ahigh level of reliability and ranged from 0.702 to 0.914.
Next, we confirmed construct validity for the 10 latent variables of this study model.Construct validity refers to how accurately the measuring tool measures the coefficientvalues and how the coefficients and the measured variables coincide [94]. To evaluate this,convergence validity and discrimination validity were examined. Convergence validityrefers to how much two or more measurement tools are related to one factor, and theaverage variance extracted (AVE) and construct reliability (CR) are representative methodsof evaluating this [95]. In this study, the AVE of all variables ranged from 0.546 to 0.828,and CR ranged from 0.943 to 0.988, indicating that the factors had convergence validity.
To confirm construct validity, convergence validity and discriminant validity shouldbe checked. Discriminant validity describes how different one factor really is from another.Discriminant validity can be verified by calculating and comparing the square of the AVEof the latent variable and the correlation coefficient between the two variables [95]. If theAVE between the two variables is greater than the square of the correlation coefficient, thetwo factors can be considered to have discriminant validity. The squared values of thecorrelation coefficients between the latent variables in the study model were all smallerthan the mean variance extraction index for each variable, confirming that the 10 variablesrepresent different concepts (Table 3).
4.2. Structural Equation Model Testing
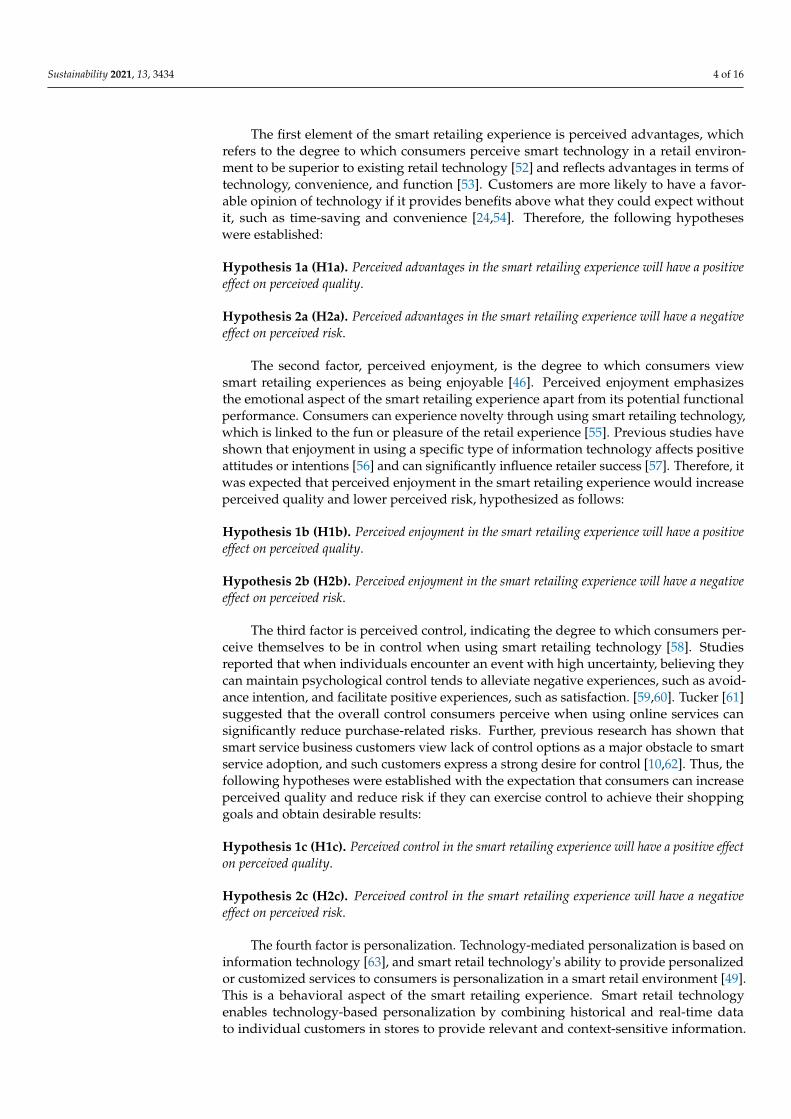
As shown above, the research model confirmed that all the individual measure-ment items explained the latent variable well, and each latent variable measured a dif-ferent concept. Afterwards, the entire model was constructed and verified to see howthe five factors of the smart retailing experience (i.e., perceived advantages, perceivedenjoyment, perceived control, customization, interactivity) affect perceived quality andperceived risk, which, in turn, affect overall, offline, and mobile satisfaction. The resultsfor the structural equation model analysis are shown in Figure 2. The fit of the study
Sustainability 2021, 13, 3434 10 of 16
model was found to be excellent (χ2(df) = 596.070(249), normed χ2 = 2.394, CFI = 0.935,TLI = 0.921, RMSEA = 0.068).
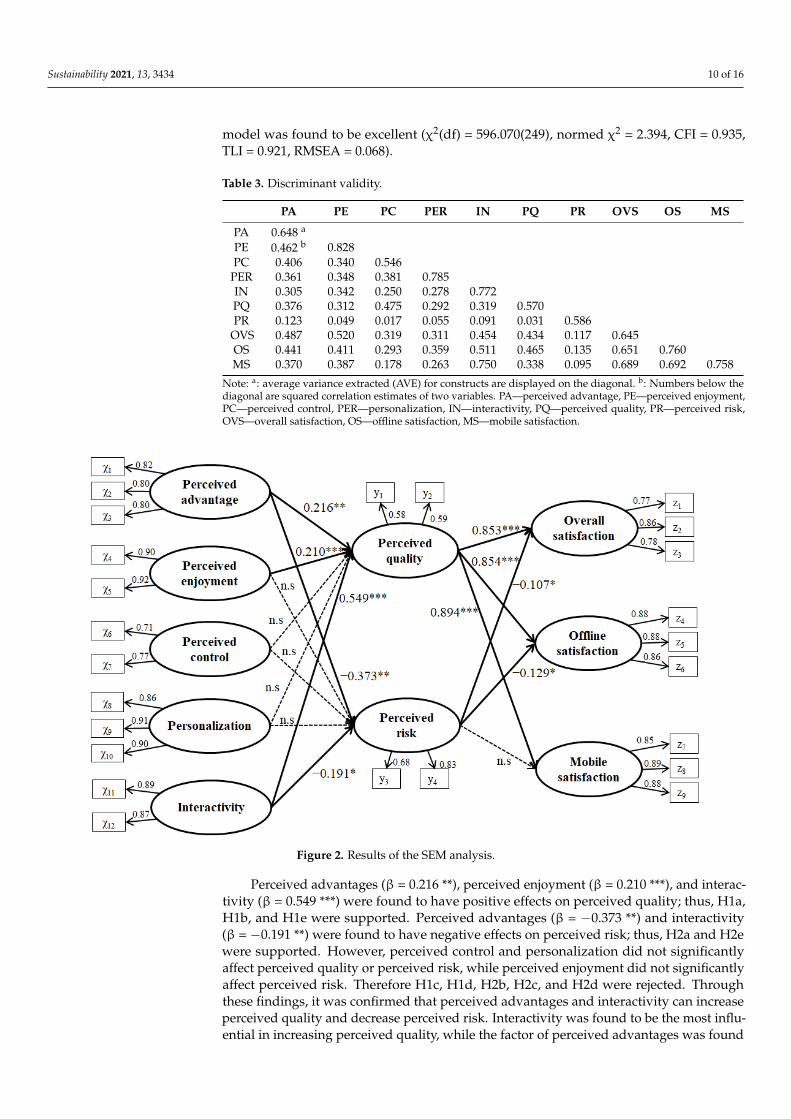
Table 3. Discriminant validity.
PA PE PC PER IN PQ PR OVS OS MS
PA 0.648 a
PE 0.462 b 0.828PC 0.406 0.340 0.546
PER 0.361 0.348 0.381 0.785IN 0.305 0.342 0.250 0.278 0.772PQ 0.376 0.312 0.475 0.292 0.319 0.570PR 0.123 0.049 0.017 0.055 0.091 0.031 0.586
OVS 0.487 0.520 0.319 0.311 0.454 0.434 0.117 0.645OS 0.441 0.411 0.293 0.359 0.511 0.465 0.135 0.651 0.760MS 0.370 0.387 0.178 0.263 0.750 0.338 0.095 0.689 0.692 0.758
Note: a: average variance extracted (AVE) for constructs are displayed on the diagonal. b: Numbers below thediagonal are squared correlation estimates of two variables. PA—perceived advantage, PE—perceived enjoyment,PC—perceived control, PER—personalization, IN—interactivity, PQ—perceived quality, PR—perceived risk,OVS—overall satisfaction, OS—offline satisfaction, MS—mobile satisfaction.
1
Figure 2. Results of the SEM analysis.
Perceived advantages (β = 0.216 **), perceived enjoyment (β = 0.210 ***), and interac-tivity (β = 0.549 ***) were found to have positive effects on perceived quality; thus, H1a,H1b, and H1e were supported. Perceived advantages (β = −0.373 **) and interactivity(β = −0.191 **) were found to have negative effects on perceived risk; thus, H2a and H2ewere supported. However, perceived control and personalization did not significantlyaffect perceived quality or perceived risk, while perceived enjoyment did not significantlyaffect perceived risk. Therefore H1c, H1d, H2b, H2c, and H2d were rejected. Throughthese findings, it was confirmed that perceived advantages and interactivity can increaseperceived quality and decrease perceived risk. Interactivity was found to be the most influ-ential in increasing perceived quality, while the factor of perceived advantages was found
Sustainability 2021, 13, 3434 11 of 16
to be important to decreasing perceived risk. Perceived enjoyment showed a significantinfluence on perceived quality, and it was found that the more enjoyable the smart retailingexperience, the higher the level quality perceived by consumers. This suggested that evenif mediated by technology use, it should be possible to elicit emotional elements through asmart retailing experience.
Next, perceived quality was found to have a positive effect on overall satisfaction(β = 0.853 ***), offline satisfaction (β = 0.854 ***), and mobile satisfaction (β = 0.894 ***);thus, H3a, H3b, and H3c were supported. Perceived risk negatively affected overallsatisfaction (β = −0.107 *) and offline satisfaction (β = −0.129 *). Therefore, H4a and H4bwere supported, but H4c was rejected, as perceived risk did not affect mobile satisfaction.Perceived quality was found to have a significant influence on satisfaction, but perceivedrisk did not significantly affect mobile satisfaction. As it was a mobile-mediated experiencein an offline store, even in an offline−mobile connected experience, consumers may haveconsidered overall and offline satisfaction to be more important than mobile satisfaction.
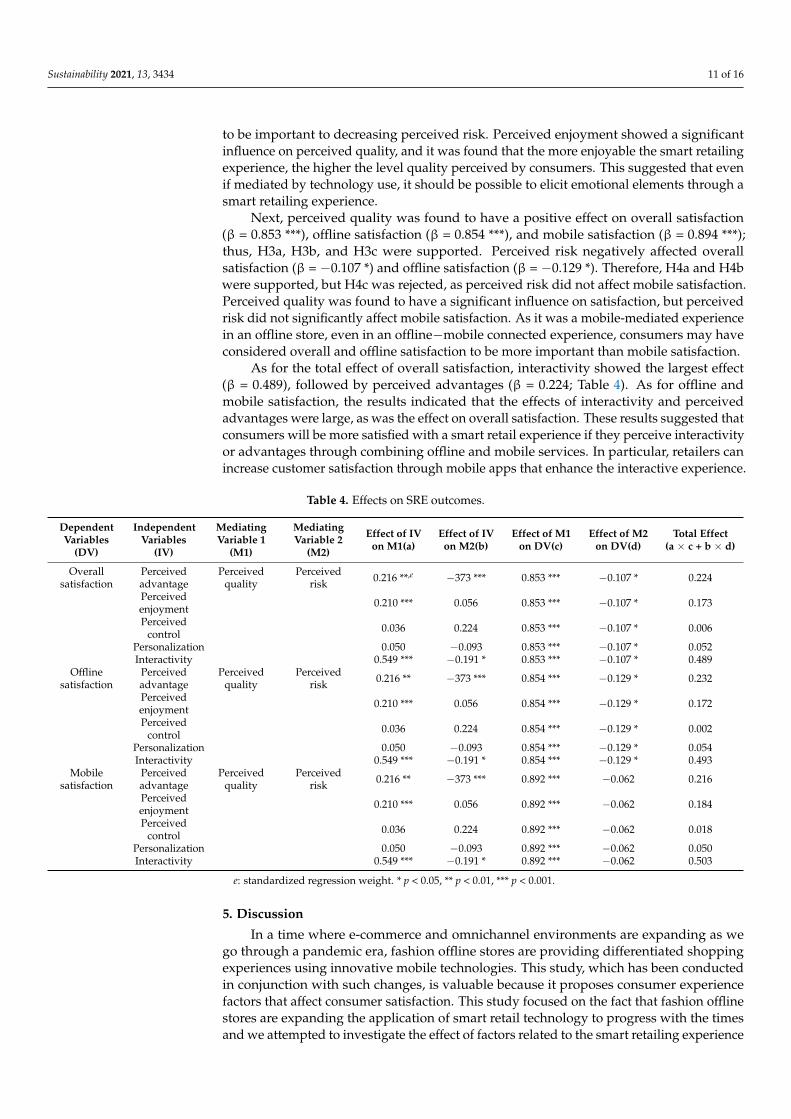
As for the total effect of overall satisfaction, interactivity showed the largest effect(β = 0.489), followed by perceived advantages (β = 0.224; Table 4). As for offline andmobile satisfaction, the results indicated that the effects of interactivity and perceivedadvantages were large, as was the effect on overall satisfaction. These results suggested thatconsumers will be more satisfied with a smart retail experience if they perceive interactivityor advantages through combining offline and mobile services. In particular, retailers canincrease customer satisfaction through mobile apps that enhance the interactive experience.
Table 4. Effects on SRE outcomes.
DependentVariables
(DV)
IndependentVariables
(IV)
MediatingVariable 1
(M1)
MediatingVariable 2
(M2)
Effect of IVon M1(a)
Effect of IVon M2(b)
Effect of M1on DV(c)
Effect of M2on DV(d)
Total Effect(a × c + b × d)
Overallsatisfaction
Perceivedadvantage
Perceivedquality
Perceivedrisk 0.216 **,e −373 *** 0.853 *** −0.107 * 0.224
Perceivedenjoyment 0.210 *** 0.056 0.853 *** −0.107 * 0.173
Perceivedcontrol 0.036 0.224 0.853 *** −0.107 * 0.006
Personalization 0.050 −0.093 0.853 *** −0.107 * 0.052Interactivity 0.549 *** −0.191 * 0.853 *** −0.107 * 0.489
Offlinesatisfaction
Perceivedadvantage
Perceivedquality
Perceivedrisk 0.216 ** −373 *** 0.854 *** −0.129 * 0.232
Perceivedenjoyment 0.210 *** 0.056 0.854 *** −0.129 * 0.172
Perceivedcontrol 0.036 0.224 0.854 *** −0.129 * 0.002
Personalization 0.050 −0.093 0.854 *** −0.129 * 0.054Interactivity 0.549 *** −0.191 * 0.854 *** −0.129 * 0.493
Mobilesatisfaction
Perceivedadvantage
Perceivedquality
Perceivedrisk 0.216 ** −373 *** 0.892 *** −0.062 0.216
Perceivedenjoyment 0.210 *** 0.056 0.892 *** −0.062 0.184
Perceivedcontrol 0.036 0.224 0.892 *** −0.062 0.018
Personalization 0.050 −0.093 0.892 *** −0.062 0.050Interactivity 0.549 *** −0.191 * 0.892 *** −0.062 0.503
e: standardized regression weight. * p < 0.05, ** p < 0.01, *** p < 0.001.
5. Discussion
In a time where e-commerce and omnichannel environments are expanding as wego through a pandemic era, fashion offline stores are providing differentiated shoppingexperiences using innovative mobile technologies. This study, which has been conductedin conjunction with such changes, is valuable because it proposes consumer experiencefactors that affect consumer satisfaction. This study focused on the fact that fashion offlinestores are expanding the application of smart retail technology to progress with the timesand we attempted to investigate the effect of factors related to the smart retailing experience
Sustainability 2021, 13, 3434 12 of 16
(i.e., perceived advantages, perceived enjoyment, perceived control, personalization, andinteractivity) on consumer evaluation (i.e., perceived quality, perceived risk) and out-comes (i.e., overall satisfaction, offline satisfaction, and mobile satisfaction). Structuralequation modeling analysis showed that perceived advantages, perceived enjoyment,and interactivity had positively affected perceived quality, while perceived advantagesand interactivity negatively affected perceived risk. This supports the results of previousstudies showing the positive effects of perceived advantage, perceived enjoyment, andinteractivity [22,34,55]. However, the perceived control and personalization factors did notsignificantly affect risk reduction and quality perception, unlike previous studies [63,65].This result reflects product characteristics as a study conducted in the fashion sector, unlikeother studies, and the experiential situation, not the actual experience. Further, it wasperceived quality that was found to have a positive effect on overall satisfaction, offlinesatisfaction, and mobile satisfaction, and perceived risk negatively affected overall andoffline satisfaction, but did not affect mobile satisfaction. This study, which examinedthe impact of the smart retailing experience, is expected to make academic and practicalcontributions to the field.
The academic significance of this study is as follows. First, this study can contribute toproviding basic data to and vitalizing research on smart retailing experiences. Although theadoption and application of smart technology has increased, few studies have specificallyinvestigated smart technology in a fashion retail environment. The relevant researchhas been mostly conceptual or qualitative, and has examined smart technology and itsapplication from the retailer’s viewpoint [96]. This study expanded the existing literatureregarding smart retail technology and contributed toward increasing the diversity of studiesby focusing on the smart retailing experience from a consumer perspective. Second, thisstudy attempted to reveal the relationships between factors related to the smart retailingexperience, consumer evaluation, and outcomes by applying the technology adoptiontheory, thereby establishing an academic foundation for these relationships. In particular,perceived advantages, perceived enjoyment, and interactivity were found to be importantfactors that influence outcomes mediated by perceived quality, while perceived advantagesand interactivity affect outcomes through perceived risk.
The results of this study are thought to be able to help retailers understand and applysmart technology and service innovation. First, retailers can utilize the factors of perceivedadvantages, interactivity, and perceived enjoyment when conceiving a smart retailingstrategy. This study’s findings indicated that, out of the factors related to the smart retailingexperience, perceived advantages and interactivity are important for increasing perceivedquality and lowering perceived risk for consumers. In addition, perceived enjoyment wasshown to increase perceived quality. When fashion retailers want to apply smart retailtechnology in offline stores, they can increase satisfaction by emphasizing the advantagesor interactivity of the retail technology so that consumers can directly recognize it. Inaddition, it is also important to provide services that allow people to perceive enjoymentduring smart retailing experiences. Second, as perceived risk decreased, overall and offlinesatisfaction increased; however, mobile satisfaction was not affected. Thus, even if a serviceis combined with an offline environment by utilizing mobile technology, since the spacewhere consumers exist is an offline store, it will be necessary to focus more on in-storeand overall services. The results of this study are thought to be able to help practitionersunderstand the consumer experience associated with smart retail technology and developeffective strategies for improving this experience and securing a competitive advantagefor retailers.
6. Limitations and Future Research
This study also has several limitations. First, it focused on the retail experienceusing offline−mobile linked technology in fashion stores. However, fashion stores use avariety of retail technologies, and different experiences with these technologies can producevarying results. Therefore, studies that examine consumer experiences related to various
Sustainability 2021, 13, 3434 13 of 16
technologies should be conducted in the future. Second, fashion stores can be classifiedinto various categories, such as luxury stores and sports stores, and the main customerbase varies according to the category. Therefore, it will be meaningful if future researchexpands into various categories. Third, this study proposed technology use as mediated byconsumer experience as a way to rejuvenate offline fashion stores. Future research shouldconsider more diverse factors that can potentially revitalize offline fashion stores. Fourth,since this study was designed for the target participants, it may be difficult to generalizethe results of this research. Participants did not respond to the questionnaire based on theirown experience but, rather, viewed the video stimuli and responded, which may have beenaccepted differently depending on the individual. Therefore, it seems that future researchshould supplement this with a more realistic and systematic research design. Fifth, futurestudies including qualitative factors will be able to expand the impact of statistical resultsand help to understand participants' perceptions. Sixth, some of the variables in this studyhad very high construct reliability, which can lead to redundancy issues. In future studies,the composition of the scale for the variable will need to be improved to justify this part.Seventh, the influence of demographic factors such as income, age, and gender should alsobe considered in the future. Finally, research confirming how consumer perceptions ofoffline retail experiences have changed post-pandemic will be interesting.
Funding: This work was supported by the Ministry of Education of the Republic of Korea and theNational Research Foundation of Korea (NRF-2018S1A5B5A07072517).
Institutional Review Board Statement: The study was conducted according to the guidelines of theDeclaration of Helsinki, and approved by the Institutional Review Board of Chung-Ang university(approval number: 1041078-201909-HRSB-271-01).
Informed Consent Statement: Informed consent was obtained from all subjects involved in the study.
Data Availability Statement: Data is not publicly available, though the data may be made availableon request from the author.
Conflicts of Interest: The author declares no conflict of interest.
References1. Pacheco, I. How Coronavirus Changed the Retail Landscape. The Wall Street Journal. 2020. Available online: https://www.wsj.
com/articles/how-coronavirus-changed-the-retail-landscape-11601976600 (accessed on 8 December 2020).2. Herring, L.; Wachinger, T.; Wigley, C. Making Stores Matter in a Multichannel World. McKinsey & Company. 2014. Available
online: https://www.mckinsey.com/industries/retail/our-insights/making-stores-matter-in-a-multichannel-world (accessedon 8 December 2020).
3. Pine, B.J.; Gilmore, J.H. The Experience Economy; Harvard Business Press: Boston, MA, USA, 2011.4. Schmitt, B.; Brakus, J.J.; Zarantonello, L. From experiential psychology to consumer experience. J. Consum. Psychol. 2015,
25, 166–171. [CrossRef]5. Spence, C.; Puccinelli, N.M.; Grewal, D.; Roggeveen, A.L. Store atmospherics: A multisensory perspective. Psychol. Mark. 2014,
31, 472–488. [CrossRef]6. Briedis, H.; Kronschnabl, A.; Rodriguez, A.; Ungerman, K. Adapting to the Next Normal in Retail: The Customer Experience
Imperative. McKinsey & Company. 2020. Available online: https://www.mckinsey.com/industries/retail/our-insights/adapting-to-the-next-normal-in-retail-the-customer-experience-imperative (accessed on 22 December 2020).
7. Clarke, D.W.; Perry, P.; Denson, H. The sensory retail environment of small fashion boutiques. J. Fash. Mark. Manag. 2012,16, 492–510. [CrossRef]
8. Pantano, E.; Dennis, C. Smart Retailing; Palgrave Pivot: Cham, Switzerland, 2019.9. Hoffman, D.L.; Novak, T.P. Consumer and object experience in the internet of things: An assemblage theory approach. J. Consum.
Res. 2018, 44, 1178–1204. [CrossRef]10. Wünderlich, N.V.; Wangenheim, F.V.; Bitner, M.J. High tech and high touch: A framework for understanding user attitudes and
behaviors related to smart interactive services. J. Serv. Res. 2013, 16, 3–20. [CrossRef]11. Caboni, F.; Hagberg, J. Augmented reality in retailing: A review of features, applications and value. Int. J. Retail. Distrib. Manag.
2019, 47, 1125–1140. [CrossRef]12. Dacko, S.G. Enabling smart retail settings via mobile augmented reality shopping apps. Technol. Forecast. Soc. Chang. 2017,
124, 243–256. [CrossRef]
Sustainability 2021, 13, 3434 14 of 16
13. Farah, M.F.; Ramadan, Z.B.; Harb, D.H. The examination of virtual reality at the intersection of consumer experience, shoppingjourney and physical retailing. J. Retail. Consum. Serv. 2019, 48, 136–143. [CrossRef]
14. Heller, J.; Chylinski, M.; de Ruyter, K.; Mahr, D.; Keeling, D.I. Touching the untouchable: Exploring multi-sensory augmentedreality in the context of online retailing. J. Retail. 2019, 95, 219–234. [CrossRef]
15. Jetter, J.; Eimecke, J.; Rese, A. Augmented reality tools for industrial applications: What are potential key performance indicatorsand who benefits? Comput. Hum. Behav. 2018, 87, 18–33. [CrossRef]
16. Pantano, E.; Rese, A.; Baier, D. Enhancing the online decision-making process by using augmented reality: A two countrycomparison of youth markets. J. Retail. Consum. Serv. 2017, 38, 81–95. [CrossRef]
17. Park, M.; Yoo, J. Effects of perceived interactivity of augmented reality on consumer responses: A mental imagery perspective.J. Retail. Consum. Serv. 2020, 52, 101–912. [CrossRef]
18. Poushneh, A.; Vasquez-Parraga, A.Z. Discernible impact of augmented reality on retail customer’s experience, satisfaction andwillingness to buy. J. Retail. Consum. Serv. 2017, 34, 229–234. [CrossRef]
19. Rese, A.; Baier, D.; Geyer-Schulz, A.; Schreiber, S. How augmented reality apps are accepted by consumers: A comparativeanalysis using scales and opinions. Technol. Forecast. Soc. Chang. 2017, 124, 306–319. [CrossRef]
20. Scholz, J.; Duffy, K. We are at home: How augmented reality reshapes mobile marketing and consumer-brand relationships.J. Retail. Consum. Serv. 2018, 44, 11–23. [CrossRef]
21. Müller-Seitz, G.; Dautzenberg, K.; Creusen, U.; Stromereder, C. Customer acceptance of rfid technology: Evidence from thegerman electronic retail sector. J. Retail. Consum. Serv. 2009, 16, 31–39. [CrossRef]
22. Bhattacharya, M. A conceptual framework of rfid adoption in retail using rogers stage model. Bus. Process. Manag. J. 2015,21, 517–540. [CrossRef]
23. Tsai, M.-C.; Lee, W.; Wu, H.-C. Determinants of rfid adoption intention: Evidence from taiwanese retail chains. Inf. Manag. 2010,47, 255–261. [CrossRef]
24. Wei, J.; Lowry, P.B.; Seedorf, S. The assimilation of rfid technology by chinese companies: A technology diffusion perspective. Inf.Manag. 2015, 52, 628–642. [CrossRef]
25. Evanschitzky, H.; Iyer, G.R.; Pillai, K.G.; Kenning, P.; Schütte, R. Consumer trial, continuous use, and economic benefits of a retailservice innovation: The case of the personal shopping assistant. J. Prod. Innov. Manag. 2015, 32, 459–475. [CrossRef]
26. Adapa, S.; Fazal-e-Hasan, S.M.; Makam, S.B.; Azeem, M.M.; Mortimer, G. Examining the antecedents and consequences ofperceived shopping value through smart retail technology. J. Retail. Consum. Serv. 2020, 52, 101–901. [CrossRef]
27. Inman, J.J.; Nikolova, H. Shopper-facing retail technology: A retailer adoption decision framework incorporating shopperattitudes and privacy concerns. J. Retail. 2017, 93, 7–28. [CrossRef]
28. Kim, H.-Y.; Lee, J.Y.; Mun, J.M.; Johnson, K.K. Consumer adoption of smart in-store technology: Assessing the predictive value ofattitude versus beliefs in the technology acceptance model. Int. J. Fash. Des. Technol. Educ. 2017, 10, 26–36. [CrossRef]
29. Gregory, R.L. Eye and Brain: The Psychology of Seeing; Princeton University Press: Princeton, NJ, USA, 2015.30. Porter, M.E.; Heppelmann, J.E. How smart, connected products are transforming competition. Harv. Bus. 2014, 92, 64–88.31. Yakhlef, A. Customer experience within retail environments: An embodied, spatial approach. Mark. Theory 2015, 15,
545–564. [CrossRef]32. Li, J.; Konus, U.; Pauwels, K.; Langerak, F. The hare and the tortoise: Do earlier adopters of online channels purchase more?
J. Retail. 2015, 91, 289–308. [CrossRef]33. Meuter, M.L.; Ostrom, A.L.; Bitner, M.J.; Roundtree, R. The influence of technology anxiety on consumer use and experiences
with self-service technologies. J. Bus. Res. 2003, 56, 899–906. [CrossRef]34. Roy, S.K.; Balaji, M.; Sadeque, S.; Nguyen, B.; Melewar, T. Constituents and consequences of smart customer experience in
retailing. Technol. Forecast. Soc. Chang. 2017, 124, 257–270. [CrossRef]35. Kallweit, K.; Spreer, P.; Toporowski, W. Why do customers use self-service information technologies in retail? The mediating
effect of perceived service quality. J. Retail. Consum. Serv. 2014, 21, 268–276. [CrossRef]36. Davis, F.D. Perceived usefulness, perceived ease of use, and user acceptance of information technology. Manag. Inf. Syst. Q. 1989,
13, 319–340. [CrossRef]37. Davis, F.D.; Bagozzi, R.P.; Warshaw, P.R. User acceptance of computer technology: A comparison of two theoretical models.
Manag. Sci. 1989, 35, 982–1003. [CrossRef]38. Falk, T.; Schepers, J.; Hammerschmidt, M.; Bauer, H.H. Identifying cross-channel dissynergies for multichannel service providers.
J. Serv. Res. 2007, 10, 143–160. [CrossRef]39. Herhausen, D.; Binder, J.; Schoegel, M.; Herrmann, A. Integrating bricks with clicks: Retailer-level and channel-level outcomes of
online–offline channel integration. J. Retail. 2015, 91, 309–325. [CrossRef]40. Montoya-Weiss, M.M.; Voss, G.B.; Grewal, D. Determinants of online channel use and overall satisfaction with a relational,
multichannel service provider. J. Acad. Mark. Sci. 2003, 31, 448–458. [CrossRef]41. Homburg, C.; Koschate, N.; Hoyer, W.D. The role of cognition and affect in the formation of customer satisfaction: A dynamic
perspective. J. Mark. 2006, 70, 21–31. [CrossRef]42. Naylor, G.; Kleiser, S.B.; Baker, J.; Yorkston, E. Using transformational appeals to enhance the retail experience. J. Retail. 2008,
84, 49–57. [CrossRef]
Sustainability 2021, 13, 3434 15 of 16
43. Verhoef, P.C.; Lemon, K.N.; Parasuraman, A.; Roggeveen, A.; Tsiros, M.; Schlesinger, L.A. Customer experience creation:Determinants, dynamics and management strategies. J. Retail. 2009, 85, 31–41. [CrossRef]
44. Foroudi, P.; Gupta, S.; Sivarajah, U.; Broderick, A. Investigating the effects of smart technology on customer dynamics andcustomer experience. Comput. Hum. Behav. 2018, 80, 271–282. [CrossRef]
45. Garrett, J.J. Elements of User Experience, the: User-Centered Design for the Web and Beyond; New Riders: Berkeley, CA, USA, 2010.46. Wünderlich, N.V.; Heinonen, K.; Ostrom, A.L.; Patricio, L.; Sousa, R.; Voss, C.; Lemmink, J.G. “Futurizing” smart service:
Implications for service researchers and managers. J. Serv. Mark. 2015, 29, 442–447. [CrossRef]47. Choi, J.-H.; Park, J.-W. Investigating the factors influencing the usage of smart entry service: Incheon international airport case
study. Int. Bus. Res. 2014, 7, 74. [CrossRef]48. Gretzel, U.; Sigala, M.; Xiang, Z.; Koo, C. Smart tourism: Foundations and developments. Electron. Mark. 2015, 25, 179–188. [CrossRef]49. Abi Ghanem, D.; Mander, S. Designing consumer engagement with the smart grids of the future: Bringing active demand
technology to everyday life. Techno. Anal. Strateg. Manag. 2014, 26, 1163–1175. [CrossRef]50. Neuhofer, B.; Buhalis, D.; Ladkin, A. Smart technologies for personalized experiences: A case study in the hospitality domain.
Electron. Mark. 2015, 25, 243–254. [CrossRef]51. Palmer, A. Customer experience management: A critical review of an emerging idea. J. Serv. Mark. 2010, 24, 196–208. [CrossRef]52. Van Noort, G.; Voorveld, H.A.; Van Reijmersdal, E.A. Interactivity in brand web sites: Cognitive, affective, and behavioral
responses explained by consumers’ online flow experience. J. Interact. Mark. 2012, 26, 223–234. [CrossRef]53. Lu, M.-T.; Tzeng, G.-H.; Cheng, H.; Hsu, C.-C. Exploring mobile banking services for user behavior in intention adoption: Using
new hybrid madm model. Serv. Bus. 2012, 9, 541–565. [CrossRef]54. Gao, L.; Bai, X. A unified perspective on the factors influencing consumer acceptance of internet of things technology. Asia Pac. J.
Mark. Logist. 2014, 26, 211–231. [CrossRef]55. Wang, R.J.-H.; Malthouse, E.C.; Krishnamurthi, L. On the go: How mobile shopping affects customer purchase behavior. J. Retail.
2015, 91, 217–234. [CrossRef]56. Brown, S.A.; Fuller, R.M.; Vician, C. Who’s afraid of the virtual world? Anxiety and computer-mediated communication. J. Assoc.
Inf. Syst. 2004, 5, 79–107. [CrossRef]57. Van der Heijden, H.; Verhagen, T. Online store image: Conceptual foundations and empirical measurement. Inf. Manag. 2004,
41, 609–617. [CrossRef]58. Liu, C.; Arnett, K.P. Exploring the factors associated with web site success in the context of electronic commerce. Inf. Manag. 2000,
38, 23–33. [CrossRef]59. Lee, J.H.; Phaal, R.; Lee, S.-H. An integrated service-device-technology roadmap for smart city development. Technol. Forecast.
Soc. Chang. 2013, 80, 286–306. [CrossRef]60. Langer, E.J.; Saegert, S. Crowding and cognitive control. J. Pers. Soc. Psychol. 1977, 35, 175–182. [CrossRef]61. Mills, R.T.; Krantz, D.S. Information, choice, and reactions to stress: A field experiment in a blood bank with laboratory analogue.
J. Pers. Soc. Psychol. 1979, 37, 608–620. [CrossRef]62. Tucker, C.E. Social networks, personalized advertising, and privacy controls. J. Mark. Res. 2014, 51, 546–562. [CrossRef]63. Paluch, S.; Blut, M. Service separation and customer satisfaction: Assessing the service separation/customer integration paradox.
J. Serv. Res. 2013, 16, 415–427. [CrossRef]64. Aguirre, E.; Mahr, D.; Grewal, D.; de Ruyter, K.; Wetzels, M. Unraveling the personalization paradox: The effect of information
collection and trust-building strategies on online advertisement effectiveness. J. Retail. 2015, 91, 34–49. [CrossRef]65. Ghose, A.; Huang, K.W. Personalized pricing and quality customization. J. Econ. Manag. Strategy 2015, 18, 1095–1135. [CrossRef]66. McMillan, S.J. Exploring models of interactivity from multiple research traditions: Users, documents, and systems. In Handbook of
New Media 2; Lievrouw, L., Livingston, S., Eds.; Sage: London, UK, 2002.67. Bucy, E.P. Interactivity in society: Locating an elusive concept. Inf. Soc. 2004, 20, 373–383. [CrossRef]68. McMillan, S.J. The researchers and the concept: Moving beyond a blind examination of interactivity. J. Interact. Advert. 2005,
5, 1–4. [CrossRef]69. Scardamalia, M.; Bereiter, C. Smart technology for self-organizing processes. Smart Learn. Environ. 2014, 1, 1–13. [CrossRef]70. Blythe, M.; Hassenzahl, M. The semantics of fun: Differentiating enjoyable experiences. In Funology 2; Blythe, M., Monk, A., Eds.;
Springer: New York, NY, USA, 2018.71. Siregar, Y.; Kent, A. Consumer experience of interactive technology in fashion stores. Int. J. Retail. Distrib. Manag. 2019,
47, 1318–1335. [CrossRef]72. Oliver, R.L. A cognitive model of the antecedents and consequences of satisfaction decisions. J. Mark. Res. 1980, 17, 460–469. [CrossRef]73. Nagel, P.J.; Cilliers, W.W. Customer satisfaction: A comprehensive approach. Int. J. Phys. Distrib. Logist. Manag. 1990, 20,
2–46. [CrossRef]74. Bitner, M.J.; Hubbert, A.R. Encounter satisfaction versus overall satisfaction versus quality. In Service Quality: New Directions in
Theory and Practice; Sage Publications: Thousand Oaks, CA, USA, 1994.75. Zeithaml, V.A.; Parasuraman, A.; Malhotra, A. Service quality delivery through web sites: A critical review of extant knowledge.
J. Acad. Mark. Sci. 2002, 30, 362–375. [CrossRef]76. Holbrook, M.B.; Corfman, K.P. Quality and Value in the Consumption Experience: Phaedrus Rides Again; Lexington Books: Lexington,
MA, USA, 1985.
Sustainability 2021, 13, 3434 16 of 16
77. Chang, H.H.; Wang, Y.-H.; Yang, W.-Y. The impact of e-service quality, customer satisfaction and loyalty on e-marketing:Moderating effect of perceived value. Total Qual. Manag. 2009, 20, 423–443. [CrossRef]
78. Cretu, A.E.; Brodie, R.J. The influence of brand image and company reputation where manufacturers market to small firms:A customer value perspective. Ind. Mark. Manag. 2007, 30, 230–240. [CrossRef]
79. Cronin, J.J., Jr.; Brady, M.K.; Hult, G.T.M. Assessing the effects of quality, value, and customer satisfaction on consumer behavioralintentions in service environments. J. Retail. 2000, 76, 193–218. [CrossRef]
80. Gotlieb, J.B.; Grewal, D.; Brown, S.W. Consumer satisfaction and perceived quality: Complementary or divergent constructs?J. Appl. Psychol. 1994, 79, 875–885. [CrossRef]
81. Zhao, L.; Lu, Y.; Zhang, L.; Chau, P.Y. Assessing the effects of service quality and justice on customer satisfaction and thecontinuance intention of mobile value-added services: An empirical test of a multidimensional model. Decis. Support Syst. 2012,52, 645–656. [CrossRef]
82. Yang, S.; Lu, Y.; Chau, P.Y.; Gupta, S. Role of channel integration on the service quality, satisfaction, and repurchase intention in amulti-channel (online-cum-mobile) retail environment. Int. J. Mob. Commun. 2017, 15, 1–25. [CrossRef]
83. Yeung, R.M.; Morris, J. An empirical study of the impact of consumer perceived risk on purchase likelihood: A modellingapproach. Int. J. Consum. Stud. 2006, 30, 294–305. [CrossRef]
84. Dowling, G.R.; Staelin, R. A model of perceived risk and intended risk-handling activity. J. Consum. Res. 1994, 21, 119–134. [CrossRef]85. Featherman, M.S.; Pavlou, P.A. Predicting e-services adoption: A perceived risk facets perspective. Int. J. Hum. Comput. Stud.
2003, 59, 451–474. [CrossRef]86. Crespo, Á.H.; Del Bosque, I.R.; de los Salmones Sánchez, M.G. The influence of perceived risk on internet shopping behavior:
A multidimensional perspective. J. Risk Res. 2009, 12, 259–277. [CrossRef]87. Luo, X.; Li, H.; Zhang, J.; Shim, J.P. Examining multi-dimensional trust and multi-faceted risk in initial acceptance of emerging
technologies: An empirical study of mobile banking services. Decis. Support Syst. 2010, 49, 222–234. [CrossRef]88. Goldsmith, R.E.; Flynn, L.R. Bricks, clicks, and pix: Apparel buyers’ use of stores, internet, and catalogs compared. Int. J. Retail.
Distrib. Manag. 2005, 33, 271–283. [CrossRef]89. Cho, S.; Workman, J. Gender, fashion innovativeness and opinion leadership, and need for touch. J. Fash. Mark. Manag. 2011,
15, 363–382. [CrossRef]90. Venkatraman, M.P. The impact of innovativeness and innovation type on adoption. J. Retail. 1991, 67, 51–67.91. Nysveen, H.; Pedersen, P.E.; Thorbjørnsen, H. Intentions to use mobile services: Antecedents and cross-service comparisons.
J. Acad. Mark. Sci. 2005, 33, 330–346. [CrossRef]92. Pitta, D.; Veloutsou, C.; McAlonan, A. Loyalty and or disloyalty to a search engine: The case of young millennials. J. Consum.
Mark. 2012, 29, 125–135.93. Kim, H.; Niehm, L.S. The impact of website quality on information quality, value, and loyalty intentions in apparel retailing.
J. Interact. Mark. 2009, 23, 221–233. [CrossRef]94. Ariño, A. Measures of strategic alliance performance: An analysis of construct validity. J. Int. Bus. Stud. 2003, 34, 66–79. [CrossRef]95. Fornell, C.; Larcker, D.F. Structural Equation Models with Unobservable Variables and Measurement Error: Algebra and Statistics;
Sage Publications: Los Angeles, CA, USA, 1981.96. Pantano, E.; Timmermans, H. What is smart for retailing? Procedia Environ. Sci. 2014, 22, 101–107. [CrossRef]