topic: offline signature verification scheme - core
TRANSCRIPT
1
NATIONAL INSTITUTE OF TECHNOLOGY,
ROURKELA.
Department of Computer Science and Engineering.
THESIS REPORT
Dissertation submitted in partial fulfillment of the requirements for the award of the degree
Bachelor of Technology.
Topic: Offline Signature Verification Scheme
Submitted By:
Prabit Kumar Mishra Mukti Ranjan Sahoo
10506027 10506015
brought to you by COREView metadata, citation and similar papers at core.ac.uk
provided by ethesis@nitr

2
NATIONAL INSTITUTE OF TECHNOLOGY, ROURKELA.
Department of Computer Science and Engineering.
THESIS REPORT
Dissertation submitted in partial fulfillment of the requirements for the award of the degree
Bachelor of Technology.
Topic: Offline Signature Verification Scheme
Project Mentor:
Prof. Banshidhar Majhi,
HOD,
Computer Science & Engineering.
Submitted By:
Prabit Kumar Mishra Mukti Ranjan Sahoo
10506027 10506015
3
DECLARATION
This is to certify that the work in this Thesis Report entitled “Offline
Signature Verification Scheme” by Prabit Kumar Mishra and Mukti
Ranjan Sahoo has been carried out under my supervision in partial
fulfillment of the requirements for the degree of Bachelor of
Technology, in Computer Science during session 2008-2009 in the
Department of Computer Science and Engineering, National Institute of
Technology Rourkela, and this work has not been submitted elsewhere
for a degree.
Place: Rourkela
Date:May11, 2009
Prof.Banshidhar Majhi
Professor and Head
Department of CSE

4
Acknowledgement
It is with great satisfaction and pride that we present our thesis on the project
undertaken under the “Research Project” paper during 7th and 8th semesters, for
partial fulfillment of our Bachelor f Technology degree at NIT Rourkela.
We are thankful to Prof. Banshidhar Majhi for being our mentor during this
endeavor . He has been the corner stone of our project and has guided us during
periods of doubts and uncertainties. His ideas and inspirations have helped us make
this nascent idea of ours into a fully fledged project.
We are also thankful to all the professors of our department for being a constant
source of inspiration and motivation during the course of the project. We offer our
heartiest thanks to our friends for their constant inspirations and their help in
collection of data samples whenever necessary.
Last but not the least, we want to acknowledge the contributions of our parents
and family members, for their constant motivation, inspirations and their belief in
us that we could make it happen.
Prabit Kumar Mishra
Mukti Ranjan Sahoo
5
CONTENTS
Abstract……………………………………………………………………………………...6
LIST OF TABLES…………………………………………………………………………..7
LIST OF FIGURES……………………………………………………………………….....8
Chapter 1 Introduction……………………………………………………………………...10
1.1 Introduction………………………………………………………………....10
1.2 Motivation…………………………………………………………………..11
1.3 Thesis Layout……………………………………………………………….11
CHAPTER 2 An Overview………………………………………………………………....13
2.1 Classification of Analysis Schemes…………………………………………….13
2.1.1 Online Analysis Schemes…………………………………………………….13
2.1.2 Offline Analysis Schemes……………………………………………………13
2.2 Types of Forgery……………………………………………………………….13
2.3 Existing techniques…………………………………………………………….15
2.3.1 Fixed Point Arithmetic method………………………………………………15
2.3.1.1 Outline Detection and Representation……………………………………...15
2.3.2 Feature Poin Extraction Method……………………………………………..16
2.3.2.1 Feature Vector Based on Polar Coordinates……………………………….16
2.3.2.2 Feature Vector Based on Cartesian Coordinates…………………………..18
CHAPTER 3: IMPLEMENTATION
3.1 Obtaining gray scale image……………………………………………………..21
3.2 Maintaining Uniformity Across All Pixels……………………………………..22
3.3 Rotation of the image…………………………………………………………...23
3.4 Dilation…………………………………………………………………………25
3.5 Thinning………………………………………………………………………...27
3.6 Thinning Algorithm…………………………………………………………….28
3.7 Determination of the crests and troughs………………………………………..35
3.8 Obtaining the required lengths……………………………………………….....38
CHAPTER 4 ANALYSIS OF THE PROPOSED SCHEME
4.1 Analysis…………………………………………………………………….40
4.1.1 Important Terms……………………………………………………...40
4.1.2 Variation of FAR and FRR with Threshold Variance………………..40
4.2 Quantitative Analysis of space required for storing Feature Points………..42
Chapter 5 Conclusion………………………………………………………………………44
REFERENCES …………………………………………………………………………….45
6
Abstract
Offline signature verification schemes are necessary to determine the authenticity
and genuineness of a variety of things which require certification using signatures.
Most offline verification schemes till date have required perfect alignment of the
signature to the specified axes. However there are situations when the sample to be
verified may not be aligned to the required axis. In that situation the current
verification schemes could reject the signature even though it may be genuine.
The suggested scheme aims to make the verification of signatures size and angle
invariant. The invariance can be achieved by scaling and rotational manipulations
on the target image.
The shape of a person’s signature remains similar in all translational, scaled and
rotational alignments of the sign. That is the number of crests, toughs and curves
remains the same irrespective of the size and orientation of the image. The ratio
between consecutive crests and troughs there by remain the same and hence can be
used to determine the genuineness of a signature.
The proposed scheme also proposes a novel way to store the information extracted
from the image after processing. The ratios obtained for verification can be stored
in a linear array, which required much less space as compared to the previously
followed schemes. The success of the proposed scheme can be determined from
the appreciable FARs and FAAs.

7
LIST OF TABLES:
Srl No. Title Page Number
1. Variation of FAR and FRR with the threshold Variance
40

8
LIST OF FIGURES:
Figure No. TITLE Page Number
1 Types of Forgery 14
2 (a) Original (b) Dilated (c) Filled (d)Outline 15
3 Original signature, its outline, and its selected samples 16
4 The signature and its envelop with the values rt, _t, At of associated
to selected sample on the envelop with Tr = 16
17
5 The signature, its envelope and sequences tht, uht, lht, twt, rwt, lwt
with Th =8 and Tw = 5.
19
6 Grayscale Image 21
7 Uniform Image 22
8 Rotated Image 24
9 The change in the pixel values made during dilation 25
10 Blurred Image 26
11 Designation of the 9 pixels in a 3 X 3 window 27
12 Counting the 01 patterns in the ordered set P2, P3, P4, . . . . P9 28
13 Preventing the deletion of end points 29
14 Points under consideration and their locations 30
15 Image Thinning 31-32
16 Flowchart of thinning algorithm 33
17 Thinning Implementation 34
18 Finding crest and trough 37
19 Variation of FAR with FRR 41

9
CHAPTER 1
INTRODUCTION
1.1 Introduction
1.2 Motivation
1.3 Thesis Layout
10
Chapter 1
Introduction
1.1 Introduction
Signature has been a distinguishing feature for person identification. Even today an
increasing number of transactions, especially related to financial and business are being
authorized via signatures. Hence the need to have methods of automatic signature
verification must be developed if authenticity is to be verified and guaranteed
successfully on a regular basis. Approaches to signature verification fall into two
categories according to the acquisition of the data: On-line and Off-line.
On-line data records the motion of the stylus (which is also part of the sensor) while the
signature is produced, and includes location, and possibly velocity, acceleration and pen
pressure, as functions of time. Online systems use this information captured during
acquisition. These dynamic characteristics are specific to each individual and sufficiently
stable as well as repetitive [1].
Off-line data is a 2-D image of the signature. Processing Off-line is complex due to the
absence of stable dynamic characteristics. Difficulty also lies in the fact that it is hard to
segment signature strokes due to highly stylish and unconventional writing styles. The
nature and the variety of the writing pen may also affect the nature of the signature
obtained. The non-repetitive nature of variation of the signatures, because of age,
illness, geographic location and perhaps to some extent the emotional state of the
person, accentuates the problem. All these coupled together cause large intra-personal
variation. A robust system has to be designed which should not only be able to consider
these factors but also detect various types of forgeries. The system should neither be
too sensitive nor too coarse. It should have an acceptable trade-off between a low False
Acceptance Rate (FAR) and a low False Rejection Rate (FRR). The designed system
should also find an optimal storage and comparison solution for the extracted feature
points [1][2][3].
We approach the problem in two steps. Initially the scanned signature image is
preprocessed to be suitable for extracting features[2]. Then the preprocessed image is
used to extract relevant geometric parameters that can distinguish signatures of
different persons. The net step involves the use of these extracted features to verify a
given image.

11
1.2 Motivation
The motivation behind the project is the growing need for a full proof signature
verification scheme which can guarantee maximum possible security from fake
signatures. The idea behind the project is also to ensure that the proposed scheme can
provide comparable and if possible better performance than already established offline
signature verification schemes.
The prospect of minimizing the memory required for storing the extracted feature
points has also been a driving force in the commencement of this project[1][2][3].
1.3 Thesis Layout
In Chapter 2 the various concepts involved in extraction of images, their preprocessing,
and extraction of feature points, verification and finally the classification of images as
fake or genuine are discussed. We also discuss the types of forgery that hinder image
authentication and the various parameters that decide the success of proposed signature
schemes. We also offer an insight into offline and online signature characteristics.
In Chapter 3 the proposed signature verification scheme along with its implementations
are looked into.
In Chapter 4, the analysis of the parameters that determine the success and failure of the
proposed signature scheme that is the quality analysis parameters are done and the
feasibility of the scheme is discussed.
12
CHAPTER 2
OVERVIEW
2.1 Classification of Analysis Schemes
2.2 Types of Forgery
2.3 Existing Methods
2.3.1 Fixed Point Arithmetic Method
2.3.2 Feature Point Extraction Method

13
CHAPTER 2 An Overview
2.1 Classification of Analysis Schemes
The analysis schemes can typically be classified into 2 types, depending on the way in which the
data is received. They are online and offline signature schemes[1] :
2.1.1 Online Analysis Schemes
Online signature schemes the data is received through sensors. The data obtained is usually
active data which includes the speed, acceleration, pressure, tip pressure, gradient etc. These data
are usually intra-person invariant that is they usually remain constant for a particular person. So
this type of signature verification is highly reliable and offers a high degree of accuracy.
However the basic shortcoming in this practice is the availability and costs involved in the
procurement of highly sensitive instruments used for obtaining and analyzing the data. These
constraints limit the usage of online identification.
Online identification can easily be extended to various other domains like iris identification,
finger print analysis , palm print analysis and retina analysis.
2.1.2 Offline Analysis Schemes
Offline analysis schemes involve extraction of passive data, the data which is obtained after the
imprint is obtained by various 3rd
party hardware like cameras and scanners in a digital format.
These methods are usually cost effective; however they lack the basic active information which
could have been obtained from other active devices. The static information derived in an off-line
signature verification system may be global, structural, geometric or statistical.
2.2 Types of Forgery
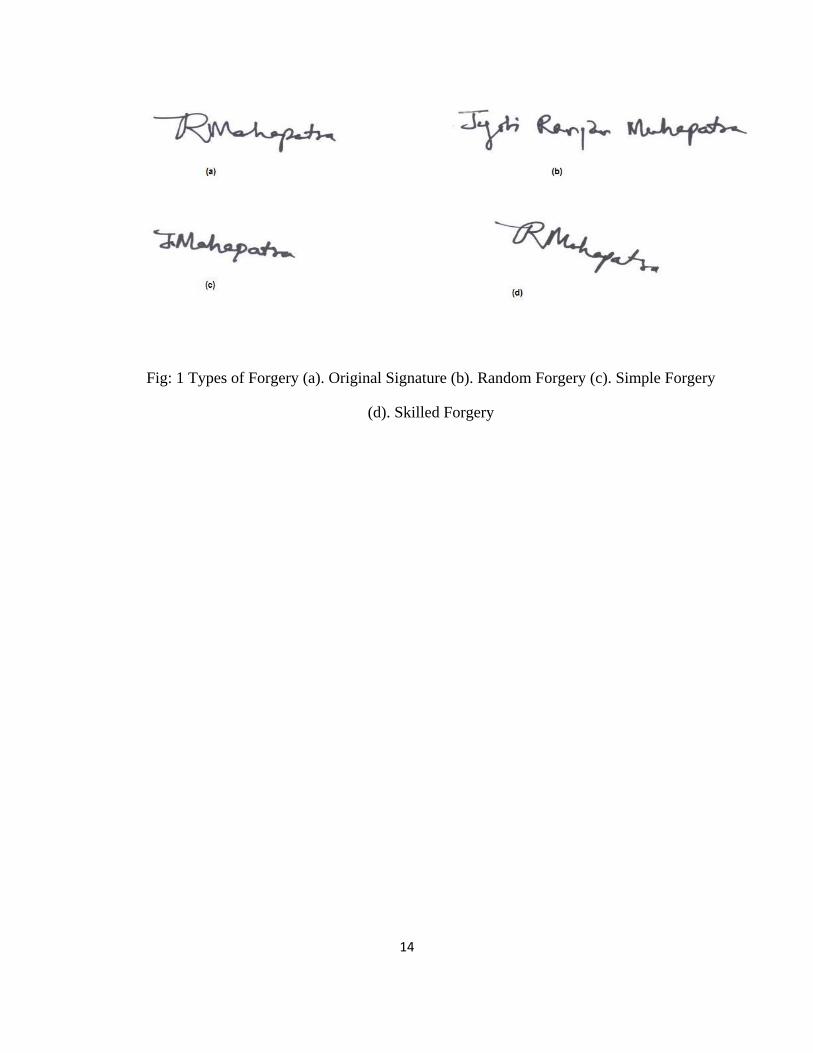
The various types of forgery include [1] :
a. Random Forgery: Random forgery is done by a person who doesn’t know the shape and
structure of the original signature.fig 1(b)
b. Simple Forgery: In this type of forgery the person concerned has a vague idea of the
actual signature, but is signing without much practice. fig 1(c)
c. Skilled Forgery: This type of forgery considers appropriate knowledge about the original
signature along with ample time for proper practice. Our proposed scheme eliminates
random and simple forgeries and also reduces skilled forgery to a great extent. fig 1(d)
14
Fig: 1 Types of Forgery (a). Original Signature (b). Random Forgery (c). Simple Forgery
(d). Skilled Forgery
15
2.3 Existing techniques:
2.3.1 Fixed Point Arithmetic method
This technique is based on geometrical features which are based on two vectors which represent
the envelope description and the interior stroke distribution in polar and Cartesian
coordinates[2].
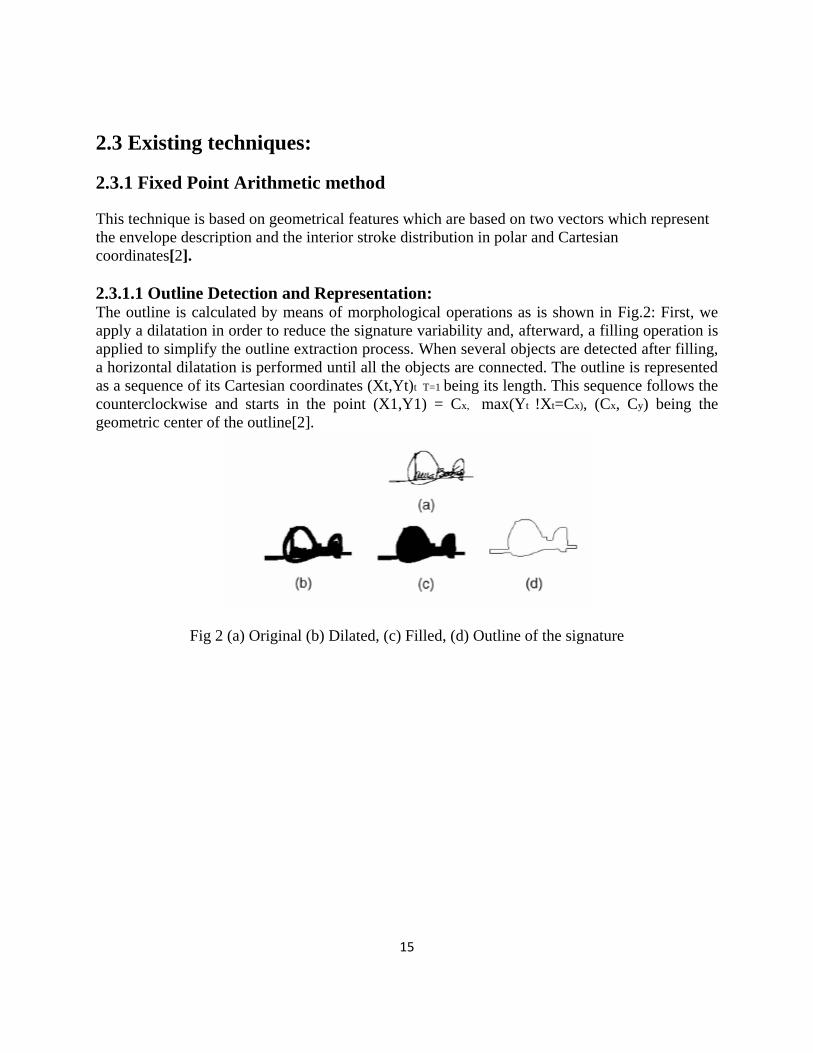
2.3.1.1 Outline Detection and Representation: The outline is calculated by means of morphological operations as is shown in Fig.2: First, we
apply a dilatation in order to reduce the signature variability and, afterward, a filling operation is
applied to simplify the outline extraction process. When several objects are detected after filling,
a horizontal dilatation is performed until all the objects are connected. The outline is represented
as a sequence of its Cartesian coordinates (Xt,Yt)t T=1 being its length. This sequence follows the
counterclockwise and starts in the point (X1,Y1) = Cx, max(Yt !Xt=Cx), (Cx, Cy) being the
geometric center of the outline[2].
Fig 2 (a) Original (b) Dilated, (c) Filled, (d) Outline of the signature
16
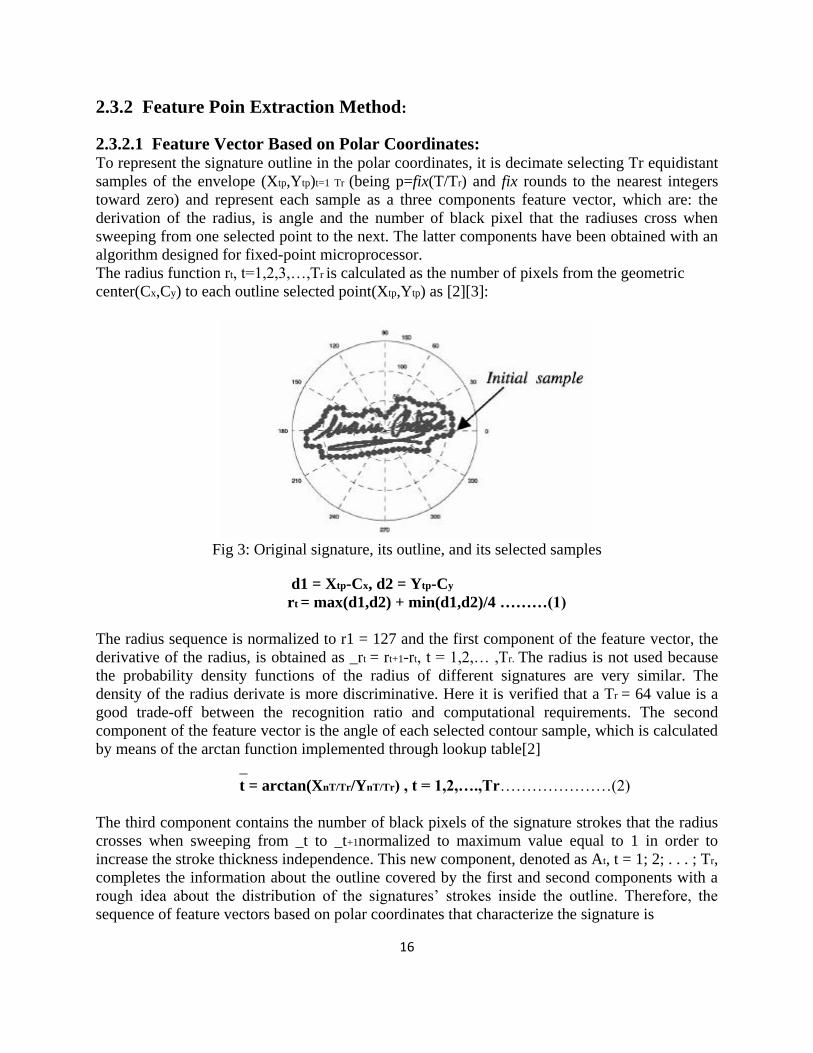
2.3.2 Feature Poin Extraction Method:
2.3.2.1 Feature Vector Based on Polar Coordinates: To represent the signature outline in the polar coordinates, it is decimate selecting Tr equidistant
samples of the envelope (Xtp,Ytp)t=1 Tr (being p=fix(T/Tr) and fix rounds to the nearest integers
toward zero) and represent each sample as a three components feature vector, which are: the
derivation of the radius, is angle and the number of black pixel that the radiuses cross when
sweeping from one selected point to the next. The latter components have been obtained with an
algorithm designed for fixed-point microprocessor.
The radius function rt, t=1,2,3,…,Tr is calculated as the number of pixels from the geometric
center(Cx,Cy) to each outline selected point(Xtp,Ytp) as [2][3]:
Fig 3: Original signature, its outline, and its selected samples
d1 = Xtp-Cx, d2 = Ytp-Cy
rt = max(d1,d2) + min(d1,d2)/4 ………(1)
The radius sequence is normalized to r1 = 127 and the first component of the feature vector, the
derivative of the radius, is obtained as _rt = rt+1-rt, t = 1,2,… ,Tr. The radius is not used because
the probability density functions of the radius of different signatures are very similar. The
density of the radius derivate is more discriminative. Here it is verified that a Tr = 64 value is a
good trade-off between the recognition ratio and computational requirements. The second
component of the feature vector is the angle of each selected contour sample, which is calculated
by means of the arctan function implemented through lookup table[2]
_
t = arctan(XnT/Tr/YnT/Tr) , t = 1,2,….,Tr…………………(2)
The third component contains the number of black pixels of the signature strokes that the radius
crosses when sweeping from _t to _t+1normalized to maximum value equal to 1 in order to
increase the stroke thickness independence. This new component, denoted as At, t = 1; 2; . . . ; Tr,
completes the information about the outline covered by the first and second components with a
rough idea about the distribution of the signatures’ strokes inside the outline. Therefore, the
sequence of feature vectors based on polar coordinates that characterize the signature is
17
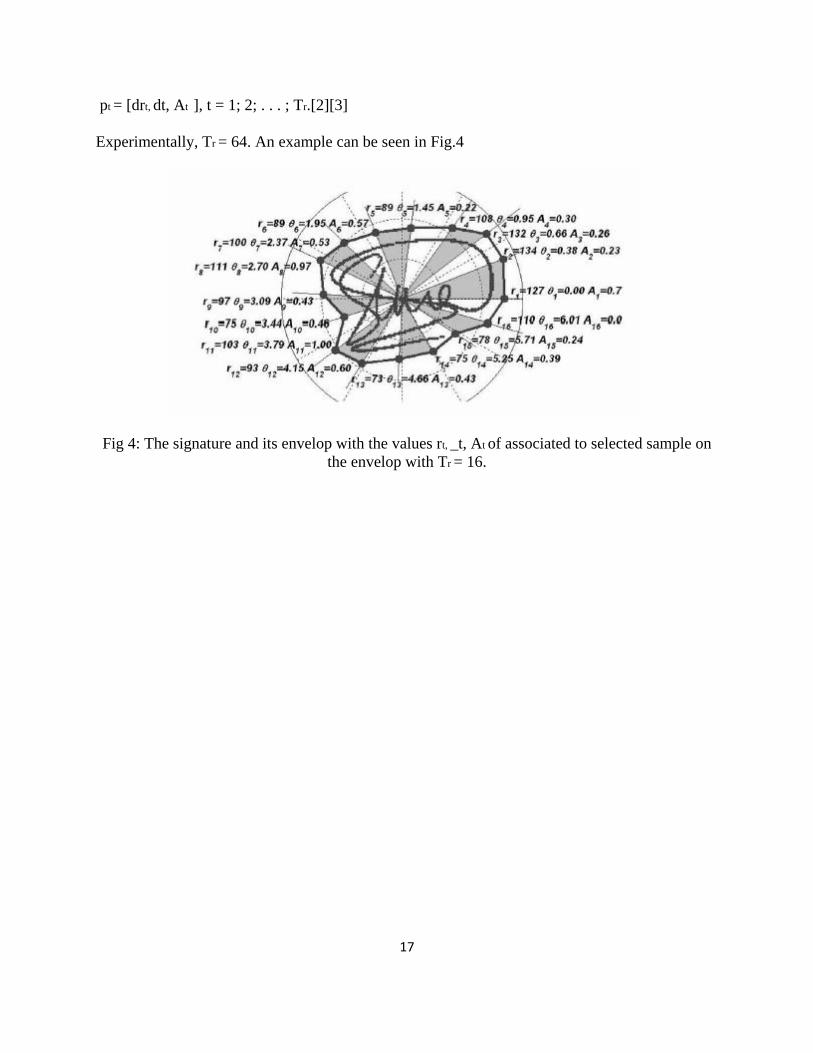
pt = [drt, dt, At ], t = 1; 2; . . . ; Tr.[2][3]
Experimentally, Tr = 64. An example can be seen in Fig.4
Fig 4: The signature and its envelop with the values rt, _t, At of associated to selected sample on
the envelop with Tr = 16.
18
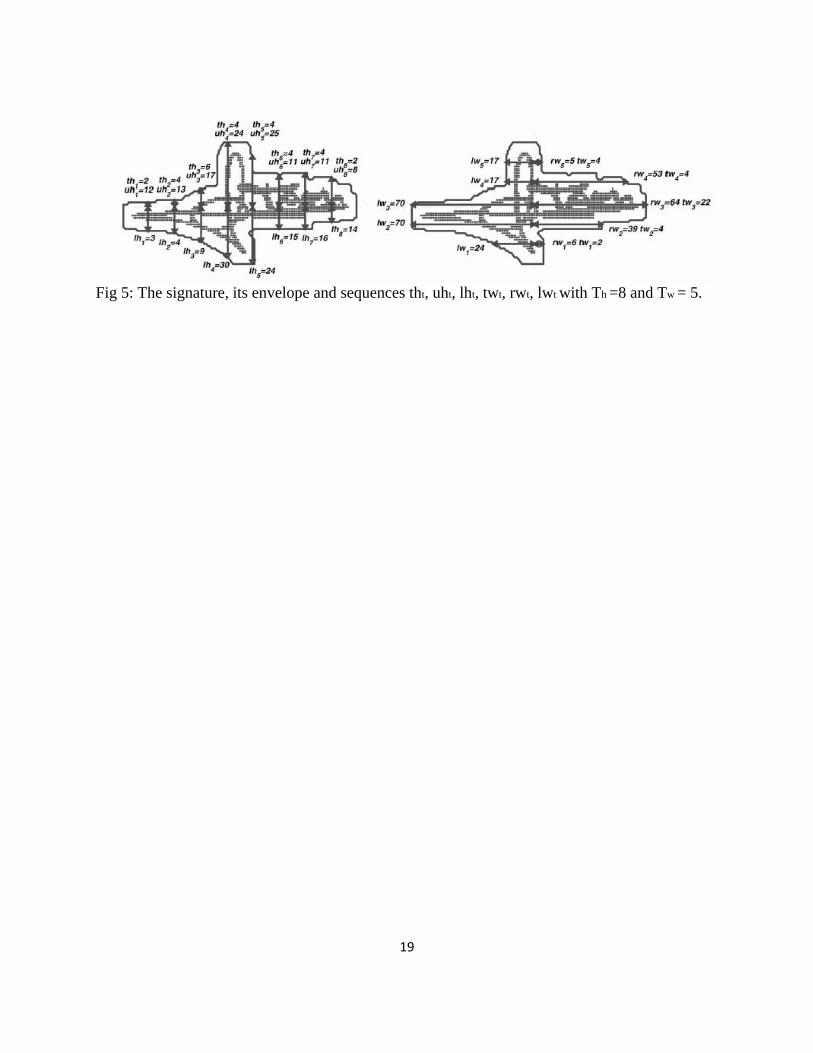
2.3.2.2 Feature Vector Based on Cartesian Coordinates:
The second feature vector is also based on the envelope and the signature strokes density
parameterization, but, in this case, in Cartesian coordinates. The envelope is divided through the
geometric center into top and bottom halves. The measurements are the height of the top half at
Th equidistant points, obtaining the sequence uht, t = 1; 2; . . . ; Th. The bottom half height is also
measured at the same Th points, getting the sequence lht, t = 1; 2; . . . ; Th.
Next, the envelope is divided in two halves once again, this time the left and right-hand sides
through the geometric center. Tw equidistant measures of the width of the right and left-hand
sides are taken, obtaining the sequences rwt, t = 1; 2; . . . ; Tw, and lwt, t = 1; 2; . . . ; Tw.
The above sequences are combined, obtaining Th + Tw long sequences as follows from[2] :
………….(3)
And
…….(4)
Both sequences characterize the signature envelope shape. Here Th = 42 and Tw = 22 are used in
the experiments, looking for a trade-off between recognition ratio and computational load.
Once both sequences have been obtained, the feature vector sequence is composed of four
dimensional vectors. The first component of the feature vector is the sequence urt, t = 1; 2; . . . ;
Th + Tl , the second component is the values of llt, t = 1; 2; . . . ; Tw + Tl .
The third feature vector component is the value of the index t in order to help the HMM
synchronism. The fourth component is the sequence trt, t = 1; 2; . . . ; Th + Tl, defined as
…..(5)
where tht, t = 1; 2; . . . ; Th , from [2], contains the number of transitions (black to white or white
to black) originated by the signature strokes when we go from the bottom side to the top side of
the signature envelope following the vertical lines used to work out uht or lht Similarly, twt, t = 1;
2. . . ; Tw, contains the number of transitions when we go from the right-hand side to the left-
hand side of the signature envelope following the horizontal lines used to work out rwt or lwt.
These sequences are gathered in the sequence of vectors ct = [urt; llt; t; trt], t = 1; 2; . . . ; Th + Tl.
Here Th = 42 and Tw = 22 sequence is used.
These sequences are illustrated in Fig.5.
19
Fig 5: The signature, its envelope and sequences tht, uht, lht, twt, rwt, lwt with Th =8 and Tw = 5.

20
CHAPTER 3
IMPLEMENTATION
3.1 Obtaining gray scale image
3.2 Maintaining Uniformity Across All Pixels
3.3 Rotation of the image
3.4 Dilation
3.5 Thinning
3.6 Thinning Algorithm
3.7 Determination of the crests and troughs
3.8 Obtaining the required lengths
21
CHAPTER 3: IMPLEMENTATION:
However, various problems are associated with scanning. We might have less critical information. Also,
the image often picks up noise which hampers the analysis .As the algorithm is rotation invariant, there is
absolutely no necessity to maintain orientation during scanning.
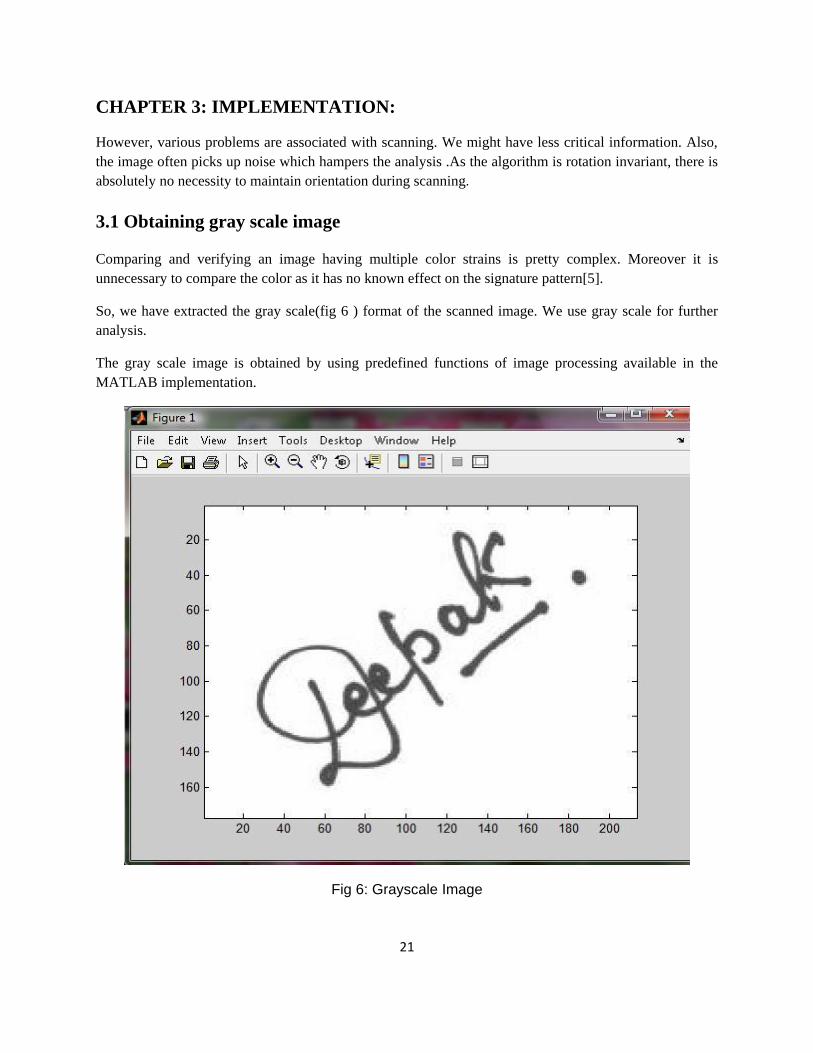
3.1 Obtaining gray scale image
Comparing and verifying an image having multiple color strains is pretty complex. Moreover it is
unnecessary to compare the color as it has no known effect on the signature pattern[5].
So, we have extracted the gray scale(fig 6 ) format of the scanned image. We use gray scale for further
analysis.
The gray scale image is obtained by using predefined functions of image processing available in the
MATLAB implementation.
Fig 6: Grayscale Image

22
3.2 Maintaining Uniformity Across All Pixels:
Often the thickness of the pen tip, type of the tip etc. Affect the image we get post scanning. The image
often contains lighter shades surrounding the actual core signature.
These often create anomalies in verification schemes. To settle matters we have created an uniform image
pattern in which all shades from black to gray are colored black and the rest area colored white.
There are 256 gray levels of a gray scale image. We need a binarized image having only black and white
values. To do so we can take any threshold value depending on our capturing device. We can have lower
values of threshold for a good image recorder. The threshold value will be high if lighter images are
obtained by the scanner.
This uniform image (fig 7) is the basis of all future analysis. The image is devoid of vague pixels and
hence is easier and more suitable to manipulate.
Fig 7 : Uniform Image
23
3.3 Rotation of the image
The image is rotated such that maximum feature points are made horizontal. The image is rotated as
follows :-
1. The geometric centre of the image is calculated by determining the centre considering the image as
rectangular.
2. A line is passed through the geometric centre and rotated from -900 to +900 .
3. The perpendicular distance of each pixel is calculated from the line and the sum of all distances from
it is calculated.
4. The line which has least sum of distances from it is found and the image is rotated about geometric
centre through an angle of tan-1 m where 'm' is the slope of the line so obtained.
For finding the geometric centre of the image, we scan the image in horizontal lines to obtain the
maximum and minimum row values. We scan the image in vertical lines to obtain the maximum and
minimum column values. The mean of these maximum and minimum values gives the required point.
For finding the angle in which the given image has been rotated , we consider the line for which the sum
of the distances of all the pixels from the line is minimum to be the horizontal line. So , we can rotate the
image to make this line horizontal and have our upright image. To do this we rotate a line about the
geometric centre from -900 to +900 in steps of 10. For each line we find the sum of the perpendicular
distances of all the pixels from this line. We obtain the slope of the line for which this sum is minimum.
By doing so we obtain a generalized line keeping a particular signature in view. The same signature will
always have the same line as the minimum sum line for any angle of rotation. So, this makes our scheme
fully rotation invariant. We are obtaining a feature which can give the angle rotated.
The angle so chosen is taken in to account considering all the pixel points of the image. So , the error of
obtaining the angle will be very less. All the pixels contribute to this angle and we have a lot of points for
a single image.
The image is rotated about geometric centre through an angle obtain from this iteration using sine and
cosine transformation used to rotate an image.
x = j * cos(a) + i * sin(a)
y= -i * cos(a) + j * sin(a)
24
where,
i is the row value of the pixel being rotated
j is the column value of the pixel being rotated
a is the angle of rotation.
This differs from the image rotation in rectangular co-ordinates because here the centre of axes is at the
top left corner of the image and the values in y axis increase towards the bottom.
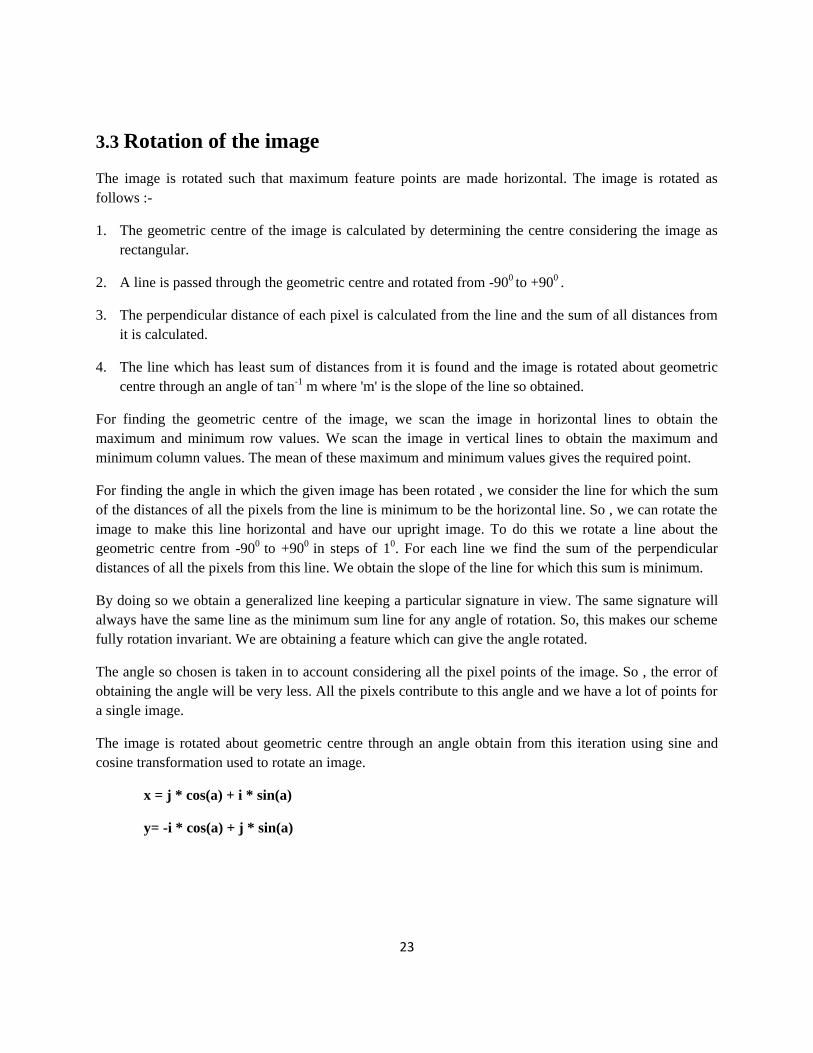
Noise is added to the image (fig 8) so obtained because we take rounded values for pixels as they have
only integral values. By doing so, many white pixels are obtained in the rotated image which should
actually be black. So, the obtained image should be treated before it is processed further.
Fig 8 : Rotated Image
25
3.4 Dilation
The rotated image has certain pixels overlapped and lost due to rounding problems. Also the
rotation brings about abnormality in the image texture.
So, we dilate the rotated image to restore normality. The dilated image is the perfect format after
which we can employ the matching techniques [2].
It is devoid of all noise, is rotation invariant, and uniform.
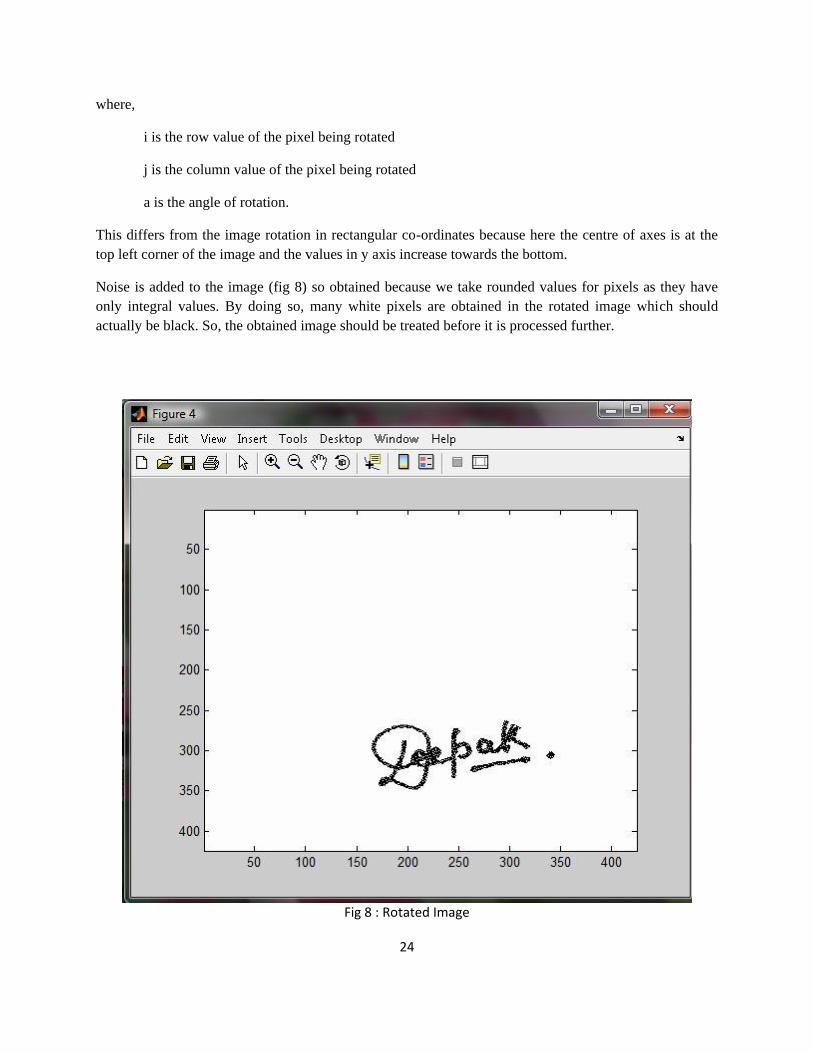
Fig 9: The change in the pixel values made during dilation
For dilation, we scan the whole image. We highlight the neighboring 8 pixels of a highlighted
pixel. Care is taken such that we do not consider the points obtained in the present process of
highlighting for highlighting other pixels. This algorithm works well because the noise lies
within the black region and these are generally too small in size. So, by just illuminating the
sides of illuminated pixels we remove the distortion and we do not have to apply any
complicated algorithm. And also we need not worry for obtaining a thicker image as we do
thinning at a later stage which just inverts the process of blurring.
Dilation thickens the image and increases the no. of illuminated pixels there by giving a 'bold'
look to the image.
This process also helps to obtain a connected image which may have become disconnected after
rotation. Rotation may make the image to have many white pixels within it. These points give a
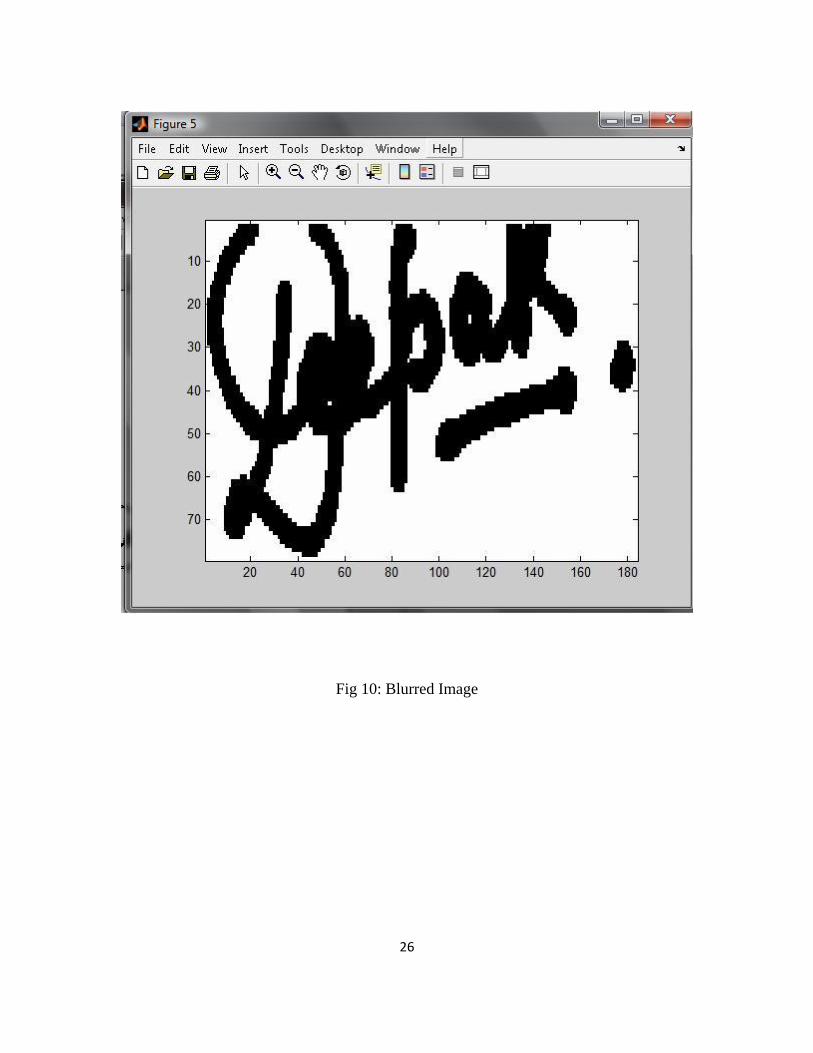
different image after thinning. Dilation makes the image (fig 10 ) continuous due to which we
get a clear and correct image after thinning.
26
Fig 10: Blurred Image
27
3.5 Thinning
It is well known that the general problem of pattern recognition lies in the effectiveness and
efficiency of extracting the distinctive features from the patterns. Our suggested stroke analysis
method is a powerful approach to recognizing the signature pattern. It should be noted that the
strokes thinned by hardware or software are accompanied by different kinds of distortion. At the
same time, the pixels are labeled so that the original image can be reconstructed from its
skeleton. Our goal is to find a faster and efficient parallel thinning algorithm. The distortion
should be as little as possible. Experimental results indicate that this method can be used to thin a
variety of digital patterns [4].
Image details
A binary digitized picture is defined by a matrix IT where each pixel IT(i, j) is either 1 or 0. The
pattern consists of those pixels that have value 1. Each stroke in the pattern is more than one
element thick. Iterative transformations are applied to matrix IT point by point according to the
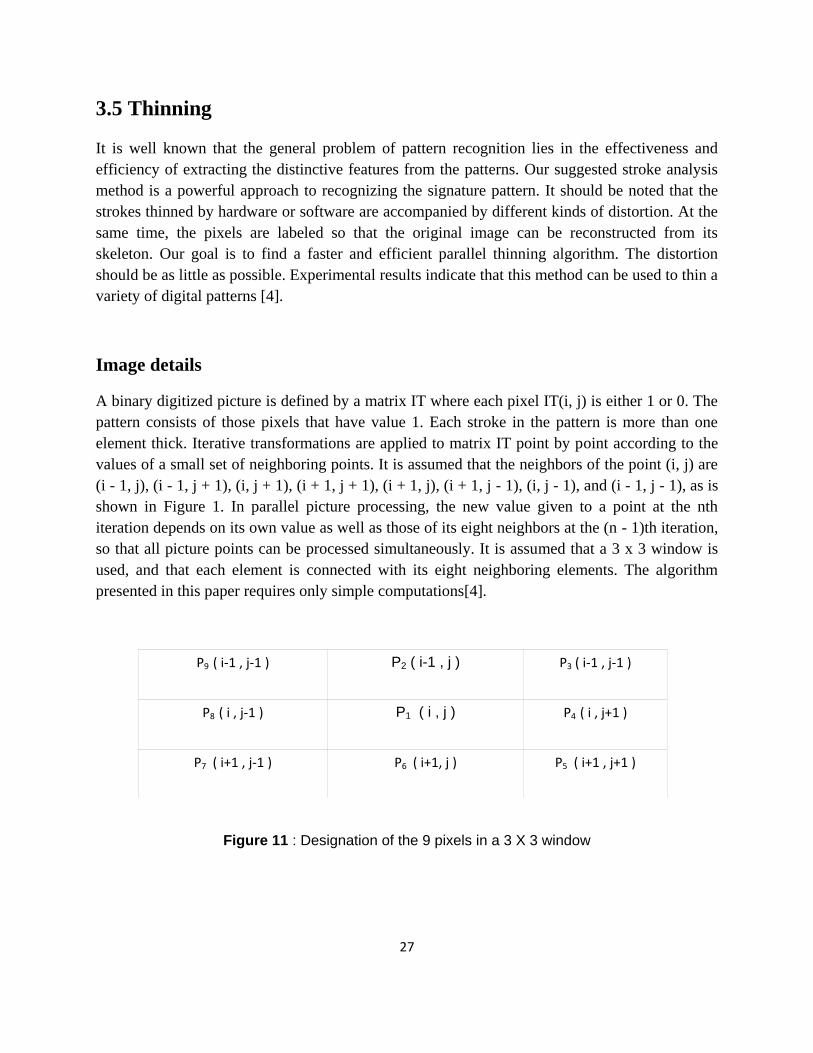
values of a small set of neighboring points. It is assumed that the neighbors of the point (i, j) are
(i - 1, j), (i - 1, j + 1), (i, j + 1), (i + 1, j + 1), (i + 1, j), (i + 1, j - 1), (i, j - 1), and (i - 1, j - 1), as is
shown in Figure 1. In parallel picture processing, the new value given to a point at the nth
iteration depends on its own value as well as those of its eight neighbors at the (n - 1)th iteration,
so that all picture points can be processed simultaneously. It is assumed that a 3 x 3 window is
used, and that each element is connected with its eight neighboring elements. The algorithm
presented in this paper requires only simple computations[4].
P9 ( i-1 , j-1 ) P2 ( i-1 , j ) P3 ( i-1 , j-1 )
P8 ( i , j-1 ) P1 ( i , j ) P4 ( i , j+1 )
P7 ( i+1 , j-1 ) P6 ( i+1, j ) P5 ( i+1 , j+1 )
Figure 11 : Designation of the 9 pixels in a 3 X 3 window
28
3.6 Thinning Algorithm
Our method for extracting the skeleton of a picture consists of removing all the contour points of
the picture except those points that belong to the skeleton.[4] In order to preserve the
connectivity of the skeleton, we divide each iteration into two sub iterations. In the first sub
iteration, the contour point P1 is deleted from the digital pattern if it satisfies the following
conditions :
(a) 2 <= B(P1) <= 6
(b) A(P1) = 1
(c) P2 * P4 * P6 = 0
(d) P4 * P6 * P8 = 0
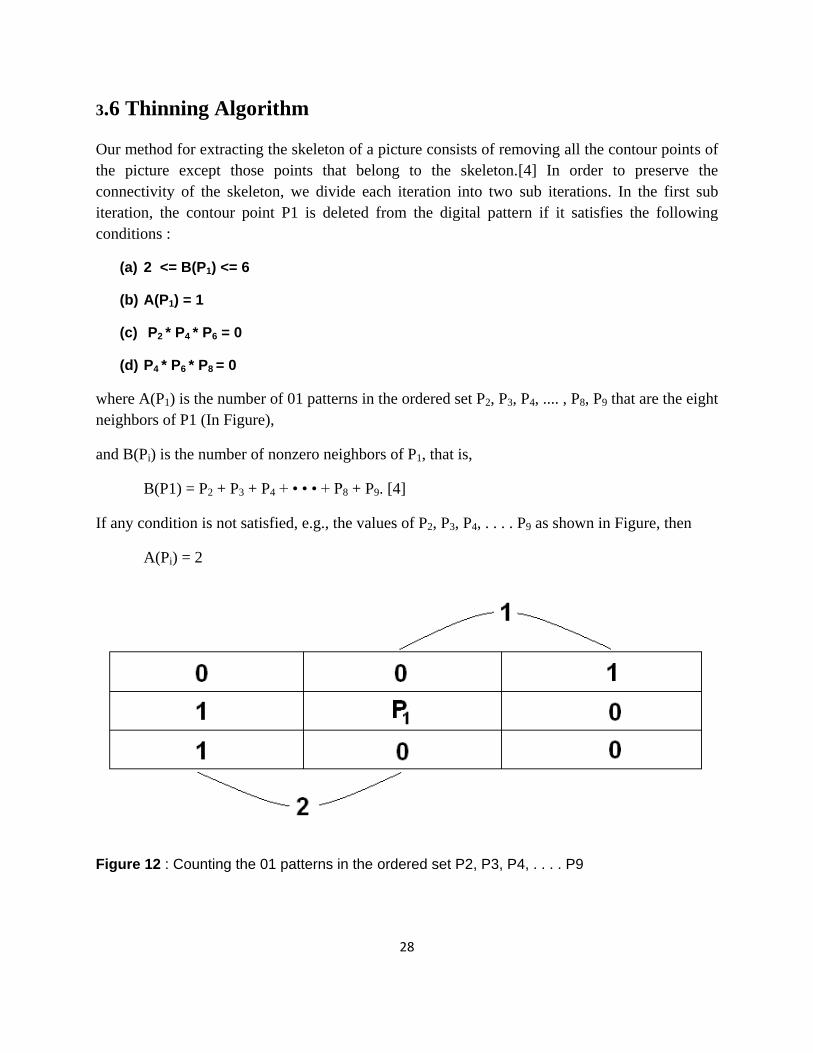
where A(P1) is the number of 01 patterns in the ordered set P2, P3, P4, .... , P8, P9 that are the eight
neighbors of P1 (In Figure),
and B(Pi) is the number of nonzero neighbors of P1, that is,
B(P1) = P2 + P3 + P4 + • • • + P8 + P9. [4]
If any condition is not satisfied, e.g., the values of P2, P3, P4, . . . . P9 as shown in Figure, then
A(Pi) = 2
Figure 12 : Counting the 01 patterns in the ordered set P2, P3, P4, . . . . P9

29
Therefore, P1 is not deleted from the picture.
In the second subiteration, only conditions (c) and (d) are changed (Figure 3) as follows:
(c') P2 x P4 x P8 = 0
(d') P2 x P6 x P8 = 0
and the rest remain the same [4].
(a) 2 <= B(P1) <= 6
By condition (a), the endpoints of a skeleton line are preserved.
(b) A(P1) = 1
condition (b) prevents the deletion of those points that lie between the endpoints of a
skeleton line, as shown in Figure 5. The iterations continue until no more points can be
removed.
Figure 13: Preventing the deletion of end points
By conditions (c) and (d) of the first sub iteration, it will be shown that the first sub iteration
removes only the south-east boundary points and the north-west corner points which do not
30
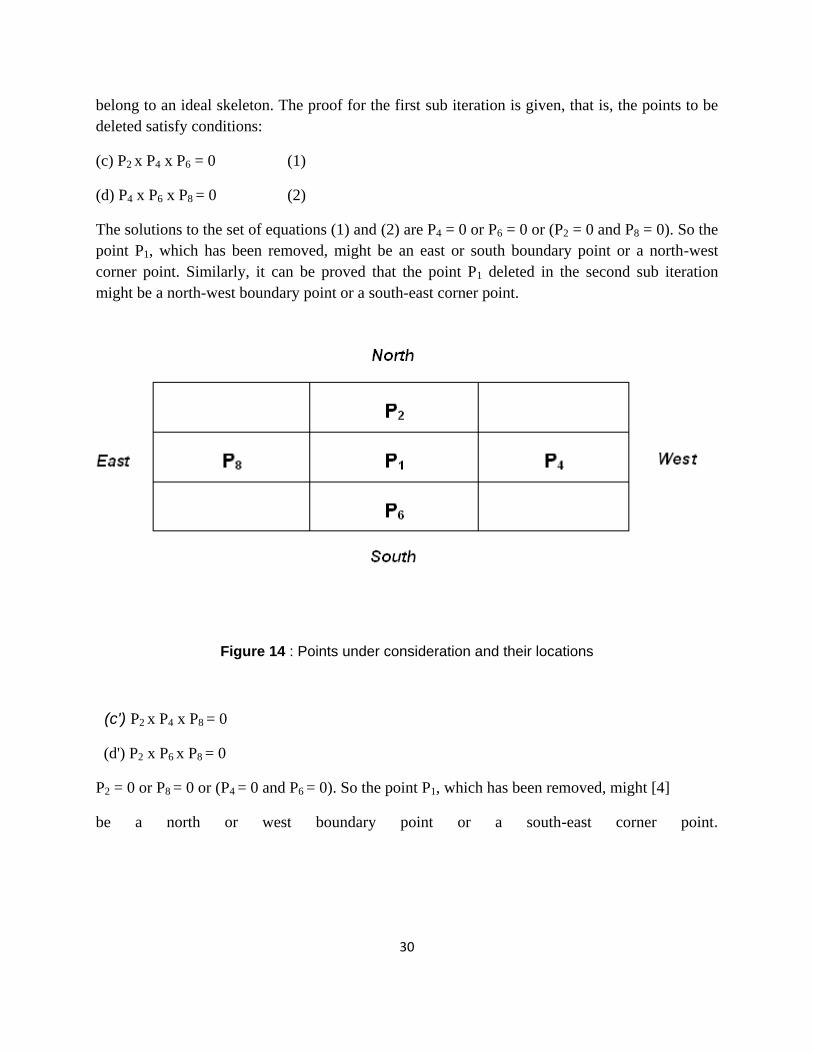
belong to an ideal skeleton. The proof for the first sub iteration is given, that is, the points to be
deleted satisfy conditions:
(c) P2 x P4 x P6 = 0 (1)
(d) P4 x P6 x P8 = 0 (2)
The solutions to the set of equations (1) and (2) are P4 = 0 or P6 = 0 or (P2 = 0 and P8 = 0). So the
point P1, which has been removed, might be an east or south boundary point or a north-west
corner point. Similarly, it can be proved that the point P1 deleted in the second sub iteration
might be a north-west boundary point or a south-east corner point.
Figure 14 : Points under consideration and their locations
(c') P2 x P4 x P8 = 0
(d') P2 x P6 x P8 = 0
P2 = 0 or P8 = 0 or (P4 = 0 and P6 = 0). So the point P1, which has been removed, might [4]
be a north or west boundary point or a south-east corner point.
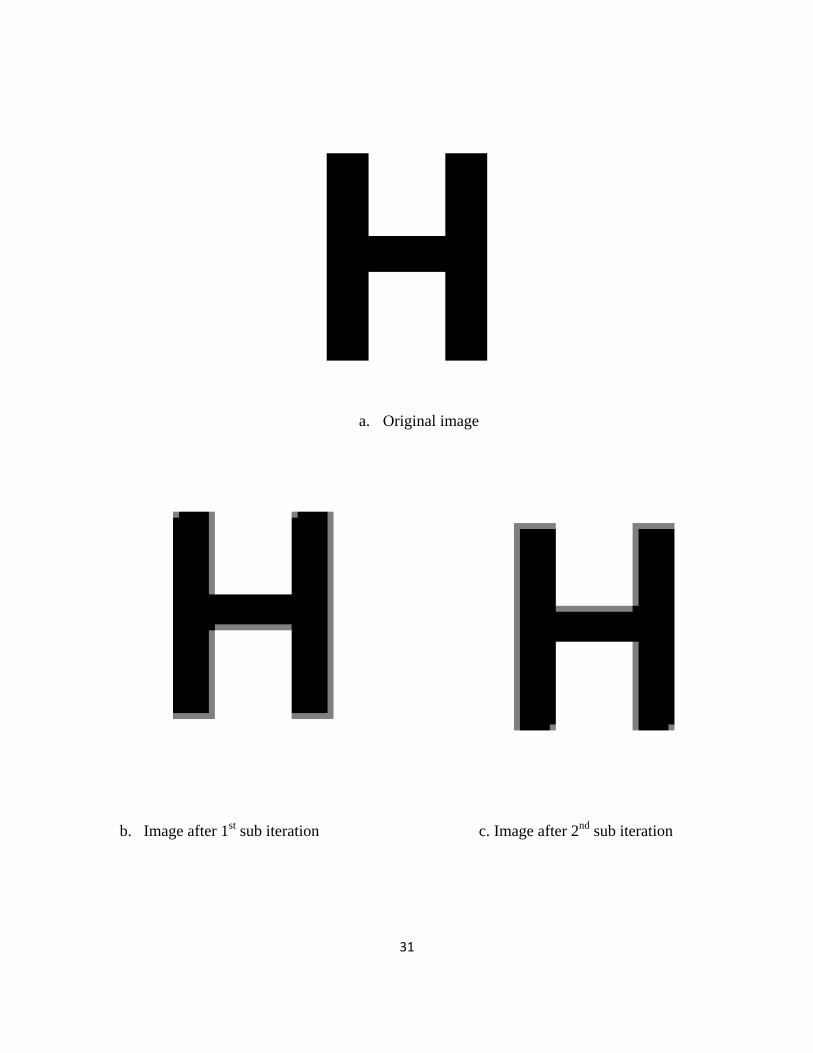
31
a. Original image
b. Image after 1st sub iteration c. Image after 2
nd sub iteration

32
d. final Image
Fig15: Image Thinning

33
Fig 16 : Flowchart of thinning algorithm
A flow chart of the proposed thinning algorithm is shown in the figure. Initially the original image
is stored in the matrix IT and a counter C is set to 0. The result of the processed picture is
stored in IT and a counter C is set to 0. The result of the processed image is stored in the matrix
IT. To save memory only two matrices IT and M are used in the program.
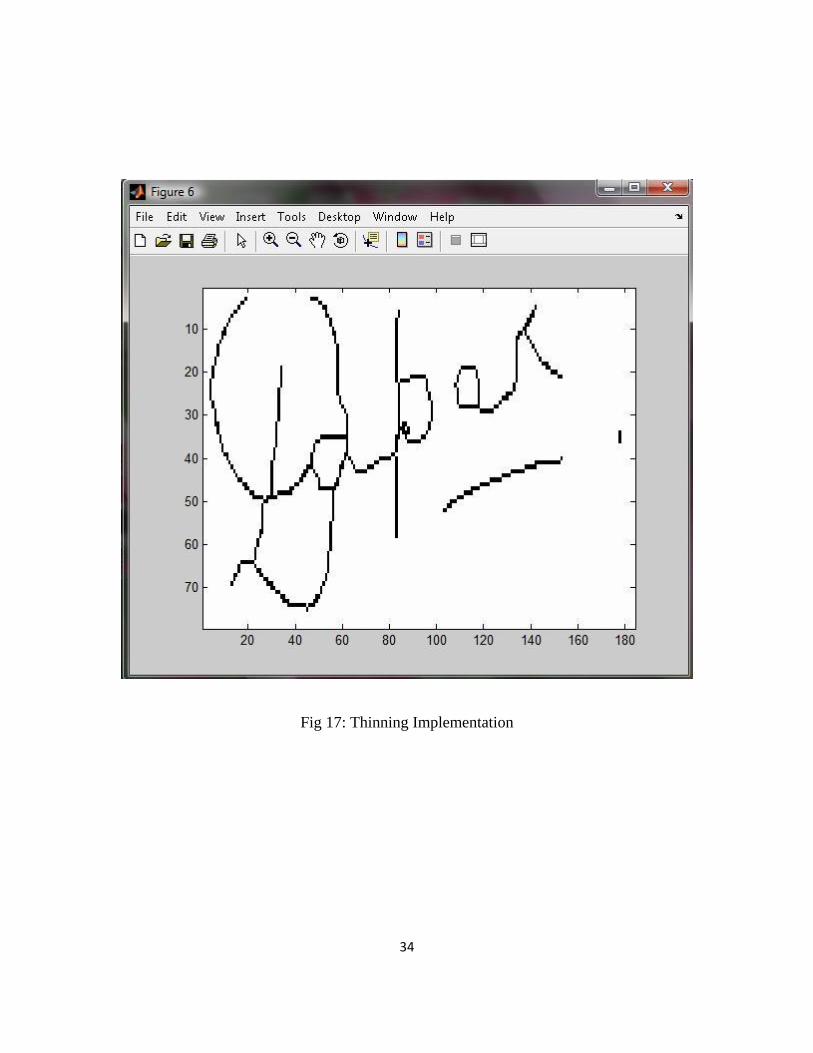
34
Fig 17: Thinning Implementation

35
3.7 Determination of the crests and troughs
The algorithm centers itself on the theory that smaller or larger, the ratio of distances between
essential feature points remains the same.
In other words we determine the crests and troughs in a signature pattern, use them as the feature
points and calculate the distance between them. For simplicity of storage we normalize the
process and calculate the ratios with the highest value taken to be 1.
Finding crest :
For a point to be crest , the following conditions are made to be satisfied
a) P(i,j) = 1
b) P(i-1,j) = P(i-1,j+1) = P(i-1,j-1) = P(i,j-1) = 0
c) Continuing in a horizontal straight line till the conditions
P(i,j+1) = 1 and P(i-1,j+1) = 0 are satisfied
d) At the end of the line
P(i-1,j) =0 and P(i,j+1) = 0 and P(i-1,j+1) = 0
When these all conditions are satisfied the mid-point of the straight line is the required crest
point.
Condition (b) ensures the starting pixel is formed by an upward slope only
For a horizontal line formed as the crest we take the midpoint of the line. To ensure it that the
full line forms the crest conditions (c) and (d) are used.
Condition (c) takes care of the points present at the middle of the line i.e. Except the end point.
No pixel above them should be highlighted.
Condition (d) takes care of the end point. Here, the slope must be decreasing.
Finding trough :
For a point to be trough , the following conditions are made to be satisfied
e) P(i,j) = 1
f) P(i+1,j) = P(i+1,j+1) = P(i+1,j-1) = P(i,j-1) = 0

36
g) Continuing in a horizontal straight line till the conditions
P(i,j+1) = 1 and P(i+1,j+1) = 0 are satisfied
h) At the end of the line
P(i+1,j) =0 and P(i,j+1) = 0 and P(i+1,j+1) = 0
When these all conditions are satisfied the mid-point of the straight line is the required trough
point.
Condition (b) ensures the starting pixel is formed by an downward slope only
For a horizontal line formed as the trough we take the midpoint of the line. To ensure it that the
full line forms the trough , conditions (c) and (d) are used.
Condition (c) takes care of the points present at the middle of the line i.e. Except the end point.
No pixel below them should be highlighted.
Condition (d) takes care of the end point. Here, the slope must be increasing.
The crests and troughs are arranged in increasing order of their x-coordinates. Distances are
calculated between ith
and (i+1)th
points. The output is similar to fig 18.
The last step is dividing all the distances with the maximum distance, there by normalizing it.
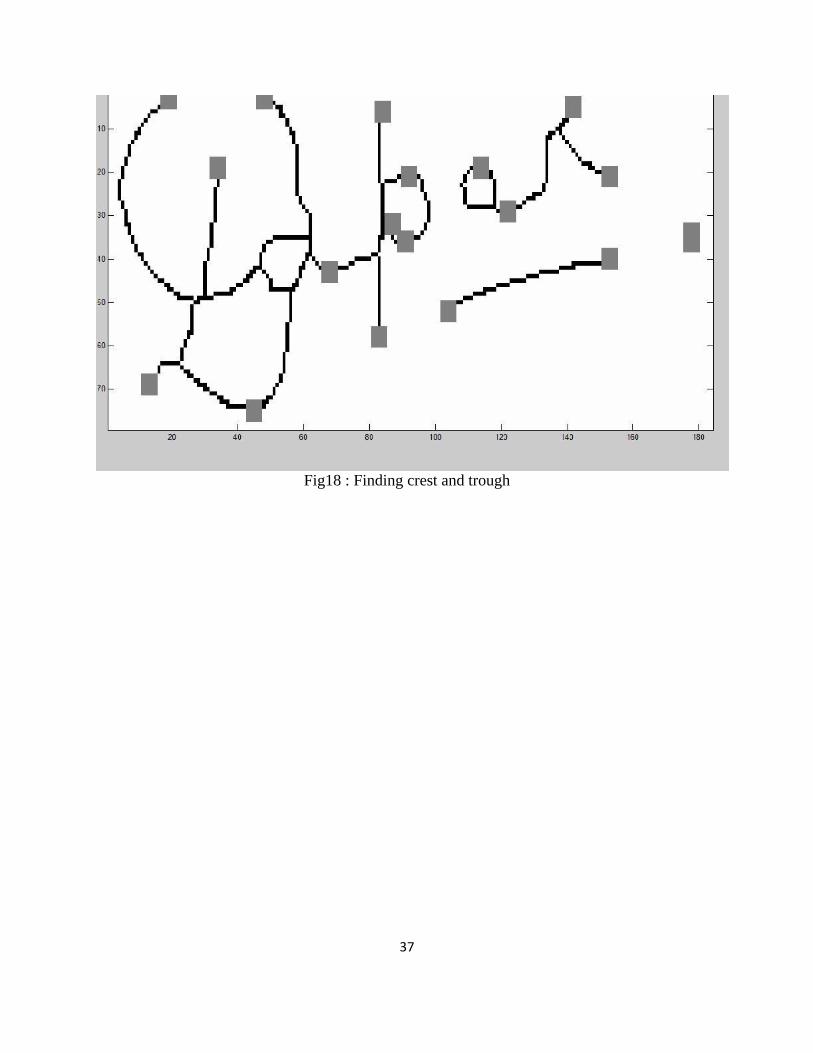
37
Fig18 : Finding crest and trough

38
3.8 Obtaining the required lengths
According to our scheme , we need find the distances between consecutive crests and troughs.
To find the order in which the occur, we arrange them in ascending order of their corresponding
column values. For the values which have the same column value we take their row values to
arrange them in ascending order.
After this, we find the distances between the consecutive points so obtained. We then find the
maximum of the distance obtained. We use it to divide all the distance values to obtain the
normalized values with maximum value as 1. By doing so we make our scheme size invariant.
The size of signatures may vary. But, the relative positions of the crests and troughs should be
same for valid signatures. So, by dividing the maximum value we normalize the signatures of all
sizes to the signature with the maximum distance value as 1.
The lengths so obtained are used in verifying other signatures which are to be matched. The
standard deviation between of these lengths is obtained and two signatures are said to be
matched if the variance lies within some threshold value, called the threshold variance. Or else
it is declared as an fake image.

39
CHAPTER 4
ANALYSIS OF THE PROPOSED SCHEME
4.1 Analysis
4.2 Quantitative Analysis of Space Required
for storing feature points.
40
Chapter 4: Analysis of the Proposed Scheme
4.1 Analysis – The analysis of a signature scheme involves the evaluation of 2 parameters: FAR &
FRR.
4.1.1 Important Terms[2]
FAR – False Acceptance Ratio. The false acceptance ratio is given by the number of fake signatures
accepted by the system with respect to the total number of comparisons made.
FRR – False Rejection Ratio – The false rejection ratio is the total number of genuine signatures
rejected by the system with respect to the total number of comparisons made.
Both FAR and FRR depend on the threshold variance parameter taken to decide the genuineness of an
image. If we choose a high threshold variance then the FRR is reduced, but at the same time the FAR also
increases.
If we choose a low threshold variance then the FAR is reduced, but at the same time the FRR also
increases.
ERR – Error rejection Rate – If the FAR of a system is same as the FRR then the system is said to be
in an optimal state. In this condition, the FAR and FRR are also known as ERR.
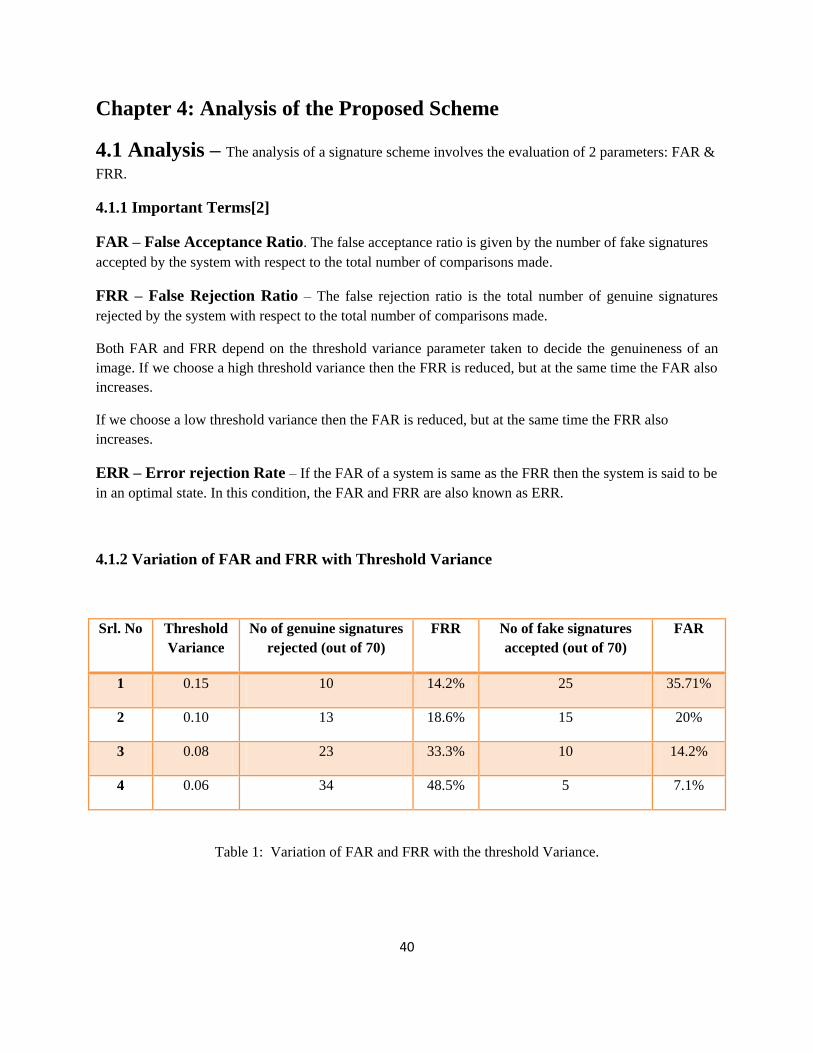
4.1.2 Variation of FAR and FRR with Threshold Variance
Srl. No Threshold
Variance
No of genuine signatures
rejected (out of 70)
FRR No of fake signatures
accepted (out of 70)
FAR
1 0.15 10 14.2% 25 35.71%
2 0.10 13 18.6% 15 20%
3 0.08 23 33.3% 10 14.2%
4 0.06 34 48.5% 5 7.1%
Table 1: Variation of FAR and FRR with the threshold Variance.
41
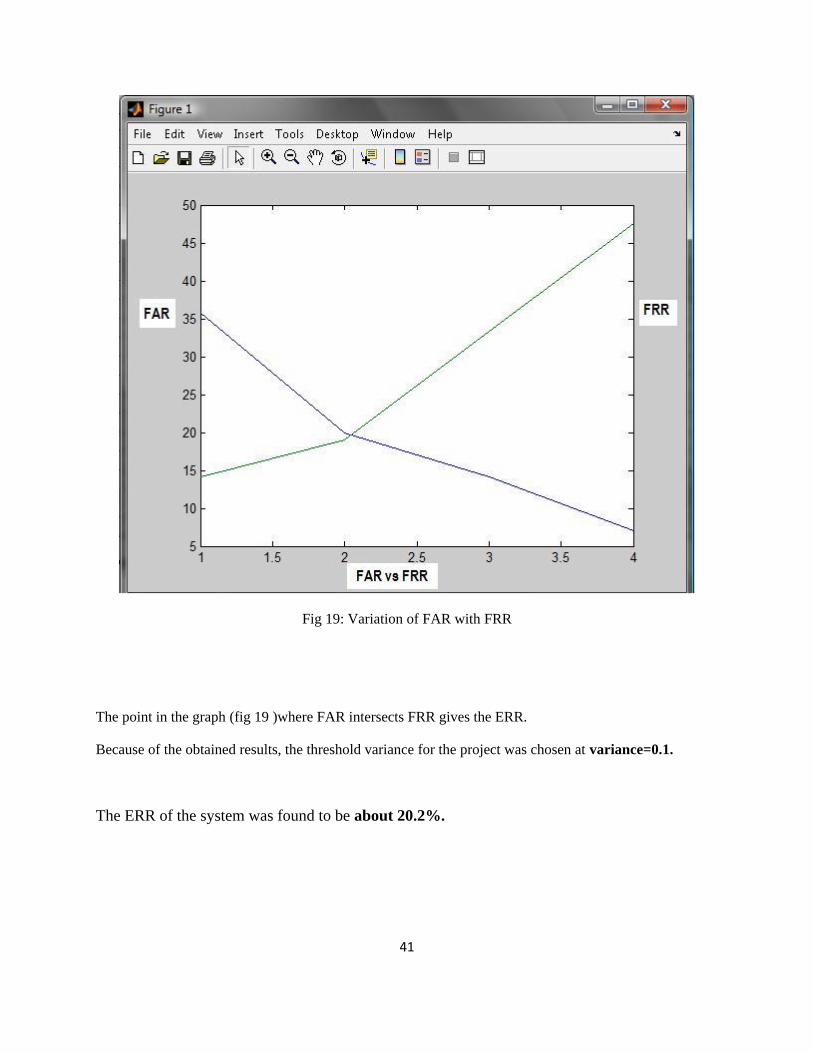
Fig 19: Variation of FAR with FRR
The point in the graph (fig 19 )where FAR intersects FRR gives the ERR.
Because of the obtained results, the threshold variance for the project was chosen at variance=0.1.
The ERR of the system was found to be about 20.2%.

42
4.2 Quantitative Analysis of space required for storing Feature Points
The feature point extraction method used as basis of the 60 feature point extraction method, which
requires storing of 3 parameters (A, r, ʘ) as floating point values, each taking 8 bytes of memory.
Hence the total memory consumed for storing feature points of 1 signature = 8 * 3 *60 bytes=1440 bytes.
In comparison, lets consider the crests and troughs obtained from fig 18.
In this case there are 18 feature points in all. They are stored as16 normalized distances.
The memory consumed = 8*16 bytes=128 bytes.
Though this figure varies from figure to figure, it is rare that a signature could contain as many as 180
feature points (When there are 180 feature points, the memory consumed by both the schemes would be
equal.) .
Hence it can be proved that the proposed scheme is more memory efficient as compared to the 60 feature
points model.

43
Chapter 5
CONCLUSION

44
Chapter 5 Conclusion
The proposed algorithm can be used as a effective signature verification system. The algorithm proposed
was successfully made rotation invariant by the rotation of the image. The Error Rejection rate was found
to be 20.2%.
The error rejection rate can further be improved by using better techniques for rotation, blurring and
thinning. Using these algorithm random and simple forgeries can be easily detected. A great number of
skilled forgeries can also be removed.
It uses a compact and memory efficient storage of feature points which reduces memory overhead and
results in faster comparisons of the data to be verified.
45
REFERENCES:
[1] Banshidhar Majhi, Y Santhosh Reddy, D Prasanna Babu, “Novel Features for Off-line
SignatureVerification” International Journal of Computers, Communications & Control, Vol.
I, No. 1, pp. 17-24, 2006.
[2] Migual A. Ferrer, Jesus B. Alonso and Carlos M. Travieso, "Off-line Geometric Parameters
for Automatic SignatureVerification Using Fixed-Point Arithmetic", IEEE Tran. on Pattern
Analysis and Machine Intelligence, vol.27, no.6, June 2005.
[3] Debasish Jena, Banshidhar Majhi, Saroj Kumar Panigrahy, Sanjay Kumar Jena “Improved
Offline Signature Verification Scheme Using Feature Point Extraction Method”.
[4] T.Y.Zhang, C.Y. Ceun “A fast algorithm for Thinning Digital Patterns”.Communications of
ACM, March 198Concepts of Image Processing.