old city of damascus, syria. - universidade do minho
TRANSCRIPT

UM
inho |
2015
Luja
in A
yman H
adba
No
ise
Ma
pp
ing
fo
r a
n U
rba
n A
rea
. S
tud
y C
ase
: O
ld C
ity o
f D
am
ascu
s,
Syri
a.
Lujain Hadba
Noise Mapping for an Urban Area.
Study Case: Old City of Damascus, Syria.
Novembro 2015
Universidade do Minho
Escola de Engenharia

Dissertação de Mestrado
Mestrado em Engenharia Urbana
Trabalho efetuado sob a orientação da
Professora Routora Ligia Maria Marques
Oliveira Torres Silva
Lujain Hadba
Noise Mapping for an Urban Area.
Study Case: Old City of Damascus, Syria.
Novembro 2015
Universidade do Minho
Escola de Engenharia
4
DECLARATION
Name: Lujain Ayman Hadba
Email: [email protected]
Student Number: pg24819
The Tittle of Master Dissertation:
Noise Mapping for an Urban Area.
Study Case: Old City of Damascus, Syria.
Supervisor: Ligia Maria Marques Oliveira Torres Silva, Ph.D
Year of Conclusion: 2015
Designated to the branch of knowledge: Master of Urban Engineering
Universidade do Minho, 2015
Signature: ___________________________________
ii
ACKNOWLEDGMENT
I would like to express my gratitude to my supervisor Prof. Ligia Silva for all the useful comments,
remarks and engagement through the learning process of this master thesis. Furthermore, I would like
to thank Prof. Ligia for introducing me to the topic as well for the support on the way.
Also, I like to thank all the help that I received from the department of Civil Engineering during the
development of the thesis, who have willingly shared their precious time during the process of work.
I would like to thank my family who has helped and supported me throughout all my staying in
Portugal and working on the thesis, both by keeping me harmonious and helping me putting pieces
together, also I would like to thank my friends, who have also supported me throughout the entire
process.
I will be grateful forever for your love.

iii
iv
ABSTRACT
Urban Noise is considered to be one of the major problems that emerged from urban growth, which affects negatively the public health and causes a negative impact on the standard of living in the cities, as a result lot of cities took steps to deal with such a problem, but because of the different sources and states of each country in the world it can’t be said that the solutions for each country were the same so it is normal that there are still a lack of action and attention toward urban noise in a lot of urban areas all over the world.
Damascus city is the capital of Syria a middle eastern country in the Arab world, located in
the west south of Syria with a population of 1.780.000 (CIVIL AFFAIRS RECORDS, CBSSYR, 2011) with a density range between 714 inhabitants/ha in crowded areas to 37 inhabitants/ha in new planned area, because of its role as the capital of Syria; it is considered to be the political and the administrative center, and it suffers from a high population in comparison with the rest of the cities of Syria and a poor urban planning development, as a result Damascus also suffers from high noise levels, mainly generated from the traffic, another reason for the high level of the noise is the lack of public awareness toward the bad effects of it.
This research aims to characterize the noise pollution in an urban area in the old city of
Damascus, the study can be divided into three steps, first: study the current situation of urban noise in the city of Damascus and determine the main sources of noise, second: compare the measured noise level with the legalization that was set by the ministry of environment, and third: prepare a noise map for the old city using the NMPB96 methodology with CADNA software to characterize the noise level depending on land use maps, population distribution numbers and traffic maps.
The noise map of the old city of Damascus can help to determine the noise levels in the old
city the main sources and suggest some solution that can be taken considering re-planning the old city to take a step toward more sustainable development for the heart of the old city of Damascus.
Keywords: Noise maps, Damascus urban planning, Noise in Damascus, Syria

v
vi
RESUMO (ABSTRACT IN PORTUGUESE)
Poluição sonora é considerada um dos principais problemas que surgiu como consequência do crescimento urbano, o que afeta negativamente a saúde pública e causa um impacto negativo sobre a qualidade de vida nas cidades. Como resultado, muitas cidades adotaram medidas para lidar com este problema, mas por causa das diferentes fontes e características de cada país no mundo, não pode ser afirmado que as soluções a implementar em cada país sejam as mesmas.
A cidade de Damasco é a capital da Síria, país do Oriente Médio, no Mundo Árabe, localizado no sudoeste da Síria com uma população de 1.780.000 (Arquivos dos Assuntos Civis, CBSSYR, 2011) com uma faixa de densidade entre 714 hab / ha em áreas concentradas, e de 37 hab / ha na nova área planeada. Devido à sua função como capital da Síria, é considerada o centro político e administrativo do país. A elevada concentração de população, em comparação com o resto das cidades da Síria, registada em Damasco trouxe como consequência altos níveis de ruído, principalmente gerados a partir do tráfego, mas também devido à falta conscientização do público para os efeitos negativos do ruído.
Esta pesquisa tem por objetivo caracterizar a poluição sonora em uma área urbana da cidade antiga de Damasco. O estudo pode ser dividido em três etapas, a primeira: estudo da situação atual de ruído urbano na cidade de Damasco e determinar as principais fontes de ruído, segunda: comparar o nível de ruído medido com a legislação que foi definida pelo Ministério do Meio Ambiente da Síria, e terceira: desenvolver um mapa de ruído para a cidade antiga de Damasco usando o modelo de cálculo NMPB96 recorrendo ao software CADNA.
O mapa de ruído da cidade antiga de Damasco pode ajudar a determinar os níveis de ruído, suas principais fontes de ruído e sugerir soluções que podem ser tomadas considerando o re-planeamento da cidade antiga e dar um passo em direção a um desenvolvimento mais sustentável para o centro de Damasco.
Palavras chave: Mapa de Ruído; Damasco e planeamento urbano; Ruído em Damasco; Síria.

vii
viii
TABLE OF CONTENTS
ACKNOWLEDGMENT ................................................................................................................... ii
LIST OF THE ABBREVIATIONS .............................................................................................. xiii
CHAPTER 1: INTRODUCTION ..................................................................................................... 1
CHAPTER 2: THE URBAN NOISE POLLUTION....................................................................... 3
2.1. TYPICAL NOISE LEVELS ........................................................................................................... 4
2.2. TYPES OF NOISE .......................................................................................................................... 6
2.2.1. Continuous Noise ...................................................................................................................... 7
2.2.2. Intermittent Noise ...................................................................................................................... 7
2.2.3. Impulsive Noise ......................................................................................................................... 8
2.2.4. Tones in Noise ........................................................................................................................... 8
2.2.5. Low-Frequency Noise ............................................................................................................... 8
2.3. NOISE SOURCES ........................................................................................................................... 9
2.3.1. Types of noise source ................................................................................................................ 9
2.3.2. Identifying noise source ............................................................................................................ 9
2.3.3. Worldwide Noise Source ......................................................................................................... 10
2.4. NOISE CONTROL TECHNIQUES ............................................................................................ 11
2.5. NOISE INDICATORS .................................................................................................................. 14
2.6. NOISE MEASUREMENTS ......................................................................................................... 14
2.6.1. Measuring Noise Pollution using a Sound Level Meter .......................................................... 14
2.6.2. Calculation and Prediction ...................................................................................................... 16
2.7. NOISE MAPPING......................................................................................................................... 19
2.7.1. Noise Mapping Assessment Methods ...................................................................................... 19
2.7.2. Noise Mapping Software ......................................................................................................... 21
2.7.3. Area to be mapped ................................................................................................................... 21
CHAPTER 3: CASE STUDY ......................................................................................................... 23
3.1. DAMASCUS PROFILE ................................................................................................................ 23
3.2. DAMASCUS CHANGES .............................................................................................................. 24
3.3. NOISE MEASUREMENTS IN DAMASCUS CITY ................................................................. 34
3.4. NOISE LEGISLATION IN SYRIA ............................................................................................. 36
3.5. OLD CITY OF DAMASCUS ....................................................................................................... 38
3.5.1. Land Use .................................................................................................................................. 39
3.5.2. Land topography ...................................................................................................................... 42
3.5.2. Urban Structure ....................................................................................................................... 42
3.5.3. Traffic flow .............................................................................................................................. 43
3.5.4. Road surface type .................................................................................................................... 45
ix
3.5.5. Building Materials ................................................................................................................... 45
3.5.6. Building Heights ...................................................................................................................... 45
3.5.7. Population Density .................................................................................................................. 47
CHAPTER 4: NOISE MAPPING FOR THE OLD CITY........................................................... 48
4.1 DEFINING THE MAIN SOURCES OF NOISE .............................................................................. 48
4.1.1Road traffic models. Traffic flows .................................................................................................. 49
Al-Mohsiniyah School............................................................................................................................. 51
4.1.2. People actions in the area .............................................................................................................. 53
4.2. DEFINING THE NOISE PROPAGATION IN DAMASCUS ..................................................... 54
4.2.1. Atmosphere attenuation ................................................................................................................. 54
4.2.2. Ground surface, elevation and road surface type........................................................................... 55
4.2.3. Barriers and Receivers ................................................................................................................... 56
4.2.4. Preforming Noise Measurements and Noise Map ......................................................................... 57
CHAPTER 5: RESULTS DISCUSSION AND RECOMMENDATIONS ................................. 67
5.1. ANALYSIS OF NOISE MAPS .......................................................................................................... 67
5.2. SUMMARY AND FURTHER DISCUSSION ................................................................................ 86
5.3. RECOMMENDATIONS .................................................................................................................. 87
CHAPTER 6: CONCLUSION AND FUTURE DEVELOPMENTS .......................................... 90
TABLES
Table 1: The liner schedule of the noise levels between the threshold and the threshold of pain ....... 6
Table 2: Measured Noise levels in some areas in the city of Damascus by (MOE, 2009) ................ 34
Table 3: Maximum proposed levels of external noise prepared based on the experience of many
countries in this area (MOE, 2009) .................................................................................................... 37
Table 4: Maximum allowable duration of exposure to a high intensity noise (MOE, 2009) ............ 37
Table 5: The maximum allowable noise intensity in different regions in the city (MOE, 2009) ...... 38
Table 6: School’s transportation services in the old city of Damascus ............................................. 51
Table 7: Default values of sound propagation (European Commission Working Group, 2006) ...... 55
Table 8: Number of vehicles passing through Medhat Basha Street ................................................. 61
Table 9: Number of vehicles through Medhat Basha Market ............................................................ 62
Table 10: Number of vehicles through Al-Thowra Street ................................................................. 63
Table 11: Area in old city exposed to noise Lden ............................................................................... 73
Table 12: Areas in the city exposed to Ld .......................................................................................... 73
Table 13: Areas in the city exposed to Le .......................................................................................... 74
Table 14: Areas in the city exposed to Ln .......................................................................................... 74
x
FIGURES
Figure 1: Continuous Noise (Kjaer, 2001) ........................................................................................... 7
Figure 2: Intermittent Noise (Kjaer, 2001) .......................................................................................... 7
Figure 3: Implosive Noise (Kjaer, 2001) ............................................................................................. 8
Figure 4: Tones in Noise (Kjaer, 2001) ............................................................................................... 8
Figure 5: Low Frequency Noise (Kjaer, 2001) .................................................................................... 9
Figure 6: Noise Control Techniques (Tripathy, 2008) ....................................................................... 11
Figure 7: Equivalent heights in relation to the ground (Dutilleux, et al., 2010) ................................ 18
Figure 8: The Map of Syria (VOA, 2013) ......................................................................................... 23
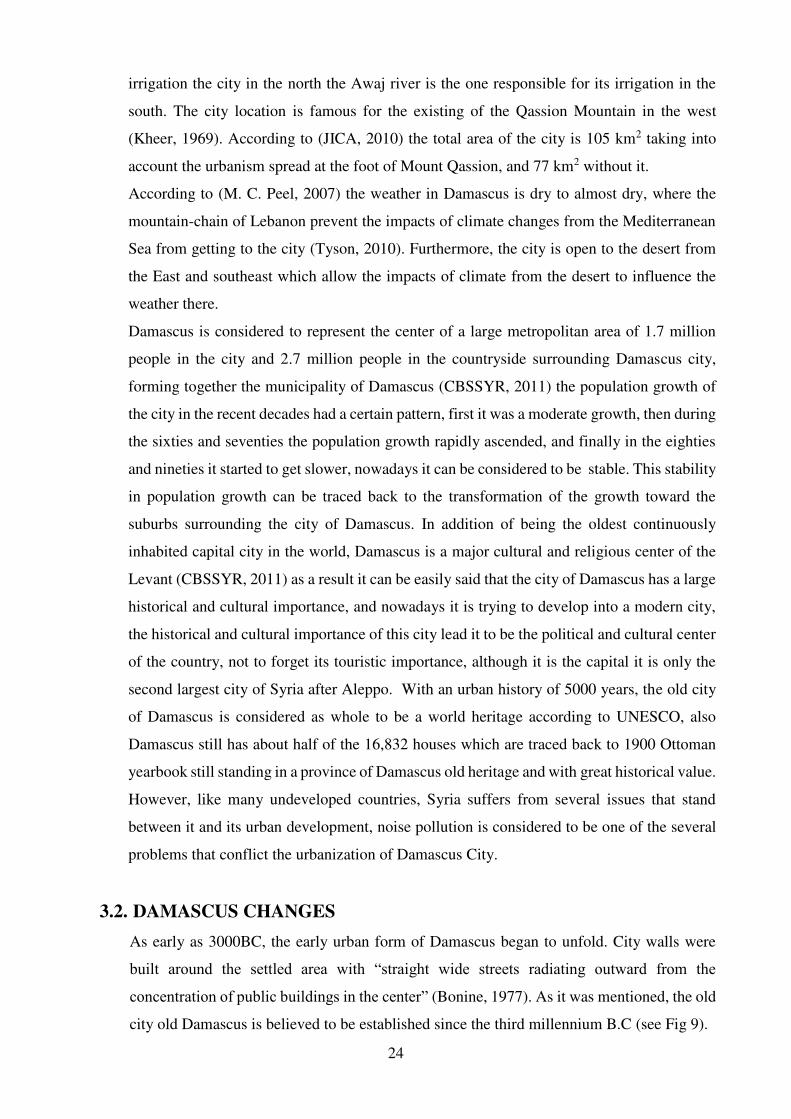
Figure 9: The temple development from a cave into a protected temple, 3000 B.C (Abdin, 2011) .. 25
Figure 10: City planning in the Canaanite Amorite era (Abdin, 2011) ............................................. 26
Figure 11: The city planning in the first Aramaic Kingdom era (Abdin, 2011) ................................ 26
Figure 12: The city planning in the second Aramaic Kingdom era (Abdin, 2011) ........................... 27
Figure 13: The city planning in the Greek era (Abdin, 2011) ........................................................... 28
Figure 14: The city planning in the Nabateans era (Abdin, 2011) ..................................................... 30
Figure 15: The city planning in the Romanian era (Abdin, 2011) ..................................................... 31
Figure 16: Damascus urban development under Roman and Byzantine (Wifstrand, 2009) ............. 31
Figure 17: Urban development of the city of Damascus in the Islamic era (Wifstrand, 2009) ......... 32
Figure 18: Urban development of the city in the Ottoman era (Wifstrand, 2009) ............................. 32
Figure 19: Urban development of Damascus under French Mandate (Wifstrand, 2009) .................. 33
Figure 20: Urban Development of Damascus city after Danger and Ecochard plan (Wifstrand, 2009)
............................................................................................................................................................ 33
Figure 21: Recent Urban Development of Damascus (Wifstrand, 2009) .......................................... 34
Figure 22: Noise survey in the street of Al-Nasser (Damascus University, 2011) ............................ 36
Figure 23: Noise survey in the street of Al-Shaalan (Damascus University, 2011) .......................... 36
Figure 24: Damascus map 2014 (UNGIWG, 2014) .......................................................................... 39
Figure 25: Land Use Map .................................................................................................................. 41
Figure 26: Old City Topography ........................................................................................................ 42
Figure 27: Old City Structure’s development from the Roman to the Arabic era (Sahar Al-qaisi, 2012)
............................................................................................................................................................ 42
Figure 28: Total number of vehicles 1984–2008 in Syria. (Almasri, Muneer, Cullinan, 2010) ........ 44
Figure 29: The linkage between old city roads and the surroundings (Al-Rez, 2010) ...................... 45
Figure 30: The Height Map of the old city ........................................................................................ 46
xi
Figure 31: Number of vehicles passing through the old city between 7:30 am until 8:30 am (Al-Rez,
2010) .................................................................................................................................................. 49
Figure 32: The schools inside the old city (Al-Rez, 2010) ................................................................ 50
Figure 33: the Numbers and types of vehicles passing near Damascus Castle in the pick hour (Al-
Rez, 2010) .......................................................................................................................................... 51
Figure 34: the Numbers and types of vehicles passing through Bab-Sharqi in the pick hours (Al-Rez,
2010) .................................................................................................................................................. 52
Figure 35: the Numbers and types of vehicles passing through Bab-Touma in the pick hours (Al-Rez,
2010) .................................................................................................................................................. 52
Figure 36: The Numbers and types of vehicles passing through Al-Hariqah Street in the pick hours
(Al-Rez, 2010) ................................................................................................................................... 52
Figure 37: Types of transportation passing through the old city (Al-Rez, 2010) .............................. 53
Figure 38: The interaction between people and vehicles inside the old city (Al-Rez, 2010) ............ 54
Figure 39: Noise attenuation depending on the distance from the source (Kjaer, 2001) ................... 55
Figure 40: Old house plan .................................................................................................................. 56
Figure 41: Acoustical Zoning Map .................................................................................................... 57
Figure 42: Importing data to CadnaA ................................................................................................ 58
Figure 43: Adding the courtyards to the buildings ............................................................................ 59
Figure 44: Adding the heights of the buildings ................................................................................. 59
Figure 45: Importing the surroundings .............................................................................................. 60
Figure 46: Medhat Basha Street ......................................................................................................... 61
Figure 47: Modelling the noise from the markets .............................................................................. 65
Figure 48: Producing the noise map .................................................................................................. 66
Figure 49: Old City of Damascus Noise map Lden ............................................................................. 67
Figure 50: Old City of Damascus Noise Map Ld ............................................................................... 68
Figure 51: Old City of Damascus Noise map Le ............................................................................... 69
Figure 52: Old City of Damascus Noise map Ln ............................................................................... 70
Figure 53: Comparing the noise map results with the Ministry of Environment Measurements ...... 71
Figure 54: Exporting the noise maps as an ArcGIS data ................................................................... 72
Figure 55: Adjusting the map on ArcGIS depending on the noise levels .......................................... 72
Figure 56 - Preforming the intersection ............................................................................................. 75
Figure 57: The intersection between the sensitive areas and the noise map for Lden ......................... 76
Figure 58: The intersection between the mixed areas and the noise map for Lden ............................. 77
Figure 59: Mixed and Sensitive areas exposed to Lden ...................................................................... 78
Figure 60: The intersection between the sensitive areas and the noise map for Ld ........................... 78
xii
Figure 61: The intersection between the mixed areas and the noise map for Ld ............................... 79
Figure 62: Mixed and Sensitive areas exposed to Ld ......................................................................... 80
Figure 63: The intersection between the sensitive areas and the noise map for Le ........................... 81
Figure 64: The intersection between the mixed areas and the noise map for Le ............................... 82
Figure 65: Mixed and Sensitive Areas exposed to Le ........................................................................ 83
Figure 66: The intersection between the sensitive areas and the noise map for Ln ........................... 84
Figure 67: The intersection between the mixed areas and the noise map for Ln ............................... 85
Figure 68: Mixed and Sensitive Areas exposed to Ln ....................................................................... 86
xiii
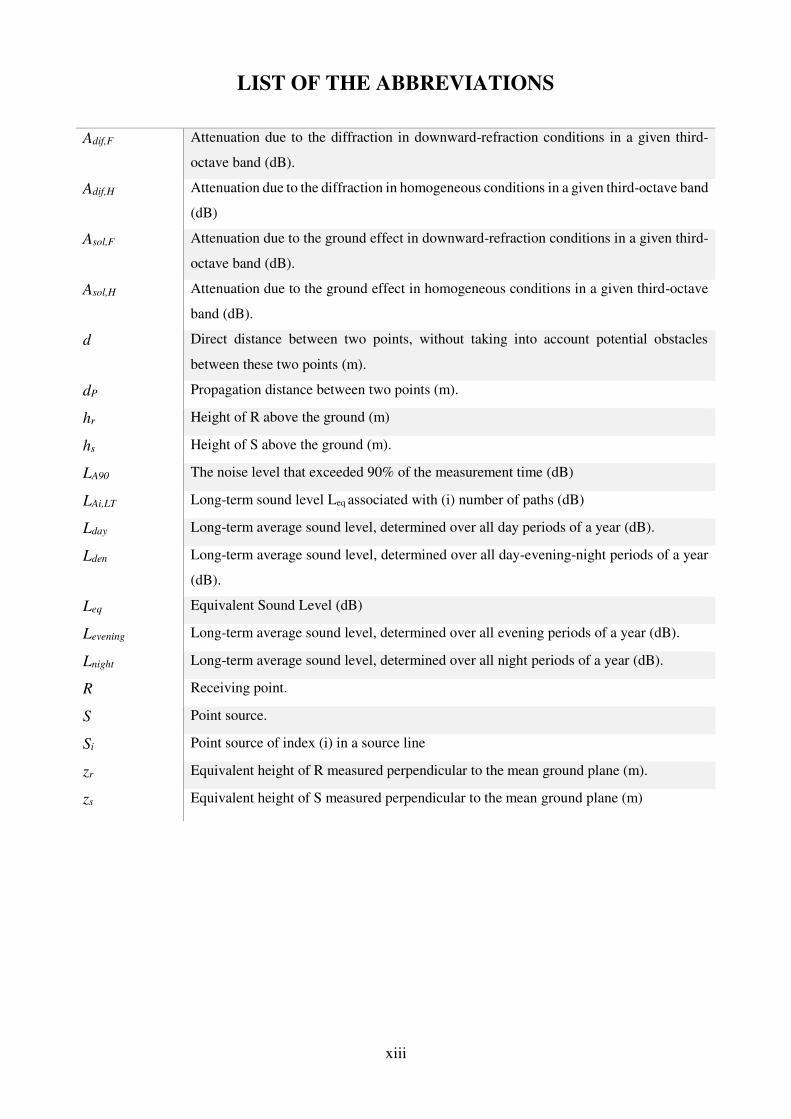
LIST OF THE ABBREVIATIONS
Adif,F Attenuation due to the diffraction in downward-refraction conditions in a given third-
octave band (dB).
Adif,H Attenuation due to the diffraction in homogeneous conditions in a given third-octave band
(dB)
Asol,F Attenuation due to the ground effect in downward-refraction conditions in a given third-
octave band (dB).
Asol,H Attenuation due to the ground effect in homogeneous conditions in a given third-octave
band (dB).
d Direct distance between two points, without taking into account potential obstacles
between these two points (m).
dP Propagation distance between two points (m).
hr Height of R above the ground (m)
hs Height of S above the ground (m).
LA90 The noise level that exceeded 90% of the measurement time (dB)
LAi,LT Long-term sound level Leq associated with (i) number of paths (dB)
Lday Long-term average sound level, determined over all day periods of a year (dB).
Lden Long-term average sound level, determined over all day-evening-night periods of a year
(dB).
Leq Equivalent Sound Level (dB)
Levening Long-term average sound level, determined over all evening periods of a year (dB).
Lnight Long-term average sound level, determined over all night periods of a year (dB).
R Receiving point.
S Point source.
Si Point source of index (i) in a source line
zr Equivalent height of R measured perpendicular to the mean ground plane (m).
zs Equivalent height of S measured perpendicular to the mean ground plane (m)

November 2015
1
CHAPTER 1: INTRODUCTION
Noise, defined as ‘unwanted sound’, is perceived as an environmental stressor and nuisance and it is
one of the major problems that the modern society suffers from. The phenomenon of noise pollution
generally consists of three inter-related elements- the source, the receiver, and the transmission path.
According to (David H.F. Liu, 1999) the source can be one or any number of devices or actions that
radiate noise or vibratory energy. Commonly the noise is largely produced by transportation sources
but it could also be produced by different types of sources. In another hand, the transmission path is
usually represented by the atmosphere through which the sound is propagated. However, it can
include the structural materials of any building containing the receiver which normally is represented
by the human.
Now a lot of countries all over the world are affected by noise pollution which mainly originates from
human activities, especially the urbanization and the development of transport and industry. As a
result, each country developed a different way to define and deal with such a problem. Damascus as
a third world country’s capital is one of the cities that have a high-density population and irregularly
urban expanding with narrow streets and poor traffic management. Leading it to face a lot of
environmental problems. Noise Pollution is one of those problems (MOE, 2009).
In Syria, the Ministry of Environmental Affairs was established and in collaboration with other
relevant ministries adopted the Syrian National Environmental Action Plan (NEAP), which proposes
several action sub-plans and programs leading to an overall sustainable development. Thus, as a
result, the Syrian Ministry of Environment made some measurements of the noise levels in different
areas of Damascus and developed some legislation considering the results of those noise
measurements (MOE, 2009). However, even after conducting the necessary measurements there were
not a significant action to be noticed.
This study aims to evaluate the current situation of noise in an important part of Damascus, the Old
City, and develop a noise map for this area. The old city of Damascus is the core of the whole city
and it has its own historical cultural importance. Additionally in an urban point of view any changes
that could be done to develop the standard of life in this area will surely affect all the areas in the city
of Damascus. In order of developing a noise map for the old city there are a lot of steps to be
considered, including gathering the population density in the old city, traffic movement, the main
sources of noise and some supporting information, then producing a land use map and a detailed
noise map using CadnaA software.
2
Afterward, the production of a noise map is followed by an analysing of the results, by comparing
the resulted noise map with the measured values by the Ministry of Environment and classifying the
most affected areas by creating an intersection between the noise map and the mixed and sensitive
areas map.
This dissertation is structured by six chapters, including the following:
The first chapter describes the introduction of the developed work
The second chapter intended to build basic knowledge of noise pollution and its levels, types, sources,
control techniques, indicators, measurements methods and maps.
The third chapter intended to introduce the case study and build a basic knowledge about the old city
of Damascus
The fourth chapter describes the application of the noise mapping method on the case study: The Old
City of Damascus
The fifth chapter includes an analyzation of the resulted noise map, summary of the results and
recommendations for the noise pollution in the old city.
The sixth chapter describes the final conclusion and the possibility of future work.
3
CHAPTER 2: THE URBAN NOISE POLLUTION
Sound is a pressure variation that the human ear can detect, where as it was mentioned earlier
noise is considered to represent the unwanted sound that could cause harm to the human ear.
A lot of health related studies confirmed that noise is one of the major environmental hazards
of modern world originating from a wide variety of sources.
First it must be pointed that it is common international practice to determine noise in terms
of levels that are expressed as a logarithmic function L of the sound pressure and adapted to
the sensitivity of the human ear (GTZ, 2002).
Environmental sound is typically measured by four descriptors, which are used to determine
the impact of environmental noise on public health and welfare. The most common measure
to express noise is the A-weighted sound level (dB (A)) (GTZ, 2002).
In the subject of protection of the public health and welfare, noise has negative effects on the
environment and the people where it could be considered one of the main sources of stress
and maybe discontinuous sleep leading as a result to a blood pressure problems. For instance,
in the research carried out by (Anianasson G, 1988) it was determined that there were
alterations in the mood of the people who were subjected to 45 dB (A) and 55 dB traffic
noise for 2 hours. Moreover, in the study of (Marks, 2007) on 12 females and 12 males, it
was observed that there were anxiety and difficulty in falling asleep in the people who were
subjected to 39, 44 and 50 dB (A) noise levels.
Discussing urban planning requires rethinking the sustainability of cities and building
healthy environments. Historically, some aspects of advancing the urban way of living have
not been considered important in city planning (Alves, Silva, & Remoaldo, 2015), where it
can be said that noise is eagerly connected to the overwhelming technological advance that
accompanied countries’ development in the last few years.
Urban noise pollution is the major factor that can degrade quality of life in the cities where
domestic and industrial sources and mainly motorized traffic are responsible for noise
emissions which decisively affect the life in today's cities. Noise normally emissions from
using the new technics to make the life easier. It could be assumed that the causes of noises
are many and varies in a lot of ways, but, in fact, it is easy to conclude that the main causes
of that are the booming growth of population in different areas of the world and the urban
sprawl over rural areas (Alves, Silva, & Remoaldo, 2015). Both of the previous causes
allowed the urban noise to grow effectively and negatively affect a wide range of urban areas
in a lot of the major cities, especially the ones that had a complicated traffic system.
4
Anyway many pieces of research declare the noise has many sources and in crowded urban
areas some sources can be effective more than others. Furthermore, according to (H.Suter,
1991) most leading noise sources will fall into the following categories: road traffic, aircraft,
railroads, construction sites, industry, noise in buildings, and consumer products. Proving
that each development has two sides so while the cities are becoming modernized they are
also becoming more subjected to environmental pollution including noise pollution.
The main problem with the conducting of any action toward reducing noise pollution is that
it is not considered to take an environmental priority unlike the important rank that air
pollution occupied for example. Furthermore, the reduction of the sound level quality was
relatively accepted by the general population as a result of the technological progress, which
eventually lead to more stress problems to emerge in the public community.
Controlling noise pollution depends internally on the economic, cultural and political state
of the country so it can be said that the reduction of environmental pollution depends entirely
on the particularities of each country. However, in the EU a significant attention was drawn
to noise pollution in 1996, when the Union’s Green Paper about Future Noise policy was
published, and the environmental commission taken into account setting some environmental
legalizations concerning noise pollution. Furthermore, according to (Silva, Oliveira, & Silva,
2013) in 2002, the European Parliament and Council adopted the European Environmental
Noise (Directive 2002/49/EC). This directive importance was illustrated by the steps taking
by it toward monitoring urban noise, requiring EU member states to produce strategic noise
maps for the major sources of noise pollution for all agglomerations with more than 250,000
inhabitants, with a deadline programmed until the year of 2007, where as a result some
affective action plans were suggested.
2.1. TYPICAL NOISE LEVELS
According to (WHO, 1999) compared to a static air pressure (105 Pa), the audible sound
pressure varies from about 20 mPa to 100 Pa; while 20 mPa corresponds to the average
person’s threshold of hearing, 100 Pa is too loud that could cause pain to the human ear, it is
called the threshold of pain.
The acoustic parameters are normally expressed as a logarithmic ratio, which can be
explained because the human ear responds logarithmically rather than linearly to stimuli
(Kjaer, 2001). This logarithmic ratio is called a decibel or dB. The linear scale is a converted
manageable scale that range from 0 dB at the threshold of hearing (20mPa) to 140 dB above
the threshold of pain.

5
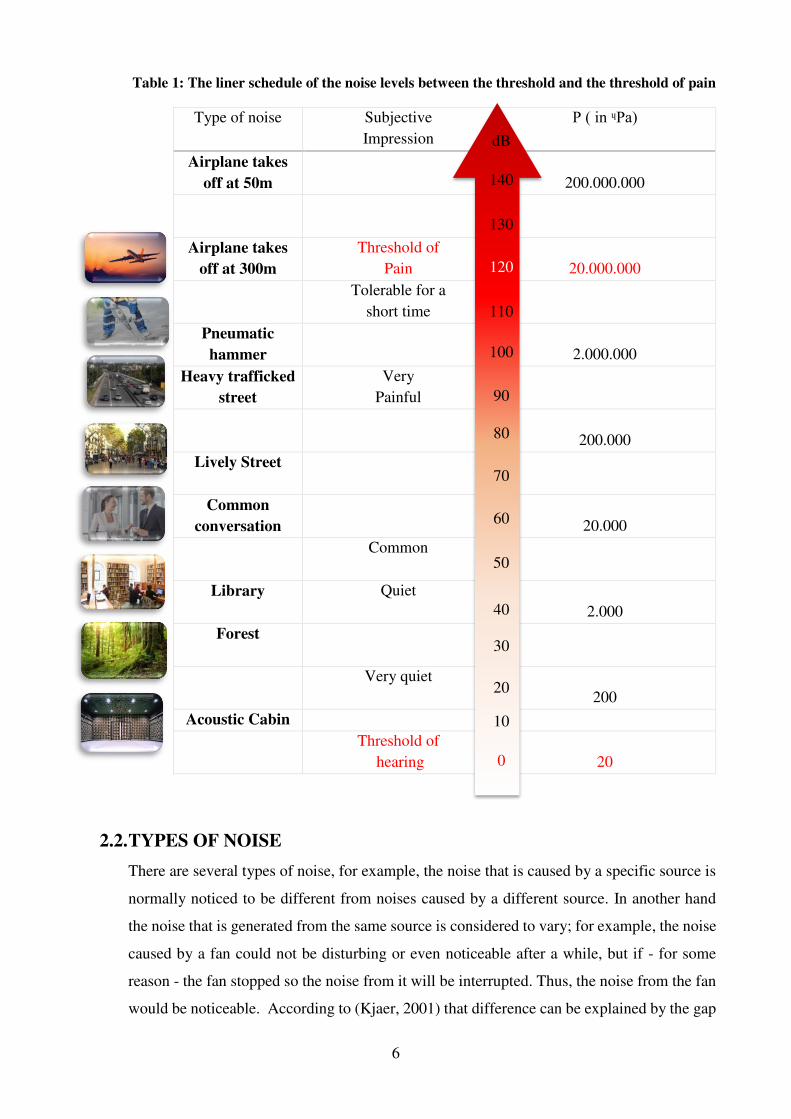
It must be mentioned that there are a large range of noise levels, as it is pointed out in the
following schedule (Table 1) which is mainly used to measure how humans perceive sound
levels.
On this linear scale of the sound levels, a reading of zero would equate to near total silence.
An acoustic cabin can reduce ambient and acoustic noise to 10 dB, and a normal conversation
about 60 dB, a heavy trafficked street would overcome a lively street with its 90 dB, while
a jet engines could reach 120 dB reaching the threshold of pain.
6
Table 1: The liner schedule of the noise levels between the threshold and the threshold of pain
Type of noise
Subjective Impression
P ( in ᶣPa)
Airplane takes
off at 50m
200.000.000
Airplane takes
off at 300m
Threshold of Pain
20.000.000
Tolerable for a short time
Pneumatic
hammer
2.000.000
Heavy trafficked
street
Very Painful
200.000
Lively Street
Common
conversation
20.000
Common
Library
Quiet 2.000
Forest
Very quiet 200
Acoustic Cabin
Threshold of hearing
20
2.2. TYPES OF NOISE
There are several types of noise, for example, the noise that is caused by a specific source is
normally noticed to be different from noises caused by a different source. In another hand
the noise that is generated from the same source is considered to vary; for example, the noise
caused by a fan could not be disturbing or even noticeable after a while, but if - for some
reason - the fan stopped so the noise from it will be interrupted. Thus, the noise from the fan
would be noticeable. According to (Kjaer, 2001) that difference can be explained by the gap
0
10
20
30
40
50
60
70
80
90
100
110
120
130
140
dB
7
between tones and noise levels, as a result in order to estimate the noise level that is emerging
from a certain source the type of that noise must be taken in consideration as the following
action of identifying the noise source so that the parameters of measuring could be known.
According to (ISO 2204, 1979) noise could be classified depending on the frequency
spectrum and time as the following:
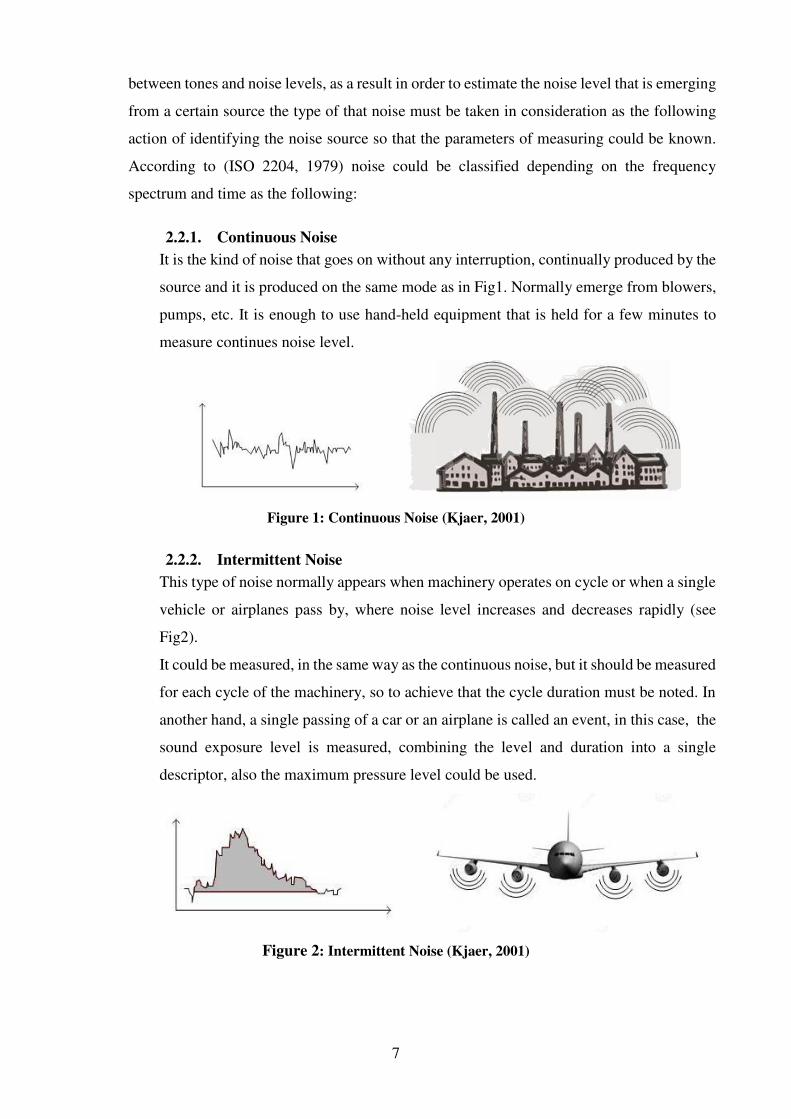
2.2.1. Continuous Noise
It is the kind of noise that goes on without any interruption, continually produced by the
source and it is produced on the same mode as in Fig1. Normally emerge from blowers,
pumps, etc. It is enough to use hand-held equipment that is held for a few minutes to
measure continues noise level.
Figure 1: Continuous Noise (Kjaer, 2001)
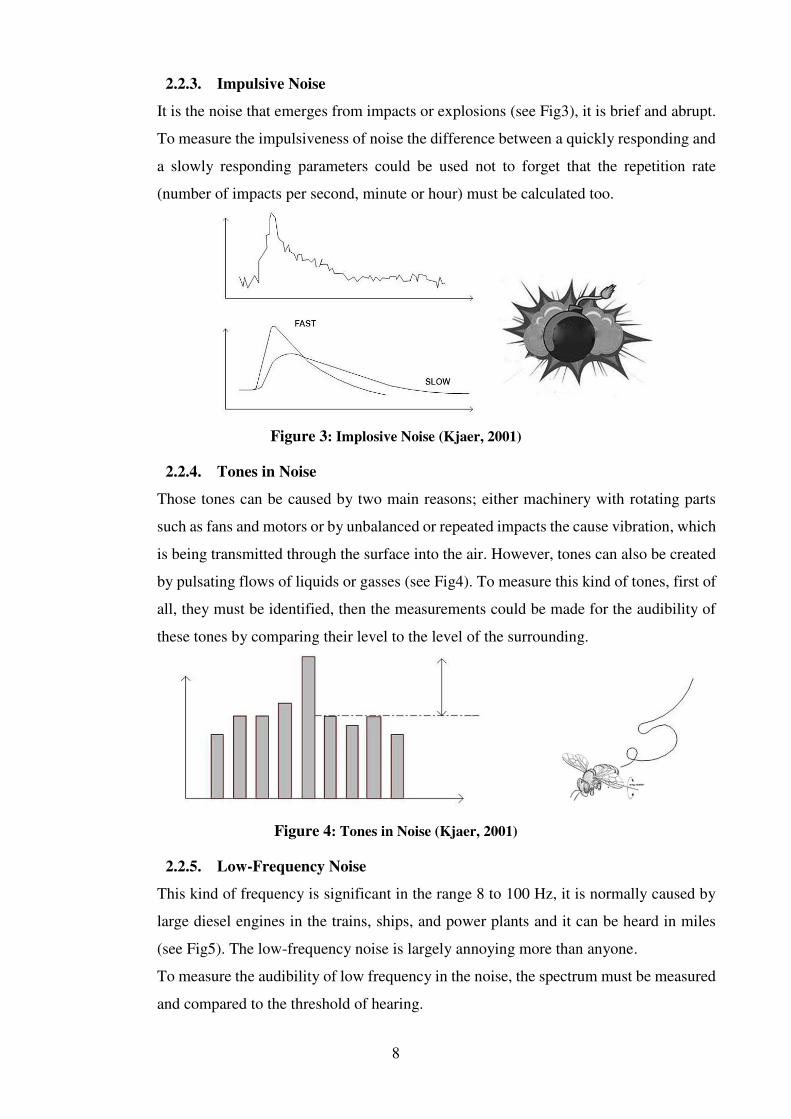
2.2.2. Intermittent Noise
This type of noise normally appears when machinery operates on cycle or when a single
vehicle or airplanes pass by, where noise level increases and decreases rapidly (see
Fig2).
It could be measured, in the same way as the continuous noise, but it should be measured
for each cycle of the machinery, so to achieve that the cycle duration must be noted. In
another hand, a single passing of a car or an airplane is called an event, in this case, the
sound exposure level is measured, combining the level and duration into a single
descriptor, also the maximum pressure level could be used.
Figure 2: Intermittent Noise (Kjaer, 2001)
8
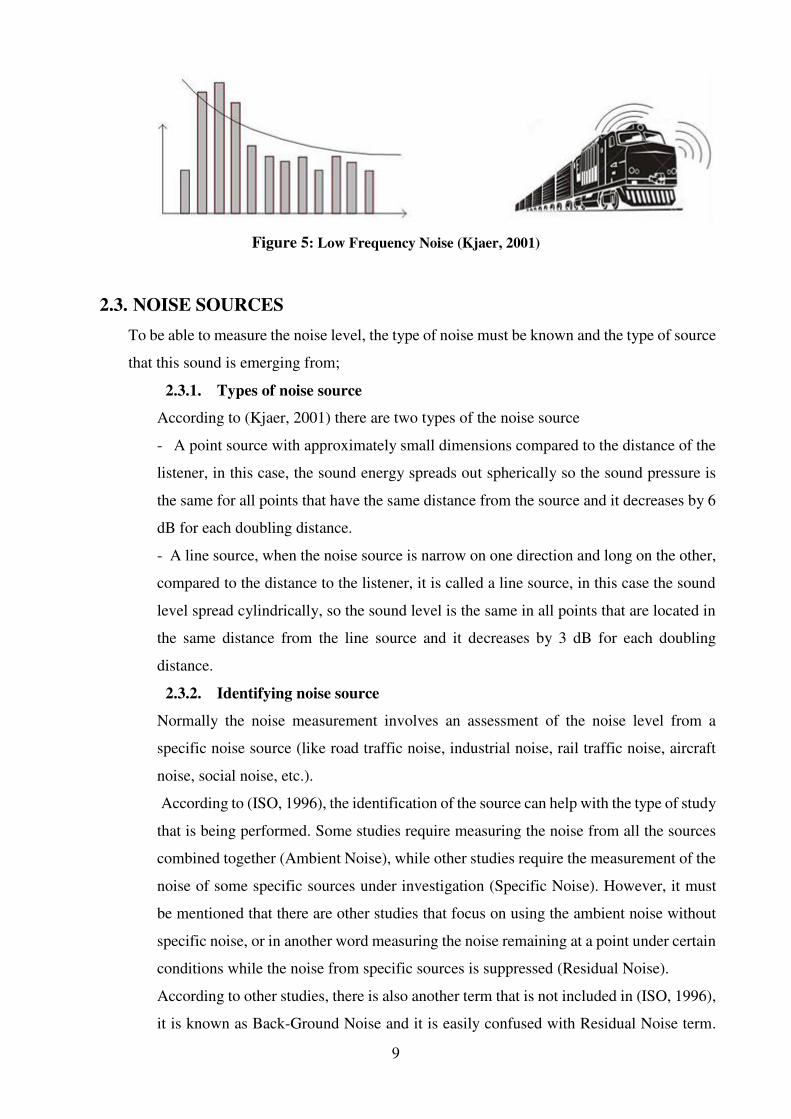
2.2.3. Impulsive Noise
It is the noise that emerges from impacts or explosions (see Fig3), it is brief and abrupt.
To measure the impulsiveness of noise the difference between a quickly responding and
a slowly responding parameters could be used not to forget that the repetition rate
(number of impacts per second, minute or hour) must be calculated too.
Figure 3: Implosive Noise (Kjaer, 2001)
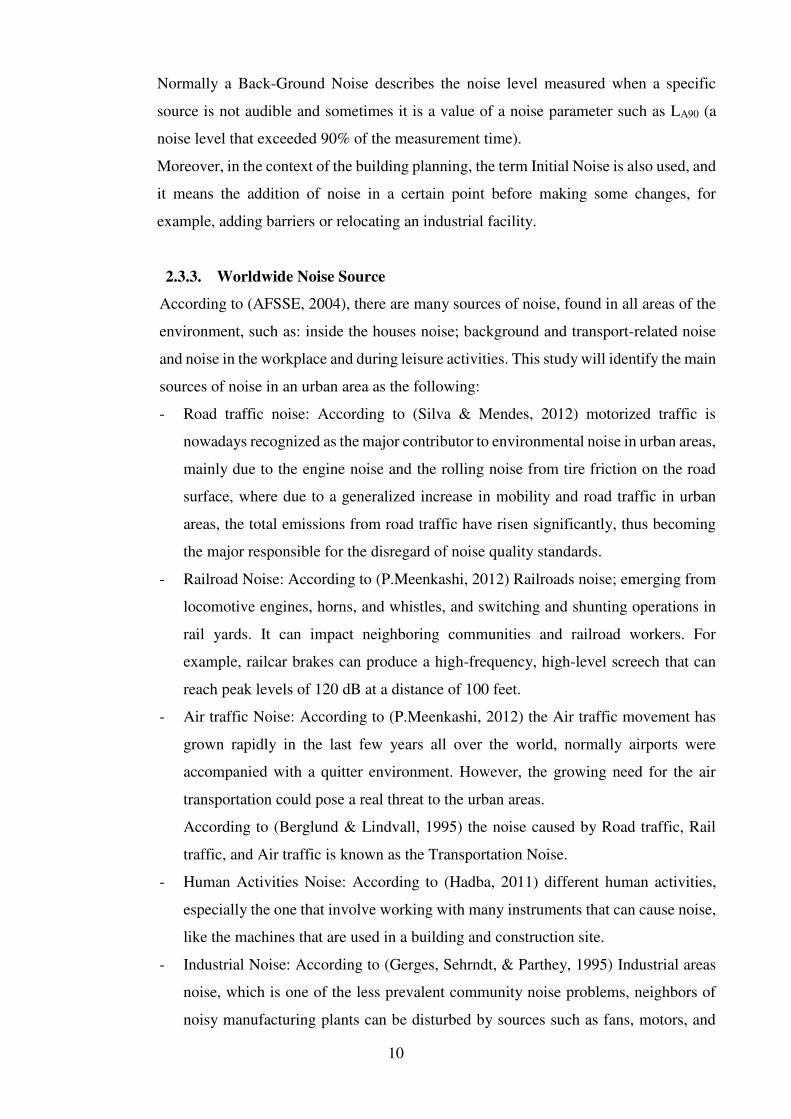
2.2.4. Tones in Noise
Those tones can be caused by two main reasons; either machinery with rotating parts
such as fans and motors or by unbalanced or repeated impacts the cause vibration, which
is being transmitted through the surface into the air. However, tones can also be created
by pulsating flows of liquids or gasses (see Fig4). To measure this kind of tones, first of
all, they must be identified, then the measurements could be made for the audibility of
these tones by comparing their level to the level of the surrounding.
Figure 4: Tones in Noise (Kjaer, 2001)
2.2.5. Low-Frequency Noise
This kind of frequency is significant in the range 8 to 100 Hz, it is normally caused by
large diesel engines in the trains, ships, and power plants and it can be heard in miles
(see Fig5). The low-frequency noise is largely annoying more than anyone.
To measure the audibility of low frequency in the noise, the spectrum must be measured
and compared to the threshold of hearing.
9
Figure 5: Low Frequency Noise (Kjaer, 2001)
2.3. NOISE SOURCES
To be able to measure the noise level, the type of noise must be known and the type of source
that this sound is emerging from;
2.3.1. Types of noise source
According to (Kjaer, 2001) there are two types of the noise source
- A point source with approximately small dimensions compared to the distance of the
listener, in this case, the sound energy spreads out spherically so the sound pressure is
the same for all points that have the same distance from the source and it decreases by 6
dB for each doubling distance.
- A line source, when the noise source is narrow on one direction and long on the other,
compared to the distance to the listener, it is called a line source, in this case the sound
level spread cylindrically, so the sound level is the same in all points that are located in
the same distance from the line source and it decreases by 3 dB for each doubling
distance.
2.3.2. Identifying noise source
Normally the noise measurement involves an assessment of the noise level from a
specific noise source (like road traffic noise, industrial noise, rail traffic noise, aircraft
noise, social noise, etc.).
According to (ISO, 1996), the identification of the source can help with the type of study
that is being performed. Some studies require measuring the noise from all the sources
combined together (Ambient Noise), while other studies require the measurement of the
noise of some specific sources under investigation (Specific Noise). However, it must
be mentioned that there are other studies that focus on using the ambient noise without
specific noise, or in another word measuring the noise remaining at a point under certain
conditions while the noise from specific sources is suppressed (Residual Noise).
According to other studies, there is also another term that is not included in (ISO, 1996),
it is known as Back-Ground Noise and it is easily confused with Residual Noise term.
10
Normally a Back-Ground Noise describes the noise level measured when a specific
source is not audible and sometimes it is a value of a noise parameter such as LA90 (a
noise level that exceeded 90% of the measurement time).
Moreover, in the context of the building planning, the term Initial Noise is also used, and
it means the addition of noise in a certain point before making some changes, for
example, adding barriers or relocating an industrial facility.
2.3.3. Worldwide Noise Source
According to (AFSSE, 2004), there are many sources of noise, found in all areas of the
environment, such as: inside the houses noise; background and transport-related noise
and noise in the workplace and during leisure activities. This study will identify the main
sources of noise in an urban area as the following:
- Road traffic noise: According to (Silva & Mendes, 2012) motorized traffic is
nowadays recognized as the major contributor to environmental noise in urban areas,
mainly due to the engine noise and the rolling noise from tire friction on the road
surface, where due to a generalized increase in mobility and road traffic in urban
areas, the total emissions from road traffic have risen significantly, thus becoming
the major responsible for the disregard of noise quality standards.
- Railroad Noise: According to (P.Meenkashi, 2012) Railroads noise; emerging from
locomotive engines, horns, and whistles, and switching and shunting operations in
rail yards. It can impact neighboring communities and railroad workers. For
example, railcar brakes can produce a high-frequency, high-level screech that can
reach peak levels of 120 dB at a distance of 100 feet.
- Air traffic Noise: According to (P.Meenkashi, 2012) the Air traffic movement has
grown rapidly in the last few years all over the world, normally airports were
accompanied with a quitter environment. However, the growing need for the air
transportation could pose a real threat to the urban areas.
According to (Berglund & Lindvall, 1995) the noise caused by Road traffic, Rail
traffic, and Air traffic is known as the Transportation Noise.
- Human Activities Noise: According to (Hadba, 2011) different human activities,
especially the one that involve working with many instruments that can cause noise,
like the machines that are used in a building and construction site.
- Industrial Noise: According to (Gerges, Sehrndt, & Parthey, 1995) Industrial areas
noise, which is one of the less prevalent community noise problems, neighbors of
noisy manufacturing plants can be disturbed by sources such as fans, motors, and
11
compressors mounted on the outside of buildings. Interior noise can also be
transmitted to the community through open windows and doors, and even through
building walls. These interior noise sources have significant impacts on industrial
workers, among whom noise-induced hearing loss is, unfortunately, common
(H.Suter, 1991) the noise caused by a manufactory depends on the number and kind
of machinery that is used inside of it. However, it is advised to locate the industrial
areas far from the residential areas.
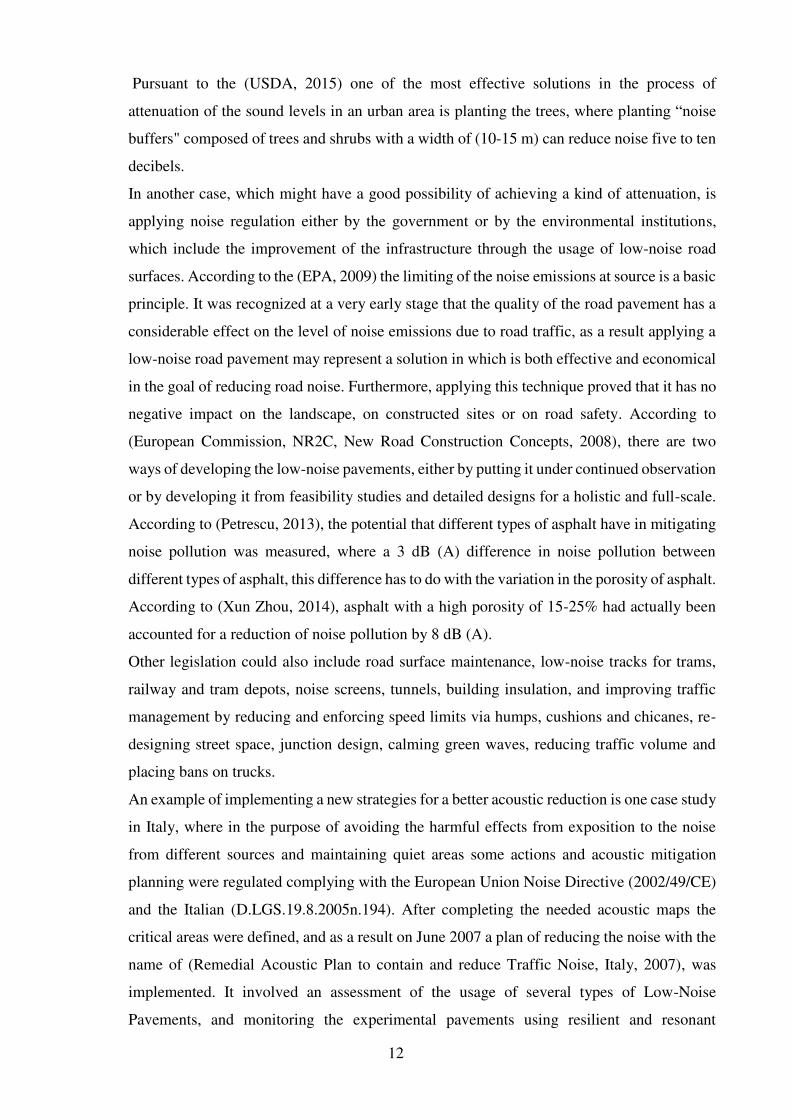
2.4. NOISE CONTROL TECHNIQUES
According to (Tripathy, 2008) noise control is the technology of obtaining an accessible noise
environment at one or more receivers, taking the economical and operational situation in
consideration.
Controlling the noise could be achieved by multiple techniques that include: reducing the
noise from the source, interrupting the path of noise and protecting the receiver (see Fig 6).
Figure 6: Noise Control Techniques (Tripathy, 2008)
This study will clarify some solutions for the noise pollution that were adopted by a lot of
studies and international institutions such as the (UNESCO Module, 2011), where it suggests
different techniques to deal with the noise problem, and where the case of considering any
solution must include the source that has been taken under investigation.
Noise control
Tehniuques
Control at the source
Reduction of the amplitude of the
existing force
Reduction of the response of various
components to the existing force
Change the operation procedure of
the noise source
Control on the
transmission path
Orientation and location of the
Enclosure Silencer , Acoustic barriers,
Absorption treatments,
Green Belts
Control at the receiverEars plugs and Muffs , Exposure
control , Education and publication,
Building Exposure and Material
12
Pursuant to the (USDA, 2015) one of the most effective solutions in the process of
attenuation of the sound levels in an urban area is planting the trees, where planting “noise
buffers" composed of trees and shrubs with a width of (10-15 m) can reduce noise five to ten
decibels.
In another case, which might have a good possibility of achieving a kind of attenuation, is
applying noise regulation either by the government or by the environmental institutions,
which include the improvement of the infrastructure through the usage of low-noise road
surfaces. According to the (EPA, 2009) the limiting of the noise emissions at source is a basic
principle. It was recognized at a very early stage that the quality of the road pavement has a
considerable effect on the level of noise emissions due to road traffic, as a result applying a
low-noise road pavement may represent a solution in which is both effective and economical
in the goal of reducing road noise. Furthermore, applying this technique proved that it has no
negative impact on the landscape, on constructed sites or on road safety. According to
(European Commission, NR2C, New Road Construction Concepts, 2008), there are two
ways of developing the low-noise pavements, either by putting it under continued observation
or by developing it from feasibility studies and detailed designs for a holistic and full-scale.
According to (Petrescu, 2013), the potential that different types of asphalt have in mitigating
noise pollution was measured, where a 3 dB (A) difference in noise pollution between
different types of asphalt, this difference has to do with the variation in the porosity of asphalt.
According to (Xun Zhou, 2014), asphalt with a high porosity of 15-25% had actually been
accounted for a reduction of noise pollution by 8 dB (A).
Other legislation could also include road surface maintenance, low-noise tracks for trams,
railway and tram depots, noise screens, tunnels, building insulation, and improving traffic
management by reducing and enforcing speed limits via humps, cushions and chicanes, re-
designing street space, junction design, calming green waves, reducing traffic volume and
placing bans on trucks.
An example of implementing a new strategies for a better acoustic reduction is one case study
in Italy, where in the purpose of avoiding the harmful effects from exposition to the noise
from different sources and maintaining quiet areas some actions and acoustic mitigation
planning were regulated complying with the European Union Noise Directive (2002/49/CE)
and the Italian (D.LGS.19.8.2005n.194). After completing the needed acoustic maps the
critical areas were defined, and as a result on June 2007 a plan of reducing the noise with the
name of (Remedial Acoustic Plan to contain and reduce Traffic Noise, Italy, 2007), was
implemented. It involved an assessment of the usage of several types of Low-Noise
Pavements, and monitoring the experimental pavements using resilient and resonant
13
technology to control low-frequency noise. First several pavement types were implemented
on one street of Milan-Naples, then those low-noise pavements were modelled by FEM to
assess performances for 6 years and leading to a decrease in road noise levels of more than
respectively 3dB(A) and 5dB(A) in comparison with a traditional porous asphalt and dense
bituminous surface.
In other cases, there are some difficulties that accompanied the possibility of changing the
roads materials, as a result the usage of a different kind of vehicles was suggested; for
example the using of electric mobility and cycling, where a lot of EU reports and researches
indicate the fact that cycling is a significant urban transport option and cycling could be
considered as one of the most sustainable modes of transport (Kenworthy, 2006).
More solutions could involve the usage of new improved materials for the houses structure
by applying some considerably effective and economical techniques on the possibly
changeable features inside the houses such as the windows and doors. According to
(Wakefield Acoustic LTD, 2013) in the purpose of improving the insulation properties of a
residence against external noise, the following prioritized list of treatments are recommended
to be applied, such as for the case of windows providing airtight perimeters seals, the usage
of heavier glass and larger airspace between sheets of glass where using a Standard double-
glazed (3mm glass, 13 mm airspace) that is openable could reduce the noise 50% more than
the noise reduction that is caused by the usage of a Single-glazed (3mm glass) that is closed,
and without any weather- stripping/seals. Also the size of the windows and its opening on it
could be adjusted to be smaller and if the window must remain opened due to the temperature
and the needs of the inertial space, the usage of a solid screen or baffle to shield must be
taken into consideration. In the case of doors it is recommended to use solid wood, solid core
or insulated steel doors, provide airtight seals along top, bottom and sides, and add a second
“storm door” separated by an airspace 100 to 150 mm (4” to 6”) deep - seal perimeters of
both doors.
Furthermore, people action is also considered to be an effective source for the noise,
according to a lot of noise studies and institutions. To control the noise caused by people
action the people must be aware of the negative impacts of noise pollution and public health,
meetings and awareness campaigns must take place to turn people attention towards noise
sources, effects and how to improve practices toward a more healthier and sustainable future.
Finally, there are a lot of suggested solutions to deal with the noise pollution that could not
be described in few lines, but it could be concluded from the previous mentioned solutions
that those solutions depend mostly on the area that they would be implemented in. The
process of choosing the possible effective solutions must consider the location potentials, the
14
political and economic situation, the previous experiments and taking advantage of other
counties expertise in the same area.
2.5. NOISE INDICATORS
The noise indicators could be specified according to (ISO, 1996) as the day-evening-night level Lden in dB (A) and is normally defined in the following formula: � � = �� [ ∗ . � �� + ∗ . � � ����+5 + ∗ . ����ℎ�+ ] In which: Lday is the A weighted long-term average sound level defined in ISO 1996-2, determined over all day periods of a year. Levening is the A weighted long-term average sound level defined in ISO 1996-2, determined over all evening periods of a year. Lnight is the A weighted long-term average sound level defined in ISO 1996-2, determined over all night periods of a year. Where the day, evening and night duration must be the same for all the sources included in the area of the study, and where the height of the assessment point depends on the application.
2.6. NOISE MEASUREMENTS
To achieve the proper protection from environmental noise, noise measurement is a necessity
for this operation to be completed. According to (ISO, 1996), the measurements for sound
level pressure can be determined either through direct evaluation by extrapolation of
measurements results by means of calculation, or by exclusive dependence on the calculation,
intended as a basis for assessing environmental noise.
The measurements can be done using a simple sound Level Meter, where the parameters that
are needed to be measured can be specified depending on the standards and regulations used
in the measuring procedure. However, most of the time the sound level meter is prepared
with an A-weighting filter to simulate the right response of the human ear, dB (A) is
considered to be the most common environmental noise to be measured.
In other cases, using the level meter is difficult or even impossible, according to (ISO, 1996)
this situation requires the use of the prediction method. Although, this method is not as
accurate as the calculation method that includes the using of a Sound Meter, it is still regarded
as functional.
2.6.1. Measuring Noise Pollution using a Sound Level Meter
Before any measuring process the objective of undertaking the measurements must
be clearly mentioned and justified. Furthermore, the form in which the data will be
documented must be also identified so the researchers can collect all the needed
information that is connected to the process of measuring.
15
After the objective of the measurements is clear, the next step is to determine where
and when the measurements will be undertaken, where the site of each potential
noise-sensitive receptors along the roadway are also identified including all
existing dwelling, all educational, community and health buildings and all
appropriate outdoor educational and passive recreational areas (Including Parks).
However, it must be noted that is some cases it is not economically possible to
conduct noise measurements to every potential sensitive dwelling, and, as a result,
a sample of noise exposures in potential sensitive dwellings could be produced.
Anyway, to execute the measurements in the right way attention must be given to
the receptor location, the surrounding terrain and the geometry of the road. In
another word, the site selection procedure must include a full spatial coverage of
all the area of study and it must make sure that all the potential noise sensitive
receptors are included.
The specifying of the area is normally accompanied with the process of measuring
and recording of all the data that are relevant to the site, which are necessary to
clearly identify the zone and to conduct an accurate road traffic noise measurements
or predictions. It is rather important that the location of the measurement of road
traffic, weather conditions and pavement surface type is well documented and
recorded.
Then the measurement process starts. First of all, the measurement data must be
calculated using appropriately certificated instrumentation system which comply
with the procedure such as ISO (1996).It must be mentioned that the measurement
that are always attended are more preferred than the unattended ones. Even if it is
hard or difficult to attend the measurement through the whole process it is
recommended at least to conduct 1 hour of attendance in the 24 hours measurement
time for each site
A collection of data about traffic condition during the time of measurements are
undertaken is an always preferred process, such as knowing the annual average of
daily traffic (AADT) or the average of daily traffic (ADT). Those data are
important to ensure that the daily traffic condition experienced during the
measurement doesn’t vary significantly from the estimated one.
To monitor the traffic data that requires measuring traffic volume, speeds and
composition for each hour during the measurement period, not to forget that the
operator must point out also to any event that may affect the traffic condition such
as road works or traffic accident.
16
All the weather data that are associated with the noise must be recorded with a
special attention to wind speed and direction, rain periods and the air temperature,
the location of the weather station or the data collection device must be also
mentioned.
Finally, all the data that was collected through the whole time of measurement must
be documented in a report document and all the form that the data was saved on
must be mentioned and cleared.
2.6.2. Calculation and Prediction
As it was mentioned earlier, the calculation involves a road traffic noise calculation
model to estimate the existing noise levels at or near the subject road segment, while
prediction involves using a road traffic noise calculation model to estimate the
future noise level at or near to the subject road segment. Normally those two
procedure involves a series of algorithms that describe and quantify the manner in
which noise is generated. According to (ISO, 1996), in some cases the
measurements are replaced or supported with calculations. However, long-term
calculations can be more reliable than the short-term measurements. Furthermore,
calculations could be another solution to define the noise level because of the
difficulty of applying the noise measurements in the area of study. Anyway in the
purpose of calculating noise levels there are some aspects that must be covered, for
example, all the data about source noise emission must be available, and the
position of it must be identified. However, it must be noted that to calculate traffic
noise, the sound power level is normally replaced with sound pressure level and
determined under well-defined conditions.
According to the (European Commission , Directive 2002/49/EC of the European
Parliment and of the council of 25 June 2002, 2002), the values of the indicators
Lden and Lnight can be determined using measurements and computation as we have
discussed earlier or using different methods for the prediction where using
computation is the only possibility.
In some cases, it is preferred for each country to use its own national methods for
determining the noise level and calculating the indicators, which could mean
including an additional indicator that includes the evening as a spirited period.
However, for the countries that don’t have a national computation method
European Commission recommended the usage of the French national computation
method ‘NMPB-Routes-96’ and the French Standard ‘XPS 31-133’ is suggested,
17
which according to (EUROPEAN COMMISSION & DG Environment, 2003)
includes meteorological effects and describes a detailed procedure to calculate
sound levels that are normally caused by road traffic. NMPB-Routes-96 method
was prepared by a team of French noise pollution experts in 1996, and was validated
for a large experimental campaign on real sites with difficult and complex
topography. According to the results of the experiments the agreement between the
measurements and calculation in NMPB-96 is good although in some cases of
down-train conditions NMPB tends to give higher results which can cause
problems to the authorities with the costs that can be given from applying a larger
solution than it is needed to be. In the year of 2000 some revision that were made
for NMPB to eventually produce the new revised version as NMPB-Routes-2008.
As an overview that is presented in (Dutilleux, et al., 2010) on the developed
method the calculation distance limit is limited to 800 m from the road and the
receiver point must be at least on the height of 2 m or more. It must be noticed that
with the increasing of the receiver height the distance of the validity field increase.
First, the method depends on calculations which are made by a third-octave band
from 100 Hz to 5 kHz and it doesn’t contain any computation so it is totally a
manual procedure.
Second, the method is based on breaking down sources into point sources, and it
could be used to calculate sound level Leq over two periods, Day and Night or over
three periods Day, Evening and Night, depending on the regulation followed by the
authority in the area of application.
Generally this method was set by the French to calculate road noise but it could be
simply adopted for railway noise and industrial noise.
Furthermore, the method of NMPB normally depends on the propagation path,
where several paths could exist between the source and the receiver depending on
the topography of the studied area and the obstacles.
In the case of a lot of paths a long-term noise level is associated to each path i,
LAi,LT . This level can be estimated from several computations depending on
different condition. One is made for homogeneous conditions and another is made
for downward conditions. There are also the atmosphere conditions which are not
favorable for sound propagation, known as upward-refection conditions and
includes all atmosphere conditions causing a rise in acoustic energy toward the sky
and producing sound levels at the receiver lower than those produced in the
homogenous conditions.
18
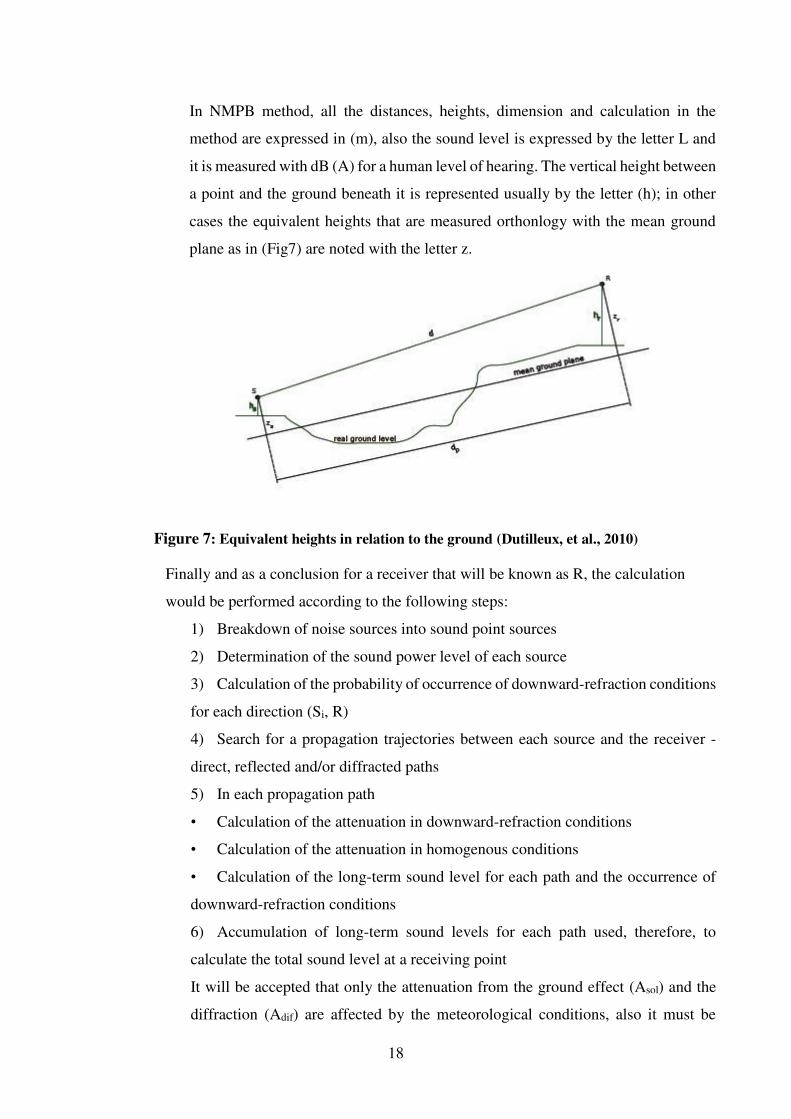
In NMPB method, all the distances, heights, dimension and calculation in the
method are expressed in (m), also the sound level is expressed by the letter L and
it is measured with dB (A) for a human level of hearing. The vertical height between
a point and the ground beneath it is represented usually by the letter (h); in other
cases the equivalent heights that are measured orthonlogy with the mean ground
plane as in (Fig7) are noted with the letter z.
Figure 7: Equivalent heights in relation to the ground (Dutilleux, et al., 2010)
Finally and as a conclusion for a receiver that will be known as R, the calculation
would be performed according to the following steps:
1) Breakdown of noise sources into sound point sources
2) Determination of the sound power level of each source
3) Calculation of the probability of occurrence of downward-refraction conditions
for each direction (Si, R)
4) Search for a propagation trajectories between each source and the receiver -
direct, reflected and/or diffracted paths
5) In each propagation path
• Calculation of the attenuation in downward-refraction conditions
• Calculation of the attenuation in homogenous conditions
• Calculation of the long-term sound level for each path and the occurrence of
downward-refraction conditions
6) Accumulation of long-term sound levels for each path used, therefore, to
calculate the total sound level at a receiving point
It will be accepted that only the attenuation from the ground effect (Asol) and the
diffraction (Adif) are affected by the meteorological conditions, also it must be
19
mentioned that when the method is being used for legal purposes, such as applying
the French order of May 1995 then the calculation hypotheses must be a
representative of an average annual situation concerning the traffic, ground and
atmosphere.
2.7. NOISE MAPPING
Noise map could be described as a map of an area which is colored according to the noise level in the
area. The noise map normally includes contour lines which show the boundaries between different
noise levels in an area. However, according to the (European Commission , Directive 2002/49/EC of
the European Parliment and of the council of 25 June 2002, 2002) noise map could also be represented
as graphical plots, numerical data in tables and/or numerical data in electronic form.
According to the (European Commission , Directive 2002/49/EC of the European Parliment and of
the council of 25 June 2002, 2002) noise maps are designed for a global assessment of the noise
exposure in given areas due to the different noise sources or the overall predictions for the whole area
in the purposes of providing information to the public and decision makers on the noise exposure
locally, nationally and internationally and finally to develop action plans to deal with the noise
pollution.
It must be noted that technically a noise map is a presentation of the data that either includes an
existing, a previous or a predicted noise situation in terms of noise indicators, also when the noise
map includes the exceeding of a limit value it is known as conflict map.
The European Commission stated that a noise map must include the number of dwelling in a certain
area that are exposed to specific values of noise indicators and the number of people that are affected
in a certain area.
Also the noise map study must include the cost-benefit ratios or other economic data on mitigations
measures or scenarios, and must provide a basis for the data to be sent to the Commission, provide a
source of information for the public and provide a basis for action plan, and each of these goals
requires a different noise map.
2.7.1. Noise Mapping Assessment Methods
The assessment methods for noise mapping auto to help to indicate the values of
the Lden and Lnight which can be determined by computation or by measurements
as it was explained in the measurements and calculation methods section, as a
result, and according to (European Union, 2002), the most practical way to
ensure that the noise maps and related population exposure statistics are directly
comparable across member states is to introduce a universal calculation method.
20
The main objective of finding an assessment method to measure and calculate
the noise was to find a common European noise prediction method, and those
methods according to the (European Commission , Directive 2002/49/EC of the
European Parliment and of the council of 25 June 2002, 2002) must be especially
established by the European Commission in accordance with the principles that
were adopted in ISO 1996-2:1987 and ISO 1996-1:1982.
Furthermore there are two possibilities that could occur in the case of the
adoption of a method to develop a noise map, in the first possibility each country
determines an existing national method to find the long-term indicators, where
for national methods some could imply to introduce the evening period as a
separate period to be considered and the use of the average measurements over
a year, also some existed methods adopted the exclusion of the façade reflection,
the incorporation of the night and the assessment position, in any case the
adoption of these methods shouldn’t affect the legally founded noise abatement
programs as well as the financial compensation and mitigation scheme that are
connected to these programs, in the second possibility there are no existing
national methods so, in that case, the following methods are recommended by
the EU Commission as temporary computation methods;
- For industrial noise: ISO 9613-2: (Acoustics – Attenuation of sound and
propagation outdoors, Part 2; General method of calculation)
Suitable noise emission data (input data) for this method can be obtained from
measurements according to the following methods, ISO 8297:1994, En ISO
3744: 1995 or EN ISO 3746: 1995
- For Aircraft noise around airports: ECAC.CEAC Doc.29 “ report on Standard
Method for computing Noise Contours around Civil Airports”
- For Road Traffic noise: The French national computation method “NMPB”
and the French standard “XPS 31-133”
- For Railway Noise: the national computation method “Standards-
Rekenmethode II” as it was published in 20 of November 1996
Anyway, if other methods are chosen to be used the reason to do so must be
demonstrated and the results must be equivalent to those set out above.
21
2.7.2. Noise Mapping Software
There are several ways of producing noise maps, in some cases some empirical
models are used such as INM for airports noise mapping while in a lot of other
cases the models are based on the physical propagation of the sound outdoors
(ISO 9631). Normally the usage of the mapping software is rather easy and the
results are accurate, but that also depends on the quality of the input data. To
make sure that the results are accurate most of the time they are compared with
the measurements if they were available, and to be able to predicate the noise that
is produced by road or by railways the input data must involve a description of
the noise sources such as speed, number of vehicles etc. In another case, to be
able to predicate the industrial noise the most important thing in the description
of the noise source is the sound power levels, directivity and working periods
(ISO 3740).
The software used to simulate the noise is rather useful, especially when the
measurements are not possible, some of the following software are the most
commonly used to prepare noise maps:
( LimA, CadnA, Code_Tympon, IMMI, Predictor, Olive tree Lab Terrain, Sound
Plan, Noise3d Online). However, for the software to be effective the EU
Commission set specific requirements:
1) Be based on the previous mentioned computation methods.
2) Contain a site modeling Facility.
3) Contain a source emission models; geometrical information on the noise
sources would be obtained from the modeling facility.
4) Contain a noise propagation facilities.
5) Contain facilities for the presentation of the mapping information relating to
outdoor noise levels.
6) Data export interface to EC databases.
2.7.3. Area to be mapped
According to (EPA, 2009), to perform a correct spatial study the area to be
analyzed must be fully understood by the researcher, and, as a result, there are
two types of area of interests:
The area to be mapped: those areas are determined according to the regulation
that are set by the government. Agglomerations are defined as areas and the study
of noise in this areas require the identifying of all the noise sources. Therefore all
22
roads, railways, aircraft movement and industrial places inside the agglomeration
must be taken into consideration especially when noise level exceed 55 dB for
Lden and/or 50 dB for Lnight in any area inside this agglomeration.
In another case, all major airports, major railways, and major roads are defined
normally by the location of the sources and the calculation process for such cases
must include all the places that are exposed to a noise level more than 55dB for
Lden and/or 50 dB for Lnight near those major sources
The areas to be modeled: in the case of accurately evaluating noise levels at the
edge of the agglomeration area. It is important to consider all the noise sources
and propagation screening objects from an area beyond the area of study, so as a
result the application of the modeled area is used. However, in the case of
performing measurements for major roads, major railways, and airports the noise
source is located in the same area of the noise mapping and the area to be
modeled, in this case, is the same area to be mapped.
After the specification of the area of study, there must be a geographical
demonstration for the area in which the input datasets are required and the noise
level will be calculated.
23
CHAPTER 3: CASE STUDY
3.1. Damascus Profile
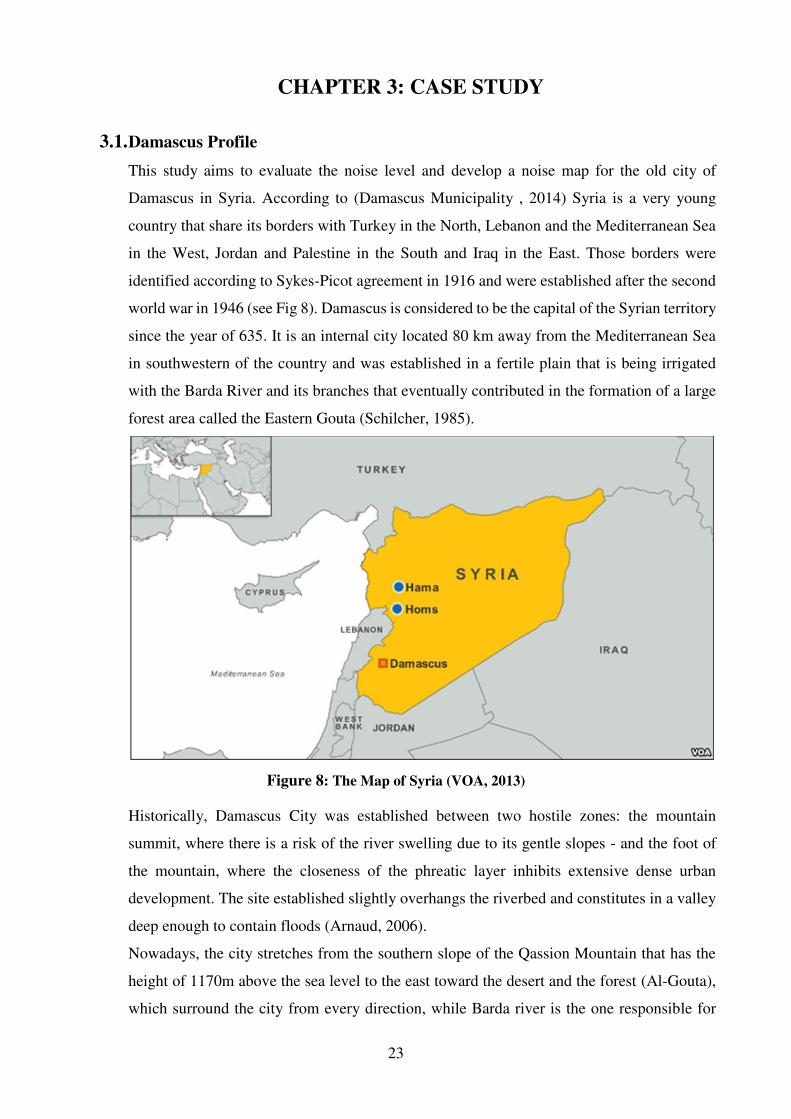
This study aims to evaluate the noise level and develop a noise map for the old city of
Damascus in Syria. According to (Damascus Municipality , 2014) Syria is a very young
country that share its borders with Turkey in the North, Lebanon and the Mediterranean Sea
in the West, Jordan and Palestine in the South and Iraq in the East. Those borders were
identified according to Sykes-Picot agreement in 1916 and were established after the second
world war in 1946 (see Fig 8). Damascus is considered to be the capital of the Syrian territory
since the year of 635. It is an internal city located 80 km away from the Mediterranean Sea
in southwestern of the country and was established in a fertile plain that is being irrigated
with the Barda River and its branches that eventually contributed in the formation of a large
forest area called the Eastern Gouta (Schilcher, 1985).
Figure 8: The Map of Syria (VOA, 2013)
Historically, Damascus City was established between two hostile zones: the mountain
summit, where there is a risk of the river swelling due to its gentle slopes - and the foot of
the mountain, where the closeness of the phreatic layer inhibits extensive dense urban
development. The site established slightly overhangs the riverbed and constitutes in a valley
deep enough to contain floods (Arnaud, 2006).
Nowadays, the city stretches from the southern slope of the Qassion Mountain that has the
height of 1170m above the sea level to the east toward the desert and the forest (Al-Gouta),
which surround the city from every direction, while Barda river is the one responsible for
24
irrigation the city in the north the Awaj river is the one responsible for its irrigation in the
south. The city location is famous for the existing of the Qassion Mountain in the west
(Kheer, 1969). According to (JICA, 2010) the total area of the city is 105 km2 taking into
account the urbanism spread at the foot of Mount Qassion, and 77 km2 without it.
According to (M. C. Peel, 2007) the weather in Damascus is dry to almost dry, where the
mountain-chain of Lebanon prevent the impacts of climate changes from the Mediterranean
Sea from getting to the city (Tyson, 2010). Furthermore, the city is open to the desert from
the East and southeast which allow the impacts of climate from the desert to influence the
weather there.
Damascus is considered to represent the center of a large metropolitan area of 1.7 million
people in the city and 2.7 million people in the countryside surrounding Damascus city,
forming together the municipality of Damascus (CBSSYR, 2011) the population growth of
the city in the recent decades had a certain pattern, first it was a moderate growth, then during
the sixties and seventies the population growth rapidly ascended, and finally in the eighties
and nineties it started to get slower, nowadays it can be considered to be stable. This stability
in population growth can be traced back to the transformation of the growth toward the
suburbs surrounding the city of Damascus. In addition of being the oldest continuously
inhabited capital city in the world, Damascus is a major cultural and religious center of the
Levant (CBSSYR, 2011) as a result it can be easily said that the city of Damascus has a large
historical and cultural importance, and nowadays it is trying to develop into a modern city,
the historical and cultural importance of this city lead it to be the political and cultural center
of the country, not to forget its touristic importance, although it is the capital it is only the
second largest city of Syria after Aleppo. With an urban history of 5000 years, the old city
of Damascus is considered as whole to be a world heritage according to UNESCO, also
Damascus still has about half of the 16,832 houses which are traced back to 1900 Ottoman
yearbook still standing in a province of Damascus old heritage and with great historical value.
However, like many undeveloped countries, Syria suffers from several issues that stand
between it and its urban development, noise pollution is considered to be one of the several
problems that conflict the urbanization of Damascus City.
3.2. DAMASCUS CHANGES
As early as 3000BC, the early urban form of Damascus began to unfold. City walls were
built around the settled area with “straight wide streets radiating outward from the
concentration of public buildings in the center” (Bonine, 1977). As it was mentioned, the old
city old Damascus is believed to be established since the third millennium B.C (see Fig 9).
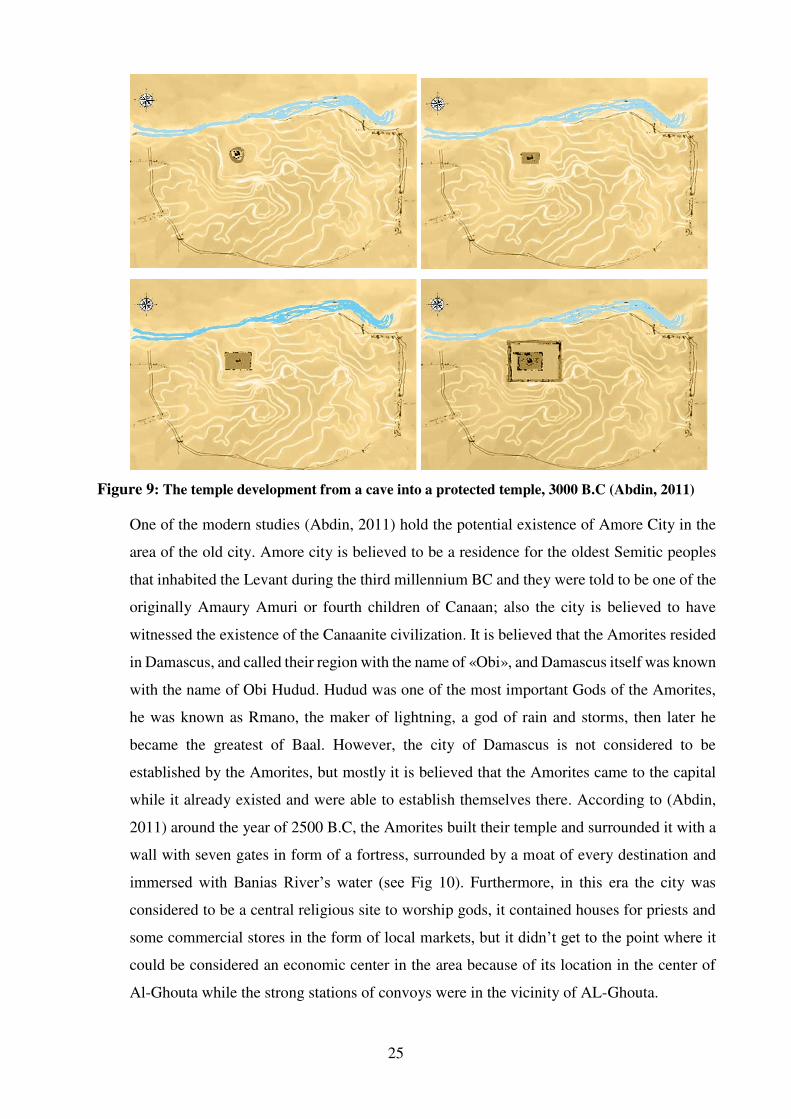
25
Figure 9: The temple development from a cave into a protected temple, 3000 B.C (Abdin, 2011)
One of the modern studies (Abdin, 2011) hold the potential existence of Amore City in the
area of the old city. Amore city is believed to be a residence for the oldest Semitic peoples
that inhabited the Levant during the third millennium BC and they were told to be one of the
originally Amaury Amuri or fourth children of Canaan; also the city is believed to have
witnessed the existence of the Canaanite civilization. It is believed that the Amorites resided
in Damascus, and called their region with the name of «Obi», and Damascus itself was known
with the name of Obi Hudud. Hudud was one of the most important Gods of the Amorites,
he was known as Rmano, the maker of lightning, a god of rain and storms, then later he
became the greatest of Baal. However, the city of Damascus is not considered to be
established by the Amorites, but mostly it is believed that the Amorites came to the capital
while it already existed and were able to establish themselves there. According to (Abdin,
2011) around the year of 2500 B.C, the Amorites built their temple and surrounded it with a
wall with seven gates in form of a fortress, surrounded by a moat of every destination and
immersed with Banias River’s water (see Fig 10). Furthermore, in this era the city was
considered to be a central religious site to worship gods, it contained houses for priests and
some commercial stores in the form of local markets, but it didn’t get to the point where it
could be considered an economic center in the area because of its location in the center of
Al-Ghouta while the strong stations of convoys were in the vicinity of AL-Ghouta.
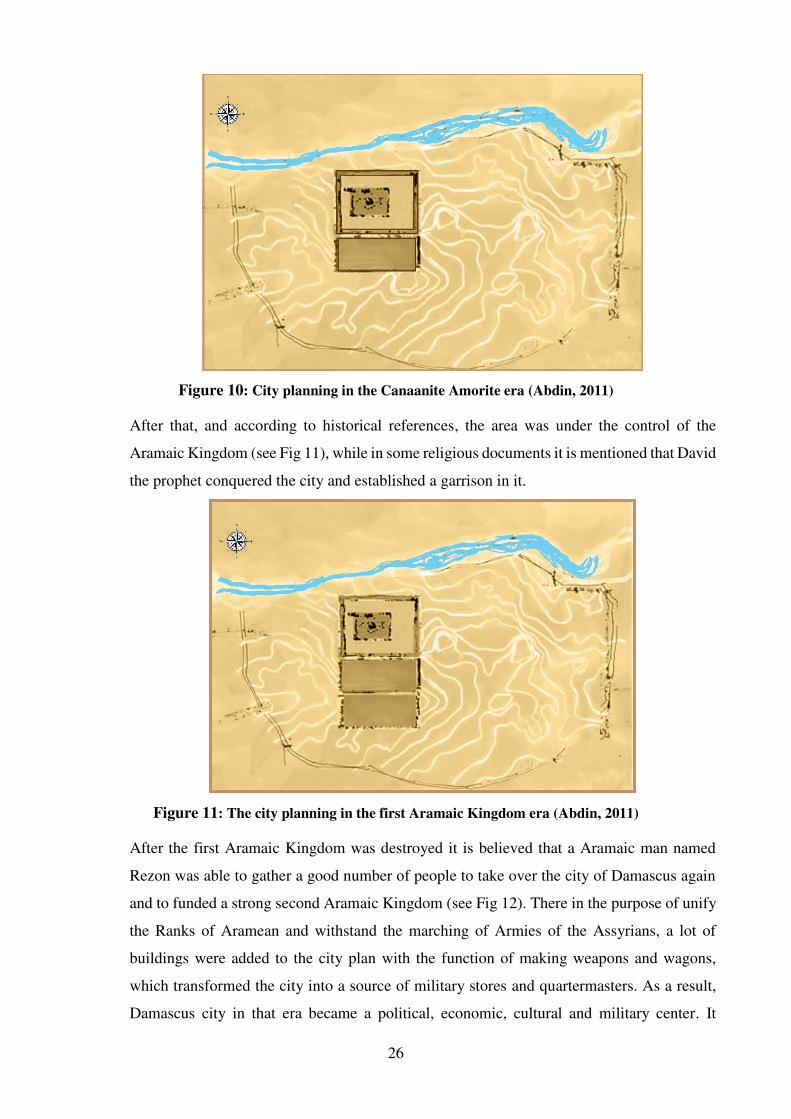
26
Figure 10: City planning in the Canaanite Amorite era (Abdin, 2011)
After that, and according to historical references, the area was under the control of the
Aramaic Kingdom (see Fig 11), while in some religious documents it is mentioned that David
the prophet conquered the city and established a garrison in it.
Figure 11: The city planning in the first Aramaic Kingdom era (Abdin, 2011)
After the first Aramaic Kingdom was destroyed it is believed that a Aramaic man named
Rezon was able to gather a good number of people to take over the city of Damascus again
and to funded a strong second Aramaic Kingdom (see Fig 12). There in the purpose of unify
the Ranks of Aramean and withstand the marching of Armies of the Assyrians, a lot of
buildings were added to the city plan with the function of making weapons and wagons,
which transformed the city into a source of military stores and quartermasters. As a result,
Damascus city in that era became a political, economic, cultural and military center. It
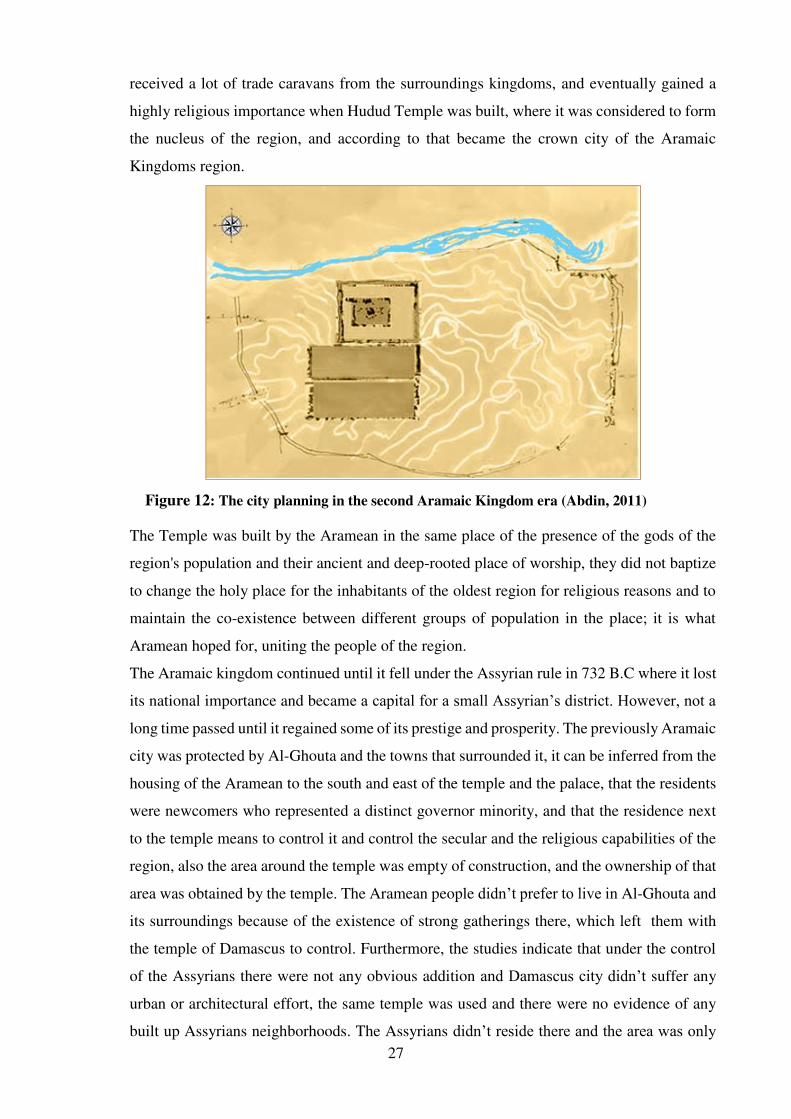
27
received a lot of trade caravans from the surroundings kingdoms, and eventually gained a
highly religious importance when Hudud Temple was built, where it was considered to form
the nucleus of the region, and according to that became the crown city of the Aramaic
Kingdoms region.
Figure 12: The city planning in the second Aramaic Kingdom era (Abdin, 2011)
The Temple was built by the Aramean in the same place of the presence of the gods of the
region's population and their ancient and deep-rooted place of worship, they did not baptize
to change the holy place for the inhabitants of the oldest region for religious reasons and to
maintain the co-existence between different groups of population in the place; it is what
Aramean hoped for, uniting the people of the region.
The Aramaic kingdom continued until it fell under the Assyrian rule in 732 B.C where it lost
its national importance and became a capital for a small Assyrian’s district. However, not a
long time passed until it regained some of its prestige and prosperity. The previously Aramaic
city was protected by Al-Ghouta and the towns that surrounded it, it can be inferred from the
housing of the Aramean to the south and east of the temple and the palace, that the residents
were newcomers who represented a distinct governor minority, and that the residence next
to the temple means to control it and control the secular and the religious capabilities of the
region, also the area around the temple was empty of construction, and the ownership of that
area was obtained by the temple. The Aramean people didn’t prefer to live in Al-Ghouta and
its surroundings because of the existence of strong gatherings there, which left them with
the temple of Damascus to control. Furthermore, the studies indicate that under the control
of the Assyrians there were not any obvious addition and Damascus city didn’t suffer any
urban or architectural effort, the same temple was used and there were no evidence of any
built up Assyrians neighborhoods. The Assyrians didn’t reside there and the area was only
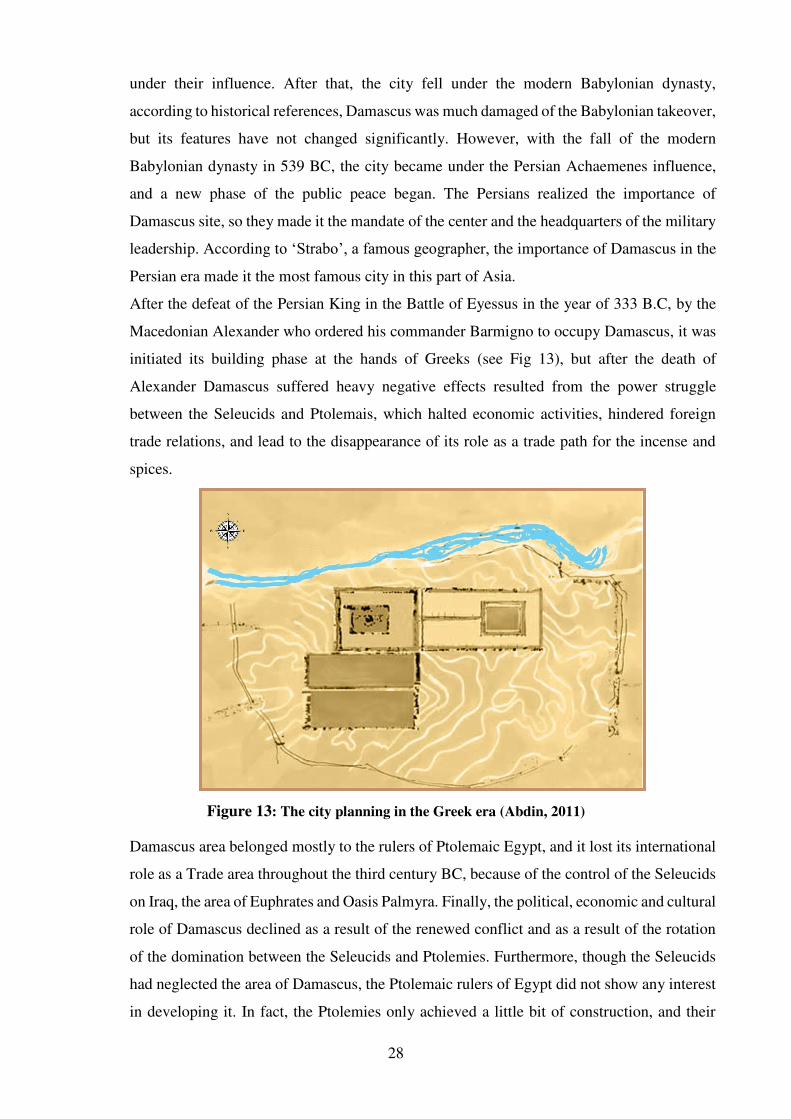
28
under their influence. After that, the city fell under the modern Babylonian dynasty,
according to historical references, Damascus was much damaged of the Babylonian takeover,
but its features have not changed significantly. However, with the fall of the modern
Babylonian dynasty in 539 BC, the city became under the Persian Achaemenes influence,
and a new phase of the public peace began. The Persians realized the importance of
Damascus site, so they made it the mandate of the center and the headquarters of the military
leadership. According to ‘Strabo’, a famous geographer, the importance of Damascus in the
Persian era made it the most famous city in this part of Asia.
After the defeat of the Persian King in the Battle of Eyessus in the year of 333 B.C, by the
Macedonian Alexander who ordered his commander Barmigno to occupy Damascus, it was
initiated its building phase at the hands of Greeks (see Fig 13), but after the death of
Alexander Damascus suffered heavy negative effects resulted from the power struggle
between the Seleucids and Ptolemais, which halted economic activities, hindered foreign
trade relations, and lead to the disappearance of its role as a trade path for the incense and
spices.
Figure 13: The city planning in the Greek era (Abdin, 2011)
Damascus area belonged mostly to the rulers of Ptolemaic Egypt, and it lost its international
role as a Trade area throughout the third century BC, because of the control of the Seleucids
on Iraq, the area of Euphrates and Oasis Palmyra. Finally, the political, economic and cultural
role of Damascus declined as a result of the renewed conflict and as a result of the rotation
of the domination between the Seleucids and Ptolemies. Furthermore, though the Seleucids
had neglected the area of Damascus, the Ptolemaic rulers of Egypt did not show any interest
in developing it. In fact, the Ptolemies only achieved a little bit of construction, and their
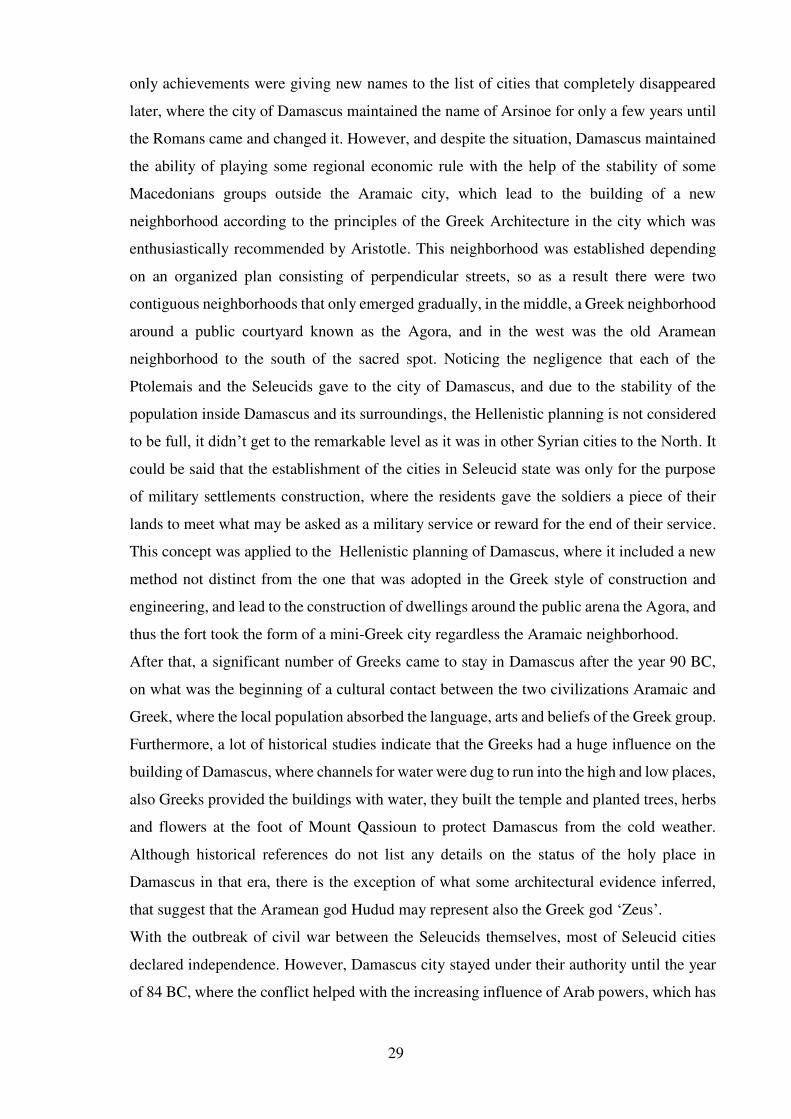
29
only achievements were giving new names to the list of cities that completely disappeared
later, where the city of Damascus maintained the name of Arsinoe for only a few years until
the Romans came and changed it. However, and despite the situation, Damascus maintained
the ability of playing some regional economic rule with the help of the stability of some
Macedonians groups outside the Aramaic city, which lead to the building of a new
neighborhood according to the principles of the Greek Architecture in the city which was
enthusiastically recommended by Aristotle. This neighborhood was established depending
on an organized plan consisting of perpendicular streets, so as a result there were two
contiguous neighborhoods that only emerged gradually, in the middle, a Greek neighborhood
around a public courtyard known as the Agora, and in the west was the old Aramean
neighborhood to the south of the sacred spot. Noticing the negligence that each of the
Ptolemais and the Seleucids gave to the city of Damascus, and due to the stability of the
population inside Damascus and its surroundings, the Hellenistic planning is not considered
to be full, it didn’t get to the remarkable level as it was in other Syrian cities to the North. It
could be said that the establishment of the cities in Seleucid state was only for the purpose
of military settlements construction, where the residents gave the soldiers a piece of their
lands to meet what may be asked as a military service or reward for the end of their service.
This concept was applied to the Hellenistic planning of Damascus, where it included a new
method not distinct from the one that was adopted in the Greek style of construction and
engineering, and lead to the construction of dwellings around the public arena the Agora, and
thus the fort took the form of a mini-Greek city regardless the Aramaic neighborhood.
After that, a significant number of Greeks came to stay in Damascus after the year 90 BC,
on what was the beginning of a cultural contact between the two civilizations Aramaic and
Greek, where the local population absorbed the language, arts and beliefs of the Greek group.
Furthermore, a lot of historical studies indicate that the Greeks had a huge influence on the
building of Damascus, where channels for water were dug to run into the high and low places,
also Greeks provided the buildings with water, they built the temple and planted trees, herbs
and flowers at the foot of Mount Qassioun to protect Damascus from the cold weather.
Although historical references do not list any details on the status of the holy place in
Damascus in that era, there is the exception of what some architectural evidence inferred,
that suggest that the Aramean god Hudud may represent also the Greek god ‘Zeus’.
With the outbreak of civil war between the Seleucids themselves, most of Seleucid cities
declared independence. However, Damascus city stayed under their authority until the year
of 84 BC, where the conflict helped with the increasing influence of Arab powers, which has
30
always existed in the surroundings of Damascus area, most notably two Arabs group were in
control the Aloatoriyons and the Nabataeans.
However, with the growing weakness of the Seleucids and their civil war, the weakness of
the Ptolemais and the corruption of their management, not to forget the emergence of the
occupation risks, Damascus required the protection of the Nabataeans, which lead as a result
the Nabateans to be taken out of the valleys and force them to be into contact with the civilian
population in Damascus, not as individuals and businessmen as they were in the past, but as
a force of Arab Nabataean taking the control of the city of Damascus as the capital of in their
region, and like other newcomers their residence required new housing as close as possible
to the temple and markets, where a new god the’ Lat’ was introduced by the Arab component
to the holy place. This Nabataean’s neighborhood was to the east of the Greek section in the
side of Bab Touma (see Fig 14), also the Nabateans were able to remove the risk of the
occupation of Damascus by other tribes, this period is characterized by the increasing
delegations of Arab migrations to the Syrian desert, especially the surroundings of
Damascus.
Figure 14: The city planning in the Nabateans era (Abdin, 2011)
Depending on the previously mentioned historical development of the old city, it could be
said that it was the Hellenic era (336-146 BC) that strongly contributed to the city’s
morphological legacy. The study of (Bonine, 1977) highlights the grid street patterns, public
baths, temples, theaters, sports stadiums, agora and the porticos.
Then, the Romans followed the Greeks, developing the existing cities (see Fig 15) and
establishing new ones. In 64BC Syria became a central province of the Roman Empire –
boasting grand cities with famed monuments such as those still visible today at Palmyra,
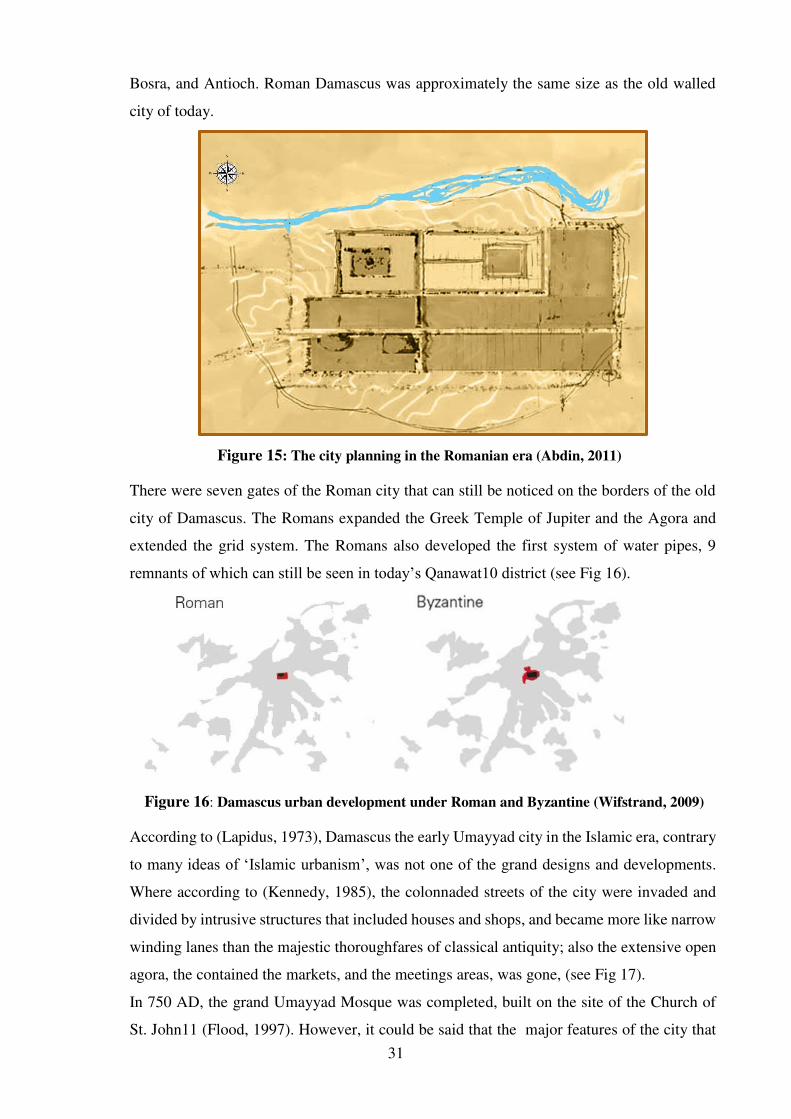
31
Bosra, and Antioch. Roman Damascus was approximately the same size as the old walled
city of today.
Figure 15: The city planning in the Romanian era (Abdin, 2011)
There were seven gates of the Roman city that can still be noticed on the borders of the old
city of Damascus. The Romans expanded the Greek Temple of Jupiter and the Agora and
extended the grid system. The Romans also developed the first system of water pipes, 9
remnants of which can still be seen in today’s Qanawat10 district (see Fig 16).
Figure 16: Damascus urban development under Roman and Byzantine (Wifstrand, 2009)
According to (Lapidus, 1973), Damascus the early Umayyad city in the Islamic era, contrary
to many ideas of ‘Islamic urbanism’, was not one of the grand designs and developments.
Where according to (Kennedy, 1985), the colonnaded streets of the city were invaded and
divided by intrusive structures that included houses and shops, and became more like narrow
winding lanes than the majestic thoroughfares of classical antiquity; also the extensive open
agora, the contained the markets, and the meetings areas, was gone, (see Fig 17).
In 750 AD, the grand Umayyad Mosque was completed, built on the site of the Church of
St. John11 (Flood, 1997). However, it could be said that the major features of the city that
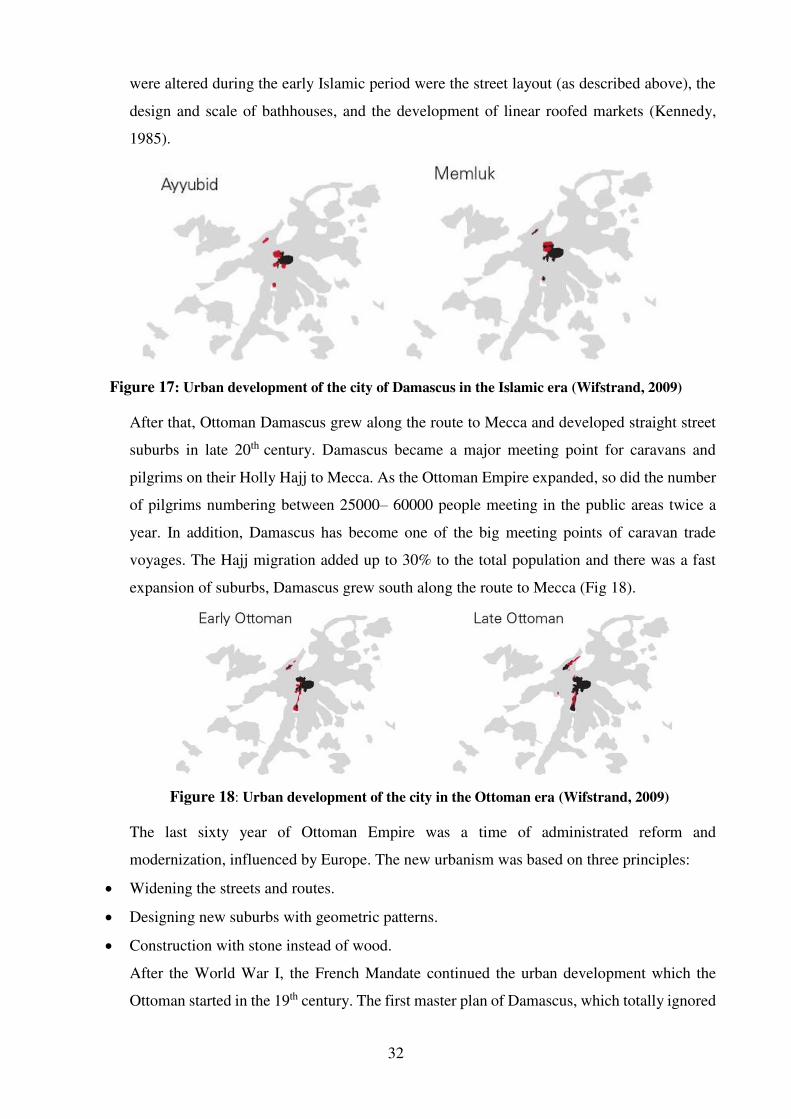
32
were altered during the early Islamic period were the street layout (as described above), the
design and scale of bathhouses, and the development of linear roofed markets (Kennedy,
1985).
Figure 17: Urban development of the city of Damascus in the Islamic era (Wifstrand, 2009)
After that, Ottoman Damascus grew along the route to Mecca and developed straight street
suburbs in late 20th century. Damascus became a major meeting point for caravans and
pilgrims on their Holly Hajj to Mecca. As the Ottoman Empire expanded, so did the number
of pilgrims numbering between 25000– 60000 people meeting in the public areas twice a
year. In addition, Damascus has become one of the big meeting points of caravan trade
voyages. The Hajj migration added up to 30% to the total population and there was a fast
expansion of suburbs, Damascus grew south along the route to Mecca (Fig 18).
Figure 18: Urban development of the city in the Ottoman era (Wifstrand, 2009)
The last sixty year of Ottoman Empire was a time of administrated reform and
modernization, influenced by Europe. The new urbanism was based on three principles:
Widening the streets and routes.
Designing new suburbs with geometric patterns.
Construction with stone instead of wood.
After the World War I, the French Mandate continued the urban development which the
Ottoman started in the 19th century. The first master plan of Damascus, which totally ignored
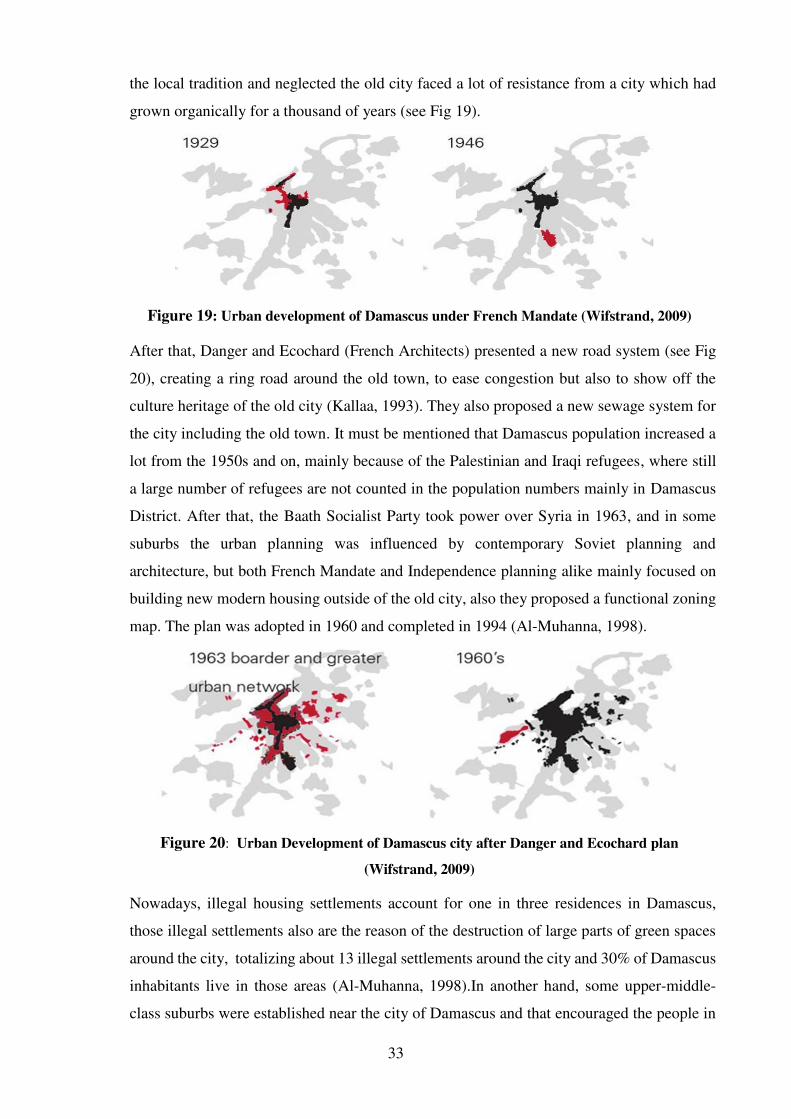
33
the local tradition and neglected the old city faced a lot of resistance from a city which had
grown organically for a thousand of years (see Fig 19).
Figure 19: Urban development of Damascus under French Mandate (Wifstrand, 2009)
After that, Danger and Ecochard (French Architects) presented a new road system (see Fig
20), creating a ring road around the old town, to ease congestion but also to show off the
culture heritage of the old city (Kallaa, 1993). They also proposed a new sewage system for
the city including the old town. It must be mentioned that Damascus population increased a
lot from the 1950s and on, mainly because of the Palestinian and Iraqi refugees, where still
a large number of refugees are not counted in the population numbers mainly in Damascus
District. After that, the Baath Socialist Party took power over Syria in 1963, and in some
suburbs the urban planning was influenced by contemporary Soviet planning and
architecture, but both French Mandate and Independence planning alike mainly focused on
building new modern housing outside of the old city, also they proposed a functional zoning
map. The plan was adopted in 1960 and completed in 1994 (Al-Muhanna, 1998).
Figure 20: Urban Development of Damascus city after Danger and Ecochard plan
(Wifstrand, 2009)
Nowadays, illegal housing settlements account for one in three residences in Damascus,
those illegal settlements also are the reason of the destruction of large parts of green spaces
around the city, totalizing about 13 illegal settlements around the city and 30% of Damascus
inhabitants live in those areas (Al-Muhanna, 1998).In another hand, some upper-middle-
class suburbs were established near the city of Damascus and that encouraged the people in
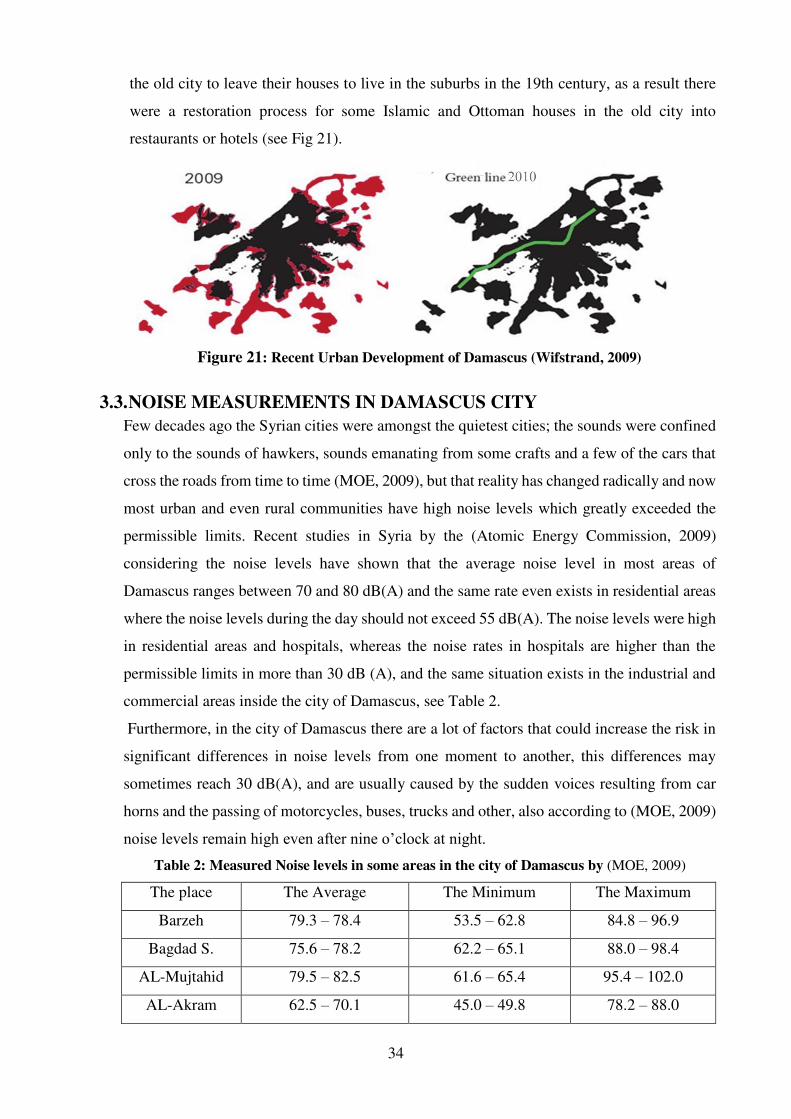
34
the old city to leave their houses to live in the suburbs in the 19th century, as a result there
were a restoration process for some Islamic and Ottoman houses in the old city into
restaurants or hotels (see Fig 21).
Figure 21: Recent Urban Development of Damascus (Wifstrand, 2009)
3.3. NOISE MEASUREMENTS IN DAMASCUS CITY
Few decades ago the Syrian cities were amongst the quietest cities; the sounds were confined
only to the sounds of hawkers, sounds emanating from some crafts and a few of the cars that
cross the roads from time to time (MOE, 2009), but that reality has changed radically and now
most urban and even rural communities have high noise levels which greatly exceeded the
permissible limits. Recent studies in Syria by the (Atomic Energy Commission, 2009)
considering the noise levels have shown that the average noise level in most areas of
Damascus ranges between 70 and 80 dB(A) and the same rate even exists in residential areas
where the noise levels during the day should not exceed 55 dB(A). The noise levels were high
in residential areas and hospitals, whereas the noise rates in hospitals are higher than the
permissible limits in more than 30 dB (A), and the same situation exists in the industrial and
commercial areas inside the city of Damascus, see Table 2.
Furthermore, in the city of Damascus there are a lot of factors that could increase the risk in
significant differences in noise levels from one moment to another, this differences may
sometimes reach 30 dB(A), and are usually caused by the sudden voices resulting from car
horns and the passing of motorcycles, buses, trucks and other, also according to (MOE, 2009)
noise levels remain high even after nine o’clock at night. Table 2: Measured Noise levels in some areas in the city of Damascus by (MOE, 2009)
The place The Average The Minimum The Maximum
Barzeh 79.3 – 78.4 53.5 – 62.8 84.8 – 96.9
Bagdad S. 75.6 – 78.2 62.2 – 65.1 88.0 – 98.4
AL-Mujtahid 79.5 – 82.5 61.6 – 65.4 95.4 – 102.0
AL-Akram 62.5 – 70.1 45.0 – 49.8 78.2 – 88.0
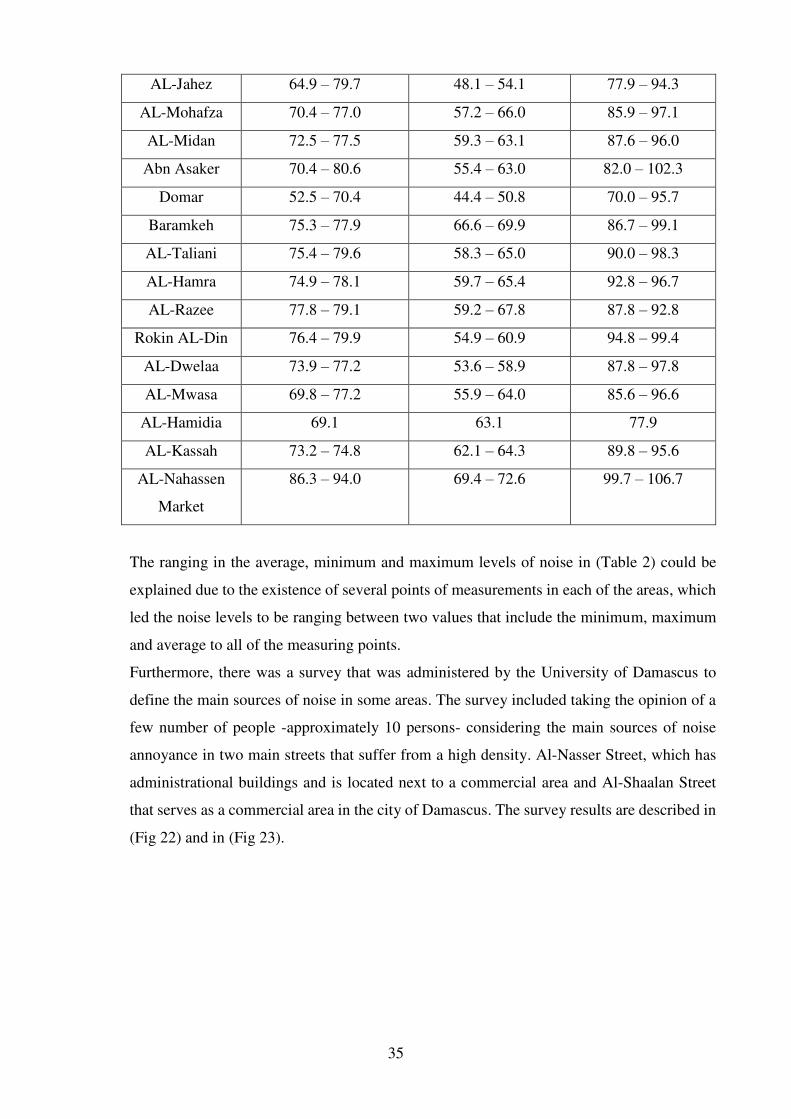
35
AL-Jahez 64.9 – 79.7 48.1 – 54.1 77.9 – 94.3
AL-Mohafza 70.4 – 77.0 57.2 – 66.0 85.9 – 97.1
AL-Midan 72.5 – 77.5 59.3 – 63.1 87.6 – 96.0
Abn Asaker 70.4 – 80.6 55.4 – 63.0 82.0 – 102.3
Domar 52.5 – 70.4 44.4 – 50.8 70.0 – 95.7
Baramkeh 75.3 – 77.9 66.6 – 69.9 86.7 – 99.1
AL-Taliani 75.4 – 79.6 58.3 – 65.0 90.0 – 98.3
AL-Hamra 74.9 – 78.1 59.7 – 65.4 92.8 – 96.7
AL-Razee 77.8 – 79.1 59.2 – 67.8 87.8 – 92.8
Rokin AL-Din 76.4 – 79.9 54.9 – 60.9 94.8 – 99.4
AL-Dwelaa 73.9 – 77.2 53.6 – 58.9 87.8 – 97.8
AL-Mwasa 69.8 – 77.2 55.9 – 64.0 85.6 – 96.6
AL-Hamidia 69.1 63.1 77.9
AL-Kassah 73.2 – 74.8 62.1 – 64.3 89.8 – 95.6
AL-Nahassen
Market
86.3 – 94.0 69.4 – 72.6 99.7 – 106.7
The ranging in the average, minimum and maximum levels of noise in (Table 2) could be
explained due to the existence of several points of measurements in each of the areas, which
led the noise levels to be ranging between two values that include the minimum, maximum
and average to all of the measuring points.
Furthermore, there was a survey that was administered by the University of Damascus to
define the main sources of noise in some areas. The survey included taking the opinion of a
few number of people -approximately 10 persons- considering the main sources of noise
annoyance in two main streets that suffer from a high density. Al-Nasser Street, which has
administrational buildings and is located next to a commercial area and Al-Shaalan Street
that serves as a commercial area in the city of Damascus. The survey results are described in
(Fig 22) and in (Fig 23).
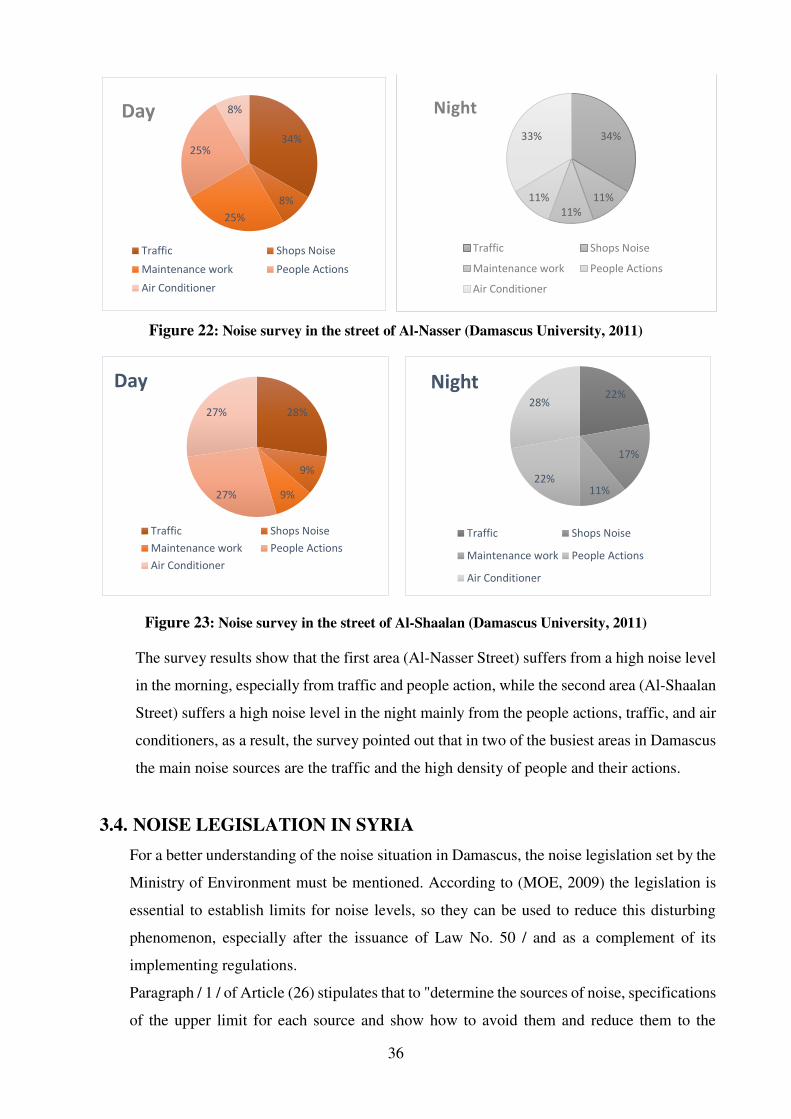
36
Figure 22: Noise survey in the street of Al-Nasser (Damascus University, 2011)
Figure 23: Noise survey in the street of Al-Shaalan (Damascus University, 2011)
The survey results show that the first area (Al-Nasser Street) suffers from a high noise level
in the morning, especially from traffic and people action, while the second area (Al-Shaalan
Street) suffers a high noise level in the night mainly from the people actions, traffic, and air
conditioners, as a result, the survey pointed out that in two of the busiest areas in Damascus
the main noise sources are the traffic and the high density of people and their actions.
3.4. NOISE LEGISLATION IN SYRIA
For a better understanding of the noise situation in Damascus, the noise legislation set by the
Ministry of Environment must be mentioned. According to (MOE, 2009) the legislation is
essential to establish limits for noise levels, so they can be used to reduce this disturbing
phenomenon, especially after the issuance of Law No. 50 / and as a complement of its
implementing regulations.
Paragraph / 1 / of Article (26) stipulates that to "determine the sources of noise, specifications
of the upper limit for each source and show how to avoid them and reduce them to the
34%
8%
25%
25%
8%Day
Traffic Shops Noise
Maintenance work People Actions
Air Conditioner
34%
11%
11%
11%
33%
Night
Traffic Shops Noise
Maintenance work People Actions
Air Conditioner
28%
9%
9%27%
27%
Day
Traffic Shops Noise
Maintenance work People Actions
Air Conditioner
22%
17%
11%22%
28%
Night
Traffic Shops Noise
Maintenance work People Actions
Air Conditioner
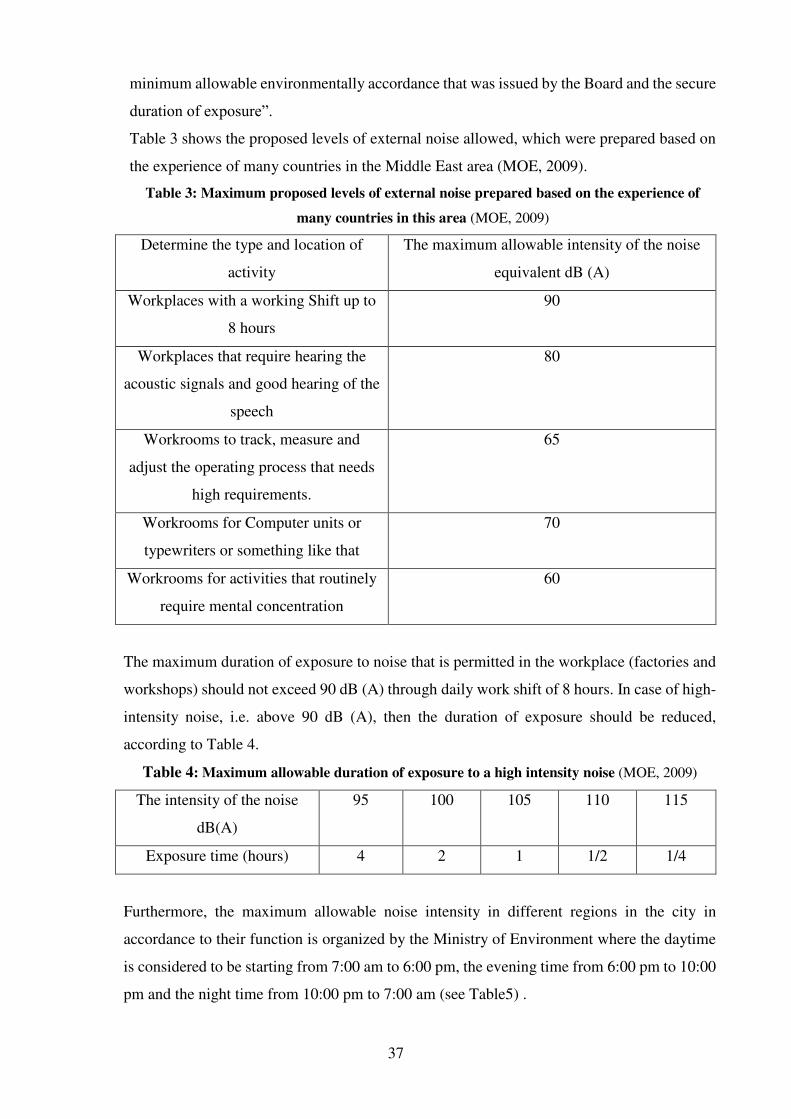
37
minimum allowable environmentally accordance that was issued by the Board and the secure
duration of exposure”.
Table 3 shows the proposed levels of external noise allowed, which were prepared based on
the experience of many countries in the Middle East area (MOE, 2009).
Table 3: Maximum proposed levels of external noise prepared based on the experience of
many countries in this area (MOE, 2009)
Determine the type and location of
activity
The maximum allowable intensity of the noise
equivalent dB (A)
Workplaces with a working Shift up to
8 hours
90
Workplaces that require hearing the
acoustic signals and good hearing of the
speech
80
Workrooms to track, measure and
adjust the operating process that needs
high requirements.
65
Workrooms for Computer units or
typewriters or something like that
70
Workrooms for activities that routinely
require mental concentration
60
The maximum duration of exposure to noise that is permitted in the workplace (factories and
workshops) should not exceed 90 dB (A) through daily work shift of 8 hours. In case of high-
intensity noise, i.e. above 90 dB (A), then the duration of exposure should be reduced,
according to Table 4.
Table 4: Maximum allowable duration of exposure to a high intensity noise (MOE, 2009)
The intensity of the noise
dB(A)
95 100 105 110 115
Exposure time (hours) 4 2 1 1/2 1/4
Furthermore, the maximum allowable noise intensity in different regions in the city in
accordance to their function is organized by the Ministry of Environment where the daytime
is considered to be starting from 7:00 am to 6:00 pm, the evening time from 6:00 pm to 10:00
pm and the night time from 10:00 pm to 7:00 am (see Table5) .
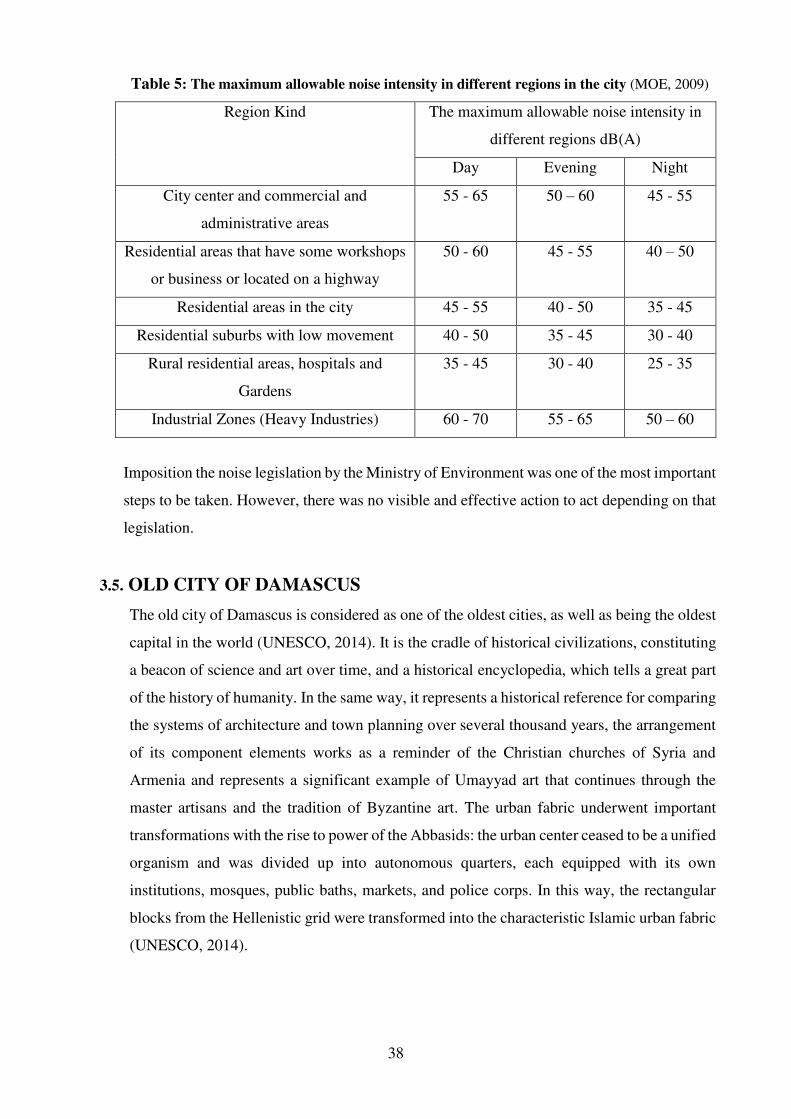
38
Table 5: The maximum allowable noise intensity in different regions in the city (MOE, 2009)
Region Kind
The maximum allowable noise intensity in
different regions dB(A)
Day Evening Night
City center and commercial and
administrative areas
55 - 65 50 – 60 45 - 55
Residential areas that have some workshops
or business or located on a highway
50 - 60 45 - 55 40 – 50
Residential areas in the city 45 - 55 40 - 50 35 - 45
Residential suburbs with low movement 40 - 50 35 - 45 30 - 40
Rural residential areas, hospitals and
Gardens
35 - 45 30 - 40 25 - 35
Industrial Zones (Heavy Industries) 60 - 70 55 - 65 50 – 60
Imposition the noise legislation by the Ministry of Environment was one of the most important
steps to be taken. However, there was no visible and effective action to act depending on that
legislation.
3.5. OLD CITY OF DAMASCUS
The old city of Damascus is considered as one of the oldest cities, as well as being the oldest
capital in the world (UNESCO, 2014). It is the cradle of historical civilizations, constituting
a beacon of science and art over time, and a historical encyclopedia, which tells a great part
of the history of humanity. In the same way, it represents a historical reference for comparing
the systems of architecture and town planning over several thousand years, the arrangement
of its component elements works as a reminder of the Christian churches of Syria and
Armenia and represents a significant example of Umayyad art that continues through the
master artisans and the tradition of Byzantine art. The urban fabric underwent important
transformations with the rise to power of the Abbasids: the urban center ceased to be a unified
organism and was divided up into autonomous quarters, each equipped with its own
institutions, mosques, public baths, markets, and police corps. In this way, the rectangular
blocks from the Hellenistic grid were transformed into the characteristic Islamic urban fabric
(UNESCO, 2014).
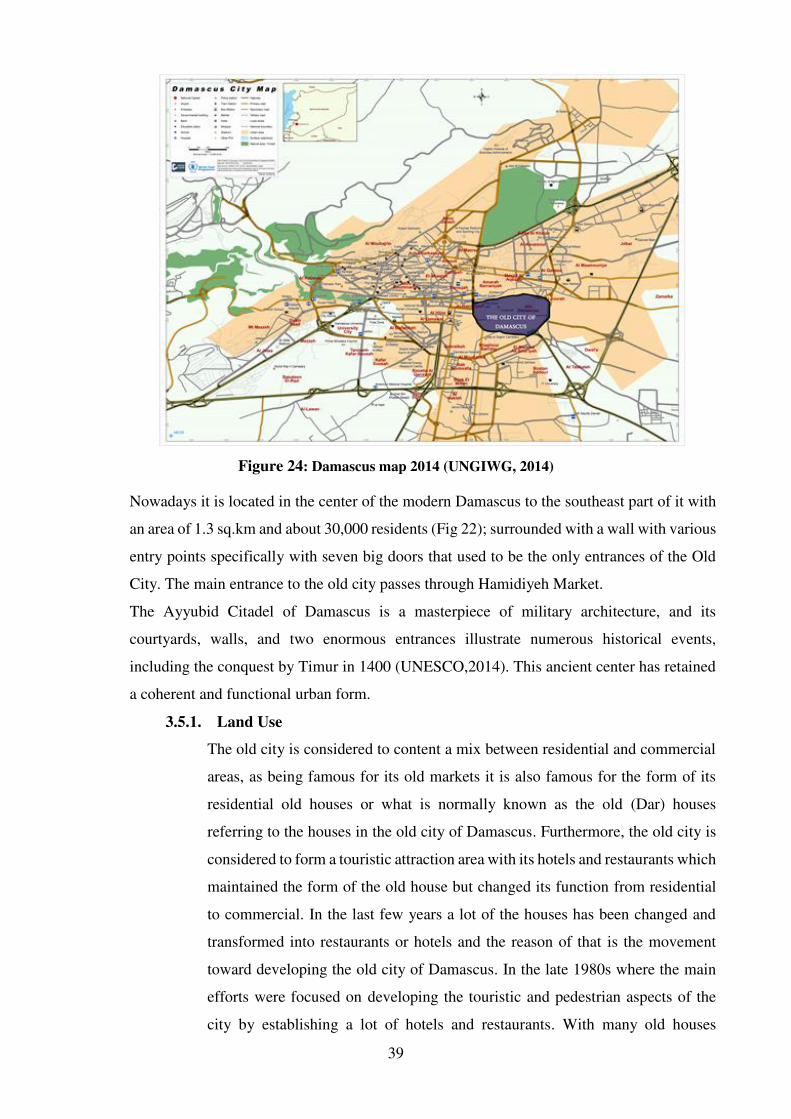
39
Figure 24: Damascus map 2014 (UNGIWG, 2014)
Nowadays it is located in the center of the modern Damascus to the southeast part of it with
an area of 1.3 sq.km and about 30,000 residents (Fig 22); surrounded with a wall with various
entry points specifically with seven big doors that used to be the only entrances of the Old
City. The main entrance to the old city passes through Hamidiyeh Market.
The Ayyubid Citadel of Damascus is a masterpiece of military architecture, and its
courtyards, walls, and two enormous entrances illustrate numerous historical events,
including the conquest by Timur in 1400 (UNESCO,2014). This ancient center has retained
a coherent and functional urban form.
3.5.1. Land Use
The old city is considered to content a mix between residential and commercial
areas, as being famous for its old markets it is also famous for the form of its
residential old houses or what is normally known as the old (Dar) houses
referring to the houses in the old city of Damascus. Furthermore, the old city is
considered to form a touristic attraction area with its hotels and restaurants which
maintained the form of the old house but changed its function from residential
to commercial. In the last few years a lot of the houses has been changed and
transformed into restaurants or hotels and the reason of that is the movement
toward developing the old city of Damascus. In the late 1980s where the main
efforts were focused on developing the touristic and pedestrian aspects of the
city by establishing a lot of hotels and restaurants. With many old houses
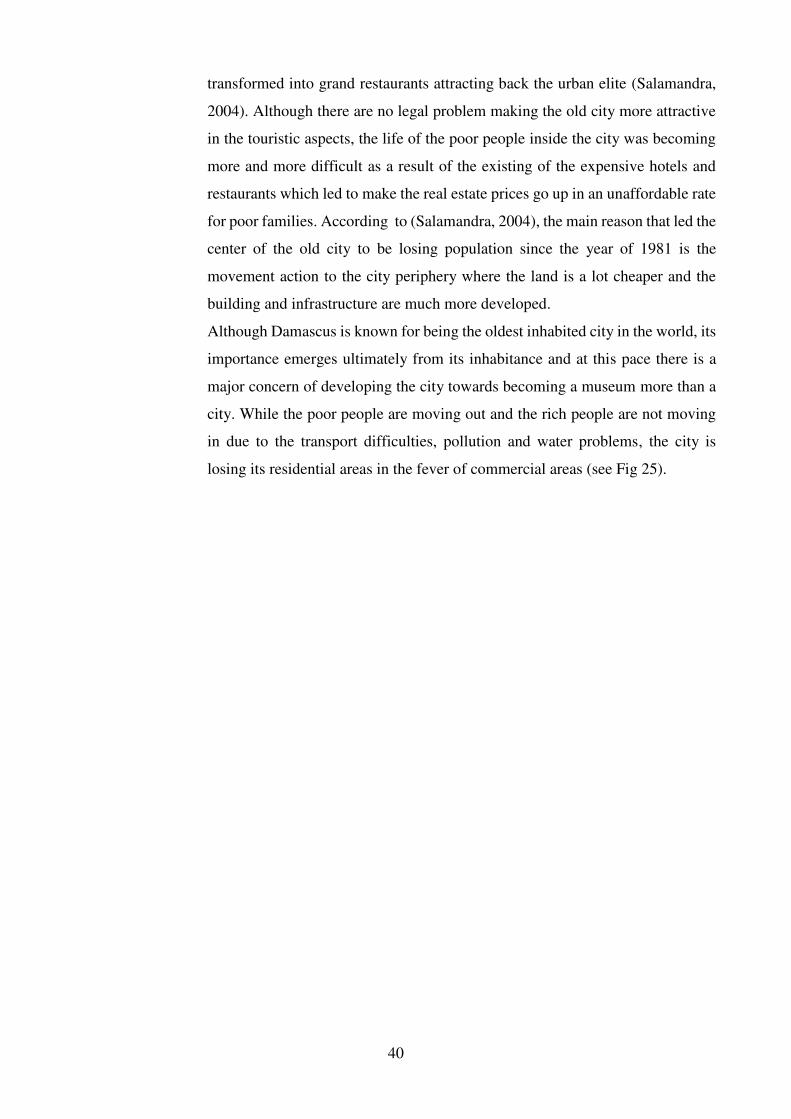
40
transformed into grand restaurants attracting back the urban elite (Salamandra,
2004). Although there are no legal problem making the old city more attractive
in the touristic aspects, the life of the poor people inside the city was becoming
more and more difficult as a result of the existing of the expensive hotels and
restaurants which led to make the real estate prices go up in an unaffordable rate
for poor families. According to (Salamandra, 2004), the main reason that led the
center of the old city to be losing population since the year of 1981 is the
movement action to the city periphery where the land is a lot cheaper and the
building and infrastructure are much more developed.
Although Damascus is known for being the oldest inhabited city in the world, its
importance emerges ultimately from its inhabitance and at this pace there is a
major concern of developing the city towards becoming a museum more than a
city. While the poor people are moving out and the rich people are not moving
in due to the transport difficulties, pollution and water problems, the city is
losing its residential areas in the fever of commercial areas (see Fig 25).
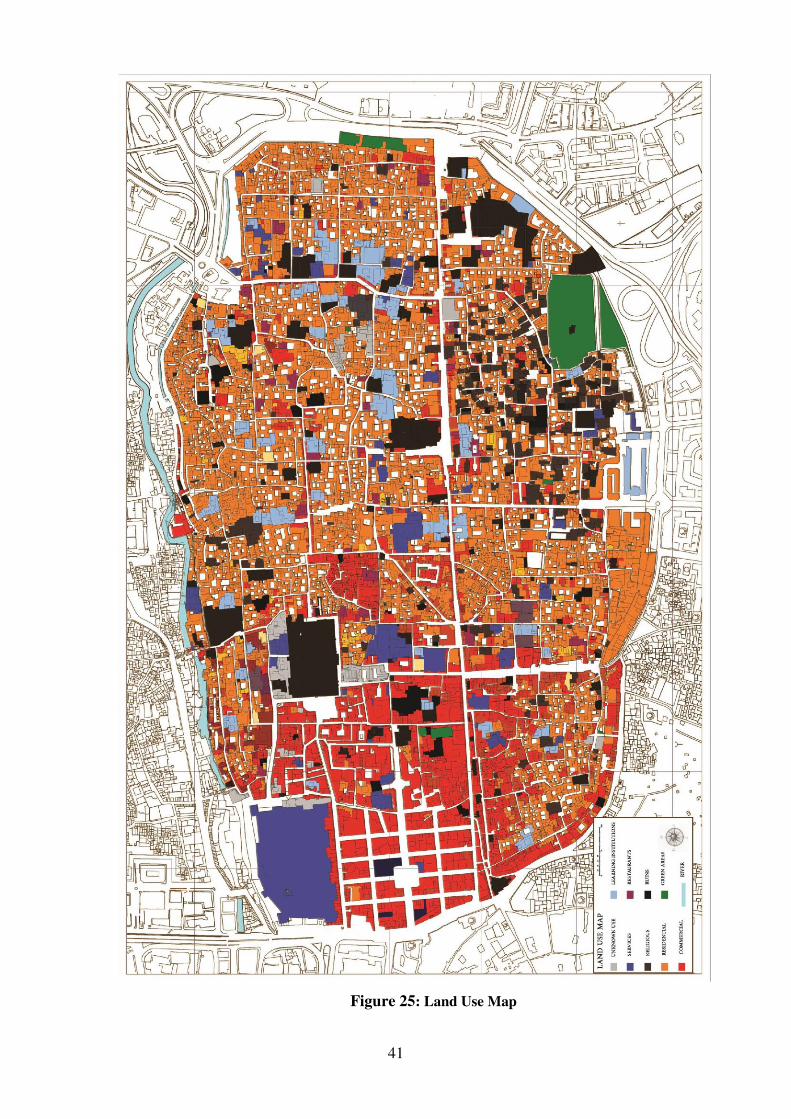
41
Figure 25: Land Use Map
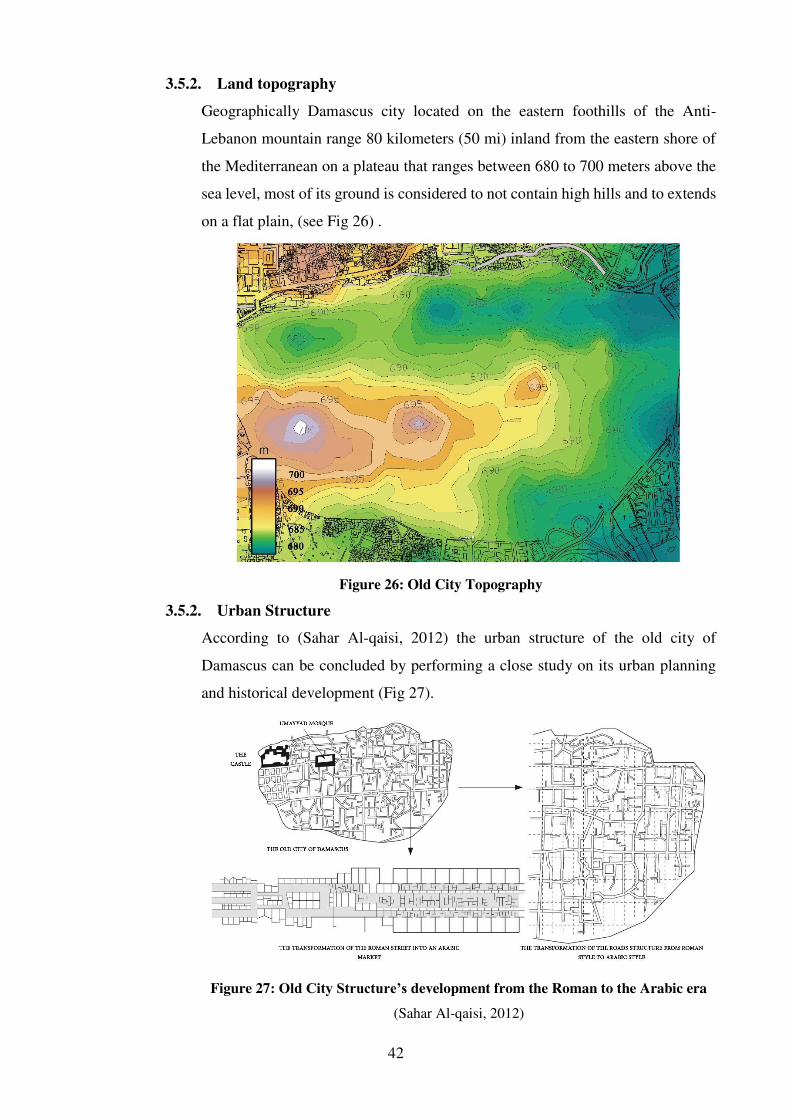
42
3.5.2. Land topography
Geographically Damascus city located on the eastern foothills of the Anti-
Lebanon mountain range 80 kilometers (50 mi) inland from the eastern shore of
the Mediterranean on a plateau that ranges between 680 to 700 meters above the
sea level, most of its ground is considered to not contain high hills and to extends
on a flat plain, (see Fig 26) .
Figure 26: Old City Topography
3.5.2. Urban Structure
According to (Sahar Al-qaisi, 2012) the urban structure of the old city of
Damascus can be concluded by performing a close study on its urban planning
and historical development (Fig 27).
Figure 27: Old City Structure’s development from the Roman to the Arabic era
(Sahar Al-qaisi, 2012)
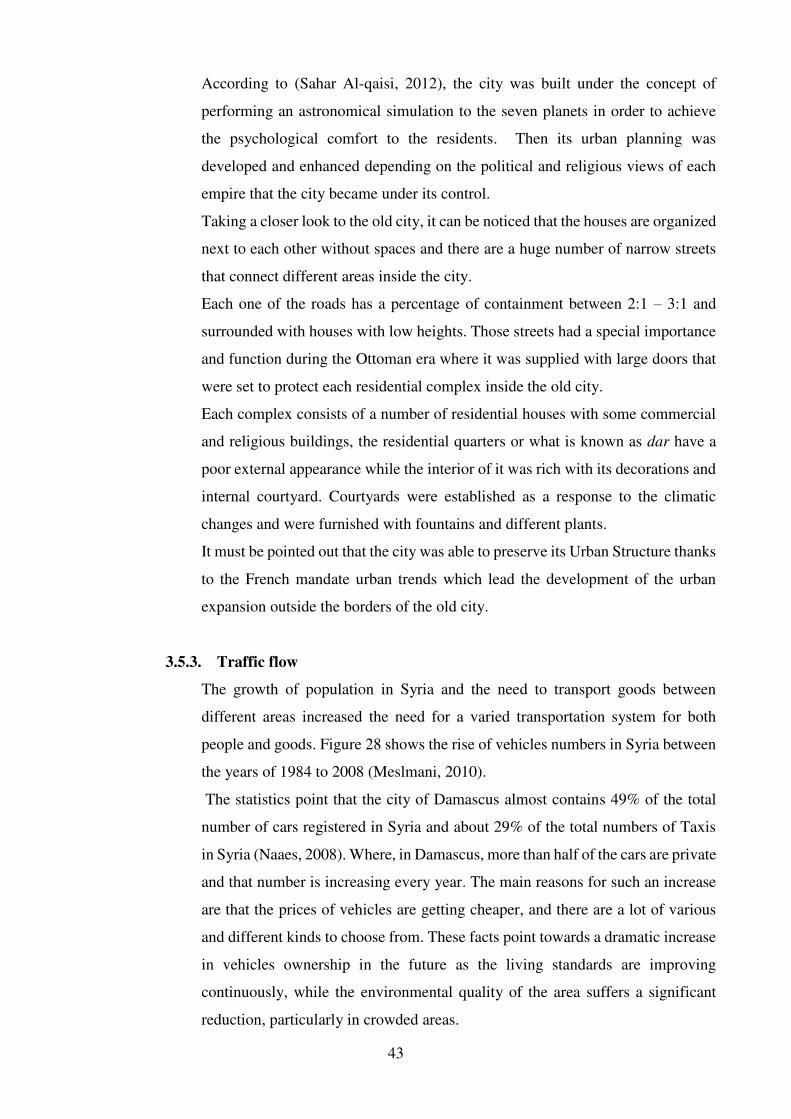
43
According to (Sahar Al-qaisi, 2012), the city was built under the concept of
performing an astronomical simulation to the seven planets in order to achieve
the psychological comfort to the residents. Then its urban planning was
developed and enhanced depending on the political and religious views of each
empire that the city became under its control.
Taking a closer look to the old city, it can be noticed that the houses are organized
next to each other without spaces and there are a huge number of narrow streets
that connect different areas inside the city.
Each one of the roads has a percentage of containment between 2:1 – 3:1 and
surrounded with houses with low heights. Those streets had a special importance
and function during the Ottoman era where it was supplied with large doors that
were set to protect each residential complex inside the old city.
Each complex consists of a number of residential houses with some commercial
and religious buildings, the residential quarters or what is known as dar have a
poor external appearance while the interior of it was rich with its decorations and
internal courtyard. Courtyards were established as a response to the climatic
changes and were furnished with fountains and different plants.
It must be pointed out that the city was able to preserve its Urban Structure thanks
to the French mandate urban trends which lead the development of the urban
expansion outside the borders of the old city.
3.5.3. Traffic flow
The growth of population in Syria and the need to transport goods between
different areas increased the need for a varied transportation system for both
people and goods. Figure 28 shows the rise of vehicles numbers in Syria between
the years of 1984 to 2008 (Meslmani, 2010).
The statistics point that the city of Damascus almost contains 49% of the total
number of cars registered in Syria and about 29% of the total numbers of Taxis
in Syria (Naaes, 2008). Where, in Damascus, more than half of the cars are private
and that number is increasing every year. The main reasons for such an increase
are that the prices of vehicles are getting cheaper, and there are a lot of various
and different kinds to choose from. These facts point towards a dramatic increase
in vehicles ownership in the future as the living standards are improving
continuously, while the environmental quality of the area suffers a significant
reduction, particularly in crowded areas.
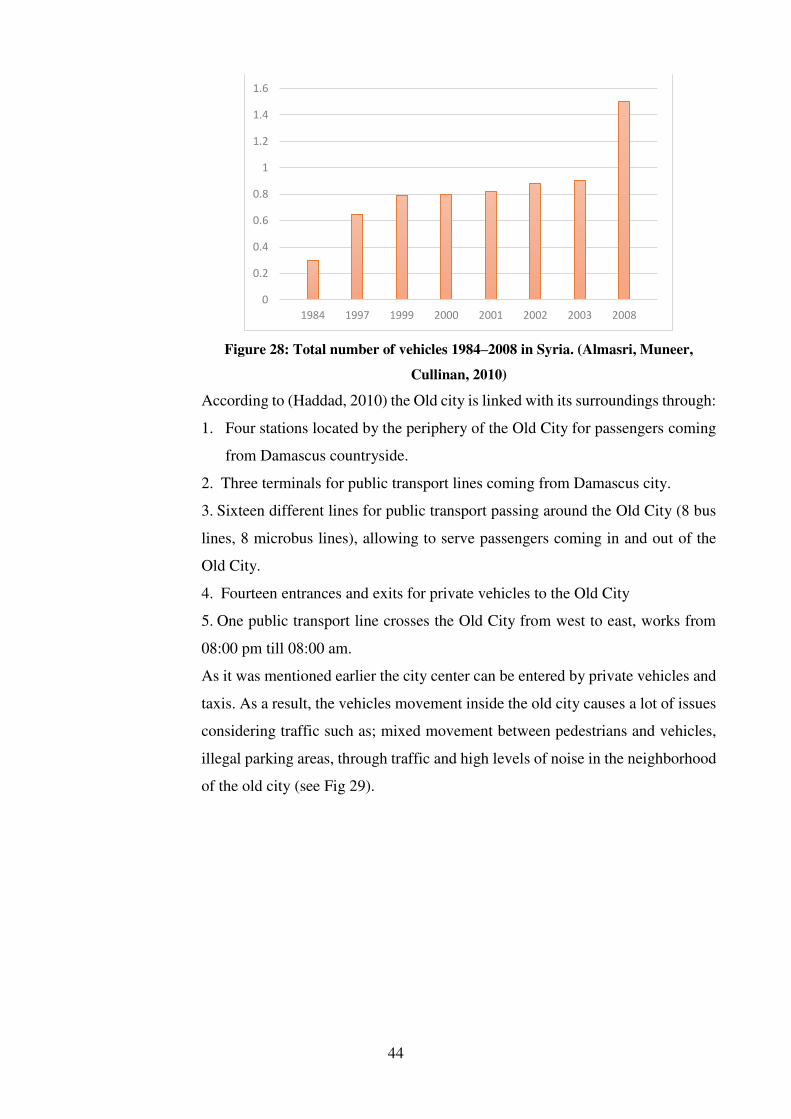
44
Figure 28: Total number of vehicles 1984–2008 in Syria. (Almasri, Muneer,
Cullinan, 2010)
According to (Haddad, 2010) the Old city is linked with its surroundings through:
1. Four stations located by the periphery of the Old City for passengers coming
from Damascus countryside.
2. Three terminals for public transport lines coming from Damascus city.
3. Sixteen different lines for public transport passing around the Old City (8 bus
lines, 8 microbus lines), allowing to serve passengers coming in and out of the
Old City.
4. Fourteen entrances and exits for private vehicles to the Old City
5. One public transport line crosses the Old City from west to east, works from
08:00 pm till 08:00 am.
As it was mentioned earlier the city center can be entered by private vehicles and
taxis. As a result, the vehicles movement inside the old city causes a lot of issues
considering traffic such as; mixed movement between pedestrians and vehicles,
illegal parking areas, through traffic and high levels of noise in the neighborhood
of the old city (see Fig 29).
0
0.2
0.4
0.6
0.8
1
1.2
1.4
1.6
1984 1997 1999 2000 2001 2002 2003 2008
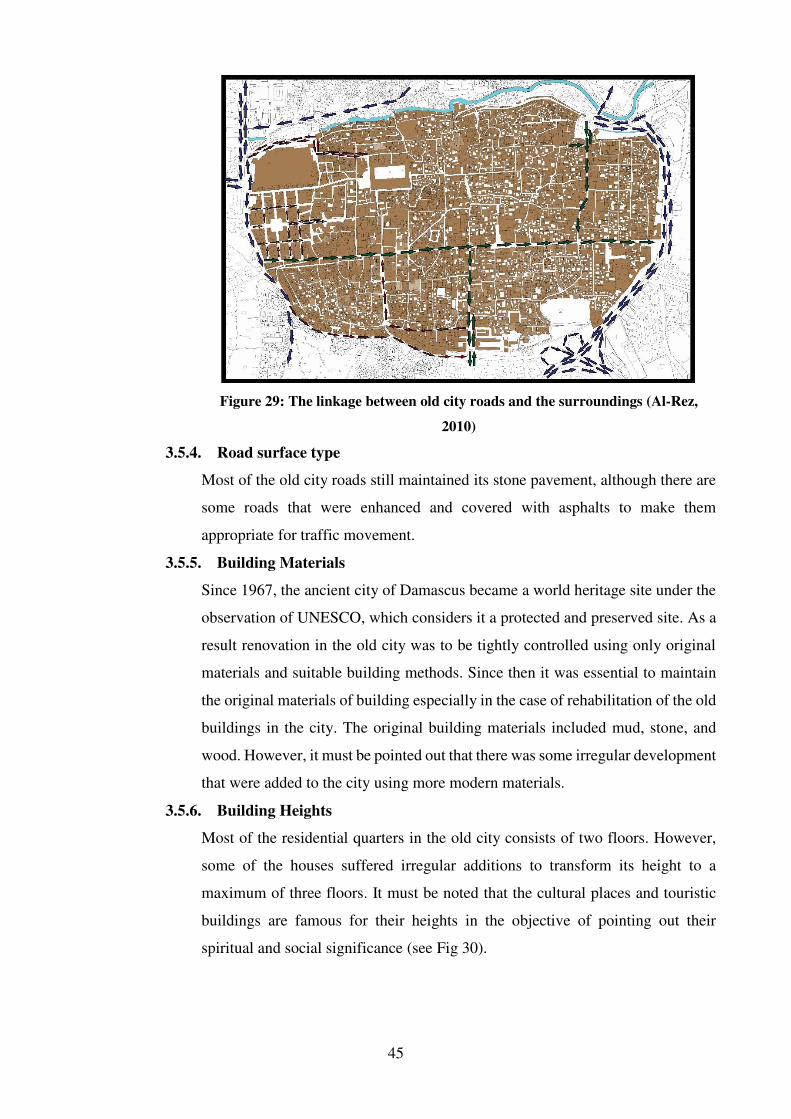
45
Figure 29: The linkage between old city roads and the surroundings (Al-Rez,
2010)
3.5.4. Road surface type
Most of the old city roads still maintained its stone pavement, although there are
some roads that were enhanced and covered with asphalts to make them
appropriate for traffic movement.
3.5.5. Building Materials
Since 1967, the ancient city of Damascus became a world heritage site under the
observation of UNESCO, which considers it a protected and preserved site. As a
result renovation in the old city was to be tightly controlled using only original
materials and suitable building methods. Since then it was essential to maintain
the original materials of building especially in the case of rehabilitation of the old
buildings in the city. The original building materials included mud, stone, and
wood. However, it must be pointed out that there was some irregular development
that were added to the city using more modern materials.
3.5.6. Building Heights
Most of the residential quarters in the old city consists of two floors. However,
some of the houses suffered irregular additions to transform its height to a
maximum of three floors. It must be noted that the cultural places and touristic
buildings are famous for their heights in the objective of pointing out their
spiritual and social significance (see Fig 30).
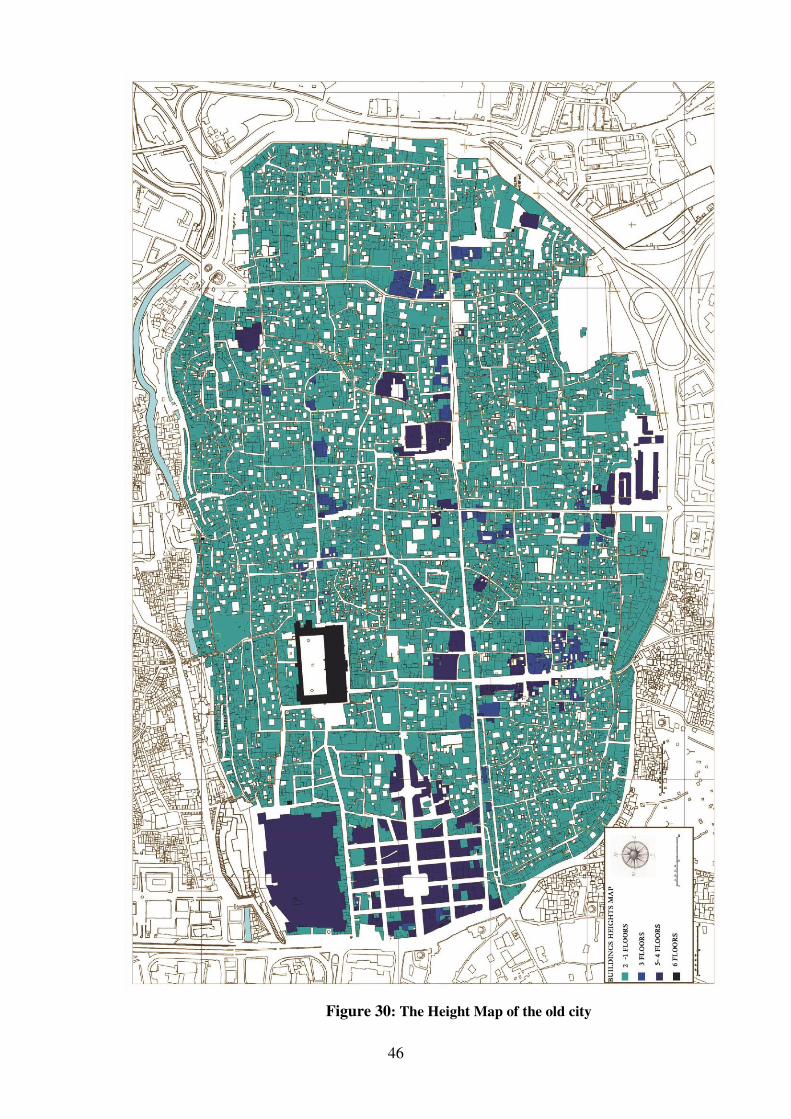
46
Figure 30: The Height Map of the old city
47
3.5.7. Population Density
It is considered somewhat difficult to develop a practical profile of old
Damascus’s current residences, while some of damascene residence maintained
their homes in the old city, especially in the Christian areas, a lot have left.
It was mentioned earlier that a lot of people preferred to replace the crowded and
difficult situation in old modest Arabic houses to live in the more modern
developed houses outside the old city. Furthermore, the population growth in the
old city took a negative rate since the eighties and the nineties, in the same time
it got slower for all the area of the municipality. The number of the residences
inside the old city of Damascus was estimated to reach about 30000 inhabitants
in the year of 2011, over an area of 140 Ha, with a density of 177 inhabitants/ha
(CBSSYR, 2011).
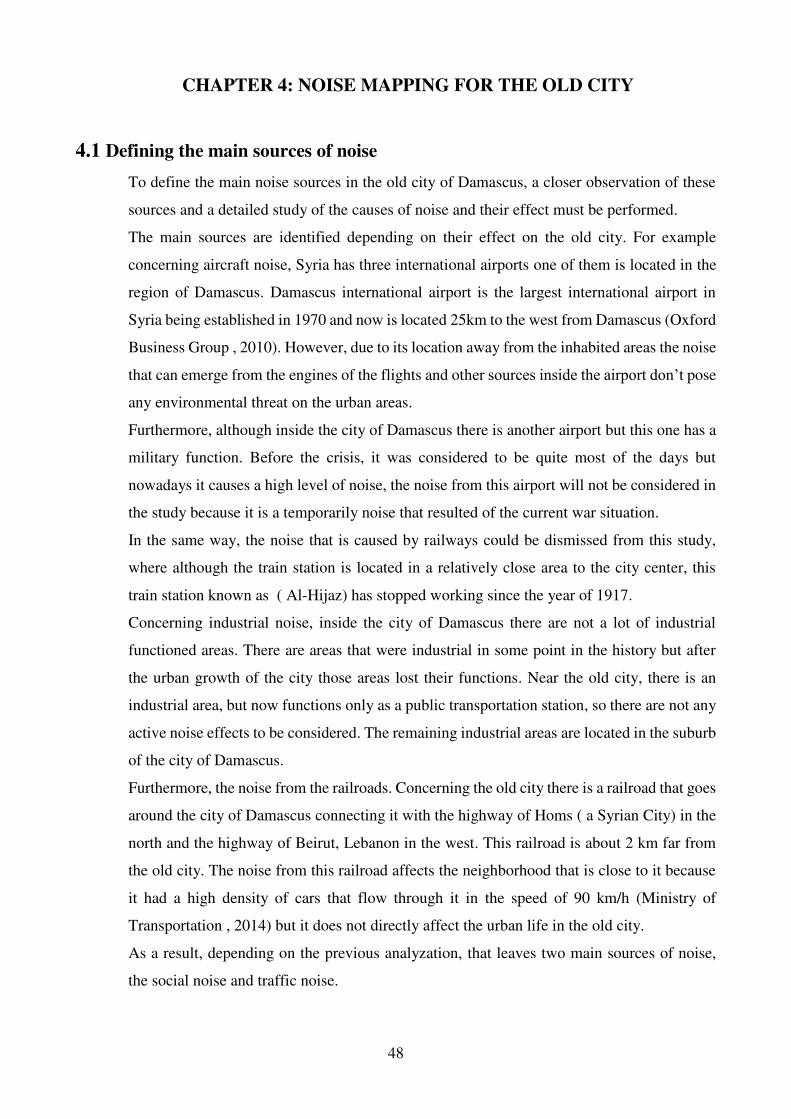
48
CHAPTER 4: NOISE MAPPING FOR THE OLD CITY
4.1 Defining the main sources of noise
To define the main noise sources in the old city of Damascus, a closer observation of these
sources and a detailed study of the causes of noise and their effect must be performed.
The main sources are identified depending on their effect on the old city. For example
concerning aircraft noise, Syria has three international airports one of them is located in the
region of Damascus. Damascus international airport is the largest international airport in
Syria being established in 1970 and now is located 25km to the west from Damascus (Oxford
Business Group , 2010). However, due to its location away from the inhabited areas the noise
that can emerge from the engines of the flights and other sources inside the airport don’t pose
any environmental threat on the urban areas.
Furthermore, although inside the city of Damascus there is another airport but this one has a
military function. Before the crisis, it was considered to be quite most of the days but
nowadays it causes a high level of noise, the noise from this airport will not be considered in
the study because it is a temporarily noise that resulted of the current war situation.
In the same way, the noise that is caused by railways could be dismissed from this study,
where although the train station is located in a relatively close area to the city center, this
train station known as ( Al-Hijaz) has stopped working since the year of 1917.
Concerning industrial noise, inside the city of Damascus there are not a lot of industrial
functioned areas. There are areas that were industrial in some point in the history but after
the urban growth of the city those areas lost their functions. Near the old city, there is an
industrial area, but now functions only as a public transportation station, so there are not any
active noise effects to be considered. The remaining industrial areas are located in the suburb
of the city of Damascus.
Furthermore, the noise from the railroads. Concerning the old city there is a railroad that goes
around the city of Damascus connecting it with the highway of Homs ( a Syrian City) in the
north and the highway of Beirut, Lebanon in the west. This railroad is about 2 km far from
the old city. The noise from this railroad affects the neighborhood that is close to it because
it had a high density of cars that flow through it in the speed of 90 km/h (Ministry of
Transportation , 2014) but it does not directly affect the urban life in the old city.
As a result, depending on the previous analyzation, that leaves two main sources of noise,
the social noise and traffic noise.
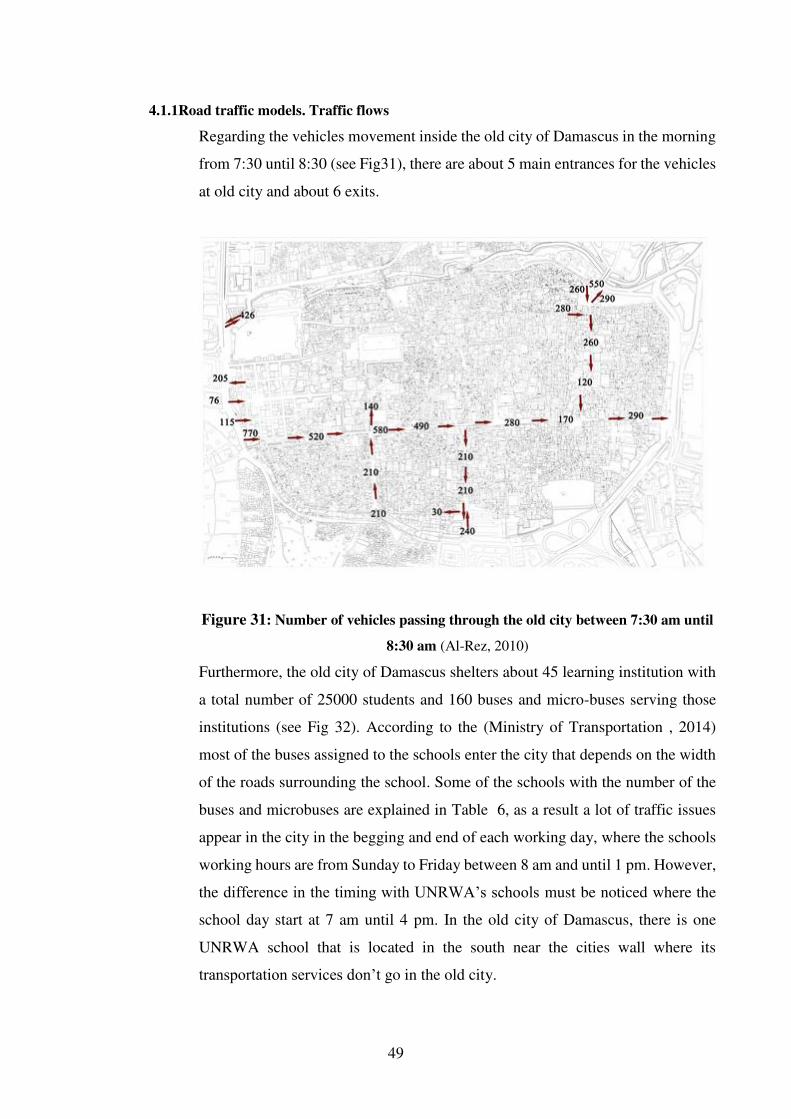
49
4.1.1Road traffic models. Traffic flows
Regarding the vehicles movement inside the old city of Damascus in the morning
from 7:30 until 8:30 (see Fig31), there are about 5 main entrances for the vehicles
at old city and about 6 exits.
Figure 31: Number of vehicles passing through the old city between 7:30 am until
8:30 am (Al-Rez, 2010)
Furthermore, the old city of Damascus shelters about 45 learning institution with
a total number of 25000 students and 160 buses and micro-buses serving those
institutions (see Fig 32). According to the (Ministry of Transportation , 2014)
most of the buses assigned to the schools enter the city that depends on the width
of the roads surrounding the school. Some of the schools with the number of the
buses and microbuses are explained in Table 6, as a result a lot of traffic issues
appear in the city in the begging and end of each working day, where the schools
working hours are from Sunday to Friday between 8 am and until 1 pm. However,
the difference in the timing with UNRWA’s schools must be noticed where the
school day start at 7 am until 4 pm. In the old city of Damascus, there is one
UNRWA school that is located in the south near the cities wall where its
transportation services don’t go in the old city.
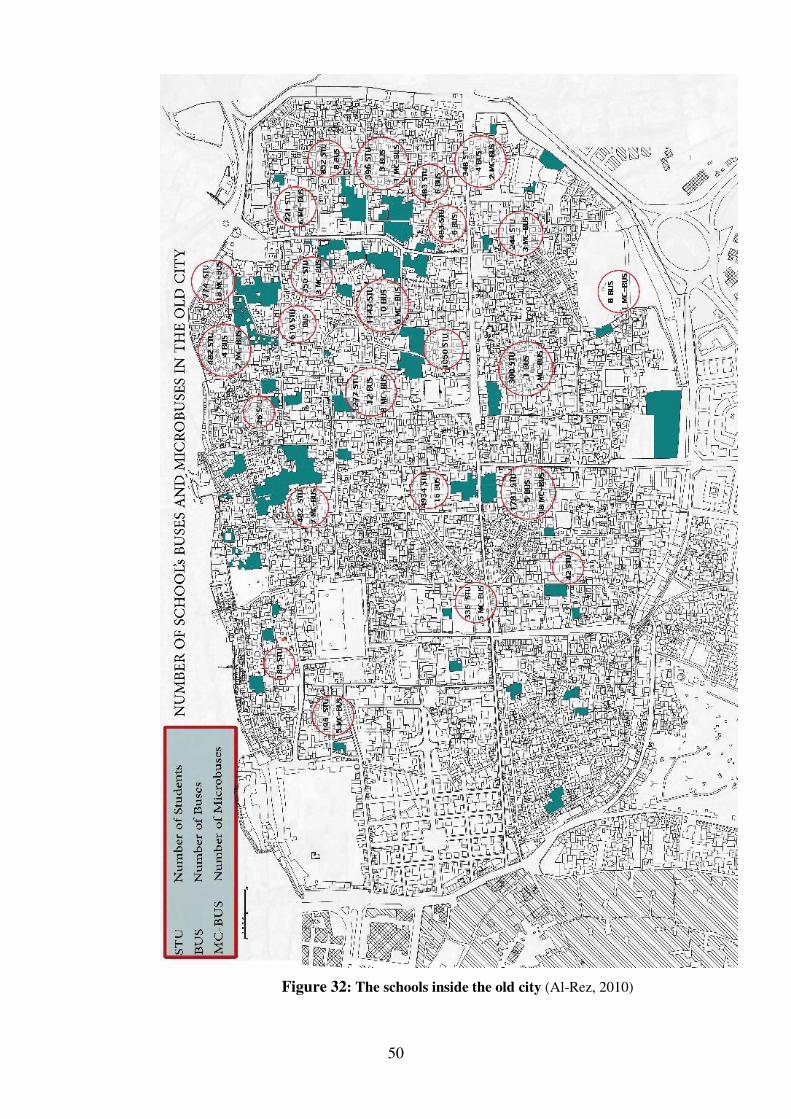
50
Figure 32: The schools inside the old city (Al-Rez, 2010)
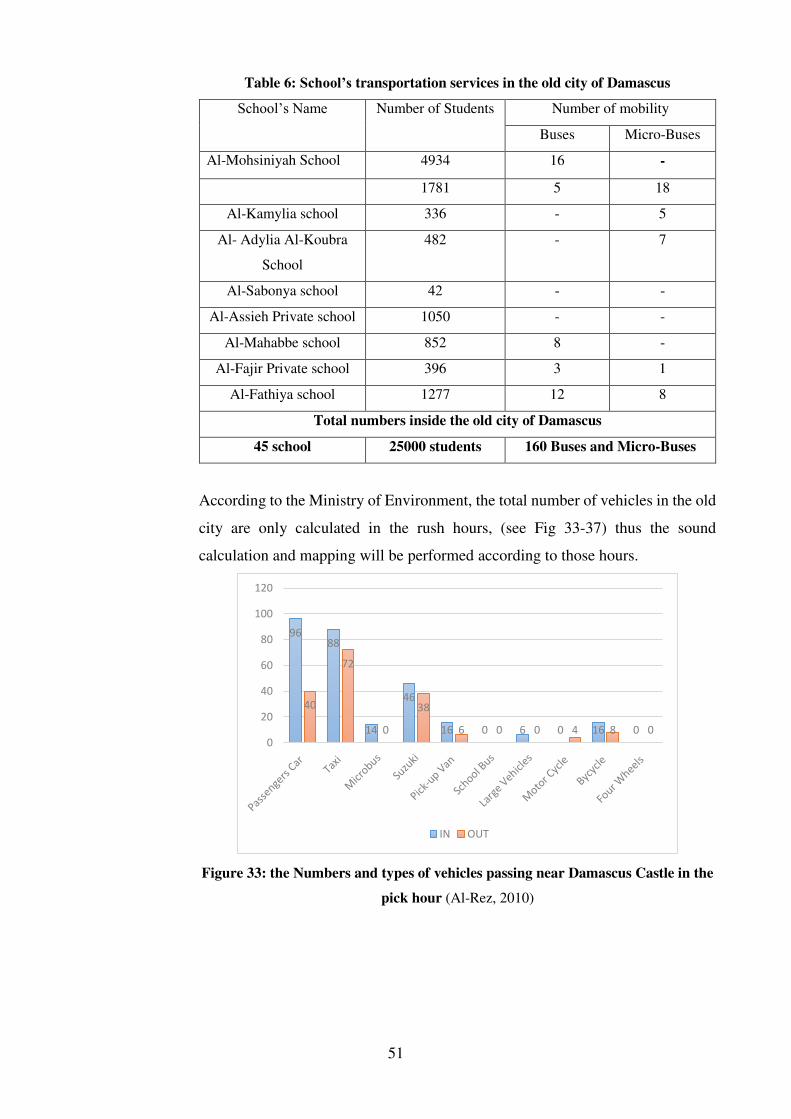
51
Table 6: School’s transportation services in the old city of Damascus
School’s Name Number of Students Number of mobility
Buses Micro-Buses
Al-Mohsiniyah School 4934 16 -
1781 5 18
Al-Kamylia school 336 - 5
Al- Adylia Al-Koubra
School
482 - 7
Al-Sabonya school 42 - -
Al-Assieh Private school 1050 - -
Al-Mahabbe school 852 8 -
Al-Fajir Private school 396 3 1
Al-Fathiya school 1277 12 8
Total numbers inside the old city of Damascus
45 school 25000 students 160 Buses and Micro-Buses
According to the Ministry of Environment, the total number of vehicles in the old
city are only calculated in the rush hours, (see Fig 33-37) thus the sound
calculation and mapping will be performed according to those hours.
Figure 33: the Numbers and types of vehicles passing near Damascus Castle in the
pick hour (Al-Rez, 2010)
9688
14
46
16 0 6 0 16 0
40
72
0
38
6 0 0 4 8 00
20
40
60
80
100
120
IN OUT
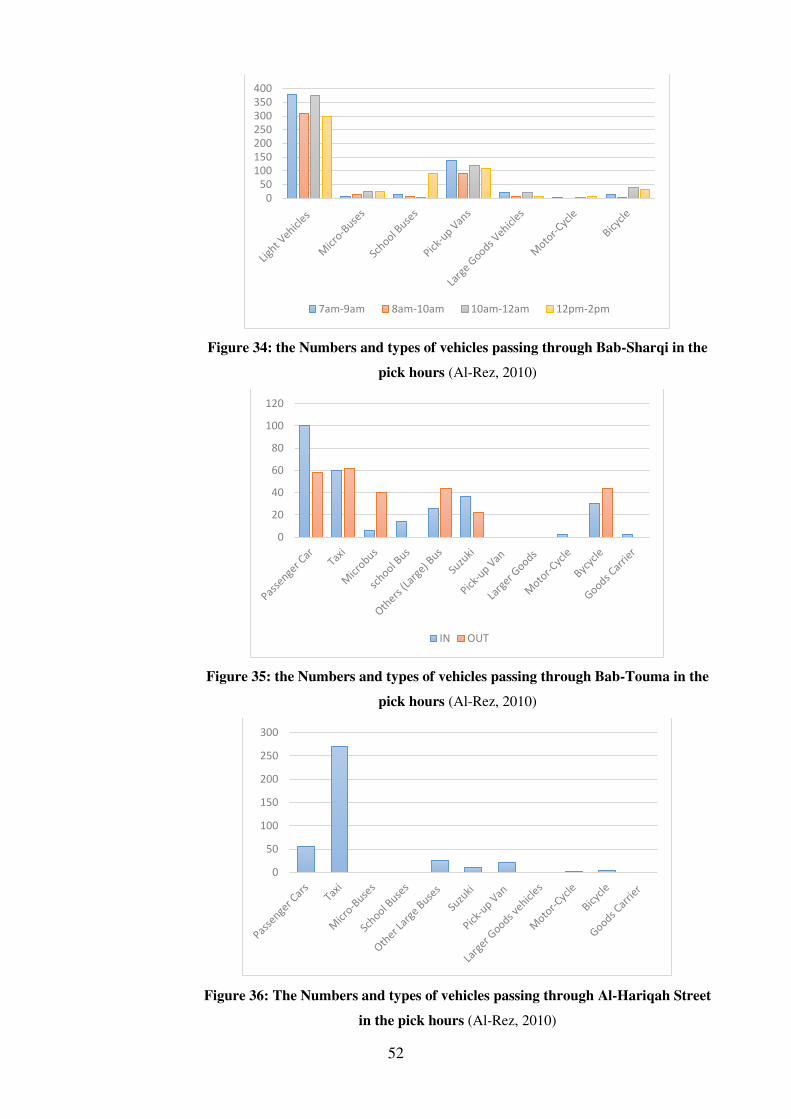
52
Figure 34: the Numbers and types of vehicles passing through Bab-Sharqi in the
pick hours (Al-Rez, 2010)
Figure 35: the Numbers and types of vehicles passing through Bab-Touma in the
pick hours (Al-Rez, 2010)
Figure 36: The Numbers and types of vehicles passing through Al-Hariqah Street
in the pick hours (Al-Rez, 2010)
0
50
100
150
200
250
300
350
400
7am-9am 8am-10am 10am-12am 12pm-2pm
0
20
40
60
80
100
120
IN OUT
0
50
100
150
200
250
300
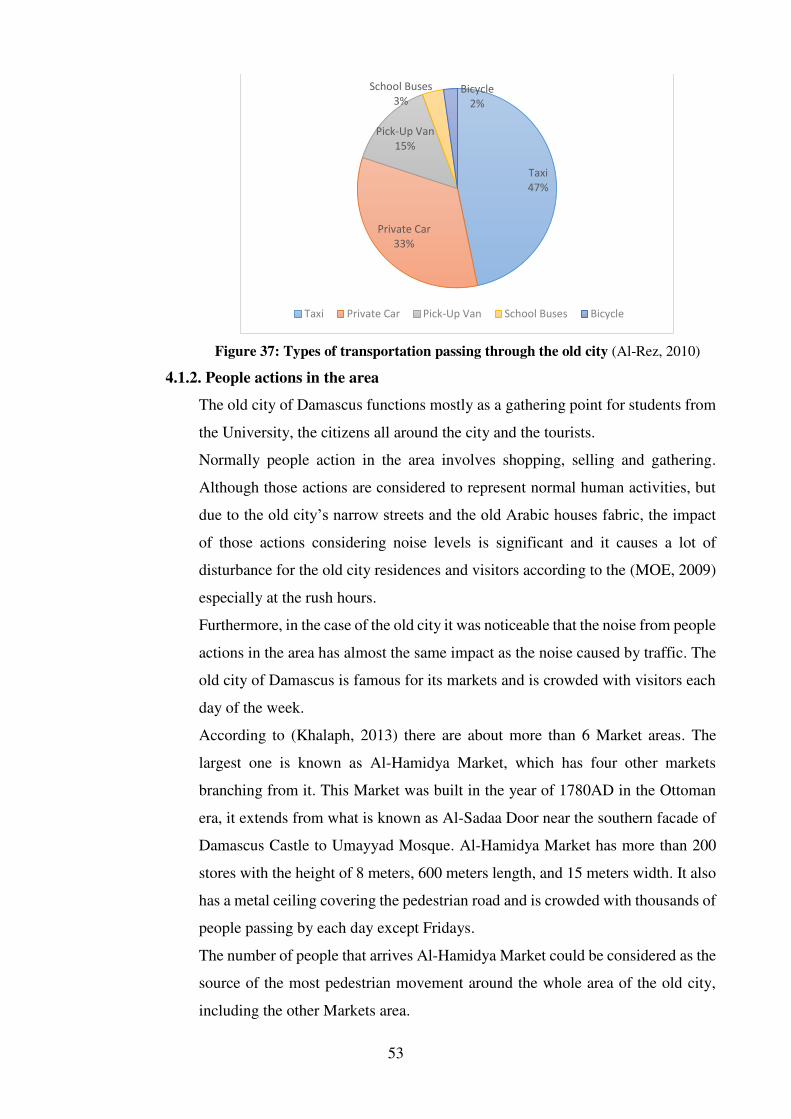
53
Figure 37: Types of transportation passing through the old city (Al-Rez, 2010)
4.1.2. People actions in the area
The old city of Damascus functions mostly as a gathering point for students from
the University, the citizens all around the city and the tourists.
Normally people action in the area involves shopping, selling and gathering.
Although those actions are considered to represent normal human activities, but
due to the old city’s narrow streets and the old Arabic houses fabric, the impact
of those actions considering noise levels is significant and it causes a lot of
disturbance for the old city residences and visitors according to the (MOE, 2009)
especially at the rush hours.
Furthermore, in the case of the old city it was noticeable that the noise from people
actions in the area has almost the same impact as the noise caused by traffic. The
old city of Damascus is famous for its markets and is crowded with visitors each
day of the week.
According to (Khalaph, 2013) there are about more than 6 Market areas. The
largest one is known as Al-Hamidya Market, which has four other markets
branching from it. This Market was built in the year of 1780AD in the Ottoman
era, it extends from what is known as Al-Sadaa Door near the southern facade of
Damascus Castle to Umayyad Mosque. Al-Hamidya Market has more than 200
stores with the height of 8 meters, 600 meters length, and 15 meters width. It also
has a metal ceiling covering the pedestrian road and is crowded with thousands of
people passing by each day except Fridays.
The number of people that arrives Al-Hamidya Market could be considered as the
source of the most pedestrian movement around the whole area of the old city,
including the other Markets area.
Taxi
47%
Private Car
33%
Pick-Up Van
15%
School Buses
3%Bicycle
2%
Taxi Private Car Pick-Up Van School Buses Bicycle
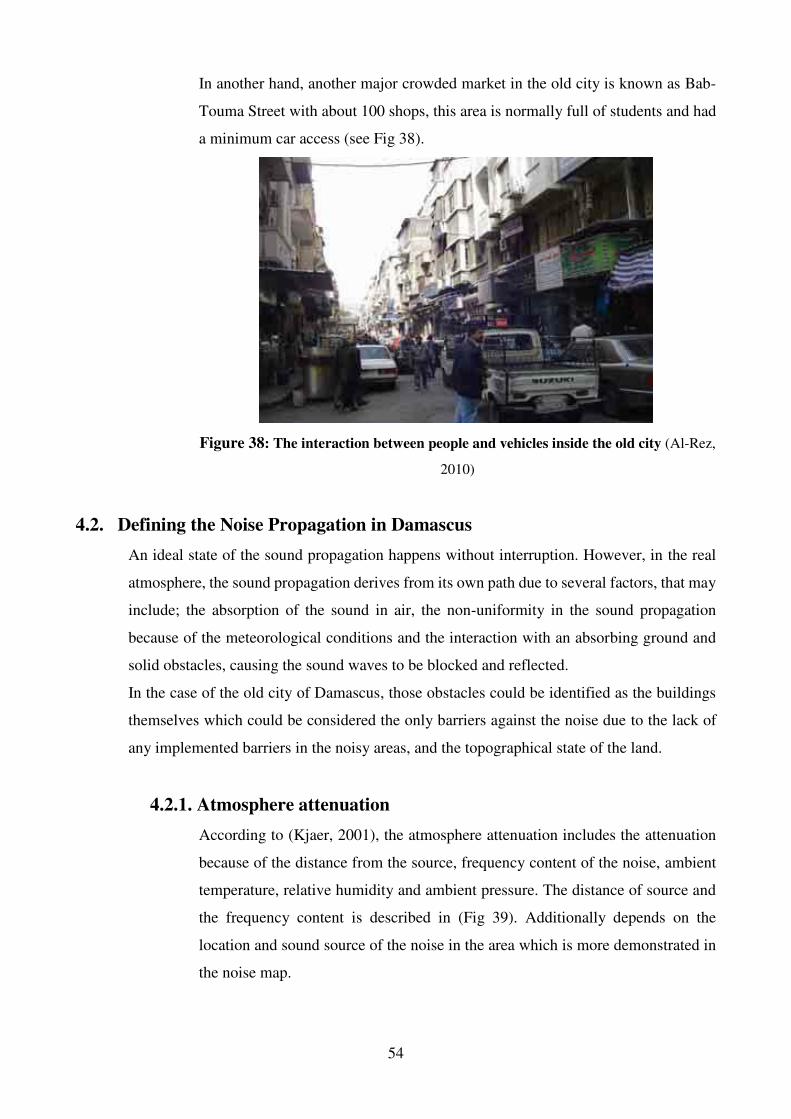
54
In another hand, another major crowded market in the old city is known as Bab-
Touma Street with about 100 shops, this area is normally full of students and had
a minimum car access (see Fig 38).
Figure 38: The interaction between people and vehicles inside the old city (Al-Rez,
2010)
4.2. Defining the Noise Propagation in Damascus
An ideal state of the sound propagation happens without interruption. However, in the real
atmosphere, the sound propagation derives from its own path due to several factors, that may
include; the absorption of the sound in air, the non-uniformity in the sound propagation
because of the meteorological conditions and the interaction with an absorbing ground and
solid obstacles, causing the sound waves to be blocked and reflected.
In the case of the old city of Damascus, those obstacles could be identified as the buildings
themselves which could be considered the only barriers against the noise due to the lack of
any implemented barriers in the noisy areas, and the topographical state of the land.
4.2.1. Atmosphere attenuation
According to (Kjaer, 2001), the atmosphere attenuation includes the attenuation
because of the distance from the source, frequency content of the noise, ambient
temperature, relative humidity and ambient pressure. The distance of source and
the frequency content is described in (Fig 39). Additionally depends on the
location and sound source of the noise in the area which is more demonstrated in
the noise map.
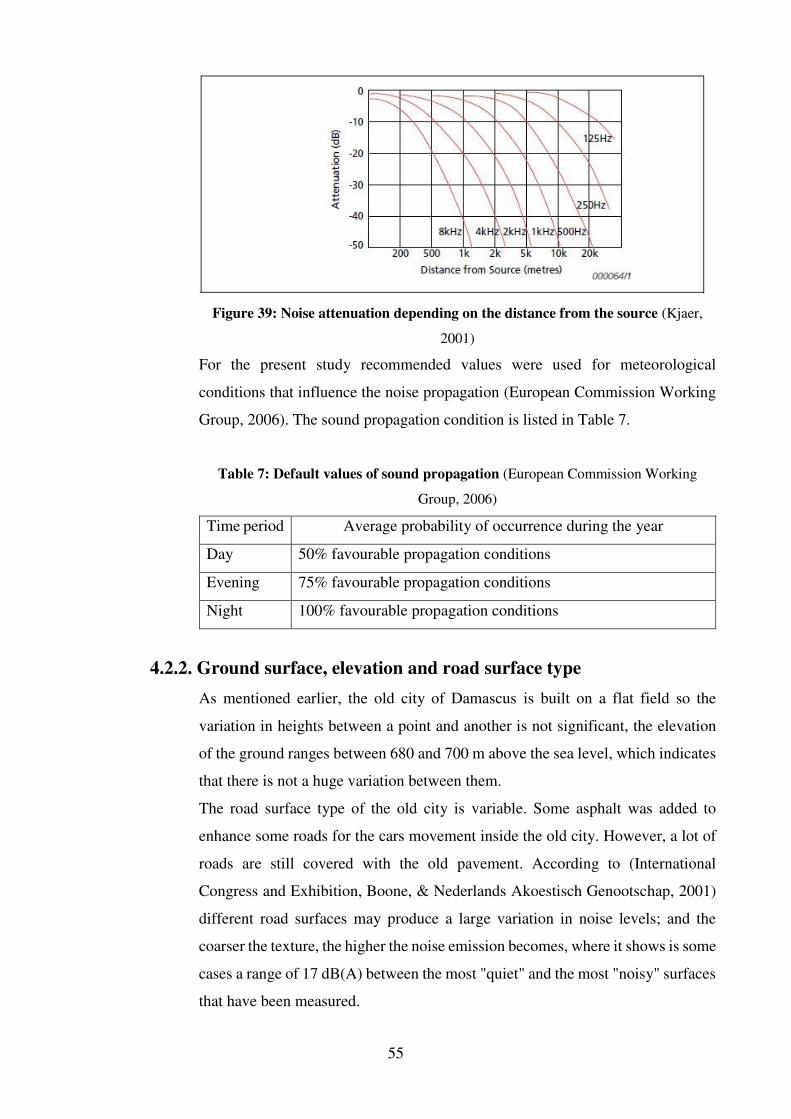
55
Figure 39: Noise attenuation depending on the distance from the source (Kjaer,
2001)
For the present study recommended values were used for meteorological
conditions that influence the noise propagation (European Commission Working
Group, 2006). The sound propagation condition is listed in Table 7.
Table 7: Default values of sound propagation (European Commission Working
Group, 2006)
Time period Average probability of occurrence during the year
Day 50% favourable propagation conditions
Evening 75% favourable propagation conditions
Night 100% favourable propagation conditions
4.2.2. Ground surface, elevation and road surface type
As mentioned earlier, the old city of Damascus is built on a flat field so the
variation in heights between a point and another is not significant, the elevation
of the ground ranges between 680 and 700 m above the sea level, which indicates
that there is not a huge variation between them.
The road surface type of the old city is variable. Some asphalt was added to
enhance some roads for the cars movement inside the old city. However, a lot of
roads are still covered with the old pavement. According to (International
Congress and Exhibition, Boone, & Nederlands Akoestisch Genootschap, 2001)
different road surfaces may produce a large variation in noise levels; and the
coarser the texture, the higher the noise emission becomes, where it shows is some
cases a range of 17 dB(A) between the most "quiet" and the most "noisy" surfaces
that have been measured.
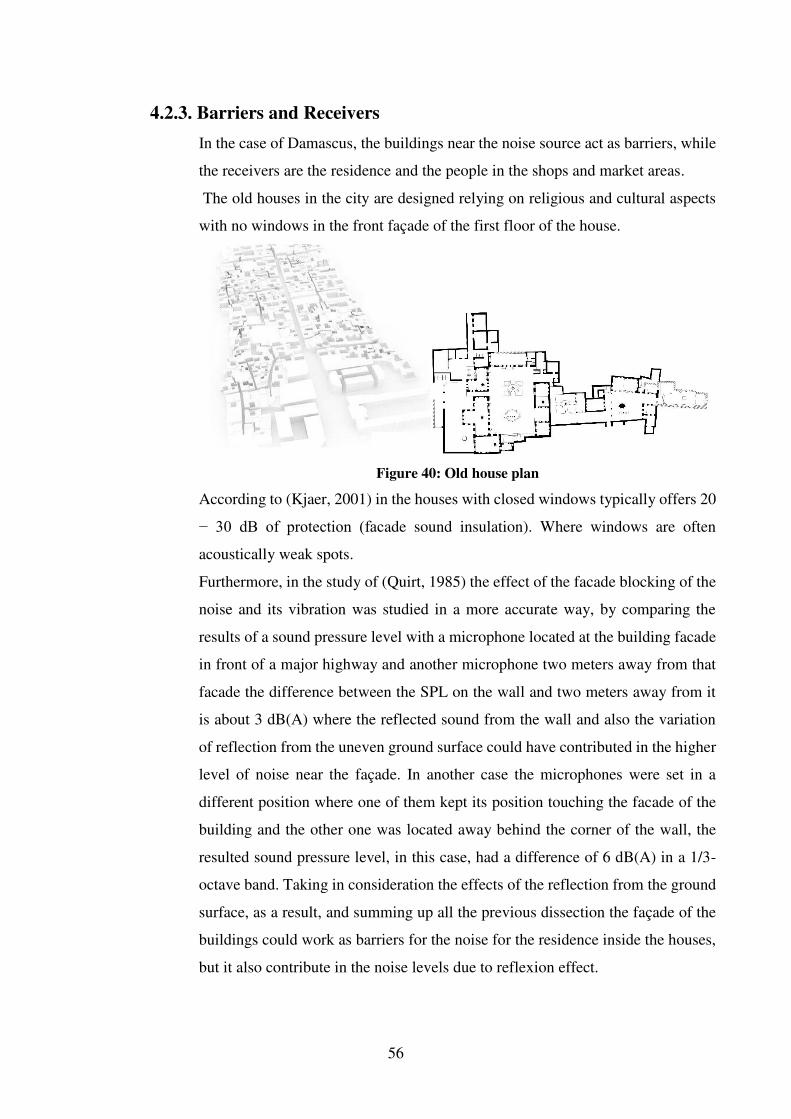
56
4.2.3. Barriers and Receivers
In the case of Damascus, the buildings near the noise source act as barriers, while
the receivers are the residence and the people in the shops and market areas.
The old houses in the city are designed relying on religious and cultural aspects
with no windows in the front façade of the first floor of the house.
Figure 40: Old house plan
According to (Kjaer, 2001) in the houses with closed windows typically offers 20
− 30 dB of protection (facade sound insulation). Where windows are often
acoustically weak spots.
Furthermore, in the study of (Quirt, 1985) the effect of the facade blocking of the
noise and its vibration was studied in a more accurate way, by comparing the
results of a sound pressure level with a microphone located at the building facade
in front of a major highway and another microphone two meters away from that
facade the difference between the SPL on the wall and two meters away from it
is about 3 dB(A) where the reflected sound from the wall and also the variation
of reflection from the uneven ground surface could have contributed in the higher
level of noise near the façade. In another case the microphones were set in a
different position where one of them kept its position touching the facade of the
building and the other one was located away behind the corner of the wall, the
resulted sound pressure level, in this case, had a difference of 6 dB(A) in a 1/3-
octave band. Taking in consideration the effects of the reflection from the ground
surface, as a result, and summing up all the previous dissection the façade of the
buildings could work as barriers for the noise for the residence inside the houses,
but it also contribute in the noise levels due to reflexion effect.
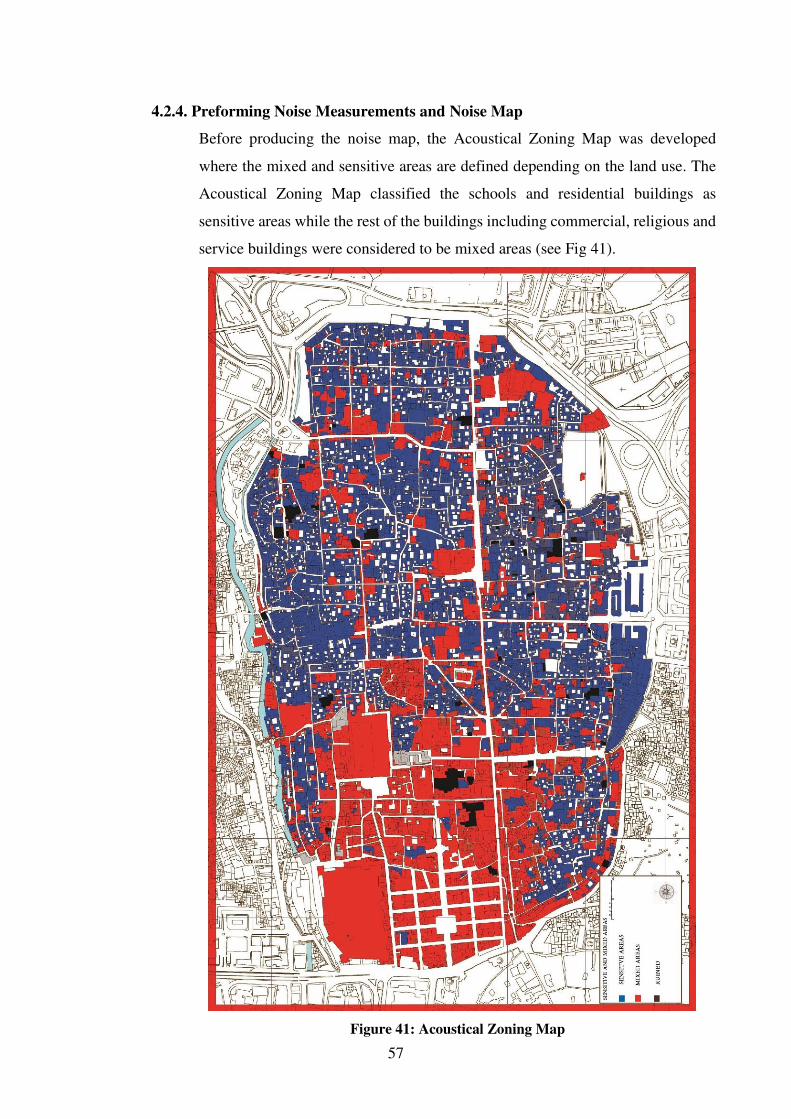
57
4.2.4. Preforming Noise Measurements and Noise Map
Before producing the noise map, the Acoustical Zoning Map was developed
where the mixed and sensitive areas are defined depending on the land use. The
Acoustical Zoning Map classified the schools and residential buildings as
sensitive areas while the rest of the buildings including commercial, religious and
service buildings were considered to be mixed areas (see Fig 41).
Figure 41: Acoustical Zoning Map
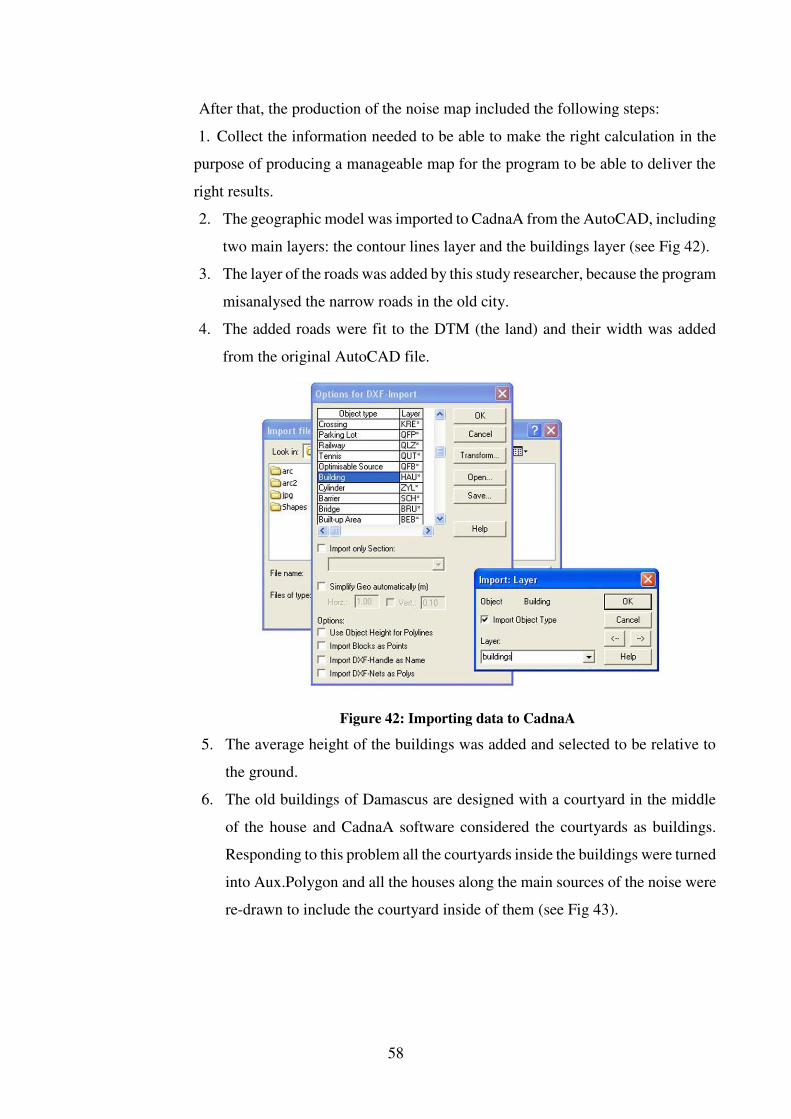
58
After that, the production of the noise map included the following steps:
1. Collect the information needed to be able to make the right calculation in the
purpose of producing a manageable map for the program to be able to deliver the
right results.
2. The geographic model was imported to CadnaA from the AutoCAD, including
two main layers: the contour lines layer and the buildings layer (see Fig 42).
3. The layer of the roads was added by this study researcher, because the program
misanalysed the narrow roads in the old city.
4. The added roads were fit to the DTM (the land) and their width was added
from the original AutoCAD file.
Figure 42: Importing data to CadnaA
5. The average height of the buildings was added and selected to be relative to
the ground.
6. The old buildings of Damascus are designed with a courtyard in the middle
of the house and CadnaA software considered the courtyards as buildings.
Responding to this problem all the courtyards inside the buildings were turned
into Aux.Polygon and all the houses along the main sources of the noise were
re-drawn to include the courtyard inside of them (see Fig 43).
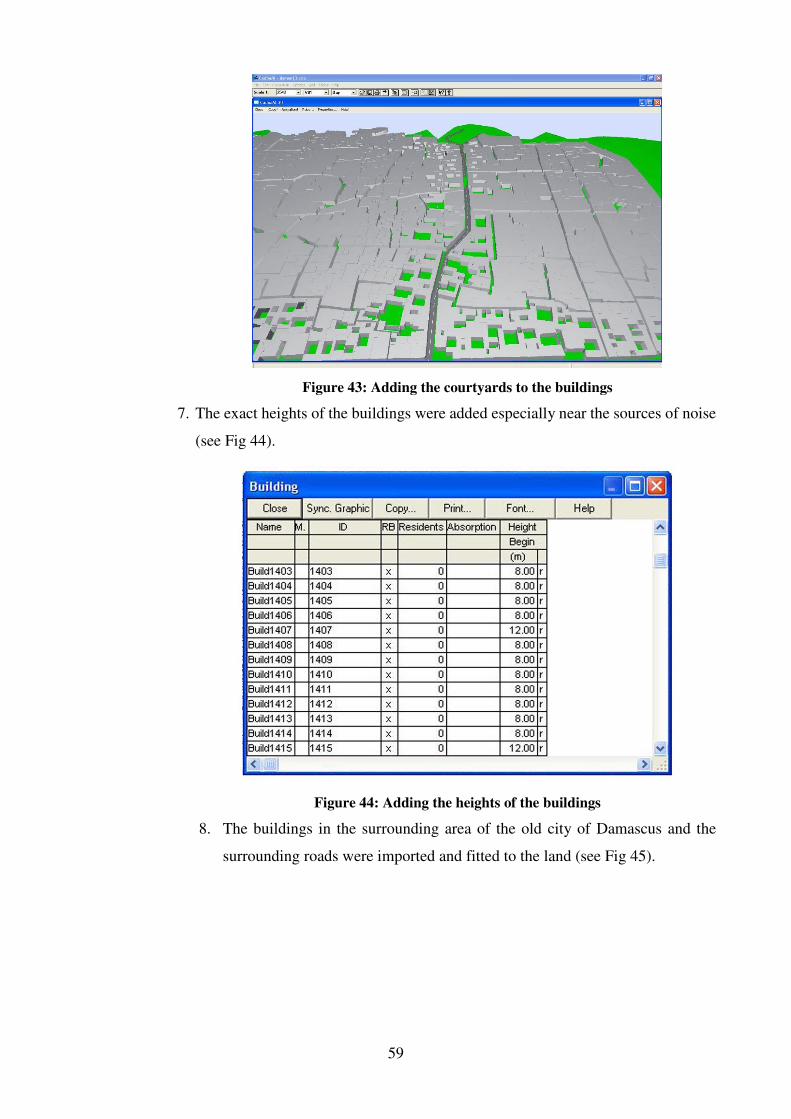
59
Figure 43: Adding the courtyards to the buildings
7. The exact heights of the buildings were added especially near the sources of noise
(see Fig 44).
Figure 44: Adding the heights of the buildings
8. The buildings in the surrounding area of the old city of Damascus and the
surrounding roads were imported and fitted to the land (see Fig 45).
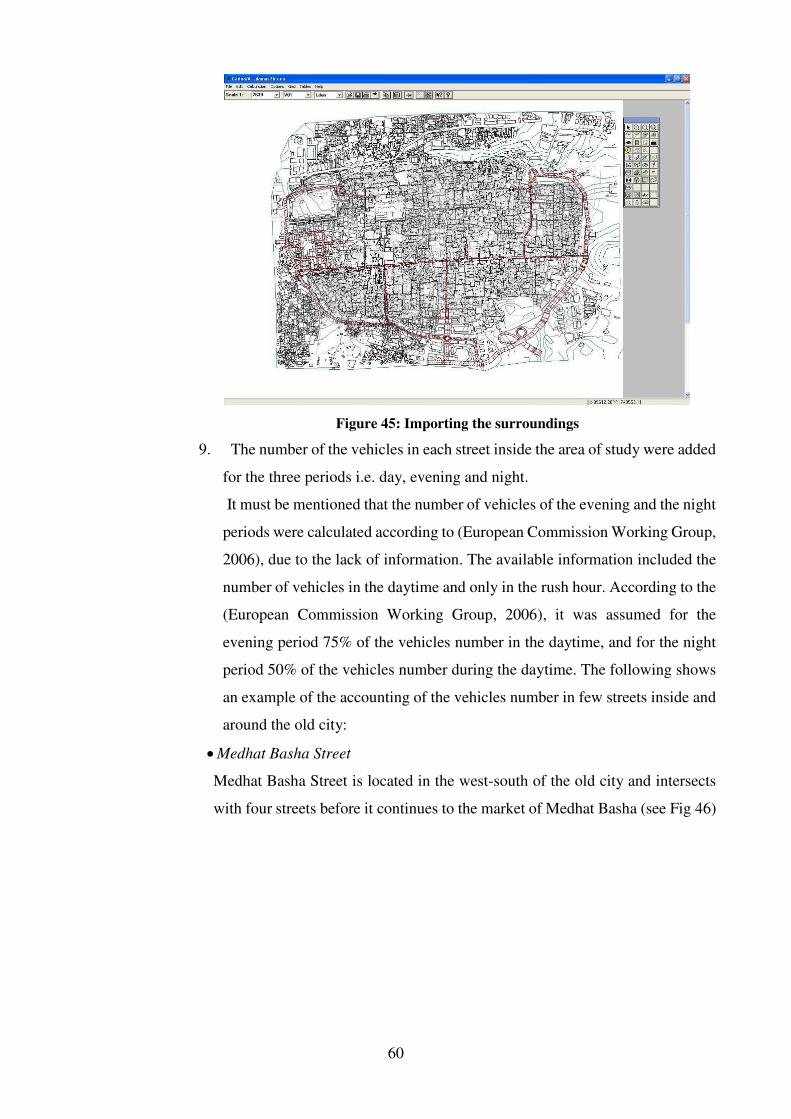
60
Figure 45: Importing the surroundings
9. The number of the vehicles in each street inside the area of study were added
for the three periods i.e. day, evening and night.
It must be mentioned that the number of vehicles of the evening and the night
periods were calculated according to (European Commission Working Group,
2006), due to the lack of information. The available information included the
number of vehicles in the daytime and only in the rush hour. According to the
(European Commission Working Group, 2006), it was assumed for the
evening period 75% of the vehicles number in the daytime, and for the night
period 50% of the vehicles number during the daytime. The following shows
an example of the accounting of the vehicles number in few streets inside and
around the old city:
Medhat Basha Street
Medhat Basha Street is located in the west-south of the old city and intersects
with four streets before it continues to the market of Medhat Basha (see Fig 46)
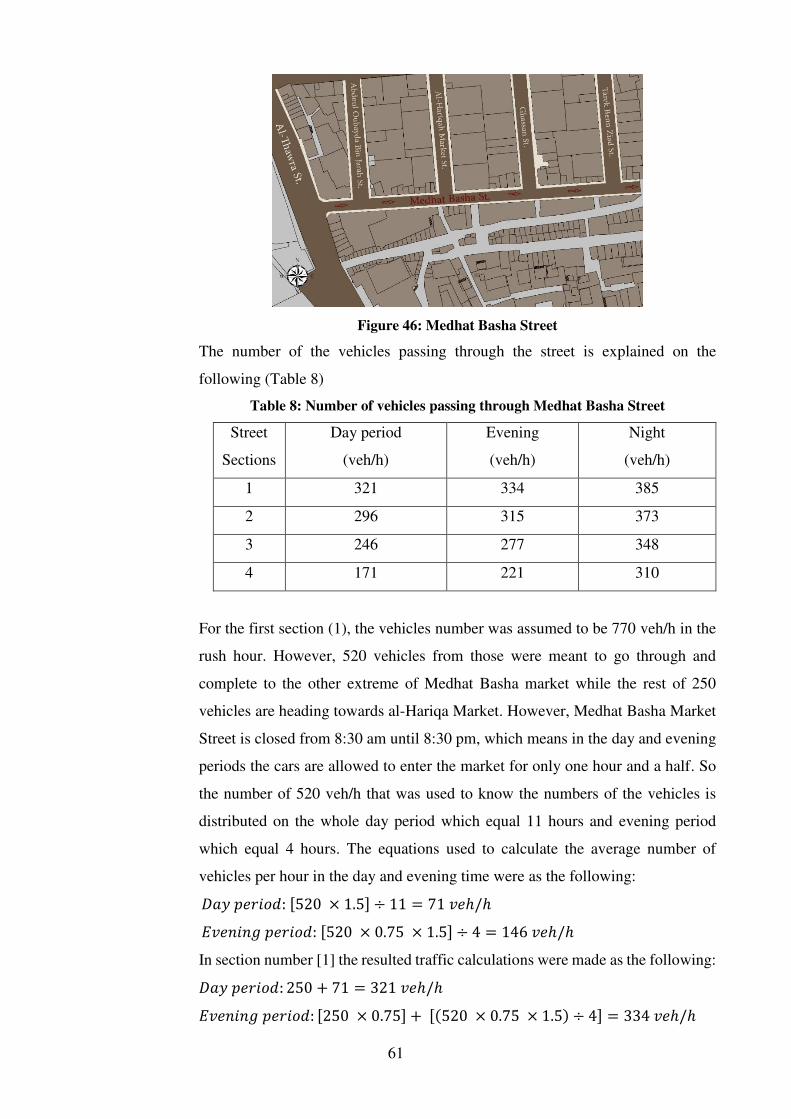
61
Figure 46: Medhat Basha Street
The number of the vehicles passing through the street is explained on the
following (Table 8)
Table 8: Number of vehicles passing through Medhat Basha Street
Street
Sections
Day period
(veh/h)
Evening
(veh/h)
Night
(veh/h)
1 321 334 385
2 296 315 373
3 246 277 348
4 171 221 310
For the first section (1), the vehicles number was assumed to be 770 veh/h in the
rush hour. However, 520 vehicles from those were meant to go through and
complete to the other extreme of Medhat Basha market while the rest of 250
vehicles are heading towards al-Hariqa Market. However, Medhat Basha Market
Street is closed from 8:30 am until 8:30 pm, which means in the day and evening
periods the cars are allowed to enter the market for only one hour and a half. So
the number of 520 veh/h that was used to know the numbers of the vehicles is
distributed on the whole day period which equal 11 hours and evening period
which equal 4 hours. The equations used to calculate the average number of
vehicles per hour in the day and evening time were as the following: �� �� : [ × . ] ÷ = � ℎ/ℎ � � � �� : [ × . × . ] ÷ = � ℎ/ℎ
In section number [1] the resulted traffic calculations were made as the following: �� �� : + = � ℎ/ℎ � � � �� : [ × . ] + [ × . × . ÷ ] = � ℎ/ℎ
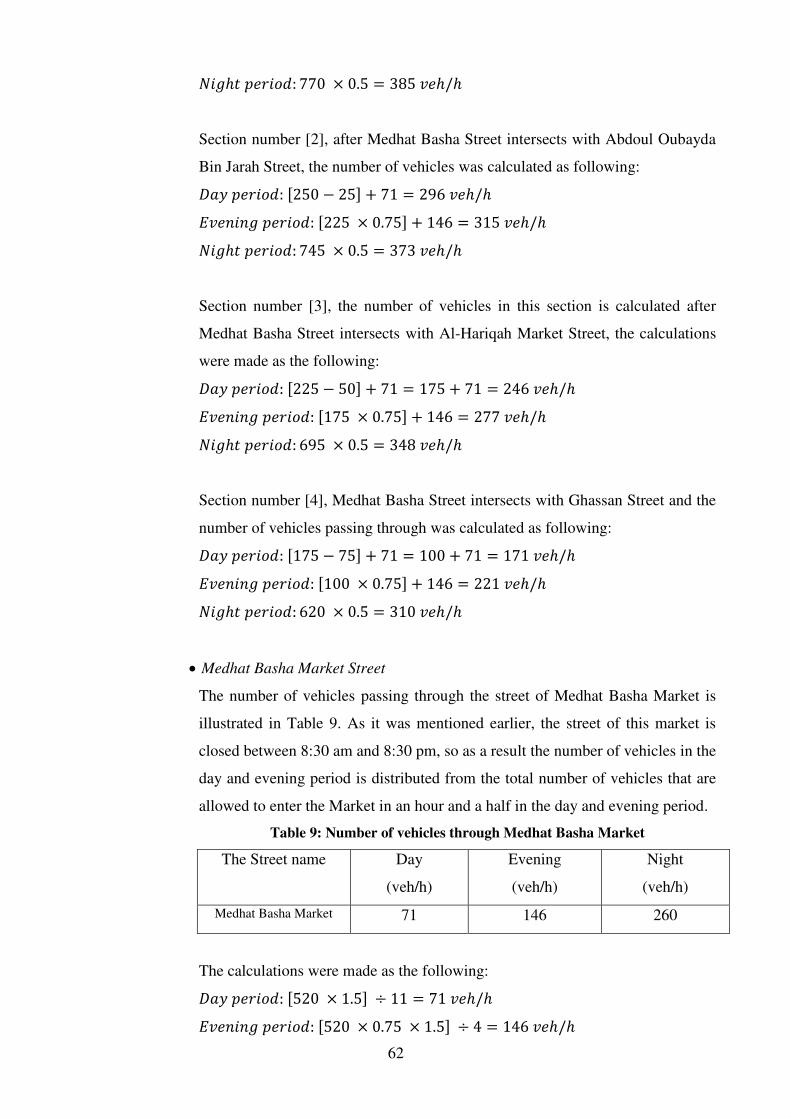
62
���ℎ� �� : × . = � ℎ/ℎ
Section number [2], after Medhat Basha Street intersects with Abdoul Oubayda
Bin Jarah Street, the number of vehicles was calculated as following: �� �� : [ − ] + = � ℎ/ℎ � � � �� : [ × . ] + = � ℎ/ℎ ���ℎ� �� : × . = � ℎ/ℎ
Section number [3], the number of vehicles in this section is calculated after
Medhat Basha Street intersects with Al-Hariqah Market Street, the calculations
were made as the following: �� �� : [ − ] + = + = � ℎ/ℎ � � � �� : [ × . ] + = � ℎ/ℎ ���ℎ� �� : × . = � ℎ/ℎ
Section number [4], Medhat Basha Street intersects with Ghassan Street and the
number of vehicles passing through was calculated as following: �� �� : [ − ] + = + = � ℎ/ℎ � � � �� : [ × . ] + = � ℎ/ℎ ���ℎ� �� : × . = � ℎ/ℎ
Medhat Basha Market Street
The number of vehicles passing through the street of Medhat Basha Market is
illustrated in Table 9. As it was mentioned earlier, the street of this market is
closed between 8:30 am and 8:30 pm, so as a result the number of vehicles in the
day and evening period is distributed from the total number of vehicles that are
allowed to enter the Market in an hour and a half in the day and evening period.
Table 9: Number of vehicles through Medhat Basha Market
The Street name Day
(veh/h)
Evening
(veh/h)
Night
(veh/h)
Medhat Basha Market 71 146 260
The calculations were made as the following: �� �� : [ × . ] ÷ = � ℎ/ℎ � � � �� : [ × . × . ] ÷ = � ℎ/ℎ
63
���ℎ� �� : × . = � ℎ/ℎ
Al-Thowra Street
After the number of vehicles inside the old city was added to the program, the
number of vehicles surrounding the area of the study must be taken into
consideration for the purpose of including the effects of the surrounding areas.
One of the main roads surrounding the old city is Al-Thowra Street. This street is
located in the west of the old city, parallel to the castle, and is considered to form
the main traffic source for the Al-Hariqah Market, the Castle Street and Medhat
Basha Street areas. The number of vehicles in Al-Thowra Street are demonstrated
in Table 10.
Table 10: Number of vehicles through Al-Thowra Street
Street Sections Day period
(veh/h)
Evening
(veh/h)
Night
(veh/h)
1 3000 2250 1500
2 2200 1650 1100
3 2642 1982 1321
4 2942 2207 1471
5 2866 2150 1433
6 2751 2063 1375
7 2430 1822 1215
According to (Naaes, 2008) the number of vehicles in Al-Thowra Street could
reach, during the rush hour, more than 3000 vehicles, which causes a traffic
congestion and lead to the traffic speed to be limited between 17 and 22 km/hour.
Depending on that, the numbers of vehicles in Al-Thowra Street, in the day,
evening and night periods were added to each section as the following:
Section number [1], the calculations were made as the following: �� �� : � ℎ/ℎ � � � �� : × . = � ℎ/ℎ ���ℎ� �� : × . = � ℎ/ℎ
Section number [2], Al-Thowra Street intersects with Al –Naser Street, which is
a two-way street mostly used by the vehicle's owner to move between the old city
64
and the modern one, depending on that the number of the vehicles was calculated
in section [2] as the following: �� �� : � ℎ/ℎ � � � �� : × . = � ℎ/ℎ ���ℎ� �� : × . = � ℎ/ℎ
Section [3], it was mentioned earlier that Al-Thowra Street is the main source for
traffic in Al-Hariqah Market area, so it is normal for it to continue to reach the
entrances and the exit of that area. First, it intersects with the exit, where an extra
number of vehicles that passed through is added to the vehicles number passing
each hour in the day period as the following: �� �� : + = � ℎ/ℎ � � � �� : × . = � ℎ/ℎ ���ℎ� �� : × . = � ℎ/ℎ
Section [4], before Al-Thowra Street continues to meet with the rest of Al-Hariqah
Market’s streets, it intersects with Fakhri Al-Baroudi Street, it is a one-way street
and it provides Al-Thowra Street with extra amount of vehicles, as the following: �� �� : + = � ℎ/ℎ � � � �� : × . = � ℎ/ℎ ���ℎ� �� : × . = � ℎ/ℎ
Section [5], Al-Thowra Street reaches the second entrance to Al-Hariqah Market,
and the number of vehicles decreases depending on that, as the following: �� �� : − = � ℎ/ℎ � � � �� : × . = � ℎ/ℎ ���ℎ� �� : × . = � ℎ/ℎ
Section [6], Al-Thowra Street reaches the first entrance of Al-Hariqah Market,
and a greater amount of vehicles passes from it to this entrance, the vehicles
calculations were made as the following: �� �� : − = � ℎ/ℎ � � � �� : × . = � ℎ/ℎ ���ℎ� �� : × . = � ℎ/ℎ
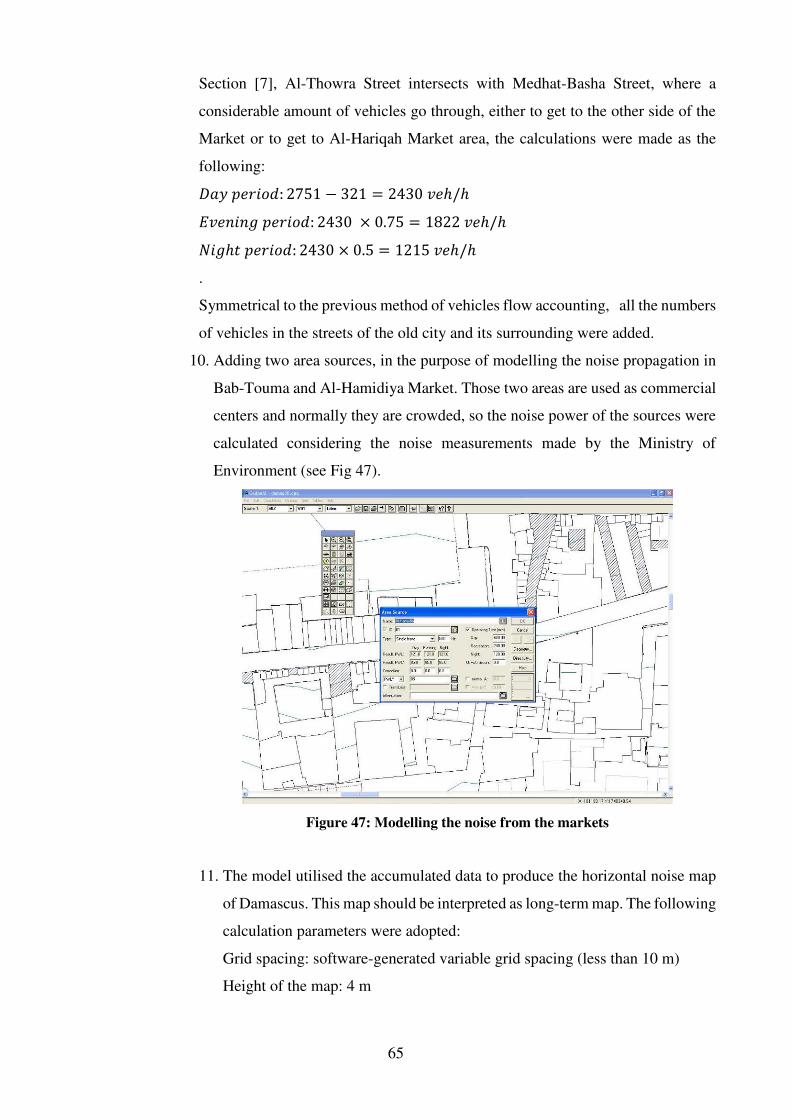
65
Section [7], Al-Thowra Street intersects with Medhat-Basha Street, where a
considerable amount of vehicles go through, either to get to the other side of the
Market or to get to Al-Hariqah Market area, the calculations were made as the
following: �� �� : − = � ℎ/ℎ � � � �� : × . = � ℎ/ℎ ���ℎ� �� : × . = � ℎ/ℎ
.
Symmetrical to the previous method of vehicles flow accounting, all the numbers
of vehicles in the streets of the old city and its surrounding were added.
10. Adding two area sources, in the purpose of modelling the noise propagation in
Bab-Touma and Al-Hamidiya Market. Those two areas are used as commercial
centers and normally they are crowded, so the noise power of the sources were
calculated considering the noise measurements made by the Ministry of
Environment (see Fig 47).
Figure 47: Modelling the noise from the markets
11. The model utilised the accumulated data to produce the horizontal noise map
of Damascus. This map should be interpreted as long-term map. The following
calculation parameters were adopted:
Grid spacing: software-generated variable grid spacing (less than 10 m)
Height of the map: 4 m
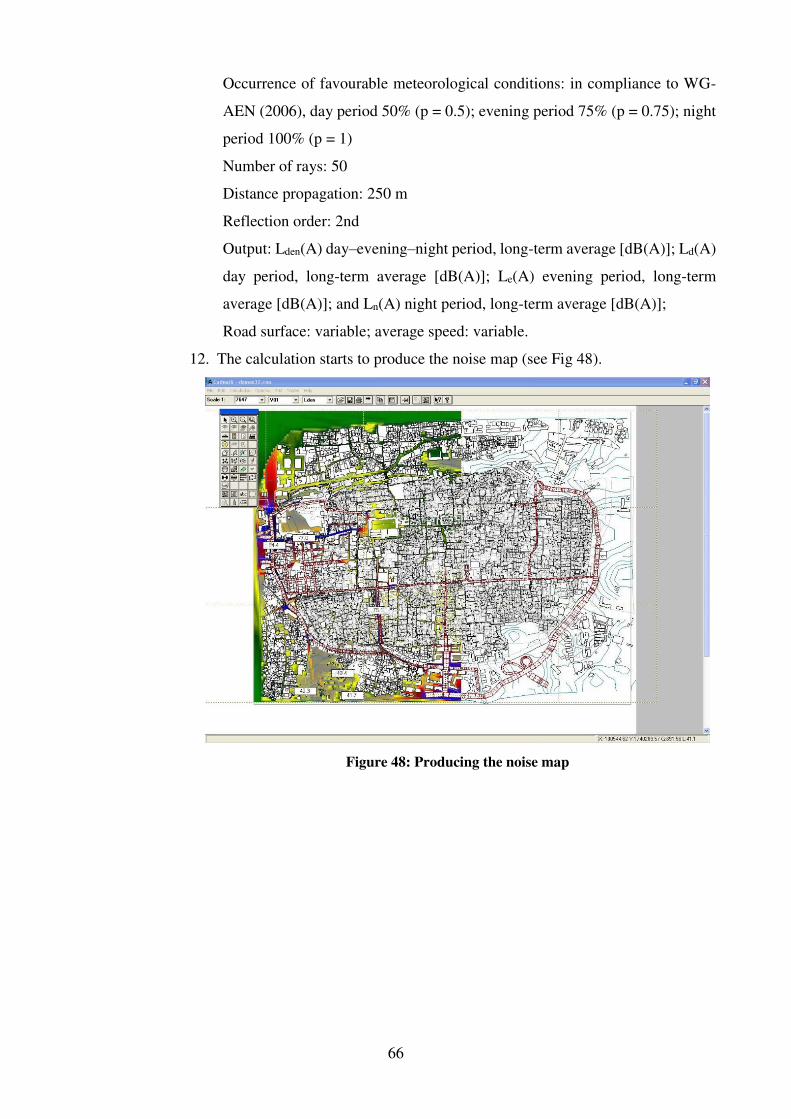
66
Occurrence of favourable meteorological conditions: in compliance to WG-
AEN (2006), day period 50% (p = 0.5); evening period 75% (p = 0.75); night
period 100% (p = 1)
Number of rays: 50
Distance propagation: 250 m
Reflection order: 2nd
Output: Lden(A) day–evening–night period, long-term average [dB(A)]; Ld(A)
day period, long-term average [dB(A)]; Le(A) evening period, long-term
average [dB(A)]; and Ln(A) night period, long-term average [dB(A)];
Road surface: variable; average speed: variable.
12. The calculation starts to produce the noise map (see Fig 48).
Figure 48: Producing the noise map
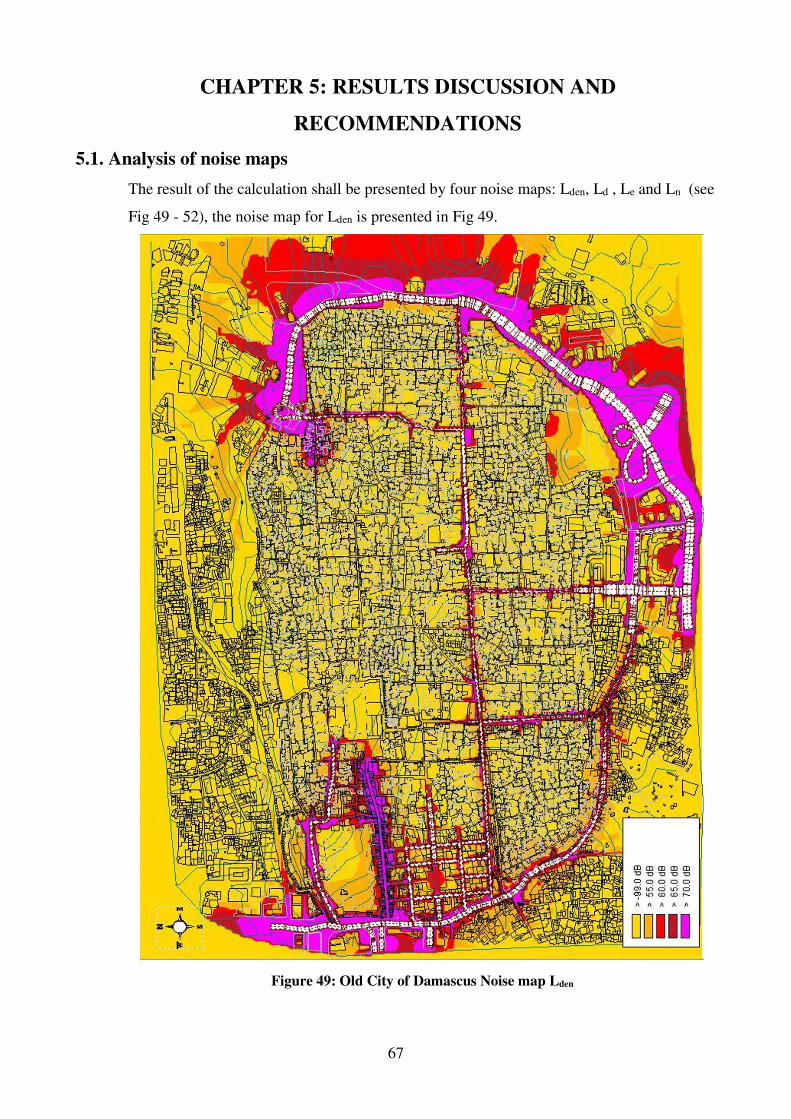
67
CHAPTER 5: RESULTS DISCUSSION AND
RECOMMENDATIONS
5.1. Analysis of noise maps
The result of the calculation shall be presented by four noise maps: Lden, Ld , Le and Ln (see
Fig 49 - 52), the noise map for Lden is presented in Fig 49.
Figure 49: Old City of Damascus Noise map Lden
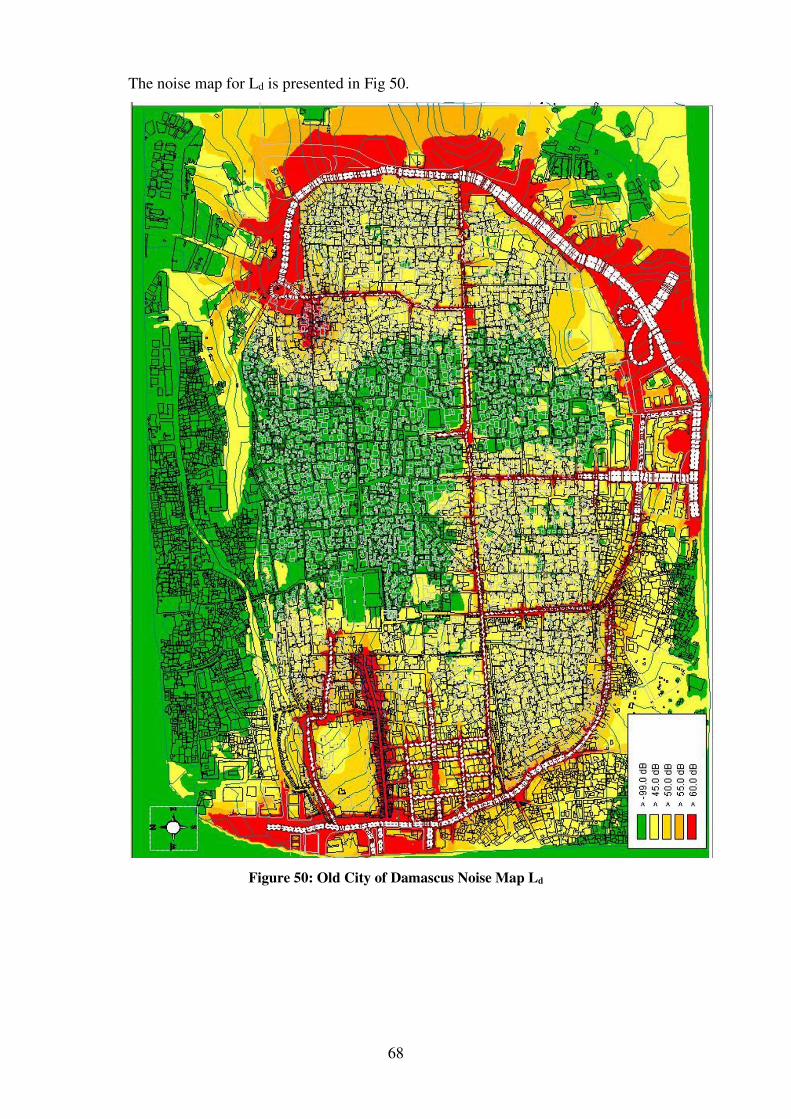
68
The noise map for Ld is presented in Fig 50.
Figure 50: Old City of Damascus Noise Map Ld
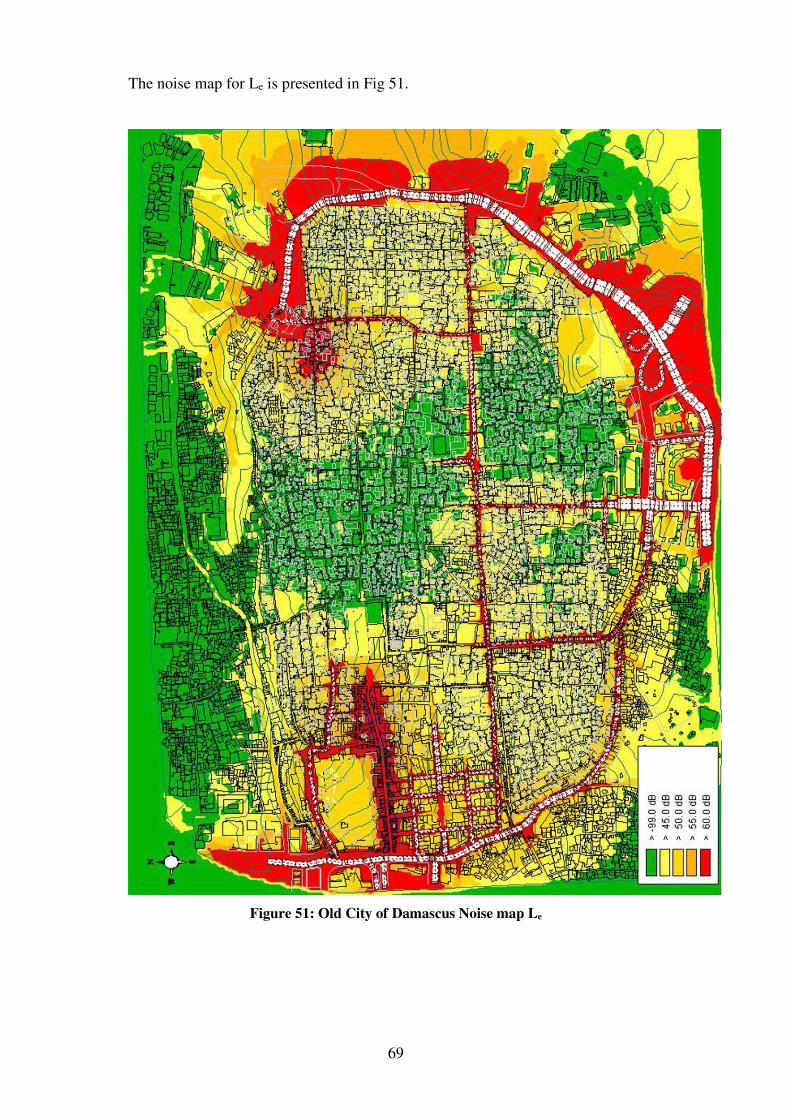
69
The noise map for Le is presented in Fig 51.
Figure 51: Old City of Damascus Noise map Le
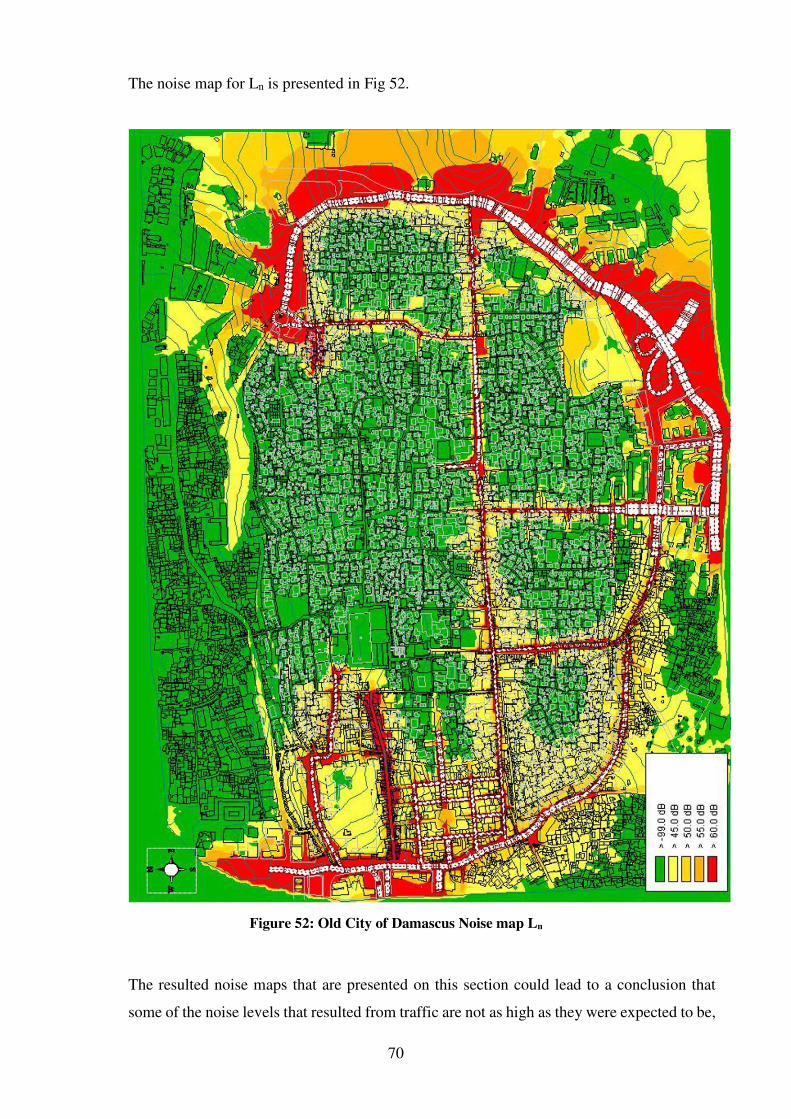
70
The noise map for Ln is presented in Fig 52.
Figure 52: Old City of Damascus Noise map Ln
The resulted noise maps that are presented on this section could lead to a conclusion that
some of the noise levels that resulted from traffic are not as high as they were expected to be,
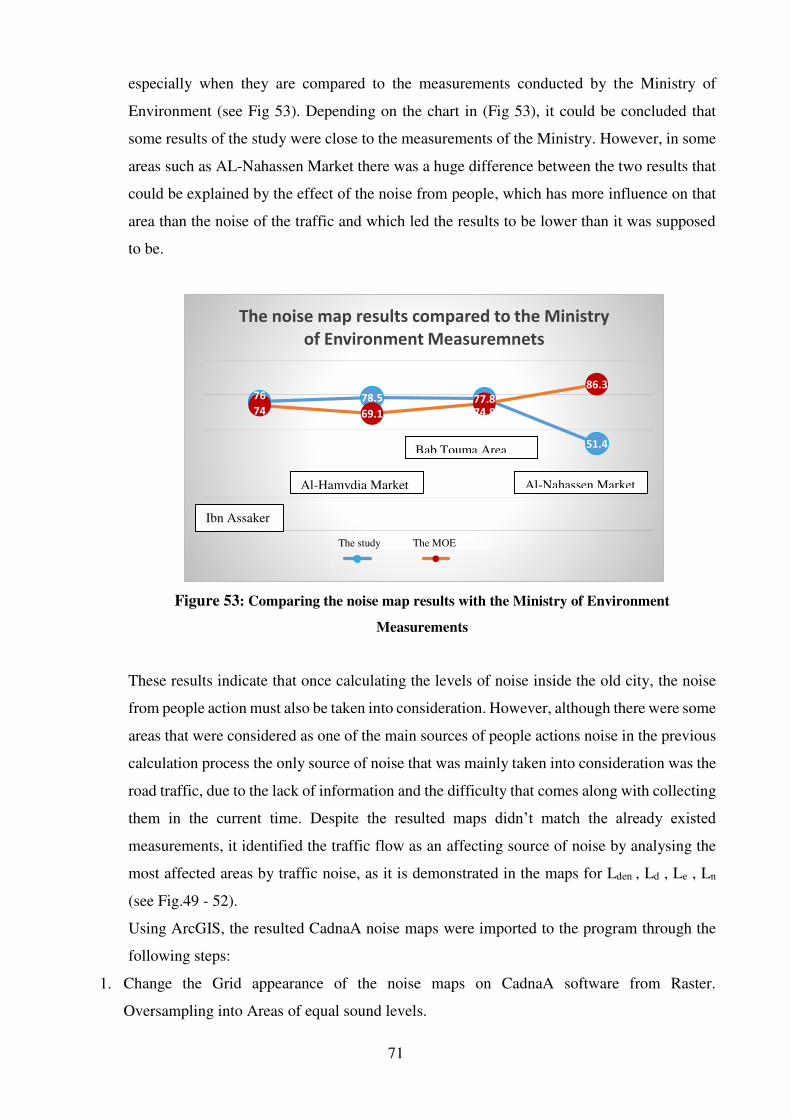
71
especially when they are compared to the measurements conducted by the Ministry of
Environment (see Fig 53). Depending on the chart in (Fig 53), it could be concluded that
some results of the study were close to the measurements of the Ministry. However, in some
areas such as AL-Nahassen Market there was a huge difference between the two results that
could be explained by the effect of the noise from people, which has more influence on that
area than the noise of the traffic and which led the results to be lower than it was supposed
to be.
Figure 53: Comparing the noise map results with the Ministry of Environment
Measurements
These results indicate that once calculating the levels of noise inside the old city, the noise
from people action must also be taken into consideration. However, although there were some
areas that were considered as one of the main sources of people actions noise in the previous
calculation process the only source of noise that was mainly taken into consideration was the
road traffic, due to the lack of information and the difficulty that comes along with collecting
them in the current time. Despite the resulted maps didn’t match the already existed
measurements, it identified the traffic flow as an affecting source of noise by analysing the
most affected areas by traffic noise, as it is demonstrated in the maps for Lden , Ld , Le , Ln
(see Fig.49 - 52).
Using ArcGIS, the resulted CadnaA noise maps were imported to the program through the
following steps:
1. Change the Grid appearance of the noise maps on CadnaA software from Raster.
Oversampling into Areas of equal sound levels.
76 78.5 77.8
51.4
74 69.1 74.8
86.3
The noise map results compared to the Ministry
of Environment Measuremnets
Ibn Assaker
Al-Hamydia Market
Bab Touma Area
Al-Nahassen Market
The study The MOE
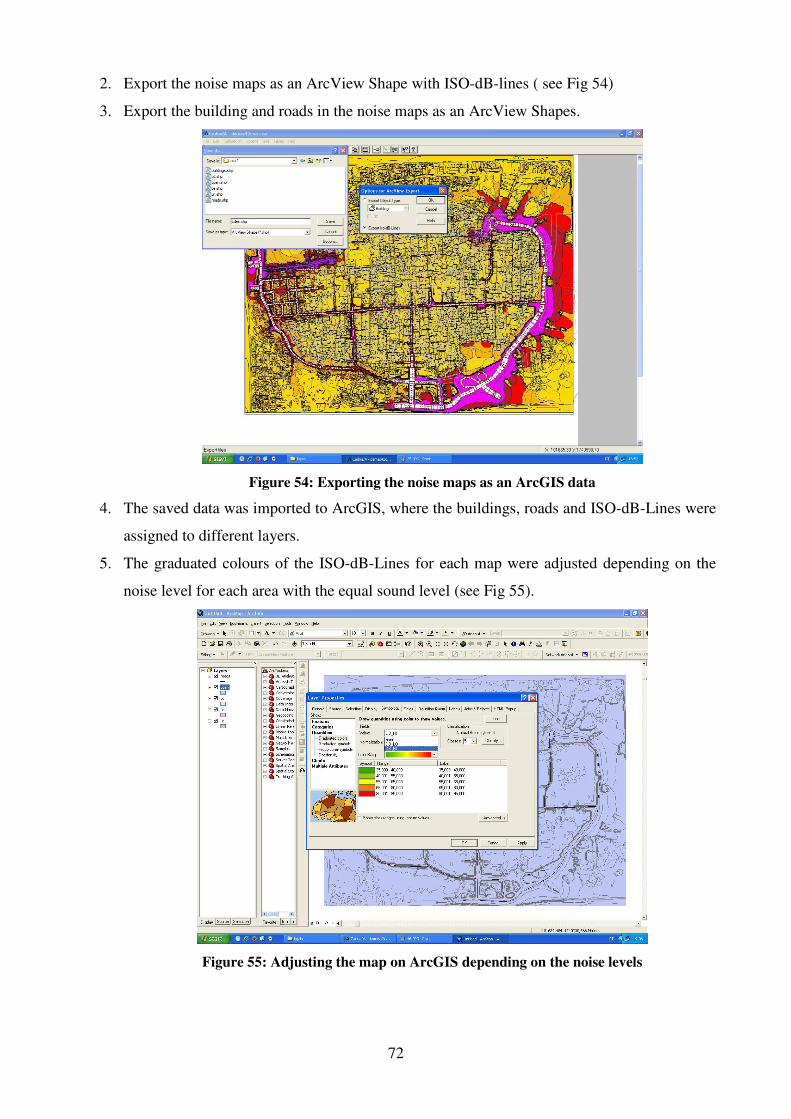
72
2. Export the noise maps as an ArcView Shape with ISO-dB-lines ( see Fig 54)
3. Export the building and roads in the noise maps as an ArcView Shapes.
Figure 54: Exporting the noise maps as an ArcGIS data
4. The saved data was imported to ArcGIS, where the buildings, roads and ISO-dB-Lines were
assigned to different layers.
5. The graduated colours of the ISO-dB-Lines for each map were adjusted depending on the
noise level for each area with the equal sound level (see Fig 55).
Figure 55: Adjusting the map on ArcGIS depending on the noise levels
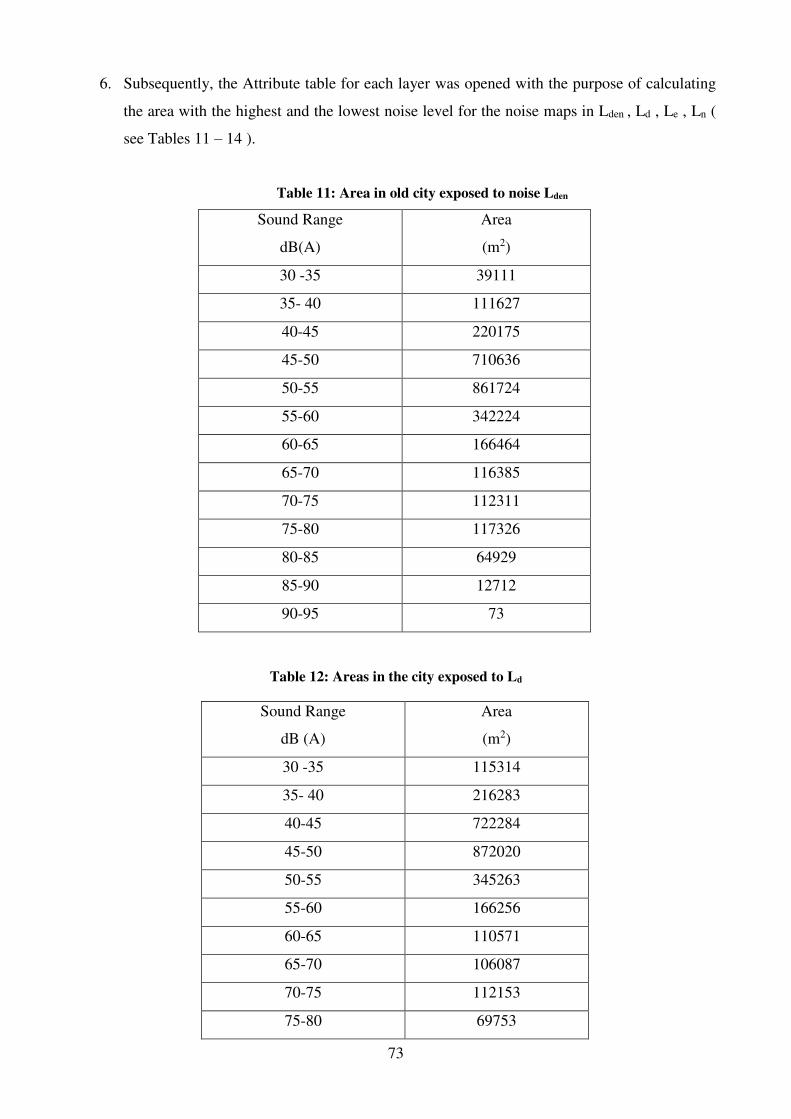
73
6. Subsequently, the Attribute table for each layer was opened with the purpose of calculating
the area with the highest and the lowest noise level for the noise maps in Lden , Ld , Le , Ln (
see Tables 11 – 14 ).
Table 11: Area in old city exposed to noise Lden
Sound Range
dB(A)
Area
(m2)
30 -35 39111
35- 40 111627
40-45 220175
45-50 710636
50-55 861724
55-60 342224
60-65 166464
65-70 116385
70-75 112311
75-80 117326
80-85 64929
85-90 12712
90-95 73
Table 12: Areas in the city exposed to Ld
Sound Range
dB (A)
Area
(m2)
30 -35 115314
35- 40 216283
40-45 722284
45-50 872020
50-55 345263
55-60 166256
60-65 110571
65-70 106087
70-75 112153
75-80 69753
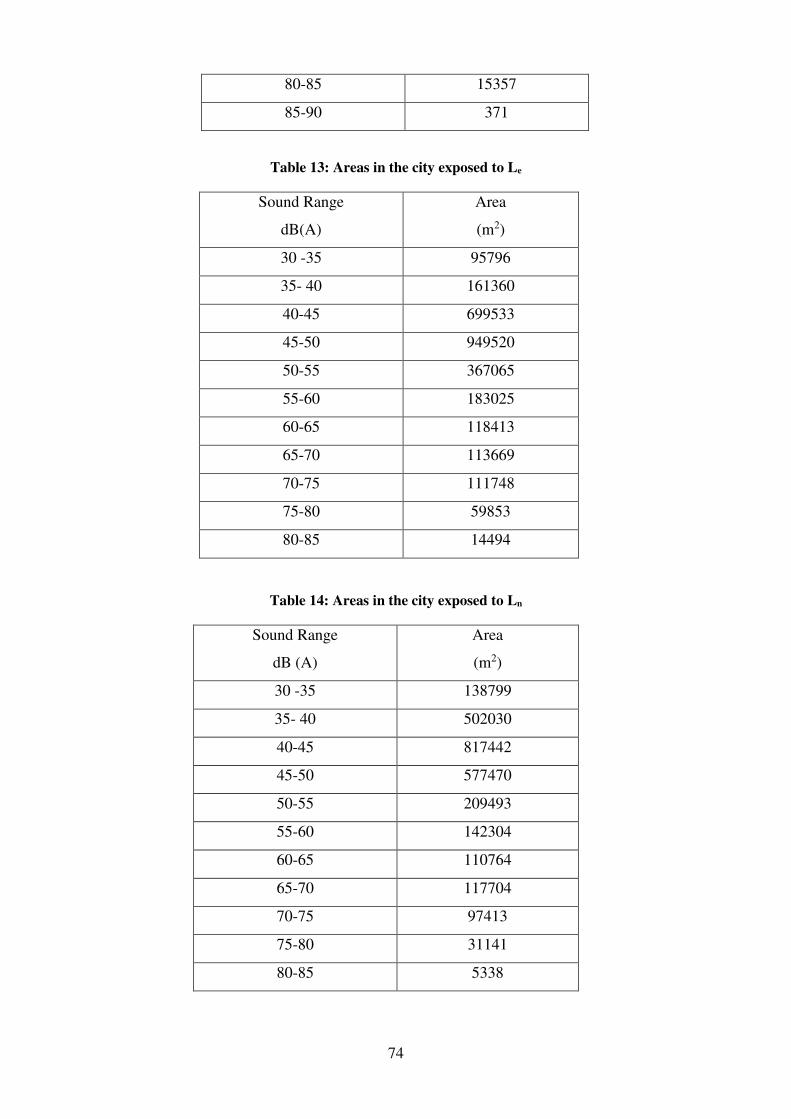
74
80-85 15357
85-90 371
Table 13: Areas in the city exposed to Le
Sound Range
dB(A)
Area
(m2)
30 -35 95796
35- 40 161360
40-45 699533
45-50 949520
50-55 367065
55-60 183025
60-65 118413
65-70 113669
70-75 111748
75-80 59853
80-85 14494
Table 14: Areas in the city exposed to Ln
Sound Range
dB (A)
Area
(m2)
30 -35 138799
35- 40 502030
40-45 817442
45-50 577470
50-55 209493
55-60 142304
60-65 110764
65-70 117704
70-75 97413
75-80 31141
80-85 5338
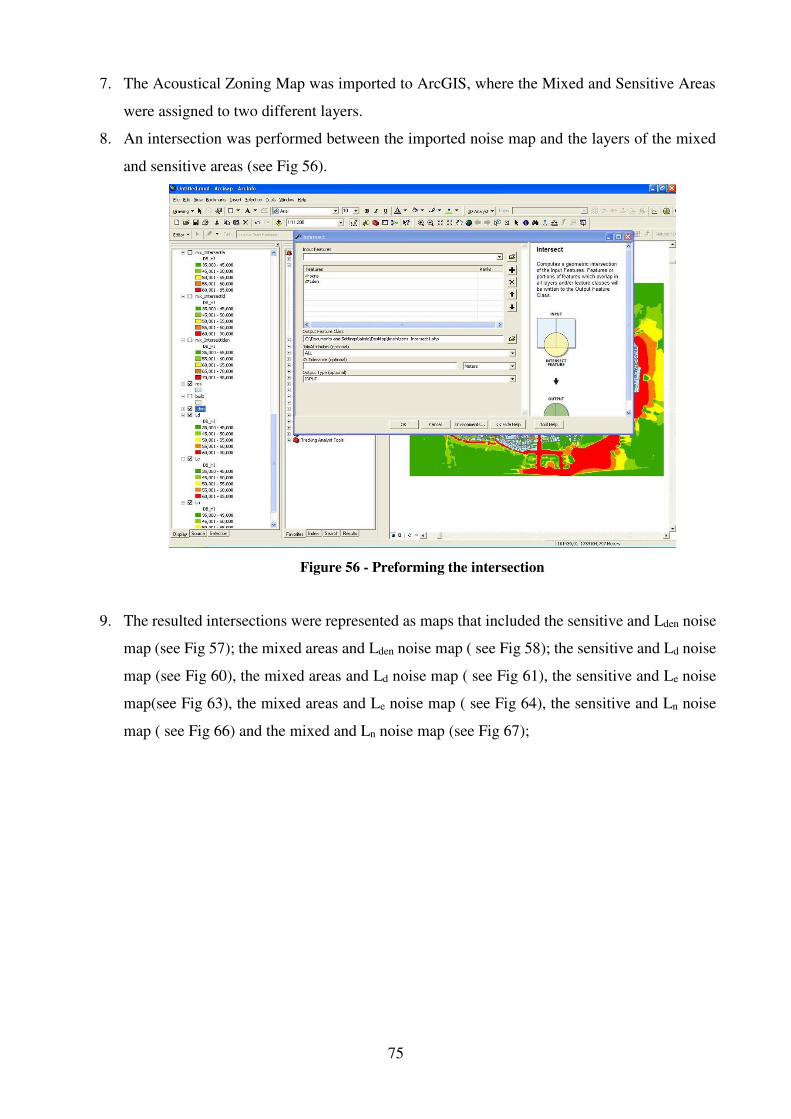
75
7. The Acoustical Zoning Map was imported to ArcGIS, where the Mixed and Sensitive Areas
were assigned to two different layers.
8. An intersection was performed between the imported noise map and the layers of the mixed
and sensitive areas (see Fig 56).
Figure 56 - Preforming the intersection
9. The resulted intersections were represented as maps that included the sensitive and Lden noise
map (see Fig 57); the mixed areas and Lden noise map ( see Fig 58); the sensitive and Ld noise
map (see Fig 60), the mixed areas and Ld noise map ( see Fig 61), the sensitive and Le noise
map(see Fig 63), the mixed areas and Le noise map ( see Fig 64), the sensitive and Ln noise
map ( see Fig 66) and the mixed and Ln noise map (see Fig 67);
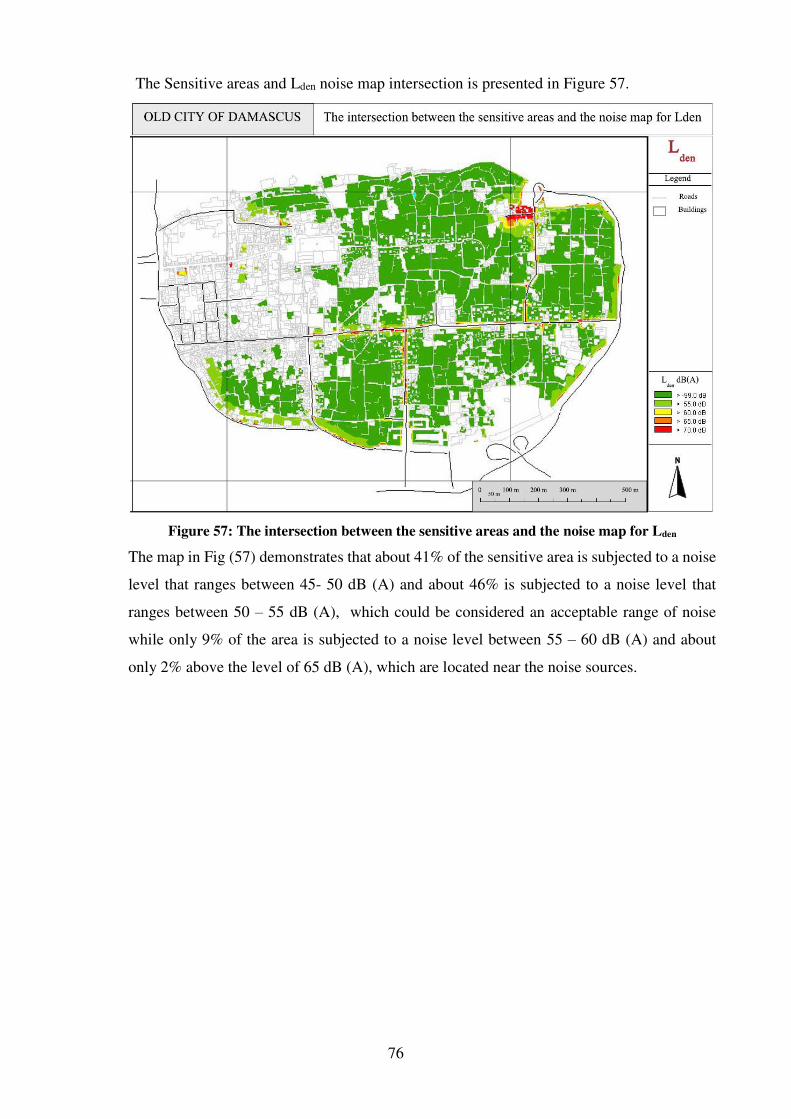
76
The Sensitive areas and Lden noise map intersection is presented in Figure 57.
Figure 57: The intersection between the sensitive areas and the noise map for Lden
The map in Fig (57) demonstrates that about 41% of the sensitive area is subjected to a noise
level that ranges between 45- 50 dB (A) and about 46% is subjected to a noise level that
ranges between 50 – 55 dB (A), which could be considered an acceptable range of noise
while only 9% of the area is subjected to a noise level between 55 – 60 dB (A) and about
only 2% above the level of 65 dB (A), which are located near the noise sources.
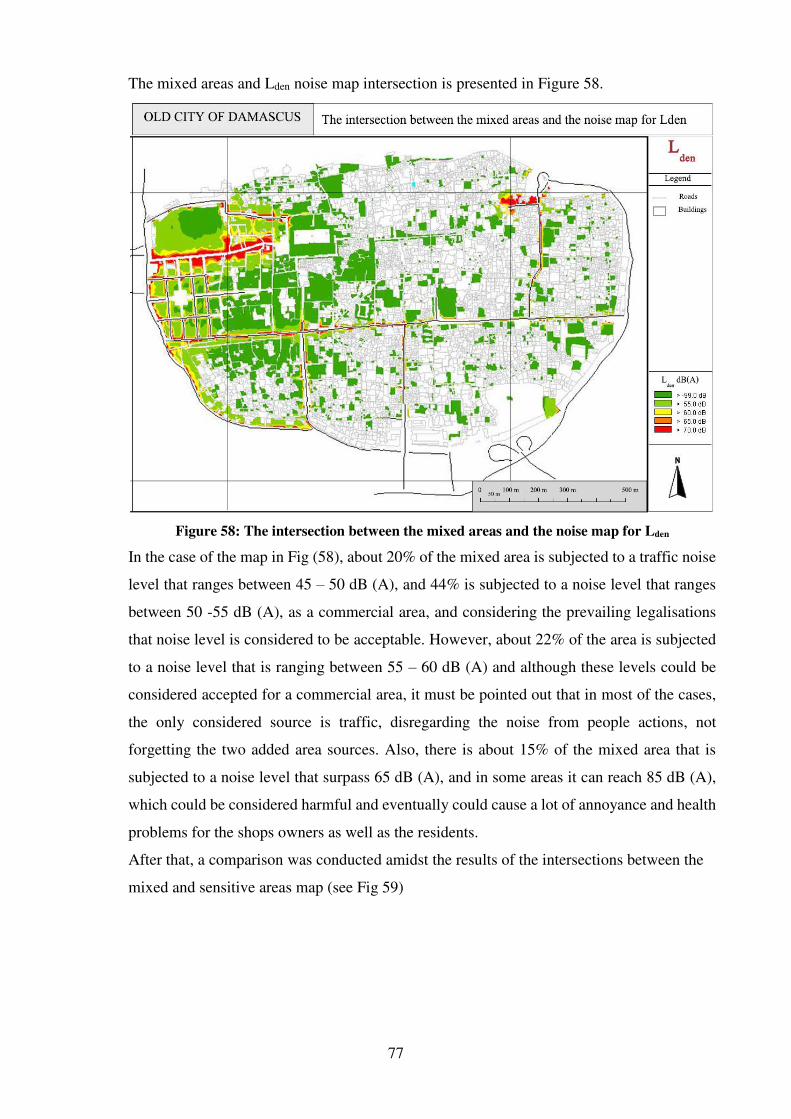
77
The mixed areas and Lden noise map intersection is presented in Figure 58.
Figure 58: The intersection between the mixed areas and the noise map for Lden
In the case of the map in Fig (58), about 20% of the mixed area is subjected to a traffic noise
level that ranges between 45 – 50 dB (A), and 44% is subjected to a noise level that ranges
between 50 -55 dB (A), as a commercial area, and considering the prevailing legalisations
that noise level is considered to be acceptable. However, about 22% of the area is subjected
to a noise level that is ranging between 55 – 60 dB (A) and although these levels could be
considered accepted for a commercial area, it must be pointed out that in most of the cases,
the only considered source is traffic, disregarding the noise from people actions, not
forgetting the two added area sources. Also, there is about 15% of the mixed area that is
subjected to a noise level that surpass 65 dB (A), and in some areas it can reach 85 dB (A),
which could be considered harmful and eventually could cause a lot of annoyance and health
problems for the shops owners as well as the residents.
After that, a comparison was conducted amidst the results of the intersections between the
mixed and sensitive areas map (see Fig 59)
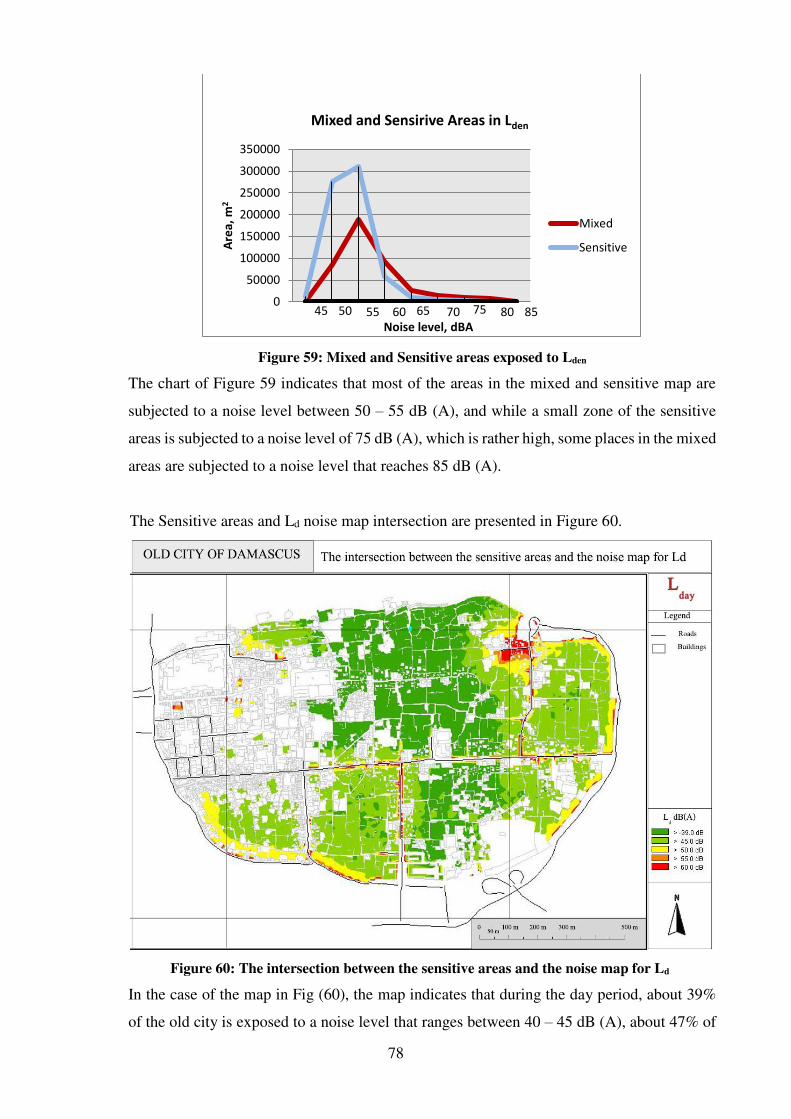
78
Figure 59: Mixed and Sensitive areas exposed to Lden
The chart of Figure 59 indicates that most of the areas in the mixed and sensitive map are
subjected to a noise level between 50 – 55 dB (A), and while a small zone of the sensitive
areas is subjected to a noise level of 75 dB (A), which is rather high, some places in the mixed
areas are subjected to a noise level that reaches 85 dB (A).
The Sensitive areas and Ld noise map intersection are presented in Figure 60.
Figure 60: The intersection between the sensitive areas and the noise map for Ld
In the case of the map in Fig (60), the map indicates that during the day period, about 39%
of the old city is exposed to a noise level that ranges between 40 – 45 dB (A), about 47% of
45 50 55 60 65 70 75 80 850
50000
100000
150000
200000
250000
300000
350000
Are
a,
m2
Noise level, dBA
Mixed and Sensirive Areas in Lden
Mixed
Sensitive
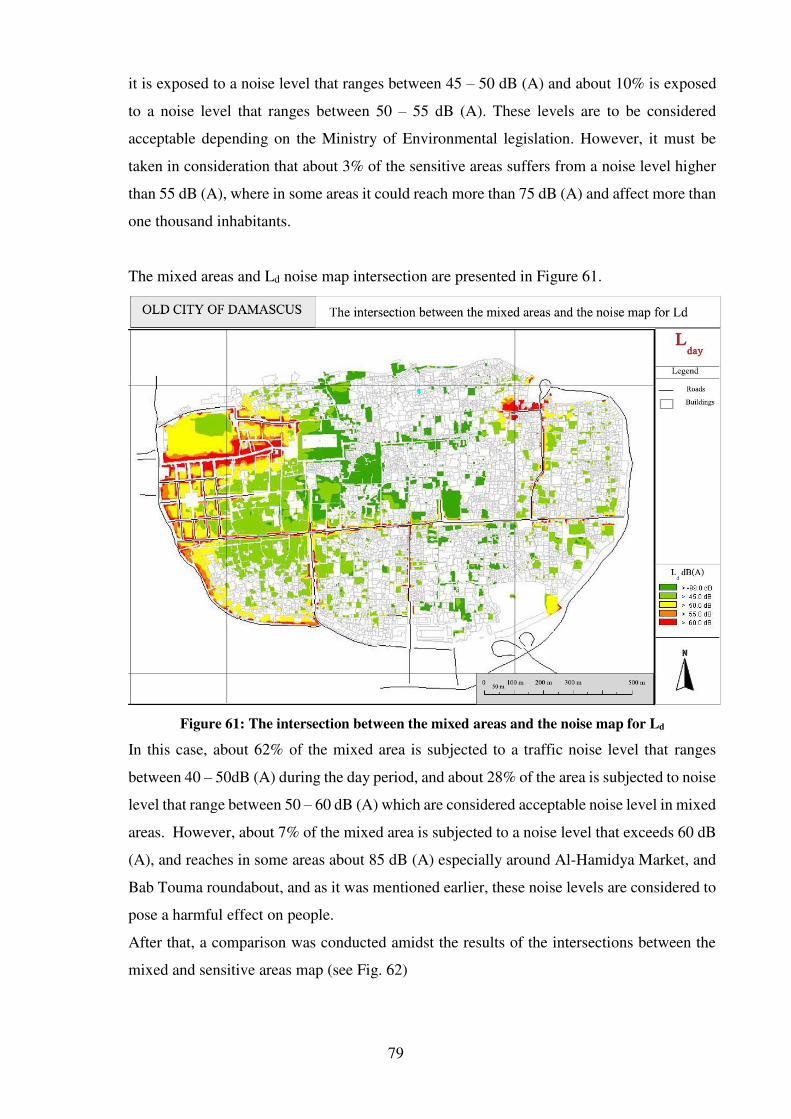
79
it is exposed to a noise level that ranges between 45 – 50 dB (A) and about 10% is exposed
to a noise level that ranges between 50 – 55 dB (A). These levels are to be considered
acceptable depending on the Ministry of Environmental legislation. However, it must be
taken in consideration that about 3% of the sensitive areas suffers from a noise level higher
than 55 dB (A), where in some areas it could reach more than 75 dB (A) and affect more than
one thousand inhabitants.
The mixed areas and Ld noise map intersection are presented in Figure 61.
Figure 61: The intersection between the mixed areas and the noise map for Ld
In this case, about 62% of the mixed area is subjected to a traffic noise level that ranges
between 40 – 50dB (A) during the day period, and about 28% of the area is subjected to noise
level that range between 50 – 60 dB (A) which are considered acceptable noise level in mixed
areas. However, about 7% of the mixed area is subjected to a noise level that exceeds 60 dB
(A), and reaches in some areas about 85 dB (A) especially around Al-Hamidya Market, and
Bab Touma roundabout, and as it was mentioned earlier, these noise levels are considered to
pose a harmful effect on people.
After that, a comparison was conducted amidst the results of the intersections between the
mixed and sensitive areas map (see Fig. 62)
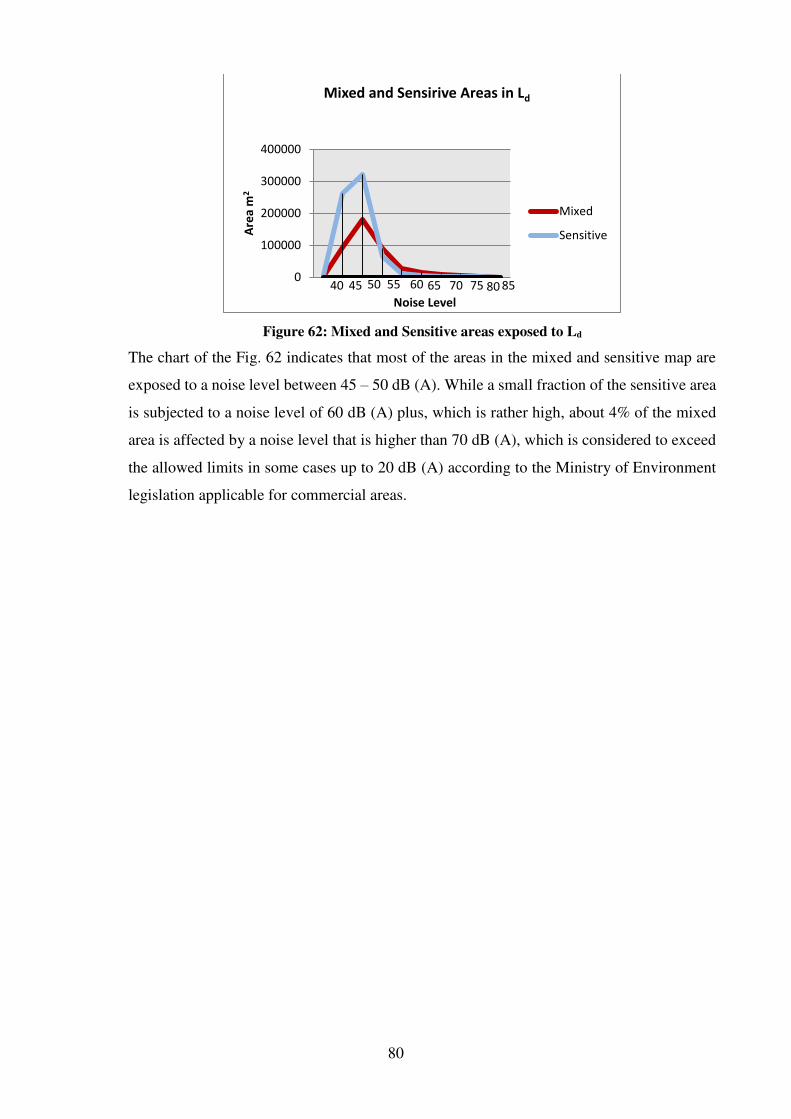
80
Figure 62: Mixed and Sensitive areas exposed to Ld
The chart of the Fig. 62 indicates that most of the areas in the mixed and sensitive map are
exposed to a noise level between 45 – 50 dB (A). While a small fraction of the sensitive area
is subjected to a noise level of 60 dB (A) plus, which is rather high, about 4% of the mixed
area is affected by a noise level that is higher than 70 dB (A), which is considered to exceed
the allowed limits in some cases up to 20 dB (A) according to the Ministry of Environment
legislation applicable for commercial areas.
40 45 50 55 60 65 70 75 80 850
100000
200000
300000
400000
Are
a m
2
Noise Level
Mixed and Sensirive Areas in Ld
Mixed
Sensitive
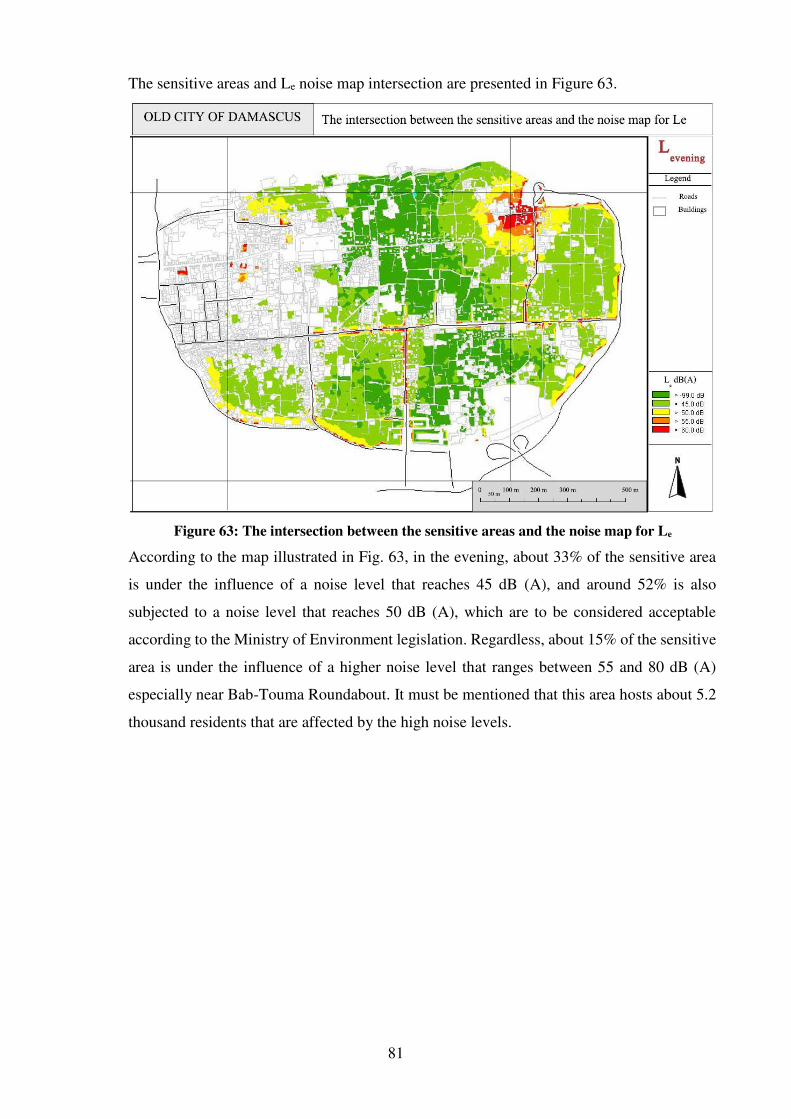
81
The sensitive areas and Le noise map intersection are presented in Figure 63.
Figure 63: The intersection between the sensitive areas and the noise map for Le
According to the map illustrated in Fig. 63, in the evening, about 33% of the sensitive area
is under the influence of a noise level that reaches 45 dB (A), and around 52% is also
subjected to a noise level that reaches 50 dB (A), which are to be considered acceptable
according to the Ministry of Environment legislation. Regardless, about 15% of the sensitive
area is under the influence of a higher noise level that ranges between 55 and 80 dB (A)
especially near Bab-Touma Roundabout. It must be mentioned that this area hosts about 5.2
thousand residents that are affected by the high noise levels.
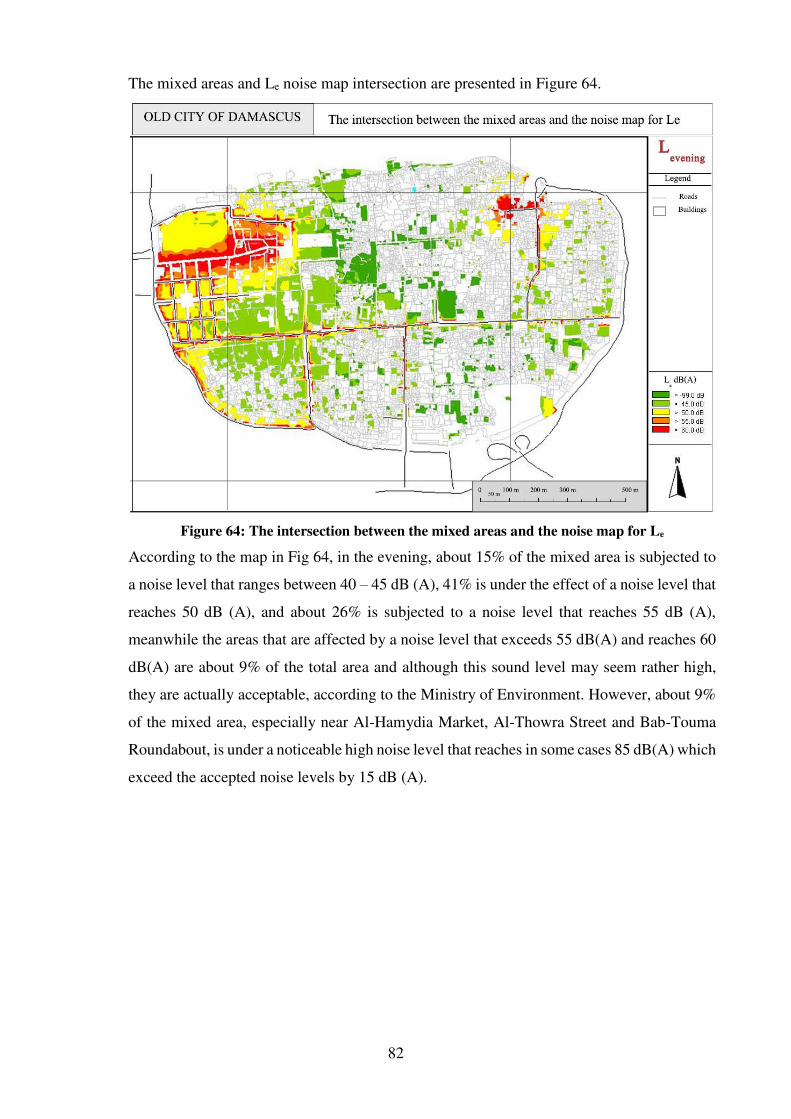
82
The mixed areas and Le noise map intersection are presented in Figure 64.
Figure 64: The intersection between the mixed areas and the noise map for Le
According to the map in Fig 64, in the evening, about 15% of the mixed area is subjected to
a noise level that ranges between 40 – 45 dB (A), 41% is under the effect of a noise level that
reaches 50 dB (A), and about 26% is subjected to a noise level that reaches 55 dB (A),
meanwhile the areas that are affected by a noise level that exceeds 55 dB(A) and reaches 60
dB(A) are about 9% of the total area and although this sound level may seem rather high,
they are actually acceptable, according to the Ministry of Environment. However, about 9%
of the mixed area, especially near Al-Hamydia Market, Al-Thowra Street and Bab-Touma
Roundabout, is under a noticeable high noise level that reaches in some cases 85 dB(A) which
exceed the accepted noise levels by 15 dB (A).
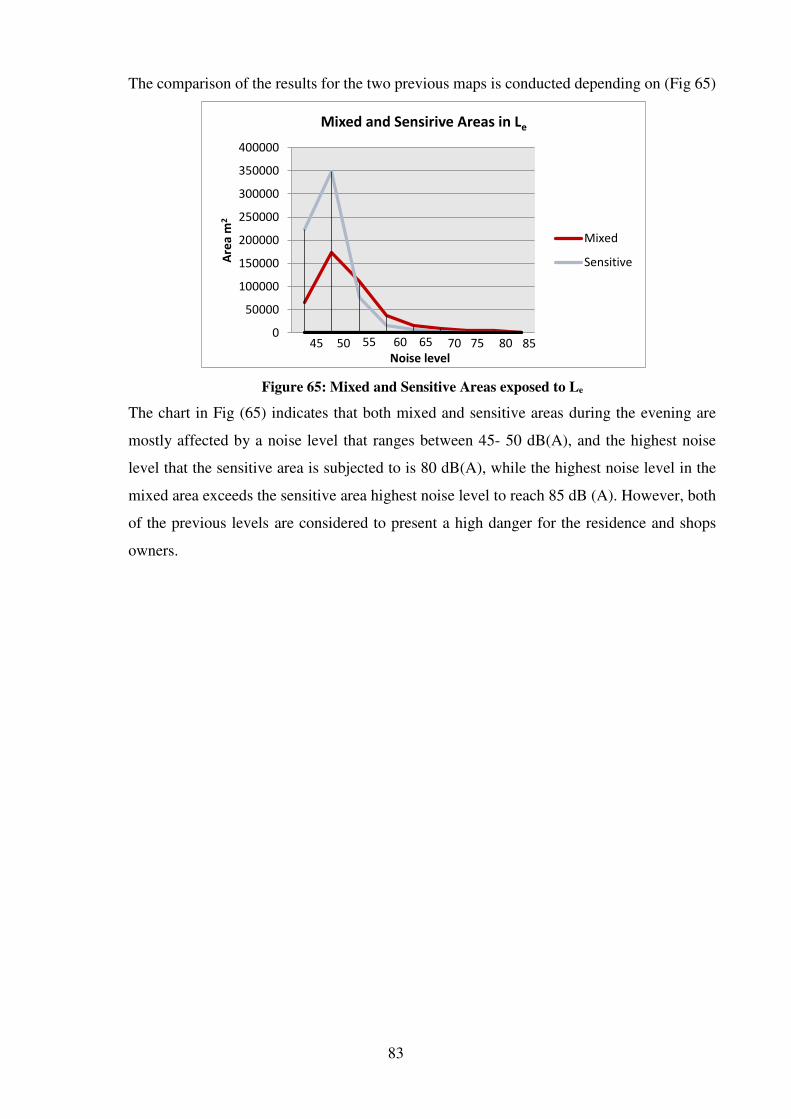
83
The comparison of the results for the two previous maps is conducted depending on (Fig 65)
Figure 65: Mixed and Sensitive Areas exposed to Le
The chart in Fig (65) indicates that both mixed and sensitive areas during the evening are
mostly affected by a noise level that ranges between 45- 50 dB(A), and the highest noise
level that the sensitive area is subjected to is 80 dB(A), while the highest noise level in the
mixed area exceeds the sensitive area highest noise level to reach 85 dB (A). However, both
of the previous levels are considered to present a high danger for the residence and shops
owners.
45 50 55 60 65 70 75 80 850
50000
100000
150000
200000
250000
300000
350000
400000
Are
a m
2
Noise level
Mixed and Sensirive Areas in Le
Mixed
Sensitive
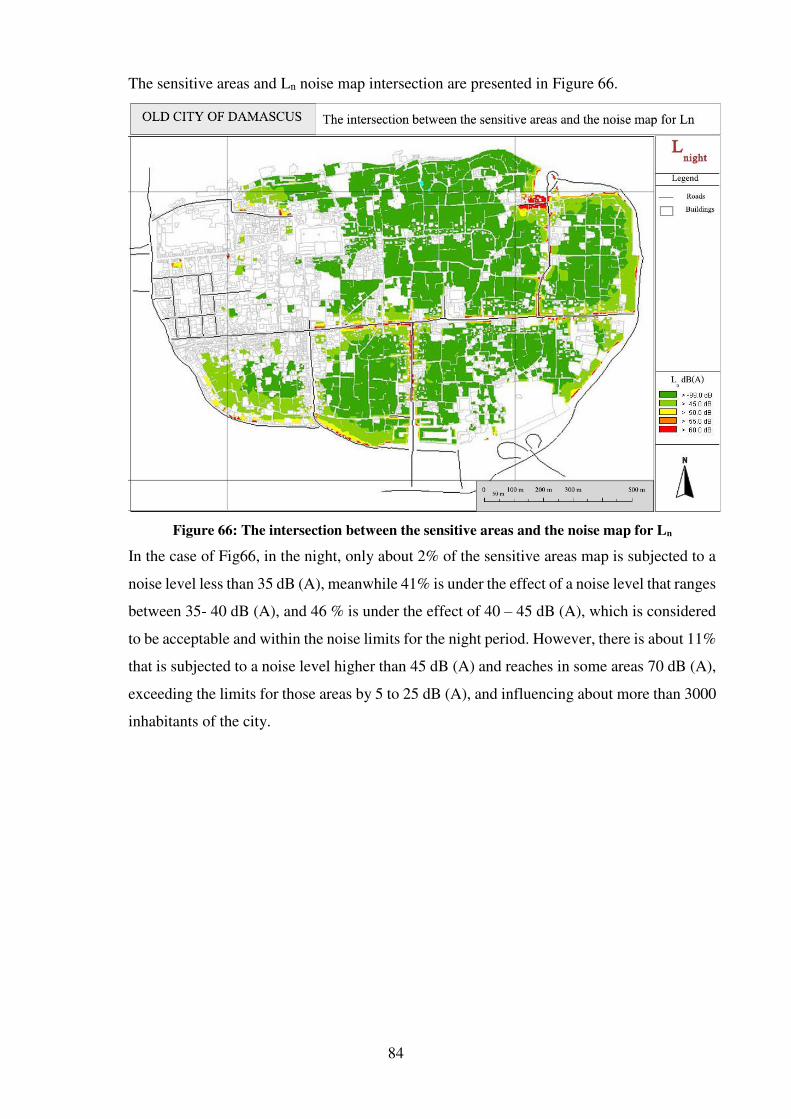
84
The sensitive areas and Ln noise map intersection are presented in Figure 66.
Figure 66: The intersection between the sensitive areas and the noise map for Ln
In the case of Fig66, in the night, only about 2% of the sensitive areas map is subjected to a
noise level less than 35 dB (A), meanwhile 41% is under the effect of a noise level that ranges
between 35- 40 dB (A), and 46 % is under the effect of 40 – 45 dB (A), which is considered
to be acceptable and within the noise limits for the night period. However, there is about 11%
that is subjected to a noise level higher than 45 dB (A) and reaches in some areas 70 dB (A),
exceeding the limits for those areas by 5 to 25 dB (A), and influencing about more than 3000
inhabitants of the city.
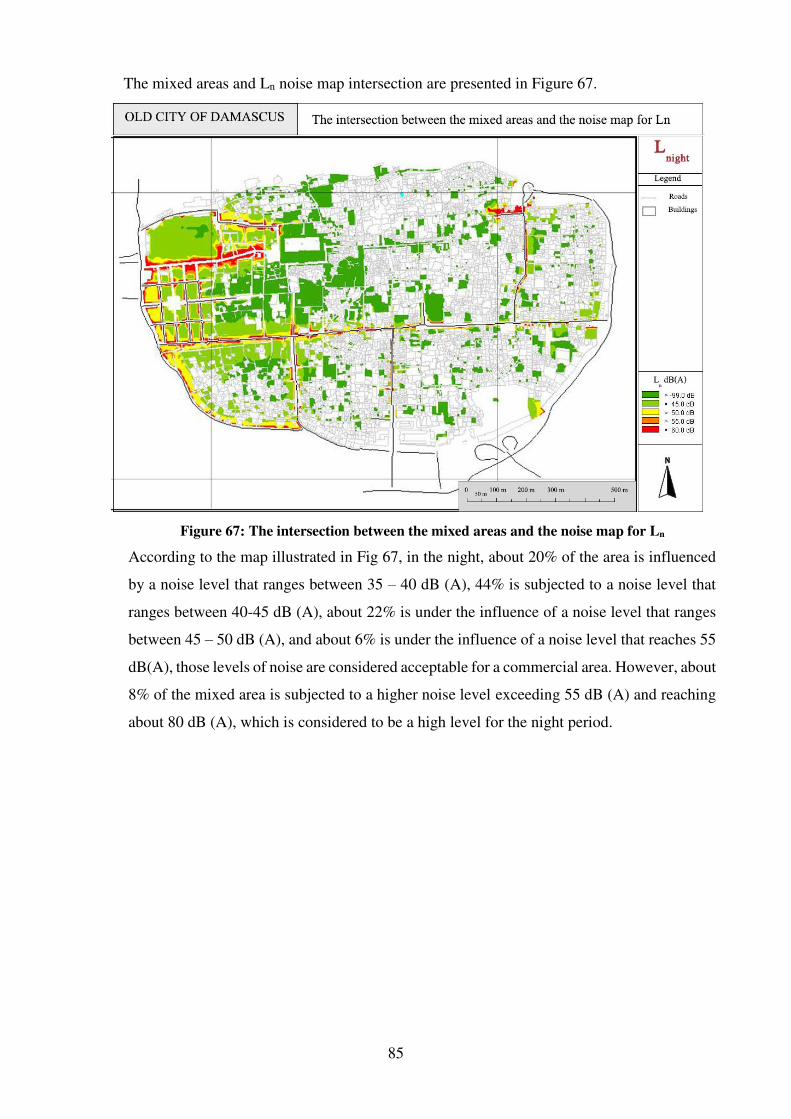
85
The mixed areas and Ln noise map intersection are presented in Figure 67.
Figure 67: The intersection between the mixed areas and the noise map for Ln
According to the map illustrated in Fig 67, in the night, about 20% of the area is influenced
by a noise level that ranges between 35 – 40 dB (A), 44% is subjected to a noise level that
ranges between 40-45 dB (A), about 22% is under the influence of a noise level that ranges
between 45 – 50 dB (A), and about 6% is under the influence of a noise level that reaches 55
dB(A), those levels of noise are considered acceptable for a commercial area. However, about
8% of the mixed area is subjected to a higher noise level exceeding 55 dB (A) and reaching
about 80 dB (A), which is considered to be a high level for the night period.
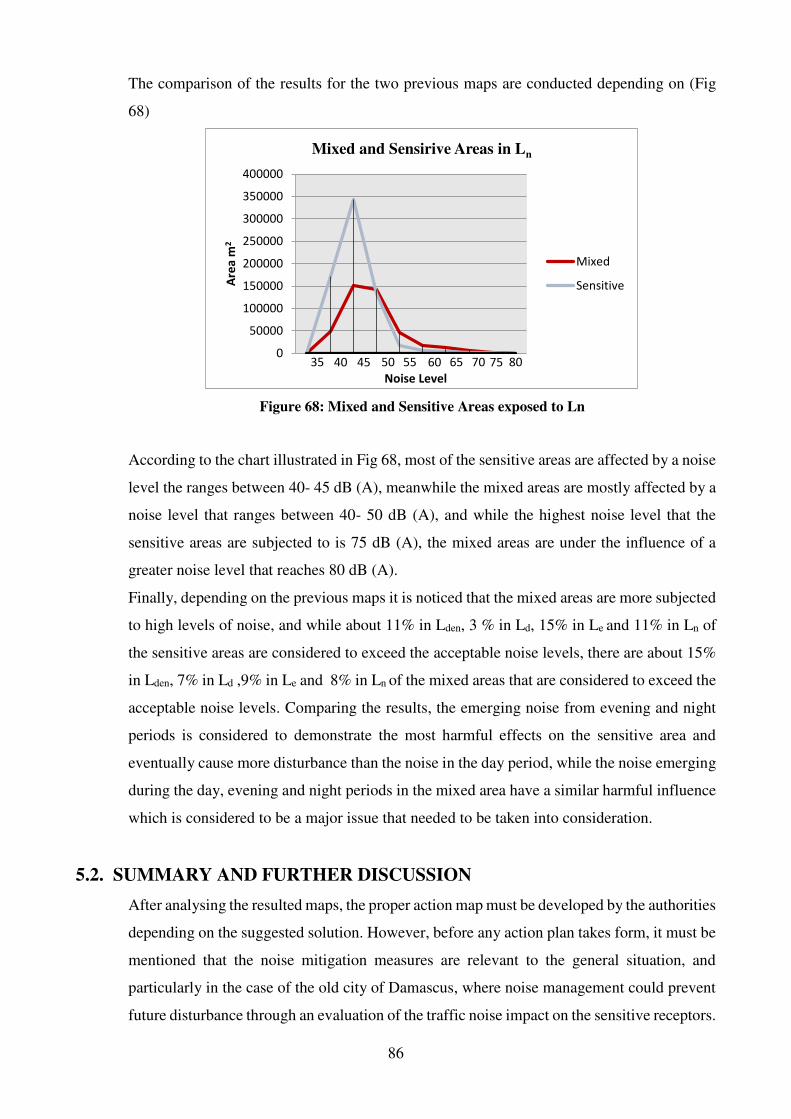
86
The comparison of the results for the two previous maps are conducted depending on (Fig
68)
Figure 68: Mixed and Sensitive Areas exposed to Ln
According to the chart illustrated in Fig 68, most of the sensitive areas are affected by a noise
level the ranges between 40- 45 dB (A), meanwhile the mixed areas are mostly affected by a
noise level that ranges between 40- 50 dB (A), and while the highest noise level that the
sensitive areas are subjected to is 75 dB (A), the mixed areas are under the influence of a
greater noise level that reaches 80 dB (A).
Finally, depending on the previous maps it is noticed that the mixed areas are more subjected
to high levels of noise, and while about 11% in Lden, 3 % in Ld, 15% in Le and 11% in Ln of
the sensitive areas are considered to exceed the acceptable noise levels, there are about 15%
in Lden, 7% in Ld ,9% in Le and 8% in Ln of the mixed areas that are considered to exceed the
acceptable noise levels. Comparing the results, the emerging noise from evening and night
periods is considered to demonstrate the most harmful effects on the sensitive area and
eventually cause more disturbance than the noise in the day period, while the noise emerging
during the day, evening and night periods in the mixed area have a similar harmful influence
which is considered to be a major issue that needed to be taken into consideration.
5.2. SUMMARY AND FURTHER DISCUSSION
After analysing the resulted maps, the proper action map must be developed by the authorities
depending on the suggested solution. However, before any action plan takes form, it must be
mentioned that the noise mitigation measures are relevant to the general situation, and
particularly in the case of the old city of Damascus, where noise management could prevent
future disturbance through an evaluation of the traffic noise impact on the sensitive receptors.
35 40 45 50 55 60 65 70 75 800
50000
100000
150000
200000
250000
300000
350000
400000
Are
a m
2
Noise Level
Mixed and Sensirive Areas in Ln
Mixed
Sensitive
87
The process of evaluation for the action map is completely different from only suggested
solutions and finds the areas that are hugely affected with the noise. The action plan is related
to all the actions of a management process, from the making of the decision to the
implementation of the various noise control actions.
According to previously mentioned studies, any action plan to be taken after producing the
noise map needs between 3 to 6 years to be evaluated, where for example in Syria most
planning authorities have a long term time period that ranges between (2-4 years) to develop
a plan and (4-6) years to implement it. Furthermore, the life cycle for a planning project often
foresees 15-20 years or more. Thus, this marks the importance in making an ongoing
interaction between the various planning levels, including different majors’ point of view,
i.e. an Architectural point of view considers the legalisation assigned by the local authorities
in advance of any needed action and takes the economic and social possibilities under
consideration. In another word, before discussing any future plan, all the involved authorities
must be included in the decision-making process. After that, the proper authorities should
conduct a special procedure in the purpose of implementing the noise mitigating measures,
those measures must also be accompanied with monitoring and measuring process, on a
regular basis, for the environmental and social impacts of the measures implemented.
Additionally, and according to (European Union, 2002), each action plan should contain
estimates in terms of the reduction of the number of people affected, as depending on that
before the implementation of any action plan, the number of people that are less affected by
the noise must be estimated so in the following mitigation actions the number of people could
be used as a goal to achieve point. The noise reduction at the source can be, in principle, the
Lw’’ reduced step by step until there are no residents left with a Lnight of more than 50 dB (A).
In the case of Damascus, an implementation of any monitoring system in the purpose of noise
mitigation seems to be not possible in the current situation, where the environmental aspects
take a low priority compared with the economic and social needs. The planning of a new
urban form concerning the old city of Damascus is still not taking the environmental issues
as a problem either by ignoring the issues or by not having the access to the new techniques,
so the implementing of any action plan is still a distant possibility. However, this study
could form a base for other studies that could conduct and be the first step towards an
environmental awareness.
5.3. Recommendations
The Syrian Ministry of Environment (MOE, 2009) recommended some practices to avoid
and control noise impact and conflict situations. It must be pointed that, those
88
recommendations involve the whole city of Damascus, and most of them aren’t implemented.
The Ministry suggested the following ways:
- Spread awareness about the noise and its role on damaging the public health especially
the health of children, and their intellectual and physical development, through various
media coordination and cooperation with the Ministry of Information.
- Mitigation of noise inside schools and hospitals by planting their courtyards, the
surrounding areas and roads with a belt of trees, where the trees can play the role of the
barriers against sounds as each row of trees reduces noise by 1.5 dB and the lush trees
absorb 25% of the noise level.
- Monitor the implementation of some legislation such as the Traffic Act No. 19 Dated
30.03.1974 which was amended by Law No. 6 Date 02/07/1979 that puts some limits on
the noise produced by the vehicles, especially in the third paragraph of Article 87 that
prevent the use of vehicle horns and provide provisions for engine control.
- Monitor the implementation of the decision that prevents the usage of motorcycles and
vehicles with three wheels inside some areas of the city of Damascus.
- Prevent the passage of the aircrafts over cities and populated areas.
- Complete the implementation of arterial roads around the big cities to prevent passing
through traffic in the city.
- Monitor the implementation of the decision that prevents the usage of loudspeakers and
tape recorders in the streets and shops.
- Obligate the industries owners from which high levels of noise emerge to use anti-noise
machines and implement some insulation for the floors or use sound insulation material
so that the sound waves do not spread to the outside. In addition, obligate them to educate
the workers of these industries into using silencers on their ears.
- Reconsideration of the planning and organization of some areas in the cities, and consider
the possibility of expansion and reforestation of some streets to reduce noise.
- Briefing the cities with green belts, increase the gardens and parks in the area, and plant
the streets sidewalks and bisectors.
- Transfer the industries that are considered to have harmful effects on the health, the
environment, and that cause noise; such as blacksmithing and repairing cars, outside the
administrative borders of the cities, and create special industrial zones.
However, although those previous recommendations could form an act toward the noise
pollution, not all of them are effective in the case of the old city and furthermore most of them
are not even implemented. As a response, this paper covers different recommendations that
89
could work as complimentary to the Ministry recommendations and compatible with the old
city conditions;
- Reducing the speed limits for the vehicles inside and in the surroundings of the old city.
- Reducing the hours that the Markets open and close within the old city.
- Enforce the prohibition of loudspeakers usage by the shop owners.
- Not only depending on public awareness, but include their participation in the decision-
making by Advisory boards that usually consists of invited representatives of different
social groups, such as the political representatives, police personnel, fire department
members, citizens’ initiatives, environmental associations, local administrators, religious
groups, schools or others who are affected by ongoing planning processes, workshops and
public participation events which are mostly effective in the new planning process.
- Consider including new types of vehicles such as electric means of transportation inside
the walls of the old city as a primary step toward the developing of a better understanding
of the electric mobility.
- Provide places for the school buses to stop and wait for children near the areas of the
schools, and in the event of cases that involves the necessity of passing through the old
city to get to the area of the school, decreasing the number of big buses by the usage of
smaller vehicles such as microbuses.
- Encourage the usage of an eco-friendly transportation system inside the old city, e.g.
bicycles, and add some areas to park those with specific lanes inside the old city,
encouraging also the establishment of some stores in the purpose of renting this kind of
transportation.
- Changing the materials of the roads, as it was mentioned before, to a low-noise type of
material.
- Provide the modern buildings in the old city, which form a minority, with noise blocking
materials for the floors, and in addition considering the change of the materials of
windows and doors as well.
- Finally, use other countries expertise as a reference and try to develop useful measures
depending on that.
The recommendations that are suggested by this study could work as a complimentary to the
ones that were suggested by the Ministry of Environment, where there is not an exact point
where they are not met, and where more flexible and fit solutions were suggested.
90
CHAPTER 6: CONCLUSION AND FUTURE
DEVELOPMENTS
It is well known that the interference of noise with the everyday activities (annoyance) is
related to the noise exposure. Noise annoyance in the urban environment is mostly related to
the traffic flow other than any other sources. Especially in the case of Damascus, a lot of
studies indicated the negative effects of the noise on the public health and its leading role in
causing the sleep disturbance and other kinds of discomfort. In the city of Damascus,
according to the results provided by the noise maps, the most affected areas are those located
immediately near the noise sources. However, the noise effects started to get less relevant
towards the north of the old city, where there is no noticeable traffic movement. While the
most affected zones are located in the west of the old city, due to the existing of two major
markets; Al-Hamidya market and Al-Hariqah Market. Although, Al-Hamidya Market was
only designed to include the movement of pedestrians, it still forms a huge source of noise
due to it being one of the most crowded Markets in the old city of Damascus. Meanwhile,
the high level of noise in Al-Hariqah Market could be explained by the traffic movement at
it. Besides, both Al-Hamidya Market and Al-Hariqah Market are greatly affected by the big
amount of vehicles that passes through Al-Thowra Street during the rush hours, where it
ranges between 3000 to 5000 vehicles/hour, passing through with a speed of 20km/h.
Furthermore, according to the resulting noise maps, the roads surrounding the old city cause
higher levels of noise other than the streets that pass through the old city. According to that,
different solutions were suggested to deal with the noise problem. However, in order for
those solutions to be effective further researches and studies must be taken into consideration
by the responsible authorities to implement them inside the old city without ignoring the
effect of the people awareness in the whole process.
Furthermore, according to many earlier mentioned studies, a good number of the solutions
for the noise problem found the implementing of noise barriers, covering the roads, changing
the building material, adding sound insulation materials or planting rows of trees as useful
solutions to deal with the noise. However the old city of Damascus has limited access to any
of those solutions, depending on its location and its status as a world heritage site. Letting
alone the current political, social and economic situation in Damascus, which, in this case,
makes the noise pollution not to be taken as a high environmental risk with a lot of issues
that ranks in front of it and taking the priority both in the governmental and social point of
view, leaving the problem of noise pending indefinitely without any possible solution.
91
Noise is not a minor problem that could go away with the time, it is a considerable issue that
could cause social and health problems. But with the higher institutions not recognizing
environmental issues like noise and air pollution, such cases may remain not solved for other
ten or twenty years.
Eventually, this study doesn’t aim only to draw other studies attention towards the noise issue
inside the old city of Damascus. It aims to draw the attention of the responsible authorities
to the noise problem in a small area of the whole city of Damascus, an area involves a limited
access of vehicles if compared with other places around the city. The solutions suggested are
with a great deal of consideration for the current state of the country and it doesn’t require to
be implemented immediately, but to be served as advisement and further analysed to be able
to be implemented in the future after the present political situation is over and the rebuilding
and reconstruction process starts.
92
REFERENCES
Abbott, P. a. (1999). The Calculation of Road Traffic Noise - Extending the range of propagation.
Crowthorne: Unpublished Project Report PR/SE/611/99, Transport Research Laboratory.
Abdin, M. Y. (2011). Damascene, upon the emergence and growth of the city (In Arabic). Damascus:
Damascus University .
AFSSE, A. F. (2004). Health imapcts of noise. 94704 Maisons-Alfort : Agence Française de sécurité
sanitaire environnementale.
Al-Muhanna, Z. (1998). Building Systems and the development of housing in the city of Damascus
since the thirties until the nineties (in Arabic). Basil al-Assad Journal of Engineering Science,
15-36.
Al-Rez, A. (2010). Traffic management in the old city of Damascus. Directorate of the Old City of
Damascus. Damascus.
Alves, J. A., Silva, L. T., & Remoaldo, P. C. (2015). The Influence of Low-Frequency Noise Pollution
on the Quality of Life and Place in Sustainable Cities: A Case Study from Northern Portugal.
. Sustainability, 7, 13920-13946.
Anianasson G, P. Y. (1988). Noise Sensitivity and Annoynce caused by traffic noise in persons with
imapaired Hearing. Journal of Sound and Vibration, 543-548.
Arnaud, J. (2006). Damas: Urbanisme et Architecture, 1860-1925. Paris: Sindbad.
Atomic Energy Commission. (2009). Noise Analysis in the city of Damascus. Department of Physics,
Atomic Energy Commission of Syria.
Berglund, B., & Lindvall, T. (1995). Community Noise. Stockholm: Stockholm University and
Karolinska Institute.
Bonine, M. (1977). From Uruk to Casablanca: Prespactives on the Urban Experience of the Middle
East. Journal of Urban History, 141-180.
CBSSYR, C. B. (2011). Population & Demographic Indicators. Damascus: Central Bureau of
Statistics.
Damascus Municipality . (2014). The City of Damascus, Syria. Damascus.
Damascus University. (2011). Survey about Noise in two main Markets in Damascus City. Damascus:
Damascus University, Ministry of Higher Education.
David H.F. Liu, H. C. (1999). Environmental Engineers Handbook, Noise pollution. Boca Raton:
CRC Press LLC.
93
Dutilleux, G., Defrance, J., Ecotière, D., Gauvreau, B., Bérengier, M., Besnard, F., & Duc, E. L.
(2010). NMPB-Routes-2008: The Revision of the French Method of Road Traffic Noise
Prediction. Acta Acustica united with Acustica, 452-462.
Ecotière, D. (2008). Révision de la NMPB-Roads-96 - Calcul des occurrences météorologiques
favorables à la propagation (in frensh). Bagneux : Service studies on transport and road
improvements.
EPA, E. P. (2009). Guidance Note for Noise Action Planning. Johnstown Castle, Co. Wexford:
ENVIRONMENTAL PROTECTION AGENCY.
European Commission . (2002). Directive 2002/49/EC of the European Parliment and of the council
of 25 June 2002.
European Commission. (2008). NR2C, New Road Construction Concepts. European Commission .
European Commission Working Group. (2006). Assesment of Exposure to Noise ( WG-AEN).
European Commission.
EUROPEAN COMMISSION, & DG Environment. (2003). Adaptation and revision of the interim
noise computation methods for the purpose of strategic noise mapping. EUROPEAN
COMMISSION.
European Union. (2002). Directive 2002/49/EC, Environmental Noise Directive, the assessment and
management of environmental noise. European Commission.
Flood, F. (1997). Umayyad Survivals and Mamluk Revivals: Qalawunid Architecture and the Great
Mosque of Damascus. Muqarnas 14, 57-79.
Gerges, S. N., Sehrndt, G. A., & Parthey, W. (1995). Occupational exposure to noise: Noise Sources.
In W. H. WHO, Occupational exposure to noise (pp. 103-124). Geneva: World Health
Organization .
GTZ, T. S. (2002). Module 5C Noise and its Abatement. Eschborn: GTZ, Division 44.
Hadba, A. (2011). Environmental Pollution (in Arabic). Damascus.
Haddad, A. A. (2010). Traffic and Transport, City of Damascus. Marseille Confernce. Marseille.
International Congress and Exhibition, Boone, R., & Nederlands Akoestisch Genootschap. (2001).
Inter-noise 2001 the 2001 International Congress and Exhibition on Noise Control
Engineering, The Hague, The Netherlands, 2001, August 28-30 : proceedings. The 2001,
International congress and exhibition. Maastricht: Nederlands Akoestisch Genootschap.
ISO 2204, I. O. (1979). Acoustics - Guide to International standards. Geneva: International
Organization for Standardization.
ISO, I. O. (1996). Assessment Environmental Noise. Geneva: International Organization for
Standardization.
94
JICA, J. I. (2010). The Project for Urban Planning and Development in Damascus Metropolitan Area
in the Syrian Arab Republic. Tokyo : Ministry of Local Administration (MoLA).
Kallaa, M. (1993). Les Temps de l'Urbanisme: Enquetes d'Histoire Orale: Damas et le Temps
d'Ecochard (in French). Paris: Laboratoire Théorie des Mutations Urbaines.
Kennedy, H. (1985). From Polis to Madina: Urban Changes in Late Antiquity and Early islamic Syria
Past and Present. Oxford Journals, 3-27.
Khalaph, A. A. (2013). Craft development of traditional handicrafts and traditional markets (In
Arabic). Tishren University Journal.
Kheer, S. (1969). The City of Damascus, a study in Urban Geography,. Damascus: Ministry of
Culture and Tourism and National Guidance.
Kjaer, B. (2001). Environmental Noise. The Hague: Brüel & Kjær Sound and Vibration Measurement
A/S.
Lapidus, I. (1973). The Evolution of Muslim Urban Society, Comparative Studies in Society and
History .
M. C. Peel, B. L. (2007). Updated world map of the Koppen-Geiger climate. Hydrology and Earth
System Sciences Discussions, European Geosciences Union.
Marks, A. a. (2007). Associations between noise sensitivity and sleep, subjectively evaluated sleep
quality, annoyance and performance after exposure to nocturnal traffic noise. . Noise and
Health Journal 9, 1-7.
Ministry of Transportation . (2014). Traffic situation in Damascus City. Damascus: Ministry of
Transportation.
MOE, M. o. (2009). Environmental Noise. Damascus: Ministry of Environment .
Mousa, A. (1991). Regional climate. Damascus: Damascus University.
Mrkajic, V., Stamenkovic, M., Males, M., Vukelic, D., & Hodolic, J. (2010). PROPOSAL FOR
REDUCING PROBLEMS OF THE AIR POLLUTION AND NOISE IN THE URBAN
ENVIRONMENT. Carpathian Journal of Earth and Environmental Sciences.
Naaes, H. (2008). Air Pollution from cars and traffic in the city of Damascus. (In Arabic). Damascus:
Damascus University .
Oxford Business Group . (2010). The Report: Syria. Oxford: Oxford Business Group.
P.Meenkashi. (2012). ELEMENTS OF ENVIRONMENTAL SCIENCE AND ENGINEERING. Delhi:
Delhi University .
Petrescu, V. a. (2013). Research on noise pollution in densely populated urban areas. Environmental
Engineering and Management .
Quirt, J. (1985). Controlling sound transmission into buildings. Ottawa: National Research Council
Canada, Division of Building Research.
95
Remedial Acoustic Plan to contain and reduce Traffic Noise, Italy. (2007).
S.E.Samuels, & C.P.Huybregts. (1998). New relationship between L10 and Leq for road traffic noise.
Internoise. Christchurch: The International Institute of Noise Control Engineering (I-INCE).
Sahar Al-qaisi, S. A.-K. (2012). The Characteristics of the traditional Urban Configeration of Arabic
Islamic Cities ( In Arabic). Engineering Magazine, 187-207.
Salama, J. M. (2014). Damascus in the Abbasid era. Karachi: Zamzam Publishers and Distributors.
Salamandra, C. (2004). A new Old Damascus: Authenticity and Distinction in Urban Syria.
Bloomington: Indiana University .
Schilcher, L. S. (1985). Families in Politics: Damascene Factions and Estates of the 18th and 19th.
Wiesbaden: F. Steiner.
Silva, L. T., & Mendes, J. F. (2012). City noise-air: an environmental quality index for cities.
Sustainable Cities and Society, 4, 1; 11.
Silva, L. T., Oliveira, M., & Silva, J. F. (2013). Urban form indicators as proxy on the noise exposure
of buildings. Applied Acoustics, 76, 366; 376.
Suter, A. H. (1991, Novmber ). Noise and its effects. Administrative Conference of the United States,
(pp. 1-47).
TRANSPORT, D. O. (1988). The Calculation of Road Traffic Noise. London : Crown .
Tripathy, D. P. (2008). Noise Pollution. Delhi: APH Publishing Corporation.
Tyson, P. J. (2010). SUNSHINE GUIDE TO THE DAMASCUS AREA, SYRIA. www.climates.com.
UNESCO Module, U. N. (2011). Noise Pollution. Paris: UNESCO.
UNESCO, U. N. (2014). The Ancient City of Damascus. Paris: UNESCO.
UNGIWG, T. U. (2014). Damascus Map. New York: The United Nations Geographic Information
Working Group.
USDA, N. A. (2015). Noise Attenuation. Lincoln: National Agroforestry Center.
Wakefield Acoustic LTD. (2013). The Noise control Manual for the city of Vancouver. Victoria:
Wakefield Acoustic.
WHO, W. H. (1999). Guidlines for Community Noise. Geneva: World Health Organization.
Wifstrand, E. (2009). Urban Development of Damascus. Basel: ETH Studio Basel.
Y. Brunet, J. L. (1996). Estimating long-term microclimatic conditions for long-range sound
propagation studies. 7th Long range Sound Propagation Symposium. Lyon: Ecole Centrale
de Lyon.
Zhou, X., Shekhar, S., & Ali, R. Y. (2014). Spatiotemporal change footprint pattern discovery: an
inter-disciplinary survey. Hoboken: WIREs Data Mining Knowl Discov.