smart survey report, idleb governorate, syria
TRANSCRIPT
SMART Survey Report,
Idleb Governorate,
Syria
Physicians Across Continents-Turkey
August 2017
Contents List of Acronyms ............................................................................................................... 3
Acknowledgements .......................................................................................................... 4
Executive summary .......................................................................................................... 5
1. Introduction ................................................................................................................... 8
2. Survey Objective .......................................................................................................... 8
3. Methodology ................................................................................................................. 9
3.1 Sample size .......................................................................................................................................... 9
3.2 Sampling procedure: selecting clusters ......................................................................................... 10
3.3 Sampling procedure: selecting households and children ............................................................ 11
3.4 Case definitions and inclusion criteria ............................................................................................ 12
3.5 Questionnaire, training and supervision ......................................................................................... 13
3.6 Data entry and analysis .................................................................................................................... 14
3.7 Characteristic of the sample ............................................................................................................ 14
4. Results ....................................................................................................................... 16
4.1 Anthropometric results (based on WHO standards 2006): ......................................................... 16
4.1.1 Prevalence of acute malnutrition based on weight-for-height z-scores ............. 16
4.1.2 Prevalence of acute malnutrition based on MUAC cut offs (and / or edema): .. 18
4.1.3: Prevalence of underweight based on weight-for-age z-score (WAZ) ................ 19
4.1.4: Prevalence of stunting based on height-for-age z-score (HAZ) ......................... 20
4.1.5: Prevalence of overweight based on weight for height z-score (HAZ) ............... 21
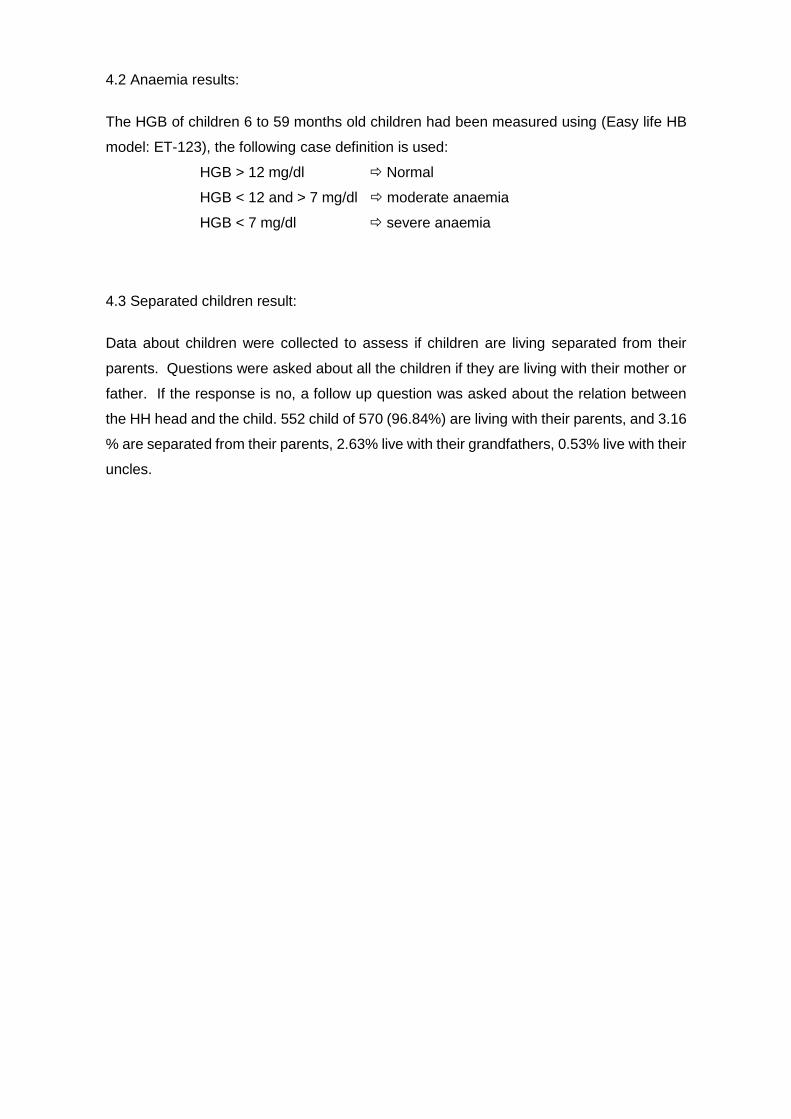
4.2 Anaemia results: ................................................................................................................................ 23
4.3 Separated children result: ................................................................................................................ 23
5. Discussion .................................................................................................................. 24
6. Recommendations and priorities ................................................................................. 25
7. Appendices ................................................................................................................. 26
List of Acronyms
CDC Centers for Disease Control and Prevention
CCCM Camp Coordination and Camp Management
CI Confidence Interval
ENA Emergency Nutrition Assessment
GAM Global Acute Malnutrition
HAZ Height-for-Age Z-Scores
HFA Height-for-Age
IDP Internally Displaced People
IYCF Infant and Young Child Feeding
IYCF-E Infant and Young Child Feeding in Emergencies
MAM Moderate Acute Malnutrition
MUAC Mid-Upper Arm Circumference
NGO Non-Governmental Organization
NPM Need and Population Monitoring
PAC Physicians Across Continents
PPS Probability Proportional to Size
PSU Primary Sampling Unit
RC Reserve Cluster
SAM Severe Acute Malnutrition
SD Standard Deviation
SMART Standardized Monitoring and Assessment of Relief and Transitions
WAZ Weight-for-Age Z-Scores
WFA Weight-for-Age
WFH Weight-for-Height
WHO World Health Organization
WHZ Weight-for-Height Z-Scores

Acknowledgements
We thank the United Nations Children's Fund (UNICEF) for support and funding for this
survey and Physicians Across Continents – Turkey (PAC-Turkey for their planning and
implementation
Executive summary
After six years of war and deterioration of Health and nutrition services in Syria, there was
a need to determine the nutrition situation. Physicians Across Continents (PAC) in
coordination with Nutrition cluster conduct a Standardized Monitoring and Assessment of
Relief and Transitions (SMART) survey in Idleb governorate in June 2014. However, after
the Survey there were major changes in the situation. There were new accessible areas.
These areas had been accessible from Turkey after being under the opposition’s control.
There were a huge number of Internally Displaced People (IDPs) coming from other
besieged areas (Aleppo, Madaiya, Dariya) and due to these changes, we planned to
conduct a new SMART survey in Idleb governorate to determine the current nutrition status.
Idleb governorate is located in north of Syria and contains Host community and IDPs, most
of them are Muslim, This survey was conducted between 10 to14 July 2017. Thirty clusters
from Idleb governorate had been surveyed. These clusters has been selected randomly to
represent all Idleb communities. Need and Population Monitoring (NPM) and CCCM data
was used to estimate the population size. After we selected the clusters we used Simple
or Systematic random sampling methods to select the Households in each cluster.
The main objective of the survey was to determine the Global Acute Malnutrition (GAM)
prevalence in Idleb governorate.578 children 6 – 59 month from 411 Household (HH) were
included in the survey. All selected clusters had been visited and no reserved cluster had
been used. Table 1 below summarizes Major nutrition related findings.
.
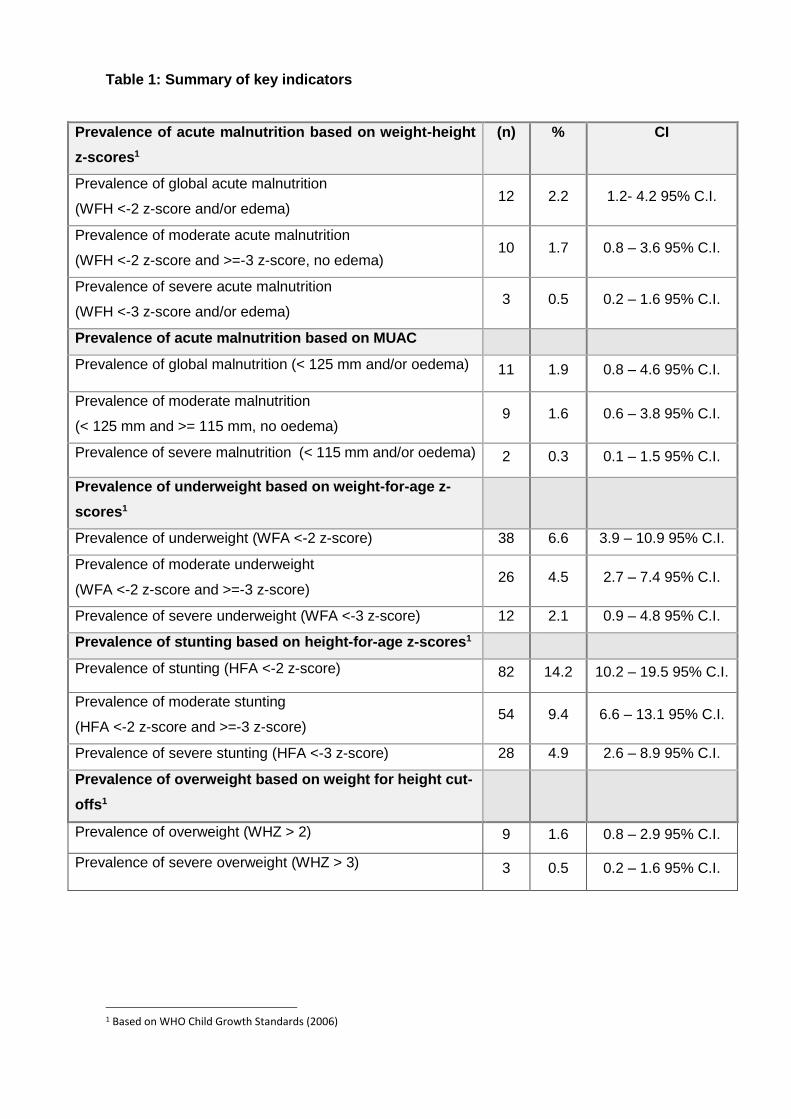
Table 1: Summary of key indicators
Prevalence of acute malnutrition based on weight-height
z-scores1
(n) % CI
Prevalence of global acute malnutrition
(WFH <-2 z-score and/or edema) 12 2.2 1.2- 4.2 95% C.I.
Prevalence of moderate acute malnutrition
(WFH <-2 z-score and >=-3 z-score, no edema) 10 1.7 0.8 – 3.6 95% C.I.
Prevalence of severe acute malnutrition
(WFH <-3 z-score and/or edema) 3 0.5 0.2 – 1.6 95% C.I.
Prevalence of acute malnutrition based on MUAC
Prevalence of global malnutrition (< 125 mm and/or oedema) 11 1.9 0.8 – 4.6 95% C.I.
Prevalence of moderate malnutrition
(< 125 mm and >= 115 mm, no oedema) 9 1.6 0.6 – 3.8 95% C.I.
Prevalence of severe malnutrition (< 115 mm and/or oedema) 2 0.3 0.1 – 1.5 95% C.I.
Prevalence of underweight based on weight-for-age z-
scores1
Prevalence of underweight (WFA <-2 z-score) 38 6.6 3.9 – 10.9 95% C.I.
Prevalence of moderate underweight
(WFA <-2 z-score and >=-3 z-score) 26 4.5 2.7 – 7.4 95% C.I.
Prevalence of severe underweight (WFA <-3 z-score) 12 2.1 0.9 – 4.8 95% C.I.
Prevalence of stunting based on height-for-age z-scores1
Prevalence of stunting (HFA <-2 z-score) 82 14.2 10.2 – 19.5 95% C.I.
Prevalence of moderate stunting
(HFA <-2 z-score and >=-3 z-score) 54 9.4 6.6 – 13.1 95% C.I.
Prevalence of severe stunting (HFA <-3 z-score) 28 4.9 2.6 – 8.9 95% C.I.
Prevalence of overweight based on weight for height cut-
offs1
Prevalence of overweight (WHZ > 2) 9 1.6 0.8 – 2.9 95% C.I.
Prevalence of severe overweight (WHZ > 3) 3 0.5 0.2 – 1.6 95% C.I.
1 Based on WHO Child Growth Standards (2006)
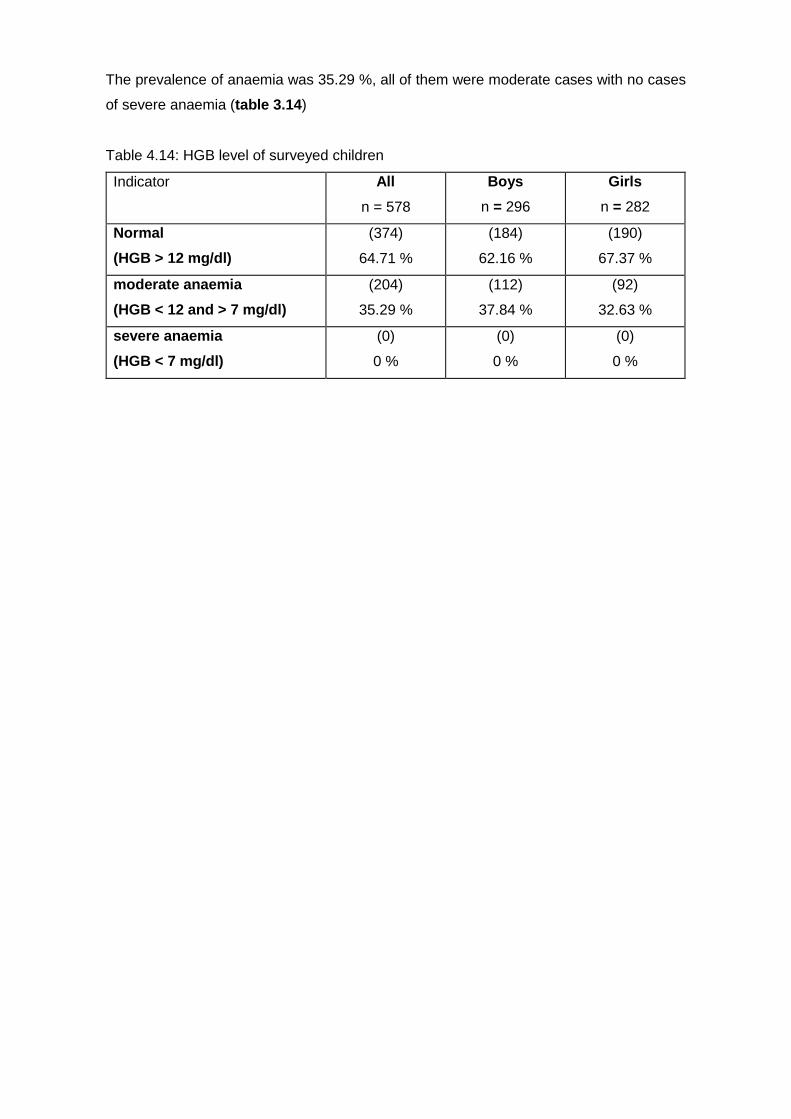
The prevalence of anaemia was 35.29 %, all of them were moderate cases with no cases
of severe anaemia (table 3.14)
Table 4.14: HGB level of surveyed children
Indicator All
n = 578
Boys
n = 296
Girls
n = 282
Normal
(HGB > 12 mg/dl)
(374)
64.71 %
(184)
62.16 %
(190)
67.37 %
moderate anaemia
(HGB < 12 and > 7 mg/dl)
(204)
35.29 %
(112)
37.84 %
(92)
32.63 %
severe anaemia
(HGB < 7 mg/dl)
(0)
0 %
(0)
0 %
(0)
0 %
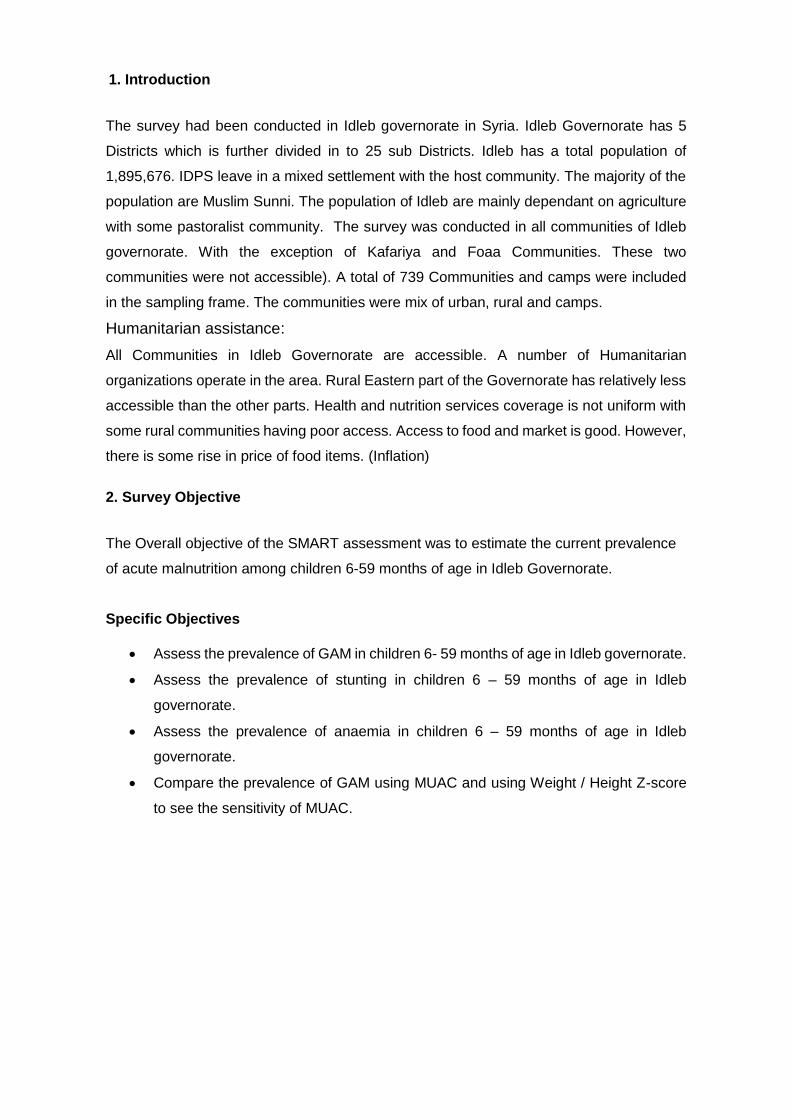
1. Introduction
The survey had been conducted in Idleb governorate in Syria. Idleb Governorate has 5
Districts which is further divided in to 25 sub Districts. Idleb has a total population of
1,895,676. IDPS leave in a mixed settlement with the host community. The majority of the
population are Muslim Sunni. The population of Idleb are mainly dependant on agriculture
with some pastoralist community. The survey was conducted in all communities of Idleb
governorate. With the exception of Kafariya and Foaa Communities. These two
communities were not accessible). A total of 739 Communities and camps were included
in the sampling frame. The communities were mix of urban, rural and camps.
Humanitarian assistance:
All Communities in Idleb Governorate are accessible. A number of Humanitarian
organizations operate in the area. Rural Eastern part of the Governorate has relatively less
accessible than the other parts. Health and nutrition services coverage is not uniform with
some rural communities having poor access. Access to food and market is good. However,
there is some rise in price of food items. (Inflation)
2. Survey Objective
The Overall objective of the SMART assessment was to estimate the current prevalence
of acute malnutrition among children 6-59 months of age in Idleb Governorate.
Specific Objectives
• Assess the prevalence of GAM in children 6- 59 months of age in Idleb governorate.
• Assess the prevalence of stunting in children 6 – 59 months of age in Idleb
governorate.
• Assess the prevalence of anaemia in children 6 – 59 months of age in Idleb
governorate.
• Compare the prevalence of GAM using MUAC and using Weight / Height Z-score
to see the sensitivity of MUAC.
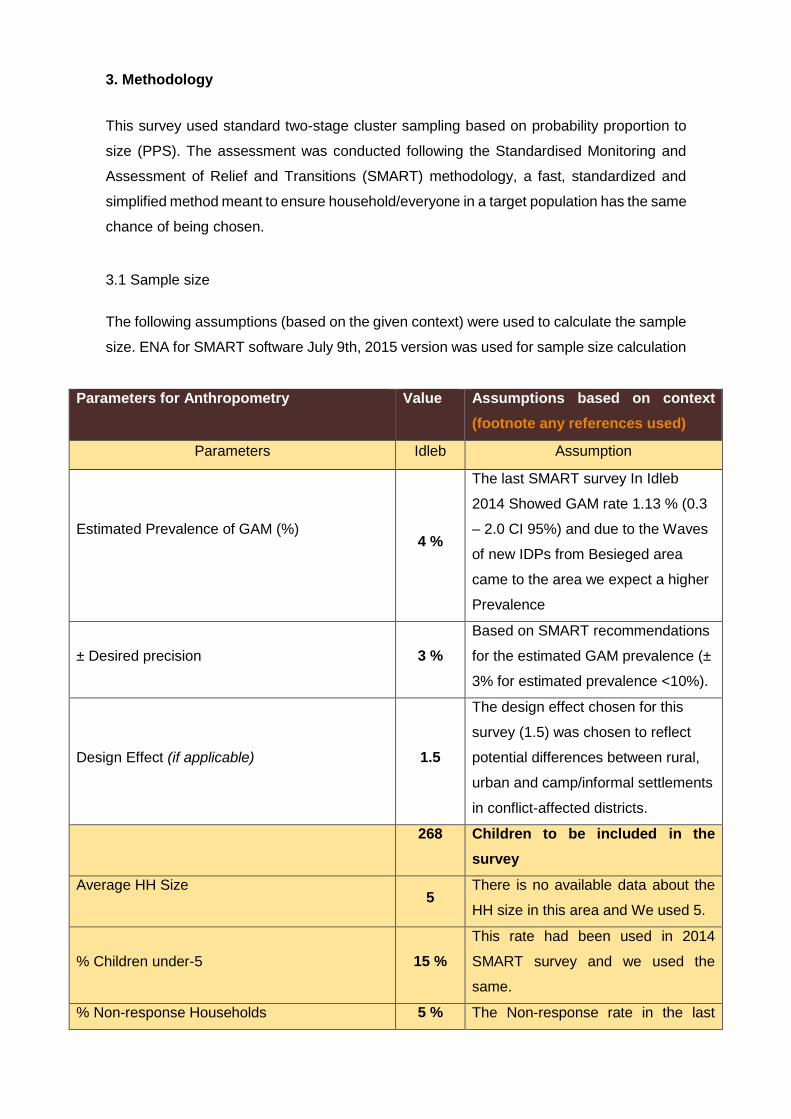
3. Methodology
This survey used standard two-stage cluster sampling based on probability proportion to
size (PPS). The assessment was conducted following the Standardised Monitoring and
Assessment of Relief and Transitions (SMART) methodology, a fast, standardized and
simplified method meant to ensure household/everyone in a target population has the same
chance of being chosen.
3.1 Sample size
The following assumptions (based on the given context) were used to calculate the sample
size. ENA for SMART software July 9th, 2015 version was used for sample size calculation
Assumptions based on context
(footnote any references used)
Value Parameters for Anthropometry
Assumption Idleb Parameters
The last SMART survey In Idleb
2014 Showed GAM rate 1.13 % (0.3
– 2.0 CI 95%) and due to the Waves
of new IDPs from Besieged area
came to the area we expect a higher
Prevalence
4 % Estimated Prevalence of GAM (%)
Based on SMART recommendations
for the estimated GAM prevalence (±
3% for estimated prevalence <10%).
3 % ± Desired precision
The design effect chosen for this
survey (1.5) was chosen to reflect
potential differences between rural,
urban and camp/informal settlements
in conflict-affected districts.
1.5 Design Effect (if applicable)
Children to be included in the
survey
268
There is no available data about the
HH size in this area and We used 5. 5
Average HH Size
This rate had been used in 2014
SMART survey and we used the
same.
15 % % Children under-5
The Non-response rate in the last 5 % % Non-response Households
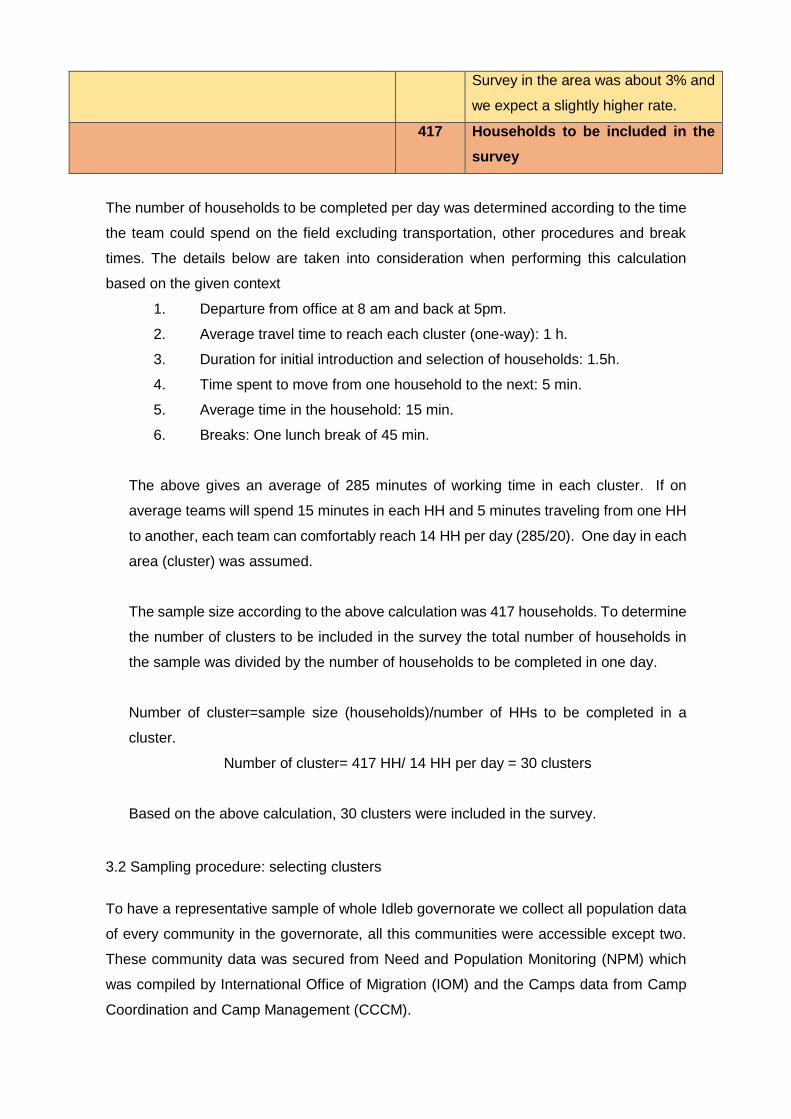
Survey in the area was about 3% and
we expect a slightly higher rate.
Households to be included in the
survey
417
The number of households to be completed per day was determined according to the time
the team could spend on the field excluding transportation, other procedures and break
times. The details below are taken into consideration when performing this calculation
based on the given context
1. Departure from office at 8 am and back at 5pm.
2. Average travel time to reach each cluster (one-way): 1 h.
3. Duration for initial introduction and selection of households: 1.5h.
4. Time spent to move from one household to the next: 5 min.
5. Average time in the household: 15 min.
6. Breaks: One lunch break of 45 min.
The above gives an average of 285 minutes of working time in each cluster. If on
average teams will spend 15 minutes in each HH and 5 minutes traveling from one HH
to another, each team can comfortably reach 14 HH per day (285/20). One day in each
area (cluster) was assumed.
The sample size according to the above calculation was 417 households. To determine
the number of clusters to be included in the survey the total number of households in
the sample was divided by the number of households to be completed in one day.
Number of cluster=sample size (households)/number of HHs to be completed in a
cluster.
Number of cluster= 417 HH/ 14 HH per day = 30 clusters
Based on the above calculation, 30 clusters were included in the survey.
3.2 Sampling procedure: selecting clusters
To have a representative sample of whole Idleb governorate we collect all population data
of every community in the governorate, all this communities were accessible except two.
These community data was secured from Need and Population Monitoring (NPM) which
was compiled by International Office of Migration (IOM) and the Camps data from Camp
Coordination and Camp Management (CCCM).
The result is representative of the whole governorate Districts (five districts) and whole sub
district (25 sub-district), only to communities were inaccessible (Kafariya and Foah)
The population data was put it in on list to generate the sampling frame then transferred to ENA
software for SMART and randomly selected 30 clusters and 4 reserve clusters. Clusters have been
selected using the PPS (Probability Proportional to size) method. Appendix 2
Shows the sampling frame and the selected clusters.
3.3 Sampling procedure: selecting households and children
Some of the communities selected had bigger population hence have two clusters selected
in each (clusters 1, 2) (clusters 16, 17) (clusters 27, 28). Additional information was
collected about these big Communities. Segmentation was done using ENA software for
SMART. Two segments were selected in this community, which the team l visited. This
stage had been done before the fieldwork.
To select Households in each cluster we used Systematic random sampling methods
according to cluster size and the availability of HH list or the ability to build a HH list, in
some clusters the teams used the segmentation,
Systematic random sampling was used in big clusters, the team count all the HH in the
cluster then they calculated the sampling interval and then by using the Random number
table selected randomly the first HH to be visited then we selected the following HH by
adding the sample interval.
All abandoned HH had been excluded before starting to select the HH, all absent HH had
been revisited at the end of the day and if it is still absent the team only put a notice on the
cluster control form and they did not replace it.
Also, if there is a child absent in the selected HH, the team revisited the HH at the end of
the day and if the child had return they measure the child, if not returned they put a notice
on the Cluster control form.
3.4 Case definitions and inclusion criteria
For this survey, all members who live under the same roof and eat from the same spot
were considered as a household
All children 6 – 59 month lives in the selected HH were included in the anthropometry
survey, all children had a known age and we did not use any other inclusion criteria.
For measuring the length and height, all children under 2 years (6 – 23 month) had been
measured laying down (Length) and all children more than 2 years (24 – 59 month) had
been measured standing up (Height).
WHO 2006 standards was used to analyze and report the anthropometry data.
Data collected to assess anemia in children 6 – 59 months age. All children 6 – 59 months
of age who lives in the selected HH were measured for Hemoglobin (HGB) using Easy life
HB model: ET-123 used to measure the haemoglobin.
The following cut-off is used to assess anemia:
• HGB > 12 mg/dl normal and there is no anemia
• HGB between 7 – 11.99 mg/dl there is a moderate anemia,
• HGB < 7 mg/dl there is a severe anemia.
Data about separated children was also collected, children who are separated from their
father and mother. Question was asked whether the child is living with his father or mother
or any other (questionnaire in Appendix 6).
3.5 Questionnaire, training and supervision
Questionnaire:
The questionnaire was prepared in Arabic language and all the interviews were conducted
in Arabic language all teams members were Arabic speaker. We did not need to do a
translation and back-translation for the questionnaire. The questionnaire had three module,
one for anthropometric measurement, one for HGB, and the other one for separated
children (Appendix 6)
Survey teams and supervision:
Twenty-seven participants attended enumerators training. Only 18 of them were selected
for data collection. Two supervisors were used to ensure data quality. A total of six team
were involved in the data collection. Each team consisted of 3 members, one team leader,
one measurer and one assistant. All enumerators were community health workers who had
nutrition background. Two supervisors were employed to supervise the data collection.
Each supervisor was responsible for three teams, and each day of field work the supervisor
would make sure that the data collected is of good quality.
Training:
A face to face training of the enumerators was conducted at the PAC training center in
Qah-Idleb for 6 days. 27 trainees attended the training. (5 male and 22 female)
The training covered the following topics:
• General survey objectives,
• overview of survey design,
• Household selection procedures,
• Anthropometric measurements,
• Signs and symptoms of malnutrition,
• Data collection and interview skills,
• How to fill the questionnaire and other format,
• Determining age of a child,
• Measuring HGB)
On the last day of the training, a standardization test was conducted. The supervisors
measured 10 different children between 6 – 59 month twice for Weight, Length or Height
and MUAC. Then each team also measured the 10 children twice. The measurements were
entered to the ENA software and analysed. Field test (pilot test) was done before starting
the actual data collection. The pilot test was done in a camp near to Qah, Idleb.
3.6 Data entry and analysis
The collected data had been entered in daily basis, the data had been scanned every day
and this scanned files sent to data entry every day. Two data encoders entered the data
separately on daily basis. The data has been entered to the ENA software for SMART (Ver
of 9 July 2015).The data had been reviewed every day and if there is any feedback in
general or for a specific team the survey manger sent these feedbacks before the staring
of the next day
To ensure high quality of data entry, at the end of data entry double entry check had been
applied correction of any data entry error is corrected accordingly. Data analysis was done
after appropriate cleaning of data entry errors. To analyse the data some outliers (extremely
Z-scores) had been excluded, we used the WHO flag exclusion criteria.
3.7 Characteristic of the sample
A total of 578 children, 296 boys and 282 girls, aged 6-59 months from 608 households in
30 clusters in Idleb governorate were included in the survey, this total number of children
included in the survey exceeded the planned requirement of 418 children (150 %) - Table
2.3. The exact age of 90% of children aged 6-59 months was determined using family card,
and an event calendar was used to determine the remaining 10%.
626 (297 boys and 329 girls) were included in the analysis (1 missing weight and height
and 1 excluded using WHO flags).
2.1 % of households (N=9) were absent on a first and second visit or refused to collaborate
with the survey teams on the day of data collection (table 2.4).
.
549 out of 625 surveyed HH were host community (87.84 %) and 4.48 % were IDPs from
less than one years and 7.68% were IDPs from more than one year.
The total number of 6-59 month children included (observed) in the survey was 578
exceeded the planned requirement of 268 children. The percent of eligible children included
in the survey refers to the total number of eligible children (6-59months) that live in the
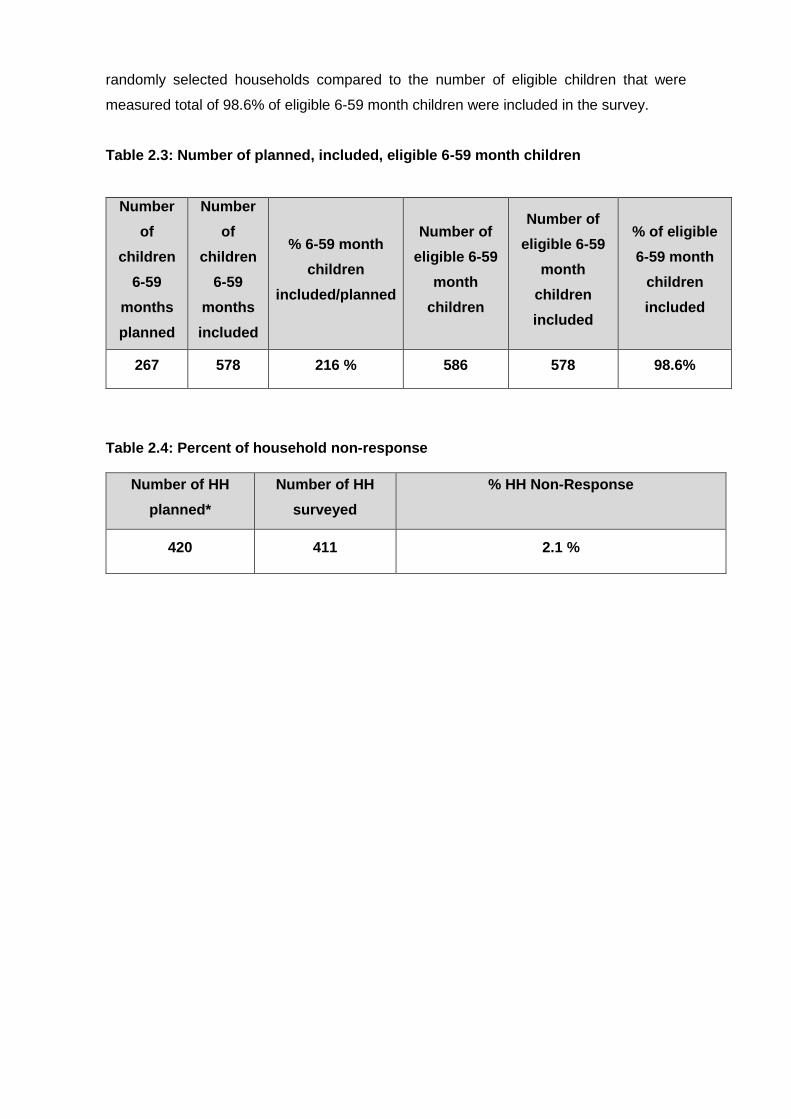
randomly selected households compared to the number of eligible children that were
measured total of 98.6% of eligible 6-59 month children were included in the survey.
Table 2.3: Number of planned, included, eligible 6-59 month children
Number
of
children
6-59
months
planned
Number
of
children
6-59
months
included
% 6-59 month
children
included/planned
Number of
eligible 6-59
month
children
Number of
eligible 6-59
month
children
included
% of eligible
6-59 month
children
included
267 578 216 % 586 578 98.6%
Table 2.4: Percent of household non-response
Number of HH
planned*
Number of HH
surveyed
% HH Non-Response
420 411 2.1 %
4. Results
4.1 Anthropometric results (based on WHO standards 2006):
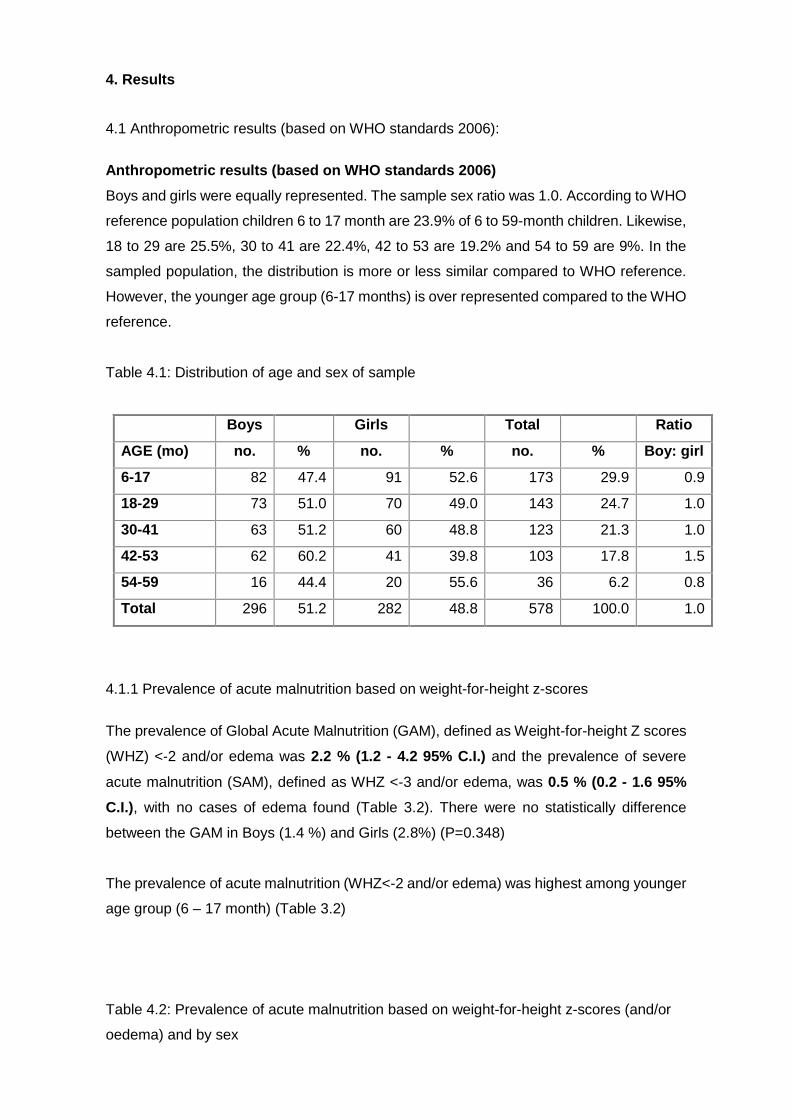
Anthropometric results (based on WHO standards 2006)
Boys and girls were equally represented. The sample sex ratio was 1.0. According to WHO
reference population children 6 to 17 month are 23.9% of 6 to 59-month children. Likewise,
18 to 29 are 25.5%, 30 to 41 are 22.4%, 42 to 53 are 19.2% and 54 to 59 are 9%. In the
sampled population, the distribution is more or less similar compared to WHO reference.
However, the younger age group (6-17 months) is over represented compared to the WHO
reference.
Table 4.1: Distribution of age and sex of sample
Boys Girls Total Ratio
AGE (mo) no. % no. % no. % Boy: girl
6-17 82 47.4 91 52.6 173 29.9 0.9
18-29 73 51.0 70 49.0 143 24.7 1.0
30-41 63 51.2 60 48.8 123 21.3 1.0
42-53 62 60.2 41 39.8 103 17.8 1.5
54-59 16 44.4 20 55.6 36 6.2 0.8
Total 296 51.2 282 48.8 578 100.0 1.0
4.1.1 Prevalence of acute malnutrition based on weight-for-height z-scores
The prevalence of Global Acute Malnutrition (GAM), defined as Weight-for-height Z scores
(WHZ) <‐2 and/or edema was 2.2 % (1.2 - 4.2 95% C.I.) and the prevalence of severe
acute malnutrition (SAM), defined as WHZ <‐3 and/or edema, was 0.5 % (0.2 - 1.6 95%
C.I.), with no cases of edema found (Table 3.2). There were no statistically difference
between the GAM in Boys (1.4 %) and Girls (2.8%) (P=0.348)
The prevalence of acute malnutrition (WHZ<-2 and/or edema) was highest among younger
age group (6 – 17 month) (Table 3.2)
Table 4.2: Prevalence of acute malnutrition based on weight-for-height z-scores (and/or
oedema) and by sex
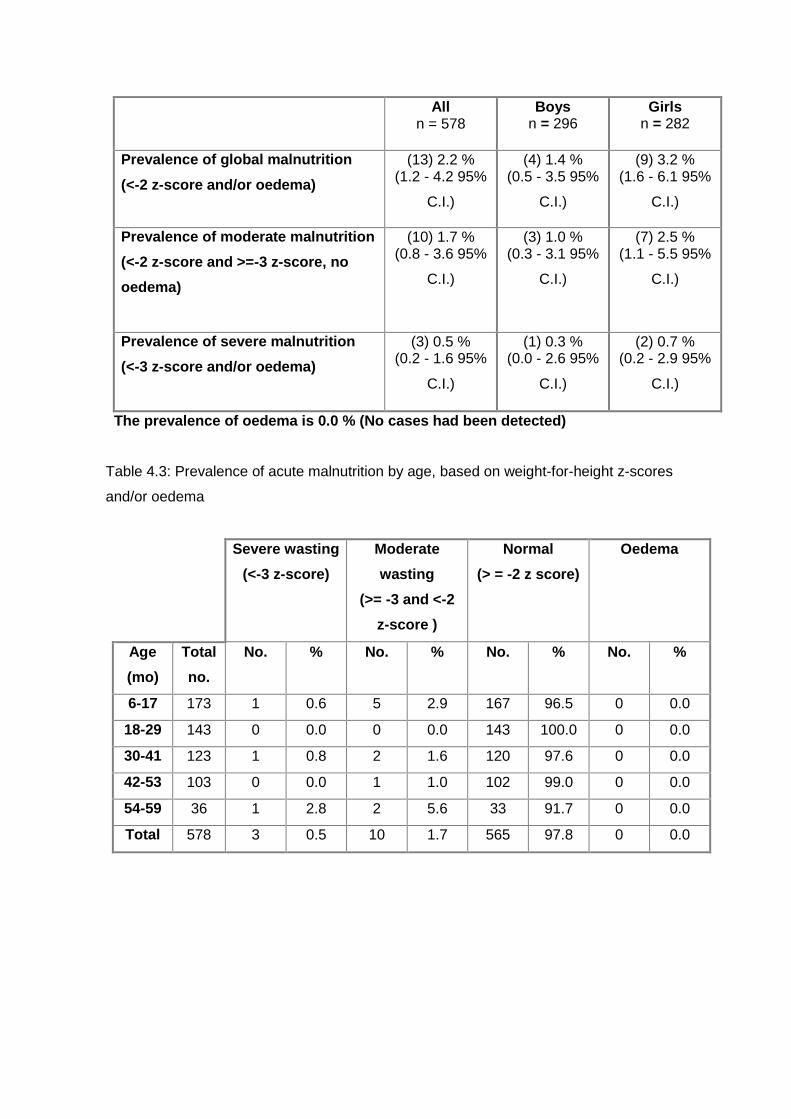
All n = 578
Boys n = 296
Girls n = 282
Prevalence of global malnutrition
(<-2 z-score and/or oedema)
(13) 2.2 % (1.2 - 4.2 95%
C.I.)
(4) 1.4 % (0.5 - 3.5 95%
C.I.)
(9) 3.2 % (1.6 - 6.1 95%
C.I.)
Prevalence of moderate malnutrition
(<-2 z-score and >=-3 z-score, no
oedema)
(10) 1.7 % (0.8 - 3.6 95%
C.I.)
(3) 1.0 % (0.3 - 3.1 95%
C.I.)
(7) 2.5 % (1.1 - 5.5 95%
C.I.)
Prevalence of severe malnutrition
(<-3 z-score and/or oedema)
(3) 0.5 % (0.2 - 1.6 95%
C.I.)
(1) 0.3 % (0.0 - 2.6 95%
C.I.)
(2) 0.7 % (0.2 - 2.9 95%
C.I.)
The prevalence of oedema is 0.0 % (No cases had been detected)
Table 4.3: Prevalence of acute malnutrition by age, based on weight-for-height z-scores
and/or oedema
Severe wasting
(<-3 z-score)
Moderate
wasting
(>= -3 and <-2
z-score )
Normal
(> = -2 z score)
Oedema
Age
(mo)
Total
no.
No. % No. % No. % No. %
6-17 173 1 0.6 5 2.9 167 96.5 0 0.0
18-29 143 0 0.0 0 0.0 143 100.0 0 0.0
30-41 123 1 0.8 2 1.6 120 97.6 0 0.0
42-53 103 0 0.0 1 1.0 102 99.0 0 0.0
54-59 36 1 2.8 2 5.6 33 91.7 0 0.0
Total 578 3 0.5 10 1.7 565 97.8 0 0.0
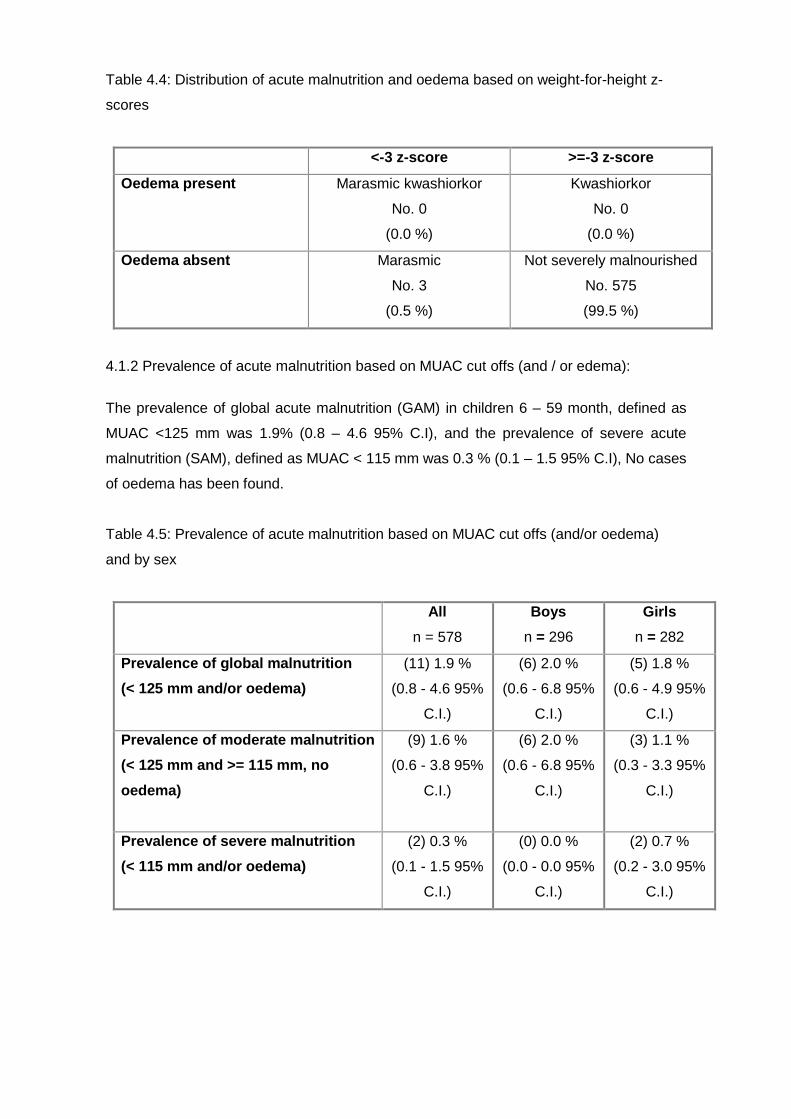
Table 4.4: Distribution of acute malnutrition and oedema based on weight-for-height z-
scores
<-3 z-score >=-3 z-score
Oedema present Marasmic kwashiorkor
No. 0
(0.0 %)
Kwashiorkor
No. 0
(0.0 %)
Oedema absent Marasmic
No. 3
(0.5 %)
Not severely malnourished
No. 575
(99.5 %)
4.1.2 Prevalence of acute malnutrition based on MUAC cut offs (and / or edema):
The prevalence of global acute malnutrition (GAM) in children 6 – 59 month, defined as
MUAC <125 mm was 1.9% (0.8 – 4.6 95% C.I), and the prevalence of severe acute
malnutrition (SAM), defined as MUAC < 115 mm was 0.3 % (0.1 – 1.5 95% C.I), No cases
of oedema has been found.
Table 4.5: Prevalence of acute malnutrition based on MUAC cut offs (and/or oedema)
and by sex
All
n = 578
Boys
n = 296
Girls
n = 282
Prevalence of global malnutrition
(< 125 mm and/or oedema)
(11) 1.9 %
(0.8 - 4.6 95%
C.I.)
(6) 2.0 %
(0.6 - 6.8 95%
C.I.)
(5) 1.8 %
(0.6 - 4.9 95%
C.I.)
Prevalence of moderate malnutrition
(< 125 mm and >= 115 mm, no
oedema)
(9) 1.6 %
(0.6 - 3.8 95%
C.I.)
(6) 2.0 %
(0.6 - 6.8 95%
C.I.)
(3) 1.1 %
(0.3 - 3.3 95%
C.I.)
Prevalence of severe malnutrition
(< 115 mm and/or oedema)
(2) 0.3 %
(0.1 - 1.5 95%
C.I.)
(0) 0.0 %
(0.0 - 0.0 95%
C.I.)
(2) 0.7 %
(0.2 - 3.0 95%
C.I.)
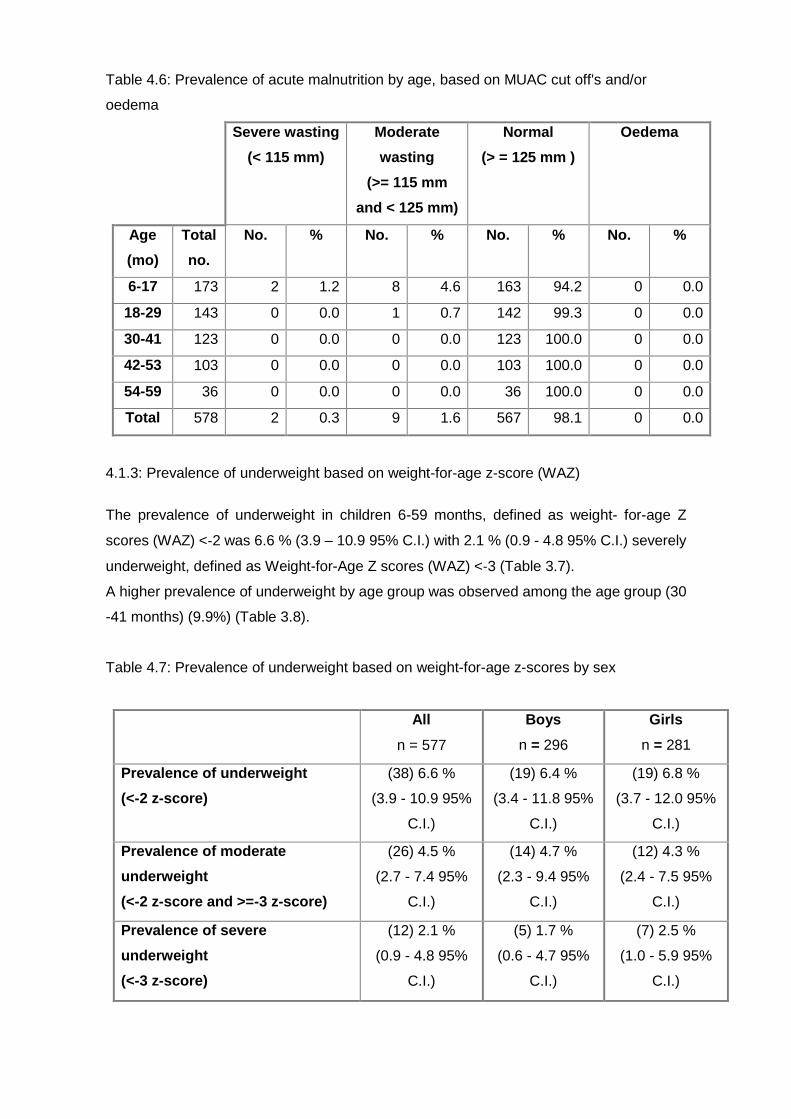
Table 4.6: Prevalence of acute malnutrition by age, based on MUAC cut off's and/or
oedema
Severe wasting
(< 115 mm)
Moderate
wasting
(>= 115 mm
and < 125 mm)
Normal
(> = 125 mm )
Oedema
Age
(mo)
Total
no.
No. % No. % No. % No. %
6-17 173 2 1.2 8 4.6 163 94.2 0 0.0
18-29 143 0 0.0 1 0.7 142 99.3 0 0.0
30-41 123 0 0.0 0 0.0 123 100.0 0 0.0
42-53 103 0 0.0 0 0.0 103 100.0 0 0.0
54-59 36 0 0.0 0 0.0 36 100.0 0 0.0
Total 578 2 0.3 9 1.6 567 98.1 0 0.0
4.1.3: Prevalence of underweight based on weight-for-age z-score (WAZ)
The prevalence of underweight in children 6-59 months, defined as weight- for-age Z
scores (WAZ) <‐2 was 6.6 % (3.9 – 10.9 95% C.I.) with 2.1 % (0.9 - 4.8 95% C.I.) severely
underweight, defined as Weight-for-Age Z scores (WAZ) <‐3 (Table 3.7).
A higher prevalence of underweight by age group was observed among the age group (30
-41 months) (9.9%) (Table 3.8).
Table 4.7: Prevalence of underweight based on weight-for-age z-scores by sex
All
n = 577
Boys
n = 296
Girls
n = 281
Prevalence of underweight
(<-2 z-score)
(38) 6.6 %
(3.9 - 10.9 95%
C.I.)
(19) 6.4 %
(3.4 - 11.8 95%
C.I.)
(19) 6.8 %
(3.7 - 12.0 95%
C.I.)
Prevalence of moderate
underweight
(<-2 z-score and >=-3 z-score)
(26) 4.5 %
(2.7 - 7.4 95%
C.I.)
(14) 4.7 %
(2.3 - 9.4 95%
C.I.)
(12) 4.3 %
(2.4 - 7.5 95%
C.I.)
Prevalence of severe
underweight
(<-3 z-score)
(12) 2.1 %
(0.9 - 4.8 95%
C.I.)
(5) 1.7 %
(0.6 - 4.7 95%
C.I.)
(7) 2.5 %
(1.0 - 5.9 95%
C.I.)

Table 4.8: Prevalence of underweight by age, based on weight-for-age z-scores
Severe
underweight
(<-3 z-score)
Moderate
underweight
(>= -3 and <-2
z-score )
Normal
(> = -2 z score)
Oedema
Age
(mo)
Total
no.
No. % No. % No. % No. %
6-17 172 2 1.2 8 4.7 162 94.2 0 0.0
18-29 143 1 0.7 9 6.3 133 93.0 0 0.0
30-41 123 5 4.1 6 4.9 112 91.1 0 0.0
42-53 103 2 1.9 3 2.9 98 95.1 0 0.0
54-59 36 2 5.6 0 0.0 34 94.4 0 0.0
Total 577 12 2.1 26 4.5 539 93.4 0 0.0
4.1.4: Prevalence of stunting based on height-for-age z-score (HAZ)
The prevalence of stunting, defined as Height-for-age Z scores (HAZ) <‐2 in children 6-59
months was 14.2 % (10.2 – 19.5 95% C.I.). Meanwhile 4.9 % (2.6 – 8.9 95% C.I.) children
severely stunted, defined as height-for-age Z scores (HAZ) <‐3 (Table 4.9).The difference
between boys (13.6%) and girls (14.9%) was not statistically significant (p=0.720).Stunting
peaked amongst the age group of 30-41 months (22.8%) (Table 4.10).
Table 4.9: Prevalence of stunting based on height-for-age z-scores and by sex
All
n = 576
Boys
n = 295
Girls
n = 281
Prevalence of stunting
(<-2 z-score)
(82) 14.2 %
(10.2 - 19.5 95%
C.I.)
(40) 13.6 %
(9.5 - 19.0 95%
C.I.)
(42) 14.9 %
(10.1 - 21.6
95% C.I.)
Prevalence of moderate
stunting
(<-2 z-score and >=-3 z-score)
(54) 9.4 %
(6.6 - 13.1 95%
C.I.)
(28) 9.5 %
(6.3 - 14.1 95%
C.I.)
(26) 9.3 %
(5.6 - 14.9 95%
C.I.)
Prevalence of severe stunting
(<-3 z-score)
(28) 4.9 %
(2.6 - 8.9 95%
C.I.)
(12) 4.1 %
(1.9 - 8.4 95%
C.I.)
(16) 5.7 %
(3.1 - 10.3 95%
C.I.)
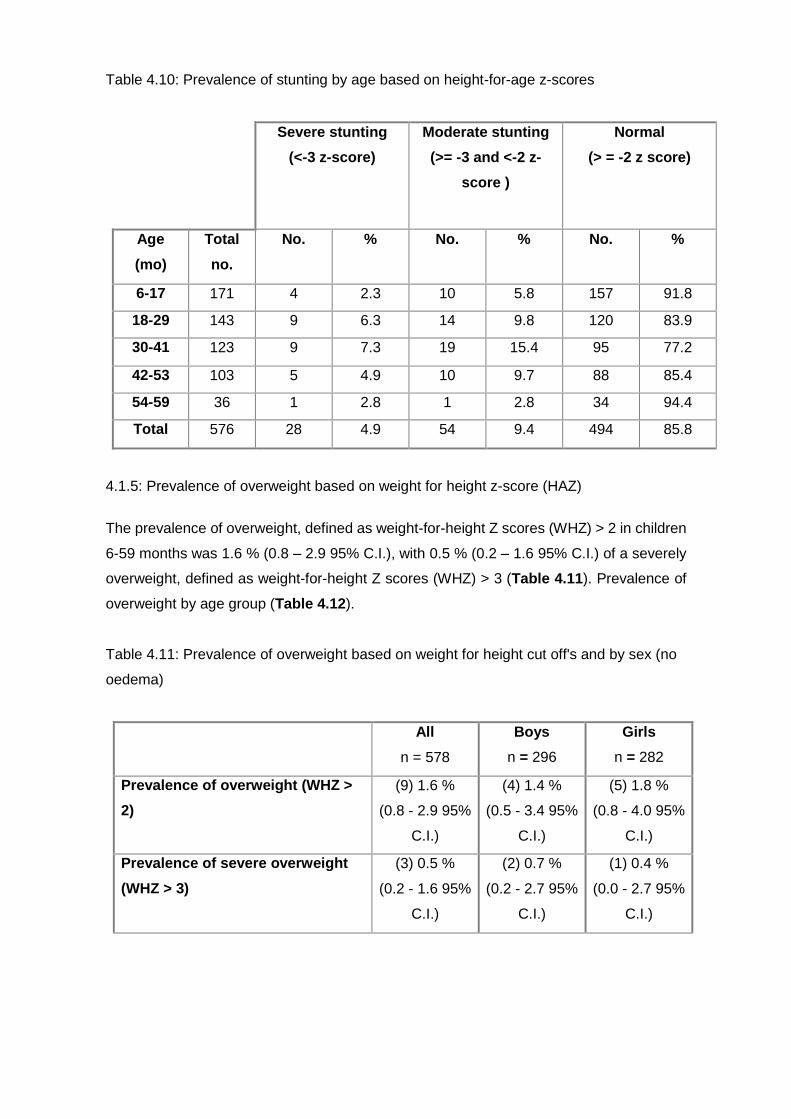
Table 4.10: Prevalence of stunting by age based on height-for-age z-scores
Severe stunting
(<-3 z-score)
Moderate stunting
(>= -3 and <-2 z-
score )
Normal
(> = -2 z score)
Age
(mo)
Total
no.
No. % No. % No. %
6-17 171 4 2.3 10 5.8 157 91.8
18-29 143 9 6.3 14 9.8 120 83.9
30-41 123 9 7.3 19 15.4 95 77.2
42-53 103 5 4.9 10 9.7 88 85.4
54-59 36 1 2.8 1 2.8 34 94.4
Total 576 28 4.9 54 9.4 494 85.8
4.1.5: Prevalence of overweight based on weight for height z-score (HAZ)
The prevalence of overweight, defined as weight-for-height Z scores (WHZ) > 2 in children
6-59 months was 1.6 % (0.8 – 2.9 95% C.I.), with 0.5 % (0.2 – 1.6 95% C.I.) of a severely
overweight, defined as weight-for-height Z scores (WHZ) > 3 (Table 4.11). Prevalence of
overweight by age group (Table 4.12).
Table 4.11: Prevalence of overweight based on weight for height cut off's and by sex (no
oedema)
All
n = 578
Boys
n = 296
Girls
n = 282
Prevalence of overweight (WHZ >
2)
(9) 1.6 %
(0.8 - 2.9 95%
C.I.)
(4) 1.4 %
(0.5 - 3.4 95%
C.I.)
(5) 1.8 %
(0.8 - 4.0 95%
C.I.)
Prevalence of severe overweight
(WHZ > 3)
(3) 0.5 %
(0.2 - 1.6 95%
C.I.)
(2) 0.7 %
(0.2 - 2.7 95%
C.I.)
(1) 0.4 %
(0.0 - 2.7 95%
C.I.)
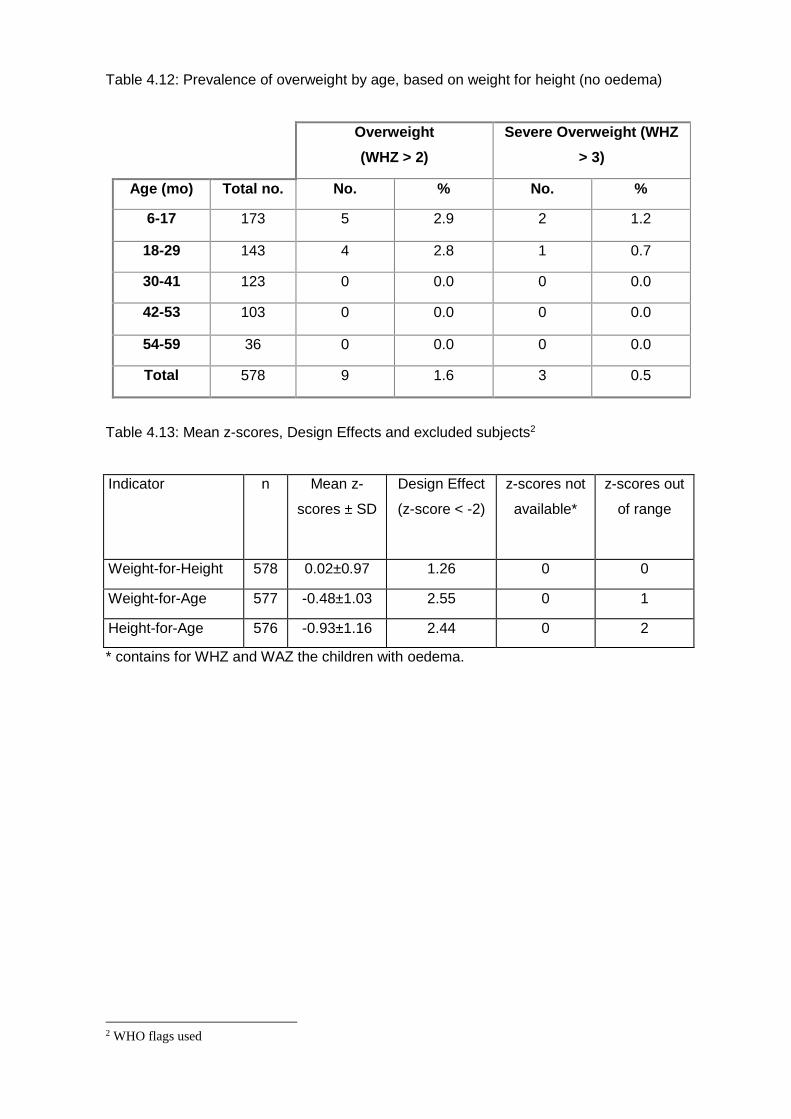
Table 4.12: Prevalence of overweight by age, based on weight for height (no oedema)
Overweight
(WHZ > 2)
Severe Overweight (WHZ
> 3)
Age (mo) Total no. No. % No. %
6-17 173 5 2.9 2 1.2
18-29 143 4 2.8 1 0.7
30-41 123 0 0.0 0 0.0
42-53 103 0 0.0 0 0.0
54-59 36 0 0.0 0 0.0
Total 578 9 1.6 3 0.5
Table 4.13: Mean z-scores, Design Effects and excluded subjects2
Indicator n Mean z-
scores ± SD
Design Effect
(z-score < -2)
z-scores not
available*
z-scores out
of range
Weight-for-Height 578 0.02±0.97 1.26 0 0
Weight-for-Age 577 -0.48±1.03 2.55 0 1
Height-for-Age 576 -0.93±1.16 2.44 0 2
* contains for WHZ and WAZ the children with oedema.
2 WHO flags used
4.2 Anaemia results:
The HGB of children 6 to 59 months old children had been measured using (Easy life HB
model: ET-123), the following case definition is used:
HGB > 12 mg/dl Normal
HGB < 12 and > 7 mg/dl moderate anaemia
HGB < 7 mg/dl severe anaemia
4.3 Separated children result:
Data about children were collected to assess if children are living separated from their
parents. Questions were asked about all the children if they are living with their mother or
father. If the response is no, a follow up question was asked about the relation between
the HH head and the child. 552 child of 570 (96.84%) are living with their parents, and 3.16
% are separated from their parents, 2.63% live with their grandfathers, 0.53% live with their
uncles.
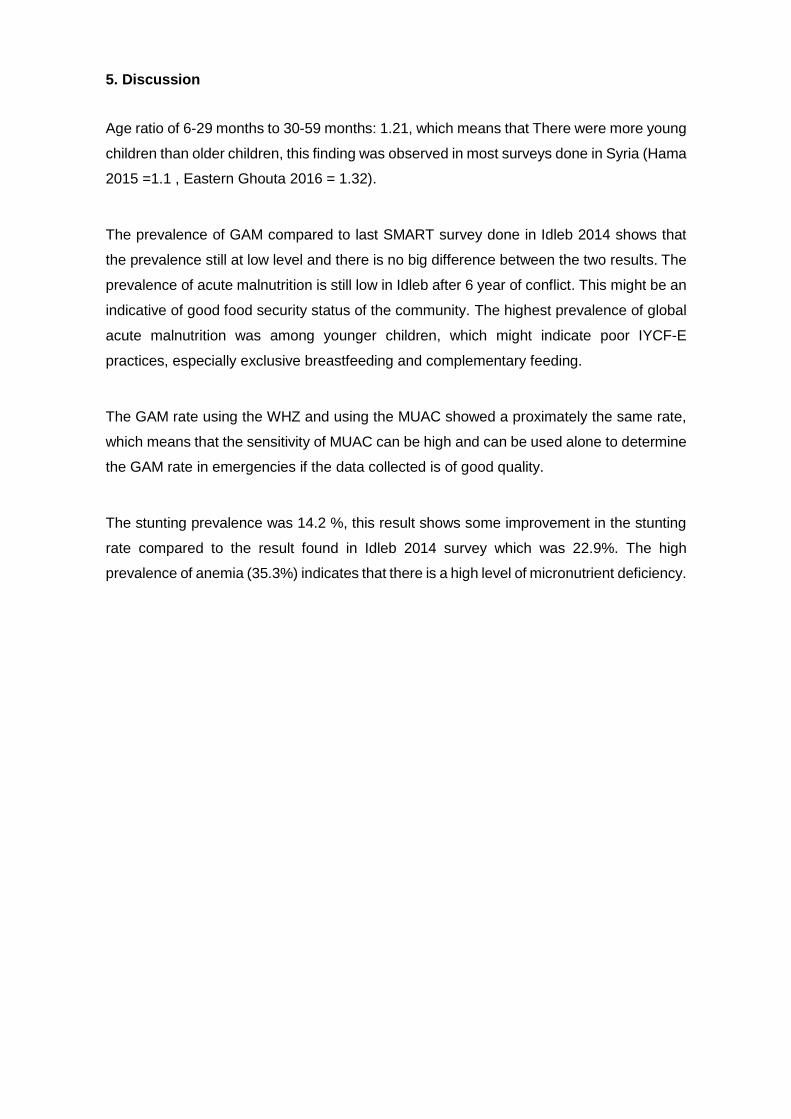
5. Discussion
Age ratio of 6-29 months to 30-59 months: 1.21, which means that There were more young
children than older children, this finding was observed in most surveys done in Syria (Hama
2015 =1.1 , Eastern Ghouta 2016 = 1.32).
The prevalence of GAM compared to last SMART survey done in Idleb 2014 shows that
the prevalence still at low level and there is no big difference between the two results. The
prevalence of acute malnutrition is still low in Idleb after 6 year of conflict. This might be an
indicative of good food security status of the community. The highest prevalence of global
acute malnutrition was among younger children, which might indicate poor IYCF-E
practices, especially exclusive breastfeeding and complementary feeding.
The GAM rate using the WHZ and using the MUAC showed a proximately the same rate,
which means that the sensitivity of MUAC can be high and can be used alone to determine
the GAM rate in emergencies if the data collected is of good quality.
The stunting prevalence was 14.2 %, this result shows some improvement in the stunting
rate compared to the result found in Idleb 2014 survey which was 22.9%. The high
prevalence of anemia (35.3%) indicates that there is a high level of micronutrient deficiency.

6. Recommendations and priorities
• There is need for close follow up of the nutrition status of children 6 to 59 months
of age.
• Even though the stunting has reduced since 2014, projects focusing on prevention
of stunting should be strengthened. This includes infant and young child feeding
projects.
• The prevalence of anaemia is very high. Micro nutrient supplement and
awareness creation about prevention of anaemia should be focus of projects
implemented in the area.
• Child protection projects focusing on family tracing and reunification should be
considered.
• In emergency context in the area MUAC can be used as a sensitive indicator of
acute malnutrition
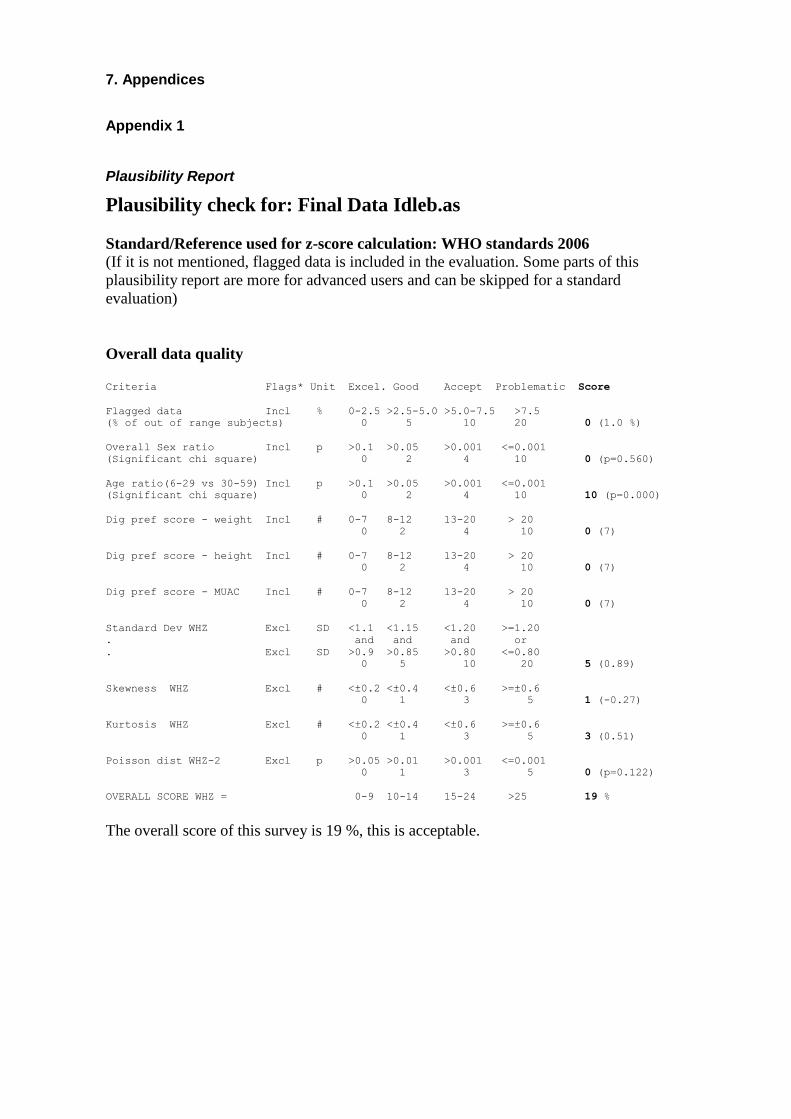
7. Appendices
Appendix 1
Plausibility Report
Plausibility check for: Final Data Idleb.as
Standard/Reference used for z-score calculation: WHO standards 2006 (If it is not mentioned, flagged data is included in the evaluation. Some parts of this
plausibility report are more for advanced users and can be skipped for a standard
evaluation)
Overall data quality
Criteria Flags* Unit Excel. Good Accept Problematic Score
Flagged data Incl % 0-2.5 >2.5-5.0 >5.0-7.5 >7.5
(% of out of range subjects) 0 5 10 20 0 (1.0 %)
Overall Sex ratio Incl p >0.1 >0.05 >0.001 <=0.001
(Significant chi square) 0 2 4 10 0 (p=0.560)
Age ratio(6-29 vs 30-59) Incl p >0.1 >0.05 >0.001 <=0.001
(Significant chi square) 0 2 4 10 10 (p=0.000)
Dig pref score - weight Incl # 0-7 8-12 13-20 > 20
0 2 4 10 0 (7)
Dig pref score - height Incl # 0-7 8-12 13-20 > 20
0 2 4 10 0 (7)
Dig pref score - MUAC Incl # 0-7 8-12 13-20 > 20
0 2 4 10 0 (7)
Standard Dev WHZ Excl SD <1.1 <1.15 <1.20 >=1.20
. and and and or
. Excl SD >0.9 >0.85 >0.80 <=0.80
0 5 10 20 5 (0.89)
Skewness WHZ Excl # <±0.2 <±0.4 <±0.6 >=±0.6
0 1 3 5 1 (-0.27)
Kurtosis WHZ Excl # <±0.2 <±0.4 <±0.6 >=±0.6
0 1 3 5 3 (0.51)
Poisson dist WHZ-2 Excl p >0.05 >0.01 >0.001 <=0.001
0 1 3 5 0 (p=0.122)
OVERALL SCORE WHZ = 0-9 10-14 15-24 >25 19 %
The overall score of this survey is 19 %, this is acceptable.
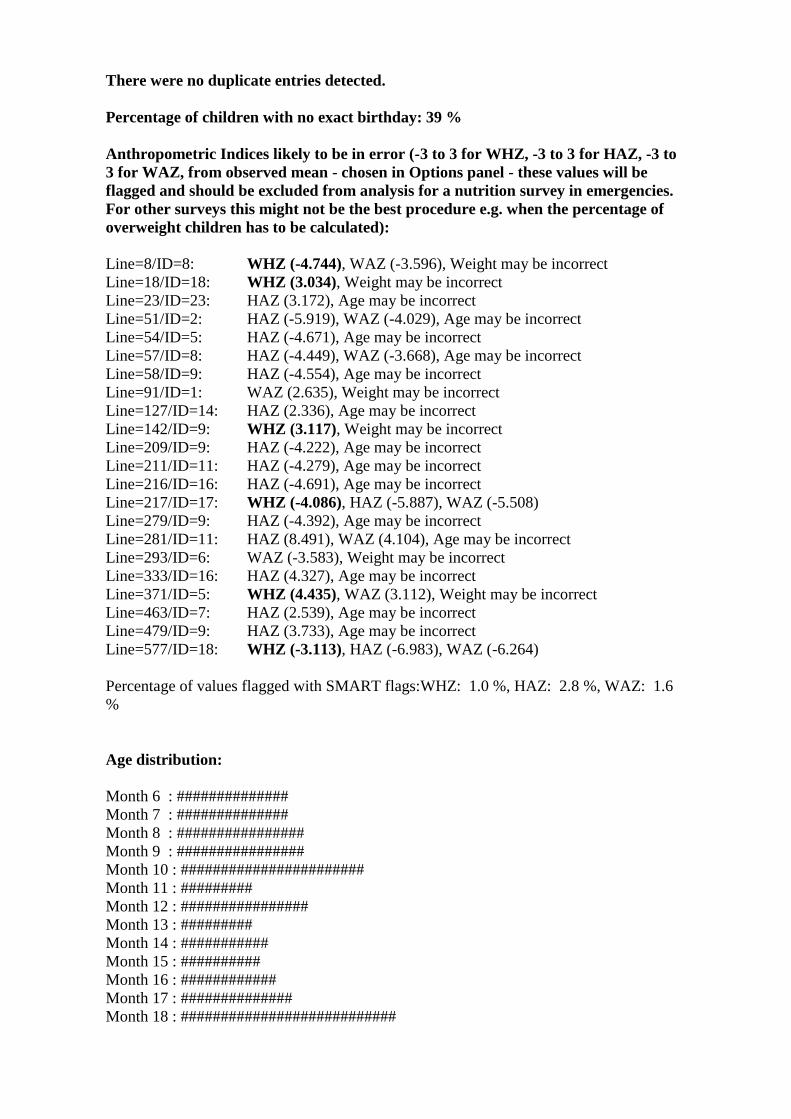
There were no duplicate entries detected.
Percentage of children with no exact birthday: 39 %
Anthropometric Indices likely to be in error (-3 to 3 for WHZ, -3 to 3 for HAZ, -3 to
3 for WAZ, from observed mean - chosen in Options panel - these values will be
flagged and should be excluded from analysis for a nutrition survey in emergencies.
For other surveys this might not be the best procedure e.g. when the percentage of
overweight children has to be calculated):
Line=8/ID=8: WHZ (-4.744), WAZ (-3.596), Weight may be incorrect
Line=18/ID=18: WHZ (3.034), Weight may be incorrect
Line=23/ID=23: HAZ (3.172), Age may be incorrect
Line=51/ID=2: HAZ (-5.919), WAZ (-4.029), Age may be incorrect
Line=54/ID=5: HAZ (-4.671), Age may be incorrect
Line=57/ID=8: HAZ (-4.449), WAZ (-3.668), Age may be incorrect
Line=58/ID=9: HAZ (-4.554), Age may be incorrect
Line=91/ID=1: WAZ (2.635), Weight may be incorrect
Line=127/ID=14: HAZ (2.336), Age may be incorrect
Line=142/ID=9: WHZ (3.117), Weight may be incorrect
Line=209/ID=9: HAZ (-4.222), Age may be incorrect
Line=211/ID=11: HAZ (-4.279), Age may be incorrect
Line=216/ID=16: HAZ (-4.691), Age may be incorrect
Line=217/ID=17: WHZ (-4.086), HAZ (-5.887), WAZ (-5.508)
Line=279/ID=9: HAZ (-4.392), Age may be incorrect
Line=281/ID=11: HAZ (8.491), WAZ (4.104), Age may be incorrect
Line=293/ID=6: WAZ (-3.583), Weight may be incorrect
Line=333/ID=16: HAZ (4.327), Age may be incorrect
Line=371/ID=5: WHZ (4.435), WAZ (3.112), Weight may be incorrect
Line=463/ID=7: HAZ (2.539), Age may be incorrect
Line=479/ID=9: HAZ (3.733), Age may be incorrect
Line=577/ID=18: WHZ (-3.113), HAZ (-6.983), WAZ (-6.264)
Percentage of values flagged with SMART flags:WHZ: 1.0 %, HAZ: 2.8 %, WAZ: 1.6
%
Age distribution:
Month 6 : ##############
Month 7 : ##############
Month 8 : ################
Month 9 : ################
Month 10 : #######################
Month 11 : #########
Month 12 : ################
Month 13 : #########
Month 14 : ###########
Month 15 : ##########
Month 16 : ############
Month 17 : ##############
Month 18 : ###########################
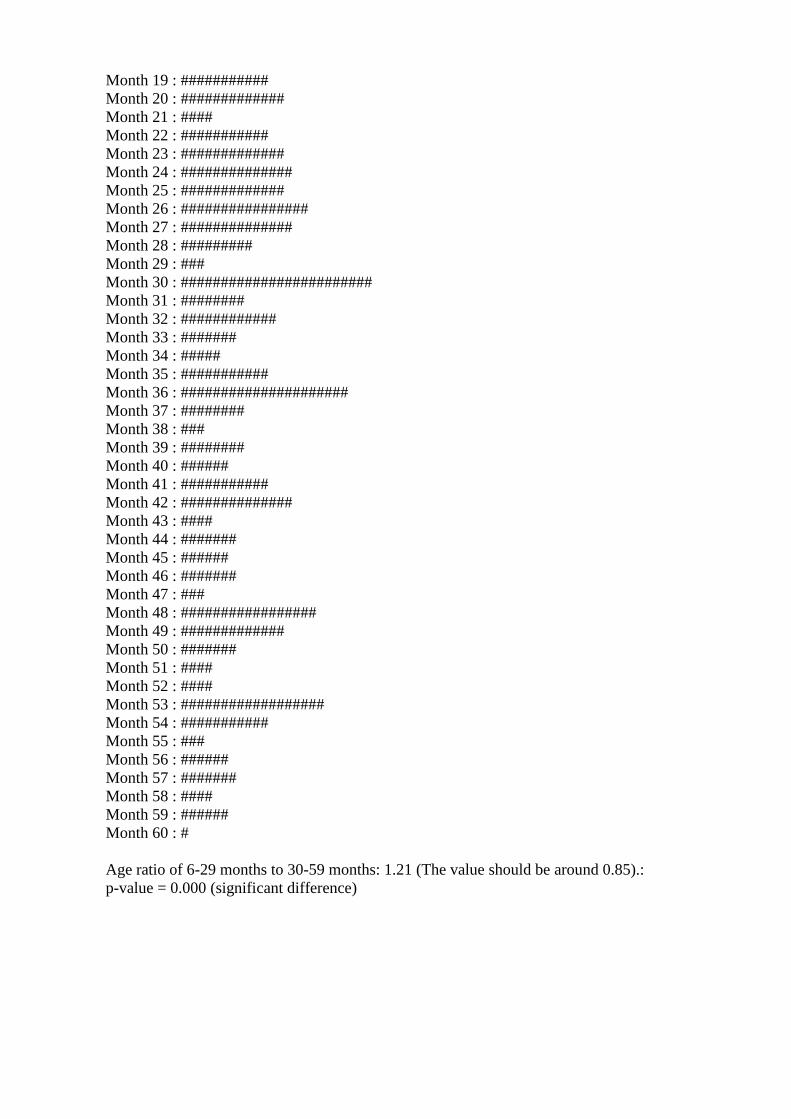
Month 19 : ###########
Month 20 : #############
Month 21 : ####
Month 22 : ###########
Month 23 : #############
Month 24 : ##############
Month 25 : #############
Month 26 : ################
Month 27 : ##############
Month 28 : #########
Month 29 : ###
Month 30 : ########################
Month 31 : ########
Month 32 : ############
Month 33 : #######
Month 34 : #####
Month 35 : ###########
Month 36 : #####################
Month 37 : ########
Month 38 : ###
Month 39 : ########
Month 40 : ######
Month 41 : ###########
Month 42 : ##############
Month 43 : ####
Month 44 : #######
Month 45 : ######
Month 46 : #######
Month 47 : ###
Month 48 : #################
Month 49 : #############
Month 50 : #######
Month 51 : ####
Month 52 : ####
Month 53 : ##################
Month 54 : ###########
Month 55 : ###
Month 56 : ######
Month 57 : #######
Month 58 : ####
Month 59 : ######
Month 60 : #
Age ratio of 6-29 months to 30-59 months: 1.21 (The value should be around 0.85).:
p-value = 0.000 (significant difference)
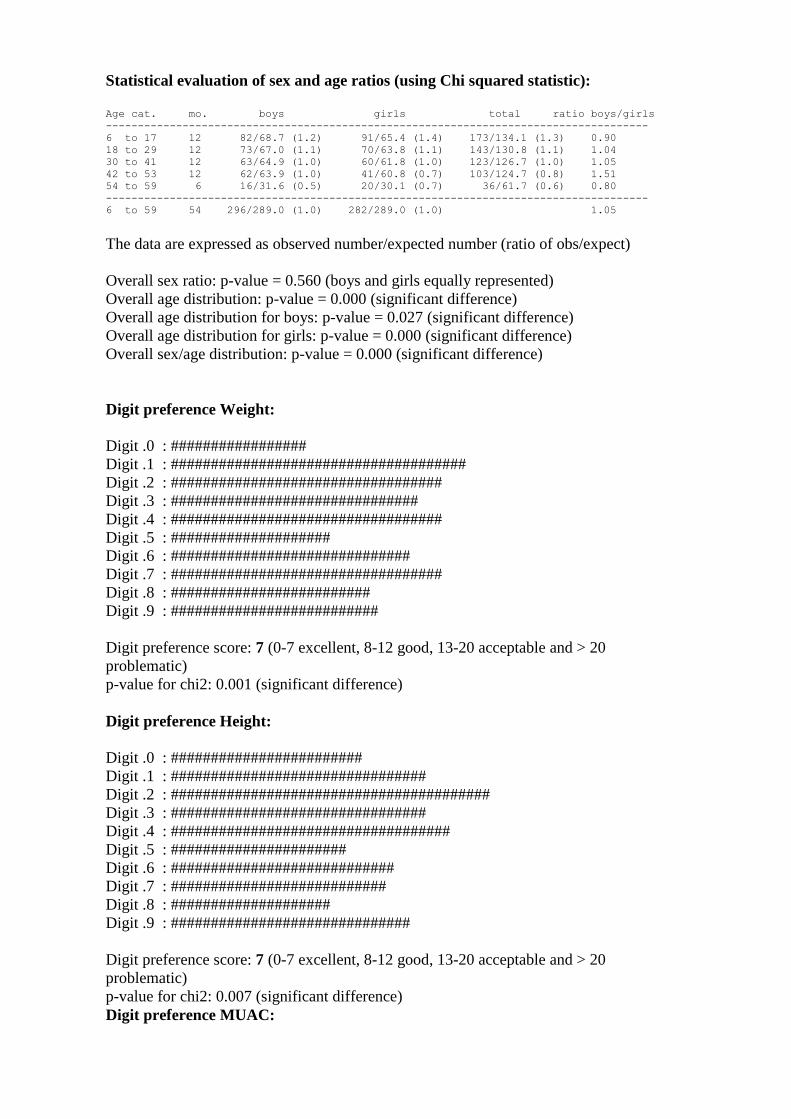
Statistical evaluation of sex and age ratios (using Chi squared statistic): Age cat. mo. boys girls total ratio boys/girls
-------------------------------------------------------------------------------------
6 to 17 12 82/68.7 (1.2) 91/65.4 (1.4) 173/134.1 (1.3) 0.90
18 to 29 12 73/67.0 (1.1) 70/63.8 (1.1) 143/130.8 (1.1) 1.04
30 to 41 12 63/64.9 (1.0) 60/61.8 (1.0) 123/126.7 (1.0) 1.05
42 to 53 12 62/63.9 (1.0) 41/60.8 (0.7) 103/124.7 (0.8) 1.51
54 to 59 6 16/31.6 (0.5) 20/30.1 (0.7) 36/61.7 (0.6) 0.80
-------------------------------------------------------------------------------------
6 to 59 54 296/289.0 (1.0) 282/289.0 (1.0) 1.05
The data are expressed as observed number/expected number (ratio of obs/expect)
Overall sex ratio: p-value = 0.560 (boys and girls equally represented)
Overall age distribution: p-value = 0.000 (significant difference)
Overall age distribution for boys: p-value = 0.027 (significant difference)
Overall age distribution for girls: p-value = 0.000 (significant difference)
Overall sex/age distribution: p-value = 0.000 (significant difference)
Digit preference Weight:
Digit .0 : #################
Digit .1 : #####################################
Digit .2 : ##################################
Digit .3 : ###############################
Digit .4 : ##################################
Digit .5 : ####################
Digit .6 : ##############################
Digit .7 : ##################################
Digit .8 : #########################
Digit .9 : ##########################
Digit preference score: 7 (0-7 excellent, 8-12 good, 13-20 acceptable and > 20
problematic)
p-value for chi2: 0.001 (significant difference)
Digit preference Height:
Digit .0 : ########################
Digit .1 : ################################
Digit .2 : ########################################
Digit .3 : ################################
Digit .4 : ###################################
Digit .5 : ######################
Digit .6 : ############################
Digit .7 : ###########################
Digit .8 : ####################
Digit .9 : ##############################
Digit preference score: 7 (0-7 excellent, 8-12 good, 13-20 acceptable and > 20
problematic)
p-value for chi2: 0.007 (significant difference)
Digit preference MUAC:
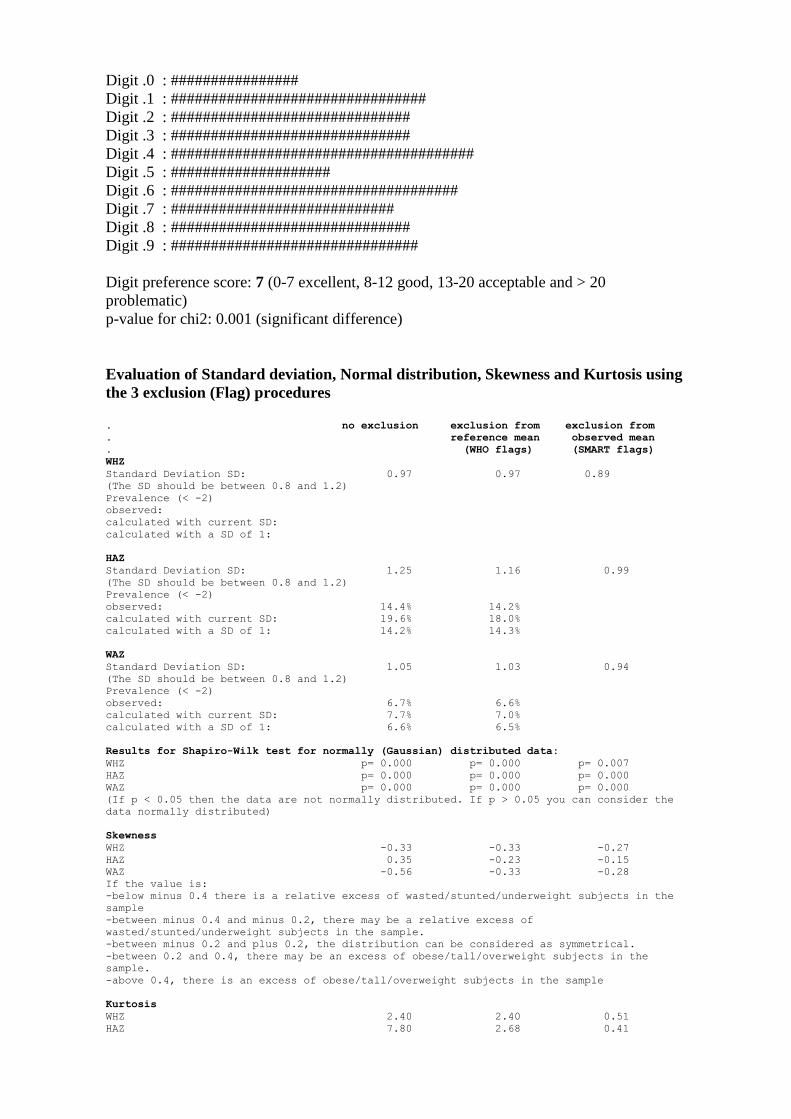
Digit .0 : ################
Digit .1 : ################################
Digit .2 : ##############################
Digit .3 : ##############################
Digit .4 : ######################################
Digit .5 : ####################
Digit .6 : ####################################
Digit .7 : ############################
Digit .8 : ##############################
Digit .9 : ###############################
Digit preference score: 7 (0-7 excellent, 8-12 good, 13-20 acceptable and > 20
problematic)
p-value for chi2: 0.001 (significant difference)
Evaluation of Standard deviation, Normal distribution, Skewness and Kurtosis using
the 3 exclusion (Flag) procedures . no exclusion exclusion from exclusion from
. reference mean observed mean
. (WHO flags) (SMART flags)
WHZ
Standard Deviation SD: 0.97 0.97 0.89
(The SD should be between 0.8 and 1.2)
Prevalence (< -2)
observed:
calculated with current SD:
calculated with a SD of 1:
HAZ
Standard Deviation SD: 1.25 1.16 0.99
(The SD should be between 0.8 and 1.2)
Prevalence (< -2)
observed: 14.4% 14.2%
calculated with current SD: 19.6% 18.0%
calculated with a SD of 1: 14.2% 14.3%
WAZ
Standard Deviation SD: 1.05 1.03 0.94
(The SD should be between 0.8 and 1.2)
Prevalence (< -2)
observed: 6.7% 6.6%
calculated with current SD: 7.7% 7.0%
calculated with a SD of 1: 6.6% 6.5%
Results for Shapiro-Wilk test for normally (Gaussian) distributed data:
WHZ p= 0.000 p= 0.000 p= 0.007
HAZ p= 0.000 p= 0.000 p= 0.000
WAZ p= 0.000 p= 0.000 p= 0.000
(If p < 0.05 then the data are not normally distributed. If p > 0.05 you can consider the
data normally distributed)
Skewness
WHZ -0.33 -0.33 -0.27
HAZ 0.35 -0.23 -0.15
WAZ -0.56 -0.33 -0.28
If the value is:
-below minus 0.4 there is a relative excess of wasted/stunted/underweight subjects in the
sample
-between minus 0.4 and minus 0.2, there may be a relative excess of
wasted/stunted/underweight subjects in the sample.
-between minus 0.2 and plus 0.2, the distribution can be considered as symmetrical.
-between 0.2 and 0.4, there may be an excess of obese/tall/overweight subjects in the
sample.
-above 0.4, there is an excess of obese/tall/overweight subjects in the sample
Kurtosis
WHZ 2.40 2.40 0.51
HAZ 7.80 2.68 0.41
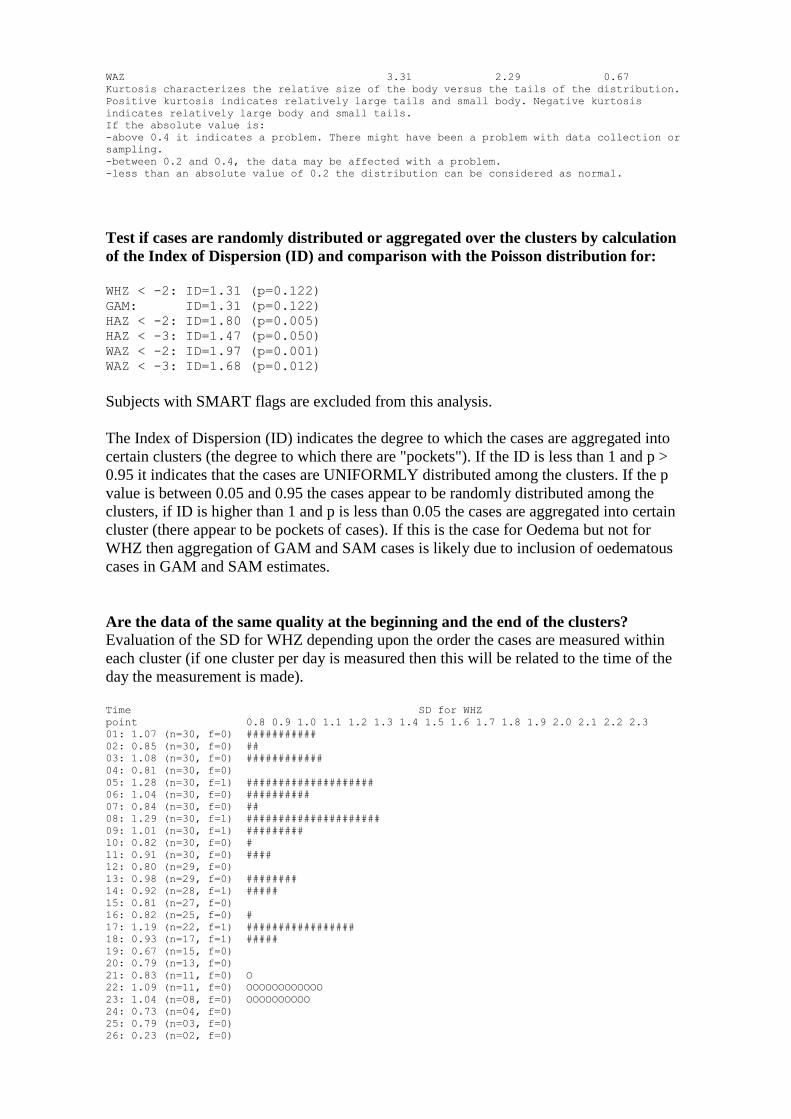
WAZ 3.31 2.29 0.67
Kurtosis characterizes the relative size of the body versus the tails of the distribution.
Positive kurtosis indicates relatively large tails and small body. Negative kurtosis
indicates relatively large body and small tails.
If the absolute value is:
-above 0.4 it indicates a problem. There might have been a problem with data collection or
sampling.
-between 0.2 and 0.4, the data may be affected with a problem.
-less than an absolute value of 0.2 the distribution can be considered as normal.
Test if cases are randomly distributed or aggregated over the clusters by calculation
of the Index of Dispersion (ID) and comparison with the Poisson distribution for: WHZ < -2: ID=1.31 (p=0.122)
GAM: ID=1.31 (p=0.122)
HAZ < -2: ID=1.80 (p=0.005)
HAZ < -3: ID=1.47 (p=0.050)
WAZ < -2: ID=1.97 (p=0.001)
WAZ < -3: ID=1.68 (p=0.012)
Subjects with SMART flags are excluded from this analysis.
The Index of Dispersion (ID) indicates the degree to which the cases are aggregated into
certain clusters (the degree to which there are "pockets"). If the ID is less than 1 and p >
0.95 it indicates that the cases are UNIFORMLY distributed among the clusters. If the p
value is between 0.05 and 0.95 the cases appear to be randomly distributed among the
clusters, if ID is higher than 1 and p is less than 0.05 the cases are aggregated into certain
cluster (there appear to be pockets of cases). If this is the case for Oedema but not for
WHZ then aggregation of GAM and SAM cases is likely due to inclusion of oedematous
cases in GAM and SAM estimates.
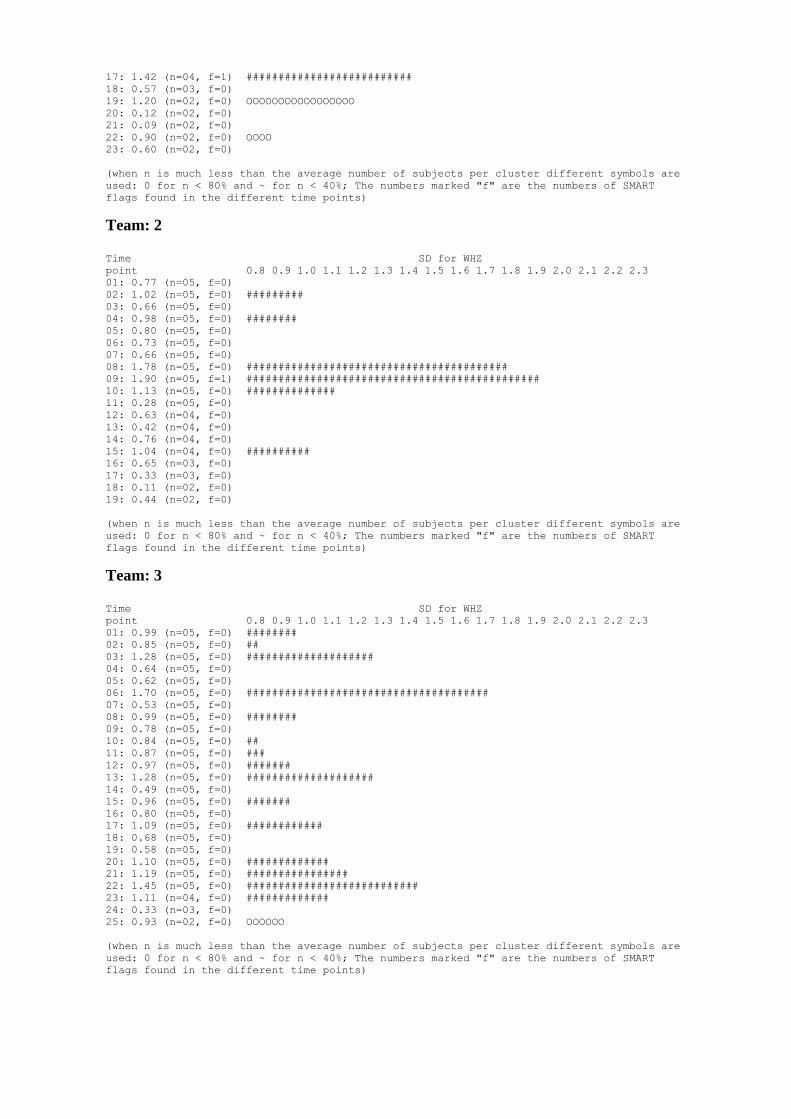
Are the data of the same quality at the beginning and the end of the clusters? Evaluation of the SD for WHZ depending upon the order the cases are measured within
each cluster (if one cluster per day is measured then this will be related to the time of the
day the measurement is made).
Time SD for WHZ
point 0.8 0.9 1.0 1.1 1.2 1.3 1.4 1.5 1.6 1.7 1.8 1.9 2.0 2.1 2.2 2.3
01: 1.07 (n=30, f=0) ###########
02: 0.85 (n=30, f=0) ##
03: 1.08 (n=30, f=0) ############
04: 0.81 (n=30, f=0)
05: 1.28 (n=30, f=1) ####################
06: 1.04 (n=30, f=0) ##########
07: 0.84 (n=30, f=0) ##
08: 1.29 (n=30, f=1) #####################
09: 1.01 (n=30, f=1) #########
10: 0.82 (n=30, f=0) #
11: 0.91 (n=30, f=0) ####
12: 0.80 (n=29, f=0)
13: 0.98 (n=29, f=0) ########
14: 0.92 (n=28, f=1) #####
15: 0.81 (n=27, f=0)
16: 0.82 (n=25, f=0) #
17: 1.19 (n=22, f=1) #################
18: 0.93 (n=17, f=1) #####
19: 0.67 (n=15, f=0)
20: 0.79 (n=13, f=0)
21: 0.83 (n=11, f=0) O
22: 1.09 (n=11, f=0) OOOOOOOOOOOO
23: 1.04 (n=08, f=0) OOOOOOOOOO
24: 0.73 (n=04, f=0)
25: 0.79 (n=03, f=0)
26: 0.23 (n=02, f=0)
(when n is much less than the average number of subjects per cluster different symbols are
used: 0 for n < 80% and ~ for n < 40%; The numbers marked "f" are the numbers of SMART
flags found in the different time points)
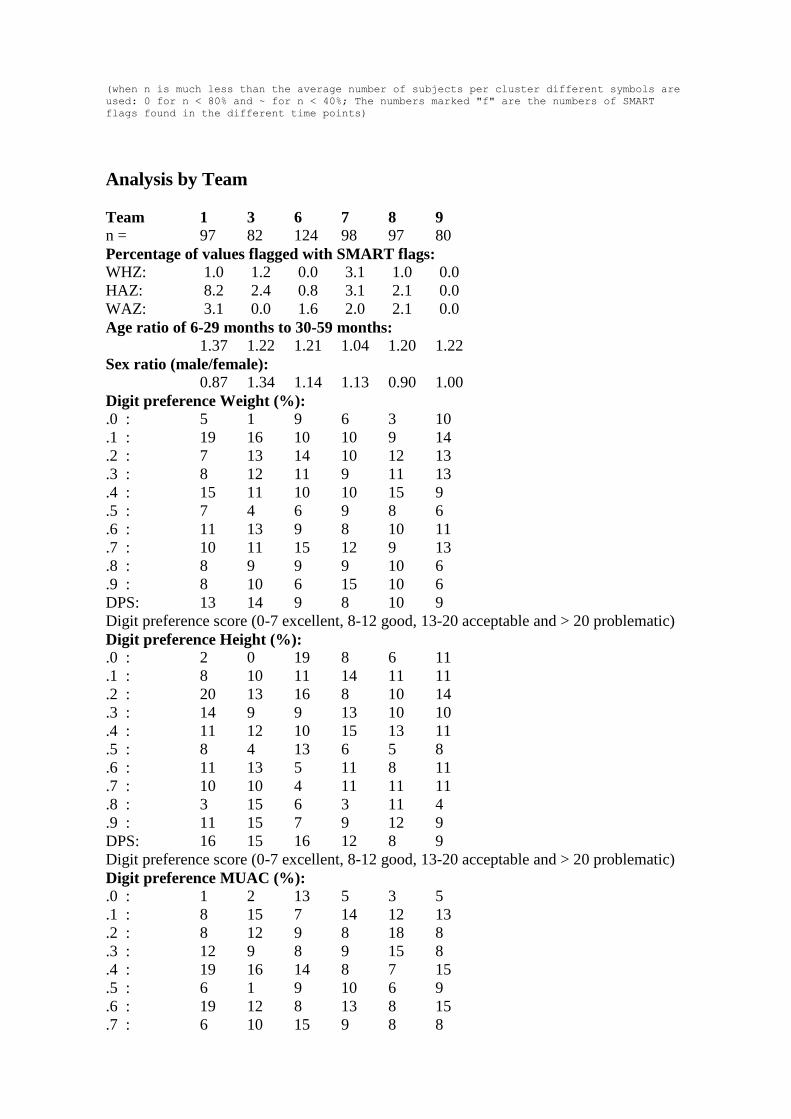
Analysis by Team
Team 1 3 6 7 8 9 n = 97 82 124 98 97 80
Percentage of values flagged with SMART flags: WHZ: 1.0 1.2 0.0 3.1 1.0 0.0
HAZ: 8.2 2.4 0.8 3.1 2.1 0.0
WAZ: 3.1 0.0 1.6 2.0 2.1 0.0
Age ratio of 6-29 months to 30-59 months: 1.37 1.22 1.21 1.04 1.20 1.22
Sex ratio (male/female): 0.87 1.34 1.14 1.13 0.90 1.00
Digit preference Weight (%): .0 : 5 1 9 6 3 10
.1 : 19 16 10 10 9 14
.2 : 7 13 14 10 12 13
.3 : 8 12 11 9 11 13
.4 : 15 11 10 10 15 9
.5 : 7 4 6 9 8 6
.6 : 11 13 9 8 10 11
.7 : 10 11 15 12 9 13
.8 : 8 9 9 9 10 6
.9 : 8 10 6 15 10 6
DPS: 13 14 9 8 10 9
Digit preference score (0-7 excellent, 8-12 good, 13-20 acceptable and > 20 problematic)
Digit preference Height (%): .0 : 2 0 19 8 6 11
.1 : 8 10 11 14 11 11
.2 : 20 13 16 8 10 14
.3 : 14 9 9 13 10 10
.4 : 11 12 10 15 13 11
.5 : 8 4 13 6 5 8
.6 : 11 13 5 11 8 11
.7 : 10 10 4 11 11 11
.8 : 3 15 6 3 11 4
.9 : 11 15 7 9 12 9
DPS: 16 15 16 12 8 9
Digit preference score (0-7 excellent, 8-12 good, 13-20 acceptable and > 20 problematic)
Digit preference MUAC (%): .0 : 1 2 13 5 3 5
.1 : 8 15 7 14 12 13
.2 : 8 12 9 8 18 8
.3 : 12 9 8 9 15 8
.4 : 19 16 14 8 7 15
.5 : 6 1 9 10 6 9
.6 : 19 12 8 13 8 15
.7 : 6 10 15 9 8 8
.8 : 8 10 10 12 12 9
.9 : 12 13 8 10 9 13
DPS: 18 15 8 9 14 11
Digit preference score (0-7 excellent, 8-12 good, 13-20 acceptable and > 20 problematic)
Standard deviation of WHZ: SD 1.01 0.93 0.97 0.95 0.76 1.02
Prevalence (< -2) observed:
% 6.2 2.5
Prevalence (< -2) calculated with current SD:
% 5.8 3.0
Prevalence (< -2) calculated with a SD of 1:
% 5.7 2.7
Standard deviation of HAZ: SD 1.52 1.09 1.13 1.27 1.18 1.08
observed:
% 32.0 7.3 16.1 14.3 4.1 10.0
calculated with current SD:
% 38.1 11.1 16.2 18.5 16.3 11.4
calculated with a SD of 1:
% 32.3 9.2 13.3 12.8 12.3 9.6
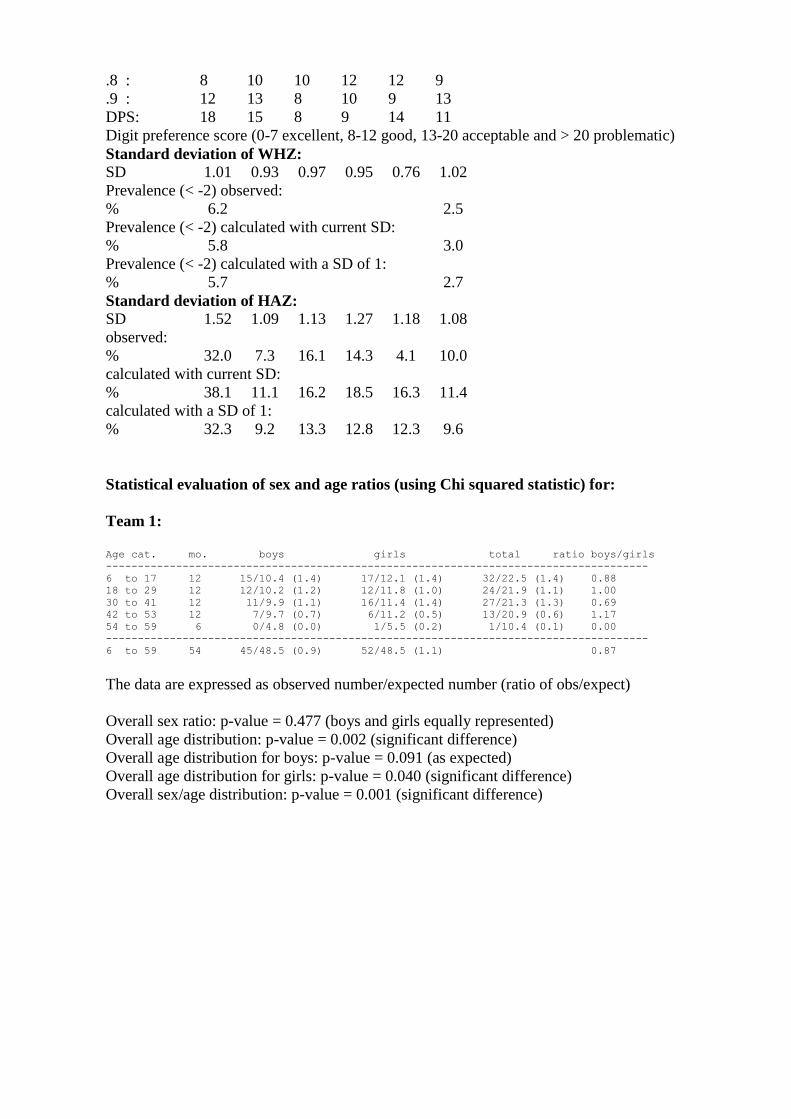
Statistical evaluation of sex and age ratios (using Chi squared statistic) for:
Team 1: Age cat. mo. boys girls total ratio boys/girls
-------------------------------------------------------------------------------------
6 to 17 12 15/10.4 (1.4) 17/12.1 (1.4) 32/22.5 (1.4) 0.88
18 to 29 12 12/10.2 (1.2) 12/11.8 (1.0) 24/21.9 (1.1) 1.00
30 to 41 12 11/9.9 (1.1) 16/11.4 (1.4) 27/21.3 (1.3) 0.69
42 to 53 12 7/9.7 (0.7) 6/11.2 (0.5) 13/20.9 (0.6) 1.17
54 to 59 6 0/4.8 (0.0) 1/5.5 (0.2) 1/10.4 (0.1) 0.00
-------------------------------------------------------------------------------------
6 to 59 54 45/48.5 (0.9) 52/48.5 (1.1) 0.87
The data are expressed as observed number/expected number (ratio of obs/expect)
Overall sex ratio: p-value = 0.477 (boys and girls equally represented)
Overall age distribution: p-value = 0.002 (significant difference)
Overall age distribution for boys: p-value = 0.091 (as expected)
Overall age distribution for girls: p-value = 0.040 (significant difference)
Overall sex/age distribution: p-value = 0.001 (significant difference)
Team 2: Age cat. mo. boys girls total ratio boys/girls
-------------------------------------------------------------------------------------
6 to 17 12 12/10.9 (1.1) 11/8.1 (1.4) 23/19.0 (1.2) 1.09
18 to 29 12 14/10.6 (1.3) 8/7.9 (1.0) 22/18.5 (1.2) 1.75
30 to 41 12 8/10.3 (0.8) 8/7.7 (1.0) 16/18.0 (0.9) 1.00
42 to 53 12 11/10.1 (1.1) 7/7.6 (0.9) 18/17.7 (1.0) 1.57
54 to 59 6 2/5.0 (0.4) 1/3.7 (0.3) 3/8.8 (0.3) 2.00
-------------------------------------------------------------------------------------
6 to 59 54 47/41.0 (1.1) 35/41.0 (0.9) 1.34
The data are expressed as observed number/expected number (ratio of obs/expect)
Overall sex ratio: p-value = 0.185 (boys and girls equally represented)
Overall age distribution: p-value = 0.242 (as expected)
Overall age distribution for boys: p-value = 0.466 (as expected)
Overall age distribution for girls: p-value = 0.545 (as expected)
Overall sex/age distribution: p-value = 0.075 (as expected)
Team 3: Age cat. mo. boys girls total ratio boys/girls
-------------------------------------------------------------------------------------
6 to 17 12 20/15.3 (1.3) 18/13.5 (1.3) 38/28.8 (1.3) 1.11
18 to 29 12 15/14.9 (1.0) 15/13.1 (1.1) 30/28.1 (1.1) 1.00
30 to 41 12 14/14.5 (1.0) 8/12.7 (0.6) 22/27.2 (0.8) 1.75
42 to 53 12 13/14.2 (0.9) 11/12.5 (0.9) 24/26.8 (0.9) 1.18
54 to 59 6 4/7.0 (0.6) 6/6.2 (1.0) 10/13.2 (0.8) 0.67
-------------------------------------------------------------------------------------
6 to 59 54 66/62.0 (1.1) 58/62.0 (0.9) 1.14
The data are expressed as observed number/expected number (ratio of obs/expect)
Overall sex ratio: p-value = 0.473 (boys and girls equally represented)
Overall age distribution: p-value = 0.271 (as expected)
Overall age distribution for boys: p-value = 0.579 (as expected)
Overall age distribution for girls: p-value = 0.442 (as expected)
Overall sex/age distribution: p-value = 0.132 (as expected)
Team 4: Age cat. mo. boys girls total ratio boys/girls
-------------------------------------------------------------------------------------
6 to 17 12 13/12.1 (1.1) 17/10.7 (1.6) 30/22.7 (1.3) 0.76
18 to 29 12 9/11.8 (0.8) 11/10.4 (1.1) 20/22.2 (0.9) 0.82
30 to 41 12 13/11.4 (1.1) 10/10.1 (1.0) 23/21.5 (1.1) 1.30
42 to 53 12 16/11.2 (1.4) 4/9.9 (0.4) 20/21.1 (0.9) 4.00
54 to 59 6 1/5.5 (0.2) 4/4.9 (0.8) 5/10.5 (0.5) 0.25
-------------------------------------------------------------------------------------
6 to 59 54 52/49.0 (1.1) 46/49.0 (0.9) 1.13
The data are expressed as observed number/expected number (ratio of obs/expect)
Overall sex ratio: p-value = 0.544 (boys and girls equally represented)
Overall age distribution: p-value = 0.235 (as expected)
Overall age distribution for boys: p-value = 0.152 (as expected)
Overall age distribution for girls: p-value = 0.112 (as expected)
Overall sex/age distribution: p-value = 0.006 (significant difference)
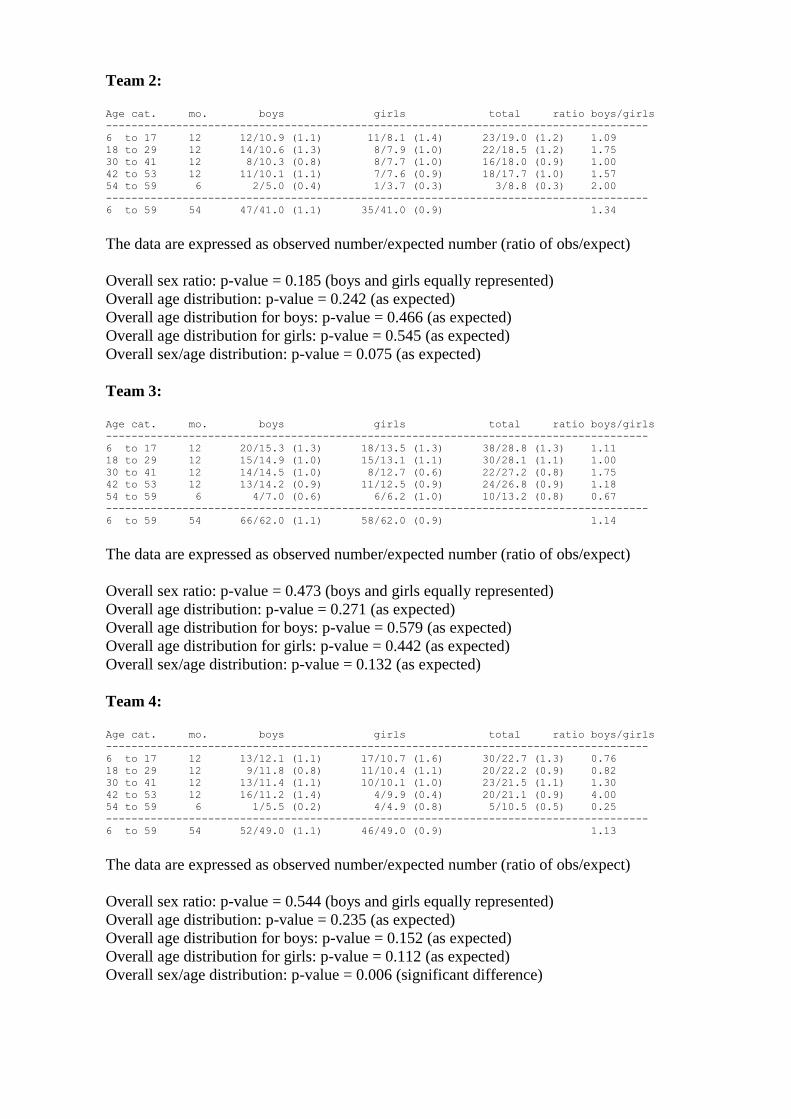
Team 5: Age cat. mo. boys girls total ratio boys/girls
-------------------------------------------------------------------------------------
6 to 17 12 13/10.7 (1.2) 13/11.8 (1.1) 26/22.5 (1.2) 1.00
18 to 29 12 13/10.4 (1.2) 14/11.5 (1.2) 27/21.9 (1.2) 0.93
30 to 41 12 7/10.1 (0.7) 11/11.2 (1.0) 18/21.3 (0.8) 0.64
42 to 53 12 7/9.9 (0.7) 8/11.0 (0.7) 15/20.9 (0.7) 0.88
54 to 59 6 6/4.9 (1.2) 5/5.4 (0.9) 11/10.4 (1.1) 1.20
-------------------------------------------------------------------------------------
6 to 59 54 46/48.5 (0.9) 51/48.5 (1.1) 0.90
The data are expressed as observed number/expected number (ratio of obs/expect)
Overall sex ratio: p-value = 0.612 (boys and girls equally represented)
Overall age distribution: p-value = 0.415 (as expected)
Overall age distribution for boys: p-value = 0.524 (as expected)
Overall age distribution for girls: p-value = 0.827 (as expected)
Overall sex/age distribution: p-value = 0.301 (as expected)
Team 6: Age cat. mo. boys girls total ratio boys/girls
-------------------------------------------------------------------------------------
6 to 17 12 9/9.3 (1.0) 15/9.3 (1.6) 24/18.6 (1.3) 0.60
18 to 29 12 10/9.0 (1.1) 10/9.0 (1.1) 20/18.1 (1.1) 1.00
30 to 41 12 10/8.8 (1.1) 7/8.8 (0.8) 17/17.5 (1.0) 1.43
42 to 53 12 8/8.6 (0.9) 5/8.6 (0.6) 13/17.3 (0.8) 1.60
54 to 59 6 3/4.3 (0.7) 3/4.3 (0.7) 6/8.5 (0.7) 1.00
-------------------------------------------------------------------------------------
6 to 59 54 40/40.0 (1.0) 40/40.0 (1.0) 1.00
The data are expressed as observed number/expected number (ratio of obs/expect)
Overall sex ratio: p-value = 1.000 (boys and girls equally represented)
Overall age distribution: p-value = 0.460 (as expected)
Overall age distribution for boys: p-value = 0.951 (as expected)
Overall age distribution for girls: p-value = 0.208 (as expected)
Overall sex/age distribution: p-value = 0.159 (as expected)
Evaluation of the SD for WHZ depending upon the order the cases are measured
within each cluster (if one cluster per day is measured then this will be related to the
time of the day the measurement is made).
Team: 1 Time SD for WHZ
point 0.8 0.9 1.0 1.1 1.2 1.3 1.4 1.5 1.6 1.7 1.8 1.9 2.0 2.1 2.2 2.3
01: 1.17 (n=05, f=0) ###############
02: 0.93 (n=05, f=0) ######
03: 0.88 (n=05, f=0) ###
04: 1.46 (n=05, f=0) ############################
05: 1.27 (n=05, f=0) ####################
06: 0.97 (n=05, f=0) #######
07: 1.54 (n=05, f=0) ###############################
08: 0.91 (n=05, f=0) #####
09: 0.60 (n=05, f=0)
10: 0.86 (n=05, f=0) ###
11: 0.98 (n=05, f=0) ########
12: 0.48 (n=05, f=0)
13: 1.03 (n=05, f=0) ##########
14: 0.85 (n=05, f=0) ##
15: 1.04 (n=05, f=0) ##########
16: 0.74 (n=05, f=0)
17: 1.42 (n=04, f=1) ##########################
18: 0.57 (n=03, f=0)
19: 1.20 (n=02, f=0) OOOOOOOOOOOOOOOOO
20: 0.12 (n=02, f=0)
21: 0.09 (n=02, f=0)
22: 0.90 (n=02, f=0) OOOO
23: 0.60 (n=02, f=0)
(when n is much less than the average number of subjects per cluster different symbols are
used: 0 for n < 80% and ~ for n < 40%; The numbers marked "f" are the numbers of SMART
flags found in the different time points)
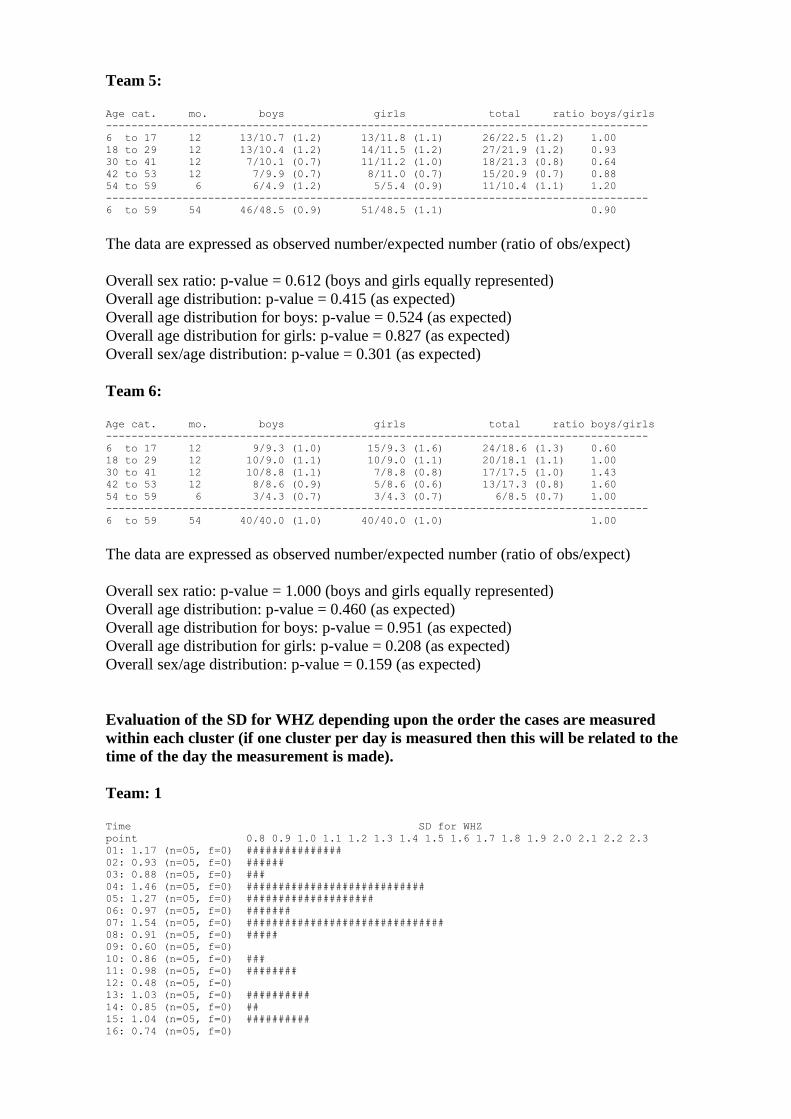
Team: 2 Time SD for WHZ
point 0.8 0.9 1.0 1.1 1.2 1.3 1.4 1.5 1.6 1.7 1.8 1.9 2.0 2.1 2.2 2.3
01: 0.77 (n=05, f=0)
02: 1.02 (n=05, f=0) #########
03: 0.66 (n=05, f=0)
04: 0.98 (n=05, f=0) ########
05: 0.80 (n=05, f=0)
06: 0.73 (n=05, f=0)
07: 0.66 (n=05, f=0)
08: 1.78 (n=05, f=0) #########################################
09: 1.90 (n=05, f=1) ##############################################
10: 1.13 (n=05, f=0) ##############
11: 0.28 (n=05, f=0)
12: 0.63 (n=04, f=0)
13: 0.42 (n=04, f=0)
14: 0.76 (n=04, f=0)
15: 1.04 (n=04, f=0) ##########
16: 0.65 (n=03, f=0)
17: 0.33 (n=03, f=0)
18: 0.11 (n=02, f=0)
19: 0.44 (n=02, f=0)
(when n is much less than the average number of subjects per cluster different symbols are
used: 0 for n < 80% and ~ for n < 40%; The numbers marked "f" are the numbers of SMART
flags found in the different time points)
Team: 3 Time SD for WHZ
point 0.8 0.9 1.0 1.1 1.2 1.3 1.4 1.5 1.6 1.7 1.8 1.9 2.0 2.1 2.2 2.3
01: 0.99 (n=05, f=0) ########
02: 0.85 (n=05, f=0) ##
03: 1.28 (n=05, f=0) ####################
04: 0.64 (n=05, f=0)
05: 0.62 (n=05, f=0)
06: 1.70 (n=05, f=0) ######################################
07: 0.53 (n=05, f=0)
08: 0.99 (n=05, f=0) ########
09: 0.78 (n=05, f=0)
10: 0.84 (n=05, f=0) ##
11: 0.87 (n=05, f=0) ###
12: 0.97 (n=05, f=0) #######
13: 1.28 (n=05, f=0) ####################
14: 0.49 (n=05, f=0)
15: 0.96 (n=05, f=0) #######
16: 0.80 (n=05, f=0)
17: 1.09 (n=05, f=0) ############
18: 0.68 (n=05, f=0)
19: 0.58 (n=05, f=0)
20: 1.10 (n=05, f=0) #############
21: 1.19 (n=05, f=0) ################
22: 1.45 (n=05, f=0) ###########################
23: 1.11 (n=04, f=0) #############
24: 0.33 (n=03, f=0)
25: 0.93 (n=02, f=0) OOOOOO
(when n is much less than the average number of subjects per cluster different symbols are
used: 0 for n < 80% and ~ for n < 40%; The numbers marked "f" are the numbers of SMART
flags found in the different time points)
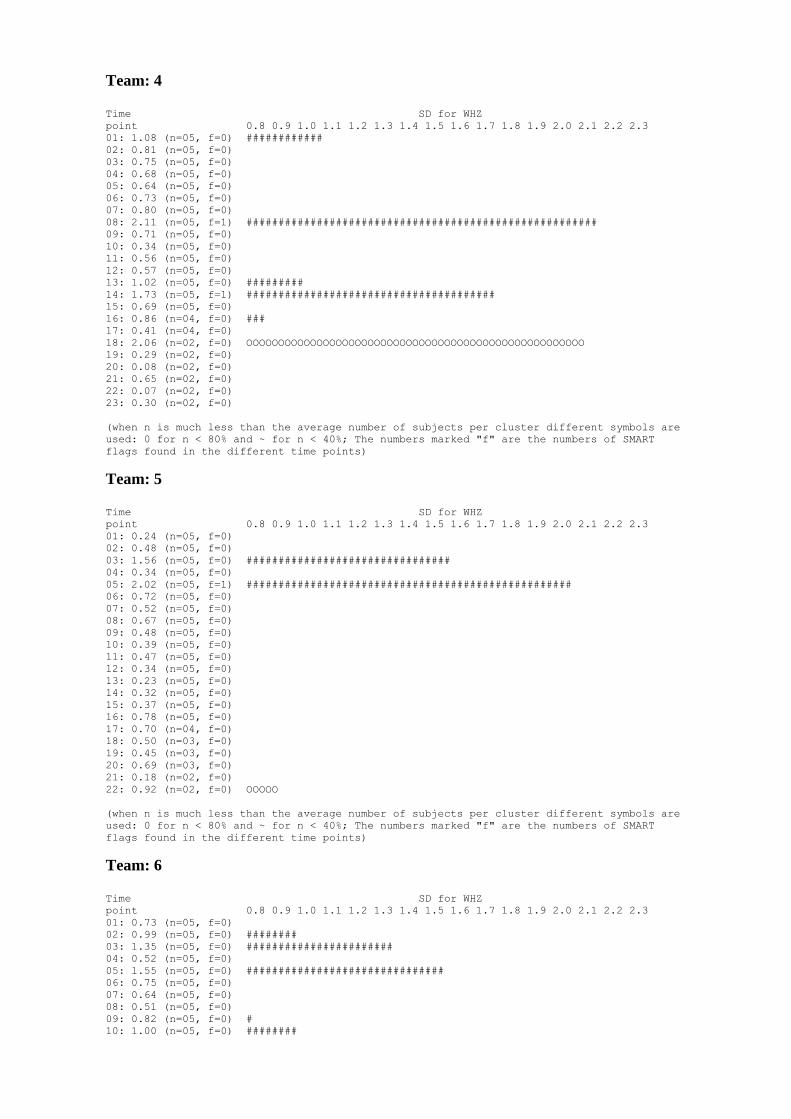
Team: 4 Time SD for WHZ
point 0.8 0.9 1.0 1.1 1.2 1.3 1.4 1.5 1.6 1.7 1.8 1.9 2.0 2.1 2.2 2.3
01: 1.08 (n=05, f=0) ############
02: 0.81 (n=05, f=0)
03: 0.75 (n=05, f=0)
04: 0.68 (n=05, f=0)
05: 0.64 (n=05, f=0)
06: 0.73 (n=05, f=0)
07: 0.80 (n=05, f=0)
08: 2.11 (n=05, f=1) #######################################################
09: 0.71 (n=05, f=0)
10: 0.34 (n=05, f=0)
11: 0.56 (n=05, f=0)
12: 0.57 (n=05, f=0)
13: 1.02 (n=05, f=0) #########
14: 1.73 (n=05, f=1) #######################################
15: 0.69 (n=05, f=0)
16: 0.86 (n=04, f=0) ###
17: 0.41 (n=04, f=0)
18: 2.06 (n=02, f=0) OOOOOOOOOOOOOOOOOOOOOOOOOOOOOOOOOOOOOOOOOOOOOOOOOOOOO
19: 0.29 (n=02, f=0)
20: 0.08 (n=02, f=0)
21: 0.65 (n=02, f=0)
22: 0.07 (n=02, f=0)
23: 0.30 (n=02, f=0)
(when n is much less than the average number of subjects per cluster different symbols are
used: 0 for n < 80% and ~ for n < 40%; The numbers marked "f" are the numbers of SMART
flags found in the different time points)
Team: 5 Time SD for WHZ
point 0.8 0.9 1.0 1.1 1.2 1.3 1.4 1.5 1.6 1.7 1.8 1.9 2.0 2.1 2.2 2.3
01: 0.24 (n=05, f=0)
02: 0.48 (n=05, f=0)
03: 1.56 (n=05, f=0) ################################
04: 0.34 (n=05, f=0)
05: 2.02 (n=05, f=1) ###################################################
06: 0.72 (n=05, f=0)
07: 0.52 (n=05, f=0)
08: 0.67 (n=05, f=0)
09: 0.48 (n=05, f=0)
10: 0.39 (n=05, f=0)
11: 0.47 (n=05, f=0)
12: 0.34 (n=05, f=0)
13: 0.23 (n=05, f=0)
14: 0.32 (n=05, f=0)
15: 0.37 (n=05, f=0)
16: 0.78 (n=05, f=0)
17: 0.70 (n=04, f=0)
18: 0.50 (n=03, f=0)
19: 0.45 (n=03, f=0)
20: 0.69 (n=03, f=0)
21: 0.18 (n=02, f=0)
22: 0.92 (n=02, f=0) OOOOO
(when n is much less than the average number of subjects per cluster different symbols are
used: 0 for n < 80% and ~ for n < 40%; The numbers marked "f" are the numbers of SMART
flags found in the different time points)
Team: 6 Time SD for WHZ
point 0.8 0.9 1.0 1.1 1.2 1.3 1.4 1.5 1.6 1.7 1.8 1.9 2.0 2.1 2.2 2.3
01: 0.73 (n=05, f=0)
02: 0.99 (n=05, f=0) ########
03: 1.35 (n=05, f=0) #######################
04: 0.52 (n=05, f=0)
05: 1.55 (n=05, f=0) ###############################
06: 0.75 (n=05, f=0)
07: 0.64 (n=05, f=0)
08: 0.51 (n=05, f=0)
09: 0.82 (n=05, f=0) #
10: 1.00 (n=05, f=0) ########
11: 1.43 (n=05, f=0) ##########################
12: 1.42 (n=05, f=0) ##########################
13: 1.11 (n=05, f=0) #############
14: 1.08 (n=04, f=0) ############
15: 0.78 (n=03, f=0)
16: 0.70 (n=03, f=0)
17: 0.78 (n=02, f=0)
18: 0.70 (n=02, f=0)
(when n is much less than the average number of subjects per cluster different symbols are
used: 0 for n < 80% and ~ for n < 40%; The numbers marked "f" are the numbers of SMART
flags found in the different time points)
(for better comparison it can be helpful to copy/paste part of this report into Excel)
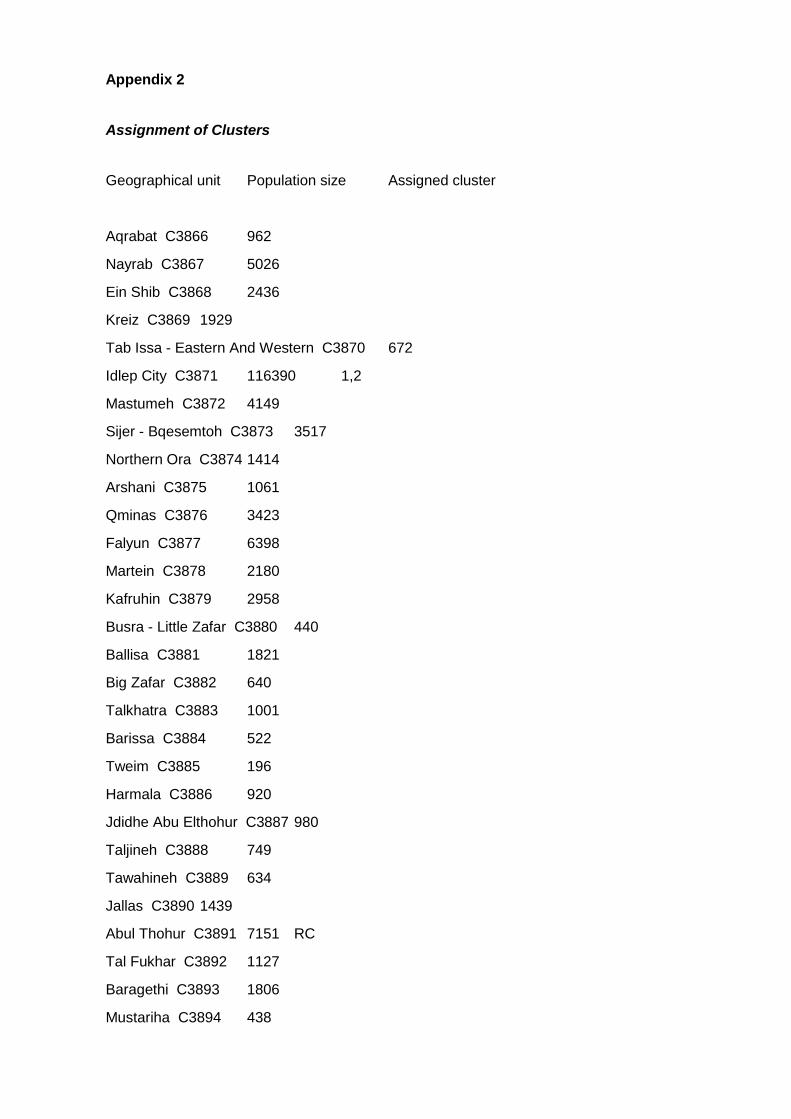
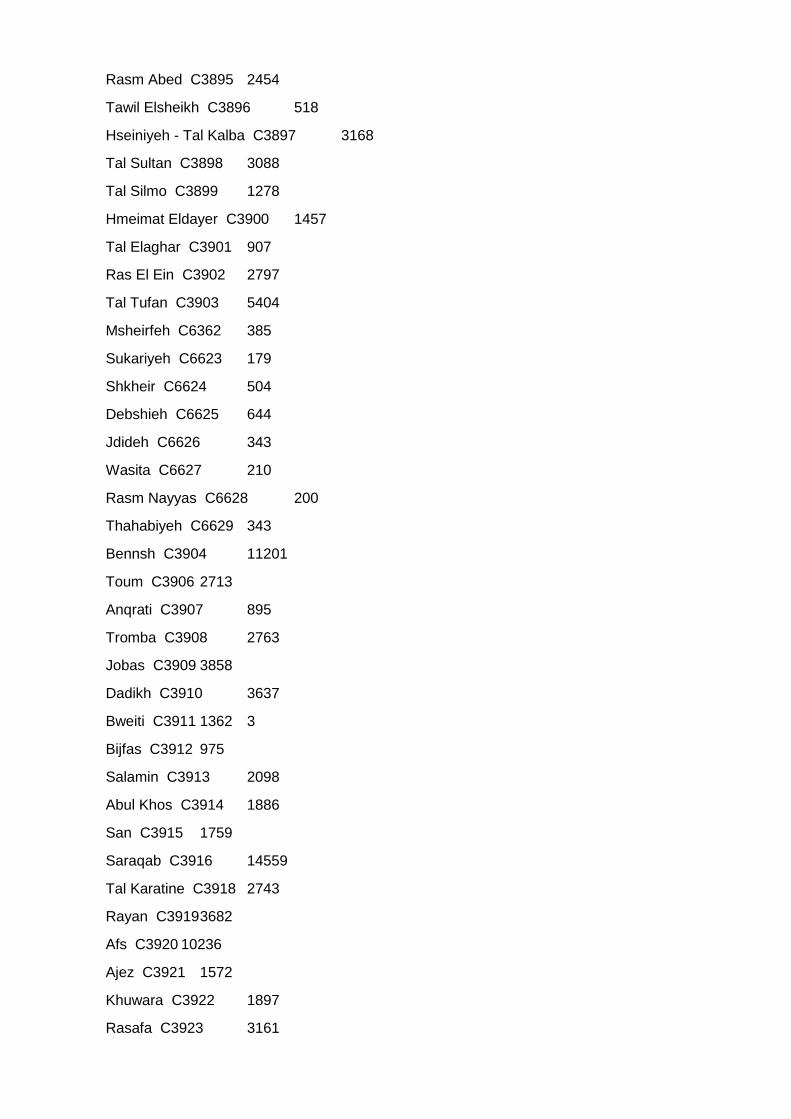
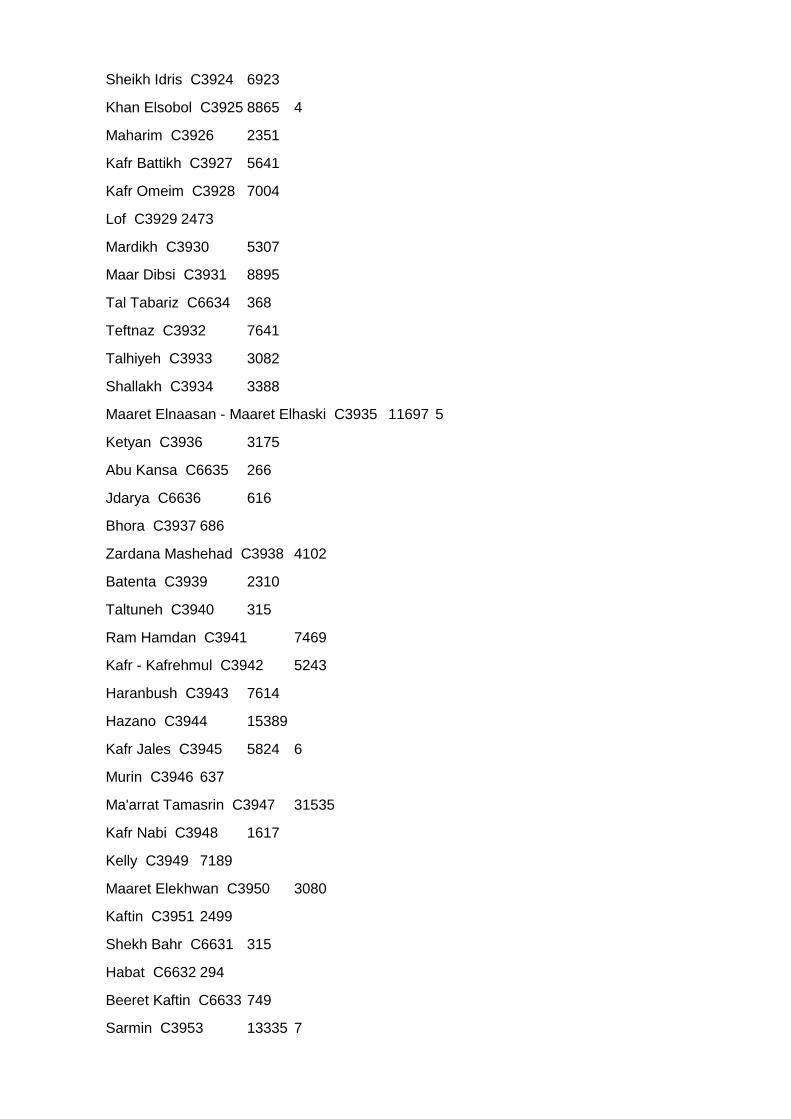
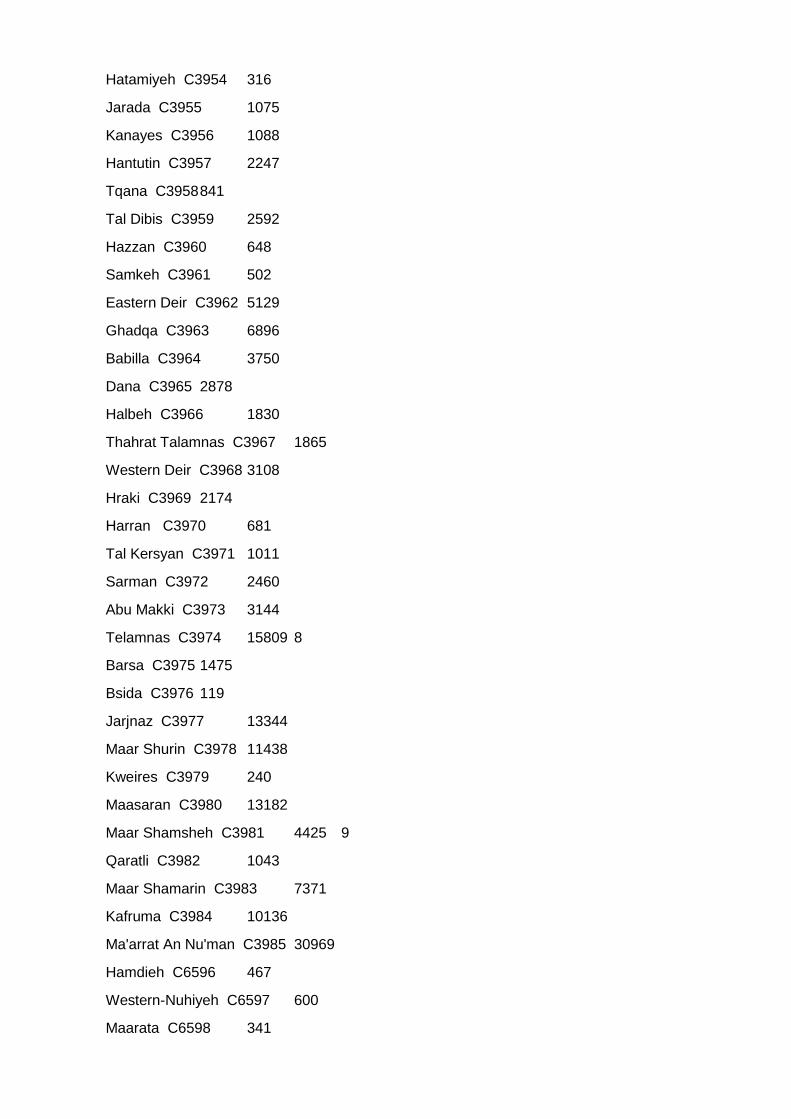
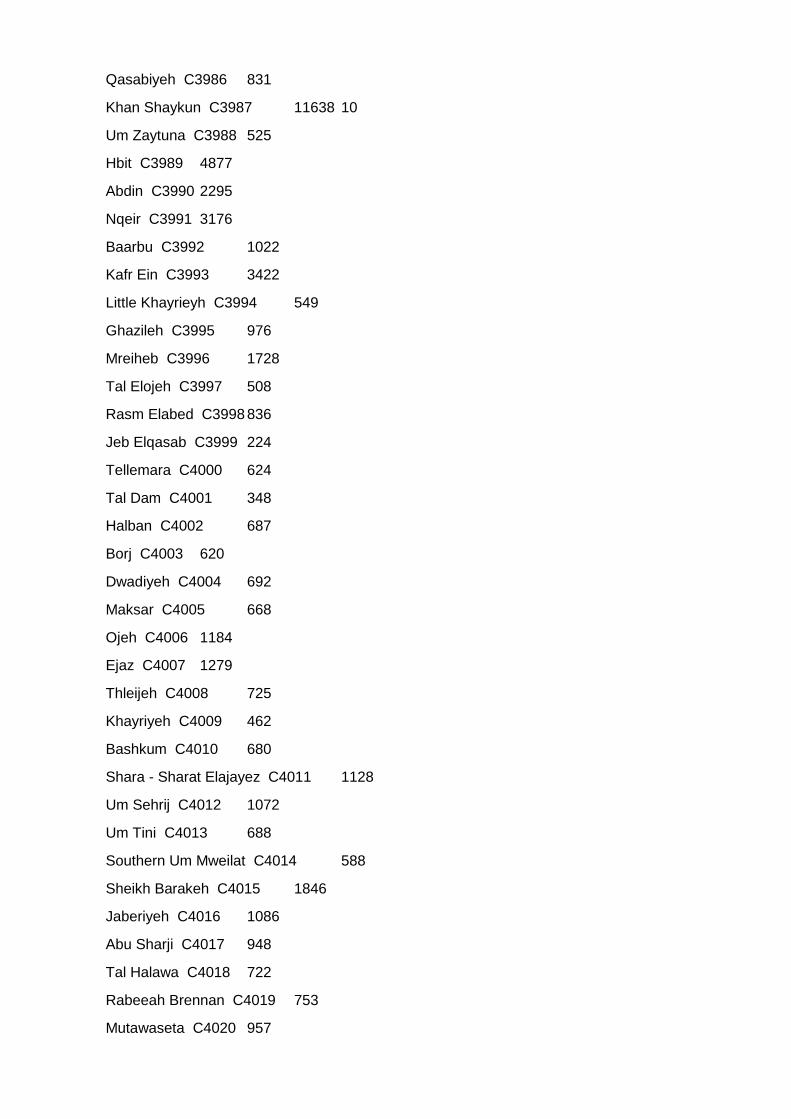
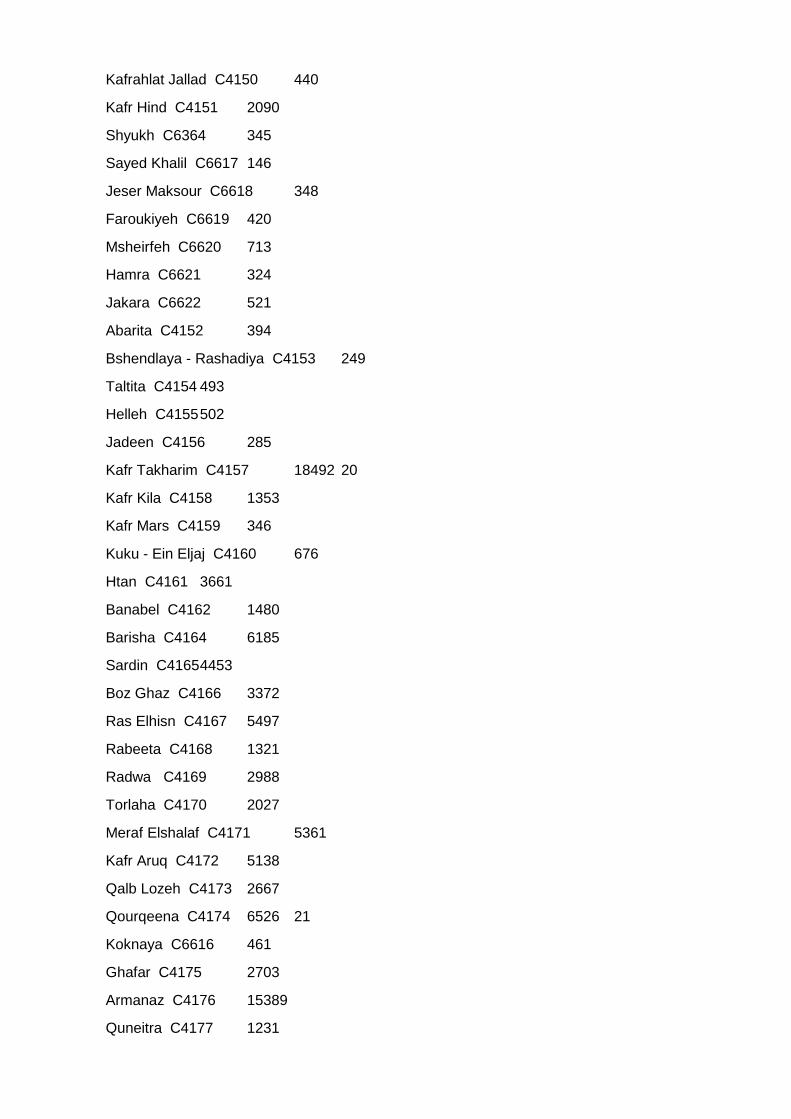
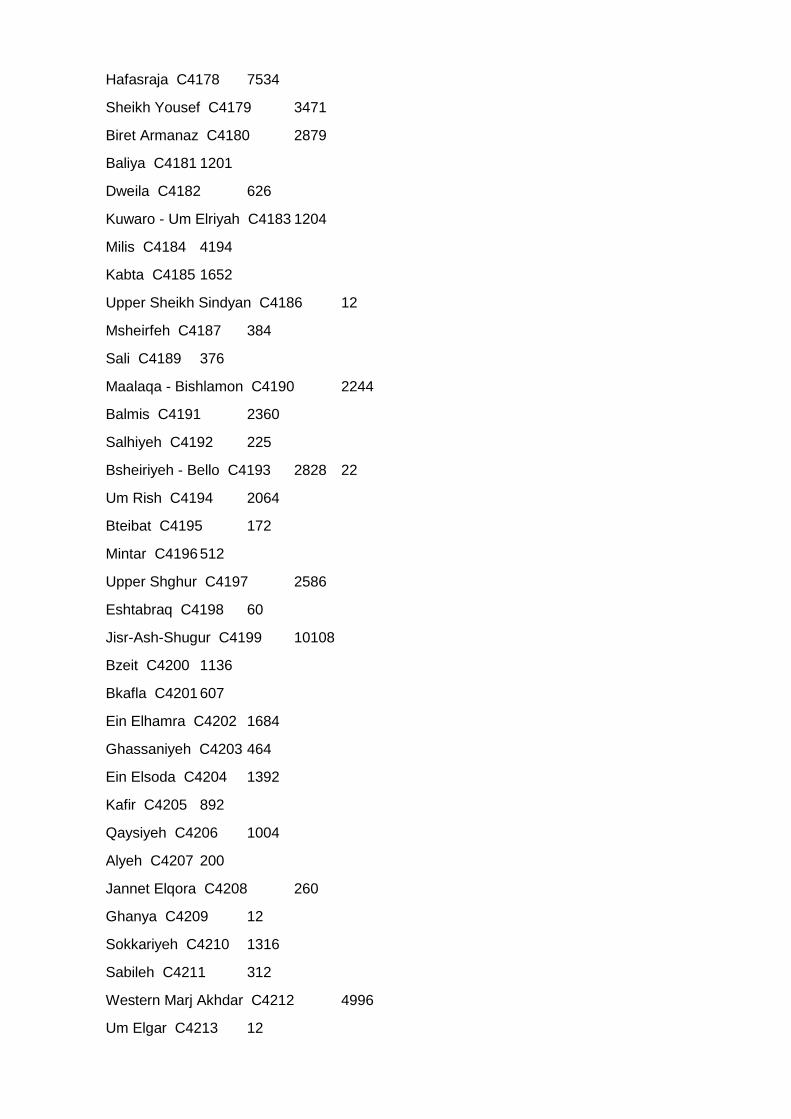
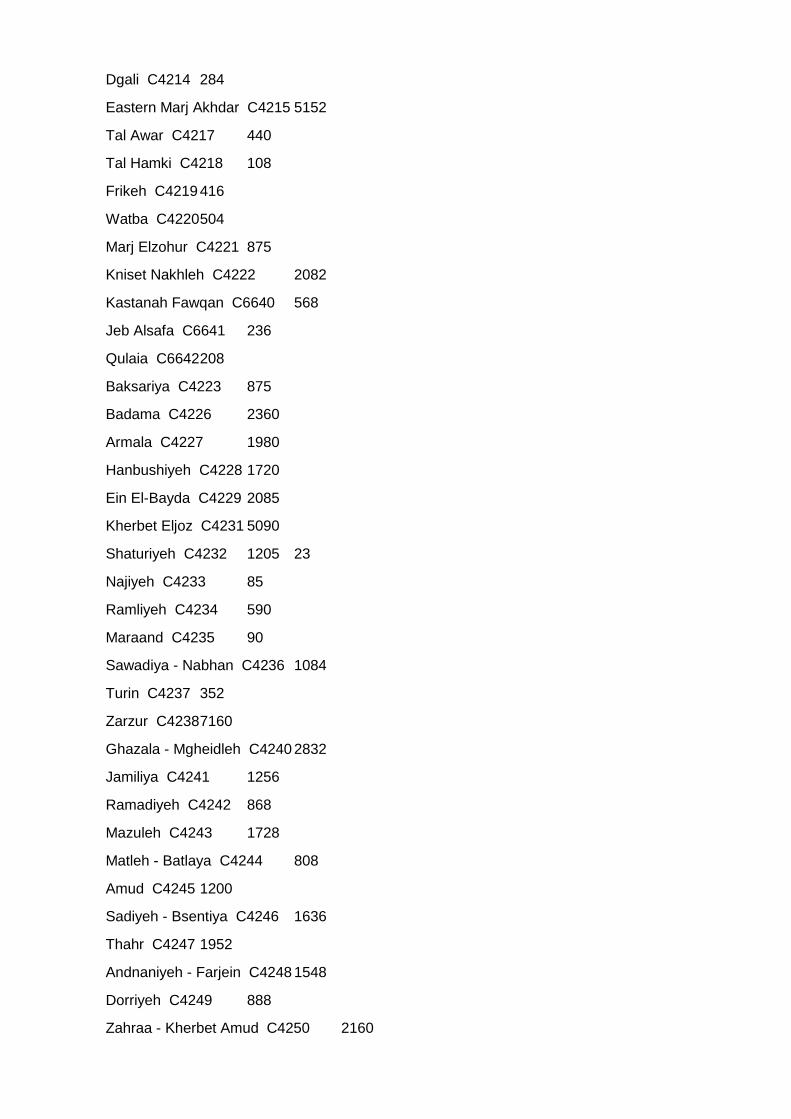
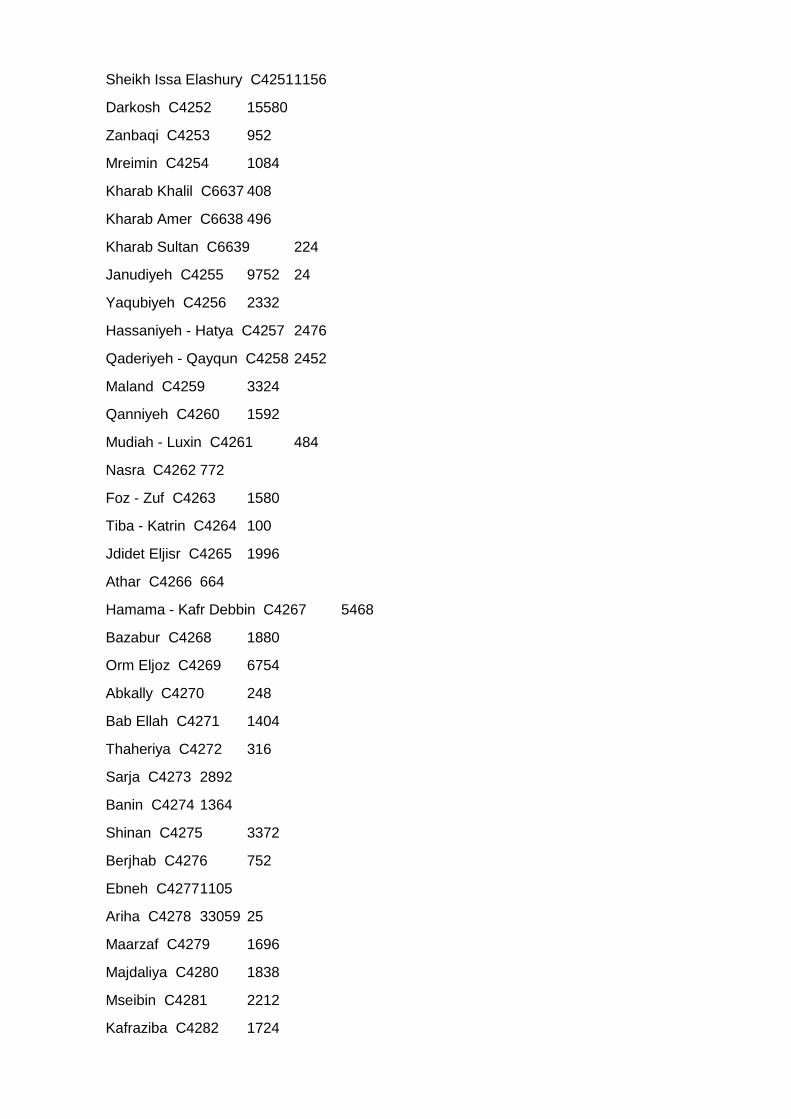
Appendix 2
Assignment of Clusters
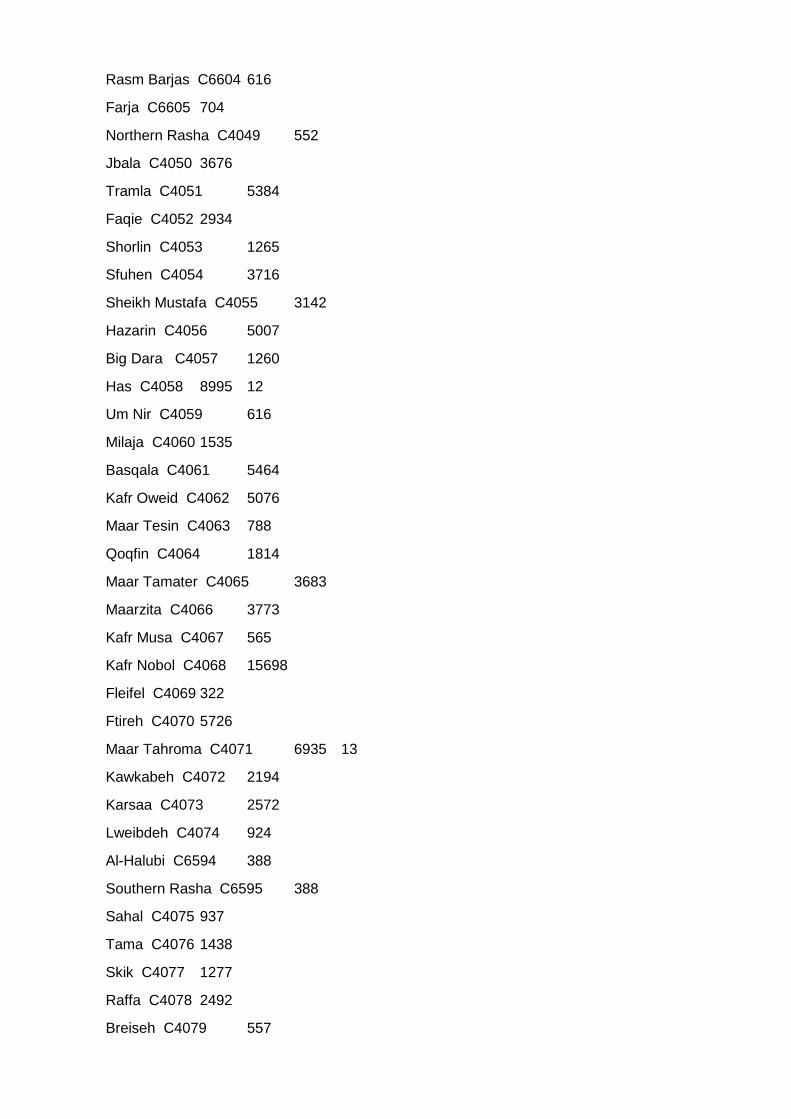
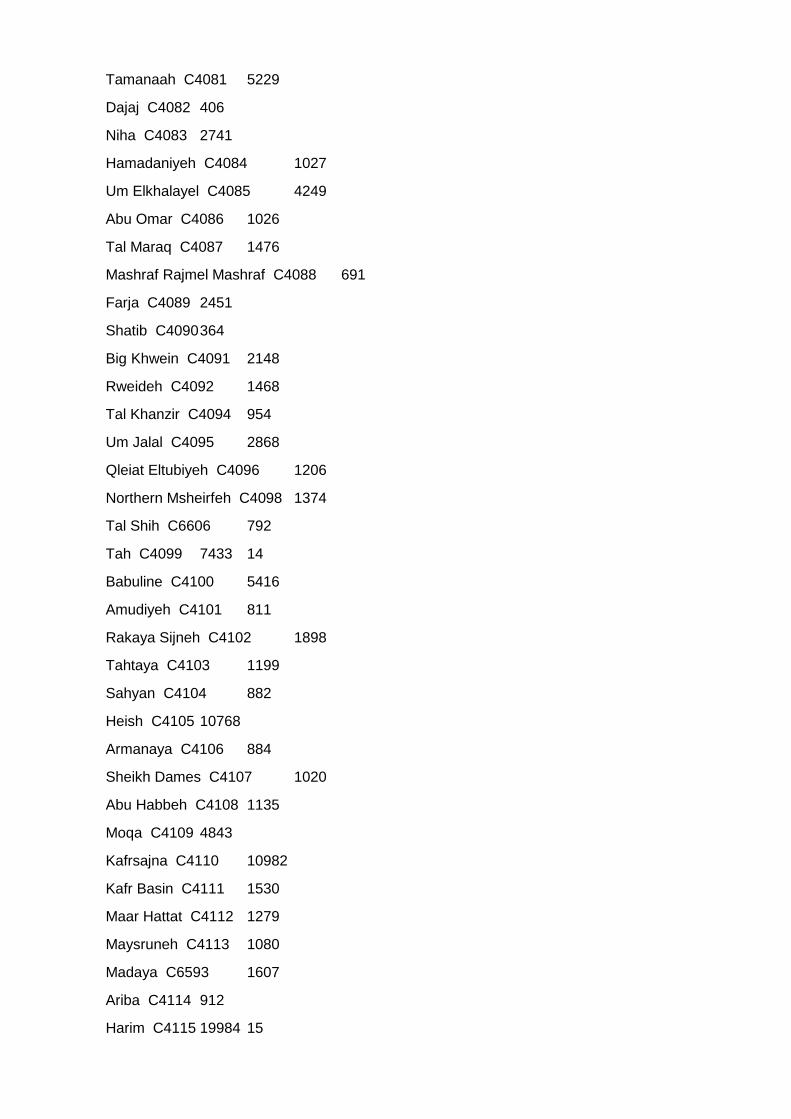
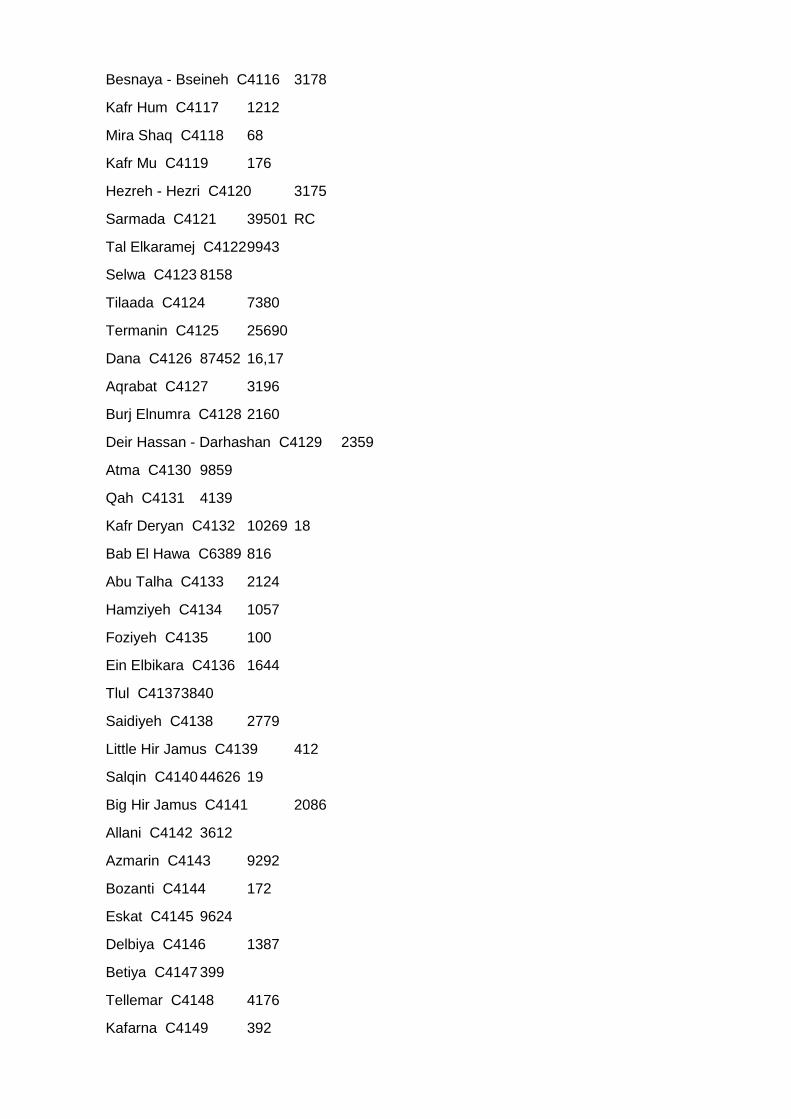
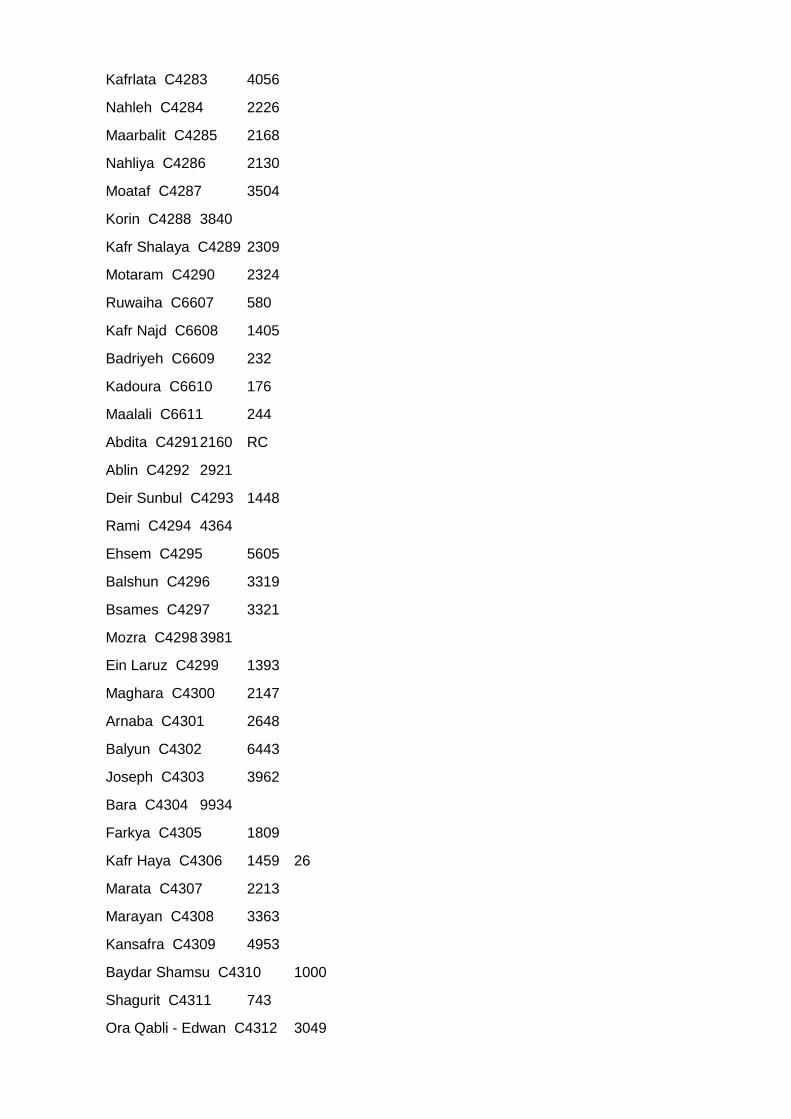
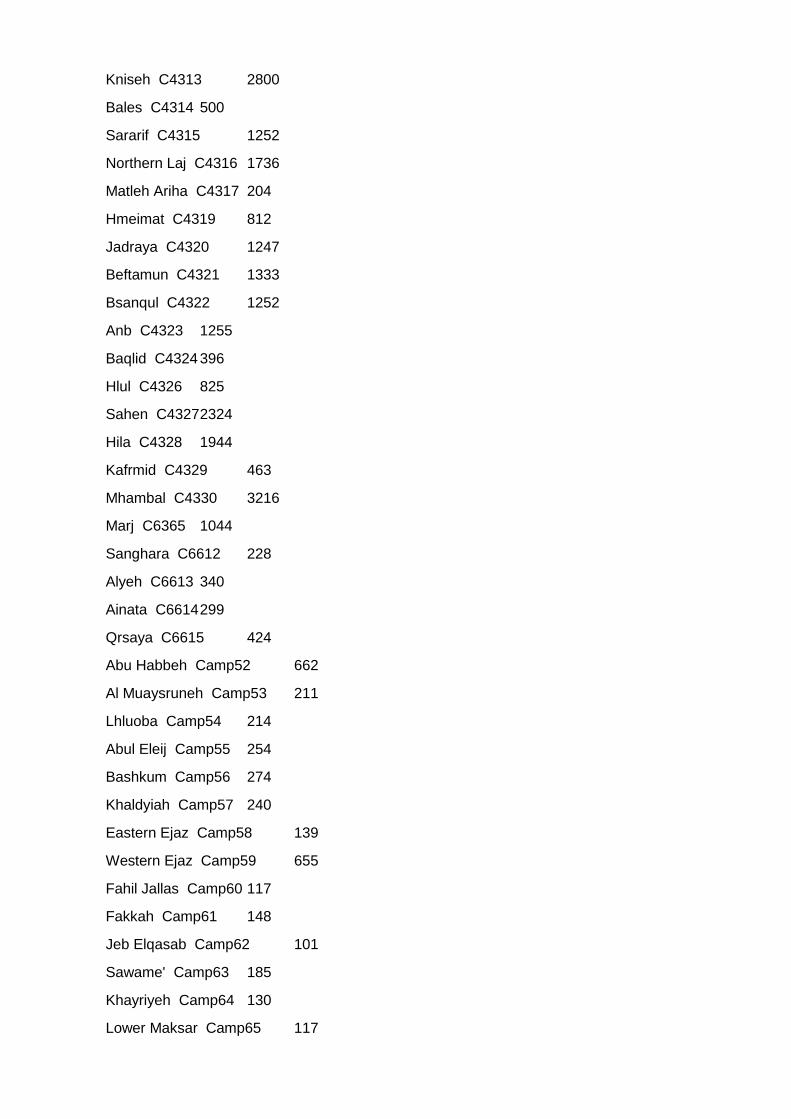
Geographical unit Population size Assigned cluster
Aqrabat C3866 962
Nayrab C3867 5026
Ein Shib C3868 2436
Kreiz C3869 1929
Tab Issa - Eastern And Western C3870 672
Idlep City C3871 116390 1,2
Mastumeh C3872 4149
Sijer - Bqesemtoh C3873 3517
Northern Ora C3874 1414
Arshani C3875 1061
Qminas C3876 3423
Falyun C3877 6398
Martein C3878 2180
Kafruhin C3879 2958
Busra - Little Zafar C3880 440
Ballisa C3881 1821
Big Zafar C3882 640
Talkhatra C3883 1001
Barissa C3884 522
Tweim C3885 196
Harmala C3886 920
Jdidhe Abu Elthohur C3887 980
Taljineh C3888 749
Tawahineh C3889 634
Jallas C3890 1439
Abul Thohur C3891 7151 RC
Tal Fukhar C3892 1127
Baragethi C3893 1806
Mustariha C3894 438
Rasm Abed C3895 2454
Tawil Elsheikh C3896 518
Hseiniyeh - Tal Kalba C3897 3168
Tal Sultan C3898 3088
Tal Silmo C3899 1278
Hmeimat Eldayer C3900 1457
Tal Elaghar C3901 907
Ras El Ein C3902 2797
Tal Tufan C3903 5404
Msheirfeh C6362 385
Sukariyeh C6623 179
Shkheir C6624 504
Debshieh C6625 644
Jdideh C6626 343
Wasita C6627 210
Rasm Nayyas C6628 200
Thahabiyeh C6629 343
Bennsh C3904 11201
Toum C3906 2713
Anqrati C3907 895
Tromba C3908 2763
Jobas C3909 3858
Dadikh C3910 3637
Bweiti C3911 1362 3
Bijfas C3912 975
Salamin C3913 2098
Abul Khos C3914 1886
San C3915 1759
Saraqab C3916 14559
Tal Karatine C3918 2743
Rayan C3919 3682
Afs C3920 10236
Ajez C3921 1572
Khuwara C3922 1897
Rasafa C3923 3161
Sheikh Idris C3924 6923
Khan Elsobol C3925 8865 4
Maharim C3926 2351
Kafr Battikh C3927 5641
Kafr Omeim C3928 7004
Lof C3929 2473
Mardikh C3930 5307
Maar Dibsi C3931 8895
Tal Tabariz C6634 368
Teftnaz C3932 7641
Talhiyeh C3933 3082
Shallakh C3934 3388
Maaret Elnaasan - Maaret Elhaski C3935 11697 5
Ketyan C3936 3175
Abu Kansa C6635 266
Jdarya C6636 616
Bhora C3937 686
Zardana Mashehad C3938 4102
Batenta C3939 2310
Taltuneh C3940 315
Ram Hamdan C3941 7469
Kafr - Kafrehmul C3942 5243
Haranbush C3943 7614
Hazano C3944 15389
Kafr Jales C3945 5824 6
Murin C3946 637
Ma'arrat Tamasrin C3947 31535
Kafr Nabi C3948 1617
Kelly C3949 7189
Maaret Elekhwan C3950 3080
Kaftin C3951 2499
Shekh Bahr C6631 315
Habat C6632 294
Beeret Kaftin C6633 749
Sarmin C3953 13335 7
Hatamiyeh C3954 316
Jarada C3955 1075
Kanayes C3956 1088
Hantutin C3957 2247
Tqana C3958 841
Tal Dibis C3959 2592
Hazzan C3960 648
Samkeh C3961 502
Eastern Deir C3962 5129
Ghadqa C3963 6896
Babilla C3964 3750
Dana C3965 2878
Halbeh C3966 1830
Thahrat Talamnas C3967 1865
Western Deir C3968 3108
Hraki C3969 2174
Harran C3970 681
Tal Kersyan C3971 1011
Sarman C3972 2460
Abu Makki C3973 3144
Telamnas C3974 15809 8
Barsa C3975 1475
Bsida C3976 119
Jarjnaz C3977 13344
Maar Shurin C3978 11438
Kweires C3979 240
Maasaran C3980 13182
Maar Shamsheh C3981 4425 9
Qaratli C3982 1043
Maar Shamarin C3983 7371
Kafruma C3984 10136
Ma'arrat An Nu'man C3985 30969
Hamdieh C6596 467
Western-Nuhiyeh C6597 600
Maarata C6598 341
Qasabiyeh C3986 831
Khan Shaykun C3987 11638 10
Um Zaytuna C3988 525
Hbit C3989 4877
Abdin C3990 2295
Nqeir C3991 3176
Baarbu C3992 1022
Kafr Ein C3993 3422
Little Khayrieyh C3994 549
Ghazileh C3995 976
Mreiheb C3996 1728
Tal Elojeh C3997 508
Rasm Elabed C3998 836
Jeb Elqasab C3999 224
Tellemara C4000 624
Tal Dam C4001 348
Halban C4002 687
Borj C4003 620
Dwadiyeh C4004 692
Maksar C4005 668
Ojeh C4006 1184
Ejaz C4007 1279
Thleijeh C4008 725
Khayriyeh C4009 462
Bashkum C4010 680
Shara - Sharat Elajayez C4011 1128
Um Sehrij C4012 1072
Um Tini C4013 688
Southern Um Mweilat C4014 588
Sheikh Barakeh C4015 1846
Jaberiyeh C4016 1086
Abu Sharji C4017 948
Tal Halawa C4018 722
Rabeeah Brennan C4019 753
Mutawaseta C4020 957
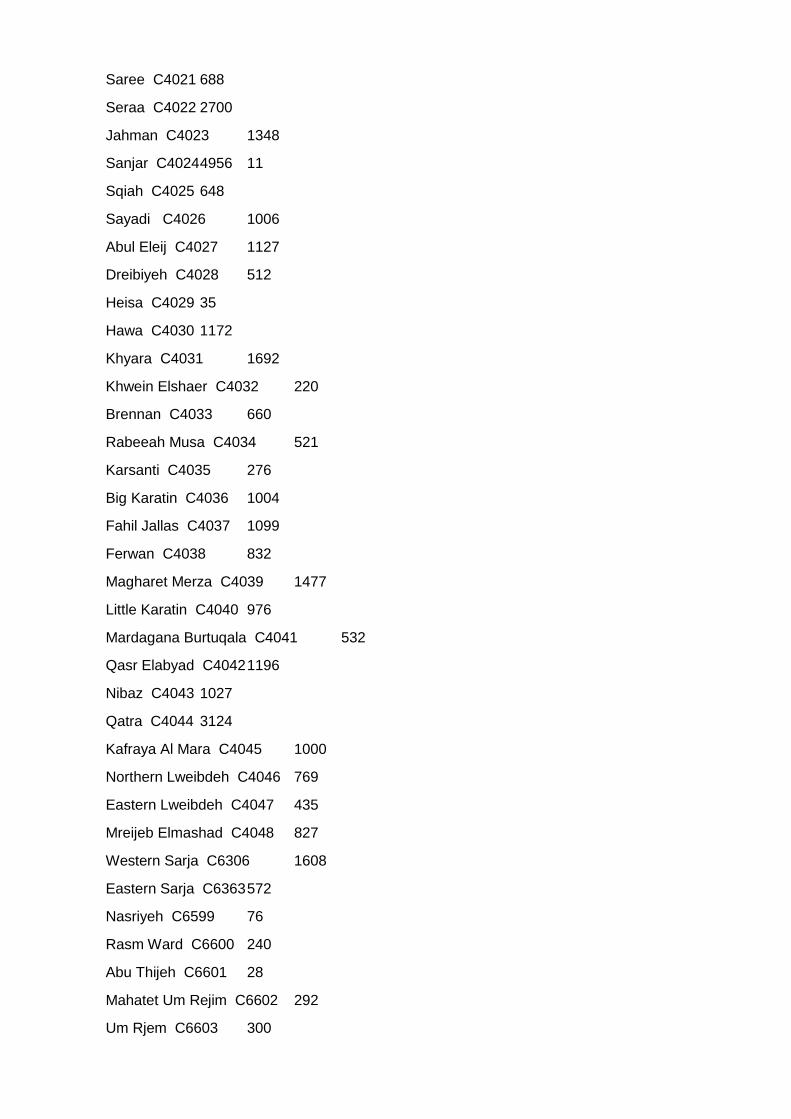
Saree C4021 688
Seraa C4022 2700
Jahman C4023 1348
Sanjar C4024 4956 11
Sqiah C4025 648
Sayadi C4026 1006
Abul Eleij C4027 1127
Dreibiyeh C4028 512
Heisa C4029 35
Hawa C4030 1172
Khyara C4031 1692
Khwein Elshaer C4032 220
Brennan C4033 660
Rabeeah Musa C4034 521
Karsanti C4035 276
Big Karatin C4036 1004
Fahil Jallas C4037 1099
Ferwan C4038 832
Magharet Merza C4039 1477
Little Karatin C4040 976
Mardagana Burtuqala C4041 532
Qasr Elabyad C4042 1196
Nibaz C4043 1027
Qatra C4044 3124
Kafraya Al Mara C4045 1000
Northern Lweibdeh C4046 769
Eastern Lweibdeh C4047 435
Mreijeb Elmashad C4048 827
Western Sarja C6306 1608
Eastern Sarja C6363 572
Nasriyeh C6599 76
Rasm Ward C6600 240
Abu Thijeh C6601 28
Mahatet Um Rejim C6602 292
Um Rjem C6603 300
Rasm Barjas C6604 616
Farja C6605 704
Northern Rasha C4049 552
Jbala C4050 3676
Tramla C4051 5384
Faqie C4052 2934
Shorlin C4053 1265
Sfuhen C4054 3716
Sheikh Mustafa C4055 3142
Hazarin C4056 5007
Big Dara C4057 1260
Has C4058 8995 12
Um Nir C4059 616
Milaja C4060 1535
Basqala C4061 5464
Kafr Oweid C4062 5076
Maar Tesin C4063 788
Qoqfin C4064 1814
Maar Tamater C4065 3683
Maarzita C4066 3773
Kafr Musa C4067 565
Kafr Nobol C4068 15698
Fleifel C4069 322
Ftireh C4070 5726
Maar Tahroma C4071 6935 13
Kawkabeh C4072 2194
Karsaa C4073 2572
Lweibdeh C4074 924
Al-Halubi C6594 388
Southern Rasha C6595 388
Sahal C4075 937
Tama C4076 1438
Skik C4077 1277
Raffa C4078 2492
Breiseh C4079 557
Tamanaah C4081 5229
Dajaj C4082 406
Niha C4083 2741
Hamadaniyeh C4084 1027
Um Elkhalayel C4085 4249
Abu Omar C4086 1026
Tal Maraq C4087 1476
Mashraf Rajmel Mashraf C4088 691
Farja C4089 2451
Shatib C4090 364
Big Khwein C4091 2148
Rweideh C4092 1468
Tal Khanzir C4094 954
Um Jalal C4095 2868
Qleiat Eltubiyeh C4096 1206
Northern Msheirfeh C4098 1374
Tal Shih C6606 792
Tah C4099 7433 14
Babuline C4100 5416
Amudiyeh C4101 811
Rakaya Sijneh C4102 1898
Tahtaya C4103 1199
Sahyan C4104 882
Heish C4105 10768
Armanaya C4106 884
Sheikh Dames C4107 1020
Abu Habbeh C4108 1135
Moqa C4109 4843
Kafrsajna C4110 10982
Kafr Basin C4111 1530
Maar Hattat C4112 1279
Maysruneh C4113 1080
Madaya C6593 1607
Ariba C4114 912
Harim C4115 19984 15
Besnaya - Bseineh C4116 3178
Kafr Hum C4117 1212
Mira Shaq C4118 68
Kafr Mu C4119 176
Hezreh - Hezri C4120 3175
Sarmada C4121 39501 RC
Tal Elkaramej C4122 9943
Selwa C4123 8158
Tilaada C4124 7380
Termanin C4125 25690
Dana C4126 87452 16,17
Aqrabat C4127 3196
Burj Elnumra C4128 2160
Deir Hassan - Darhashan C4129 2359
Atma C4130 9859
Qah C4131 4139
Kafr Deryan C4132 10269 18
Bab El Hawa C6389 816
Abu Talha C4133 2124
Hamziyeh C4134 1057
Foziyeh C4135 100
Ein Elbikara C4136 1644
Tlul C4137 3840
Saidiyeh C4138 2779
Little Hir Jamus C4139 412
Salqin C4140 44626 19
Big Hir Jamus C4141 2086
Allani C4142 3612
Azmarin C4143 9292
Bozanti C4144 172
Eskat C4145 9624
Delbiya C4146 1387
Betiya C4147 399
Tellemar C4148 4176
Kafarna C4149 392
Kafrahlat Jallad C4150 440
Kafr Hind C4151 2090
Shyukh C6364 345
Sayed Khalil C6617 146
Jeser Maksour C6618 348
Faroukiyeh C6619 420
Msheirfeh C6620 713
Hamra C6621 324
Jakara C6622 521
Abarita C4152 394
Bshendlaya - Rashadiya C4153 249
Taltita C4154 493
Helleh C4155 502
Jadeen C4156 285
Kafr Takharim C4157 18492 20
Kafr Kila C4158 1353
Kafr Mars C4159 346
Kuku - Ein Eljaj C4160 676
Htan C4161 3661
Banabel C4162 1480
Barisha C4164 6185
Sardin C4165 4453
Boz Ghaz C4166 3372
Ras Elhisn C4167 5497
Rabeeta C4168 1321
Radwa C4169 2988
Torlaha C4170 2027
Meraf Elshalaf C4171 5361
Kafr Aruq C4172 5138
Qalb Lozeh C4173 2667
Qourqeena C4174 6526 21
Koknaya C6616 461
Ghafar C4175 2703
Armanaz C4176 15389
Quneitra C4177 1231
Hafasraja C4178 7534
Sheikh Yousef C4179 3471
Biret Armanaz C4180 2879
Baliya C4181 1201
Dweila C4182 626
Kuwaro - Um Elriyah C4183 1204
Milis C4184 4194
Kabta C4185 1652
Upper Sheikh Sindyan C4186 12
Msheirfeh C4187 384
Sali C4189 376
Maalaqa - Bishlamon C4190 2244
Balmis C4191 2360
Salhiyeh C4192 225
Bsheiriyeh - Bello C4193 2828 22
Um Rish C4194 2064
Bteibat C4195 172
Mintar C4196 512
Upper Shghur C4197 2586
Eshtabraq C4198 60
Jisr-Ash-Shugur C4199 10108
Bzeit C4200 1136
Bkafla C4201 607
Ein Elhamra C4202 1684
Ghassaniyeh C4203 464
Ein Elsoda C4204 1392
Kafir C4205 892
Qaysiyeh C4206 1004
Alyeh C4207 200
Jannet Elqora C4208 260
Ghanya C4209 12
Sokkariyeh C4210 1316
Sabileh C4211 312
Western Marj Akhdar C4212 4996
Um Elgar C4213 12
Dgali C4214 284
Eastern Marj Akhdar C4215 5152
Tal Awar C4217 440
Tal Hamki C4218 108
Frikeh C4219 416
Watba C4220 504
Marj Elzohur C4221 875
Kniset Nakhleh C4222 2082
Kastanah Fawqan C6640 568
Jeb Alsafa C6641 236
Qulaia C6642 208
Baksariya C4223 875
Badama C4226 2360
Armala C4227 1980
Hanbushiyeh C4228 1720
Ein El-Bayda C4229 2085
Kherbet Eljoz C4231 5090
Shaturiyeh C4232 1205 23
Najiyeh C4233 85
Ramliyeh C4234 590
Maraand C4235 90
Sawadiya - Nabhan C4236 1084
Turin C4237 352
Zarzur C4238 7160
Ghazala - Mgheidleh C4240 2832
Jamiliya C4241 1256
Ramadiyeh C4242 868
Mazuleh C4243 1728
Matleh - Batlaya C4244 808
Amud C4245 1200
Sadiyeh - Bsentiya C4246 1636
Thahr C4247 1952
Andnaniyeh - Farjein C4248 1548
Dorriyeh C4249 888
Zahraa - Kherbet Amud C4250 2160
Sheikh Issa Elashury C4251 1156
Darkosh C4252 15580
Zanbaqi C4253 952
Mreimin C4254 1084
Kharab Khalil C6637 408
Kharab Amer C6638 496
Kharab Sultan C6639 224
Janudiyeh C4255 9752 24
Yaqubiyeh C4256 2332
Hassaniyeh - Hatya C4257 2476
Qaderiyeh - Qayqun C4258 2452
Maland C4259 3324
Qanniyeh C4260 1592
Mudiah - Luxin C4261 484
Nasra C4262 772
Foz - Zuf C4263 1580
Tiba - Katrin C4264 100
Jdidet Eljisr C4265 1996
Athar C4266 664
Hamama - Kafr Debbin C4267 5468
Bazabur C4268 1880
Orm Eljoz C4269 6754
Abkally C4270 248
Bab Ellah C4271 1404
Thaheriya C4272 316
Sarja C4273 2892
Banin C4274 1364
Shinan C4275 3372
Berjhab C4276 752
Ebneh C4277 1105
Ariha C4278 33059 25
Maarzaf C4279 1696
Majdaliya C4280 1838
Mseibin C4281 2212
Kafraziba C4282 1724
Kafrlata C4283 4056
Nahleh C4284 2226
Maarbalit C4285 2168
Nahliya C4286 2130
Moataf C4287 3504
Korin C4288 3840
Kafr Shalaya C4289 2309
Motaram C4290 2324
Ruwaiha C6607 580
Kafr Najd C6608 1405
Badriyeh C6609 232
Kadoura C6610 176
Maalali C6611 244
Abdita C4291 2160 RC
Ablin C4292 2921
Deir Sunbul C4293 1448
Rami C4294 4364
Ehsem C4295 5605
Balshun C4296 3319
Bsames C4297 3321
Mozra C4298 3981
Ein Laruz C4299 1393
Maghara C4300 2147
Arnaba C4301 2648
Balyun C4302 6443
Joseph C4303 3962
Bara C4304 9934
Farkya C4305 1809
Kafr Haya C4306 1459 26
Marata C4307 2213
Marayan C4308 3363
Kansafra C4309 4953
Baydar Shamsu C4310 1000
Shagurit C4311 743
Ora Qabli - Edwan C4312 3049
Kniseh C4313 2800
Bales C4314 500
Sararif C4315 1252
Northern Laj C4316 1736
Matleh Ariha C4317 204
Hmeimat C4319 812
Jadraya C4320 1247
Beftamun C4321 1333
Bsanqul C4322 1252
Anb C4323 1255
Baqlid C4324 396
Hlul C4326 825
Sahen C4327 2324
Hila C4328 1944
Kafrmid C4329 463
Mhambal C4330 3216
Marj C6365 1044
Sanghara C6612 228
Alyeh C6613 340
Ainata C6614 299
Qrsaya C6615 424
Abu Habbeh Camp52 662
Al Muaysruneh Camp53 211
Lhluoba Camp54 214
Abul Eleij Camp55 254
Bashkum Camp56 274
Khaldyiah Camp57 240
Eastern Ejaz Camp58 139
Western Ejaz Camp59 655
Fahil Jallas Camp60 117
Fakkah Camp61 148
Jeb Elqasab Camp62 101
Sawame' Camp63 185
Khayriyeh Camp64 130
Lower Maksar Camp65 117
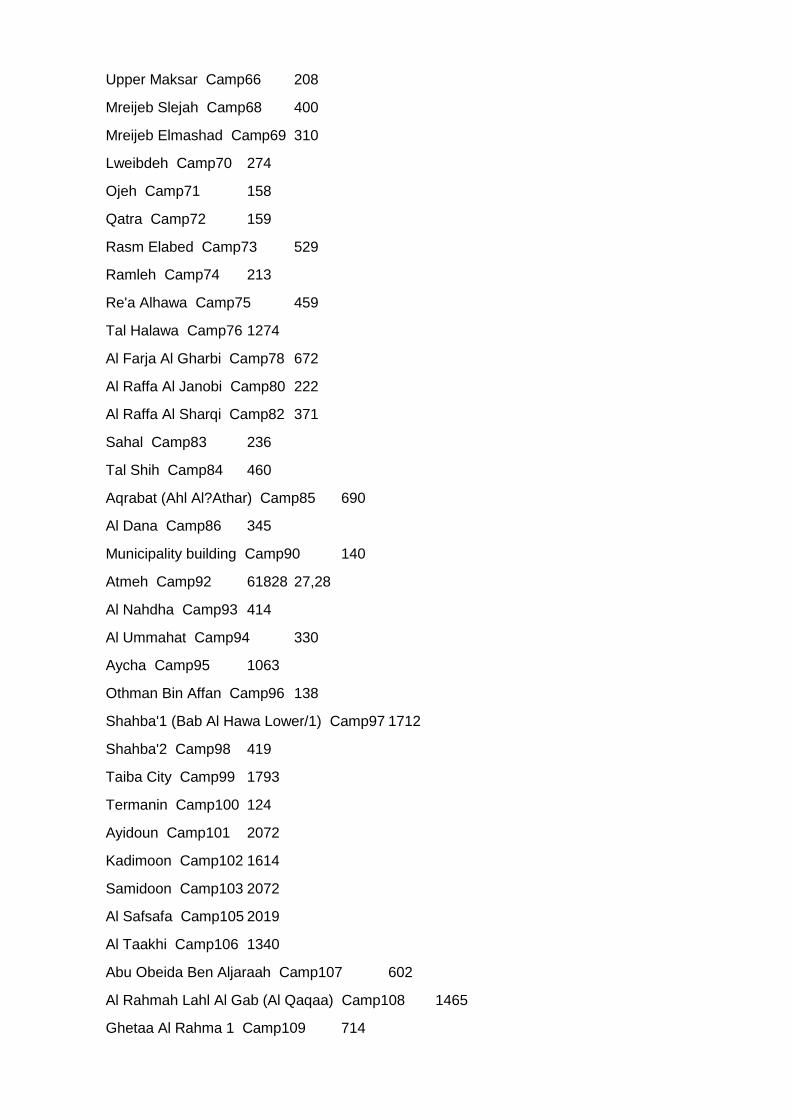
Upper Maksar Camp66 208
Mreijeb Slejah Camp68 400
Mreijeb Elmashad Camp69 310
Lweibdeh Camp70 274
Ojeh Camp71 158
Qatra Camp72 159
Rasm Elabed Camp73 529
Ramleh Camp74 213
Re'a Alhawa Camp75 459
Tal Halawa Camp76 1274
Al Farja Al Gharbi Camp78 672
Al Raffa Al Janobi Camp80 222
Al Raffa Al Sharqi Camp82 371
Sahal Camp83 236
Tal Shih Camp84 460
Aqrabat (Ahl Al?Athar) Camp85 690
Al Dana Camp86 345
Municipality building Camp90 140
Atmeh Camp92 61828 27,28
Al Nahdha Camp93 414
Al Ummahat Camp94 330
Aycha Camp95 1063
Othman Bin Affan Camp96 138
Shahba'1 (Bab Al Hawa Lower/1) Camp97 1712
Shahba'2 Camp98 419
Taiba City Camp99 1793
Termanin Camp100 124
Ayidoun Camp101 2072
Kadimoon Camp102 1614
Samidoon Camp103 2072
Al Safsafa Camp105 2019
Al Taakhi Camp106 1340
Abu Obeida Ben Aljaraah Camp107 602
Al Rahmah Lahl Al Gab (Al Qaqaa) Camp108 1465
Ghetaa Al Rahma 1 Camp109 714
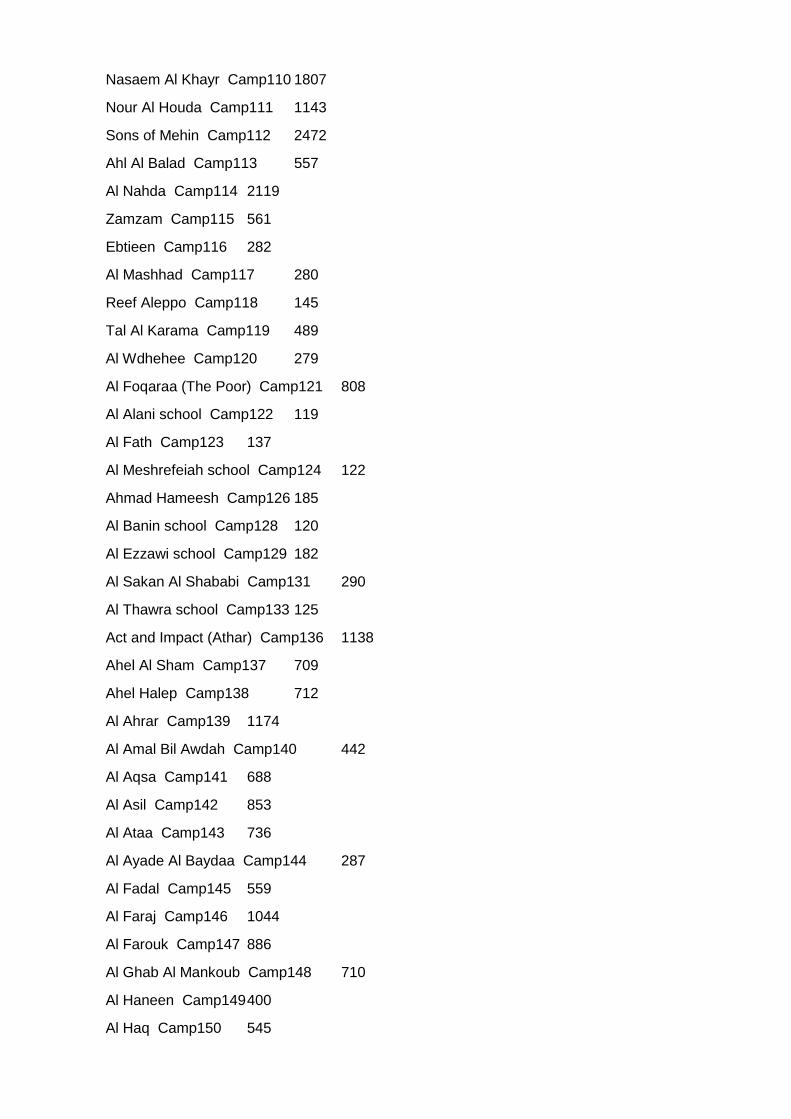
Nasaem Al Khayr Camp110 1807
Nour Al Houda Camp111 1143
Sons of Mehin Camp112 2472
Ahl Al Balad Camp113 557
Al Nahda Camp114 2119
Zamzam Camp115 561
Ebtieen Camp116 282
Al Mashhad Camp117 280
Reef Aleppo Camp118 145
Tal Al Karama Camp119 489
Al Wdhehee Camp120 279
Al Foqaraa (The Poor) Camp121 808
Al Alani school Camp122 119
Al Fath Camp123 137
Al Meshrefeiah school Camp124 122
Ahmad Hameesh Camp126 185
Al Banin school Camp128 120
Al Ezzawi school Camp129 182
Al Sakan Al Shababi Camp131 290
Al Thawra school Camp133 125
Act and Impact (Athar) Camp136 1138
Ahel Al Sham Camp137 709
Ahel Halep Camp138 712
Al Ahrar Camp139 1174
Al Amal Bil Awdah Camp140 442
Al Aqsa Camp141 688
Al Asil Camp142 853
Al Ataa Camp143 736
Al Ayade Al Baydaa Camp144 287
Al Fadal Camp145 559
Al Faraj Camp146 1044
Al Farouk Camp147 886
Al Ghab Al Mankoub Camp148 710
Al Haneen Camp149 400
Al Haq Camp150 545
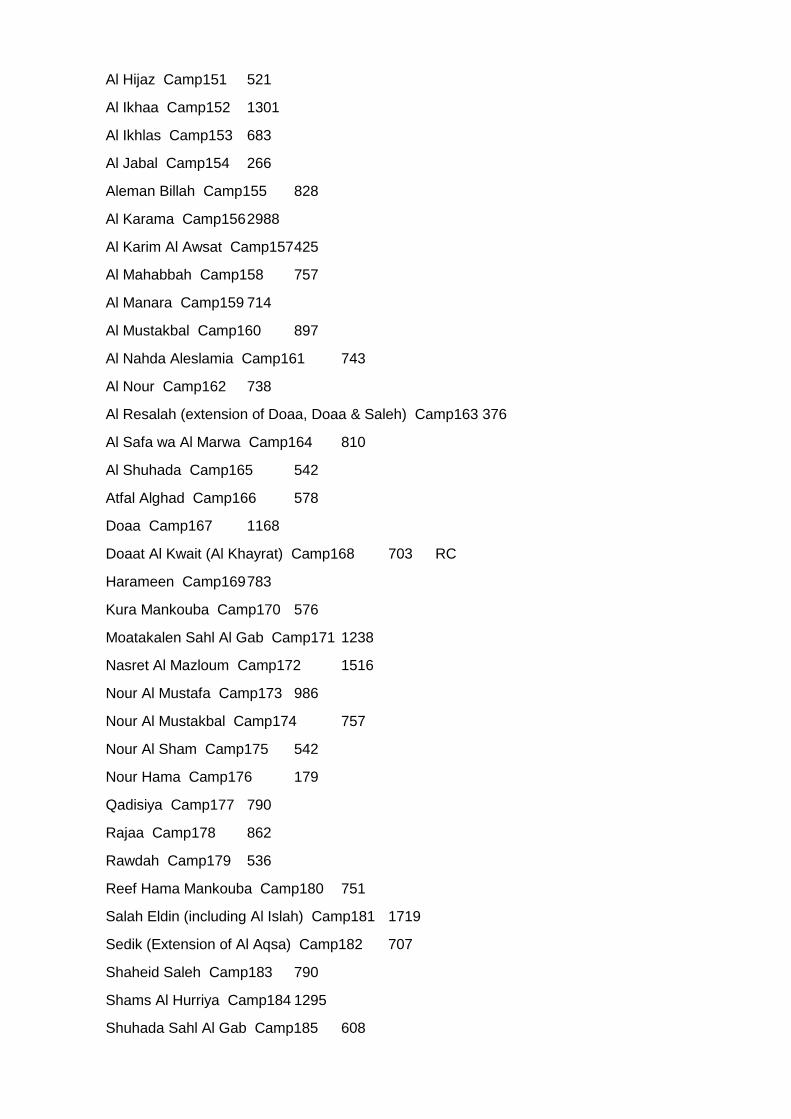
Al Hijaz Camp151 521
Al Ikhaa Camp152 1301
Al Ikhlas Camp153 683
Al Jabal Camp154 266
Aleman Billah Camp155 828
Al Karama Camp156 2988
Al Karim Al Awsat Camp157 425
Al Mahabbah Camp158 757
Al Manara Camp159 714
Al Mustakbal Camp160 897
Al Nahda Aleslamia Camp161 743
Al Nour Camp162 738
Al Resalah (extension of Doaa, Doaa & Saleh) Camp163 376
Al Safa wa Al Marwa Camp164 810
Al Shuhada Camp165 542
Atfal Alghad Camp166 578
Doaa Camp167 1168
Doaat Al Kwait (Al Khayrat) Camp168 703 RC
Harameen Camp169 783
Kura Mankouba Camp170 576
Moatakalen Sahl Al Gab Camp171 1238
Nasret Al Mazloum Camp172 1516
Nour Al Mustafa Camp173 986
Nour Al Mustakbal Camp174 757
Nour Al Sham Camp175 542
Nour Hama Camp176 179
Qadisiya Camp177 790
Rajaa Camp178 862
Rawdah Camp179 536
Reef Hama Mankouba Camp180 751
Salah Eldin (including Al Islah) Camp181 1719
Sedik (Extension of Al Aqsa) Camp182 707
Shaheid Saleh Camp183 790
Shams Al Hurriya Camp184 1295
Shuhada Sahl Al Gab Camp185 608
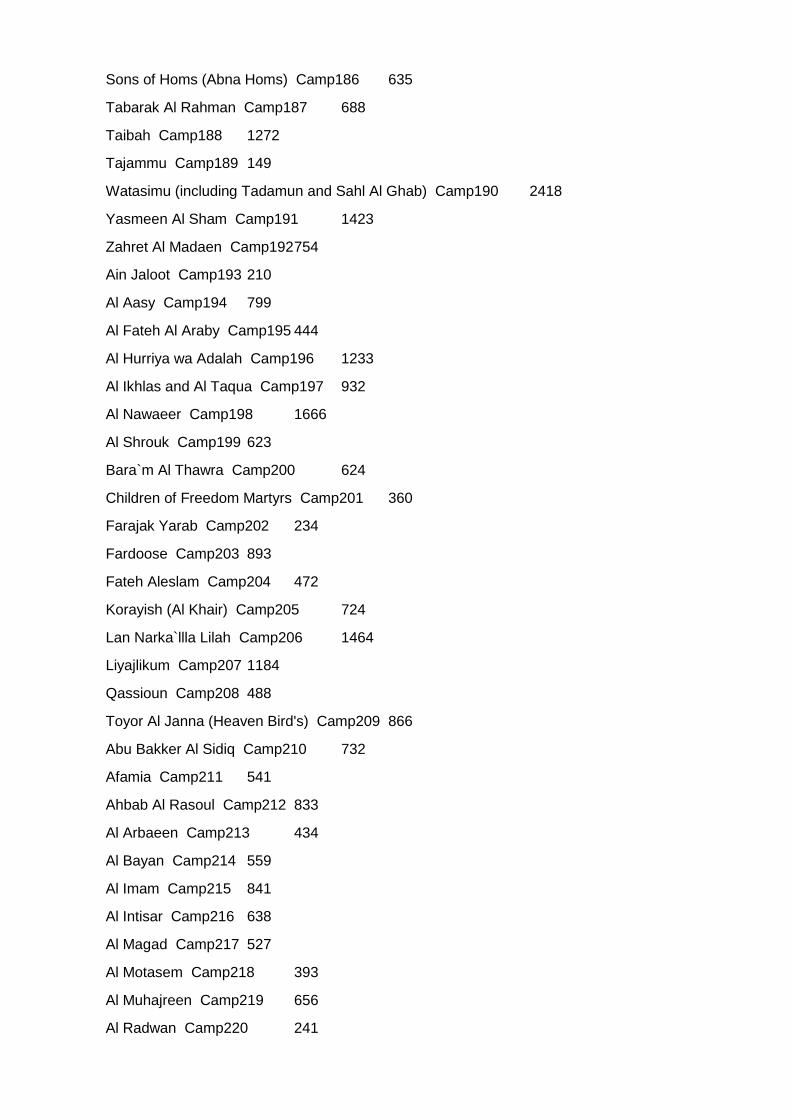
Sons of Homs (Abna Homs) Camp186 635
Tabarak Al Rahman Camp187 688
Taibah Camp188 1272
Tajammu Camp189 149
Watasimu (including Tadamun and Sahl Al Ghab) Camp190 2418
Yasmeen Al Sham Camp191 1423
Zahret Al Madaen Camp192 754
Ain Jaloot Camp193 210
Al Aasy Camp194 799
Al Fateh Al Araby Camp195 444
Al Hurriya wa Adalah Camp196 1233
Al Ikhlas and Al Taqua Camp197 932
Al Nawaeer Camp198 1666
Al Shrouk Camp199 623
Bara`m Al Thawra Camp200 624
Children of Freedom Martyrs Camp201 360
Farajak Yarab Camp202 234
Fardoose Camp203 893
Fateh Aleslam Camp204 472
Korayish (Al Khair) Camp205 724
Lan Narka`llla Lilah Camp206 1464
Liyajlikum Camp207 1184
Qassioun Camp208 488
Toyor Al Janna (Heaven Bird's) Camp209 866
Abu Bakker Al Sidiq Camp210 732
Afamia Camp211 541
Ahbab Al Rasoul Camp212 833
Al Arbaeen Camp213 434
Al Bayan Camp214 559
Al Imam Camp215 841
Al Intisar Camp216 638
Al Magad Camp217 527
Al Motasem Camp218 393
Al Muhajreen Camp219 656
Al Radwan Camp220 241
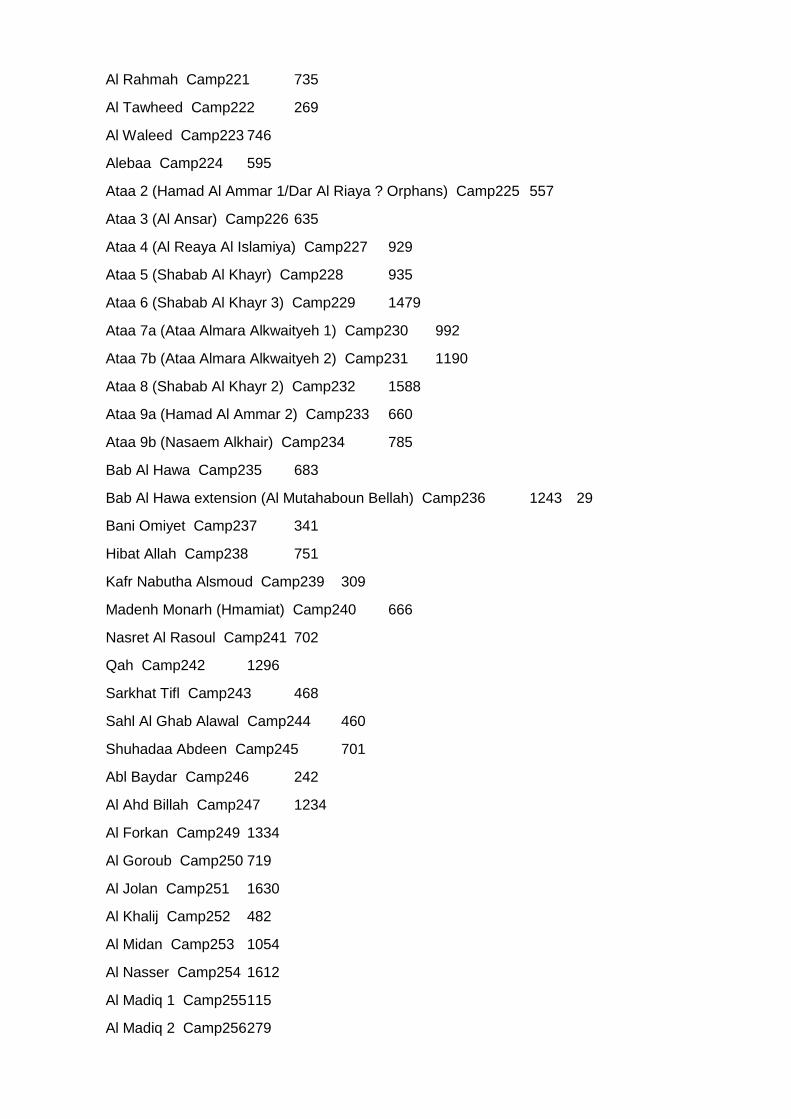
Al Rahmah Camp221 735
Al Tawheed Camp222 269
Al Waleed Camp223 746
Alebaa Camp224 595
Ataa 2 (Hamad Al Ammar 1/Dar Al Riaya ? Orphans) Camp225 557
Ataa 3 (Al Ansar) Camp226 635
Ataa 4 (Al Reaya Al Islamiya) Camp227 929
Ataa 5 (Shabab Al Khayr) Camp228 935
Ataa 6 (Shabab Al Khayr 3) Camp229 1479
Ataa 7a (Ataa Almara Alkwaityeh 1) Camp230 992
Ataa 7b (Ataa Almara Alkwaityeh 2) Camp231 1190
Ataa 8 (Shabab Al Khayr 2) Camp232 1588
Ataa 9a (Hamad Al Ammar 2) Camp233 660
Ataa 9b (Nasaem Alkhair) Camp234 785
Bab Al Hawa Camp235 683
Bab Al Hawa extension (Al Mutahaboun Bellah) Camp236 1243 29
Bani Omiyet Camp237 341
Hibat Allah Camp238 751
Kafr Nabutha Alsmoud Camp239 309
Madenh Monarh (Hmamiat) Camp240 666
Nasret Al Rasoul Camp241 702
Qah Camp242 1296
Sarkhat Tifl Camp243 468
Sahl Al Ghab Alawal Camp244 460
Shuhadaa Abdeen Camp245 701
Abl Baydar Camp246 242
Al Ahd Billah Camp247 1234
Al Forkan Camp249 1334
Al Goroub Camp250 719
Al Jolan Camp251 1630
Al Khalij Camp252 482
Al Midan Camp253 1054
Al Nasser Camp254 1612
Al Madiq 1 Camp255 115
Al Madiq 2 Camp256 279
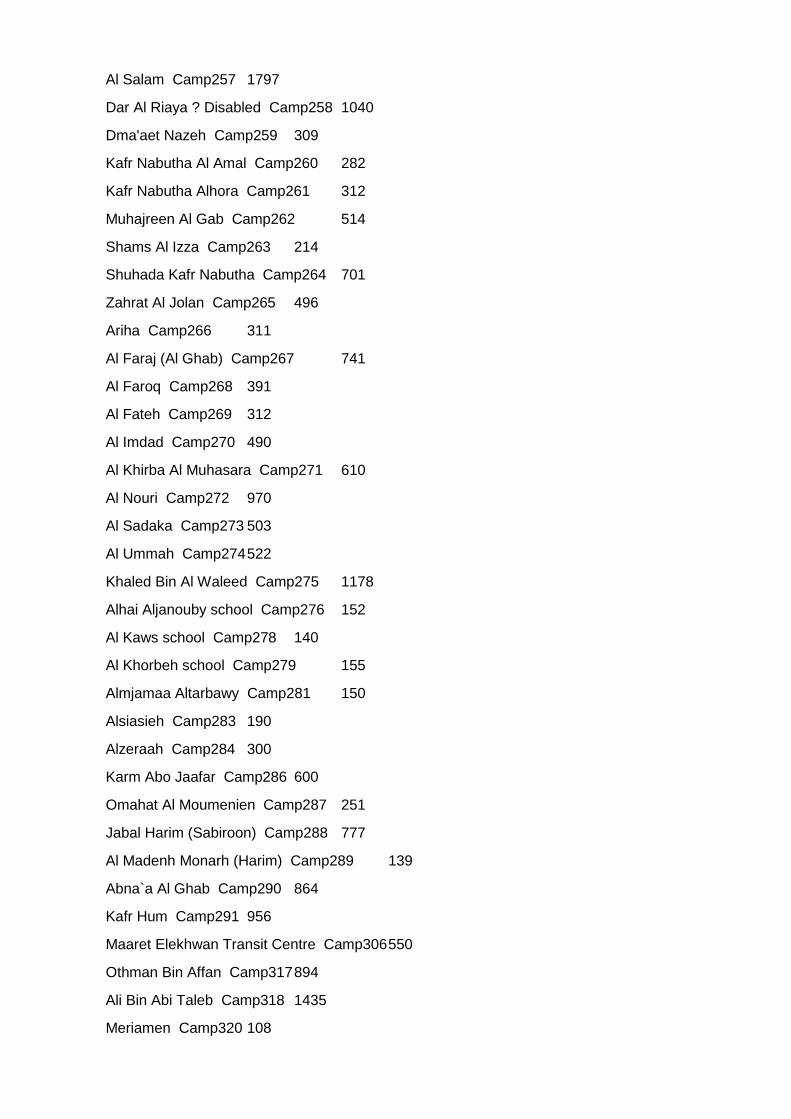
Al Salam Camp257 1797
Dar Al Riaya ? Disabled Camp258 1040
Dma'aet Nazeh Camp259 309
Kafr Nabutha Al Amal Camp260 282
Kafr Nabutha Alhora Camp261 312
Muhajreen Al Gab Camp262 514
Shams Al Izza Camp263 214
Shuhada Kafr Nabutha Camp264 701
Zahrat Al Jolan Camp265 496
Ariha Camp266 311
Al Faraj (Al Ghab) Camp267 741
Al Faroq Camp268 391
Al Fateh Camp269 312
Al Imdad Camp270 490
Al Khirba Al Muhasara Camp271 610
Al Nouri Camp272 970
Al Sadaka Camp273 503
Al Ummah Camp274 522
Khaled Bin Al Waleed Camp275 1178
Alhai Aljanouby school Camp276 152
Al Kaws school Camp278 140
Al Khorbeh school Camp279 155
Almjamaa Altarbawy Camp281 150
Alsiasieh Camp283 190
Alzeraah Camp284 300
Karm Abo Jaafar Camp286 600
Omahat Al Moumenien Camp287 251
Jabal Harim (Sabiroon) Camp288 777
Al Madenh Monarh (Harim) Camp289 139
Abna`a Al Ghab Camp290 864
Kafr Hum Camp291 956
Maaret Elekhwan Transit Centre Camp306 550
Othman Bin Affan Camp317 894
Ali Bin Abi Taleb Camp318 1435
Meriamen Camp320 108
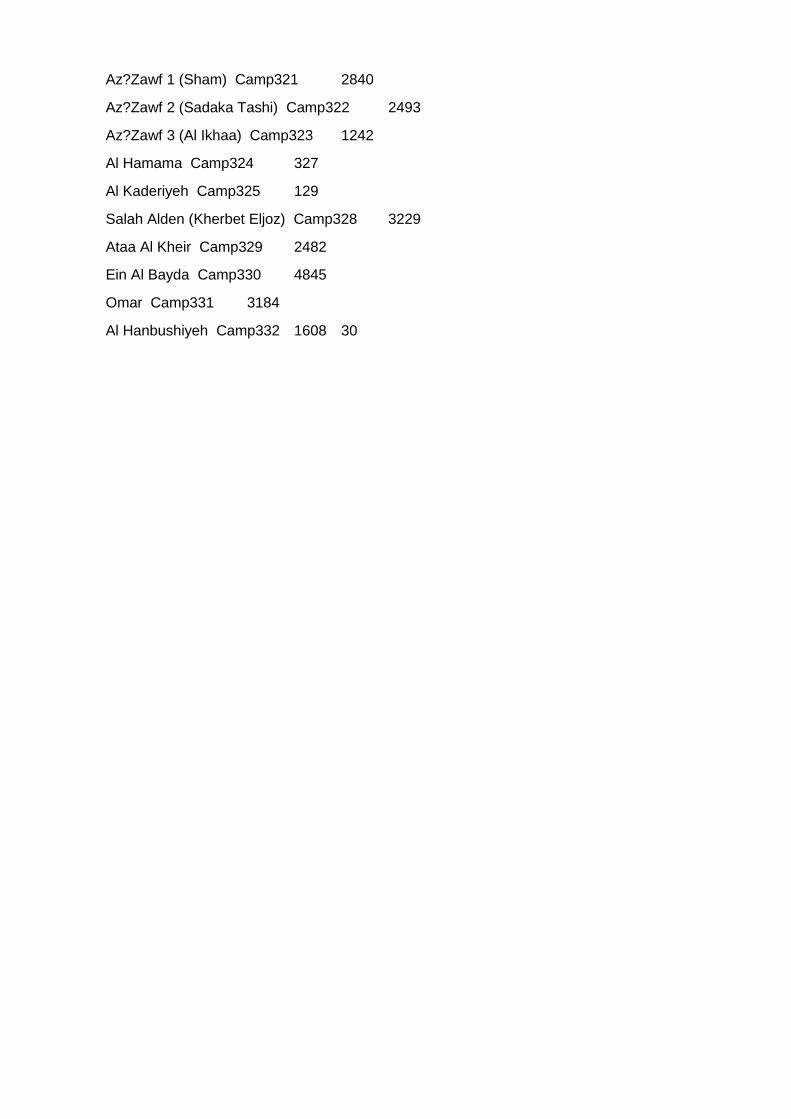
Az?Zawf 1 (Sham) Camp321 2840
Az?Zawf 2 (Sadaka Tashi) Camp322 2493
Az?Zawf 3 (Al Ikhaa) Camp323 1242
Al Hamama Camp324 327
Al Kaderiyeh Camp325 129
Salah Alden (Kherbet Eljoz) Camp328 3229
Ataa Al Kheir Camp329 2482
Ein Al Bayda Camp330 4845
Omar Camp331 3184
Al Hanbushiyeh Camp332 1608 30
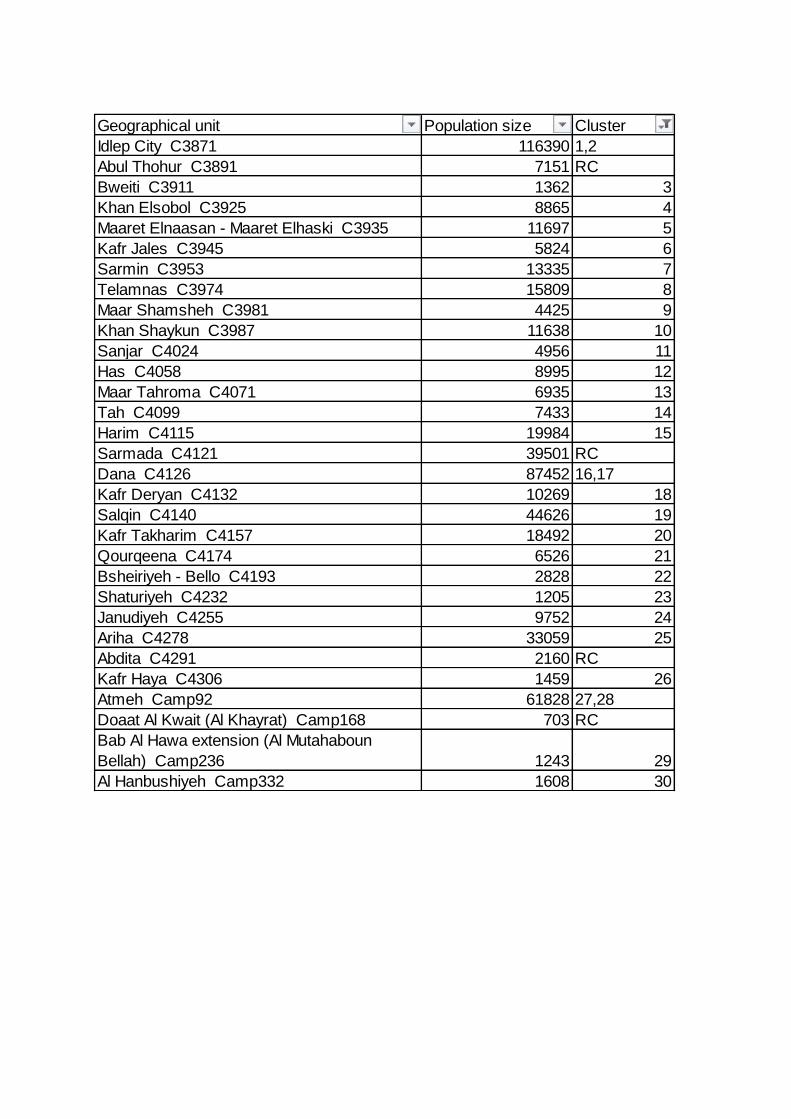
Geographical unit Population size Cluster
Idlep City C3871 116390 1,2
Abul Thohur C3891 7151 RC
Bweiti C3911 1362 3
Khan Elsobol C3925 8865 4
Maaret Elnaasan - Maaret Elhaski C3935 11697 5
Kafr Jales C3945 5824 6
Sarmin C3953 13335 7
Telamnas C3974 15809 8
Maar Shamsheh C3981 4425 9
Khan Shaykun C3987 11638 10
Sanjar C4024 4956 11
Has C4058 8995 12
Maar Tahroma C4071 6935 13
Tah C4099 7433 14
Harim C4115 19984 15
Sarmada C4121 39501 RC
Dana C4126 87452 16,17
Kafr Deryan C4132 10269 18
Salqin C4140 44626 19
Kafr Takharim C4157 18492 20
Qourqeena C4174 6526 21
Bsheiriyeh - Bello C4193 2828 22
Shaturiyeh C4232 1205 23
Janudiyeh C4255 9752 24
Ariha C4278 33059 25
Abdita C4291 2160 RC
Kafr Haya C4306 1459 26
Atmeh Camp92 61828 27,28
Doaat Al Kwait (Al Khayrat) Camp168 703 RC
Bab Al Hawa extension (Al Mutahaboun
Bellah) Camp236 1243 29
Al Hanbushiyeh Camp332 1608 30
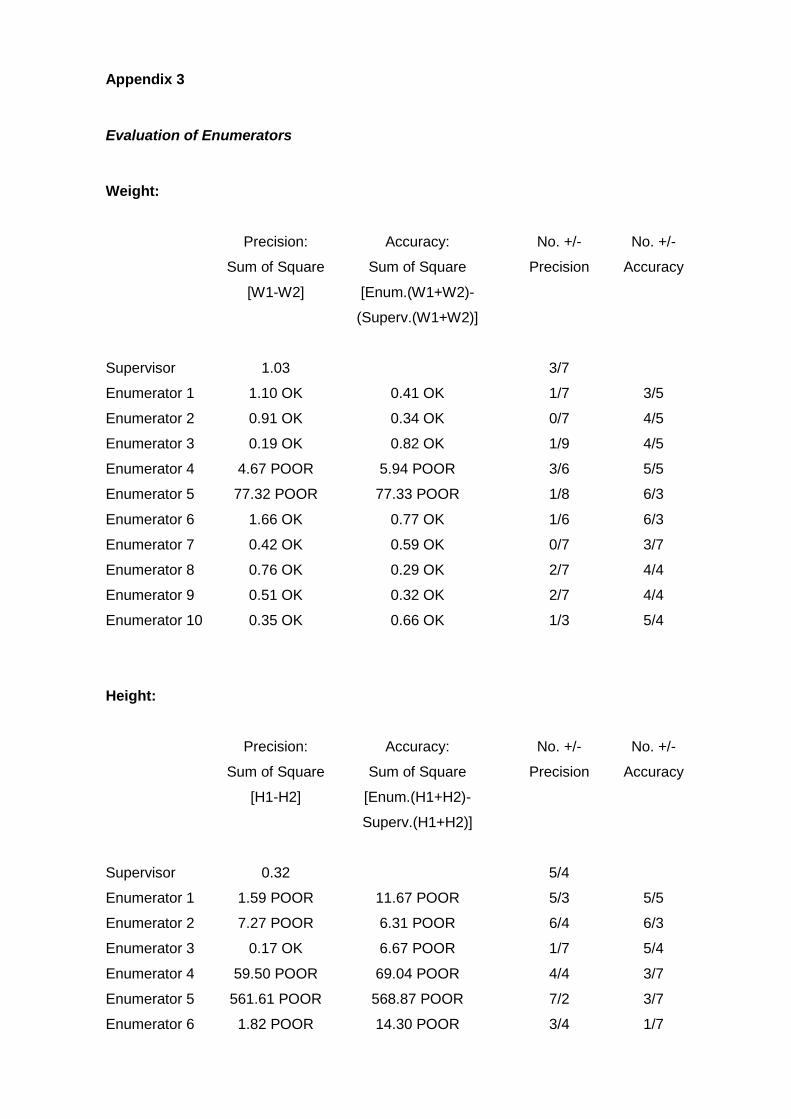
Appendix 3
Evaluation of Enumerators
Weight:
Precision: Accuracy: No. +/- No. +/-
Sum of Square Sum of Square Precision Accuracy
[W1-W2] [Enum.(W1+W2)-
(Superv.(W1+W2)]
Supervisor 1.03 3/7
Enumerator 1 1.10 OK 0.41 OK 1/7 3/5
Enumerator 2 0.91 OK 0.34 OK 0/7 4/5
Enumerator 3 0.19 OK 0.82 OK 1/9 4/5
Enumerator 4 4.67 POOR 5.94 POOR 3/6 5/5
Enumerator 5 77.32 POOR 77.33 POOR 1/8 6/3
Enumerator 6 1.66 OK 0.77 OK 1/6 6/3
Enumerator 7 0.42 OK 0.59 OK 0/7 3/7
Enumerator 8 0.76 OK 0.29 OK 2/7 4/4
Enumerator 9 0.51 OK 0.32 OK 2/7 4/4
Enumerator 10 0.35 OK 0.66 OK 1/3 5/4
Height:
Precision: Accuracy: No. +/- No. +/-
Sum of Square Sum of Square Precision Accuracy
[H1-H2] [Enum.(H1+H2)-
Superv.(H1+H2)]
Supervisor 0.32 5/4
Enumerator 1 1.59 POOR 11.67 POOR 5/3 5/5
Enumerator 2 7.27 POOR 6.31 POOR 6/4 6/3
Enumerator 3 0.17 OK 6.67 POOR 1/7 5/4
Enumerator 4 59.50 POOR 69.04 POOR 4/4 3/7
Enumerator 5 561.61 POOR 568.87 POOR 7/2 3/7
Enumerator 6 1.82 POOR 14.30 POOR 3/4 1/7
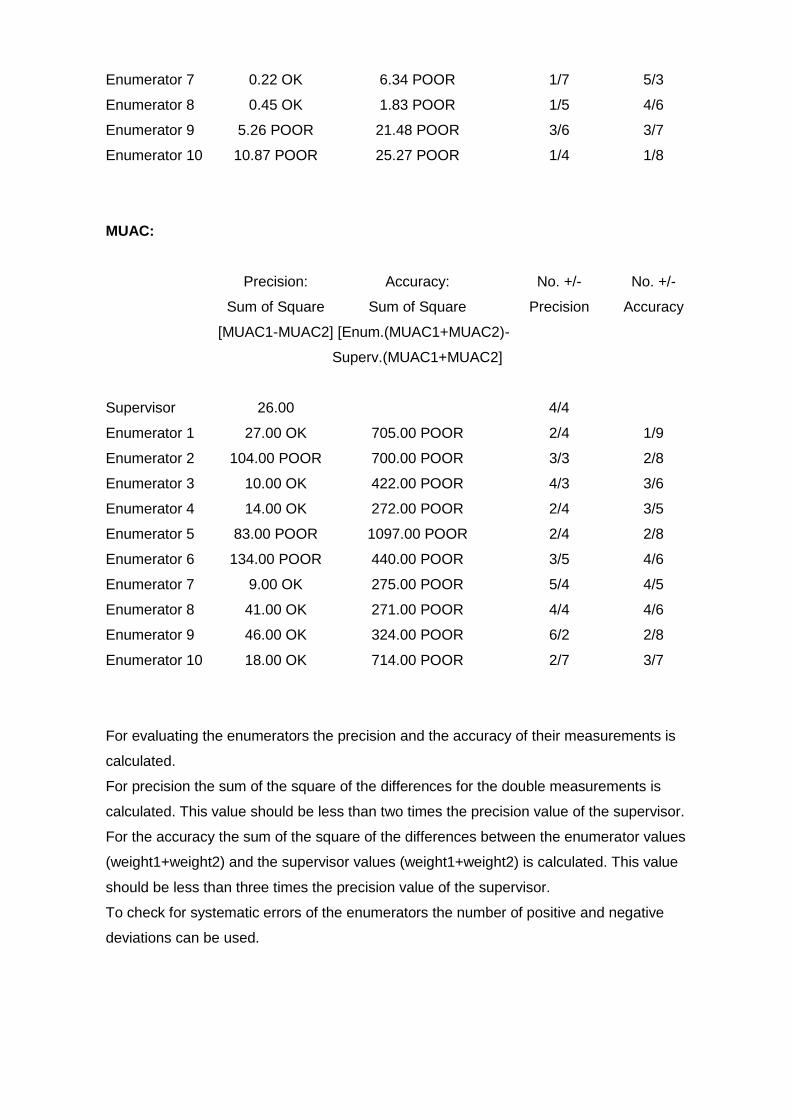
Enumerator 7 0.22 OK 6.34 POOR 1/7 5/3
Enumerator 8 0.45 OK 1.83 POOR 1/5 4/6
Enumerator 9 5.26 POOR 21.48 POOR 3/6 3/7
Enumerator 10 10.87 POOR 25.27 POOR 1/4 1/8
MUAC:
Precision: Accuracy: No. +/- No. +/-
Sum of Square Sum of Square Precision Accuracy
[MUAC1-MUAC2] [Enum.(MUAC1+MUAC2)-
Superv.(MUAC1+MUAC2]
Supervisor 26.00 4/4
Enumerator 1 27.00 OK 705.00 POOR 2/4 1/9
Enumerator 2 104.00 POOR 700.00 POOR 3/3 2/8
Enumerator 3 10.00 OK 422.00 POOR 4/3 3/6
Enumerator 4 14.00 OK 272.00 POOR 2/4 3/5
Enumerator 5 83.00 POOR 1097.00 POOR 2/4 2/8
Enumerator 6 134.00 POOR 440.00 POOR 3/5 4/6
Enumerator 7 9.00 OK 275.00 POOR 5/4 4/5
Enumerator 8 41.00 OK 271.00 POOR 4/4 4/6
Enumerator 9 46.00 OK 324.00 POOR 6/2 2/8
Enumerator 10 18.00 OK 714.00 POOR 2/7 3/7
For evaluating the enumerators the precision and the accuracy of their measurements is
calculated.
For precision the sum of the square of the differences for the double measurements is
calculated. This value should be less than two times the precision value of the supervisor.
For the accuracy the sum of the square of the differences between the enumerator values
(weight1+weight2) and the supervisor values (weight1+weight2) is calculated. This value
should be less than three times the precision value of the supervisor.
To check for systematic errors of the enumerators the number of positive and negative
deviations can be used.
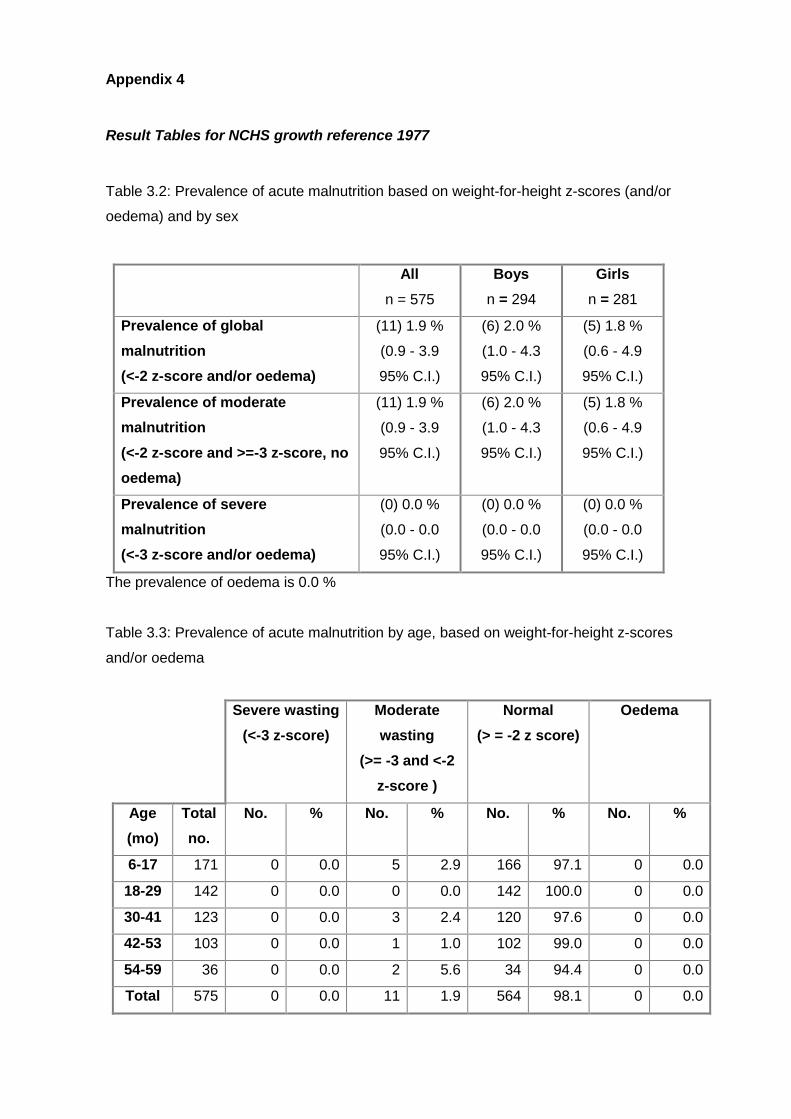
Appendix 4
Result Tables for NCHS growth reference 1977
Table 3.2: Prevalence of acute malnutrition based on weight-for-height z-scores (and/or
oedema) and by sex
All
n = 575
Boys
n = 294
Girls
n = 281
Prevalence of global
malnutrition
(<-2 z-score and/or oedema)
(11) 1.9 %
(0.9 - 3.9
95% C.I.)
(6) 2.0 %
(1.0 - 4.3
95% C.I.)
(5) 1.8 %
(0.6 - 4.9
95% C.I.)
Prevalence of moderate
malnutrition
(<-2 z-score and >=-3 z-score, no
oedema)
(11) 1.9 %
(0.9 - 3.9
95% C.I.)
(6) 2.0 %
(1.0 - 4.3
95% C.I.)
(5) 1.8 %
(0.6 - 4.9
95% C.I.)
Prevalence of severe
malnutrition
(<-3 z-score and/or oedema)
(0) 0.0 %
(0.0 - 0.0
95% C.I.)
(0) 0.0 %
(0.0 - 0.0
95% C.I.)
(0) 0.0 %
(0.0 - 0.0
95% C.I.)
The prevalence of oedema is 0.0 %
Table 3.3: Prevalence of acute malnutrition by age, based on weight-for-height z-scores
and/or oedema
Severe wasting
(<-3 z-score)
Moderate
wasting
(>= -3 and <-2
z-score )
Normal
(> = -2 z score)
Oedema
Age
(mo)
Total
no.
No. % No. % No. % No. %
6-17 171 0 0.0 5 2.9 166 97.1 0 0.0
18-29 142 0 0.0 0 0.0 142 100.0 0 0.0
30-41 123 0 0.0 3 2.4 120 97.6 0 0.0
42-53 103 0 0.0 1 1.0 102 99.0 0 0.0
54-59 36 0 0.0 2 5.6 34 94.4 0 0.0
Total 575 0 0.0 11 1.9 564 98.1 0 0.0
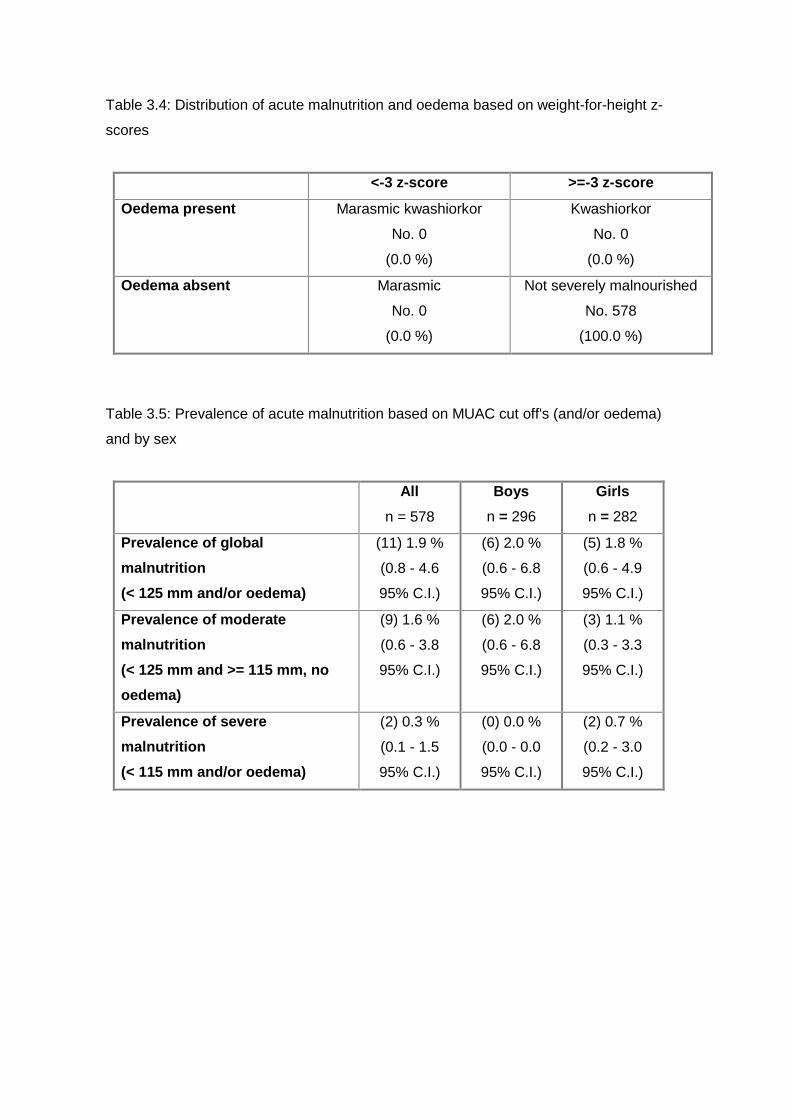
Table 3.4: Distribution of acute malnutrition and oedema based on weight-for-height z-
scores
<-3 z-score >=-3 z-score
Oedema present Marasmic kwashiorkor
No. 0
(0.0 %)
Kwashiorkor
No. 0
(0.0 %)
Oedema absent Marasmic
No. 0
(0.0 %)
Not severely malnourished
No. 578
(100.0 %)
Table 3.5: Prevalence of acute malnutrition based on MUAC cut off's (and/or oedema)
and by sex
All
n = 578
Boys
n = 296
Girls
n = 282
Prevalence of global
malnutrition
(< 125 mm and/or oedema)
(11) 1.9 %
(0.8 - 4.6
95% C.I.)
(6) 2.0 %
(0.6 - 6.8
95% C.I.)
(5) 1.8 %
(0.6 - 4.9
95% C.I.)
Prevalence of moderate
malnutrition
(< 125 mm and >= 115 mm, no
oedema)
(9) 1.6 %
(0.6 - 3.8
95% C.I.)
(6) 2.0 %
(0.6 - 6.8
95% C.I.)
(3) 1.1 %
(0.3 - 3.3
95% C.I.)
Prevalence of severe
malnutrition
(< 115 mm and/or oedema)
(2) 0.3 %
(0.1 - 1.5
95% C.I.)
(0) 0.0 %
(0.0 - 0.0
95% C.I.)
(2) 0.7 %
(0.2 - 3.0
95% C.I.)
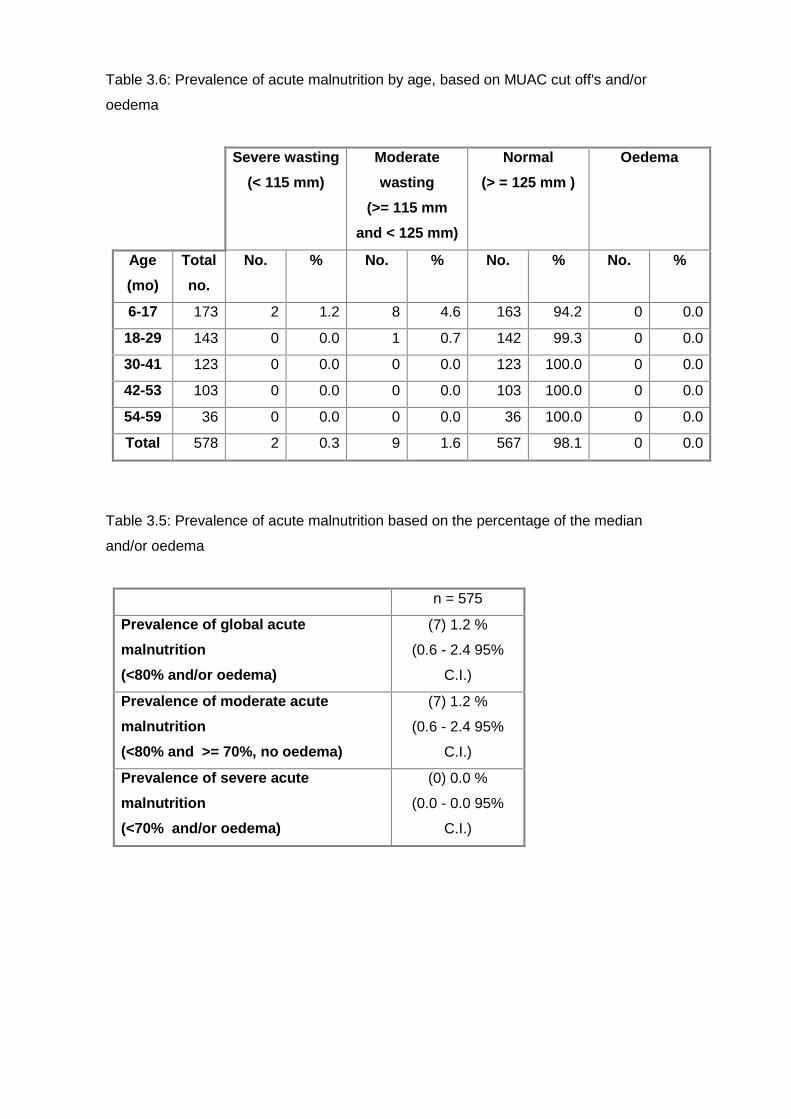
Table 3.6: Prevalence of acute malnutrition by age, based on MUAC cut off's and/or
oedema
Severe wasting
(< 115 mm)
Moderate
wasting
(>= 115 mm
and < 125 mm)
Normal
(> = 125 mm )
Oedema
Age
(mo)
Total
no.
No. % No. % No. % No. %
6-17 173 2 1.2 8 4.6 163 94.2 0 0.0
18-29 143 0 0.0 1 0.7 142 99.3 0 0.0
30-41 123 0 0.0 0 0.0 123 100.0 0 0.0
42-53 103 0 0.0 0 0.0 103 100.0 0 0.0
54-59 36 0 0.0 0 0.0 36 100.0 0 0.0
Total 578 2 0.3 9 1.6 567 98.1 0 0.0
Table 3.5: Prevalence of acute malnutrition based on the percentage of the median
and/or oedema
n = 575
Prevalence of global acute
malnutrition
(<80% and/or oedema)
(7) 1.2 %
(0.6 - 2.4 95%
C.I.)
Prevalence of moderate acute
malnutrition
(<80% and >= 70%, no oedema)
(7) 1.2 %
(0.6 - 2.4 95%
C.I.)
Prevalence of severe acute
malnutrition
(<70% and/or oedema)
(0) 0.0 %
(0.0 - 0.0 95%
C.I.)
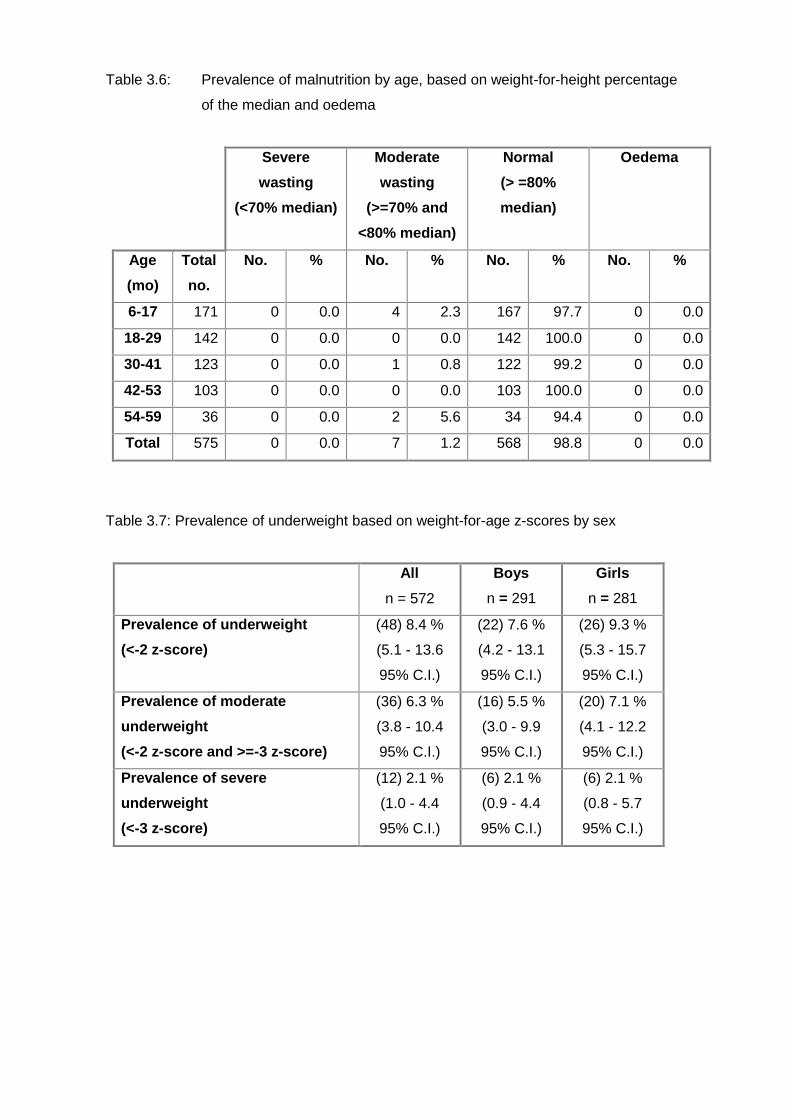
Table 3.6: Prevalence of malnutrition by age, based on weight-for-height percentage
of the median and oedema
Severe
wasting
(<70% median)
Moderate
wasting
(>=70% and
<80% median)
Normal
(> =80%
median)
Oedema
Age
(mo)
Total
no.
No. % No. % No. % No. %
6-17 171 0 0.0 4 2.3 167 97.7 0 0.0
18-29 142 0 0.0 0 0.0 142 100.0 0 0.0
30-41 123 0 0.0 1 0.8 122 99.2 0 0.0
42-53 103 0 0.0 0 0.0 103 100.0 0 0.0
54-59 36 0 0.0 2 5.6 34 94.4 0 0.0
Total 575 0 0.0 7 1.2 568 98.8 0 0.0
Table 3.7: Prevalence of underweight based on weight-for-age z-scores by sex
All
n = 572
Boys
n = 291
Girls
n = 281
Prevalence of underweight
(<-2 z-score)
(48) 8.4 %
(5.1 - 13.6
95% C.I.)
(22) 7.6 %
(4.2 - 13.1
95% C.I.)
(26) 9.3 %
(5.3 - 15.7
95% C.I.)
Prevalence of moderate
underweight
(<-2 z-score and >=-3 z-score)
(36) 6.3 %
(3.8 - 10.4
95% C.I.)
(16) 5.5 %
(3.0 - 9.9
95% C.I.)
(20) 7.1 %
(4.1 - 12.2
95% C.I.)
Prevalence of severe
underweight
(<-3 z-score)
(12) 2.1 %
(1.0 - 4.4
95% C.I.)
(6) 2.1 %
(0.9 - 4.4
95% C.I.)
(6) 2.1 %
(0.8 - 5.7
95% C.I.)
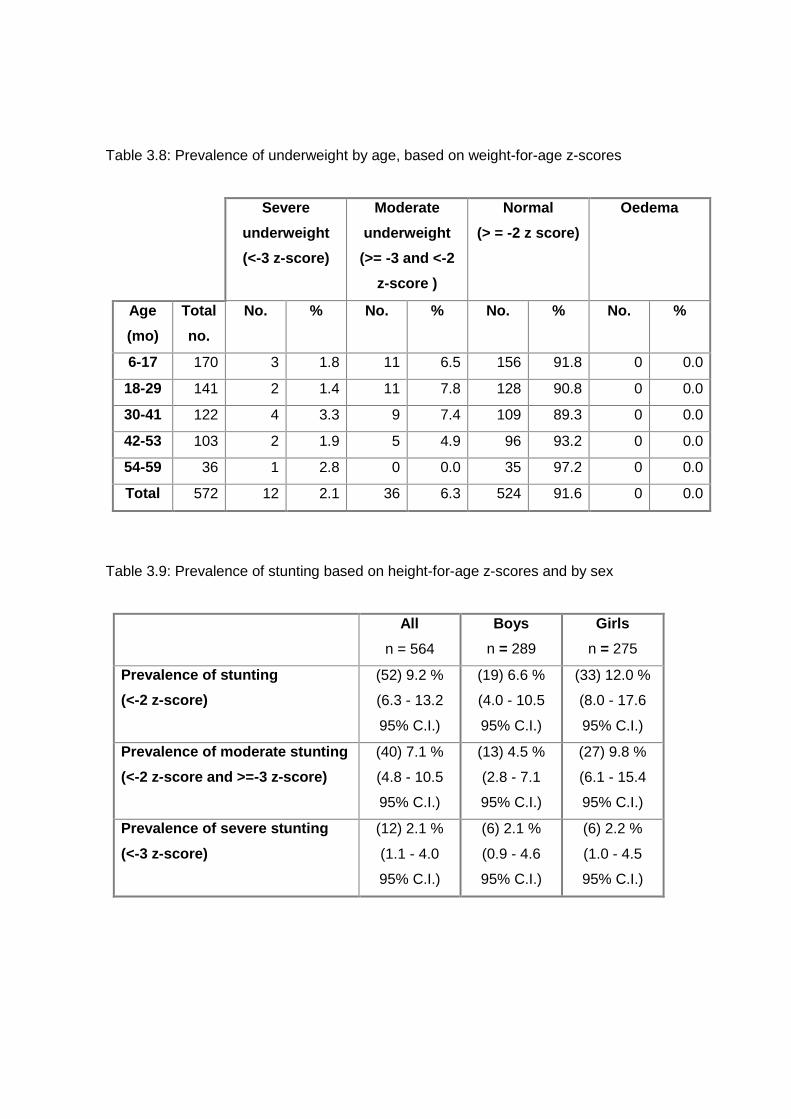
Table 3.8: Prevalence of underweight by age, based on weight-for-age z-scores
Severe
underweight
(<-3 z-score)
Moderate
underweight
(>= -3 and <-2
z-score )
Normal
(> = -2 z score)
Oedema
Age
(mo)
Total
no.
No. % No. % No. % No. %
6-17 170 3 1.8 11 6.5 156 91.8 0 0.0
18-29 141 2 1.4 11 7.8 128 90.8 0 0.0
30-41 122 4 3.3 9 7.4 109 89.3 0 0.0
42-53 103 2 1.9 5 4.9 96 93.2 0 0.0
54-59 36 1 2.8 0 0.0 35 97.2 0 0.0
Total 572 12 2.1 36 6.3 524 91.6 0 0.0
Table 3.9: Prevalence of stunting based on height-for-age z-scores and by sex
All
n = 564
Boys
n = 289
Girls
n = 275
Prevalence of stunting
(<-2 z-score)
(52) 9.2 %
(6.3 - 13.2
95% C.I.)
(19) 6.6 %
(4.0 - 10.5
95% C.I.)
(33) 12.0 %
(8.0 - 17.6
95% C.I.)
Prevalence of moderate stunting
(<-2 z-score and >=-3 z-score)
(40) 7.1 %
(4.8 - 10.5
95% C.I.)
(13) 4.5 %
(2.8 - 7.1
95% C.I.)
(27) 9.8 %
(6.1 - 15.4
95% C.I.)
Prevalence of severe stunting
(<-3 z-score)
(12) 2.1 %
(1.1 - 4.0
95% C.I.)
(6) 2.1 %
(0.9 - 4.6
95% C.I.)
(6) 2.2 %
(1.0 - 4.5
95% C.I.)
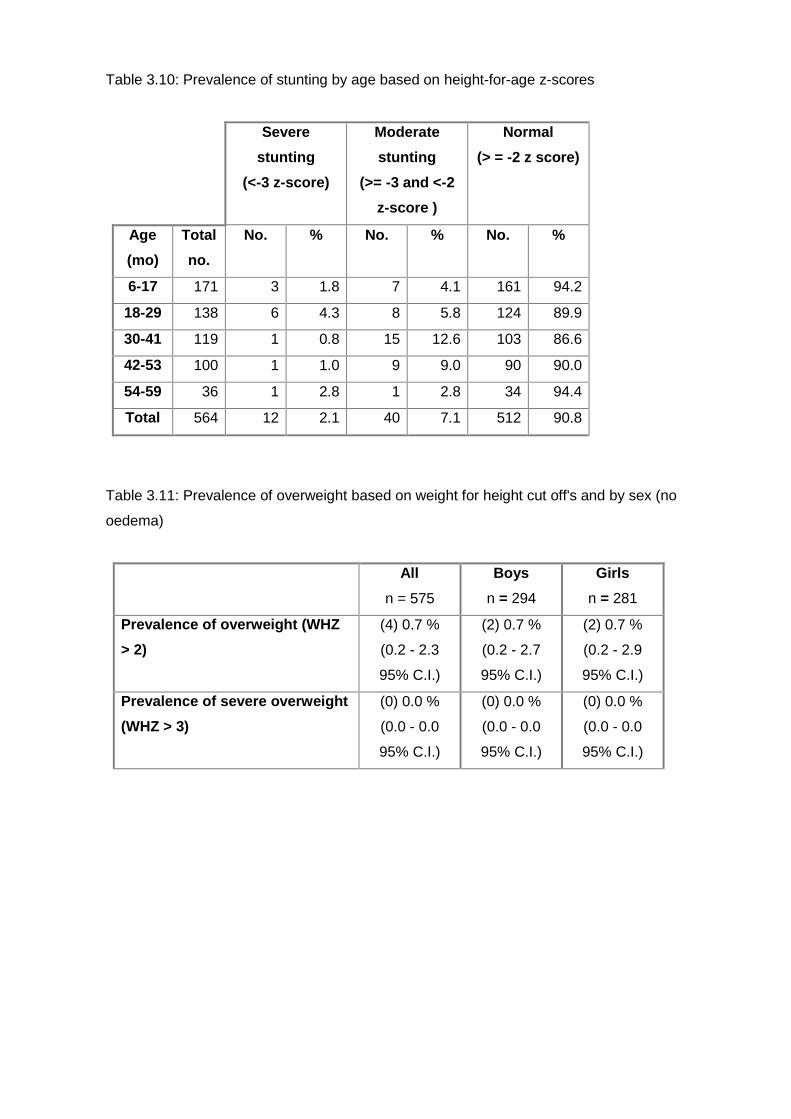
Table 3.10: Prevalence of stunting by age based on height-for-age z-scores
Severe
stunting
(<-3 z-score)
Moderate
stunting
(>= -3 and <-2
z-score )
Normal
(> = -2 z score)
Age
(mo)
Total
no.
No. % No. % No. %
6-17 171 3 1.8 7 4.1 161 94.2
18-29 138 6 4.3 8 5.8 124 89.9
30-41 119 1 0.8 15 12.6 103 86.6
42-53 100 1 1.0 9 9.0 90 90.0
54-59 36 1 2.8 1 2.8 34 94.4
Total 564 12 2.1 40 7.1 512 90.8
Table 3.11: Prevalence of overweight based on weight for height cut off's and by sex (no
oedema)
All
n = 575
Boys
n = 294
Girls
n = 281
Prevalence of overweight (WHZ
> 2)
(4) 0.7 %
(0.2 - 2.3
95% C.I.)
(2) 0.7 %
(0.2 - 2.7
95% C.I.)
(2) 0.7 %
(0.2 - 2.9
95% C.I.)
Prevalence of severe overweight
(WHZ > 3)
(0) 0.0 %
(0.0 - 0.0
95% C.I.)
(0) 0.0 %
(0.0 - 0.0
95% C.I.)
(0) 0.0 %
(0.0 - 0.0
95% C.I.)
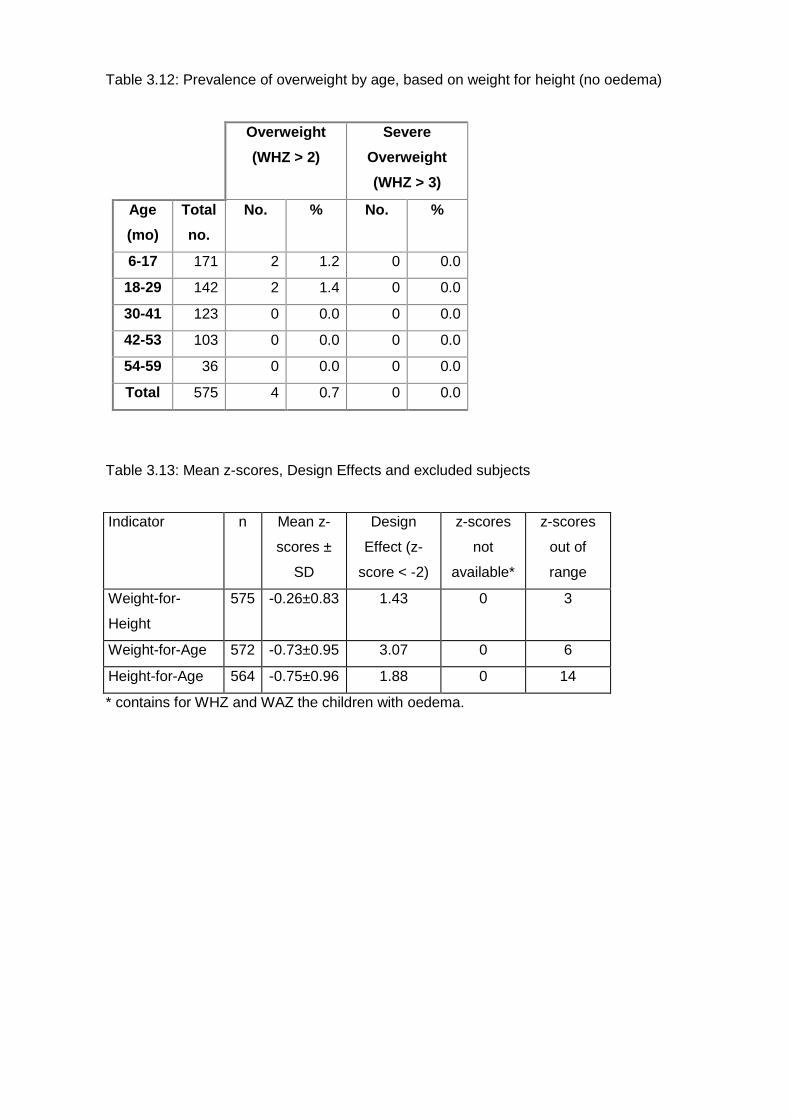
Table 3.12: Prevalence of overweight by age, based on weight for height (no oedema)
Overweight
(WHZ > 2)
Severe
Overweight
(WHZ > 3)
Age
(mo)
Total
no.
No. % No. %
6-17 171 2 1.2 0 0.0
18-29 142 2 1.4 0 0.0
30-41 123 0 0.0 0 0.0
42-53 103 0 0.0 0 0.0
54-59 36 0 0.0 0 0.0
Total 575 4 0.7 0 0.0
Table 3.13: Mean z-scores, Design Effects and excluded subjects
Indicator n Mean z-
scores ±
SD
Design
Effect (z-
score < -2)
z-scores
not
available*
z-scores
out of
range
Weight-for-
Height
575 -0.26±0.83 1.43 0 3
Weight-for-Age 572 -0.73±0.95 3.07 0 6
Height-for-Age 564 -0.75±0.96 1.88 0 14
* contains for WHZ and WAZ the children with oedema.
Appendix 5
Maps of area
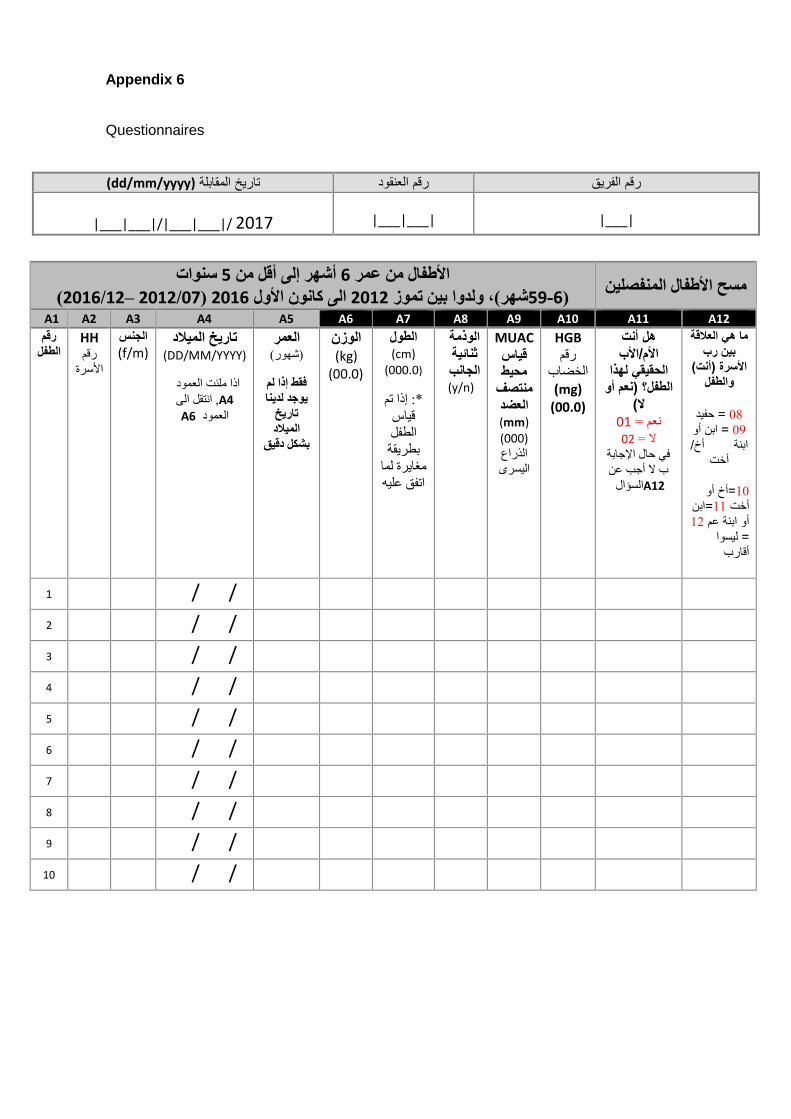
Appendix 6
Questionnaires
رقم الفريق رقم العنقود (dd/mm/yyyy)تاريخ المقابلة
|___|___|/|___|___|/ 2017
|___|___|
|___|
سنوات 5أشهر إلى أقل من 6فال من عمر األط (12/2016– 07/2012) 2016الى كانون األول 2012تموز بين شهر(، ولدوا6-59)
المنفصلينمسح األطفال
A1 A2 A3 A4 A5 A6 A7 A8 A9 A10 A11 A12
رقم
الطفلHH رقم
األسرة
الجنس
(f/m) تاريخ الميالد
(DD/MM/YYYY)
ملئت العموداذا A4 انتقل الى ,
A6العمود
العمر
(شهور)
فقط إذا لم
يوجد لدينا
تاريخ
الميالد
بشكل دقيق
الوزن(kg)
(00.0)
الطول(cm)
(000.0)
*: إذا تم
ياس ق
الطفل
بطريقة
مغايرة لما
اتفق عليه
الوذمة
ثنائية
الجانب(y/n)
MUAC
قياس
محيط
منتصف
العضد(mm)
(000)
الذراع
اليسرى
HGB رقم
الخضاب
(mg) (00.0)
أنت هل األب/األم
لهذا الحقيقي أو )نعم الطفل؟
ال(
01نعم =
02ال =
في حال اإلجابة
ب ال أجب عن
A12السؤال
ما هي العالقة بين رب
األسرة )أنت( والطفل
= حفيد 08= ابن أو 09
ابنة أخ/ أخت
=أخ أو 10
=ابن 11أخت 12أو ابنة عم
= ليسوا أقارب
1 / /
2 / /
3 / /
4 / /
5 / /
6 / /
7 / /
8 / /
9 / /
10 / /

رقم الفريق رقم العنقود (dd/mm/yyyy)تاريخ المقابلة
|___|___|/|___|___|/ 2017
|___|___|
|___|
سنوات 5أشهر إلى أقل من 6فال من عمر األطالى كانون األول 2012تموز بين شهر(، ولدوا6-59)
2016 (07/2012 –12/2016)
األطفال المنفصلينمسح
A1 A2 A3 A4 A5 A6 A7 A8 A9 A10 A11 A12
رقم
الطفلHH رقم
األسرة
الجن
س
(f/m)
تاريخ الميالد(DD/MM/YY
YY)
ملئت العموداذا A4 انتقل الى ,
A6العمود
العمر
(شهور)
فقط إذا لم
يوجد لدينا
تاريخ
الميالد
بشكل دقيق
الوزن(kg)
(00.0)
الطول(cm)
(000.0)
*: إذا تم
ياس ق
الطفل
بطريقة
مغايرة
لما اتفق
عليه
الوذمة
ثنائية
الجانب(y/n)
MUAC
قياس محيط
منتصف العضد(mm)
(000)
الذراع اليسرى
HGB رقم
الخضاب
(mg) (00.0)
أنت هل األب/األم
الحقيقي لهذا
الطفل؟ ال( أو )نعم
01نعم =
02ال =
في حال
اإلجابة ب
ال أجب عن
السؤال
التالي A12
ما هي العالقة بين رب
األسرة )أنت( والطفل
= حفيد 08= ابن أو 09
ابنة أخ/ أخت
=أخ أو 10
=ابن 11أخت 12أو ابنة عم
= ليسوا أقارب
11 / /
12 / /
13 / /
14 / /
15 / /
16 / /
17 / /
18 / /
19 / /
20 / /
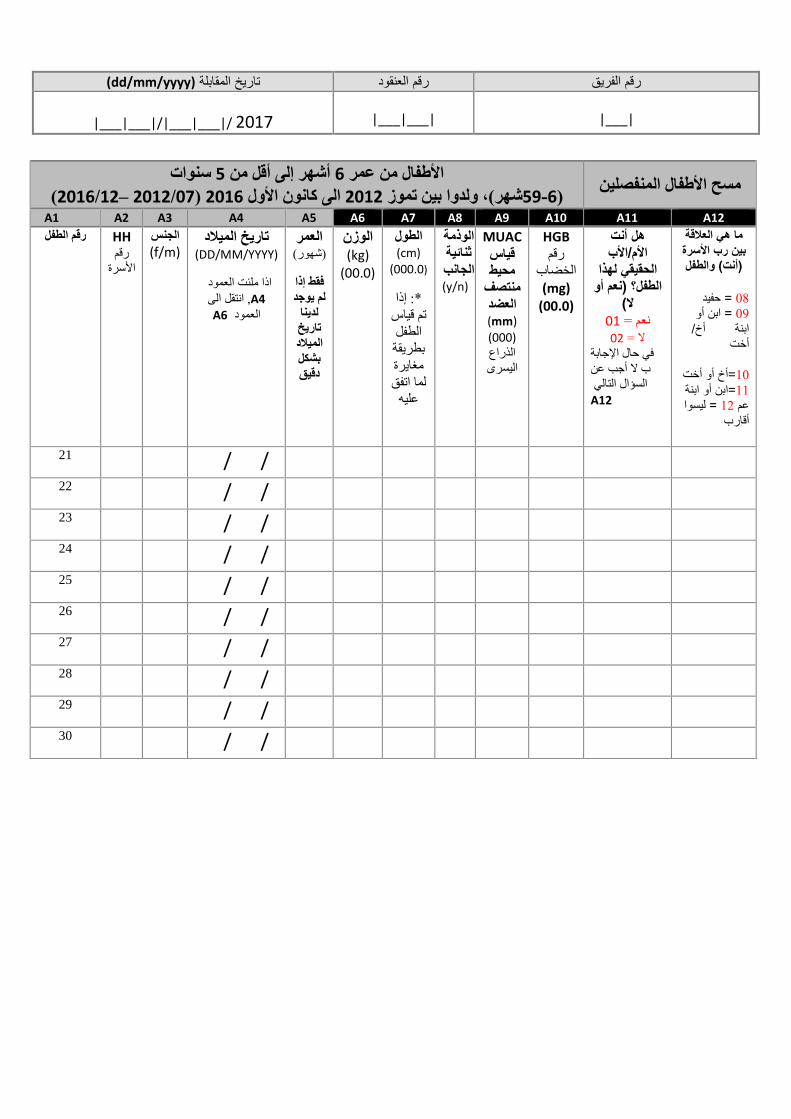
رقم الفريق رقم العنقود (dd/mm/yyyy)تاريخ المقابلة
|___|___|/|___|___|/ 2017
|___|___|
|___|
سنوات 5أشهر إلى أقل من 6فال من عمر األط (12/2016– 07/2012) 2016الى كانون األول 2012تموز بين شهر(، ولدوا6-59)
مسح األطفال المنفصلين
A1 A2 A3 A4 A5 A6 A7 A8 A9 A10 A11 A12
HH رقم الطفل رقم
األسرة
الجنس
(f/m) تاريخ الميالد
(DD/MM/YYYY)
ملئت العموداذا A4 انتقل الى ,
A6العمود
العمر
(شهور)
فقط إذا
لم يوجد
لدينا
تاريخ
الميالد
بشكل
دقيق
الوزن(kg)
(00.0)
الطول(cm)
(000.0)
*: إذا
ياس قتم
الطفل
بطريقة
مغايرة
لما اتفق
عليه
الوذمة
ثنائية
الجانب(y/n)
MUAC
قياس
محيط
منتصف
العضد(mm)
(000)
الذراع
اليسرى
HGB رقم
الخضاب
(mg) (00.0)
أنت هل األب/األم
لهذا الحقيقي أو )نعم الطفل؟
ال(
01نعم =
02ال =
في حال اإلجابة
ب ال أجب عن
السؤال التالي A12
ما هي العالقة بين رب األسرة )أنت( والطفل
= حفيد 08= ابن أو 09
ابنة أخ/ أخت
=أخ أو أخت 10=ابن أو ابنة 11= ليسوا 12عم
أقارب
21 / /
22 / /
23 / /
24 / /
25 / /
26 / /
27 / /
28 / /
29 / /
30 / /