nrc 3d imaging technology for museum and heritage applications
TRANSCRIPT
NRC Publications Archive (NPArC)Archives des publications du CNRC (NPArC)
Publisher’s version / la version de l'éditeur: The Journal of Visualization and Computer Animation, 14, 3, pp. 121-138, 2003
NRC 3D Imaging Technology for Museum and Heritage ApplicationsTaylor, J.; Beraldin, J-A; Godin, G.; Cournoyer, L.; Baribeau, R.; Rioux, M.; Domey, J.
Contact us / Contactez nous: [email protected].
http://nparc.cisti-icist.nrc-cnrc.gc.ca/npsi/jsp/nparc_cp.jsp?lang=frL’accès à ce site Web et l’utilisation de son contenu sont assujettis aux conditions présentées dans le site
Web page / page Webhttp://dx.doi.org/10.1002/vis.311http://nparc.cisti-icist.nrc-cnrc.gc.ca/npsi/ctrl?action=rtdoc&an=5765704&lang=enhttp://nparc.cisti-icist.nrc-cnrc.gc.ca/npsi/ctrl?action=rtdoc&an=5765704&lang=fr
LISEZ CES CONDITIONS ATTENTIVEMENT AVANT D’UTILISER CE SITE WEB.
READ THESE TERMS AND CONDITIONS CAREFULLY BEFORE USING THIS WEBSITE.
Access and use of this website and the material on it are subject to the Terms and Conditions set forth athttp://nparc.cisti-icist.nrc-cnrc.gc.ca/npsi/jsp/nparc_cp.jsp?lang=en
National Research
Council Canada
Institute for
Information Technology
Conseil national
de recherches Canada
Institut de technologie
de l'information
NRC 3D Technology for Museum and Heritage Applications * Taylor, J., Beraldin, J.-A., Godin, G., Cournoyer, L., Baribeau, R., Blais, F., Rioux, M., and Domey, J. 2003 * published in The Journal of Visualization and Computer Animation.
Volume 14, (3), 2003. pp. 121-138. NRC 46586.
Copyright 2003 by
National Research Council of Canada
Permission is granted to quote short excerpts and to reproduce figures and tables from this report,
provided that the source of such material is fully acknowledged.
Submitted to: The Journal of Visualization and Computer Animation
NRC 3D Imaging Technology for Museum & Heritage Applications
J. Taylor, J-A Beraldin, G. Godin, L. Cournoyer, R. Baribeau, M. Rioux & J. Domey
Visual Information Technology
Institute for Information Technology
National Research Council of Canada
Ottawa, Canada, K1A OR6
Tel. (1) 613 991 1127 Fax. (1) 613 952 0215
email: [email protected]
Abstract
The National Research Council of Canada (NRC) has developed and patented three
high-resolution 3D imaging systems and processing algorithms which have been applied to
a wide range of museum and heritage recording applications. The systems have been
designed for different imaging applications and, in collaboration with a number of national
and international museums and cultural agencies, have been used to scan a wide variety of
objects and sites. The objective of this paper is to present a summary of the 3D technology
and examples of its heritage applications.
Keywords: 3D imaging, museum and heritage applications, laser range sensing, shape
and appearance modeling.
Introduction:
The Visual Information Technology Group of the National Research Council of
Canada (NRC), has developed three high resolution 3D digital or “laser scanner” imaging
systems and processing algorithms which have been applied to a variety of heritage
recording projects. These projects have been undertaken in collaboration with several
Canadian museums including the Canadian Conservation Institute, the Canadian Museum
of Civilization and the National Gallery of Canada. In addition, we have also collaborated
on several international demonstration projects with institutions including the British
Museum, the Centre de recherche et de restauration des musées de France, the Peabody
Museum, the Israel Antiquities Authority, the State Administration of Cultural Heritage in
China and in Italy with the Universites of Lecce, Florence, Padova, Ferrara, and Stanford.
One of the systems, the High Resolution Color Laser Scanner, has been used for
scanning typical museum and art gallery collections including paintings, ethnographic and
archaeological collections and natural history specimens. Two monochrome systems, the
Biris 3D Laser Camera and the Large Volume Laser Scanner, have been used in the field
to digitize archaeological site features, architectural elements on historic buildings and
large sculptures.
The purpose of this paper is to present a summary of the 3D technology and some
examples of the museum and heritage recording applications demonstrated to date.
NRC 3D Imaging Systems
The three laser scanner systems use triangulation based scanning and detection
systems and are designed for different types of objects and imaging applications.
Autosyncronized Spot Scanning Technology
Two of the systems, the High Resolution Color Laser Scanner and the Large
Volume of View Scanner (also known as a Random Access Camera) are based on the
patented autosynchronized spot scanning principle [1]. The camera configuration (Figure
1) differs from the usual spot triangulation of other systems in that the directions of
projection of the laser beam and the optical axis of the detection system are rotated
synchronously through a double-sided mirror. The camera works by projecting a small
low power – object safe - laser spot from a laser source to the object via one side of the
scanning mirror. The spot is then imaged on a charge-coupled device (CCD) detector via
the opposite side of the scanning mirror and the spatial (x,y,z) coordinates of the spot on
the object are obtained by triangulation. As such, the instantaneous field of view of the
position detector follows the spot as it scans the scene. The focal length of the lens is
therefore related only to the desired depth of field or measurement range and not to the
total lateral field of view.
The autosynchronized-scanning configuration offers a number of significant
features that alleviate compromises between field of view, resolution and shadow effects. It
allows very large fields of view, which enables full coverage of the scene without
compromising the measurement uncertainty jz. With smaller triangulation angles, a
reduction of shadow effects is inherently achieved and, due to the small instantaneous field
of view, the system is relatively immune to effects from ambient light. Speckle noise is
reduced through spatial filtering by way of the synchronous scan/detection arrangement. It
also yields a considerable reduction in the optical head size compared to conventional
triangulation methods.
Figure 2 illustrates the resolution limits of the autosynchronized technology in
relation to the size of object to be scanned. In the X and Y directions (perpendicular to the
laser projection), optical triangulation is limited by the diffraction of the laser beam [2,3,4].
As shown in the diagram, the laser beam does not maintain collimation with distance. The
smaller the beam, the larger is the divergence produced by diffraction. The solid line shows
the relationship between the X and Y axis and physical dimensions of the object. While
diffraction imposes resolution constraints on the X and Y axes, in a well designed system,
the Z axis resolution is limited by laser speckle as shown in the dotted line [5].
High Resolution Color Laser Scanner
For scanning museum objects such as paintings, ethnographic and archaeological
collections and natural history specimens, one very important feature of the
autosynchronized system is that two relatively simple modifications can be made which
enable simultaneous shape and color digitization. As illustrated in Figure 3, three laser
wavelengths - red, green and blue (RGB) are used as the laser source. When superimposed
in the scanning system, it results in the projection of a 50 – 100 micron diameter “white”
laser spot on the object. In the detector, a color separation device such as a prism or a
dispersive optical element is added near the lens to split the three RGB wavelengths
reflected from the object on the CCD detector. The amplitudes of the three peaks are
converted into reflectance values for the three wavelengths by a calibration process that
takes into account the geometry of illumination and detection at each surface element [6].
Due to the simultaneous position and amplitude digitizing of the three colors on the CCD,
the geometric shape (x,y,z) data and the color (R,G,B) data are recorded in perfect
registration. This is a unique feature of the technology – particularly for recording
important works of art.
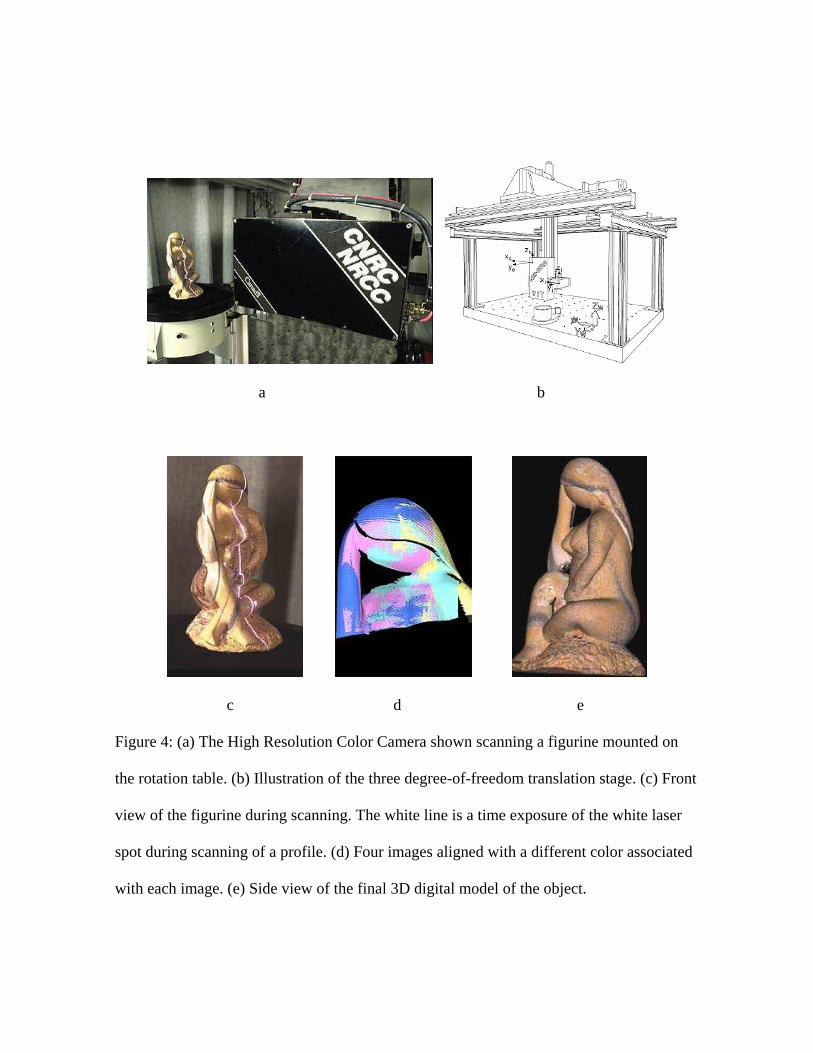
In operation, the camera (Figure 4a) is mounted on a stable three degree-of-
freedom translation stage (illustrated in Figure 4b), which is also equipped with a rotation
table. Depending on the shape of the object, scans are made either by rotating the object on
the rotation table or by scanning successive views using the translation stage. Each view is
composed of 1024 profiles and each profile contains 1024 coordinates of x, y, z, R, G, B
shape and color data (Figure 4c). In order to digitize a complete object, a series of
successive scans or overlapping multiple images are recorded over the complete surface of
the object. The scans are subsequently merged (Figure 4d) into a final archival quality 3D
digital model of the object (Figure 4e).
In its maximum resolution configuration, this system provides a spatial (x and y)
resolution of 50 microns (0.050 mm) and a depth (z) uncertainty of 10 microns (0.010
mm). This resolution is sufficient to record and examine fine brush stroke details on
paintings as well as tool mark features on sculptures and archaeological objects. Other
specifications of the High Resolution Camera in comparison to the other NRC camera
systems are presented in Table 1.
On a commercial basis, NRC has licensed this technology to Arius3D
(http://www.arius3d.com).
The Large Volume of View (Random Access) Laser Scanner
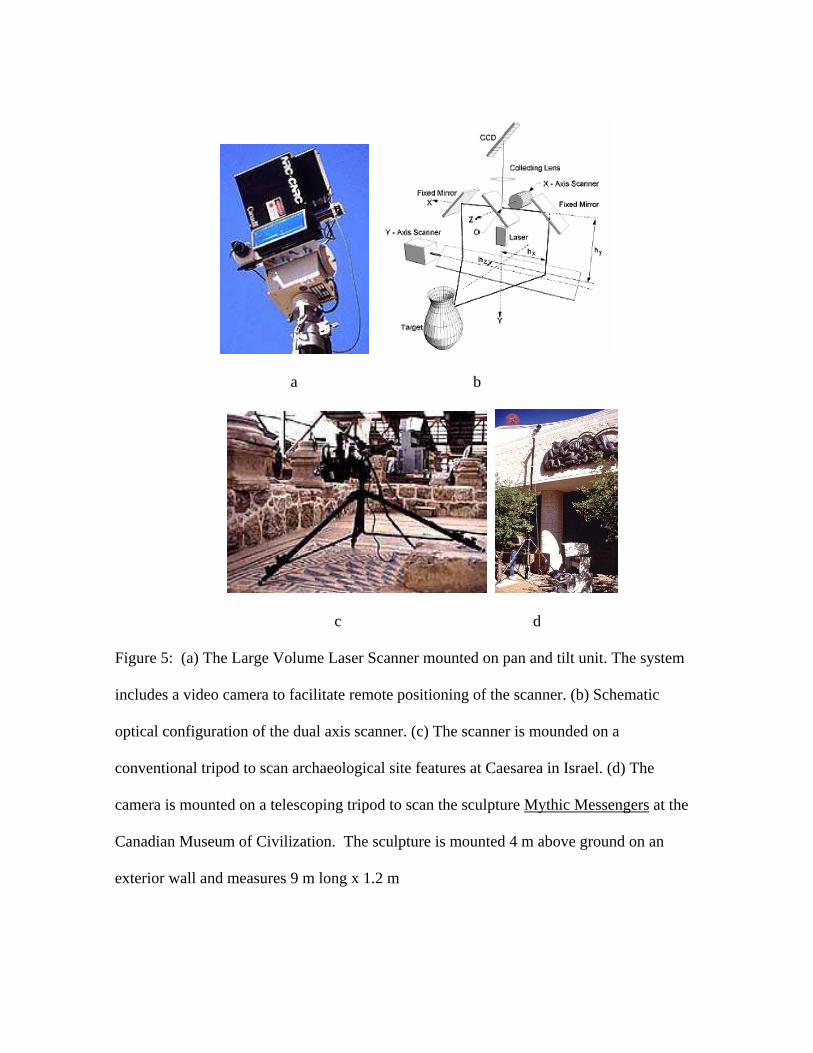
The Large Volume of View Laser Scanner (Figure 5a) – which is also known as a
Random Access Scanner - is also based on NRC's autosynchronized laser scanner
technology [7]. It is a dual axis scanning system and is designed for high-resolution
monochrome 3D digitization of large structures.
The basic optical configuration for the system depicted in Figure 5b. The x-axis
scanner achieves the synchronised scanning, while the y-axis scanner provides deflection
of both the projected and the detected beam. Both mirrors are driven by galvanometers.
This configuration enables two imaging modes. For raster mode imaging, the x-axis
scanner (fast axis) is used for the line scanning while the y-axis (slower speed) vertically
deflects the scanned beam to produce a raster image. For panoramic scan mode imaging,
the x-axis scanner is used for vertical scans while the camera is rotated on a motorized pan
and tilt stage to record panoramic views of the scene. In operation, the scanner can be
mounted either on a conventional photographic tripod (Figure 5c) or on a custom designed
telescoping tripod, which can be raised to a height of 10 m (Figure 5d).
The system allows 3D recordings at a camera to object distance (camera standoff)
which ranges from 50 cm to 10 m. At a standoff of 50 cm, it provides a resolution of 70
microns (0.07 mm), which increases as the square of the distance. For example, at a 10 m
standoff, the resolution is 5 mm. Spatial sampling resolution along the x and y scan
directions is determined by the laser beam diffraction limit as discussed above. Theoretical
predictions and laboratory measurements have shown that images with a resolution of
more than 10,000 x 10,000 are possible. This spatial resolution combined with a z
measurement uncertainty of better than 0.1 mm at close range yield very high-resolution
images. Other specifications are listed in Table 1.
For museum and heritage applications, the system has been used to for recording
archaeological site features in Israel as well as for digitizing large sculptures at the
Canadian Museum of Civilization. Although the Large Volume Laser Scanner is currently
a research prototype system in our laboratory and is not commercially available for
heritage applications, a commercial space flight version was constructed for a space flight
by Neptec (http://www.neptec.com/) in 2001 [8].
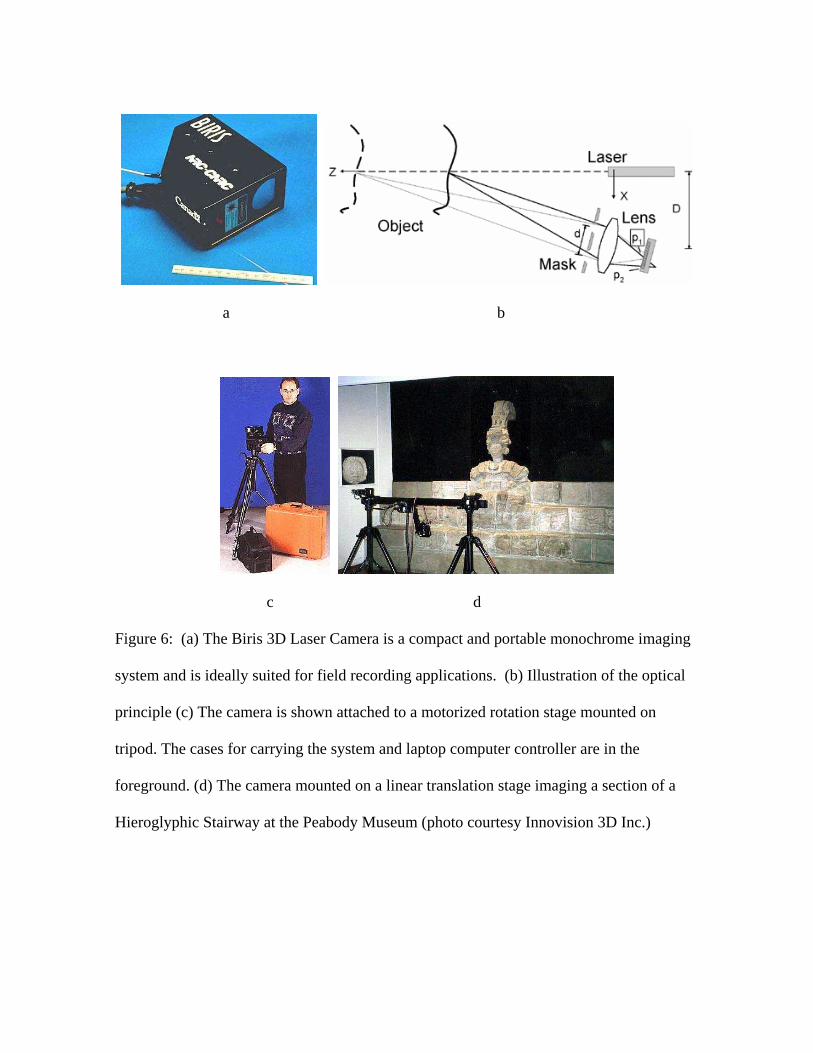
The Biris 3D Laser Camera
The Biris 3D Laser Camera (Figure 6a) is a portable monochrome 3D imaging
system developed to work in difficult environments where reliability, robustness, and ease
of maintenance are as important as accuracy [9]. Based on NRC's patented BIRIS dual
aperture technology, as illustrated in Figure 6b, the main components of the Biris camera
are a standard CCD camera, a camera lens, and a mask with two apertures. This mask
replaces the iris of the camera lens - hence the name Bi-iris. A laser line, produced by a
solid-state laser diode and a cylindrical lens, is projected on the object. A double image of
the laser line is measured on the CCD camera at p1 and p2. The separation between the
two imaged lines and their relative location on the CCD are proportional to the distance
between the object and the camera. Hence, they provide information about the shape and
dimensions of the object. Furthermore, this technique, when combined with advanced
signal processing algorithms, allows Biris to become very tolerant of ambient light
illumination, e.g. sunlight. This is particularly important for archaeological and
architectural field recording applications.
The camera, controlled by a laptop computer, is mounted either on a conventional
tripod (Figure 6c) or on a motorized linear translation stage (Figure 6d). The Biris camera
has a maximum range (camera to object distance) of 2 m and an accuracy of 80 microns
(0.08 mm) at a range of 0.3 m and 1.8 mm at 1 m. Additional specifications are provided in
Table 1.
We have used the Biris system to digitize architectural building elements and
sculptures in Italy. In addition, Innovision 3D has also used the scanner to record a section
of a Hieroglyphic Stairway at the Peabody Museum and archaeological sites in China.
Commercially, NRC has licensed this technology to the ShapeGrabber Corporation
(http://www.shapegrabber.com/). Innovision 3D provides a commercial scanning service
using this scanner (http://www.innovision3d.com/).
Model acquisition and construction
A model is a digital representation of the geometry and appearance of an object on
which one can perform operations. Our strategy is to acquire a high-resolution geometric
model of the surface, along with parameters of a reflectance model. The model is
represented as a triangular mesh at a resolution comparable to the original geometric data,
with a colour-per-vertex description of a diffuse reflectance model. This representation,
quite generic in nature, embeds all the information gathered by the sensing process.
Analytical tasks can then be performed on the model (or in some cases on the original
data). This model also fits directly with current polygon-based rendering hardware. Other
representations for display purposes can then be derived from the high-resolution mesh.
However, the high-resolution mesh can be viewed as the archival quality digital record or
3D digital reference model of the object or scene, which serves as the starting point for all
subsequent studies and/or transformations.
Constructing the models
In using 3D digitizing for analytical applications, there are several situations where
a single image suffices to perform a task, for example detection and monitoring of cracks,
or documentation of tool marks on specific areas of a work. However, most objects and
environments require the acquisition of more than one range image in order to achieve
sufficient coverage of the surface of interest. The necessary number of images will depend
on the shape of the object and its amount of self-occlusion, the eventual presence of
obstacles to sensor positioning, as well as on the size of the object if it exceeds the field of
view of the sensor. Another benefit of merging different views is that the unavoidable
noise present in the original data is filtered through the integration process, given that there
are no biases in the data.
We have collaborated with researchers at InnovMetric Software Inc. and the
Canadian Conservation Institute on the development of 3D modeling methodology for the
construction of models from a set of range images [10]. This approach, described in
Figure 7, is now commercially implemented in InnovMetric’s PolyworksTM software suite
[11]. The first three steps form the acquisition loop: range images are acquired one at a
time, until the desired surface coverage is obtained; a user-guided tool sequentially aligns
(or registers) each new image with the previous ones, and to rapidly detect surface areas
not yet measured. The following steps constitute the modeling sequence: these completely
automated steps globally refine the alignment between images, integrate them into a
unified model that can be directly used, or alternately geometrically compressed and
texture-mapped. If required, the models can be manually edited at any step of the modeling
sequence.
Appearance modeling
As described above, the High Resolution Color Scanner uses a three-wavelength
RGB laser source as the illuminant. The detector sensor measures the energy reflected
from the object at each component wavelength. This quantity is a function of the absolute
power of the illuminating laser, the distance between the sensor and the surface, the
orientation of the imaged surface element relative to the camera, as well as the intrinsic
reflectance properties at that point on the surface.
With active range sensing, the position and orientation of the surface can be derived
from the range data, and the power of the incident laser is monitored. Since optical
triangulation relies on controlling the angles of incidence and measuring the direction of
reflected light, the remaining unknown element in the image formation process is the
intrinsic reflectance function. Under certain conditions, the parameters of a dichromatic
model, composed of the sum of a diffuse and a specular component, can be computed [12].
Often, only the diffuse component will be of interest, since the specular part is more
difficult to estimate, and may not be observable at all points on the surface given a finite
set of observations. Each view in the set of images provides one pair of incident and
reflected directions. Thus, for each sensed surface element, assuming a dichromatic model,
at least the diffuse Lambertian component can always be estimated.
Derived representations
Derived graphical representations can be obtained from the high-resolution model.
For models that incorporate colour information, perhaps the most useful one for
visualization applications is the texture-mapped compressed mesh model. One can
compute a texture to be applied on a compressed version of the original model in order to
approximate the appearance of the full resolution coloured model (Figure 8). An algorithm
for the automatic generation of this map is coupled with the vertex removal mesh
compression method [13]. It requires that, during the geometric compression, the algorithm
keep track of where each removed vertex projects on the compressed version of the model.
When the desired level of compression is reached, the original vertices are protected and
transposed into the associated triangle in a tessellated texture map. The main challenge is
to tessellate the rectangular texture map efficiently, given a set of triangles of varying
proportions and size, while preserving as much of the colour information as possible, and
avoiding discontinuities between adjacent model triangles. For virtual display applications,
this is a very important aspect for museums. The use of 3D models which represent the
shape, subtle color variations, material characteristics (ivory, bone, stone, metal, wood)
and features such as tool mark details as closely as possible to the actual object is a
paramount consideration. In short, the fidelity of the 3D models to the actual objects is a
priority.
Alternately vertices of the high-resolution model can be handled as a cloud of
points that is fed into a point-based rendering. Compared with the original points from the
simple union of the original images, vertices of the integrated model undergo filtering
through the weighted averaging surface reconstruction, and are organized in a more regular
sampling pattern on the surface.
Museum and Heritage Applications
During the research and development phase of the technology, we have
collaborated on a number of projects to test and demonstrate a number of “real life”
museum and heritage recording applications with several Canadian and international
museums and cultural agencies. Some projects included testing "museum applications" by
scanning objects typically found in museums and art galleries including paintings, small
sculpture, archaeological and ethnographic collections as well as natural history specimens.
Other projects included demonstrations of the “heritage applications” for recording remote
archaeological site features, architectural building elements on historic buildings as well as
large sculptures. The scope of the applications covered a wide range of activities from the
provision of an archival 3D digital model for future reference in the event of a disaster, to
interactive displays, to conservation and art historical research and for replication. In
instances the data augments existing documentation techniques and in others it provides a
completely new level of information unobtainable from other techniques [14,15]. Example
applications are presented in the following sections.
3D Virtual Museum Display and Exhibition Applications
Three-dimensional models of museum objects that retain close fidelity of the 3D
models to the actual objects provide some unique virtual display and exhibition
applications for museums. For example, using information kiosks - either in the museum
or in a remote site connected to a high-speed communication network – visitors can
interactively examine 3D models from any perspective in stereo. The models can also be
incorporated into 3D VR Theatre presentations [16] and virtual museum web exhibitions.
This application was demonstrated in two exhibitions in collaboration with the
Canadian Museum of Civilization (CMC). The first was The 3rd Dimension: A New Way
of Seeing in Cyberspace at CMC in 1997 [17]. For exhibition, 3D images of objects from
the Museum's collection were digitized using a prototype commercial color laser scanner
(Figure 9a). Two interactive display station information kiosks were used for stereo image
display – one at the Museum (Figure 9b) and the second “remote site” at the Royal British
Columbia Museum in Victoria Canada. Visitors in either museum could select an object
from a menu, examine stereoscopic 3D images of it and access associated text information.
Stereo glasses were provided for viewing the images. In addition to rotating the object,
visitors could zoom in and examine specific details of interest.
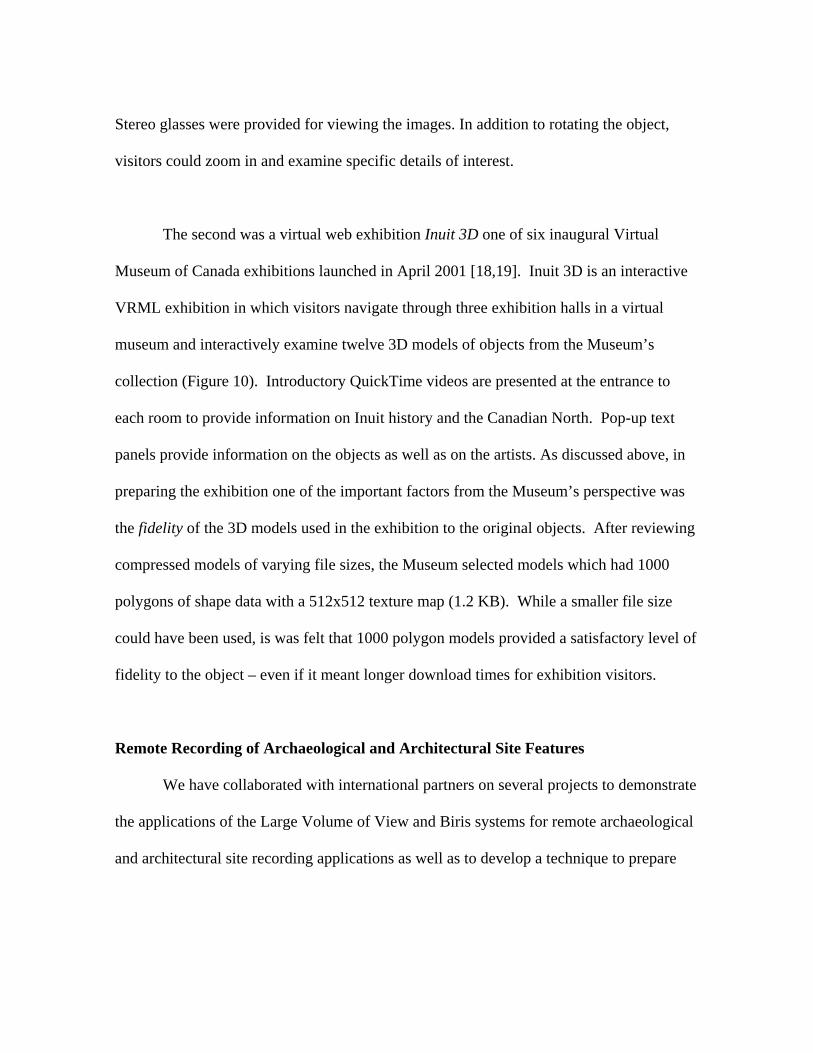
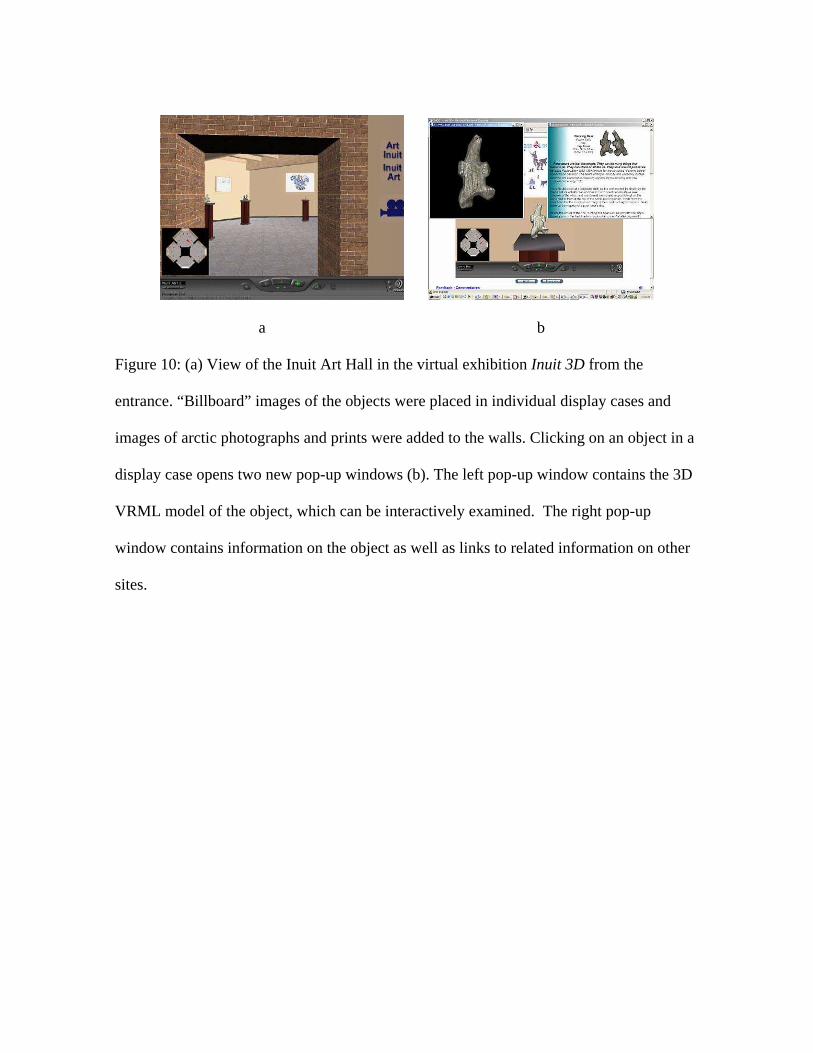
The second was a virtual web exhibition Inuit 3D one of six inaugural Virtual
Museum of Canada exhibitions launched in April 2001 [18,19]. Inuit 3D is an interactive
VRML exhibition in which visitors navigate through three exhibition halls in a virtual
museum and interactively examine twelve 3D models of objects from the Museum’s
collection (Figure 10). Introductory QuickTime videos are presented at the entrance to
each room to provide information on Inuit history and the Canadian North. Pop-up text
panels provide information on the objects as well as on the artists. As discussed above, in
preparing the exhibition one of the important factors from the Museum’s perspective was
the fidelity of the 3D models used in the exhibition to the original objects. After reviewing
compressed models of varying file sizes, the Museum selected models which had 1000
polygons of shape data with a 512x512 texture map (1.2 KB). While a smaller file size
could have been used, is was felt that 1000 polygon models provided a satisfactory level of
fidelity to the object – even if it meant longer download times for exhibition visitors.
Remote Recording of Archaeological and Architectural Site Features
We have collaborated with international partners on several projects to demonstrate
the applications of the Large Volume of View and Biris systems for remote archaeological
and architectural site recording applications as well as to develop a technique to prepare
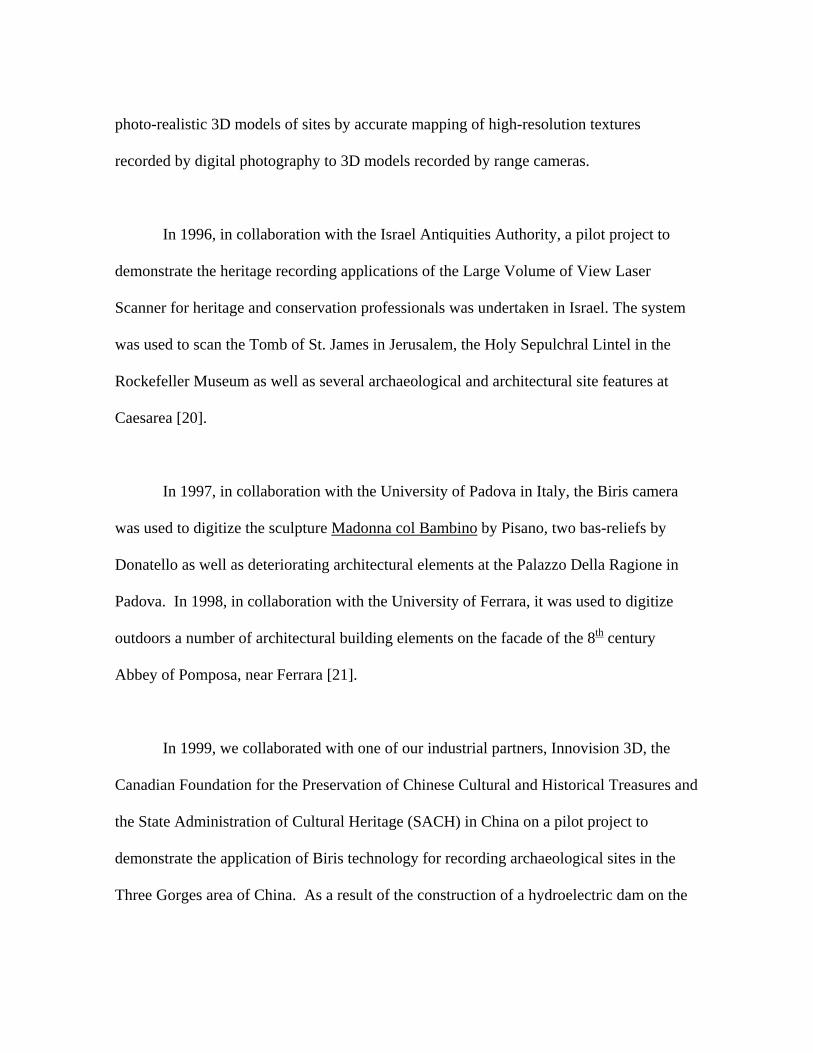
photo-realistic 3D models of sites by accurate mapping of high-resolution textures
recorded by digital photography to 3D models recorded by range cameras.
In 1996, in collaboration with the Israel Antiquities Authority, a pilot project to
demonstrate the heritage recording applications of the Large Volume of View Laser
Scanner for heritage and conservation professionals was undertaken in Israel. The system
was used to scan the Tomb of St. James in Jerusalem, the Holy Sepulchral Lintel in the
Rockefeller Museum as well as several archaeological and architectural site features at
Caesarea [20].
In 1997, in collaboration with the University of Padova in Italy, the Biris camera
was used to digitize the sculpture Madonna col Bambino by Pisano, two bas-reliefs by
Donatello as well as deteriorating architectural elements at the Palazzo Della Ragione in
Padova. In 1998, in collaboration with the University of Ferrara, it was used to digitize
outdoors a number of architectural building elements on the facade of the 8th century
Abbey of Pomposa, near Ferrara [21].
In 1999, we collaborated with one of our industrial partners, Innovision 3D, the
Canadian Foundation for the Preservation of Chinese Cultural and Historical Treasures and
the State Administration of Cultural Heritage (SACH) in China on a pilot project to
demonstrate the application of Biris technology for recording archaeological sites in the
Three Gorges area of China. As a result of the construction of a hydroelectric dam on the
Yangtze River, an estimated 800-1000 heritage sites along the River will be flooded and
lost by 2009. Consequently, the recording of these sites represents a significant challenge
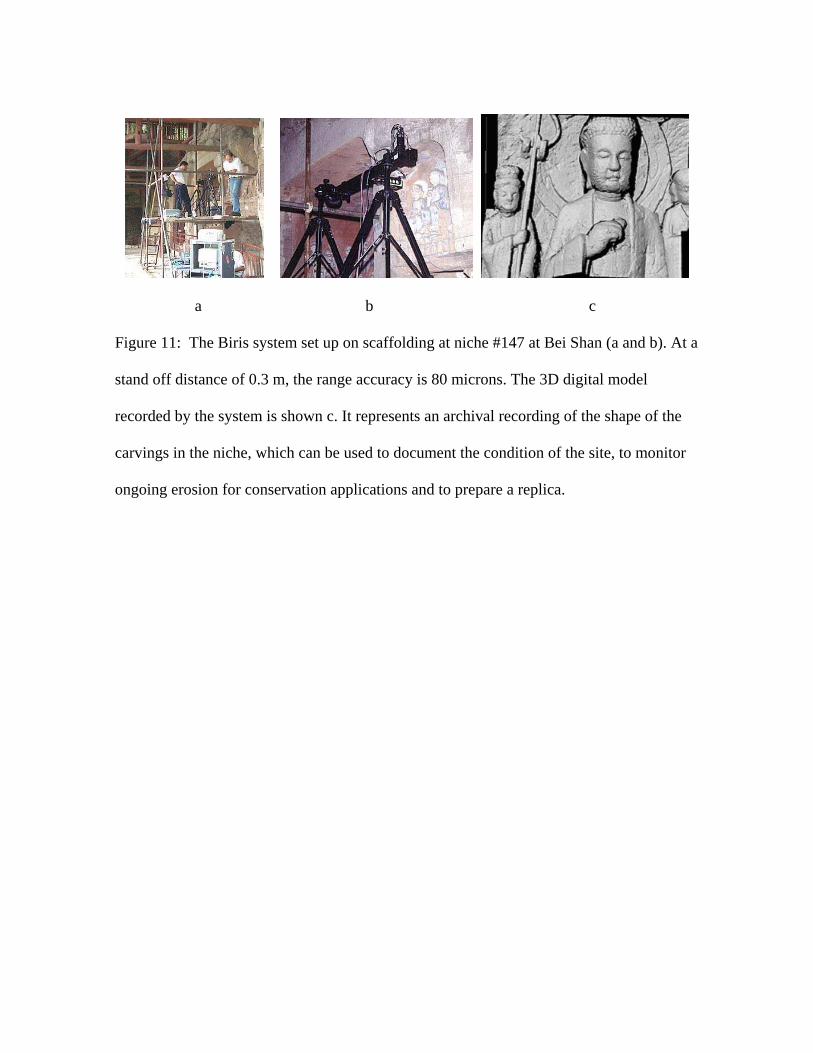
for Chinese heritage officials. For the project, a Biris camera was mounted on a linear
translation stage and was used to digitize the shape details of rock carvings in a niche at the
Bei Shan (Big Foot) rock-carving site near Dazu (Figure 11). The Bei Shan site dates to the
ninth century and consists of rock carvings cut into 264 niches on a large hillside rock
outcrop. The project led to the donation to SACH of a Biris based ShapeGrabber camera
system specifically designed for field recording by Innovision 3D and the Canadian
Foundation.
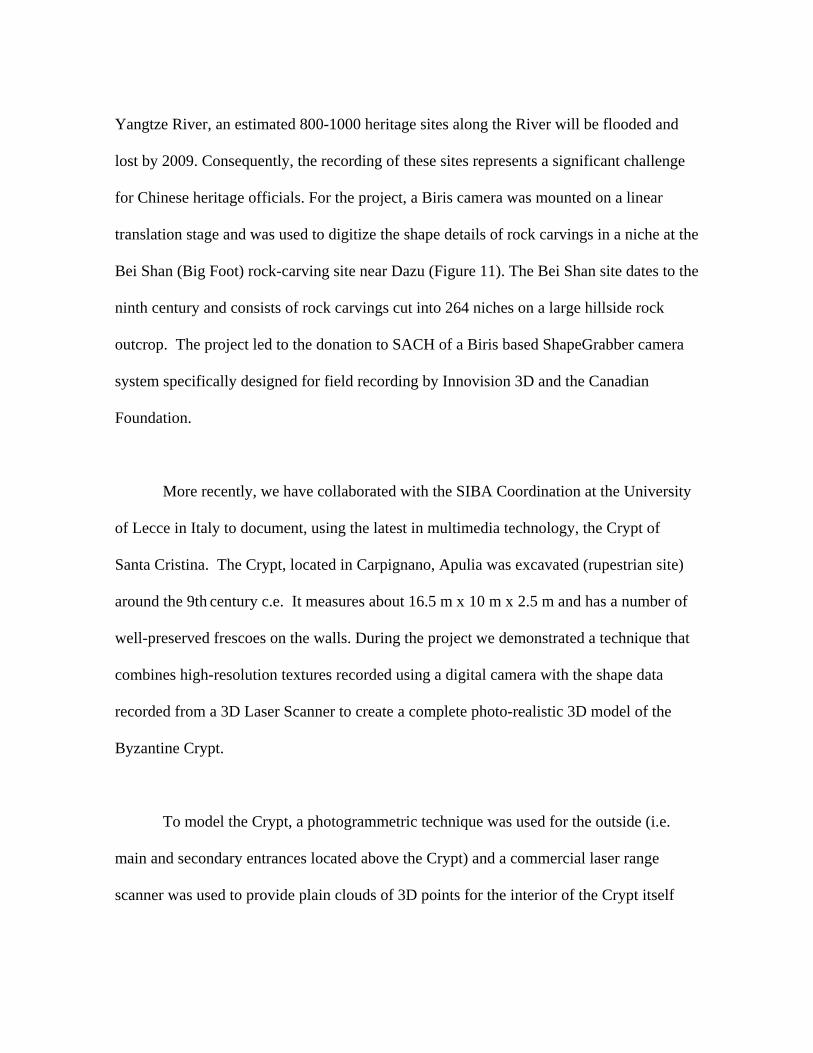
More recently, we have collaborated with the SIBA Coordination at the University
of Lecce in Italy to document, using the latest in multimedia technology, the Crypt of
Santa Cristina. The Crypt, located in Carpignano, Apulia was excavated (rupestrian site)
around the 9th century c.e. It measures about 16.5 m x 10 m x 2.5 m and has a number of
well-preserved frescoes on the walls. During the project we demonstrated a technique that
combines high-resolution textures recorded using a digital camera with the shape data
recorded from a 3D Laser Scanner to create a complete photo-realistic 3D model of the
Byzantine Crypt.
To model the Crypt, a photogrammetric technique was used for the outside (i.e.
main and secondary entrances located above the Crypt) and a commercial laser range
scanner was used to provide plain clouds of 3D points for the interior of the Crypt itself
(located underground). Texture was acquired with a high-resolution 6 mega-pixel digital
camera. The 2D digital photographs were not only used to produce 3D textured models
but also to perform geometric measurements. Proper camera calibration and bundle
adjustment algorithms combine in digital photogrammetry to give accurate feature
coordinates and reliable pose estimations [22].
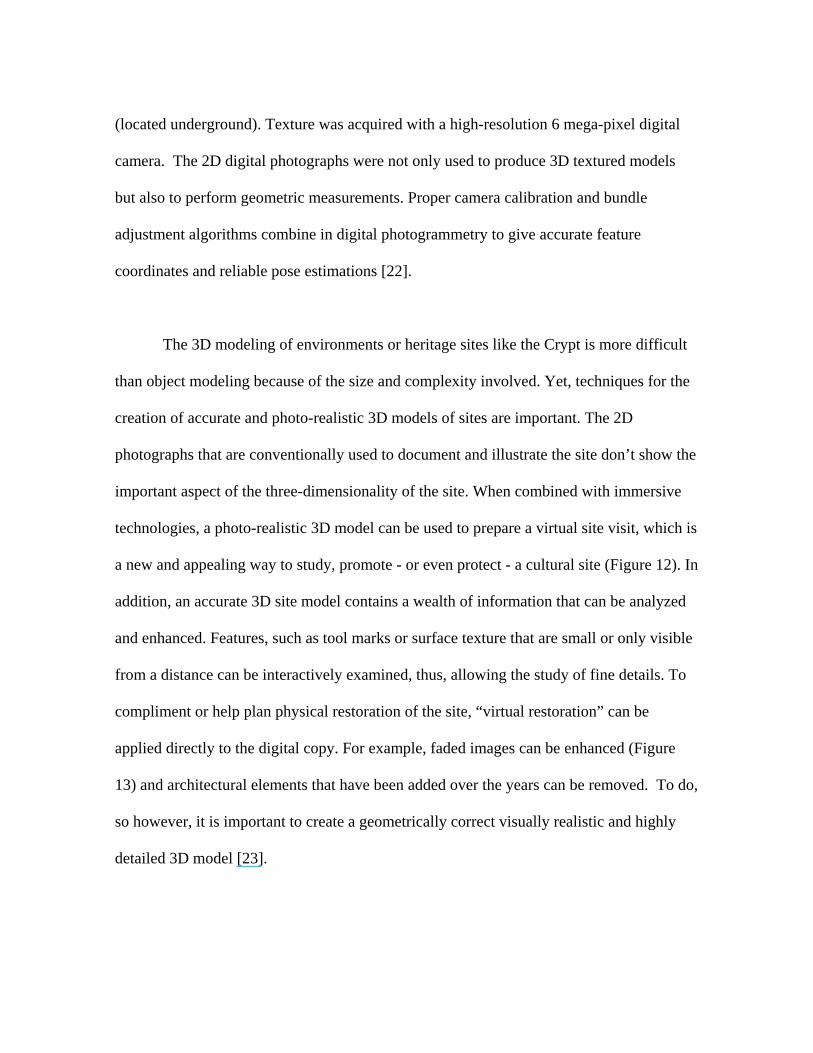
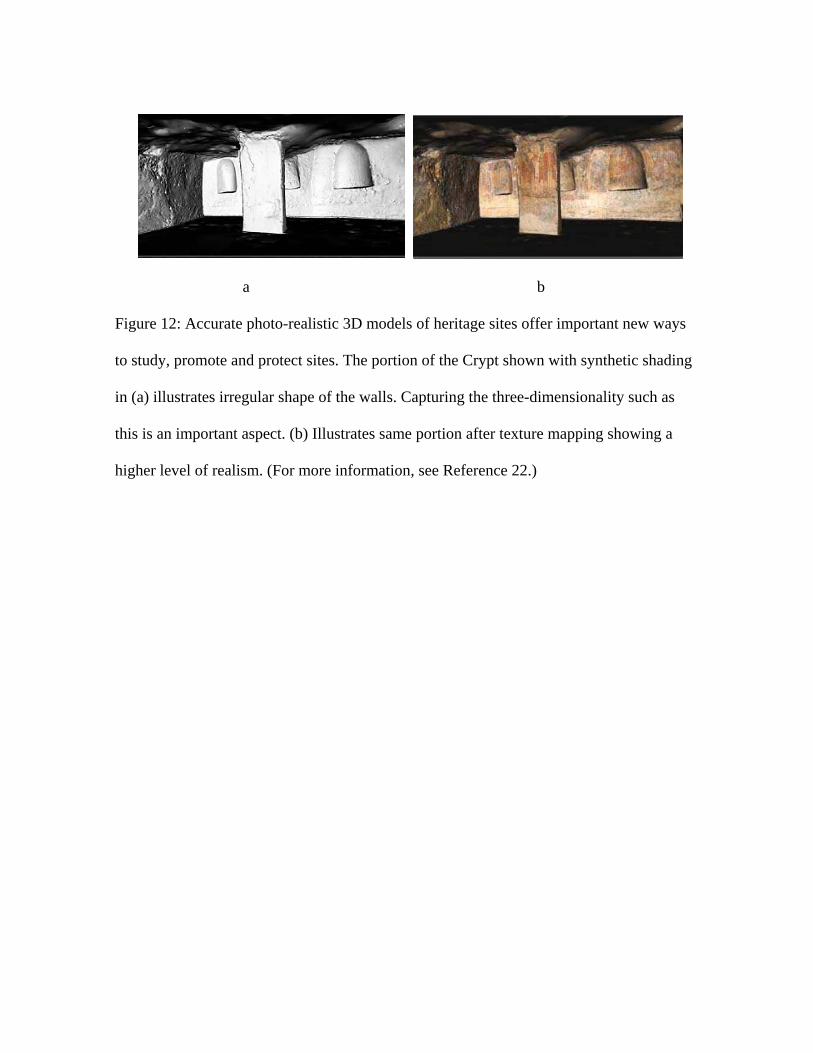
The 3D modeling of environments or heritage sites like the Crypt is more difficult
than object modeling because of the size and complexity involved. Yet, techniques for the
creation of accurate and photo-realistic 3D models of sites are important. The 2D
photographs that are conventionally used to document and illustrate the site don’t show the
important aspect of the three-dimensionality of the site. When combined with immersive
technologies, a photo-realistic 3D model can be used to prepare a virtual site visit, which is
a new and appealing way to study, promote - or even protect - a cultural site (Figure 12). In
addition, an accurate 3D site model contains a wealth of information that can be analyzed
and enhanced. Features, such as tool marks or surface texture that are small or only visible
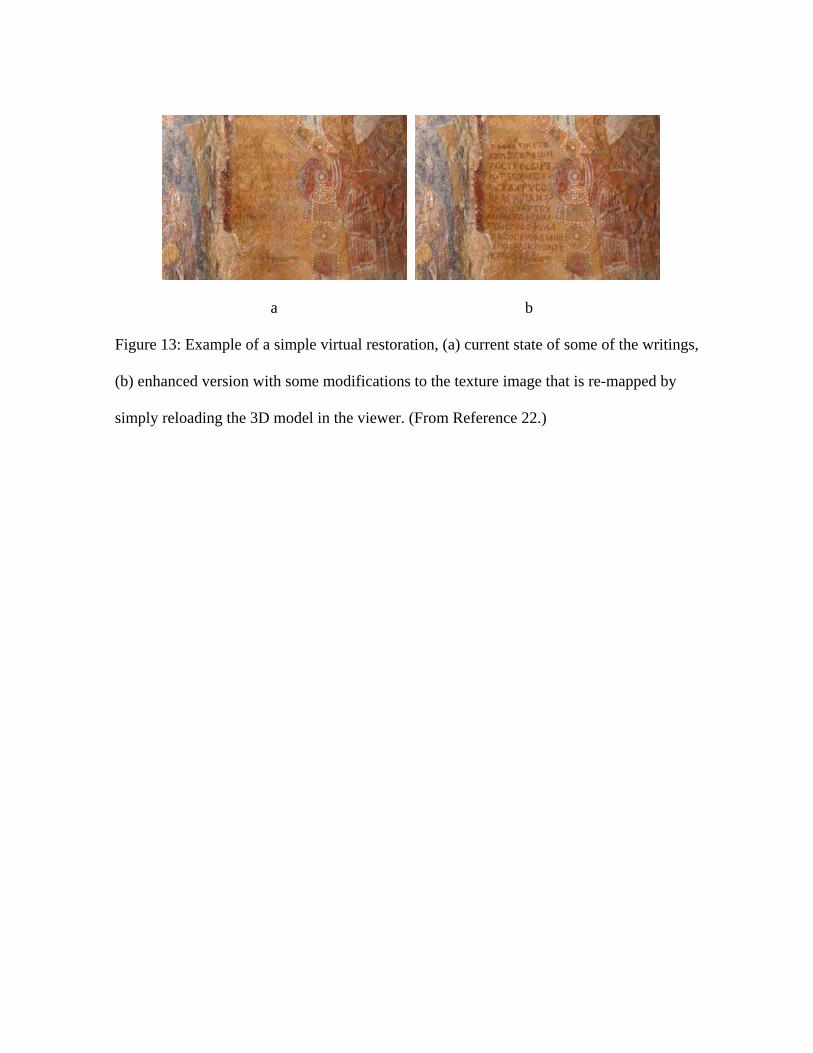
from a distance can be interactively examined, thus, allowing the study of fine details. To
compliment or help plan physical restoration of the site, “virtual restoration” can be
applied directly to the digital copy. For example, faded images can be enhanced (Figure
13) and architectural elements that have been added over the years can be removed. To do,
so however, it is important to create a geometrically correct visually realistic and highly
detailed 3D model [23].
Art Connoisseurship and Conservation Research Applications
Museum curators, art historians and conservators frequently use a variety of
traditional scientific techniques such as X-radiography, infrared photography and
ultraviolet fluorescence photography for connoisseurship and conservation research
examinations on museum collections.
In combination with a variety of computer graphics applications, 3D imaging of
works of art offers a significant new analytical tool to curators, historians and conservators,
which provides some new and unique types of information which otherwise is not
obtainable using traditional techniques. The high-resolution 3D image data contain a
wealth of information that can be used for modeling, display, comparison, measurement
and analysis applications. For example, curators and historians can zoom in and
interactively examine small features such as signatures and tool marks or details on larger
objects that can be difficult to study on the actual objects. Art conservators can monitor
and measure crack pattern formations on paintings and changes to corrosion formations on
sculpture. The following are some examples.
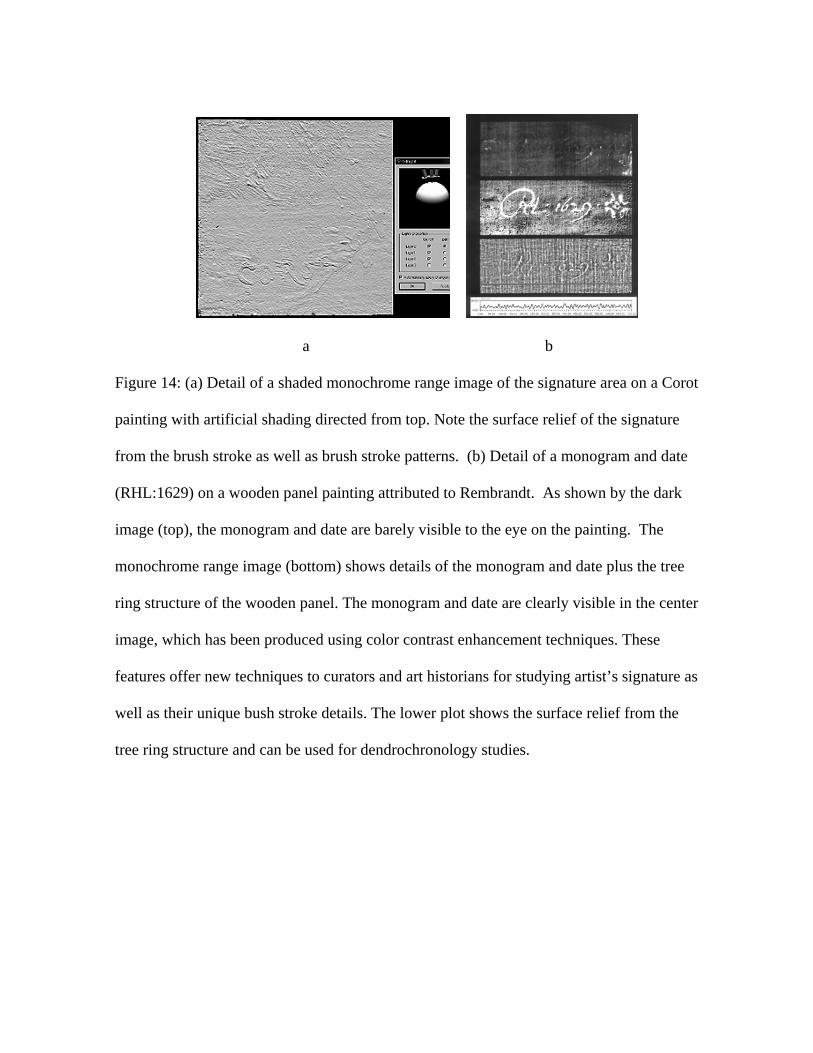
For paintings with varnished surfaces, a unique feature of the shape data captured
by the High Resolution Color Scanner is that it originates from the immediate surface of
the paint layer, under the varnish, rather than from the varnish surface. This results in a
detailed high-resolution recording of the surface relief or 3D structure of the paint layer
from brush stroke details as well as crack pattern formations due to aging. No other
technique captures this type of information. As a result, the artificial shading feature as
well as contrast enhancement techniques in the graphics package can be used to zoom in
and interactively examine features such as the artist’s signature (Figure 14), brush stroke
details or crack pattern formations.
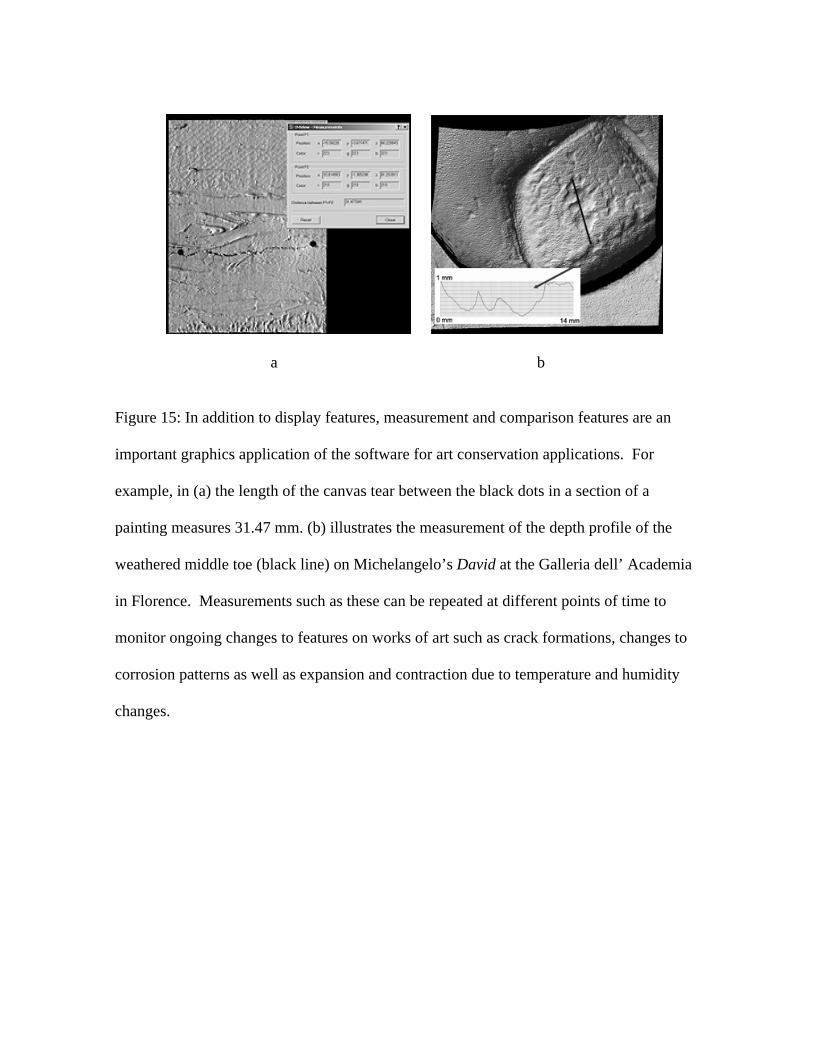
The graphic applications also provide some unique measurement and monitoring
techniques for conservation applications. For example, Figure 15a illustrates the
measurement of the length of a canvas tear in a painting while Figure 15b illustrates the
measurement of the depth profile of the weathered middle toe on Michelangelo’s David at
the Galleria dell’ Academia in Florence [24].
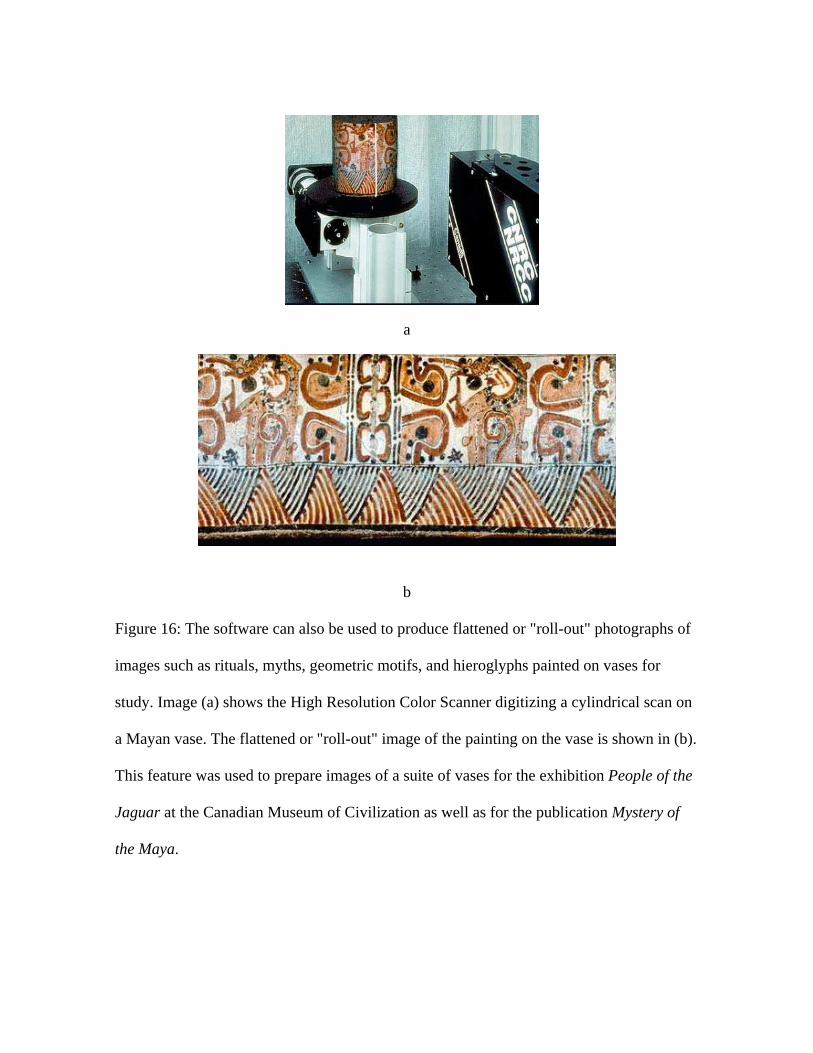
Another important application is that computer graphics software can be used to
generate unique views of objects which can be used for both research and museum display
applications. Figure 16 illustrates a flattened or "roll-out" image painted on a Mayan vase
prepared for the exhibition People of the Jaguar at the Canadian Museum of Civilization.
The sequence of images depicting a dancing snake-man tells a story about death and the
Underworld around the circumference of the vase. “Rolling-out” the images like this not
only facilitates study and comparison with similar images, it can be used for text panels in
an exhibition to explain the story as well as in publications [25].
Future Research and Development
To continue development of the technology, there are several areas of research
interest to us. We have recently completed a study of the laser scanning of marble – which
has unique optical properties [26]. Other areas of ongoing research interests are the
development of “cost effective” virtual environment display systems utilizing laptops as
well as a content-based 3D search engine for cultural applications [27]. Digital 3D imaging
can benefit from advances in VLSI technology in order to accelerate its deployment in
many fields like visual communication and industrial automation. NRC and the Institute
for Scientific and Technological Research IRST, Trento Italy have initiated activities on
VLSI opto-sensors optimized for 3D vision. This project is targeted at the integration of
key sensors for 3D vision. These sensors could become an integral part of future intelligent
digitizers that will be capable of measuring accurately and simultaneously colour
(reflectance) and 3D. This, in turn, will accelerate the development of hand-held 3D
cameras, and, multi-resolution random access laser scanners for fast search and tracking of
3D features. All these digitizers will require a thorough VLSI integration of basic laser
camera functions to achieve size and cost reduction and most importantly, higher
performance. A number of prototype sensors have been fabricated using standard CMOS
technology that allows the monolithic integration of photo-sensors, together with readout
circuits, and digital signal processors [28].
One area of future research of interest to us is the use of more than three
wavelengths for improved color recording using the High Resolution Color camera. As
noted above the current system uses three RGB wavelengths. Recent studies have shown
that the average ∆E94 accuracy with the actual set of three wavelengths is found to be in the
range 3~5 units. This can be reduced to a range of 2~3 units using optimal three
wavelengths [29]. A substantial reduction of error is predicted when more than three
sampling wavelengths are used, as the average error is found to diminish by 50% each time
the number of sampling wavelengths increases by one. The average color error can be
brought down to less than one just noticeable difference equivalent with four or five
sampling wavelengths [30]. As a result, one area of research we are intending to pursue is
the use of five wavelengths to improve the color recording characteristics of the system.
Conclusions
This paper has presented an overview of the imaging systems developed at NRC
and some of the museums and heritage recording applications. For heritage recording,
perhaps the most important aspect is that the image data obtained using the 3D imaging
systems provides an accurate high resolution three-dimensional digital record of the object.
This "3D digital model" data can be retained as an archival quality record of the object and
used for a variety of activities including display, research, conservation, replication and
VR applications.
References
1. Rioux, M., Digital 3-D imaging: theory and applications. SPIE Proceedings,
Videometrics III, Boston, MA. October 31-November 4, Vol. 2350, 1994. pp. 2-15.
2. Rioux, M., Bechthold, G., Taylor, D., and Duggan, M. Design of a large depth of view
three-dimensional camera for robot vision. Opt. Eng. 26(12): 1245-1250; 1987. NRC
29130.
3. Rioux, M. Color 3-D electronic imaging of the surface of the human body. SPIE
Proceedings, Automatic Systems for the Identification and Inspection of Humans, San
Diego, CA. July 28-29, 1994. Vol. 2277. pp. 42-54. NRC 38344.
4. Beraldin, J.-A., Blais, F., Cournoyer, L., Godin, G., and Rioux, M. Active 3D sensing.
Modelli E Metodi per lo studio e la conservazione dell'architettura storica, University:
Scola Normale Superiore, Pisa 10: 22-46; 2000. NRC 44159
5. Baribeau, R., and Rioux, M. Centroid fluctuations of speckled targets. Appl. Opt.
30(26): 3752-3755; 1991. NRC 33147 9/10/91.
6. Baribeau, R., Cournoyer, L., Godin, G.and Rioux, M. “Colour Three-Dimensional
Modelling of Museum Objects”, Imaging the Past, Electronic Imaging and Computer
Graphics in Museum and Archaeology, British Museum, Occasional Paper Number
114, 1996, London, 199 - 209.
7. Rioux, M., Beraldin, J.-A., Blais, F., Godin, G.and Cournoyer, L., “High Resolution
Digital 3-D Imaging of Large Structures”, Three-Dimensional Image Capture, SPIE
Proceedings, Volume 3023, 11 February, 1997, San Jose, CA, 109 - 118.
8. Blais, F., Beraldin, J.-A., Cournoyer, L., El-Hakim, S.F., Picard, M., Domey, J., Rioux,
M., The NRC 3D Laser Tracking System: IIT’s Contribution to International Space
Station Project, Proceedings of the 2001 Workshop of Italy-Canada on 3D Digital
Imaging and Modeling Application of : Heritage, Industry, Medicine, & Land, Padova,
Italy. April 3-4, 2001. NRC 44181.
9. Beraldin, J.-A., Blais, F., Cournoyer, L., Rioux, M., Bernier, F., and Harrison, N.,
“Portable Digital 3-D Imaging System for Remote Sites”, 3D Data Modelling and
Imaging, The 1998 IEEE International Symp. On Circuit and Systems, Monterey, CA,
USA: 326-333. May 31-June 3, 1998.
10. Soucy, M., Godin, G., Baribeau, R., Blais, F. and Rioux, M. “Sensors and Algorithms
for the Construction of Digital 3-D Colour Models of Real Objects”, ICIP-96
Proceedings, 1996 IEEE International Conference on Image Processing, Vol. II of III,
Lausanne, Switzerland, 16-19 September, 1996, 409-412.
11. Innovmetric Software Inc. Retrieved February 15, 2003 from
http://www.innovmetric.com
12. Baribeau, R., Rioux M. and Godin G., “Color Reflectance Modelling Using a
Polychromatic Laser Range Sensor”. IEEE Trans. Pattern Anal. Machine Int., 14(2):
(1992), 263-269.
13. Soucy, M., Godin, G., Rioux, M. “A texture-mapping approach for the compression of
colored 3D triangulations”, The Visual Computer, vol. 12, 1996. pp. 503-514.
14. Godin, G., Cournoyer, L., Domey, J. and Taylor, J., "Three-dimensional recording of
objects and sites using laser range imaging", Quaderni 10, Centro di Ricerche
Informatiche per i Beni Culturali, X 2000, ISSN 1126-6090, 139 - 150.
15. Godin, G., Beraldin, J.-A., Taylor, J, Cournoyer, L., Rioux, M., El-Hakim, S.,
Baribeau, R., Blais, F., Boulanger, P., Picard, M., and Domey, J. ,"Active Optical 3-D
Imaging for Heritage Applications." Proceedings of the IEEE Computer Graphics &
Applications: Special Issue on Computer Graphics in Art History & Archaeology,
ISSN 0272-1716, September/October 2002, Vol. 22, No. 5, pp. 24-36. NRC 44945.
16. MacDonald, G., Corcoran, F., Taylor, J., Boulanger, P. and Rioux, M., “CMC’s 3D
Virtual Reality Theatre: VR Tours of Two Tombs during the Mysteries of Egypt
Exhibition”, MMM 99, Modeling Multimedia and Information Systems, Ottawa,
Canada, 4-6 October 1999, (ISBN 981-02-4146-1), pp 167- 177.
17. Livingstone, F., Evans, K., Taylor, J., Rioux, M., and Arsenault-Desfossés, H., “The
3rd Dimension: A New Way of Seeing in Cyberspace”, Electronic Imaging and the
Visual Arts, EVA’97 Paris, Musée du Louvre, Conference Proceedings, 2 Septembre,
1997, 10.1 - 10.13.
18. Corcoran, F., Demaine, J., Picard, M., Dicaire, L-G. and Taylor. J., INUIT 3D: An
Interactive Virtual 3D Web Exhibition, Museums and the Web 2002, 17-20 April 2002,
Boston. Retrieved 15 February 18, 2003 from:
http://www.archimuse.com/mw2002/papers/corcoran/corcoran.html
19. Virtual Museum of Canada: Retrieved 15 February 18, 2003 from:
http://www.virtualmuseum.ca/
20. Domey, J., Cournoyer, L., Taylor, J. and Letellier, R., Demonstration of Heritage 3-D
Imaging Applications in Israel.
Retrieved 15 February 18, 2003 from: http://www.vit.iit.nrc.ca/Israel/Israel.html
21. Beraldin, J.-A., Blais, F., Cournoyer, L., Rioux, M., and El-Hakim,S., “Portable Digital
3-D Imaging System for Remote Sites”, Applications of BIRIS Technology to Heritage
Applications in Italy 1997-98. Retrieved 15 February 18, 2003 from:
http://www.vit.iit.nrc.ca/Biris_Italy/3dima.htm
22. Beraldin, J.-A. , Picard, M., El-Hakim, S.F., Godin, G., Valzano, V., Bandiera, A., and
Lataouche, D. "Virtualizing a Byzantine Crypt by Combining High-Resolution
Textures with Laser Scanner 3D Data." Proceedings of VSMM 2002, 25-27 September
2002, Gyeongju, Korea. NRC 44959.
23. Beraldin, J.-A., Picard M., El-Hakim, S.F., Godin, G.., Latouche C., Valzano V.,
Bandiera A., "Exploring a Bysantine Crypt through a High-Resolution Texture Mapped
3D Model: Combining Range Data and Photogrammetry:", International Workshop on
Scanning for Cultural Heritage Recording - Complementing or Replacing
Photogrammetry, Corfu, Greece, Sept. 01 and 02, 2002: NRC 44916
24. NRC 3D Laser Scanning, Participation in the Digital Michelangelo Project, Florence,
Italy, February 1999. Retrieved 15 February 18, 2003 from:
http://www.vit.iit.nrc.ca/Florence_99/NRC_3D_Florence.html
25. Ruddell, N., "Mystery of the Maya", Canadian Museum of Civilization, 1995, ISBN 0-
660-14040-3.
26. Godin, G., Rioux, M., Beraldin, J.-A., Levoy, M., Cournoyer, L. and Blais, F., An
assessment of laser range measurement on marble surfaces, à paraître: 5th Conference
on Optical 3D Measurement Techniques, 1-4 octobre 2001, Vienne, Autriche., NRC
44210
27. Paquet, E., Peters, S., Beraldin, J.A., Valzano, V., Vandiera, A. and Banderia, A.,
"Virtualization, Virtual Environments and Content-Based Retrieval of Three-
Dimensional Information for Cultural Applications", Videometrics VII, Proceedings of
Electronic Imaging Science and Technology, SPIE Vol. 5013, 2003, pp 137-147. NRC
44978.
28. Gonzo, L., Simoni, A., Gottardi, M., Stoppa D. and, Beraldin, J.-A., "Sensors
Optimized for 3D Digitization", IEEE Trans. Intrusm. And Meas. In press 2003
29. Baribeau, R., Spectral Estimation from Laser Scanner Data for Accurate Color
Rendering of Objects, SPIE 4421, 2001.

30. R. Baribeau. Optimized spectral estimation methods for improved colorimetry with
laser scanning systems. Proc. 1st Int. Symp. 3D Data Processing, Visualization and
Transmission, Padova (Italy) 2002, Proceedings of IEEE Computer Society, ISBN 0-
7695-1521-5, pp. 400-404 (2002).
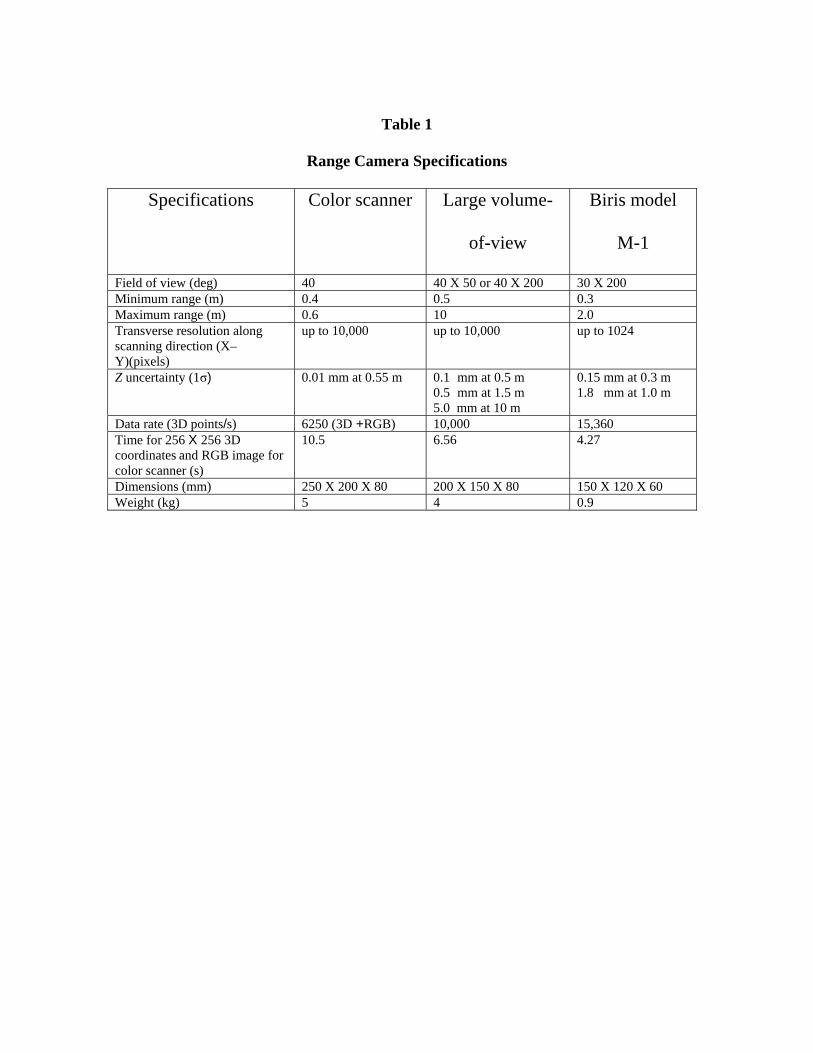
Table 1
Range Camera Specifications
Specifications Color scanner Large volume-
of-view
Biris model
M-1
Field of view (deg) 40 40 X 50 or 40 X 200 30 X 200 Minimum range (m) 0.4 0.5 0.3 Maximum range (m) 0.6 10 2.0 Transverse resolution along scanning direction (X–Y)(pixels)
up to 10,000 up to 10,000 up to 1024
Z uncertainty (1j) 0.01 mm at 0.55 m 0.1 mm at 0.5 m 0.5 mm at 1.5 m 5.0 mm at 10 m
0.15 mm at 0.3 m 1.8 mm at 1.0 m
Data rate (3D points/s) 6250 (3D +RGB) 10,000 15,360 Time for 256 X 256 3D coordinates and RGB image for color scanner (s)
10.5 6.56 4.27
Dimensions (mm) 250 X 200 X 80 200 X 150 X 80 150 X 120 X 60 Weight (kg) 5 4 0.9
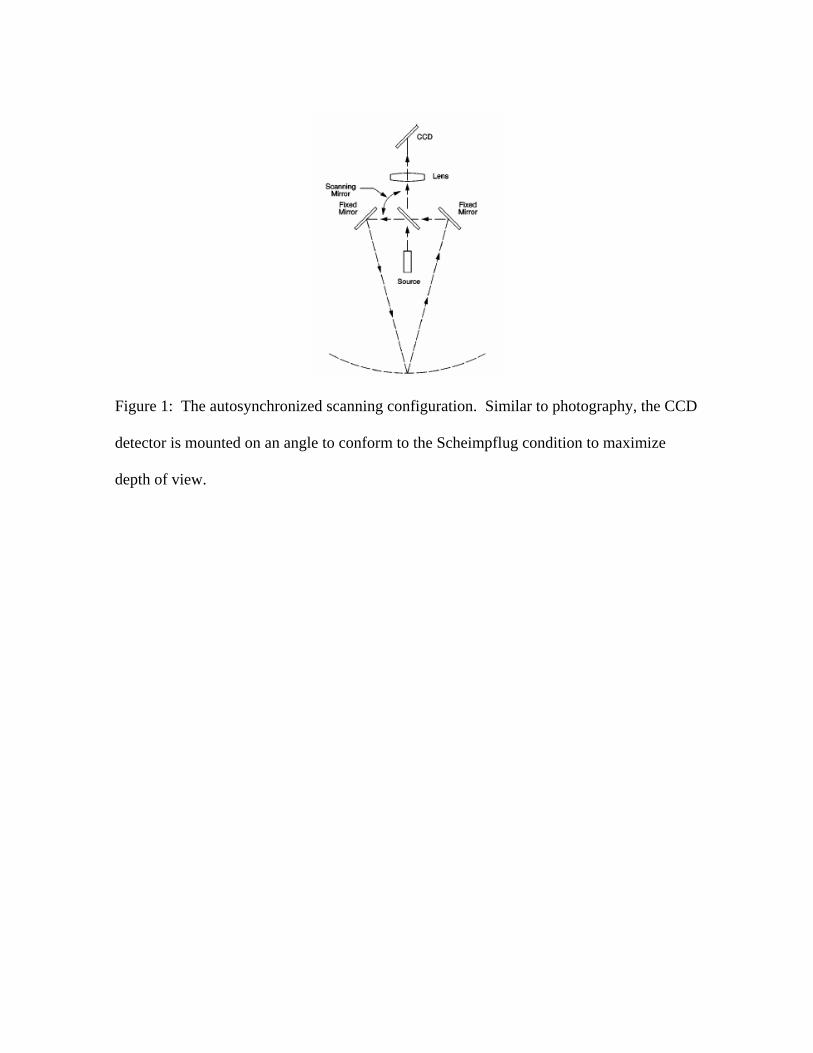
Figure 1: The autosynchronized scanning configuration. Similar to photography, the CCD
detector is mounted on an angle to conform to the Scheimpflug condition to maximize
depth of view.
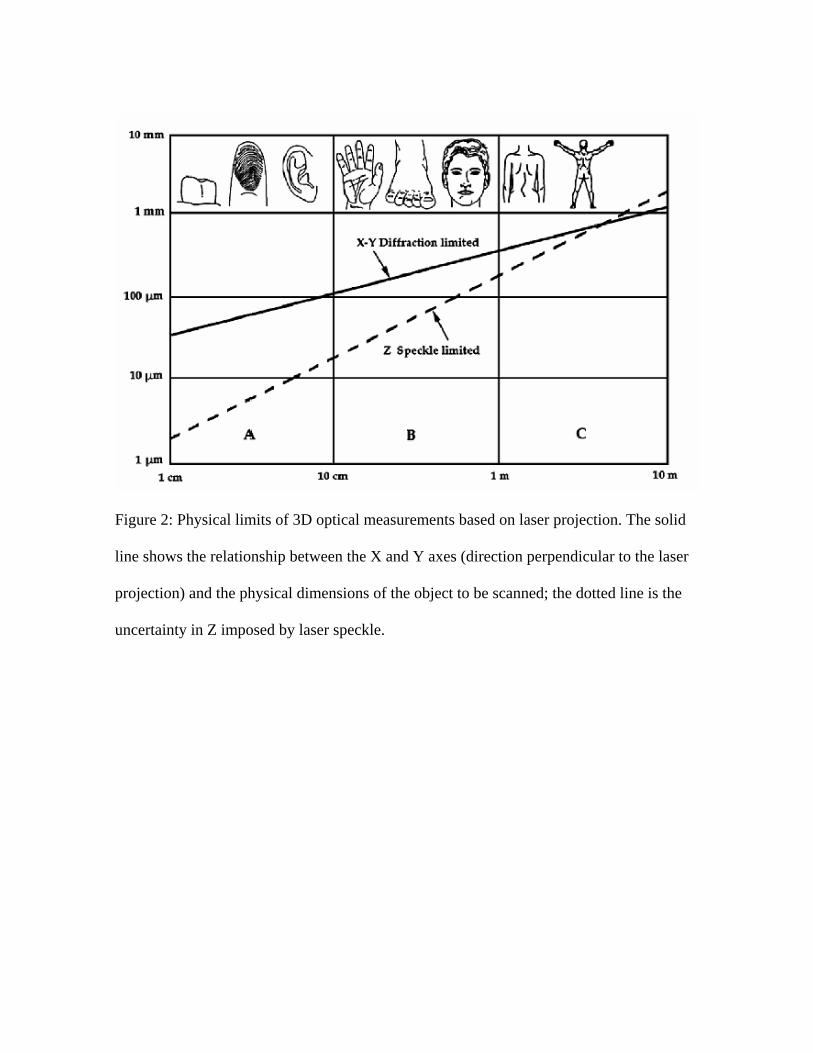
Figure 2: Physical limits of 3D optical measurements based on laser projection. The solid
line shows the relationship between the X and Y axes (direction perpendicular to the laser
projection) and the physical dimensions of the object to be scanned; the dotted line is the
uncertainty in Z imposed by laser speckle.
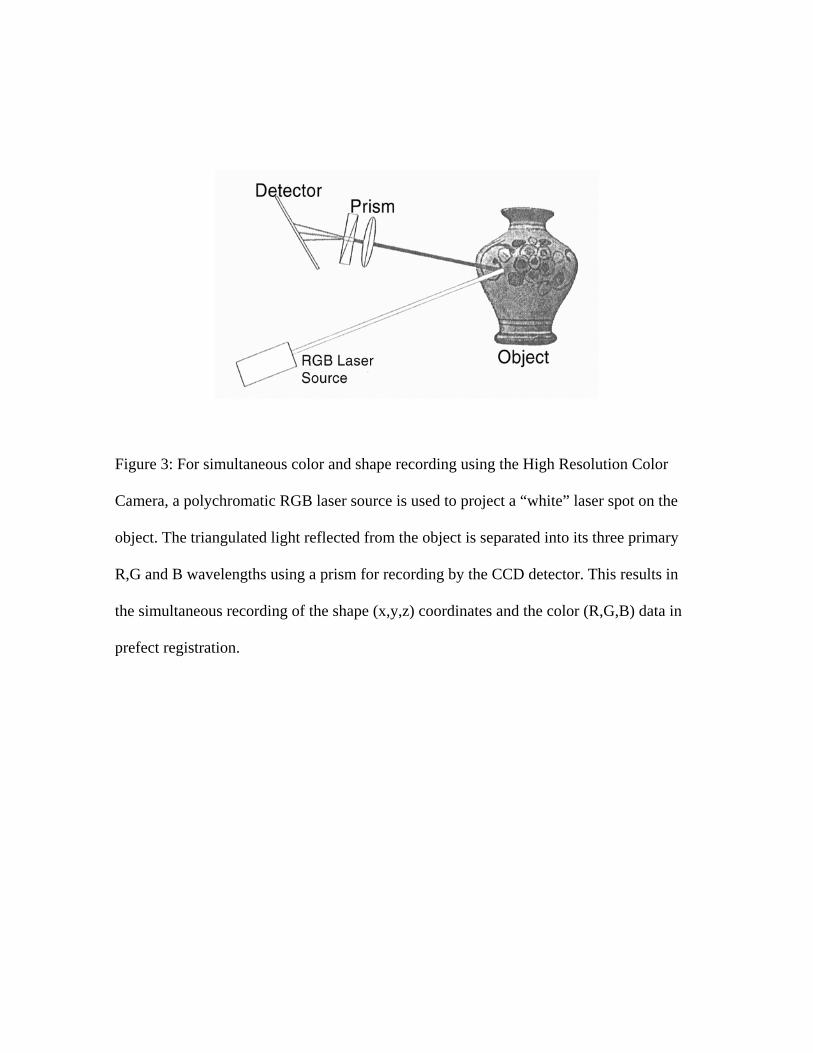
Figure 3: For simultaneous color and shape recording using the High Resolution Color
Camera, a polychromatic RGB laser source is used to project a “white” laser spot on the
object. The triangulated light reflected from the object is separated into its three primary
R,G and B wavelengths using a prism for recording by the CCD detector. This results in
the simultaneous recording of the shape (x,y,z) coordinates and the color (R,G,B) data in
prefect registration.
a b
c d e
Figure 4: (a) The High Resolution Color Camera shown scanning a figurine mounted on
the rotation table. (b) Illustration of the three degree-of-freedom translation stage. (c) Front
view of the figurine during scanning. The white line is a time exposure of the white laser
spot during scanning of a profile. (d) Four images aligned with a different color associated
with each image. (e) Side view of the final 3D digital model of the object.
a b
c d
Figure 5: (a) The Large Volume Laser Scanner mounted on pan and tilt unit. The system
includes a video camera to facilitate remote positioning of the scanner. (b) Schematic
optical configuration of the dual axis scanner. (c) The scanner is mounded on a
conventional tripod to scan archaeological site features at Caesarea in Israel. (d) The
camera is mounted on a telescoping tripod to scan the sculpture Mythic Messengers at the
Canadian Museum of Civilization. The sculpture is mounted 4 m above ground on an
exterior wall and measures 9 m long x 1.2 m
a b
c d
Figure 6: (a) The Biris 3D Laser Camera is a compact and portable monochrome imaging
system and is ideally suited for field recording applications. (b) Illustration of the optical
principle (c) The camera is shown attached to a motorized rotation stage mounted on
tripod. The cases for carrying the system and laptop computer controller are in the
foreground. (d) The camera mounted on a linear translation stage imaging a section of a
Hieroglyphic Stairway at the Peabody Museum (photo courtesy Innovision 3D Inc.)
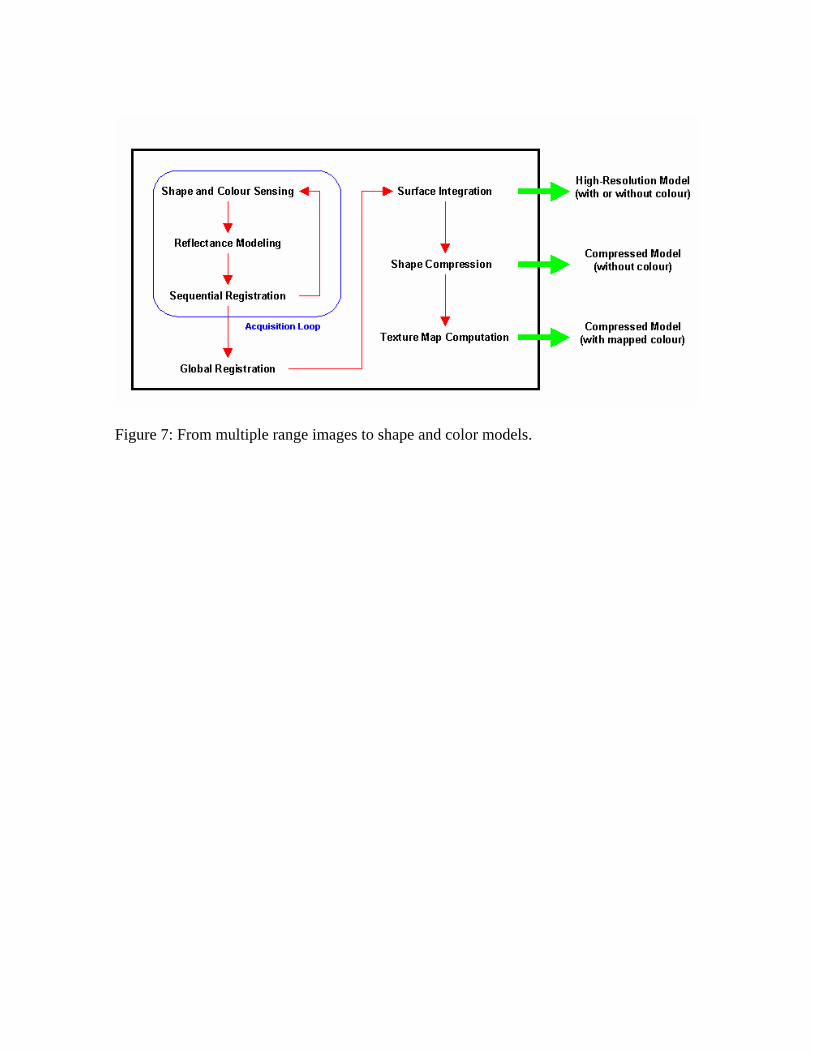
Figure 7: From multiple range images to shape and color models.
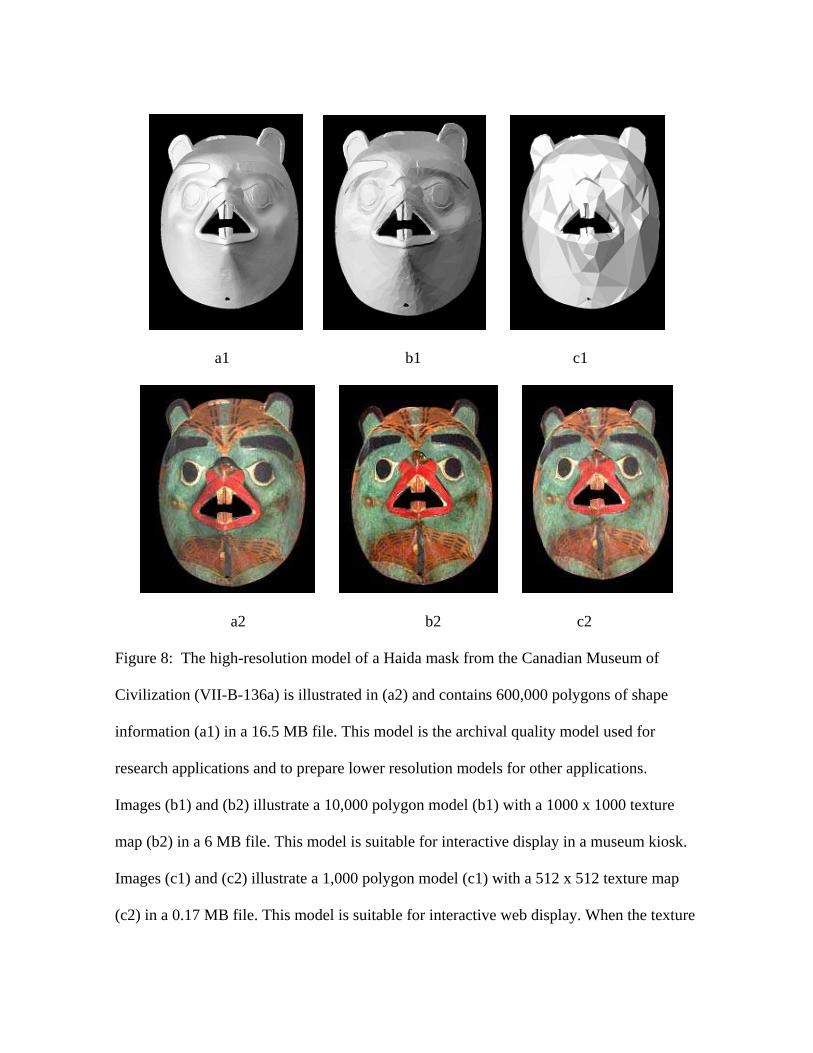
a1 b1 c1
a2 b2 c2
Figure 8: The high-resolution model of a Haida mask from the Canadian Museum of
Civilization (VII-B-136a) is illustrated in (a2) and contains 600,000 polygons of shape
information (a1) in a 16.5 MB file. This model is the archival quality model used for
research applications and to prepare lower resolution models for other applications.
Images (b1) and (b2) illustrate a 10,000 polygon model (b1) with a 1000 x 1000 texture
map (b2) in a 6 MB file. This model is suitable for interactive display in a museum kiosk.
Images (c1) and (c2) illustrate a 1,000 polygon model (c1) with a 512 x 512 texture map
(c2) in a 0.17 MB file. This model is suitable for interactive web display. When the texture

maps are applied to the compressed models, it generates a 3D appearance that
approximates the appearance of the full resolution colored model. Thus a close
approximation to the fidelity of the high-resolution model is retained in the 3D model used
for museum visualization as well as web applications.
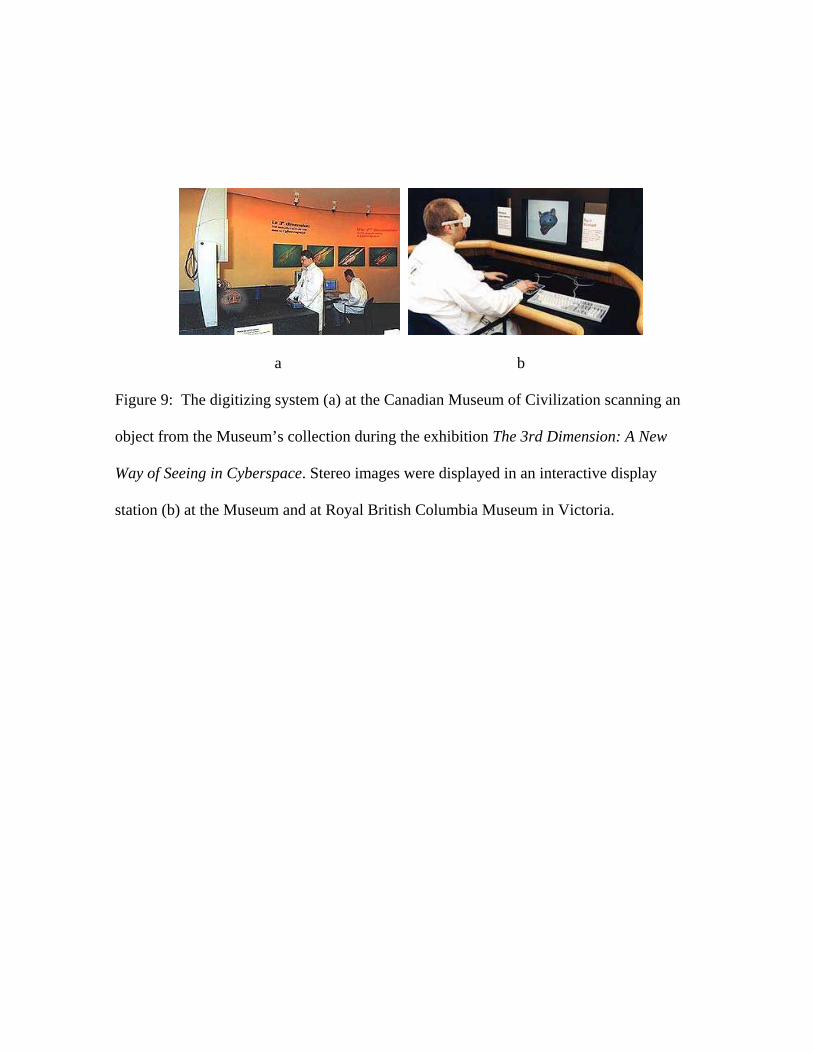
a b
Figure 9: The digitizing system (a) at the Canadian Museum of Civilization scanning an
object from the Museum’s collection during the exhibition The 3rd Dimension: A New
Way of Seeing in Cyberspace. Stereo images were displayed in an interactive display
station (b) at the Museum and at Royal British Columbia Museum in Victoria.
a b
Figure 10: (a) View of the Inuit Art Hall in the virtual exhibition Inuit 3D from the
entrance. “Billboard” images of the objects were placed in individual display cases and
images of arctic photographs and prints were added to the walls. Clicking on an object in a
display case opens two new pop-up windows (b). The left pop-up window contains the 3D
VRML model of the object, which can be interactively examined. The right pop-up
window contains information on the object as well as links to related information on other
sites.
a b c
Figure 11: The Biris system set up on scaffolding at niche #147 at Bei Shan (a and b). At a
stand off distance of 0.3 m, the range accuracy is 80 microns. The 3D digital model
recorded by the system is shown c. It represents an archival recording of the shape of the
carvings in the niche, which can be used to document the condition of the site, to monitor
ongoing erosion for conservation applications and to prepare a replica.
a b
Figure 12: Accurate photo-realistic 3D models of heritage sites offer important new ways
to study, promote and protect sites. The portion of the Crypt shown with synthetic shading
in (a) illustrates irregular shape of the walls. Capturing the three-dimensionality such as
this is an important aspect. (b) Illustrates same portion after texture mapping showing a
higher level of realism. (For more information, see Reference 22.)
a b
Figure 13: Example of a simple virtual restoration, (a) current state of some of the writings,
(b) enhanced version with some modifications to the texture image that is re-mapped by
simply reloading the 3D model in the viewer. (From Reference 22.)
a b
Figure 14: (a) Detail of a shaded monochrome range image of the signature area on a Corot
painting with artificial shading directed from top. Note the surface relief of the signature
from the brush stroke as well as brush stroke patterns. (b) Detail of a monogram and date
(RHL:1629) on a wooden panel painting attributed to Rembrandt. As shown by the dark
image (top), the monogram and date are barely visible to the eye on the painting. The
monochrome range image (bottom) shows details of the monogram and date plus the tree
ring structure of the wooden panel. The monogram and date are clearly visible in the center
image, which has been produced using color contrast enhancement techniques. These
features offer new techniques to curators and art historians for studying artist’s signature as
well as their unique bush stroke details. The lower plot shows the surface relief from the
tree ring structure and can be used for dendrochronology studies.
a b
Figure 15: In addition to display features, measurement and comparison features are an
important graphics application of the software for art conservation applications. For
example, in (a) the length of the canvas tear between the black dots in a section of a
painting measures 31.47 mm. (b) illustrates the measurement of the depth profile of the
weathered middle toe (black line) on Michelangelo’s David at the Galleria dell’ Academia
in Florence. Measurements such as these can be repeated at different points of time to
monitor ongoing changes to features on works of art such as crack formations, changes to
corrosion patterns as well as expansion and contraction due to temperature and humidity
changes.
a
b
Figure 16: The software can also be used to produce flattened or "roll-out" photographs of
images such as rituals, myths, geometric motifs, and hieroglyphs painted on vases for
study. Image (a) shows the High Resolution Color Scanner digitizing a cylindrical scan on
a Mayan vase. The flattened or "roll-out" image of the painting on the vase is shown in (b).
This feature was used to prepare images of a suite of vases for the exhibition People of the
Jaguar at the Canadian Museum of Civilization as well as for the publication Mystery of
the Maya.