nõges&nõges 2013. weak trends in ice phenology
TRANSCRIPT
EUROPEAN LARGE LAKES III
Weak trends in ice phenology of Estonian large lakes despitesignificant warming trends
Peeter Noges • Tiina Noges
Received: 29 December 2012 / Accepted: 26 May 2013 / Published online: 7 June 2013
� Springer Science+Business Media Dordrecht 2013
Abstract We studied changes in air temperature
(AT) in Tartu, Estonia, since 1866; ice phenology in
two Estonian large lakes since the 1920s; and daily
surface water temperatures (SWT) in these lakes since
the 1940s. The Mann–Kendall test showed increasing
AT trends in all seasons with biggest changes in
spring. The strongest increase in SWT occurred in
April and August. The temperature increase has
accelerated since 1961. Despite significant trends in
the seasonal AT and SWT of Estonian large lakes,
trends in ice phenology were weak or absent, implying
that the processes governing ice phenology are more
complex than those governing lake SWT. Greater
snowfall was associated with later ice breakup, longer
duration of ice cover, and greater ice thickness, while
the relationship between winter rainfall and these ice
parameters was the opposite. In the deeper Lake
Peipsi, ice-on occurred later and ice-off earlier than in
the shallower Vortsjarv. The dates of both ice-on and
ice-off responded more sensitively to AT in the case of
Peipsi than in the case of Vortsjarv. An increase of the
average November–March AT by 2�C would presum-
ably halve the ice cover duration in Peipsi but shorten
it only by about 20% in Vortsjarv.
Keywords Air temperature � Surface water
temperature � Freezing date � Ice breakup date �Lake morphometry
Introduction
Water has a high heat absorption capacity and can
absorb or lose large amounts of energy without
undergoing large changes in temperature. Water
temperature tends thus to respond more to long-term
patterns rather than to short-term fluctuations in AT,
and is likely to be affected by climate warming
(Livingstone & Dokulil, 2001). As a result, changes in
lakes’ heat balance, temperature profiles and vertical
mixing can be expected and these, in turn, can affect
vertical fluxes of nutrients and dissolved oxygen and
hence the productivity and composition of lake
plankton (Jankowski et al., 2006). Thermal conditions
of lakes are of socio-economic relevance, for instance
for tourism, fisheries and water supply. Water tem-
perature is thus an important indicator for the heat
balance of lakes, which can affect the lake ecosystem
and its services. Although lakes and reservoirs make
up only a small percentage of the Earth’s surface, they
act as sentinels that reflect the influence of climate
change in their much broader catchments (Adrian
Guest editors: D. Straile, D. Gerdeaux, D. M. Livingstone,
P. Noges, F. Peeters & K.-O. Rothhaupt / European Large
Lakes III. Large lakes under changing environmental
conditions
P. Noges (&) � T. Noges
Centre for Limnology, Institute of Agricultural and
Environmental Sciences, Estonian University of Life
Sciences, 61117 Rannu, Tartu County, Estonia
e-mail: [email protected]
123
Hydrobiologia (2014) 731:5–18
DOI 10.1007/s10750-013-1572-z
et al., 2009; Williamson et al., 2009). Inland waters are
not just passively subjected to the impacts of global
climate change, but being the deposition sites of
terrestrially derived carbon and outgassing of green-
house gases, they become hotspots for carbon cycling
and regulating climate change (Cole et al., 2007). Thus
the understanding of the resistance, resilience, and
responses of lakes to environmental change is crucial
to their effective management (Williamson et al.,
2008, 2009).
Over the last 100 years (1906–2005), the global
mean surface AT has risen at a mean rate of
0.07 ± 0.02�C per decade when estimated by a linear
trend, and the rate of warming over the last 50 years is
almost double that (0.13 ± 0.03�C, IPCC, 2007). In
the Baltic Sea basin the annual mean near-surface AT
has increased at almost the same rate over the period
1871–2004—by 0.1�C per decade in the north ([60�N)
and by 0.07�C per decade in the south (\60�N,
including Estonia)—with the strongest warming
occurring in spring and winter (BACC, 2008). Changes
in the surface water temperature (SWT) of lakes
generally follow the changes in AT, while a strong
regional and supra-regional coherence is provided
through atmospheric teleconnections such as the North
Atlantic Oscillation (Livingstone et al., 2010b).
In areas experiencing winter ice cover on lakes, its
duration varies from some days in northern Spain,
northern Italy and Scotland to more than 200 days in
northern Europe and high alpine regions (Noges et al.,
2009). Ice-on and ice-off are complex phenomena
controlled by many interacting meteorological and
some non-meteorological forcing factors. Air temper-
ature is the key driver determining the timing of ice
breakup, with both long-term trends and short-term
variability in AT being reflected in the timing of ice
breakup (Palecki & Barry, 1986; Assel & Robertson,
1995; Weyhenmeyer et al., 2004). Among meteoro-
logical factors, the amount of precipitation (Vavrus
et al., 1996; Beltaos, 2004), wind speed, wind
direction, and cloud cover (Palecki & Barry, 1986)
also have certain effects. The amount of winter
precipitation can exert a positive feedback both on
the duration of ice cover and ice break-up date. If
warmer winters still have more precipitation in the
form of snow, the thicker snow cover could last longer
and avoid snow-melt and even the effects of an AT
increase due to high albedo. And also vice versa—on
the basis of observations made at the Tartu-Toravere
Actinometric Station (Tooming, 1996), surface albedo
between 1953 and 1994 decreased substantially,
especially in March (-21%) and April (-13%) due
to the reduced snow cover. This reduction coincided
with an increase in temperature over the same period,
mainly observed in winter (up to 4.0�C in March). As
temperature and albedo exert a positive feedback, the
seasonal decrease of albedo intensified the absorption
of radiation at the surface and thereby contributed to a
rise in AT.
Our previous studies covering the period
1961–2004 (Noges, 2009) showed the existence of
significant increasing trends in AT in Estonia (Janu-
ary–April, July–August) and in the water temperature
of Estonian large lakes (April, August). Parn (2006),
who analysed the timing of ice break-up on Peipsi and
the dates when water temperature passed through 5
and 10�C, found that over the period 1947–2000, ice
break-up shifted more than 1 week earlier (P = 0.02),
while there was no trend in the 5 and 10�C temperature
crossing dates.
Based on the most comprehensive available data
covering nearly 150 years of AT and precipitation
measurements, 90 years of ice phenology records and
65 years of SWT and ice thickness measurements, our
study aimed to reveal long-term and more recent
trends in these variables and to analyse the sensitivity
of the water temperature and the ice regime in two
large, shallow, Estonian lakes, Vortsjarv and Peipsi, to
climatic forcing. Vortsjarv (270 km2, mean depth
2.8 m) is the largest lake located entirely within the
borders of Estonia, whereas Peipsi, situated *65 km
from Vortsjarv, is a transboundary lake shared
between Estonia and Russia (Fig. 1). The data
analysed in this paper characterize only the largest
of the three parts of the lake, Peipsi sensu stricto
(2,611 km2, mean depth 8.3 m).
In view of the reported increasing trends in AT and
the shortening of the duration of ice cover in the
northern hemisphere during the last century (e.g.,
Magnuson et al., 2000; Weyhenmeyer et al., 2004,
2011; Dibike et al., 2011, 2012; Bernhardt et al.,
2012), we expected a similar phenomenon in lakes
Vortsjarv and Peipsi. These lakes are large and
shallow and therefore their water temperature should
respond highly sensitively to changes in AT. We
hypothesized that increasing snowfall could exert a
positive effect, and increasing winter rainfall a neg-
ative effect, on ice duration.
6 Hydrobiologia (2014) 731:5–18
123

Materials and methods
We studied long-term data on AT and precipitation in
Tartu, Estonia (monthly averages available since 1866,
daily since 1881); dates of ice cover formation (ice-on)
and ice melt (ice-off) on two Estonian large lakes,
Peipsi (Mustvee station) and Vortsjarv (Rannu Joesuu
station), available since the 1920s; and data on ice
thickness and daily water temperatures in these lakes,
available since the 1940s (Tables 1, 2). All these data
were provided by the Estonian Meteorological and
Hydrological Institute. The ice-on date was defined as
the starting date of a stable ice cover (no open water
visible from the observation station). To be considered
stable, the ice cover had to last for at least 20 days. The
start of the ice drift in spring was considered the end
date of the ice cover and registered as the ice-off date.
Ice thickness was measured at a drill hole at a distance
from the shore (1 km in Vortsjarv and 2 km in Peipsi)
every 10 days during stable ice cover. We split the
December–March precipitation into snowfall and
rainfall depending on the average daily AT (\0 or
[0�C). We used the Jones et al. (1997) NAO index for
winter (NAOWi, XII–III average) as a climate variation
proxy for the whole period. The time-series of NAOWi,
updated to the winter of 2011/2012, was downloaded
from http://www.cru.uea.ac.uk/*timo/datapages/naoi.
htm (last accessed on 20 December 2012).
We applied a non-parametric Mann–Kendall test to
detect gradual trends and a parametric cumulative
deviation test to detect step changes in mean val-
ues (eWater toolkit http://www.toolkit.net.au/Tools/
TREND, last accessed on 20 Dec 2012). Details of
these methods are described by Kundzewicz & Robson
(2004). Besides the full periods determined by data
availability, tests for trends and step changes were also
conducted for the period 1961–2011, which is likely to
have larger anthropogenic trends embedded in the
climate data (IPCC, 2007).
Results
Trends in air and water temperatures
The Mann–Kendall trend analysis revealed several
significant increasing trends in air and water temper-
ature in Estonia and in lakes Peipsi and Vortsjarv
(Table 1; Fig. 2), but no significant decreasing trend.
The annual mean AT in Tartu increased by 0.09�C per
decade since 1866 and by 0.44�C per decade since
Fig. 1 Location map of lakes Vortsjarv and Peipsi. Diamonds show the locations of measurement stations
Hydrobiologia (2014) 731:5–18 7
123
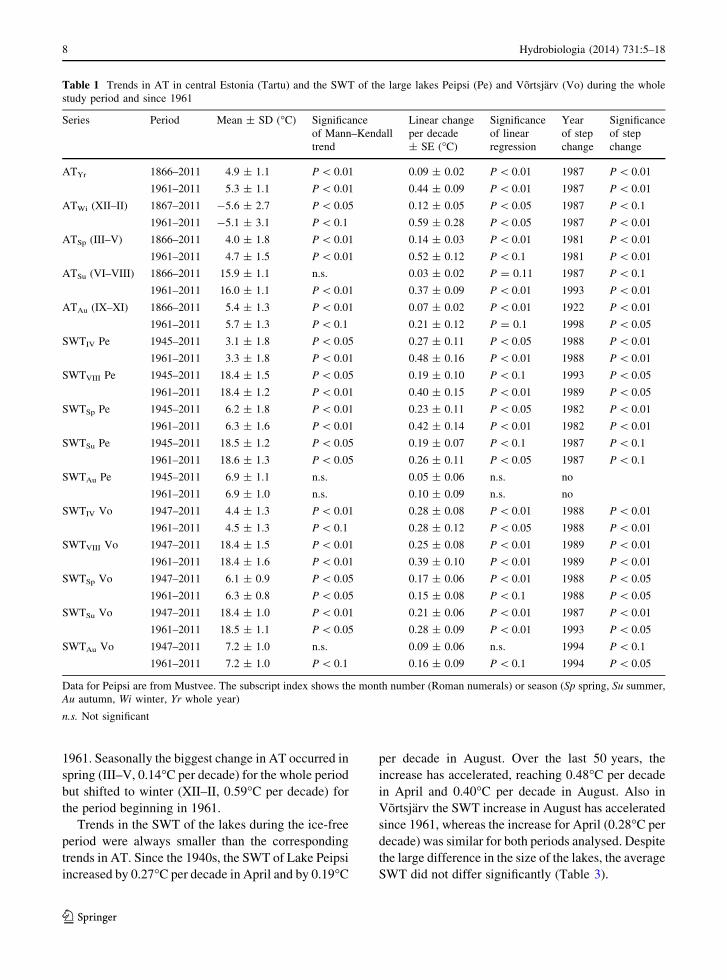
1961. Seasonally the biggest change in AT occurred in
spring (III–V, 0.14�C per decade) for the whole period
but shifted to winter (XII–II, 0.59�C per decade) for
the period beginning in 1961.
Trends in the SWT of the lakes during the ice-free
period were always smaller than the corresponding
trends in AT. Since the 1940s, the SWT of Lake Peipsi
increased by 0.27�C per decade in April and by 0.19�C
per decade in August. Over the last 50 years, the
increase has accelerated, reaching 0.48�C per decade
in April and 0.40�C per decade in August. Also in
Vortsjarv the SWT increase in August has accelerated
since 1961, whereas the increase for April (0.28�C per
decade) was similar for both periods analysed. Despite
the large difference in the size of the lakes, the average
SWT did not differ significantly (Table 3).
Table 1 Trends in AT in central Estonia (Tartu) and the SWT of the large lakes Peipsi (Pe) and Vortsjarv (Vo) during the whole
study period and since 1961
Series Period Mean ± SD (�C) Significance
of Mann–Kendall
trend
Linear change
per decade
± SE (�C)
Significance
of linear
regression
Year
of step
change
Significance
of step
change
ATYr 1866–2011 4.9 ± 1.1 P \ 0.01 0.09 ± 0.02 P \ 0.01 1987 P \ 0.01
1961–2011 5.3 ± 1.1 P \ 0.01 0.44 ± 0.09 P \ 0.01 1987 P \ 0.01
ATWi (XII–II) 1867–2011 -5.6 ± 2.7 P \ 0.05 0.12 ± 0.05 P \ 0.05 1987 P \ 0.1
1961–2011 -5.1 ± 3.1 P \ 0.1 0.59 ± 0.28 P \ 0.05 1987 P \ 0.01
ATSp (III–V) 1866–2011 4.0 ± 1.8 P \ 0.01 0.14 ± 0.03 P \ 0.01 1981 P \ 0.01
1961–2011 4.7 ± 1.5 P \ 0.01 0.52 ± 0.12 P \ 0.1 1981 P \ 0.01
ATSu (VI–VIII) 1866–2011 15.9 ± 1.1 n.s. 0.03 ± 0.02 P = 0.11 1987 P \ 0.1
1961–2011 16.0 ± 1.1 P \ 0.01 0.37 ± 0.09 P \ 0.01 1993 P \ 0.01
ATAu (IX–XI) 1866–2011 5.4 ± 1.3 P \ 0.01 0.07 ± 0.02 P \ 0.01 1922 P \ 0.01
1961–2011 5.7 ± 1.3 P \ 0.1 0.21 ± 0.12 P = 0.1 1998 P \ 0.05
SWTIV Pe 1945–2011 3.1 ± 1.8 P \ 0.05 0.27 ± 0.11 P \ 0.05 1988 P \ 0.01
1961–2011 3.3 ± 1.8 P \ 0.01 0.48 ± 0.16 P \ 0.01 1988 P \ 0.01
SWTVIII Pe 1945–2011 18.4 ± 1.5 P \ 0.05 0.19 ± 0.10 P \ 0.1 1993 P \ 0.05
1961–2011 18.4 ± 1.2 P \ 0.01 0.40 ± 0.15 P \ 0.01 1989 P \ 0.05
SWTSp Pe 1945–2011 6.2 ± 1.8 P \ 0.01 0.23 ± 0.11 P \ 0.05 1982 P \ 0.01
1961–2011 6.3 ± 1.6 P \ 0.01 0.42 ± 0.14 P \ 0.01 1982 P \ 0.01
SWTSu Pe 1945–2011 18.5 ± 1.2 P \ 0.05 0.19 ± 0.07 P \ 0.1 1987 P \ 0.1
1961–2011 18.6 ± 1.3 P \ 0.05 0.26 ± 0.11 P \ 0.05 1987 P \ 0.1
SWTAu Pe 1945–2011 6.9 ± 1.1 n.s. 0.05 ± 0.06 n.s. no
1961–2011 6.9 ± 1.0 n.s. 0.10 ± 0.09 n.s. no
SWTIV Vo 1947–2011 4.4 ± 1.3 P \ 0.01 0.28 ± 0.08 P \ 0.01 1988 P \ 0.01
1961–2011 4.5 ± 1.3 P \ 0.1 0.28 ± 0.12 P \ 0.05 1988 P \ 0.01
SWTVIII Vo 1947–2011 18.4 ± 1.5 P \ 0.01 0.25 ± 0.08 P \ 0.01 1989 P \ 0.01
1961–2011 18.4 ± 1.6 P \ 0.01 0.39 ± 0.10 P \ 0.01 1989 P \ 0.01
SWTSp Vo 1947–2011 6.1 ± 0.9 P \ 0.05 0.17 ± 0.06 P \ 0.01 1988 P \ 0.05
1961–2011 6.3 ± 0.8 P \ 0.05 0.15 ± 0.08 P \ 0.1 1988 P \ 0.05
SWTSu Vo 1947–2011 18.4 ± 1.0 P \ 0.01 0.21 ± 0.06 P \ 0.01 1987 P \ 0.01
1961–2011 18.5 ± 1.1 P \ 0.05 0.28 ± 0.09 P \ 0.01 1993 P \ 0.05
SWTAu Vo 1947–2011 7.2 ± 1.0 n.s. 0.09 ± 0.06 n.s. 1994 P \ 0.1
1961–2011 7.2 ± 1.0 P \ 0.1 0.16 ± 0.09 P \ 0.1 1994 P \ 0.05
Data for Peipsi are from Mustvee. The subscript index shows the month number (Roman numerals) or season (Sp spring, Su summer,
Au autumn, Wi winter, Yr whole year)
n.s. Not significant
8 Hydrobiologia (2014) 731:5–18
123
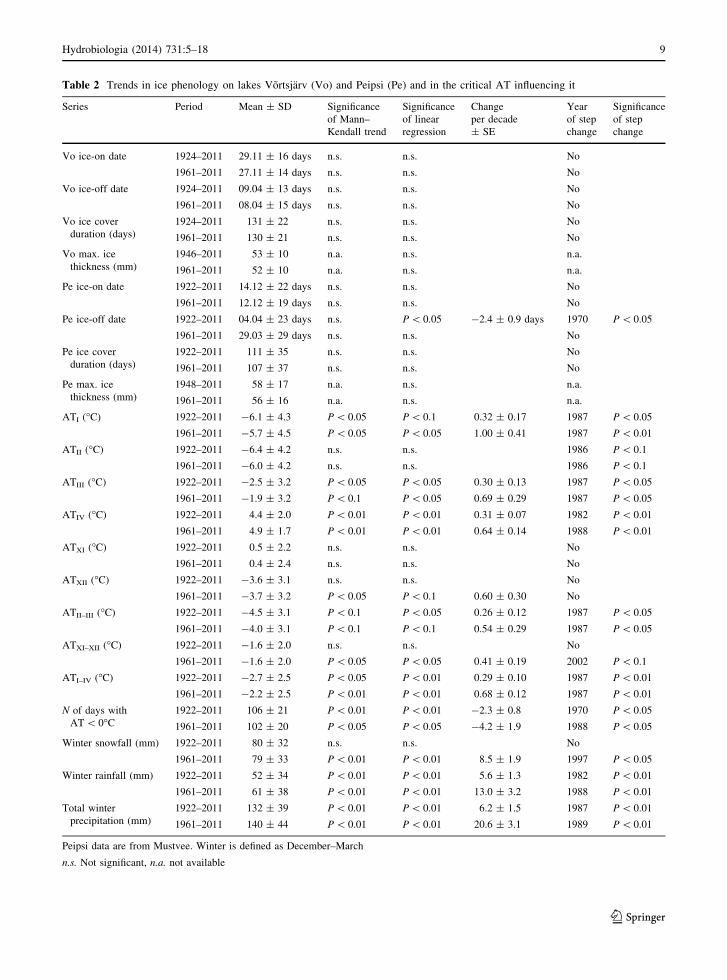
Table 2 Trends in ice phenology on lakes Vortsjarv (Vo) and Peipsi (Pe) and in the critical AT influencing it
Series Period Mean ± SD Significance
of Mann–
Kendall trend
Significance
of linear
regression
Change
per decade
± SE
Year
of step
change
Significance
of step
change
Vo ice-on date 1924–2011 29.11 ± 16 days n.s. n.s. No
1961–2011 27.11 ± 14 days n.s. n.s. No
Vo ice-off date 1924–2011 09.04 ± 13 days n.s. n.s. No
1961–2011 08.04 ± 15 days n.s. n.s. No
Vo ice cover
duration (days)
1924–2011 131 ± 22 n.s. n.s. No
1961–2011 130 ± 21 n.s. n.s. No
Vo max. ice
thickness (mm)
1946–2011 53 ± 10 n.a. n.s. n.a.
1961–2011 52 ± 10 n.a. n.s. n.a.
Pe ice-on date 1922–2011 14.12 ± 22 days n.s. n.s. No
1961–2011 12.12 ± 19 days n.s. n.s. No
Pe ice-off date 1922–2011 04.04 ± 23 days n.s. P \ 0.05 -2.4 ± 0.9 days 1970 P \ 0.05
1961–2011 29.03 ± 29 days n.s. n.s. No
Pe ice cover
duration (days)
1922–2011 111 ± 35 n.s. n.s. No
1961–2011 107 ± 37 n.s. n.s. No
Pe max. ice
thickness (mm)
1948–2011 58 ± 17 n.a. n.s. n.a.
1961–2011 56 ± 16 n.a. n.s. n.a.
ATI (�C) 1922–2011 -6.1 ± 4.3 P \ 0.05 P \ 0.1 0.32 ± 0.17 1987 P \ 0.05
1961–2011 -5.7 ± 4.5 P \ 0.05 P \ 0.05 1.00 ± 0.41 1987 P \ 0.01
ATII (�C) 1922–2011 -6.4 ± 4.2 n.s. n.s. 1986 P \ 0.1
1961–2011 -6.0 ± 4.2 n.s. n.s. 1986 P \ 0.1
ATIII (�C) 1922–2011 -2.5 ± 3.2 P \ 0.05 P \ 0.05 0.30 ± 0.13 1987 P \ 0.05
1961–2011 -1.9 ± 3.2 P \ 0.1 P \ 0.05 0.69 ± 0.29 1987 P \ 0.05
ATIV (�C) 1922–2011 4.4 ± 2.0 P \ 0.01 P \ 0.01 0.31 ± 0.07 1982 P \ 0.01
1961–2011 4.9 ± 1.7 P \ 0.01 P \ 0.01 0.64 ± 0.14 1988 P \ 0.01
ATXI (�C) 1922–2011 0.5 ± 2.2 n.s. n.s. No
1961–2011 0.4 ± 2.4 n.s. n.s. No
ATXII (�C) 1922–2011 -3.6 ± 3.1 n.s. n.s. No
1961–2011 -3.7 ± 3.2 P \ 0.05 P \ 0.1 0.60 ± 0.30 No
ATII–III (�C) 1922–2011 -4.5 ± 3.1 P \ 0.1 P \ 0.05 0.26 ± 0.12 1987 P \ 0.05
1961–2011 -4.0 ± 3.1 P \ 0.1 P \ 0.1 0.54 ± 0.29 1987 P \ 0.05
ATXI–XII (�C) 1922–2011 -1.6 ± 2.0 n.s. n.s. No
1961–2011 -1.6 ± 2.0 P \ 0.05 P \ 0.05 0.41 ± 0.19 2002 P \ 0.1
ATI–IV (�C) 1922–2011 -2.7 ± 2.5 P \ 0.05 P \ 0.01 0.29 ± 0.10 1987 P \ 0.01
1961–2011 -2.2 ± 2.5 P \ 0.01 P \ 0.01 0.68 ± 0.12 1987 P \ 0.01
N of days with
AT \ 0�C
1922–2011 106 ± 21 P \ 0.01 P \ 0.01 -2.3 ± 0.8 1970 P \ 0.05
1961–2011 102 ± 20 P \ 0.05 P \ 0.05 -4.2 ± 1.9 1988 P \ 0.05
Winter snowfall (mm) 1922–2011 80 ± 32 n.s. n.s. No
1961–2011 79 ± 33 P \ 0.01 P \ 0.01 8.5 ± 1.9 1997 P \ 0.05
Winter rainfall (mm) 1922–2011 52 ± 34 P \ 0.01 P \ 0.01 5.6 ± 1.3 1982 P \ 0.01
1961–2011 61 ± 38 P \ 0.01 P \ 0.01 13.0 ± 3.2 1988 P \ 0.01
Total winter
precipitation (mm)
1922–2011 132 ± 39 P \ 0.01 P \ 0.01 6.2 ± 1.5 1987 P \ 0.01
1961–2011 140 ± 44 P \ 0.01 P \ 0.01 20.6 ± 3.1 1989 P \ 0.01
Peipsi data are from Mustvee. Winter is defined as December–March
n.s. Not significant, n.a. not available
Hydrobiologia (2014) 731:5–18 9
123

Among the 30 temperature time-series analysed in
Table 1, 17 showed a significant step change in the
mean value during 1987–1989, five during 1993–1994
and four during 1981–1982. Conspicuously, abrupt
shifts in AT (in 1981, 1987 and 1993) either coincided
with abrupt shifts in water temperature or (mostly)
preceded those by 1 or 2 years.
In relation to ice phenology, AT trends for the cold
half year (XI–III) were studied in more detail
(Table 2). Since 1922, almost equal increasing trends
(0.30–0.32�C/decade) occurred in January, March and
April. In the second half of this period (1961–2011),
the slope of the trend almost tripled for January
(1.00�C/decade) but only doubled for March (0.69�C/
decade) and April (0.65�C/decade). In neither period
was the AT trend for February or November
significant, whereas for December the trend became
significant only in the later period starting in 1961.
The winter (December–March) NAO index (NAOWi)
had a marginally significant (P = 0.05) decreasing trend
since 1866 but no trend since 1961 (not shown).
Trends in ice parameters
There were clear differences in ice phenology between
the two large lakes (Table 3). On the larger Lake Peipsi,
ice cover formed on average 2 weeks later (P \ 0.001)
and disappeared 1 week earlier (P \ 0.05) than on
Vortsjarv. Despite a significantly (P \ 0.01) shorter ice
cover duration on Peipsi, the maximum ice thickness on
the two lakes was almost equal (56 ± 16 cm for Peipsi
and 52 ± 10 cm for Vortsjarv).
Fig. 2 Decadal changes in AT and in the SWT of lakes Peipsi
and Vortsjarv (numerical data presented in Table 1). The
subscripts denote the month number or season (Sp spring, Su
summer, Au autumn, Wi winter, Yr whole year) followed by the
lake name (Pe Peipsi, Vo Vortsjarv) and the beginning year of
the relevant period (all of which end in 2011). n.s. Mann–
Kendall trend non-significant. Seasonally different patterns are
used for better visualization
Table 3 Lake
morphometry and
differences in SWT and ice
parameters for the lakes
studied based on the period
1961–2011
n.s. Not significanta Only the large part of the
lake, the so-called Peipsi
sensu stricto
Variable Vortsjarv Peipsia P
Surface area (km2) 270 2,611
Mean depth (m) 2.8 8.3
SWTSp (�C) 6.3 ± 0.8 6.3 ± 1.6 n.s.
SWTSu (�C) 18.5 ± 1.1 18.6 ± 1.3 n.s.
SWTAu (�C) 7.2 ± 1.0 6.9 ± 1.0 n.s.
SWTIV (�C) 4.5 ± 1.3 3.3 ± 1.8 \0.001
SWTVIII (�C) 18.4 ± 1.6 18.4 ± 1.2 n.s.
Ice-on date 29 Nov. ± 14 days 12 Dec. ± 19 days \0.001
Ice-off date 08 Apr. ± 15 days 29 Mar. ± 28 days \0.05
Ice duration (days) 130 ± 21 107 ± 37 \0.001
Max. ice thickness (cm) 52 56 n.s.
10 Hydrobiologia (2014) 731:5–18
123
Among ice-on and ice-off dates, the only significant
change was the shift of ice-off in Peipsi to an earlier
date since the 1920s (2.4 days per decade, Table 2).
The resulting shortening of ice cover duration was not
statistically significant.
The total amount of precipitation in winter, as well
as the amount of winter rainfall, increased in both of the
periods analysed, but showed 2–3 times steeper slopes
for the period beginning in 1961. The number of days
with negative AT during winter decreased significantly
since 1922, while the average daily amount of precip-
itation (= snowfall) during these days increased. The
total amount of snowfall had no trend during the period
1922–2011, but showed a strong increase during the
period 1961–2011 (Table 2). Curiously, the average
total amounts of winter snowfall for the two periods
were still almost equal.
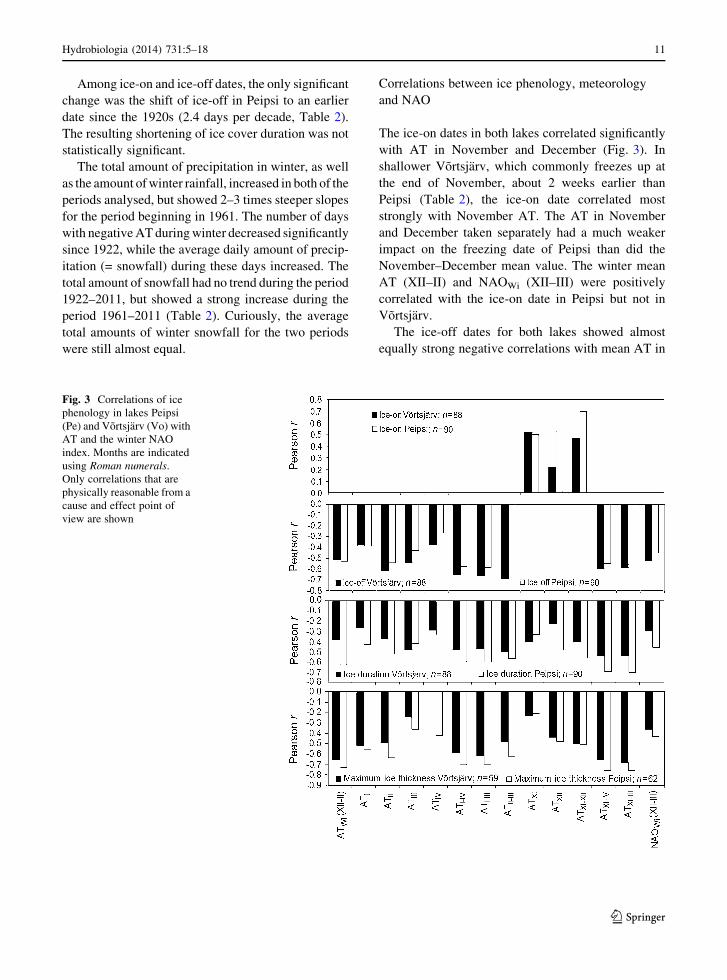
Correlations between ice phenology, meteorology
and NAO
The ice-on dates in both lakes correlated significantly
with AT in November and December (Fig. 3). In
shallower Vortsjarv, which commonly freezes up at
the end of November, about 2 weeks earlier than
Peipsi (Table 2), the ice-on date correlated most
strongly with November AT. The AT in November
and December taken separately had a much weaker
impact on the freezing date of Peipsi than did the
November–December mean value. The winter mean
AT (XII–II) and NAOWi (XII–III) were positively
correlated with the ice-on date in Peipsi but not in
Vortsjarv.
The ice-off dates for both lakes showed almost
equally strong negative correlations with mean AT in
Fig. 3 Correlations of ice
phenology in lakes Peipsi
(Pe) and Vortsjarv (Vo) with
AT and the winter NAO
index. Months are indicated
using Roman numerals.
Only correlations that are
physically reasonable from a
cause and effect point of
view are shown
Hydrobiologia (2014) 731:5–18 11
123
January–April, January–March and February–March.
Among single months, the strongest relationship with
AT occurred in February. Most of the correlations
between AT and ice-off dates were stronger for
smaller and shallower Vortsjarv than for Peipsi.
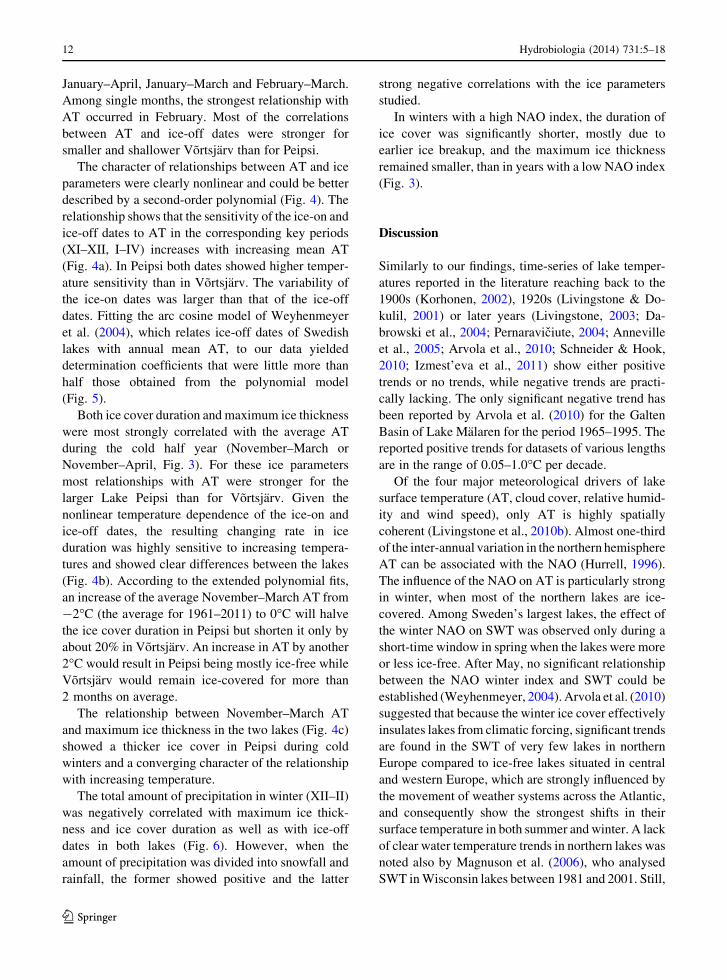
The character of relationships between AT and ice
parameters were clearly nonlinear and could be better
described by a second-order polynomial (Fig. 4). The
relationship shows that the sensitivity of the ice-on and
ice-off dates to AT in the corresponding key periods
(XI–XII, I–IV) increases with increasing mean AT
(Fig. 4a). In Peipsi both dates showed higher temper-
ature sensitivity than in Vortsjarv. The variability of
the ice-on dates was larger than that of the ice-off
dates. Fitting the arc cosine model of Weyhenmeyer
et al. (2004), which relates ice-off dates of Swedish
lakes with annual mean AT, to our data yielded
determination coefficients that were little more than
half those obtained from the polynomial model
(Fig. 5).
Both ice cover duration and maximum ice thickness
were most strongly correlated with the average AT
during the cold half year (November–March or
November–April, Fig. 3). For these ice parameters
most relationships with AT were stronger for the
larger Lake Peipsi than for Vortsjarv. Given the
nonlinear temperature dependence of the ice-on and
ice-off dates, the resulting changing rate in ice
duration was highly sensitive to increasing tempera-
tures and showed clear differences between the lakes
(Fig. 4b). According to the extended polynomial fits,
an increase of the average November–March AT from
-2�C (the average for 1961–2011) to 0�C will halve
the ice cover duration in Peipsi but shorten it only by
about 20% in Vortsjarv. An increase in AT by another
2�C would result in Peipsi being mostly ice-free while
Vortsjarv would remain ice-covered for more than
2 months on average.
The relationship between November–March AT
and maximum ice thickness in the two lakes (Fig. 4c)
showed a thicker ice cover in Peipsi during cold
winters and a converging character of the relationship
with increasing temperature.
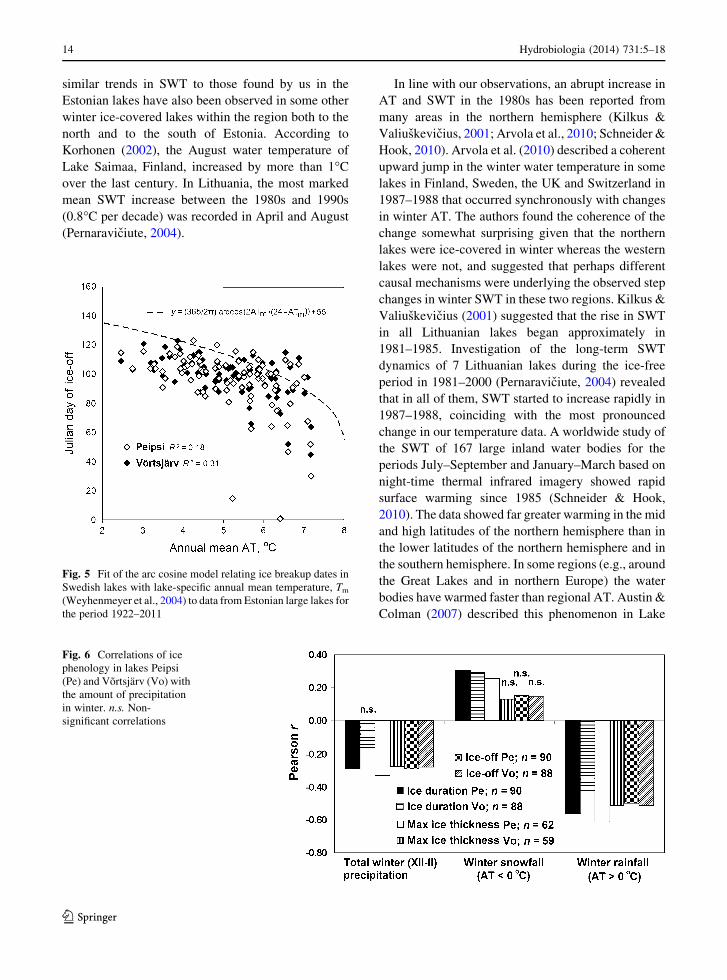
The total amount of precipitation in winter (XII–II)
was negatively correlated with maximum ice thick-
ness and ice cover duration as well as with ice-off
dates in both lakes (Fig. 6). However, when the
amount of precipitation was divided into snowfall and
rainfall, the former showed positive and the latter
strong negative correlations with the ice parameters
studied.
In winters with a high NAO index, the duration of
ice cover was significantly shorter, mostly due to
earlier ice breakup, and the maximum ice thickness
remained smaller, than in years with a low NAO index
(Fig. 3).
Discussion
Similarly to our findings, time-series of lake temper-
atures reported in the literature reaching back to the
1900s (Korhonen, 2002), 1920s (Livingstone & Do-
kulil, 2001) or later years (Livingstone, 2003; Da-
browski et al., 2004; Pernaraviciute, 2004; Anneville
et al., 2005; Arvola et al., 2010; Schneider & Hook,
2010; Izmest’eva et al., 2011) show either positive
trends or no trends, while negative trends are practi-
cally lacking. The only significant negative trend has
been reported by Arvola et al. (2010) for the Galten
Basin of Lake Malaren for the period 1965–1995. The
reported positive trends for datasets of various lengths
are in the range of 0.05–1.0�C per decade.
Of the four major meteorological drivers of lake
surface temperature (AT, cloud cover, relative humid-
ity and wind speed), only AT is highly spatially
coherent (Livingstone et al., 2010b). Almost one-third
of the inter-annual variation in the northern hemisphere
AT can be associated with the NAO (Hurrell, 1996).
The influence of the NAO on AT is particularly strong
in winter, when most of the northern lakes are ice-
covered. Among Sweden’s largest lakes, the effect of
the winter NAO on SWT was observed only during a
short-time window in spring when the lakes were more
or less ice-free. After May, no significant relationship
between the NAO winter index and SWT could be
established (Weyhenmeyer, 2004). Arvola et al. (2010)
suggested that because the winter ice cover effectively
insulates lakes from climatic forcing, significant trends
are found in the SWT of very few lakes in northern
Europe compared to ice-free lakes situated in central
and western Europe, which are strongly influenced by
the movement of weather systems across the Atlantic,
and consequently show the strongest shifts in their
surface temperature in both summer and winter. A lack
of clear water temperature trends in northern lakes was
noted also by Magnuson et al. (2006), who analysed
SWT in Wisconsin lakes between 1981 and 2001. Still,
12 Hydrobiologia (2014) 731:5–18
123
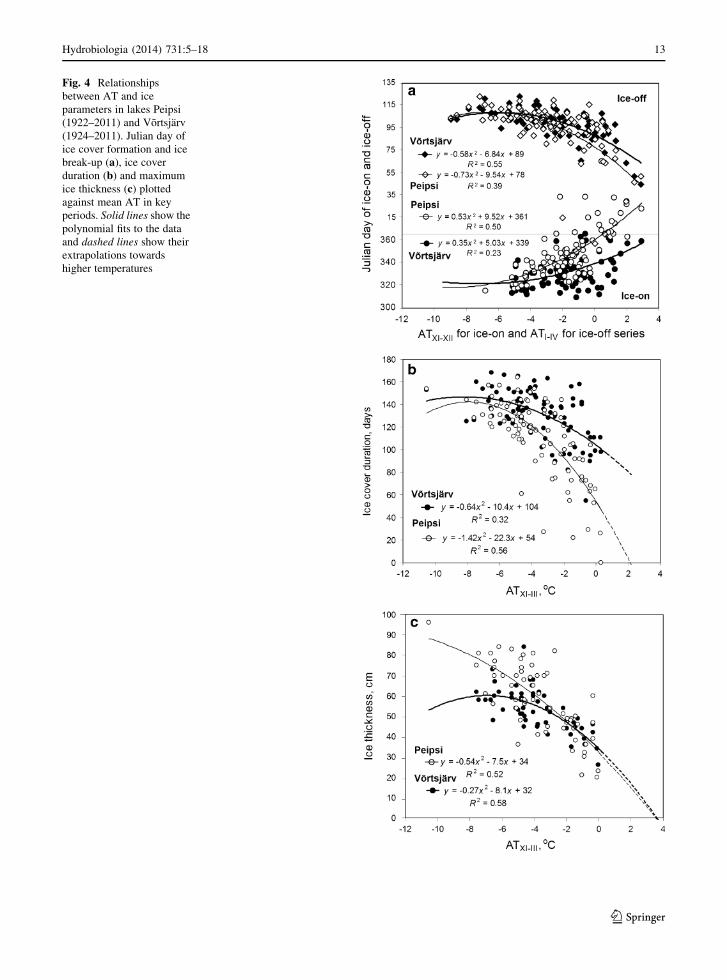
Fig. 4 Relationships
between AT and ice
parameters in lakes Peipsi
(1922–2011) and Vortsjarv
(1924–2011). Julian day of
ice cover formation and ice
break-up (a), ice cover
duration (b) and maximum
ice thickness (c) plotted
against mean AT in key
periods. Solid lines show the
polynomial fits to the data
and dashed lines show their
extrapolations towards
higher temperatures
Hydrobiologia (2014) 731:5–18 13
123
similar trends in SWT to those found by us in the
Estonian lakes have also been observed in some other
winter ice-covered lakes within the region both to the
north and to the south of Estonia. According to
Korhonen (2002), the August water temperature of
Lake Saimaa, Finland, increased by more than 1�C
over the last century. In Lithuania, the most marked
mean SWT increase between the 1980s and 1990s
(0.8�C per decade) was recorded in April and August
(Pernaraviciute, 2004).
In line with our observations, an abrupt increase in
AT and SWT in the 1980s has been reported from
many areas in the northern hemisphere (Kilkus &
Valiuskevicius, 2001; Arvola et al., 2010; Schneider &
Hook, 2010). Arvola et al. (2010) described a coherent
upward jump in the winter water temperature in some
lakes in Finland, Sweden, the UK and Switzerland in
1987–1988 that occurred synchronously with changes
in winter AT. The authors found the coherence of the
change somewhat surprising given that the northern
lakes were ice-covered in winter whereas the western
lakes were not, and suggested that perhaps different
causal mechanisms were underlying the observed step
changes in winter SWT in these two regions. Kilkus &
Valiuskevicius (2001) suggested that the rise in SWT
in all Lithuanian lakes began approximately in
1981–1985. Investigation of the long-term SWT
dynamics of 7 Lithuanian lakes during the ice-free
period in 1981–2000 (Pernaraviciute, 2004) revealed
that in all of them, SWT started to increase rapidly in
1987–1988, coinciding with the most pronounced
change in our temperature data. A worldwide study of
the SWT of 167 large inland water bodies for the
periods July–September and January–March based on
night-time thermal infrared imagery showed rapid
surface warming since 1985 (Schneider & Hook,
2010). The data showed far greater warming in the mid
and high latitudes of the northern hemisphere than in
the lower latitudes of the northern hemisphere and in
the southern hemisphere. In some regions (e.g., around
the Great Lakes and in northern Europe) the water
bodies have warmed faster than regional AT. Austin &
Colman (2007) described this phenomenon in Lake
Fig. 5 Fit of the arc cosine model relating ice breakup dates in
Swedish lakes with lake-specific annual mean temperature, Tm
(Weyhenmeyer et al., 2004) to data from Estonian large lakes for
the period 1922–2011
Fig. 6 Correlations of ice
phenology in lakes Peipsi
(Pe) and Vortsjarv (Vo) with
the amount of precipitation
in winter. n.s. Non-
significant correlations
14 Hydrobiologia (2014) 731:5–18
123
Superior based on in situ measurements and associated
it with the earlier start of positive thermal stratification
caused by earlier ice melt. The lack of trends in the
date of ice-off in Estonian lakes obviously explains
why trends in SWT did not exceed trends in AT in
Estonia. Intuitively, one might also relate the more
rapid increase in lake SWT, as compared to AT, to the
browning trend described for lakes in the northern
hemisphere (e.g. Roulet & Moore, 2006), as coloured
lakes absorb more light energy per unit volume in the
surface layers than clear lakes, which should cause
their greater heating during the day. However, as
shown by Houser (2006), the rate of heating during the
day did not compensate for the higher rate of heat loss
at night in the coloured lakes and as a consequence, the
epilimnion temperature was inversely correlated with
water colour.
As a result of changing winter climate, trends in ice
phenology have been reported from all regions of the
globe experiencing winter ice cover on lakes
(reviewed for example by Magnuson et al., 2000;
Livingstone et al., 2010a). The indicators include
freezing date, breakup date, duration of ice cover or
number of ice days, maximum ice thickness and the
spatial extent of ice cover in a region or on individual
water bodies.
Despite the occurrence of several significant trends
in seasonal AT and the water temperatures of the
Estonian large lakes, trends in ice phenology were
weak or absent, implying that the processes governing
ice phenology are more complex than those governing
lake surface temperature.
Air temperature, especially in the period
1–3 months before freeze-up and breakup, has been
considered the primary factor determining ice phenol-
ogy (e.g. Palecki & Barry, 1986; Robertson et al.,
1992; Livingstone, 1997, 2000; Duguay et al., 2006).
Various studies suggest a linear relationship between
AT and the freeze-up and breakup dates (e.g. Palecki
& Barry, 1986; Skinner, 1993; Assel & Robertson,
1995; Williams et al., 2004). A number of recent
studies (Weyhenmeyer et al., 2004, 2011; Livingstone
& Adrian, 2009; Livingstone et al., 2010a) have shown
that the relationship between AT and ice phenology is
inherently nonlinear. Based on comprehensive histor-
ical ice phenology data from Sweden, Weyhenmeyer
et al. (2004) showed that the relationship between the
timing of ice-off and AT can be well described by an
arc cosine function. Because AT varies sinusoidally
during the year, the duration of the period (D) with AT
below 0�C is an arc cosine function of the smoothed
AT. D responds to changes in annual mean temper-
ature approximately linearly within a range of
3–9 months, but the relationship deviates increasingly
from linearity as D approaches 0 or 12 months.
Our results confirmed the nonlinear character of the
relationship between AT and the key dates in ice
phenology. Although the duration of ice cover in the
Estonian large lakes still exceeds 3 months on aver-
age, it has been considerably shorter in several years,
especially in Peipsi where permanent ice cover has
repeatedly lasted less than 1 month. The Weyhen-
meyer et al. (2004) arc cosine model for predicting ice
breakup dates based on annual mean AT did not fit our
data well for several reasons. Firstly, it was based on
regional temperature patterns in Sweden (relationships
between means, amplitudes and phase shifts in
temperature cycles in air and lake surface water).
Secondly, the model used aggregated data over a
number of years or a number of lakes, whereas our
data represented single lake-year combinations that
increased the scatter. Thirdly, a systematic difference
between our data and the Swedish data could be
caused by different criteria used for defining the
calendar date of ice breakup, which was the end of ice
cover in our case but could be the end of all ice
phenomena in the case of the Swedish data. As the arc
cosine model used annual mean temperature and did
not account for lake-specific features of the relation-
ship, we preferred to use AT for the key periods which
had strongest correlations with ice phenology. We
found the quadratic fit sufficiently good to predict the
further divergence of the ice regime of the two large
lakes, as they captured the nonlinearity of the AT–ice
relationships and described 50% or more of the
variation in the long-term ice phenology.
As there were no significant trends in November
and November–December average AT, i.e. in the key
period for ice formation, the lack of trends in ice-on
dates is easily explainable. There is, however, no good
explanation for the lack of trend in the ice breakup
dates in Vortsjarv and in ice cover duration for both
large lakes. Vavrus et al. (1996) showed that increased
snowfall causes a monotonic delay in the breakup
date, whereas decreased snowfall nonlinearly hastens
ice decay. Although our data showed that there has
been a significant increase in winter snowfall, this
increase can hardly explain the lack of trends in the ice
Hydrobiologia (2014) 731:5–18 15
123
breakup dates because the amount of winter rainfall
increased even more. Given the strong negative
correlation between winter rainfall and the ice param-
eters, this should rather have amplified the effect of
increasing AT in March and April.
The generally similar climatic forcing acting on the
two lakes, which are located in a flat landscape about
65 km from each other, and the similar structure of the
available data, presented a good opportunity to study
the effect of lake-specific differences on their temper-
ature and ice regimes. Differences in ice phenology
between Vortsjarv and Peipsi were in line with the
observations and model results of Bernhardt et al.
(2012), according to which deeper and clearer lakes
have later ice-on and earlier ice-off dates, resulting in
shorter periods of ice cover than in the case of shallow
and more turbid lakes. There seems to be a general
consensus among investigators regarding the later
freezing of deeper lakes compared to shallower ones.
Due to the high specific heat content of water, the
deeper the lake, the longer the periods with AT below
0�C that are needed to cool down the lake so that ice
can form on its surface (Stewart & Haugen, 1990;
Korhonen, 2006; Sporka et al., 2006; Benson et al.,
2012). The later freezing of deeper lakes shortens the
duration of their ice cover, and, as a result of the
nonlinear relationship between ice duration and AT
discussed earlier, increases the sensitivity of these
lakes to AT changes. Differences in the sensitivity of
the ice cover on Vortsjarv and Peipsi to AT were
clearly revealed in our data (Fig. 4). The largest lake in
Europe, Lake Ladoga in Russia (mean depth 51 m), is
likely to respond quite rapidly to future warming,
since this lake is, on average, completely covered with
ice only in February (Karetnikov & Naumenko, 2008).
The large lakes in Sweden are also becoming increas-
ingly ice-free (Weyhenmeyer et al., 2008). Upon
losing their ice cover, the large lakes in Europe may
shift from a dimictic to a monomictic type in the near
future, which would have important ramifications with
respect to their chemistry and phytoplankton.
As shown by several authors (Korhonen, 2006;
Sporka et al., 2006; Adrian et al., 2009; Benson et al.,
2012), individual physical lake properties influence
freezing processes much more strongly than thawing
processes, which are therefore much more clearly
regulated by external meteorological forcing. Spatial
analysis of ice phenology trends across the Laurentian
Great Lakes region during a recent warming period
(Jensen et al., 2007) showed stronger trends toward
later freeze date in larger lakes. Significant differences
also occurred in the ice-off dates of Vortsjarv and
Peipsi, with the larger lake opening earlier and being
more sensitive to temperature forcing. We hypothesize
that this difference might result from the longer wind
fetch on Peipsi, which often causes strong ice drift and
piling up of the ice on the shore (Jaani, 2001).
The effect of lake surface area on ice phenology is
more debatable, and despite rather strong correlations
found in some datasets between surface area and mean
ice breakup date (Wynne et al., 1996), Stewart &
Haugen (1990) concluded that lakes with large surface
areas do not necessarily freeze later than lakes with
small surface areas.
Conclusions
Air temperature data from Tartu since 1866 showed
increasing trends in all seasons, with the biggest
changes occurring in spring. In the larger Lake Peipsi,
with a shorter ice cover, the biggest changes in water
temperature since the 1940s also occurred in spring,
whereas in the smaller Vortsjarv they occurred in
summer.
Increases in air and water temperatures have
accelerated during the last 50 years, with step changes
occurring mostly in the 1980s.
Despite several significant trends in seasonal AT and
in the SWT of Estonian large lakes, trends in ice
phenology were weak or absent, implying that the
processes governing ice phenology are more complex
than those governing lake surface temperature. Greater
snowfall was associated with later ice breakup, longer
duration and greater thickness of ice, while the
relationship between winter rainfall and these ice
parameters was the opposite.
Our data confirmed the nonlinearity of the rela-
tionship between AT and the freeze-up and breakup
dates and showed that this relationship can be
described well by a quadratic function. However,
there are also notable differences between the two
large lakes that are attributable to differences in
morphometry. The deeper Lake Peipsi had later ice-on
and earlier ice-off, whereas both dates showed higher
temperature sensitivity than in Vortsjarv. As a conse-
quence, an increase of the average November–March
AT by 2�C would presumably halve the ice cover
16 Hydrobiologia (2014) 731:5–18
123
duration in Peipsi, but would shorten it only by about
20% in Vortsjarv.
Acknowledgments The study was supported by the Estonian
target funding project SF 0170011508, by grants 8729 and 9102
from the Estonian Science Foundation, by 7th EU Framework
Programme, Theme 6 (Environment including Climate Change)
project REFRESH (Adaptive strategies to Mitigate the Impacts
of Climate Change on European Freshwater Ecosystems,
Contract No. 244121) and by EU Regional Development
Foundation, Environmental Conservation and Environmental
Technology R&D Programme project VeeOBS (3.2.0802.11-
0043). We wish to thank Dr. David Livingstone for advice and
for checking the English language of our manuscript.
References
Adrian, R., C. M. O’Reilly, H. Zagarese, S. B. Baines, D.
O. Hessen, W. Keller, D. M. Livingstone, R. Sommaruga,
D. Straile, E. Van Donk, G. A. Weyhenmeyer & M.
Winder, 2009. Lakes as sentinels of climate change. Lim-
nology and Oceanography 54: 2283–2297.
Anneville, O., S. Gammeter & D. Straile, 2005. Phosphorus
decrease and climate variability: mediators of synchrony in
phytoplankton changes among European peri-alpine lakes.
Freshwater Biology 50: 1731–1746.
Arvola, L., D. G. George, D. M. Livingstone, M. Jarvinen, T.
Blenckner, M. T. Dokulil, E. Jennings, C. N. Aonghusa, P.
Noges, T. Noges & G. A. Weyhenmeyer, 2010. The impact
of changing climate on the thermal characteristics of lakes.
In George, D. G. (ed.), The Impact of Climate Change on
European Lakes, Aquatic Ecology Series 4. Springer,
Dordrecht: 85–101.
Assel, R. & D. M. Robertson, 1995. Changes in winter air
temperatures near Lake Michigan, 1851–1993, as deter-
mined from regional lake-ice records. Limnology and
Oceanography 40: 165–176.
Austin, J. A. & S. M. Colman, 2007. Lake Superior summer
water temperatures are increasing more rapidly than
regional air temperatures: a positive ice-albedo feedback.
Geophysical Research Letters 34: L06604. doi:10.1029/
2006GL029021.
BACC, 2008. Assessment of Climate Change for the Baltic Sea
Basin. Regional Climate Studies. Springer, Berlin.
Beltaos, S., 2004. Climate impacts on the ice regime of an
Atlantic river. Nordic Hydrology 35: 81–99.
Benson, B. J., J. J. Magnuson, O. P. Jensen, V. M. Card, G.
Hodgkins, J. Korhonen, D. M. Livingstone, K. M. Stewart,
G. A. Weyhenmeyer & N. G. Granin, 2012. Extreme events,
trends, and variability in Northern Hemisphere lake-ice
phenology (1855–2005). Climatic Change 112: 299–323.
Bernhardt, J., C. Engelhardt, G. Kirillin & J. Matschullat, 2012.
Lake ice phenology in Berlin-Brandenburg from
1947–2007: observations and model hindcasts. Climatic
Change 112: 791–817.
Cole, J. J., Y. T. Prairie, N. F. Caraco, W. H. McDowell, L.
J. Tranvik, R. G. Striegl, C. M. Duarte, P. Kortelainen, J.
A. Downing, J. J. Middelburg & J. Melack, 2007. Plumbing
the global carbon cycle: integrating inland waters into the
terrestrial carbon budget. Ecosystems 10: 171–184.
Dabrowski, M., W. Marszelewski & R. Skowron, 2004. The
trends and dependencies between air and water tempera-
tures in lakes in northern Poland from 1961–2000.
Hydrology and Earth System Sciences 8: 79–87.
Dibike, Y., T. Prowse, T. Saloranta & R. Ahmed, 2011.
Response of Northern Hemisphere lake-ice cover and lake-
water thermal structure patterns to a changing climate.
Hydrological Processes 25: 2942–2953.
Dibike, Y., T. Prowse, B. Bonsal, L. de Rham & T. Saloranta,
2012. Simulation of North American lake-ice cover char-
acteristics under contemporary and future climate condi-
tions. International Journal of Climatology 32: 695–709.
Duguay, C. R., T. D. Prowse, B. R. Bonsal, R. D. Brown, M.
P. Lacroix & P. Menard, 2006. Recent trends in Canadian
lake ice cover. Hydrological Processes 20: 781–801.
Houser, J. N., 2006. Water color affects the stratification, sur-
face temperature, heat content, and mean epilimnetic
irradiance of small lakes. Canadian Journal of Fisheries and
Aquatic Sciences 63: 2447–2455.
Hurrell, J. W., 1996. Influence of variations in extra-tropical
wintertime teleconnections on Northern Hemisphere tem-
perature. Geophysical Research Letters 23: 665–668.
IPCC, 2007. Climate Change 2007: the physical science basis.
In Solomon, S., D. Qin, M. Manning, Z. Chen, M. Marquis,
K. B. Averyt, M. Tignor & H. L. Miller (eds), Contribution
of Working Group I to the Fourth Assessment Report of the
Intergovernmental Panel on Climate Change. Cambridge
University Press, Cambridge.
Izmest’eva, L. R., E. A. Silow & E. Litchman, 2011. Long-term
dynamics of Lake Baikal pelagic phytoplankton under
climate change. Inland Water Biology 4: 301–307.
Jaani, A., 2001. Thermal regime and ice conditions. In Noges, T.
(ed.), Lake Peipsi. Meteorology, Hydrology, Hydrochem-
istry. Sulemees Publishers, Tartu: 65–72.
Jankowski, T., D. M. Livingstone, R. Forster, H. Buhrer & P.
Niederhauser, 2006. Consequences of the 2003 European
heatwave for lakes: implications for a warmer world.
Limnology and Oceanography 51: 815–819.
Jensen, O. P., B. J. Benson, J. J. Magnuson, V. M. Card, M.
N. Futter, P. A. Soranno & K. M. Stewart, 2007. Spatial
analysis of ice phenology trends across the Laurentian
Great Lakes region during a recent warming period. Lim-
nology and Oceanography 52: 2013–2026.
Jones, P. D., T. Jonsson & D. Wheeler, 1997. Extension to the
North Atlantic Oscillation using early instrumental pres-
sure observations from Gibraltar and South-West Iceland.
International Journal of Climatology 17: 1433–1450.
Karetnikov, S. G. & M. A. Naumenko, 2008. Recent trends in
Lake Ladoga ice cover. Hydrobiologia 599: 41–48.
Kilkus, K. & G. Valiuskevicius, 2001. Klimato svyravimu
atspindziai ezeru ir upiu hidrologiniuose bei hidrofiziniu-
ose rodikliuose. In Bukantis, A. (ed.), Klimato svyravimu
poveikis fiziniams geograiniams procesams Lietuvoje.
Vilniaus Universitetas, Vilnius: 194–230.
Korhonen, J., 2002. Suomen vesistojen lampotilaolot 1900-luvulla.
Suomen Ymparisto 566: 1–115.
Korhonen, J., 2006. Long-term trends in lake ice cover in Fin-
land. Proceedings of the 18th IAHR International Sympo-
sium on Ice: 71–78.
Hydrobiologia (2014) 731:5–18 17
123
Kundzewicz, Z. W. & A. J. Robson, 2004. Change detection in
hydrological records – a review of the methodology.
Hydrological Sciences Journal 49: 7–19.
Livingstone, D. M., 1997. Break-up dates of Alpine lakes as
proxy data for local and regional mean surface air tem-
peratures. Climatic Change 37: 407–439.
Livingstone, D. M., 2000. Large-scale climatic forcing detected
in historical observations of lake ice break-up. Verhandl-
ungen der Internationalen Vereinigung fur Limnologie
27(5): 2775–2783.
Livingstone, D. M., 2003. Impact of secular climate change on
the thermal structure of a large temperate central European
lake. Climatic Change 57: 205–225.
Livingstone, D. M. & R. Adrian, 2009. Modeling the duration of
intermittent ice cover on a lake for climate-change studies.
Limnology and Oceanography 54: 1709–1722.
Livingstone, D. M. & M. T. Dokulil, 2001. Eighty years of
spatially coherent Austrian lake surface water temperatures
and their relationship to regional air temperature and the
North Atlantic Oscillation. Limnology and Oceanography
46: 1220–1227.
Livingstone, D. M., R. Adrian, T. Blenckner, G. George & G.
A. Weyhenmeyer, 2010a. Lake ice phenology. In George, D.
G. (ed.), The Impact of Climate Change on European Lakes,
Aquatic Ecology Series 4. Springer, Dordrecht: 51–61.
Livingstone, D. M., R. Adrian, L. Arvola, T. Blenckner, M.
T. Dokulil, R. E. Hari, G. George, T. Jankowski, M.
Jarvinen, E. Jennings, P. Noges, T. Noges, D. Straile & G.
A. Weyhenmeyer, 2010b. Regional and supra-regional
coherence in limnological variables. In George, D. G. (ed.),
The Impact of Climate Change on European Lakes,
Aquatic Ecology Series 4. Springer, Dordrecht: 311–337.
Magnuson, J. J., D. M. Robertson, B. J. Benson, R. H. Wynne, D.
M. Livingstone, T. Arai, R. A. Assel, R. G. Barry, V. Card, E.
Kuusisto, N. G. Granin, T. D. Prowse, K. M. Stewart & V.
S. Vuglinski, 2000. Historical trends in lake and river ice
cover in the Northern Hemisphere. Science 289: 1743–1746.
Magnuson, J. J., B. J. Benson, J. D. Lenters & D. M. Robertson,
2006. Climate-driven variability and change. In Magnuson,
J. J., T. K. Kratz & B. J. Benson (eds), Long-Term
Dynamics of Lakes in the Landscape: Long-Term Eco-
logical Research on North Temperate Lakes. Oxford Uni-
versity Press, Oxford: 123–150.
Noges, T., 2009. Trends in air temperature in Estonia and in
water temperature of Estonian large lakes in 1961–2004,
possible consequences on water quality. Verhandlungen
der internationalen Vereinigung fur Limnologie 30(7):
997–999.
Noges, T., P. Noges, A. Jolma & J. Kaitaranta, 2009. Impacts of
climate change on physical characteristics of lakes in
Europe. JRC Scientific and Technical Reports, EUR 24064
EN. Office for Official Publications of the European
Communities, Luxembourg.
Palecki, M. A. & R. G. Barry, 1986. Freeze-up and break-up of
lakes as an index of temperature changes during the tran-
sition seasons: a case study for Finland. Journal of Climate
and Applied Meteorology 25: 893–902.
Parn, O., 2006. Jaanahtuste ja veetemperatuuri tundlikkus kli-
ima muutusele. Publicationes Geophysicales Universitatis
Tartuensis 50: 97–106.
Pernaraviciute, B., 2004. The impact of climate change on
thermal regime of Lithuanian lakes. Ekologija 2: 58–63.
Robertson, D. M., R. A. Ragotzkie & J. J. Magnuson, 1992.
Lake ice records used to detect historical and future cli-
matic changes. Climatic Change 21: 407–427.
Roulet, N. & T. R. Moore, 2006. Browning the waters. Nature
444: 283–284.
Schneider, P. & S. J. Hook, 2010. Space observations of inland
water bodies show rapid surface warming since 1985.
Geophysical Research Letters 37: L22405. doi:10.1029/
2010GL045059.
Skinner, W. R., 1993. Lake ice conditions as a cryospheric
indicator for detecting climate variability in Canada. In
Detection Strategies for Snow and Ice. Proceedings of the
International Workshop on Snow and Lake Ice Cover, and
the Climate System, 30–31 March 1992, Niagara, ON,
Canada: 204–240.
Sporka, F., D. M. Livingstone, E. Stuchlık, J. Turek & J. Galas,
2006. Water temperatures and ice cover in the lakes of the
Tatra Mountains. Biologia 61: 77–90.
Stewart, K. M. & R. K. Haugen, 1990. Influence of lake mor-
phometry on ice dates. Verhandlungen der internationale
Vereinigung fur Limnologie 24(1): 122–127.
Tooming, H., 1996. Changes in surface albedo and air temper-
ature at Tartu, Estonia. Tellus 48A: 722–726.
Vavrus, S. J., R. H. Wynne & J. A. Foley, 1996. Measuring the
sensitivity of southern Wisconsin lake ice to climate vari-
ations and lake depth using a numerical model. Limnology
and Oceanography 41: 822–831.
Weyhenmeyer, G. A., 2004. Synchrony in relationships between
the North Atlantic Oscillation and water chemistry among
Sweden’s largest lakes. Limnology and Oceanography 49:
1191–1201.
Weyhenmeyer, G. A., M. Meili & D. M. Livingstone, 2004.
Nonlinear temperature response of lake ice breakup.
Geophysical Research Letters 31: L07203.
Weyhenmeyer, G. A., A.-K. Westoo & E. Willen, 2008.
Increasingly ice-free winters and their effects on water
quality in Sweden’s largest lakes. Hydrobiologia 599:
111–118.
Weyhenmeyer, G. A., D. M. Livingstone, M. Meili, O. Jensen,
B. Benson & J. J. Magnuson, 2011. Large geographical
differences in the sensitivity of ice-covered lakes and rivers
in the Northern Hemisphere to temperature changes. Glo-
bal Change Biology 17: 268–275.
Williams, G., K. L. Layman & H. G. Stefan, 2004. Dependence
of lake ice covers on climatic, geographic and bathymetric
variables. Cold Regions Science and Technology 40:
145–164.
Williamson, C. E., W. Dodds, T. K. Kratz & M. Palmer, 2008.
Lakes and streams as sentinels of environmental change in
terrestrial and atmospheric processes. Frontiers in Ecology
and the Environment 6: 247–254.
Williamson, C. E., J. E. Saros & D. W. Schindler, 2009. Sen-
tinels of change. Science 323: 887–889.
Wynne, R. H., J. J. Magnuson, M. K. Clayton, T. M. Lillesand &
D. C. Rodman, 1996. Determinants of temporal coherence
in the satellite-derived 1987–1994 ice breakup dates of
lakes on the Laurentian Shield. Limnology and Oceanog-
raphy 41: 832–838.
18 Hydrobiologia (2014) 731:5–18
123